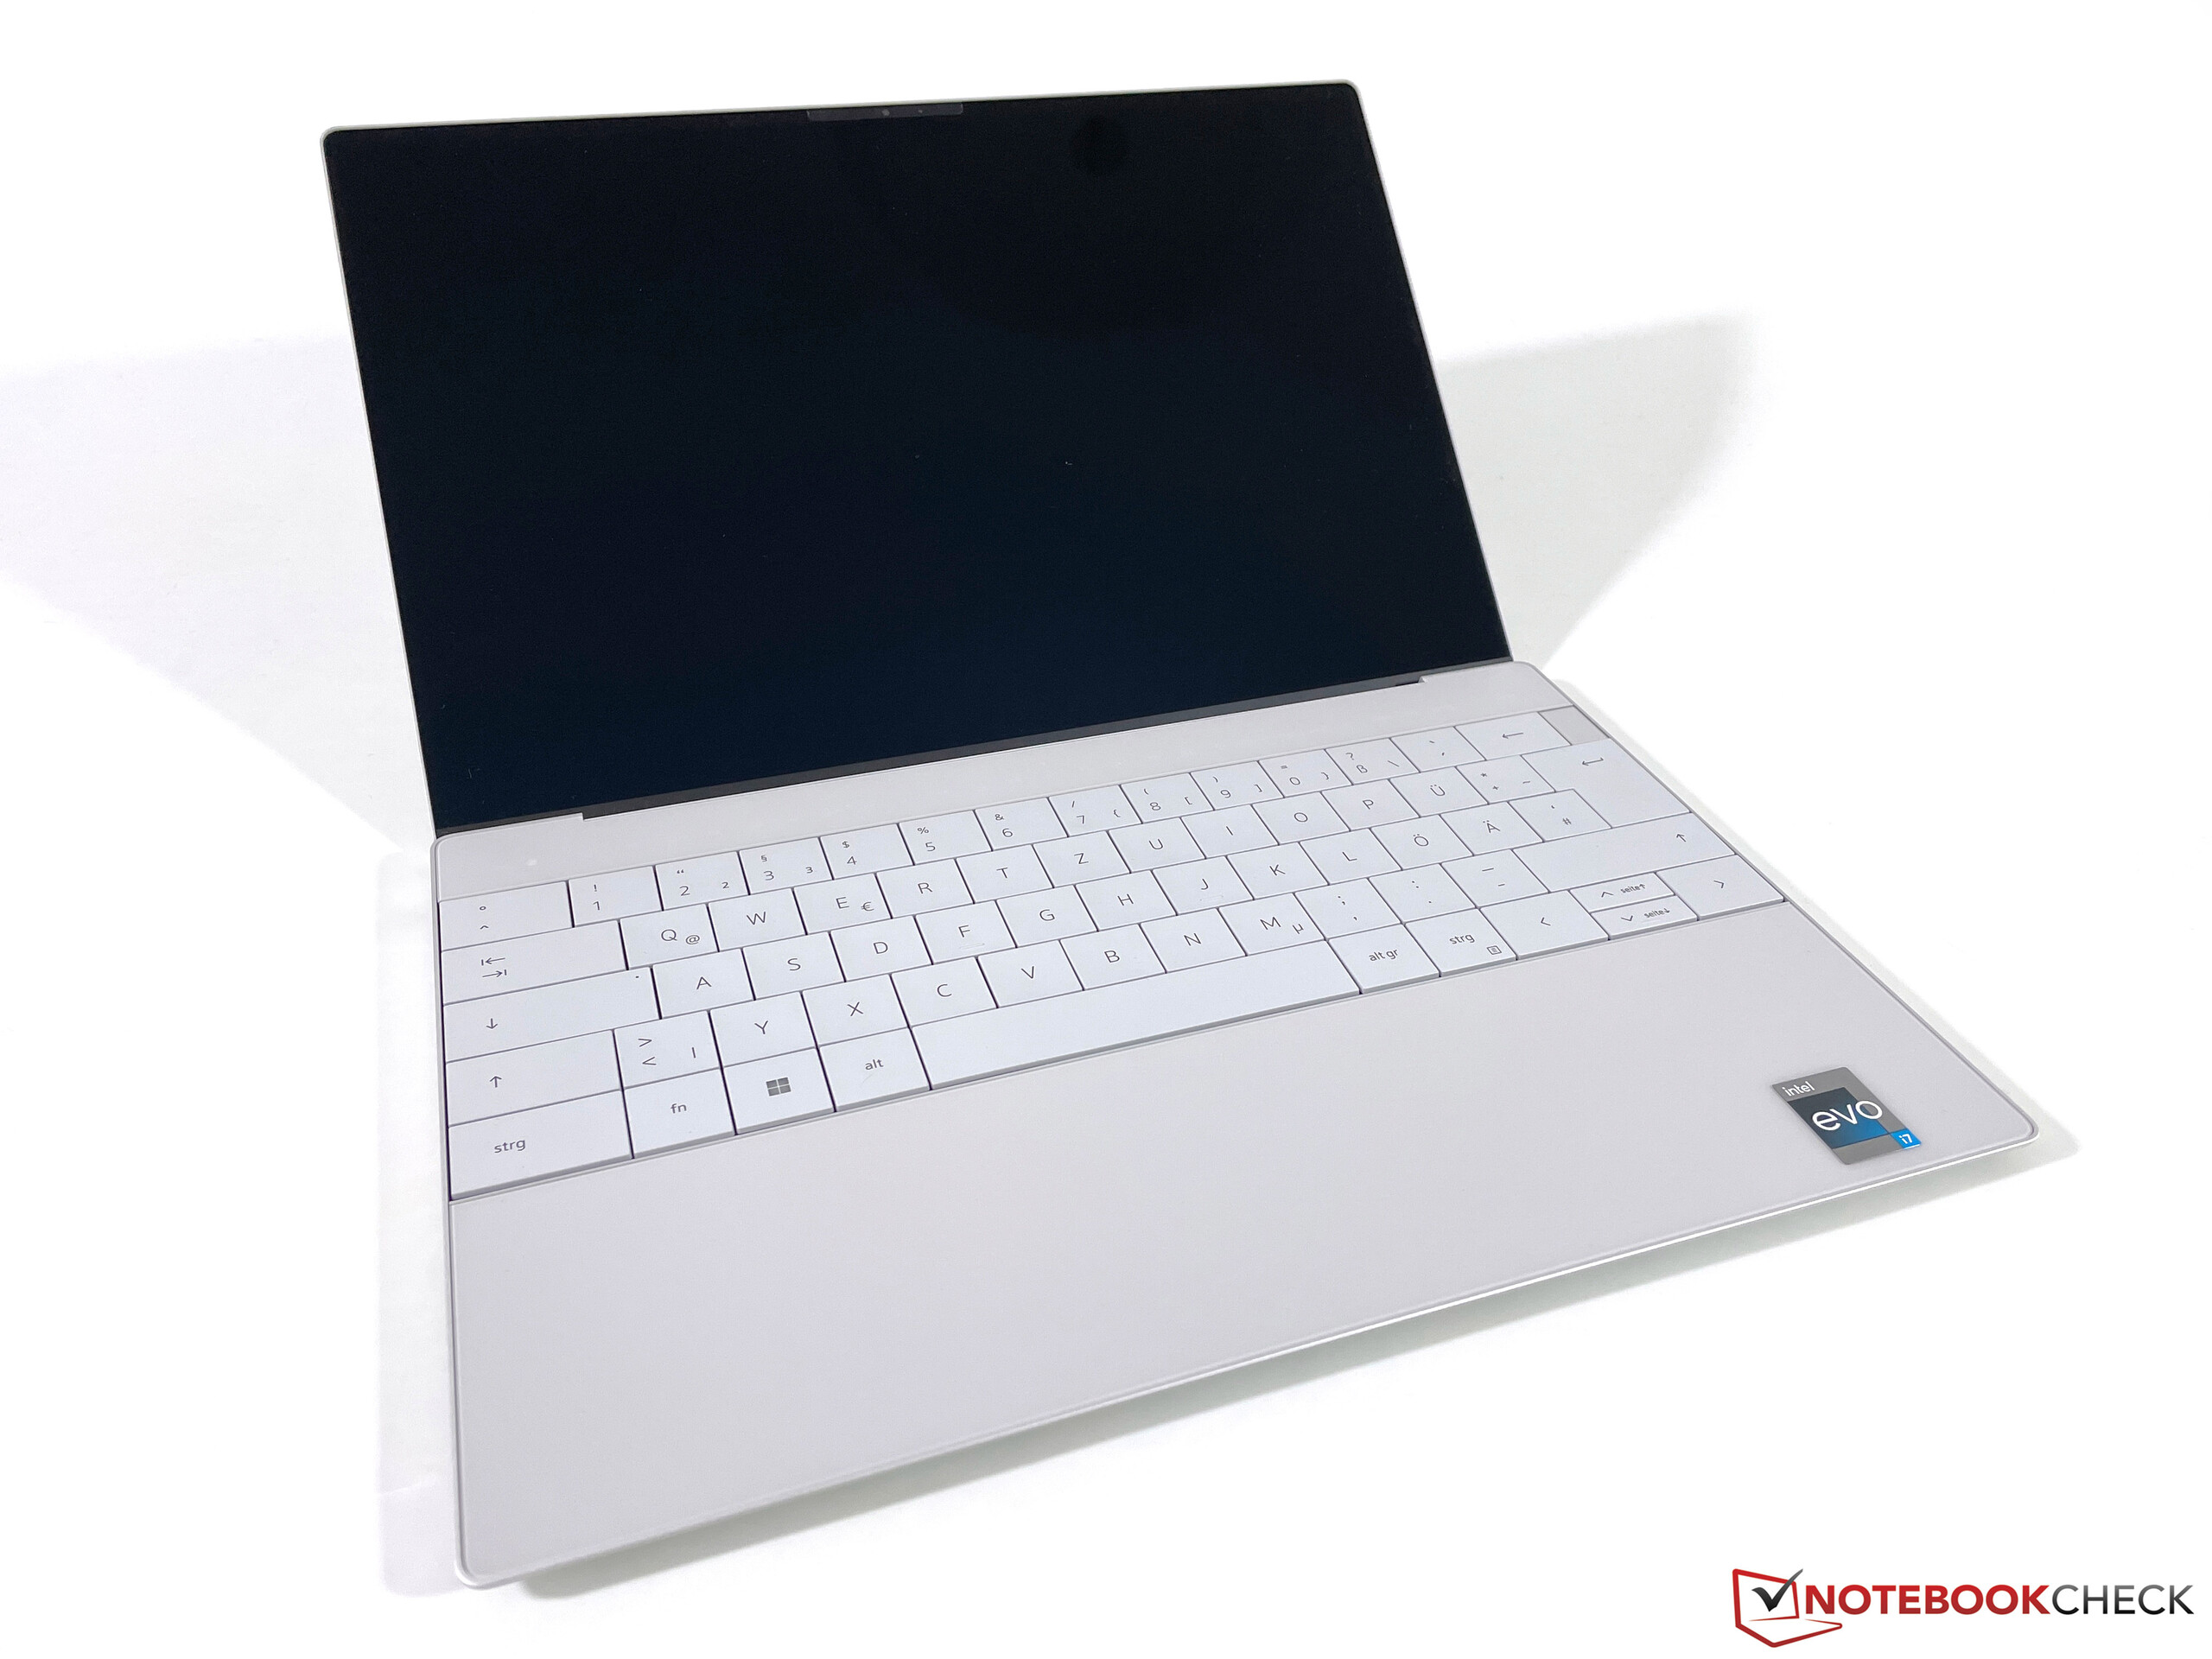
Recensione del portatile Dell XPS 13 Plus: La configurazione base è la scelta migliore?

Non ne abbiamo mai abbastanza di XPS. Dopo il "xPS 13 più veloce finora", un XPS 13 Plus con un Core i7-1260P e un pannello 4K, abbiamo ora il modello Plus entry-level dotato di un Core i5-1240P, un pannello Full HD e un'unità SSD Micron da 512 GB. L'ingresso nel mondo degli XPS ad alte prestazioni costa attualmente 1.350 euro (~$1.385).
Come promemoria: Da quest'anno, Dell offre il compatto XPS 13 in due versioni: L'XPS 13 "normale"XPS 13 "normale con CPU Intel Alder Lake della serie U, e l'XPS 13 Plus.XPS 13 Plus con chip Alder Lake P più potenti. Abbiamo già recensito entrambe le versioni e abbiamo concluso che le differenze di prestazioni sono sostanziali. Questo vale non solo per la CPU e l'iGPU, ma anche per il dispositivo di archiviazione.
In questo aggiornamento della recensione, porremo le seguenti domande: Vale la pena spendere di più per il Core i7? Qual è la differenza di prestazioni rispetto al modello Alder Lake U (i5)? E la durata della batteria, considerando che Alder Lake U raddoppia l'autonomia di Alder Lake P?
Come in precedenza, ci sono concorrenti che hanno ottenuto punteggi migliori nelle nostre recensioni. Innanzitutto, ilApple MacBook Air 2020 M1 Entry e l' Asus Zenbook S 13 OLEDentrambi tendenzialmente più economici dell'XPS 13 Plus i5 entry-level.
Altri portatili Dell XPS 13 recensiti da Notebookcheck
XPS 13 Plus 9320 i7-1260P(4K, Alder Lake P 2022)
XPS 13 9315 i5-1230U(Full HD, Alder Lake U 2022)
XPS 13 9310 Core i7(Full HD, Tiger Lake 2021)
In questo aggiornamento non ci soffermeremo sulla lavorazione, sulla configurazione delle porte, sui dispositivi di input o sugli altoparlanti; fate invece riferimento alla nostra recensione dell'XPS 13 Plus 9320 i7-1260P.XPS 13 Plus 9320 i7-1260P (4K, Alder Lake P 2022)
Potenziali concorrenti a confronto
Punteggio | Data | Modello | Peso | Altezza | Dimensione | Risoluzione | Prezzo |
|---|---|---|---|---|---|---|---|
| 86.1 % v7 (old) | 08/2022 | Dell XPS 13 Plus 9320 i5-1240p i5-1240P, Iris Xe G7 80EUs | 1.2 kg | 15.3 mm | 13.40" | 1920x1200 | |
| 91.1 % v7 (old) | 12/2020 | Apple MacBook Air 2020 M1 Entry M1, M1 7-Core GPU | 1.3 kg | 16.1 mm | 13.30" | 2560x1600 | |
| 90.1 % v7 (old) | 07/2022 | Asus Zenbook S 13 OLED R7 6800U, Radeon 680M | 1.1 kg | 14.9 mm | 13.30" | 2880x1800 | |
| 89.8 % v7 (old) | 02/2021 | Lenovo ThinkPad X1 Nano-20UN002UGE i7-1160G7, Iris Xe G7 96EUs | 946 gr | 16 mm | 13.00" | 2160x1350 | |
| 88.8 % v7 (old) | 02/2022 | Huawei MateBook 13s i5 11300H i5-11300H, Iris Xe G7 80EUs | 1.3 kg | 16.5 mm | 13.40" | 2520x1680 | |
| 86.9 % v7 (old) | 07/2022 | Dell XPS 13 Plus 9320 4K i7-1260P, Iris Xe G7 96EUs | 1.2 kg | 15.3 mm | 13.40" | 3840x2400 |
Connettività - Aggiornamenti SSD solo per il modello XPS Plus
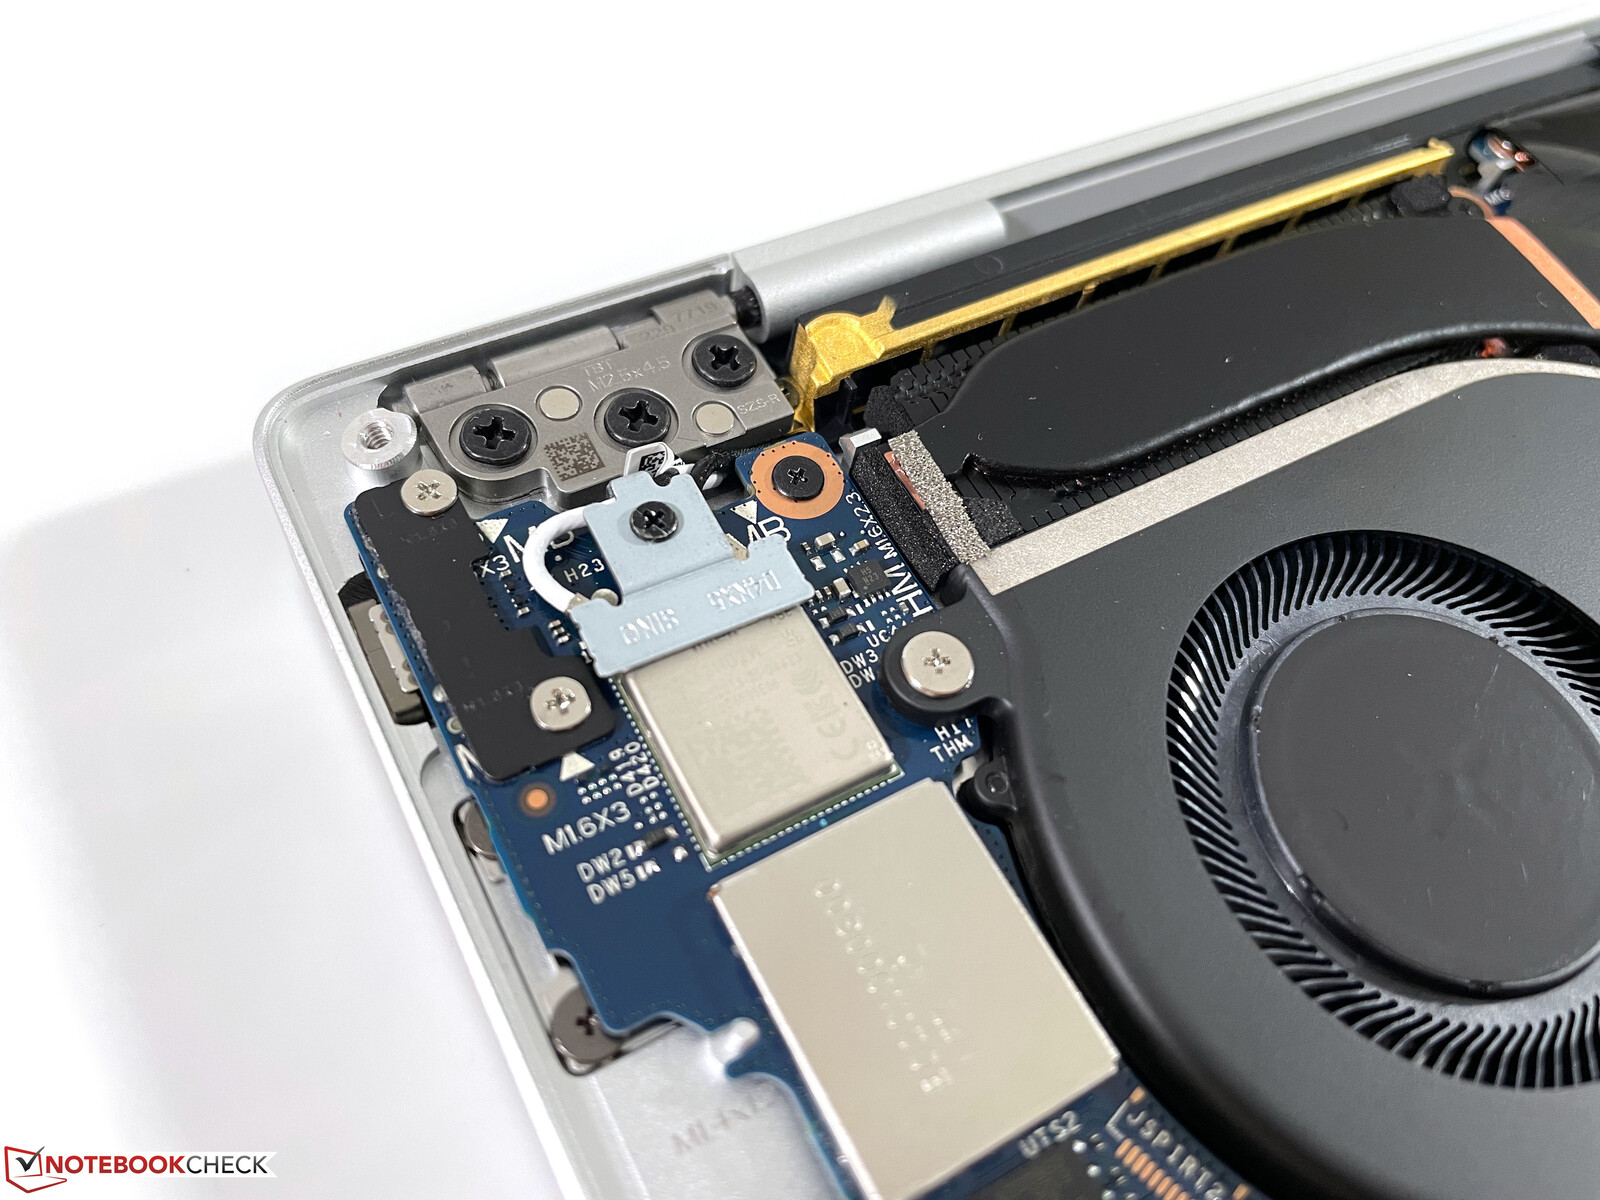
Comunicazione
Con questa unità siamo riusciti a connetterci alla rete Wi-Fi 6E fornita dal nostro router. Questo non è stato possibile con la variante 4K/i7 del Plus
Webcam


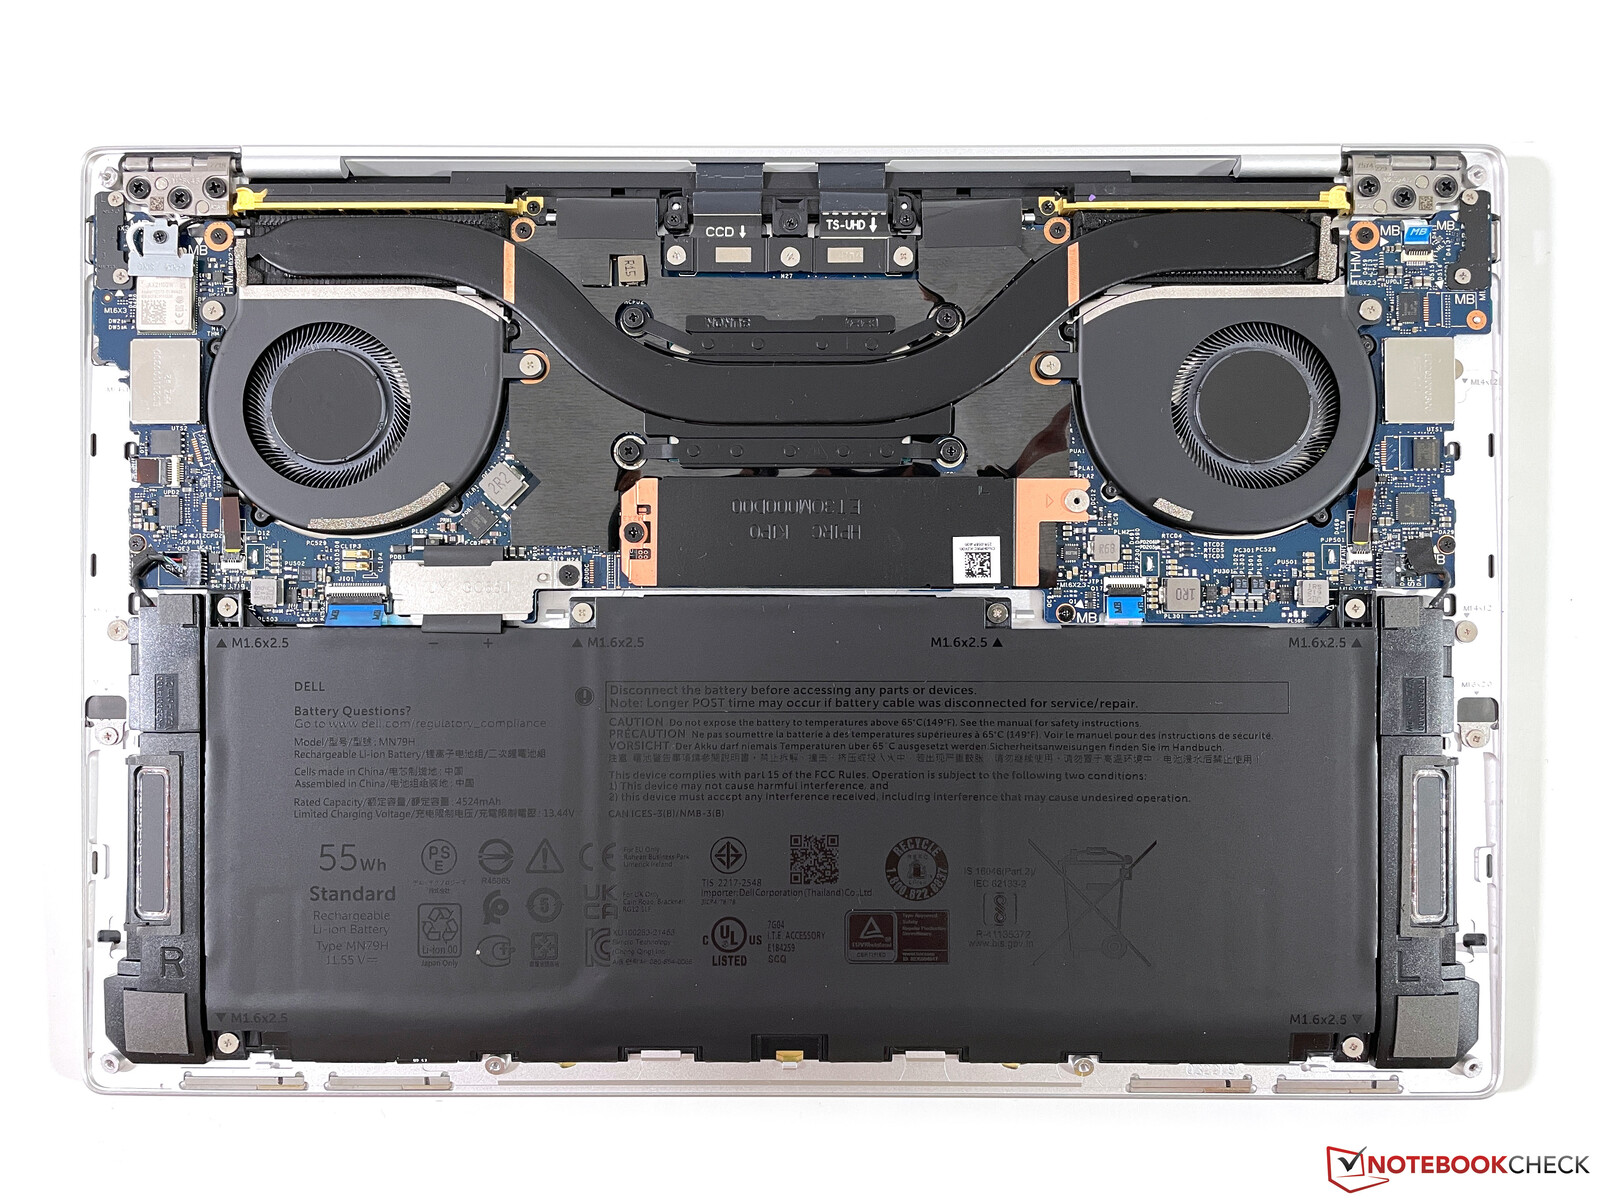
Manutenzione
Il coperchio inferiore è fissato con sei viti Torx (T5) ed è facile da rimuovere. L'interno ha un layout ben organizzato, ma gli utenti possono solo pulire le ventole o sostituire l'unità SSD M.2
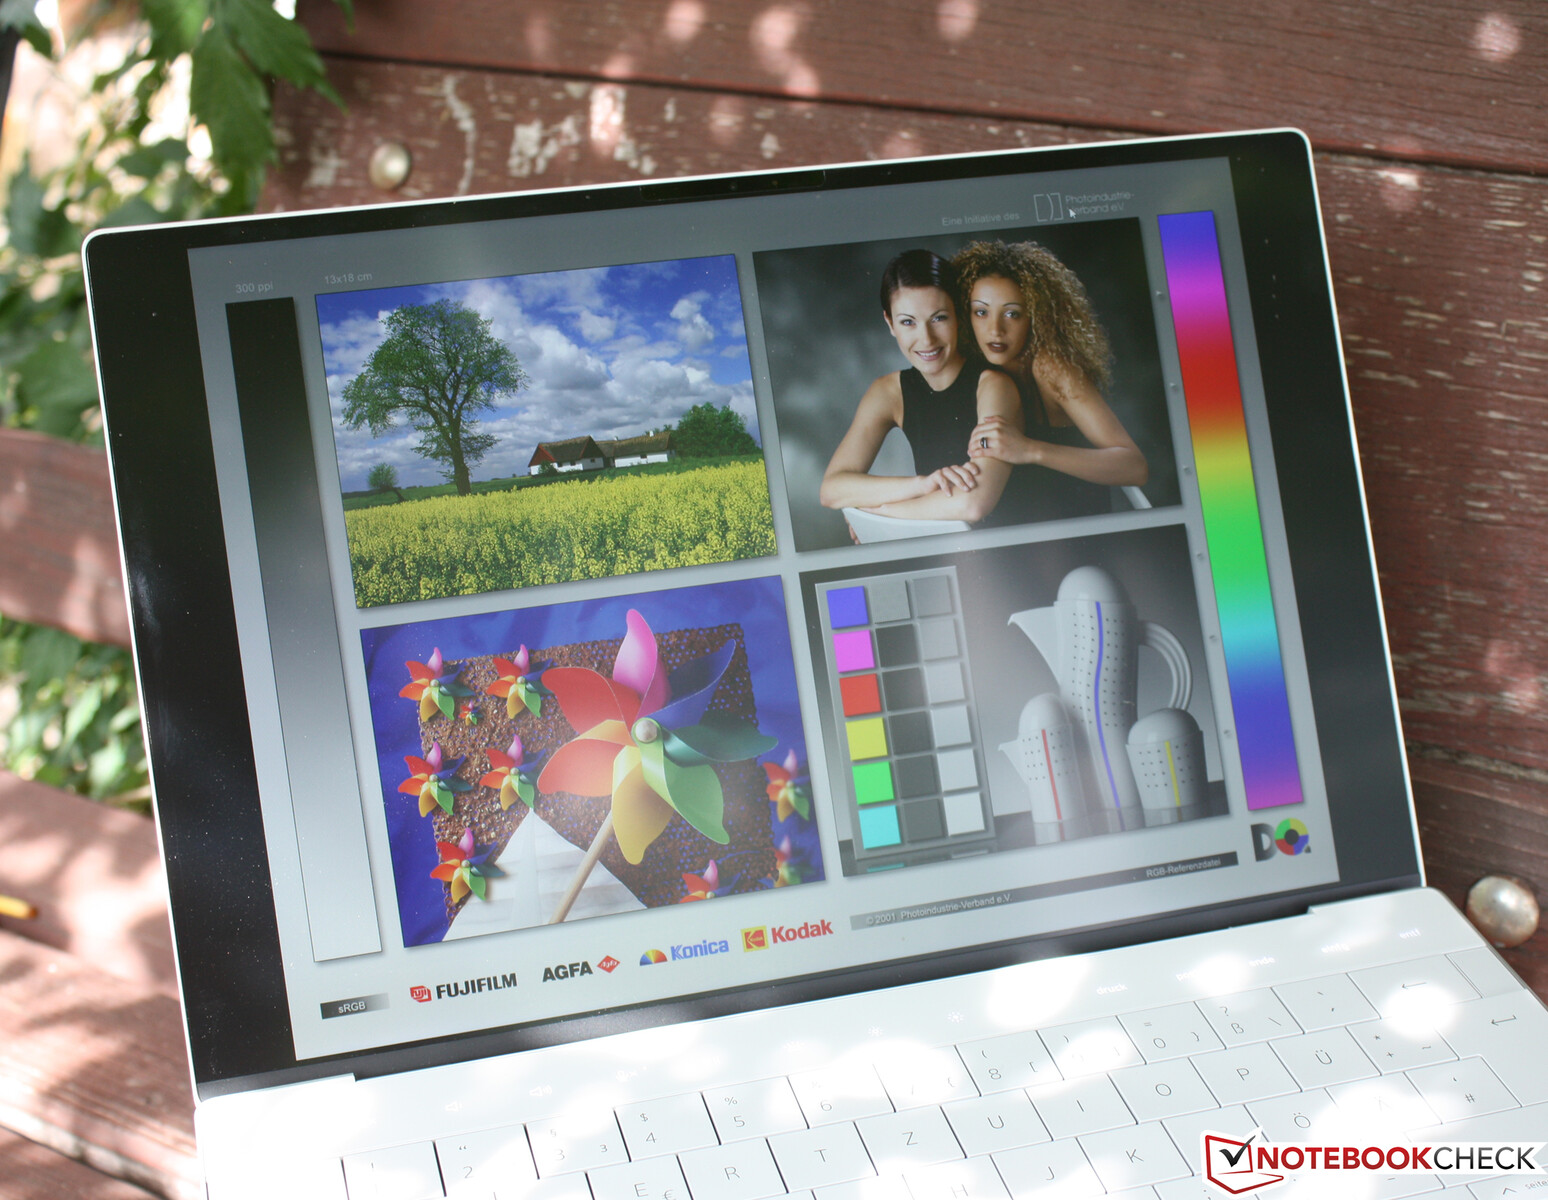
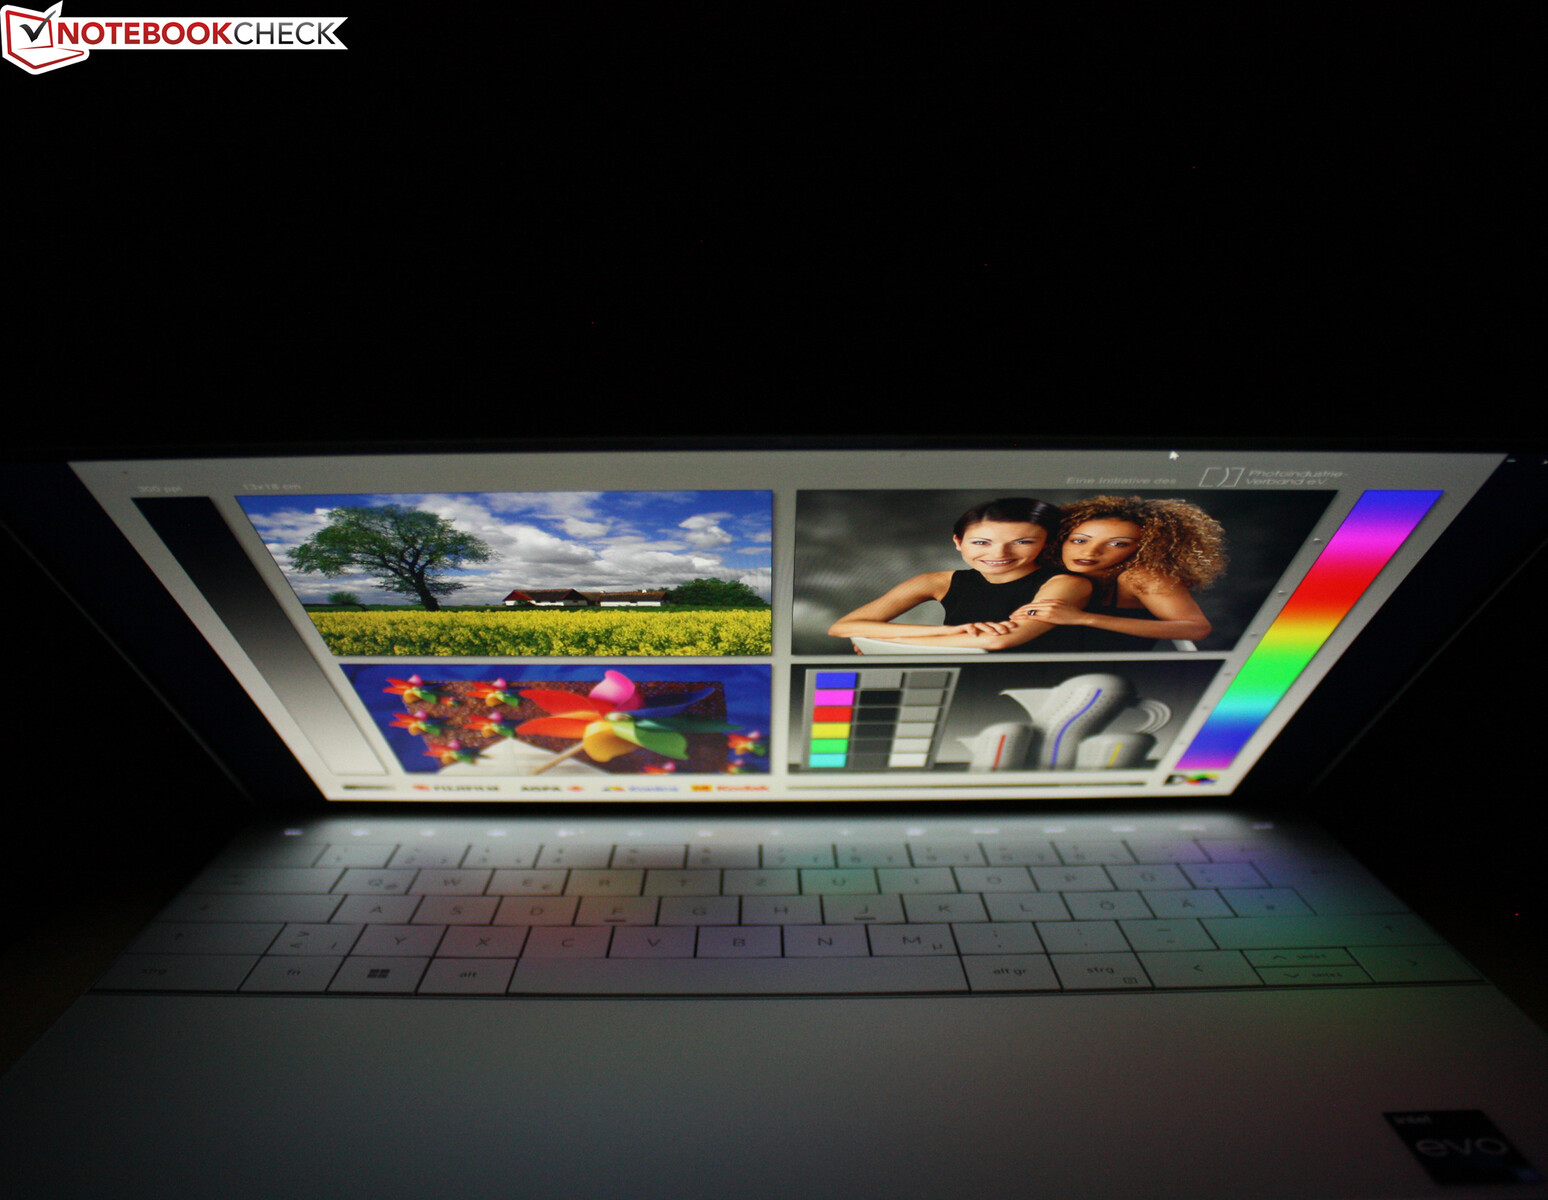
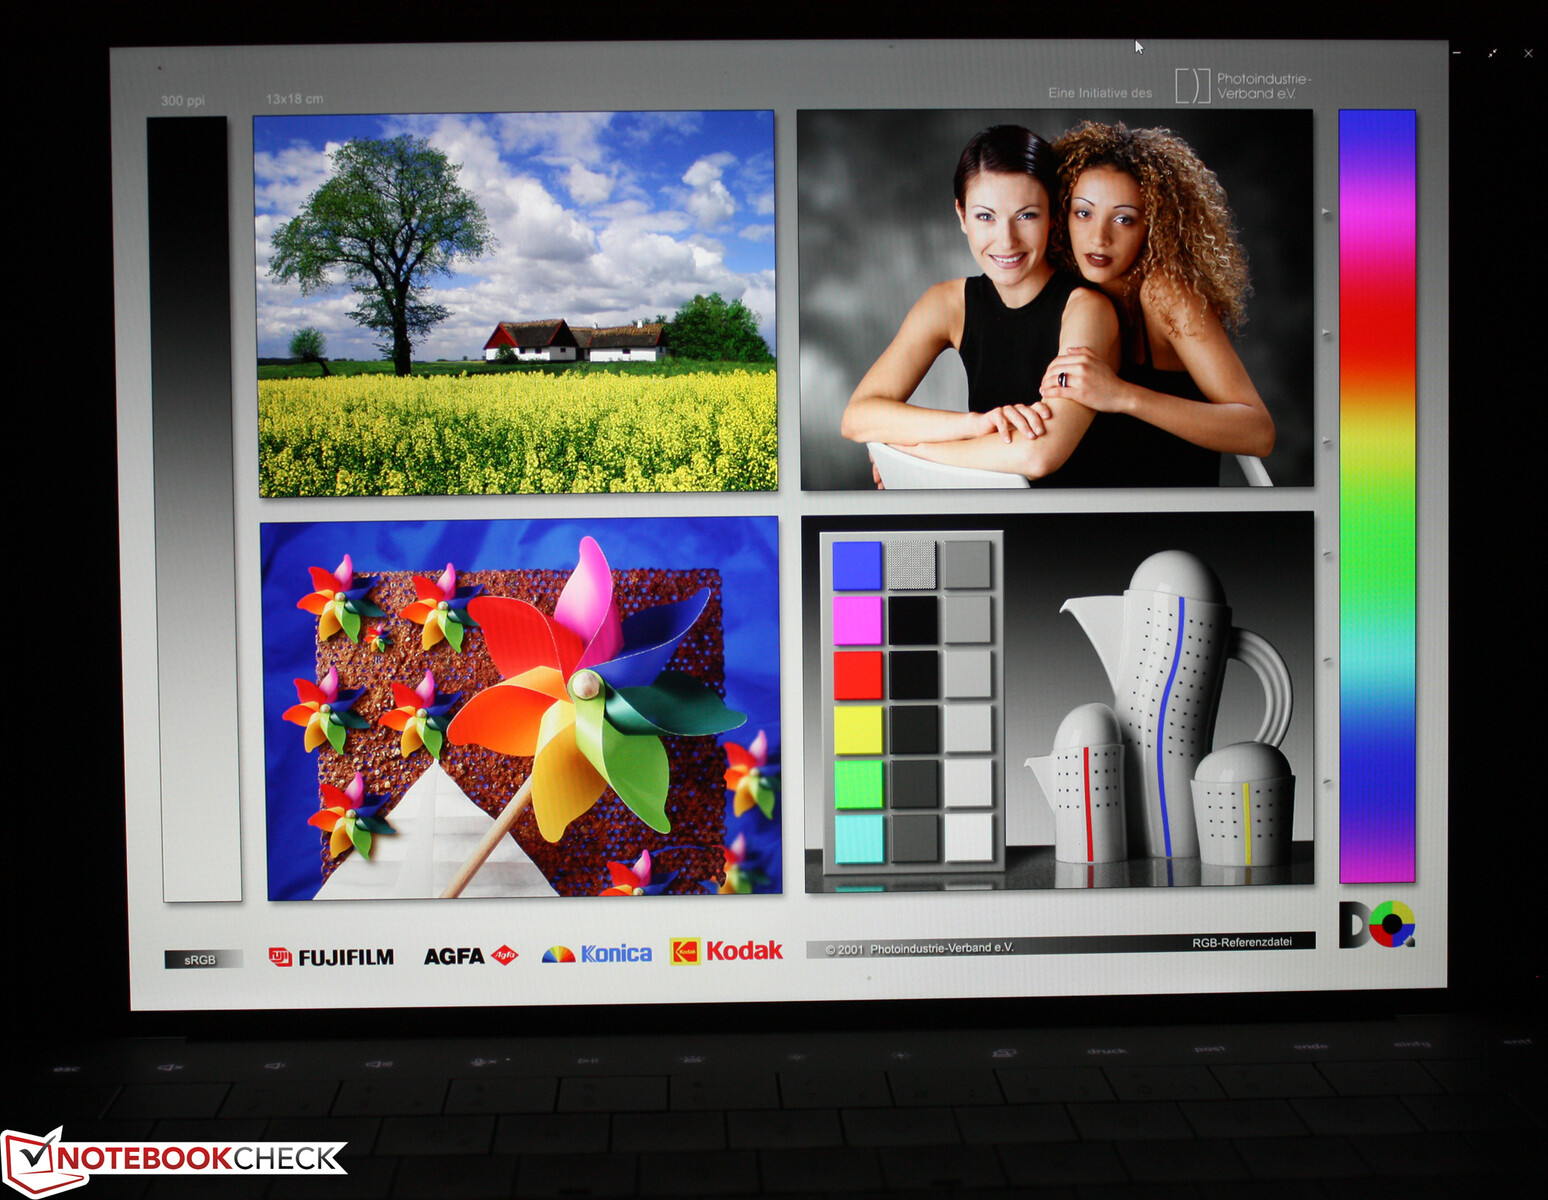
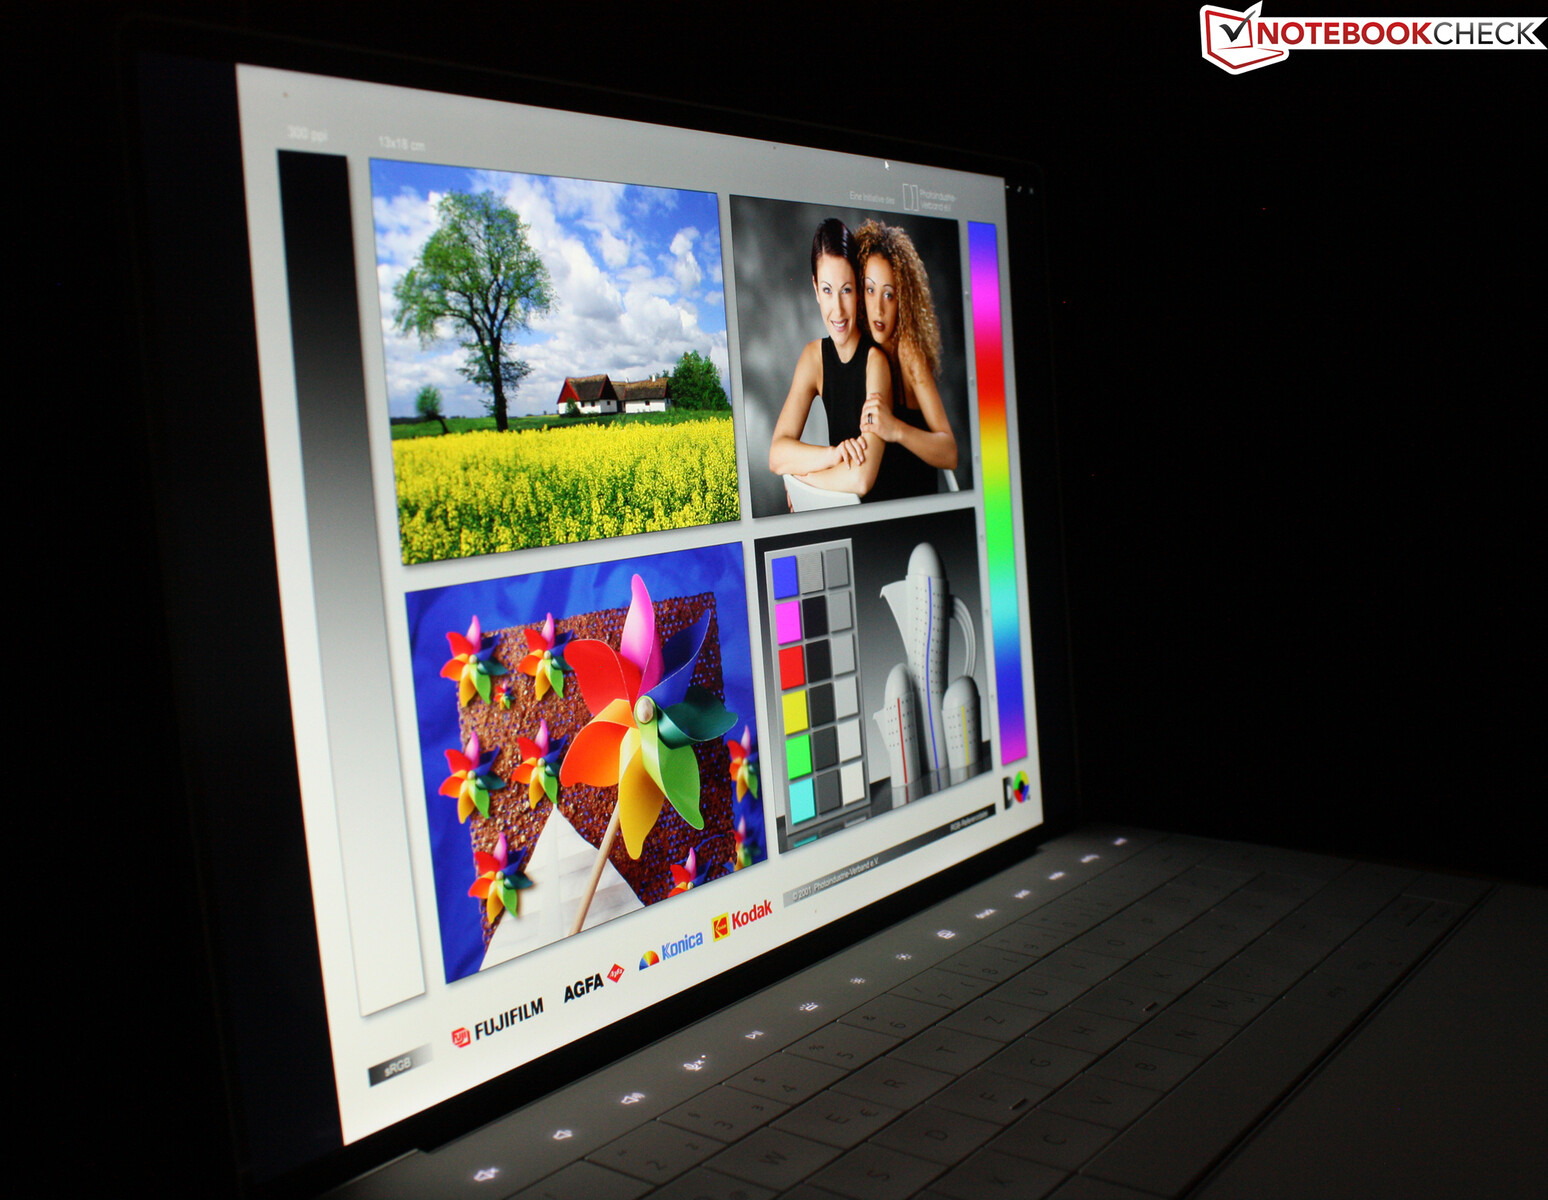
Display - Subnotebook Dell con pannello luminoso
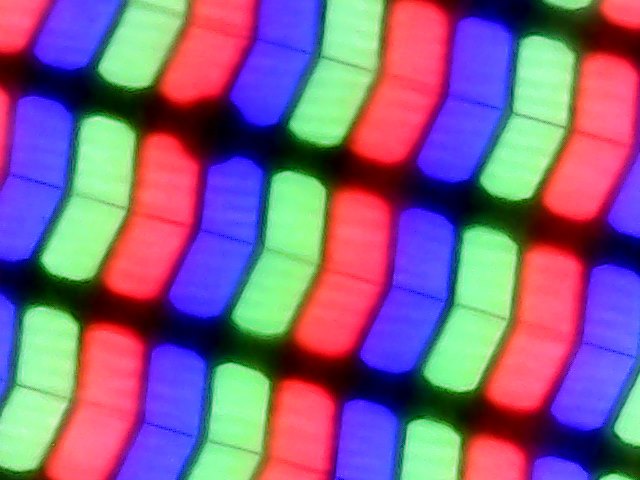
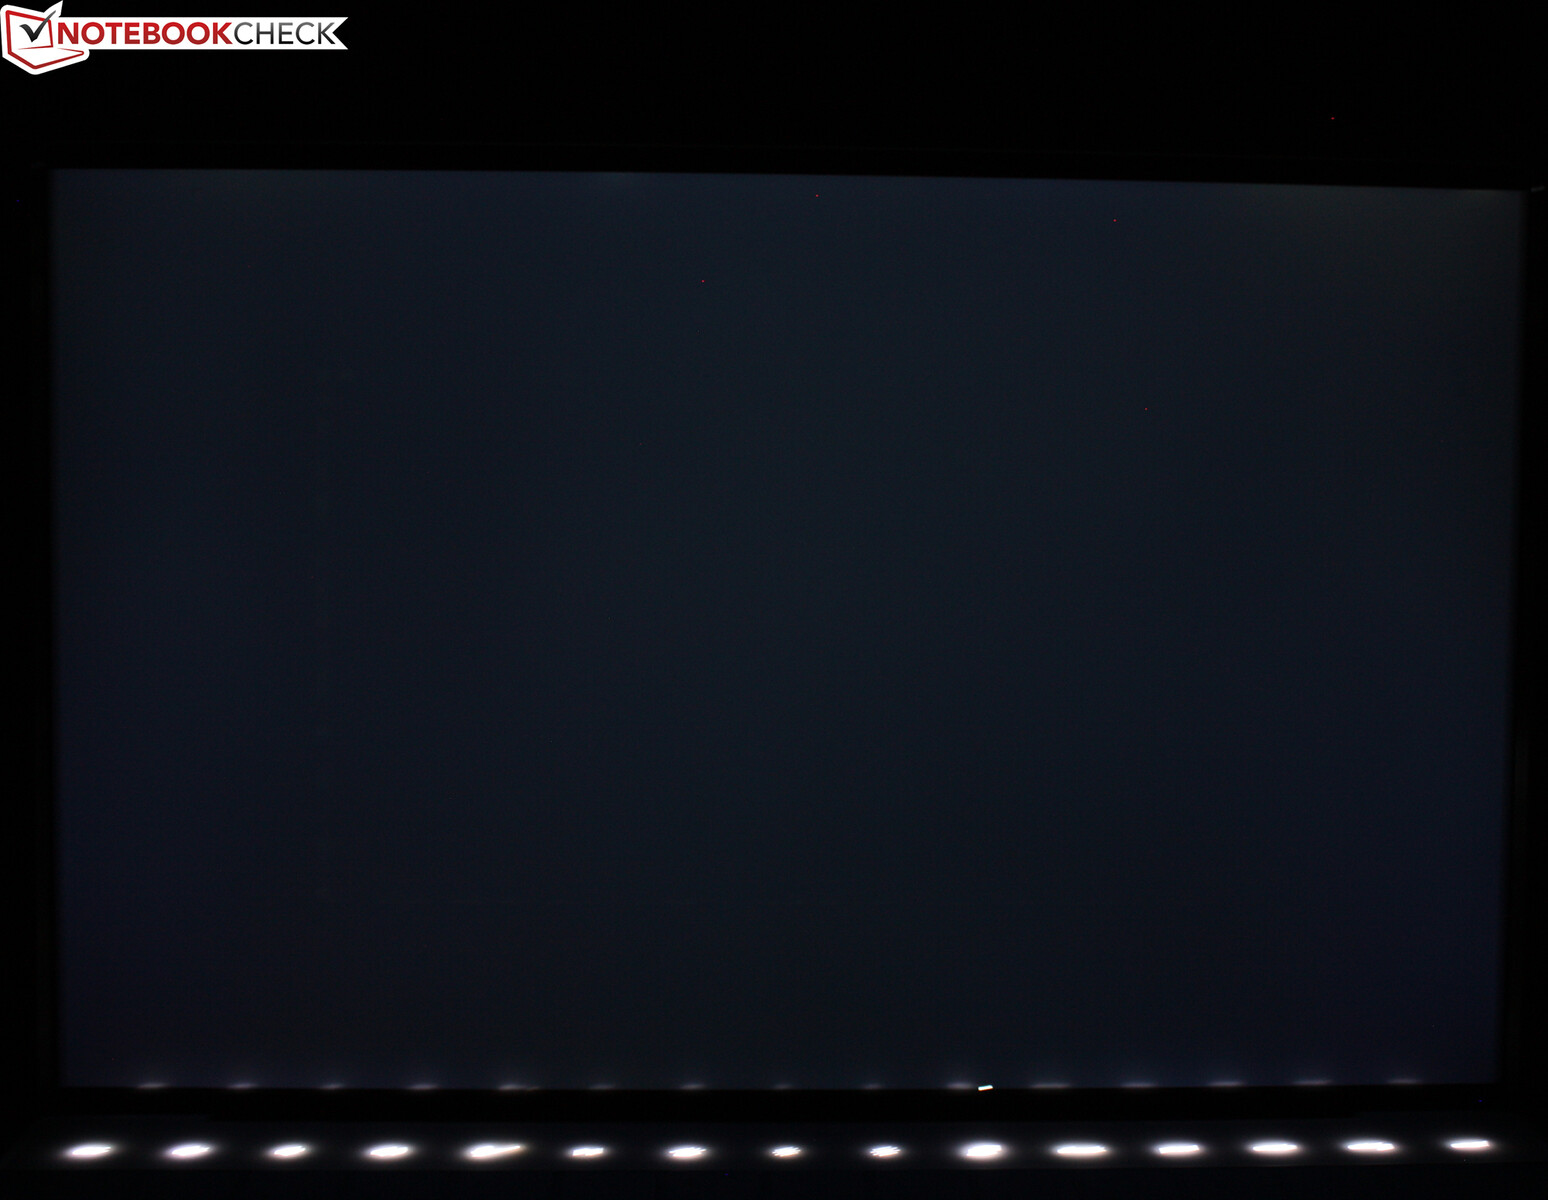
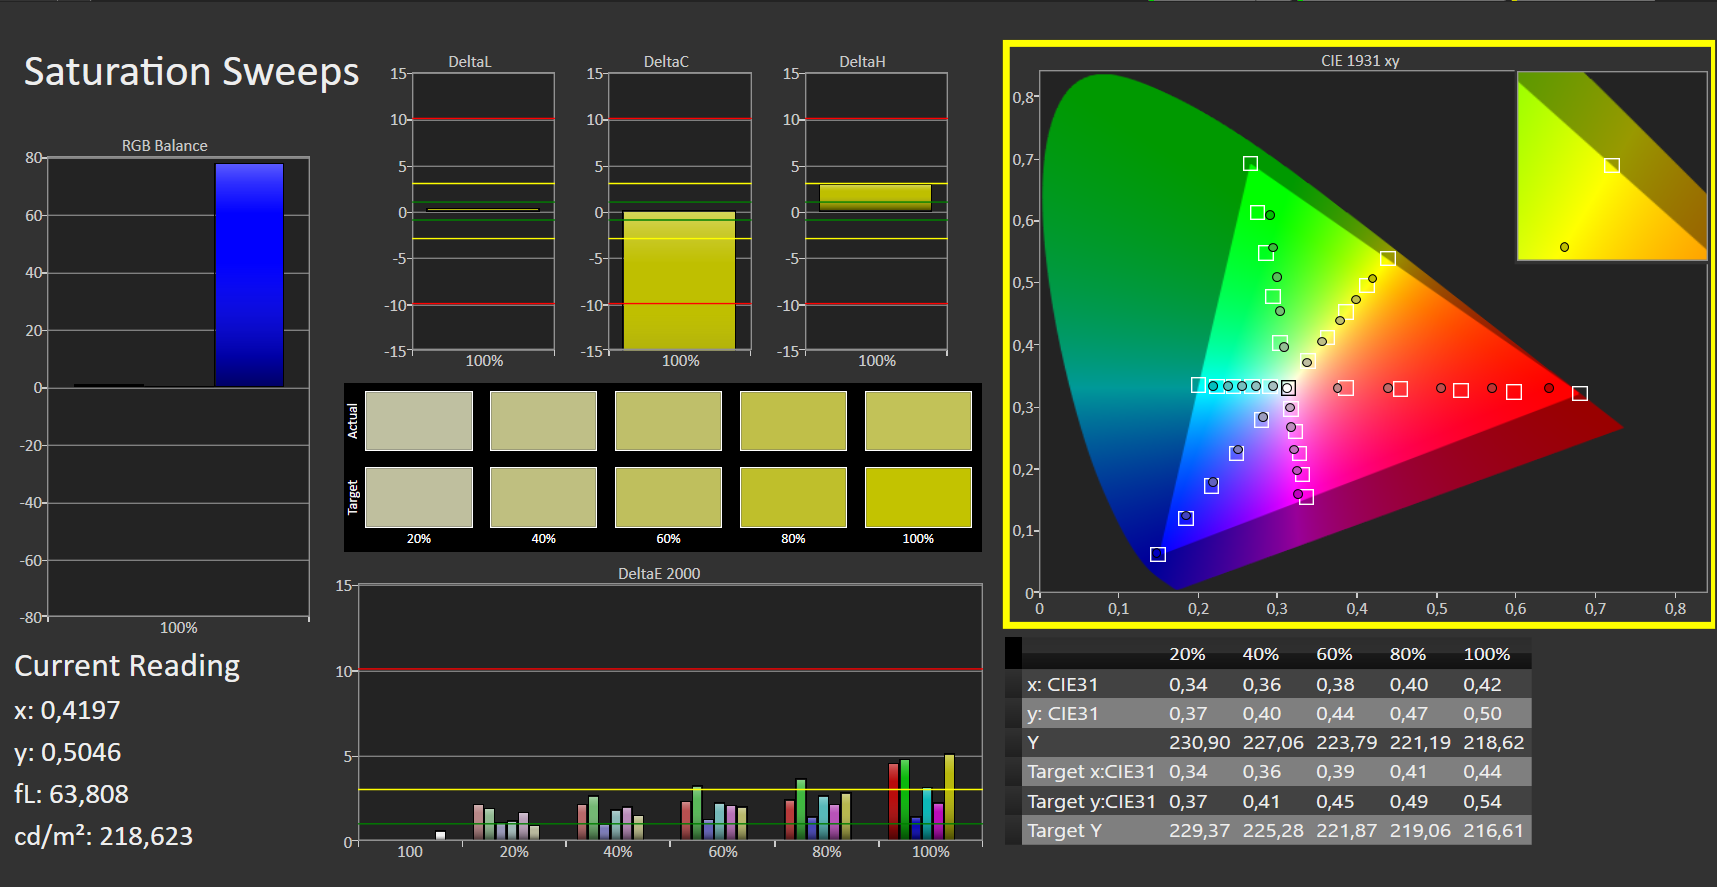
Il nostro XPS Plus 9320 ha a bordo la variante più semplice del pannello, il LQ134N1 da 1.920x1.200 pixel di Sharp. È lo stesso pannello presente nel modello Modello entry-level XPS 9315e di conseguenza tutti i parametri, dal contrasto alla luminosità, fino allo spazio colore, sono molto simili. Il bleeding dello schermo è marginalmente visibile sul bordo superiore sinistro quando si utilizza uno sfondo nero e la massima luminosità. La luminosità è elevata, pari a 460 cd/m² (media), e riteniamo che le specifiche del produttore di 500 cd/m² siano veritiere (max 498 cd/m²).
Il pannello 4K nellaVersione Plus con i7 (Sharp LQ134R1) aveva una luminosità identica di 473 cd/m² (media) nelle nostre misurazioni, ma aveva un contrasto maggiore. 1.764:1 invece di 940:1; questo è un argomento a favore del pannello 4K. Esiste un pannello OLED alternativo per la versione Plus, ma non abbiamo ancora avuto modo di recensirlo.
La luminosità è leggermente diminuita a batteria, con un calo di 78 cd/m² (centro: 420 cd/m²). L'XPS 13 Plus non utilizza il PWM per abbassare i livelli di luminosità. I tre screenshot mostrano una linea omogenea al 100%, 50% e 0% di luminosità.
| |||||||||||||||||||||||||
Distribuzione della luminosità: 85 %
Al centro con la batteria: 420 cd/m²
Contrasto: 940:1 (Nero: 0.53 cd/m²)
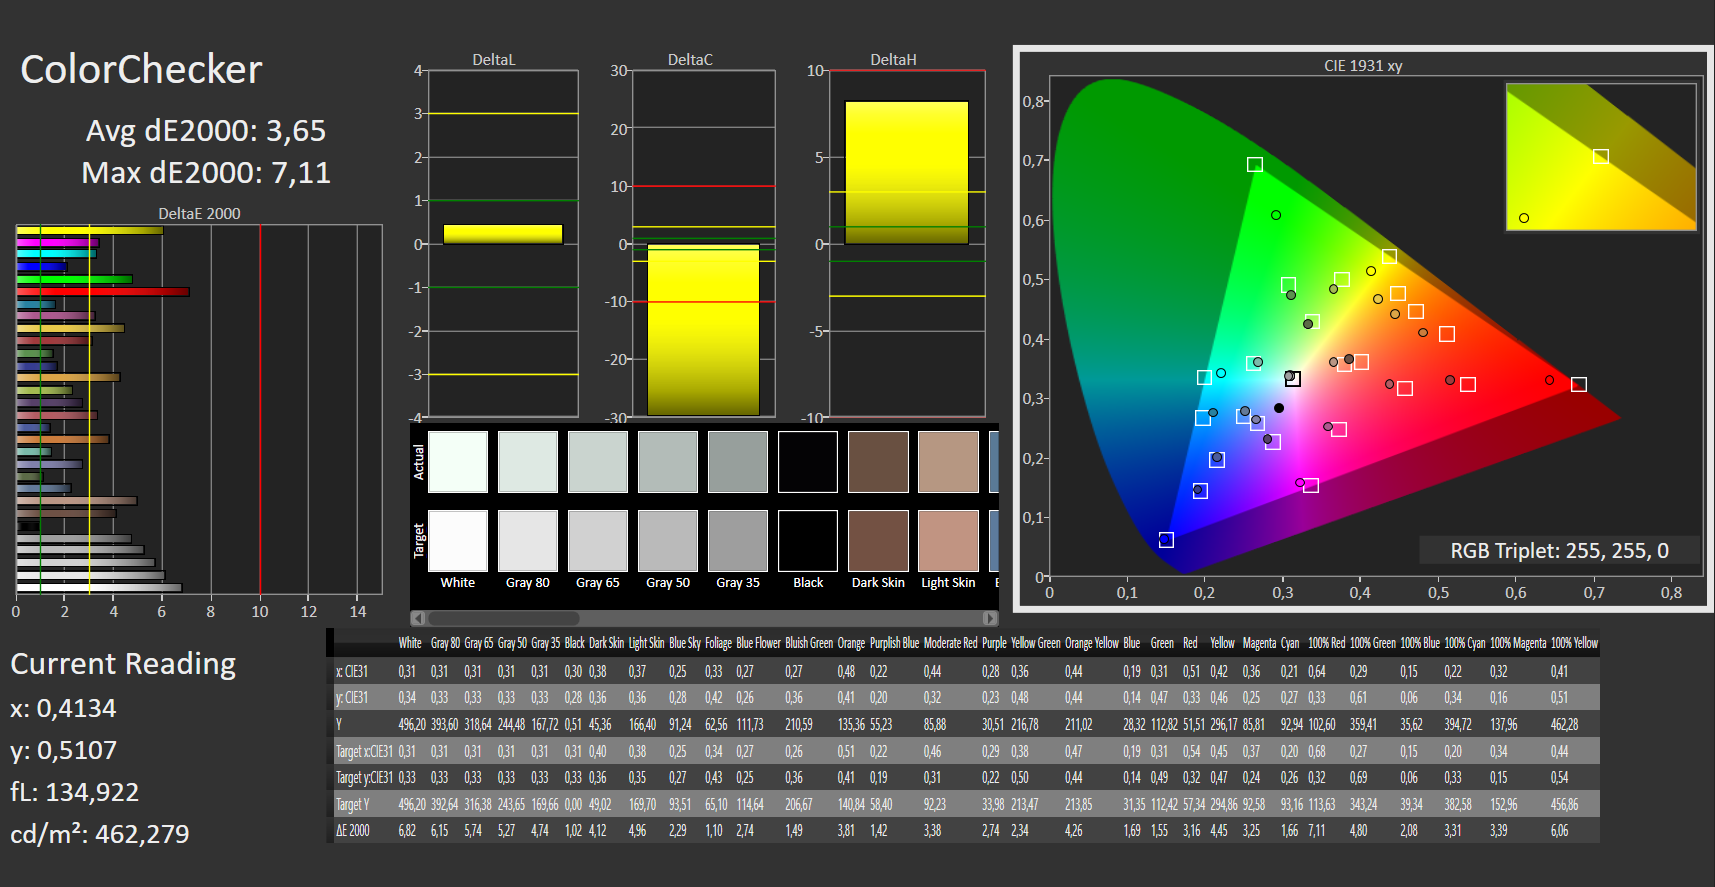
ΔE ColorChecker Calman: 3.65 | ∀{0.5-29.43 Ø4.72}
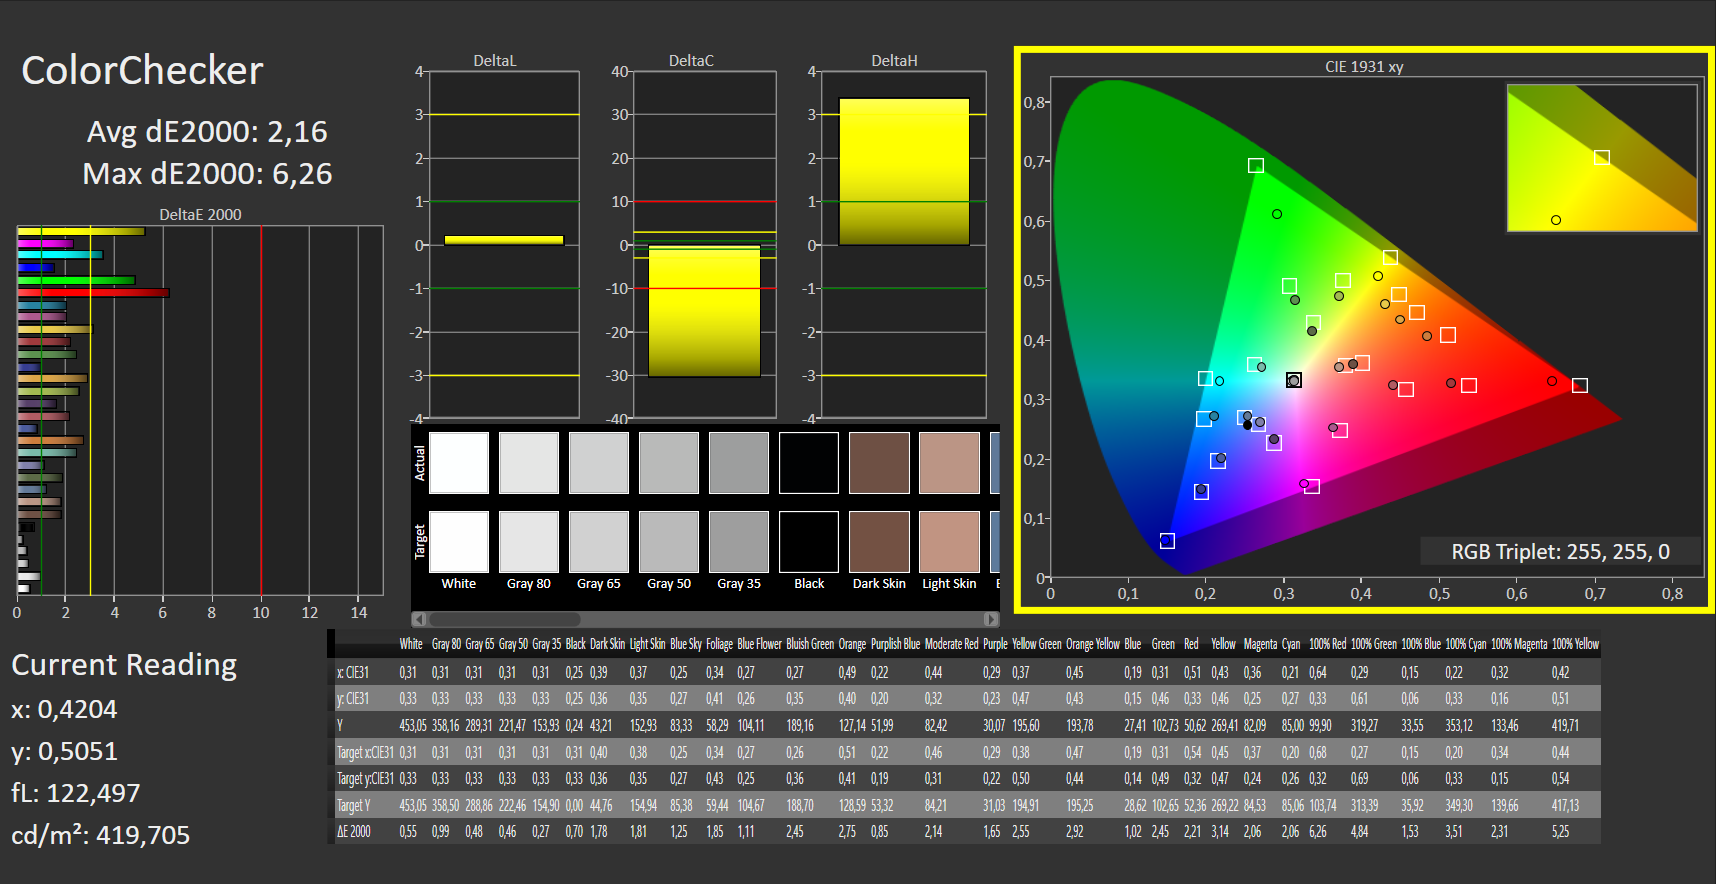
calibrated: 2.16
ΔE Greyscale Calman: 4.25 | ∀{0.09-98 Ø4.97}
71% AdobeRGB 1998 (Argyll 3D)
99% sRGB (Argyll 3D)
69% Display P3 (Argyll 3D)
Gamma: 2.45
CCT: 6690 K
| Dell XPS 13 Plus 9320 i5-1240p Sharp SHP1548 LQ134N1, IPS, 1920x1200, 13.4" | Dell XPS 13 9315, i5-1230U Sharp SHP1548 LQ134N1, IPS, 1920x1200, 13.4" | Dell XPS 13 Plus 9320 4K LQ134R1, IPS, 3840x2400, 13.4" | Apple MacBook Air 2020 M1 Entry IPS, 2560x1600, 13.3" | Asus Zenbook S 13 OLED SDC4172, OLED, 2880x1800, 13.3" | Lenovo ThinkPad X1 Nano-20UN002UGE MND007ZA1-2, IPS, 2160x1350, 13" | Huawei MateBook 13s i5 11300H TL134GDXP02-0, LTPS, 2520x1680, 13.4" | |
|---|---|---|---|---|---|---|---|
| Display | 0% | 6% | 22% | 28% | 1% | -6% | |
| Display P3 Coverage (%) | 69 | 69 0% | 76.5 11% | 98.6 43% | 99.8 45% | 70.4 2% | 65.2 -6% |
| sRGB Coverage (%) | 99 | 100 1% | 100 1% | 100 1% | 100 1% | 99.9 1% | 92 -7% |
| AdobeRGB 1998 Coverage (%) | 71 | 71 0% | 76 7% | 85.9 21% | 97.8 38% | 72 1% | 67.5 -5% |
| Response Times | 3% | 5% | 4% | 94% | -19% | -5% | |
| Response Time Grey 50% / Grey 80% * (ms) | 45 ? | 40 ? 11% | 38.9 ? 14% | 31 ? 31% | 2.1 ? 95% | 46.8 ? -4% | 44.8 ? -0% |
| Response Time Black / White * (ms) | 21 ? | 22 ? -5% | 21.9 ? -4% | 26.1 ? -24% | 1.68 ? 92% | 28 ? -33% | 22.8 ? -9% |
| PWM Frequency (Hz) | 118000 ? | 240.4 ? | 9804 ? | ||||
| Screen | 10% | 28% | 30% | 215% | 39% | 35% | |
| Brightness middle (cd/m²) | 498 | 466 -6% | 494 -1% | 417 -16% | 336 -33% | 460 -8% | 468 -6% |
| Brightness (cd/m²) | 460 | 442 -4% | 474 3% | 395 -14% | 338 -27% | 434 -6% | 450 -2% |
| Brightness Distribution (%) | 85 | 89 5% | 89 5% | 91 7% | 99 16% | 92 8% | 92 8% |
| Black Level * (cd/m²) | 0.53 | 0.4 25% | 0.28 47% | 0.39 26% | 0.02 96% | 0.27 49% | 0.23 57% |
| Contrast (:1) | 940 | 1165 24% | 1764 88% | 1069 14% | 16800 1687% | 1704 81% | 2035 116% |
| Colorchecker dE 2000 * | 3.65 | 3.03 17% | 3.1 15% | 1.12 69% | 1.8 51% | 1.1 70% | 2 45% |
| Colorchecker dE 2000 max. * | 7.11 | 6.68 6% | 4.2 41% | 2.71 62% | 3.8 47% | 4.5 37% | 5.5 23% |
| Colorchecker dE 2000 calibrated * | 2.16 | 2.34 -8% | 1.5 31% | 0.77 64% | 1.8 17% | 1 54% | 1.5 31% |
| Greyscale dE 2000 * | 4.25 | 3.12 27% | 3.2 25% | 1.7 60% | 0.9 79% | 1.6 62% | 2.6 39% |
| Gamma | 2.45 90% | 2.41 91% | 2.41 91% | 2207 0% | 2.22 99% | 2.2 100% | 2.17 101% |
| CCT | 6690 97% | 6418 101% | 6189 105% | 6870 95% | 6580 99% | 6475 100% | 6511 100% |
| Color Space (Percent of AdobeRGB 1998) (%) | 65.7 | ||||||
| Color Space (Percent of sRGB) (%) | 99.9 | ||||||
| Media totale (Programma / Settaggio) | 4% /
7% | 13% /
20% | 19% /
25% | 112% /
157% | 7% /
22% | 8% /
20% |
* ... Meglio usare valori piccoli
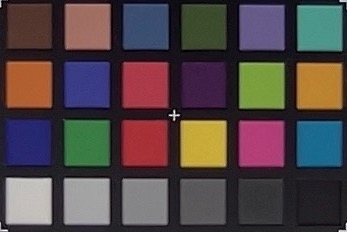
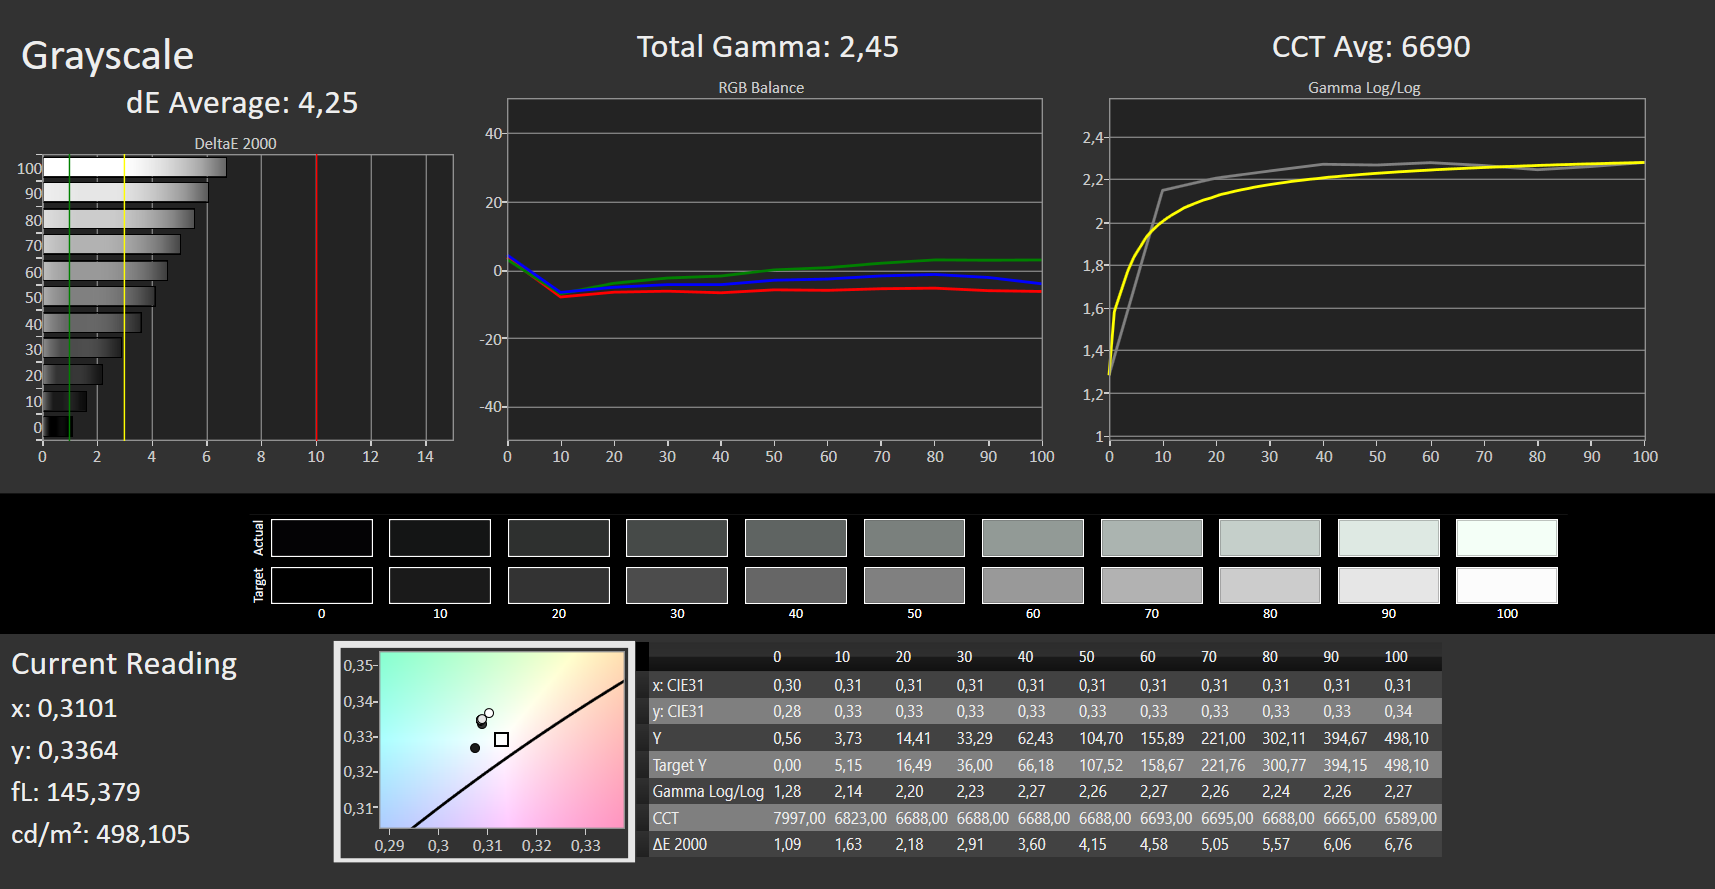
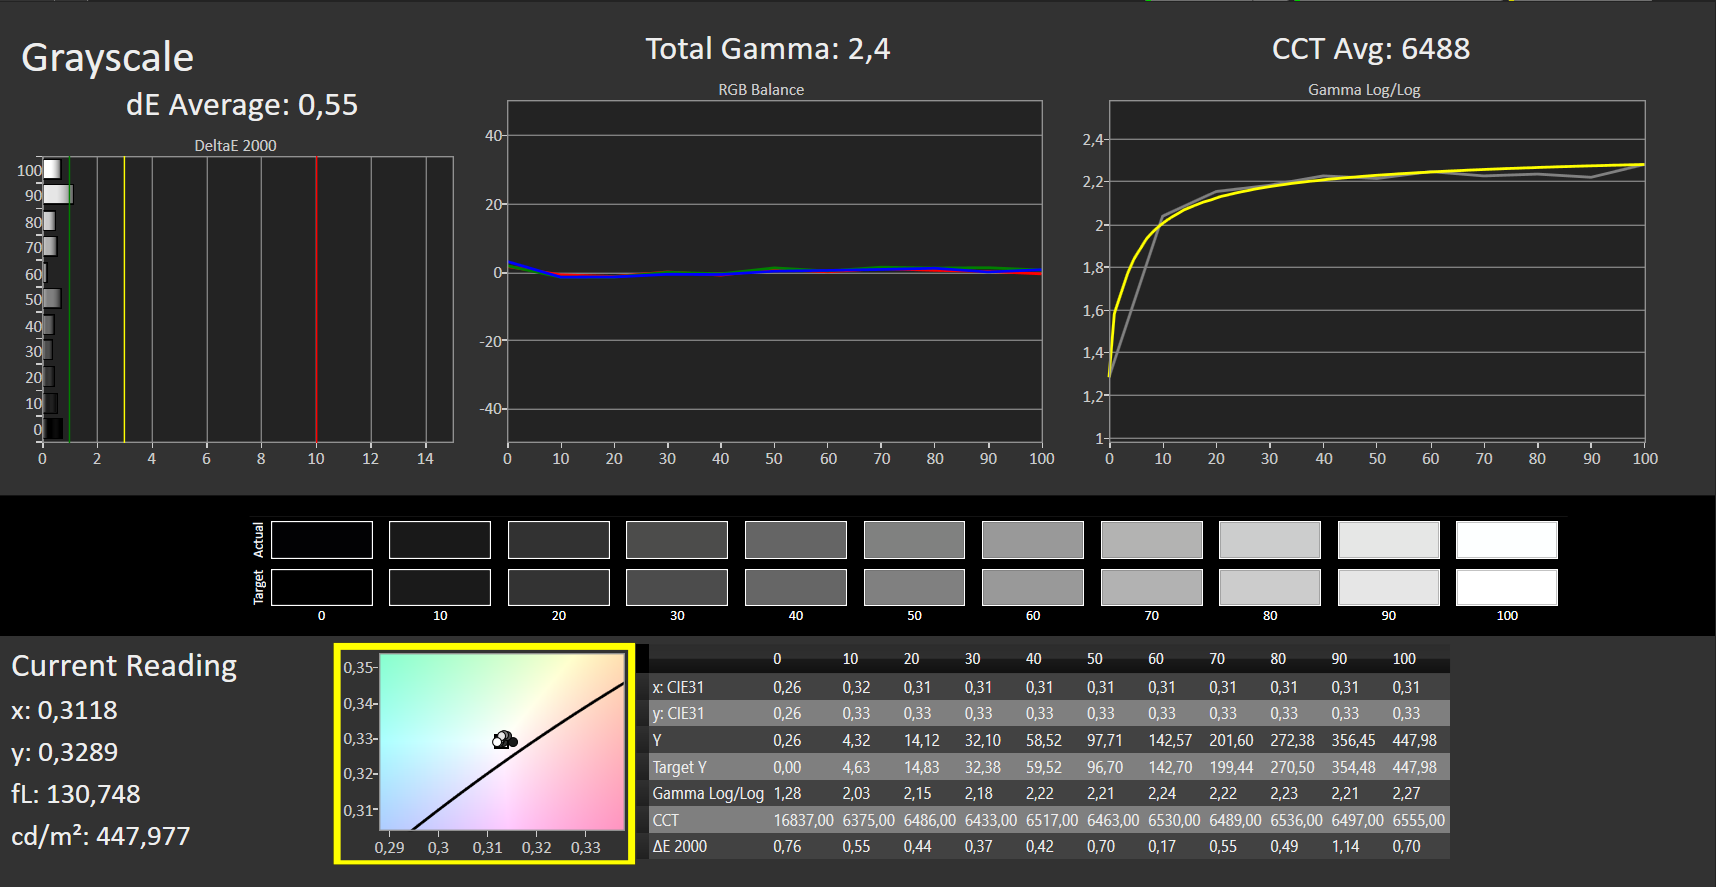
Abbiamo notato due cose durante l'analisi con il software professionale CalMAN (X-Rite i1 Pro 2): il 100% di sRGB è coperto. Inoltre, c'è un Delta E di oltre 4,0 per la scala di grigi e di poco inferiore a 4 per i colori. Ciò rende altamente consigliabile una calibrazione, in quanto elimina il leggero impatto del colore con il grigio. Lo sforzo di eseguire una calibrazione è ricompensato da un eccellente Delta E inferiore a 0,5. Se si dispone della stessa configurazione del display (Sharp LQ134N1), è possibile migliorare il proprio portatile Dell utilizzando il profilo di colore fornito nel riquadro precedente.

Tempi di risposta del Display
| ↔ Tempi di risposta dal Nero al Bianco | ||
|---|---|---|
| 21 ms ... aumenta ↗ e diminuisce ↘ combinato | ↗ 8 ms Incremento |  |
| ↘ 13 ms Calo | ||
| Lo schermo mostra buoni tempi di risposta durante i nostri tests, ma potrebbe essere troppo lento per i gamers competitivi. In confronto, tutti i dispositivi di test variano da 0.1 (minimo) a 240 (massimo) ms. » 47 % di tutti i dispositivi è migliore. Questo significa che i tempi di risposta rilevati sono simili alla media di tutti i dispositivi testati (19.8 ms). | ||
| ↔ Tempo di risposta dal 50% Grigio all'80% Grigio | ||
| 45 ms ... aumenta ↗ e diminuisce ↘ combinato | ↗ 20 ms Incremento |  |
| ↘ 25 ms Calo | ||
| Lo schermo mostra tempi di risposta lenti nei nostri tests e sarà insoddisfacente per i gamers. In confronto, tutti i dispositivi di test variano da 0.165 (minimo) a 636 (massimo) ms. » 77 % di tutti i dispositivi è migliore. Questo significa che i tempi di risposta rilevati sono peggiori rispetto alla media di tutti i dispositivi testati (31 ms). | ||
Sfarfallio dello schermo / PWM (Pulse-Width Modulation)
| flickering dello schermo / PWM non rilevato | ≤ 100 % settaggio luminosita' |    | |
In confronto: 52 % di tutti i dispositivi testati non utilizza PWM per ridurre la luminosita' del display. Se è rilevato PWM, una media di 7763 (minimo: 5 - massimo: 343500) Hz è stata rilevata. | |||
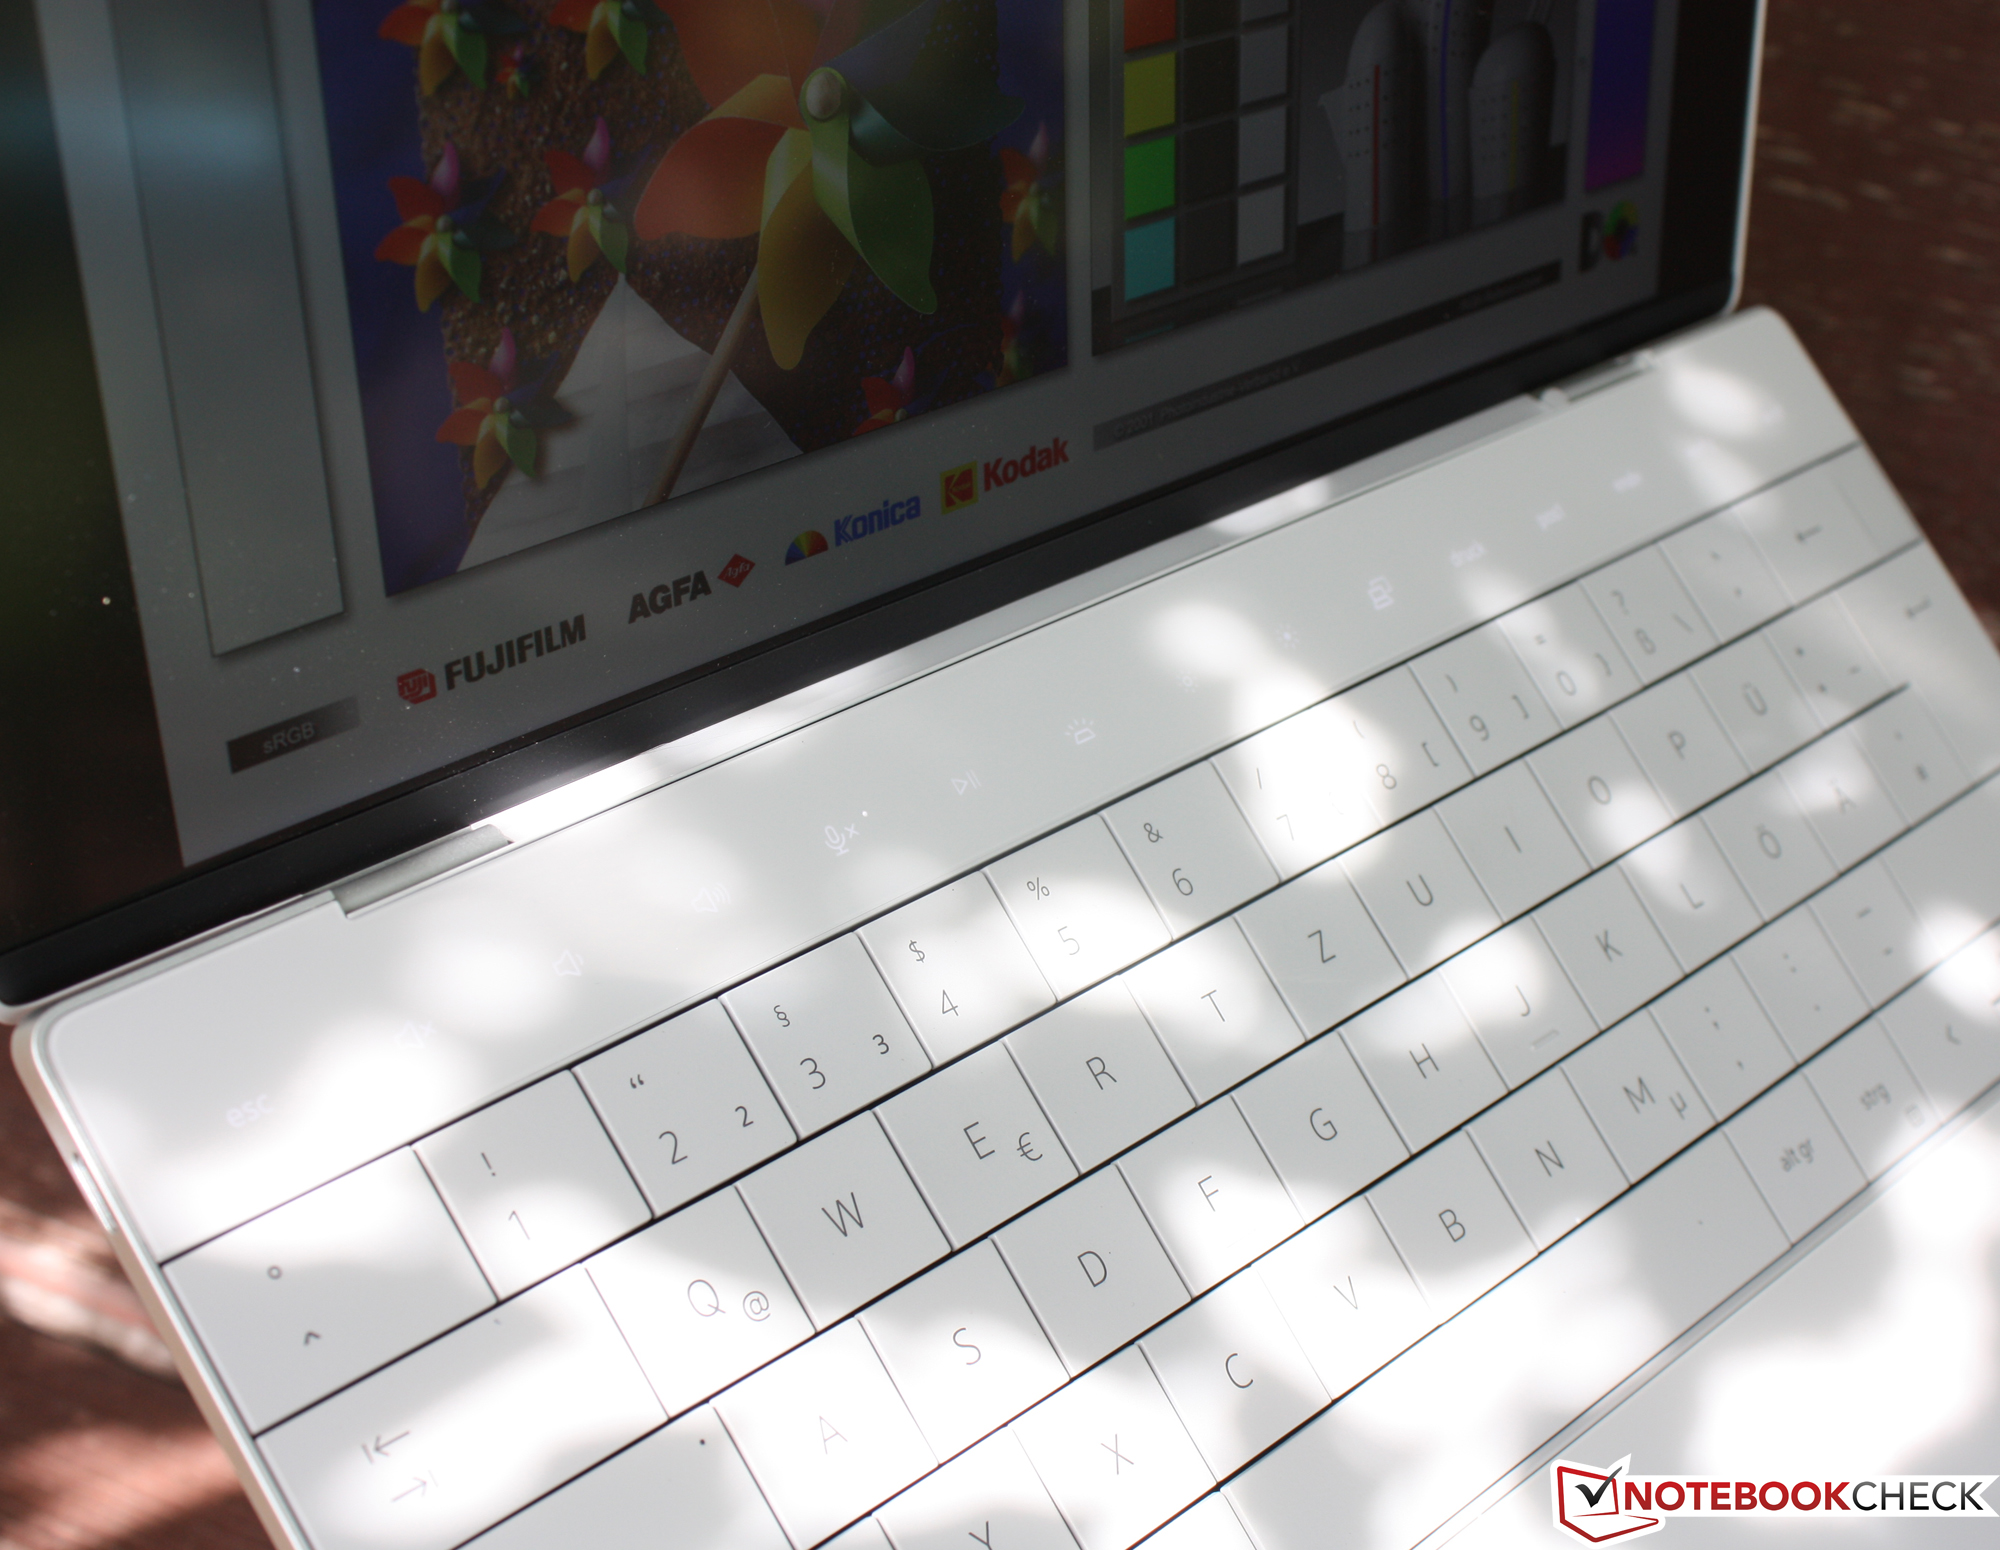
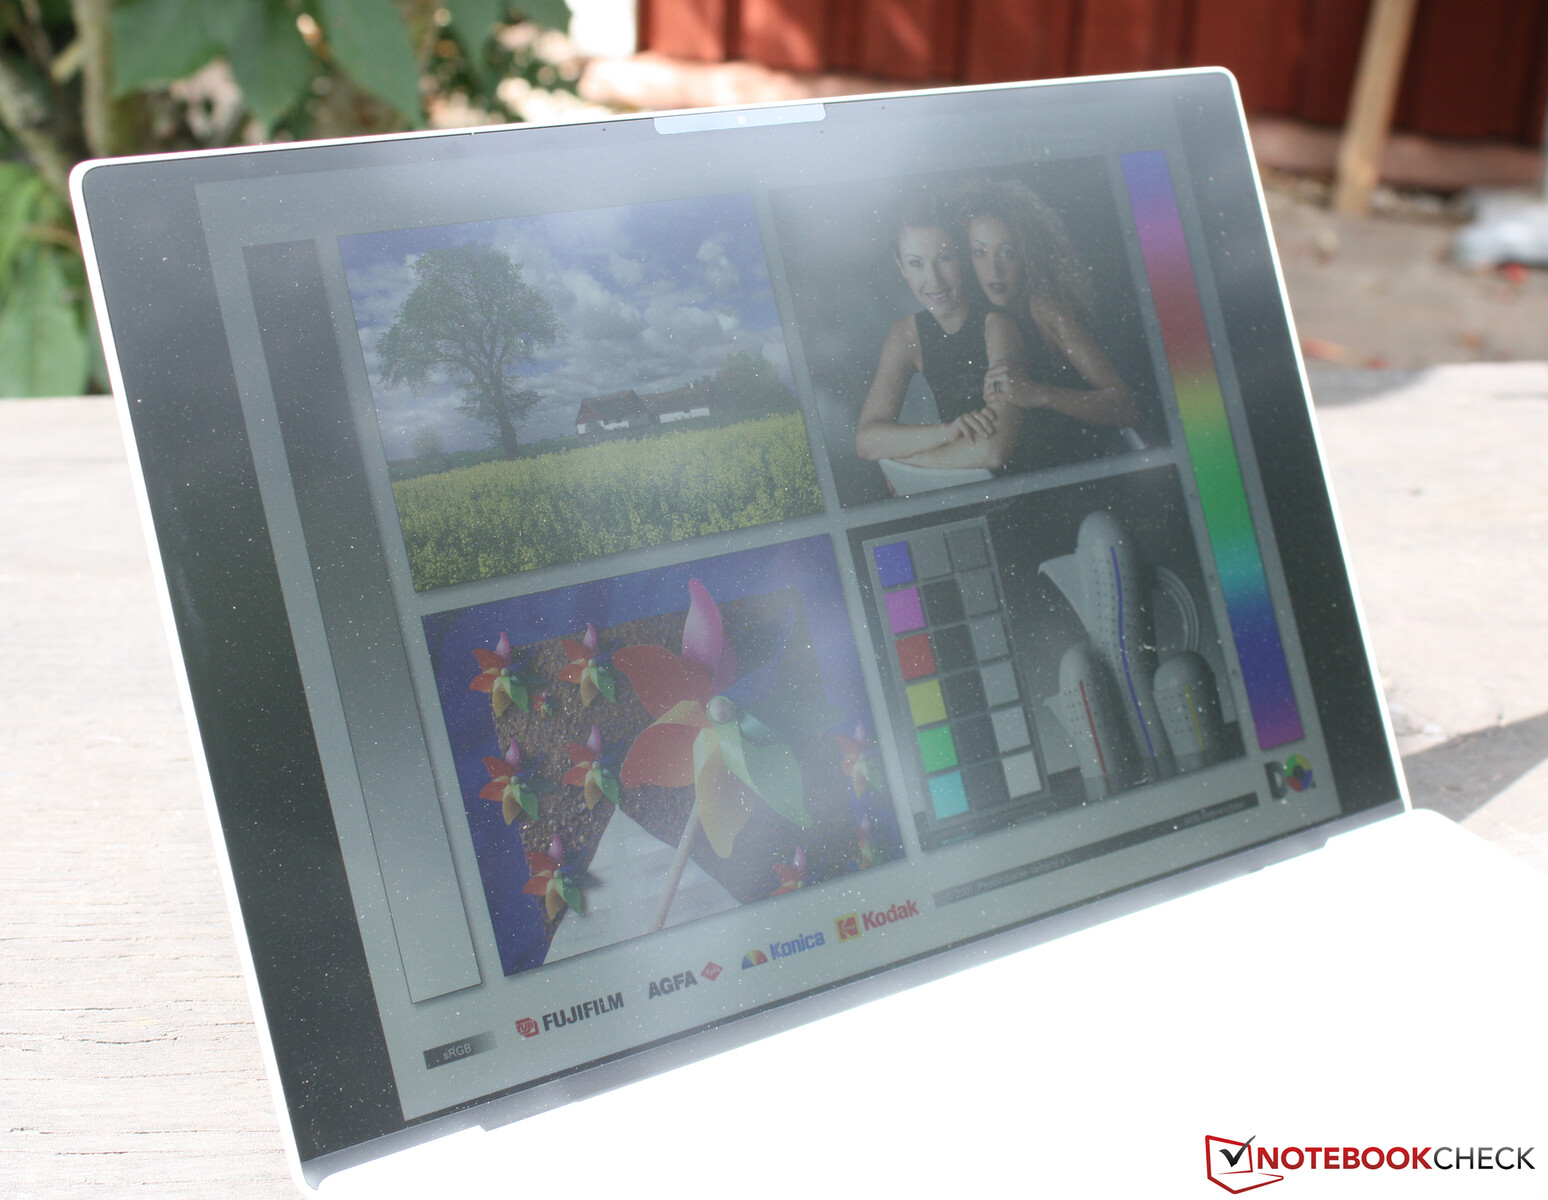
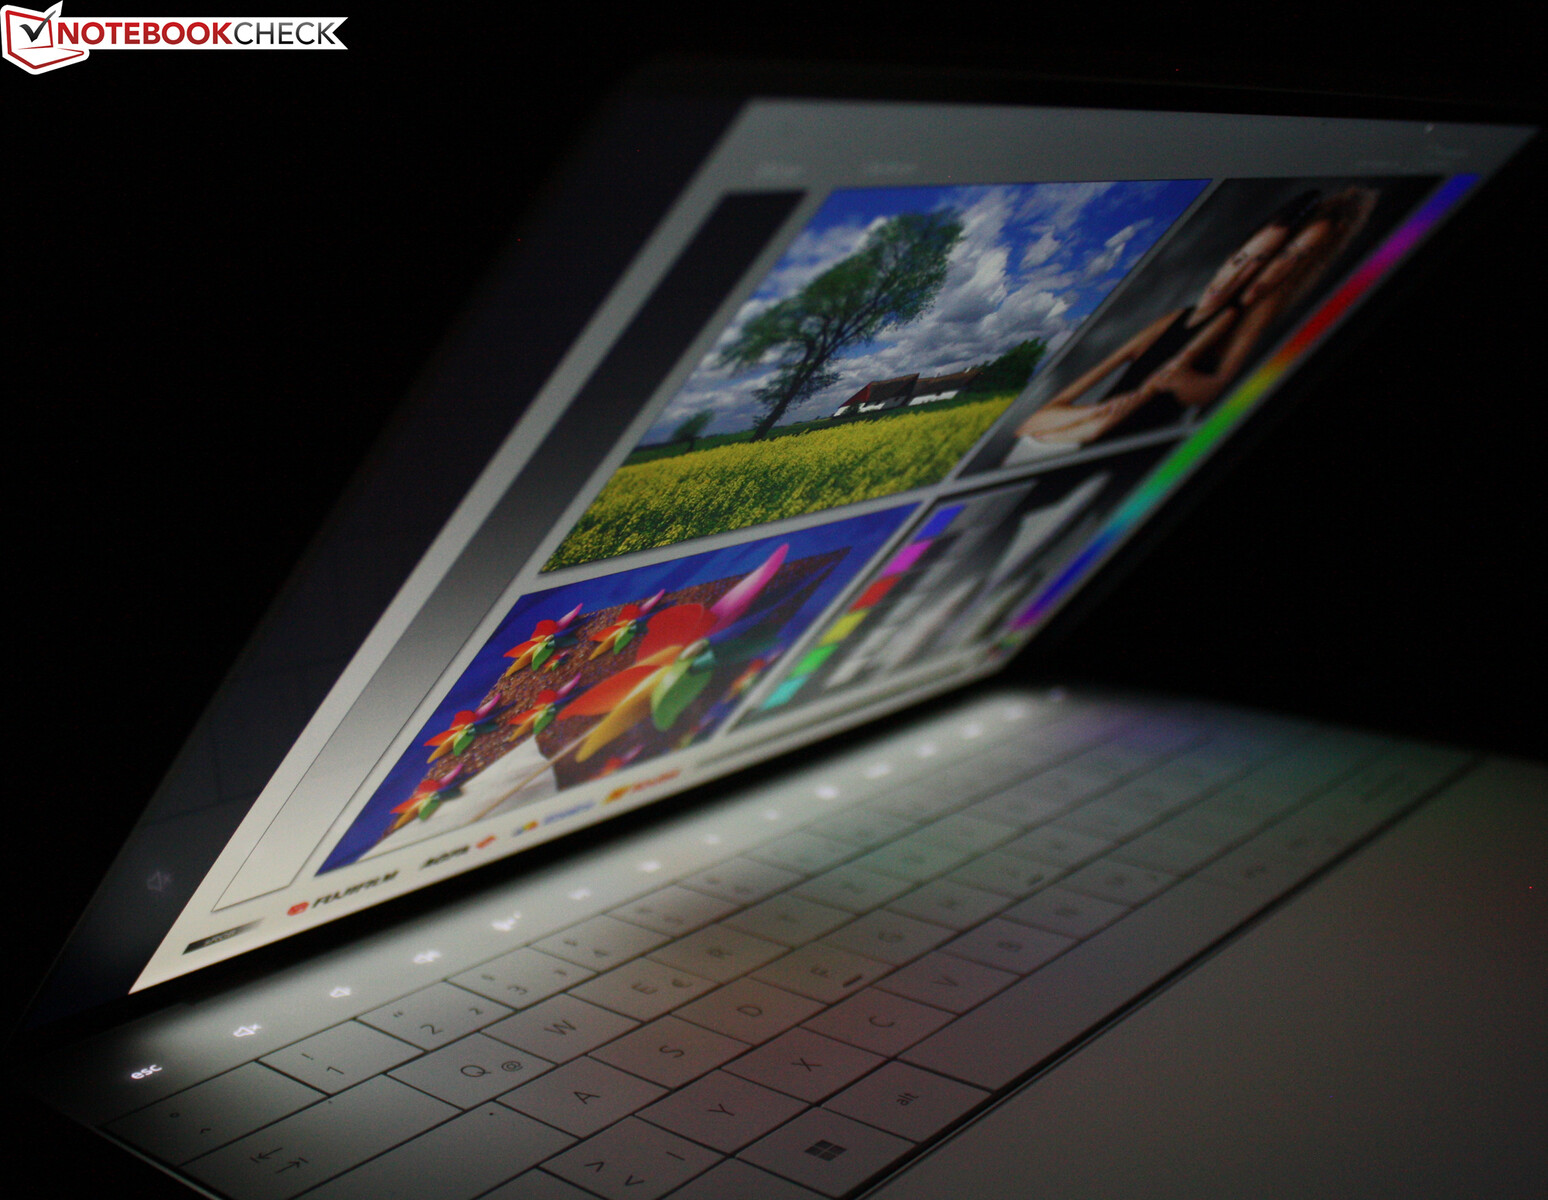
Il pannello Full HD antiriflesso si fa notare al sole con la sua luminosità di 400 nit, ma i riflessi opachi sono difficili da evitare alla luce del sole
Prestazioni: meno potenza sostenuta con l'Intel i5
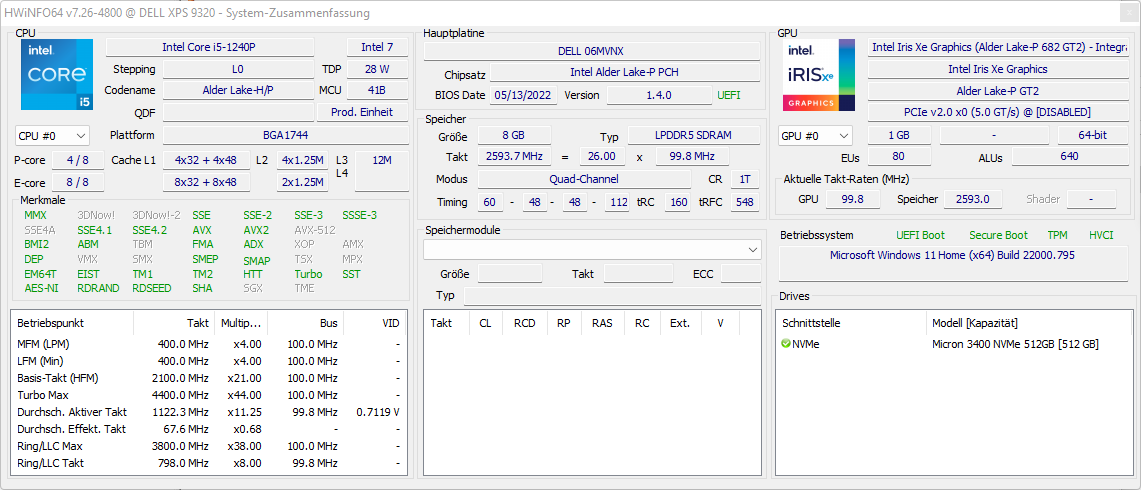
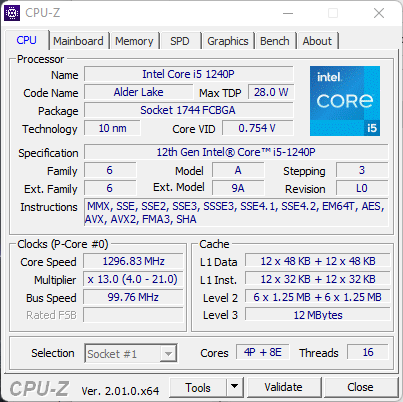
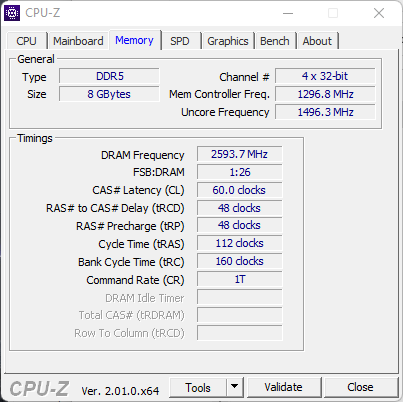
L'XPS 13 Plus è equipaggiato esclusivamente con i processori Alder Lake P, ovvero con i modelliCore i5-1240P e Corei7-1260P (4 core per le prestazioni e 8 core per l'efficienza in ciascun caso), o in alternativa con il Core i7-1280P che dispone di due core aggiuntivi per le prestazioni. Gli utenti possono scegliere tra 8, 16 o 32 GB di RAM (LPDDR5-5200); i 32 GB di RAM sono disponibili solo in combinazione con una delle CPU i7. Il nostro dispositivo di prova deve gestire 8 GB di memoria LPDDR5; la RAM è integrata, ma collegata in modalità dual-channel. Un'unità SSD M.2 da 512 GB di Micron completa la dotazione. L'unità SSD è inserita in un alloggiamento.
Condizioni di prova
Dell fornisce quattro diversi profili di prestazioni nel Power Manager preinstallato (Optimized, Quiet, Ultra Performance e Cool), ma non esamineremo ulteriormente il profilo Cool. Abbiamo eseguito i seguenti benchmark e misurazioni utilizzando la modalità Ultra Performance. Con le sue due ventole, le prestazioni di raffreddamento dell'XPS 13 Plus sono piuttosto buone per un dispositivo compatto. Nell'uso quotidiano e durante i picchi di carico a breve termine, il dispositivo è spesso silenzioso anche in questa modalità. Le due ventole sono un po' più rumorose sotto il carico massimo della CPU, ma in compenso le prestazioni sono decenti. Il processore può teoricamente consumare fino a 64 watt in tutte e tre le modalità, ma solo la modalità Ultra Performance è in grado di mantenere il limite di prestazioni PL1 (59 watt) a partire da Cinebench R15
Processore
Con i suoi 4 core per le prestazioni e gli 8 core per l'efficienza, ilCore i5-1240P si colloca ai primi posti in termini di prestazioni, come mostra la nostra valutazione delle prestazioni della CPU. Il 1260P è in cima alla classifica, seguito dal Ryzen 7 6800U. I core P funzionano fino a 4,4 GHz, ma questo risultato viene raggiunto solo con un carico a singolo core. Questo è esattamente il tipo di carico che è ancora importante nell'uso quotidiano, ed è per questo che è consigliabile dare un'occhiata ai risultati single-core. I chip Alder Lake P sono leggermente in testa (Cinebench), seguiti dai chipAMD 6800U ancora una volta. A seconda del benchmark, tuttavia, ci sono anche forti deviazioni da questo dato, come ad esempio l'Apple M1 nel test di Blender
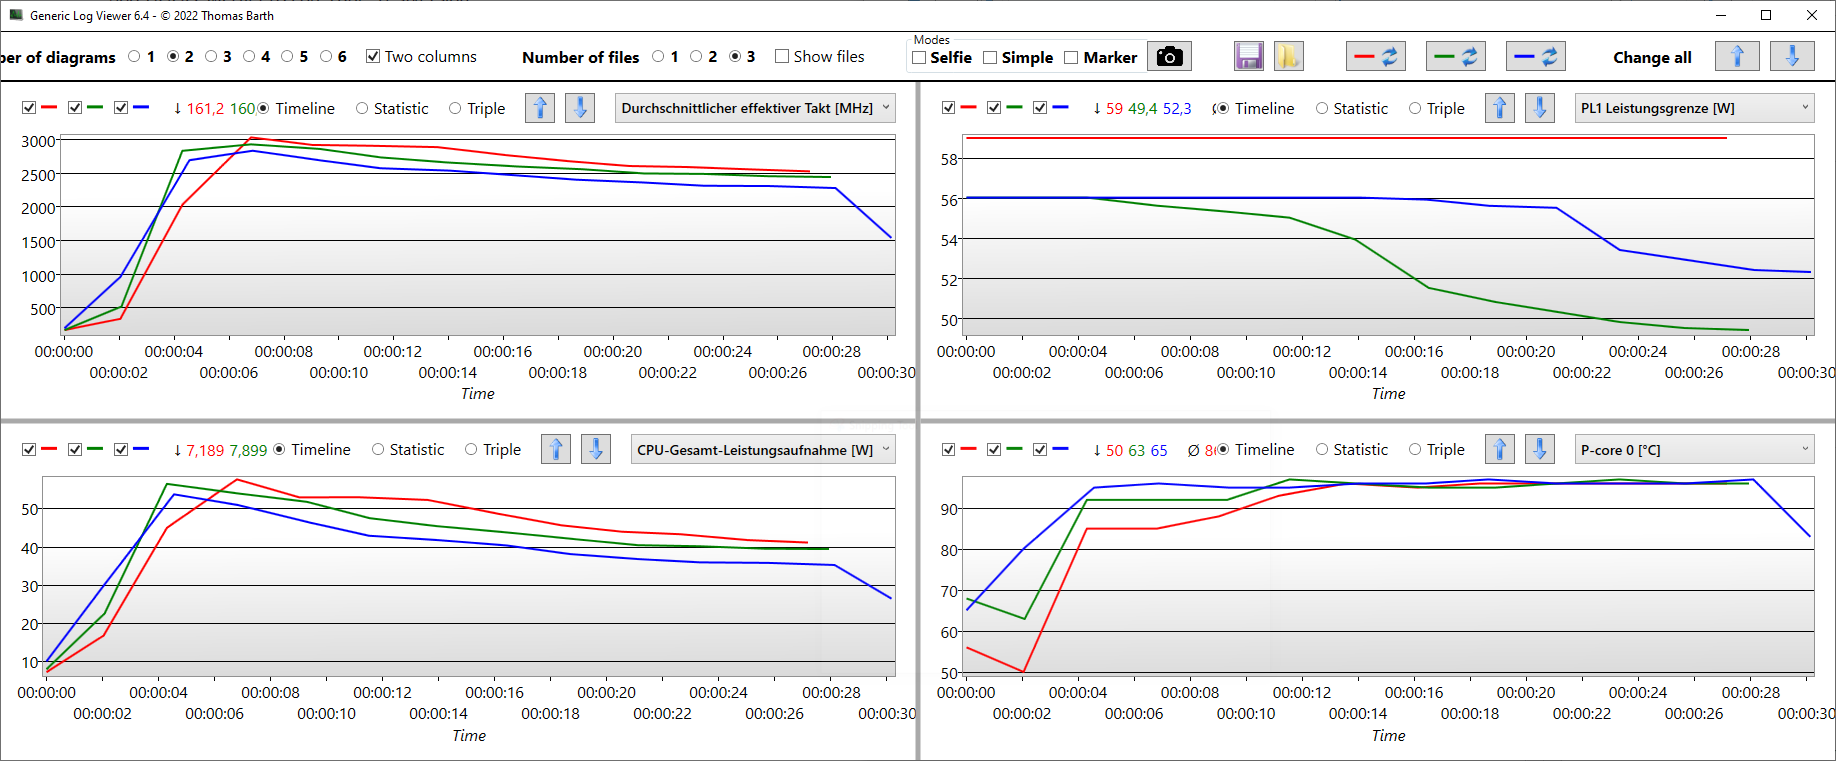
Abbiamo eseguito il benchmark Cinebench R15 Multi nelle tre modalità di prestazioni. In Ultra Performance (rosso), è consentito un PL1 di 59 watt e la frequenza di clock di 3,0 GHz è anche la più alta. La modalità Optimized riduce il PL1 a 56 watt, così come la modalità Quiet. Tuttavia, la velocità di clock inizia a subire un graduale throttling dopo soli 5 secondi in modalità Quiet, motivo per cui il PL1 scende a poco meno di 50 watt (PL2: 48 watt), mentre la velocità di clock scende di conseguenza a 2,5 GHz.
Nel ciclo Cinebench R15 Multi, la velocità di clock aumenta a 3,0 GHz prima di scendere a 2,5 GHz insieme a un calo del consumo energetico totale. Poiché i core P si stanno già riscaldando a 95 °C (~203 °F), la velocità di clock viene continuamente ridotta in tutte le esecuzioni successive del ciclo R15, motivo per cui anche i punteggi diminuiscono. Il punteggio non è più di 1.591 punti dopo circa 20 esecuzioni, ma solo di 1.213 punti. Si tratta di una perdita del 24%. Ili5-1230U nel modello xPS entry-level è molto indietro di circa 500 punti. Ancora una volta, la concorrenza AMD si dimostra solida e non può essere scalzata dal trono. IlAsus Zenbook S13 OLED guida la classifica R15.
Il Multi loop di Cinebench conferma ancora una volta il punto debole dei processori Alder Lake. All'inizio, le prestazioni multi-core sono praticamente alla pari con l'attuale AMD Ryzen 7 6800Uche consuma molto meno, con un massimo di 30 watt. Successivamente, l'i5/i7 dell'XPS 13 Plus si assesta sui 34 watt, ma offre prestazioni inferiori rispetto al 6800U delloZenBook S 13 con 25 watt.
Cinebench R15 Multi endurance test
Cinebench R15: CPU Single 64Bit | CPU Multi 64Bit
Cinebench R20: CPU (Multi Core) | CPU (Single Core)
Cinebench R23: Multi Core | Single Core
Blender: v2.79 BMW27 CPU
7-Zip 18.03: 7z b 4 | 7z b 4 -mmt1
LibreOffice : 20 Documents To PDF
R Benchmark 2.5: Overall mean
HWBOT x265 Benchmark v2.2: 4k Preset
| CPU Performance rating | |
| Media della classe Subnotebook | |
| Dell XPS 13 Plus 9320 4K | |
| Asus Zenbook S 13 OLED | |
| Dell XPS 13 Plus 9320 i5-1240p | |
| Media Intel Core i5-1240P | |
| Apple MacBook Air 2020 M1 Entry -1! | |
| Huawei MateBook 13s i5 11300H | |
| Lenovo ThinkPad X1 Nano-20UN002UGE -1! | |
| Cinebench R15 / CPU Single 64Bit | |
| Media della classe Subnotebook (72.4 - 322, n=57, ultimi 2 anni) | |
| Dell XPS 13 Plus 9320 4K | |
| Asus Zenbook S 13 OLED | |
| Dell XPS 13 Plus 9320 i5-1240p | |
| Apple MacBook Air 2020 M1 Entry | |
| Lenovo ThinkPad X1 Nano-20UN002UGE | |
| Huawei MateBook 13s i5 11300H | |
| Media Intel Core i5-1240P (91.8 - 243, n=18) | |
| Cinebench R15 / CPU Multi 64Bit | |
| Media della classe Subnotebook (327 - 3345, n=57, ultimi 2 anni) | |
| Asus Zenbook S 13 OLED | |
| Dell XPS 13 Plus 9320 4K | |
| Dell XPS 13 Plus 9320 4K | |
| Dell XPS 13 Plus 9320 i5-1240p | |
| Media Intel Core i5-1240P (407 - 2007, n=19) | |
| Apple MacBook Air 2020 M1 Entry | |
| Huawei MateBook 13s i5 11300H | |
| Huawei MateBook 13s i5 11300H | |
| Lenovo ThinkPad X1 Nano-20UN002UGE | |
| Cinebench R20 / CPU (Multi Core) | |
| Media della classe Subnotebook (579 - 8541, n=57, ultimi 2 anni) | |
| Asus Zenbook S 13 OLED | |
| Dell XPS 13 Plus 9320 4K | |
| Dell XPS 13 Plus 9320 i5-1240p | |
| Media Intel Core i5-1240P (763 - 4456, n=16) | |
| Huawei MateBook 13s i5 11300H | |
| Apple MacBook Air 2020 M1 Entry | |
| Lenovo ThinkPad X1 Nano-20UN002UGE | |
| Cinebench R20 / CPU (Single Core) | |
| Media della classe Subnotebook (128 - 832, n=57, ultimi 2 anni) | |
| Dell XPS 13 Plus 9320 4K | |
| Dell XPS 13 Plus 9320 i5-1240p | |
| Asus Zenbook S 13 OLED | |
| Media Intel Core i5-1240P (251 - 653, n=16) | |
| Lenovo ThinkPad X1 Nano-20UN002UGE | |
| Huawei MateBook 13s i5 11300H | |
| Apple MacBook Air 2020 M1 Entry | |
| Cinebench R23 / Multi Core | |
| Media della classe Subnotebook (1555 - 21812, n=60, ultimi 2 anni) | |
| Asus Zenbook S 13 OLED | |
| Dell XPS 13 Plus 9320 4K | |
| Dell XPS 13 Plus 9320 i5-1240p | |
| Media Intel Core i5-1240P (277 - 11556, n=20) | |
| Apple MacBook Air 2020 M1 Entry | |
| Lenovo ThinkPad X1 Nano-20UN002UGE | |
| Huawei MateBook 13s i5 11300H | |
| Cinebench R23 / Single Core | |
| Media della classe Subnotebook (358 - 2213, n=61, ultimi 2 anni) | |
| Dell XPS 13 Plus 9320 4K | |
| Dell XPS 13 Plus 9320 i5-1240p | |
| Apple MacBook Air 2020 M1 Entry | |
| Asus Zenbook S 13 OLED | |
| Media Intel Core i5-1240P (640 - 1689, n=18) | |
| Huawei MateBook 13s i5 11300H | |
| Blender / v2.79 BMW27 CPU | |
| Apple MacBook Air 2020 M1 Entry | |
| Lenovo ThinkPad X1 Nano-20UN002UGE | |
| Huawei MateBook 13s i5 11300H | |
| Media Intel Core i5-1240P (285 - 1926, n=16) | |
| Media della classe Subnotebook (159 - 2271, n=58, ultimi 2 anni) | |
| Dell XPS 13 Plus 9320 i5-1240p | |
| Dell XPS 13 Plus 9320 4K | |
| Asus Zenbook S 13 OLED | |
| 7-Zip 18.03 / 7z b 4 | |
| Asus Zenbook S 13 OLED | |
| Media della classe Subnotebook (11668 - 77867, n=57, ultimi 2 anni) | |
| Dell XPS 13 Plus 9320 4K | |
| Dell XPS 13 Plus 9320 i5-1240p | |
| Apple MacBook Air 2020 M1 Entry | |
| Media Intel Core i5-1240P (7254 - 47002, n=16) | |
| Huawei MateBook 13s i5 11300H | |
| Lenovo ThinkPad X1 Nano-20UN002UGE | |
| 7-Zip 18.03 / 7z b 4 -mmt1 | |
| Media della classe Subnotebook (2643 - 6699, n=59, ultimi 2 anni) | |
| Apple MacBook Air 2020 M1 Entry | |
| Asus Zenbook S 13 OLED | |
| Dell XPS 13 Plus 9320 4K | |
| Huawei MateBook 13s i5 11300H | |
| Dell XPS 13 Plus 9320 i5-1240p | |
| Lenovo ThinkPad X1 Nano-20UN002UGE | |
| Media Intel Core i5-1240P (2197 - 5320, n=16) | |
| LibreOffice / 20 Documents To PDF | |
| Dell XPS 13 Plus 9320 i5-1240p | |
| Media Intel Core i5-1240P (46.4 - 120.5, n=16) | |
| Media della classe Subnotebook (39.9 - 220, n=56, ultimi 2 anni) | |
| Asus Zenbook S 13 OLED | |
| Lenovo ThinkPad X1 Nano-20UN002UGE | |
| Huawei MateBook 13s i5 11300H | |
| Dell XPS 13 Plus 9320 4K | |
| Apple MacBook Air 2020 M1 Entry | |
| R Benchmark 2.5 / Overall mean | |
| Apple MacBook Air 2020 M1 Entry | |
| Lenovo ThinkPad X1 Nano-20UN002UGE | |
| Huawei MateBook 13s i5 11300H | |
| Media Intel Core i5-1240P (0.4987 - 1.236, n=16) | |
| Media della classe Subnotebook (0.4024 - 1.456, n=58, ultimi 2 anni) | |
| Asus Zenbook S 13 OLED | |
| Dell XPS 13 Plus 9320 i5-1240p | |
| Dell XPS 13 Plus 9320 4K | |
| HWBOT x265 Benchmark v2.2 / 4k Preset | |
| Media della classe Subnotebook (0.97 - 25.1, n=57, ultimi 2 anni) | |
| Asus Zenbook S 13 OLED | |
| Dell XPS 13 Plus 9320 4K | |
| Dell XPS 13 Plus 9320 i5-1240p | |
| Media Intel Core i5-1240P (1.99 - 12.9, n=16) | |
| Huawei MateBook 13s i5 11300H | |
| Lenovo ThinkPad X1 Nano-20UN002UGE | |
* ... Meglio usare valori piccoli
AIDA64: FP32 Ray-Trace | FPU Julia | CPU SHA3 | CPU Queen | FPU SinJulia | FPU Mandel | CPU AES | CPU ZLib | FP64 Ray-Trace | CPU PhotoWorxx
| Performance rating | |
| Asus Zenbook S 13 OLED | |
| Media della classe Subnotebook | |
| Huawei MateBook 13s i5 11300H | |
| Dell XPS 13 Plus 9320 4K | |
| Dell XPS 13 Plus 9320 i5-1240p | |
| Media Intel Core i5-1240P | |
| Lenovo ThinkPad X1 Nano-20UN002UGE | |
| AIDA64 / FP32 Ray-Trace | |
| Media della classe Subnotebook (1135 - 32888, n=58, ultimi 2 anni) | |
| Asus Zenbook S 13 OLED | |
| Huawei MateBook 13s i5 11300H | |
| Lenovo ThinkPad X1 Nano-20UN002UGE | |
| Media Intel Core i5-1240P (2405 - 9694, n=16) | |
| Dell XPS 13 Plus 9320 4K | |
| Dell XPS 13 Plus 9320 i5-1240p | |
| AIDA64 / FPU Julia | |
| Asus Zenbook S 13 OLED | |
| Media della classe Subnotebook (5218 - 123315, n=58, ultimi 2 anni) | |
| Huawei MateBook 13s i5 11300H | |
| Media Intel Core i5-1240P (7407 - 49934, n=16) | |
| Lenovo ThinkPad X1 Nano-20UN002UGE | |
| Dell XPS 13 Plus 9320 4K | |
| Dell XPS 13 Plus 9320 i5-1240p | |
| AIDA64 / CPU SHA3 | |
| Media della classe Subnotebook (444 - 5287, n=58, ultimi 2 anni) | |
| Asus Zenbook S 13 OLED | |
| Huawei MateBook 13s i5 11300H | |
| Lenovo ThinkPad X1 Nano-20UN002UGE | |
| Dell XPS 13 Plus 9320 4K | |
| Dell XPS 13 Plus 9320 i5-1240p | |
| Media Intel Core i5-1240P (415 - 2462, n=16) | |
| AIDA64 / CPU Queen | |
| Asus Zenbook S 13 OLED | |
| Dell XPS 13 Plus 9320 4K | |
| Dell XPS 13 Plus 9320 i5-1240p | |
| Media Intel Core i5-1240P (29405 - 76736, n=16) | |
| Media della classe Subnotebook (10579 - 95002, n=50, ultimi 2 anni) | |
| Huawei MateBook 13s i5 11300H | |
| Lenovo ThinkPad X1 Nano-20UN002UGE | |
| AIDA64 / FPU SinJulia | |
| Asus Zenbook S 13 OLED | |
| Media della classe Subnotebook (744 - 18418, n=58, ultimi 2 anni) | |
| Dell XPS 13 Plus 9320 4K | |
| Dell XPS 13 Plus 9320 i5-1240p | |
| Media Intel Core i5-1240P (2135 - 6540, n=16) | |
| Huawei MateBook 13s i5 11300H | |
| Lenovo ThinkPad X1 Nano-20UN002UGE | |
| AIDA64 / FPU Mandel | |
| Asus Zenbook S 13 OLED | |
| Media della classe Subnotebook (3341 - 65433, n=58, ultimi 2 anni) | |
| Huawei MateBook 13s i5 11300H | |
| Lenovo ThinkPad X1 Nano-20UN002UGE | |
| Media Intel Core i5-1240P (5113 - 23992, n=16) | |
| Dell XPS 13 Plus 9320 i5-1240p | |
| Dell XPS 13 Plus 9320 4K | |
| AIDA64 / CPU AES | |
| Asus Zenbook S 13 OLED | |
| Huawei MateBook 13s i5 11300H | |
| Lenovo ThinkPad X1 Nano-20UN002UGE | |
| Media della classe Subnotebook (638 - 96917, n=58, ultimi 2 anni) | |
| Media Intel Core i5-1240P (8849 - 90370, n=16) | |
| Dell XPS 13 Plus 9320 i5-1240p | |
| Dell XPS 13 Plus 9320 4K | |
| AIDA64 / CPU ZLib | |
| Media della classe Subnotebook (164.9 - 1379, n=58, ultimi 2 anni) | |
| Dell XPS 13 Plus 9320 4K | |
| Dell XPS 13 Plus 9320 i5-1240p | |
| Asus Zenbook S 13 OLED | |
| Media Intel Core i5-1240P (101.6 - 812, n=16) | |
| Huawei MateBook 13s i5 11300H | |
| Lenovo ThinkPad X1 Nano-20UN002UGE | |
| AIDA64 / FP64 Ray-Trace | |
| Media della classe Subnotebook (610 - 17495, n=58, ultimi 2 anni) | |
| Asus Zenbook S 13 OLED | |
| Huawei MateBook 13s i5 11300H | |
| Lenovo ThinkPad X1 Nano-20UN002UGE | |
| Media Intel Core i5-1240P (1154 - 5258, n=16) | |
| Dell XPS 13 Plus 9320 4K | |
| Dell XPS 13 Plus 9320 i5-1240p | |
| AIDA64 / CPU PhotoWorxx | |
| Media della classe Subnotebook (6569 - 85600, n=58, ultimi 2 anni) | |
| Dell XPS 13 Plus 9320 4K | |
| Dell XPS 13 Plus 9320 i5-1240p | |
| Lenovo ThinkPad X1 Nano-20UN002UGE | |
| Huawei MateBook 13s i5 11300H | |
| Media Intel Core i5-1240P (11873 - 43661, n=16) | |
| Asus Zenbook S 13 OLED | |
Prestazioni del sistema
In pratica, l'XPS 13 Plus è un computer reattivo, ma si colloca nella parte bassa della classifica PC Mark 10. Perché? Il motivo è il basso punteggio in Essentials, che potrebbe essere causato dalla lentezza dell'SSD Micron - di cui parleremo tra poco. Il 4K Plus con l'SSD Samsung (1 TB) guadagna molti più punti nei sub-punteggi. In ogni caso, l'XPS Plus non è in grado di sottrarre il primato all'Asus Zenbook S 13 OLED Asus Zenbook S 13 OLED.
CrossMark: Overall | Productivity | Creativity | Responsiveness
| PCMark 10 / Score | |
| Media della classe Subnotebook (4920 - 9939, n=44, ultimi 2 anni) | |
| Asus Zenbook S 13 OLED | |
| Dell XPS 13 Plus 9320 4K | |
| Media Intel Core i5-1240P, Intel Iris Xe Graphics G7 80EUs (4881 - 5345, n=11) | |
| Huawei MateBook 13s i5 11300H | |
| Dell XPS 13 Plus 9320 i5-1240p | |
| Dell XPS 13 9315, i5-1230U | |
| Lenovo ThinkPad X1 Nano-20UN002UGE | |
| PCMark 10 / Essentials | |
| Asus Zenbook S 13 OLED | |
| Dell XPS 13 Plus 9320 4K | |
| Media della classe Subnotebook (8552 - 11646, n=44, ultimi 2 anni) | |
| Media Intel Core i5-1240P, Intel Iris Xe Graphics G7 80EUs (8890 - 10652, n=11) | |
| Dell XPS 13 9315, i5-1230U | |
| Huawei MateBook 13s i5 11300H | |
| Lenovo ThinkPad X1 Nano-20UN002UGE | |
| Dell XPS 13 Plus 9320 i5-1240p | |
| PCMark 10 / Productivity | |
| Media della classe Subnotebook (5435 - 16606, n=44, ultimi 2 anni) | |
| Asus Zenbook S 13 OLED | |
| Dell XPS 13 Plus 9320 4K | |
| Dell XPS 13 Plus 9320 i5-1240p | |
| Media Intel Core i5-1240P, Intel Iris Xe Graphics G7 80EUs (6118 - 7058, n=11) | |
| Dell XPS 13 9315, i5-1230U | |
| Huawei MateBook 13s i5 11300H | |
| Lenovo ThinkPad X1 Nano-20UN002UGE | |
| PCMark 10 / Digital Content Creation | |
| Media della classe Subnotebook (5722 - 13779, n=44, ultimi 2 anni) | |
| Asus Zenbook S 13 OLED | |
| Dell XPS 13 Plus 9320 4K | |
| Media Intel Core i5-1240P, Intel Iris Xe Graphics G7 80EUs (5169 - 6213, n=11) | |
| Dell XPS 13 Plus 9320 i5-1240p | |
| Huawei MateBook 13s i5 11300H | |
| Lenovo ThinkPad X1 Nano-20UN002UGE | |
| Dell XPS 13 9315, i5-1230U | |
| CrossMark / Overall | |
| Dell XPS 13 Plus 9320 4K | |
| Media della classe Subnotebook (365 - 2356, n=59, ultimi 2 anni) | |
| Media Intel Core i5-1240P, Intel Iris Xe Graphics G7 80EUs (1392 - 1553, n=7) | |
| Asus Zenbook S 13 OLED | |
| Dell XPS 13 Plus 9320 i5-1240p | |
| Apple MacBook Air 2020 M1 Entry | |
| Huawei MateBook 13s i5 11300H | |
| Dell XPS 13 9315, i5-1230U | |
| CrossMark / Productivity | |
| Dell XPS 13 Plus 9320 4K | |
| Media della classe Subnotebook (364 - 2277, n=59, ultimi 2 anni) | |
| Asus Zenbook S 13 OLED | |
| Media Intel Core i5-1240P, Intel Iris Xe Graphics G7 80EUs (1393 - 1524, n=7) | |
| Huawei MateBook 13s i5 11300H | |
| Dell XPS 13 Plus 9320 i5-1240p | |
| Dell XPS 13 9315, i5-1230U | |
| Apple MacBook Air 2020 M1 Entry | |
| CrossMark / Creativity | |
| Dell XPS 13 Plus 9320 4K | |
| Media della classe Subnotebook (372 - 2743, n=59, ultimi 2 anni) | |
| Dell XPS 13 Plus 9320 i5-1240p | |
| Apple MacBook Air 2020 M1 Entry | |
| Media Intel Core i5-1240P, Intel Iris Xe Graphics G7 80EUs (1426 - 1647, n=7) | |
| Asus Zenbook S 13 OLED | |
| Dell XPS 13 9315, i5-1230U | |
| Huawei MateBook 13s i5 11300H | |
| CrossMark / Responsiveness | |
| Huawei MateBook 13s i5 11300H | |
| Dell XPS 13 Plus 9320 4K | |
| Media Intel Core i5-1240P, Intel Iris Xe Graphics G7 80EUs (1267 - 1545, n=7) | |
| Media della classe Subnotebook (312 - 1854, n=59, ultimi 2 anni) | |
| Dell XPS 13 Plus 9320 i5-1240p | |
| Asus Zenbook S 13 OLED | |
| Dell XPS 13 9315, i5-1230U | |
| Apple MacBook Air 2020 M1 Entry | |
| PCMark 10 Score | 4903 punti | |
Aiuto | ||
| AIDA64 / Memory Copy | |
| Media della classe Subnotebook (14554 - 131023, n=58, ultimi 2 anni) | |
| Dell XPS 13 Plus 9320 i5-1240p | |
| Media Intel Core i5-1240P (23312 - 70537, n=16) | |
| AIDA64 / Memory Read | |
| Media della classe Subnotebook (15948 - 127174, n=58, ultimi 2 anni) | |
| Dell XPS 13 Plus 9320 i5-1240p | |
| Media Intel Core i5-1240P (18989 - 70553, n=16) | |
| AIDA64 / Memory Write | |
| Media della classe Subnotebook (15709 - 135141, n=58, ultimi 2 anni) | |
| Dell XPS 13 Plus 9320 i5-1240p | |
| Media Intel Core i5-1240P (23454 - 62496, n=16) | |
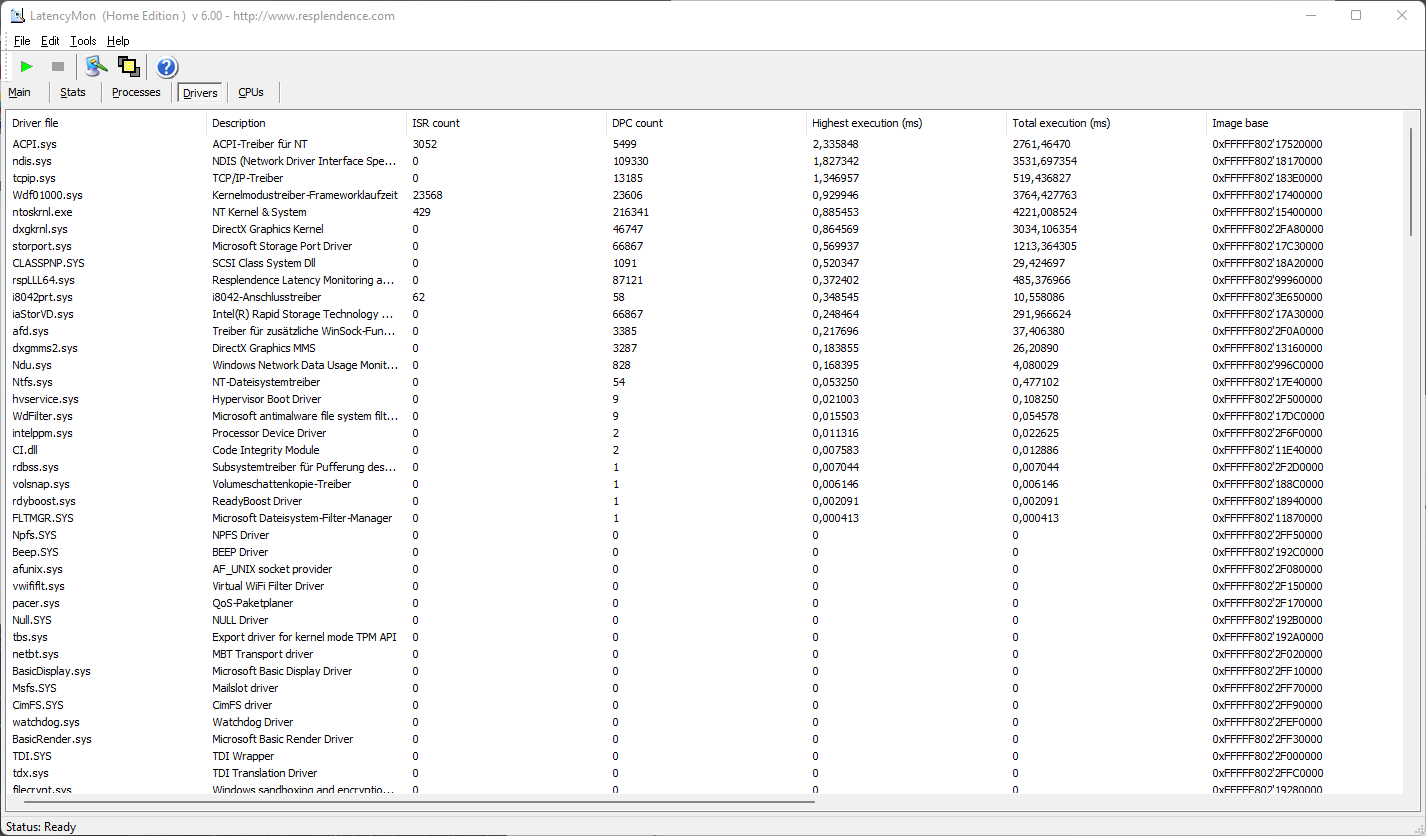
Latenze DPC
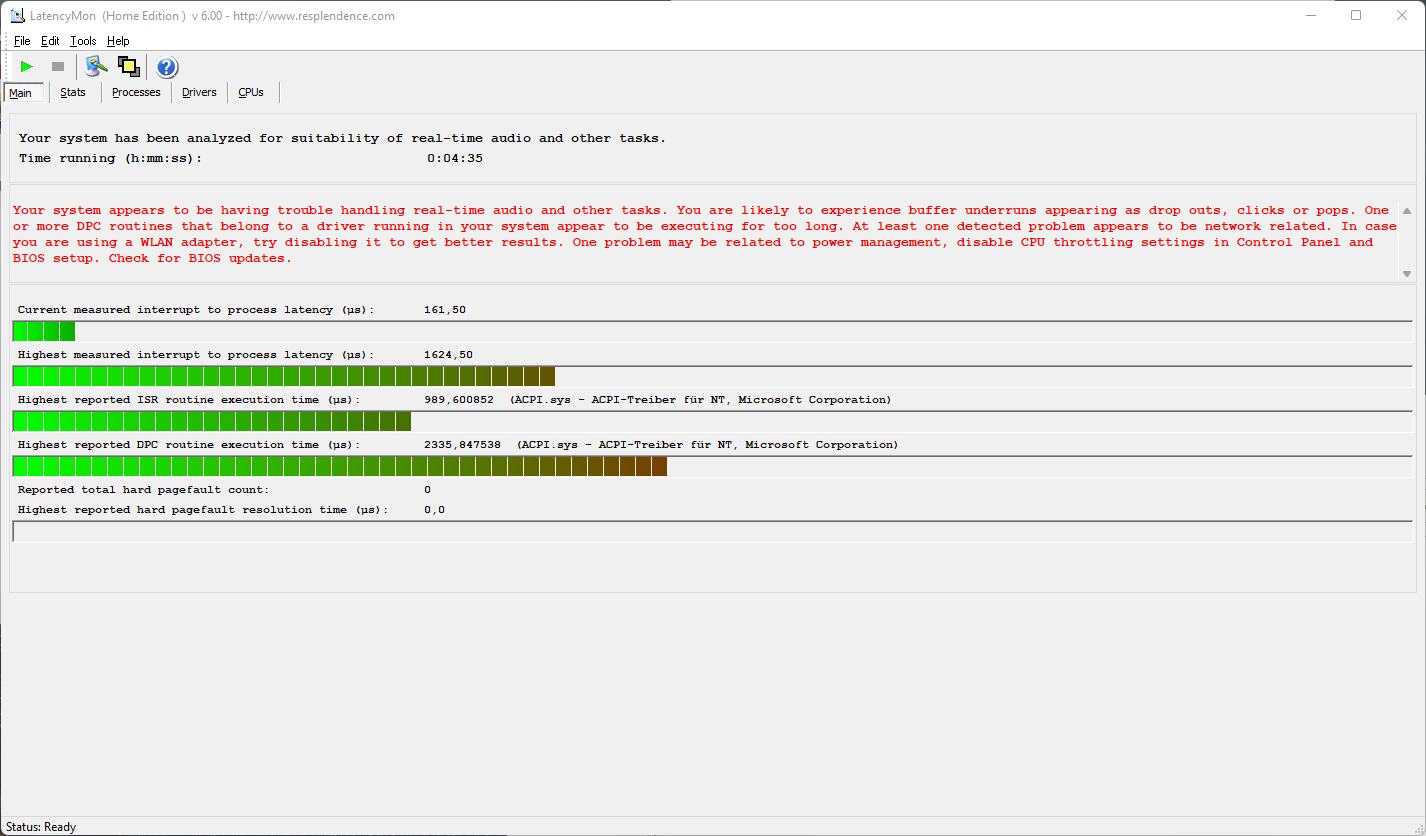
Il nostro test di latenza standardizzato (navigazione web, YouTube 4K, carico della CPU) rivela problemi; il driver ACPI causa problemi. Ciò si è verificato anche con l'XPS 13 Plus i7/4K. Pertanto, l'XPS 13 Plus è adatto all'uso di applicazioni audio in tempo reale solo in misura limitata con la versione del BIOS e le impostazioni del driver attuali
| DPC Latencies / LatencyMon - interrupt to process latency (max), Web, Youtube, Prime95 | |
| Dell XPS 13 Plus 9320 i5-1240p | |
| Lenovo ThinkPad X1 Nano-20UN002UGE | |
| Huawei MateBook 13s i5 11300H | |
| Dell XPS 13 Plus 9320 4K | |
| Asus Zenbook S 13 OLED | |
* ... Meglio usare valori piccoli
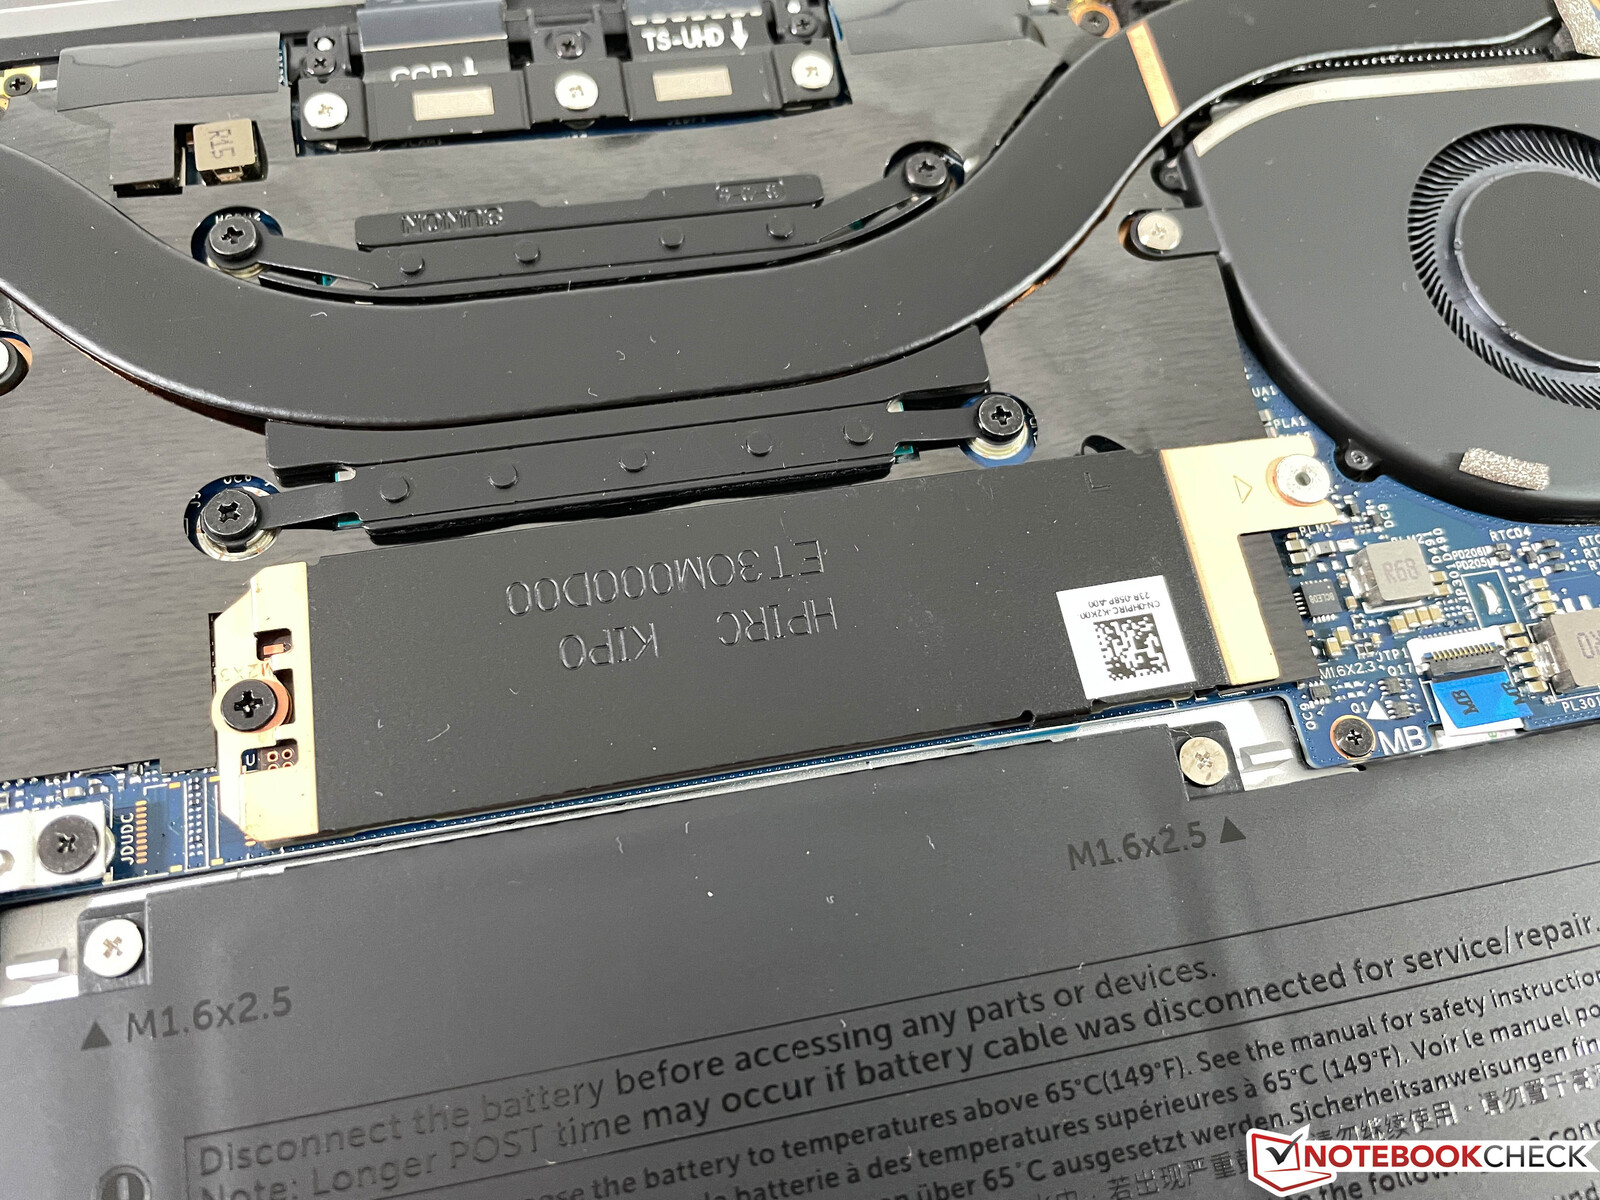
Immagazzinamento
L'unità SSD Micron 3400 da 512 GB è collegata come dispositivo M.2. Come promemoria, l'XPS 13 Plus utilizza slot M.2, che consentono di aggiornare l'SSD in un secondo momento. Il semplice XPS 13 utilizza chip saldati a bordo. Dei 512 GB, circa 312 GB sono disponibili per l'utente dopo il primo avvio.
Il Micron 3400 si posiziona all'ultimo posto nei test. I chip Phison e Samsung della concorrenza - ma anche dell'XPS 13 Plus - si sono classificati all'ultimo posto.XPS 13 Plus (i7 + 1 TB) sono semplicemente più veloci. Quindi non tutti gli XPS Plus hanno a bordo il miglior hardware possibile: L'XPS 9320 4K con SSD Samsung da 1 TB ha prestazioni migliori.
Per ulteriori confronti e benchmark, consultare i nostri Articolo sui benchmark di HDD/SSD.

* ... Meglio usare valori piccoli
Continuous load read: DiskSpd Read Loop, Queue Depth 8
Scheda grafica
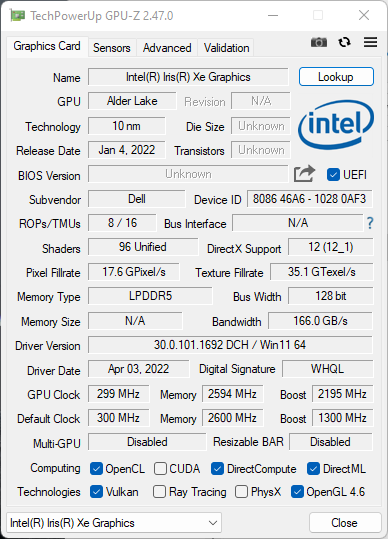
LaIris Xe Graphics G7 80EU utilizzata nei processori Tiger Lake è una vecchia conoscenza; è utilizzata anche nelle CPU Alder Lake. Nel complesso, le prestazioni grafiche sono nella media in base ai risultati misti di 3DMark. La stessa iGPU ha mostrato risultati migliori nel modello XPS 13 9305
| 3DMark 11 Performance | 5500 punti | |
| 3DMark Cloud Gate Standard Score | 10751 punti | |
| 3DMark Fire Strike Score | 3722 punti | |
| 3DMark Time Spy Score | 1290 punti | |
Aiuto | ||
Prestazioni di gioco
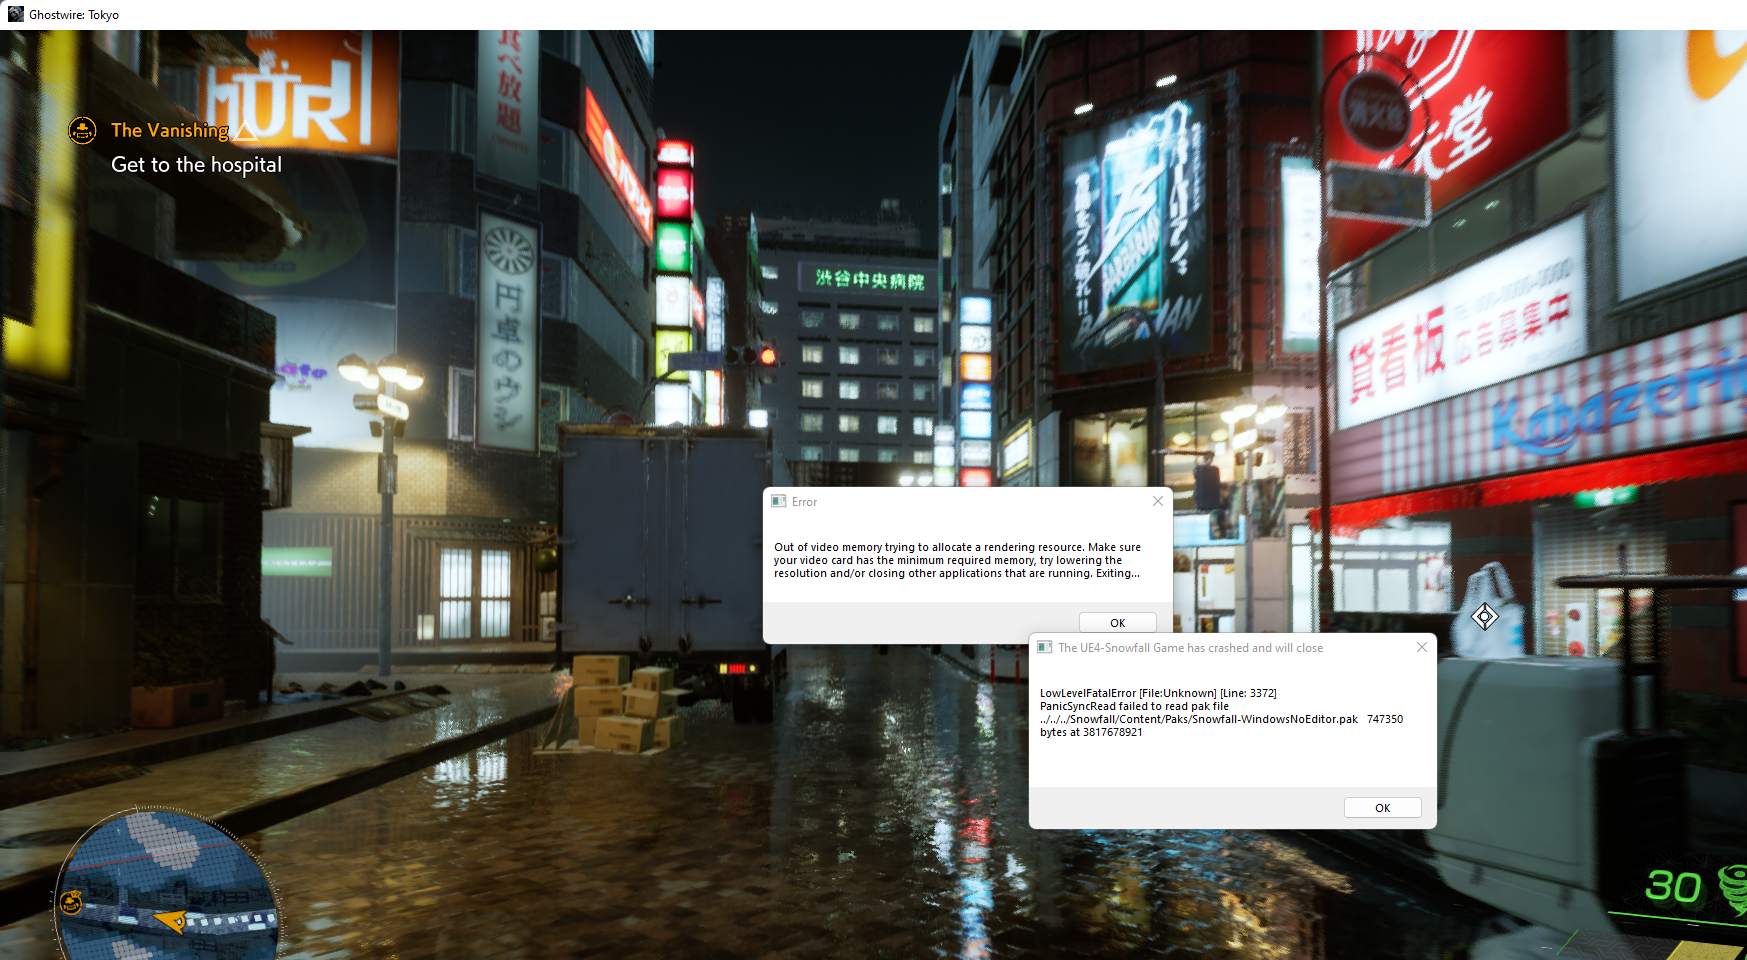
Tuttavia, l'Iris Xe è abbastanza potente in questo caso, anche se di solito si è limitati a dettagli medi o alti al massimo, anche in titoli semplici. Tuttavia, laRadeon 680M è significativamente più veloce, anche nei benchmark di gioco. LaIris Xe Graphics G7 è una scelta decente per l'uso multimediale quotidiano, poiché anche i video ad alta risoluzione non rappresentano un problema. Le prestazioni grafiche si riducono solo marginalmente con l'alimentazione a batteria. Ulteriori benchmark della GPU sono disponibili qui.
| Ghostwire Tokyo - 1280x720 Lowest Settings | |
| Dell XPS 13 Plus 9320 i5-1240p | |
| Media Intel Iris Xe Graphics G7 80EUs (n=1) | |
Witcher 3 funziona senza problemi in Full HD e con impostazioni elevate. Utilizziamo l'impostazione Ultra in Full HD per testare la stabilità della iGPU sotto carico. Anche se 22-23 FPS non sono più giocabili in questo caso, rimangono costanti, il che indica una potenza di uscita costante. La frequenza di clock della GPU di 1.300 MHz viene mantenuta
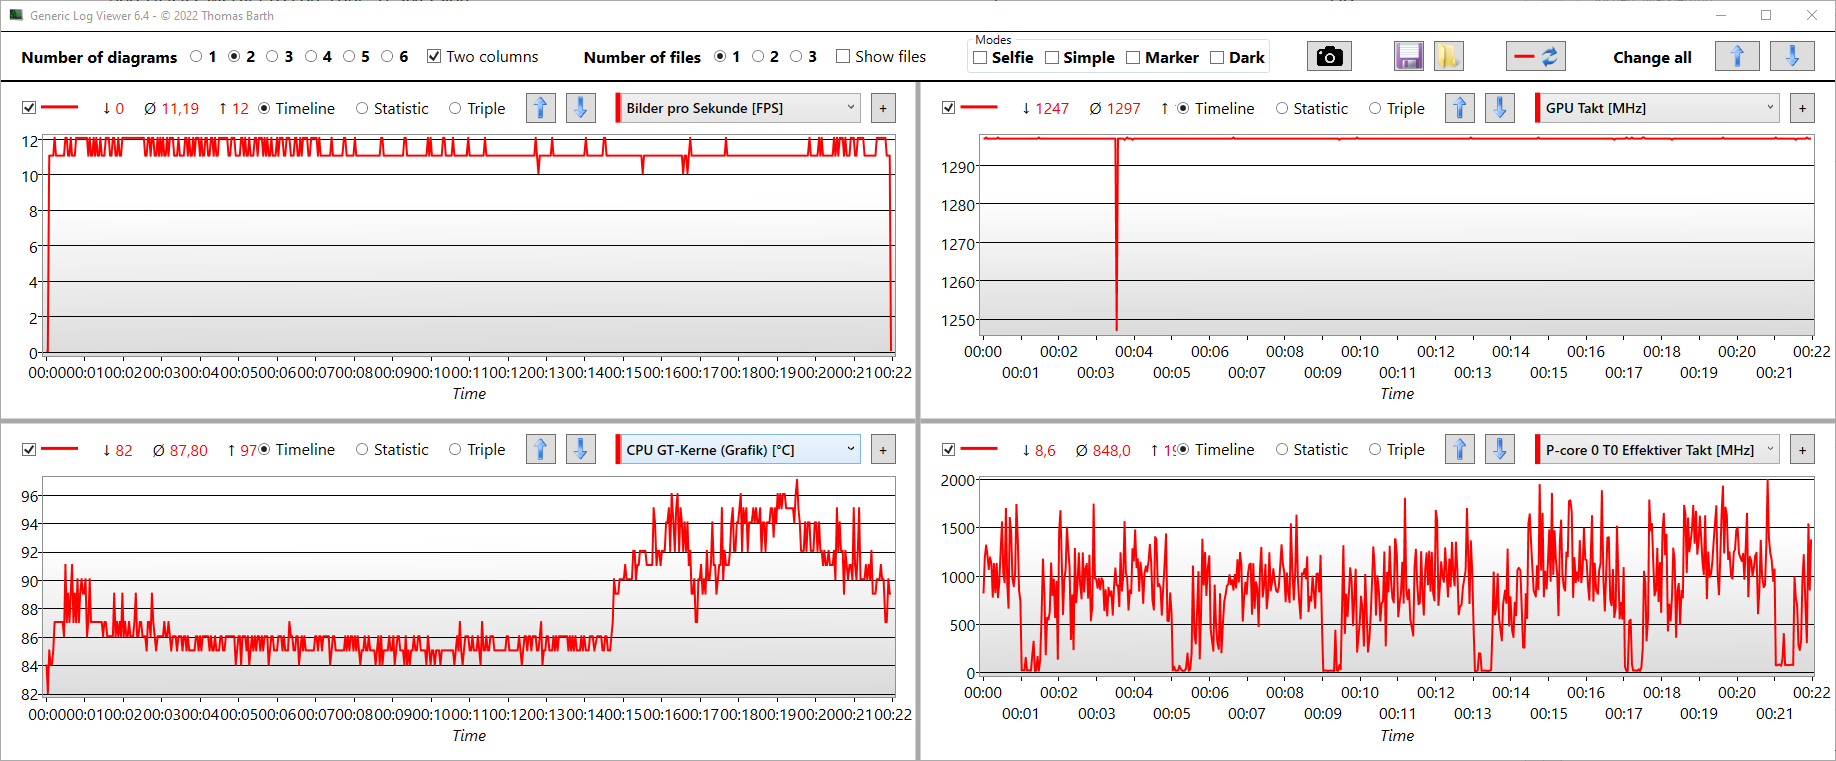
The Witcher 3 FPS diagram
| basso | medio | alto | ultra | |
|---|---|---|---|---|
| GTA V (2015) | 91 | 32 | ||
| The Witcher 3 (2015) | 75.5 | 48.1 | 31.9 | 13.1 |
| Dota 2 Reborn (2015) | 134.4 | 119.5 | 70.9 | 66.1 |
| Final Fantasy XV Benchmark (2018) | 36.3 | 19.7 | 11.7 | |
| X-Plane 11.11 (2018) | 28.5 | 23.7 | 28.8 | |
| Far Cry 5 (2018) | 61 | 28 | ||
| Strange Brigade (2018) | 67.7 | 30.7 | 24.4 | |
| Ghostwire Tokyo (2022) |
Emissioni - più rumorose di Alder Lake U
Emissioni acustiche
Quando si eseguono attività meno impegnative, le due ventole dell'XPS 13 Plus sono solitamente disattivate o funzionano al massimo al livello più basso. Questo è udibile solo nel silenzio più assoluto. Le ventole si accendono più o meno spesso a seconda della modalità di alimentazione, con le prestazioni Ultra che le fanno girare più spesso. Tuttavia, si spengono sempre in caso di utilizzo inattivo, anche in questa modalità. Quando si utilizza la modalità Ottimizzata, il portatile da 13 pollici è molto silenzioso e può essere portato anche in ambienti sensibili al rumore.
La rumorosità aumenta sotto carico, sia in modalità Ottimizzata che Ultra Performance, a causa degli elevati limiti di potenza. Abbiamo misurato un massimo di 47 dB(A) nello stress test e con un carico elevato della CPU. Si tratta di un valore notevole, ma non ci sono frequenze sgradevoli. Se si desidera che il portatile sia meno rumoroso, è possibile utilizzare la modalità Quiet, che produce un massimo di 38 dB(A) anche sotto carico elevato.
Se siete alla ricerca di silenziosità, non avete necessariamente bisogno di un Alder Lake U. Il modelloXPS 13 9315 ha un livello di rumore massimo di 40 dB(A). Il fattore decisivo in questo caso è l'utilizzo della corrispondente modalità di alimentazione Quiet.
Rumorosità
| Idle |
| 26.2 / 26.2 / 26.2 dB(A) |
| Sotto carico |
| 38.4 / 47.1 dB(A) |
 | ||
30 dB silenzioso 40 dB(A) udibile 50 dB(A) rumoroso |
||
min: | ||
| Dell XPS 13 Plus 9320 i5-1240p Iris Xe G7 80EUs, i5-1240P, Micron 3400 MTFDKBA512TFH 512GB | Asus Zenbook S 13 OLED Radeon 680M, R7 6800U, Samsung PM9A1 MZVL21T0HCLR | Lenovo ThinkPad X1 Nano-20UN002UGE Iris Xe G7 96EUs, i7-1160G7, WDC PC SN530 SDBPNPZ-512G | Huawei MateBook 13s i5 11300H Iris Xe G7 80EUs, i5-11300H, Phison Electronics PS5012 | Dell XPS 13 Plus 9320 4K Iris Xe G7 96EUs, i7-1260P, Samsung PM9A1 MZVL21T0HCLR | Dell XPS 13 9315, i5-1230U Iris Xe G7 80EUs, i5-1230U, Micron 3460 256 GB Soldered | |
|---|---|---|---|---|---|---|
| Noise | 10% | 3% | 6% | 4% | 2% | |
| off /ambiente * (dB) | 26 | 24 8% | 24.9 4% | 24.5 6% | 24.4 6% | 26 -0% |
| Idle Minimum * (dB) | 26.2 | 24 8% | 24.9 5% | 24.5 6% | 24.4 7% | 26 1% |
| Idle Average * (dB) | 26.2 | 24 8% | 26.3 -0% | 24.5 6% | 24.4 7% | 26 1% |
| Idle Maximum * (dB) | 26.2 | 24 8% | 31.8 -21% | 28 -7% | 25.5 3% | 27.5 -5% |
| Load Average * (dB) | 38.4 | 33.1 14% | 34.3 11% | 35.9 7% | 40.4 -5% | 39.5 -3% |
| Load Maximum * (dB) | 47.1 | 41.7 11% | 37.5 20% | 38.6 18% | 45.5 3% | 39.6 16% |
| Witcher 3 ultra * (dB) | 40.2 | 34.3 | 35.9 | 45.5 | 39.6 |
* ... Meglio usare valori piccoli
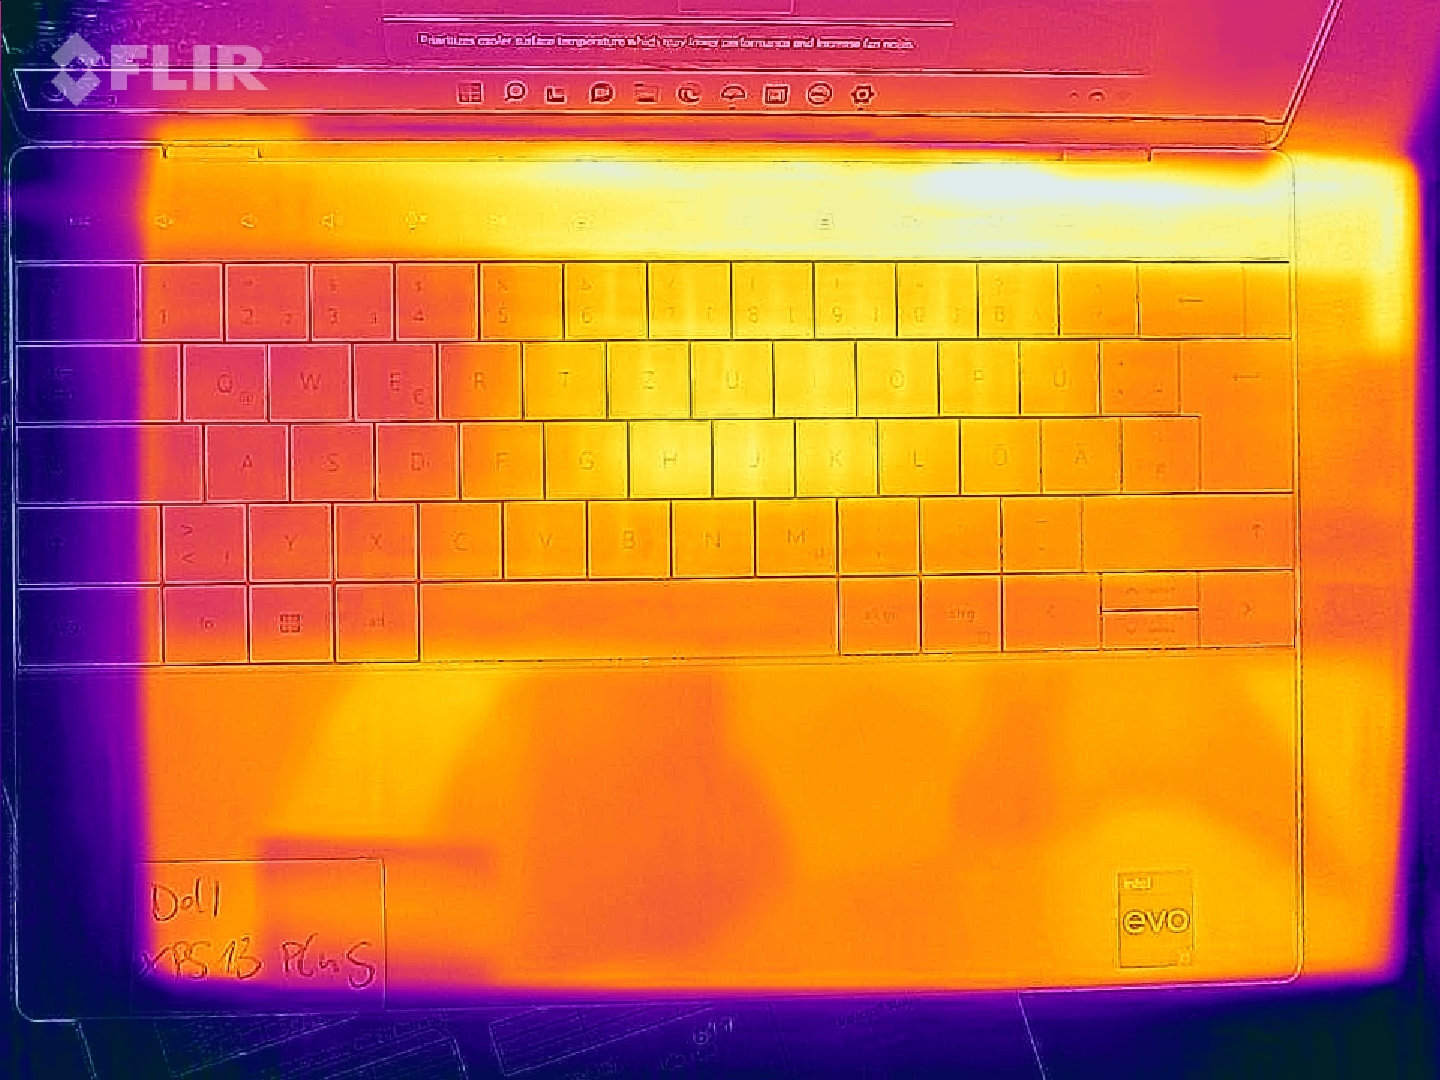
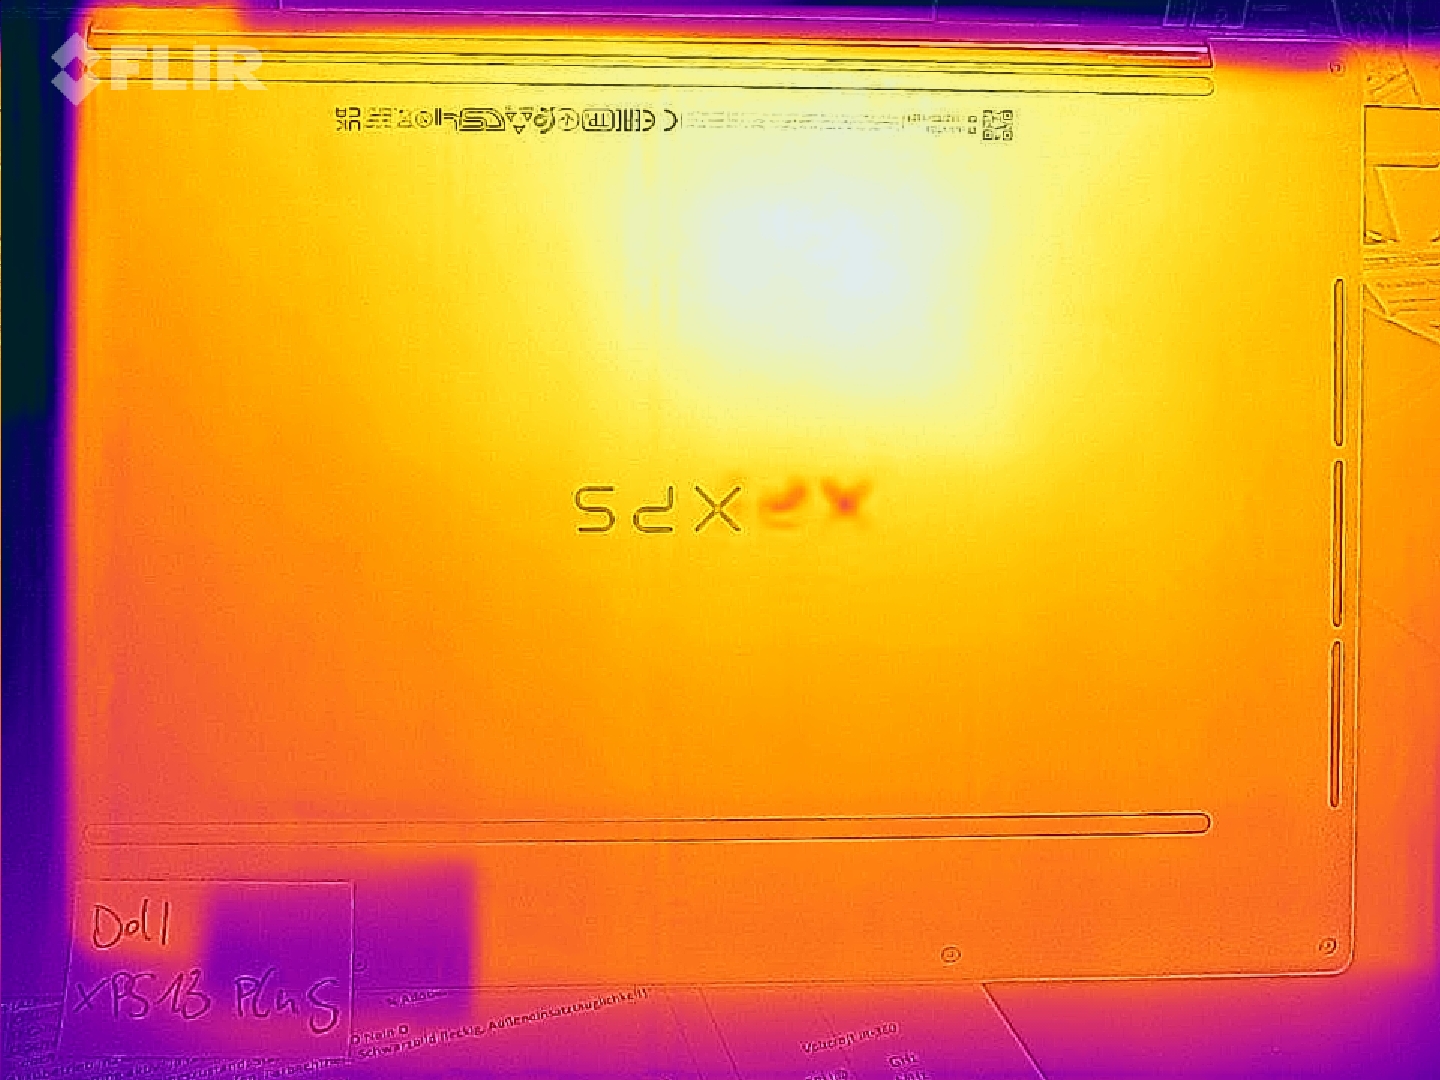
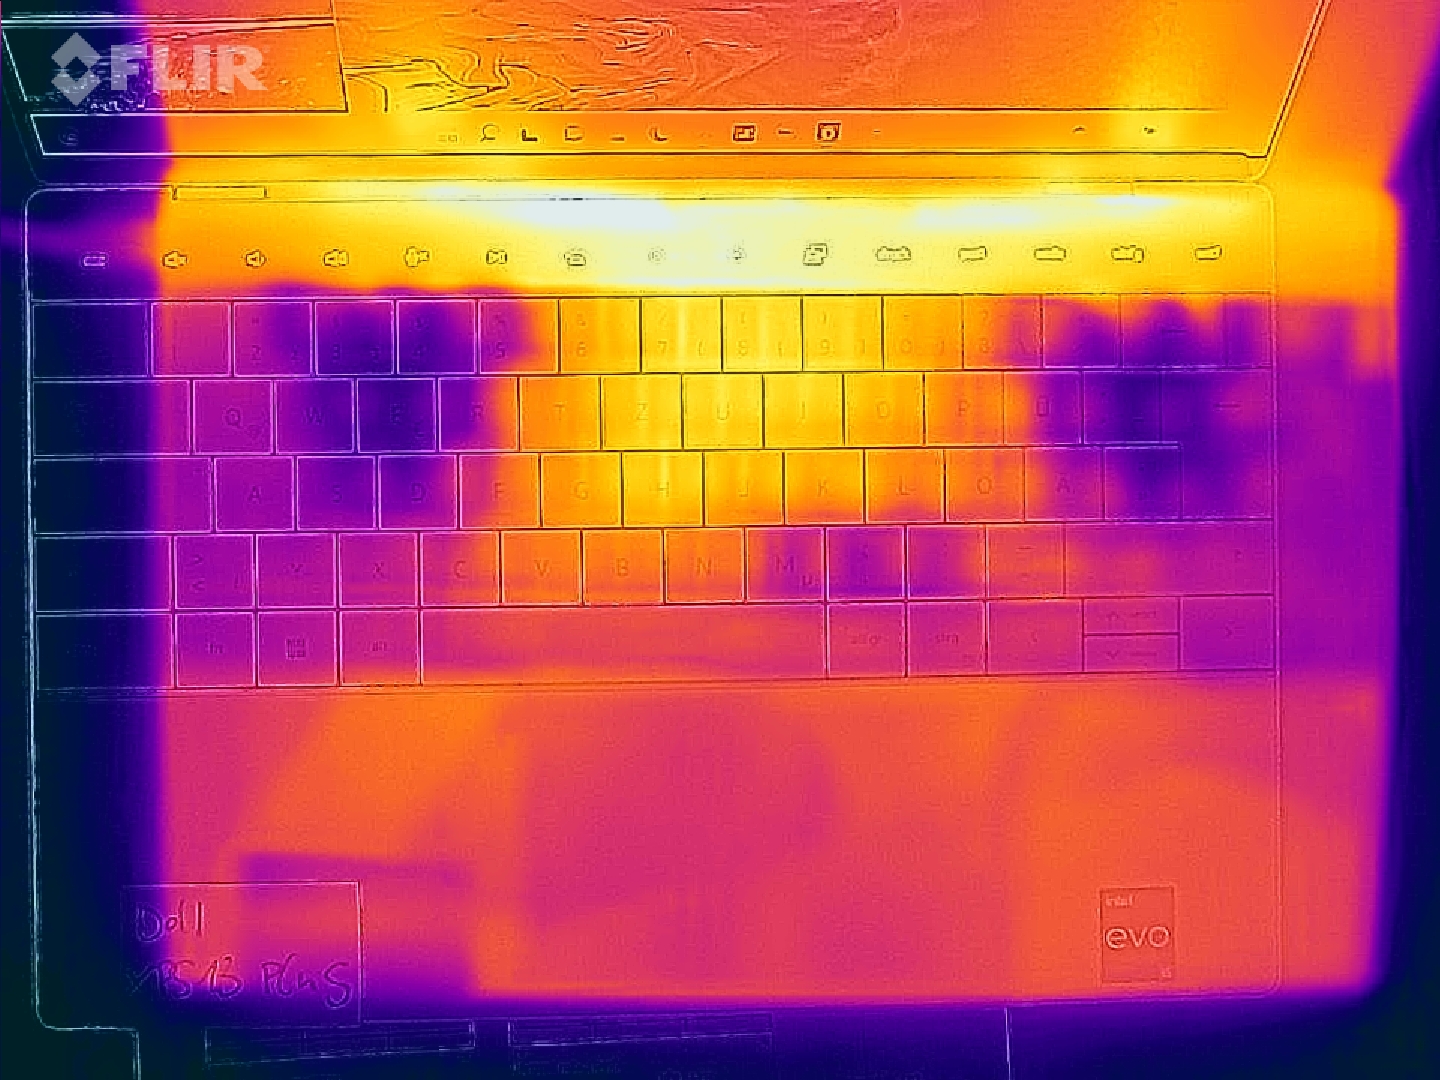
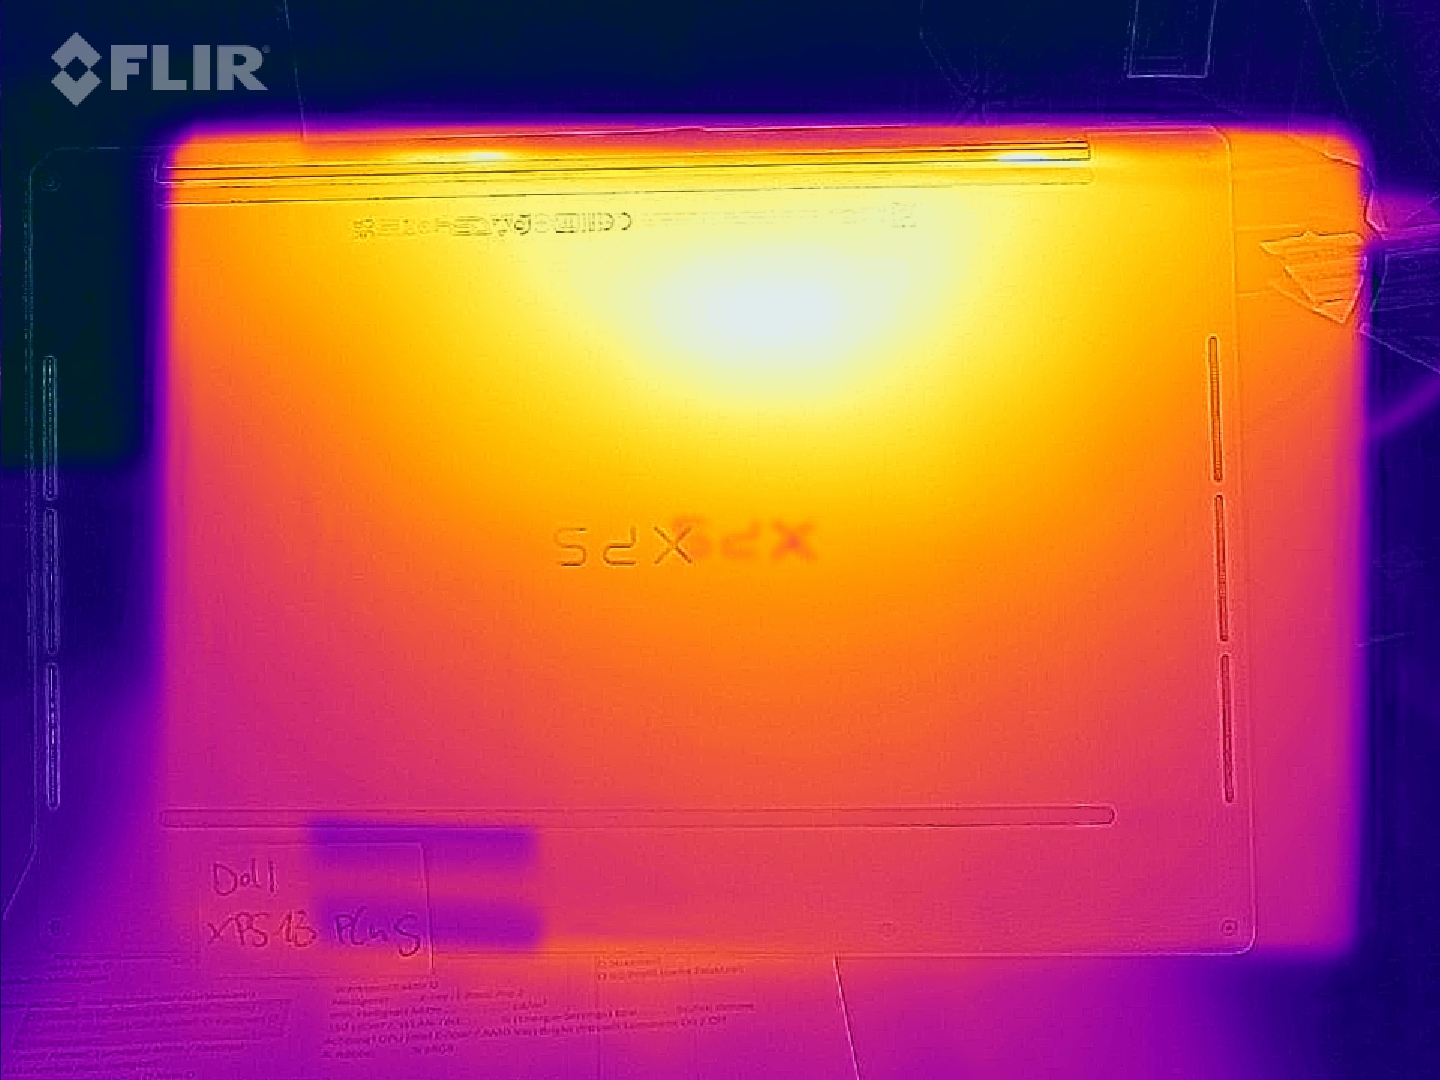
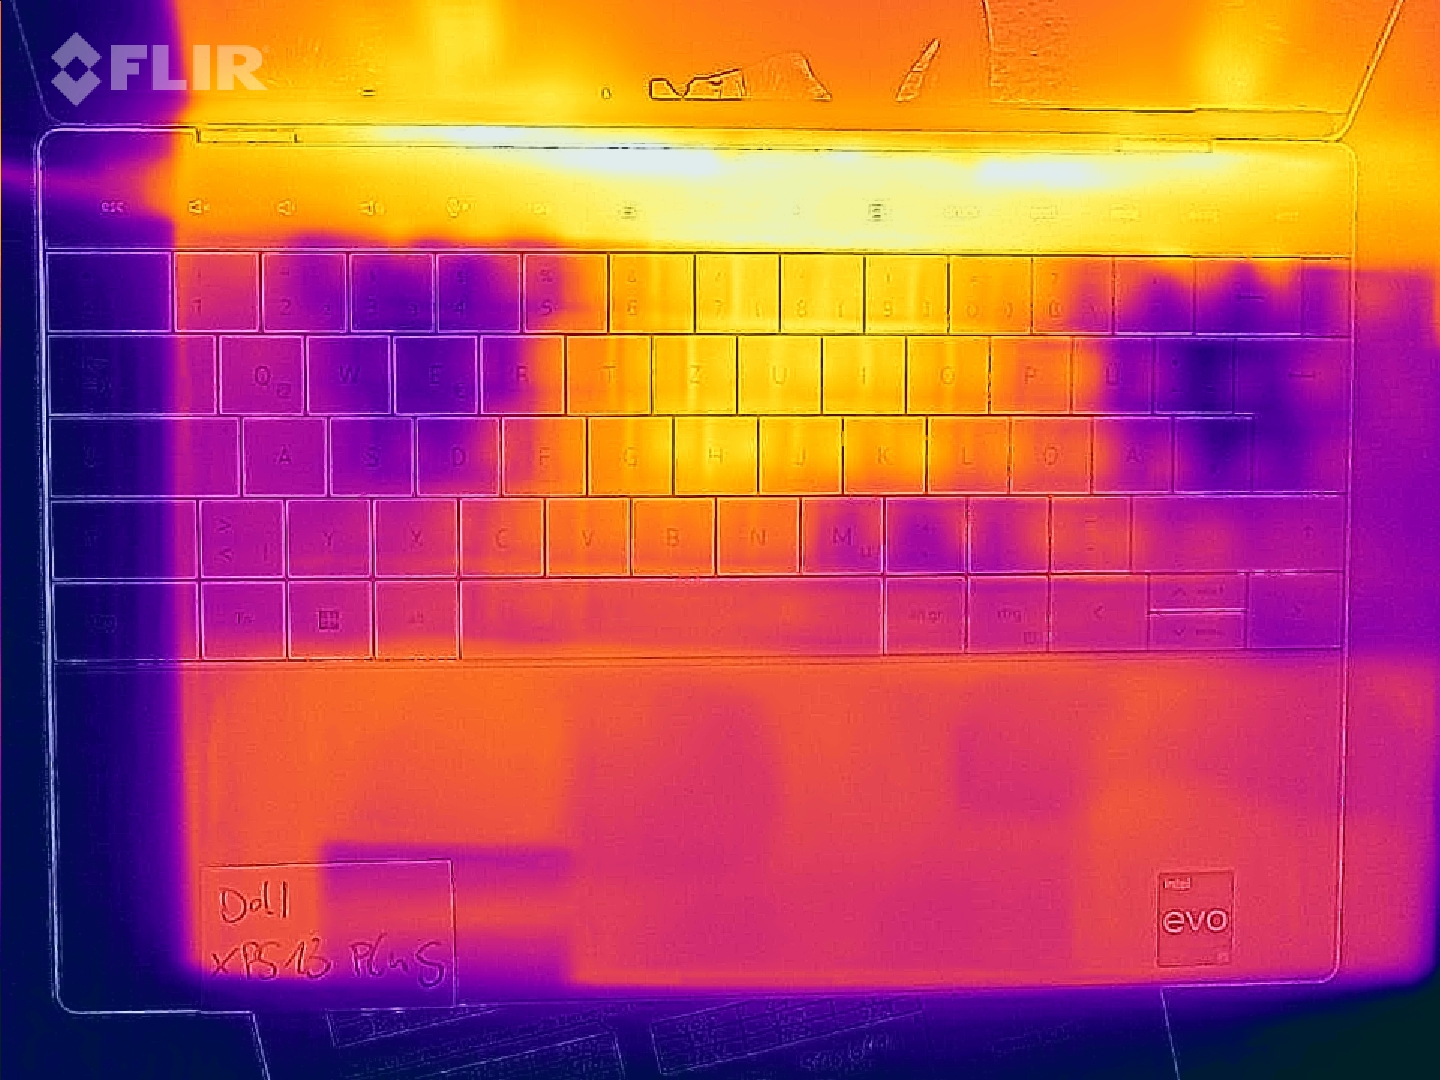
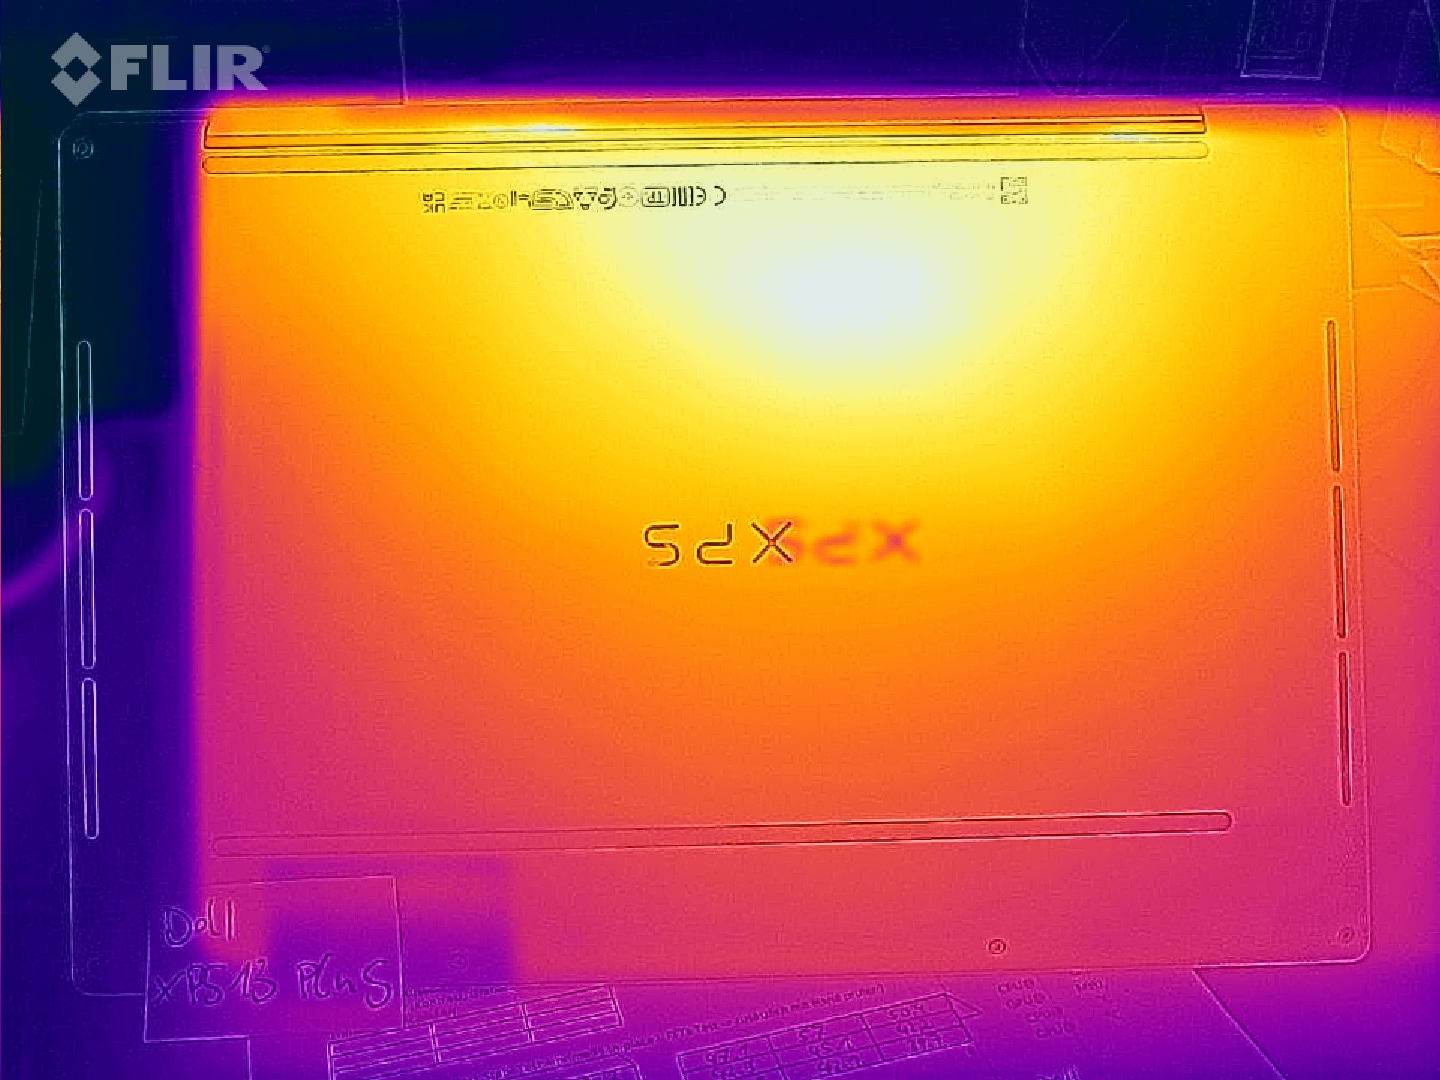
Temperatura
La custodia mantiene una temperatura piacevole nell'uso quotidiano. Il 13 pollici può essere appoggiato sulle ginocchia senza problemi quando si è in viaggio. Tuttavia, la parte inferiore e l'area superiore della tastiera si riscaldano in particolare in caso di carico pesante e continuo o durante i giochi. La parte inferiore raggiunge quasi 57 °C (~135 °F) in alcuni punti. Riteniamo che una superficie piana sia consigliabile per la circolazione dell'aria.
L'alimentatore compatto da 60 watt si scalda molto e raggiunge i 61 °C (~142 °F).
(-) La temperatura massima sul lato superiore è di 47.6 °C / 118 F, rispetto alla media di 35.9 °C / 97 F, che varia da 21.4 a 59 °C per questa classe Subnotebook.
(-) Il lato inferiore si riscalda fino ad un massimo di 57 °C / 135 F, rispetto alla media di 39.2 °C / 103 F
(±) In idle, la temperatura media del lato superiore è di 34.2 °C / 94 F, rispetto alla media deld ispositivo di 30.8 °C / 87 F.
(-) Riproducendo The Witcher 3, la temperatura media per il lato superiore e' di 39.3 °C / 103 F, rispetto alla media del dispositivo di 30.8 °C / 87 F.
(±) I poggiapolsi e il touchpad possono diventare molto caldi al tatto con un massimo di 39.8 °C / 103.6 F.
(-) La temperatura media della zona del palmo della mano di dispositivi simili e'stata di 28.2 °C / 82.8 F (-11.6 °C / -20.8 F).
| Dell XPS 13 Plus 9320 i5-1240p Intel Core i5-1240P, Intel Iris Xe Graphics G7 80EUs | Apple MacBook Air 2020 M1 Entry Apple M1, Apple M1 7-Core GPU | Asus Zenbook S 13 OLED AMD Ryzen 7 6800U, AMD Radeon 680M | Lenovo ThinkPad X1 Nano-20UN002UGE Intel Core i7-1160G7, Intel Iris Xe Graphics G7 96EUs | Huawei MateBook 13s i5 11300H Intel Core i5-11300H, Intel Iris Xe Graphics G7 80EUs | Dell XPS 13 Plus 9320 4K Intel Core i7-1260P, Intel Iris Xe Graphics G7 96EUs | Dell XPS 13 9315, i5-1230U Intel Core i5-1230U, Intel Iris Xe Graphics G7 80EUs | |
|---|---|---|---|---|---|---|---|
| Heat | 24% | 16% | 26% | 25% | 21% | 14% | |
| Maximum Upper Side * (°C) | 47.6 | 44 8% | 47.9 -1% | 42.2 11% | 42.8 10% | 41.1 14% | 42.3 11% |
| Maximum Bottom * (°C) | 57 | 44 23% | 56.1 2% | 47.5 17% | 46.9 18% | 48.8 14% | 44.9 21% |
| Idle Upper Side * (°C) | 38.8 | 27 30% | 26.8 31% | 24.3 37% | 25.2 35% | 28 28% | 32.5 16% |
| Idle Bottom * (°C) | 41 | 27 34% | 27.3 33% | 25.3 38% | 26 37% | 29.3 29% | 38.2 7% |
* ... Meglio usare valori piccoli
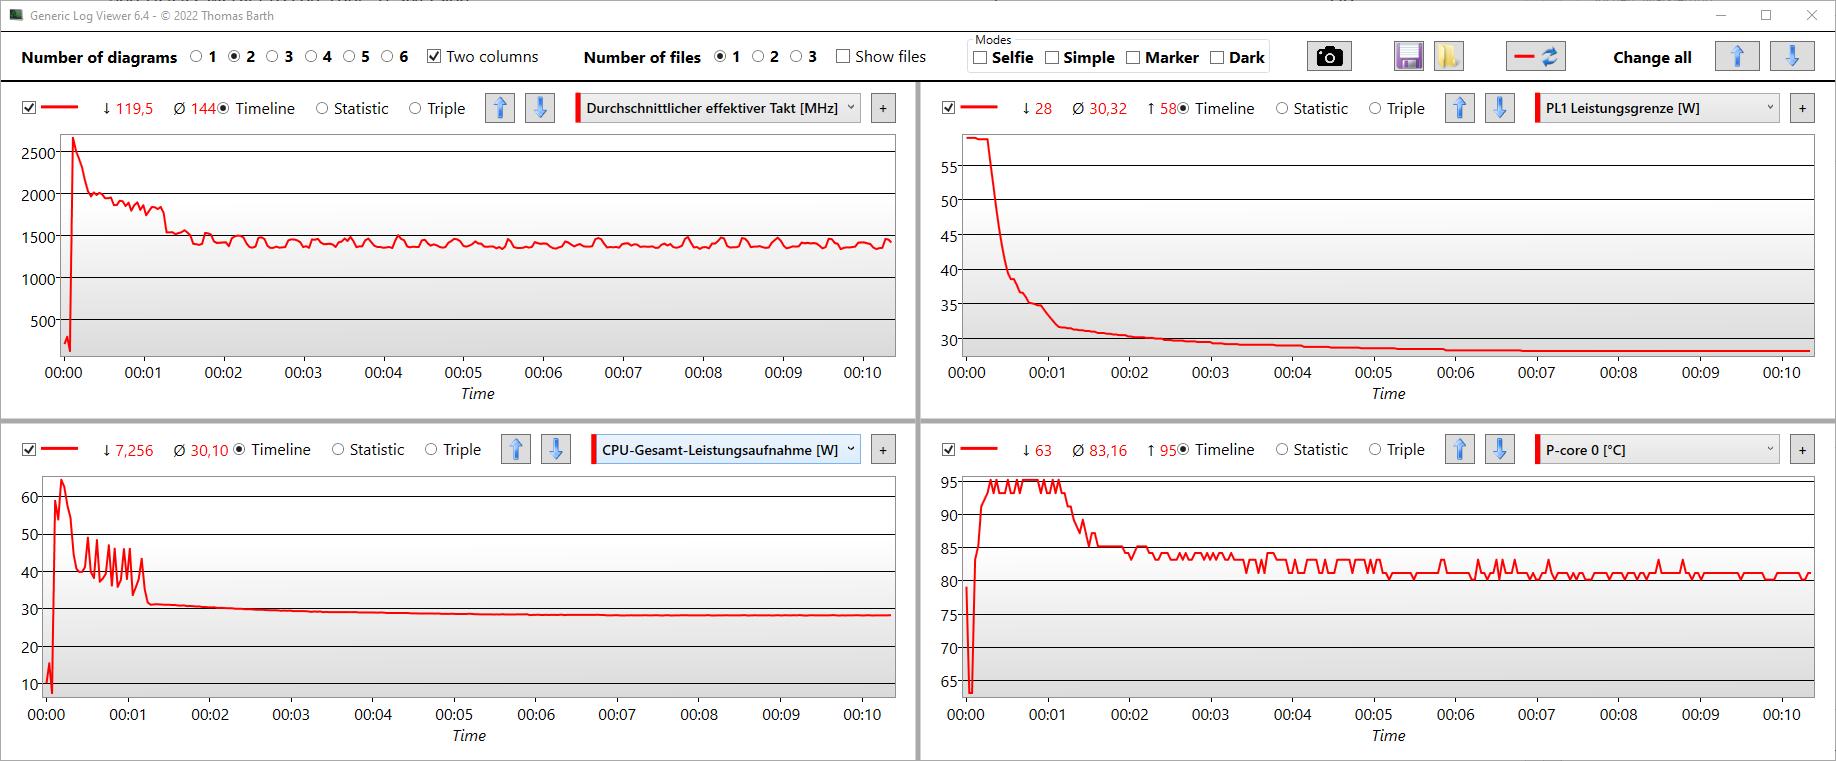
Test da sforzo
Il consumo del processore si assesta a 30 watt durante lo stress test. Prima di ciò, si possono raggiungere circa 60 watt per alcuni secondi, ma poi si scende a 40-30 watt nel primo minuto. Il throttling si attiva quando il core P raggiunge i 95 °C (~203 °F). Le prestazioni non sono state influenzate dallo stress test.
Dell XPS 13 Plus 9320 i5-1240p analisi audio
(+) | gli altoparlanti sono relativamente potenti (84.36 dB)
Bassi 100 - 315 Hz
(±) | bassi ridotti - in media 13.7% inferiori alla media
(±) | la linearità dei bassi è media (9.4% delta rispetto alla precedente frequenza)
Medi 400 - 2000 Hz
(+) | medi bilanciati - solo only 2.4% rispetto alla media
(+) | medi lineari (4.9% delta rispetto alla precedente frequenza)
Alti 2 - 16 kHz
(±) | alti elevati - circa 6.2% superiori alla media
(+) | alti lineari (3.3% delta rispetto alla precedente frequenza)
Nel complesso 100 - 16.000 Hz
(+) | suono nel complesso lineare (13.8% differenza dalla media)
Rispetto alla stessa classe
» 24% di tutti i dispositivi testati in questa classe è stato migliore, 6% simile, 70% peggiore
» Il migliore ha avuto un delta di 5%, medio di 18%, peggiore di 53%
Rispetto a tutti i dispositivi testati
» 15% di tutti i dispositivi testati in questa classe è stato migliore, 4% similare, 81% peggiore
» Il migliore ha avuto un delta di 4%, medio di 24%, peggiore di 134%
Asus Zenbook S 13 OLED analisi audio
(±) | potenza degli altiparlanti media ma buona (76.5 dB)
Bassi 100 - 315 Hz
(±) | bassi ridotti - in media 12.6% inferiori alla media
(±) | la linearità dei bassi è media (11.1% delta rispetto alla precedente frequenza)
Medi 400 - 2000 Hz
(±) | medi elevati - circa 5.8% superiore alla media
(+) | medi lineari (4.7% delta rispetto alla precedente frequenza)
Alti 2 - 16 kHz
(+) | Alti bilanciati - appena 2.6% dalla media
(+) | alti lineari (5.3% delta rispetto alla precedente frequenza)
Nel complesso 100 - 16.000 Hz
(+) | suono nel complesso lineare (14.7% differenza dalla media)
Rispetto alla stessa classe
» 30% di tutti i dispositivi testati in questa classe è stato migliore, 5% simile, 64% peggiore
» Il migliore ha avuto un delta di 5%, medio di 18%, peggiore di 53%
Rispetto a tutti i dispositivi testati
» 19% di tutti i dispositivi testati in questa classe è stato migliore, 4% similare, 77% peggiore
» Il migliore ha avuto un delta di 4%, medio di 24%, peggiore di 134%
Gestione dell'energia
Consumo di energia
Abbiamo condotto uno stress test con Prime95 e FurMark (Ultra Performance). Al sistema vengono concessi 63 watt per un minuto, dopodiché la velocità di clock viene lentamente ridotta; il consumo energetico scende da 56 a 49 watt nel corso del tempo (da 1:00 a 3:00).
Il sovraccarico dell'alimentatore da 60 watt può influire sul tempo di ricarica: La batteria si carica molto lentamente solo durante uno stress test; in questo caso l'energia viene razionata. La batteria precedentemente scaricata è stata caricata solo al 18% dopo un'ora. Questo rende difficile stressare il dispositivo e caricare la batteria allo stesso tempo.
Molti portatili compatti con CPU Alder Lake P hanno questo problema. Tuttavia, poiché questa situazione si verifica sempre e solo per un periodo di tempo molto breve, gli effetti sono minori nella pratica. Anche la batteria non si scarica. Il modello modello XPS 13 economico con CPU Alder Lake U non ha questo problema, nonostante il piccolo alimentatore da 45 watt. Anche se lo stress test gestisce 47 watt anche in questo caso, è solo per pochi secondi. Il sistema ha bisogno solo di 26 watt costanti e non più di 40-45 watt. Il grafico che mostra il consumo energetico durante il test Witcher 3 / Stress test presenta un confronto con l'Alder Lake U XPS a risparmio energetico.
| Off / Standby | |
| Idle | |
| Sotto carico |
|
Leggenda:
min: | |
| Dell XPS 13 Plus 9320 i5-1240p i5-1240P, Iris Xe G7 80EUs, Micron 3400 MTFDKBA512TFH 512GB, IPS, 1920x1200, 13.4" | Apple MacBook Air 2020 M1 Entry M1, M1 7-Core GPU, Apple SSD AP0256Q, IPS, 2560x1600, 13.3" | Asus Zenbook S 13 OLED R7 6800U, Radeon 680M, Samsung PM9A1 MZVL21T0HCLR, OLED, 2880x1800, 13.3" | Lenovo ThinkPad X1 Nano-20UN002UGE i7-1160G7, Iris Xe G7 96EUs, WDC PC SN530 SDBPNPZ-512G, IPS, 2160x1350, 13" | Huawei MateBook 13s i5 11300H i5-11300H, Iris Xe G7 80EUs, Phison Electronics PS5012, LTPS, 2520x1680, 13.4" | Dell XPS 13 Plus 9320 4K i7-1260P, Iris Xe G7 96EUs, Samsung PM9A1 MZVL21T0HCLR, IPS, 3840x2400, 13.4" | Dell XPS 13 9315, i5-1230U i5-1230U, Iris Xe G7 80EUs, Micron 3460 256 GB Soldered, IPS, 1920x1200, 13.4" | Media Intel Iris Xe Graphics G7 80EUs | Media della classe Subnotebook | |
|---|---|---|---|---|---|---|---|---|---|
| Power Consumption | 56% | 22% | 40% | 23% | 2% | 47% | 30% | 31% | |
| Idle Minimum * (Watt) | 10 | 1.9 81% | 4.8 52% | 3.3 67% | 4.2 58% | 7 30% | 3.6 64% | 4.49 ? 55% | 3.86 ? 61% |
| Idle Average * (Watt) | 12.3 | 6.4 48% | 8.7 29% | 5.7 54% | 8.1 34% | 11 11% | 6.8 45% | 7.4 ? 40% | 6.61 ? 46% |
| Idle Maximum * (Watt) | 15.5 | 7 55% | 10.1 35% | 9.1 41% | 9 42% | 11.4 26% | 6.8 56% | 9.26 ? 40% | 8 ? 48% |
| Load Average * (Watt) | 43 | 25 42% | 45.6 -6% | 29.6 31% | 41.7 3% | 59.7 -39% | 24 44% | 36.6 ? 15% | 42.2 ? 2% |
| Witcher 3 ultra * (Watt) | 43.1 | 42.4 2% | 27.7 36% | 40.1 7% | 49.4 -15% | 23.6 45% | |||
| Load Maximum * (Watt) | 62.8 | 30.3 52% | 49.5 21% | 55.1 12% | 68 -8% | 63 -0% | 47 25% | 61.7 ? 2% | 64.5 ? -3% |
* ... Meglio usare valori piccoli
Energy consumption during The Witcher 3 / Stress test
Energy consumption with an external monitor
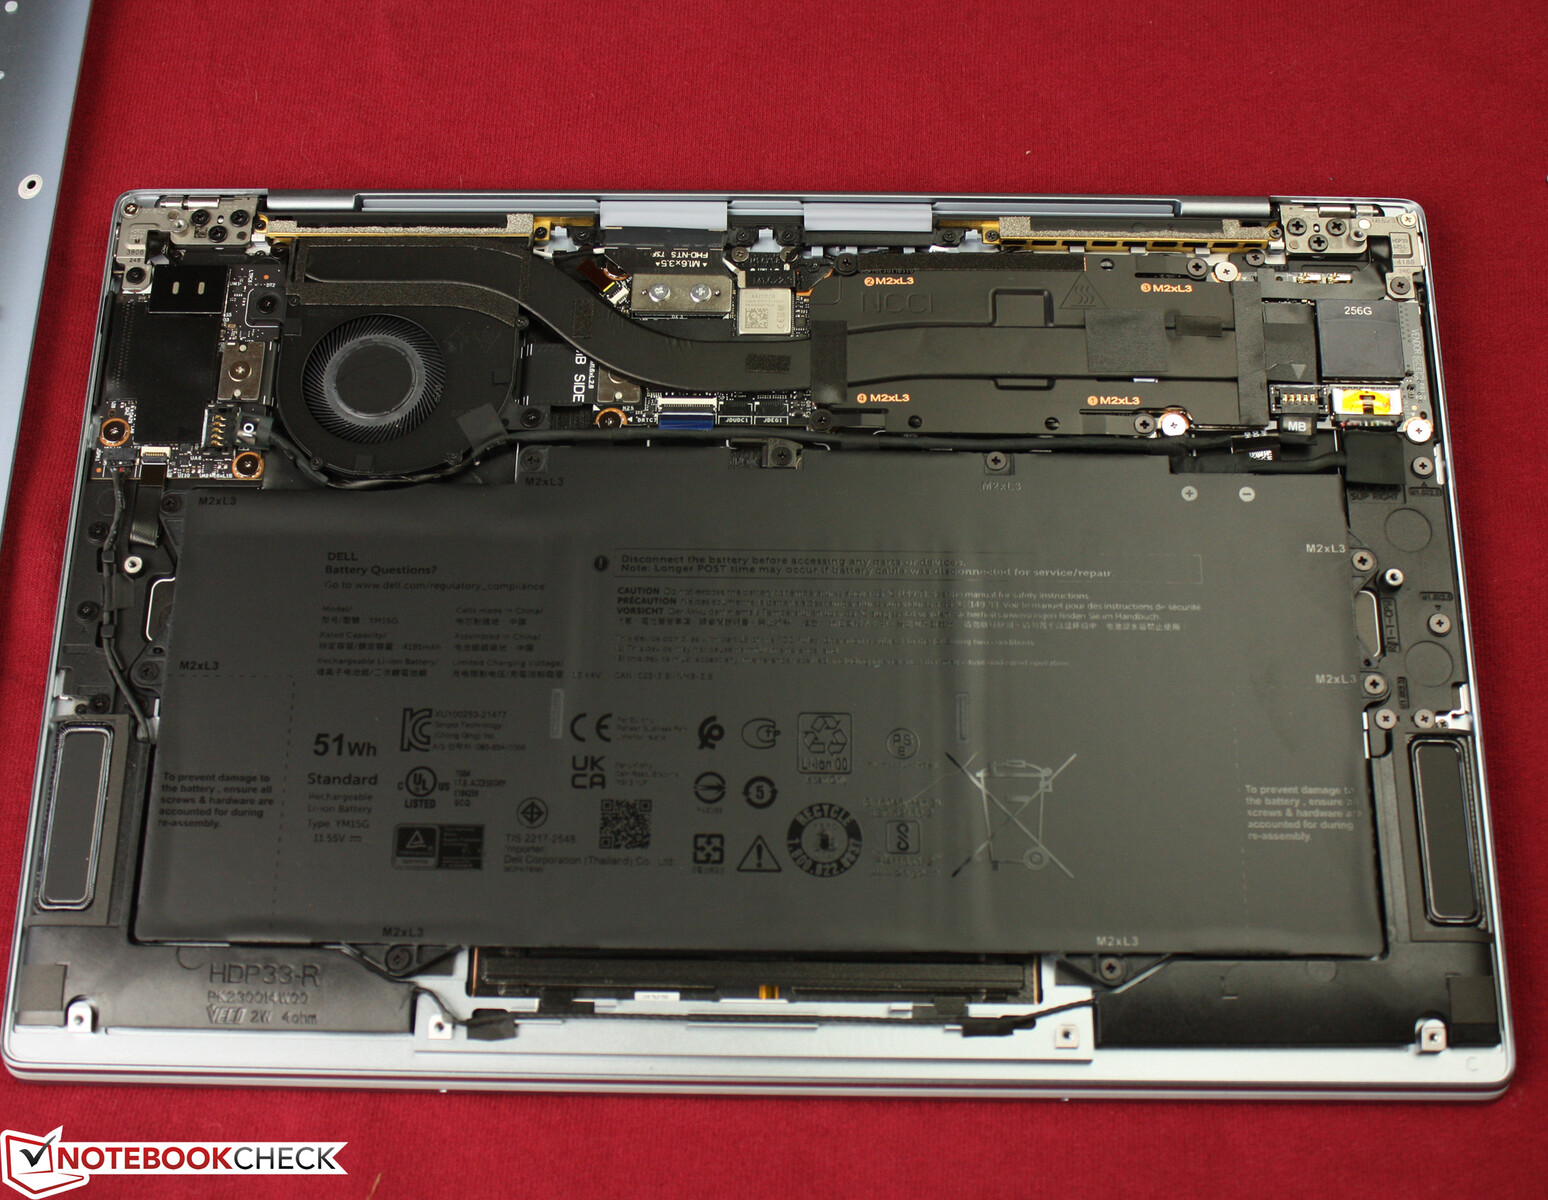
Durata della batteria
Dell ha aumentato la capacità della batteria a 55 Wh nella versione Plus, ma l'autonomia è ancora inferiore a quella del modello precedente Full HD 9305 a causa dell'aumento del consumo energetico. Quest'ultimo riusciva a durare 554 minuti, mentre ora ne dura solo 480. L'XPS 13 Plus rimane indietro rispetto alla concorrenza con queste 8 ore: IlMacBook Air 2020 M1 Entry raddoppia e anche il potenteAsus Zenbook S 13 OLED dura oltre un'ora in più (550 minuti). Il campione di durata della batteria di Dell è disponibile solo con l'XPS 13 9315.XPS 13 9315 con Alder Lake U.
L'autonomia della batteria diminuisce significativamente alla massima luminosità. Invece di 150 cd/m², vengono utilizzati 420 cd/m², che portano a 6 ore. Gli elevati limiti di potenza, rispettivamente di 59 e 48 watt, si riflettono in un'autonomia a carico ridotto di 96 minuti (Battery Eater Classic). In questo caso, i 146 minuti delAsus Zenbook S 13 OLED mostrano che il R7 6800U, che ha circa la stessa potenza, gestisce l'energia in modo più efficiente - ma ha anche una batteria più potente da 67 Wh.
I 55 watt richiedono 1:30 ore per raggiungere l'80% di carica. Ci vogliono 2:40 ore per raggiungere il 100%.
| Dell XPS 13 Plus 9320 i5-1240p i5-1240P, Iris Xe G7 80EUs, 55 Wh | Apple MacBook Air 2020 M1 Entry M1, M1 7-Core GPU, 49.9 Wh | Asus Zenbook S 13 OLED R7 6800U, Radeon 680M, 67 Wh | Lenovo ThinkPad X1 Nano-20UN002UGE i7-1160G7, Iris Xe G7 96EUs, 48.2 Wh | Huawei MateBook 13s i5 11300H i5-11300H, Iris Xe G7 80EUs, 60 Wh | Dell XPS 13 Plus 9320 4K i7-1260P, Iris Xe G7 96EUs, 55 Wh | Dell XPS 13 9315, i5-1230U i5-1230U, Iris Xe G7 80EUs, 51 Wh | Dell XPS 13 9305 Core i5 FHD i5-1135G7, Iris Xe G7 80EUs, 52 Wh | Media della classe Subnotebook | |
|---|---|---|---|---|---|---|---|---|---|
| Autonomia della batteria | 100% | 33% | 12% | 9% | -17% | 74% | 48% | 49% | |
| WiFi v1.3 (h) | 8 | 16 100% | 9.2 15% | 9.9 24% | 9.4 18% | 6.9 -14% | 14.8 85% | 9.2 15% | 14 ? 75% |
| Load (h) | 1.6 | 2.4 50% | 1.6 0% | 1.6 0% | 1.3 -19% | 2.6 63% | 2.9 81% | 1.969 ? 23% | |
| H.264 (h) | 15.2 | 15.4 | 11 | 11 | 15.4 ? | ||||
| Reader / Idle (h) | 25.4 | 28.6 ? |
Pro
Contro
Verdetto - L'i7 e l'SSD Samsung da 1 TB sono la scelta migliore per le prestazioni
Qual è l'XPS 13 giusto per me? Se siete alla ricerca di prestazioni all'avanguardia in un formato subnotebook, graviterete inevitabilmente verso la variante Alder Lake P sotto forma di XPS 13 Plus
La scelta del Core i7-1260P promette un aumento delle prestazioni di un buon 10% secondo i benchmark. Questo vale per la potenza di elaborazione pura, ma anche per le prestazioni del sistema. Inoltre, il Core i7 offre un vantaggio del 18% sotto carico continuo rispetto al Core i5, che ha subito un throttling più evidente nel ciclo di Cinebench.
Le prestazioni del sistema (PCMarks) traggono vantaggio dalla veloce unità SSD Samsung da 1 TB presente nel sistema di test del Core i7, mentre Dell ha equipaggiato il modello i5 Plus con una più lenta unità Micron da 512 GB. Tuttavia, i clienti non hanno voce in capitolo per quanto riguarda il produttore di SSD. Il costo aggiuntivo per l'unità SSD da un terabyte, il modello Core i7-1260P e 16 GB di RAM è di 300 euro (~$307). Sembra un prezzo equo
Il touchscreen UHD+ potrebbe far pendere l'ago della bilancia? Probabilmente no, perché a parte la risoluzione più alta e il contrasto migliore, non copre lo spazio colore P3, che può essere importante per l'uso professionale. Inoltre, può essere ordinato con qualsiasi processore, compreso il Core i5
In breve, il Core i7 abbinato all'SSD da 1 TB di Samsung è esattamente il prodotto Dell giusto per i fanatici delle prestazioni
Ma l'XPS 13 Plus ha un buon rapporto qualità-prezzo? Gli utenti che vogliono ottenere le migliori prestazioni possibili da un portatile da 13 pollici (PCMark, R15 loop e test della CPU) - e a un prezzo interessante - potrebbero dare un'occhiata all'Asus Zenbook S 13 OLED Asus Zenbook S 13 OLEDche dovrebbe essere disponibile a partire da 1.300 euro (~$1.332). Viene fornito con lo spazio colore P3, un SSD da 512 GB (Samsung), 16 GB di RAM e, naturalmente, un jack audio combo da 3,5 mm. Lo Zenbook S 13 OLED ha ricevuto una valutazione del 90%. La mancanza di porte Thunderbolt 4 è probabilmente lo svantaggio maggiore
Poco distante e con una valutazione ancora più alta, anche se con una potenza di elaborazione leggermente inferiore, si trova il Apple MacBook Air 2020 M1 Entry. Nonostante il raffreddamento passivo, offre prestazioni sufficienti e una maggiore efficienza, ma il display non supporta l'HDR. Abbiamo anche recensito il nuovo MacBook Air 2022 M2, una versione entry-level con processore Apple M2.
Prezzo e disponibilità
Il Dell XPS 13 Plus 9320 nella configurazione con Core i5-1240p, SSD da 512 GB, 8 GB di RAM e display Full HD è attualmente disponibile nel negozio online Dell per 1.299 dollari. Dell consente inoltre di personalizzare il dispositivo in base alle proprie esigenze.
Dell XPS 13 Plus 9320 i5-1240p
- 08/10/2022 v7 (old)
Sebastian Jentsch
Price comparison

