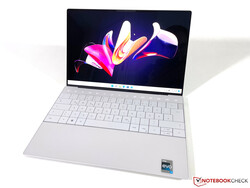
Recensione del portatile Dell XPS 13 Plus 9320 - L'XPS 13 ora ha una Touch Bar

Dell offre due versioni del compatto XPS 13: il normale XPS 13 con CPU Alder Lake serie U a partire da 999 dollari e il nuovo XPS 13 Plus con chip Alder Lake serie P più potenti a partire da 1299 dollari. Entrambi i modelli utilizzano un case completamente nuovo e presentano grandi cambiamenti rispetto al precedenteXPS 13 9310che è rimasto sostanzialmente invariato per un paio d'anni
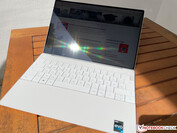
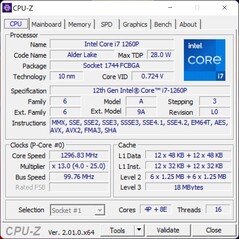
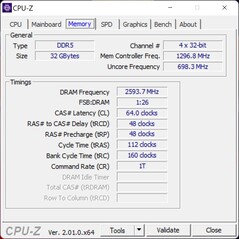
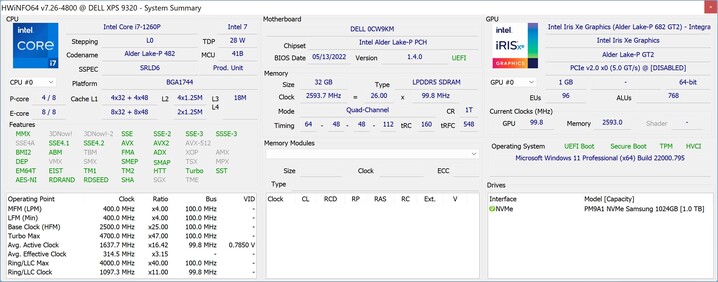
La nostra unità di prova del nuovo XPS 13 Plus è ben equipaggiata con Intel Core i7-1260P, 32 GB di RAM LPDDR5-5200 e un'unità SSD PCIe 4.0 da 1 TB. Il display è il noto pannello 4K con rapporto di aspetto 16:10, dotato anche di touchscreen. A differenza del normale XPS 13 9320, l'XPS 13 Plus può essere configurato anche con uno schermo OLED da 3,5K. La nostra unità in prova ha un prezzo di 2099 dollari e Dell offre ancora una volta una Developer's Edition con Linux.
Potenziali concorrenti a confronto
Punteggio | Data | Modello | Peso | Altezza | Dimensione | Risoluzione | Prezzo |
|---|---|---|---|---|---|---|---|
| 86.9 % v7 (old) | 07/2022 | Dell XPS 13 Plus 9320 4K i7-1260P, Iris Xe G7 96EUs | 1.2 kg | 15.3 mm | 13.40" | 3840x2400 | |
| 90.1 % v7 (old) | 07/2022 | Asus Zenbook S 13 OLED R7 6800U, Radeon 680M | 1.1 kg | 14.9 mm | 13.30" | 2880x1800 | |
| 89.8 % v7 (old) | 02/2021 | Lenovo ThinkPad X1 Nano-20UN002UGE i7-1160G7, Iris Xe G7 96EUs | 946 gr | 16 mm | 13.00" | 2160x1350 | |
| 91.1 % v7 (old) | 12/2020 | Apple MacBook Air 2020 M1 Entry M1, M1 7-Core GPU | 1.3 kg | 16.1 mm | 13.30" | 2560x1600 | |
| 88.8 % v7 (old) | 02/2022 | Huawei MateBook 13s i5 11300H i5-11300H, Iris Xe G7 80EUs | 1.3 kg | 16.5 mm | 13.40" | 2520x1680 | |
| 87.4 % v7 (old) | 12/2020 | Dell XPS 13 9310 Core i7 4K i7-1185G7, Iris Xe G7 96EUs | 1.3 kg | 14.8 mm | 13.40" | 3840x2400 |
I nostri Top 10
» Top 10 Portatili Multimedia
» Top 10 Portatili Gaming
» Top 10 Portatili Gaming Leggeri
» Top 10 Portatili da Ufficio e Business economici
» Top 10 Portatili Premium da Ufficio/Business
» Top 10 Portatili sotto i 300 Euro
» Top 10 Portatili sotto i 500 Euro
» Top 10 dei Portatili Workstation
» Top 10 Subnotebooks
» Top 10 Ultrabooks
» Top 10 Convertibili
» Top 10 Tablets
» Top 10 Tablets Windows
» Top 10 Smartphones
Custodia - XPS 13 con un nuovo design
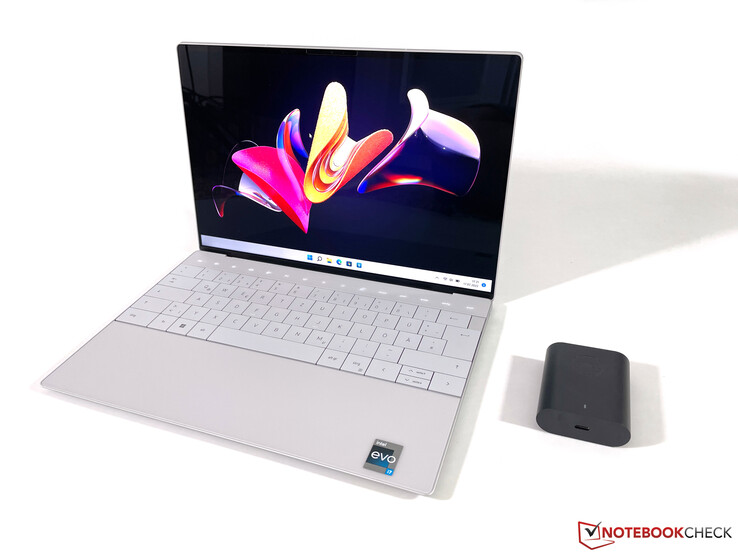
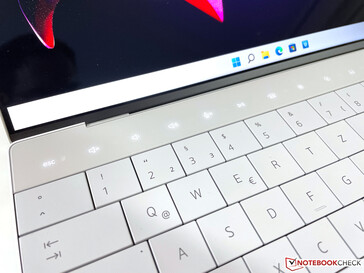
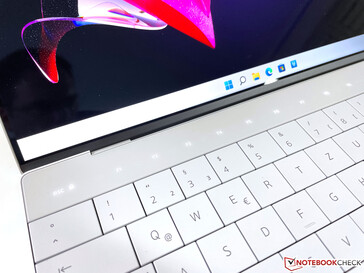
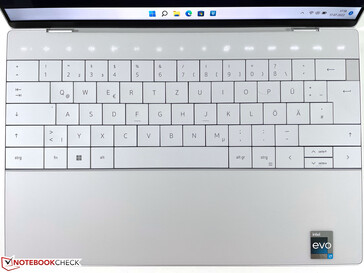
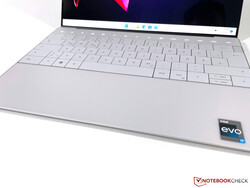
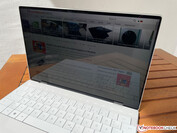
Non è facile distinguere il nuovo XPS 13 Plus dal suo predecessore quando il coperchio è chiuso, soprattutto nella nostra opzione di colore Platinum. L'XPS 13 Plus è disponibile anche in grigio scuro (Graphite). Il design di base, con la parte posteriore angolata e l'unità di base a forma di cuneo, è ancora lo stesso, ma le differenze principali si notano immediatamente quando si apre il coperchio. Dell abbandona la tastiera chiclet e implementa un'unità più tradizionale senza spazi tra i tasti. Non ci sono i tipici tasti funzione, ma una barra tattile capacitiva (di cui parleremo più avanti). Ci piace soprattutto la nuova area di appoggio del palmo, che utilizza un unico pezzo di vetro e le impronte digitali non sono affatto un problema. Soprattutto i modelli più scuri delle versioni precedenti si coprivano rapidamente di impronte digitali. Le cornici del display sono molto strette e consentono di ottenere un ottimo rapporto schermo/corpo dell'89%.
La stabilità dell'XPS 13 Plus è eccellente e l'intero dispositivo, realizzato principalmente in alluminio, lascia un'impressione di grande robustezza. Né l'unità di base né il coperchio possono essere spinti o ruotati. Ci piace anche la regolazione delle cerniere, ma non è facile aprire il coperchio con una sola mano perché non c'è una rientranza nella parte anteriore dell'unità di base. L'angolo di apertura massimo è di 135 gradi.
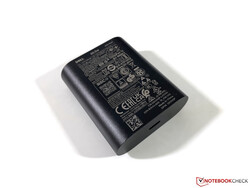
Sia il vecchioDell XPS 13 9310e il nuovo XPS 13 Plus sono i dispositivi più compatti del nostro gruppo di confronto e non è un problema mettere l'XPS 13 in una borsa/zaino. Il peso, invece, è nella media e sia l'Asus Zenbook S 13così come ilThinkPad X1 Nanosono notevolmente più leggeri. L'alimentatore da 60W è molto compatto, ma i lunghi cavi di collegamento aumentano comunque il peso complessivo a 254 grammi.
Connettività - Dell butta via il jack stereo da 3,5 mm
Il numero di porte sul monitor XPS 13 è stato continuamente ridotto.XPS 13negli ultimi due anni e questa tendenza continua purtroppo con il nuovo XPS 13 Plus (e anche con il normale XPS 13). Mentre Apple inizia a includere un maggior numero di porte (sul nuovo MacBook Air M2, ad esempio), Dell fa un ulteriore passo avanti ed elimina il jack stereo da 3,5 mm. C'è solo una porta USB-C con pieno supporto Thunderbolt 4 su ciascun lato. Dell include almeno due adattatori (per USB-A e 3,5 mm) per impostazione predefinita, ma preferiremmo un maggior numero di porte sul dispositivo. Anche il lettore di schede del predecessore è stato rimosso.
Comunicazione
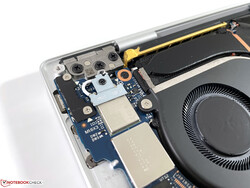
Dell equipaggia il nuovo XPS 13 Plus con un moderno modulo AX211E di Intel, che supporta l'ultimo standard Wi-Fi 6E. Tuttavia, non siamo riusciti a utilizzare la corrispondente rete a 6 GHz del nostro router di riferimento. Abbiamo già riscontrato questo problema sulle nuove versioni degliXPS 15eXPS 17dove la configurazione delle antenne non supportava i 6 GHz, ma questo sarebbe molto strano per un design completamente nuovo. Siamo già in contatto con Dell e aggiorneremo l'articolo non appena avremo nuove informazioni.
Le prestazioni Wi-Fi nelle normali reti Wi-Fi 6 sono ancora molto buone e stabili. Non abbiamo riscontrato alcun problema di connessione durante la nostra recensione, né con il nostro router di riferimento, né con l'AVM Frtitz!Box 7490 (Wi-Fi 5). È supportato anche il Bluetooth 5.2.
Webcam
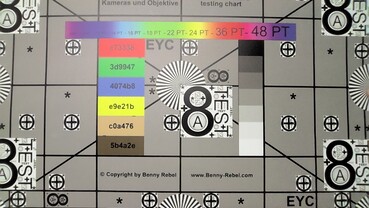
Dell utilizza ancora una webcam a 720p, ma la qualità delle immagini è buona, almeno in condizioni di buona illuminazione. Tuttavia, un sensore da 1080p sarebbe stato più adeguato, considerando il numero crescente di videoconferenze e molti produttori lo riconoscono.
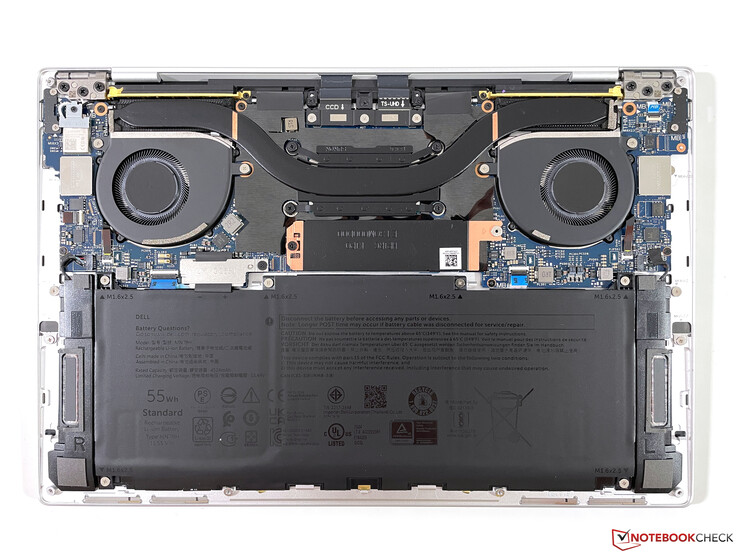
Manutenzione
Dispositivi di input - XPS 13 utilizza un nuovo design della tastiera
Tastiera
I dispositivi di input hanno subito un'importante revisione e l'XPS 13 Plus si differenzia anche dall'XPS 13 normale. Dell rinuncia alla tastiera chiclet per il modello Plus e utilizza un layout più tradizionale senza spazi tra i singoli tasti. Il produttore utilizza l'intera larghezza dello chassis e i tasti sono comodamente grandi. Siamo inoltre positivamente sorpresi dall'esperienza di digitazione fluida con un feedback preciso, nonostante la corsa limitata dei tasti (1,0 mm). Nel complesso, questa è una buona tastiera e la preferiamo alla vecchia. Tuttavia, se si è abituati alle tastiere chiclet, potrebbe essere necessario un po' di tempo per abituarsi al layout, poiché è più difficile percepire la transizione tra i tasti. Il pulsante di accensione si trova nell'angolo superiore destro ed è molto stretto, in modo da non disturbare durante la digitazione. È presente anche un lettore di impronte digitali.
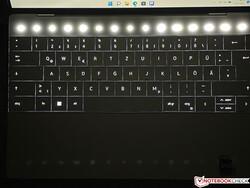
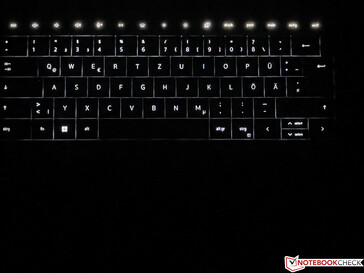
Poi c'è la barra sensibile al tocco con i tasti funzione, che è sempre illuminata e mostra funzioni speciali come la luminosità o il controllo del volume oppure i normali tasti F. In generale funziona bene, ma l'illuminazione può essere fastidiosa negli ambienti più bui e non si può regolare. Sono disponibili due diverse intensità, ma la regolazione automatica non ha sempre funzionato in modo affidabile sulla nostra unità. L'illuminazione può anche essere un problema se si guarda un video di sera, anche quando è impostata sulla luminosità più bassa. Nel complesso, la barra a sfioramento è più che altro un espediente e non vediamo alcun vantaggio rispetto ai normali pulsanti. L'illuminazione della tastiera non può essere controllata tramite sensore e non è molto luminosa nemmeno con l'impostazione più alta.
Touchpad e touchscreen
Dell ha nascosto il clickpad sotto i palmari e non si vedono bordi o transizioni. L'area di input inizia sul bordo sinistro della barra spaziatrice e termina sul bordo destro del tasto Alt Gr. Ci siamo abituati abbastanza rapidamente e non abbiamo avuto problemi con la transizione mancante, ma diventa un po' più complicato se si vuole attivare un clic destro nell'angolo in basso a destra. Vi consigliamo di toccare semplicemente con due dita per fare clic con il tasto destro. È possibile fare clic sul pad su tutta la superficie e il rumore del clic non è troppo forte. Durante la nostra recensione abbiamo apprezzato molto le buone capacità di scorrimento della superficie di vetro.
È possibile utilizzare anche il touchscreen capacitivo, che funziona come previsto. Tuttavia, il display oscilla sempre un po' quando lo si tocca.
Display - Dell offre pannelli IPS e OLED
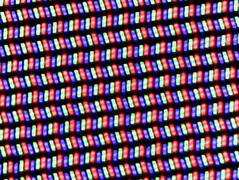
Dell offre quattro diversi pannelli per l'XPS 13 Plus. Oltre a due modelli FHD con e senza touchscreen (l'unità non touch ha anche uno strato di vetro e non c'è l'opzione opaca), c'è uno schermo OLED da 3,5K e lo schermo IPS da 4K della nostra unità di recensione. Il pannello è ancora una volta fornito da Sharp e il numero di modello è identico a quello del modello precedente modello precedentema abbiamo notato alcune differenze. La qualità dell'immagine soggettiva è ancora eccellente, ma possono verificarsi problemi di ridimensionamento con alcune applicazioni.
Dell pubblicizza una luminosità di 500 cd/m², ma la nostra unità in prova raggiunge solo 474 nits in media. Il valore del nero (0,28) è ancora buono se si considera la luminosità e il rapporto di contrasto è molto buono, pari a ~1700:1. La luminosità minima di ~30 nits può però essere un problema, soprattutto se lo si utilizza in ambienti molto bui. Ovviamente non è molto ergonomico, ma succede.
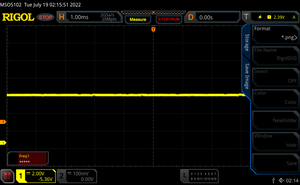
Mentre lo schermo OLED opzionale dell'XPS 13 soffre di sfarfallio PWM, questa volta non siamo riusciti a rilevare alcuno sfarfallio sul display IPS. I tempi di risposta sono notevolmente migliori rispetto allo schermo 4K del precedente XPS 13 9310 e non ci sono problemi di ghosting. Il backlight bleeding è un problema minore solo sul bordo superiore quando si utilizza la massima luminosità, ma in pratica non si nota. Anche la stabilità dell'angolo di visione dello schermo IPS è molto buona.
| |||||||||||||||||||||||||
Distribuzione della luminosità: 89 %
Al centro con la batteria: 493 cd/m²
Contrasto: 1764:1 (Nero: 0.28 cd/m²)
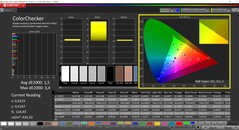
ΔE ColorChecker Calman: 3.1 | ∀{0.5-29.43 Ø4.76}
calibrated: 1.5
ΔE Greyscale Calman: 3.2 | ∀{0.09-98 Ø5}
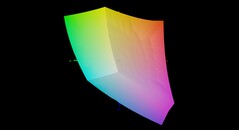
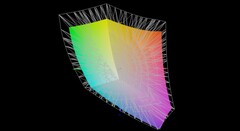
76% AdobeRGB 1998 (Argyll 3D)
100% sRGB (Argyll 3D)
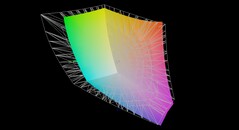
76.5% Display P3 (Argyll 3D)
Gamma: 2.41
CCT: 6189 K
| Dell XPS 13 Plus 9320 4K LQ134R1, IPS, 3840x2400, 13.4" | Asus Zenbook S 13 OLED SDC4172, OLED, 2880x1800, 13.3" | Lenovo ThinkPad X1 Nano-20UN002UGE MND007ZA1-2, IPS, 2160x1350, 13" | Apple MacBook Air 2020 M1 Entry IPS, 2560x1600, 13.3" | Huawei MateBook 13s i5 11300H TL134GDXP02-0, LTPS, 2520x1680, 13.4" | Dell XPS 13 9310 Core i7 4K Sharp LQ134R1, IPS, 3840x2400, 13.4" | Dell XPS 13 9310 OLED Samsung 134XK01, OLED, 3456x2160, 13.4" | |
|---|---|---|---|---|---|---|---|
| Display | 20% | -4% | 14% | -11% | 3% | 20% | |
| Display P3 Coverage (%) | 76.5 | 99.8 30% | 70.4 -8% | 98.6 29% | 65.2 -15% | 80.2 5% | 99.7 30% |
| sRGB Coverage (%) | 100 | 100 0% | 99.9 0% | 100 0% | 92 -8% | 100 0% | 100 0% |
| AdobeRGB 1998 Coverage (%) | 76 | 97.8 29% | 72 -5% | 85.9 13% | 67.5 -11% | 78.9 4% | 97.7 29% |
| Response Times | 94% | -24% | 1% | -10% | -68% | 92% | |
| Response Time Grey 50% / Grey 80% * (ms) | 38.9 ? | 2.1 ? 95% | 46.8 ? -20% | 31 ? 20% | 44.8 ? -15% | 59.2 ? -52% | 2.2 ? 94% |
| Response Time Black / White * (ms) | 21.9 ? | 1.68 ? 92% | 28 ? -28% | 26.1 ? -19% | 22.8 ? -4% | 40.4 ? -84% | 2.2 ? 90% |
| PWM Frequency (Hz) | 240.4 ? | 118000 ? | 9804 ? | 2137 ? | 240.4 ? | ||
| Screen | 111% | 14% | 10% | 5% | -5% | -43% | |
| Brightness middle (cd/m²) | 494 | 336 -32% | 460 -7% | 417 -16% | 468 -5% | 508.7 3% | 384 -22% |
| Brightness (cd/m²) | 474 | 338 -29% | 434 -8% | 395 -17% | 450 -5% | 479 1% | 387 -18% |
| Brightness Distribution (%) | 89 | 99 11% | 92 3% | 91 2% | 92 3% | 84 -6% | 97 9% |
| Black Level * (cd/m²) | 0.28 | 0.02 93% | 0.27 4% | 0.39 -39% | 0.23 18% | 0.3 -7% | |
| Contrast (:1) | 1764 | 16800 852% | 1704 -3% | 1069 -39% | 2035 15% | 1696 -4% | |
| Colorchecker dE 2000 * | 3.1 | 1.8 42% | 1.1 65% | 1.12 64% | 2 35% | 2.72 12% | 4.56 -47% |
| Colorchecker dE 2000 max. * | 4.2 | 3.8 10% | 4.5 -7% | 2.71 35% | 5.5 -31% | 4.7 -12% | 7.27 -73% |
| Colorchecker dE 2000 calibrated * | 1.5 | 1.8 -20% | 1 33% | 0.77 49% | 1.5 -0% | 1.92 -28% | 4.52 -201% |
| Greyscale dE 2000 * | 3.2 | 0.9 72% | 1.6 50% | 1.7 47% | 2.6 19% | 3.4 -6% | 1.5 53% |
| Gamma | 2.41 91% | 2.22 99% | 2.2 100% | 2207 0% | 2.17 101% | 2.11 104% | 2.26 97% |
| CCT | 6189 105% | 6580 99% | 6475 100% | 6870 95% | 6511 100% | 6245 104% | 6219 105% |
| Color Space (Percent of AdobeRGB 1998) (%) | 65.7 | 70.7 | 87.1 | ||||
| Color Space (Percent of sRGB) (%) | 99.9 | 100 | 100 | ||||
| Media totale (Programma / Settaggio) | 75% /
89% | -5% /
5% | 8% /
9% | -5% /
-0% | -23% /
-12% | 23% /
-5% |
* ... Meglio usare valori piccoli
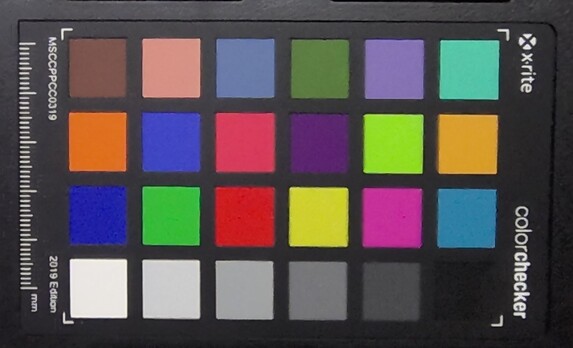
Durante la nostra analisi con il software professionale CalMAN (X-Rite i1 Pro 2) abbiamo notato che il pannello copre solo il piccolo riferimento cromatico sRGB, anche se Dell pubblicizza una copertura del 90% del più ampio gamut P3. Non possiamo sostenere questa affermazione e siamo già in contatto con il produttore. Il modello precedente precedente non era molto migliore da questo punto di vista.
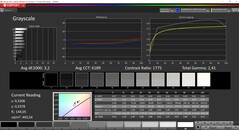
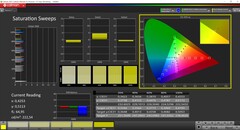
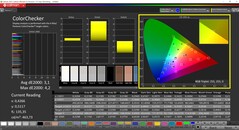
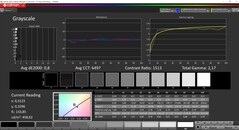
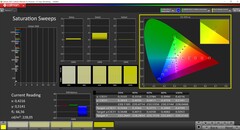
L'immagine è un po' calda e c'è una leggera tonalità gialla, che si nota. Le deviazioni cromatiche rispetto al riferimento sRGB sono comprese nell'intervallo 3-4 senza alcun valore anomalo, il che va benissimo per gli scenari di utilizzo quotidiano. La nostra calibrazione (il profilo può essere scaricato gratuitamente nel riquadro in alto) elimina il cast del colore e anche le deviazioni cromatiche sono migliori, solo il 100% di rosso è ancora leggermente al di sopra del limite importante di 3. La nostra calibrazione migliora l'immagine, ma la luminosità massima scende di circa 35 nits. Abbiamo già detto che il pannello copre solo il piccolo gamut sRGB e P3 e AdobeRGB solo per il 76%. Se avete bisogno di un gamut più ampio, siete costretti a prendere l'XPS 13 con lo schermo OLED opzionale.
Tempi di risposta del Display
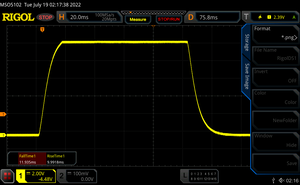
| ↔ Tempi di risposta dal Nero al Bianco | ||
|---|---|---|
| 21.9 ms ... aumenta ↗ e diminuisce ↘ combinato | ↗ 11.9 ms Incremento | |
| ↘ 10 ms Calo | ||
| Lo schermo mostra buoni tempi di risposta durante i nostri tests, ma potrebbe essere troppo lento per i gamers competitivi. In confronto, tutti i dispositivi di test variano da 0.1 (minimo) a 240 (massimo) ms. » 48 % di tutti i dispositivi è migliore. Questo significa che i tempi di risposta rilevati sono simili alla media di tutti i dispositivi testati (20.1 ms). | ||
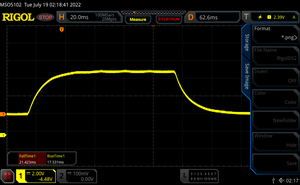
| ↔ Tempo di risposta dal 50% Grigio all'80% Grigio | ||
| 38.9 ms ... aumenta ↗ e diminuisce ↘ combinato | ↗ 21.4 ms Incremento | |
| ↘ 17.5 ms Calo | ||
| Lo schermo mostra tempi di risposta lenti nei nostri tests e sarà insoddisfacente per i gamers. In confronto, tutti i dispositivi di test variano da 0.165 (minimo) a 636 (massimo) ms. » 58 % di tutti i dispositivi è migliore. Questo significa che i tempi di risposta rilevati sono peggiori rispetto alla media di tutti i dispositivi testati (31.5 ms). | ||
Sfarfallio dello schermo / PWM (Pulse-Width Modulation)
| flickering dello schermo / PWM non rilevato | |||
In confronto: 53 % di tutti i dispositivi testati non utilizza PWM per ridurre la luminosita' del display. Se è rilevato PWM, una media di 8020 (minimo: 5 - massimo: 343500) Hz è stata rilevata. | |||
Prestazioni - Alder Lake-P e PCIe 4.0
Il nuovo XPS 13 Plus è disponibile solo con CPU Alder Lake-P, a partire dal modelloCore i5-1240Pe ilCore i7-1260P(ognuno con 4 core per le prestazioni e 8 core per l'efficienza) fino alCore i7-1280Pcon due core aggiuntivi per le prestazioni (la configurazione è simile a quella del Core i7-12700H).Core i7-12700H). Gli utenti possono inoltre scegliere tra 8, 16 o 32 GB di RAM (LPDDR5-5200), ma l'opzione da 32 GB è disponibile solo con le CPU i7.
Recensione Impostazioni
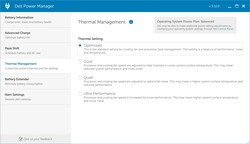
Dell offre quattro diversi profili di prestazioni nel software Power Manager precaricato(Ottimizzato, Silenzioso, Ultra Performance e Fresco), ma non abbiamo potuto dare un'occhiata approfondita al profilo Fresco. Le impostazioni TDP degli altri profili sono elencate nella tabella seguente.
| Silenzioso | Ottimizzato | Ultra Performance | |
|---|---|---|---|
| TDP carico CPU | 64 -> 13 Watt | 64 -> 20 Watt | 64 -> 34 Watt |
| TDP Stress test | 64 -> 13 Watts | 64 -> 20 Watts | 64 -> 64 Watts |
Le prestazioni della CPU calano abbastanza rapidamente con l'impostazione predefinita Ottimizzato, per cui abbiamo utilizzato il profilo Ultra Performance per i benchmark e le misurazioni seguenti. Le prestazioni di raffreddamento del nuovo XPS 13 Plus sono in realtà piuttosto buone per un dispositivo compatto e le ventole sono generalmente silenziose in situazioni quotidiane o durante brevi scenari di picco di carico. Le due ventole diventano un po' più rumorose in caso di carichi di lavoro sostenuti, ma le prestazioni sono comunque abbastanza buone. Il processore può consumare fino a 64 W in tutte e tre le modalità, ma questo valore viene solitamente raggiunto solo per un secondo.
Processore - Core i7-1260P
IlCore i7-1260Pè attualmente una scelta molto popolare per i subnotebook costosi e il potenziale di prestazioni con la sua configurazione ibrida (4 core per le prestazioni e 8 per l'efficienza) è molto elevato. Rispetto al vecchioXPS 13 9310con il Tiger Lake Core i7-1185G7le prestazioni sono superiori di circa il 50% (in media) nei benchmark sintetici.
Cinebench R15 Multi Loop
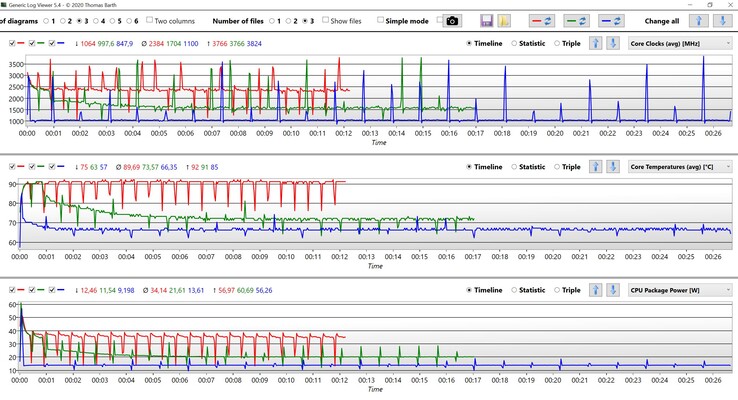
Il nostro Cinebench Multi loop conferma l'attuale problema dei processori Alder Lake di Intel. Le prestazioni multi-core sono praticamente alla pari con quelle dell'attualeAMD Ryzen 7 6800Uall'inizio, ma il Ryzen consuma solo 30W. L'i7 dell'XPS 13 Plus si stabilizza a 34W nel corso del test e le prestazioni sono leggermente inferiori rispetto allo Zenbook S 13 con il 6800U a 25W
Anche il profilo di prestazioni Ottimizzato conferma che Alder Lake-P non è competitivo a limiti di potenza inferiori, perché l'XPS 13 Plus a 20W è solo leggermente superiore alle vecchie CPU Tiger Lake con quattro core. Il profilo Quiet riduce ulteriormente il TDP a 13W, il che si traduce in 650-700 punti nel multi loop CB R15
Le prestazioni single-core (importanti per gli scenari quotidiani) sono indubbiamente molto buone, ma al costo di consumi elevati
Le prestazioni multi-core sono un po' più basse per quanto riguarda la batteria (-6%) grazie a limiti di potenza leggermente inferiori (54/27W). Altri benchmark della CPU sono disponibili qui.
Cinebench R23: Multi Core | Single Core
Cinebench R20: CPU (Multi Core) | CPU (Single Core)
Cinebench R15: CPU Multi 64Bit | CPU Single 64Bit
Blender: v2.79 BMW27 CPU
7-Zip 18.03: 7z b 4 | 7z b 4 -mmt1
Geekbench 5.5: Multi-Core | Single-Core
HWBOT x265 Benchmark v2.2: 4k Preset
LibreOffice : 20 Documents To PDF
R Benchmark 2.5: Overall mean
| CPU Performance rating | |
| Media della classe Subnotebook | |
| Dell XPS 13 Plus 9320 4K | |
| Asus Zenbook S 13 OLED | |
| Media Intel Core i7-1260P | |
| Apple MacBook Pro 13 2022 M2 -5! | |
| Apple MacBook Air 2020 M1 Entry -1! | |
| Dell XPS 13 9310 Core i7 4K | |
| Huawei MateBook 13s i5 11300H | |
| Lenovo ThinkPad X1 Nano-20UN002UGE -1! | |
| Cinebench R23 / Multi Core | |
| Media della classe Subnotebook (1555 - 21812, n=72, ultimi 2 anni) | |
| Asus Zenbook S 13 OLED | |
| Dell XPS 13 Plus 9320 4K | |
| Media Intel Core i7-1260P (3173 - 12150, n=27) | |
| Apple MacBook Pro 13 2022 M2 | |
| Apple MacBook Air 2020 M1 Entry | |
| Lenovo ThinkPad X1 Nano-20UN002UGE | |
| Huawei MateBook 13s i5 11300H | |
| Dell XPS 13 9310 Core i7 4K | |
| Cinebench R23 / Single Core | |
| Media della classe Subnotebook (358 - 2165, n=73, ultimi 2 anni) | |
| Dell XPS 13 Plus 9320 4K | |
| Media Intel Core i7-1260P (1155 - 1812, n=25) | |
| Apple MacBook Pro 13 2022 M2 | |
| Apple MacBook Air 2020 M1 Entry | |
| Asus Zenbook S 13 OLED | |
| Dell XPS 13 9310 Core i7 4K | |
| Huawei MateBook 13s i5 11300H | |
| Cinebench R20 / CPU (Multi Core) | |
| Media della classe Subnotebook (579 - 8541, n=67, ultimi 2 anni) | |
| Asus Zenbook S 13 OLED | |
| Dell XPS 13 Plus 9320 4K | |
| Media Intel Core i7-1260P (1234 - 4748, n=25) | |
| Apple MacBook Pro 13 2022 M2 | |
| Huawei MateBook 13s i5 11300H | |
| Dell XPS 13 9310 Core i7 4K | |
| Apple MacBook Air 2020 M1 Entry | |
| Lenovo ThinkPad X1 Nano-20UN002UGE | |
| Cinebench R20 / CPU (Single Core) | |
| Dell XPS 13 Plus 9320 4K | |
| Media della classe Subnotebook (128 - 826, n=67, ultimi 2 anni) | |
| Media Intel Core i7-1260P (448 - 698, n=25) | |
| Dell XPS 13 9310 Core i7 4K | |
| Asus Zenbook S 13 OLED | |
| Lenovo ThinkPad X1 Nano-20UN002UGE | |
| Huawei MateBook 13s i5 11300H | |
| Apple MacBook Air 2020 M1 Entry | |
| Apple MacBook Pro 13 2022 M2 | |
| Cinebench R15 / CPU Multi 64Bit | |
| Media della classe Subnotebook (327 - 3345, n=67, ultimi 2 anni) | |
| Asus Zenbook S 13 OLED | |
| Dell XPS 13 Plus 9320 4K | |
| Dell XPS 13 Plus 9320 4K | |
| Media Intel Core i7-1260P (549 - 2034, n=29) | |
| Apple MacBook Pro 13 2022 M2 | |
| Apple MacBook Air 2020 M1 Entry | |
| Huawei MateBook 13s i5 11300H | |
| Huawei MateBook 13s i5 11300H | |
| Dell XPS 13 9310 Core i7 4K | |
| Lenovo ThinkPad X1 Nano-20UN002UGE | |
| Cinebench R15 / CPU Single 64Bit | |
| Media della classe Subnotebook (72.4 - 322, n=67, ultimi 2 anni) | |
| Dell XPS 13 Plus 9320 4K | |
| Asus Zenbook S 13 OLED | |
| Media Intel Core i7-1260P (165.4 - 260, n=27) | |
| Apple MacBook Pro 13 2022 M2 | |
| Dell XPS 13 9310 Core i7 4K | |
| Apple MacBook Air 2020 M1 Entry | |
| Lenovo ThinkPad X1 Nano-20UN002UGE | |
| Huawei MateBook 13s i5 11300H | |
| Blender / v2.79 BMW27 CPU | |
| Apple MacBook Air 2020 M1 Entry | |
| Dell XPS 13 9310 Core i7 4K | |
| Lenovo ThinkPad X1 Nano-20UN002UGE | |
| Apple MacBook Pro 13 2022 M2 | |
| Huawei MateBook 13s i5 11300H | |
| Media della classe Subnotebook (159 - 2271, n=70, ultimi 2 anni) | |
| Media Intel Core i7-1260P (264 - 906, n=26) | |
| Dell XPS 13 Plus 9320 4K | |
| Asus Zenbook S 13 OLED | |
| 7-Zip 18.03 / 7z b 4 | |
| Asus Zenbook S 13 OLED | |
| Media della classe Subnotebook (11668 - 77867, n=67, ultimi 2 anni) | |
| Dell XPS 13 Plus 9320 4K | |
| Media Intel Core i7-1260P (16146 - 47064, n=25) | |
| Apple MacBook Air 2020 M1 Entry | |
| Huawei MateBook 13s i5 11300H | |
| Lenovo ThinkPad X1 Nano-20UN002UGE | |
| Dell XPS 13 9310 Core i7 4K | |
| 7-Zip 18.03 / 7z b 4 -mmt1 | |
| Media della classe Subnotebook (2643 - 6442, n=69, ultimi 2 anni) | |
| Apple MacBook Air 2020 M1 Entry | |
| Asus Zenbook S 13 OLED | |
| Dell XPS 13 Plus 9320 4K | |
| Media Intel Core i7-1260P (4064 - 5791, n=25) | |
| Dell XPS 13 9310 Core i7 4K | |
| Huawei MateBook 13s i5 11300H | |
| Lenovo ThinkPad X1 Nano-20UN002UGE | |
| Geekbench 5.5 / Multi-Core | |
| Media della classe Subnotebook (2557 - 17218, n=62, ultimi 2 anni) | |
| Dell XPS 13 Plus 9320 4K | |
| Apple MacBook Pro 13 2022 M2 | |
| Media Intel Core i7-1260P (3866 - 10570, n=25) | |
| Asus Zenbook S 13 OLED | |
| Apple MacBook Air 2020 M1 Entry | |
| Dell XPS 13 9310 Core i7 4K | |
| Huawei MateBook 13s i5 11300H | |
| Lenovo ThinkPad X1 Nano-20UN002UGE | |
| Geekbench 5.5 / Single-Core | |
| Apple MacBook Pro 13 2022 M2 | |
| Media della classe Subnotebook (726 - 2350, n=62, ultimi 2 anni) | |
| Apple MacBook Air 2020 M1 Entry | |
| Dell XPS 13 Plus 9320 4K | |
| Media Intel Core i7-1260P (1436 - 1786, n=25) | |
| Dell XPS 13 9310 Core i7 4K | |
| Asus Zenbook S 13 OLED | |
| Huawei MateBook 13s i5 11300H | |
| Lenovo ThinkPad X1 Nano-20UN002UGE | |
| HWBOT x265 Benchmark v2.2 / 4k Preset | |
| Media della classe Subnotebook (0.97 - 25.1, n=67, ultimi 2 anni) | |
| Asus Zenbook S 13 OLED | |
| Dell XPS 13 Plus 9320 4K | |
| Media Intel Core i7-1260P (3.45 - 13.6, n=26) | |
| Huawei MateBook 13s i5 11300H | |
| Lenovo ThinkPad X1 Nano-20UN002UGE | |
| Dell XPS 13 9310 Core i7 4K | |
| LibreOffice / 20 Documents To PDF | |
| Media della classe Subnotebook (38.5 - 220, n=66, ultimi 2 anni) | |
| Asus Zenbook S 13 OLED | |
| Lenovo ThinkPad X1 Nano-20UN002UGE | |
| Huawei MateBook 13s i5 11300H | |
| Media Intel Core i7-1260P (40.2 - 65.7, n=25) | |
| Dell XPS 13 9310 Core i7 4K | |
| Dell XPS 13 Plus 9320 4K | |
| Apple MacBook Air 2020 M1 Entry | |
| R Benchmark 2.5 / Overall mean | |
| Apple MacBook Air 2020 M1 Entry | |
| Lenovo ThinkPad X1 Nano-20UN002UGE | |
| Huawei MateBook 13s i5 11300H | |
| Dell XPS 13 9310 Core i7 4K | |
| Media della classe Subnotebook (0.403 - 1.456, n=68, ultimi 2 anni) | |
| Asus Zenbook S 13 OLED | |
| Media Intel Core i7-1260P (0.4559 - 0.727, n=25) | |
| Dell XPS 13 Plus 9320 4K | |
* ... Meglio usare valori piccoli
| Power Consumption - Cinebench R15 Multi Efficiency (external Monitor) | |
| Apple MacBook Pro 13 2022 M2 | |
| Asus Zenbook S 13 OLED | |
| Apple MacBook Air 2020 M1 Entry | |
| Dell XPS 13 Plus 9320 4K | |
| Huawei MateBook 13s i5 11300H | |
AIDA64: FP32 Ray-Trace | FPU Julia | CPU SHA3 | CPU Queen | FPU SinJulia | FPU Mandel | CPU AES | CPU ZLib | FP64 Ray-Trace | CPU PhotoWorxx
| Performance rating | |
| Asus Zenbook S 13 OLED | |
| Media della classe Subnotebook | |
| Huawei MateBook 13s i5 11300H | |
| Media Intel Core i7-1260P | |
| Dell XPS 13 Plus 9320 4K | |
| Lenovo ThinkPad X1 Nano-20UN002UGE | |
| AIDA64 / FP32 Ray-Trace | |
| Media della classe Subnotebook (1135 - 32888, n=68, ultimi 2 anni) | |
| Asus Zenbook S 13 OLED | |
| Huawei MateBook 13s i5 11300H | |
| Lenovo ThinkPad X1 Nano-20UN002UGE | |
| Media Intel Core i7-1260P (2176 - 10898, n=26) | |
| Dell XPS 13 Plus 9320 4K | |
| AIDA64 / FPU Julia | |
| Asus Zenbook S 13 OLED | |
| Media della classe Subnotebook (5218 - 123315, n=68, ultimi 2 anni) | |
| Huawei MateBook 13s i5 11300H | |
| Media Intel Core i7-1260P (11015 - 56906, n=26) | |
| Lenovo ThinkPad X1 Nano-20UN002UGE | |
| Dell XPS 13 Plus 9320 4K | |
| AIDA64 / CPU SHA3 | |
| Media della classe Subnotebook (444 - 5287, n=68, ultimi 2 anni) | |
| Asus Zenbook S 13 OLED | |
| Huawei MateBook 13s i5 11300H | |
| Lenovo ThinkPad X1 Nano-20UN002UGE | |
| Media Intel Core i7-1260P (669 - 2709, n=26) | |
| Dell XPS 13 Plus 9320 4K | |
| AIDA64 / CPU Queen | |
| Asus Zenbook S 13 OLED | |
| Dell XPS 13 Plus 9320 4K | |
| Media Intel Core i7-1260P (42571 - 82493, n=26) | |
| Media della classe Subnotebook (10579 - 115682, n=67, ultimi 2 anni) | |
| Huawei MateBook 13s i5 11300H | |
| Lenovo ThinkPad X1 Nano-20UN002UGE | |
| AIDA64 / FPU SinJulia | |
| Asus Zenbook S 13 OLED | |
| Media della classe Subnotebook (744 - 18418, n=68, ultimi 2 anni) | |
| Dell XPS 13 Plus 9320 4K | |
| Media Intel Core i7-1260P (2901 - 6975, n=26) | |
| Huawei MateBook 13s i5 11300H | |
| Lenovo ThinkPad X1 Nano-20UN002UGE | |
| AIDA64 / FPU Mandel | |
| Asus Zenbook S 13 OLED | |
| Media della classe Subnotebook (3341 - 65433, n=68, ultimi 2 anni) | |
| Huawei MateBook 13s i5 11300H | |
| Lenovo ThinkPad X1 Nano-20UN002UGE | |
| Media Intel Core i7-1260P (5950 - 26376, n=26) | |
| Dell XPS 13 Plus 9320 4K | |
| AIDA64 / CPU AES | |
| Asus Zenbook S 13 OLED | |
| Huawei MateBook 13s i5 11300H | |
| Lenovo ThinkPad X1 Nano-20UN002UGE | |
| Media della classe Subnotebook (638 - 124284, n=68, ultimi 2 anni) | |
| Media Intel Core i7-1260P (16041 - 92356, n=26) | |
| Dell XPS 13 Plus 9320 4K | |
| AIDA64 / CPU ZLib | |
| Media della classe Subnotebook (164.9 - 1379, n=68, ultimi 2 anni) | |
| Dell XPS 13 Plus 9320 4K | |
| Asus Zenbook S 13 OLED | |
| Media Intel Core i7-1260P (259 - 771, n=26) | |
| Huawei MateBook 13s i5 11300H | |
| Lenovo ThinkPad X1 Nano-20UN002UGE | |
| AIDA64 / FP64 Ray-Trace | |
| Media della classe Subnotebook (610 - 17495, n=68, ultimi 2 anni) | |
| Asus Zenbook S 13 OLED | |
| Huawei MateBook 13s i5 11300H | |
| Lenovo ThinkPad X1 Nano-20UN002UGE | |
| Media Intel Core i7-1260P (1237 - 5858, n=26) | |
| Dell XPS 13 Plus 9320 4K | |
| AIDA64 / CPU PhotoWorxx | |
| Media della classe Subnotebook (6569 - 64588, n=68, ultimi 2 anni) | |
| Dell XPS 13 Plus 9320 4K | |
| Lenovo ThinkPad X1 Nano-20UN002UGE | |
| Huawei MateBook 13s i5 11300H | |
| Media Intel Core i7-1260P (13261 - 43652, n=26) | |
| Asus Zenbook S 13 OLED | |
Prestazioni del sistema
Il nuovo XPS 13 Plus è un dispositivo molto reattivo, come dimostrano anche i buoni punteggi dei benchmark. Non abbiamo riscontrato stutters o crash durante la nostra recensione.
CrossMark: Overall | Productivity | Creativity | Responsiveness
| PCMark 10 / Score | |
| Media della classe Subnotebook (4920 - 8424, n=54, ultimi 2 anni) | |
| Asus Zenbook S 13 OLED | |
| Dell XPS 13 Plus 9320 4K | |
| Media Intel Core i7-1260P, Intel Iris Xe Graphics G7 96EUs (4796 - 6068, n=17) | |
| Huawei MateBook 13s i5 11300H | |
| Dell XPS 13 9310 Core i7 4K | |
| Lenovo ThinkPad X1 Nano-20UN002UGE | |
| PCMark 10 / Essentials | |
| Asus Zenbook S 13 OLED | |
| Dell XPS 13 Plus 9320 4K | |
| Media della classe Subnotebook (8552 - 11406, n=54, ultimi 2 anni) | |
| Media Intel Core i7-1260P, Intel Iris Xe Graphics G7 96EUs (9260 - 11251, n=17) | |
| Huawei MateBook 13s i5 11300H | |
| Dell XPS 13 9310 Core i7 4K | |
| Lenovo ThinkPad X1 Nano-20UN002UGE | |
| PCMark 10 / Productivity | |
| Media della classe Subnotebook (5435 - 16132, n=54, ultimi 2 anni) | |
| Asus Zenbook S 13 OLED | |
| Media Intel Core i7-1260P, Intel Iris Xe Graphics G7 96EUs (6167 - 8629, n=17) | |
| Dell XPS 13 Plus 9320 4K | |
| Dell XPS 13 9310 Core i7 4K | |
| Huawei MateBook 13s i5 11300H | |
| Lenovo ThinkPad X1 Nano-20UN002UGE | |
| PCMark 10 / Digital Content Creation | |
| Media della classe Subnotebook (5722 - 12442, n=54, ultimi 2 anni) | |
| Asus Zenbook S 13 OLED | |
| Dell XPS 13 Plus 9320 4K | |
| Media Intel Core i7-1260P, Intel Iris Xe Graphics G7 96EUs (5231 - 6908, n=17) | |
| Huawei MateBook 13s i5 11300H | |
| Dell XPS 13 9310 Core i7 4K | |
| Lenovo ThinkPad X1 Nano-20UN002UGE | |
| CrossMark / Overall | |
| Dell XPS 13 Plus 9320 4K | |
| Media Intel Core i7-1260P, Intel Iris Xe Graphics G7 96EUs (1484 - 1811, n=16) | |
| Media della classe Subnotebook (365 - 2038, n=67, ultimi 2 anni) | |
| Asus Zenbook S 13 OLED | |
| Apple MacBook Air 2020 M1 Entry | |
| Huawei MateBook 13s i5 11300H | |
| CrossMark / Productivity | |
| Media Intel Core i7-1260P, Intel Iris Xe Graphics G7 96EUs (1486 - 1755, n=16) | |
| Dell XPS 13 Plus 9320 4K | |
| Media della classe Subnotebook (364 - 1918, n=67, ultimi 2 anni) | |
| Asus Zenbook S 13 OLED | |
| Huawei MateBook 13s i5 11300H | |
| Apple MacBook Air 2020 M1 Entry | |
| CrossMark / Creativity | |
| Dell XPS 13 Plus 9320 4K | |
| Media della classe Subnotebook (372 - 2396, n=67, ultimi 2 anni) | |
| Media Intel Core i7-1260P, Intel Iris Xe Graphics G7 96EUs (1451 - 1872, n=16) | |
| Apple MacBook Air 2020 M1 Entry | |
| Asus Zenbook S 13 OLED | |
| Huawei MateBook 13s i5 11300H | |
| CrossMark / Responsiveness | |
| Media Intel Core i7-1260P, Intel Iris Xe Graphics G7 96EUs (1253 - 1807, n=16) | |
| Huawei MateBook 13s i5 11300H | |
| Dell XPS 13 Plus 9320 4K | |
| Media della classe Subnotebook (312 - 1889, n=67, ultimi 2 anni) | |
| Asus Zenbook S 13 OLED | |
| Apple MacBook Air 2020 M1 Entry | |
| PCMark 10 Score | 5558 punti | |
Aiuto | ||
| AIDA64 / Memory Copy | |
| Media della classe Subnotebook (14554 - 109734, n=68, ultimi 2 anni) | |
| Dell XPS 13 Plus 9320 4K | |
| Media Intel Core i7-1260P (25125 - 71544, n=25) | |
| Huawei MateBook 13s i5 11300H | |
| Asus Zenbook S 13 OLED | |
| Lenovo ThinkPad X1 Nano-20UN002UGE | |
| AIDA64 / Memory Read | |
| Media della classe Subnotebook (15948 - 127174, n=68, ultimi 2 anni) | |
| Dell XPS 13 Plus 9320 4K | |
| Huawei MateBook 13s i5 11300H | |
| Media Intel Core i7-1260P (24983 - 72065, n=25) | |
| Lenovo ThinkPad X1 Nano-20UN002UGE | |
| Asus Zenbook S 13 OLED | |
| AIDA64 / Memory Write | |
| Media della classe Subnotebook (15709 - 117898, n=68, ultimi 2 anni) | |
| Dell XPS 13 Plus 9320 4K | |
| Huawei MateBook 13s i5 11300H | |
| Media Intel Core i7-1260P (23512 - 66799, n=25) | |
| Lenovo ThinkPad X1 Nano-20UN002UGE | |
| Asus Zenbook S 13 OLED | |
| AIDA64 / Memory Latency | |
| Asus Zenbook S 13 OLED | |
| Lenovo ThinkPad X1 Nano-20UN002UGE | |
| Media della classe Subnotebook (6.8 - 187.8, n=67, ultimi 2 anni) | |
| Huawei MateBook 13s i5 11300H | |
| Media Intel Core i7-1260P (77.9 - 118.4, n=21) | |
* ... Meglio usare valori piccoli
Latenza DPC
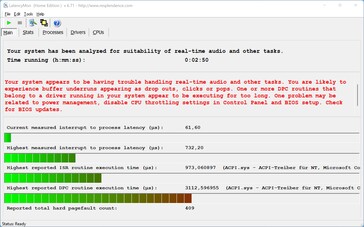
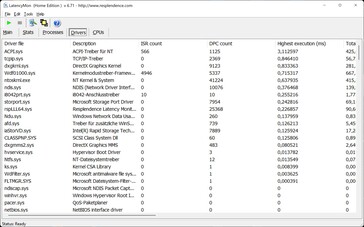
Il nostro test di latenza standardizzato (navigazione web, YouTube 4K, carico della CPU) non mostra alcun problema di base, ma un driver crea alcuni problemi. Ciò significa che l'XPS 13 Plus non è ideale per le applicazioni audio in tempo reale con l'attuale versione del BIOS.
| DPC Latencies / LatencyMon - interrupt to process latency (max), Web, Youtube, Prime95 | |
| Lenovo ThinkPad X1 Nano-20UN002UGE | |
| Dell XPS 13 9310 Core i7 4K | |
| Huawei MateBook 13s i5 11300H | |
| Dell XPS 13 Plus 9320 4K | |
| Asus Zenbook S 13 OLED | |
* ... Meglio usare valori piccoli
Dispositivi di archiviazione
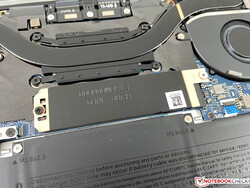
Dell utilizza veloci unità SSD PCIe-4.0 per il nuovo XPS 13 Plus. La nostra unità di prova è dotata di un'unità da 1 TB, ma è possibile utilizzare solo 813 GB per i propri file dopo la configurazione iniziale. I portatili Windows di solito offrono circa 900 GB (con unità da 1 TB). Le prestazioni dell'unità SSD Samsung (PM9A1) sono molto buone e stabili con carichi di lavoro sostenuti, il che non è scontato considerando la posizione proprio accanto all'unità di raffreddamento e al condotto termico. Altri benchmark sulle SSD sono elencati qui.
* ... Meglio usare valori piccoli
Disk Throttling: DiskSpd Read Loop, Queue Depth 8
Prestazioni della GPU
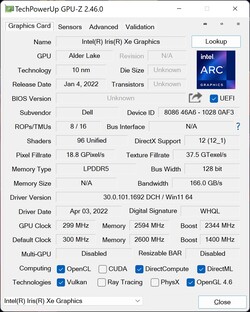
Per quanto riguarda la GPU possiamo essere brevi, dato che le CPU Alder Lake utilizzano ancora la stessaIris Xe Graphics G7che già conosciamo dalla generazione Tiger Lake del precedente XPS 13 9310. Il nuovo XPS 13 Plus beneficia leggermente dei moduli RAM più veloci, ma le prestazioni complessive della GPU sono paragonabili a quelle del vecchio modello. La nuovaRadeon 680M iGPUè notevolmente più veloce, sia nei benchmark sintetici che in quelli di gioco. Di solito si è limitati a dettagli medio/alti in titoli semplici quando si gioca con l'XPS 13 Plus
L'XPS non supera lo stress test 3DMark Time Spy, anche con il profilo Ultra Performance, anche se il calo di prestazioni è molto ridotto (96,4%) e non si nota durante il gioco. Anche il nostro ciclo Witcher 3 mostra prestazioni costanti (sebbene il carico della CPU in questo titolo sia relativamente basso)
L'Iris Xe Graphics G7 di Intel è ancora una scelta decente per scopi multimediali, compresa la riproduzione di video ad alta risoluzione, e le prestazioni grafiche sono solo leggermente più lente con la batteria. Altri benchmark della GPU sono disponibili nella nostra sezione tecnologia.
| Power Consumption - Witcher 3 ultra Efficiency (external Monitor) | |
| Media della classe Subnotebook (0.4246 - 1.096, n=12, ultimi 2 anni) | |
| Asus Zenbook S 13 OLED | |
| Media Intel Iris Xe Graphics G7 96EUs (0.2055 - 0.842, n=110) | |
| Huawei MateBook 13s i5 11300H | |
| Dell XPS 13 Plus 9320 4K | |
| 3DMark 11 Performance | 7499 punti | |
| 3DMark Cloud Gate Standard Score | 22229 punti | |
| 3DMark Fire Strike Score | 4985 punti | |
| 3DMark Time Spy Score | 1974 punti | |
Aiuto | ||
Witcher 3 FPS Chart
| basso | medio | alto | ultra | QHD | 4K | |
|---|---|---|---|---|---|---|
| GTA V (2015) | 115.1 | 102.1 | 26.2 | 11 | ||
| The Witcher 3 (2015) | 99 | 62 | 34 | 14.3 | ||
| Dota 2 Reborn (2015) | 109.9 | 85.2 | 68.2 | 60.6 | 26.7 | |
| Final Fantasy XV Benchmark (2018) | 44.7 | 25.3 | 25.3 | 13.9 | ||
| X-Plane 11.11 (2018) | 55.5 | 42.9 | 36.9 | 19.1 | ||
| Far Cry 5 (2018) | 59 | 32 | 29 | 26 | ||
| Strange Brigade (2018) | 95.2 | 45.9 | 36.4 | 29.5 | ||
| F1 2021 (2021) | 112.6 | 53.1 | 42.4 | 29.7 | ||
| Farming Simulator 22 (2021) | 103 | 46 | 34 | 31 |
Emissioni - XPS 13 Plus con ventole più rumorose
Rumore del sistema
Le due ventole del nuovo XPS 13 Plus sono solitamente disattivate o funzionano alla velocità più bassa (udibile solo in ambienti silenziosi) durante i carichi di lavoro leggeri. Il rumore aumenta rapidamente quando si stressa il sistema, sia con il profilo Ottimizzato che con quello Ultra Performance, a causa degli elevati limiti di potenza del processore Alder Lake. Possiamo misurare fino a 45 dB(A) durante lo stress test e il carico elevato della CPU, che è chiaramente udibile, ma non ci sono frequenze fastidiose dalle ventole. Il profilo Ottimizzato porta a 40,4 dB(A). È consigliabile utilizzare il profilo Quiet se si desidera la massima silenziosità, con un massimo di 35 dB(A) in caso di carichi di lavoro elevati.
| Silenzioso | Ottimizzato | Ultra Performance | |
|---|---|---|---|
| 3DMark 06 | 33,1 dB(A) | 40,4 dB(A) | 40,4 dB(A) |
| CB R23 Single | 33,1 dB(A) | 40,4 dB(A) | 40,4 dB(A) |
| CB R23 Multi | 35 dB(A) | 40,4 dB(A) | 45,5 dB(A) |
| Il Witcher 3 | 35 dB(A) | 40,4 dB(A) | 45,5 dB(A) |
| Stress test | 35 dB(A) | 40,4 dB(A) | 45,5 dB(A) |
Nel complesso, il nuovo XPS 13 Plus è notevolmente più rumoroso del vecchio modello e anche uno dei più rumorosi del gruppo di confronto. Abbiamo notato un po' di rumore elettronico dall'SSD durante i nostri benchmark, ma è stata l'unica situazione.
Rumorosità
| Idle |
| 24.4 / 24.4 / 25.5 dB(A) |
| Sotto carico |
| 40.4 / 45.5 dB(A) |
 | ||
30 dB silenzioso 40 dB(A) udibile 50 dB(A) rumoroso |
||
min: | ||
| Dell XPS 13 Plus 9320 4K Iris Xe G7 96EUs, i7-1260P, Samsung PM9A1 MZVL21T0HCLR | Asus Zenbook S 13 OLED Radeon 680M, R7 6800U, Samsung PM9A1 MZVL21T0HCLR | Lenovo ThinkPad X1 Nano-20UN002UGE Iris Xe G7 96EUs, i7-1160G7, WDC PC SN530 SDBPNPZ-512G | Huawei MateBook 13s i5 11300H Iris Xe G7 80EUs, i5-11300H, Phison Electronics PS5012 | Dell XPS 13 9310 Core i7 4K Iris Xe G7 96EUs, i7-1185G7, Micron 2300 512GB MTFDHBA512TDV | |
|---|---|---|---|---|---|
| Noise | 7% | 3% | 5% | 4% | |
| off /ambiente * (dB) | 24.4 | 24 2% | 24.9 -2% | 24.5 -0% | 27.7 -14% |
| Idle Minimum * (dB) | 24.4 | 24 2% | 24.9 -2% | 24.5 -0% | 27.8 -14% |
| Idle Average * (dB) | 24.4 | 24 2% | 26.3 -8% | 24.5 -0% | 27.8 -14% |
| Idle Maximum * (dB) | 25.5 | 24 6% | 31.8 -25% | 28 -10% | 27.8 -9% |
| Load Average * (dB) | 40.4 | 33.1 18% | 34.3 15% | 35.9 11% | 27.9 31% |
| Witcher 3 ultra * (dB) | 45.5 | 40.2 12% | 34.3 25% | 35.9 21% | 32.8 28% |
| Load Maximum * (dB) | 45.5 | 41.7 8% | 37.5 18% | 38.6 15% | 37 19% |
* ... Meglio usare valori piccoli
Temperatura
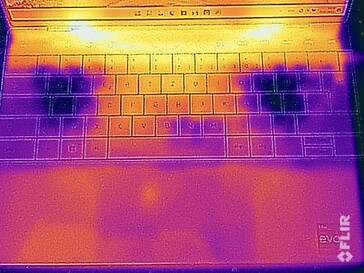
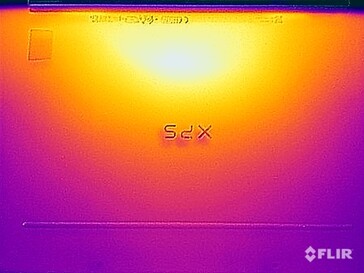
Lo chassis dell'XPS 13 Plus rimane comodamente fresco durante i carichi di lavoro quotidiani e si può anche appoggiare sulle ginocchia senza problemi. Se si lavora a lungo o si gioca, invece, le temperature superficiali sono elevate nella parte inferiore e superiore dell'area della tastiera (lungo la grande heat pipe) e si consiglia di utilizzare una superficie solida. L'alimentatore compatto non si surriscalda eccessivamente, fino a 47 °C.
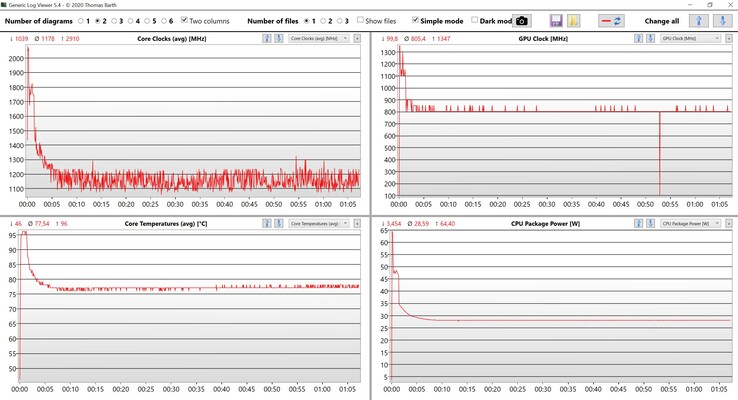
Il consumo del processore si stabilizza a 27 W durante lo stress test e non abbiamo notato alcun deficit di prestazioni subito dopo lo stress test.
(±) La temperatura massima sul lato superiore è di 41.1 °C / 106 F, rispetto alla media di 35.9 °C / 97 F, che varia da 21.4 a 59 °C per questa classe Subnotebook.
(-) Il lato inferiore si riscalda fino ad un massimo di 48.8 °C / 120 F, rispetto alla media di 39.3 °C / 103 F
(+) In idle, la temperatura media del lato superiore è di 26.8 °C / 80 F, rispetto alla media deld ispositivo di 30.8 °C / 87 F.
(±) Riproducendo The Witcher 3, la temperatura media per il lato superiore e' di 34.4 °C / 94 F, rispetto alla media del dispositivo di 30.8 °C / 87 F.
(+) I poggiapolsi e il touchpad raggiungono la temperatura massima della pelle (33 °C / 91.4 F) e quindi non sono caldi.
(-) La temperatura media della zona del palmo della mano di dispositivi simili e'stata di 28.2 °C / 82.8 F (-4.8 °C / -8.6 F).
| Dell XPS 13 Plus 9320 4K Intel Core i7-1260P, Intel Iris Xe Graphics G7 96EUs | Asus Zenbook S 13 OLED AMD Ryzen 7 6800U, AMD Radeon 680M | Lenovo ThinkPad X1 Nano-20UN002UGE Intel Core i7-1160G7, Intel Iris Xe Graphics G7 96EUs | Apple MacBook Air 2020 M1 Entry Apple M1, Apple M1 7-Core GPU | Huawei MateBook 13s i5 11300H Intel Core i5-11300H, Intel Iris Xe Graphics G7 80EUs | Dell XPS 13 9310 Core i7 4K Intel Core i7-1185G7, Intel Iris Xe Graphics G7 96EUs | |
|---|---|---|---|---|---|---|
| Heat | -5% | 7% | 4% | 5% | -1% | |
| Maximum Upper Side * (°C) | 41.1 | 47.9 -17% | 42.2 -3% | 44 -7% | 42.8 -4% | 47 -14% |
| Maximum Bottom * (°C) | 48.8 | 56.1 -15% | 47.5 3% | 44 10% | 46.9 4% | 45 8% |
| Idle Upper Side * (°C) | 28 | 26.8 4% | 24.3 13% | 27 4% | 25.2 10% | 27.8 1% |
| Idle Bottom * (°C) | 29.3 | 27.3 7% | 25.3 14% | 27 8% | 26 11% | 28.6 2% |
* ... Meglio usare valori piccoli
Altoparlanti
Dell utilizza un nuovo sistema di altoparlanti quadrupli per l'XPS 13 Plus e la qualità è migliore rispetto al vecchio XPS 13 9310.XPS 13 9310e alla pari con ilMacBook Air M1. Il suono è molto ricco e i video o la musica di sottofondo sono decisamente piacevoli.
Dell XPS 13 Plus 9320 4K analisi audio
(±) | potenza degli altiparlanti media ma buona (79 dB)
Bassi 100 - 315 Hz
(±) | bassi ridotti - in media 7.3% inferiori alla media
(±) | la linearità dei bassi è media (9.4% delta rispetto alla precedente frequenza)
Medi 400 - 2000 Hz
(+) | medi bilanciati - solo only 3.7% rispetto alla media
(+) | medi lineari (5.7% delta rispetto alla precedente frequenza)
Alti 2 - 16 kHz
(+) | Alti bilanciati - appena 3.4% dalla media
(+) | alti lineari (4.3% delta rispetto alla precedente frequenza)
Nel complesso 100 - 16.000 Hz
(+) | suono nel complesso lineare (10.7% differenza dalla media)
Rispetto alla stessa classe
» 8% di tutti i dispositivi testati in questa classe è stato migliore, 3% simile, 89% peggiore
» Il migliore ha avuto un delta di 5%, medio di 18%, peggiore di 53%
Rispetto a tutti i dispositivi testati
» 5% di tutti i dispositivi testati in questa classe è stato migliore, 2% similare, 93% peggiore
» Il migliore ha avuto un delta di 4%, medio di 24%, peggiore di 134%
Apple MacBook Air 2020 M1 Entry analisi audio
(±) | potenza degli altiparlanti media ma buona (79.6 dB)
Bassi 100 - 315 Hz
(±) | bassi ridotti - in media 7.1% inferiori alla media
(±) | la linearità dei bassi è media (9.5% delta rispetto alla precedente frequenza)
Medi 400 - 2000 Hz
(+) | medi bilanciati - solo only 2.2% rispetto alla media
(+) | medi lineari (5.3% delta rispetto alla precedente frequenza)
Alti 2 - 16 kHz
(+) | Alti bilanciati - appena 2.3% dalla media
(+) | alti lineari (4% delta rispetto alla precedente frequenza)
Nel complesso 100 - 16.000 Hz
(+) | suono nel complesso lineare (8.7% differenza dalla media)
Rispetto alla stessa classe
» 3% di tutti i dispositivi testati in questa classe è stato migliore, 1% simile, 96% peggiore
» Il migliore ha avuto un delta di 5%, medio di 18%, peggiore di 53%
Rispetto a tutti i dispositivi testati
» 2% di tutti i dispositivi testati in questa classe è stato migliore, 1% similare, 97% peggiore
» Il migliore ha avuto un delta di 4%, medio di 24%, peggiore di 134%
Dell XPS 13 9310 Core i7 4K analisi audio
(+) | gli altoparlanti sono relativamente potenti (84.6 dB)
Bassi 100 - 315 Hz
(±) | bassi ridotti - in media 13.1% inferiori alla media
(±) | la linearità dei bassi è media (11.1% delta rispetto alla precedente frequenza)
Medi 400 - 2000 Hz
(+) | medi bilanciati - solo only 4.3% rispetto alla media
(+) | medi lineari (4.2% delta rispetto alla precedente frequenza)
Alti 2 - 16 kHz
(+) | Alti bilanciati - appena 1.5% dalla media
(+) | alti lineari (3.8% delta rispetto alla precedente frequenza)
Nel complesso 100 - 16.000 Hz
(+) | suono nel complesso lineare (10.9% differenza dalla media)
Rispetto alla stessa classe
» 9% di tutti i dispositivi testati in questa classe è stato migliore, 3% simile, 88% peggiore
» Il migliore ha avuto un delta di 5%, medio di 18%, peggiore di 53%
Rispetto a tutti i dispositivi testati
» 6% di tutti i dispositivi testati in questa classe è stato migliore, 2% similare, 92% peggiore
» Il migliore ha avuto un delta di 4%, medio di 24%, peggiore di 134%
Gestione dell'energia - 4K e Alder Lake influenzano l'autonomia della batteria
Consumo di energia
Abbiamo già visto che la CPU può consumare più di 50W per brevi periodi, quindi non sorprende che l'alimentatore da 60W incluso sia insufficiente in questi scenari. Attualmente possiamo osservare questo problema su molti sistemi compatti Alder Lake. Tuttavia, la durata del picco di carico è molto limitata in questo caso, quindi non è un grosso problema nella pratica e la batteria non si scarica.
La ricarica della batteria quando si stressa il dispositivo sarà comunque molto lenta. Le nostre misurazioni in idle mostrano anche un aumento dei consumi rispetto al modello precedente modello precedenteche era dotato di display 4K.
| Off / Standby | |
| Idle | |
| Sotto carico |
|
Leggenda:
min: | |
| Dell XPS 13 Plus 9320 4K i7-1260P, Iris Xe G7 96EUs, Samsung PM9A1 MZVL21T0HCLR, IPS, 3840x2400, 13.4" | Asus Zenbook S 13 OLED R7 6800U, Radeon 680M, Samsung PM9A1 MZVL21T0HCLR, OLED, 2880x1800, 13.3" | Lenovo ThinkPad X1 Nano-20UN002UGE i7-1160G7, Iris Xe G7 96EUs, WDC PC SN530 SDBPNPZ-512G, IPS, 2160x1350, 13" | Apple MacBook Air 2020 M1 Entry M1, M1 7-Core GPU, Apple SSD AP0256Q, IPS, 2560x1600, 13.3" | Huawei MateBook 13s i5 11300H i5-11300H, Iris Xe G7 80EUs, Phison Electronics PS5012, LTPS, 2520x1680, 13.4" | Dell XPS 13 9310 Core i7 4K i7-1185G7, Iris Xe G7 96EUs, Micron 2300 512GB MTFDHBA512TDV, IPS, 3840x2400, 13.4" | Dell XPS 13 9310 OLED i7-1185G7, Iris Xe G7 96EUs, Toshiba XG6 KXG60ZNV512G, OLED, 3456x2160, 13.4" | Media Intel Iris Xe Graphics G7 96EUs | Media della classe Subnotebook | |
|---|---|---|---|---|---|---|---|---|---|
| Power Consumption | 20% | 38% | 53% | 21% | 25% | 22% | 12% | 25% | |
| Idle Minimum * (Watt) | 7 | 4.8 31% | 3.3 53% | 1.9 73% | 4.2 40% | 4.3 39% | 5.7 19% | 5.51 ? 21% | 3.96 ? 43% |
| Idle Average * (Watt) | 11 | 8.7 21% | 5.7 48% | 6.4 42% | 8.1 26% | 8.3 25% | 6 45% | 8.66 ? 21% | 6.86 ? 38% |
| Idle Maximum * (Watt) | 11.4 | 10.1 11% | 9.1 20% | 7 39% | 9 21% | 8.8 23% | 12.3 -8% | 10.9 ? 4% | 8.44 ? 26% |
| Load Average * (Watt) | 59.7 | 45.6 24% | 29.6 50% | 25 58% | 41.7 30% | 46.2 23% | 44.4 26% | 45.6 ? 24% | 43.9 ? 26% |
| Witcher 3 ultra * (Watt) | 49.4 | 42.4 14% | 27.7 44% | 40.1 19% | 42.2 15% | 36.5 26% | |||
| Load Maximum * (Watt) | 63 | 49.5 21% | 55.1 13% | 30.3 52% | 68 -8% | 47.3 25% | 47.8 24% | 67.8 ? -8% | 66.6 ? -6% |
* ... Meglio usare valori piccoli
Power Consumption Witcher 3 / Stress test
Power Consumption with external screen
Durata della batteria
Dell ha aumentato la capacità della batteria da 52 a 55 Wh, ma l'autonomia è comunque diminuita rispetto al predecessore 4K a causa dei consumi più elevati. A 150 nits (il 47% della luminosità massima dell'unità in prova), il nostro test Wi-Fi dura solo 7 ore e solo ~5,5 ore alla massima luminosità. La differenza con il test video a 150 nits, che dura quasi 11 ore, è particolarmente evidente. Questo è il risultato della CPU Alder Lake, che consuma molta energia anche in scenari di carico single-core.
Il pannello Pannello OLED del vecchio XPS 13 9310 era leggermente peggiore della sua controparte IPS 4K in termini di autonomia della batteria, quindi ci aspettiamo lo stesso per questa generazione. Se cercate l'XPS 13 Plus con la migliore autonomia della batteria, vi consigliamo sicuramente il pannello standard da 1200p (1920 x 1200 pixel).
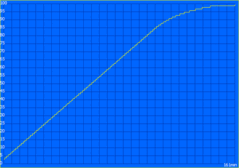
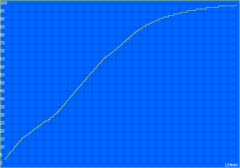
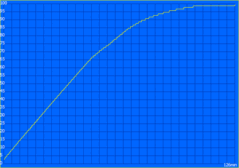
Dell offre diverse impostazioni per la ricarica della batteria ed è anche possibile impostare limiti manuali. Con l'impostazione predefinita sono necessari circa 160 minuti prima che la batteria sia completamente carica all'accensione del dispositivo. La modalità Express riduce il tempo di 25 minuti e l'alimentatore da 100 W di altri 10 minuti.
| Dell XPS 13 Plus 9320 4K i7-1260P, Iris Xe G7 96EUs, 55 Wh | Asus Zenbook S 13 OLED R7 6800U, Radeon 680M, 67 Wh | Lenovo ThinkPad X1 Nano-20UN002UGE i7-1160G7, Iris Xe G7 96EUs, 48.2 Wh | Apple MacBook Air 2020 M1 Entry M1, M1 7-Core GPU, 49.9 Wh | Huawei MateBook 13s i5 11300H i5-11300H, Iris Xe G7 80EUs, 60 Wh | Dell XPS 13 9310 Core i7 4K i7-1185G7, Iris Xe G7 96EUs, 52 Wh | Dell XPS 13 9310 OLED i7-1185G7, Iris Xe G7 96EUs, 52 Wh | Media della classe Subnotebook | |
|---|---|---|---|---|---|---|---|---|
| Autonomia della batteria | 52% | 35% | 132% | 20% | 4% | -6% | 62% | |
| H.264 (h) | 11 | 15.2 38% | 15.4 40% | 11 0% | 16.1 ? 46% | |||
| WiFi v1.3 (h) | 6.9 | 9.2 33% | 9.9 43% | 16 132% | 9.4 36% | 7.2 4% | 6.5 -6% | 13.4 ? 94% |
| Load (h) | 1.3 | 2.4 85% | 1.6 23% | 1.6 23% | 1.915 ? 47% |
Pro
Contro
Verdetto - XPS 13 Plus è potente, ma ha i suoi svantaggi
Ci sono molti argomenti di cui parlare dopo la nostra recensione del nuovo XPS 13 Plus. Dell non ha solo aggiornato la generazione di processori, ma ha anche deciso di offrire due modelli completamente diversi d'ora in poi. L'XPS 13 Plus riceve i chip Intel Alder Lake-P, più veloci, e il Core i7-1260P.Core i7-1260Pnella nostra unità di recensione offre buone prestazioni. Tuttavia, il dispositivo mostra ancora una volta i problemi delle attuali CPU Intel, perché le prestazioni elevate richiedono molta energia. Questo influisce sull'autonomia della batteria e sulle temperature, per cui il nuovo modello (anche con il profilo energetico ottimizzato ) è più rumoroso del vecchio XPS 13 9310 XPS 13 9310. Anche le prestazioni della GPU non sono cambiate e le CPU Ryzen 6000 di AMD, come nello Zenbook S 13, offrono maggiori prestazioni e sono anche molto più efficienti
Dell continua anche la tendenza al minimalismo, perché l'XPS 13 Plus non ha più il lettore di schede e nemmeno il jack stereo da 3,5 mm, il che significa che ci sono solo due porte USB-C. Sono molto versatili grazie al supporto Thunderbolt 4, ma in pratica sono scomode. Siamo rimasti sorpresi anche dalla touch bar capacitiva dopo l'esperimento fallito per Apple. La touch bar con i tasti funzione funziona bene in generale, ma non c'è alcun valore aggiunto qui e il controllo automatico della luminosità non funziona sempre in modo affidabile. La nuova tastiera lascia un'impressione discreta, ma ci è piaciuta molto l'area di appoggio per il palmo della mano realizzata in un unico pezzo di vetro, che non crea problemi di impronte digitali ed è facile da usare. Anche il nuovo sistema audio è molto buono e rappresenta un miglioramento rispetto al vecchio modello
Il nuovo Dell XPS 13 offre molte prestazioni, ma al costo di ventole più rumorose e di una minore autonomia della batteria. Ci sono anche alcune scelte di design, come la barra touch capacitiva sopra la tastiera e il minimalismo in termini di porte, che possono risultare fastidiose
Dell deve anche fare attenzione a non perdere il contatto con i rivali in termini di display, perché lo schermo 4K opzionale copre solo il piccolo gamut sRGB. Se si desidera il P3, attualmente si è costretti ad acquistare il pannello OLED da 3,5K opzionale, che nel vecchio modello soffriva di sfarfallio PWM. La qualità dell'immagine soggettiva dello schermo 4K è comunque molto buona. Tuttavia, l'alta risoluzione influisce anche sull'autonomia della batteria e 5,5-7 ore nel nostro test Wi-Fi non sono un record. Se avete bisogno di tempi di autonomia più lunghi, dovreste sicuramente acquistare uno dei pannelli Full-HD (con e senza supporto touch). Piccoli problemi, come la mancanza del supporto Wi-Fi a 6 GHz o la webcam a 720p, incidono un po' sull'impressione generale
L'XPS 13 Plus deve competere con rivali molto validi. Per cominciare, siamo curiosi di recensire l'XPS 13 standard con CPU Alder Lake-U e senza touch bar (aspettiamo l'unità di prova tra un paio di giorni). L'attuale AsusZenbook S 13con CPU AMD Ryzen 6000 è superiore sotto molti aspetti e l'XPS 13 Plus fatica persino a tenere il passo del vecchioApple MacBook Air M1in alcuni aspetti, che è molto più economico. E non crediamo che la situazione cambierà rispetto al nuovo MacBook Air M2, anch'esso attualmente in fase di recensione.
Prezzo e disponibilità
È possibile ordinare l'XPS 13 Plus presso il negozio online Dell a partire da 1299 dollari. La nostra unità di recensione con Core i7, 32 GB di RAM, 1 TB di memoria SSD e schermo 4K costa 2099 dollari ed è disponibile presso Best Buy, ad esempio.
Dell XPS 13 Plus 9320 4K
- 07/19/2022 v7 (old)
Andreas Osthoff


