Recensione del portatile Dell XPS 13 9315: Basse prestazioni, incredibile durata della batteria

L'ultima versione del popolare portatile da 13 pollici di Dell non solo viene lanciata con un modello gemello "Plus", ma anche con uno chassis aggiornato con un numero ancora minore di porte. Poiché il minimalismo è di moda, le CPU Alder Lake-U di Intel sono le uniche opzioni che si adattano al concetto generale dell'XPS 13 "di base". Sebbene questa linea di CPU offra prestazioni di picco e continue significativamente inferiori, è molto efficiente dal punto di vista energetico grazie all'elevato numero di core E. Di conseguenza, il nostro dispositivo di prova riesce a superare la soglia delle 15 ore nel test Wi-Fi a luminosità ridotta.
Oggi diamo un'occhiata al modello base dell'XPS 13 9315. Con un i5-1230U, solo 8 GB di RAM e un'unità SSD da 256 GB, è improbabile che possa battere qualsiasi record. Poiché tutti (!) i componenti, compreso il modulo Wi-Fi, sono saldati, non è possibile aggiornare il sistema in un secondo momento.
Confrontiamo l'XPS 13 9315 con il modello Plus 9320 (processore P, 4K) e con i modelli della concorrenza di Dell. La tabella seguente mostra i modelli che si avvicinano all'XPS 13 e quelli che hanno ricevuto una valutazione ancora migliore.
Altri portatili XPS di Dell recensiti da Notebookcheck
XPS 13 Plus 9320 i7-1260P (4K, Alder Lake 2022)XPS 13 Plus 9320 i5-1240P (FHD, da pubblicare a breve)XPS 13 9310 Core i7 (FHD, Tiger Lake 2021)
Potenziali concorrenti a confronto
Punteggio | Data | Modello | Peso | Altezza | Dimensione | Risoluzione | Prezzo |
|---|---|---|---|---|---|---|---|
| 88.2 % v7 (old) | 08/2022 | Dell XPS 13 9315, i5-1230U i5-1230U, Iris Xe G7 80EUs | 1.2 kg | 14 mm | 13.40" | 1920x1200 | |
| 91.1 % v7 (old) | 12/2020 | Apple MacBook Air 2020 M1 Entry M1, M1 7-Core GPU | 1.3 kg | 16.1 mm | 13.30" | 2560x1600 | |
| 90.1 % v7 (old) | 07/2022 | Asus Zenbook S 13 OLED R7 6800U, Radeon 680M | 1.1 kg | 14.9 mm | 13.30" | 2880x1800 | |
| 89.8 % v7 (old) | 02/2021 | Lenovo ThinkPad X1 Nano-20UN002UGE i7-1160G7, Iris Xe G7 96EUs | 946 gr | 16 mm | 13.00" | 2160x1350 | |
| 88.8 % v7 (old) | 02/2022 | Huawei MateBook 13s i5 11300H i5-11300H, Iris Xe G7 80EUs | 1.3 kg | 16.5 mm | 13.40" | 2520x1680 | |
| 86.9 % v7 (old) | 07/2022 | Dell XPS 13 Plus 9320 4K i7-1260P, Iris Xe G7 96EUs | 1.2 kg | 15.3 mm | 13.40" | 3840x2400 | |
| 86.1 % v7 (old) | 08/2022 | Dell XPS 13 Plus 9320 i5-1240p i5-1240P, Iris Xe G7 80EUs | 1.2 kg | 15.3 mm | 13.40" | 1920x1200 |
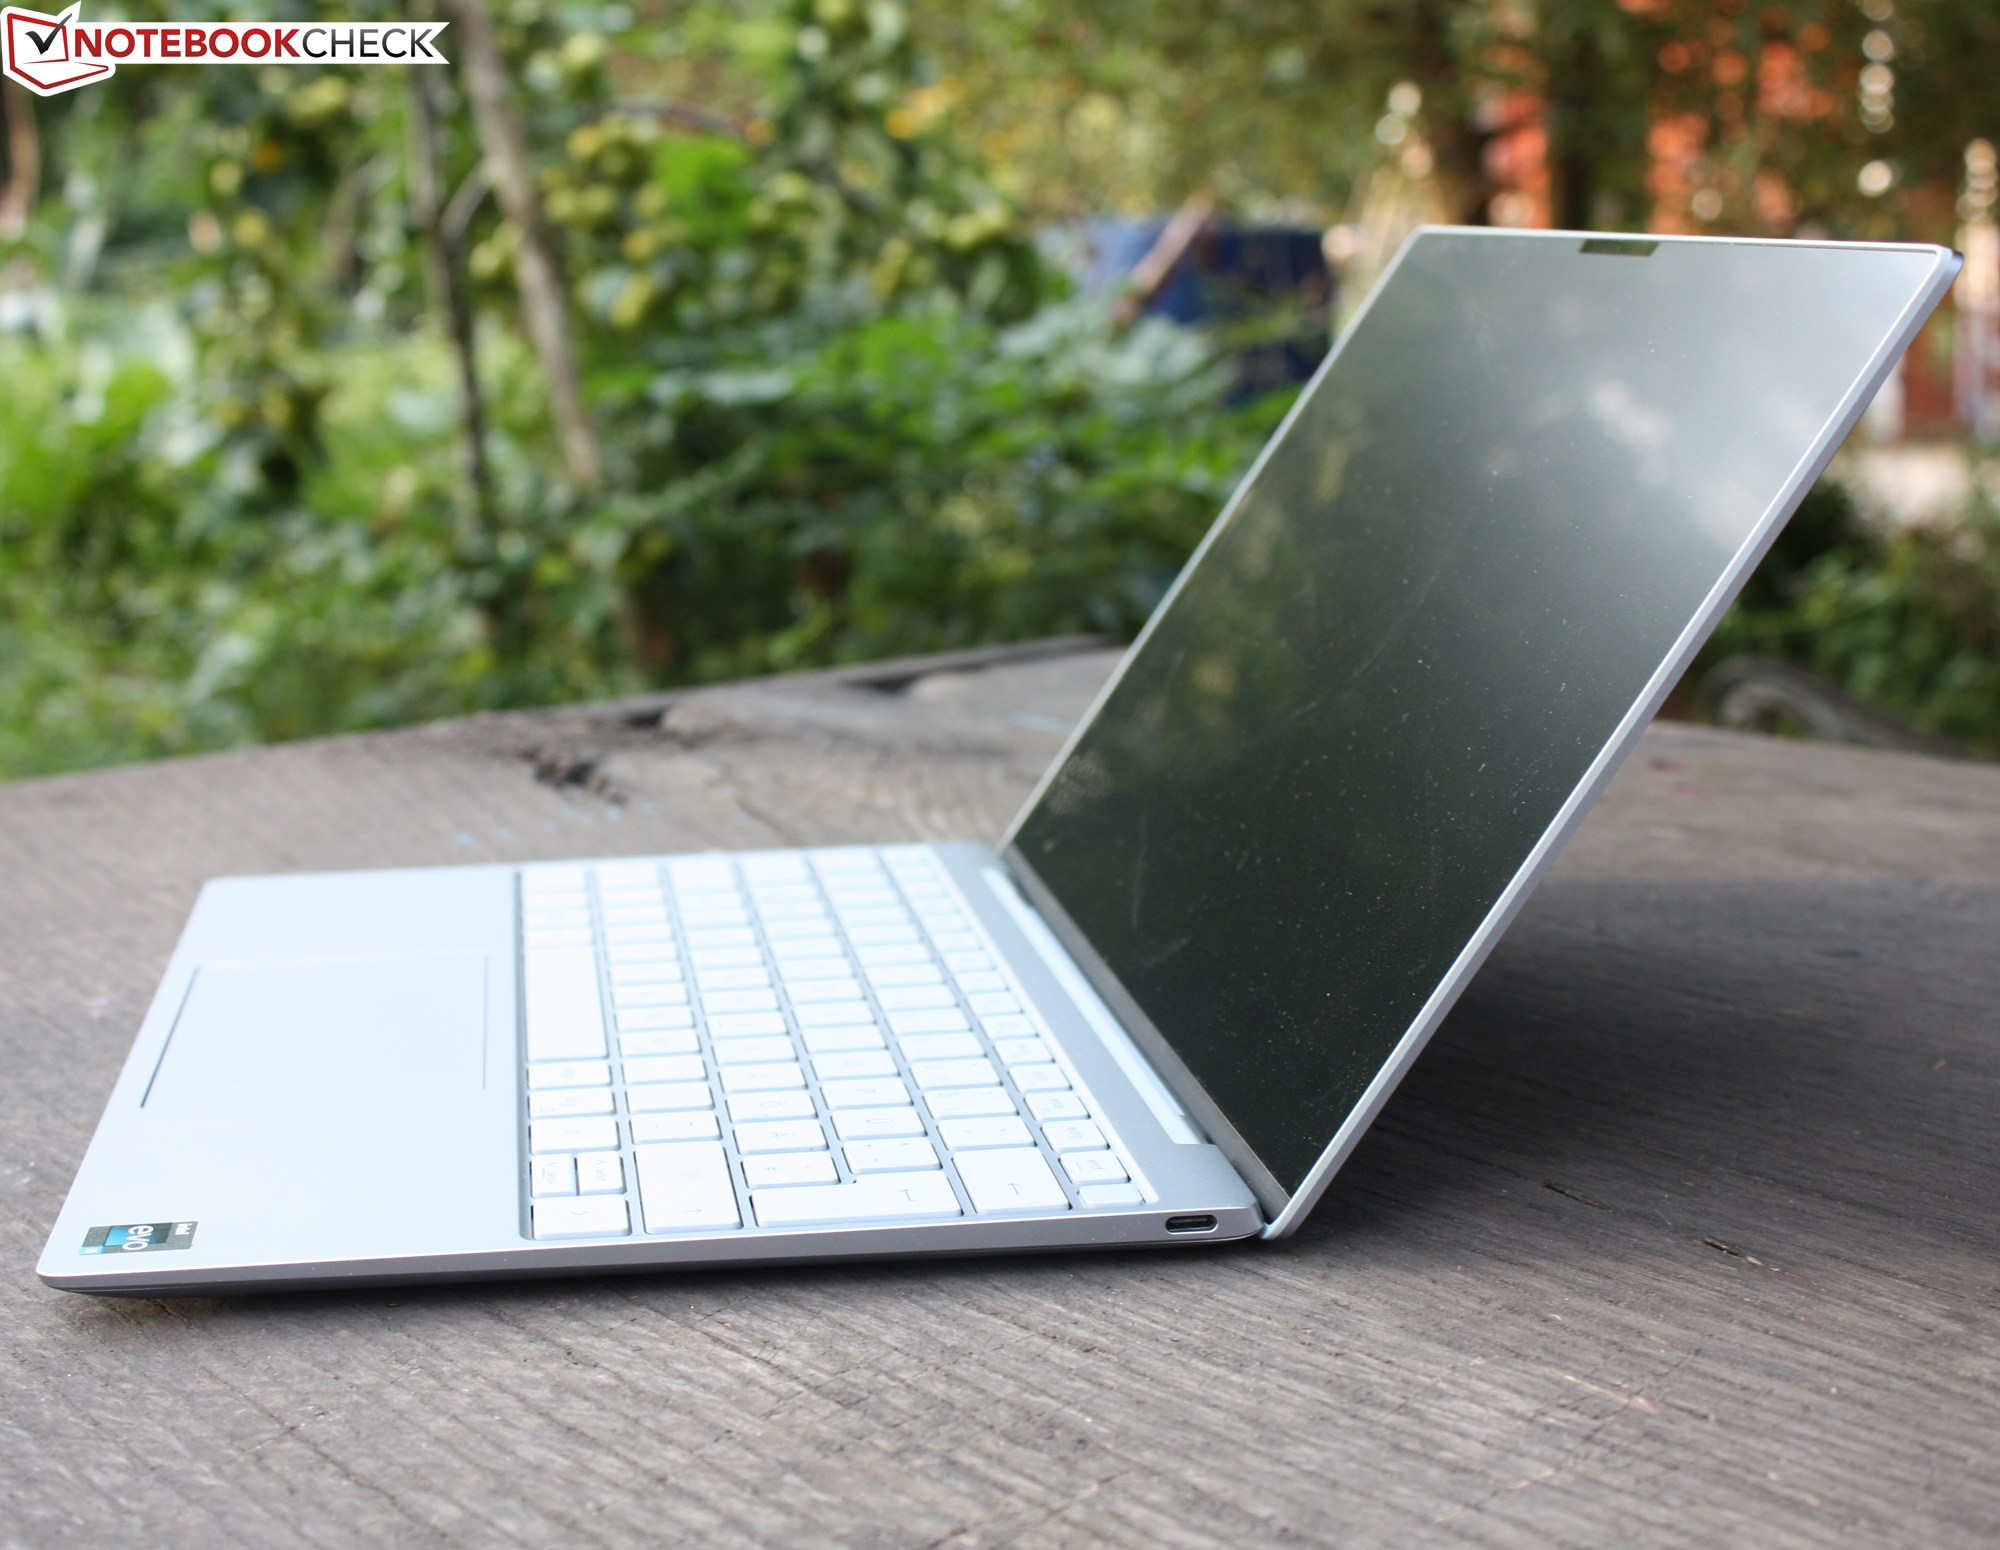
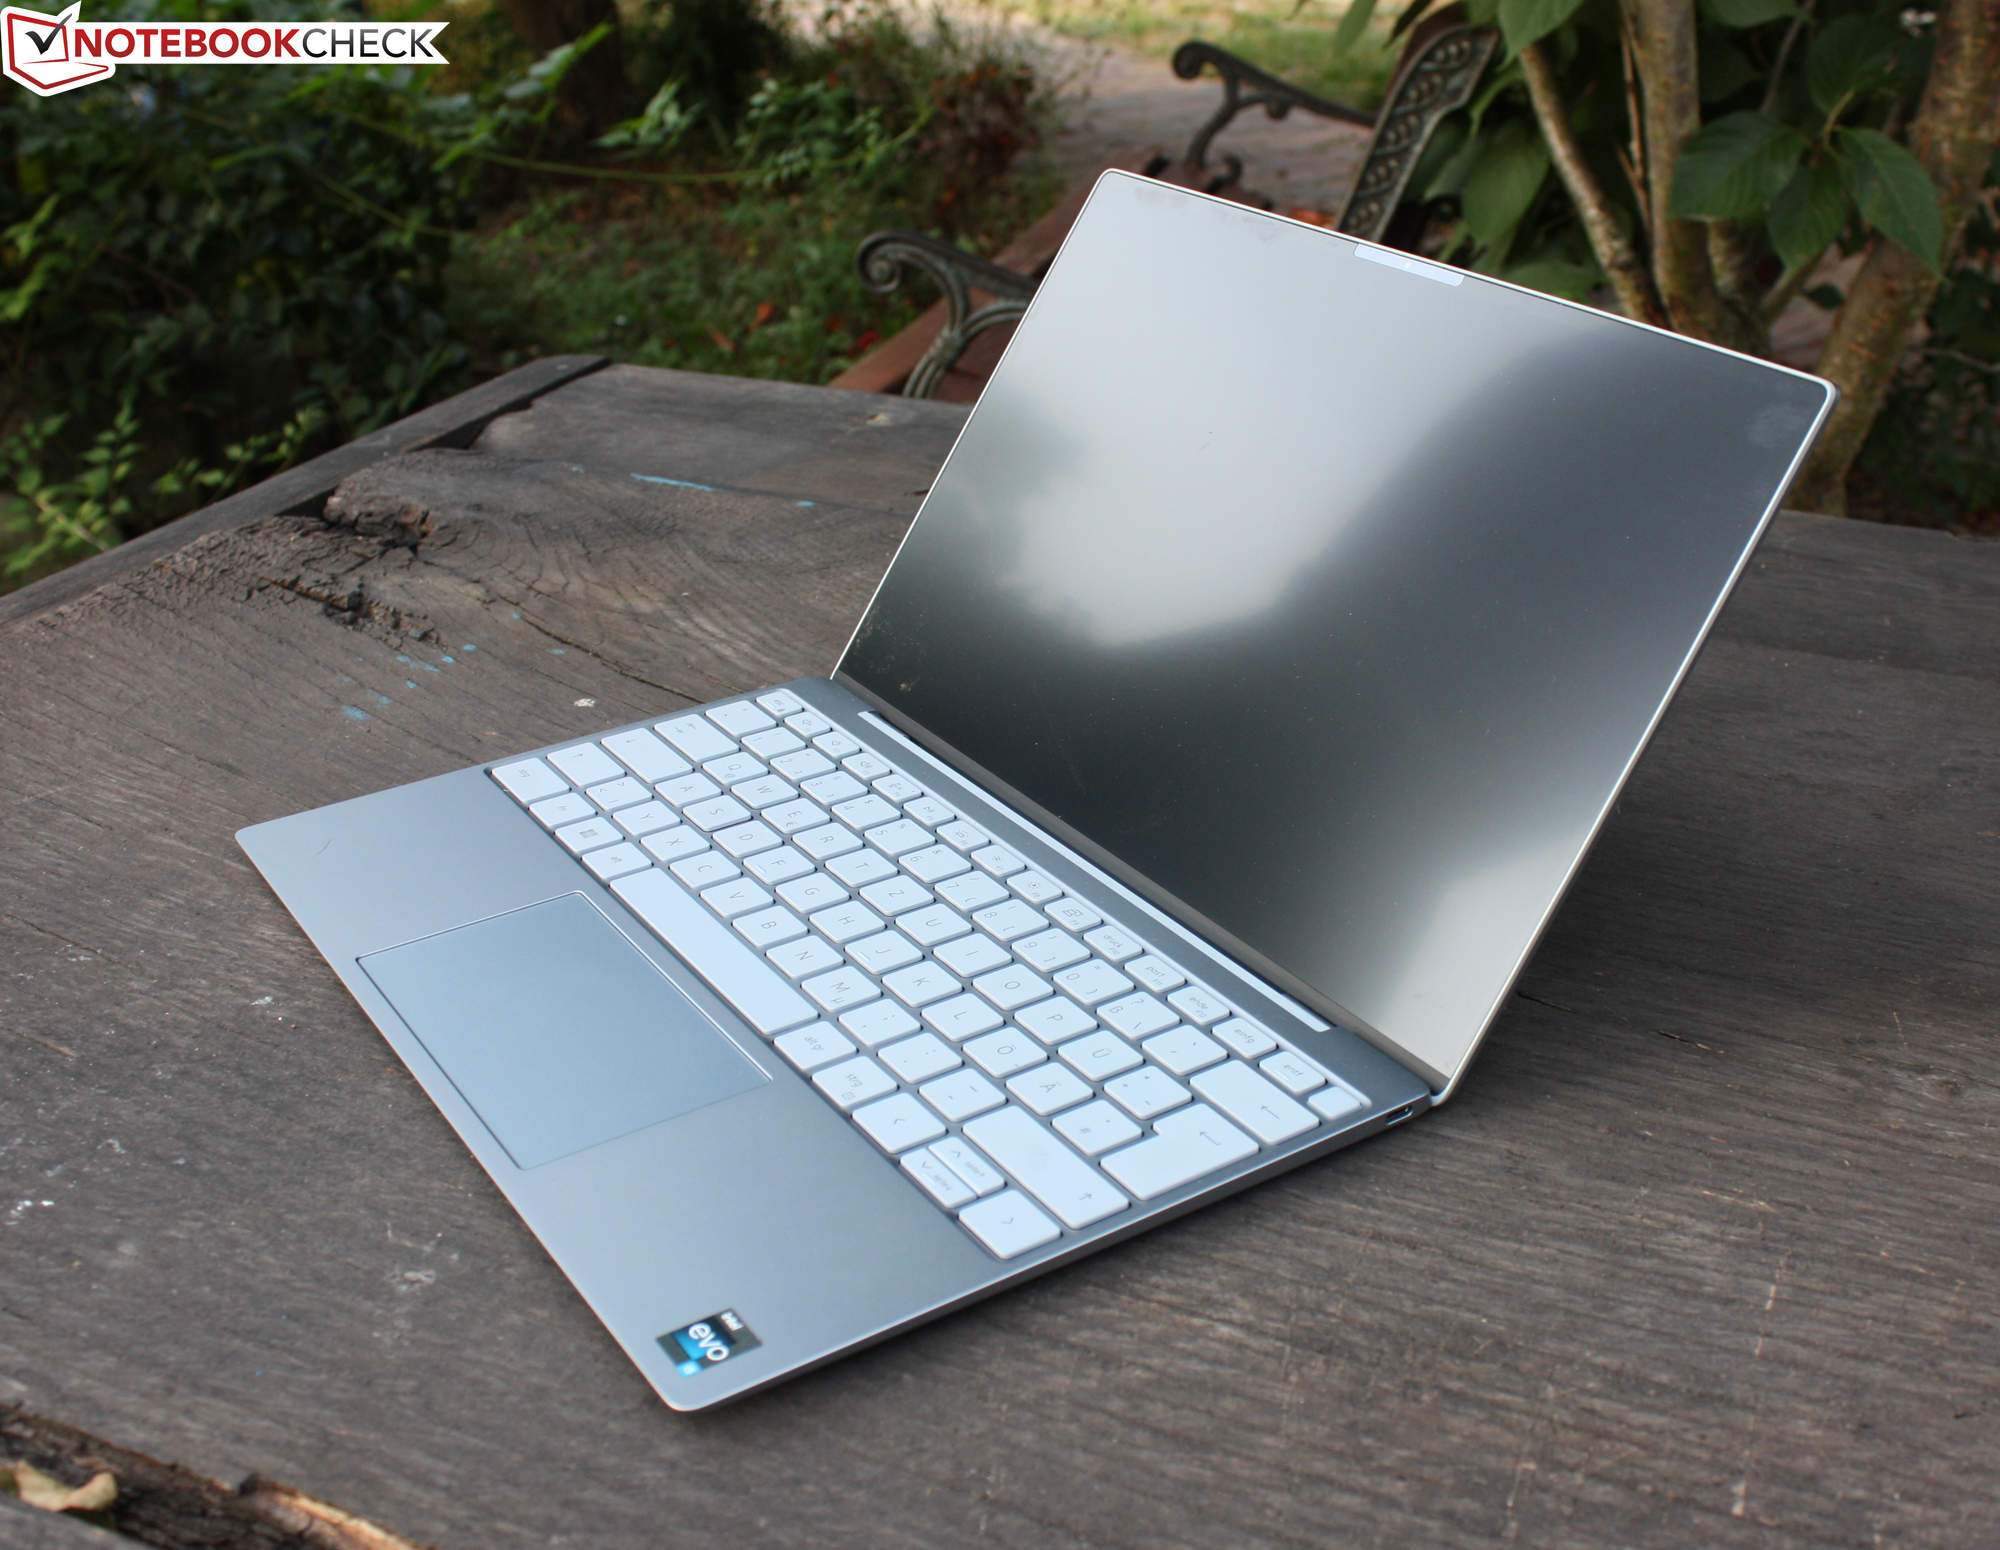
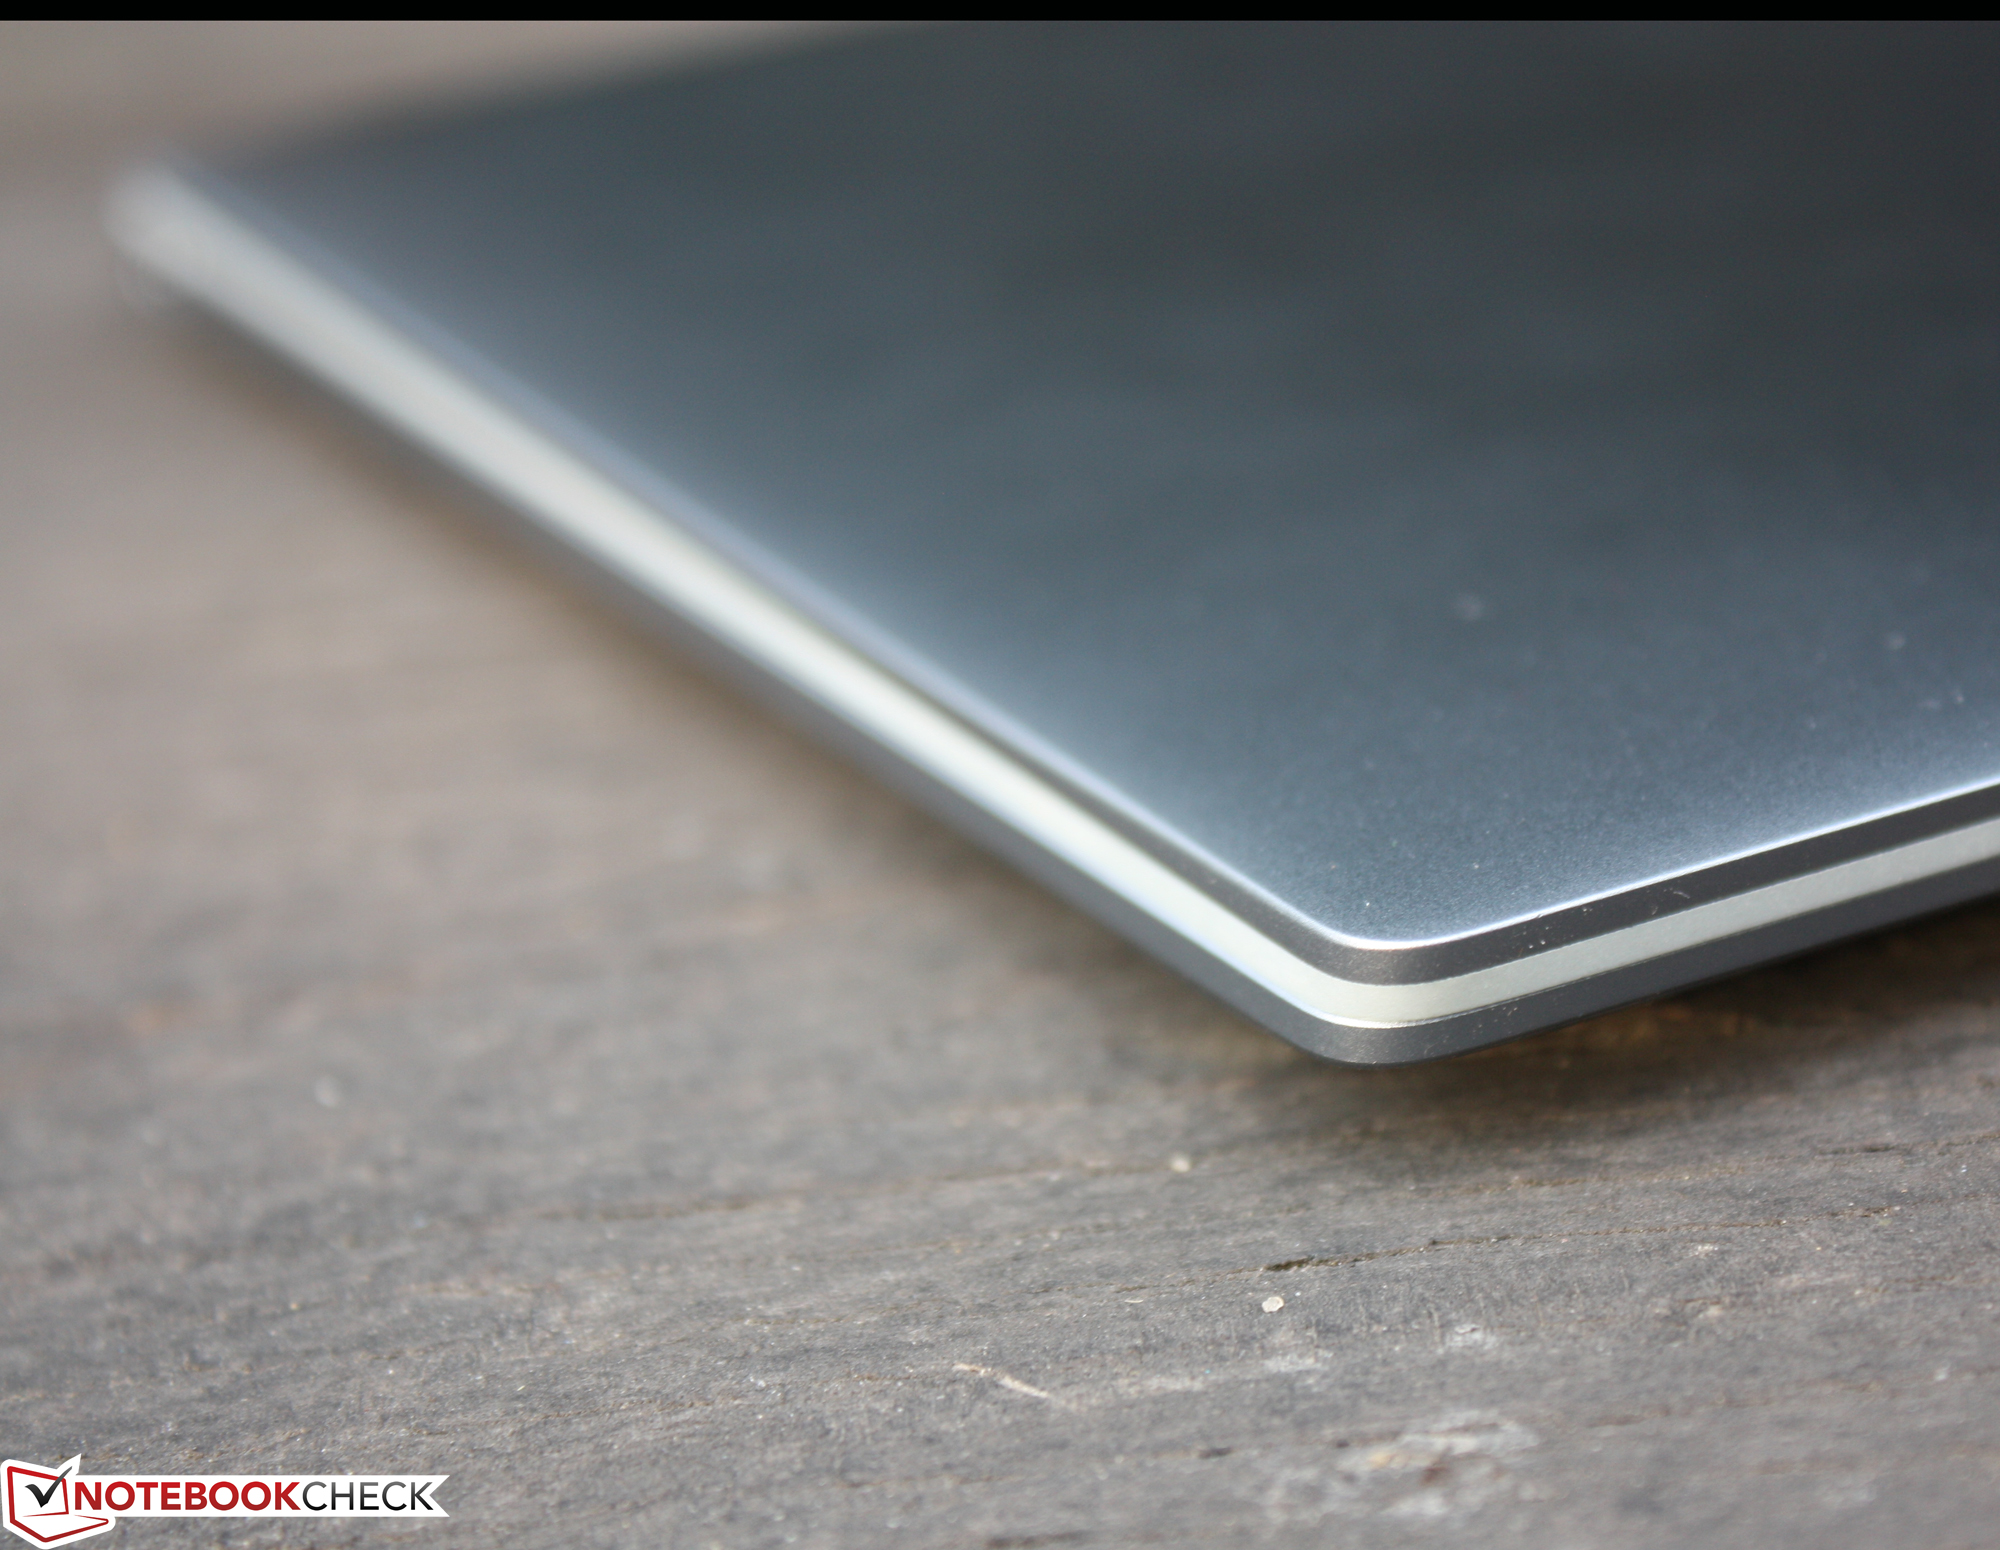
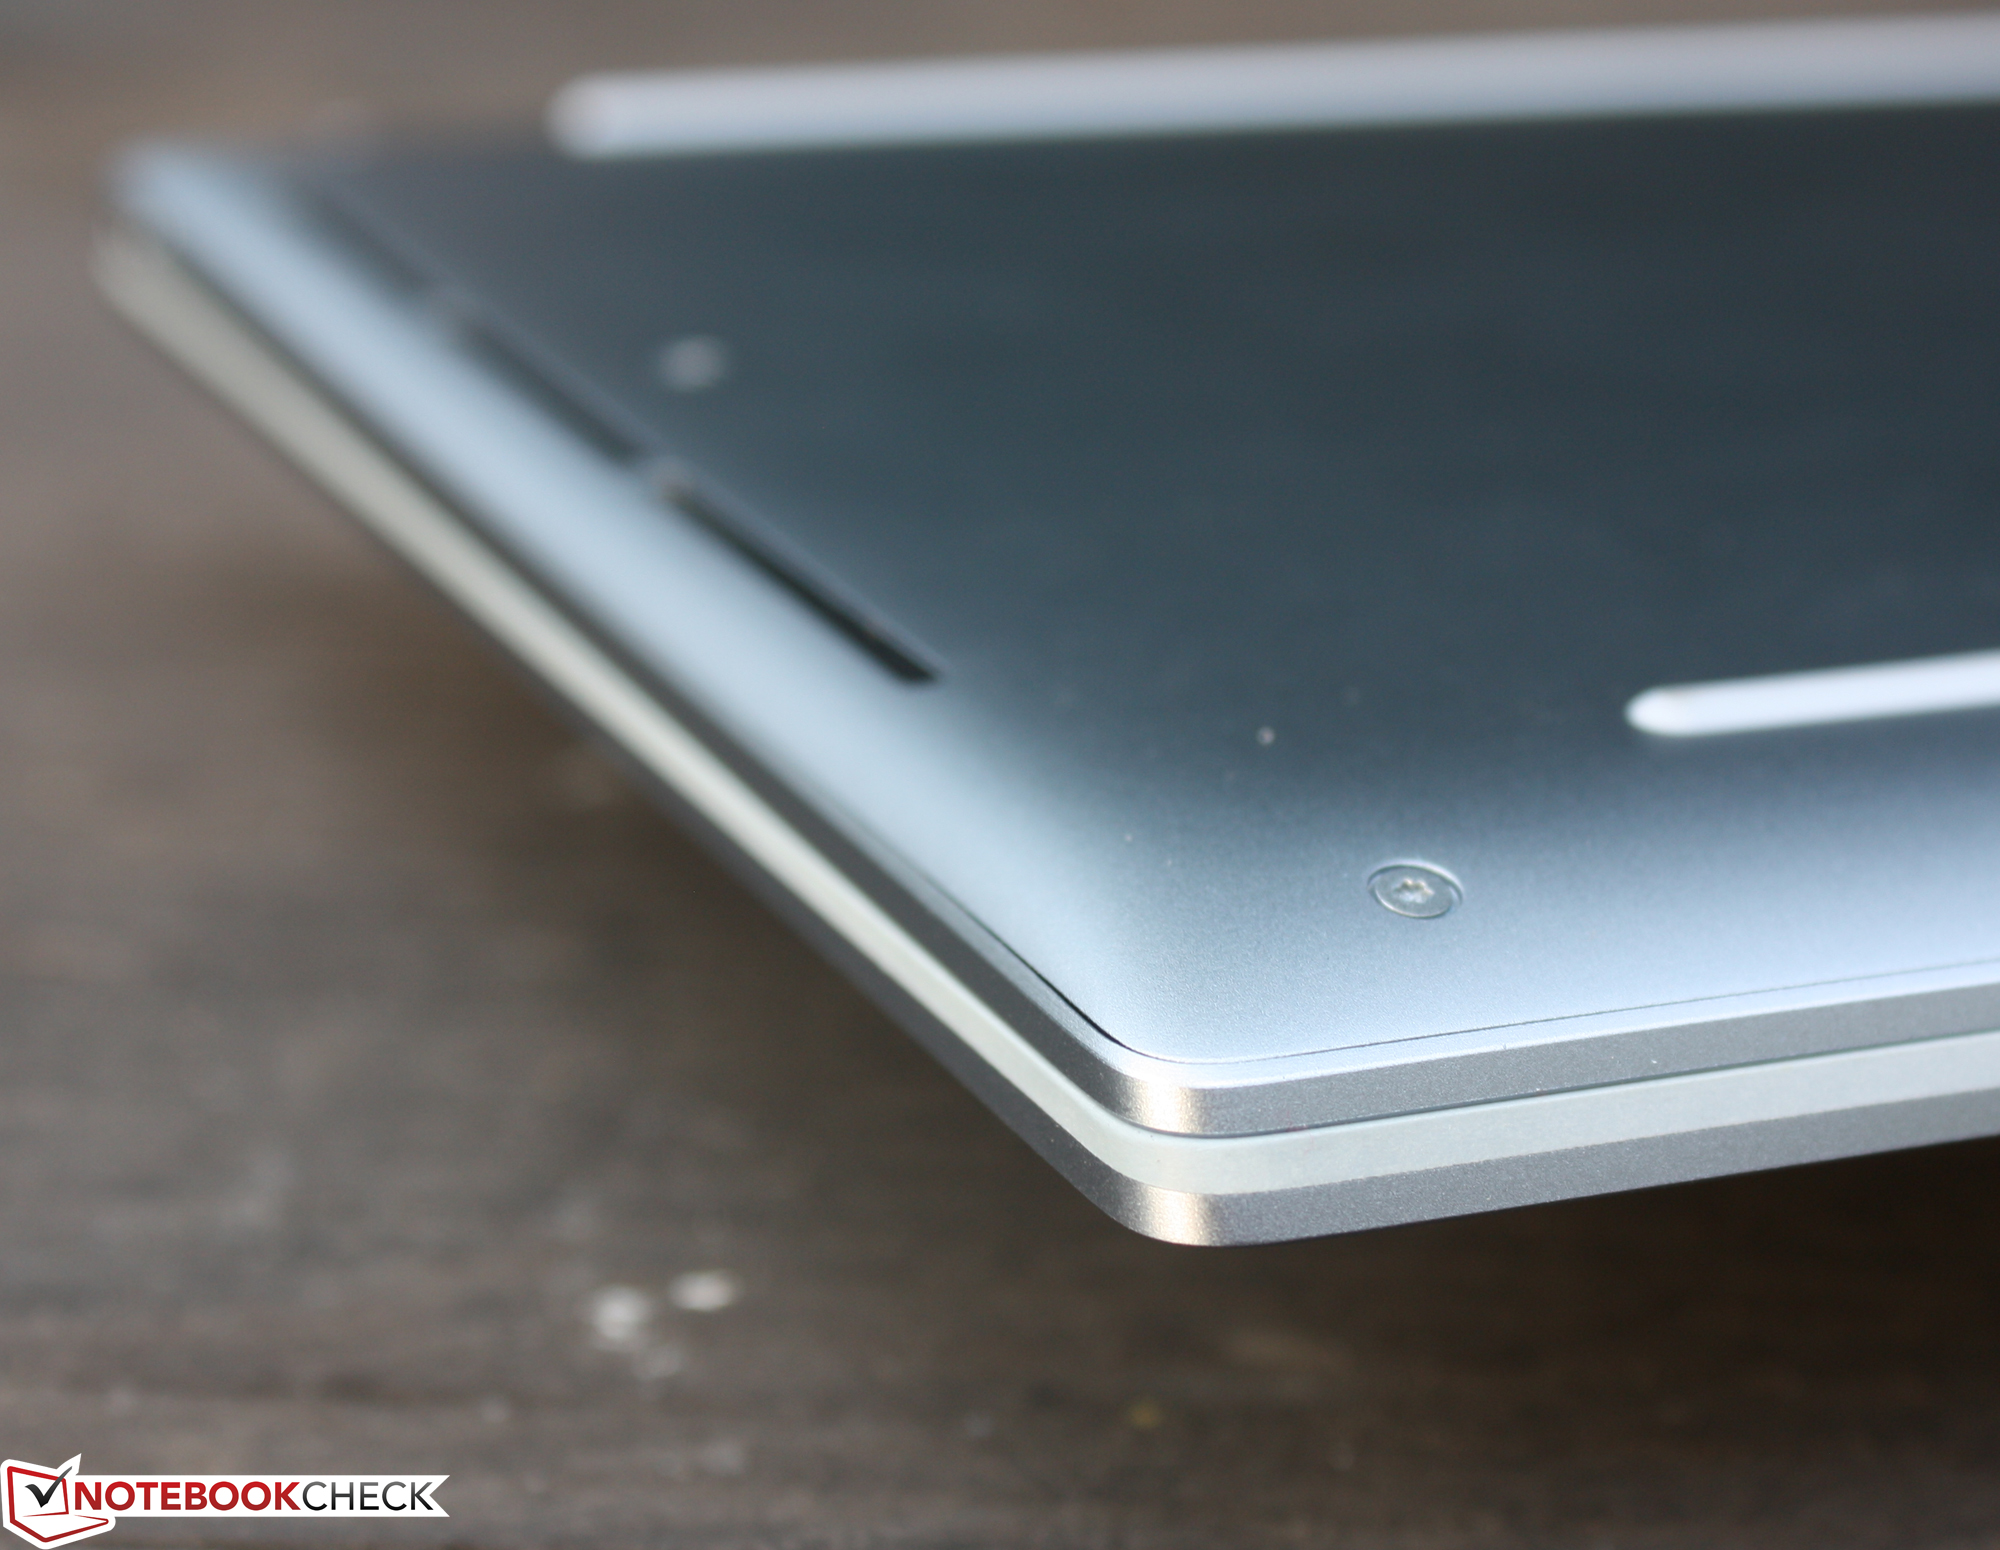
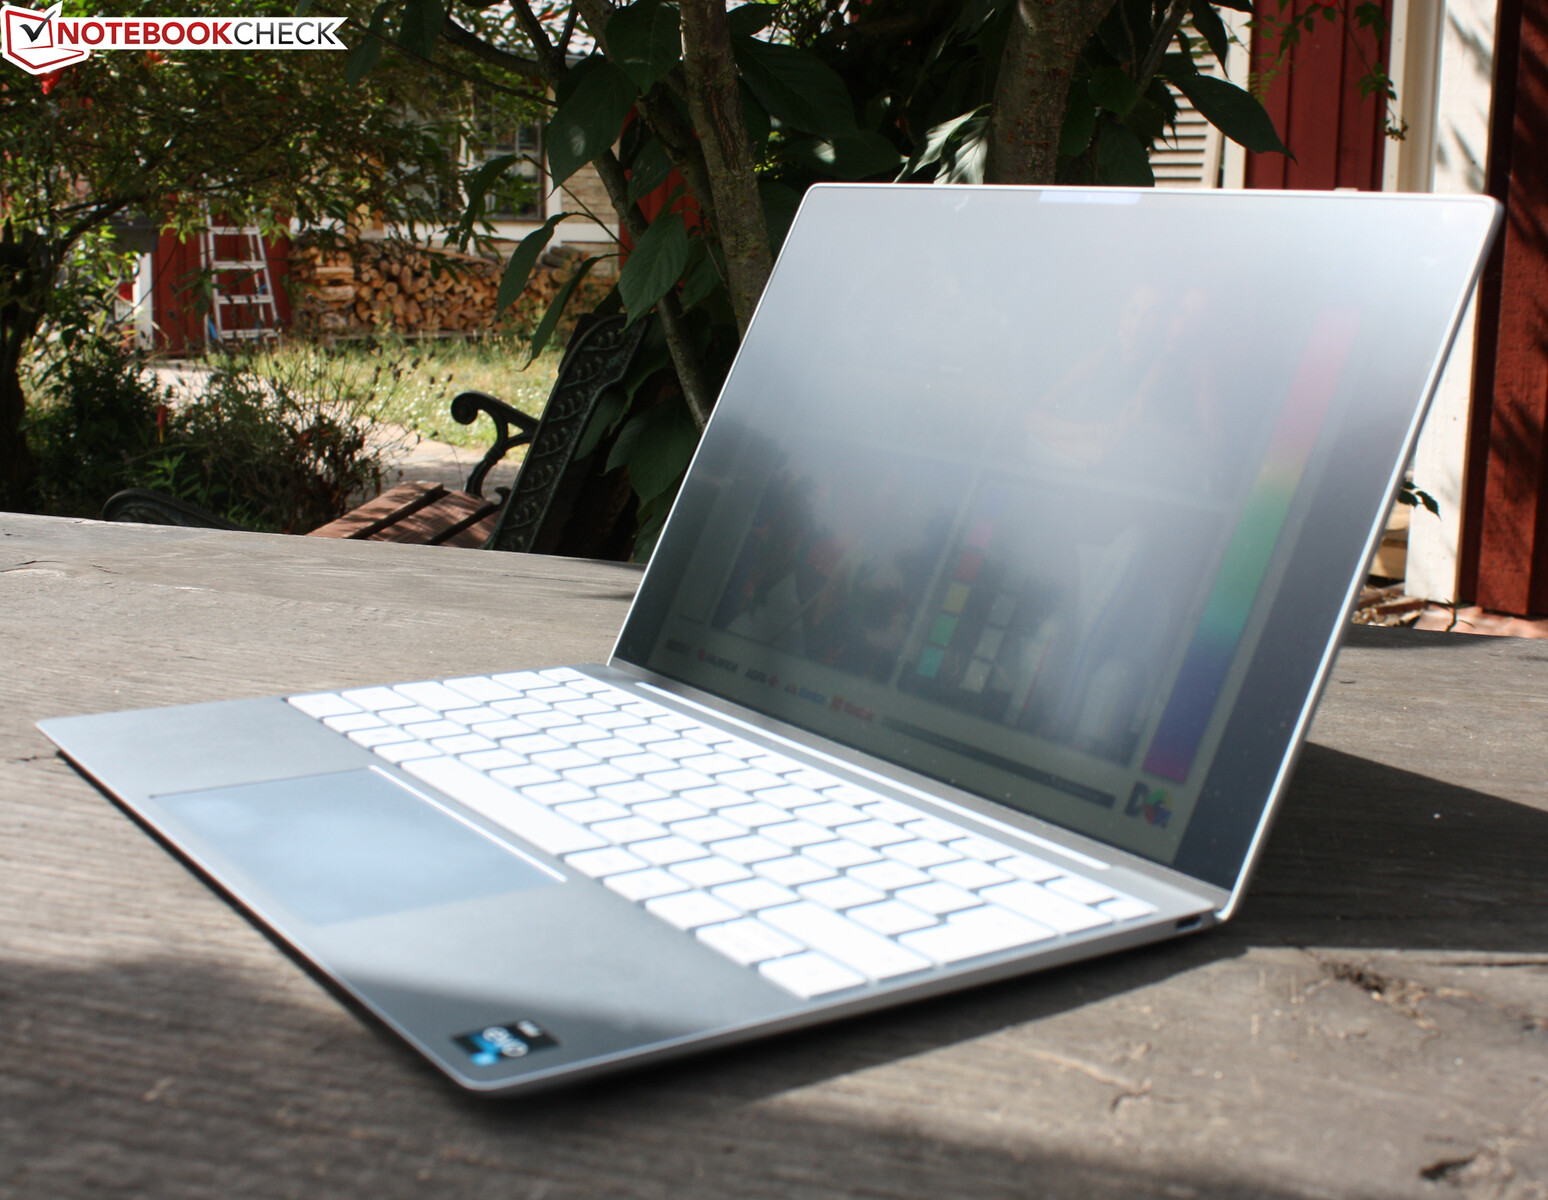
Custodia - Ultrabook robusto ed elegante
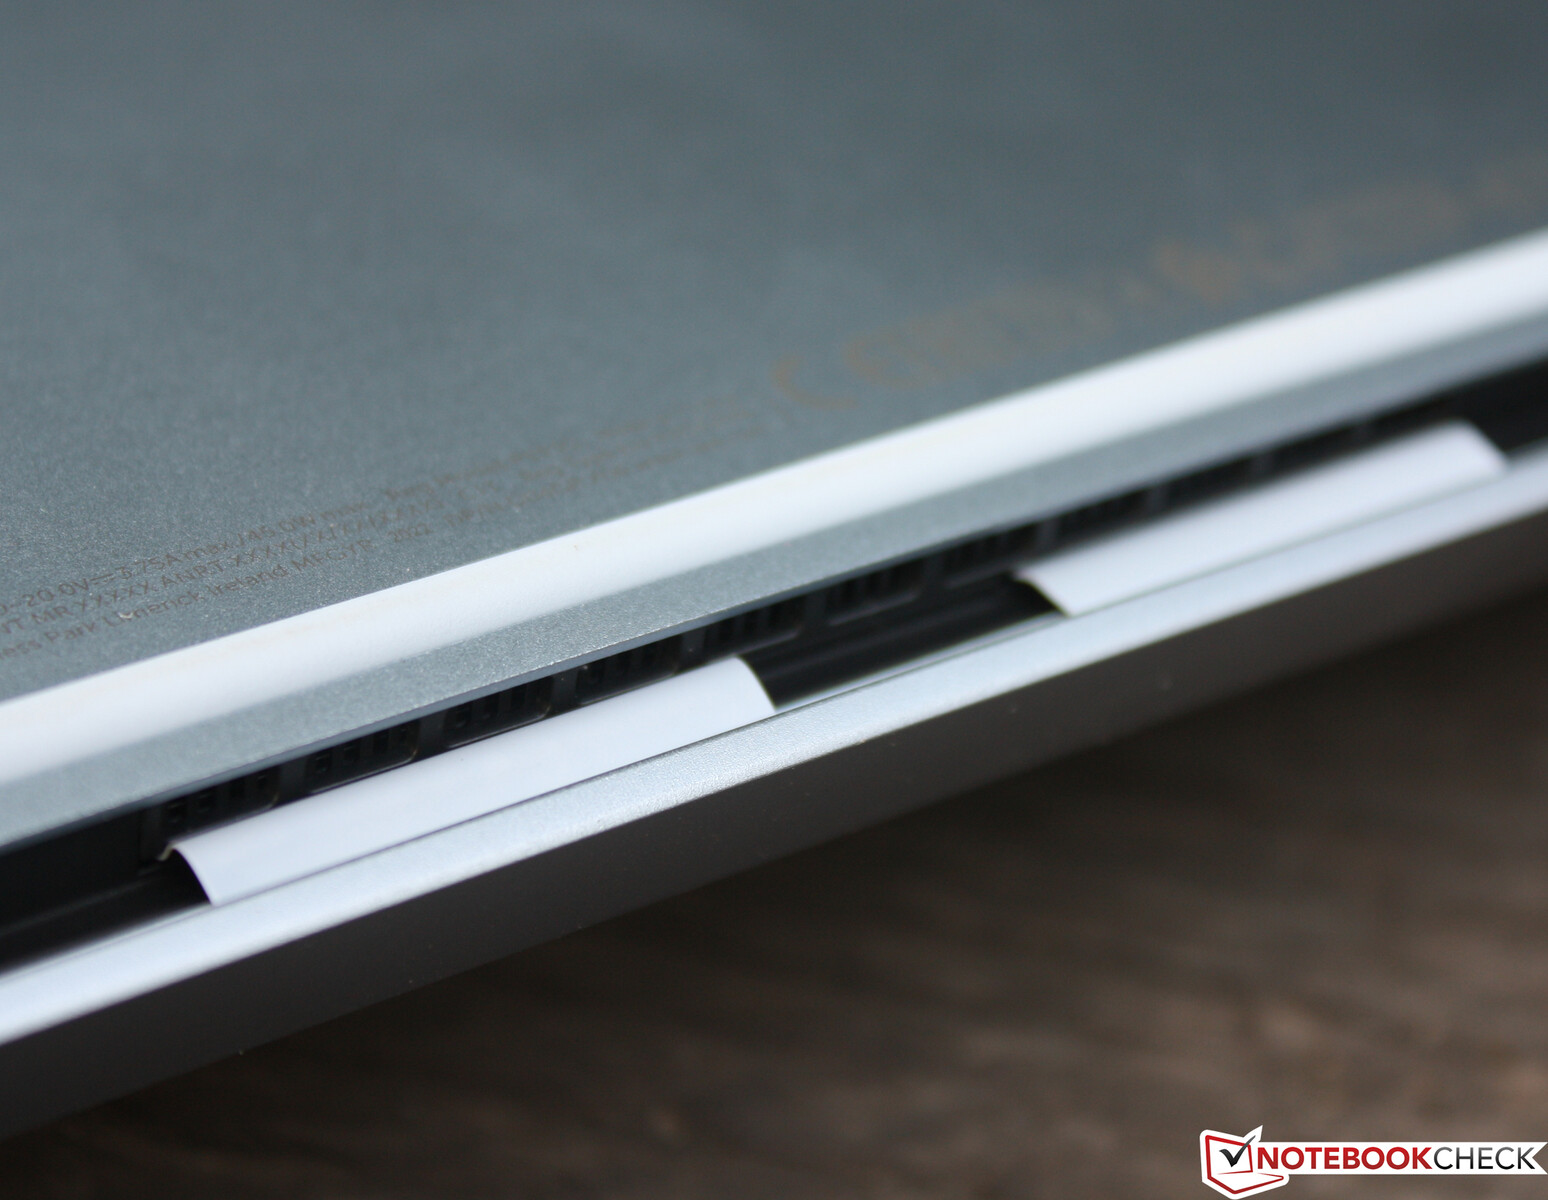
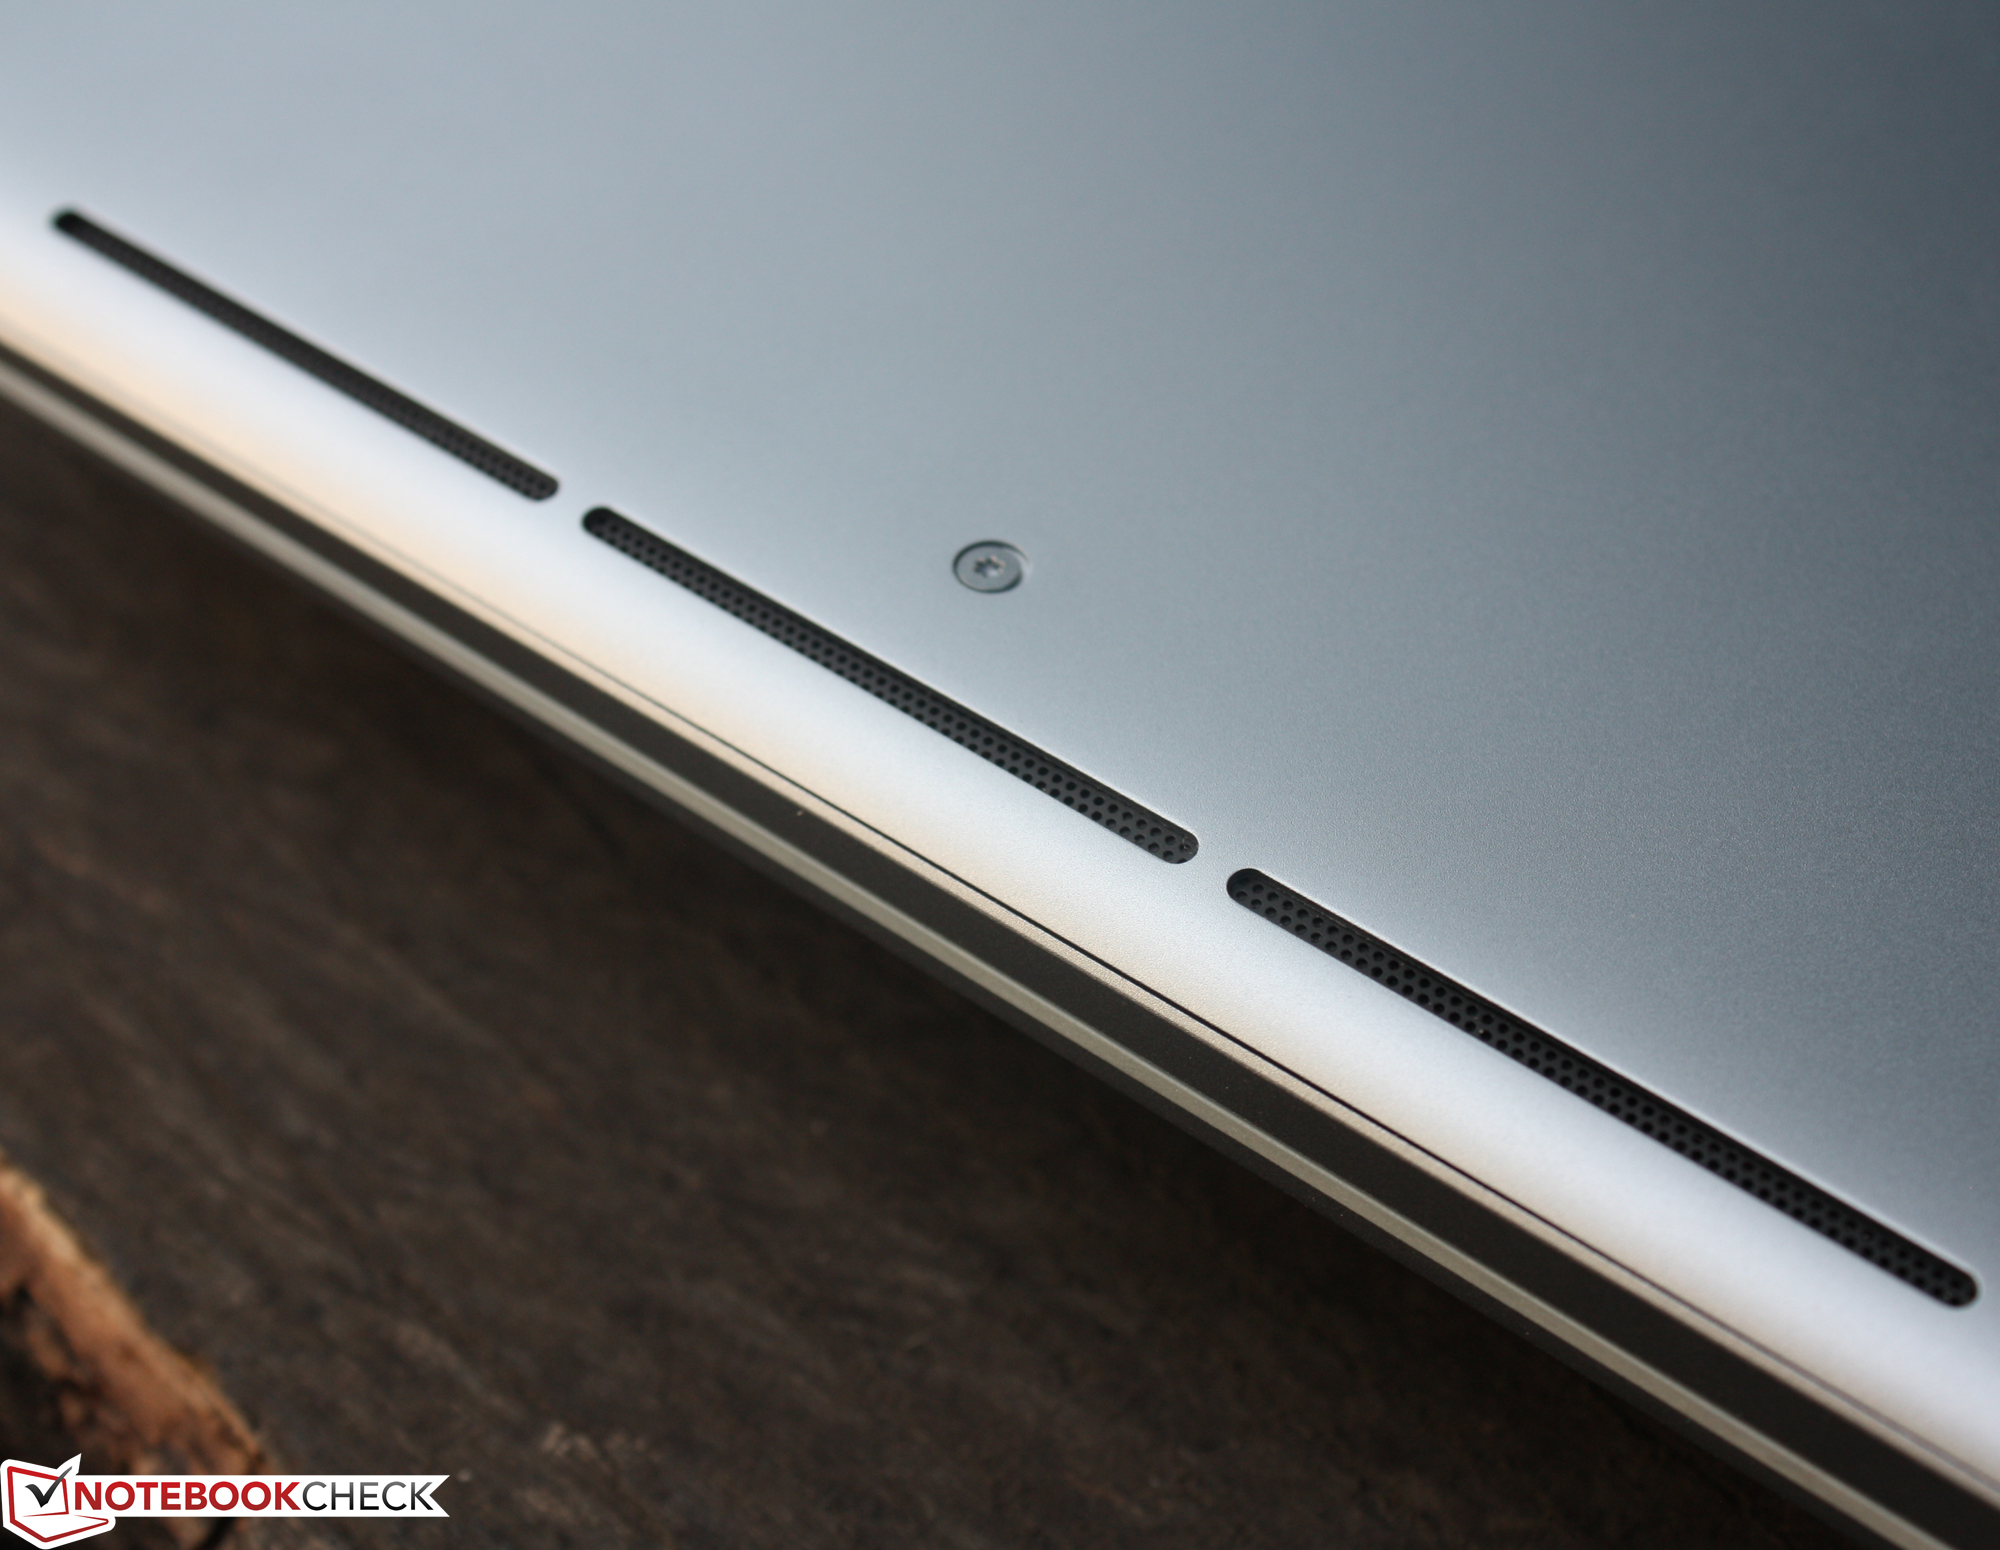
Nonostante la predilezione per gli spigoli vivi del passato, questa volta le cose sono leggermente più rotonde. Tutti gli angoli sono arrotondati e la piastra inferiore presenta una leggera curva. Il taglio di quasi tutte le porte, ad eccezione delle due porte di tipo C, consente di ottenere un design minimalista e molto resistente alle torsioni. L'unità di base è solida e robusta, anche se si avverte qualche scricchiolio quando si cerca di ruotarla dagli angoli. L'area della tastiera è rigida e non cede sotto pressione. Lo stesso vale per i poggiapolsi, che sono solidi come una roccia.
Le cerniere sono solide e vengono mantenute in posizione chiusa magneticamente. L'apertura del coperchio è un po' difficile, poiché non c'è nulla sul bordo che aiuti ad afferrarlo e passa senza soluzione di continuità nell'unità di base. Tuttavia, dopo aver fissato un piccolo spazio, è possibile aprire il portatile con una sola mano. Durante questa operazione, la base pesante assicura che il dispositivo rimanga sul tavolo
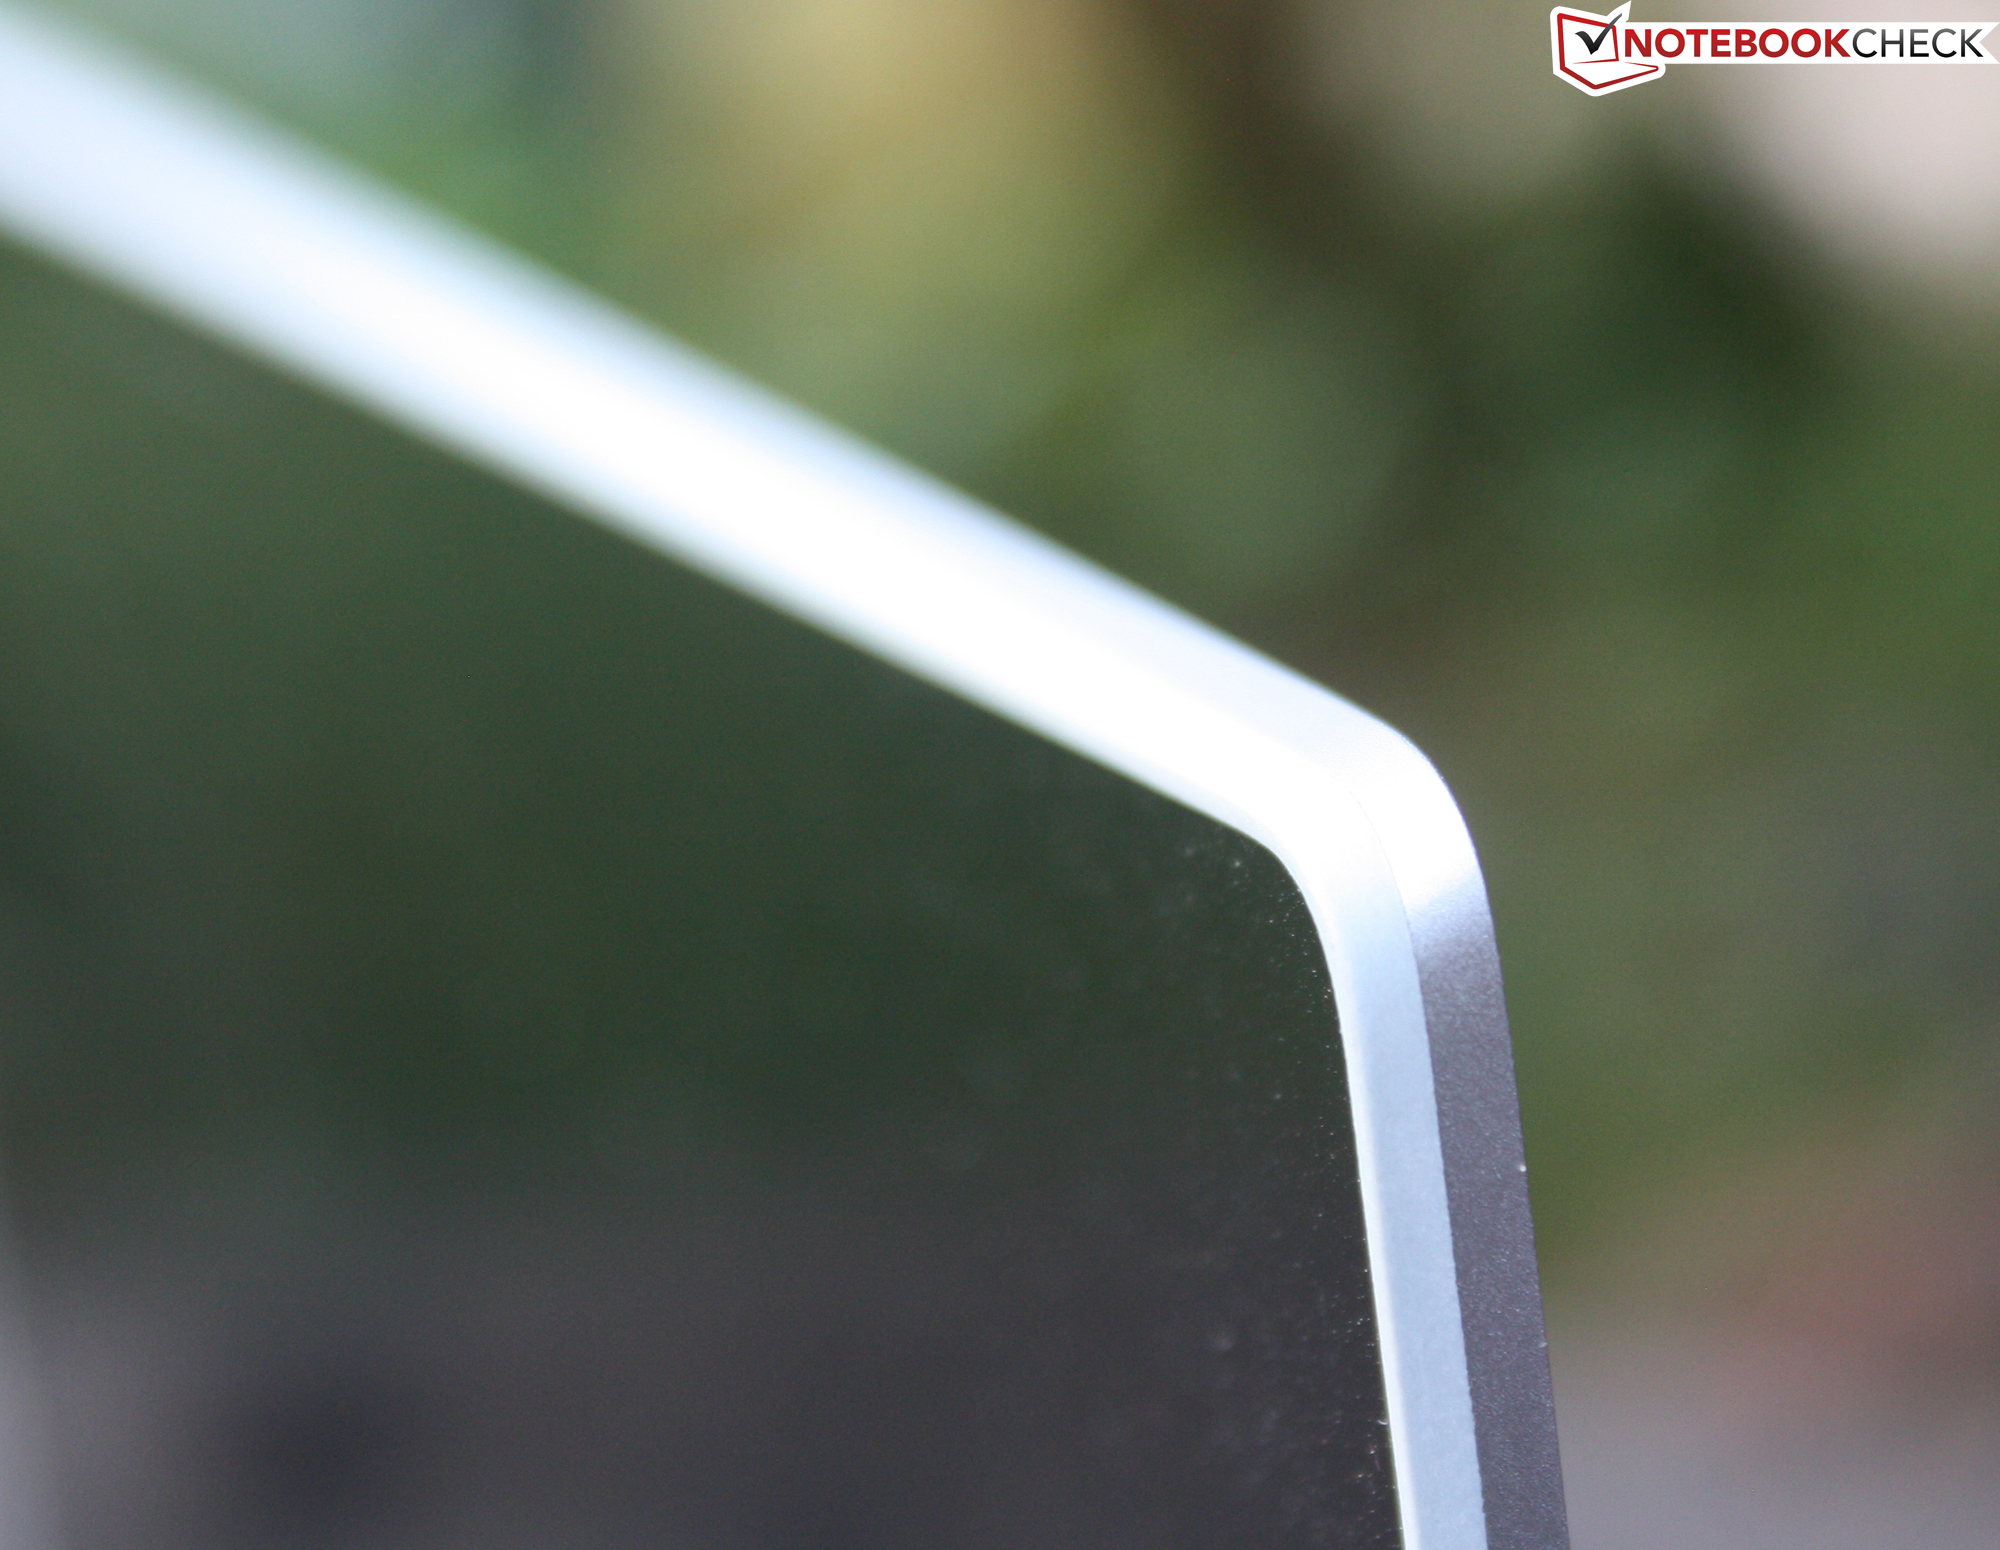
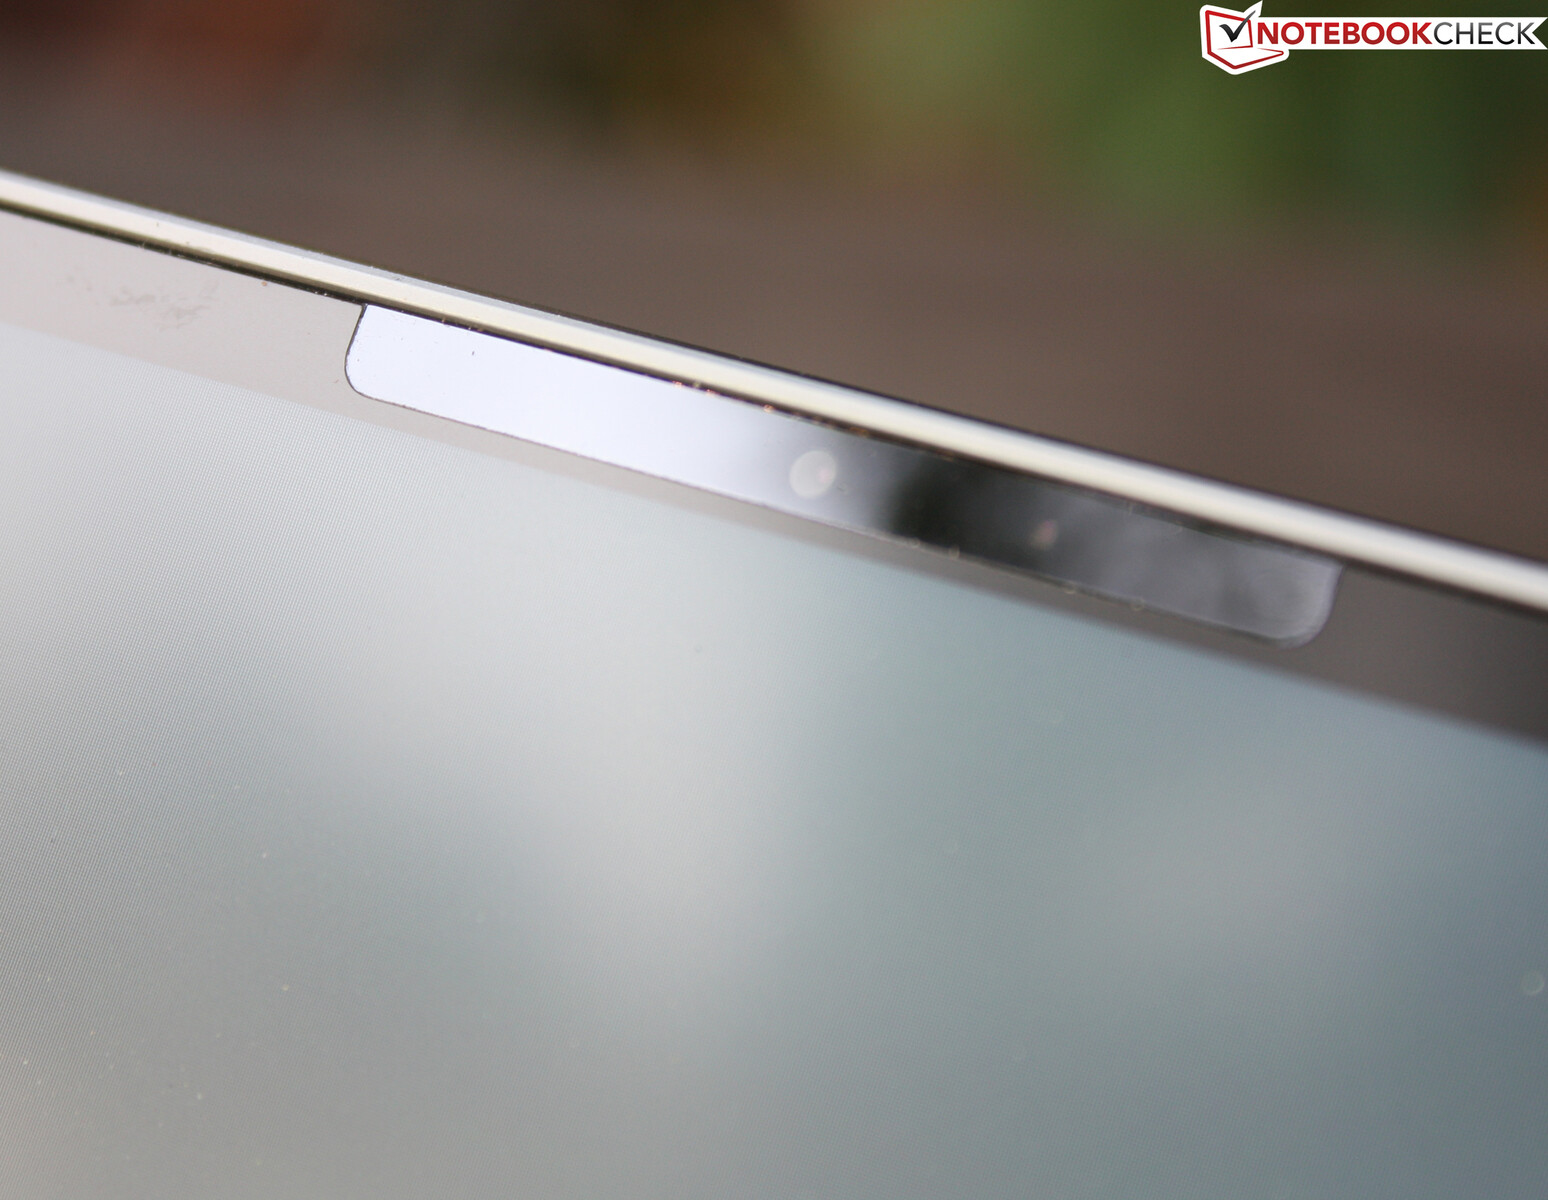
La cerniera può essere aperta fino a un angolo massimo di circa 135 gradi, dove si ferma bruscamente senza traballare. Il coperchio in alluminio è resistente alla torsione. La pressione sul retro non provoca alcun cedimento o distorsione del display. La webcam è stata spostata sulla cornice nera del display, facendola scomparire visivamente. Tuttavia, la tacca della webcam non sporge nell'area del display. Le cornici dello schermo sono molto ridotte e il rapporto schermo/corpo è dell'89%.
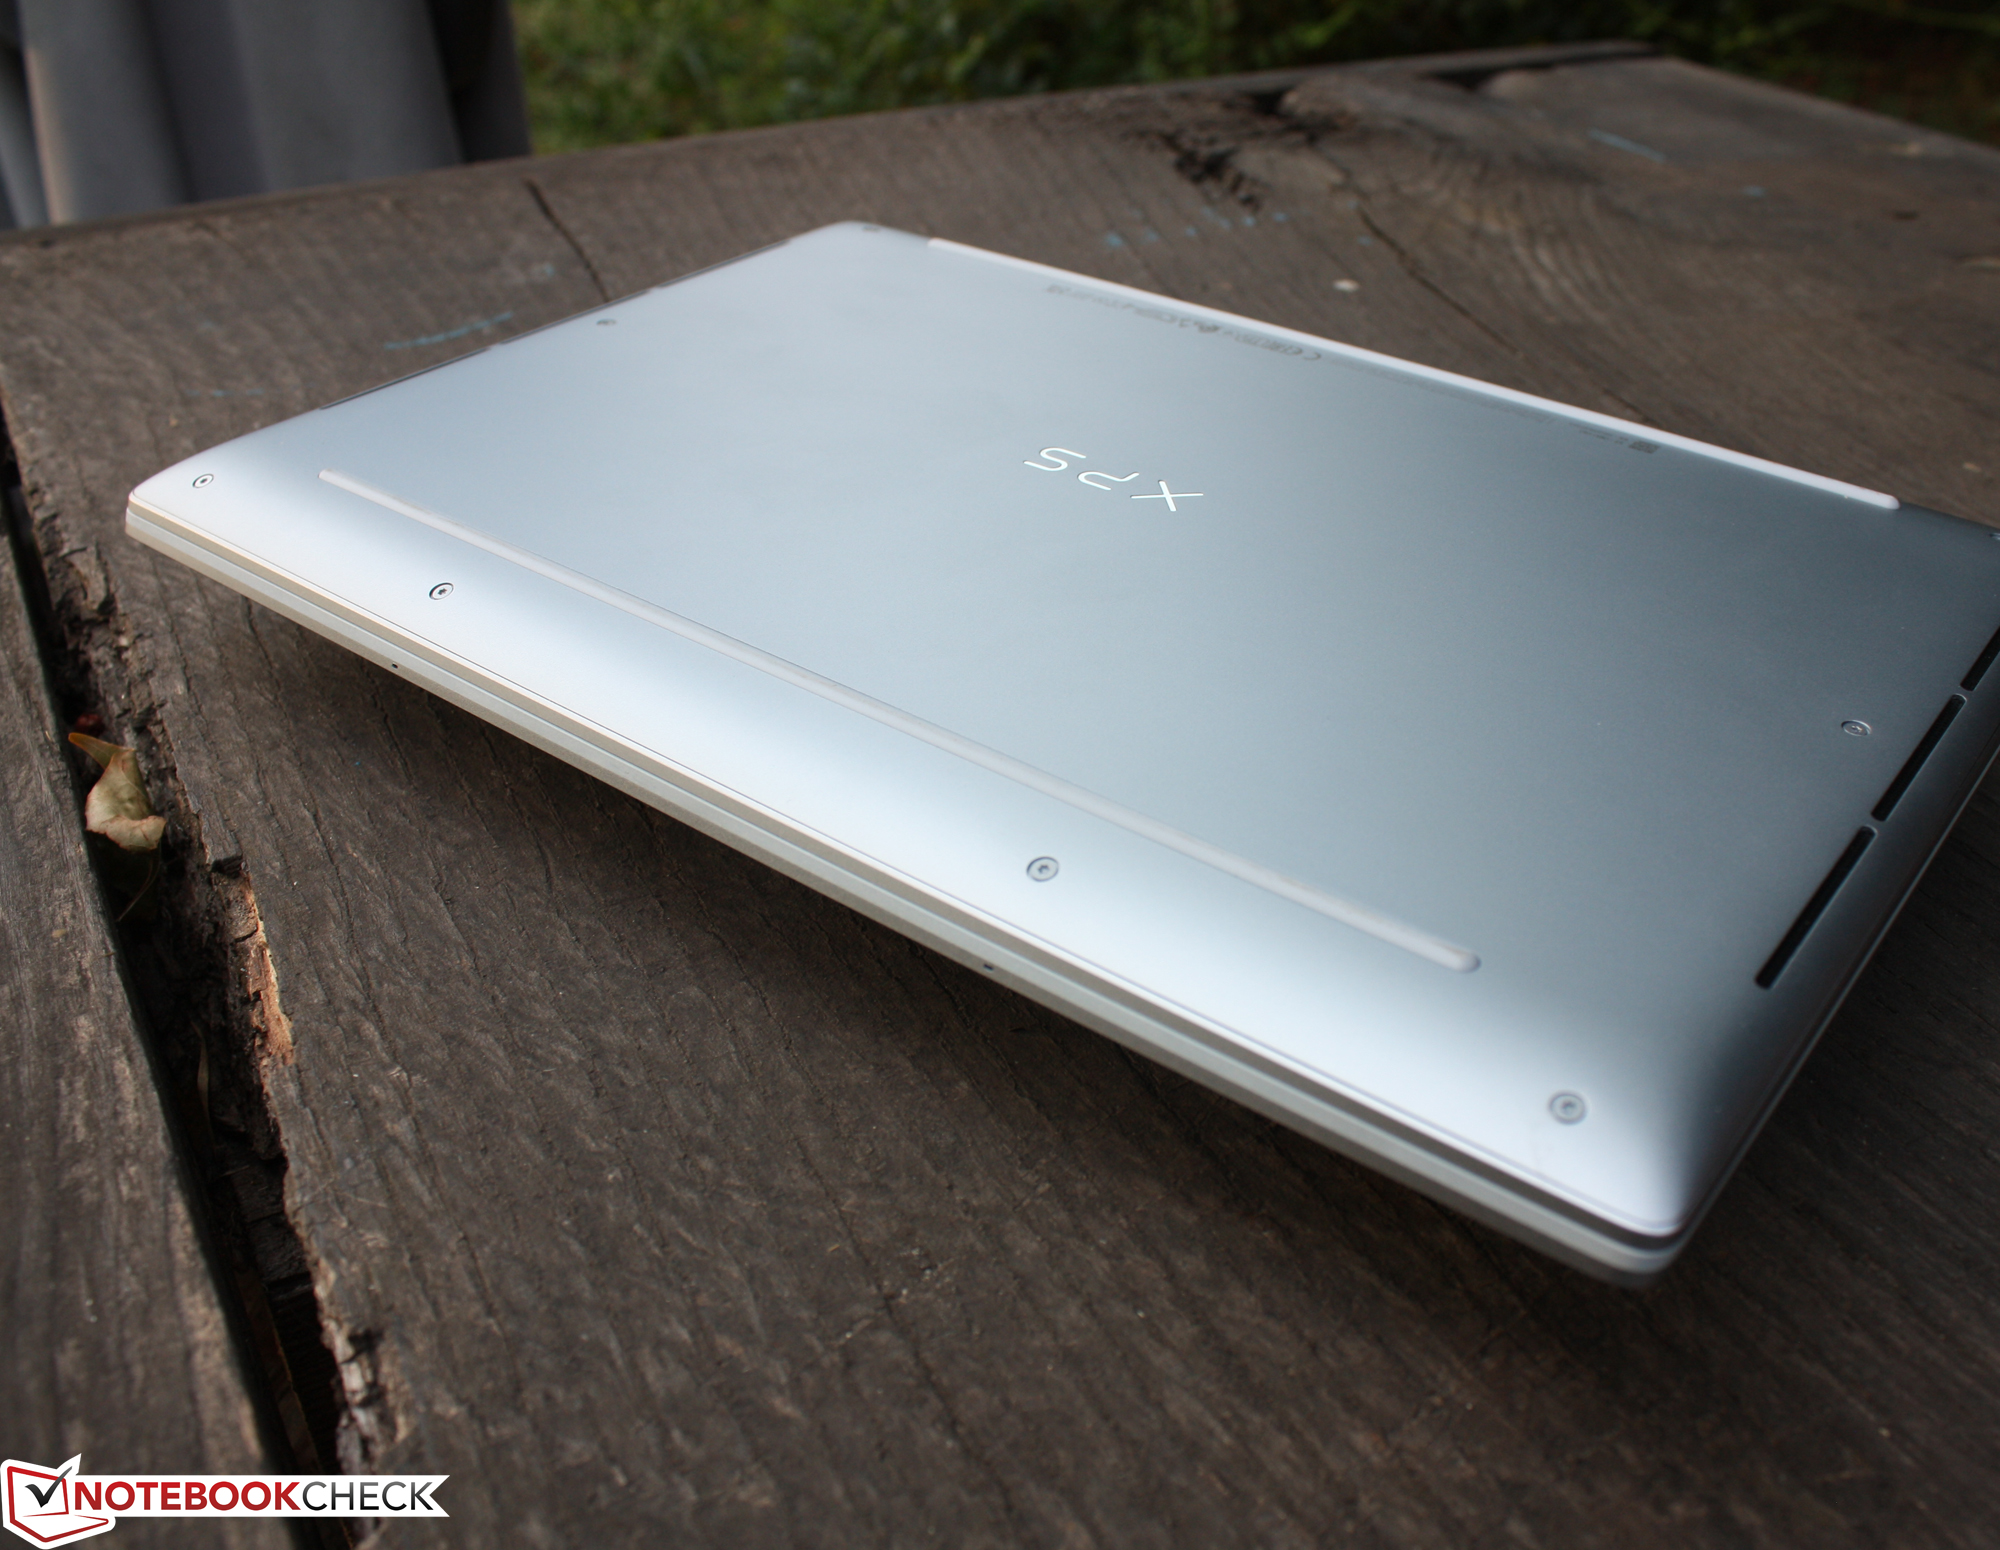
Il nuovo XPS 13 9315 e il precedente Dell XPS 13 9310 sono i dispositivi più compatti del nostro confronto e possono essere trasportati facilmente in qualsiasi borsa o zaino. Il peso è nella media con entrambi i modelli Asus Zenbook S 13 e il ThinkPad X1 Nano sono più leggeri. Tuttavia, il 9315 pesa 100 grammi in meno rispetto al 9310 del 2021. C'è solo una piccola differenza tra la versione Plus e quella non-Plus di 81 grammi o ~0,18 libbre (1161 contro 1242 grammi/~2,56 contro 2,74 libbre) a favore della versione non-Plus. Sebbene l'adattatore CA da 45 watt sia compatto come un portafoglio, i cavi lunghi comportano un peso di 245 grammi (~0,54 libbre). Il caricatore da 65 watt del modello Plus ha le stesse dimensioni ridotte.
Connettività - Laptop Dell con solo due porte
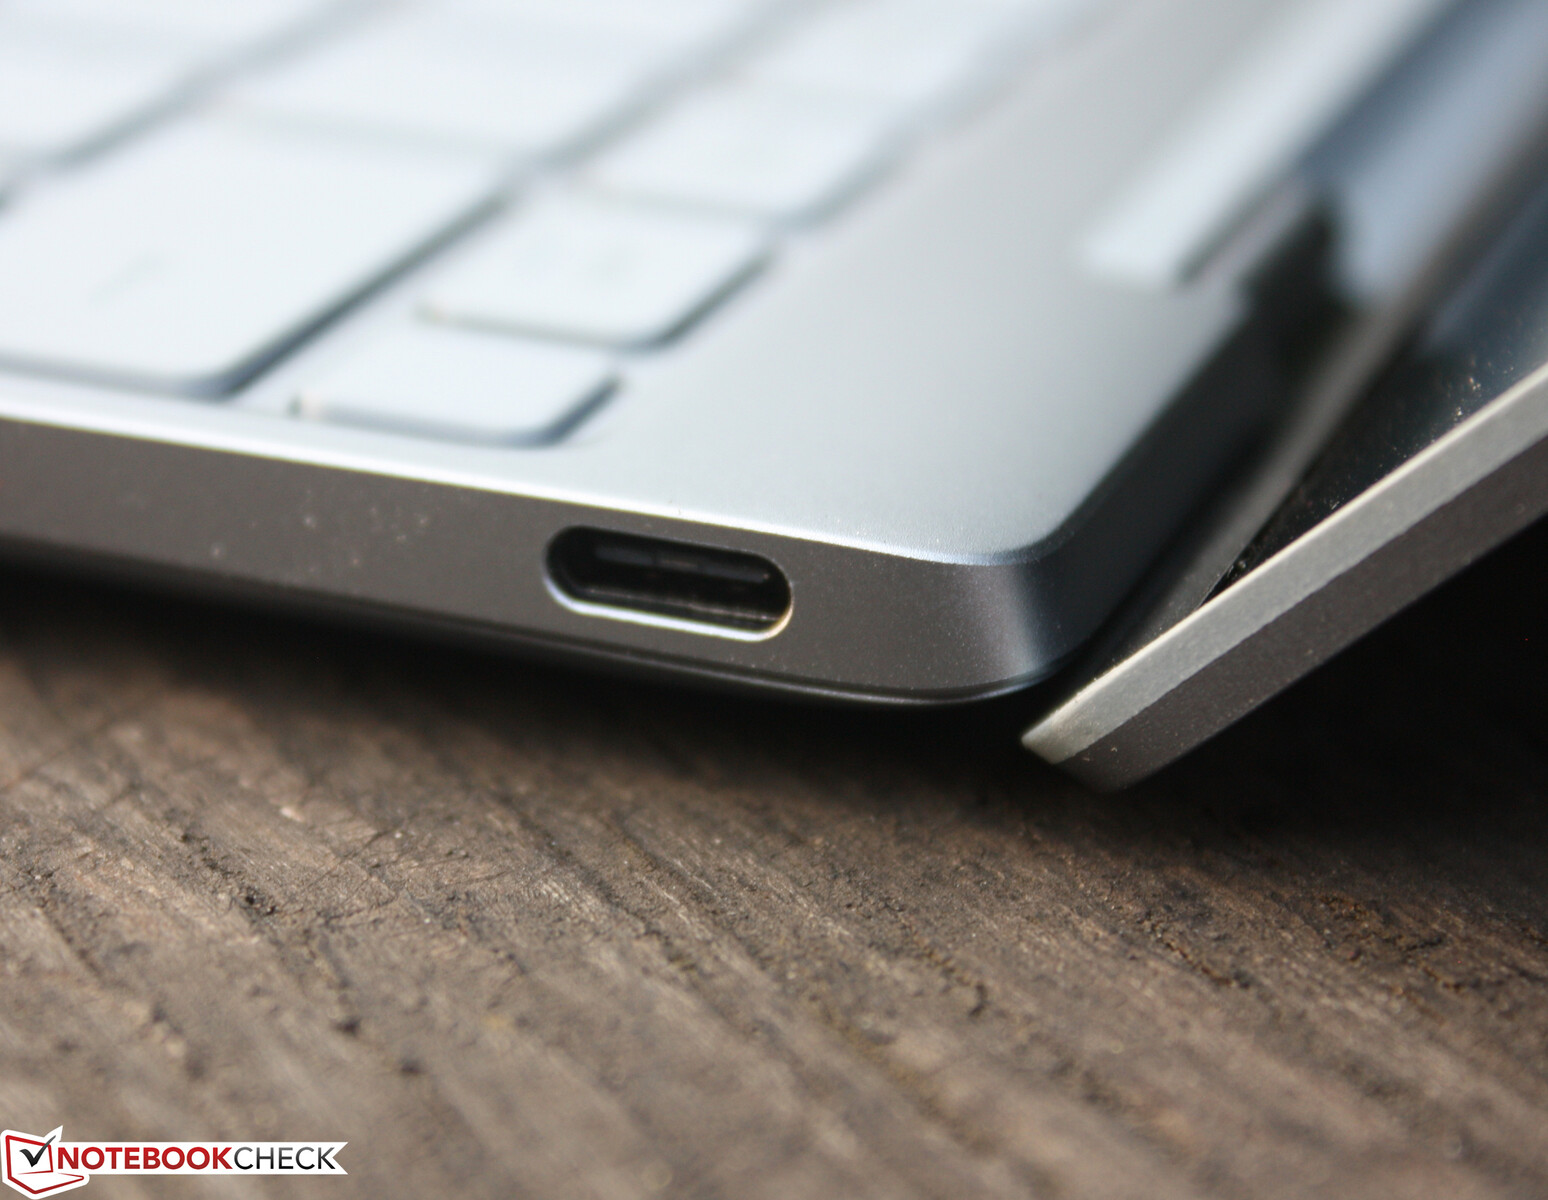
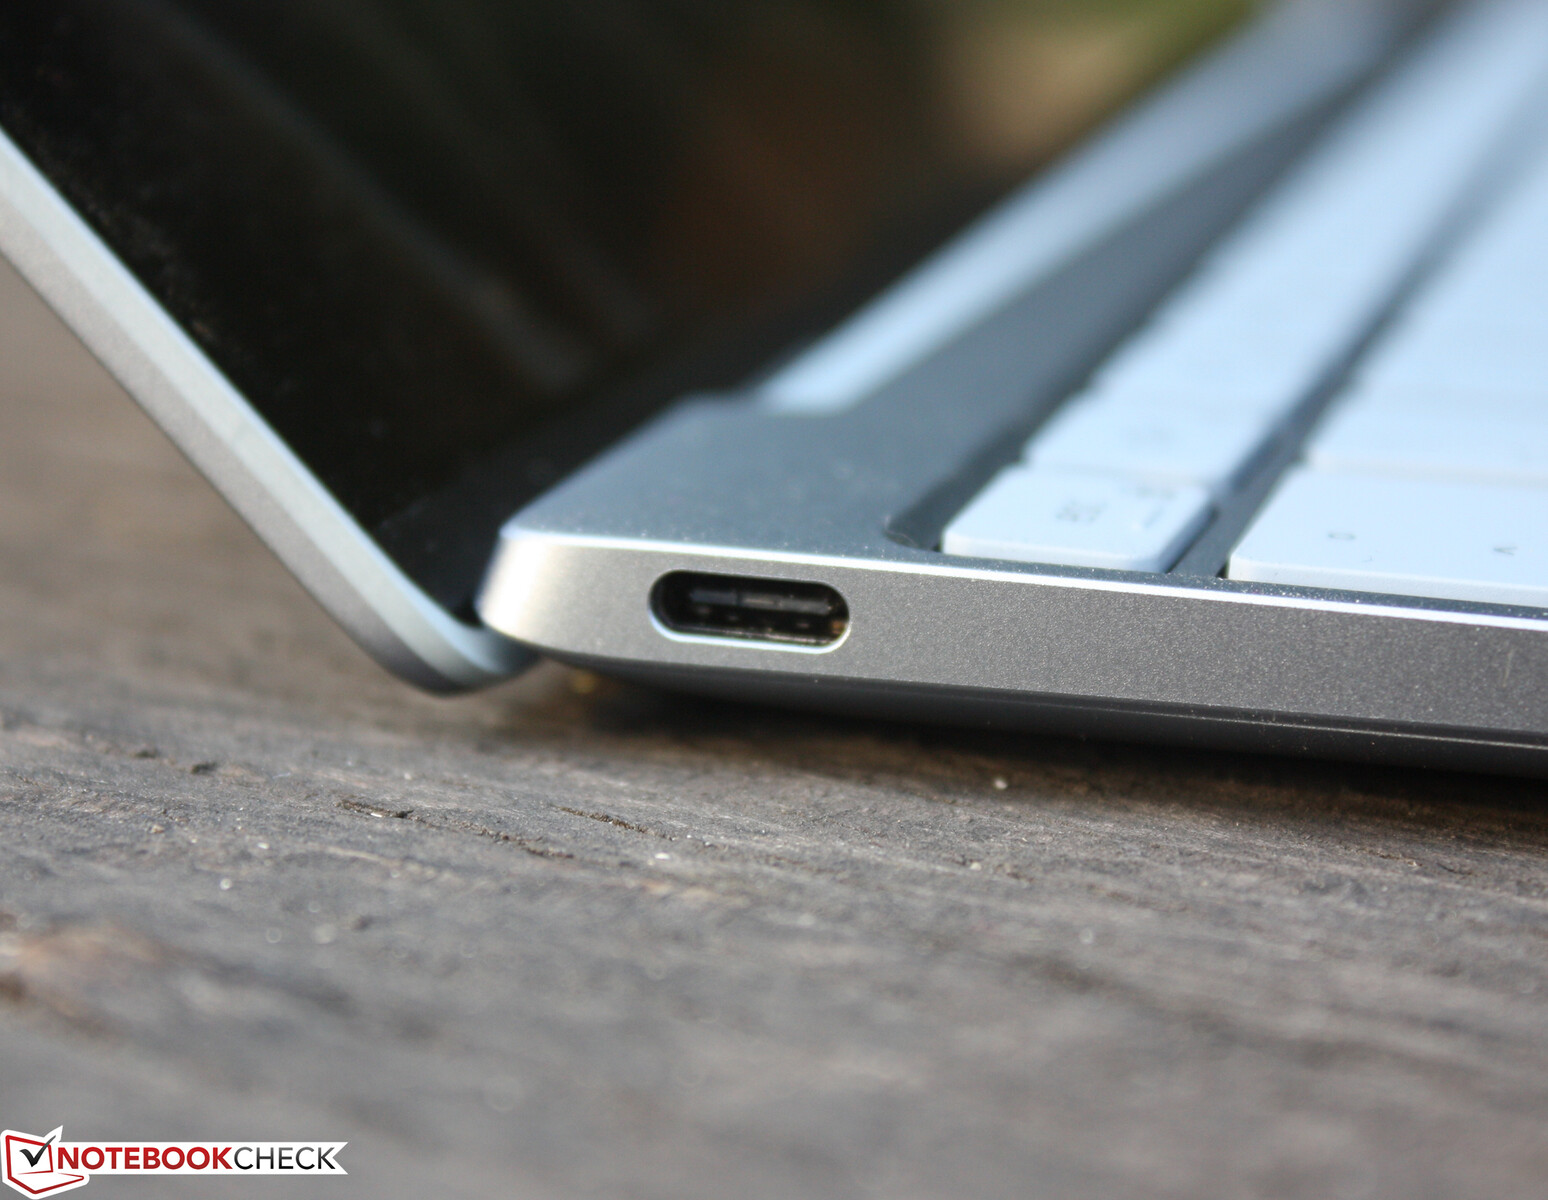
Per non lasciare gli utenti a grattarsi la testa quando cercano di collegare cuffie da 3,5 mm o un mouse USB di tipo A, Dell include due adattatori: Un piccolo convertitore da tipo-C a tipo-A e un dongle da tipo-C a 3,5 mm per cuffie e auricolari. Le porte Thunderbolt Type-C fungono anche da porte di ricarica tramite Power Delivery. Come di consueto, sono anche in grado di emettere un segnale DisplayPort con audio. Il lettore di schede dell'XPS 2021 non è più incluso. Per l'alimentazione dell'XPS viene utilizzato un adattatore CA da 45 watt, di dimensioni contenute.
Comunicazione
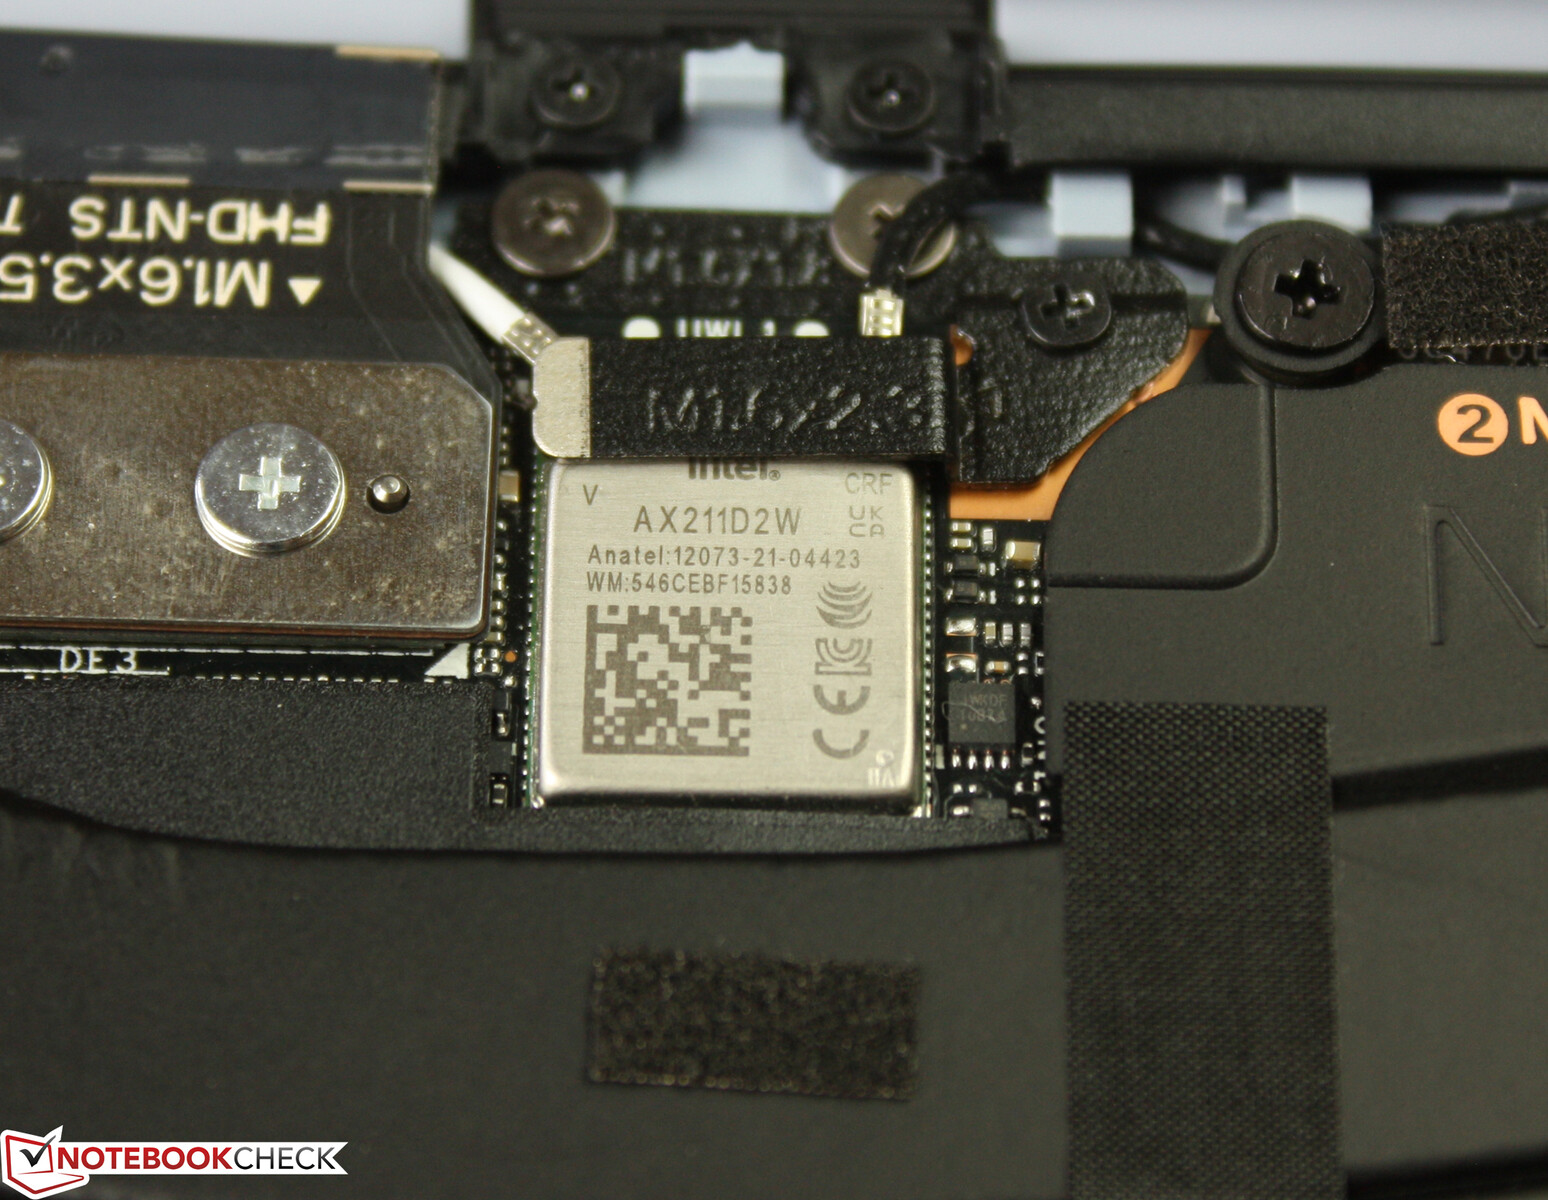
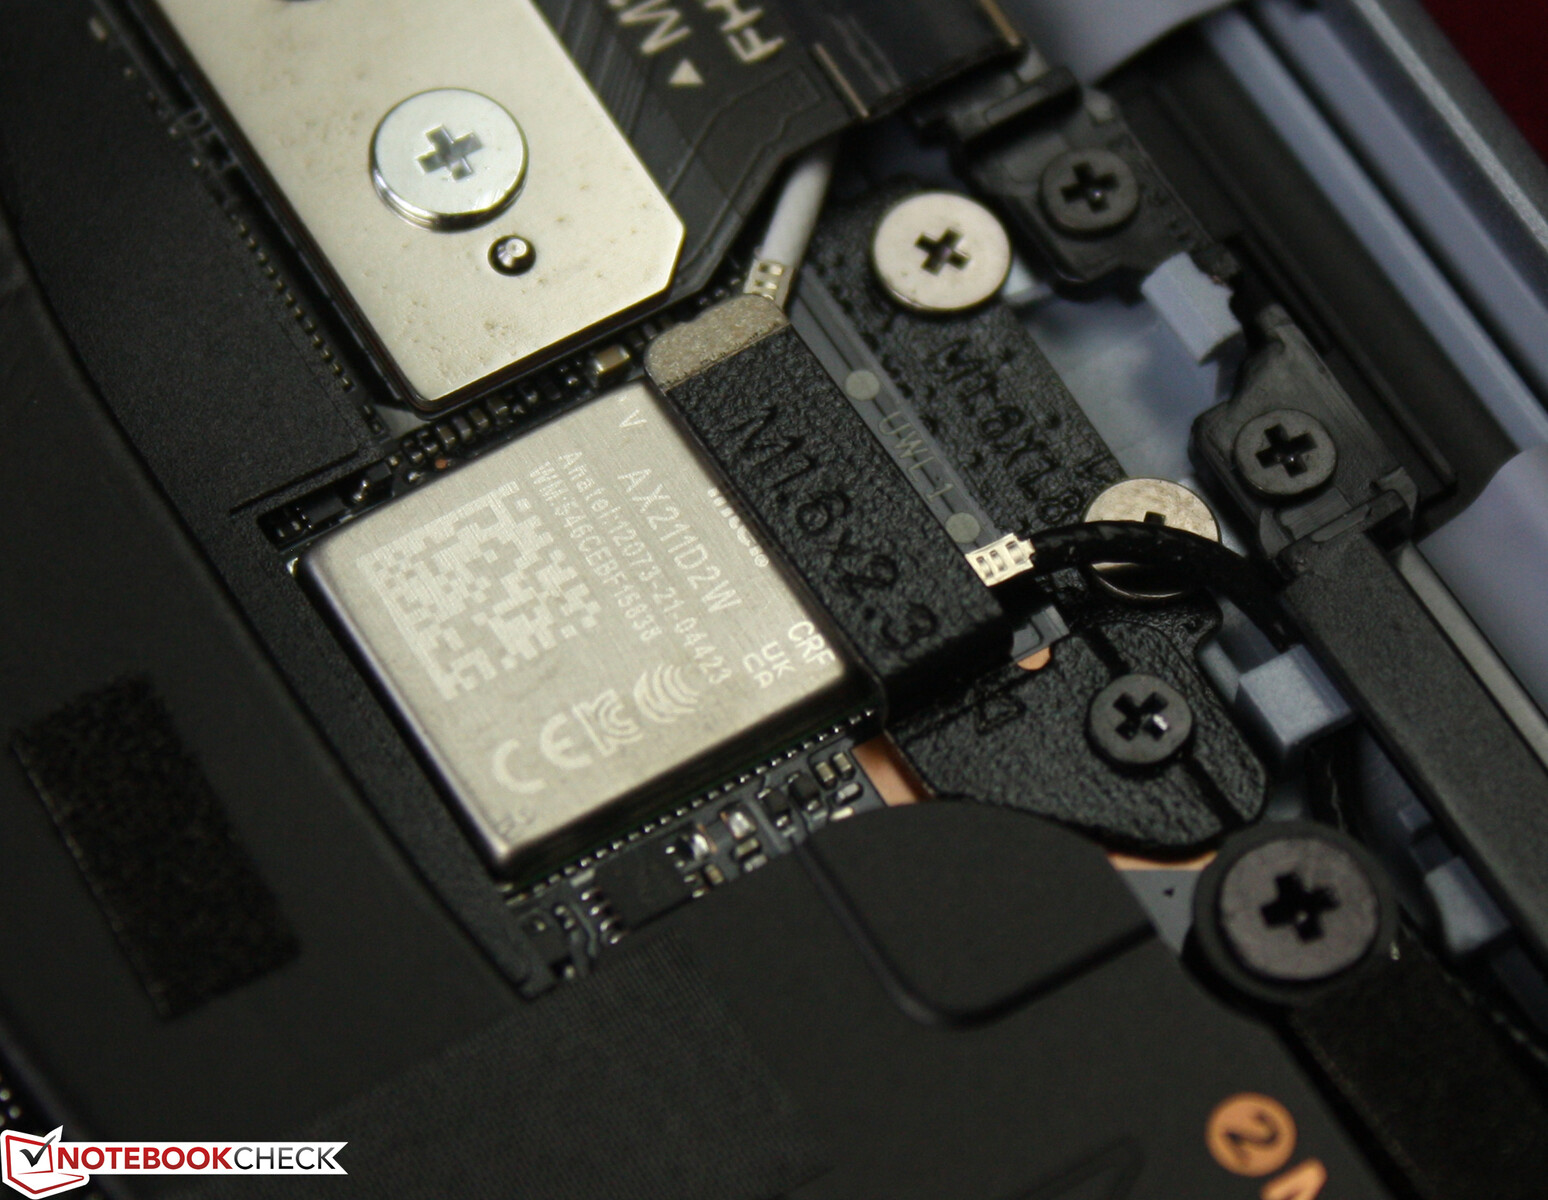
Dell ha dotato l'ultimo XPS 13 di un moderno modulo Intel AX211E per la connettività Wi-Fi 6E. Le prestazioni Wi-Fi all'interno della nostra rete Wi-Fi 6E sono eccellenti e costanti. In un test con il nostro router di riferimento Asus, non abbiamo riscontrato alcun problema di connettività Wi-Fi e la velocità di trasferimento dei dati è stata stabile. È supportato anche il Bluetooth 5.2.
Webcam
La webcam non è dotata di un otturatore meccanico o elettrico tramite il tasto Fn. Il microfono ha un proprio tasto di scelta rapida. Almeno, un LED bianco accanto alla webcam mostra chiaramente quando sta registrando. La risoluzione di 1280 x 720 pixel non è niente di eccezionale: bassa risoluzione e notevole rumore d'immagine anche di giorno.


Sicurezza
L'XPS 13 dispone di due metodi di autenticazione: un sensore di impronte digitali all'interno del pulsante di accensione e una fotocamera a doppio sensore con funzionalità a infrarossi. Questo permette agli utenti di selezionare il riconoscimento facciale dalle impostazioni di Windows. Se lo si desidera, il portatile può disconnettersi automaticamente quando l'utente corrente è fuori casa. Al ritorno dalla pausa pranzo, Windows Hello effettua automaticamente il log-in.
Accessori
La confezione comprende un adattatore da USB-C a USB-A, un dongle audio per dispositivi da 3,5 mm e un adattatore CA da 45 watt con un cavo fisso di tipo-C. Il cavo di tipo C dell'adattatore CA da 65 watt del modello Plus è modulare.
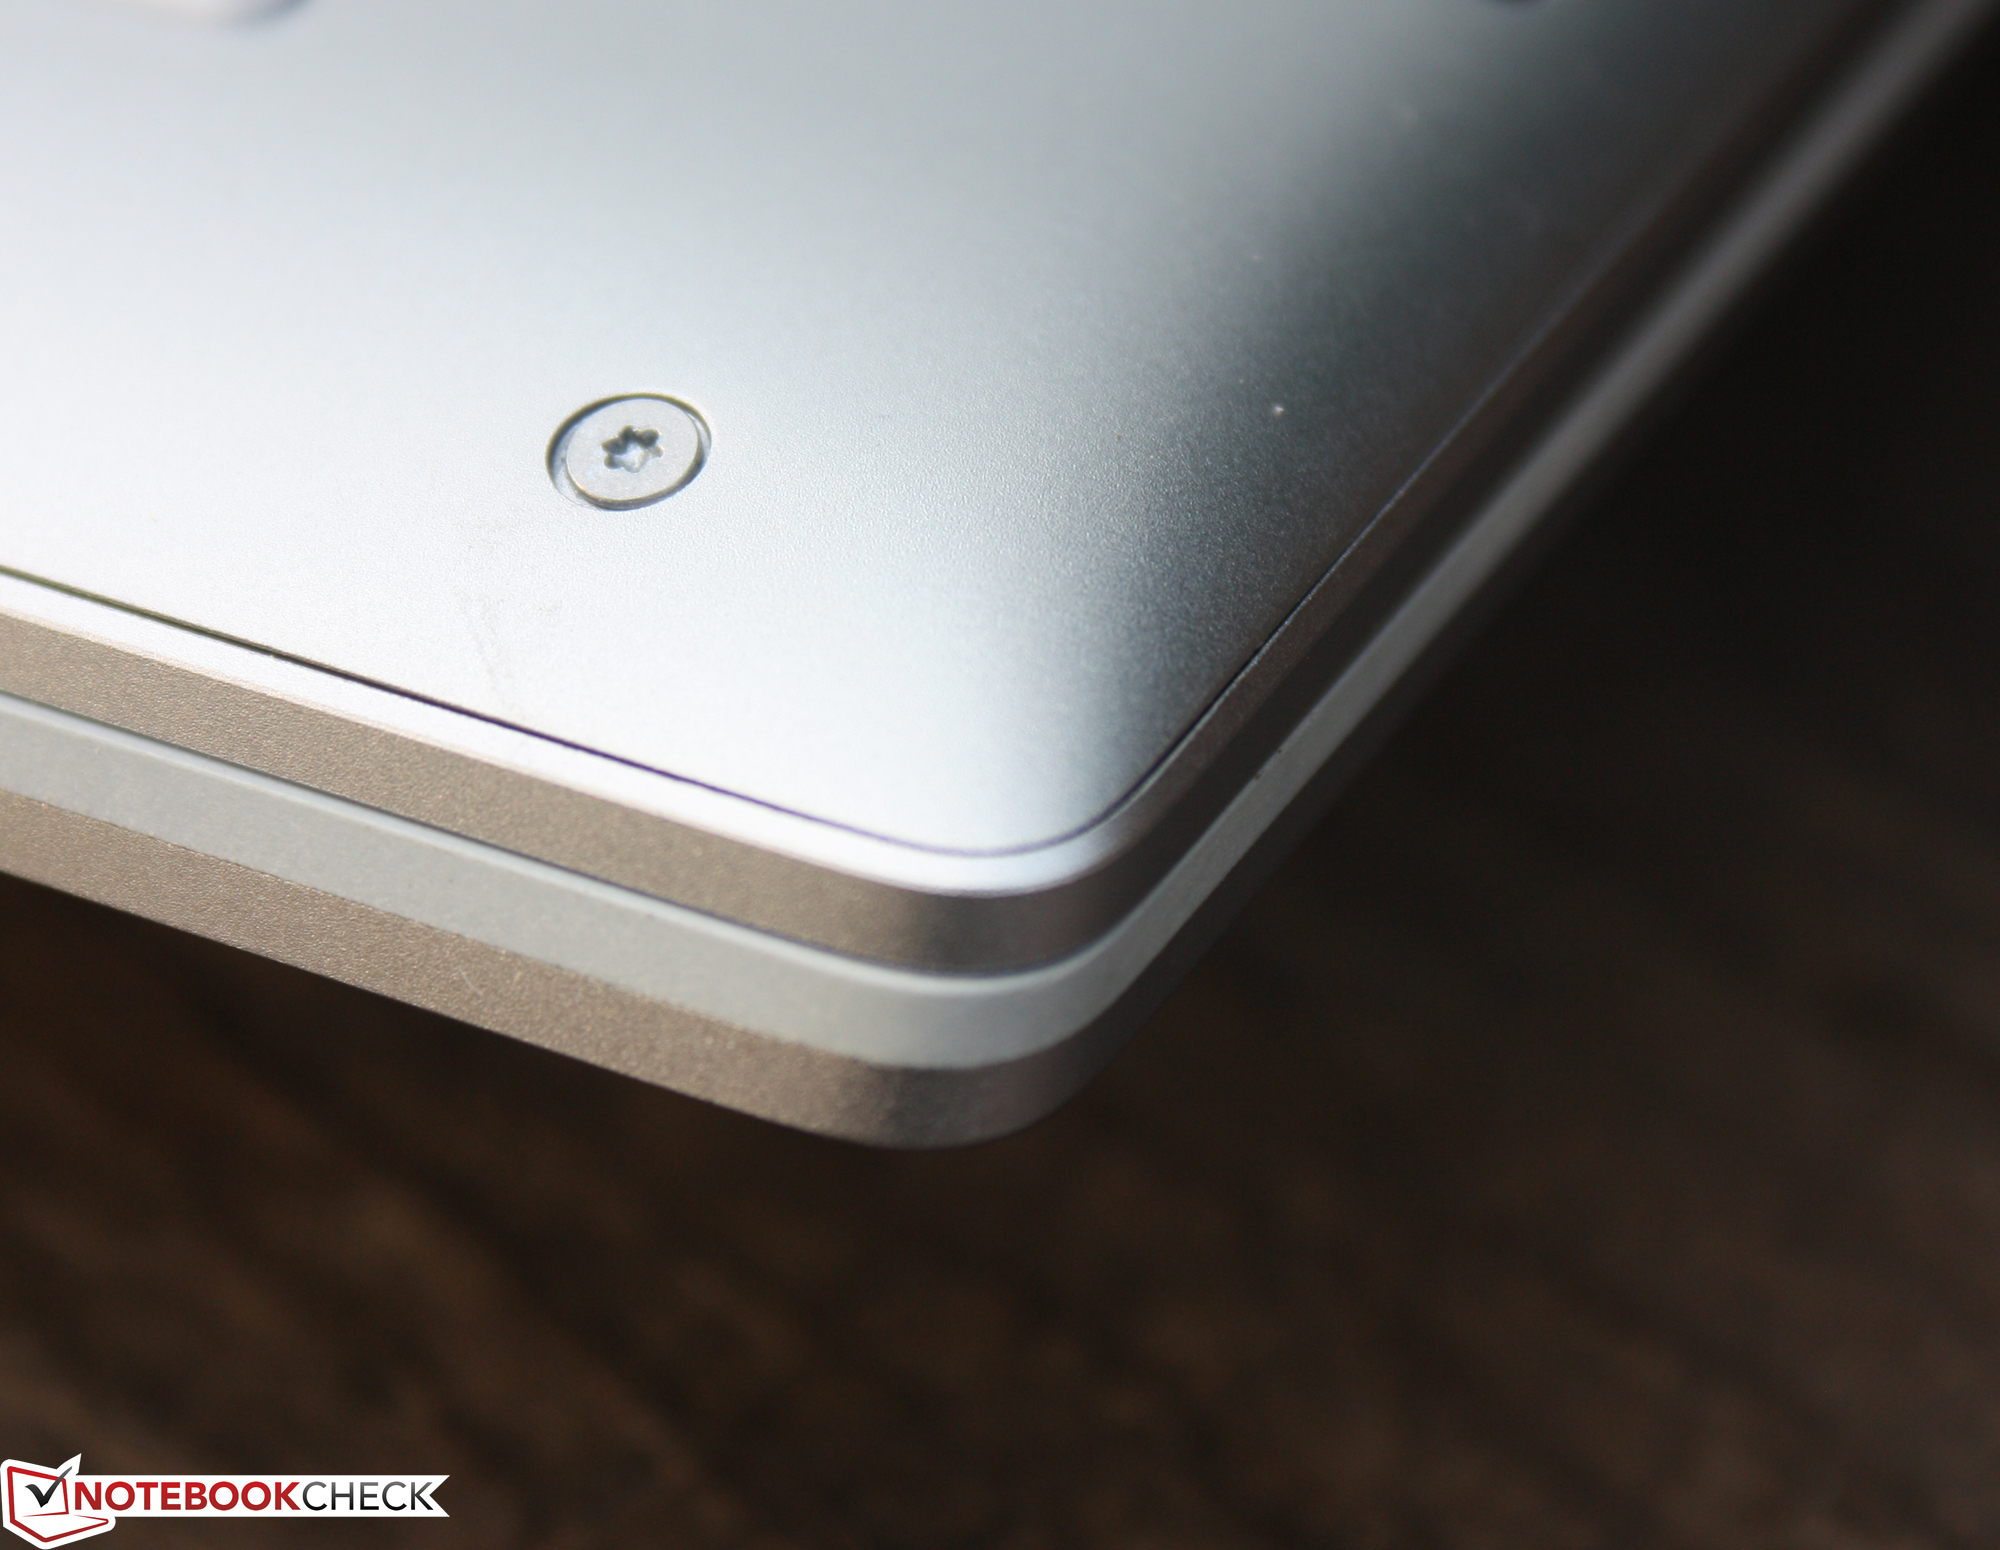
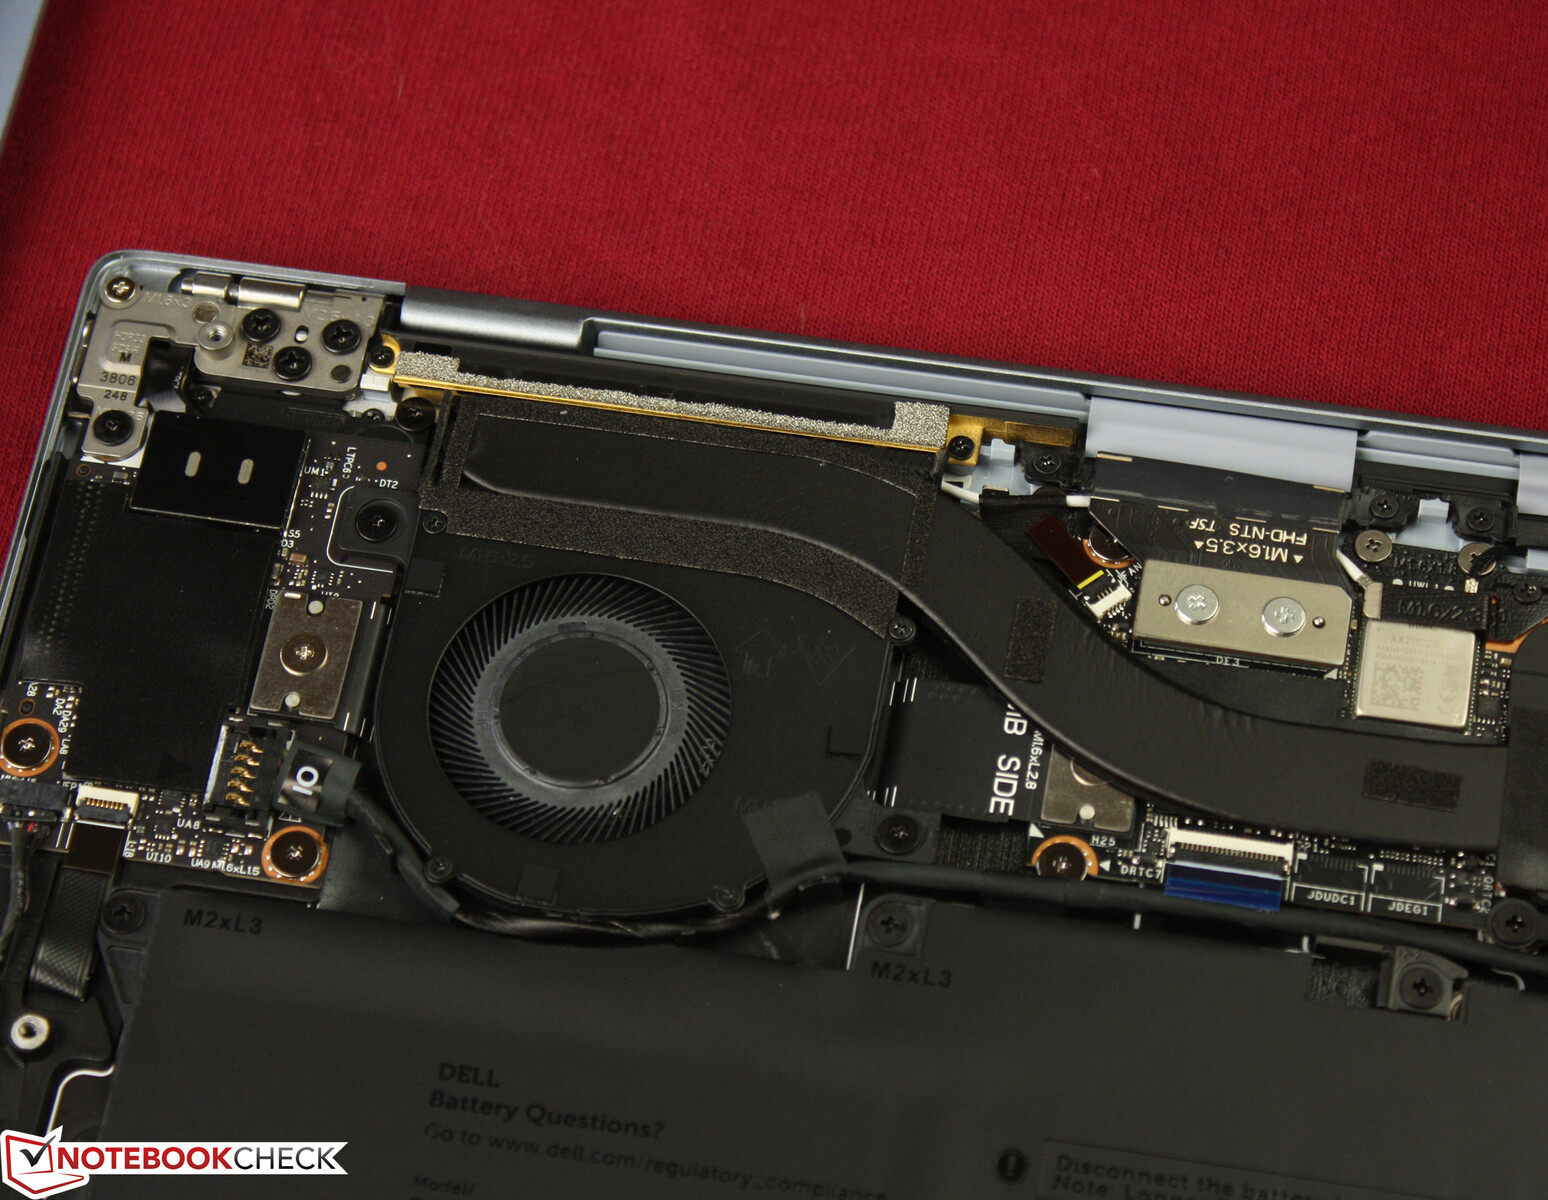
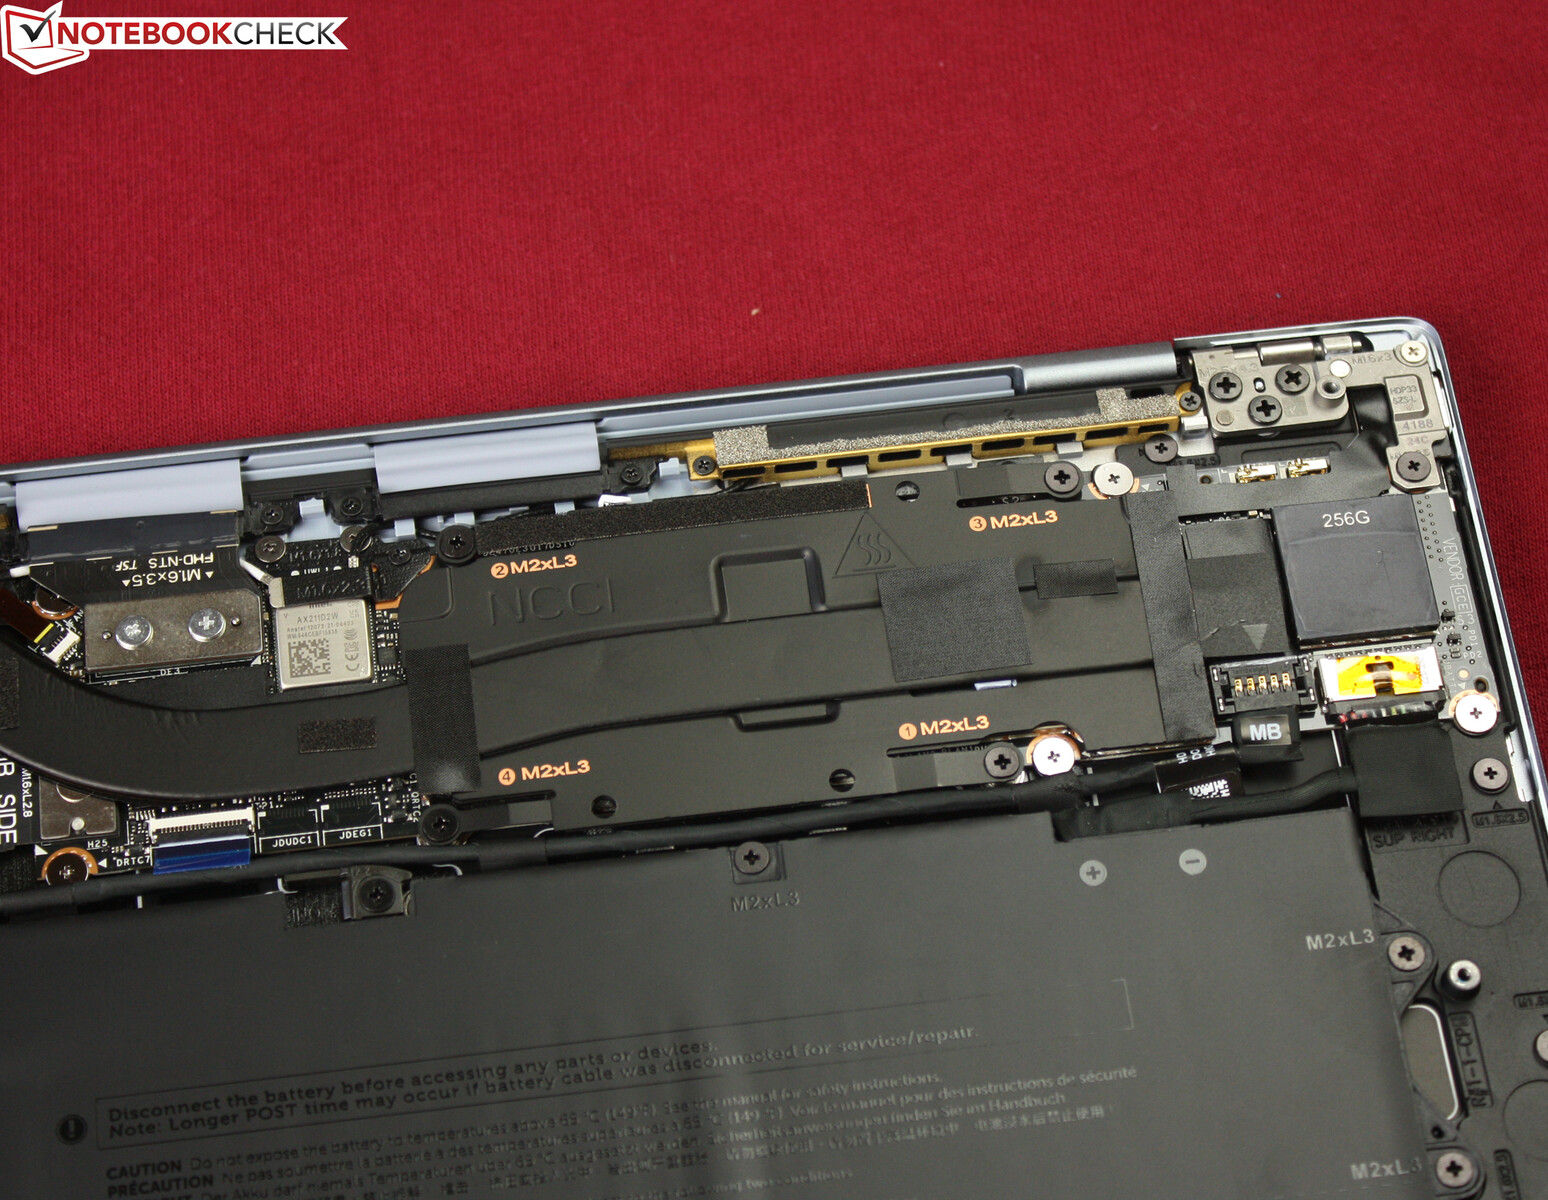
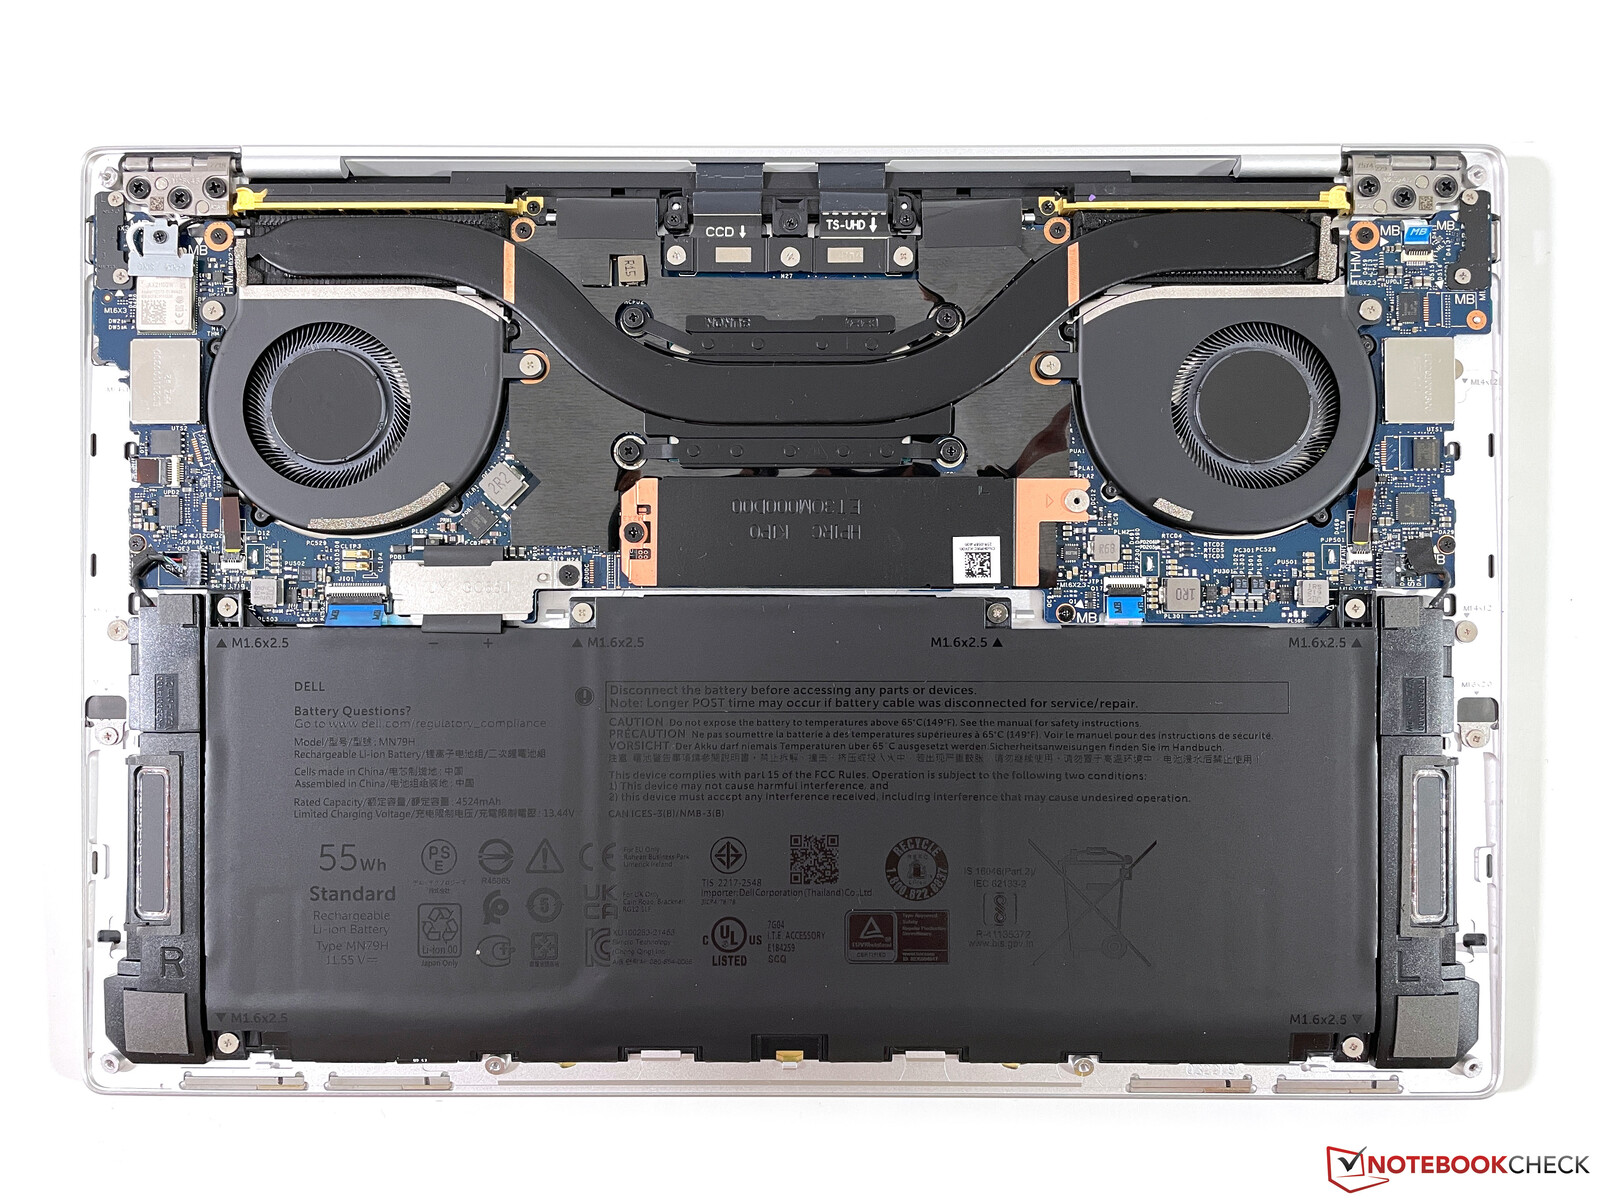
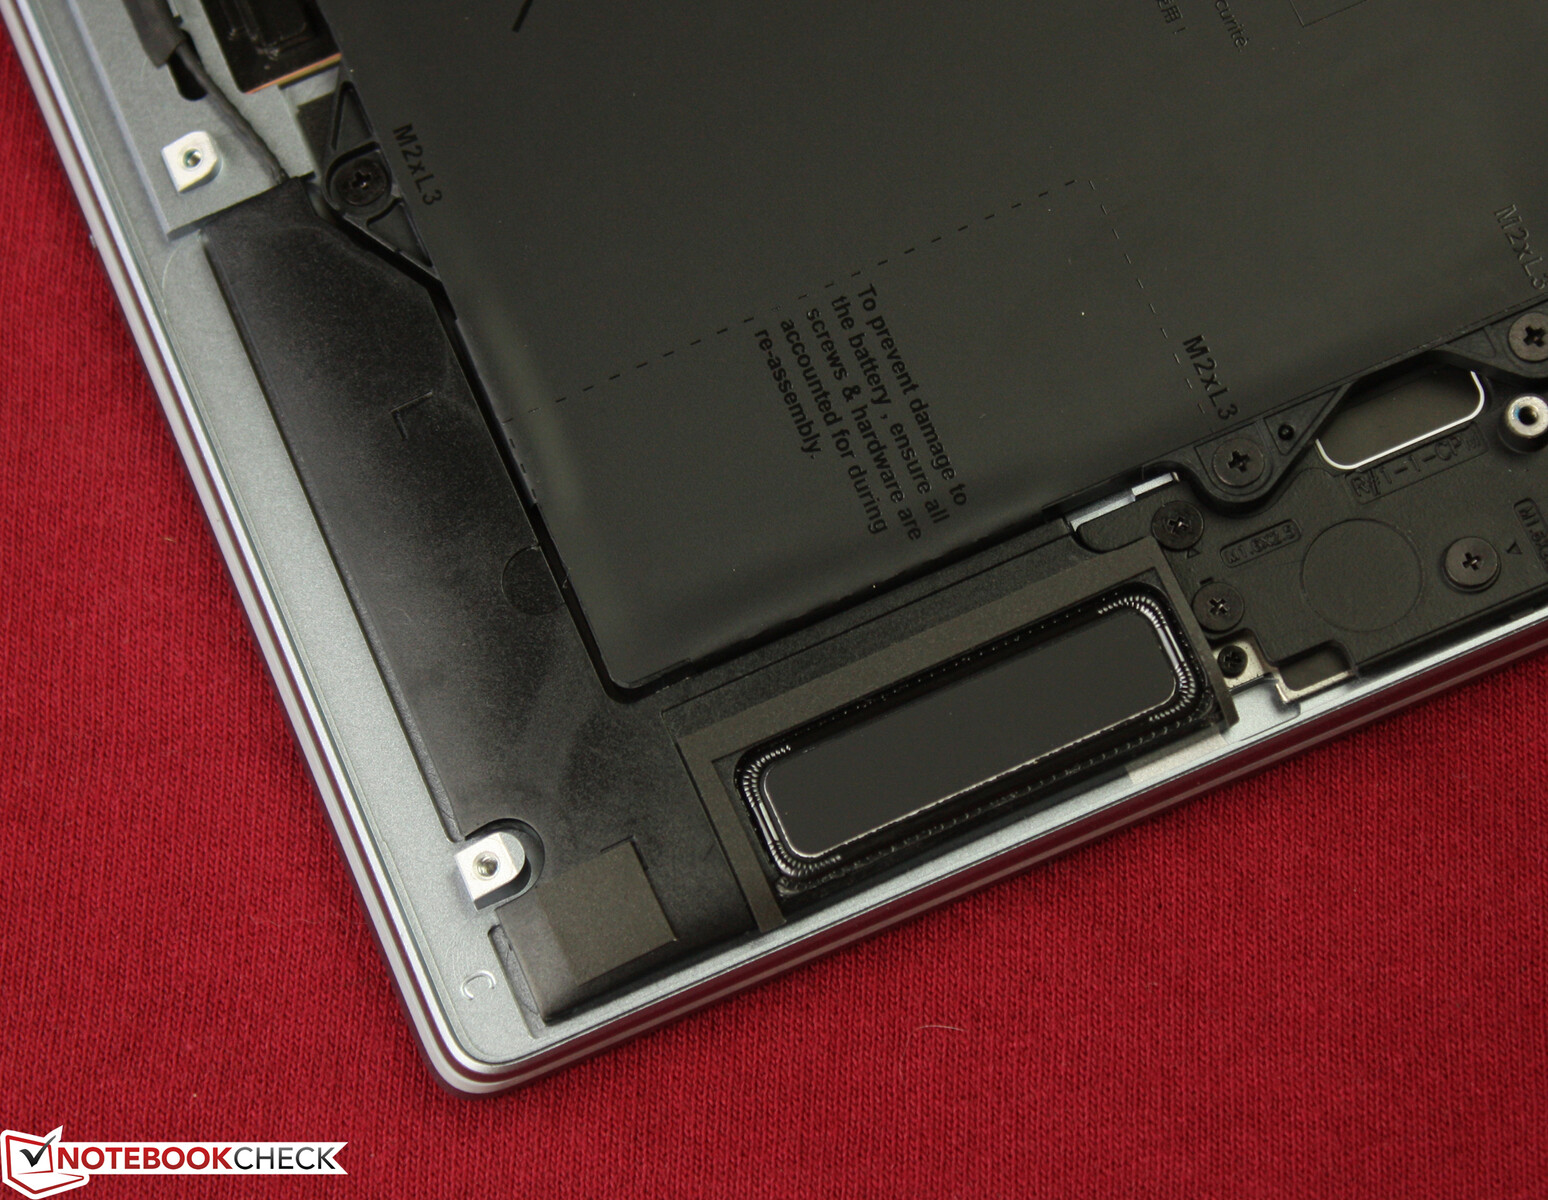
Manutenzione
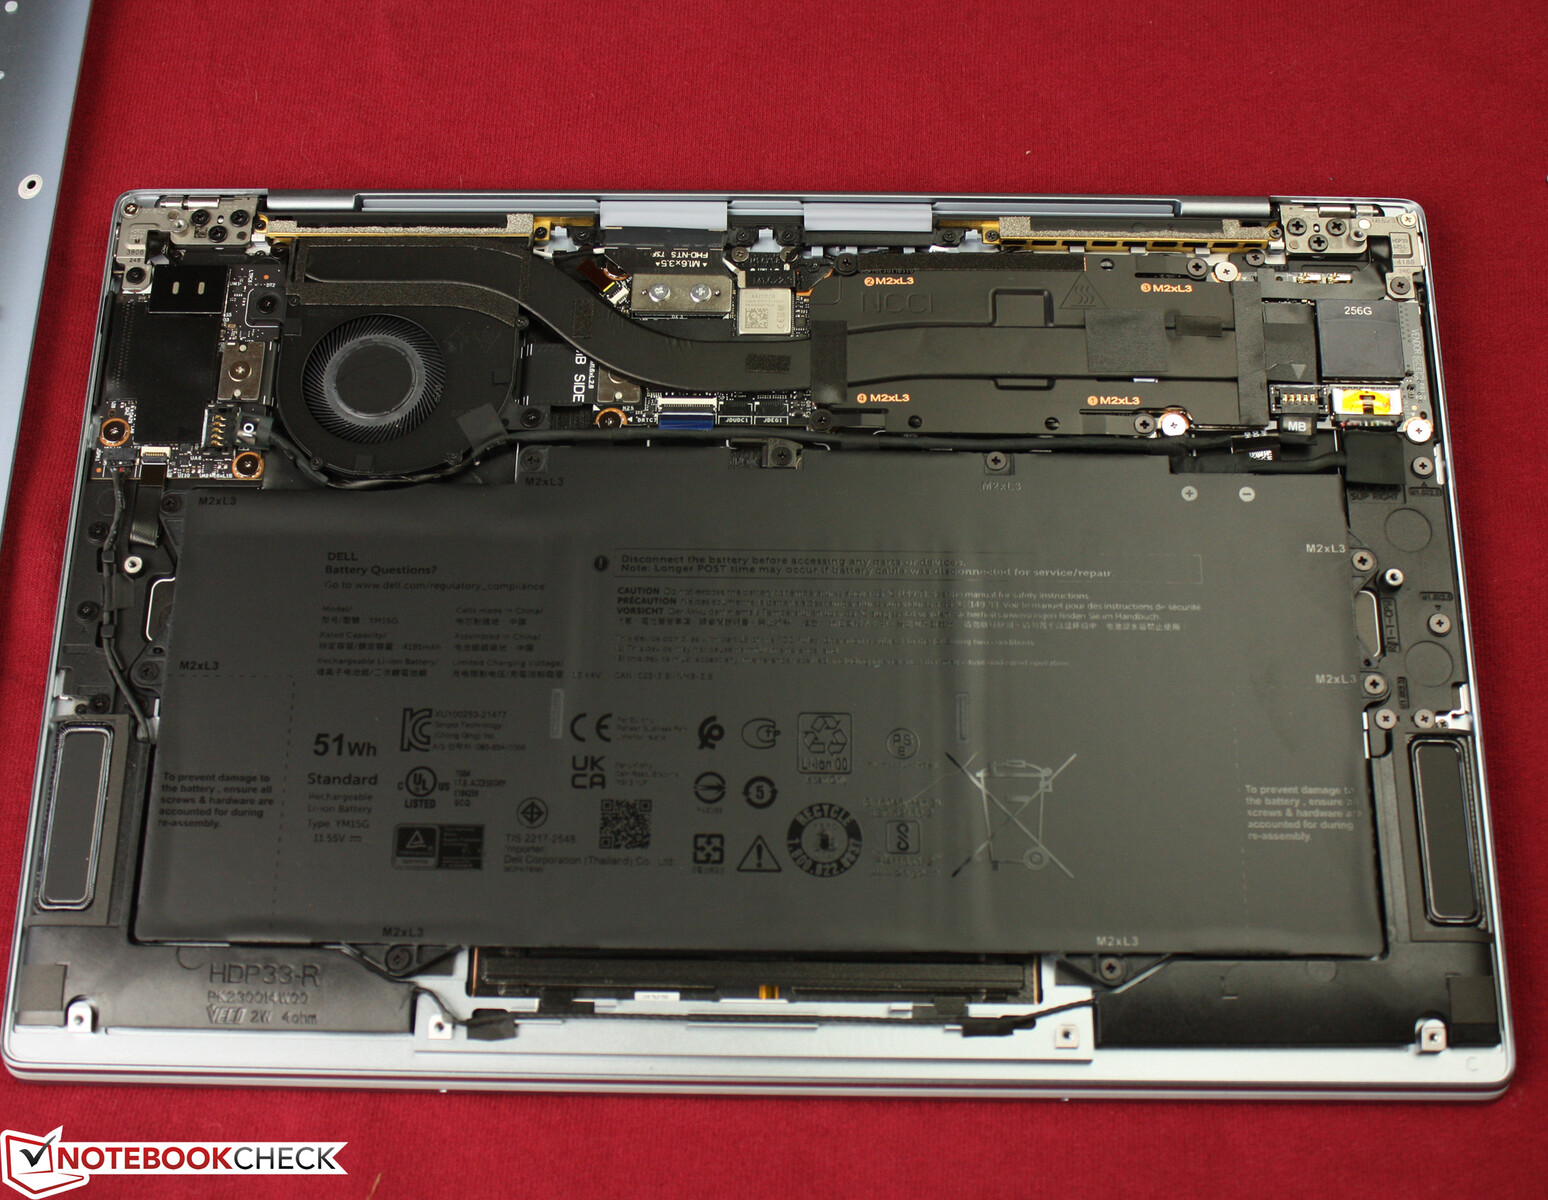
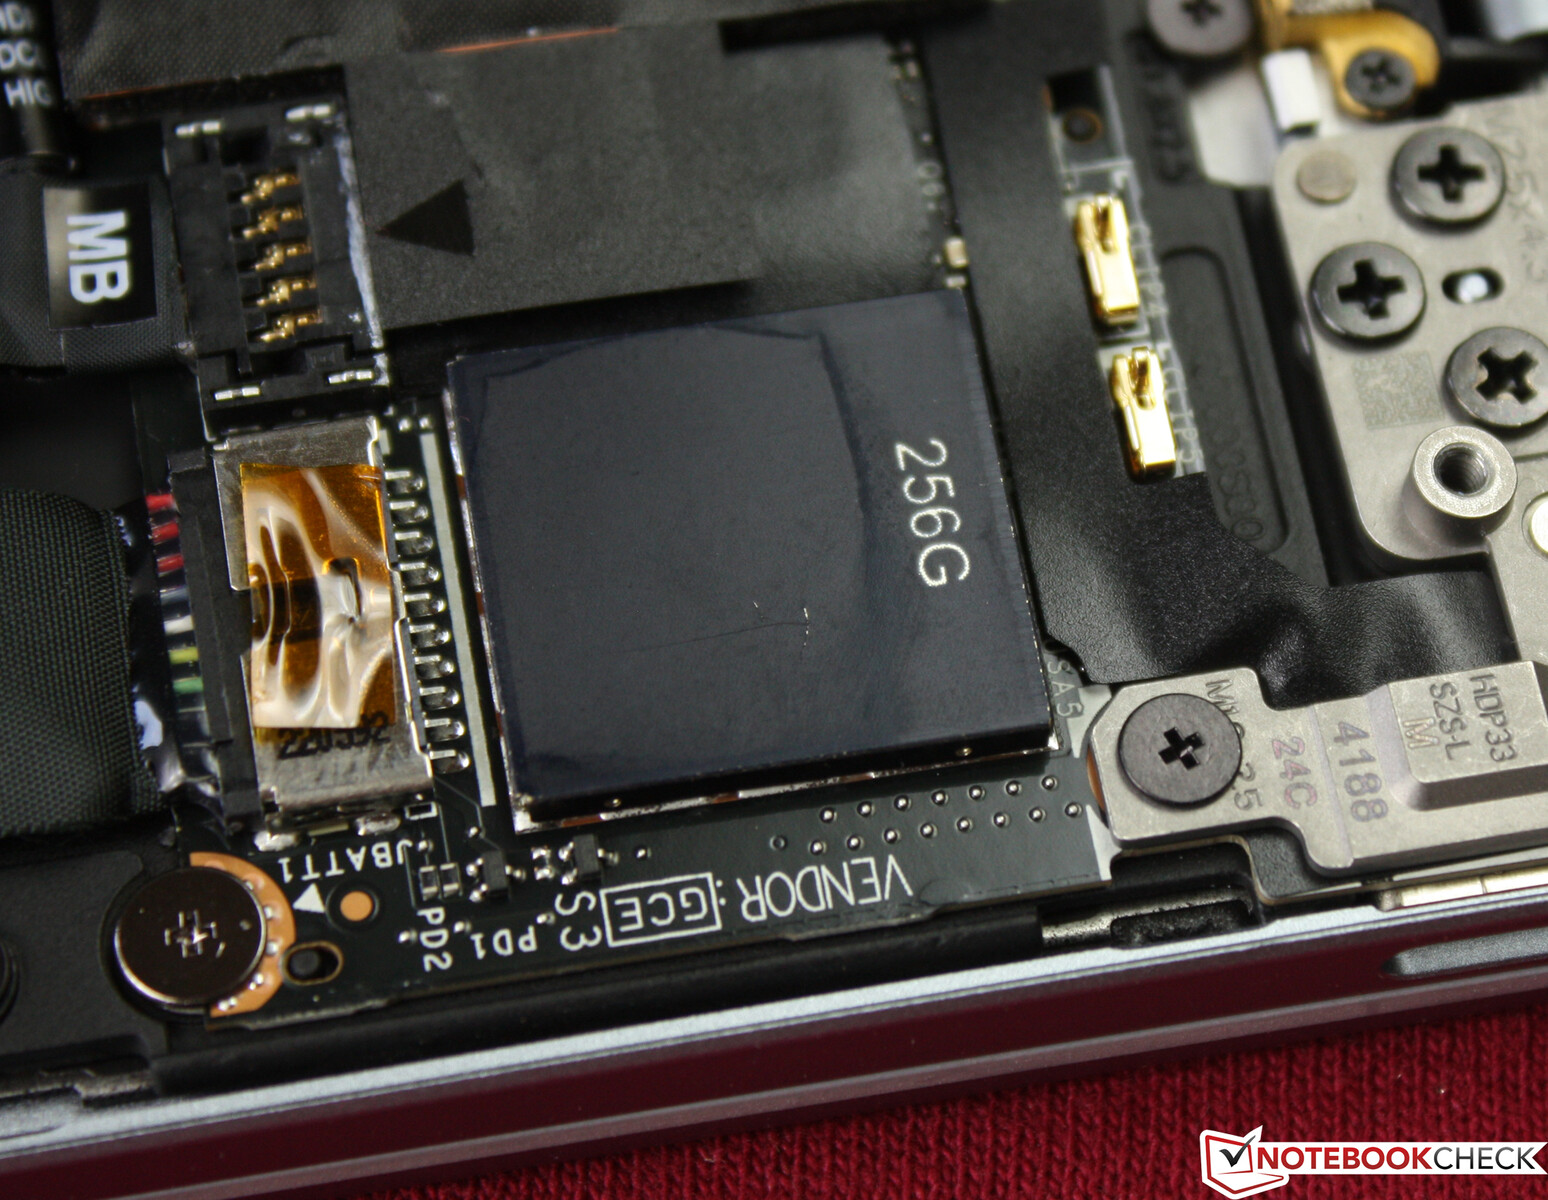
La piastra inferiore è fissata con 6 viti Torx (T5) ed è facile da rimuovere. L'interno sembra molto organizzato e le opzioni di manutenzione si limitano alla pulizia della ventola. L'unità SSD Micron è saldata e non può essere sostituita! Questo è in contrasto con l'XPS 13 Plus, dove l'SSD M.2-2280 può essere sostituito, anche se i moduli RAM e Wi-Fi sono ancora fissi.
Garanzia
Dell offre una garanzia standard di 12 mesi.
Dispositivi di input - Computer portatile Dell con digitazione antiscivolo
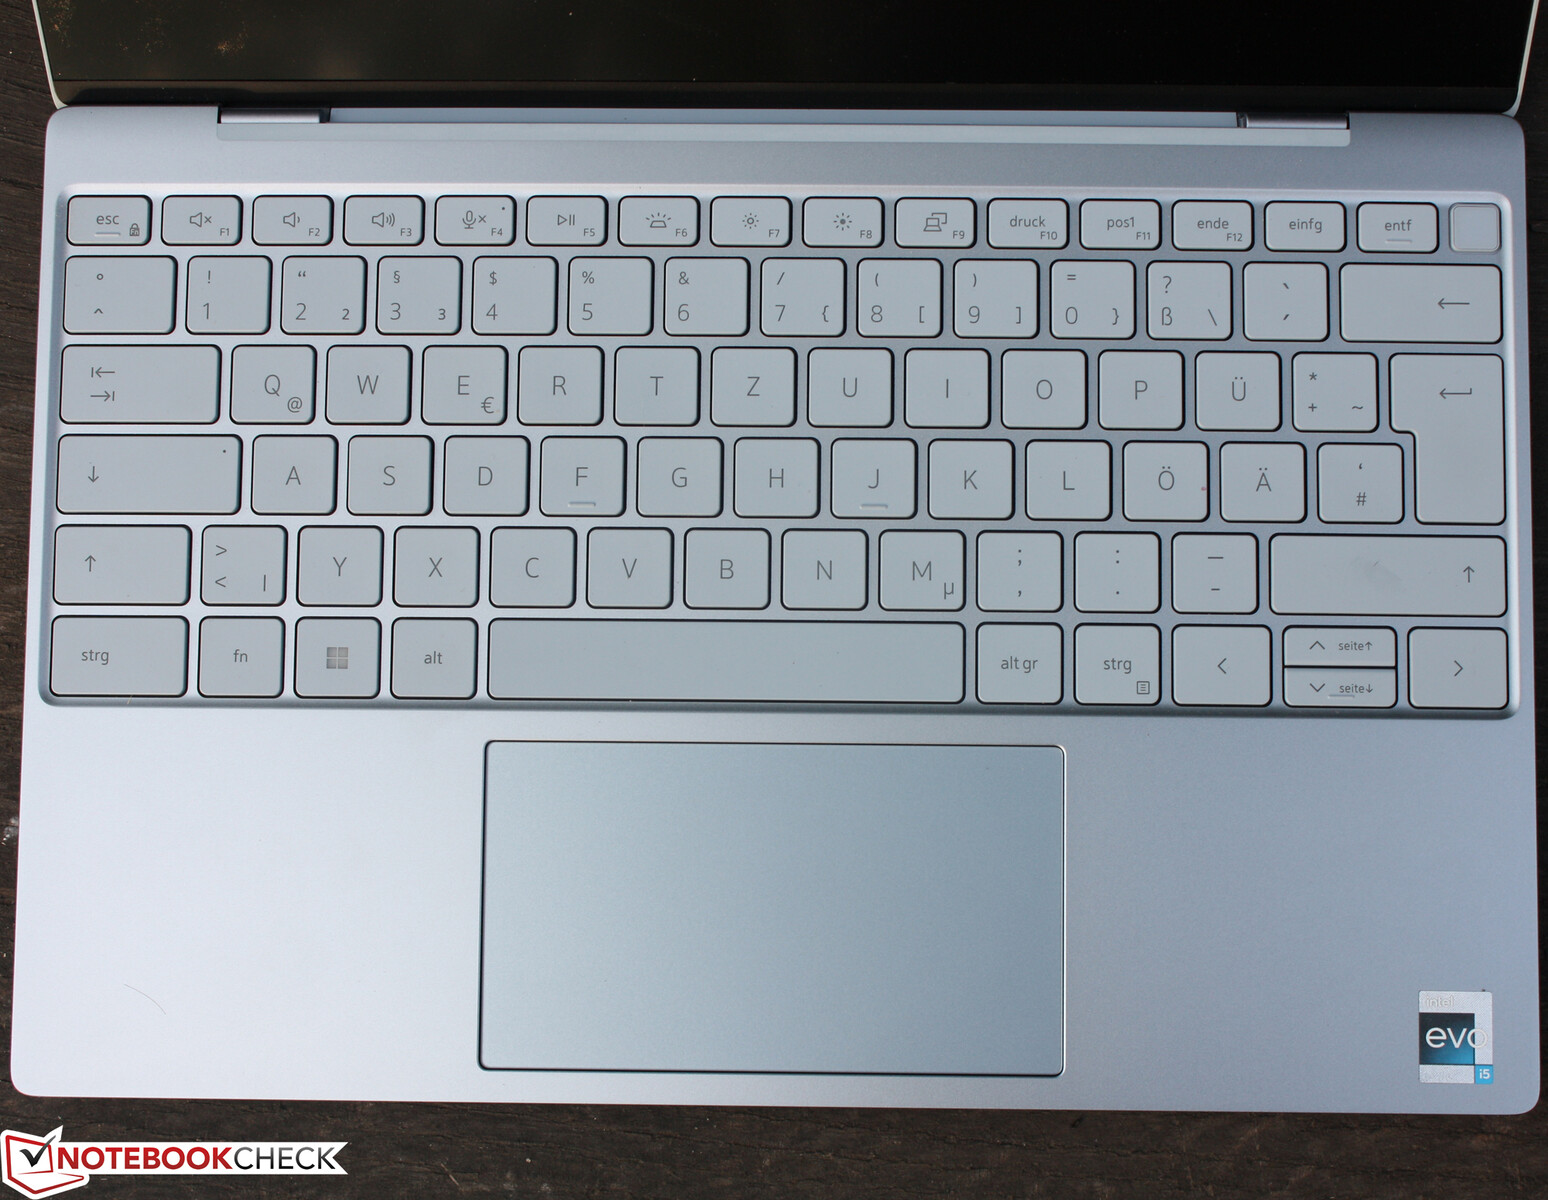
Tastiera
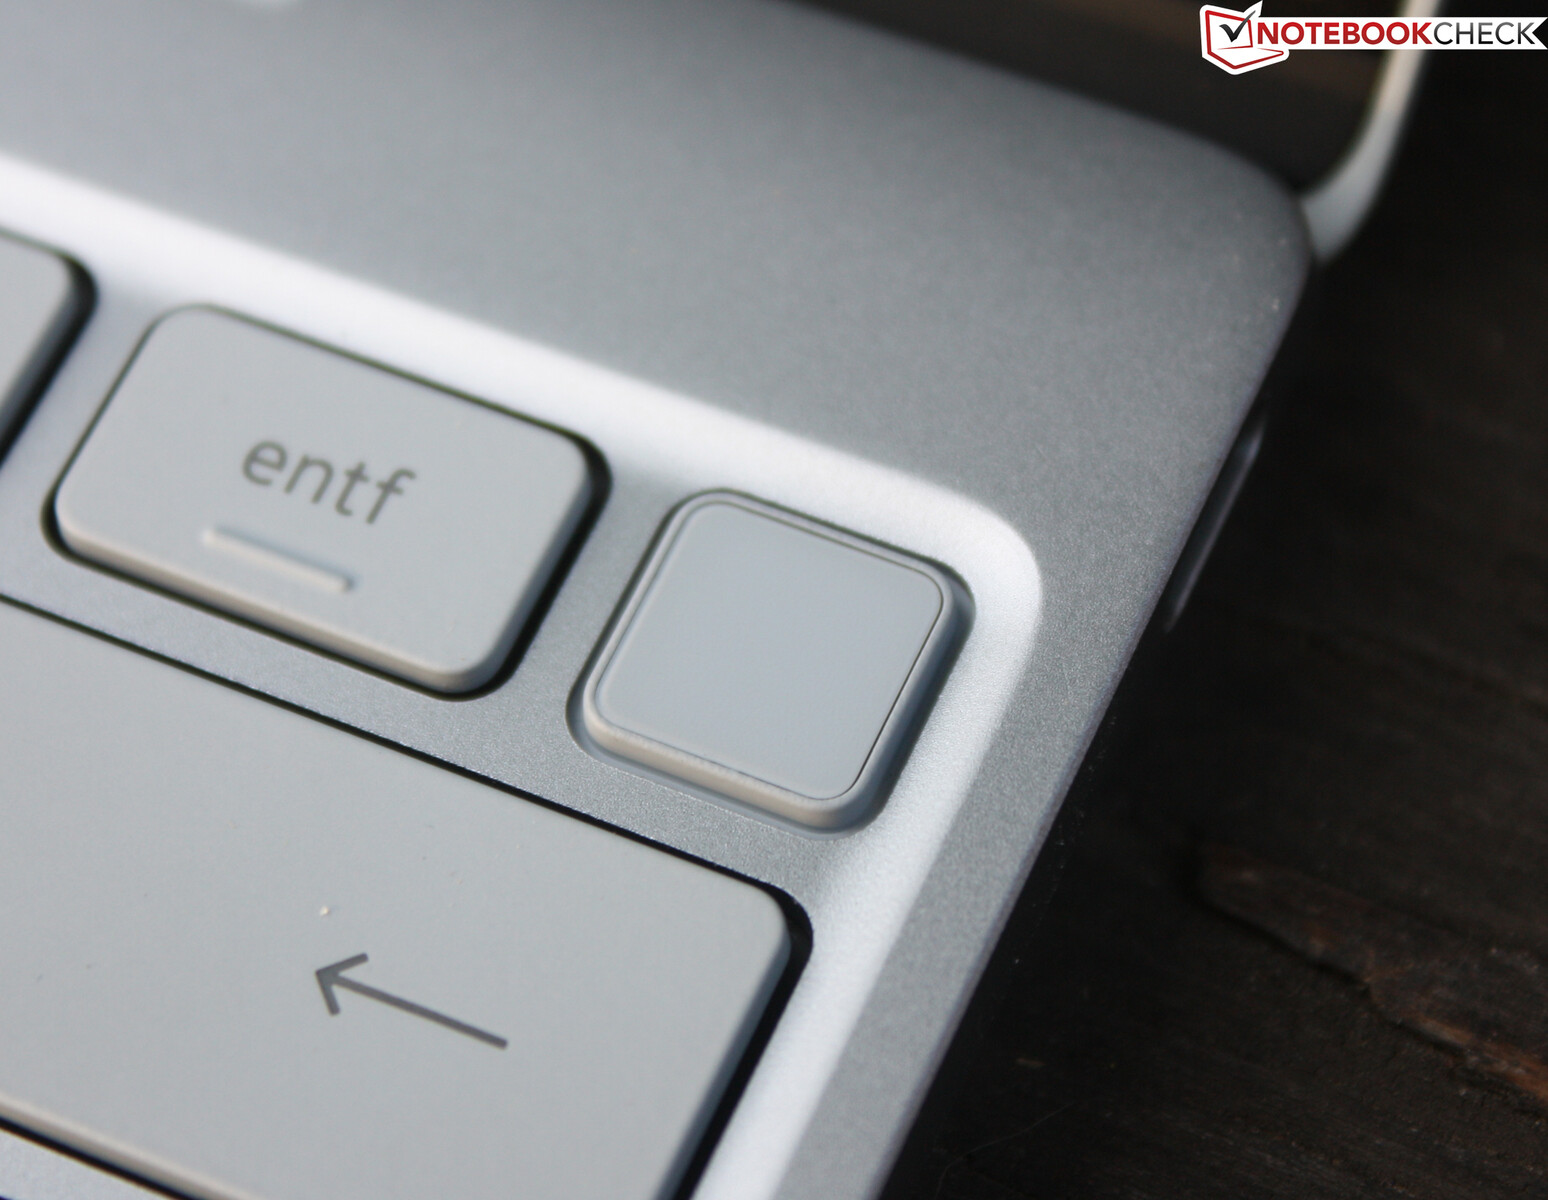
Rispetto all'XPS 13 del 2021, la tastiera rimane invariata sia in termini di feedback che di layout. Si estende per tutta la larghezza dell'unità di base e, sebbene i tasti freccia su e giù siano molto piccoli, sono presenti contrassegni aptici su di essi. Il livello secondario dei tasti F può essere utilizzato per i soliti scopi. Può essere attivato in modo permanente tramite Esc+Fn, il che è comodo se non si utilizzano i tasti F1-F12. I tasti offrono un feedback deciso, al limite dell'eccessivo. Il punto di attuazione è distinto. Può sembrare un po' debole, in parte a causa della corsa ridotta. I tasti con cupola in gomma antiscivolo ruvida garantiscono un'esperienza di digitazione veloce, precisa e piacevole. Anche la generosa quantità di spazio tra i tasti è un vantaggio in questo senso. I tasti sono piatti e non lucidi come quelli di altre tastiere per computer portatili, grazie alla loro texture quasi gommata.
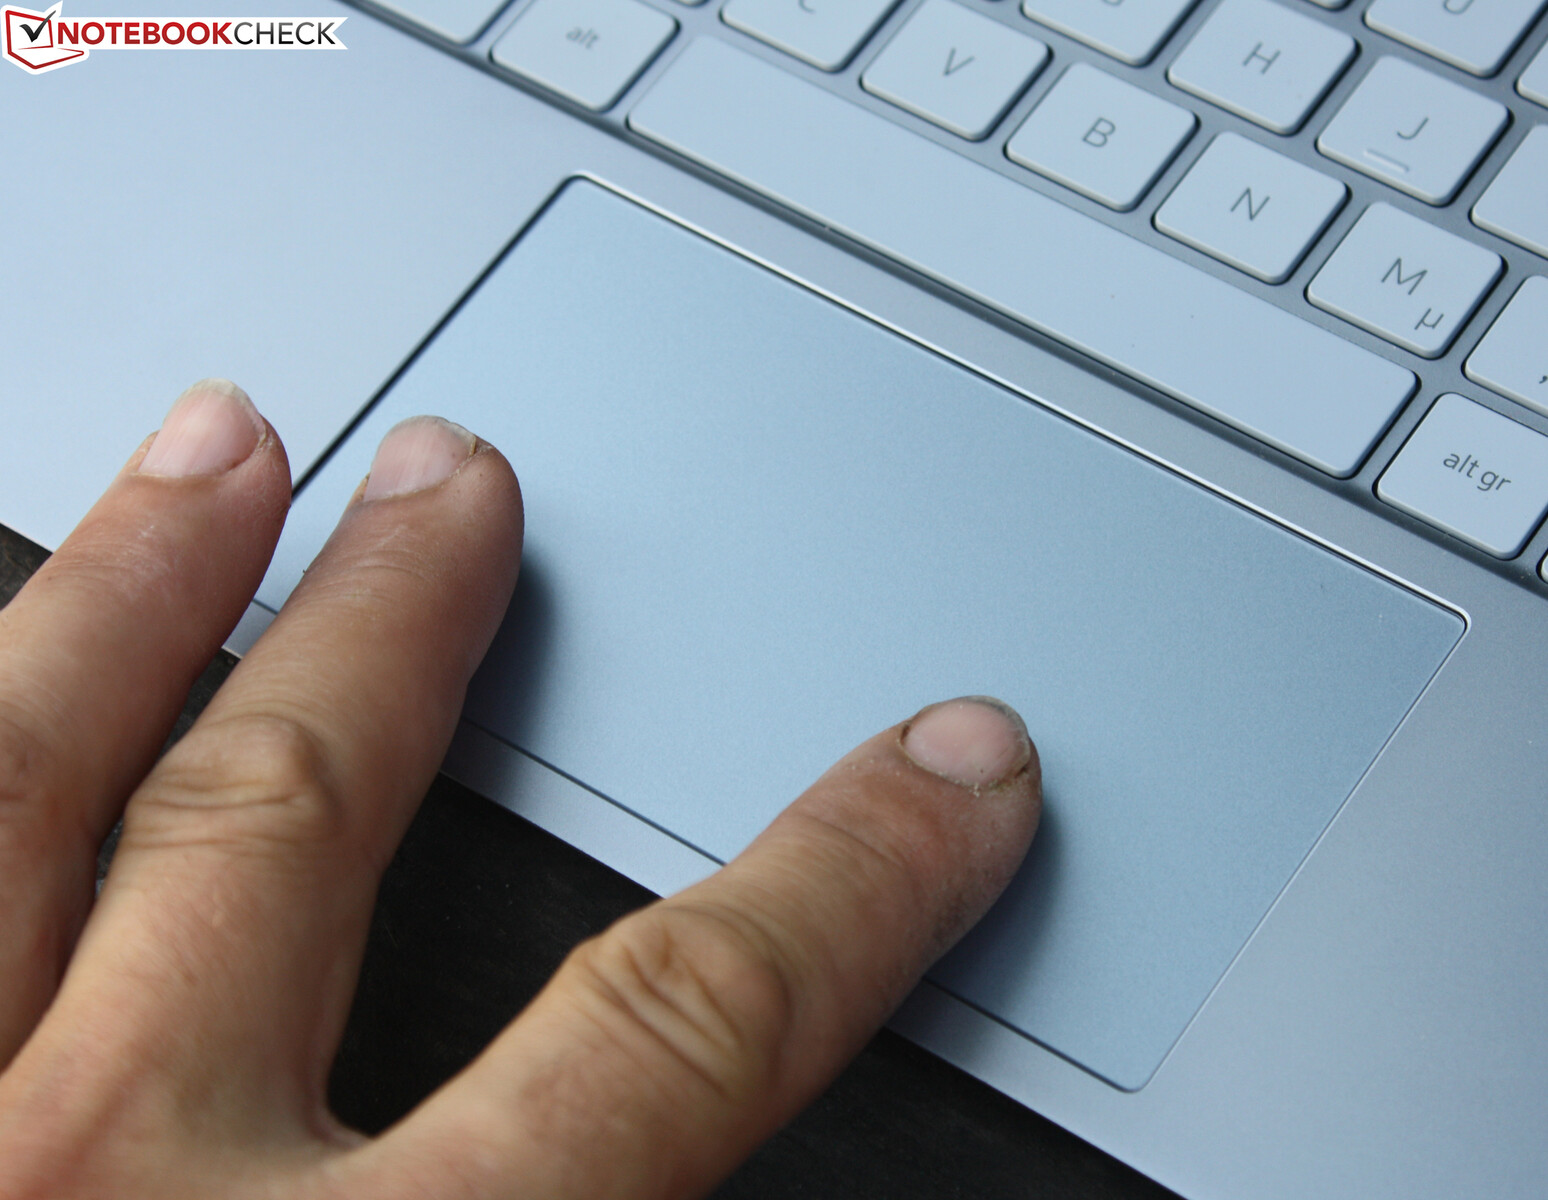
Touchpad
Il clickpad liscio produce clic scialbi e silenziosi. La corsa è ridotta e appena percettibile nel terzo superiore del touchpad. Il pad leggermente incassato che supporta i consueti comandi gestuali a due dita consente un flusso di lavoro rapido. Sebbene sia piuttosto grande, con una diagonale di 12,7 cm (5 in), questo non è più raro al giorno d'oggi. Il clickpad è perfettamente centrato tra i poggiapolsi. Non c'è un tasto Fn per disabilitare la sostituzione del mouse. Fortunatamente, questo è diventato quasi superfluo, dato che il pad riconosce in modo affidabile i palmi appoggiati su di esso e impedisce gli input accidentali.
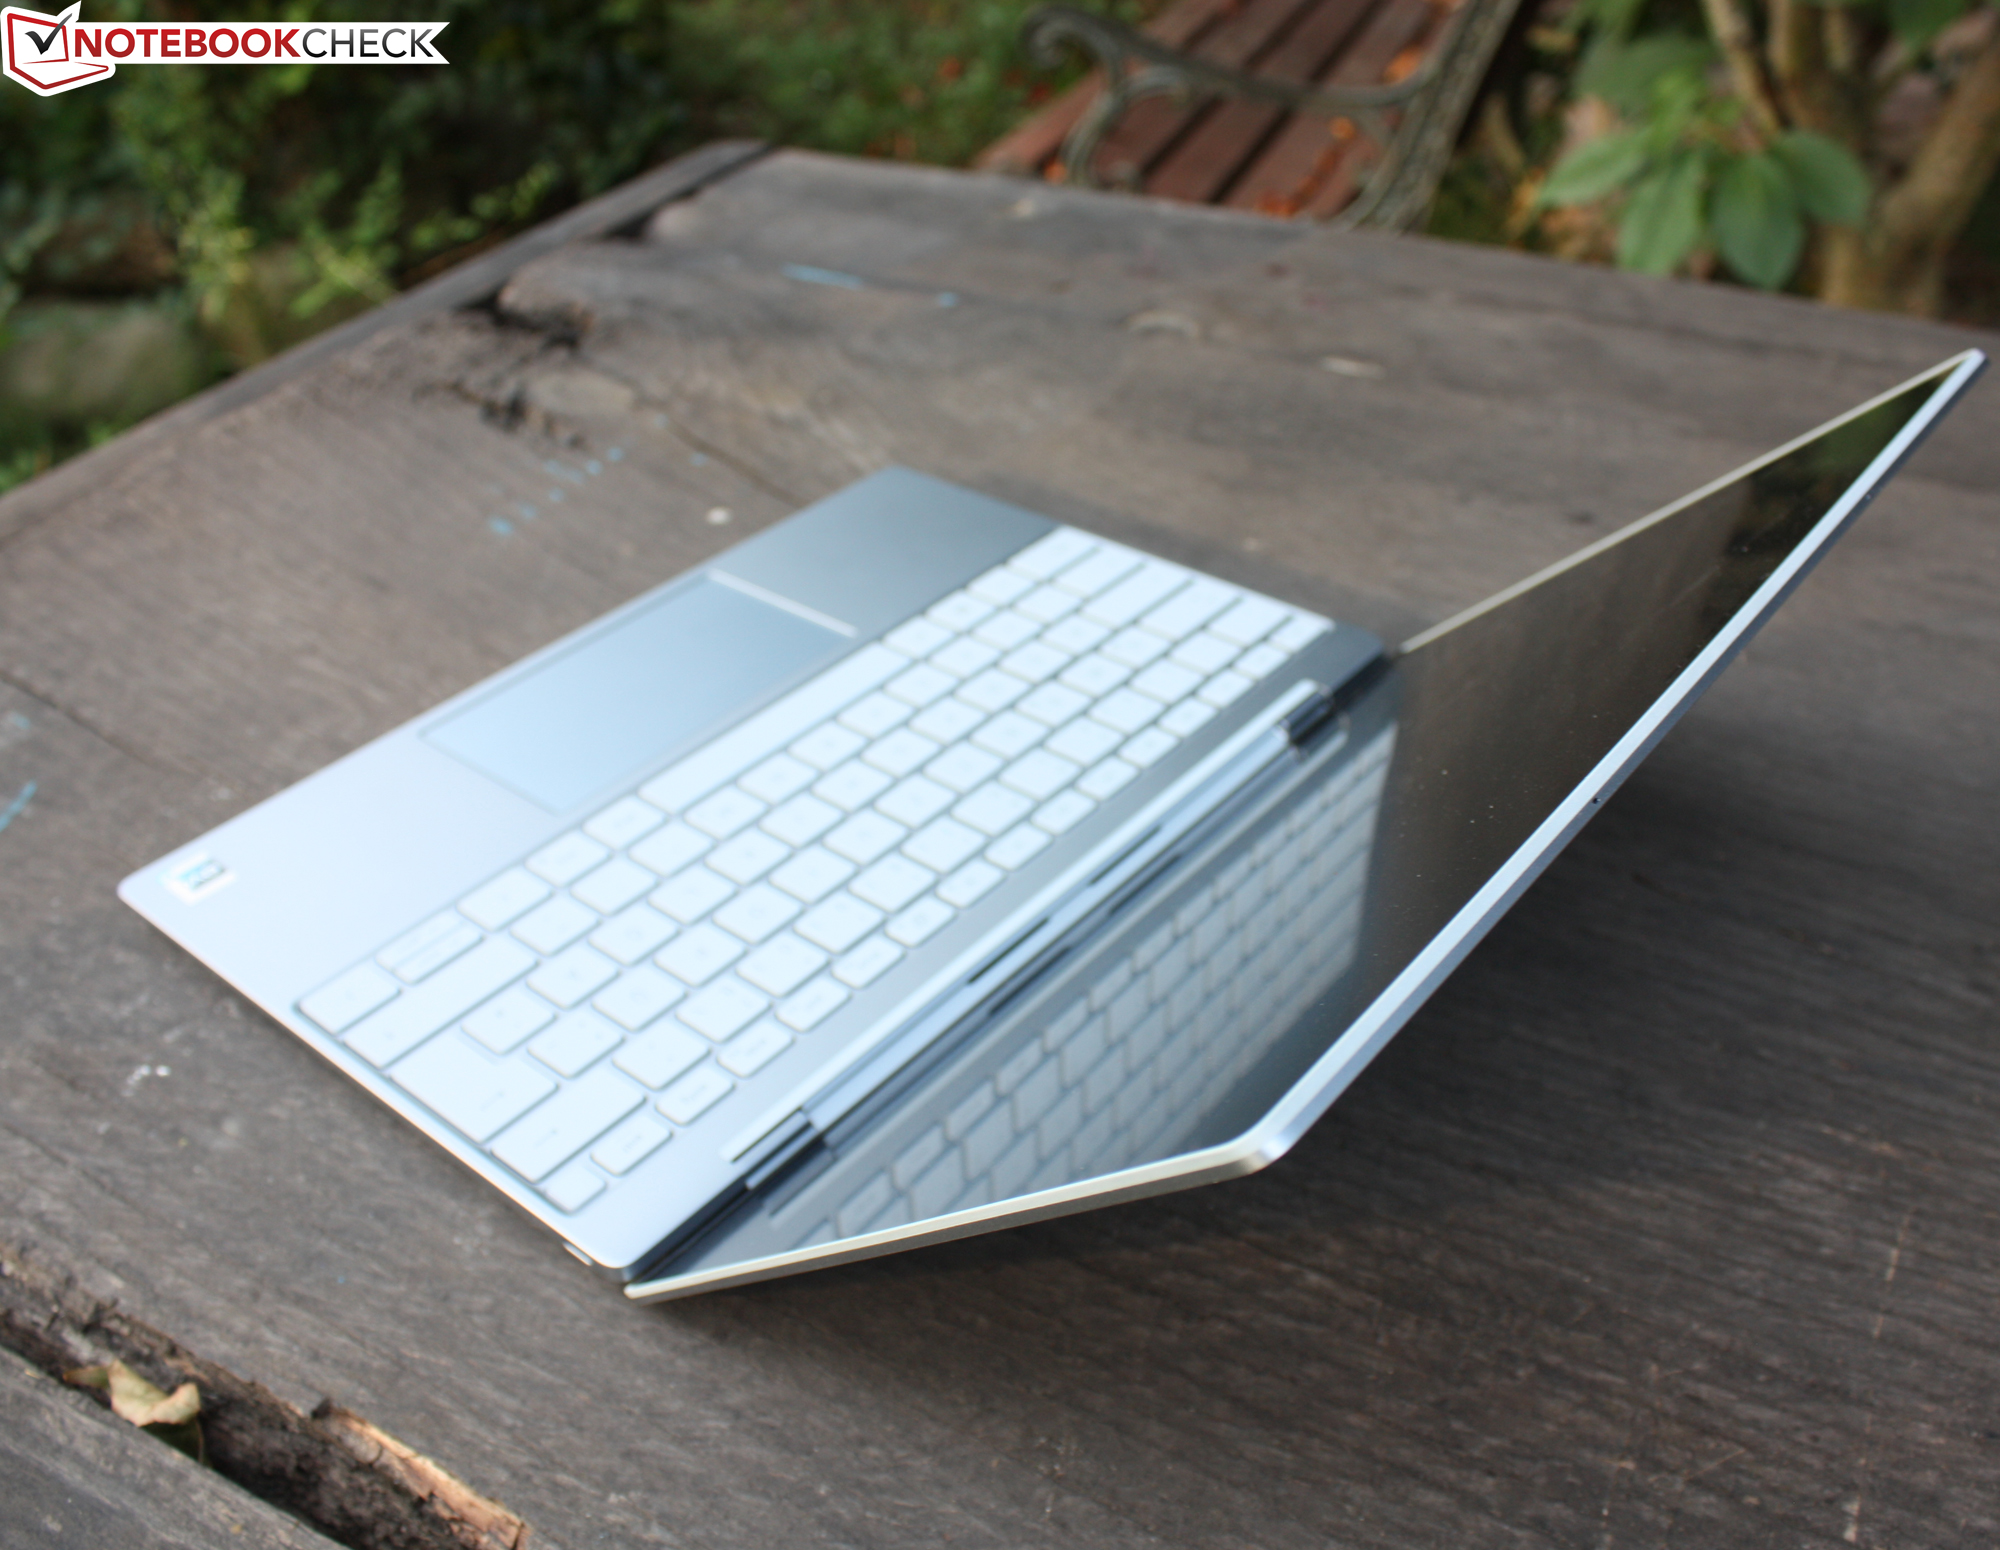
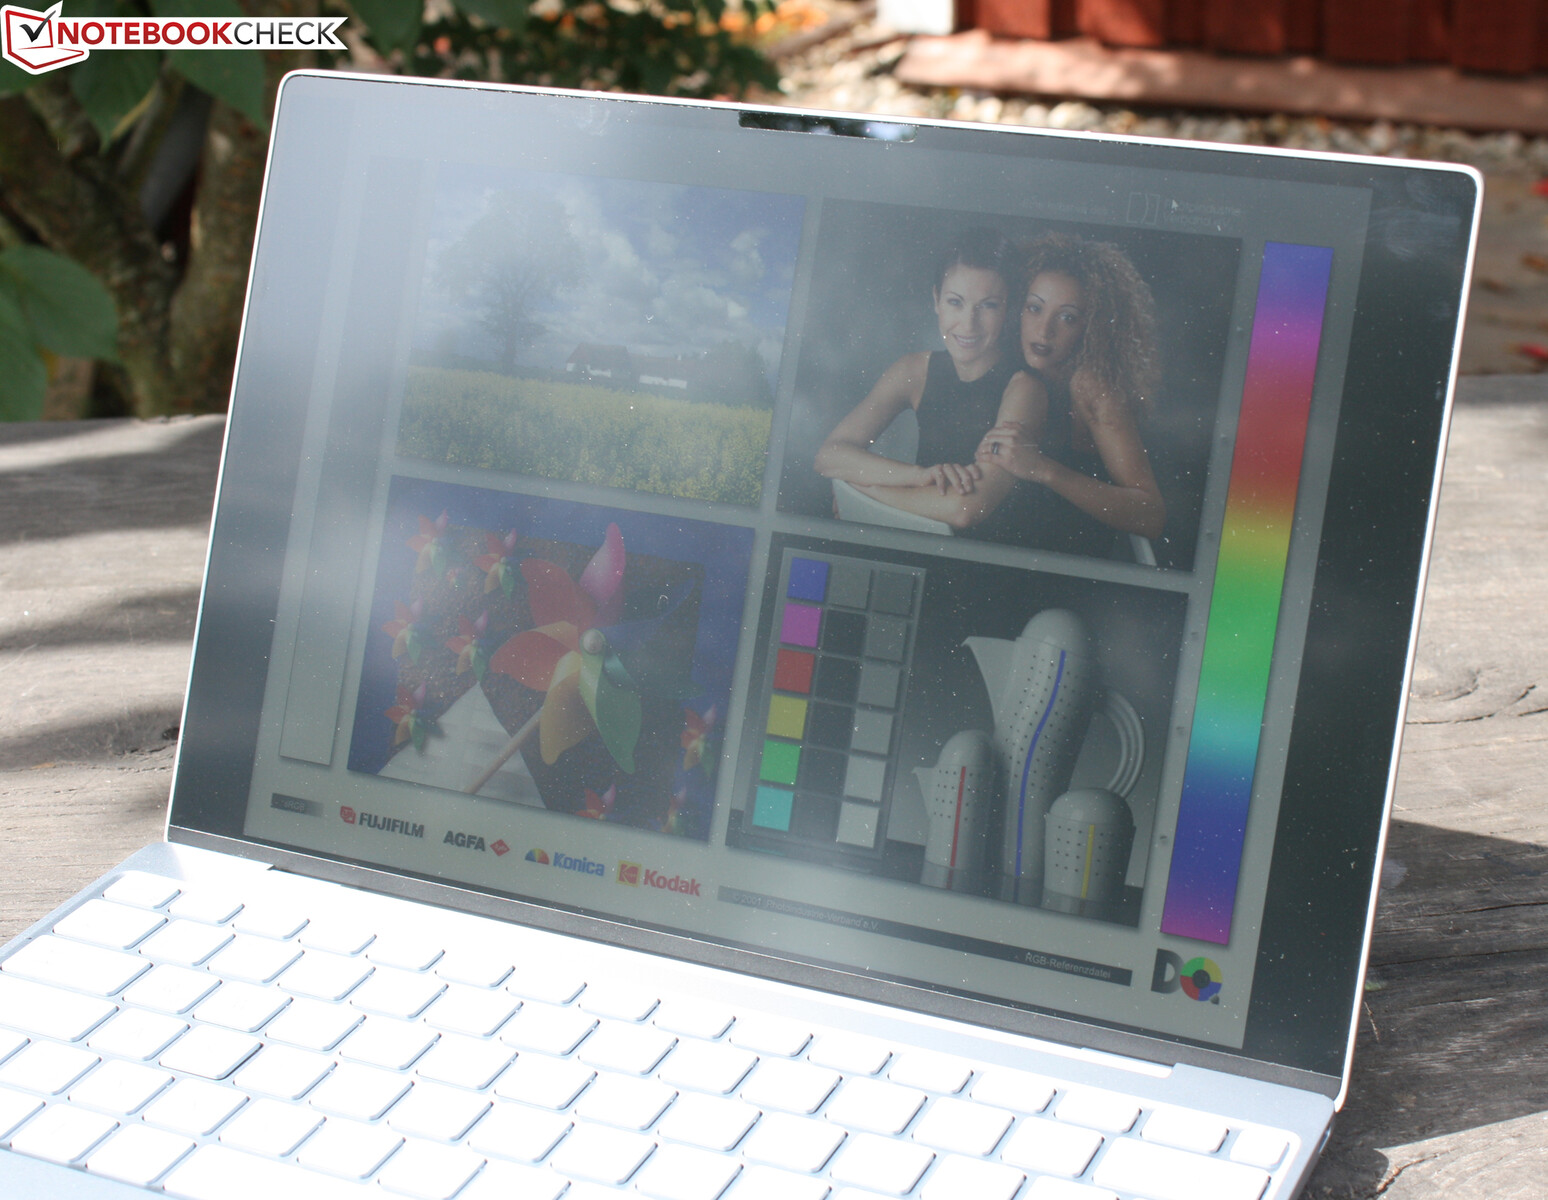
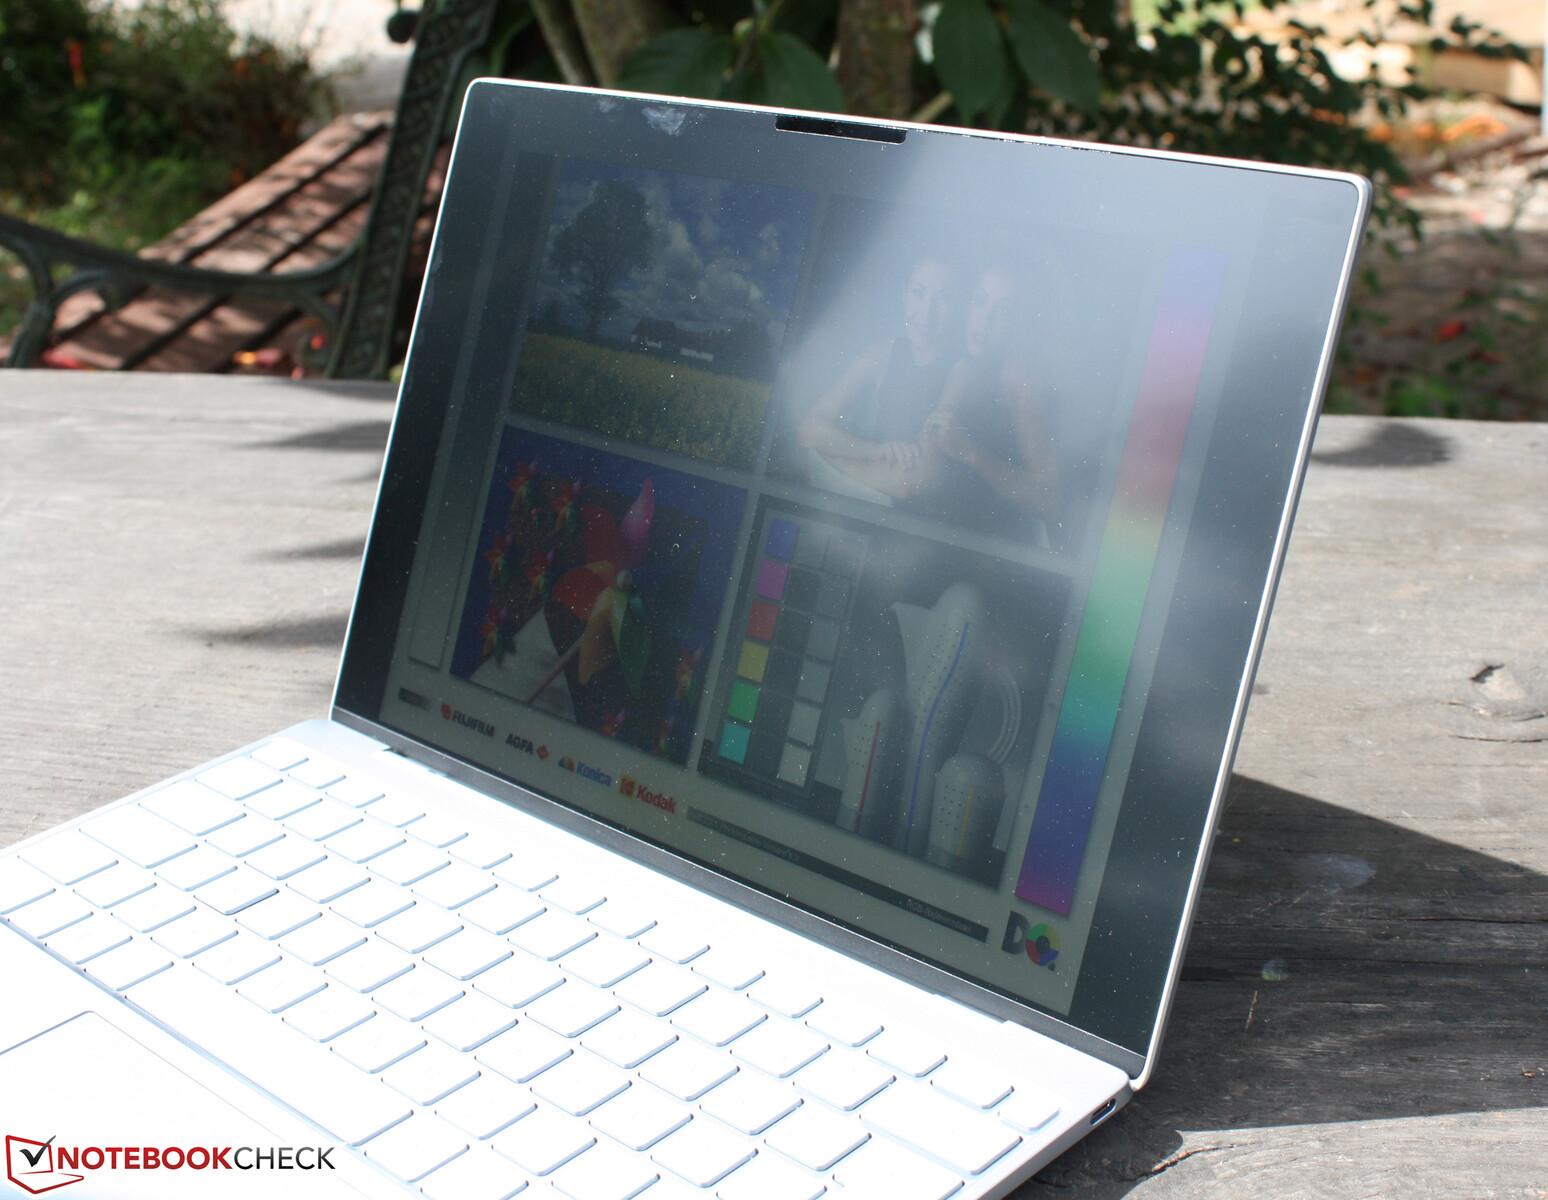
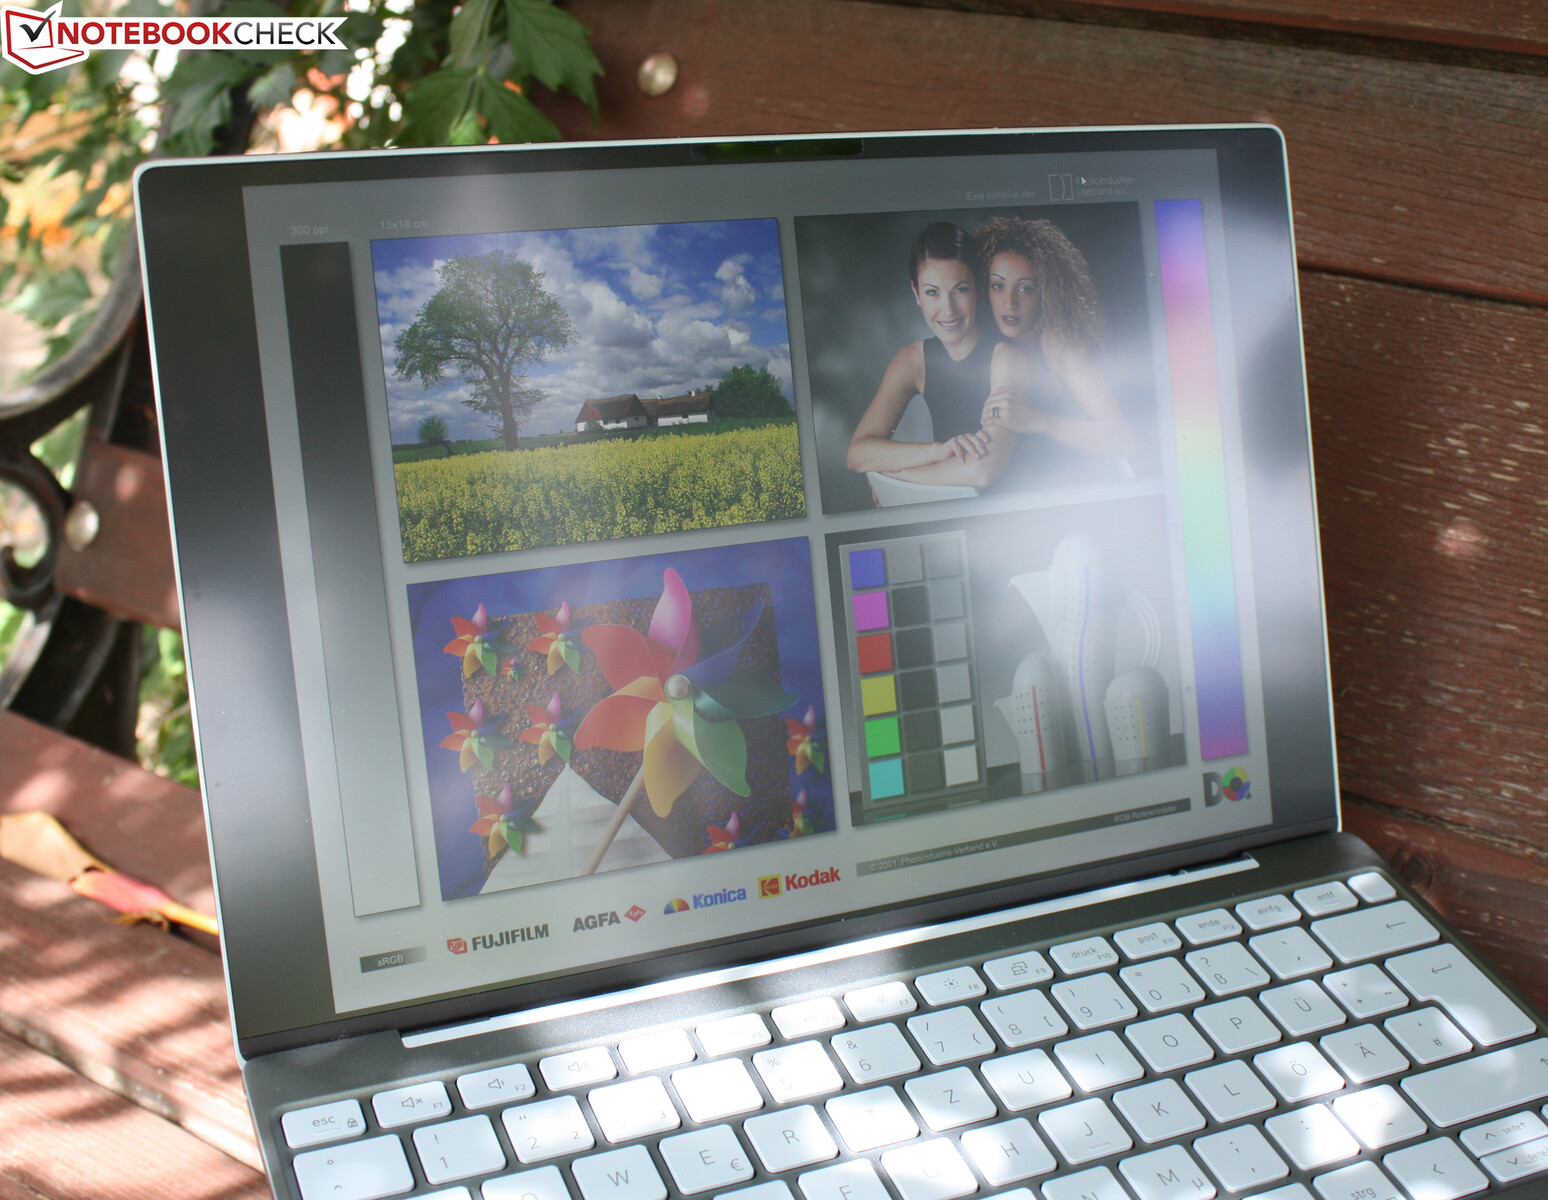
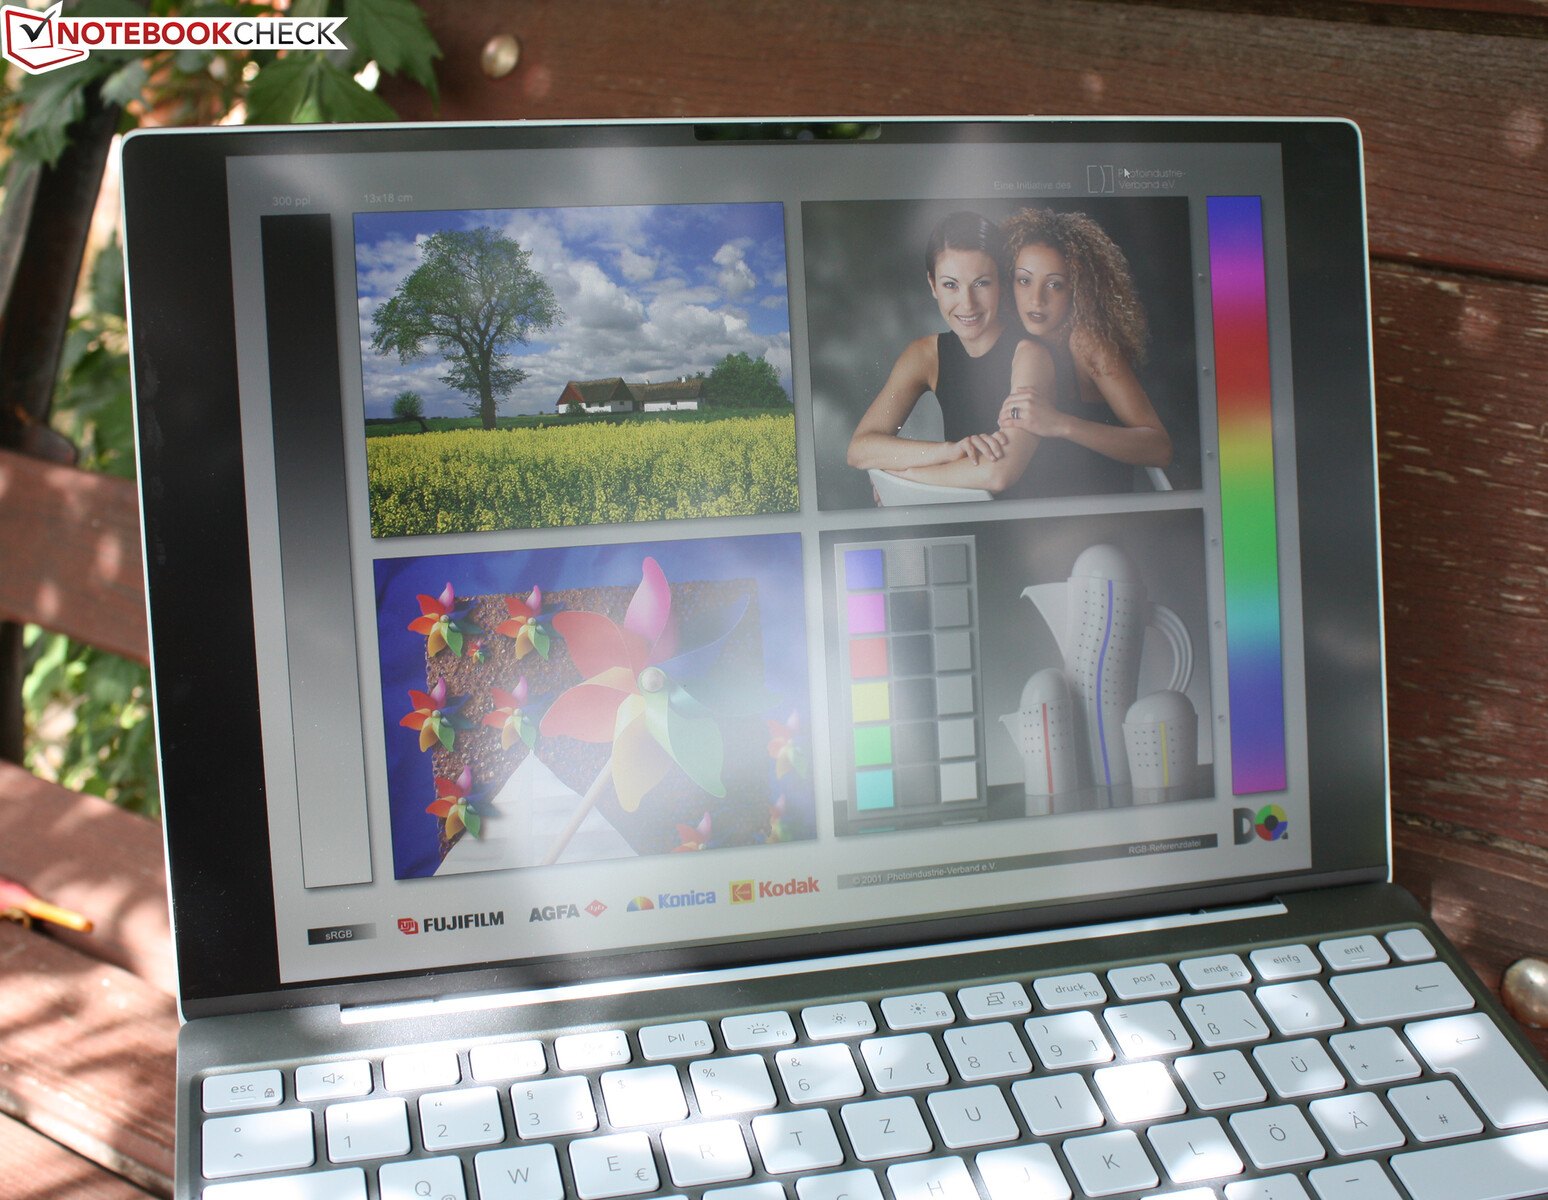
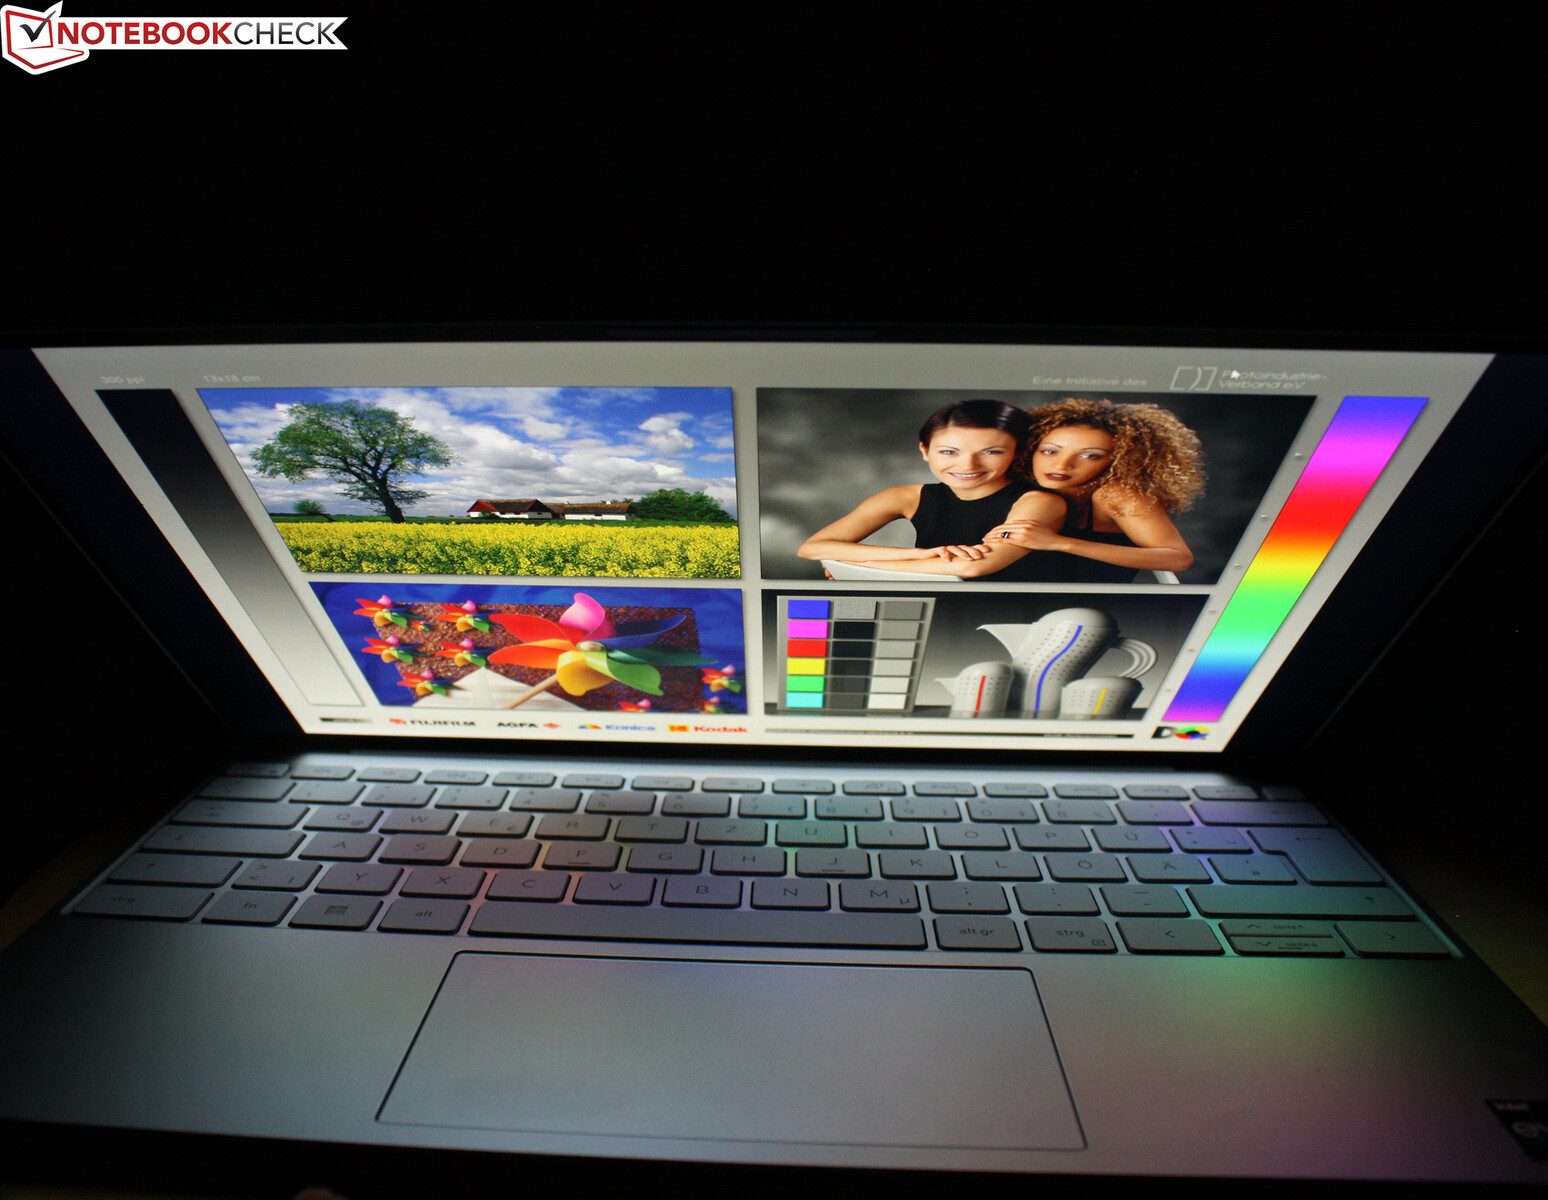
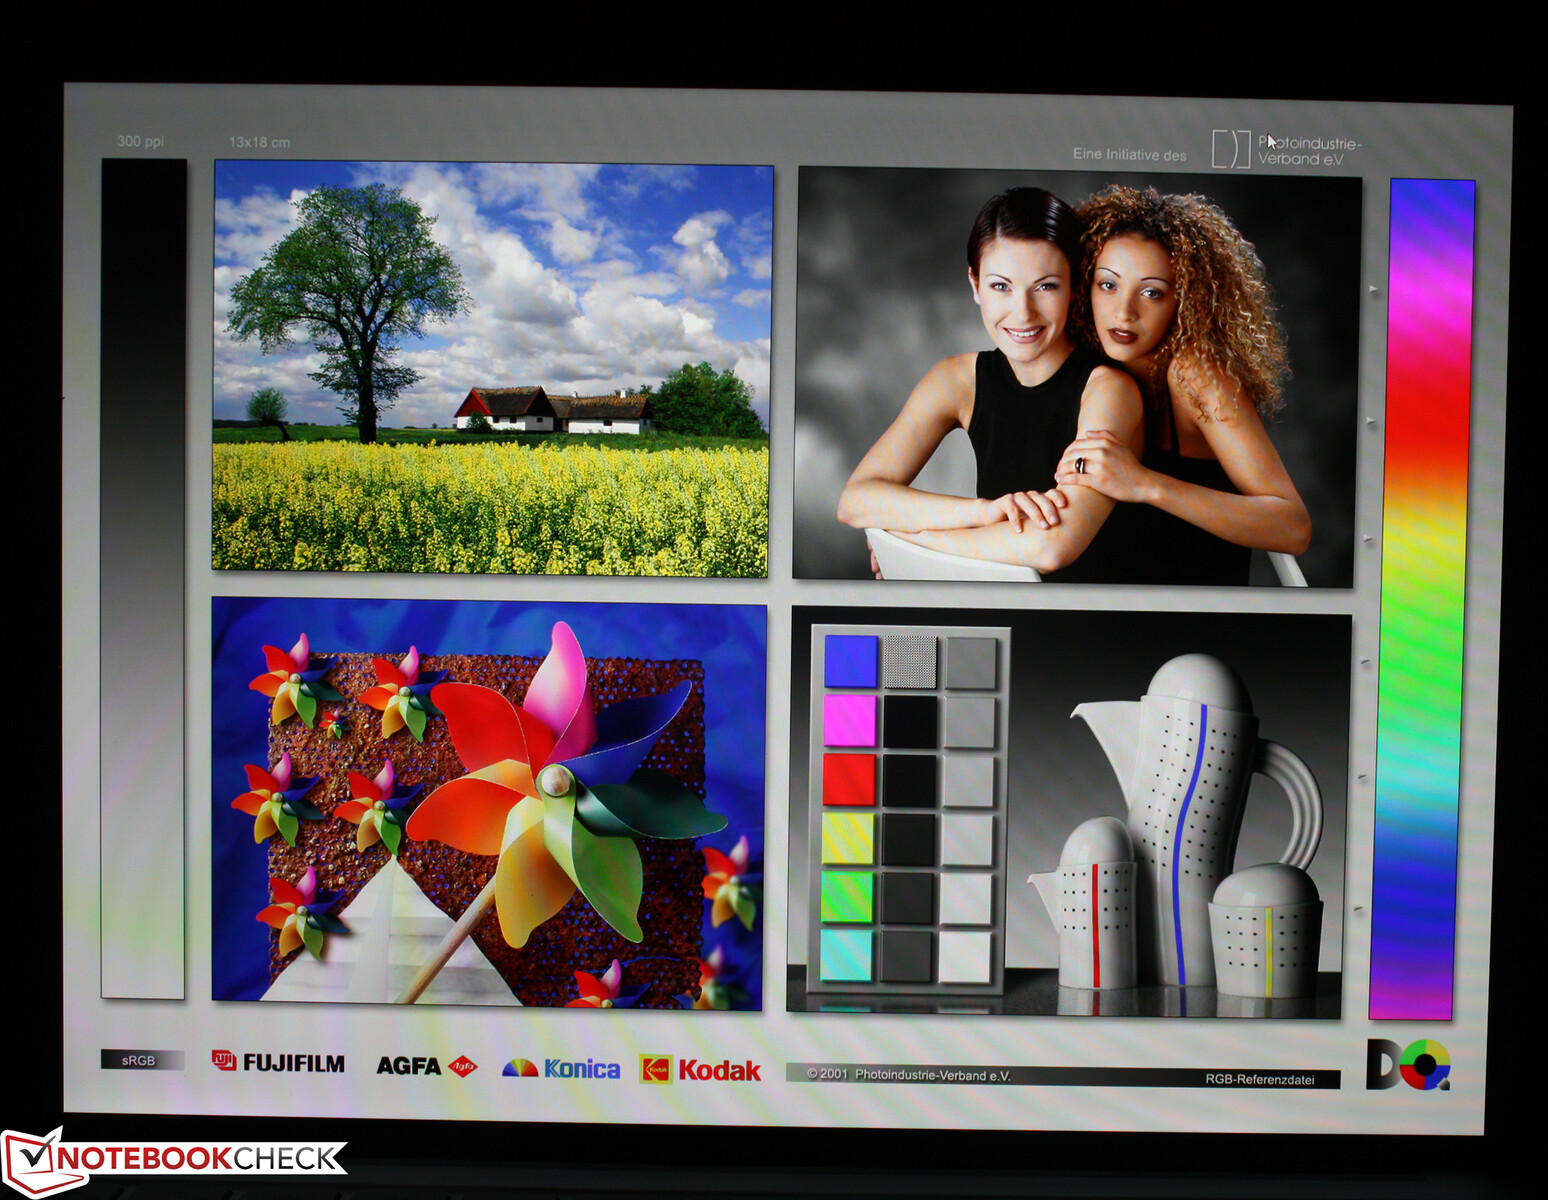
Display - Display luminoso per laptop per uso esterno
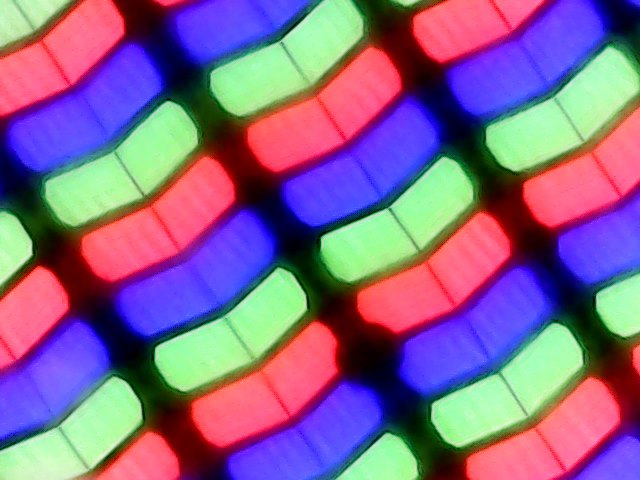
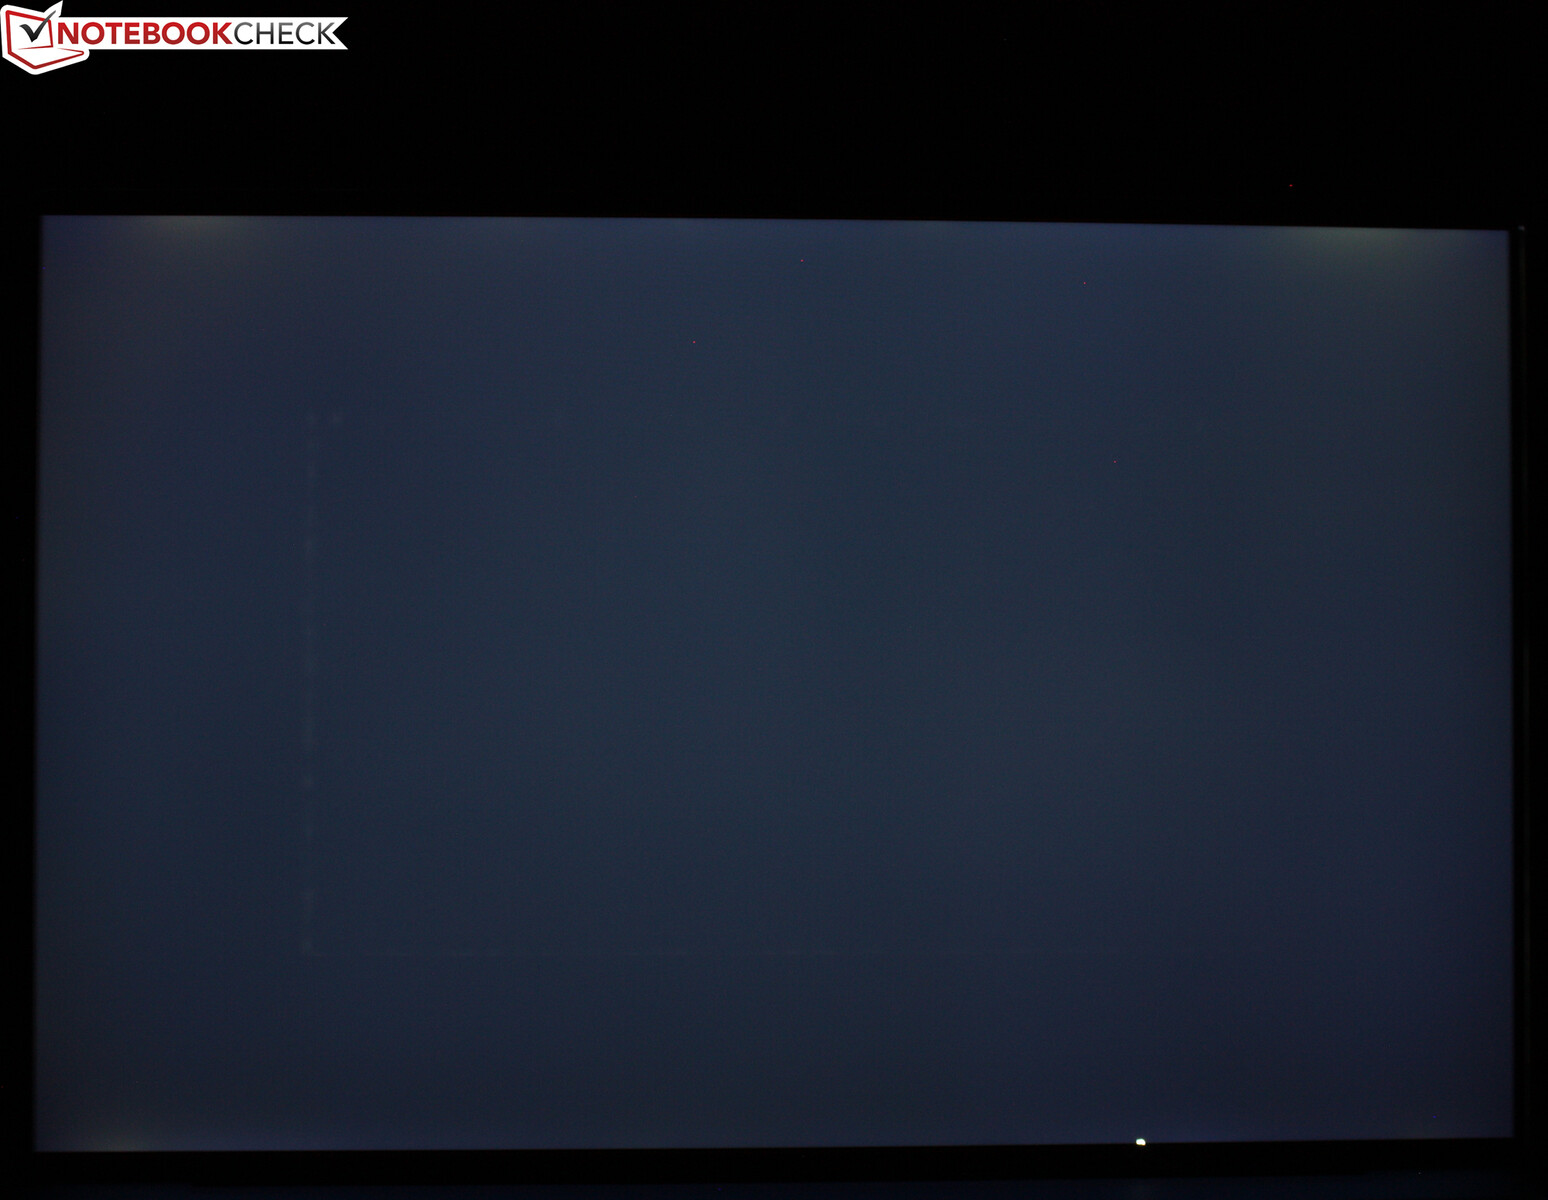
Il nostro XPS 9315 utilizza il display Sharp predefinito con una risoluzione di 1920 x 1200 pixel e il pannello IPS LQ134N1 che presenta un leggero backlight-bleeding vicino al bordo superiore quando si visualizza un'immagine completamente nera alla massima luminosità. Sebbene la luminosità di 442 nits (media) sia elevata, è inferiore ai 500 nits dichiarati dal produttore (abbiamo misurato solo fino a 466 nits).
Il pannello 4K della versione Plus (Sharp LQ134R1) è leggermente più luminoso con 473 nits (media), ma offre soprattutto un contrasto migliore. 1165:1 invece di 1764:1 rendono il pannello 4K del Plus il chiaro vincitore.
Nota: la luminanza scende leggermente in modalità batteria e diminuisce di 60 nits (media: 406 nits). L'opzione del display OLED è disponibile solo sulla variante Plus.
L'XPS 13 non utilizza il PWM per controllare la luminosità del display. I nostri tre screenshot mostrano una linea omogenea al 100, 50 e 0 per cento di luminosità.
| |||||||||||||||||||||||||
Distribuzione della luminosità: 89 %
Al centro con la batteria: 406 cd/m²
Contrasto: 1165:1 (Nero: 0.4 cd/m²)
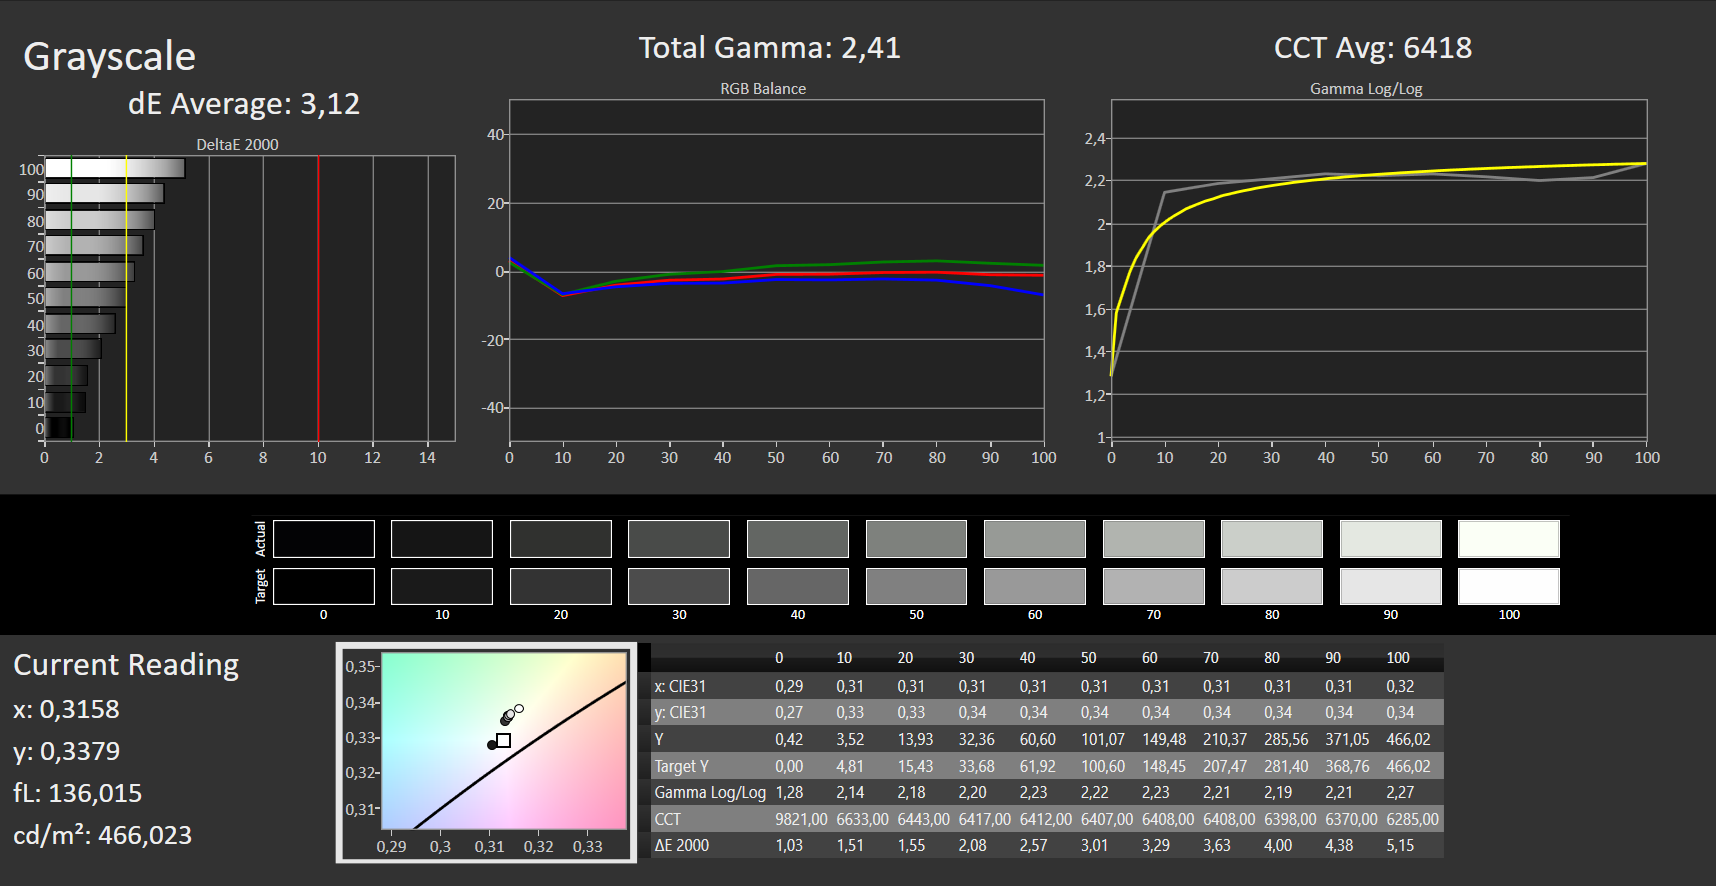
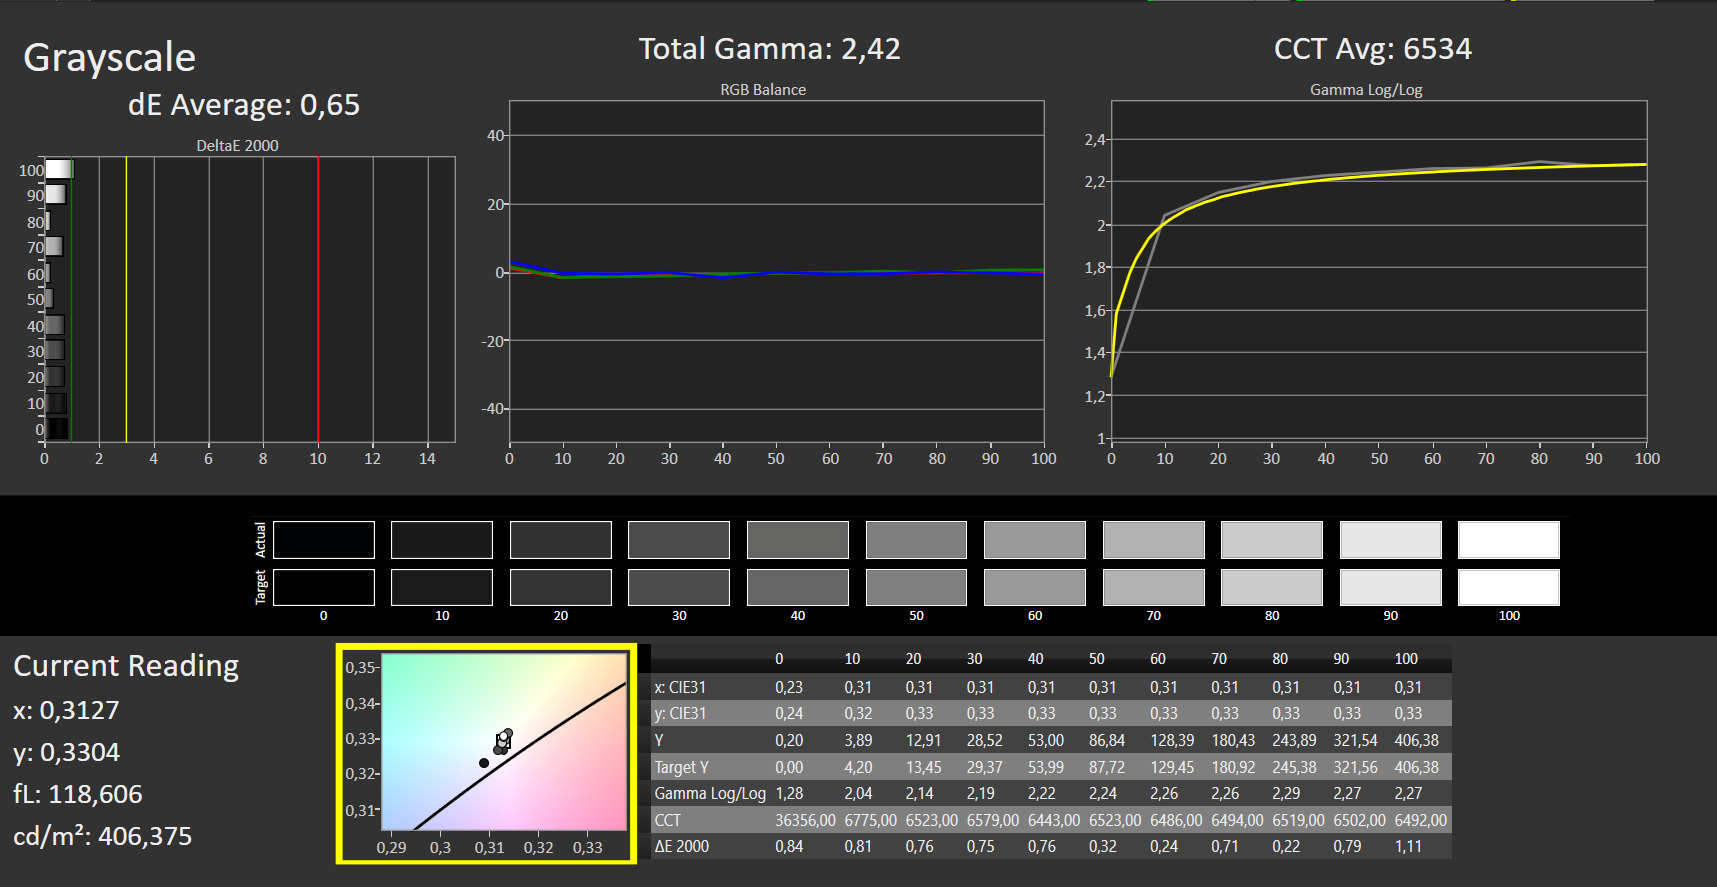
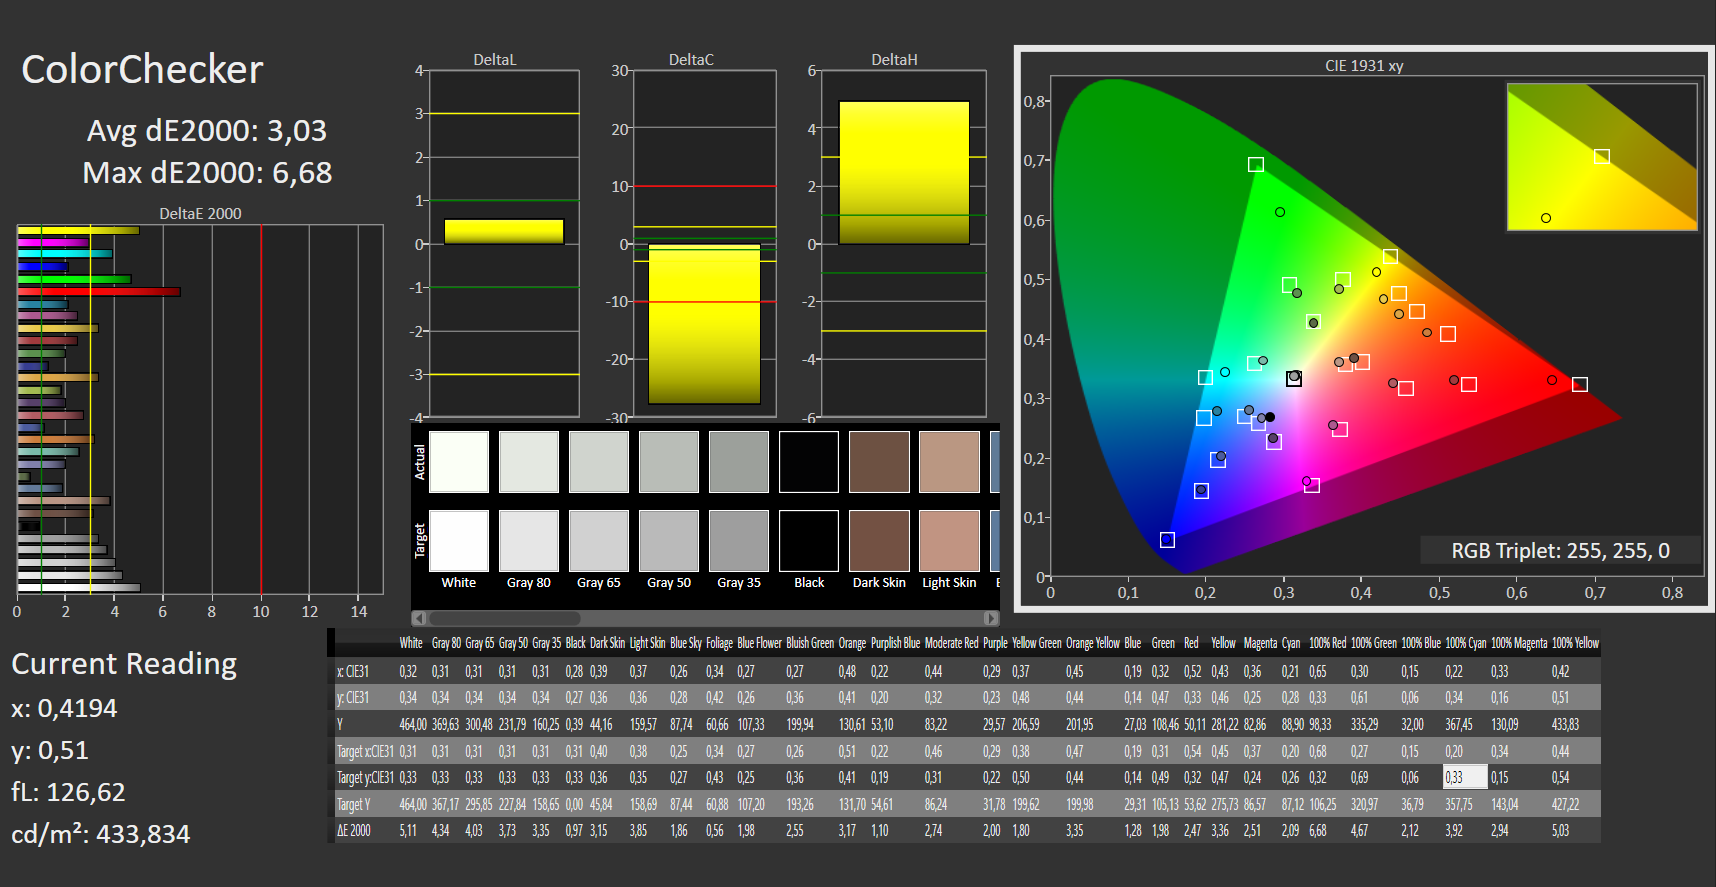
ΔE ColorChecker Calman: 3.03 | ∀{0.5-29.43 Ø4.71}
calibrated: 2.34
ΔE Greyscale Calman: 3.12 | ∀{0.09-98 Ø4.96}
71% AdobeRGB 1998 (Argyll 3D)
100% sRGB (Argyll 3D)
69% Display P3 (Argyll 3D)
Gamma: 2.41
CCT: 6418 K
| Dell XPS 13 9315, i5-1230U Sharp SHP1548 LQ134N1, IPS, 1920x1200, 13.4" | Apple MacBook Air 2020 M1 Entry IPS, 2560x1600, 13.3" | Asus Zenbook S 13 OLED SDC4172, OLED, 2880x1800, 13.3" | Lenovo ThinkPad X1 Nano-20UN002UGE MND007ZA1-2, IPS, 2160x1350, 13" | Huawei MateBook 13s i5 11300H TL134GDXP02-0, LTPS, 2520x1680, 13.4" | Dell XPS 13 Plus 9320 4K LQ134R1, IPS, 3840x2400, 13.4" | |
|---|---|---|---|---|---|---|
| Display | 21% | 28% | 1% | -6% | 6% | |
| Display P3 Coverage (%) | 69 | 98.6 43% | 99.8 45% | 70.4 2% | 65.2 -6% | 76.5 11% |
| sRGB Coverage (%) | 100 | 100 0% | 100 0% | 99.9 0% | 92 -8% | 100 0% |
| AdobeRGB 1998 Coverage (%) | 71 | 85.9 21% | 97.8 38% | 72 1% | 67.5 -5% | 76 7% |
| Response Times | 2% | 94% | -22% | -8% | 2% | |
| Response Time Grey 50% / Grey 80% * (ms) | 40 ? | 31 ? 22% | 2.1 ? 95% | 46.8 ? -17% | 44.8 ? -12% | 38.9 ? 3% |
| Response Time Black / White * (ms) | 22 ? | 26.1 ? -19% | 1.68 ? 92% | 28 ? -27% | 22.8 ? -4% | 21.9 ? -0% |
| PWM Frequency (Hz) | 118000 ? | 240.4 ? | 9804 ? | |||
| Screen | 23% | 175% | 31% | 25% | 18% | |
| Brightness middle (cd/m²) | 466 | 417 -11% | 336 -28% | 460 -1% | 468 0% | 494 6% |
| Brightness (cd/m²) | 442 | 395 -11% | 338 -24% | 434 -2% | 450 2% | 474 7% |
| Brightness Distribution (%) | 89 | 91 2% | 99 11% | 92 3% | 92 3% | 89 0% |
| Black Level * (cd/m²) | 0.4 | 0.39 2% | 0.02 95% | 0.27 32% | 0.23 43% | 0.28 30% |
| Contrast (:1) | 1165 | 1069 -8% | 16800 1342% | 1704 46% | 2035 75% | 1764 51% |
| Colorchecker dE 2000 * | 3.03 | 1.12 63% | 1.8 41% | 1.1 64% | 2 34% | 3.1 -2% |
| Colorchecker dE 2000 max. * | 6.68 | 2.71 59% | 3.8 43% | 4.5 33% | 5.5 18% | 4.2 37% |
| Colorchecker dE 2000 calibrated * | 2.34 | 0.77 67% | 1.8 23% | 1 57% | 1.5 36% | 1.5 36% |
| Greyscale dE 2000 * | 3.12 | 1.7 46% | 0.9 71% | 1.6 49% | 2.6 17% | 3.2 -3% |
| Gamma | 2.41 91% | 2207 0% | 2.22 99% | 2.2 100% | 2.17 101% | 2.41 91% |
| CCT | 6418 101% | 6870 95% | 6580 99% | 6475 100% | 6511 100% | 6189 105% |
| Color Space (Percent of AdobeRGB 1998) (%) | 65.7 | |||||
| Color Space (Percent of sRGB) (%) | 99.9 | |||||
| Media totale (Programma / Settaggio) | 15% /
20% | 99% /
132% | 3% /
17% | 4% /
14% | 9% /
13% |
* ... Meglio usare valori piccoli
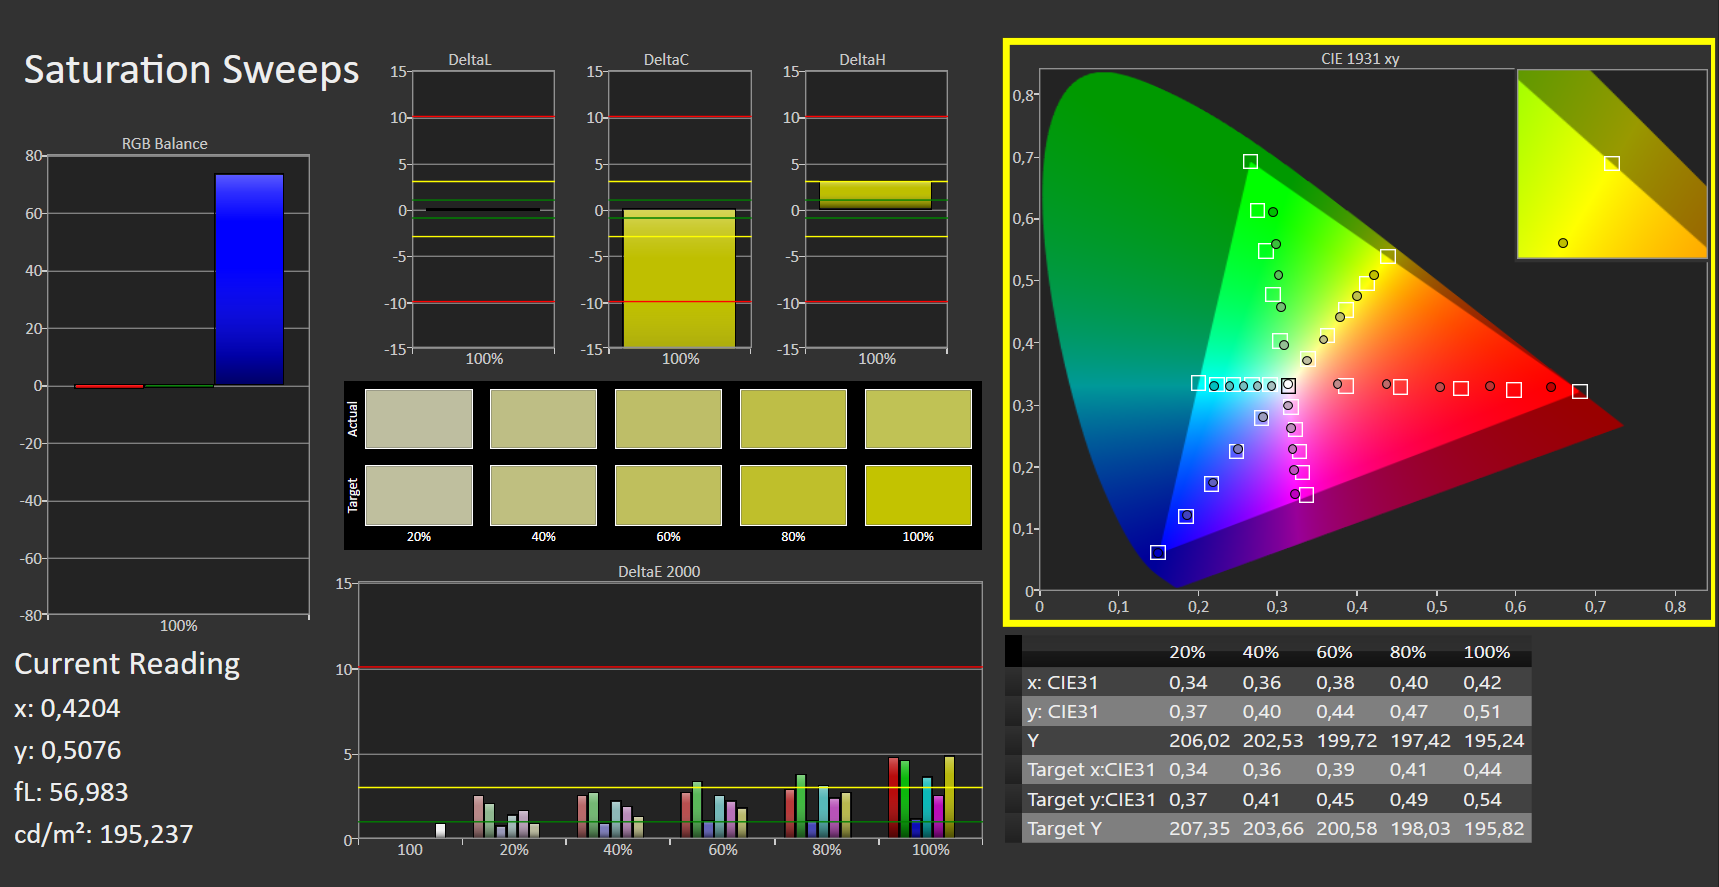
Abbiamo notato due cose durante la nostra analisi con il software professionale CalMAN (X-Rite i1 Pro 2): Mentre il pannello copre il 100% dello spazio colore sRGB, non si avvicina al 100% dello spazio colore P3. Inoltre, abbiamo misurato un deltaE di circa 3,0 per i colori e la scala di grigi. Ciò rende superflua la calibrazione per un uso normale. Gli utenti che scelgono di farlo sono ricompensati con un eccellente deltaE inferiore a 1,0. Se possedete un Dell XPS 13 con la stessa opzione di visualizzazione, la vostra esperienza visiva può essere migliorata applicando il nostro profilo colore calibrato (linkato nel riquadro sopra).


Tempi di risposta del Display
| ↔ Tempi di risposta dal Nero al Bianco | ||
|---|---|---|
| 22 ms ... aumenta ↗ e diminuisce ↘ combinato | ↗ 9 ms Incremento |  |
| ↘ 13 ms Calo | ||
| Lo schermo mostra buoni tempi di risposta durante i nostri tests, ma potrebbe essere troppo lento per i gamers competitivi. In confronto, tutti i dispositivi di test variano da 0.1 (minimo) a 240 (massimo) ms. » 49 % di tutti i dispositivi è migliore. Questo significa che i tempi di risposta rilevati sono peggiori rispetto alla media di tutti i dispositivi testati (19.8 ms). | ||
| ↔ Tempo di risposta dal 50% Grigio all'80% Grigio | ||
| 40 ms ... aumenta ↗ e diminuisce ↘ combinato | ↗ 20 ms Incremento |  |
| ↘ 20 ms Calo | ||
| Lo schermo mostra tempi di risposta lenti nei nostri tests e sarà insoddisfacente per i gamers. In confronto, tutti i dispositivi di test variano da 0.165 (minimo) a 636 (massimo) ms. » 61 % di tutti i dispositivi è migliore. Questo significa che i tempi di risposta rilevati sono peggiori rispetto alla media di tutti i dispositivi testati (30.9 ms). | ||
Sfarfallio dello schermo / PWM (Pulse-Width Modulation)
| flickering dello schermo / PWM non rilevato | ≤ 100 % settaggio luminosita' |    | |
In confronto: 52 % di tutti i dispositivi testati non utilizza PWM per ridurre la luminosita' del display. Se è rilevato PWM, una media di 7744 (minimo: 5 - massimo: 343500) Hz è stata rilevata. | |||
Mentre il pannello opaco FHD non-touch brilla letteralmente all'aperto con la sua luminosità di 400 nit, i riflessi opachi sono quasi inevitabili sotto la luce del sole.
Prestazioni - Laptop XPS con prestazioni dimezzate
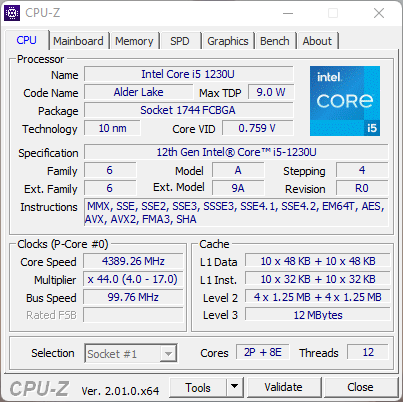
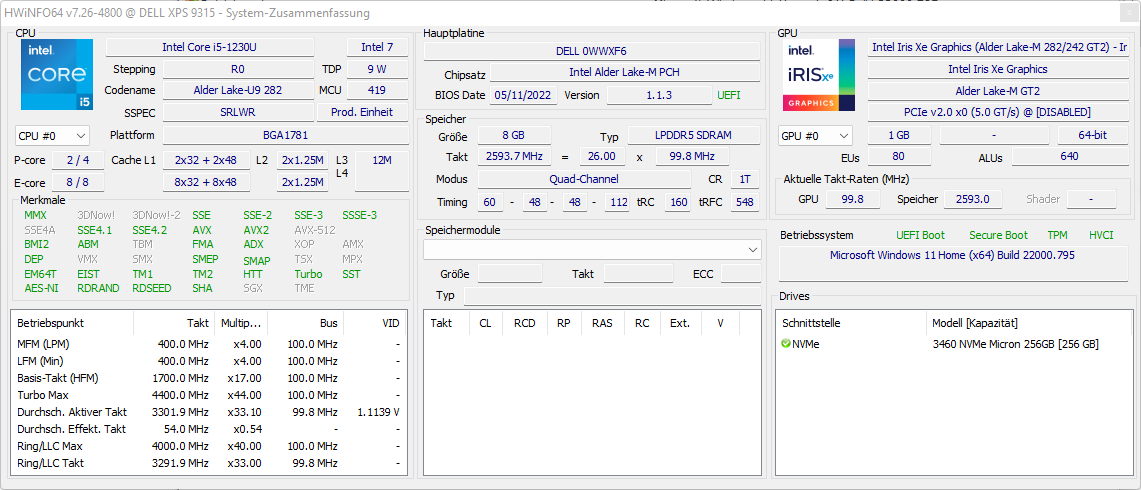
La CPU dell'XPS 13 è basata sul chip Alder Lake-M (serie U da 9W) ed è composta da 2 core per le prestazioni (core P) e 8 core per l'efficienza (core E). Poiché solo i core P supportano l'hyper-threading, è possibile elaborare un totale di 12 thread contemporaneamente. I core P hanno un clock da 1 a 4,4 GHz e i core E da 0,7 a 3,3 GHz. Sebbene sia disponibile un i7-1250U (4,7 GHz) per il modello XPS non-Plus, questo non cambia le sue caratteristiche di basse prestazioni. Se si cerca un nuovo XPS con il massimo delle prestazioni, non c'è alternativa all'XPS 13 Plus, che è dotato solo di processori Alder Lake-P (Core i5-1240P, Core i7-1260P) con 4 core per le prestazioni e 8 core per l'efficienza.
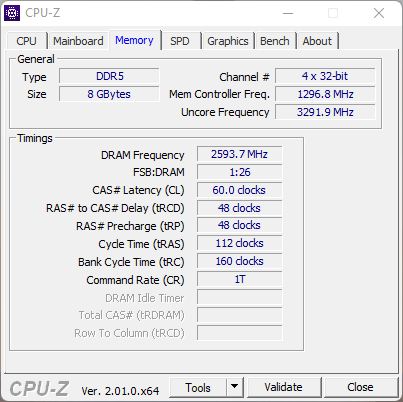
Gli acquirenti possono scegliere tra 8, 16 o 32 GB di RAM (LPDDR5-5200), con l'opzione da 32 GB disponibile solo in combinazione con la CPU i7. Questo permette a Dell di immagazzinare meno componenti, dato che la RAM è saldata.
Condizioni di prova
Poiché, a differenza del modello XPS 13 Plusnon c'è un Power Manager preinstallato sul nostro dispositivo di prova, le impostazioni di Windows dovranno essere sufficienti. Per i nostri test utilizziamo il profilo prestazioni con la modalità di risparmio energetico disattivata.
Processore
Esaminiamo il comportamento della CPU sotto un carico continuo realistico con l'aiuto del nostro ciclo Cinebench R15. La CPU Alder Lake-U si comporta in modo coerente, anche se inizia il test a un livello molto basso. Tutti i concorrenti sono più veloci in questo test.
Il solito picco di prestazioni di 10-15 secondi è completamente assente. Questo non è il caso delle CPU della serie P (XPS 13 Plus i7 e i5), che sono anche in grado di mantenere punteggi più alti a lungo termine. In breve Un XPS 13 Plus è più del doppio (i5) o del triplo (i7) rispetto al nostro modello base.
Durante il primo loop, la velocità di clock e l'assorbimento di energia diminuiscono dopo soli dieci secondi e il PL1 scende da 15 a soli 10 watt. Questo tipo di prestazioni non farà guadagnare al nostro XPS nessuna medaglia. Mentre Alder Lake-U ottiene un risultato medio nella nostra valutazione delle prestazioni della CPU, si piazza all'ultimo posto in tutti i test multi-thread e in AIDA64. Alder Lake-P è una scelta migliore per gli amanti delle prestazioni, poiché il 1240P e il 1260P sono in testa alla classifica e sono persino in grado di competere con l'AMD Ryzen 7 6800U AMD Ryzen 7 6800U (Zenbook S 13 OLED) nei benchmark multi-thread.
Cinebench R15 Multi Loop
Cinebench R23: Multi Core | Single Core
Cinebench R20: CPU (Multi Core) | CPU (Single Core)
Cinebench R15: CPU Multi 64Bit | CPU Single 64Bit
7-Zip 18.03: 7z b 4 | 7z b 4 -mmt1
Geekbench 5.5: Multi-Core | Single-Core
| CPU Performance rating | |
| Media della classe Subnotebook | |
| Dell XPS 13 Plus 9320 4K | |
| Asus Zenbook S 13 OLED | |
| Dell XPS 13 Plus 9320 i5-1240p | |
| Apple MacBook Air 2020 M1 Entry | |
| Huawei MateBook 13s i5 11300H | |
| Media Intel Core i5-1230U | |
| Lenovo ThinkPad X1 Nano-20UN002UGE -1! | |
| Dell XPS 13 9315, i5-1230U | |
| Cinebench R23 / Multi Core | |
| Media della classe Subnotebook (1555 - 21812, n=59, ultimi 2 anni) | |
| Asus Zenbook S 13 OLED | |
| Dell XPS 13 Plus 9320 4K | |
| Dell XPS 13 Plus 9320 i5-1240p | |
| Apple MacBook Air 2020 M1 Entry | |
| Lenovo ThinkPad X1 Nano-20UN002UGE | |
| Huawei MateBook 13s i5 11300H | |
| Media Intel Core i5-1230U (3066 - 7264, n=3) | |
| Dell XPS 13 9315, i5-1230U | |
| Cinebench R23 / Single Core | |
| Media della classe Subnotebook (358 - 2213, n=60, ultimi 2 anni) | |
| Dell XPS 13 Plus 9320 4K | |
| Dell XPS 13 Plus 9320 i5-1240p | |
| Apple MacBook Air 2020 M1 Entry | |
| Asus Zenbook S 13 OLED | |
| Media Intel Core i5-1230U (1135 - 1512, n=3) | |
| Dell XPS 13 9315, i5-1230U | |
| Huawei MateBook 13s i5 11300H | |
| Cinebench R20 / CPU (Multi Core) | |
| Media della classe Subnotebook (579 - 8541, n=56, ultimi 2 anni) | |
| Asus Zenbook S 13 OLED | |
| Dell XPS 13 Plus 9320 4K | |
| Dell XPS 13 Plus 9320 i5-1240p | |
| Huawei MateBook 13s i5 11300H | |
| Media Intel Core i5-1230U (1175 - 2802, n=3) | |
| Apple MacBook Air 2020 M1 Entry | |
| Lenovo ThinkPad X1 Nano-20UN002UGE | |
| Dell XPS 13 9315, i5-1230U | |
| Cinebench R20 / CPU (Single Core) | |
| Media della classe Subnotebook (128 - 832, n=56, ultimi 2 anni) | |
| Dell XPS 13 Plus 9320 4K | |
| Dell XPS 13 Plus 9320 i5-1240p | |
| Asus Zenbook S 13 OLED | |
| Lenovo ThinkPad X1 Nano-20UN002UGE | |
| Media Intel Core i5-1230U (441 - 580, n=3) | |
| Dell XPS 13 9315, i5-1230U | |
| Huawei MateBook 13s i5 11300H | |
| Apple MacBook Air 2020 M1 Entry | |
| Cinebench R15 / CPU Multi 64Bit | |
| Media della classe Subnotebook (327 - 3345, n=56, ultimi 2 anni) | |
| Asus Zenbook S 13 OLED | |
| Dell XPS 13 Plus 9320 4K | |
| Dell XPS 13 Plus 9320 4K | |
| Dell XPS 13 Plus 9320 i5-1240p | |
| Apple MacBook Air 2020 M1 Entry | |
| Huawei MateBook 13s i5 11300H | |
| Huawei MateBook 13s i5 11300H | |
| Lenovo ThinkPad X1 Nano-20UN002UGE | |
| Media Intel Core i5-1230U (433 - 1254, n=3) | |
| Dell XPS 13 9315, i5-1230U | |
| Cinebench R15 / CPU Single 64Bit | |
| Media della classe Subnotebook (72.4 - 322, n=56, ultimi 2 anni) | |
| Dell XPS 13 Plus 9320 4K | |
| Asus Zenbook S 13 OLED | |
| Dell XPS 13 Plus 9320 i5-1240p | |
| Apple MacBook Air 2020 M1 Entry | |
| Lenovo ThinkPad X1 Nano-20UN002UGE | |
| Huawei MateBook 13s i5 11300H | |
| Dell XPS 13 9315, i5-1230U | |
| Media Intel Core i5-1230U (120.1 - 221, n=3) | |
| 7-Zip 18.03 / 7z b 4 | |
| Asus Zenbook S 13 OLED | |
| Media della classe Subnotebook (11668 - 77867, n=56, ultimi 2 anni) | |
| Dell XPS 13 Plus 9320 4K | |
| Dell XPS 13 Plus 9320 i5-1240p | |
| Apple MacBook Air 2020 M1 Entry | |
| Huawei MateBook 13s i5 11300H | |
| Media Intel Core i5-1230U (12470 - 34505, n=3) | |
| Lenovo ThinkPad X1 Nano-20UN002UGE | |
| Dell XPS 13 9315, i5-1230U | |
| 7-Zip 18.03 / 7z b 4 -mmt1 | |
| Media della classe Subnotebook (2643 - 6699, n=58, ultimi 2 anni) | |
| Apple MacBook Air 2020 M1 Entry | |
| Asus Zenbook S 13 OLED | |
| Dell XPS 13 Plus 9320 4K | |
| Huawei MateBook 13s i5 11300H | |
| Dell XPS 13 Plus 9320 i5-1240p | |
| Lenovo ThinkPad X1 Nano-20UN002UGE | |
| Media Intel Core i5-1230U (3873 - 4870, n=3) | |
| Dell XPS 13 9315, i5-1230U | |
| Geekbench 5.5 / Multi-Core | |
| Media della classe Subnotebook (2557 - 17218, n=49, ultimi 2 anni) | |
| Dell XPS 13 Plus 9320 4K | |
| Asus Zenbook S 13 OLED | |
| Apple MacBook Air 2020 M1 Entry | |
| Dell XPS 13 9315, i5-1230U | |
| Media Intel Core i5-1230U (4193 - 7309, n=3) | |
| Huawei MateBook 13s i5 11300H | |
| Lenovo ThinkPad X1 Nano-20UN002UGE | |
| Dell XPS 13 Plus 9320 i5-1240p | |
| Geekbench 5.5 / Single-Core | |
| Media della classe Subnotebook (726 - 2224, n=49, ultimi 2 anni) | |
| Apple MacBook Air 2020 M1 Entry | |
| Dell XPS 13 Plus 9320 4K | |
| Dell XPS 13 9315, i5-1230U | |
| Dell XPS 13 Plus 9320 i5-1240p | |
| Media Intel Core i5-1230U (1454 - 1640, n=3) | |
| Asus Zenbook S 13 OLED | |
| Huawei MateBook 13s i5 11300H | |
| Lenovo ThinkPad X1 Nano-20UN002UGE | |
AIDA64: FP32 Ray-Trace | FPU Julia | CPU SHA3 | CPU Queen | FPU SinJulia | FPU Mandel | CPU AES | CPU ZLib | FP64 Ray-Trace | CPU PhotoWorxx
| Performance rating | |
| Asus Zenbook S 13 OLED | |
| Media della classe Subnotebook | |
| Huawei MateBook 13s i5 11300H | |
| Dell XPS 13 Plus 9320 4K | |
| Dell XPS 13 Plus 9320 i5-1240p | |
| Lenovo ThinkPad X1 Nano-20UN002UGE | |
| Media Intel Core i5-1230U | |
| Dell XPS 13 9315, i5-1230U | |
| AIDA64 / FP32 Ray-Trace | |
| Media della classe Subnotebook (1135 - 32888, n=57, ultimi 2 anni) | |
| Asus Zenbook S 13 OLED | |
| Huawei MateBook 13s i5 11300H | |
| Lenovo ThinkPad X1 Nano-20UN002UGE | |
| Dell XPS 13 Plus 9320 4K | |
| Dell XPS 13 Plus 9320 i5-1240p | |
| Media Intel Core i5-1230U (2344 - 6360, n=3) | |
| Dell XPS 13 9315, i5-1230U | |
| AIDA64 / FPU Julia | |
| Asus Zenbook S 13 OLED | |
| Media della classe Subnotebook (5218 - 123315, n=57, ultimi 2 anni) | |
| Huawei MateBook 13s i5 11300H | |
| Lenovo ThinkPad X1 Nano-20UN002UGE | |
| Dell XPS 13 Plus 9320 4K | |
| Dell XPS 13 Plus 9320 i5-1240p | |
| Media Intel Core i5-1230U (11867 - 31714, n=3) | |
| Dell XPS 13 9315, i5-1230U | |
| AIDA64 / CPU SHA3 | |
| Media della classe Subnotebook (444 - 5287, n=57, ultimi 2 anni) | |
| Asus Zenbook S 13 OLED | |
| Huawei MateBook 13s i5 11300H | |
| Lenovo ThinkPad X1 Nano-20UN002UGE | |
| Dell XPS 13 Plus 9320 4K | |
| Dell XPS 13 Plus 9320 i5-1240p | |
| Media Intel Core i5-1230U (772 - 1711, n=3) | |
| Dell XPS 13 9315, i5-1230U | |
| AIDA64 / CPU Queen | |
| Asus Zenbook S 13 OLED | |
| Dell XPS 13 Plus 9320 4K | |
| Dell XPS 13 Plus 9320 i5-1240p | |
| Media della classe Subnotebook (10579 - 95002, n=47, ultimi 2 anni) | |
| Dell XPS 13 9315, i5-1230U | |
| Huawei MateBook 13s i5 11300H | |
| Media Intel Core i5-1230U (30824 - 52533, n=3) | |
| Lenovo ThinkPad X1 Nano-20UN002UGE | |
| AIDA64 / FPU SinJulia | |
| Asus Zenbook S 13 OLED | |
| Media della classe Subnotebook (744 - 18418, n=57, ultimi 2 anni) | |
| Dell XPS 13 Plus 9320 4K | |
| Dell XPS 13 Plus 9320 i5-1240p | |
| Huawei MateBook 13s i5 11300H | |
| Lenovo ThinkPad X1 Nano-20UN002UGE | |
| Media Intel Core i5-1230U (2269 - 3947, n=3) | |
| Dell XPS 13 9315, i5-1230U | |
| AIDA64 / FPU Mandel | |
| Asus Zenbook S 13 OLED | |
| Media della classe Subnotebook (3341 - 65433, n=57, ultimi 2 anni) | |
| Huawei MateBook 13s i5 11300H | |
| Lenovo ThinkPad X1 Nano-20UN002UGE | |
| Dell XPS 13 Plus 9320 i5-1240p | |
| Dell XPS 13 Plus 9320 4K | |
| Media Intel Core i5-1230U (6379 - 15896, n=3) | |
| Dell XPS 13 9315, i5-1230U | |
| AIDA64 / CPU AES | |
| Asus Zenbook S 13 OLED | |
| Huawei MateBook 13s i5 11300H | |
| Lenovo ThinkPad X1 Nano-20UN002UGE | |
| Media della classe Subnotebook (638 - 96917, n=57, ultimi 2 anni) | |
| Dell XPS 13 Plus 9320 i5-1240p | |
| Dell XPS 13 Plus 9320 4K | |
| Media Intel Core i5-1230U (18011 - 31941, n=3) | |
| Dell XPS 13 9315, i5-1230U | |
| AIDA64 / CPU ZLib | |
| Media della classe Subnotebook (164.9 - 1379, n=57, ultimi 2 anni) | |
| Dell XPS 13 Plus 9320 4K | |
| Dell XPS 13 Plus 9320 i5-1240p | |
| Asus Zenbook S 13 OLED | |
| Huawei MateBook 13s i5 11300H | |
| Media Intel Core i5-1230U (229 - 495, n=3) | |
| Lenovo ThinkPad X1 Nano-20UN002UGE | |
| Dell XPS 13 9315, i5-1230U | |
| AIDA64 / FP64 Ray-Trace | |
| Media della classe Subnotebook (610 - 17495, n=57, ultimi 2 anni) | |
| Asus Zenbook S 13 OLED | |
| Huawei MateBook 13s i5 11300H | |
| Lenovo ThinkPad X1 Nano-20UN002UGE | |
| Dell XPS 13 Plus 9320 4K | |
| Dell XPS 13 Plus 9320 i5-1240p | |
| Media Intel Core i5-1230U (1328 - 3305, n=3) | |
| Dell XPS 13 9315, i5-1230U | |
| AIDA64 / CPU PhotoWorxx | |
| Media della classe Subnotebook (6569 - 85600, n=57, ultimi 2 anni) | |
| Dell XPS 13 Plus 9320 4K | |
| Dell XPS 13 Plus 9320 i5-1240p | |
| Lenovo ThinkPad X1 Nano-20UN002UGE | |
| Huawei MateBook 13s i5 11300H | |
| Media Intel Core i5-1230U (17516 - 37042, n=3) | |
| Asus Zenbook S 13 OLED | |
| Dell XPS 13 9315, i5-1230U | |
Prestazioni del sistema
Sorprendentemente, le prestazioni dell'applicazione non sono così scarse come le prestazioni di calcolo eAlder-Lake-U è invece a volte leggermente inferiore e a volte leggermente superiore alla media, a seconda della categoria. Il deficit rispetto alle varianti XPS 13 Plus 9320 i5 e i7 è più che significativo nella maggior parte dei punteggi dei componenti. Il punteggio relativo alla creazione di contenuti digitali mostra l'influenza dell'unità SSD: Con Samsung (1 TB), l'XPS è ai vertici, con Micron (512 GB) agli ultimi posti.
CrossMark: Overall | Productivity | Creativity | Responsiveness
| PCMark 10 / Score | |
| Media della classe Subnotebook (4920 - 9939, n=46, ultimi 2 anni) | |
| Asus Zenbook S 13 OLED | |
| Dell XPS 13 Plus 9320 4K | |
| Huawei MateBook 13s i5 11300H | |
| Dell XPS 13 Plus 9320 i5-1240p | |
| Dell XPS 13 9315, i5-1230U | |
| Lenovo ThinkPad X1 Nano-20UN002UGE | |
| Media Intel Core i5-1230U, Intel Iris Xe Graphics G7 80EUs (4001 - 4943, n=3) | |
| PCMark 10 / Essentials | |
| Asus Zenbook S 13 OLED | |
| Media della classe Subnotebook (8552 - 11646, n=46, ultimi 2 anni) | |
| Dell XPS 13 Plus 9320 4K | |
| Dell XPS 13 9315, i5-1230U | |
| Huawei MateBook 13s i5 11300H | |
| Lenovo ThinkPad X1 Nano-20UN002UGE | |
| Media Intel Core i5-1230U, Intel Iris Xe Graphics G7 80EUs (8348 - 10139, n=3) | |
| Dell XPS 13 Plus 9320 i5-1240p | |
| PCMark 10 / Productivity | |
| Media della classe Subnotebook (5435 - 16606, n=46, ultimi 2 anni) | |
| Asus Zenbook S 13 OLED | |
| Dell XPS 13 Plus 9320 4K | |
| Dell XPS 13 Plus 9320 i5-1240p | |
| Dell XPS 13 9315, i5-1230U | |
| Huawei MateBook 13s i5 11300H | |
| Media Intel Core i5-1230U, Intel Iris Xe Graphics G7 80EUs (5735 - 6692, n=3) | |
| Lenovo ThinkPad X1 Nano-20UN002UGE | |
| PCMark 10 / Digital Content Creation | |
| Media della classe Subnotebook (5722 - 13779, n=46, ultimi 2 anni) | |
| Asus Zenbook S 13 OLED | |
| Dell XPS 13 Plus 9320 4K | |
| Dell XPS 13 Plus 9320 i5-1240p | |
| Huawei MateBook 13s i5 11300H | |
| Lenovo ThinkPad X1 Nano-20UN002UGE | |
| Dell XPS 13 9315, i5-1230U | |
| Media Intel Core i5-1230U, Intel Iris Xe Graphics G7 80EUs (3632 - 4833, n=3) | |
| CrossMark / Overall | |
| Media della classe Subnotebook (365 - 2356, n=59, ultimi 2 anni) | |
| Dell XPS 13 Plus 9320 4K | |
| Asus Zenbook S 13 OLED | |
| Dell XPS 13 Plus 9320 i5-1240p | |
| Apple MacBook Air 2020 M1 Entry | |
| Huawei MateBook 13s i5 11300H | |
| Dell XPS 13 9315, i5-1230U | |
| Media Intel Core i5-1230U, Intel Iris Xe Graphics G7 80EUs (1117 - 1383, n=3) | |
| CrossMark / Productivity | |
| Media della classe Subnotebook (364 - 2277, n=59, ultimi 2 anni) | |
| Dell XPS 13 Plus 9320 4K | |
| Asus Zenbook S 13 OLED | |
| Huawei MateBook 13s i5 11300H | |
| Dell XPS 13 Plus 9320 i5-1240p | |
| Dell XPS 13 9315, i5-1230U | |
| Media Intel Core i5-1230U, Intel Iris Xe Graphics G7 80EUs (1187 - 1356, n=3) | |
| Apple MacBook Air 2020 M1 Entry | |
| CrossMark / Creativity | |
| Media della classe Subnotebook (372 - 2743, n=59, ultimi 2 anni) | |
| Dell XPS 13 Plus 9320 4K | |
| Dell XPS 13 Plus 9320 i5-1240p | |
| Apple MacBook Air 2020 M1 Entry | |
| Asus Zenbook S 13 OLED | |
| Dell XPS 13 9315, i5-1230U | |
| Media Intel Core i5-1230U, Intel Iris Xe Graphics G7 80EUs (1095 - 1469, n=3) | |
| Huawei MateBook 13s i5 11300H | |
| CrossMark / Responsiveness | |
| Huawei MateBook 13s i5 11300H | |
| Dell XPS 13 Plus 9320 4K | |
| Media della classe Subnotebook (312 - 1854, n=59, ultimi 2 anni) | |
| Dell XPS 13 Plus 9320 i5-1240p | |
| Asus Zenbook S 13 OLED | |
| Dell XPS 13 9315, i5-1230U | |
| Media Intel Core i5-1230U, Intel Iris Xe Graphics G7 80EUs (990 - 1224, n=3) | |
| Apple MacBook Air 2020 M1 Entry | |
| PCMark 10 Score | 4633 punti | |
Aiuto | ||
| AIDA64 / Memory Copy | |
| Media della classe Subnotebook (14554 - 131023, n=57, ultimi 2 anni) | |
| Dell XPS 13 Plus 9320 4K | |
| Dell XPS 13 Plus 9320 i5-1240p | |
| Huawei MateBook 13s i5 11300H | |
| Dell XPS 13 9315, i5-1230U | |
| Media Intel Core i5-1230U (32539 - 60944, n=3) | |
| Asus Zenbook S 13 OLED | |
| Lenovo ThinkPad X1 Nano-20UN002UGE | |
| AIDA64 / Memory Read | |
| Media della classe Subnotebook (15948 - 127174, n=57, ultimi 2 anni) | |
| Dell XPS 13 Plus 9320 i5-1240p | |
| Dell XPS 13 Plus 9320 4K | |
| Dell XPS 13 9315, i5-1230U | |
| Huawei MateBook 13s i5 11300H | |
| Media Intel Core i5-1230U (31342 - 60435, n=3) | |
| Lenovo ThinkPad X1 Nano-20UN002UGE | |
| Asus Zenbook S 13 OLED | |
| AIDA64 / Memory Write | |
| Media della classe Subnotebook (15709 - 135141, n=57, ultimi 2 anni) | |
| Dell XPS 13 Plus 9320 4K | |
| Dell XPS 13 9315, i5-1230U | |
| Dell XPS 13 Plus 9320 i5-1240p | |
| Huawei MateBook 13s i5 11300H | |
| Media Intel Core i5-1230U (33224 - 65665, n=3) | |
| Lenovo ThinkPad X1 Nano-20UN002UGE | |
| Asus Zenbook S 13 OLED | |
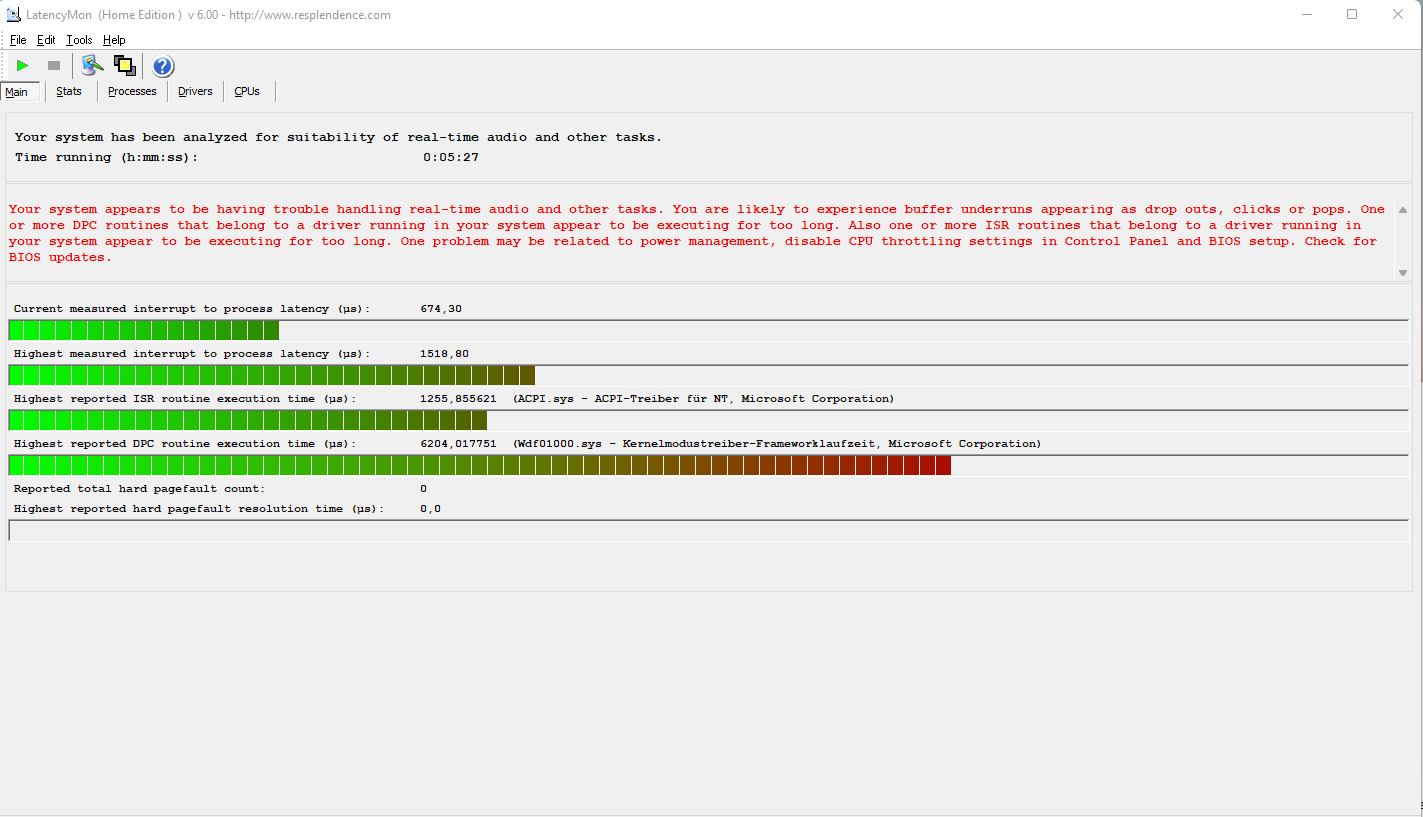
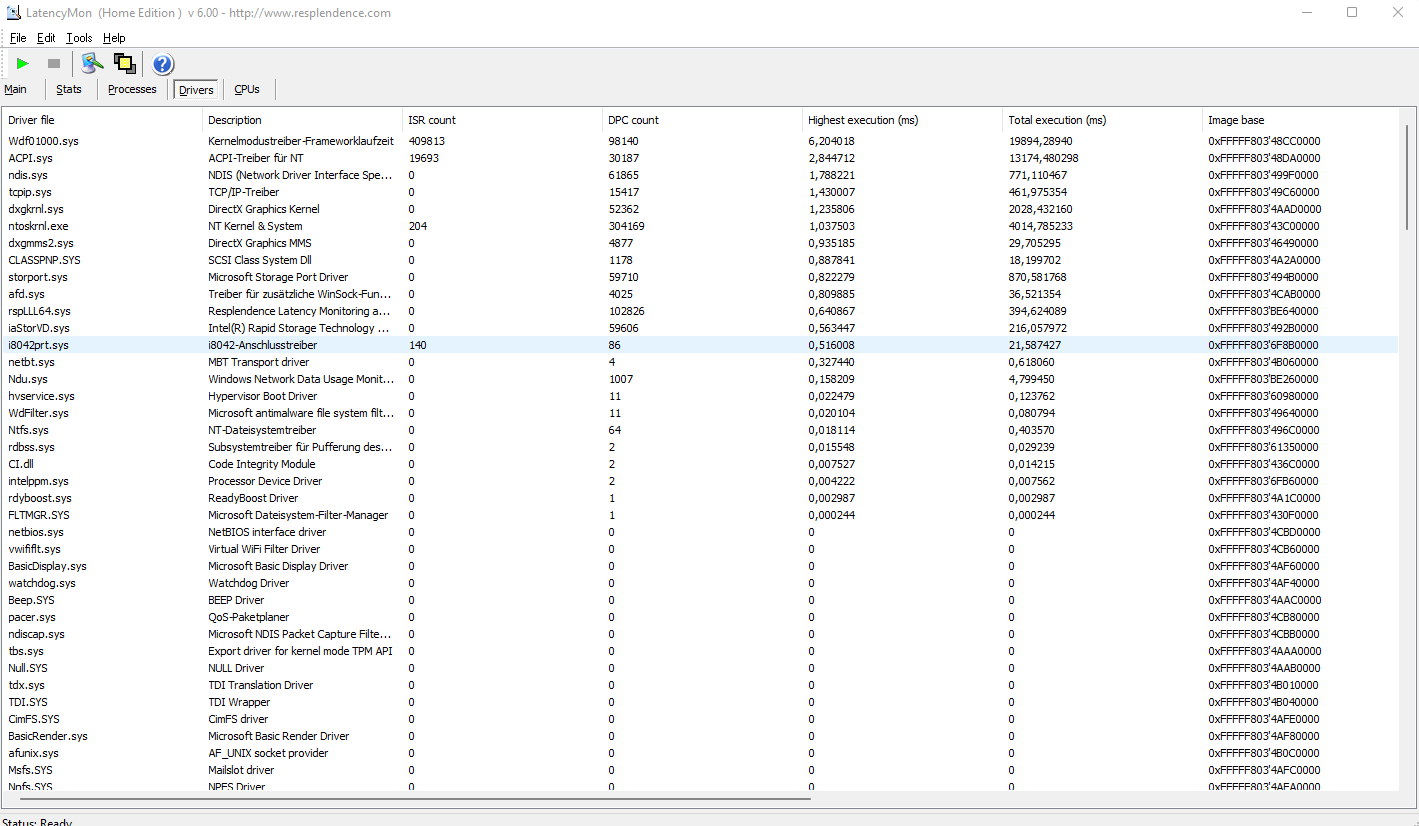
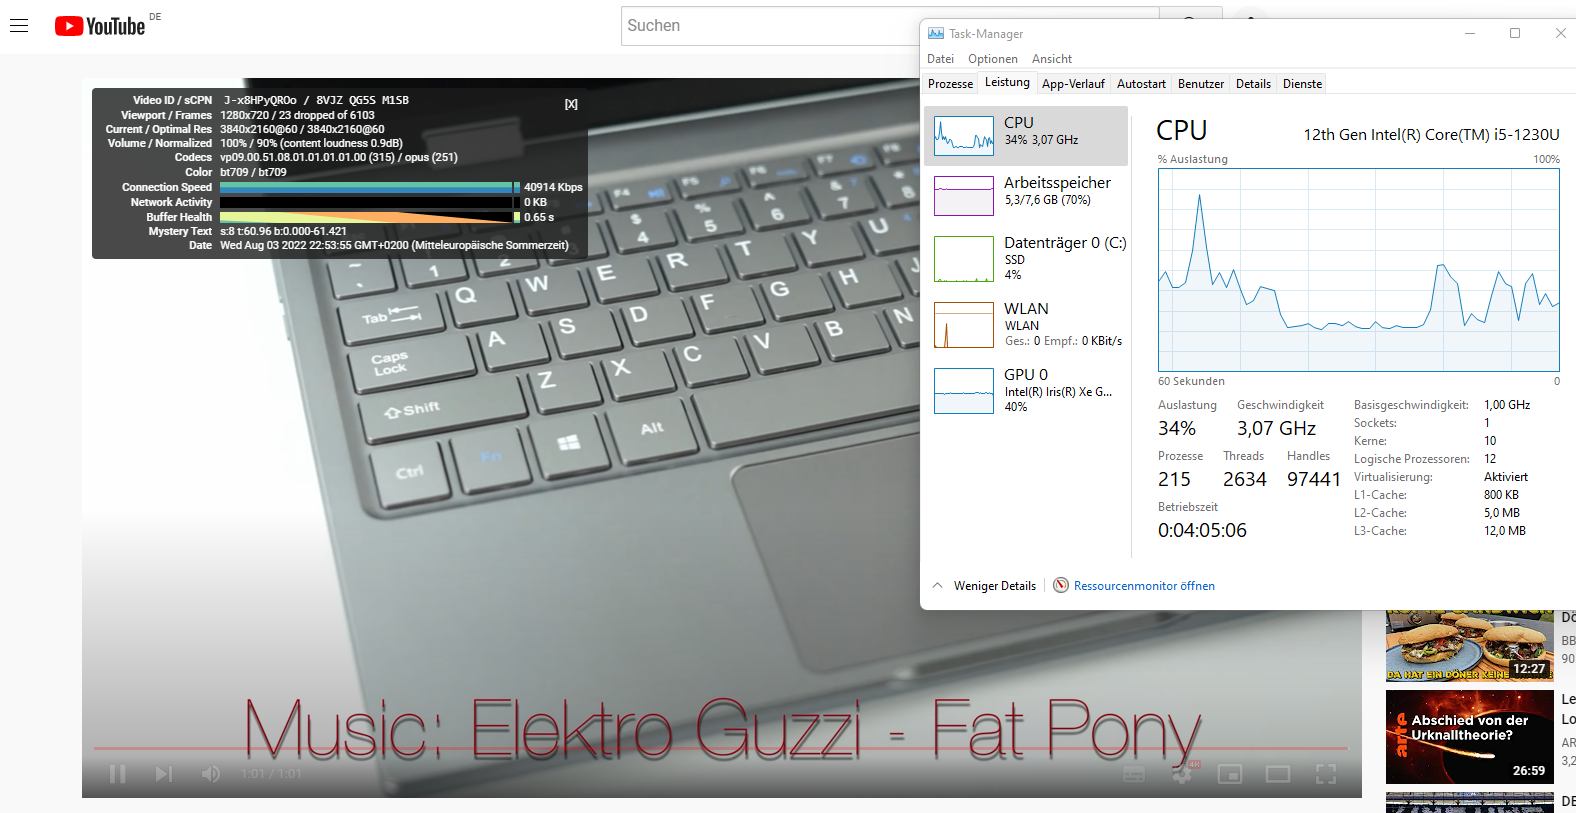
Latenze DPC
L'XPS 13 non ha sotto controllo le sue latenze DPC che, allo stato attuale dei driver e dell'hardware, superano quelle di tutti i concorrenti. Il driver in modalità kernel è il più importante, mentre l'ACPI è il secondo più vicino. L'editing audio e video in tempo reale non è quindi possibile con l'unità Alder Lake-U XPS. Abbiamo riscontrato problemi di perdita di fotogrammi durante la riproduzione di video YouTube 4K. La riproduzione del video citato comporta un carico dell'iGPU di circa il 46%.
| DPC Latencies / LatencyMon - interrupt to process latency (max), Web, Youtube, Prime95 | |
| Dell XPS 13 9315, i5-1230U | |
| Dell XPS 13 Plus 9320 i5-1240p | |
| Lenovo ThinkPad X1 Nano-20UN002UGE | |
| Huawei MateBook 13s i5 11300H | |
| Dell XPS 13 Plus 9320 4K | |
| Asus Zenbook S 13 OLED | |
* ... Meglio usare valori piccoli
Soluzione di stoccaggio
Dell utilizza un'unità SSD di Micron. L'unità SSD non è disponibile nel fattore di forma M.2 a slot, ma come modello fisso onboard. Secondo Micron, l'unità SSD supporta PCIe Gen4. L'XPS 13 Plus utilizza chip M.2-2280 Samsung. Il nostro dispositivo di prova ha una capacità di archiviazione di soli 256 GB, di cui solo 123 GB sono disponibili per gli utenti dopo la configurazione iniziale.
Il modello di Micron si posiziona sempre all'ultimo posto nei nostri benchmark di archiviazione e si colloca molto al di sotto di quanto Phison Electronics e i chip Samsung sono in grado di ottenere nei laptop della concorrenza e nell'XPS 13 Plus di Dell. La distinzione è ancora una volta chiara: se le prestazioni sono quelle che cercate, l'XPS 13 Plus è la strada da percorrere.
Ulteriori confronti e benchmark sono disponibili nella nostra tabella di confronto.

* ... Meglio usare valori piccoli
Disk Throttling: DiskSpd Read Loop, Queue Depth 8
Prestazioni della GPU
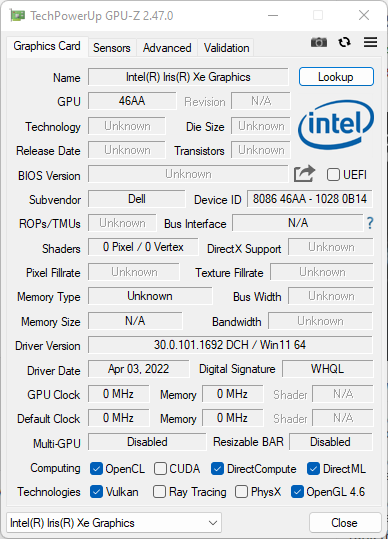
Le CPU Alder Lake si affidano ancora alla ben nota Grafica Iris Xe G7 introdotta per la prima volta con i processori Tiger Lake. Tuttavia, le prestazioni sono più lente e l'Iris Xe nel nostro dispositivo di test arriva ultima in tutti i benchmark. La Iris Xe Graphics G7 80EUs è una scelta popolare di iGPU con prestazioni inferiori in questo caso. Il deficit rispetto alla Iris Xe Graphics G7 96EUs (Alder Lake P, XPS 13 Plus) è compreso tra il 20 e l'80%.
| 3DMark 06 Standard Score | 15617 punti | |
| 3DMark 11 Performance | 4260 punti | |
| 3DMark Cloud Gate Standard Score | 14350 punti | |
| 3DMark Fire Strike Score | 3048 punti | |
| 3DMark Time Spy Score | 1053 punti | |
Aiuto | ||
Prestazioni di gioco
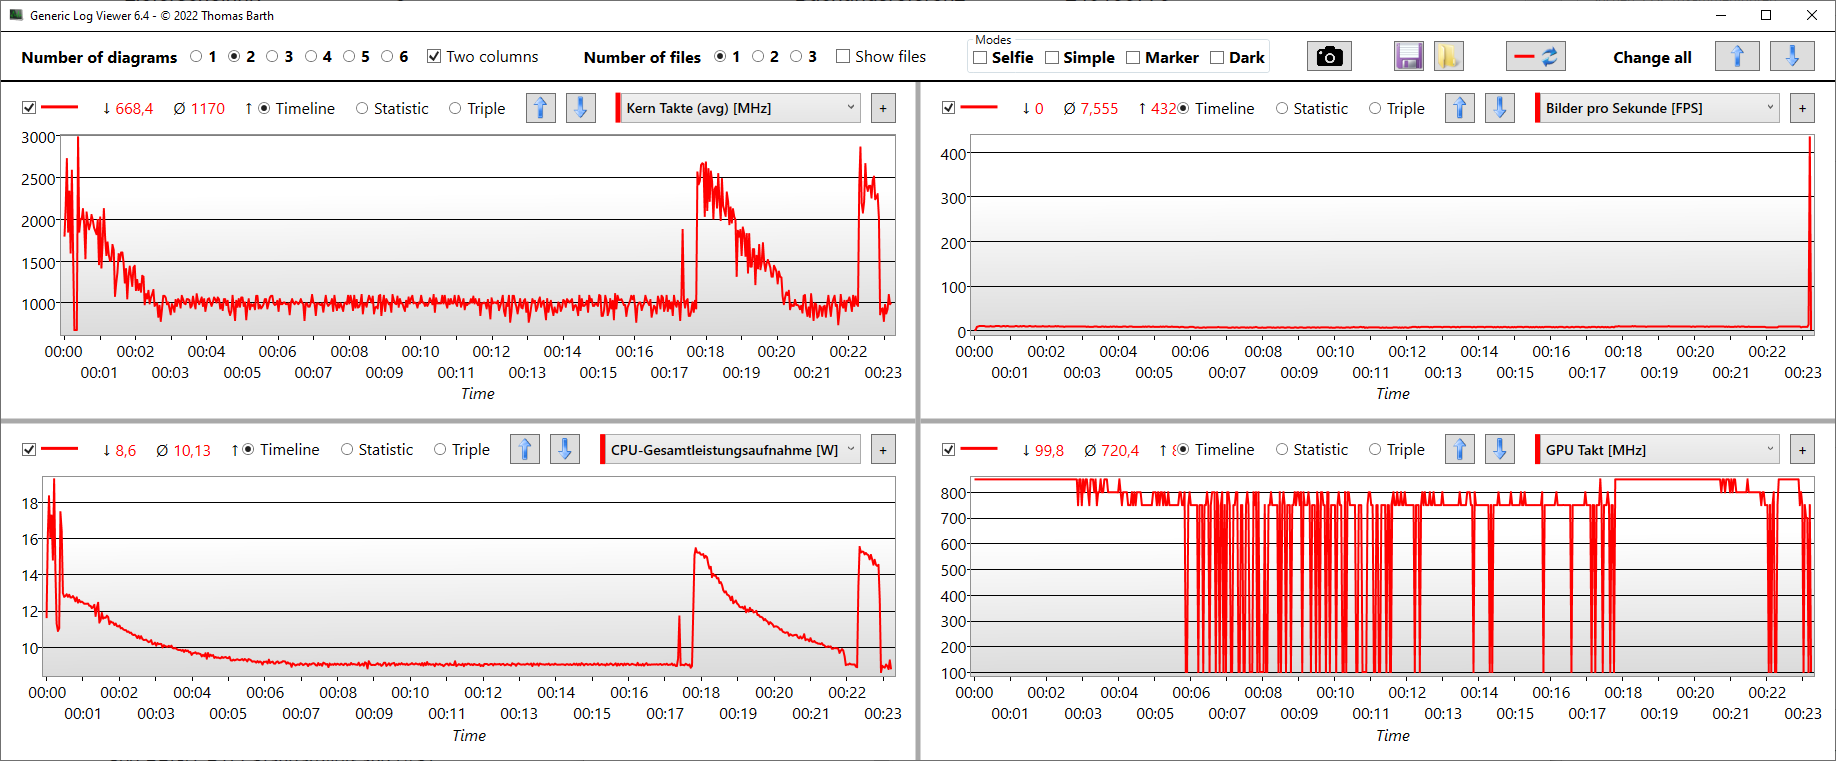
L'XPS 13 non è adatto ai giochi e abbiamo riscontrato glitch visivi e crash in titoli del 2022 come Ghostwire Tokyo. Come mostra il grafico degli FPS, sia gli FPS che le velocità di clock dell'iGPU (100-800 MHz) fluttuano in modo anomalo. Essendo più che sufficiente per i video ad alta risoluzione, la Iris Xe Graphics è comunque adatta all'uso multimediale quotidiano. Le prestazioni della GPU sono leggermente limitate in modalità batteria. AltroI benchmark della GPU sono disponibili qui.
| Ghostwire Tokyo - 1920x1080 Low Settings | |
| Dell XPS 13 9315, i5-1230U | |
| Media Intel Iris Xe Graphics G7 80EUs (13.5 - 25.8, n=2) | |
Witcher 3 FPS Graph
| basso | medio | alto | ultra | |
|---|---|---|---|---|
| GTA V (2015) | 31 | 10 | ||
| The Witcher 3 (2015) | 67 | 47 | 22 | 8 |
| Final Fantasy XV Benchmark (2018) | 18.9 | 10.8 | 5.24 | |
| Far Cry 5 (2018) | 22 | 14 | ||
| Strange Brigade (2018) | 47.5 | 6 | 17.8 | |
| Ghostwire Tokyo (2022) | 25 gravi problemi grafici (out of video memory) | 19 gravi problemi grafici (out of video memory) |
Emissioni - Il processore Alder Lake più economico
Rumore del sistema
In scenari poco impegnativi, la singola ventola spesso rimane al minimo e anche quando è attiva, il suo vortice è appena percettibile. Questo è il caso della maggior parte delle attività quotidiane, come la navigazione sul Web, la sincronizzazione delle immagini di One Drive o la riproduzione di video. In situazioni più impegnative, il rumore si fa sentire rapidamente. Abbiamo misurato un massimo di 39,5 dB(A) durante il nostro stress test e quando l'utilizzo della CPU è elevato. Almeno il rumore della ventola, molto evidente, non è aggravato da un tono fastidioso.
Rumorosità
| Idle |
| 26 / 26 / 27.5 dB(A) |
| Sotto carico |
| 39.5 / 39.6 dB(A) |
 | ||
30 dB silenzioso 40 dB(A) udibile 50 dB(A) rumoroso |
||
min: | ||
| Dell XPS 13 9315, i5-1230U Iris Xe G7 80EUs, i5-1230U, Micron 3460 256 GB Soldered | Dell XPS 13 Plus 9320 4K Iris Xe G7 96EUs, i7-1260P, Samsung PM9A1 MZVL21T0HCLR | Dell XPS 13 Plus 9320 i5-1240p Iris Xe G7 80EUs, i5-1240P, Micron 3400 MTFDKBA512TFH 512GB | Asus Zenbook S 13 OLED Radeon 680M, R7 6800U, Samsung PM9A1 MZVL21T0HCLR | Lenovo ThinkPad X1 Nano-20UN002UGE Iris Xe G7 96EUs, i7-1160G7, WDC PC SN530 SDBPNPZ-512G | Huawei MateBook 13s i5 11300H Iris Xe G7 80EUs, i5-11300H, Phison Electronics PS5012 | |
|---|---|---|---|---|---|---|
| Noise | -1% | -2% | 7% | 3% | 5% | |
| off /ambiente * (dB) | 26 | 24.4 6% | 26 -0% | 24 8% | 24.9 4% | 24.5 6% |
| Idle Minimum * (dB) | 26 | 24.4 6% | 26.2 -1% | 24 8% | 24.9 4% | 24.5 6% |
| Idle Average * (dB) | 26 | 24.4 6% | 26.2 -1% | 24 8% | 26.3 -1% | 24.5 6% |
| Idle Maximum * (dB) | 27.5 | 25.5 7% | 26.2 5% | 24 13% | 31.8 -16% | 28 -2% |
| Load Average * (dB) | 39.5 | 40.4 -2% | 38.4 3% | 33.1 16% | 34.3 13% | 35.9 9% |
| Witcher 3 ultra * (dB) | 39.6 | 45.5 -15% | 40.2 -2% | 34.3 13% | 35.9 9% | |
| Load Maximum * (dB) | 39.6 | 45.5 -15% | 47.1 -19% | 41.7 -5% | 37.5 5% | 38.6 3% |
* ... Meglio usare valori piccoli
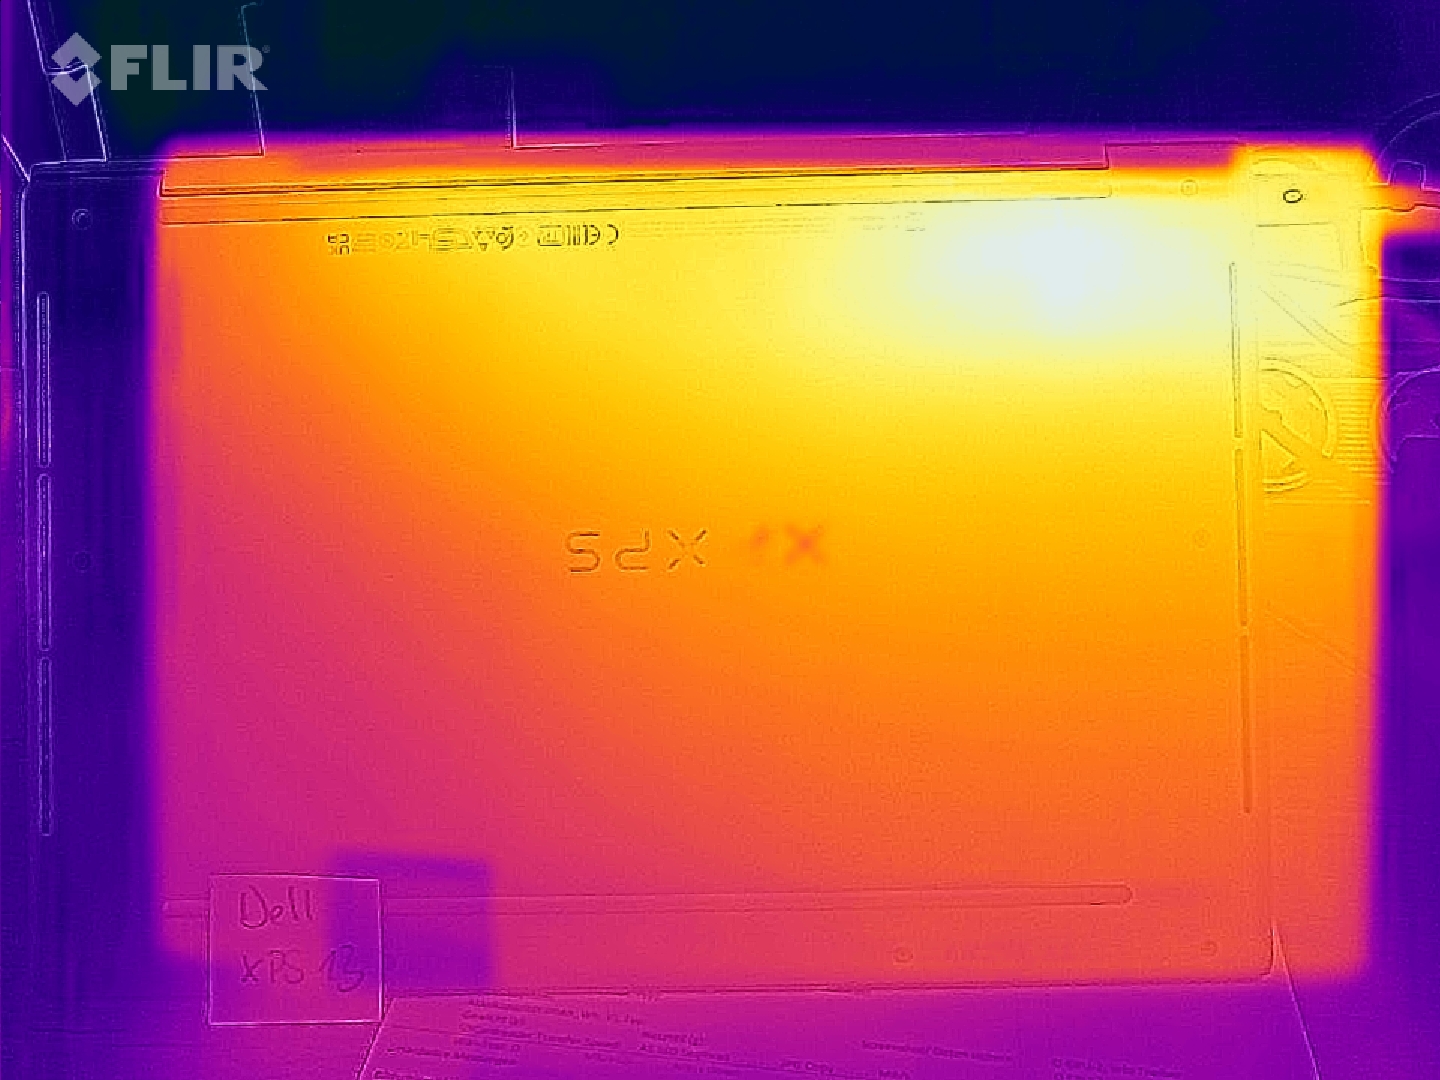
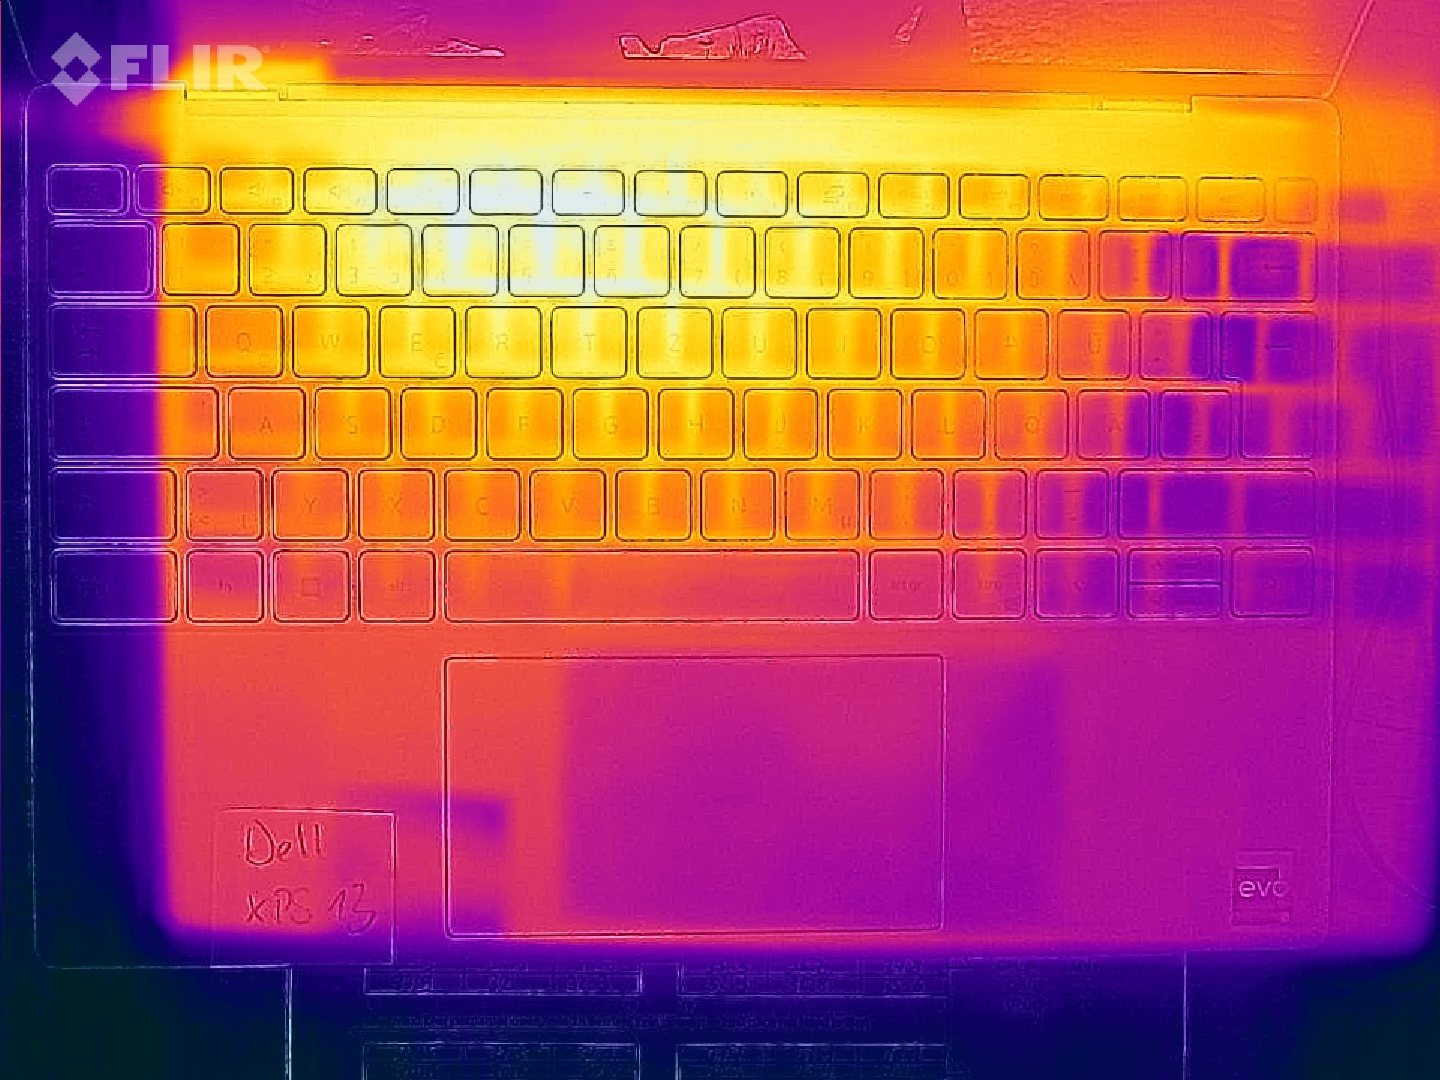
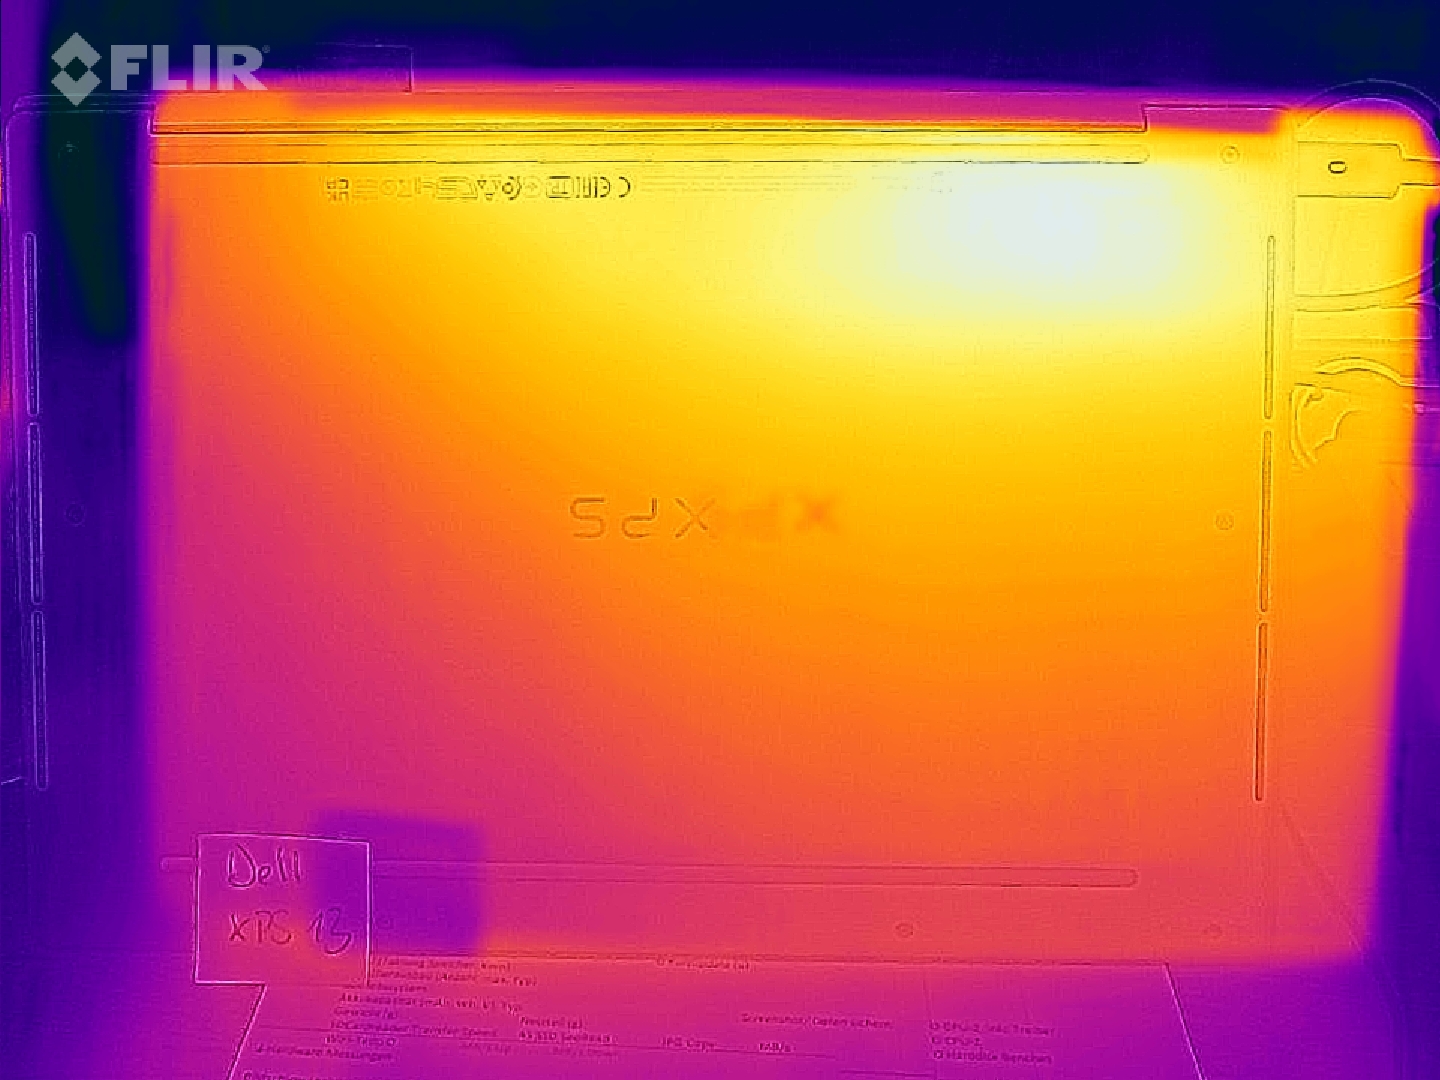
Temperatura
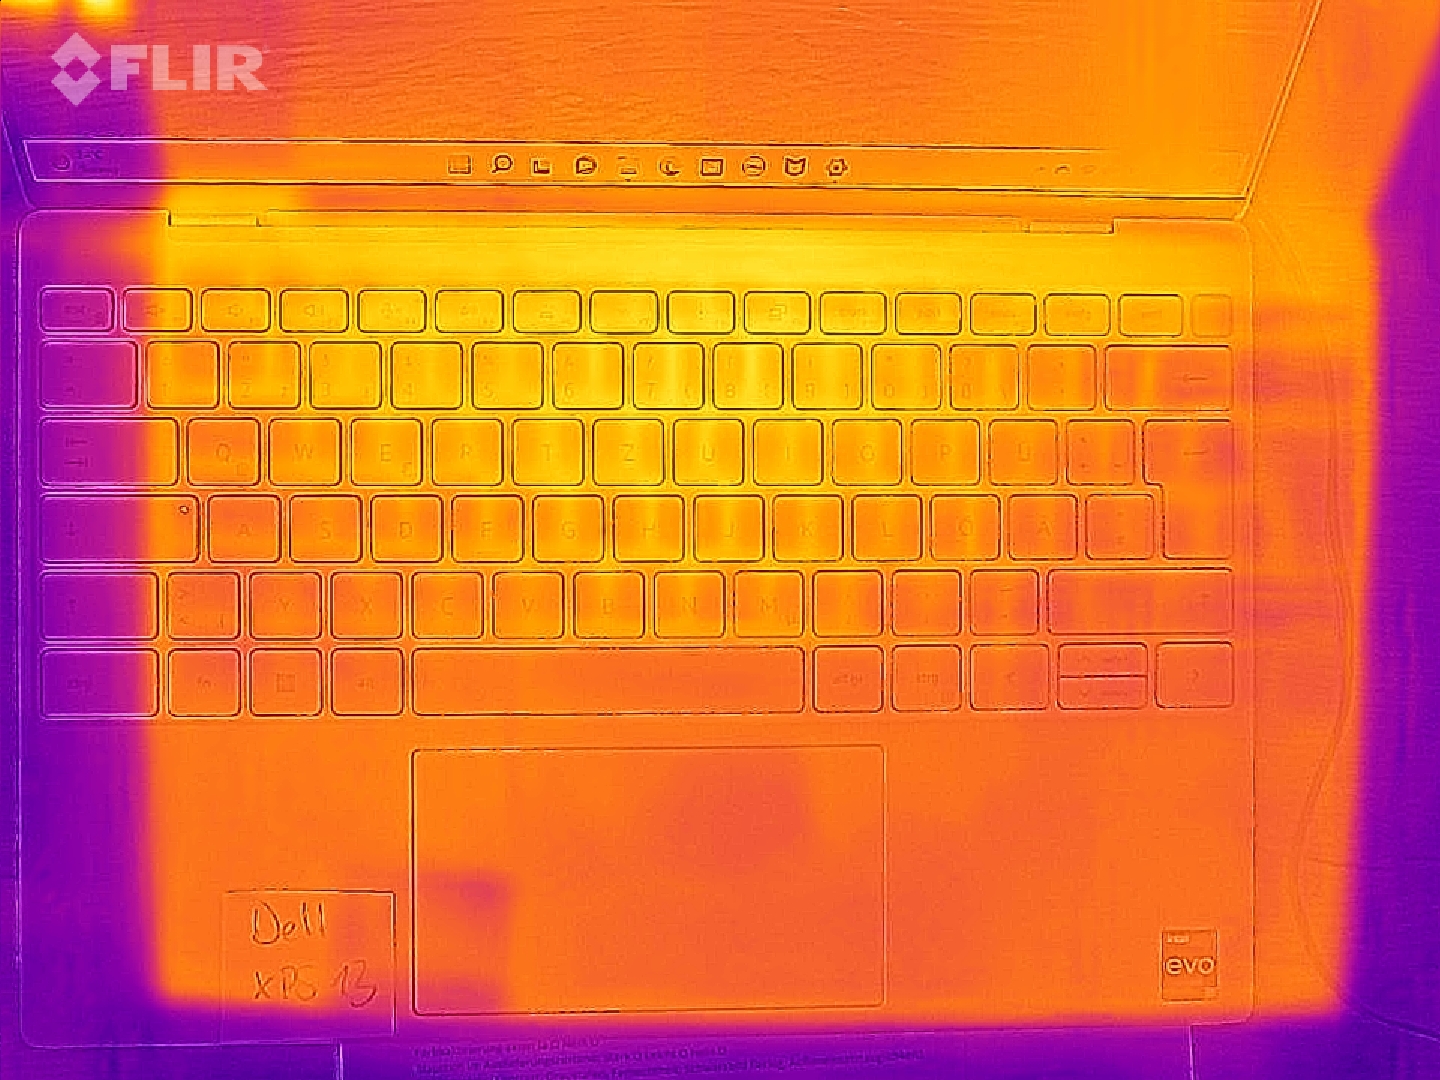
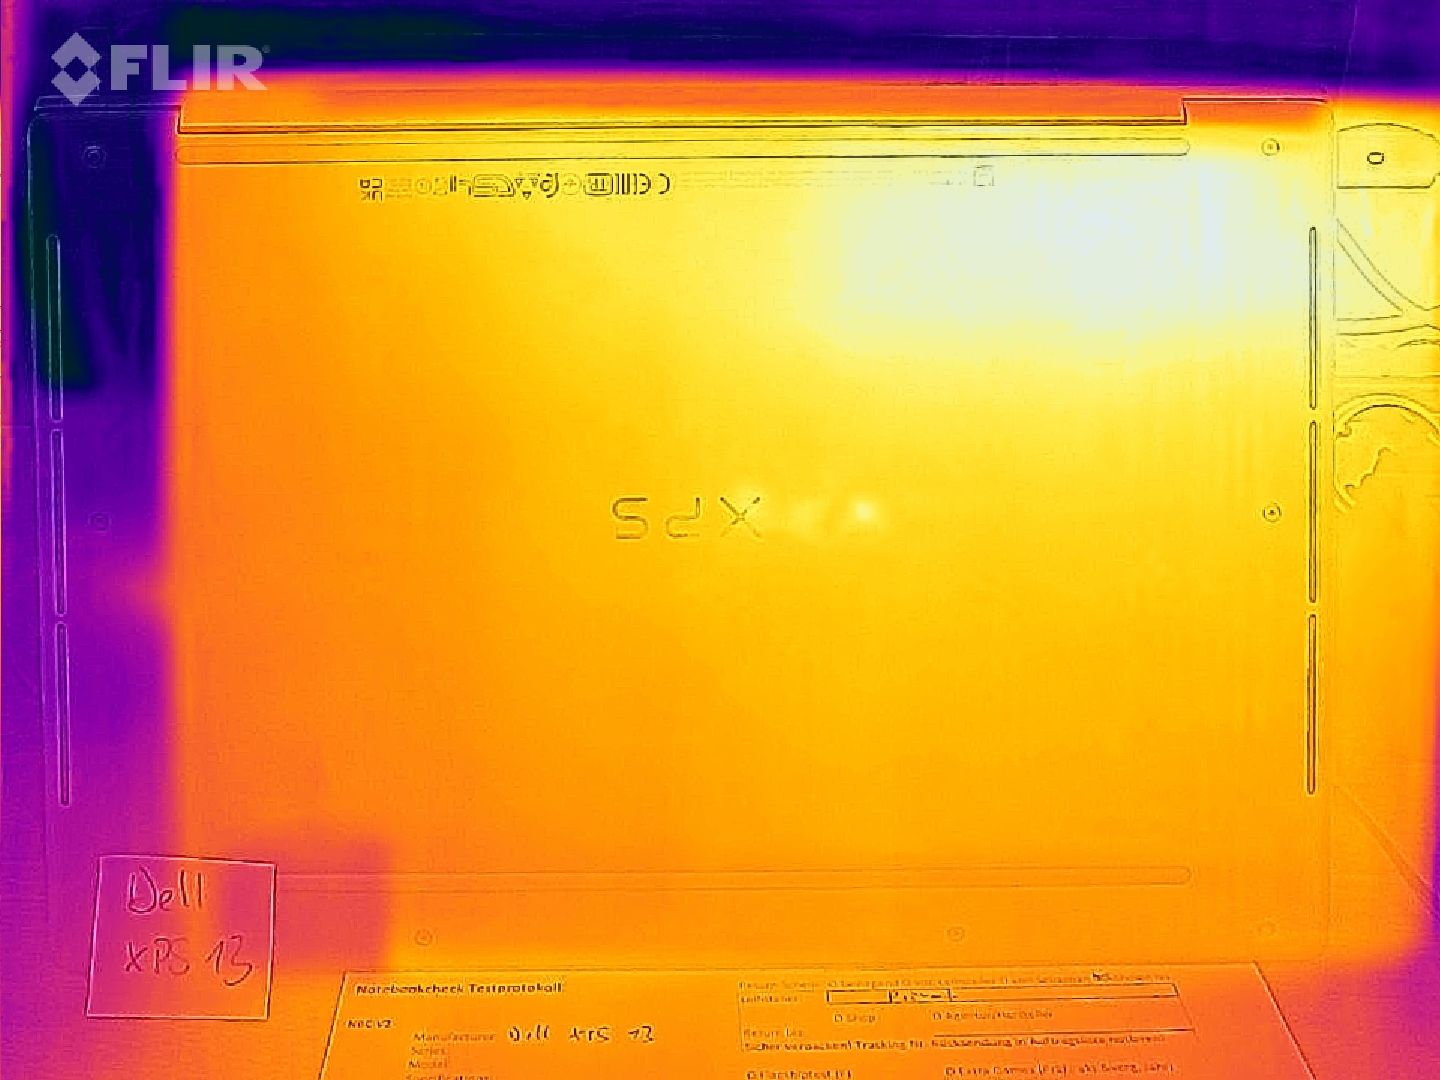
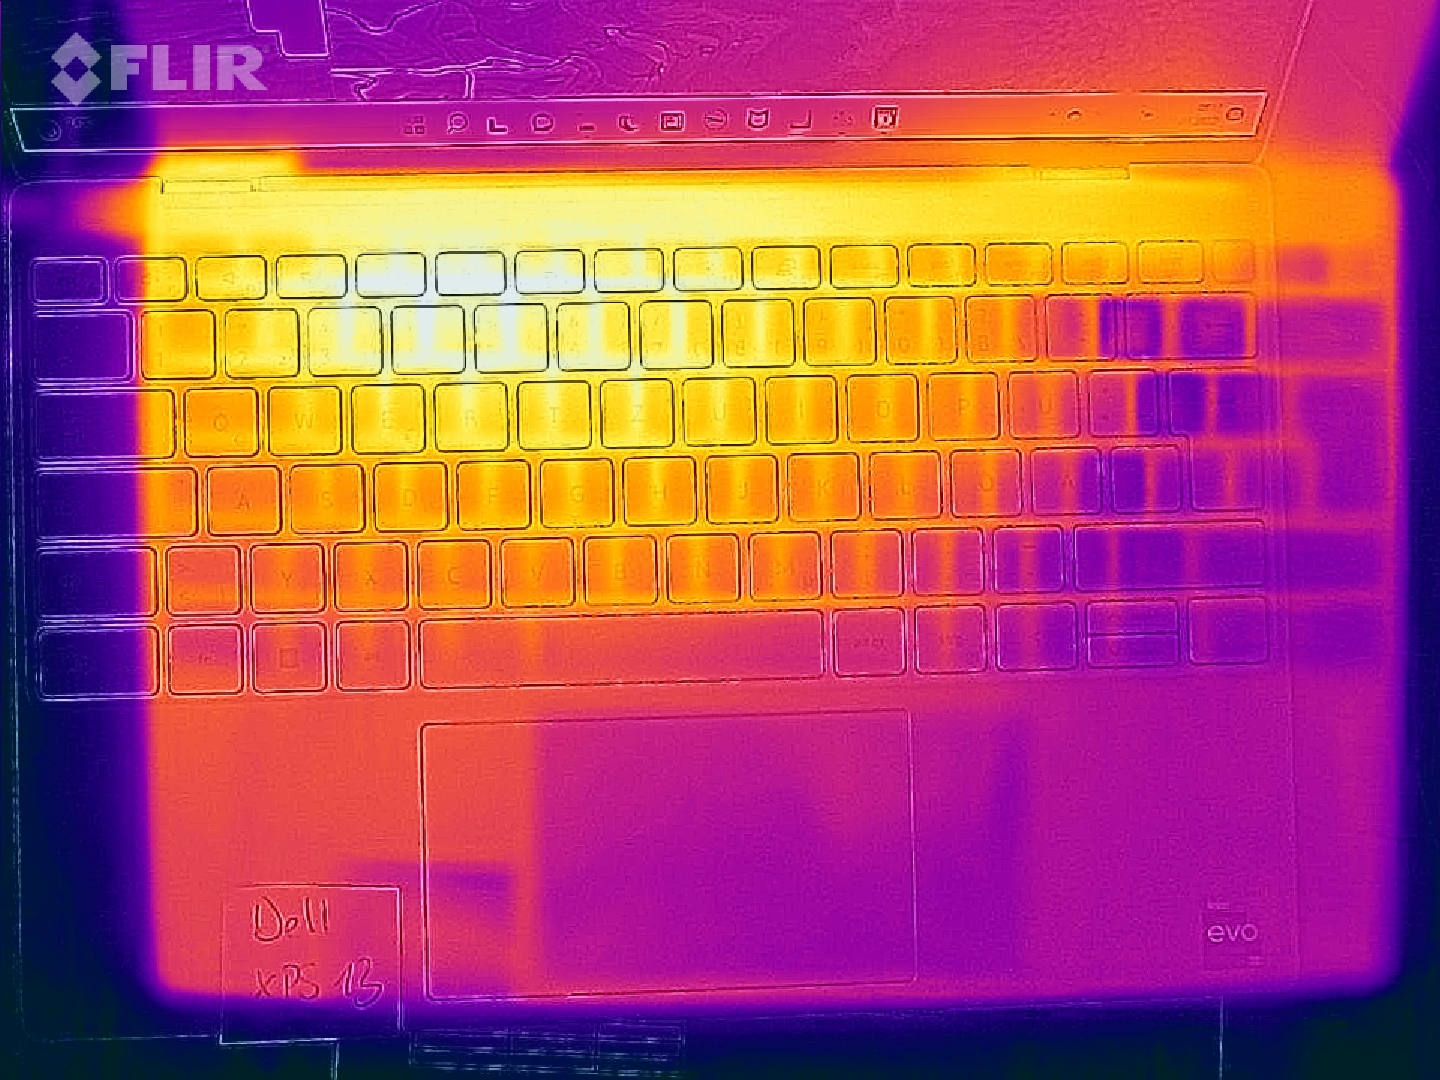
Il case dell'XPS 13 rimane piacevolmente fresco durante l'uso quotidiano e può essere appoggiato sulle gambe durante i viaggi senza alcun problema. In caso di carico prolungato e molto elevato o durante il gioco, la parte inferiore del dispositivo e la parte superiore della tastiera diventano particolarmente calde. I punti caldi sulla parte superiore e inferiore raggiungono rispettivamente 46 °C (114,8 °F) e 44 °C (111,2 °F). L'adattatore CA compatto da 45 watt raggiunge solo 42 °C (107,6 °F).
(±) La temperatura massima sul lato superiore è di 42.3 °C / 108 F, rispetto alla media di 35.9 °C / 97 F, che varia da 21.4 a 59 °C per questa classe Subnotebook.
(±) Il lato inferiore si riscalda fino ad un massimo di 44.9 °C / 113 F, rispetto alla media di 39.2 °C / 103 F
(+) In idle, la temperatura media del lato superiore è di 30.8 °C / 87 F, rispetto alla media deld ispositivo di 30.8 °C / 87 F.
(±) Riproducendo The Witcher 3, la temperatura media per il lato superiore e' di 36.5 °C / 98 F, rispetto alla media del dispositivo di 30.8 °C / 87 F.
(+) I poggiapolsi e il touchpad raggiungono la temperatura massima della pelle (34.4 °C / 93.9 F) e quindi non sono caldi.
(-) La temperatura media della zona del palmo della mano di dispositivi simili e'stata di 28.2 °C / 82.8 F (-6.2 °C / -11.1 F).
| Dell XPS 13 9315, i5-1230U Intel Core i5-1230U, Intel Iris Xe Graphics G7 80EUs | Dell XPS 13 Plus 9320 4K Intel Core i7-1260P, Intel Iris Xe Graphics G7 96EUs | Dell XPS 13 Plus 9320 i5-1240p Intel Core i5-1240P, Intel Iris Xe Graphics G7 80EUs | Apple MacBook Air 2020 M1 Entry Apple M1, Apple M1 7-Core GPU | Asus Zenbook S 13 OLED AMD Ryzen 7 6800U, AMD Radeon 680M | Lenovo ThinkPad X1 Nano-20UN002UGE Intel Core i7-1160G7, Intel Iris Xe Graphics G7 96EUs | Huawei MateBook 13s i5 11300H Intel Core i5-11300H, Intel Iris Xe Graphics G7 80EUs | |
|---|---|---|---|---|---|---|---|
| Heat | 8% | -17% | 11% | 2% | 13% | 12% | |
| Maximum Upper Side * (°C) | 42.3 | 41.1 3% | 47.6 -13% | 44 -4% | 47.9 -13% | 42.2 -0% | 42.8 -1% |
| Maximum Bottom * (°C) | 44.9 | 48.8 -9% | 57 -27% | 44 2% | 56.1 -25% | 47.5 -6% | 46.9 -4% |
| Idle Upper Side * (°C) | 32.5 | 28 14% | 38.8 -19% | 27 17% | 26.8 18% | 24.3 25% | 25.2 22% |
| Idle Bottom * (°C) | 38.2 | 29.3 23% | 41 -7% | 27 29% | 27.3 29% | 25.3 34% | 26 32% |
* ... Meglio usare valori piccoli
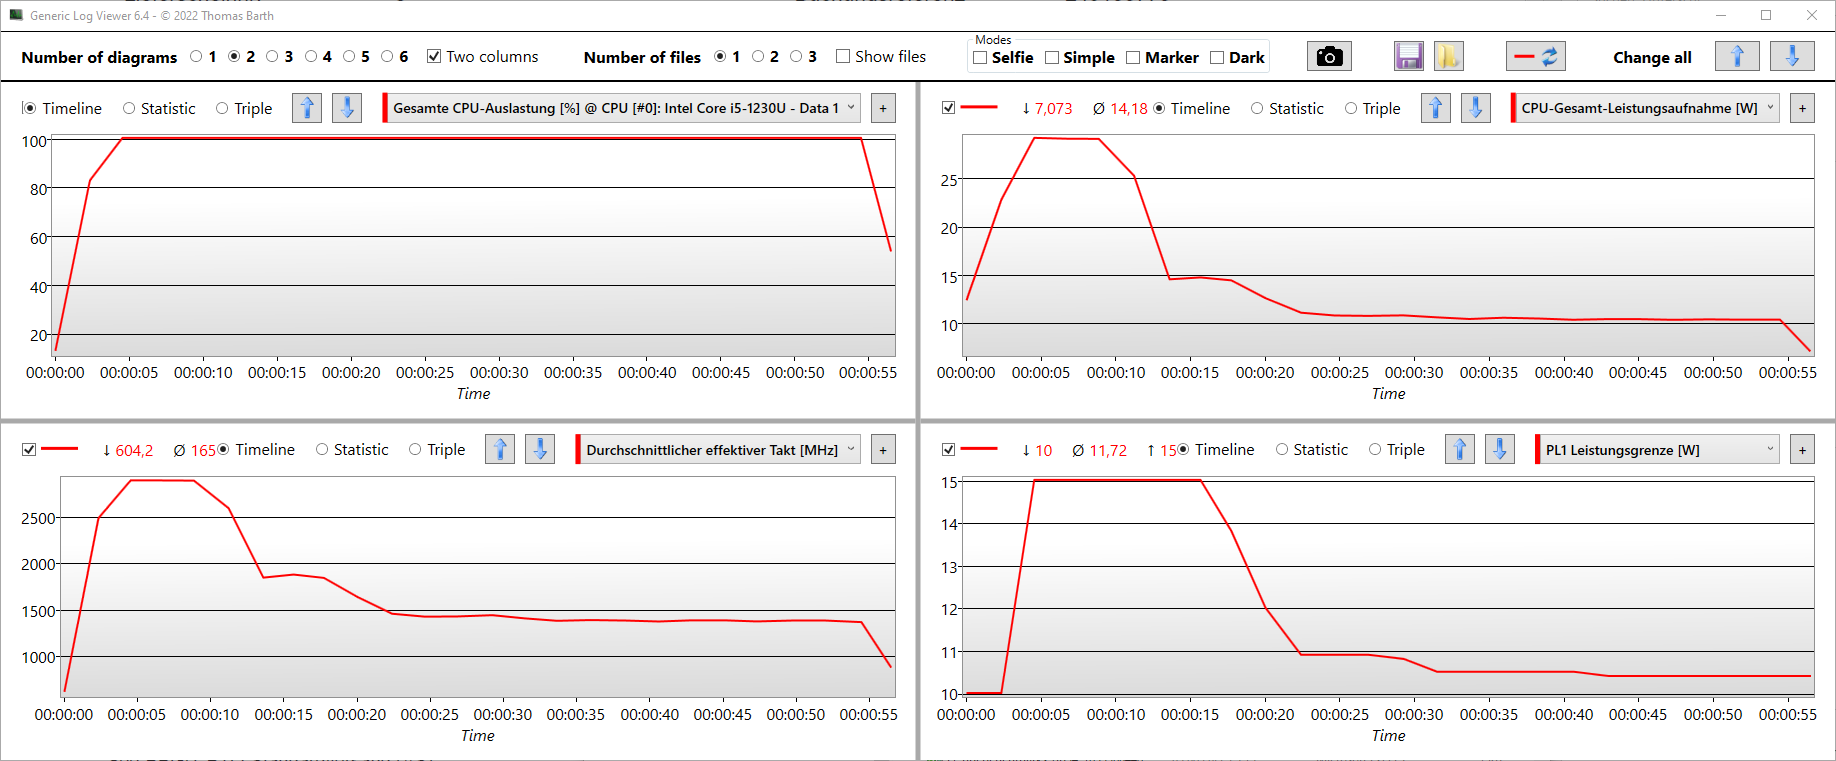
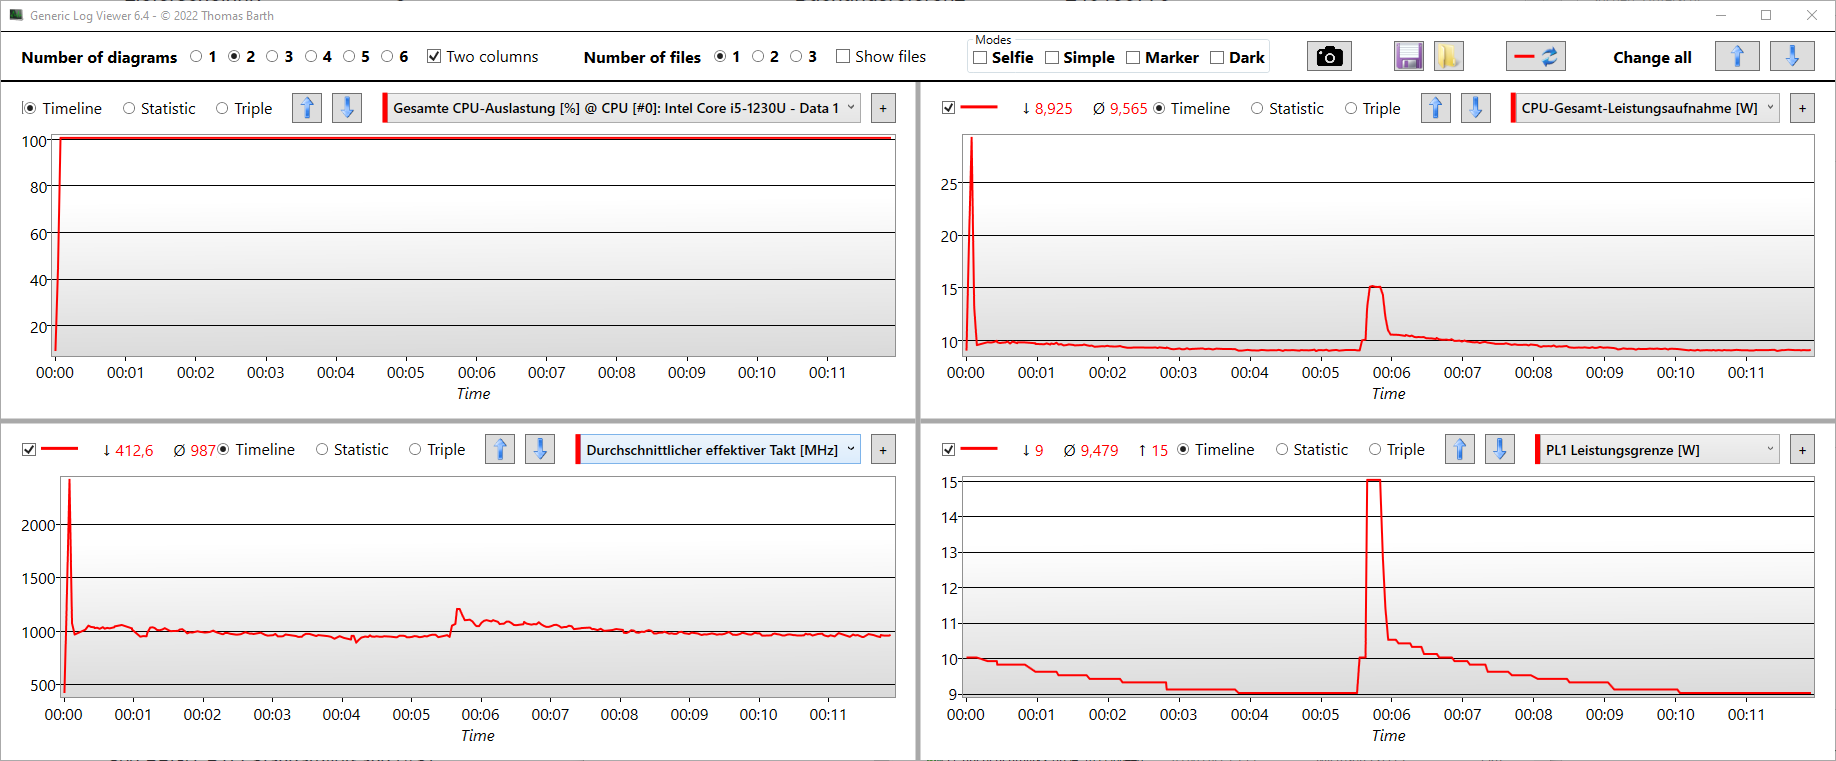
Stress test
La velocità di clock passa inizialmente a 2,5 GHz dopo pochi secondi, con un picco temporaneo di consumo di 29 watt (CPU). Successivamente, il consumo scende a meno di 10 watt grazie al throttling della velocità di clock a circa 1000 MHz. Durante il nostro stress test, Prime95 e FurMark vengono eseguiti in parallelo per stressare simultaneamente CPU e GPU. Ogni 5 minuti la CPU raggiunge temporaneamente un picco di consumo di 15 watt, anche se questo dura solo pochi secondi e le velocità di clock non aumentano in modo significativo.
Altoparlanti
Gli altoparlanti producono un suono eccellente che regge persino il confronto con gli altoparlanti dei grandi portatili da gioco. Il woofer e i tweeter sono combinati internamente, almeno per il lato destro e sinistro. I bassi sono adatti a giochi e film. Il livello di volume massimo è elevato, considerando le dimensioni ridotte del portatile. Inoltre, gli altoparlanti non distorcono a volume massimo.
Poiché il nostro XPS 13 non è più dotato di jack per le cuffie, il produttore ha incluso un dongle da tipo C a 3,5 mm. Considerando l'enorme quantità di cuffie Bluetooth presenti sul mercato, l'omissione della porta audio combinata potrebbe essere giustificata. Tuttavia, questa soluzione occupa una porta di tipo C, mentre l'altra viene potenzialmente utilizzata per la ricarica.
Le voci catturate dai microfoni bidirezionali sopra la webcam hanno un suono quasi cristallino e rimangono omogenee anche cambiando la distanza tra l'utente e il microfono. È un'ottima soluzione per le videochiamate. Il microfono può essere disattivato tramite una scorciatoia Fn.
Dell XPS 13 9315, i5-1230U analisi audio
(±) | potenza degli altiparlanti media ma buona (81.81 dB)
Bassi 100 - 315 Hz
(±) | bassi ridotti - in media 11.6% inferiori alla media
(±) | la linearità dei bassi è media (10.7% delta rispetto alla precedente frequenza)
Medi 400 - 2000 Hz
(+) | medi bilanciati - solo only 1.6% rispetto alla media
(+) | medi lineari (5.8% delta rispetto alla precedente frequenza)
Alti 2 - 16 kHz
(+) | Alti bilanciati - appena 4.2% dalla media
(±) | la linearità degli alti è media (7.1% delta rispetto alla precedente frequenza)
Nel complesso 100 - 16.000 Hz
(+) | suono nel complesso lineare (11.3% differenza dalla media)
Rispetto alla stessa classe
» 12% di tutti i dispositivi testati in questa classe è stato migliore, 2% simile, 86% peggiore
» Il migliore ha avuto un delta di 5%, medio di 18%, peggiore di 53%
Rispetto a tutti i dispositivi testati
» 7% di tutti i dispositivi testati in questa classe è stato migliore, 2% similare, 91% peggiore
» Il migliore ha avuto un delta di 4%, medio di 23%, peggiore di 134%
Asus Zenbook S 13 OLED analisi audio
(±) | potenza degli altiparlanti media ma buona (76.5 dB)
Bassi 100 - 315 Hz
(±) | bassi ridotti - in media 12.6% inferiori alla media
(±) | la linearità dei bassi è media (11.1% delta rispetto alla precedente frequenza)
Medi 400 - 2000 Hz
(±) | medi elevati - circa 5.8% superiore alla media
(+) | medi lineari (4.7% delta rispetto alla precedente frequenza)
Alti 2 - 16 kHz
(+) | Alti bilanciati - appena 2.6% dalla media
(+) | alti lineari (5.3% delta rispetto alla precedente frequenza)
Nel complesso 100 - 16.000 Hz
(+) | suono nel complesso lineare (14.7% differenza dalla media)
Rispetto alla stessa classe
» 31% di tutti i dispositivi testati in questa classe è stato migliore, 5% simile, 64% peggiore
» Il migliore ha avuto un delta di 5%, medio di 18%, peggiore di 53%
Rispetto a tutti i dispositivi testati
» 19% di tutti i dispositivi testati in questa classe è stato migliore, 4% similare, 76% peggiore
» Il migliore ha avuto un delta di 4%, medio di 23%, peggiore di 134%
Dell XPS 13 9310 Core i7 FHD analisi audio
(+) | gli altoparlanti sono relativamente potenti (84.6 dB)
Bassi 100 - 315 Hz
(-) | quasi nessun basso - in media 16.1% inferiori alla media
(±) | la linearità dei bassi è media (13.1% delta rispetto alla precedente frequenza)
Medi 400 - 2000 Hz
(+) | medi bilanciati - solo only 2.6% rispetto alla media
(+) | medi lineari (4.6% delta rispetto alla precedente frequenza)
Alti 2 - 16 kHz
(+) | Alti bilanciati - appena 1.3% dalla media
(+) | alti lineari (4% delta rispetto alla precedente frequenza)
Nel complesso 100 - 16.000 Hz
(+) | suono nel complesso lineare (10.7% differenza dalla media)
Rispetto alla stessa classe
» 9% di tutti i dispositivi testati in questa classe è stato migliore, 3% simile, 88% peggiore
» Il migliore ha avuto un delta di 5%, medio di 18%, peggiore di 53%
Rispetto a tutti i dispositivi testati
» 6% di tutti i dispositivi testati in questa classe è stato migliore, 2% similare, 93% peggiore
» Il migliore ha avuto un delta di 4%, medio di 23%, peggiore di 134%
Gestione dell'energia - Laptop portatile ad alta efficienza energetica di Dell
Consumo di energia
La lentezza delle prestazioni rispetto alla versione Plus fa pensare che il nostro XPS sia un campione del mondo in fatto di efficienza energetica. Questo è vero e abbiamo misurato un consumo di 24 watt durante un carico di lavoro medio. In questo scenario, la versione Plus con Alder Lake-P 1240P consuma 43 e il modello 1260P quasi 49 watt. Il "Consumo Witcher 3/Stress Test" mostra le evidenti differenze tra i modelli Alder Lake-U e -P, in particolare quando i SoC sono sottoposti a un carico continuo.
Durante lo stress test, il consumo si stabilizza a 27 watt e rimane costante a questo livello. I punteggi di un benchmark eseguito subito dopo lo stress test non sono stati influenzati negativamente.
| Off / Standby | |
| Idle | |
| Sotto carico |
|
Leggenda:
min: | |
| Dell XPS 13 9315, i5-1230U i5-1230U, Iris Xe G7 80EUs, Micron 3460 256 GB Soldered, IPS, 1920x1200, 13.4" | Apple MacBook Air 2020 M1 Entry M1, M1 7-Core GPU, Apple SSD AP0256Q, IPS, 2560x1600, 13.3" | Asus Zenbook S 13 OLED R7 6800U, Radeon 680M, Samsung PM9A1 MZVL21T0HCLR, OLED, 2880x1800, 13.3" | Lenovo ThinkPad X1 Nano-20UN002UGE i7-1160G7, Iris Xe G7 96EUs, WDC PC SN530 SDBPNPZ-512G, IPS, 2160x1350, 13" | Huawei MateBook 13s i5 11300H i5-11300H, Iris Xe G7 80EUs, Phison Electronics PS5012, LTPS, 2520x1680, 13.4" | Dell XPS 13 Plus 9320 4K i7-1260P, Iris Xe G7 96EUs, Samsung PM9A1 MZVL21T0HCLR, IPS, 3840x2400, 13.4" | Dell XPS 13 Plus 9320 i5-1240p i5-1240P, Iris Xe G7 80EUs, Micron 3400 MTFDKBA512TFH 512GB, IPS, 1920x1200, 13.4" | Media Intel Iris Xe Graphics G7 80EUs | Media della classe Subnotebook | |
|---|---|---|---|---|---|---|---|---|---|
| Power Consumption | 16% | -48% | -11% | -43% | -86% | -97% | -31% | -26% | |
| Idle Minimum * (Watt) | 3.6 | 1.9 47% | 4.8 -33% | 3.3 8% | 4.2 -17% | 7 -94% | 10 -178% | 4.49 ? -25% | 3.73 ? -4% |
| Idle Average * (Watt) | 6.8 | 6.4 6% | 8.7 -28% | 5.7 16% | 8.1 -19% | 11 -62% | 12.3 -81% | 7.4 ? -9% | 6.57 ? 3% |
| Idle Maximum * (Watt) | 6.8 | 7 -3% | 10.1 -49% | 9.1 -34% | 9 -32% | 11.4 -68% | 15.5 -128% | 9.26 ? -36% | 7.93 ? -17% |
| Load Average * (Watt) | 24 | 25 -4% | 45.6 -90% | 29.6 -23% | 41.7 -74% | 59.7 -149% | 43 -79% | 36.6 ? -53% | 42.1 ? -75% |
| Witcher 3 ultra * (Watt) | 23.6 | 42.4 -80% | 27.7 -17% | 40.1 -70% | 49.4 -109% | 43.1 -83% | |||
| Load Maximum * (Watt) | 47 | 30.3 36% | 49.5 -5% | 55.1 -17% | 68 -45% | 63 -34% | 62.8 -34% | 61.7 ? -31% | 65.1 ? -39% |
* ... Meglio usare valori piccoli
Consumption Witcher 3/Stress Test
Consumption external Monitor
Durata della batteria
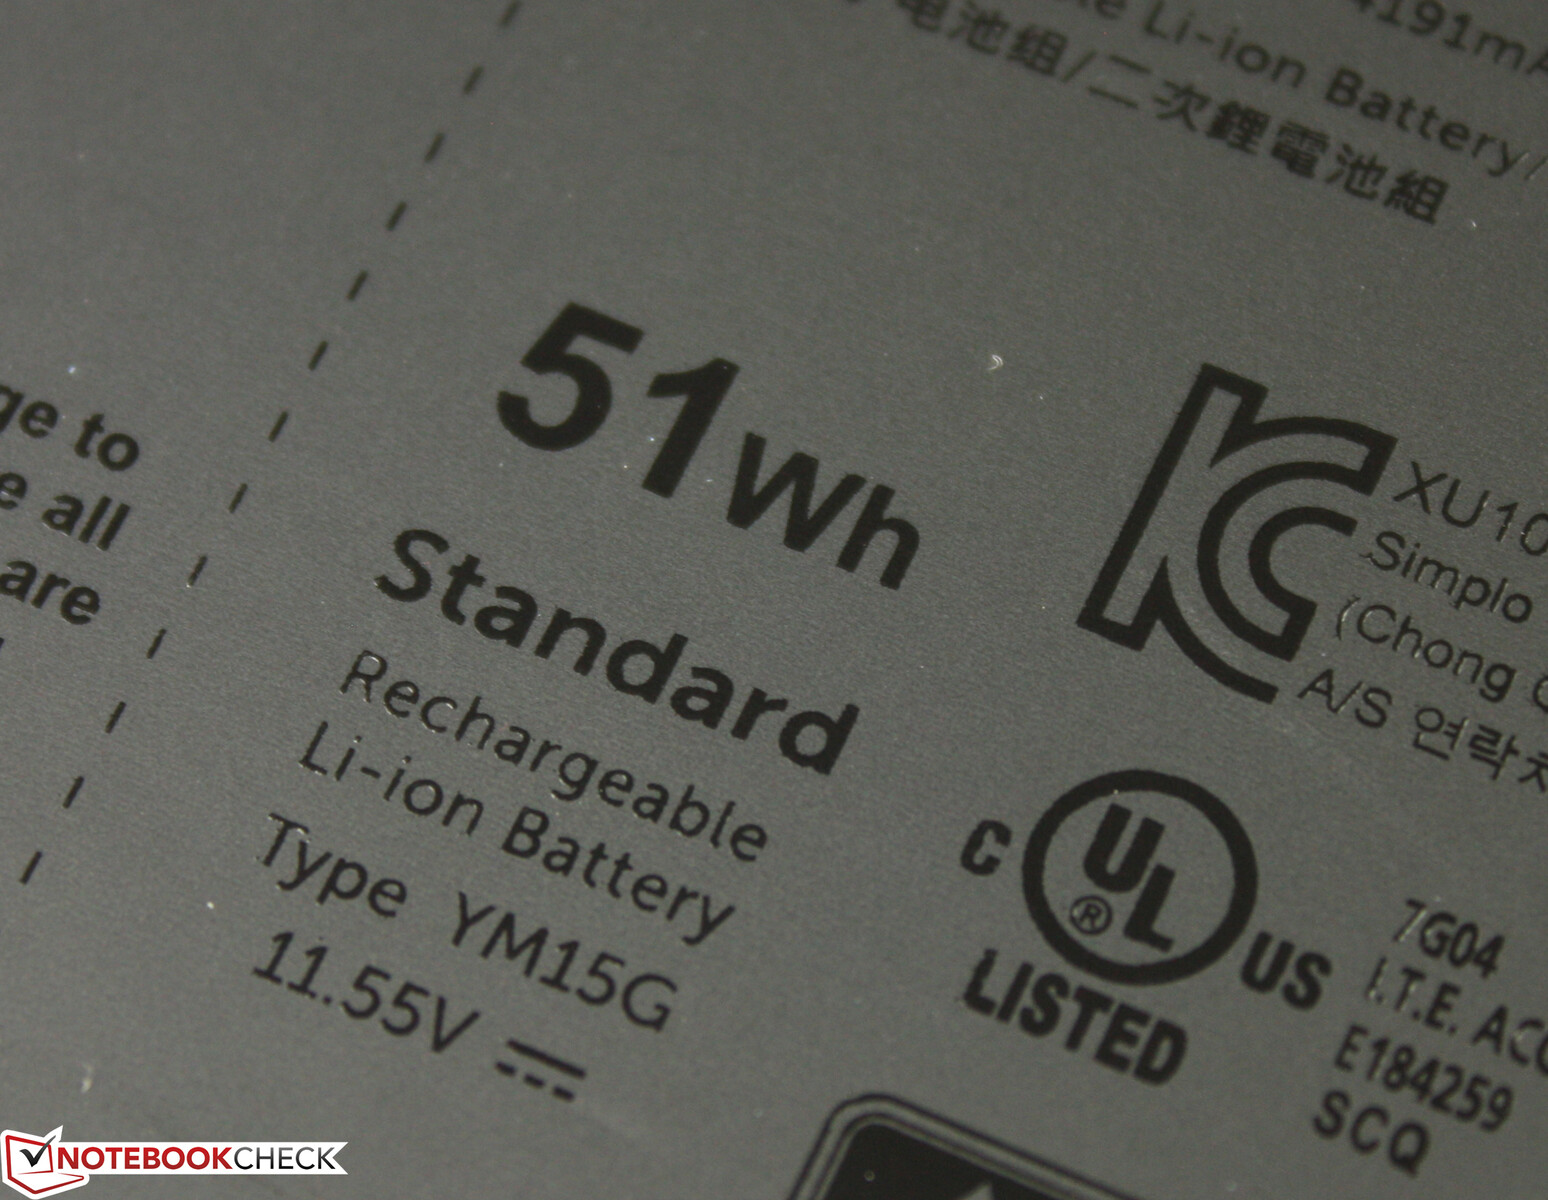
Con un'autonomia di quasi 15 ore nel nostro test Wi-Fi a una luminosità ridotta (150 nits), l'XPS 13 con Alder Lake-U mostra i suoi muscoli. Anche con la massima luminosità, il test dura 10:22 ore, un risultato ancora più impressionante se si considera l'altissima luminosità massima dell'XPS (406 nits, leggermente inferiore con la batteria). A differenza del modello Plus, il portatile XPS di base è dotato di una batteria da 51 W anziché 55 W. Il test di carico di Battery Eater dura insolitamente a lungo alla massima luminosità, il che non deve sorprendere se si considerano le prestazioni lente del SoC.
| Dell XPS 13 9315, i5-1230U i5-1230U, Iris Xe G7 80EUs, 51 Wh | Apple MacBook Air 2020 M1 Entry M1, M1 7-Core GPU, 49.9 Wh | Asus Zenbook S 13 OLED R7 6800U, Radeon 680M, 67 Wh | Lenovo ThinkPad X1 Nano-20UN002UGE i7-1160G7, Iris Xe G7 96EUs, 48.2 Wh | Huawei MateBook 13s i5 11300H i5-11300H, Iris Xe G7 80EUs, 60 Wh | Dell XPS 13 Plus 9320 4K i7-1260P, Iris Xe G7 96EUs, 55 Wh | Dell XPS 13 Plus 9320 i5-1240p i5-1240P, Iris Xe G7 80EUs, 55 Wh | Media della classe Subnotebook | |
|---|---|---|---|---|---|---|---|---|
| Autonomia della batteria | 8% | -23% | -36% | -37% | -52% | -42% | -14% | |
| WiFi v1.3 (h) | 14.8 | 16 8% | 9.2 -38% | 9.9 -33% | 9.4 -36% | 6.9 -53% | 8 -46% | 13.9 ? -6% |
| Load (h) | 2.6 | 2.4 -8% | 1.6 -38% | 1.6 -38% | 1.3 -50% | 1.6 -38% | 2.04 ? -22% | |
| H.264 (h) | 15.2 | 15.4 | 11 | 11 | 15.3 ? |
Pro
Contro
Verdetto - Metà delle prestazioni, due volte la durata della batteria
Prestazioni limitate come compromesso per un'eccellente portabilità: il modello di fascia bassa 2022 XPS 13 con Alder Lake-U Con CPU Alder Lake-U e pannello IPS FHD è un dispositivo interessante per il lavoro d'ufficio leggero. Con un'autonomia ridicola di quasi 15 ore, raddoppia il risultato del modello gemello XPS 13 Plus. Dell punta su un display luminoso adatto all'uso quotidiano, ci sono due porte Thunderbolt 4 e altoparlanti con un woofer e un tweeter. Grazie a questo, guardare un film utilizzando gli altoparlanti integrati è un'esperienza piacevole.
Forse è questo il motivo della mancanza di un jack per le cuffie e di un lettore di schede? O forse è il concetto di minimalismo? In ogni caso, è possibile far funzionare un portatile con due sole porte di tipo C, una delle quali è occupata dall'adattatore CA, purché si sia disposti a farlo. Tuttavia, c'è un ostacolo invisibile all'interno, poiché l'XPS 13 non può essere aggiornato in alcun modo. La RAM, il modulo Wi-Fi e l'SSD sono tutti fissi. Questo aspetto deve essere preso in considerazione quando si opta per un modello di fascia bassa con 256 GB di memoria.
Lunga durata della batteria, chassis solido, dispositivi di input adatti all'uso quotidiano e audio potenziato dal subwoofer: anche l'XPS 13 entry-level può regalare emozioni.
Ci sono dei compromessi in termini di prestazioni e il chip Alder Lake-U non regge il confronto con altri subnotebook con la stessa CPU. Il deficit di prestazioni rispetto alle CPU Alder Lake-P dell'XPS 13 Plus è molto significativo. Almeno Dell traccia una linea chiara: Se siete alla ricerca di prestazioni, il Plus è l'unica opzione. Per la navigazione sul web, l'intrattenimento e la posta, la versione XPS di base è sufficiente.
La nuova serie XPS: Divisa in due classi di prestazioni. L'XPS di base si concentra sulla portabilità invece di cercare di spremere il massimo delle prestazioni dai suoi componenti.
L'XPS 13 di fascia bassa rimane indietro rispetto allo Zenbook S 13 con CPU AMD Ryzen 6000 e anche rispetto al Apple MacBook Air M1, l'XPS 13 si trova in difficoltà. Pertanto, il confronto con il nuovo MacBook Air M2che stiamo recensendo, è improbabile che dipinga Dell in una luce favorevole, anche quando ci si concentra sull'XPS 13 Plus.
L'autore sta attualmente recensendo il modello XPS 13 Plus modello base con display FHD, 512 GB e Core i5 Alder Lake. Abbiamo anche recensito l'XPS 13 Plus con display 4K e i7 Das XPS 13 ha ora una Touch Bar.
Prezzo e disponibilità
Il 2022 XPS 13 9315 è ora disponibile presso il negozio online Dell a partire da 999 dollari. Il modello Plus parte da 1299 dollari.
Dell XPS 13 9315, i5-1230U
- 08/05/2022 v7 (old)
Sebastian Jentsch
Price comparison

