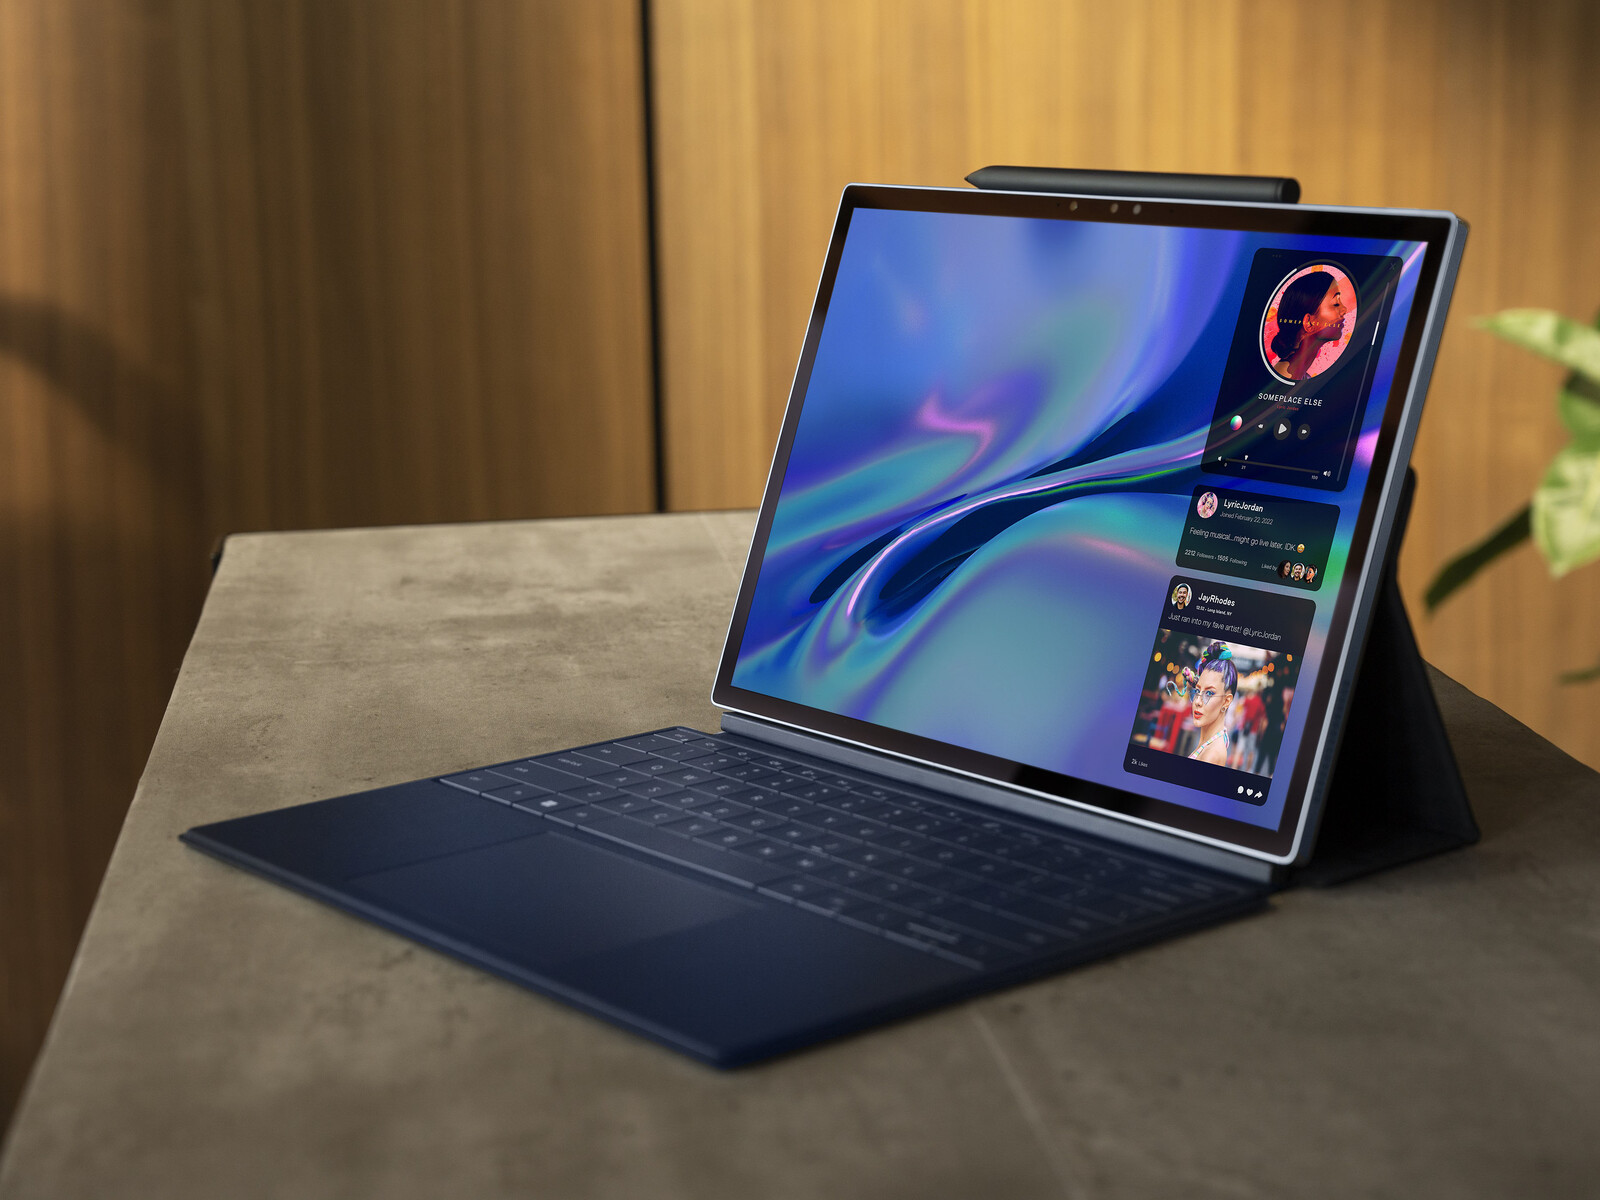
Il Dell Surface Pro 8: recensione del convertibile 2-in-1 XPS 13 9315
Al CES 2022 Dell ha presentato tre diversi modelli di XPS 13: l' XPS 13 9320 Plus a conchiglia, XPS 13 9315 a conchigliae XPS 13 9315 2-in-1. Dopo aver esaminato i due modelli a conchiglia, siamo ora pronti ad affrontare il modello 2-in-1 che, guarda caso, è il primo modello XPS staccabile della storia primo modello XPS staccabile in quasi un decennio.
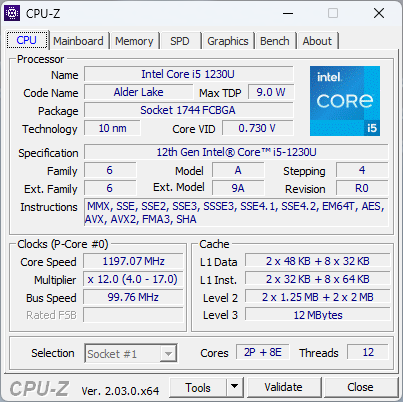
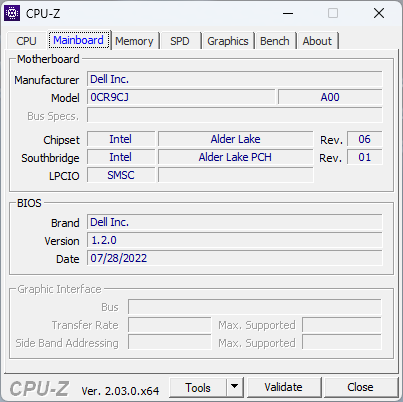
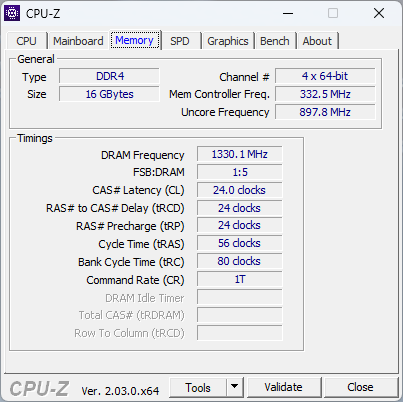
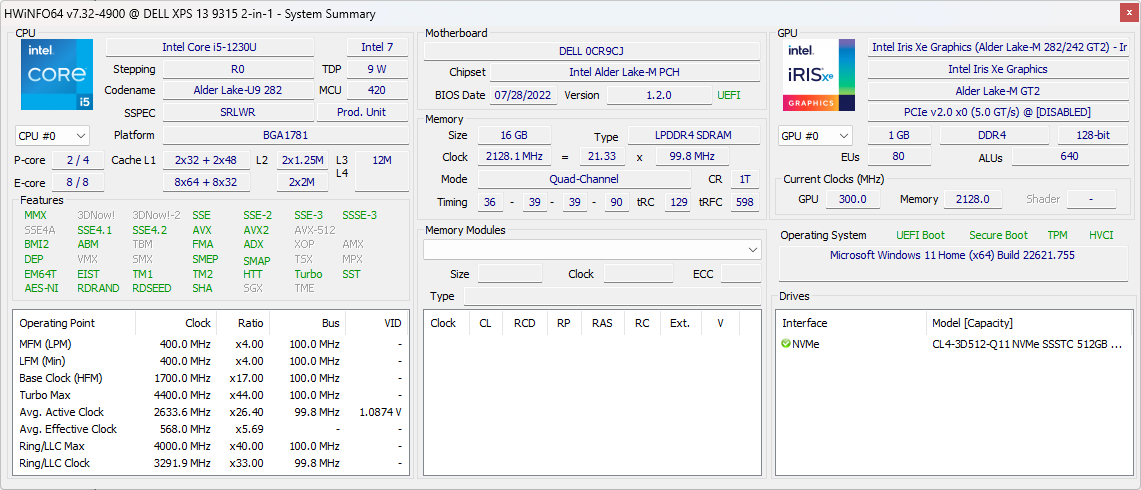
La configurazione in esame è dotata di CPU Alder Lake Core i5-1230U di 12a generazione, 16 GB di RAM LPDDR4x e 512 GB di SSD NVMe per circa 1400 dollari. Sono disponibili anche altre SKU con CPU Core i7-1250U, 5G eSIM e varie capacità di RAM/SSD, ma tutte le opzioni sono dotate dello stesso schermo touchscreen IPS 3:2 2880 x 1920.
Tra i concorrenti diretti in questo settore ci sono altri tablet Windows o detachable, in particolare il Microsoft Surface Pro 8 e il più costoso HP Elite x2 in misura minore.
Altre recensioni Dell:
Potenziali concorrenti a confronto
Punteggio | Data | Modello | Peso | Altezza | Dimensione | Risoluzione | Prezzo |
|---|---|---|---|---|---|---|---|
| 90.1 % v7 (old) | 11/2022 | Dell XPS 13 9315 2-in-1 Core i5-1230U i5-1230U, Iris Xe G7 80EUs | 764 gr | 7.4 mm | 13.00" | 2880x1920 | |
| 87.3 % v7 (old) | 09/2022 | Dell XPS 13 Plus 9320 i7-1280P OLED i7-1280P, Iris Xe G7 96EUs | 1.3 kg | 15.28 mm | 13.40" | 3456x2160 | |
| 89.1 % v7 (old) | 11/2021 | Microsoft Surface Pro 8, i7-1185G7 i7-1185G7, Iris Xe G7 96EUs | 891 gr | 8.5 mm | 13.00" | 2880x1920 | |
| 90.3 % v7 (old) | 08/2022 | HP Spectre x360 13.5 14t-ef000 i7-1255U, Iris Xe G7 96EUs | 1.4 kg | 17 mm | 13.50" | 3000x2000 | |
| 86.1 % v7 (old) | 10/2021 | Lenovo ThinkBook Plus Gen2 Core i5 i5-1130G7, Iris Xe G7 80EUs | 1.2 kg | 13.9 mm | 13.30" | 2560x1600 | |
| 92.3 % v7 (old) | 07/2022 | Apple MacBook Air M2 Entry M2, M2 8-Core GPU | 1.2 kg | 11.3 mm | 13.60" | 2560x1664 |
Custodia - Più leggera di un Surface Pro 8
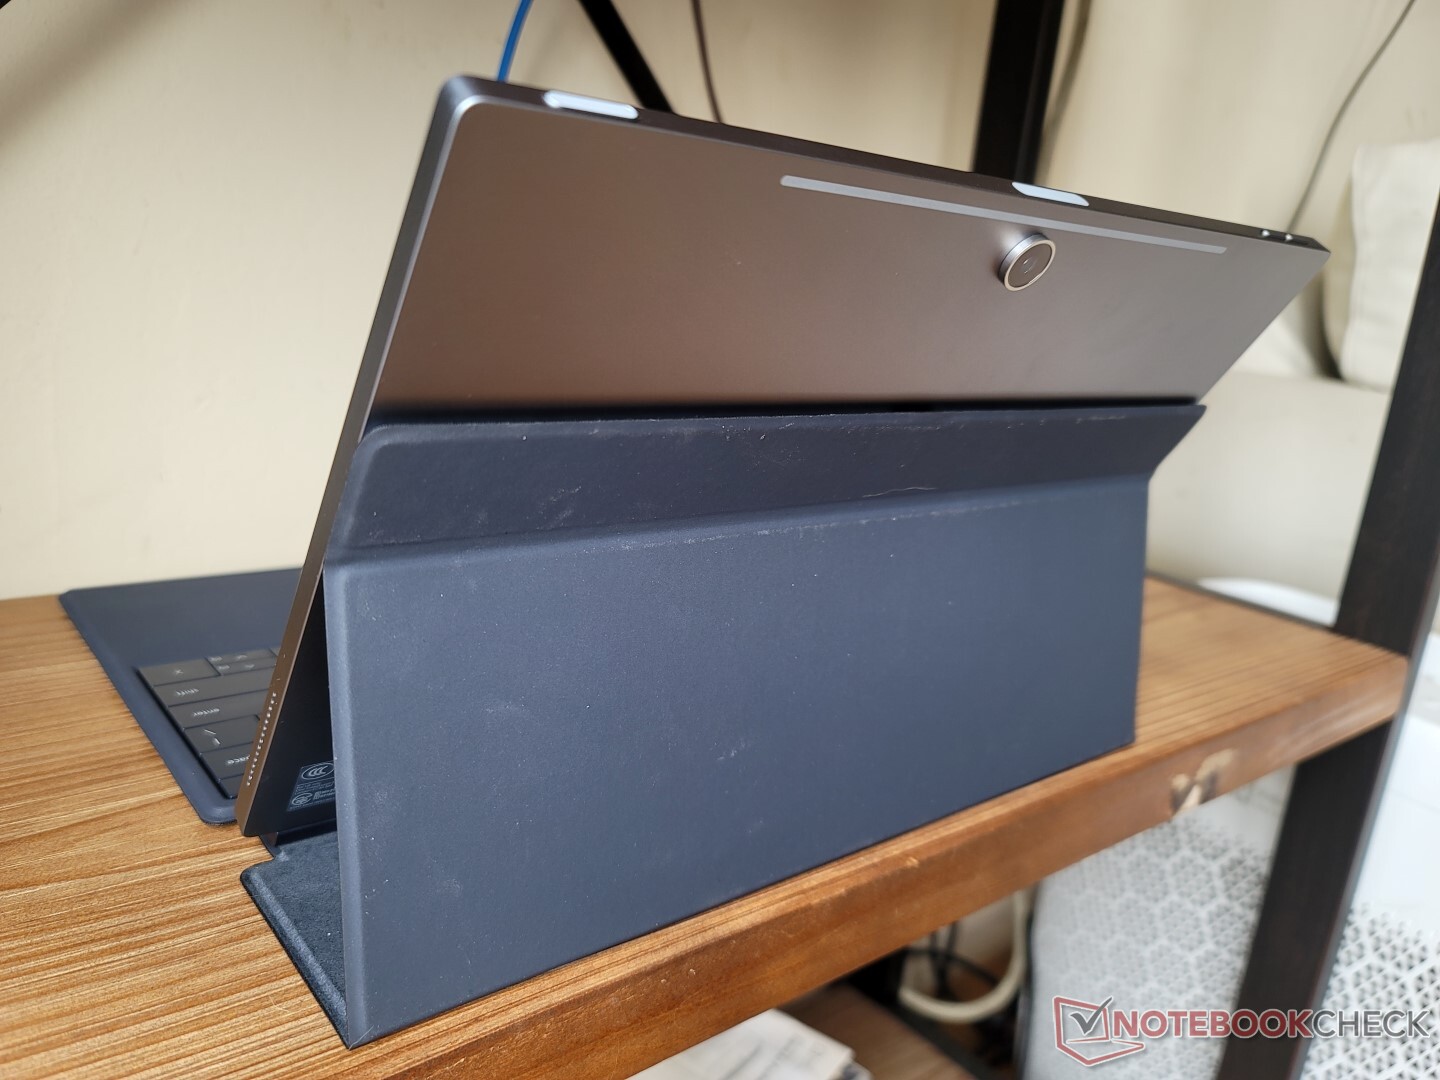
Lo scheletro è in alluminio sul retro e sui bordi, mentre la parte anteriore è in vetro Gorilla Glass. La finitura opaca è robusta e di alta qualità, come ci si aspetterebbe, con un colore e una consistenza simili ai coperchi esterni dell'XPS 13 9300 XPS 13 9300 o della serie XPS 15. Si nota una leggera deformazione quando si cerca di ruotare l'unità, ma non è tale da destare preoccupazione.
Se si esercita una pressione al centro del dorso, si producono lievi depressioni e rumori udibili. Ciò è probabilmente dovuto al piccolo spazio d'aria tra il guscio esterno e i componenti interni, ma anche in questo caso non c'è da preoccuparsi.
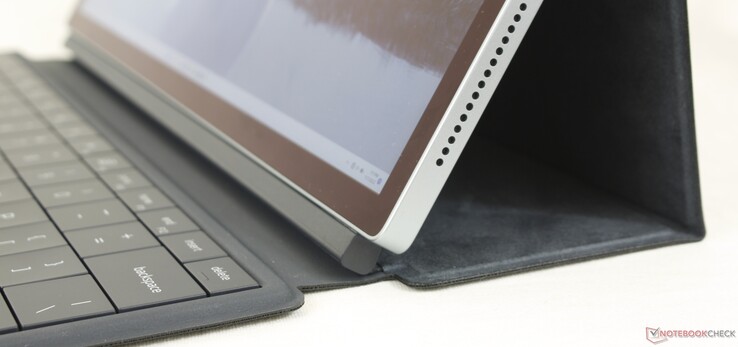
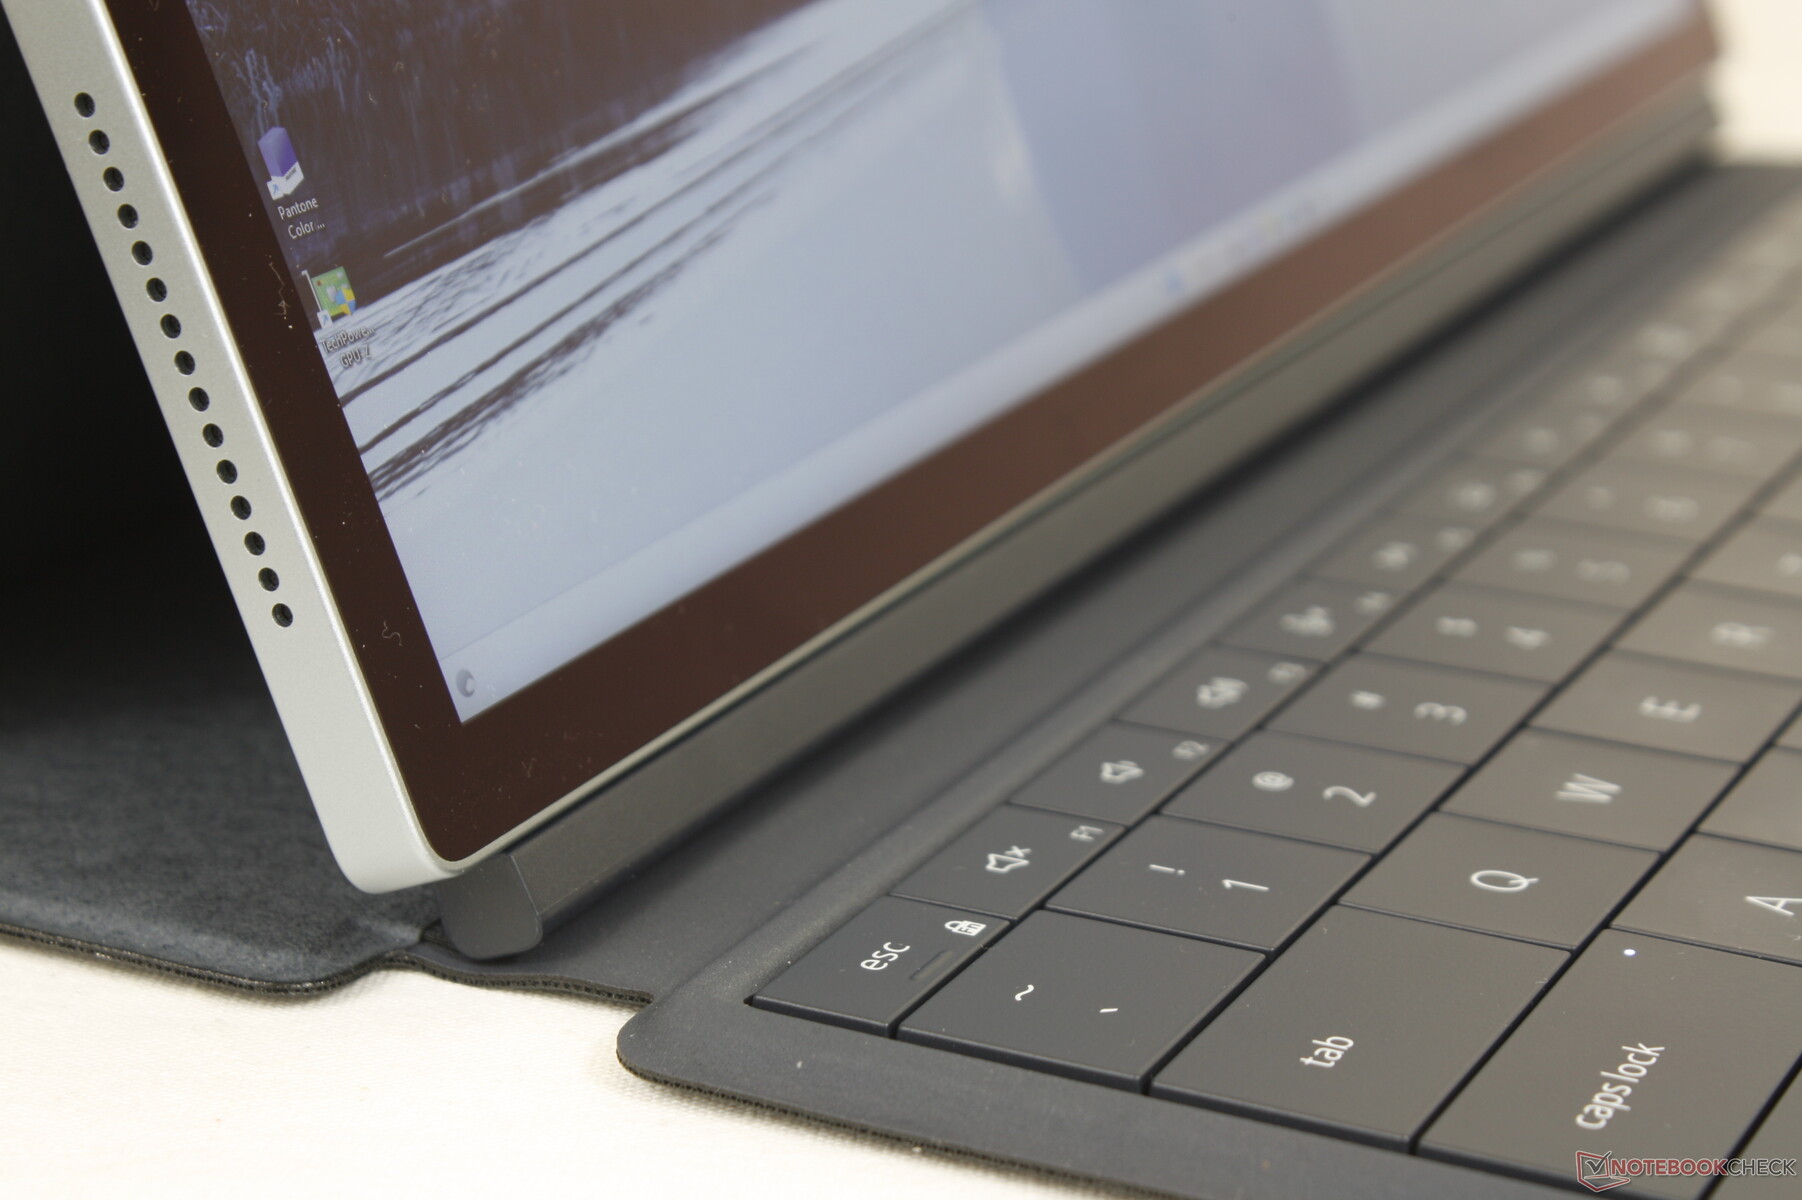
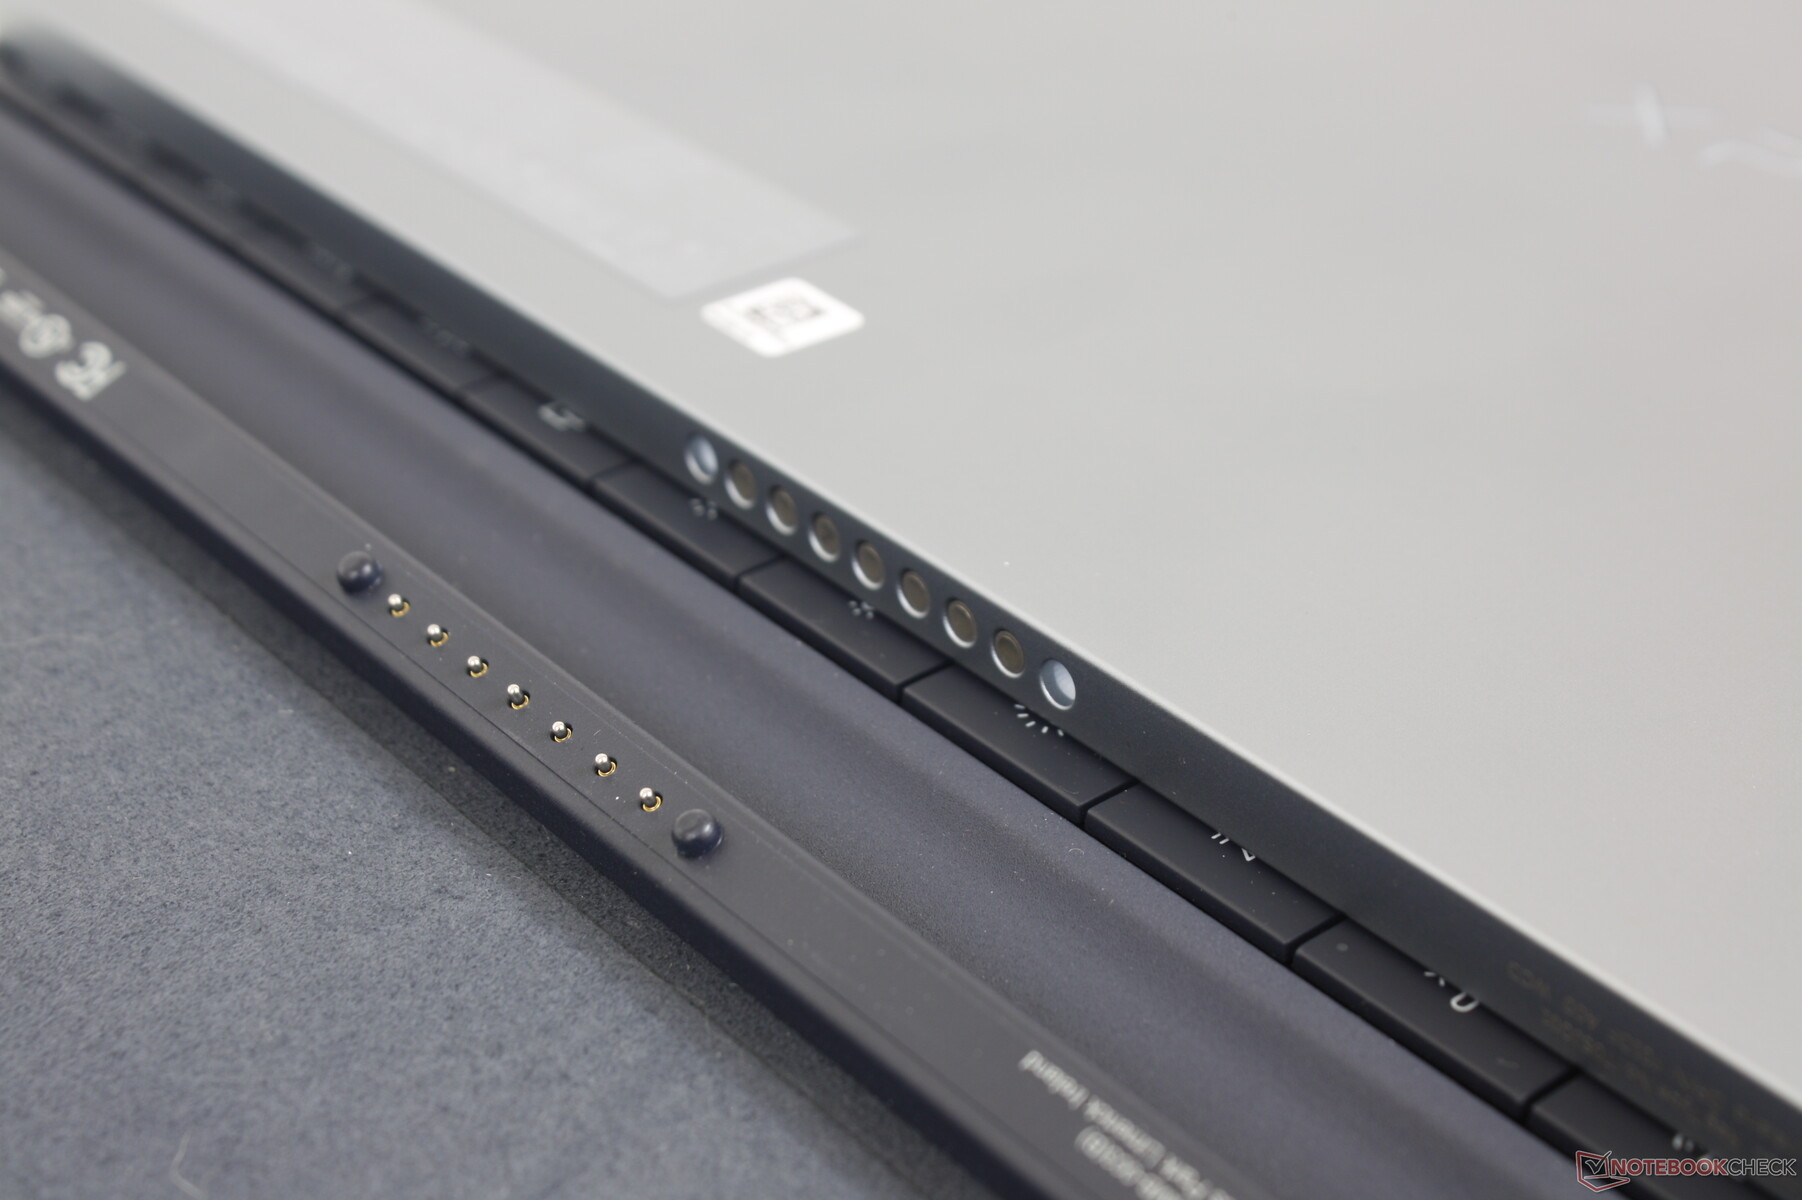
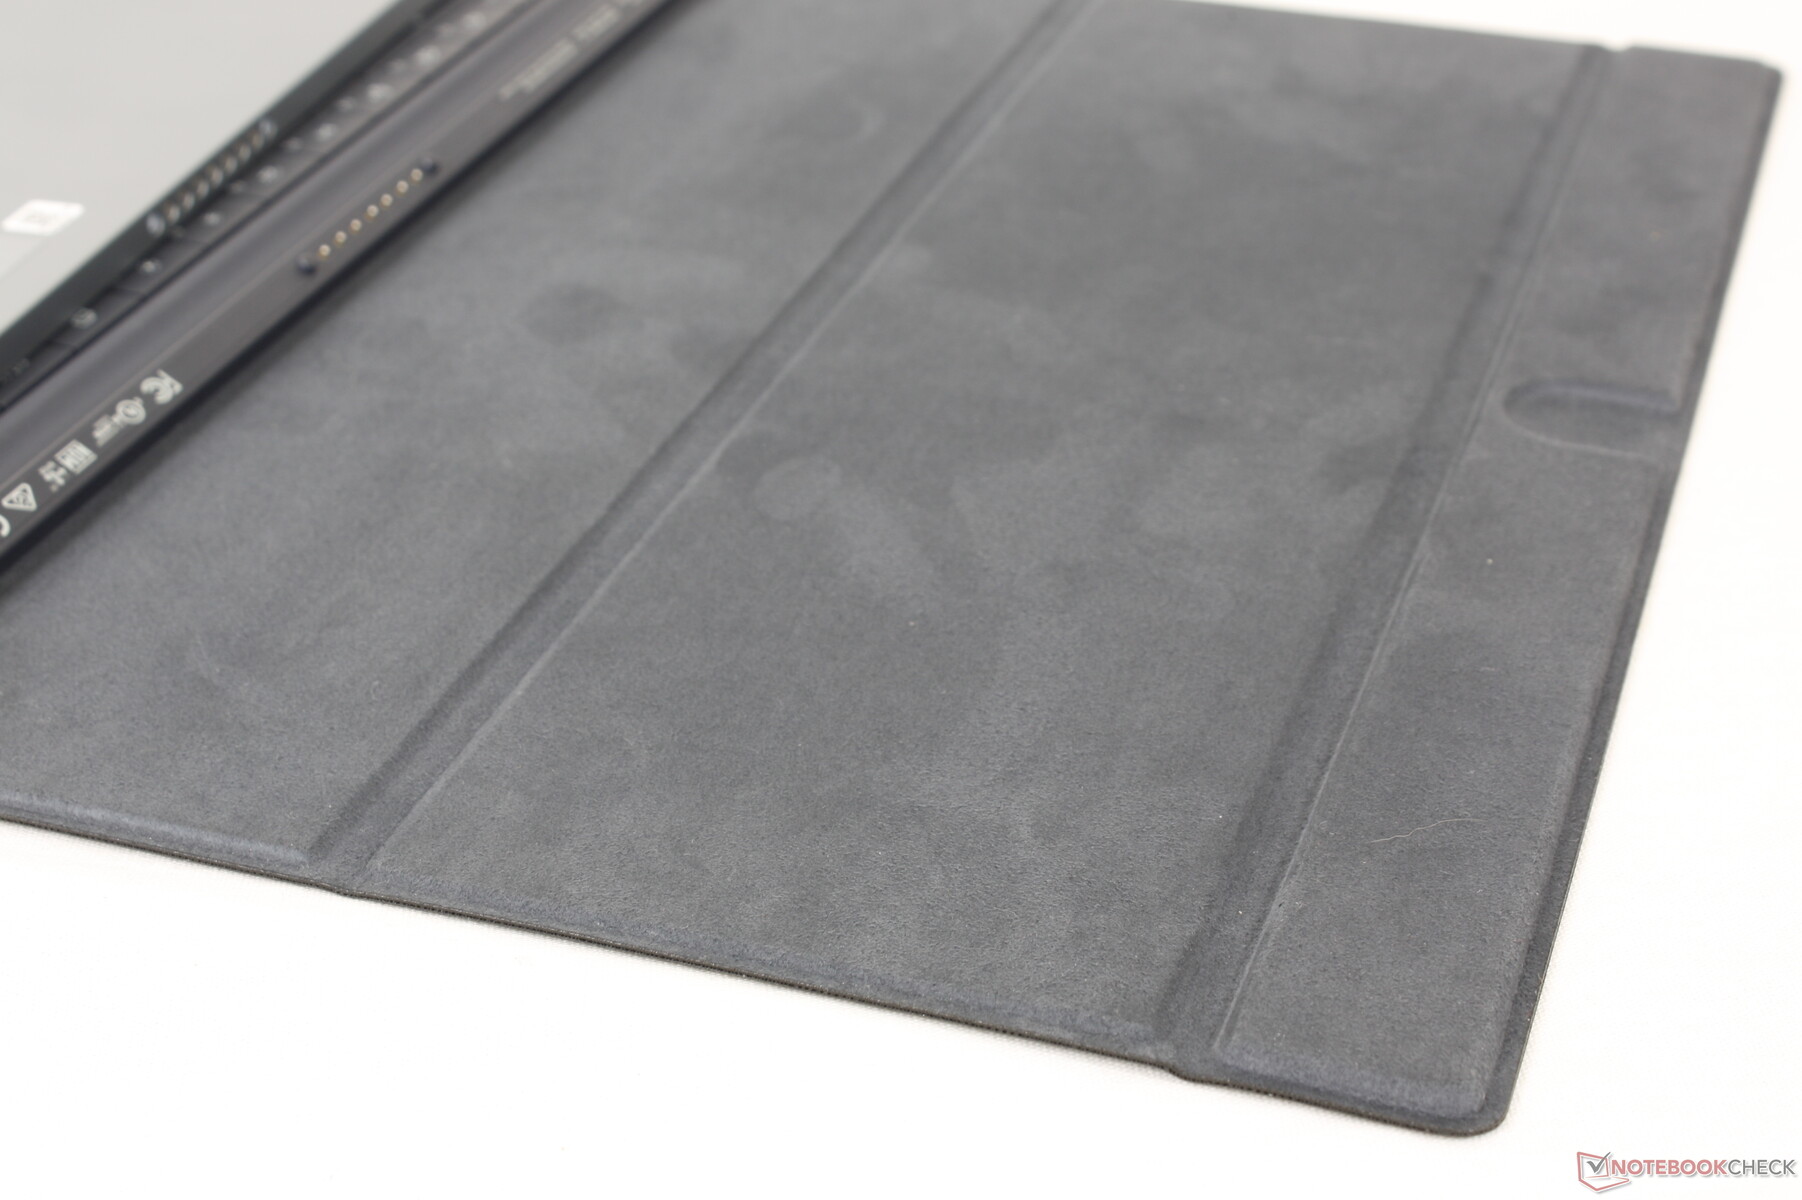
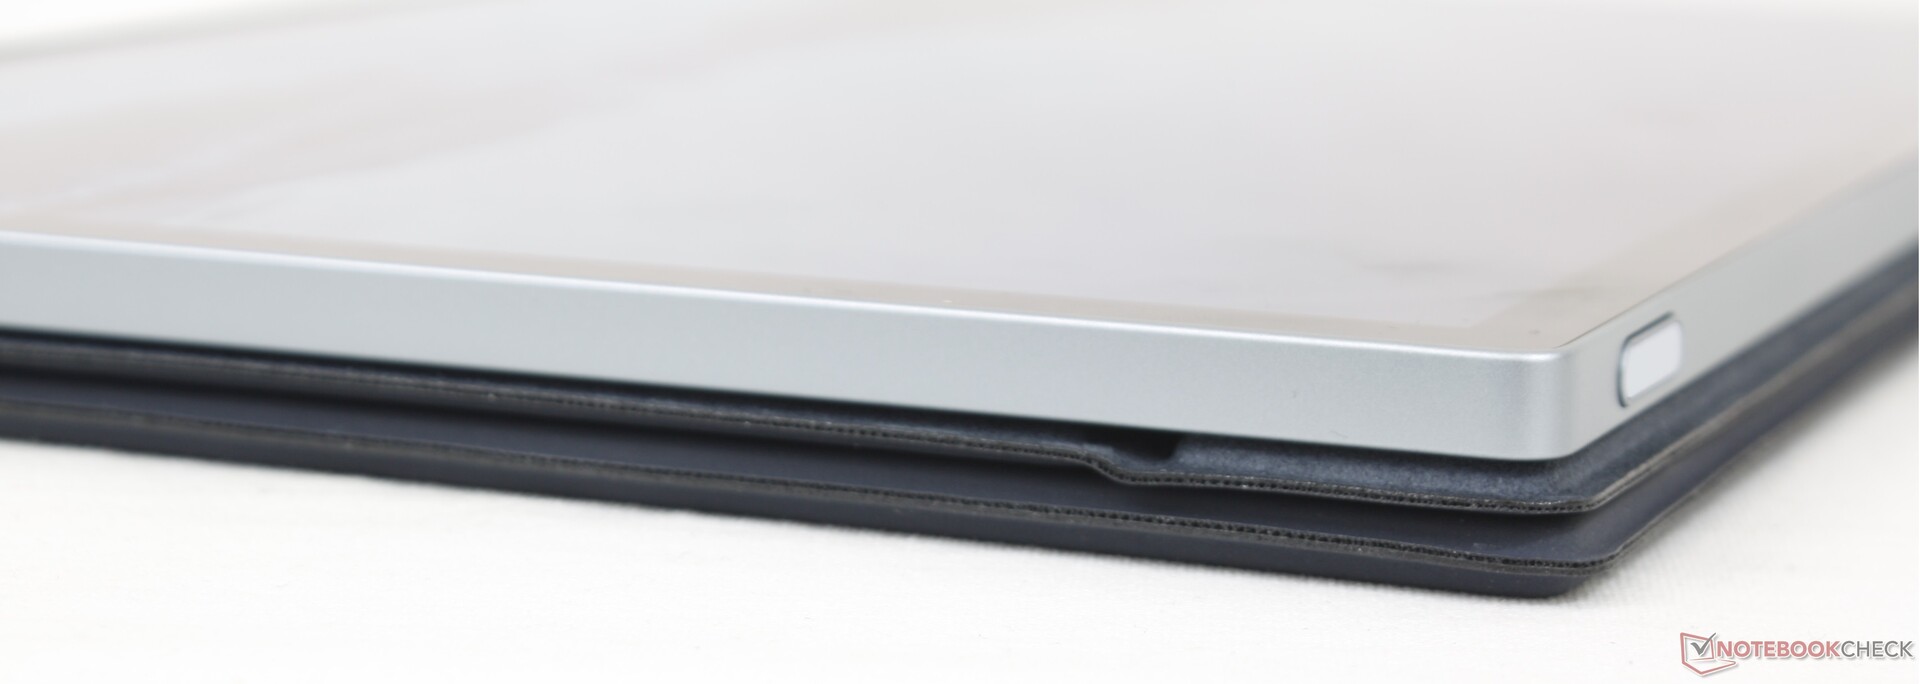
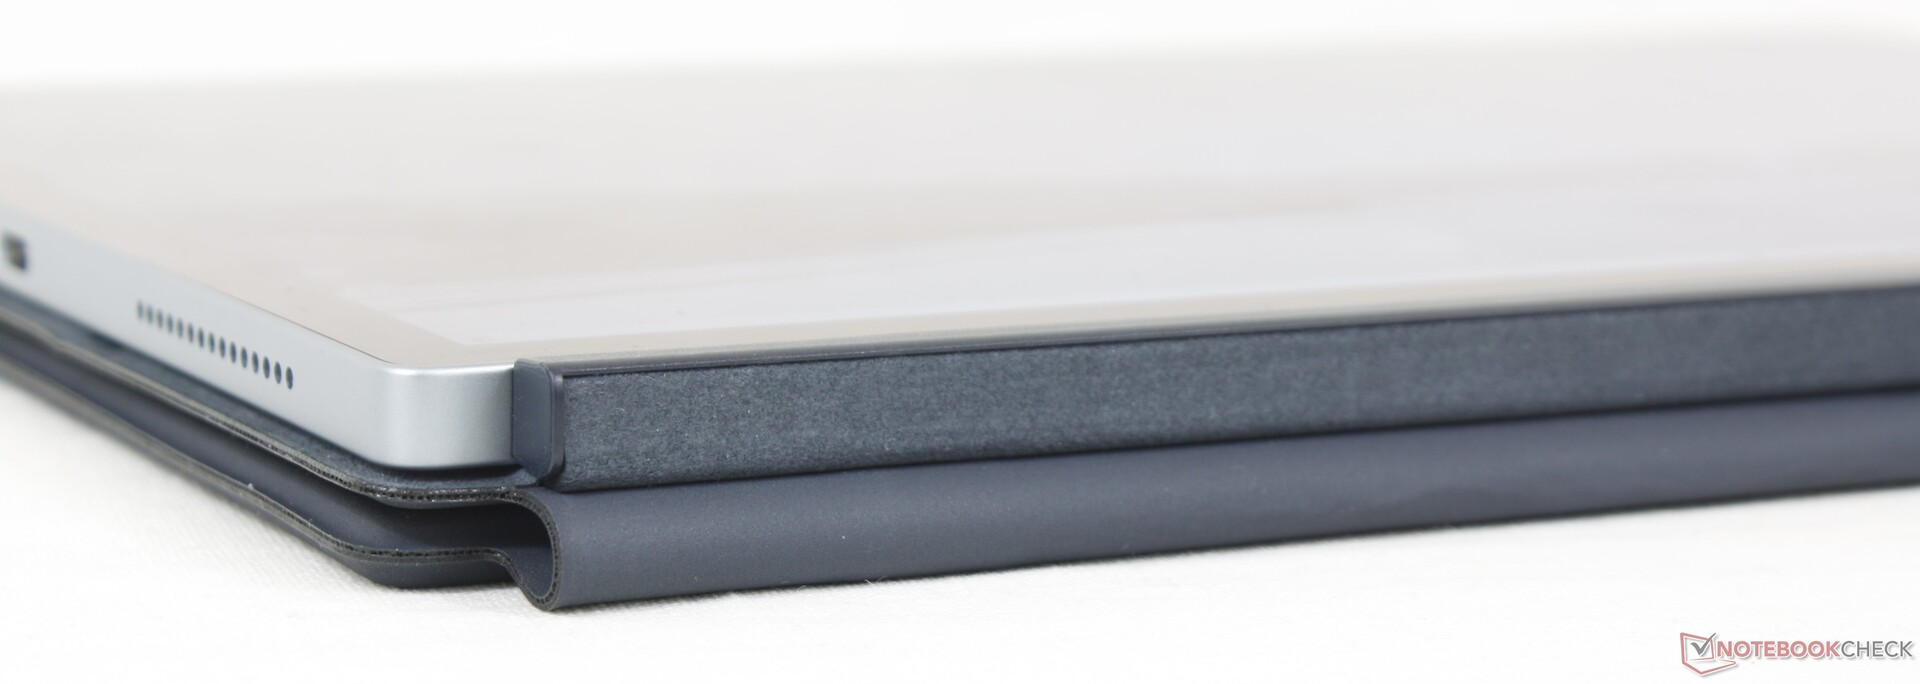
Il supporto magnetico per la tastiera (o folio) è un materiale morbido al tatto, non dissimile dalle superfici in Alcantara del supporto per la tastiera del Surface Pro 8. Tuttavia, la soluzione Dell si differenzia in modo significativo dalla versione Microsoft perché include una copertura posteriore, mentre la Type Cover del Surface Pro è costituita solo da tastiera e touchpad. Questa parte posteriore offre una protezione aggiuntiva contro graffi e scalfitture al costo di un peso maggiore.
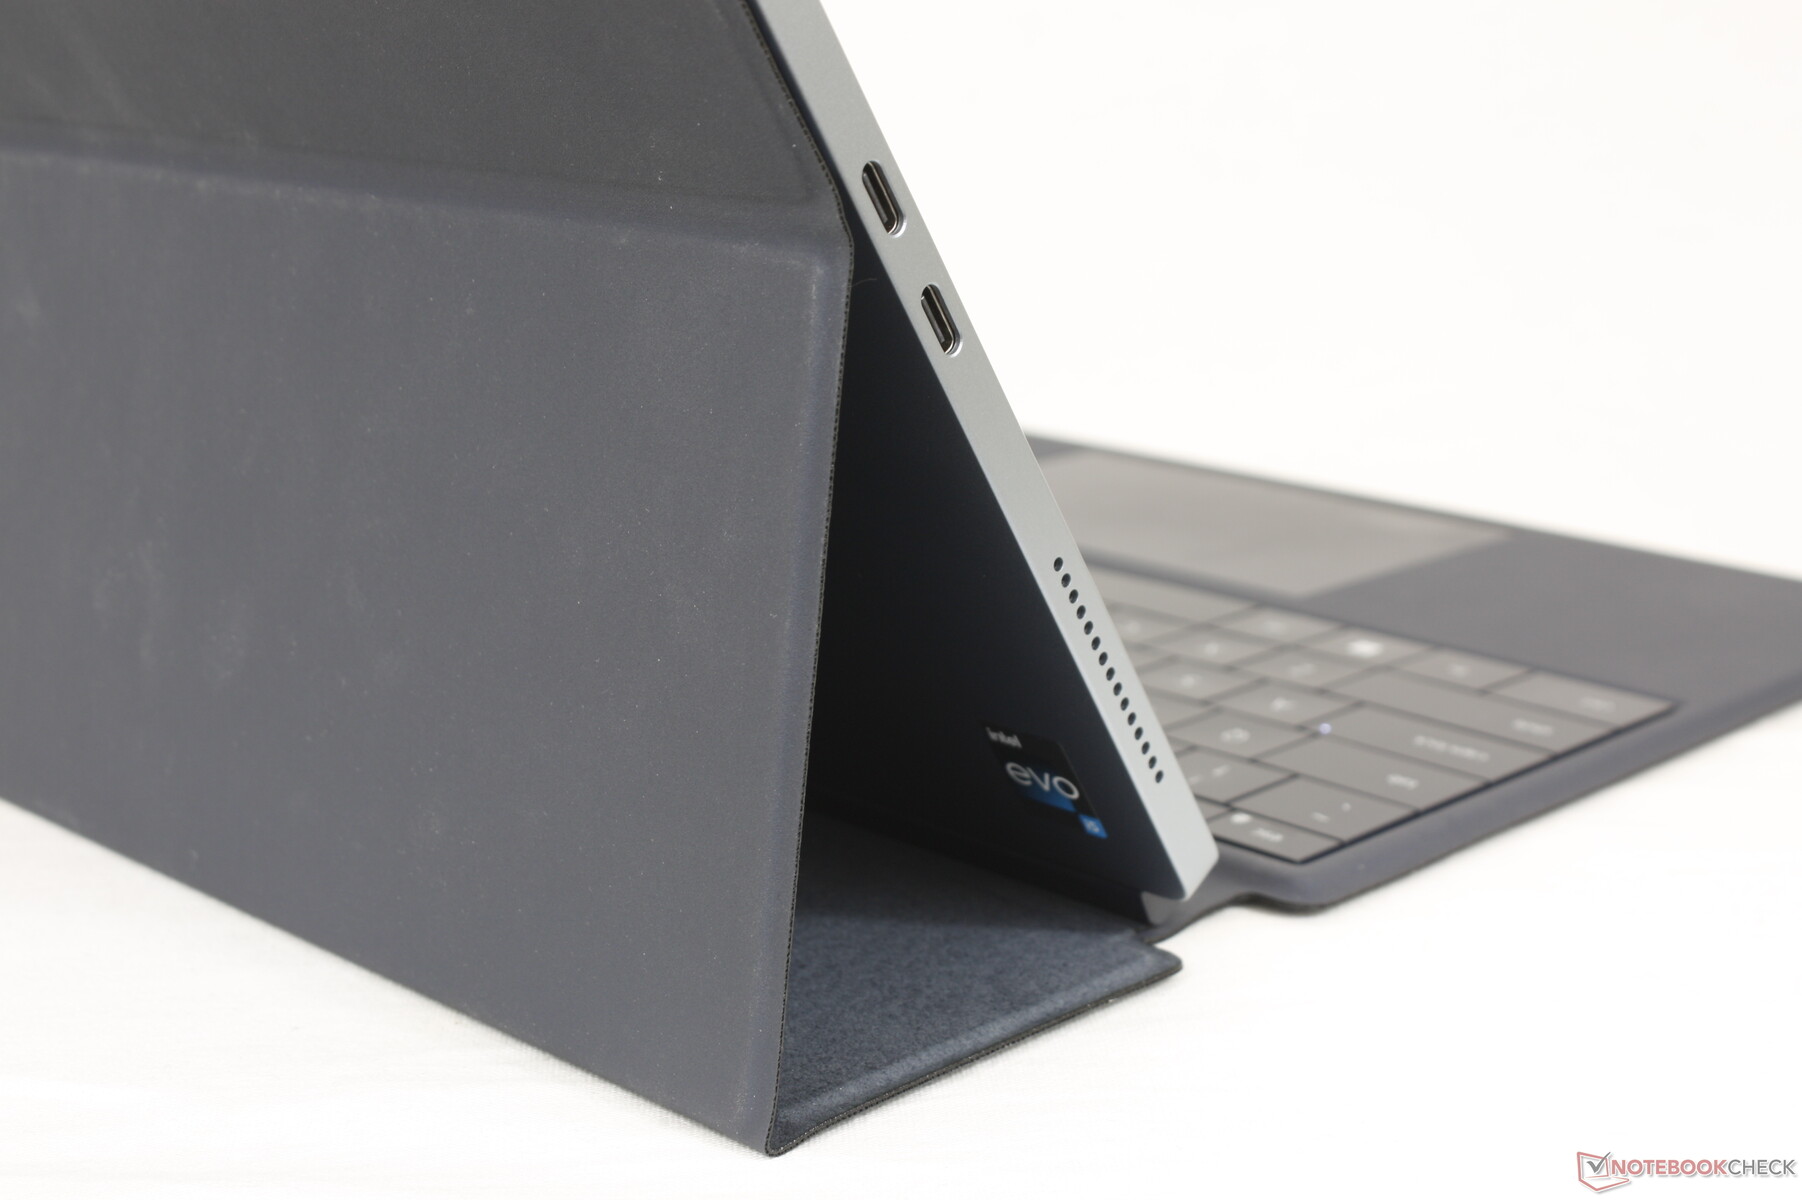
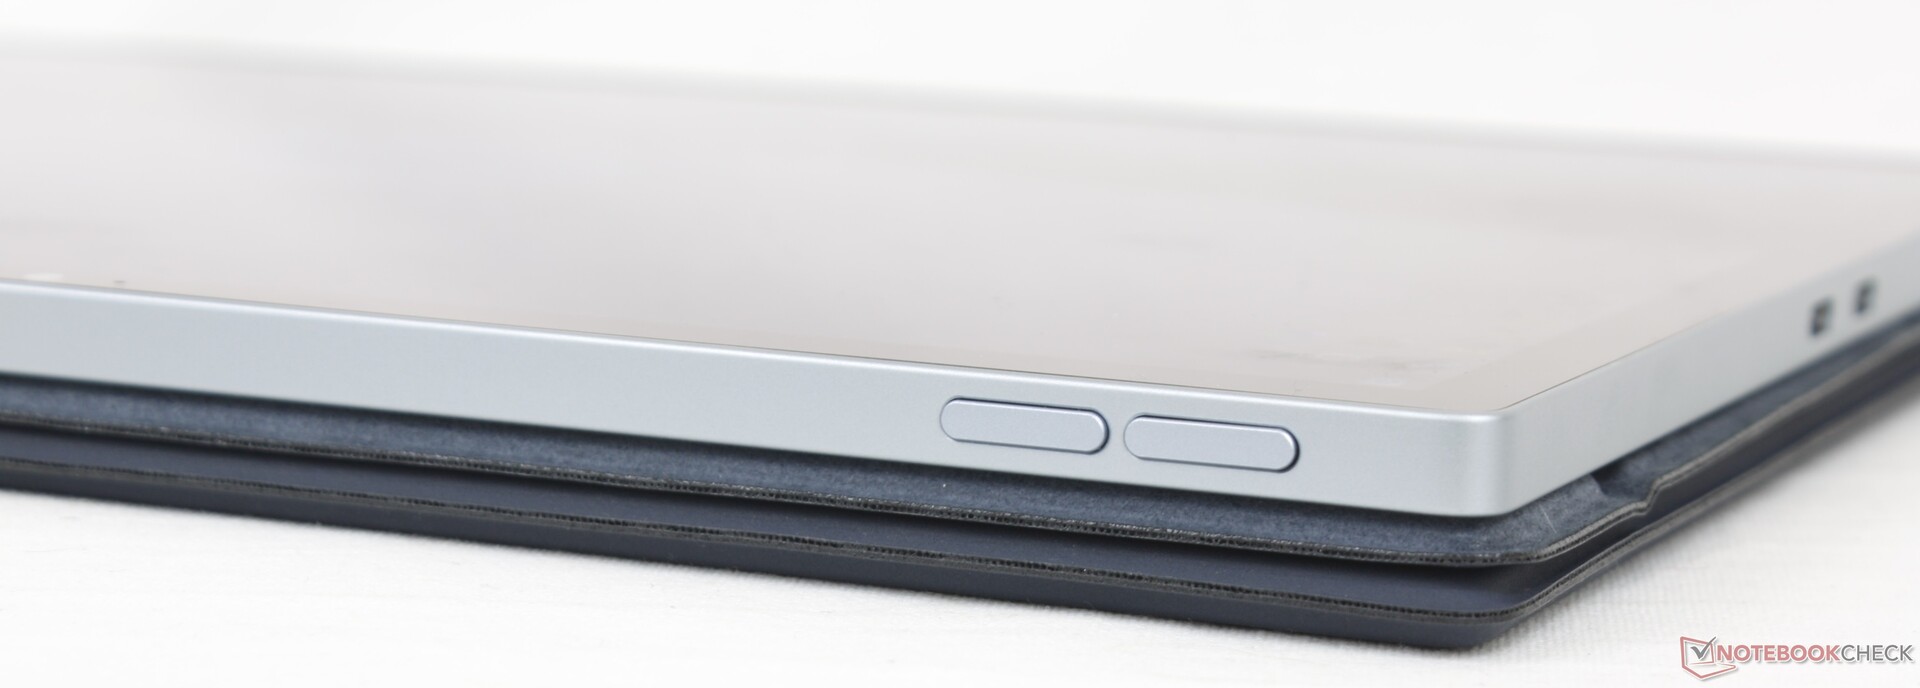
Per ancorare il tablet Dell alla modalità laptop, la parte posteriore del folio può essere regolata solo a 100, 115 e 125 gradi, mentre la cerniera del Surface Pro 8 può muoversi più liberamente. In altre parole, l'XPS 13 9315 2-in-1 richiede il folio dock opzionale per sorreggersi, mentre il Surface Pro 8 ha un più comodo supporto integrato.
Il tablet di per sé è molto leggero, con soli 764 g rispetto ai quasi 900 g del Surface Pro 8. Gran parte del risparmio di peso può essere attribuito al design senza ventola del Dell, mentre il modello Microsoft incorpora una ventola per un migliore raffreddamento. Il peso combinato del tablet e della custodia è di 1305 g, un valore che si avvicina a quello di molti modelli a conchiglia da 13,5 pollici, come l'HP Spectre x360 13.5.1 e l'HP Spectre x360 13.5.1.HP Spectre x360 13.5.
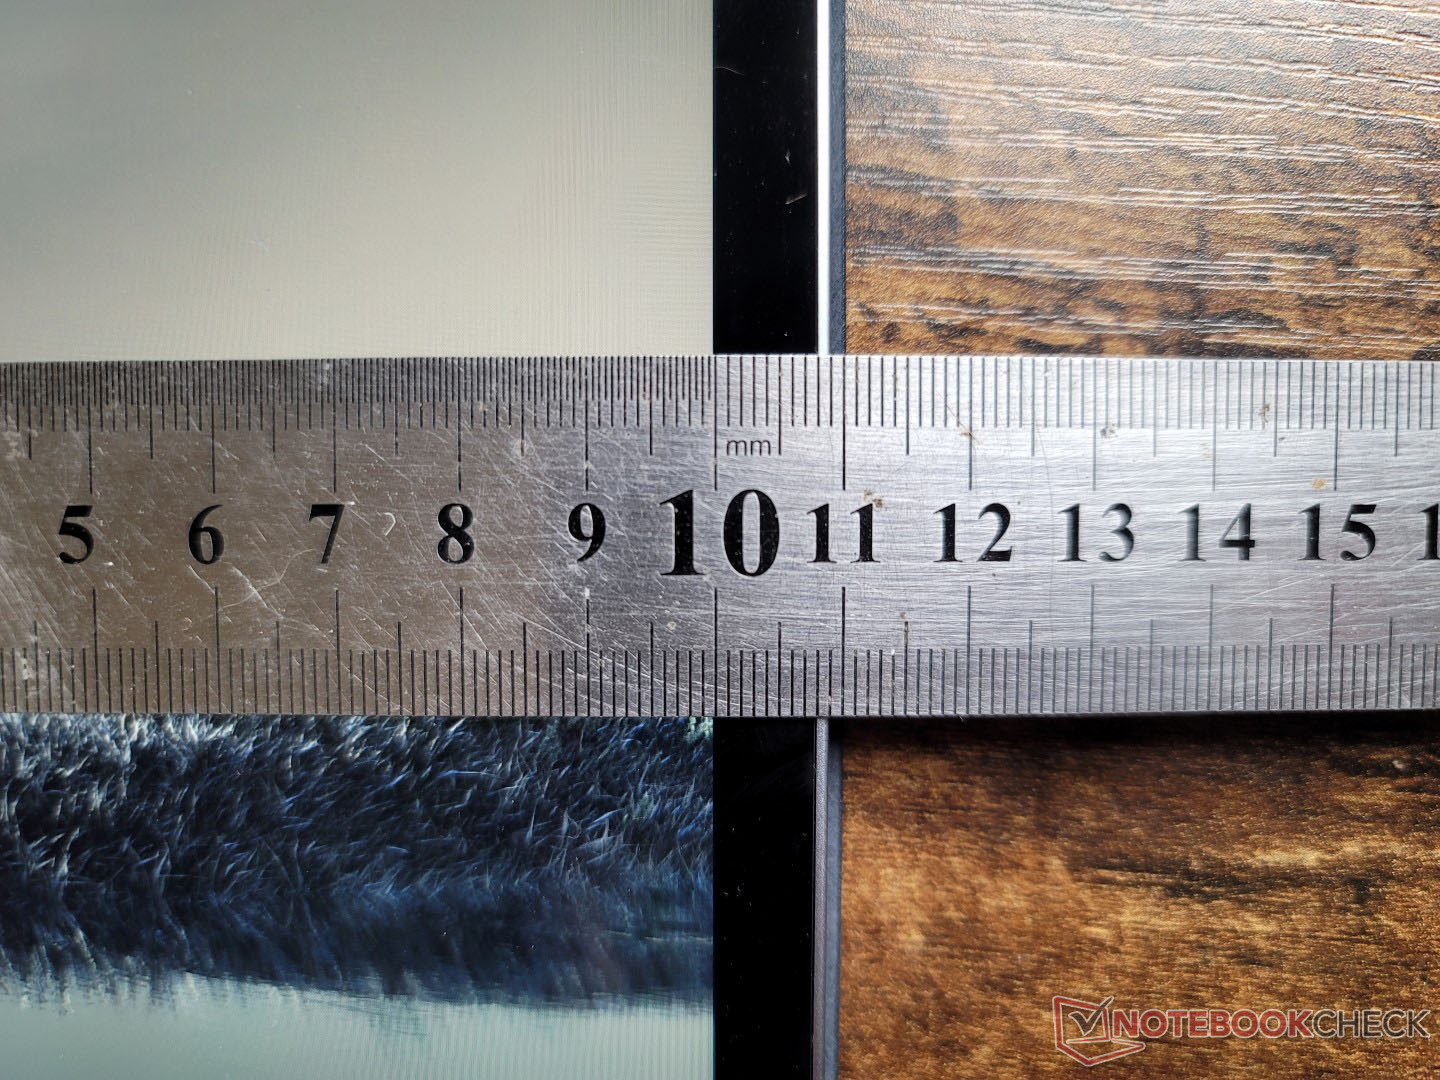
Le configurazioni 5G dell'XPS 13 9315 2-in-1 sono leggermente più spesse di 4/10 di millimetro (7,8 contro 7,4 mm). Tutte le opzioni sono comunque più sottili del Surface Pro 8 di poco, pur essendo quasi identiche in lunghezza e larghezza.
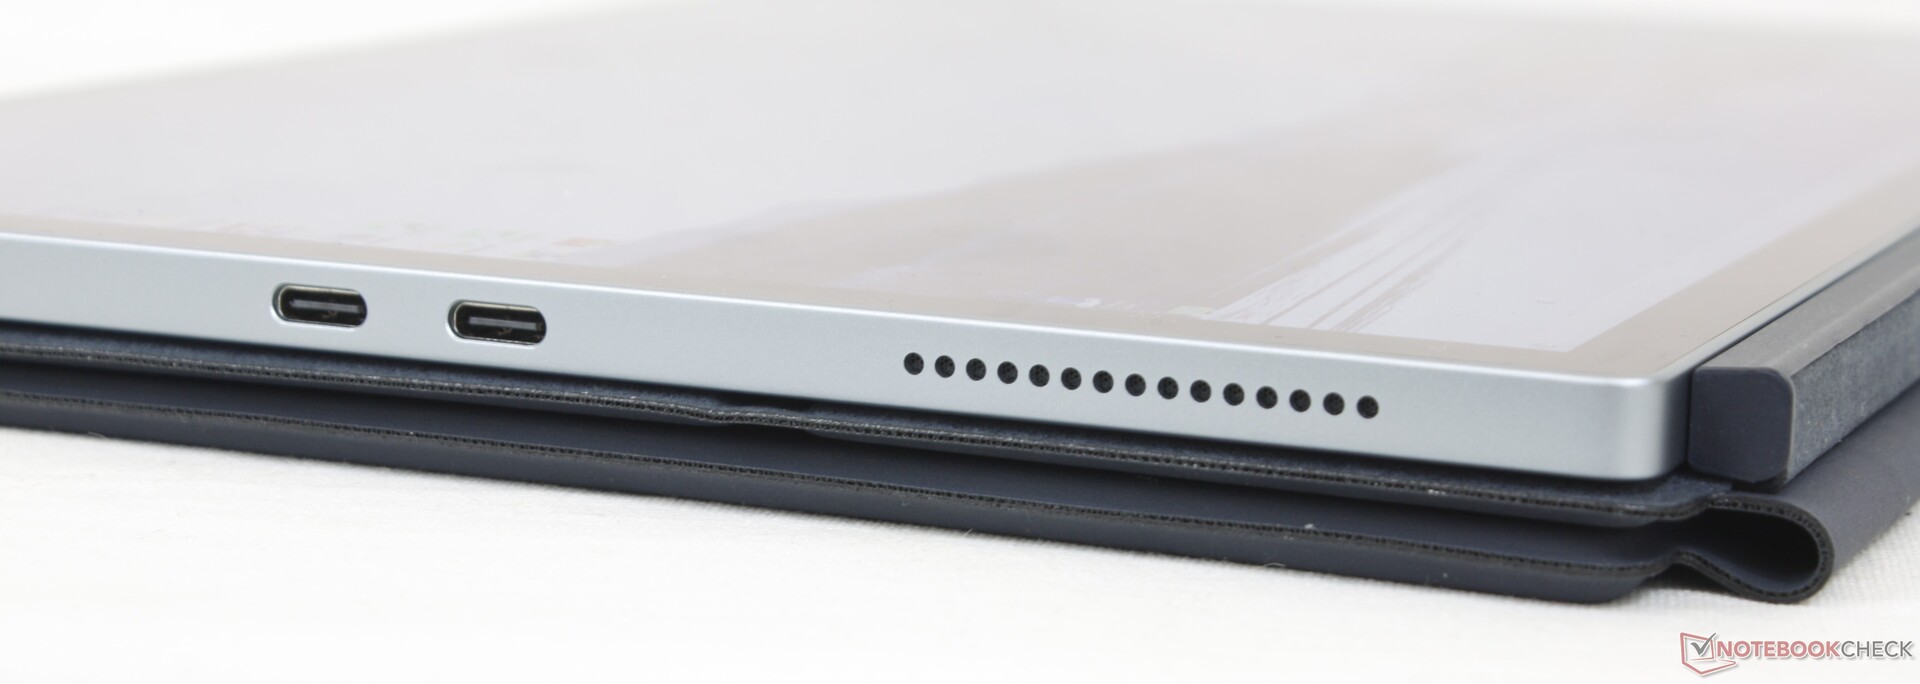
Connettività - Nessun jack audio
Lungo il bordo sinistro sono presenti solo due porte USB-C, ognuna delle quali è compatibile con i dispositivi Thunderbolt 4. Gli utenti dovranno dotarsi di docking station e adattatori per sfruttare al meglio le due porte. Si tenga presente che non c'è nemmeno un jack audio da 3,5 mm, mentre il Surface Pro 8 ne è dotato.
Comunicazione
L'Intel 1675 AX211 è di serie per la compatibilità con il Wi-Fi 6E e il Bluetooth 5.2. Le velocità di trasferimento sono rapide e costanti quando sono accoppiate alla nostra rete a 6 GHz, ma le velocità medie di ricezione sono un po' più lente del previsto.
| Networking | |
| iperf3 transmit AX12 | |
| Microsoft Surface Pro 8, i7-1185G7 | |
| Lenovo ThinkBook Plus Gen2 Core i5 | |
| iperf3 receive AX12 | |
| Microsoft Surface Pro 8, i7-1185G7 | |
| Lenovo ThinkBook Plus Gen2 Core i5 | |
| iperf3 receive AXE11000 6GHz | |
| HP Spectre x360 13.5 14t-ef000 | |
| Dell XPS 13 9315 2-in-1 Core i5-1230U | |
| iperf3 receive AXE11000 | |
| Apple MacBook Air M2 Entry | |
| iperf3 transmit AXE11000 | |
| Apple MacBook Air M2 Entry | |
| iperf3 transmit AXE11000 6GHz | |
| HP Spectre x360 13.5 14t-ef000 | |
| Dell XPS 13 9315 2-in-1 Core i5-1230U | |
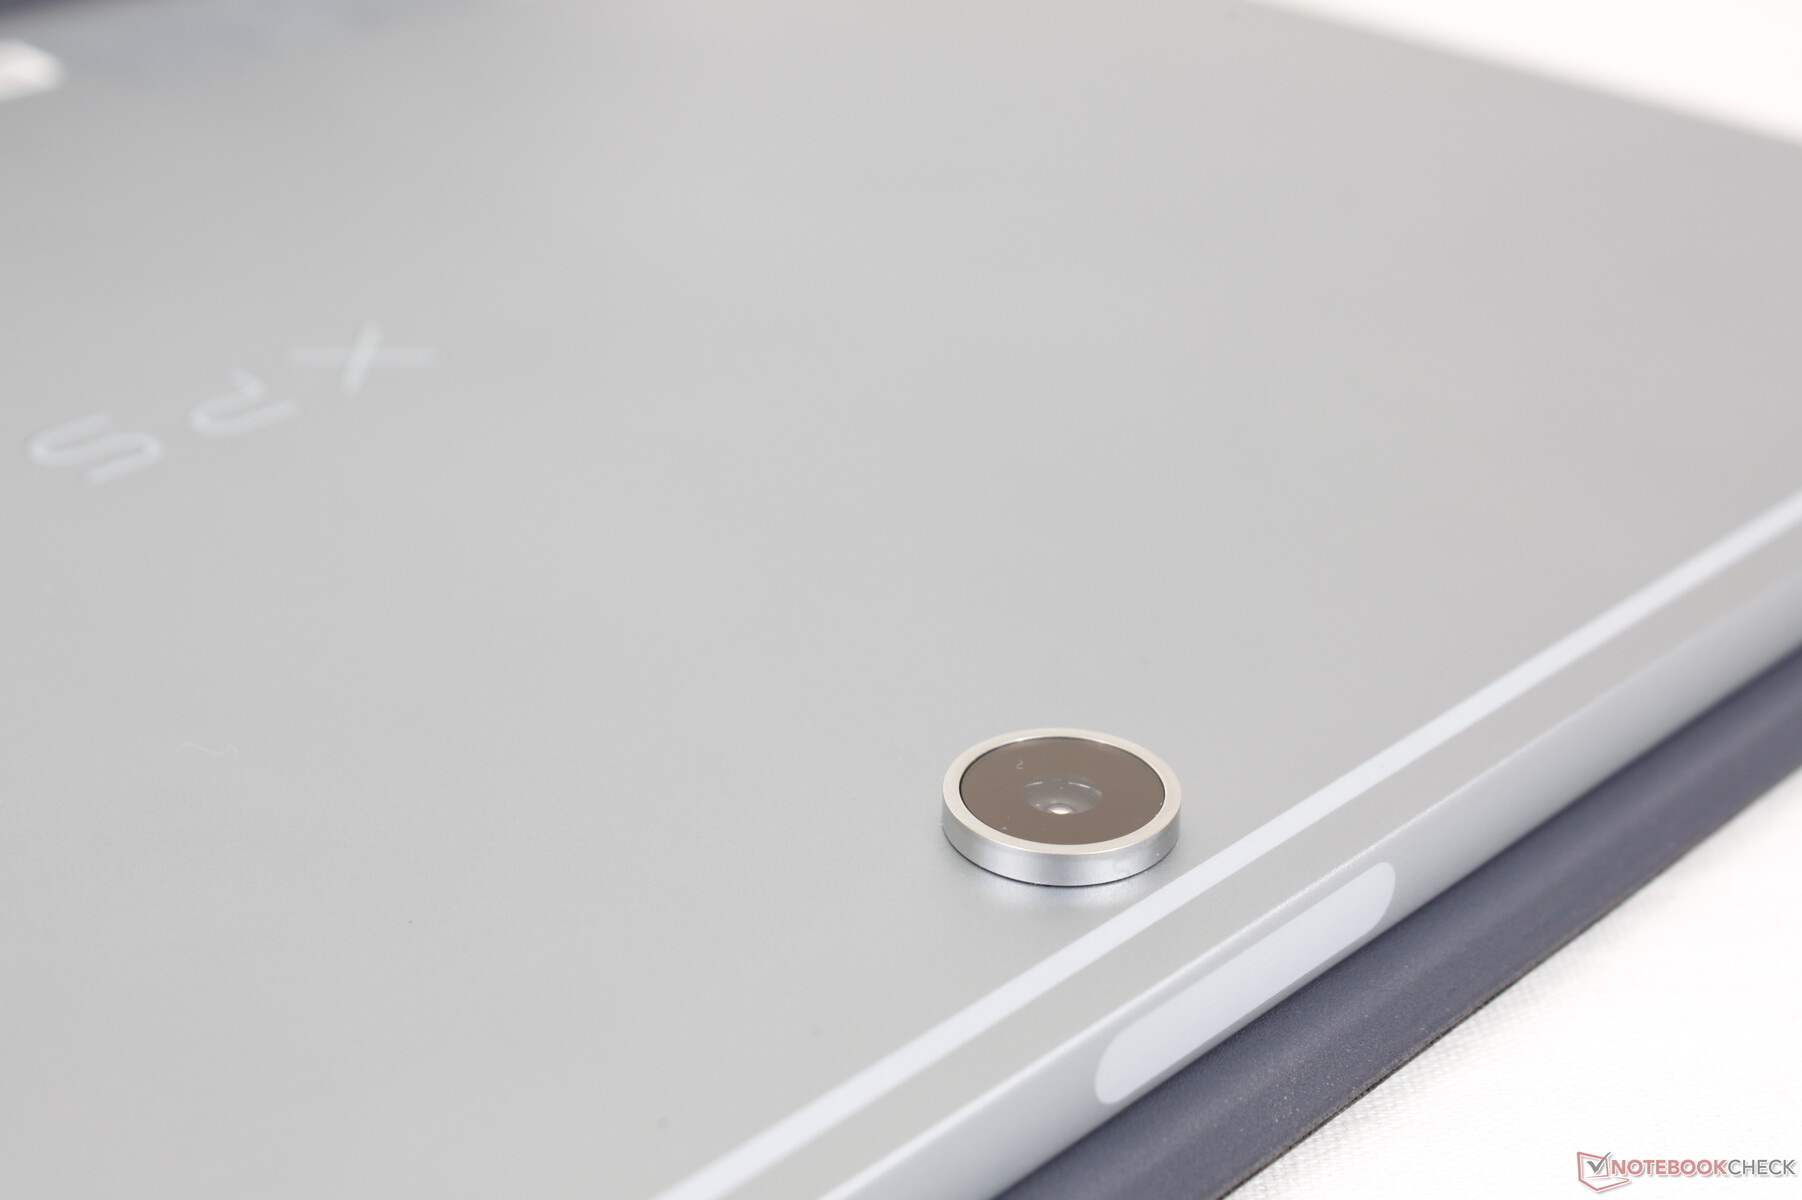
Webcam
La fotocamera posteriore è da 11 MP che, forse non a caso, è 1 MP in più rispetto alla fotocamera del Surface Pro 8. La qualità dell'immagine è nettamente superiore a quella delle webcam dei laptop, anche se la precisione dei colori ha ancora molta strada da fare.
L'IR è presente per il supporto di Windows Hello. Purtroppo non è presente l'otturatore della webcam per motivi di privacy.


Accessori e garanzia
La confezione include due pratici adattatori USB-C per la conversione a USB-A e audio da 3,5 mm. Come nel caso di Microsoft e della serie di tablet Surface Pro, tuttavia, la base della tastiera staccabile e lo stilo attivo magnetico sono venduti separatamente a un prezzo aggiuntivo di 100 dollari ciascuno. In altre parole, dovrete aggiungere 200 dollari al prezzo iniziale se volete sia la base della tastiera che la penna.
La garanzia standard limitata di un anno del produttore è valida se acquistata negli Stati Uniti.
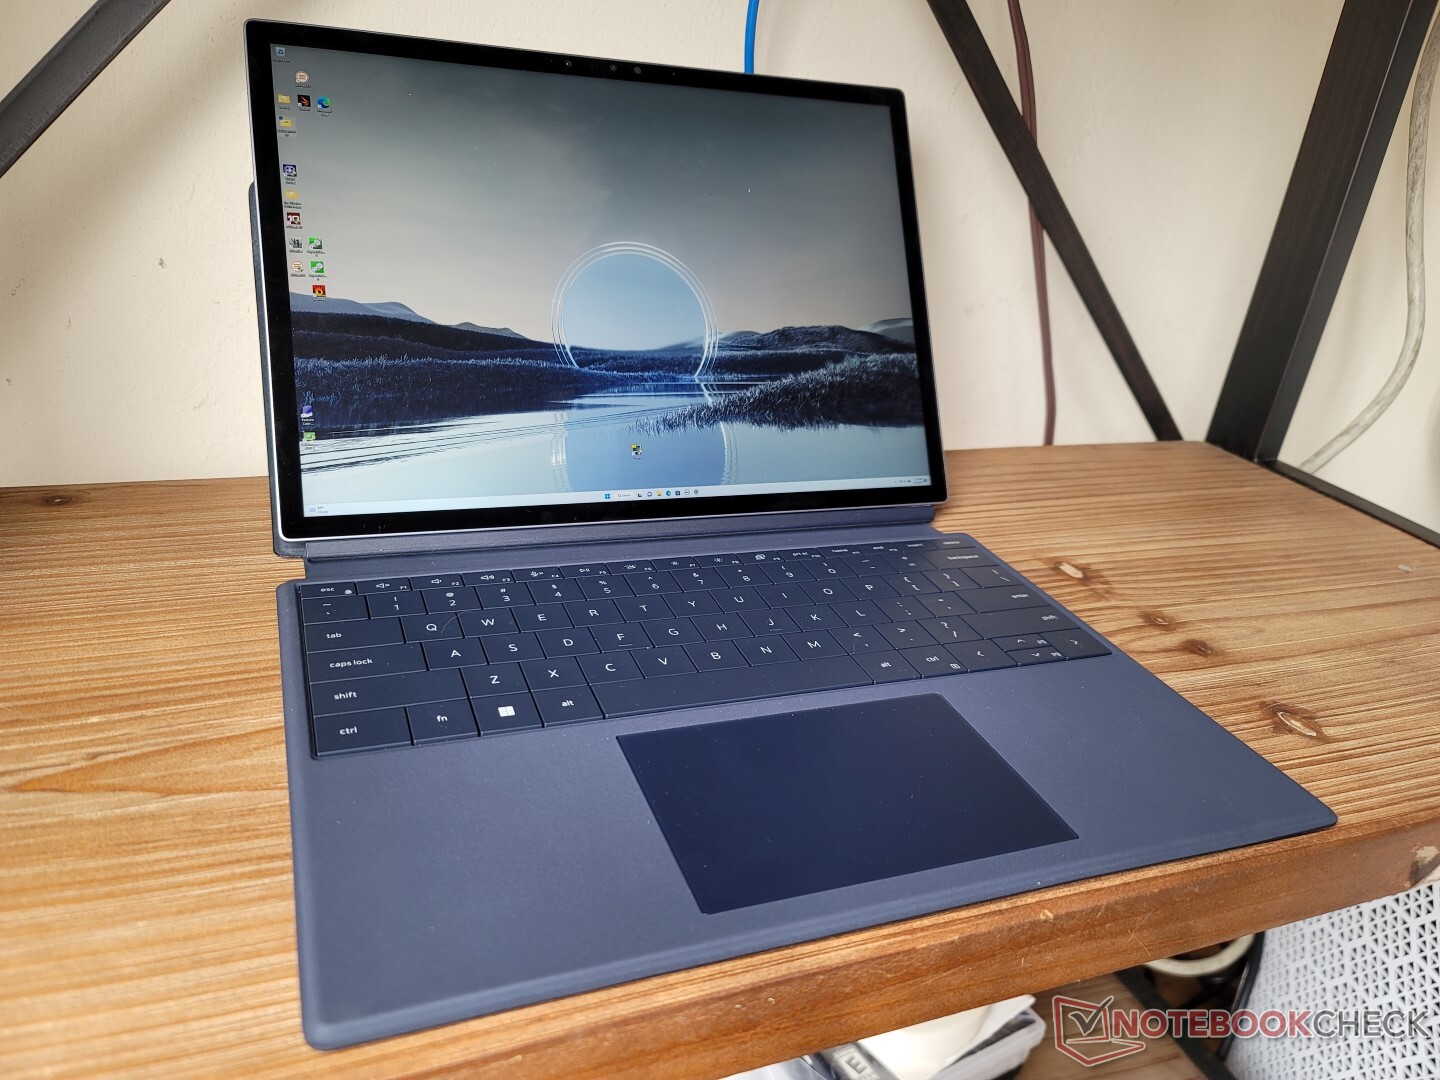
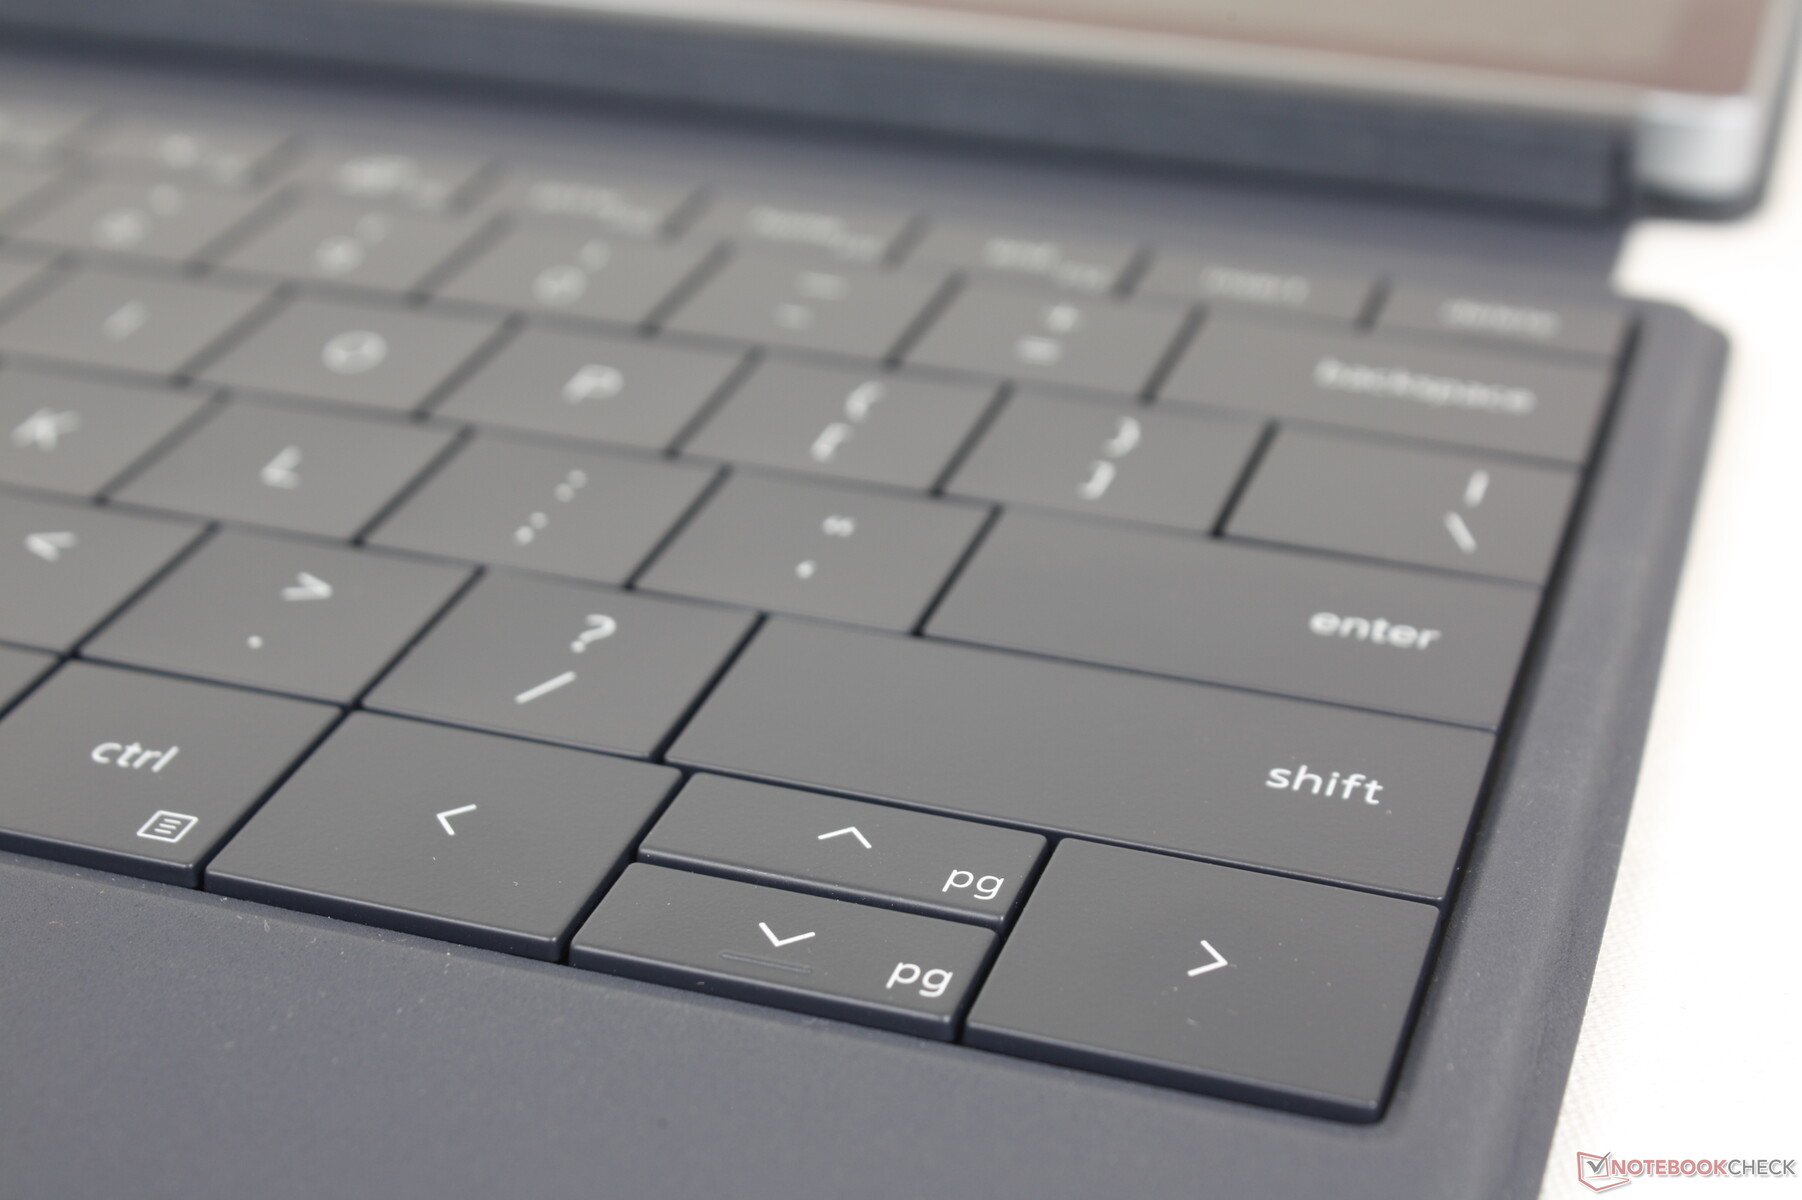
Dispositivi di input - Una delle tastiere staccabili più confortevoli
Tastiera
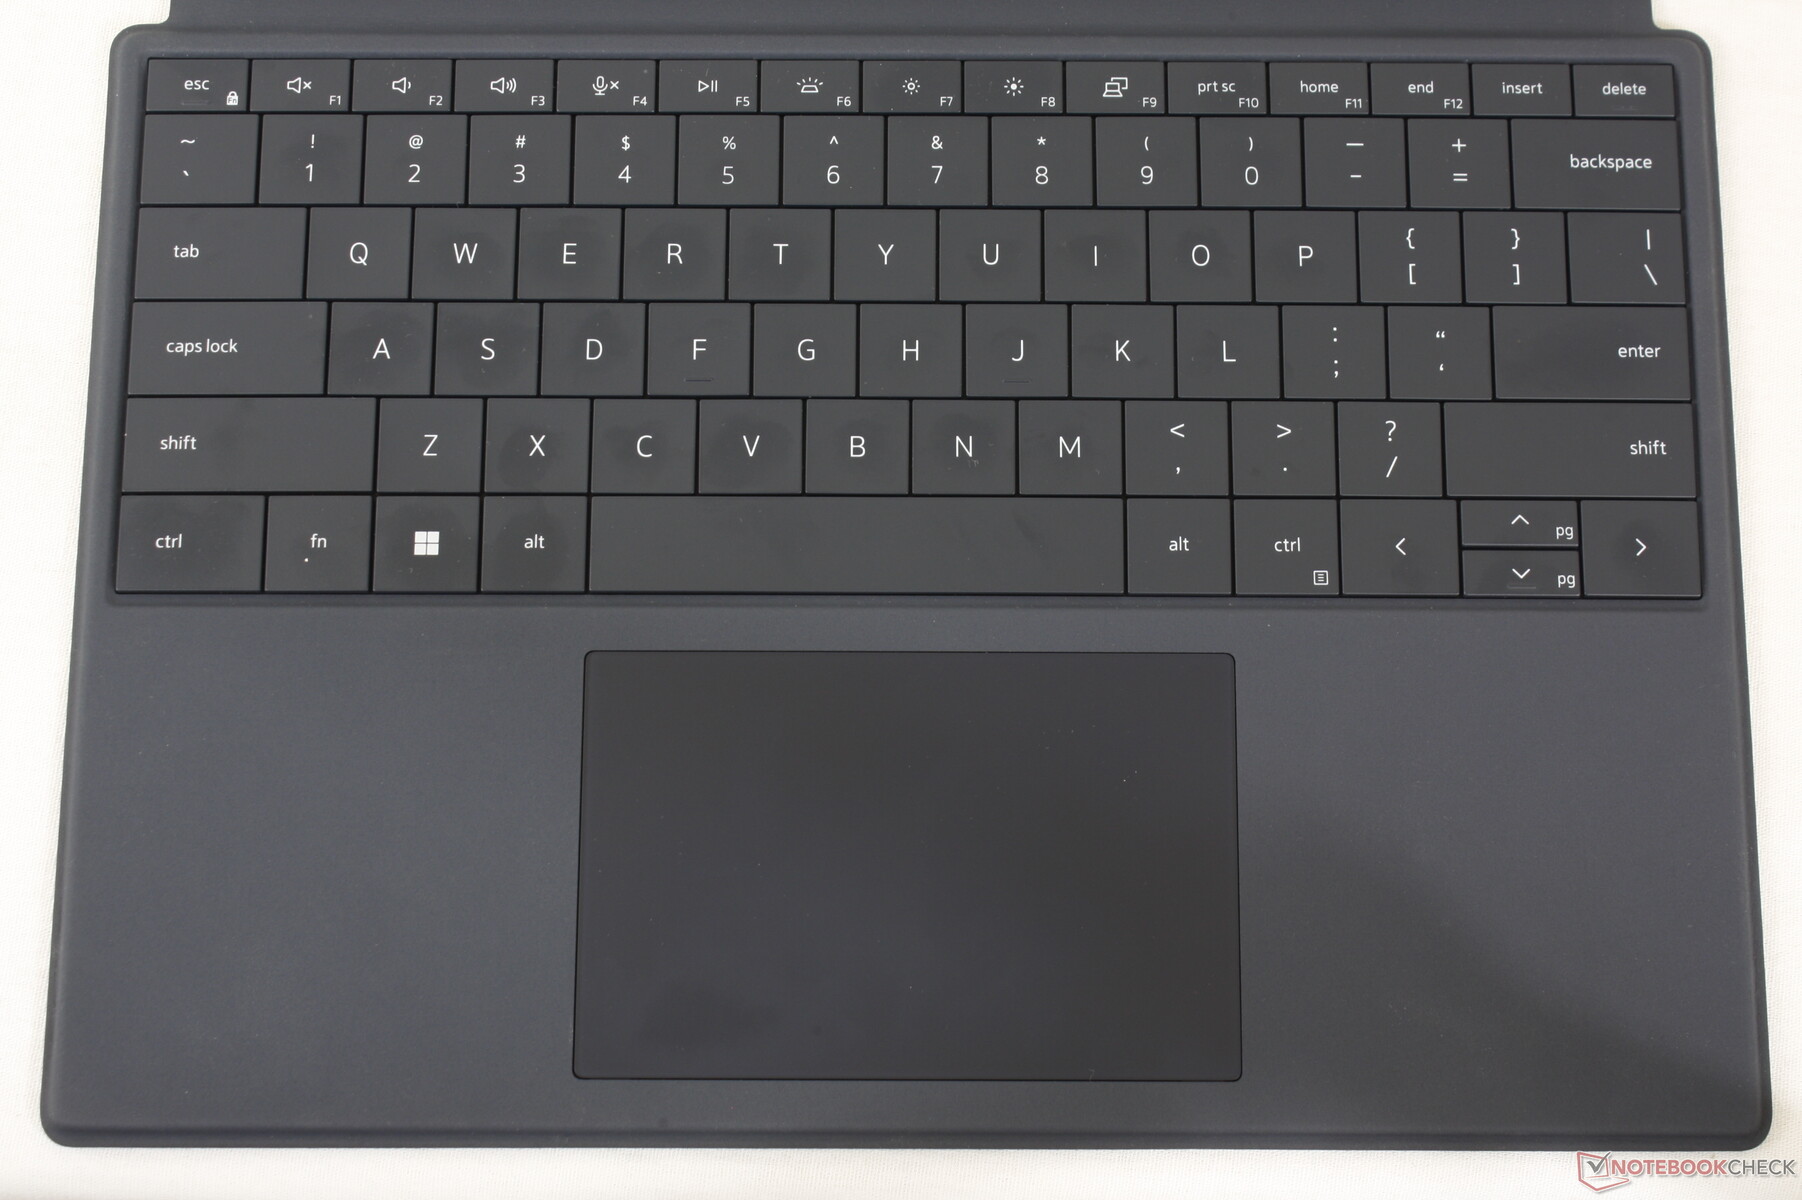
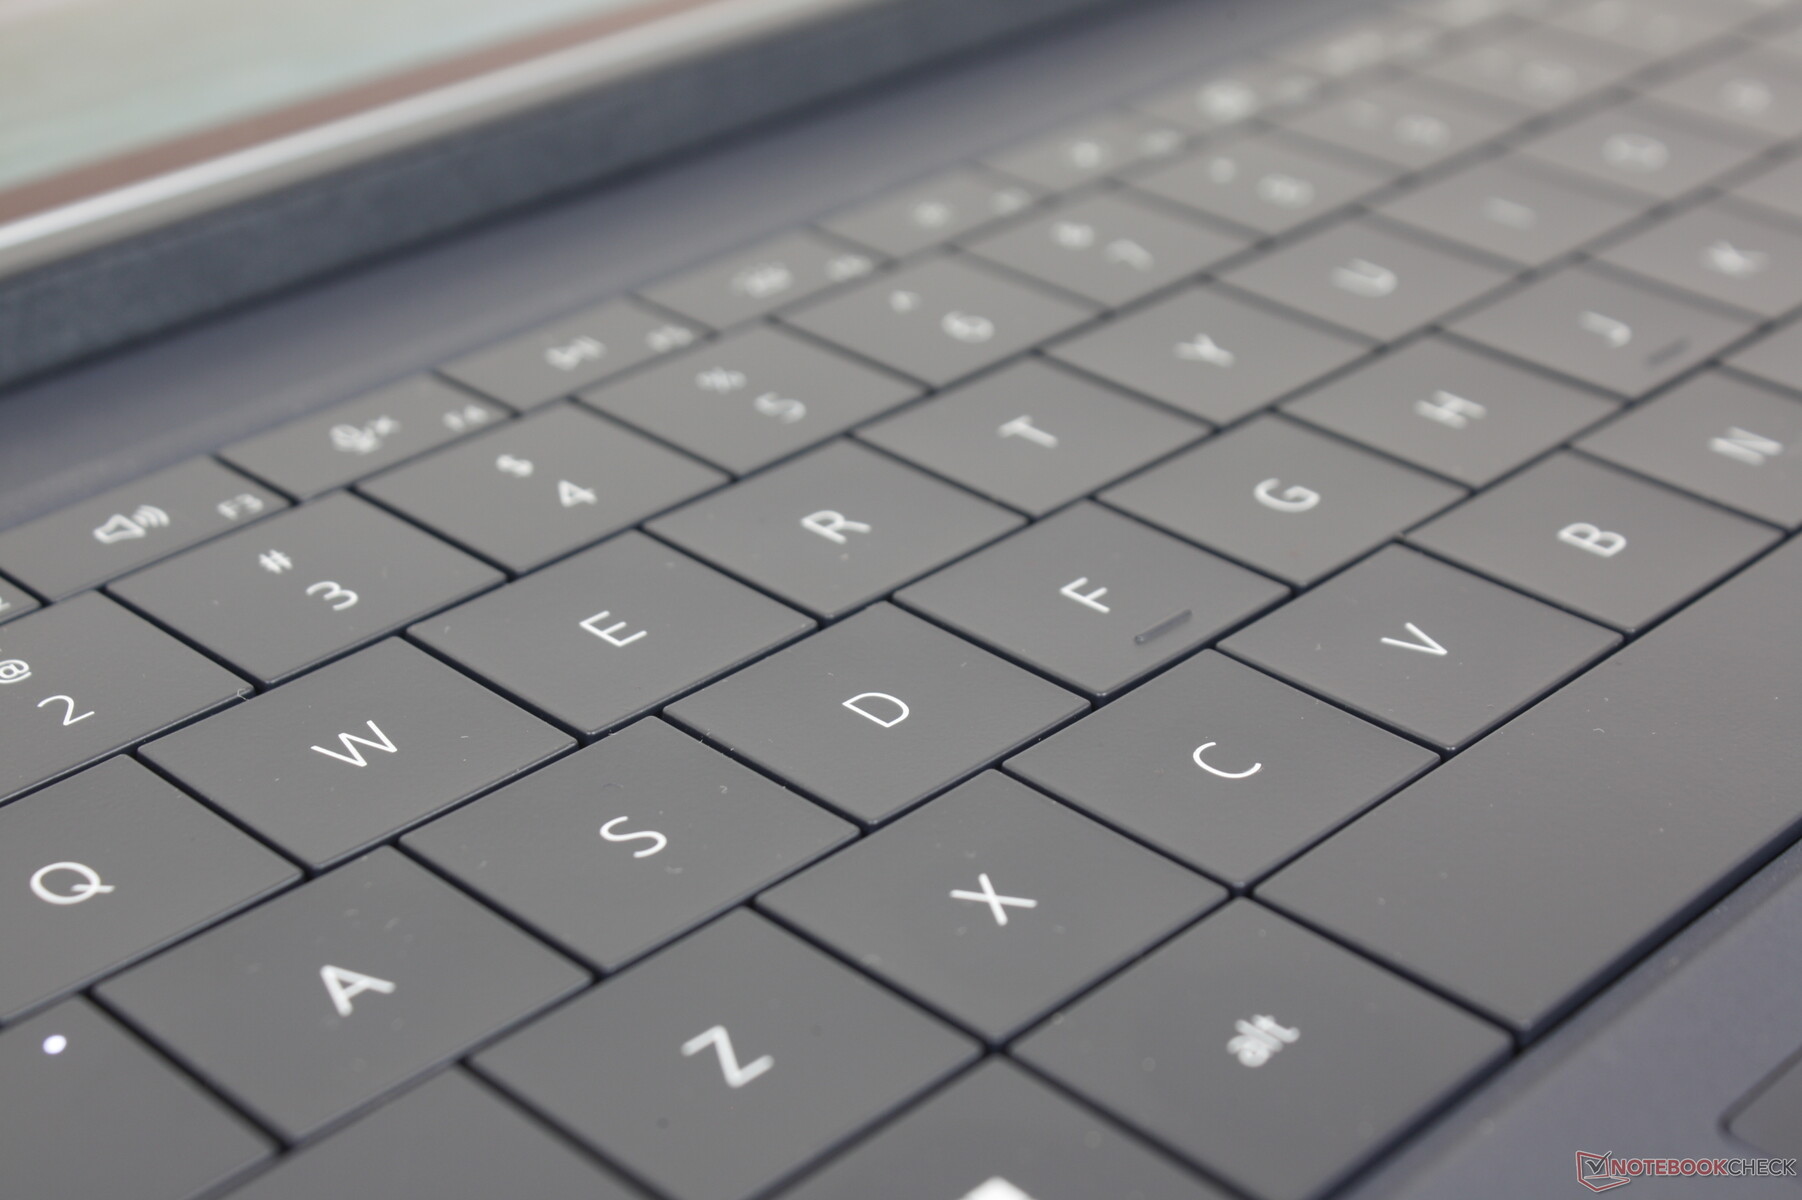
La tastiera è modellata sulla base di quella dell'XPS 13 Plus 9320 XPS 13 Plus 9320 e quindi la sensazione è quasi la stessa per quanto riguarda la corsa e il feedback. Alcuni potrebbero ritenere che la corsa dei tasti di 1,0 mm sia troppo ridotta, ma la sensazione complessiva è comunque molto migliore di quanto ci si aspetti da una base staccabile, dato che molte tastiere di questa categoria sono famose per lo scarso feedback dei tasti, la sensazione di scarsa qualità e i tasti spugnosi. La tastiera dell'XPS 13 9315 2-in-1 si avvicina di più a quella di un vero Ultrabook
Detto questo, il layout della tastiera non è identico a quello dell'XPS 13 Plus 9320. Quest'ultima tastiera è leggermente più ampia e incorpora sia il pulsante di accensione che la riga capacitiva dei comandi funzione. Per il resto, lo stile dei caratteri e la retroilluminazione bianca sono sostanzialmente identici.
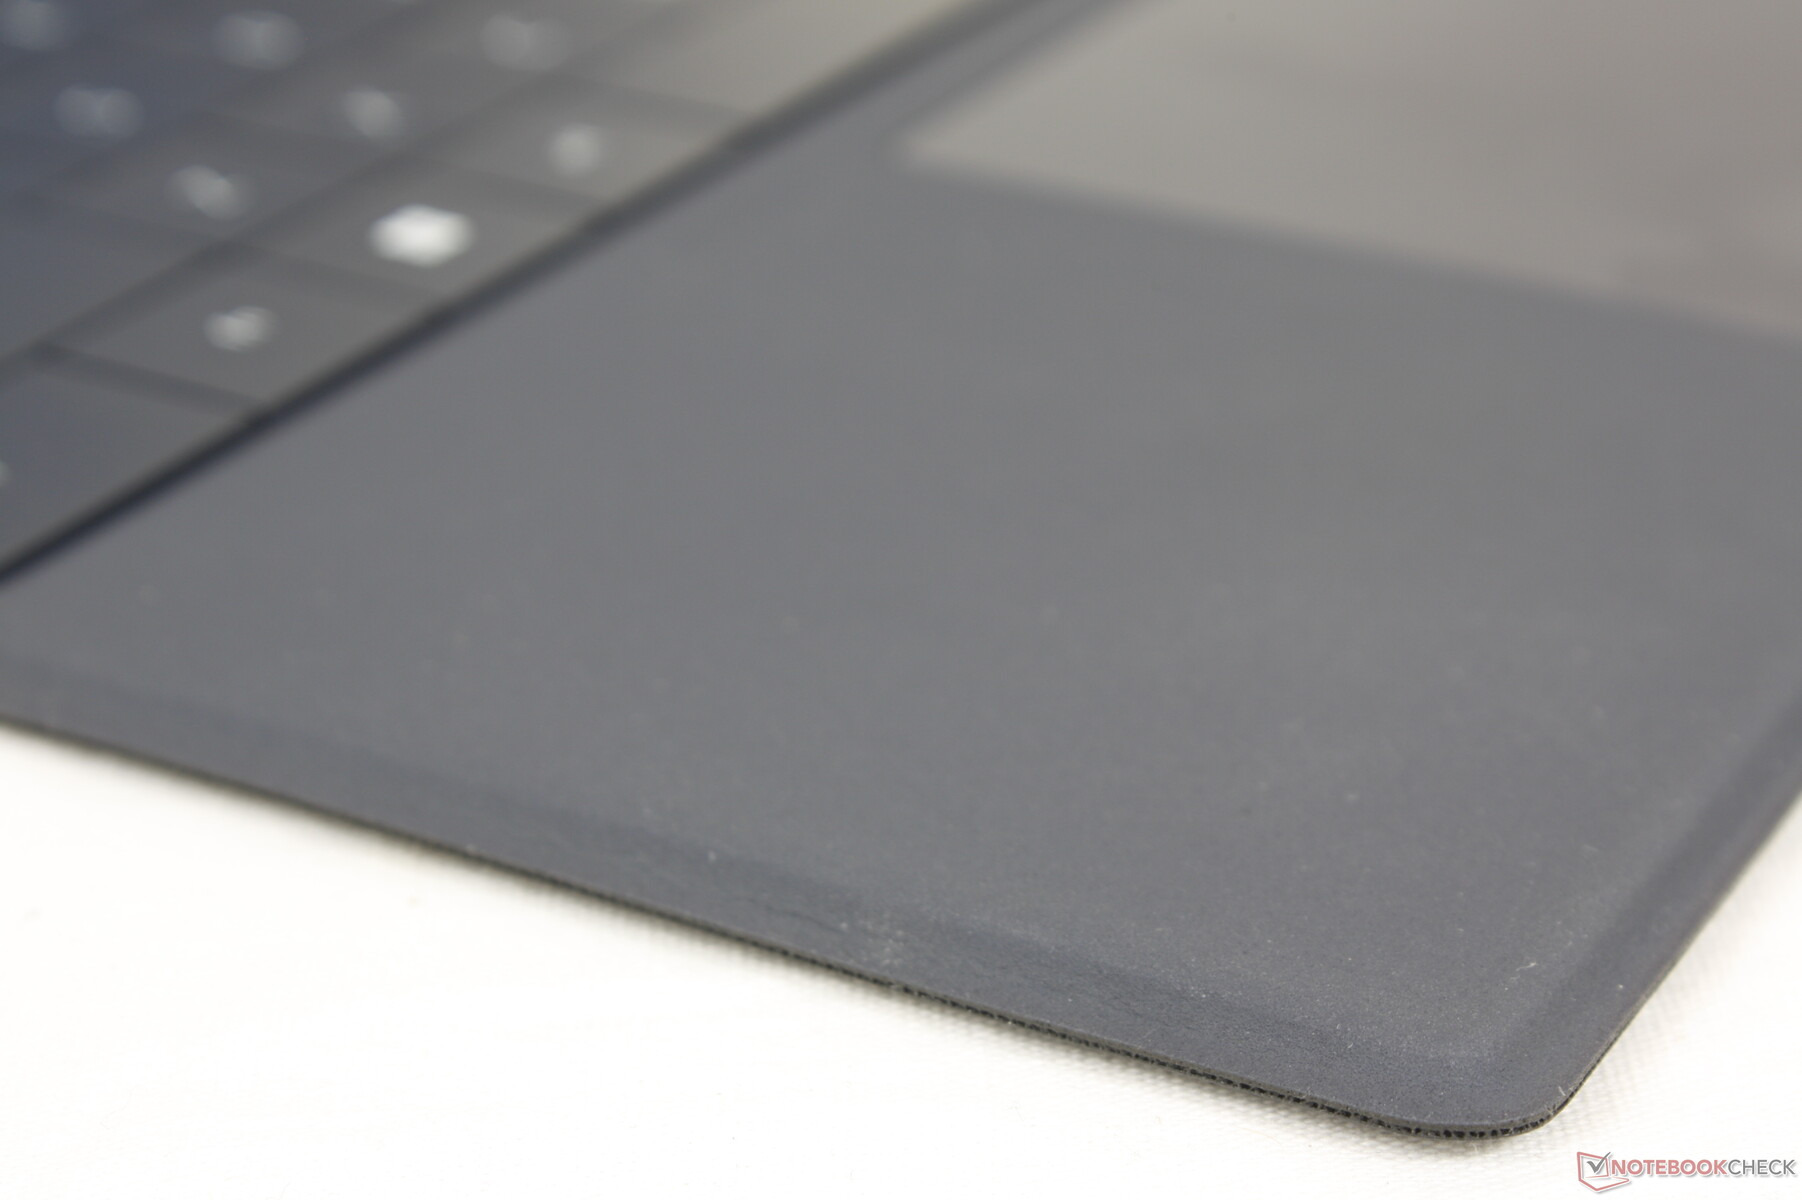
Touchpad
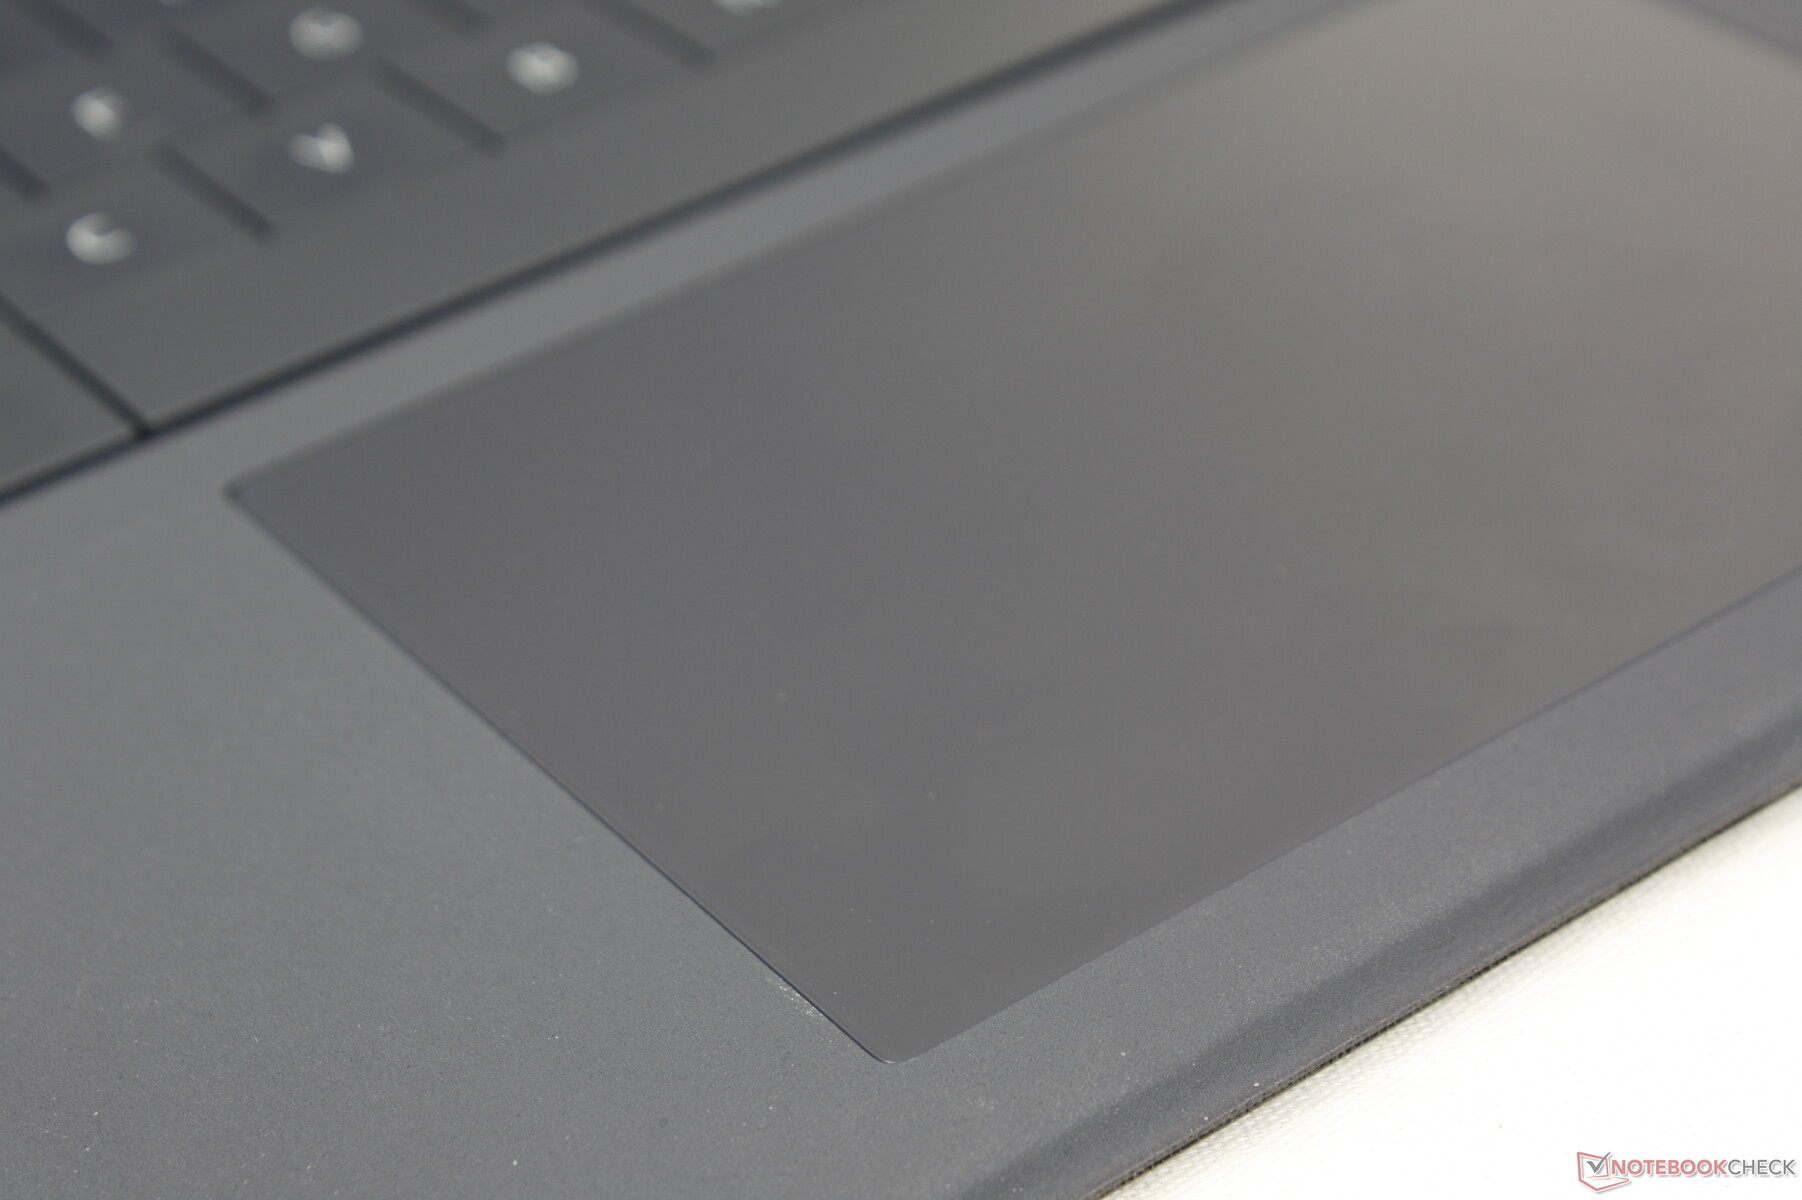
Il clickpad è più grande di quello del Serie Surface Pro (11,4 x 7,5 cm contro 10,2 x 5,3 cm) per facilitare lo scorrimento e l'esecuzione di input multi-touch. La sua superficie è completamente liscia e non si impunta, anche quando si scivola alla velocità della doccia. Tuttavia, il feedback quando si fa clic è molto più debole rispetto alla maggior parte dei computer portatili, e quindi non è così soddisfacente da usare come il clickpad dei più tradizionali computer portatili XPS 13 9315 a conchiglia.
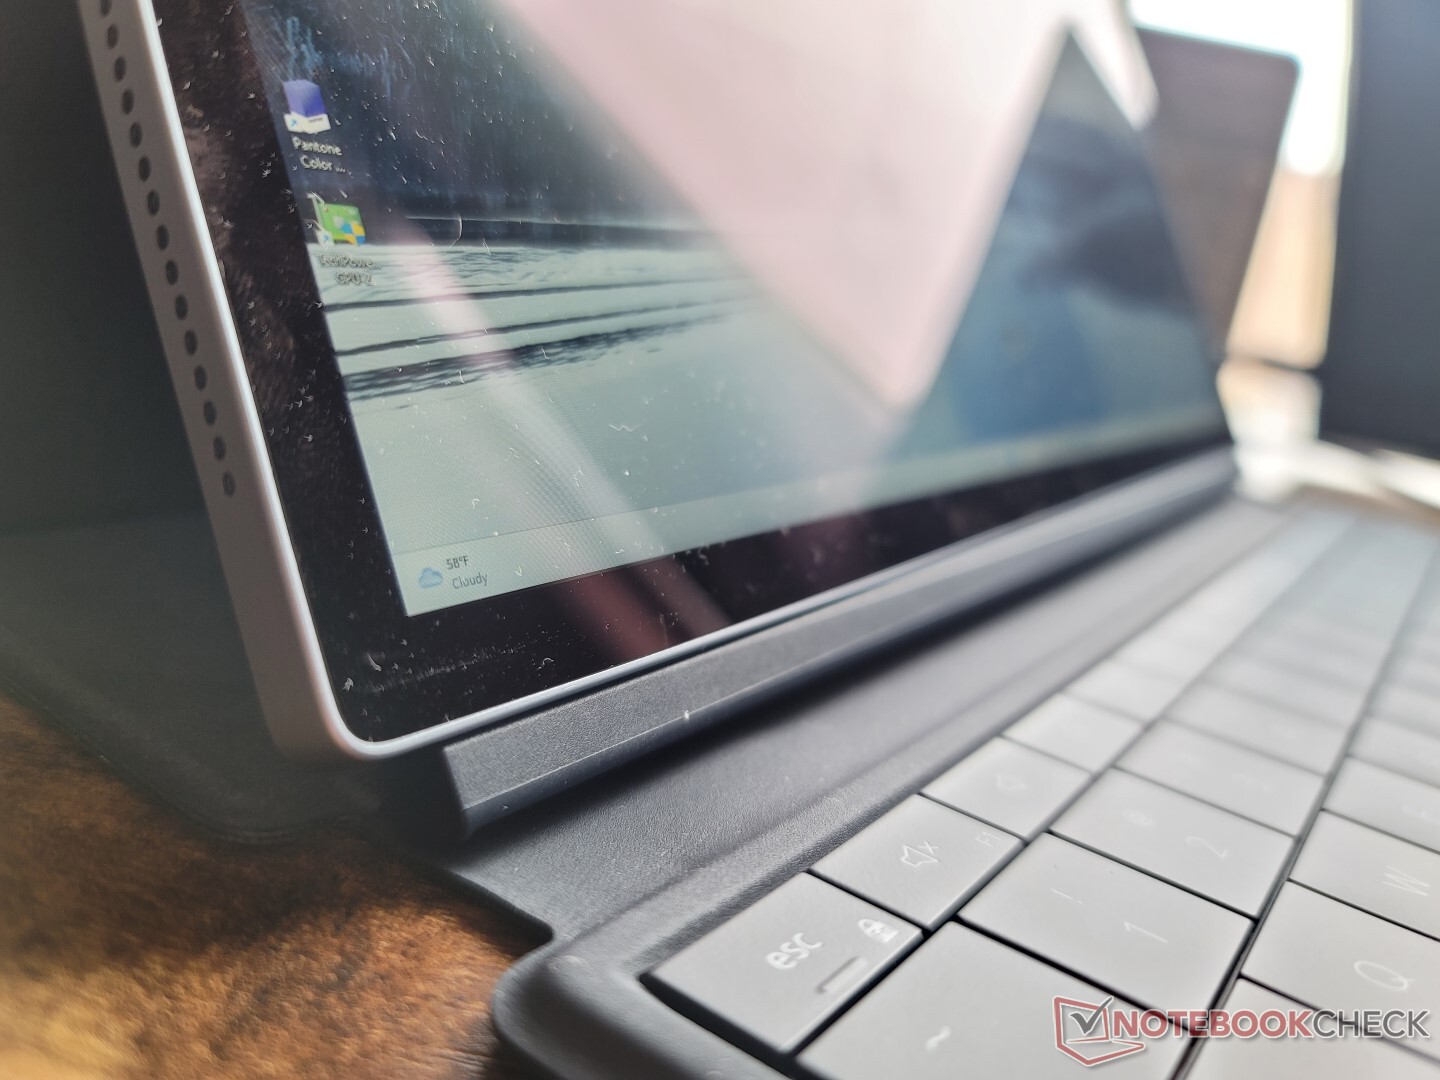
Display - Solo 60 Hz
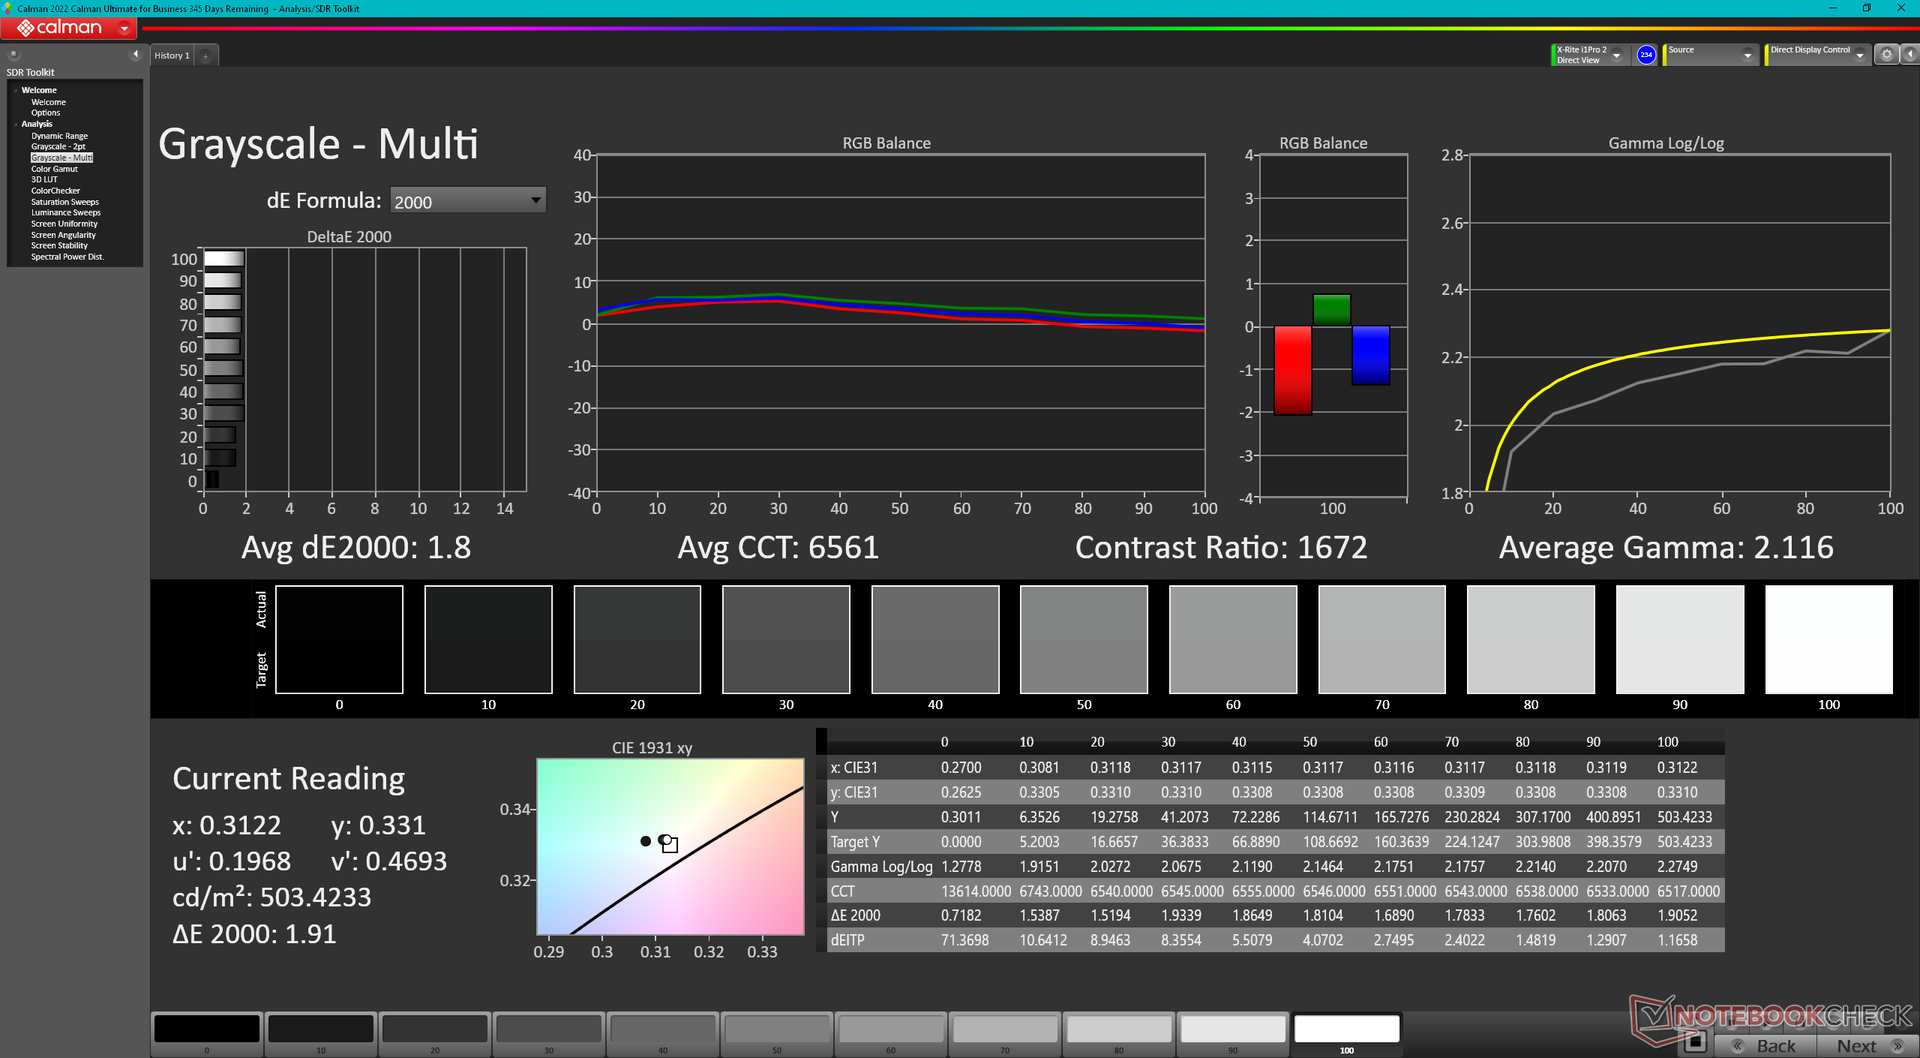
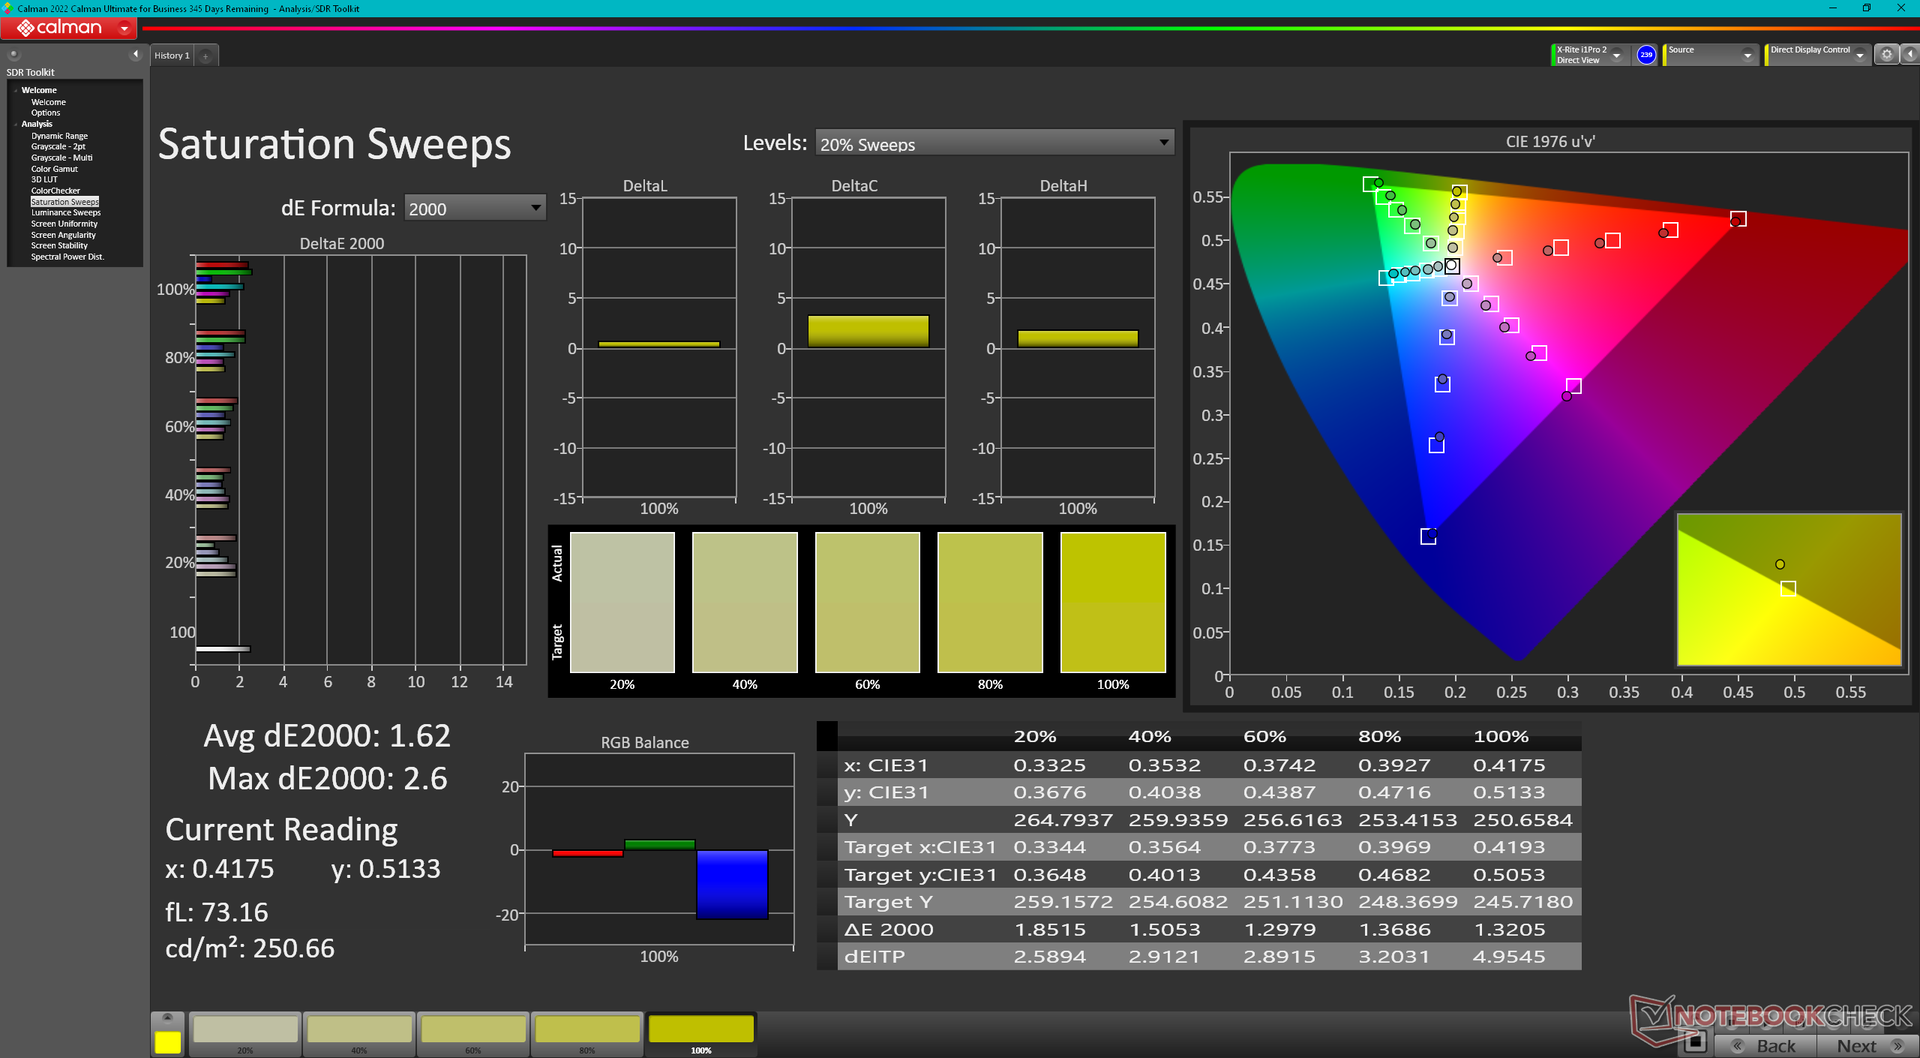
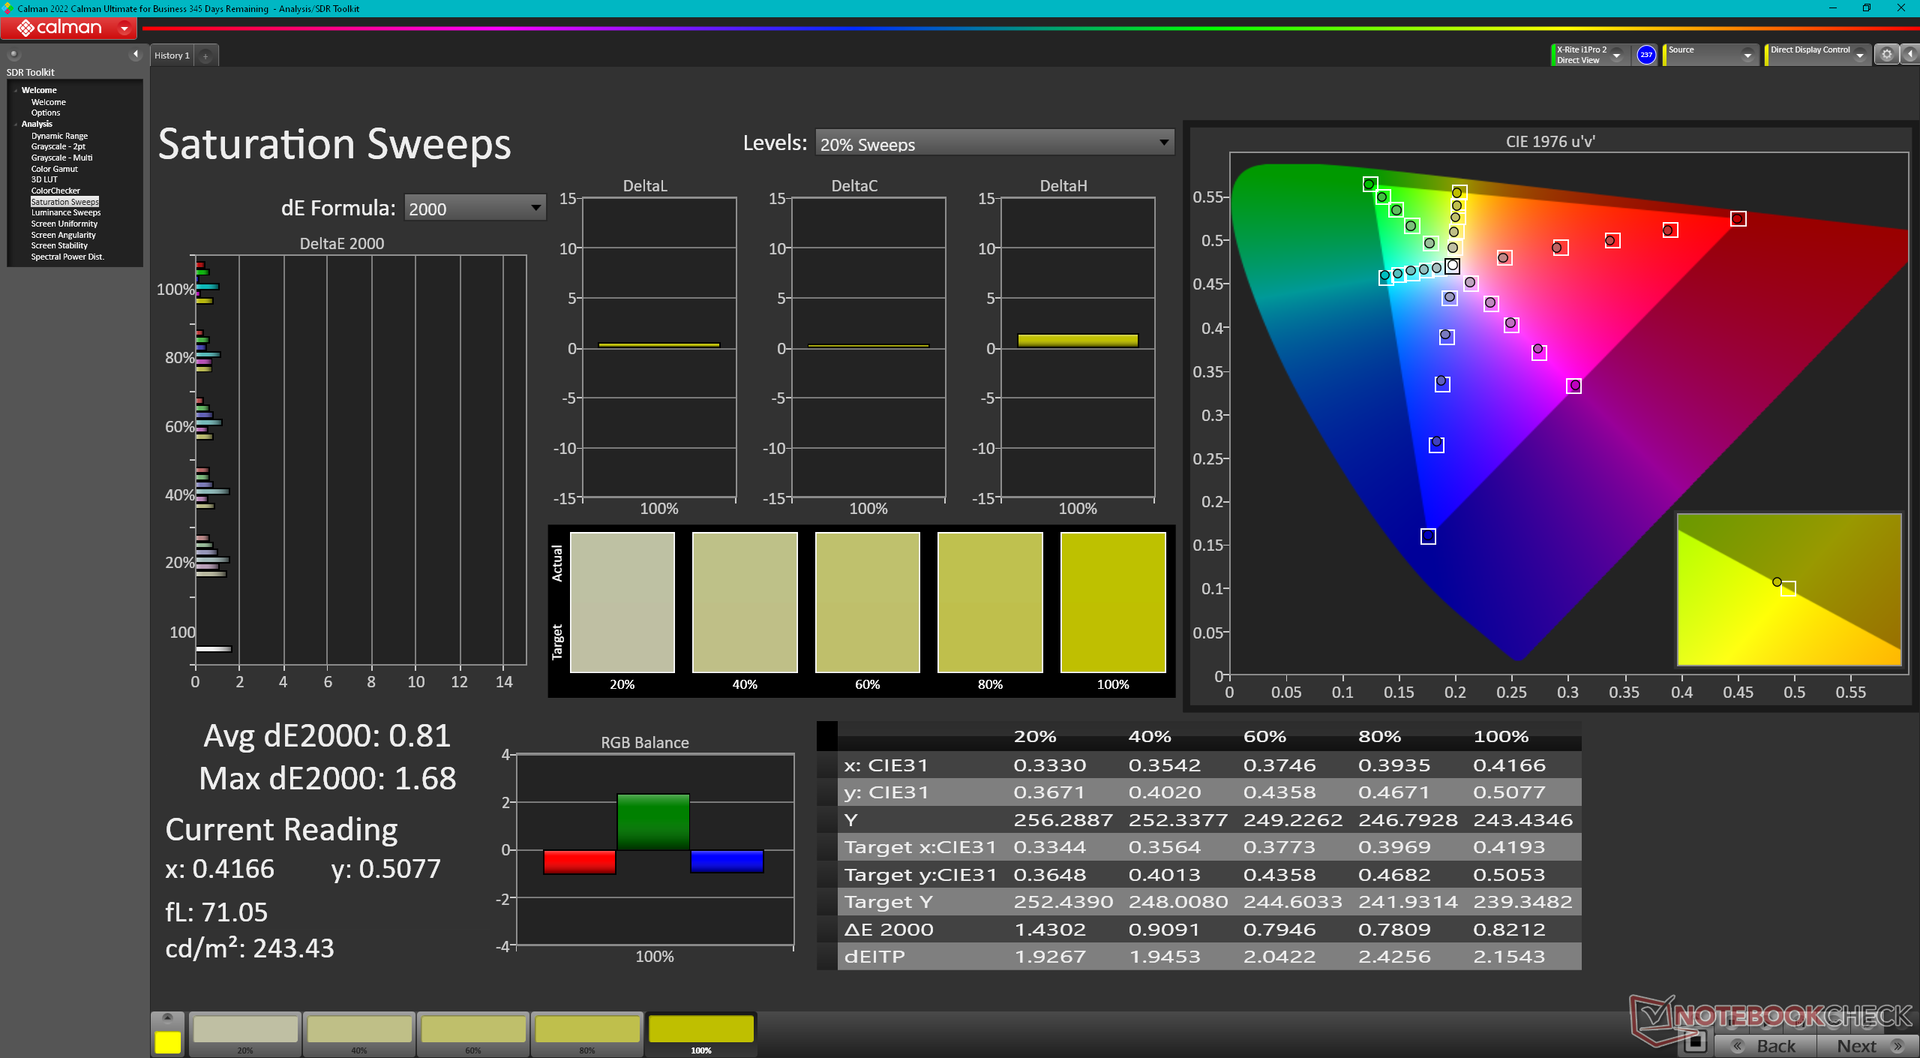
Dell pubblicizza un display da 500 nit con copertura sRGB completa, che possiamo confermare con le nostre misurazioni indipendenti. Anche il rapporto di contrasto è molto buono per un pannello IPS, circa 1500:1, e non c'è PWM sui livelli di luminosità più bassi, a differenza dell'equivalente Microsoft. L'esperienza visiva è appropriata per un tablet Windows di fascia alta, almeno a prima vista.
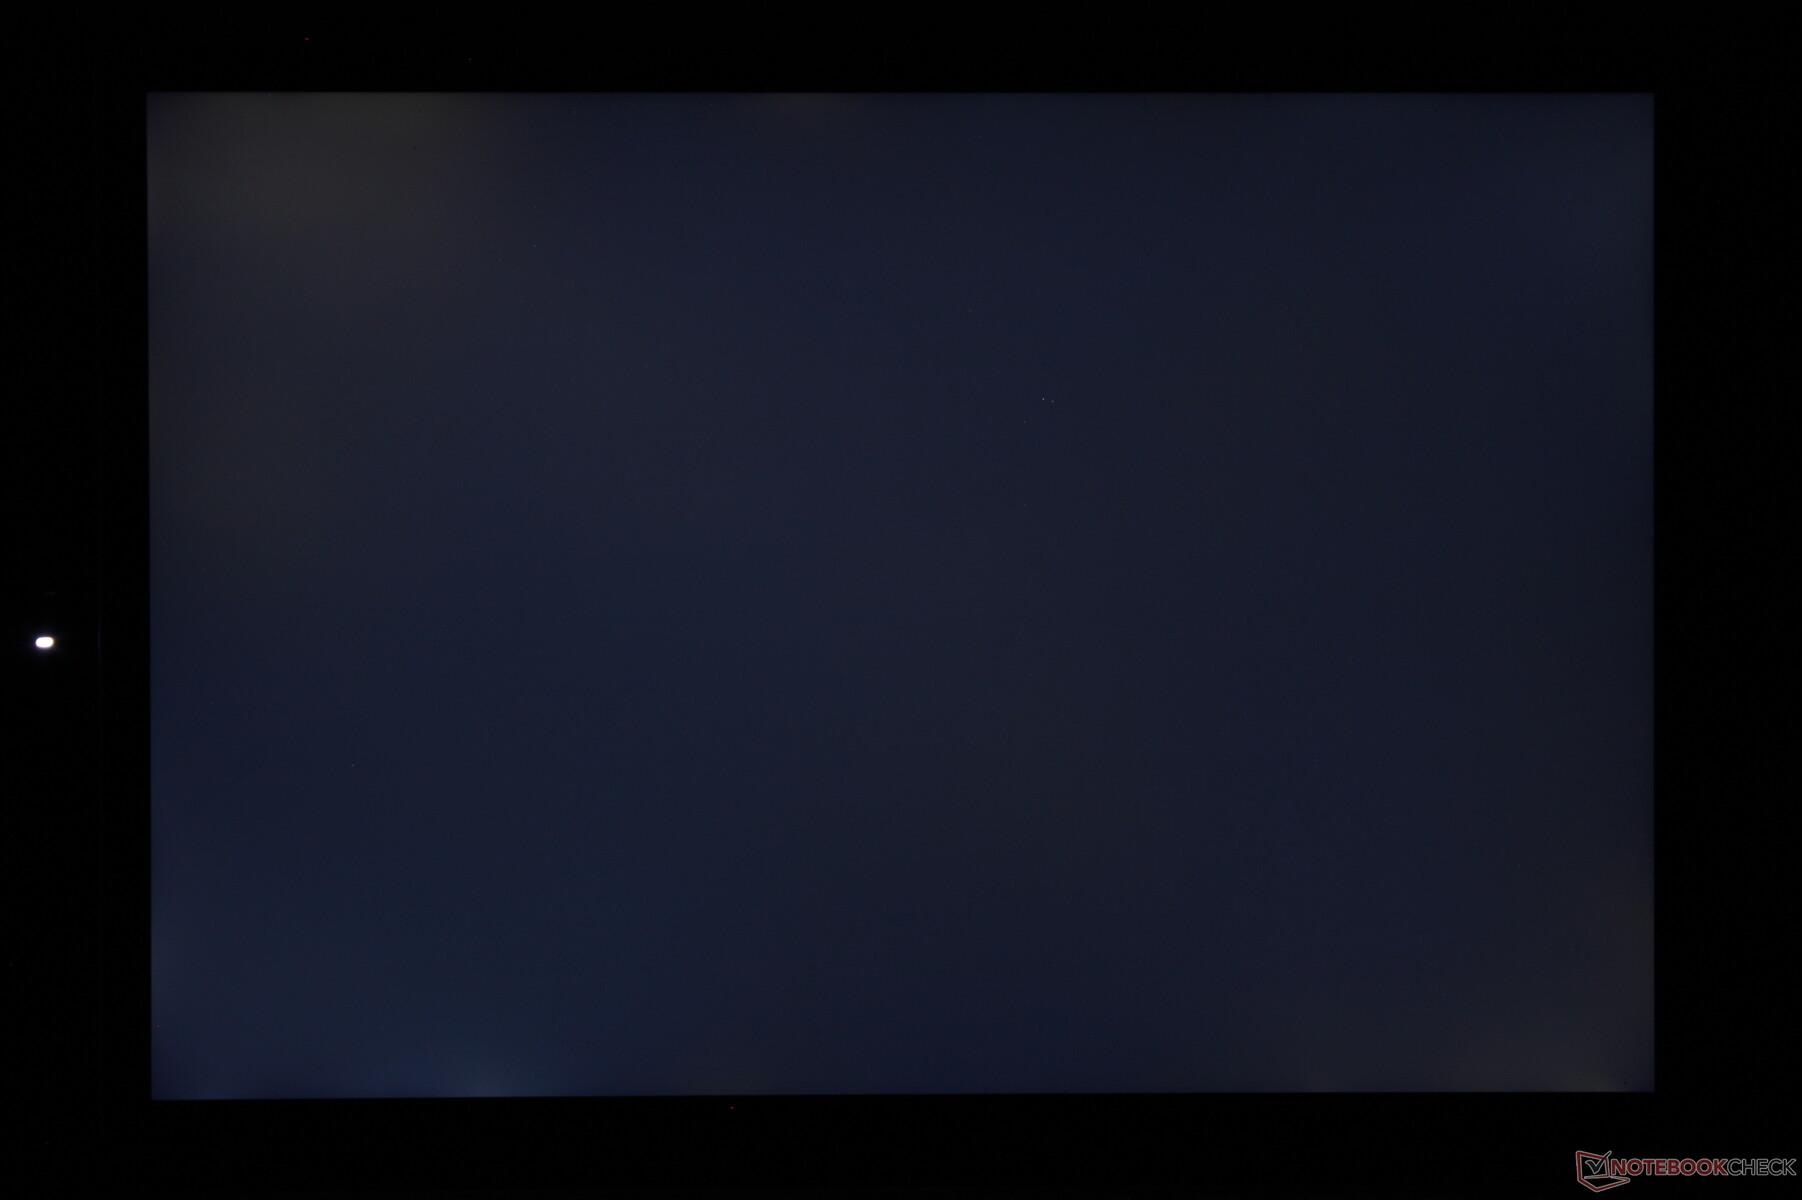
Ci sono due inconvenienti degni di nota che vale la pena menzionare. In primo luogo, i tempi di risposta in bianco e nero e in grigio sono relativamente lenti e si notano le immagini fantasma quando si sposta il cursore o si scorrono le pagine web. In secondo luogo, l'uniformità della luminosità avrebbe potuto essere migliore: la parte superiore sinistra dello schermo è più luminosa di circa 50 nits rispetto a quella inferiore destra. Non si tratta di nulla di grave, ma un'opzione OLED avrebbe potuto facilmente risolvere entrambi gli svantaggi.
Ci piacerebbe vedere pannelli con una frequenza di aggiornamento più elevata e magari con colori P3 completi sulle future SKU. Il Surface Pro 8, ad esempio, ha una frequenza di aggiornamento di 120 Hz per aumentare la reattività dell'interfaccia utente. Nel frattempo, gli utenti dovranno prendere in considerazione portatili a conchiglia come il Dell XPS 13 Plus 9320 o l'Asus VivoBook Asus VivoBook per trovare funzioni OLED al momento.
| |||||||||||||||||||||||||
Distribuzione della luminosità: 87 %
Al centro con la batteria: 507 cd/m²
Contrasto: 1491:1 (Nero: 0.34 cd/m²)
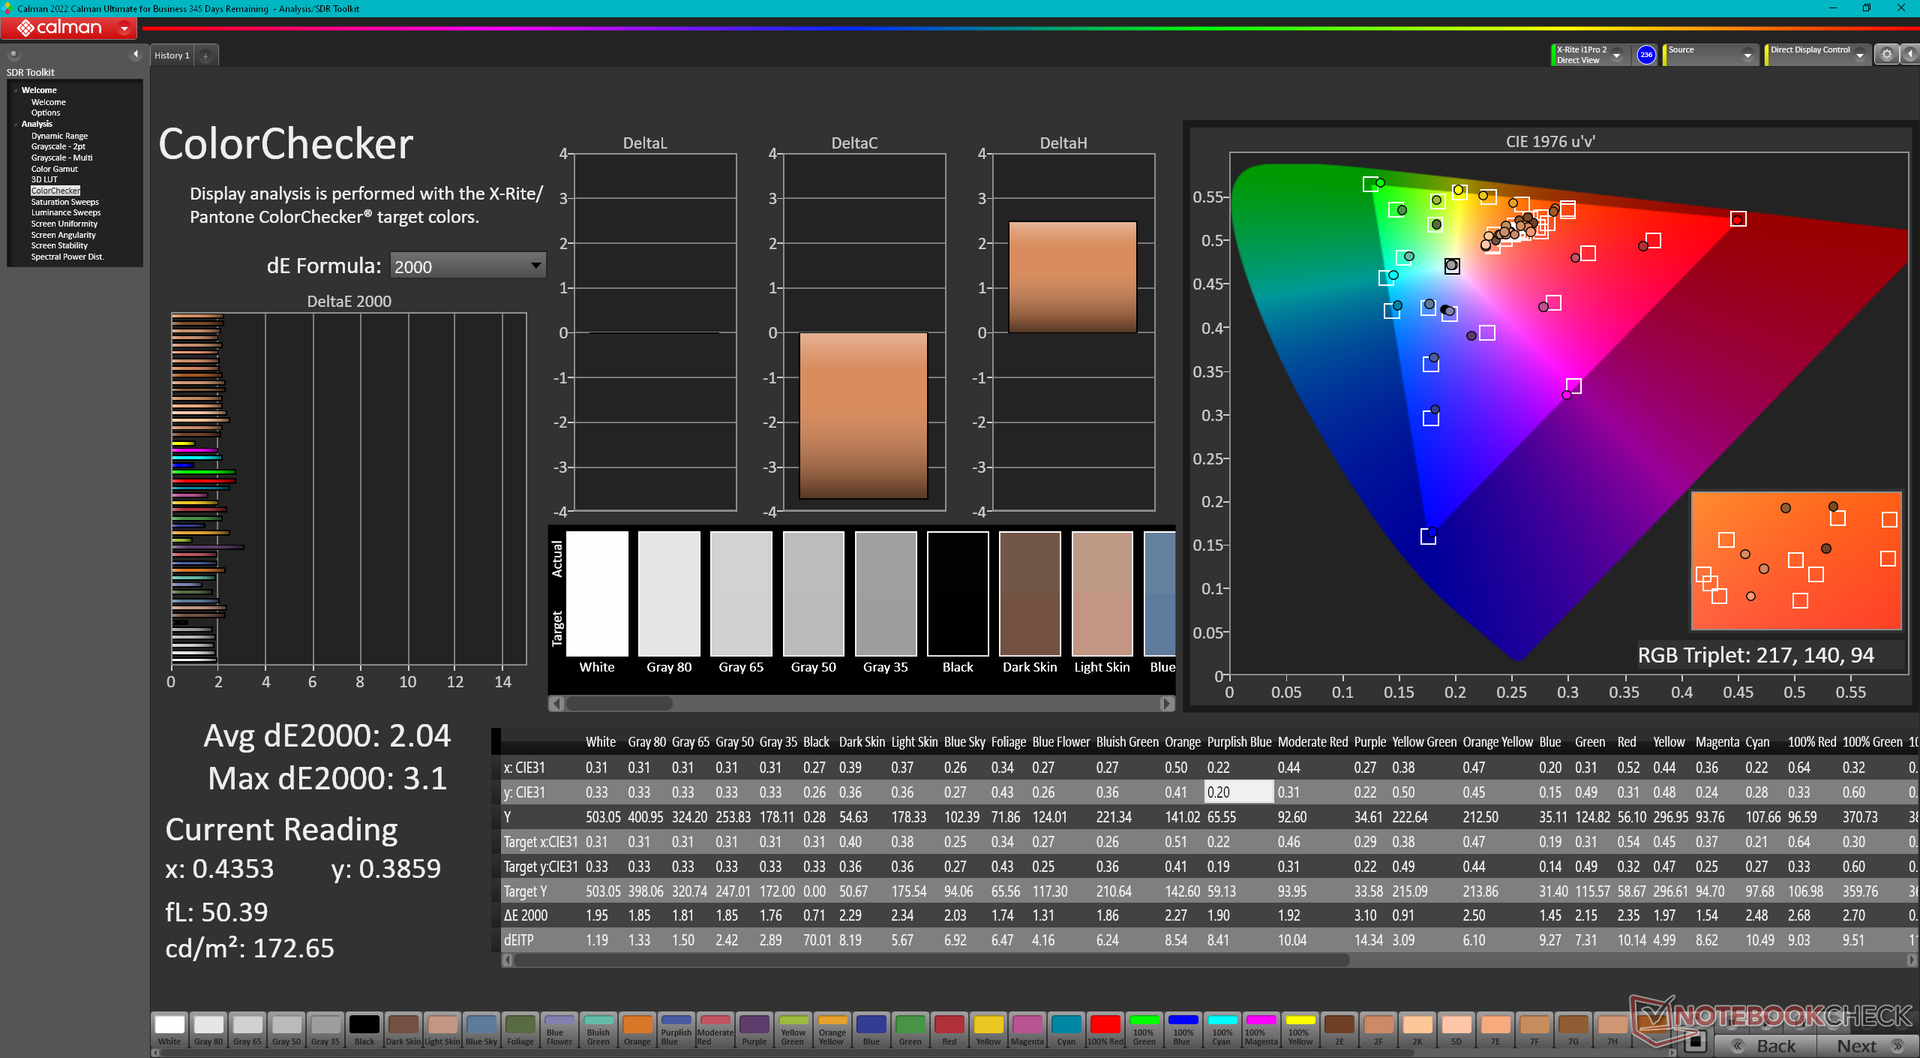
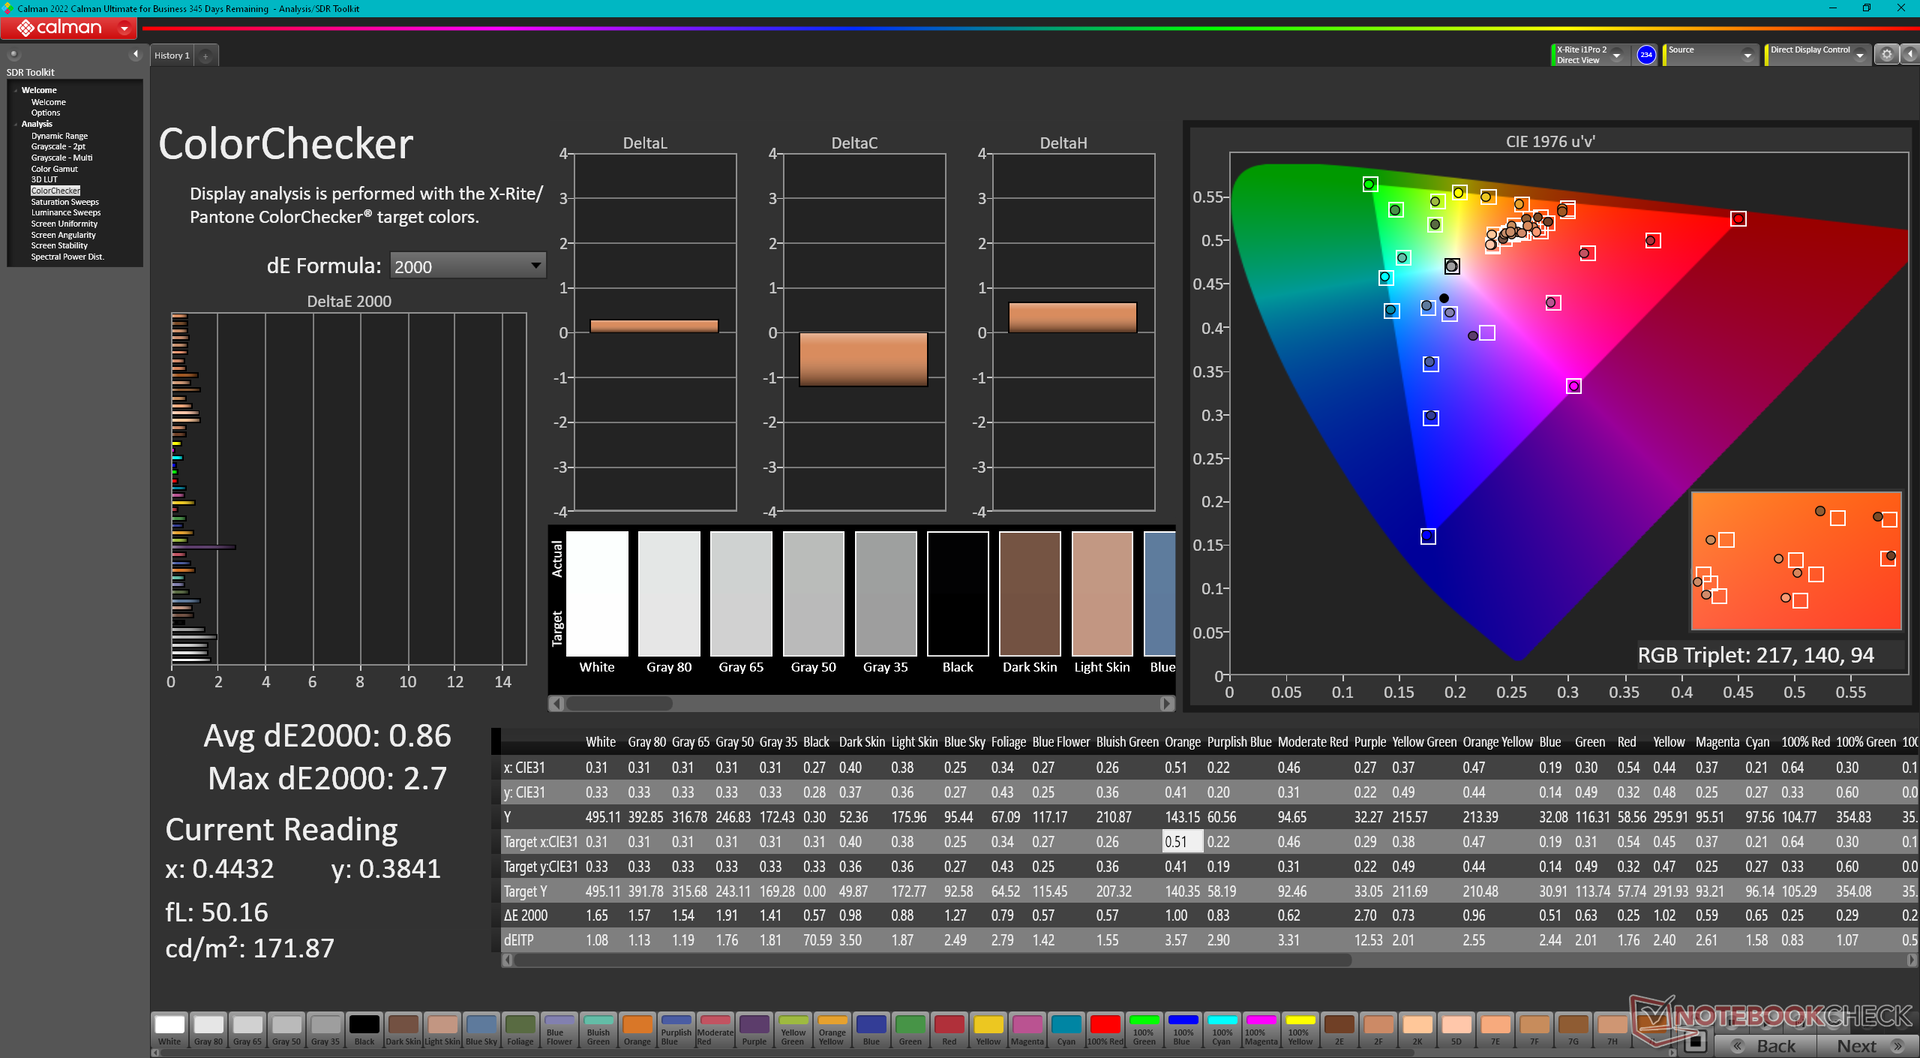
ΔE ColorChecker Calman: 2.04 | ∀{0.5-29.43 Ø4.71}
calibrated: 0.86
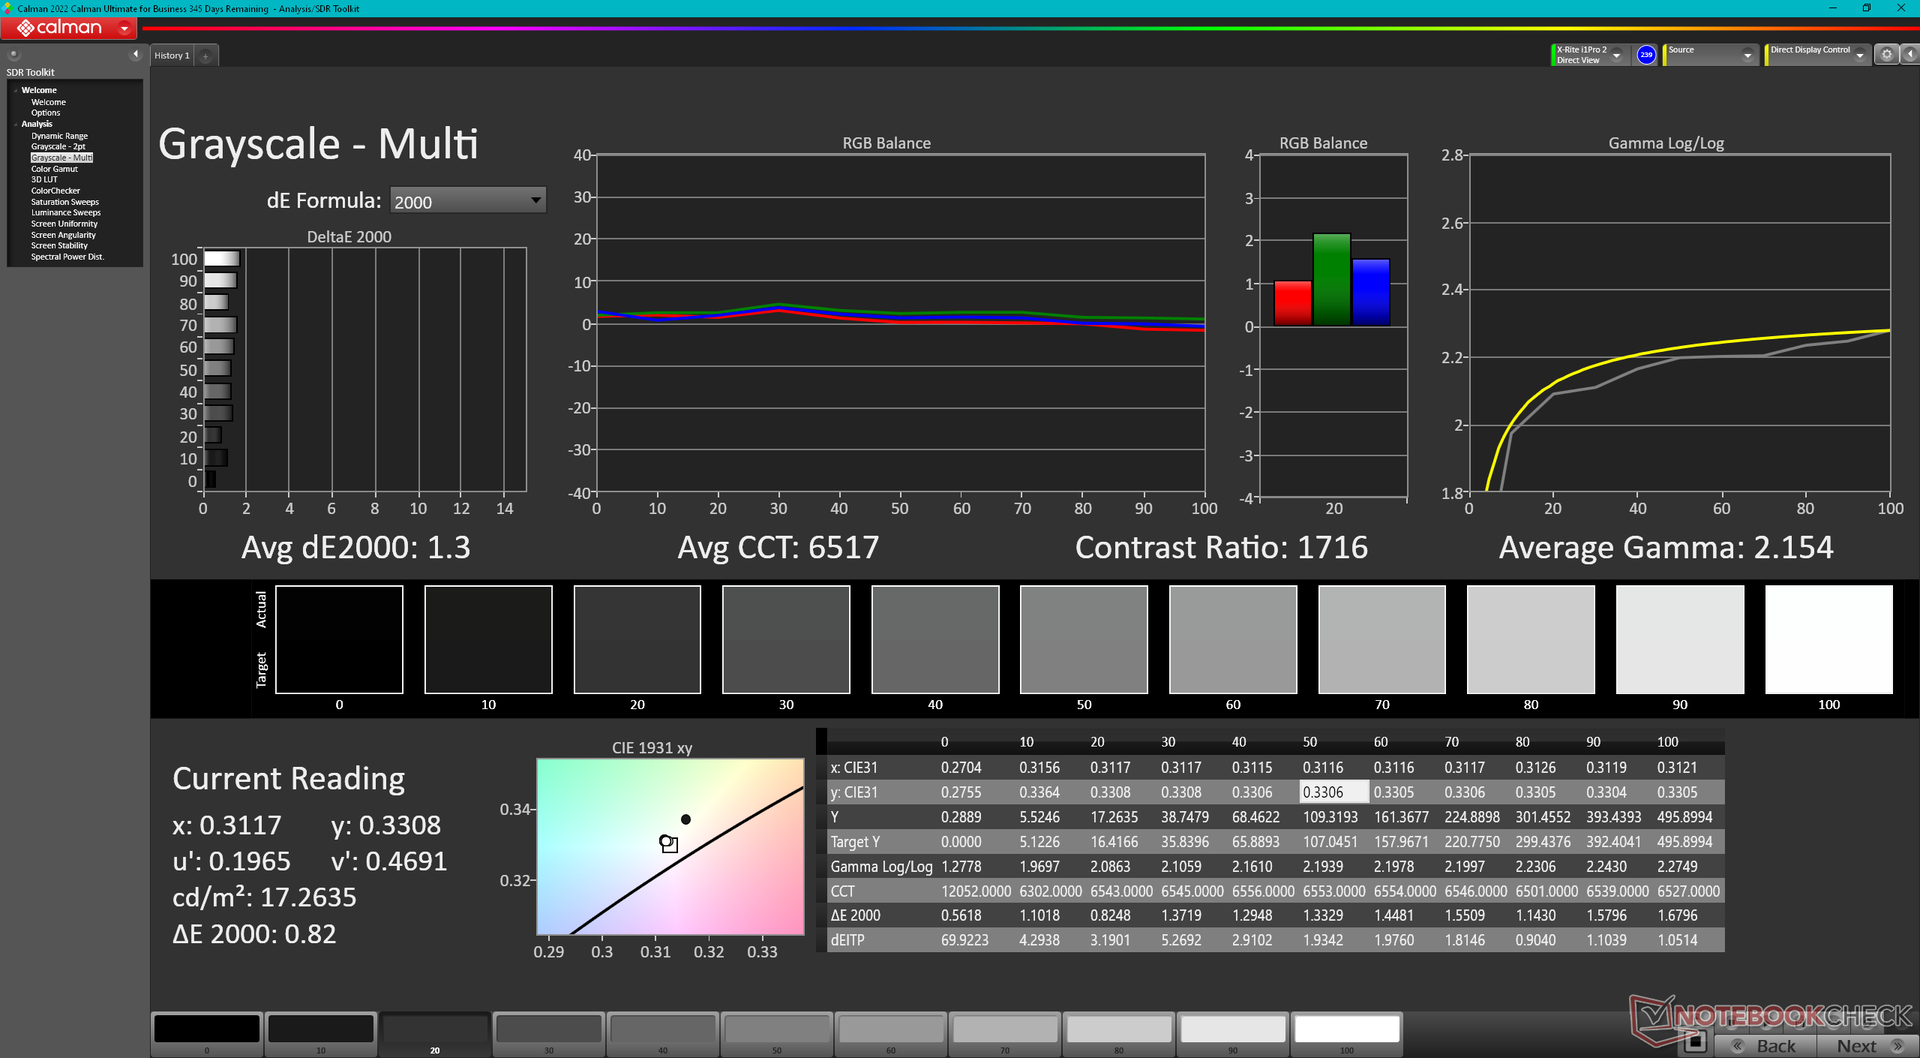
ΔE Greyscale Calman: 1.8 | ∀{0.09-98 Ø4.96}
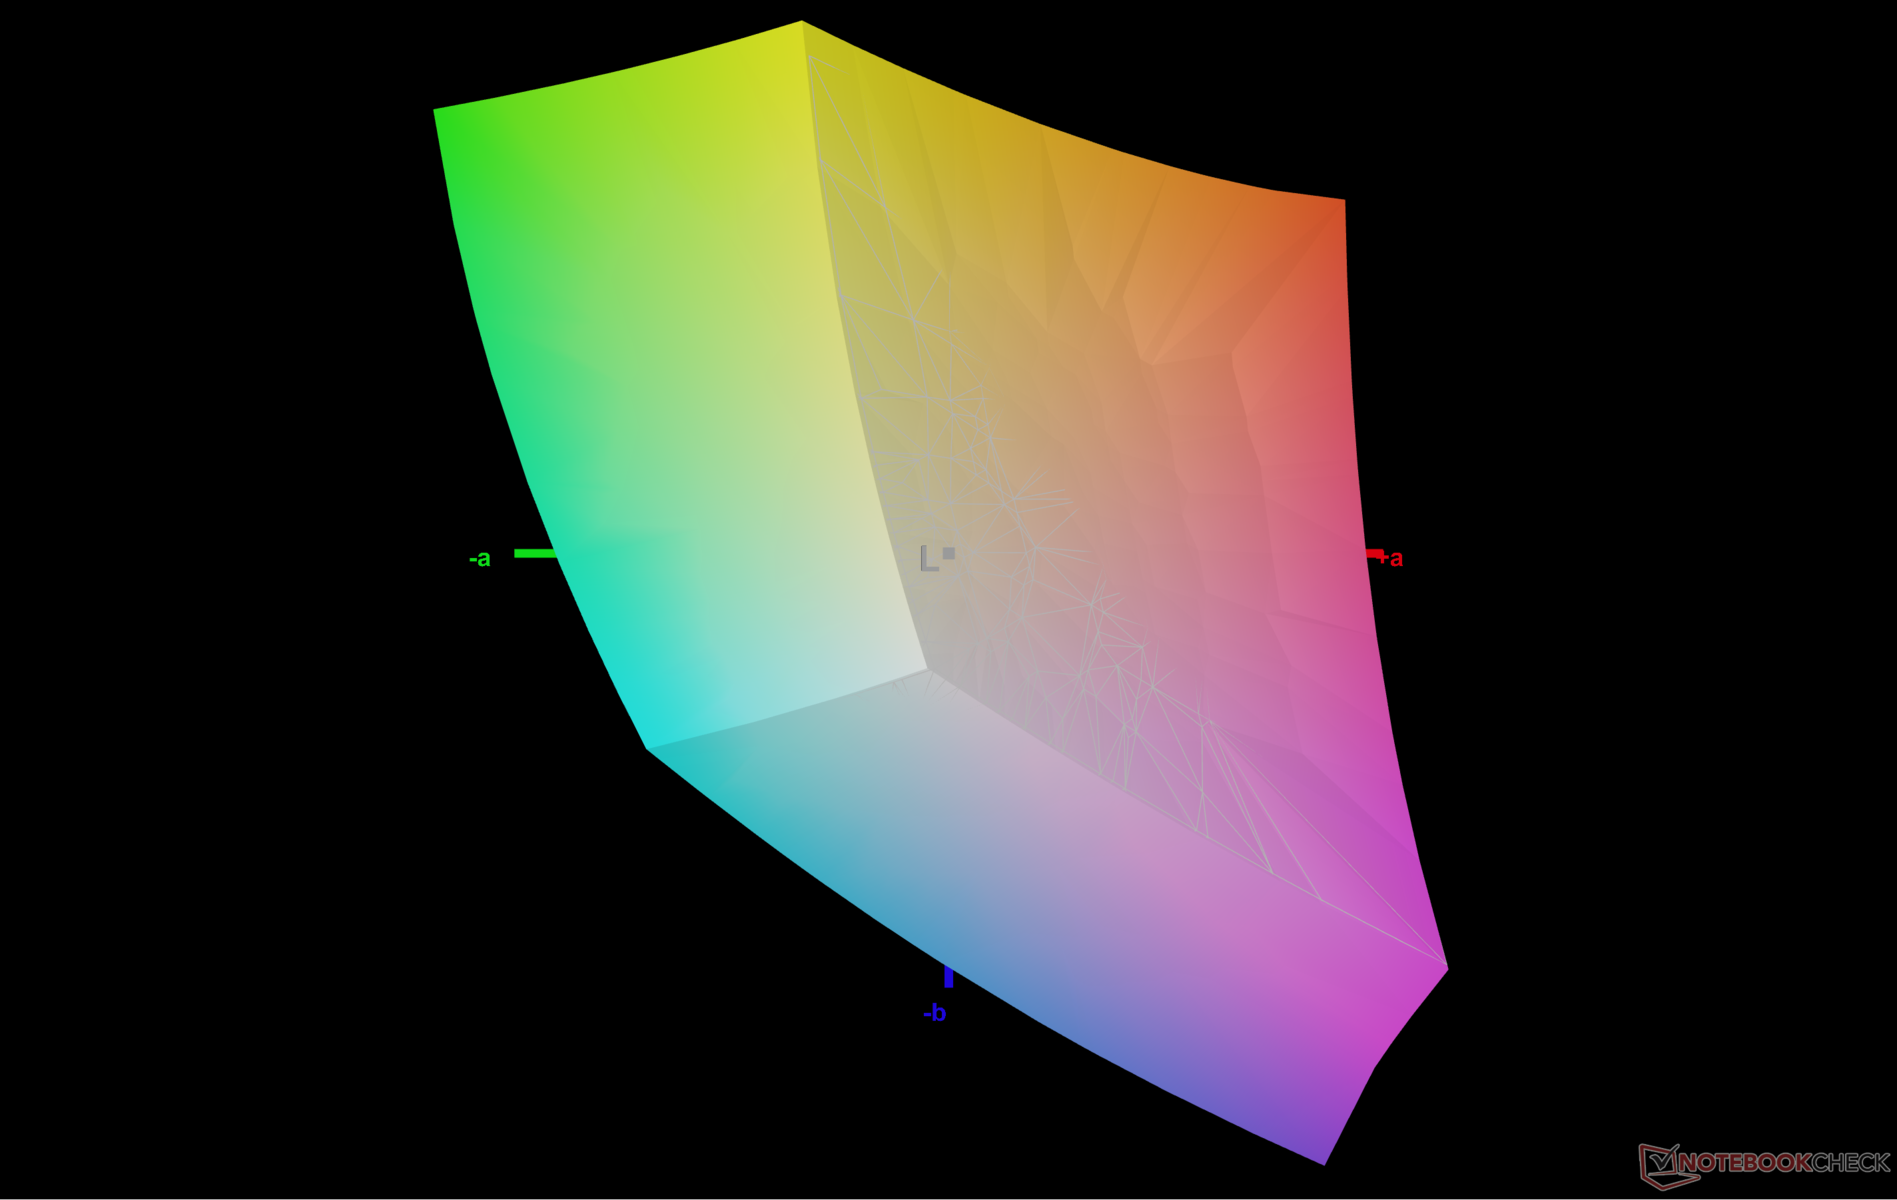
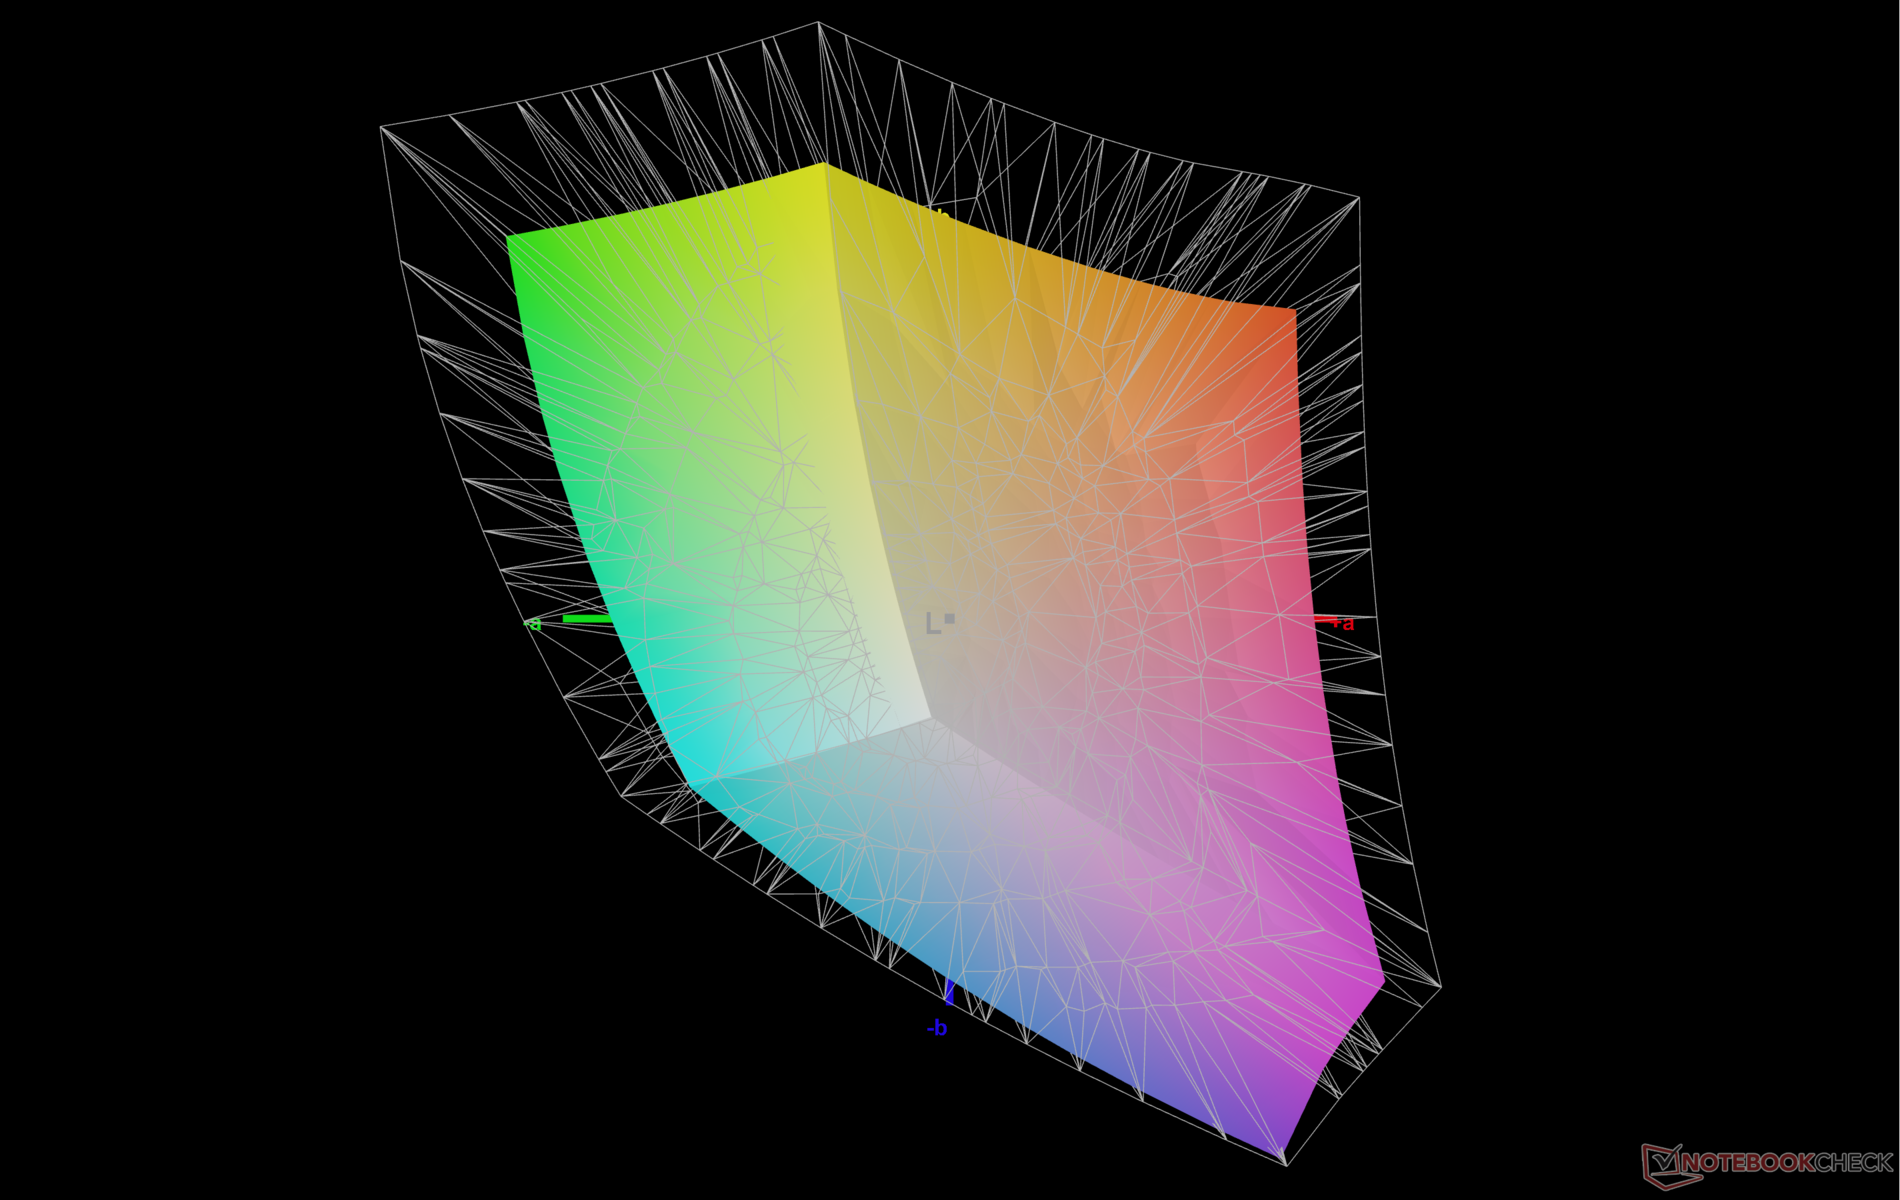
72.6% AdobeRGB 1998 (Argyll 3D)
99.8% sRGB (Argyll 3D)
70.7% Display P3 (Argyll 3D)
Gamma: 2.12
CCT: 6561 K
| Dell XPS 13 9315 2-in-1 Core i5-1230U BOE NE13A1M, IPS, 2880x1920, 13" | Dell XPS 13 Plus 9320 i7-1280P OLED Samsung 134XK04, OLED, 3456x2160, 13.4" | Microsoft Surface Pro 8, i7-1185G7 LP129WT212166, IPS, 2880x1920, 13" | HP Spectre x360 13.5 14t-ef000 SDC4160, OLED, 3000x2000, 13.5" | Lenovo ThinkBook Plus Gen2 Core i5 CSOT T3 MND307DA1-5 (LCD), IPS, E-Ink, 2560x1600, 13.3" | Apple MacBook Air M2 Entry IPS, 2560x1664, 13.6" | |
|---|---|---|---|---|---|---|
| Display | 26% | 6% | 22% | -1% | 20% | |
| Display P3 Coverage (%) | 70.7 | 99.5 41% | 78.2 11% | 99.9 41% | 70.1 -1% | 98.4 39% |
| sRGB Coverage (%) | 99.8 | 100 0% | 100 0% | 100 0% | 98 -2% | 99.9 0% |
| AdobeRGB 1998 Coverage (%) | 72.6 | 98.4 36% | 77.6 7% | 90.8 25% | 72.2 -1% | 87.6 21% |
| Response Times | 93% | 1% | 94% | -5% | 13% | |
| Response Time Grey 50% / Grey 80% * (ms) | 44 ? | 2.6 ? 94% | 46.4 ? -5% | 1.9 ? 96% | 42.8 ? 3% | 32.9 ? 25% |
| Response Time Black / White * (ms) | 24.8 ? | 2.1 ? 92% | 23.2 ? 6% | 2.16 ? 91% | 28 ? -13% | 24.9 ? -0% |
| PWM Frequency (Hz) | 59.5 | 29760 ? | 60.2 ? | |||
| Screen | -27% | -19% | -29% | -36% | 5% | |
| Brightness middle (cd/m²) | 507 | 371.8 -27% | 444 -12% | 351.7 -31% | 404 -20% | 526 4% |
| Brightness (cd/m²) | 486 | 374 -23% | 451 -7% | 351 -28% | 388 -20% | 486 0% |
| Brightness Distribution (%) | 87 | 98 13% | 91 5% | 87 0% | 94 8% | 87 0% |
| Black Level * (cd/m²) | 0.34 | 0.43 -26% | 0.24 29% | 0.38 -12% | ||
| Contrast (:1) | 1491 | 1033 -31% | 1683 13% | 1384 -7% | ||
| Colorchecker dE 2000 * | 2.04 | 2.37 -16% | 2 2% | 1.78 13% | 3.1 -52% | 1.3 36% |
| Colorchecker dE 2000 max. * | 3.1 | 6.1 -97% | 3.2 -3% | 6.14 -98% | 6.9 -123% | 2.7 13% |
| Colorchecker dE 2000 calibrated * | 0.86 | 1.7 -98% | 1.3 -51% | 0.7 19% | ||
| Greyscale dE 2000 * | 1.8 | 2 -11% | 1.8 -0% | 2.3 -28% | 3.7 -106% | 2 -11% |
| Gamma | 2.12 104% | 2.29 96% | 2.11 104% | 2.11 104% | 2.26 97% | 2.25 98% |
| CCT | 6561 99% | 6261 104% | 6417 101% | 6683 97% | 5936 110% | 6858 95% |
| Media totale (Programma / Settaggio) | 31% /
9% | -4% /
-11% | 29% /
7% | -14% /
-24% | 13% /
9% |
* ... Meglio usare valori piccoli
Il display è già ben calibrato, con valori medi di DeltaE in scala di grigi e a colori di soli 1,8 e 2,04 rispettivamente. Calibrando ulteriormente il display con un colorimetro X-Rite, le medie scenderebbero a 1,3 e 0,86, ma per la maggior parte degli utenti la calibrazione non sarà necessaria.
Tempi di risposta del Display
| ↔ Tempi di risposta dal Nero al Bianco | ||
|---|---|---|
| 24.8 ms ... aumenta ↗ e diminuisce ↘ combinato | ↗ 11.6 ms Incremento | 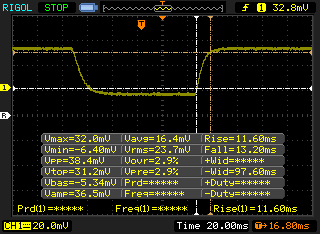 |
| ↘ 13.2 ms Calo | ||
| Lo schermo mostra buoni tempi di risposta durante i nostri tests, ma potrebbe essere troppo lento per i gamers competitivi. In confronto, tutti i dispositivi di test variano da 0.1 (minimo) a 240 (massimo) ms. » 58 % di tutti i dispositivi è migliore. Questo significa che i tempi di risposta rilevati sono peggiori rispetto alla media di tutti i dispositivi testati (19.8 ms). | ||
| ↔ Tempo di risposta dal 50% Grigio all'80% Grigio | ||
| 44 ms ... aumenta ↗ e diminuisce ↘ combinato | ↗ 23.6 ms Incremento | 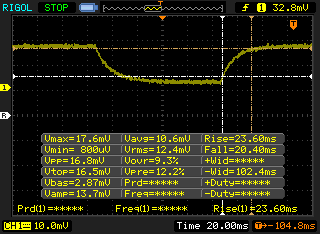 |
| ↘ 20.4 ms Calo | ||
| Lo schermo mostra tempi di risposta lenti nei nostri tests e sarà insoddisfacente per i gamers. In confronto, tutti i dispositivi di test variano da 0.165 (minimo) a 636 (massimo) ms. » 73 % di tutti i dispositivi è migliore. Questo significa che i tempi di risposta rilevati sono peggiori rispetto alla media di tutti i dispositivi testati (31 ms). | ||
Sfarfallio dello schermo / PWM (Pulse-Width Modulation)
| flickering dello schermo / PWM non rilevato | 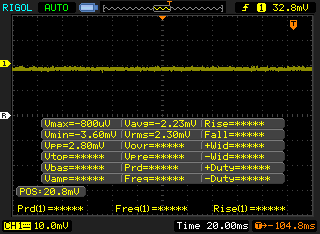 | ||
In confronto: 52 % di tutti i dispositivi testati non utilizza PWM per ridurre la luminosita' del display. Se è rilevato PWM, una media di 7754 (minimo: 5 - massimo: 343500) Hz è stata rilevata. | |||
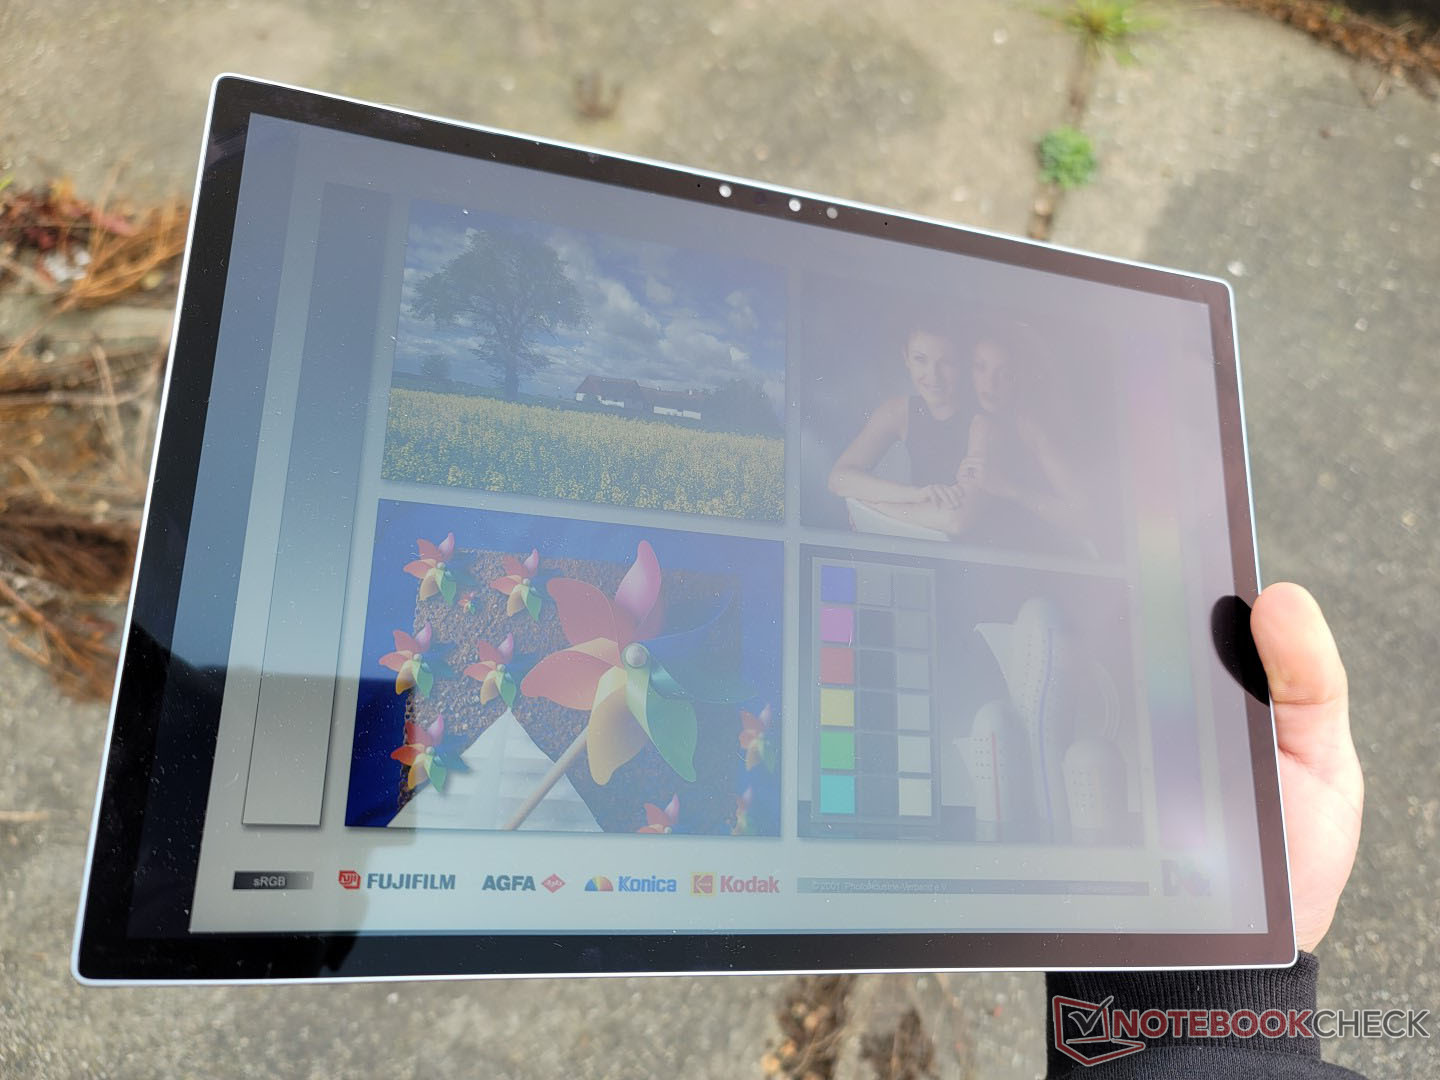
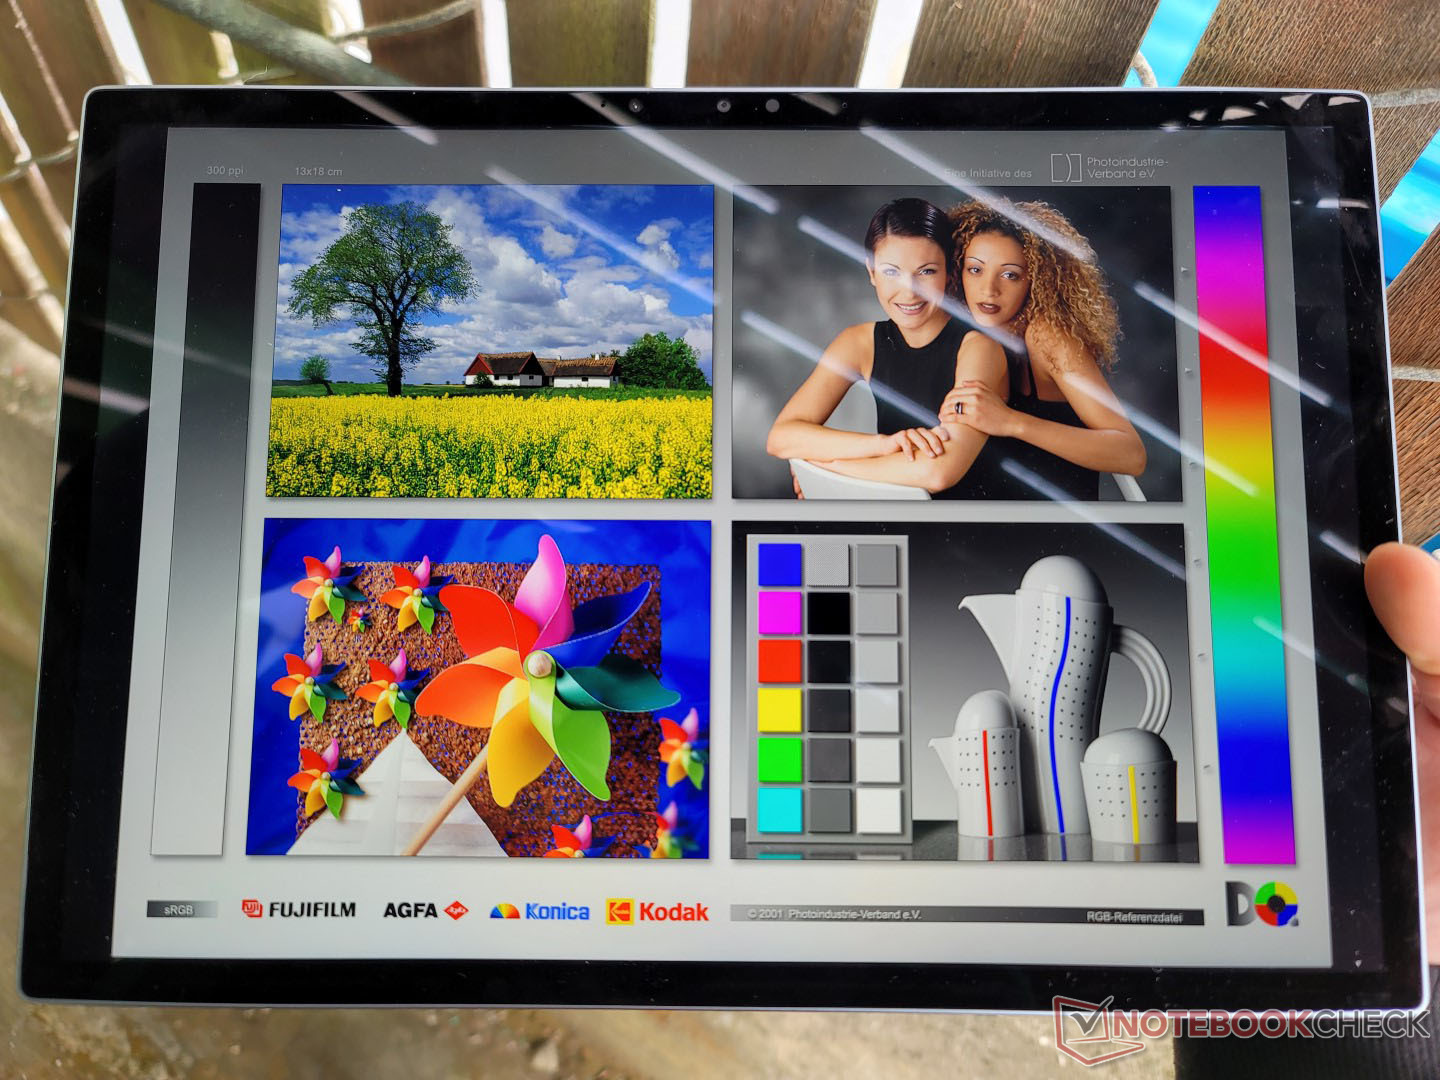
I riflessi sono sempre presenti ed essenzialmente inevitabili sul touchscreen lucido. Fortunatamente, il display è abbastanza luminoso da ridurre al minimo i riflessi quando si lavora all'aperto all'ombra. In condizioni di maggiore luminosità, tuttavia, i colori e l'esperienza visiva si degradano rapidamente. Alcuni modelli HP Elite x2 dispongono di opzioni di visualizzazione a 1000 nit, che lo renderebbero due volte più luminoso del Dell per facilitare la leggibilità all'aperto.

Prestazioni - Buone prestazioni della CPU, prestazioni della GPU mediocri
Condizioni di test
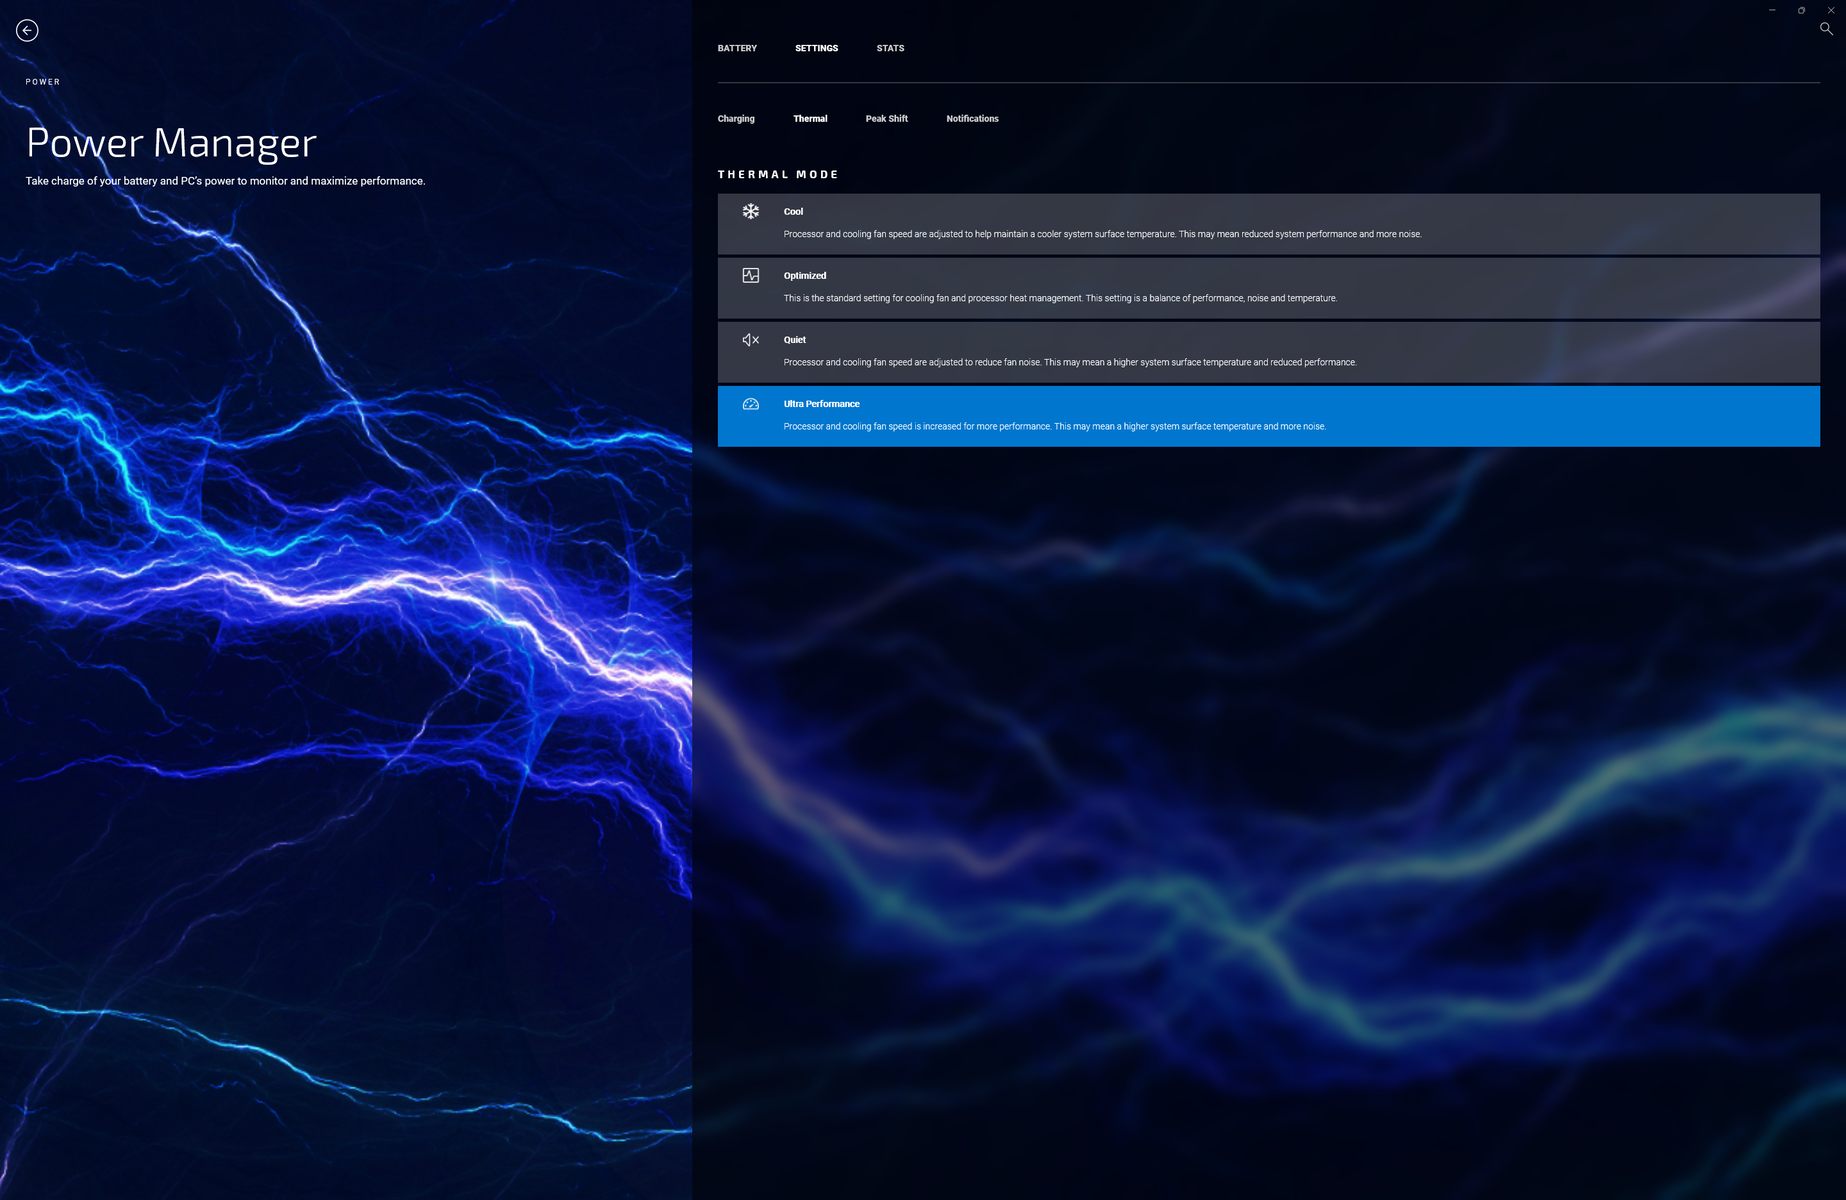
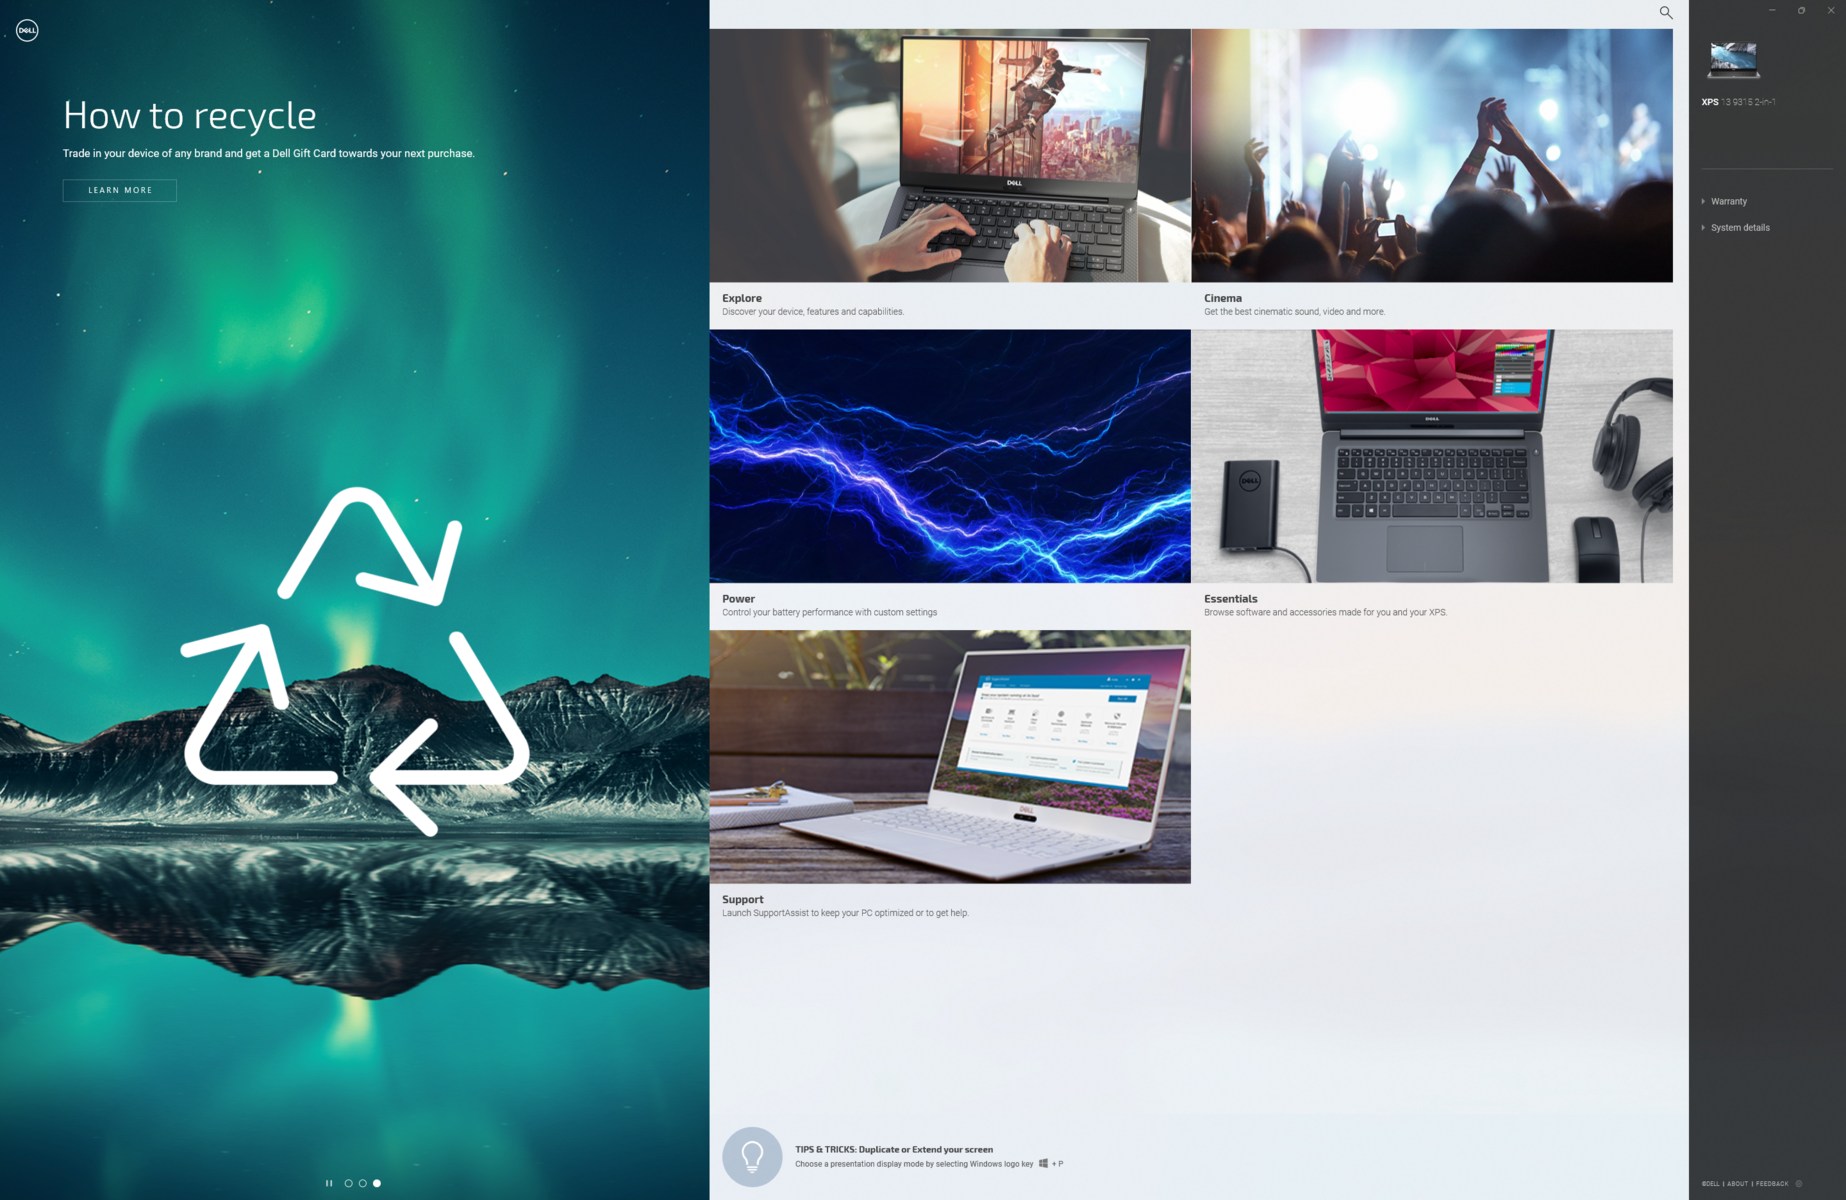
Abbiamo impostato la nostra unità in modalità "Ultra performance" e "Best performance" tramite Dell Power Manager e Windows, rispettivamente, prima di eseguire i benchmark qui sotto. I proprietari dovrebbero familiarizzare con il software My Dell, in quanto è l'hub di controllo per regolare il comportamento di ricarica, le prestazioni del sistema, le notifiche e altro ancora, come mostrano gli screenshot qui sotto.
Processore
L'XPS 13 9315 2-in-1 condivide lo stesso processore Core i5-1230U Che si trova nell'XPS 13 9315 a conchiglia. Ci si potrebbe aspettare che il modello a conchiglia sia un po' più veloce del modello 2-in-1, ma è vero il contrario. I risultati riportati di seguito mostrano che l'XPS 13 9315 2-in-1 è nettamente superiore all'XPS 13 9315 clamshell con un margine significativo di circa il 70% nei carichi di lavoro multi-thread. I risultati sono abbastanza ampi da superare anche il Core i7-1185G7 del Surface Pro 8.
L'aggiornamento al Core i7-1250U Dovrebbe incrementare le prestazioni solo di circa il 5%, in base alla nostra esperienza con l'ultimo HP Envy x360 13. Per ottenere prestazioni molto più elevate, è meglio prendere in considerazione l'XPS 13 Plus 9320 e le sue opzioni di CPU serie P.
La sostenibilità delle prestazioni è limitata sull'XPS 13 9315 2-in-1 poiché si tratta di un design senza ventole. Quando si esegue CineBench R15 xT in loop, ad esempio, il punteggio iniziale di 1252 punti scende costantemente a 750 punti nel corso del tempo, rappresentando una perdita di prestazioni del 40%. Tuttavia, le prestazioni sono ancora superiori a quelle della stessa CPU nell'XPS 13 9315 clamshell di circa il 50%, anche dopo aver tenuto conto del throttling su entrambe le macchine.
Cinebench R15 Multi Loop
Cinebench R23: Multi Core | Single Core
Cinebench R15: CPU Multi 64Bit | CPU Single 64Bit
Blender: v2.79 BMW27 CPU
7-Zip 18.03: 7z b 4 | 7z b 4 -mmt1
Geekbench 5.5: Multi-Core | Single-Core
HWBOT x265 Benchmark v2.2: 4k Preset
LibreOffice : 20 Documents To PDF
R Benchmark 2.5: Overall mean
| HWBOT x265 Benchmark v2.2 / 4k Preset | |
| Dell XPS 13 Plus 9320 i7-1280P OLED | |
| HP Spectre x360 13.5 14t-ef000 | |
| Dell XPS 13 9315 2-in-1 Core i5-1230U | |
| Microsoft Surface Pro 8, i7-1185G7 | |
* ... Meglio usare valori piccoli
AIDA64: FP32 Ray-Trace | FPU Julia | CPU SHA3 | CPU Queen | FPU SinJulia | FPU Mandel | CPU AES | CPU ZLib | FP64 Ray-Trace | CPU PhotoWorxx
| Performance rating | |
| Dell XPS 13 Plus 9320 i7-1280P OLED | |
| HP Spectre x360 13.5 14t-ef000 | |
| Microsoft Surface Pro 8, i7-1185G7 | |
| Dell XPS 13 9315 2-in-1 Core i5-1230U | |
| Lenovo ThinkBook Plus Gen2 Core i5 | |
| Media Intel Core i5-1230U | |
| AIDA64 / FP32 Ray-Trace | |
| Dell XPS 13 Plus 9320 i7-1280P OLED | |
| HP Spectre x360 13.5 14t-ef000 | |
| Microsoft Surface Pro 8, i7-1185G7 | |
| Dell XPS 13 9315 2-in-1 Core i5-1230U | |
| Lenovo ThinkBook Plus Gen2 Core i5 | |
| Media Intel Core i5-1230U (2344 - 6360, n=3) | |
| AIDA64 / FPU Julia | |
| Dell XPS 13 Plus 9320 i7-1280P OLED | |
| HP Spectre x360 13.5 14t-ef000 | |
| Dell XPS 13 9315 2-in-1 Core i5-1230U | |
| Microsoft Surface Pro 8, i7-1185G7 | |
| Lenovo ThinkBook Plus Gen2 Core i5 | |
| Media Intel Core i5-1230U (11867 - 31714, n=3) | |
| AIDA64 / CPU Queen | |
| Dell XPS 13 Plus 9320 i7-1280P OLED | |
| HP Spectre x360 13.5 14t-ef000 | |
| Dell XPS 13 9315 2-in-1 Core i5-1230U | |
| Microsoft Surface Pro 8, i7-1185G7 | |
| Media Intel Core i5-1230U (30824 - 52533, n=3) | |
| Lenovo ThinkBook Plus Gen2 Core i5 | |
| AIDA64 / FPU SinJulia | |
| Dell XPS 13 Plus 9320 i7-1280P OLED | |
| Microsoft Surface Pro 8, i7-1185G7 | |
| HP Spectre x360 13.5 14t-ef000 | |
| Dell XPS 13 9315 2-in-1 Core i5-1230U | |
| Lenovo ThinkBook Plus Gen2 Core i5 | |
| Media Intel Core i5-1230U (2269 - 3947, n=3) | |
| AIDA64 / FPU Mandel | |
| Dell XPS 13 Plus 9320 i7-1280P OLED | |
| HP Spectre x360 13.5 14t-ef000 | |
| Microsoft Surface Pro 8, i7-1185G7 | |
| Dell XPS 13 9315 2-in-1 Core i5-1230U | |
| Lenovo ThinkBook Plus Gen2 Core i5 | |
| Media Intel Core i5-1230U (6379 - 15896, n=3) | |
| AIDA64 / CPU ZLib | |
| Dell XPS 13 Plus 9320 i7-1280P OLED | |
| HP Spectre x360 13.5 14t-ef000 | |
| Dell XPS 13 9315 2-in-1 Core i5-1230U | |
| Media Intel Core i5-1230U (229 - 495, n=3) | |
| Lenovo ThinkBook Plus Gen2 Core i5 | |
| Microsoft Surface Pro 8, i7-1185G7 | |
| AIDA64 / FP64 Ray-Trace | |
| Dell XPS 13 Plus 9320 i7-1280P OLED | |
| HP Spectre x360 13.5 14t-ef000 | |
| Microsoft Surface Pro 8, i7-1185G7 | |
| Dell XPS 13 9315 2-in-1 Core i5-1230U | |
| Lenovo ThinkBook Plus Gen2 Core i5 | |
| Media Intel Core i5-1230U (1328 - 3305, n=3) | |
| AIDA64 / CPU PhotoWorxx | |
| Dell XPS 13 Plus 9320 i7-1280P OLED | |
| HP Spectre x360 13.5 14t-ef000 | |
| Lenovo ThinkBook Plus Gen2 Core i5 | |
| Microsoft Surface Pro 8, i7-1185G7 | |
| Dell XPS 13 9315 2-in-1 Core i5-1230U | |
| Media Intel Core i5-1230U (17516 - 37042, n=3) | |
Prestazioni del sistema
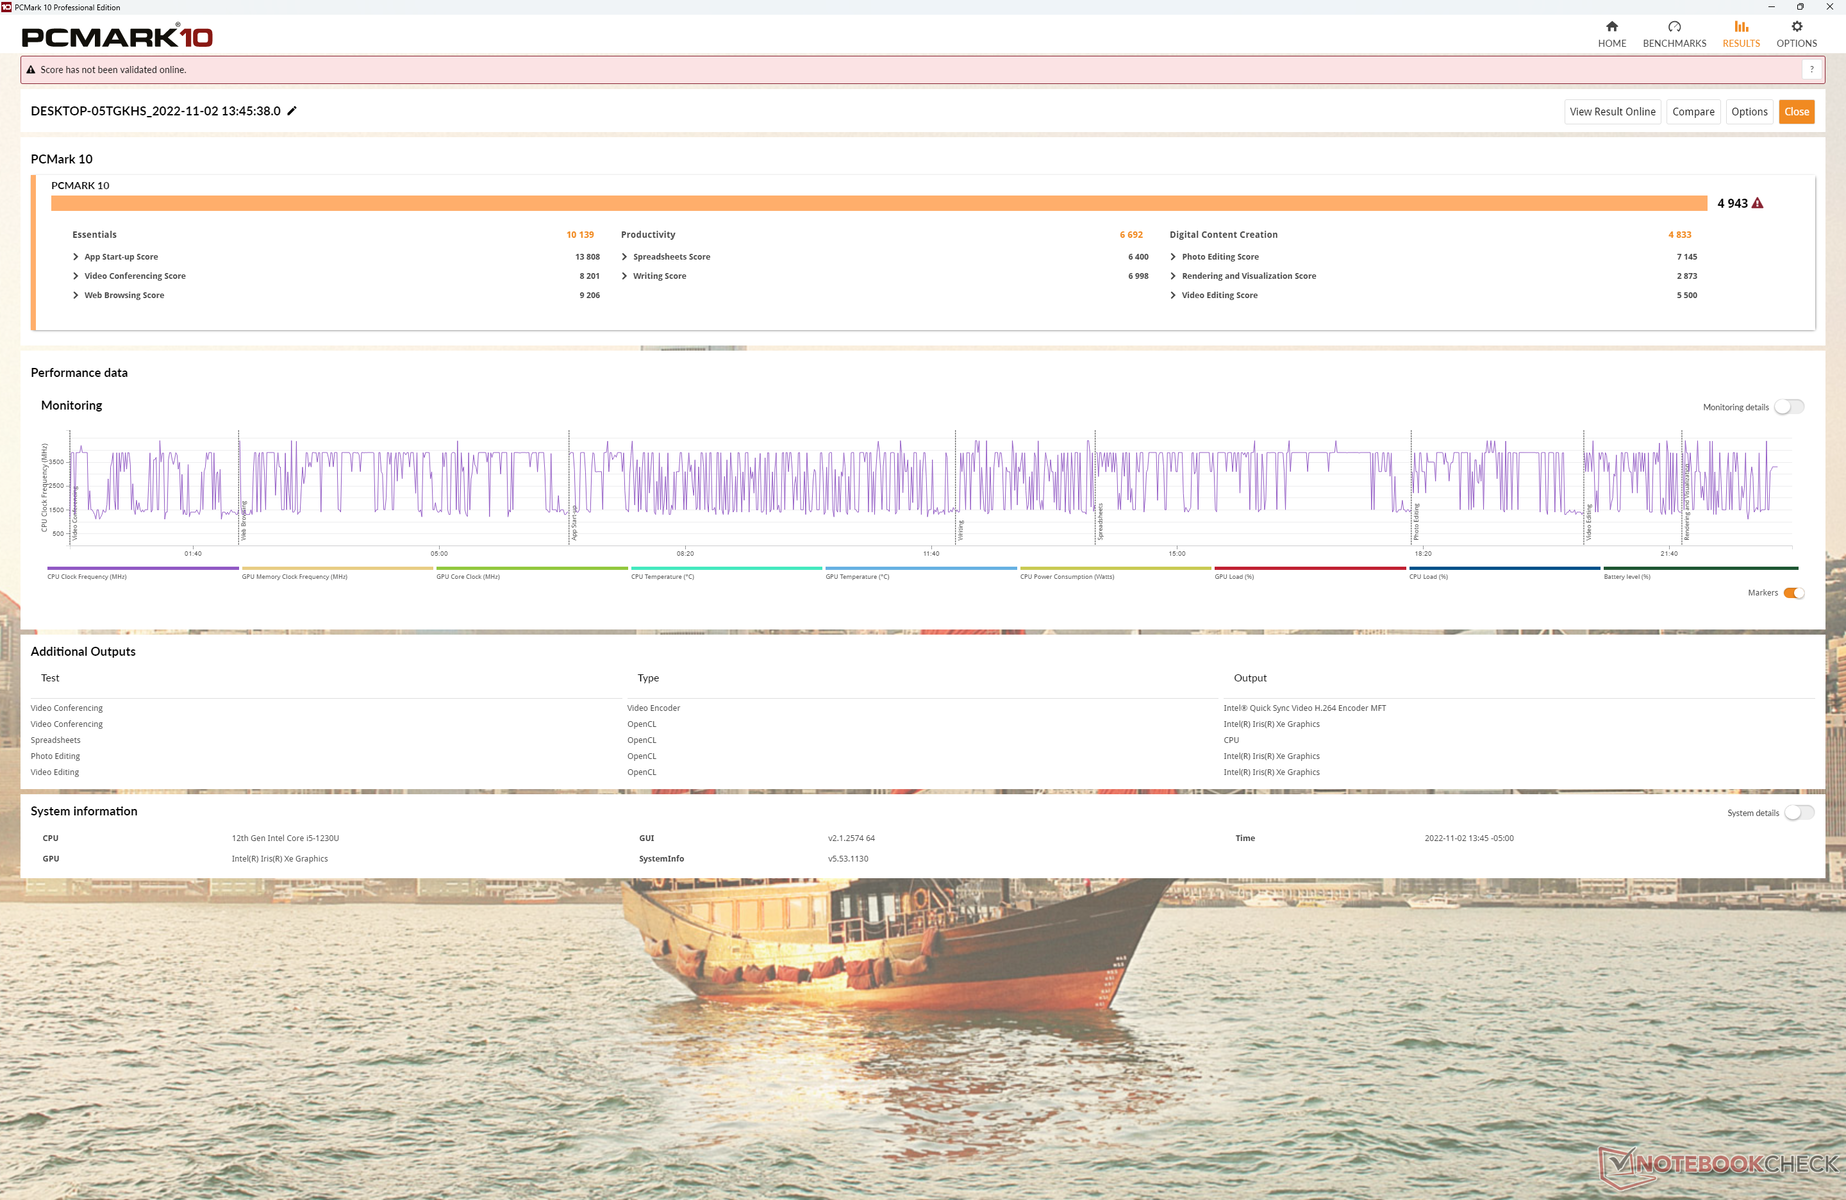
I risultati di PCMark 10 sono paragonabili a quelli del Surface Pro 8, tranne che nel sottotest Creazione di contenuti digitali, dove le prestazioni grafiche sono più importanti. Ciò è in linea con i risultati dei nostri test sulla GPU, dove l'XPS 13 9315 2-in-1 presenta prestazioni grafiche inferiori alla media della categoria.
CrossMark: Overall | Productivity | Creativity | Responsiveness
| PCMark 10 / Score | |
| Dell XPS 13 Plus 9320 i7-1280P OLED | |
| HP Spectre x360 13.5 14t-ef000 | |
| Microsoft Surface Pro 8, i7-1185G7 | |
| Dell XPS 13 9315 2-in-1 Core i5-1230U | |
| Media Intel Core i5-1230U, Intel Iris Xe Graphics G7 80EUs (4001 - 4943, n=3) | |
| Lenovo ThinkBook Plus Gen2 Core i5 | |
| PCMark 10 / Essentials | |
| HP Spectre x360 13.5 14t-ef000 | |
| Dell XPS 13 Plus 9320 i7-1280P OLED | |
| Lenovo ThinkBook Plus Gen2 Core i5 | |
| Dell XPS 13 9315 2-in-1 Core i5-1230U | |
| Microsoft Surface Pro 8, i7-1185G7 | |
| Media Intel Core i5-1230U, Intel Iris Xe Graphics G7 80EUs (8348 - 10139, n=3) | |
| PCMark 10 / Productivity | |
| HP Spectre x360 13.5 14t-ef000 | |
| Dell XPS 13 Plus 9320 i7-1280P OLED | |
| Dell XPS 13 9315 2-in-1 Core i5-1230U | |
| Microsoft Surface Pro 8, i7-1185G7 | |
| Media Intel Core i5-1230U, Intel Iris Xe Graphics G7 80EUs (5735 - 6692, n=3) | |
| Lenovo ThinkBook Plus Gen2 Core i5 | |
| PCMark 10 / Digital Content Creation | |
| Dell XPS 13 Plus 9320 i7-1280P OLED | |
| Microsoft Surface Pro 8, i7-1185G7 | |
| HP Spectre x360 13.5 14t-ef000 | |
| Dell XPS 13 9315 2-in-1 Core i5-1230U | |
| Media Intel Core i5-1230U, Intel Iris Xe Graphics G7 80EUs (3632 - 4833, n=3) | |
| Lenovo ThinkBook Plus Gen2 Core i5 | |
| CrossMark / Overall | |
| Dell XPS 13 Plus 9320 i7-1280P OLED | |
| HP Spectre x360 13.5 14t-ef000 | |
| Apple MacBook Air M2 Entry | |
| Microsoft Surface Pro 8, i7-1185G7 | |
| Dell XPS 13 9315 2-in-1 Core i5-1230U | |
| Media Intel Core i5-1230U, Intel Iris Xe Graphics G7 80EUs (1117 - 1383, n=3) | |
| CrossMark / Productivity | |
| Dell XPS 13 Plus 9320 i7-1280P OLED | |
| HP Spectre x360 13.5 14t-ef000 | |
| Microsoft Surface Pro 8, i7-1185G7 | |
| Apple MacBook Air M2 Entry | |
| Dell XPS 13 9315 2-in-1 Core i5-1230U | |
| Media Intel Core i5-1230U, Intel Iris Xe Graphics G7 80EUs (1187 - 1356, n=3) | |
| CrossMark / Creativity | |
| Dell XPS 13 Plus 9320 i7-1280P OLED | |
| Apple MacBook Air M2 Entry | |
| HP Spectre x360 13.5 14t-ef000 | |
| Microsoft Surface Pro 8, i7-1185G7 | |
| Dell XPS 13 9315 2-in-1 Core i5-1230U | |
| Media Intel Core i5-1230U, Intel Iris Xe Graphics G7 80EUs (1095 - 1469, n=3) | |
| CrossMark / Responsiveness | |
| Dell XPS 13 Plus 9320 i7-1280P OLED | |
| HP Spectre x360 13.5 14t-ef000 | |
| Dell XPS 13 9315 2-in-1 Core i5-1230U | |
| Media Intel Core i5-1230U, Intel Iris Xe Graphics G7 80EUs (990 - 1224, n=3) | |
| Microsoft Surface Pro 8, i7-1185G7 | |
| Apple MacBook Air M2 Entry | |
| PCMark 10 Score | 4943 punti | |
Aiuto | ||
| AIDA64 / Memory Copy | |
| Dell XPS 13 Plus 9320 i7-1280P OLED | |
| HP Spectre x360 13.5 14t-ef000 | |
| Dell XPS 13 9315 2-in-1 Core i5-1230U | |
| Microsoft Surface Pro 8, i7-1185G7 | |
| Lenovo ThinkBook Plus Gen2 Core i5 | |
| Media Intel Core i5-1230U (32539 - 60944, n=3) | |
| AIDA64 / Memory Read | |
| Dell XPS 13 Plus 9320 i7-1280P OLED | |
| Lenovo ThinkBook Plus Gen2 Core i5 | |
| HP Spectre x360 13.5 14t-ef000 | |
| Microsoft Surface Pro 8, i7-1185G7 | |
| Dell XPS 13 9315 2-in-1 Core i5-1230U | |
| Media Intel Core i5-1230U (31342 - 60435, n=3) | |
| AIDA64 / Memory Write | |
| Dell XPS 13 9315 2-in-1 Core i5-1230U | |
| Lenovo ThinkBook Plus Gen2 Core i5 | |
| HP Spectre x360 13.5 14t-ef000 | |
| Dell XPS 13 Plus 9320 i7-1280P OLED | |
| Microsoft Surface Pro 8, i7-1185G7 | |
| Media Intel Core i5-1230U (33224 - 65665, n=3) | |
| AIDA64 / Memory Latency | |
| Dell XPS 13 9315 2-in-1 Core i5-1230U | |
| Dell XPS 13 Plus 9320 i7-1280P OLED | |
| Microsoft Surface Pro 8, i7-1185G7 | |
| HP Spectre x360 13.5 14t-ef000 | |
| Lenovo ThinkBook Plus Gen2 Core i5 | |
| Media Intel Core i5-1230U (104.3 - 105.3, n=3) | |
* ... Meglio usare valori piccoli
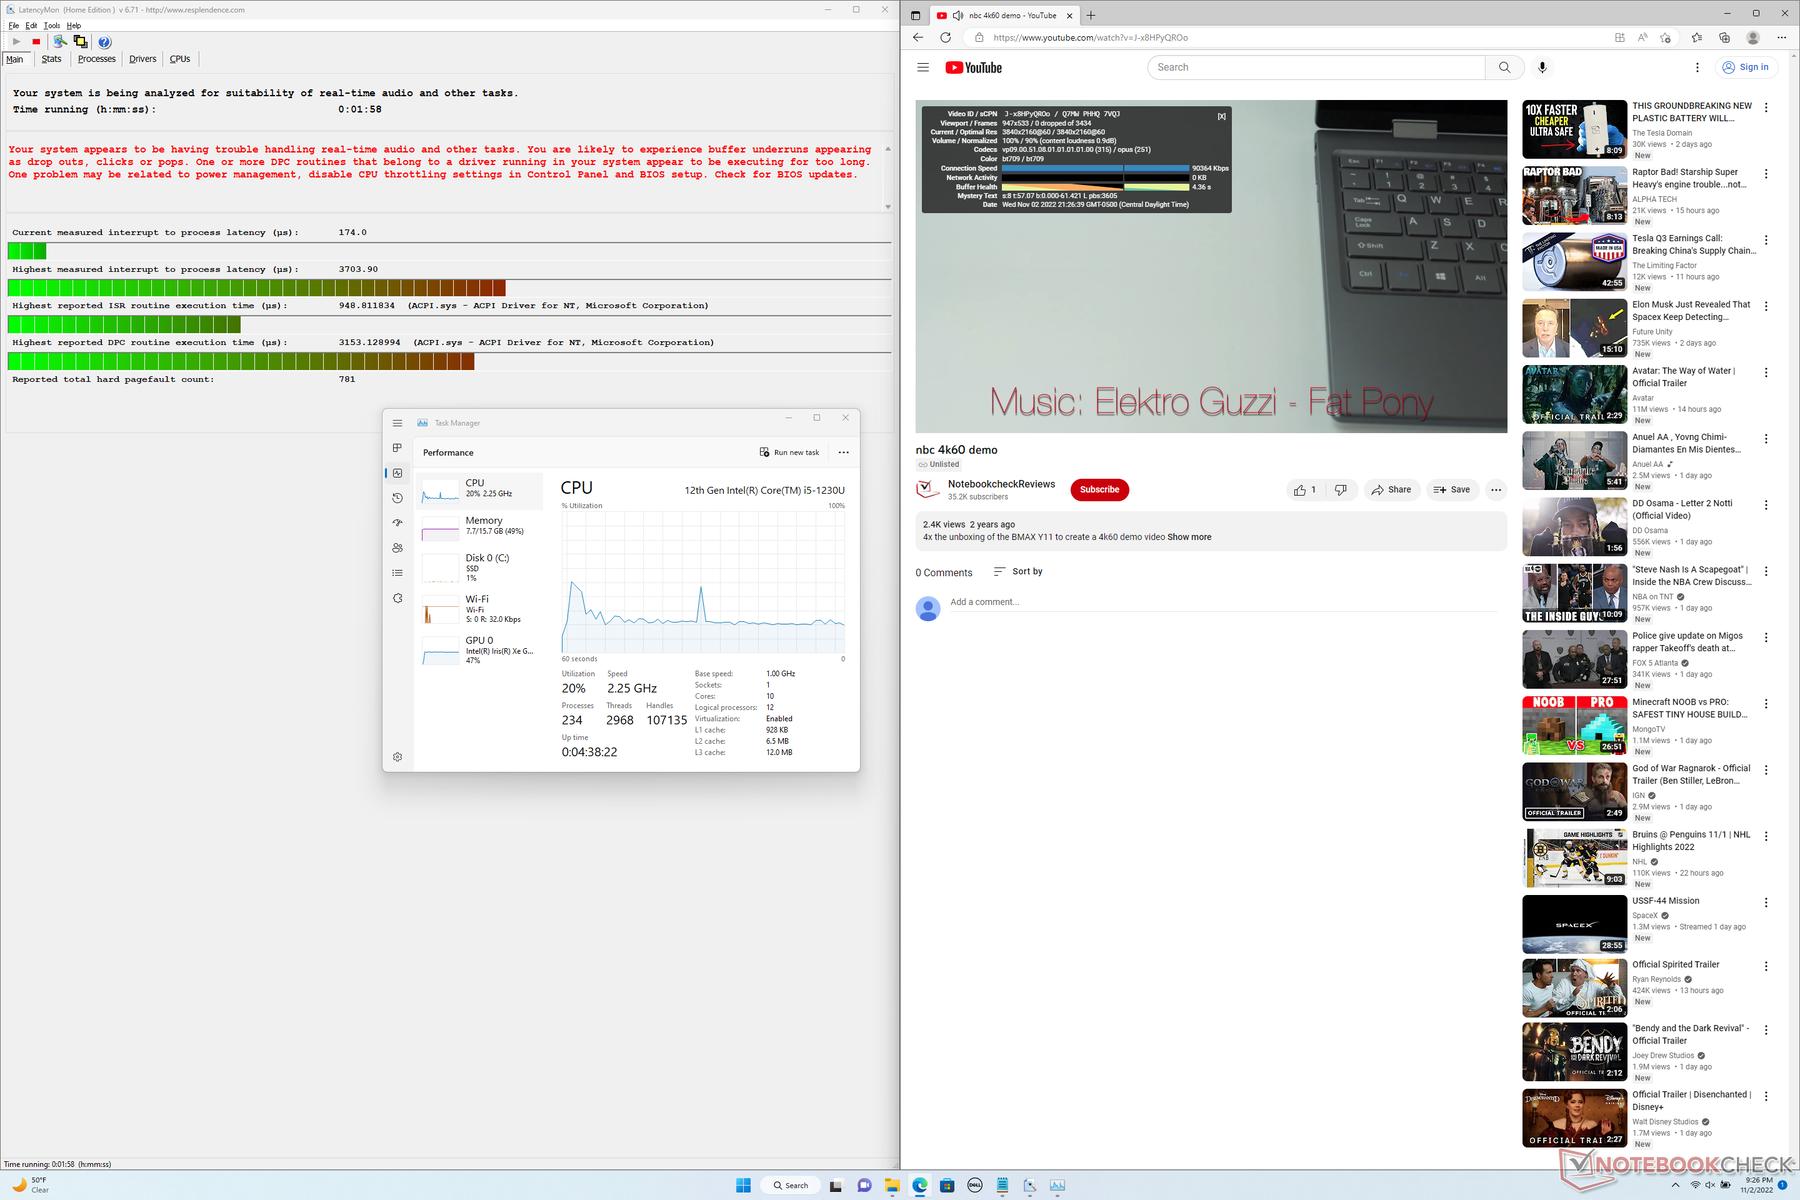
Latenza DPC
LatencyMon rivela problemi di DPC quando si aprono più schede del browser della nostra homepage. la riproduzione di video 4K a 60 FPS è invece perfetta, senza cadute di fotogrammi.

| DPC Latencies / LatencyMon - interrupt to process latency (max), Web, Youtube, Prime95 | |
| Dell XPS 13 9315 2-in-1 Core i5-1230U | |
| Lenovo ThinkBook Plus Gen2 Core i5 | |
| HP Spectre x360 13.5 14t-ef000 | |
| Microsoft Surface Pro 8, i7-1185G7 | |
| Dell XPS 13 Plus 9320 i7-1280P OLED | |
* ... Meglio usare valori piccoli
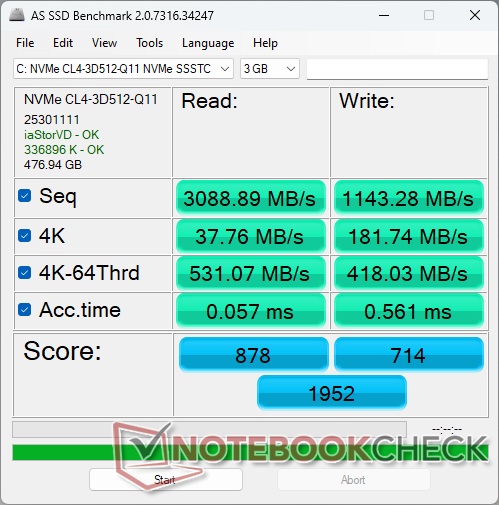
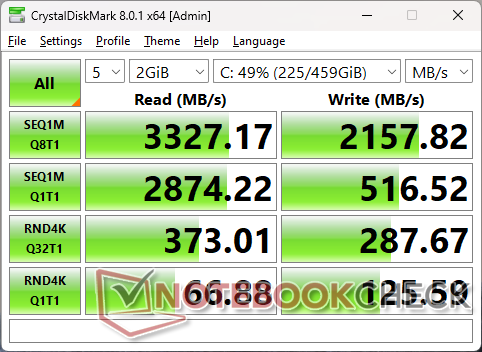
Dispositivi di archiviazione - PCIe4 a velocità PCIe3
Dell offre opzioni di archiviazione PCIe4 x4 da 256 GB, 512 GB e 1 TB. Purtroppo, le prestazioni sono più simili a quelle della maggior parte delle unità PCIe3 x4 che a quelle di PCIe4 x4. Benchmark come CrystalDiskMark e DiskSpd mostrano velocità massime di lettura e scrittura di soli 3300 MB/s e 2200 MB/s, rispettivamente, rispetto ai 7000 MB/s o più veloci delle unità Samsung 980 Pro Samsung 980 Pro PCIe4 x4 di Samsung. Tuttavia, i 3000 MB/s sono più che sufficienti considerando il fattore di forma e la CPU Core U-series.

* ... Meglio usare valori piccoli
Disk Throttling: DiskSpd Read Loop, Queue Depth 8
Prestazioni della GPU
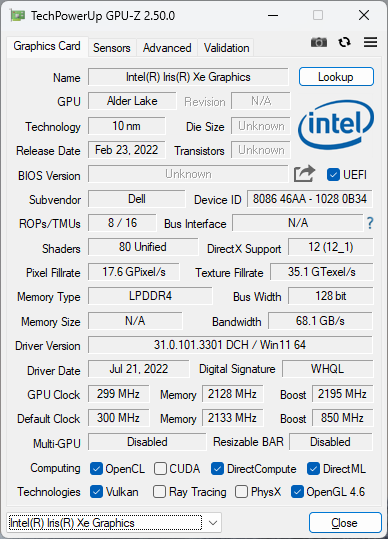
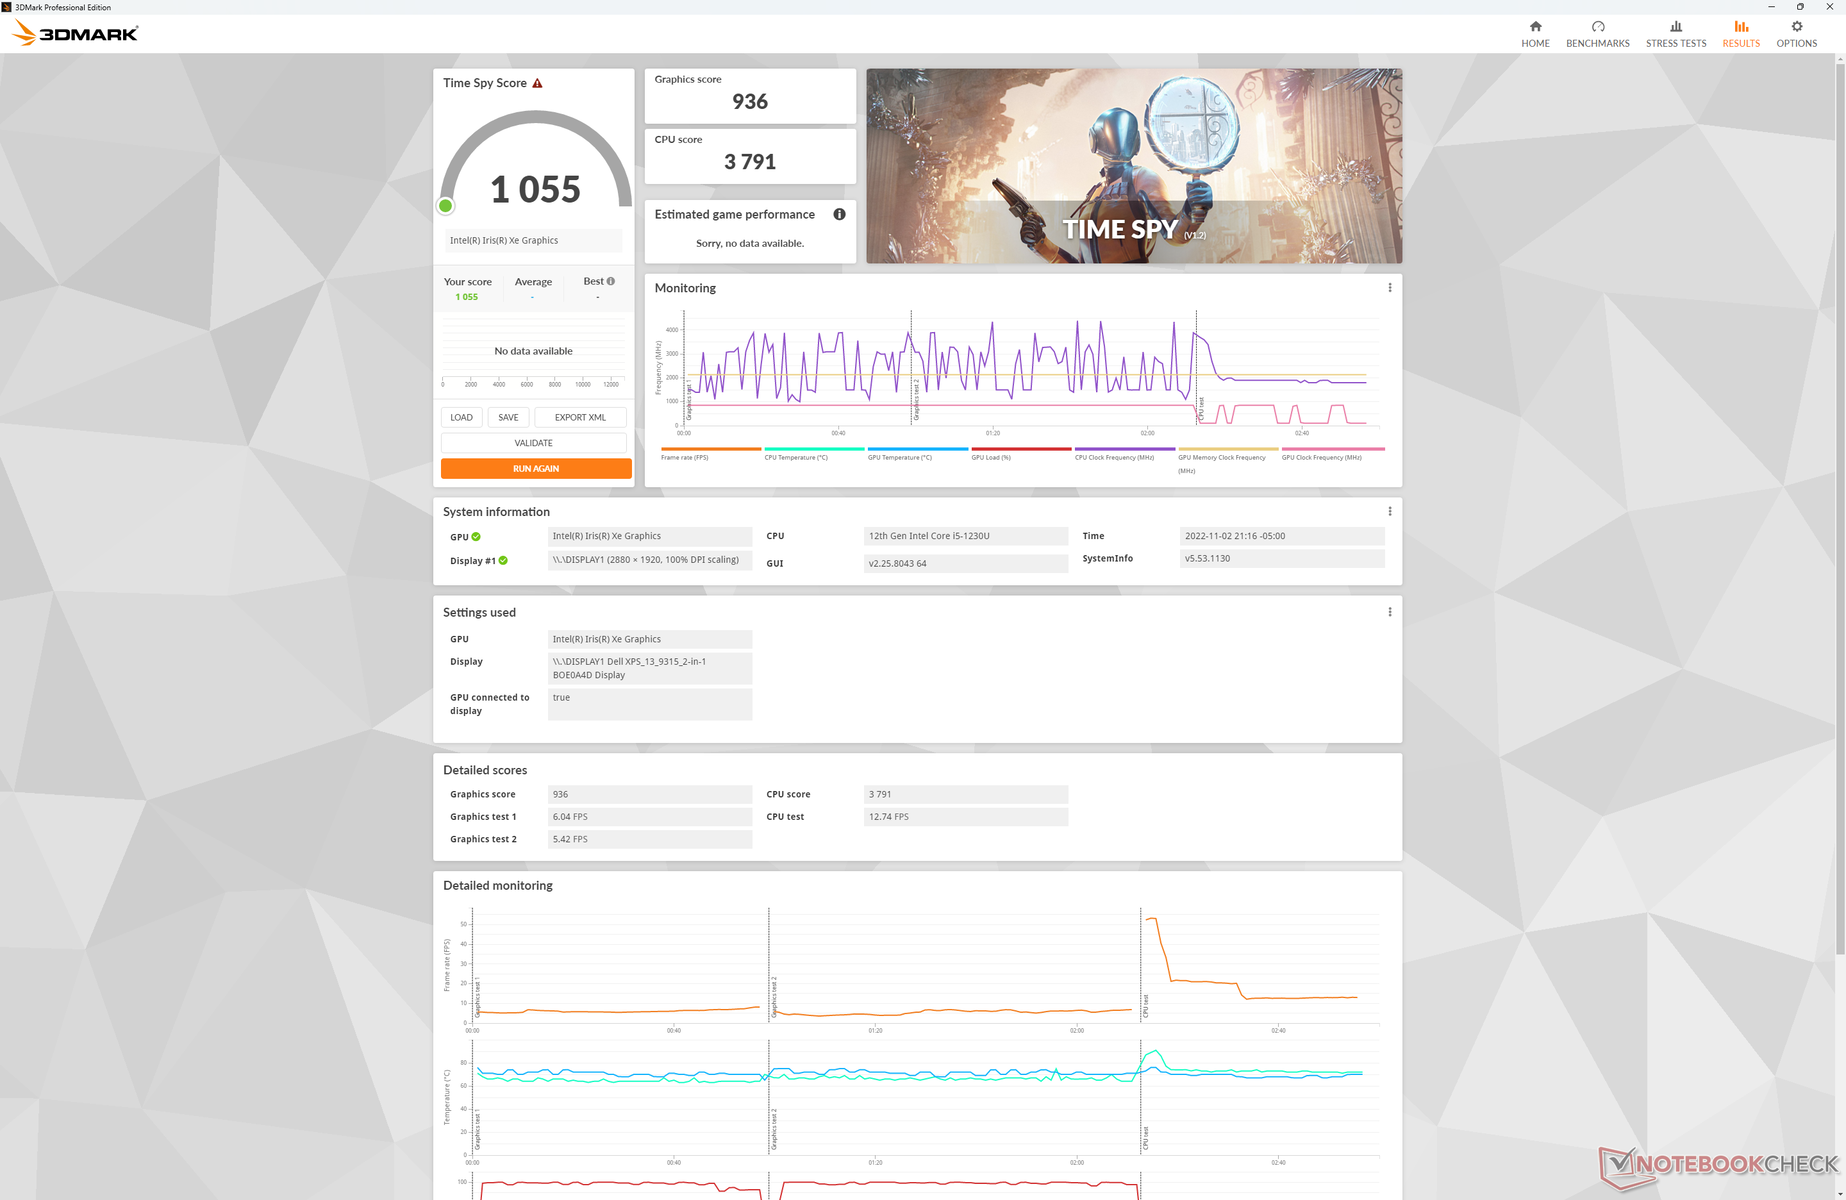
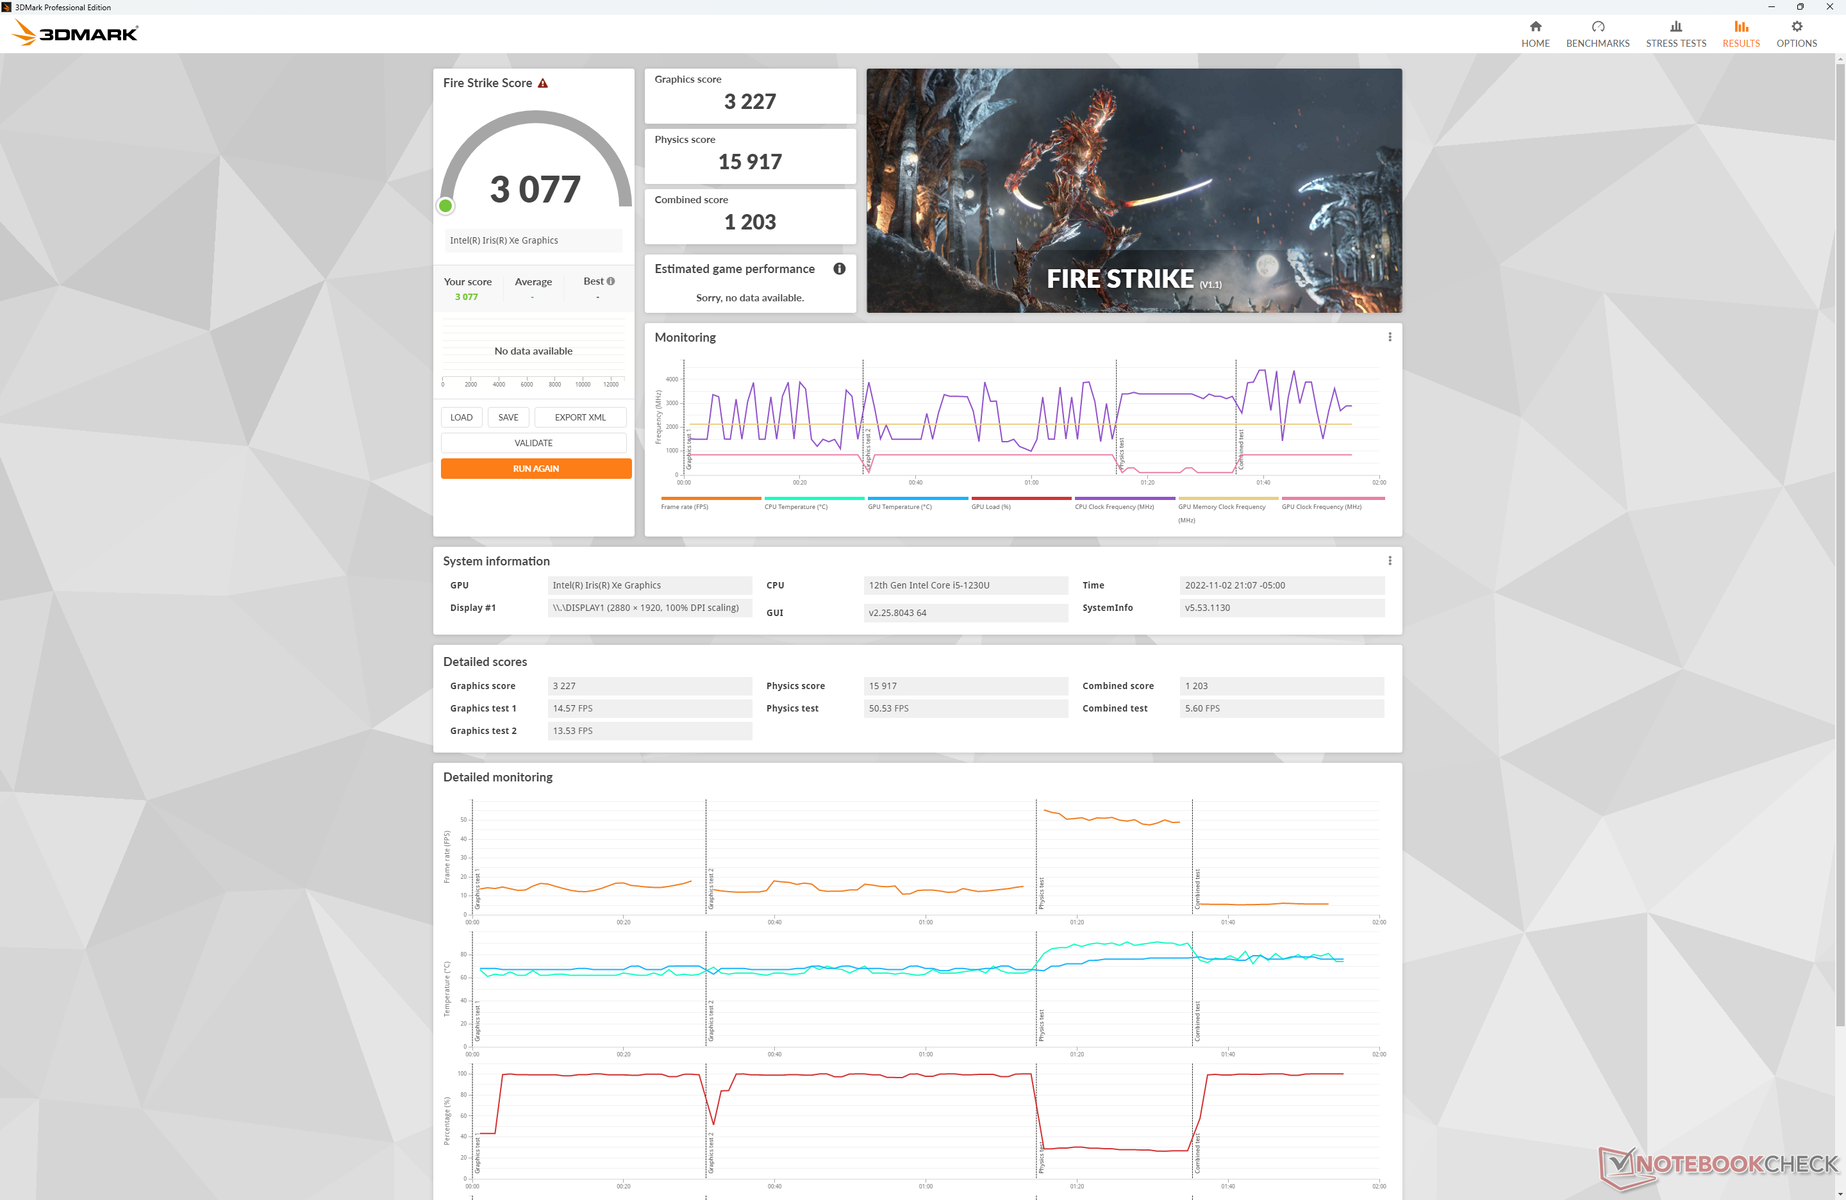
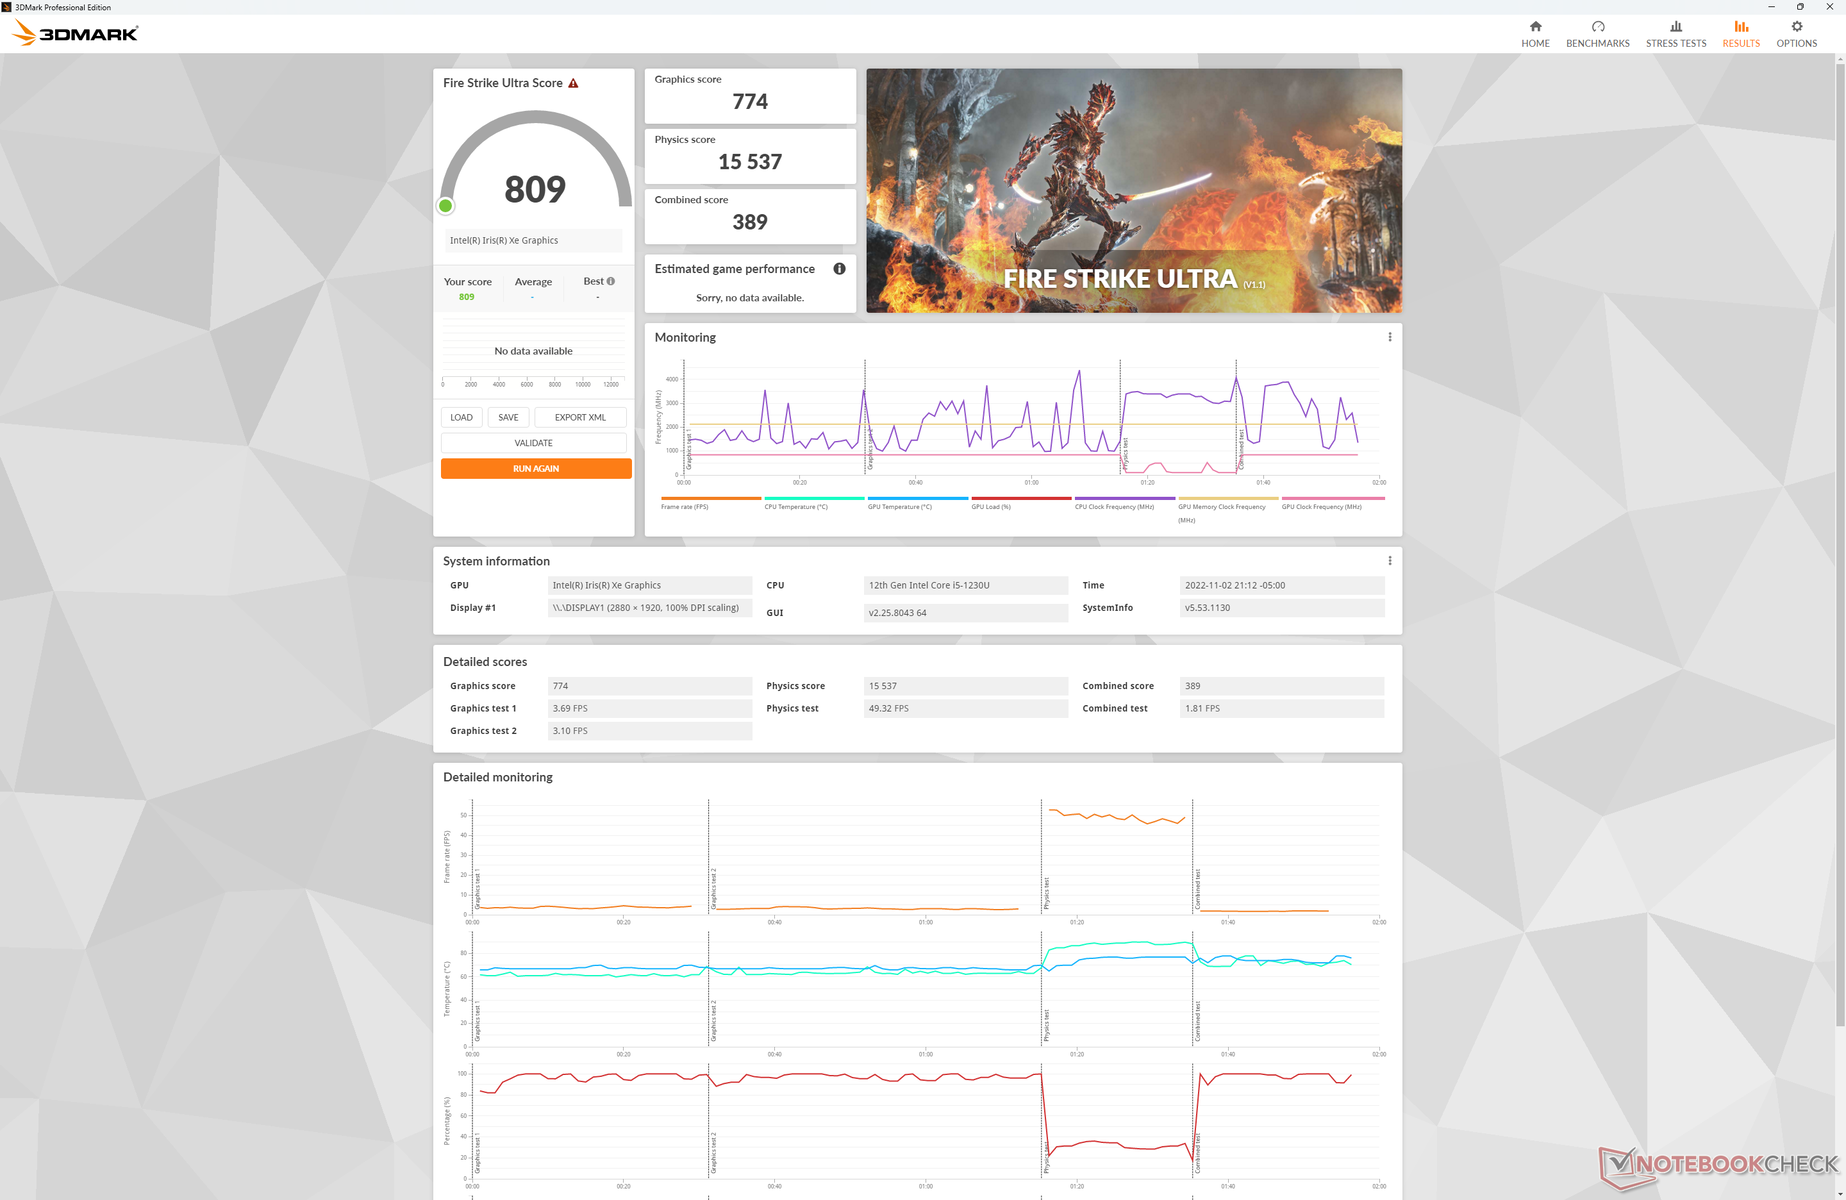
Mentre le prestazioni della CPU sono migliori del previsto, le prestazioni grafiche non sono altrettanto buone. i risultati di 3DMark sono più lenti di circa il 10-20% rispetto alla media dei portatili del nostro database con lo stesso processore integrato Iris Xe 80 EU integrataper essere paragonabili a quelli delThinkBook Plus Gen 2 dello scorso annoil gioco è ancora possibile se si utilizzano solo le impostazioni più basse.
L'aggiornamento alla SKU Core i7-1250U con l'unità Iris Xe 96 EU dovrebbe incrementare le prestazioni grafiche di circa il 36%, in base alla nostra esperienza con l'HP Envy x360 13. Esistono configurazioni con soli 8 GB di RAM invece di 16 GB, che non consigliamo, altrimenti le prestazioni grafiche ne risentirebbero ancora di più.
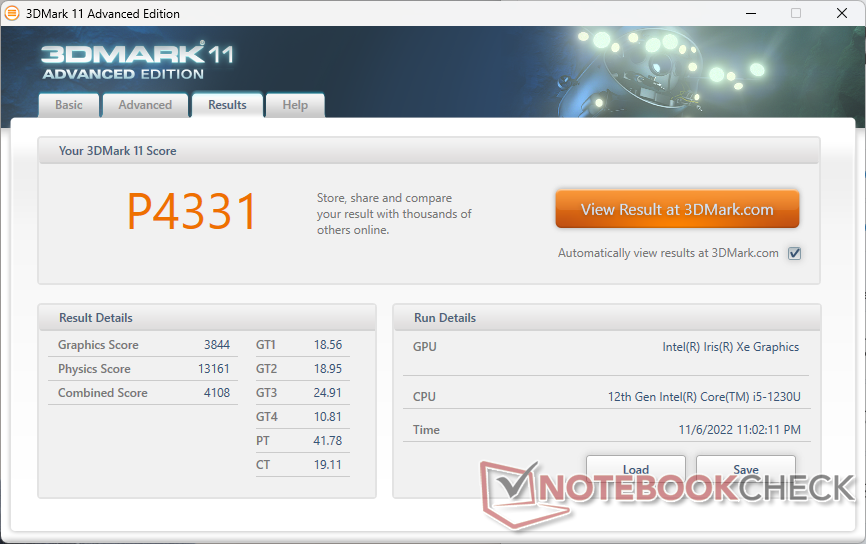
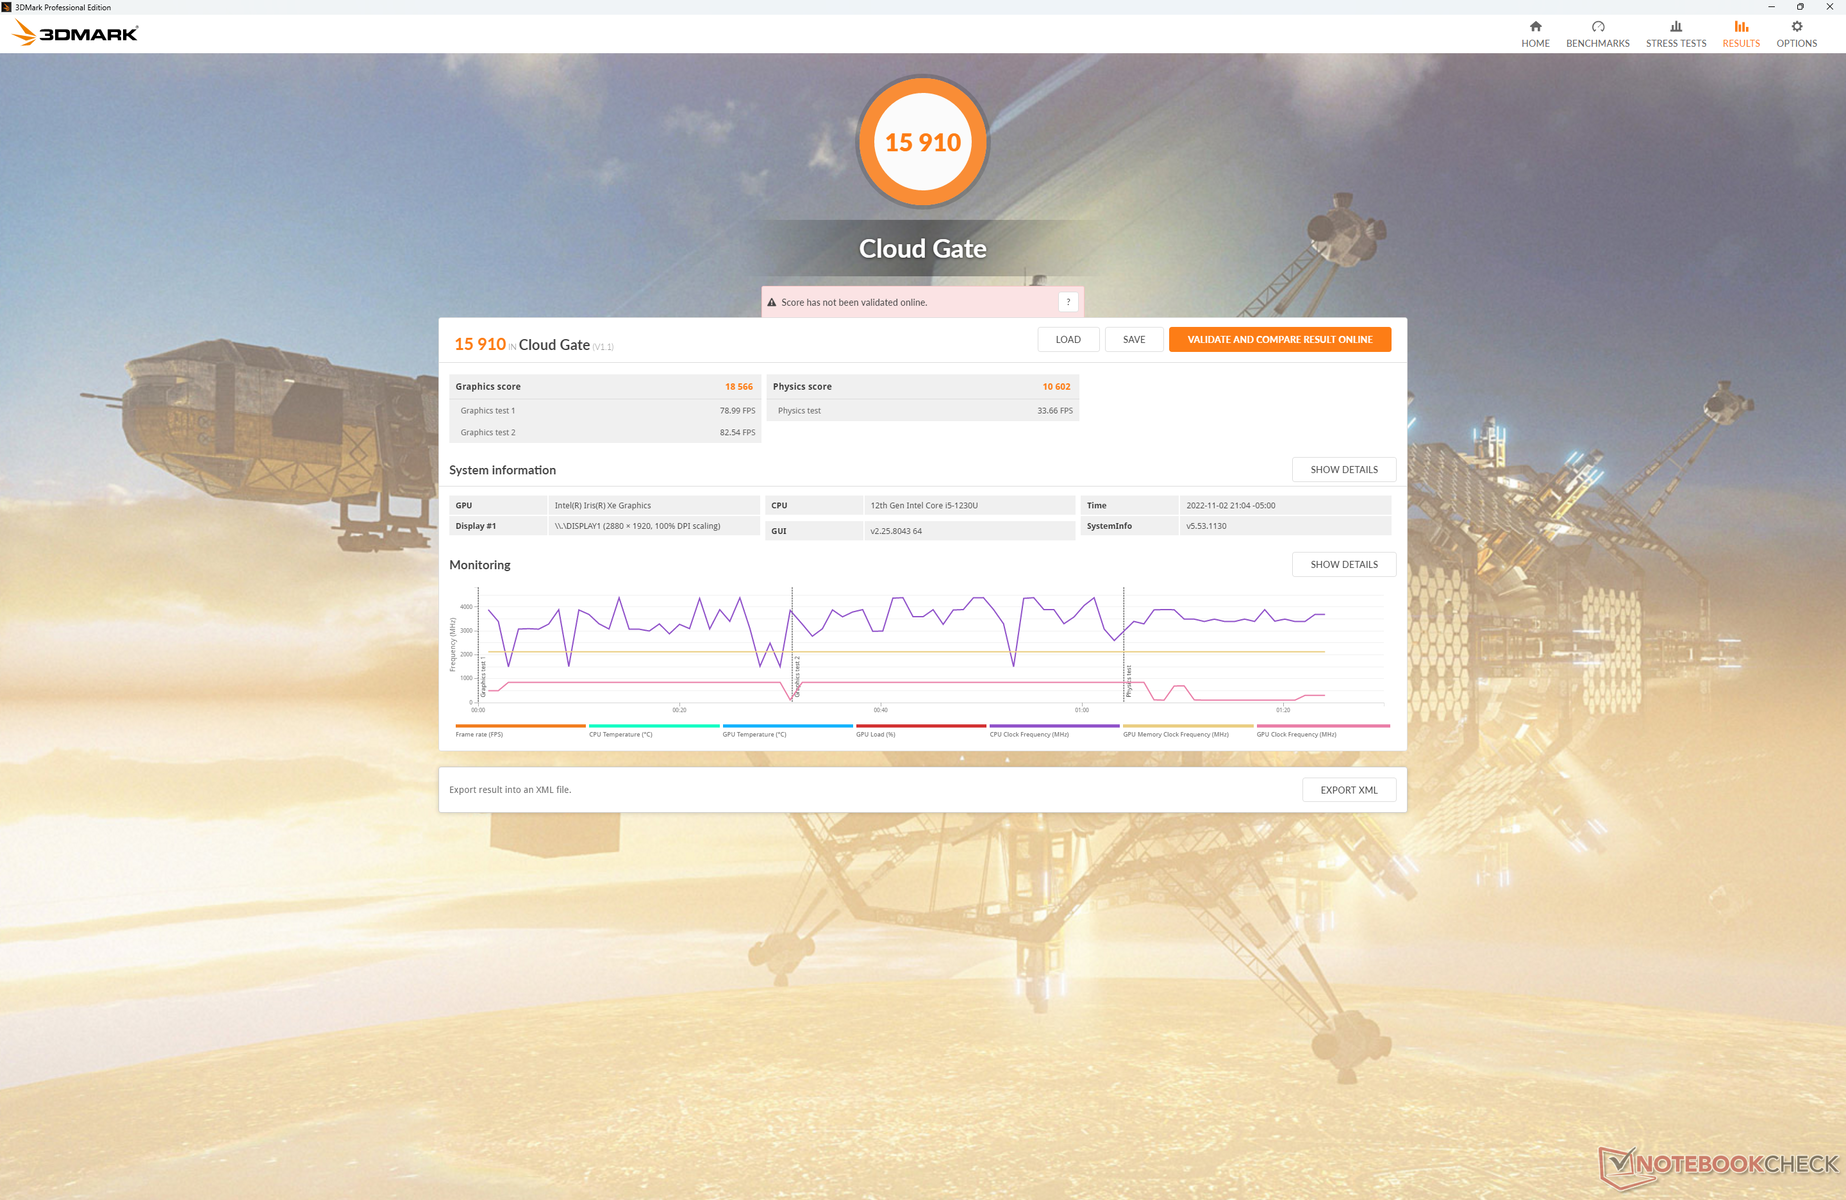
| 3DMark 11 Performance | 4331 punti | |
| 3DMark Cloud Gate Standard Score | 15910 punti | |
| 3DMark Fire Strike Score | 3077 punti | |
| 3DMark Time Spy Score | 1055 punti | |
Aiuto | ||
* ... Meglio usare valori piccoli
| Final Fantasy XV Benchmark - 1280x720 Lite Quality | |
| Microsoft Surface Pro 8, i7-1185G7 | |
| Dell XPS 13 Plus 9320 i7-1280P OLED | |
| HP Spectre x360 13.5 14t-ef000 | |
| Media Intel Iris Xe Graphics G7 80EUs (8.32 - 45.6, n=107) | |
| Dell XPS 13 9315 2-in-1 Core i5-1230U | |
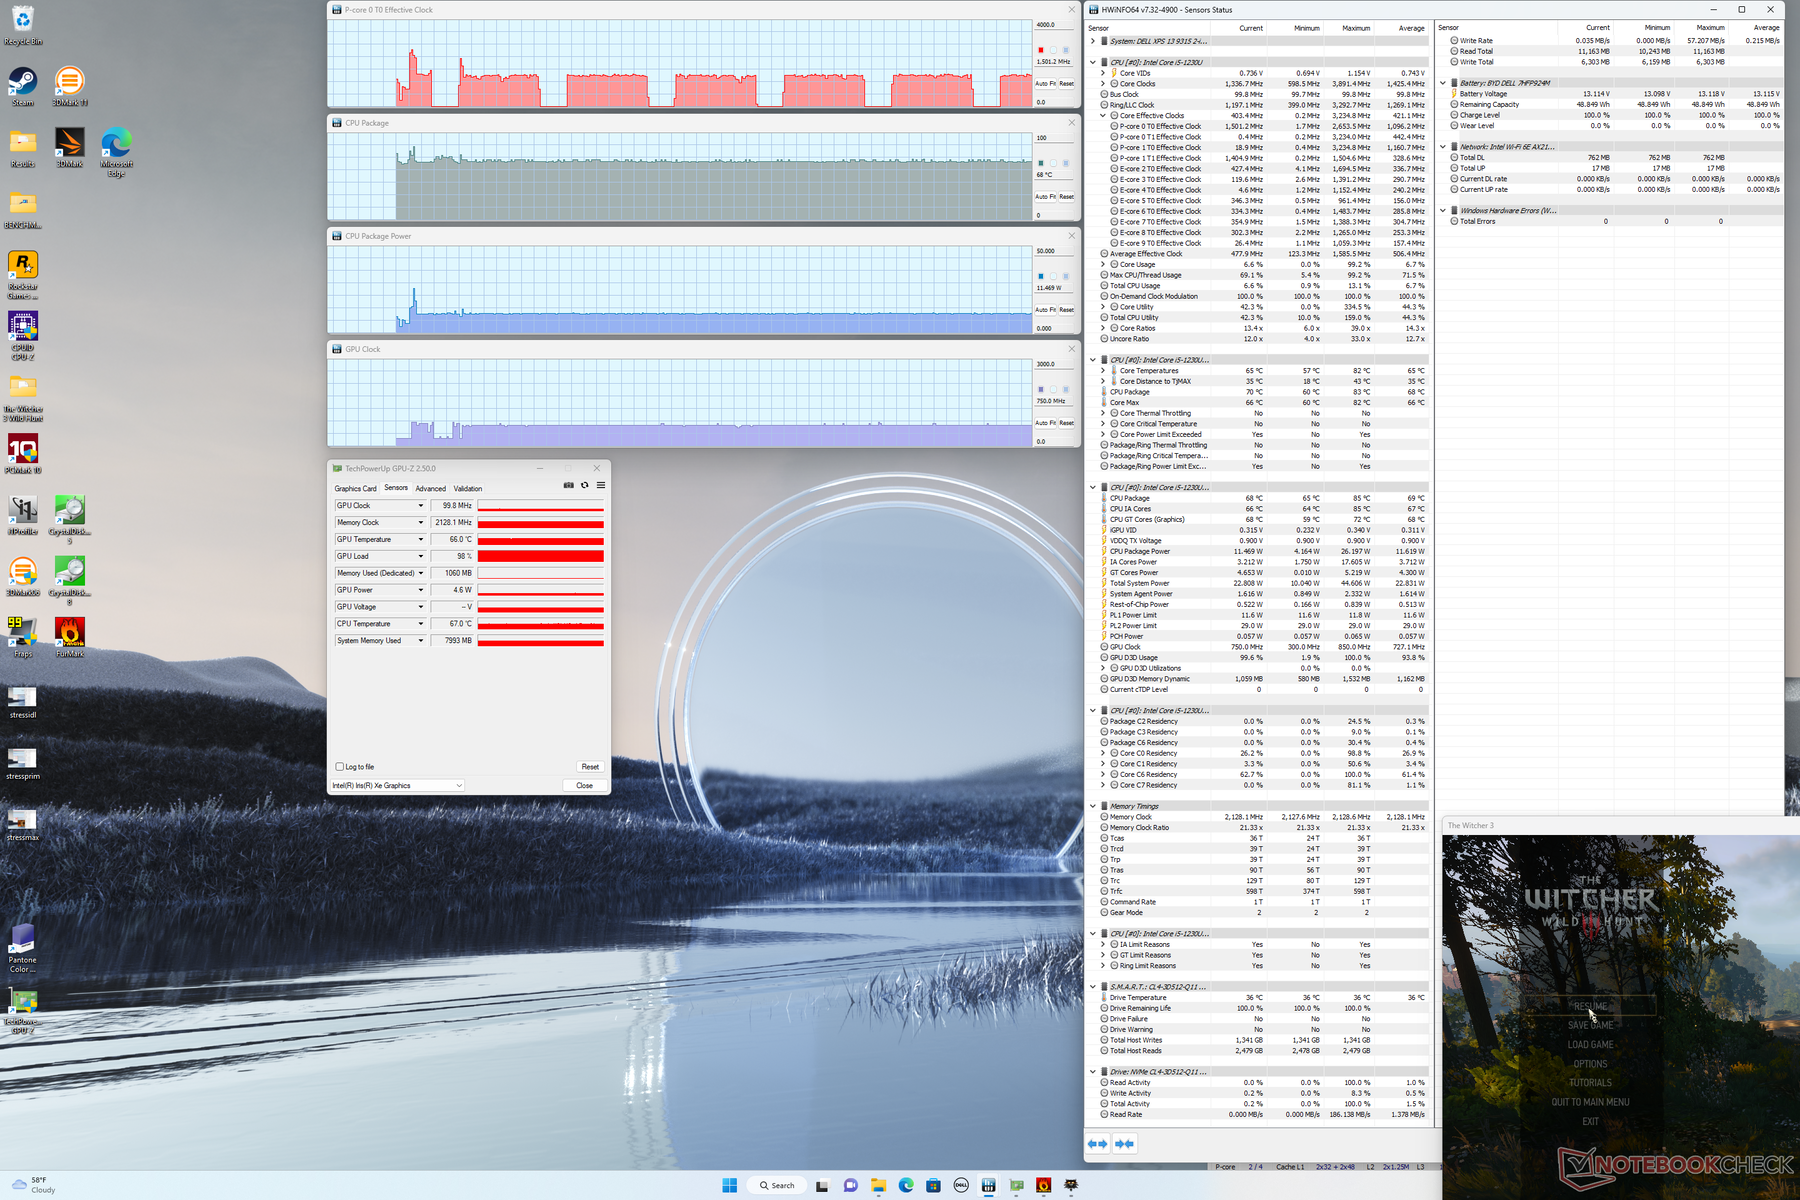
Le frequenze dei fotogrammi sono costanti quando il computer è al minimo Witcher 3 per non interrompere nessuna attività in background. Abbiamo sperimentato un singolo caso in cui le prestazioni sono scese a 36 FPS prima di risalire alla normalità, ma fortunatamente si è trattato solo di un'eccezione e di uno schema.
Witcher 3 FPS Chart
| basso | medio | alto | ultra | |
|---|---|---|---|---|
| GTA V (2015) | 60.9 | 38.4 | 11.7 | 6.06 |
| The Witcher 3 (2015) | 57.7 | 38.9 | 19.9 | 8.5 |
| Dota 2 Reborn (2015) | 101.2 | 75.8 | 37.6 | 34.2 |
| Final Fantasy XV Benchmark (2018) | 27 | |||
| X-Plane 11.11 (2018) | 31.2 | 25.1 | 22 |
Emissioni - Nessun ventilatore!
Rumore del sistema
Mentre il Surface Pro 8 utilizza una ventola interna per il raffreddamento, l'XPS 13 9315 2-in-1 è raffreddato passivamente per tutte le configurazioni, compresa la SKU Core i7. Non c'è alcun rumore di ventola o di bobina per un sistema completamente silenzioso.
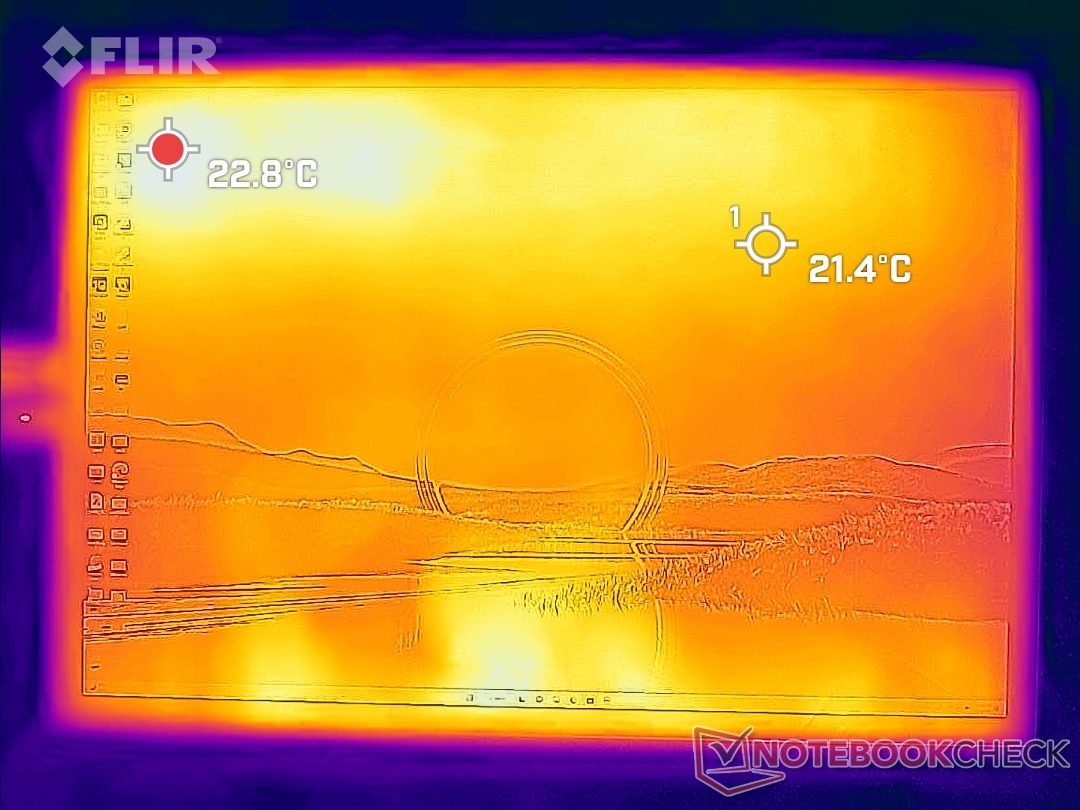
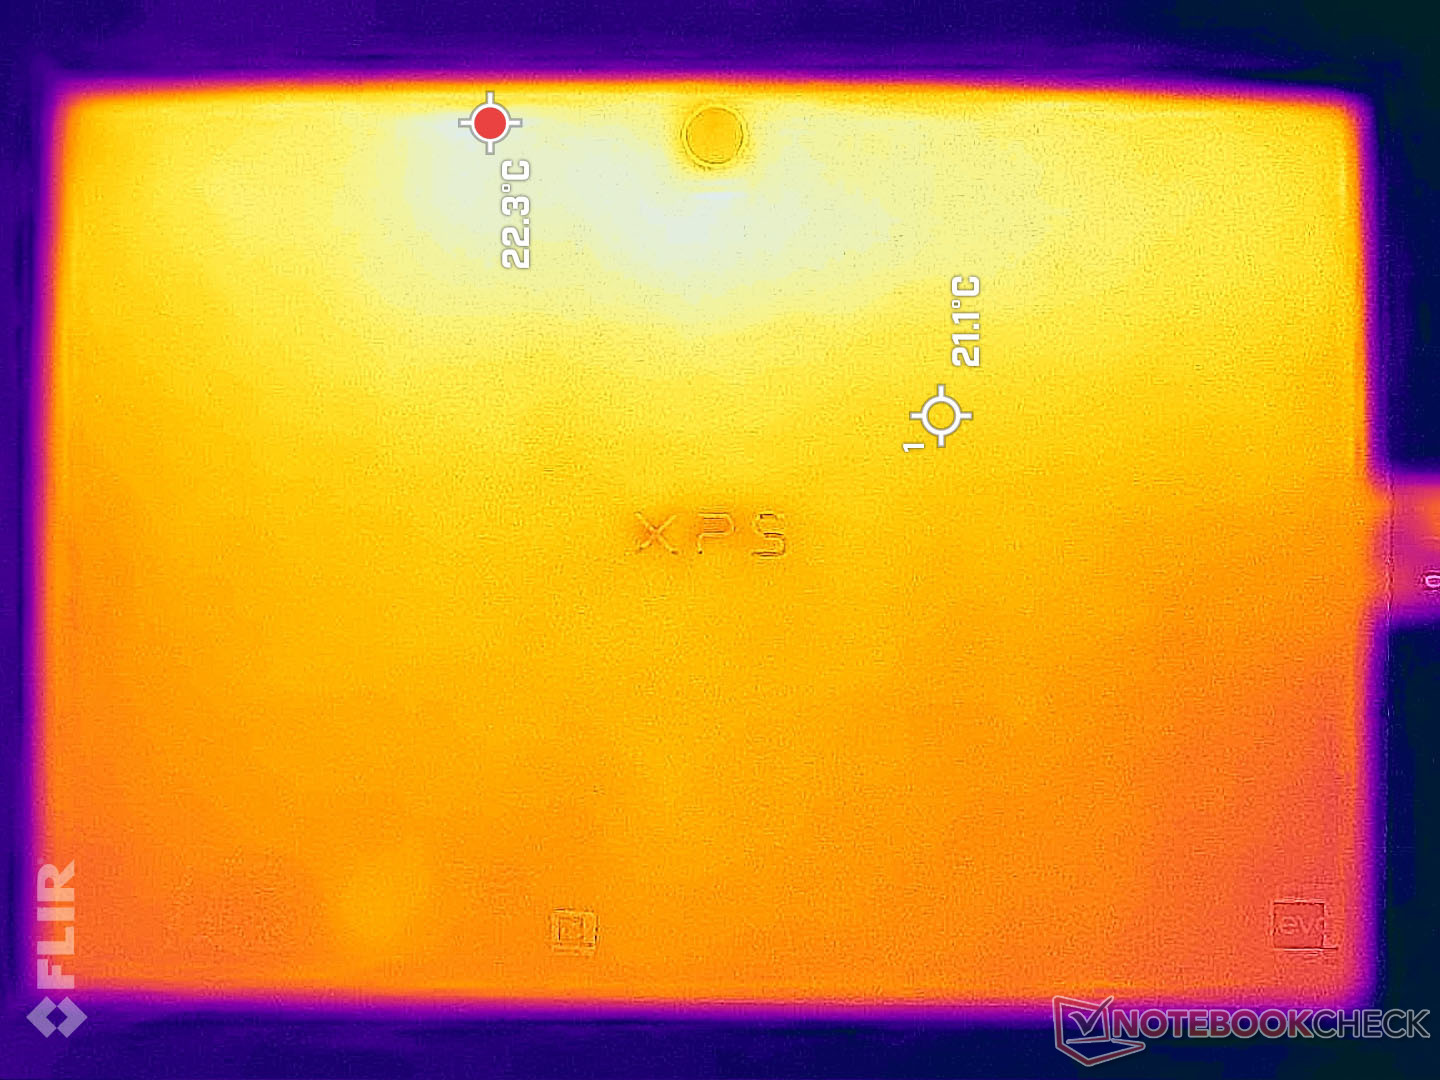
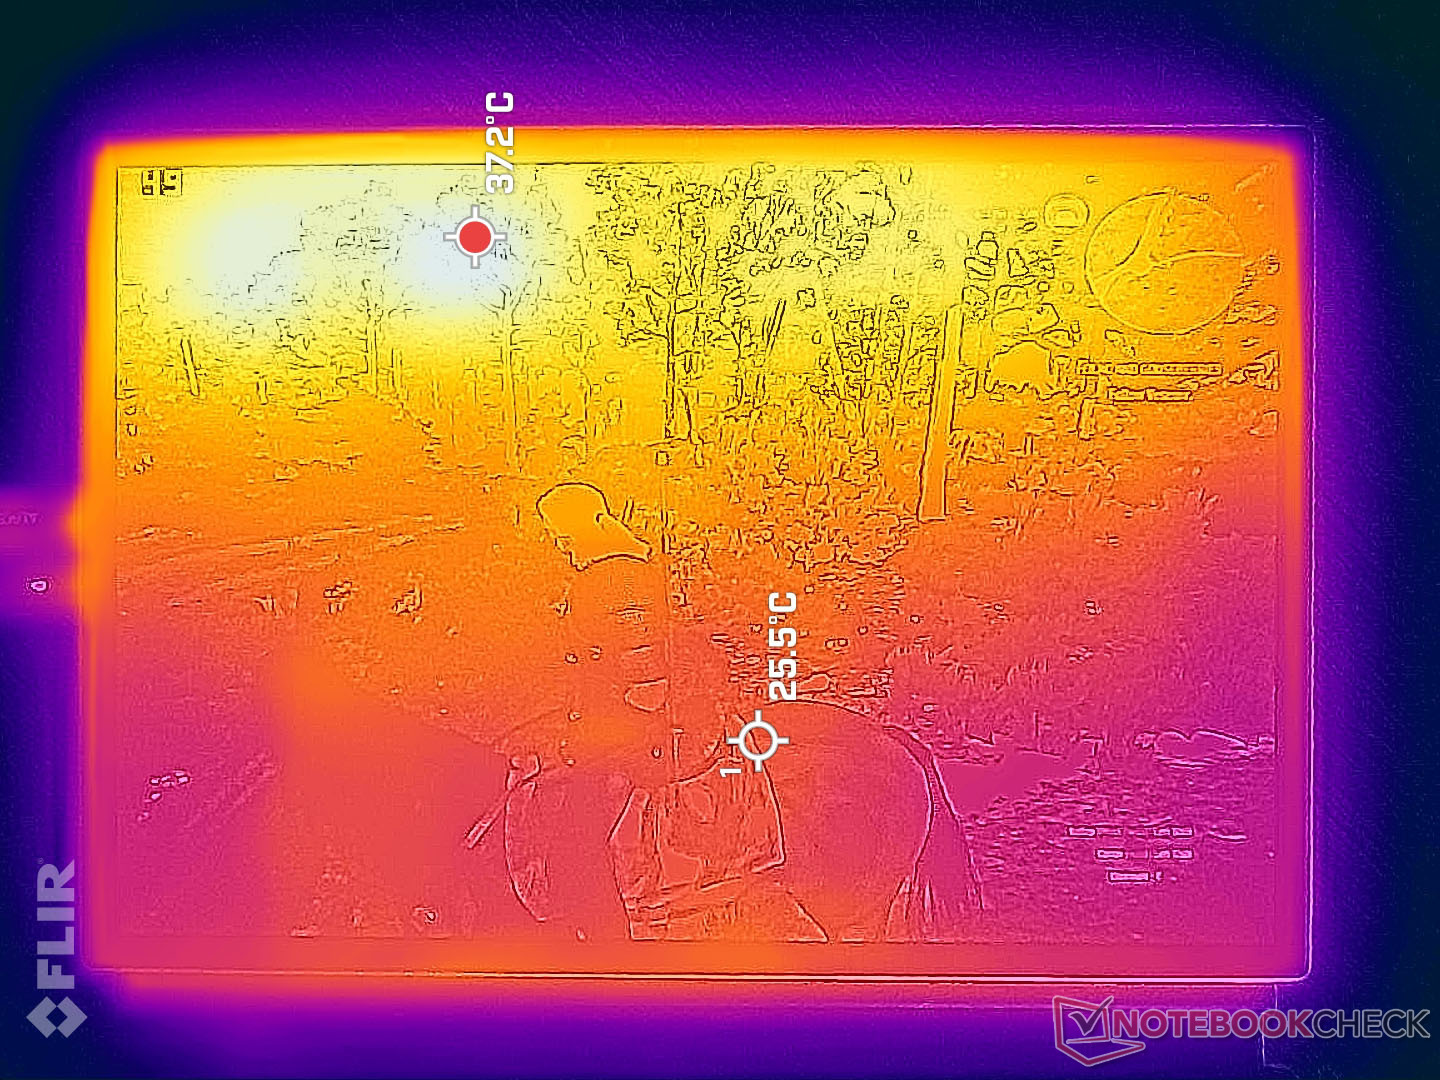
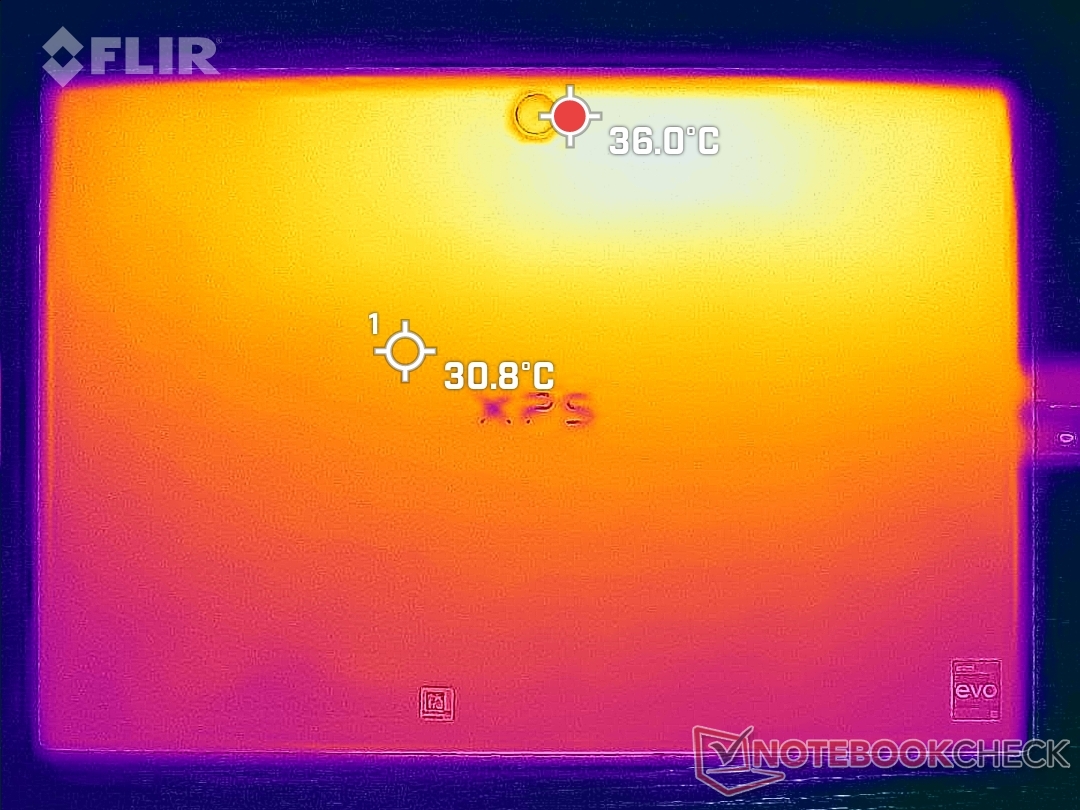
Temperatura
Le temperature superficiali sono generalmente più calde lungo la metà superiore dell'unità, mentre la metà inferiore è sensibilmente più fredda. I punti caldi sulla parte anteriore e posteriore possono raggiungere rispettivamente 42 C e 39 C, rispetto ai soli 30 C dei punti più freddi. L'unità non diventa mai scomoda da tenere in mano, indipendentemente dall'orientamento o dal posizionamento. Le temperature complessive sono molto più fresche di quelle registrate sul Surface Pro 8, dove l'intera parte anteriore e posteriore dell'unità può raggiungere i 43°C e i 48°C.
(±) La temperatura massima sul lato superiore è di 41.8 °C / 107 F, rispetto alla media di 35.4 °C / 96 F, che varia da 19.6 a 60 °C per questa classe Convertible.
(+) Il lato inferiore si riscalda fino ad un massimo di 38.2 °C / 101 F, rispetto alla media di 36.9 °C / 98 F
(+) In idle, la temperatura media del lato superiore è di 25.5 °C / 78 F, rispetto alla media deld ispositivo di 30.3 °C / 87 F.
(+) I poggiapolsi e il touchpad sono piu' freddi della temperatura della pelle con un massimo di 29.8 °C / 85.6 F e sono quindi freddi al tatto.
(±) La temperatura media della zona del palmo della mano di dispositivi simili e'stata di 28 °C / 82.4 F (-1.8 °C / -3.2 F).
| Dell XPS 13 9315 2-in-1 Core i5-1230U Intel Core i5-1230U, Intel Iris Xe Graphics G7 80EUs | Microsoft Surface Pro 8, i7-1185G7 Intel Core i7-1185G7, Intel Iris Xe Graphics G7 96EUs | HP Spectre x360 13.5 14t-ef000 Intel Core i7-1255U, Intel Iris Xe Graphics G7 96EUs | Lenovo ThinkBook Plus Gen2 Core i5 Intel Core i5-1130G7, Intel Iris Xe Graphics G7 80EUs | Apple MacBook Air M2 Entry Apple M2, Apple M2 8-Core GPU | |
|---|---|---|---|---|---|
| Heat | -2% | 14% | -11% | 1% | |
| Maximum Upper Side * (°C) | 41.8 | 45 -8% | 36.4 13% | 42 -0% | 44.5 -6% |
| Maximum Bottom * (°C) | 38.2 | 47.2 -24% | 37 3% | 44.5 -16% | 44.4 -16% |
| Idle Upper Side * (°C) | 27.4 | 24.1 12% | 20.8 24% | 29.8 -9% | 23.9 13% |
| Idle Bottom * (°C) | 27.2 | 23.4 14% | 22.6 17% | 31.9 -17% | 23.6 13% |
* ... Meglio usare valori piccoli
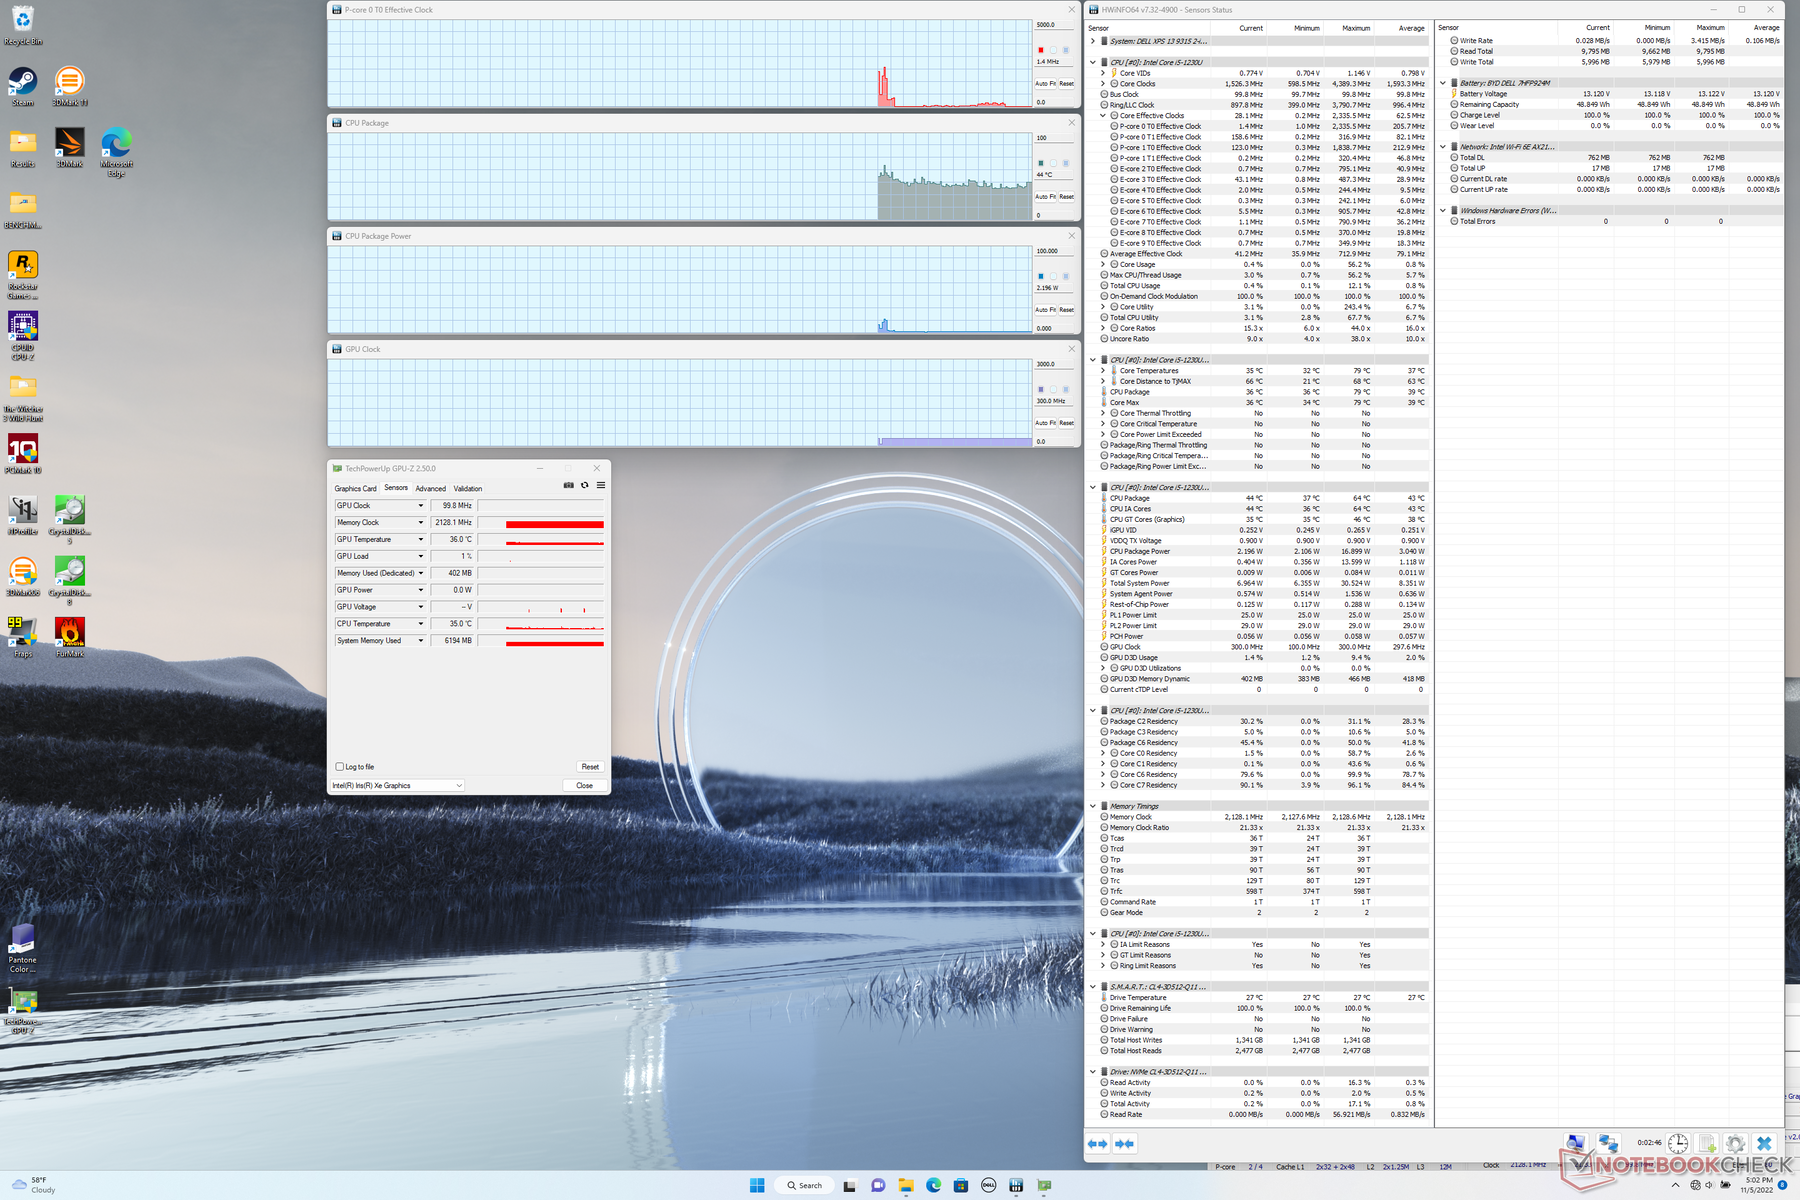
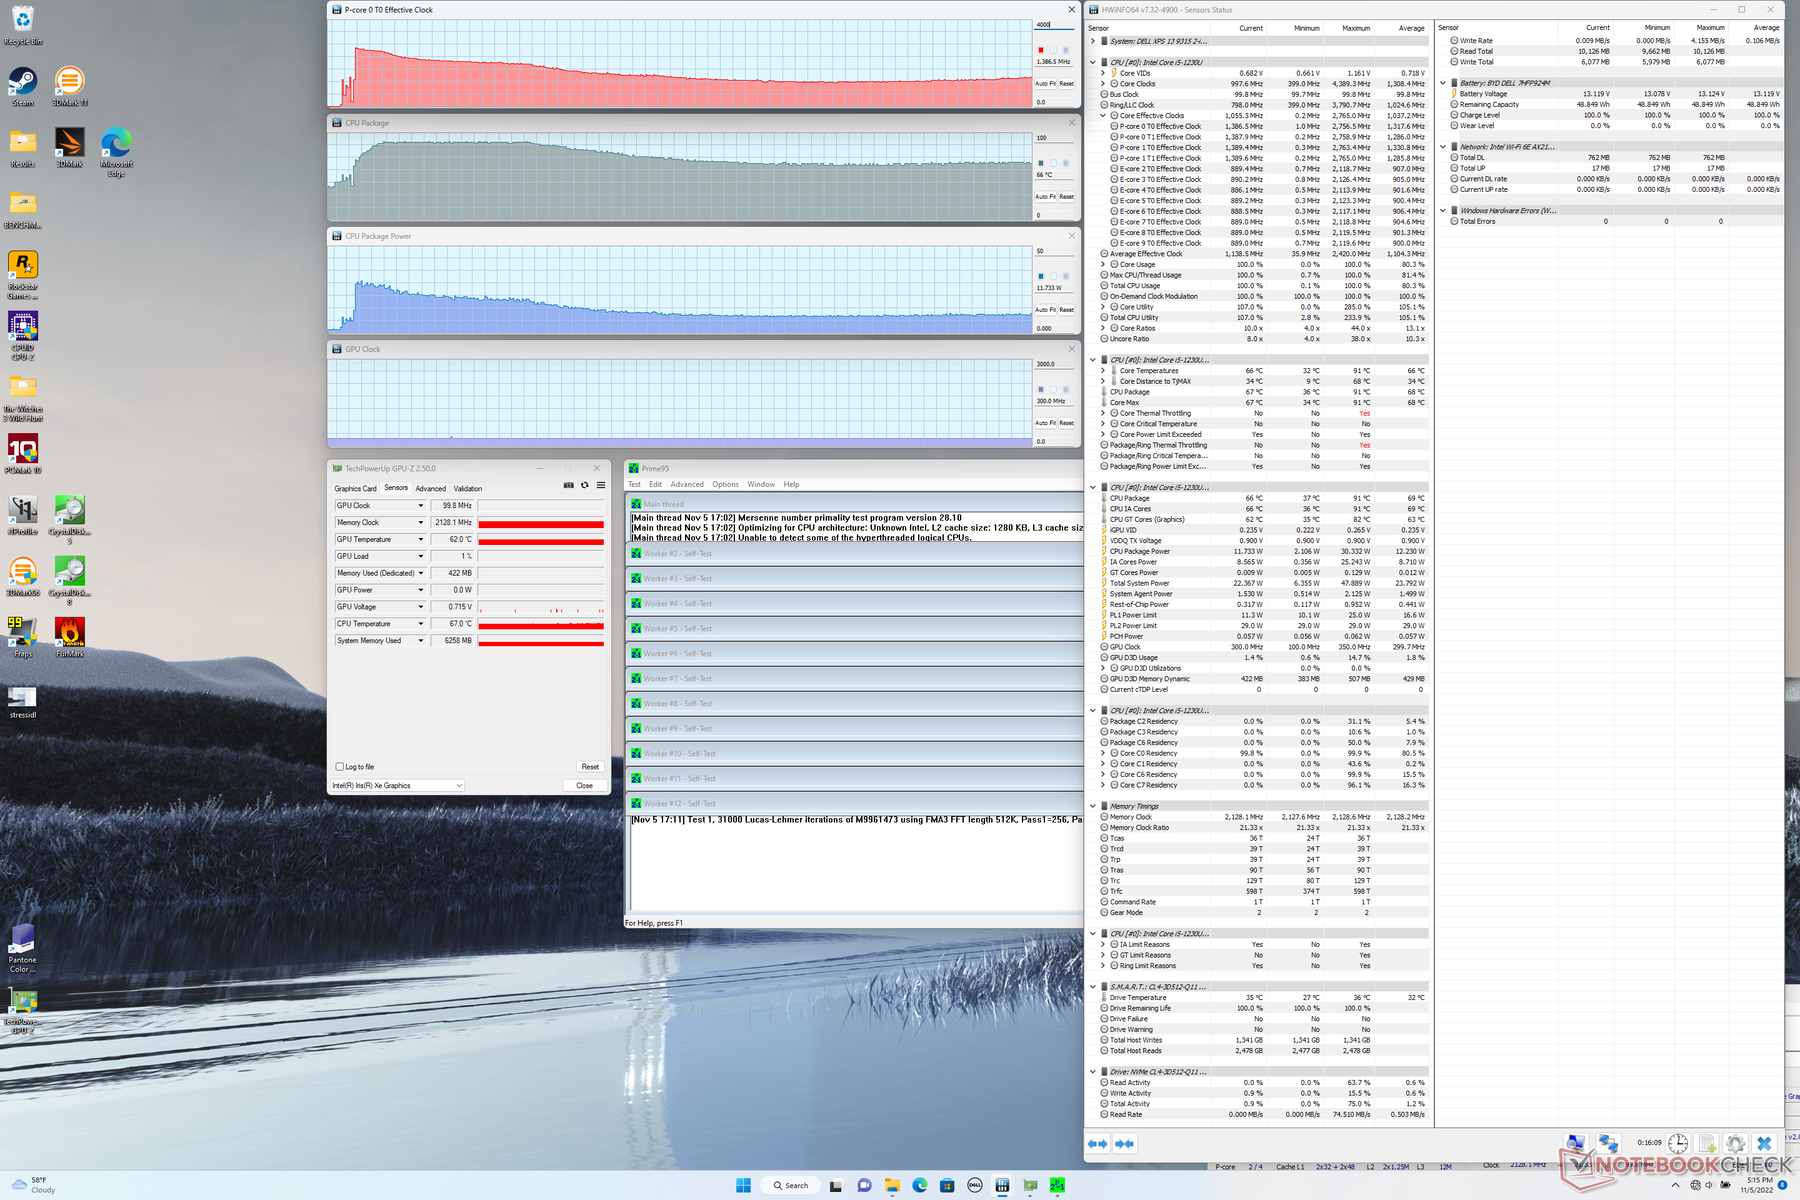
Stress test
Sotto lo stress di Prime95, la CPU raggiunge i 2,7 GHz e i 29 W per circa 20 secondi o fino a quando la temperatura del core raggiunge i 90 C. In seguito, la velocità di clock e l'assorbimento di potenza della scheda diminuiscono costantemente prima di stabilizzarsi a 1,4 GHz e 12 W, rispettivamente, per mantenere la temperatura del core a 66 C, molto più fredda. Le velocità di clock limitate non sono inaspettate se si considera il design senza ventola e il fattore di forma del tablet. Ripetendo questo test sul Surface Pro 8 raffreddato a ventola, il consumo di energia della CPU sarebbe stato superiore, pari a 26 W, ma con una temperatura del core simile a 65 C.
La frequenza di clock della GPU si stabilizza a 750 MHz durante il funzionamento Witcher 3 rispetto ai 1147 MHz del molto più veloce XPS 14 9320 Core i7 clamshell.
Le prestazioni della CPU non sono artificialmente limitate se si utilizza l'alimentazione a batteria. i risultati di 3DMark 11 tra batteria e rete elettrica sono quasi identici.
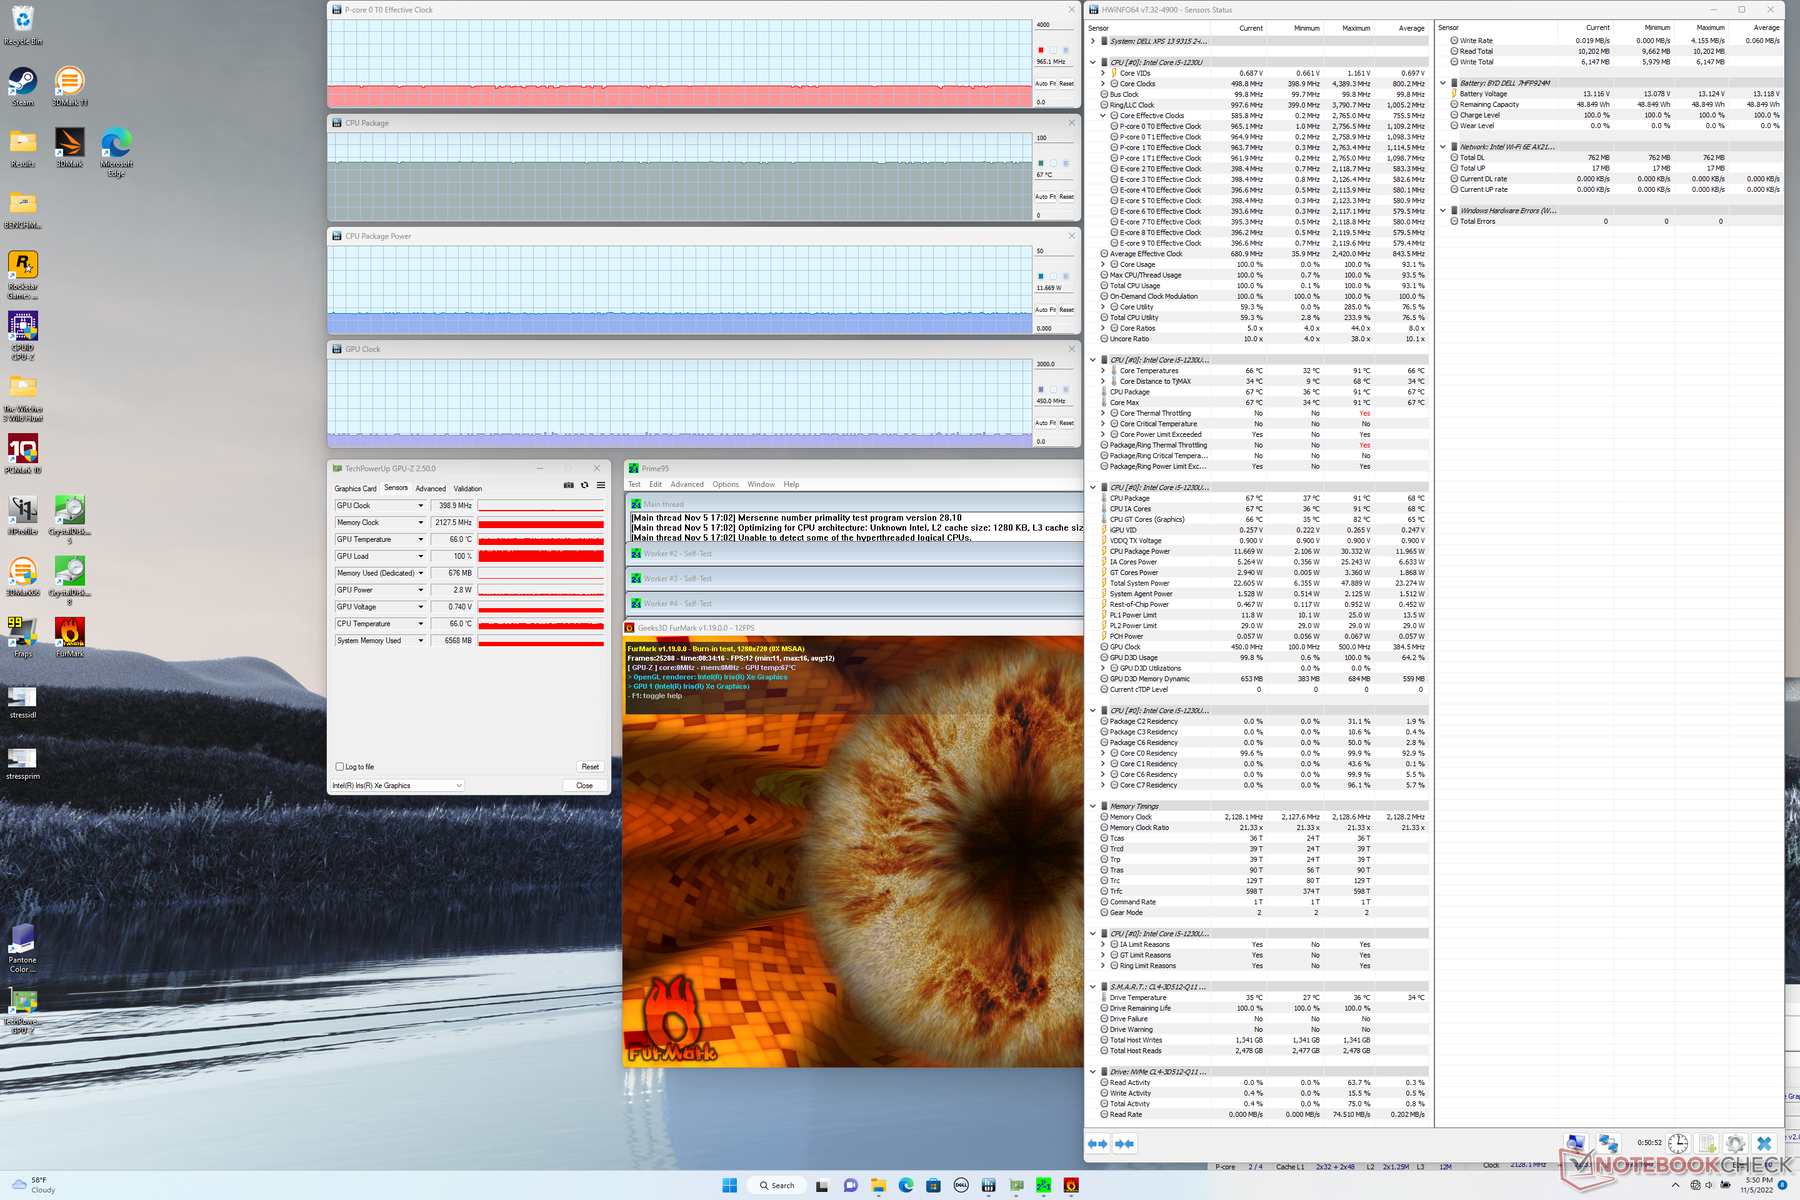
| Clock della CPU (GHz) | Clock della GPU (MHz) | Temperatura media della CPU (°C) | |
| Sistema inattivo | -- | -- | 44 |
| Prime95 Stress | 1.4 | -- | 66 |
| Prime95 + FurMark Stress | 1,0 | 450 | 67 |
| Witcher 3 Stress | ~1,5 | 750 | 68 |
Altoparlanti
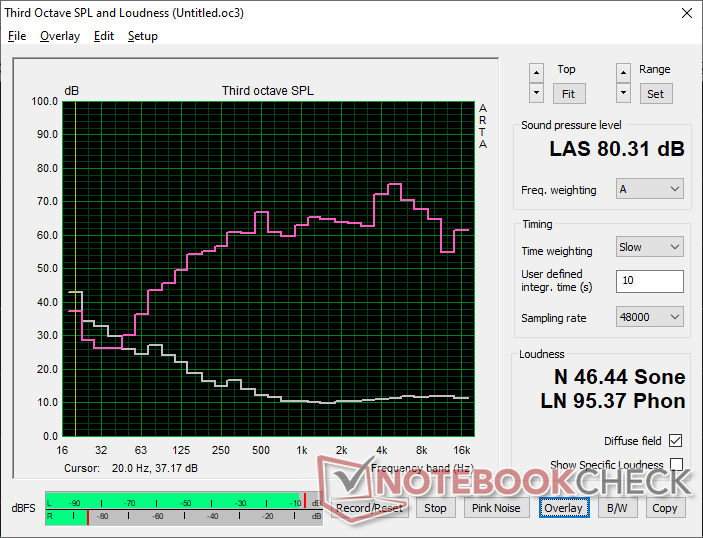
Dell XPS 13 9315 2-in-1 Core i5-1230U analisi audio
(±) | potenza degli altiparlanti media ma buona (80.3 dB)
Bassi 100 - 315 Hz
(±) | bassi ridotti - in media 8.9% inferiori alla media
(+) | bassi in lineaa (5.7% delta rispetto alla precedente frequenza)
Medi 400 - 2000 Hz
(+) | medi bilanciati - solo only 2.2% rispetto alla media
(+) | medi lineari (5.2% delta rispetto alla precedente frequenza)
Alti 2 - 16 kHz
(±) | alti elevati - circa 5.5% superiori alla media
(+) | alti lineari (6.8% delta rispetto alla precedente frequenza)
Nel complesso 100 - 16.000 Hz
(+) | suono nel complesso lineare (11.9% differenza dalla media)
Rispetto alla stessa classe
» 11% di tutti i dispositivi testati in questa classe è stato migliore, 3% simile, 85% peggiore
» Il migliore ha avuto un delta di 6%, medio di 20%, peggiore di 57%
Rispetto a tutti i dispositivi testati
» 9% di tutti i dispositivi testati in questa classe è stato migliore, 2% similare, 89% peggiore
» Il migliore ha avuto un delta di 4%, medio di 23%, peggiore di 134%
Apple MacBook Pro 16 2021 M1 Pro analisi audio
(+) | gli altoparlanti sono relativamente potenti (84.7 dB)
Bassi 100 - 315 Hz
(+) | bassi buoni - solo 3.8% dalla media
(+) | bassi in lineaa (5.2% delta rispetto alla precedente frequenza)
Medi 400 - 2000 Hz
(+) | medi bilanciati - solo only 1.3% rispetto alla media
(+) | medi lineari (2.1% delta rispetto alla precedente frequenza)
Alti 2 - 16 kHz
(+) | Alti bilanciati - appena 1.9% dalla media
(+) | alti lineari (2.7% delta rispetto alla precedente frequenza)
Nel complesso 100 - 16.000 Hz
(+) | suono nel complesso lineare (4.6% differenza dalla media)
Rispetto alla stessa classe
» 0% di tutti i dispositivi testati in questa classe è stato migliore, 0% simile, 100% peggiore
» Il migliore ha avuto un delta di 5%, medio di 17%, peggiore di 45%
Rispetto a tutti i dispositivi testati
» 0% di tutti i dispositivi testati in questa classe è stato migliore, 0% similare, 100% peggiore
» Il migliore ha avuto un delta di 4%, medio di 23%, peggiore di 134%
Gestione dell'energia - Molto efficiente
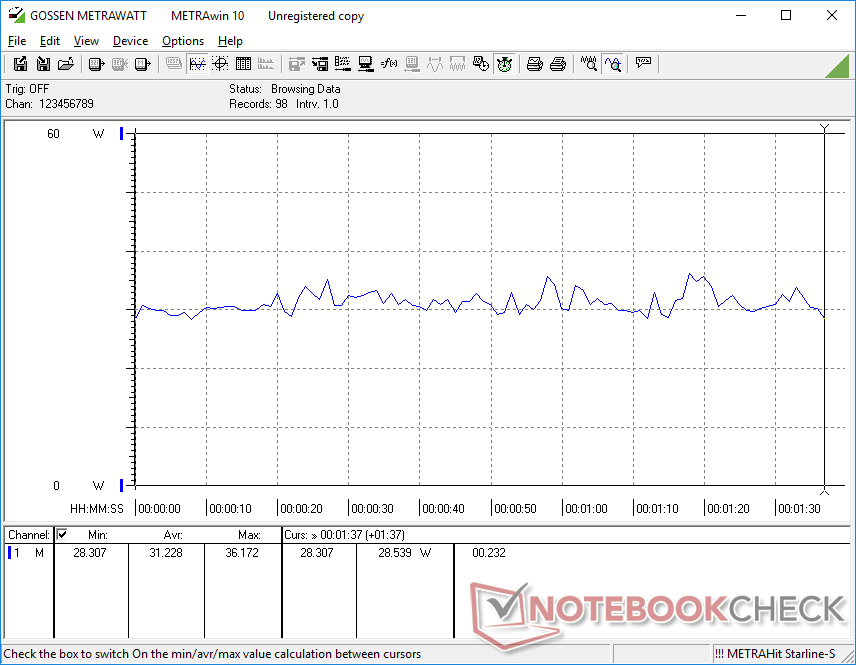
Consumo di energia
Il funzionamento al minimo sul desktop con l'impostazione di luminosità più bassa consuma solo 5 W, mentre l'impostazione di luminosità massima richiederebbe circa 3 W in più. I risultati sono molto vicini a quelli che abbiamo registrato sul ThinkBook Plus Gen 2 equipaggiato con la stessa CPU Core i5-1230U quando sottoposto a carichi simili. Il Surface Pro 8 Core i7 assorbe oltre il 50% di energia in più quando è sottoposto a carichi elevati, poiché offre prestazioni grafiche molto più veloci rispetto alla nostra SKU Core i5 Dell
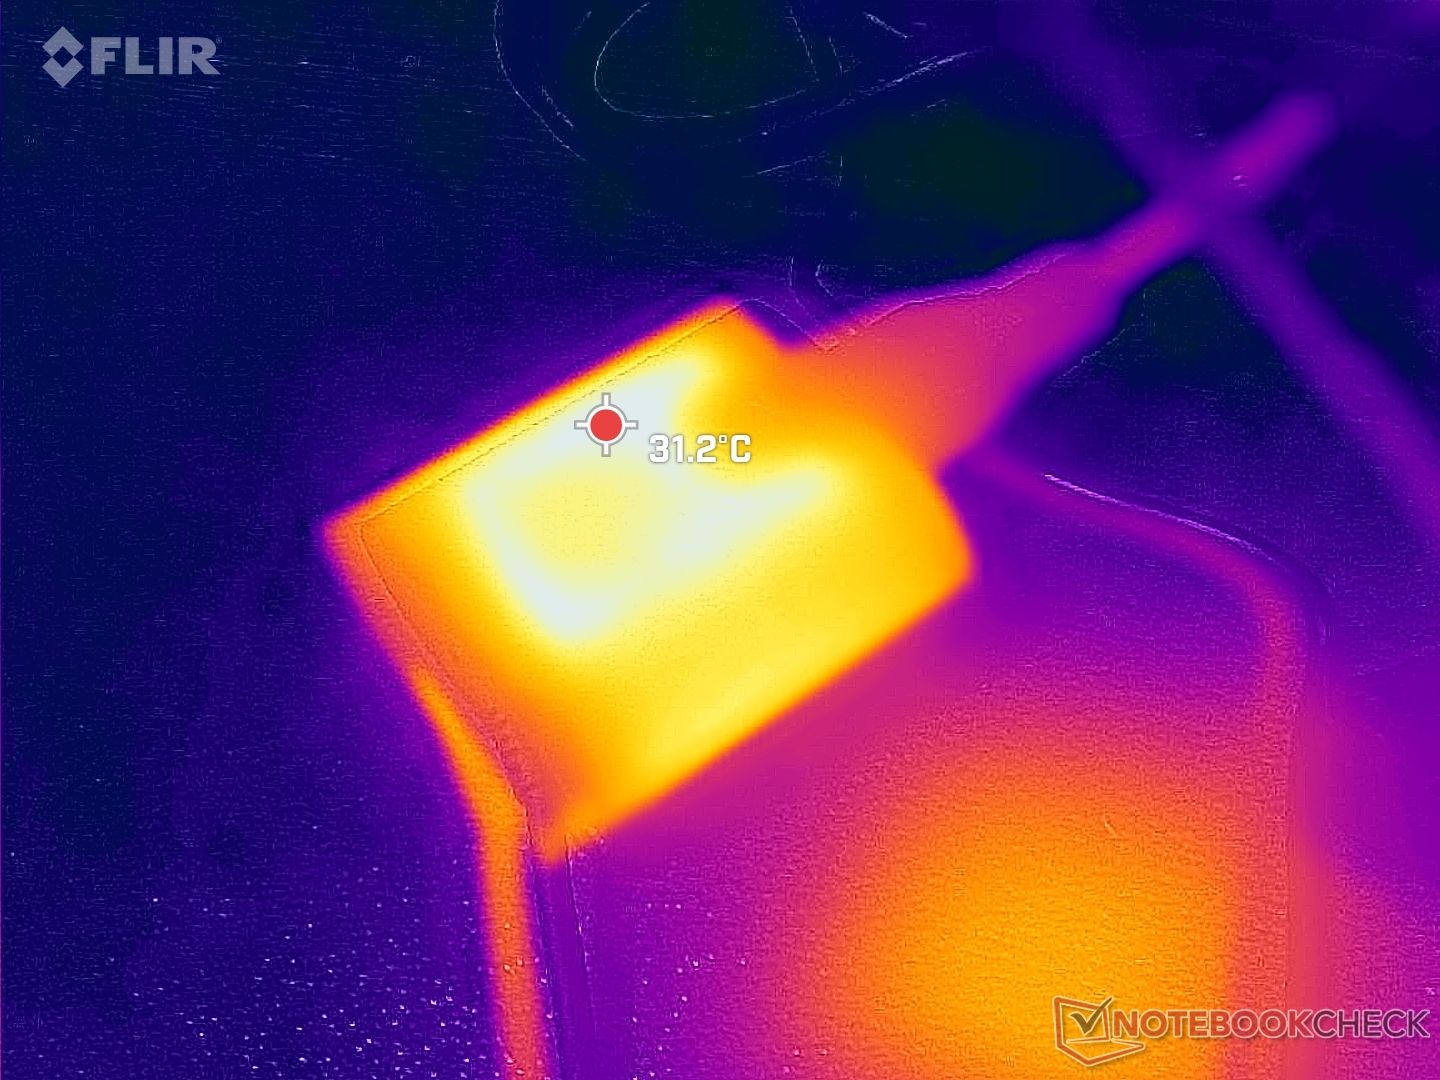
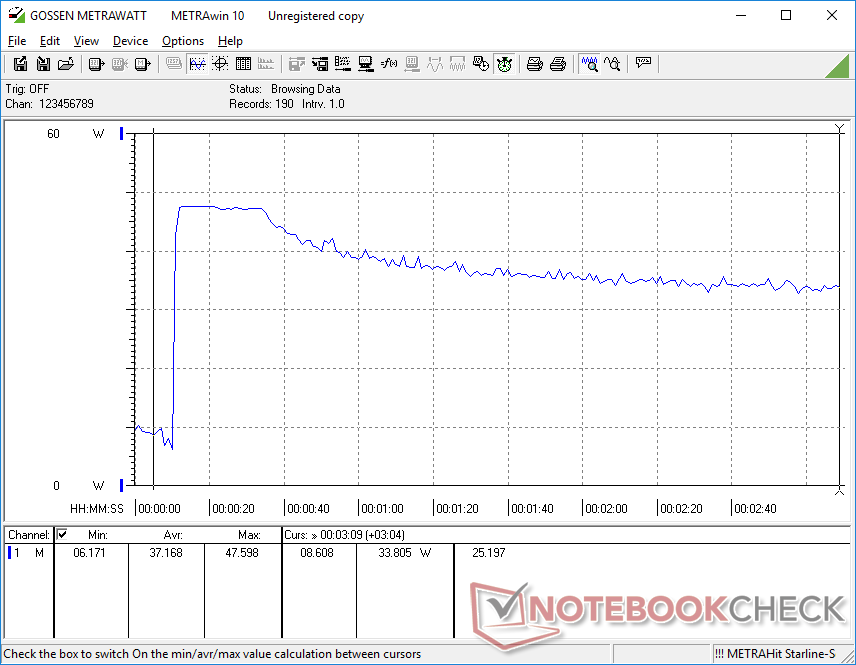
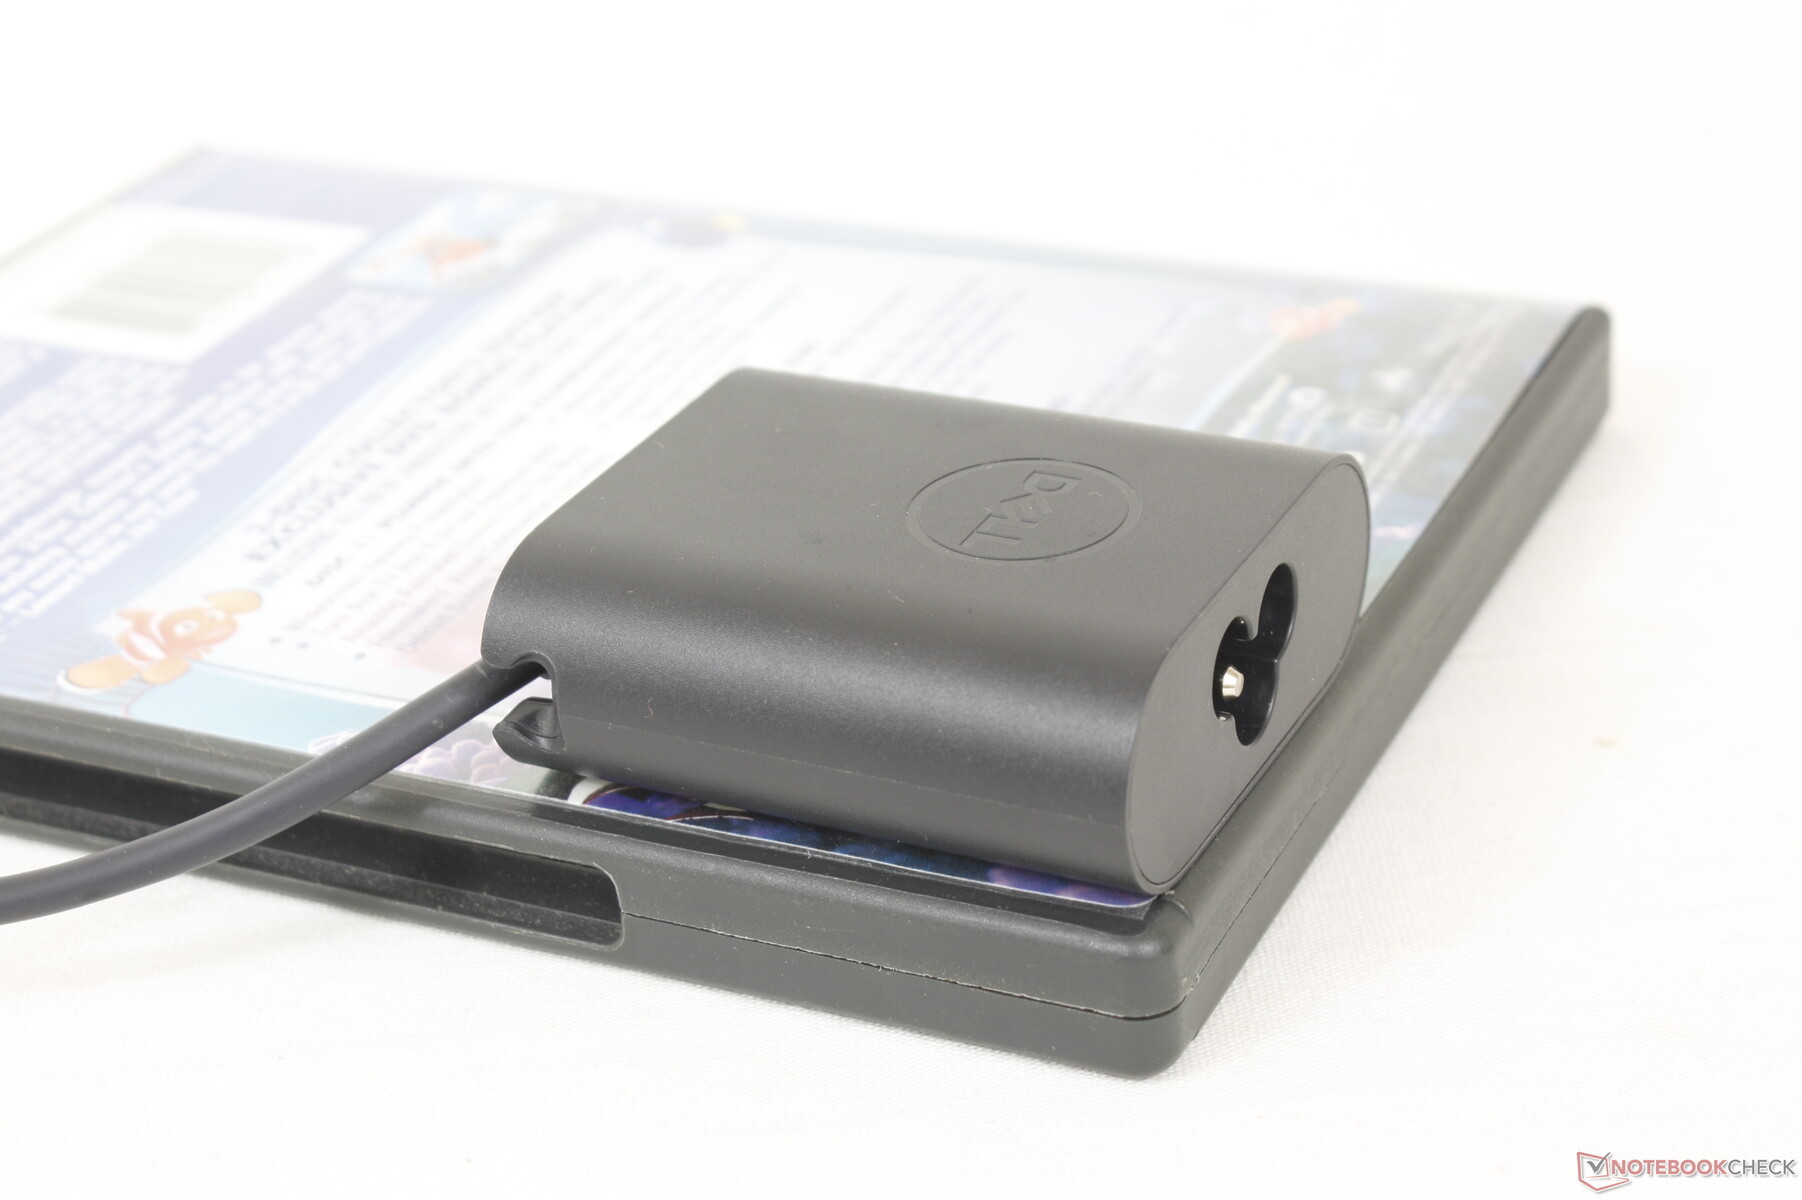
Siamo riusciti a registrare un consumo massimo di 48 W dal piccolo adattatore CA USB-C da 45 W (~6 x 5,5 x 2,2 cm). Questo valore è solo temporaneo, come mostrano i grafici sottostanti, poiché il Turbo Boost della CPU è limitato.

| Off / Standby | |
| Idle | |
| Sotto carico |
|
Leggenda:
min: | |
| Dell XPS 13 9315 2-in-1 Core i5-1230U i5-1230U, Iris Xe G7 80EUs, , IPS, 2880x1920, 13" | Dell XPS 13 Plus 9320 i7-1280P OLED i7-1280P, Iris Xe G7 96EUs, WDC PC SN810 512GB, OLED, 3456x2160, 13.4" | Microsoft Surface Pro 8, i7-1185G7 i7-1185G7, Iris Xe G7 96EUs, Toshiba KBG40ZNS256G NVMe, IPS, 2880x1920, 13" | HP Spectre x360 13.5 14t-ef000 i7-1255U, Iris Xe G7 96EUs, Micron 3400 1TB MTFDKBA1T0TFH, OLED, 3000x2000, 13.5" | Lenovo ThinkBook Plus Gen2 Core i5 i5-1130G7, Iris Xe G7 80EUs, Samsung PM9A1 MZVL2512HCJQ, IPS, E-Ink, 2560x1600, 13.3" | Apple MacBook Air M2 Entry M2, M2 8-Core GPU, Apple SSD AP0256Z, IPS, 2560x1664, 13.6" | |
|---|---|---|---|---|---|---|
| Power Consumption | -46% | -23% | -19% | -5% | 13% | |
| Idle Minimum * (Watt) | 5.2 | 6.5 -25% | 3.9 25% | 4 23% | 5 4% | 1.87 64% |
| Idle Average * (Watt) | 7.9 | 7.8 1% | 8.5 -8% | 4.9 38% | 7.9 -0% | 9.2 -16% |
| Idle Maximum * (Watt) | 8 | 13 -63% | 9.8 -23% | 12.5 -56% | 8.3 -4% | 9.3 -16% |
| Load Average * (Watt) | 31.2 | 56.6 -81% | 48 -54% | 48.1 -54% | 30.9 1% | 28.5 9% |
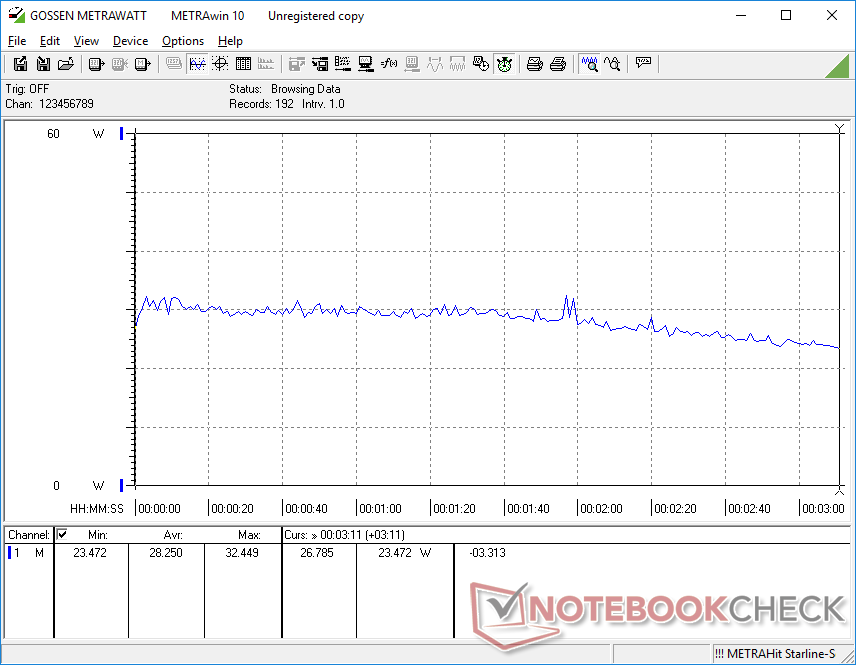
| Witcher 3 ultra * (Watt) | 28.2 | 49.2 -74% | 41.5 -47% | 35.8 -27% | 25.2 11% | 27.4 3% |
| Load Maximum * (Watt) | 47.6 | 63 -32% | 63 -32% | 65.2 -37% | 66.8 -40% | 31 35% |
* ... Meglio usare valori piccoli
Power Consumption Witcher 3 / Stresstest
Power Consumption external Monitor
Durata della batteria
La batteria da 49,5 Wh è solo leggermente più piccola delle batterie da 51,5 Wh e 53 Wh del Surface Pro 8 e del ThinkBook Plus Gen 2, rispettivamente. I tempi di esecuzione sono comunque eccellenti, con quasi 9 ore di utilizzo reale della WLAN rispetto alle circa 8 ore delle alternative Microsoft e Lenovo sopra citate.
La ricarica da vuoto a pieno regime richiede circa 2-2,5 ore.
| Dell XPS 13 9315 2-in-1 Core i5-1230U i5-1230U, Iris Xe G7 80EUs, 49.5 Wh | Dell XPS 13 Plus 9320 i7-1280P OLED i7-1280P, Iris Xe G7 96EUs, 55 Wh | Microsoft Surface Pro 8, i7-1185G7 i7-1185G7, Iris Xe G7 96EUs, 51.5 Wh | HP Spectre x360 13.5 14t-ef000 i7-1255U, Iris Xe G7 96EUs, 66 Wh | Lenovo ThinkBook Plus Gen2 Core i5 i5-1130G7, Iris Xe G7 80EUs, 53 Wh | Apple MacBook Air M2 Entry M2, M2 8-Core GPU, 52.6 Wh | |
|---|---|---|---|---|---|---|
| Autonomia della batteria | -36% | -28% | 16% | -16% | 45% | |
| Reader / Idle (h) | 13.6 | 20.4 50% | ||||
| WiFi v1.3 (h) | 9 | 5.8 -36% | 7.6 -16% | 8 -11% | 7.6 -16% | 15.2 69% |
| Load (h) | 2 | 1.2 -40% | 2.2 10% | 2.4 20% | ||
| H.264 (h) | 10.1 | 16.5 |
Pro
Contro
Verdetto - XPS o Surface Pro?
L'XPS 13 9315 2-in-1 è il miglior concorrente del Microsoft Surface Pro microsoft. Alcuni aspetti sono migliori rispetto al modello Microsoft, mentre altri sono peggiori. In particolare, la base della tastiera staccabile offre tasti più solidi, un clickpad più grande e una migliore protezione dai graffi. Il tablet è anche più sottile e leggero del Surface Pro 8, senza dover ridurre drasticamente le prestazioni del processore. Infatti, il Core i5-1230U del Dell ha prestazioni simili a quelle del Core i7-1185G7 del Surface Pro 8, nonostante il design senza ventole del Dell. Il produttore promette anche SKU eSIM 5G nel prossimo futuro, mentre al momento non esistono opzioni di questo tipo per il Surface Pro
Ci sono comunque una manciata di motivi per prendere in considerazione il modello Microsoft invece del Dell. Ad esempio, il Surface Pro 8 integra un jack audio da 3,5 mm che alcuni utenti potrebbero apprezzare. Anche le prestazioni grafiche sono nettamente superiori, dato che la GPU del Dell tende a non essere all'altezza di altri portatili con grafica integrata simile. La mancanza di opzioni di visualizzazione a 120 Hz è forse la più evidente, in quanto rende il tablet Dell più goffo e meno reattivo. La limitazione a 60 Hz non era un grosso problema in passato, ma sta diventando sempre più un handicap ora che i laptop, i monitor e gli smartphone ad alta frequenza di aggiornamento sono di uso comune
Un Surface Pro senza il nome Surface Pro. L'XPS 13 9315 2-in-1 supera la Type Cover del Microsoft Surface Pro in termini di comfort, ma il touchscreen a 60 Hz sembra datato rispetto a quello del Surface Pro 8 a 120 Hz.
Se si intende scrivere molto e inviare e-mail, l'XPS 13 9315 2-in-1 potrebbe essere l'opzione migliore per la sua tastiera dock superiore. Se invece si intende utilizzare più spesso il touchscreen in modalità tablet, è difficile rinunciare alla frequenza di aggiornamento e alla reattività del display del Surface Pro. Se Dell è in grado di offrire ulteriori opzioni di visualizzazione in futuro, allora la serie XPS 13 9315 2-in-1 può essere consigliata molto più facilmente per un maggior numero di scenari di utilizzo.
Prezzo e disponibilità
L'XPS 13 9315 2-in-1 sarà disponibile dal 14 novembre. Rivenditori come Amazon stanno già elencando alcune SKU per il pre-ordine. Il posto migliore per ordinare al momento è Dell, dove i prezzi di partono da 1.000 dollari USA senza tastiera dock o penna.
Dell XPS 13 9315 2-in-1 Core i5-1230U
- 11/08/2022 v7 (old)
Allen Ngo
Price comparison

