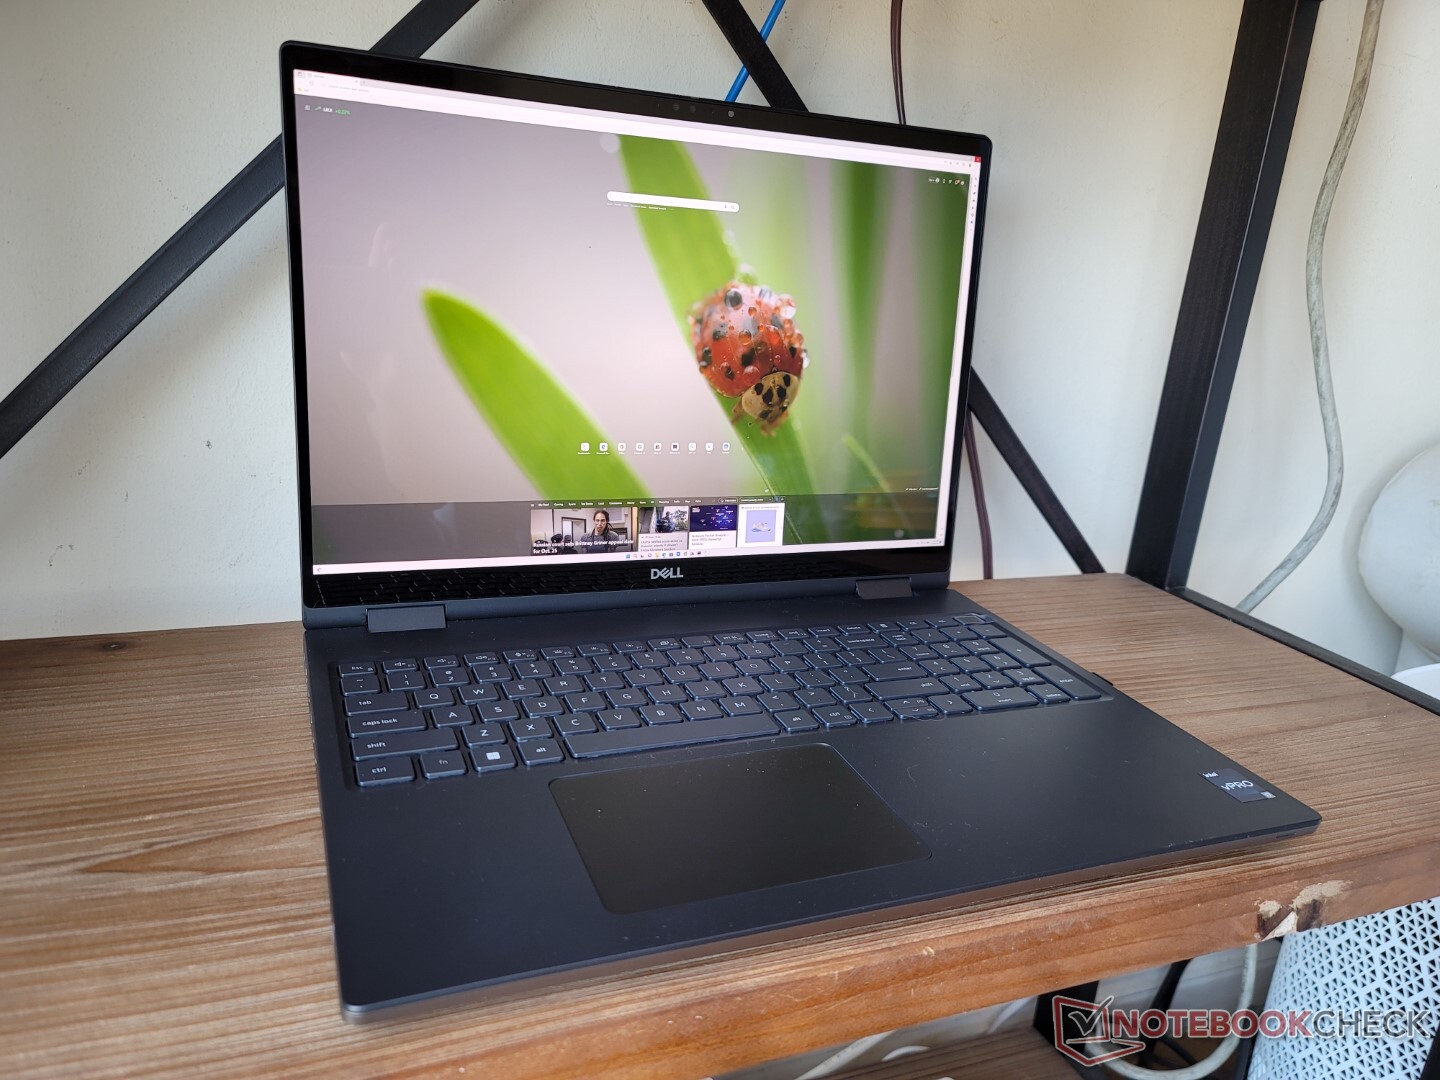
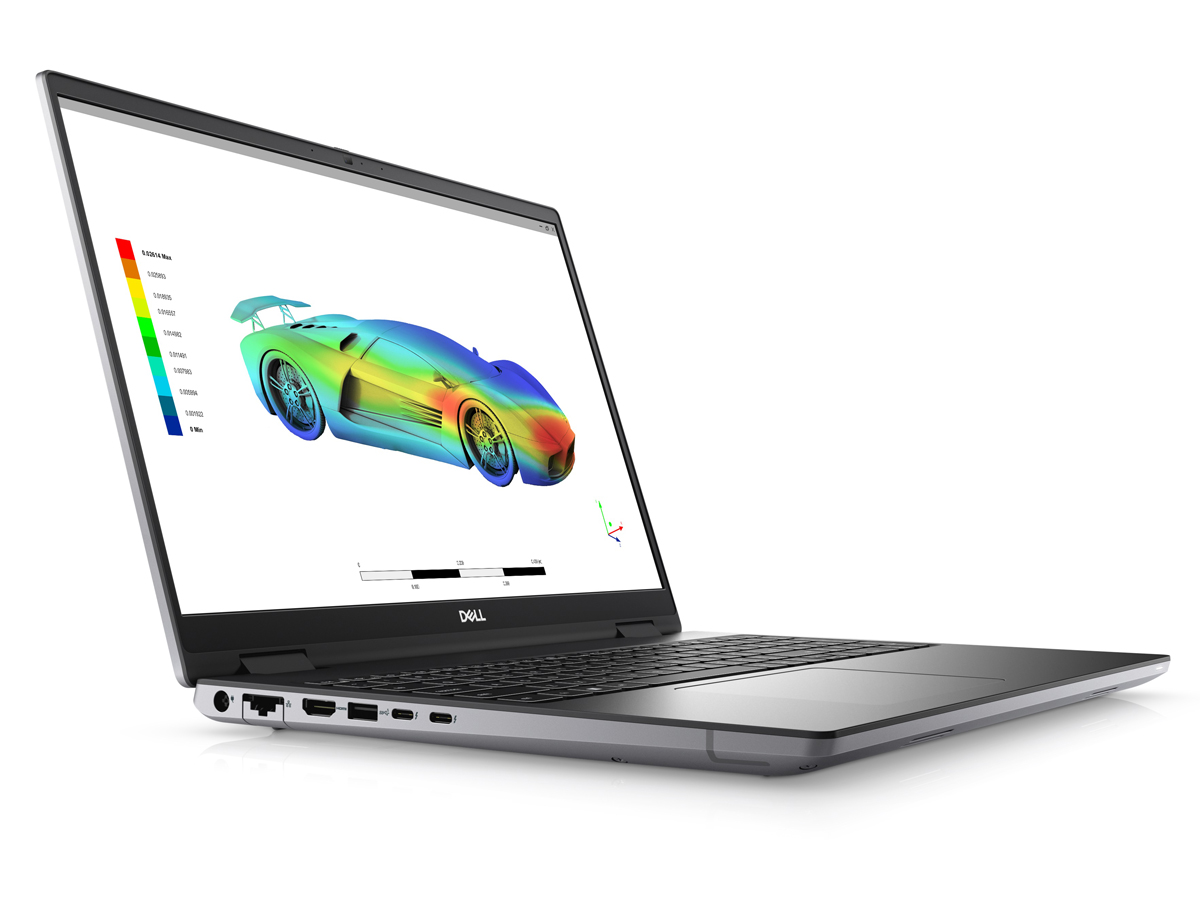
Recensione della workstation Dell Precision 7670: Debutto del Core i7-12850HX e della RAM CAMM

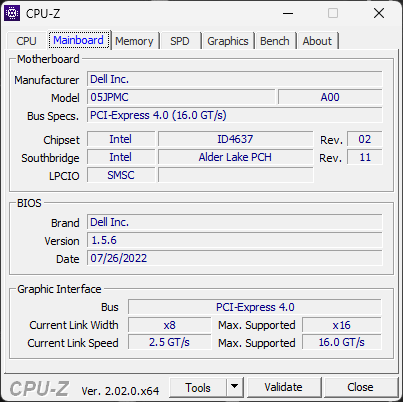
La serie Precision 7000 ospita le workstation mobili di punta di Dell, a differenza della serie Precision 5000 di fascia media e della serie Precision 3000 economica. Precision 7670 è il primo modello da 16 pollici della famiglia e si colloca tra Precision 7560 da 15,6 pollici e Precision 7760 da 17,3 pollici. Confusamente, Dell produce due varianti del Precision 7670 chiamate "Performance base" e "Thin base". Questa recensione è dedicata alla variante "Thin base", mentre la recensione del modello "Performance base" verrà pubblicata in un secondo momento.
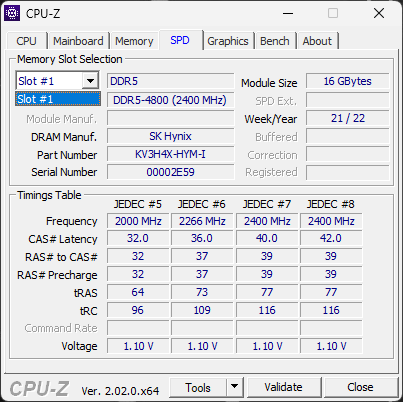
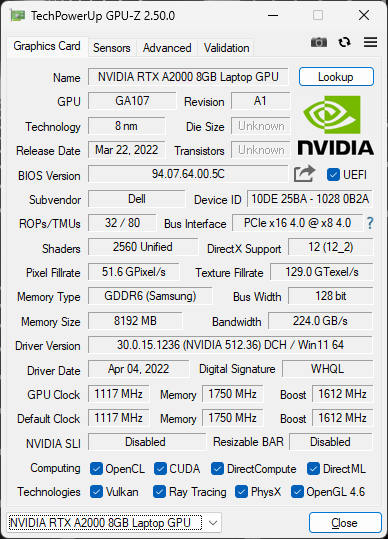
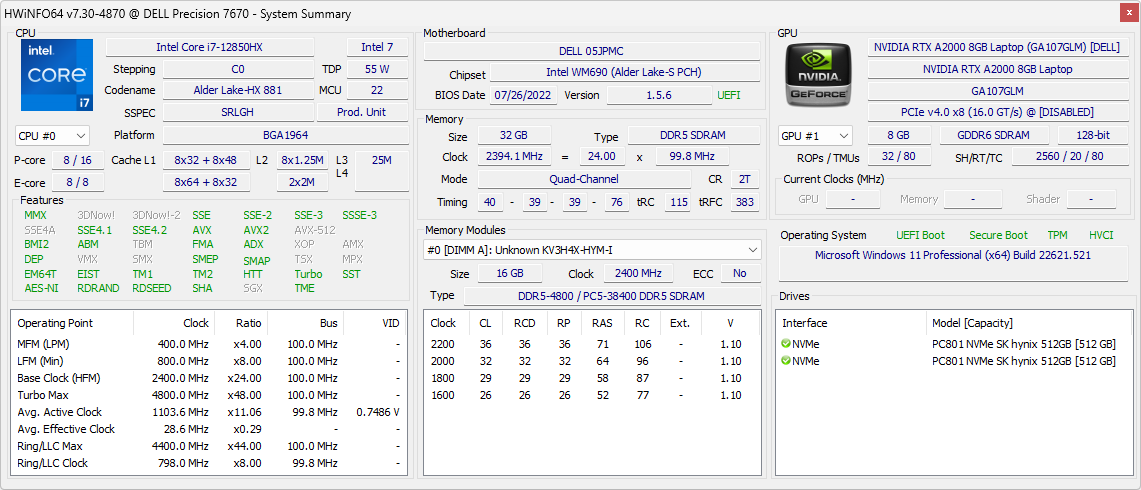
Le opzioni sono molto ampie e vanno dal Core i5-12600HX all'i9-12950HX, la grafica Iris Xe fino alla discreta Nvidia RTX A5500, il display FHD IPS fino al 4K OLED e anche la RAM SODIMM o CAMM fino a 128 GB. La nostra specifica unità di recensione è una configurazione di fascia media con i7-12850HX, RTX A2000 da 95 W e schermo touchscreen OLED 4K, al prezzo di circa 4100 dollari.
Purtroppo al momento non ci sono opzioni di RAM Xeon o ECC per Precision 7670, ma vPro è supportato su tutte le SKU.
Al momento ci sono pochi concorrenti diretti, dato che il settore delle workstation da 16 pollici è ancora relativamente nuovo. Le alternative attuali includono il Asus ProArt StudioBook Pro 16, Lenovo ThinkPad P1 G4e lo ZBook Fury 16 di HP.
Altre recensioni Dell:
Potenziali concorrenti a confronto
Punteggio | Data | Modello | Peso | Altezza | Dimensione | Risoluzione | Prezzo |
|---|---|---|---|---|---|---|---|
| 88.4 % v7 (old) | 10/2022 | Dell Precision 7670 i7-12850HX, RTX A2000 Laptop GPU | 2.7 kg | 24.7 mm | 16.00" | 3840x2400 | |
| 89.3 % v7 (old) | Lenovo ThinkPad P1 G4-20Y4Z9DVUS i7-11800H, T1200 Laptop GPU | 1.8 kg | 17.7 mm | 16.00" | 2560x1600 | ||
v (old) | 12/2021 | Asus ProArt StudioBook 16 W7600H5A-2BL2 W-11955M, RTX A5000 Laptop GPU | 2.4 kg | 21.4 mm | 16.00" | 3840x2400 | |
| 88.3 % v7 (old) | 10/2021 | Dell Precision 5000 5560 i7-11850H, RTX A2000 Laptop GPU | 2 kg | 18 mm | 15.60" | 3840x2400 | |
| 87.8 % v7 (old) | 09/2020 | Dell Precision 7550 W-10885M, Quadro RTX 5000 Max-Q | 2.8 kg | 27.36 mm | 15.60" | 3840x2160 | |
| 90.3 % v7 (old) | 10/2021 | HP ZBook Fury 15 G8 i9-11950H, RTX A5000 Laptop GPU | 2.5 kg | 25.9 mm | 15.60" | 3840x2160 |
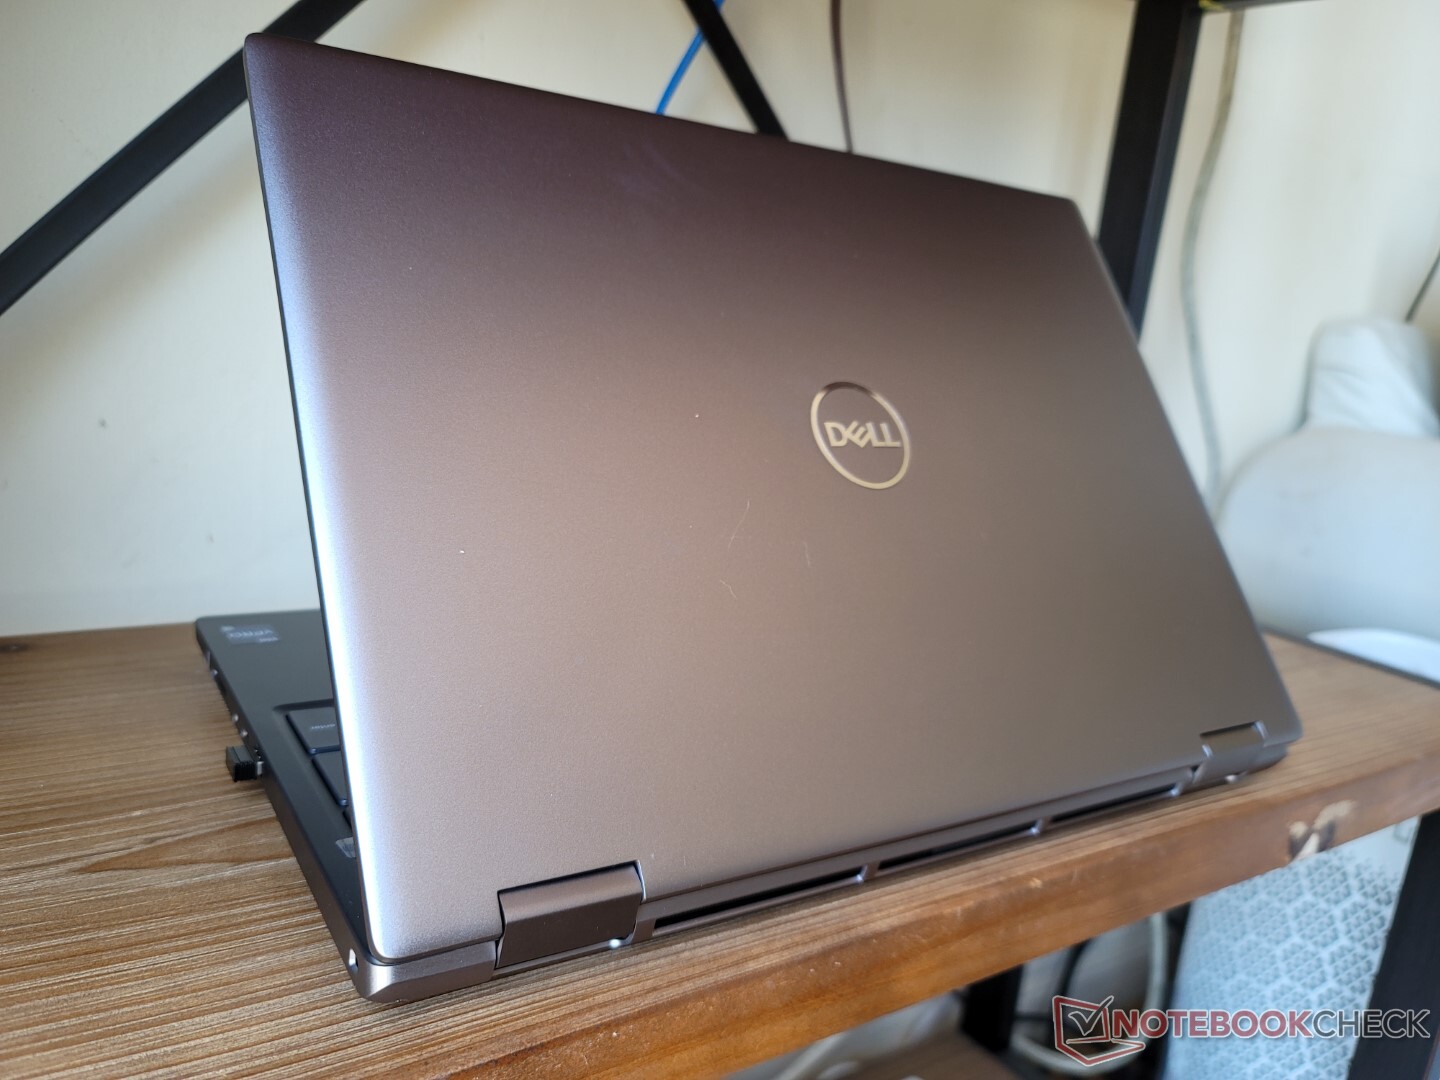
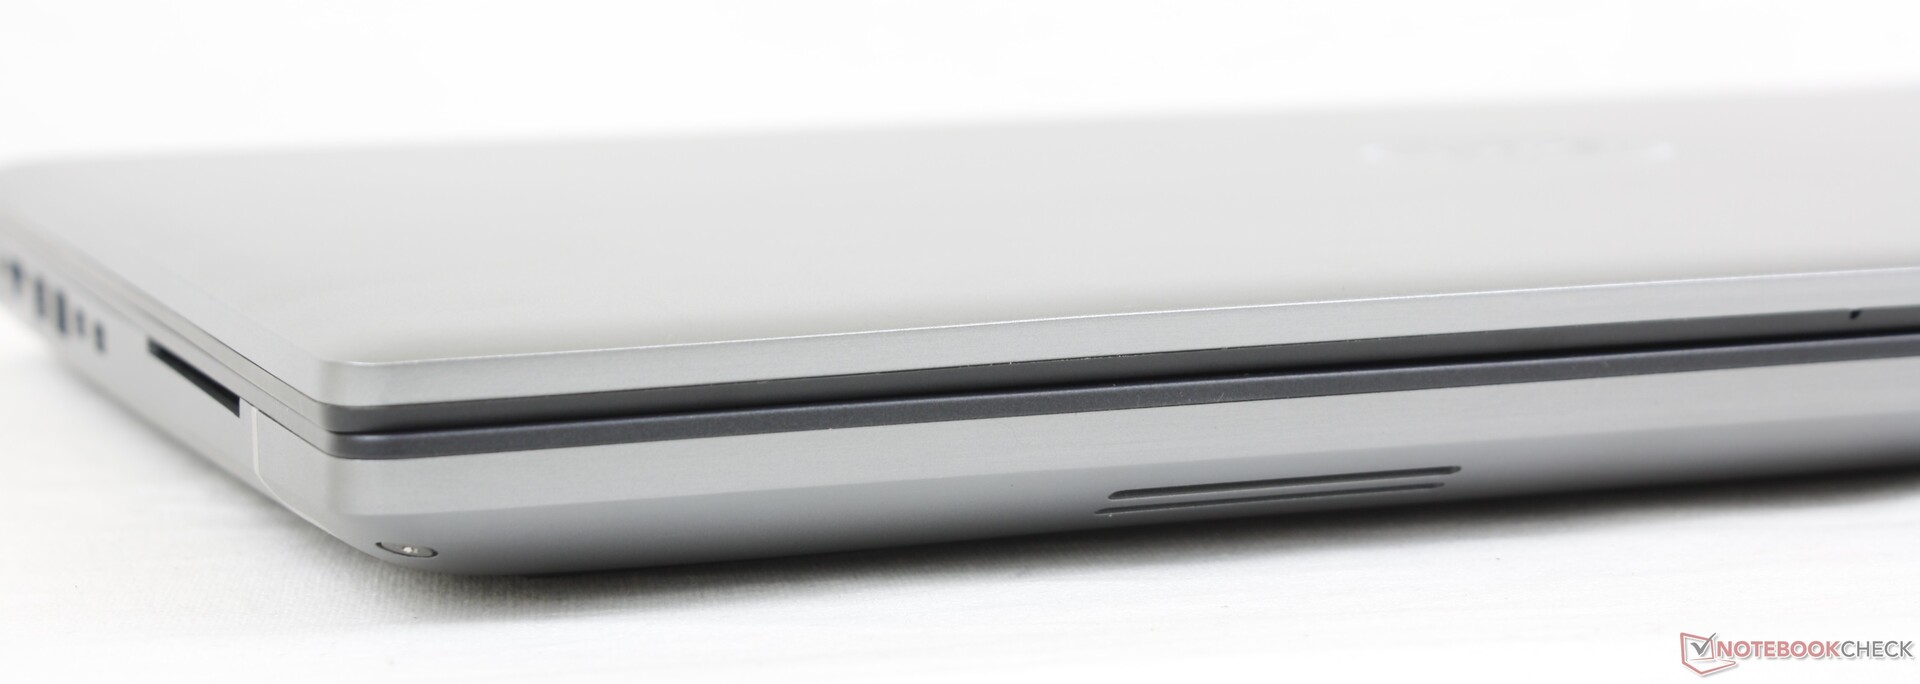
Custodia - Look and Feel classico Precision
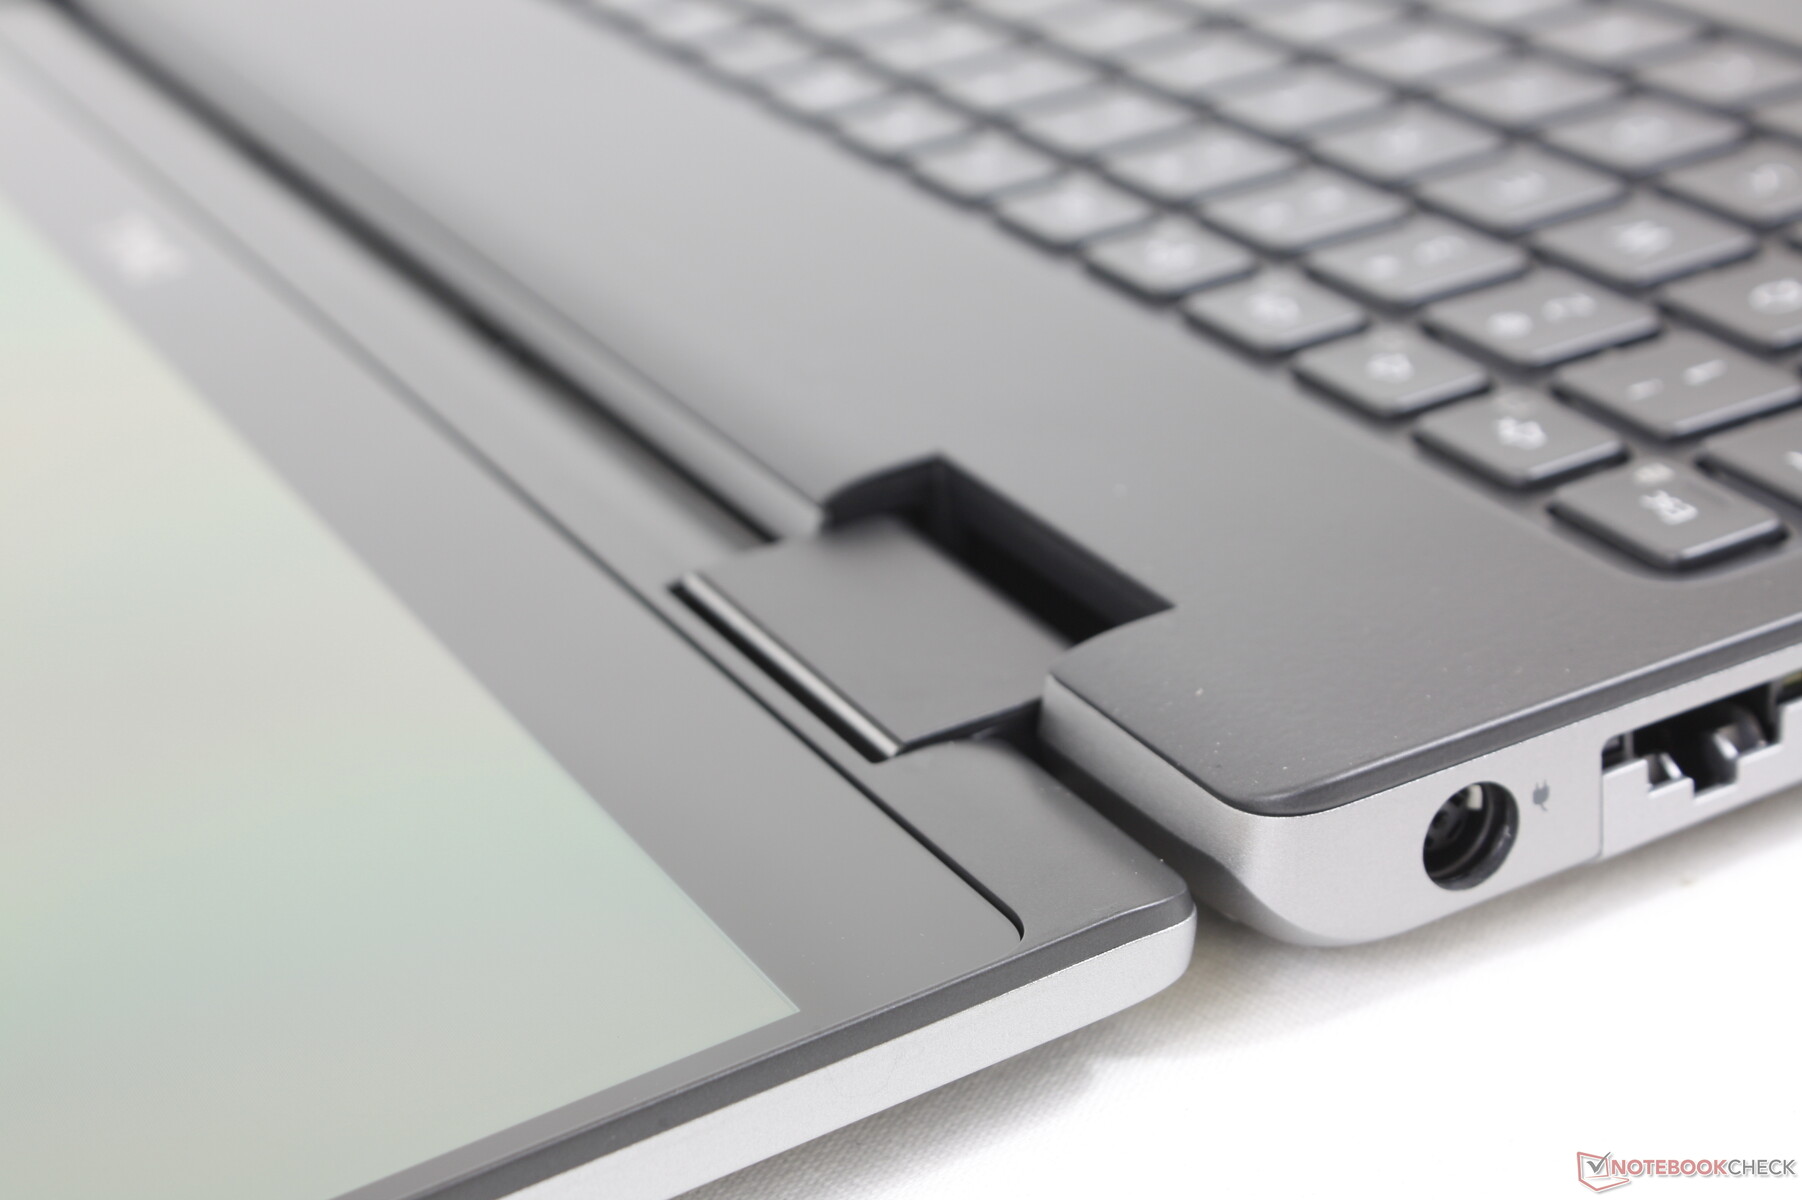
Il design e i materiali del telaio sono molto simili a quelli del modello 2020 Precision 7550. Il piano della tastiera nera, ad esempio, è ancora leggermente gommato per una sensazione di qualità superiore, mentre lo scheletro esterno in metallo rimane spesso per una prima impressione più forte rispetto al ThinkPad P1 G1 ThinkPad P1 G4 o Asus ProArt StudioBook. Se si esercita una pressione sulla parte centrale della tastiera o sul coperchio esterno, le loro superfici si deformano leggermente di più rispetto a quelle di uno HP ZBook Studioma per il resto non notiamo scricchiolii o grandi punti deboli.
Il Precision 7670 è ancora relativamente grande e pesante, nonostante la nostra unità di prova sia la versione "Thin base". Con uno spessore di 24,7 mm, il sistema è più spesso dell'Asus ProArt StudioBook 16 e appena più sottile dell'HP ZBook Fury 15 G8. È anche molto più pesante di diverse centinaia di grammi, in parte a causa del fattore di forma 16:10 da 16 pollici.
La "base Performance" è più spessa di circa 3 mm e più pesante di almeno 70 g rispetto alla "base Thin", a seconda della configurazione.
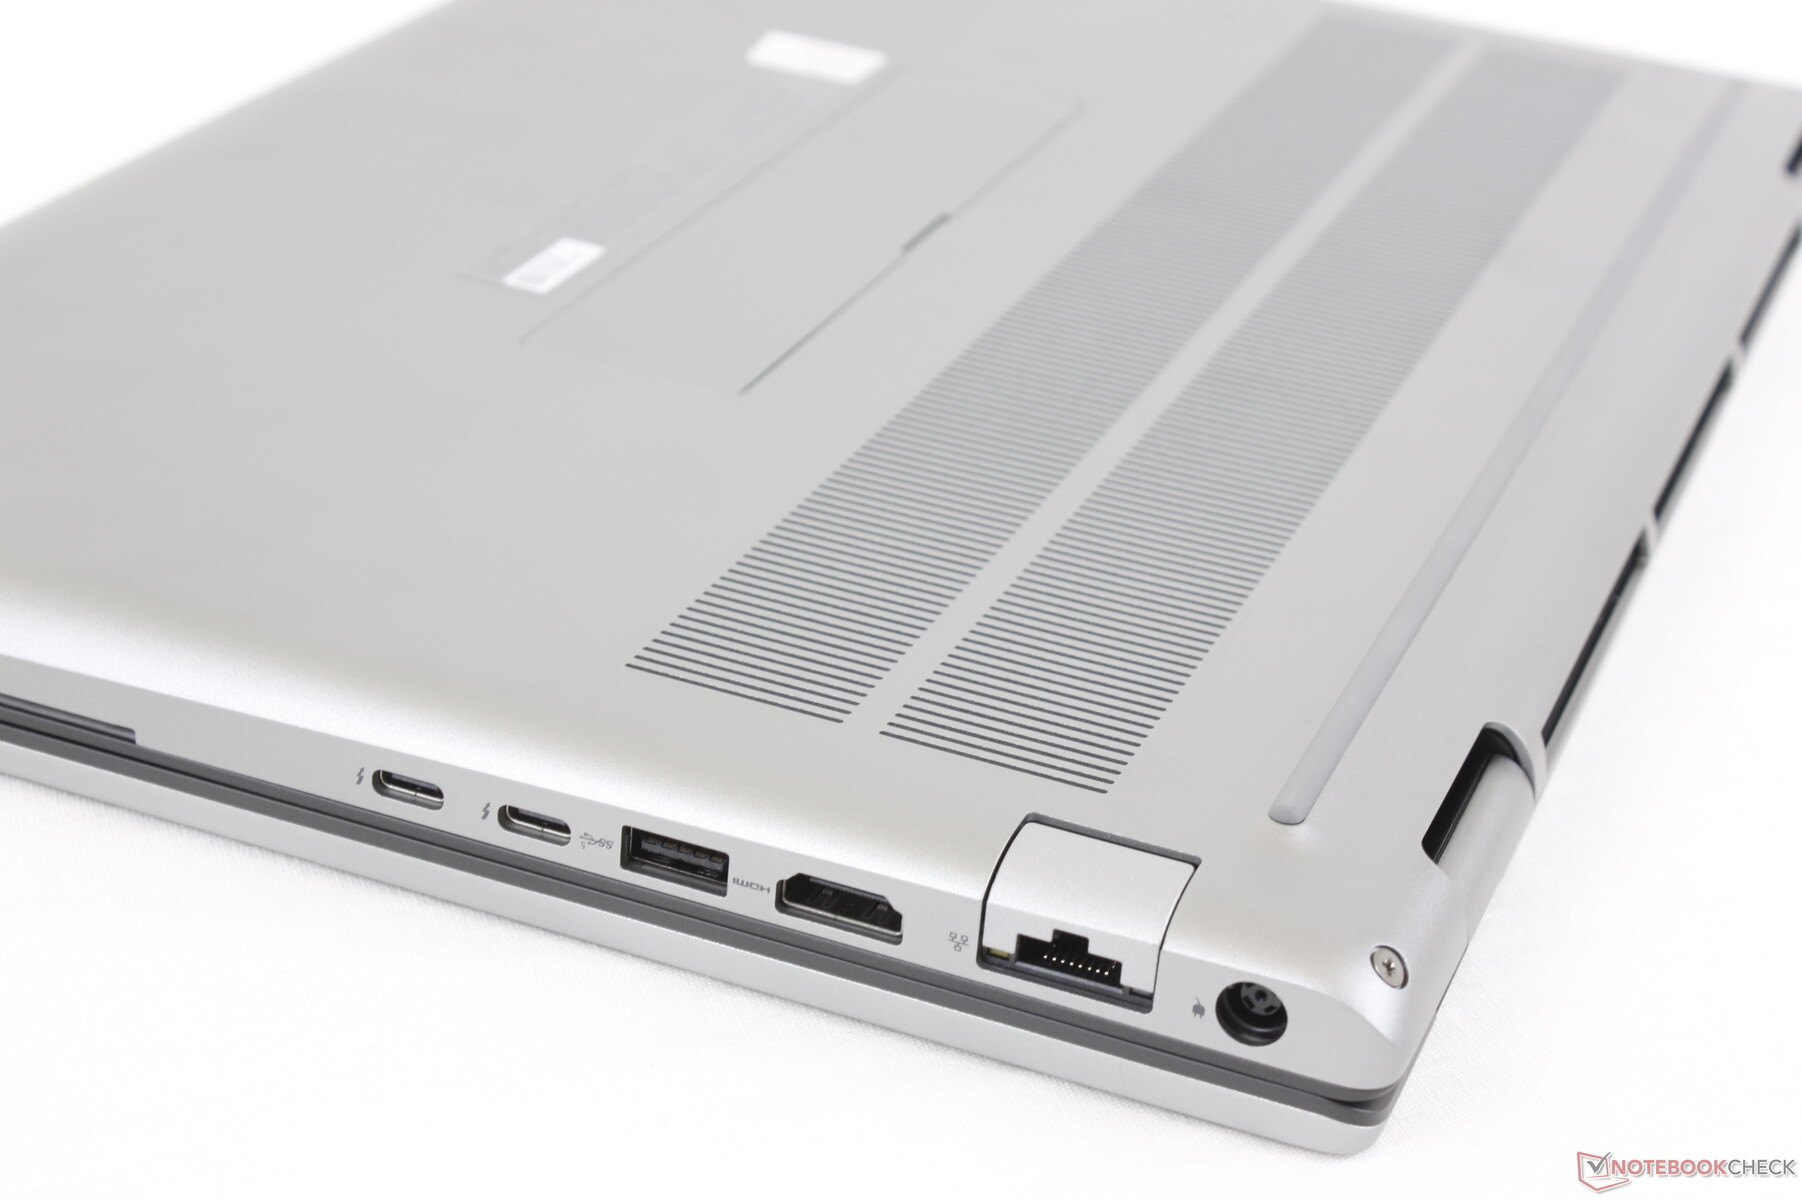
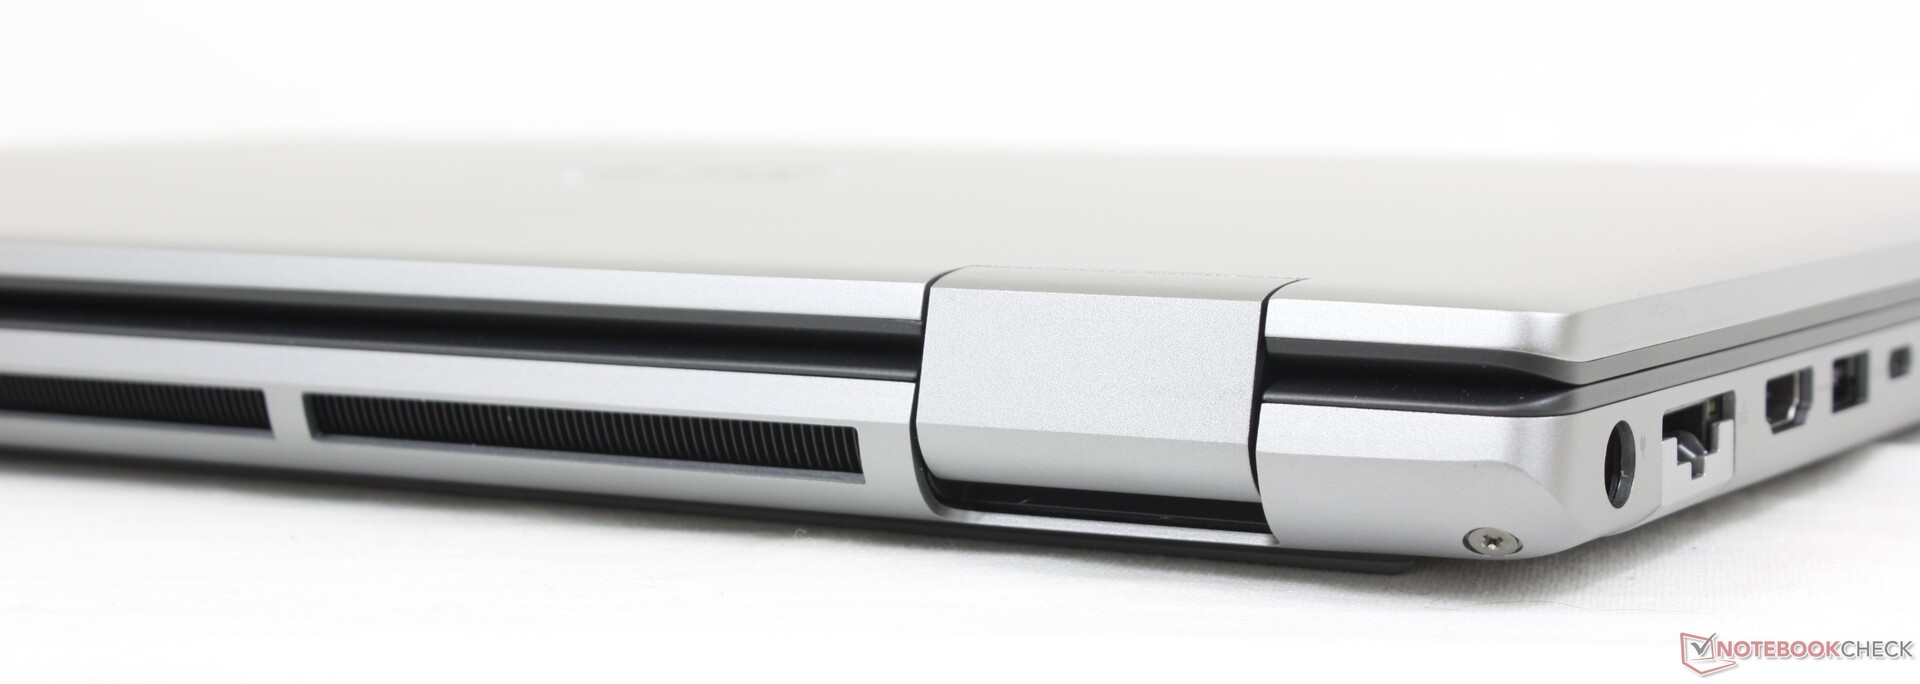
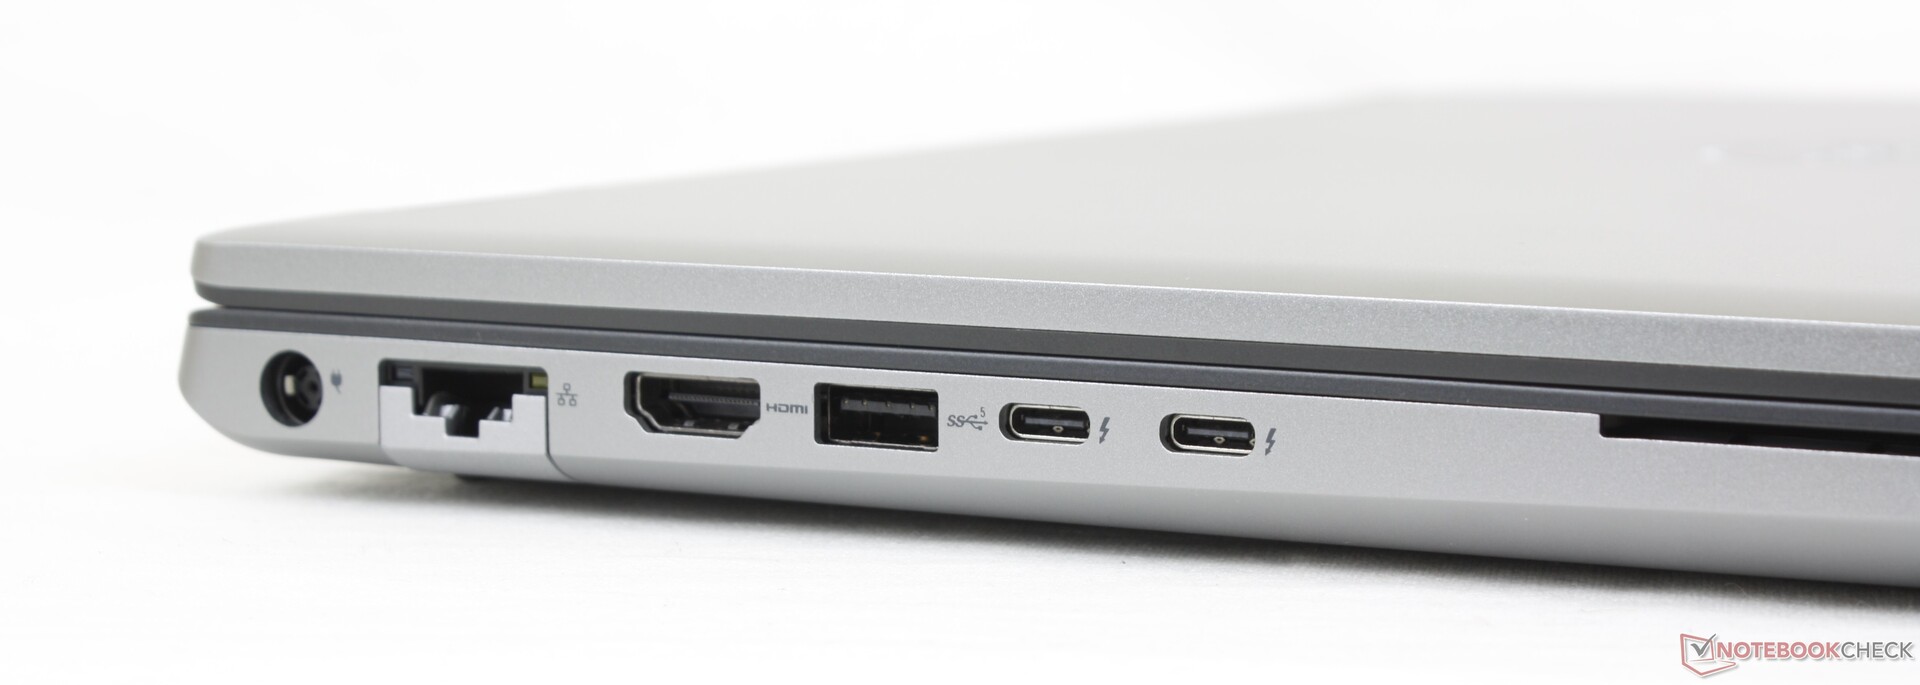
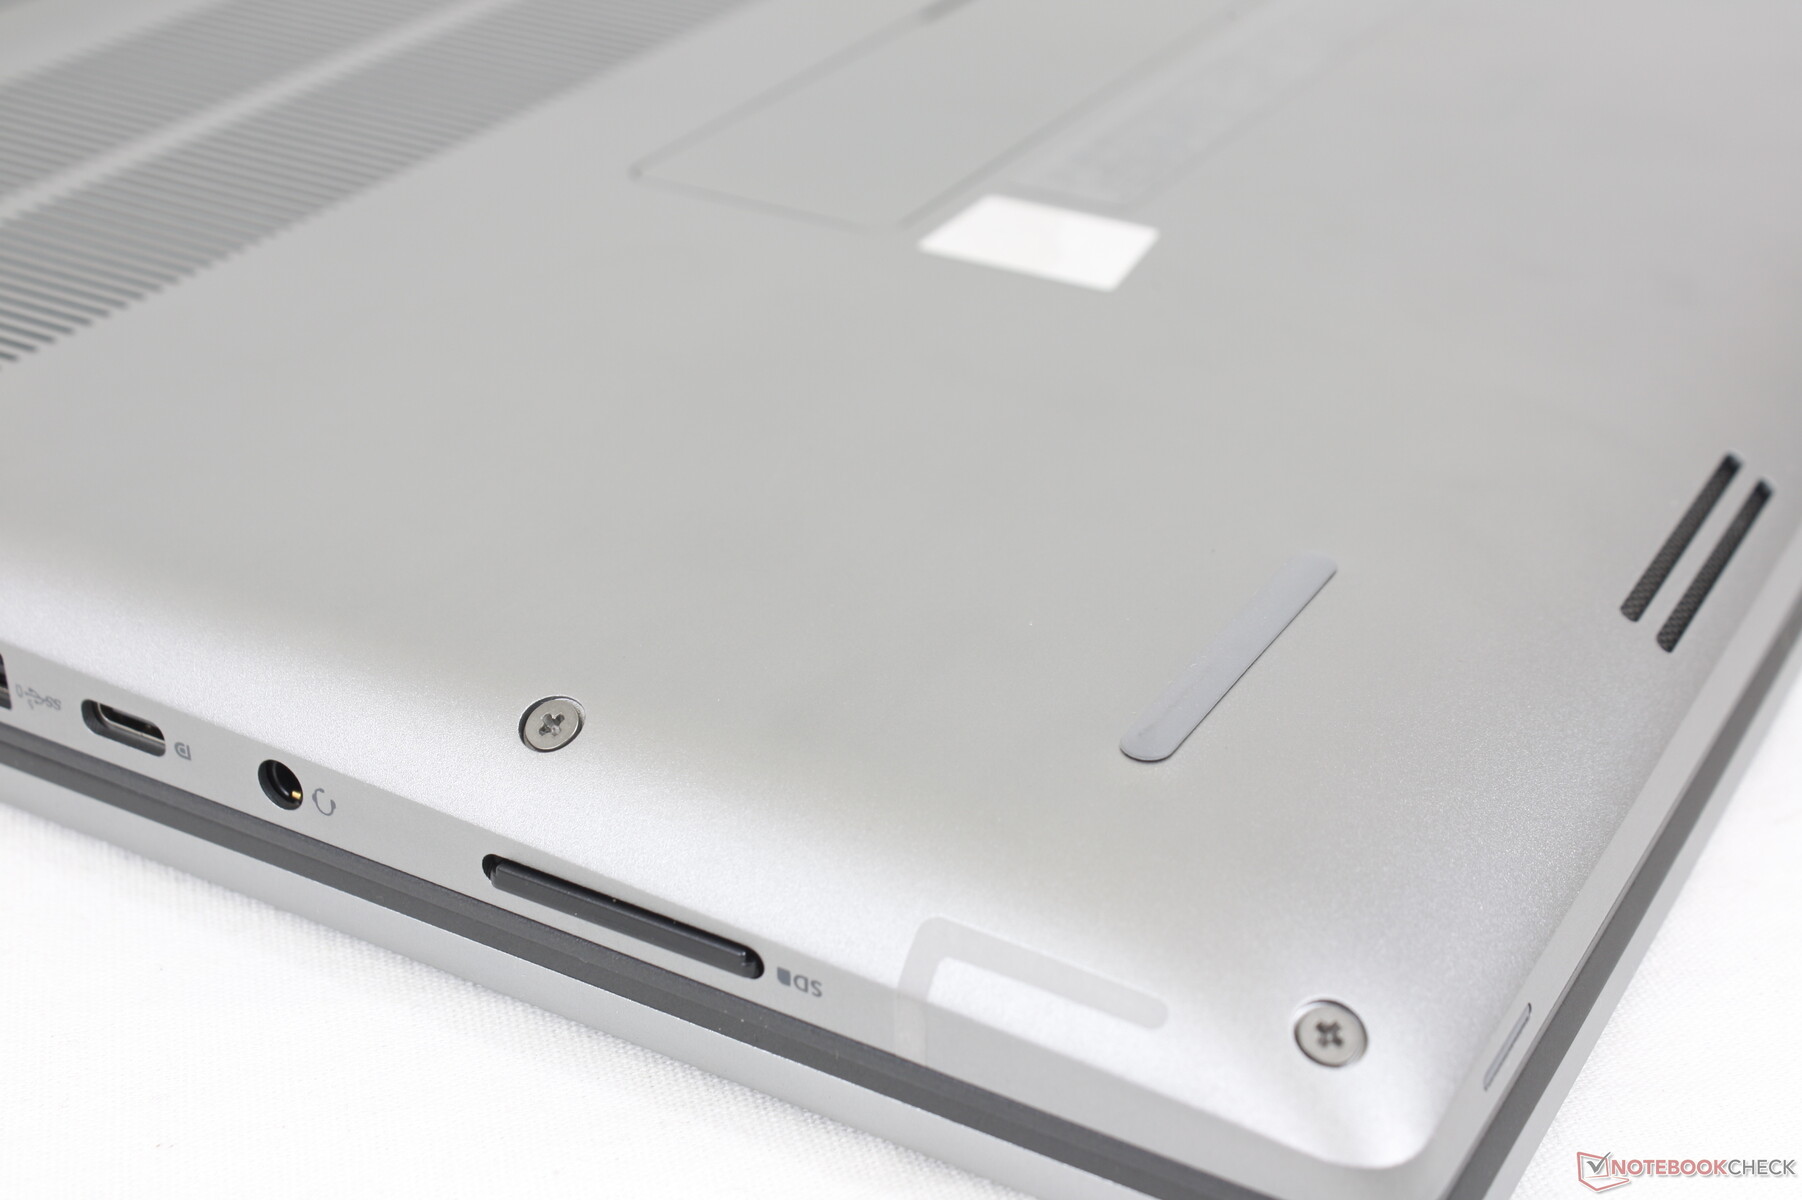
Connettività - Thunderbolt 4 ma senza PD-In
Le opzioni per le porte sono eccellenti, soprattutto perché ci sono più porte USB rispetto alla maggior parte delle altre workstation. Molte porte si trovano lungo il bordo sinistro, mentre quelle sul bordo destro sono piuttosto vicine alla parte anteriore. Si noti che la porta RJ-45 supporta solo velocità fino a 1 Gbps anziché 10 Gbps.
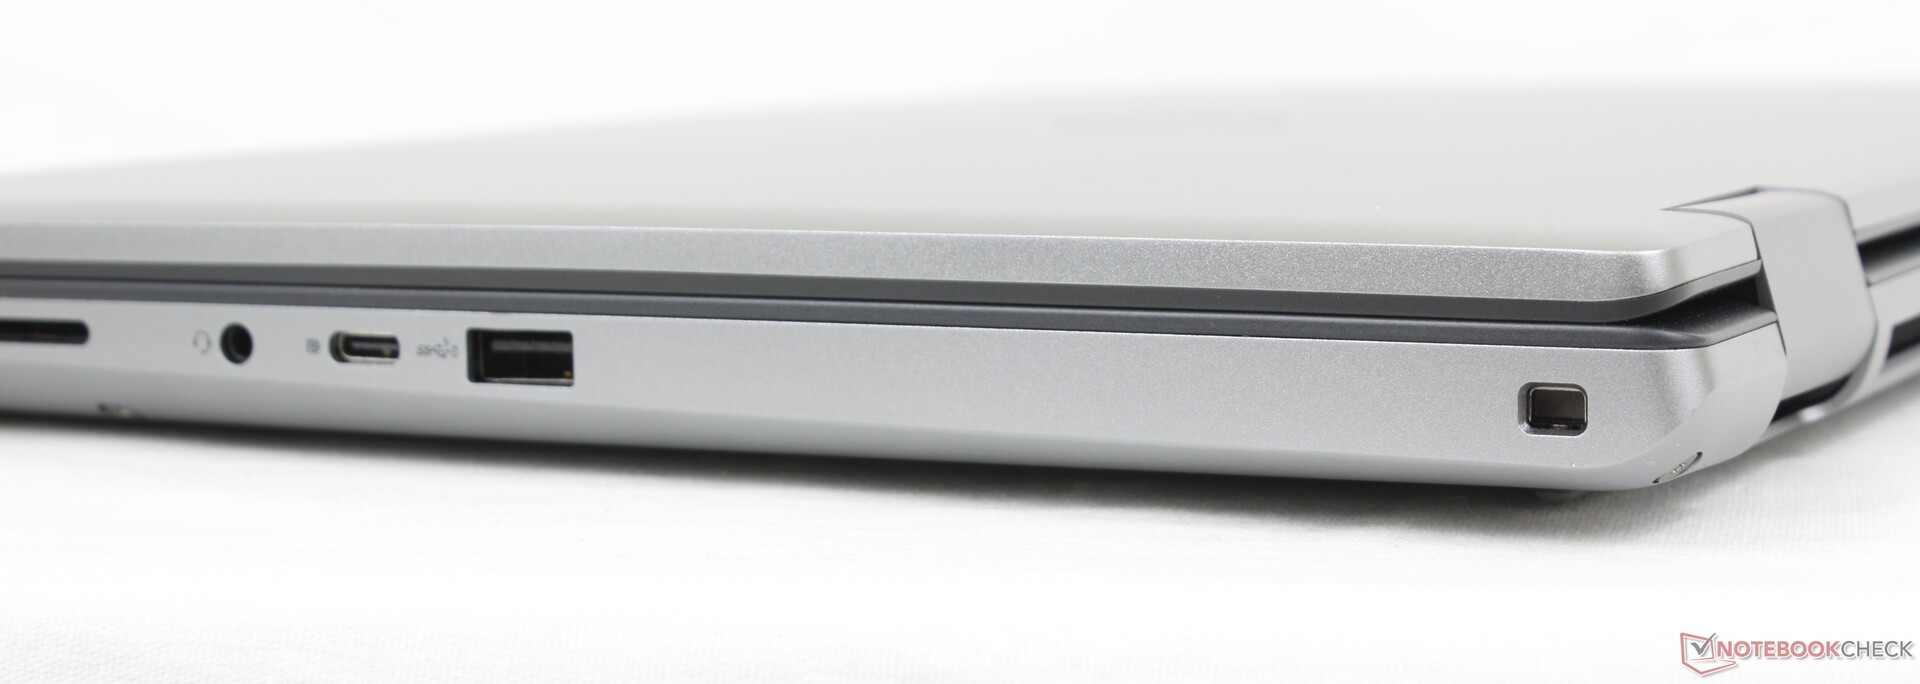
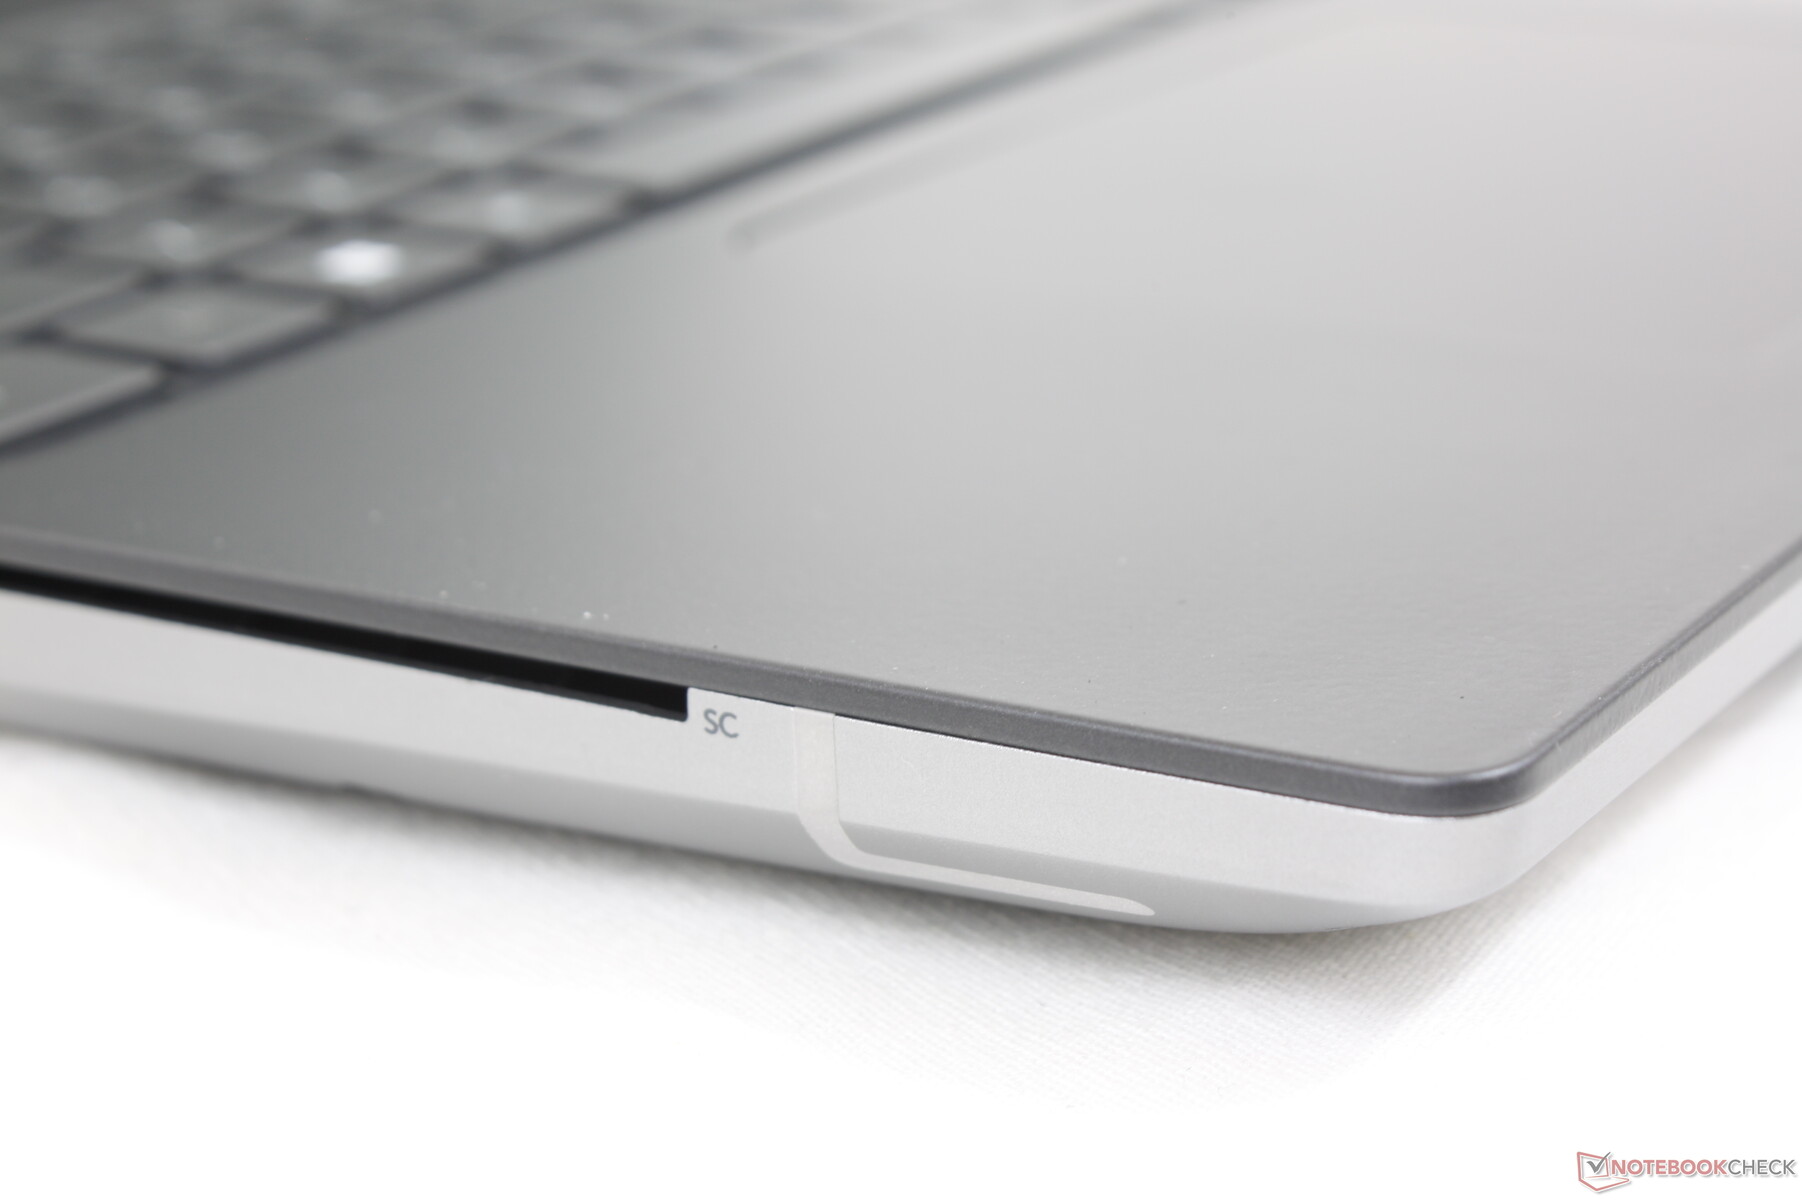
Lettore di schede SD
La velocità di trasferimento con il lettore SD a molla è pari a quella di Precision 7550 o due volte superiore a quella di ZBook Fury G8 HP ZBook Fury G8. Lo spostamento di 1 GB di immagini dalla nostra scheda UHS-II al desktop richiede solo 5-6 secondi.
| SD Card Reader | |
| average JPG Copy Test (av. of 3 runs) | |
| Lenovo ThinkPad P1 G4-20Y4Z9DVUS (Angelbird AV Pro V60) | |
| Dell Precision 5000 5560 (AV Pro V60) | |
| Dell Precision 7670 (Toshiba Exceria Pro SDXC 64 GB UHS-II) | |
| Dell Precision 7550 (Toshiba Exceria Pro SDXC 64 GB UHS-II) | |
| HP ZBook Fury 15 G8 (AV Pro V60) | |
| Asus ProArt StudioBook 16 W7600H5A-2BL2 (AV Pro SD microSD 128 GB V60) | |
| maximum AS SSD Seq Read Test (1GB) | |
| Dell Precision 5000 5560 (AV Pro V60) | |
| Dell Precision 7550 (Toshiba Exceria Pro SDXC 64 GB UHS-II) | |
| Dell Precision 7670 (Toshiba Exceria Pro SDXC 64 GB UHS-II) | |
| Lenovo ThinkPad P1 G4-20Y4Z9DVUS (Angelbird AV Pro V60) | |
| HP ZBook Fury 15 G8 (AV Pro V60) | |
| Asus ProArt StudioBook 16 W7600H5A-2BL2 (AV Pro SD microSD 128 GB V60) | |
Comunicazione
Un Intel AX211 è fornito di serie per la connettività Wi-Fi 6E e Bluetooth opzionale. Purtroppo, il Wi-Fi 6E non è necessariamente più veloce del Wi-Fi 6 in molte situazioni. La velocità di trasferimento sembra variare molto di più sul nostro Precision 7670 rispetto alla maggior parte delle altre workstation, anche a soli uno o due metri di distanza dal nostro punto di accesso a 6 GHz.
| Networking | |
| iperf3 transmit AX12 | |
| Lenovo ThinkPad P1 G4-20Y4Z9DVUS | |
| HP ZBook Fury 15 G8 | |
| Dell Precision 7550 | |
| Dell Precision 5000 5560 | |
| Asus ProArt StudioBook 16 W7600H5A-2BL2 | |
| iperf3 receive AX12 | |
| Dell Precision 5000 5560 | |
| Lenovo ThinkPad P1 G4-20Y4Z9DVUS | |
| Dell Precision 7550 | |
| HP ZBook Fury 15 G8 | |
| Asus ProArt StudioBook 16 W7600H5A-2BL2 | |
| iperf3 receive AXE11000 6GHz | |
| Dell Precision 7670 | |
| iperf3 transmit AXE11000 6GHz | |
| Dell Precision 7670 | |
Webcam
La webcam da 2 MP rappresenta un miglioramento rispetto alle webcam da 1 MP presenti sulla maggior parte dei sistemi XPS. Tuttavia, non è ancora all'altezza delle fotocamere da 5 MP presenti sulla maggior parte dei più recenti computer portatili HP
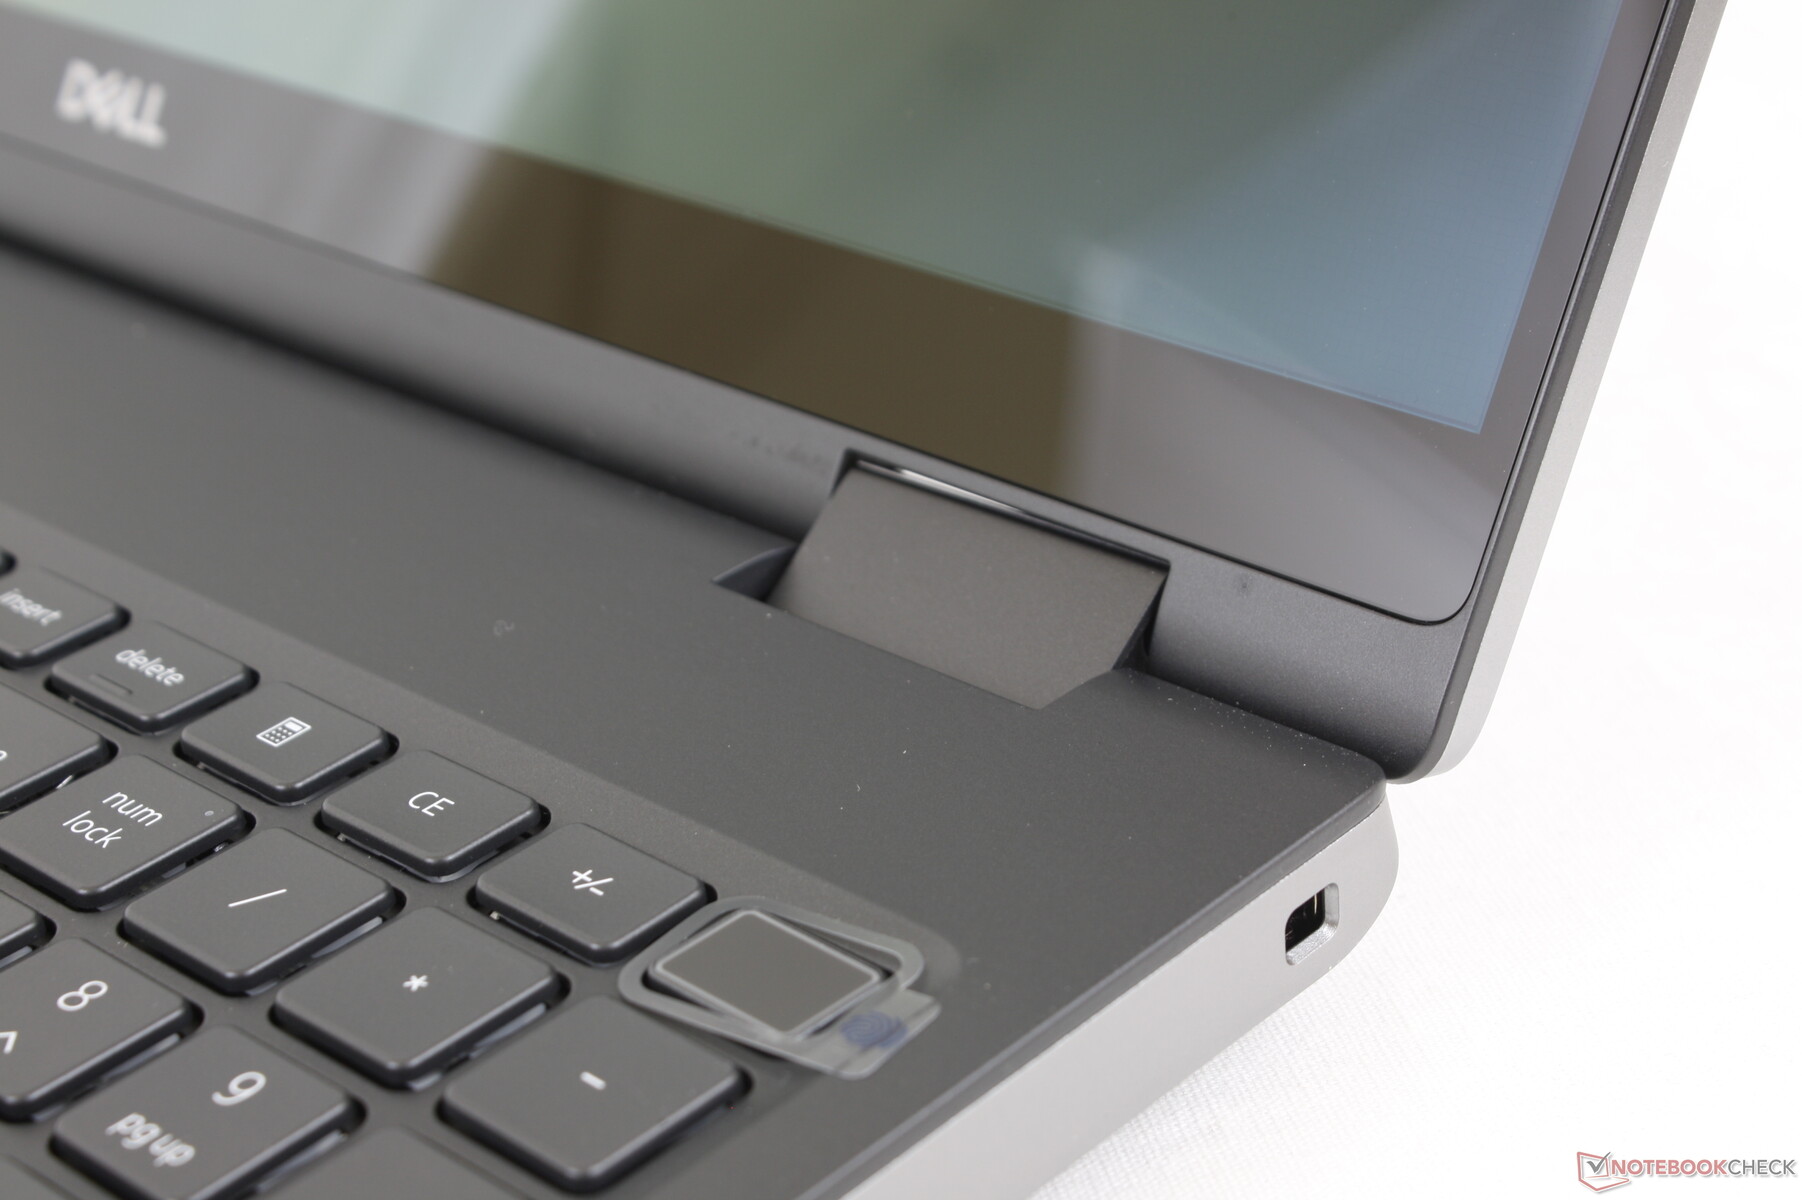
Sono inclusi sia l'IR che l'otturatore, rispettivamente per il supporto di Windows Hello e per la privacy.


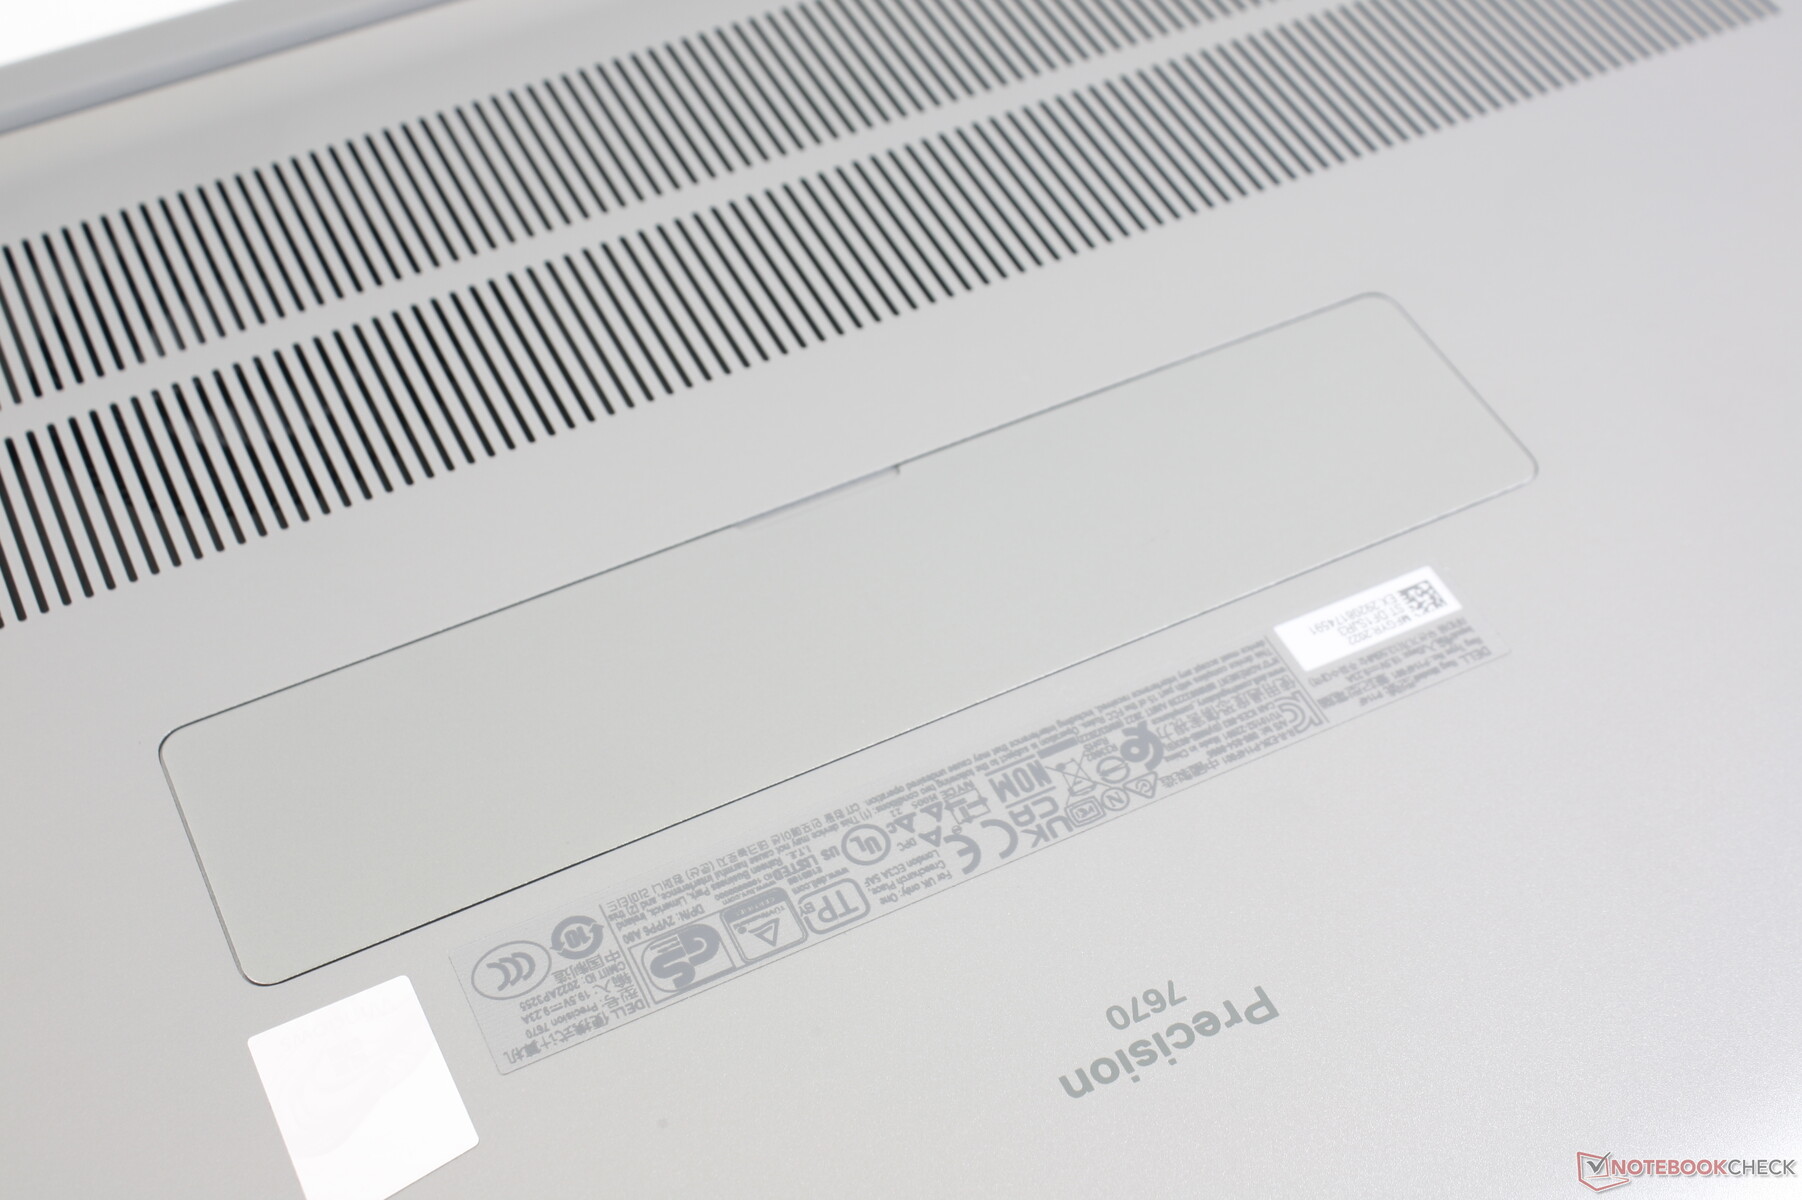
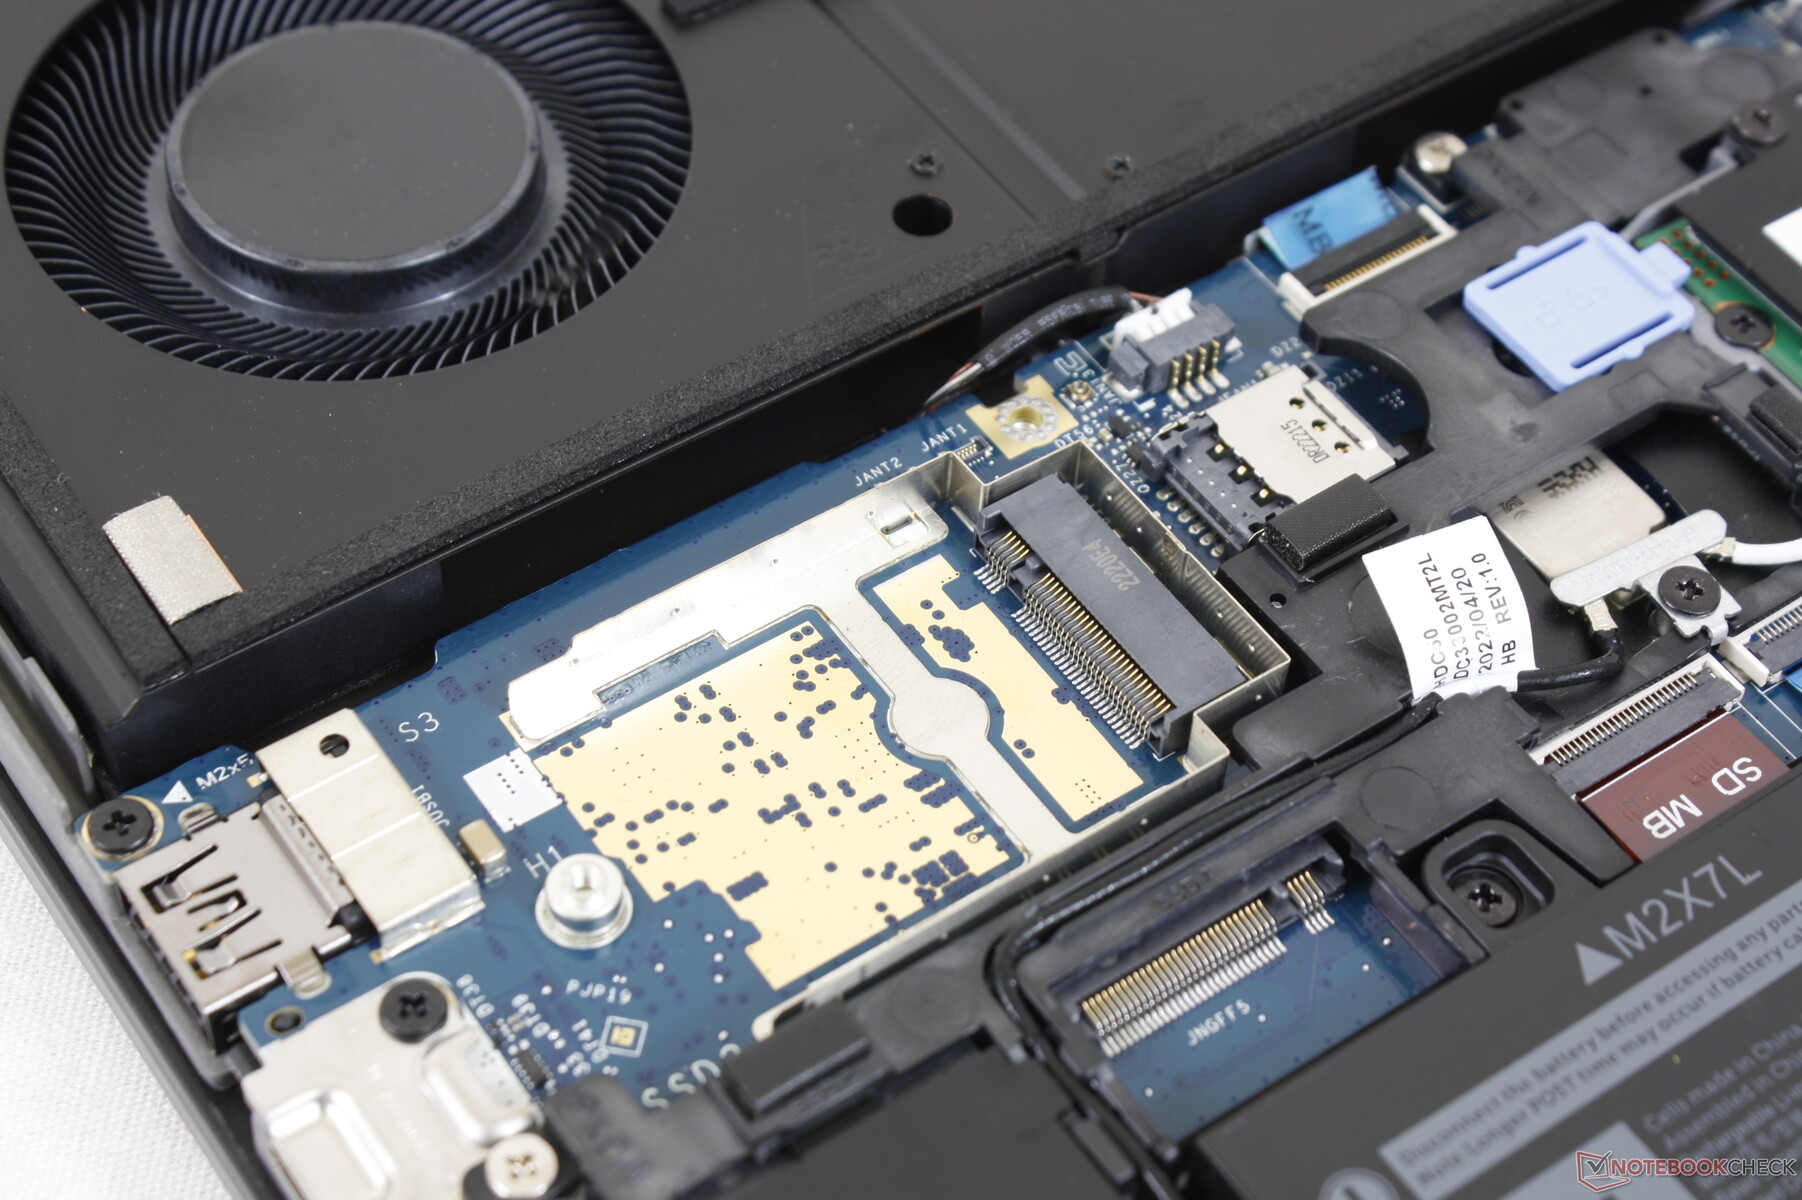
Manutenzione - Facile accesso
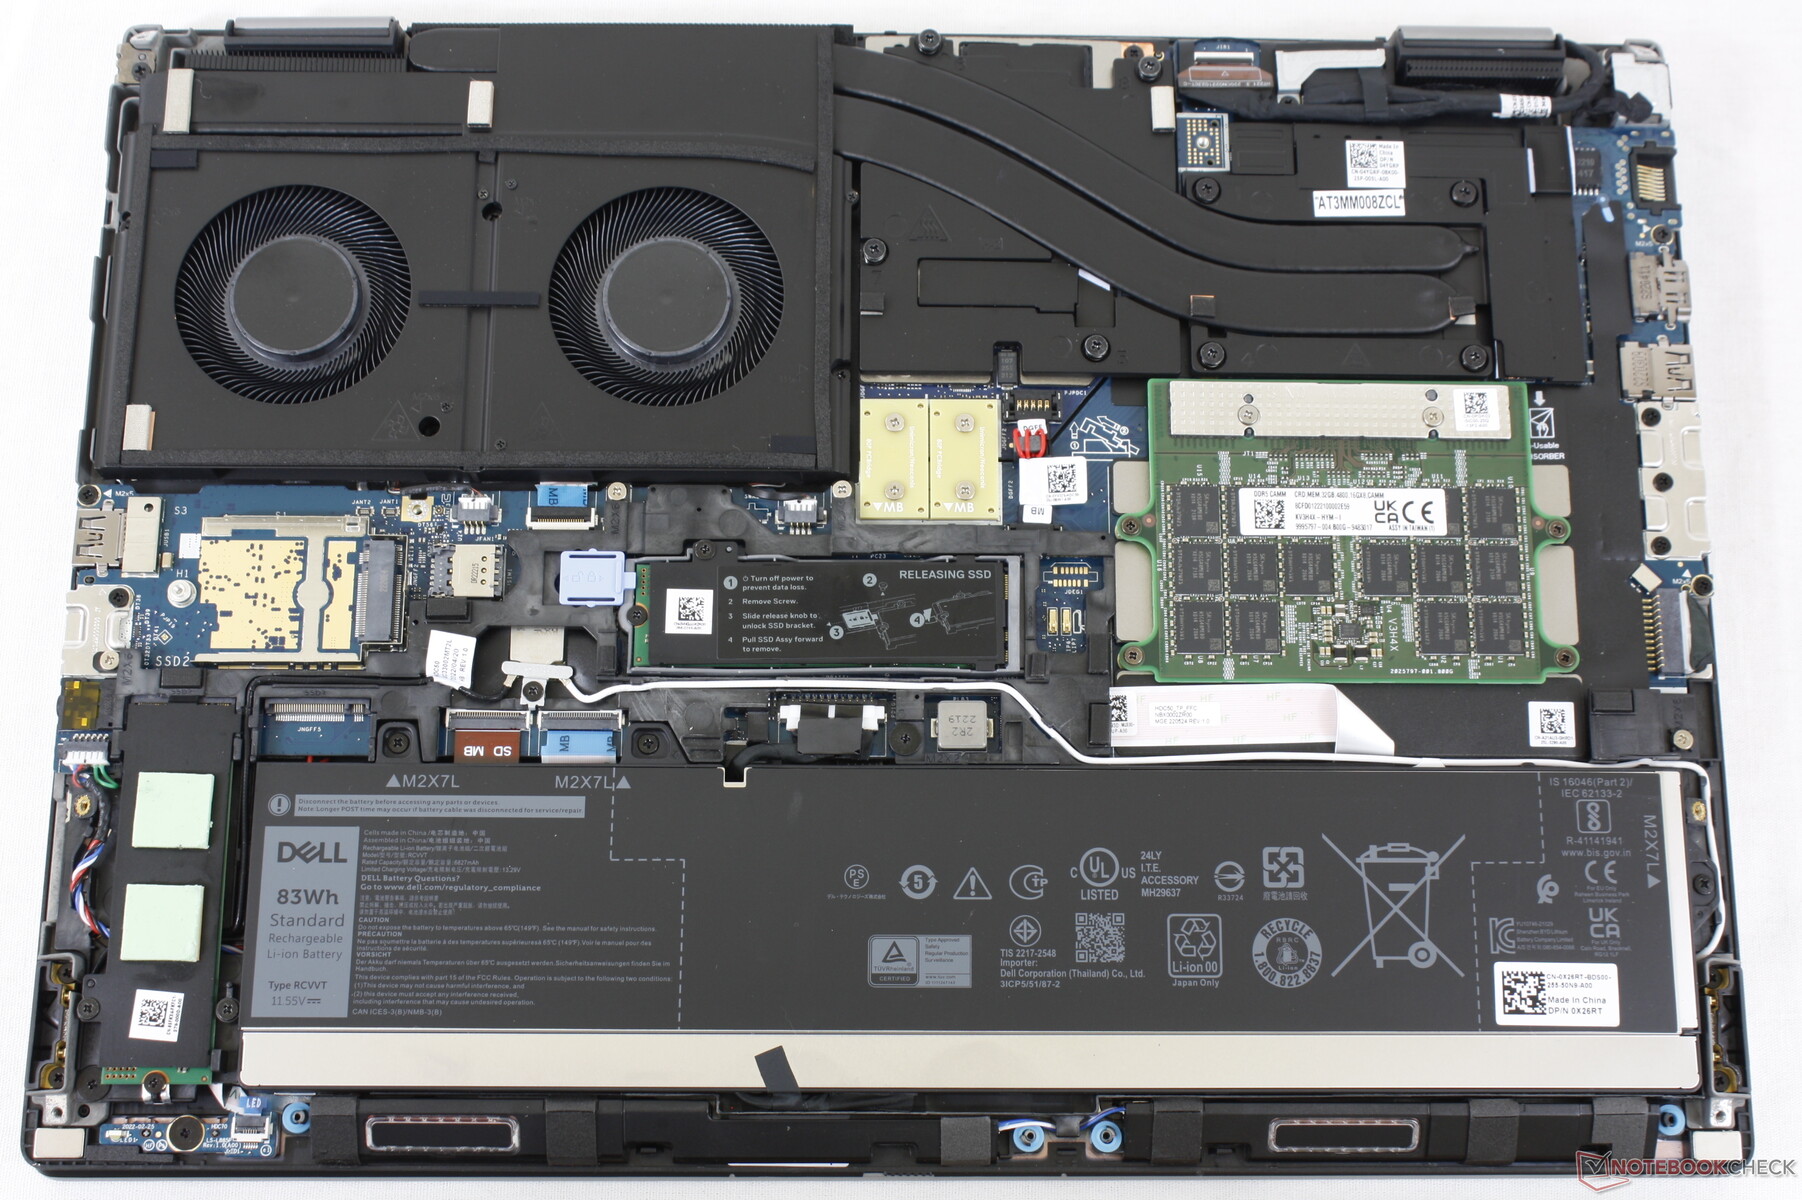
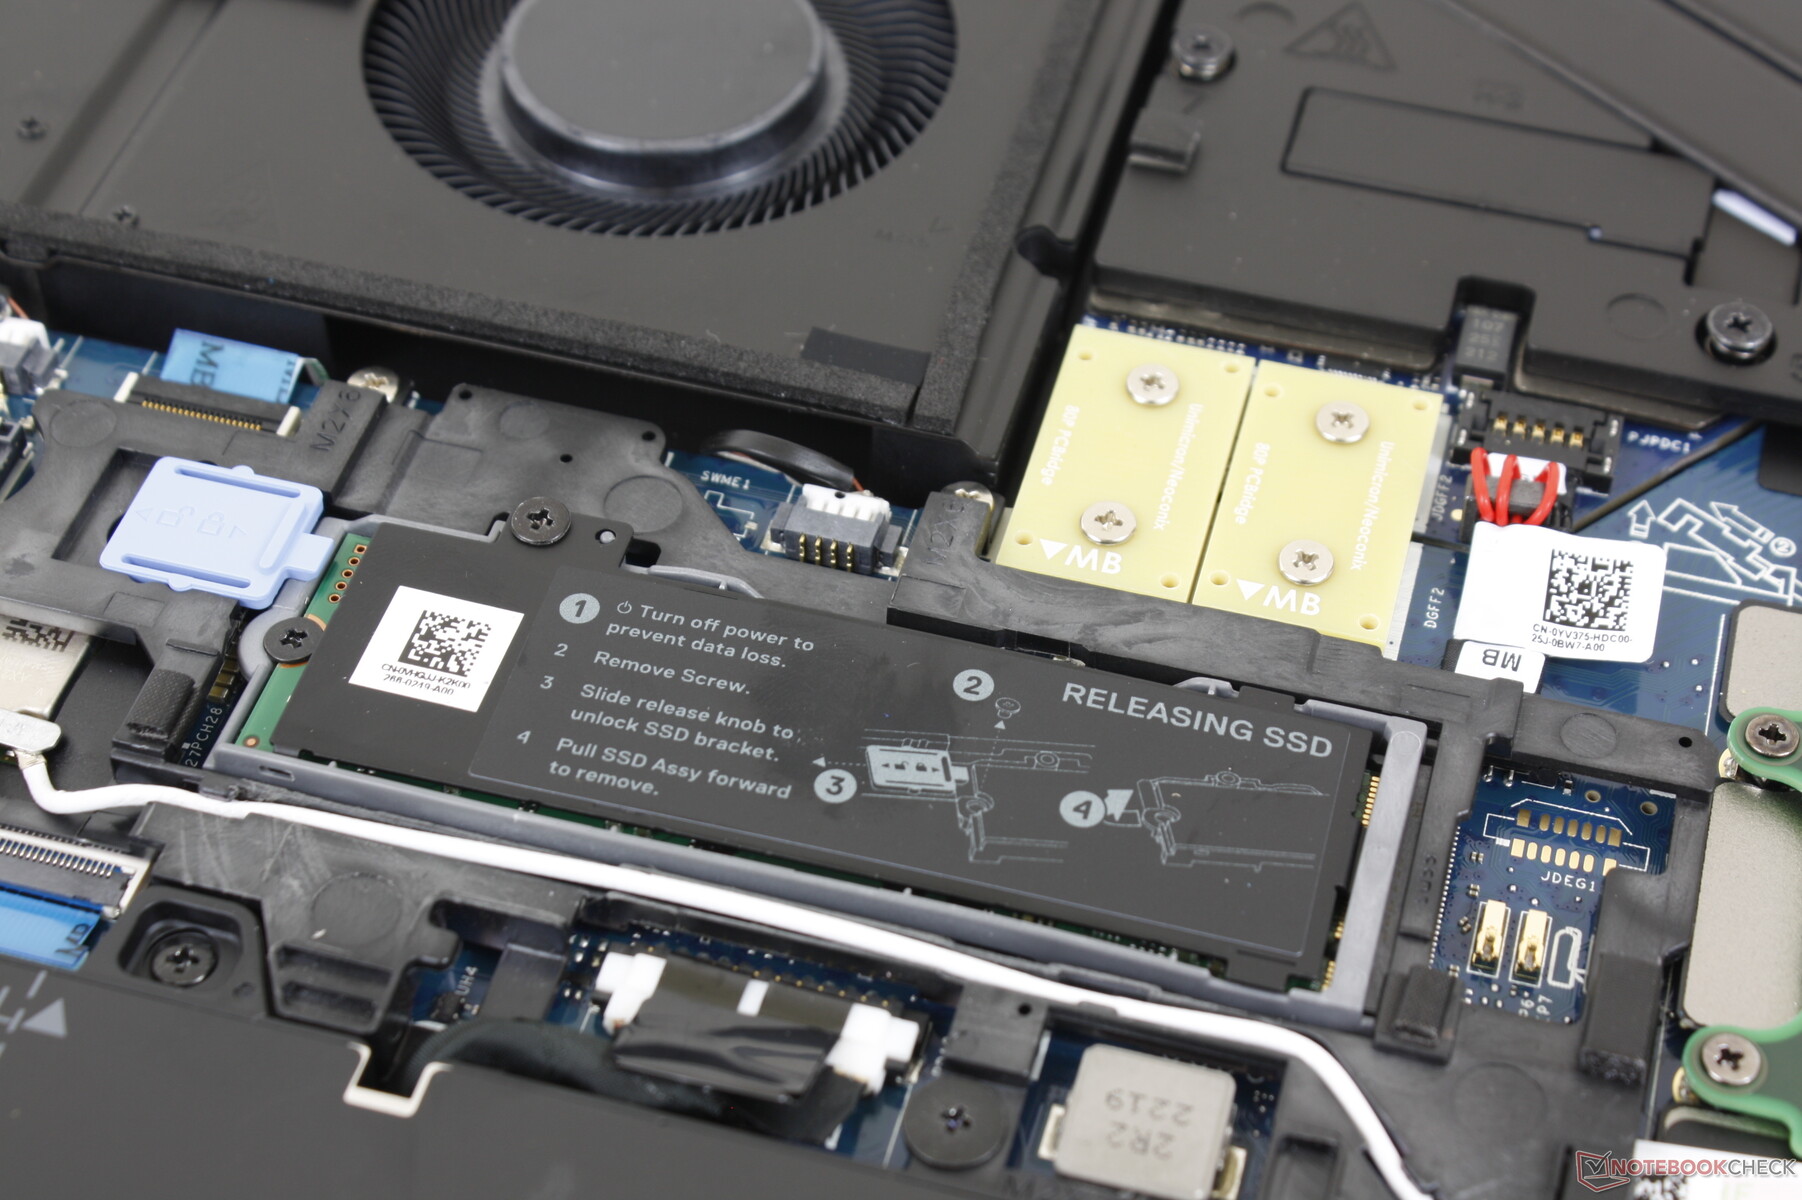
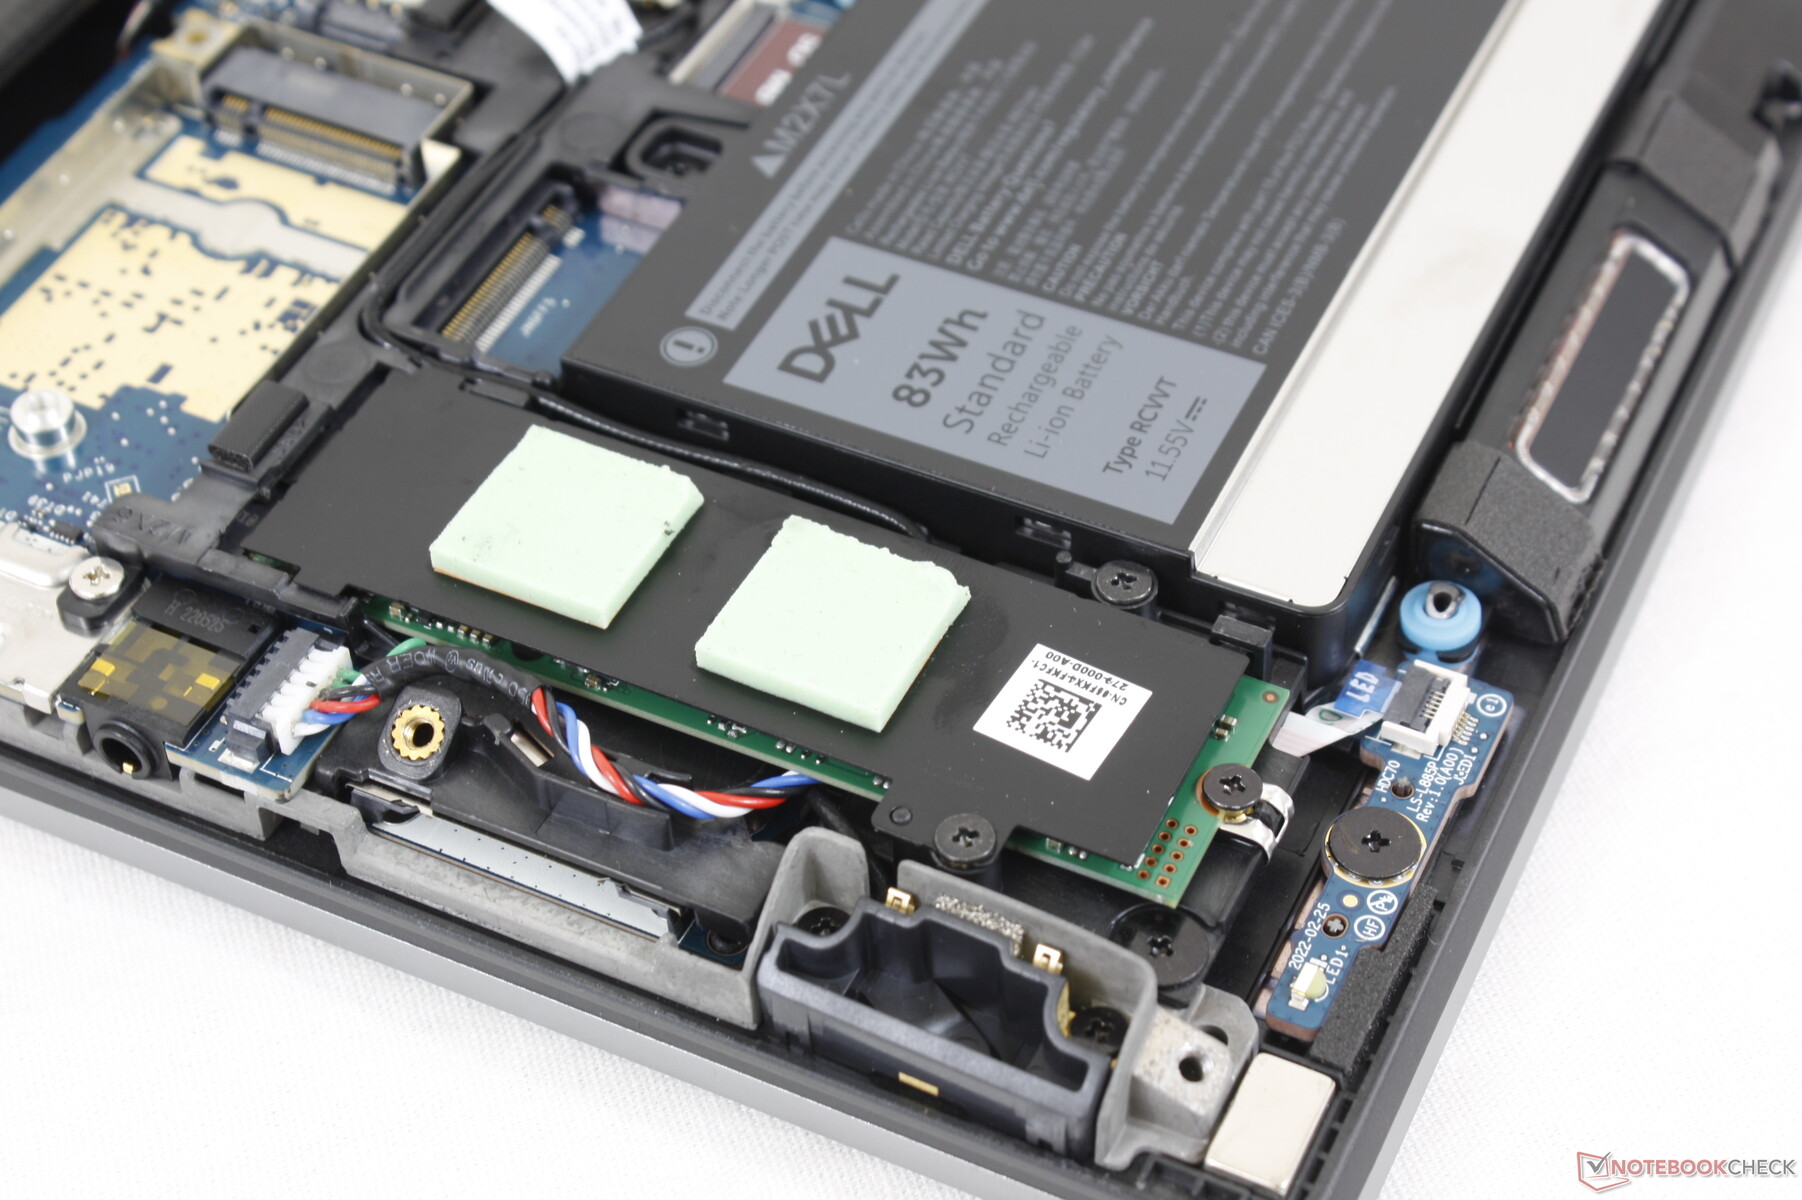
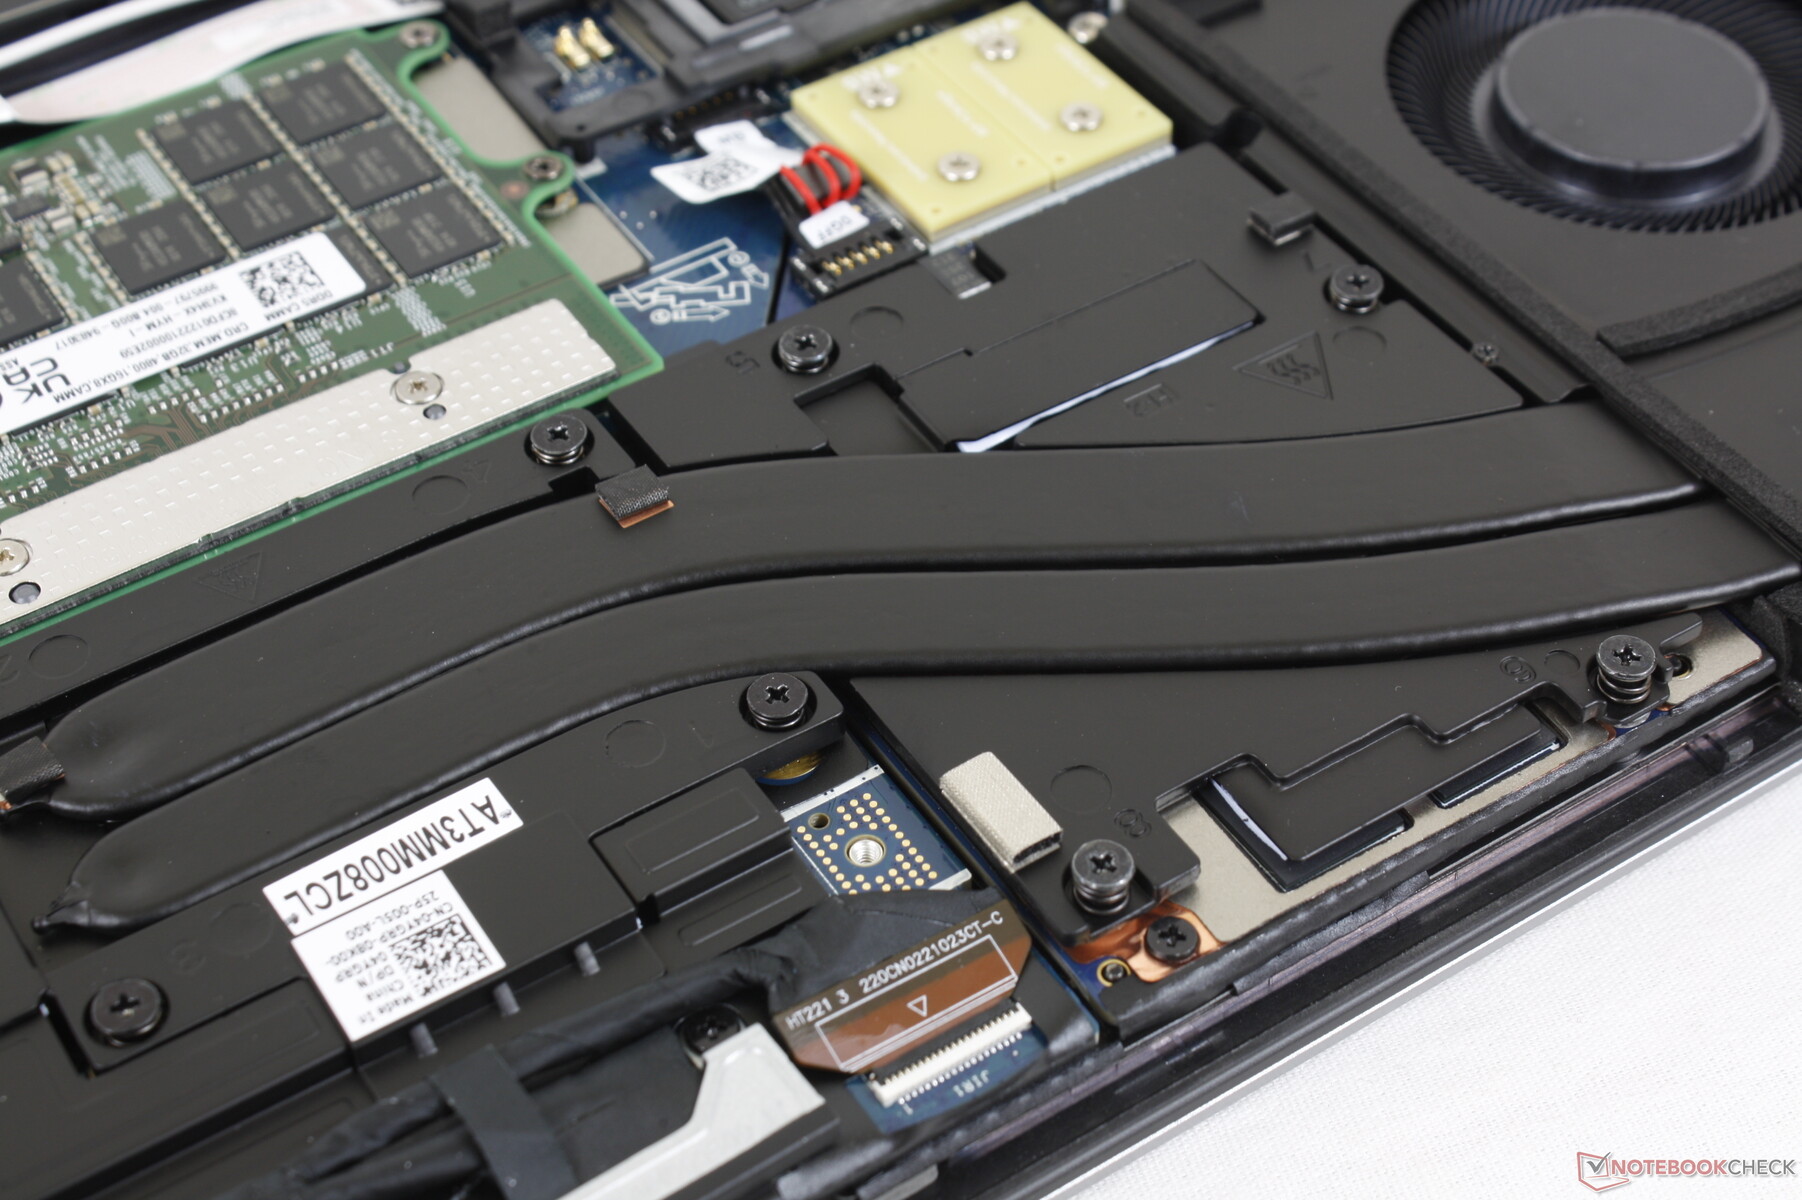
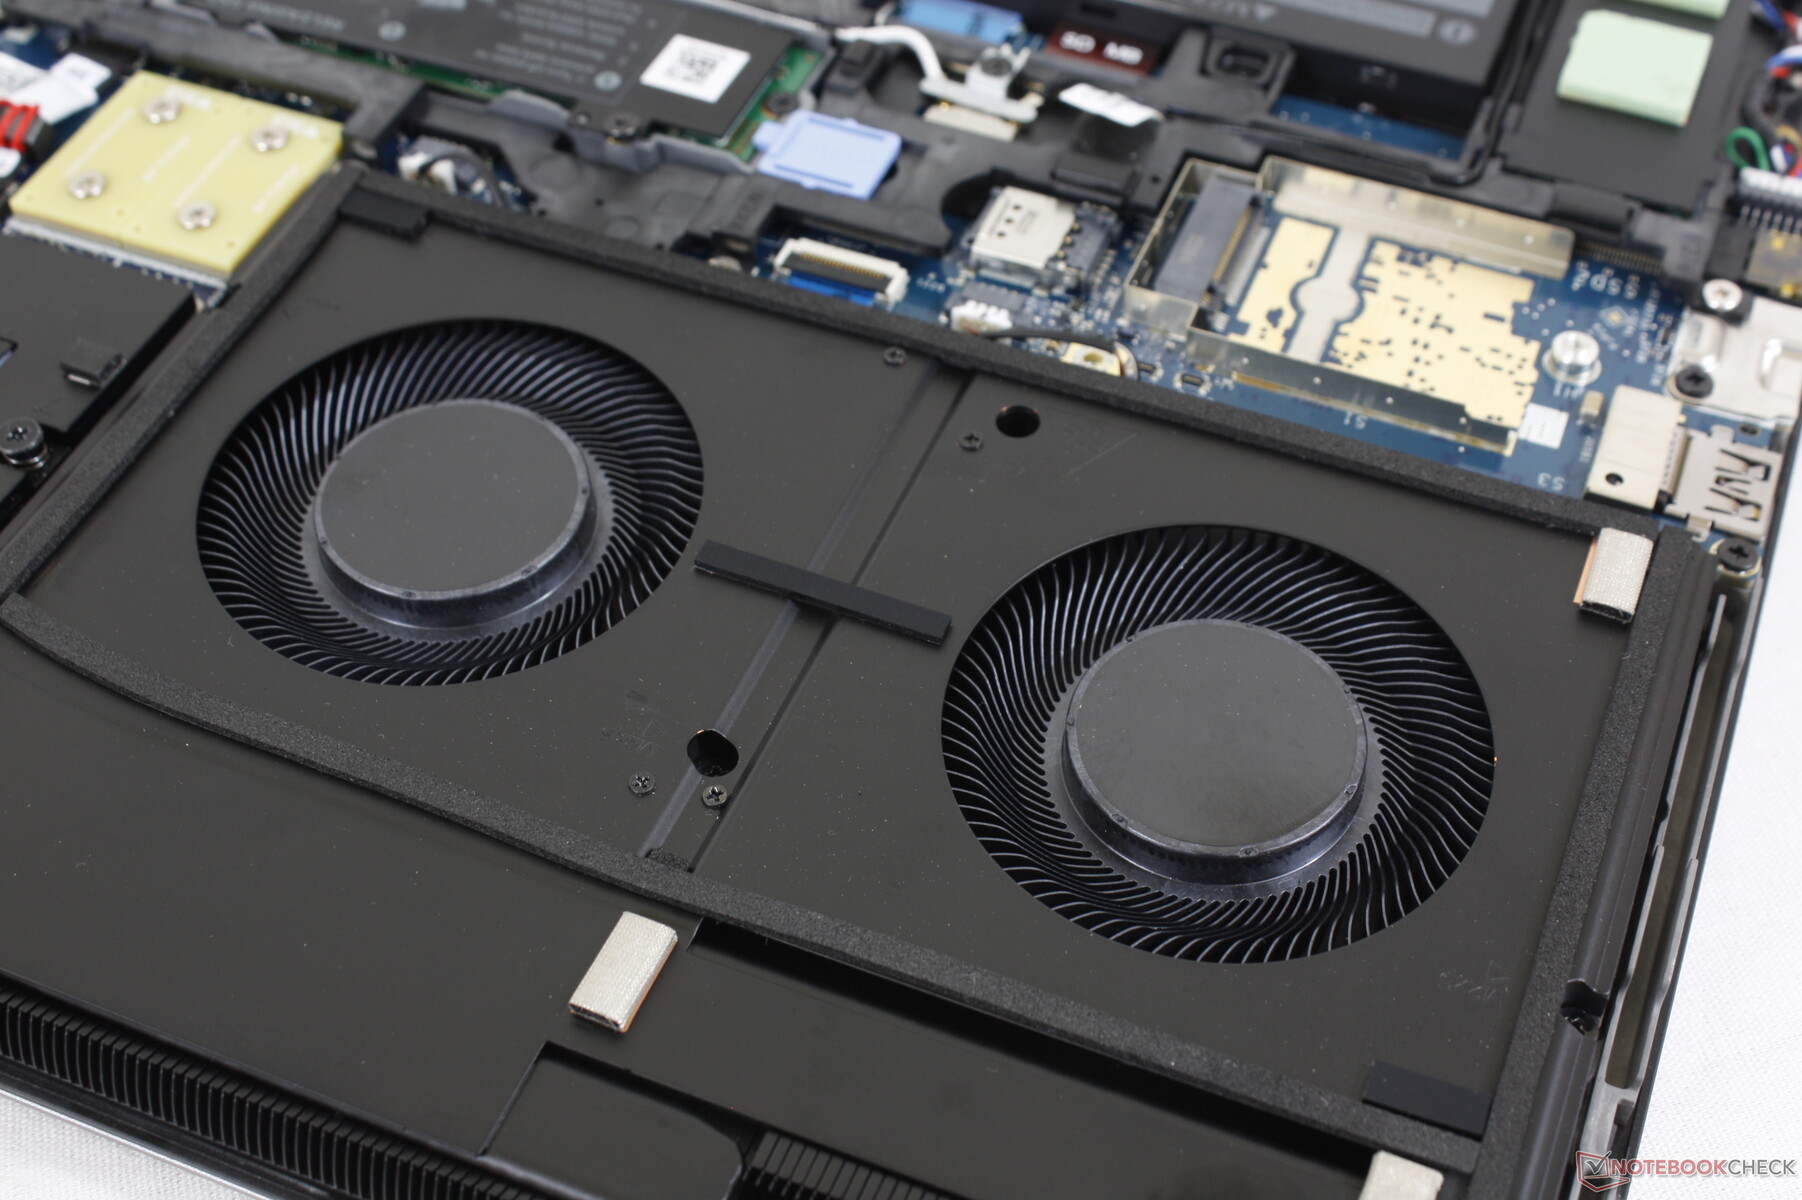
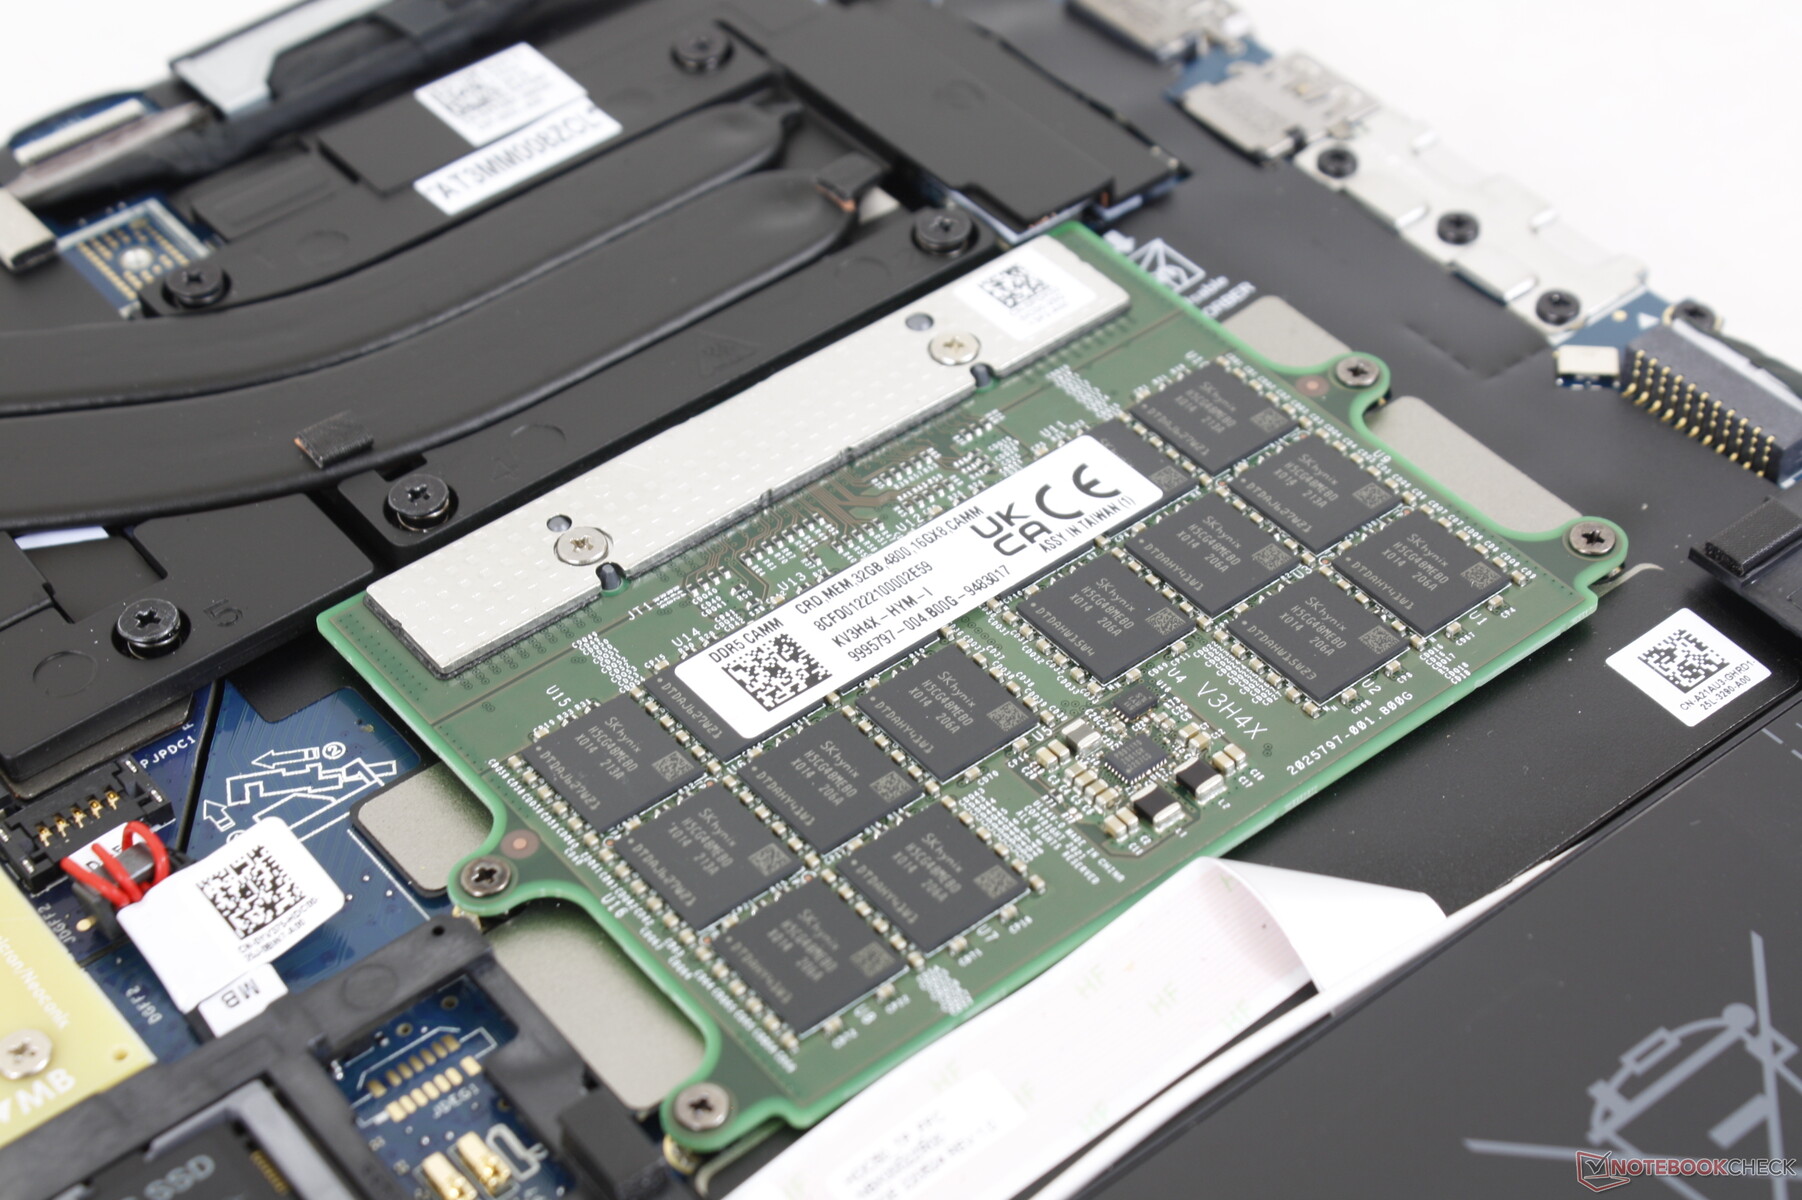
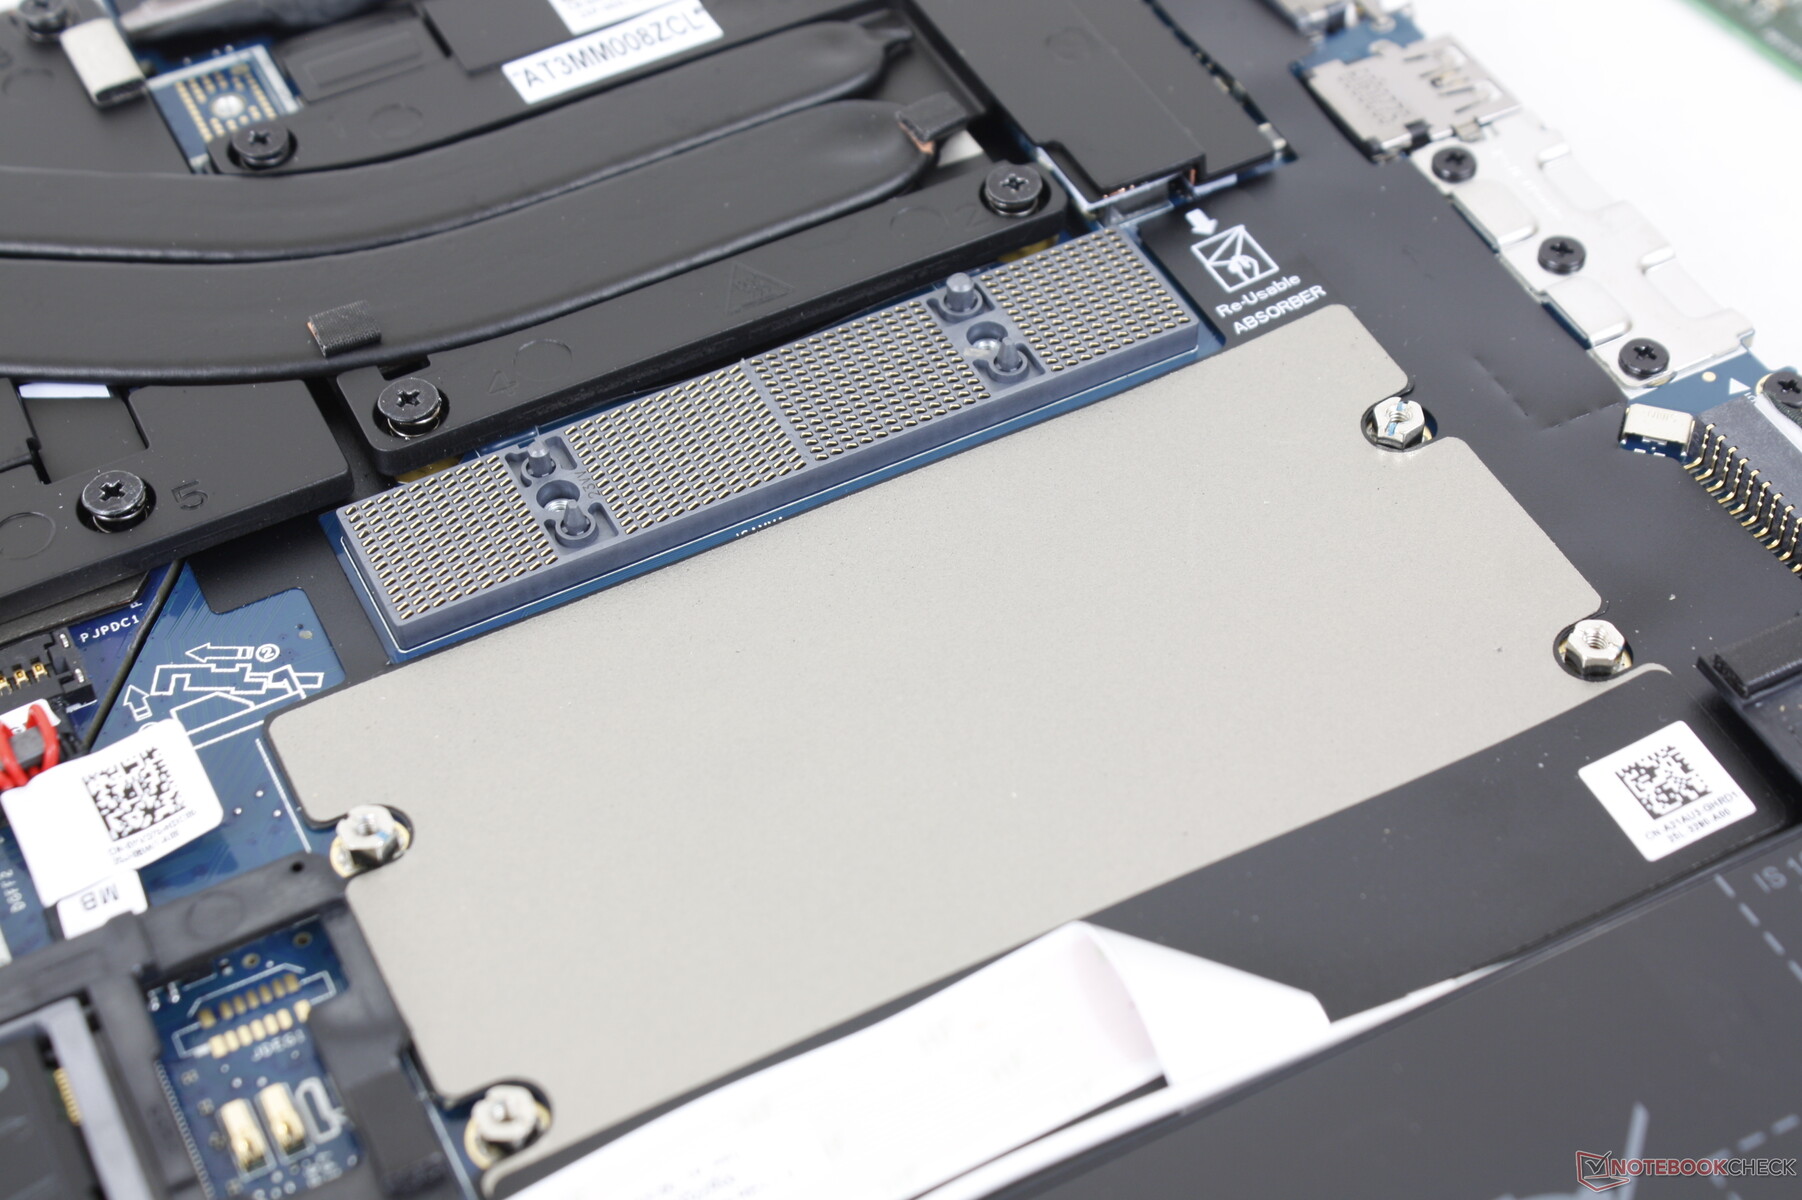
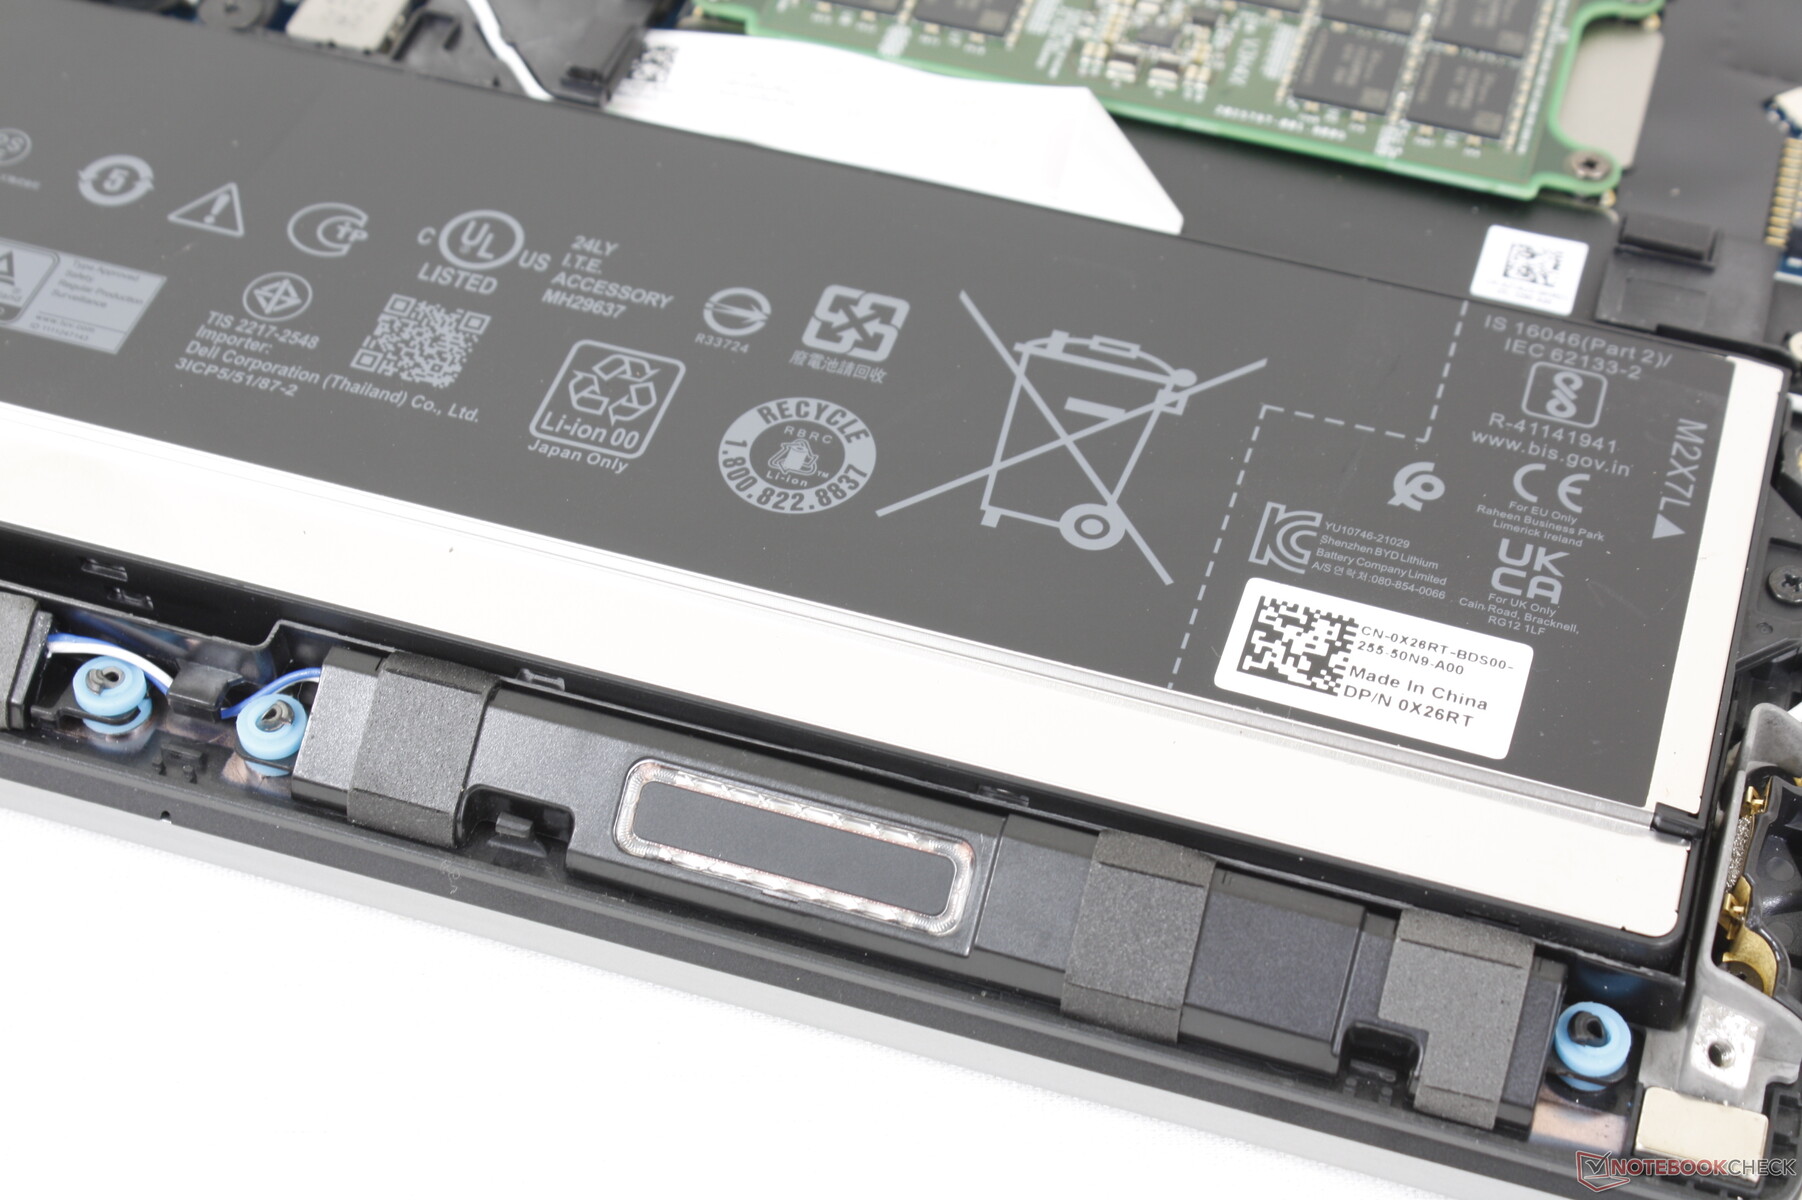
Il pannello inferiore è fissato con 6 viti Philips per facilitare la manutenzione. Gli utenti hanno accesso a due slot M.2 PCIe4 x4 2280, slot WAN, slot Nano-SIM e slot SODIMM o CAMM, a seconda della configurazione. Il modulo WLAN non è rimovibile.
Alcune configurazioni possono ospitare fino a tre unità SSD M.2, come dimostra il terzo slot M.2 vicino al bordo della batteria.
Ulteriori informazioni sulla RAM CAMM sono disponibili nella nostra pagina di anteprima qui.
Accessori e garanzia
La confezione non contiene altri extra oltre all'adattatore CA e alla documentazione. La garanzia limitata di tre anni del produttore è standard se acquistata direttamente da Dell.
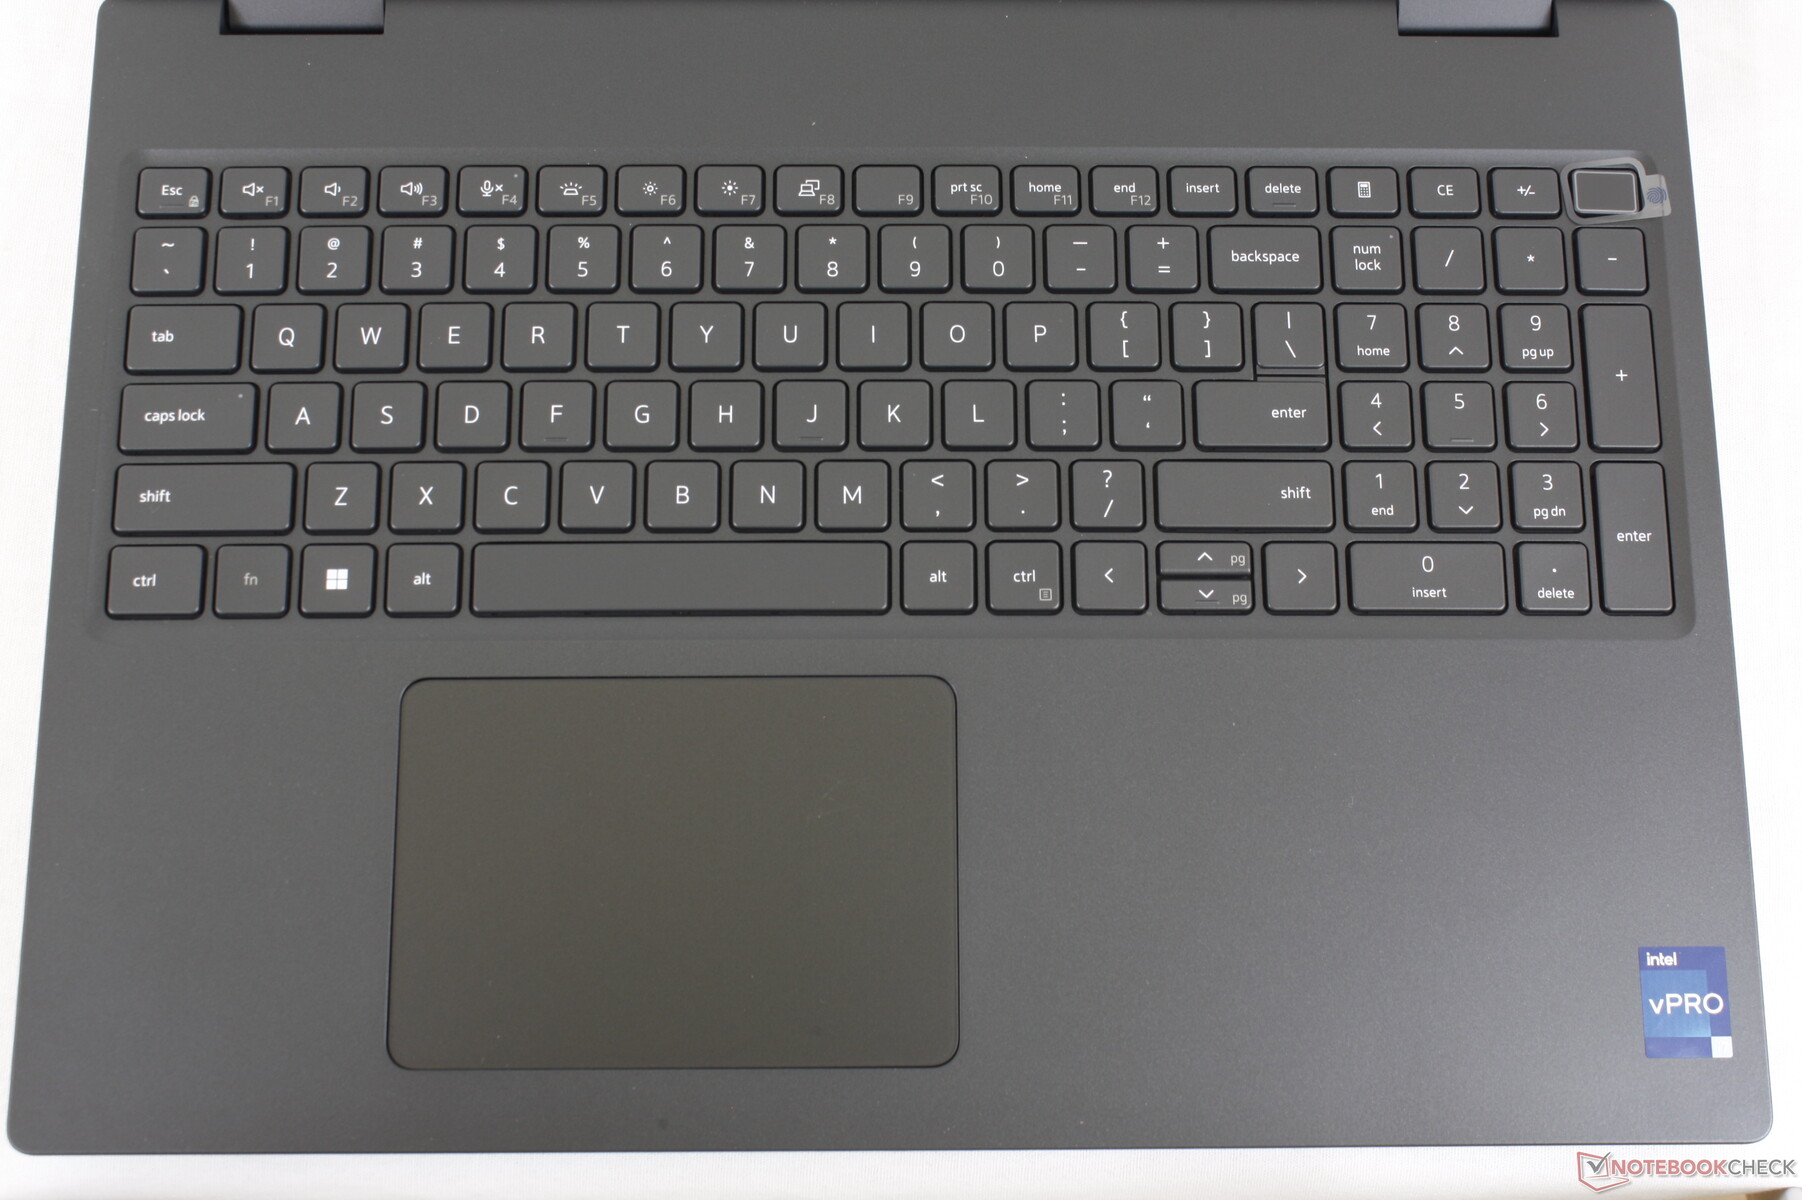
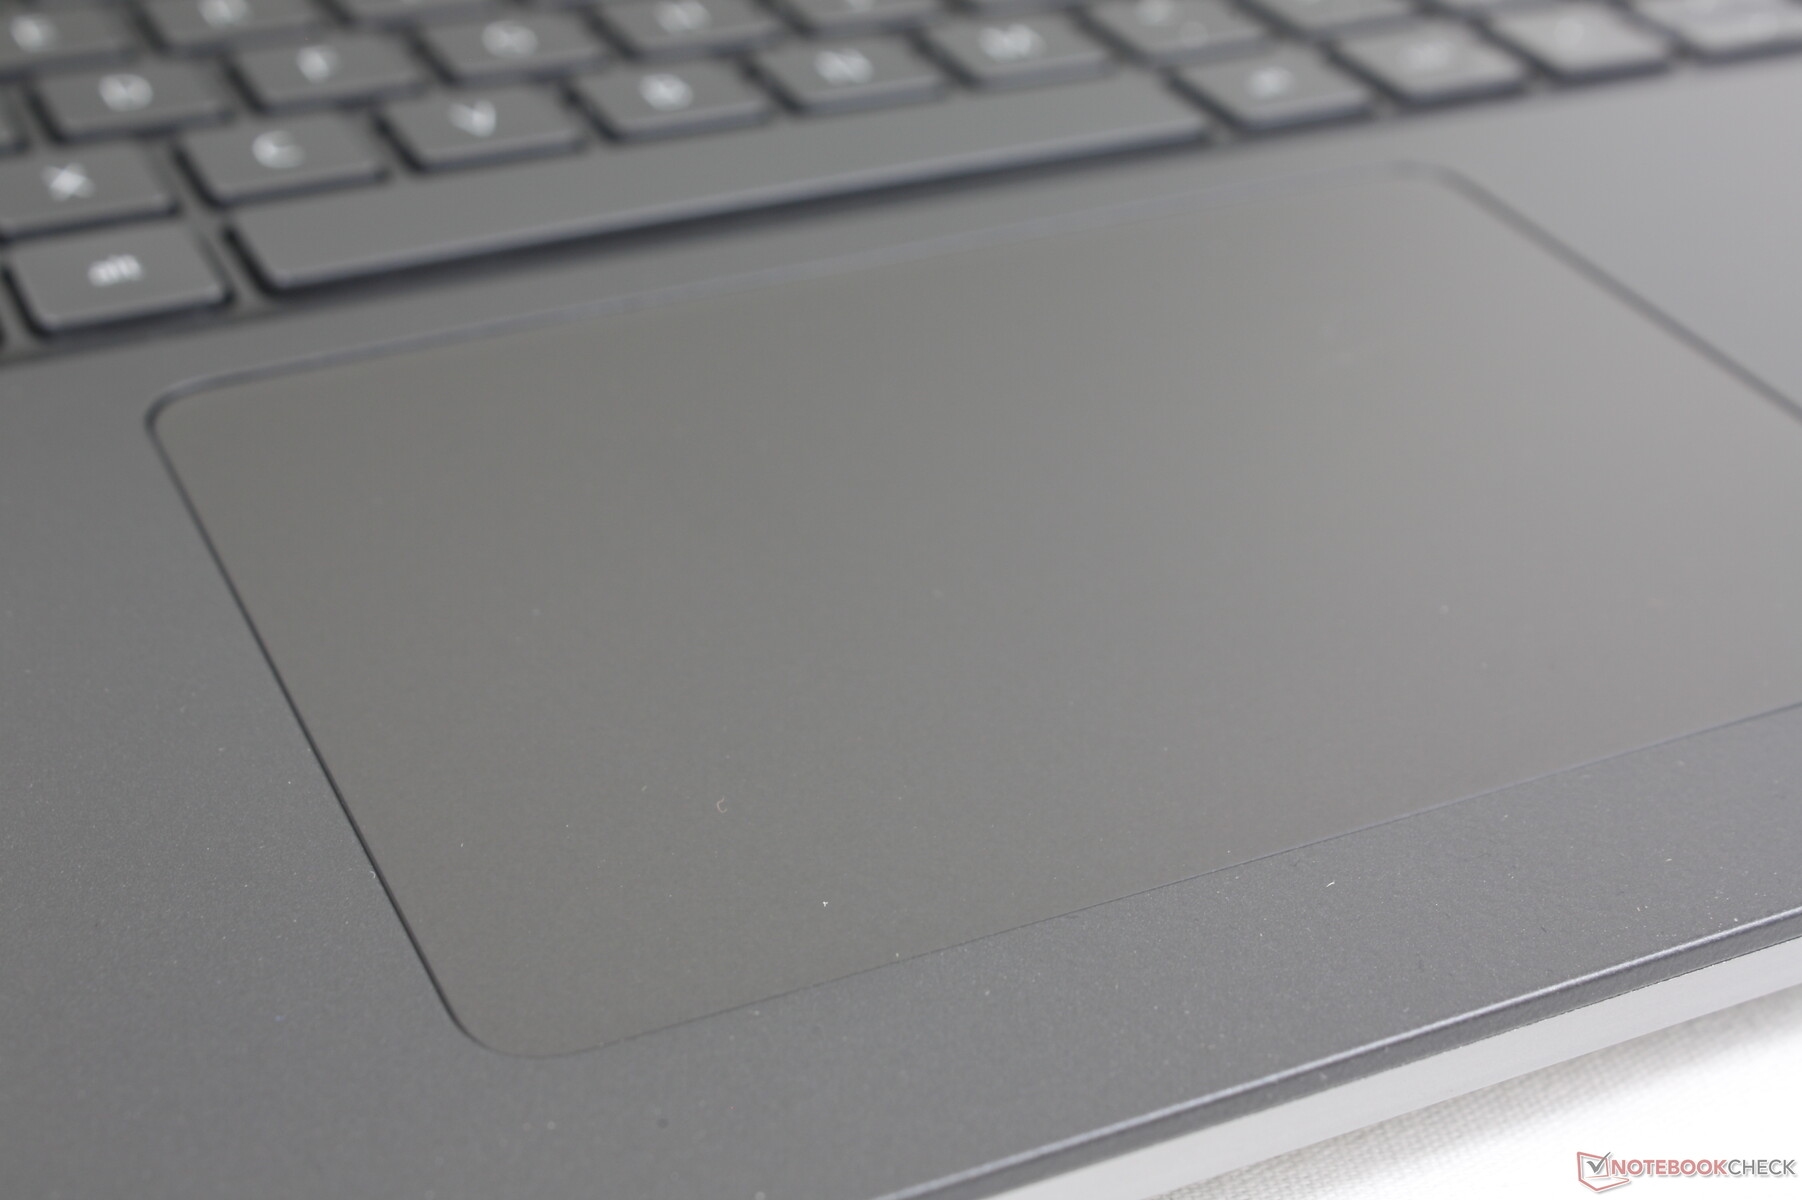
Dispositivi di input - Ampio clickpad con una comoda tastiera
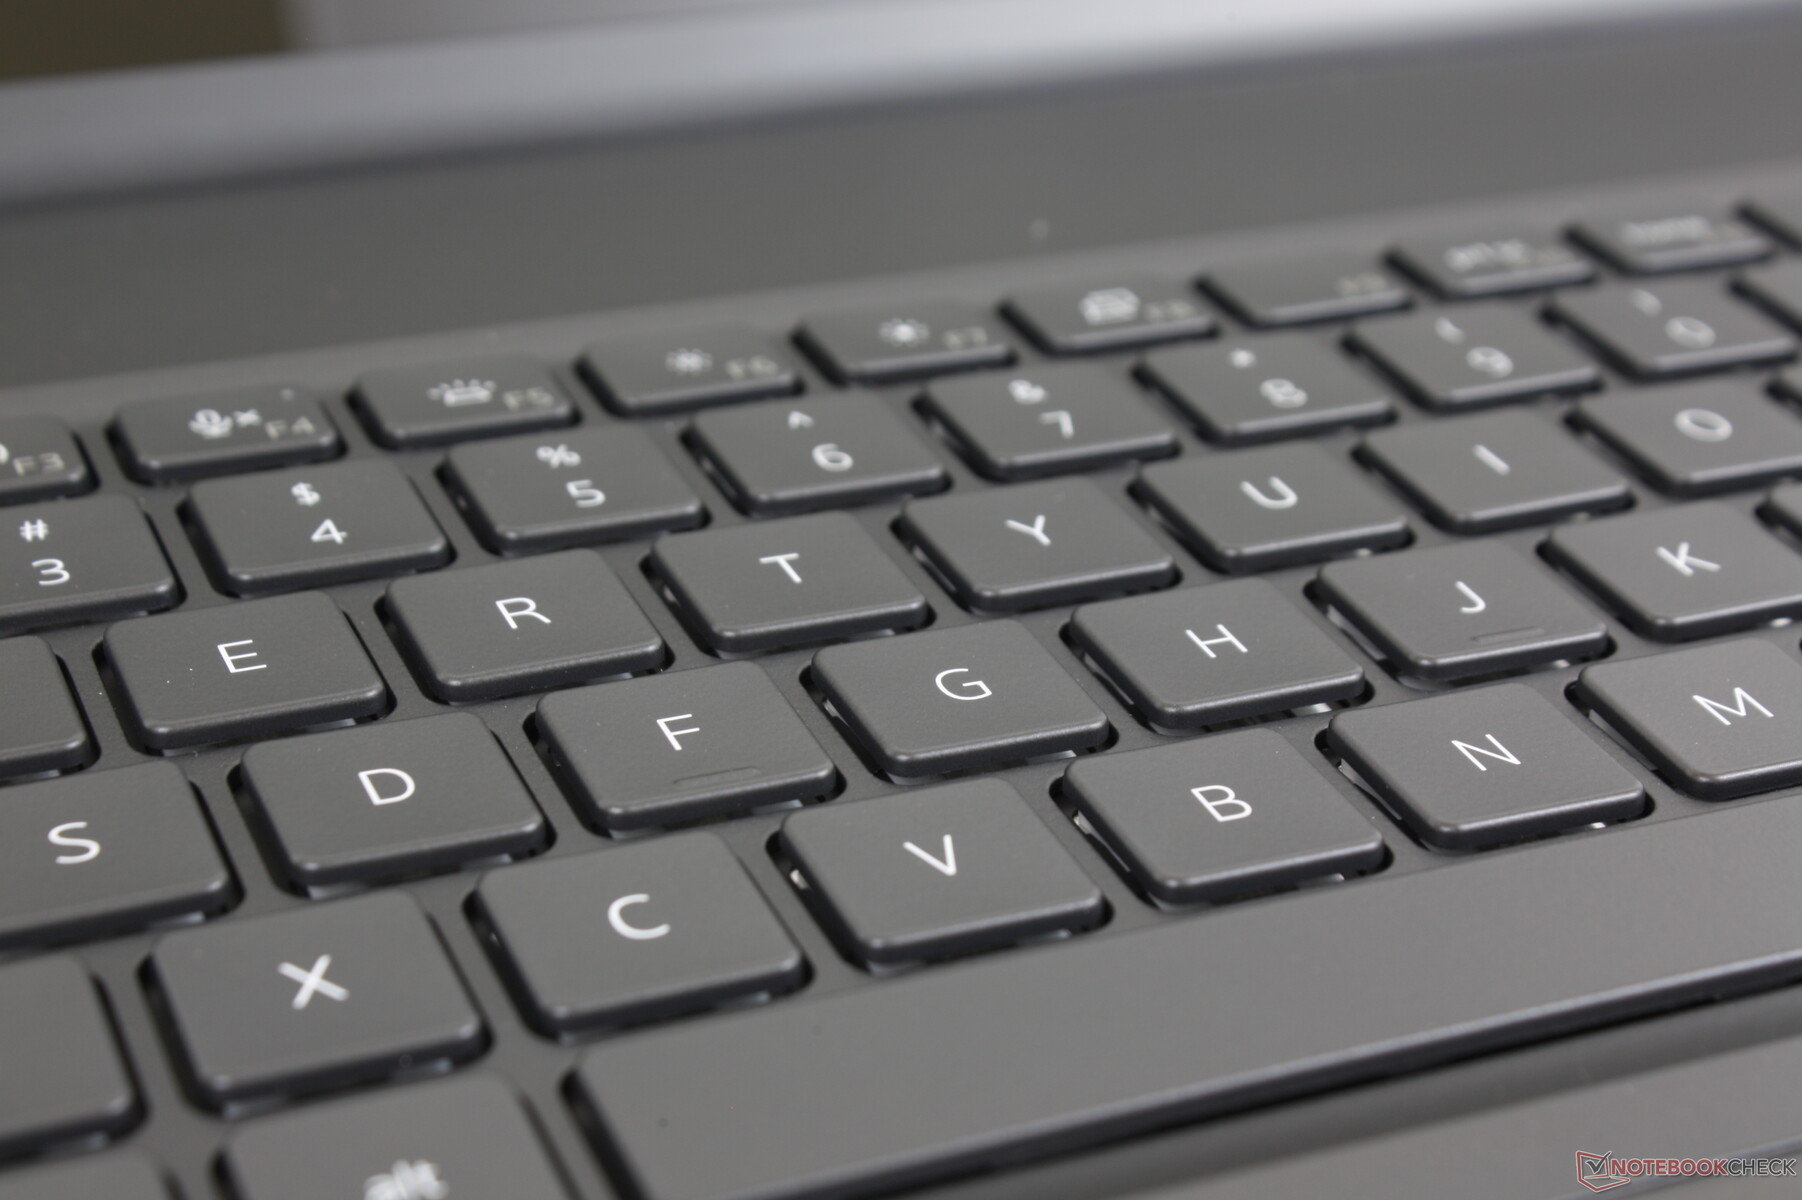
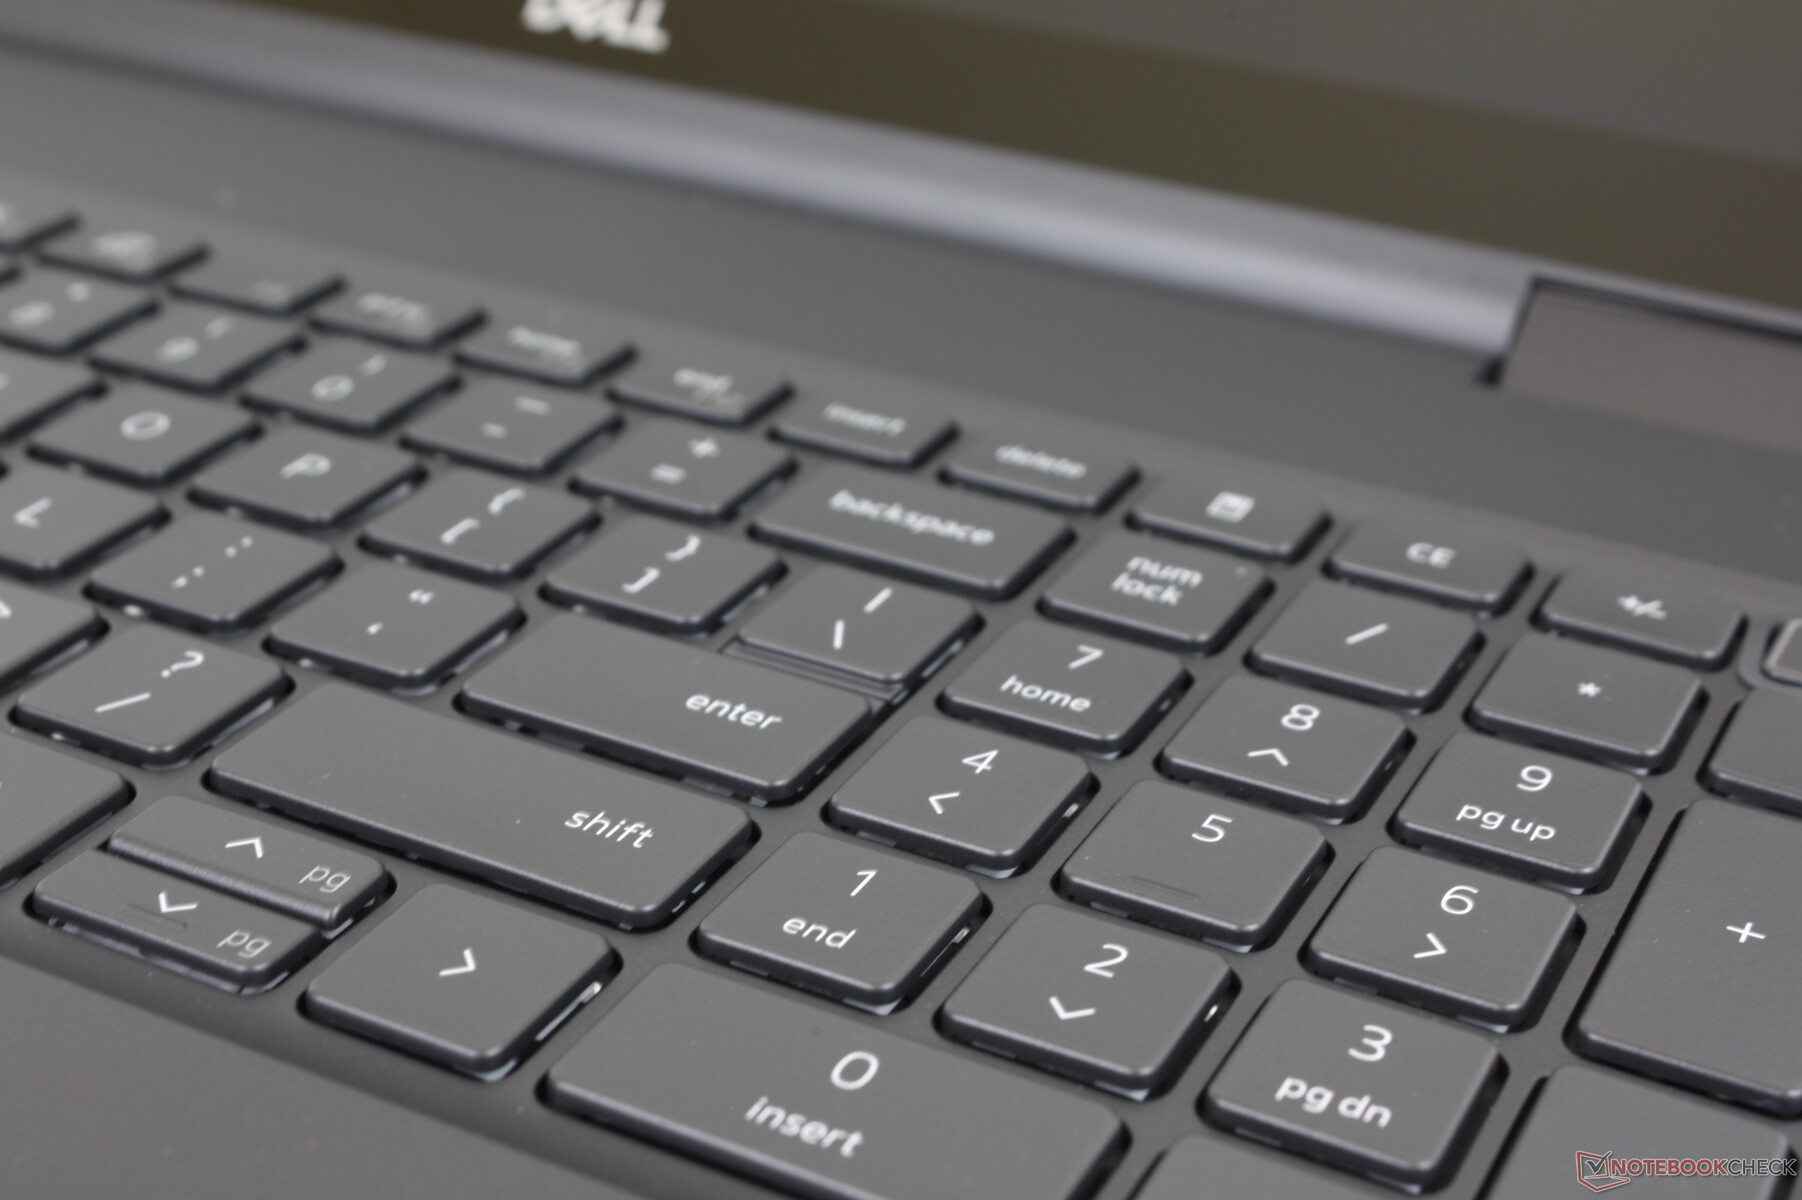
Tastiera
Il layout dei tasti e il feedback non sono cambiati rispetto al modello Precision 7550. Troviamo che i tasti siano leggermente più rumorosi di quelli della serie XPS, ma con un feedback più forte e una corsa più profonda. Tuttavia, i tasti freccia sono ancora angusti, a differenza dei tasti freccia più grandi del ThinkPad P1 G4 o dell'Asus ProArt StudioBook.
Touchpad
Il clickpad è più grande di quello di Precision 7550 (11,5 x 8 cm contro 10 x 6,5 cm). Tuttavia, non ci sono più pulsanti dedicati per il mouse e quindi l'esperienza d'uso è più vicina a quella di un Ultrabook tradizionale che a quella di un ThinkPad o di uno ZBook business-centric, dove i pulsanti del mouse sono ancora in primo piano. Personalmente preferiamo i pulsanti dedicati per facilitare le operazioni di trascinamento, ma la mancanza di pulsanti ha portato a una superficie del clickpad più ampia, che altri potrebbero apprezzare.
Display - Nessuna opzione a 120 Hz
In questo momento Dell offre tre opzioni di display
- 1200p, 60 Hz, 60% sRGB, 250 nits, non touch
- 1200p, 60 Hz, 99% DCI-P3, 500 nits, non touch, IPS
- 2400p, 60 Hz, 100 percento DCI-P3, 400 nits, touch, OLED
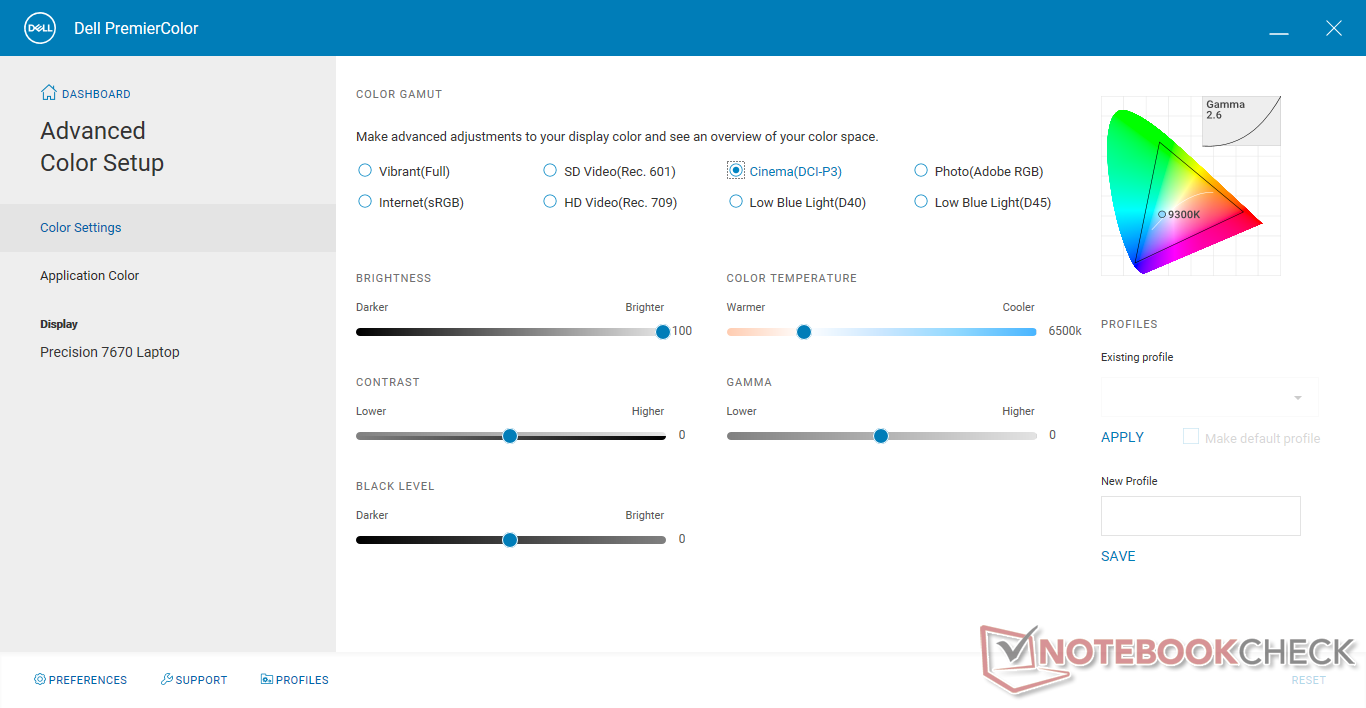
Le nostre misurazioni indipendenti riportate di seguito riflettono solo l'opzione in grassetto di cui sopra. Se l'accuratezza dei colori è importante per i vostri carichi di lavoro, vi consigliamo di evitare l'opzione base a 250 nit, poiché la riproduzione dei colori è scarsa come quella di molti computer portatili economici. I possessori dovrebbero familiarizzare con il software Dell PremierColor per regolare il profilo del colore del display
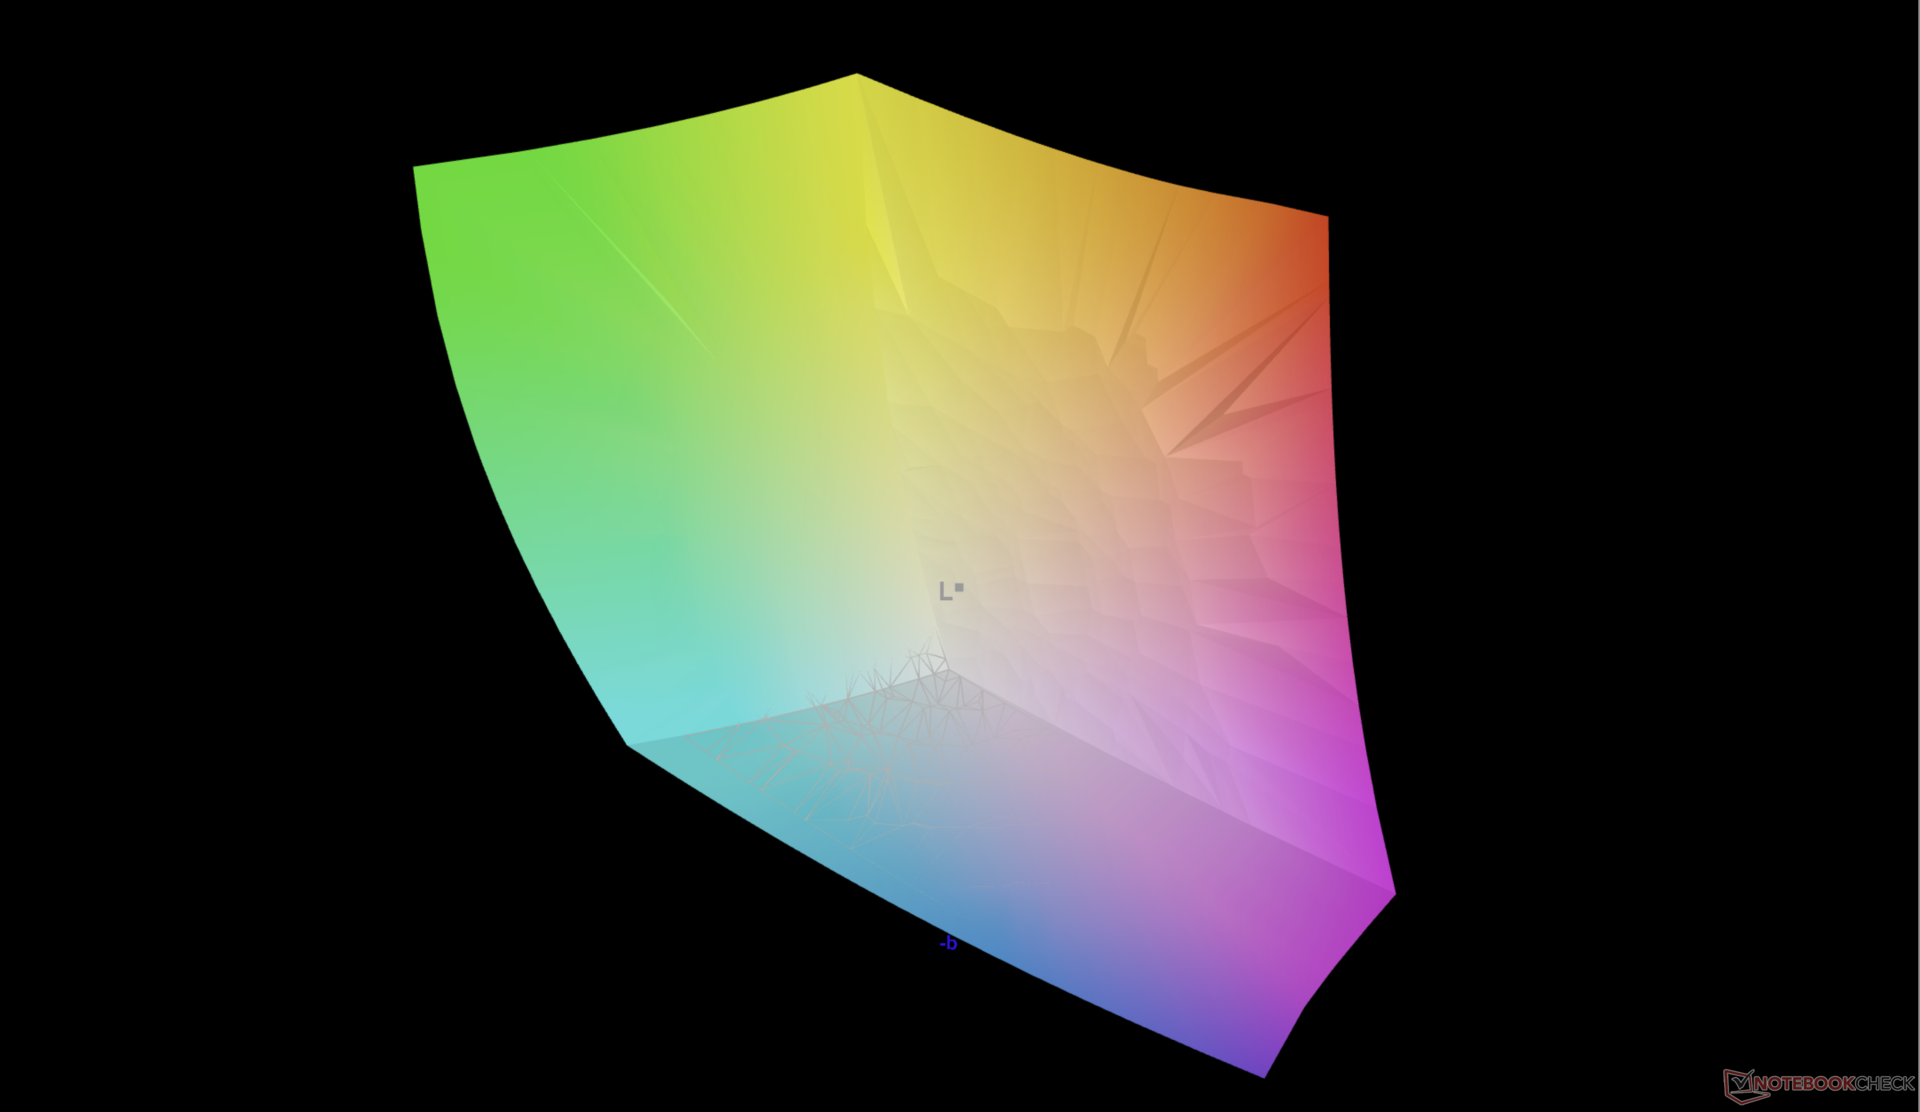
Anche se siamo in grado di confermare la piena copertura DCI-P3 del pannello OLED con il nostro colorimetro X-Rite, la luminosità massima dello schermo è solo di circa 340 nits rispetto ai 400 nits pubblicizzati, anche dopo aver disabilitato il controllo automatico della luminosità. Questo rende il nostro schermo più debole rispetto alla maggior parte delle altre workstation, dove la luminosità di 450 nits o superiore è comune.
| |||||||||||||||||||||||||
Distribuzione della luminosità: 98 %
Al centro con la batteria: 340.1 cd/m²
Contrasto: ∞:1 (Nero: 0 cd/m²)
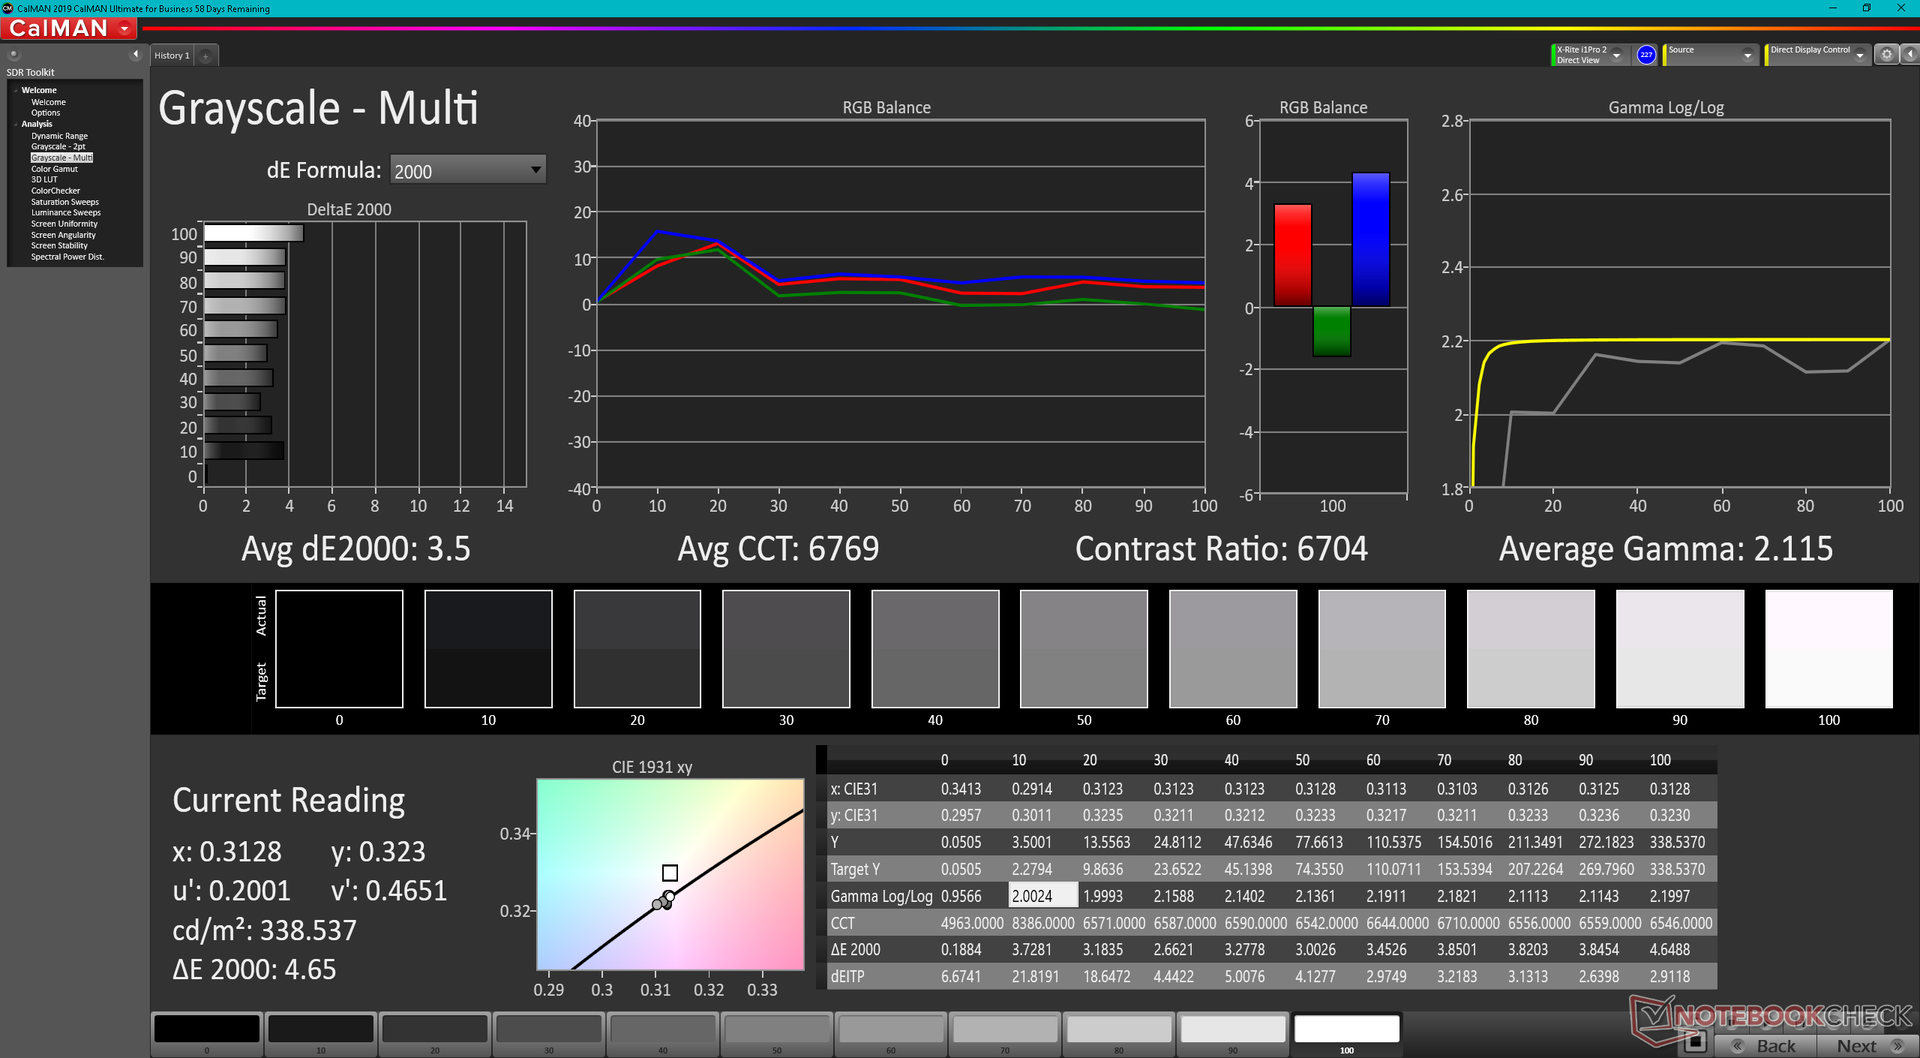
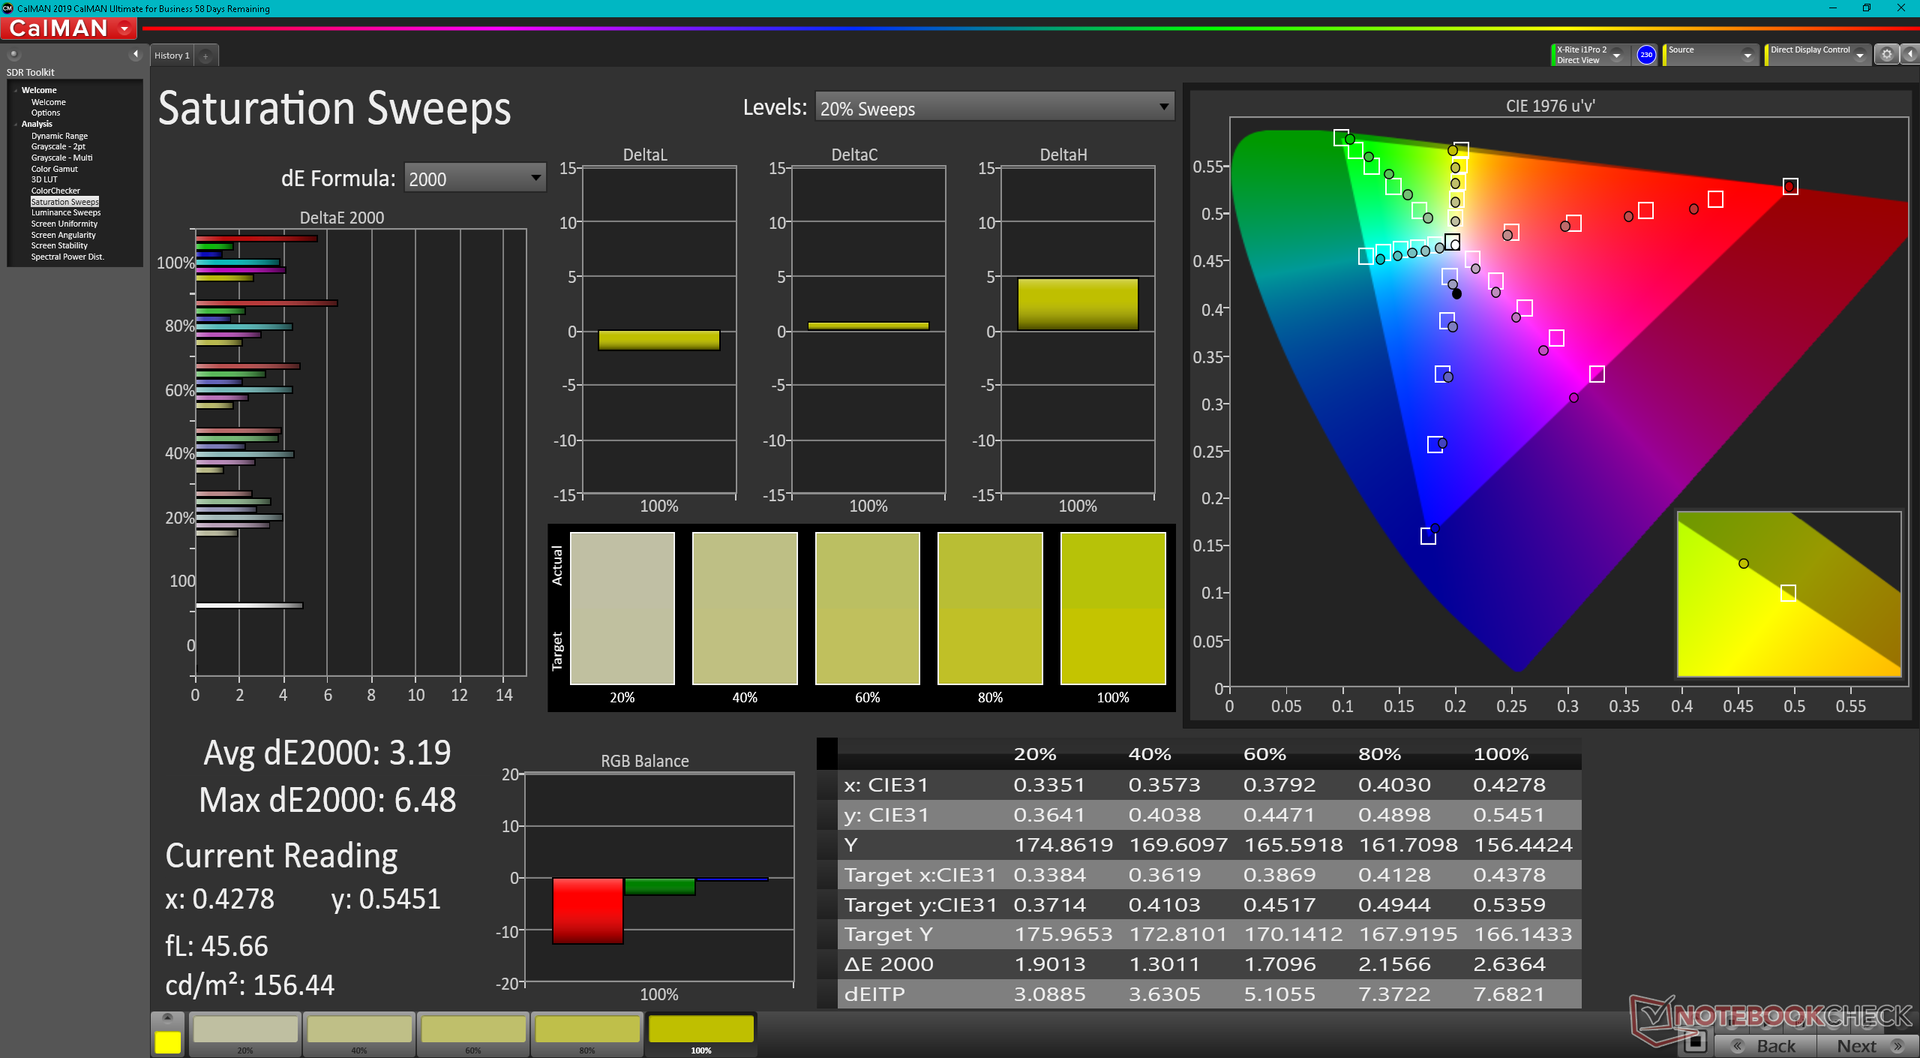
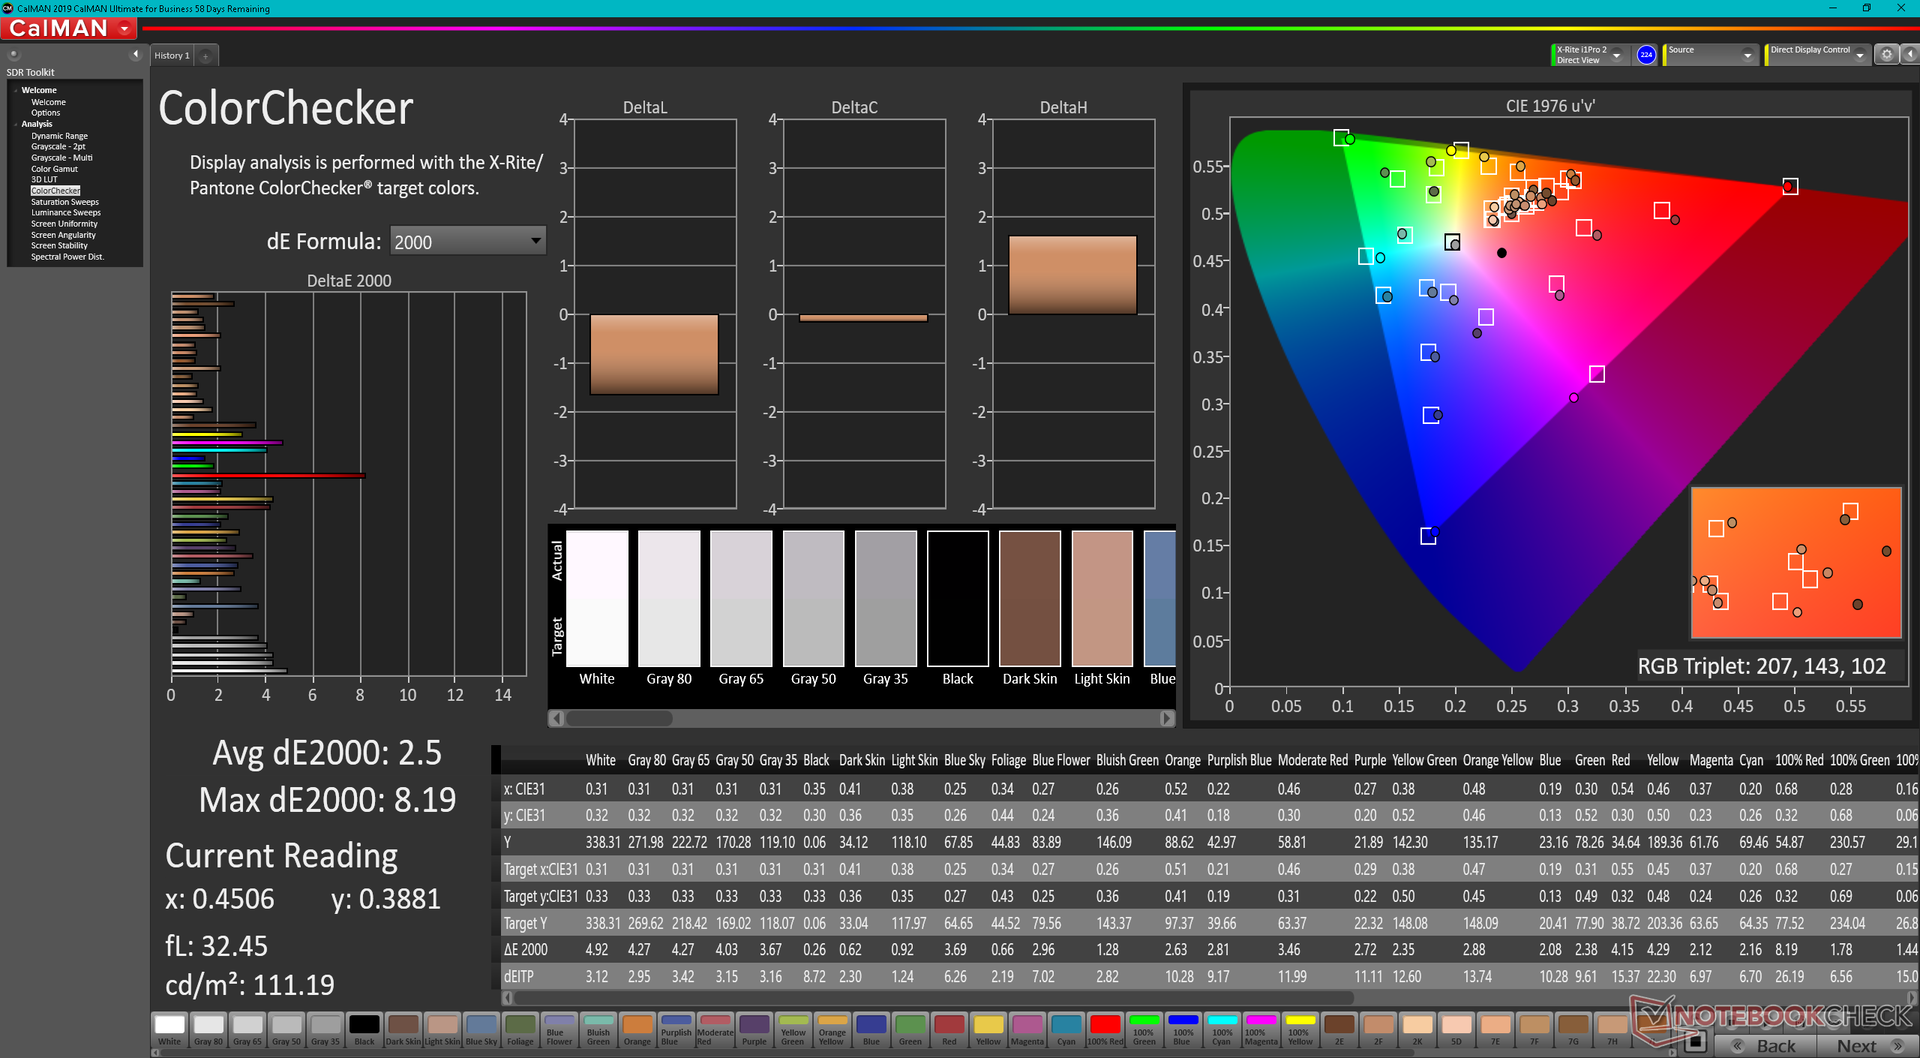
ΔE ColorChecker Calman: 2.5 | ∀{0.5-29.43 Ø4.71}
ΔE Greyscale Calman: 3.5 | ∀{0.09-98 Ø4.96}
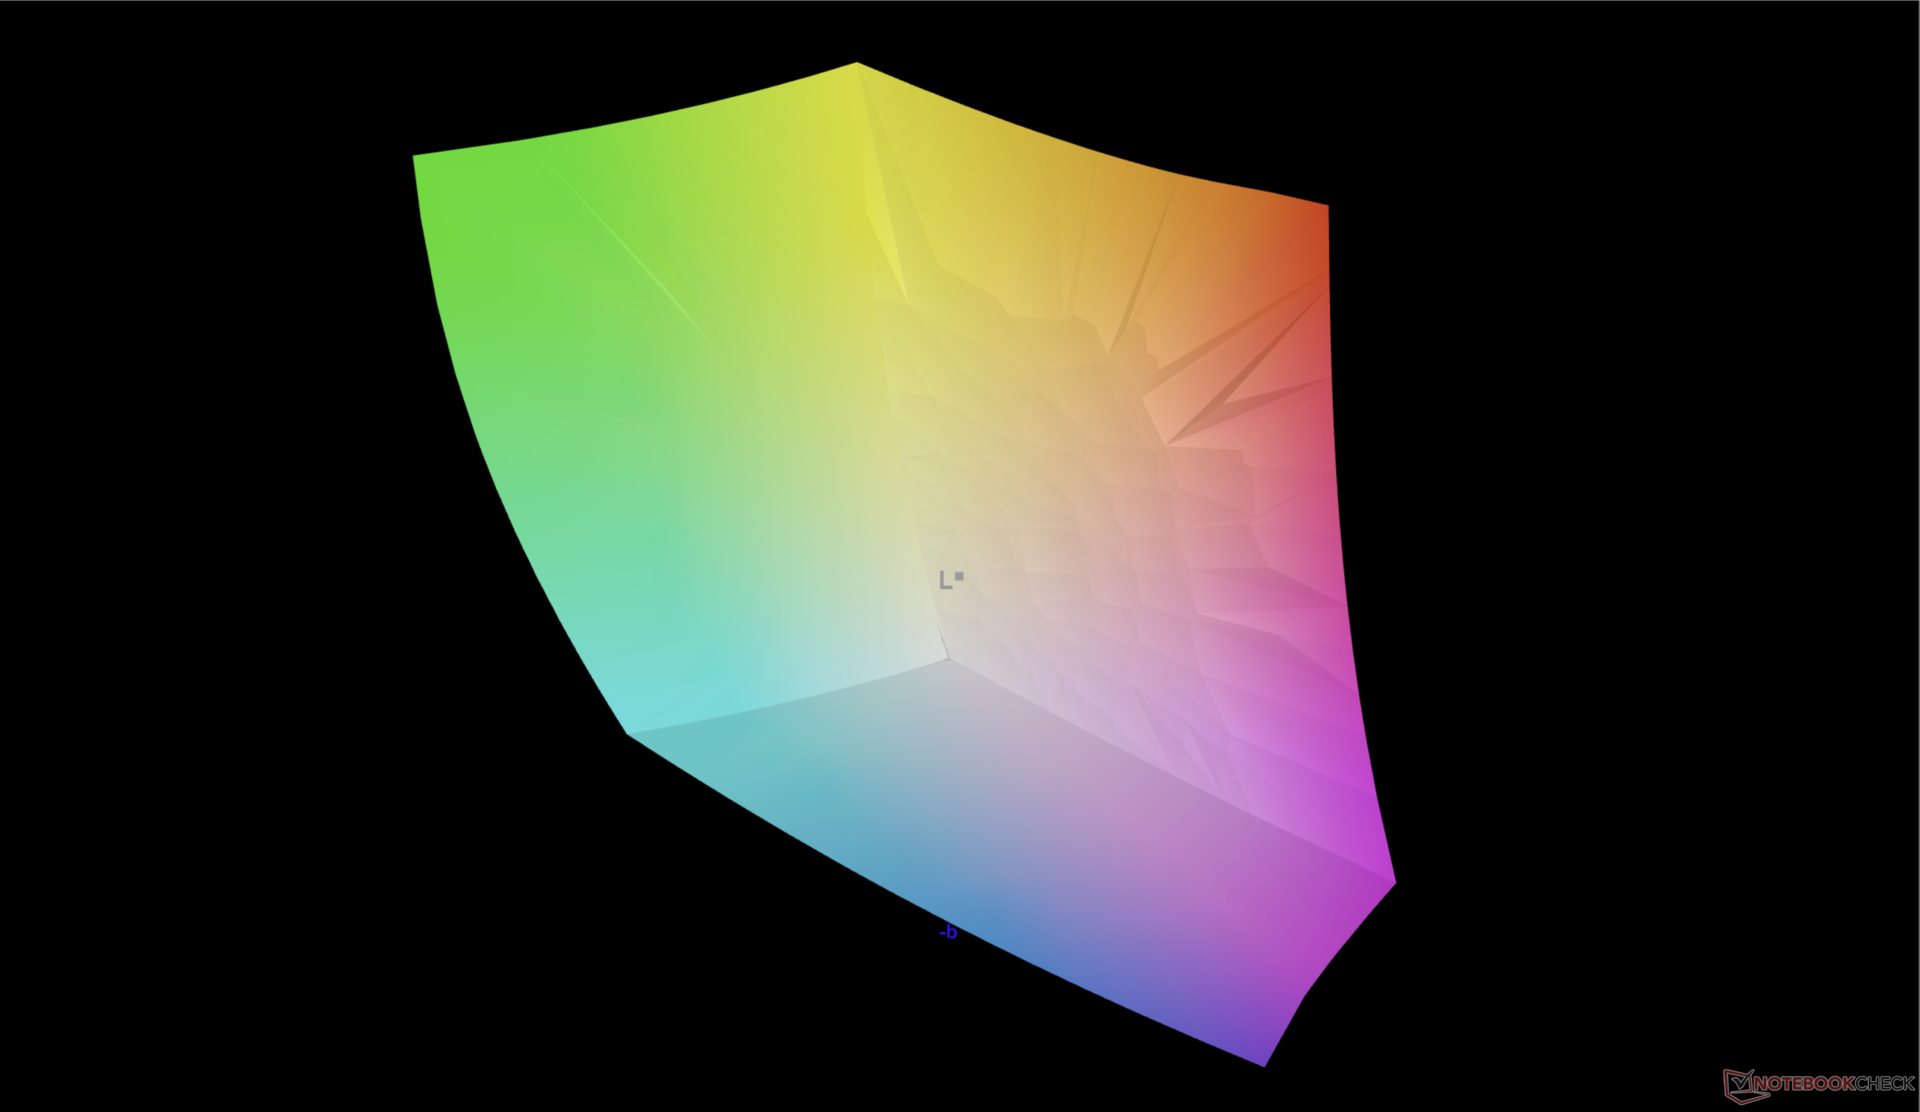
97.5% AdobeRGB 1998 (Argyll 3D)
100% sRGB (Argyll 3D)
99.9% Display P3 (Argyll 3D)
Gamma: 2.12
CCT: 6704 K
| Dell Precision 7670 Samsung 160YV03, OLED, 3840x2400, 16" | Lenovo ThinkPad P1 G4-20Y4Z9DVUS NE160QDM-N63, IPS, 2560x1600, 16" | Asus ProArt StudioBook 16 W7600H5A-2BL2 ATNA60YV02-0, OLED, 3840x2400, 16" | Dell Precision 5000 5560 Sharp LQ156R1, IPS, 3840x2400, 15.6" | Dell Precision 7550 AU Optronics B156ZAN, IPS, 3840x2160, 15.6" | HP ZBook Fury 15 G8 BOE0969, IPS, 3840x2160, 15.6" | |
|---|---|---|---|---|---|---|
| Display | -17% | 0% | -1% | -6% | -5% | |
| Display P3 Coverage (%) | 99.9 | 72.7 -27% | 99.9 0% | 94.9 -5% | 82.1 -18% | 95.9 -4% |
| sRGB Coverage (%) | 100 | 99.3 -1% | 100 0% | 100 0% | 99.6 0% | 100 0% |
| AdobeRGB 1998 Coverage (%) | 97.5 | 74.7 -23% | 98.6 1% | 100 3% | 96.8 -1% | 87.3 -10% |
| Response Times | -1494% | -3% | -1902% | -2098% | -565% | |
| Response Time Grey 50% / Grey 80% * (ms) | 1.9 ? | 40.8 -2047% | 2 ? -5% | 47.2 ? -2384% | 51.2 ? -2595% | 14.8 ? -679% |
| Response Time Black / White * (ms) | 2 ? | 20.8 -940% | 2 ? -0% | 30.4 ? -1420% | 34 ? -1600% | 11 ? -450% |
| PWM Frequency (Hz) | 59.5 ? | 240 ? | ||||
| Screen | 7% | 18% | -4% | -16% | -10% | |
| Brightness middle (cd/m²) | 340.1 | 441 30% | 353 4% | 501.5 47% | 473.5 39% | 626 84% |
| Brightness (cd/m²) | 342 | 420 23% | 360 5% | 467 37% | 461 35% | 589 72% |
| Brightness Distribution (%) | 98 | 90 -8% | 96 -2% | 83 -15% | 90 -8% | 87 -11% |
| Black Level * (cd/m²) | 0.27 | 0.44 | 0.55 | 0.58 | ||
| Colorchecker dE 2000 * | 2.5 | 2.6 -4% | 2.45 2% | 4.73 -89% | 4.8 -92% | 5.41 -116% |
| Colorchecker dE 2000 max. * | 8.19 | 6 27% | 3.75 54% | 8.45 -3% | 8.73 -7% | 9.05 -11% |
| Greyscale dE 2000 * | 3.5 | 4.5 -29% | 1.88 46% | 3.6 -3% | 5.6 -60% | 6.2 -77% |
| Gamma | 2.12 104% | 2.18 101% | 2.31 95% | 2.08 106% | 2.34 94% | 2.66 83% |
| CCT | 6704 97% | 6623 98% | 6441 101% | 6447 101% | 7549 86% | 6101 107% |
| Contrast (:1) | 1633 | 1140 | 861 | 1079 | ||
| Colorchecker dE 2000 calibrated * | 1.2 | 2.77 | 0.51 | 3.08 | 0.6 | |
| Color Space (Percent of AdobeRGB 1998) (%) | 86.4 | |||||
| Color Space (Percent of sRGB) (%) | 99.7 | |||||
| Media totale (Programma / Settaggio) | -501% /
-273% | 5% /
10% | -636% /
-348% | -707% /
-392% | -193% /
-109% |
* ... Meglio usare valori piccoli
In nessuna pubblicità o materiale Dell si parla di un display pre-calibrato in fabbrica. La scala di grigi e i colori sono comunque ragionevolmente precisi sul nostro pannello OLED, con valori medi di deltaE di soli 3,5 e 2,5, rispettivamente.
Tempi di risposta del Display
| ↔ Tempi di risposta dal Nero al Bianco | ||
|---|---|---|
| 2 ms ... aumenta ↗ e diminuisce ↘ combinato | ↗ 0.8 ms Incremento | 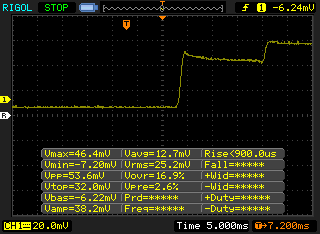 |
| ↘ 1.2 ms Calo | ||
| Lo schermo ha mostrato valori di risposta molto veloci nei nostri tests ed è molto adatto per i gaming veloce. In confronto, tutti i dispositivi di test variano da 0.1 (minimo) a 240 (massimo) ms. » 11 % di tutti i dispositivi è migliore. Questo significa che i tempi di risposta rilevati sono migliori rispettto alla media di tutti i dispositivi testati (19.8 ms). | ||
| ↔ Tempo di risposta dal 50% Grigio all'80% Grigio | ||
| 1.9 ms ... aumenta ↗ e diminuisce ↘ combinato | ↗ 1.1 ms Incremento | 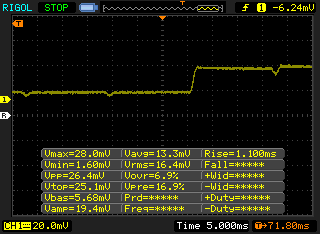 |
| ↘ 0.8 ms Calo | ||
| Lo schermo ha mostrato valori di risposta molto veloci nei nostri tests ed è molto adatto per i gaming veloce. In confronto, tutti i dispositivi di test variano da 0.165 (minimo) a 636 (massimo) ms. » 9 % di tutti i dispositivi è migliore. Questo significa che i tempi di risposta rilevati sono migliori rispettto alla media di tutti i dispositivi testati (31 ms). | ||
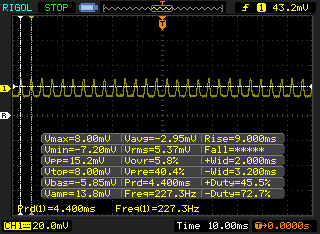
Sfarfallio dello schermo / PWM (Pulse-Width Modulation)
| flickering dello schermo / PWM rilevato | 59.5 Hz | ≤ 100 % settaggio luminosita' |  |
Il display sfarfalla a 59.5 Hz (Probabilmente a causa dell'uso di PWM) Flickering rilevato ad una luminosita' di 100 % o inferiore. Non dovrebbe verificarsi flickering o PWM sopra questo valore di luminosita'. La frequenza di 59.5 Hz è molto bassa, quindi il flickering potrebbe causare stanchezza agli occhi e mal di testa con un utilizzo prolungato. In confronto: 52 % di tutti i dispositivi testati non utilizza PWM per ridurre la luminosita' del display. Se è rilevato PWM, una media di 7757 (minimo: 5 - massimo: 343500) Hz è stata rilevata. | |||
Lo sfarfallio è presente a tutti i livelli di luminosità, come nella maggior parte degli altri pannelli OLED. Siamo riusciti a rilevare una frequenza di 250 Hz dall'1 al 56% di luminosità e di 59,5 Hz dal 57% di luminosità al massimo.
Nonostante si tratti di un display tecnicamente "antiriflesso", i riflessi sono molto forti. La retroilluminazione non è abbastanza luminosa per una visione confortevole nella maggior parte degli scenari esterni, a meno che non ci si trovi all'ombra. Se la visibilità all'aperto è importante, vi consigliamo di provare l'HP ZBook Fury 15 G8.HP ZBook Fury 15 G8 che ha un display quasi due volte più luminoso della nostra unità Precision.
Prestazioni - Intel vPro per tutti
Condizioni di test
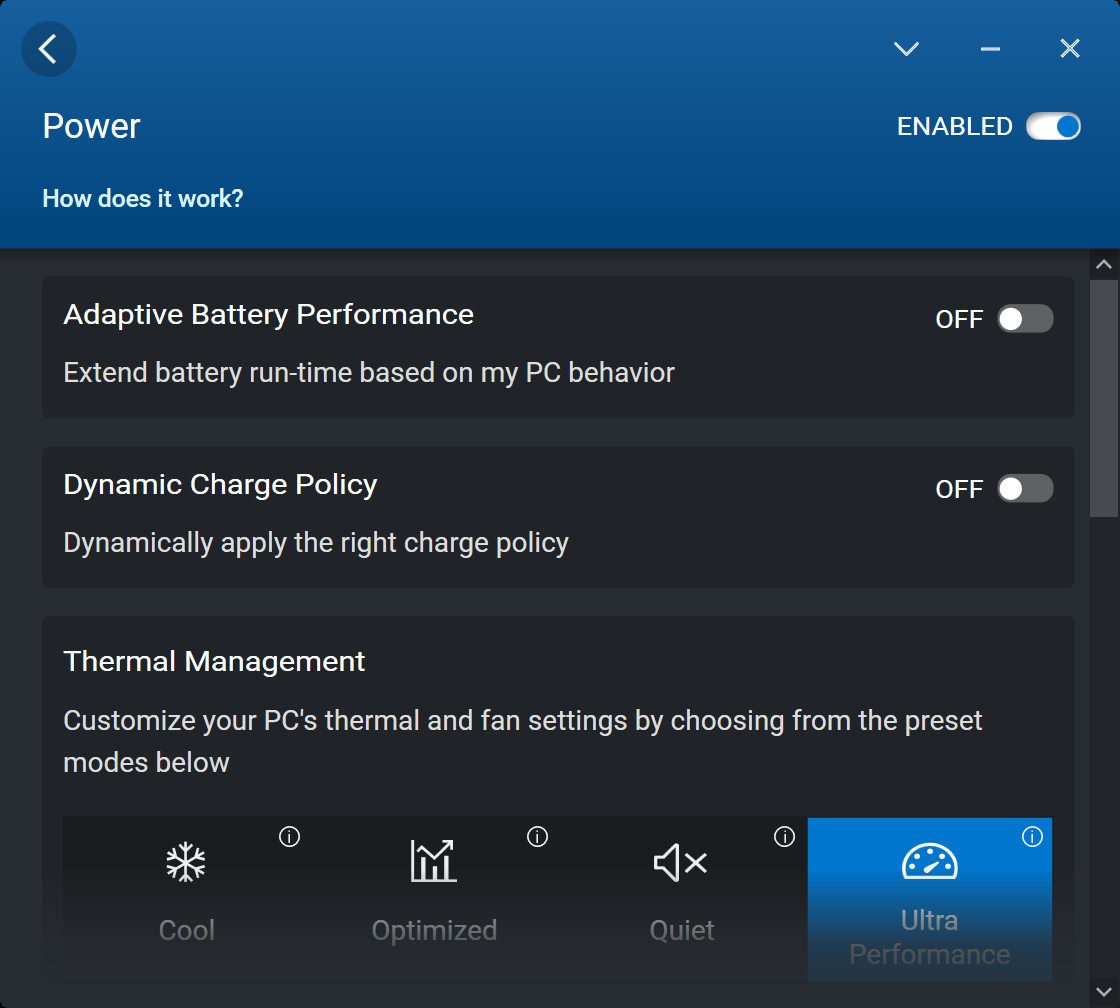
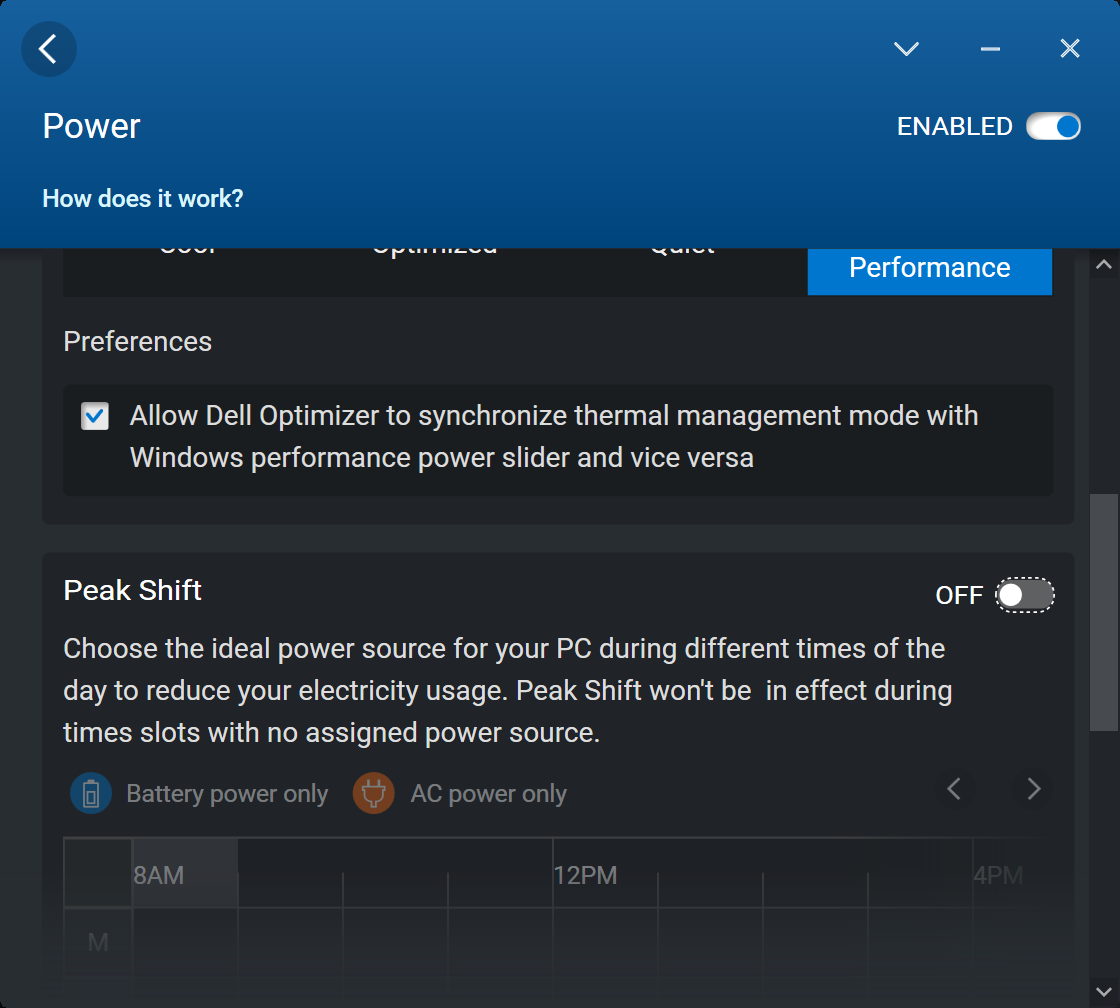
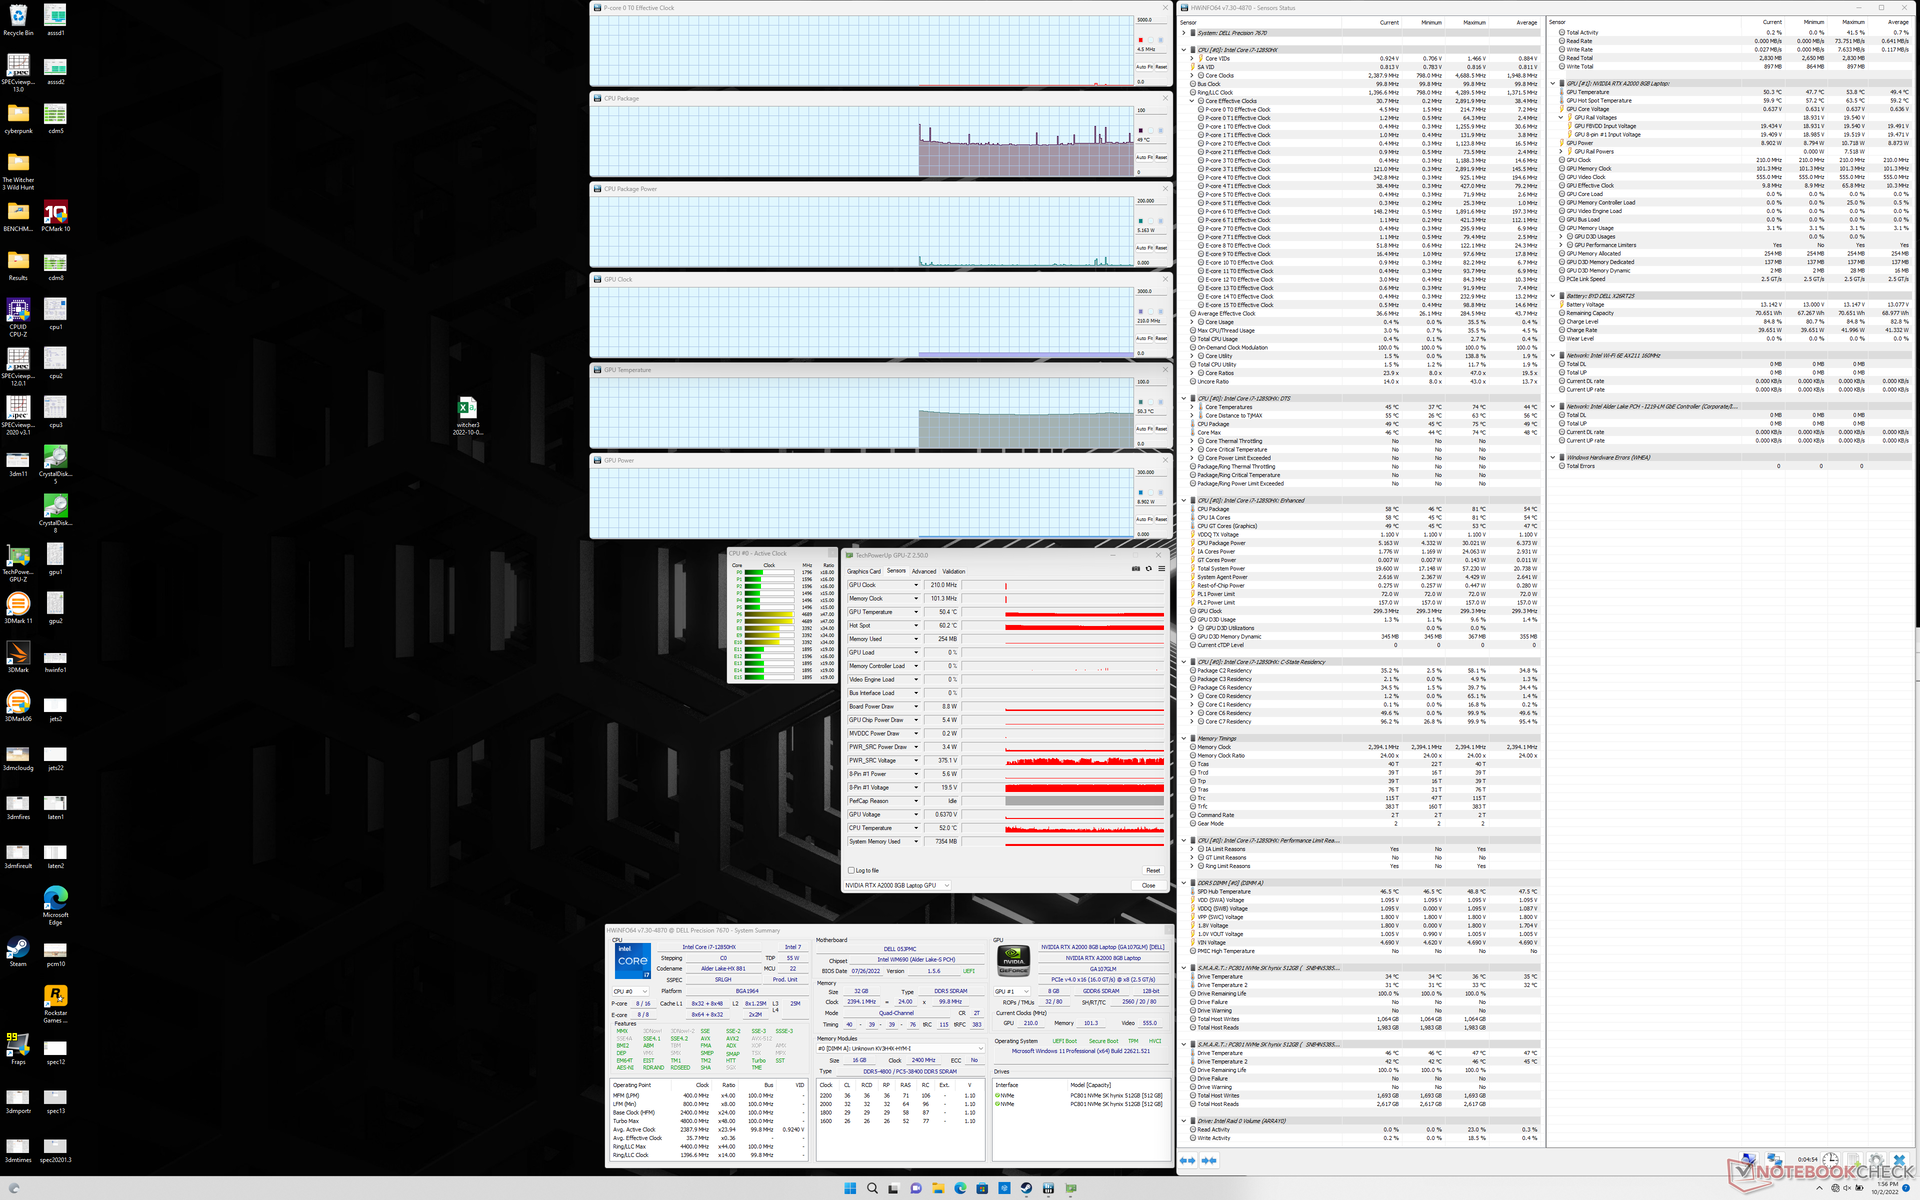
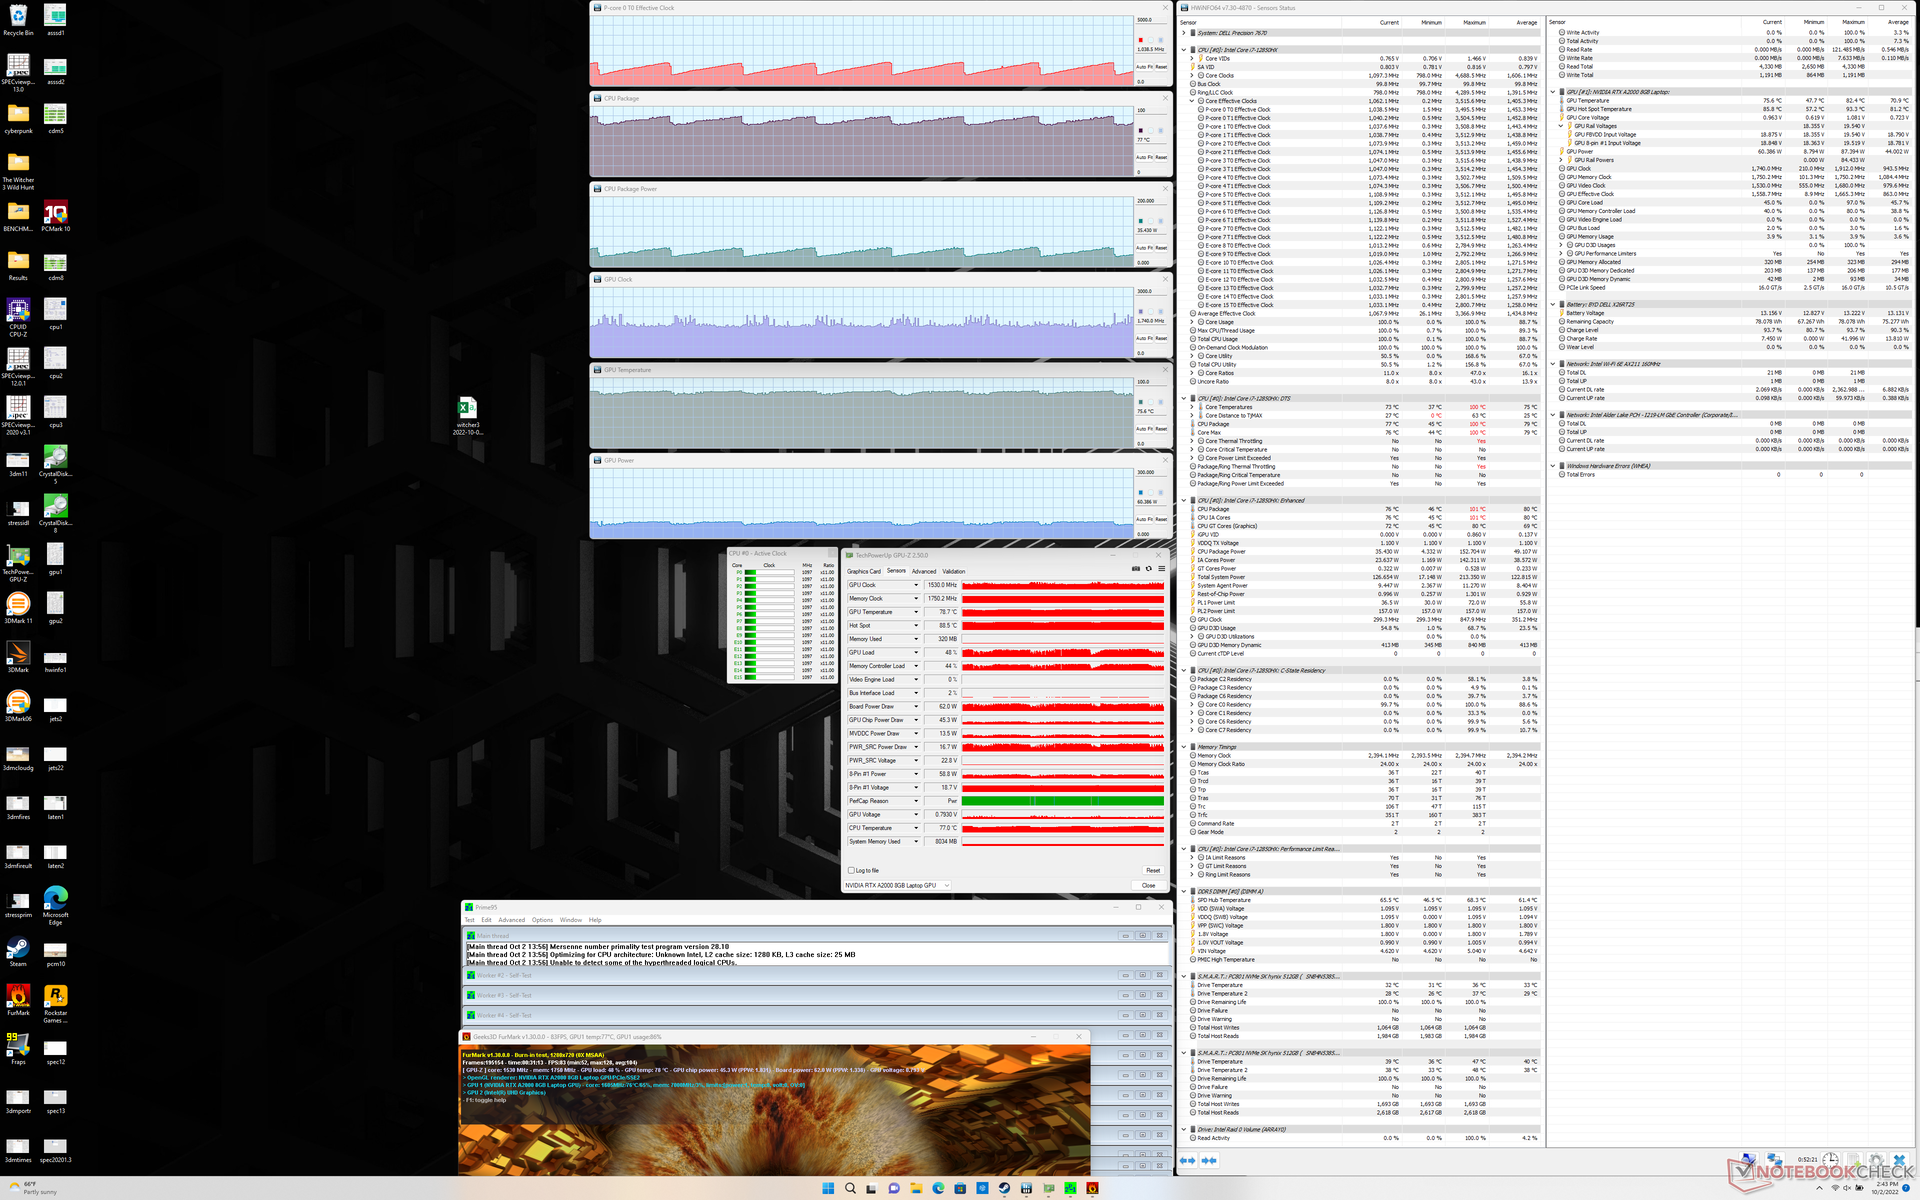
Abbiamo impostato la nostra unità in modalità Ultra Performance tramite il software Dell Optimizer e la GPU in modalità discreta tramite il pannello di controllo Nvidia prima di eseguire i benchmark qui sotto. Purtroppo, il profilo di alimentazione può essere regolato tramite Windows, Dell Optimizer o Dell Power Manager, il che può creare molta confusione. Si consiglia di attivare la sincronizzazione del profilo energetico tra le tre diverse applicazioni tramite Optimizer, come mostrato nella schermata sottostante.
Processore
Sulla carta, il Core i7-12850HX condivide frequenze di clock, numero di core e dimensioni della cache simili a quelle del modello i7-12800HX ma con l'aggiunta del supporto vPro. In realtà, però, le loro prestazioni possono variare in modo significativo
Le prestazioni della CPU sono più vicine a quelle del Core i7-12800H che al Core i7-12800HX. In effetti, le prestazioni multi-thread sono più lente di circa il 30% rispetto all'i7-12800HX, come si vede nel modello MSI GE67 HX MSI GE67 HXa causa della soluzione di raffreddamento più performante. Nonostante ciò, le prestazioni sono ancora tra le più veloci rispetto ad altre workstation, dato che molte di esse utilizzano ancora CPU Intel di 11a generazione.
La sostenibilità del Turbo Boost avrebbe potuto essere migliore. Quando si esegue CineBench R15 xT in loop, le prestazioni calano fino al 25% dopo due o tre ripetizioni, il che spiega l'ampio deficit di prestazioni rispetto al Core i7-12800HX di cui sopra.
Cinebench R15 Multi Loop
Cinebench R23: Multi Core | Single Core
Cinebench R15: CPU Multi 64Bit | CPU Single 64Bit
Blender: v2.79 BMW27 CPU
7-Zip 18.03: 7z b 4 | 7z b 4 -mmt1
Geekbench 5.5: Multi-Core | Single-Core
HWBOT x265 Benchmark v2.2: 4k Preset
LibreOffice : 20 Documents To PDF
R Benchmark 2.5: Overall mean
| Cinebench R20 / CPU (Multi Core) | |
| MSI GE67 HX 12UGS | |
| Media Intel Core i7-12850HX (6217 - 6764, n=2) | |
| Dell Precision 7670 | |
| Razer Blade 17 RTX 3080 Ti | |
| Lenovo Legion 7 16ARHA7 | |
| HP Envy 16 h0112nr | |
| Asus Zenbook Pro 15 OLED UM535Q | |
| Lenovo ThinkPad P1 G4-20Y4Z9DVUS | |
| HP ZBook Fury 15 G8 | |
| Dell Precision 5000 5470 | |
| Asus ProArt StudioBook 16 W7600H5A-2BL2 | |
| Dell Precision 7550 | |
| Dell Precision 5000 5560 | |
| Cinebench R20 / CPU (Single Core) | |
| Razer Blade 17 RTX 3080 Ti | |
| Media Intel Core i7-12850HX (687 - 708, n=2) | |
| Dell Precision 7670 | |
| Dell Precision 5000 5470 | |
| HP Envy 16 h0112nr | |
| MSI GE67 HX 12UGS | |
| HP ZBook Fury 15 G8 | |
| Lenovo Legion 7 16ARHA7 | |
| Lenovo ThinkPad P1 G4-20Y4Z9DVUS | |
| Dell Precision 5000 5560 | |
| Asus Zenbook Pro 15 OLED UM535Q | |
| Asus ProArt StudioBook 16 W7600H5A-2BL2 | |
| Dell Precision 7550 | |
| Cinebench R23 / Multi Core | |
| MSI GE67 HX 12UGS | |
| Media Intel Core i7-12850HX (15093 - 17510, n=2) | |
| Razer Blade 17 RTX 3080 Ti | |
| Dell Precision 7670 | |
| Lenovo Legion 7 16ARHA7 | |
| HP Envy 16 h0112nr | |
| Dell Precision 5000 5470 | |
| Asus Zenbook Pro 15 OLED UM535Q | |
| Lenovo ThinkPad P1 G4-20Y4Z9DVUS | |
| HP ZBook Fury 15 G8 | |
| Asus ProArt StudioBook 16 W7600H5A-2BL2 | |
| Dell Precision 5000 5560 | |
| Cinebench R23 / Single Core | |
| Razer Blade 17 RTX 3080 Ti | |
| MSI GE67 HX 12UGS | |
| Dell Precision 5000 5470 | |
| HP Envy 16 h0112nr | |
| Media Intel Core i7-12850HX (1596 - 1845, n=2) | |
| HP ZBook Fury 15 G8 | |
| Dell Precision 7670 | |
| Lenovo Legion 7 16ARHA7 | |
| Dell Precision 5000 5560 | |
| Lenovo ThinkPad P1 G4-20Y4Z9DVUS | |
| Asus ProArt StudioBook 16 W7600H5A-2BL2 | |
| Asus Zenbook Pro 15 OLED UM535Q | |
| Cinebench R15 / CPU Multi 64Bit | |
| MSI GE67 HX 12UGS | |
| Media Intel Core i7-12850HX (2432 - 2926, n=2) | |
| HP Envy 16 h0112nr | |
| Dell Precision 7670 | |
| Lenovo Legion 7 16ARHA7 | |
| Dell Precision 5000 5470 | |
| Razer Blade 17 RTX 3080 Ti | |
| Asus Zenbook Pro 15 OLED UM535Q | |
| Lenovo ThinkPad P1 G4-20Y4Z9DVUS | |
| Asus ProArt StudioBook 16 W7600H5A-2BL2 | |
| HP ZBook Fury 15 G8 | |
| Dell Precision 7550 | |
| Dell Precision 5000 5560 | |
| Cinebench R15 / CPU Single 64Bit | |
| Razer Blade 17 RTX 3080 Ti | |
| Media Intel Core i7-12850HX (253 - 268, n=2) | |
| MSI GE67 HX 12UGS | |
| HP Envy 16 h0112nr | |
| Dell Precision 7670 | |
| Lenovo Legion 7 16ARHA7 | |
| Dell Precision 5000 5470 | |
| HP ZBook Fury 15 G8 | |
| Asus Zenbook Pro 15 OLED UM535Q | |
| Dell Precision 5000 5560 | |
| Lenovo ThinkPad P1 G4-20Y4Z9DVUS | |
| Asus ProArt StudioBook 16 W7600H5A-2BL2 | |
| Dell Precision 7550 | |
| Blender / v2.79 BMW27 CPU | |
| Dell Precision 5000 5560 | |
| Dell Precision 7550 | |
| Asus ProArt StudioBook 16 W7600H5A-2BL2 | |
| HP ZBook Fury 15 G8 | |
| Lenovo ThinkPad P1 G4-20Y4Z9DVUS | |
| HP Envy 16 h0112nr | |
| Dell Precision 5000 5470 | |
| Asus Zenbook Pro 15 OLED UM535Q | |
| Razer Blade 17 RTX 3080 Ti | |
| Lenovo Legion 7 16ARHA7 | |
| Dell Precision 7670 | |
| Media Intel Core i7-12850HX (181 - 205, n=2) | |
| MSI GE67 HX 12UGS | |
| 7-Zip 18.03 / 7z b 4 | |
| MSI GE67 HX 12UGS | |
| Lenovo Legion 7 16ARHA7 | |
| Razer Blade 17 RTX 3080 Ti | |
| Media Intel Core i7-12850HX (53893 - 69464, n=2) | |
| Asus Zenbook Pro 15 OLED UM535Q | |
| HP Envy 16 h0112nr | |
| Dell Precision 7670 | |
| Dell Precision 5000 5470 | |
| Lenovo ThinkPad P1 G4-20Y4Z9DVUS | |
| HP ZBook Fury 15 G8 | |
| Dell Precision 7550 | |
| Asus ProArt StudioBook 16 W7600H5A-2BL2 | |
| Dell Precision 5000 5560 | |
| 7-Zip 18.03 / 7z b 4 -mmt1 | |
| Razer Blade 17 RTX 3080 Ti | |
| Media Intel Core i7-12850HX (5608 - 5916, n=2) | |
| HP ZBook Fury 15 G8 | |
| Dell Precision 5000 5560 | |
| HP Envy 16 h0112nr | |
| Lenovo Legion 7 16ARHA7 | |
| MSI GE67 HX 12UGS | |
| Dell Precision 7670 | |
| Lenovo ThinkPad P1 G4-20Y4Z9DVUS | |
| Asus Zenbook Pro 15 OLED UM535Q | |
| Dell Precision 5000 5470 | |
| Dell Precision 7550 | |
| Asus ProArt StudioBook 16 W7600H5A-2BL2 | |
| Geekbench 5.5 / Multi-Core | |
| MSI GE67 HX 12UGS | |
| Razer Blade 17 RTX 3080 Ti | |
| HP Envy 16 h0112nr | |
| Media Intel Core i7-12850HX (11509 - 13095, n=2) | |
| Dell Precision 5000 5470 | |
| Dell Precision 7670 | |
| Lenovo Legion 7 16ARHA7 | |
| Asus Zenbook Pro 15 OLED UM535Q | |
| Dell Precision 7550 | |
| Asus ProArt StudioBook 16 W7600H5A-2BL2 | |
| Lenovo ThinkPad P1 G4-20Y4Z9DVUS | |
| Geekbench 5.5 / Single-Core | |
| Dell Precision 5000 5470 | |
| Media Intel Core i7-12850HX (1777 - 1787, n=2) | |
| Dell Precision 7670 | |
| HP Envy 16 h0112nr | |
| MSI GE67 HX 12UGS | |
| Razer Blade 17 RTX 3080 Ti | |
| Lenovo Legion 7 16ARHA7 | |
| Lenovo ThinkPad P1 G4-20Y4Z9DVUS | |
| Asus Zenbook Pro 15 OLED UM535Q | |
| Asus ProArt StudioBook 16 W7600H5A-2BL2 | |
| Dell Precision 7550 | |
| HWBOT x265 Benchmark v2.2 / 4k Preset | |
| MSI GE67 HX 12UGS | |
| Lenovo Legion 7 16ARHA7 | |
| Dell Precision 7670 | |
| Media Intel Core i7-12850HX (17.2 - 17.3, n=2) | |
| Razer Blade 17 RTX 3080 Ti | |
| Asus Zenbook Pro 15 OLED UM535Q | |
| HP Envy 16 h0112nr | |
| HP ZBook Fury 15 G8 | |
| Lenovo ThinkPad P1 G4-20Y4Z9DVUS | |
| Asus ProArt StudioBook 16 W7600H5A-2BL2 | |
| Dell Precision 5000 5470 | |
| Dell Precision 7550 | |
| Dell Precision 5000 5560 | |
| LibreOffice / 20 Documents To PDF | |
| Lenovo Legion 7 16ARHA7 | |
| HP ZBook Fury 15 G8 | |
| Lenovo ThinkPad P1 G4-20Y4Z9DVUS | |
| Asus Zenbook Pro 15 OLED UM535Q | |
| Dell Precision 7670 | |
| Dell Precision 5000 5560 | |
| Media Intel Core i7-12850HX (46.9 - 48.6, n=2) | |
| Dell Precision 7550 | |
| Razer Blade 17 RTX 3080 Ti | |
| Dell Precision 5000 5470 | |
| HP Envy 16 h0112nr | |
| MSI GE67 HX 12UGS | |
| Asus ProArt StudioBook 16 W7600H5A-2BL2 | |
| R Benchmark 2.5 / Overall mean | |
| Dell Precision 7550 | |
| Asus ProArt StudioBook 16 W7600H5A-2BL2 | |
| Lenovo ThinkPad P1 G4-20Y4Z9DVUS | |
| HP ZBook Fury 15 G8 | |
| Dell Precision 5000 5560 | |
| Asus Zenbook Pro 15 OLED UM535Q | |
| Lenovo Legion 7 16ARHA7 | |
| Dell Precision 5000 5470 | |
| Dell Precision 7670 | |
| Media Intel Core i7-12850HX (0.45 - 0.4698, n=2) | |
| MSI GE67 HX 12UGS | |
| HP Envy 16 h0112nr | |
| Razer Blade 17 RTX 3080 Ti | |
Cinebench R23: Multi Core | Single Core
Cinebench R15: CPU Multi 64Bit | CPU Single 64Bit
Blender: v2.79 BMW27 CPU
7-Zip 18.03: 7z b 4 | 7z b 4 -mmt1
Geekbench 5.5: Multi-Core | Single-Core
HWBOT x265 Benchmark v2.2: 4k Preset
LibreOffice : 20 Documents To PDF
R Benchmark 2.5: Overall mean
* ... Meglio usare valori piccoli
AIDA64: FP32 Ray-Trace | FPU Julia | CPU SHA3 | CPU Queen | FPU SinJulia | FPU Mandel | CPU AES | CPU ZLib | FP64 Ray-Trace | CPU PhotoWorxx
| Performance rating | |
| Media Intel Core i7-12850HX | |
| HP ZBook Fury 15 G8 | |
| Lenovo ThinkPad P1 G4-20Y4Z9DVUS | |
| Dell Precision 7670 | |
| Asus ProArt StudioBook 16 W7600H5A-2BL2 -9! | |
| Dell Precision 5000 5560 -9! | |
| AIDA64 / FP32 Ray-Trace | |
| Lenovo ThinkPad P1 G4-20Y4Z9DVUS | |
| Media Intel Core i7-12850HX (12983 - 16752, n=2) | |
| HP ZBook Fury 15 G8 | |
| Dell Precision 7670 | |
| AIDA64 / FPU Julia | |
| Media Intel Core i7-12850HX (68219 - 87231, n=2) | |
| Dell Precision 7670 | |
| Lenovo ThinkPad P1 G4-20Y4Z9DVUS | |
| HP ZBook Fury 15 G8 | |
| AIDA64 / CPU SHA3 | |
| Lenovo ThinkPad P1 G4-20Y4Z9DVUS | |
| HP ZBook Fury 15 G8 | |
| Media Intel Core i7-12850HX (3098 - 3818, n=2) | |
| Dell Precision 7670 | |
| AIDA64 / CPU Queen | |
| HP ZBook Fury 15 G8 | |
| Lenovo ThinkPad P1 G4-20Y4Z9DVUS | |
| Media Intel Core i7-12850HX (26716 - 95664, n=2) | |
| Dell Precision 7670 | |
| AIDA64 / FPU SinJulia | |
| Media Intel Core i7-12850HX (9869 - 11286, n=2) | |
| HP ZBook Fury 15 G8 | |
| Dell Precision 7670 | |
| Lenovo ThinkPad P1 G4-20Y4Z9DVUS | |
| AIDA64 / FPU Mandel | |
| Media Intel Core i7-12850HX (34218 - 42580, n=2) | |
| Lenovo ThinkPad P1 G4-20Y4Z9DVUS | |
| HP ZBook Fury 15 G8 | |
| Dell Precision 7670 | |
| AIDA64 / CPU AES | |
| Lenovo ThinkPad P1 G4-20Y4Z9DVUS | |
| HP ZBook Fury 15 G8 | |
| Media Intel Core i7-12850HX (63362 - 80775, n=2) | |
| Dell Precision 7670 | |
| AIDA64 / CPU ZLib | |
| Media Intel Core i7-12850HX (817 - 1102, n=2) | |
| Dell Precision 7670 | |
| Lenovo ThinkPad P1 G4-20Y4Z9DVUS | |
| HP ZBook Fury 15 G8 | |
| Asus ProArt StudioBook 16 W7600H5A-2BL2 | |
| Asus ProArt StudioBook 16 W7600H5A-2BL2 | |
| Dell Precision 5000 5560 | |
| AIDA64 / FP64 Ray-Trace | |
| Media Intel Core i7-12850HX (7671 - 9145, n=2) | |
| Lenovo ThinkPad P1 G4-20Y4Z9DVUS | |
| HP ZBook Fury 15 G8 | |
| Dell Precision 7670 | |
| AIDA64 / CPU PhotoWorxx | |
| Dell Precision 7670 | |
| Media Intel Core i7-12850HX (33415 - 42035, n=2) | |
| HP ZBook Fury 15 G8 | |
| Lenovo ThinkPad P1 G4-20Y4Z9DVUS | |
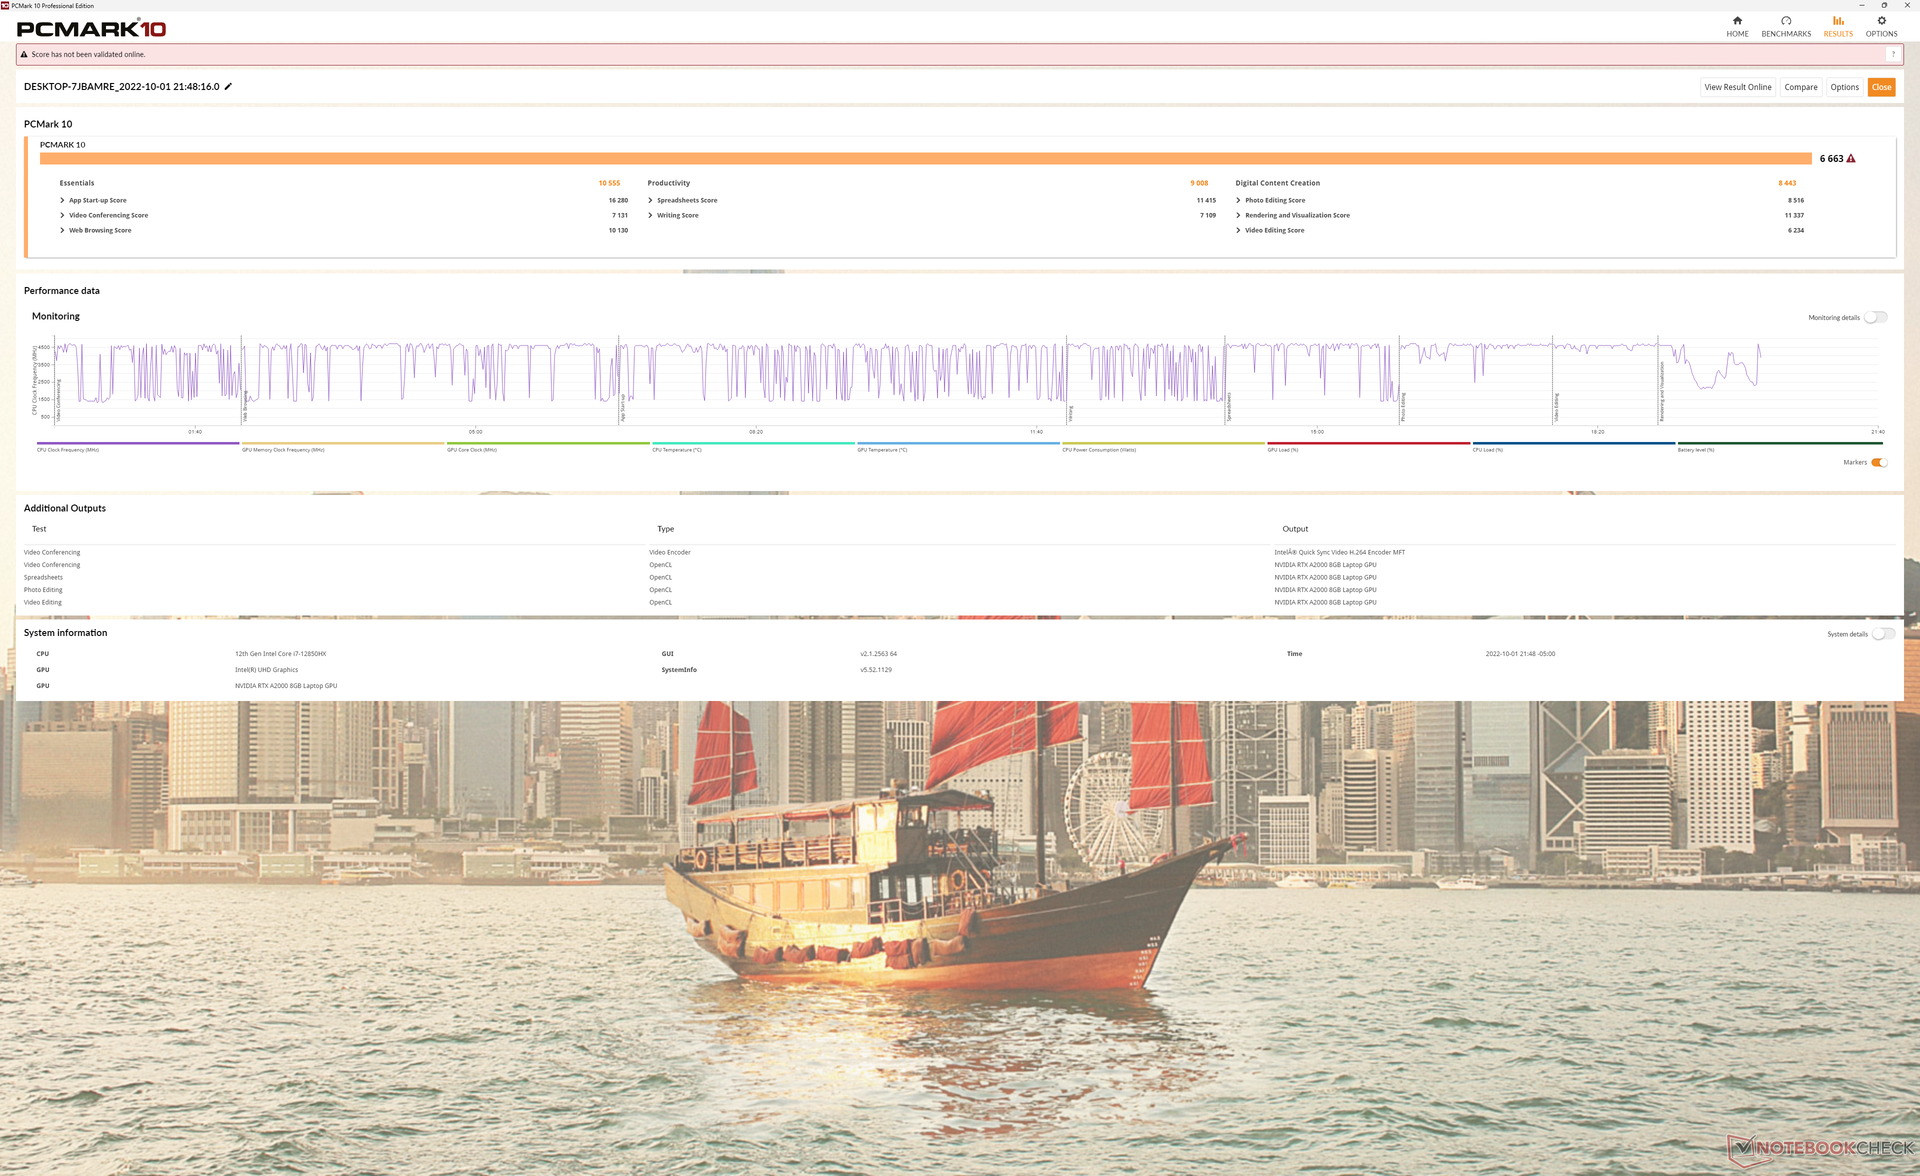
Prestazioni del sistema
I risultati di PCMark 10 sono simili a quelli di altre workstation dotate di CPU Core serie H e GPU Nvidia Quadro. I modelli con la più veloce RTX A5000 come l'HP ZBook Fury 15 G8 superano comunque la nostra unità di test Precision 7670 in benchmark pesanti dal punto di vista della GPU come Digital Content Creation.
CrossMark: Overall | Productivity | Creativity | Responsiveness
| PCMark 10 / Score | |
| Asus ProArt StudioBook 16 W7600H5A-2BL2 | |
| HP ZBook Fury 15 G8 | |
| Dell Precision 5000 5560 | |
| Dell Precision 7670 | |
| Lenovo ThinkPad P1 G4-20Y4Z9DVUS | |
| Dell Precision 7550 | |
| PCMark 10 / Essentials | |
| Dell Precision 5000 5560 | |
| Dell Precision 7670 | |
| Asus ProArt StudioBook 16 W7600H5A-2BL2 | |
| HP ZBook Fury 15 G8 | |
| Lenovo ThinkPad P1 G4-20Y4Z9DVUS | |
| Dell Precision 7550 | |
| PCMark 10 / Productivity | |
| Dell Precision 7670 | |
| Dell Precision 5000 5560 | |
| Asus ProArt StudioBook 16 W7600H5A-2BL2 | |
| HP ZBook Fury 15 G8 | |
| Lenovo ThinkPad P1 G4-20Y4Z9DVUS | |
| Dell Precision 7550 | |
| PCMark 10 / Digital Content Creation | |
| Asus ProArt StudioBook 16 W7600H5A-2BL2 | |
| HP ZBook Fury 15 G8 | |
| Dell Precision 5000 5560 | |
| Dell Precision 7670 | |
| Lenovo ThinkPad P1 G4-20Y4Z9DVUS | |
| Dell Precision 7550 | |
| CrossMark / Overall | |
| Lenovo ThinkPad P1 G4-20Y4Z9DVUS | |
| Dell Precision 7670 | |
| CrossMark / Productivity | |
| Lenovo ThinkPad P1 G4-20Y4Z9DVUS | |
| Dell Precision 7670 | |
| CrossMark / Creativity | |
| Dell Precision 7670 | |
| Lenovo ThinkPad P1 G4-20Y4Z9DVUS | |
| CrossMark / Responsiveness | |
| Lenovo ThinkPad P1 G4-20Y4Z9DVUS | |
| Dell Precision 7670 | |
| PCMark 10 Score | 6663 punti | |
Aiuto | ||
| AIDA64 / Memory Copy | |
| Dell Precision 7670 | |
| HP ZBook Fury 15 G8 | |
| Lenovo ThinkPad P1 G4-20Y4Z9DVUS | |
| AIDA64 / Memory Read | |
| Dell Precision 7670 | |
| HP ZBook Fury 15 G8 | |
| Lenovo ThinkPad P1 G4-20Y4Z9DVUS | |
| AIDA64 / Memory Write | |
| Dell Precision 7670 | |
| HP ZBook Fury 15 G8 | |
| Lenovo ThinkPad P1 G4-20Y4Z9DVUS | |
| AIDA64 / Memory Latency | |
| HP ZBook Fury 15 G8 | |
| Dell Precision 7670 | |
| Lenovo ThinkPad P1 G4-20Y4Z9DVUS | |
| Asus ProArt StudioBook 16 W7600H5A-2BL2 | |
| Asus ProArt StudioBook 16 W7600H5A-2BL2 | |
* ... Meglio usare valori piccoli
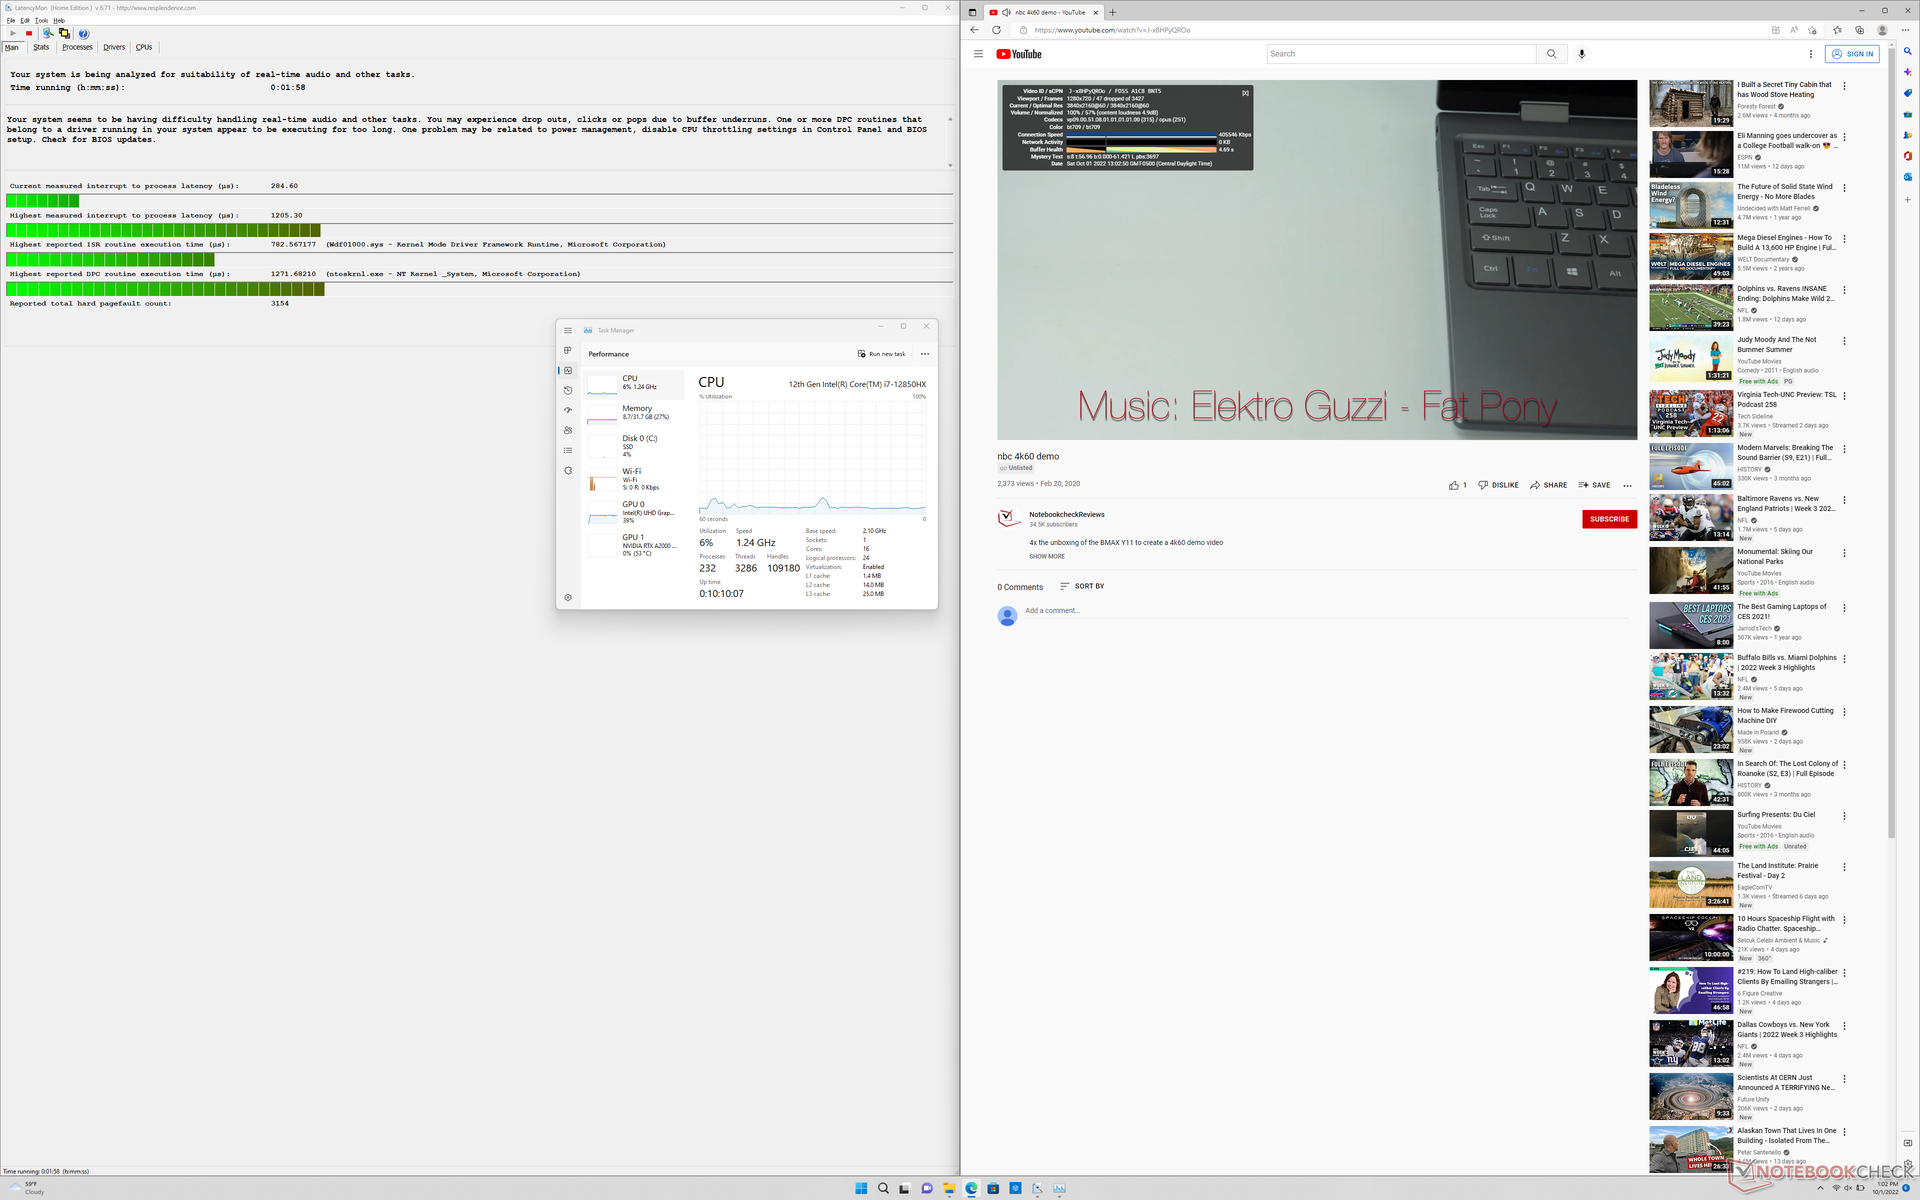
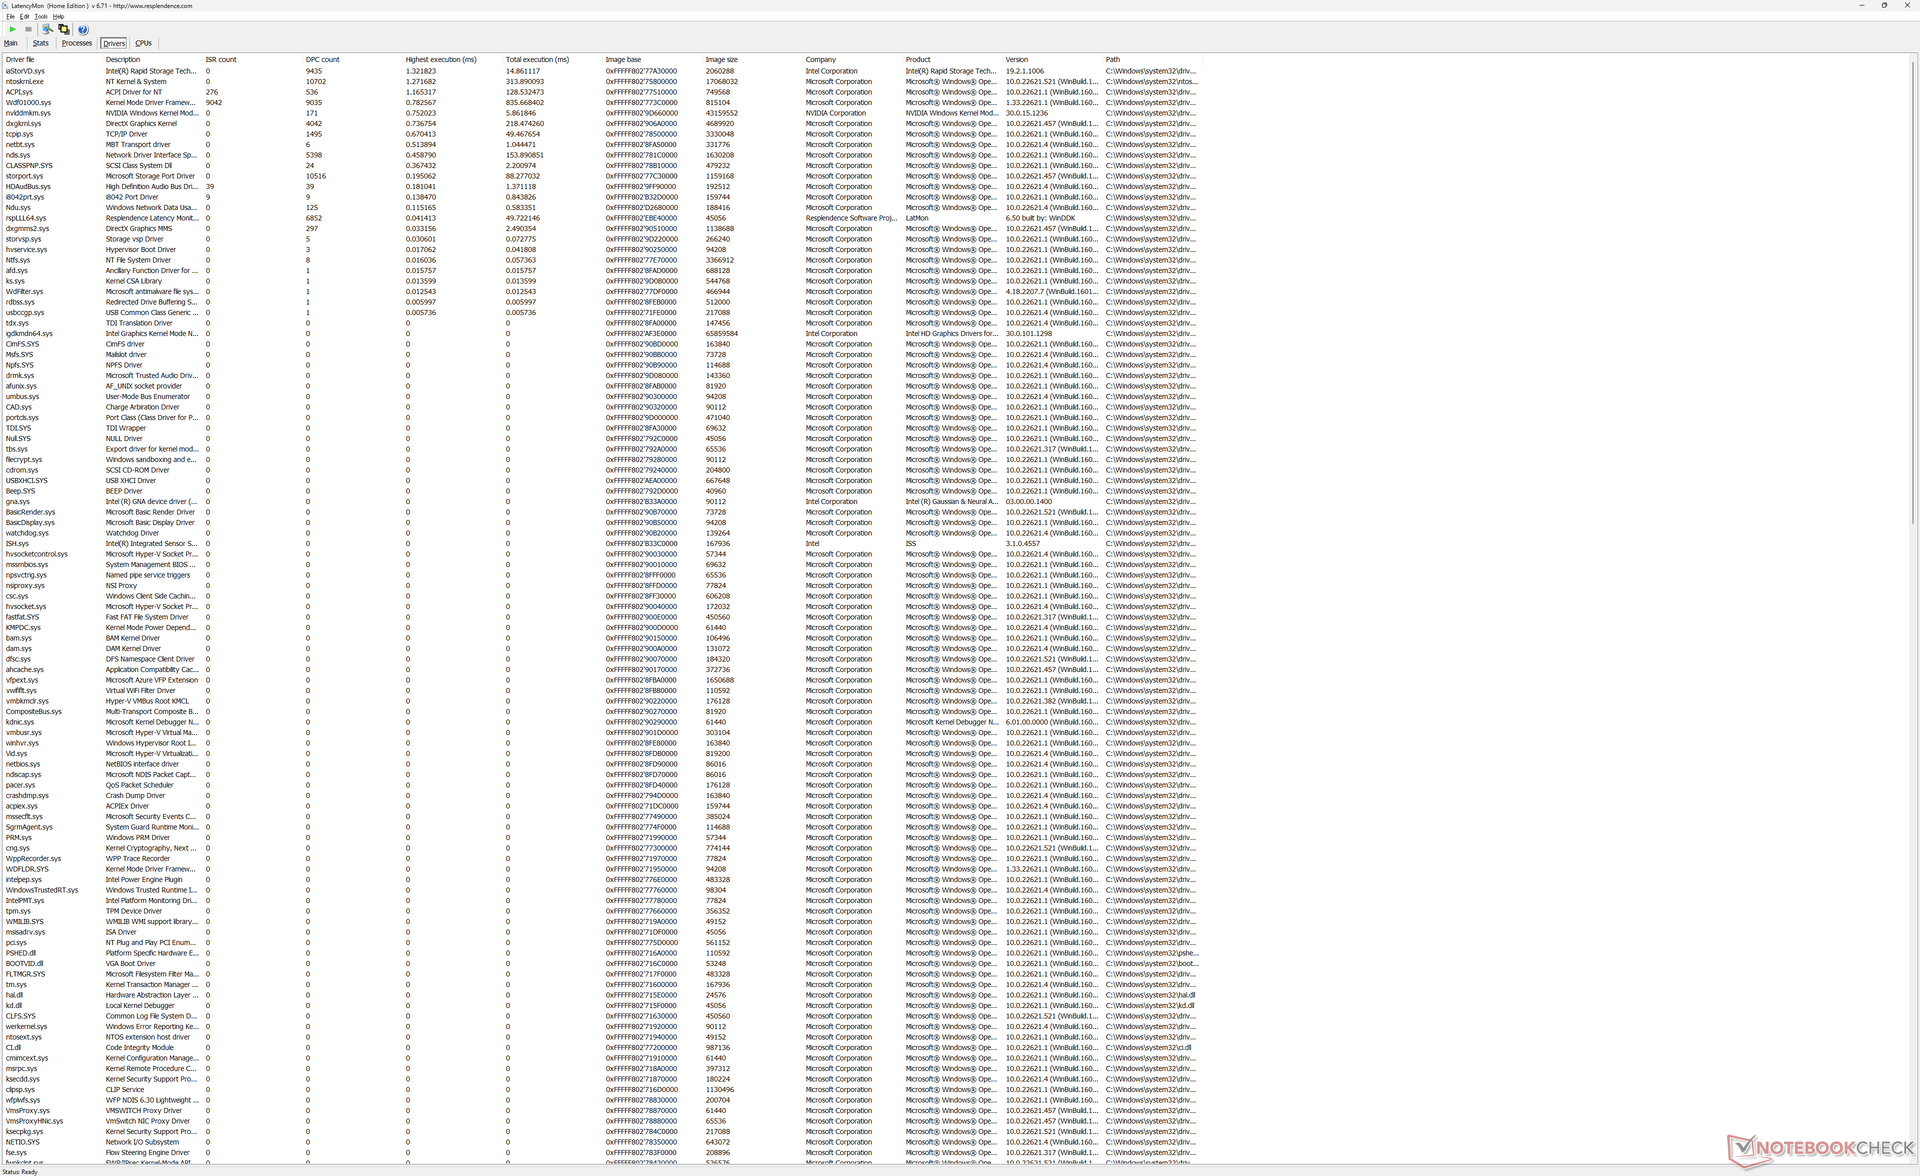
Latenza DPC
latencyMon rivela piccoli problemi di DPC quando si aprono più schede del browser della nostra homepage. Inoltre, la riproduzione di video 4K a 60 FPS è imperfetta, con 47 fotogrammi caduti durante il nostro video di prova della durata di un minuto.
| DPC Latencies / LatencyMon - interrupt to process latency (max), Web, Youtube, Prime95 | |
| Dell Precision 7550 | |
| Asus ProArt StudioBook 16 W7600H5A-2BL2 | |
| Lenovo ThinkPad P1 G4-20Y4Z9DVUS | |
| Dell Precision 7670 | |
| Dell Precision 5000 5560 | |
| HP ZBook Fury 15 G8 | |
* ... Meglio usare valori piccoli
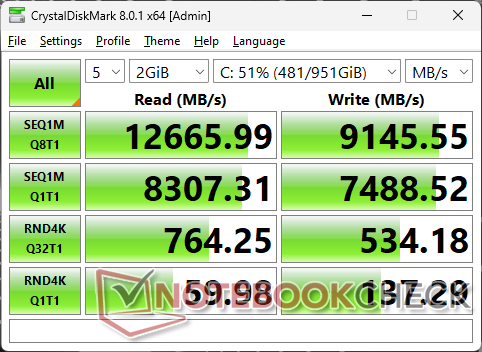
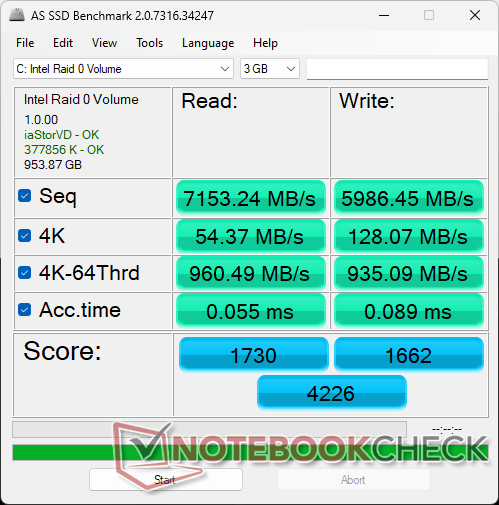
Dispositivi di archiviazione - Velocità pazzesche con PCIe4 x4 RAID 0
Tutte le configurazioni possono supportare fino a due unità SSD M.2, mentre alcune ne supportano fino a tre. La nostra unità di prova specifica è dotata di due SK Hynix PC801 PCIe4 x4 NVMe in RAID 0 per velocità di lettura e scrittura sequenziale di quasi 13000 MB/s e 9200 MB/s, rispettivamente. Quando sono state sollecitate con DiskSpd, le unità non hanno mostrato segni di rallentamento delle prestazioni anche dopo lunghi periodi. Per favorire la dissipazione del calore, le unità SSD in dotazione sono dotate di diffusori di calore o pad termici.

| Drive Performance rating - Percent | |
| Dell Precision 5000 5560 | |
| Dell Precision 7670 | |
| Lenovo ThinkPad P1 G4-20Y4Z9DVUS | |
| Asus ProArt StudioBook 16 W7600H5A-2BL2 | |
| HP ZBook Fury 15 G8 | |
| Dell Precision 7550 | |
* ... Meglio usare valori piccoli
Disk Throttling: DiskSpd Read Loop, Queue Depth 8
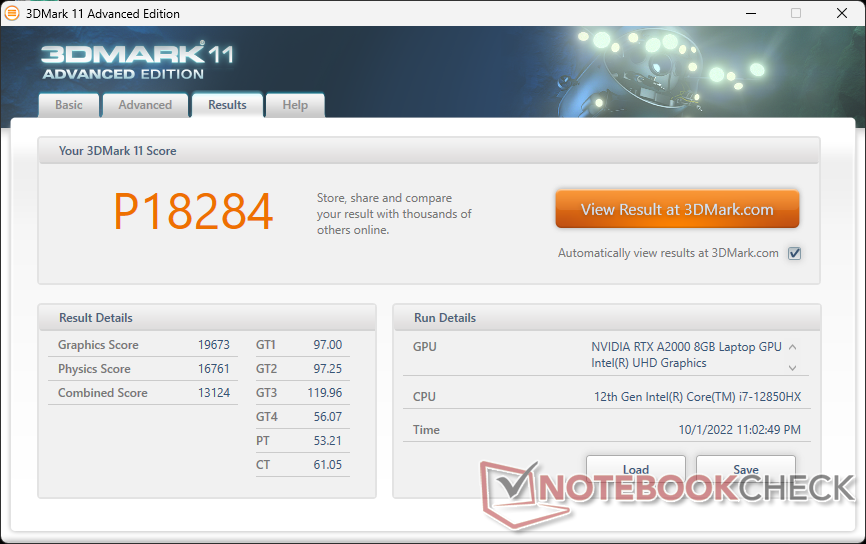
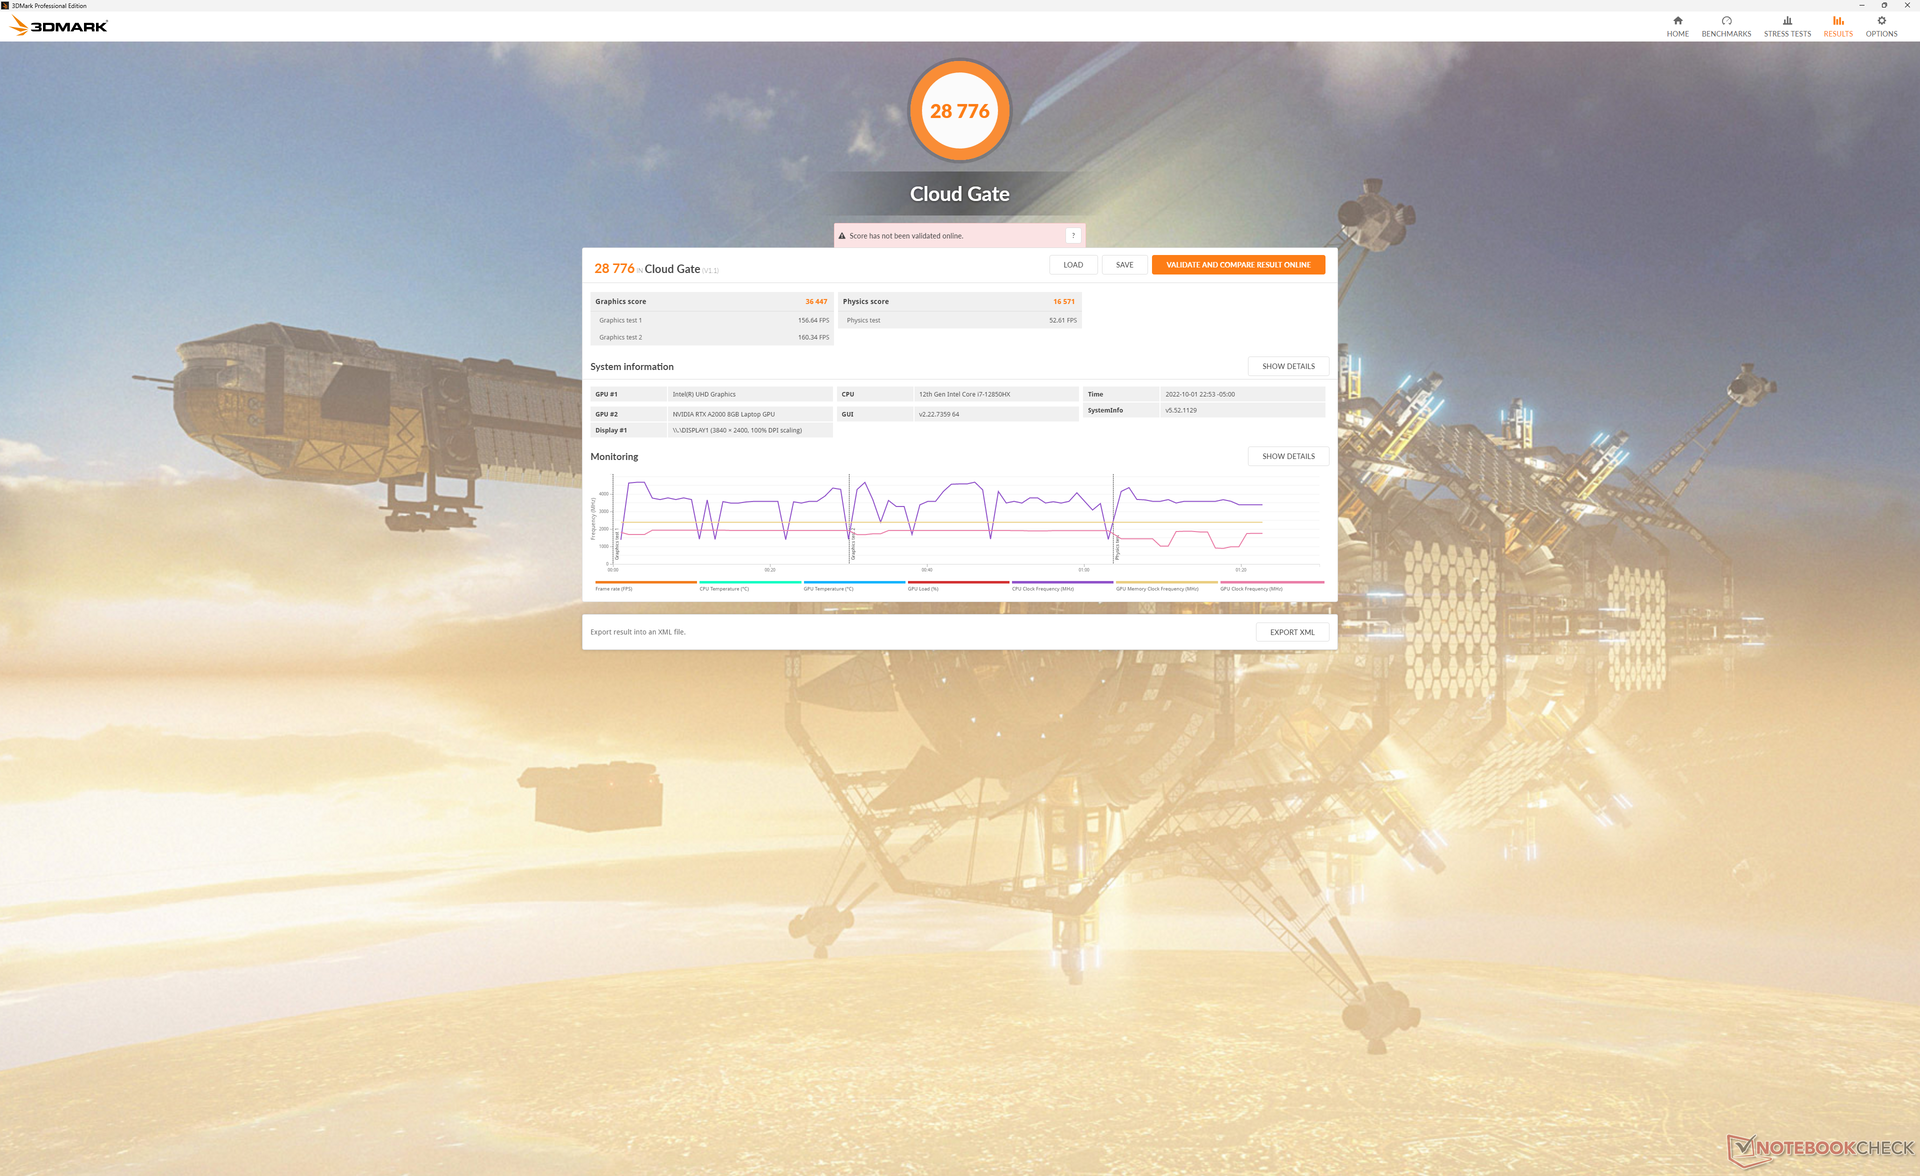
Prestazioni della GPU - Grafica TGP a 95 W
Il RTX A2000 è derivata dalla GeForce RTX 3050 Ti e quindi entrambe le GPU condividono numeri simili di prestazioni grezze. L'aggiornamento alla RTX A3000 o RTX A5500 dovrebbe aumentare le prestazioni rispettivamente del 15-20% e del 70-90%.
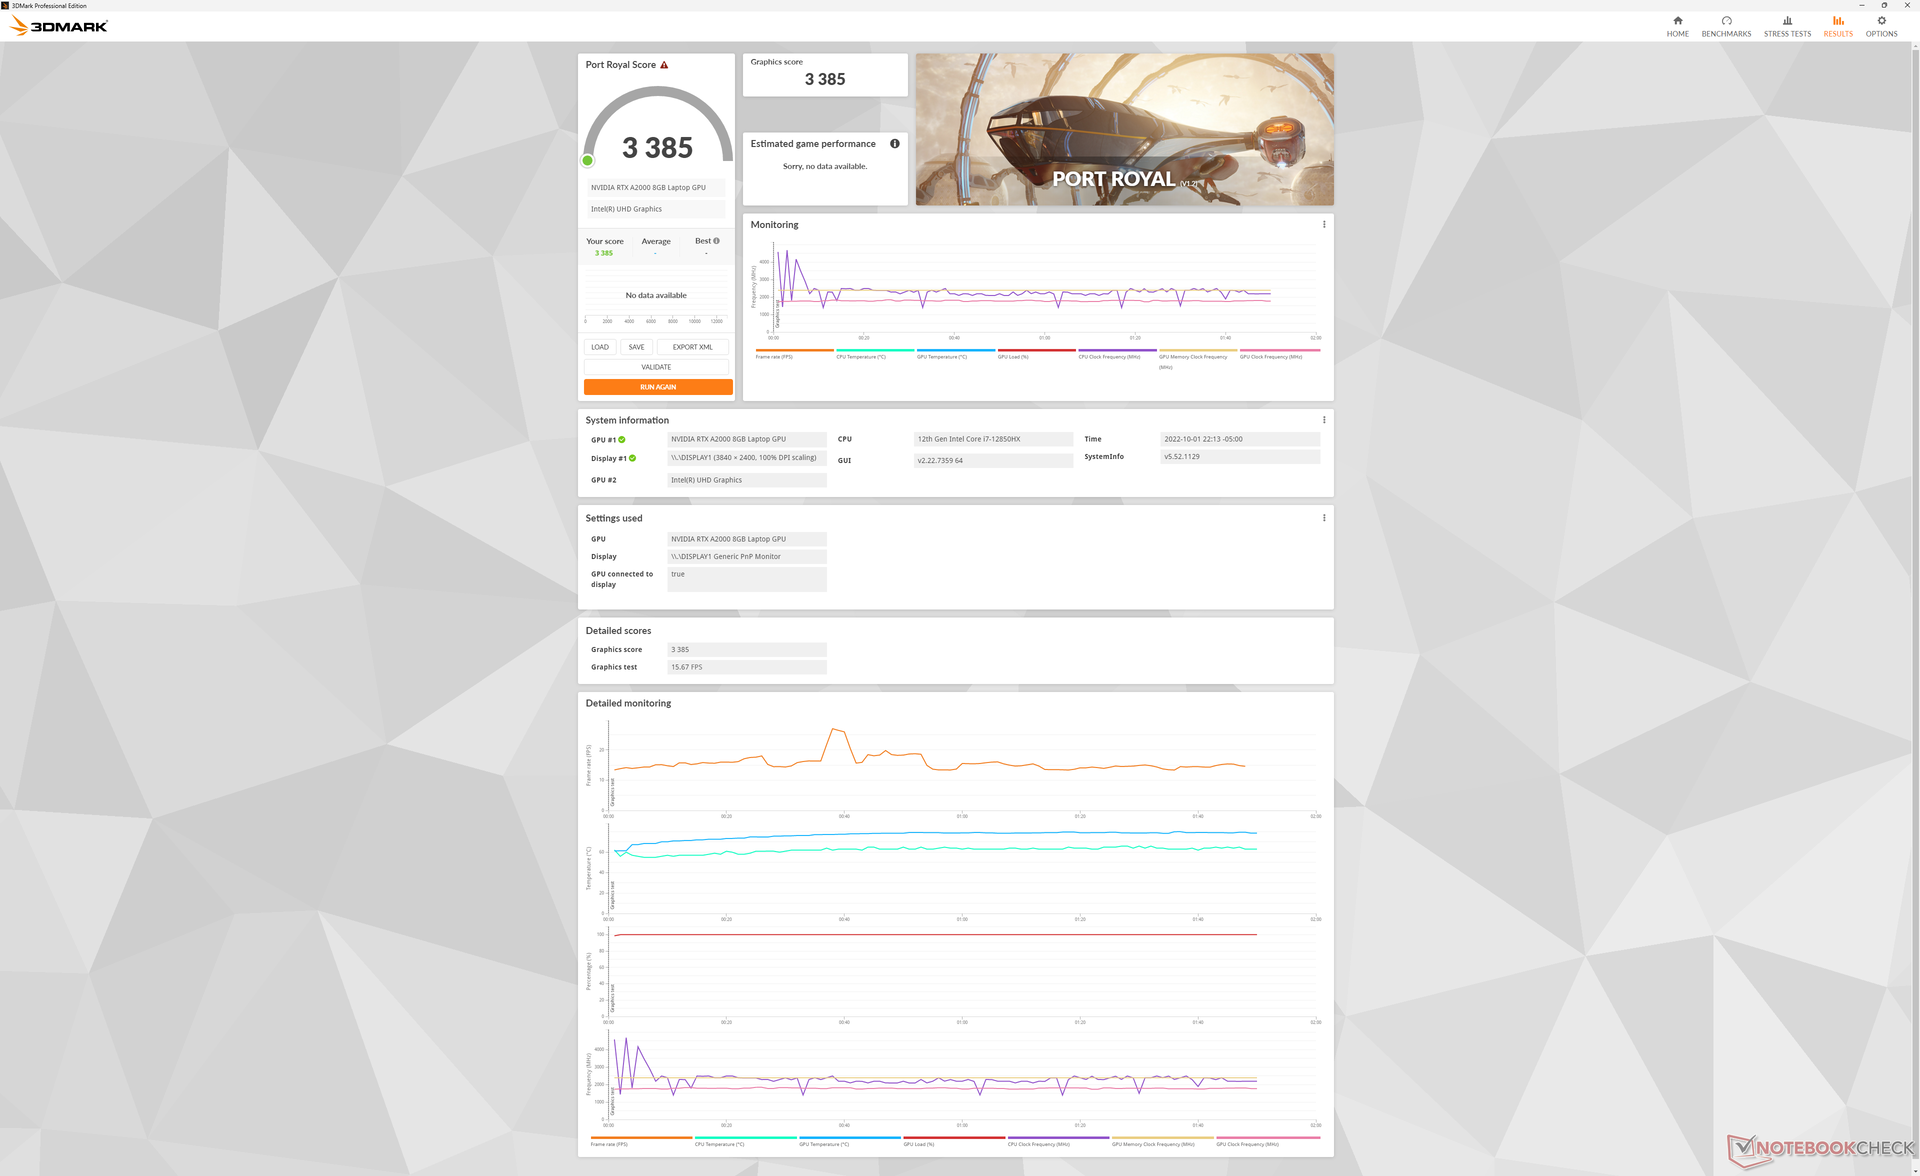
È interessante notare che le prestazioni del ray-tracing Port Royal sono significativamente migliori rispetto a quelle registrate con il vecchio modelloPrecision 5560 anche se condividono la stessa GPU RTX A2000. Sospettiamo che ciò sia dovuto sia all'obiettivo TGP molto più elevato (95 W contro 45 W) sia al driver Nvidia più recente (512.36 contro 472.12) del nostro Precision 7670.
| 3DMark 11 - 1280x720 Performance GPU | |
| MSI GE67 HX 12UGS | |
| HP ZBook Fury 15 G8 | |
| HP Envy 16 h0112nr | |
| Dell Precision 7550 | |
| HP ZBook Fury 17 G8-4A6A9EA | |
| Dell Precision 7670 | |
| Media NVIDIA RTX A2000 Laptop GPU (14831 - 19823, n=9) | |
| Asus Zenbook Pro 15 OLED UM535Q | |
| Dell Precision 5000 5560 | |
| Dell Precision 5000 5470 | |
| Lenovo ThinkPad P1 G4-20Y4Z9DVUS | |
| 3DMark 11 Performance | 18284 punti | |
| 3DMark Cloud Gate Standard Score | 28776 punti | |
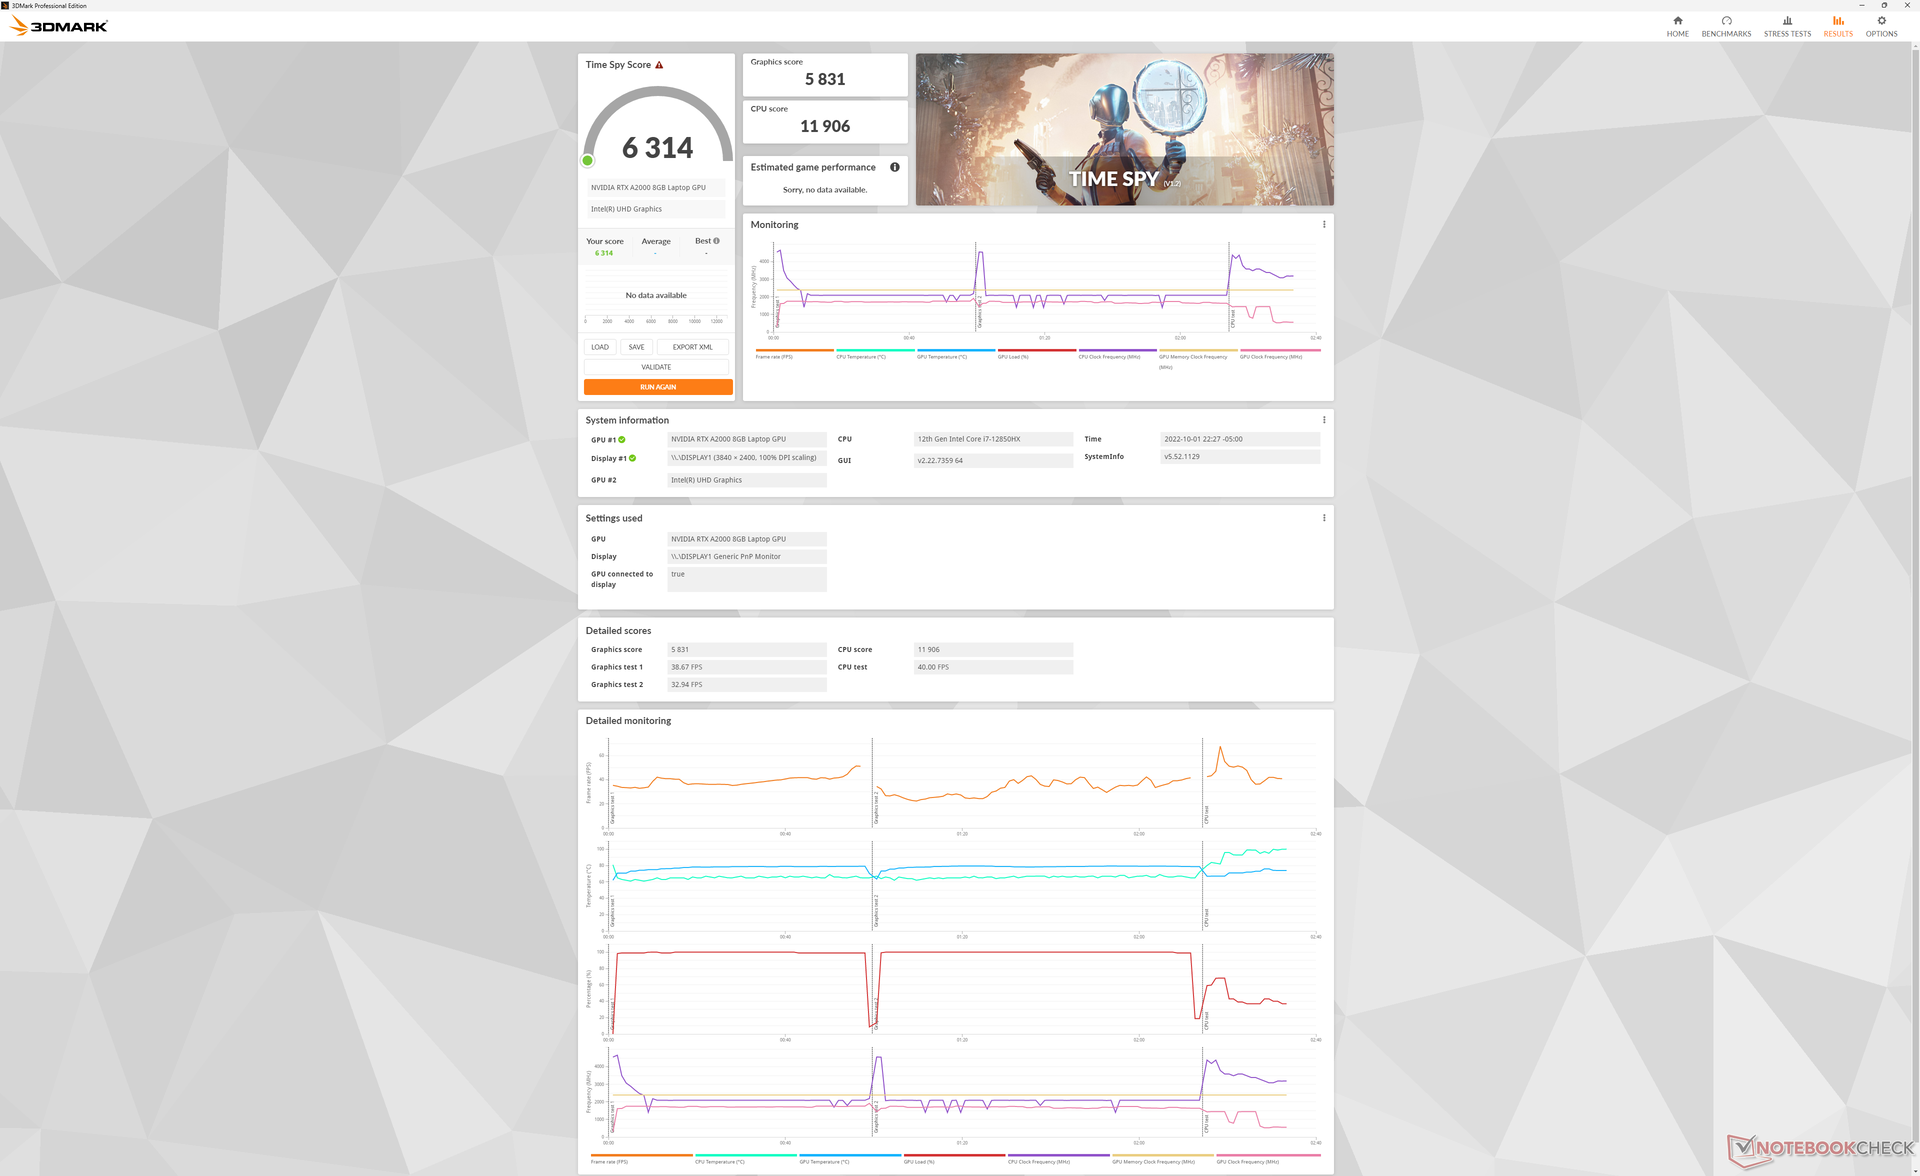
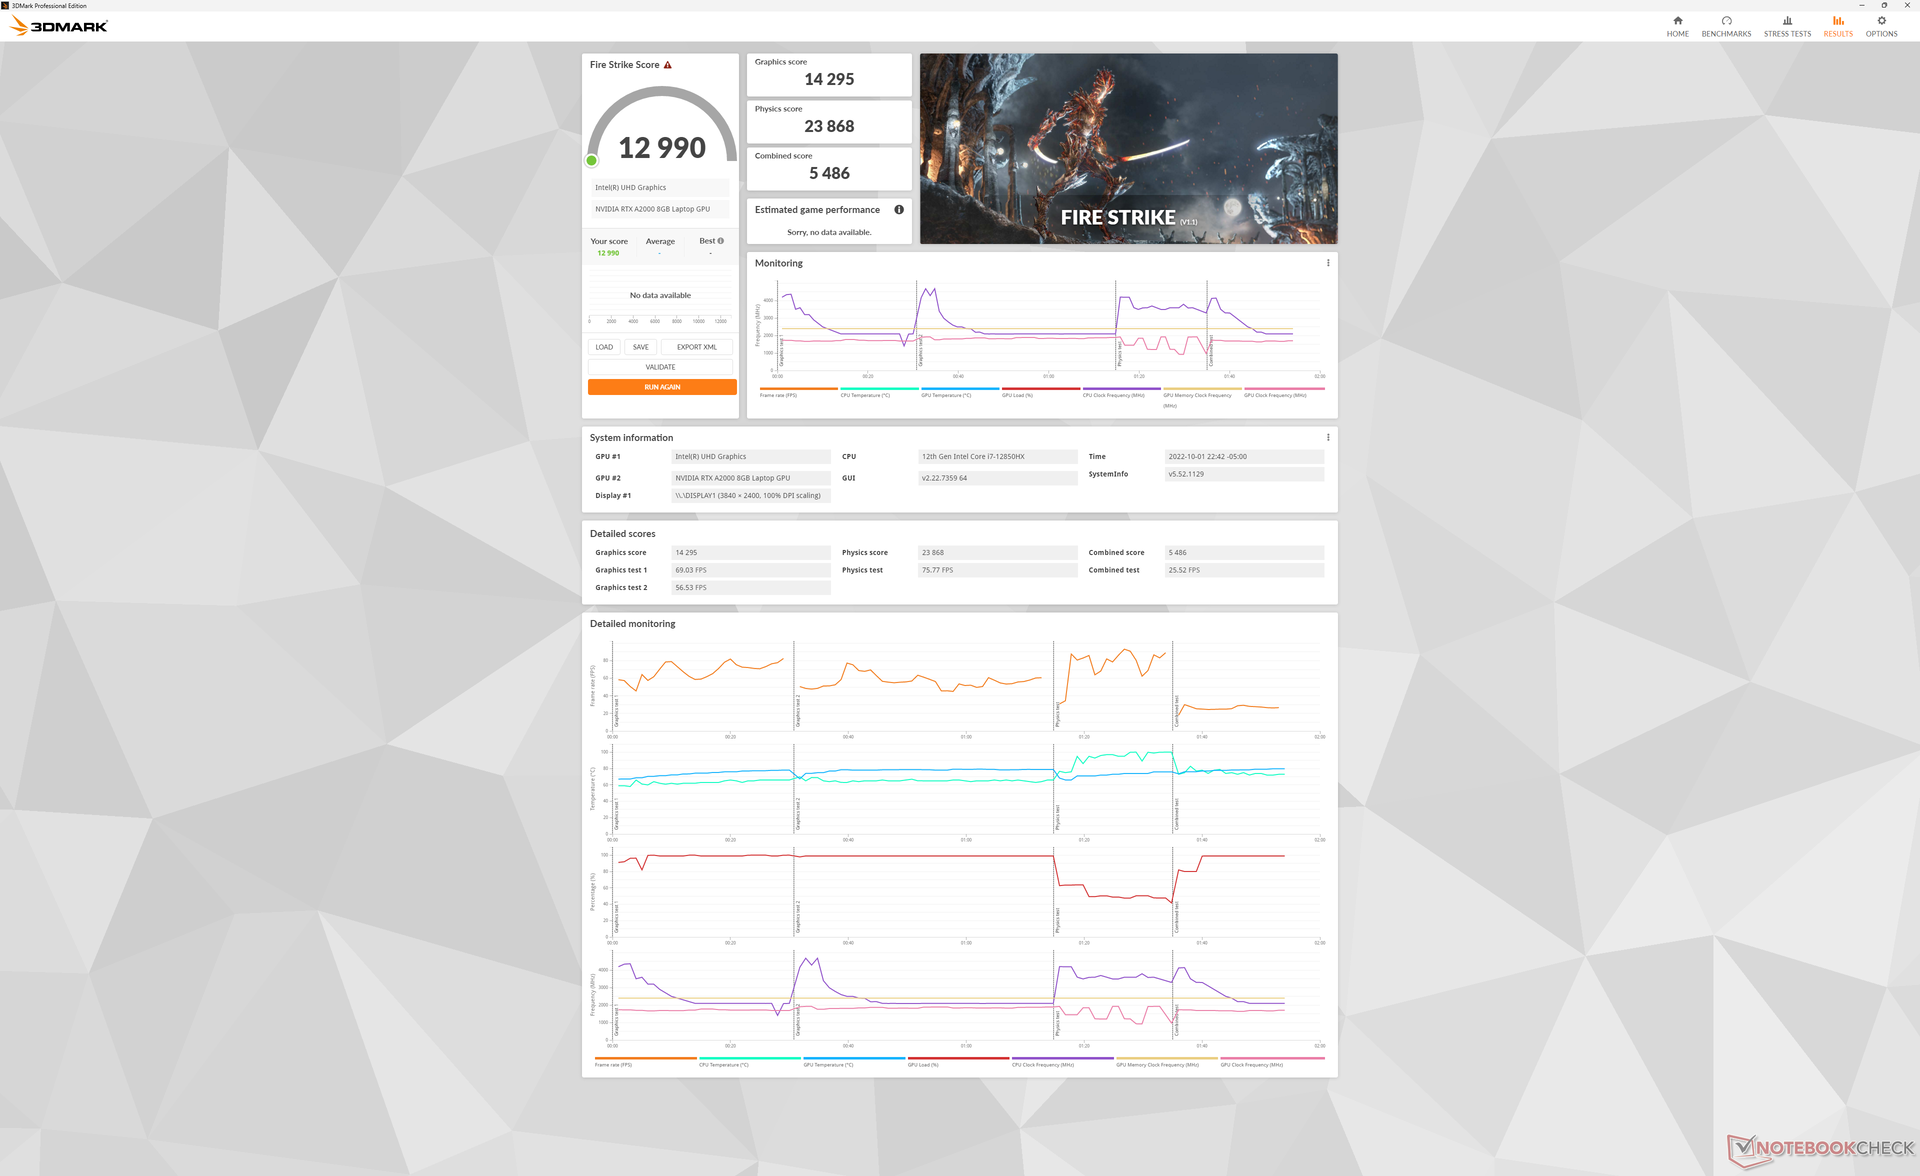
| 3DMark Fire Strike Score | 12990 punti | |
| 3DMark Time Spy Score | 6314 punti | |
Aiuto | ||
| Blender | |
| v3.3 Classroom HIP/AMD | |
| Lenovo Legion 7 16ARHA7 | |
| v3.3 Classroom OPTIX/RTX | |
| Dell Precision 5000 5470 | |
| HP Envy 16 h0112nr | |
| Dell Precision 7670 | |
| v3.3 Classroom CUDA | |
| Dell Precision 5000 5470 | |
| HP Envy 16 h0112nr | |
| Dell Precision 7670 | |
| v3.3 Classroom CPU | |
| HP Envy 16 h0112nr | |
| Dell Precision 5000 5470 | |
| Lenovo Legion 7 16ARHA7 | |
| Dell Precision 7670 | |
* ... Meglio usare valori piccoli
Witcher 3 FPS Chart
| basso | medio | alto | ultra | QHD | 4K | |
|---|---|---|---|---|---|---|
| GTA V (2015) | 181.7 | 177.6 | 155.1 | 79.1 | 57.1 | |
| The Witcher 3 (2015) | 297.1 | 181.7 | 108.6 | 57.4 | ||
| Dota 2 Reborn (2015) | 180.8 | 159.3 | 145.1 | 128.8 | 78.5 | |
| Final Fantasy XV Benchmark (2018) | 129.5 | 80.4 | 60.6 | 44.4 | 26 | |
| X-Plane 11.11 (2018) | 135.2 | 104.1 | 85.5 | 55.1 | ||
| Strange Brigade (2018) | 325 | 151.2 | 120.9 | 103.5 | 76.8 | |
| Cyberpunk 2077 1.6 (2022) | 78.5 | 65.1 | 55 | 44.3 | 27.4 |
Emissioni
Rumore del sistema
Le ventole non sono quasi mai silenziose nemmeno quando sono al minimo sul desktop, ma sono comunque silenziose e difficili da notare durante i bassi carichi. Durante la riproduzione di video, i livelli di rumorosità si mantengono sotto i 28 dB(A) a fronte di uno sfondo silenzioso di 22,7 dB(A). Il rumore della ventola è ancora più silenzioso, con 24,5 dB(A) durante la navigazione web o l'elaborazione di testi, simile a quello osservato sullo ZBook Fury 15 G8 o sul modello 5560 Precision 5560
I livelli di rumore aumentano un po' rapidamente quando si introducono carichi più elevati. La prima scena di benchmark di 3DMark 06, ad esempio, ha portato il rumore della ventola a 49 dB(A) anche quando è stato impostato il profilo di alimentazione bilanciato. Il rumore della ventola raggiunge un picco di circa 52 dB(A) se si eseguono carichi estremi come Prime95 e FurMark, proprio come avviene su Precision 5560. In altre parole, il Precision 7670 funziona in modo silenzioso nella maggior parte delle condizioni, ma diventa piuttosto rumoroso se si introduce anche solo un po' di stress.
Rumorosità
| Idle |
| 22.9 / 22.9 / 24.5 dB(A) |
| Sotto carico |
| 48.7 / 52.1 dB(A) |
 | ||
30 dB silenzioso 40 dB(A) udibile 50 dB(A) rumoroso |
||
min: | ||
| Dell Precision 7670 RTX A2000 Laptop GPU, i7-12850HX, SK Hynix HFS001TEJ9X115N | Lenovo ThinkPad P1 G4-20Y4Z9DVUS T1200 Laptop GPU, i7-11800H, Samsung PM9A1 MZVL2512HCJQ | Asus ProArt StudioBook 16 W7600H5A-2BL2 RTX A5000 Laptop GPU, W-11955M, 2x Micron 2300 2TB MTFDHBA2T0TDV (RAID 0) | Dell Precision 5000 5560 RTX A2000 Laptop GPU, i7-11850H, Samsung PM9A1 MZVL22T0HBLB | Dell Precision 7550 Quadro RTX 5000 Max-Q, W-10885M, SK Hynix PC601A NVMe 1TB | HP ZBook Fury 15 G8 RTX A5000 Laptop GPU, i9-11950H, Samsung PM981a MZVLB1T0HBLR | |
|---|---|---|---|---|---|---|
| Noise | -3% | -3% | 11% | -9% | 3% | |
| off /ambiente * (dB) | 22.7 | 24.3 -7% | 26 -15% | 23.4 -3% | 25.8 -14% | 24.1 -6% |
| Idle Minimum * (dB) | 22.9 | 24.3 -6% | 26 -14% | 23.6 -3% | 25.8 -13% | 24.1 -5% |
| Idle Average * (dB) | 22.9 | 24.3 -6% | 26 -14% | 23.6 -3% | 25.8 -13% | 24.1 -5% |
| Idle Maximum * (dB) | 24.5 | 26.6 -9% | 26.5 -8% | 23.6 4% | 25.9 -6% | 24.8 -1% |
| Load Average * (dB) | 48.7 | 46.8 4% | 42 14% | 25.8 47% | 51.2 -5% | 37.8 22% |
| Witcher 3 ultra * (dB) | 45.2 | 46.8 -4% | 40.1 11% | 51.9 -15% | 44.2 2% | |
| Load Maximum * (dB) | 52.1 | 46.8 10% | 43 17% | 41.4 21% | 51.9 -0% | 44.2 15% |
* ... Meglio usare valori piccoli
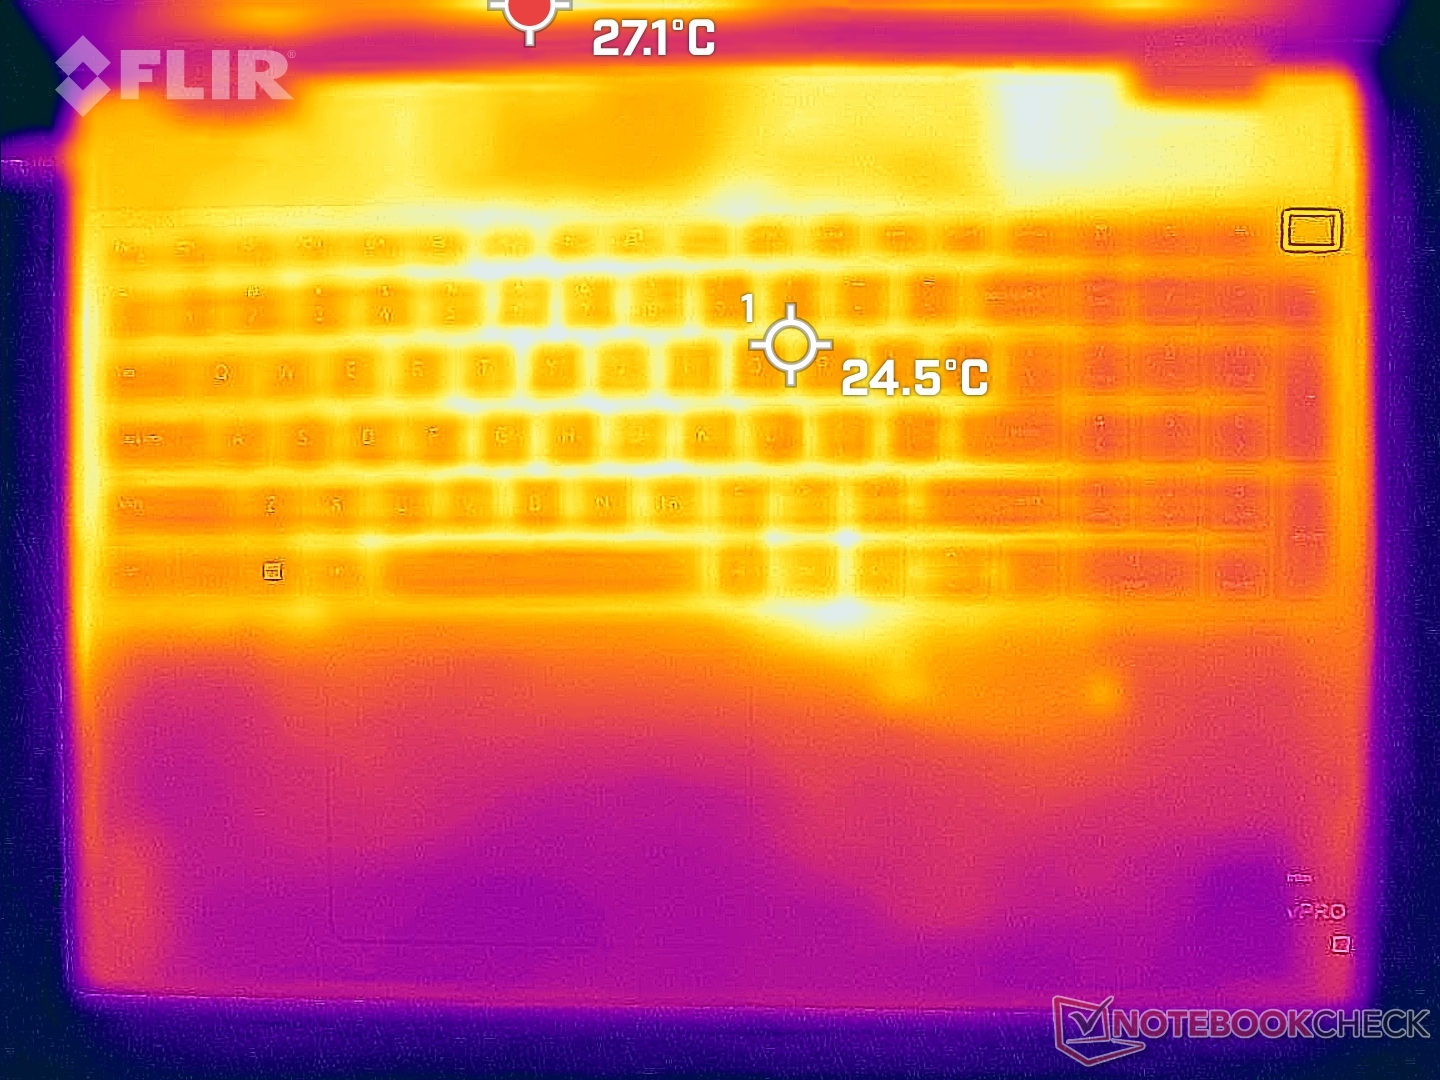
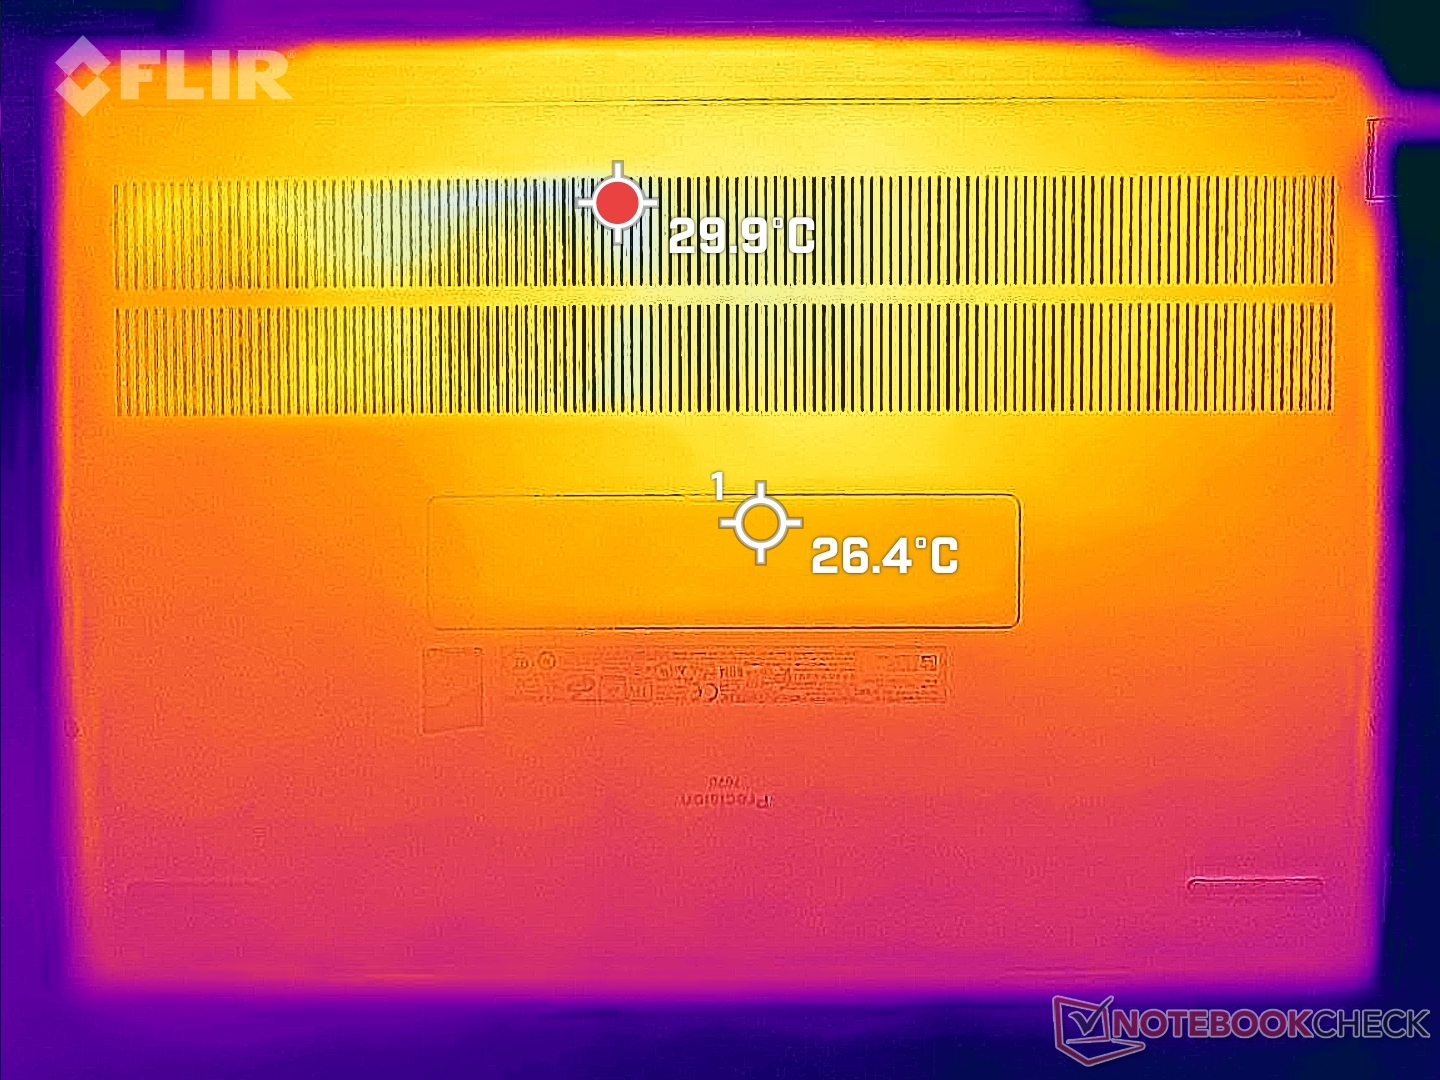
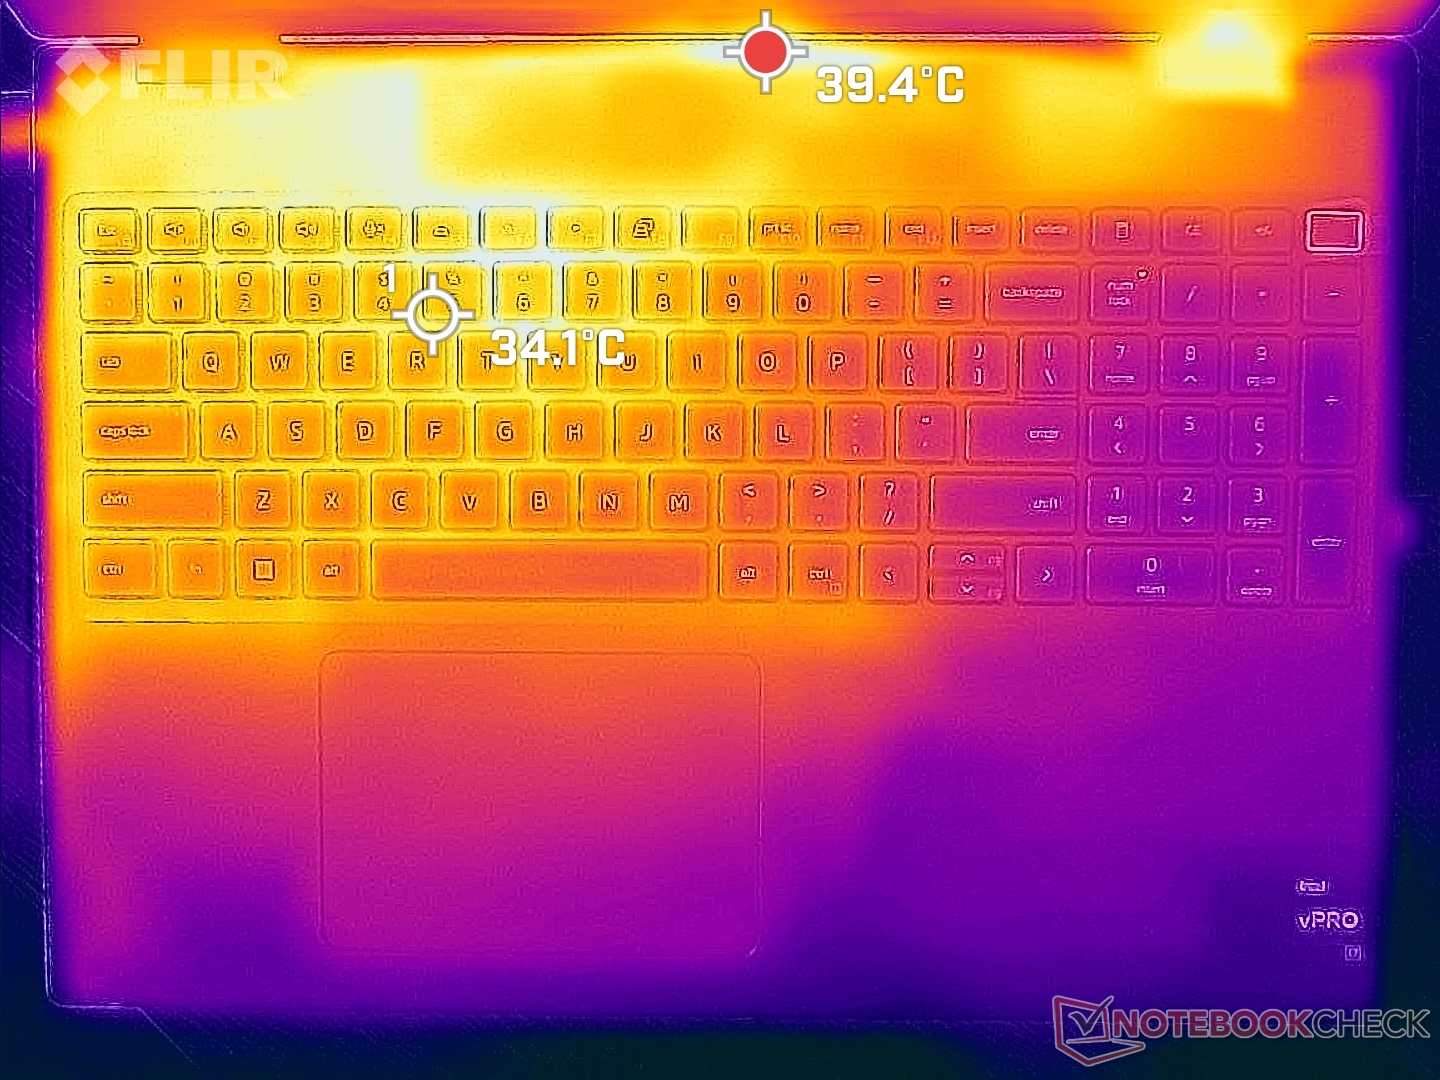
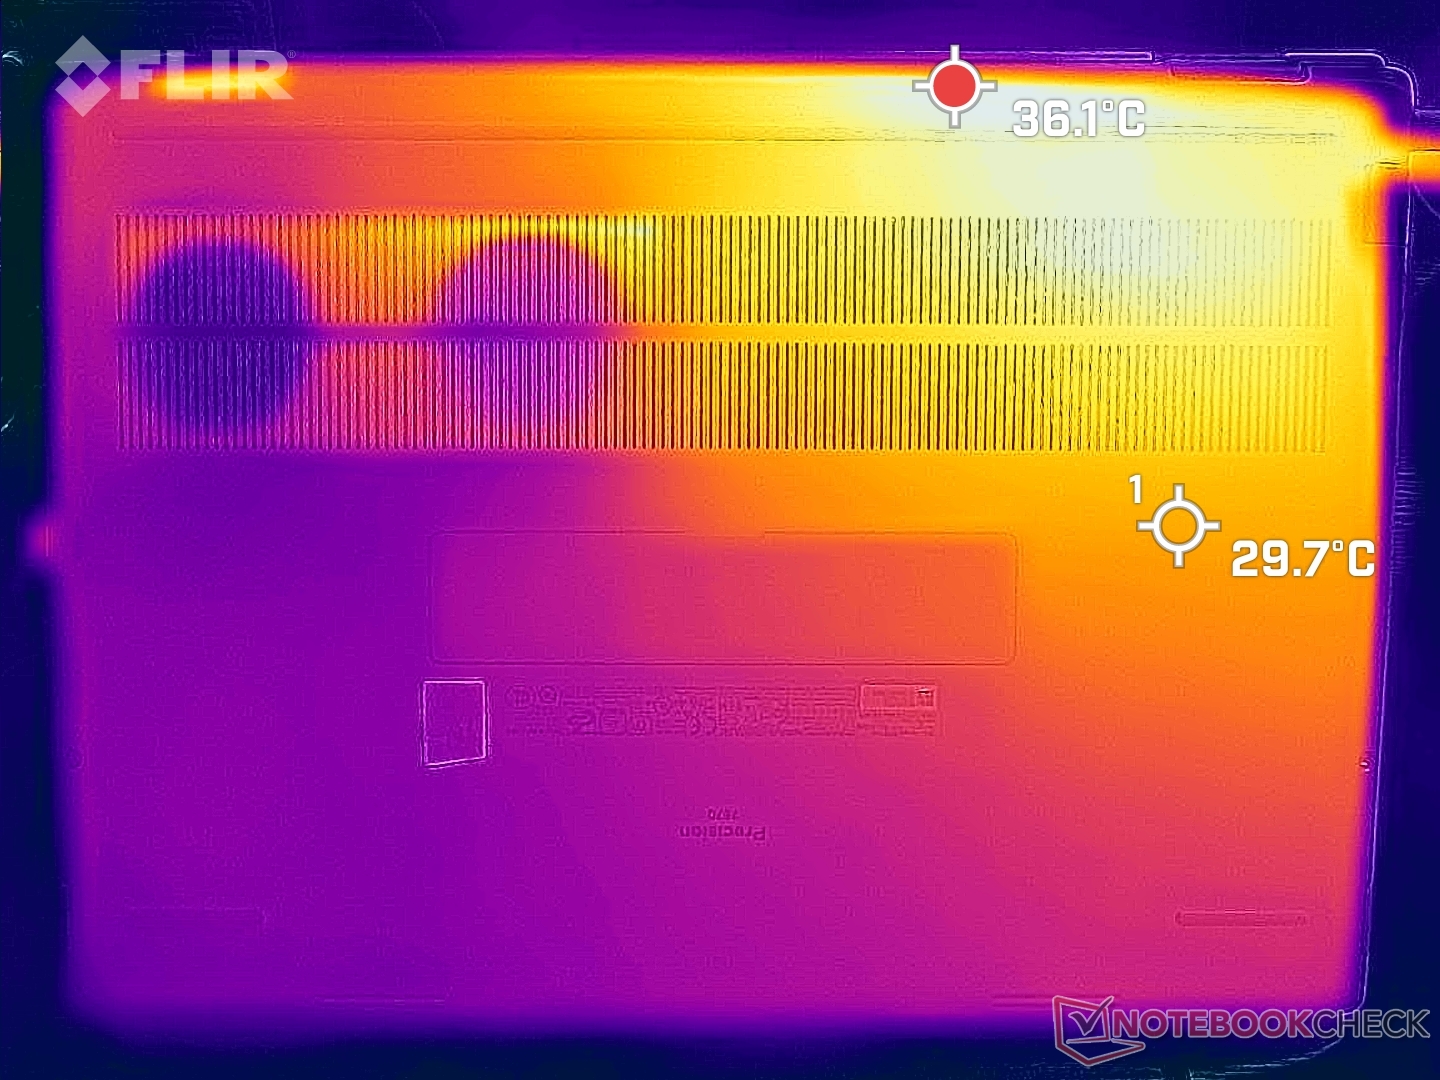
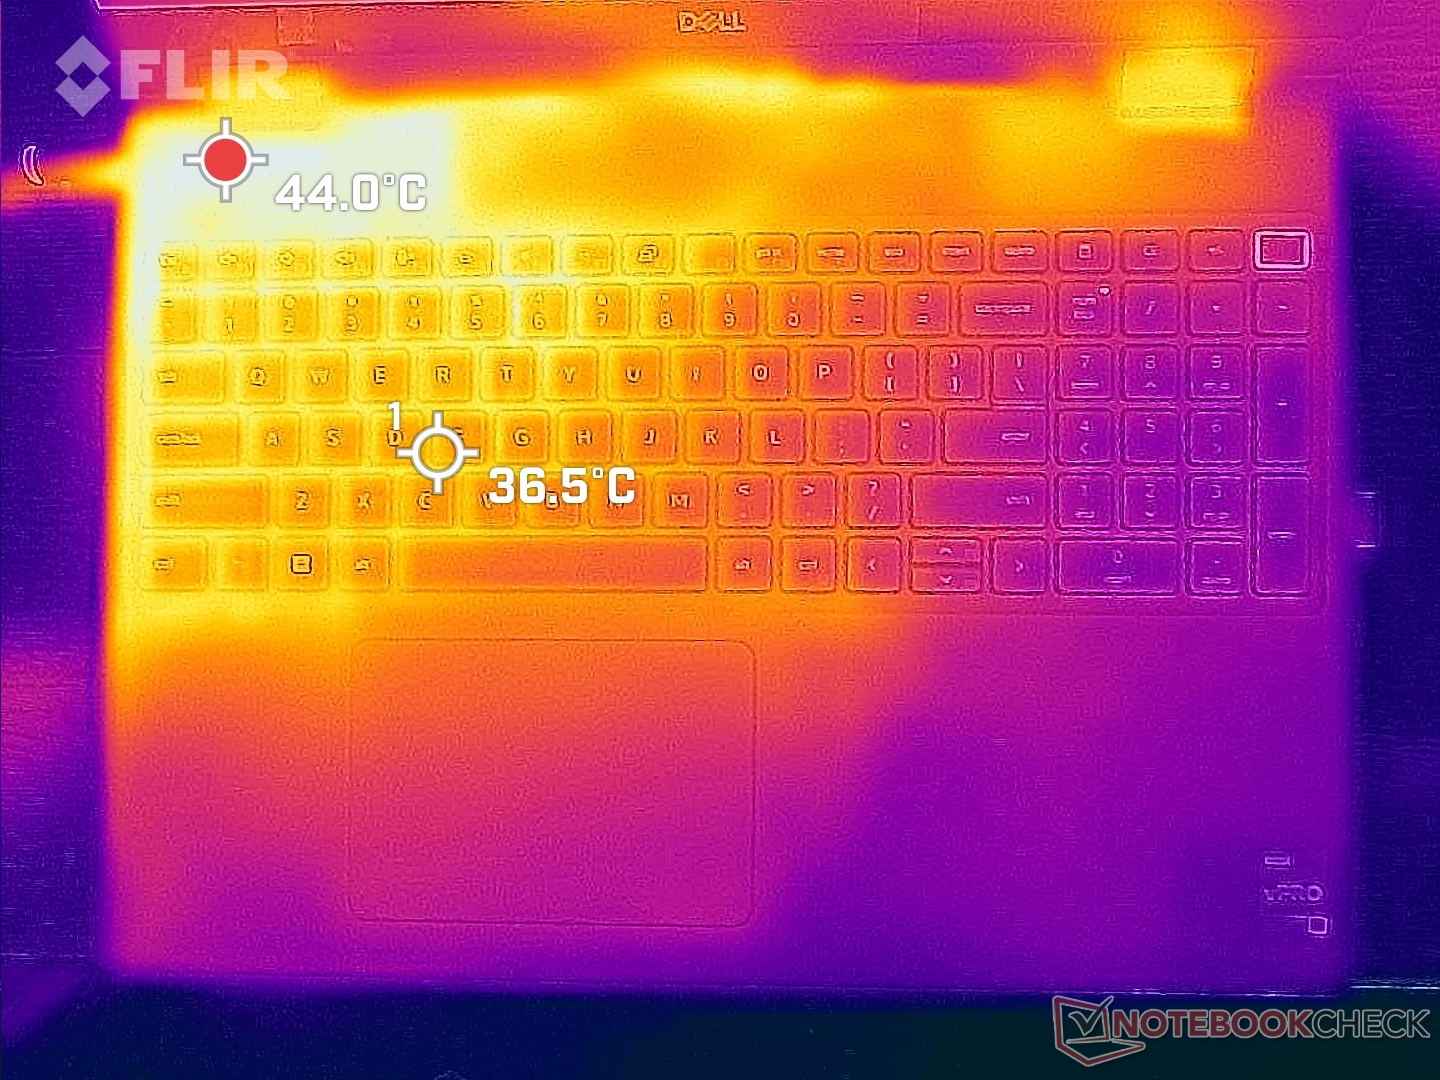
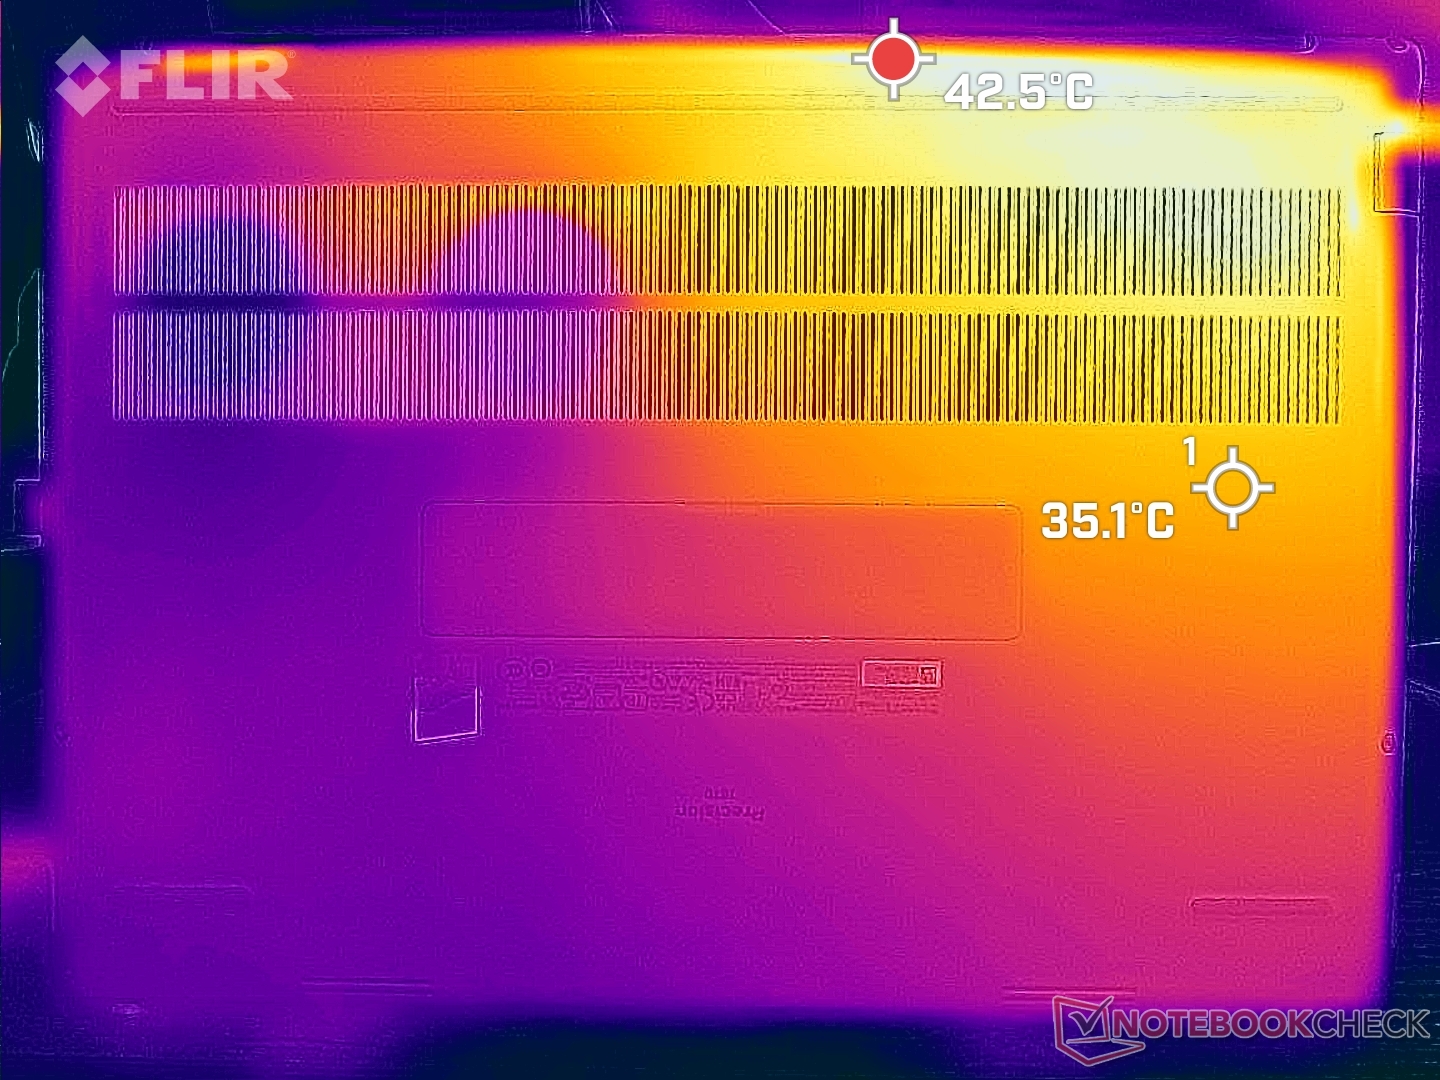
Temperatura
Le temperature di superficie sono sempre calde, indipendentemente dal carico sullo schermo. In modalità risparmio energetico, ad esempio, il piano della tastiera e la parte inferiore si assestano a 30 C ciascuno, rispetto ai 26 C della parte inferiore.Lenovo ThinkPad P1 G4. IlAsus ProArt StudioBook Pro 16 può essere ancora più caldo, con quasi 35 C in condizioni simili.
Siamo riusciti a registrare punti caldi di 51 C e 46 C rispettivamente sulla parte superiore e inferiore, quando si eseguono carichi estremi. La metà sinistra dello chassis sarà sempre più calda di quella destra a causa del posizionamento della soluzione di raffreddamento e dei processori all'interno.
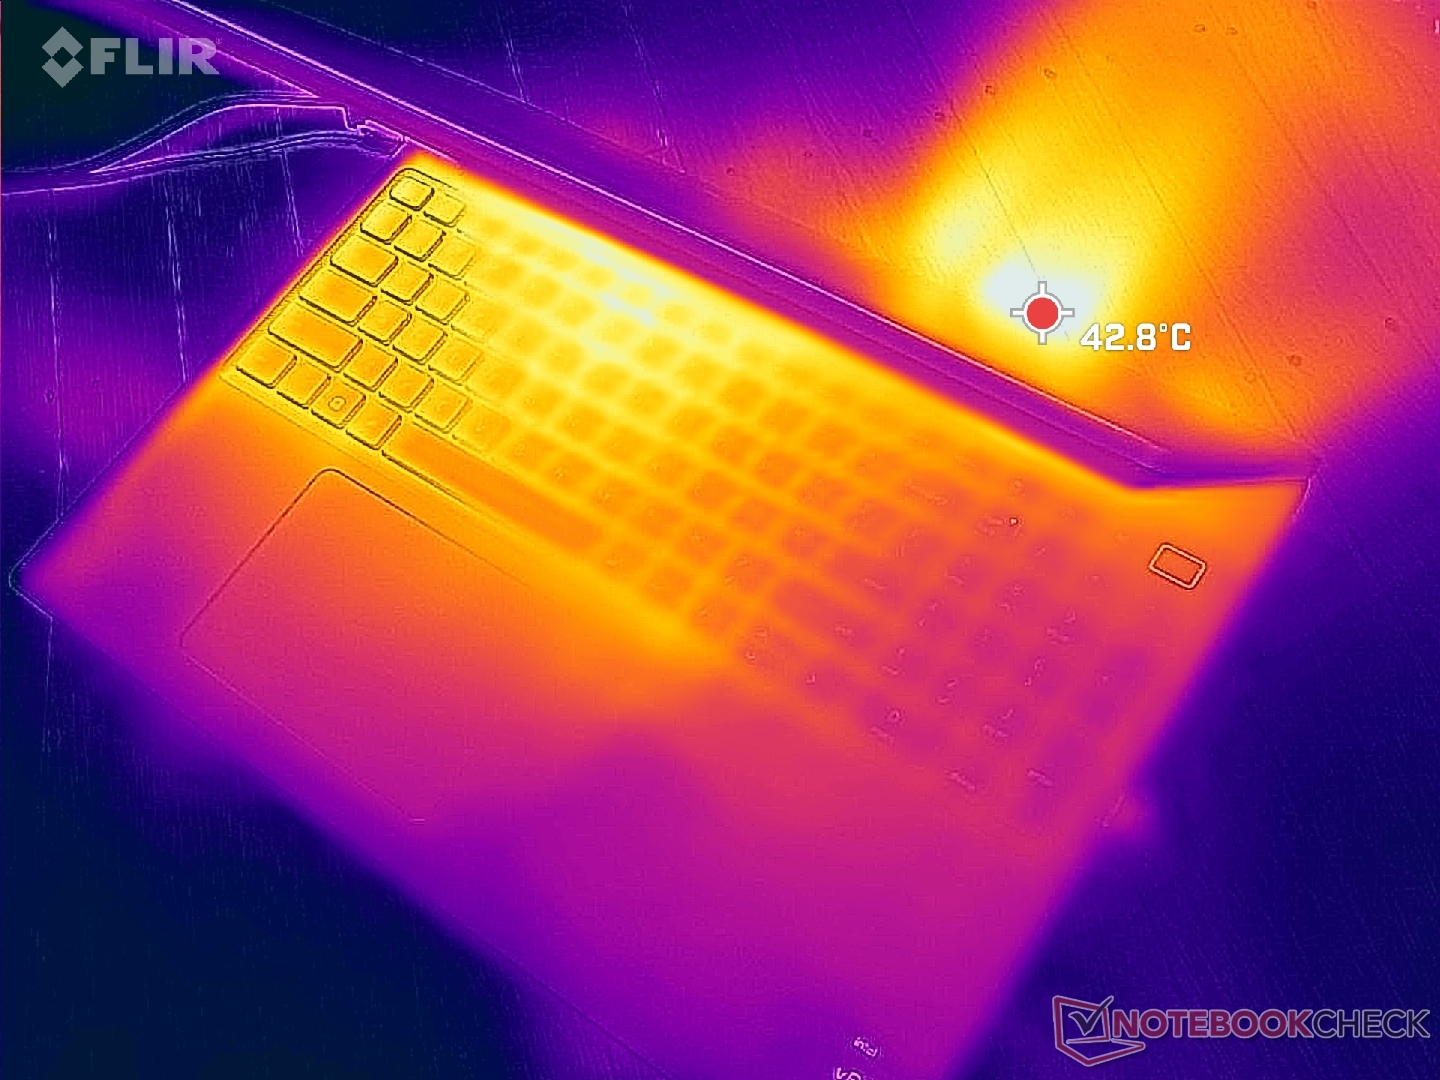
(-) La temperatura massima sul lato superiore è di 51 °C / 124 F, rispetto alla media di 38.2 °C / 101 F, che varia da 22.2 a 69.8 °C per questa classe Workstation.
(-) Il lato inferiore si riscalda fino ad un massimo di 45.8 °C / 114 F, rispetto alla media di 41.1 °C / 106 F
(+) In idle, la temperatura media del lato superiore è di 29.8 °C / 86 F, rispetto alla media deld ispositivo di 32 °C / 90 F.
(±) Riproducendo The Witcher 3, la temperatura media per il lato superiore e' di 37.1 °C / 99 F, rispetto alla media del dispositivo di 32 °C / 90 F.
(+) I poggiapolsi e il touchpad raggiungono la temperatura massima della pelle (34.2 °C / 93.6 F) e quindi non sono caldi.
(-) La temperatura media della zona del palmo della mano di dispositivi simili e'stata di 27.8 °C / 82 F (-6.4 °C / -11.6 F).
| Dell Precision 7670 Intel Core i7-12850HX, NVIDIA RTX A2000 Laptop GPU | Lenovo ThinkPad P1 G4-20Y4Z9DVUS Intel Core i7-11800H, NVIDIA T1200 Laptop GPU | Asus ProArt StudioBook 16 W7600H5A-2BL2 Intel Xeon W-11955M, NVIDIA RTX A5000 Laptop GPU | Dell Precision 5000 5560 Intel Core i7-11850H, NVIDIA RTX A2000 Laptop GPU | Dell Precision 7550 Intel Xeon W-10885M, NVIDIA Quadro RTX 5000 Max-Q | HP ZBook Fury 15 G8 Intel Core i9-11950H, NVIDIA RTX A5000 Laptop GPU | |
|---|---|---|---|---|---|---|
| Heat | 5% | -3% | -1% | 2% | 4% | |
| Maximum Upper Side * (°C) | 51 | 49.9 2% | 45.7 10% | 48.2 5% | 49 4% | 45.6 11% |
| Maximum Bottom * (°C) | 45.8 | 56.7 -24% | 48.3 -5% | 42.6 7% | 51 -11% | 57.6 -26% |
| Idle Upper Side * (°C) | 31.8 | 25.5 20% | 35.3 -11% | 34.8 -9% | 28.2 11% | 26 18% |
| Idle Bottom * (°C) | 32.6 | 26.2 20% | 34.4 -6% | 35.2 -8% | 32 2% | 28.8 12% |
* ... Meglio usare valori piccoli
Stress test
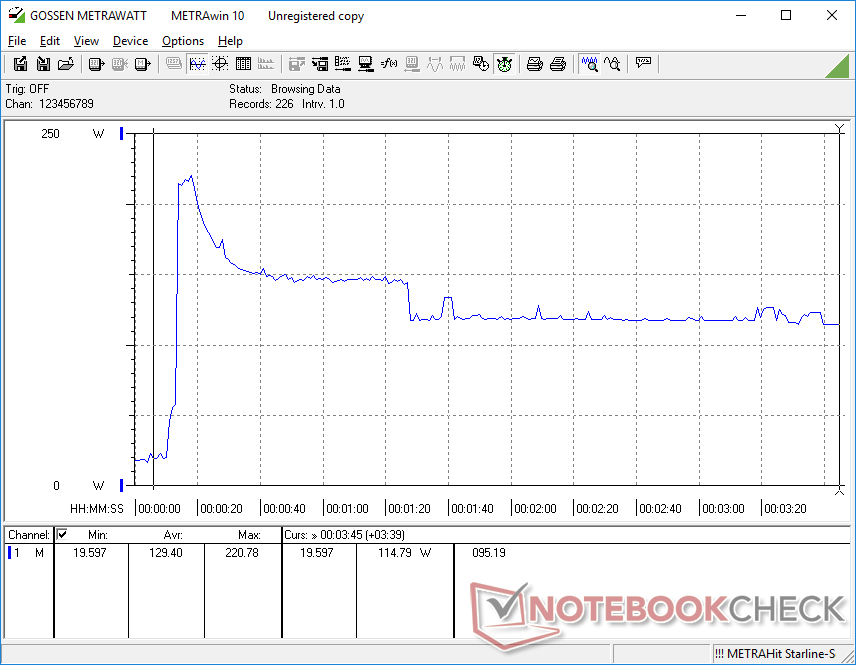
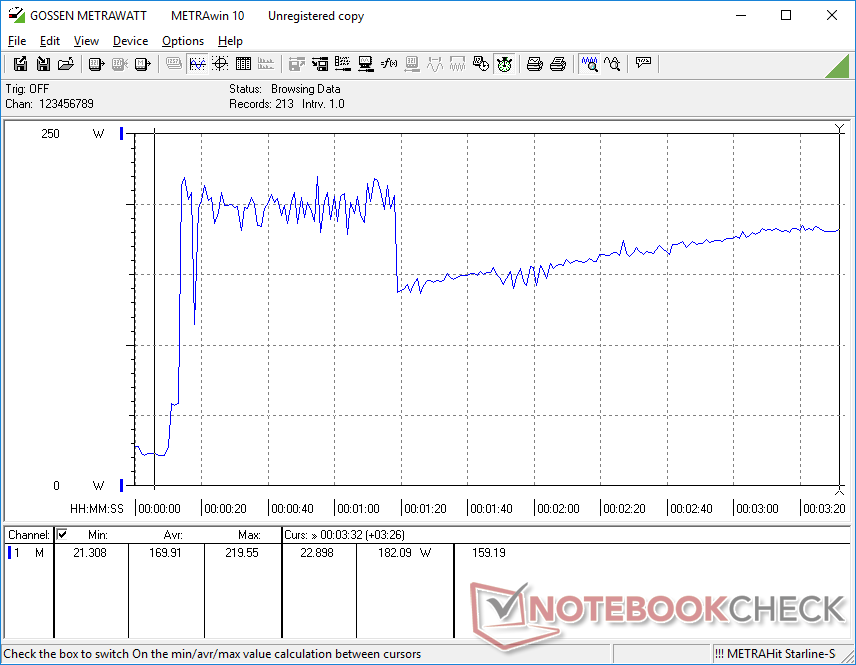
Quando si esegue Prime95 per stressare la CPU, la velocità di clock e l'assorbimento di potenza della scheda raggiungono rispettivamente 3,5 GHz e 153 W, con una durata massima di un paio di secondi. La temperatura del core raggiungeva i 100 C durante questo breve periodo. La frequenza di clock e l'assorbimento di potenza sono poi diminuiti costantemente prima di stabilizzarsi rispettivamente a 2,2-2,4 GHz e 73 W, al fine di mantenere una temperatura del core più tollerabile di 85 C. Le prestazioni del Turbo Boost non sono quindi così buone come speravamo considerando le dimensioni di questa workstation.
Quando si esegue Witcher 3 per rappresentare un carico pesante costante, le velocità di clock della GPU, la temperatura e l'assorbimento di energia si stabilizzano rispettivamente a 1777 MHz, 80 C e 80 W, rispetto a 1462 MHz, 75 C e 45 W, rispettivamente, sulla più piccola Precision 5560 con la stessa GPU RTX A2000.
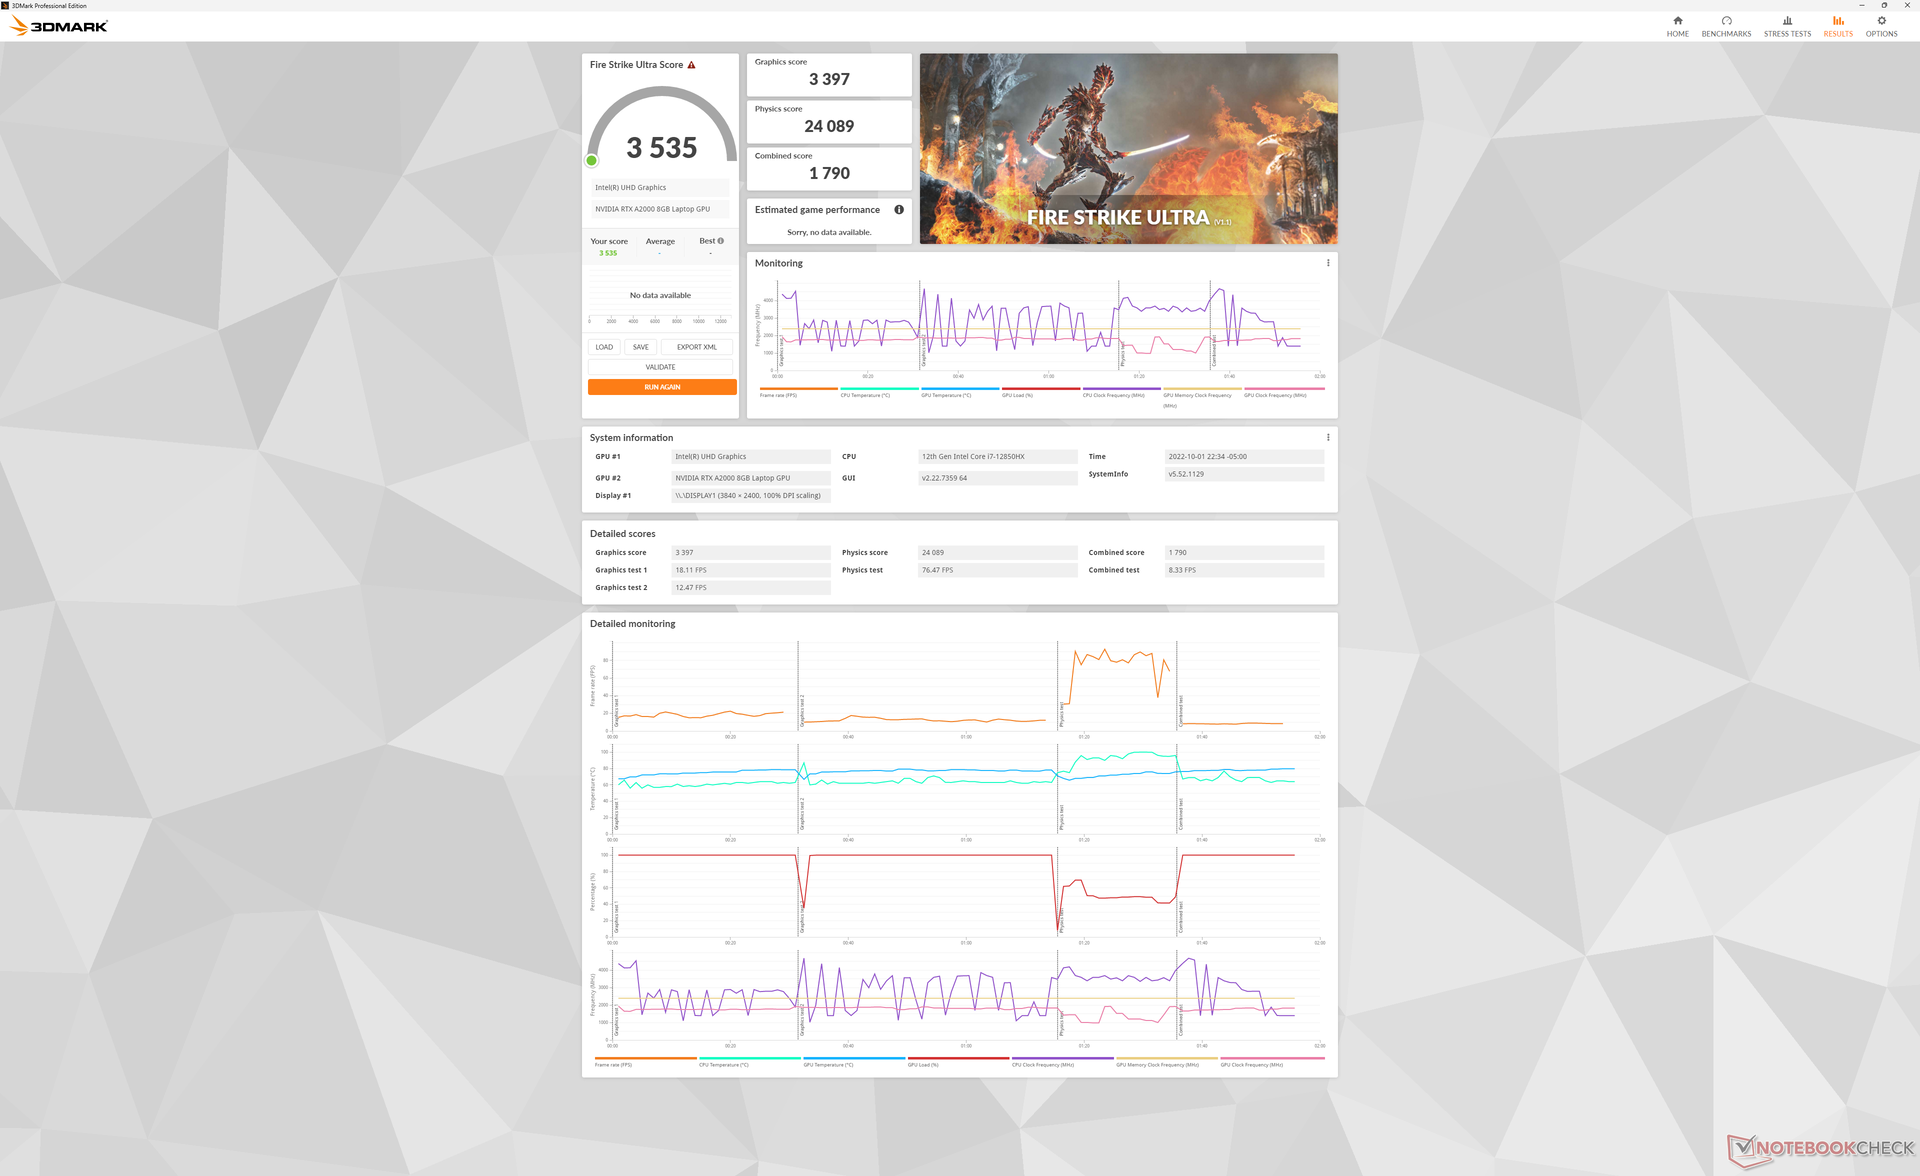
Il funzionamento a batteria limita le prestazioni. Un test di Fire Strike a batteria restituirebbe punteggi di Fisica e Grafica pari a 9820 e 6911 punti, rispettivamente, rispetto a 23868 e 14295 punti con alimentazione a rete.
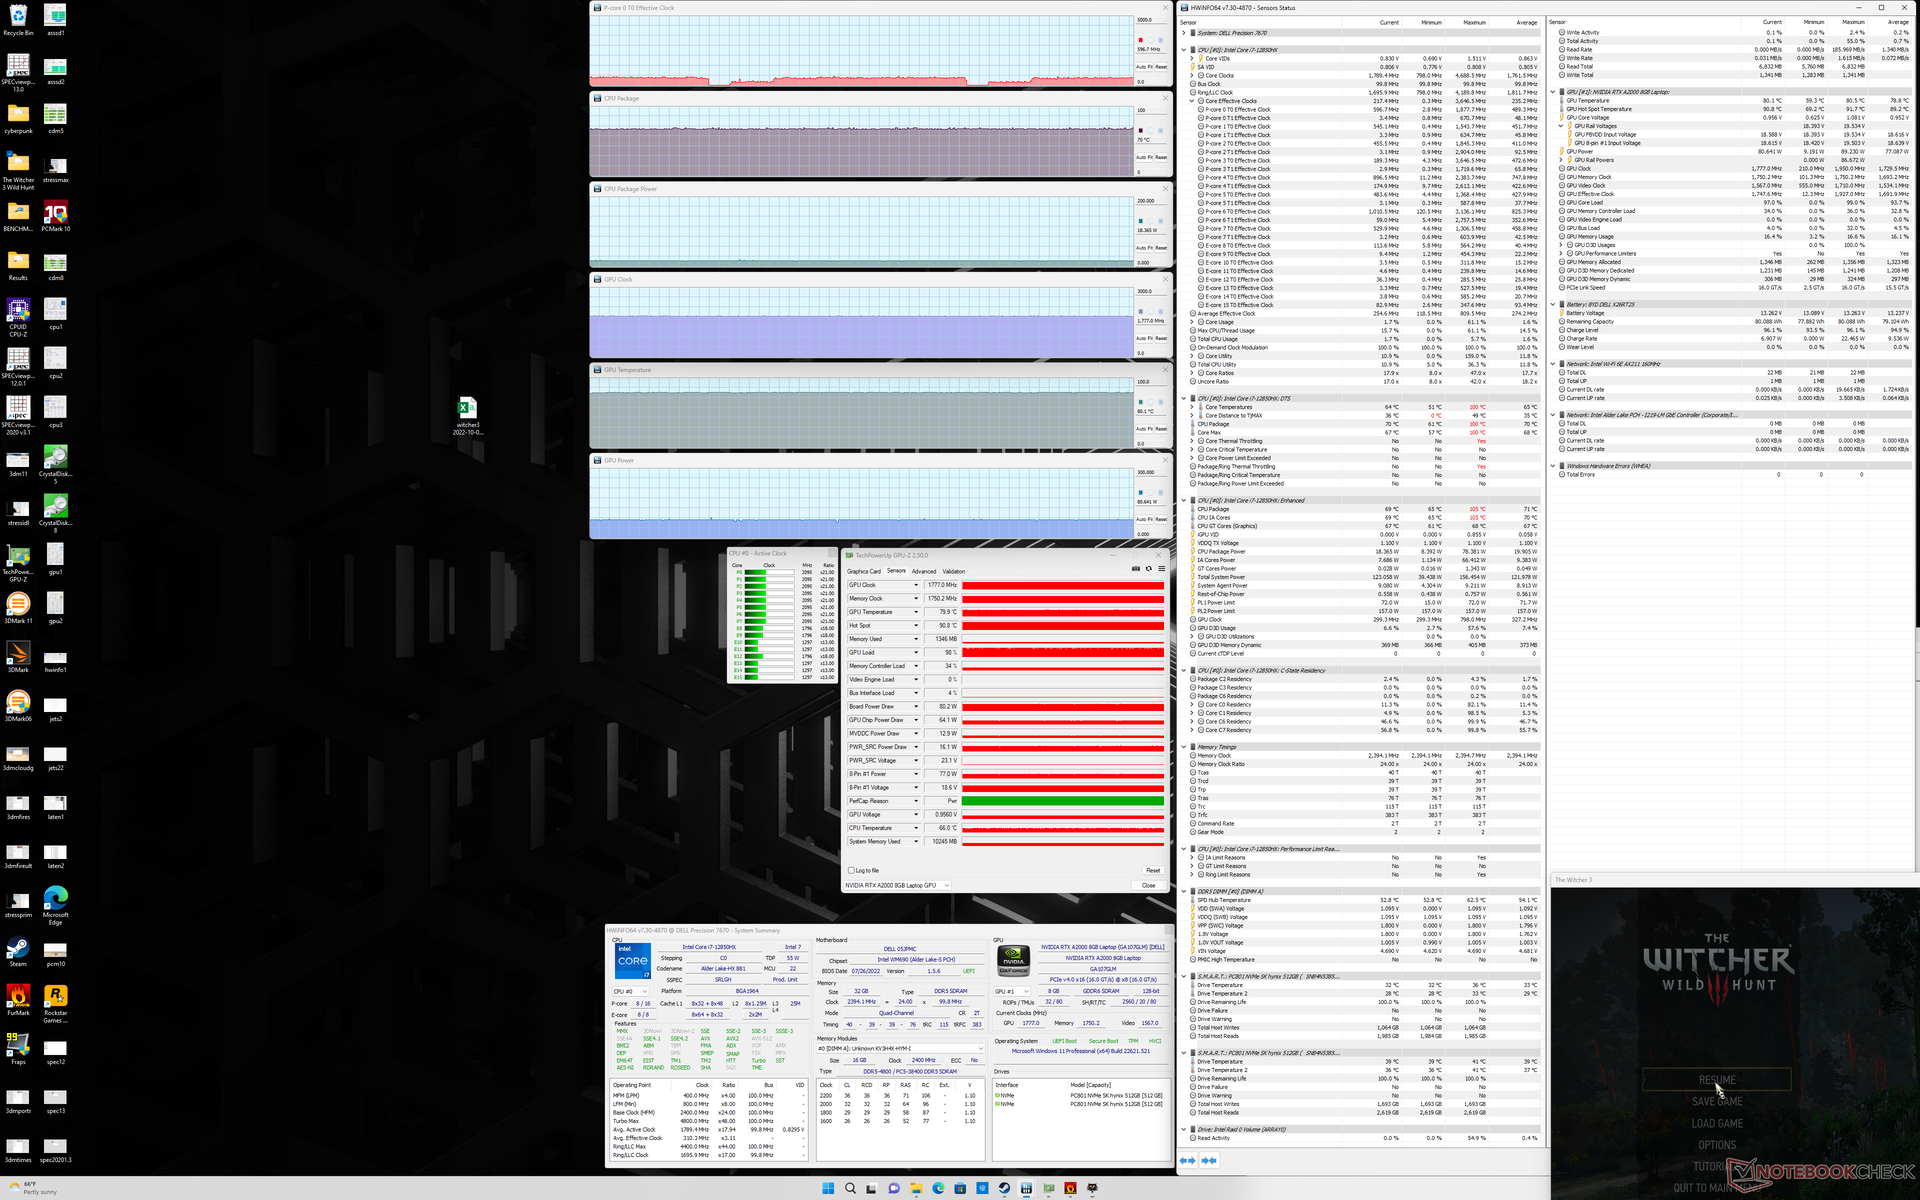
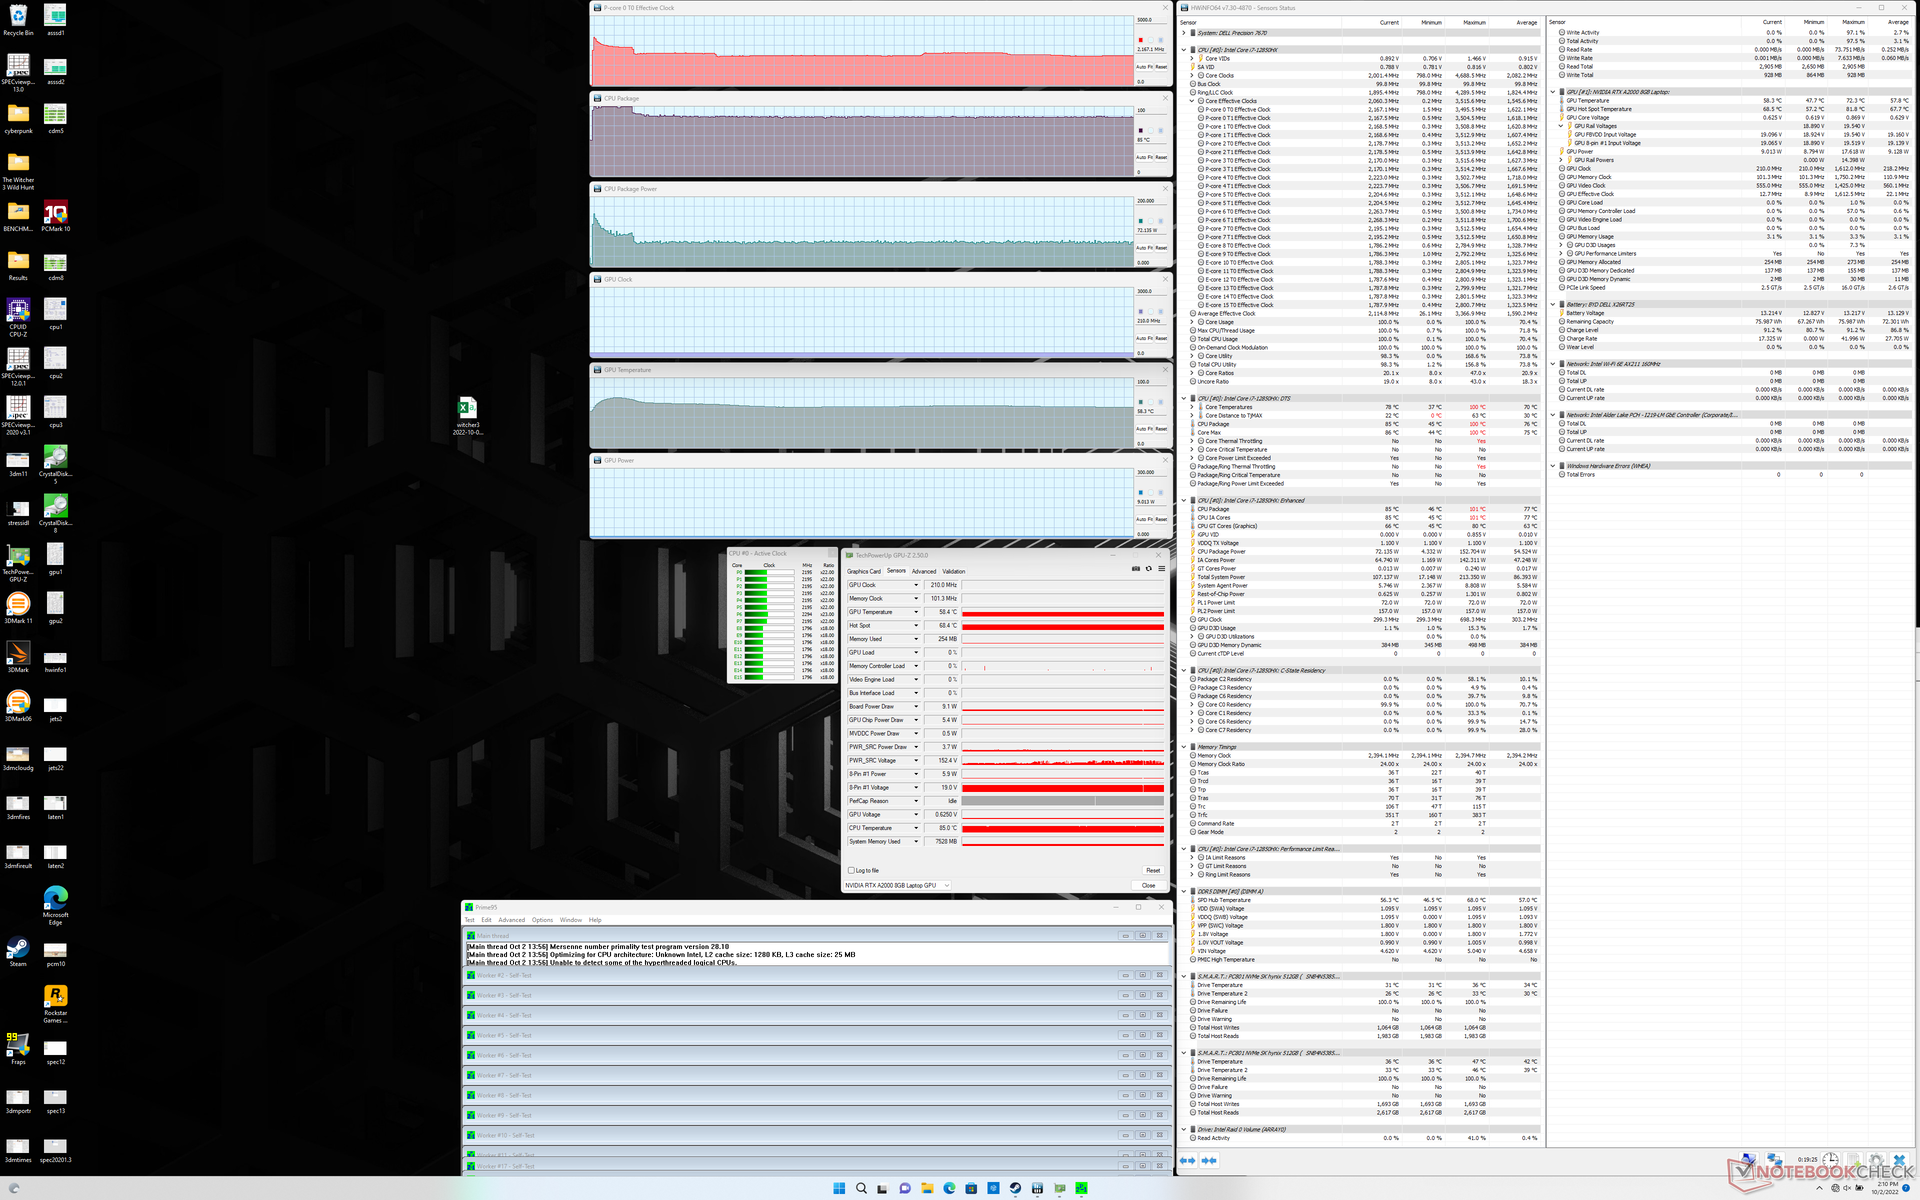
| Clock della CPU (GHz) | Clock della GPU (MHz) | Temperatura media della CPU (°C) | Temperatura media della GPU (°C) | |
| Sistema inattivo | -- | -- | 49 | 50 |
| Stress Prime95 | 2,2 | -- | 85 | 58 |
| Prime95 + FurMark Stress | 0,8 - 1,3 | ~1450 | 76 - 86 | 62 - 72 |
| Witcher 3 Stress | 0,6 | 1777 | 70 | 80 |
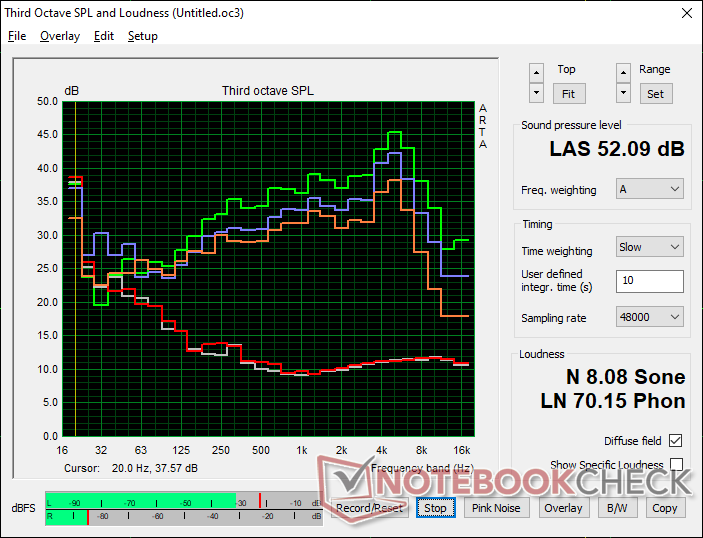
Altoparlanti
Dell Precision 7670 analisi audio
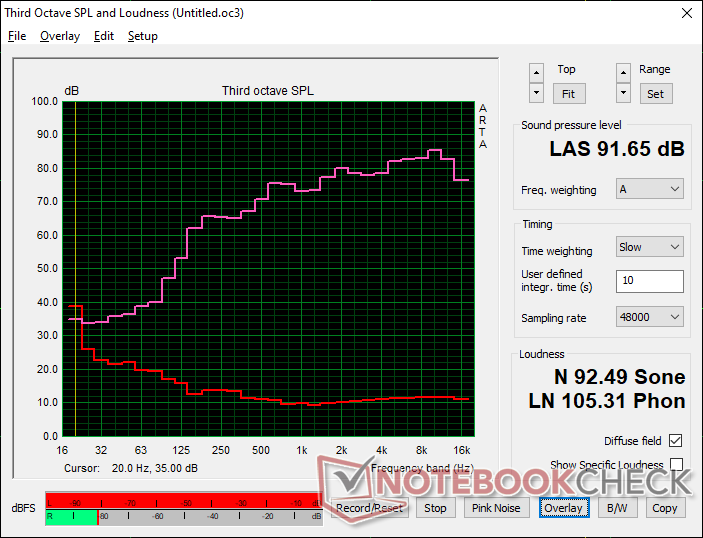
(+) | gli altoparlanti sono relativamente potenti (91.7 dB)
Bassi 100 - 315 Hz
(-) | quasi nessun basso - in media 16.8% inferiori alla media
(+) | bassi in lineaa (6.7% delta rispetto alla precedente frequenza)
Medi 400 - 2000 Hz
(+) | medi bilanciati - solo only 3.5% rispetto alla media
(+) | medi lineari (3.9% delta rispetto alla precedente frequenza)
Alti 2 - 16 kHz
(+) | Alti bilanciati - appena 4.6% dalla media
(+) | alti lineari (2% delta rispetto alla precedente frequenza)
Nel complesso 100 - 16.000 Hz
(+) | suono nel complesso lineare (12.2% differenza dalla media)
Rispetto alla stessa classe
» 18% di tutti i dispositivi testati in questa classe è stato migliore, 3% simile, 79% peggiore
» Il migliore ha avuto un delta di 7%, medio di 17%, peggiore di 35%
Rispetto a tutti i dispositivi testati
» 10% di tutti i dispositivi testati in questa classe è stato migliore, 2% similare, 88% peggiore
» Il migliore ha avuto un delta di 4%, medio di 23%, peggiore di 134%
Apple MacBook Pro 16 2021 M1 Pro analisi audio
(+) | gli altoparlanti sono relativamente potenti (84.7 dB)
Bassi 100 - 315 Hz
(+) | bassi buoni - solo 3.8% dalla media
(+) | bassi in lineaa (5.2% delta rispetto alla precedente frequenza)
Medi 400 - 2000 Hz
(+) | medi bilanciati - solo only 1.3% rispetto alla media
(+) | medi lineari (2.1% delta rispetto alla precedente frequenza)
Alti 2 - 16 kHz
(+) | Alti bilanciati - appena 1.9% dalla media
(+) | alti lineari (2.7% delta rispetto alla precedente frequenza)
Nel complesso 100 - 16.000 Hz
(+) | suono nel complesso lineare (4.6% differenza dalla media)
Rispetto alla stessa classe
» 0% di tutti i dispositivi testati in questa classe è stato migliore, 0% simile, 100% peggiore
» Il migliore ha avuto un delta di 5%, medio di 17%, peggiore di 45%
Rispetto a tutti i dispositivi testati
» 0% di tutti i dispositivi testati in questa classe è stato migliore, 0% similare, 100% peggiore
» Il migliore ha avuto un delta di 4%, medio di 23%, peggiore di 134%
Gestione dell'energia - Molto impegnativa
Consumo di energia
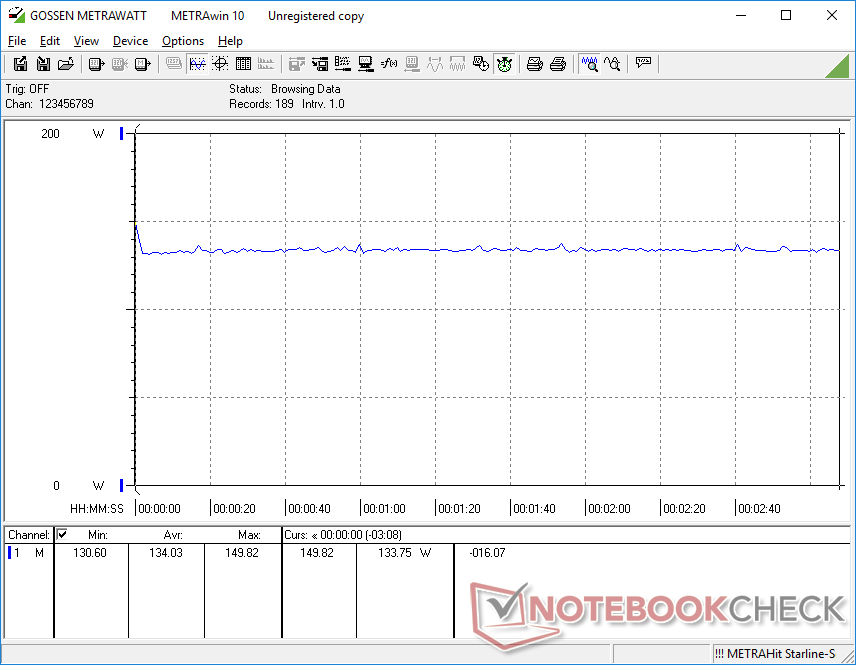
Il sistema è piuttosto esigente nella maggior parte delle condizioni. Il consumo di energia varia tra i 7 W e i 25 W quando è al minimo sul desktop, mentre carichi più elevati come 3DMark 06 o Witcher 3 assorbono circa 140 W ciascuno. L'Asus ProArt StudioBook 16 o Precision 5560 consumano solo 132 W o 96 W in condizioni simili
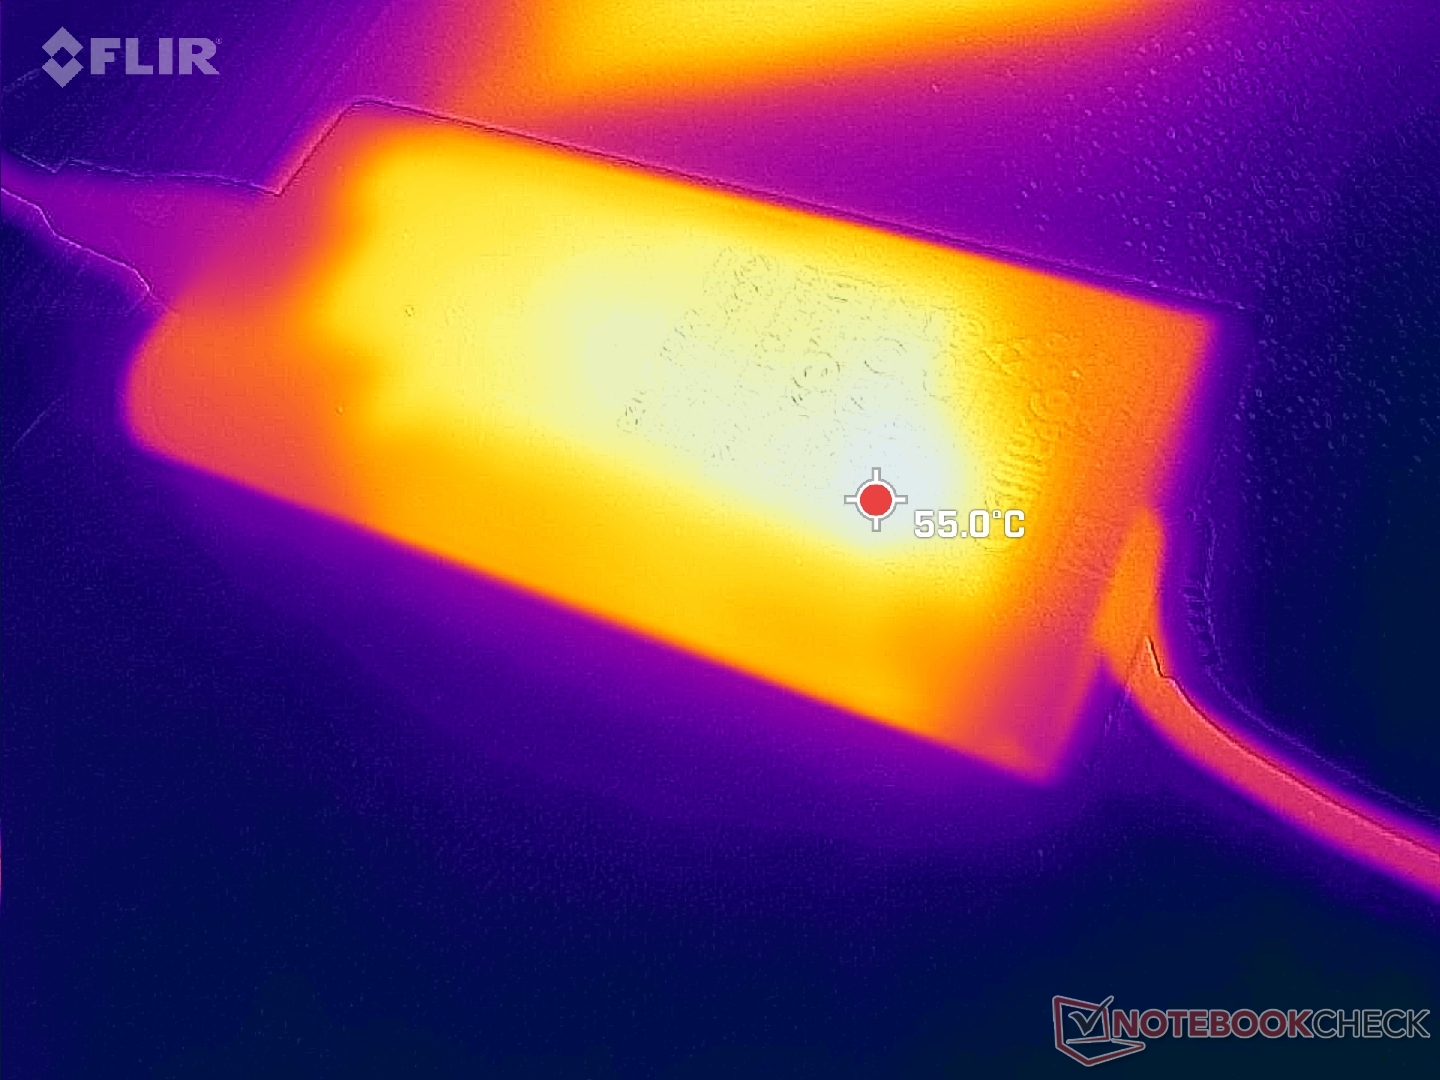
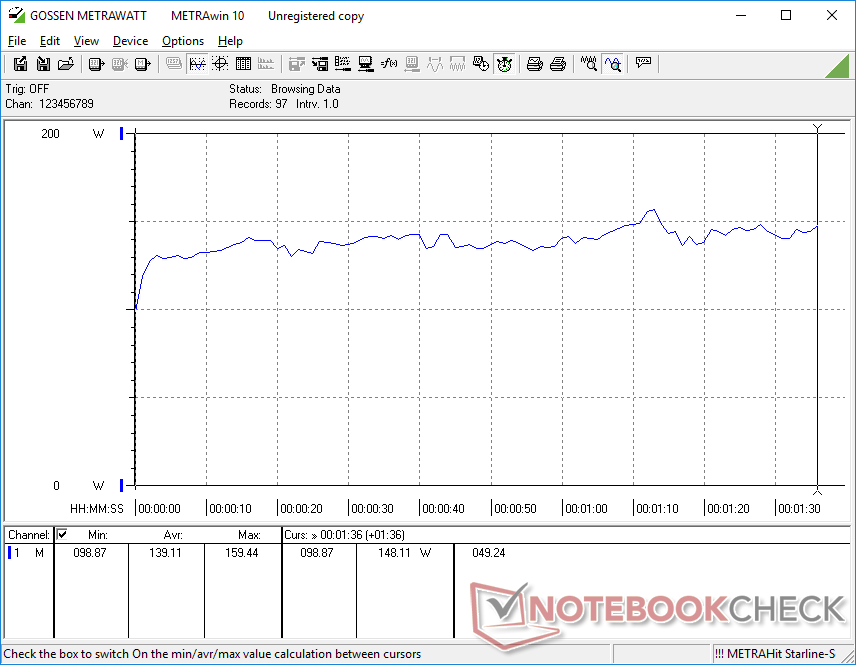
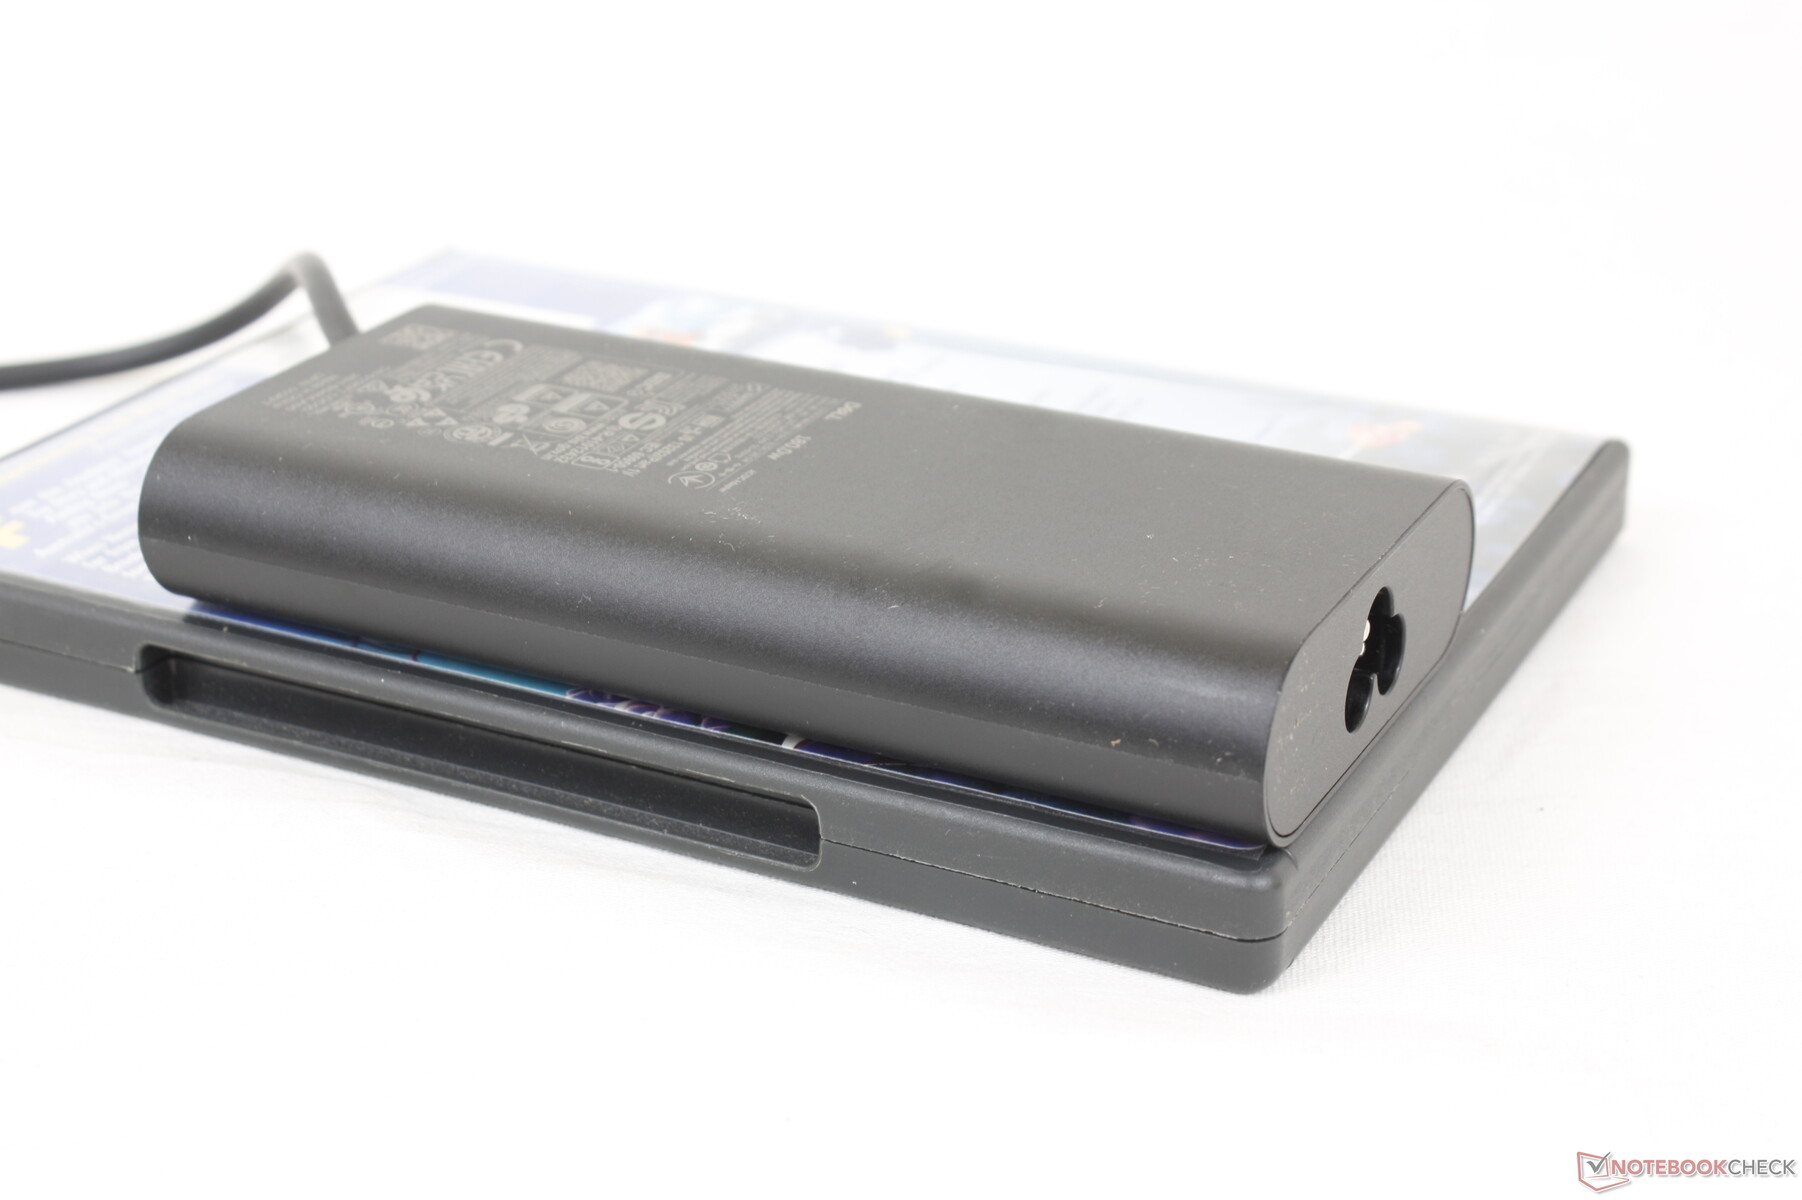
Il consumo energetico può raggiungere i 221 W quando la CPU e la GPU sono al massimo dell'utilizzo, nonostante l'adattatore CA di medie dimensioni (~13,7 x 6,6 x 2,3 cm) sia dimensionato per soli 180 W. Questa velocità estremamente elevata durerebbe al massimo un minuto prima di scendere a 114 W se la CPU è sotto sforzo o a 180 W se sia la CPU che la GPU sono sotto sforzo simultaneamente. Di conseguenza, la velocità di ricarica del portatile potrebbe rallentare fino a fermarsi in condizioni così estreme
Dell offre un adattatore CA da 240 W più capace se si configura il modello Precision 7670 con opzioni di GPU più veloci. Sulla base dei risultati ottenuti con l'adattatore CA da 180 W, tuttavia, forse l'opzione da 240 W dovrebbe essere standard per tutte le configurazioni Nvidia RTX.
| Off / Standby | |
| Idle | |
| Sotto carico |
|
Leggenda:
min: | |
| Dell Precision 7670 i7-12850HX, RTX A2000 Laptop GPU, SK Hynix HFS001TEJ9X115N, OLED, 3840x2400, 16" | Lenovo ThinkPad P1 G4-20Y4Z9DVUS i7-11800H, T1200 Laptop GPU, Samsung PM9A1 MZVL2512HCJQ, IPS, 2560x1600, 16" | Asus ProArt StudioBook 16 W7600H5A-2BL2 W-11955M, RTX A5000 Laptop GPU, 2x Micron 2300 2TB MTFDHBA2T0TDV (RAID 0), OLED, 3840x2400, 16" | Dell Precision 5000 5560 i7-11850H, RTX A2000 Laptop GPU, Samsung PM9A1 MZVL22T0HBLB, IPS, 3840x2400, 15.6" | Dell Precision 7550 W-10885M, Quadro RTX 5000 Max-Q, SK Hynix PC601A NVMe 1TB, IPS, 3840x2160, 15.6" | HP ZBook Fury 15 G8 i9-11950H, RTX A5000 Laptop GPU, Samsung PM981a MZVLB1T0HBLR, IPS, 3840x2160, 15.6" | |
|---|---|---|---|---|---|---|
| Power Consumption | 9% | -14% | 16% | -12% | -13% | |
| Idle Minimum * (Watt) | 7.5 | 9.9 -32% | 12.4 -65% | 6.2 17% | 8.2 -9% | 8.3 -11% |
| Idle Average * (Watt) | 9.5 | 13.9 -46% | 16.5 -74% | 13.9 -46% | 16.8 -77% | 19.9 -109% |
| Idle Maximum * (Watt) | 28.4 | 14.6 49% | 25 12% | 23.8 16% | 24.4 14% | 21.8 23% |
| Load Average * (Watt) | 139.1 | 95 32% | 132 5% | 95.7 31% | 131 6% | 110.9 20% |
| Witcher 3 ultra * (Watt) | 134 | 98.9 26% | 132 1% | 87 35% | 156.6 -17% | 165 -23% |
| Load Maximum * (Watt) | 220.8 | 170.8 23% | 134 39% | 132.6 40% | 201.8 9% | 171.8 22% |
* ... Meglio usare valori piccoli
Power Consumption Witcher 3 / Stresstest
Power Consumption external Monitor
Durata della batteria
Il tempo di funzionamento della WLAN è di poco inferiore alle 6 ore, più breve di quello dei modelli Precision 5560 o 7550 Precision 7550. Questo è dovuto in gran parte al pannello OLED che consuma più energia rispetto all'IPS quando si visualizzano i colori bianchi. Poiché la maggior parte dei siti web è prevalentemente di colore bianco, la durata della batteria, generalmente più breve, non è inaspettata
La ricarica con l'adattatore CA in dotazione richiede circa 2 ore. Il sistema non può essere ricaricato tramite USB-C perché non supporta il PD-in.
| Dell Precision 7670 i7-12850HX, RTX A2000 Laptop GPU, 83 Wh | Lenovo ThinkPad P1 G4-20Y4Z9DVUS i7-11800H, T1200 Laptop GPU, 90 Wh | Asus ProArt StudioBook 16 W7600H5A-2BL2 W-11955M, RTX A5000 Laptop GPU, 90 Wh | Dell Precision 5000 5560 i7-11850H, RTX A2000 Laptop GPU, 86 Wh | Dell Precision 7550 W-10885M, Quadro RTX 5000 Max-Q, 95 Wh | HP ZBook Fury 15 G8 i9-11950H, RTX A5000 Laptop GPU, 94 Wh | |
|---|---|---|---|---|---|---|
| Autonomia della batteria | 49% | -15% | 32% | 23% | 5% | |
| Reader / Idle (h) | 7.9 | 12 52% | 11.1 41% | |||
| WiFi v1.3 (h) | 5.9 | 8.8 49% | 5 -15% | 6.3 7% | 8.9 51% | 6.2 5% |
| Load (h) | 1.3 | 1.8 38% | 1 -23% | |||
| H.264 (h) | 1.8 | |||||
| Witcher 3 ultra (h) | 1.6 |
Pro
Contro
Verdetto - Potente senza essere troppo grande
Il Precision 7670 compete direttamente con l'HP ZBook Fury 16 G9. Dal momento che non abbiamo ancora recensito il modello HP, possiamo solo confrontare il nostro Precision con il 16 polliciLenovo ThinkPad P1 G4 oAsus ProArt StudioBook Pro 16 W7600. Il modello Dell è in grado di offrire prestazioni della CPU significativamente più veloci rispetto a entrambi, oltre a molte altre caratteristiche ausiliarie, tra cui una manutenzione più semplice, la connettività WAN e un maggior numero di opzioni di archiviazione.
Il modello Precision 7670 dà il meglio di sé quando è configurato con opzioni di CPU e GPU di fascia alta. Tuttavia, con le opzioni di fascia più bassa, è possibile trovare alternative più sottili e leggere in grado di offrire lo stesso livello di prestazioni.
Il peso è uno degli svantaggi principali di Precision 7670, in quanto il sistema pesa quasi quanto il più grande Precision 7550 da 17,3 pollici. Inoltre, è un po' deludente che il Core i7-12850HX non riesca a sostenere le velocità di clock Turbo Boost per periodi prolungati, nonostante il peso elevato. È ancora veloce, ma la soluzione di raffreddamento che lo sovrasta ne limita il potenziale. La mancanza di una CPU Xeon rende Precision 7670 più simile a un laptop di tipo Studio che a una vera e propria workstation.
Il modello Precision 7670 è comunque ottimo per gli utenti più potenti, che possono trarre vantaggio dalla presenza di tutti i core Intel di 12a generazione e di una GPU RTX A5500 di fascia alta. Per le configurazioni di fascia bassa, tuttavia, i modelli da 16 pollici più sottili e leggeri, come i già citati Lenovo o Asus, possono ancora essere delle valide alternative.
Prezzo e disponibilità
Precision 7670 è attualmente disponibile su Newegg con una sola configurazione. Si consiglia di ordinare direttamente da Dell per una selezione più ampia di configurazioni e opzioni di garanzia.
Dell Precision 7670
- 10/06/2022 v7 (old)
Allen Ngo
Price comparison

