Recensione del portatile Dell Inspiron 14 Plus 7420: Per utenti esperti con un budget limitato
Dell ha introdotto tre diversi modelli Inspiron 14 7420 da 14 pollici per il 2022: l'Inspiron 14 7420 standard, l'Inspiron 14 7420 2-in-1 e l'Inspiron 14 7420 Plus. Questa recensione si concentra sul modello Plus, che monta processori Core serie H molto più veloci e grafica discreta Nvidia GeForce RTX, pensata per gli utenti potenti insoddisfatti dei soliti Ultrabook della serie Core-U.
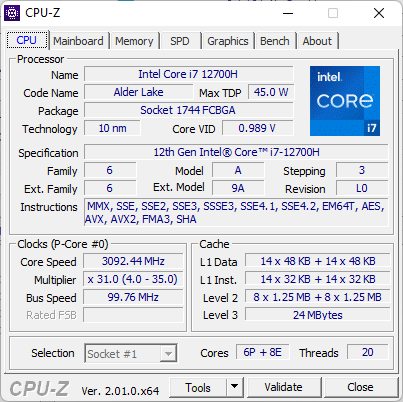
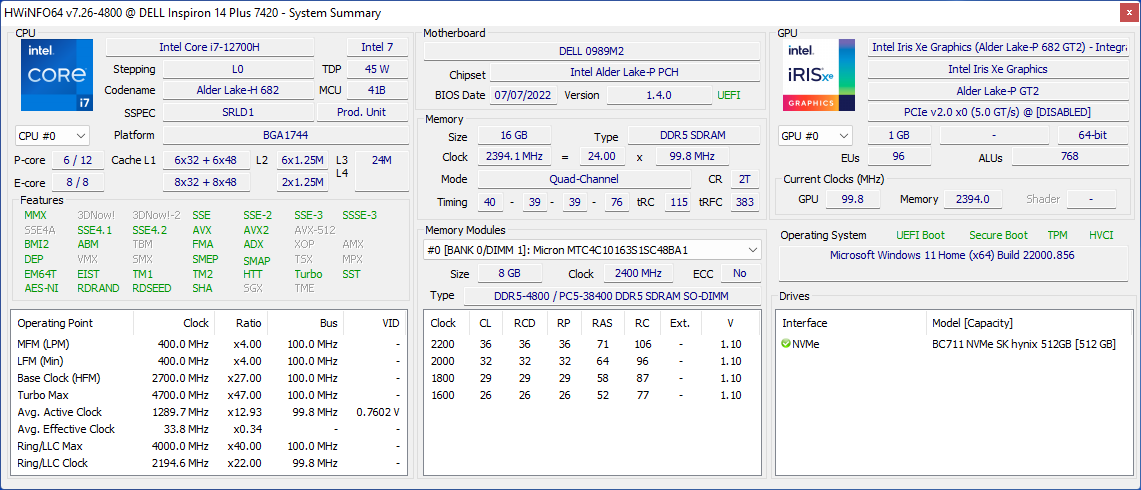
La nostra specifica unità di recensione è dotata di CPU Alder Lake-H Core i7-12700H e GPU GeForce RTX 3050 per circa 1400 dollari al dettaglio. Sono previste altre SKU con Core i5-12500H, RTX 3050 Ti o grafica integrata e una batteria più piccola da 54 Wh, ma tutte le configurazioni sono dotate dello stesso pannello con risoluzione 2,2K 2240 x 1400.
I concorrenti includono altri portatili da 14 pollici ad alte prestazioni come Asus VivoBook Pro 14, HP Pavilion 14 Plus, Schenker Vision 14, HP Envy 14, o il Lenovo IdeaPad 5 Pro 14. Anche Razer Blade 14 e Asus Zephyrus G14 possono essere considerati alternative, ma sono significativamente più costosi.
Altre recensioni Dell:
Potenziali concorrenti a confronto
Punteggio | Data | Modello | Peso | Altezza | Dimensione | Risoluzione | Prezzo |
|---|---|---|---|---|---|---|---|
| 87.2 % v7 (old) | 09/2022 | Dell Inspiron 14 Plus 7420 i7-12700H, GeForce RTX 3050 4GB Laptop GPU | 1.7 kg | 18.87 mm | 14.00" | 2240x1400 | |
| 86.3 % v7 (old) | 07/2022 | Asus Vivobook Pro 14 M3401QC-KM007T R5 5600H, GeForce RTX 3050 4GB Laptop GPU | 1.5 kg | 19 mm | 14.00" | 2880x1800 | |
| 83.7 % v7 (old) | 06/2022 | Dell Inspiron 14 7420 2-in-1 i7-1255U, Iris Xe G7 96EUs | 1.6 kg | 17.86 mm | 14.00" | 1920x1200 | |
| 87.7 % v7 (old) | 01/2022 | Schenker Vision 14 i7-11370H, GeForce RTX 3050 Ti Laptop GPU | 1.1 kg | 15.6 mm | 14.00" | 2880x1800 | |
v (old) | 10/2021 | Asus Zenbook 14X UX5400E i7-1165G7, GeForce MX450 | 1.4 kg | 16.9 mm | 14.00" | 2880x1800 | |
| 82.3 % v7 (old) | 07/2021 | MSI Summit E14 A11SCS i7-1185G7, GeForce GTX 1650 Ti Max-Q | 1.3 kg | 16 mm | 14.00" | 3840x2160 | |
| 86.5 % v7 (old) | 02/2021 | HP Envy 14-eb0010nr i5-1135G7, GeForce GTX 1650 Ti Max-Q | 1.6 kg | 17.9 mm | 14.00" | 1920x1200 |
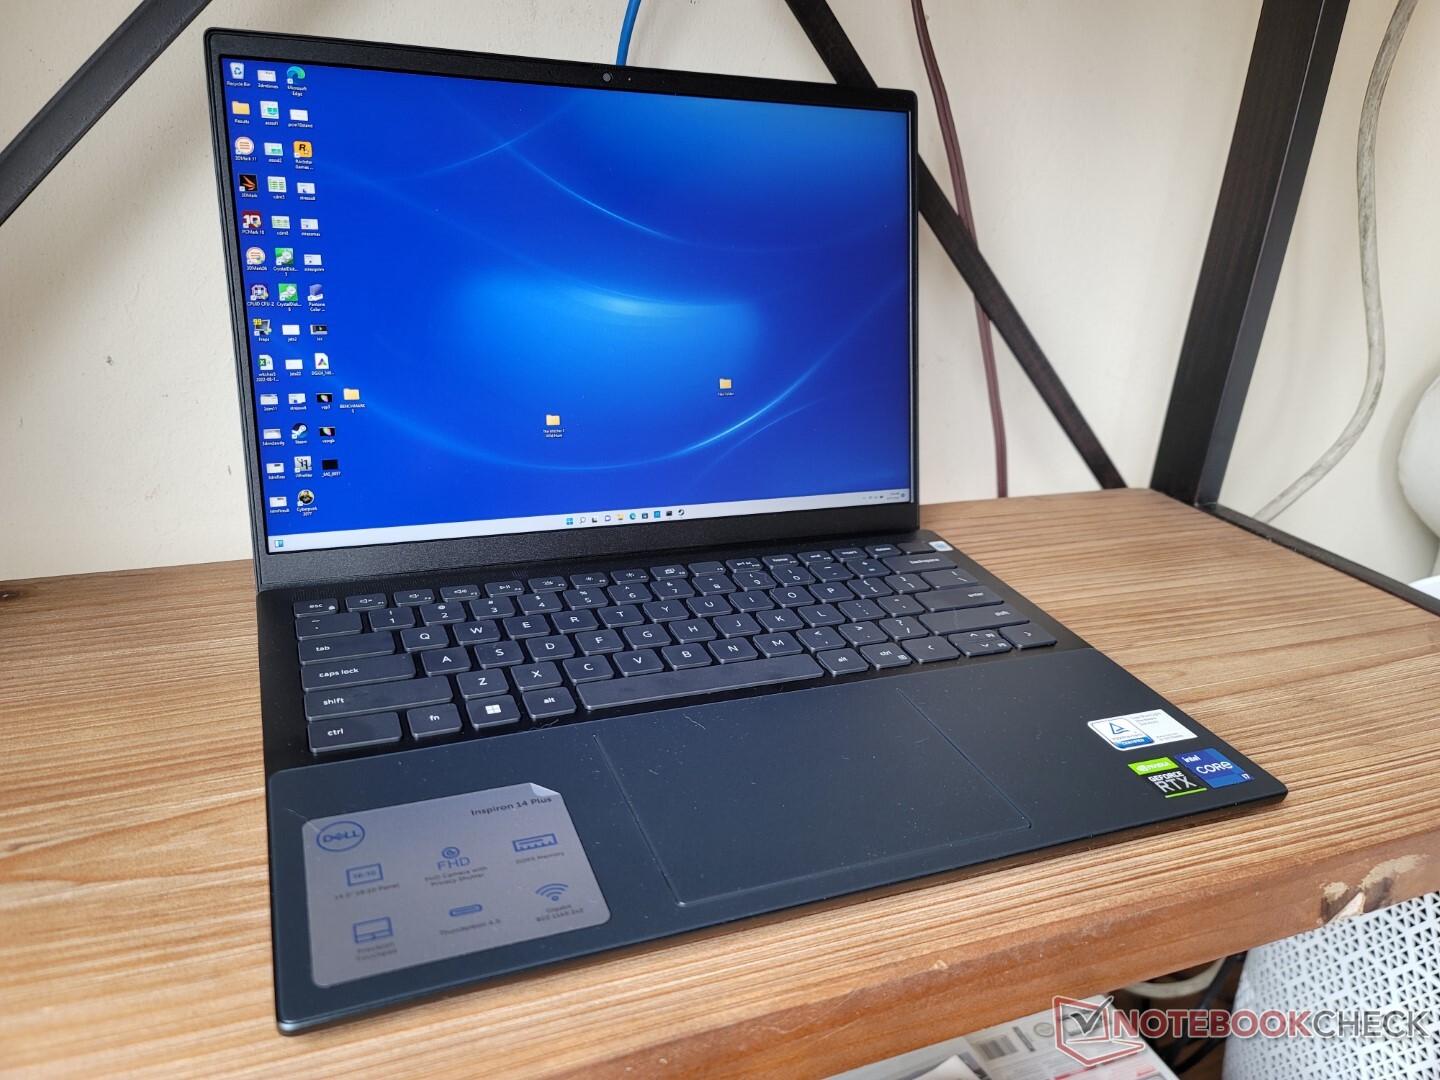
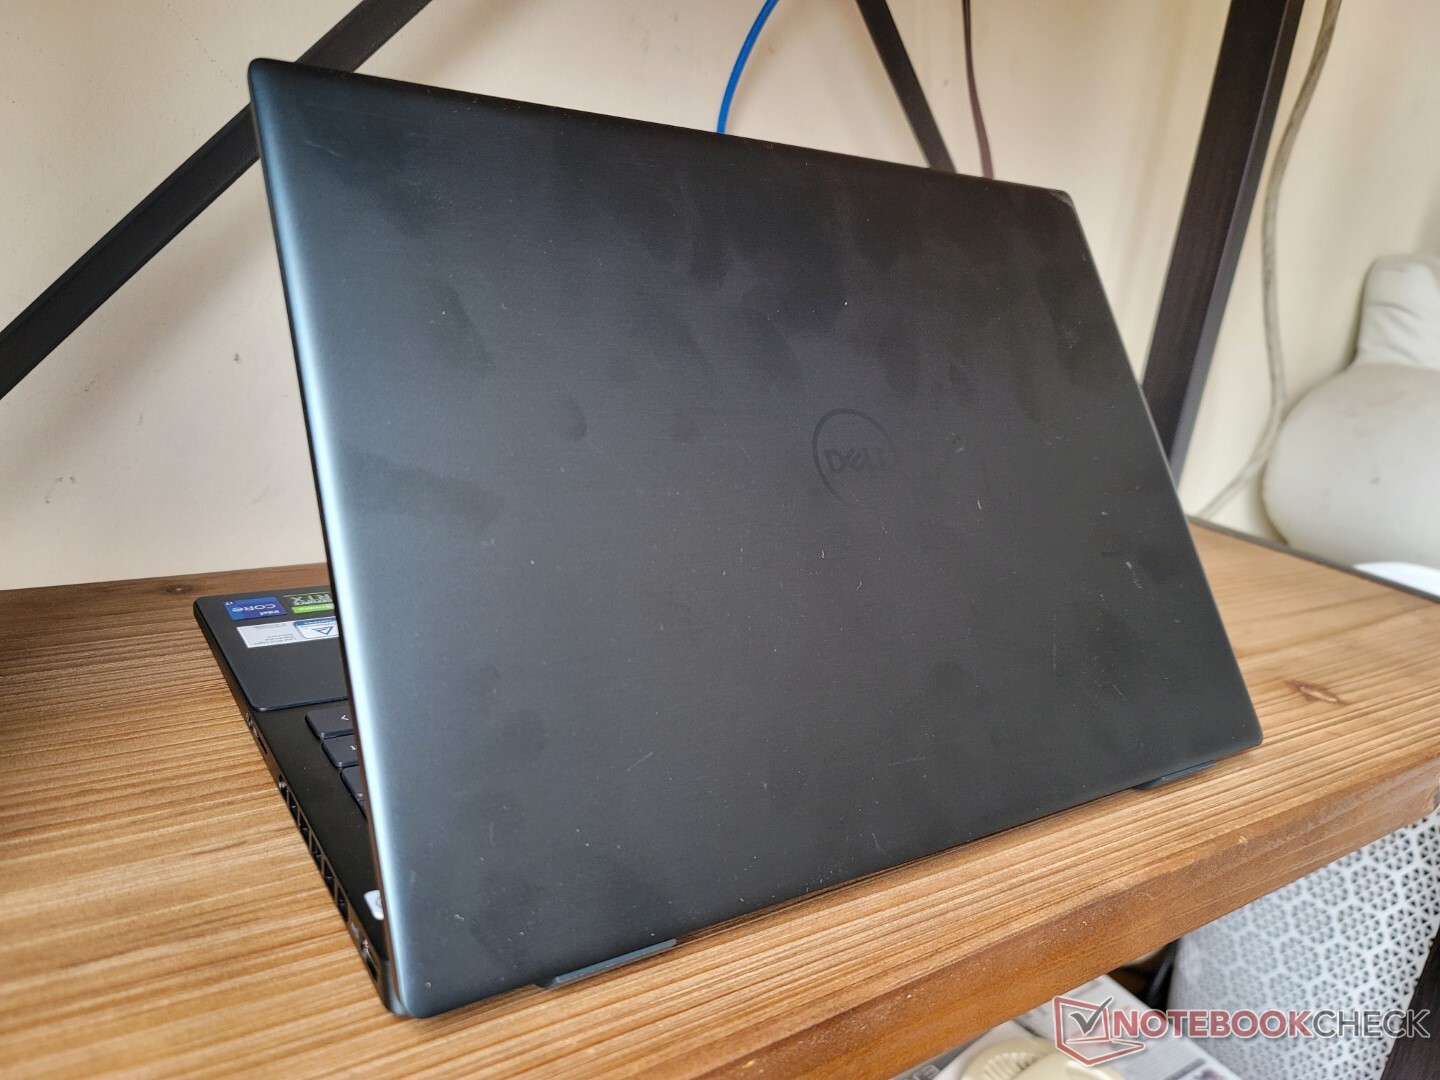
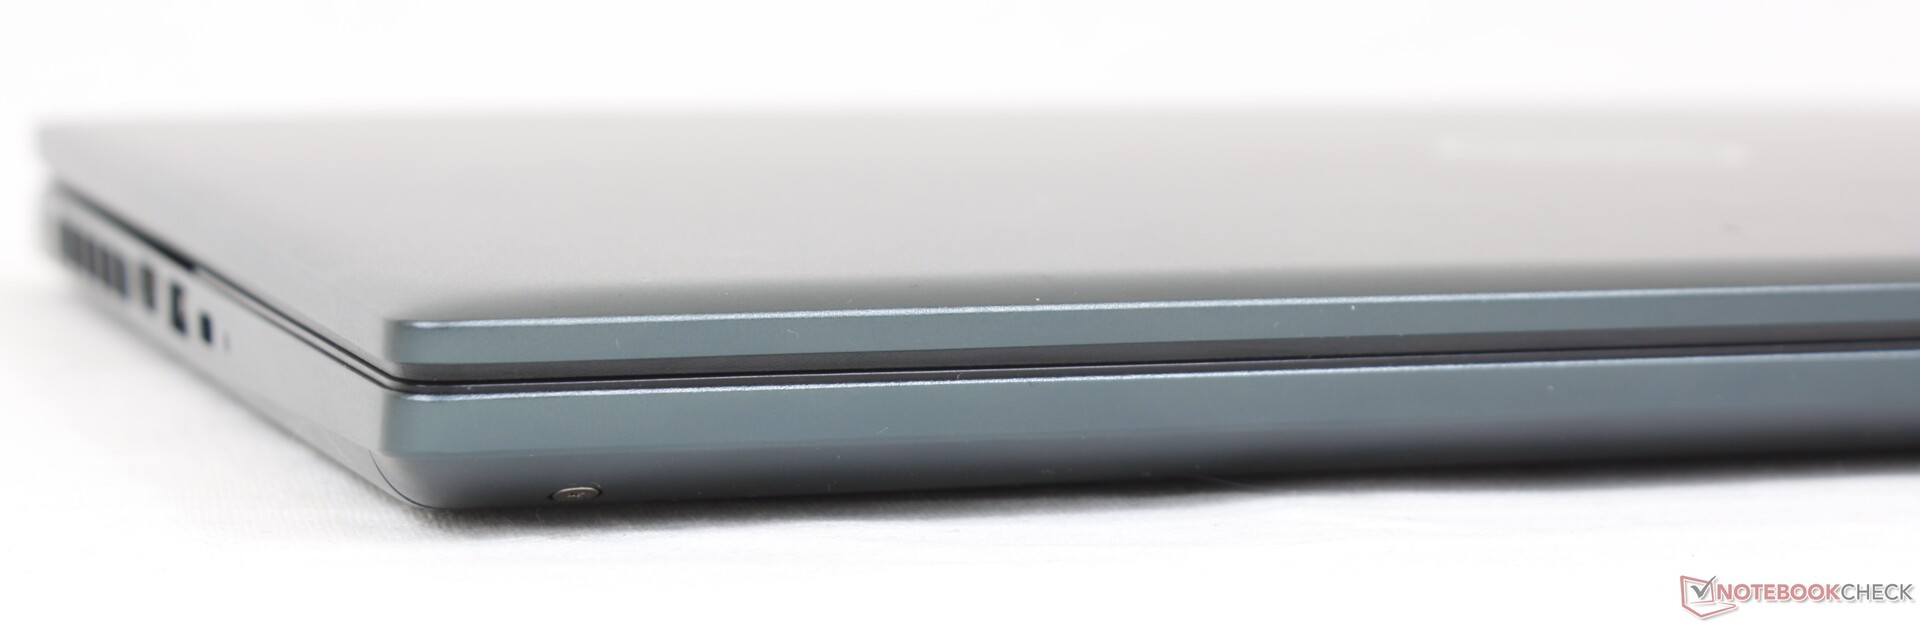
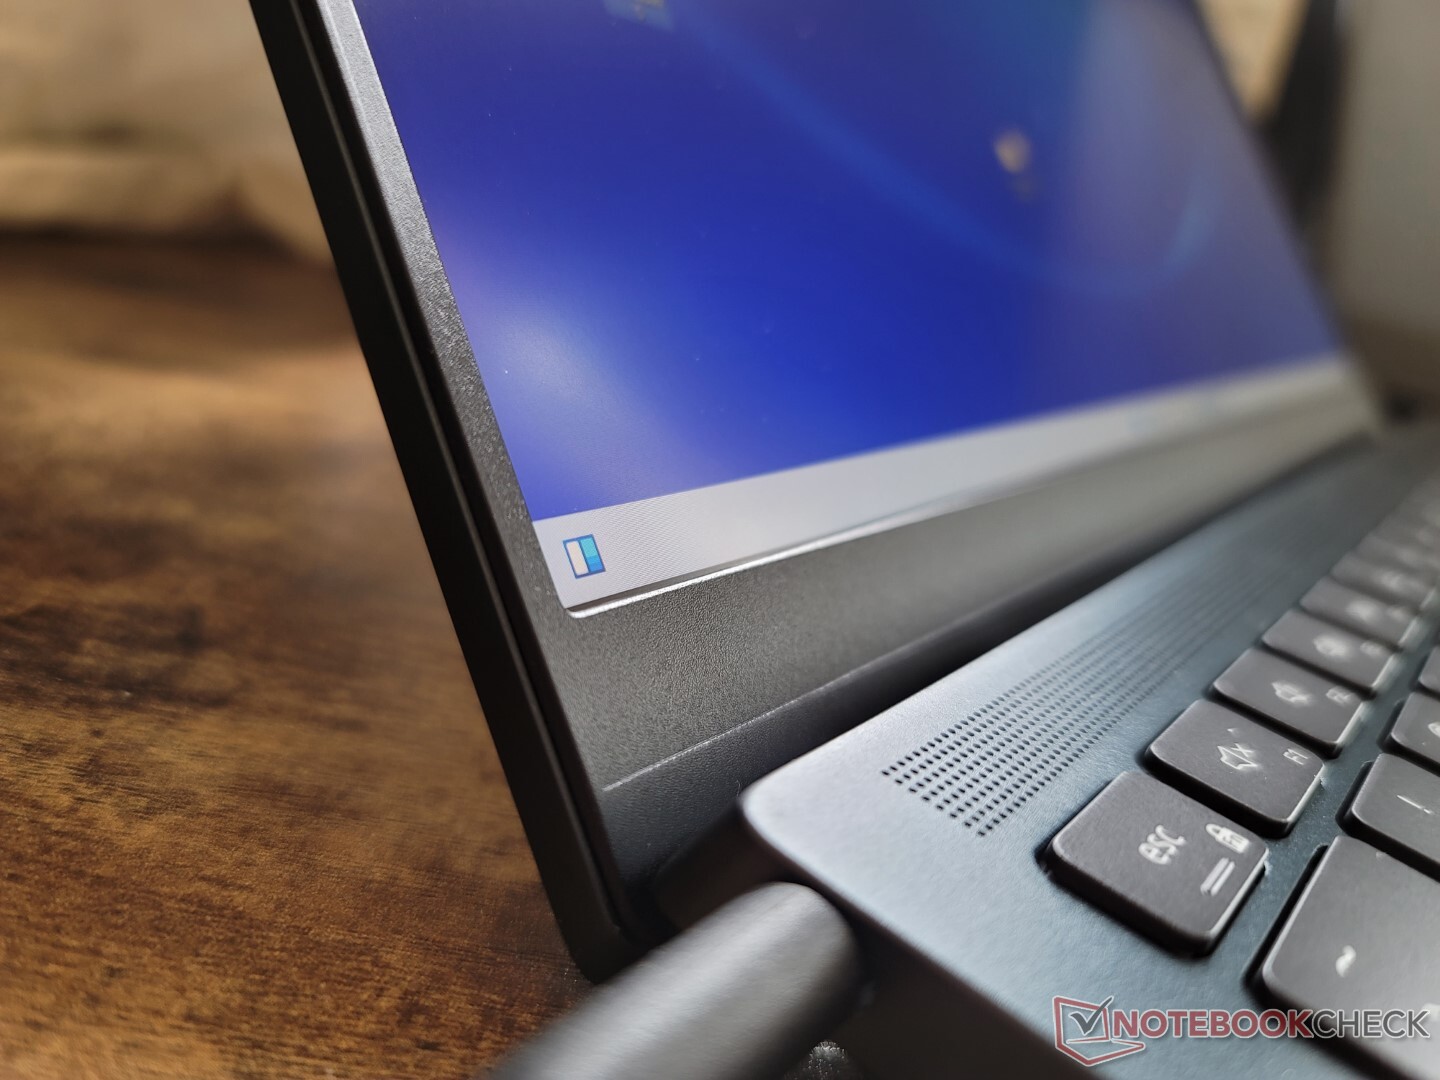
Caso - Un Inspiron 16 7620 in miniatura
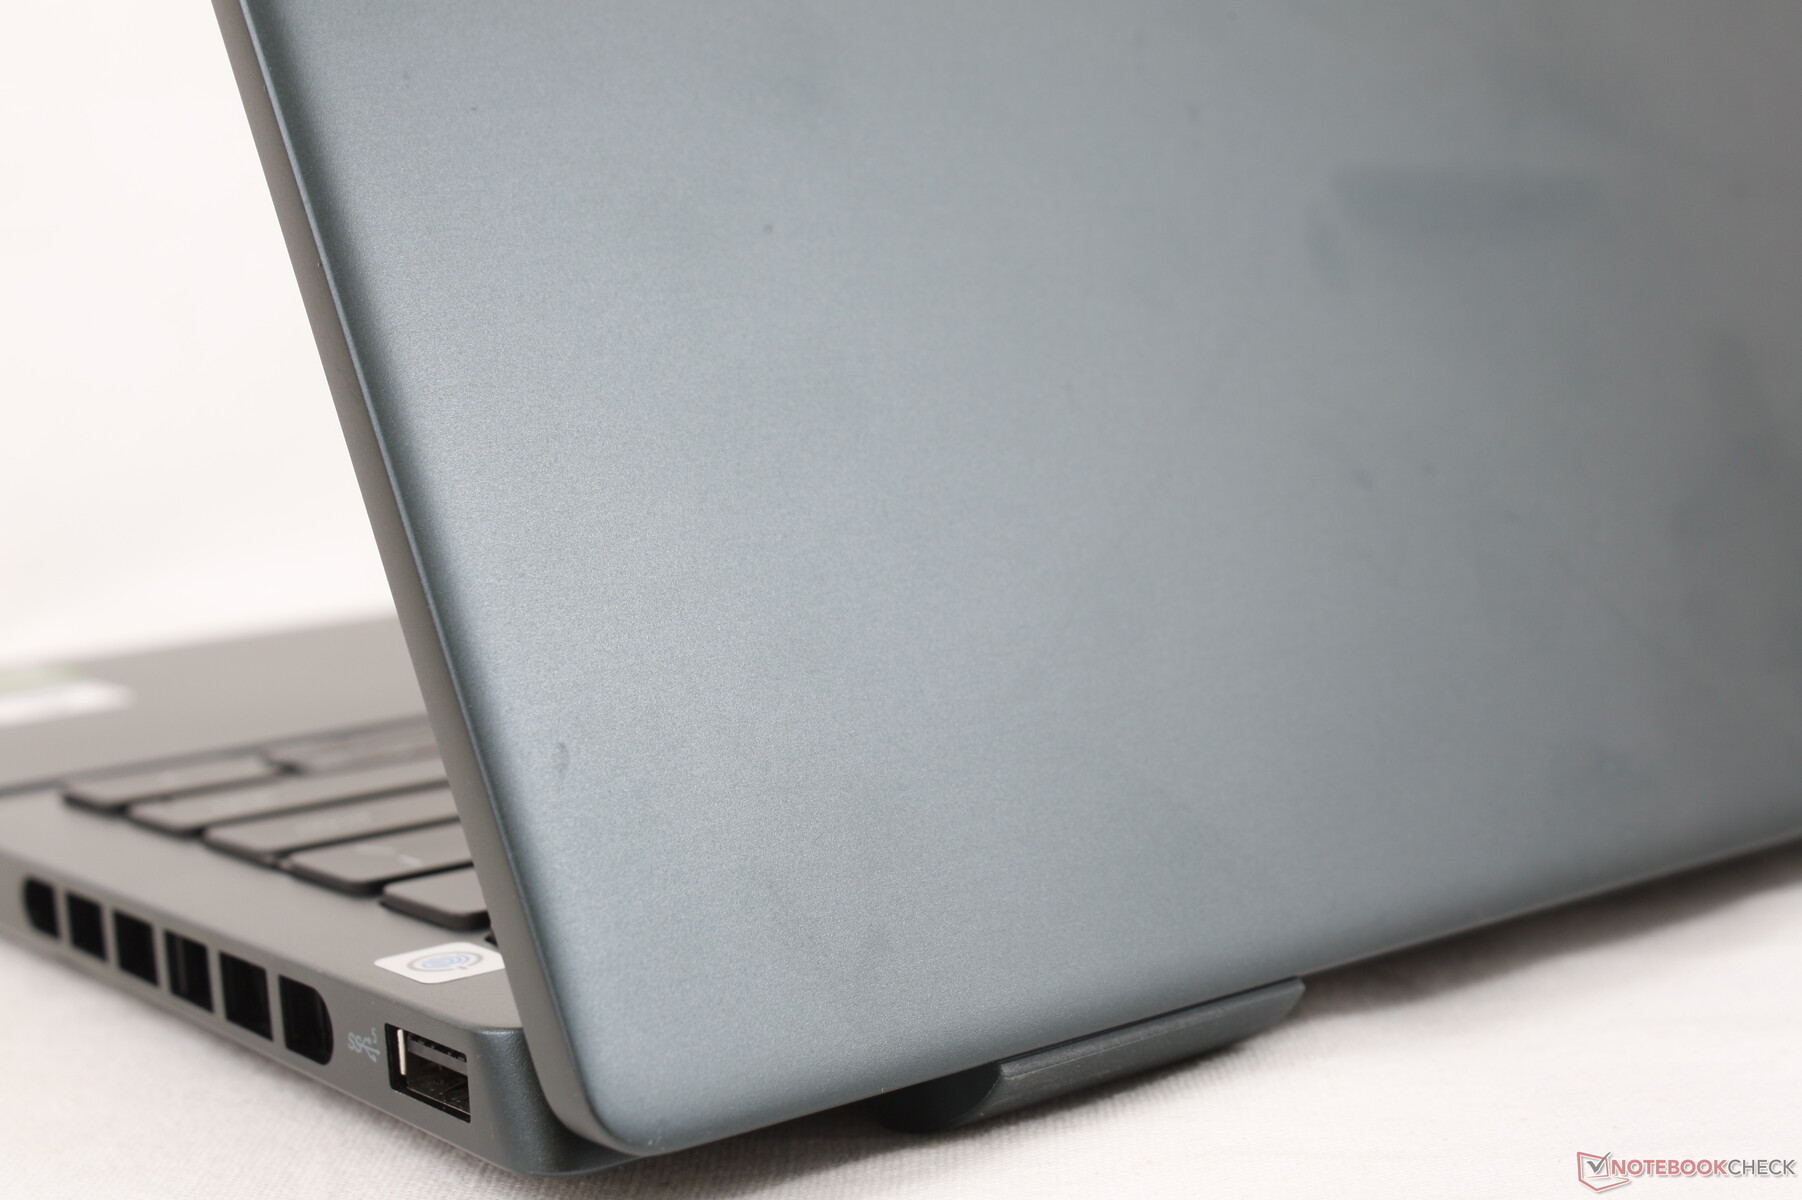
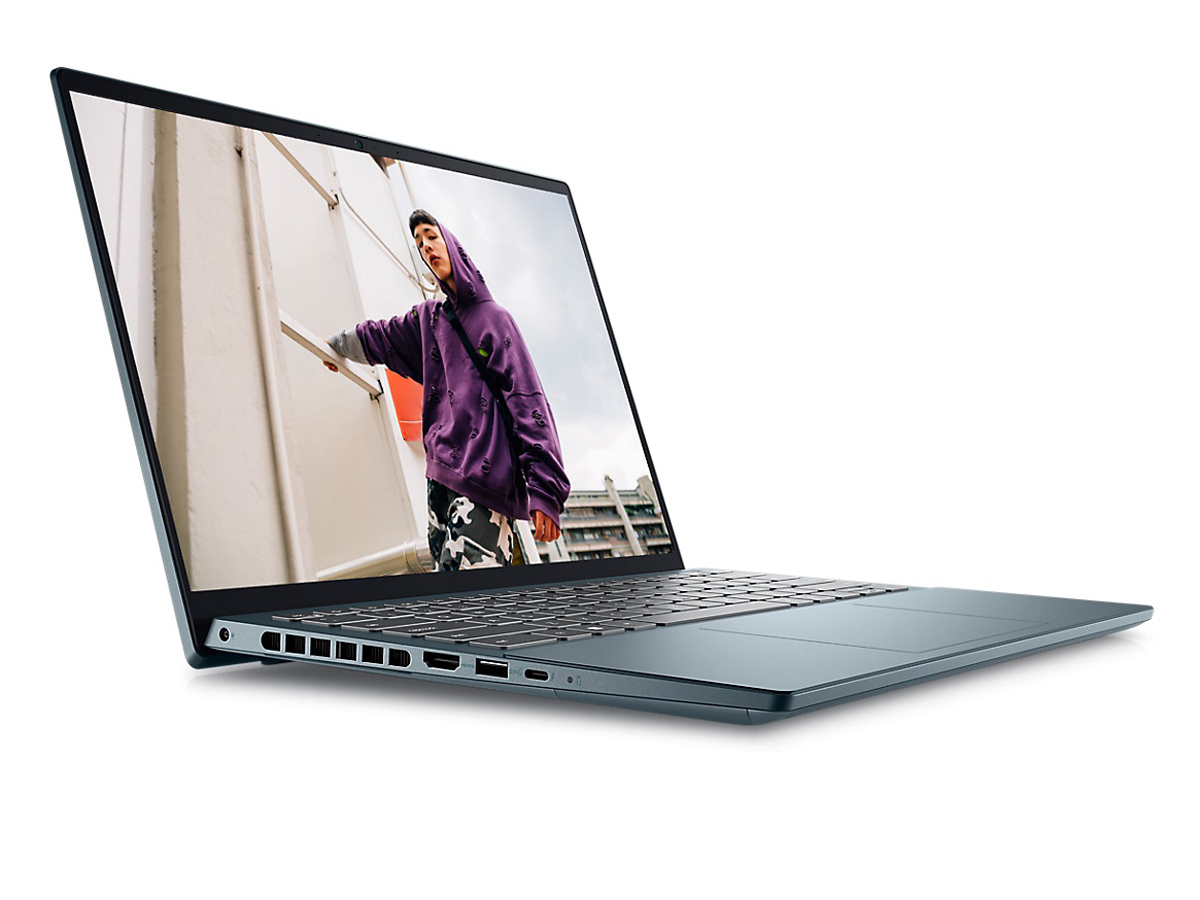
Il telaio può essere meglio descritto come una versione più piccola del modello Inspiron 16 7620 Plus poiché entrambi condividono lo stesso linguaggio di design. I materiali utilizzati per lo chassis metallico e lo strato di Mylar sopra il clickpad e il palm rest sono simili a quelli dell'Inspiron più grande. La sensazione è quella di una superficie liscia e opaca dall'alto verso il basso, che quasi imita il coperchio esterno in metallo liscio di un XPS 15
L'aspetto più debole dello scheletro è forse il coperchio, che si torce facilmente. Si avvertono lievi scricchiolii quando si ruota la base e la pressione sul centro della tastiera ne deforma leggermente la superficie. Anche se questo modello costa quasi quanto un Dell XPS 15, non aspettatevi che sia costruito con la stessa robustezza.
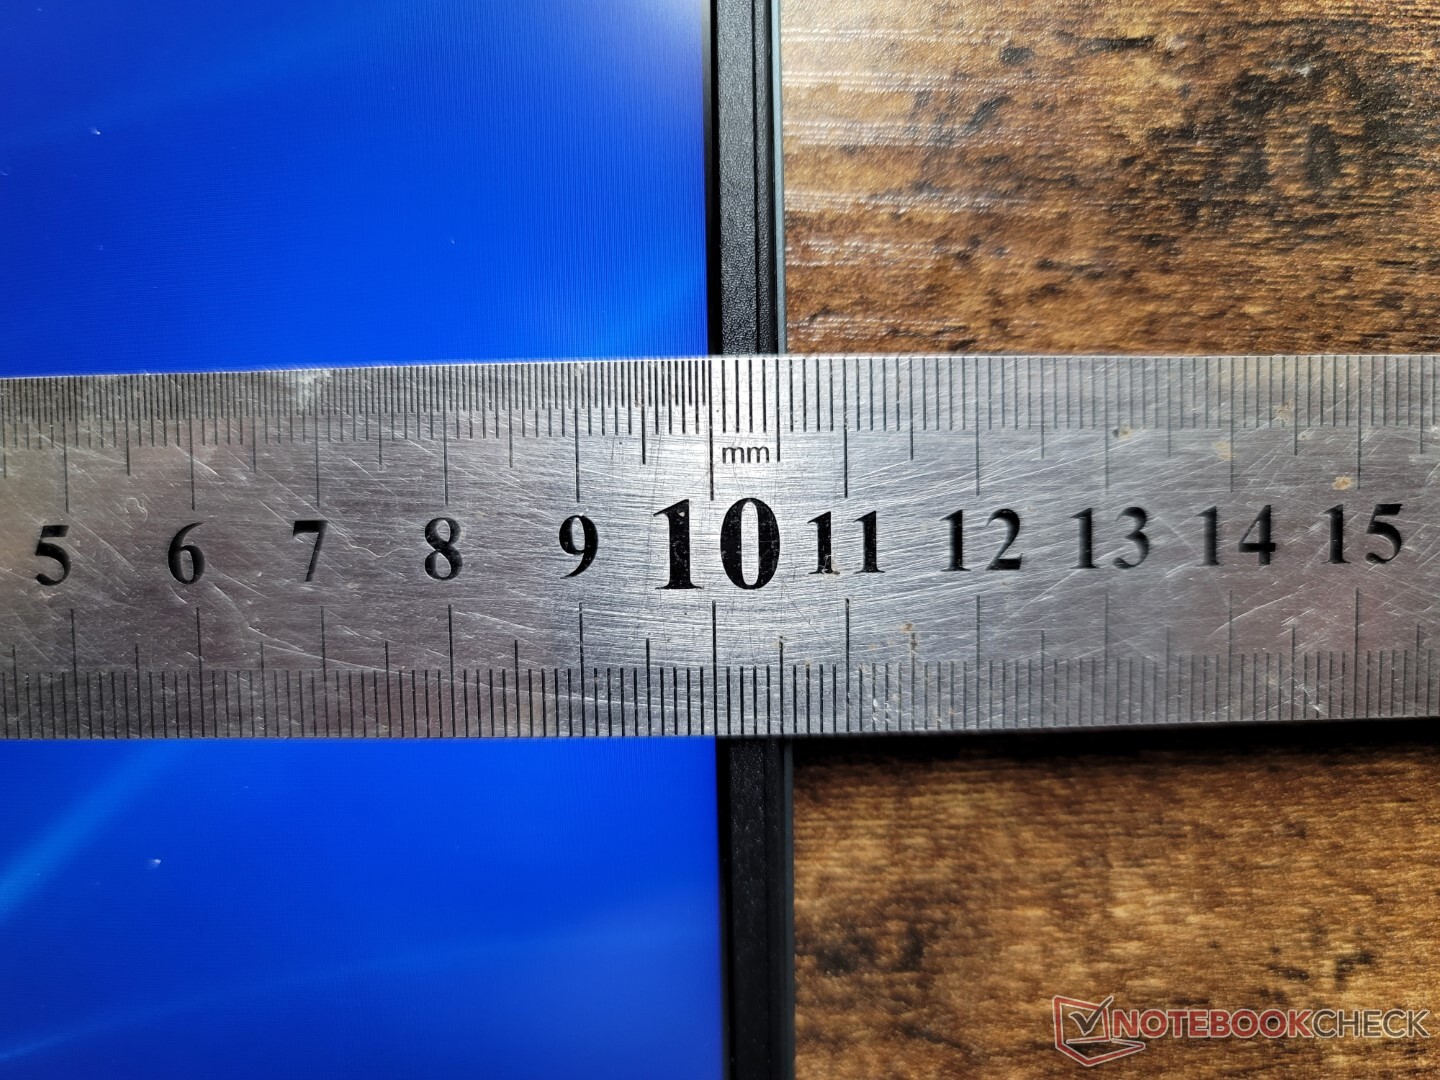
Ci si potrebbe aspettare che l'Inspiron 14 Plus 7620 sia più grande e più pesante dell'Inspiron 14 7620 2-in-1, ma non è così. L'ingombro è identico a quello della versione 2-in-1, mentre è solo un po' più spesso e pesante, nonostante l'hardware significativamente più potente al suo interno. Tuttavia, è ancora più pesante e più grande della maggior parte degli altri portatili da 14 pollici, come l'HP Envy 14,Asus Zenbook 14Xo Schenker Vision 14, tutti dotati di grafica discreta Nvidia.
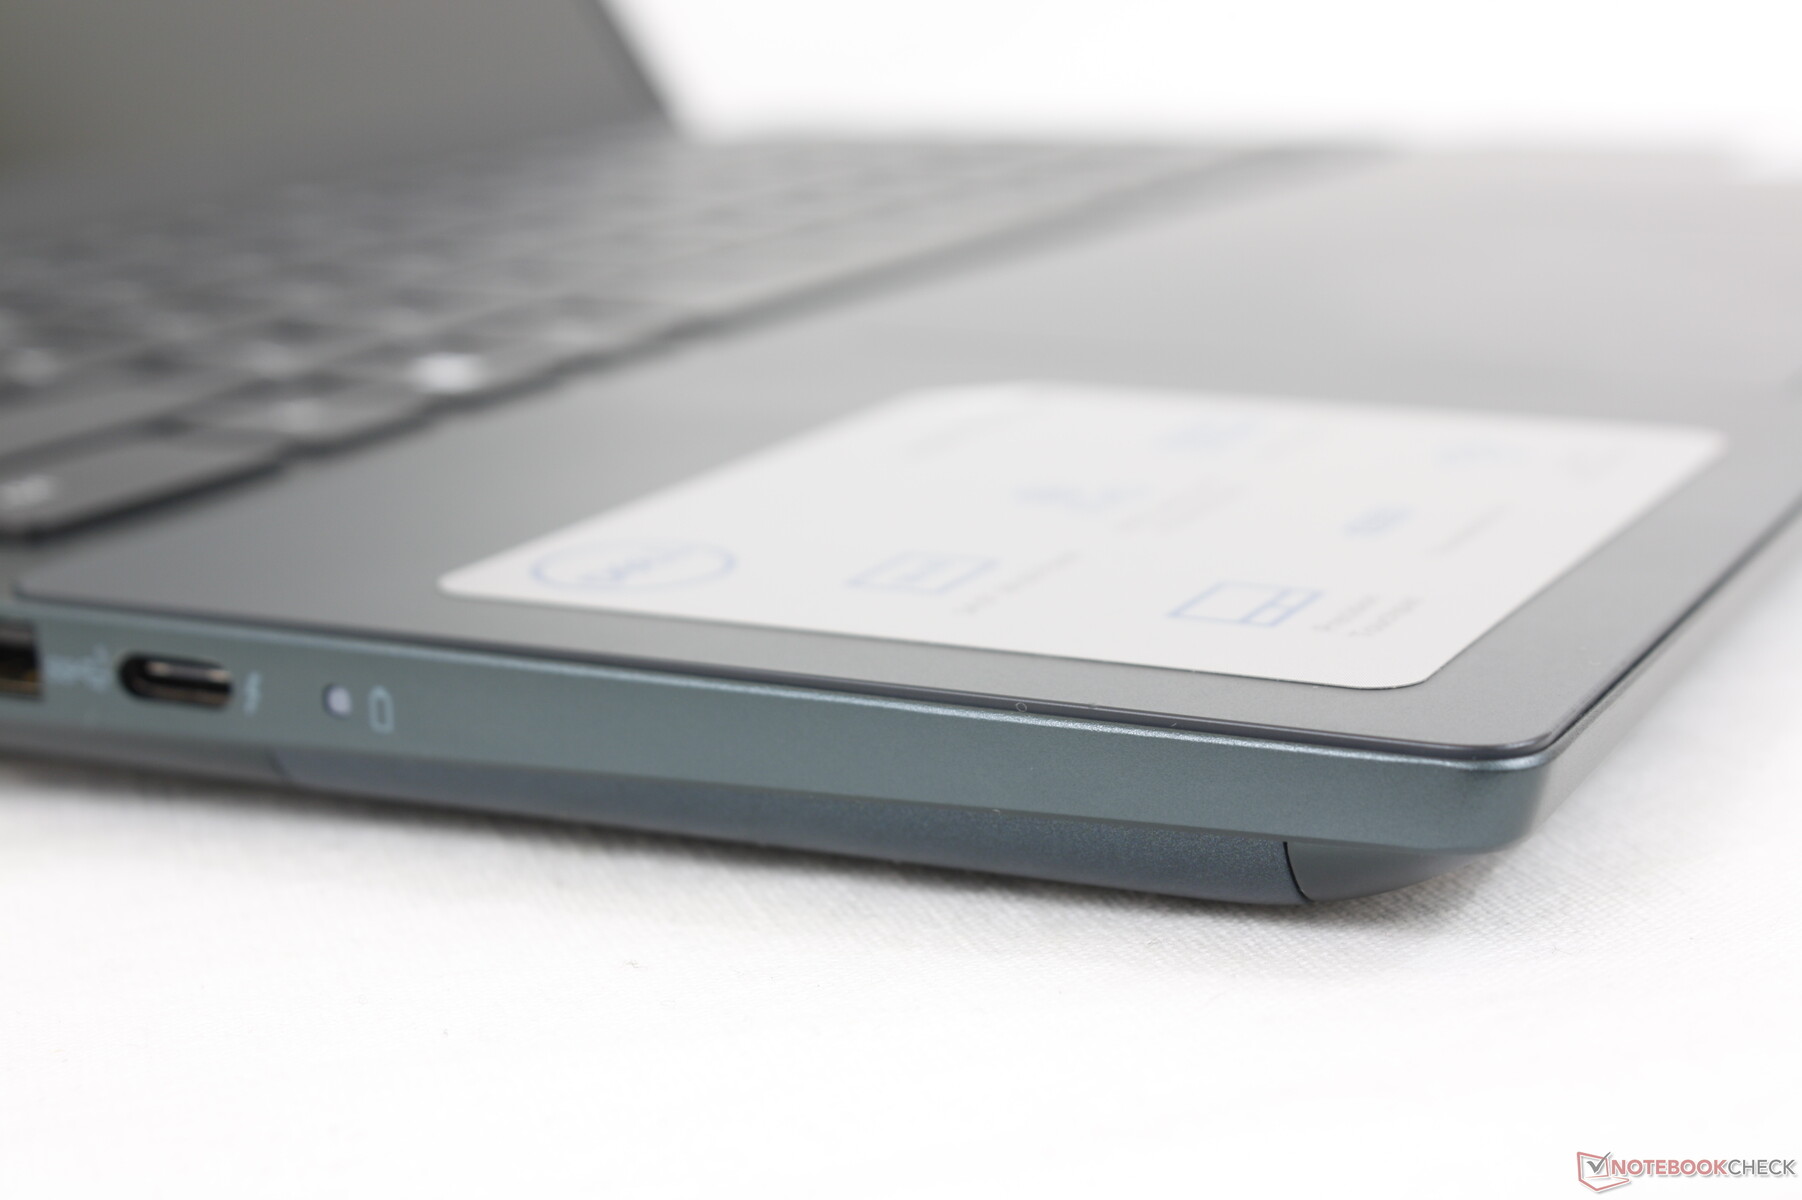
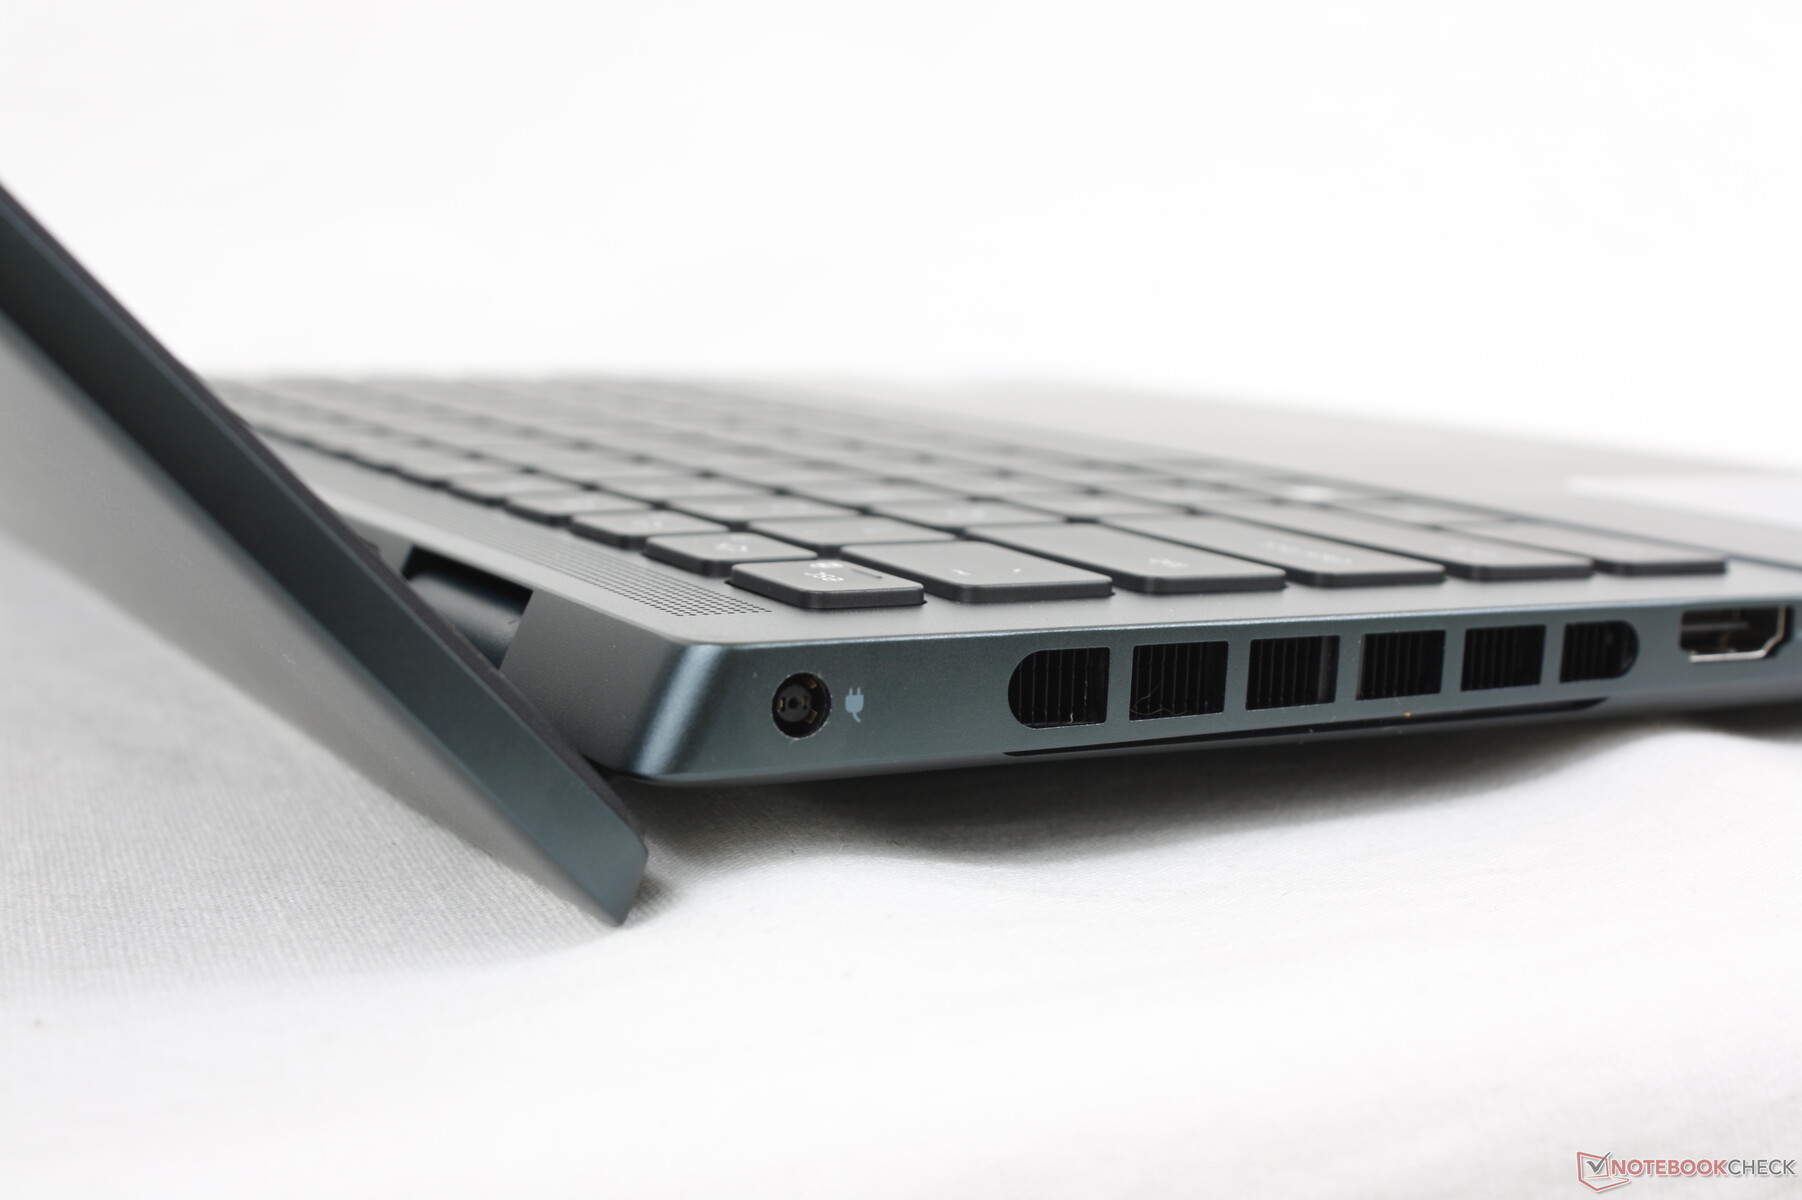
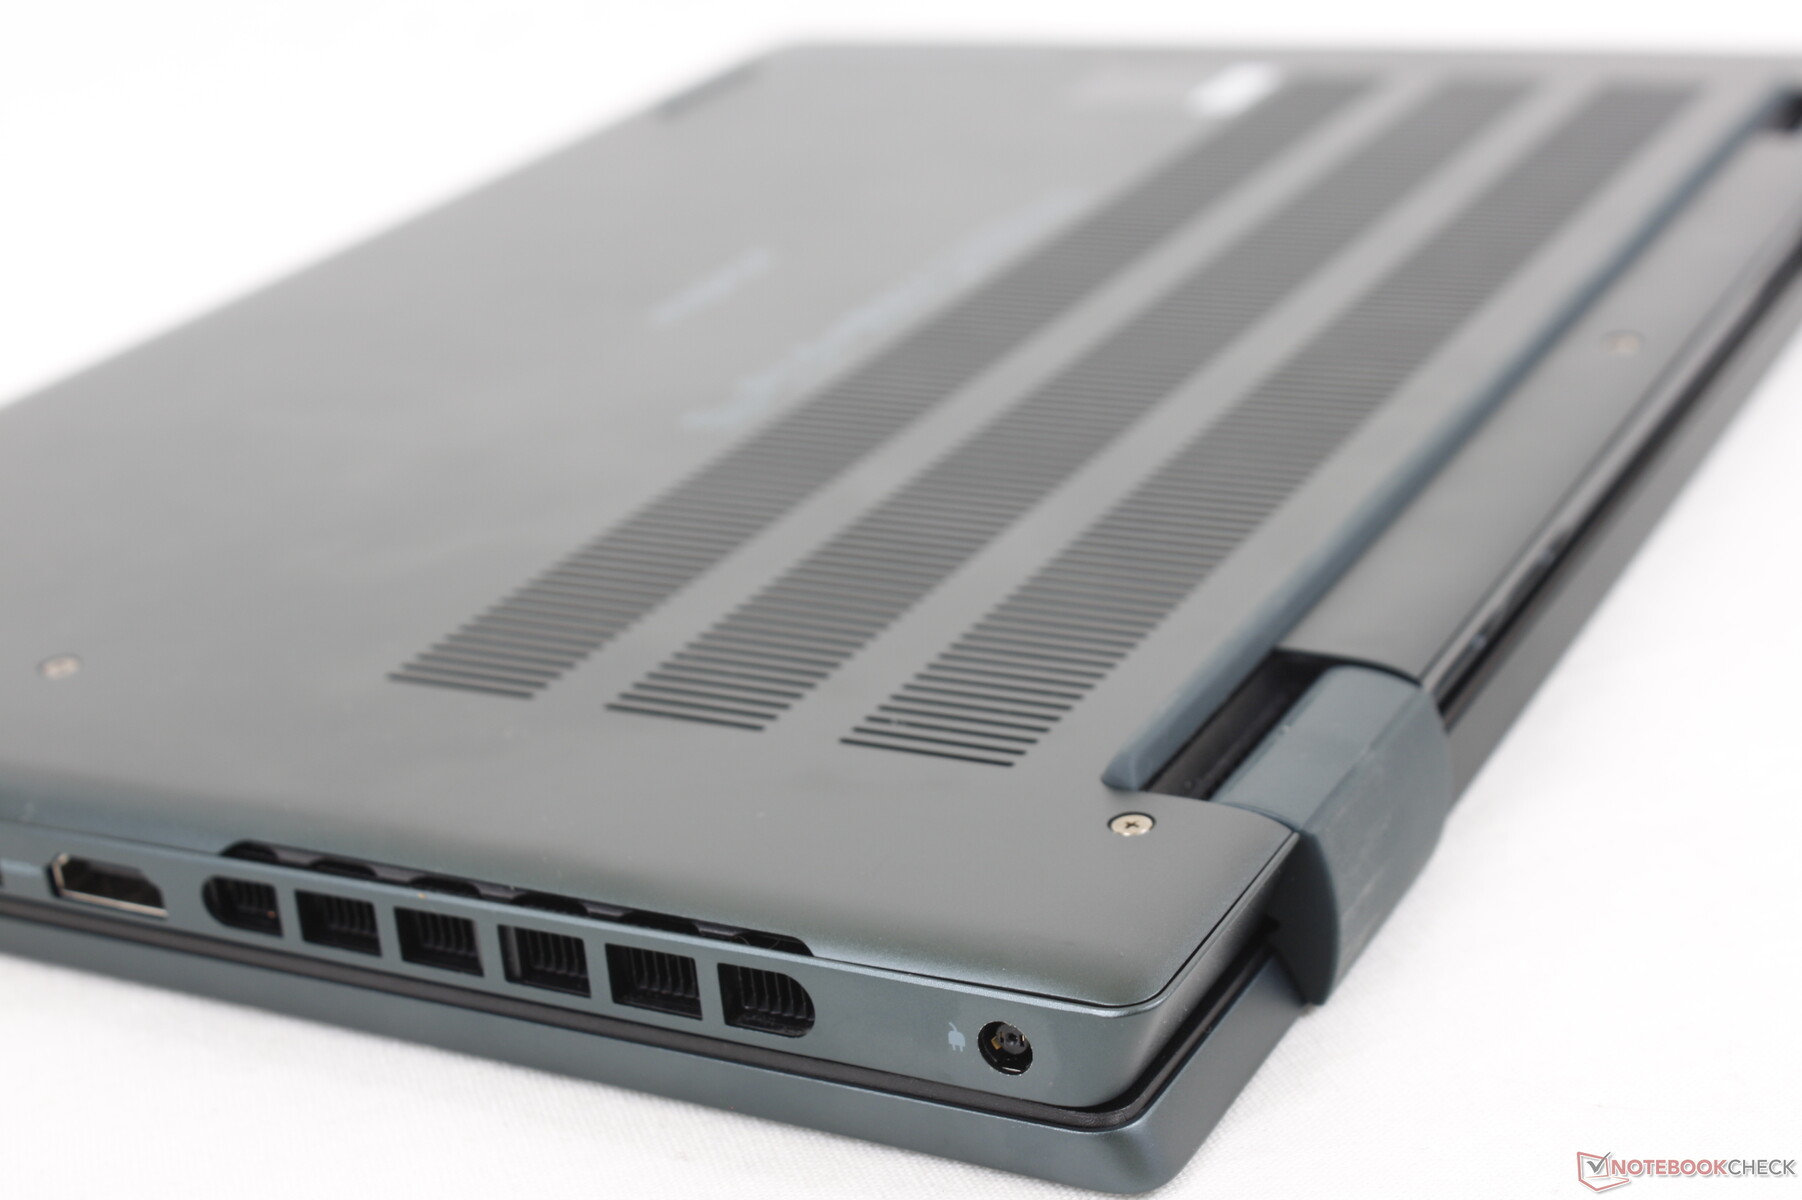
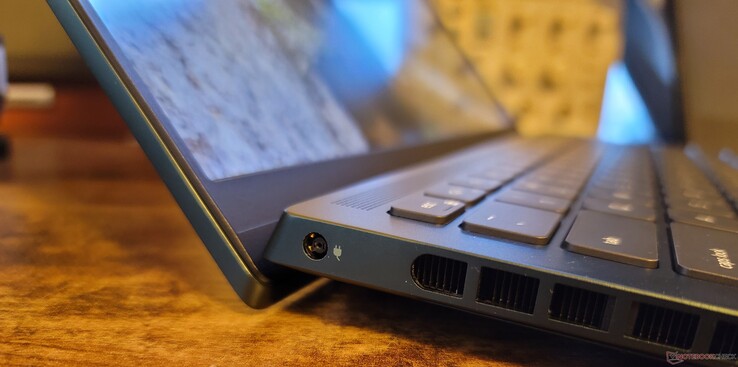
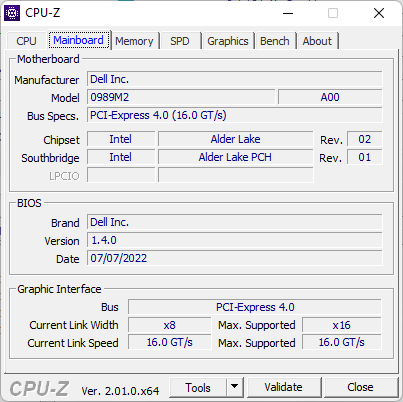
Connettività - Supporto Thunderbolt 4
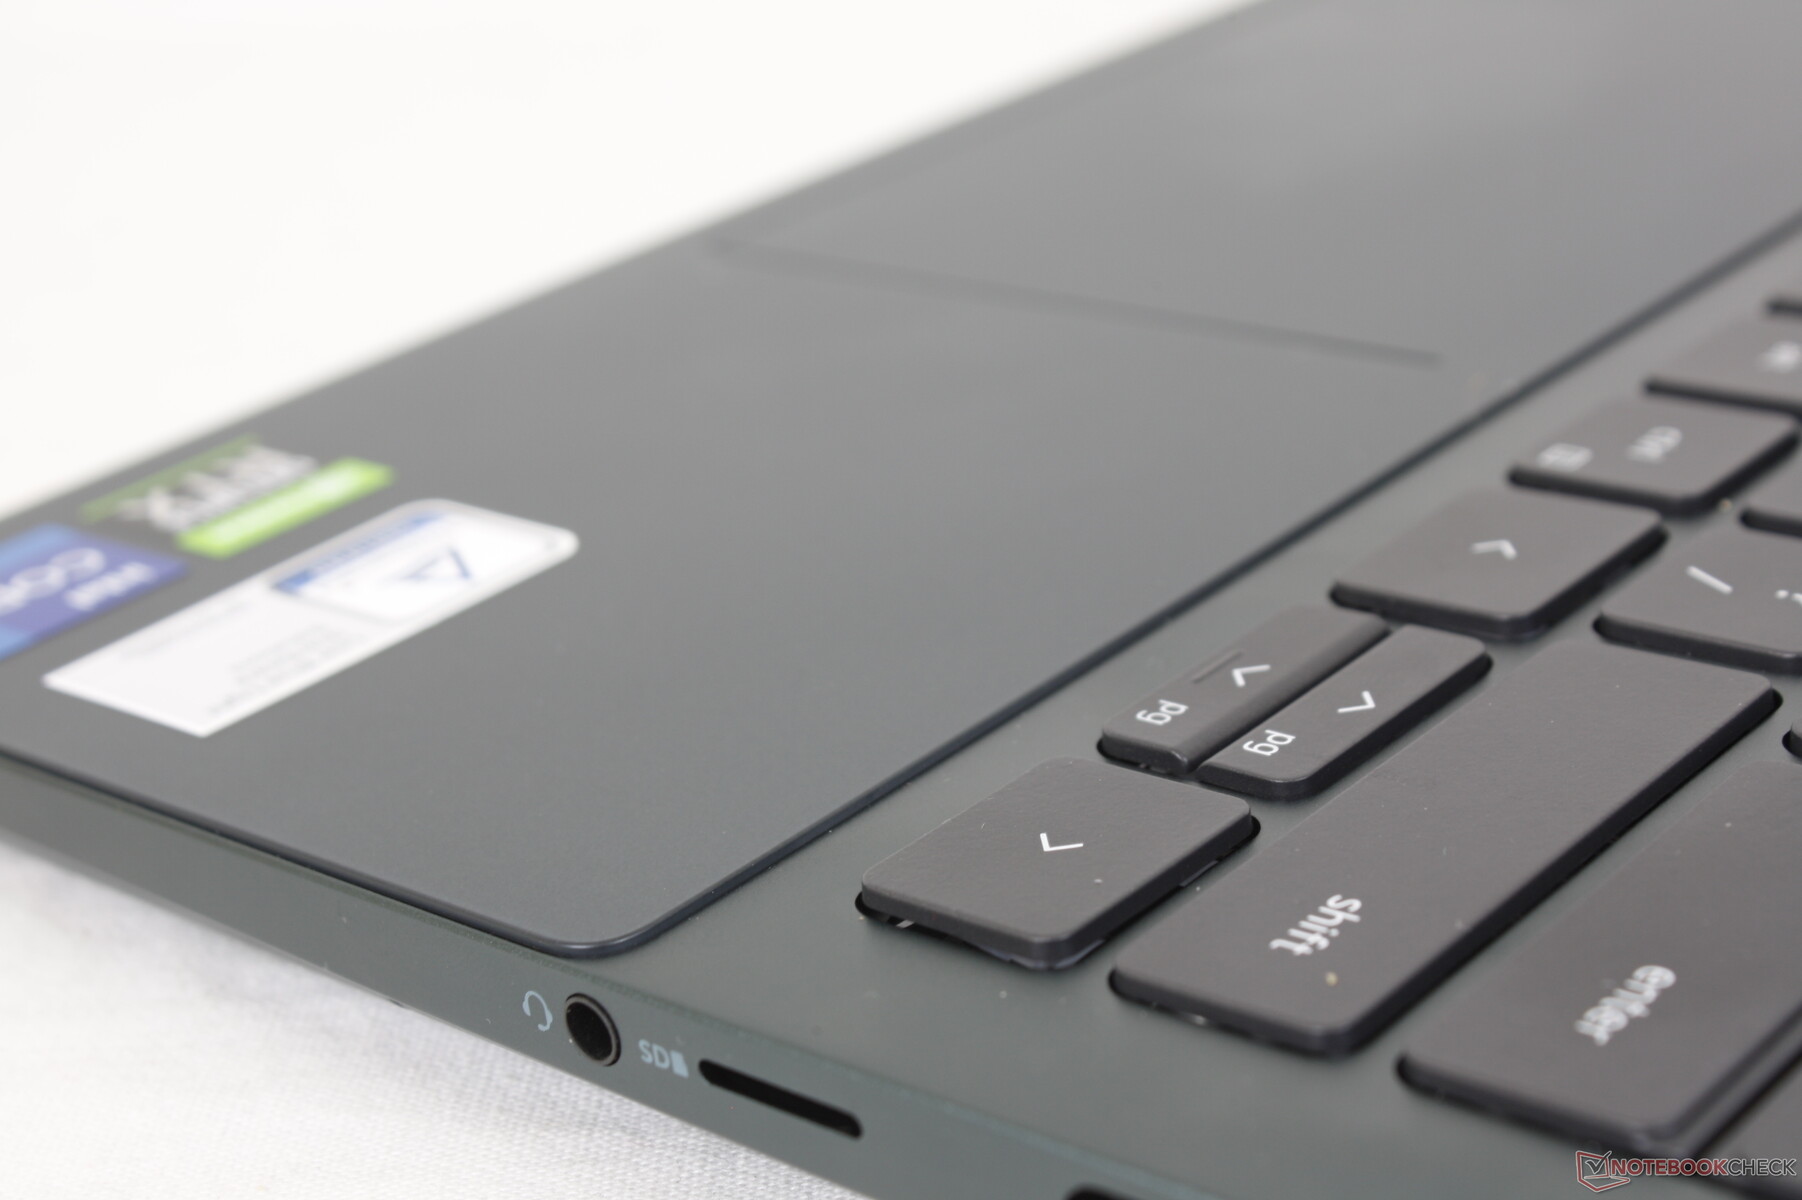
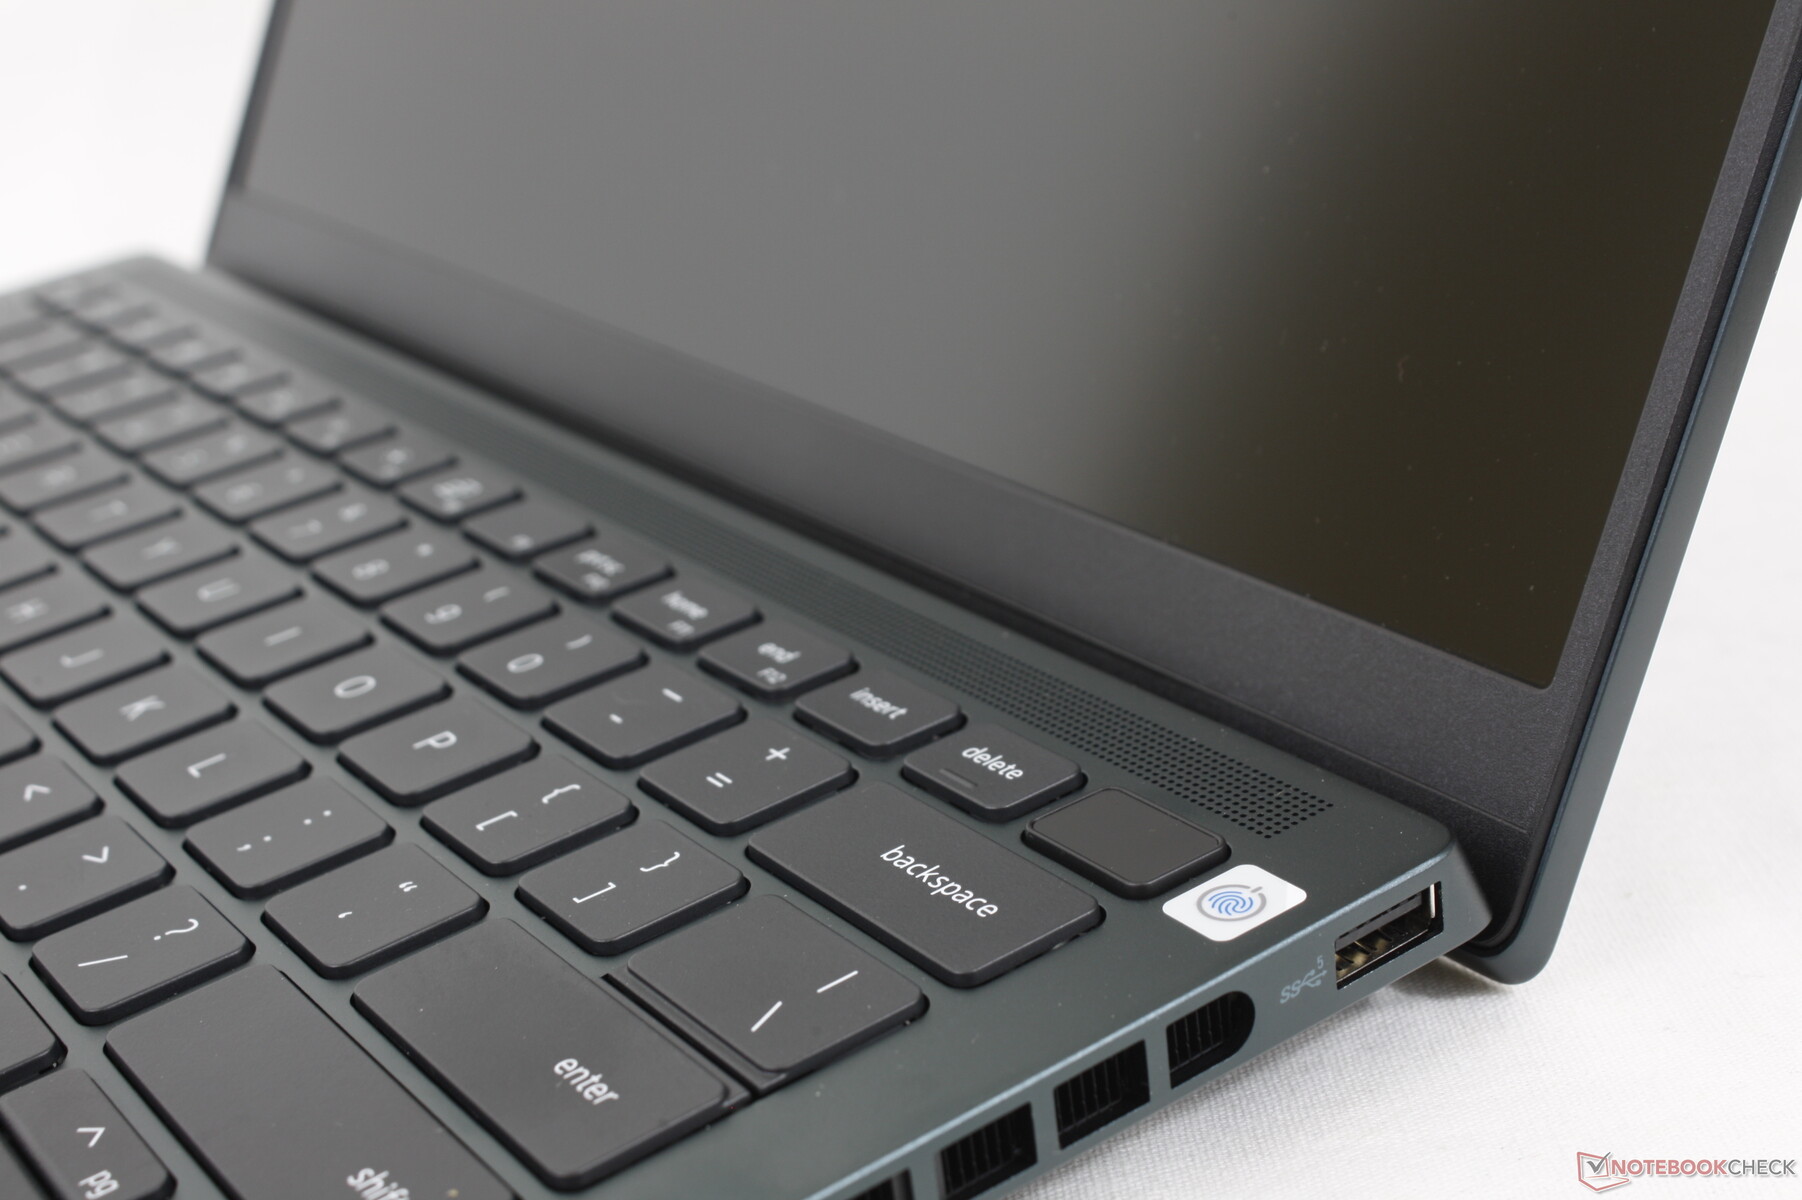
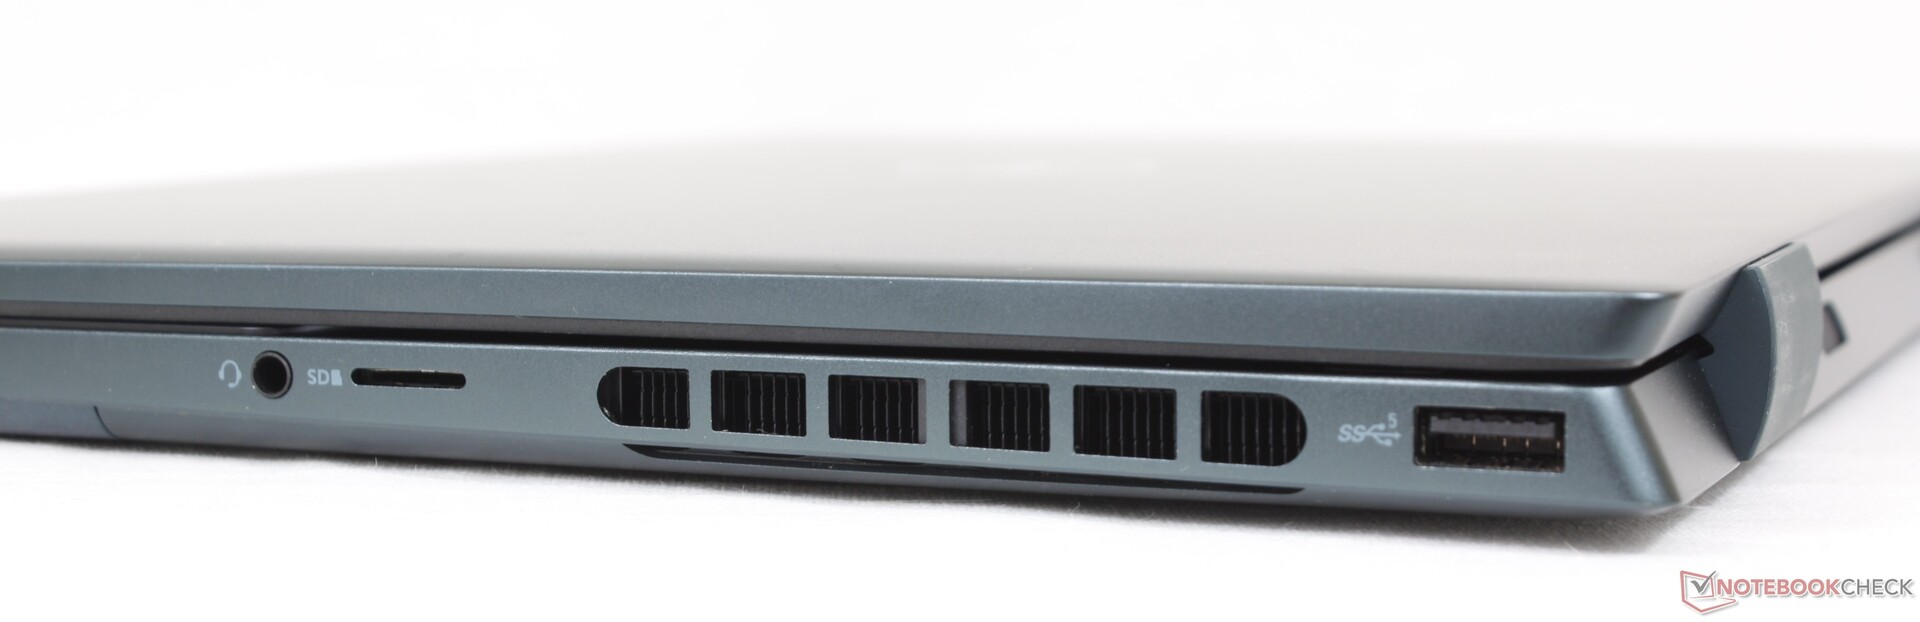
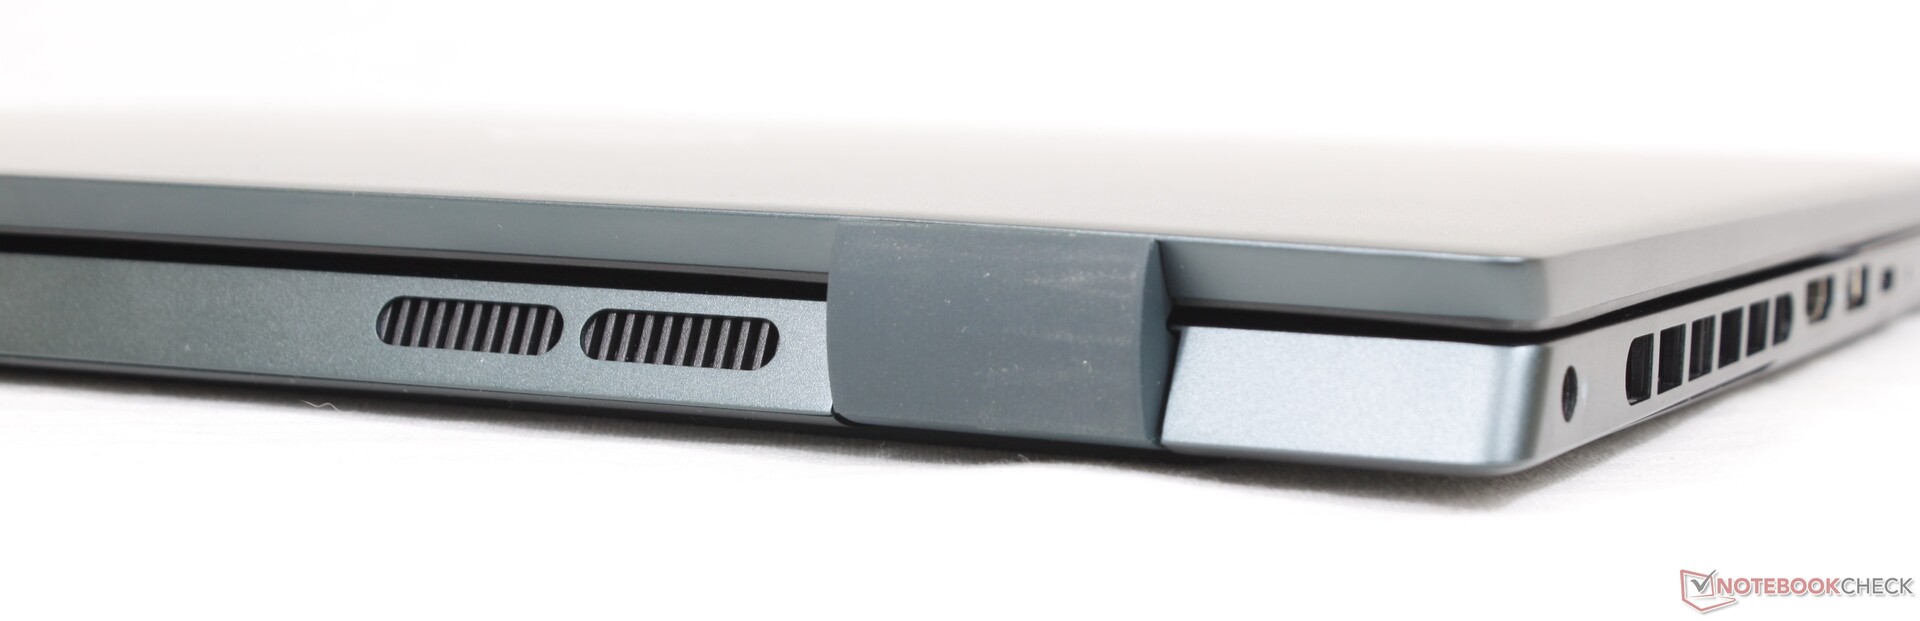
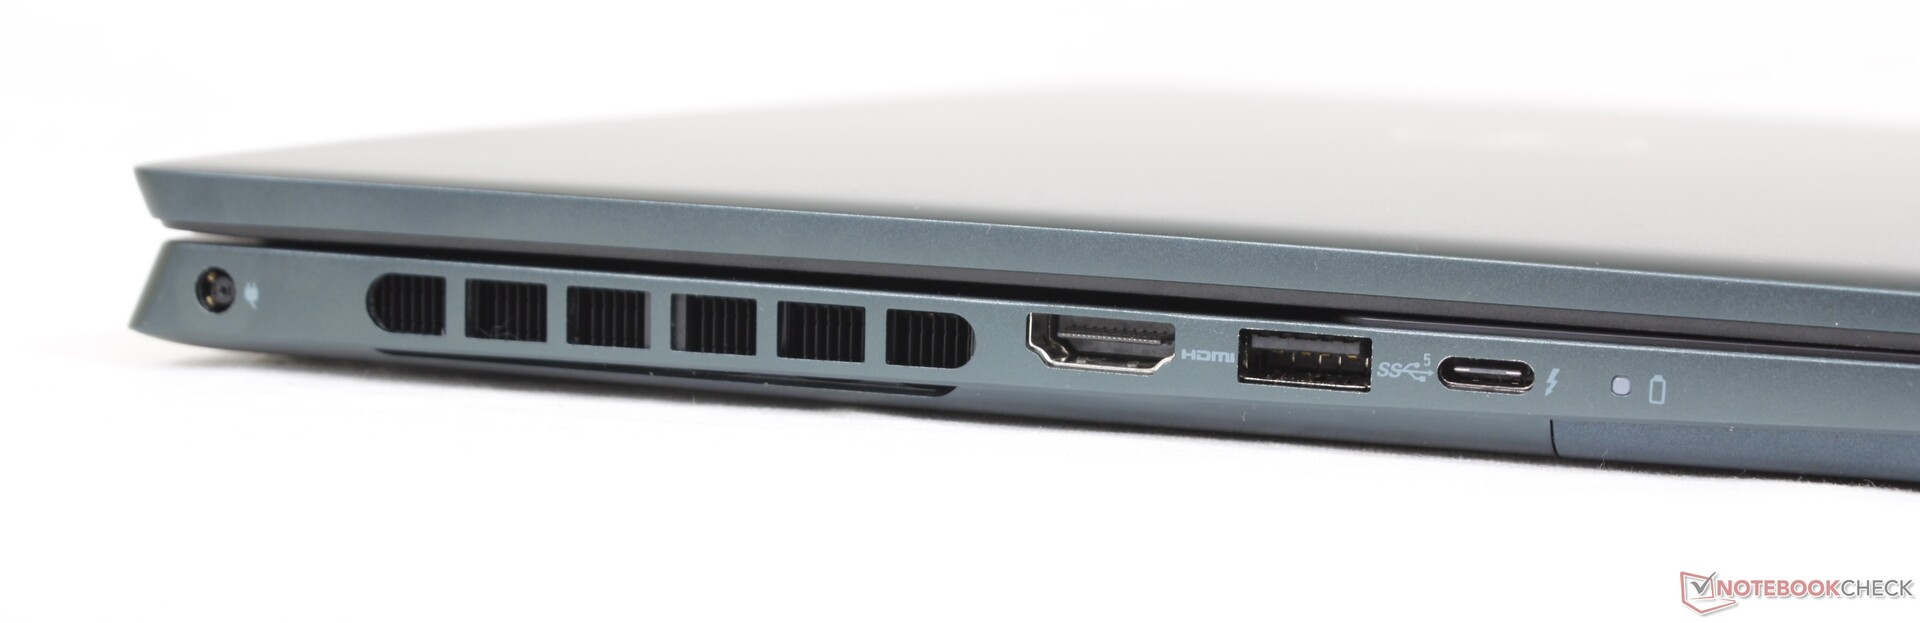
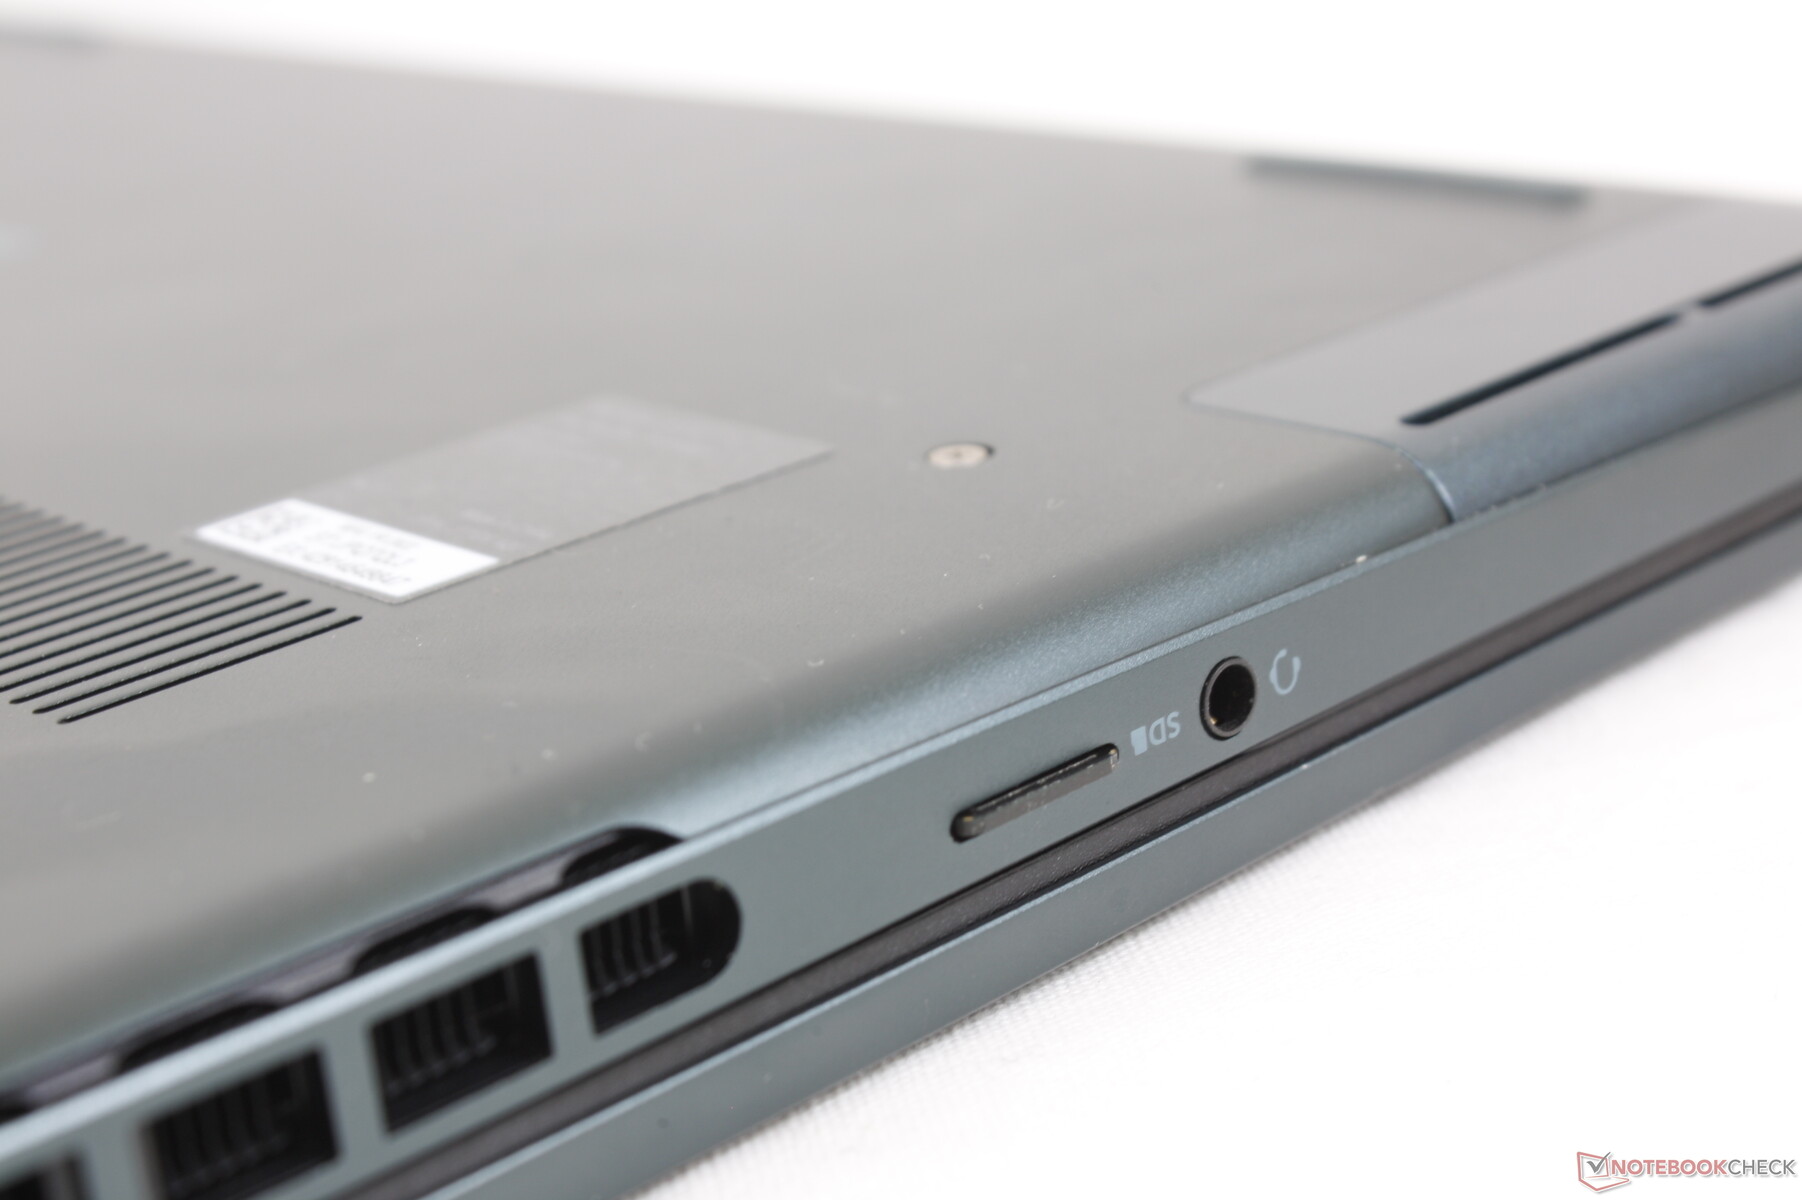
Le opzioni delle porte sono identiche a quelle dell'Inspiron 16 Plus 7620, anche se il lettore SD di dimensioni standard è stato sostituito da uno più piccolo per microSD. Apprezziamo il supporto per Thunderbolt 4, dato che né il concorrente HP Pavilion Plus 14 né l'Asus Vivobook Pro 14 OLED supportano la Thunderbolt pur avendo porte USB-C.
Lettore di schede SD
Le velocità di trasferimento dal lettore MicroSD a molla integrato sono lente, proprio come quelle osservate sull'Inspiron 14 7420 2-in-1. Lo spostamento di 1 GB di immagini dalla nostra scheda di prova UHS-II al desktop richiede circa 45 secondi.
| SD Card Reader | |
| average JPG Copy Test (av. of 3 runs) | |
| MSI Summit E14 A11SCS (AV Pro V60) | |
| Schenker Vision 14 (Angelbird AV Pro V60) | |
| HP Envy 14-eb0010nr (Toshiba Exceria Pro M501 microSDXC 32GB) | |
| Asus Zenbook 14X UX5400E (AV Pro SD microSD 128 GB V60) | |
| Asus Vivobook Pro 14 M3401QC-KM007T (AV Pro SD microSD 128 GB V60) | |
| Dell Inspiron 14 Plus 7420 (AV PRO microSD 128 GB V60) | |
| Dell Inspiron 14 7420 2-in-1 (Toshiba Exceria Pro SDXC 64 GB UHS-II) | |
| maximum AS SSD Seq Read Test (1GB) | |
| MSI Summit E14 A11SCS (AV Pro V60) | |
| Schenker Vision 14 (Angelbird AV Pro V60) | |
| HP Envy 14-eb0010nr (Toshiba Exceria Pro M501 microSDXC 32GB) | |
| Asus Zenbook 14X UX5400E (AV Pro SD microSD 128 GB V60) | |
| Asus Vivobook Pro 14 M3401QC-KM007T (AV Pro SD microSD 128 GB V60) | |
| Dell Inspiron 14 Plus 7420 (AV PRO microSD 128 GB V60) | |
| Dell Inspiron 14 7420 2-in-1 (Toshiba Exceria Pro SDXC 64 GB UHS-II) | |
Comunicazione
La connettività Wi-Fi 6E e Bluetooth 5.2 è garantita da un Intel AX211. Sebbene non abbiamo riscontrato problemi quando siamo stati accoppiati alla nostra rete a 6 GHz, le velocità di trasmissione sono state leggermente più instabili di quelle di ricezione, come mostrato dal grafico seguente.
| Networking | |
| iperf3 transmit AX12 | |
| Schenker Vision 14 | |
| HP Envy 14-eb0010nr | |
| MSI Summit E14 A11SCS | |
| Asus Zenbook 14X UX5400E | |
| iperf3 receive AX12 | |
| Schenker Vision 14 | |
| MSI Summit E14 A11SCS | |
| HP Envy 14-eb0010nr | |
| Asus Zenbook 14X UX5400E | |
| iperf3 receive AXE11000 6GHz | |
| Dell Inspiron 14 Plus 7420 | |
| Dell Inspiron 14 7420 2-in-1 | |
| Asus Vivobook Pro 14 M3401QC-KM007T | |
| iperf3 transmit AXE11000 6GHz | |
| Dell Inspiron 14 Plus 7420 | |
| Dell Inspiron 14 7420 2-in-1 | |
| Asus Vivobook Pro 14 M3401QC-KM007T | |
Webcam
la webcam da 2 MP offre una qualità d'immagine simile a quella della webcam da 2 MP dell'Inspiron 14 7420 2-in-1 standard. L'otturatore fisico per la privacy è di serie, mentre Windows Hello e IR non sono supportati.


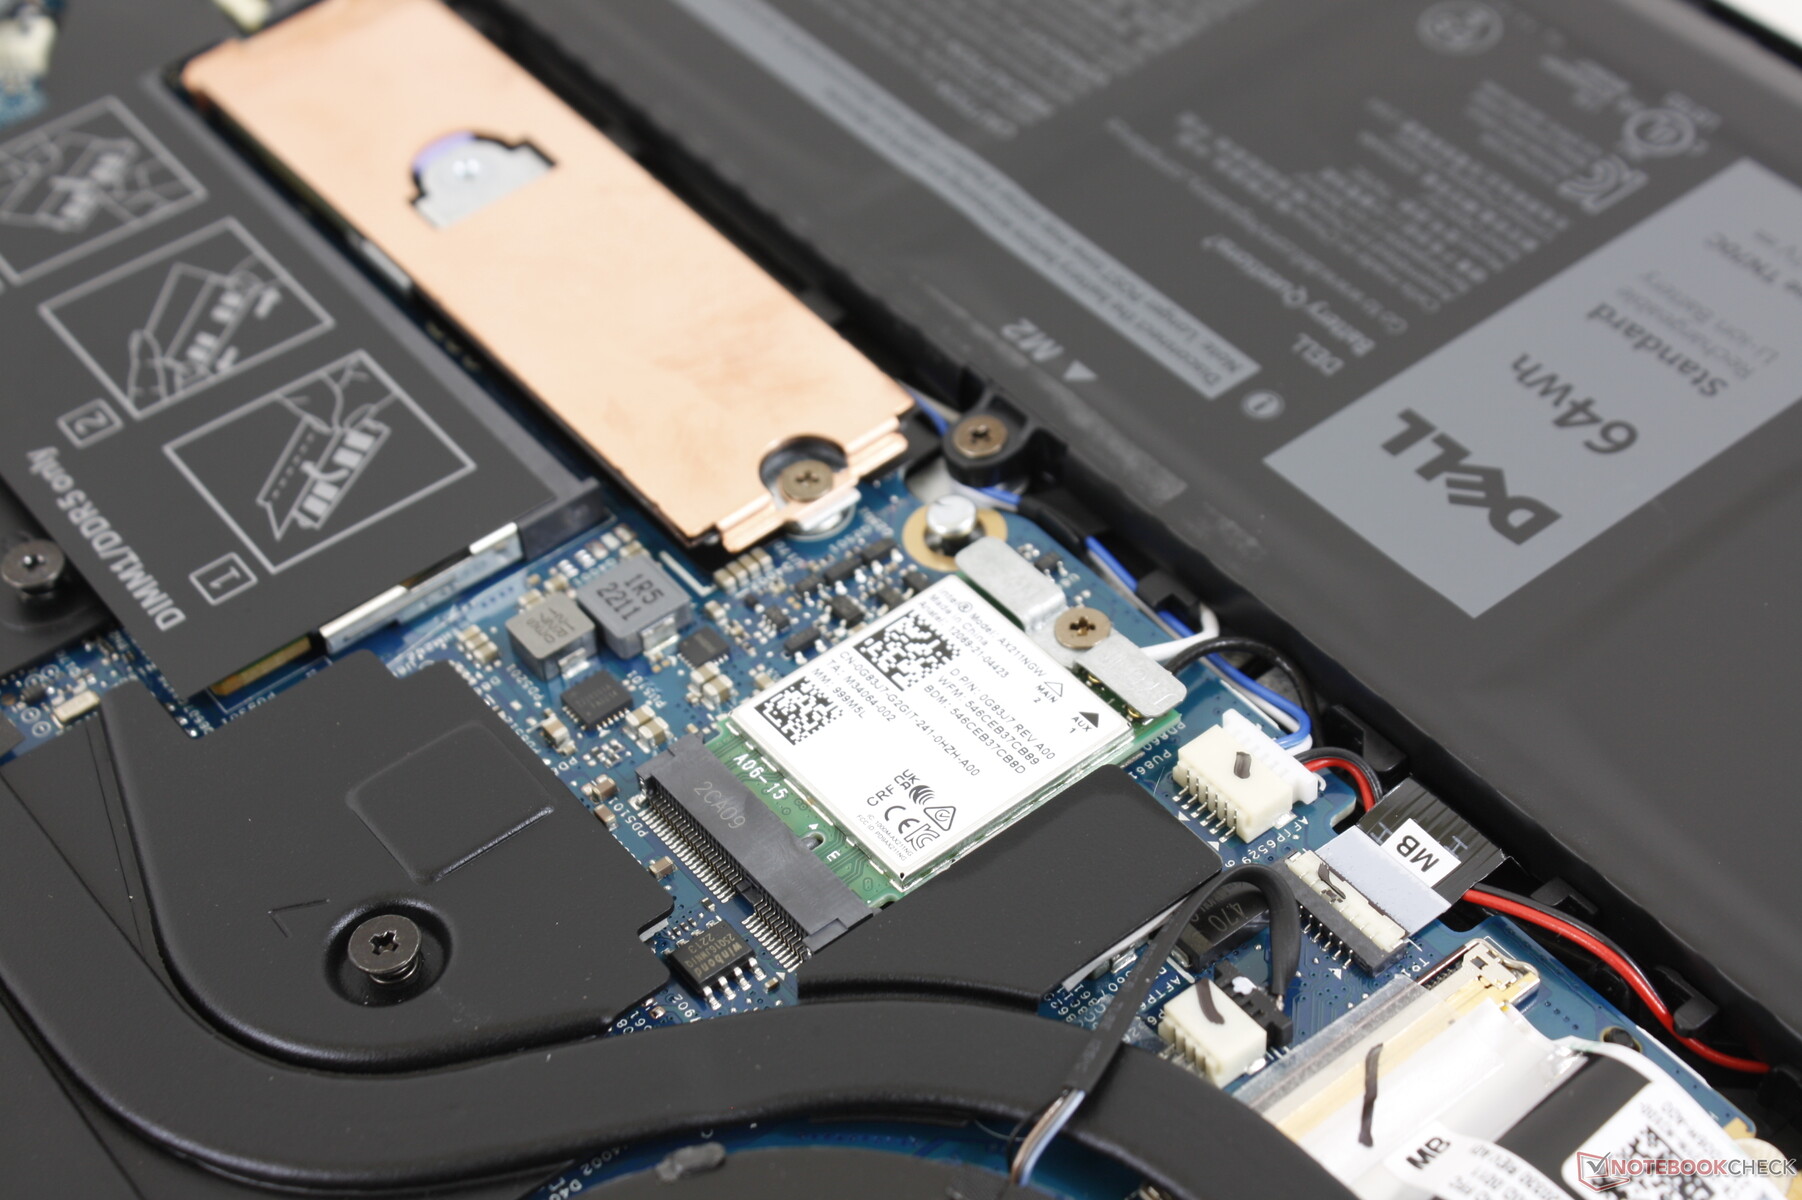
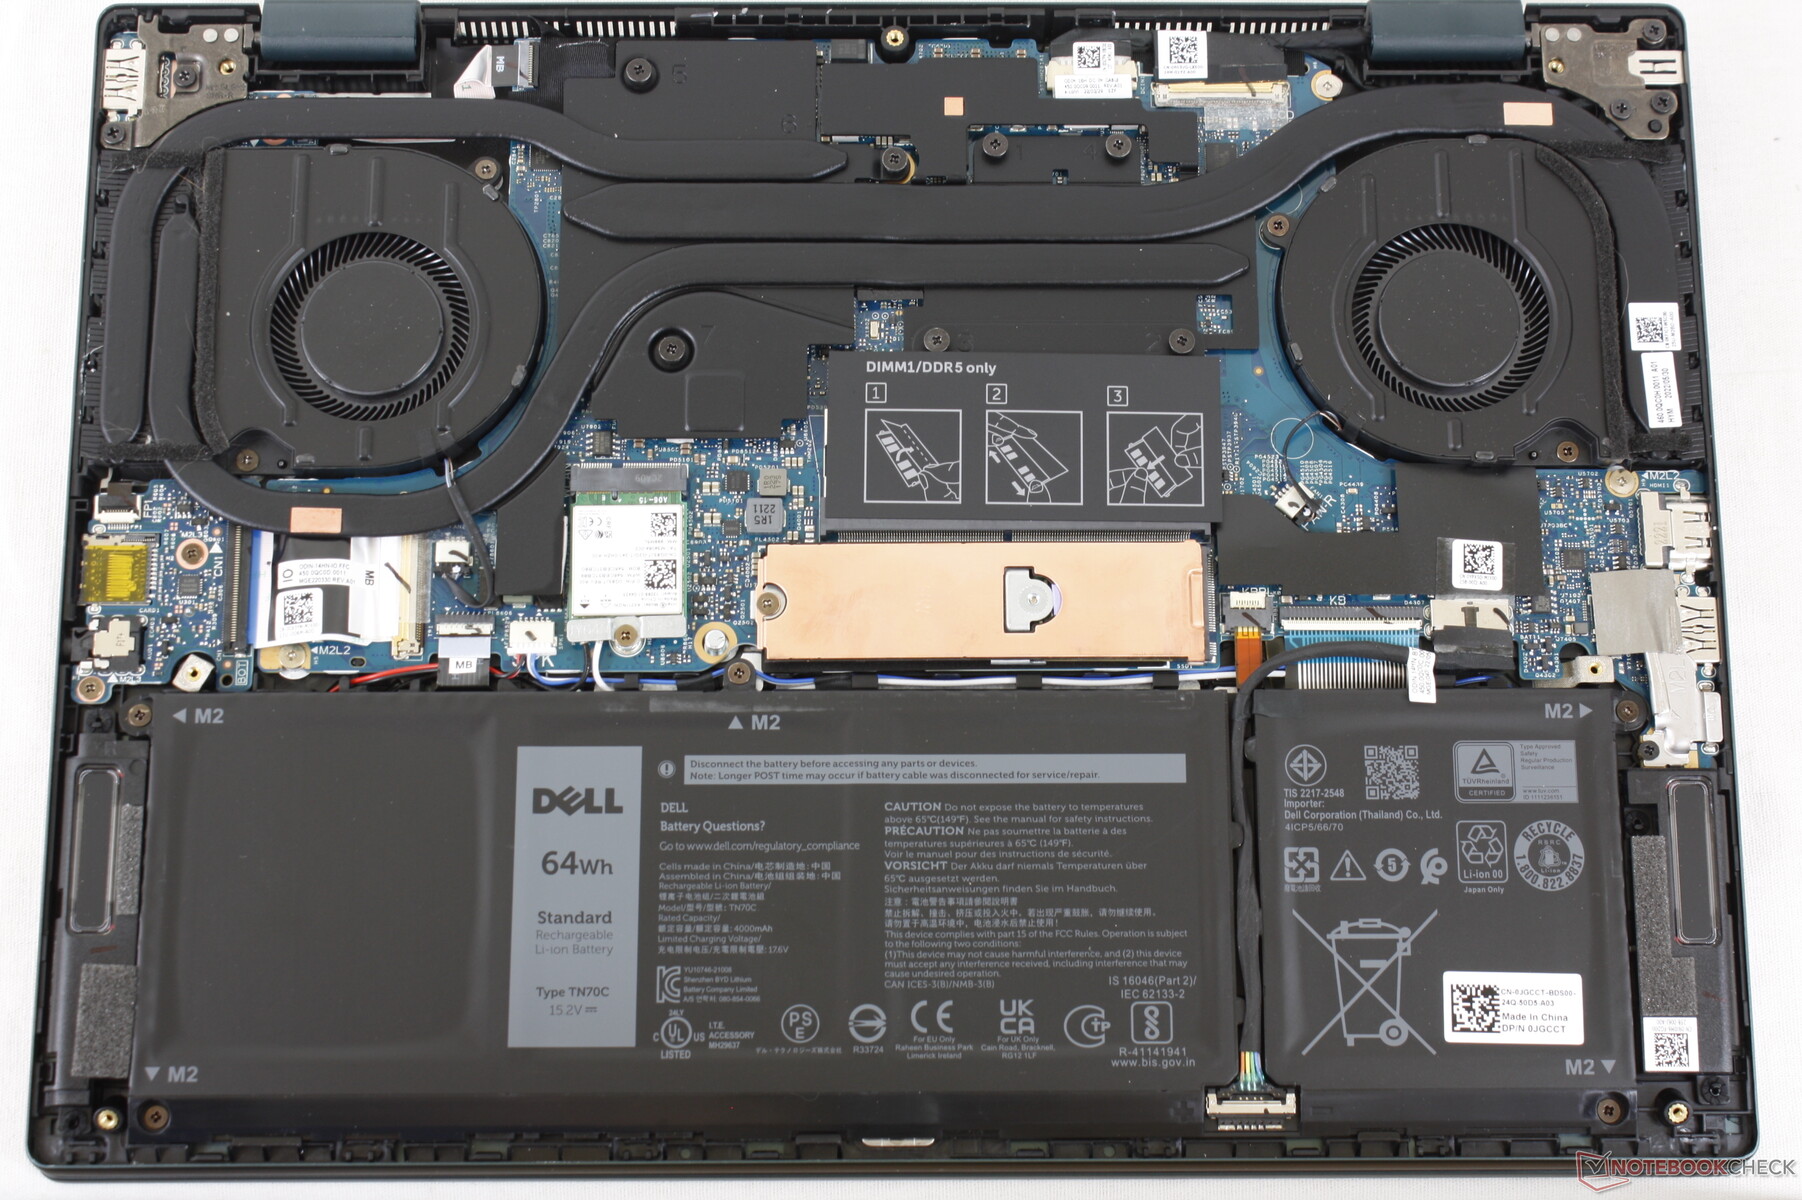
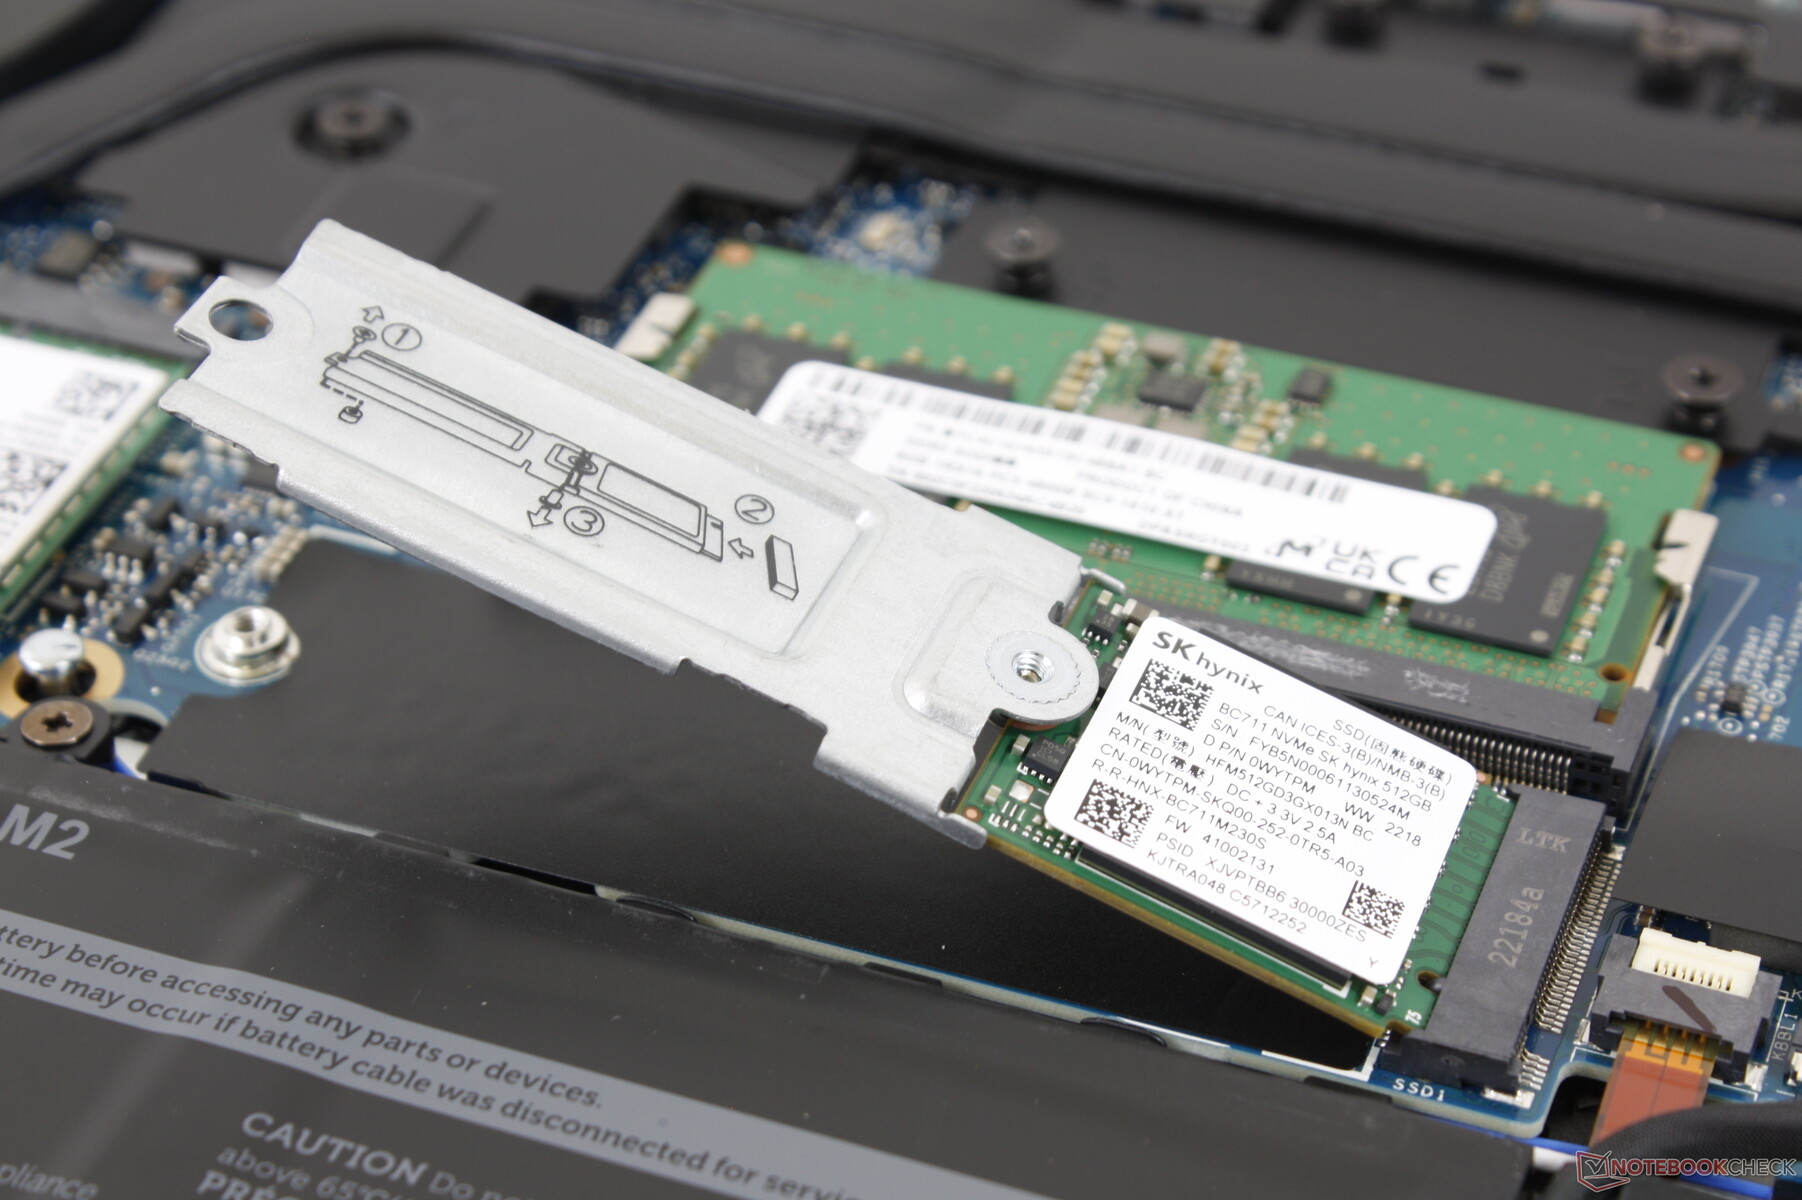
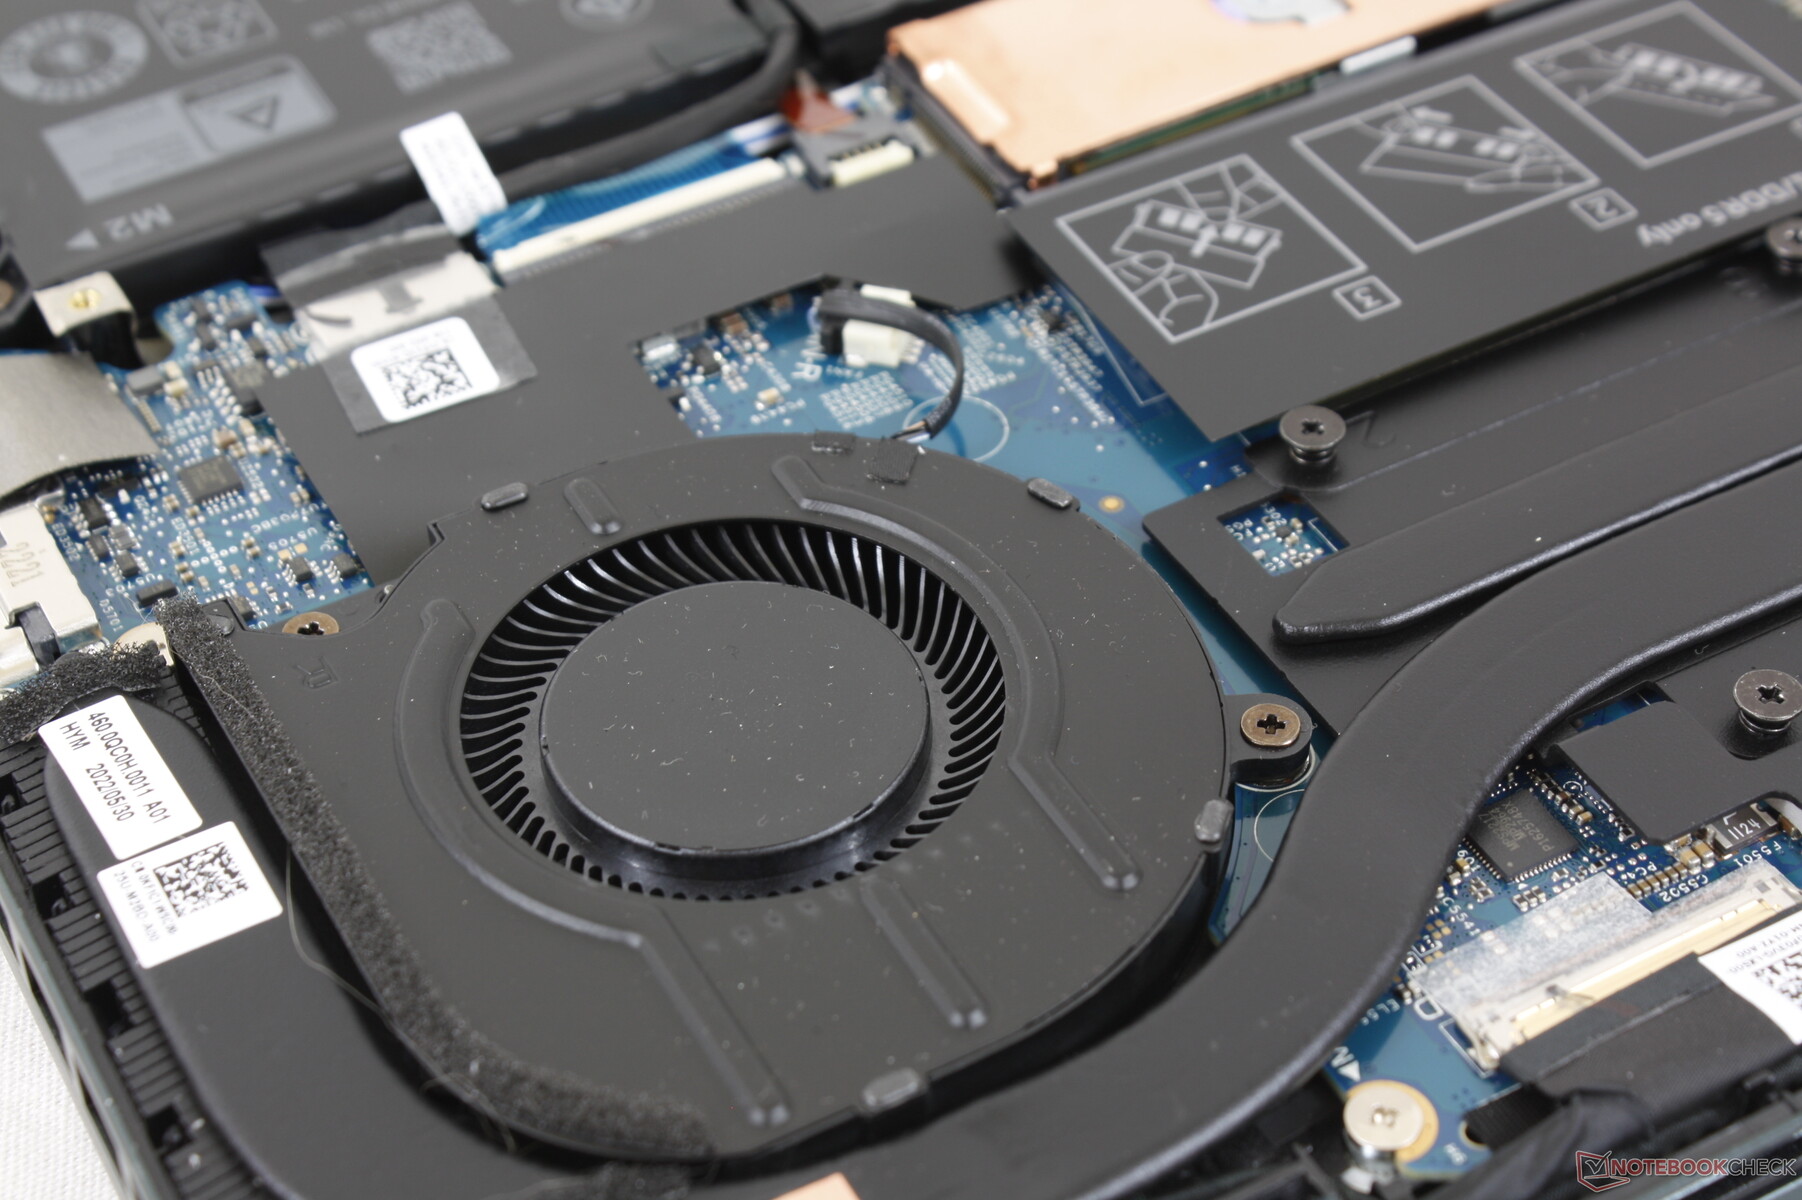
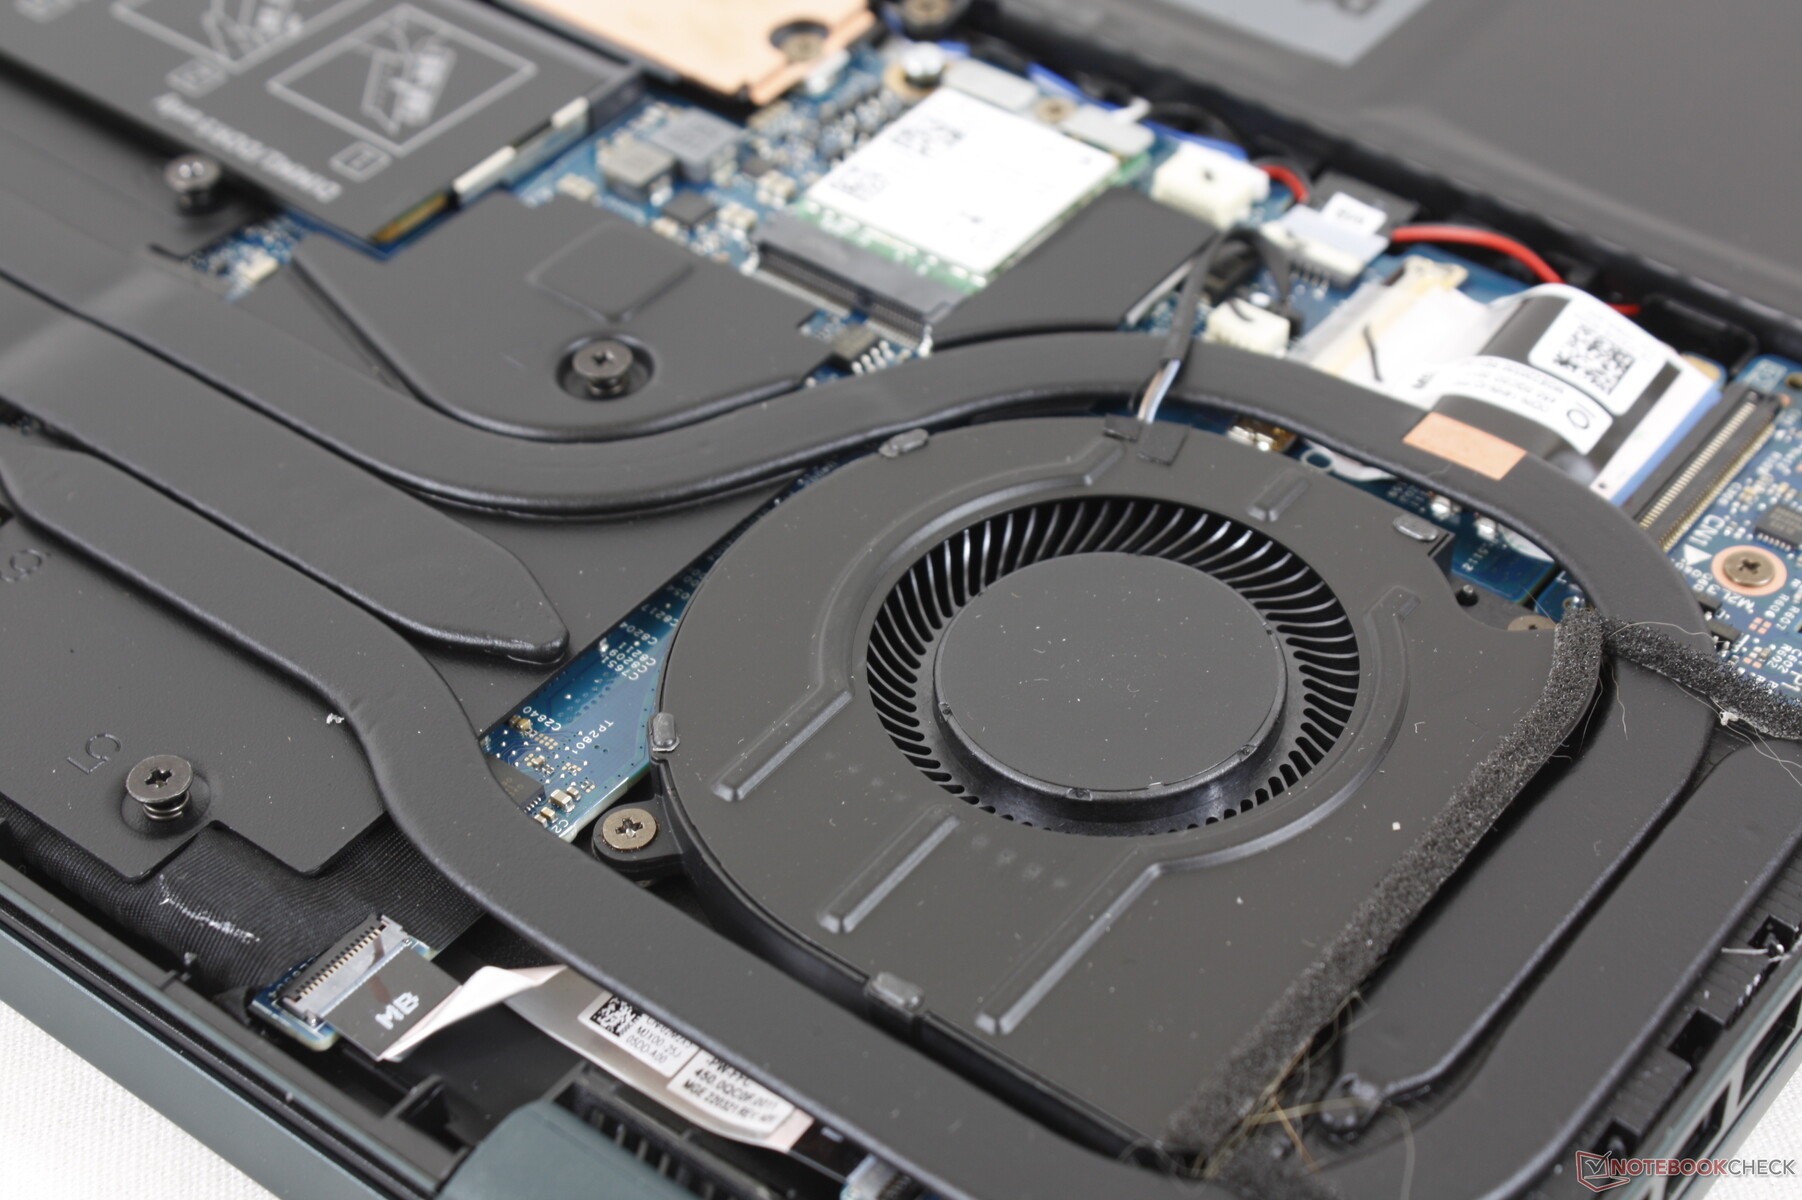
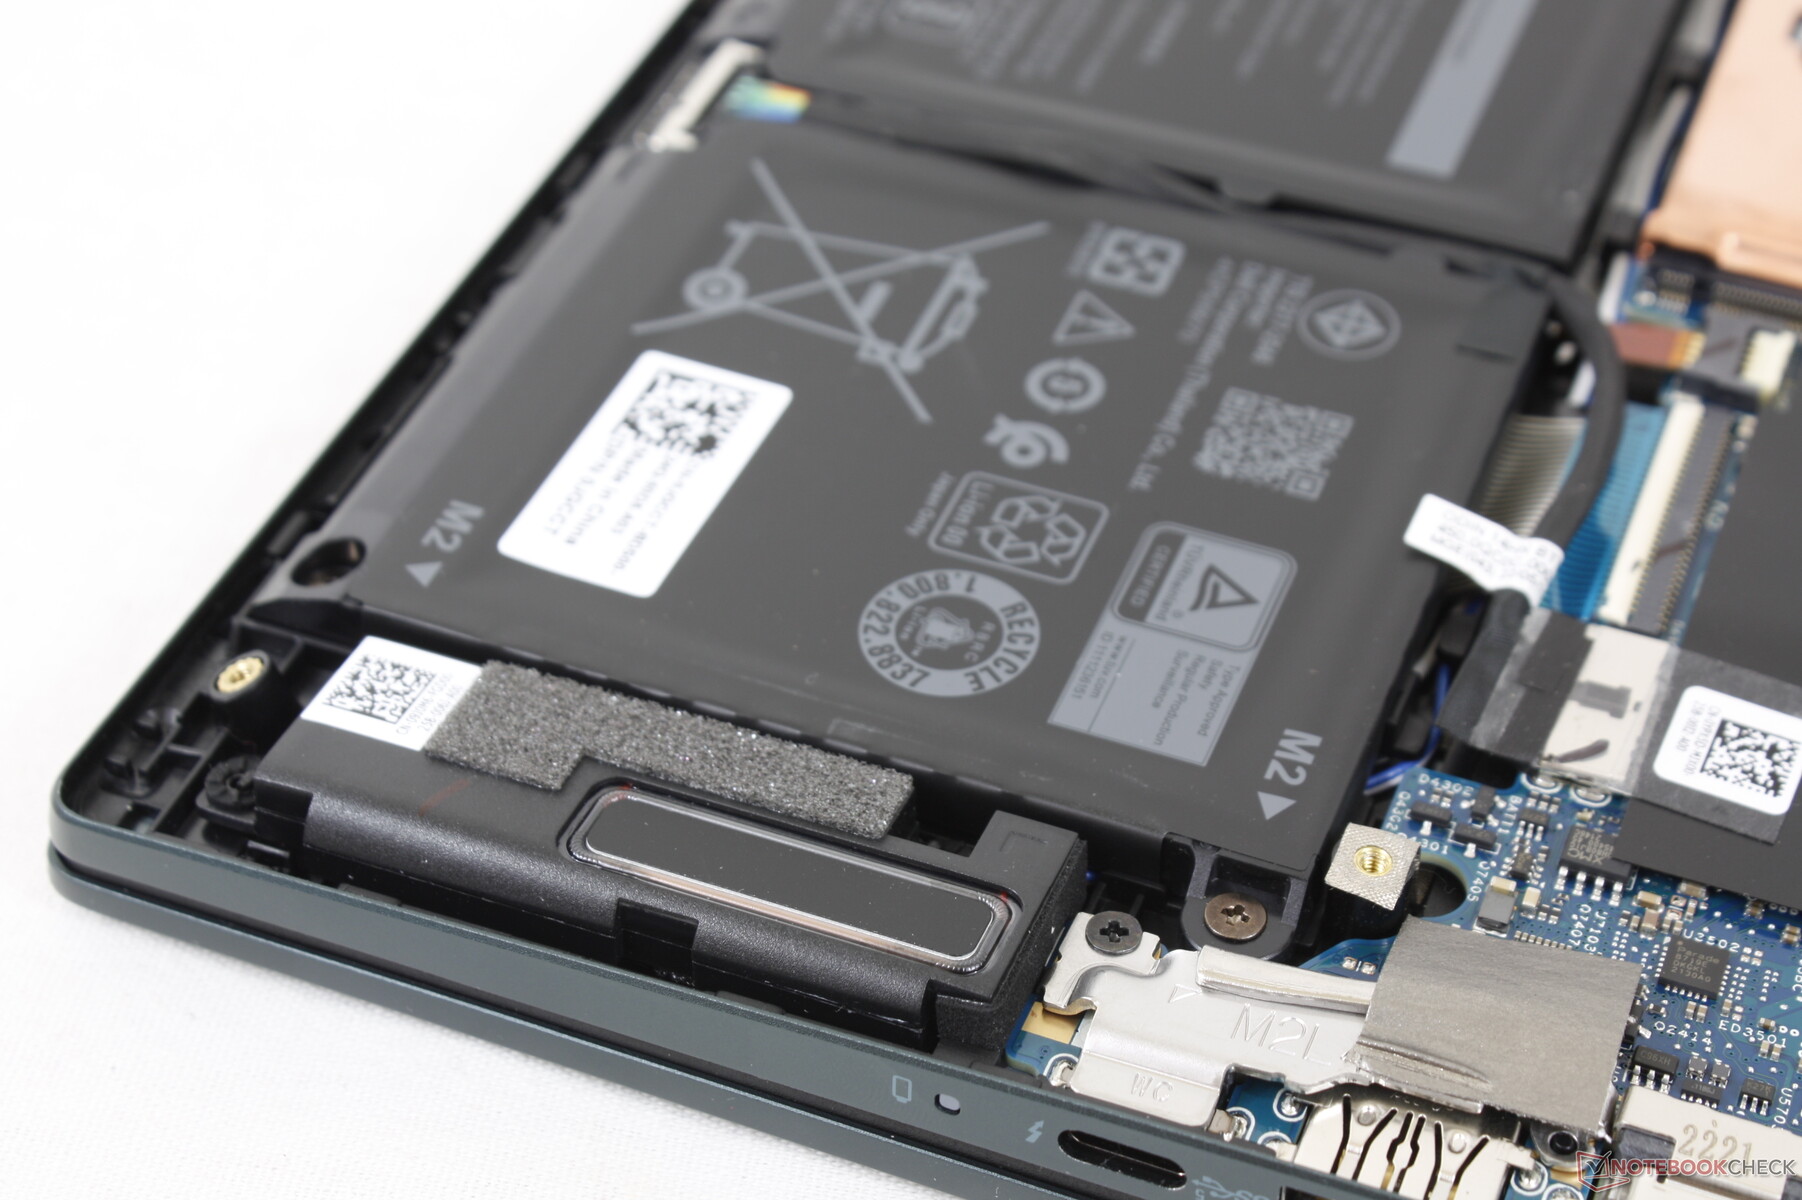
Manutenzione
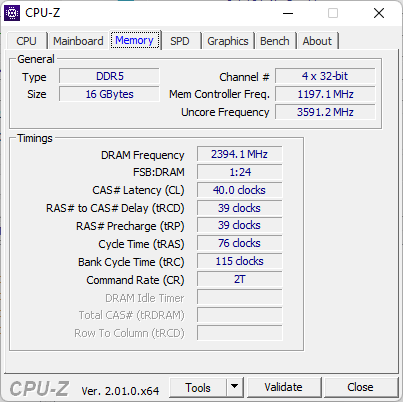
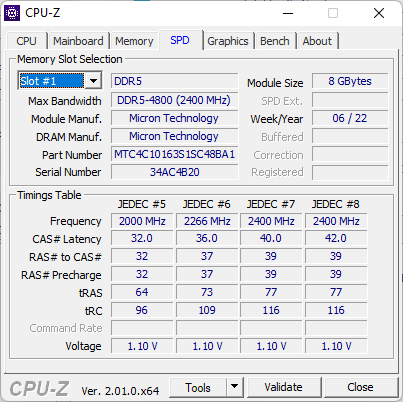
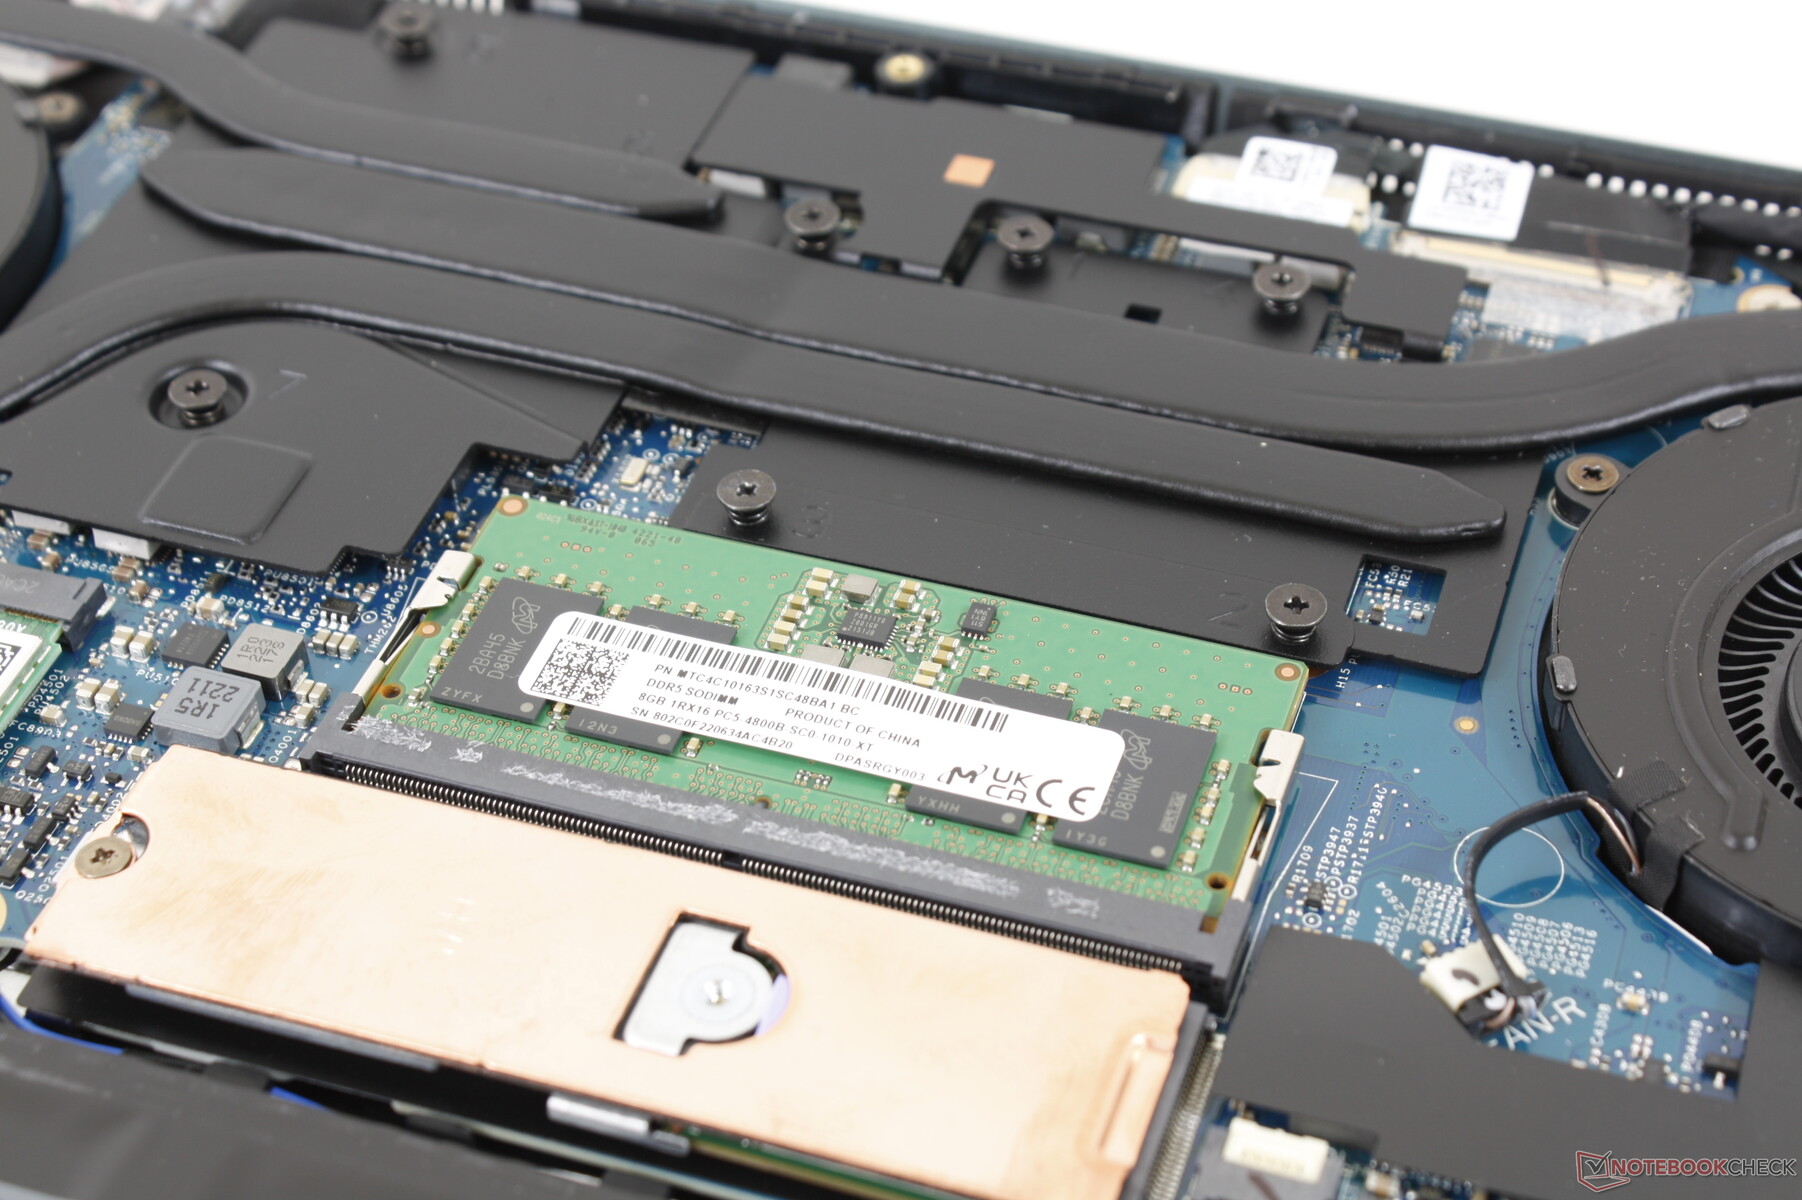
Il pannello inferiore si stacca abbastanza facilmente con un cacciavite Philips e un bordo di plastica affilato. Una volta all'interno, gli utenti possono intervenire sulla batteria, su 1 slot di memoria M.2 2280, su 1 slot SODIMM DDR5 e sul modulo M.2 WLAN. Si noti che 8 GB di RAM sono saldati su tutte le SKU, il che significa che gli utenti possono aggiungere un solo modulo per una capacità massima di RAM di 40 GB.
Accessori e garanzia
La confezione non contiene altri extra oltre all'adattatore CA e alla documentazione. Se acquistato negli Stati Uniti, si applica la consueta garanzia limitata di un anno.
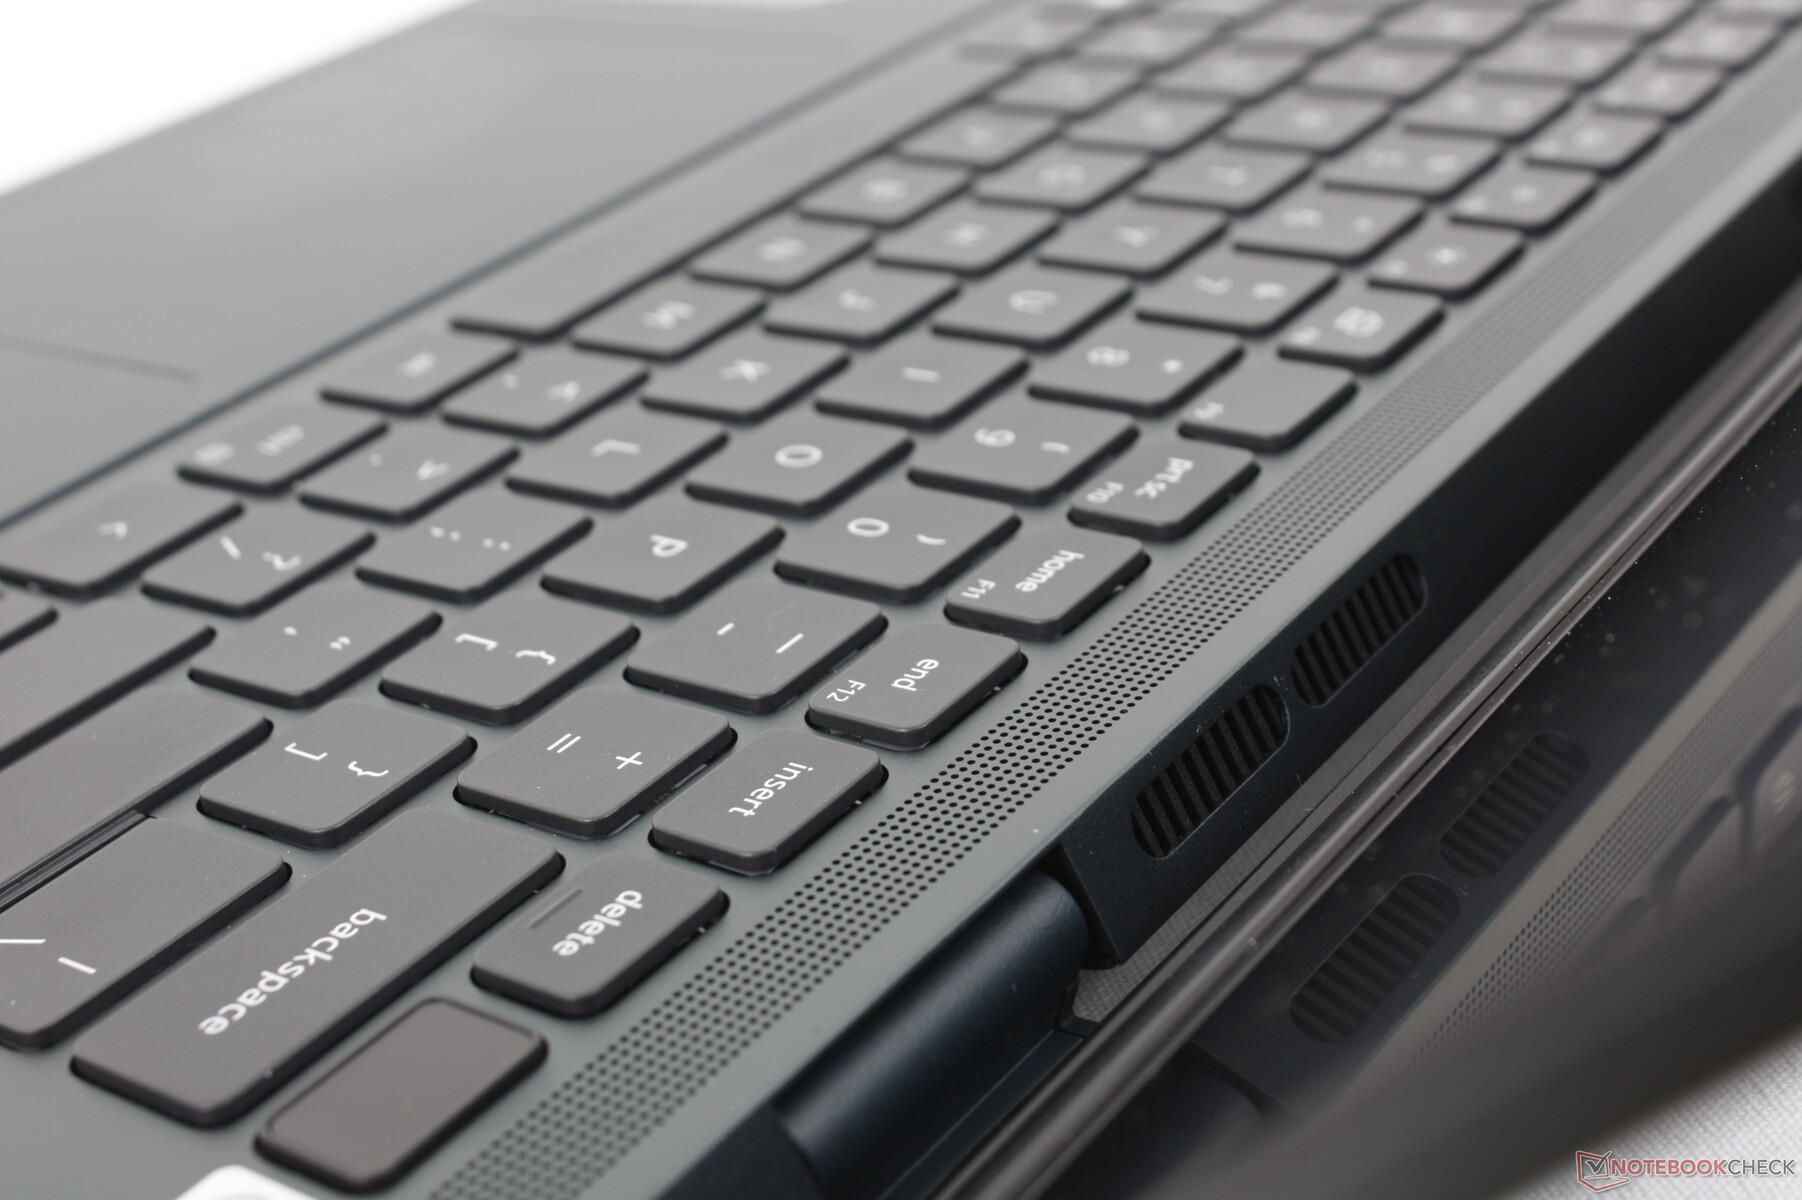
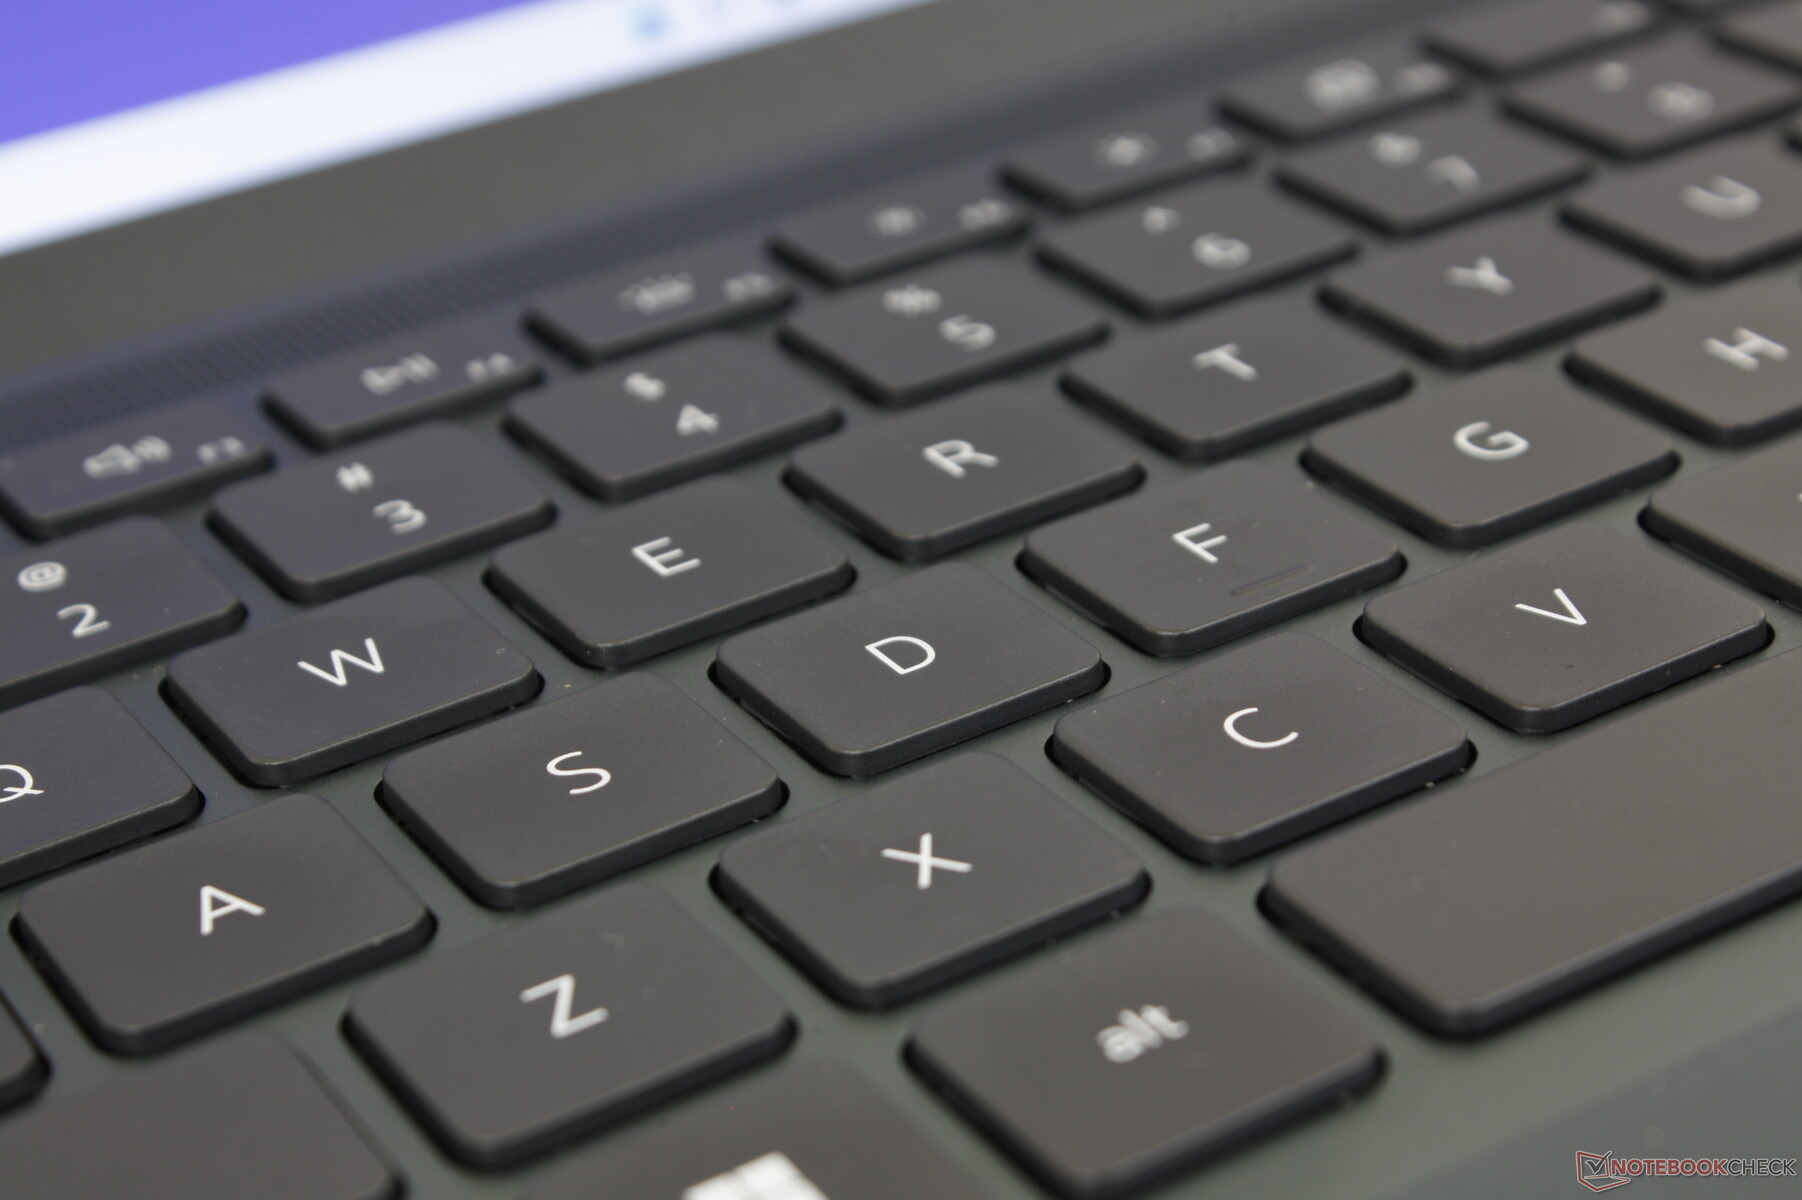
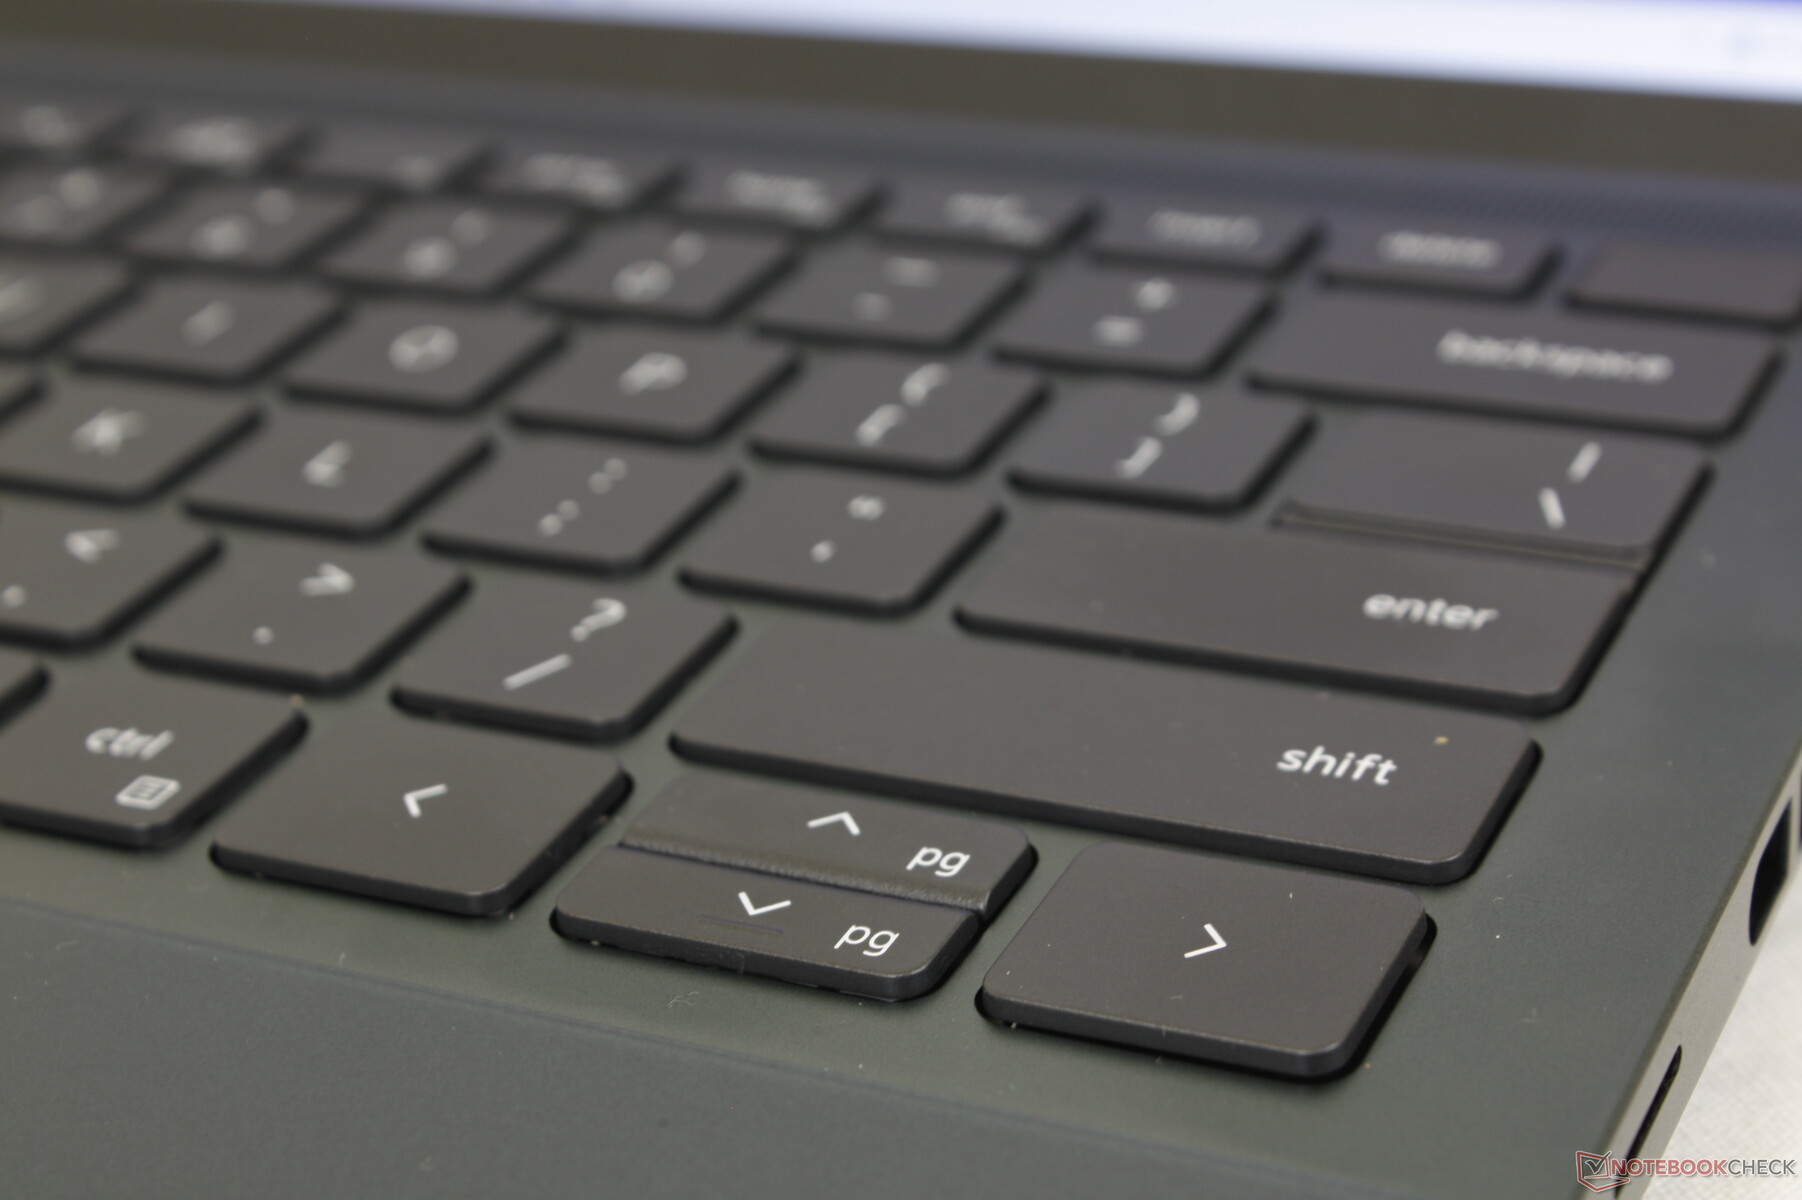
Dispositivi di input - Già visti e rivisti
Tastiera e touchpad
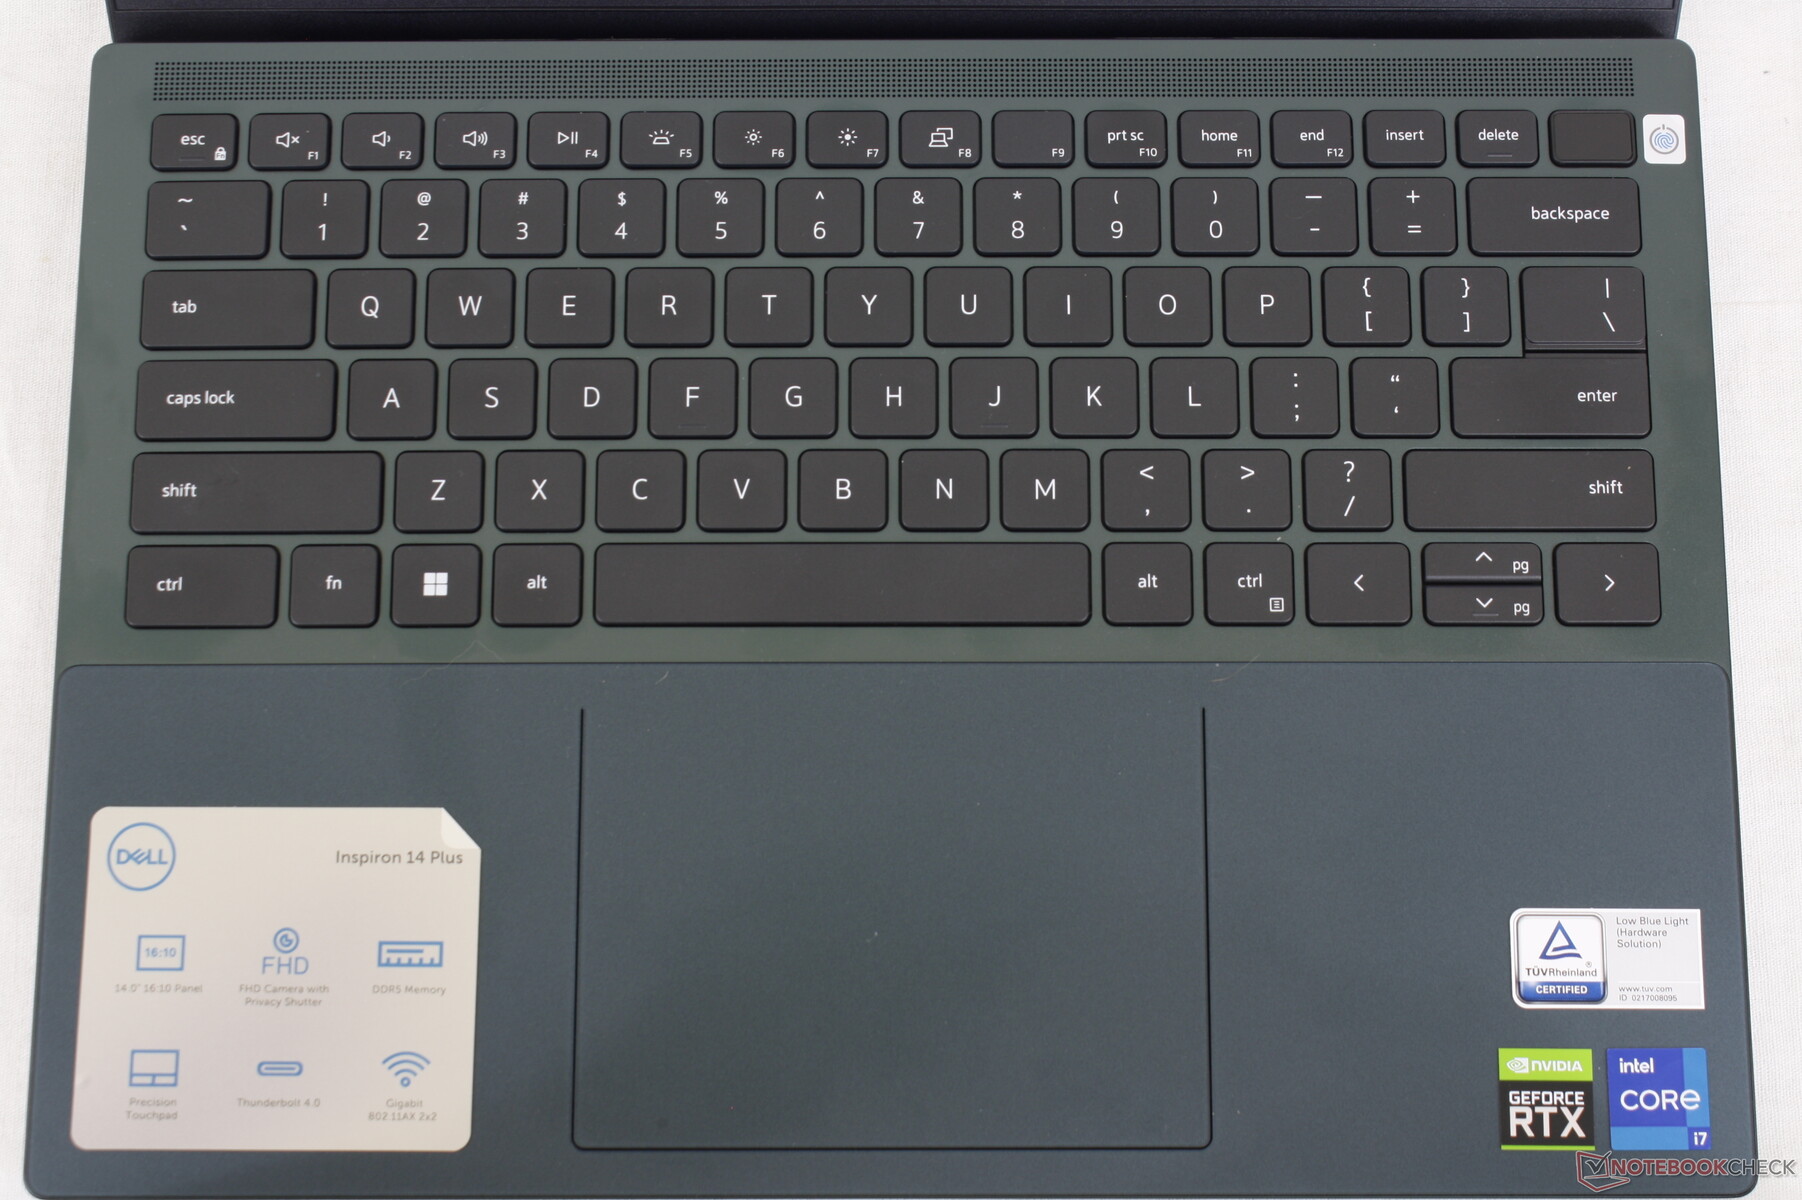
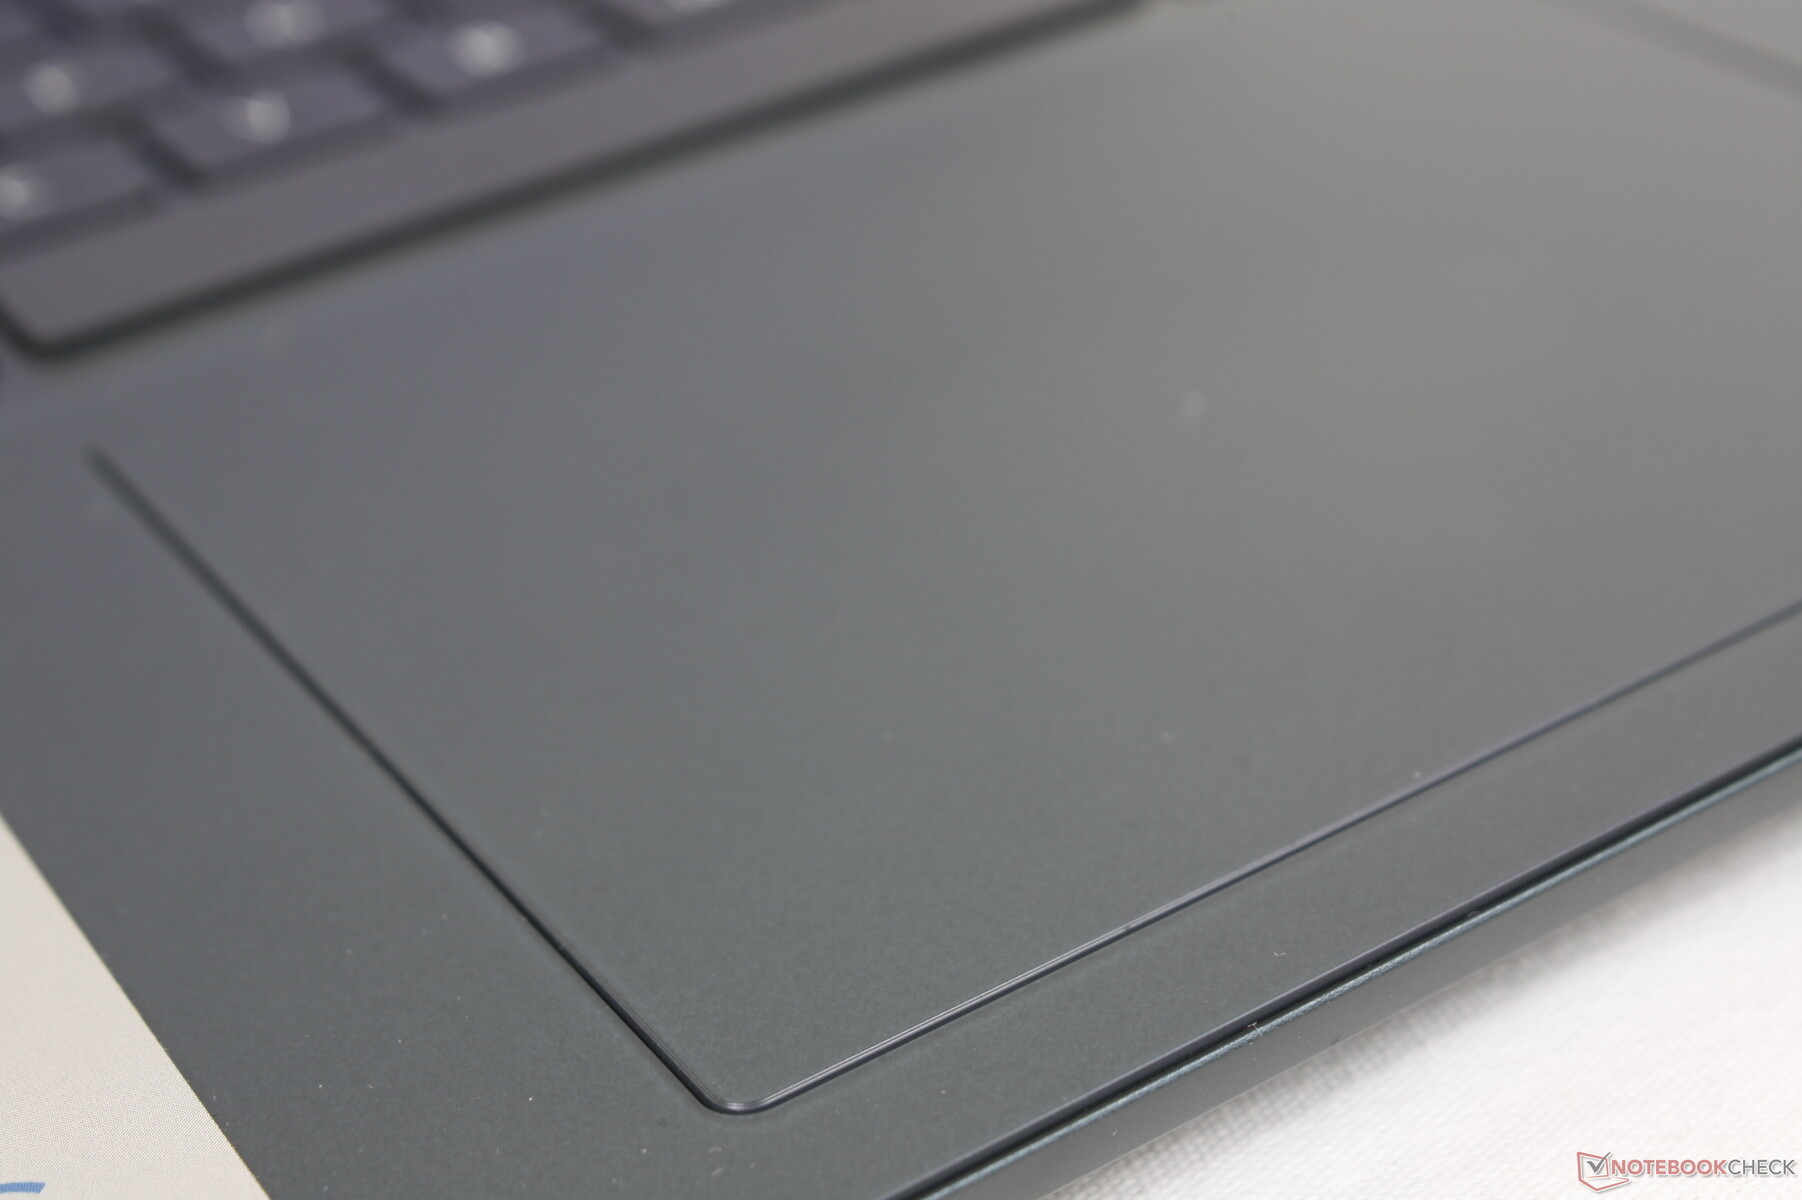
L'esperienza di digitazione è la stessa del modello Inspiron 16 Plus 7620,Inspiron 16 7620 2-in-1o Inspiron 14 7420 2-in-1 poiché tutti e quattro i modelli condividono gli stessi tasti della tastiera e il clickpad in Mylar. Anche i simboli dei tasti primari e secondari e le dimensioni del clickpad (11,5 x 8 cm) sono identici tra i modelli, indipendentemente dalle differenze di dimensioni dello schermo. In breve, i tasti hanno un feedback adeguato e un rumore moderato, tranne il tasto Spazio che sembra un po' troppo superficiale. Allo stesso modo, la superficie del clickpad funziona in modo affidabile per il controllo standard del cursore, mentre i tasti integrati sono troppo morbidi e spugnosi quando si trascina e si rilascia.
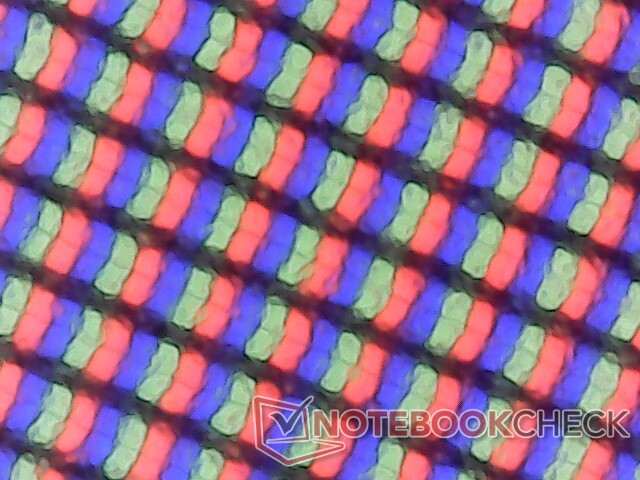
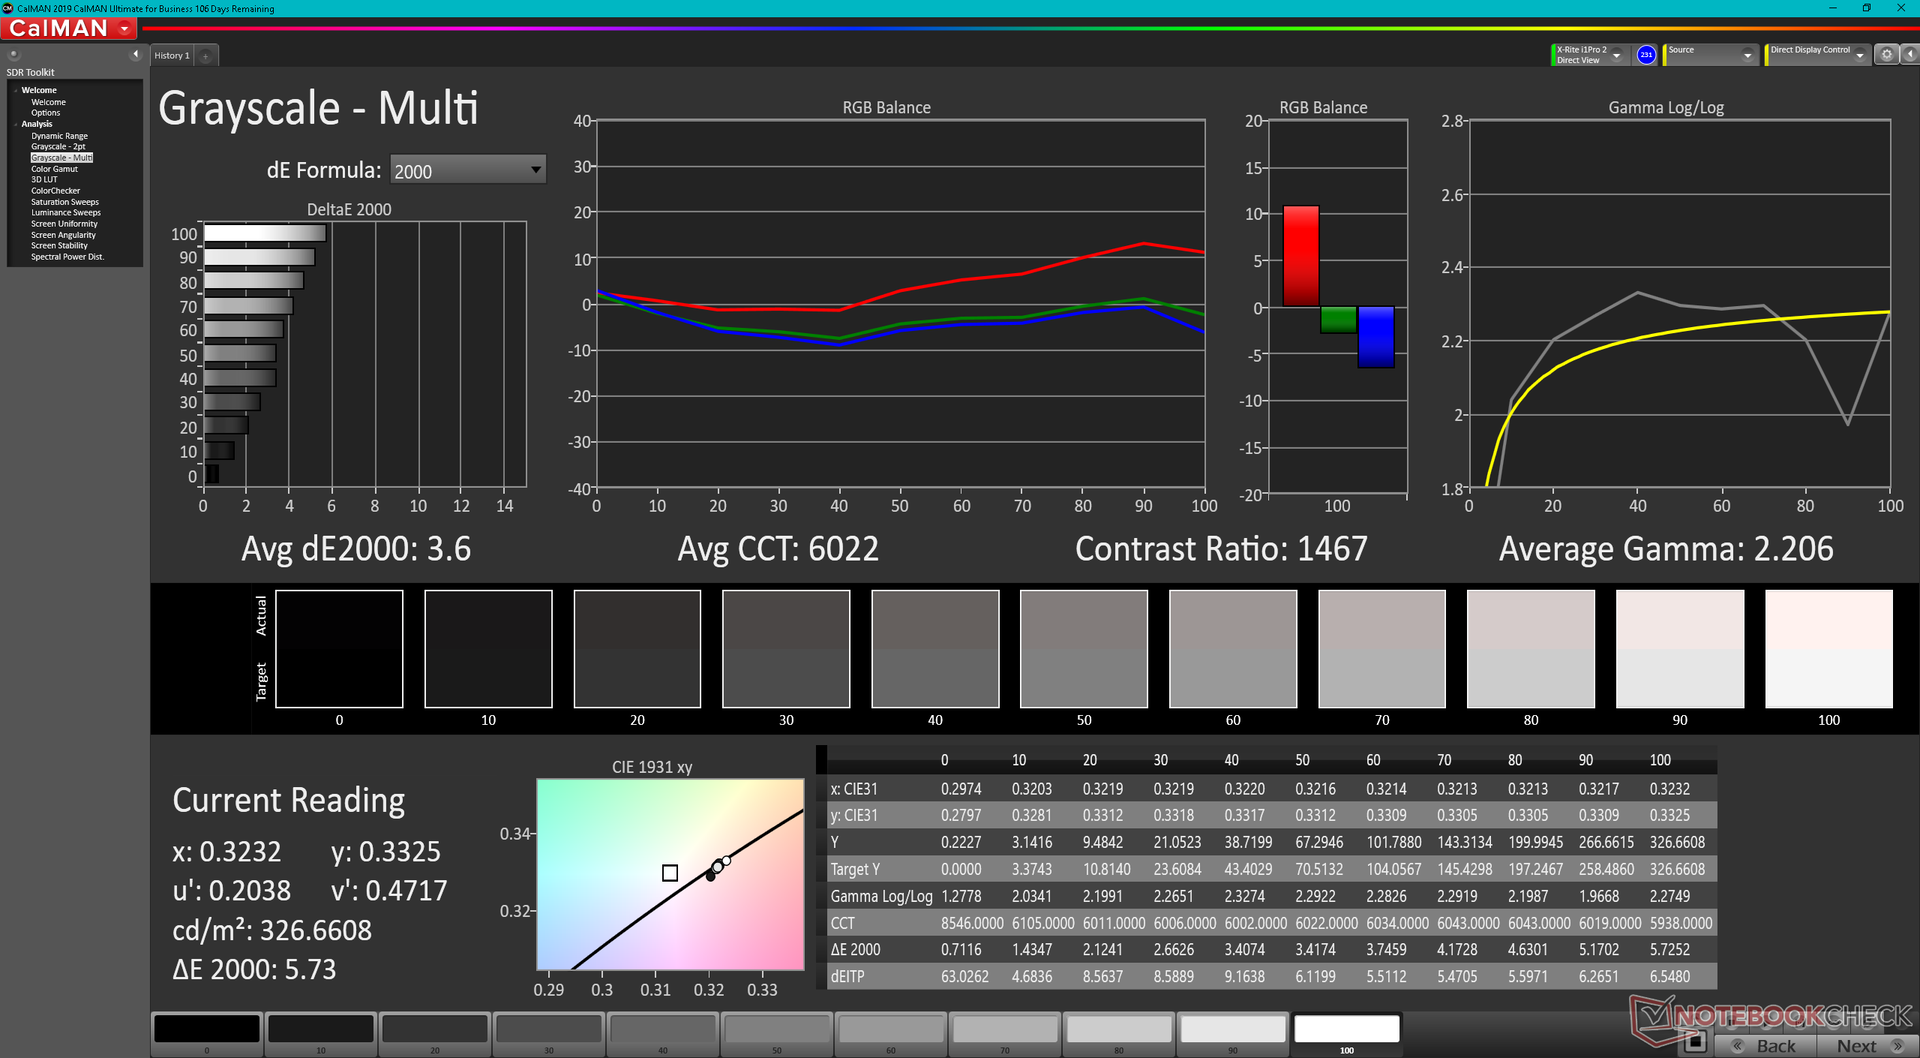
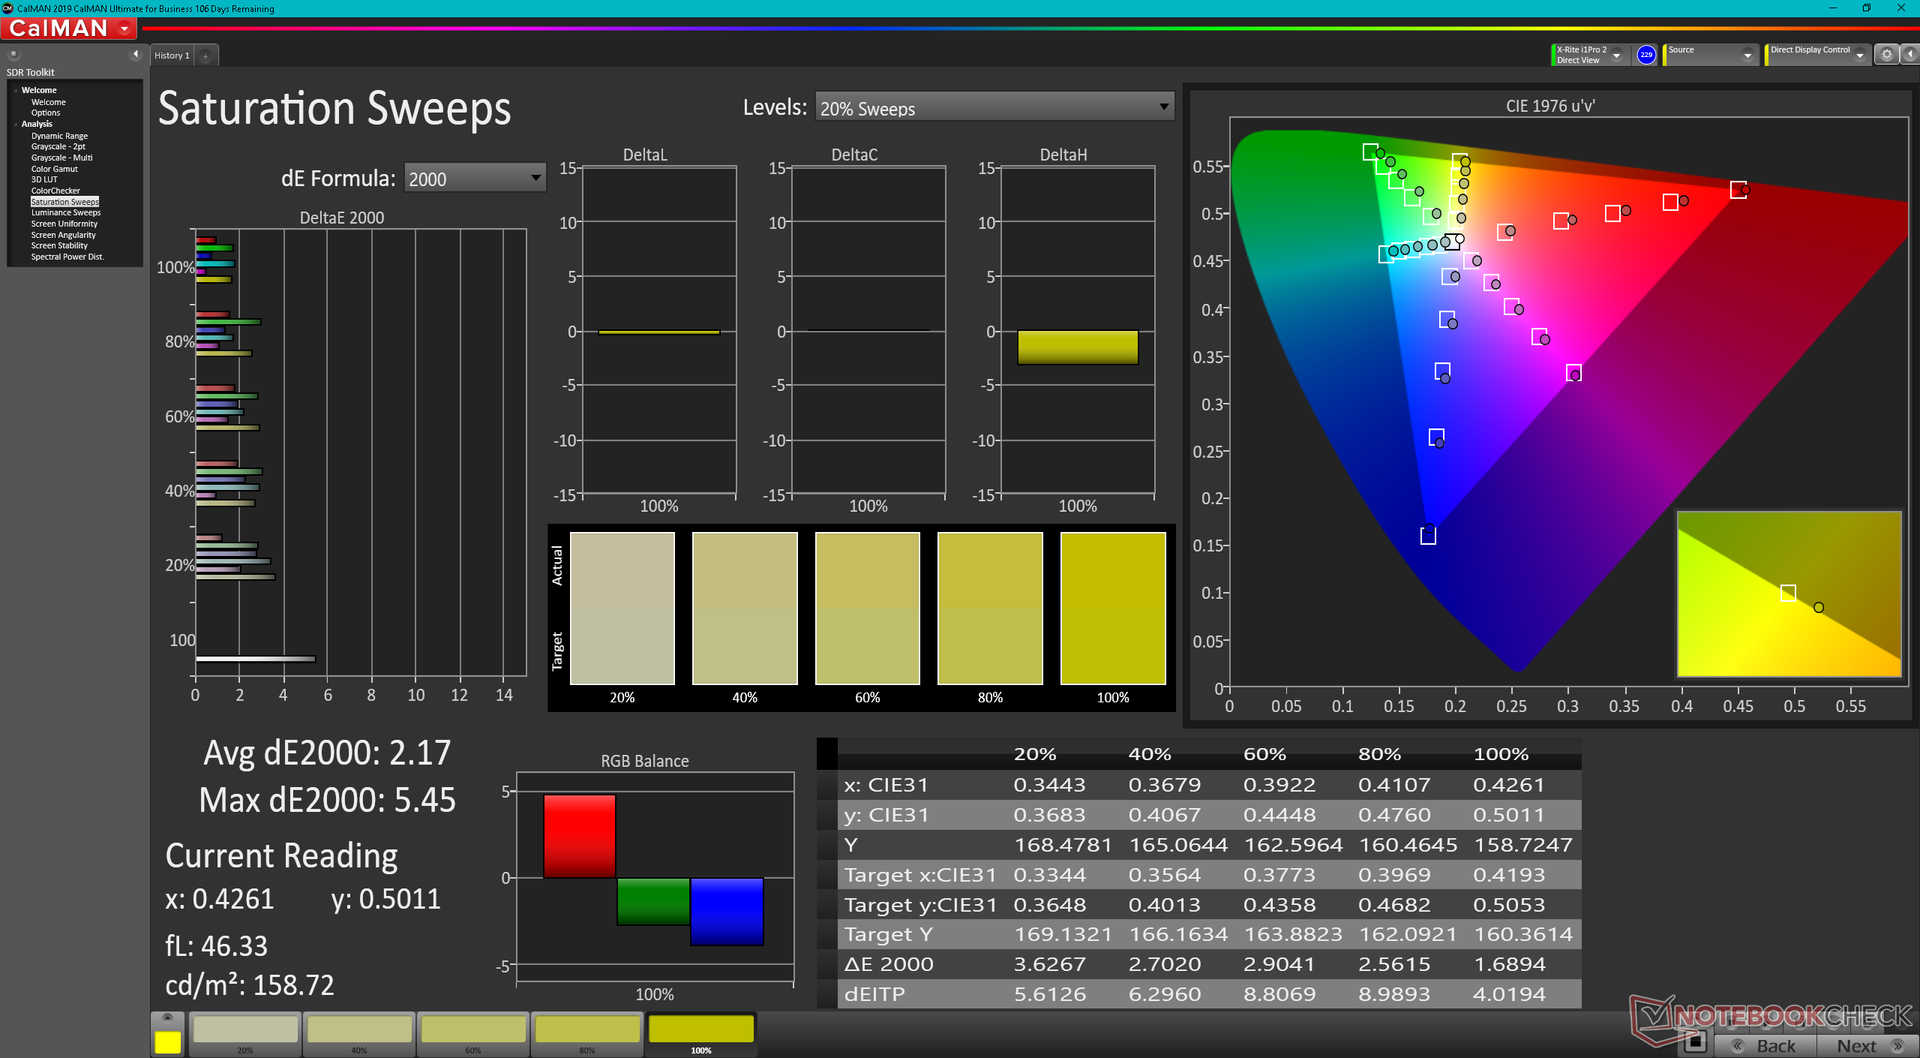
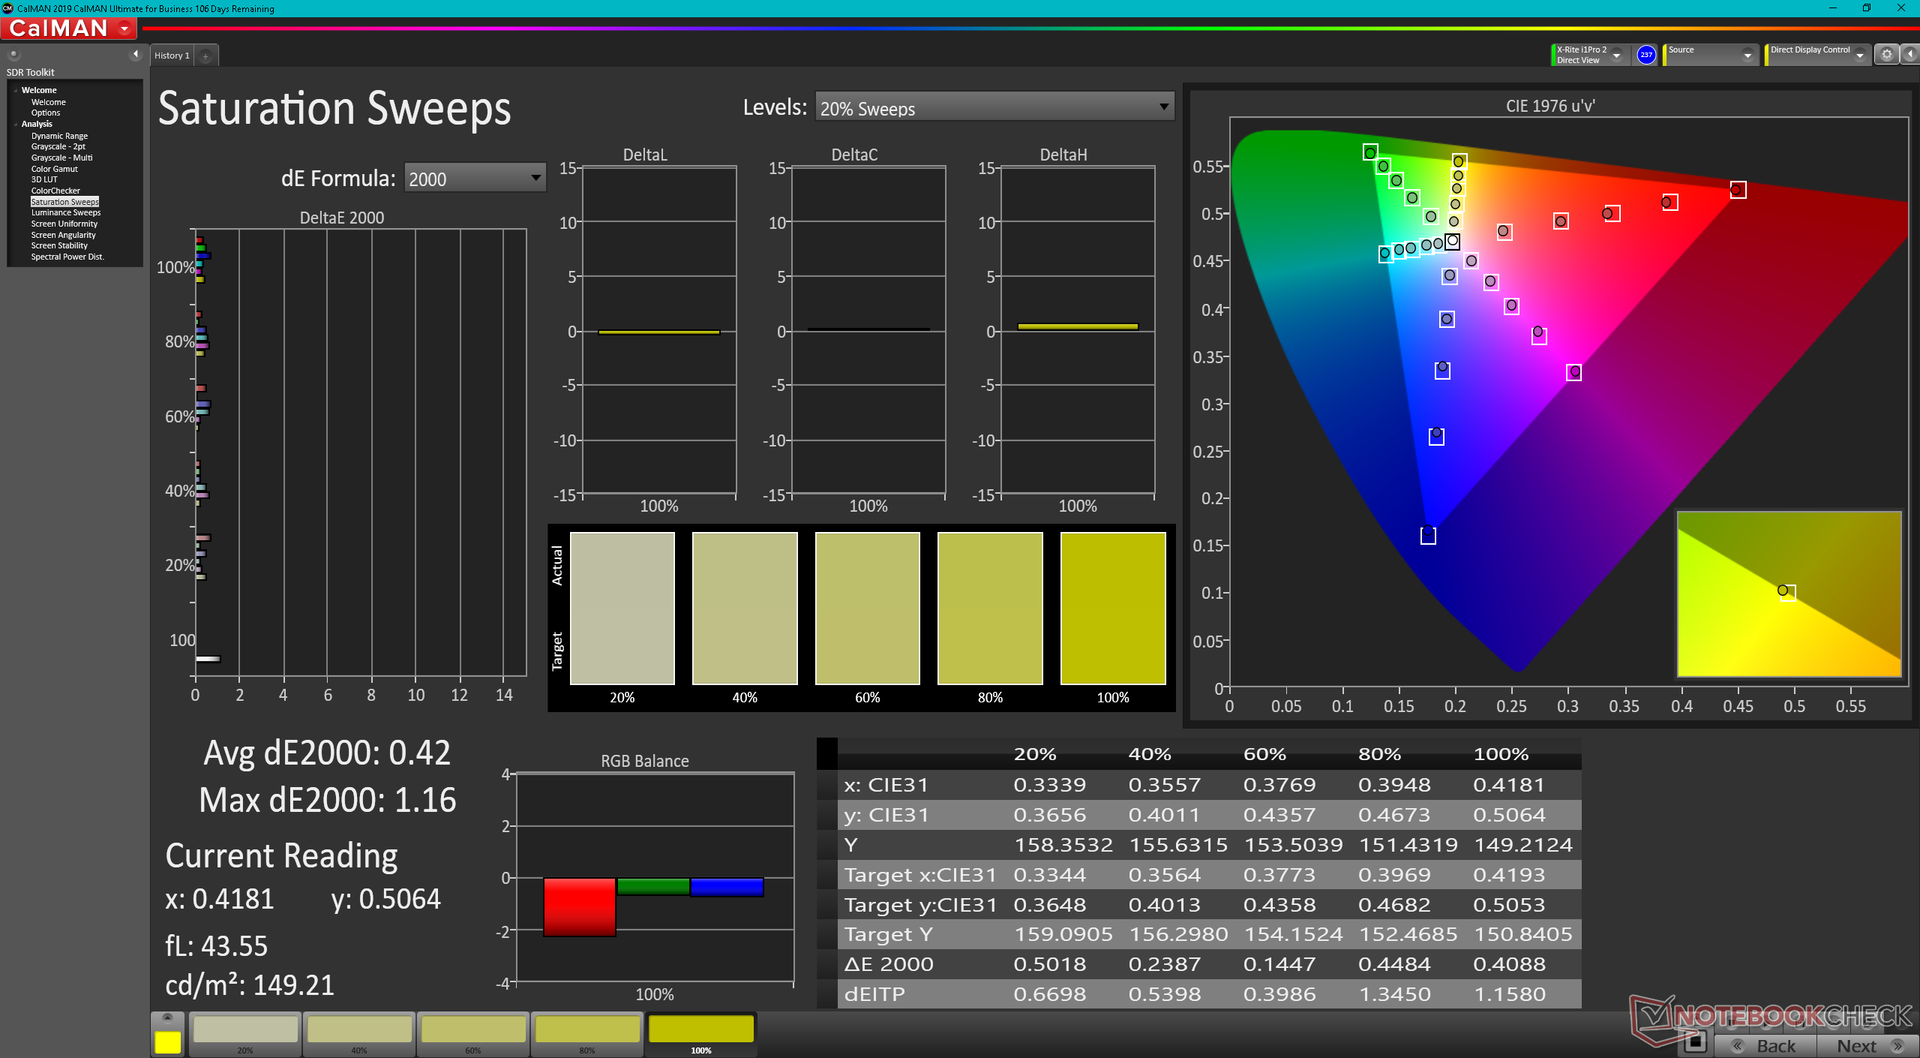
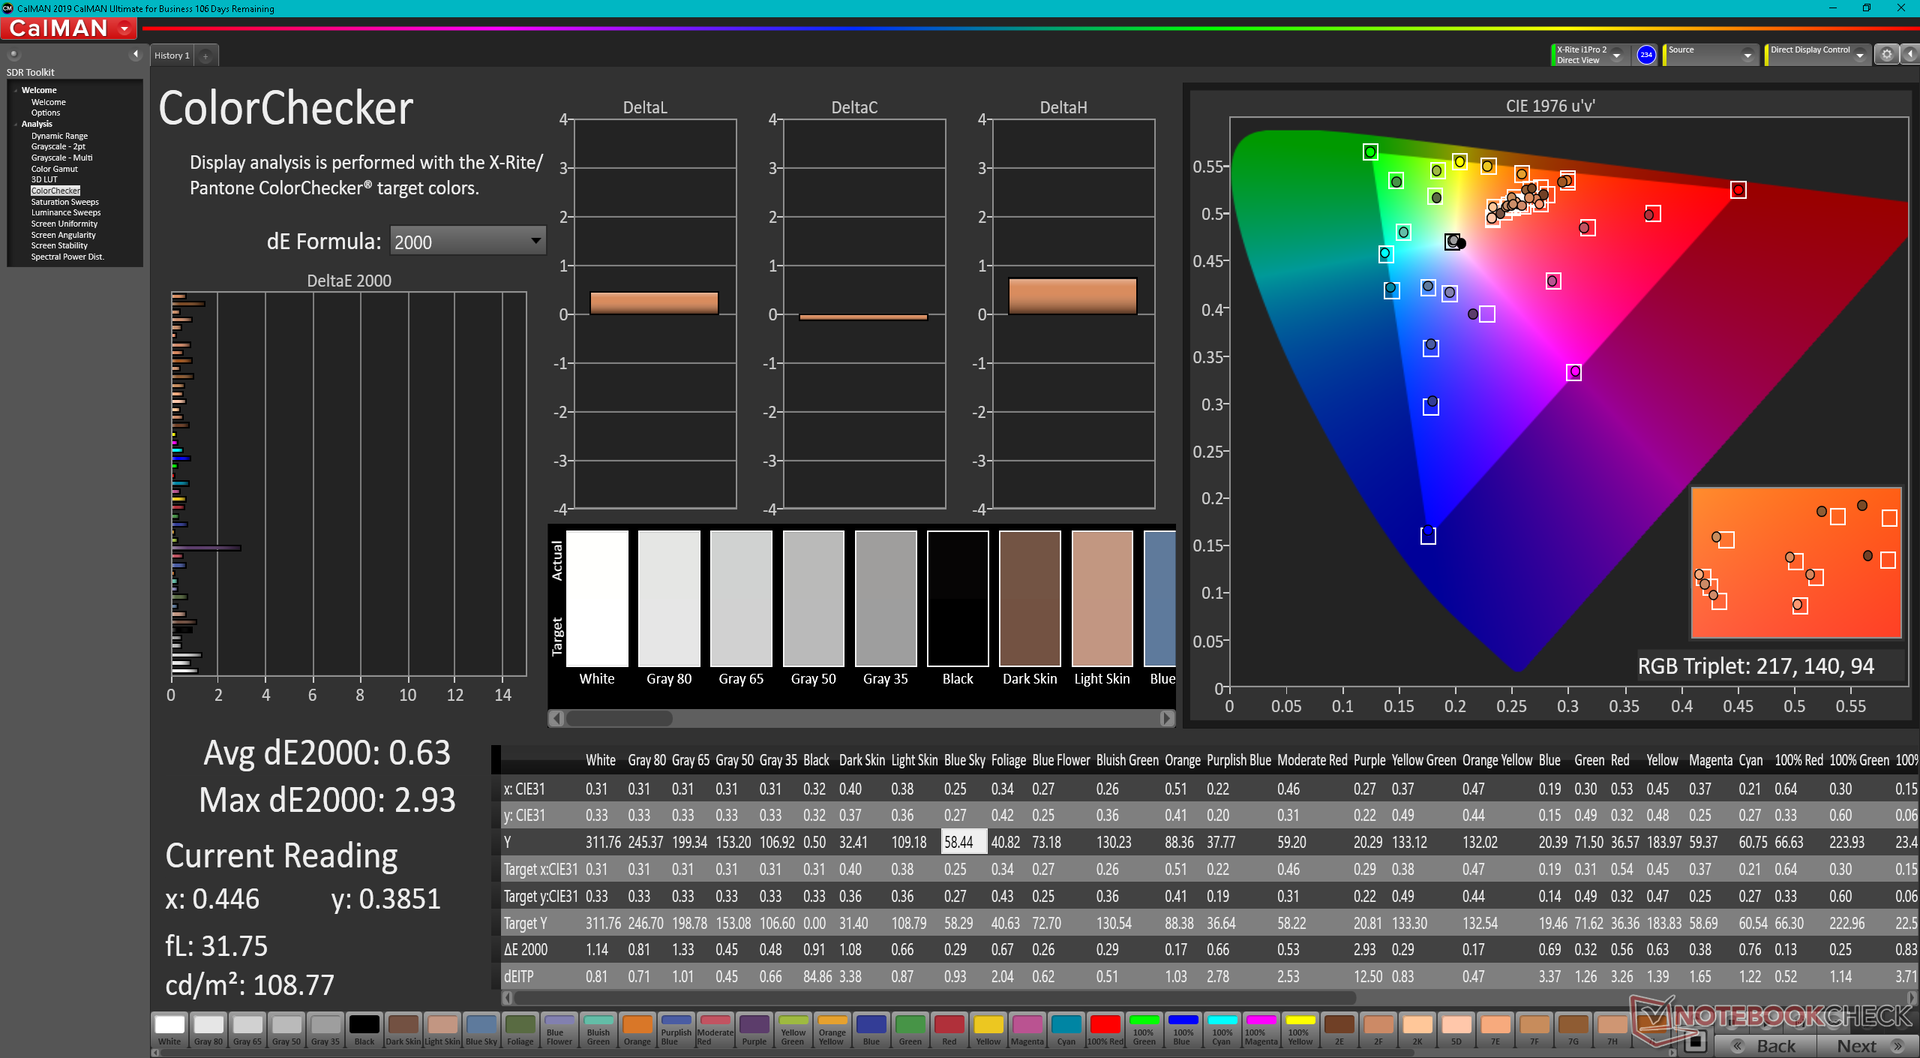
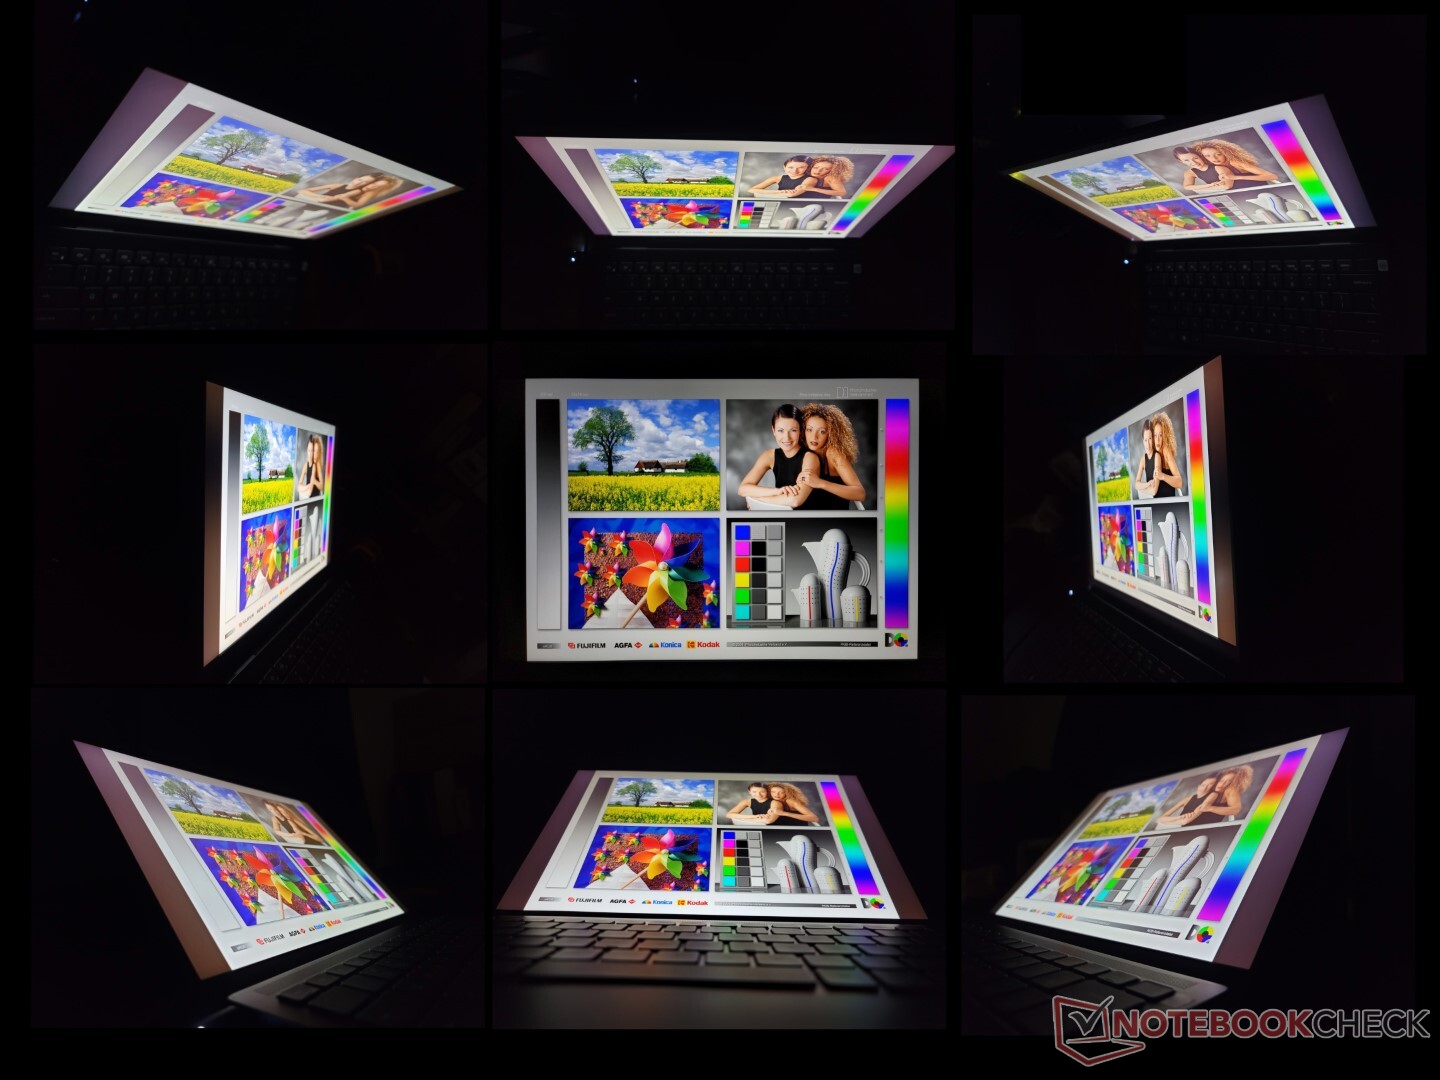
Display - Copertura completa sRGB e 60 Hz
Mentre altri portatili da 14 pollici puntano in genere a risoluzioni native di 1200p, 1800p o 2160p, l'Inspiron 14 Plus 7420 è dotato di un pannello da 2,2K o 2240 x 1400, relativamente poco comune. Le caratteristiche principali sono comunque solide, tra cui la copertura completa sRGB, il rapporto di contrasto di circa 1000:1 e tempi di risposta decenti per la sua classe di dimensioni. È un peccato che non siano disponibili opzioni OLED o lucide per aumentare ulteriormente i colori o la nitidezza.
| |||||||||||||||||||||||||
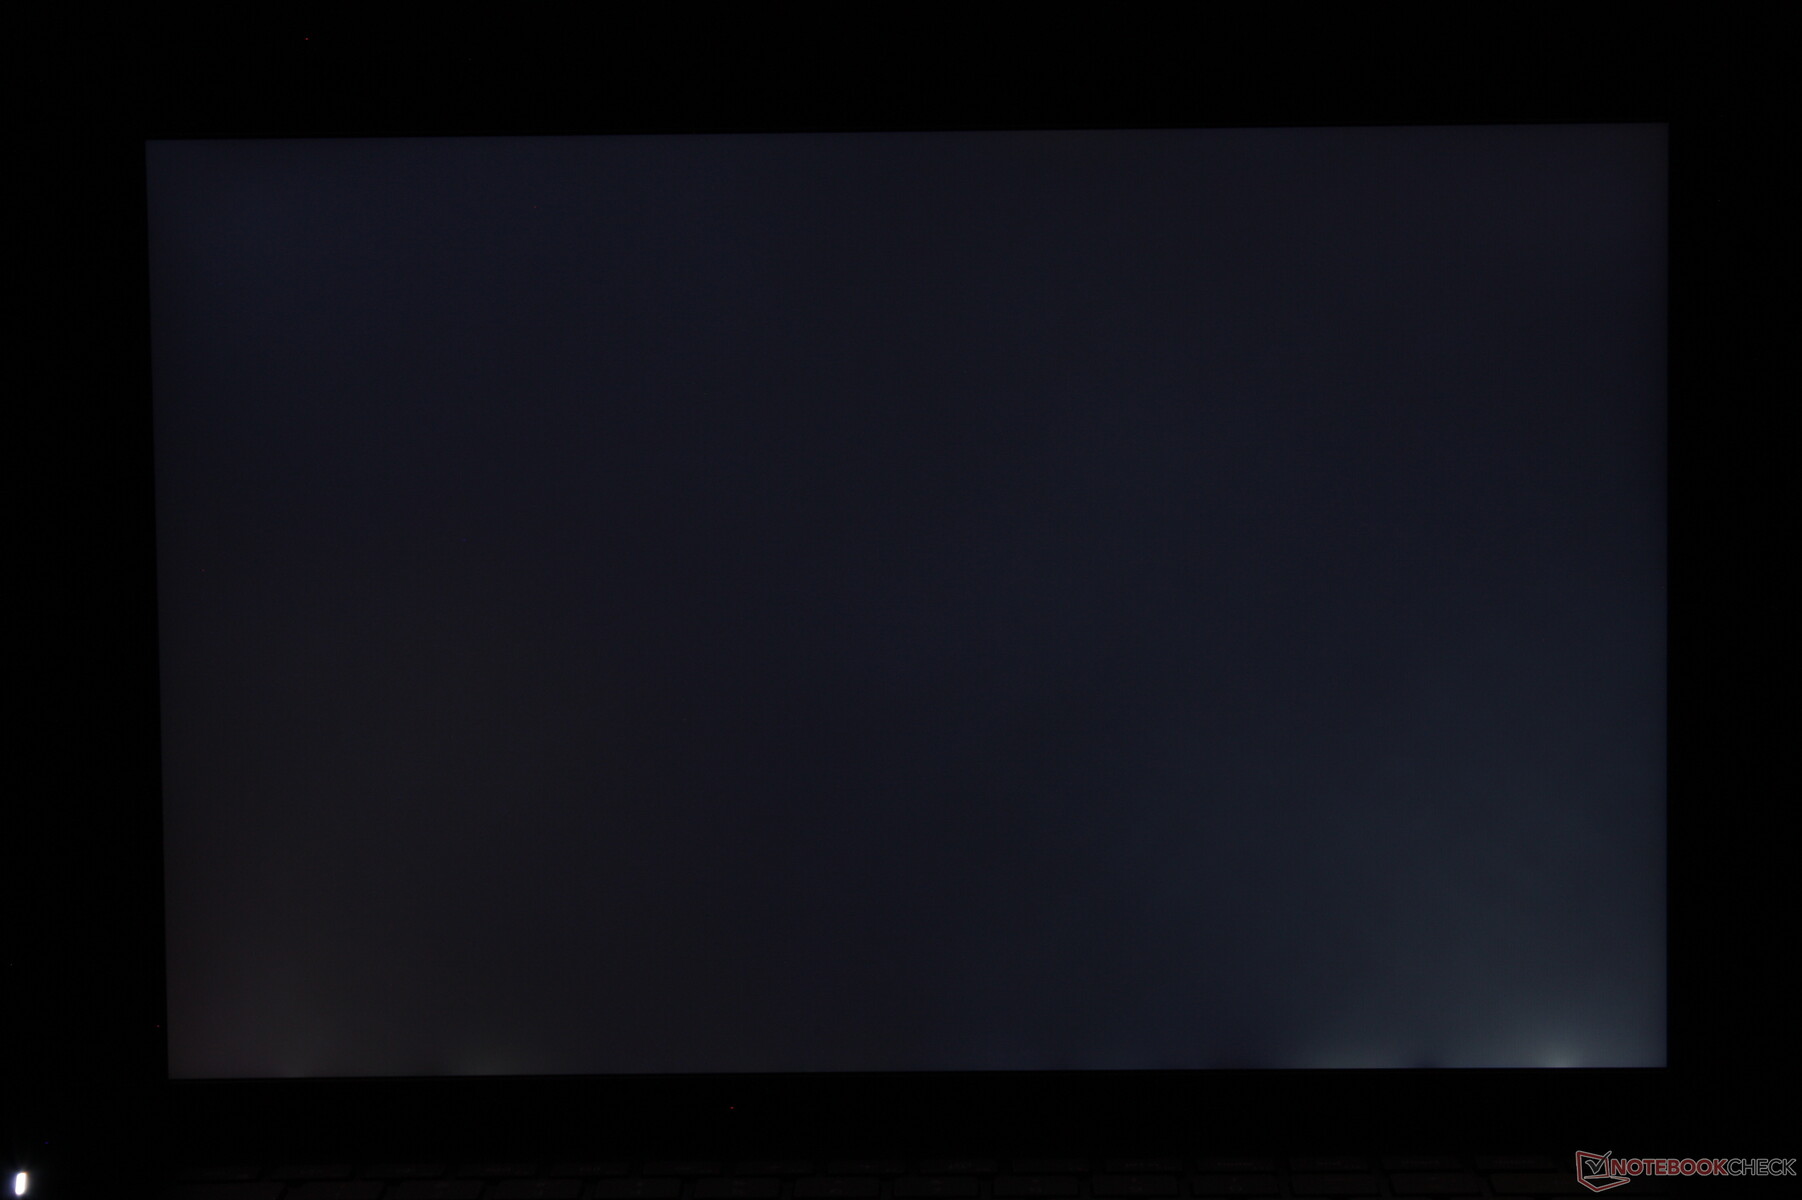
Distribuzione della luminosità: 85 %
Al centro con la batteria: 331.1 cd/m²
Contrasto: 1142:1 (Nero: 0.29 cd/m²)
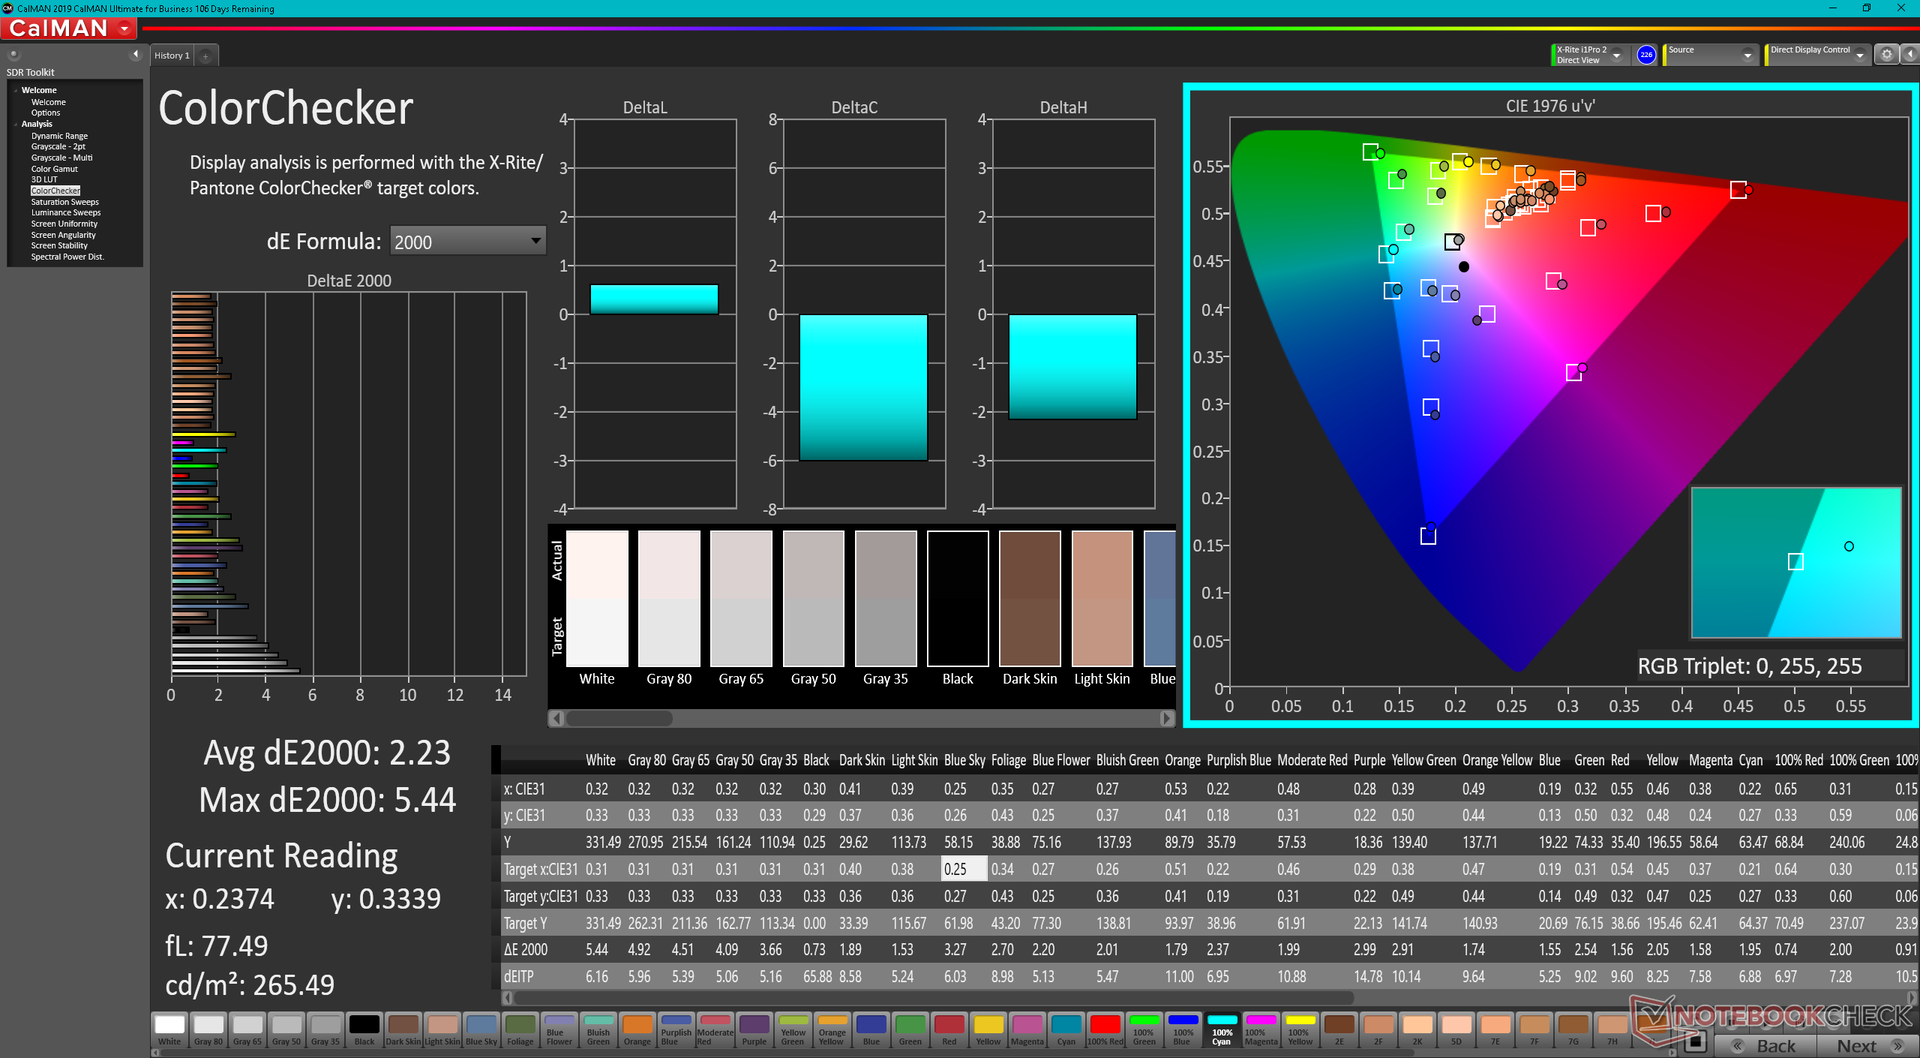
ΔE ColorChecker Calman: 2.23 | ∀{0.5-29.43 Ø4.72}
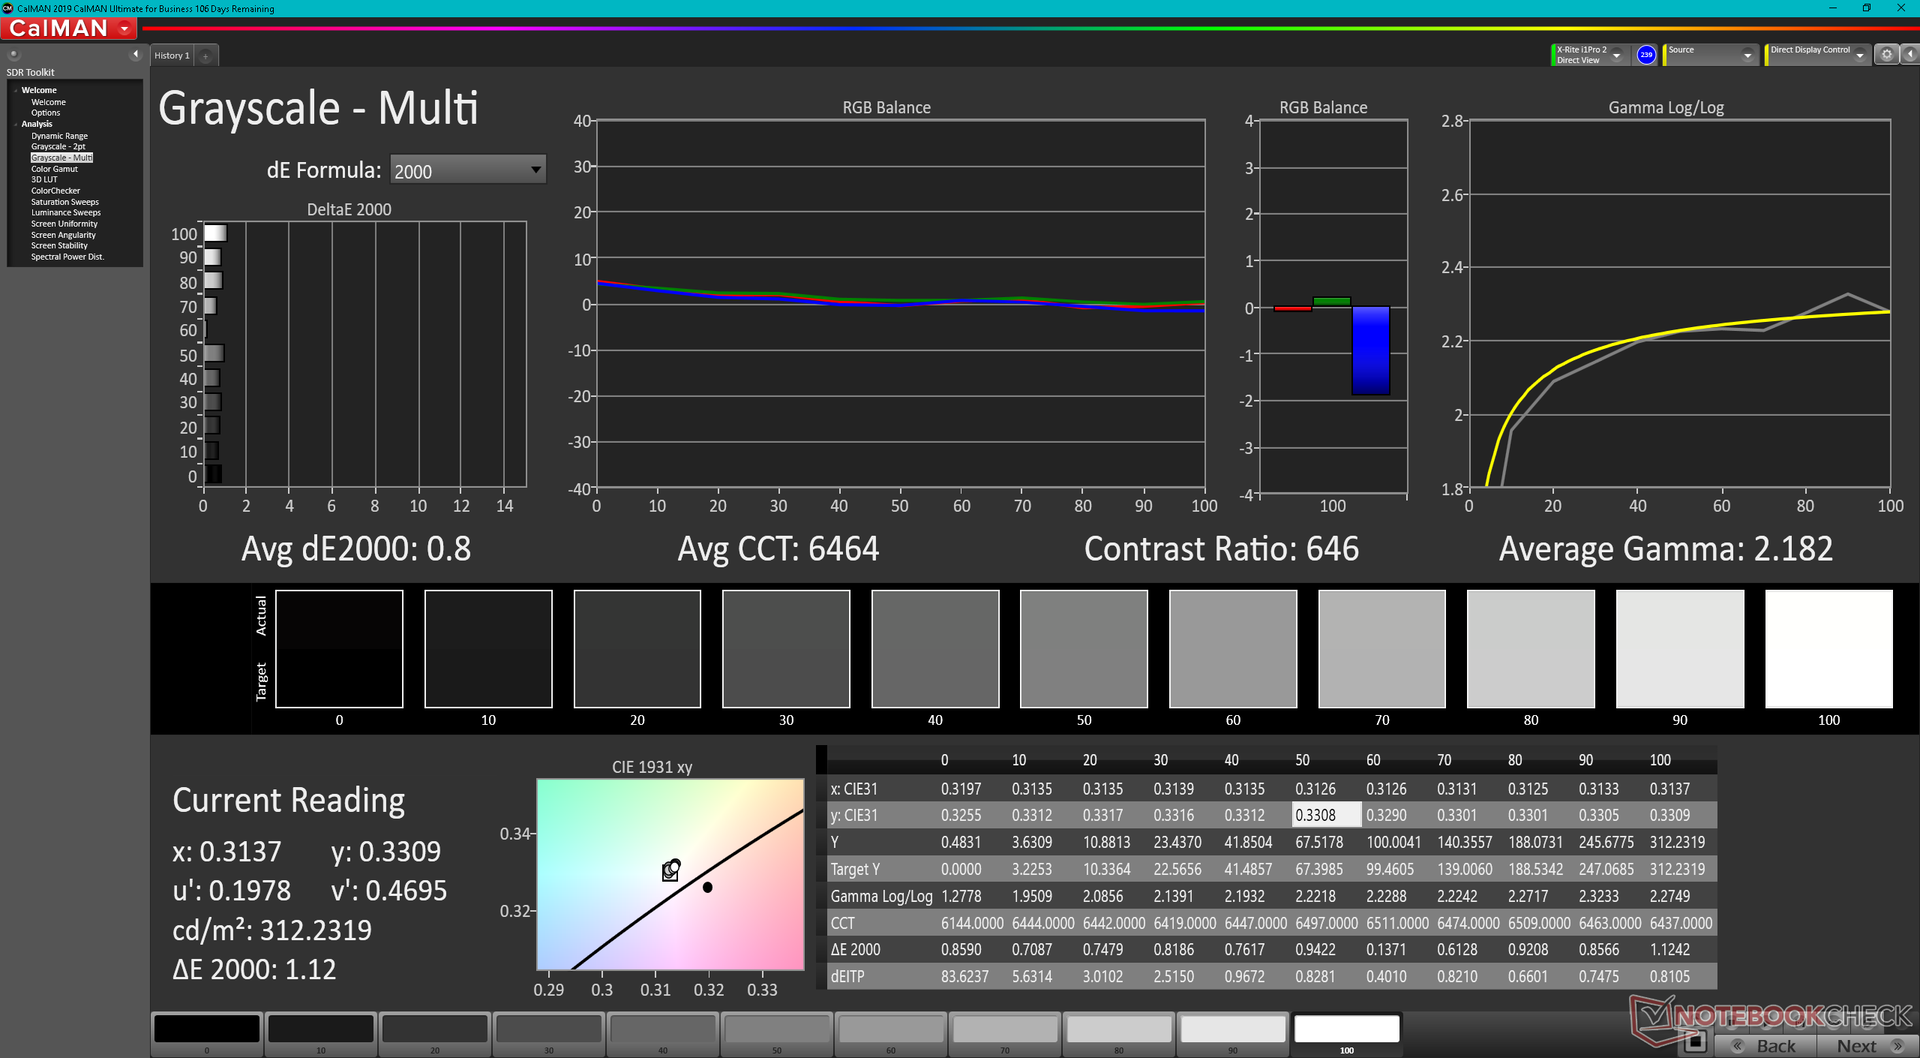
calibrated: 0.63
ΔE Greyscale Calman: 3.6 | ∀{0.09-98 Ø4.97}
69.5% AdobeRGB 1998 (Argyll 3D)
99.3% sRGB (Argyll 3D)
68.8% Display P3 (Argyll 3D)
Gamma: 2.21
CCT: 6022 K
| Dell Inspiron 14 Plus 7420 InfoVision 140NWHE, IPS, 2240x1400, 14" | Asus Vivobook Pro 14 M3401QC-KM007T SAMSUNG: SDC4171, OLED, 2880x1800, 14" | Dell Inspiron 14 7420 2-in-1 BOE NV14N42, IPS, 1920x1200, 14" | Schenker Vision 14 MNE007ZA1, IPS, 2880x1800, 14" | Asus Zenbook 14X UX5400E Samsung SDC4154, OLED, 2880x1800, 14" | MSI Summit E14 A11SCS AU Optronics AUO123B, IPS, 3840x2160, 14" | HP Envy 14-eb0010nr AU Optronics AUOF392, IPS, 1920x1200, 14" | |
|---|---|---|---|---|---|---|---|
| Display | 27% | -43% | 5% | 28% | 24% | 8% | |
| Display P3 Coverage (%) | 68.8 | 99.41 44% | 38.6 -44% | 74.3 8% | 100 45% | 87.5 27% | 77.1 12% |
| sRGB Coverage (%) | 99.3 | 99.94 1% | 56.2 -43% | 97.6 -2% | 100 1% | 100 1% | 99.8 1% |
| AdobeRGB 1998 Coverage (%) | 69.5 | 94.79 36% | 39.9 -43% | 75.7 9% | 96 38% | 99.4 43% | 76.7 10% |
| Response Times | 89% | 13% | -2% | 93% | -47% | -95% | |
| Response Time Grey 50% / Grey 80% * (ms) | 32.8 ? | 3 ? 91% | 27.2 ? 17% | 40.4 ? -23% | 2 ? 94% | 52 ? -59% | 61.2 ? -87% |
| Response Time Black / White * (ms) | 22.8 ? | 3 ? 87% | 20.8 ? 9% | 18.4 ? 19% | 2 ? 91% | 30.8 ? -35% | 46 ? -102% |
| PWM Frequency (Hz) | 360 | ||||||
| Screen | 41% | -113% | -8% | 13% | -70% | -8% | |
| Brightness middle (cd/m²) | 331.1 | 384 16% | 269.4 -19% | 407 23% | 379 14% | 593.3 79% | 412 24% |
| Brightness (cd/m²) | 326 | 385 18% | 260 -20% | 407 25% | 381 17% | 571 75% | 392 20% |
| Brightness Distribution (%) | 85 | 98 15% | 89 5% | 94 11% | 93 9% | 87 2% | 81 -5% |
| Black Level * (cd/m²) | 0.29 | 0.07 76% | 0.41 -41% | 0.25 14% | 0.1 66% | 0.53 -83% | 0.32 -10% |
| Contrast (:1) | 1142 | 5486 380% | 657 -42% | 1628 43% | 3790 232% | 1119 -2% | 1288 13% |
| Colorchecker dE 2000 * | 2.23 | 1.75 22% | 6.53 -193% | 2.6 -17% | 2.3 -3% | 4.42 -98% | 1.88 16% |
| Colorchecker dE 2000 max. * | 5.44 | 3.41 37% | 19.76 -263% | 4.4 19% | 4.16 24% | 7.16 -32% | 3.06 44% |
| Colorchecker dE 2000 calibrated * | 0.63 | 2.32 -268% | 3.13 -397% | 2 -217% | 2.42 -284% | 4.3 -583% | 1.96 -211% |
| Greyscale dE 2000 * | 3.6 | 1.06 71% | 5.4 -50% | 2.7 25% | 2.12 41% | 3.2 11% | 2.2 39% |
| Gamma | 2.21 100% | 2.39 92% | 2.05 107% | 2.18 101% | 2.42 91% | 2.04 108% | 2.1 105% |
| CCT | 6022 108% | 6440 101% | 6007 108% | 6316 103% | 6737 96% | 6650 98% | |
| Color Space (Percent of AdobeRGB 1998) (%) | 68.7 | ||||||
| Color Space (Percent of sRGB) (%) | 99.8 | ||||||
| Media totale (Programma / Settaggio) | 52% /
45% | -48% /
-80% | -2% /
-5% | 45% /
28% | -31% /
-47% | -32% /
-17% |
* ... Meglio usare valori piccoli
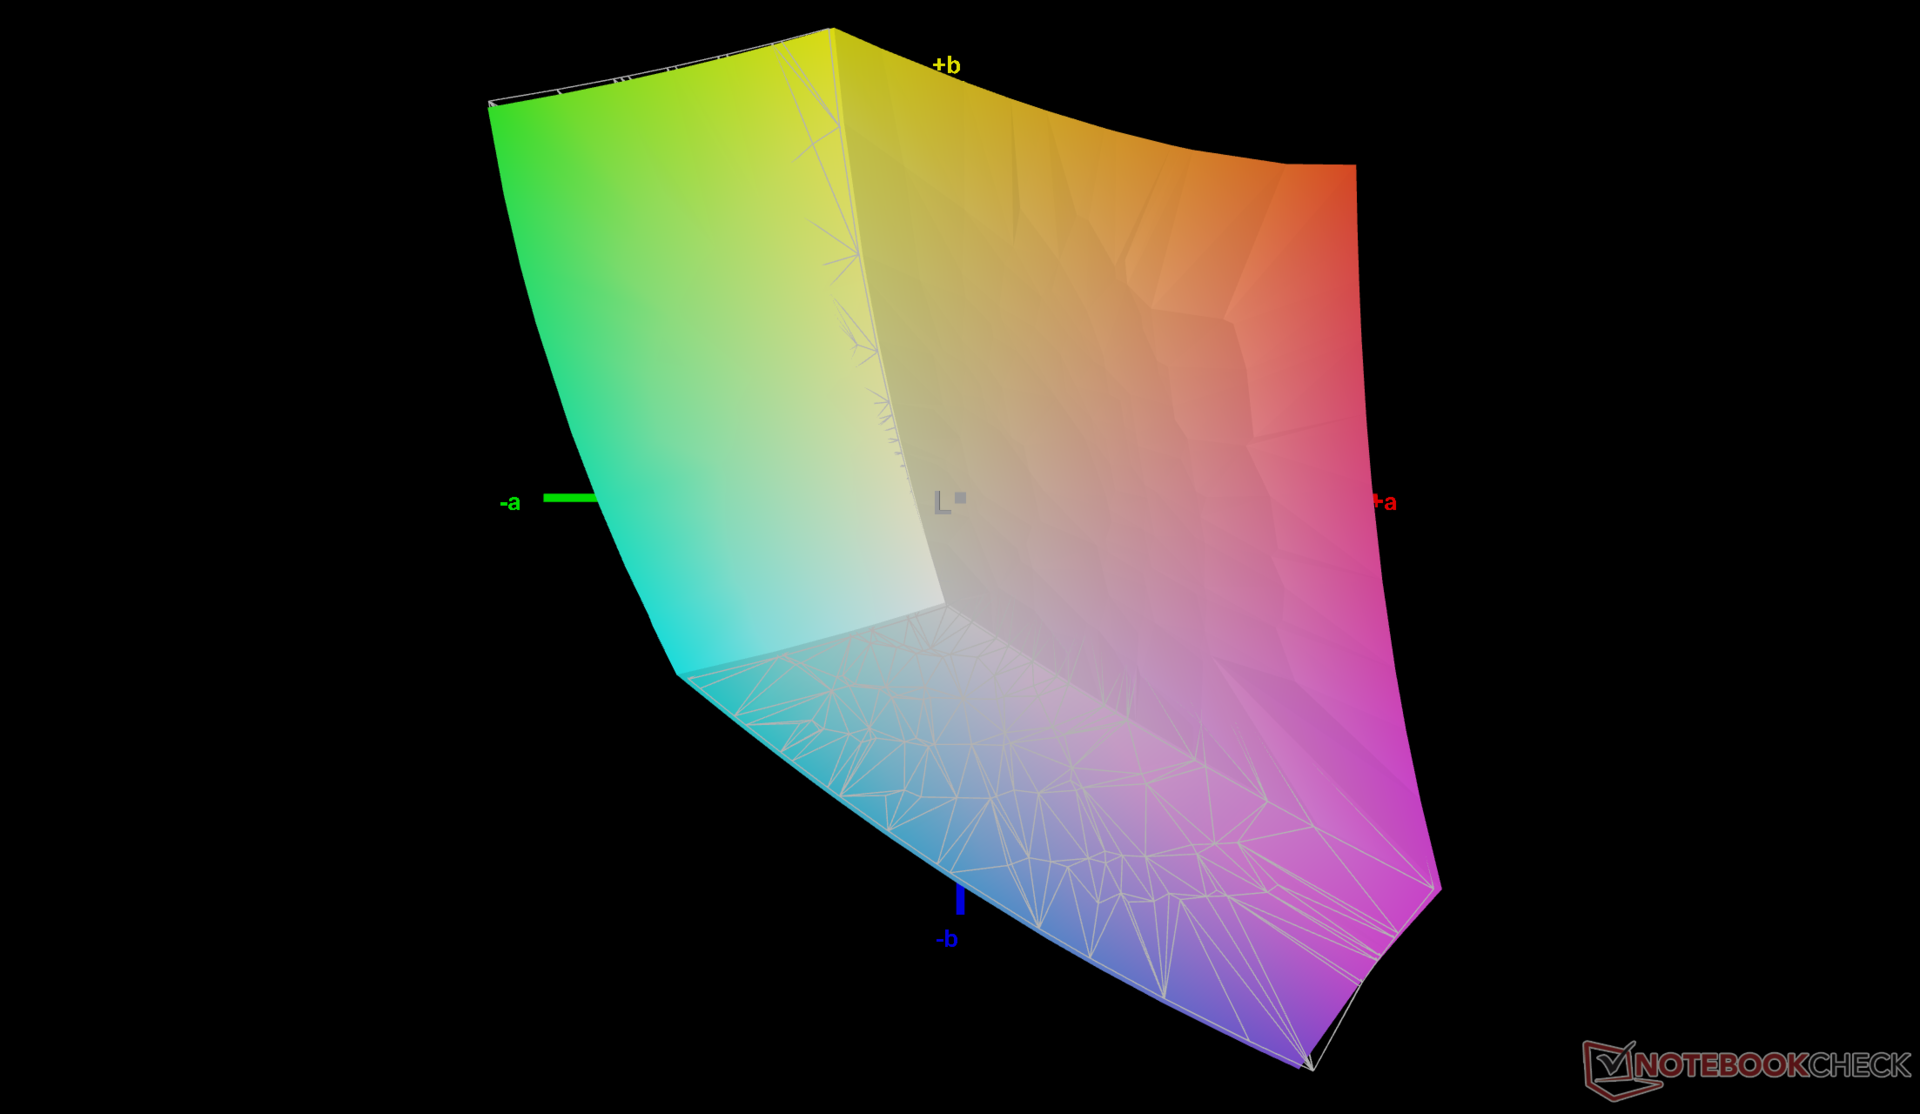
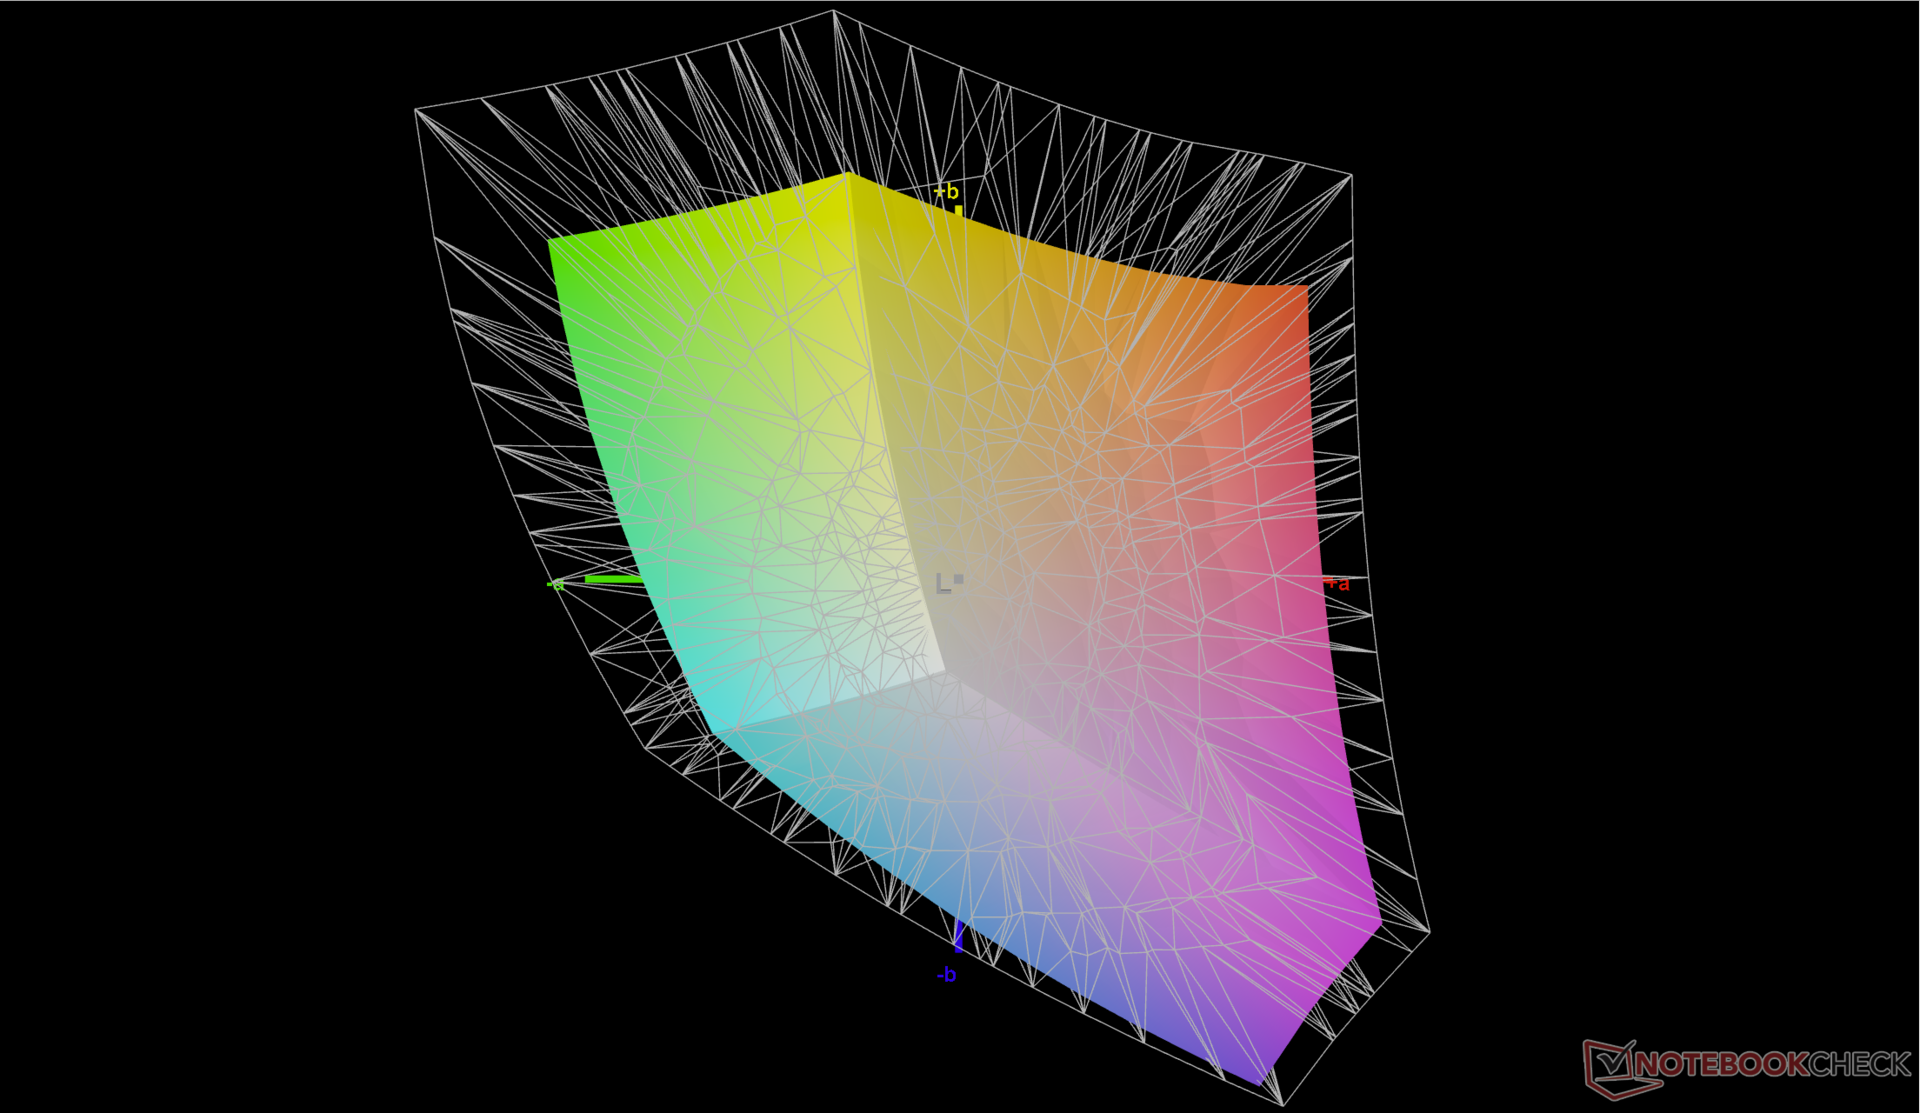
Il display non è stato calibrato in fabbrica e quindi i suoi colori non sono così accurati come potrebbero essere. In particolare, la temperatura del colore è troppo calda (circa 6000) rispetto ai 6500 dello standard sRGB. Dopo una corretta calibrazione con il nostro colorimetro X-Rite, i valori medi del DeltaE della scala di grigi e del colore passerebbero da 3,6 e 2,23 a soli 0,8 e 0,63, rispettivamente. Consigliamo una calibrazione da parte dell'utente finale per sfruttare appieno la copertura sRGB al 100% del pannello.
Tempi di risposta del Display
| ↔ Tempi di risposta dal Nero al Bianco | ||
|---|---|---|
| 22.8 ms ... aumenta ↗ e diminuisce ↘ combinato | ↗ 12 ms Incremento | 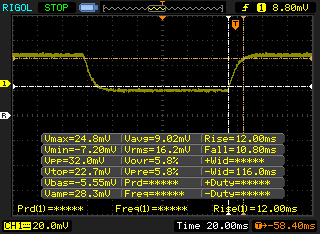 |
| ↘ 10.8 ms Calo | ||
| Lo schermo mostra buoni tempi di risposta durante i nostri tests, ma potrebbe essere troppo lento per i gamers competitivi. In confronto, tutti i dispositivi di test variano da 0.1 (minimo) a 240 (massimo) ms. » 51 % di tutti i dispositivi è migliore. Questo significa che i tempi di risposta rilevati sono peggiori rispetto alla media di tutti i dispositivi testati (19.8 ms). | ||
| ↔ Tempo di risposta dal 50% Grigio all'80% Grigio | ||
| 32.8 ms ... aumenta ↗ e diminuisce ↘ combinato | ↗ 16 ms Incremento | 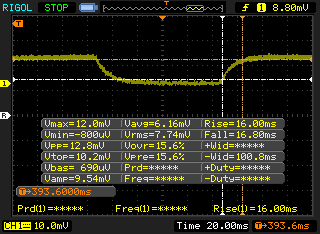 |
| ↘ 16.8 ms Calo | ||
| Lo schermo mostra tempi di risposta lenti nei nostri tests e sarà insoddisfacente per i gamers. In confronto, tutti i dispositivi di test variano da 0.165 (minimo) a 636 (massimo) ms. » 44 % di tutti i dispositivi è migliore. Questo significa che i tempi di risposta rilevati sono simili alla media di tutti i dispositivi testati (31 ms). | ||
Sfarfallio dello schermo / PWM (Pulse-Width Modulation)
| flickering dello schermo / PWM non rilevato | 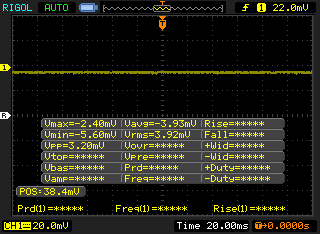 | ||
In confronto: 52 % di tutti i dispositivi testati non utilizza PWM per ridurre la luminosita' del display. Se è rilevato PWM, una media di 7763 (minimo: 5 - massimo: 343500) Hz è stata rilevata. | |||
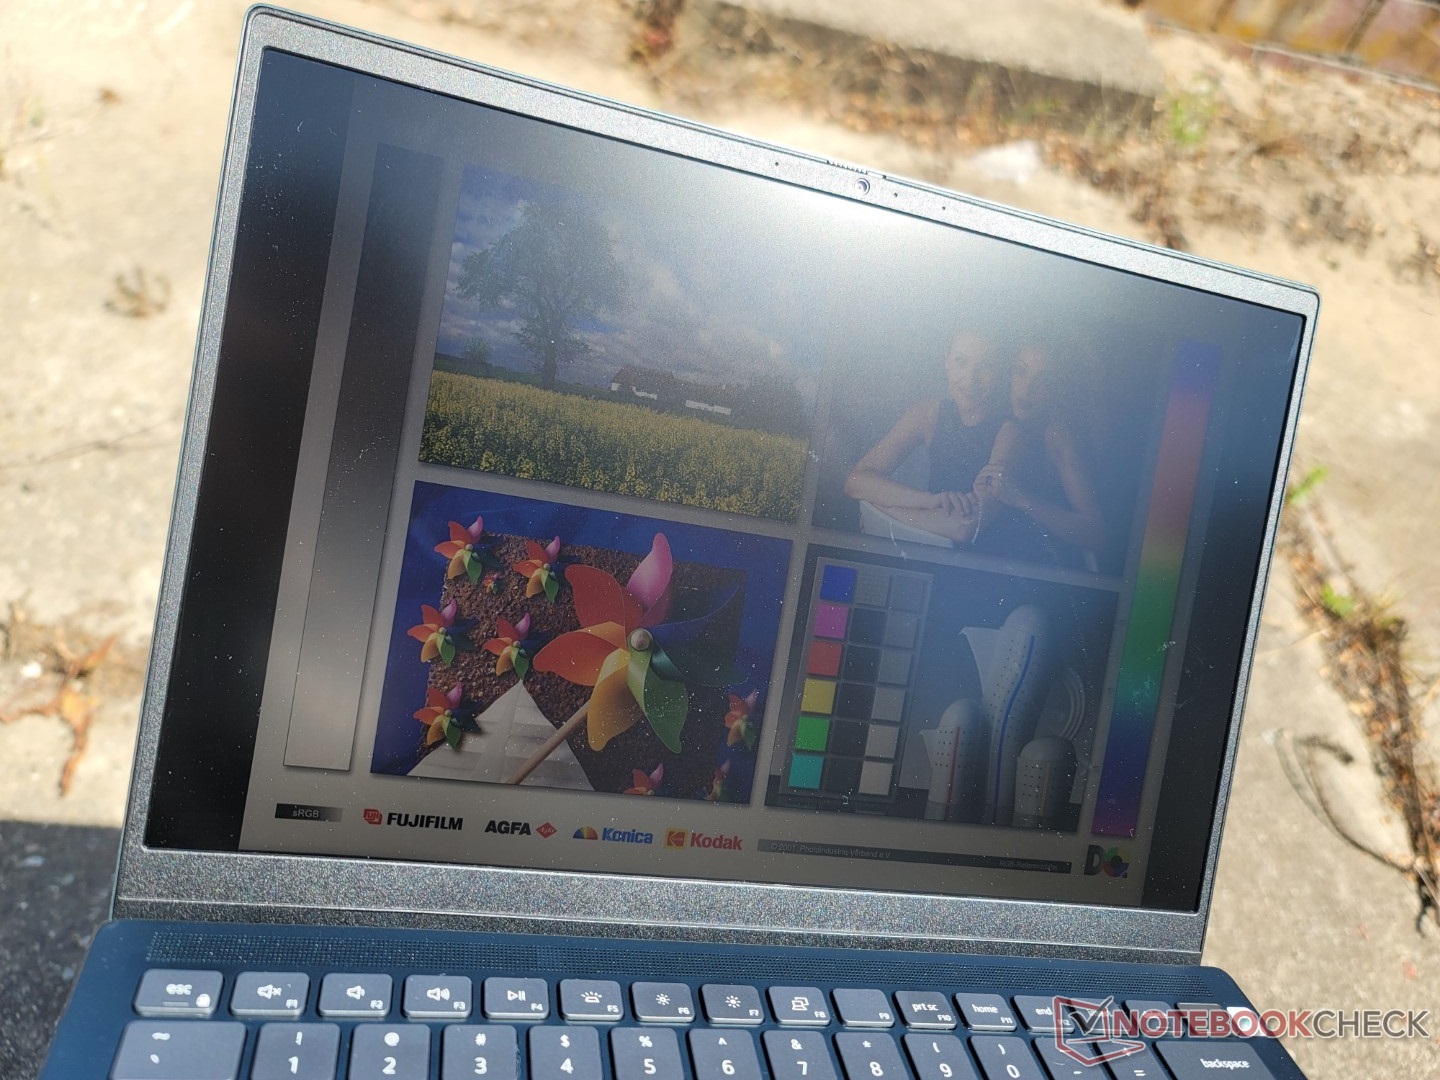
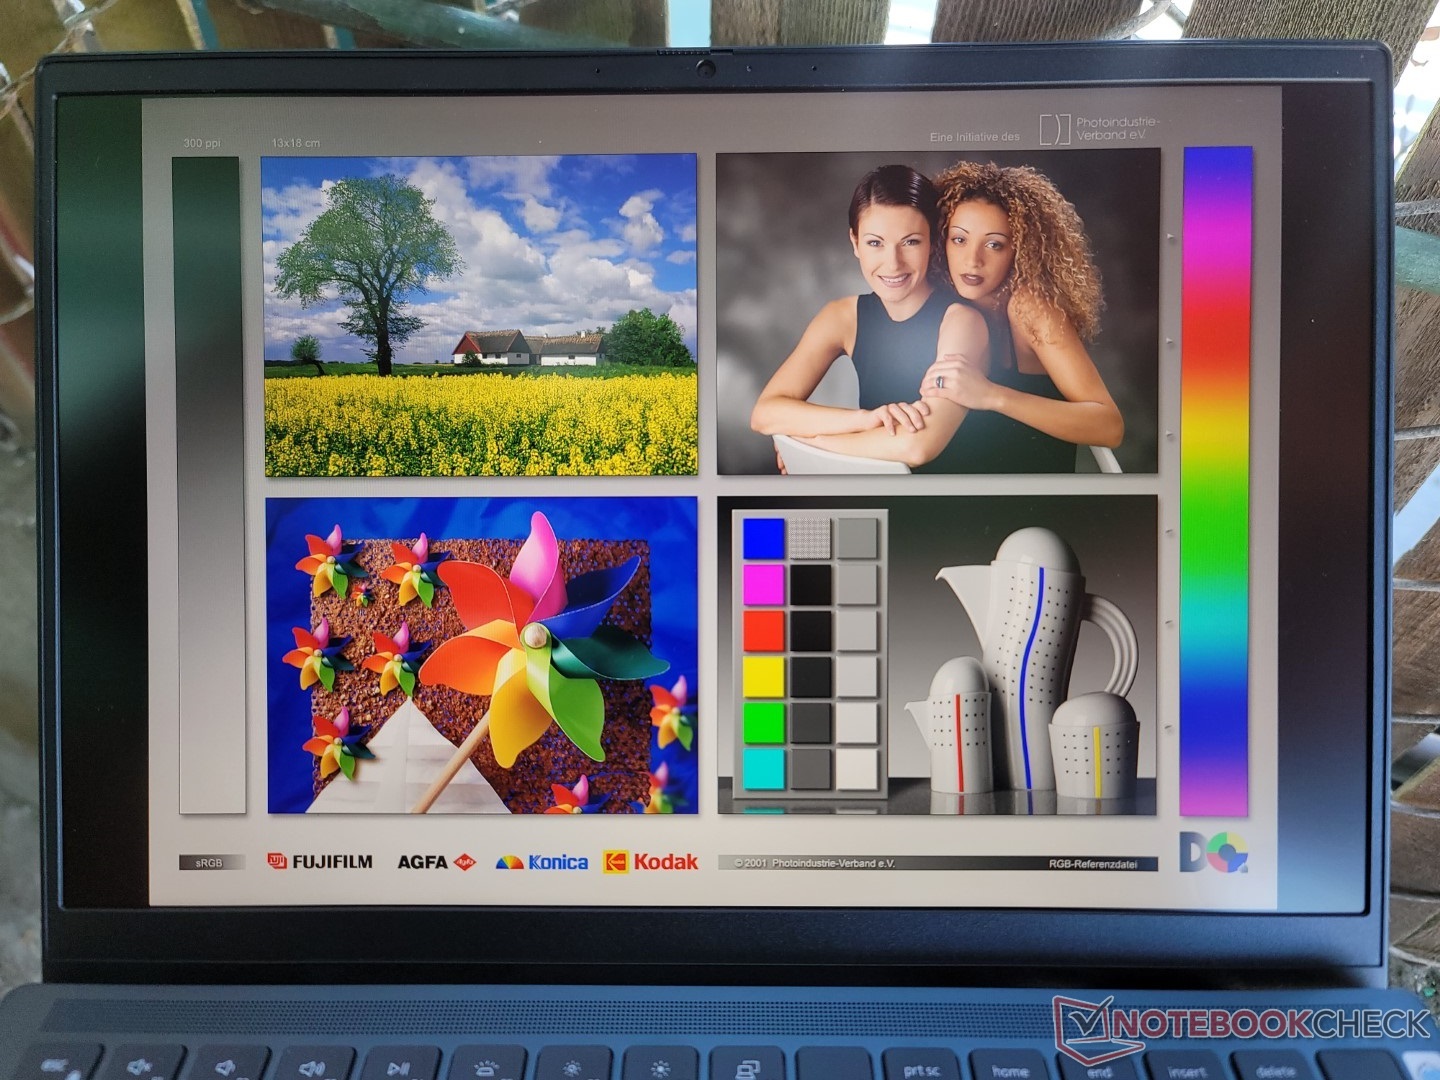
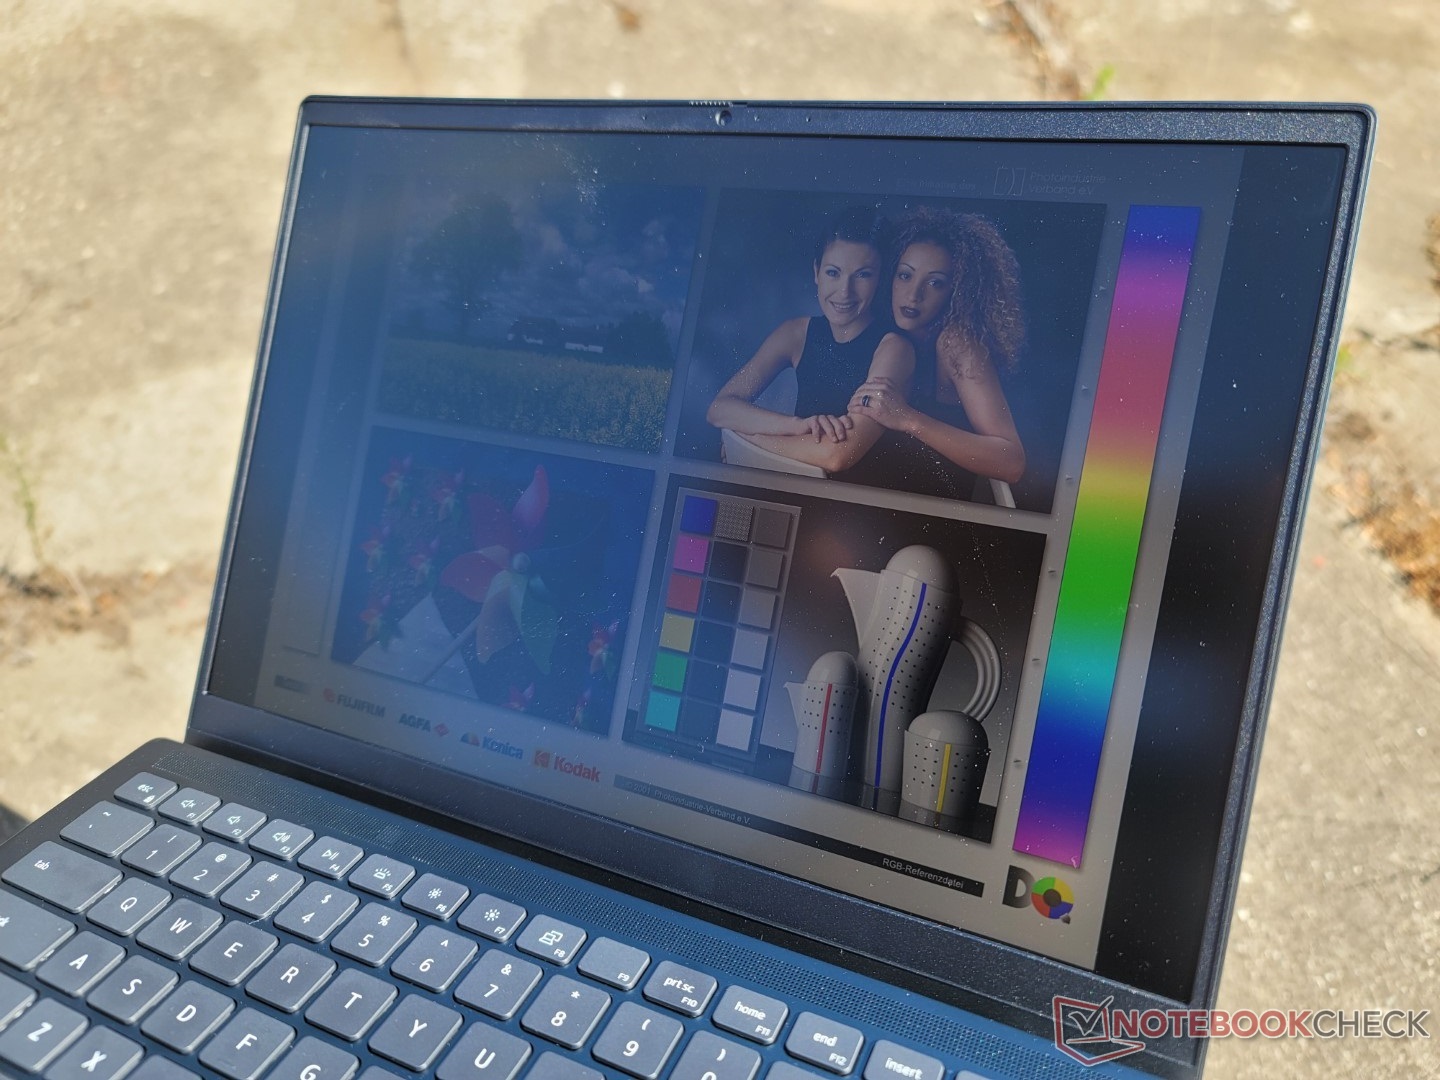
La visibilità all'aperto è insoddisfacente, in quanto il display ha una media di soli 300 nit alla sua impostazione massima. Se si lavora all'aperto, è consigliabile lavorare all'ombra, altrimenti lo schermo si sbiadisce con l'illuminazione ambientale più intensa. IlMSI Summit E14 ha uno schermo significativamente più luminoso e offre comunque opzioni di GPU discrete.
Prestazioni - 14 pollici sovralimentati
Condizioni di test
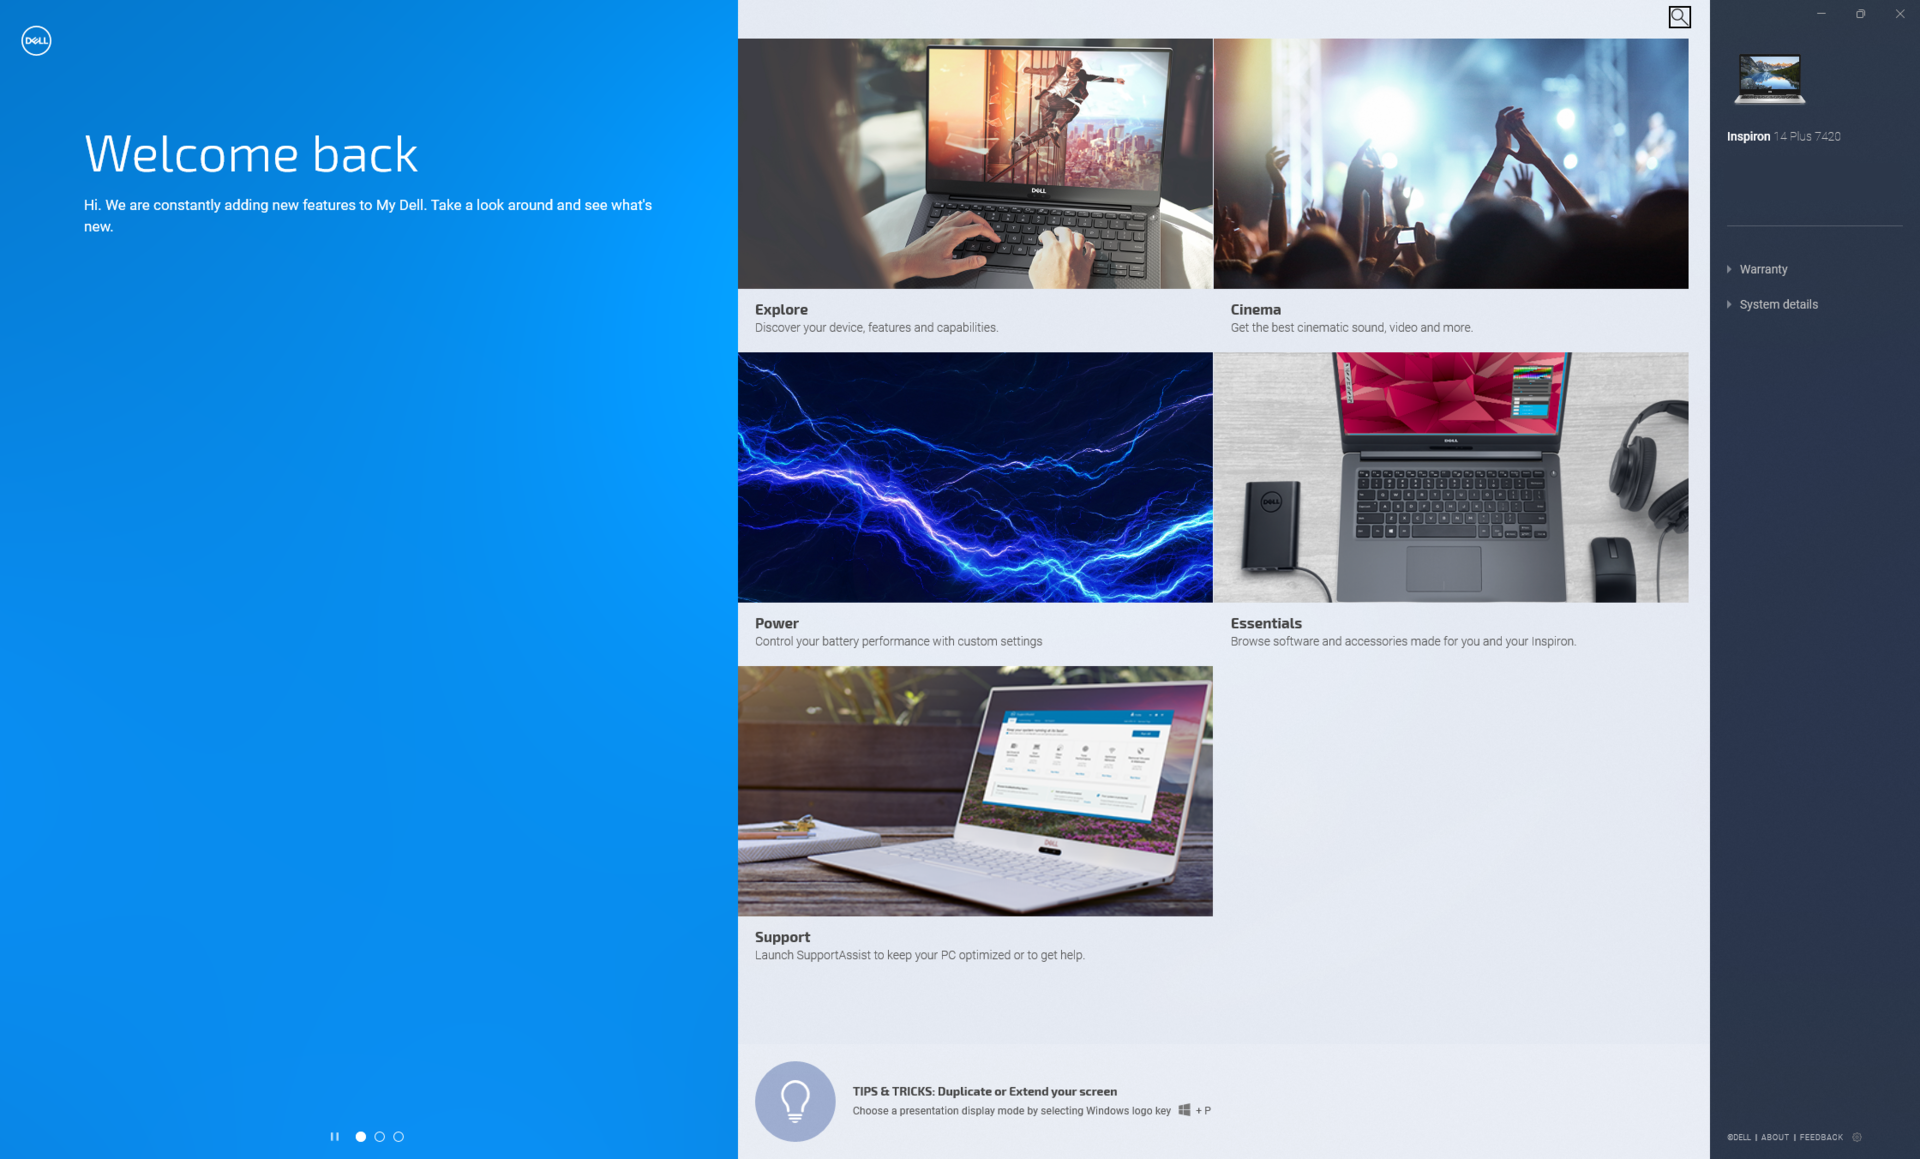
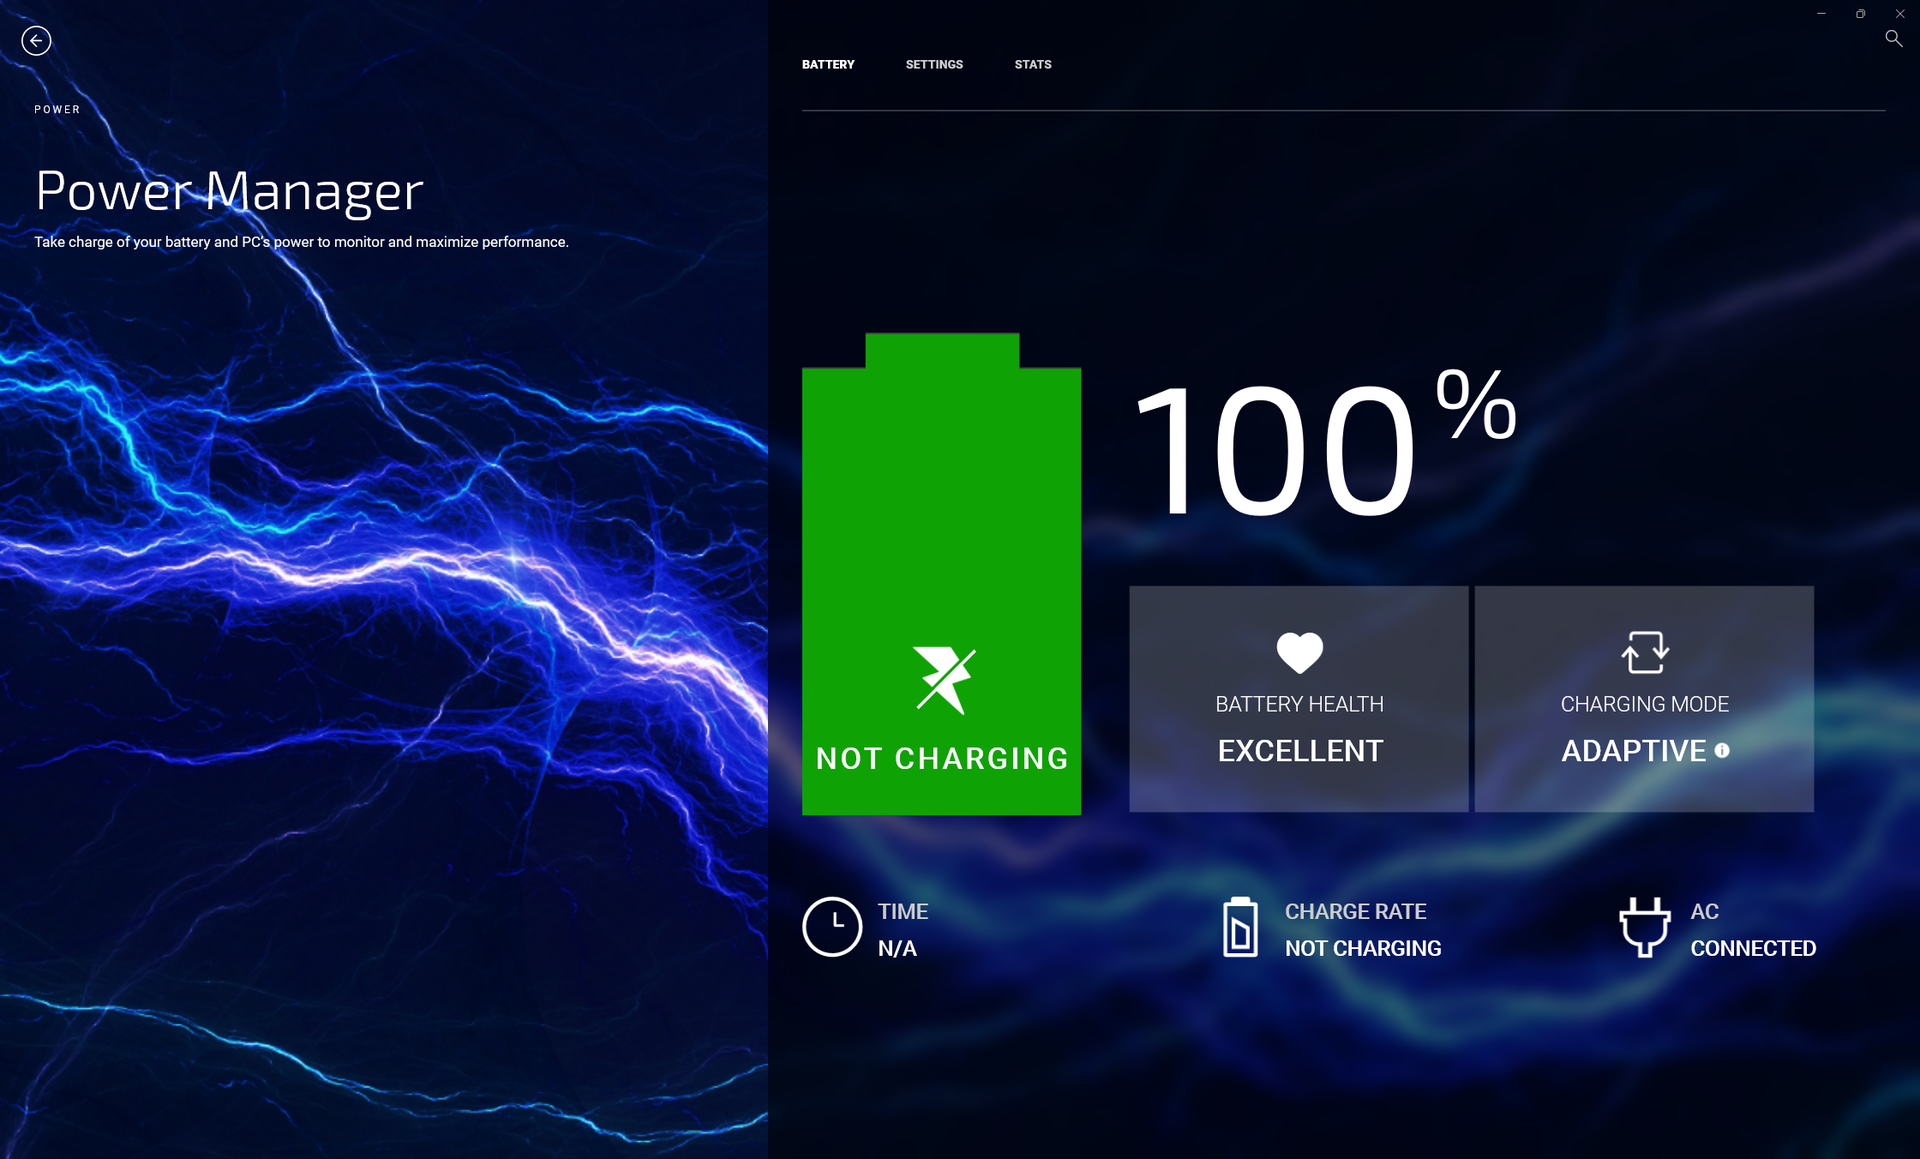
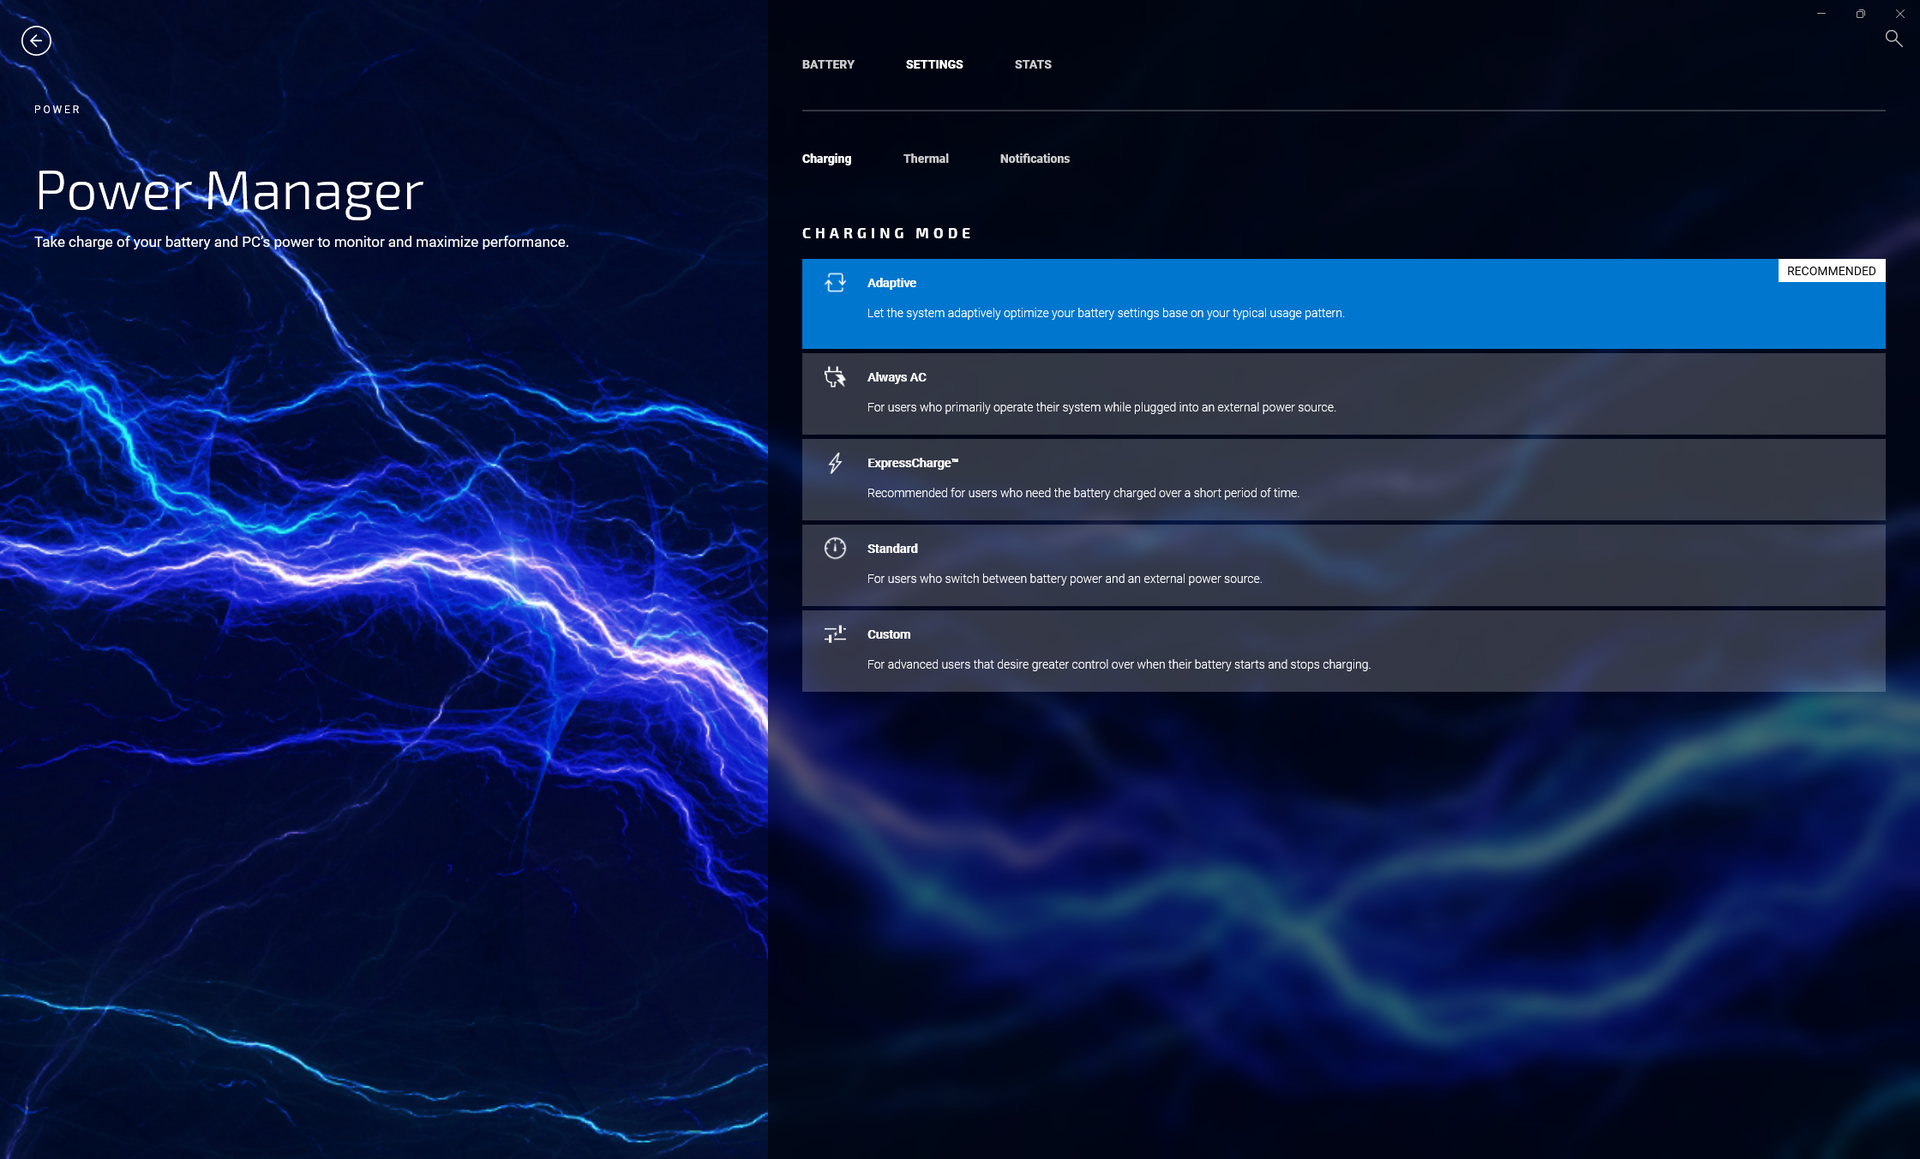
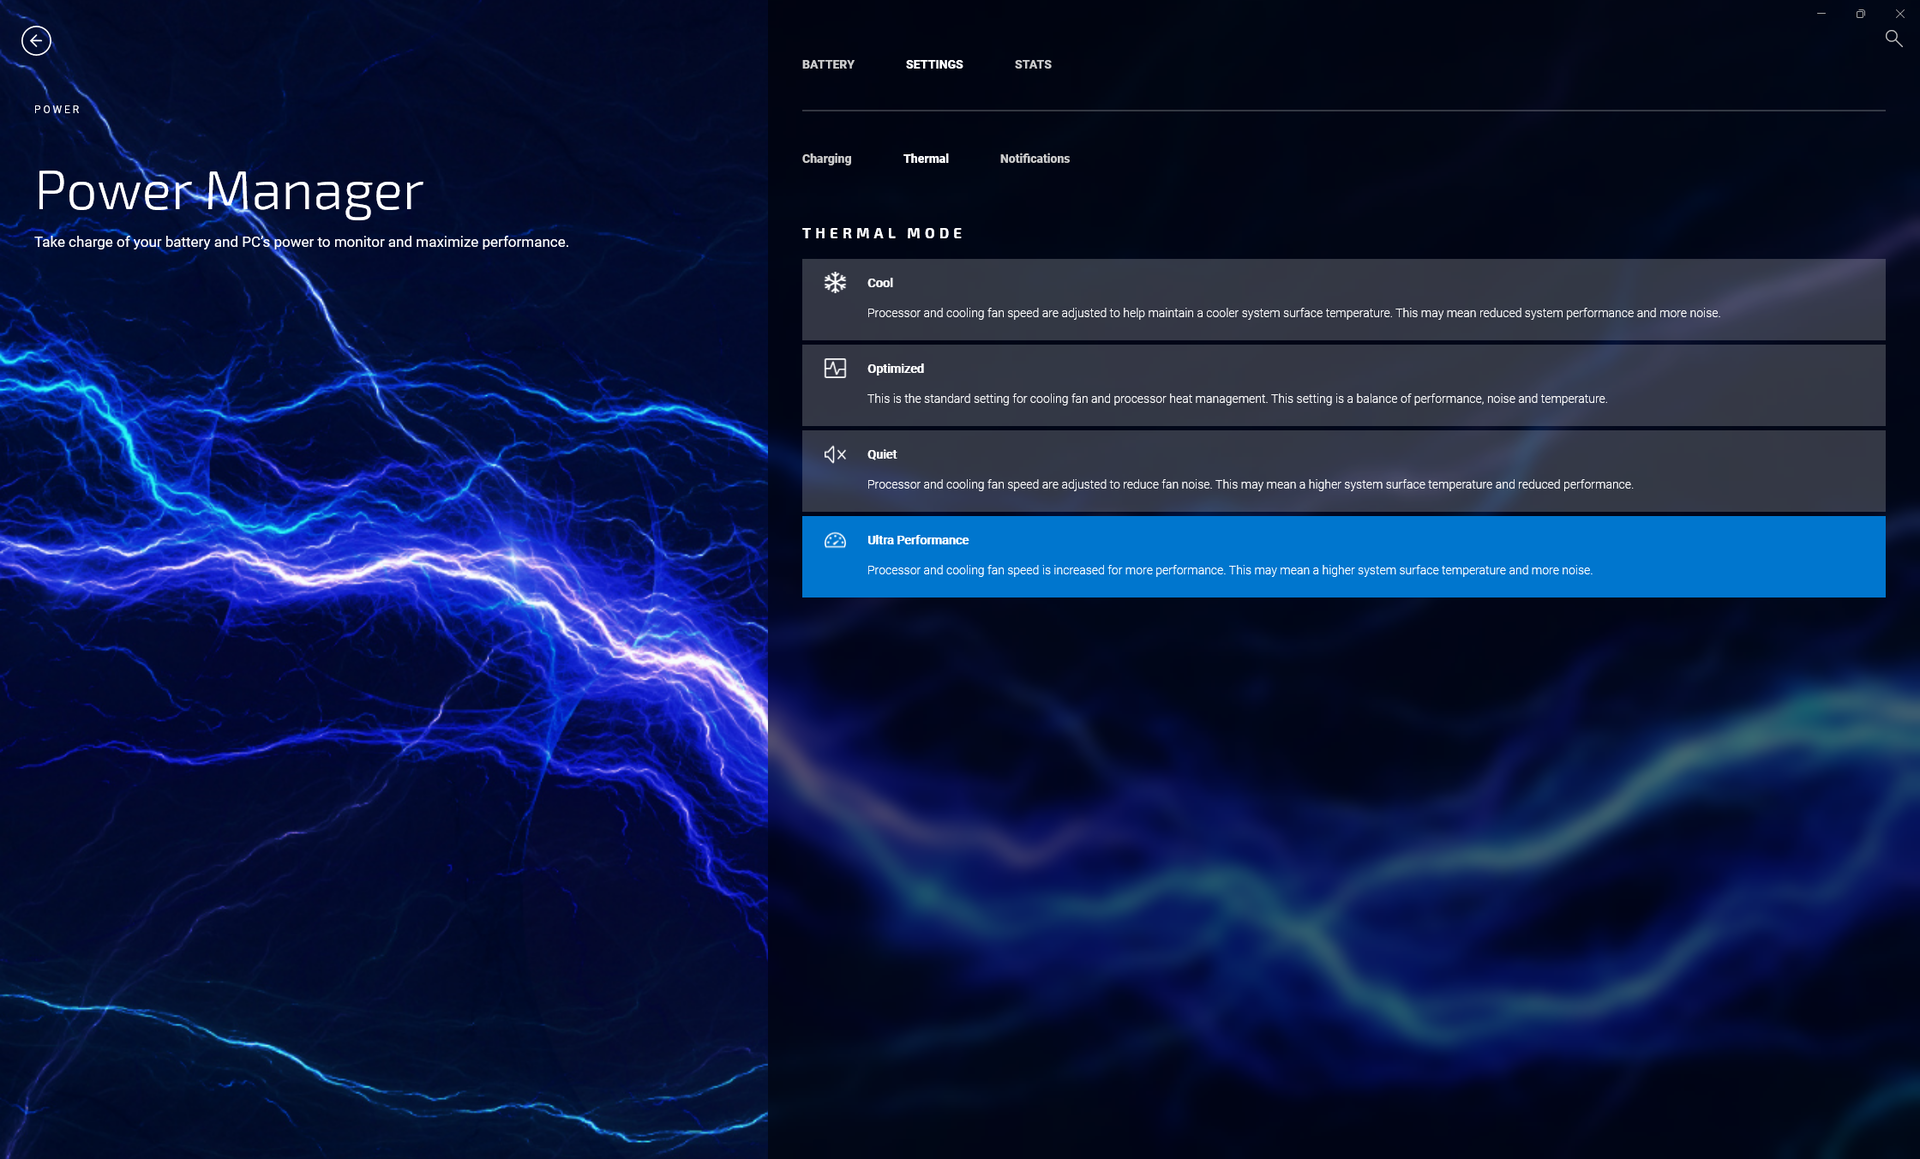
Abbiamo impostato la nostra unità in modalità Ultra Performance tramite il software My Dell prima di eseguire i benchmark qui sotto. Si raccomanda ai possessori di familiarizzare con My Dell in quanto funge da portale per l'assistenza in garanzia, il comportamento di carica della batteria, le prestazioni del sistema e altro ancora, come mostrano gli screenshot qui sotto
Optimus standard è supportato per passare dalla GPU integrata a quella discreta GeForce RTX 3050. Optimus avanzato, MUX e WhisperMode non sono supportati.
Processore
Le prestazioni della CPU possono essere analizzate dal punto di vista del bicchiere mezzo pieno o mezzo vuoto. Da un punto di vista pessimistico, il Core i7-12700H da 45 W Core i7-12700H del Dell è un po' deludente, in quanto le sue prestazioni multi-thread sono circa il 10% più lente rispetto a quelle di altri portatili dotati dello stesso processore. Dal punto di vista ottimistico, il Dell è significativamente più veloce della maggior parte degli altri portatili da 14 pollici in cui le CPU da 15 W, 25 W o 35 W sono più comuni. Questo è uno dei portatili più piccoli che si possono avere con il Core i7-12700H, ma il rovescio della medaglia è che le sue prestazioni Turbo Boost sono successivamente più limitate rispetto ai portatili più grandi con la stessa opzione di processore. Dopotutto, il Core i7-12700H si trova spesso anche nei computer portatili da gioco. Il Lenovo Legion Slim 7 da 16 pollici con la stessa CPU, ad esempio, offre prestazioni superiori del 30% rispetto al nostro Inspiron 14 Plus
Le limitate prestazioni Turbo Boost della nostra CPU possono essere dimostrate eseguendo CineBench R15 xT in loop. Come mostra il grafico seguente, il nostro punteggio iniziale di 2410 punti si riduce del 21% al terzo o quarto ciclo, rappresentando un notevole calo delle prestazioni.
Cinebench R15 Multi Loop
Cinebench R23: Multi Core | Single Core
Cinebench R15: CPU Multi 64Bit | CPU Single 64Bit
Blender: v2.79 BMW27 CPU
7-Zip 18.03: 7z b 4 | 7z b 4 -mmt1
Geekbench 5.5: Multi-Core | Single-Core
HWBOT x265 Benchmark v2.2: 4k Preset
LibreOffice : 20 Documents To PDF
R Benchmark 2.5: Overall mean
* ... Meglio usare valori piccoli
AIDA64: FP32 Ray-Trace | FPU Julia | CPU SHA3 | CPU Queen | FPU SinJulia | FPU Mandel | CPU AES | CPU ZLib | FP64 Ray-Trace | CPU PhotoWorxx
| Performance rating | |
| Media Intel Core i7-12700H | |
| Dell Inspiron 14 Plus 7420 | |
| Asus Vivobook Pro 14 M3401QC-KM007T | |
| Schenker Vision 14 | |
| Asus Zenbook 14X UX5400E | |
| MSI Summit E14 A11SCS | |
| Dell Inspiron 14 7420 2-in-1 | |
| AIDA64 / FP32 Ray-Trace | |
| Dell Inspiron 14 Plus 7420 | |
| Media Intel Core i7-12700H (2585 - 17957, n=64) | |
| Asus Vivobook Pro 14 M3401QC-KM007T | |
| Schenker Vision 14 | |
| Asus Zenbook 14X UX5400E | |
| MSI Summit E14 A11SCS | |
| Dell Inspiron 14 7420 2-in-1 | |
| AIDA64 / FPU Julia | |
| Asus Vivobook Pro 14 M3401QC-KM007T | |
| Dell Inspiron 14 Plus 7420 | |
| Media Intel Core i7-12700H (12439 - 90760, n=64) | |
| Schenker Vision 14 | |
| Asus Zenbook 14X UX5400E | |
| MSI Summit E14 A11SCS | |
| Dell Inspiron 14 7420 2-in-1 | |
| AIDA64 / CPU SHA3 | |
| Media Intel Core i7-12700H (833 - 4242, n=64) | |
| Dell Inspiron 14 Plus 7420 | |
| Schenker Vision 14 | |
| Asus Vivobook Pro 14 M3401QC-KM007T | |
| Asus Zenbook 14X UX5400E | |
| MSI Summit E14 A11SCS | |
| Dell Inspiron 14 7420 2-in-1 | |
| AIDA64 / CPU Queen | |
| Media Intel Core i7-12700H (57923 - 103202, n=63) | |
| Dell Inspiron 14 Plus 7420 | |
| Asus Vivobook Pro 14 M3401QC-KM007T | |
| Dell Inspiron 14 7420 2-in-1 | |
| Schenker Vision 14 | |
| Asus Zenbook 14X UX5400E | |
| MSI Summit E14 A11SCS | |
| AIDA64 / FPU SinJulia | |
| Media Intel Core i7-12700H (3249 - 9939, n=64) | |
| Asus Vivobook Pro 14 M3401QC-KM007T | |
| Dell Inspiron 14 Plus 7420 | |
| Schenker Vision 14 | |
| Asus Zenbook 14X UX5400E | |
| MSI Summit E14 A11SCS | |
| Dell Inspiron 14 7420 2-in-1 | |
| AIDA64 / FPU Mandel | |
| Asus Vivobook Pro 14 M3401QC-KM007T | |
| Dell Inspiron 14 Plus 7420 | |
| Media Intel Core i7-12700H (7135 - 44760, n=64) | |
| Schenker Vision 14 | |
| MSI Summit E14 A11SCS | |
| Asus Zenbook 14X UX5400E | |
| Dell Inspiron 14 7420 2-in-1 | |
| AIDA64 / CPU AES | |
| Asus Vivobook Pro 14 M3401QC-KM007T | |
| Media Intel Core i7-12700H (31839 - 144360, n=64) | |
| Schenker Vision 14 | |
| Asus Zenbook 14X UX5400E | |
| Dell Inspiron 14 Plus 7420 | |
| MSI Summit E14 A11SCS | |
| Dell Inspiron 14 7420 2-in-1 | |
| AIDA64 / CPU ZLib | |
| Media Intel Core i7-12700H (305 - 1171, n=64) | |
| Dell Inspiron 14 Plus 7420 | |
| Asus Vivobook Pro 14 M3401QC-KM007T | |
| Dell Inspiron 14 7420 2-in-1 | |
| Schenker Vision 14 | |
| Asus Zenbook 14X UX5400E | |
| MSI Summit E14 A11SCS | |
| AIDA64 / FP64 Ray-Trace | |
| Dell Inspiron 14 Plus 7420 | |
| Media Intel Core i7-12700H (1437 - 9692, n=64) | |
| Asus Vivobook Pro 14 M3401QC-KM007T | |
| Schenker Vision 14 | |
| Asus Zenbook 14X UX5400E | |
| MSI Summit E14 A11SCS | |
| Dell Inspiron 14 7420 2-in-1 | |
| AIDA64 / CPU PhotoWorxx | |
| MSI Summit E14 A11SCS | |
| Dell Inspiron 14 Plus 7420 | |
| Media Intel Core i7-12700H (12863 - 52207, n=64) | |
| Asus Zenbook 14X UX5400E | |
| Schenker Vision 14 | |
| Dell Inspiron 14 7420 2-in-1 | |
| Asus Vivobook Pro 14 M3401QC-KM007T | |
Prestazioni del sistema
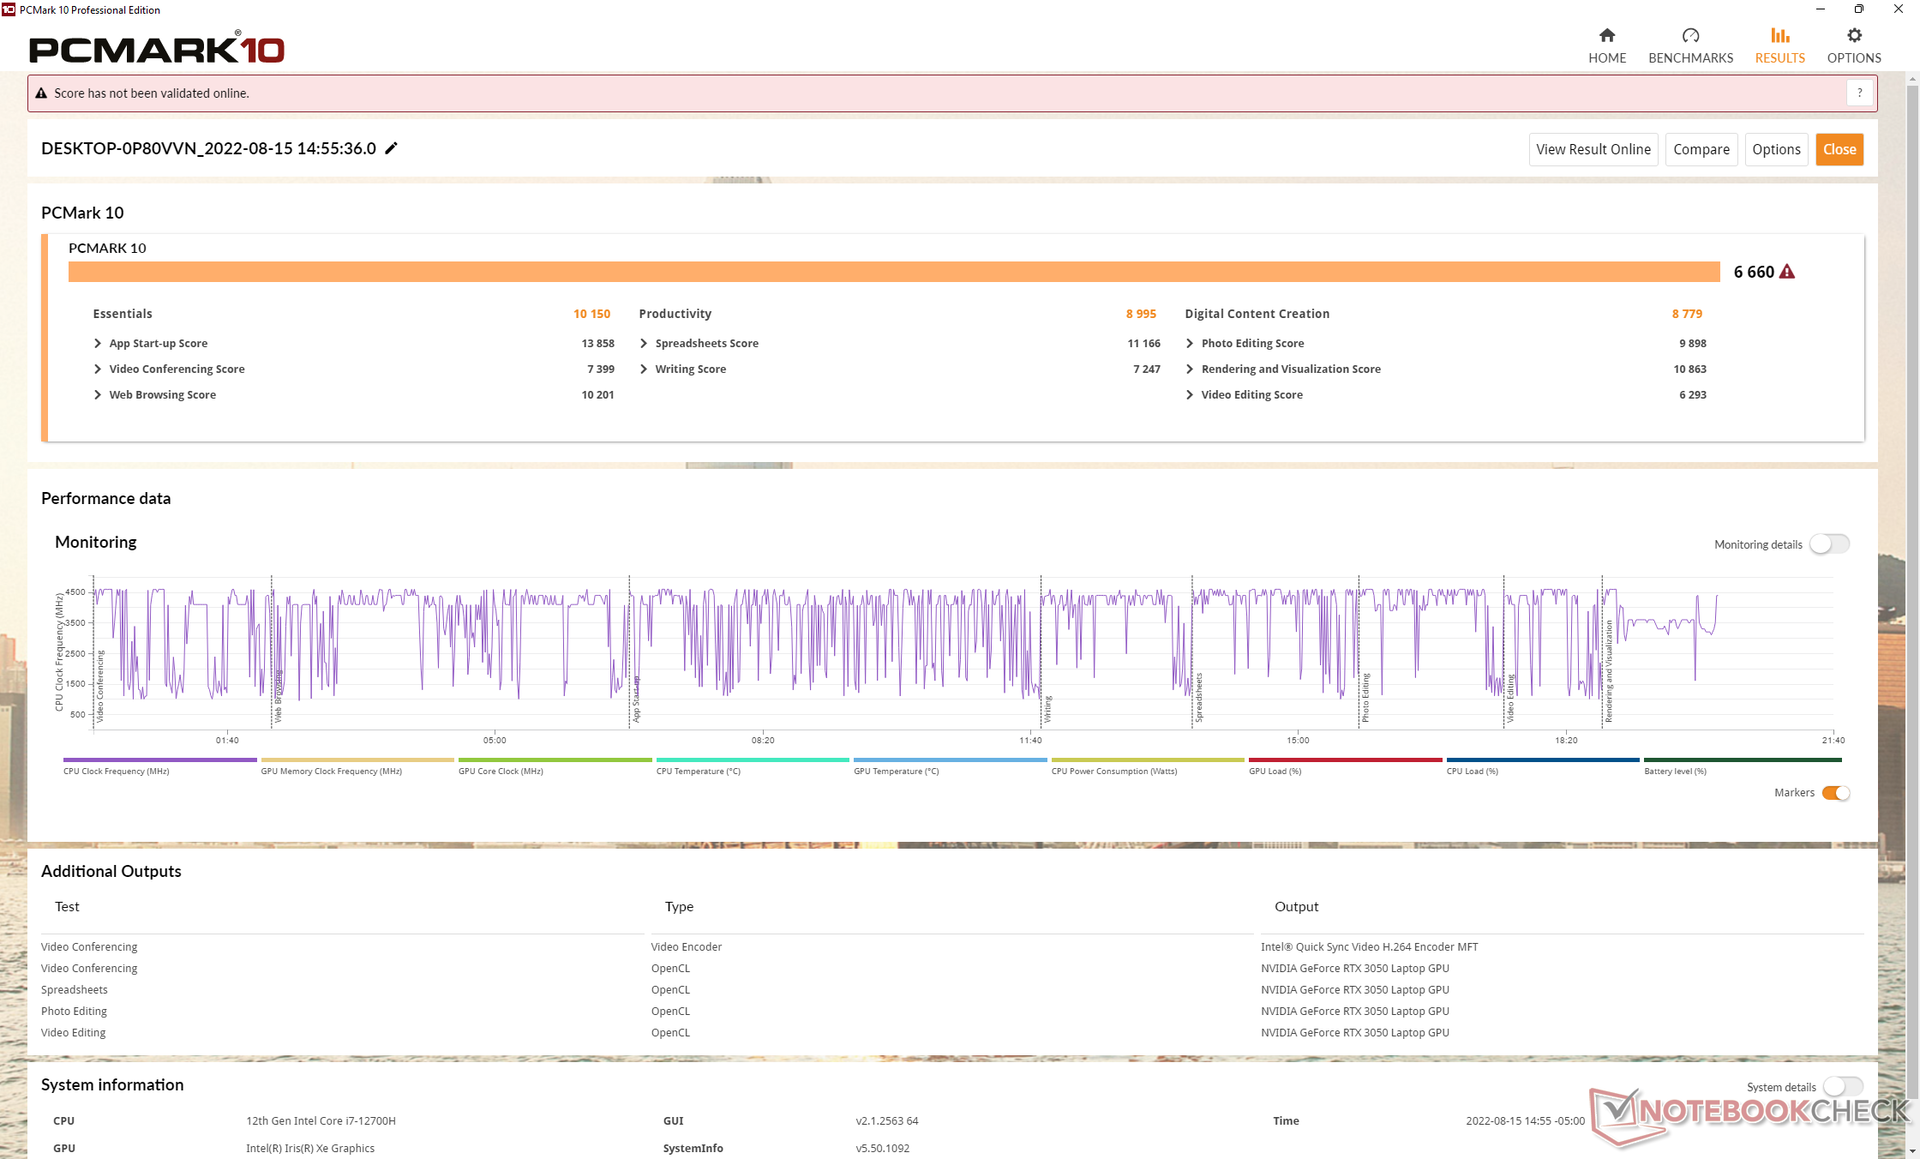
I risultati di PCMark 10 sono eccellenti e superiori anche a quelli di concorrenti come lo Schenker Vision 14 con la più veloce grafica RTX 3050 Ti o ilAsus Vivobook Pro 14 con CPU AMD Ryzen 5600H. Non c'è dubbio che il Core i7-12700H abbia svolto un ruolo fondamentale nell'aumentare le prestazioni complessive dell'Inspiron 14 Plus 7420 rispetto alla maggior parte degli altri portatili multimediali da 14 pollici.
CrossMark: Overall | Productivity | Creativity | Responsiveness
| PCMark 10 / Score | |
| Media Intel Core i7-12700H, NVIDIA GeForce RTX 3050 4GB Laptop GPU (6660 - 6879, n=3) | |
| Dell Inspiron 14 Plus 7420 | |
| Schenker Vision 14 | |
| Asus Vivobook Pro 14 M3401QC-KM007T | |
| HP Envy 14-eb0010nr | |
| MSI Summit E14 A11SCS | |
| Dell Inspiron 14 7420 2-in-1 | |
| Asus Zenbook 14X UX5400E | |
| PCMark 10 / Essentials | |
| Media Intel Core i7-12700H, NVIDIA GeForce RTX 3050 4GB Laptop GPU (10150 - 10369, n=3) | |
| Dell Inspiron 14 7420 2-in-1 | |
| Dell Inspiron 14 Plus 7420 | |
| Asus Vivobook Pro 14 M3401QC-KM007T | |
| Schenker Vision 14 | |
| HP Envy 14-eb0010nr | |
| MSI Summit E14 A11SCS | |
| Asus Zenbook 14X UX5400E | |
| PCMark 10 / Productivity | |
| Media Intel Core i7-12700H, NVIDIA GeForce RTX 3050 4GB Laptop GPU (8995 - 9397, n=3) | |
| Dell Inspiron 14 Plus 7420 | |
| Schenker Vision 14 | |
| Asus Zenbook 14X UX5400E | |
| HP Envy 14-eb0010nr | |
| MSI Summit E14 A11SCS | |
| Asus Vivobook Pro 14 M3401QC-KM007T | |
| Dell Inspiron 14 7420 2-in-1 | |
| PCMark 10 / Digital Content Creation | |
| Media Intel Core i7-12700H, NVIDIA GeForce RTX 3050 4GB Laptop GPU (8779 - 9203, n=3) | |
| Dell Inspiron 14 Plus 7420 | |
| Asus Vivobook Pro 14 M3401QC-KM007T | |
| Schenker Vision 14 | |
| Dell Inspiron 14 7420 2-in-1 | |
| HP Envy 14-eb0010nr | |
| MSI Summit E14 A11SCS | |
| Asus Zenbook 14X UX5400E | |
| CrossMark / Overall | |
| Media Intel Core i7-12700H, NVIDIA GeForce RTX 3050 4GB Laptop GPU (1717 - 1857, n=3) | |
| Dell Inspiron 14 Plus 7420 | |
| Schenker Vision 14 | |
| Dell Inspiron 14 7420 2-in-1 | |
| Asus Vivobook Pro 14 M3401QC-KM007T | |
| CrossMark / Productivity | |
| Media Intel Core i7-12700H, NVIDIA GeForce RTX 3050 4GB Laptop GPU (1620 - 1735, n=3) | |
| Dell Inspiron 14 Plus 7420 | |
| Schenker Vision 14 | |
| Dell Inspiron 14 7420 2-in-1 | |
| Asus Vivobook Pro 14 M3401QC-KM007T | |
| CrossMark / Creativity | |
| Media Intel Core i7-12700H, NVIDIA GeForce RTX 3050 4GB Laptop GPU (1911 - 2067, n=3) | |
| Dell Inspiron 14 Plus 7420 | |
| Dell Inspiron 14 7420 2-in-1 | |
| Schenker Vision 14 | |
| Asus Vivobook Pro 14 M3401QC-KM007T | |
| CrossMark / Responsiveness | |
| Media Intel Core i7-12700H, NVIDIA GeForce RTX 3050 4GB Laptop GPU (1481 - 1651, n=3) | |
| Schenker Vision 14 | |
| Dell Inspiron 14 Plus 7420 | |
| Dell Inspiron 14 7420 2-in-1 | |
| Asus Vivobook Pro 14 M3401QC-KM007T | |
| PCMark 10 Score | 6660 punti | |
Aiuto | ||
| AIDA64 / Memory Copy | |
| MSI Summit E14 A11SCS | |
| Asus Zenbook 14X UX5400E | |
| Dell Inspiron 14 Plus 7420 | |
| Media Intel Core i7-12700H (25615 - 80511, n=64) | |
| Schenker Vision 14 | |
| Dell Inspiron 14 7420 2-in-1 | |
| Asus Vivobook Pro 14 M3401QC-KM007T | |
| AIDA64 / Memory Read | |
| Dell Inspiron 14 Plus 7420 | |
| MSI Summit E14 A11SCS | |
| Asus Zenbook 14X UX5400E | |
| Media Intel Core i7-12700H (25586 - 79442, n=64) | |
| Schenker Vision 14 | |
| Asus Vivobook Pro 14 M3401QC-KM007T | |
| Dell Inspiron 14 7420 2-in-1 | |
| AIDA64 / Memory Write | |
| Asus Zenbook 14X UX5400E | |
| MSI Summit E14 A11SCS | |
| Dell Inspiron 14 Plus 7420 | |
| Media Intel Core i7-12700H (23679 - 88660, n=64) | |
| Schenker Vision 14 | |
| Dell Inspiron 14 7420 2-in-1 | |
| Asus Vivobook Pro 14 M3401QC-KM007T | |
| AIDA64 / Memory Latency | |
| Dell Inspiron 14 Plus 7420 | |
| Asus Zenbook 14X UX5400E | |
| MSI Summit E14 A11SCS | |
| Asus Vivobook Pro 14 M3401QC-KM007T | |
| Media Intel Core i7-12700H (76.2 - 133.9, n=62) | |
| Schenker Vision 14 | |
| Dell Inspiron 14 7420 2-in-1 | |
* ... Meglio usare valori piccoli
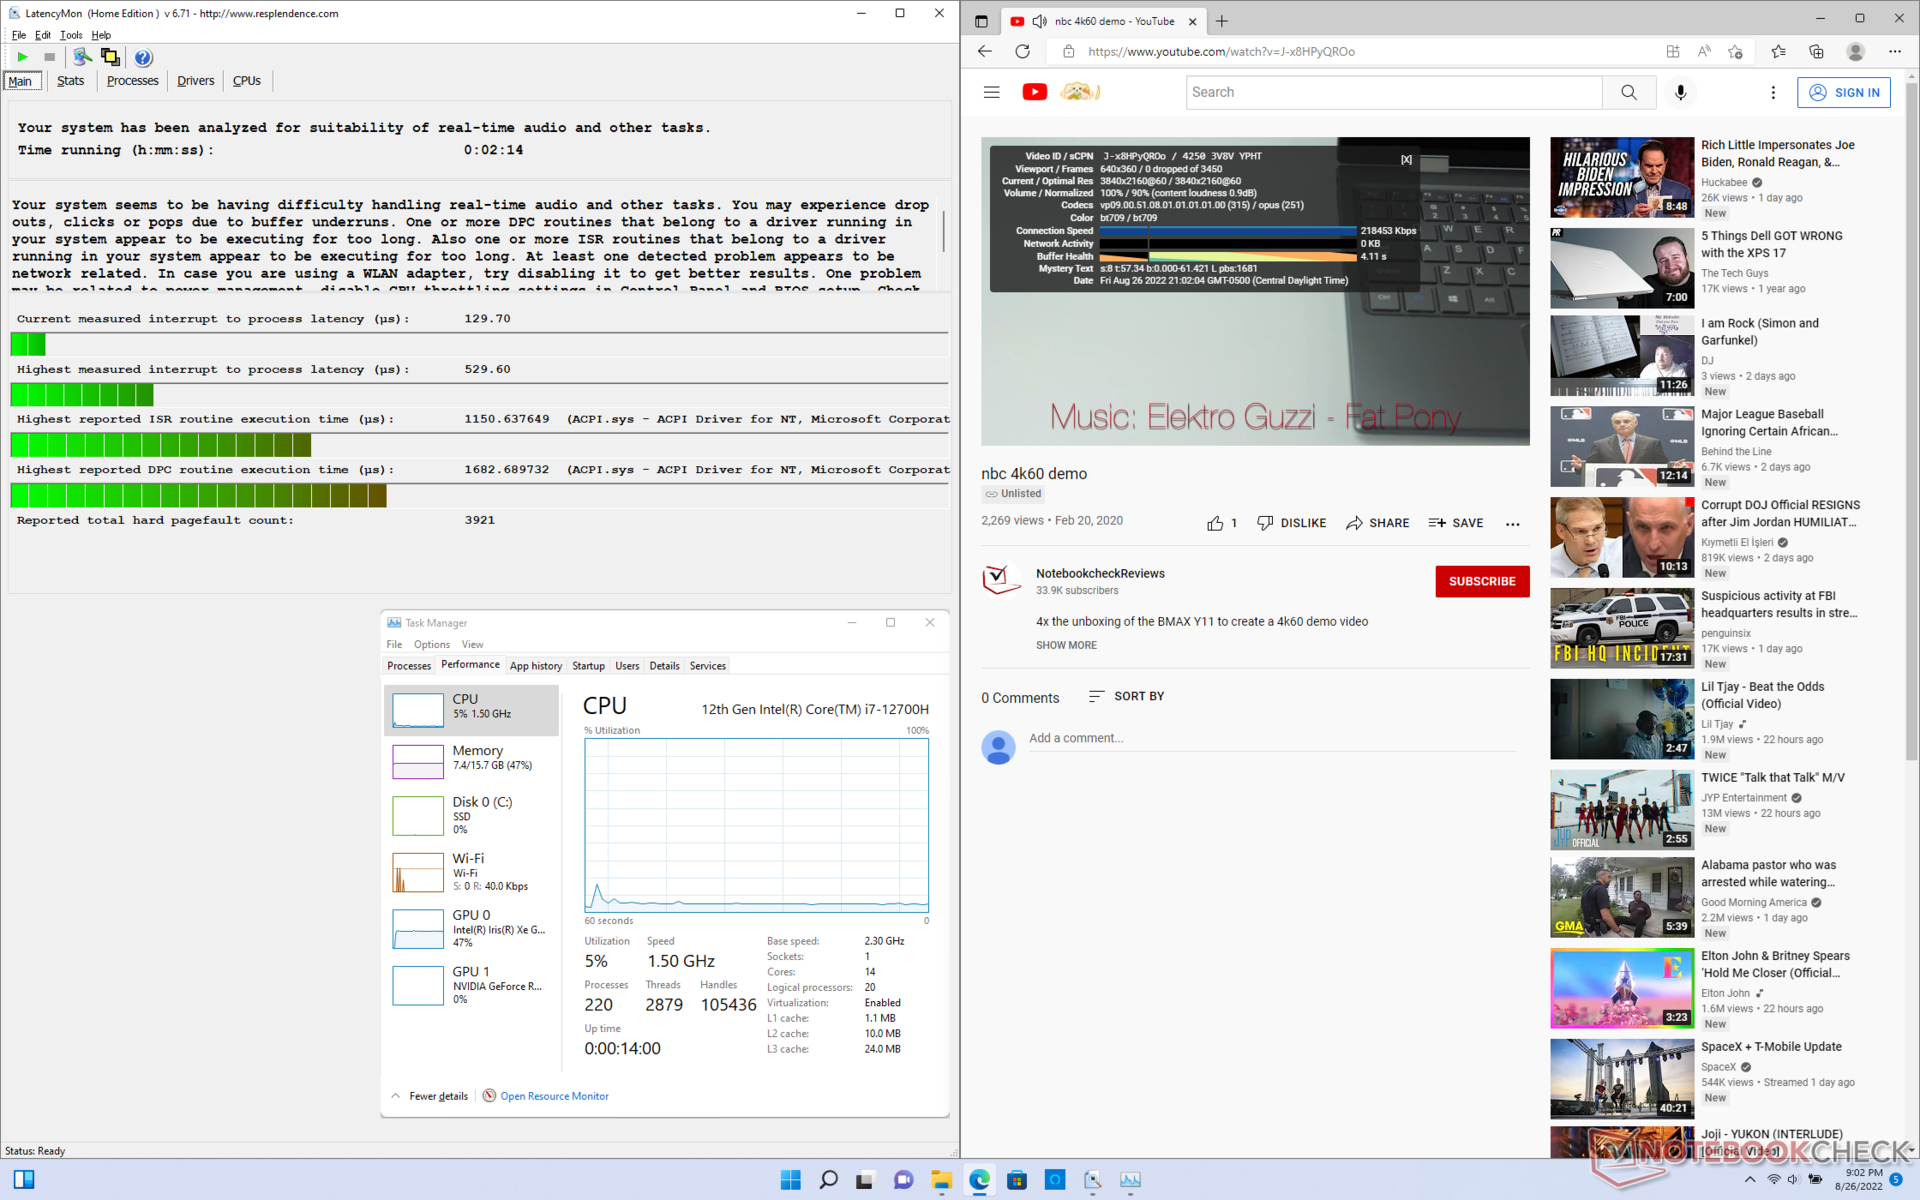
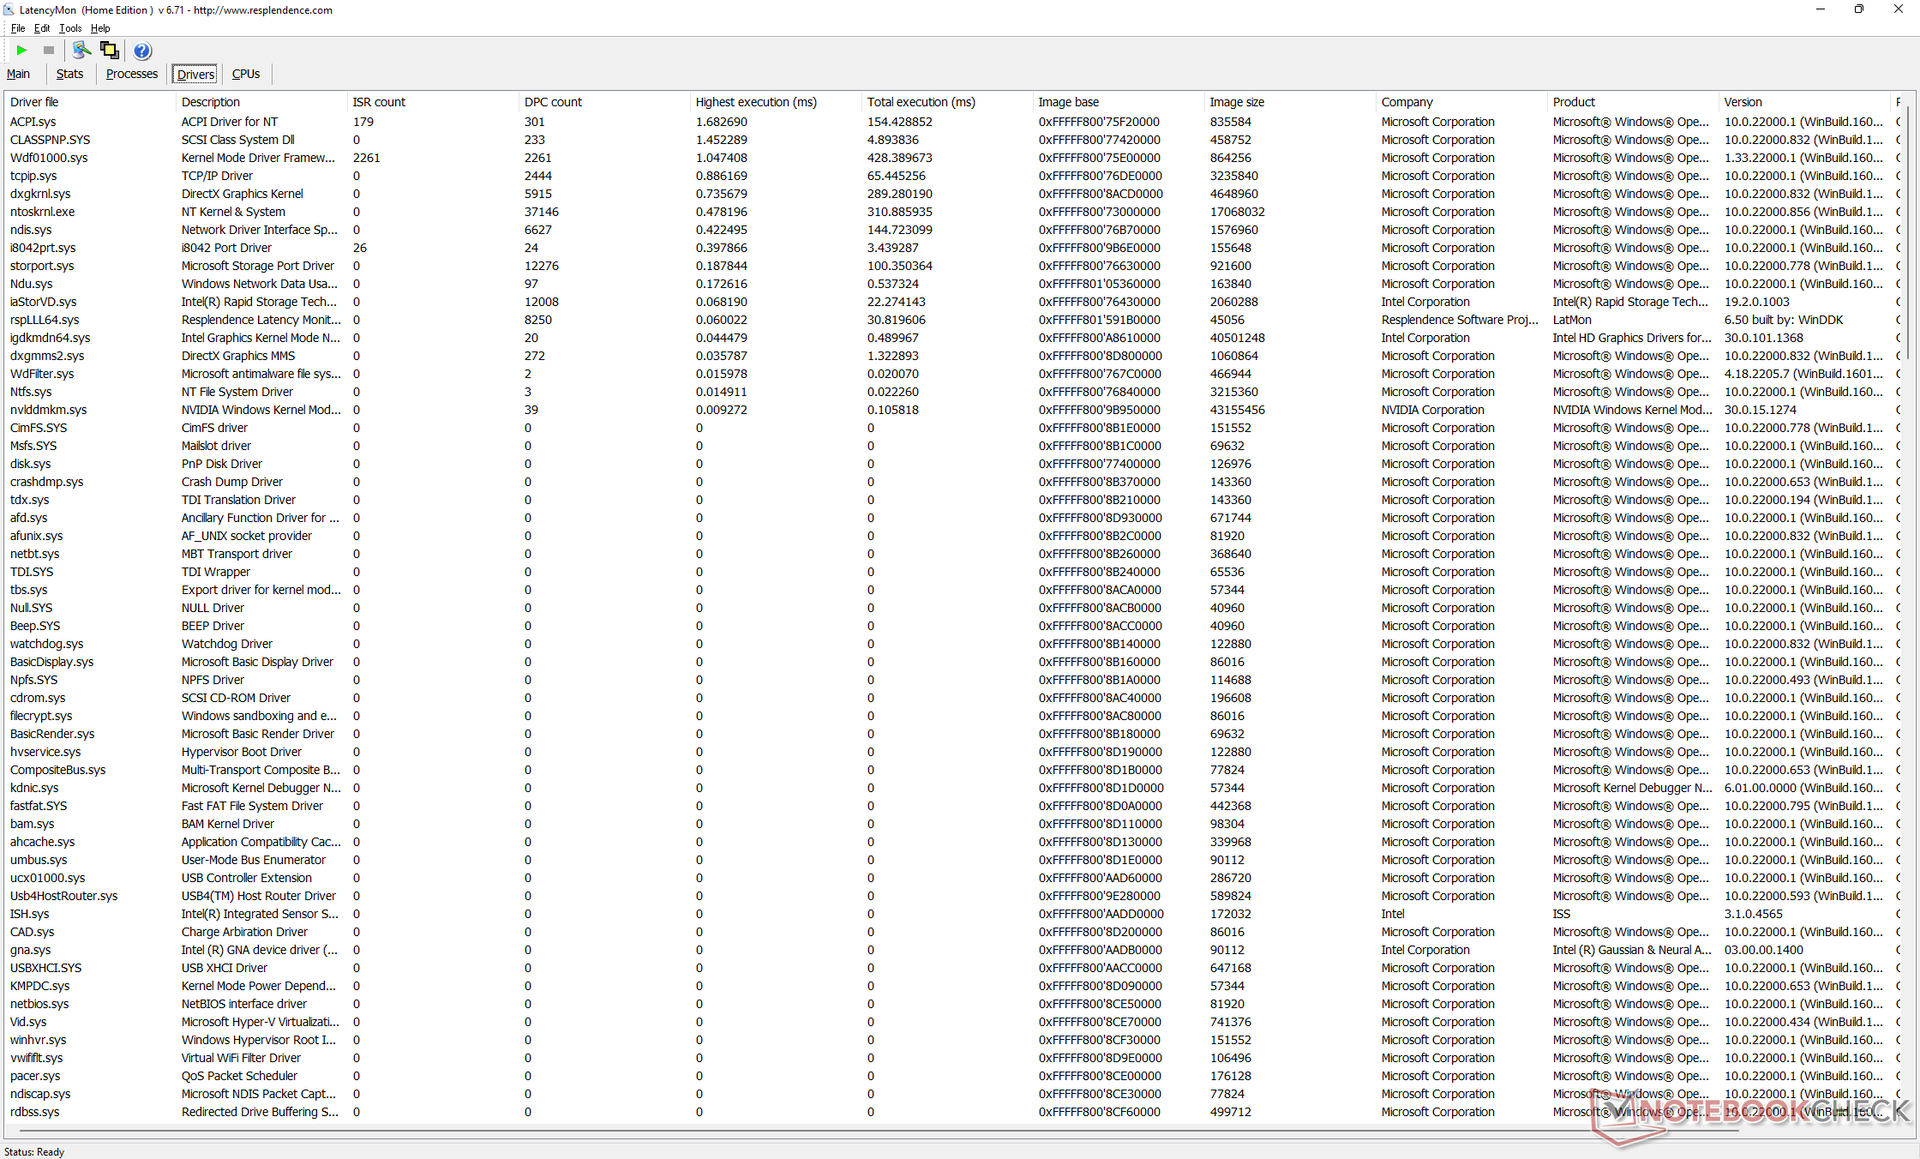
Latenza DPC
LatencyMon mostra lievi problemi di DPC quando si aprono più schede del browser della nostra homepage. la riproduzione di video 4K a 60 FPS è invece fluida e senza alcuna caduta di fotogrammi.
| DPC Latencies / LatencyMon - interrupt to process latency (max), Web, Youtube, Prime95 | |
| HP Envy 14-eb0010nr | |
| Schenker Vision 14 | |
| MSI Summit E14 A11SCS | |
| Asus Vivobook Pro 14 M3401QC-KM007T | |
| Asus Zenbook 14X UX5400E | |
| Dell Inspiron 14 7420 2-in-1 | |
| Dell Inspiron 14 Plus 7420 | |
* ... Meglio usare valori piccoli
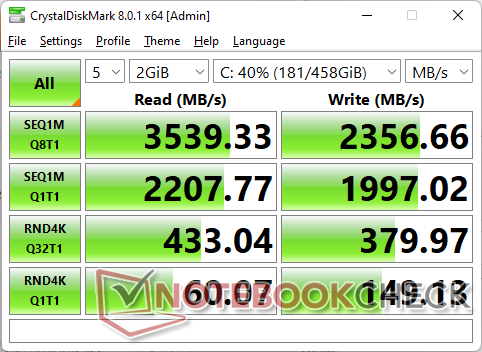
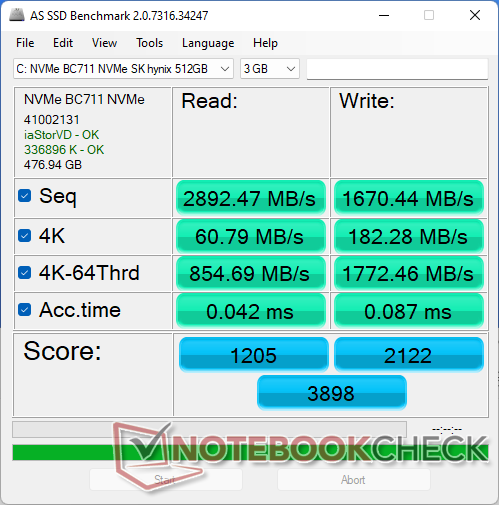
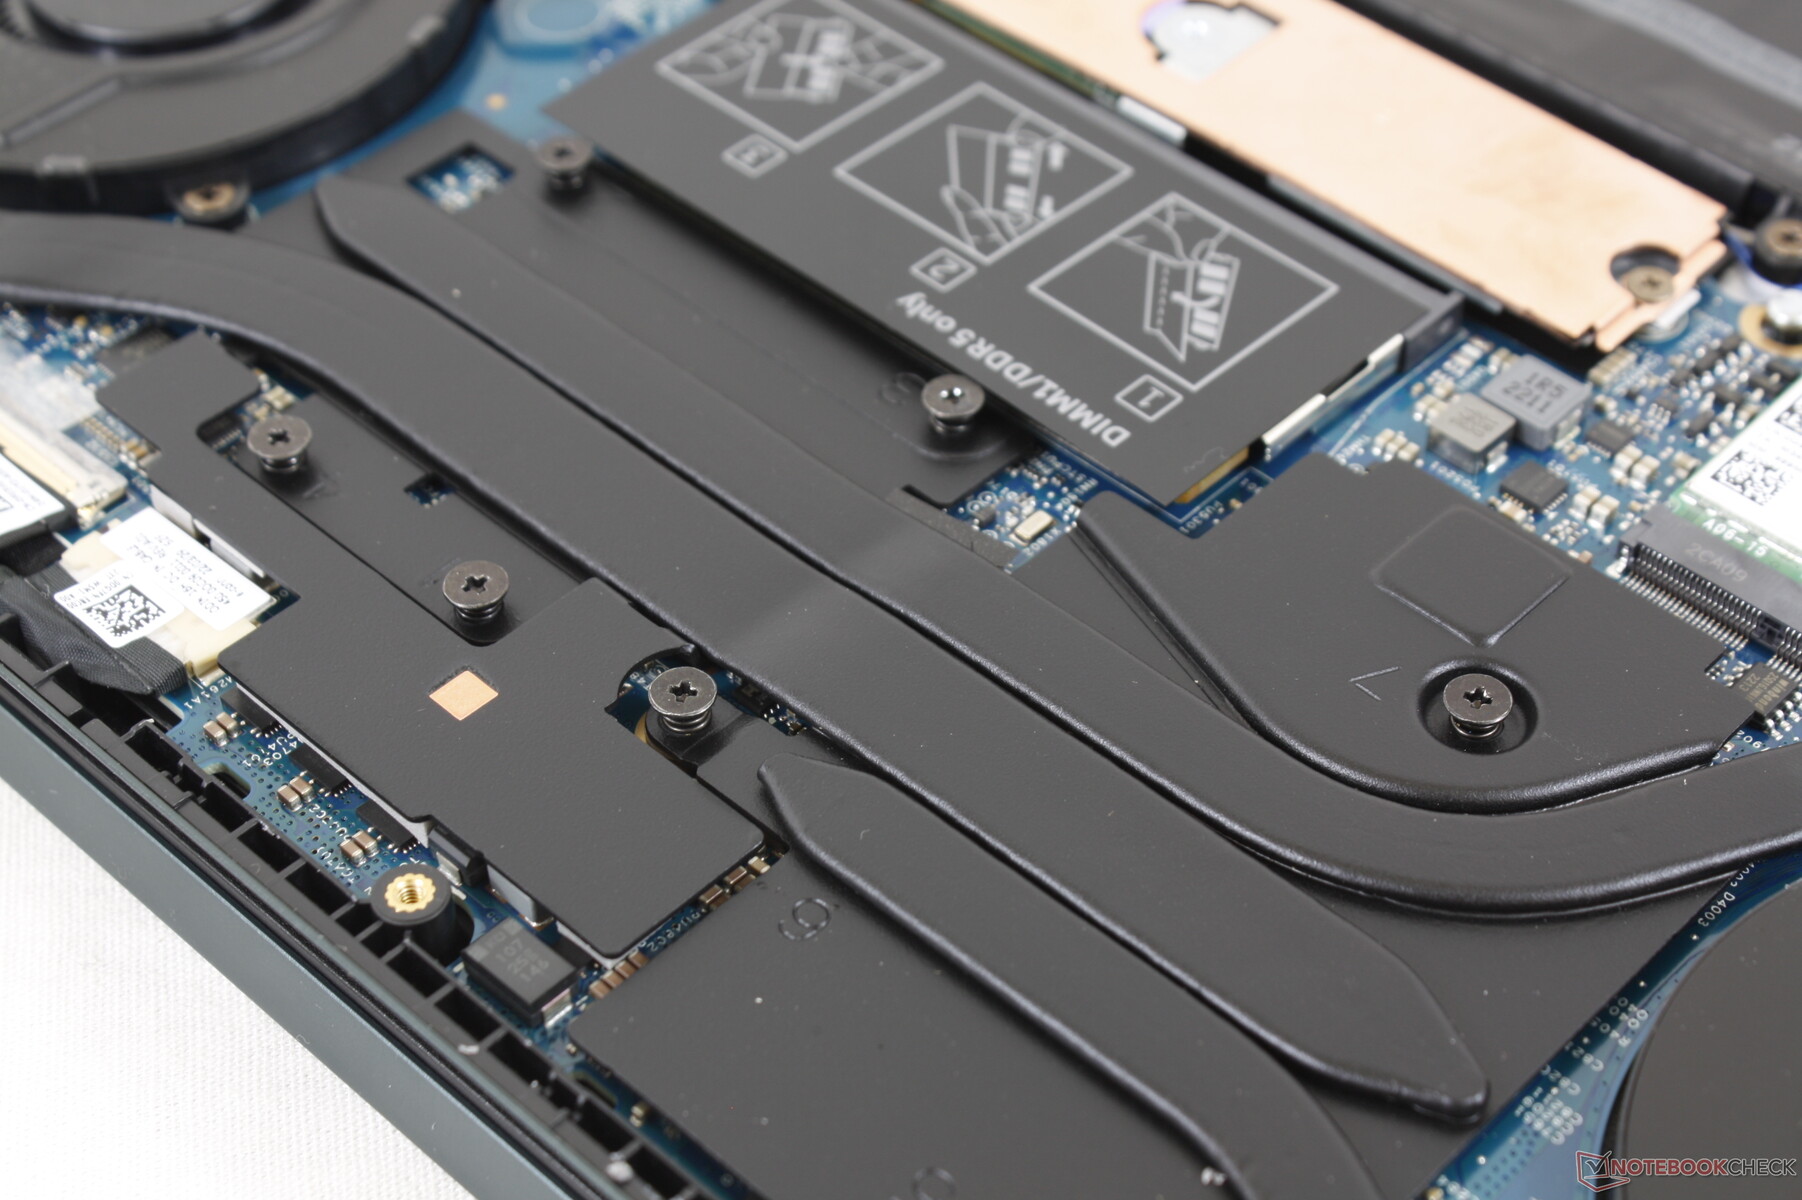
Dispositivi di stoccaggio - Diffusore di calore incluso
La nostra unità viene fornita con un disco da 512 GB SK Hynix BC711 PCIe3 NVMe che offre velocità di lettura sequenziale fino a 3600 MB/s. L'unità non presenta problemi di strozzatura delle prestazioni quando si esegue DiskSpd in loop, in quanto è dotata di un proprio diffusore di calore preinstallato. In confronto, la maggior parte degli altri OEM non ne include uno nei propri modelli di laptop economici o di fascia media. Tuttavia, sarebbe stato bello vedere opzioni PCIe4 più veloci sull'Inspiron 14 Plus 7420.

* ... Meglio usare valori piccoli
Disk Throttling: DiskSpd Read Loop, Queue Depth 8
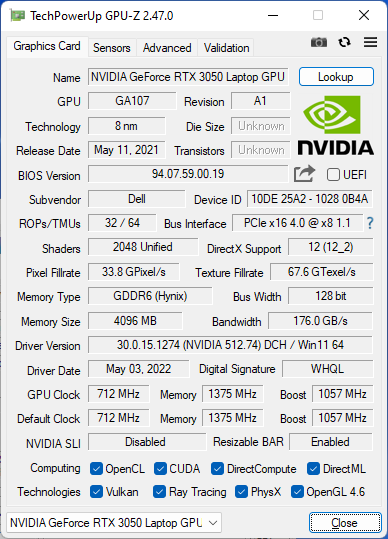
Prestazioni della GPU: veloci per le dimensioni e il prezzo
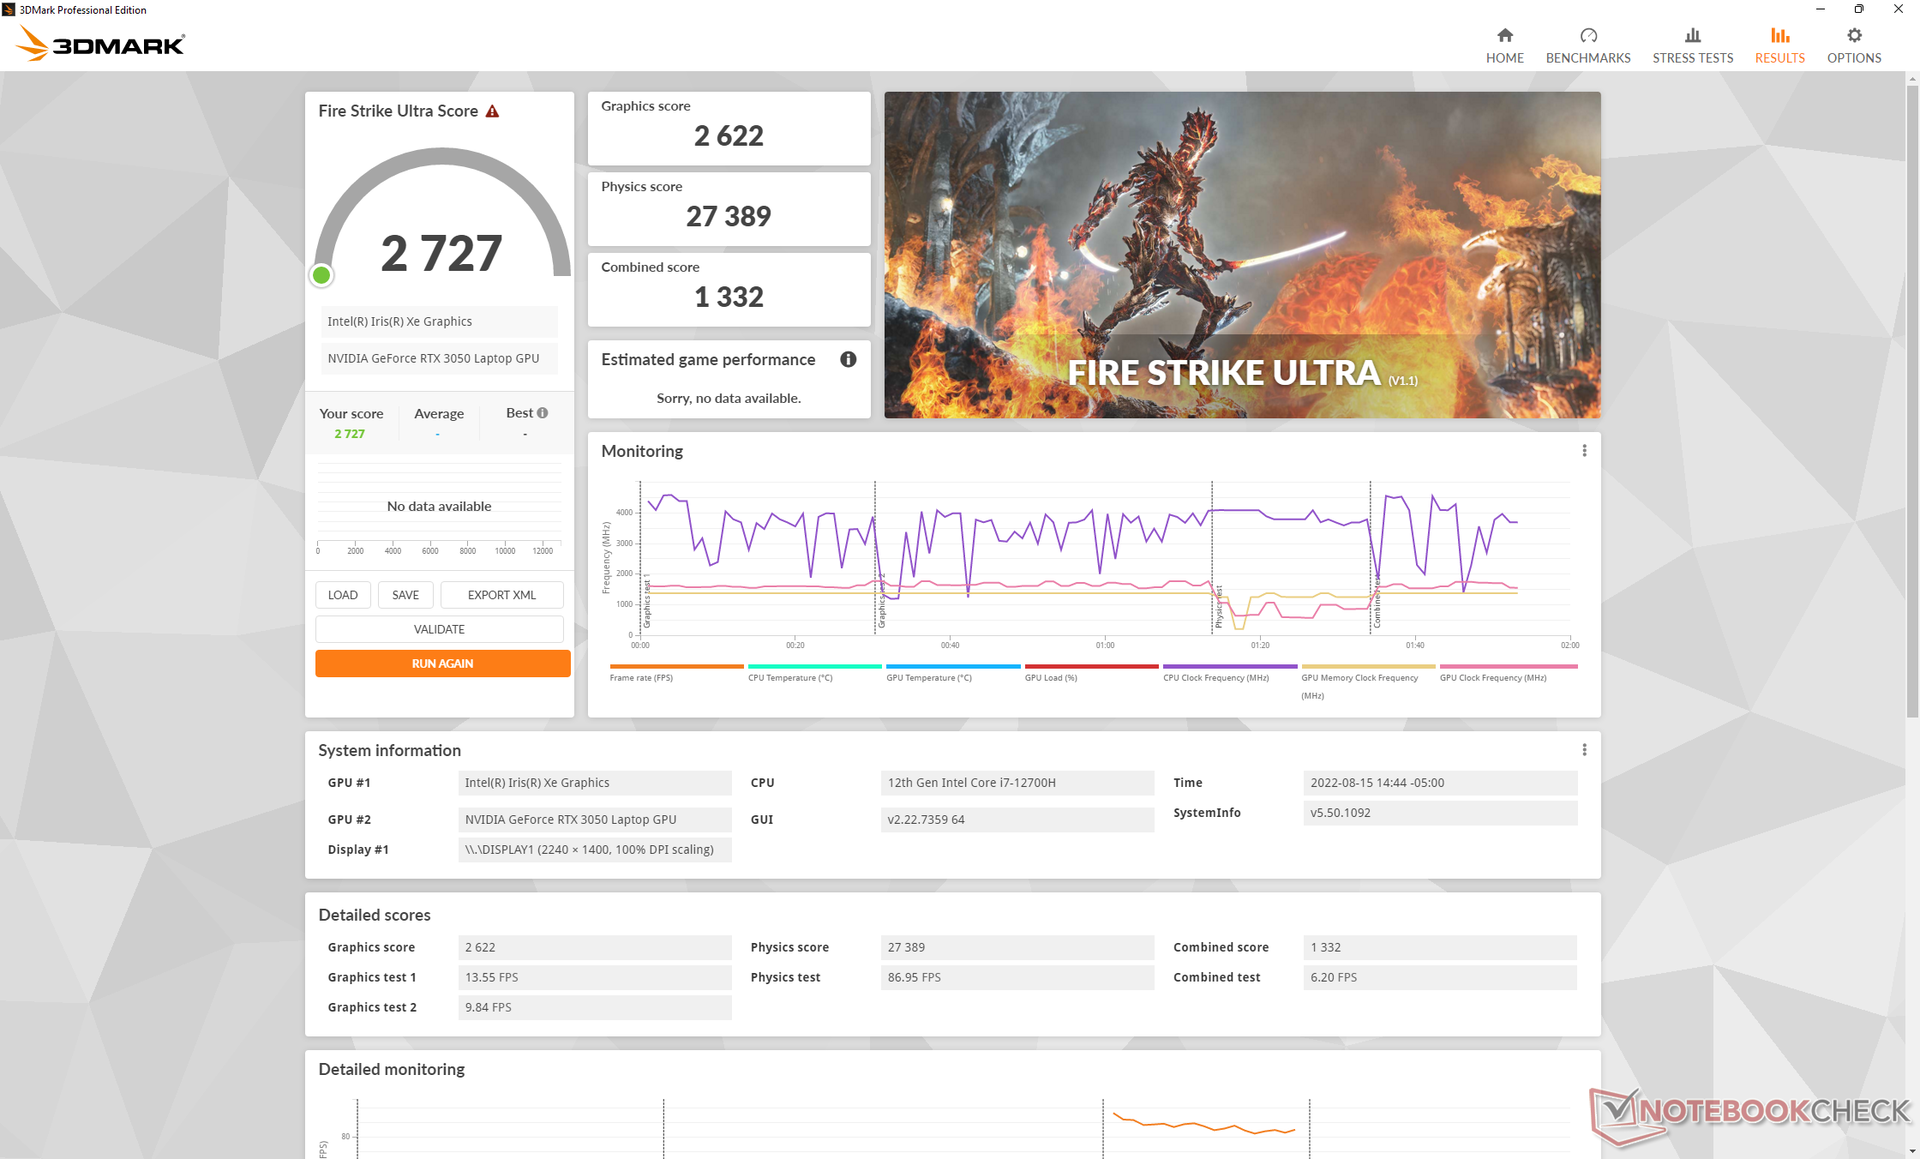
Le prestazioni grafiche sono quelle che ci aspettiamo rispetto ad altri computer portatili con la stessa GeForce RTX 3050 GPU. In effetti, i risultati sono praticamente alla pari con la RTX 3050 Ti presente sullo Schenker Vision 14 o sull'Asus ROG Flow Z13.Asus ROG Flow Z13. Dell potrebbe introdurre SKU con RTX 3050 Ti nel prossimo futuro, ma non lo raccomandiamo perché probabilmente sarà solo marginalmente più veloce della nostra SKU RTX 3050 di base.
Gli utenti che passano dalla più vecchia GTX 1650 Ti Max-Q vedranno miglioramenti significativi di circa il 50%.
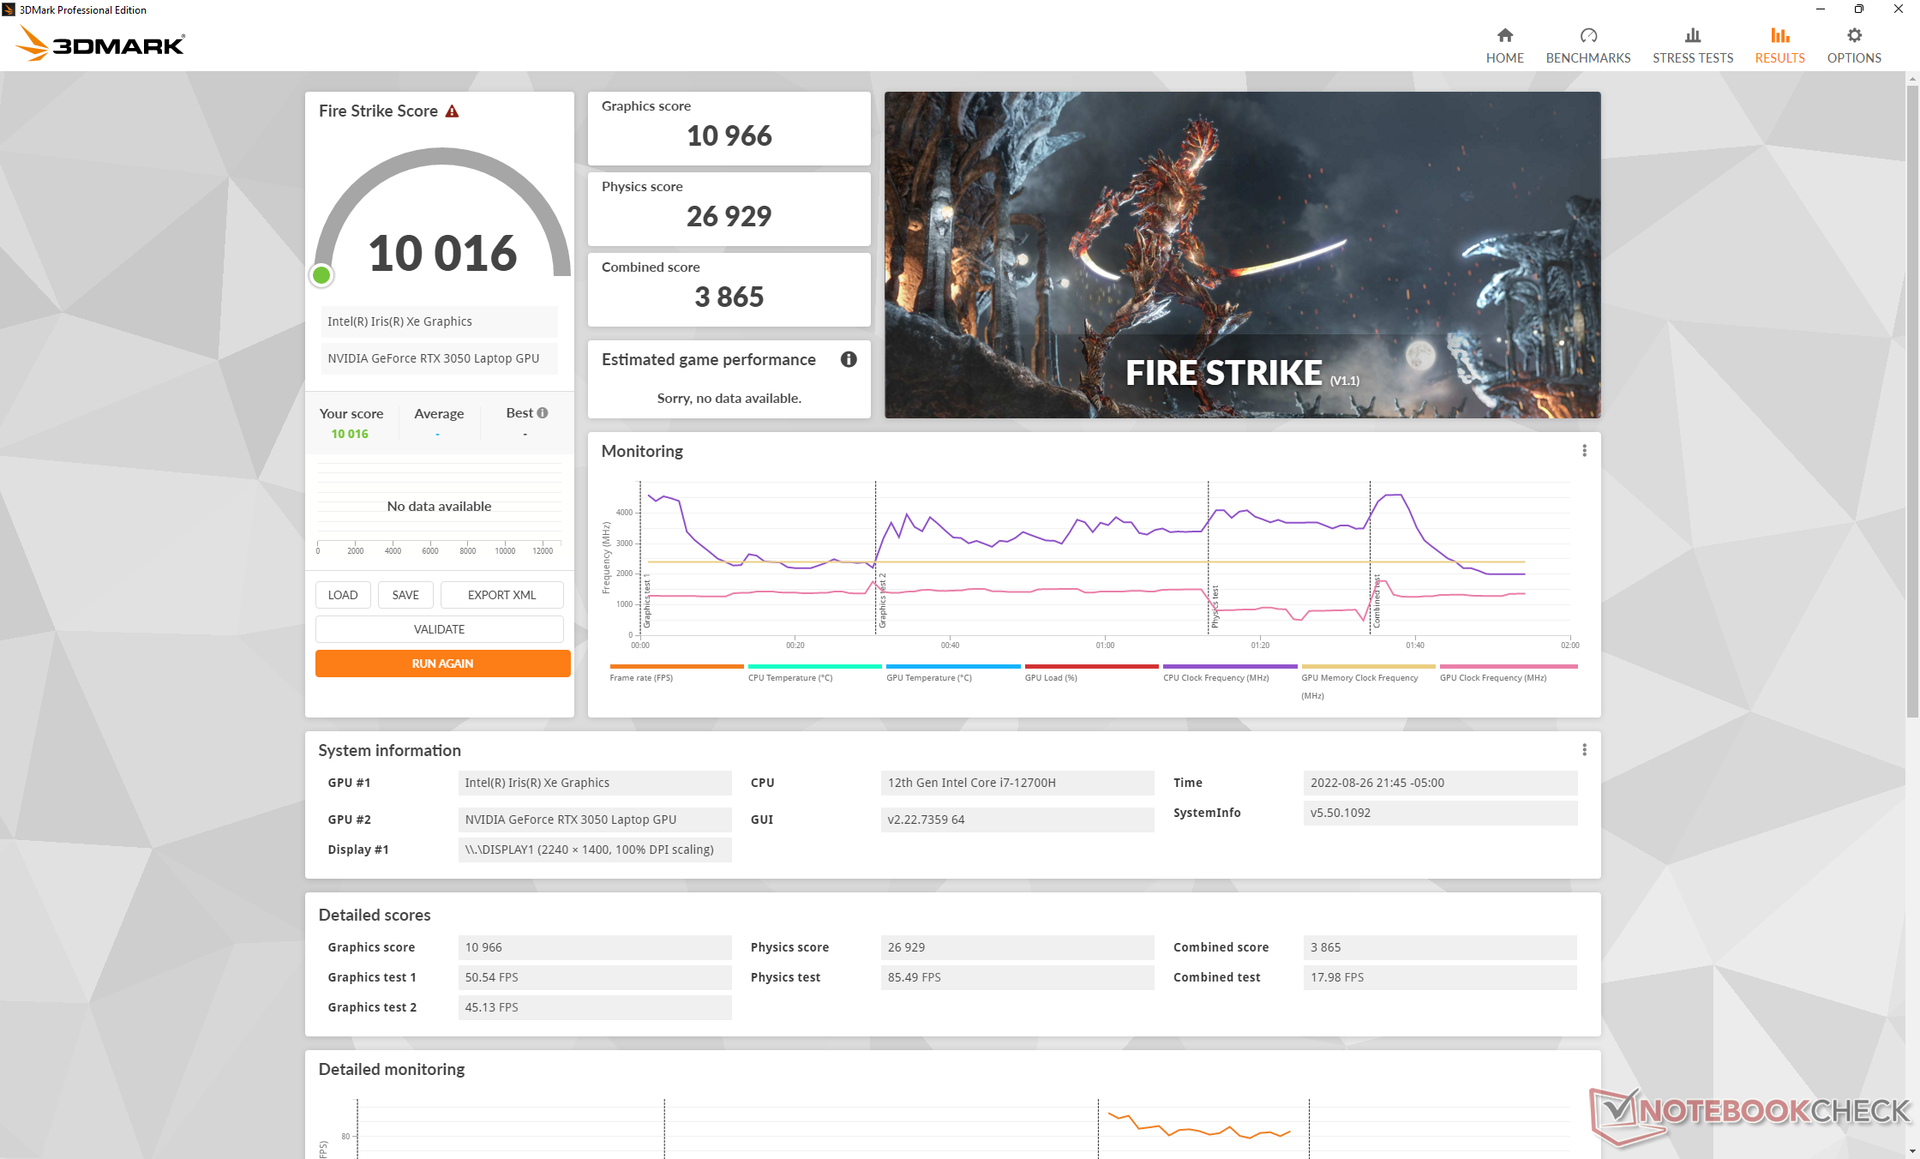
Tenete presente che le prestazioni grafiche si riducono se si utilizza la modalità Dell Optimized invece della modalità Dell Ultra Performance. Un test Fire Strike in modalità Ottimizzata restituisce un punteggio grafico di 10966 punti rispetto ai 12125 punti della modalità Ultra Performance.
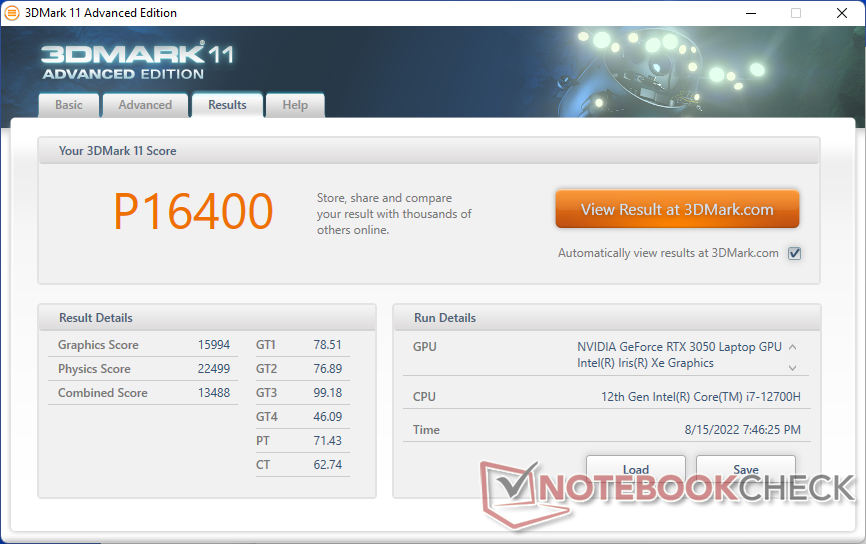
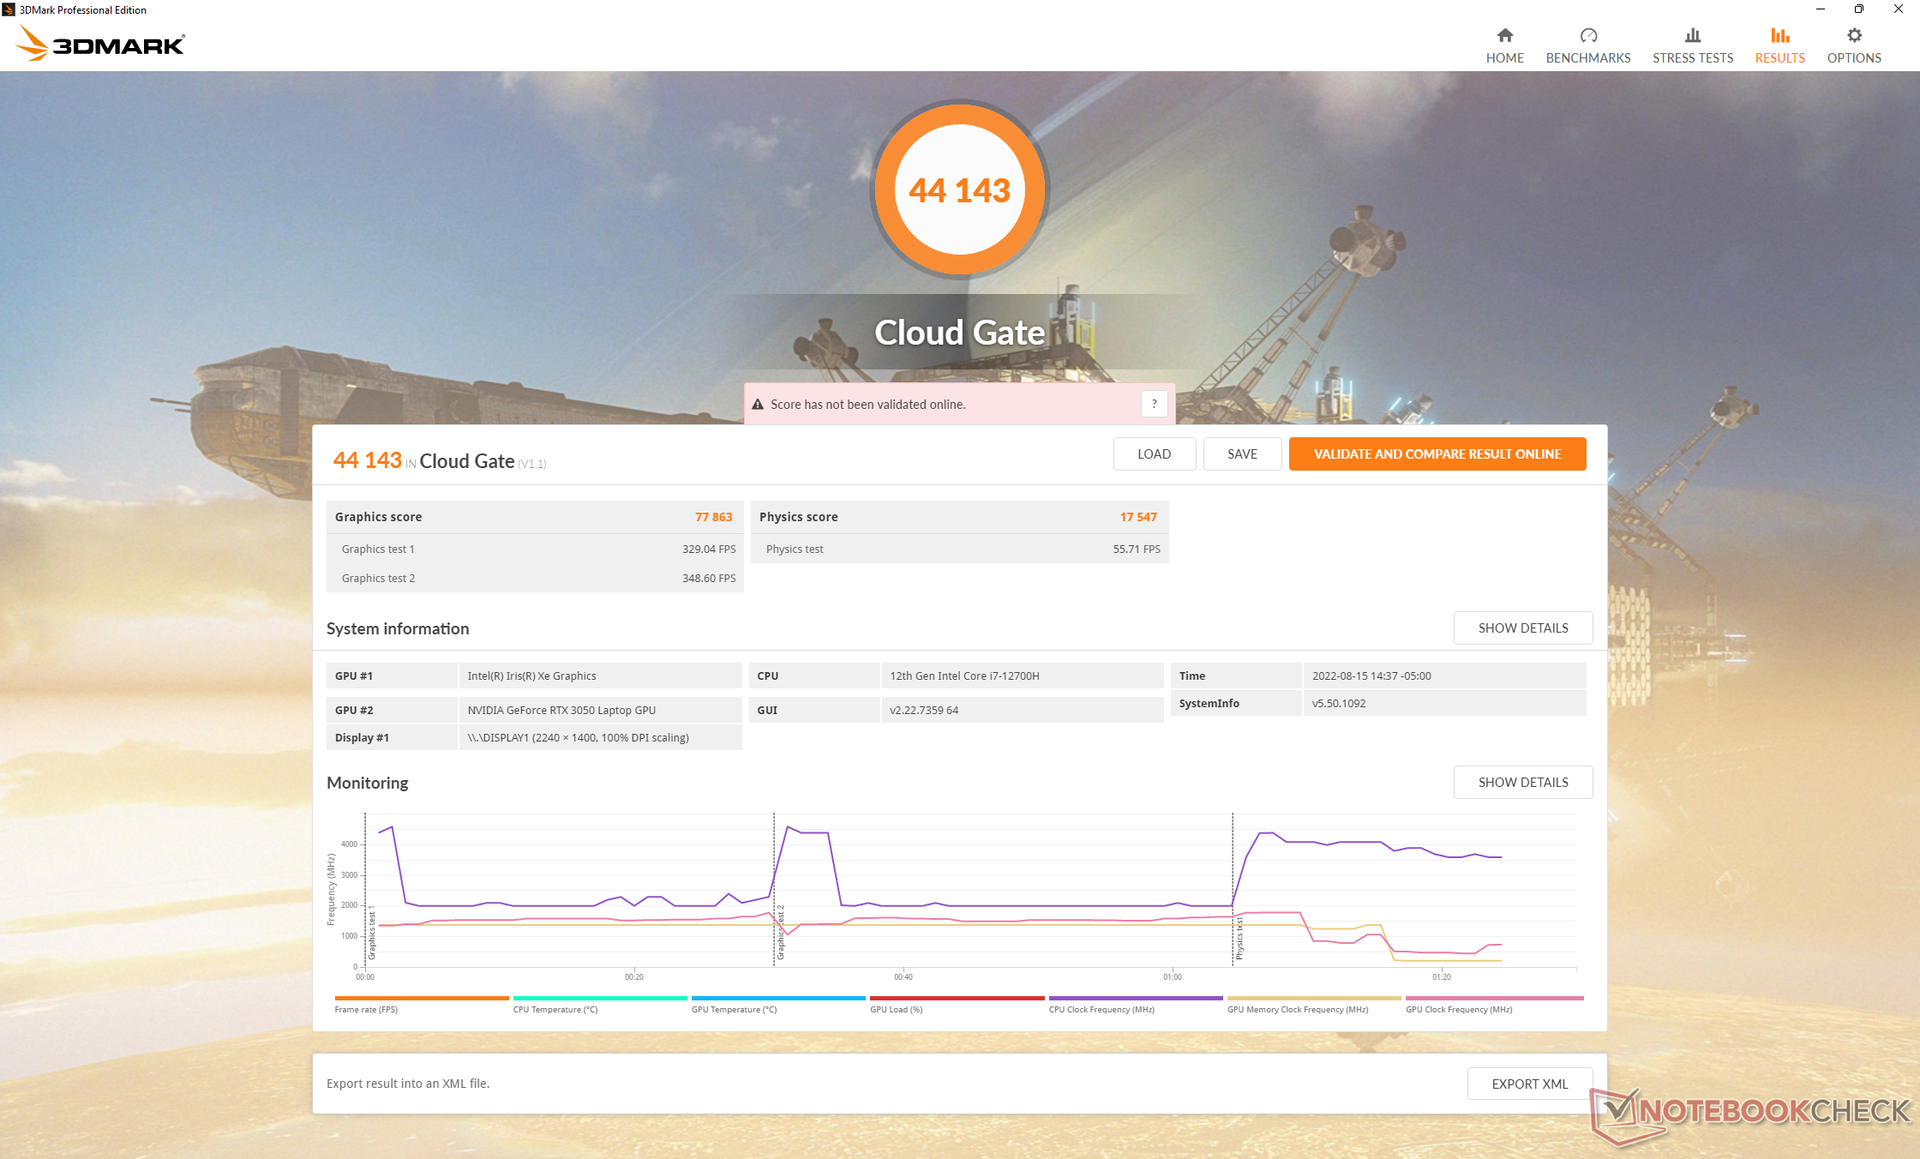
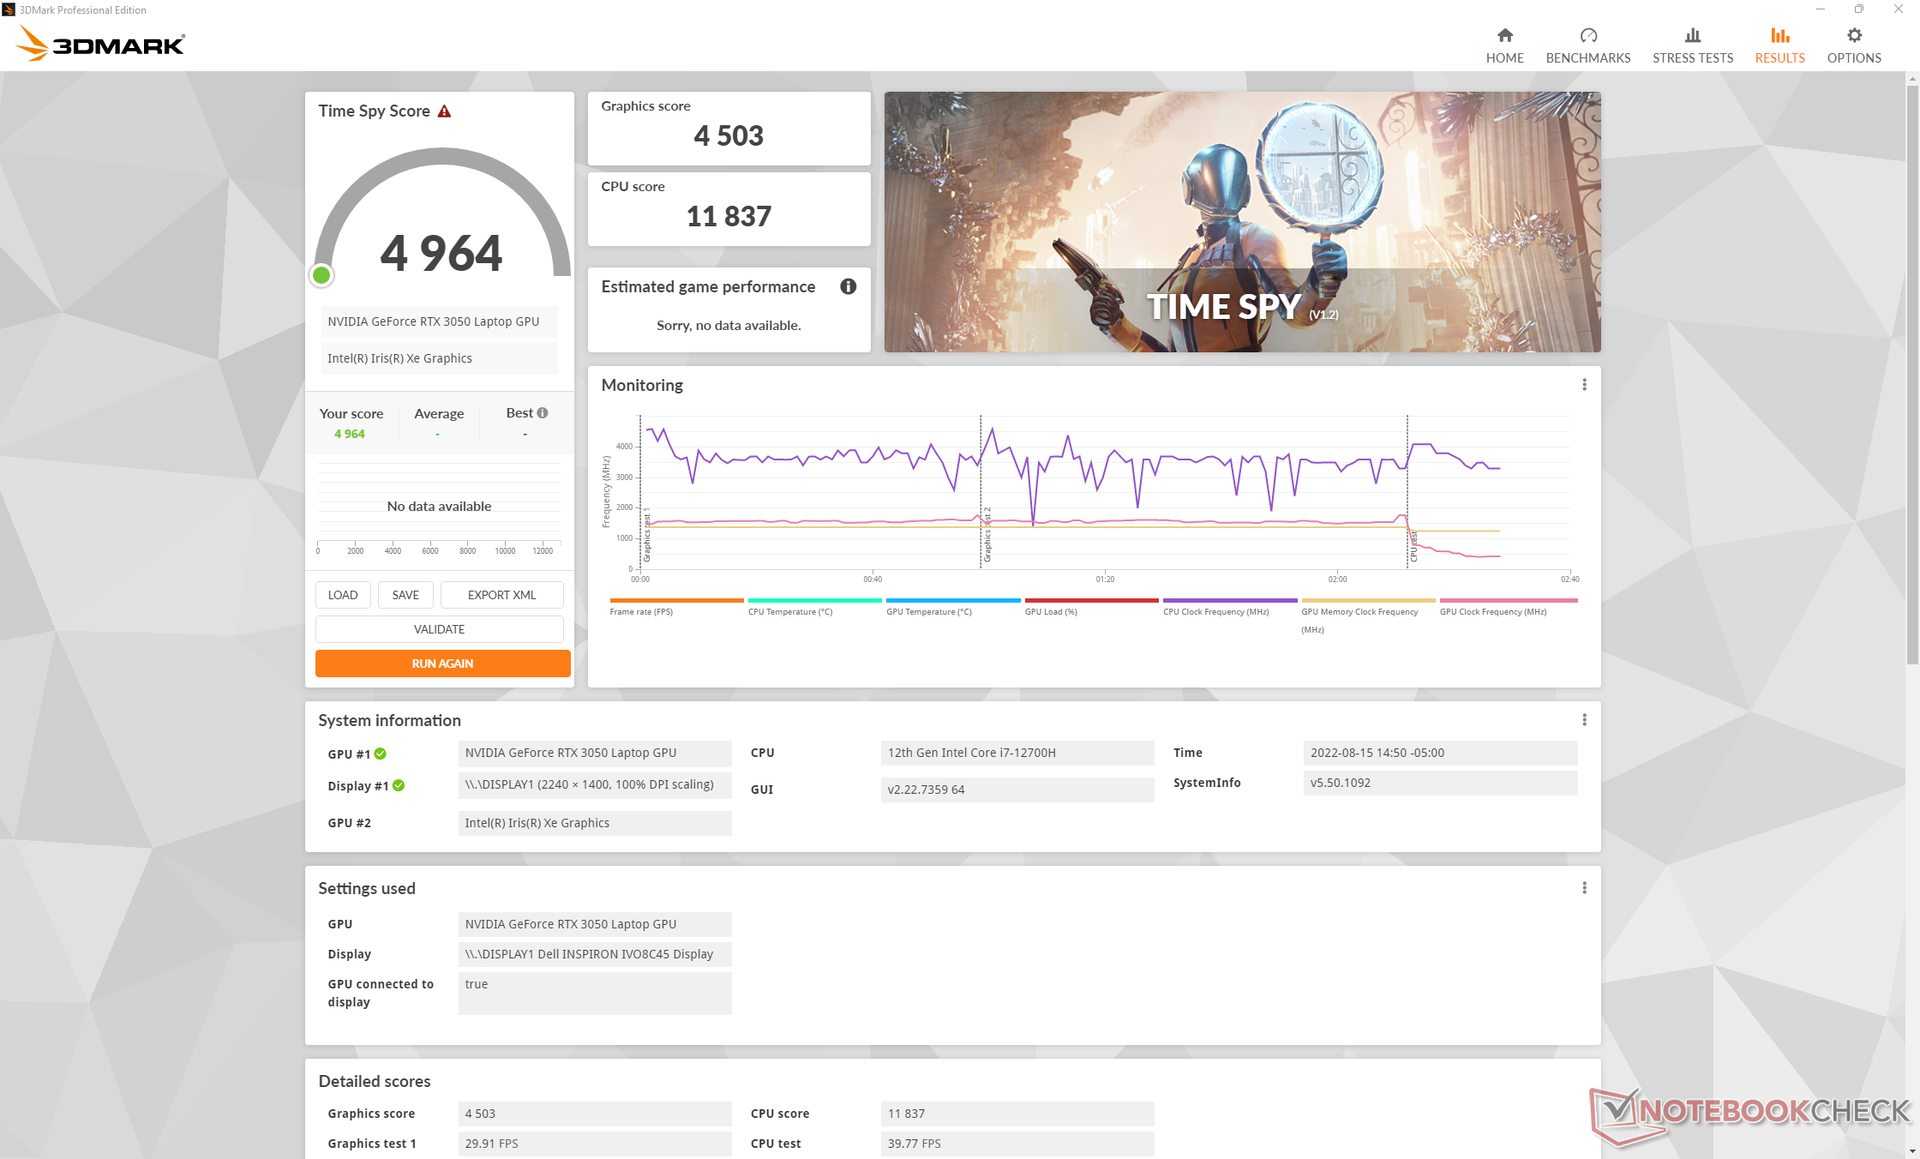

| 3DMark 11 Performance | 16400 punti | |
| 3DMark Cloud Gate Standard Score | 44143 punti | |
| 3DMark Fire Strike Score | 11060 punti | |
| 3DMark Time Spy Score | 4964 punti | |
Aiuto | ||
Witcher 3 FPS Chart
| basso | medio | alto | ultra | |
|---|---|---|---|---|
| GTA V (2015) | 181.8 | 161.4 | 111.5 | 61.8 |
| The Witcher 3 (2015) | 222.2 | 150.4 | 83.5 | 46 |
| Dota 2 Reborn (2015) | 174.4 | 158.7 | 145 | 134.4 |
| Final Fantasy XV Benchmark (2018) | 113.5 | 66.1 | 47.4 | |
| X-Plane 11.11 (2018) | 137.8 | 117.2 | 94.4 | |
| Strange Brigade (2018) | 263 | 118.2 | 94.7 | 82.4 |
| Cyberpunk 2077 1.6 (2022) | 68.6 | 55 | 41 | 33.8 |
Emissions - Ad alta voce come un giocatore
Rumore del sistema
Le ventole gemelle del sistema sono sensibili ai carichi elevati. Quando si avvia 3DMark 06, ad esempio, il rumore della ventola aumenta rapidamente prima di stabilizzarsi a circa 47 dB(A) verso la fine della prima scena di benchmark, rispetto ai 43 dB(A) dello Schenker Vision 14 o ai 35 dB(A) dell' HP Envy 14 ciascuno con grafica discreta GeForce
Eseguendo i giochi in modalità Ultra Performance, la rumorosità della ventola raggiunge quasi i 52 dB(A), un valore paragonabile a quello di molti laptop dedicati al gaming con grafica più veloce. La rumorosità della ventola scende a 48 dB(A) se si gioca in modalità Dell Optimized, ma questo comporta una piccola riduzione delle prestazioni grafiche, come già detto. Pertanto, gli utenti devono sopportare i massimi RPM delle ventole se vogliono sfruttare tutti i 50 W di potenza della GPU GeForce
Fortunatamente, le ventole sono piuttosto silenziose, con 26,5 dB(A) a fronte di uno sfondo silenzioso di 23,2 dB(A) durante le attività più banali come la navigazione web o lo streaming video. Solo quando si introducono carichi più elevati, le ventole iniziano ad aumentare rapidamente.
Rumorosità
| Idle |
| 23.2 / 23.2 / 23.2 dB(A) |
| Sotto carico |
| 47.5 / 51.7 dB(A) |
 | ||
30 dB silenzioso 40 dB(A) udibile 50 dB(A) rumoroso |
||
min: | ||
| Dell Inspiron 14 Plus 7420 GeForce RTX 3050 4GB Laptop GPU, i7-12700H, SK Hynix BC711 512GB HFM512GD3GX013N | Asus Vivobook Pro 14 M3401QC-KM007T GeForce RTX 3050 4GB Laptop GPU, R5 5600H, Intel SSD 670p SSDPEKNU512GZ | Dell Inspiron 14 7420 2-in-1 Iris Xe G7 96EUs, i7-1255U, WDC PC SN530 SDBPMPZ-512G | Schenker Vision 14 GeForce RTX 3050 Ti Laptop GPU, i7-11370H, Samsung SSD 980 Pro 1TB MZ-V8P1T0BW | Asus Zenbook 14X UX5400E GeForce MX450, i7-1165G7, SK Hynix HFM001TD3JX013N | HP Envy 14-eb0010nr GeForce GTX 1650 Ti Max-Q, i5-1135G7, Samsung SSD PM981a MZVLB256HBHQ | |
|---|---|---|---|---|---|---|
| Noise | -14% | 7% | 0% | -0% | 3% | |
| off /ambiente * (dB) | 23.2 | 25.4 -9% | 23.1 -0% | 24.3 -5% | 26 -12% | 25.9 -12% |
| Idle Minimum * (dB) | 23.2 | 25.4 -9% | 24.7 -6% | 24.3 -5% | 26 -12% | 26 -12% |
| Idle Average * (dB) | 23.2 | 25.4 -9% | 24.7 -6% | 24.3 -5% | 26 -12% | 26 -12% |
| Idle Maximum * (dB) | 23.2 | 30.9 -33% | 24.7 -6% | 25.9 -12% | 26.3 -13% | 26 -12% |
| Load Average * (dB) | 47.5 | 56 -18% | 27.7 42% | 43.3 9% | 37.1 22% | 34.9 27% |
| Witcher 3 ultra * (dB) | 51.7 | 45.1 13% | 44.6 14% | 34.5 33% | ||
| Load Maximum * (dB) | 51.7 | 56 -8% | 45.1 13% | 49.5 4% | 38 26% | 48.7 6% |
* ... Meglio usare valori piccoli
Temperatura
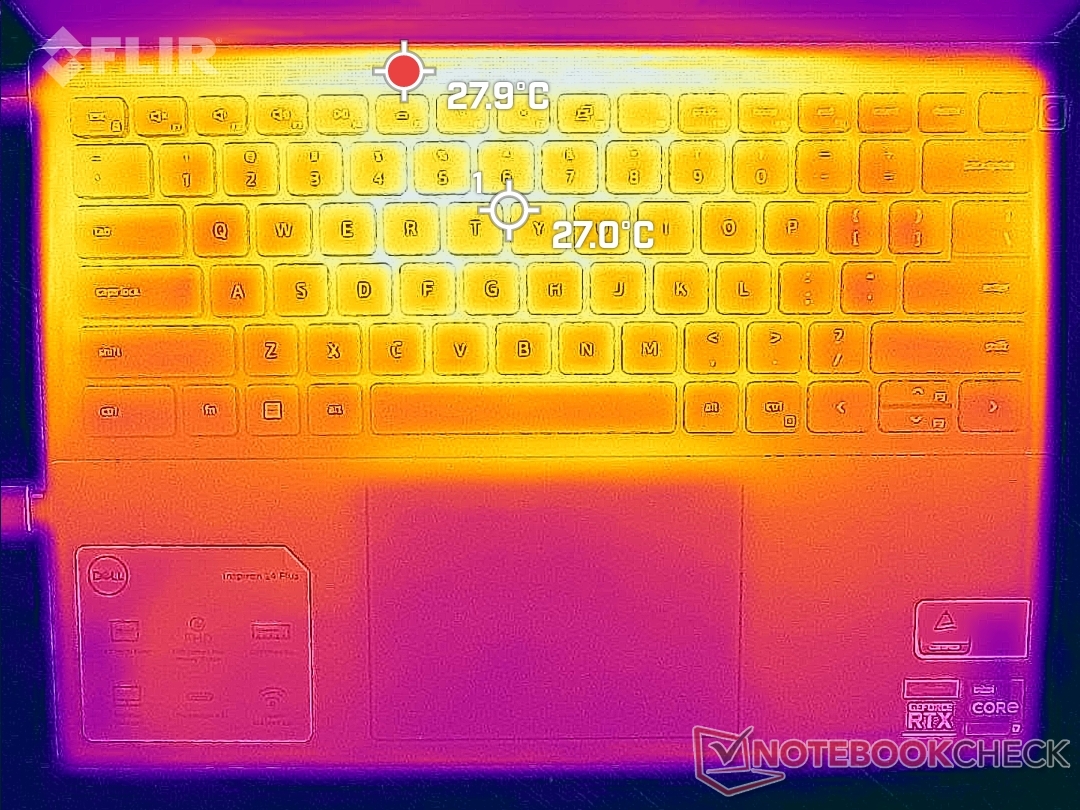
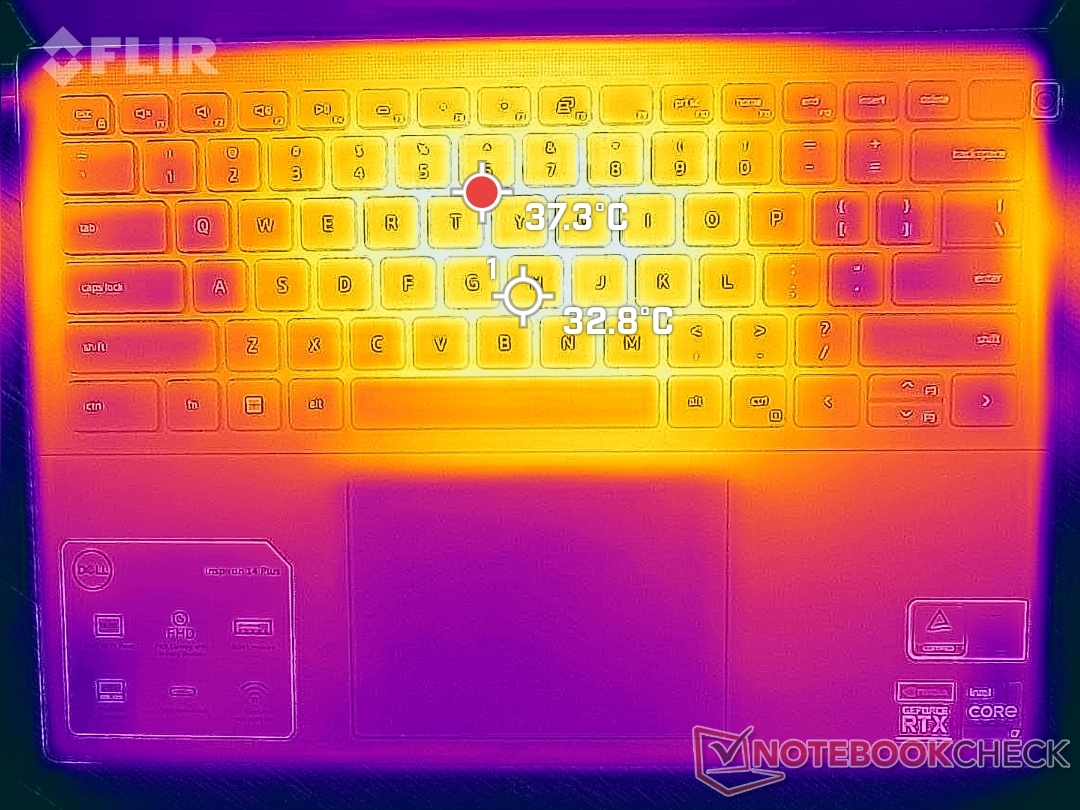
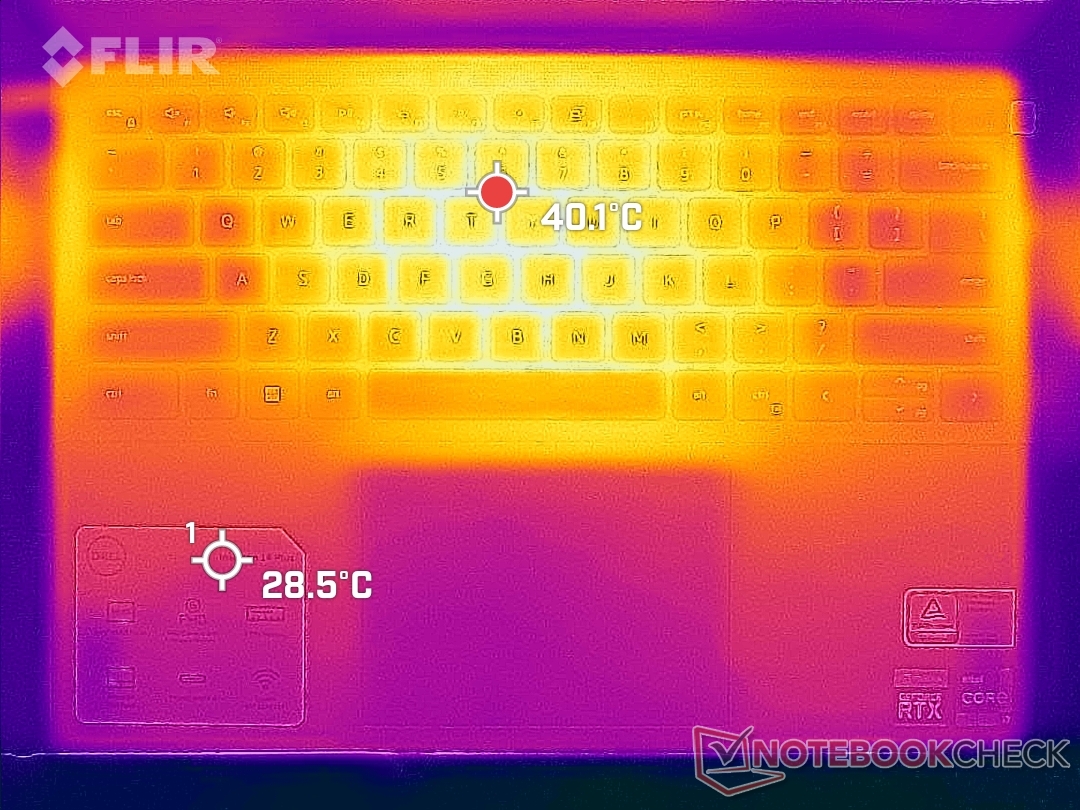
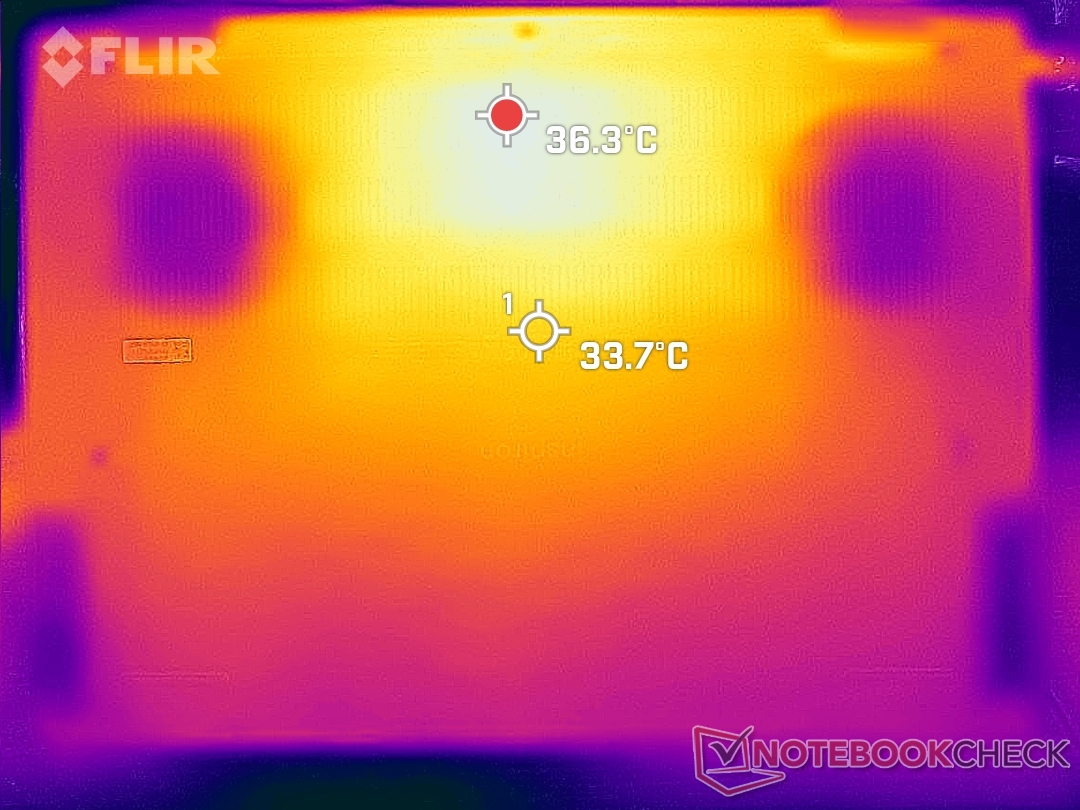
La temperatura della superficie al minimo è di circa 28 C sia nella parte superiore che in quella inferiore, simile a quella di altri portatili multimediali sottili con grafica discreta come ilAsus Vivobook Pro 14 o Schenker Vision 14. Quando si gioca, i punti caldi possono raggiungere poco più di 40 C vicino al centro della tastiera e alla parte posteriore dello chassis, mentre i poggiapiedi rimangono più confortevoli, al di sotto dei 30 C. I punti caldi sono generalmente più freschi rispetto ai già citati Asus o Schenker, che possono raggiungere i 45-55°C.
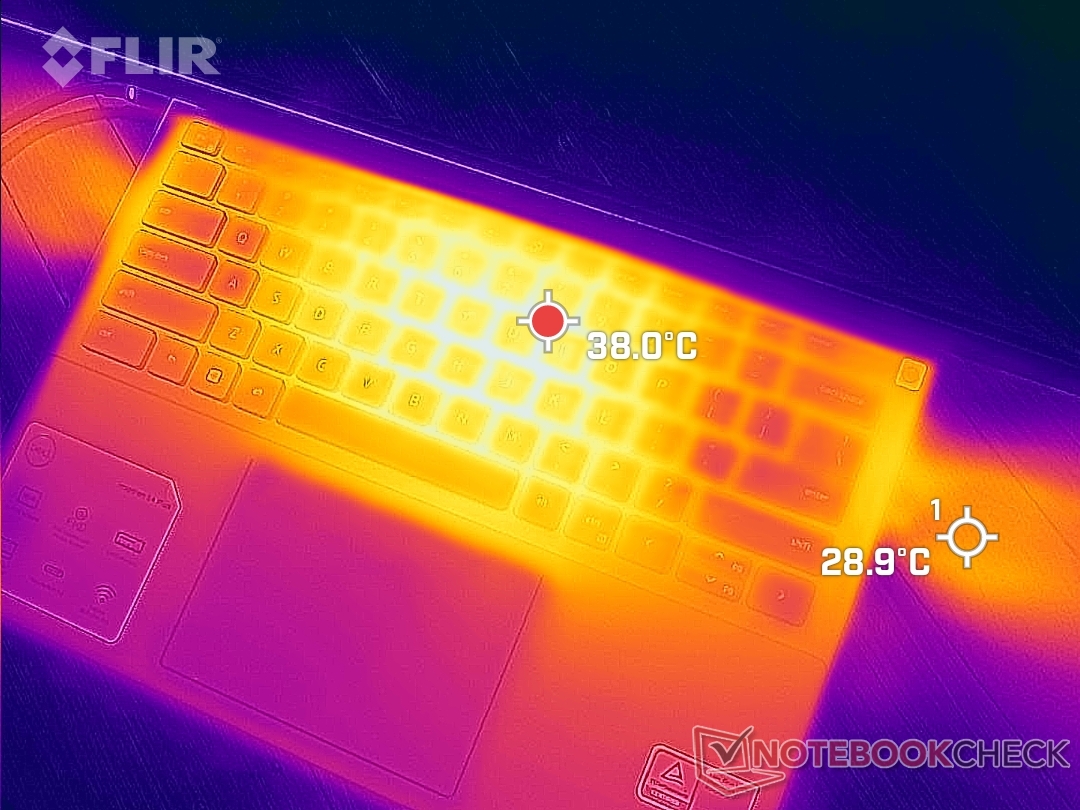
(±) La temperatura massima sul lato superiore è di 40 °C / 104 F, rispetto alla media di 36.8 °C / 98 F, che varia da 21 a 71 °C per questa classe Multimedia.
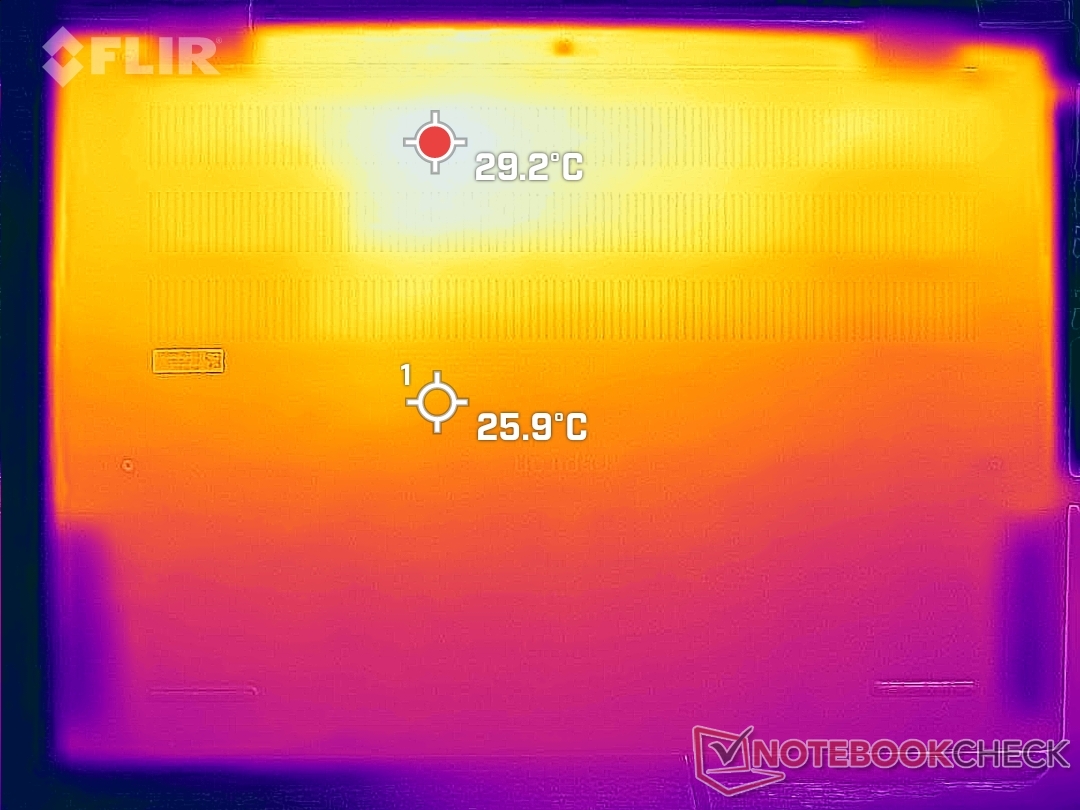
(+) Il lato inferiore si riscalda fino ad un massimo di 36.4 °C / 98 F, rispetto alla media di 39.1 °C / 102 F
(+) In idle, la temperatura media del lato superiore è di 24.2 °C / 76 F, rispetto alla media deld ispositivo di 31.3 °C / 88 F.
(+) Riproducendo The Witcher 3, la temperatura media per il lato superiore e' di 28.6 °C / 83 F, rispetto alla media del dispositivo di 31.3 °C / 88 F.
(+) I poggiapolsi e il touchpad sono piu' freddi della temperatura della pelle con un massimo di 29.4 °C / 84.9 F e sono quindi freddi al tatto.
(±) La temperatura media della zona del palmo della mano di dispositivi simili e'stata di 28.7 °C / 83.7 F (-0.7 °C / -1.2 F).

| Dell Inspiron 14 Plus 7420 Intel Core i7-12700H, NVIDIA GeForce RTX 3050 4GB Laptop GPU | Asus Vivobook Pro 14 M3401QC-KM007T AMD Ryzen 5 5600H, NVIDIA GeForce RTX 3050 4GB Laptop GPU | Dell Inspiron 14 7420 2-in-1 Intel Core i7-1255U, Intel Iris Xe Graphics G7 96EUs | Schenker Vision 14 Intel Core i7-11370H, NVIDIA GeForce RTX 3050 Ti Laptop GPU | Asus Zenbook 14X UX5400E Intel Core i7-1165G7, NVIDIA GeForce MX450 | MSI Summit E14 A11SCS Intel Core i7-1185G7, NVIDIA GeForce GTX 1650 Ti Max-Q | HP Envy 14-eb0010nr Intel Core i5-1135G7, NVIDIA GeForce GTX 1650 Ti Max-Q | |
|---|---|---|---|---|---|---|---|
| Heat | -25% | -5% | -23% | -17% | -33% | -19% | |
| Maximum Upper Side * (°C) | 40 | 42.3 -6% | 38.2 4% | 49.7 -24% | 42.4 -6% | 49.4 -23% | 41.2 -3% |
| Maximum Bottom * (°C) | 36.4 | 49.6 -36% | 45.6 -25% | 56 -54% | 47.7 -31% | 60.6 -66% | 45.6 -25% |
| Idle Upper Side * (°C) | 27 | 34.2 -27% | 27.4 -1% | 28.8 -7% | 32.3 -20% | 30.6 -13% | 31.8 -18% |
| Idle Bottom * (°C) | 29.2 | 37.9 -30% | 28.4 3% | 30.6 -5% | 31.9 -9% | 37.4 -28% | 37.8 -29% |
* ... Meglio usare valori piccoli
Stress test
Eseguendo Prime95 per stressare la CPU, la velocità di clock, la temperatura e l'assorbimento di potenza della scheda raggiungono rispettivamente 3,5 GHz, 100 C e 80 W per circa 10 secondi. Successivamente, le frequenze di clock, la temperatura e l'assorbimento di potenza della scheda diminuiscono costantemente prima di stabilizzarsi rispettivamente a 1,9 GHz, 80 C e 38 W, al fine di mantenere le temperature sotto controllo. Il calo delle prestazioni è relativamente forte in quanto il HP Pavilion Plus 14 con la stessa CPU è in grado di mantenere una velocità compresa tra 2,2 e 2,9 GHz quando viene sottoposto allo stesso test.
L'esecuzione Witcher 3 mostra che la GPU GeForce si stabilizza a 1590 MHz, 74 C e 50 W. In confronto, la RTX 3050 Ti del più grande Inspiron 16 Plus si stabilizzerebbe a 1627 MHz, 84 C e 63 W. Le temperature del core sono sorprendentemente elevate, dato che questo è uno dei pochi portatili da 14 pollici a disporre di una CPU Core serie H e di una GPU GeForce RTX. Cambiando il profilo energetico da Ultra Performance a Ottimizzato, il consumo di energia della GPU scenderà a circa 45 W o meno.
Il funzionamento a batteria limita le prestazioni. Un test di Fire Strike a batteria restituirebbe punteggi di Fisica e Grafica di soli 9493 e 7637 punti, rispettivamente, rispetto a 26940 e 12125 punti con alimentazione a rete.
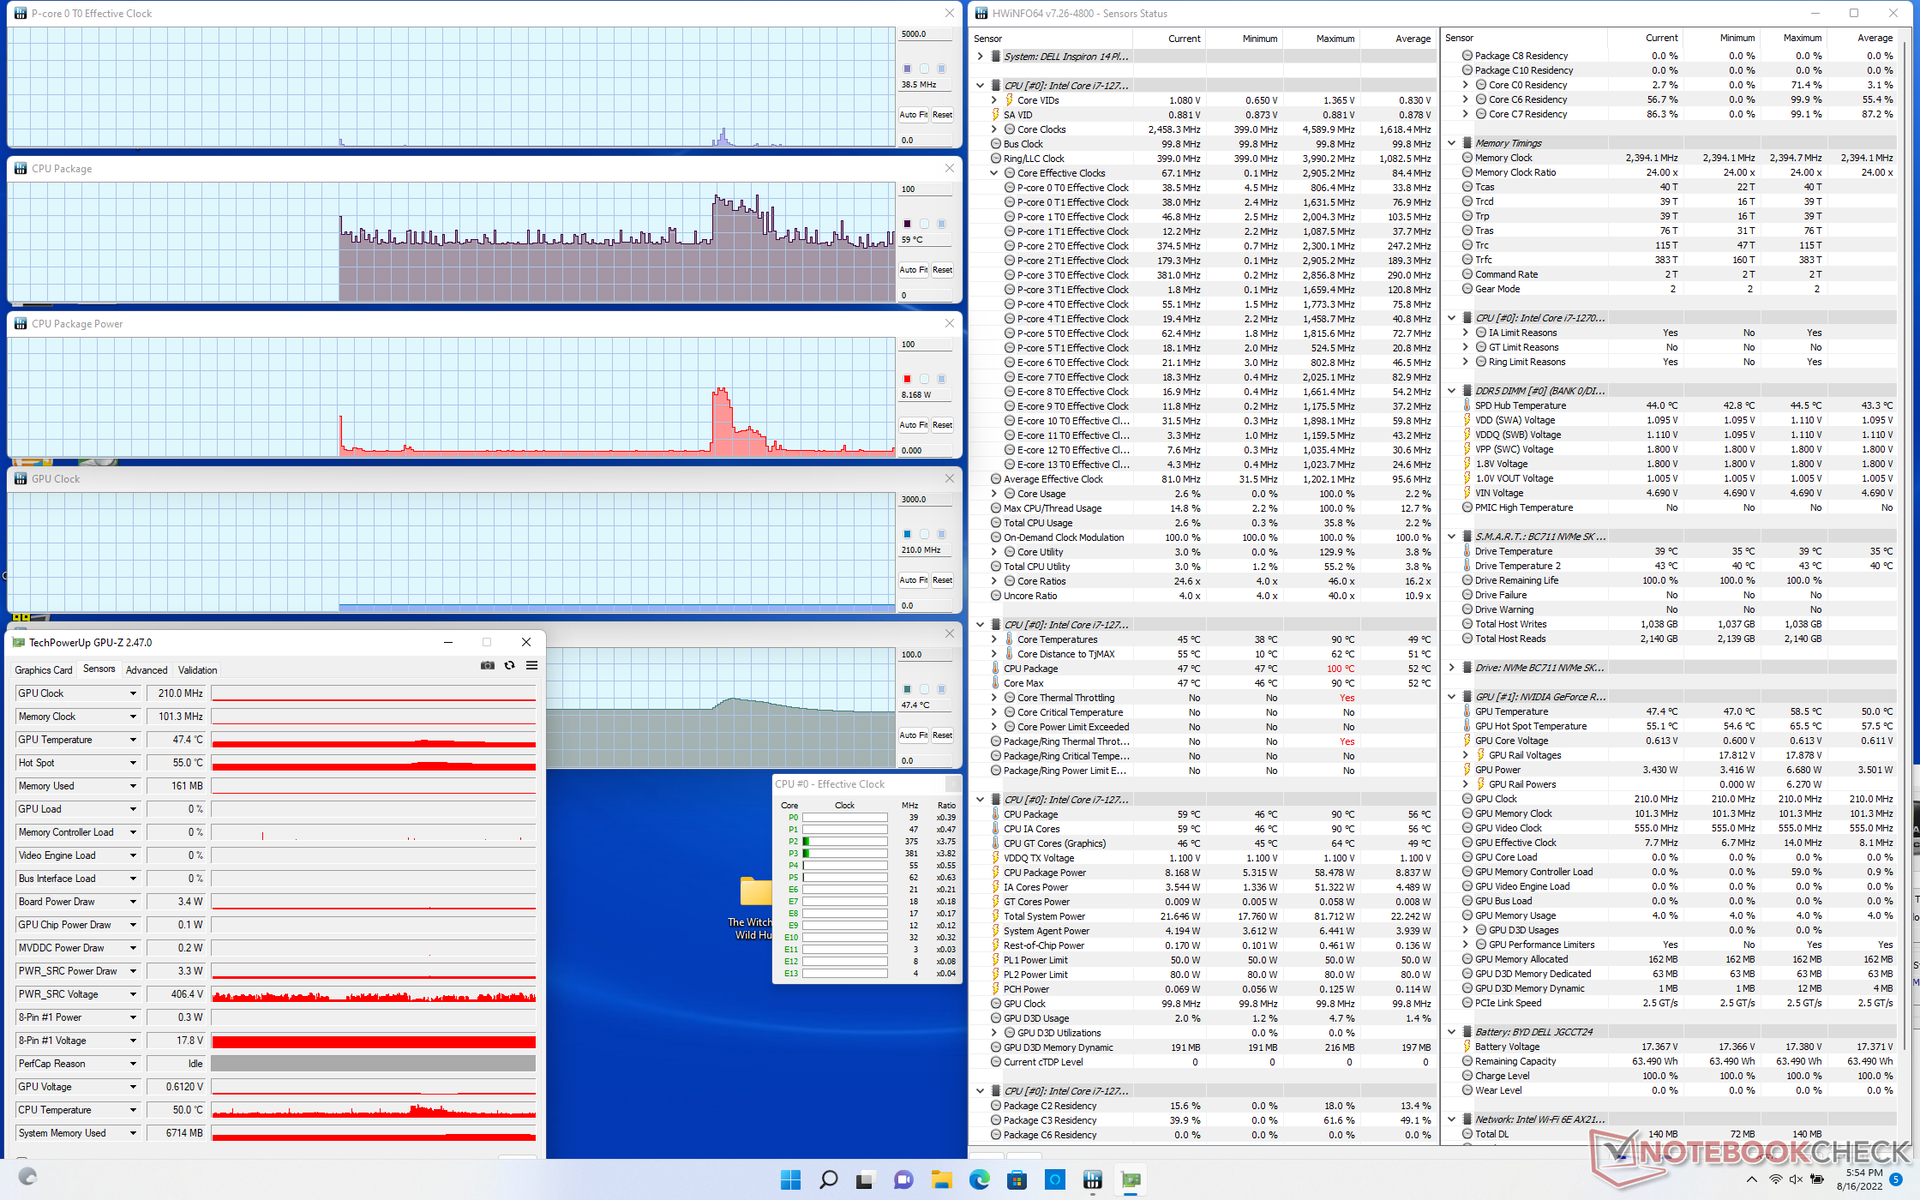
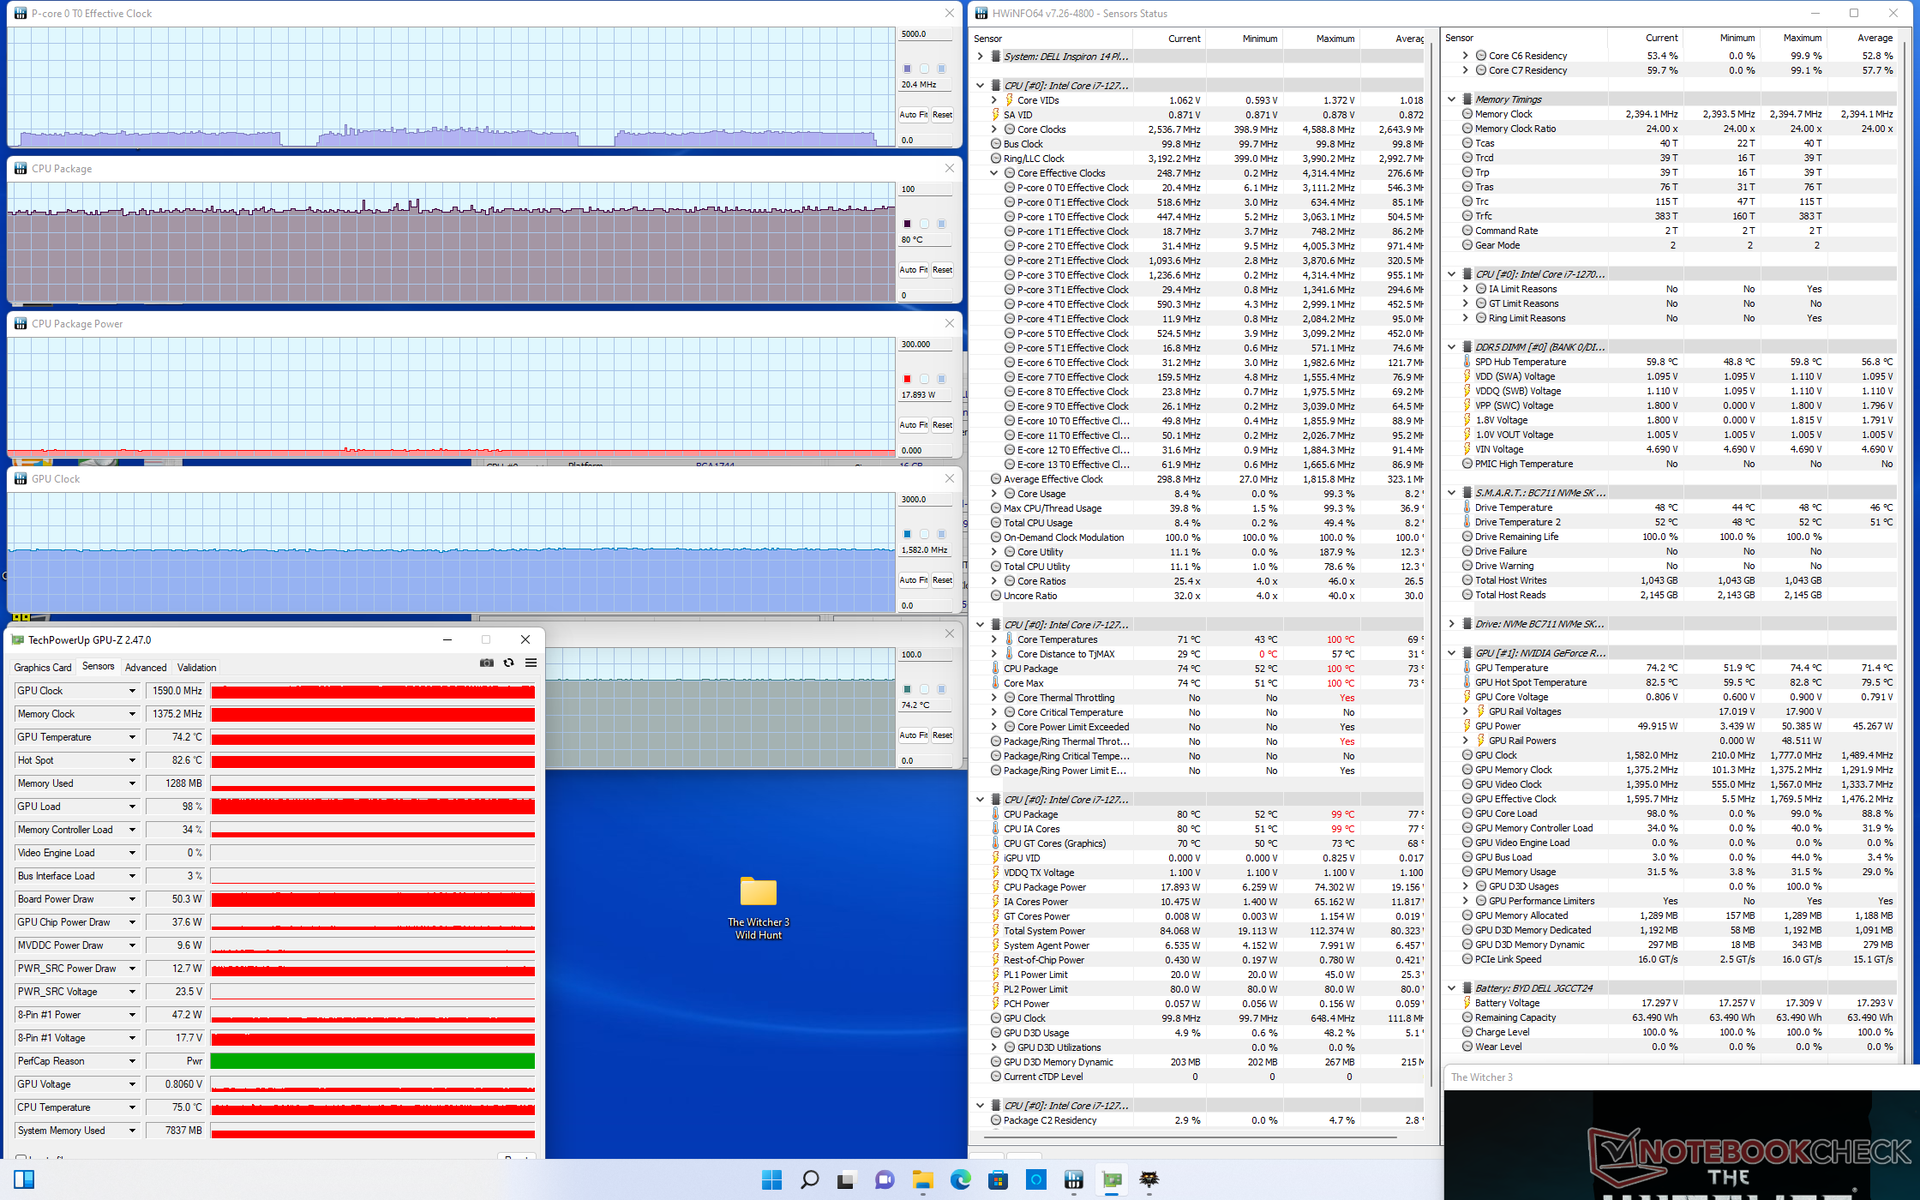
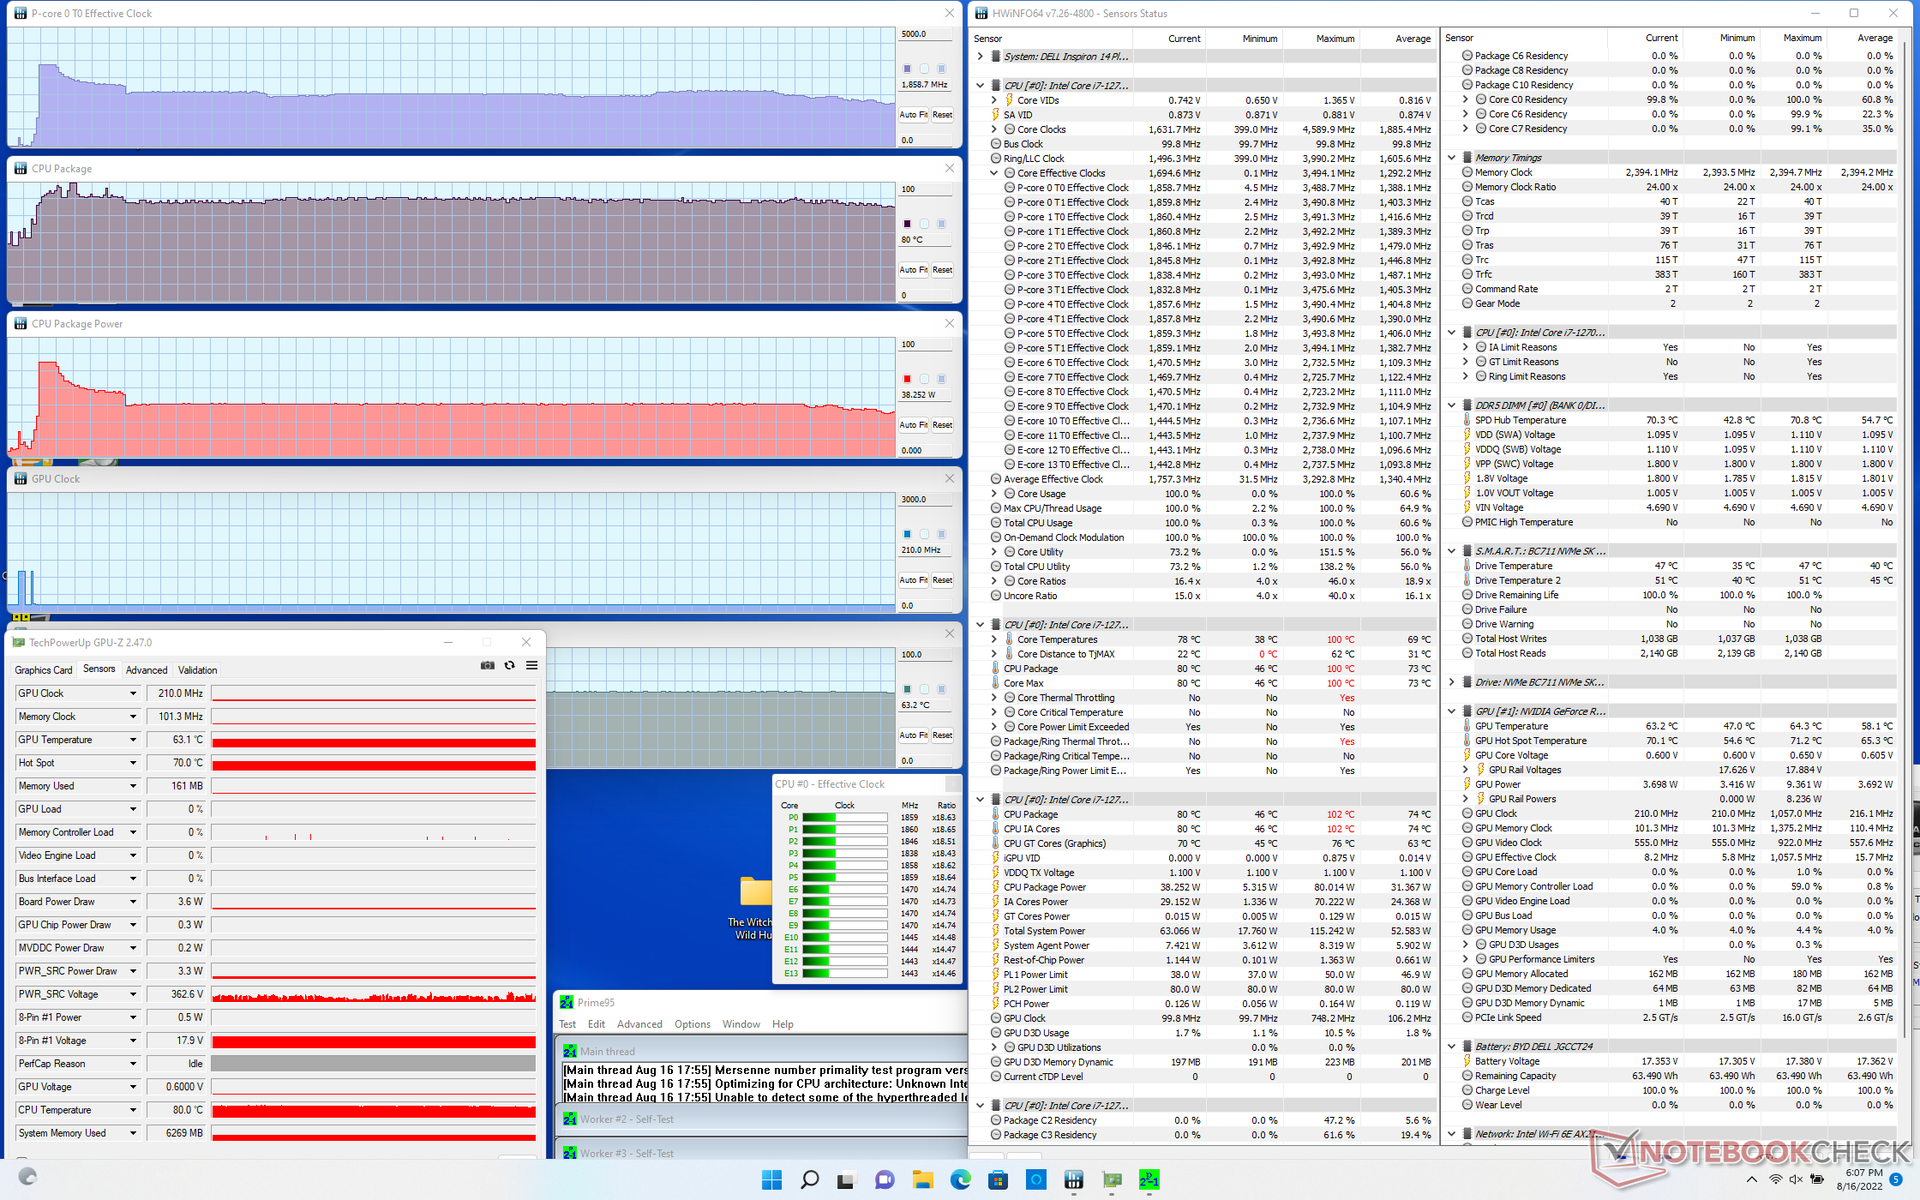
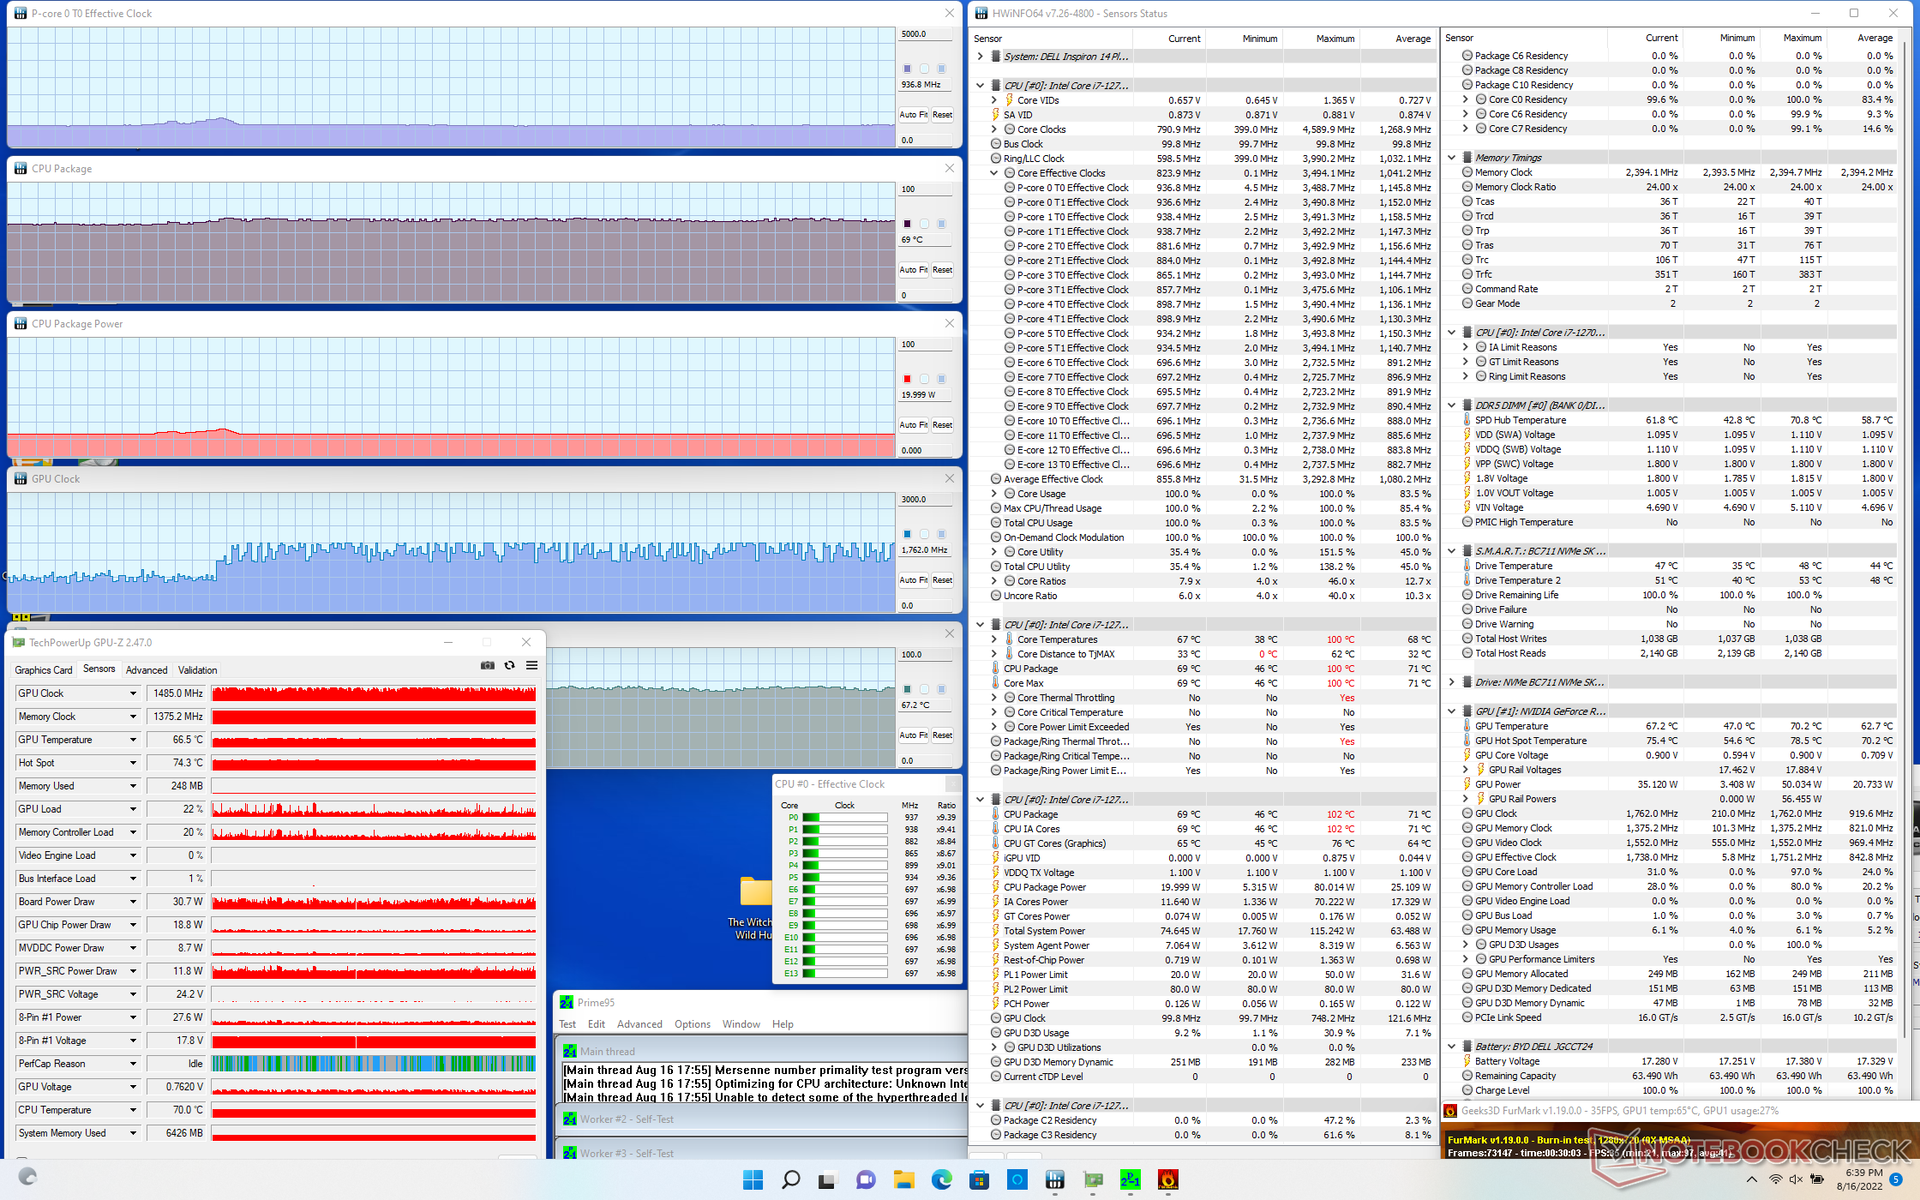
| Clock della CPU (GHz) | Clock della GPU (MHz) | Temperatura media della CPU (°C) | Temperatura media della GPU (°C) | |
| Sistema inattivo | -- | -- | 59 | 47 |
| Stress Prime95 | 1,9 | -- | 80 | 63 |
| Prime95 + FurMark Stress | 0,9 | ~1485 | 69 | 67 |
| Witcher 3 Stress | ~1.1 | 1590 | 80 | 74 |
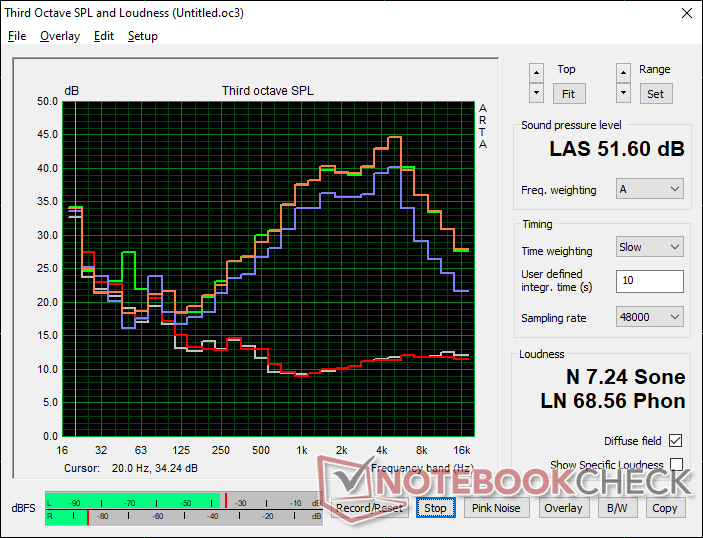
Altoparlanti
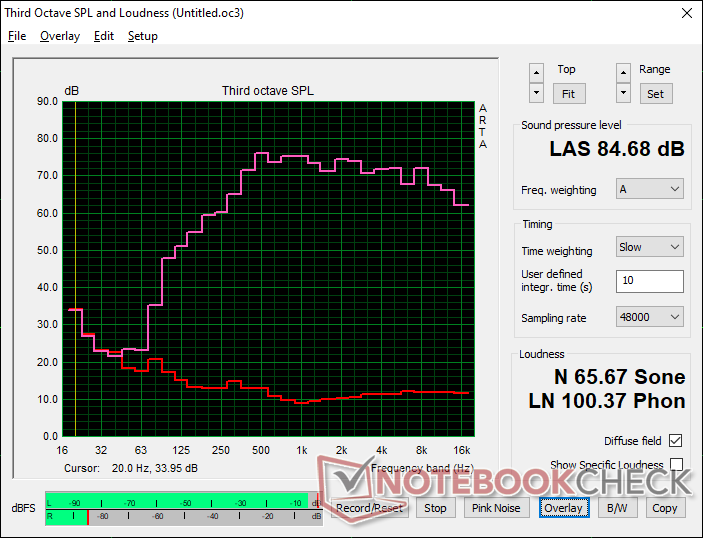
Dell Inspiron 14 Plus 7420 analisi audio
(+) | gli altoparlanti sono relativamente potenti (84.7 dB)
Bassi 100 - 315 Hz
(±) | bassi ridotti - in media 14.7% inferiori alla media
(±) | la linearità dei bassi è media (8.3% delta rispetto alla precedente frequenza)
Medi 400 - 2000 Hz
(+) | medi bilanciati - solo only 2.6% rispetto alla media
(+) | medi lineari (4.8% delta rispetto alla precedente frequenza)
Alti 2 - 16 kHz
(+) | Alti bilanciati - appena 1.8% dalla media
(+) | alti lineari (4.4% delta rispetto alla precedente frequenza)
Nel complesso 100 - 16.000 Hz
(+) | suono nel complesso lineare (10.4% differenza dalla media)
Rispetto alla stessa classe
» 15% di tutti i dispositivi testati in questa classe è stato migliore, 1% simile, 84% peggiore
» Il migliore ha avuto un delta di 5%, medio di 17%, peggiore di 45%
Rispetto a tutti i dispositivi testati
» 5% di tutti i dispositivi testati in questa classe è stato migliore, 1% similare, 93% peggiore
» Il migliore ha avuto un delta di 4%, medio di 23%, peggiore di 134%
Apple MacBook Pro 16 2021 M1 Pro analisi audio
(+) | gli altoparlanti sono relativamente potenti (84.7 dB)
Bassi 100 - 315 Hz
(+) | bassi buoni - solo 3.8% dalla media
(+) | bassi in lineaa (5.2% delta rispetto alla precedente frequenza)
Medi 400 - 2000 Hz
(+) | medi bilanciati - solo only 1.3% rispetto alla media
(+) | medi lineari (2.1% delta rispetto alla precedente frequenza)
Alti 2 - 16 kHz
(+) | Alti bilanciati - appena 1.9% dalla media
(+) | alti lineari (2.7% delta rispetto alla precedente frequenza)
Nel complesso 100 - 16.000 Hz
(+) | suono nel complesso lineare (4.6% differenza dalla media)
Rispetto alla stessa classe
» 0% di tutti i dispositivi testati in questa classe è stato migliore, 0% simile, 100% peggiore
» Il migliore ha avuto un delta di 5%, medio di 17%, peggiore di 45%
Rispetto a tutti i dispositivi testati
» 0% di tutti i dispositivi testati in questa classe è stato migliore, 0% similare, 100% peggiore
» Il migliore ha avuto un delta di 4%, medio di 23%, peggiore di 134%
Gestione dell'energia - Piccola macchina esigente
Consumo di energia
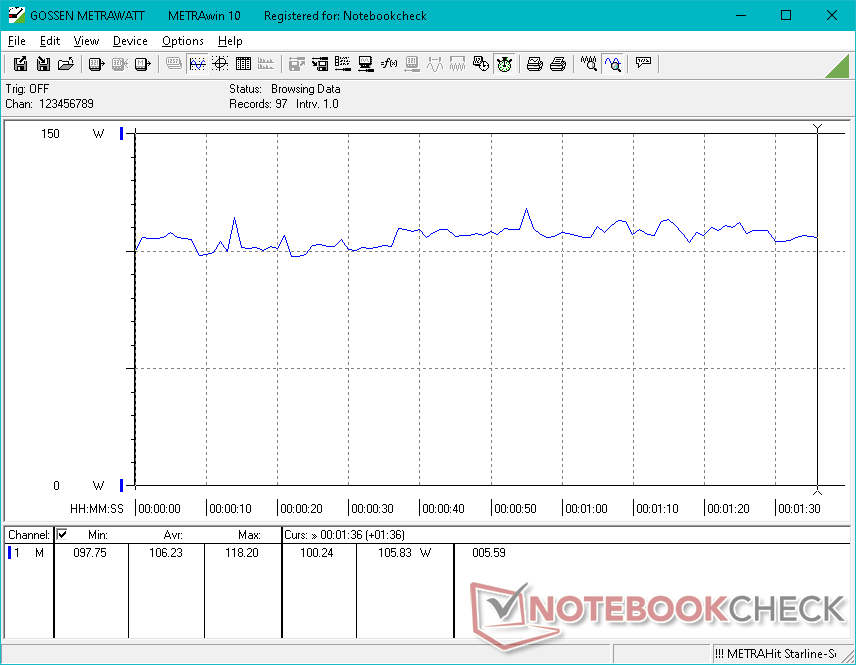
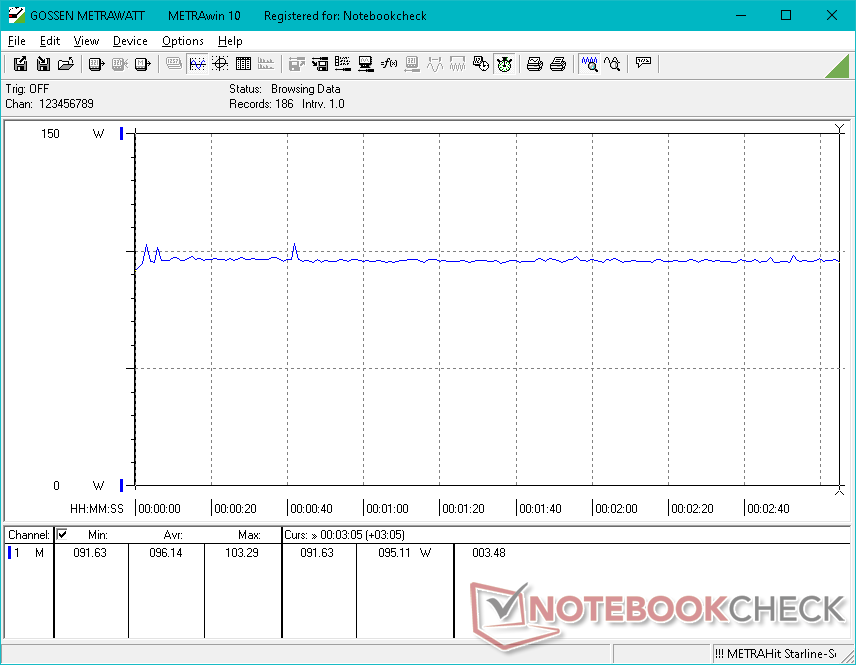
Il consumo energetico in modalità Power Saver varia da 6 W se si utilizza l'impostazione di luminosità minima a 10 W se si utilizza l'impostazione massima. Cambiando il profilo energetico in modalità Ultra Performance con la GPU Nvidia attiva, il consumo di energia al minimo sale a 20 W, circa il doppio rispetto alla maggior parte dei portatili da 14 pollici più lenti alimentati da CPU della serie U
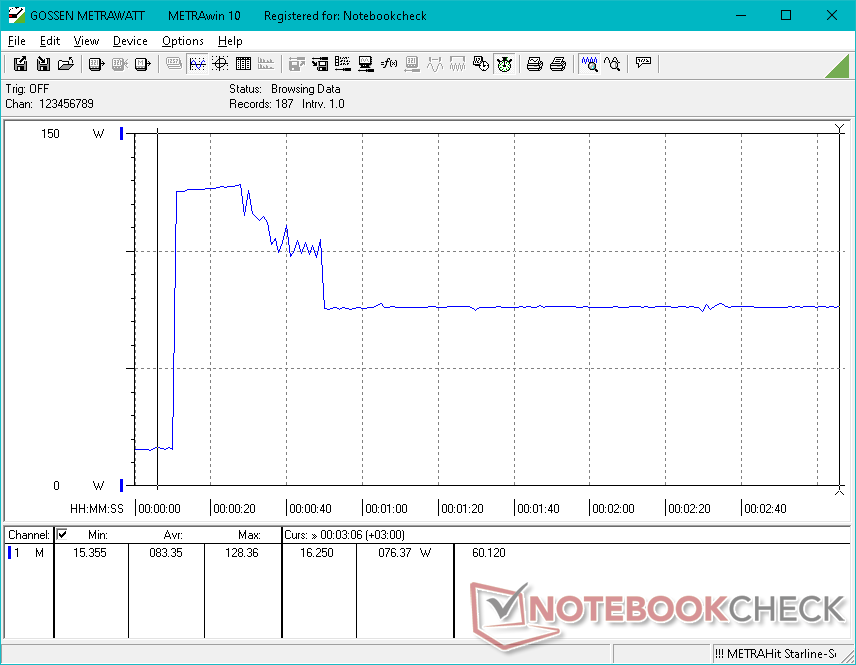
Il gioco richiede tra i 96 e i 106 W, rispetto ai soli 40 o 50 W delle alternative tradizionali con CPU della serie U. La serie H di Intel di 12a generazione è nota per essere molto esigente in aggiunta a una GPU discreta già esigente. Non c'è quindi da stupirsi se l'Inspiron 14 Plus funziona in modo più rumoroso e più caldo rispetto alla media dei portatili da 14 pollici
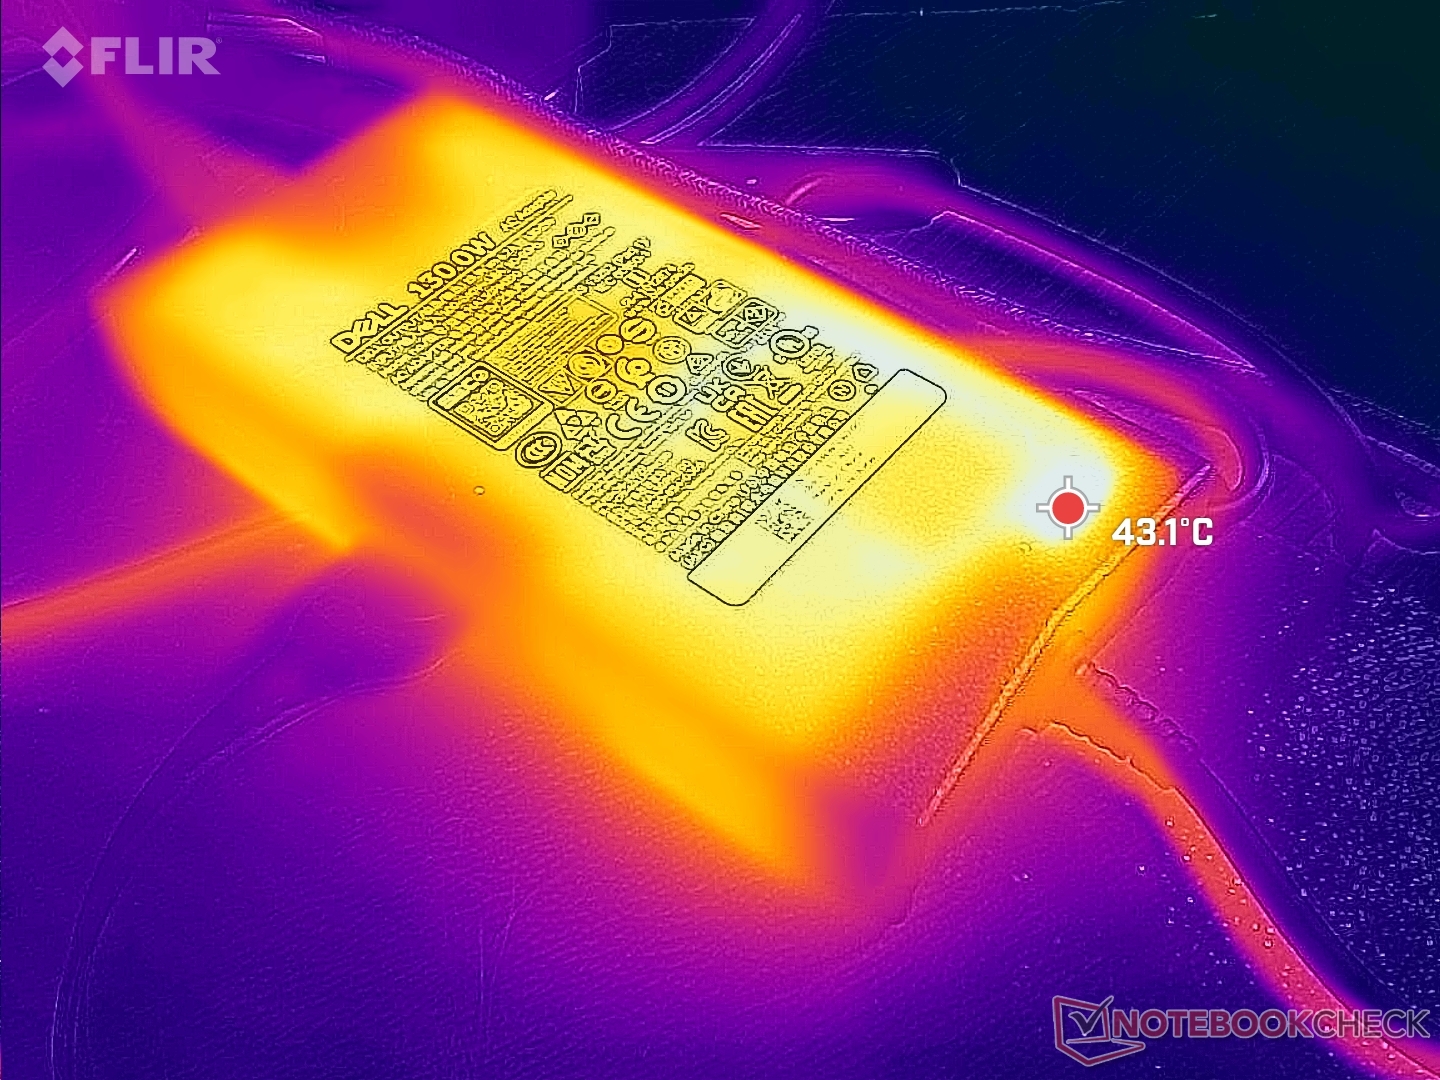
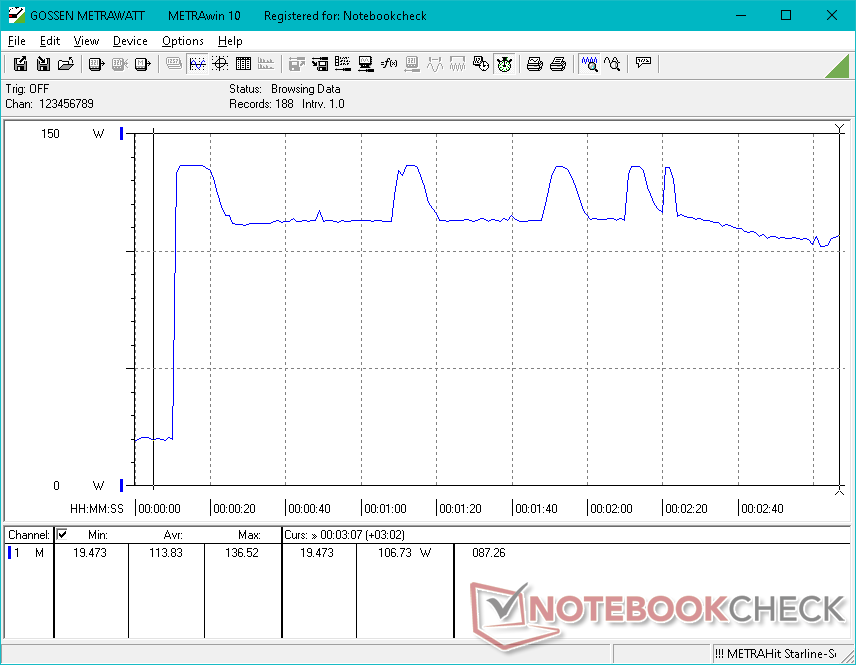
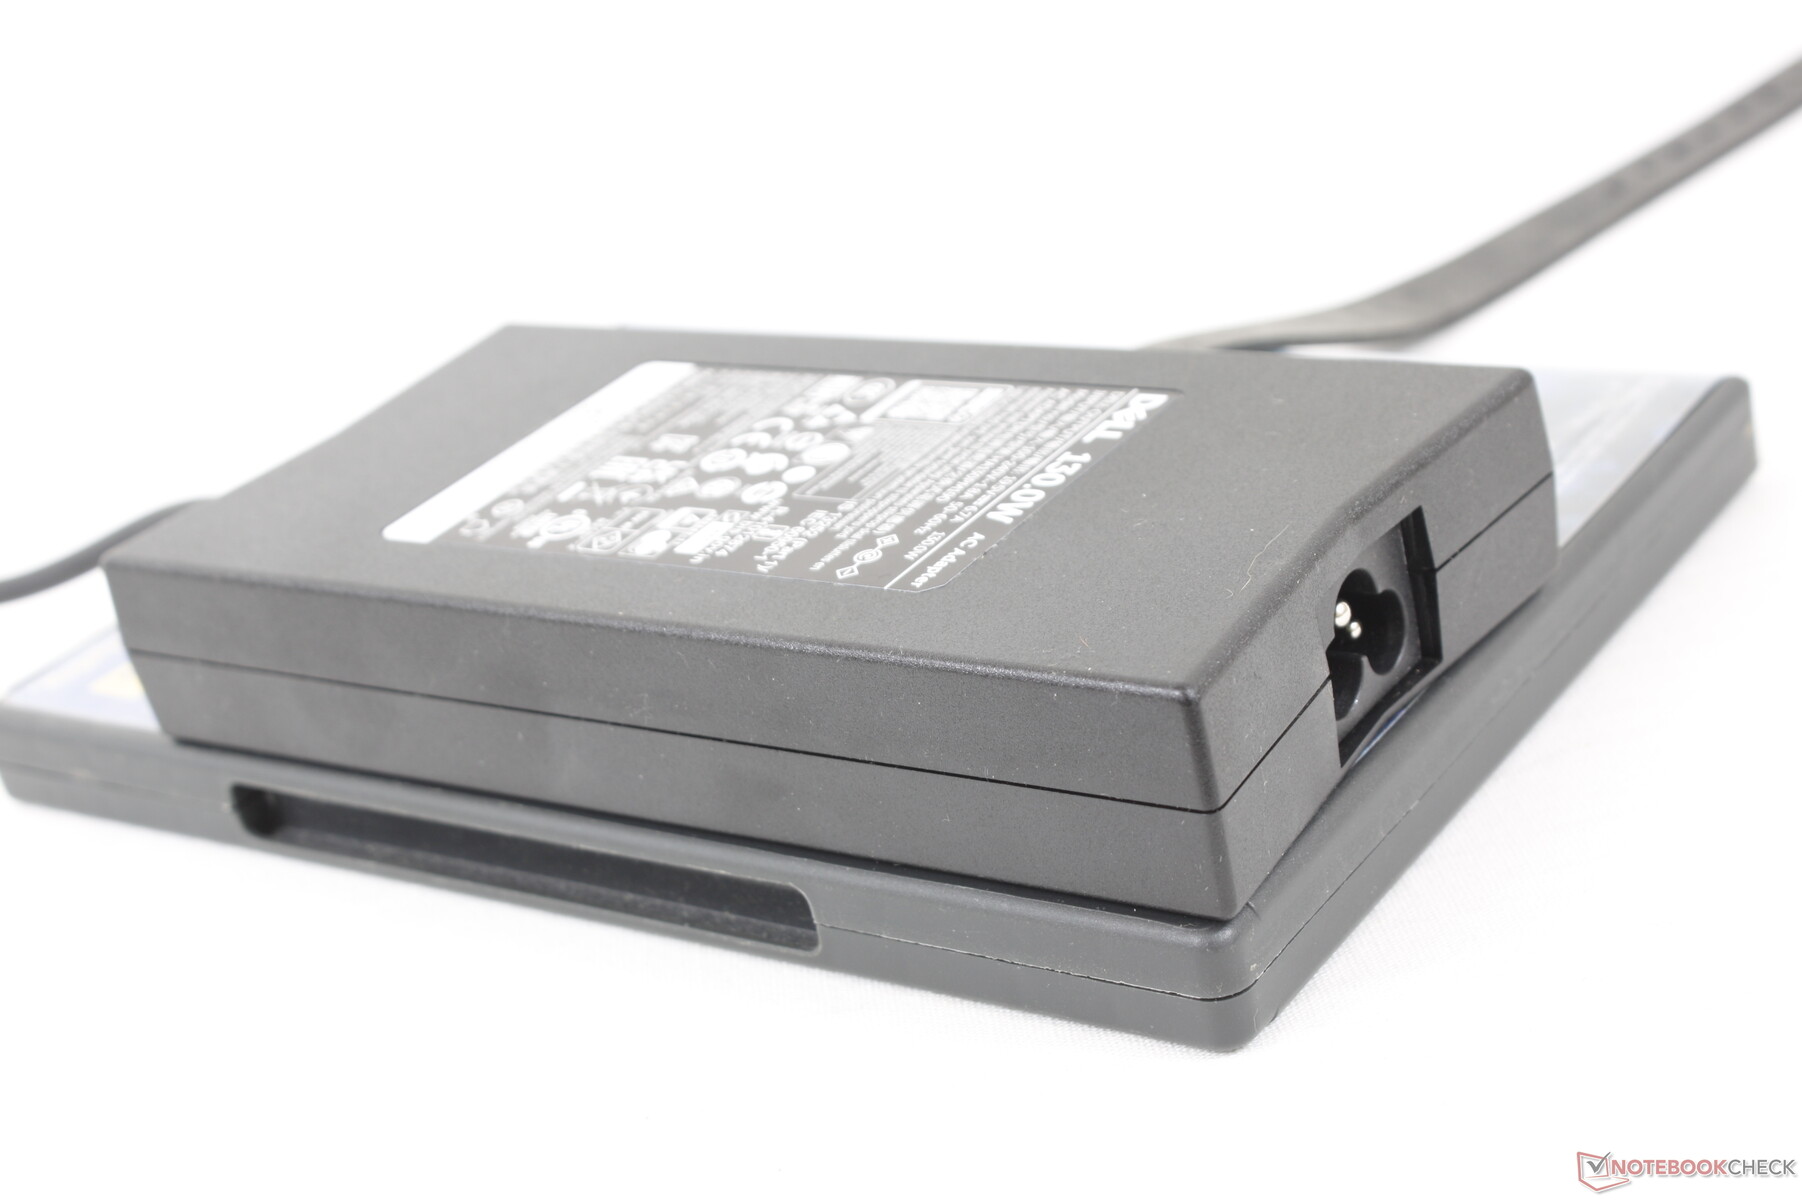
Siamo riusciti a registrare un consumo massimo di 137 W dall'adattatore CA di medie dimensioni (~15,3 x 7,5 x 2,6 cm) da 130 W quando si eseguono contemporaneamente Prime95 e FurMark. Il consumo tende a oscillare tra i 110 W e i 137 W, come mostra lo screenshot qui sotto. Aspettatevi un tasso di carica più lento se utilizzate carichi così impegnativi.
| Off / Standby | |
| Idle | |
| Sotto carico |
|
Leggenda:
min: | |
| Dell Inspiron 14 Plus 7420 i7-12700H, GeForce RTX 3050 4GB Laptop GPU, SK Hynix BC711 512GB HFM512GD3GX013N, IPS, 2240x1400, 14" | Asus Vivobook Pro 14 M3401QC-KM007T R5 5600H, GeForce RTX 3050 4GB Laptop GPU, Intel SSD 670p SSDPEKNU512GZ, OLED, 2880x1800, 14" | Dell Inspiron 14 7420 2-in-1 i7-1255U, Iris Xe G7 96EUs, WDC PC SN530 SDBPMPZ-512G, IPS, 1920x1200, 14" | Schenker Vision 14 i7-11370H, GeForce RTX 3050 Ti Laptop GPU, Samsung SSD 980 Pro 1TB MZ-V8P1T0BW, IPS, 2880x1800, 14" | Asus Zenbook 14X UX5400E i7-1165G7, GeForce MX450, SK Hynix HFM001TD3JX013N, OLED, 2880x1800, 14" | MSI Summit E14 A11SCS i7-1185G7, GeForce GTX 1650 Ti Max-Q, Phison 1TB SM2801T24GKBB4S-E162, IPS, 3840x2160, 14" | HP Envy 14-eb0010nr i5-1135G7, GeForce GTX 1650 Ti Max-Q, Samsung SSD PM981a MZVLB256HBHQ, IPS, 1920x1200, 14" | |
|---|---|---|---|---|---|---|---|
| Power Consumption | 22% | 44% | 8% | 24% | -10% | 5% | |
| Idle Minimum * (Watt) | 6.3 | 6.6 -5% | 5.2 17% | 6.7 -6% | 7.2 -14% | 9.9 -57% | 4.2 33% |
| Idle Average * (Watt) | 10.3 | 9.6 7% | 8.2 20% | 12.6 -22% | 10.4 -1% | 17.4 -69% | 18.3 -78% |
| Idle Maximum * (Watt) | 20 | 7.3 63% | 9.9 50% | 15.4 23% | 11 45% | 22.5 -13% | 19.2 4% |
| Load Average * (Watt) | 106.2 | 73 31% | 44.4 58% | 85.7 19% | 61.7 42% | 85.6 19% | 72.9 31% |
| Witcher 3 ultra * (Watt) | 96.1 | 74.4 23% | 35 64% | 83 14% | 53.6 44% | 70.9 26% | 61.5 36% |
| Load Maximum * (Watt) | 136.5 | 119 13% | 62.5 54% | 110.9 19% | 96 30% | 91.1 33% | 127.8 6% |
* ... Meglio usare valori piccoli
Power Consumption Witcher 3 / Stresstest
Power Consumption external Monitor
Durata della batteria
I tempi di esecuzione sono migliori del previsto, con oltre 7 ore di utilizzo reale della WLAN, molto vicini a quelli registrati sul più lento Inspiron 14 7420 2-in-1 senza grafica dedicata. Tuttavia, si noti che i nostri risultati si riferiscono solo alla configurazione da 64 Wh e non a quella inferiore da 54 Wh, che dovrebbe avere un'autonomia leggermente inferiore.
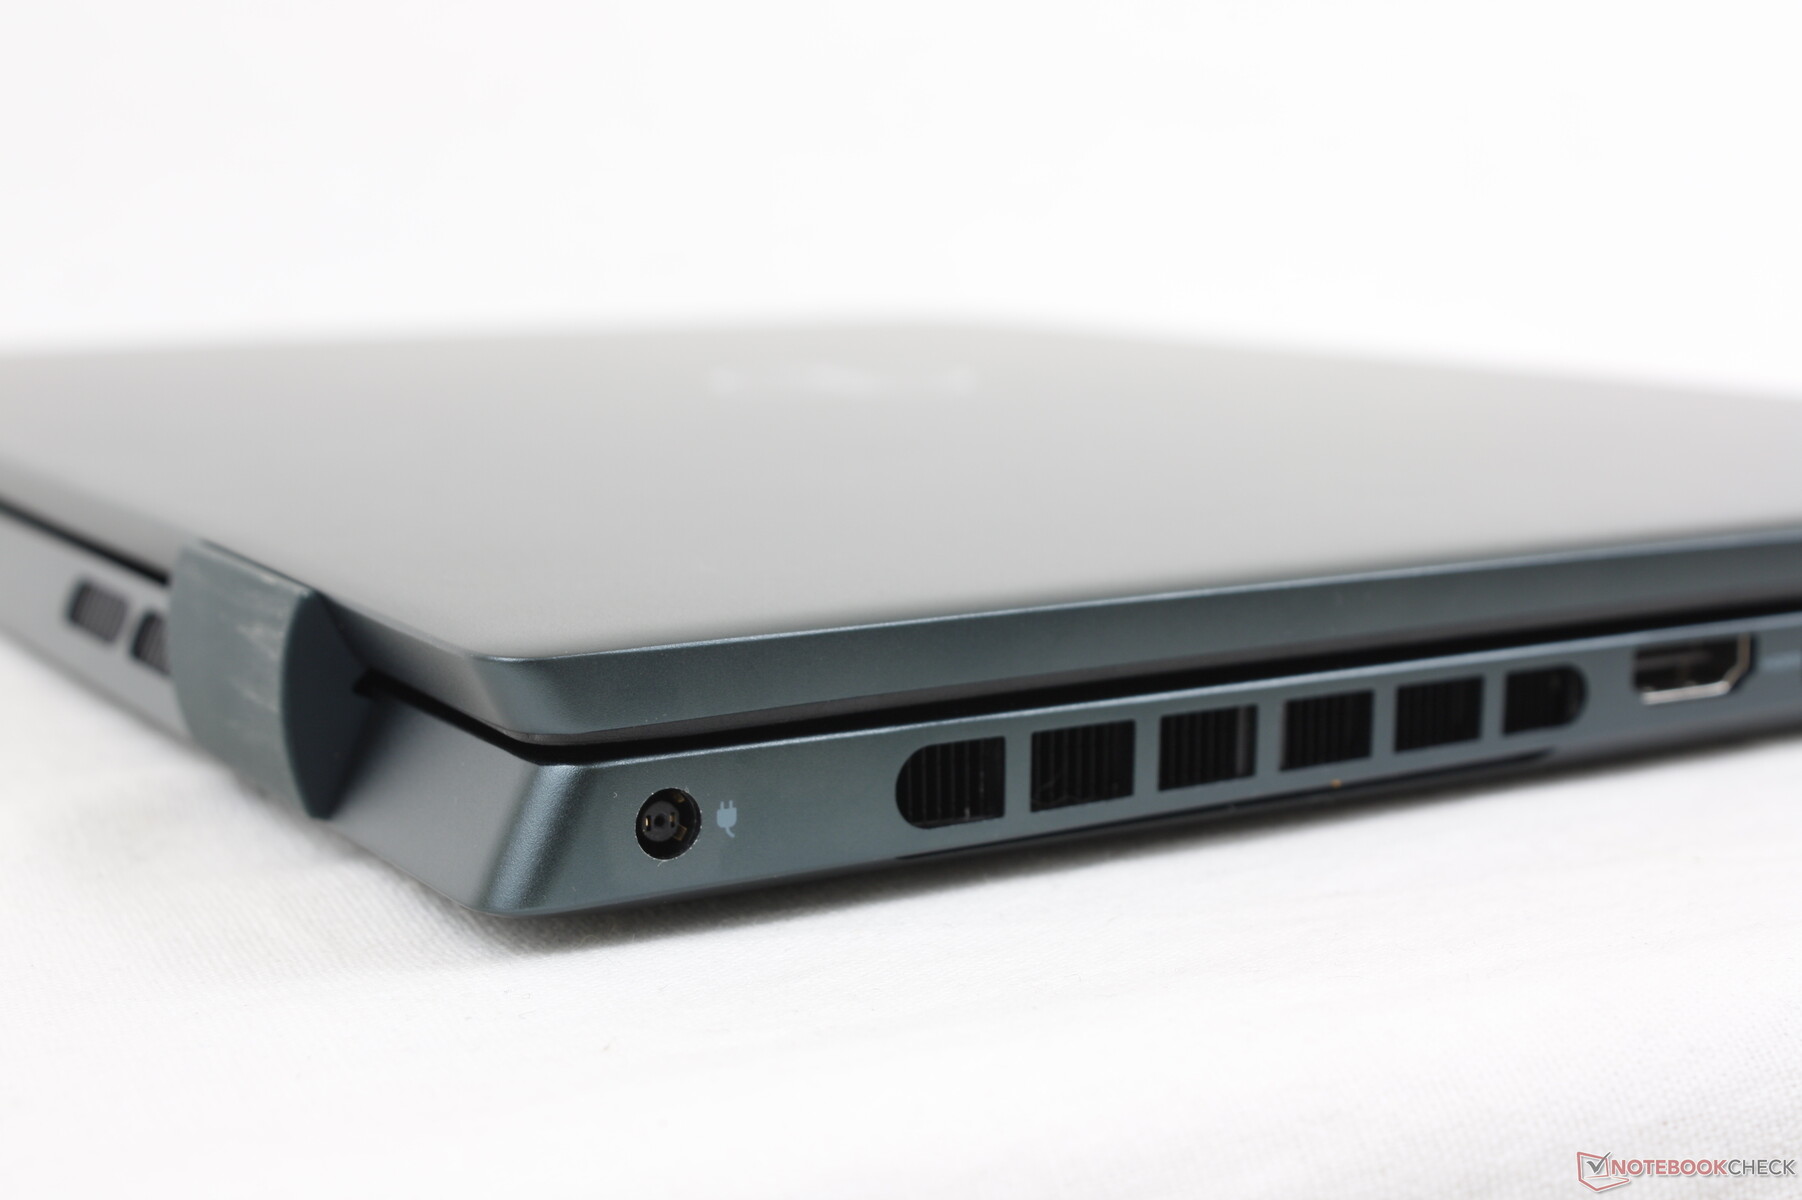
La ricarica da vuoto a pieno regime con l'adattatore CA a barile in dotazione richiede circa 2 ore. È supportata la ricarica tramite adattatori CA USB-C di terze parti.
| Dell Inspiron 14 Plus 7420 i7-12700H, GeForce RTX 3050 4GB Laptop GPU, 64 Wh | Asus Vivobook Pro 14 M3401QC-KM007T R5 5600H, GeForce RTX 3050 4GB Laptop GPU, 63 Wh | Dell Inspiron 14 7420 2-in-1 i7-1255U, Iris Xe G7 96EUs, 54 Wh | Schenker Vision 14 i7-11370H, GeForce RTX 3050 Ti Laptop GPU, 53 Wh | Asus Zenbook 14X UX5400E i7-1165G7, GeForce MX450, 63 Wh | MSI Summit E14 A11SCS i7-1185G7, GeForce GTX 1650 Ti Max-Q, 52 Wh | HP Envy 14-eb0010nr i5-1135G7, GeForce GTX 1650 Ti Max-Q, 63.3 Wh | |
|---|---|---|---|---|---|---|---|
| Autonomia della batteria | 47% | 58% | 16% | 65% | -24% | 83% | |
| Reader / Idle (h) | 11.9 | 11.5 -3% | 15.9 34% | 34 186% | 6.6 -45% | 27.7 133% | |
| WiFi v1.3 (h) | 7.2 | 9.5 32% | 7.6 6% | 5.5 -24% | 5.4 -25% | 4.5 -37% | 10.8 50% |
| Load (h) | 0.9 | 1.9 111% | 2.1 133% | 1.4 56% | 1.2 33% | 1 11% | 1.5 67% |
| H.264 (h) | 6.8 |
Pro
Contro
Verdetto - Prestazioni per taglie forti, peso per taglie forti
Se volete massimizzare le prestazioni di CPU e GPU sul vostro prossimo portatile da 14 pollici, prendete in considerazione il più costoso Razer Blade 14 o Asus Zephyrus G14. Se siete alla ricerca di un Ultrabook da 14 pollici sottile e leggero, allora il modello Asus Zenbook 14 o LG Gram 14 potrebbero essere le opzioni migliori. Per avere il meglio di entrambi i mondi, tuttavia, il Dell Inspiron 14 Plus 7420 è in grado di mantenere una linea sottile tra prestazioni estreme e portabilità, pur mantenendo i prezzi a livelli ragionevoli. Chi viaggia spesso e ha bisogno di prestazioni superiori a quelle offerte dalla serie Core U e dalla grafica integrata troverà nel Dell una soluzione solida.
L'inserimento di tanta potenza in uno chassis da 14 pollici comporta i soliti svantaggi: temperature più elevate, rumorosità della ventola, peso maggiore e consumo energetico più elevato rispetto alla maggior parte degli altri portatili della categoria da 14 pollici. Di questi quattro svantaggi, riteniamo che il peso sia quello che potrebbe essere migliorato di più, dato che il concorrenteAsus Vivobook Pro 14 è dotato di CPU AMD serie H e della stessa GPU RTX 3050 di GeForce, ma pesa un paio di centinaia di grammi in meno. Le ventole sono almeno eccellenti nel rimanere silenziose durante i carichi di elaborazione più bassi e quindi sono rumorose solo quando si eseguono applicazioni impegnative.
L'Inspiron 14 Plus 7420 può essere pesante, ma è in grado di svolgere il lavoro a velocità superiori rispetto al tipico Ultrabook.
Altri inconvenienti sono il clickpad spugnoso e il coperchio flessibile. Per un portatile da 14 pollici così pesante, sarebbe stato gradito un coperchio più rigido. Il vantaggio in termini di prestazioni rispetto alla maggior parte dei portatili da 14 pollici in questa fascia di prezzo è altrimenti il principale punto di forza del sistema.
Prezzo e disponibilità
L'Inspiron 14 Plus 7420 a conchiglia è ora in spedizione su Amazon e Newegg Rispettivamente a 1300 e 1400 dollari. Tuttavia, le configurazioni sono attualmente limitate alla sola grafica integrata. Si consiglia di acquistare direttamente da Dell se si desidera la SKU GeForce RTX 3050.
Dell Inspiron 14 Plus 7420
- 08/30/2022 v7 (old)
Allen Ngo
Price comparison

