Recensione dell'MSI WE76: La workstation mobile punta alle massime prestazioni

MSI ha venduto i suoi portatili da gioco con leggere modifiche come workstation mobili in passato. Dato che i portatili da gioco sono anche progettati per alte prestazioni, questa mossa ha senso. Il nuovo MSI WE76 è basato sull'MSI GE76, che abbiamo già recensito. Ma invece delle unità grafiche consumer GeForce, il WE76 usa le nuove GPU professionali RTX A di Nvidia, fornendo le certificazioni anche per il software professionale.
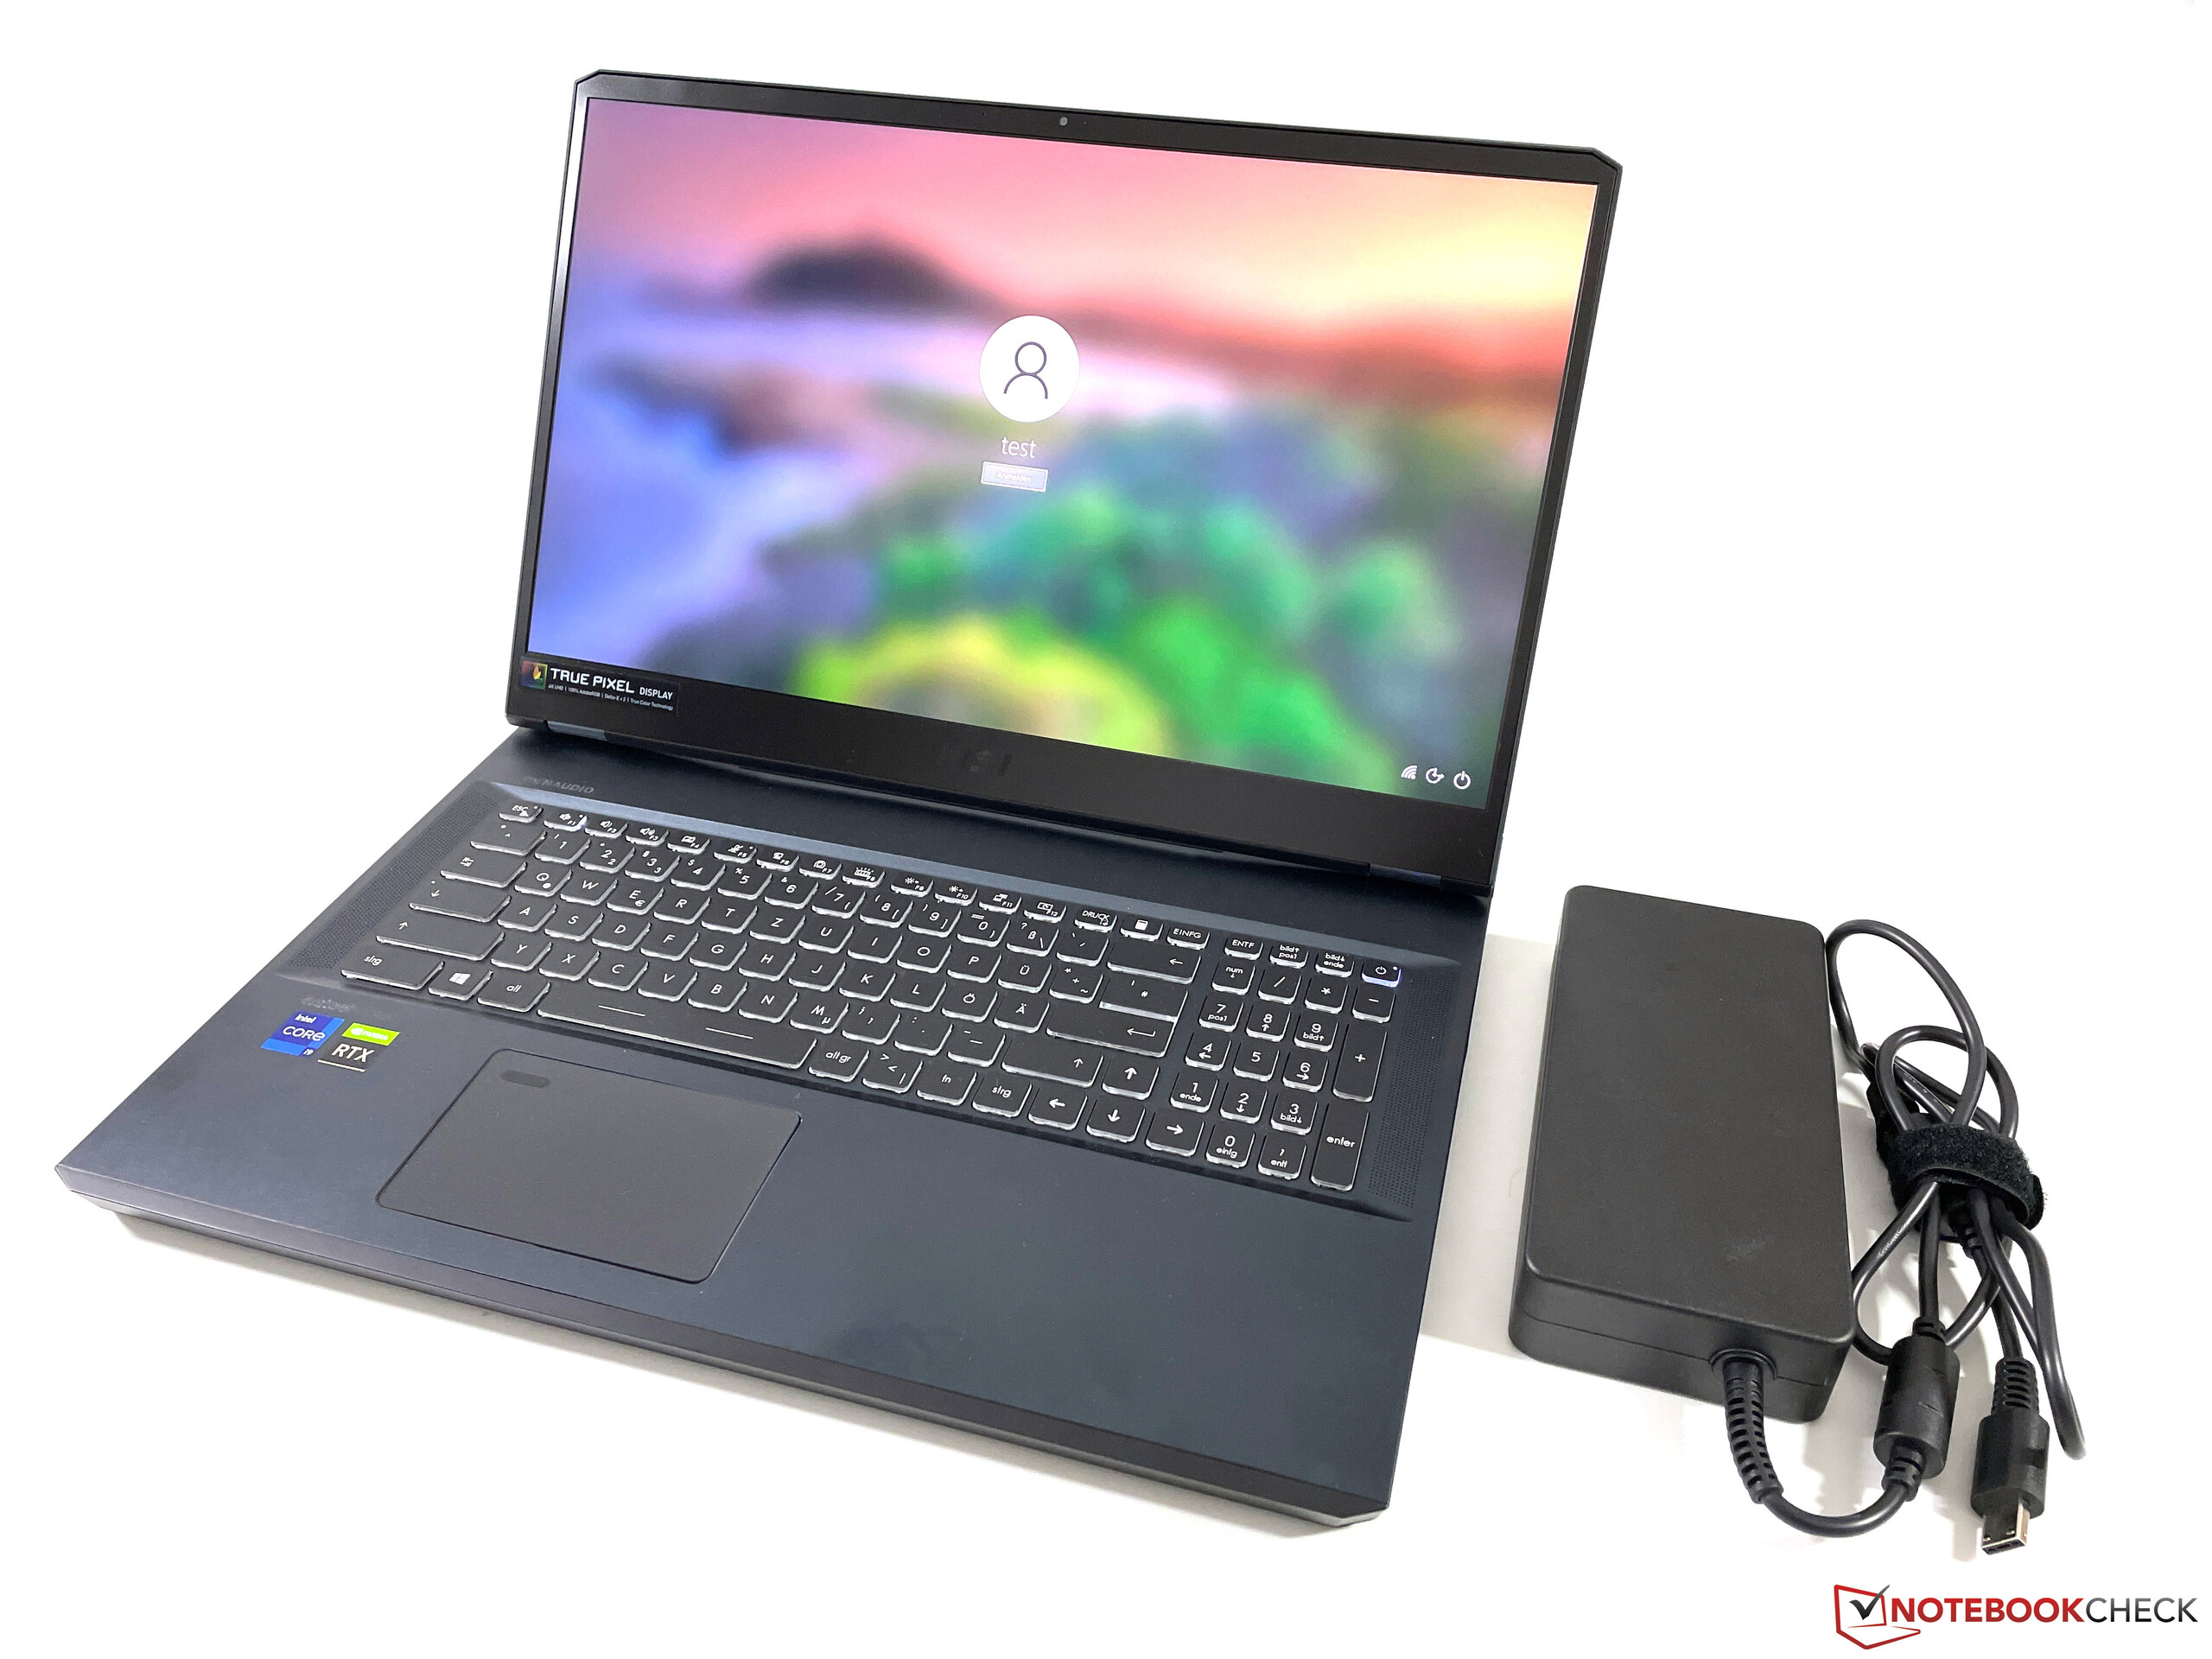
La nostra unità di recensione è la variante high-end WE76 11UM-456 che costa 4.799 euro (~$5.419) ed è equipaggiata con il Processore Core i9-11980HK, il professionale RTX A5000 GPU32 GB di RAM, un SSD PCIe 4.0 da 2 TB e un pannello 4K opaco con copertura completa AdobeRGB. C'è anche il modello alternativo WE76 11UK-464 che viene fornito con il Core i7-11800H, ilRTX A3000e un più piccolo SSD da 1 TB per 3.099 euro (~$3.499).
Possible contenders in comparison
Punteggio | Data | Modello | Peso | Altezza | Dimensione | Risoluzione | Prezzo |
|---|---|---|---|---|---|---|---|
| 88.6 % v7 (old) | 12/2021 | MSI WE76 11UM-456 i9-11980HK, RTX A5000 Laptop GPU | 2.9 kg | 25.9 mm | 17.30" | 3840x2160 | |
| 89.8 % v7 (old) | 11/2021 | Lenovo ThinkPad P1 G4-20Y4S0KS00 i7-11850H, GeForce RTX 3070 Laptop GPU | 2 kg | 17.7 mm | 16.00" | 3840x2400 | |
| 90.3 % v7 (old) | 10/2021 | HP ZBook Fury 15 G8 i9-11950H, RTX A5000 Laptop GPU | 2.5 kg | 25.9 mm | 15.60" | 3840x2160 | |
v (old) | 12/2021 | Asus ProArt StudioBook 16 W7600H5A-2BL2 W-11955M, RTX A5000 Laptop GPU | 2.4 kg | 21.4 mm | 16.00" | 3840x2400 | |
| 87.8 % v7 (old) | 10/2021 | Lenovo ThinkPad P17 G2-20YU0025G i7-11800H, RTX A2000 Laptop GPU | 3.6 kg | 28.38 mm | 17.30" | 1920x1080 | |
| 89.8 % v7 (old) | 04/2021 | HP ZBook Fury 17 G7 119W5EA i9-10885H, Quadro RTX 4000 Max-Q | 2.9 kg | 26.9 mm | 17.30" | 3840x2160 |
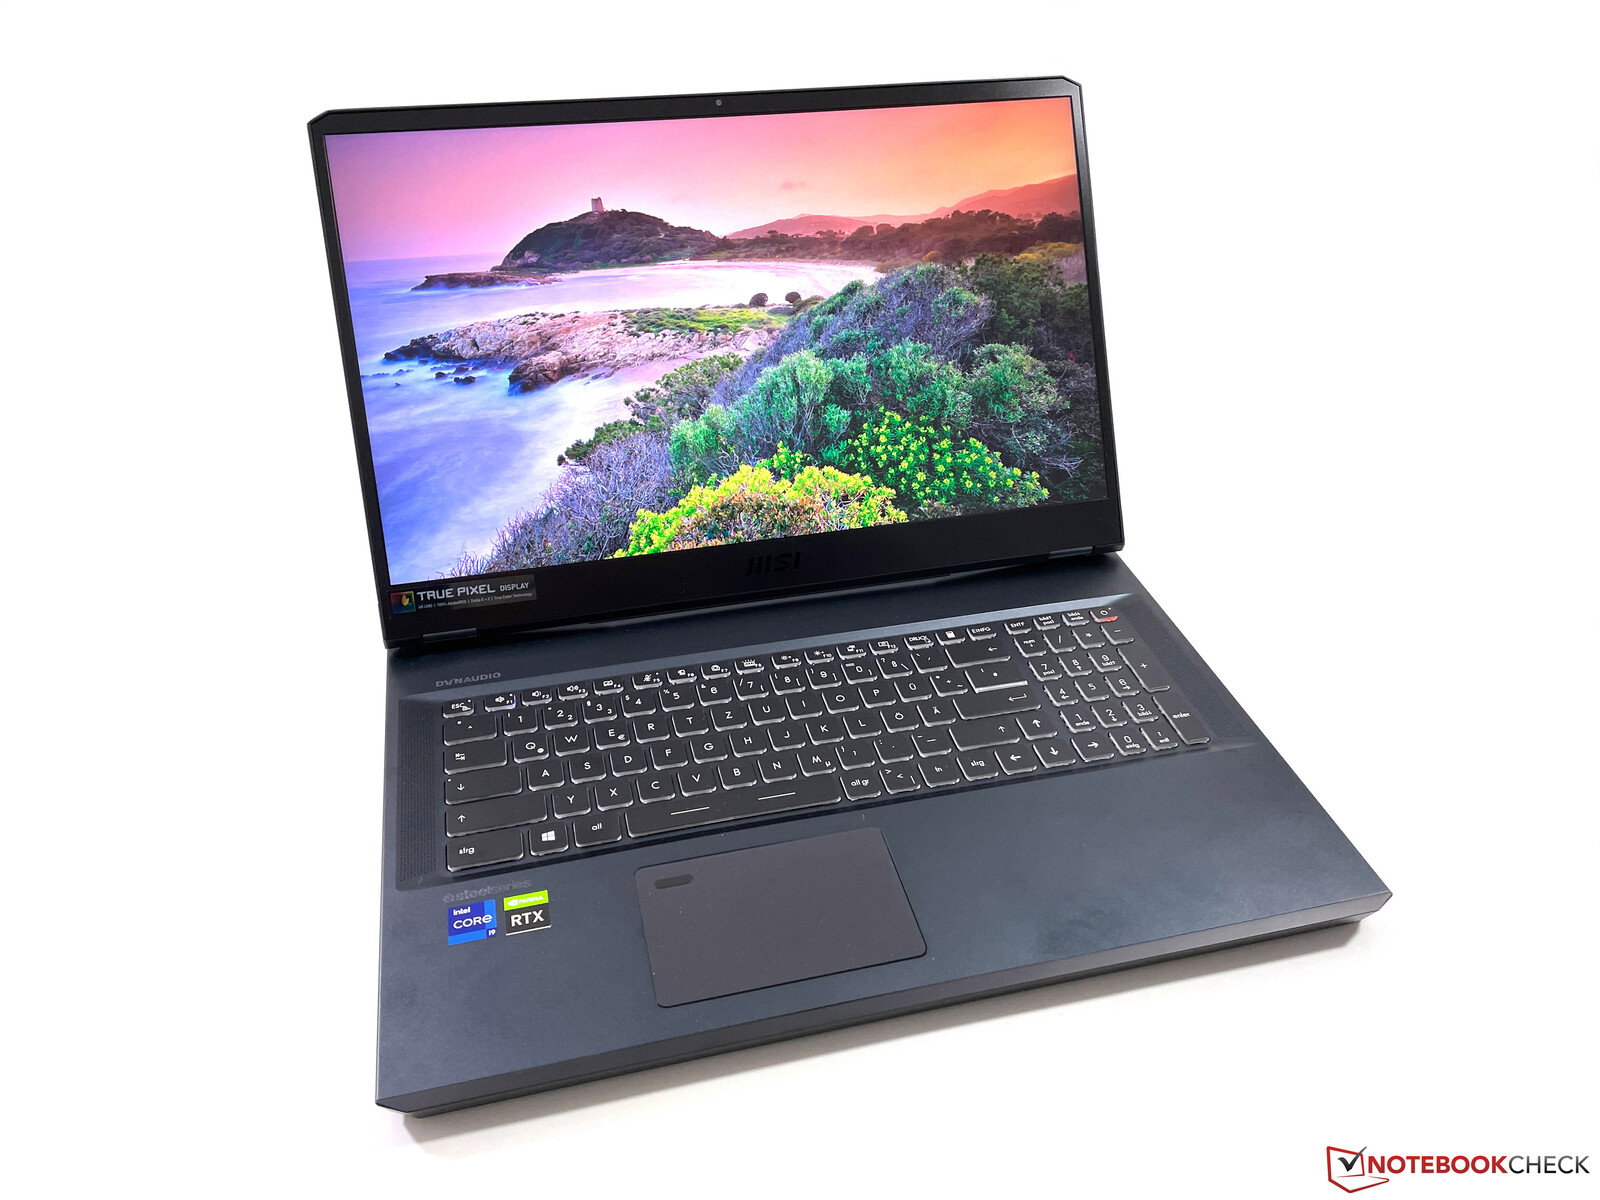
Case - MSI fa a meno dell'illuminazione
Il case dell'MSI WE76 è identico a quello del modello da gioco GE76, ma il produttore ha omesso la striscia LED sul bordo anteriore. Il design ricorda un powerhouse da gioco, ma le superfici nere e grigie opache rendono la workstation mobile abbastanza discreta, il che dovrebbe adattarsi bene anche in un ambiente d'ufficio. A causa dell'uso di un display 16:9 (che è anche il caso di molti altri modelli da 17 pollici), la cornice dello schermo sotto il display sembra molto ampia, e anche il rapporto tra il display e il case è solo del 73%.
In termini di stabilità e lavorazione, il nostro esemplare in prova è eccellente; l'unità base in particolare è estremamente resistente alla torsione. Il coperchio è un po' più flessibile, ma non possiamo causare alcuna distorsione dell'immagine. Le cerniere sono fondamentalmente anche ben regolate, anche se non possono impedire al display di oscillare in una certa misura. Inoltre, questo design delle cerniere limita l'angolo massimo di apertura a 135 gradi, che non è così generoso come in alcuni altri concorrenti
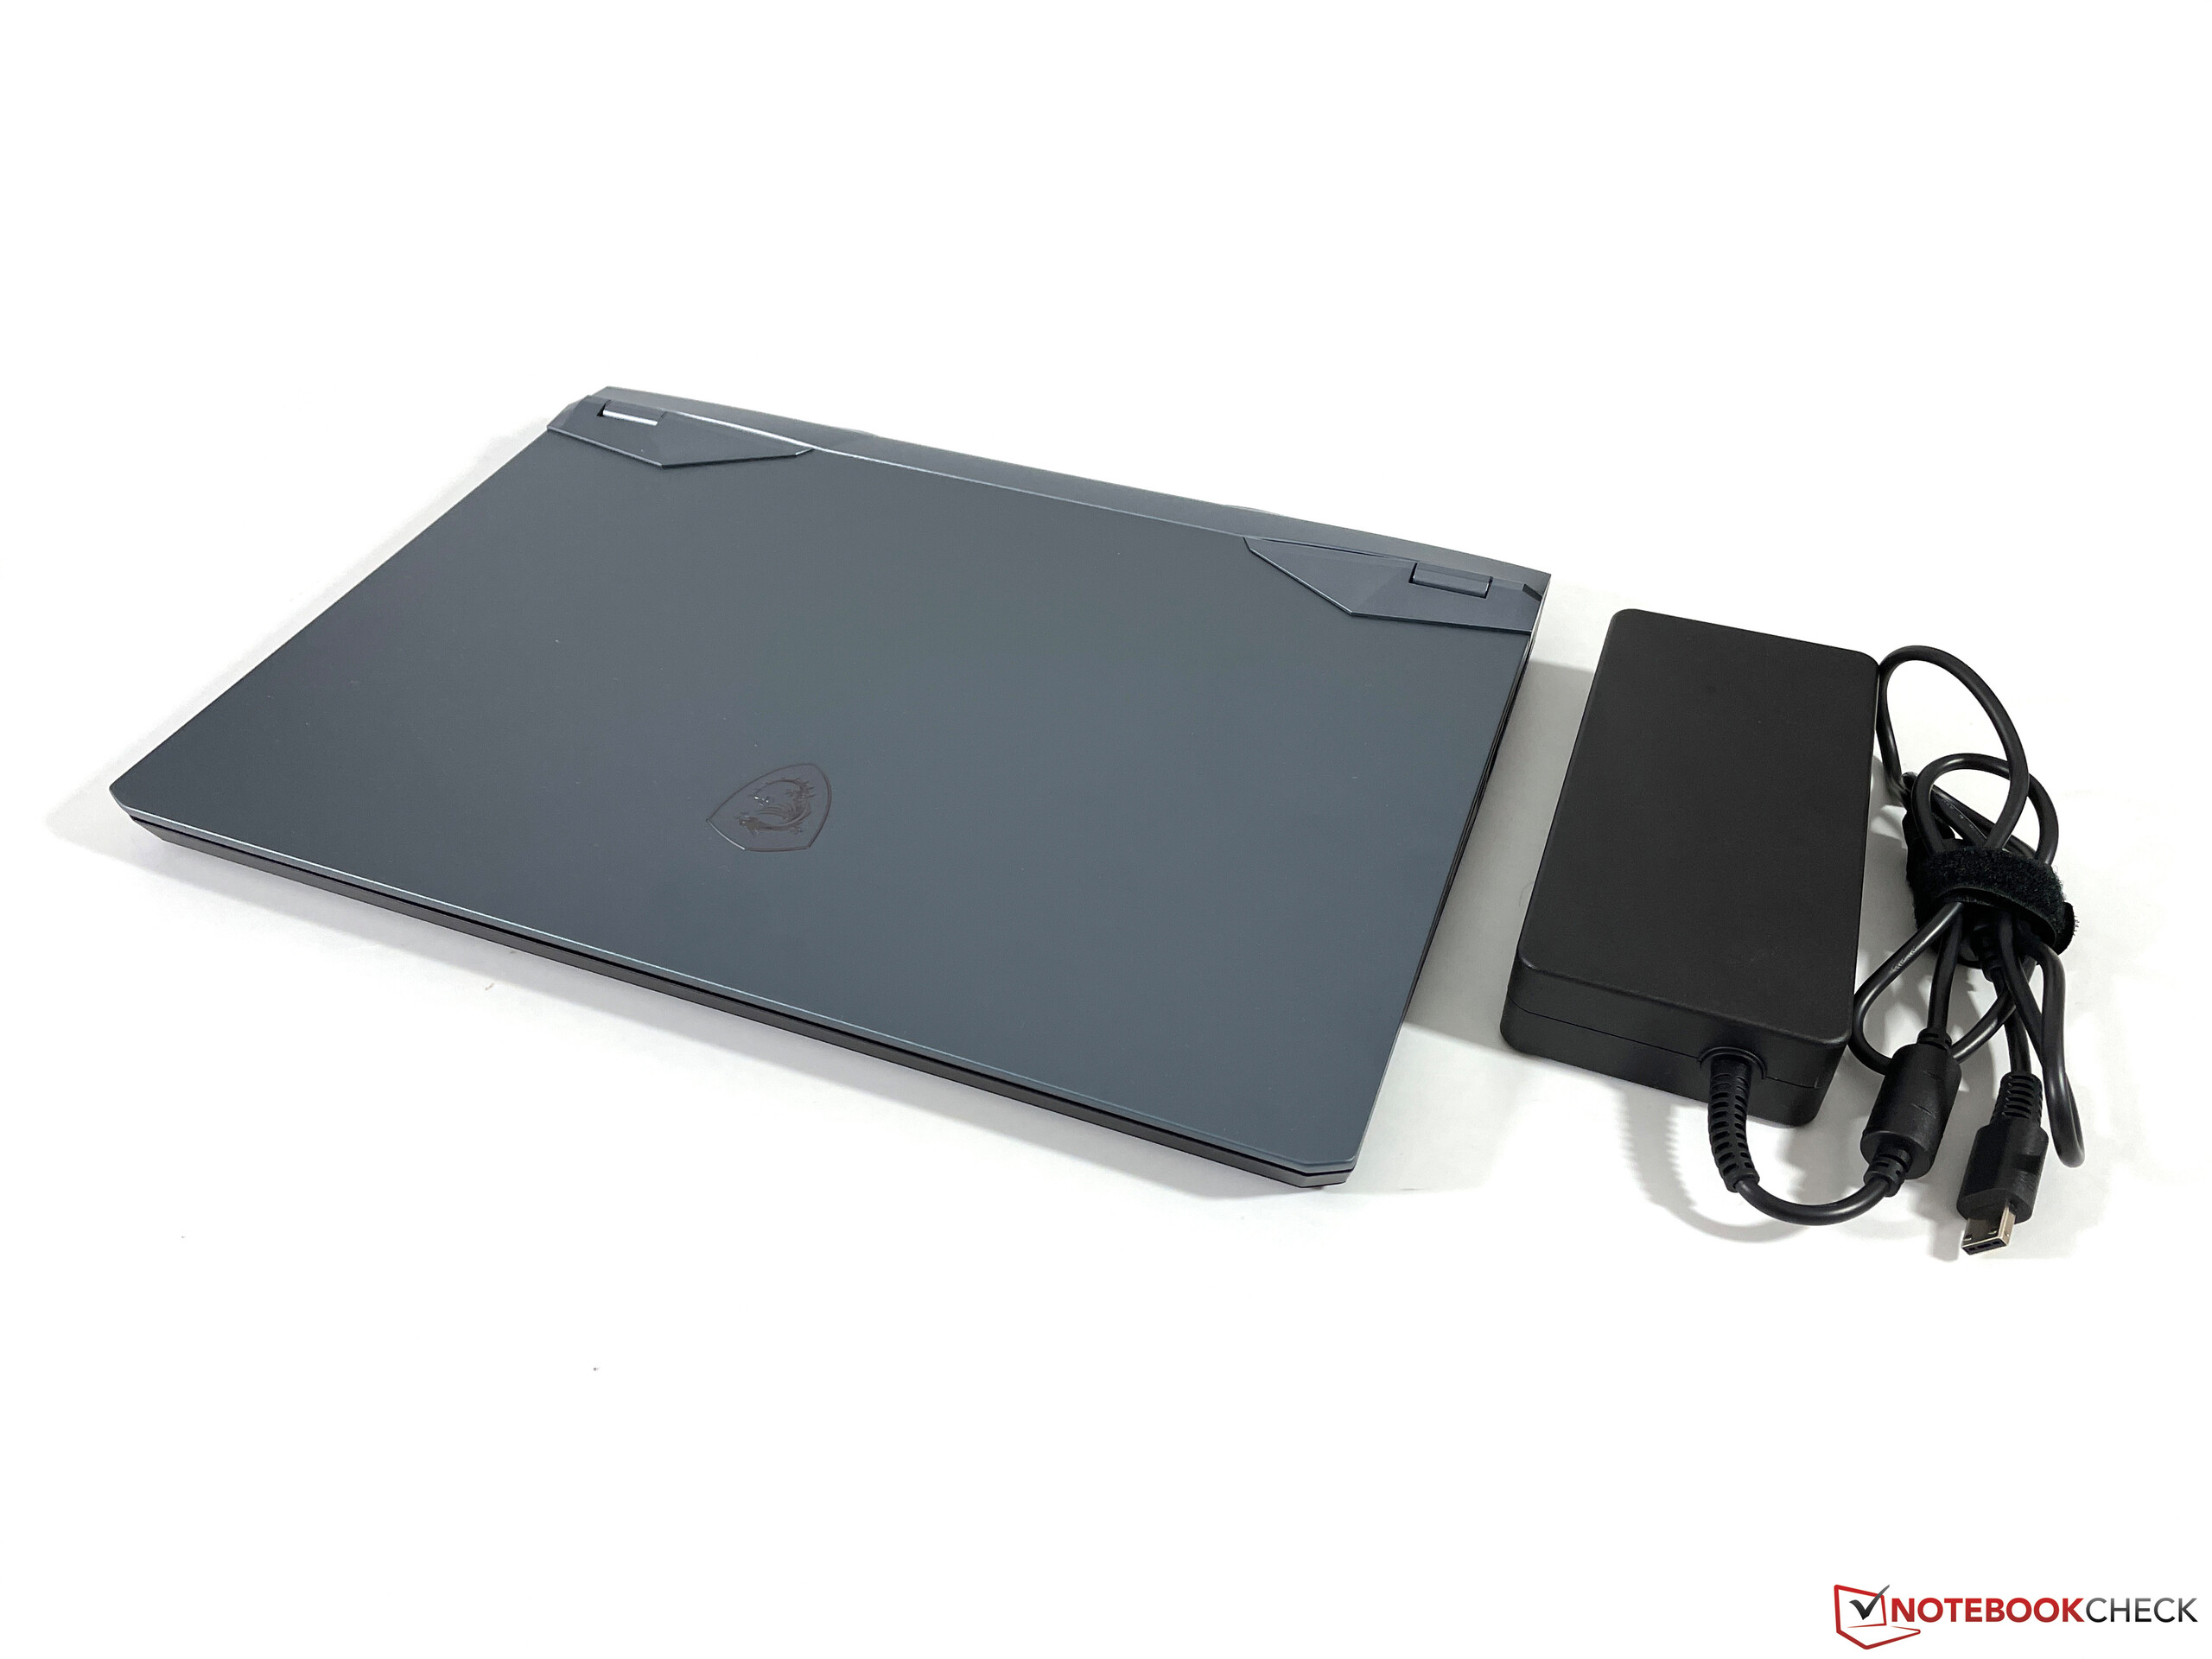
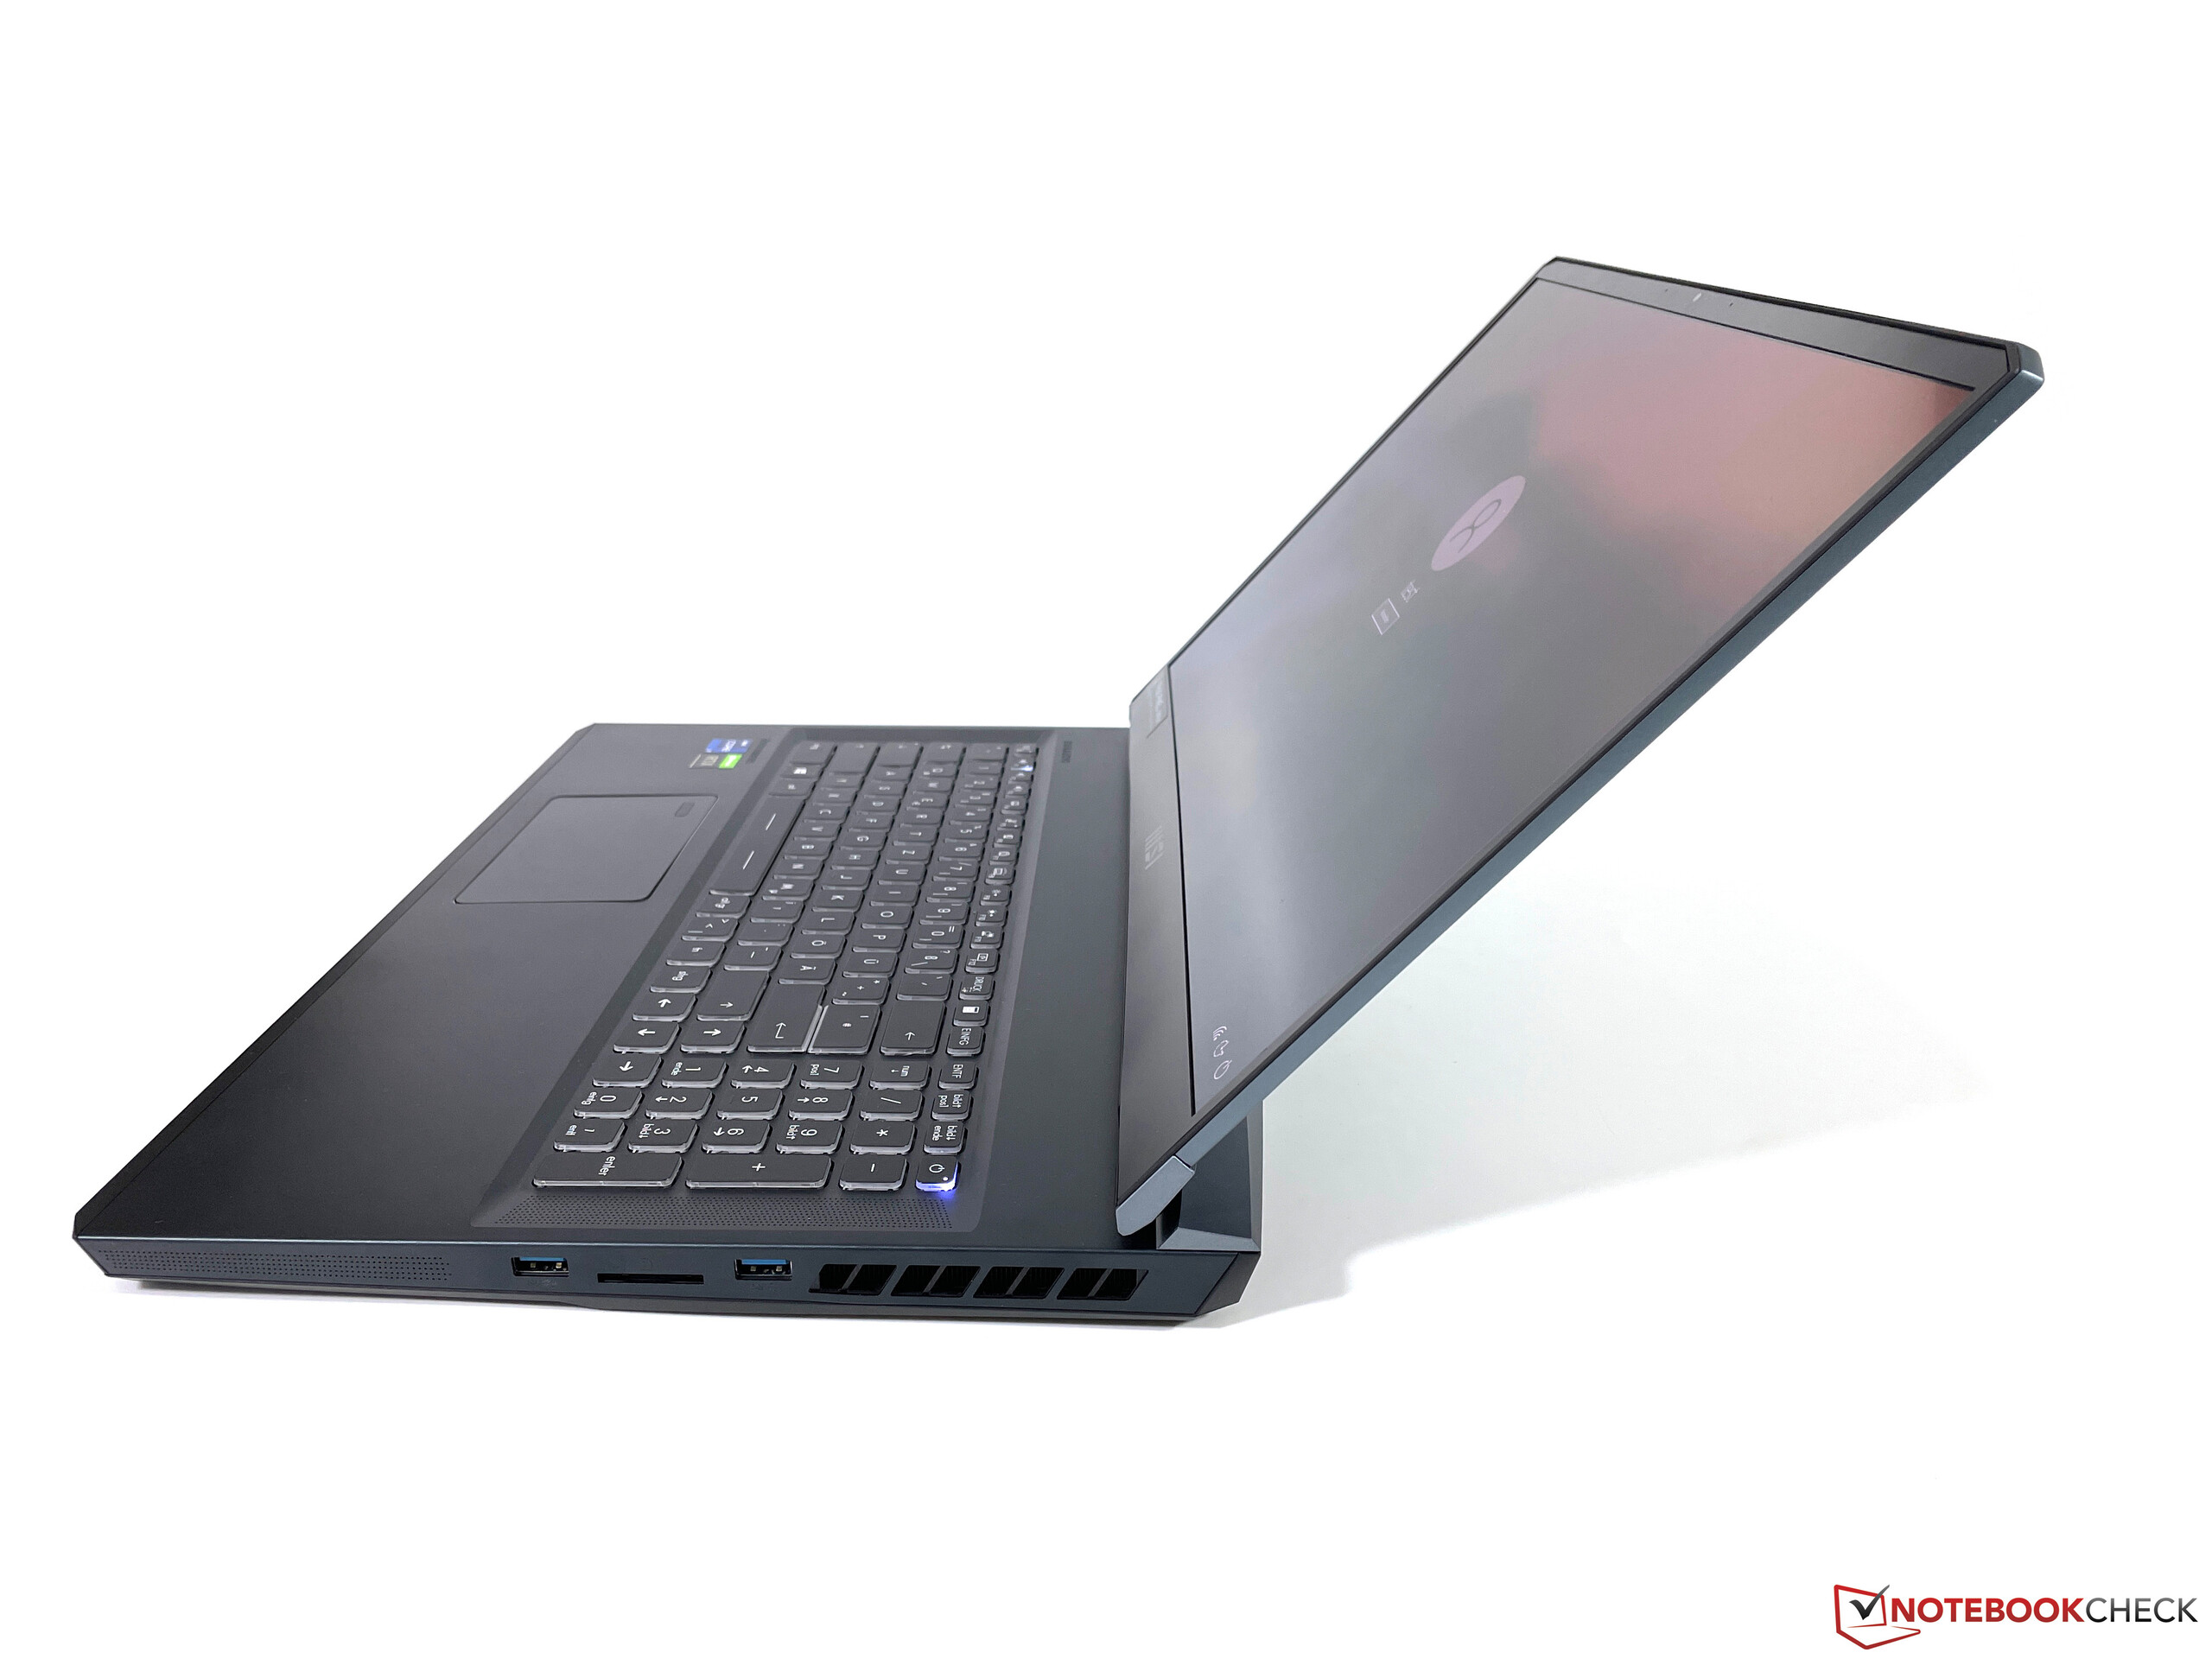
Il WE76 è una stazione di lavoro mobile convenzionale con un focus sulle prestazioni. Di conseguenza, non ci si è concentrati sul rendere il dispositivo il più sottile e snello possibile. Tuttavia, la differenza è piuttosto piccola nel confronto diretto con i nostri due concorrenti da 17 pollici, il ThinkPad P17e loZBook Fury 17. Il nostro dispositivo di test pesa 2.922 grammi, ma bisogna aggiungere altri 1.060 grammi per l'ingombrante adattatore di alimentazione quando si trasporta il portatile.
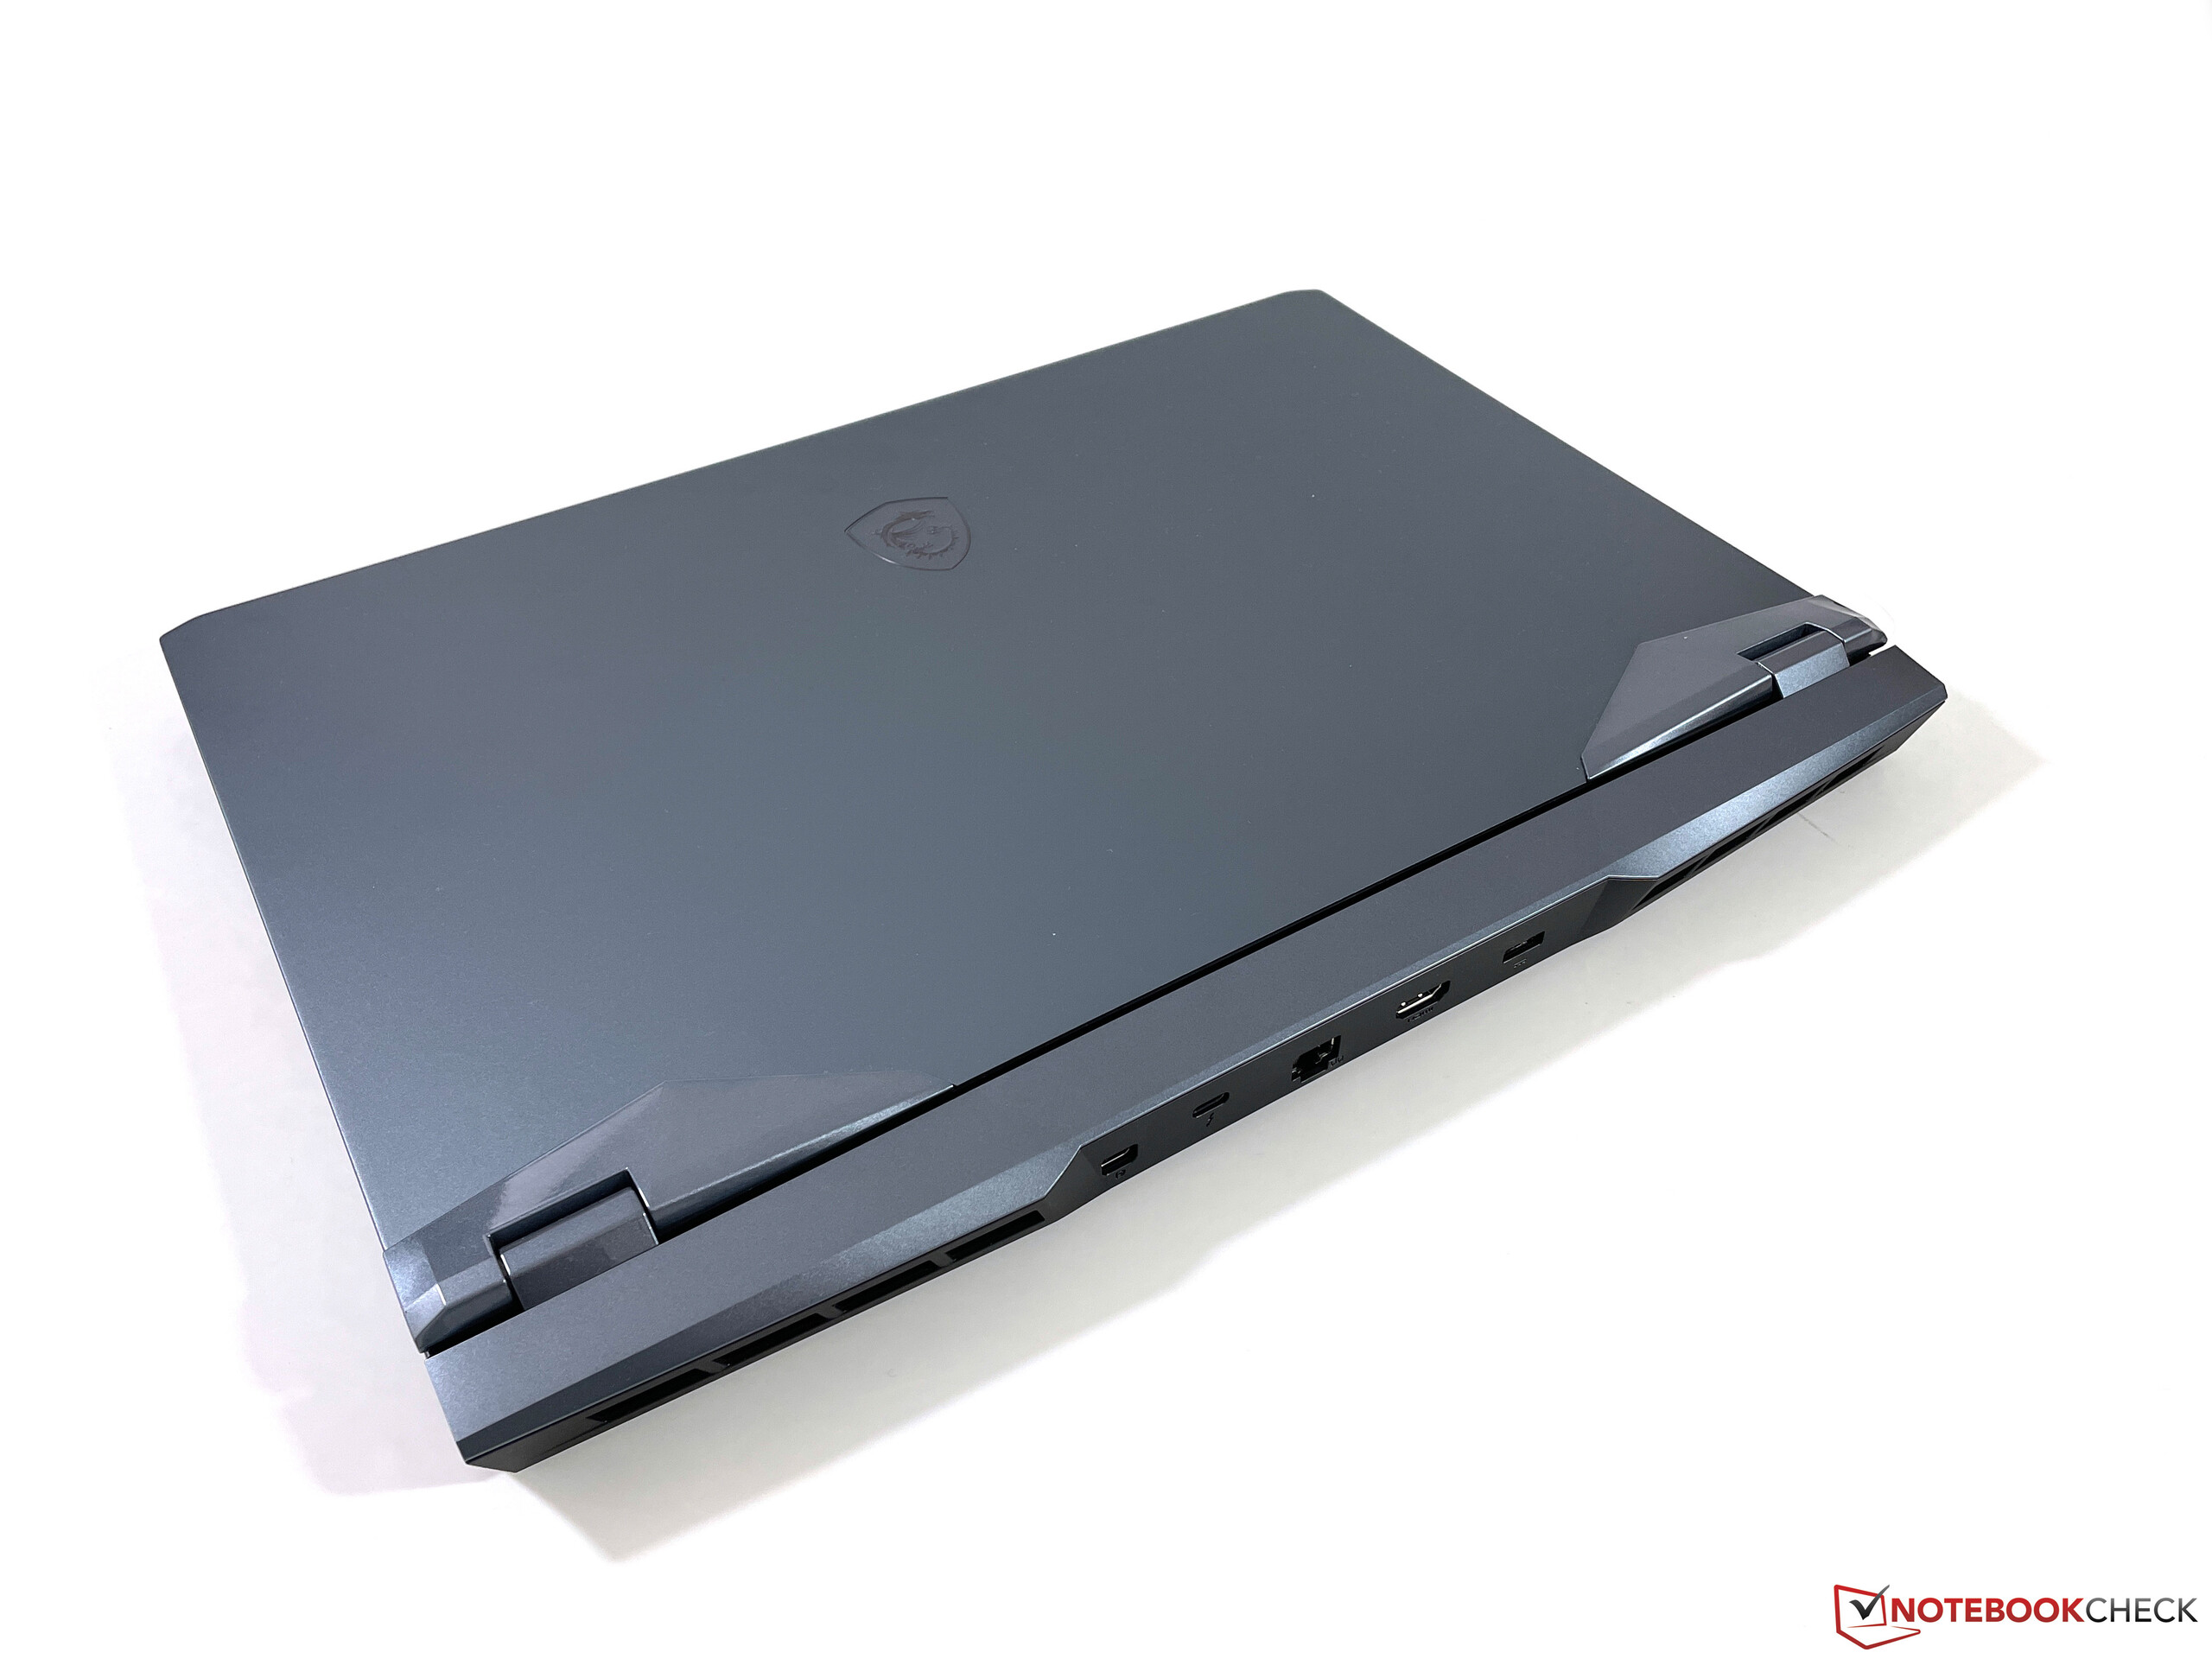
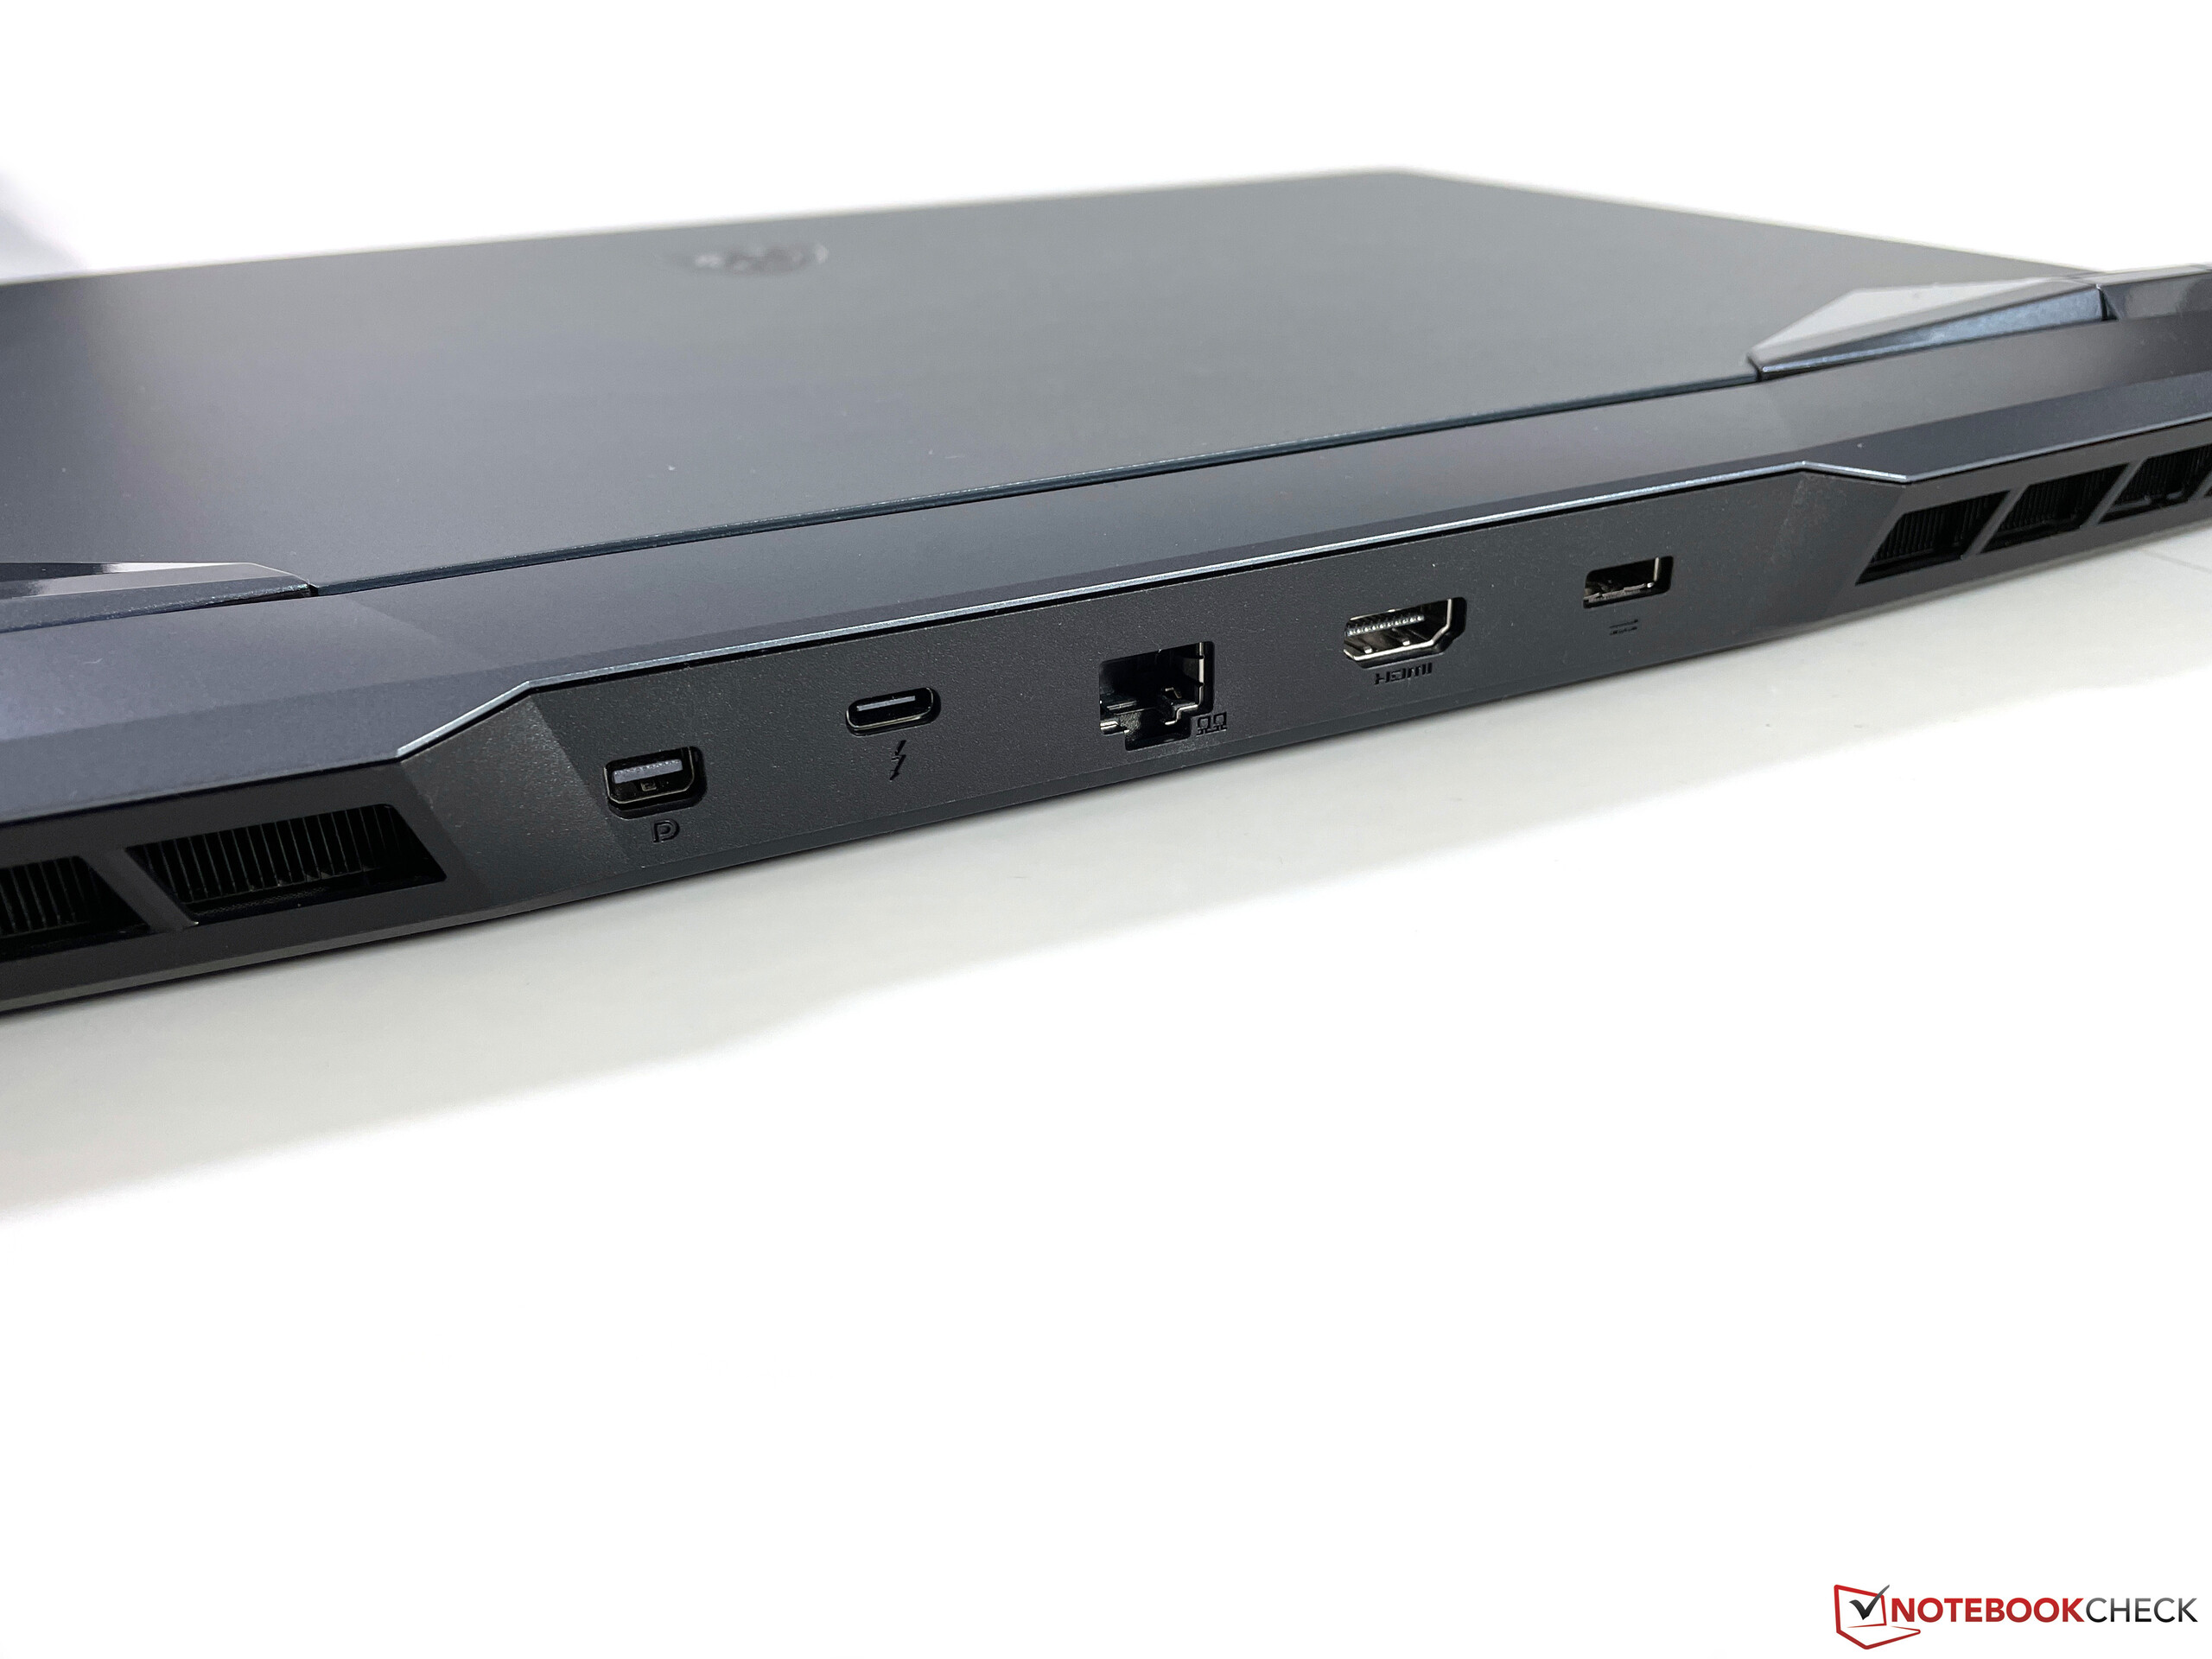
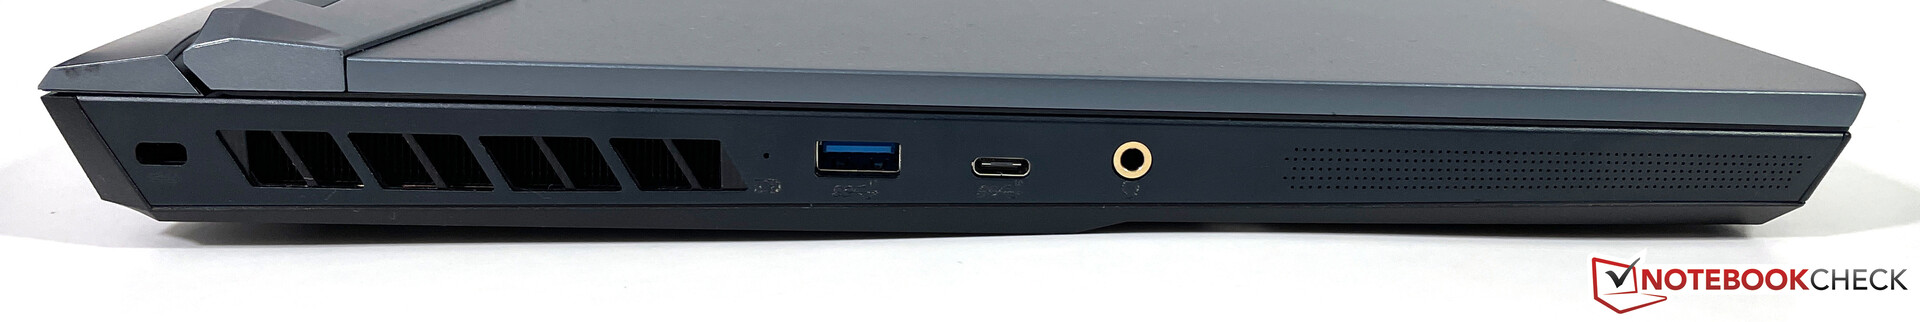
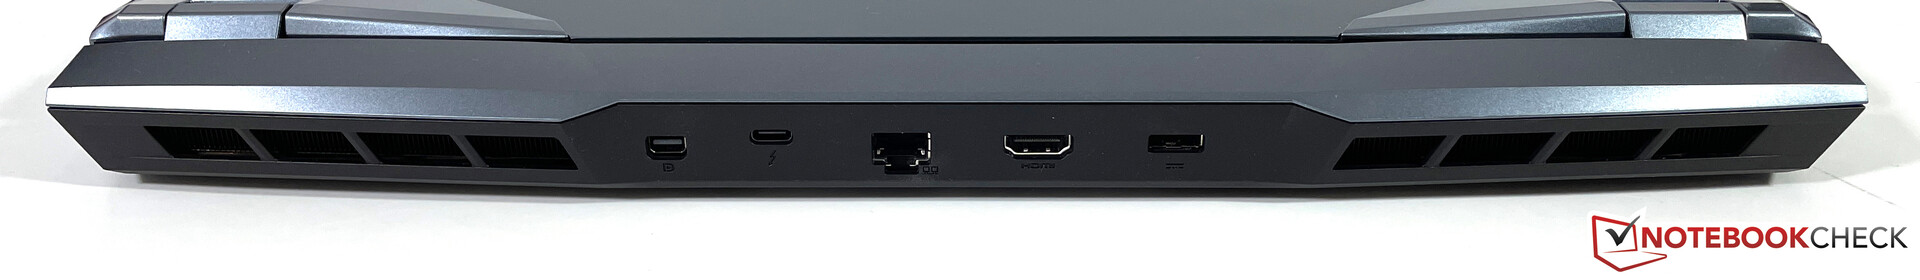
Connettività - WE76 con Thunderbolt 4/USB 4
Quando si tratta di porte, troverete tutto ciò che il vostro cuore desidera, comprese abbastanza porte USB e la moderna interfaccia Thunderbolt 4. Le porte per l'alimentatore, la LAN e i monitor esterni (massimo tre) sono sul retro, mentre le porte USB e il lettore di schede sono stati posizionati sui lati per un rapido accesso. Un lettore di smart card opzionale, d'altra parte, non è disponibile
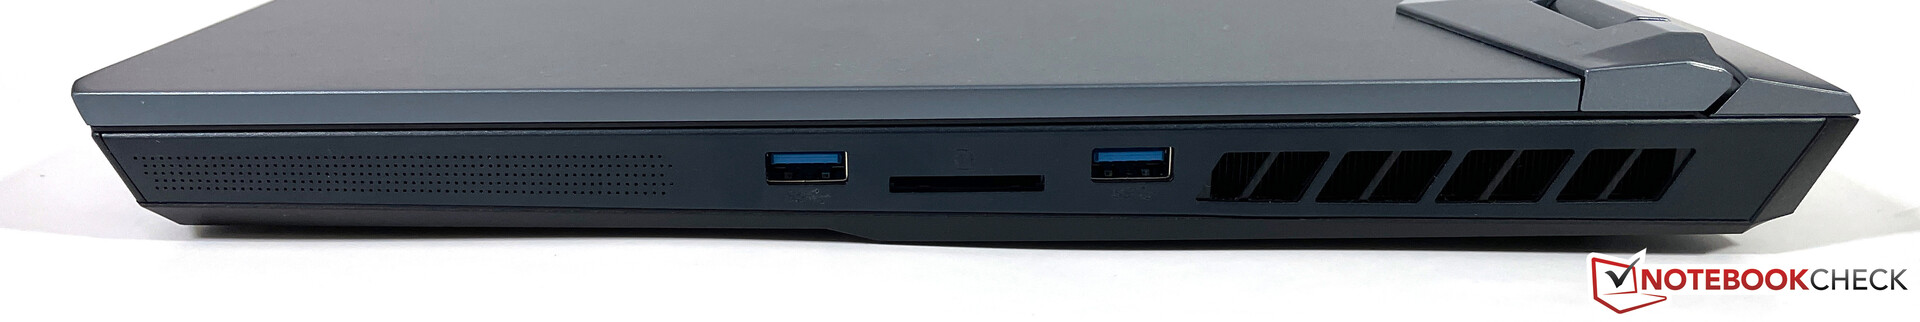
Lettore di schede SD
Il lettore di schede SD completo sulla destra è più veloce di quello del vecchio WE75. Determiniamo velocità di trasferimento di 80-90 MB/s con la nostra scheda di riferimento (Angelbird AV Pro V60). Questo è accettabile, ma alcuni concorrenti offrono moduli notevolmente più veloci. Una scheda SD inserita sporge di 4 millimetri dal case
| SD Card Reader | |
| average JPG Copy Test (av. of 3 runs) | |
| Lenovo ThinkPad P17 G2-20YU0025G (Toshiba Exceria Pro SDXC 64 GB UHS-II) | |
| HP ZBook Fury 17 G7 119W5EA (AV Pro 60) | |
| Media della classe Workstation (49.6 - 681, n=14, ultimi 2 anni) | |
| MSI WE76 11UM-456 (AV Pro V60) | |
| HP ZBook Fury 15 G8 (AV Pro V60) | |
| Asus ProArt StudioBook 16 W7600H5A-2BL2 (AV Pro SD microSD 128 GB V60) | |
| MSI WE75 9TK (Toshiba Exceria Pro SDXC 64 GB UHS-II) | |
| maximum AS SSD Seq Read Test (1GB) | |
| Media della classe Workstation (87.6 - 1455, n=14, ultimi 2 anni) | |
| Lenovo ThinkPad P17 G2-20YU0025G (Toshiba Exceria Pro SDXC 64 GB UHS-II) | |
| HP ZBook Fury 17 G7 119W5EA (AV Pro 60) | |
| MSI WE76 11UM-456 (AV Pro V60) | |
| HP ZBook Fury 15 G8 (AV Pro V60) | |
| Asus ProArt StudioBook 16 W7600H5A-2BL2 (AV Pro SD microSD 128 GB V60) | |
| MSI WE75 9TK (Toshiba Exceria Pro SDXC 64 GB UHS-II) | |
Comunicazione
MSI utilizza il veloce modulo Killer AX1675x, che supporta il moderno standard Wi-Fi 6E e il Bluetooth 5.2. Le velocità di trasferimento sono molto buone e in cima al nostro campo di confronto nel nostro test Wi-Fi standardizzato con il router Netgear Nighthawk RAX120
Webcam
Anche se la webcam 1080p sopra il display offre una risoluzione leggermente superiore ai soliti moduli 720p, la qualità dell'immagine non è ancora particolarmente buona. Abbiamo dovuto fare i conti con una quantità relativamente alta di rumore in particolare durante le nostre registrazioni. I video Full HD possono essere girati a 30 FPS


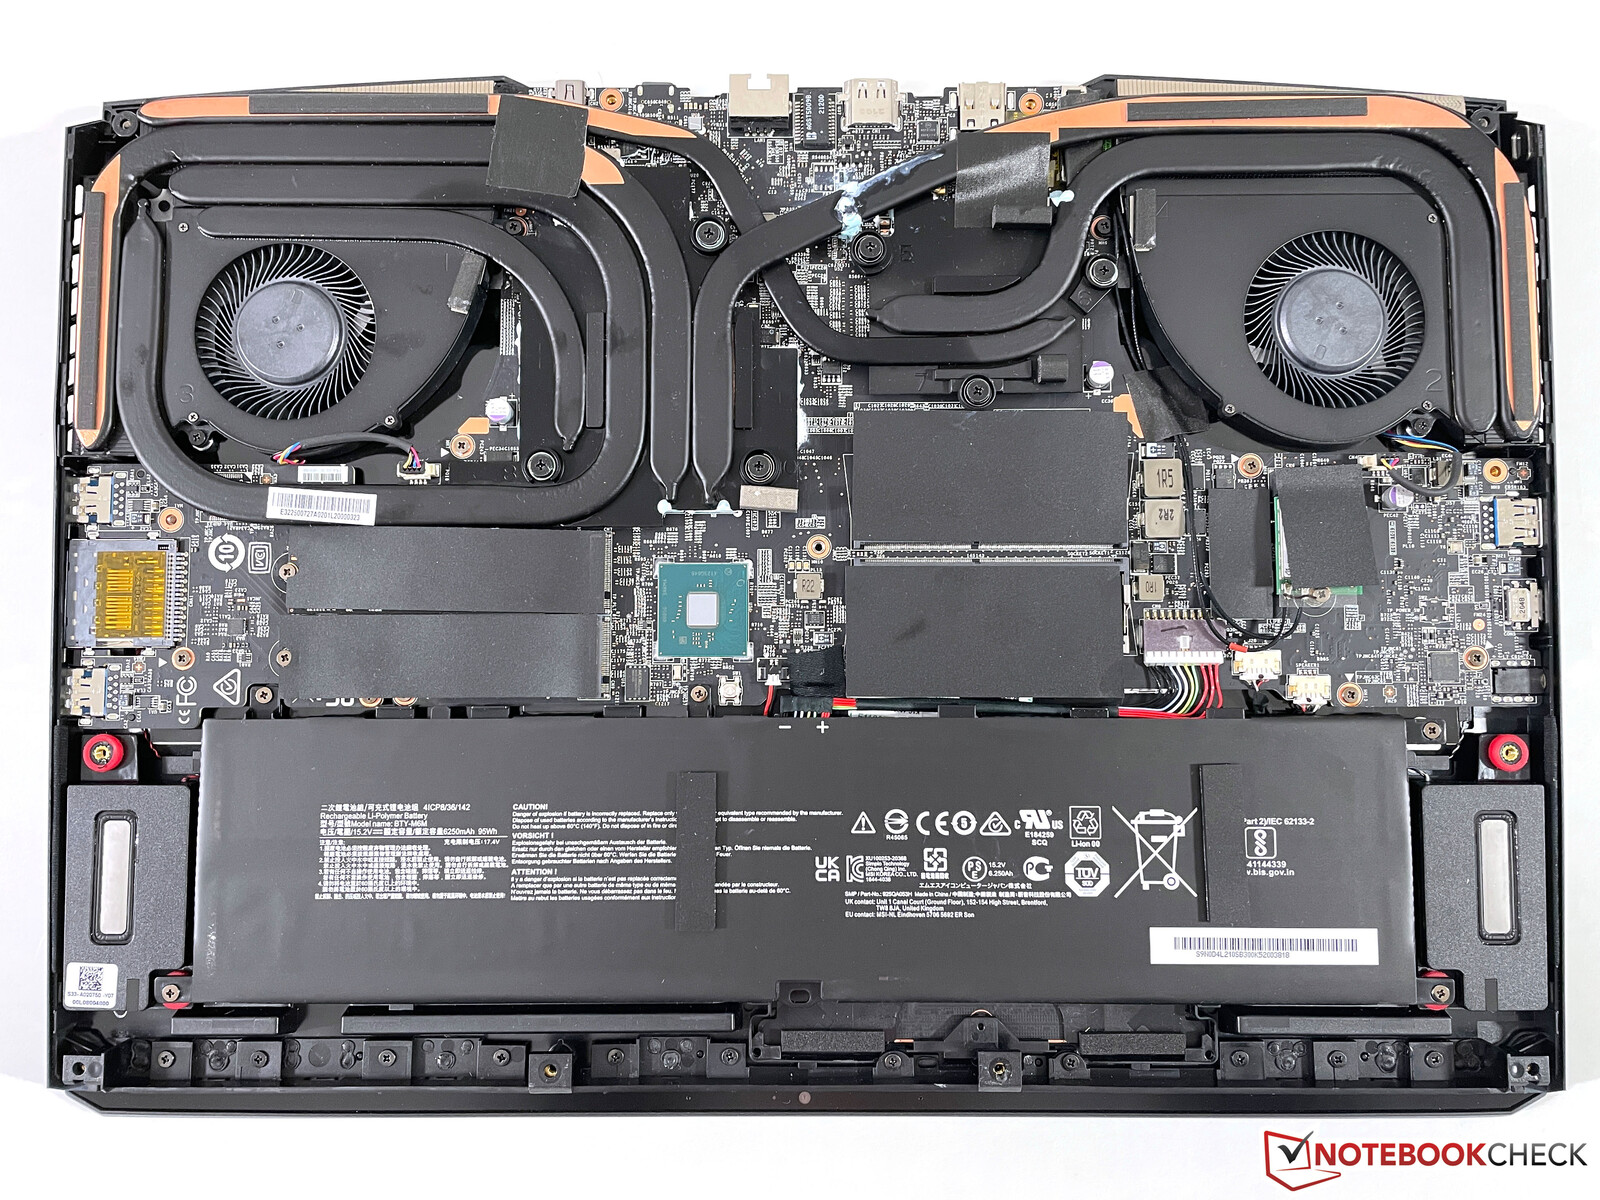
Manutenzione
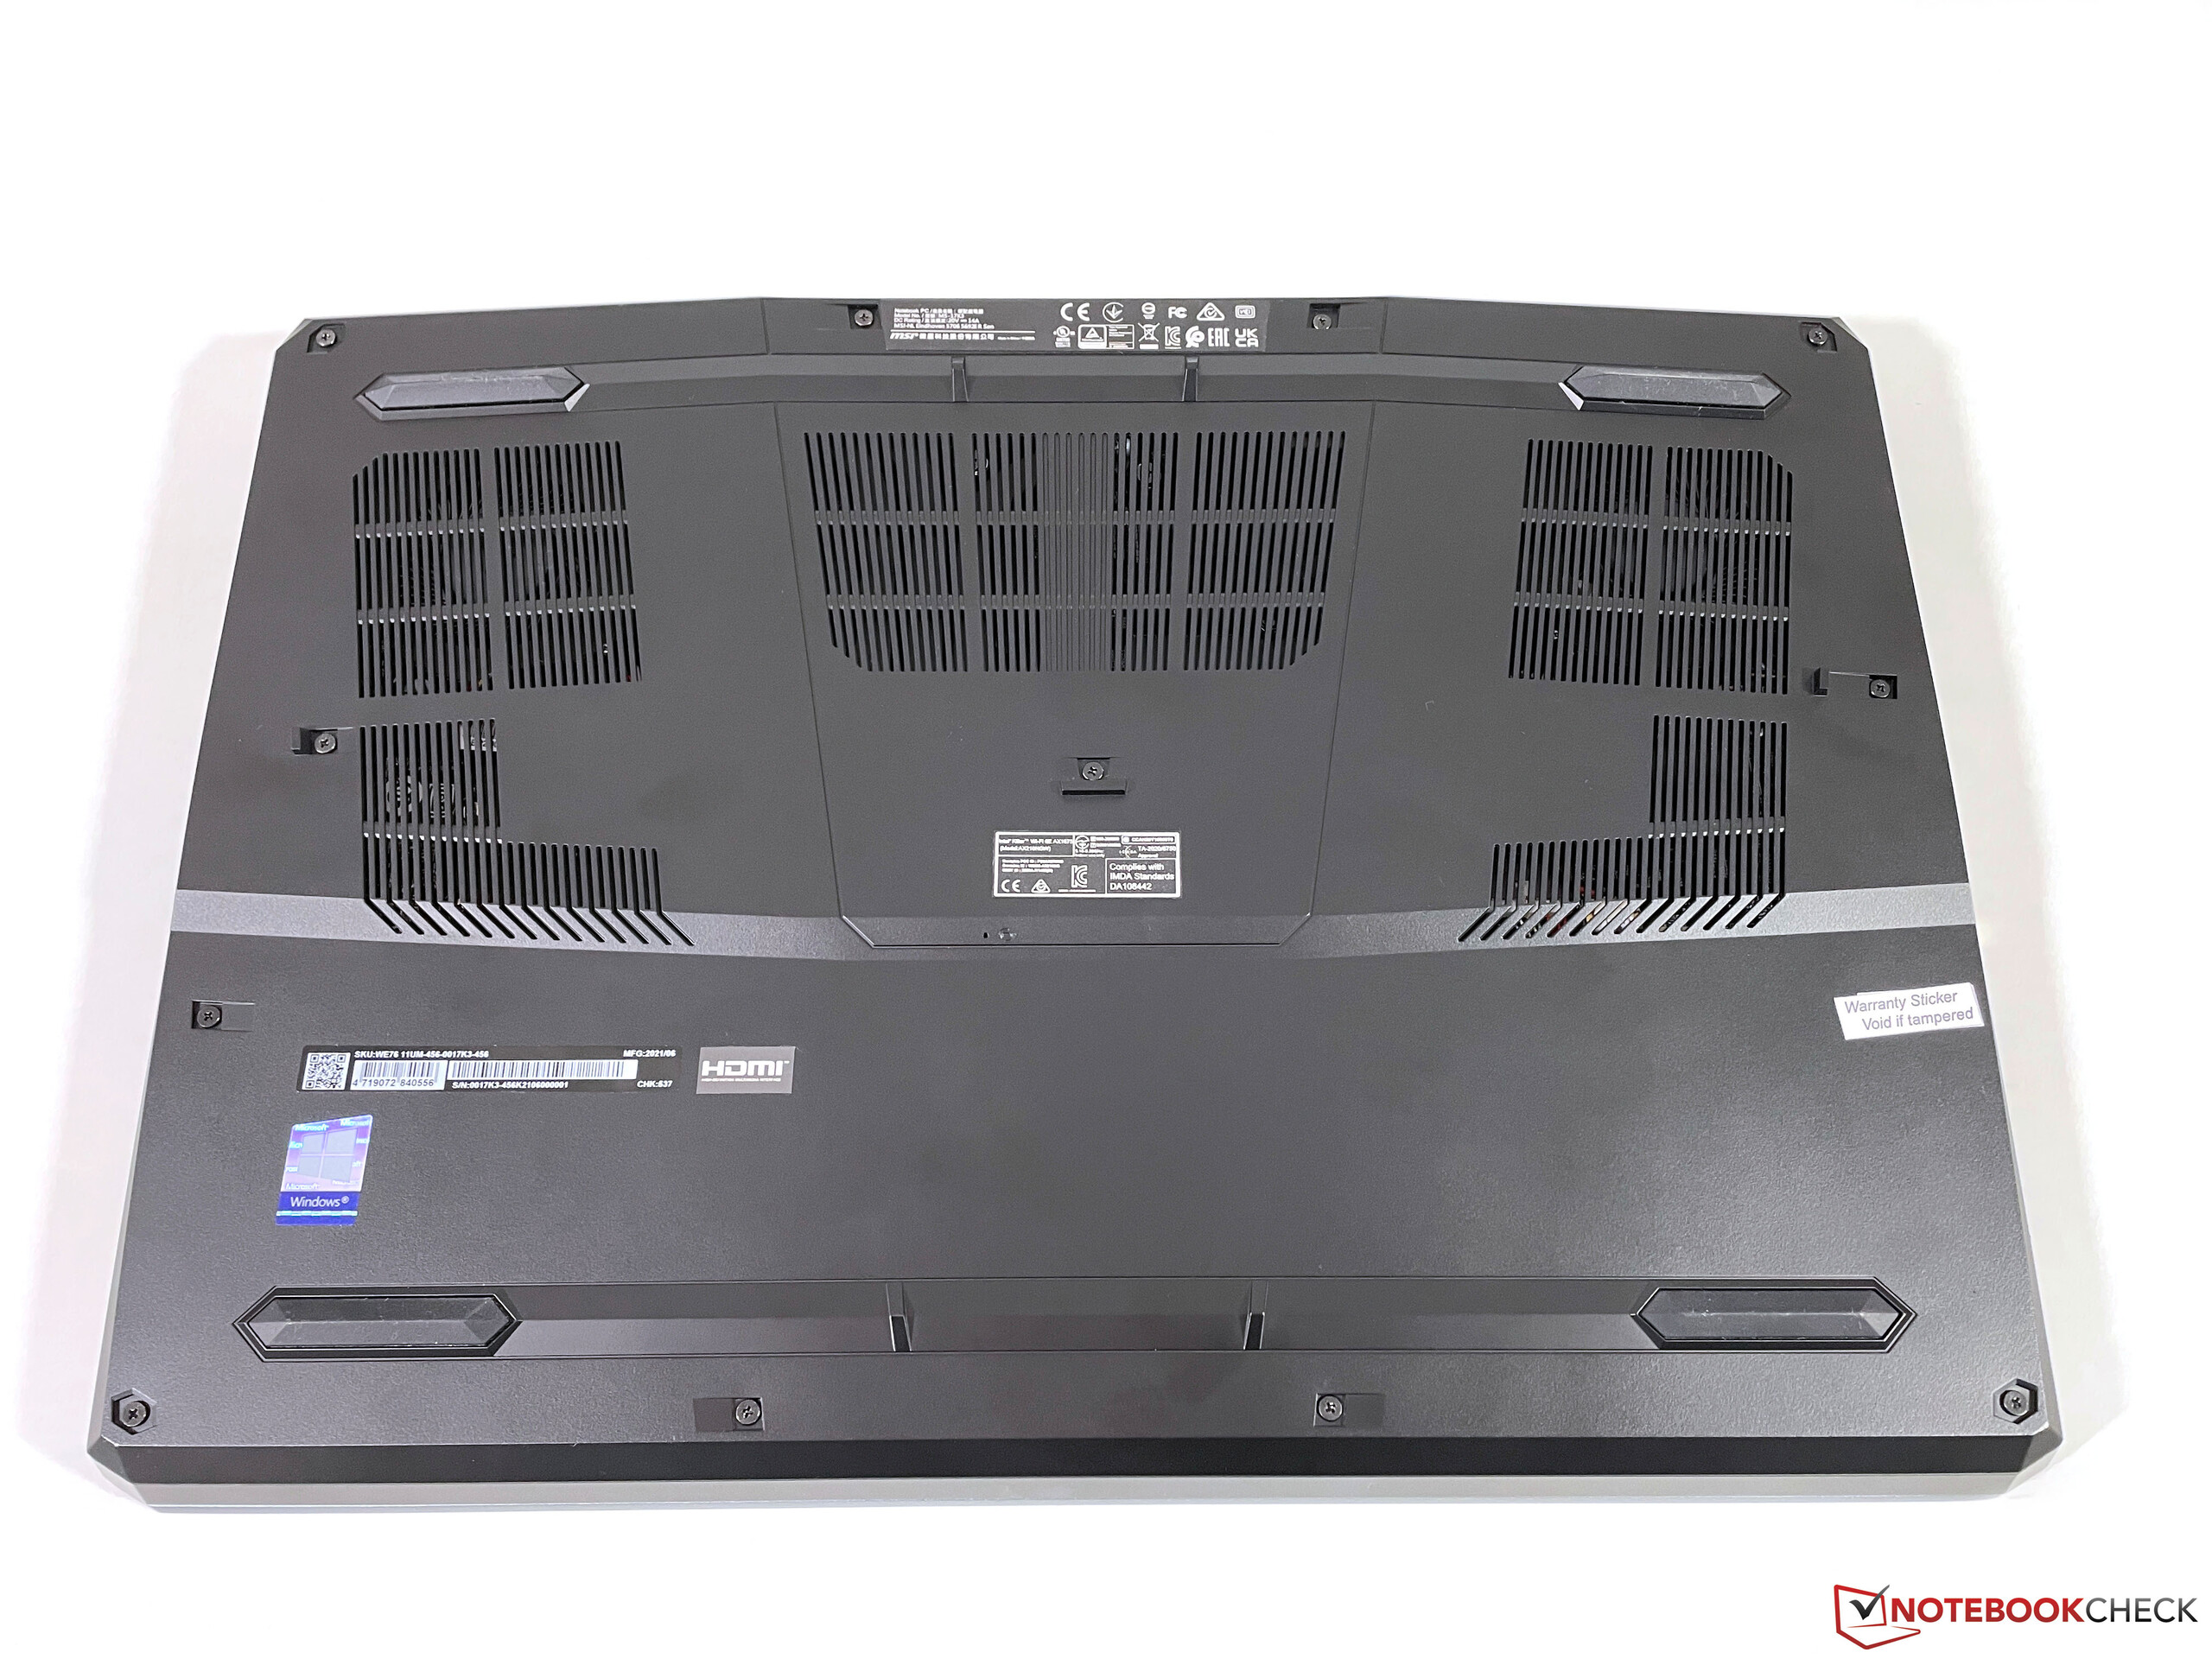
Dopo aver allentato tutte le viti a croce, il coperchio inferiore completo può essere rimosso. Oltre ai due slot SODIMM, ci sono anche due slot M.2-2280 disponibili (1x PCIe 4.0 e 1x PCIe 3.0). Anche il modulo Wi-Fi può essere sostituito
Dispositivi di input - SteelSeries con tastierino numerico
Tastiera
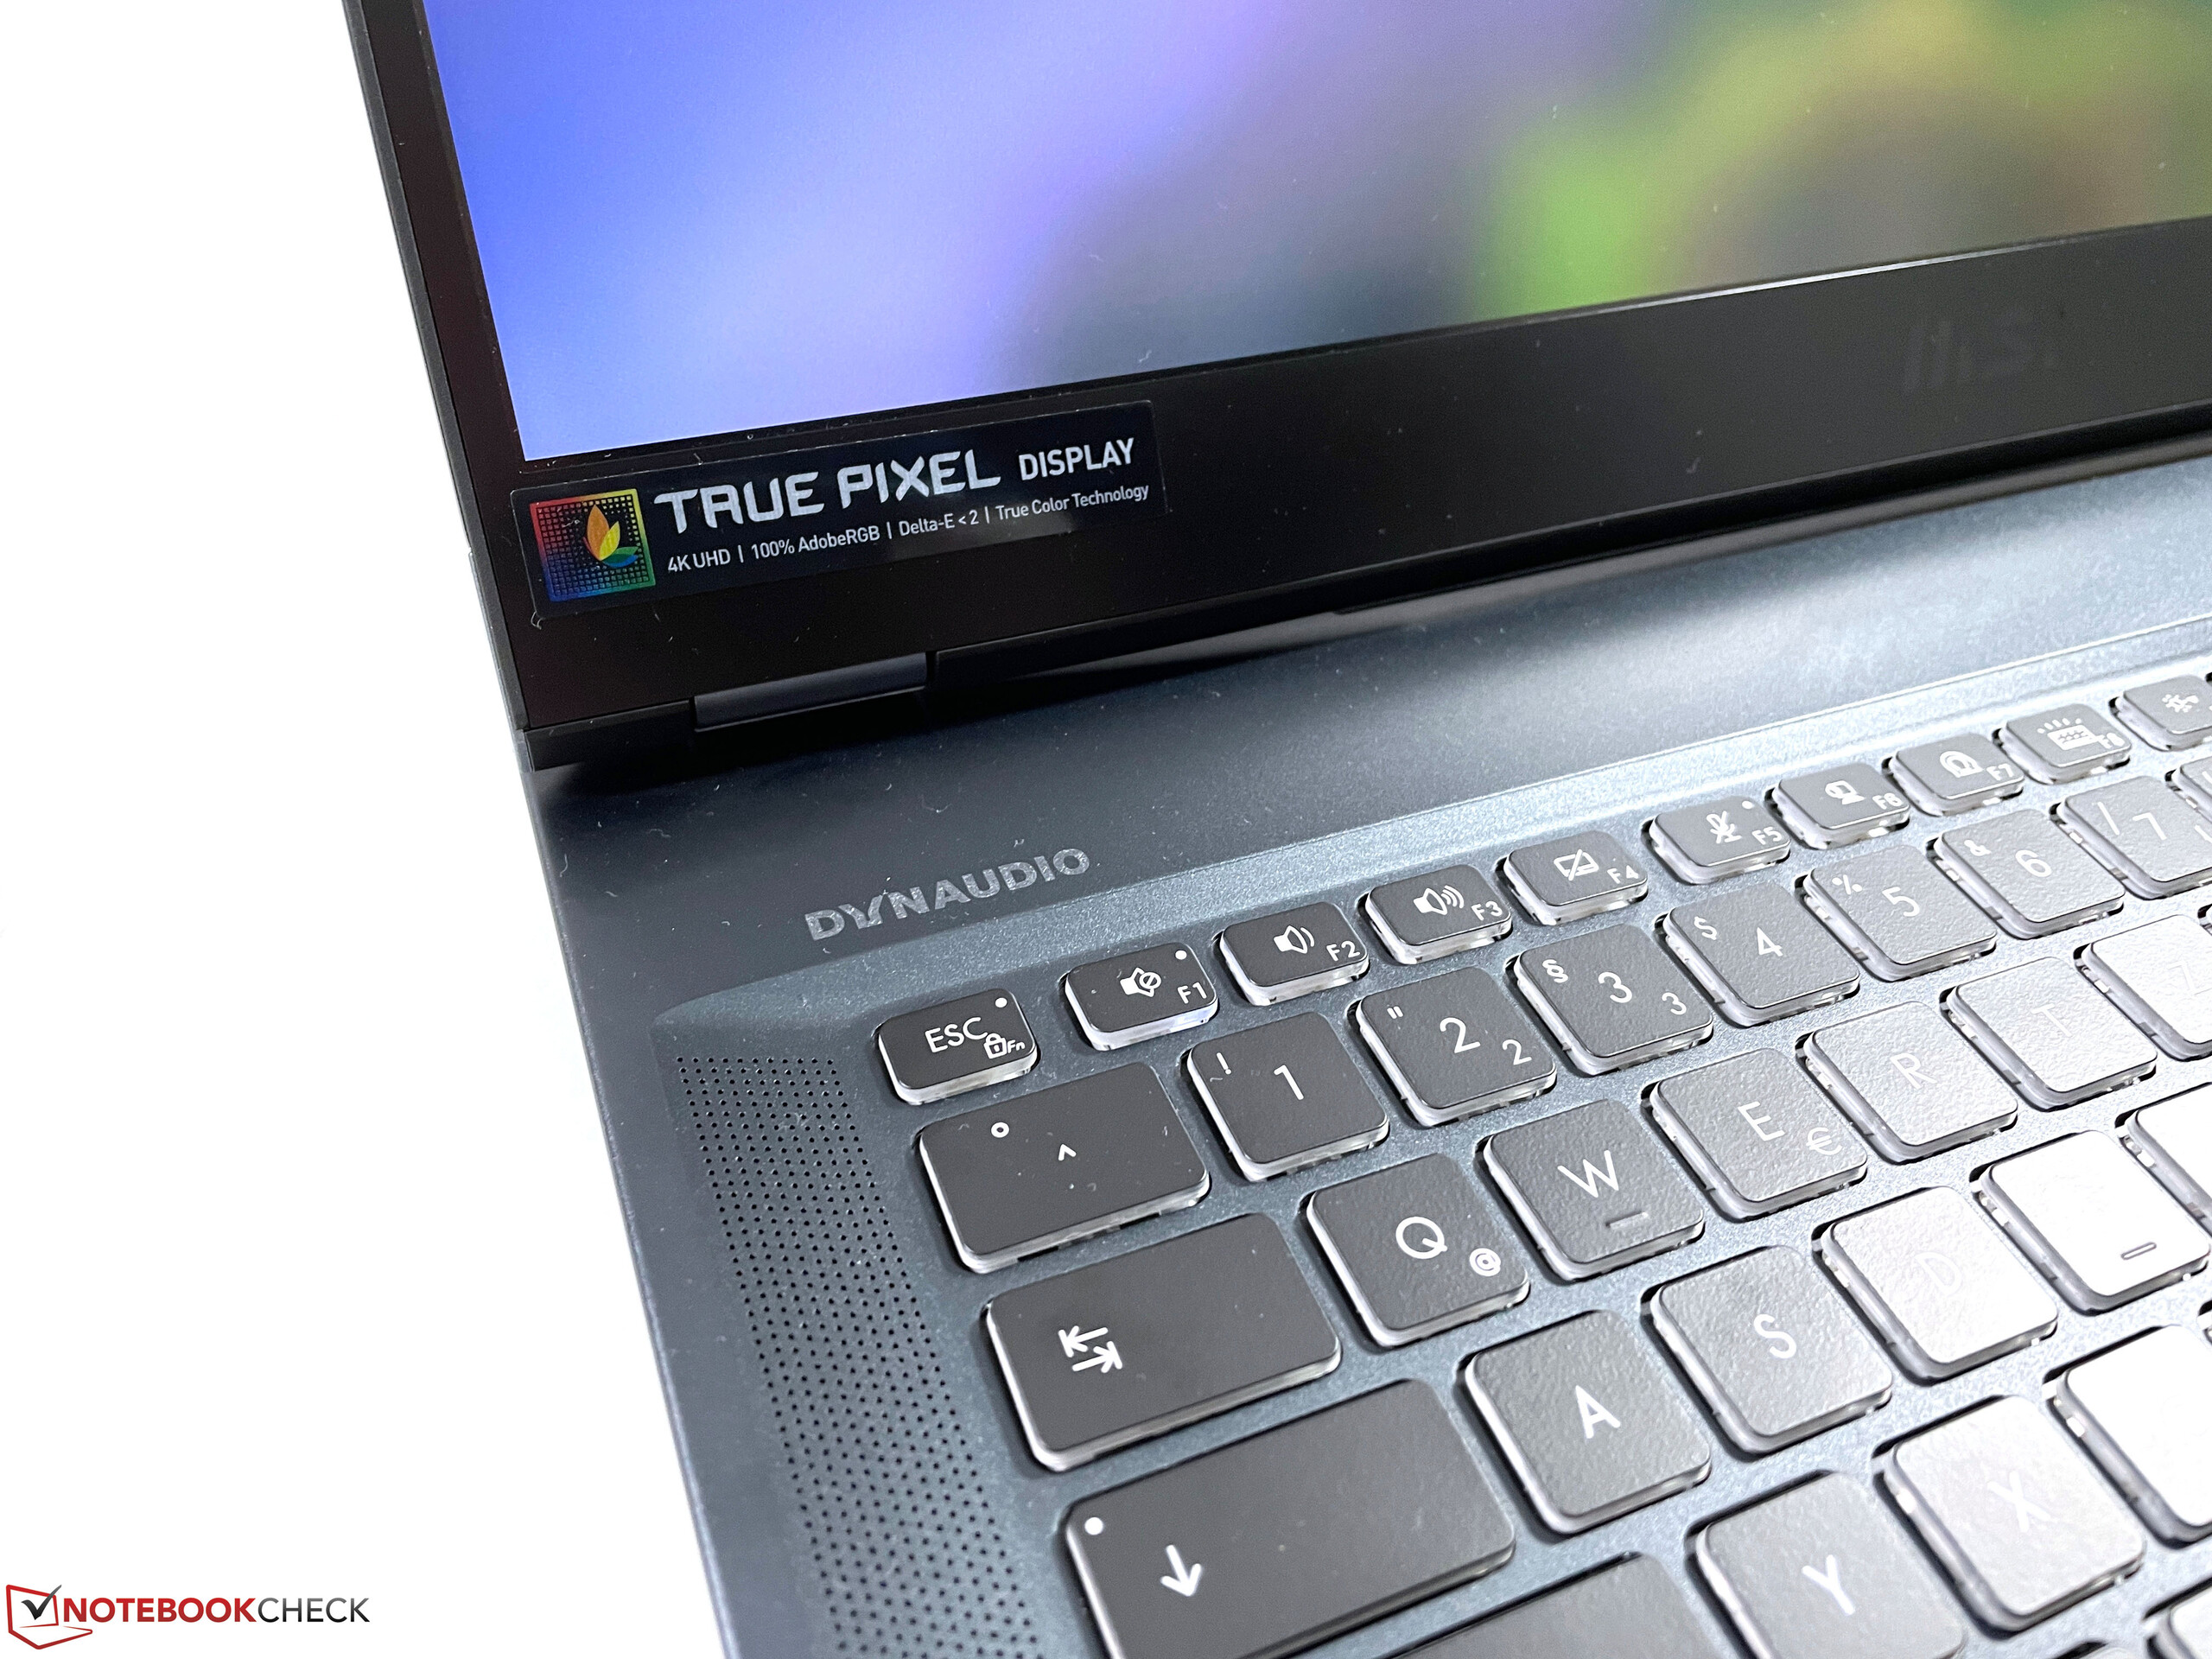
Come i suoi fratelli di gioco, la controparte workstation WE76 presenta anche una tastiera SteelSeries. Tuttavia, la retroilluminazione colorata è stata omessa; invece, c'è solo una retroilluminazione bianca. I tasti offrono una corsa relativamente lunga, e la sensazione di digitazione è molto buona e può facilmente competere con le migliori tastiere della concorrenza affermata delle workstation. Inoltre, un vero e proprio tastierino numerico è integrato sul lato destro. I suoi tasti sono un po' più stretti, ma questo non si è rivelato un problema nella pratica
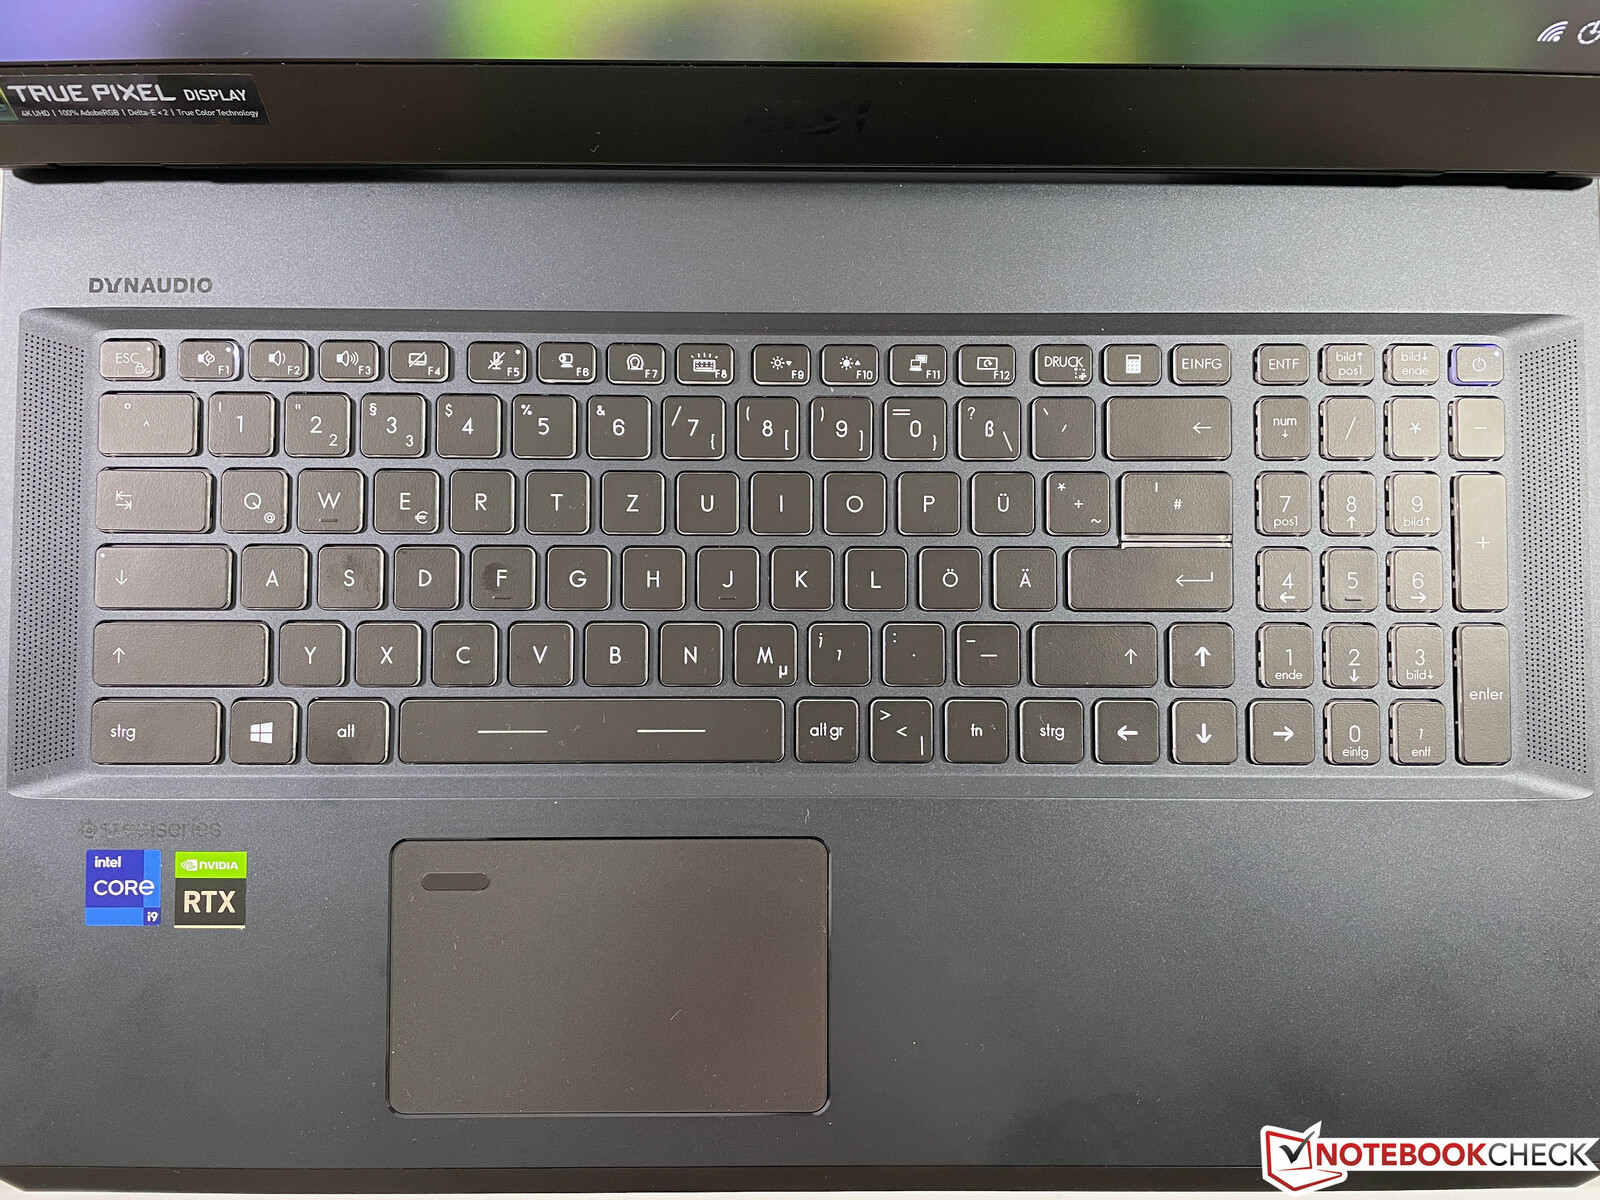

Touchpad
Con i suoi 10,5 x 6,5 cm, il ClickPad non è particolarmente grande per gli standard attuali, ma il controllo del mouse funziona senza problemi. La superficie liscia offre buone proprietà di scorrimento, e il lettore di impronte digitali integrato situato nell'angolo in alto a sinistra non è d'intralcio. Il touchpad sembra un po' sferragliante, però, perché c'è un leggero spazio prima di raggiungere il meccanismo di click vero e proprio. Questo significa che la metà inferiore può essere premuta sensibilmente senza che il click venga innescato. Inoltre, il click effettivo è troppo forte, il che lo fa sentire economico.
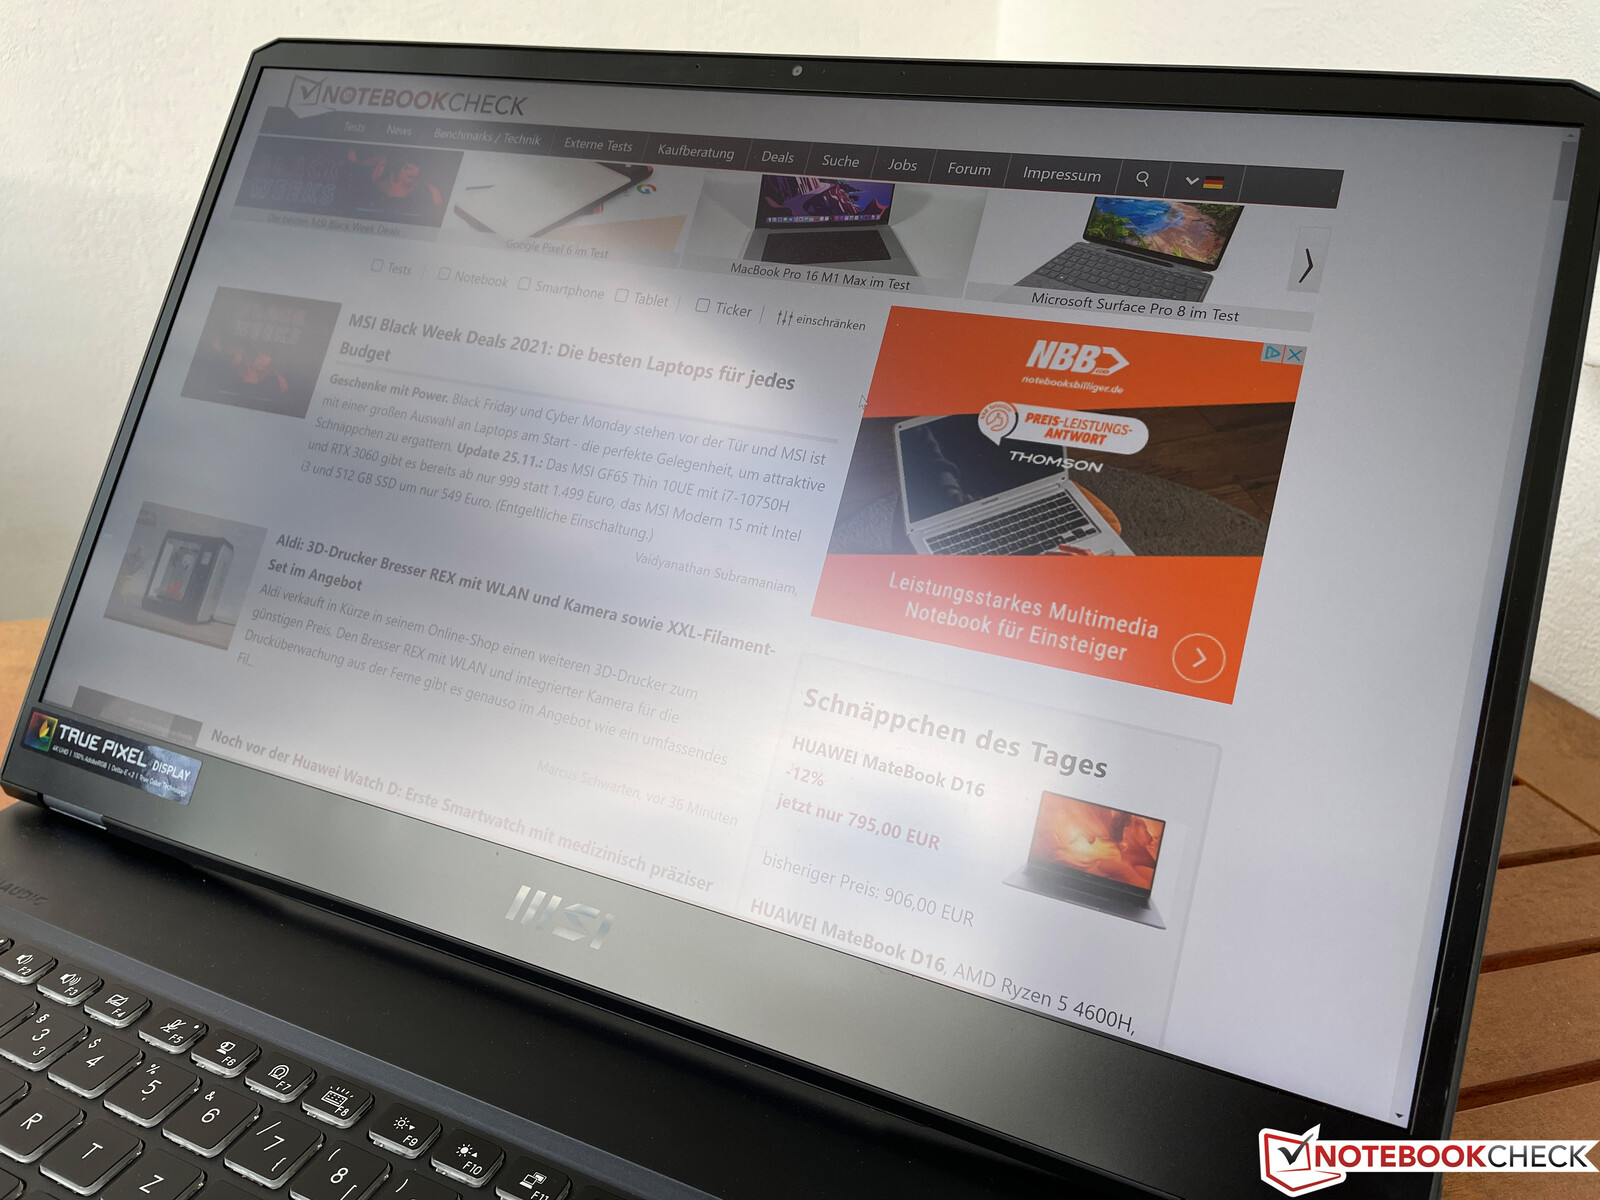
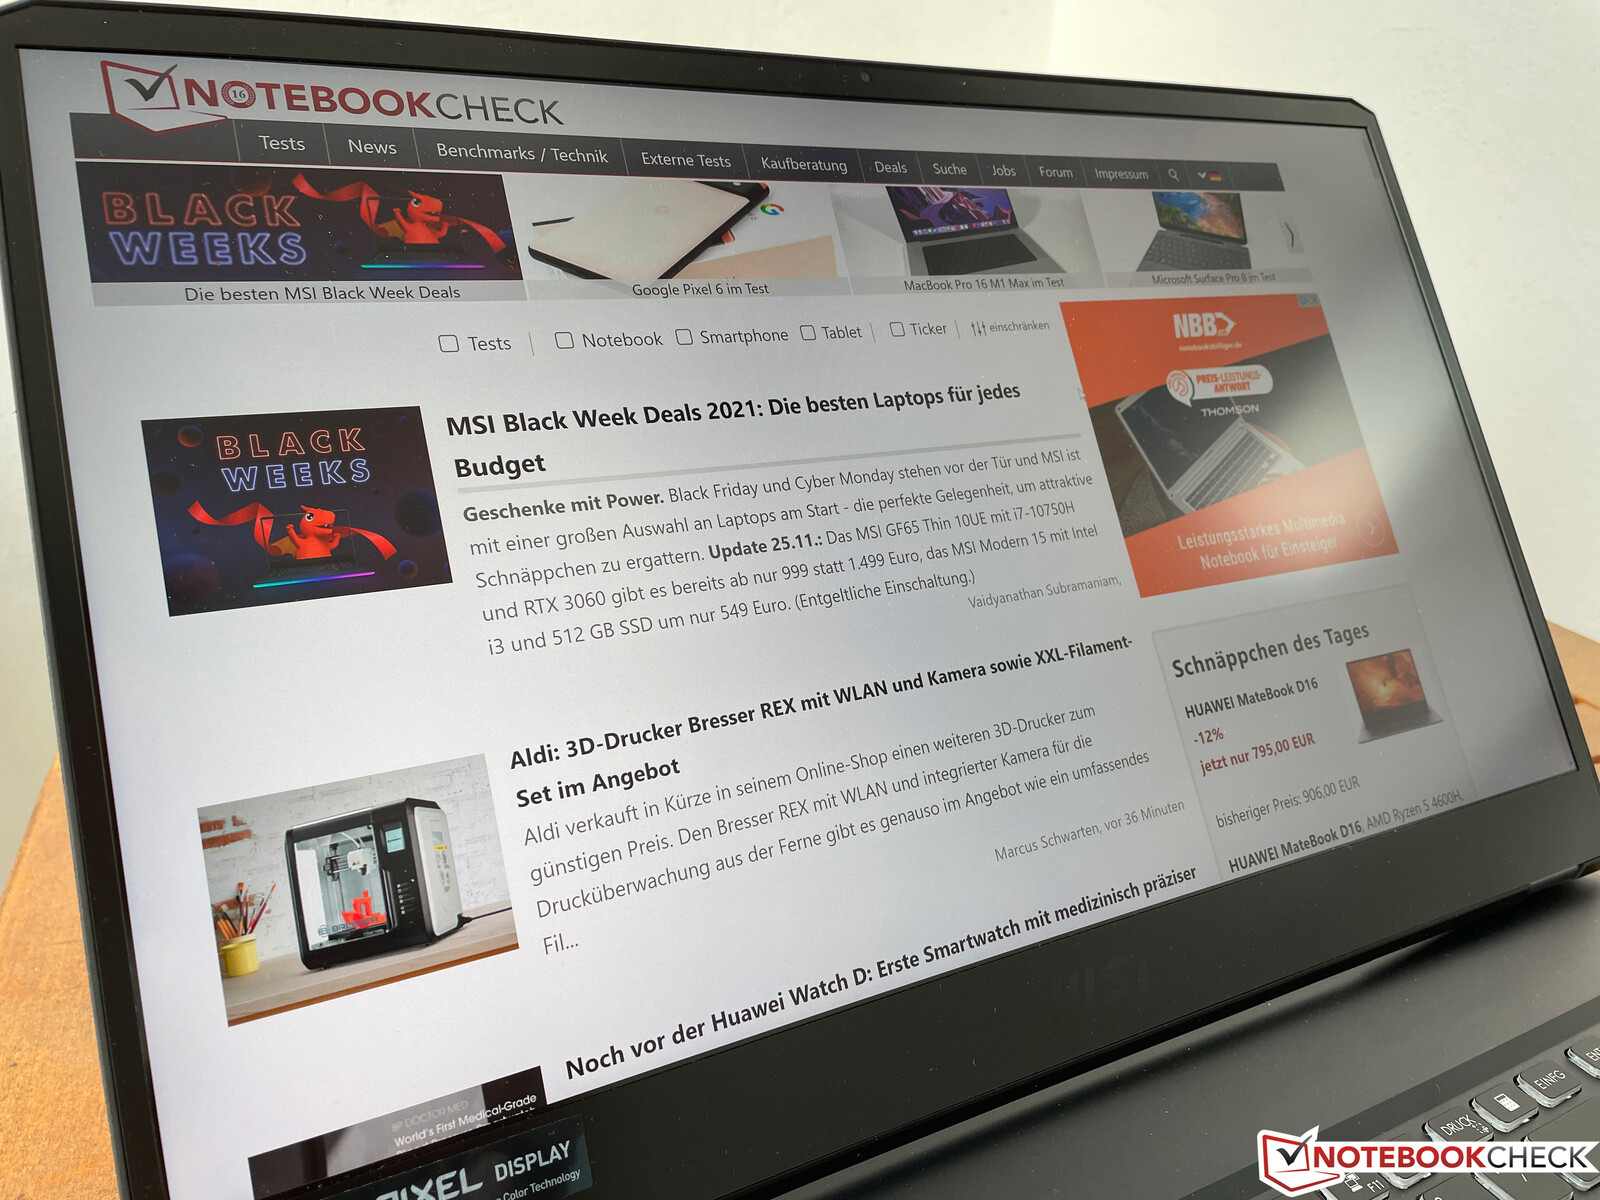
Display - Pannello 4K opaco con AdobeRGB e 120 Hz

Il WE76 è disponibile esclusivamente con un pannello 4K opaco in formato 16:9. Secondo MSI, il display copre anche lo spazio colore AdobeRGB nella sua interezza, e una frequenza di aggiornamento di 120 Hz assicura un'immagine fluida, che è anche abilitata di default. MSI si astiene dall'utilizzare qui i pannelli ancora più veloci delle sue versioni da gioco, il che ha senso, però.
L'impressione soggettiva dell'immagine del pannello è eccellente. Le immagini sono estremamente nitide, e anche le aree luminose non sembrano sgranate. Tuttavia, i colori non sono così vibranti rispetto ai pannelli OLED o mini LED di alta qualità. La luminosità media è poco più di 400 cd/m², e il rapporto di contrasto supera i 1.200:1. Nel complesso, è un notevole miglioramento rispetto al display 1080p del vecchio MSI WE75, ma alcuni dei pannelli ad alta risoluzione della concorrenza forniscono punteggi migliori.
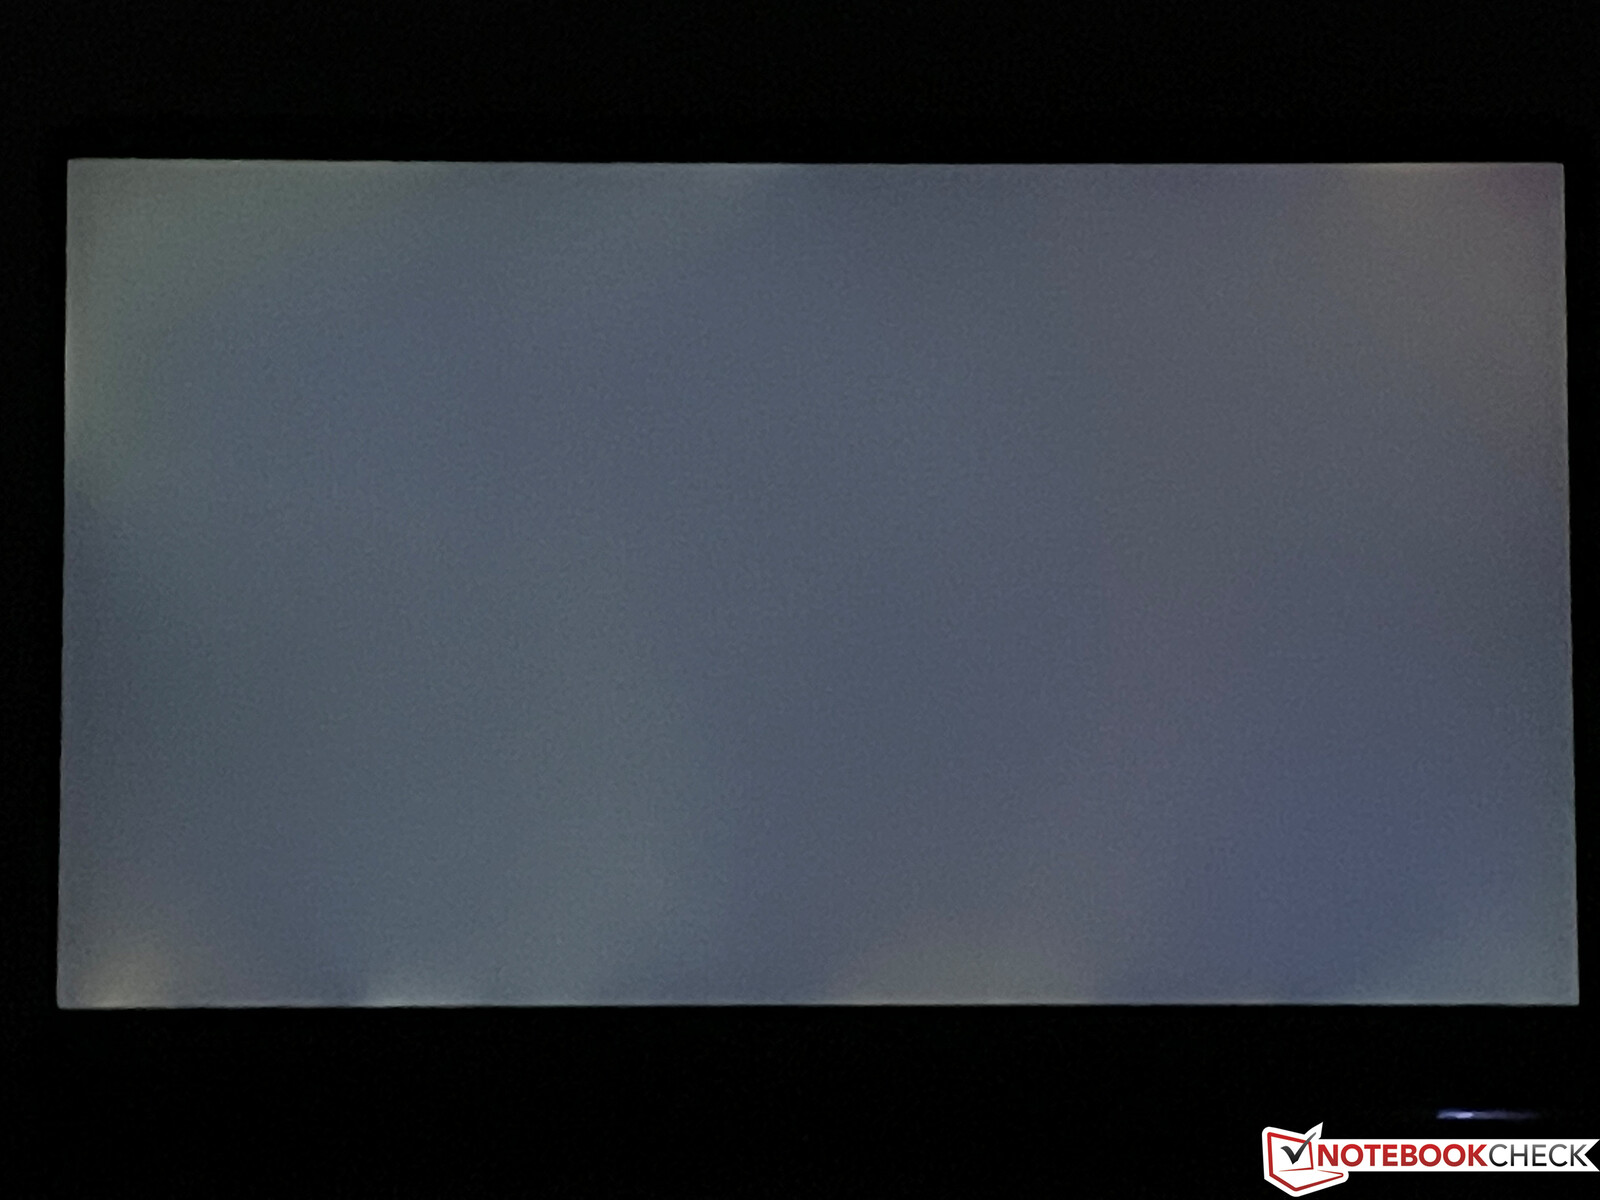
Il PWM non viene utilizzato, e i tempi di risposta sono molto veloci, il che significa che non ci sono effetti ghosting. Alla massima luminosità, si può notare una leggera emorragia dello schermo ai bordi quando si utilizza uno sfondo scuro, ma questo non si nota nella pratica.
| |||||||||||||||||||||||||
Distribuzione della luminosità: 93 %
Al centro con la batteria: 420 cd/m²
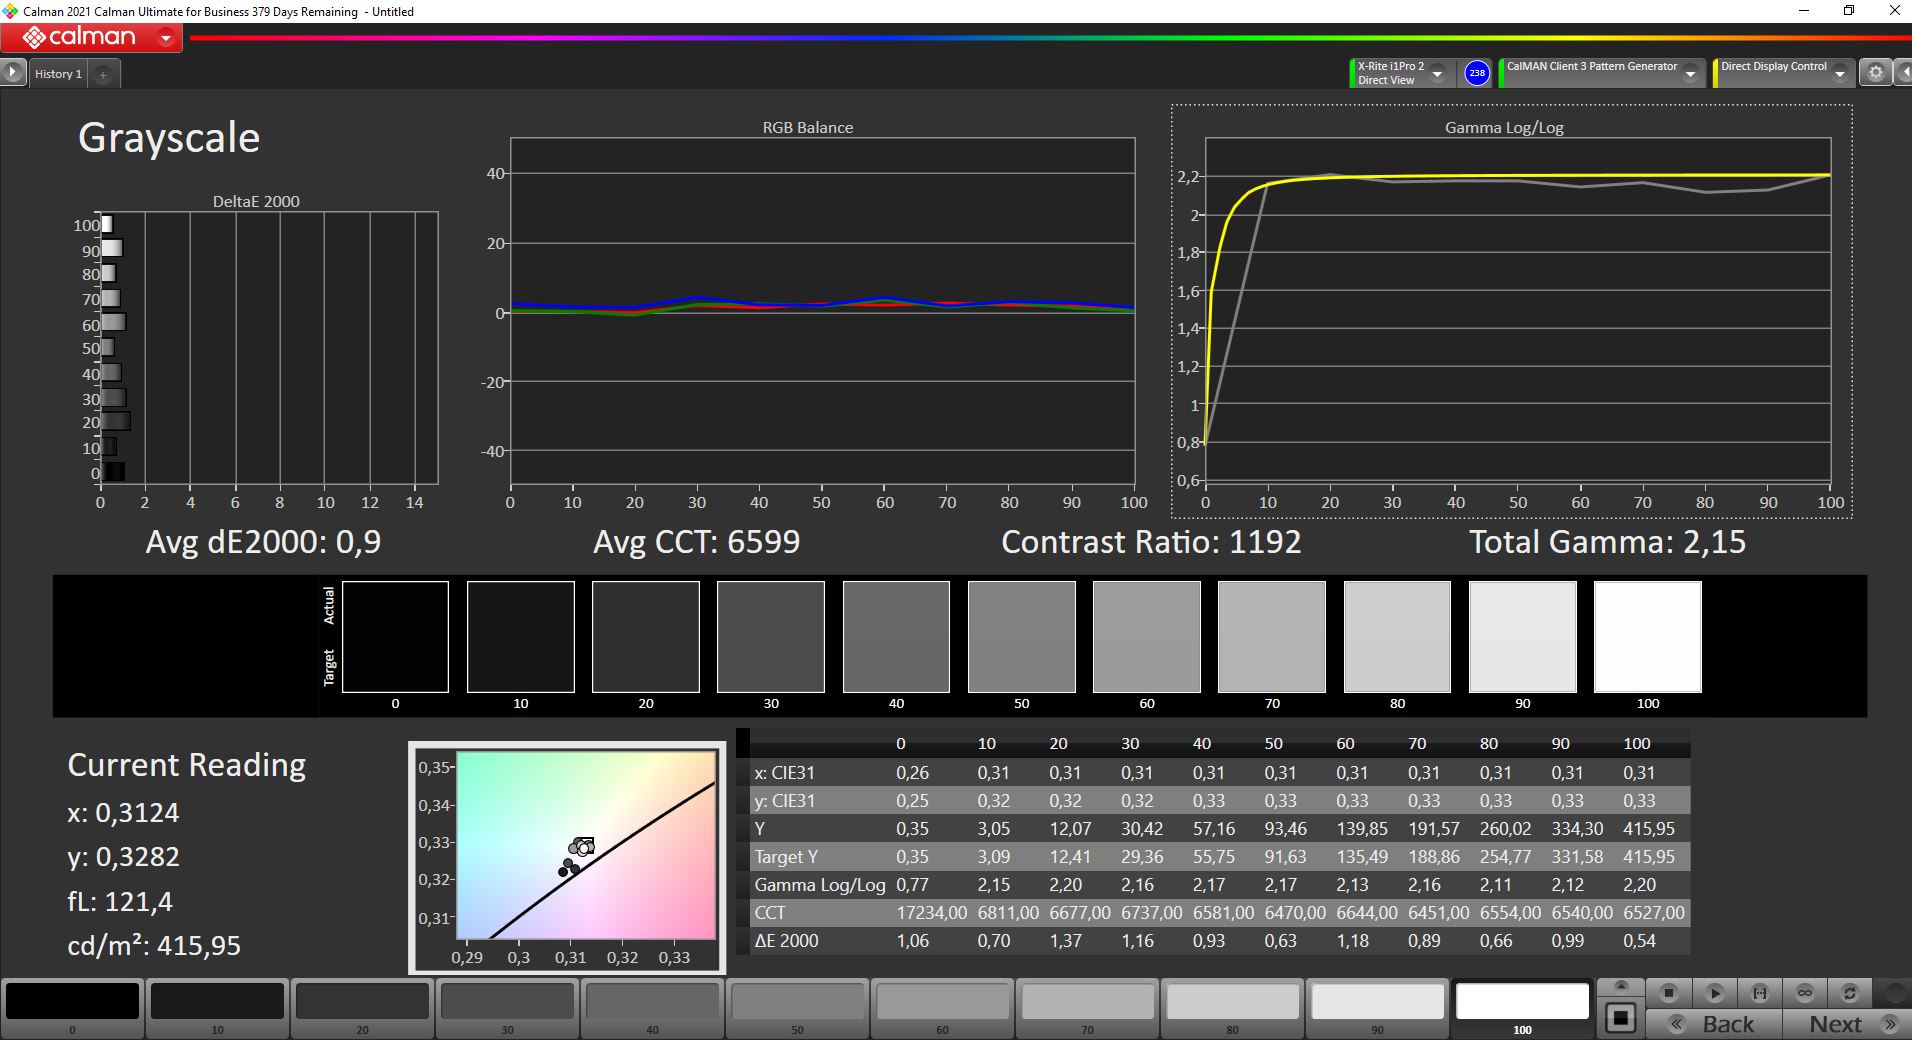
Contrasto: 1232:1 (Nero: 0.34 cd/m²)
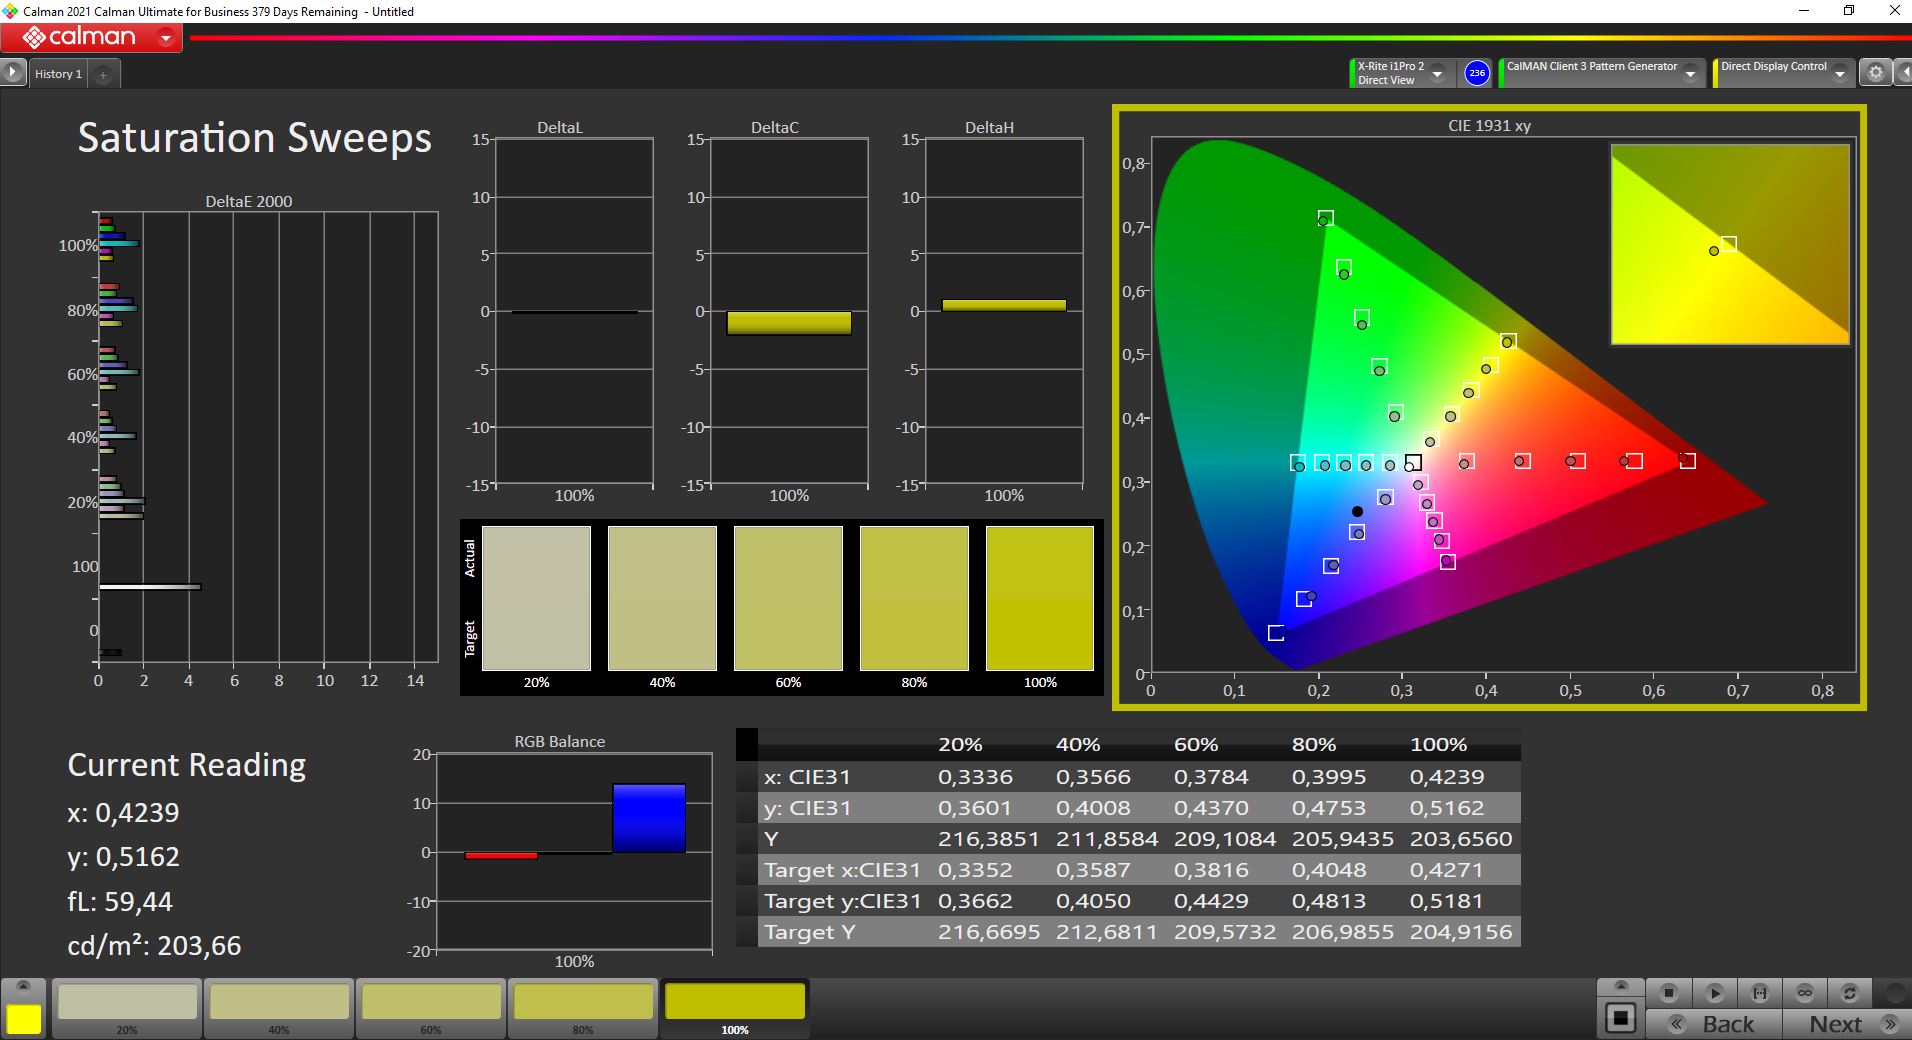
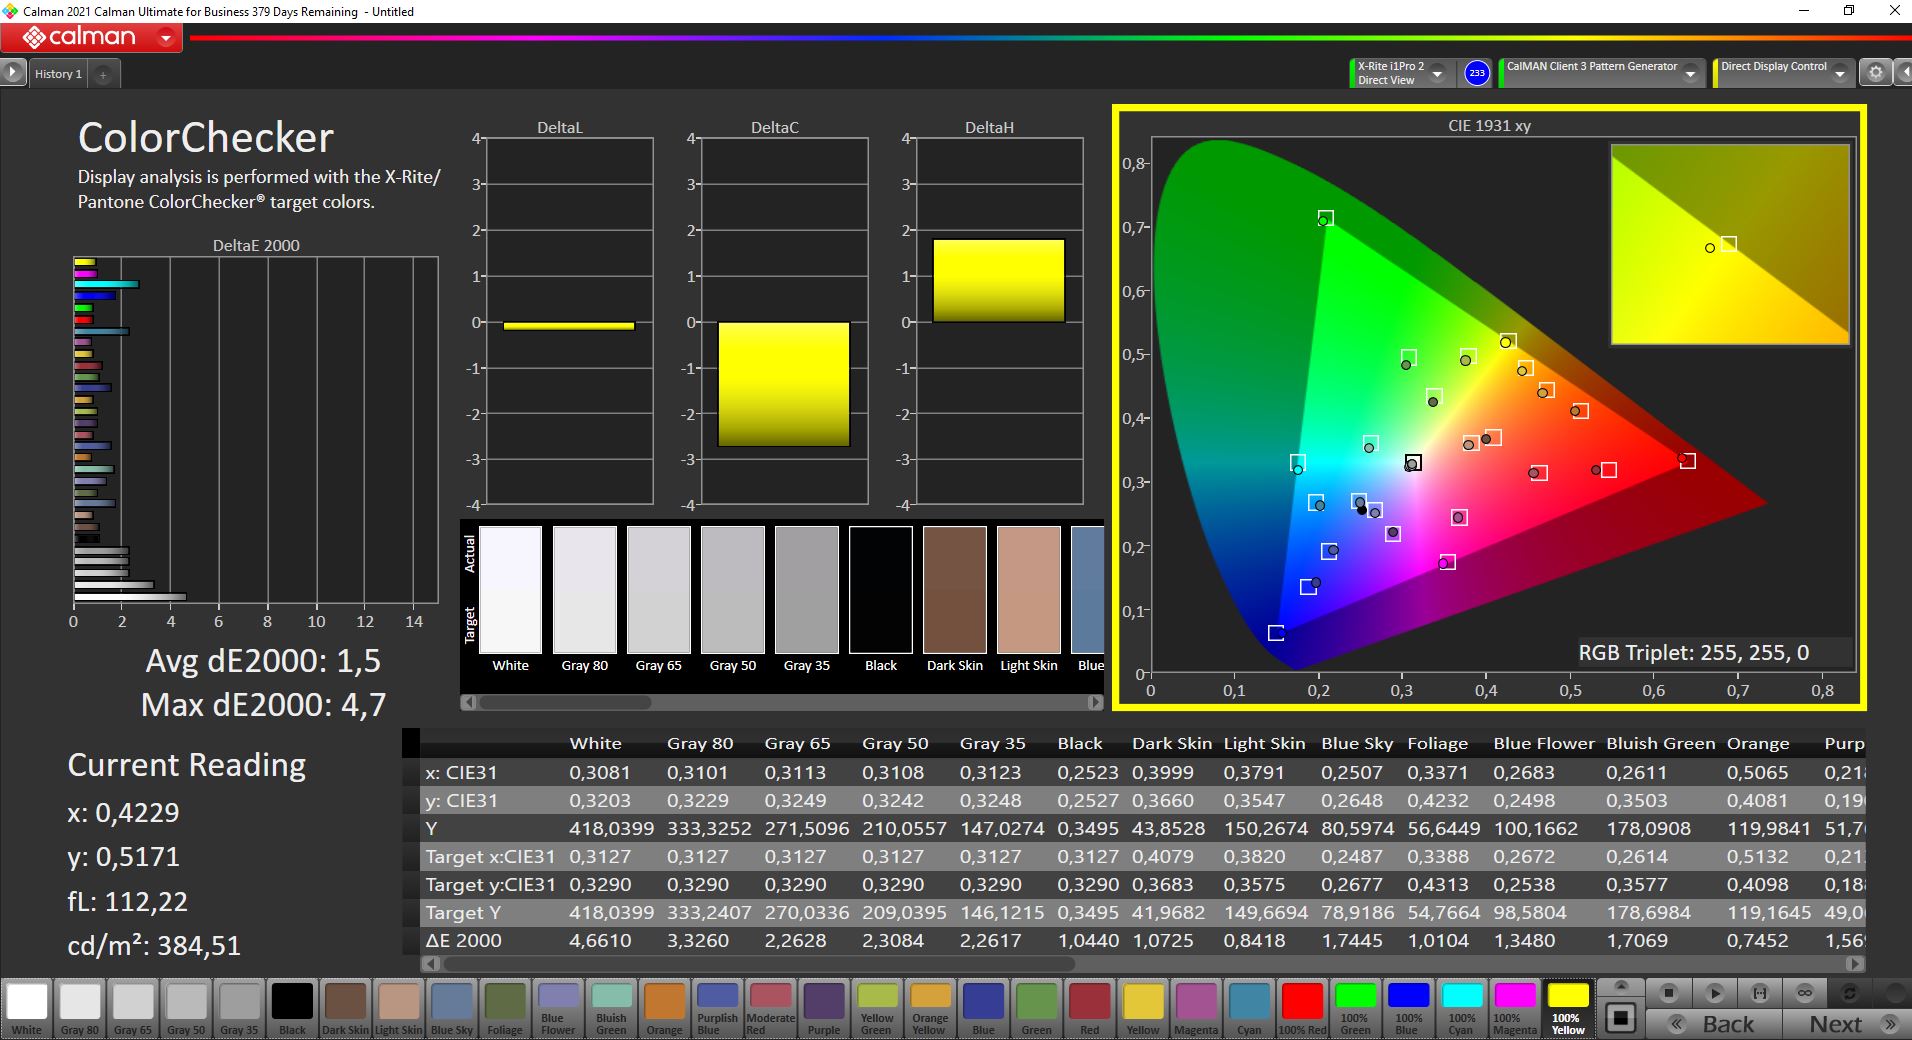
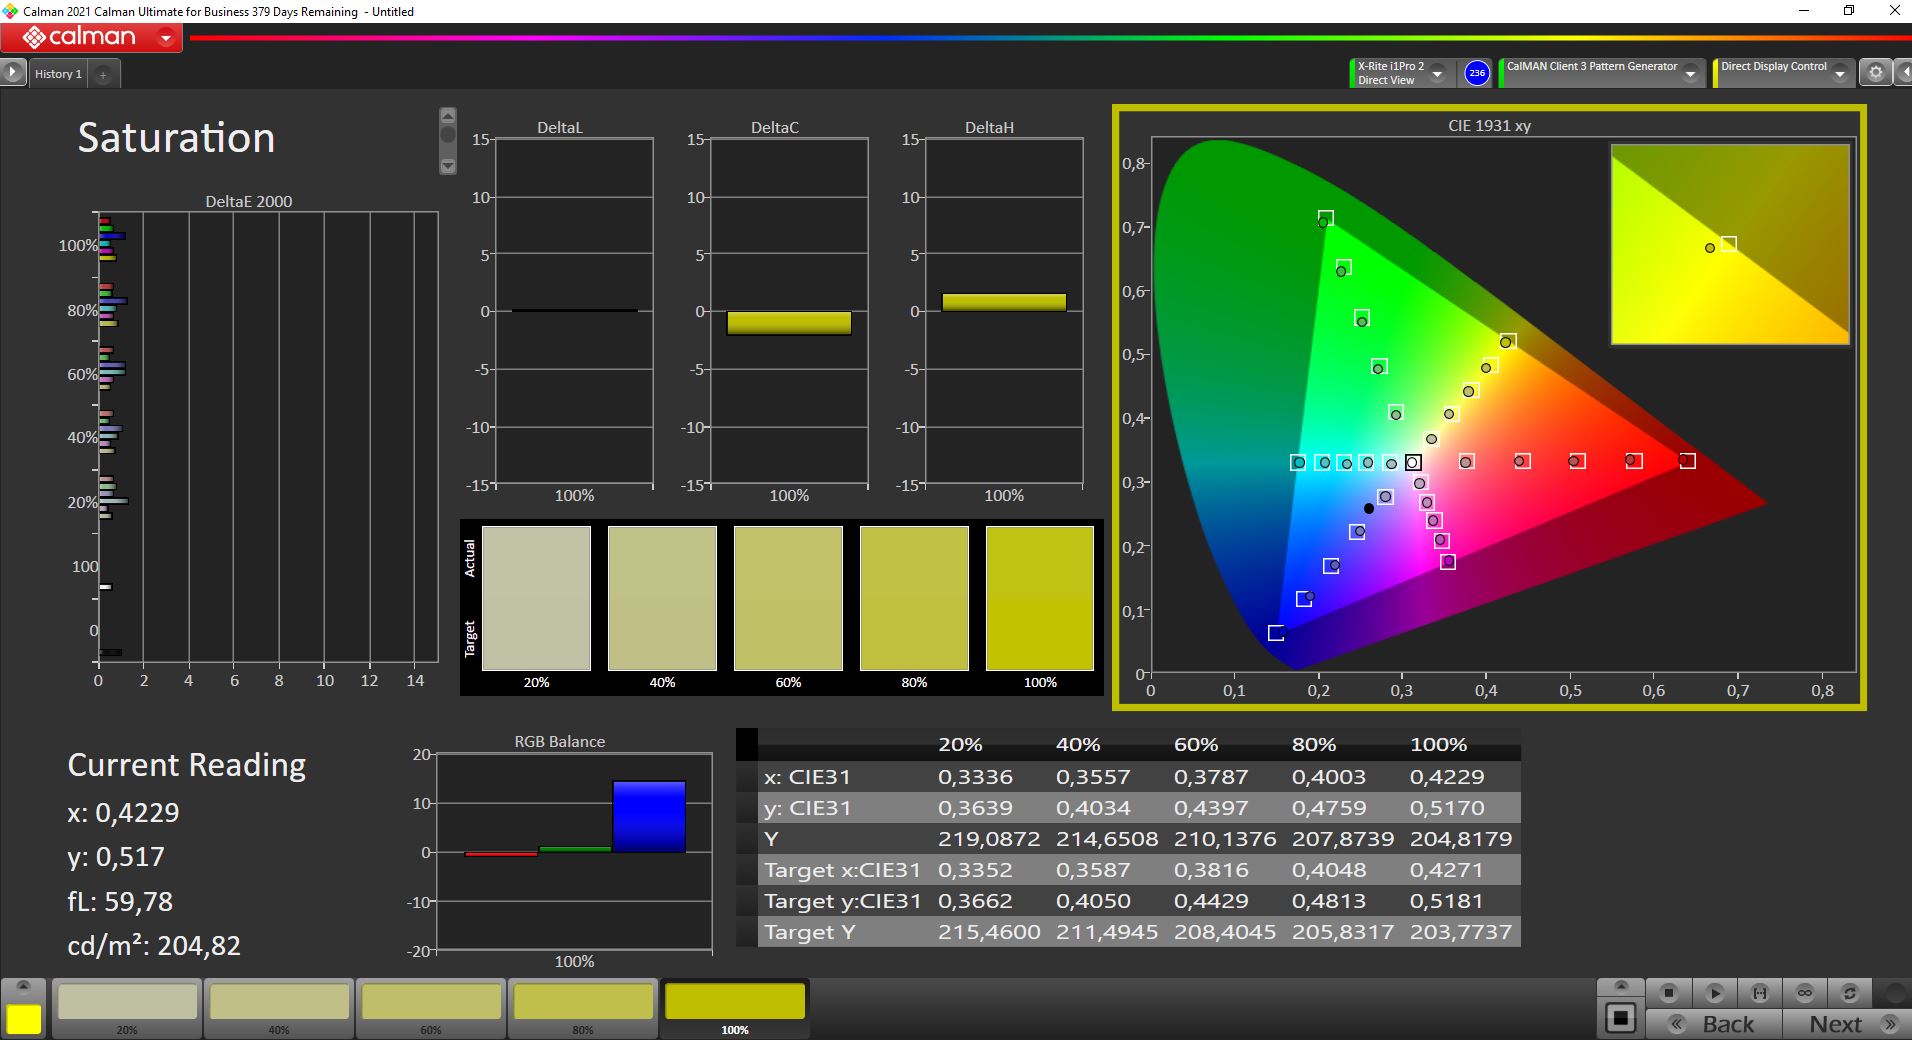
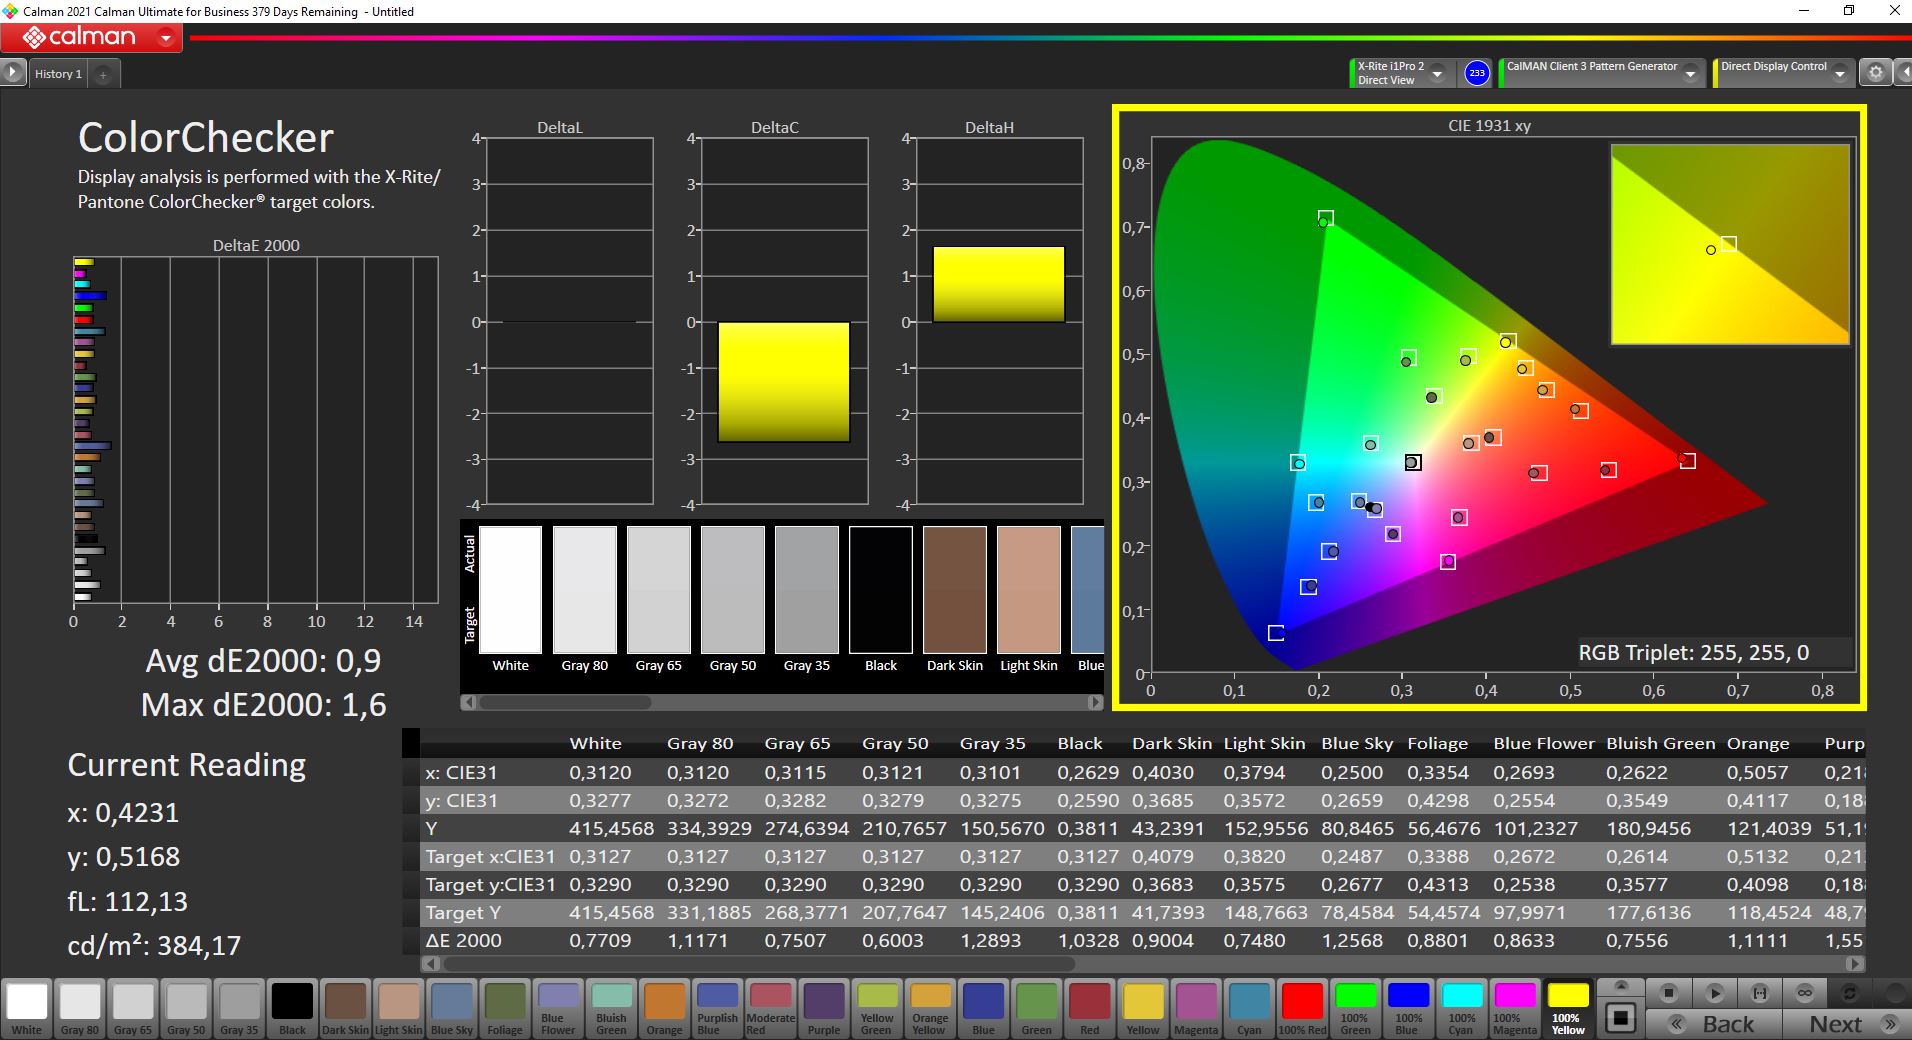
ΔE ColorChecker Calman: 1.5 | ∀{0.5-29.43 Ø4.73}
calibrated: 0.9
ΔE Greyscale Calman: 2 | ∀{0.09-98 Ø4.97}
96% AdobeRGB 1998 (Argyll 3D)
99.3% sRGB (Argyll 3D)
82.1% Display P3 (Argyll 3D)
Gamma: 2.17
CCT: 6629 K
| MSI WE76 11UM-456 B173ZAN03.3, IPS, 3840x2160, 17.3" | Lenovo ThinkPad P1 G4-20Y4S0KS00 LP160UQ1-SPB1, IPS LED, 3840x2400, 16" | HP ZBook Fury 15 G8 BOE0969, IPS, 3840x2160, 15.6" | Asus ProArt StudioBook 16 W7600H5A-2BL2 ATNA60YV02-0, OLED, 3840x2400, 16" | Lenovo ThinkPad P17 G2-20YU0025G LP173WF4-SPF7, IPS LED, 1920x1080, 17.3" | HP ZBook Fury 17 G7 119W5EA AUOCD8C, , 3840x2160, 17.3" | MSI WE75 9TK AU Optronics B173HAN04.2, IPS, 1920x1080, 17.3" | |
|---|---|---|---|---|---|---|---|
| Display | 2% | 3% | 9% | -21% | 4% | -22% | |
| Display P3 Coverage (%) | 82.1 | 85.7 4% | 95.9 17% | 99.9 22% | 67.9 -17% | 99.3 21% | 63.2 -23% |
| sRGB Coverage (%) | 99.3 | 99.4 0% | 100 1% | 100 1% | 87.3 -12% | 99.9 1% | 89.9 -9% |
| AdobeRGB 1998 Coverage (%) | 96 | 98.9 3% | 87.3 -9% | 98.6 3% | 63.9 -33% | 86.9 -9% | 64.3 -33% |
| Response Times | -202% | 7% | 85% | -115% | -244% | -132% | |
| Response Time Grey 50% / Grey 80% * (ms) | 17.6 ? | 55.2 ? -214% | 14.8 ? 16% | 2 ? 89% | 39.2 ? -123% | 56 ? -218% | 30.8 ? -75% |
| Response Time Black / White * (ms) | 10.8 ? | 31.2 ? -189% | 11 ? -2% | 2 ? 81% | 22.4 ? -107% | 40 ? -270% | 31.2 ? -189% |
| PWM Frequency (Hz) | 240 ? | ||||||
| Screen | 0% | -59% | -39% | -101% | 5% | -50% | |
| Brightness middle (cd/m²) | 419 | 630 50% | 626 49% | 353 -16% | 361 -14% | 573 37% | 287.3 -31% |
| Brightness (cd/m²) | 416 | 622 50% | 589 42% | 360 -13% | 334 -20% | 586 41% | 280 -33% |
| Brightness Distribution (%) | 93 | 90 -3% | 87 -6% | 96 3% | 87 -6% | 91 -2% | 89 -4% |
| Black Level * (cd/m²) | 0.34 | 0.41 -21% | 0.58 -71% | 0.35 -3% | 0.38 -12% | 0.26 24% | |
| Contrast (:1) | 1232 | 1537 25% | 1079 -12% | 1031 -16% | 1508 22% | 1105 -10% | |
| Colorchecker dE 2000 * | 1.5 | 2.2 -47% | 5.41 -261% | 2.45 -63% | 5.4 -260% | 1.9 -27% | 2.98 -99% |
| Colorchecker dE 2000 max. * | 4.7 | 5 -6% | 9.05 -93% | 3.75 20% | 9.9 -111% | 4.2 11% | 5.08 -8% |
| Colorchecker dE 2000 calibrated * | 0.9 | 1 -11% | 0.6 33% | 2.77 -208% | 3.2 -256% | 0.7 22% | 3.06 -240% |
| Greyscale dE 2000 * | 2 | 2.7 -35% | 6.2 -210% | 1.88 6% | 6.5 -225% | 2.9 -45% | 3 -50% |
| Gamma | 2.17 101% | 2.26 97% | 2.66 83% | 2.31 95% | 2.23 99% | 2.1 105% | 2.28 96% |
| CCT | 6629 98% | 6886 94% | 6101 107% | 6441 101% | 7351 88% | 6217 105% | 6993 93% |
| Color Space (Percent of AdobeRGB 1998) (%) | 77.6 | 58.1 | |||||
| Color Space (Percent of sRGB) (%) | 100 | 89.5 | |||||
| Media totale (Programma / Settaggio) | -67% /
-28% | -16% /
-36% | 18% /
-6% | -79% /
-86% | -78% /
-31% | -68% /
-56% |
* ... Meglio usare valori piccoli
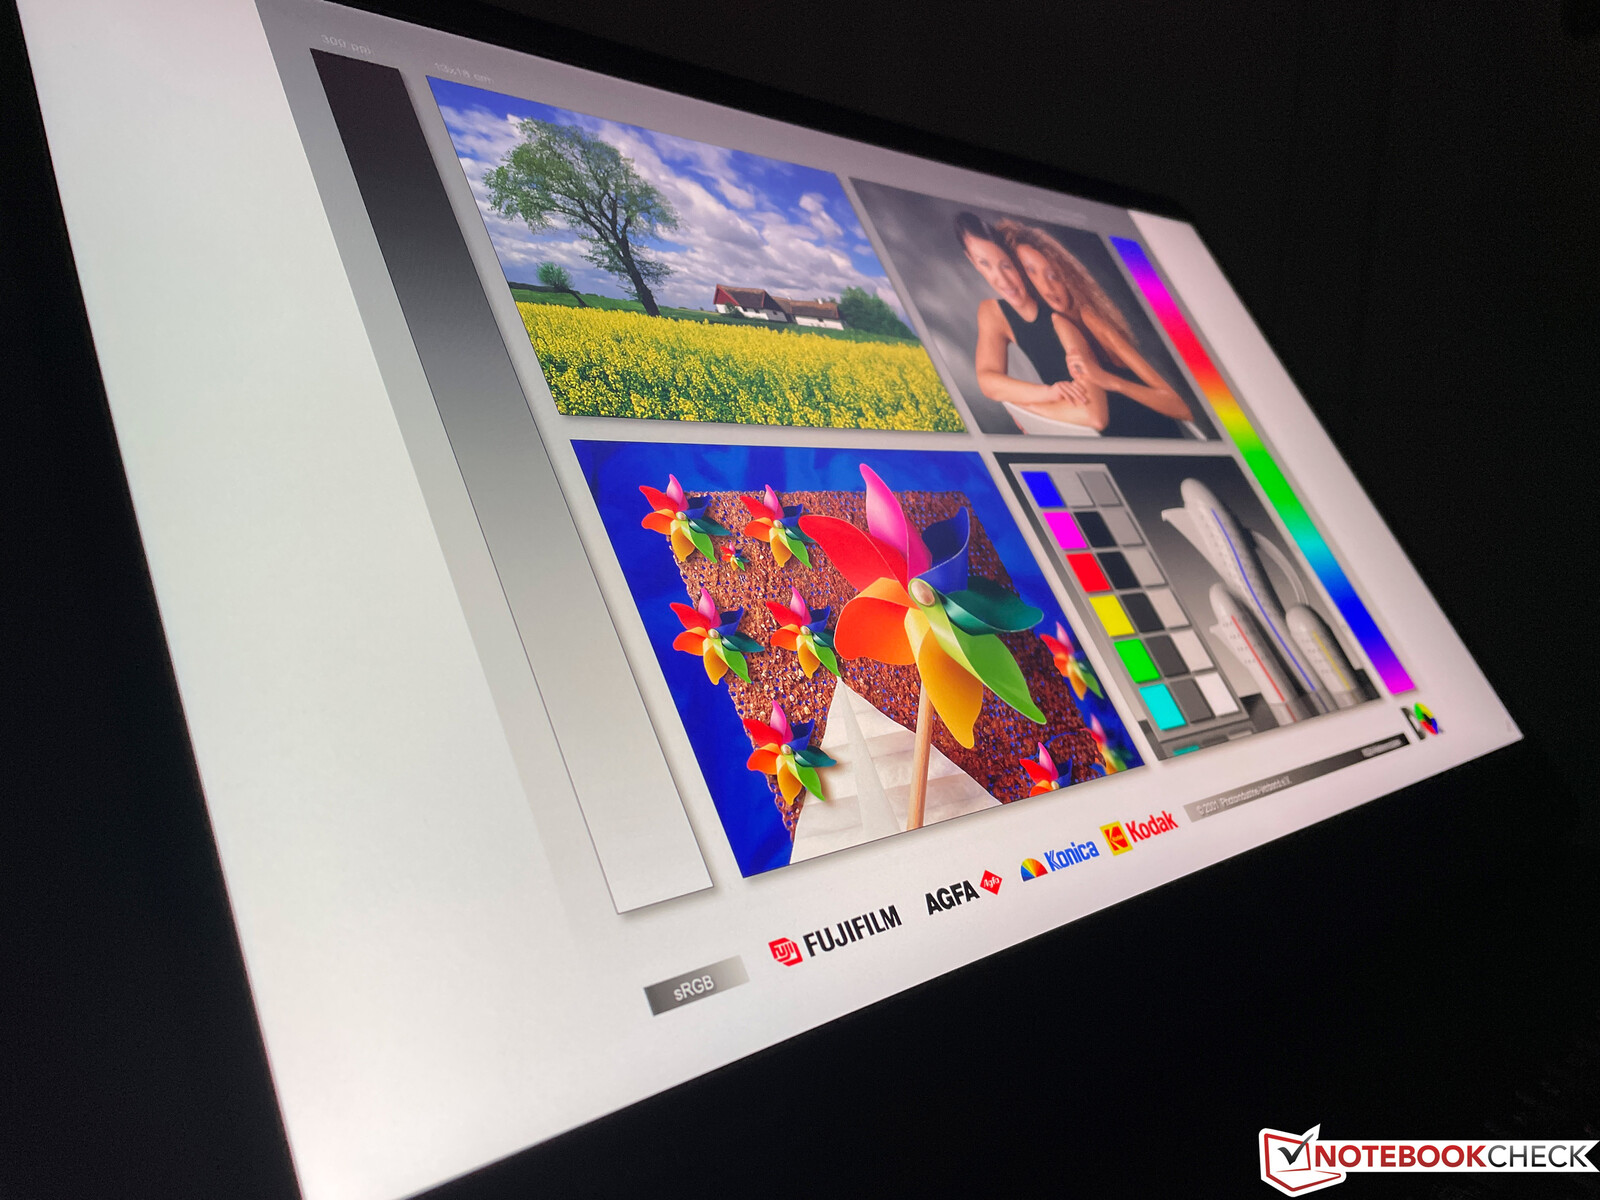
Secondo il produttore, il display 4K copre lo spazio colore AdobeRGB nella sua interezza; abbiamo misurato un tasso del 96%. MSI ha installato il software TrueColor, che può essere utilizzato per cambiare lo spazio colore. Abbiamo usato la modalità predefinita AdobeRGB
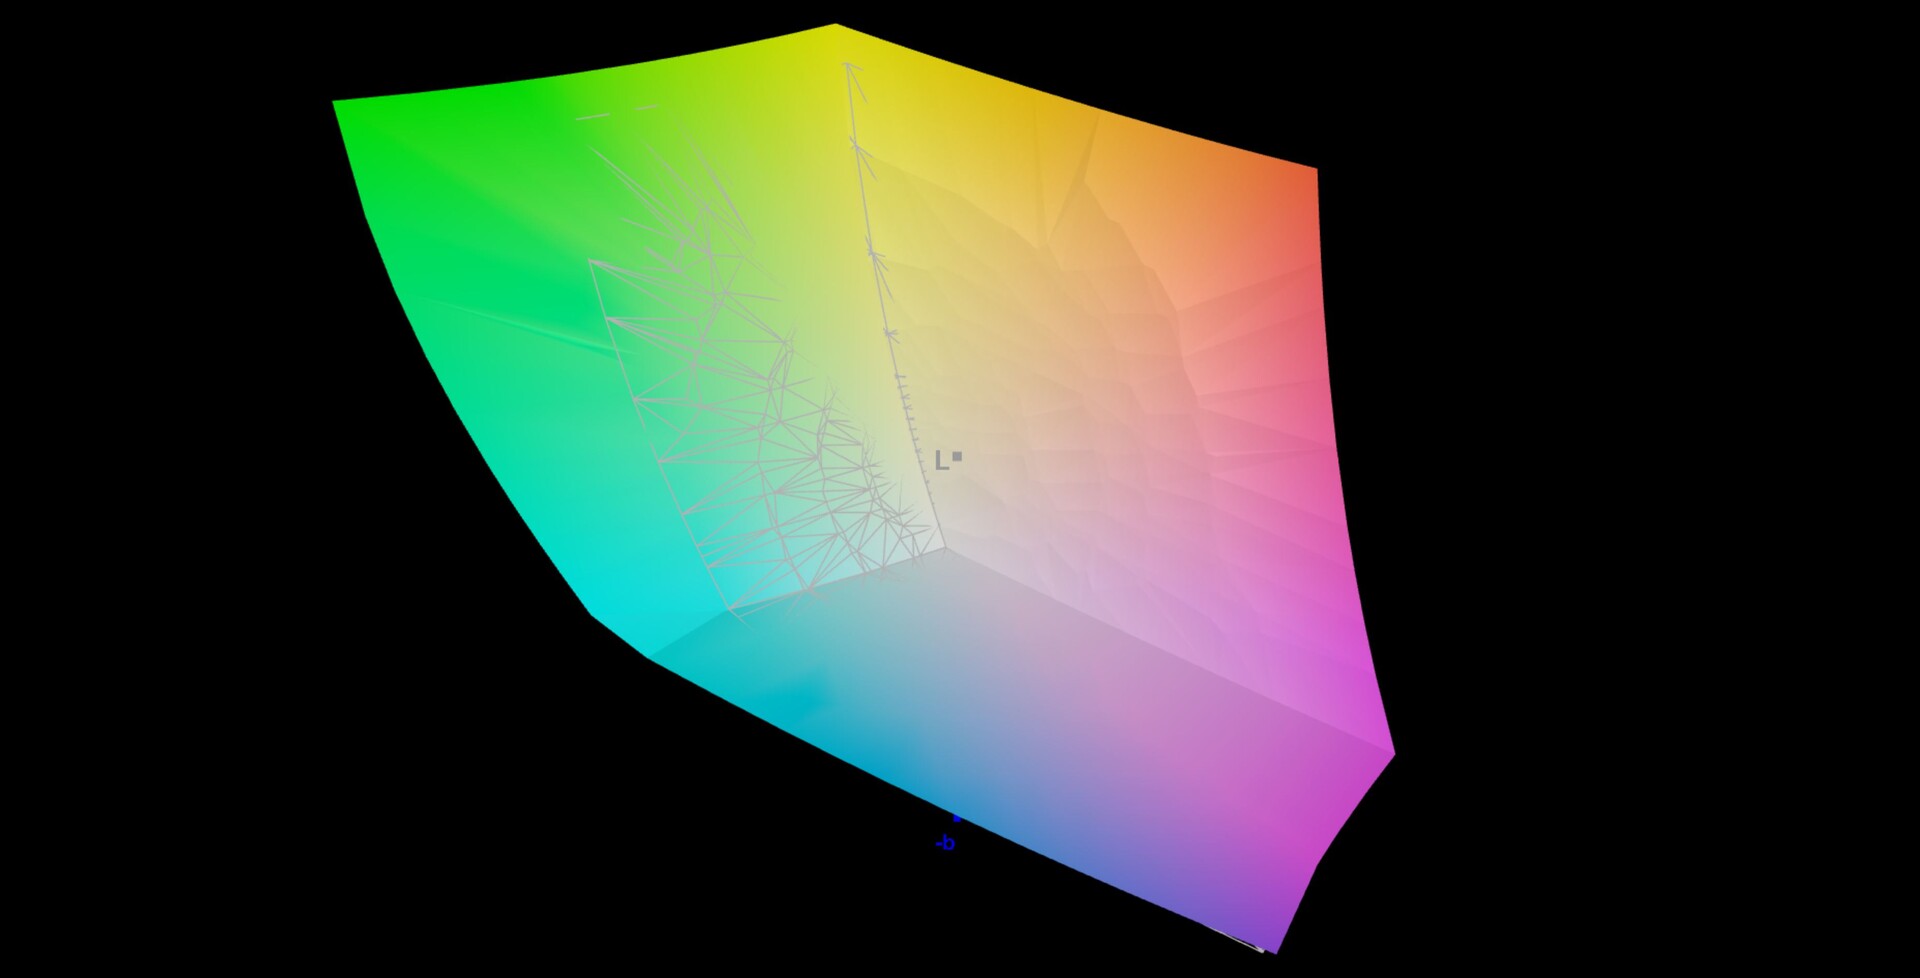
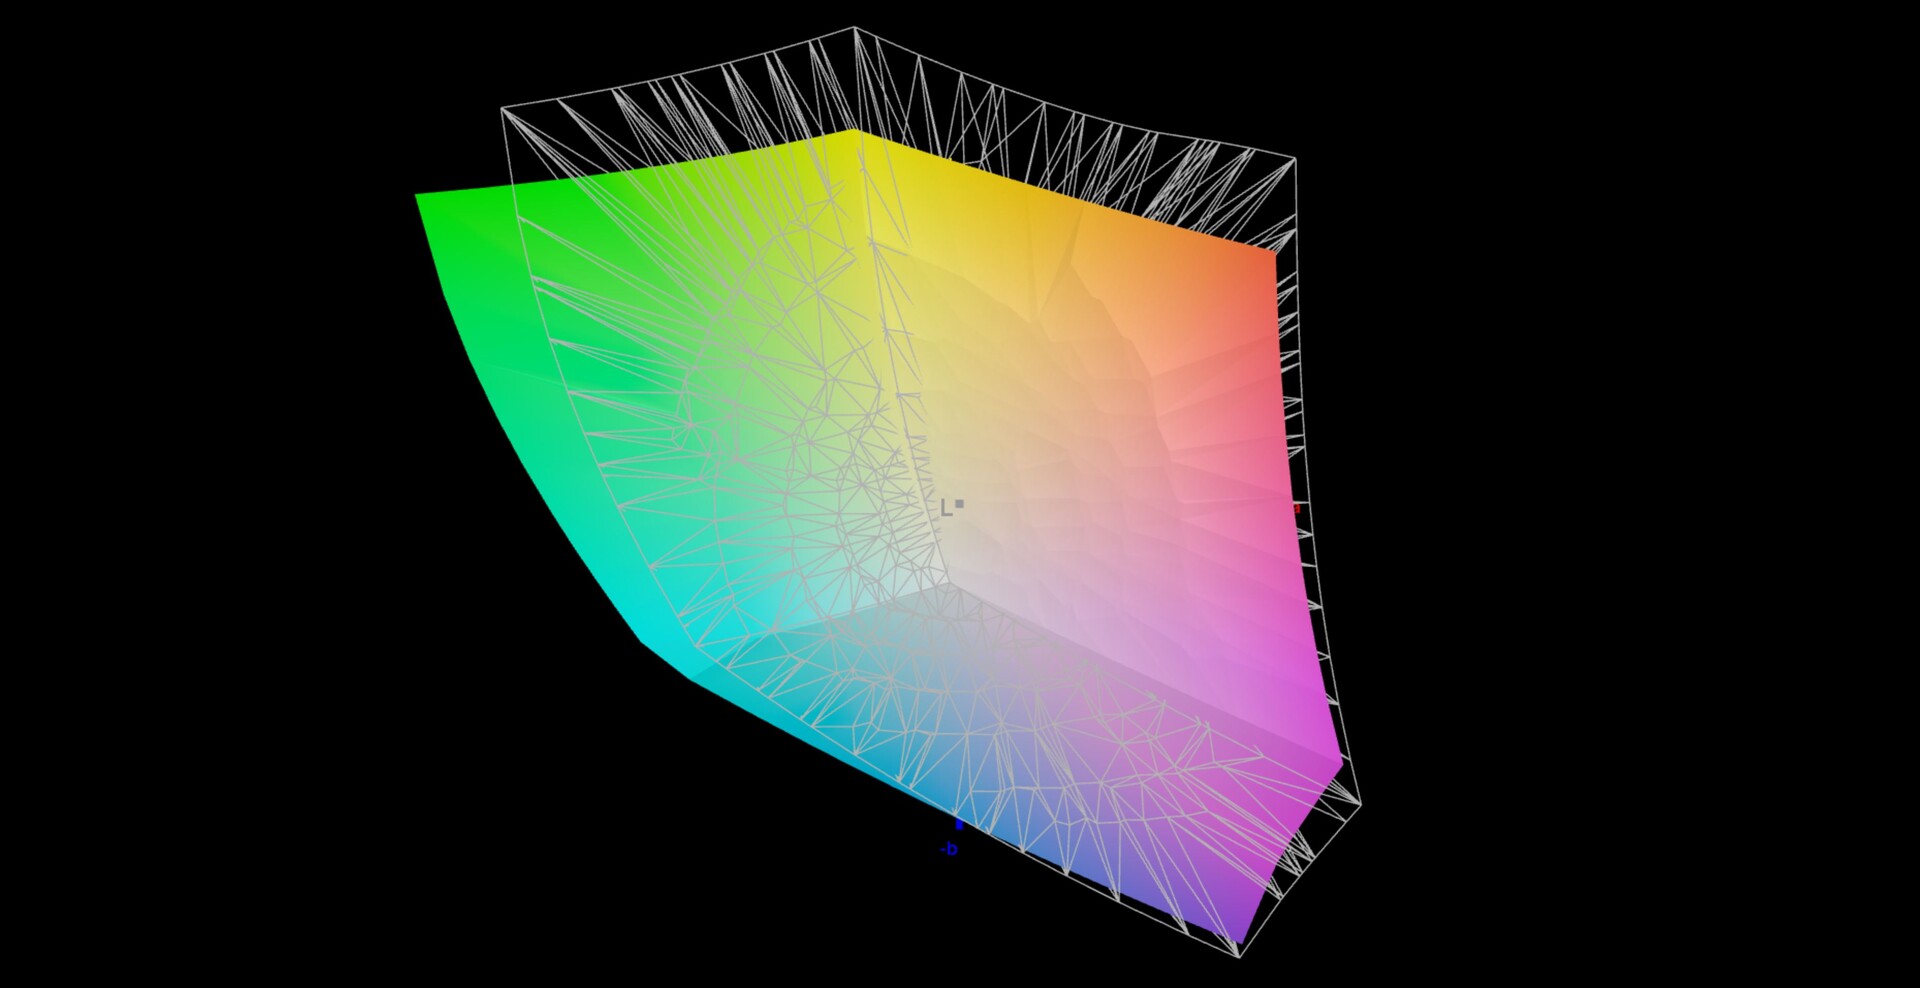
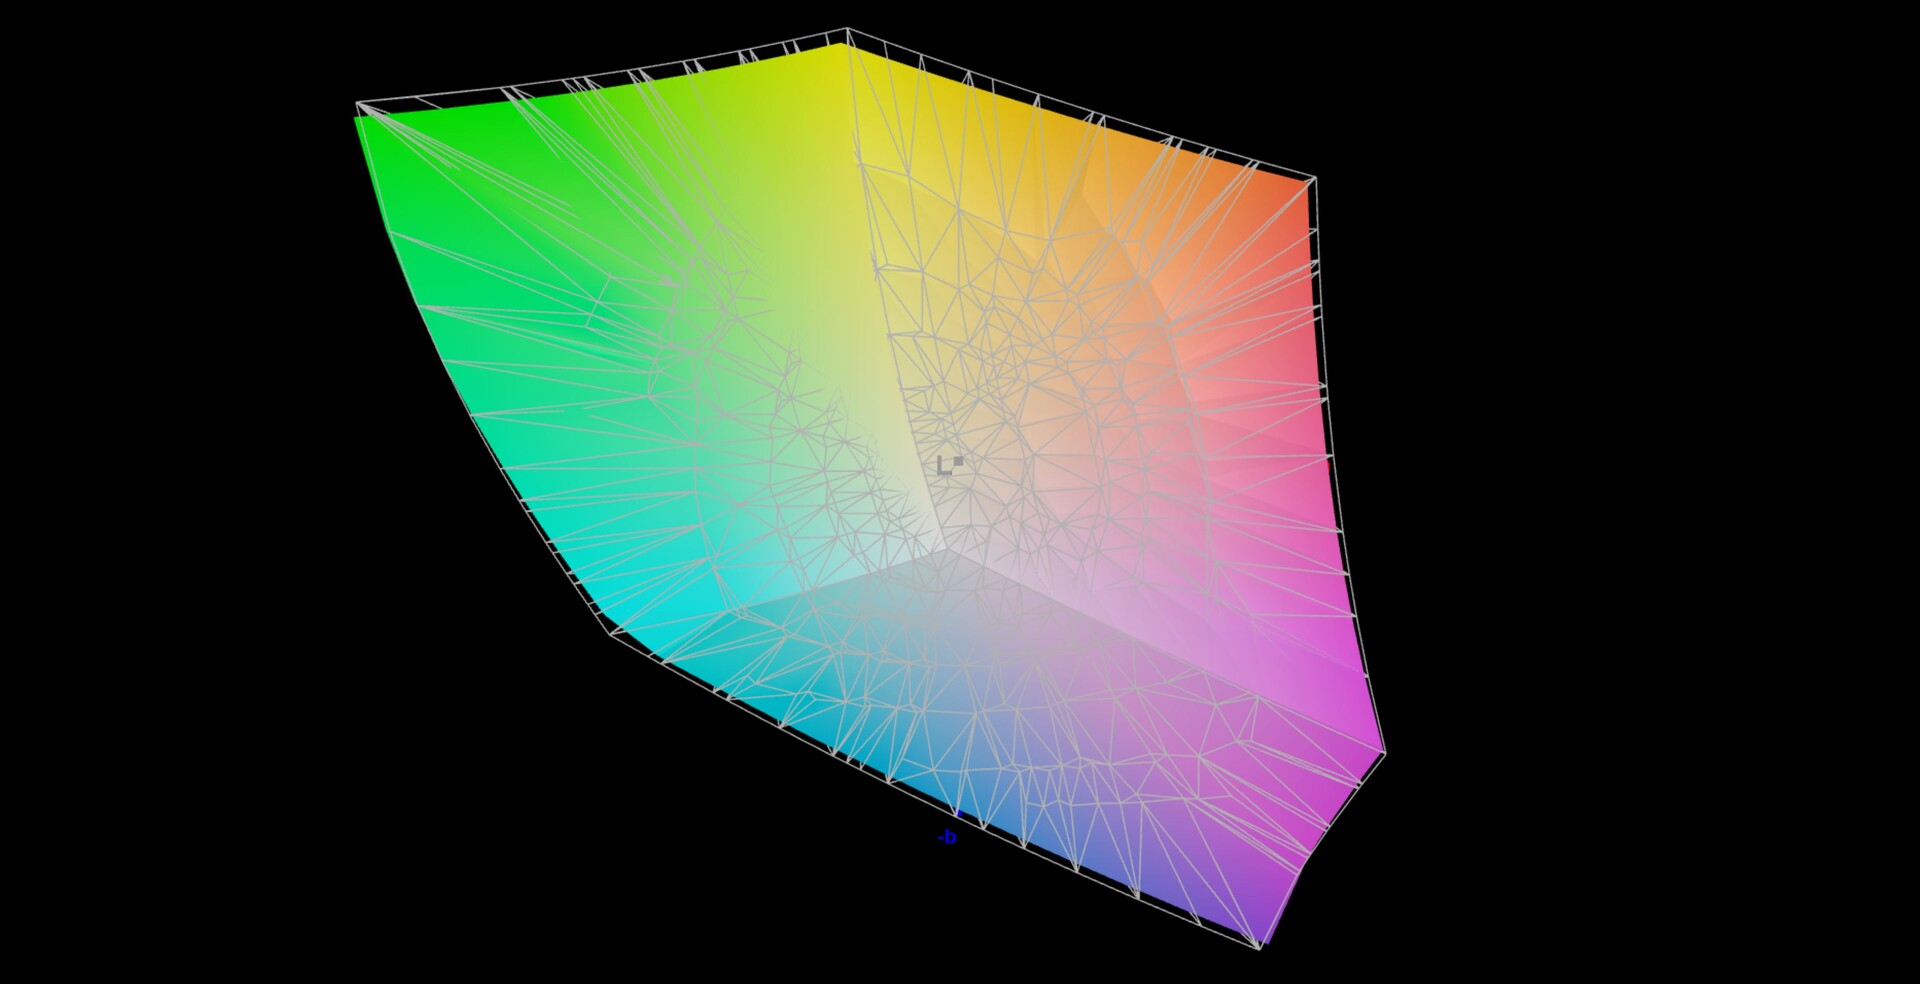
La nostra analisi (CalMAN e X-Rite i1 Pro 2) mostra che tutti i colori sono sotto la deviazione importante di 3 anche fuori dalla scatola. Tuttavia, siamo stati ancora in grado di migliorare un po' la riproduzione della scala di grigi con la nostra calibrazione (il profilo corrispondente è disponibile per il download sopra). Pertanto, il pannello 4K è adatto per l'editing di foto/video senza problemi, ma i contenuti HDR non sono supportati

Tempi di risposta del Display
| ↔ Tempi di risposta dal Nero al Bianco | ||
|---|---|---|
| 10.8 ms ... aumenta ↗ e diminuisce ↘ combinato | ↗ 5.6 ms Incremento | 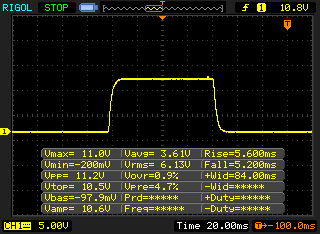 |
| ↘ 5.2 ms Calo | ||
| Lo schermo mostra buoni tempi di risposta durante i nostri tests, ma potrebbe essere troppo lento per i gamers competitivi. In confronto, tutti i dispositivi di test variano da 0.1 (minimo) a 240 (massimo) ms. » 29 % di tutti i dispositivi è migliore. Questo significa che i tempi di risposta rilevati sono migliori rispettto alla media di tutti i dispositivi testati (19.9 ms). | ||
| ↔ Tempo di risposta dal 50% Grigio all'80% Grigio | ||
| 17.6 ms ... aumenta ↗ e diminuisce ↘ combinato | ↗ 8.4 ms Incremento | 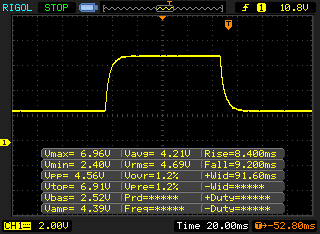 |
| ↘ 9.2 ms Calo | ||
| Lo schermo mostra buoni tempi di risposta durante i nostri tests, ma potrebbe essere troppo lento per i gamers competitivi. In confronto, tutti i dispositivi di test variano da 0.165 (minimo) a 636 (massimo) ms. » 31 % di tutti i dispositivi è migliore. Questo significa che i tempi di risposta rilevati sono migliori rispettto alla media di tutti i dispositivi testati (31.1 ms). | ||
Sfarfallio dello schermo / PWM (Pulse-Width Modulation)
| flickering dello schermo / PWM non rilevato | 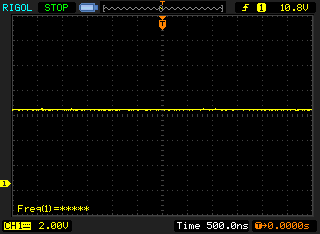 | ||
In confronto: 52 % di tutti i dispositivi testati non utilizza PWM per ridurre la luminosita' del display. Se è rilevato PWM, una media di 7794 (minimo: 5 - massimo: 343500) Hz è stata rilevata. | |||
Il WE76 non è certamente un dispositivo che verrà usato spesso in viaggio, ma la superficie opaca del pannello è naturalmente vantaggiosa all'esterno, ed è molto comodo usarlo almeno nelle giornate nuvolose. La stabilità dell'angolo di visione del display IPS non lascia spazio a critiche
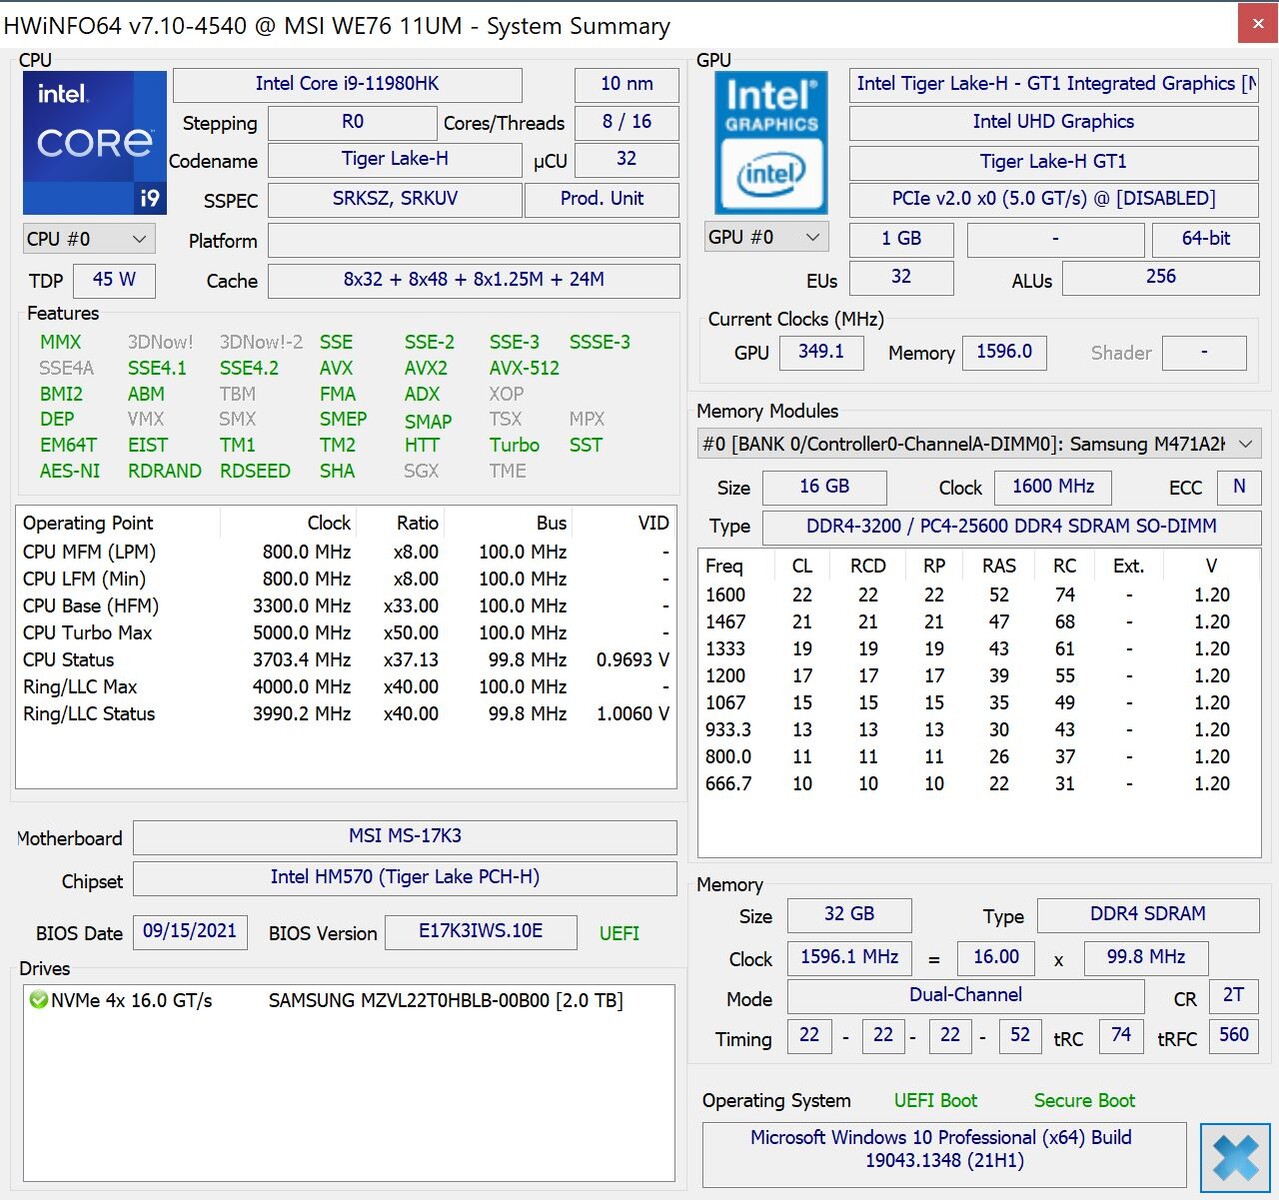
Prestazioni - WE76 con Core i9 e RTX A5000
Condizioni di prova
Oltre alle normali impostazioni di Windows, MSI offre diverse impostazioni di prestazioni con l'MSI Center Pro preinstallato. Abbiamo eseguito i seguenti test utilizzando il preset Balanced, ma per alcuni aspetti, daremo anche un'occhiata agli effetti delle altre modalità di prestazioni. La modalità High Performance influenza principalmente le prestazioni nello stress test, che è quando si stressano sia la CPU che la GPU
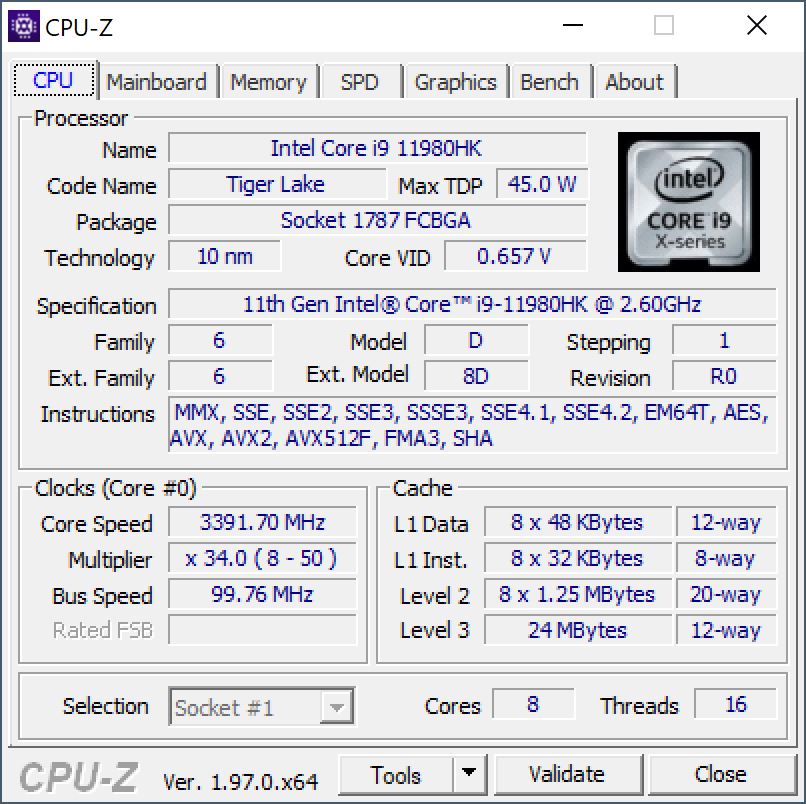
Processore
MSI ha optato per l'IntelCore i9-11980HK che si comporta molto bene nei nostri test e può spesso posizionarsi in cima al campo di confronto. Il processore può consumare un massimo di 84 watts, ma si stabilizza rapidamente a 70 watts e poi a ~62 watts. Questo sarebbe possibile anche con un normaleCore i7-11800H come possiamo vedere nel ThinkPad P17 Gen 2. Tuttavia, l'AMDRyzen 9 5900HX è un po' più veloce in una configurazione TDP comparabile (~64 watts nel caso dell Asus ROG Zephyrus Duo 15).
Le prestazioni della CPU sono notevolmente ridotte con l'alimentazione a batteria, poiché il TDP scende rapidamente a soli 45 watt e poi a 35 watt. Pertanto, ci si dovrebbe aspettare un deficit di circa il 30%-40% quando si utilizzano tutti i core. Ulteriori confronti sono disponibili nel nostro Articolo sui benchmark della CPU.
Cinebench R15 Multi endurance test
Cinebench R23: Multi Core | Single Core
Cinebench R20: CPU (Multi Core) | CPU (Single Core)
Cinebench R15: CPU Multi 64Bit | CPU Single 64Bit
Blender: v2.79 BMW27 CPU
7-Zip 18.03: 7z b 4 | 7z b 4 -mmt1
Geekbench 5.5: Multi-Core | Single-Core
HWBOT x265 Benchmark v2.2: 4k Preset
LibreOffice : 20 Documents To PDF
R Benchmark 2.5: Overall mean
| CPU Performance rating | |
| Media della classe Workstation | |
| MSI WE76 11UM-456 -1! | |
| Lenovo ThinkPad P1 G4-20Y4S0KS00 | |
| Media Intel Core i9-11980HK | |
| Asus ProArt StudioBook 16 W7600H5A-2BL2 | |
| Lenovo ThinkPad P17 G2-20YU0025G | |
| HP ZBook Fury 15 G8 -2! | |
| MSI WE75 9TK -10! | |
| HP ZBook Fury 17 G7 119W5EA | |
| Cinebench R23 / Multi Core | |
| Media della classe Workstation (14055 - 38520, n=25, ultimi 2 anni) | |
| MSI WE76 11UM-456 | |
| Lenovo ThinkPad P17 G2-20YU0025G | |
| HP ZBook Fury 15 G8 | |
| Lenovo ThinkPad P1 G4-20Y4S0KS00 | |
| Media Intel Core i9-11980HK (8459 - 13387, n=2) | |
| Asus ProArt StudioBook 16 W7600H5A-2BL2 | |
| HP ZBook Fury 17 G7 119W5EA | |
| Cinebench R23 / Single Core | |
| Media della classe Workstation (1712 - 2228, n=25, ultimi 2 anni) | |
| MSI WE76 11UM-456 | |
| HP ZBook Fury 15 G8 | |
| Media Intel Core i9-11980HK (1505 - 1613, n=2) | |
| Lenovo ThinkPad P1 G4-20Y4S0KS00 | |
| Lenovo ThinkPad P17 G2-20YU0025G | |
| Asus ProArt StudioBook 16 W7600H5A-2BL2 | |
| HP ZBook Fury 17 G7 119W5EA | |
| Cinebench R20 / CPU (Multi Core) | |
| Media della classe Workstation (5471 - 15043, n=25, ultimi 2 anni) | |
| Lenovo ThinkPad P17 G2-20YU0025G | |
| HP ZBook Fury 15 G8 | |
| Lenovo ThinkPad P1 G4-20Y4S0KS00 | |
| Media Intel Core i9-11980HK (3779 - 5256, n=8) | |
| MSI WE76 11UM-456 | |
| Asus ProArt StudioBook 16 W7600H5A-2BL2 | |
| HP ZBook Fury 17 G7 119W5EA | |
| MSI WE75 9TK | |
| Cinebench R20 / CPU (Single Core) | |
| Media della classe Workstation (671 - 857, n=25, ultimi 2 anni) | |
| MSI WE76 11UM-456 | |
| HP ZBook Fury 15 G8 | |
| Lenovo ThinkPad P1 G4-20Y4S0KS00 | |
| Media Intel Core i9-11980HK (572 - 622, n=7) | |
| Lenovo ThinkPad P17 G2-20YU0025G | |
| Asus ProArt StudioBook 16 W7600H5A-2BL2 | |
| HP ZBook Fury 17 G7 119W5EA | |
| MSI WE75 9TK | |
| Cinebench R15 / CPU Multi 64Bit | |
| Media della classe Workstation (2489 - 5810, n=25, ultimi 2 anni) | |
| MSI WE76 11UM-456 | |
| Lenovo ThinkPad P17 G2-20YU0025G | |
| Media Intel Core i9-11980HK (1696 - 2287, n=7) | |
| Lenovo ThinkPad P1 G4-20Y4S0KS00 | |
| Asus ProArt StudioBook 16 W7600H5A-2BL2 | |
| HP ZBook Fury 15 G8 | |
| HP ZBook Fury 17 G7 119W5EA | |
| MSI WE75 9TK | |
| Cinebench R15 / CPU Single 64Bit | |
| Media della classe Workstation (191.4 - 328, n=25, ultimi 2 anni) | |
| MSI WE76 11UM-456 | |
| HP ZBook Fury 15 G8 | |
| Lenovo ThinkPad P1 G4-20Y4S0KS00 | |
| Lenovo ThinkPad P17 G2-20YU0025G | |
| Media Intel Core i9-11980HK (224 - 244, n=6) | |
| Asus ProArt StudioBook 16 W7600H5A-2BL2 | |
| HP ZBook Fury 17 G7 119W5EA | |
| MSI WE75 9TK | |
| Blender / v2.79 BMW27 CPU | |
| HP ZBook Fury 17 G7 119W5EA | |
| Asus ProArt StudioBook 16 W7600H5A-2BL2 | |
| HP ZBook Fury 15 G8 | |
| Lenovo ThinkPad P1 G4-20Y4S0KS00 | |
| Media Intel Core i9-11980HK (231 - 284, n=4) | |
| Lenovo ThinkPad P17 G2-20YU0025G | |
| Media della classe Workstation (91 - 261, n=25, ultimi 2 anni) | |
| 7-Zip 18.03 / 7z b 4 | |
| Media della classe Workstation (54741 - 116969, n=25, ultimi 2 anni) | |
| MSI WE76 11UM-456 | |
| Media Intel Core i9-11980HK (45226 - 56759, n=5) | |
| Lenovo ThinkPad P1 G4-20Y4S0KS00 | |
| HP ZBook Fury 15 G8 | |
| Lenovo ThinkPad P17 G2-20YU0025G | |
| Asus ProArt StudioBook 16 W7600H5A-2BL2 | |
| HP ZBook Fury 17 G7 119W5EA | |
| 7-Zip 18.03 / 7z b 4 -mmt1 | |
| Media della classe Workstation (5126 - 6960, n=25, ultimi 2 anni) | |
| Lenovo ThinkPad P1 G4-20Y4S0KS00 | |
| HP ZBook Fury 15 G8 | |
| MSI WE76 11UM-456 | |
| Media Intel Core i9-11980HK (5428 - 5735, n=5) | |
| HP ZBook Fury 17 G7 119W5EA | |
| Lenovo ThinkPad P17 G2-20YU0025G | |
| Asus ProArt StudioBook 16 W7600H5A-2BL2 | |
| Geekbench 5.5 / Multi-Core | |
| Media della classe Workstation (11542 - 25554, n=25, ultimi 2 anni) | |
| MSI WE76 11UM-456 | |
| Media Intel Core i9-11980HK (8786 - 10081, n=5) | |
| Lenovo ThinkPad P1 G4-20Y4S0KS00 | |
| Asus ProArt StudioBook 16 W7600H5A-2BL2 | |
| Lenovo ThinkPad P17 G2-20YU0025G | |
| HP ZBook Fury 17 G7 119W5EA | |
| Geekbench 5.5 / Single-Core | |
| Media della classe Workstation (1781 - 2183, n=25, ultimi 2 anni) | |
| MSI WE76 11UM-456 | |
| Lenovo ThinkPad P1 G4-20Y4S0KS00 | |
| Media Intel Core i9-11980HK (1561 - 1679, n=5) | |
| Lenovo ThinkPad P17 G2-20YU0025G | |
| Asus ProArt StudioBook 16 W7600H5A-2BL2 | |
| HP ZBook Fury 17 G7 119W5EA | |
| HWBOT x265 Benchmark v2.2 / 4k Preset | |
| Media della classe Workstation (14.4 - 40.5, n=25, ultimi 2 anni) | |
| MSI WE76 11UM-456 | |
| Media Intel Core i9-11980HK (13.1 - 16.3, n=5) | |
| Lenovo ThinkPad P17 G2-20YU0025G | |
| Lenovo ThinkPad P1 G4-20Y4S0KS00 | |
| HP ZBook Fury 15 G8 | |
| Asus ProArt StudioBook 16 W7600H5A-2BL2 | |
| HP ZBook Fury 17 G7 119W5EA | |
| LibreOffice / 20 Documents To PDF | |
| HP ZBook Fury 17 G7 119W5EA | |
| HP ZBook Fury 15 G8 | |
| Lenovo ThinkPad P17 G2-20YU0025G | |
| Media della classe Workstation (37.1 - 74.7, n=25, ultimi 2 anni) | |
| MSI WE76 11UM-456 | |
| Lenovo ThinkPad P1 G4-20Y4S0KS00 | |
| Media Intel Core i9-11980HK (40.6 - 47.7, n=5) | |
| Asus ProArt StudioBook 16 W7600H5A-2BL2 | |
| R Benchmark 2.5 / Overall mean | |
| HP ZBook Fury 17 G7 119W5EA | |
| Asus ProArt StudioBook 16 W7600H5A-2BL2 | |
| Lenovo ThinkPad P17 G2-20YU0025G | |
| Media Intel Core i9-11980HK (0.545 - 0.565, n=5) | |
| MSI WE76 11UM-456 | |
| HP ZBook Fury 15 G8 | |
| Lenovo ThinkPad P1 G4-20Y4S0KS00 | |
| Media della classe Workstation (0.3825 - 0.603, n=25, ultimi 2 anni) | |
* ... Meglio usare valori piccoli
AIDA64: FP32 Ray-Trace | FPU Julia | CPU SHA3 | CPU Queen | FPU SinJulia | FPU Mandel | CPU AES | CPU ZLib | FP64 Ray-Trace | CPU PhotoWorxx
| Performance rating | |
| Media della classe Workstation | |
| MSI WE76 11UM-456 | |
| HP ZBook Fury 15 G8 | |
| Media Intel Core i9-11980HK | |
| HP ZBook Fury 17 G7 119W5EA | |
| Lenovo ThinkPad P1 G4-20Y4S0KS00 -9! | |
| Asus ProArt StudioBook 16 W7600H5A-2BL2 -9! | |
| Lenovo ThinkPad P17 G2-20YU0025G -9! | |
| AIDA64 / FP32 Ray-Trace | |
| Media della classe Workstation (10658 - 61611, n=25, ultimi 2 anni) | |
| MSI WE76 11UM-456 | |
| Media Intel Core i9-11980HK (14180 - 15661, n=2) | |
| HP ZBook Fury 15 G8 | |
| HP ZBook Fury 17 G7 119W5EA | |
| AIDA64 / FPU Julia | |
| Media della classe Workstation (56664 - 186971, n=25, ultimi 2 anni) | |
| MSI WE76 11UM-456 | |
| Media Intel Core i9-11980HK (59177 - 64043, n=2) | |
| HP ZBook Fury 15 G8 | |
| HP ZBook Fury 17 G7 119W5EA | |
| AIDA64 / CPU SHA3 | |
| Media della classe Workstation (2608 - 8975, n=25, ultimi 2 anni) | |
| MSI WE76 11UM-456 | |
| Media Intel Core i9-11980HK (3928 - 4220, n=2) | |
| HP ZBook Fury 15 G8 | |
| HP ZBook Fury 17 G7 119W5EA | |
| AIDA64 / CPU Queen | |
| Media della classe Workstation (60778 - 144411, n=25, ultimi 2 anni) | |
| MSI WE76 11UM-456 | |
| Media Intel Core i9-11980HK (97901 - 98443, n=2) | |
| HP ZBook Fury 15 G8 | |
| HP ZBook Fury 17 G7 119W5EA | |
| AIDA64 / FPU SinJulia | |
| Media della classe Workstation (8165 - 29343, n=25, ultimi 2 anni) | |
| MSI WE76 11UM-456 | |
| Media Intel Core i9-11980HK (10028 - 10494, n=2) | |
| HP ZBook Fury 17 G7 119W5EA | |
| HP ZBook Fury 15 G8 | |
| AIDA64 / FPU Mandel | |
| Media della classe Workstation (27301 - 98153, n=25, ultimi 2 anni) | |
| MSI WE76 11UM-456 | |
| Media Intel Core i9-11980HK (35500 - 38635, n=2) | |
| HP ZBook Fury 15 G8 | |
| HP ZBook Fury 17 G7 119W5EA | |
| AIDA64 / CPU AES | |
| Media Intel Core i9-11980HK (90742 - 141352, n=2) | |
| Media della classe Workstation (56077 - 187841, n=25, ultimi 2 anni) | |
| MSI WE76 11UM-456 | |
| HP ZBook Fury 15 G8 | |
| HP ZBook Fury 17 G7 119W5EA | |
| AIDA64 / CPU ZLib | |
| Media della classe Workstation (742 - 2148, n=25, ultimi 2 anni) | |
| MSI WE76 11UM-456 | |
| HP ZBook Fury 15 G8 | |
| HP ZBook Fury 17 G7 119W5EA | |
| Media Intel Core i9-11980HK (769 - 839, n=5) | |
| Lenovo ThinkPad P17 G2-20YU0025G | |
| Asus ProArt StudioBook 16 W7600H5A-2BL2 | |
| Asus ProArt StudioBook 16 W7600H5A-2BL2 | |
| Lenovo ThinkPad P1 G4-20Y4S0KS00 | |
| AIDA64 / FP64 Ray-Trace | |
| Media della classe Workstation (5580 - 32891, n=25, ultimi 2 anni) | |
| MSI WE76 11UM-456 | |
| Media Intel Core i9-11980HK (7662 - 8566, n=2) | |
| HP ZBook Fury 15 G8 | |
| HP ZBook Fury 17 G7 119W5EA | |
| AIDA64 / CPU PhotoWorxx | |
| Media della classe Workstation (37151 - 93684, n=25, ultimi 2 anni) | |
| HP ZBook Fury 15 G8 | |
| MSI WE76 11UM-456 | |
| Media Intel Core i9-11980HK (23047 - 25908, n=2) | |
| HP ZBook Fury 17 G7 119W5EA | |
Prestazioni del sistema
Come previsto, le prestazioni generali del sistema sono estremamente elevate. Questo può essere confermato sia dall'impressione soggettiva delle prestazioni che dai risultati dei benchmark. Non ci saranno colli di bottiglia nei prossimi anni
| PCMark 10 / Score | |
| Media della classe Workstation (6436 - 10409, n=21, ultimi 2 anni) | |
| Lenovo ThinkPad P1 G4-20Y4S0KS00 | |
| MSI WE76 11UM-456 | |
| Media Intel Core i9-11980HK, NVIDIA RTX A5000 Laptop GPU (n=1) | |
| Asus ProArt StudioBook 16 W7600H5A-2BL2 | |
| HP ZBook Fury 15 G8 | |
| Lenovo ThinkPad P17 G2-20YU0025G | |
| MSI WE75 9TK | |
| HP ZBook Fury 17 G7 119W5EA | |
| PCMark 10 / Essentials | |
| Lenovo ThinkPad P1 G4-20Y4S0KS00 | |
| Media della classe Workstation (9622 - 11157, n=21, ultimi 2 anni) | |
| Asus ProArt StudioBook 16 W7600H5A-2BL2 | |
| Lenovo ThinkPad P17 G2-20YU0025G | |
| HP ZBook Fury 15 G8 | |
| MSI WE75 9TK | |
| MSI WE76 11UM-456 | |
| Media Intel Core i9-11980HK, NVIDIA RTX A5000 Laptop GPU (n=1) | |
| HP ZBook Fury 17 G7 119W5EA | |
| PCMark 10 / Productivity | |
| Media della classe Workstation (8789 - 20616, n=21, ultimi 2 anni) | |
| MSI WE76 11UM-456 | |
| Media Intel Core i9-11980HK, NVIDIA RTX A5000 Laptop GPU (n=1) | |
| Asus ProArt StudioBook 16 W7600H5A-2BL2 | |
| Lenovo ThinkPad P1 G4-20Y4S0KS00 | |
| HP ZBook Fury 15 G8 | |
| Lenovo ThinkPad P17 G2-20YU0025G | |
| MSI WE75 9TK | |
| HP ZBook Fury 17 G7 119W5EA | |
| PCMark 10 / Digital Content Creation | |
| Media della classe Workstation (7744 - 15631, n=21, ultimi 2 anni) | |
| Lenovo ThinkPad P1 G4-20Y4S0KS00 | |
| MSI WE76 11UM-456 | |
| Media Intel Core i9-11980HK, NVIDIA RTX A5000 Laptop GPU (n=1) | |
| Asus ProArt StudioBook 16 W7600H5A-2BL2 | |
| HP ZBook Fury 15 G8 | |
| Lenovo ThinkPad P17 G2-20YU0025G | |
| HP ZBook Fury 17 G7 119W5EA | |
| MSI WE75 9TK | |
| PCMark 10 Score | 7023 punti | |
Aiuto | ||
| AIDA64 / Memory Copy | |
| Media della classe Workstation (56003 - 164795, n=25, ultimi 2 anni) | |
| MSI WE76 11UM-456 | |
| Media Intel Core i9-11980HK (42653 - 47204, n=2) | |
| AIDA64 / Memory Read | |
| Media della classe Workstation (55795 - 121563, n=25, ultimi 2 anni) | |
| Media Intel Core i9-11980HK (46298 - 47729, n=2) | |
| MSI WE76 11UM-456 | |
| AIDA64 / Memory Write | |
| Media della classe Workstation (55663 - 214520, n=25, ultimi 2 anni) | |
| MSI WE76 11UM-456 | |
| Media Intel Core i9-11980HK (45456 - 45563, n=2) | |
| AIDA64 / Memory Latency | |
| Media della classe Workstation (84.5 - 165.2, n=25, ultimi 2 anni) | |
| MSI WE76 11UM-456 | |
| Media Intel Core i9-11980HK (91.1 - 98.1, n=5) | |
* ... Meglio usare valori piccoli
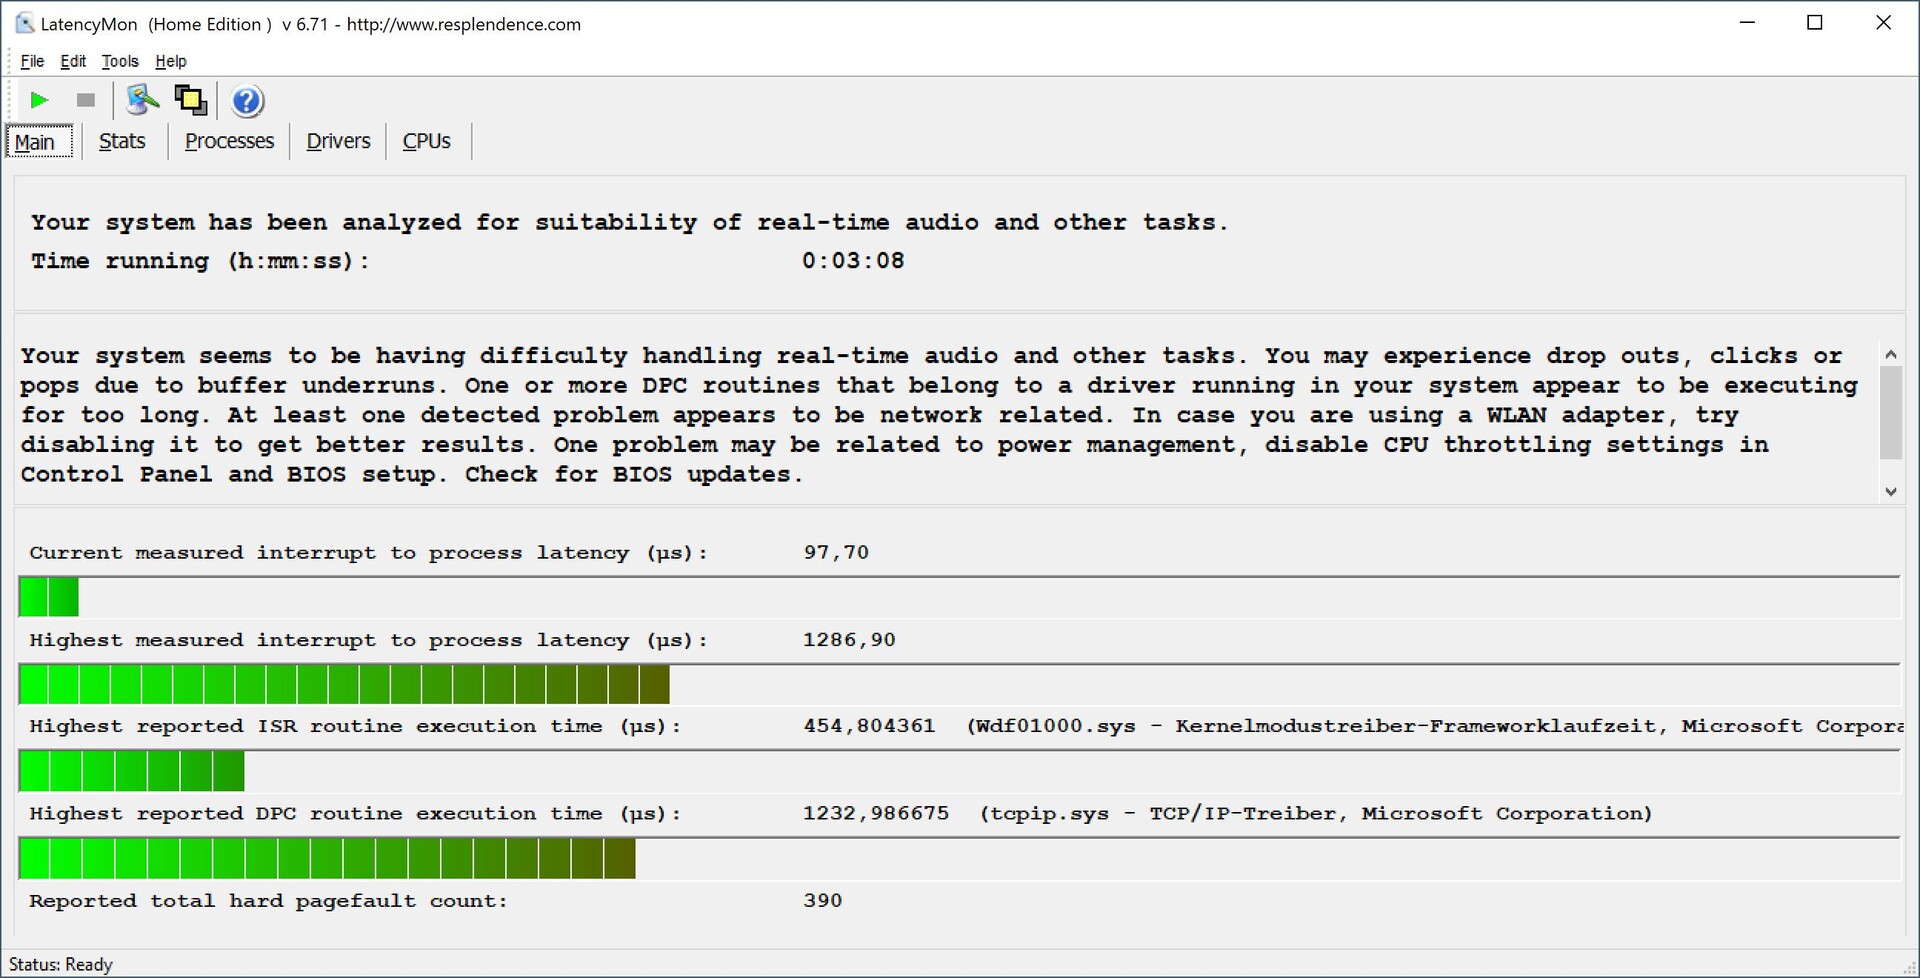
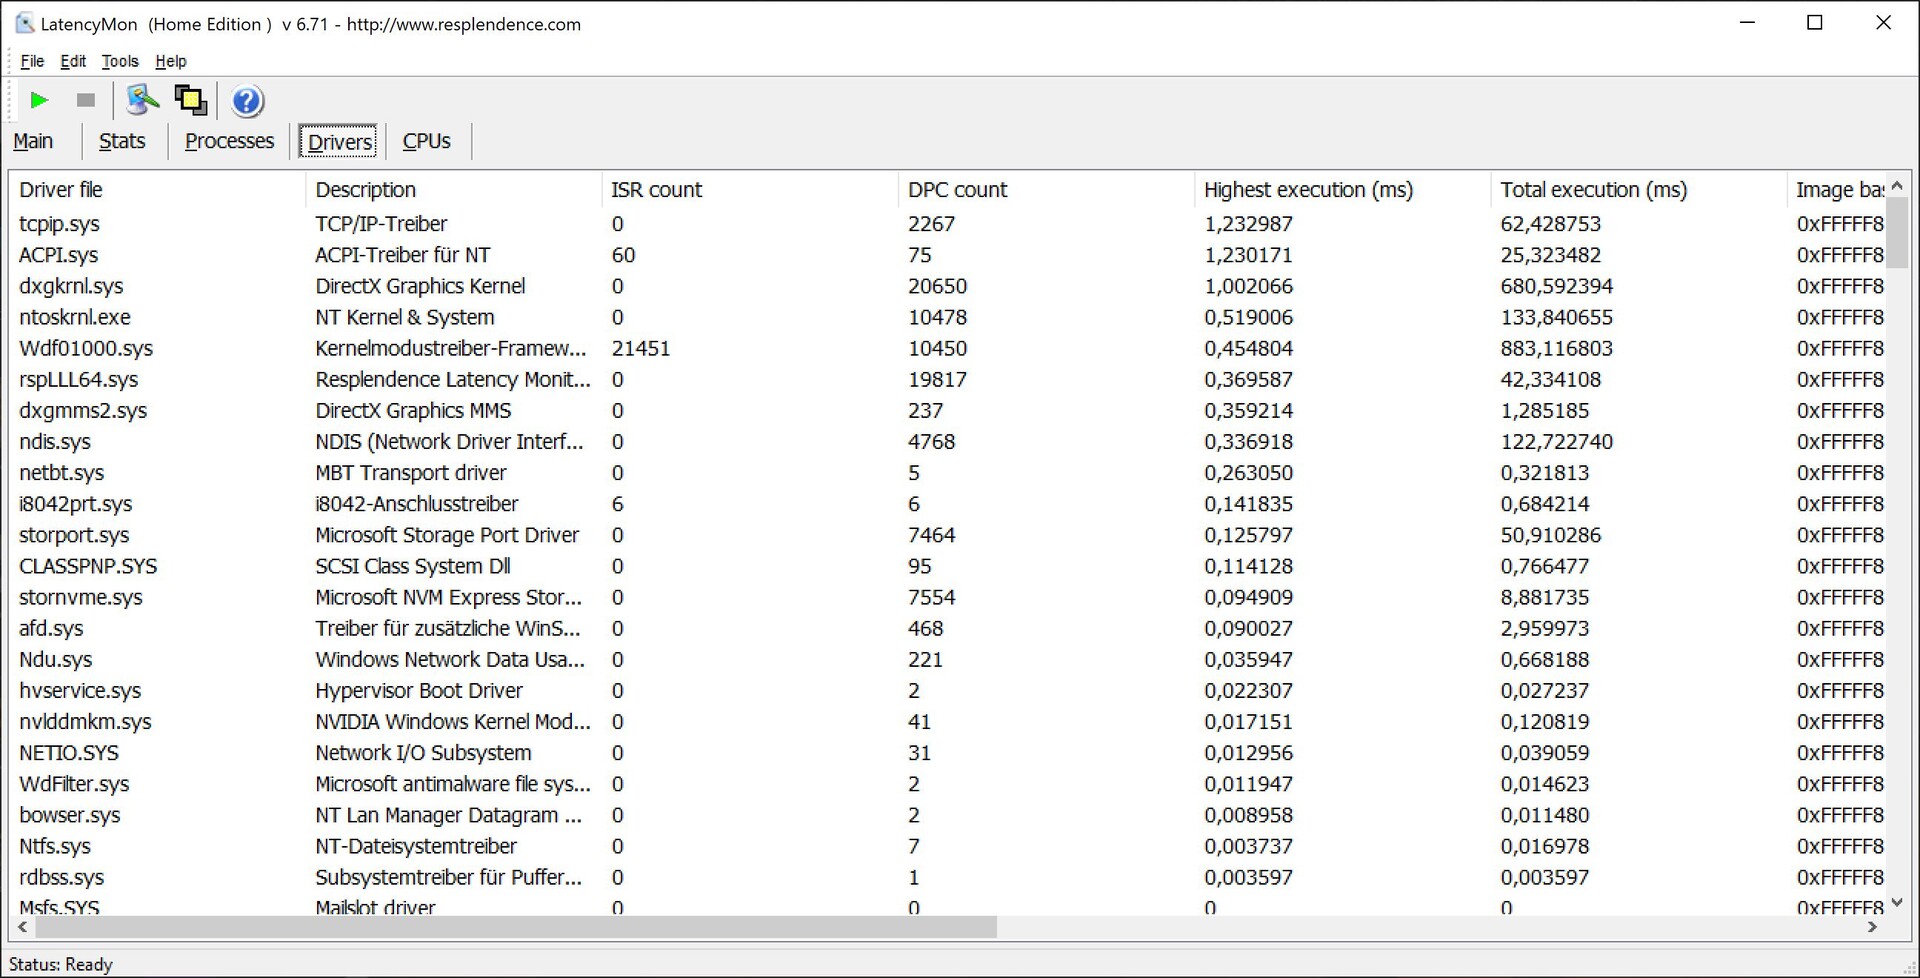
Latenze DPC
Il nostro campione da recensire del WE76 mostra latenze leggermente elevate nei nostri test con l'attuale versione del BIOS, e ci sono stati anche alcuni drop frames (fotogrammi saltati) durante la riproduzione di un video YouTube in 4K. Questo significa che il dispositivo non è idealmente adatto per applicazioni audio in tempo reale, ma gli aggiornamenti futuri potrebbero potenzialmente migliorare la situazione
| DPC Latencies / LatencyMon - interrupt to process latency (max), Web, Youtube, Prime95 | |
| Lenovo ThinkPad P17 G2-20YU0025G | |
| HP ZBook Fury 17 G7 119W5EA | |
| Asus ProArt StudioBook 16 W7600H5A-2BL2 | |
| MSI WE76 11UM-456 | |
| Lenovo ThinkPad P1 G4-20Y4S0KS00 | |
| HP ZBook Fury 15 G8 | |
* ... Meglio usare valori piccoli
Stoccaggio
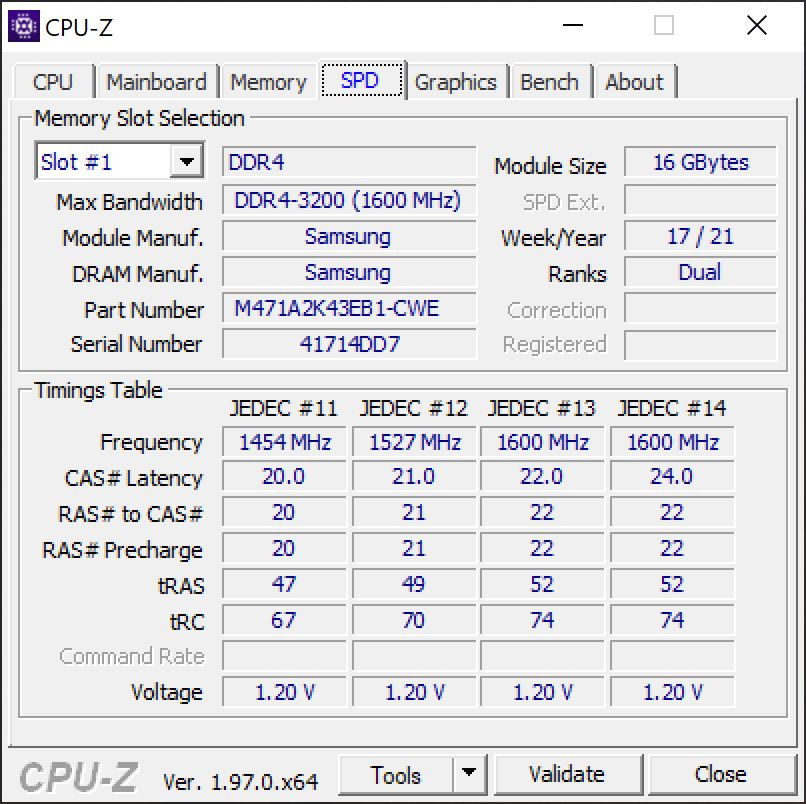
Il nostro dispositivo di prova è dotato di un Samsung PM9A1 con una capacità di archiviazione di 2 TB, di cui 1,78 TB è ancora disponibile dopo il primo avvio. Questa è un'unità PCIe 4.0 molto veloce che può essere opportunamente sfruttata dal WE76, dato che impressiona con velocità di trasferimento molto buone nei benchmark. Inoltre, il WE76 offre un altro slot M.2-2280 per un modo semplice di espandere lo storage, ma il secondo slot utilizza "solo" l'interfaccia PCIe 3.0 x4. Potete trovare ulteriori benchmark SSD qui

* ... Meglio usare valori piccoli
Continuous load read: DiskSpd Read Loop, Queue Depth 8
Scheda grafica
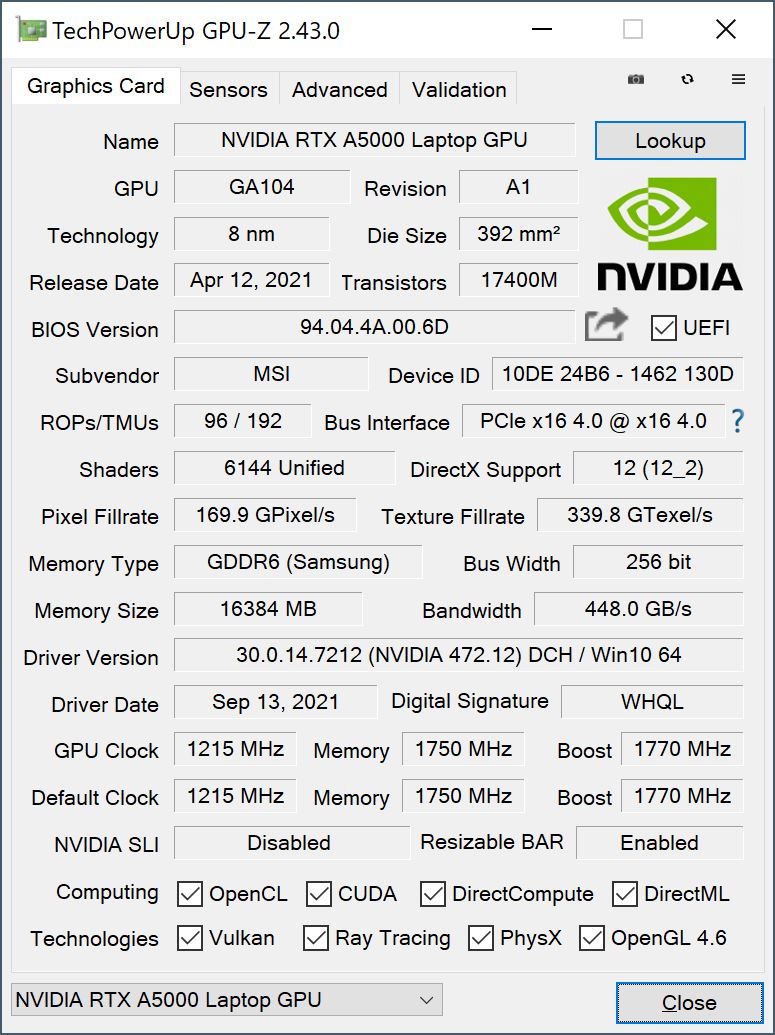
Con laNvidia RTX A5000 (Nvidia ha eliminato "Quadro" dai nomi nel frattempo), MSI ha installato la più potente GPU mobile professionale attualmente disponibile sul mercato. Con 16 GB di RAM e i driver professionali che includono le certificazioni per il software professionale, il WE76 è particolarmente adatto per complesse applicazioni CAD/CAM o grandi progetti grafici che includono il ray tracing. Con un TDP massimo di 155 watt (anche se abbiamo visto picchi fino a 180 watt a volte), la GPU è chiaramente uno dei modelli più veloci sul mercato. La soluzione di commutazione grafica Optimus di Nvidia è supportata, il che significa che la iGPU del processore viene utilizzata per compiti semplici.
Possiamo vederlo anche nei benchmark, dove il WE76 riesce a piazzarsi davanti alla concorrenza. La RTX A5000 nel HP ZBook Fury 15 G, per esempio, è più lenta del 10%-30% a seconda del benchmark. La modalità opzionale High Performance non influenza direttamente le prestazioni della GPU, e le prestazioni sono stabili in entrambe le modalità. Tuttavia, il consumo di energia è limitato a 55 watt a batteria, il che porta a una perdita di prestazioni di circa il 50%. Si prega di fare riferimento al nostro Articolo sui benchmark della GPUper ulteriori confronti.
| 3DMark 11 Performance | 32211 punti | |
| 3DMark Cloud Gate Standard Score | 35295 punti | |
| 3DMark Fire Strike Score | 24155 punti | |
| 3DMark Time Spy Score | 11185 punti | |
Aiuto | ||
Prestazioni di gioco
Anche le prestazioni di gioco del WE76 sono eccezionali, e non abbiamo riscontrato alcun problema con i driver professionali durante i nostri test. La maggior parte dei titoli può essere giocata senza problemi anche a 4K e dettagli massimi. Solo i titoli molto esigenti, come Cyberpunk 2077, richiedono una riduzione della risoluzione o dei dettagli per poter girare senza problemi. Le prestazioni di gioco sono più basse con la batteria; in The Witcher 3 (impostazioni Ultra), per esempio, le prestazioni scendono da 98 a 67 FPS. Altri benchmark di gioco sono disponibili qui
| Cyberpunk 2077 1.0 | |
| 1920x1080 Ultra Preset | |
| MSI WE76 11UM-456 | |
| Media NVIDIA RTX A5000 Laptop GPU (58.6 - 78, n=2) | |
| Asus ProArt StudioBook 16 W7600H5A-2BL2 | |
| 1920x1080 High Preset | |
| MSI WE76 11UM-456 | |
| Media NVIDIA RTX A5000 Laptop GPU (68.1 - 90, n=2) | |
| Asus ProArt StudioBook 16 W7600H5A-2BL2 | |
| F1 2021 | |
| 1920x1080 High Preset AA:T AF:16x | |
| MSI WE76 11UM-456 | |
| Asus ProArt StudioBook 16 W7600H5A-2BL2 | |
| Media NVIDIA RTX A5000 Laptop GPU (122 - 161, n=3) | |
| HP ZBook Fury 15 G8 | |
| Lenovo ThinkPad P17 G2-20YU0025G | |
| 1920x1080 Ultra High Preset + Raytracing AA:T AF:16x | |
| MSI WE76 11UM-456 | |
| Asus ProArt StudioBook 16 W7600H5A-2BL2 | |
| Media NVIDIA RTX A5000 Laptop GPU (85 - 109, n=3) | |
| HP ZBook Fury 15 G8 | |
| Lenovo ThinkPad P17 G2-20YU0025G | |
| Far Cry 6 | |
| 1920x1080 High Graphics Quality AA:T | |
| MSI WE76 11UM-456 | |
| Media NVIDIA RTX A5000 Laptop GPU (n=1) | |
| Media della classe Workstation (n=1ultimi 2 anni) | |
| 1920x1080 Ultra Graphics Quality + HD Textures AA:T | |
| MSI WE76 11UM-456 | |
| Media NVIDIA RTX A5000 Laptop GPU (n=1) | |
The Witcher 3 FPS diagram
| basso | medio | alto | ultra | QHD | 4K | |
|---|---|---|---|---|---|---|
| GTA V (2015) | 181 | 175 | 161 | 94.6 | 84.3 | 92.5 |
| The Witcher 3 (2015) | 354 | 271 | 179 | 98.3 | 74 | |
| Final Fantasy XV Benchmark (2018) | 184 | 144 | 108 | 83.6 | 51.1 | |
| X-Plane 11.11 (2018) | 136 | 114 | 90.5 | 65.3 | ||
| Far Cry 5 (2018) | 121 | 113 | 103 | 92 | 50 | |
| Strange Brigade (2018) | 412 | 251 | 213 | 191 | 146 | 86.8 |
| Cyberpunk 2077 1.0 (2020) | 118 | 104 | 90 | 78 | 51 | 25 |
| F1 2021 (2021) | 257 | 187 | 161 | 109 | 88.2 | 53.6 |
| Far Cry 6 (2021) | 120 | 103 | 95 | 89 | 79 | 51 |
Emissioni - WE76 con raffreddamento potente
Emissioni di rumore
Il controllo delle ventole è sicuramente tra i punti deboli del WE76. Anche sotto basso carico, le ventole si alzano rumorosamente di tanto in tanto, motivo per cui raccomandiamo sempre di usare la modalità Silent per le attività quotidiane, dato che le ventole sono spesso disattivate. Se avete bisogno di più prestazioni (soprattutto in termini di GPU), potete ancora modificare la modalità Performance. In generale, comunque, la workstation mobile di MSI non è più rumorosa o solo marginalmente più rumorosa sotto carico della concorrenza, che spesso è equipaggiata con componenti più deboli. Il profilo High Performance aumenta il rumore massimo della ventola da poco meno di 48 a circa 54 dB(A), che può essere descritto come fastidiosamente forte. Con la modalità CoolerBooster, si può anche attivare la massima velocità della ventola, che porta a 58,9 dB(A). Raccomandiamo di verificare le prestazioni in modalità Silent quando si gioca, poiché abbiamo potuto misurare solo 38,6 dB(A) in The Witcher 3, per esempio, il che significa che non è necessario ricorrere alle cuffie. Non siamo stati in grado di rilevare altri rumori elettronici, però
Rumorosità
| Idle |
| 24.7 / 24.7 / 27.5 dB(A) |
| Sotto carico |
| 43.7 / 47.7 dB(A) |
 | ||
30 dB silenzioso 40 dB(A) udibile 50 dB(A) rumoroso |
||
min: | ||
| MSI WE76 11UM-456 RTX A5000 Laptop GPU, i9-11980HK, Samsung PM9A1 MZVL22T0HBLB | Lenovo ThinkPad P1 G4-20Y4S0KS00 GeForce RTX 3070 Laptop GPU, i7-11850H, Samsung PM9A1 MZVL21T0HCLR | HP ZBook Fury 15 G8 RTX A5000 Laptop GPU, i9-11950H, Samsung PM981a MZVLB1T0HBLR | Asus ProArt StudioBook 16 W7600H5A-2BL2 RTX A5000 Laptop GPU, W-11955M, 2x Micron 2300 2TB MTFDHBA2T0TDV (RAID 0) | Lenovo ThinkPad P17 G2-20YU0025G RTX A2000 Laptop GPU, i7-11800H, Kioxia XG7 KXG7AZNV512G | HP ZBook Fury 17 G7 119W5EA Quadro RTX 4000 Max-Q, i9-10885H, WDC PC SN730 SDBPNTY-1T00 | MSI WE75 9TK Quadro RTX 3000 (Laptop), i7-9750H, Samsung SSD PM981 MZVLB512HAJQ | |
|---|---|---|---|---|---|---|---|
| Noise | 3% | 6% | 1% | 3% | -1% | -7% | |
| off /ambiente * (dB) | 24.7 | 23.8 4% | 24.1 2% | 26 -5% | 26.4 -7% | 24.4 1% | 28.5 -15% |
| Idle Minimum * (dB) | 24.7 | 23.8 4% | 24.1 2% | 26 -5% | 26.4 -7% | 24.4 1% | 29 -17% |
| Idle Average * (dB) | 24.7 | 23.8 4% | 24.1 2% | 26 -5% | 26.4 -7% | 26.6 -8% | 29 -17% |
| Idle Maximum * (dB) | 27.5 | 28.3 -3% | 24.8 10% | 26.5 4% | 26.4 4% | 29 -5% | 31.5 -15% |
| Load Average * (dB) | 43.7 | 38.6 12% | 37.8 14% | 42 4% | 38.1 13% | 40.2 8% | 32 27% |
| Witcher 3 ultra * (dB) | 46.6 | 47.4 -2% | 44.2 5% | 38.1 18% | 48 -3% | 44.7 4% | |
| Load Maximum * (dB) | 47.7 | 47.4 1% | 44.2 7% | 43 10% | 45 6% | 48 -1% | 56.5 -18% |
* ... Meglio usare valori piccoli
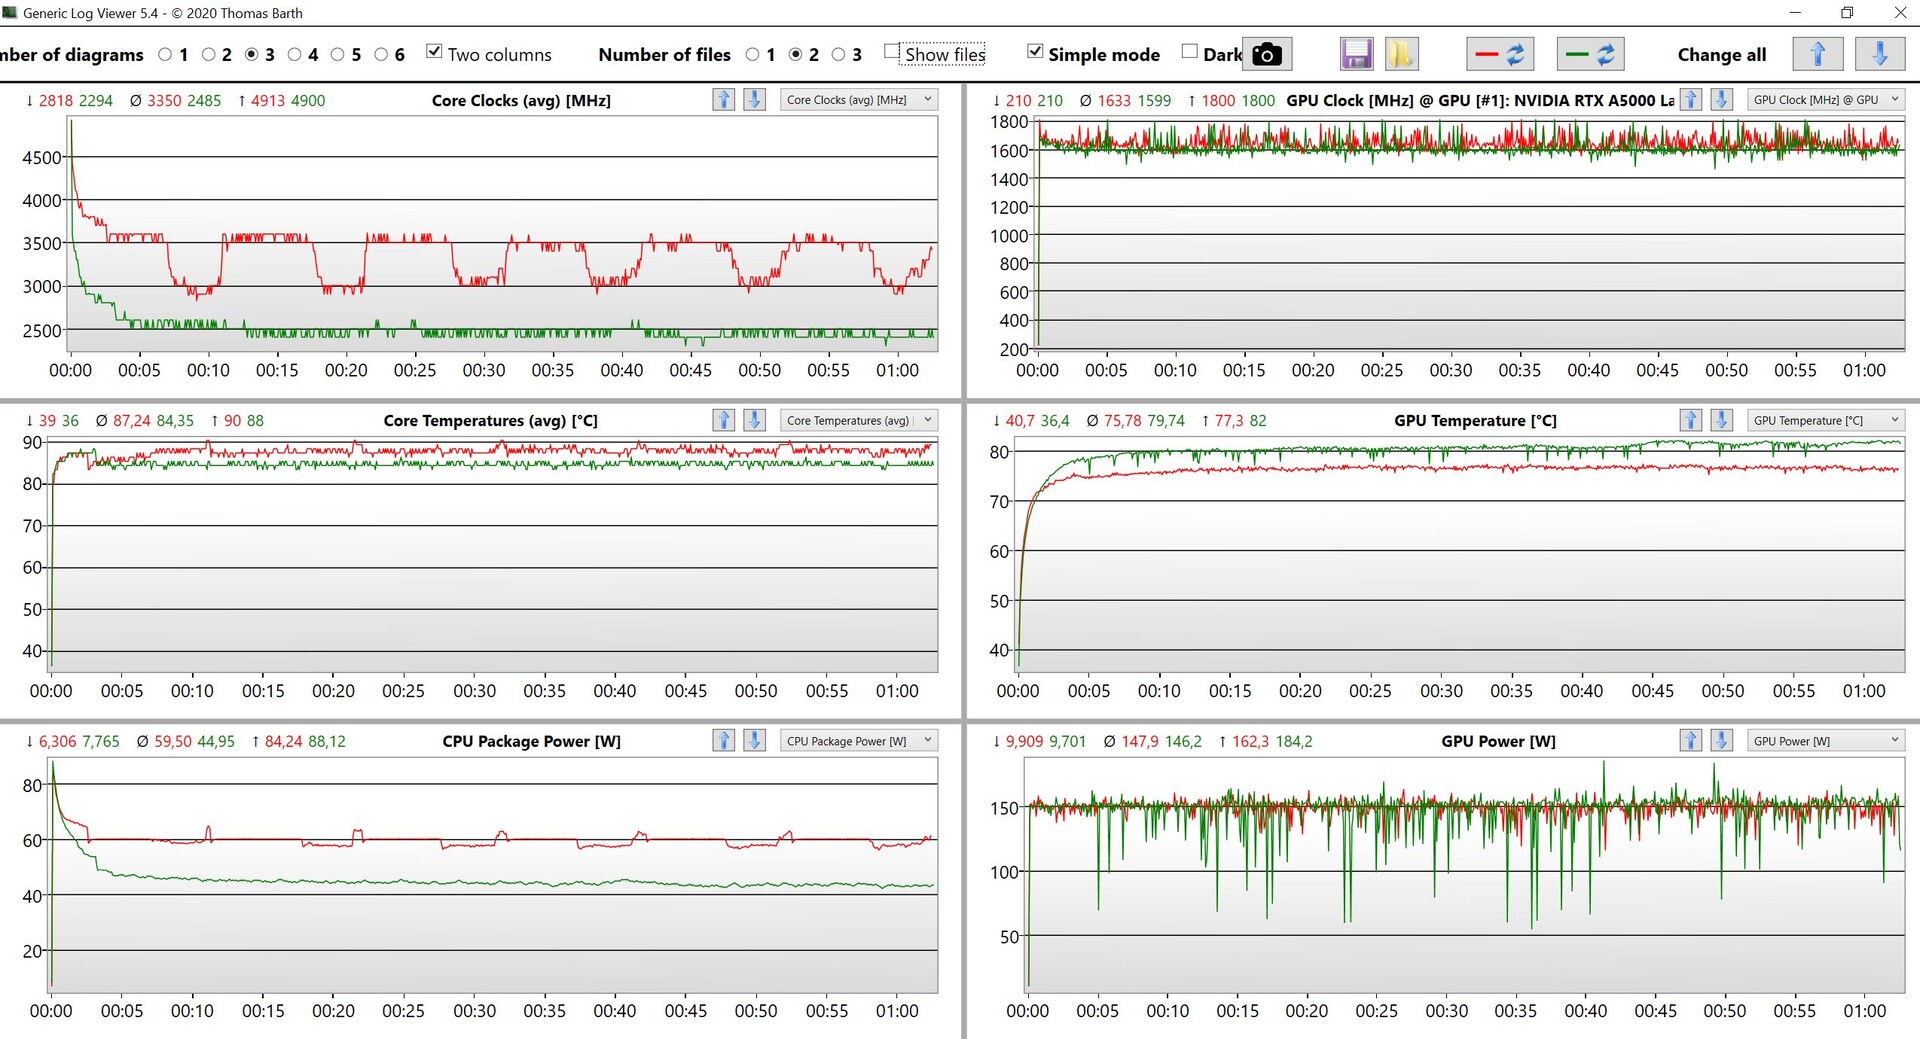
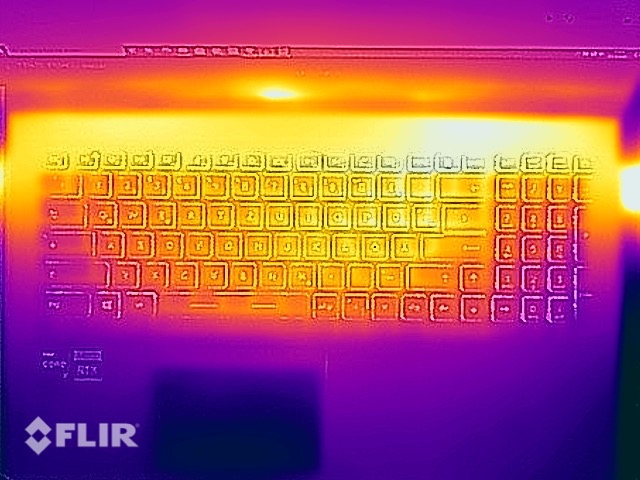
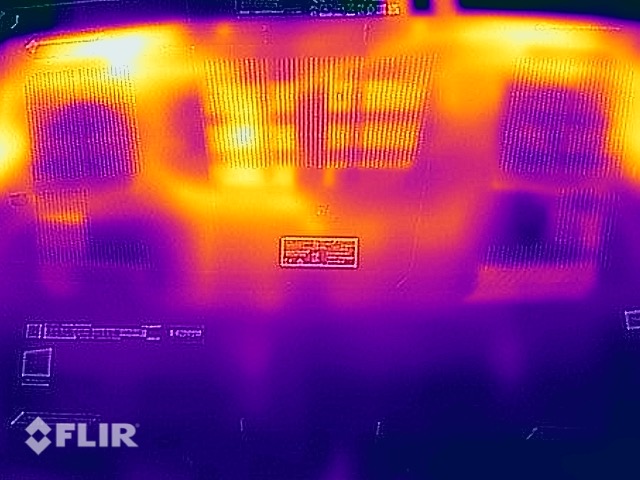
Temperatura
Il WE76 non ha problemi di temperatura, dato che l'intero case rimane molto fresco durante le attività semplici. Anche se c'è un'area sul lato posteriore sinistro del fondo sotto carico dove possiamo misurare più di 55 °C (~131 °F), non lo vediamo come un problema dato che non userete quasi mai questa workstation mobile sulle vostre ginocchia. Anche la tastiera si scalda notevolmente sotto carico elevato, ma la digitazione non ne risente.
Potete vedere la differenza tra le modalità di performance nello stress test, dato che la modalità opzionale High Performance aumenta il consumo della CPU da ~42 a 60 watts. Il consumo della GPU è costante a ~150 watts, però, e i risultati sono complessivamente molto buoni.
(-) La temperatura massima sul lato superiore è di 48.4 °C / 119 F, rispetto alla media di 38.2 °C / 101 F, che varia da 22.2 a 69.8 °C per questa classe Workstation.
(-) Il lato inferiore si riscalda fino ad un massimo di 56.2 °C / 133 F, rispetto alla media di 41.1 °C / 106 F
(+) In idle, la temperatura media del lato superiore è di 26 °C / 79 F, rispetto alla media deld ispositivo di 32 °C / 90 F.
(±) Riproducendo The Witcher 3, la temperatura media per il lato superiore e' di 37.6 °C / 100 F, rispetto alla media del dispositivo di 32 °C / 90 F.
(+) I poggiapolsi e il touchpad sono piu' freddi della temperatura della pelle con un massimo di 27.5 °C / 81.5 F e sono quindi freddi al tatto.
(±) La temperatura media della zona del palmo della mano di dispositivi simili e'stata di 27.8 °C / 82 F (+0.3 °C / 0.5 F).
| MSI WE76 11UM-456 Intel Core i9-11980HK, NVIDIA RTX A5000 Laptop GPU | Lenovo ThinkPad P1 G4-20Y4S0KS00 Intel Core i7-11850H, NVIDIA GeForce RTX 3070 Laptop GPU | HP ZBook Fury 15 G8 Intel Core i9-11950H, NVIDIA RTX A5000 Laptop GPU | Asus ProArt StudioBook 16 W7600H5A-2BL2 Intel Xeon W-11955M, NVIDIA RTX A5000 Laptop GPU | Lenovo ThinkPad P17 G2-20YU0025G Intel Core i7-11800H, NVIDIA RTX A2000 Laptop GPU | HP ZBook Fury 17 G7 119W5EA Intel Core i9-10885H, NVIDIA Quadro RTX 4000 Max-Q | MSI WE75 9TK Intel Core i7-9750H, NVIDIA Quadro RTX 3000 (Laptop) | |
|---|---|---|---|---|---|---|---|
| Heat | 2% | 6% | -3% | 7% | 12% | 8% | |
| Maximum Upper Side * (°C) | 48.4 | 51 -5% | 45.6 6% | 45.7 6% | 49.6 -2% | 46.1 5% | 40.6 16% |
| Maximum Bottom * (°C) | 56.2 | 53.5 5% | 57.6 -2% | 48.3 14% | 52.1 7% | 57.6 -2% | 46 18% |
| Idle Upper Side * (°C) | 28.6 | 28.8 -1% | 26 9% | 35.3 -23% | 26 9% | 23.4 18% | 29.2 -2% |
| Idle Bottom * (°C) | 31.8 | 29.3 8% | 28.8 9% | 34.4 -8% | 27.6 13% | 23.4 26% | 32.4 -2% |
* ... Meglio usare valori piccoli
Altoparlanti
MSI ha installato un sistema audio stereo con prestazioni accettabili. Tuttavia, il rumore della ventola predomina soprattutto quando i componenti sono sotto carico elevato (indipendentemente dal fatto che le applicazioni professionali o i giochi siano in uso), così che non si riesce a sentire molto bene gli altoparlanti. Perciò raccomandiamo di usare le cuffie in questo caso
MSI WE76 11UM-456 analisi audio
(+) | gli altoparlanti sono relativamente potenti (84.6 dB)
Bassi 100 - 315 Hz
(±) | bassi ridotti - in media 14.7% inferiori alla media
(±) | la linearità dei bassi è media (7.8% delta rispetto alla precedente frequenza)
Medi 400 - 2000 Hz
(±) | medi elevati - circa 5% superiore alla media
(+) | medi lineari (3.9% delta rispetto alla precedente frequenza)
Alti 2 - 16 kHz
(±) | alti elevati - circa 5.6% superiori alla media
(±) | la linearità degli alti è media (9.1% delta rispetto alla precedente frequenza)
Nel complesso 100 - 16.000 Hz
(±) | la linearità complessiva del suono è media (16.3% di differenza rispetto alla media
Rispetto alla stessa classe
» 44% di tutti i dispositivi testati in questa classe è stato migliore, 9% simile, 47% peggiore
» Il migliore ha avuto un delta di 7%, medio di 17%, peggiore di 35%
Rispetto a tutti i dispositivi testati
» 27% di tutti i dispositivi testati in questa classe è stato migliore, 6% similare, 68% peggiore
» Il migliore ha avuto un delta di 4%, medio di 24%, peggiore di 134%
HP ZBook Fury 17 G7 119W5EA analisi audio
(±) | potenza degli altiparlanti media ma buona (78.6 dB)
Bassi 100 - 315 Hz
(±) | bassi ridotti - in media 7.9% inferiori alla media
(±) | la linearità dei bassi è media (11.1% delta rispetto alla precedente frequenza)
Medi 400 - 2000 Hz
(+) | medi bilanciati - solo only 2.8% rispetto alla media
(+) | medi lineari (3.9% delta rispetto alla precedente frequenza)
Alti 2 - 16 kHz
(+) | Alti bilanciati - appena 2.7% dalla media
(+) | alti lineari (4.8% delta rispetto alla precedente frequenza)
Nel complesso 100 - 16.000 Hz
(+) | suono nel complesso lineare (10.9% differenza dalla media)
Rispetto alla stessa classe
» 11% di tutti i dispositivi testati in questa classe è stato migliore, 4% simile, 85% peggiore
» Il migliore ha avuto un delta di 7%, medio di 17%, peggiore di 35%
Rispetto a tutti i dispositivi testati
» 6% di tutti i dispositivi testati in questa classe è stato migliore, 2% similare, 92% peggiore
» Il migliore ha avuto un delta di 4%, medio di 24%, peggiore di 134%
Lenovo ThinkPad P17 G2-20YU0025G analisi audio
(±) | potenza degli altiparlanti media ma buona (76.6 dB)
Bassi 100 - 315 Hz
(±) | bassi ridotti - in media 14.5% inferiori alla media
(±) | la linearità dei bassi è media (9.6% delta rispetto alla precedente frequenza)
Medi 400 - 2000 Hz
(±) | medi elevati - circa 6.9% superiore alla media
(±) | linearità dei medi adeguata (7.7% delta rispetto alla precedente frequenza)
Alti 2 - 16 kHz
(+) | Alti bilanciati - appena 2.6% dalla media
(+) | alti lineari (6.6% delta rispetto alla precedente frequenza)
Nel complesso 100 - 16.000 Hz
(±) | la linearità complessiva del suono è media (20.1% di differenza rispetto alla media
Rispetto alla stessa classe
» 71% di tutti i dispositivi testati in questa classe è stato migliore, 6% simile, 23% peggiore
» Il migliore ha avuto un delta di 7%, medio di 17%, peggiore di 35%
Rispetto a tutti i dispositivi testati
» 52% di tutti i dispositivi testati in questa classe è stato migliore, 8% similare, 40% peggiore
» Il migliore ha avuto un delta di 4%, medio di 24%, peggiore di 134%
Gestione dell'energia - Alto consumo energetico
Consumo di energia
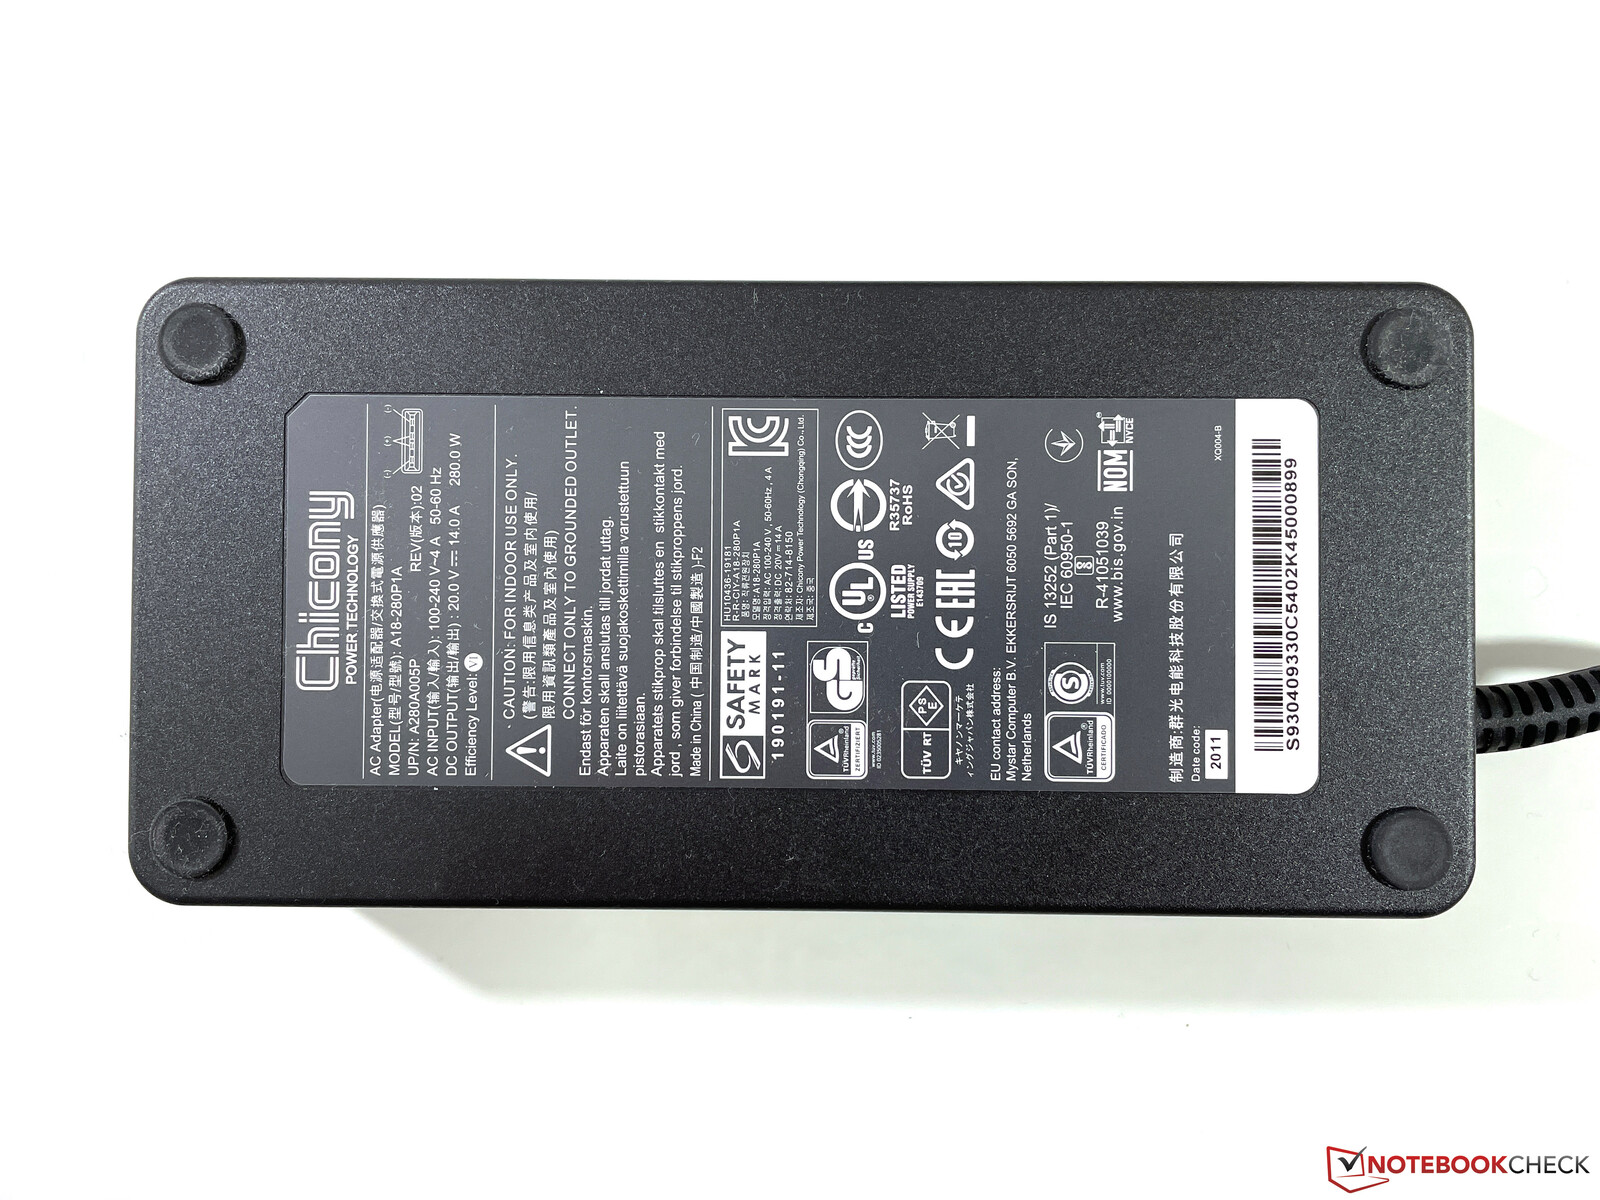
Non è una sorpresa che la workstation mobile richieda molta potenza. Grazie alla commutazione grafica automatica, i tassi di idle sono ancora entro i limiti con un massimo di 20 watts, ma sotto carico, si raggiungono fino a 281 watts, che poi si assestano abbastanza rapidamente a 245 watts (~260 watts in modalità High Performance). Ci si può aspettare circa 230 watts quando si gioca. Questo significa che l'alimentatore da 280 watt incluso ha una capacità adeguata
| Off / Standby | |
| Idle | |
| Sotto carico |
|
Leggenda:
min: | |
| MSI WE76 11UM-456 i9-11980HK, RTX A5000 Laptop GPU, Samsung PM9A1 MZVL22T0HBLB, IPS, 3840x2160, 17.3" | Lenovo ThinkPad P1 G4-20Y4S0KS00 i7-11850H, GeForce RTX 3070 Laptop GPU, Samsung PM9A1 MZVL21T0HCLR, IPS LED, 3840x2400, 16" | HP ZBook Fury 15 G8 i9-11950H, RTX A5000 Laptop GPU, Samsung PM981a MZVLB1T0HBLR, IPS, 3840x2160, 15.6" | Asus ProArt StudioBook 16 W7600H5A-2BL2 W-11955M, RTX A5000 Laptop GPU, 2x Micron 2300 2TB MTFDHBA2T0TDV (RAID 0), OLED, 3840x2400, 16" | Lenovo ThinkPad P17 G2-20YU0025G i7-11800H, RTX A2000 Laptop GPU, Kioxia XG7 KXG7AZNV512G, IPS LED, 1920x1080, 17.3" | HP ZBook Fury 17 G7 119W5EA i9-10885H, Quadro RTX 4000 Max-Q, WDC PC SN730 SDBPNTY-1T00, , 3840x2160, 17.3" | MSI WE75 9TK i7-9750H, Quadro RTX 3000 (Laptop), Samsung SSD PM981 MZVLB512HAJQ, IPS, 1920x1080, 17.3" | Media NVIDIA RTX A5000 Laptop GPU | Media della classe Workstation | |
|---|---|---|---|---|---|---|---|---|---|
| Power Consumption | 19% | 15% | 11% | 38% | 24% | 15% | 5% | 24% | |
| Idle Minimum * (Watt) | 10.5 | 8.1 23% | 8.3 21% | 12.4 -18% | 6.1 42% | 5.8 45% | 12.1 -15% | 10.4 ? 1% | 8.94 ? 15% |
| Idle Average * (Watt) | 18.6 | 20.2 -9% | 19.9 -7% | 16.5 11% | 10.9 41% | 14.8 20% | 18.4 1% | 18.3 ? 2% | 13.8 ? 26% |
| Idle Maximum * (Watt) | 20 | 21.9 -10% | 21.8 -9% | 25 -25% | 12.3 38% | 17 15% | 18.8 6% | 22.3 ? -12% | 17.5 ? 12% |
| Load Average * (Watt) | 132.4 | 88.2 33% | 110.9 16% | 132 -0% | 106.3 20% | 120.4 9% | 95.1 28% | 125.1 ? 6% | 95 ? 28% |
| Witcher 3 ultra * (Watt) | 232 | 149 36% | 165 29% | 132 43% | 124 47% | 168.4 27% | 135.5 42% | ||
| Load Maximum * (Watt) | 281.6 | 170.6 39% | 171.8 39% | 134 52% | 168.9 40% | 199.8 29% | 203.7 28% | 195.8 ? 30% | 175.2 ? 38% |
* ... Meglio usare valori piccoli
Energy consumption during our The Witcher 3 test / stress test
Energy consumption with an external monitor
Durata della batteria
La batteria da 99,9 Wh è la capacità massima che può ancora essere trasportata negli aerei. I tempi di funzionamento della batteria sono adeguati alle prestazioni e ai componenti. Con un po' più di 6 ore nel test Wi-Fi a 150 cd/m² (o 4:30 ore a piena luminosità) e poco meno di 7 ore nel test video, si può sicuramente sopravvivere a riunioni un po' più lunghe senza bisogno di una presa di corrente. Poco meno di 80 minuti è possibile sotto carico, ma questo è fattibile solo a causa delle prestazioni significativamente ridotte
| MSI WE76 11UM-456 i9-11980HK, RTX A5000 Laptop GPU, 99.9 Wh | Lenovo ThinkPad P1 G4-20Y4S0KS00 i7-11850H, GeForce RTX 3070 Laptop GPU, 90 Wh | HP ZBook Fury 15 G8 i9-11950H, RTX A5000 Laptop GPU, 94 Wh | Asus ProArt StudioBook 16 W7600H5A-2BL2 W-11955M, RTX A5000 Laptop GPU, 90 Wh | Lenovo ThinkPad P17 G2-20YU0025G i7-11800H, RTX A2000 Laptop GPU, 94 Wh | HP ZBook Fury 17 G7 119W5EA i9-10885H, Quadro RTX 4000 Max-Q, 94 Wh | MSI WE75 9TK i7-9750H, Quadro RTX 3000 (Laptop), 65 Wh | Media della classe Workstation | |
|---|---|---|---|---|---|---|---|---|
| Autonomia della batteria | 2% | -2% | -48% | 34% | 34% | -23% | 28% | |
| H.264 (h) | 6.9 | 7.2 4% | 1.8 -74% | 9.5 38% | 10.3 49% | 9.51 ? 38% | ||
| WiFi v1.3 (h) | 6.3 | 7 11% | 6.2 -2% | 5 -21% | 9.8 56% | 7.6 21% | 4.9 -22% | 8.53 ? 35% |
| Load (h) | 1.3 | 1.2 -8% | 1.4 8% | 1.7 31% | 1 -23% | 1.429 ? 10% | ||
| Witcher 3 ultra (h) | 1.6 | |||||||
| Reader / Idle (h) | 11 | 26.1 ? |
Pro
Contro
Verdetto - MSI offre molte prestazioni
Con il WE76, MSI offre chiaramente una workstation mobile tradizionale che fornisce molte prestazioni e compete direttamente con modelli come il Dell Precision 7770, il HP ZBook Fury 17e il Lenovo ThinkPad P17 Gen 2. La mobilità gioca solo un ruolo secondario in questi dispositivi, e il focus è invece sulle prestazioni, che è dove la workstation MSI eccelle.
Il fatto che il produttore abbia usato un portatile da gioco (GE76) come riferimento non è un problema per quanto ci riguarda. L'ampia illuminazione è stata omessa, e non ci sono nemmeno modelli con display a 360 Hz, che non si adatterebbero affatto visto il gruppo target. Invece, c'è un pannello 4K opaco con colori accurati, una copertura AdobeRGB quasi completa e 120 Hz, che si traduce anche in un'impressione di immagine notevolmente più liscia nell'uso quotidiano. Inoltre, c'è una tastiera molto buona che include un tastierino numerico dedicato.
In particolare, le prestazioni dellaNvidia RTX A5000 (ex Quadro) è assolutamente convincente. Anche le prestazioni del processore sono molto buone, anche se bisogna dire che le CPU mobili di AMD sono attualmente migliori, ma non sono ancora state implementate nelle workstation (questo vale per tutti i produttori).
Scheda grafica estremamente veloce, alte prestazioni di sistema, display 4K opaco e ottima tastiera: L'MSI WE76 è una workstation mobile che si concentra principalmente sulle prestazioni.
Il comportamento delle ventole è uno dei pochi punti deboli, perché spesso entrano in funzione anche durante il normale uso quotidiano, il che le fa apparire un po' irregolari. La modalità Silent opzionale è raccomandata qui, in quanto mantiene il dispositivo molto più silenzioso. Sotto carico, tuttavia, il volume massimo della ventola è perfettamente competitivo e non eccessivamente forte.
Gli utenti che hanno bisogno delle massime prestazioni non sbaglieranno con il WE76, e MSI ha anche dei vantaggi rispetto ai contendenti sopra citati. I modelli da 16 pollici leggermente più piccoli (il ThinkPad P1 Gen 4o ilAsus ProArt StudioBook 16) sono certamente più compatti e più mobili, ma offrono anche meno prestazioni in cambio.
Prezzo e disponibilità
Al momento della scrittura, è possibile trovare l'MSI WE76 con il Core i9-11980HK, la Quadro RTX A5000, 64 GB di RAM, un SSD NVME da 1 TB e Windows 10 Pro su Amazon a partire da circa 4.300 dollari.
MSI WE76 11UM-456
- 12/06/2021 v7 (old)
Andreas Osthoff
Price comparison

