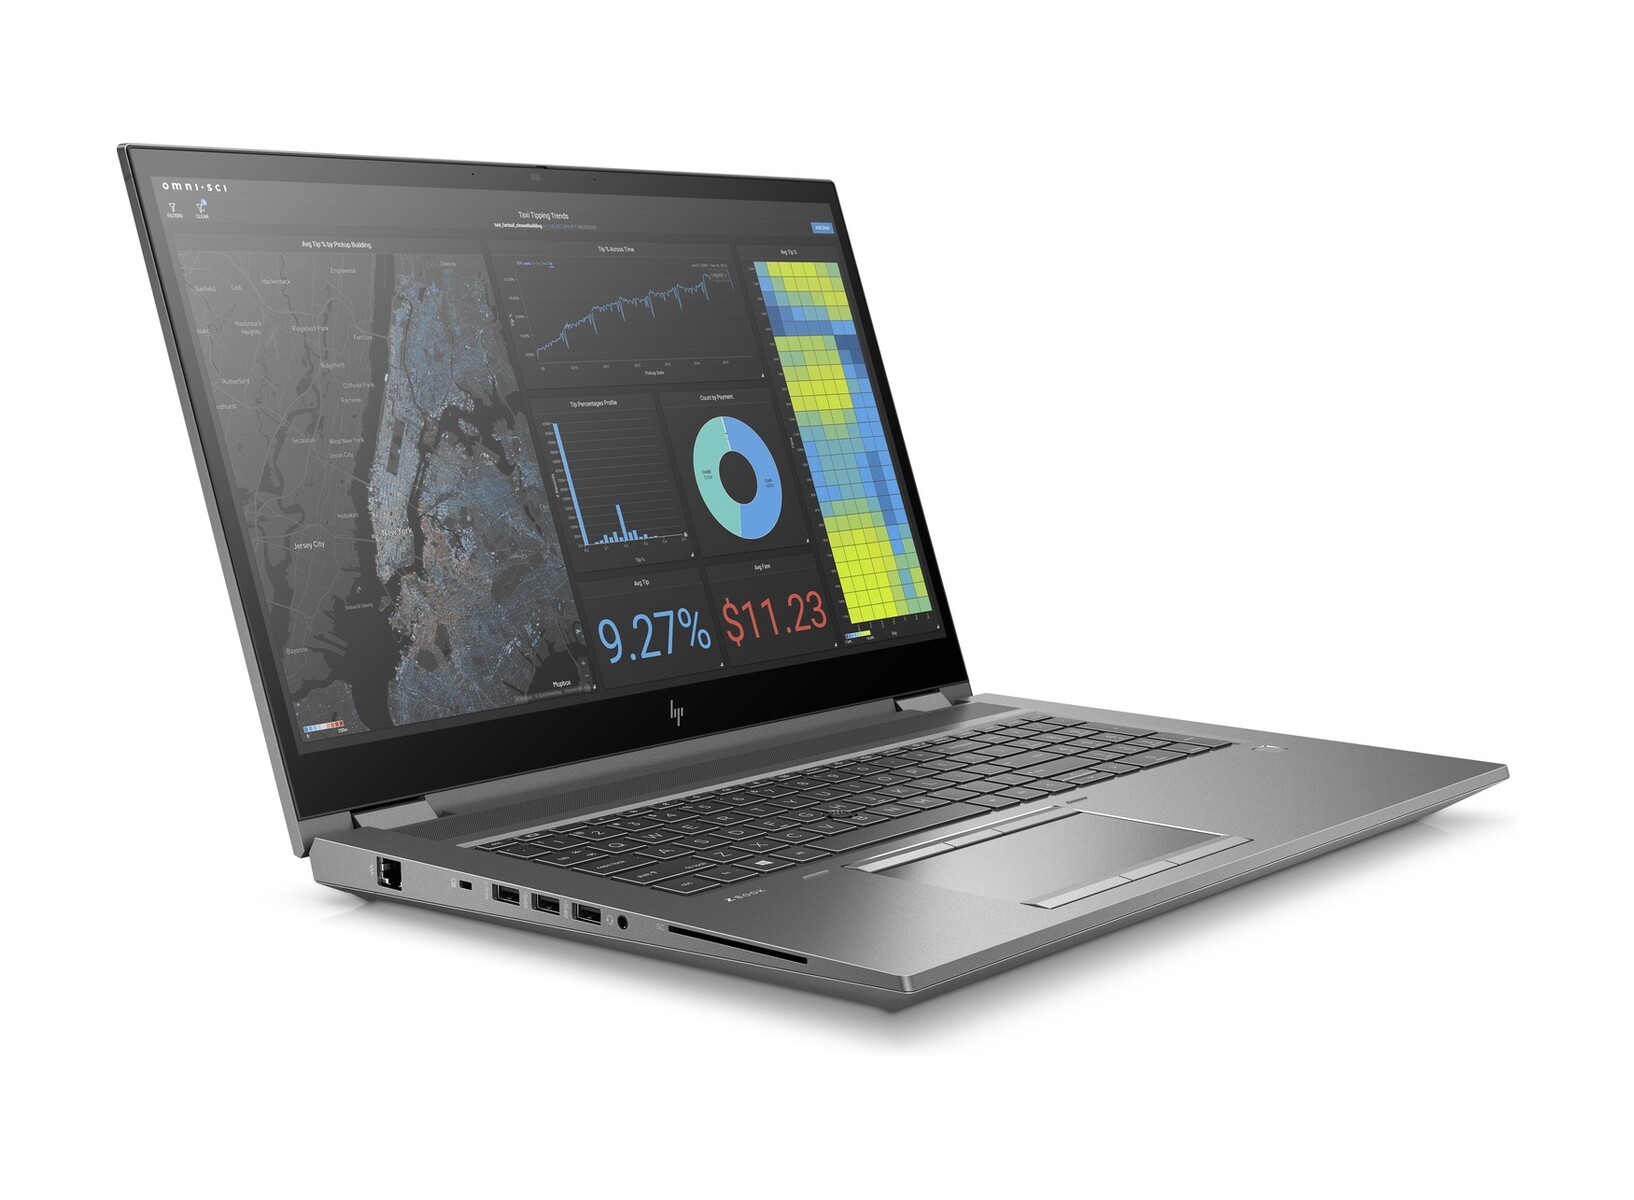
Recensione dell'HP ZBook Fury 17 G7: Molta potenza e un grande display 4K in un pacchetto più compatto

Nell'attuale generazione G7 della workstation ZBook Fury, HP usa un hardware più veloce in un case più piccolo. Abbiamo già fatto un'osservazione simile nel test del più piccolo HP ZBook Fury 15 G7 e ora lo vediamo anche nel grande ZBook Fury 17 G7. Con il modello 119W5EA, stiamo testando una delle configurazioni top con un Intel Core i9-10885H, Nvidia Quadro RTX 4000 Max-Q e 32 GB di RAM DDR4. Tutto questo è confezionato in un case che è quasi il 30% più piccolo e pesa anche meno dei suoi concorrenti.
Confronto con i potenziali concorrenti
Punteggio | Data | Modello | Peso | Altezza | Dimensione | Risoluzione | Prezzo |
|---|---|---|---|---|---|---|---|
| 89.8 % v7 (old) | 04/2021 | HP ZBook Fury 17 G7 119W5EA i9-10885H, Quadro RTX 4000 Max-Q | 2.9 kg | 26.9 mm | 17.30" | 3840x2160 | |
| 88.2 % v7 (old) | 01/2021 | Lenovo ThinkPad P73-20QR0030GE i9-9880H, Quadro RTX 4000 (Laptop) | 3.5 kg | 31 mm | 17.30" | 3840x2160 | |
| 90.2 % v7 (old) | 01/2021 | HP ZBook Fury 15 G7 W-10885M, Quadro RTX 5000 Max-Q | 2.4 kg | 25.9 mm | 15.60" | 3840x2160 | |
| 88.4 % v7 (old) | 11/2020 | Asus StudioBook Pro X W730G5T-H8050T E-2276M, Quadro RTX 5000 (Laptop) | 2.9 kg | 28.2 mm | 17.00" | 1920x1200 | |
| 87.8 % v7 (old) | 09/2020 | Dell Precision 7550 W-10885M, Quadro RTX 5000 Max-Q | 2.8 kg | 27.36 mm | 15.60" | 3840x2160 |
Case: Angolare e di alta qualità
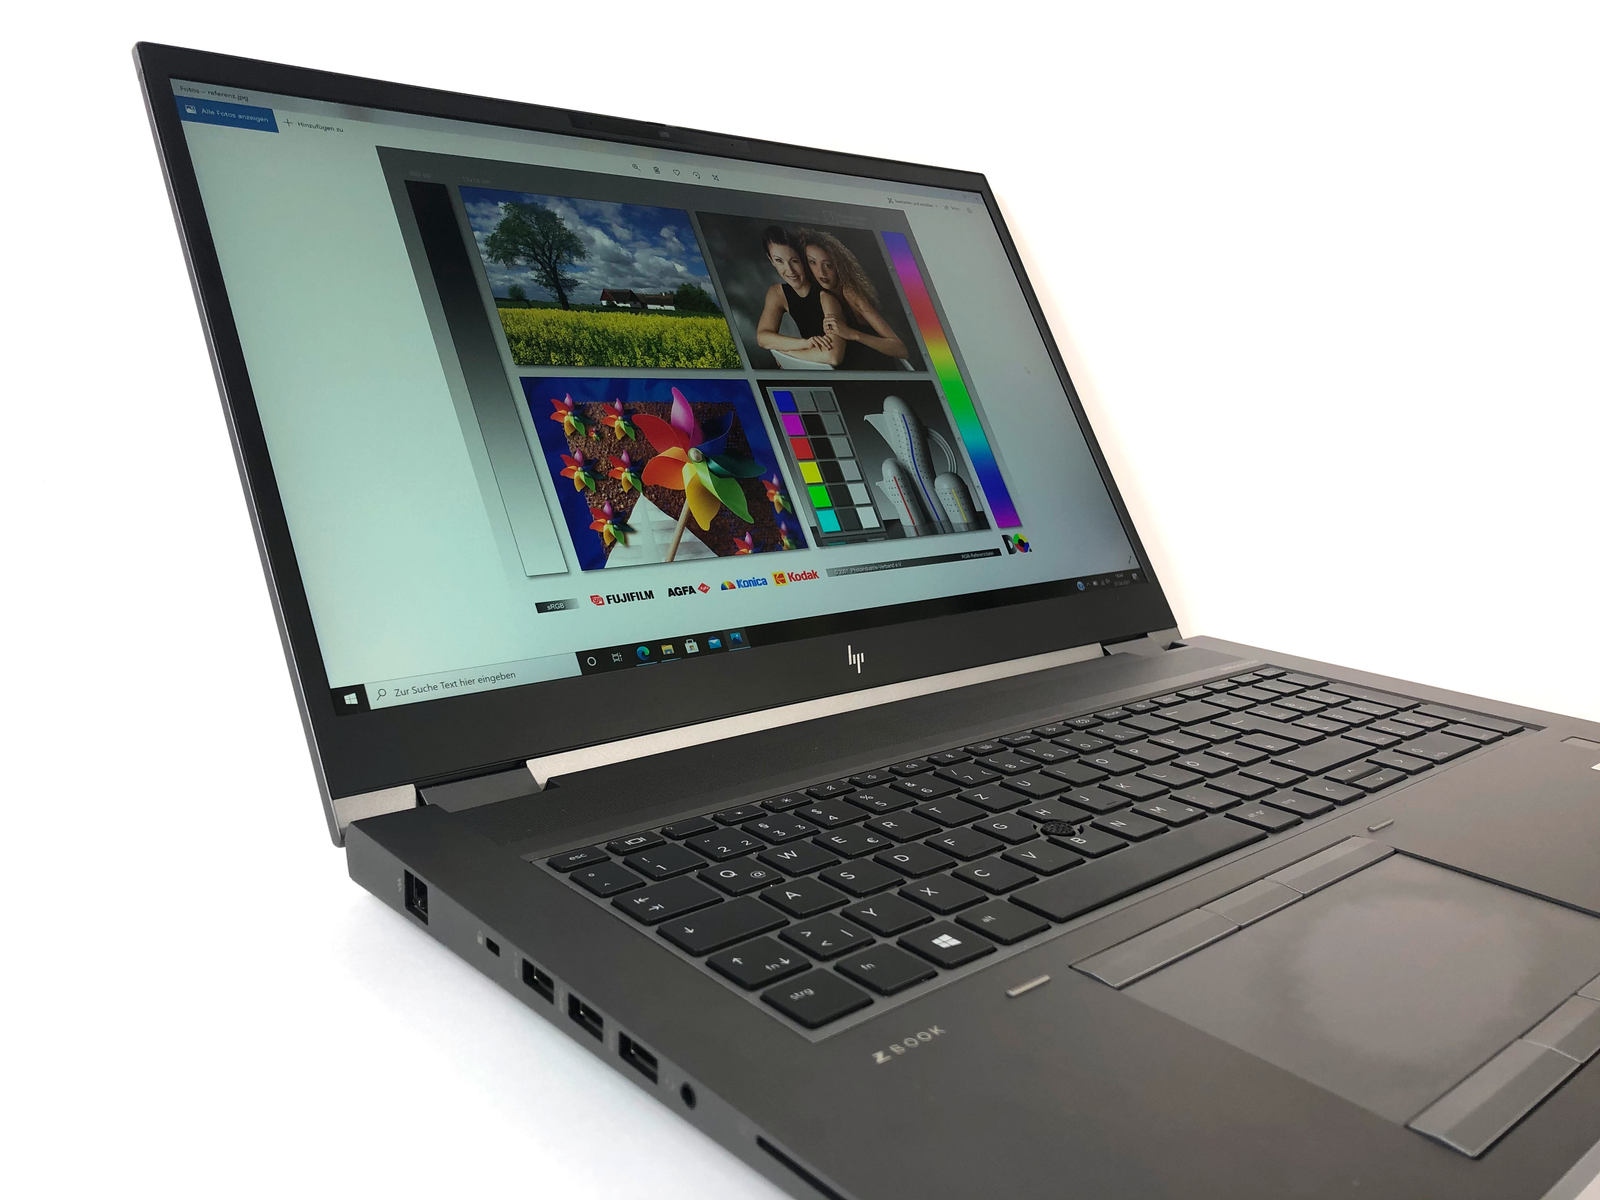
Come ci si aspetta in questa classe di prezzo, l'HP ZBook Fury 17 G7 mostra una qualità impeccabile. Le distanze regolari sono la prova di una costruzione accurata. Il case angolare non solo sembra elegante e offre una sensazione di alta qualità, ma è anche robusto (conforme a MIL STD 810H).
La cerniera offre un'ampia resistenza che è abbastanza alta da creare una posizione stabile, ma anche non troppo alta, permettendo di aprire il portatile con una sola mano. In questo, anche la base pesante del case gioca un ruolo importante. Lo spessore del case lo irrigidisce, rendendolo resistente ai tentativi di deformazione e permettendovi di sollevarlo tenendolo per un solo angolo.
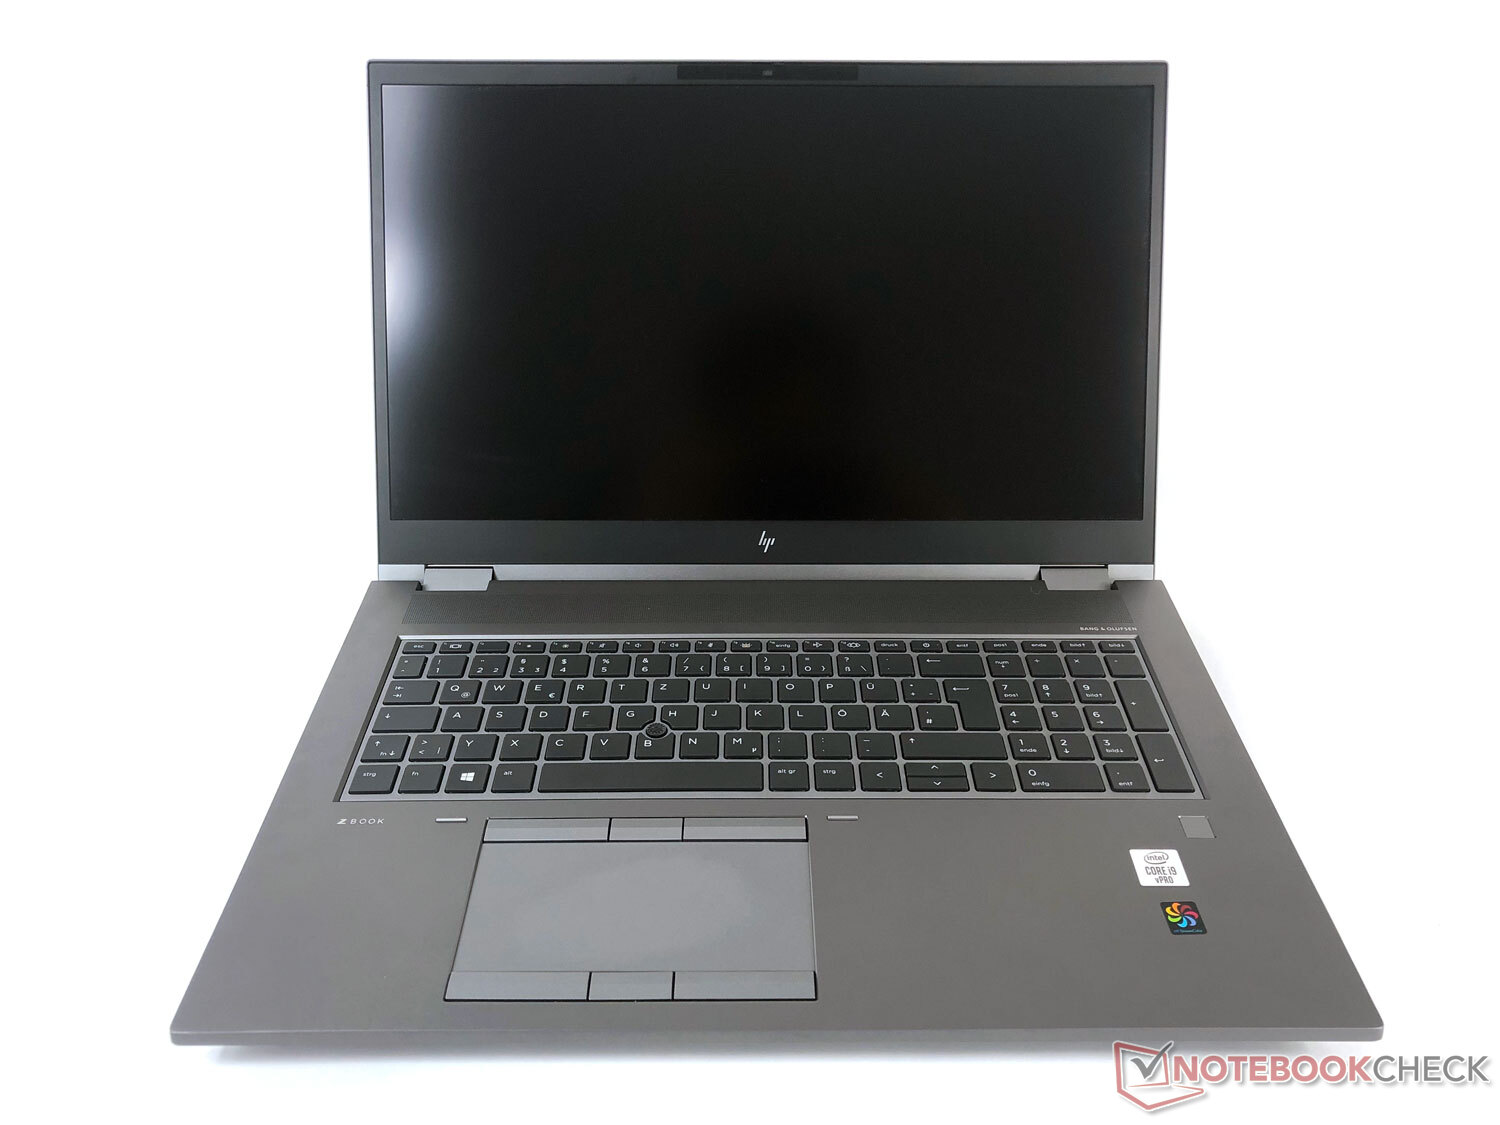


HP specifica che il nuovo HP ZBook Fury 17 G7 è il 29% più compatto del suo predecessore, pur essendo più potente. Tuttavia, anche se il dispositivo è appena passato attraverso una dieta dimagrante, è ancora abbastanza spesso (come previsto). Ma se si guarda ad altre workstation da 17.3" come il Lenovo ThinkPad P73 questo è tutto relativo: con un'altezza di quasi 2.7 cm (~1.1 in) e larghezza e profondità di 40 x 26.7 cm (~15.7 x 10.5 in), la nuova workstation di HP è significativamente più compatta. E con 2,9 kg (~6,4 lb), pesa anche più di mezzo kg in meno (~1,1 lb).
Ma naturalmente, 2.9 kg (~6.4 lb) è ancora un peso significativo e non paragonabile ai "normali" portatili da 17" come l Acer Aspire 5 che abbiamo recentemente testato. Tuttavia, in contrasto con i suoi sottili coetanei, il dispositivo non è progettato principalmente per l'uso mobile, ma per l'uso stazionario. Metterlo sulle ginocchia per lo streaming la sera o portarlo con voi in un viaggio richiede un certo sforzo. Ma coloro che sono interessati ad una potente workstation sono già informati a riguardo.
Dotazioni: Di più non sarebbe possibile
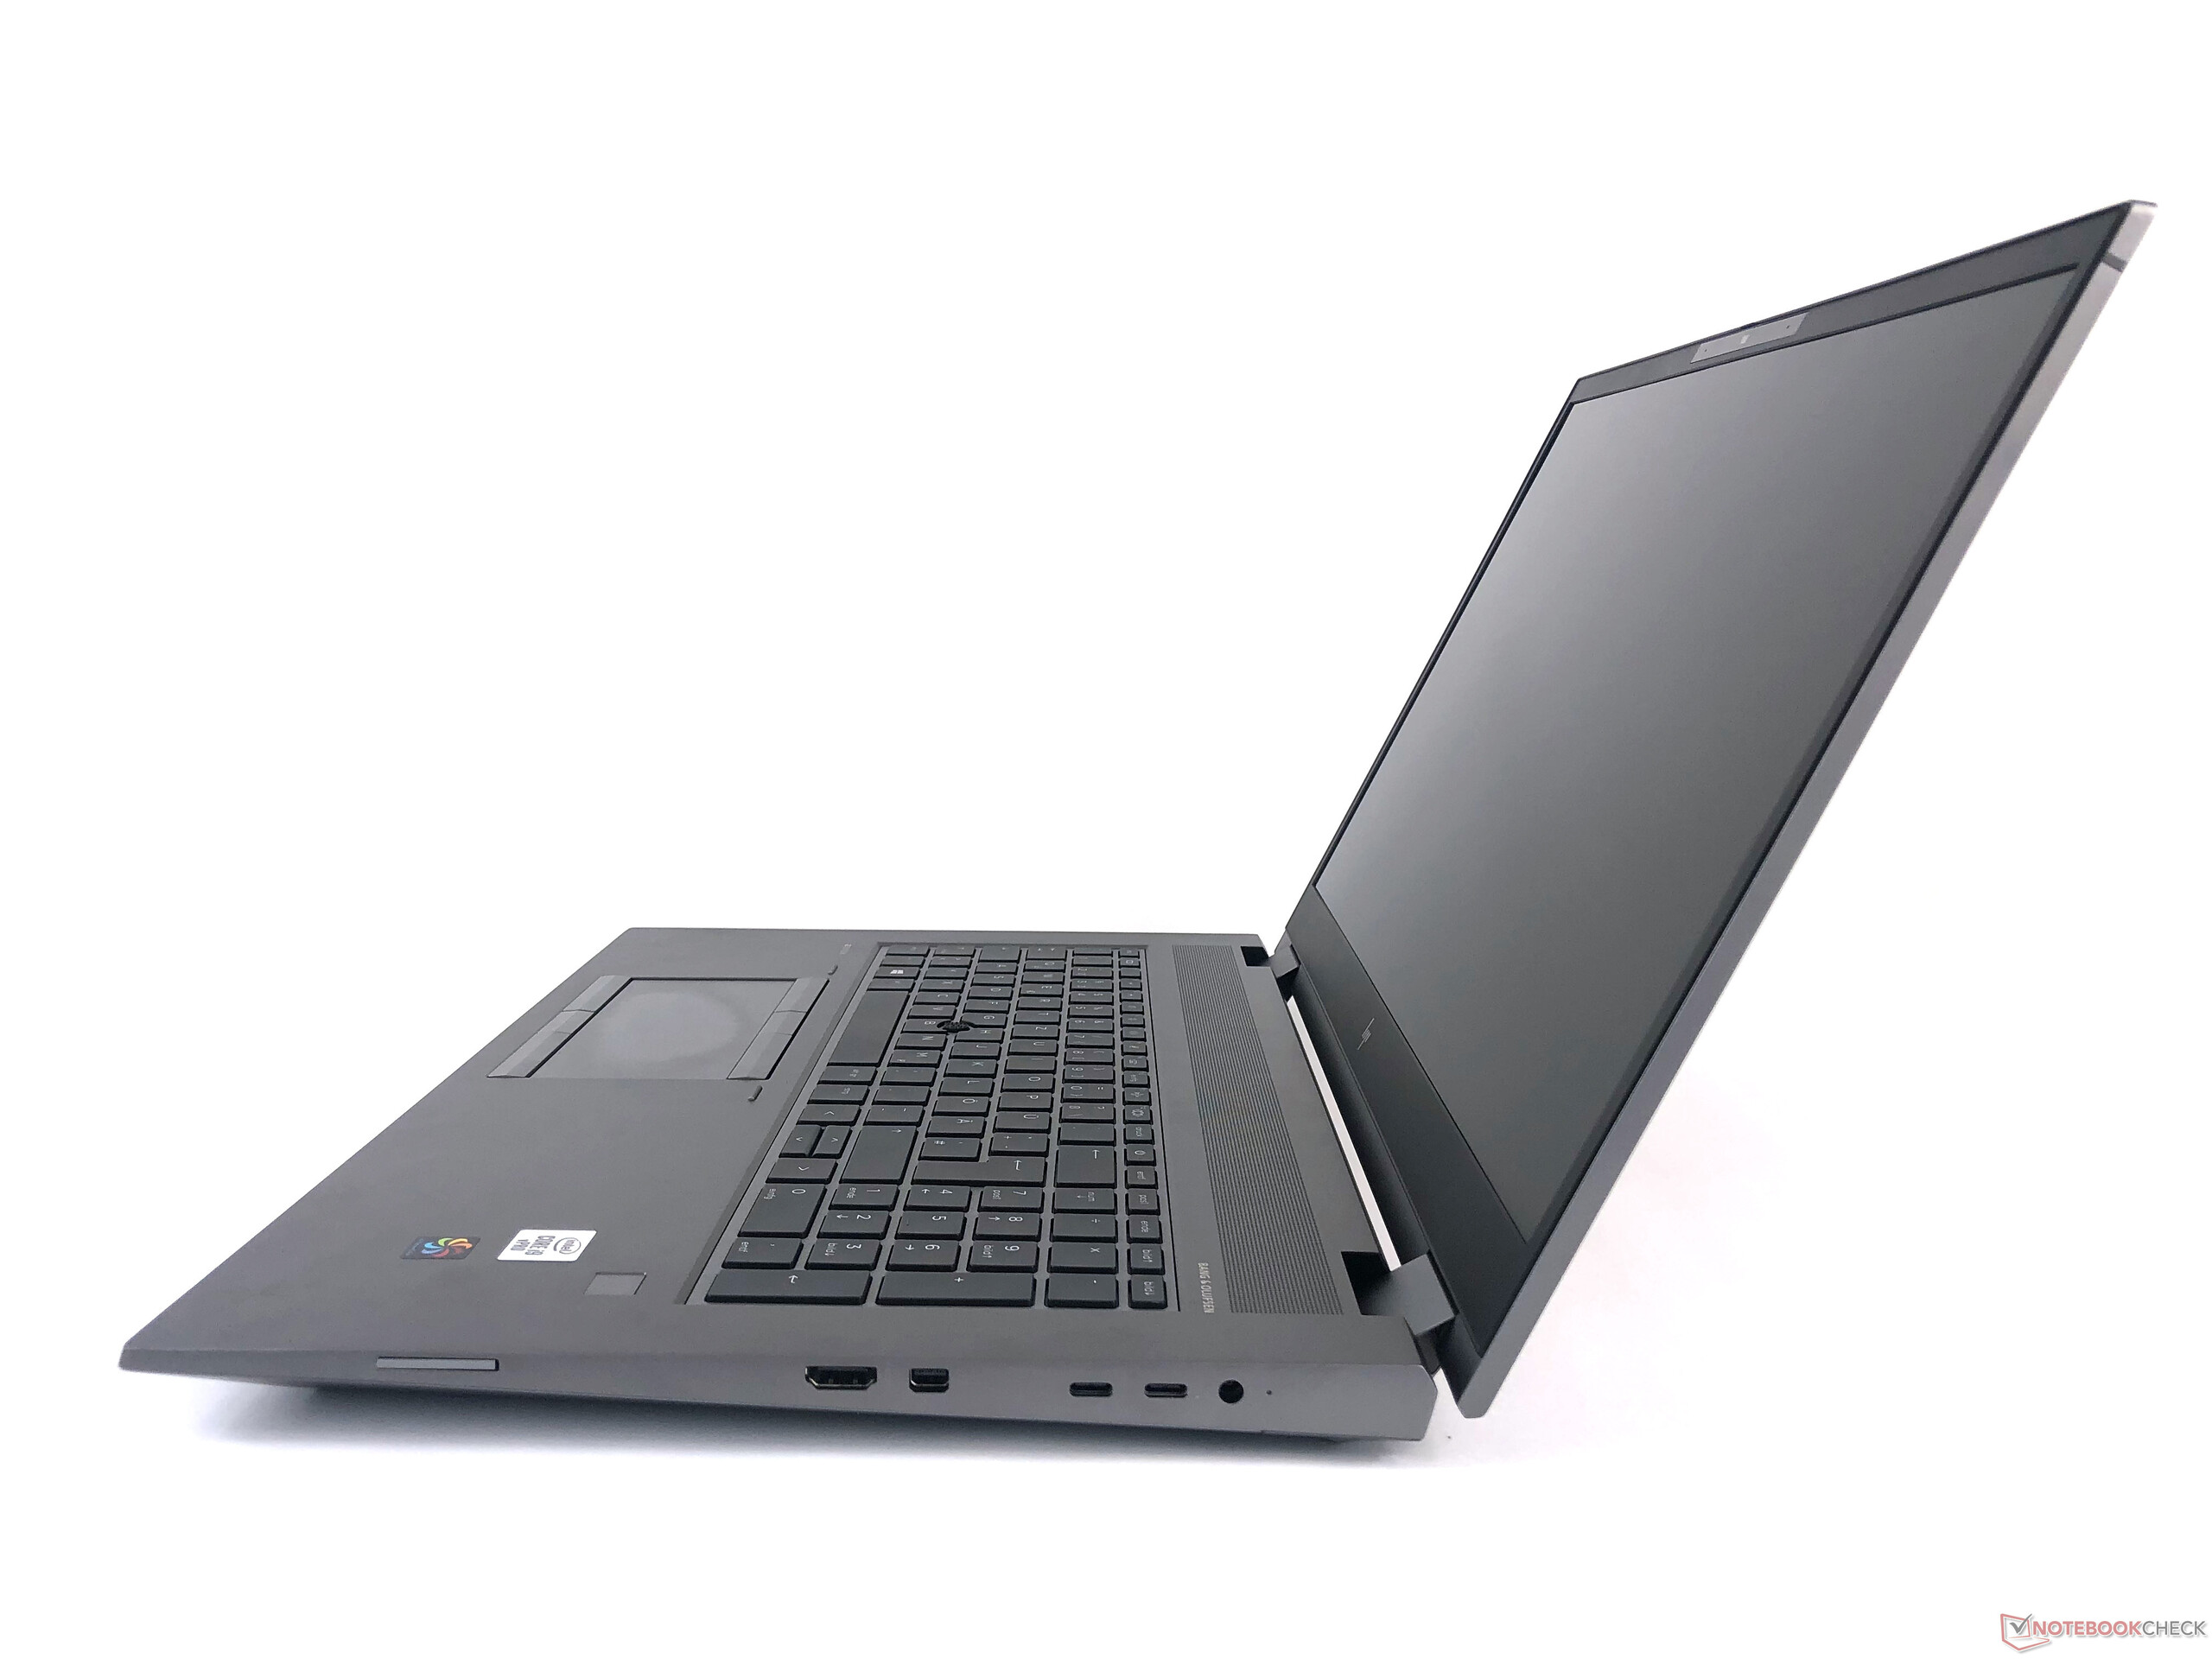
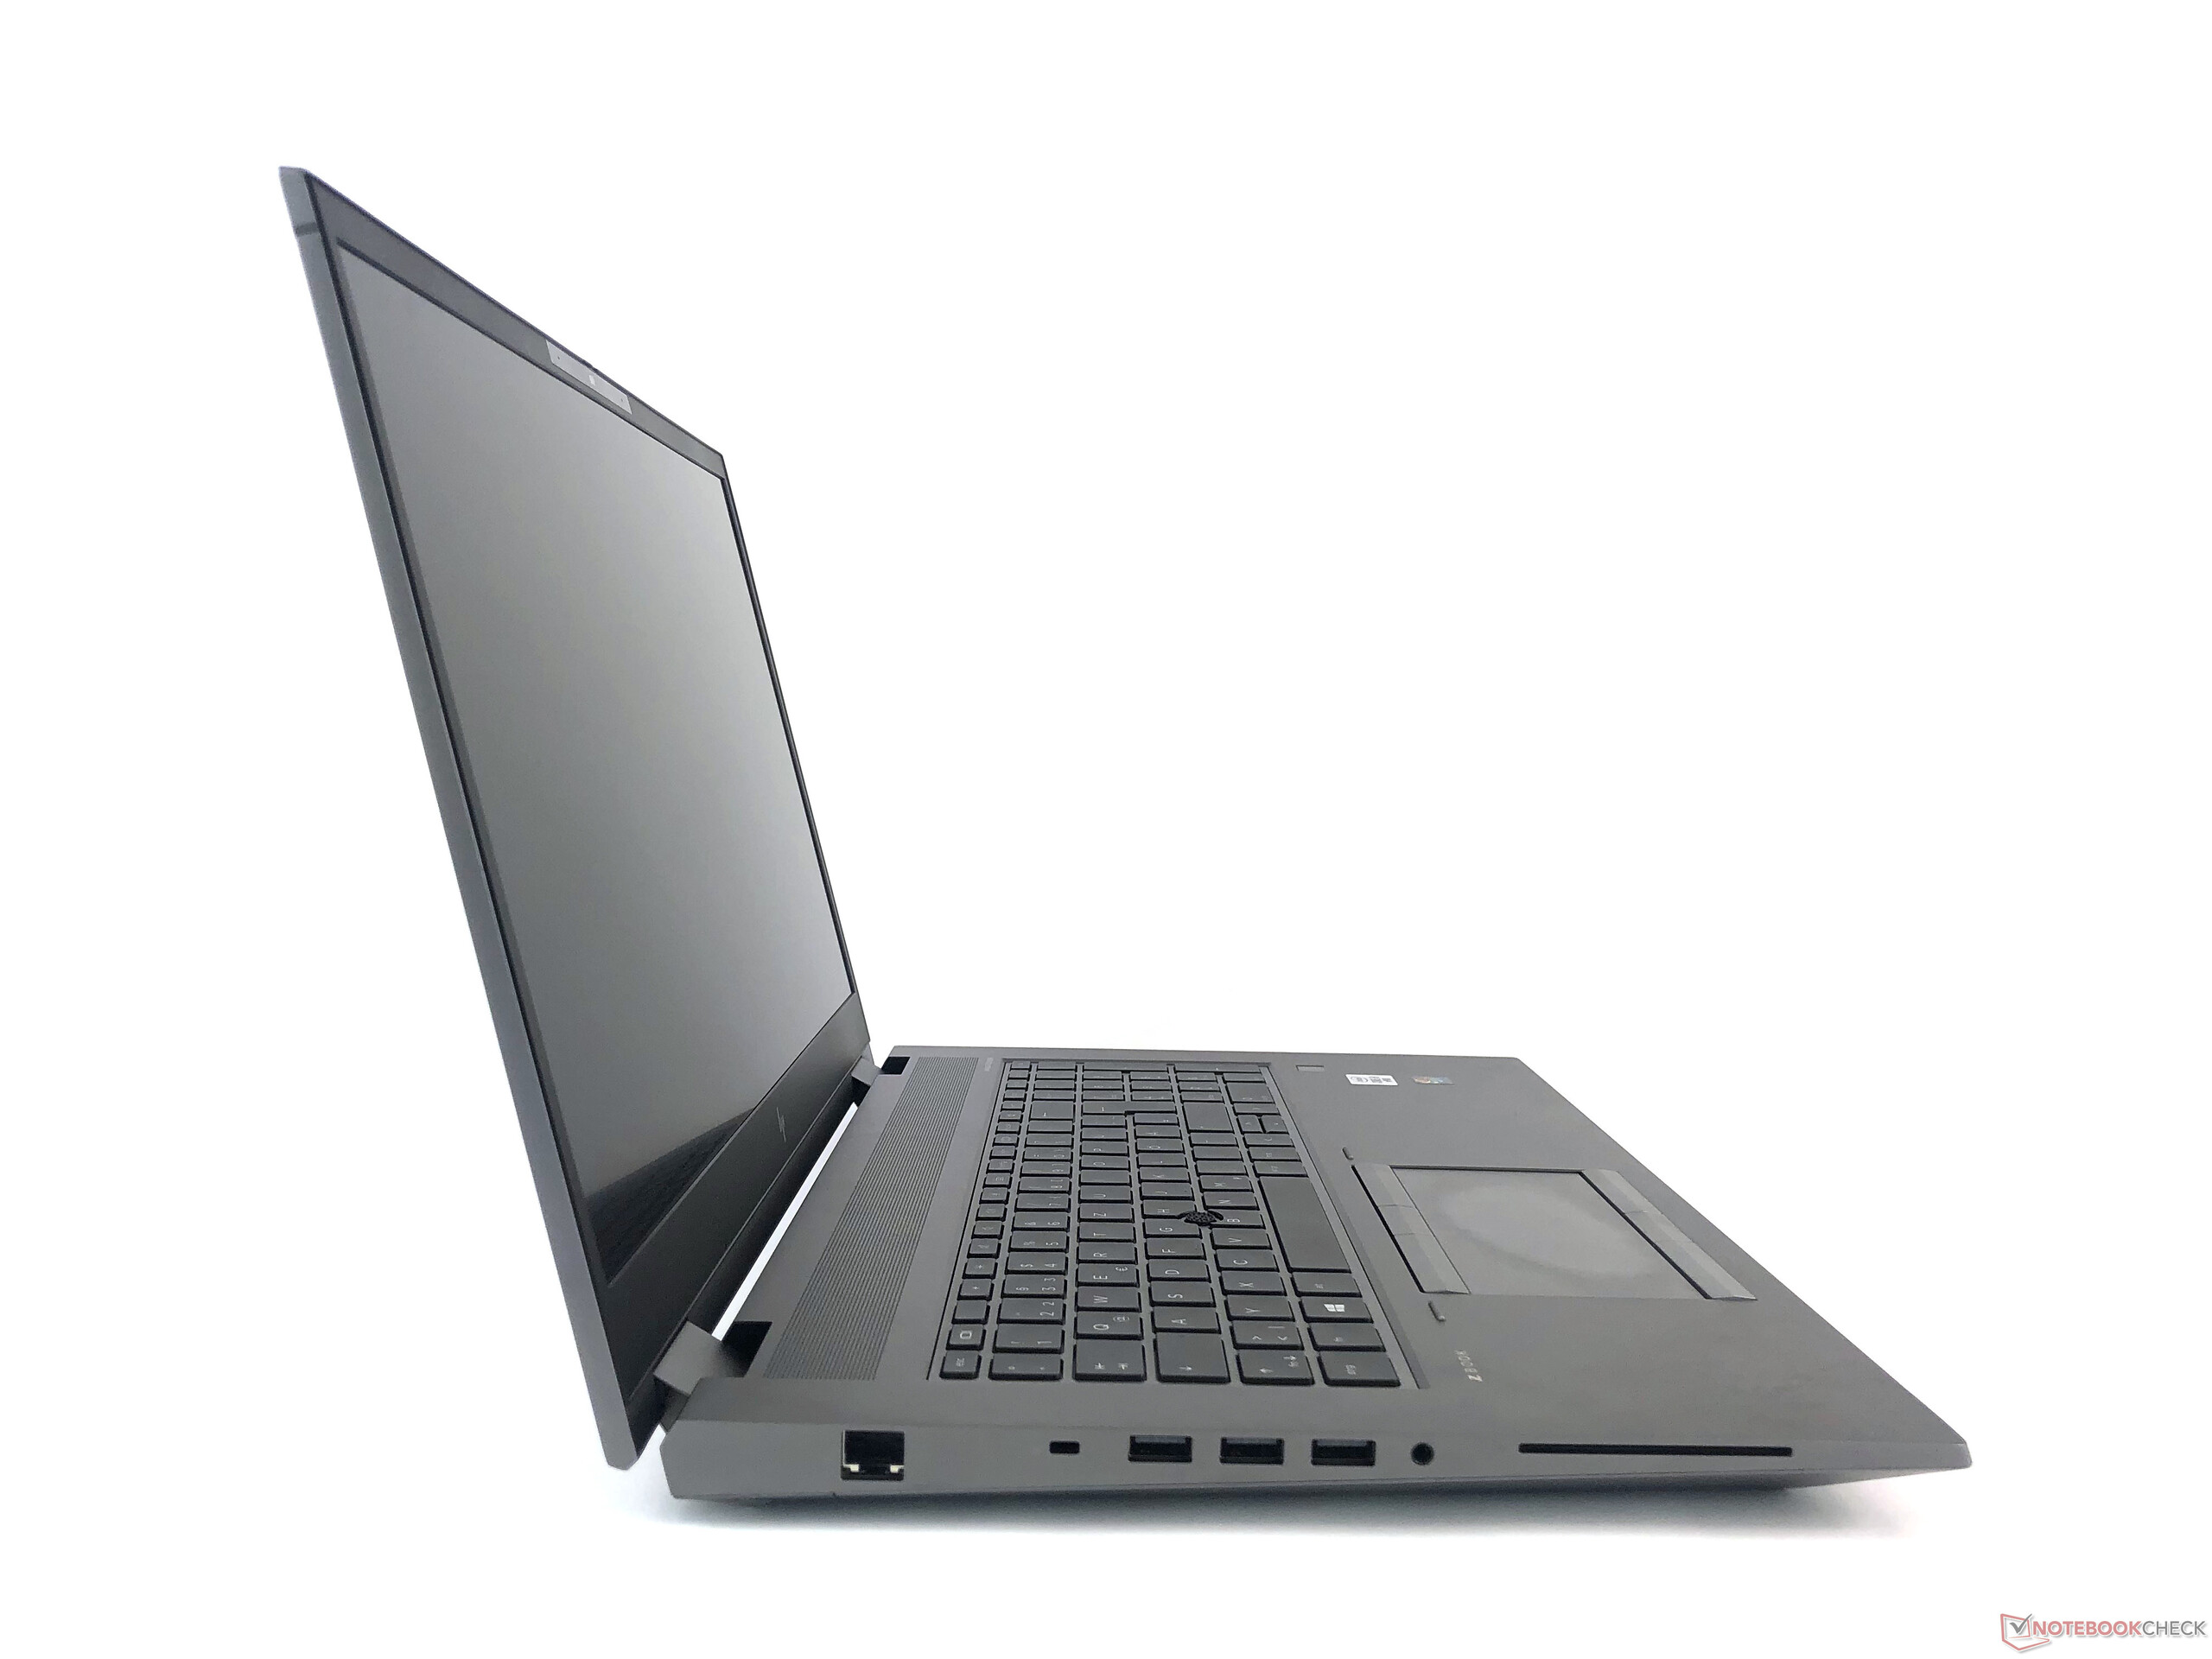
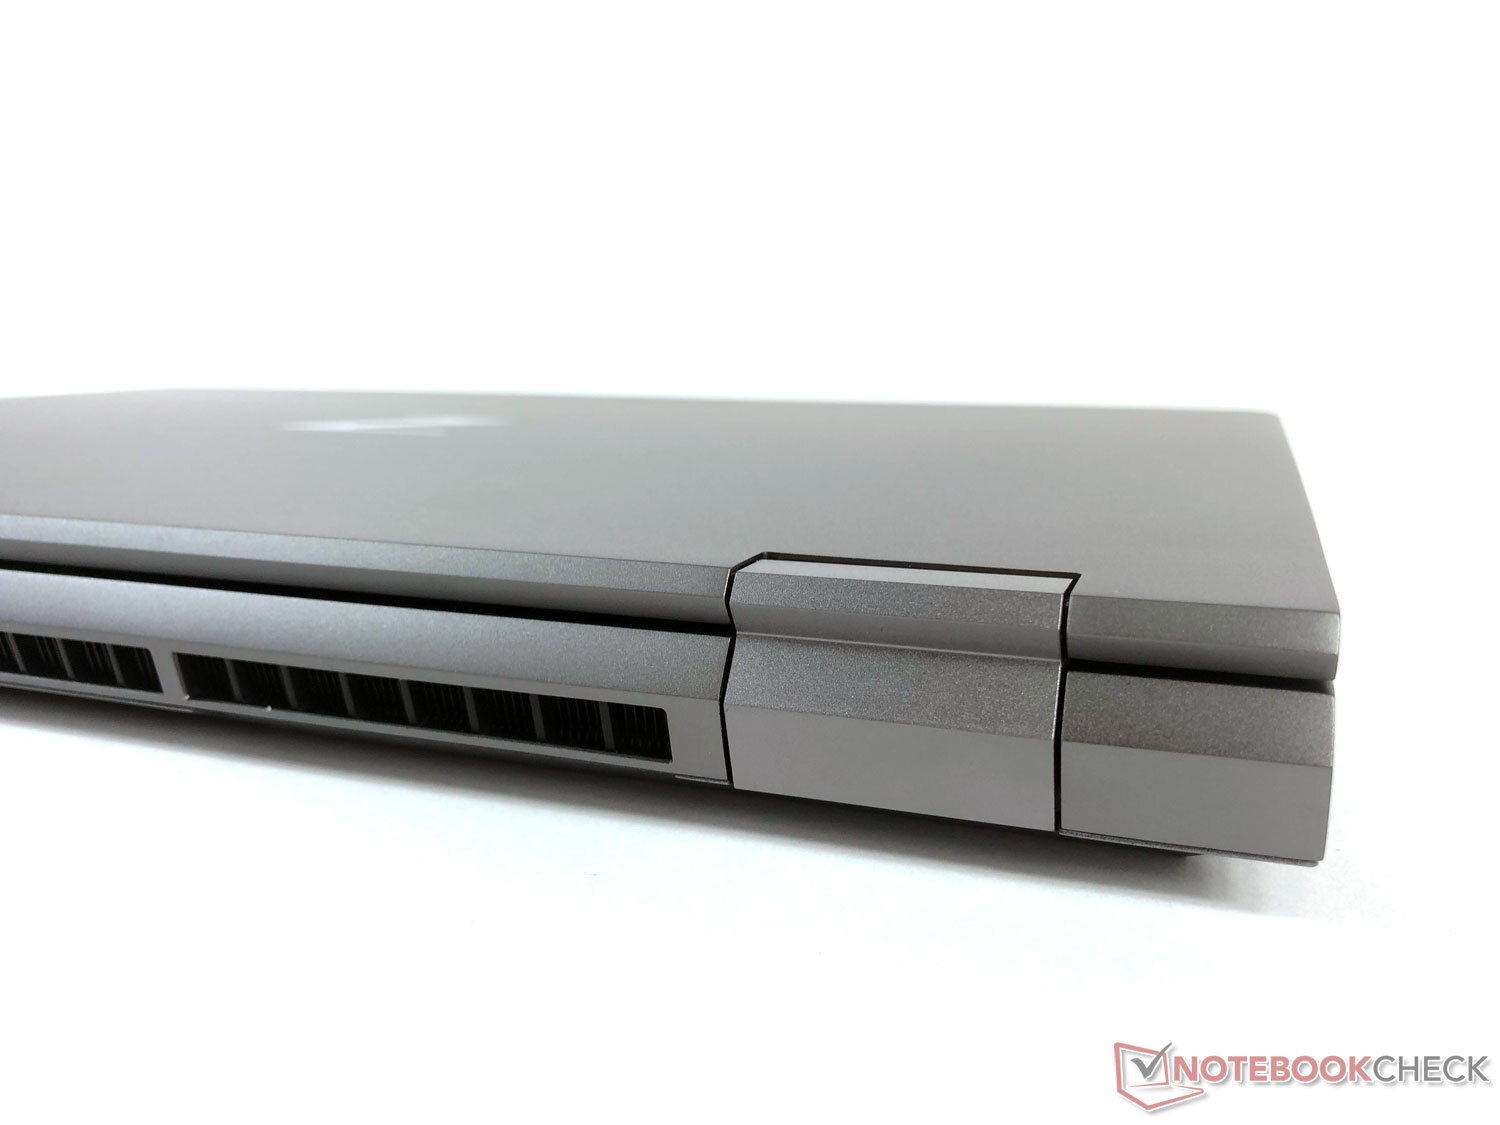
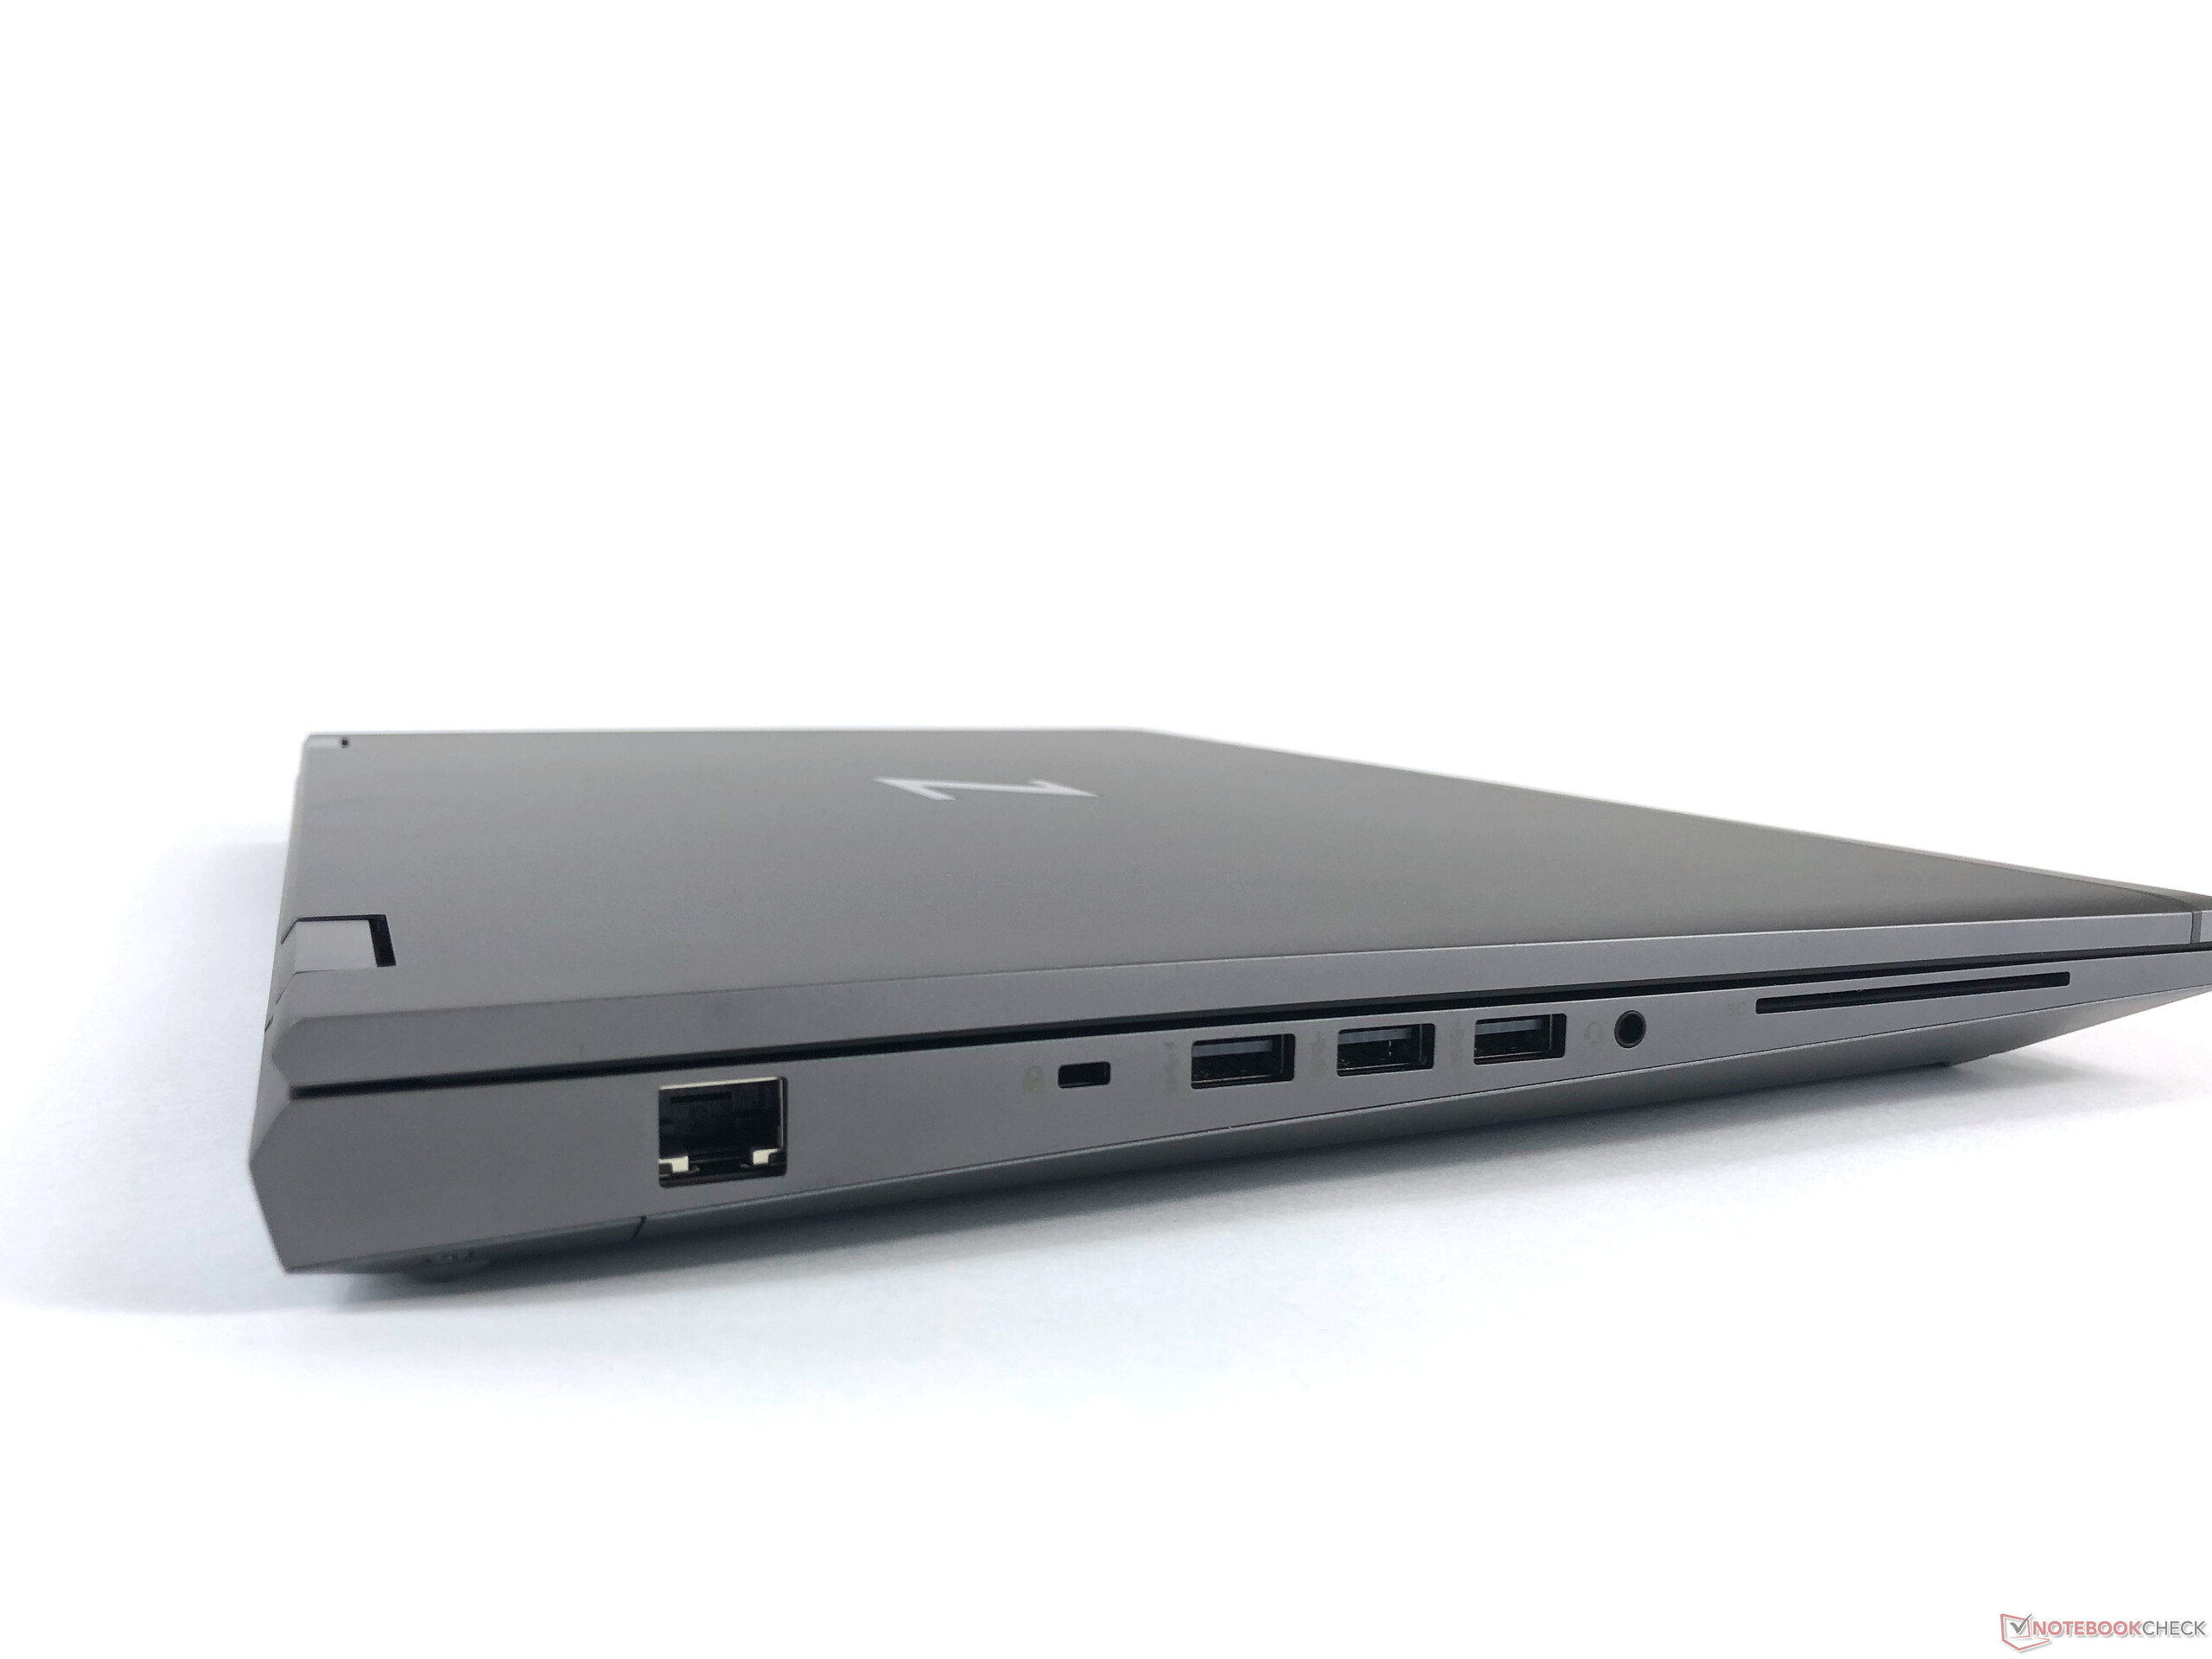
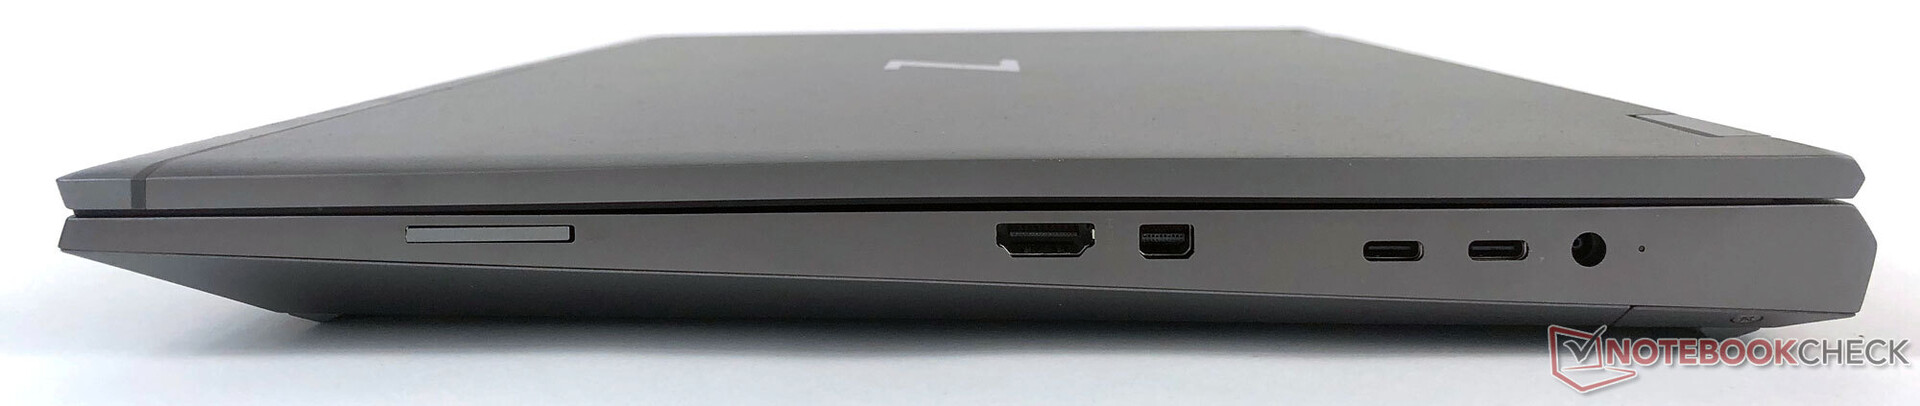
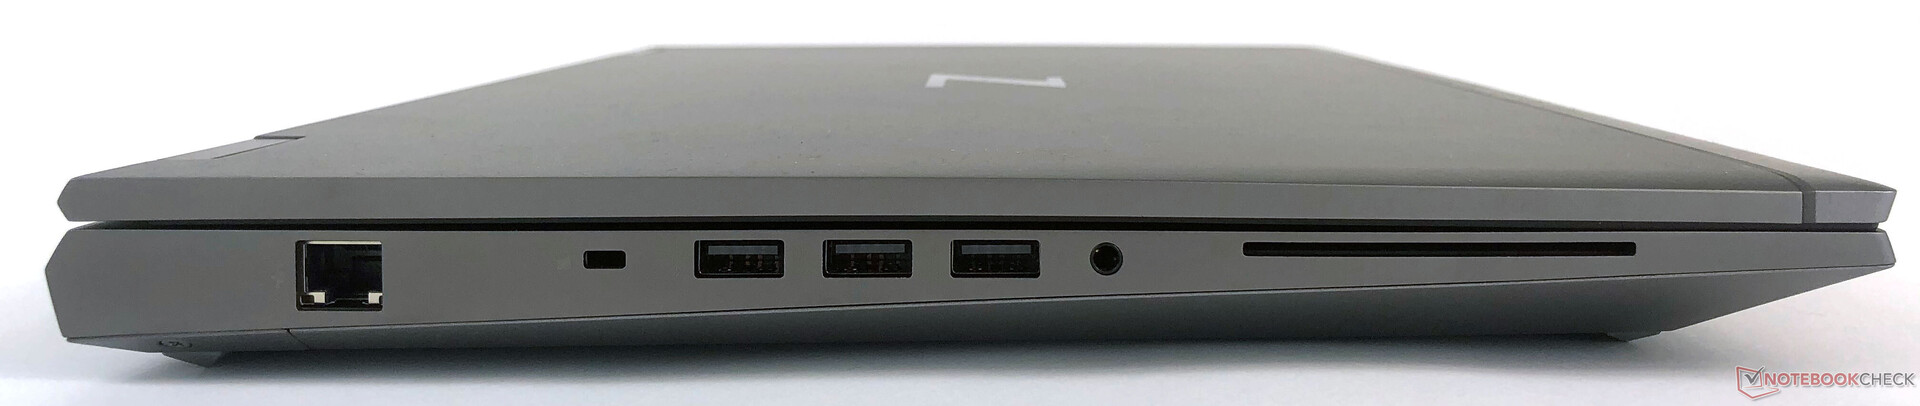
Le numerose connessioni dell'HP ZBook Fury 17 G7 sono sparse sul lato sinistro e destro del case, come è tipico dei computer portatili. Solo pochissimi utenti dovrebbero farsi mancare qualcosa qui, dato che tutte le connessioni importanti come USB-C incluso Thunderbolt 3 sono disponibili. Inoltre, c'è un'altra Mini DisplayPort 1.4 e una porta HDMI 2.0b per collegare monitor esterni. Tutte le connessioni sono facilmente accessibili e posizionate con sufficiente distanza tra loro.
Lettore di schede SD
Il lettore di schede integrato per le schede di memoria SD è leggermente più lento dei concorrenti nel nostro test con una scheda di memoria AV Pro 60. Ma nel complesso, le prestazioni sono leggermente al di sopra della media delle workstations di questa classe, quindi sono buone.
| SD Card Reader | |
| average JPG Copy Test (av. of 3 runs) | |
| Dell Precision 7550 (Toshiba Exceria Pro SDXC 64 GB UHS-II) | |
| Lenovo ThinkPad P73-20QR0030GE (Toshiba Exceria Pro SDXC 64 GB UHS-II) | |
| Asus StudioBook Pro X W730G5T-H8050T (Toshiba Exceria Pro SDXC 64 GB UHS-II) | |
| HP ZBook Fury 15 G7 (Toshiba Exceria Pro SDXC 64 GB UHS-II) | |
| HP ZBook Fury 17 G7 119W5EA (AV Pro 60) | |
| Media della classe Workstation (49.6 - 681, n=14, ultimi 2 anni) | |
| maximum AS SSD Seq Read Test (1GB) | |
| Asus StudioBook Pro X W730G5T-H8050T (Toshiba Exceria Pro SDXC 64 GB UHS-II) | |
| Media della classe Workstation (87.6 - 1455, n=14, ultimi 2 anni) | |
| HP ZBook Fury 15 G7 (Toshiba Exceria Pro SDXC 64 GB UHS-II) | |
| Dell Precision 7550 (Toshiba Exceria Pro SDXC 64 GB UHS-II) | |
| Lenovo ThinkPad P73-20QR0030GE (Toshiba Exceria Pro SDXC 64 GB UHS-II) | |
| HP ZBook Fury 17 G7 119W5EA (AV Pro 60) | |
Comunicazioni
Un quadro ancora migliore si presenta nella connettività WLAN, dove la nostra unità di test si comporta straordinariamente bene ed è superata solo dal Lenovo ThinkPad P73. I valori sono superiori a quelli degli altri dispositivi di confronto e sopra la media degli altri portatili che sono equipaggiati con l'Intel Wi-Fi 6 AX201. Quindi HP ottiene molte prestazioni dal modulo WLAN con Wi-Fi 6, e l'HP ZBook Fury 15 G7, che è equipaggiato con lo stesso modello, raggiunge solo velocità di trasmissione dati che sono la metà.
Webcam
HP ha messo una webcam a 720p al centro sopra il display. Mentre fa il suo lavoro ed è sufficiente per le videoconferenze, avremmo voluto una qualità migliore in un dispositivo di questa classe di prezzo. Un aspetto positivo è che la fotocamera può essere bloccata dietro un cursore fisico.


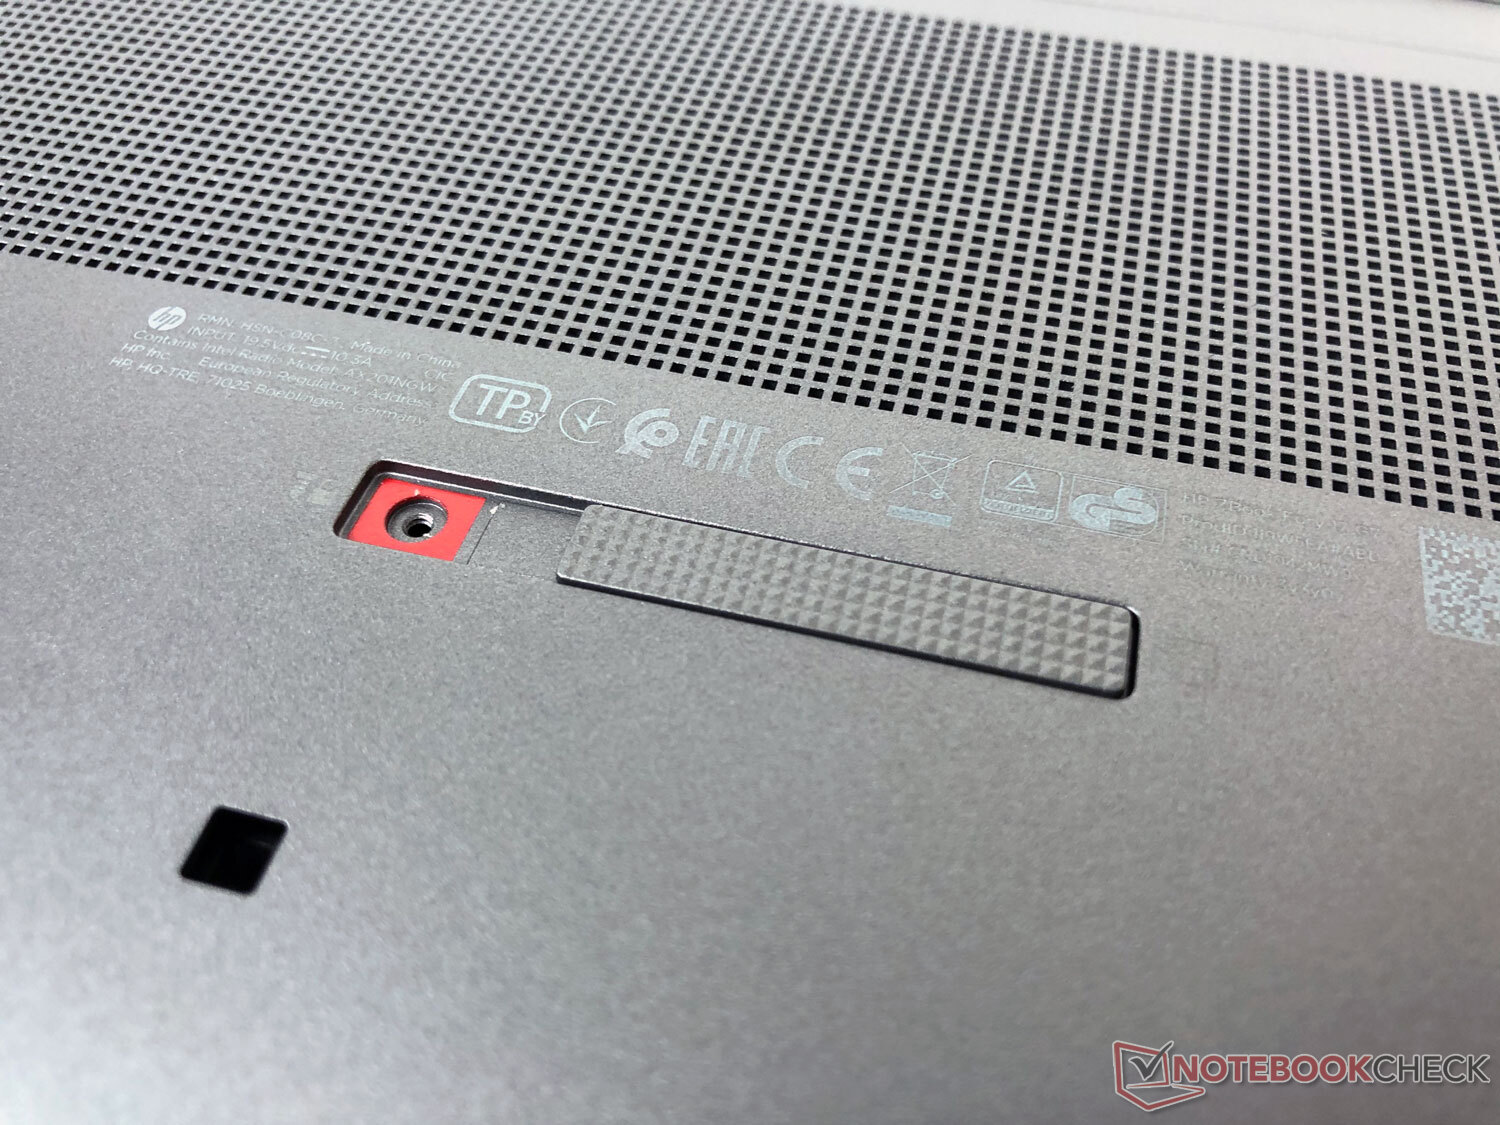
Sicurezza
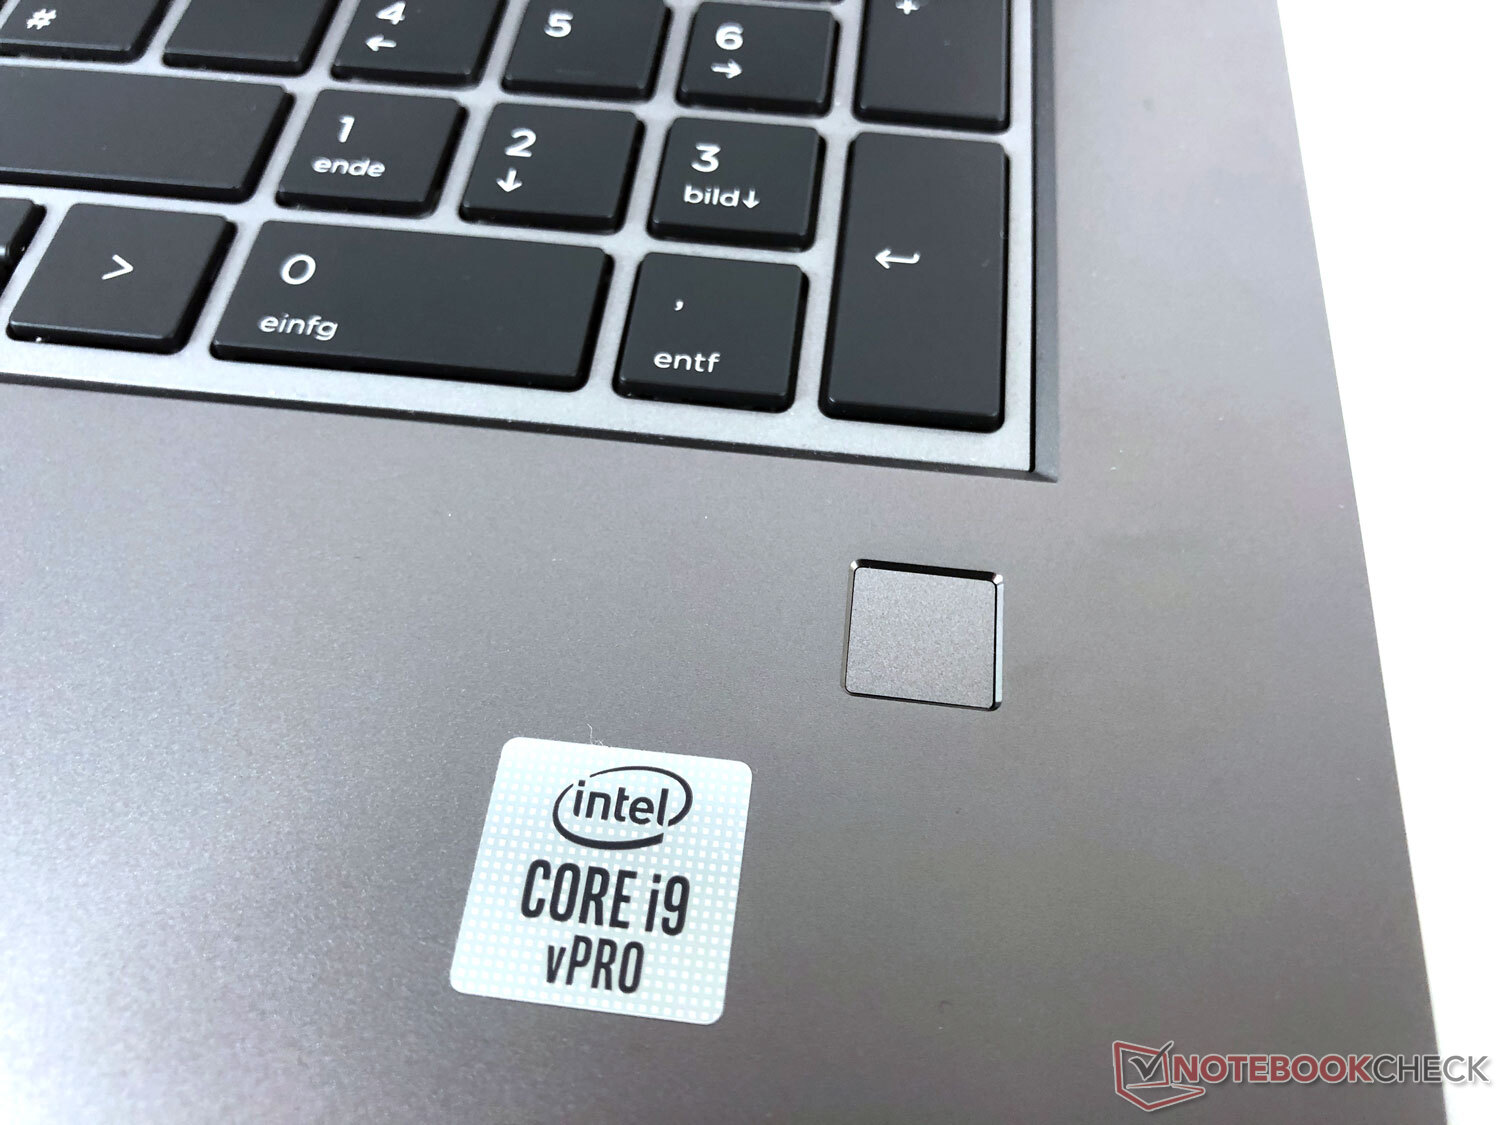
Oltre a un'intera suite di software di gestione della sicurezza, la workstation offre anche un Kensington Lock e un sensore di impronte digitali sotto il blocco dei numeri sulla destra.
Accessori
Oltre alla solita documentazione, la confezioni include un sottile caricatore intelligente che offre 200 watt, pesa 600 g (~1.3 lb),e ha un cavo che è circondato da un tessuto. HP offre anche numerosi accessori opzionali.
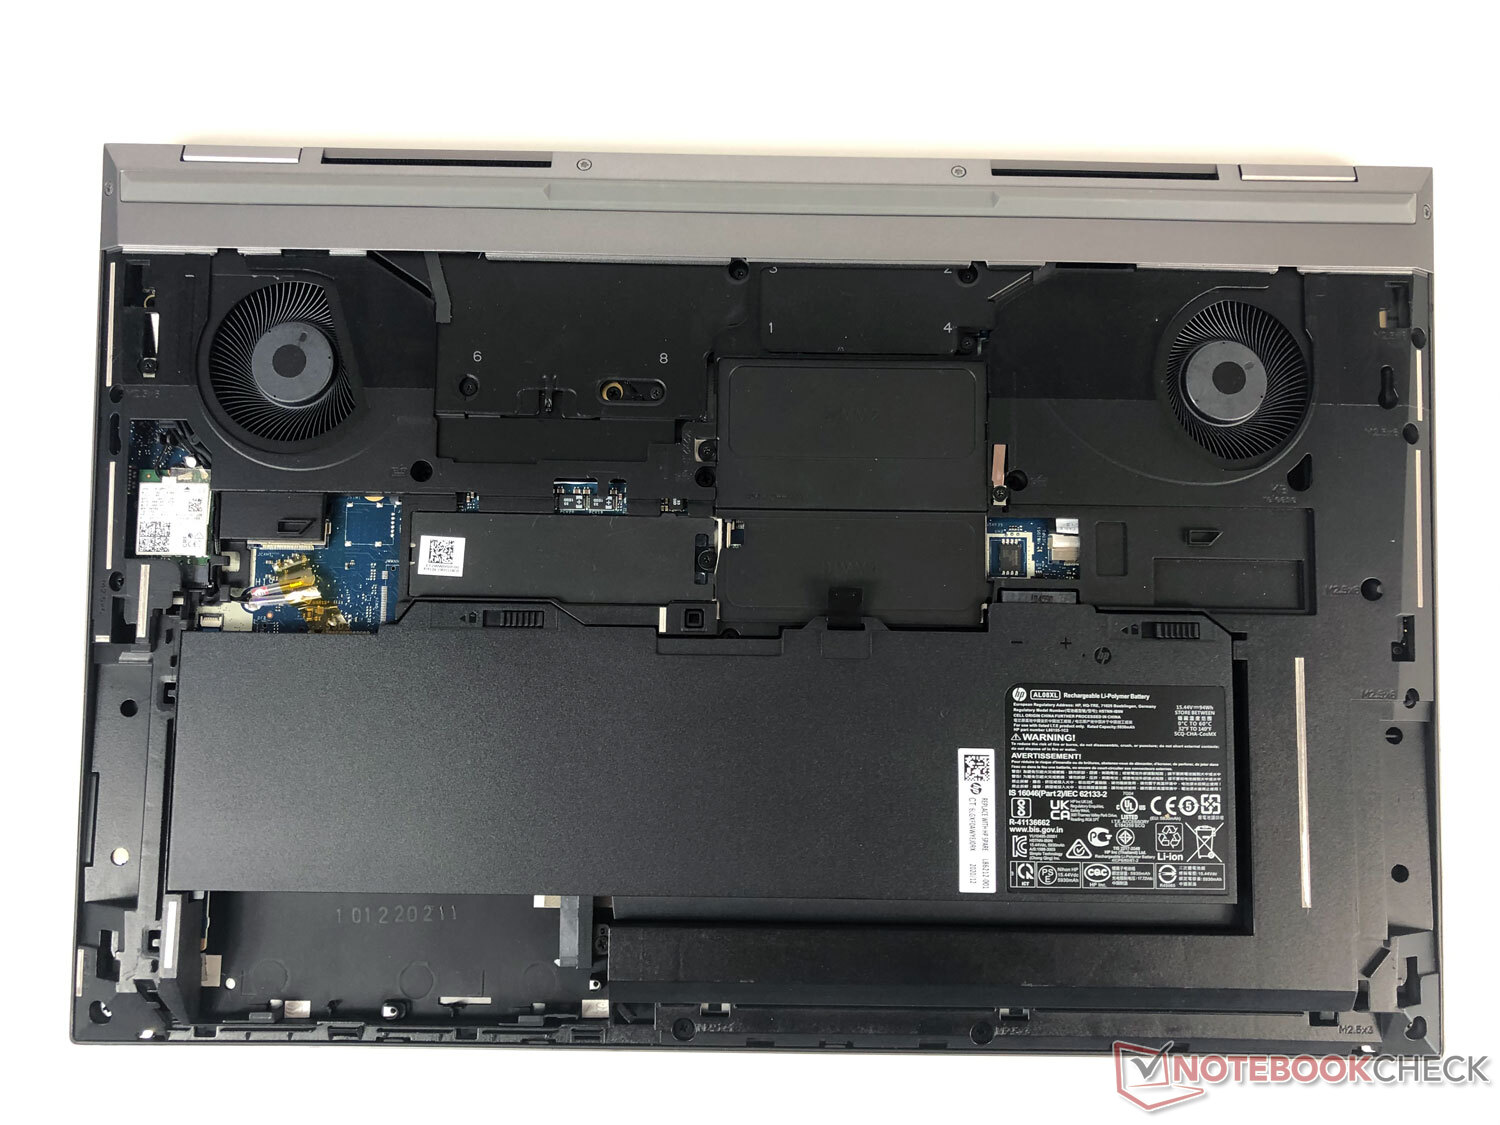
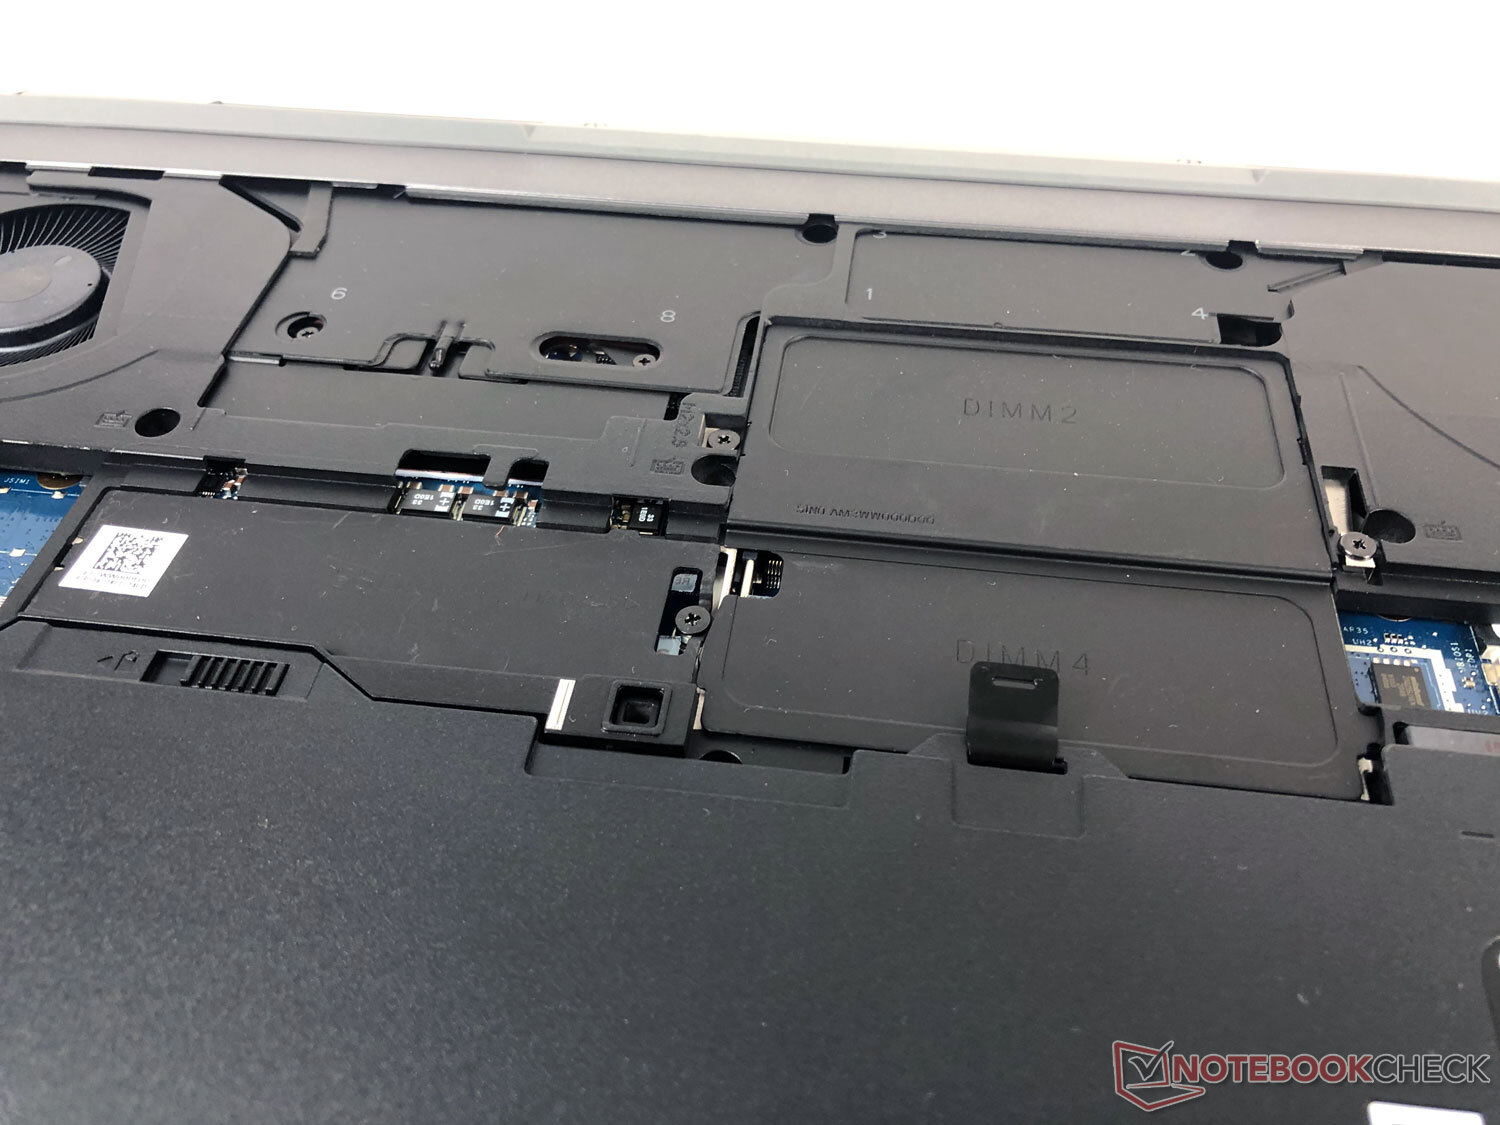
Manutenzione
È possibile sbloccare il fondo del case utilizzando un cursore epoi semplicemente rimuoverlo. In questo modo, non solo avrete accesso alle due grandi ventole, ma anche l'SSD e la RAM possono essere sostituiti. Tuttavia, avrete bisogno di un cacciavite per farlo. Anche la batteria può essere sostituita semplicemente.
Garanzia
HP offre una garanzia limitata di tre anni su parti e manodopera per la workstation mobile HP ZBook Fury 17 G7. È anche possibile acquistare ulteriori aggiornamenti della garanzia.
Dispositivi di input: La tastiera si funziona quasi come una tastiera per PC
Tastiera
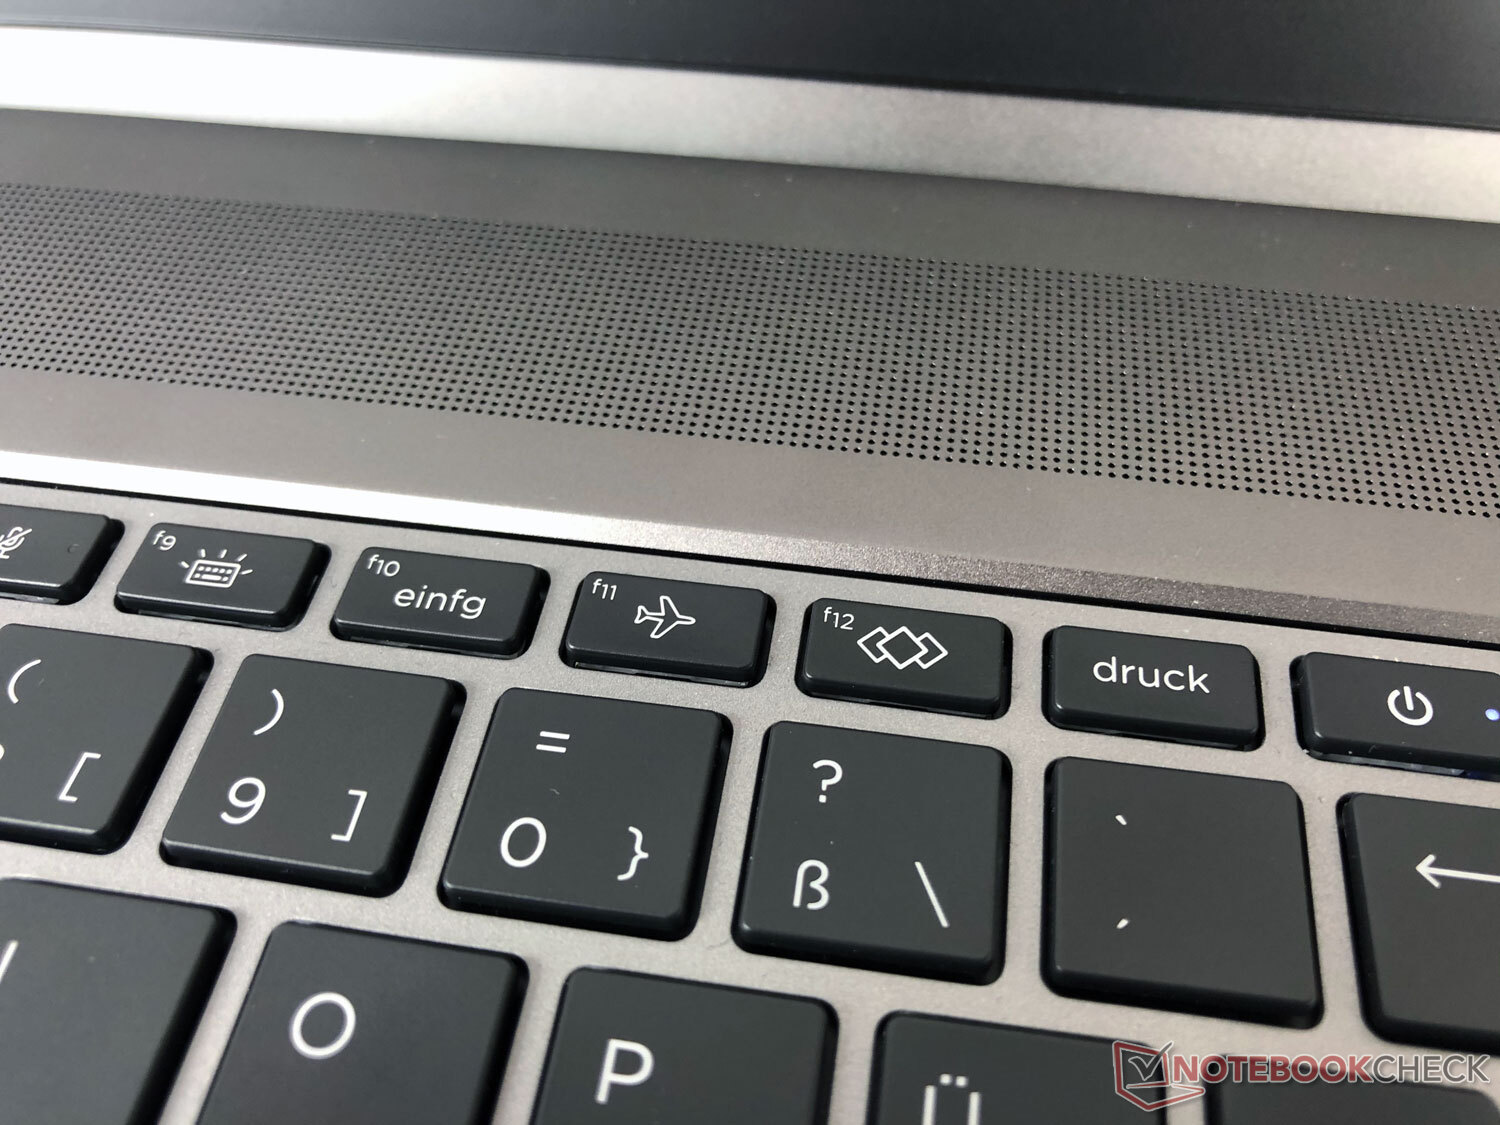
In una workstation, la tastiera è molto importante, e coloro che fanno molta digitazione su una workstation mobile faranno una buona scelta con questo modello. Nel nostro test, la tastiera dell'HP ZBook Fury 17 G7 con il suo blocco numeri fa un'ottima impressione. Con la sua ottima pressione dei tasti, la digitazione sembra quasi simile ad una normale tastiera per PC, e non c'è paragone con i molti modelli ultrasottili sul mercato. Una buona esperienza di digitazione e una digitazione fluida si manifestano rapidamente. L'etichettatura sui tasti è facilmente visibile, il che è anche dovuto all'illuminazione uniforme dello sfondo. Ad eccezione del tasto spazio, che è un po' più forte, il livello di rumore durante la digitazione rimane sicuramente entro i limiti.
Il tasto F12, che può essere configurato individualmente per avviare programmi e altro, è qualcosa di speciale. D'altra parte, il tasto di accensione, che è "nascosto" sopra il tasto backspace, è un po' insolito e richiede un po' di tempo per abituarsi.
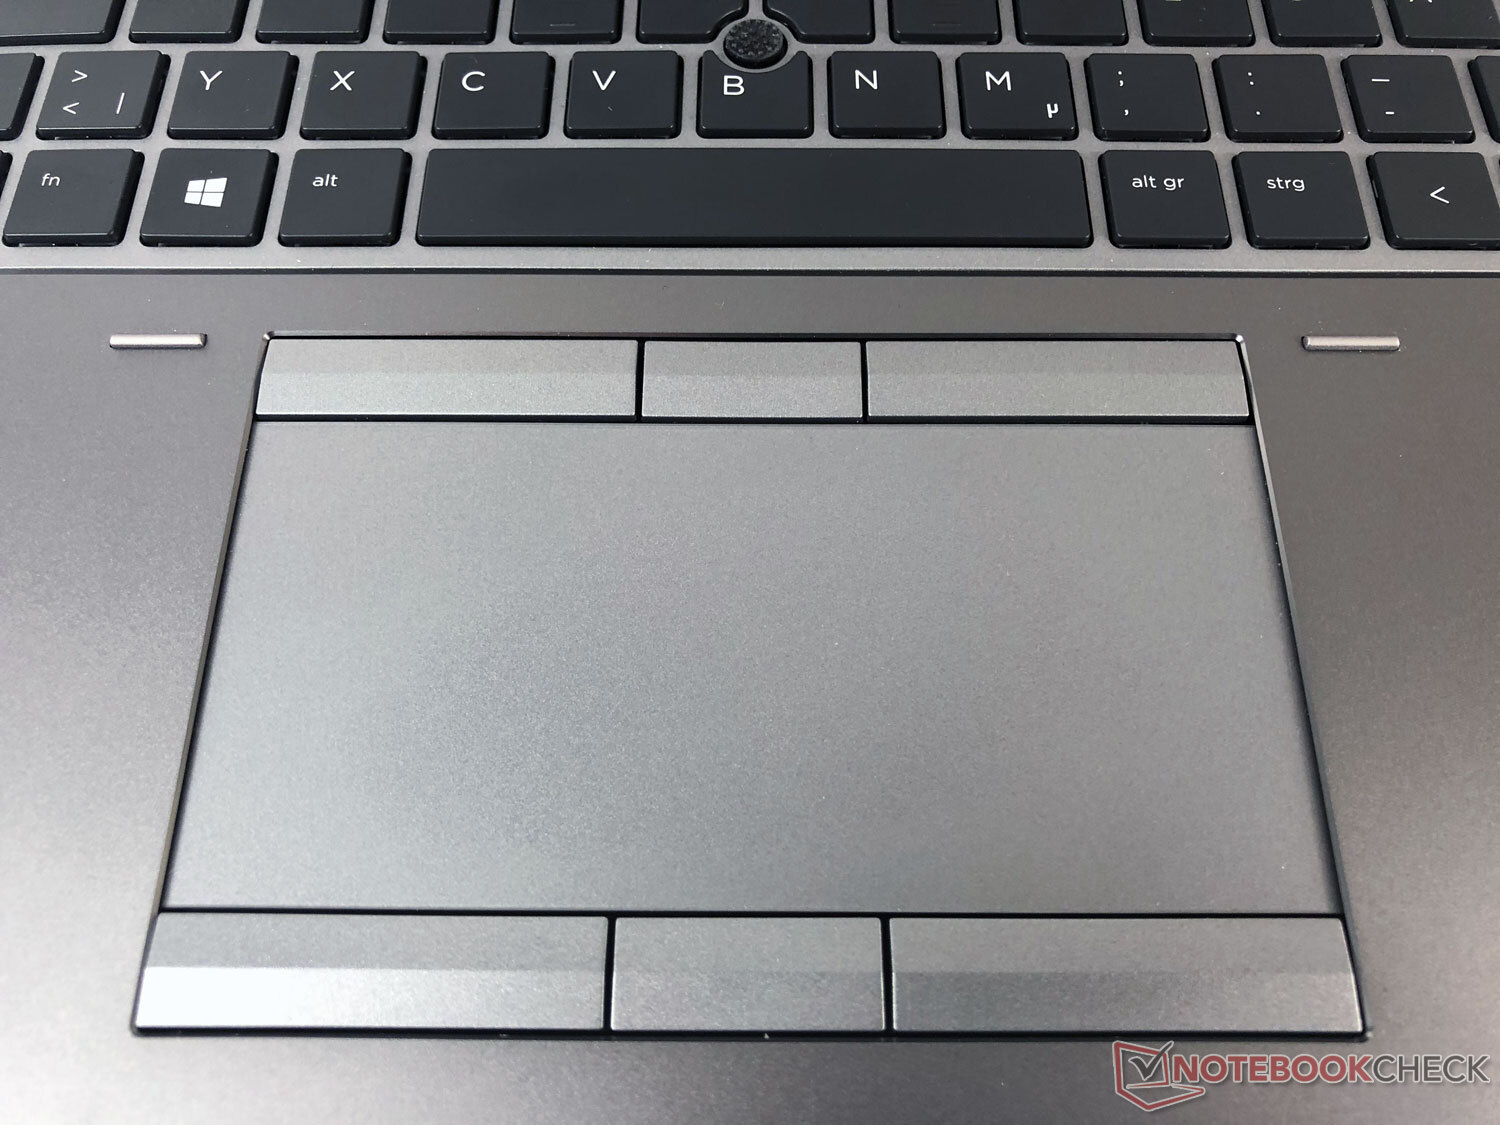
Touchpad
Il touchpad è posto sotto il centro del tasto spazio, il che significa che è spostato verso la sinistra del centro. La larghezza di 12,5 cm (~4,9 in) offre ampio spazio, ma la profondità di 6 cm (~2,4 in) è significativamente più compatta, il che è dovuto ai tasti per il puntatore sopra. Il touchpad stesso offre comode caratteristiche di scorrimento, e i soliti gesti multi-touch sono supportati. Non solo i tre tasti sopra e sotto si individuano facilmente, ma offrono anche una corsa significativa, che assicura un feedback migliore senza creare un fastidio acustico.
Il display 4K: Uno dei punti di forza del test
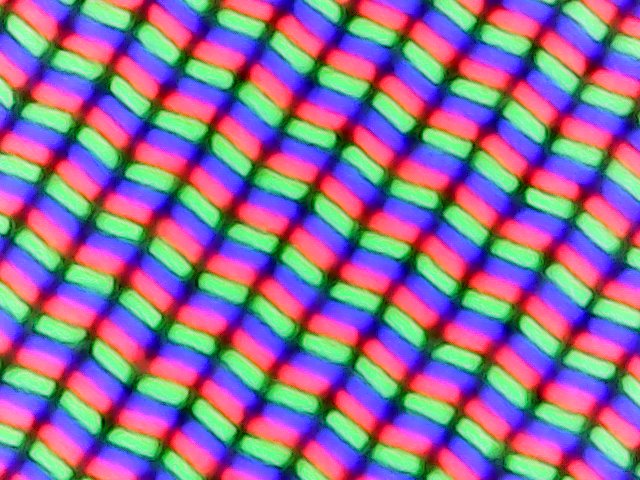
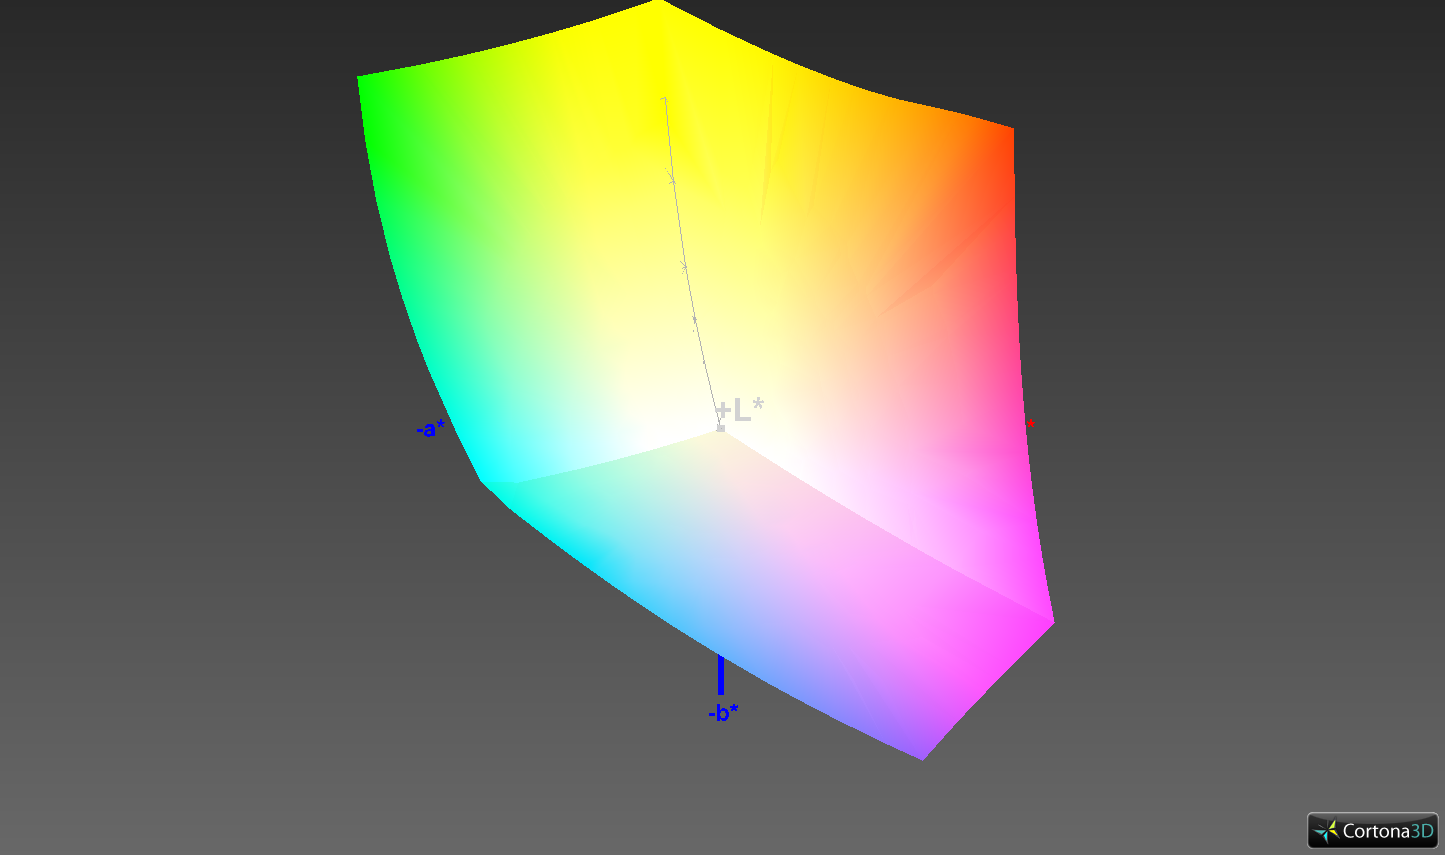
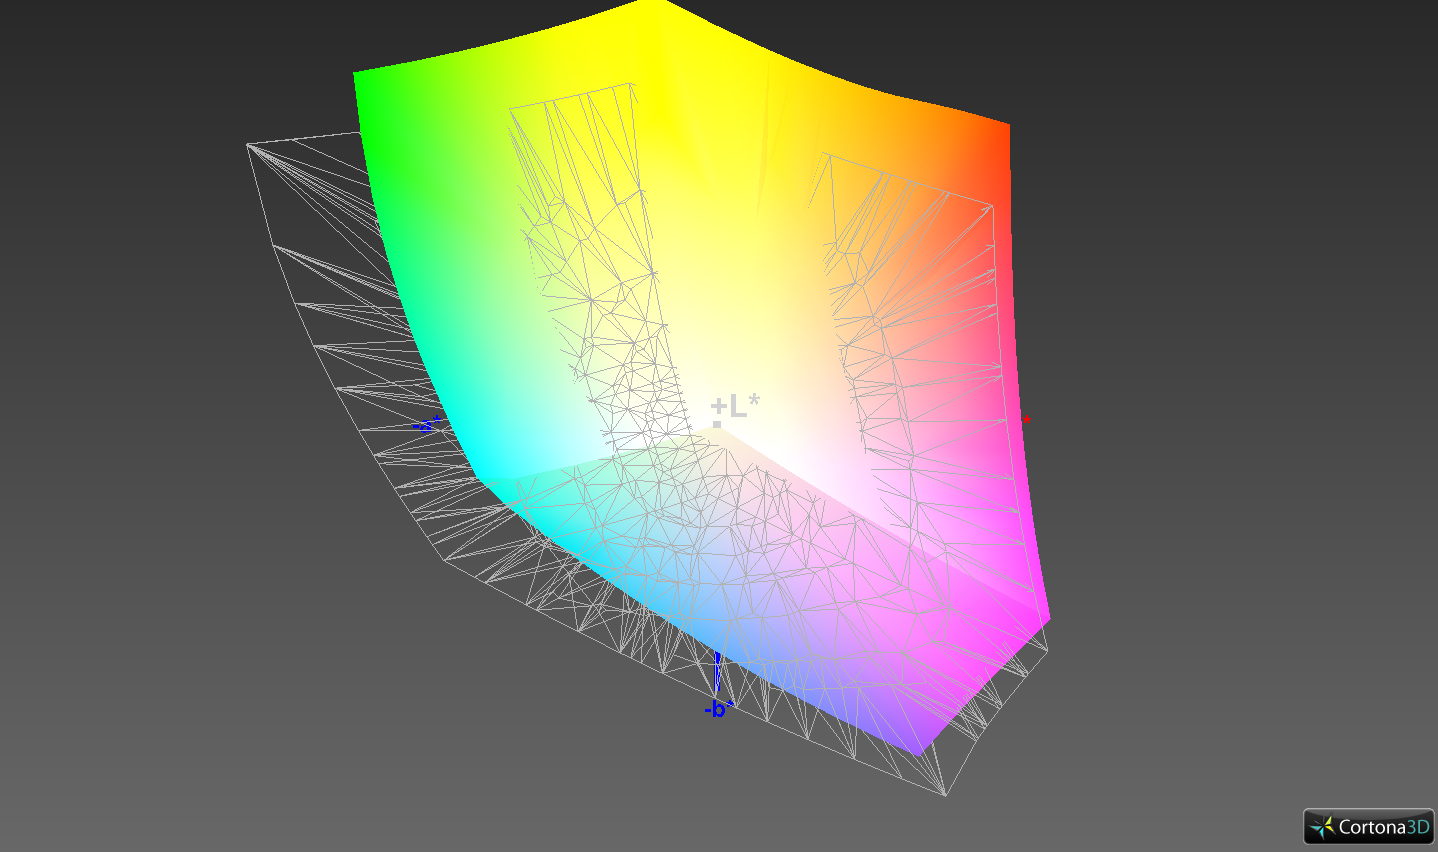
La nostra unità di prova è dotata di un display DreamColor con una risoluzione 4K (3840 x 2160 pixel). Questo è uno dei migliori che HP ha da offrire, ma rispetto al predecessore, la nuova generazione porta due cambiamenti.
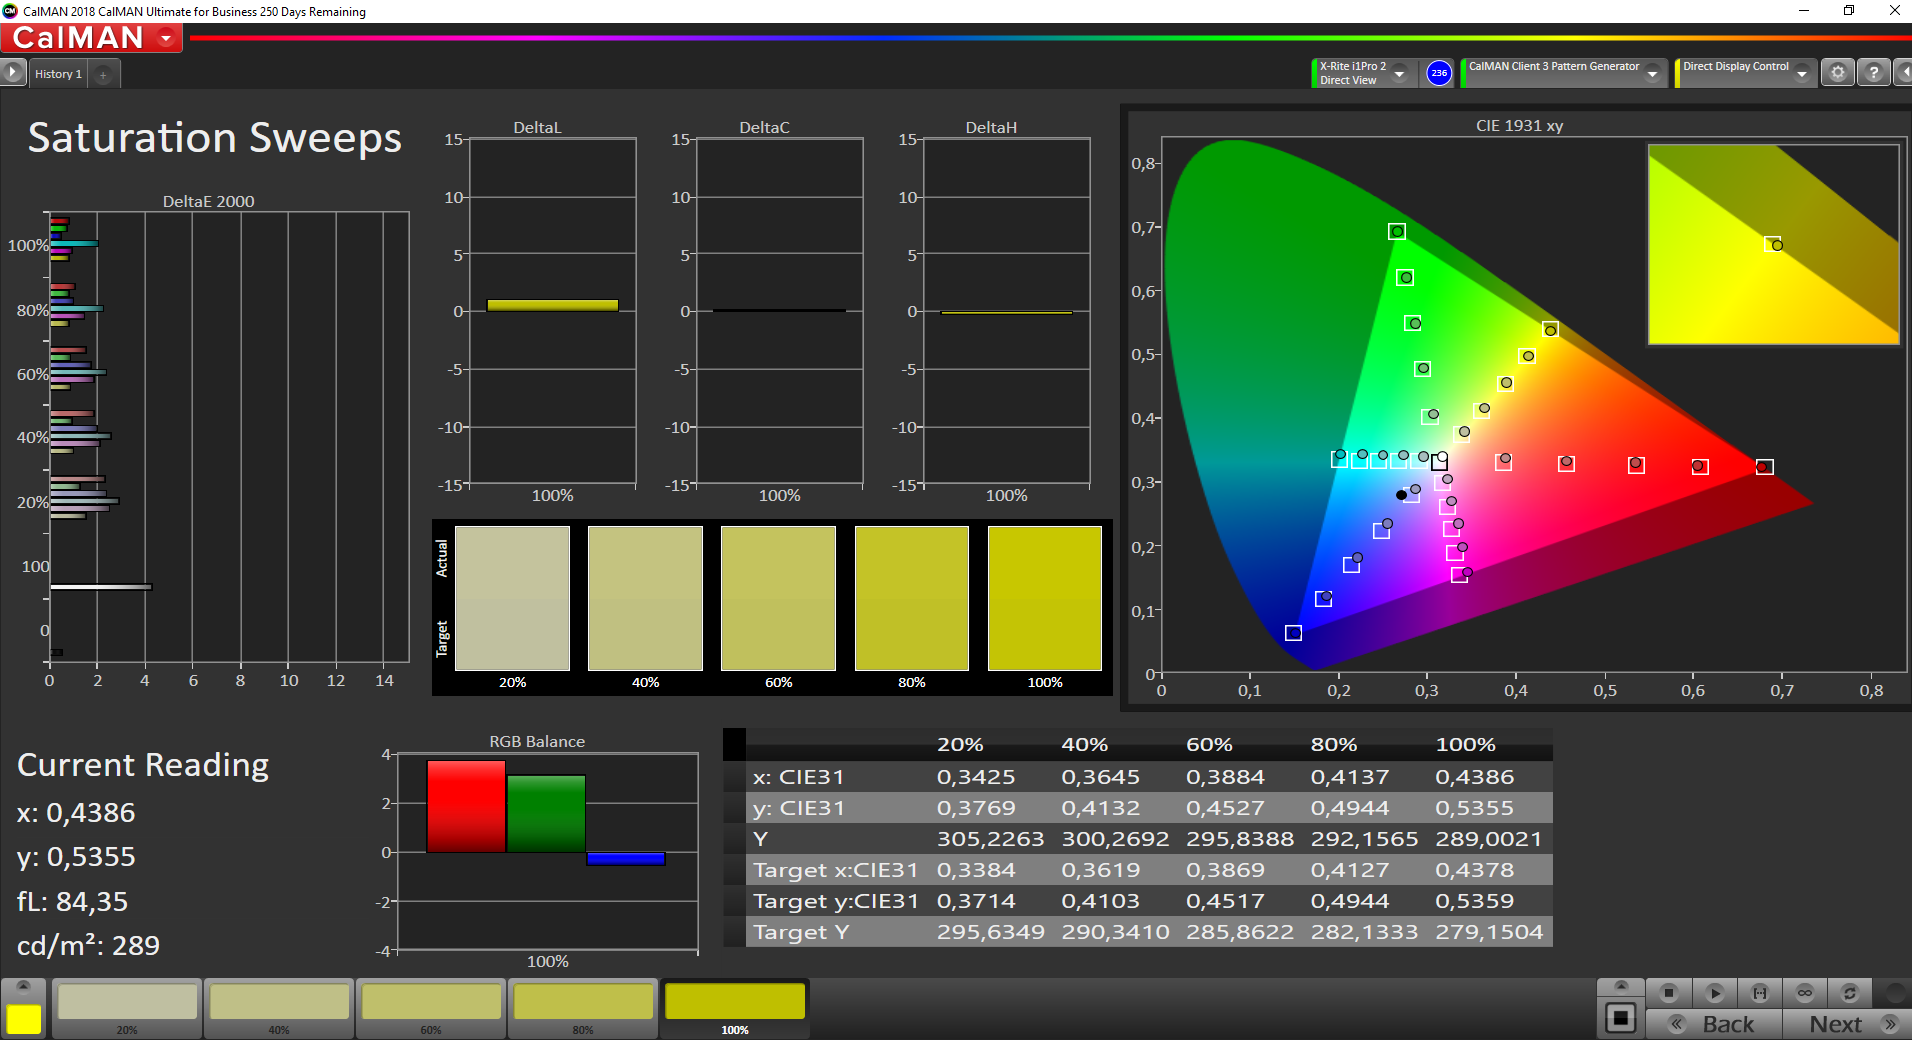
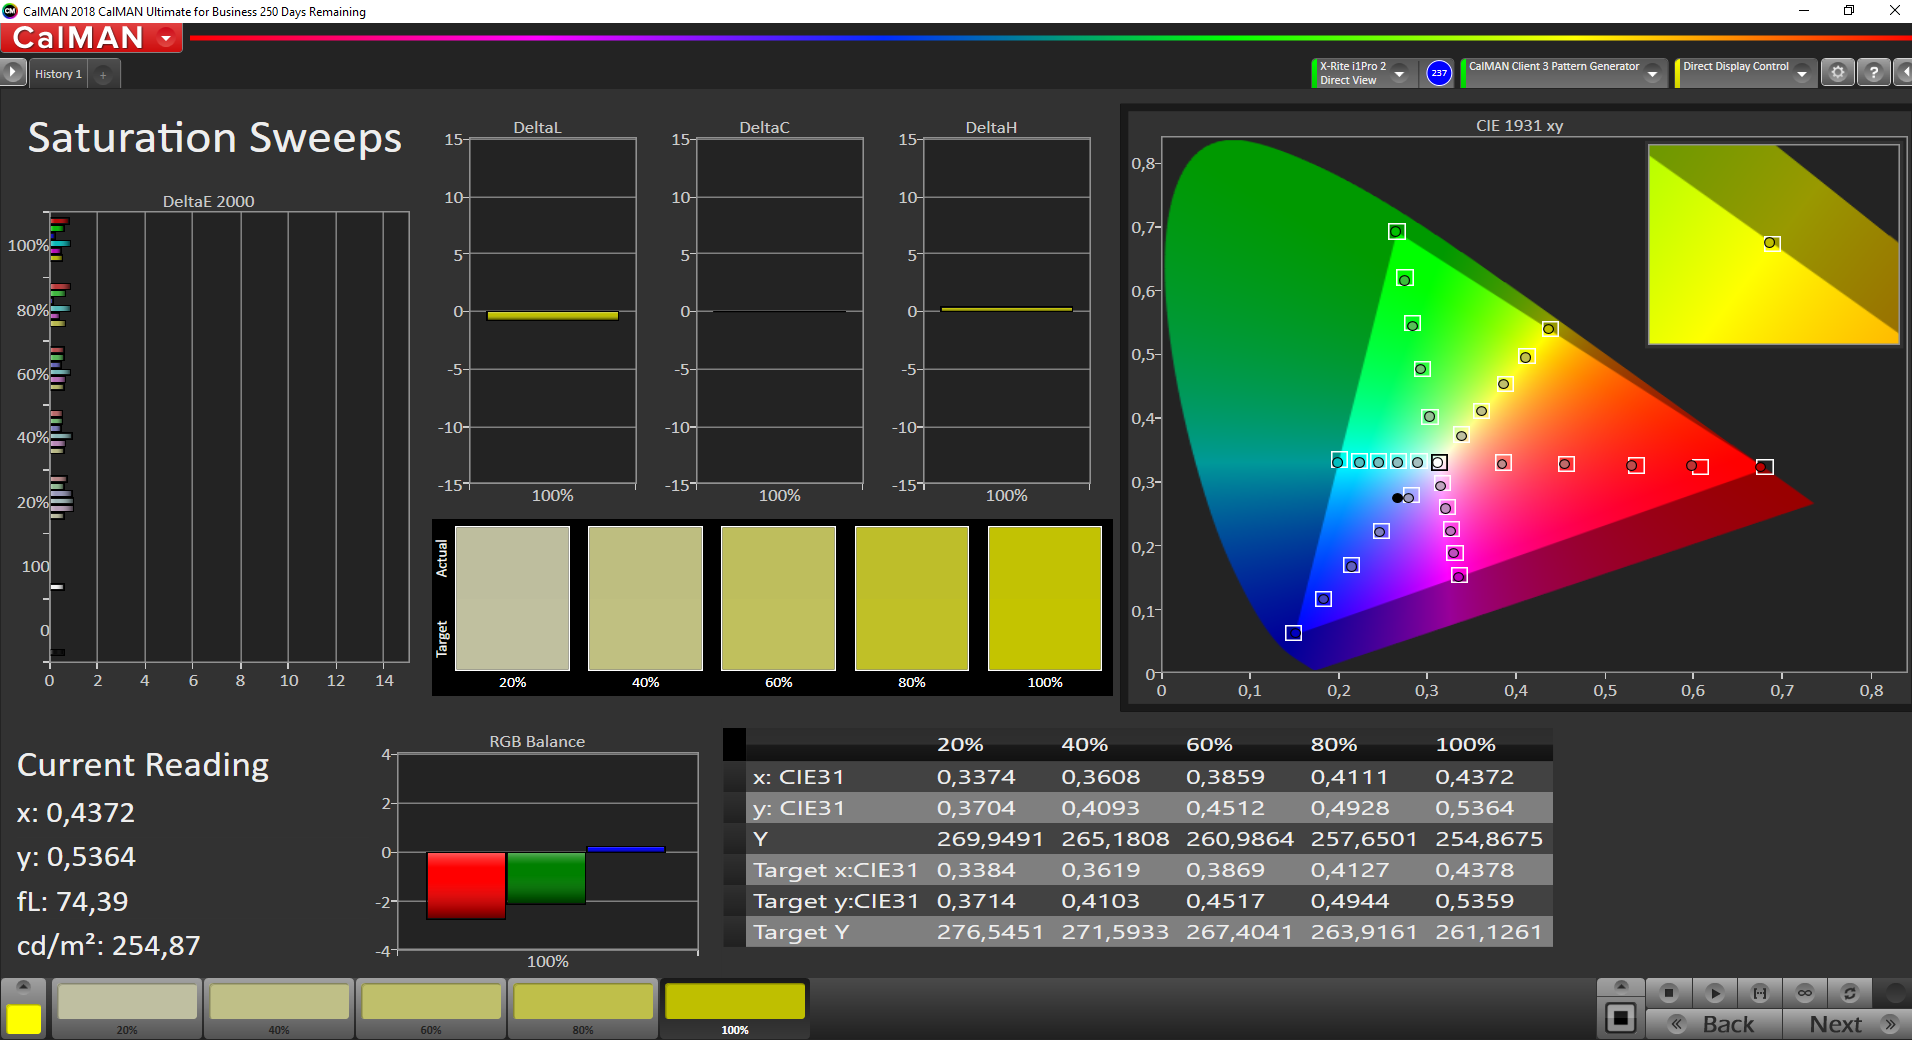
Lo spazio colore AdobeRGB non è coperto completamente fino al 100% ma solo al 77,6%, e la copertura completa si ottiene solo per DCI-P3 e sRGB. Questo è uno svantaggio soprattutto per l'elaborazione grafica professionale. D'altra parte, porta il vantaggio che i calcoli grafici sotto basso carico sono ora gestiti dalla iGPU. Prima, la scheda grafica dedicata era sempre coinvolta, il che aveva un effetto negativo sulla durata della batteria.
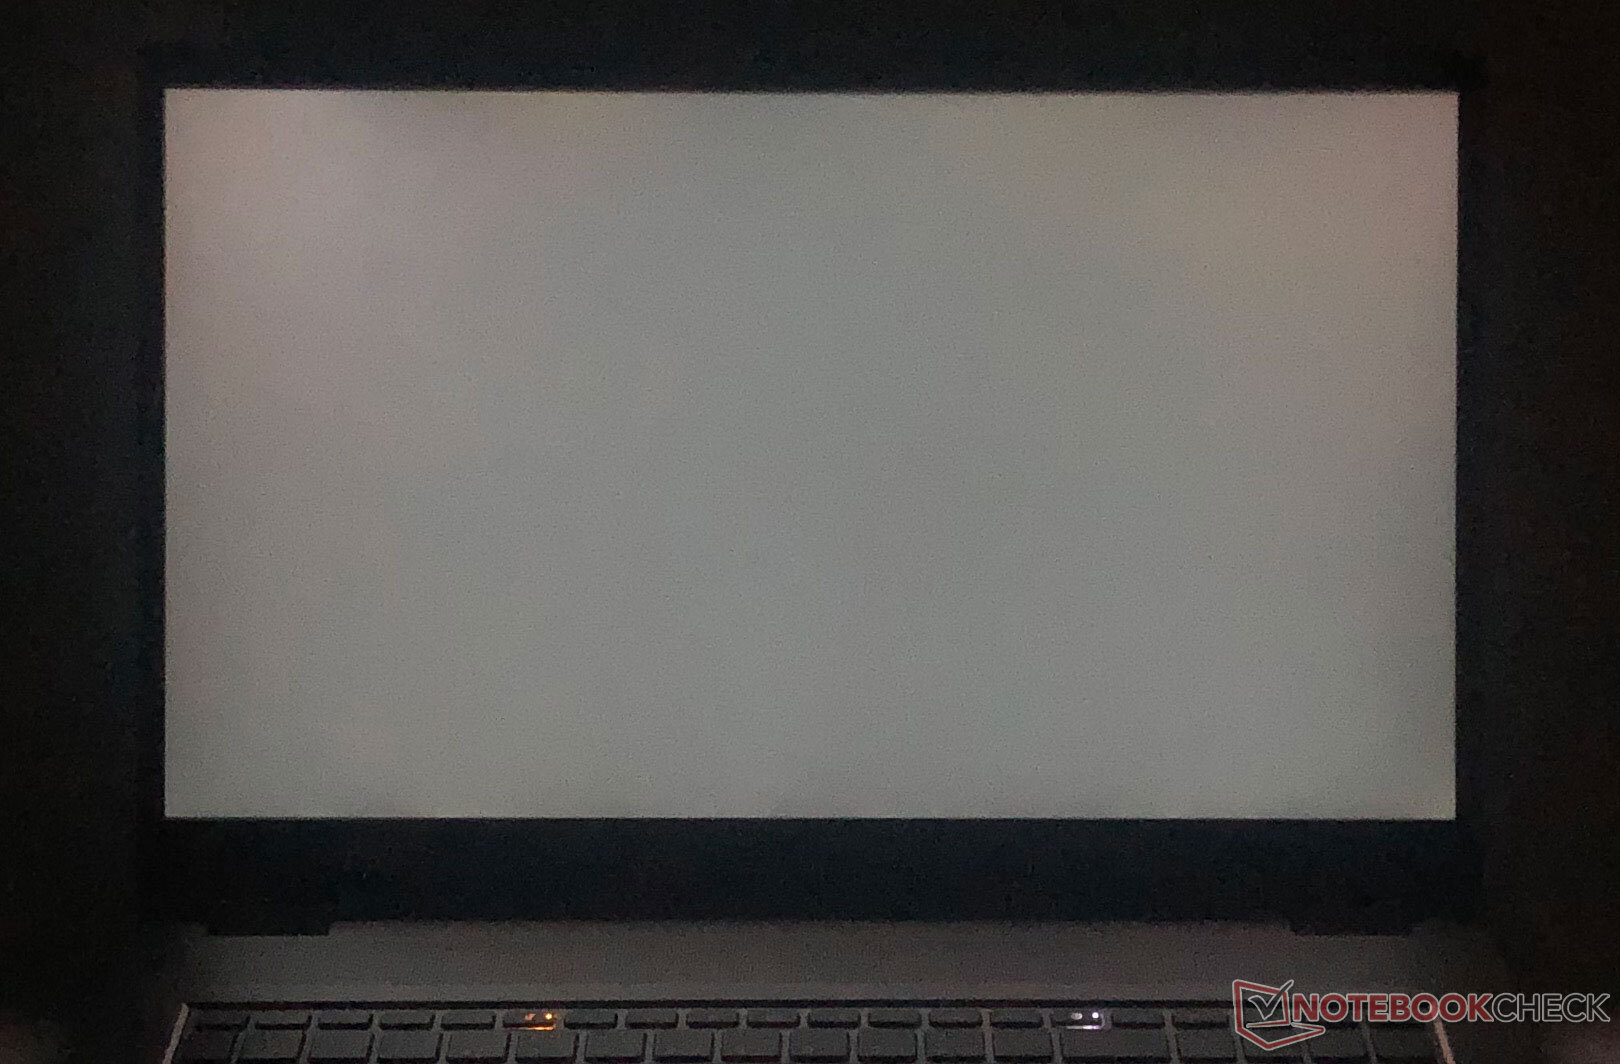
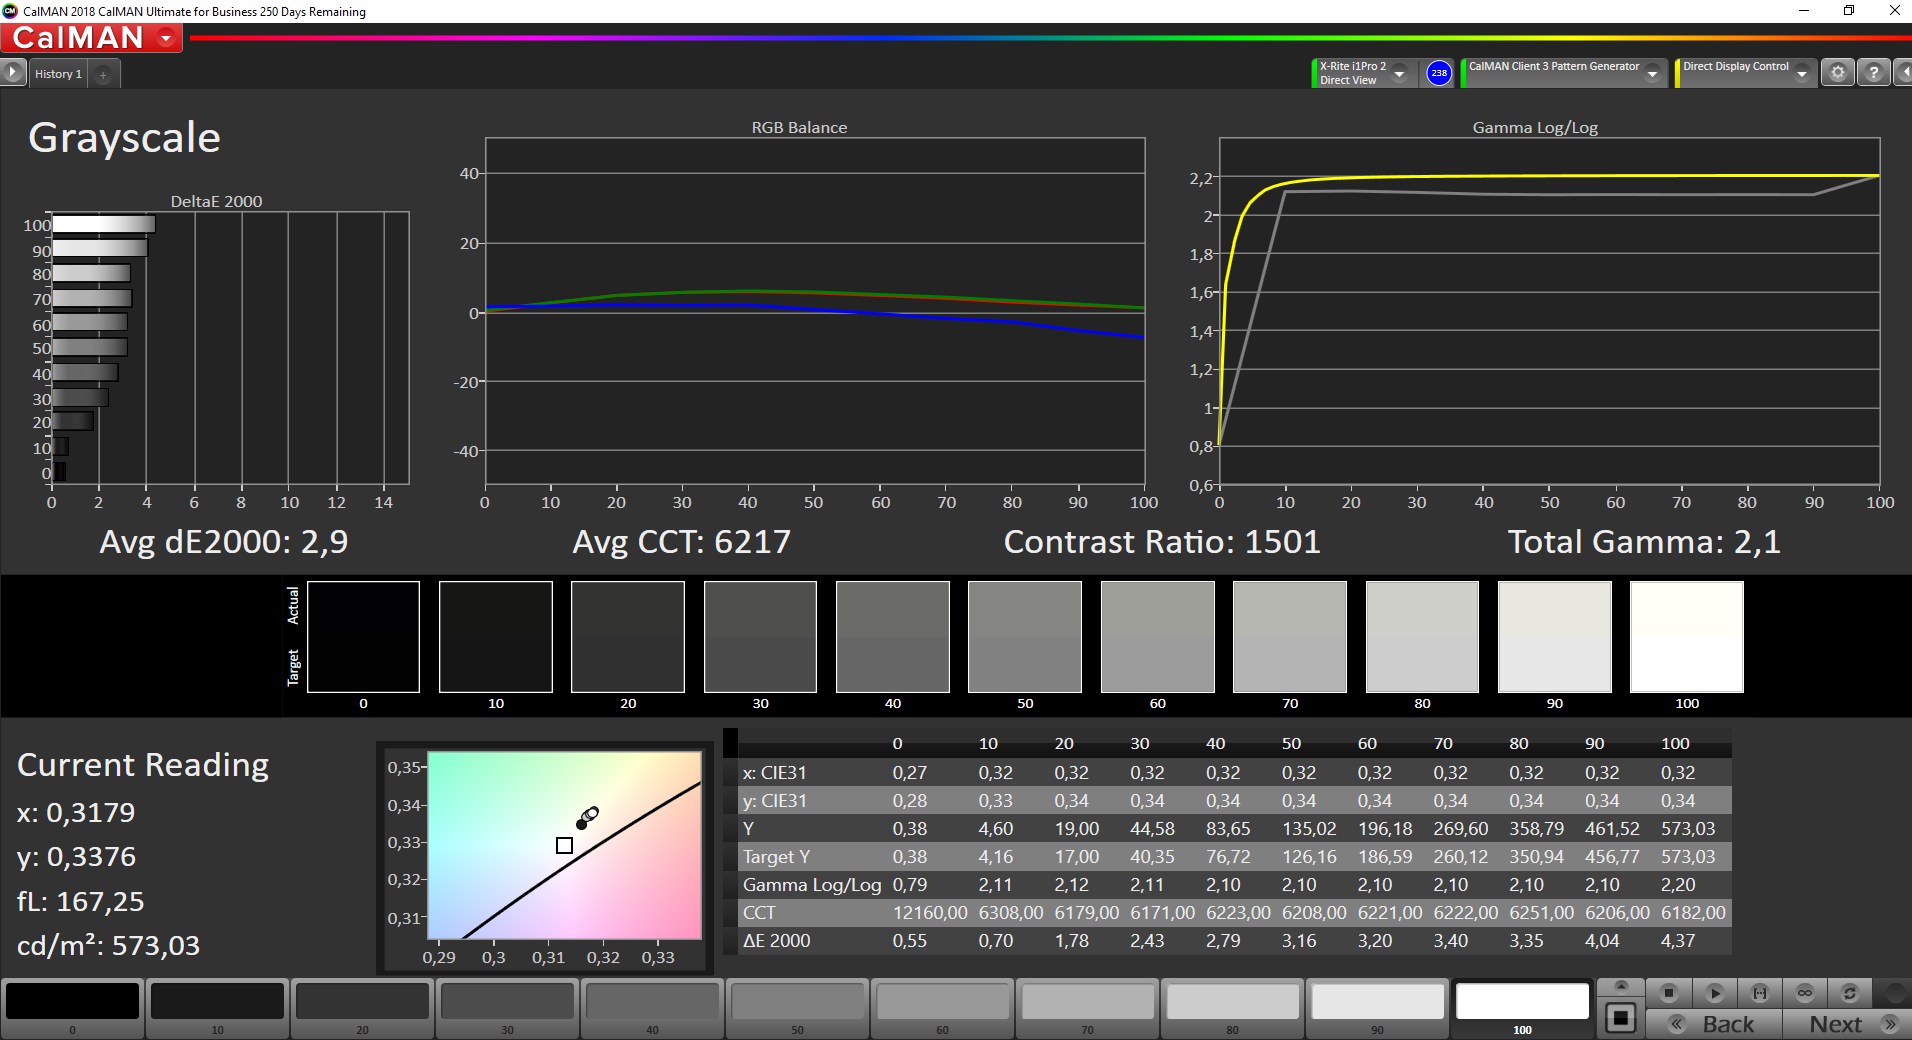
Con 600 cd/m², il display offre una luminosità piacevole e una distribuzione della luminosità abbastanza uniforme.
| |||||||||||||||||||||||||
Distribuzione della luminosità: 91 %
Al centro con la batteria: 574 cd/m²
Contrasto: 1508:1 (Nero: 0.38 cd/m²)
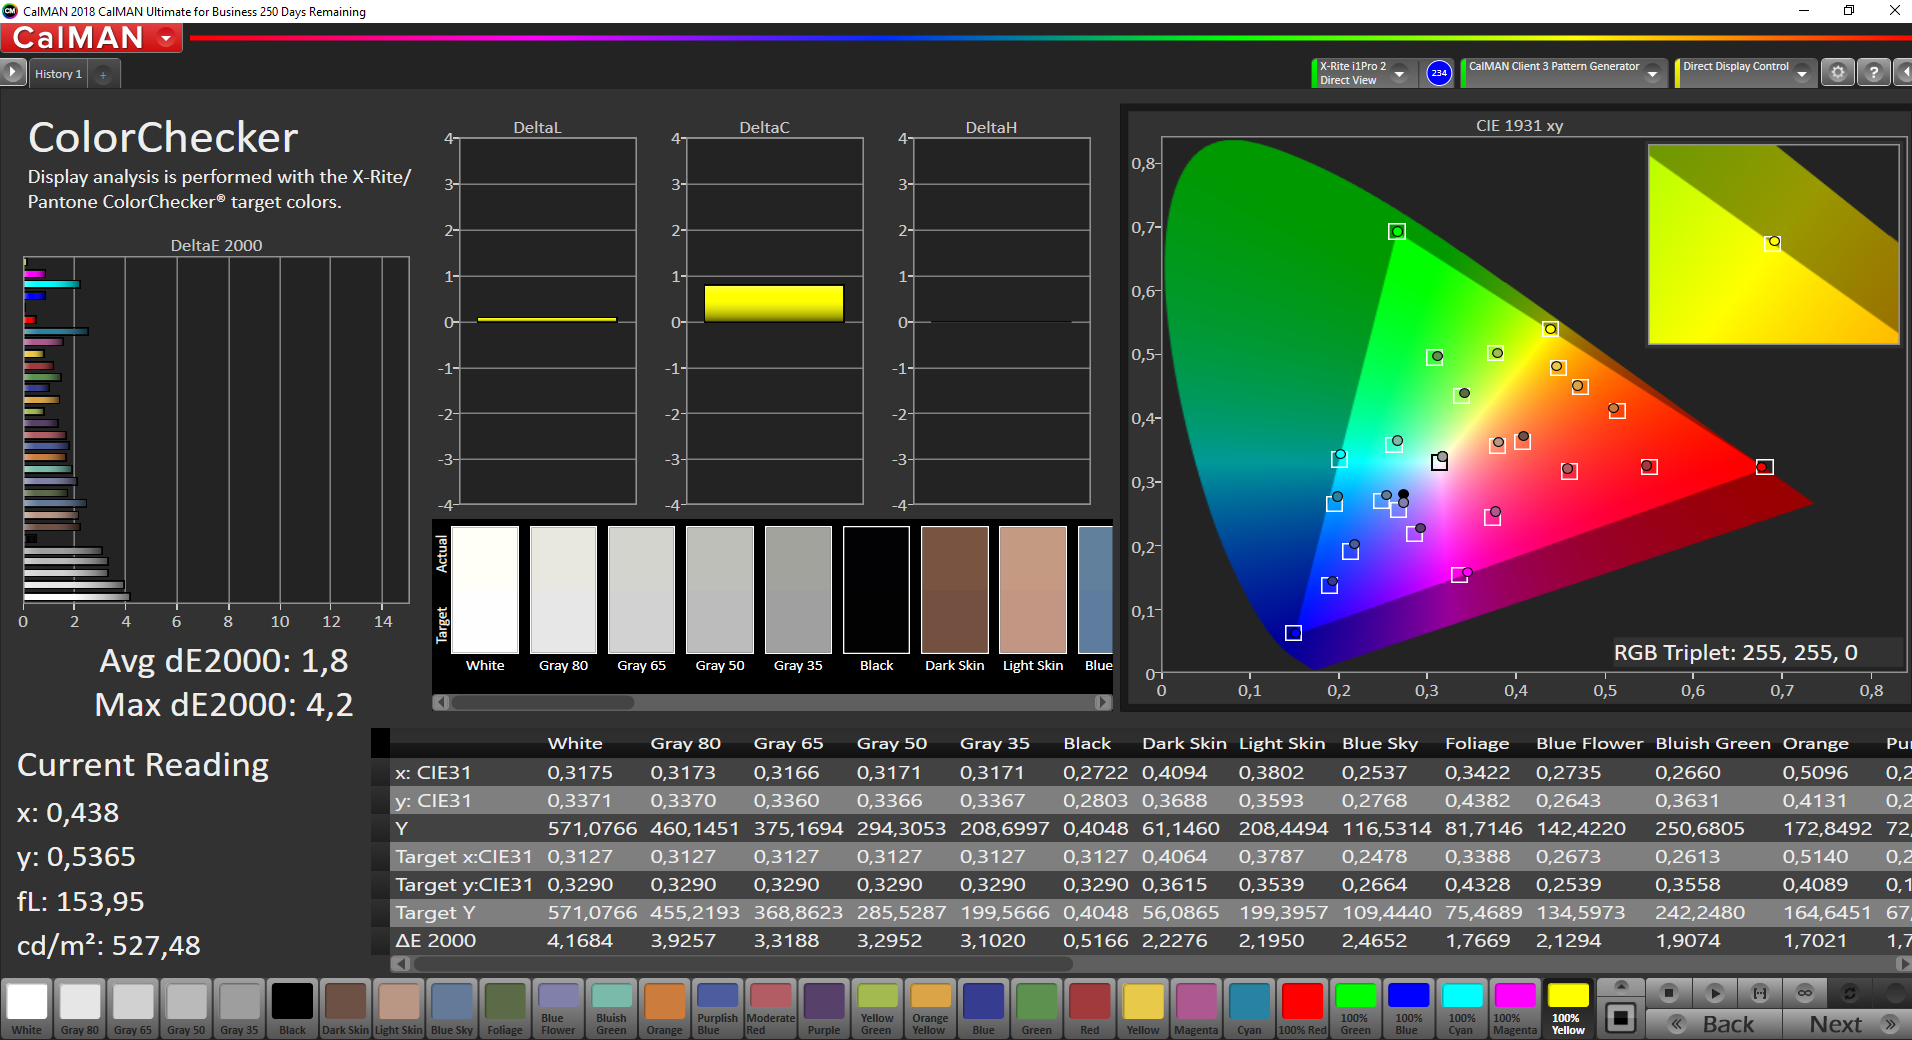
ΔE ColorChecker Calman: 1.9 | ∀{0.5-29.43 Ø4.72}
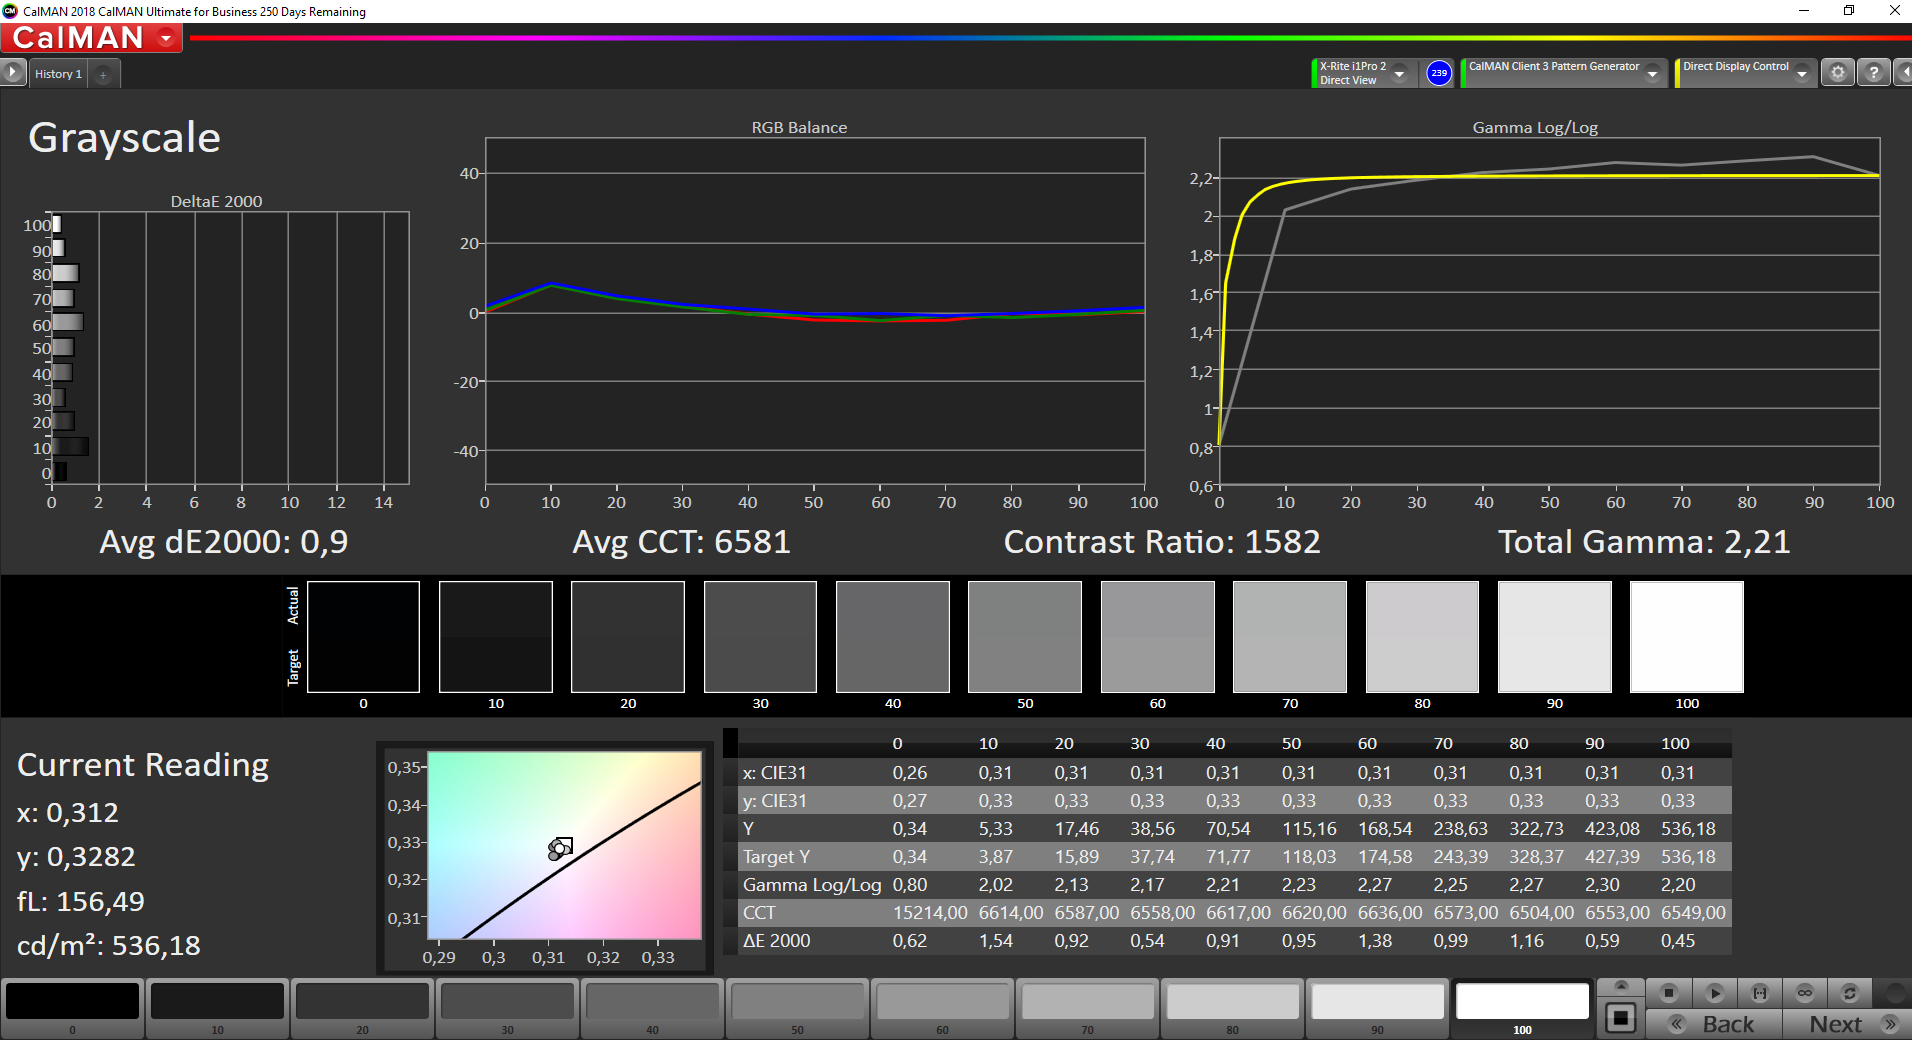
calibrated: 0.7
ΔE Greyscale Calman: 2.9 | ∀{0.09-98 Ø4.97}
100% sRGB (Argyll 1.6.3 3D)
77.6% AdobeRGB 1998 (Argyll 1.6.3 3D)
86.9% AdobeRGB 1998 (Argyll 3D)
99.9% sRGB (Argyll 3D)
99.3% Display P3 (Argyll 3D)
Gamma: 2.1
CCT: 6217 K
| HP ZBook Fury 17 G7 119W5EA AUOCD8C, , 3840x2160, 17.3" | Lenovo ThinkPad P73-20QR0030GE B173ZAN01.0, IPS, 3840x2160, 17.3" | HP ZBook Fury 15 G7 LG Philips LGD0661, IPS, 3840x2160, 15.6" | Asus StudioBook Pro X W730G5T-H8050T 17PUW1-B00, IPS LED, 1920x1200, 17" | Dell Precision 7550 AU Optronics B156ZAN, IPS, 3840x2160, 15.6" | |
|---|---|---|---|---|---|
| Display | 0% | -2% | -2% | -2% | |
| Display P3 Coverage (%) | 99.3 | 86.8 -13% | 95.6 -4% | 96 -3% | 82.1 -17% |
| sRGB Coverage (%) | 99.9 | 100 0% | 99.8 0% | 99.8 0% | 99.6 0% |
| AdobeRGB 1998 Coverage (%) | 86.9 | 98.8 14% | 84.5 -3% | 84.5 -3% | 96.8 11% |
| Response Times | 28% | 5% | 25% | 12% | |
| Response Time Grey 50% / Grey 80% * (ms) | 56 ? | 44 ? 21% | 56 ? -0% | 41.6 ? 26% | 51.2 ? 9% |
| Response Time Black / White * (ms) | 40 ? | 26.4 ? 34% | 36 ? 10% | 30.8 ? 23% | 34 ? 15% |
| PWM Frequency (Hz) | |||||
| Screen | -41% | -51% | -8% | -74% | |
| Brightness middle (cd/m²) | 573 | 366 -36% | 672.8 17% | 341 -40% | 473.5 -17% |
| Brightness (cd/m²) | 586 | 349 -40% | 674 15% | 319 -46% | 461 -21% |
| Brightness Distribution (%) | 91 | 88 -3% | 89 -2% | 80 -12% | 90 -1% |
| Black Level * (cd/m²) | 0.38 | 0.38 -0% | 0.5 -32% | 0.43 -13% | 0.55 -45% |
| Contrast (:1) | 1508 | 963 -36% | 1346 -11% | 793 -47% | 861 -43% |
| Colorchecker dE 2000 * | 1.9 | 4.3 -126% | 3.48 -83% | 1.5 21% | 4.8 -153% |
| Colorchecker dE 2000 max. * | 4.2 | 7.1 -69% | 9.44 -125% | 2.8 33% | 8.73 -108% |
| Colorchecker dE 2000 calibrated * | 0.7 | 1.1 -57% | 3.03 -333% | 0.8 -14% | 3.08 -340% |
| Greyscale dE 2000 * | 2.9 | 5.5 -90% | 3.1 -7% | 2.1 28% | 5.6 -93% |
| Gamma | 2.1 105% | 2.47 89% | 2.04 108% | 2.27 97% | 2.34 94% |
| CCT | 6217 105% | 6281 103% | 6380 102% | 6281 103% | 7549 86% |
| Color Space (Percent of AdobeRGB 1998) (%) | 77.6 | 86 11% | 75.2 -3% | 75.6 -3% | 86.4 11% |
| Color Space (Percent of sRGB) (%) | 100 | 100 0% | 100 0% | 99.8 0% | 99.7 0% |
| Media totale (Programma / Settaggio) | -4% /
-24% | -16% /
-35% | 5% /
-3% | -21% /
-50% |
* ... Meglio usare valori piccoli
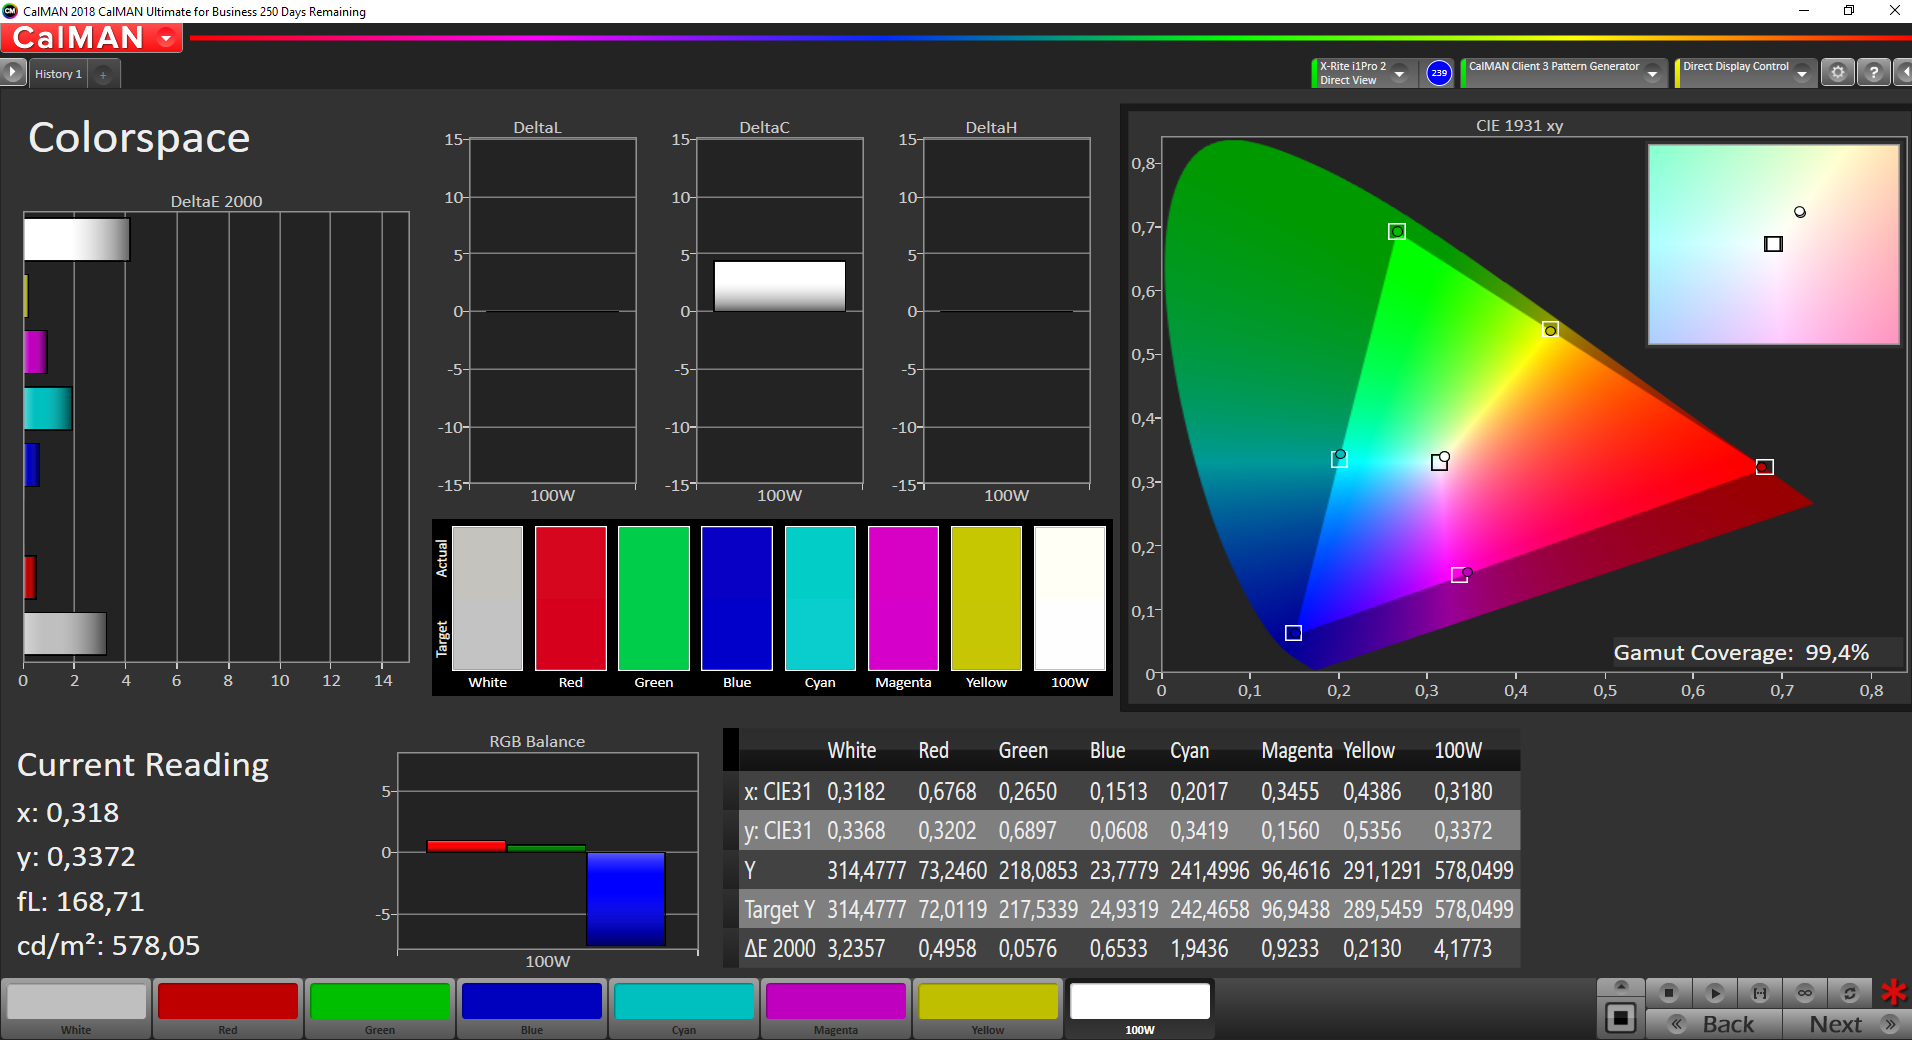
Il pannello offre un'immagine equilibrata già allo stato di consegna, ma può essere ulteriormente ottimizzata con una calibrazione. Visivamente, il display crea un'ottima impressione, offrendo colori vibranti e un buon contrasto di 1508:1.

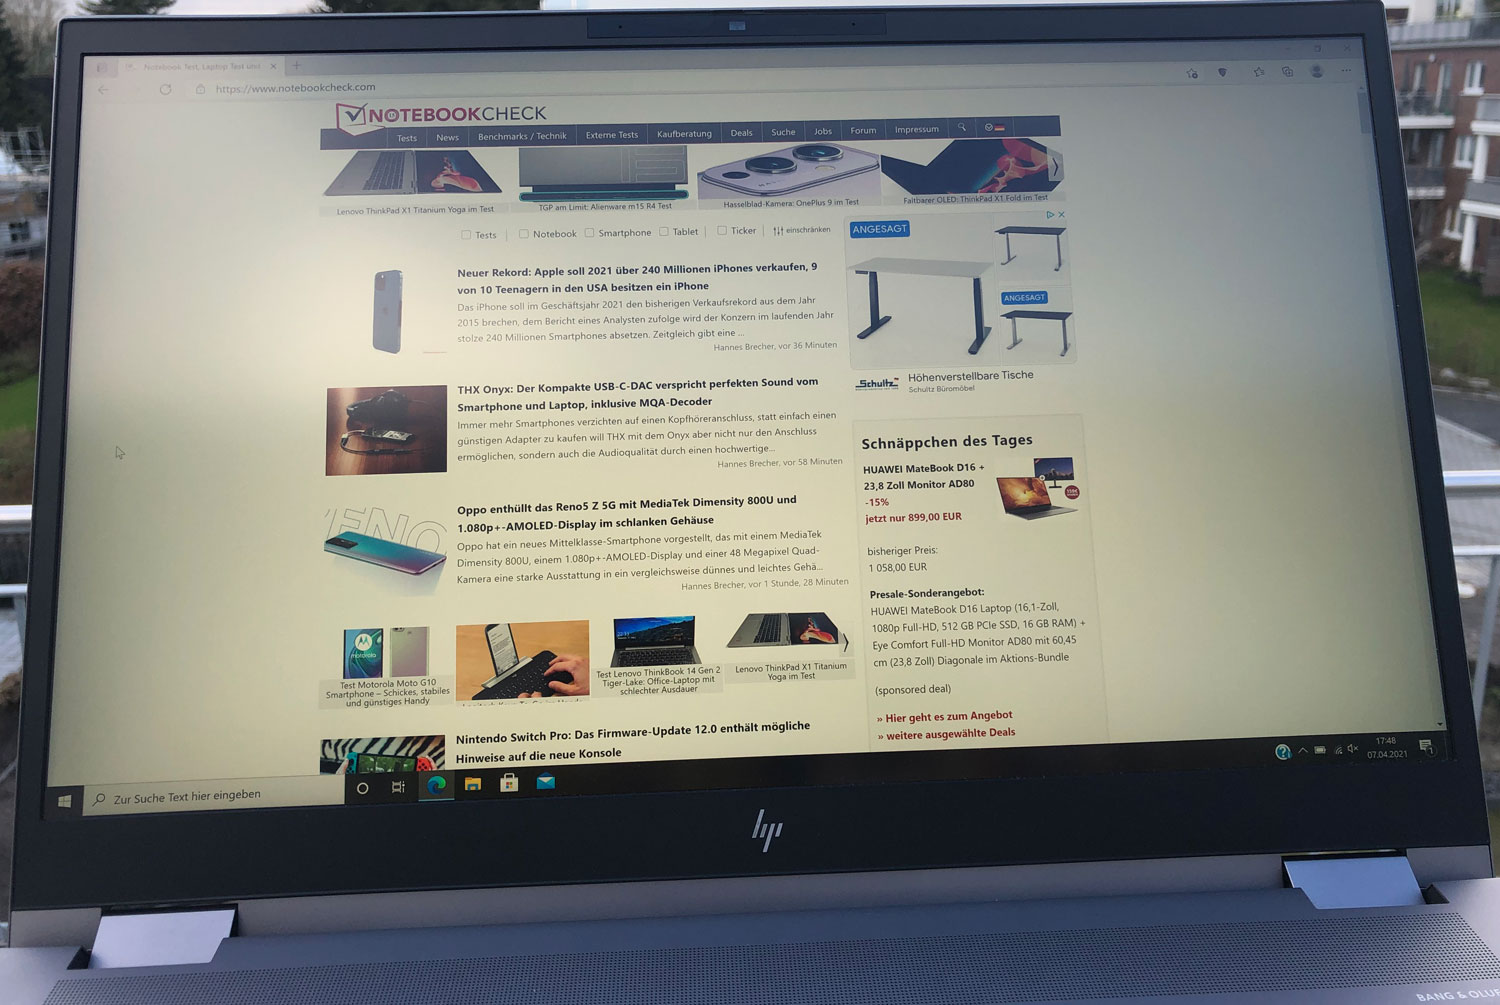
Anche se con il suo peso, la workstation mobile HP non è il partner ideale all'esterno, il display quasi ti invita a usare lo ZBook Fury 17 G7 all'aperto. Grazie all'elevata luminosità e allo schermo opaco antiriflesso, si può lavorare anche al sole.
Tempi di risposta del Display
| ↔ Tempi di risposta dal Nero al Bianco | ||
|---|---|---|
| 40 ms ... aumenta ↗ e diminuisce ↘ combinato | ↗ 22 ms Incremento | 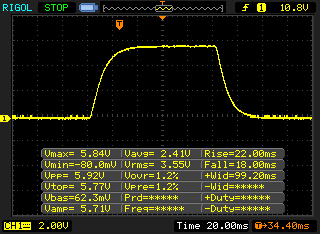 |
| ↘ 18 ms Calo | ||
| Lo schermo mostra tempi di risposta lenti nei nostri tests e sarà insoddisfacente per i gamers. In confronto, tutti i dispositivi di test variano da 0.1 (minimo) a 240 (massimo) ms. » 97 % di tutti i dispositivi è migliore. Questo significa che i tempi di risposta rilevati sono peggiori rispetto alla media di tutti i dispositivi testati (19.8 ms). | ||
| ↔ Tempo di risposta dal 50% Grigio all'80% Grigio | ||
| 56 ms ... aumenta ↗ e diminuisce ↘ combinato | ↗ 26 ms Incremento | 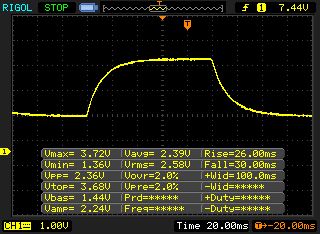 |
| ↘ 30 ms Calo | ||
| Lo schermo mostra tempi di risposta lenti nei nostri tests e sarà insoddisfacente per i gamers. In confronto, tutti i dispositivi di test variano da 0.165 (minimo) a 636 (massimo) ms. » 93 % di tutti i dispositivi è migliore. Questo significa che i tempi di risposta rilevati sono peggiori rispetto alla media di tutti i dispositivi testati (31 ms). | ||
Sfarfallio dello schermo / PWM (Pulse-Width Modulation)
| flickering dello schermo / PWM non rilevato |  | ||
In confronto: 52 % di tutti i dispositivi testati non utilizza PWM per ridurre la luminosita' del display. Se è rilevato PWM, una media di 7775 (minimo: 5 - massimo: 343500) Hz è stata rilevata. | |||
La stabilità dell'angolo di visione del pannello è esemplare, permettendoti di leggere chiaramente i contenuti anche da angoli di visione estemi.
Prestazioni: Sufficiente per qualsiasi compito
HP offre la sua workstation mobile ZBook Fury 17 G7 in varie configurazioni di equipaggiamento. Il modello 119W5EA nel nostro test, che costa quasi 4800 euro (~$5749) con un Intel Core i9-10885H e Nvidia Quadro RTX 4000 Max-Q è uno dei modelli di fascia alta del portatile da 17". Al di sopra di questo ci sono solo la CPU Xeon W-10855M e la Quadro RTX 5000 Max-Q e sotto ci sono tutta una serie di modelli, a partire dall'i7-10750He NVIDIA Quadro T1000 che costa 2300 euro (~$2754).
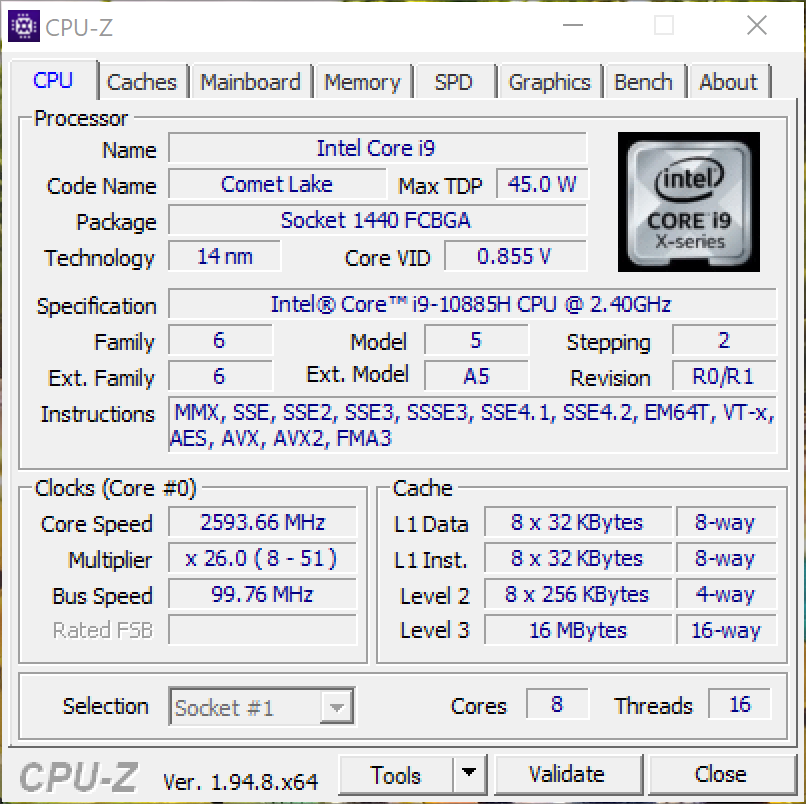
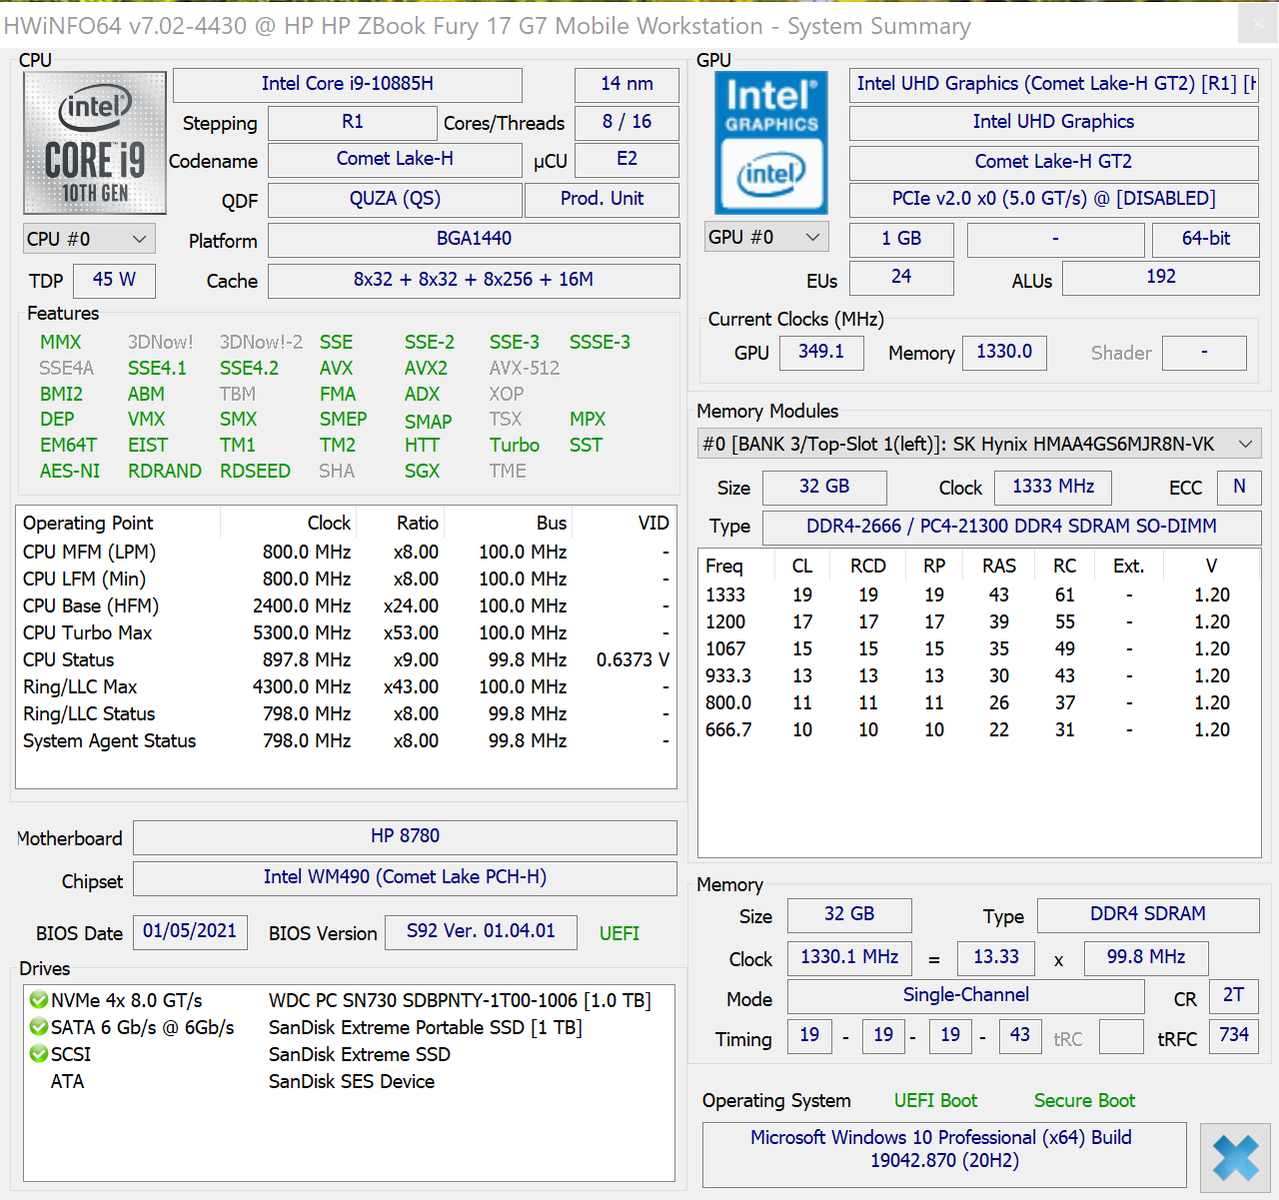
Processore
Nella nostra versione della workstation mobile, HP si affida alle prestazioni di calcolo dell'Intel Core i9-10885H. Il chip è ancora basato sulla nota architettura Comet Lake. La velocità di clock regolare è di 2,4 GHz e la massima fino a 5,3 GHz o 4,4 GHz con tutti gli 8 cores attivi. Con un massimo di 125 watt, HP ha configurato un generoso limite TDP, anche se il valore massimo viene raggiunto solo per poco tempo a causa dello sviluppo di temperature elevate. Il valore costante si assesta intorno ai 74 watt. Quando si usa la batteria, il valore scende a circa 40 watts.
Dopo un leggero calo all'inizio, la CPU è in grado di mantenere le sue prestazioni nel tempo, collocandosi a circa il livello dell'Intel Xeon W-10885M in vari benchmarks. Rispetto ad altri portatili con la stessa CPU, l'HP ZBook Fury 17 G7 ha prestazioni appena sopra la media nella maggior parte dei benchmarks.
Cinebench R15: CPU Single 64Bit | CPU Multi 64Bit
Blender: v2.79 BMW27 CPU
7-Zip 18.03: 7z b 4 -mmt1 | 7z b 4
Geekbench 5.5: Single-Core | Multi-Core
HWBOT x265 Benchmark v2.2: 4k Preset
LibreOffice : 20 Documents To PDF
R Benchmark 2.5: Overall mean
| Cinebench R20 / CPU (Single Core) | |
| Media della classe Workstation (671 - 857, n=25, ultimi 2 anni) | |
| HP ZBook Fury 15 G7 | |
| HP ZBook Fury 15 G7 | |
| HP ZBook Fury 17 G7 119W5EA | |
| Dell Precision 7550 | |
| Media Intel Core i9-10885H (460 - 513, n=3) | |
| Asus StudioBook Pro X W730G5T-H8050T | |
| Lenovo ThinkPad P73-20QR0030GE | |
| Cinebench R20 / CPU (Multi Core) | |
| Media della classe Workstation (5471 - 15043, n=25, ultimi 2 anni) | |
| Dell Precision 7550 | |
| HP ZBook Fury 15 G7 | |
| HP ZBook Fury 15 G7 | |
| HP ZBook Fury 17 G7 119W5EA | |
| Media Intel Core i9-10885H (2798 - 3762, n=3) | |
| Lenovo ThinkPad P73-20QR0030GE | |
| Asus StudioBook Pro X W730G5T-H8050T | |
| Cinebench R15 / CPU Single 64Bit | |
| Media della classe Workstation (191.4 - 328, n=25, ultimi 2 anni) | |
| HP ZBook Fury 15 G7 | |
| HP ZBook Fury 15 G7 | |
| HP ZBook Fury 17 G7 119W5EA | |
| Dell Precision 7550 | |
| Media Intel Core i9-10885H (197 - 212, n=3) | |
| Asus StudioBook Pro X W730G5T-H8050T | |
| Lenovo ThinkPad P73-20QR0030GE | |
| Cinebench R15 / CPU Multi 64Bit | |
| Media della classe Workstation (2489 - 5810, n=25, ultimi 2 anni) | |
| Dell Precision 7550 | |
| HP ZBook Fury 15 G7 | |
| HP ZBook Fury 15 G7 | |
| HP ZBook Fury 17 G7 119W5EA | |
| Lenovo ThinkPad P73-20QR0030GE | |
| Media Intel Core i9-10885H (1264 - 1726, n=3) | |
| Asus StudioBook Pro X W730G5T-H8050T | |
| Blender / v2.79 BMW27 CPU | |
| HP ZBook Fury 15 G7 | |
| Asus StudioBook Pro X W730G5T-H8050T | |
| Lenovo ThinkPad P73-20QR0030GE | |
| Media Intel Core i9-10885H (283 - 348, n=3) | |
| HP ZBook Fury 17 G7 119W5EA | |
| Dell Precision 7550 | |
| Media della classe Workstation (91 - 261, n=25, ultimi 2 anni) | |
| 7-Zip 18.03 / 7z b 4 -mmt1 | |
| Media della classe Workstation (5126 - 6960, n=25, ultimi 2 anni) | |
| HP ZBook Fury 15 G7 | |
| HP ZBook Fury 17 G7 119W5EA | |
| Media Intel Core i9-10885H (5397 - 5668, n=3) | |
| Dell Precision 7550 | |
| Asus StudioBook Pro X W730G5T-H8050T | |
| Lenovo ThinkPad P73-20QR0030GE | |
| 7-Zip 18.03 / 7z b 4 | |
| Media della classe Workstation (54741 - 116969, n=25, ultimi 2 anni) | |
| Dell Precision 7550 | |
| Lenovo ThinkPad P73-20QR0030GE | |
| HP ZBook Fury 17 G7 119W5EA | |
| Media Intel Core i9-10885H (36740 - 42993, n=3) | |
| HP ZBook Fury 15 G7 | |
| Asus StudioBook Pro X W730G5T-H8050T | |
| Geekbench 5.5 / Single-Core | |
| Media della classe Workstation (1781 - 2183, n=25, ultimi 2 anni) | |
| HP ZBook Fury 15 G7 | |
| Dell Precision 7550 | |
| HP ZBook Fury 17 G7 119W5EA | |
| Asus StudioBook Pro X W730G5T-H8050T | |
| Media Intel Core i9-10885H (1216 - 1376, n=3) | |
| Lenovo ThinkPad P73-20QR0030GE | |
| Geekbench 5.5 / Multi-Core | |
| Media della classe Workstation (11542 - 25554, n=25, ultimi 2 anni) | |
| Dell Precision 7550 | |
| Lenovo ThinkPad P73-20QR0030GE | |
| Media Intel Core i9-10885H (6529 - 7693, n=3) | |
| HP ZBook Fury 15 G7 | |
| Asus StudioBook Pro X W730G5T-H8050T | |
| HP ZBook Fury 17 G7 119W5EA | |
| HWBOT x265 Benchmark v2.2 / 4k Preset | |
| Media della classe Workstation (14.4 - 40.5, n=25, ultimi 2 anni) | |
| Dell Precision 7550 | |
| Media Intel Core i9-10885H (10.6 - 12.5, n=3) | |
| HP ZBook Fury 17 G7 119W5EA | |
| Lenovo ThinkPad P73-20QR0030GE | |
| Asus StudioBook Pro X W730G5T-H8050T | |
| HP ZBook Fury 15 G7 | |
| LibreOffice / 20 Documents To PDF | |
| HP ZBook Fury 15 G7 | |
| HP ZBook Fury 17 G7 119W5EA | |
| Media Intel Core i9-10885H (45.9 - 59.6, n=3) | |
| Asus StudioBook Pro X W730G5T-H8050T | |
| Lenovo ThinkPad P73-20QR0030GE | |
| Media della classe Workstation (37.1 - 74.7, n=25, ultimi 2 anni) | |
| Dell Precision 7550 | |
| R Benchmark 2.5 / Overall mean | |
| Lenovo ThinkPad P73-20QR0030GE | |
| Asus StudioBook Pro X W730G5T-H8050T | |
| HP ZBook Fury 17 G7 119W5EA | |
| Dell Precision 7550 | |
| Media Intel Core i9-10885H (0.564 - 0.572, n=3) | |
| HP ZBook Fury 15 G7 | |
| Media della classe Workstation (0.3825 - 0.603, n=25, ultimi 2 anni) | |
* ... Meglio usare valori piccoli
Prestazioni del sistema
Nei benchmarks sulle prestazioni del sistema, la nostra unità di prova si misura bene, tenendo il passo con i concorrenti che sono in parte dotati di hardware più potente. Le differenze tra i modelli di confronto possono essere viste solo ai limiti al massimo. La potenza è facilmente sufficiente per tutte le solite richieste di una workstation mobile. Il funzionamento quotidiano è fluido e senza alcun comportamento vistoso.
| PCMark 8 Home Score Accelerated v2 | 3750 punti | |
| PCMark 8 Creative Score Accelerated v2 | 7727 punti | |
| PCMark 8 Work Score Accelerated v2 | 4397 punti | |
| PCMark 10 Score | 5363 punti | |
Aiuto | ||
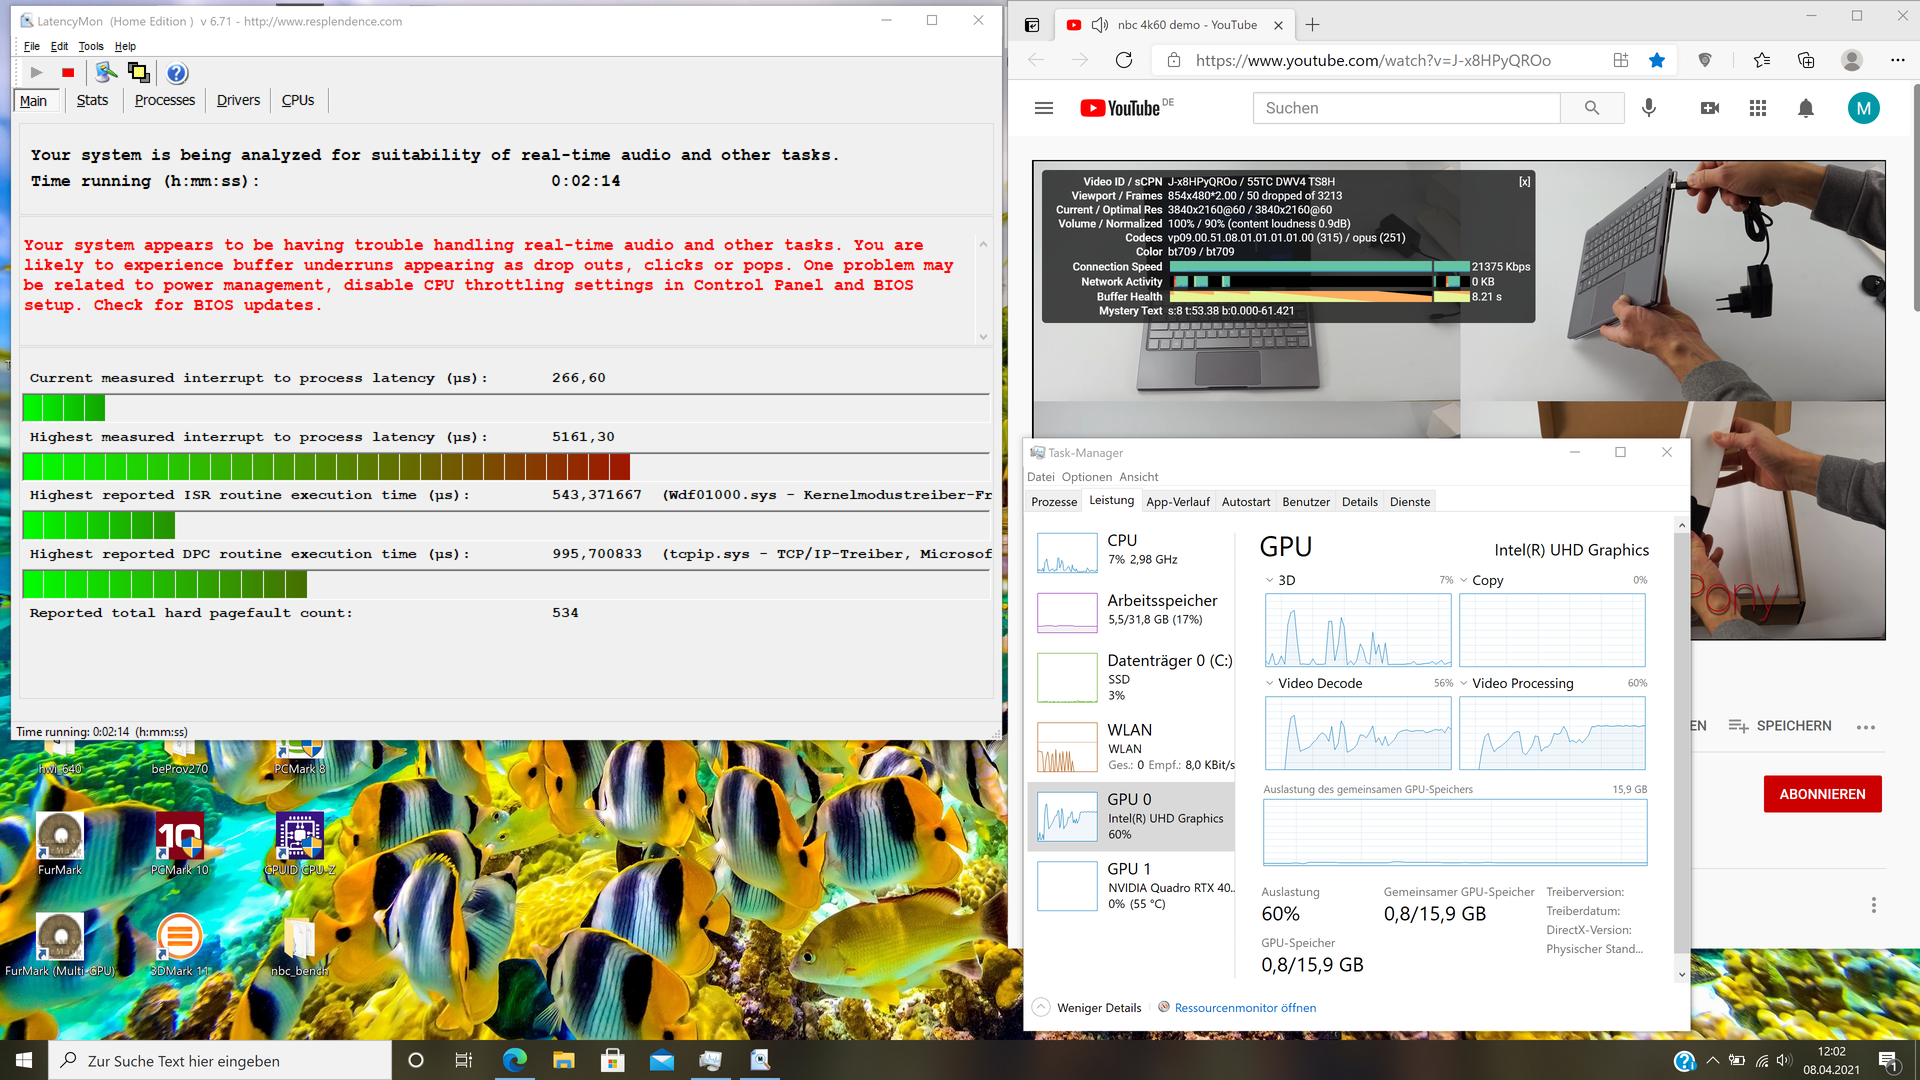
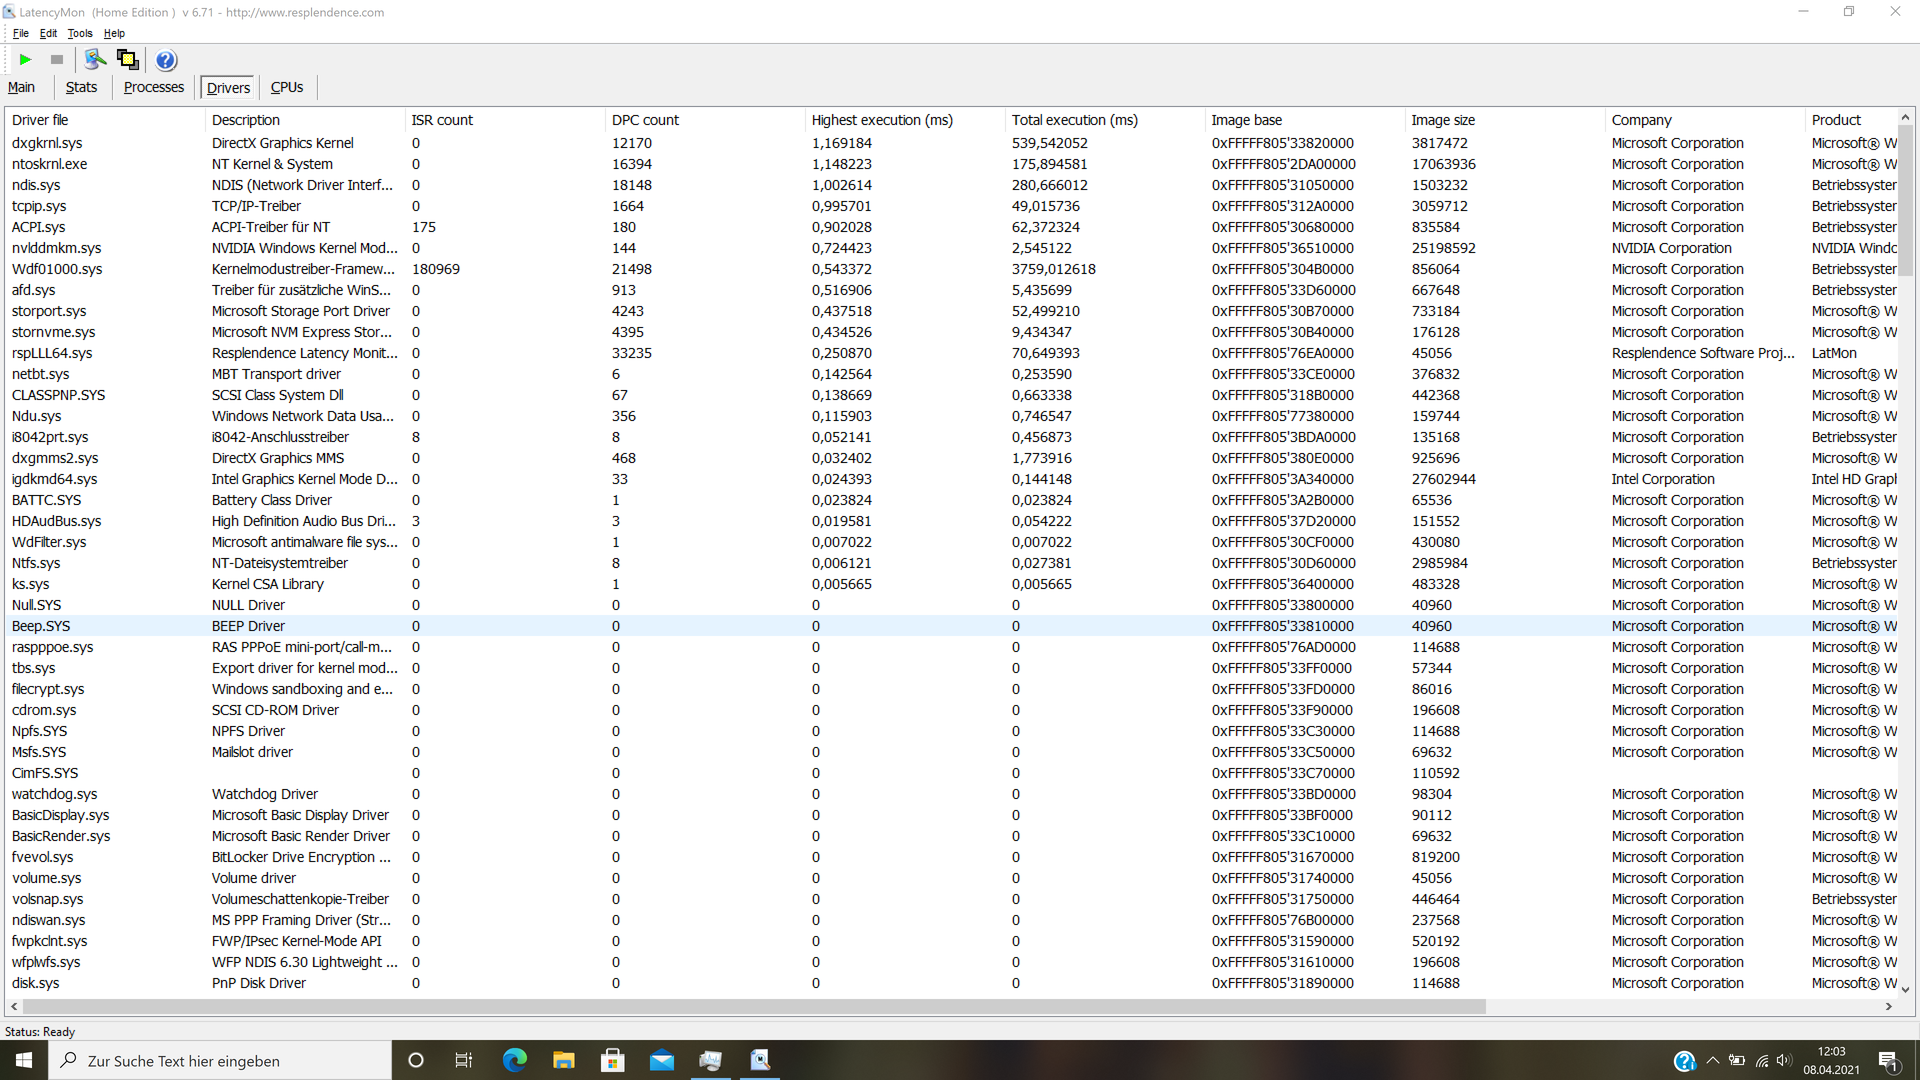
Latenze DPC
Nel test, il dispositivo ha mostrato latenze relativamente alte che non sono migliorate nemmeno in diverse ripetizioni.
| DPC Latencies / LatencyMon - interrupt to process latency (max), Web, Youtube, Prime95 | |
| Dell Precision 7550 | |
| HP ZBook Fury 17 G7 119W5EA | |
| HP ZBook Fury 15 G7 | |
| Asus StudioBook Pro X W730G5T-H8050T | |
| Lenovo ThinkPad P73-20QR0030GE | |
* ... Meglio usare valori piccoli
Soluzione di archiviazione
La soluzione di archiviazione integrata da 1 TB (circa 890 GB disponibili allo stato di consegna) offre una buona performance nella maggior parte dei test che è in parte significativamente al di sopra della media delle altre workstation, a seconda del benchmark.
| HP ZBook Fury 17 G7 119W5EA WDC PC SN730 SDBPNTY-1T00 | Lenovo ThinkPad P73-20QR0030GE Samsung PM981a MZVLB1T0HBLR | HP ZBook Fury 15 G7 Samsung PM981a MZVLB1T0HBLR | Asus StudioBook Pro X W730G5T-H8050T Intel SSD 760p SSDPEKKW010T8 | Dell Precision 7550 SK Hynix PC601A NVMe 1TB | Media WDC PC SN730 SDBPNTY-1T00 | |
|---|---|---|---|---|---|---|
| CrystalDiskMark 5.2 / 6 | -3% | 3% | 12% | -8% | 2% | |
| Write 4K (MB/s) | 116.3 | 150.1 29% | 114.1 -2% | 228.9 97% | 121 4% | 139.9 ? 20% |
| Read 4K (MB/s) | 44.68 | 48.48 9% | 57.2 28% | 74.1 66% | 42.16 -6% | 44.5 ? 0% |
| Write Seq (MB/s) | 2357 | 1414 -40% | 2580 9% | 1510 -36% | 2150 -9% | 2346 ? 0% |
| Read Seq (MB/s) | 2159 | 1262 -42% | 2527 17% | 2340 8% | 1755 -19% | 2102 ? -3% |
| Write 4K Q32T1 (MB/s) | 543 | 430.7 -21% | 480.2 -12% | 447.1 -18% | 395.3 -27% | 442 ? -19% |
| Read 4K Q32T1 (MB/s) | 390.1 | 539 38% | 387.6 -1% | 552 42% | 381.8 -2% | 460 ? 18% |
| Write Seq Q32T1 (MB/s) | 2938 | 2983 2% | 2996 2% | 1198 -59% | 2730 -7% | 3049 ? 4% |
| Read Seq Q32T1 (MB/s) | 3399 | 3549 4% | 2853 -16% | 3204 -6% | 3468 2% | 3285 ? -3% |
| AS SSD | 67% | -9% | -1% | 27% | 41% | |
| Seq Read (MB/s) | 2423 | 2627 8% | 2127 -12% | 2558 6% | 2028 -16% | 2606 ? 8% |
| Seq Write (MB/s) | 1203 | 2375 97% | 1296 8% | 1035 -14% | 1193 -1% | 1935 ? 61% |
| 4K Read (MB/s) | 42.24 | 53.5 27% | 54.8 30% | 69.6 65% | 42.31 0% | 42.9 ? 2% |
| 4K Write (MB/s) | 115.5 | 139.4 21% | 110.8 -4% | 201.5 74% | 105.5 -9% | 129.1 ? 12% |
| 4K-64 Read (MB/s) | 1630 | 1779 9% | 1420 -13% | 927 -43% | 1128 -31% | 1361 ? -17% |
| 4K-64 Write (MB/s) | 1979 | 1955 -1% | 2012 2% | 898 -55% | 1537 -22% | 1920 ? -3% |
| Access Time Read * (ms) | 0.057 | 0.055 4% | 0.046 19% | 0.038 33% | 0.069 -21% | 0.0689 ? -21% |
| Access Time Write * (ms) | 0.033 | 0.027 18% | 0.099 -200% | 0.019 42% | 0.106 -221% | 0.06215 ? -88% |
| Score Read (Points) | 1915 | 2095 9% | 1687 -12% | 1252 -35% | 1373 -28% | 1664 ? -13% |
| Score Write (Points) | 2215 | 2332 5% | 2253 2% | 1203 -46% | 1762 -20% | 2242 ? 1% |
| Score Total (Points) | 5047 | 5489 9% | 4770 -5% | 3040 -40% | 3801 -25% | 4726 ? -6% |
| Copy ISO MB/s (MB/s) | 2387 | 2932 23% | 2779 16% | 1768 -26% | 2041 ? -14% | |
| Copy Program MB/s (MB/s) | 106.4 | 595 459% | 123.3 16% | 627 489% | 552 ? 419% | |
| Copy Game MB/s (MB/s) | 356.5 | 1264 255% | 440.8 24% | 1477 314% | 1183 ? 232% | |
| Media totale (Programma / Settaggio) | 32% /
42% | -3% /
-5% | 6% /
4% | 10% /
15% | 22% /
27% |
* ... Meglio usare valori piccoli

Carico di lettura continuo: DiskSpd Read Loop, Queue Depth 8
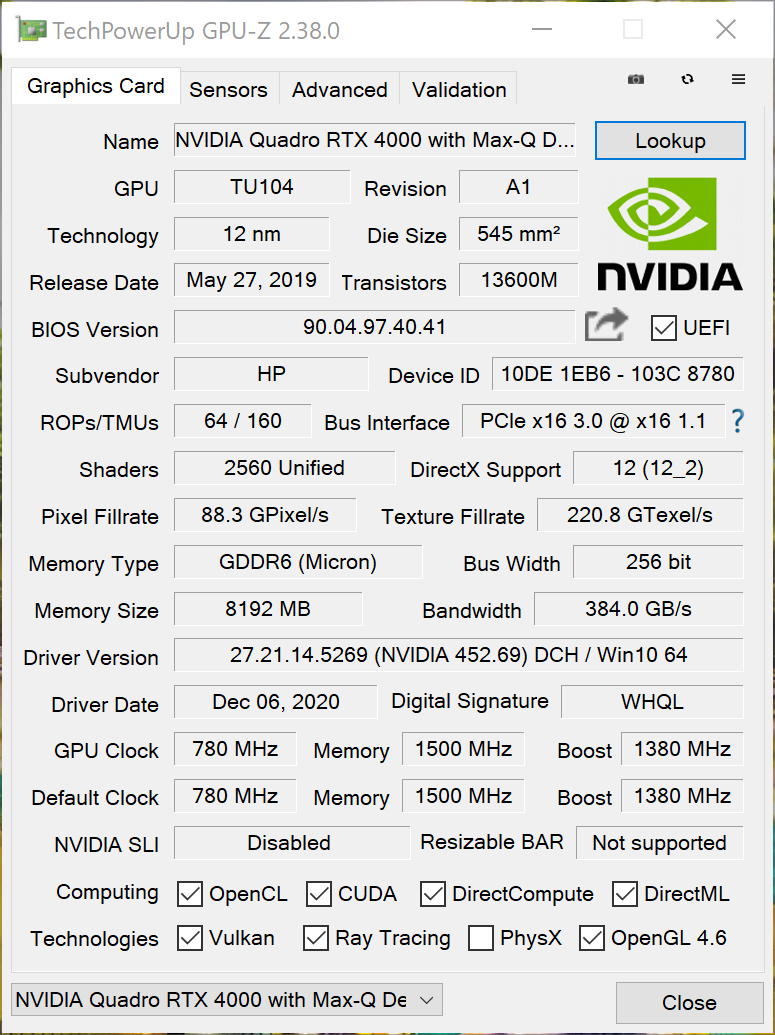
Scheda grafica
Nella nostra configurazione di test, HP utilizza la Nvidia Quadro RTX 4000 Max-Q che è la versione Max-Q della Quadro RTX 4000 che è tagliata per l'efficienza. Si basa sullo stesso chip della GeForce RTX 2080 (TU104), ma dotato di meno shaders. Funziona a una velocità di clock di base di 780 Watt e fino a 1560 MHz boost.
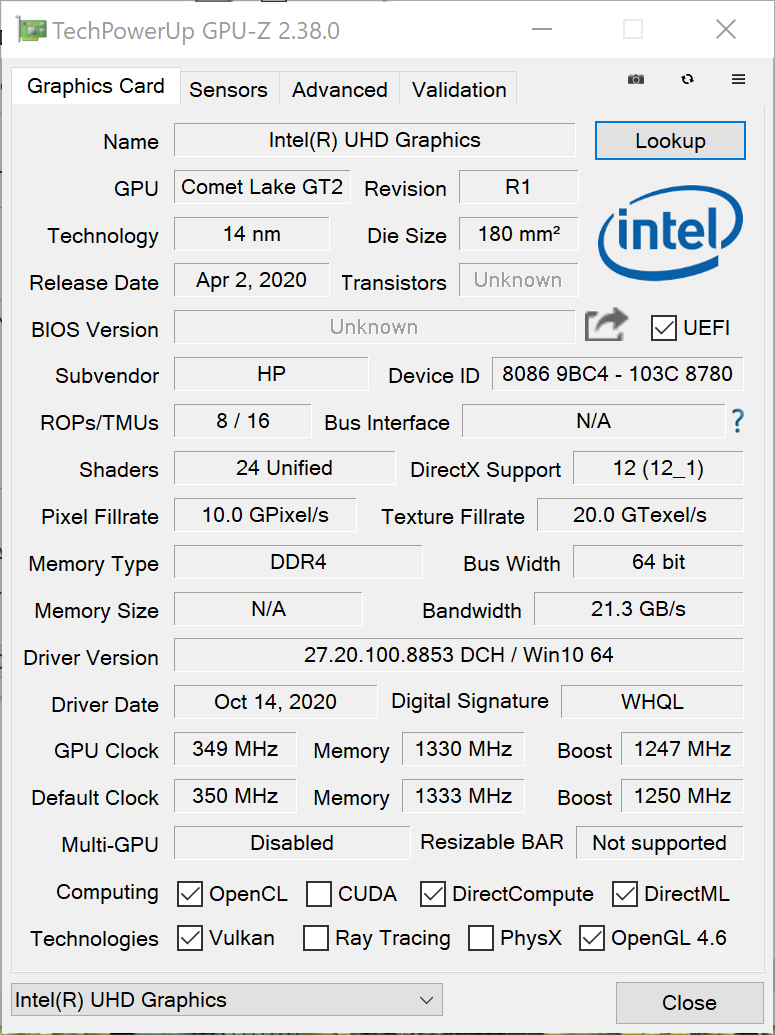
Come previsto, il dispositivo rimane dietro i modelli di confronto con i modelli ancora più quotati NVIDIA Quadro RTX 5000 Max-Q nel test, ma convince ancora con molta potenza e una valutazione che è significativamente sopra la media delle workstations. Nei compiti meno impegnativi, la GPU dedicata non viene utilizzata, e la grafica Intel UHD prende il sopravvento per la gioia della batteria. Quando si usa la batteria, il dispositivo raggiunge valori che sono circa il 50% più bassi in 3DMark 11, quindi le prestazioni complete sono disponibili solo nel funzionamento collegato alla rete elettrica.
| 3DMark 11 Performance | 19079 punti | |
| 3DMark Ice Storm Standard Score | 34399 punti | |
| 3DMark Cloud Gate Standard Score | 23809 punti | |
| 3DMark Fire Strike Score | 15010 punti | |
| 3DMark Time Spy Score | 6724 punti | |
Aiuto | ||
Prestazioni gaming
Questa casa madre non ha problemi con un gioco come"The Witcher 3," anche al massimo livello grafico. Anche negli altri giochi, i frame rates rimangono entro intervalli molto giocabili anche con risoluzione 4K. Nel corso del tempo, il frame rate cala leggermente, come mostra uno stress test 3DMark con il 91% di stabilità del frame rate. Quindi la workstation è adatta anche come portatile gaming, anche se la maggior parte degli acquirenti probabilmente apprezzerà le sue prestazioni di lavoro più di quelle gaming.
| basso | medio | alto | ultra | QHD | 4K | |
|---|---|---|---|---|---|---|
| The Witcher 3 (2015) | 221 | 178 | 115 | 62.6 | 36 | |
| Dota 2 Reborn (2015) | 131 | 116 | 107 | 101 | 65 | |
| Final Fantasy XV Benchmark (2018) | 118 | 86.5 | 68.3 | 46.3 | 29.7 | |
| X-Plane 11.11 (2018) | 93.3 | 78.8 | 66.2 | 45.3 |
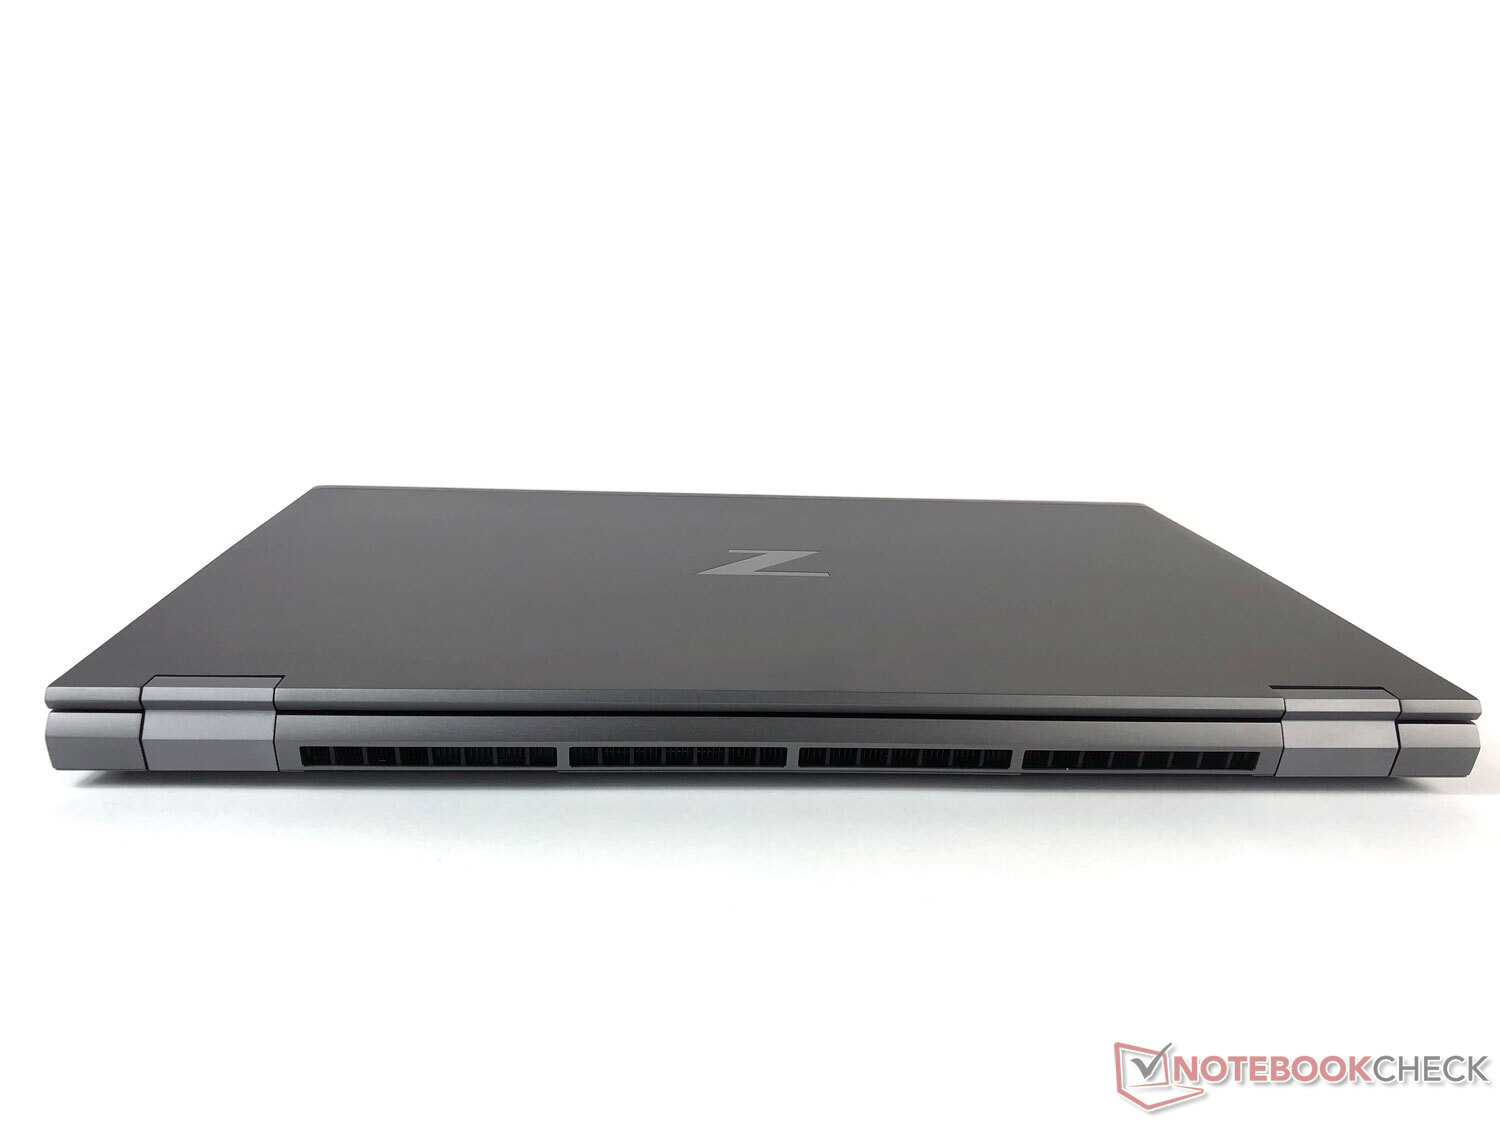
Emissioni: ventole fastidiose sotto carico
Rumorosità
Come nel più piccolo ZBook Fury 15, HP usa anche qui il raffreddamento a camera di vapore, quindi non ci sono tubi di calore tradizionali. Mentre in funzionamento inattivo o sotto basso carico, l'HP ZBook Fury 17 G7 non è udibile, la situazione cambia sotto carico. A poco meno di 50 dB(A), il livello massimo di rumore rimane ancora entro i limiti, ma le ventole che cambiano costantemente tra 45 e 48 dB(A) hanno creato un fastidio molto evidente nel test. Anche se il tentativo di far funzionare le ventole il più silenziosamente possibile è lodevole in linea di principio, una velocità costante delle ventole sarebbe significativamente meno fastidiosa. Inoltre, la nostra unità di test a volte ha prodotto un tranquillo rumore stridente (coil whine) sotto carico.
Rumorosità
| Idle |
| 24.4 / 26.6 / 29 dB(A) |
| Sotto carico |
| 40.2 / 48 dB(A) |
 | ||
30 dB silenzioso 40 dB(A) udibile 50 dB(A) rumoroso |
||
min: | ||
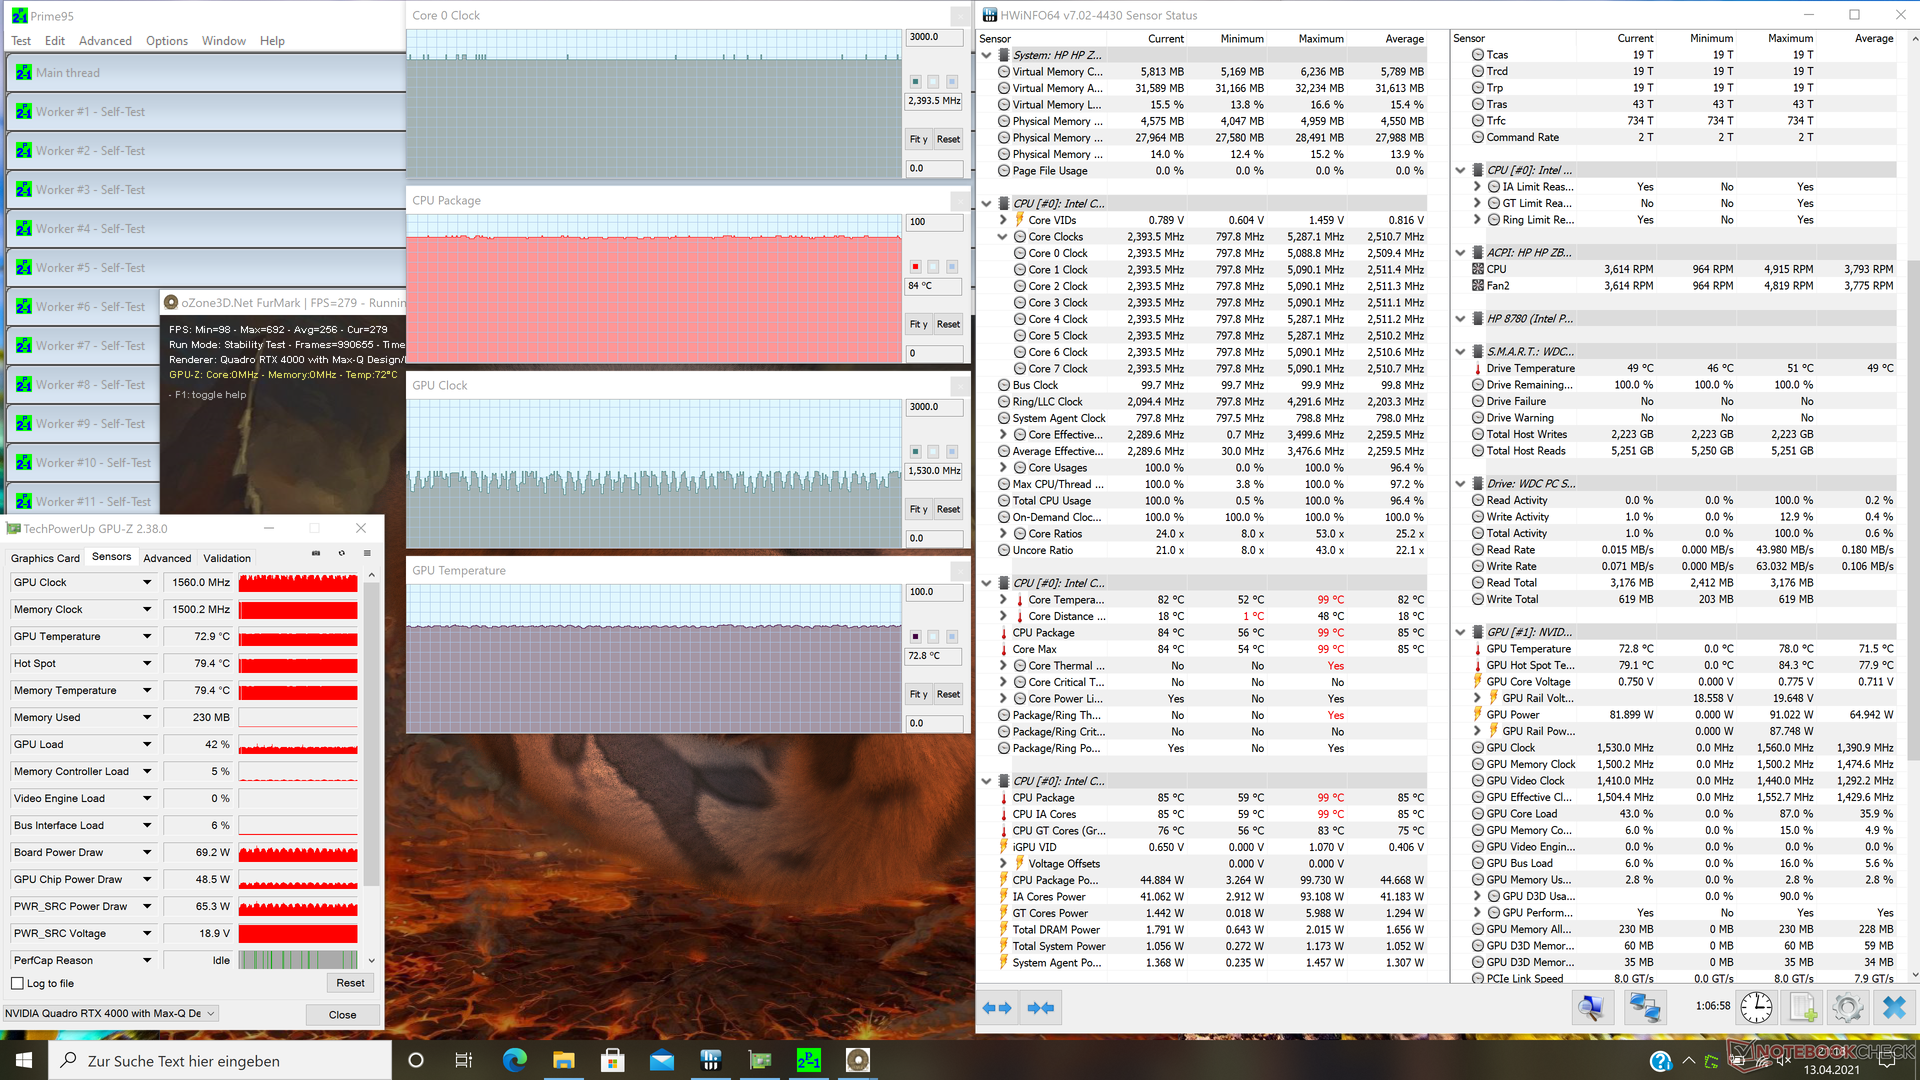
Temperature
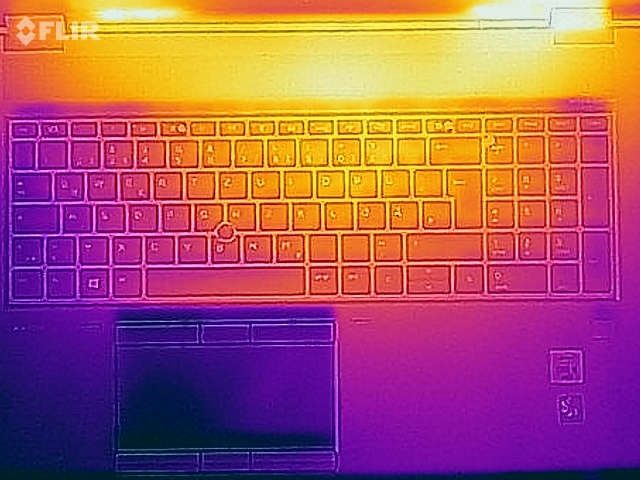
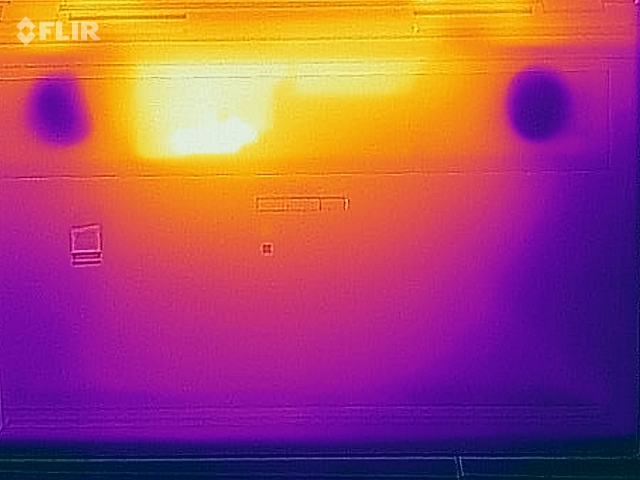
Il potente equipaggiamento hardware dell'HP ZBook Fury 17 G7 produce molto calore sotto carico. Questo non si nota solo nell'uso della ventola ma anche nello sviluppo di calore del case. Mentre il portatile rimane comodamente fresco durante il funzionamento inattivo, in particolare l'area di fronte allo schermo si riscalda significativamente sotto carico.
Questo non è sorprendente, dato che è qui che sono posizionate le grandi prese d'aria della ventola. Abbiamo misurato temperature superiori a 55 °C (131 °F). Anche la parte inferiore del case si riscalda considerevolmente, rendendo il piano di un tavolo un posto migliore per il dispositivo rispetto alle vostre ginocchia. D'altra parte, il fatto che l'area davanti rimanga significativamente più fredda è un punto positivo.
Il sistema rimane stabile nel nostro stress test con il pieno carico di Furmark e Prime95 su CPU e GPU. Dopo un picco iniziale di prestazioni, la CPU si stabilizza a circa 2400 MHz e 85 °C (185 °F) e la GPU in media a circa 1250 MHz e 73 °C (163 °F). Quando si esegue un benchmark 3DMark subito dopo lo stress test, il punteggio non è stato vistosamente inferiore.
(-) La temperatura massima sul lato superiore è di 46.1 °C / 115 F, rispetto alla media di 38.2 °C / 101 F, che varia da 22.2 a 69.8 °C per questa classe Workstation.
(-) Il lato inferiore si riscalda fino ad un massimo di 57.6 °C / 136 F, rispetto alla media di 41.1 °C / 106 F
(+) In idle, la temperatura media del lato superiore è di 22.7 °C / 73 F, rispetto alla media deld ispositivo di 32 °C / 90 F.
(±) Riproducendo The Witcher 3, la temperatura media per il lato superiore e' di 36.9 °C / 98 F, rispetto alla media del dispositivo di 32 °C / 90 F.
(+) I poggiapolsi e il touchpad sono piu' freddi della temperatura della pelle con un massimo di 30.9 °C / 87.6 F e sono quindi freddi al tatto.
(-) La temperatura media della zona del palmo della mano di dispositivi simili e'stata di 27.8 °C / 82 F (-3.1 °C / -5.6 F).
Altoparlanti
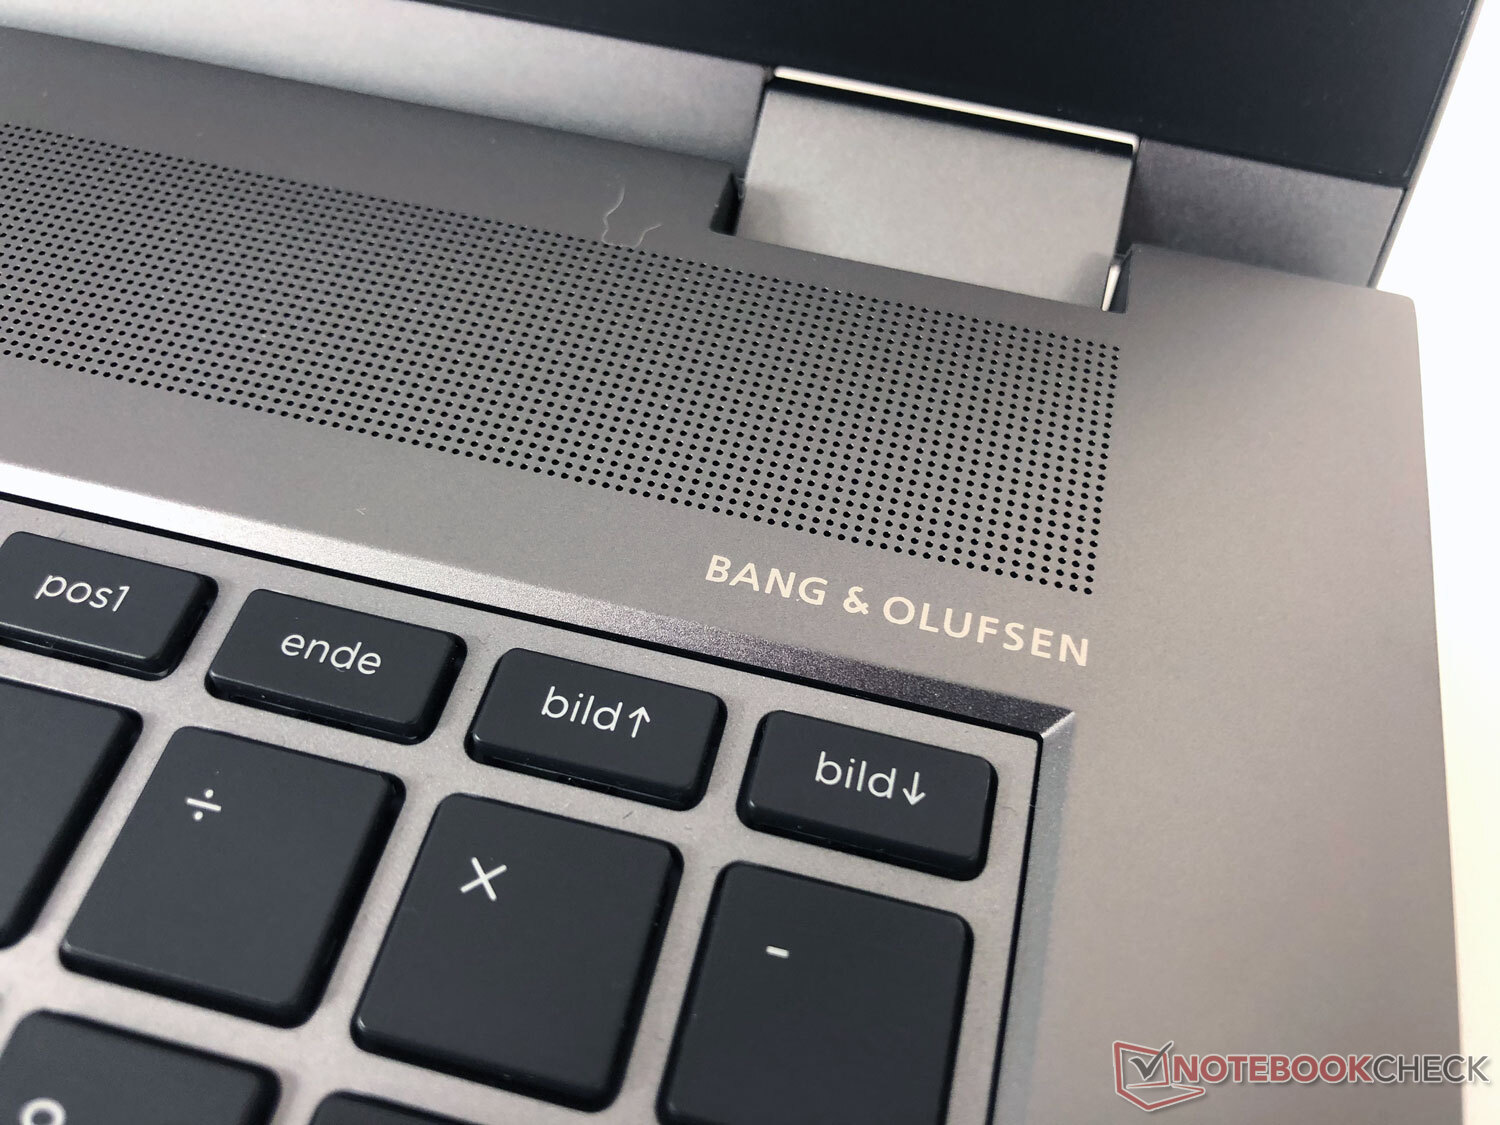
HP utilizza altoparlanti Bang & Olufsen, lasciando uno spazio relativamente grande nel case per loro. Il produttore ne fa buon uso, dotando il portatile di buoni altoparlanti stereo che producono un solido volume massimo. Mentre c'è ancora qualche margine di miglioramento in termini di riproduzione dei bassi, i medi e gli alti sono piacevoli con un buon equilibrio e linearità nel test. Quindi non è assolutamente necessario utilizzare altoparlanti esterni.
HP ZBook Fury 17 G7 119W5EA analisi audio
(±) | potenza degli altiparlanti media ma buona (78.6 dB)
Bassi 100 - 315 Hz
(±) | bassi ridotti - in media 7.9% inferiori alla media
(±) | la linearità dei bassi è media (11.1% delta rispetto alla precedente frequenza)
Medi 400 - 2000 Hz
(+) | medi bilanciati - solo only 2.8% rispetto alla media
(+) | medi lineari (3.9% delta rispetto alla precedente frequenza)
Alti 2 - 16 kHz
(+) | Alti bilanciati - appena 2.7% dalla media
(+) | alti lineari (4.8% delta rispetto alla precedente frequenza)
Nel complesso 100 - 16.000 Hz
(+) | suono nel complesso lineare (10.9% differenza dalla media)
Rispetto alla stessa classe
» 11% di tutti i dispositivi testati in questa classe è stato migliore, 4% simile, 85% peggiore
» Il migliore ha avuto un delta di 7%, medio di 17%, peggiore di 35%
Rispetto a tutti i dispositivi testati
» 6% di tutti i dispositivi testati in questa classe è stato migliore, 2% similare, 92% peggiore
» Il migliore ha avuto un delta di 4%, medio di 24%, peggiore di 134%
HP ZBook Fury 15 G7 analisi audio
(±) | potenza degli altiparlanti media ma buona (80.1 dB)
Bassi 100 - 315 Hz
(±) | bassi ridotti - in media 8% inferiori alla media
(±) | la linearità dei bassi è media (9.5% delta rispetto alla precedente frequenza)
Medi 400 - 2000 Hz
(+) | medi bilanciati - solo only 3.3% rispetto alla media
(+) | medi lineari (4.8% delta rispetto alla precedente frequenza)
Alti 2 - 16 kHz
(+) | Alti bilanciati - appena 2.2% dalla media
(+) | alti lineari (3.5% delta rispetto alla precedente frequenza)
Nel complesso 100 - 16.000 Hz
(+) | suono nel complesso lineare (10.1% differenza dalla media)
Rispetto alla stessa classe
» 6% di tutti i dispositivi testati in questa classe è stato migliore, 4% simile, 90% peggiore
» Il migliore ha avuto un delta di 7%, medio di 17%, peggiore di 35%
Rispetto a tutti i dispositivi testati
» 5% di tutti i dispositivi testati in questa classe è stato migliore, 1% similare, 94% peggiore
» Il migliore ha avuto un delta di 4%, medio di 24%, peggiore di 134%
Gestione dell'energia: Sorprendentemente efficiente
Consumo di energia
Rispetto ai concorrenti in questo test, lo ZBook Fury 17 G7 si mostra più efficiente in termini di consumo energetico. Altre workstation da 17" utilizzano molta più energia, in particolare durante il funzionamento inattivo. La nostra unità di test utilizza qui la grafica onboard, e sotto carico il dispositivo è anche abbastanza efficiente.
Durante lo stress test, il consumo massimo di energia è stato di 199,8 watt, ma questo potrebbe anche essere limitato dall'alimentatore da 200 watt. Nel corso del tempo, il consumo si livella a circa 164 watts, così che l'alimentatore ha ancora qualche capacità aggiuntiva per caricare la batteria.
| Off / Standby | |
| Idle | |
| Sotto carico |
|
Leggenda:
min: | |
| HP ZBook Fury 17 G7 119W5EA i9-10885H, Quadro RTX 4000 Max-Q, WDC PC SN730 SDBPNTY-1T00, , 3840x2160, 17.3" | Lenovo ThinkPad P73-20QR0030GE i9-9880H, Quadro RTX 4000 (Laptop), Samsung PM981a MZVLB1T0HBLR, IPS, 3840x2160, 17.3" | HP ZBook Fury 15 G7 W-10885M, Quadro RTX 5000 Max-Q, Samsung PM981a MZVLB1T0HBLR, IPS, 3840x2160, 15.6" | Asus StudioBook Pro X W730G5T-H8050T E-2276M, Quadro RTX 5000 (Laptop), Intel SSD 760p SSDPEKKW010T8, IPS LED, 1920x1200, 17" | Dell Precision 7550 W-10885M, Quadro RTX 5000 Max-Q, SK Hynix PC601A NVMe 1TB, IPS, 3840x2160, 15.6" | Media NVIDIA Quadro RTX 4000 Max-Q | Media della classe Workstation | |
|---|---|---|---|---|---|---|---|
| Power Consumption | -81% | 3% | -42% | -17% | 0% | -3% | |
| Idle Minimum * (Watt) | 5.8 | 21 -262% | 4.6 21% | 14.3 -147% | 8.2 -41% | 5.8 ? -0% | 8.94 ? -54% |
| Idle Average * (Watt) | 14.8 | 30.4 -105% | 13.6 8% | 19.2 -30% | 16.8 -14% | 14.8 ? -0% | 13.8 ? 7% |
| Idle Maximum * (Watt) | 17 | 35.8 -111% | 21.5 -26% | 24.6 -45% | 24.4 -44% | 17 ? -0% | 17.5 ? -3% |
| Load Average * (Watt) | 120.4 | 110 9% | 113.1 6% | 133 -10% | 131 -9% | 120.4 ? -0% | 95 ? 21% |
| Witcher 3 ultra * (Watt) | 168.4 | 182 -8% | 157.5 6% | 181 -7% | 156.6 7% | ||
| Load Maximum * (Watt) | 199.8 | 215.4 -8% | 199 -0% | 223 -12% | 201.8 -1% | 199.8 ? -0% | 175.2 ? 12% |
* ... Meglio usare valori piccoli
Durata della batteria
HP ha dotato lo ZBook Fury 17 G7 di una batteria da 94 Wh. Questo è identico a quello del HP ZBook Fury 15 G7, che abbiamo anche testato, il che significa che HP non usa lo spazio aggiuntivo per una batteria più grande. Il risultato è che in combinazione con il suo display più grande, rimane dietro al fratello minore nel test WLAN. Tuttavia, la durata della batteria sotto carico risulta migliore, ma questo potrebbe anche essere dovuto all'hardware più potente (Quadro RTX 5000 Max-Q invece della Quadro RTX 4000 Max-Q) nel modello più piccolo.
Rispetto al Lenovo ThinkPad P73-20QR0030GE, che utilizza solo la scheda grafica dedicata, la durata della batteria della workstation HP risulta significativamente migliore nonostante la batteria leggermente più piccola, e fornisce anche risultati migliori rispetto all'Asus StudioBook Pro X W730G5T-H8050T nella maggior parte delle misurazioni. Nel complesso, il dispositivo si posiziona bene nella media di tutte le workstation che abbiamo testato finora. Una batteria completamente vuota si ricarica completamente in meno di 2 ore.
| HP ZBook Fury 17 G7 119W5EA i9-10885H, Quadro RTX 4000 Max-Q, 94 Wh | Lenovo ThinkPad P73-20QR0030GE i9-9880H, Quadro RTX 4000 (Laptop), 99 Wh | HP ZBook Fury 15 G7 W-10885M, Quadro RTX 5000 Max-Q, 94 Wh | Asus StudioBook Pro X W730G5T-H8050T E-2276M, Quadro RTX 5000 (Laptop), 95 Wh | Dell Precision 7550 W-10885M, Quadro RTX 5000 Max-Q, 95 Wh | Media della classe Workstation | |
|---|---|---|---|---|---|---|
| Autonomia della batteria | -46% | -6% | -6% | -12% | -4% | |
| H.264 (h) | 10.3 | 4.1 -60% | 9.1 -12% | 9.51 ? -8% | ||
| WiFi v1.3 (h) | 7.6 | 3.9 -49% | 8.6 13% | 8.5 12% | 8.9 17% | 8.53 ? 12% |
| Load (h) | 1.7 | 1.2 -29% | 1.3 -24% | 1.4 -18% | 1 -41% | 1.429 ? -16% |
| Reader / Idle (h) | 13.2 | 11.1 | 26.1 ? |
Pro
Contro
Valutazione complessiva del computer portatile HP ZBook Fury 17 G7
La workstation mobile HP ZBook Fury 17 G7 riesce a convincere in molte aree del test, tra cui l'ottimo display 4K, la tastiera che permette una digitazione confortevole e le prestazioni elevate.
HP equipaggia la generazione G7 con più prestazioni, pur rendendo il dispositivo più compatto. Nel complesso, l'HP ZBook Fury 17 G7 119W5EA offre prestazioni ammirevoli durante il test.
Anche il display DreamColor opaco è convincente, anche se è dimagrito rispetto alla generazione precedente, non coprendo più l'intero spazio colore AdobeRGB. La quantità di connessioni è ampia. D'altra parte, le ventole parzialmente fastidiose e le temperature elevate (che erano dovute alle prestazioni) si sono distinte negativamente.
In totale, l'HP ZBook Fury 17 G7 offre un pacchetto complessivo molto buono che ha anche un prezzo abbastanza elevato. La buona qualità e le prestazioni hanno il loro prezzo che vale in questo caso, ed inoltre rimane ancora significativamente al di sotto di quello dell'Asus StudioBook Pro X W730G5T-H8050T. Il dispositivo soddisfa le esigenze professionali per il lavoro, ma può anche essere utilizzato per il gaming durante le pause.
Prezzo e disponibilità
Al momento del nostro test, l'HP ZBook Fury 17 G7 nella119W5EA configurazione (Core i9-10885H,Quadro RTX 4000 Max-Q 32 GB RAM, 1-TB SSD) è disponibile per 4326 Euro (~$5181) su Notebooksbilliger.de in Germania. Inoltre, sono disponibili anche vari altri modelli, il più conveniente dei quali costa solo circa la metà della nostra unità di test. Su sito USA di HP, i prezzi variano tra $1916 e $3899, e Amazon offre un modello per $2286.
HP ZBook Fury 17 G7 119W5EA
- 04/13/2021 v7 (old)
Marcus Schwarten
Price comparison
