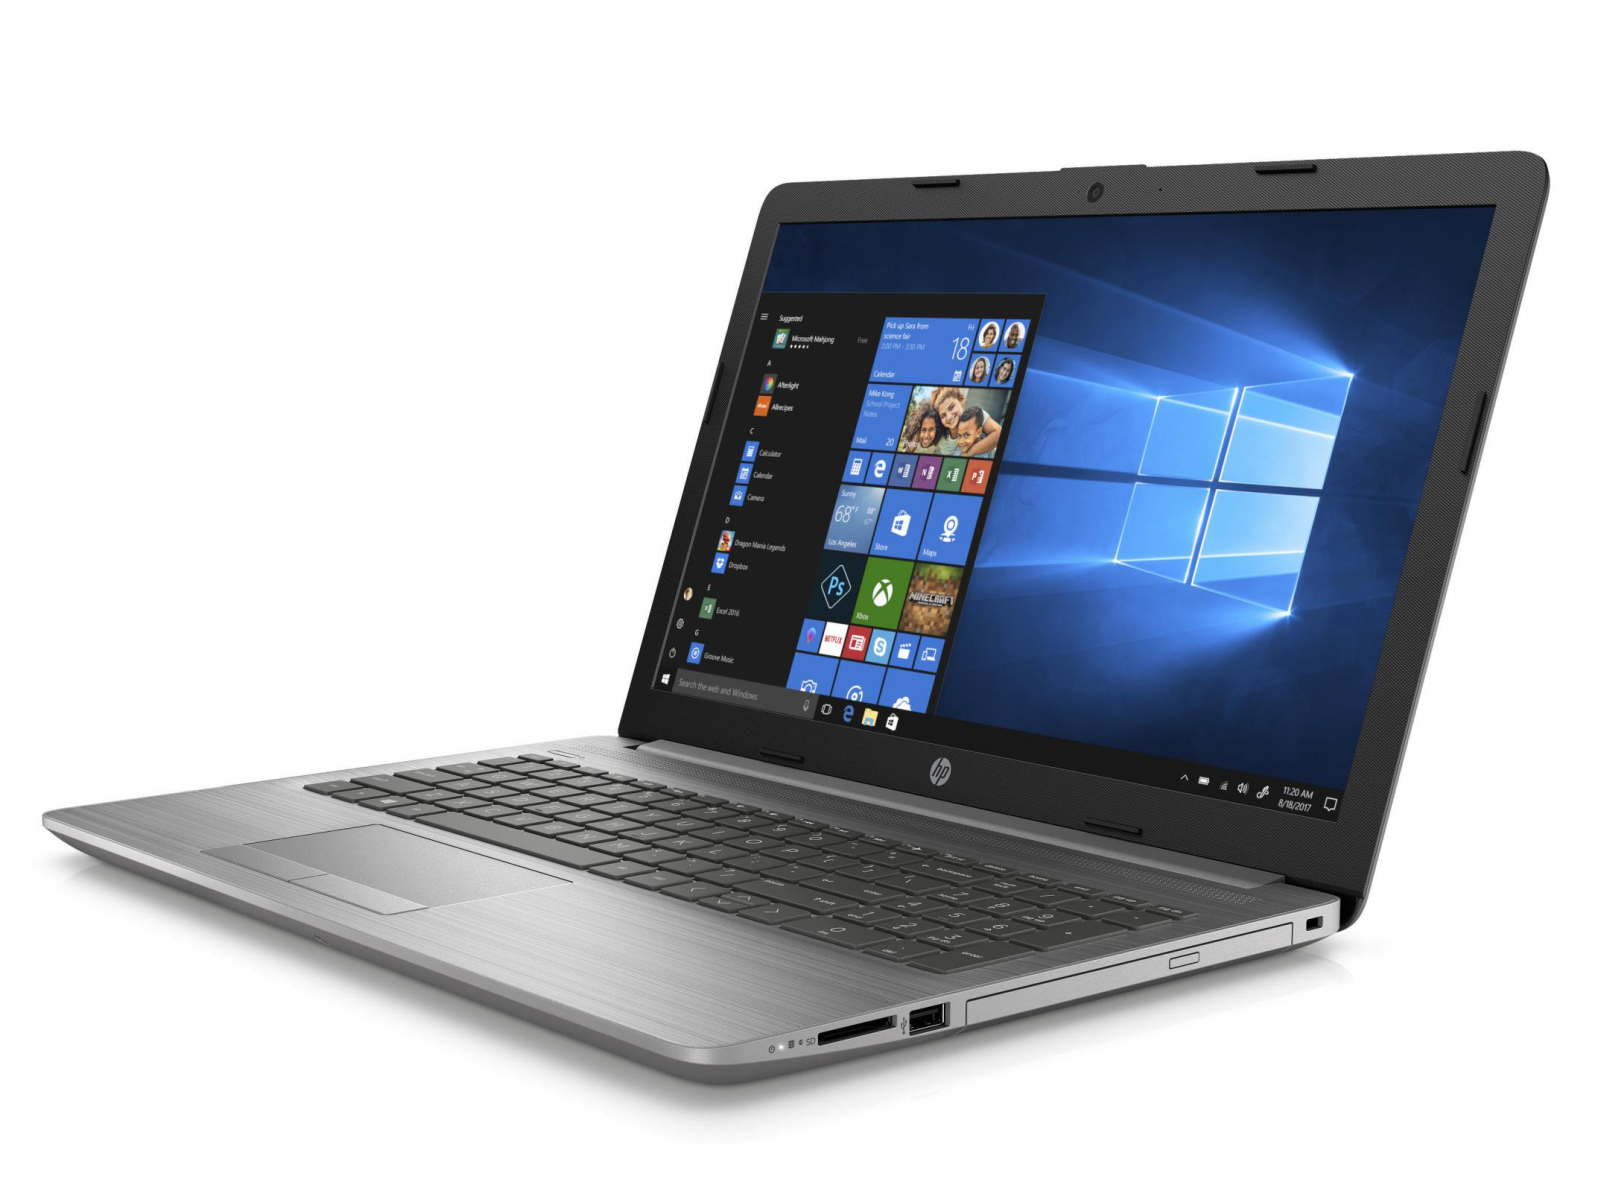
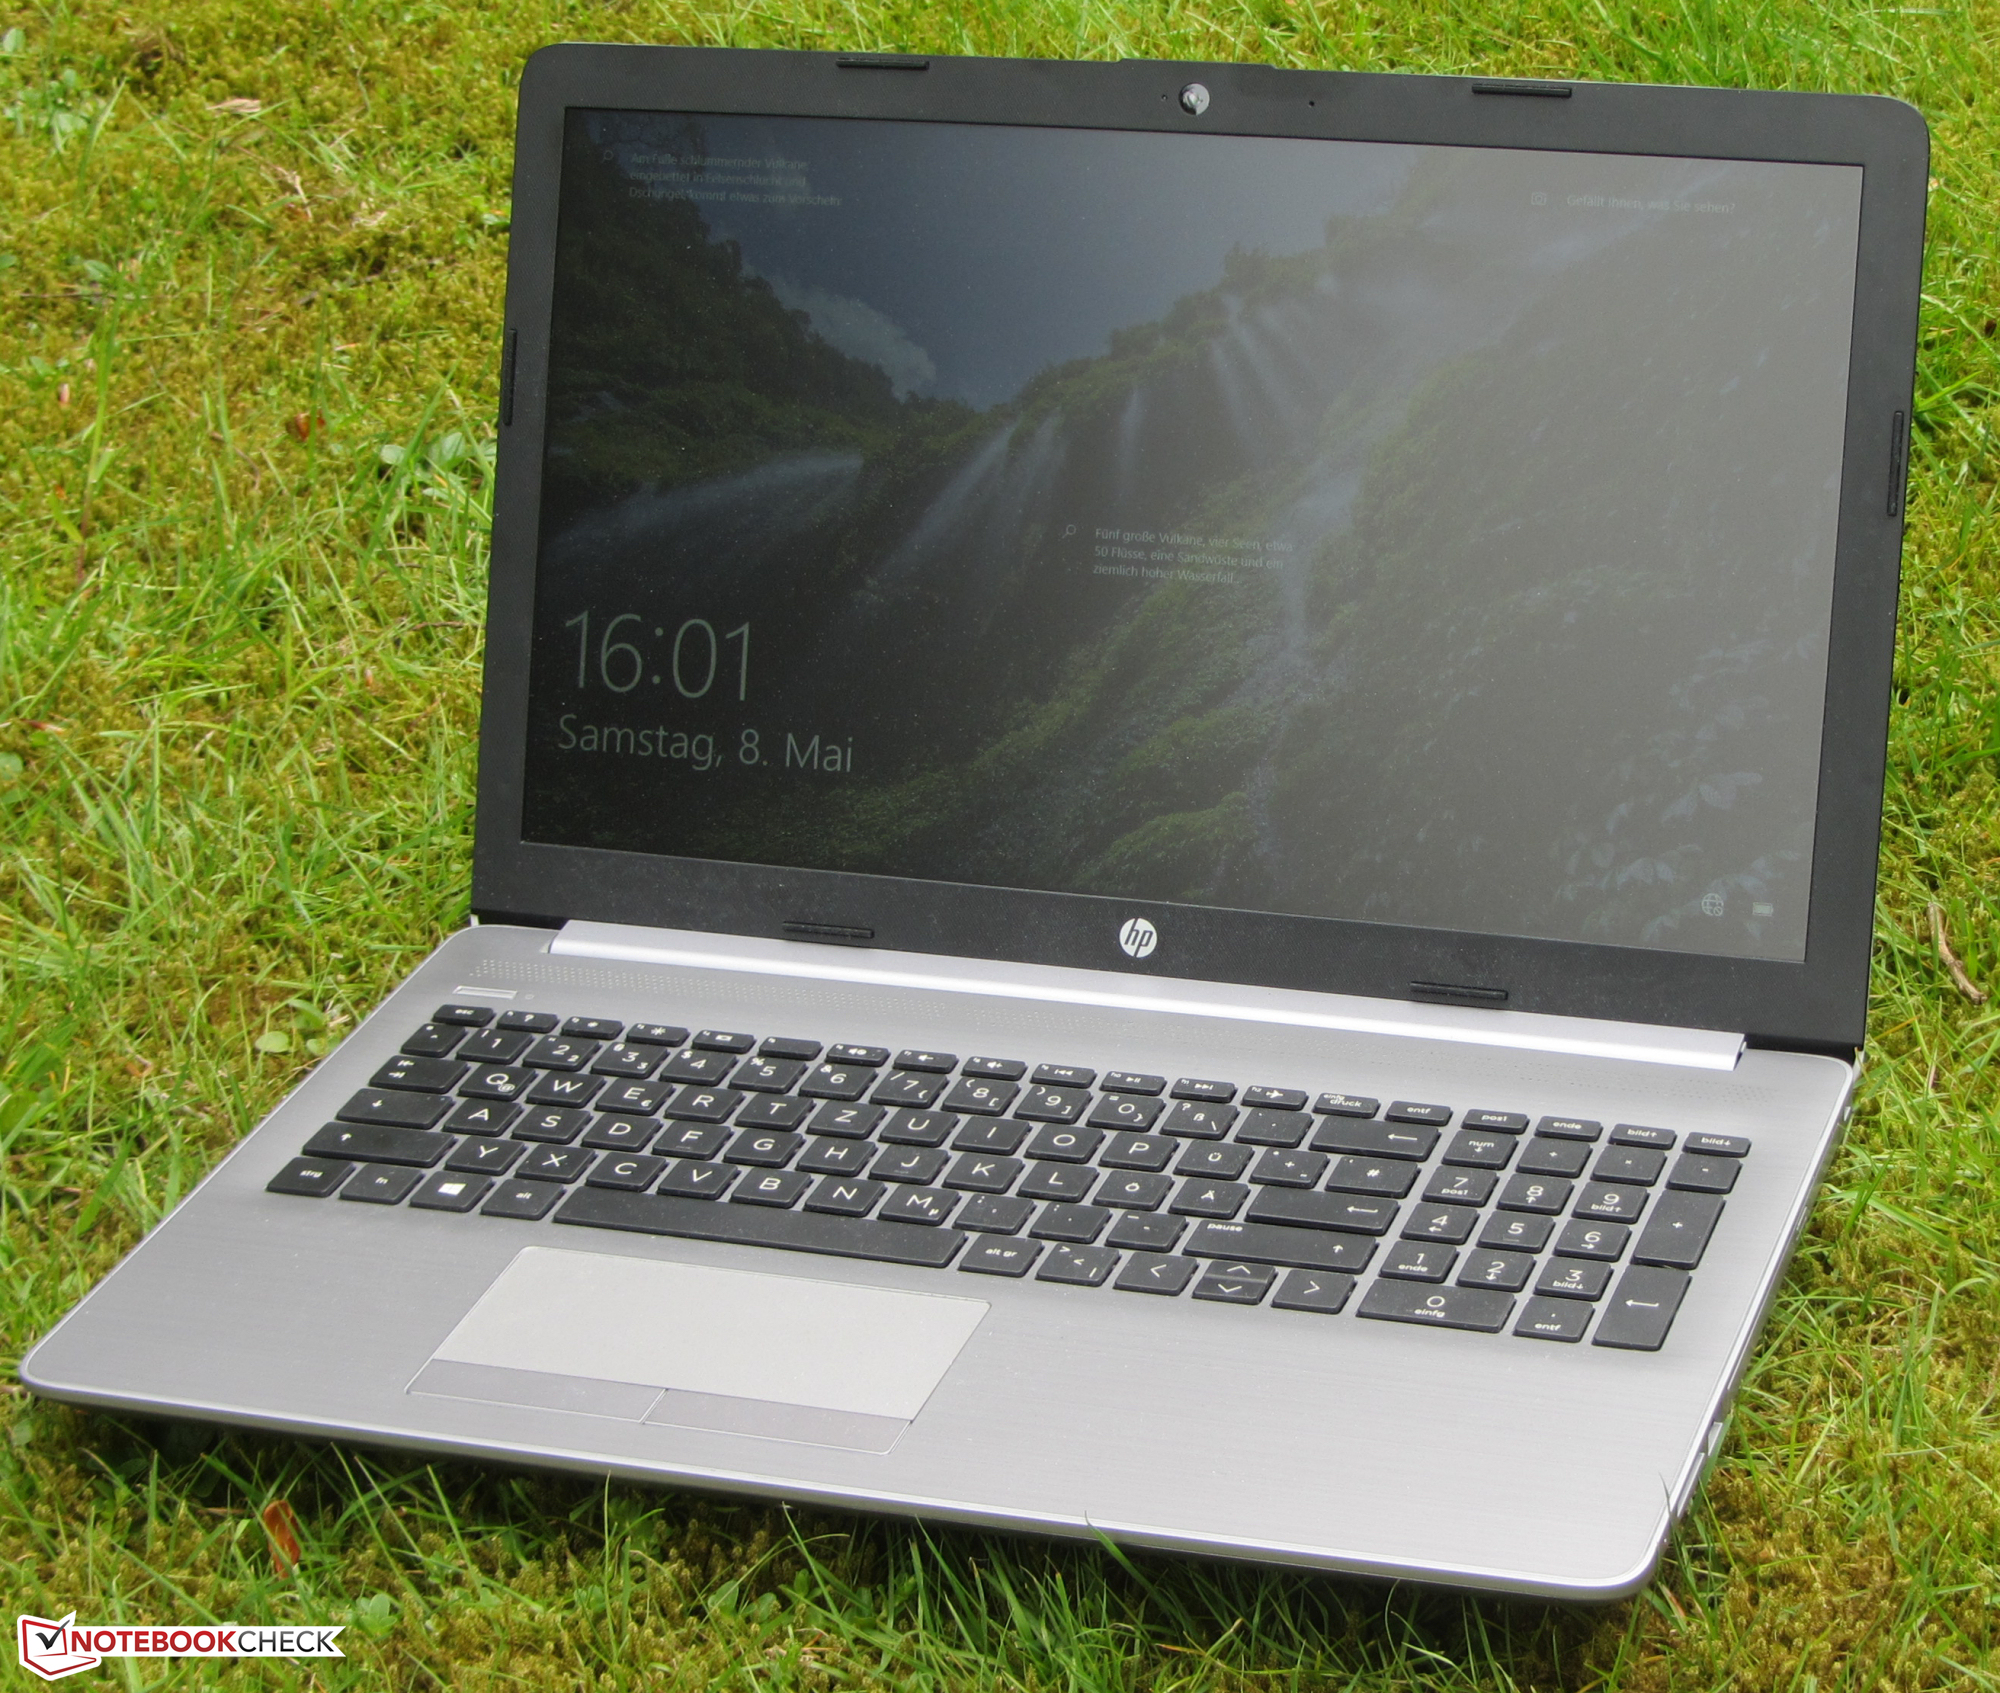
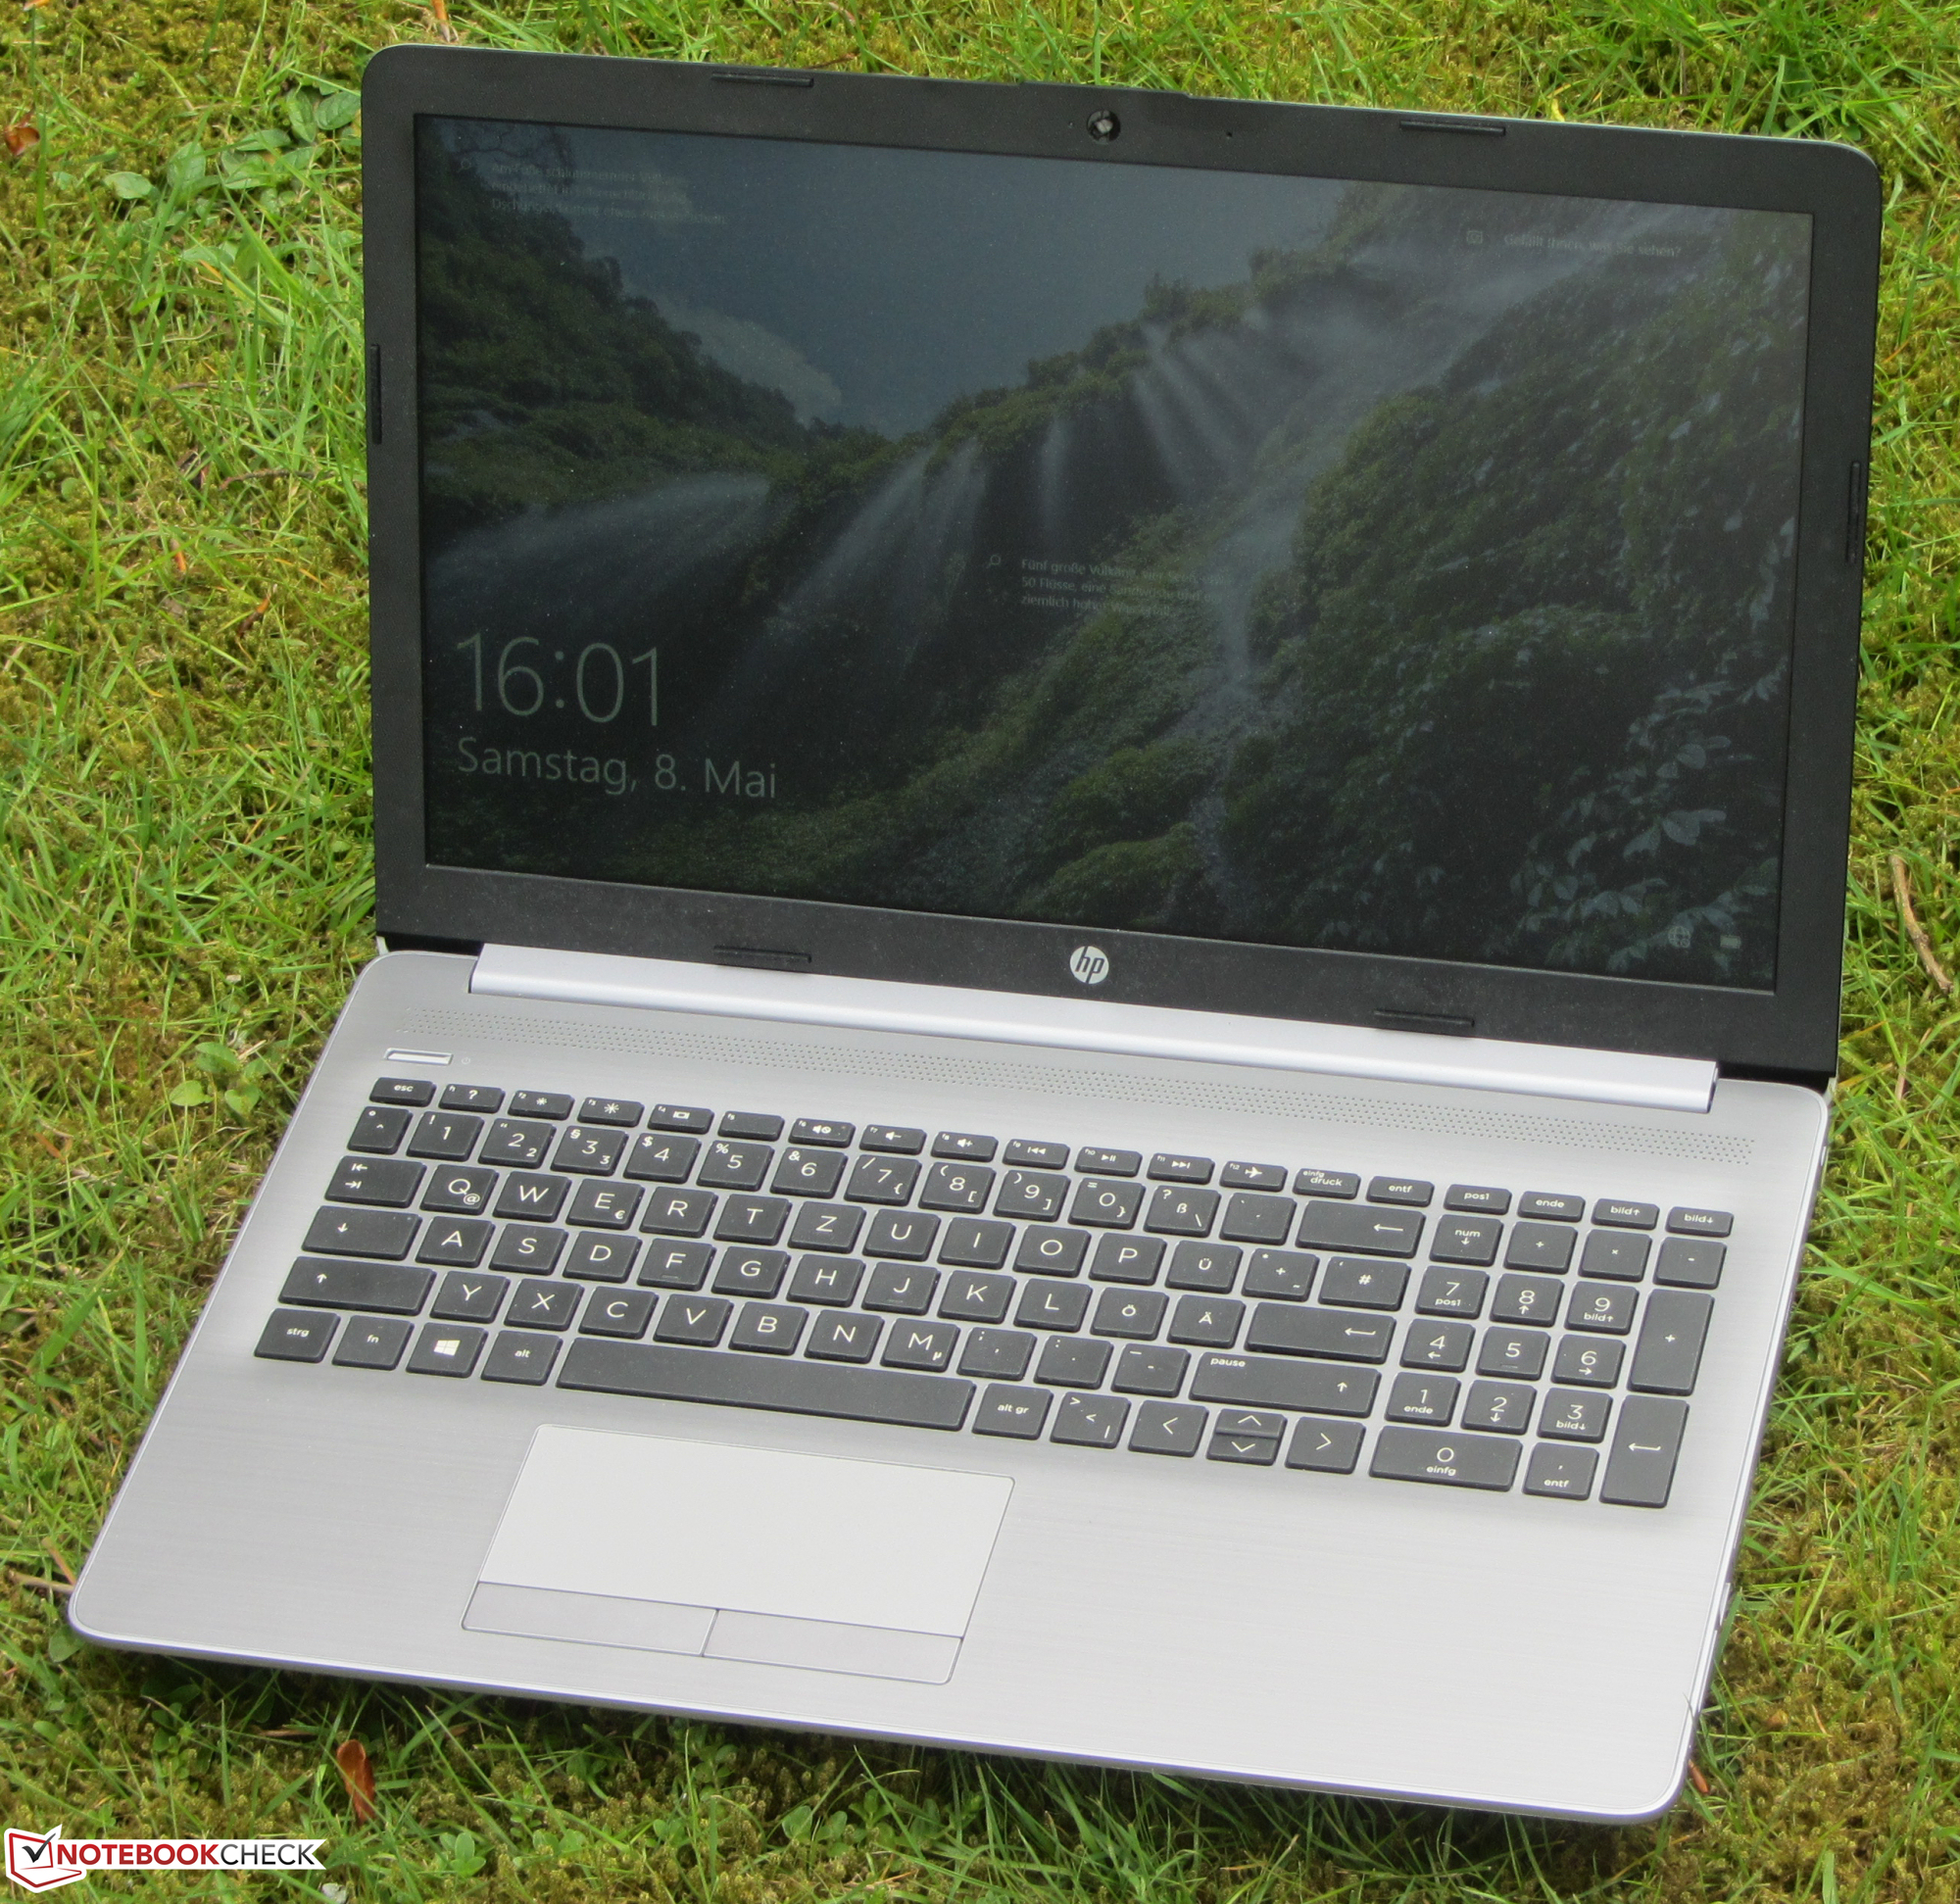
Recensione dell'HP 255 G7: varie debolezze, nessun punto di forza
Confronto con i potenziali concorrenti
Punteggio | Data | Modello | Peso | Altezza | Dimensione | Risoluzione | Prezzo |
|---|---|---|---|---|---|---|---|
| 74.6 % v7 (old) | 05/2021 | HP 255 G7 159P1EA R3 3200U, Vega 3 | 1.8 kg | 22.5 mm | 15.60" | 1920x1080 | |
| 76.5 % v7 (old) | 03/2021 | Lenovo V15-ADA 82C7009SGE Athlon 3150U, Vega 3 | 1.9 kg | 20 mm | 15.60" | 1920x1080 | |
| 81.4 % v7 (old) | 02/2021 | Acer Aspire 5 A515-56-511A i5-1135G7, Iris Xe G7 80EUs | 1.9 kg | 18 mm | 15.60" | 1920x1080 | |
| 81 % v7 (old) | 12/2020 | Dell Latitude 15 3510 NK2MC i3-10110U, UHD Graphics 620 | 1.9 kg | 18 mm | 15.60" | 1920x1080 |
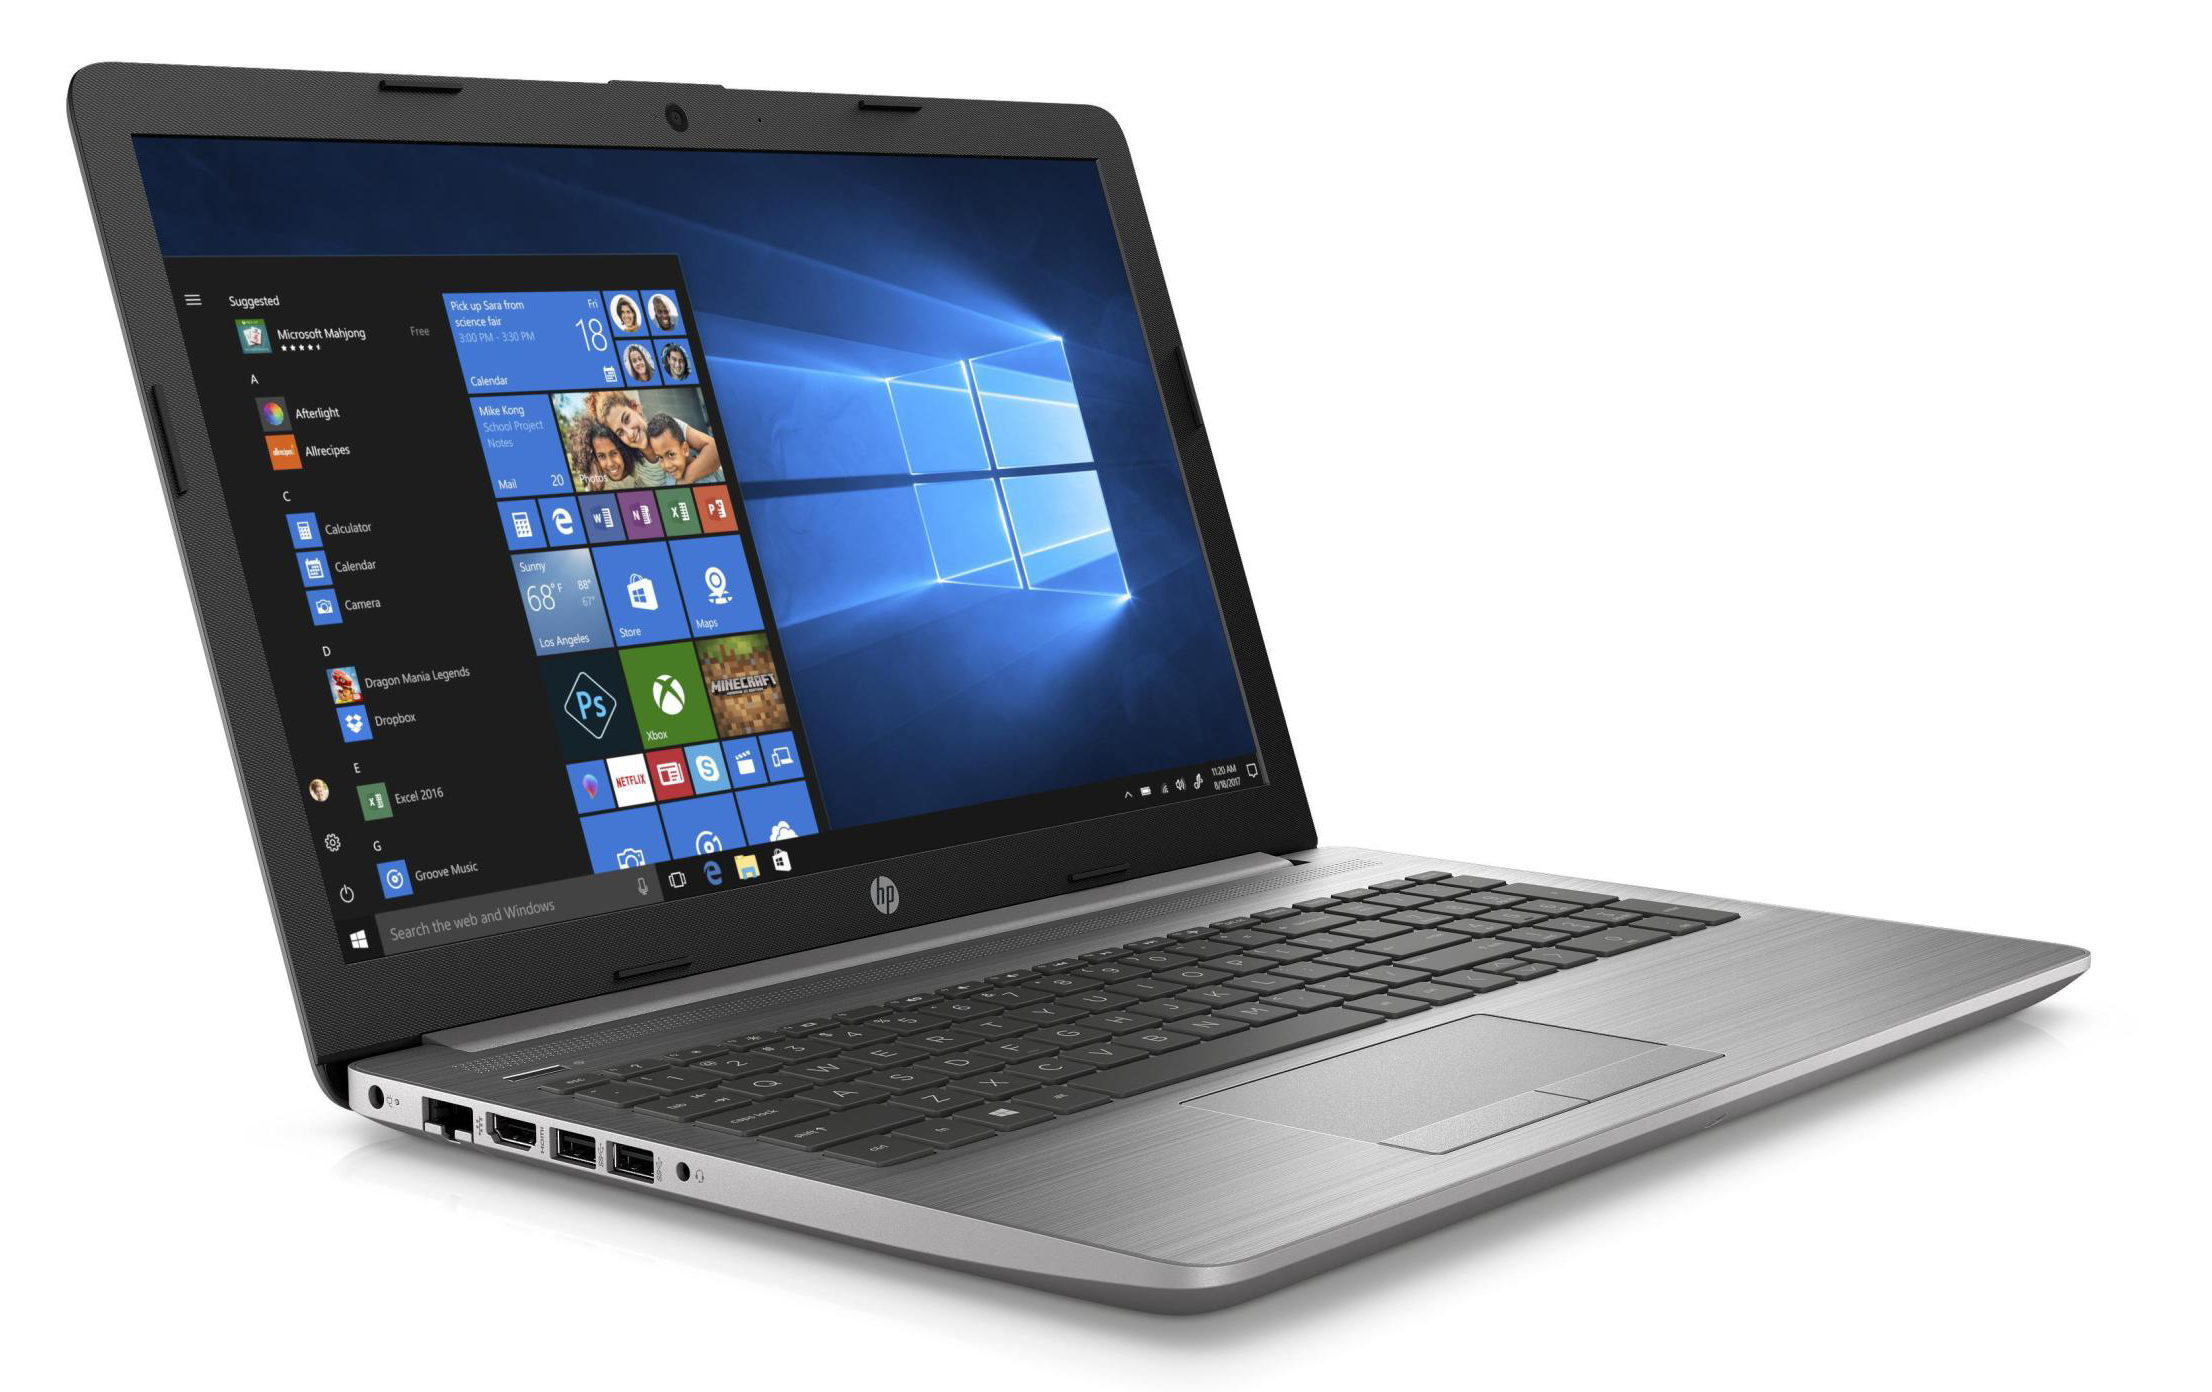

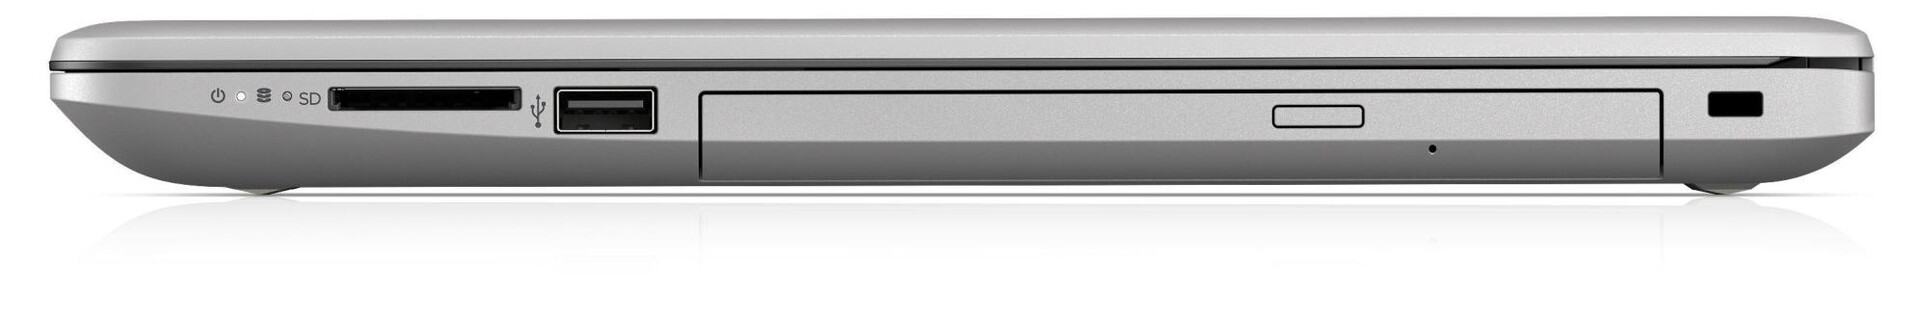
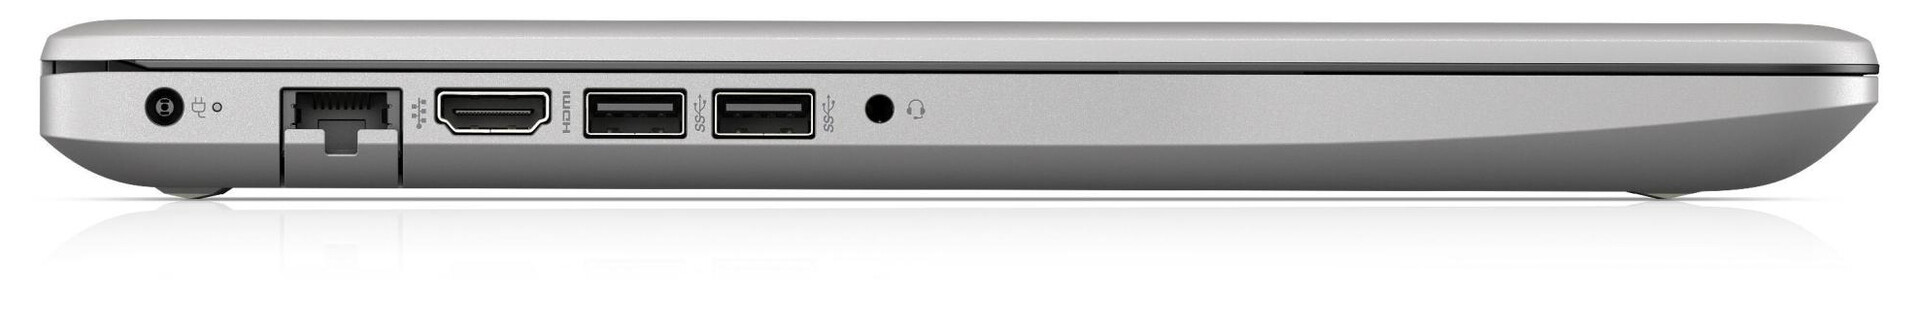
Configurazione delle porte
| SD Card Reader | |
| average JPG Copy Test (av. of 3 runs) | |
| Media della classe Office (19.8 - 198.5, n=22, ultimi 2 anni) | |
| HP 255 G7 159P1EA | |
| HP 250 G7-15S40ES (Toshiba Exceria Pro SDXC 64 GB UHS-II) | |
| Lenovo V15-ADA 82C7009SGE (Toshiba Exceria Pro SDXC 64 GB UHS-II) | |
| Dell Latitude 15 3510 NK2MC (Toshiba Exceria Pro M501 microSDXC 64GB) | |
| maximum AS SSD Seq Read Test (1GB) | |
| Media della classe Office (27.4 - 249, n=21, ultimi 2 anni) | |
| HP 255 G7 159P1EA | |
| Lenovo V15-ADA 82C7009SGE (Toshiba Exceria Pro SDXC 64 GB UHS-II) | |
| HP 250 G7-15S40ES (Toshiba Exceria Pro SDXC 64 GB UHS-II) | |
| Dell Latitude 15 3510 NK2MC (Toshiba Exceria Pro M501 microSDXC 64GB) | |


| |||||||||||||||||||||||||
Distribuzione della luminosità: 91 %
Contrasto: 398:1 (Nero: 0.5 cd/m²)
ΔE ColorChecker Calman: 11.14 | ∀{0.5-29.43 Ø4.71}
ΔE Greyscale Calman: 12.93 | ∀{0.09-98 Ø4.96}
56% sRGB (Argyll 1.6.3 3D)
36% AdobeRGB 1998 (Argyll 1.6.3 3D)
38.64% AdobeRGB 1998 (Argyll 3D)
56.3% sRGB (Argyll 3D)
37.4% Display P3 (Argyll 3D)
Gamma: 2.69
CCT: 14674 K
| HP 255 G7 159P1EA BOE0687, TN LED, 1920x1080, 15.6" | Lenovo V15-ADA 82C7009SGE Chi Mei CMN15F5, TN, 1920x1080, 15.6" | Acer Aspire 5 A515-56-511A LG Philips LGD065A, IPS, 1920x1080, 15.6" | Dell Latitude 15 3510 NK2MC Dell 156CL05, IPS, 1920x1080, 15.6" | HP 250 G7-15S40ES BOE BOE0687, TN LED, 1920x1080, 15.6" | |
|---|---|---|---|---|---|
| Display | -1% | 2% | 9% | 3% | |
| Display P3 Coverage (%) | 37.4 | 37.13 -1% | 38.32 2% | 40.78 9% | 38.64 3% |
| sRGB Coverage (%) | 56.3 | 55.8 -1% | 57.5 2% | 61.3 9% | 58.2 3% |
| AdobeRGB 1998 Coverage (%) | 38.64 | 38.36 -1% | 39.6 2% | 42.15 9% | 39.93 3% |
| Response Times | 3% | -76% | -78% | 5% | |
| Response Time Grey 50% / Grey 80% * (ms) | 38 ? | 26 ? 32% | 37 ? 3% | 38 ? -0% | 38 ? -0% |
| Response Time Black / White * (ms) | 11 ? | 14 ? -27% | 28 ? -155% | 28 ? -155% | 10 ? 9% |
| PWM Frequency (Hz) | 2500 ? | 250 | 5000 ? | ||
| Screen | 15% | 43% | 37% | -4% | |
| Brightness middle (cd/m²) | 199 | 232 17% | 285 43% | 262 32% | 178 -11% |
| Brightness (cd/m²) | 193 | 211 9% | 255 32% | 236 22% | 174 -10% |
| Brightness Distribution (%) | 91 | 82 -10% | 84 -8% | 86 -5% | 82 -10% |
| Black Level * (cd/m²) | 0.5 | 0.41 18% | 0.325 35% | 0.31 38% | 0.41 18% |
| Contrast (:1) | 398 | 566 42% | 877 120% | 845 112% | 434 9% |
| Colorchecker dE 2000 * | 11.14 | 6.83 39% | 4.23 62% | 4.92 56% | 12.66 -14% |
| Colorchecker dE 2000 max. * | 19.77 | 18.77 5% | 7.94 60% | 15.83 20% | 22.77 -15% |
| Greyscale dE 2000 * | 12.93 | 8.52 34% | 2.51 81% | 3.47 73% | 15.05 -16% |
| Gamma | 2.69 82% | 2.45 90% | 2.57 86% | 2.4 92% | 2.63 84% |
| CCT | 14674 44% | 9753 67% | 6626 98% | 6680 97% | 20050 32% |
| Color Space (Percent of AdobeRGB 1998) (%) | 36 | 35 -3% | 36 0% | 39 8% | 37 3% |
| Color Space (Percent of sRGB) (%) | 56 | 56 0% | 57 2% | 61 9% | 58 4% |
| Colorchecker dE 2000 calibrated * | 3.75 | 4.34 | 4.36 | ||
| Media totale (Programma / Settaggio) | 6% /
10% | -10% /
19% | -11% /
16% | 1% /
-2% |
* ... Meglio usare valori piccoli
Tempi di risposta del Display
| ↔ Tempi di risposta dal Nero al Bianco | ||
|---|---|---|
| 11 ms ... aumenta ↗ e diminuisce ↘ combinato | ↗ 7 ms Incremento |  |
| ↘ 4 ms Calo | ||
| Lo schermo mostra buoni tempi di risposta durante i nostri tests, ma potrebbe essere troppo lento per i gamers competitivi. In confronto, tutti i dispositivi di test variano da 0.1 (minimo) a 240 (massimo) ms. » 30 % di tutti i dispositivi è migliore. Questo significa che i tempi di risposta rilevati sono migliori rispettto alla media di tutti i dispositivi testati (19.8 ms). | ||
| ↔ Tempo di risposta dal 50% Grigio all'80% Grigio | ||
| 38 ms ... aumenta ↗ e diminuisce ↘ combinato | ↗ 19 ms Incremento |  |
| ↘ 19 ms Calo | ||
| Lo schermo mostra tempi di risposta lenti nei nostri tests e sarà insoddisfacente per i gamers. In confronto, tutti i dispositivi di test variano da 0.165 (minimo) a 636 (massimo) ms. » 55 % di tutti i dispositivi è migliore. Questo significa che i tempi di risposta rilevati sono peggiori rispetto alla media di tutti i dispositivi testati (30.9 ms). | ||
Sfarfallio dello schermo / PWM (Pulse-Width Modulation)
| flickering dello schermo / PWM rilevato | 2500 Hz | ≤ 90 % settaggio luminosita' |  |
Il display sfarfalla a 2500 Hz (Probabilmente a causa dell'uso di PWM) Flickering rilevato ad una luminosita' di 90 % o inferiore. Non dovrebbe verificarsi flickering o PWM sopra questo valore di luminosita'. La frequenza di 2500 Hz è abbastanza alta, quindi la maggioranza degli utenti sensibili al PWM non dovrebbero notare alcun flickering. In confronto: 52 % di tutti i dispositivi testati non utilizza PWM per ridurre la luminosita' del display. Se è rilevato PWM, una media di 7741 (minimo: 5 - massimo: 343500) Hz è stata rilevata. | |||
| Blender - v2.79 BMW27 CPU | |
| HP 255 G7 159P1EA (Dual-Channel) | |
| HP 255 G7 159P1EA | |
| Media AMD Ryzen 3 3200U (1439 - 1528, n=3) | |
| Lenovo V15-ADA 82C7009SGE | |
| Dell Latitude 15 3510 NK2MC | |
| HP 250 G7-15S40ES | |
| Acer Aspire 5 A515-56-511A | |
| Media della classe Office (158 - 1940, n=76, ultimi 2 anni) | |
| 7-Zip 18.03 | |
| 7z b 4 -mmt1 | |
| Media della classe Office (3387 - 6469, n=77, ultimi 2 anni) | |
| Acer Aspire 5 A515-56-511A | |
| HP 250 G7-15S40ES | |
| Dell Latitude 15 3510 NK2MC | |
| HP 255 G7 159P1EA | |
| Media AMD Ryzen 3 3200U (3333 - 3406, n=4) | |
| HP 255 G7 159P1EA (Dual-Channel) | |
| Lenovo V15-ADA 82C7009SGE | |
| 7z b 4 | |
| Media della classe Office (7098 - 76886, n=77, ultimi 2 anni) | |
| Acer Aspire 5 A515-56-511A | |
| HP 250 G7-15S40ES | |
| Dell Latitude 15 3510 NK2MC | |
| HP 255 G7 159P1EA (Dual-Channel) | |
| HP 255 G7 159P1EA | |
| Media AMD Ryzen 3 3200U (8785 - 9382, n=4) | |
| Lenovo V15-ADA 82C7009SGE | |
| Cinebench R20 | |
| CPU (Single Core) | |
| Media della classe Office (345 - 816, n=75, ultimi 2 anni) | |
| Acer Aspire 5 A515-56-511A | |
| HP 250 G7-15S40ES | |
| Dell Latitude 15 3510 NK2MC | |
| Lenovo V15-ADA 82C7009SGE | |
| HP 255 G7 159P1EA (Dual-Channel) | |
| Media AMD Ryzen 3 3200U (274 - 318, n=5) | |
| HP 255 G7 159P1EA | |
| Asus M509DA-EJ153T | |
| CPU (Multi Core) | |
| Media della classe Office (648 - 8840, n=75, ultimi 2 anni) | |
| Acer Aspire 5 A515-56-511A | |
| HP 250 G7-15S40ES | |
| Dell Latitude 15 3510 NK2MC | |
| Lenovo V15-ADA 82C7009SGE | |
| HP 255 G7 159P1EA (Dual-Channel) | |
| Media AMD Ryzen 3 3200U (453 - 727, n=5) | |
| Asus M509DA-EJ153T | |
| HP 255 G7 159P1EA | |
| Geekbench 5.5 | |
| Single-Core | |
| Media della classe Office (811 - 2175, n=73, ultimi 2 anni) | |
| Acer Aspire 5 A515-56-511A | |
| HP 250 G7-15S40ES | |
| Dell Latitude 15 3510 NK2MC | |
| Media AMD Ryzen 3 3200U (770 - 847, n=4) | |
| HP 255 G7 159P1EA (Dual-Channel) | |
| HP 255 G7 159P1EA | |
| Lenovo V15-ADA 82C7009SGE | |
| Multi-Core | |
| Media della classe Office (1483 - 16999, n=73, ultimi 2 anni) | |
| Acer Aspire 5 A515-56-511A | |
| HP 250 G7-15S40ES | |
| Dell Latitude 15 3510 NK2MC | |
| Lenovo V15-ADA 82C7009SGE | |
| Media AMD Ryzen 3 3200U (1604 - 1736, n=4) | |
| HP 255 G7 159P1EA (Dual-Channel) | |
| HP 255 G7 159P1EA | |
| HWBOT x265 Benchmark v2.2 - 4k Preset | |
| Media della classe Office (2.21 - 26, n=76, ultimi 2 anni) | |
| Acer Aspire 5 A515-56-511A | |
| HP 250 G7-15S40ES | |
| Dell Latitude 15 3510 NK2MC | |
| Lenovo V15-ADA 82C7009SGE | |
| HP 255 G7 159P1EA (Dual-Channel) | |
| Media AMD Ryzen 3 3200U (1.864 - 2.03, n=4) | |
| HP 255 G7 159P1EA | |
| Asus M509DA-EJ153T | |
| LibreOffice - 20 Documents To PDF | |
| HP 255 G7 159P1EA | |
| Lenovo V15-ADA 82C7009SGE | |
| Media AMD Ryzen 3 3200U (84.5 - 95.6, n=3) | |
| HP 255 G7 159P1EA (Dual-Channel) | |
| HP 250 G7-15S40ES | |
| Media della classe Office (39.9 - 102.3, n=76, ultimi 2 anni) | |
| Acer Aspire 5 A515-56-511A | |
| Dell Latitude 15 3510 NK2MC | |
| R Benchmark 2.5 - Overall mean | |
| Lenovo V15-ADA 82C7009SGE | |
| HP 255 G7 159P1EA (Dual-Channel) | |
| HP 255 G7 159P1EA | |
| Media AMD Ryzen 3 3200U (0.846 - 0.852, n=3) | |
| Dell Latitude 15 3510 NK2MC | |
| HP 250 G7-15S40ES | |
| Acer Aspire 5 A515-56-511A | |
| Media della classe Office (0.393 - 0.888, n=76, ultimi 2 anni) | |
* ... Meglio usare valori piccoli
| PCMark 8 Home Score Accelerated v2 | 2928 punti | |
| PCMark 8 Creative Score Accelerated v2 | 2723 punti | |
| PCMark 8 Work Score Accelerated v2 | 4400 punti | |
| PCMark 10 Score | 3187 punti | |
Aiuto | ||
| PCMark 8 - Home Score Accelerated v2 | |
| Media della classe Office (n=1ultimi 2 anni) | |
| HP 250 G7-15S40ES | |
| HP 255 G7 159P1EA | |
| Media AMD Ryzen 3 3200U, AMD Radeon RX Vega 3 (2742 - 3065, n=3) | |
| Dell Latitude 15 3510 NK2MC | |
| DPC Latencies / LatencyMon - interrupt to process latency (max), Web, Youtube, Prime95 | |
| Dell Latitude 15 3510 NK2MC | |
| HP 250 G7-15S40ES | |
| Lenovo V15-ADA 82C7009SGE | |
| Acer Aspire 5 A515-56-511A | |
| HP 255 G7 159P1EA | |
* ... Meglio usare valori piccoli

| HP 255 G7 159P1EA WDC PC SN530 SDBPNPZ-512G | Lenovo V15-ADA 82C7009SGE WDC PC SN530 SDBPMPZ-265G | Acer Aspire 5 A515-56-511A Micron 2210 MTFDHBA1T0QFD | Dell Latitude 15 3510 NK2MC Toshiba KBG40ZNS256G NVMe | HP 250 G7-15S40ES Samsung PM991 MZVLQ256HAJD | Media WDC PC SN530 SDBPNPZ-512G | Media della classe Office | |
|---|---|---|---|---|---|---|---|
| CrystalDiskMark 5.2 / 6 | 5% | 56% | 31% | 11% | 47% | 133% | |
| Write 4K (MB/s) | 128.1 | 124.8 -3% | 86.8 -32% | 150 17% | 152.5 19% | 170.1 ? 33% | 153.2 ? 20% |
| Read 4K (MB/s) | 44.05 | 43.56 -1% | 66.4 51% | 61.8 40% | 40.59 -8% | 49.4 ? 12% | 73.4 ? 67% |
| Write Seq (MB/s) | 1355 | 977 -28% | 1851 37% | 458 -66% | 720 -47% | 1731 ? 28% | 2531 ? 87% |
| Read Seq (MB/s) | 1146 | 1685 47% | 1707 49% | 1881 64% | 1131 -1% | 1643 ? 43% | 3292 ? 187% |
| Write 4K Q32T1 (MB/s) | 208.3 | 185.9 -11% | 542 160% | 338.4 62% | 423.2 103% | 453 ? 117% | 431 ? 107% |
| Read 4K Q32T1 (MB/s) | 319.6 | 272.7 -15% | 589 84% | 447.3 40% | 276.1 -14% | 488 ? 53% | 516 ? 61% |
| Write Seq Q32T1 (MB/s) | 1467 | 971 -34% | 1960 34% | 1563 7% | 968 -34% | 1791 ? 22% | 4178 ? 185% |
| Read Seq Q32T1 (MB/s) | 1334 | 2424 82% | 2227 67% | 2422 82% | 2223 67% | 2272 ? 70% | 6043 ? 353% |
| AS SSD | -9% | 62% | -19% | 8% | 52% | 135% | |
| Seq Read (MB/s) | 1119 | 2114 89% | 2023 81% | 1971 76% | 1784 59% | 1862 ? 66% | 4333 ? 287% |
| Seq Write (MB/s) | 1378 | 898 -35% | 1781 29% | 1130 -18% | 860 -38% | 1392 ? 1% | 2766 ? 101% |
| 4K Read (MB/s) | 37.37 | 34.95 -6% | 61.9 66% | 51.3 37% | 35.84 -4% | 42.1 ? 13% | 58.3 ? 56% |
| 4K Write (MB/s) | 102.9 | 107.7 5% | 128.7 25% | 119.7 16% | 105.1 2% | 163.8 ? 59% | 162.8 ? 58% |
| 4K-64 Read (MB/s) | 506 | 446.8 -12% | 904 79% | 585 16% | 464.1 -8% | 813 ? 61% | 958 ? 89% |
| 4K-64 Write (MB/s) | 539 | 194.4 -64% | 976 81% | 495.5 -8% | 773 43% | 876 ? 63% | 1648 ? 206% |
| Access Time Read * (ms) | 0.117 | 0.125 -7% | 0.107 9% | 0.107 9% | 0.07875 ? 33% | 0.08407 ? 28% | |
| Access Time Write * (ms) | 0.057 | 0.057 -0% | 0.031 46% | 0.22 -286% | 0.04 30% | 0.08225 ? -44% | 0.05895 ? -3% |
| Score Read (Points) | 656 | 693 6% | 1168 78% | 833 27% | 678 3% | 1041 ? 59% | 1450 ? 121% |
| Score Write (Points) | 780 | 392 -50% | 1283 64% | 728 -7% | 964 24% | 1179 ? 51% | 2087 ? 168% |
| Score Total (Points) | 1795 | 1388 -23% | 3053 70% | 1962 9% | 1953 9% | 2738 ? 53% | 4213 ? 135% |
| Copy ISO MB/s (MB/s) | 710 | 273.5 -61% | 771 9% | 1427 ? 101% | 2543 ? 258% | ||
| Copy Program MB/s (MB/s) | 277.6 | 184.6 -34% | 240.2 -13% | 612 ? 120% | 791 ? 185% | ||
| Copy Game MB/s (MB/s) | 539 | 281 -48% | 469.2 -13% | 1001 ? 86% | 1632 ? 203% | ||
| Media totale (Programma / Settaggio) | -2% /
-3% | 59% /
59% | 6% /
-1% | 10% /
9% | 50% /
50% | 134% /
135% |
* ... Meglio usare valori piccoli
Continuous load read: DiskSpd Read Loop, Queue Depth 8
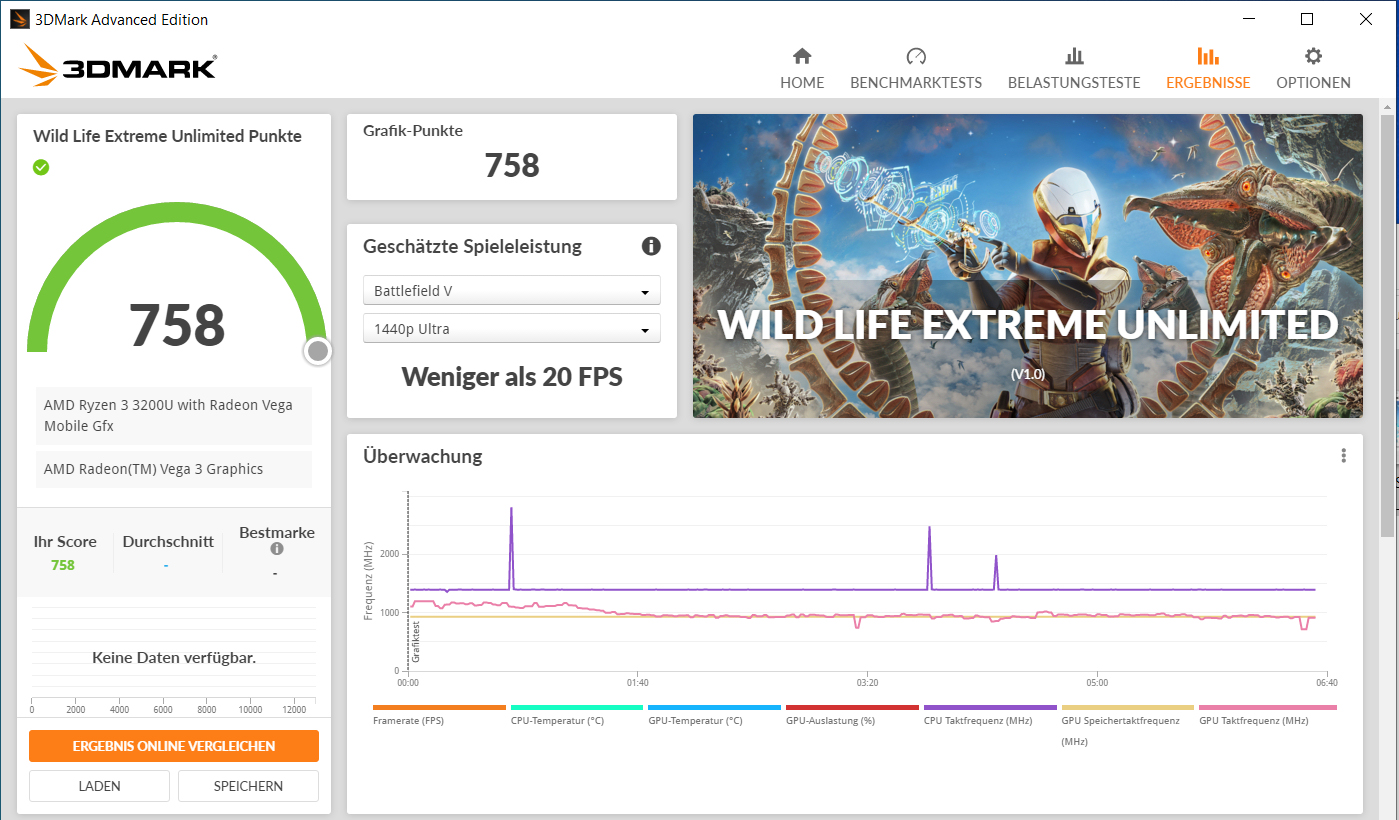
| 3DMark 11 Performance | 1996 punti | |
| 3DMark Ice Storm Standard Score | 62643 punti | |
| 3DMark Cloud Gate Standard Score | 6946 punti | |
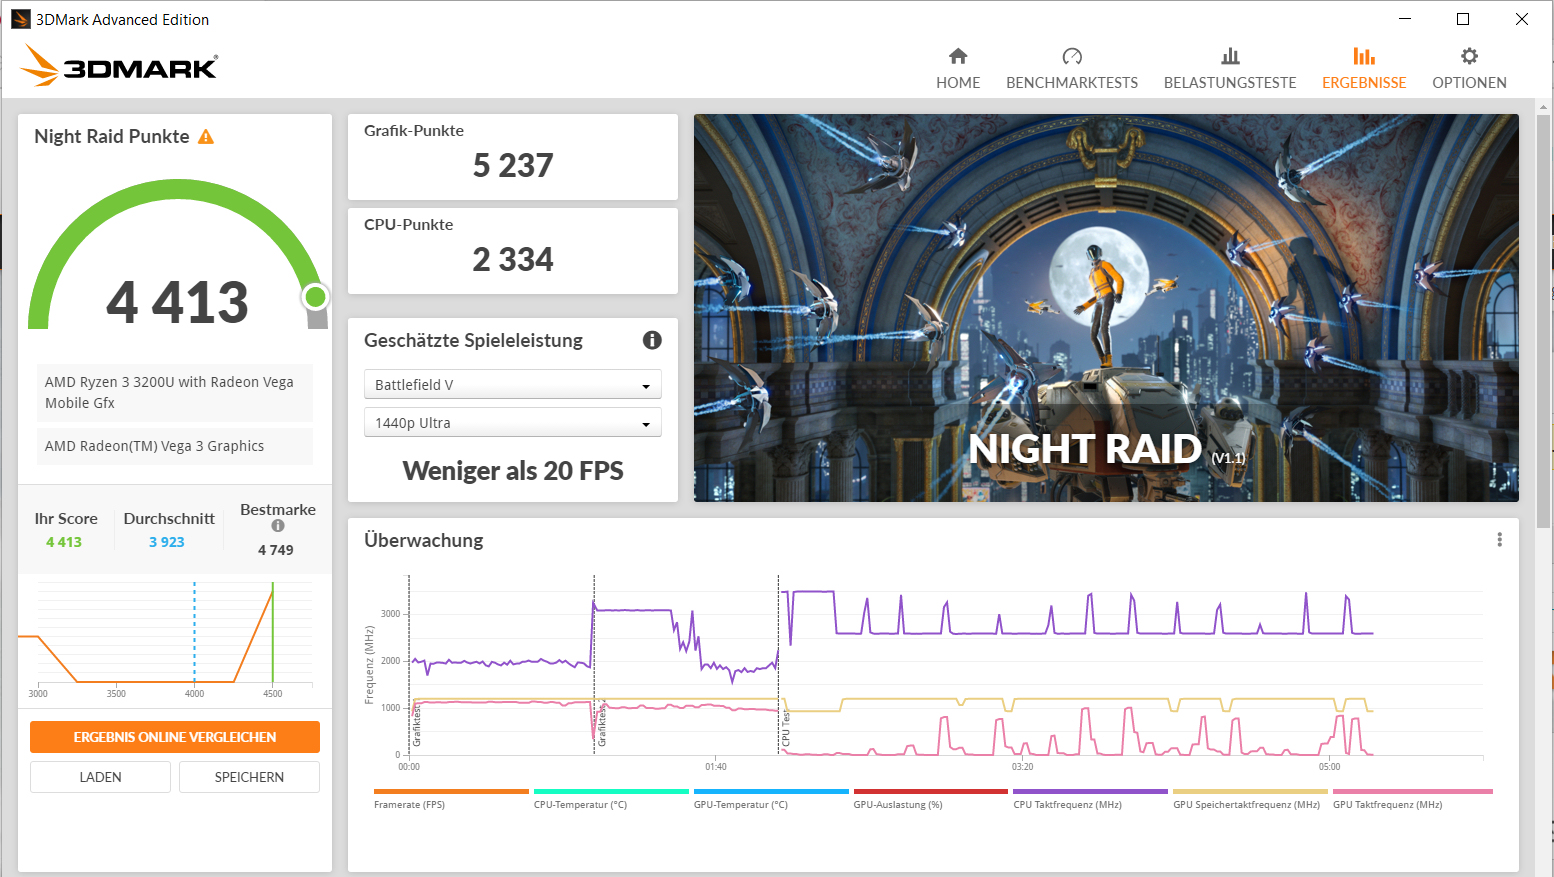
| 3DMark Fire Strike Score | 1164 punti | |
| 3DMark Time Spy Score | 438 punti | |
Aiuto | ||
| 3DMark 11 - 1280x720 Performance GPU | |
| Media della classe Office (2551 - 18313, n=73, ultimi 2 anni) | |
| Acer Aspire 5 A515-56-511A | |
| HP 250 G7-15S40ES | |
| HP 255 G7 159P1EA (Dual-Channel) | |
| HP 255 G7 159P1EA | |
| Lenovo V15-ADA 82C7009SGE | |
| Media AMD Radeon RX Vega 3 (1108 - 2048, n=14) | |
| Dell Latitude 15 3510 NK2MC | |
| 3DMark | |
| 1920x1080 Fire Strike Graphics | |
| Media della classe Office (736 - 21871, n=76, ultimi 2 anni) | |
| Acer Aspire 5 A515-56-511A | |
| HP 250 G7-15S40ES | |
| HP 255 G7 159P1EA (Dual-Channel) | |
| Lenovo V15-ADA 82C7009SGE | |
| HP 255 G7 159P1EA | |
| Media AMD Radeon RX Vega 3 (726 - 1522, n=16) | |
| Dell Latitude 15 3510 NK2MC | |
| 1280x720 Cloud Gate Standard Graphics | |
| Media della classe Office (11640 - 118515, n=39, ultimi 2 anni) | |
| Acer Aspire 5 A515-56-511A | |
| HP 255 G7 159P1EA (Dual-Channel) | |
| HP 250 G7-15S40ES | |
| HP 255 G7 159P1EA | |
| Lenovo V15-ADA 82C7009SGE | |
| Media AMD Radeon RX Vega 3 (5005 - 12278, n=16) | |
| Dell Latitude 15 3510 NK2MC | |
| 2560x1440 Time Spy Graphics | |
| Media della classe Office (493 - 6679, n=71, ultimi 2 anni) | |
| Acer Aspire 5 A515-56-511A | |
| HP 255 G7 159P1EA (Dual-Channel) | |
| HP 250 G7-15S40ES | |
| Lenovo V15-ADA 82C7009SGE | |
| HP 255 G7 159P1EA | |
| Media AMD Radeon RX Vega 3 (196 - 450, n=11) | |
| Dota 2 Reborn - 1280x720 min (0/3) fastest | |
| Media della classe Office (32.2 - 174.1, n=78, ultimi 2 anni) | |
| HP 250 G7-15S40ES | |
| Acer Aspire 5 A515-56-511A | |
| Lenovo V15-ADA 82C7009SGE | |
| HP 255 G7 159P1EA (Dual-Channel) | |
| HP 255 G7 159P1EA | |
| Media AMD Radeon RX Vega 3 (37.5 - 70.8, n=11) | |
| Dell Latitude 15 3510 NK2MC | |
| X-Plane 11.11 - 1280x720 low (fps_test=1) | |
| Media della classe Office (20.7 - 105.6, n=74, ultimi 2 anni) | |
| Acer Aspire 5 A515-56-511A | |
| HP 250 G7-15S40ES | |
| HP 255 G7 159P1EA (Dual-Channel) | |
| Lenovo V15-ADA 82C7009SGE | |
| HP 255 G7 159P1EA | |
| Media AMD Radeon RX Vega 3 (6.95 - 23.5, n=11) | |
| Strange Brigade - 1280x720 lowest AF:1 | |
| Media della classe Office (19.4 - 388, n=54, ultimi 2 anni) | |
| HP 255 G7 159P1EA (1.47.22.14 D3D12, Dual-Channel) | |
| Media AMD Radeon RX Vega 3 (24.9 - 44.7, n=5) | |
| HP 255 G7 159P1EA (1.47.22.14 D3D12) | |
| basso | medio | alto | ultra | |
|---|---|---|---|---|
| The Witcher 3 (2015) | 21.1 | 13.2 | 6.35 | 4 |
| Dota 2 Reborn (2015) | 64.2 | 44.6 | 20.9 | 19.5 |
| X-Plane 11.11 (2018) | 20.7 | 13 | 11.7 | |
| Strange Brigade (2018) | 31.6 | 11.9 | 9.1 | 7.3 |
Rumorosità
| Idle |
| 28.2 / 28.2 / 28.2 dB(A) |
| Sotto carico |
| 37 / 40.3 dB(A) |
 | ||
30 dB silenzioso 40 dB(A) udibile 50 dB(A) rumoroso |
||
min: | ||
(+) La temperatura massima sul lato superiore è di 32.8 °C / 91 F, rispetto alla media di 34.3 °C / 94 F, che varia da 21.2 a 62.5 °C per questa classe Office.
(+) Il lato inferiore si riscalda fino ad un massimo di 36.1 °C / 97 F, rispetto alla media di 36.8 °C / 98 F
(+) In idle, la temperatura media del lato superiore è di 23.9 °C / 75 F, rispetto alla media deld ispositivo di 29.5 °C / 85 F.
(+) I poggiapolsi e il touchpad sono piu' freddi della temperatura della pelle con un massimo di 26 °C / 78.8 F e sono quindi freddi al tatto.
(±) La temperatura media della zona del palmo della mano di dispositivi simili e'stata di 27.6 °C / 81.7 F (+1.6 °C / 2.9 F).
HP 255 G7 159P1EA analisi audio
(±) | potenza degli altiparlanti media ma buona (73.1 dB)
Bassi 100 - 315 Hz
(-) | quasi nessun basso - in media 23% inferiori alla media
(±) | la linearità dei bassi è media (14.5% delta rispetto alla precedente frequenza)
Medi 400 - 2000 Hz
(±) | medi elevati - circa 7.7% superiore alla media
(+) | medi lineari (6.8% delta rispetto alla precedente frequenza)
Alti 2 - 16 kHz
(+) | Alti bilanciati - appena 2.8% dalla media
(+) | alti lineari (5.3% delta rispetto alla precedente frequenza)
Nel complesso 100 - 16.000 Hz
(±) | la linearità complessiva del suono è media (21.6% di differenza rispetto alla media
Rispetto alla stessa classe
» 55% di tutti i dispositivi testati in questa classe è stato migliore, 9% simile, 37% peggiore
» Il migliore ha avuto un delta di 7%, medio di 21%, peggiore di 53%
Rispetto a tutti i dispositivi testati
» 61% di tutti i dispositivi testati in questa classe è stato migliore, 7% similare, 32% peggiore
» Il migliore ha avuto un delta di 4%, medio di 23%, peggiore di 134%
| Off / Standby | |
| Idle | |
| Sotto carico |
|
Leggenda:
min: | |
Pro
Contro

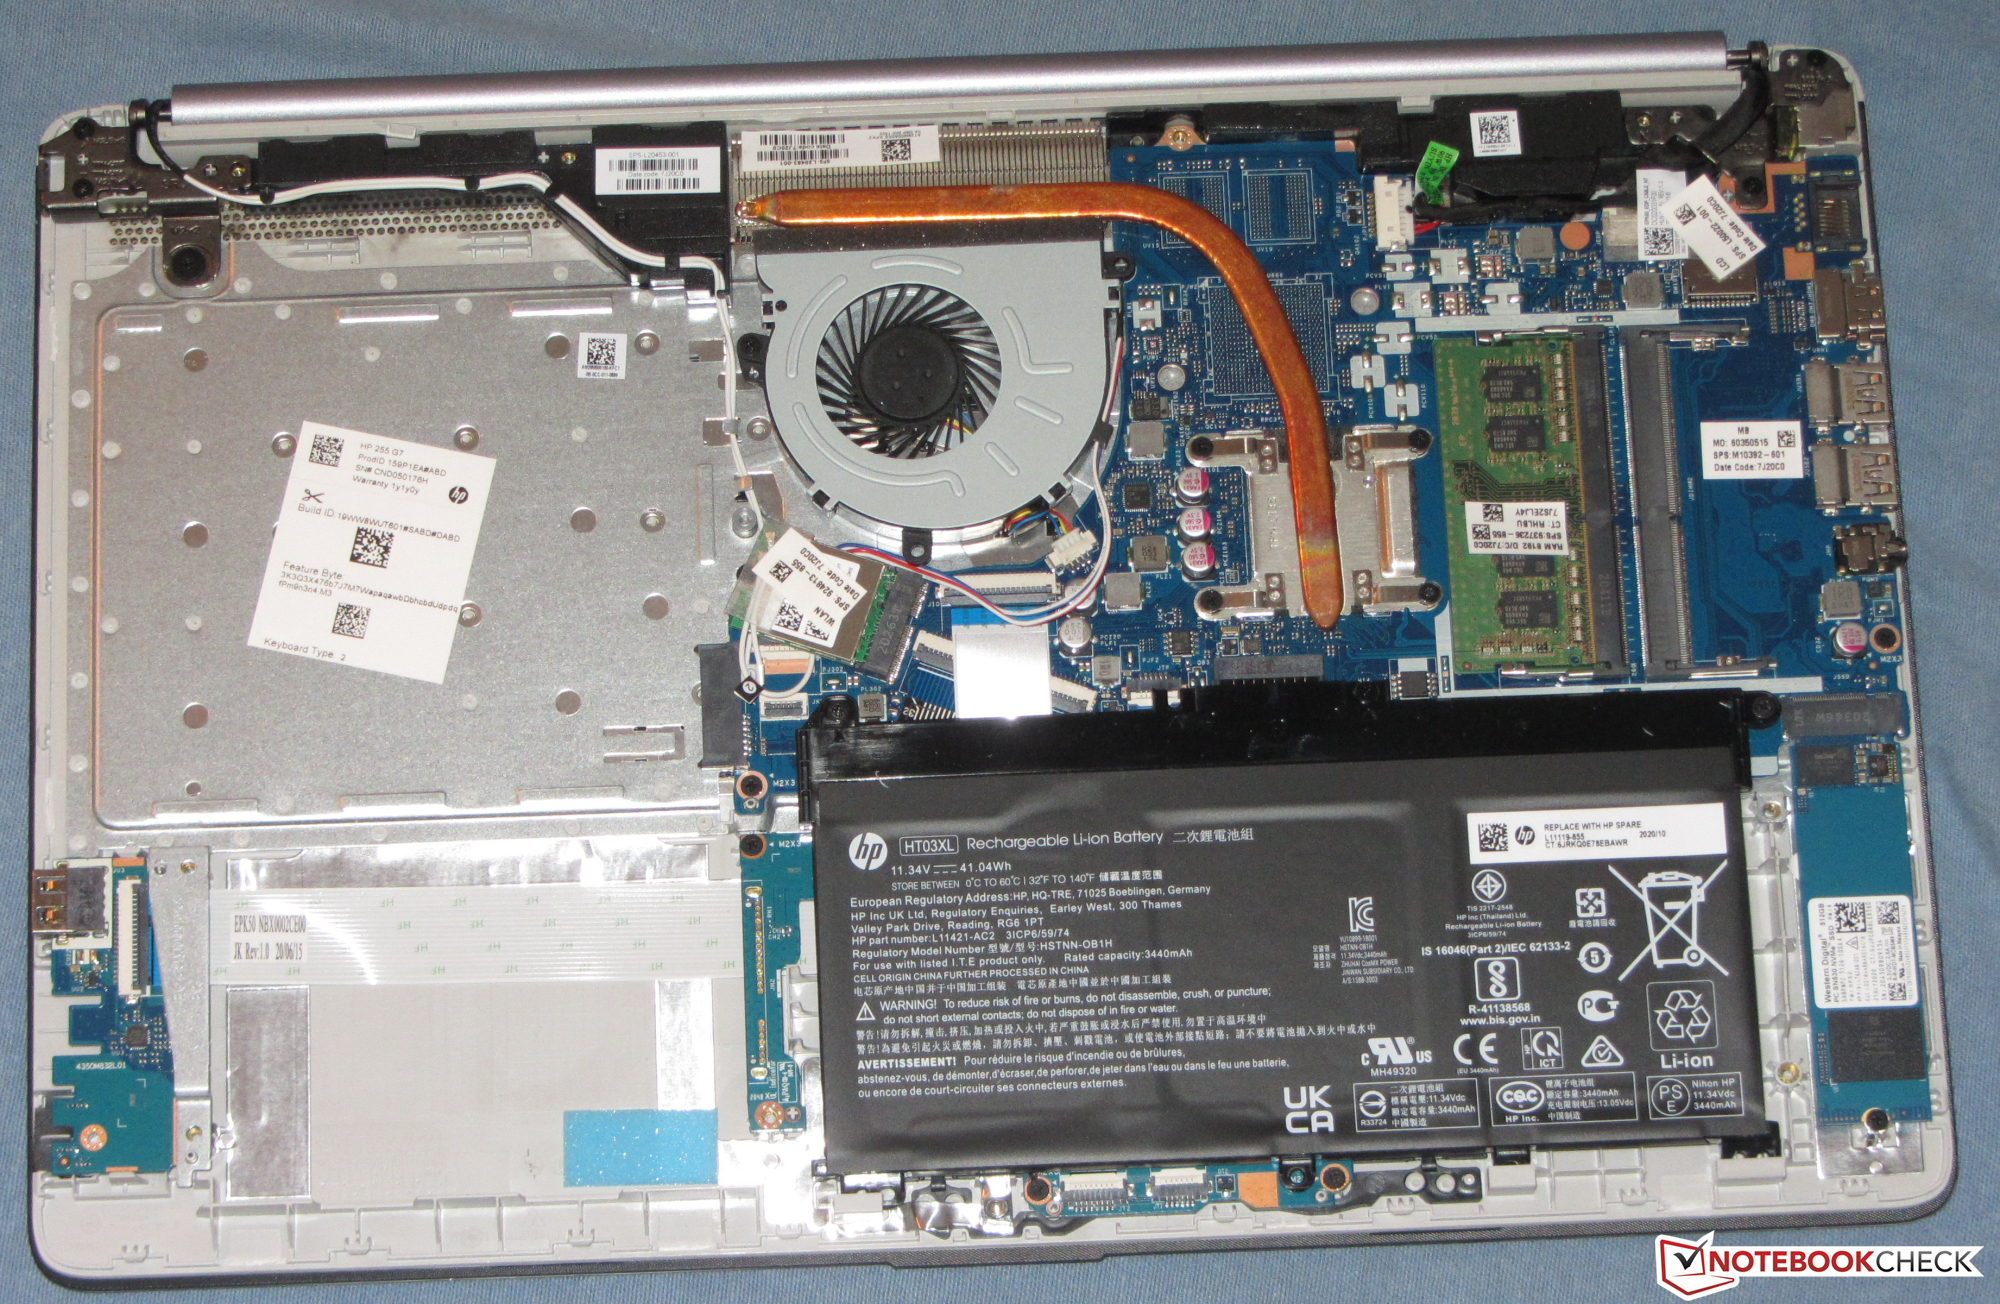
APU Ryzen 3 3200U, 8 GB di RAM (1x 8 GB, modalità single-channel, espandibile), e un SSD NVMe da 512 GB (M.2-2280) equipaggiano il portatile per l'ufficio e l'uso di Internet. Tuttavia, l'APU è al di sotto del suo potenziale perché la memoria funziona in modalità single-channel.
Non possiamo raccomandare l'acquisto del modello HP 255 G7 che abbiamo davanti. Un livello di configurazione insoddisfacente si combina con un prezzo troppo alto.
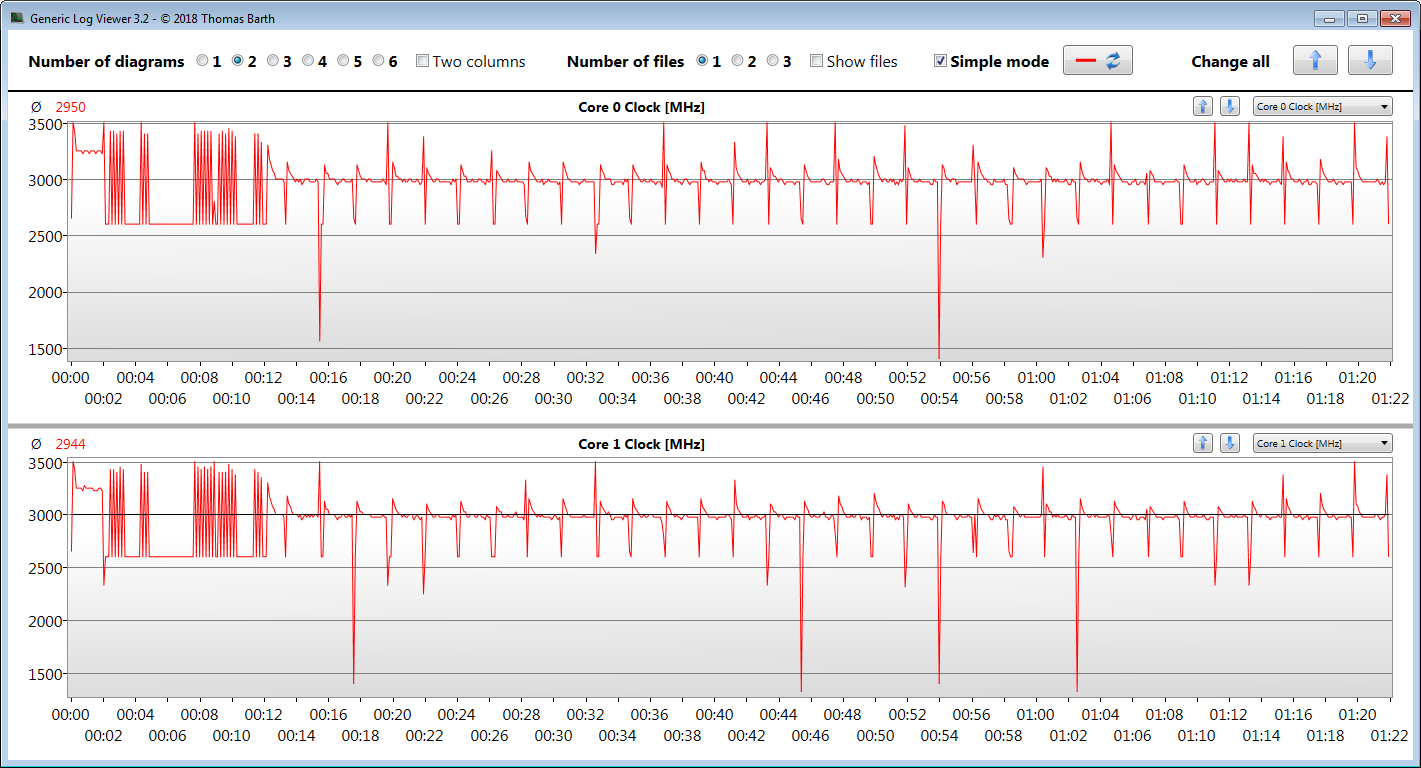
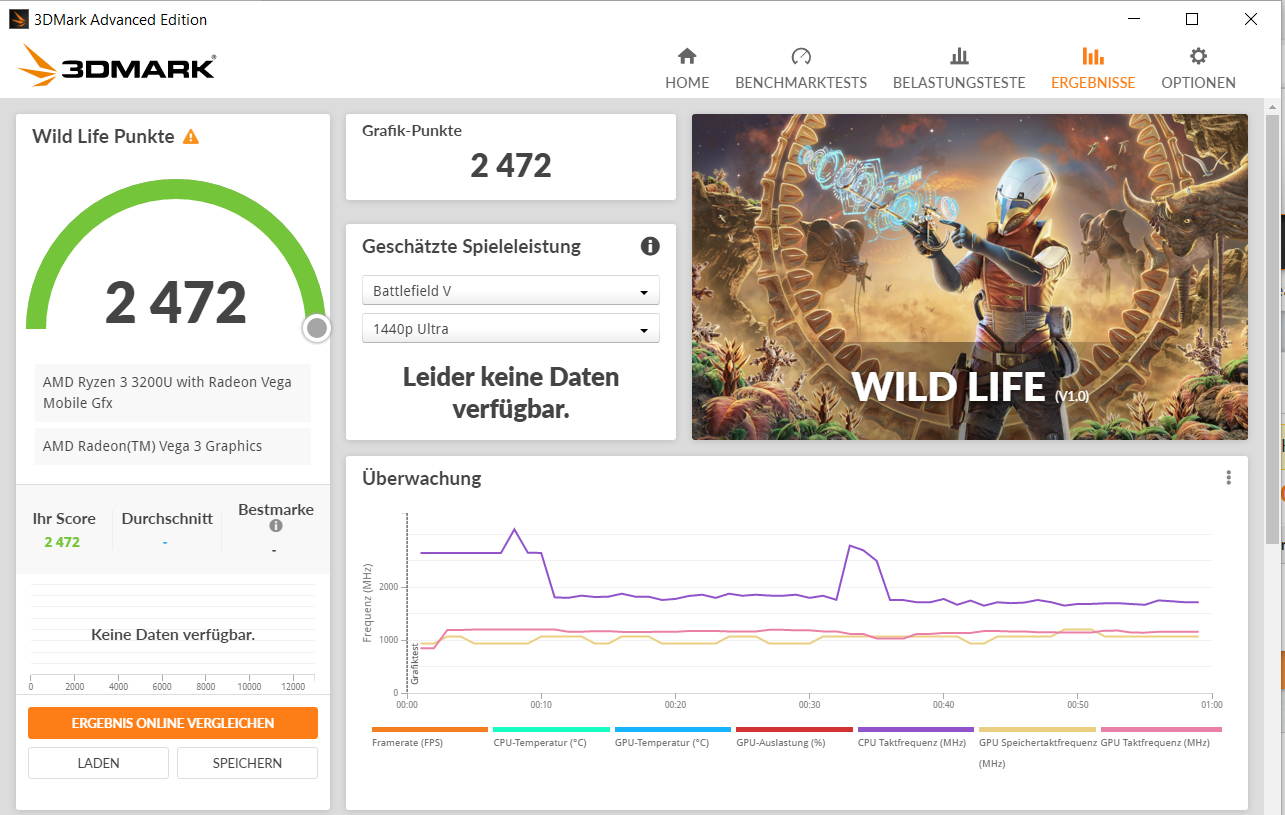
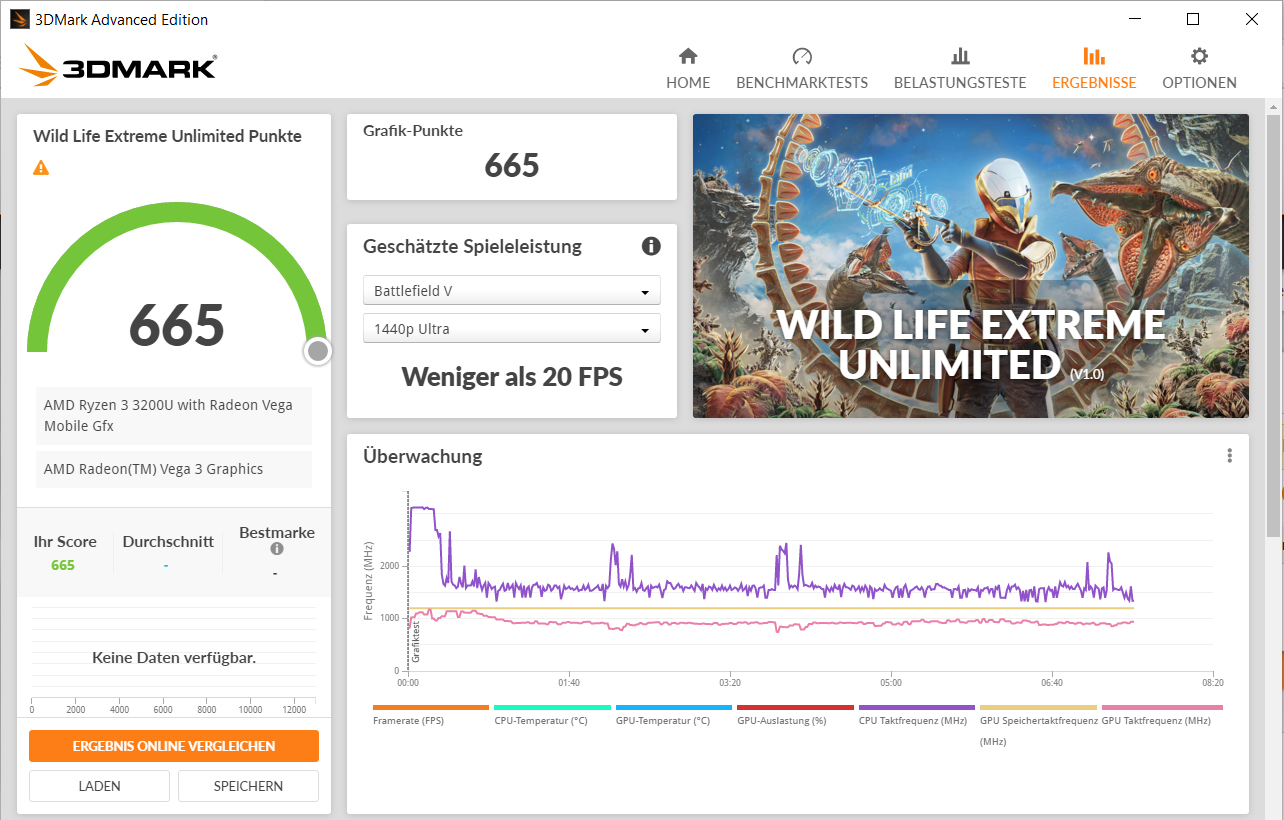
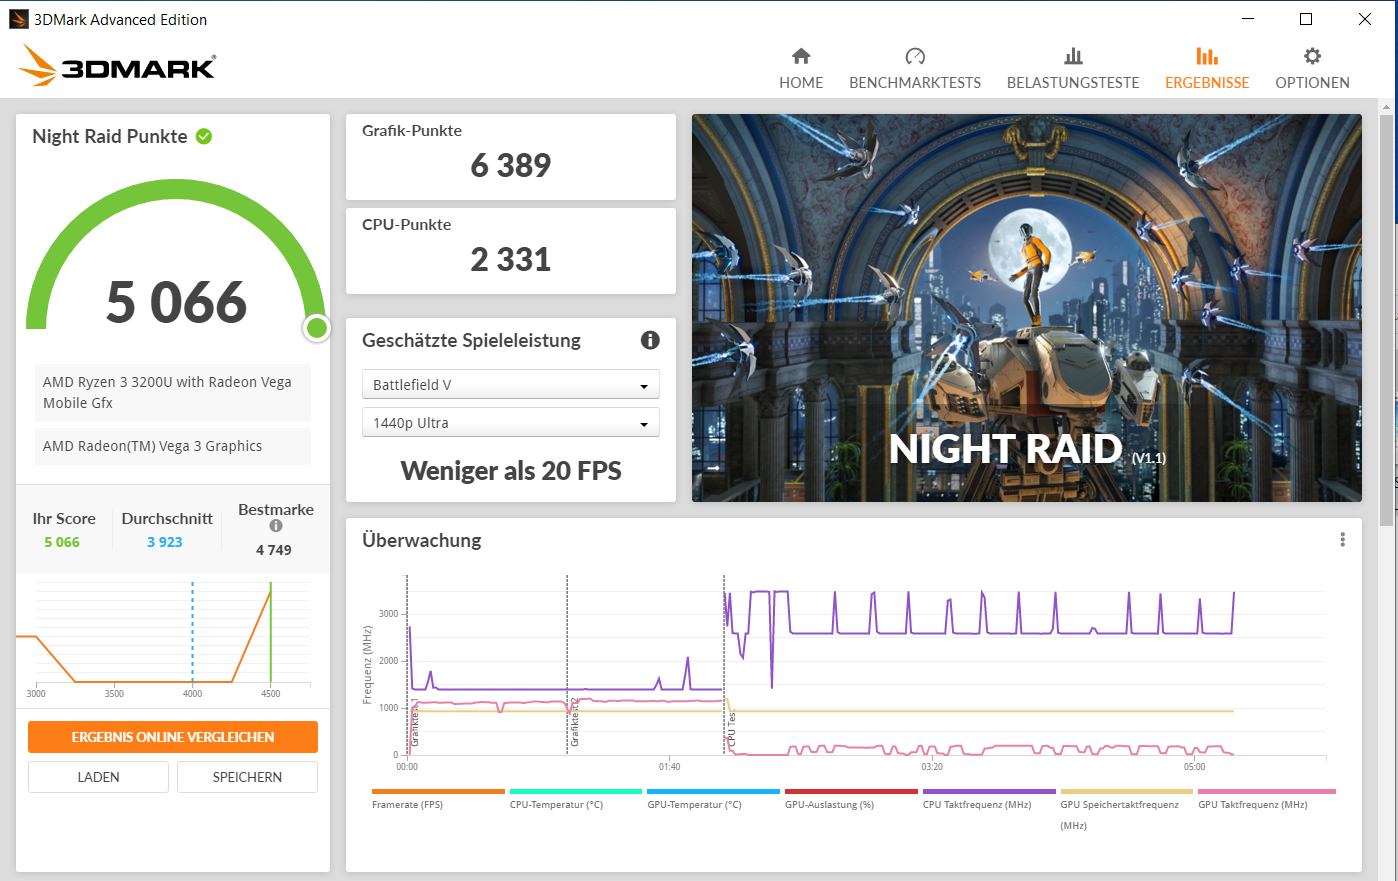
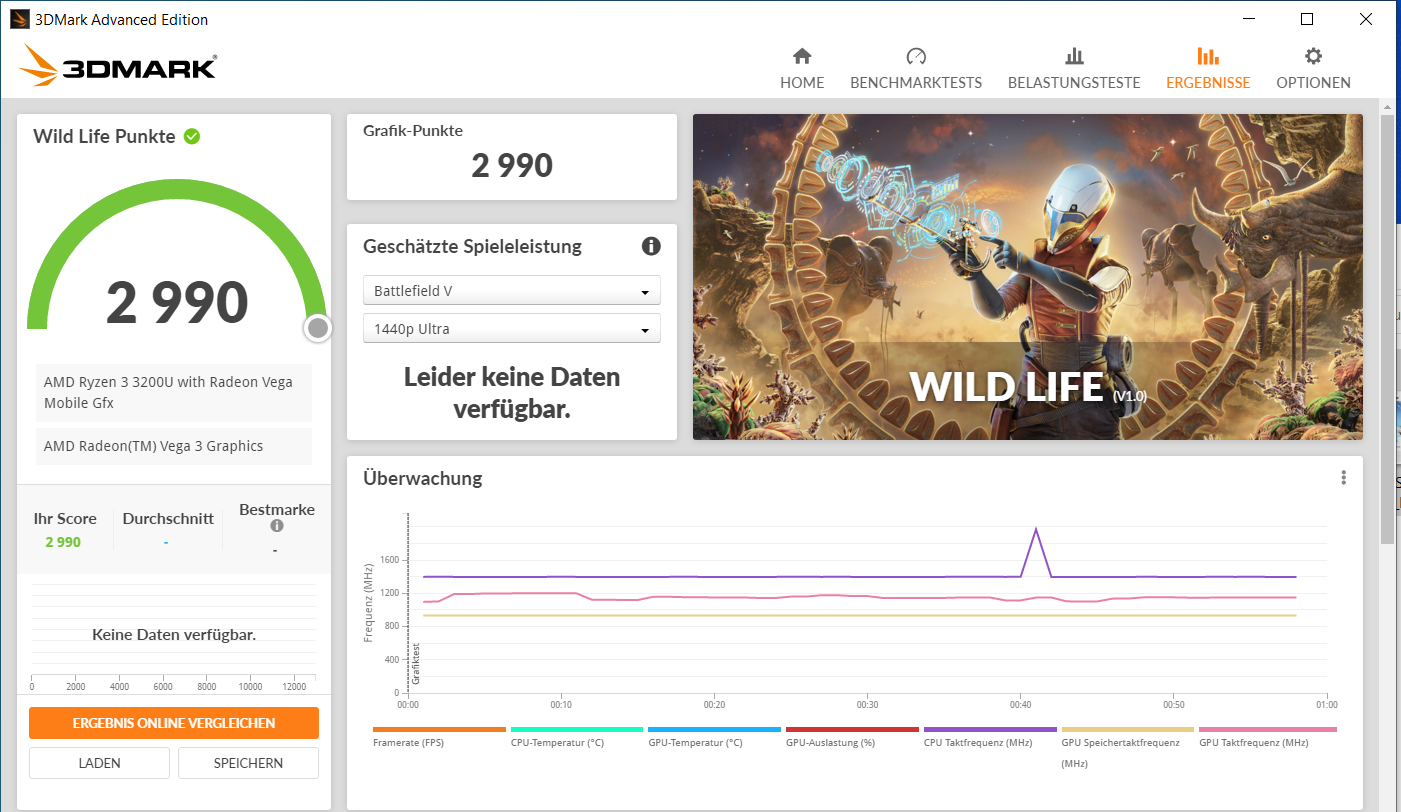
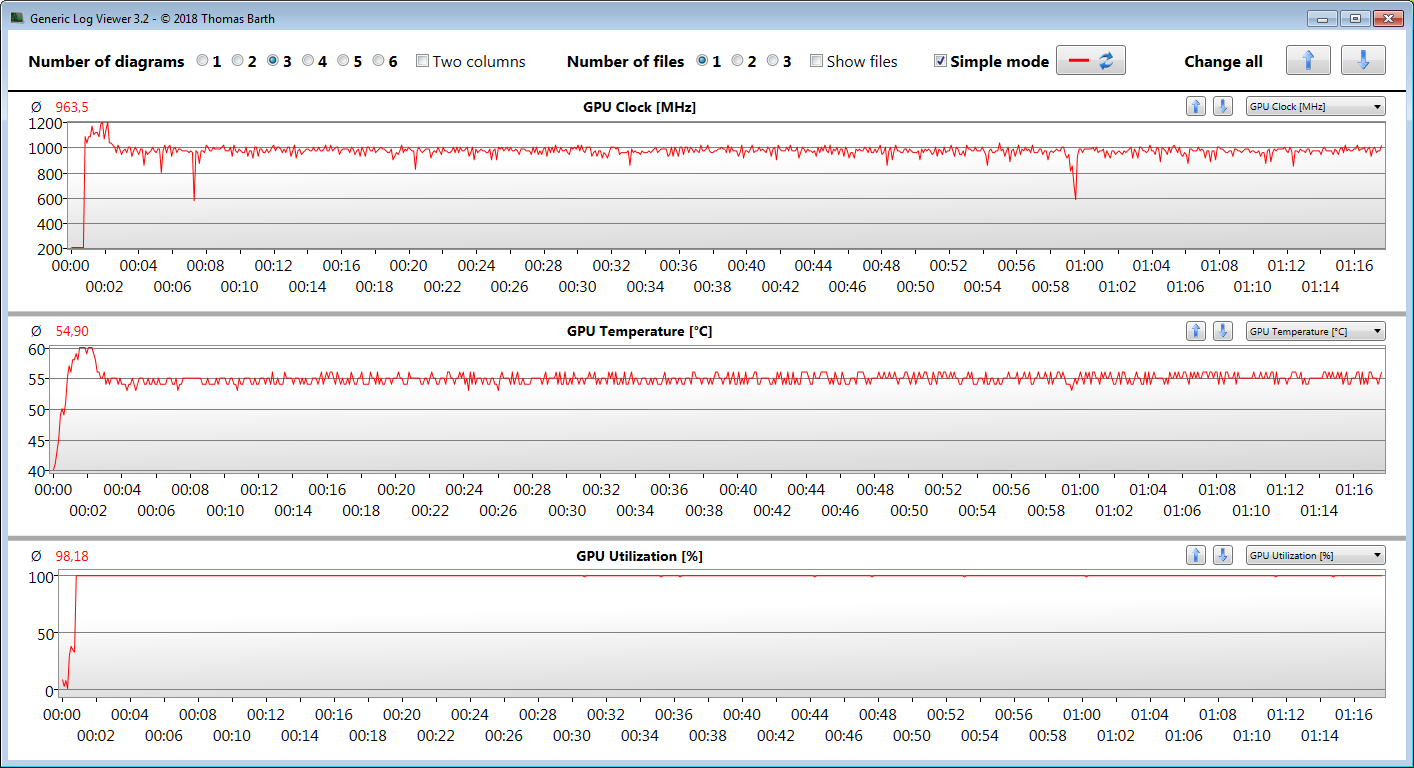
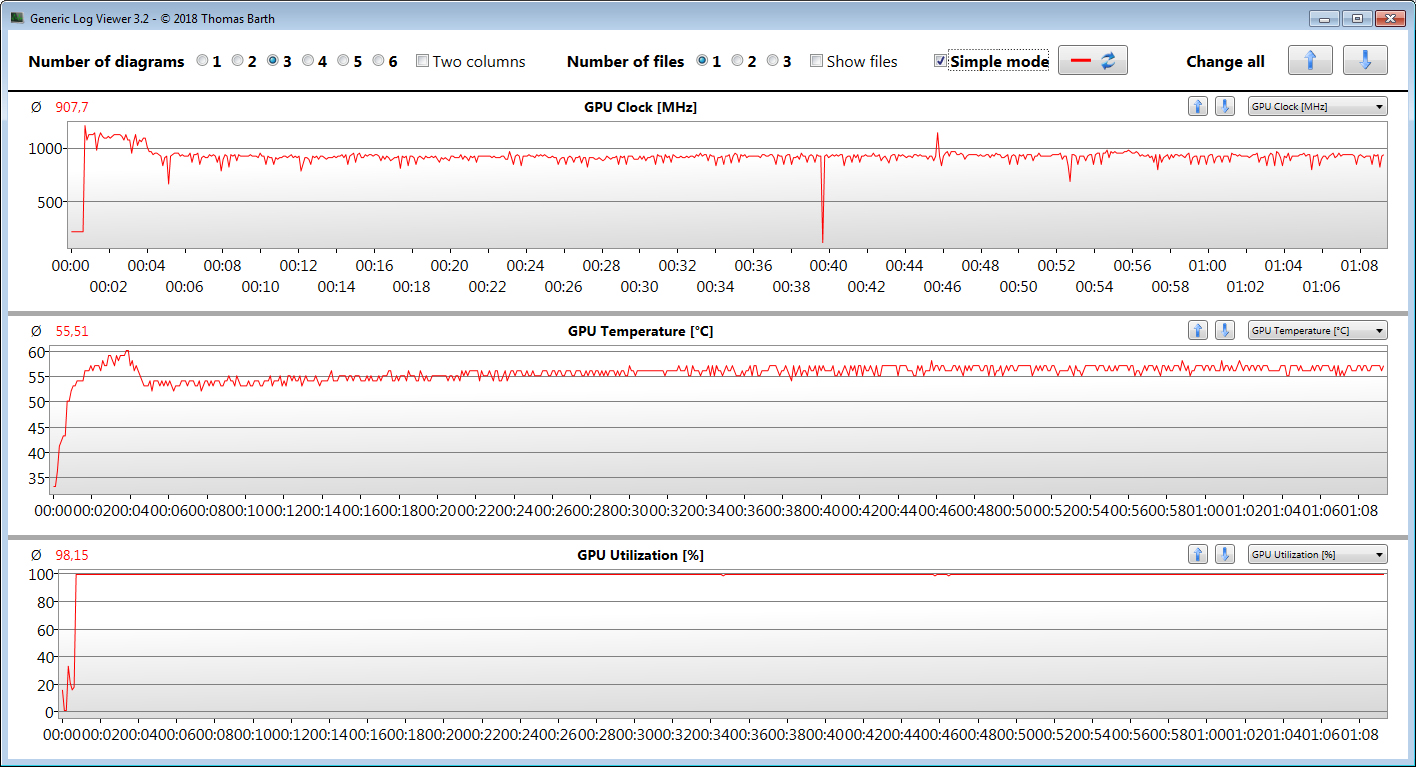
Inoltre, l'APU non è in grado di funzionare in modo costante a massima potenza - questo vale sia per la CPU che per la componente GPU. Non comprendiamo il reale motivo di questa situazione. Inoltre, il portatile si scalda appena, e la soluzione di raffreddamento installata qui dovrebbe essere in grado di tenere sotto controllo l'APU relativamente debole in tutte le situazioni.
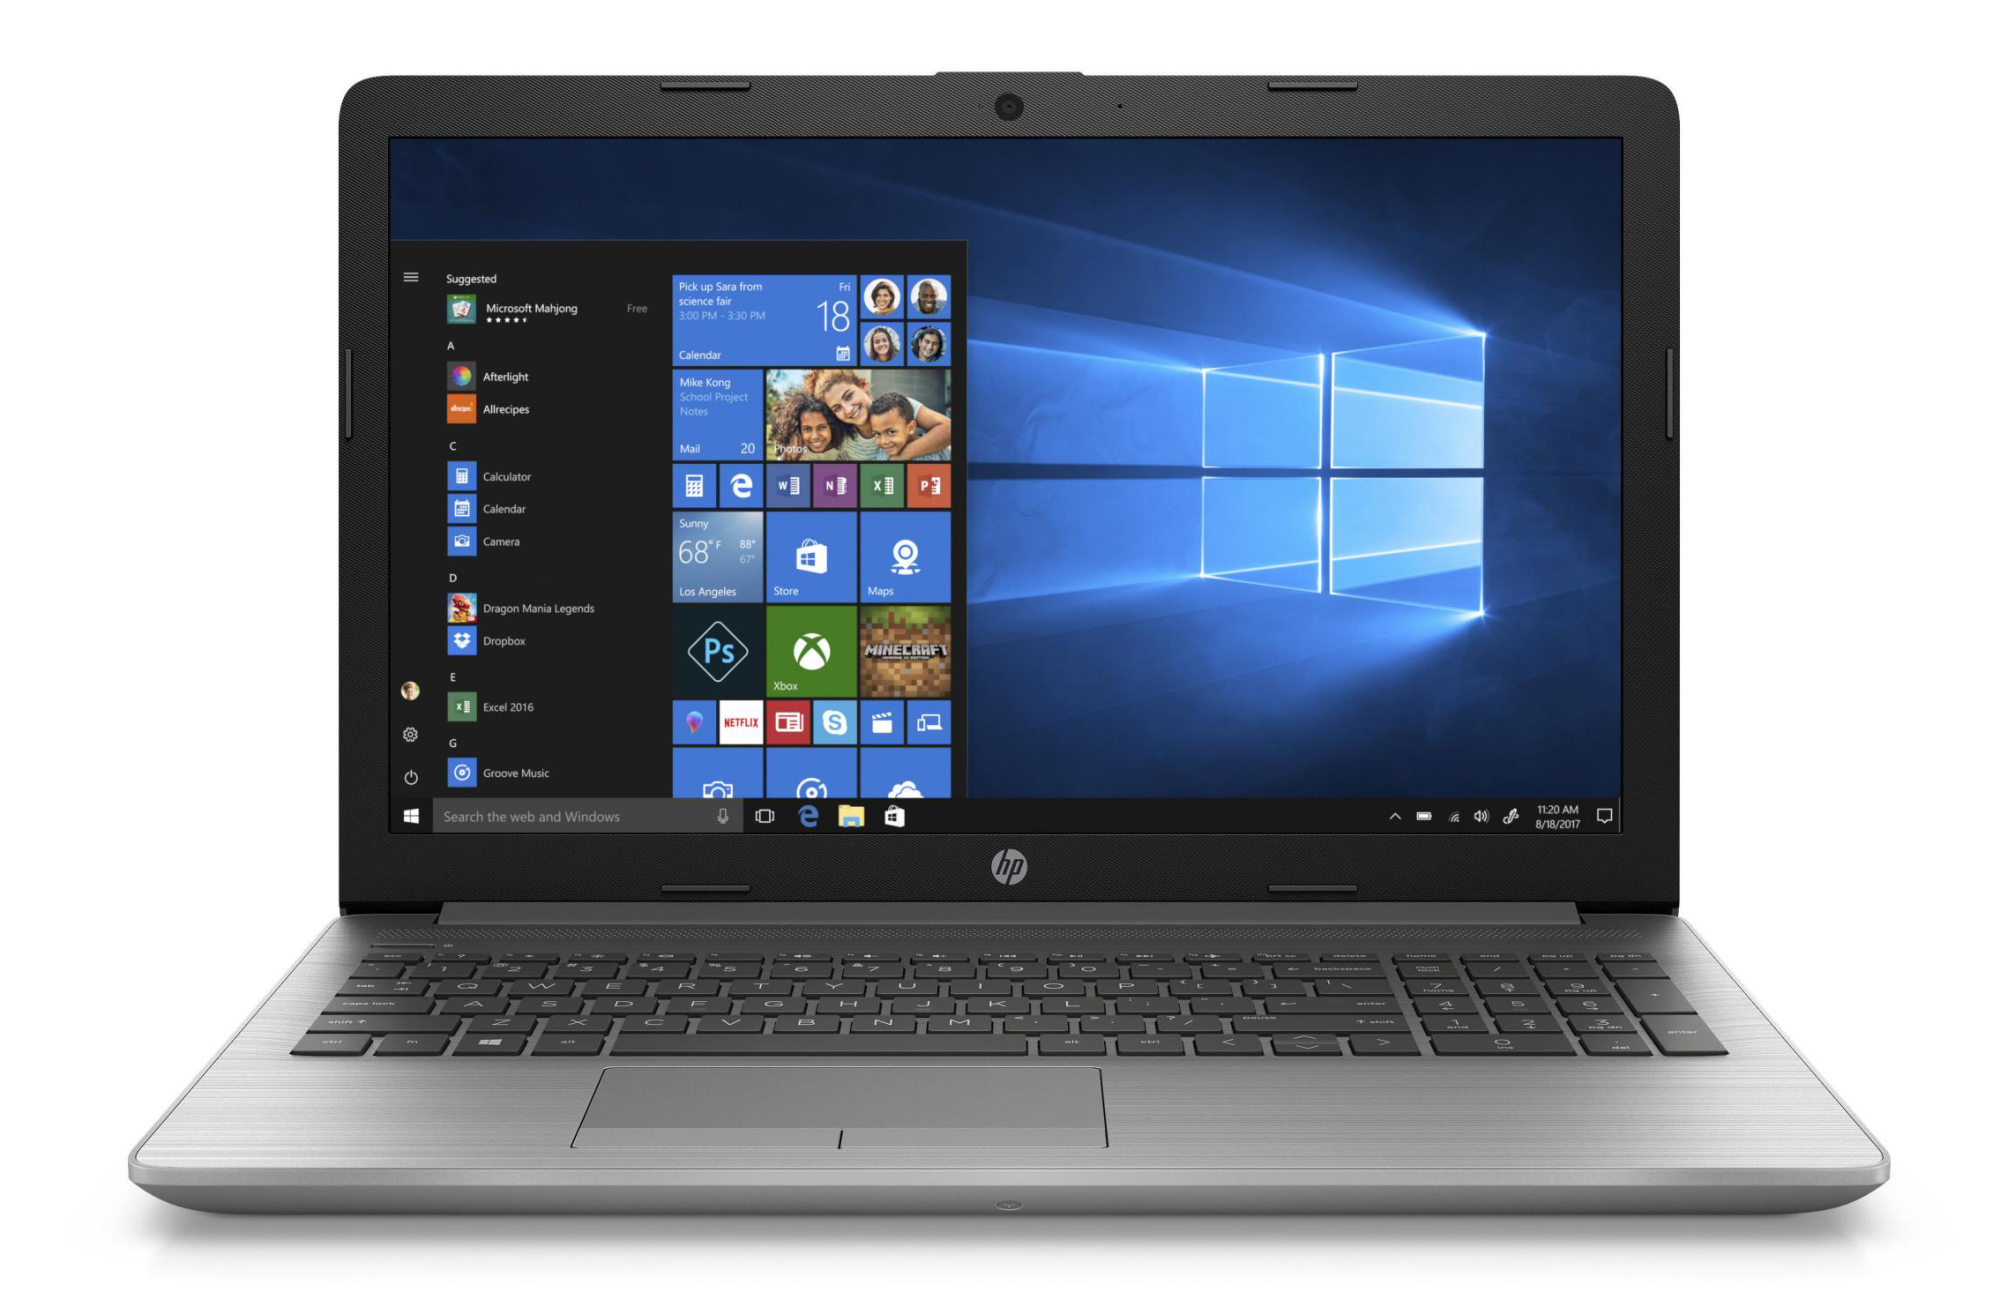
Il display è il punto più debole del portatile. HP ha installato un pannello poco luminoso con basso contrasto e angoli di visuale instabili (TN LED, Full HD), che offre anche una scarsa riproduzione dei colori e una copertura dello spazio colore insoddisfacente. Un tale display è assolutamente fuori luogo in un portatile che costa da 600 a 700 Euro (~$720 a ~$850). Il portatile non impressiona nemmeno per quanto riguarda la durata della batteria. Un'autonomia Wi-Fi di poco meno di 5.5 ore non farà impazzire nessuno.
Anche la licenza Windows 10 Pro incide sul prezzo elevato della variante di configurazione che abbiamo testato. Le versioni identicamente equipaggiate con Windows 10 Home sono un po' più economiche. Tuttavia, il prezzo non è in linea con le prestazioni fornite qui. Il livello di prezzo sarebbe solo marginalmente giustificabile se fossero installati un buon (!) display IPS e due moduli di memoria.
HP 255 G7 159P1EA
- 12/10/2022 v7 (old)
Sascha Mölck
Price comparison
