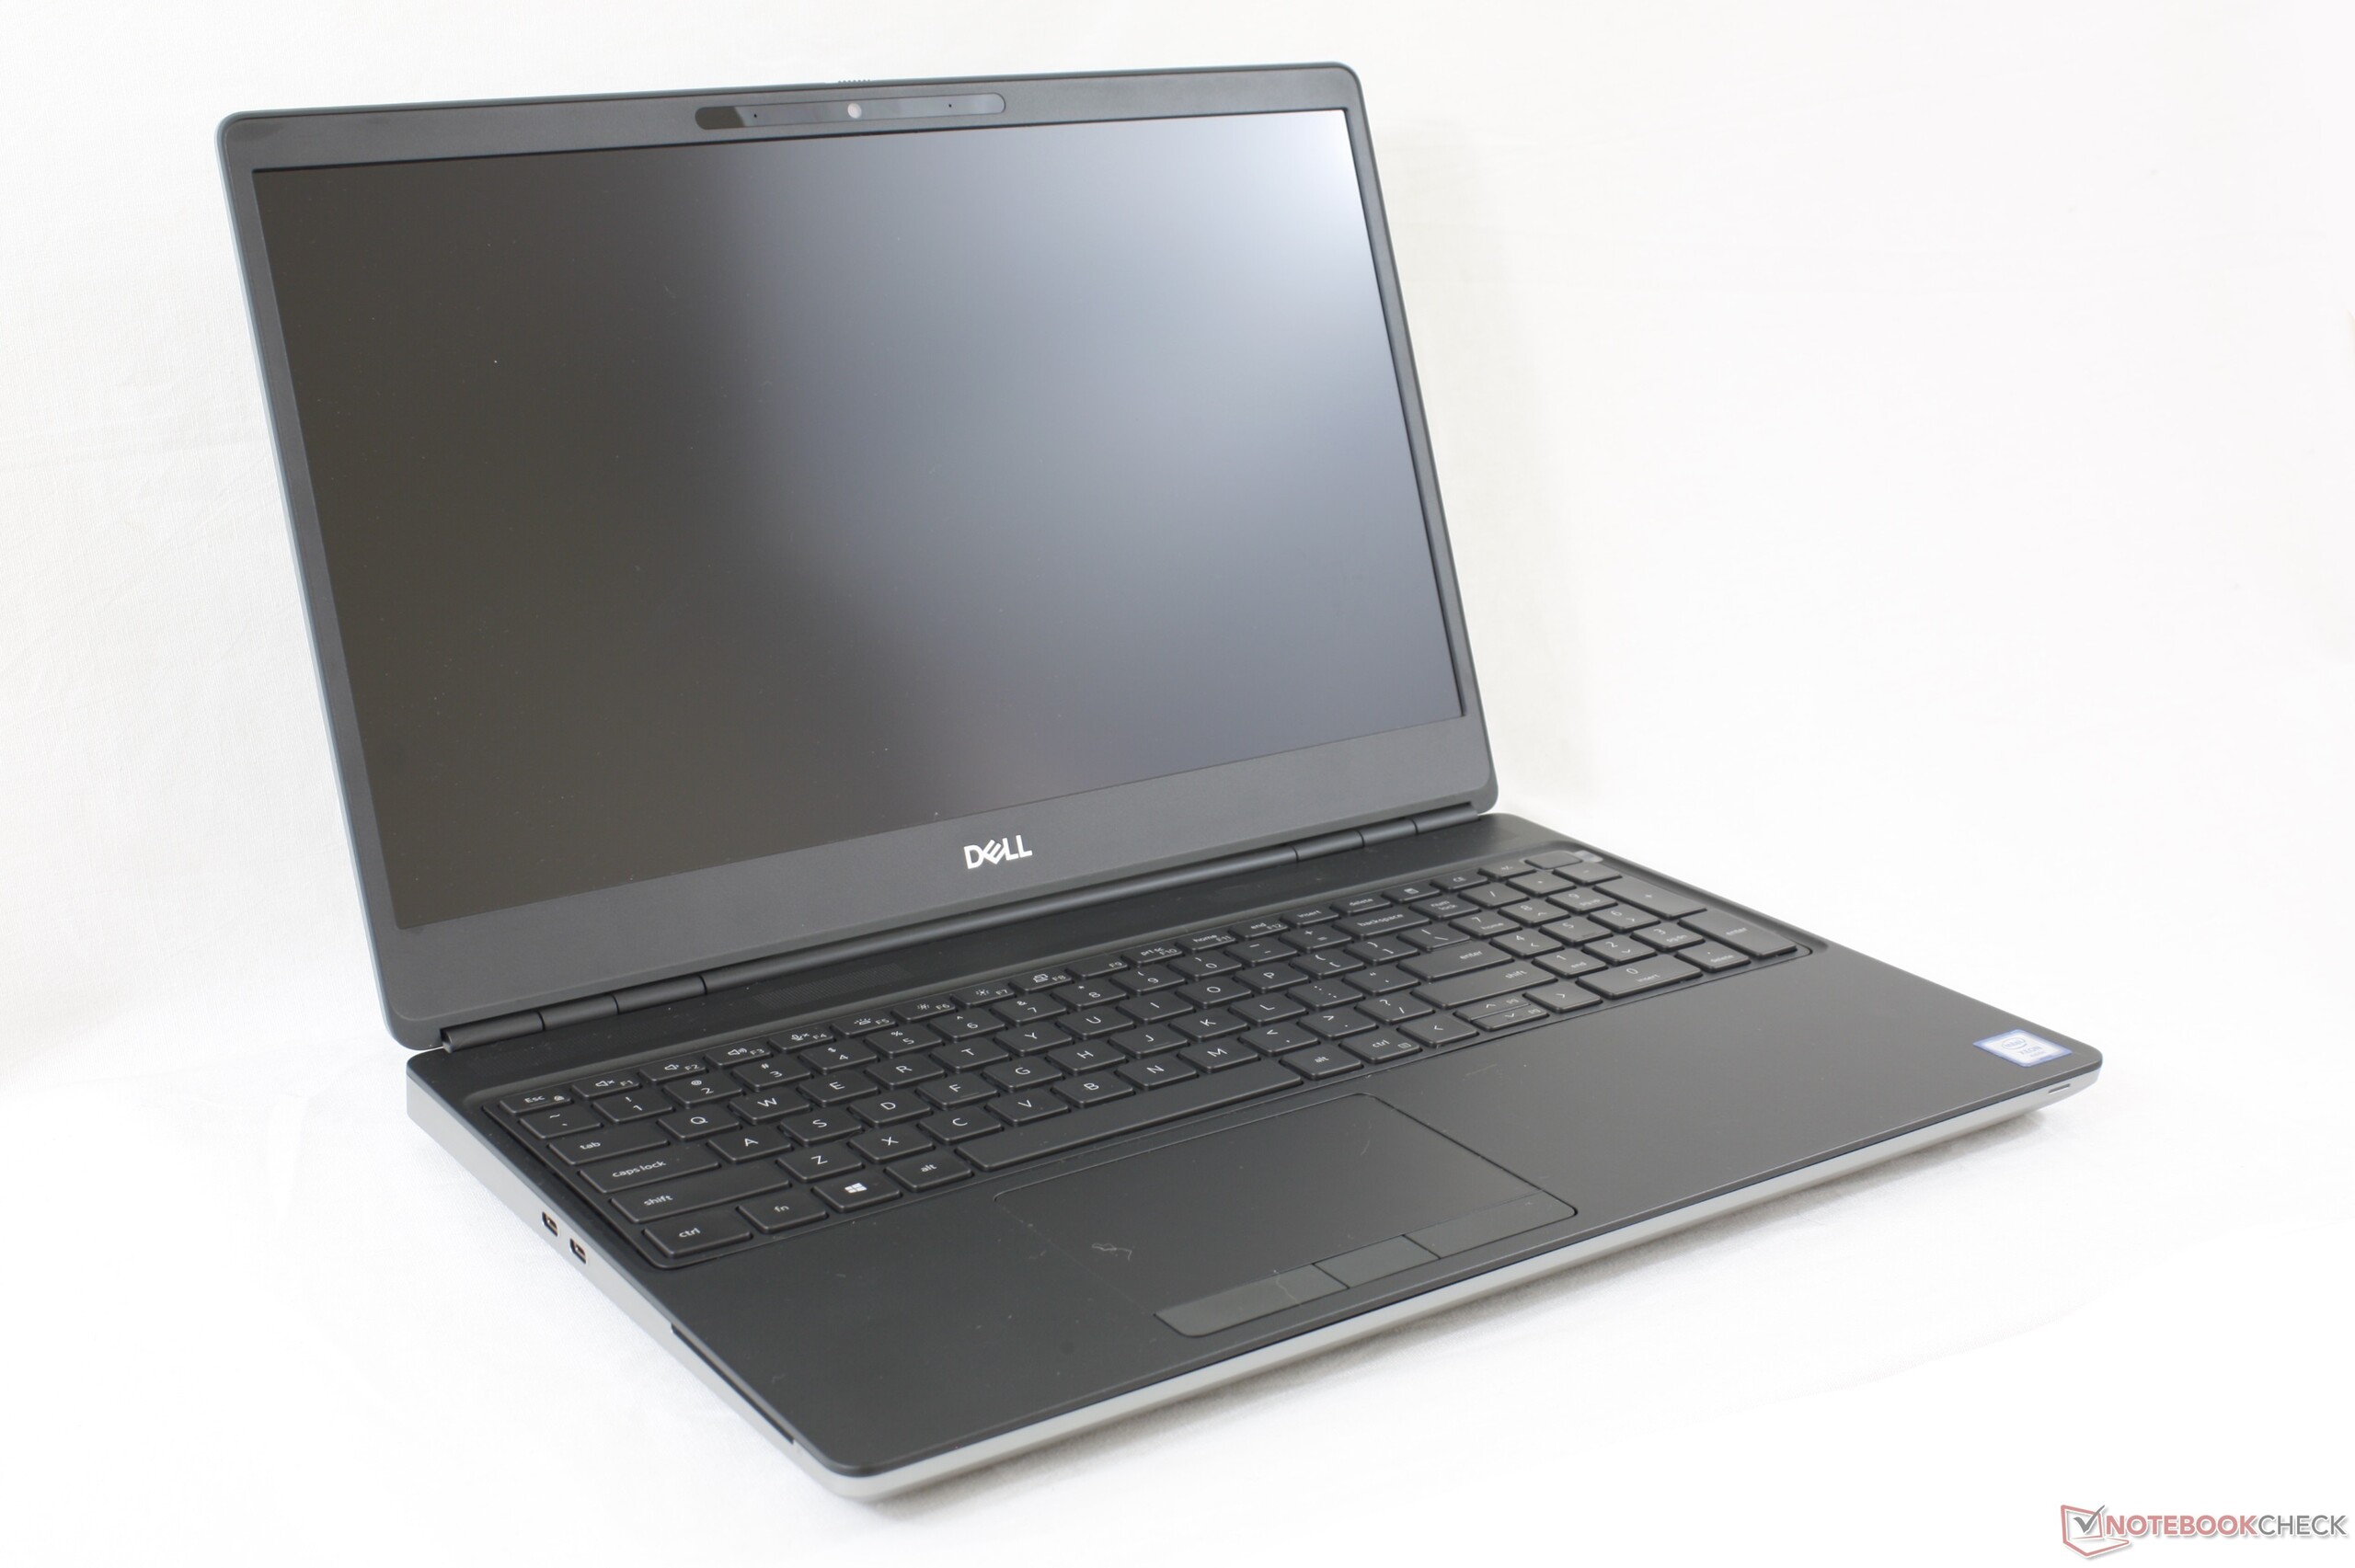
Recensione della Workstation Mobile Dell Precision 7550: L'antitesi del Precision 5550
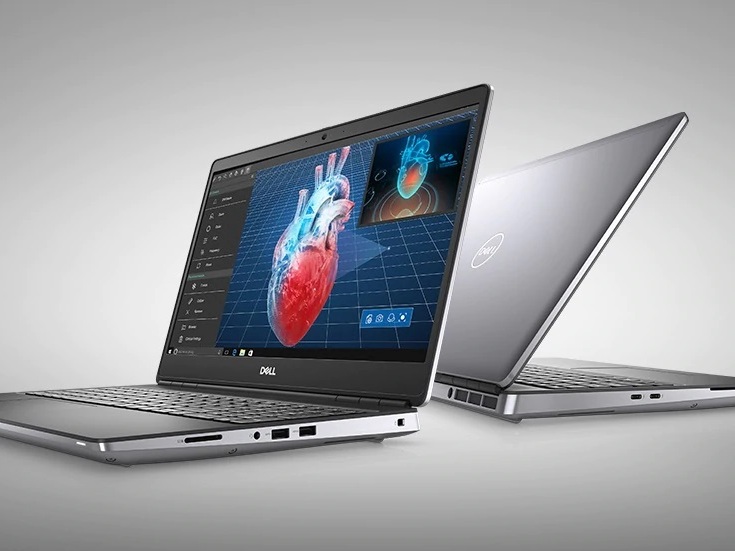
Ne avete abbastanza di computer portatili gaming ultrasottili o di Ultrabook mascherati da workstations mobili? Se è così, allora il Dell Precision 7550 da 15,6 pollici dovrebbe stuzzicare la vostra fantasia. Questo design del telaio succede all'ultima generazione Precision 7540 ed è stato costruito da zero per essere una workstation mobile a grandezza naturale, in contrasto con il Razer Blade 15 Studio, Precision 5550, o MSI WS66 che sono tutti basati su design di consumo ultrasottili già esistenti. Il Precision 7550 porta una serie di vantaggi e alcuni svantaggi che andremo oltre.
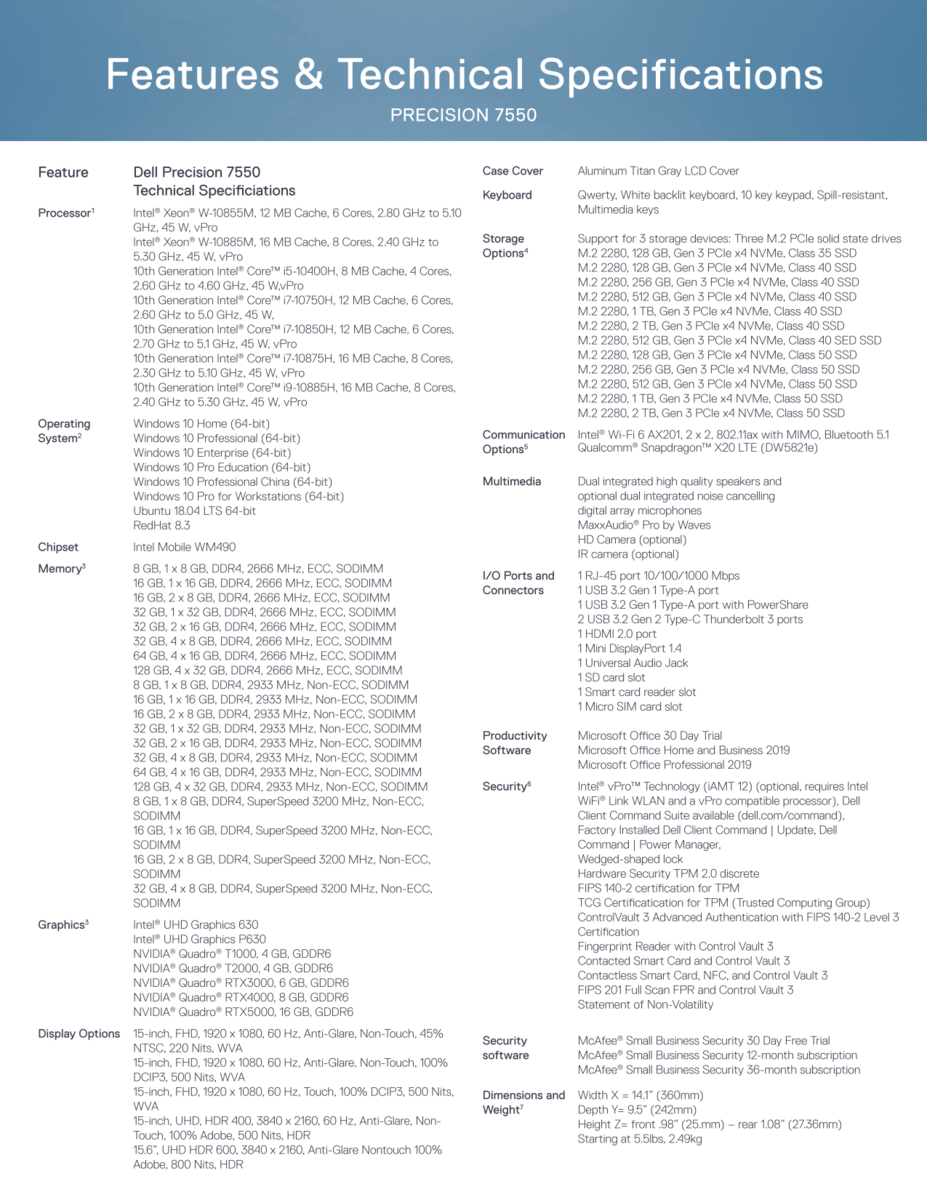
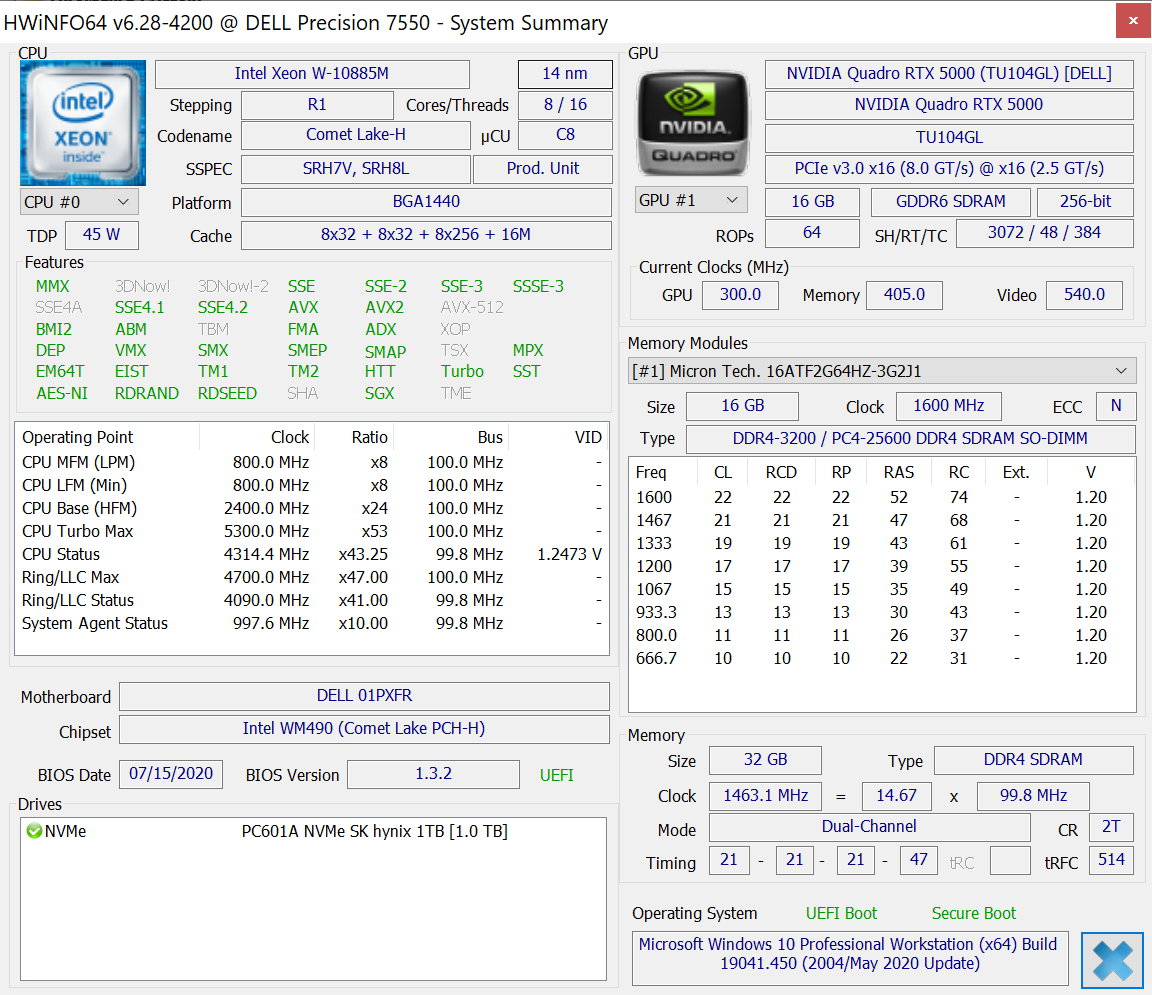
Dell offre una gamma molto ampia di opzioni di configurazione che vanno dal Core i5-10400H fino alla CPU Xeon W-10885M, UHD Graphics 630 fino alla Quadro RTX 5000 Max-Q, FHD fino al display UHD 4K e persino fino a 128 GB di RAM ECC. Tra i concorrenti diretti vi sono il Lenovo ThinkPad P53, HP ZBook 15 o la serie di workstation Fujitsu Celsius. È disponibile anche una versione da 17,3 pollici chiamata Precision 7750.
Altre recensioni Dell:
Punteggio | Data | Modello | Peso | Altezza | Dimensione | Risoluzione | Prezzo |
|---|---|---|---|---|---|---|---|
| 87.8 % v7 (old) | 09/2020 | Dell Precision 7550 W-10885M, Quadro RTX 5000 Max-Q | 2.8 kg | 27.36 mm | 15.60" | 3840x2160 | |
v (old) | Dell Precision 7540 i9-9980HK, Quadro RTX 3000 (Laptop) | 2.8 kg | 25 mm | 15.60" | 3840x2160 | ||
| 86.3 % v7 (old) | 08/2020 | Dell Precision 5550 P91F i7-10875H, Quadro T2000 Max-Q | 2 kg | 18 mm | 15.60" | 3840x2400 | |
| 82.1 % v7 (old) | 06/2020 | Acer ConceptD 3 Pro CN315-71P-73W1 i7-9750H, Quadro T1000 (Laptop) | 2.4 kg | 23.4 mm | 15.60" | 1920x1080 | |
| 89.8 % v7 (old) | 11/2019 | Lenovo ThinkPad P53-20QN000YGE i7-9850H, Quadro RTX 5000 Max-Q | 2.7 kg | 29.4 mm | 15.60" | 1920x1080 | |
| 84.4 % v7 (old) | 12/2018 | HP ZBook Studio G5-4QH10EA i7-8750H, Quadro P1000 | 2.1 kg | 18.9 mm | 15.60" | 3840x2160 |
Case
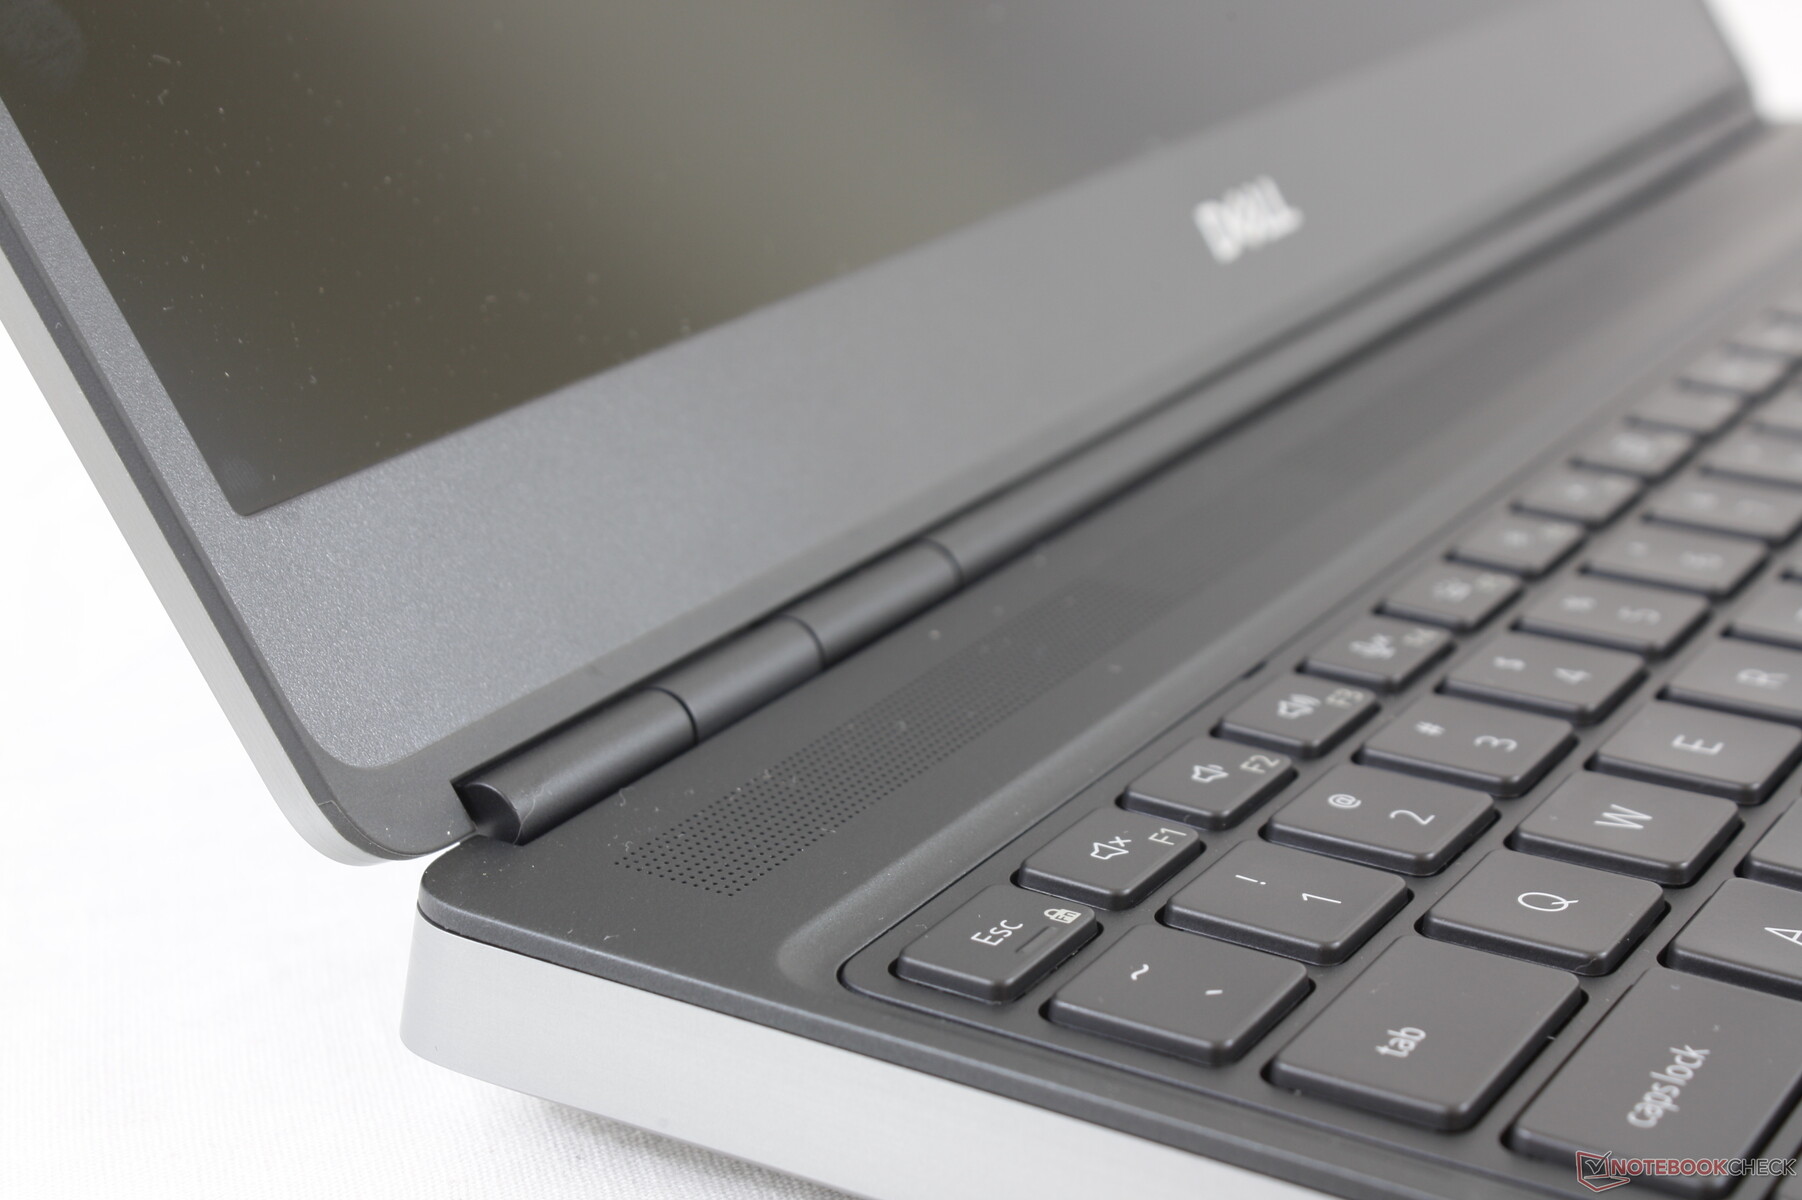
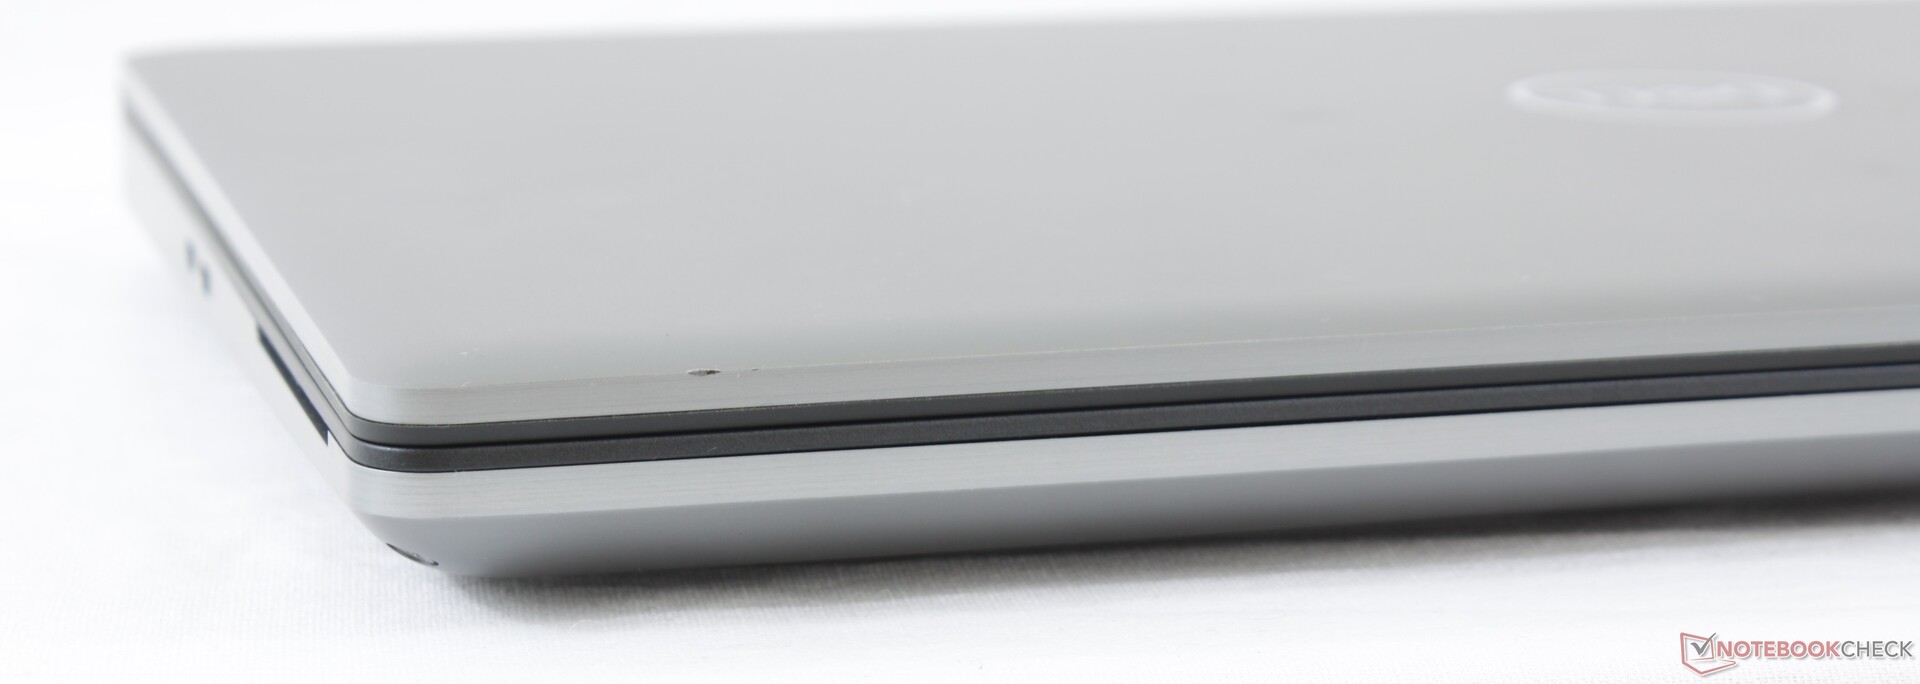
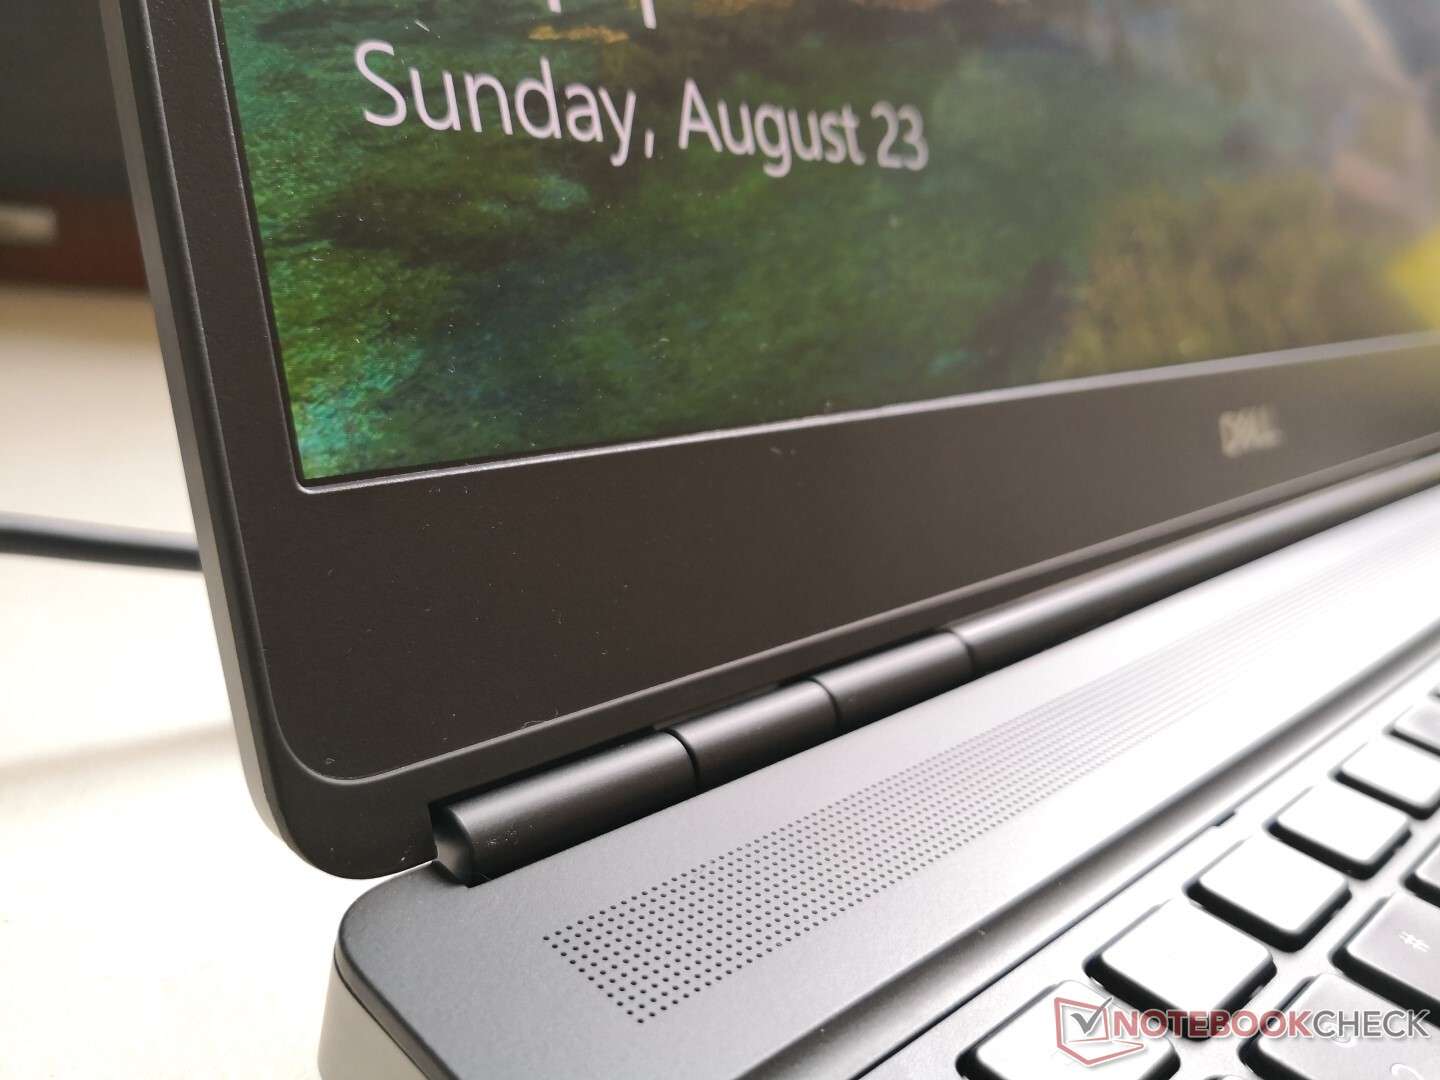
Il telaio è certificato MIL-STD 810G e per lo più in metallo ed dà una prima impressione più resistente rispetto al ThinkPad P53 in fibra di carbonio. Il suo telaio è spesso e fornisce una migliore sensazione di longevità che altrimenti non si vede su molti portatili consumer.
Per quanto forte possa essere il telaio, tuttavia, abbiamo notato alcuni difetti fisici sulla nostra unità di prova, tra cui un intaglio vicino al bordo anteriore, alcune griglie di ventilazione piegate lungo la parte posteriore, uno spazio irregolare tra il bordo anteriore della piastra inferiore e i poggiapolsi, e un altro spazio irregolare lungo il bordo del piano della tastiera, poiché la tastiera è rimovibile. È probabile che questi difetti possano essere collegati al fatto che si tratta di un'unità di prova e non di un'unità di vendita al dettaglio, ma vale la pena di controllarli due volte dopo l'acquisto, non si sa mai.
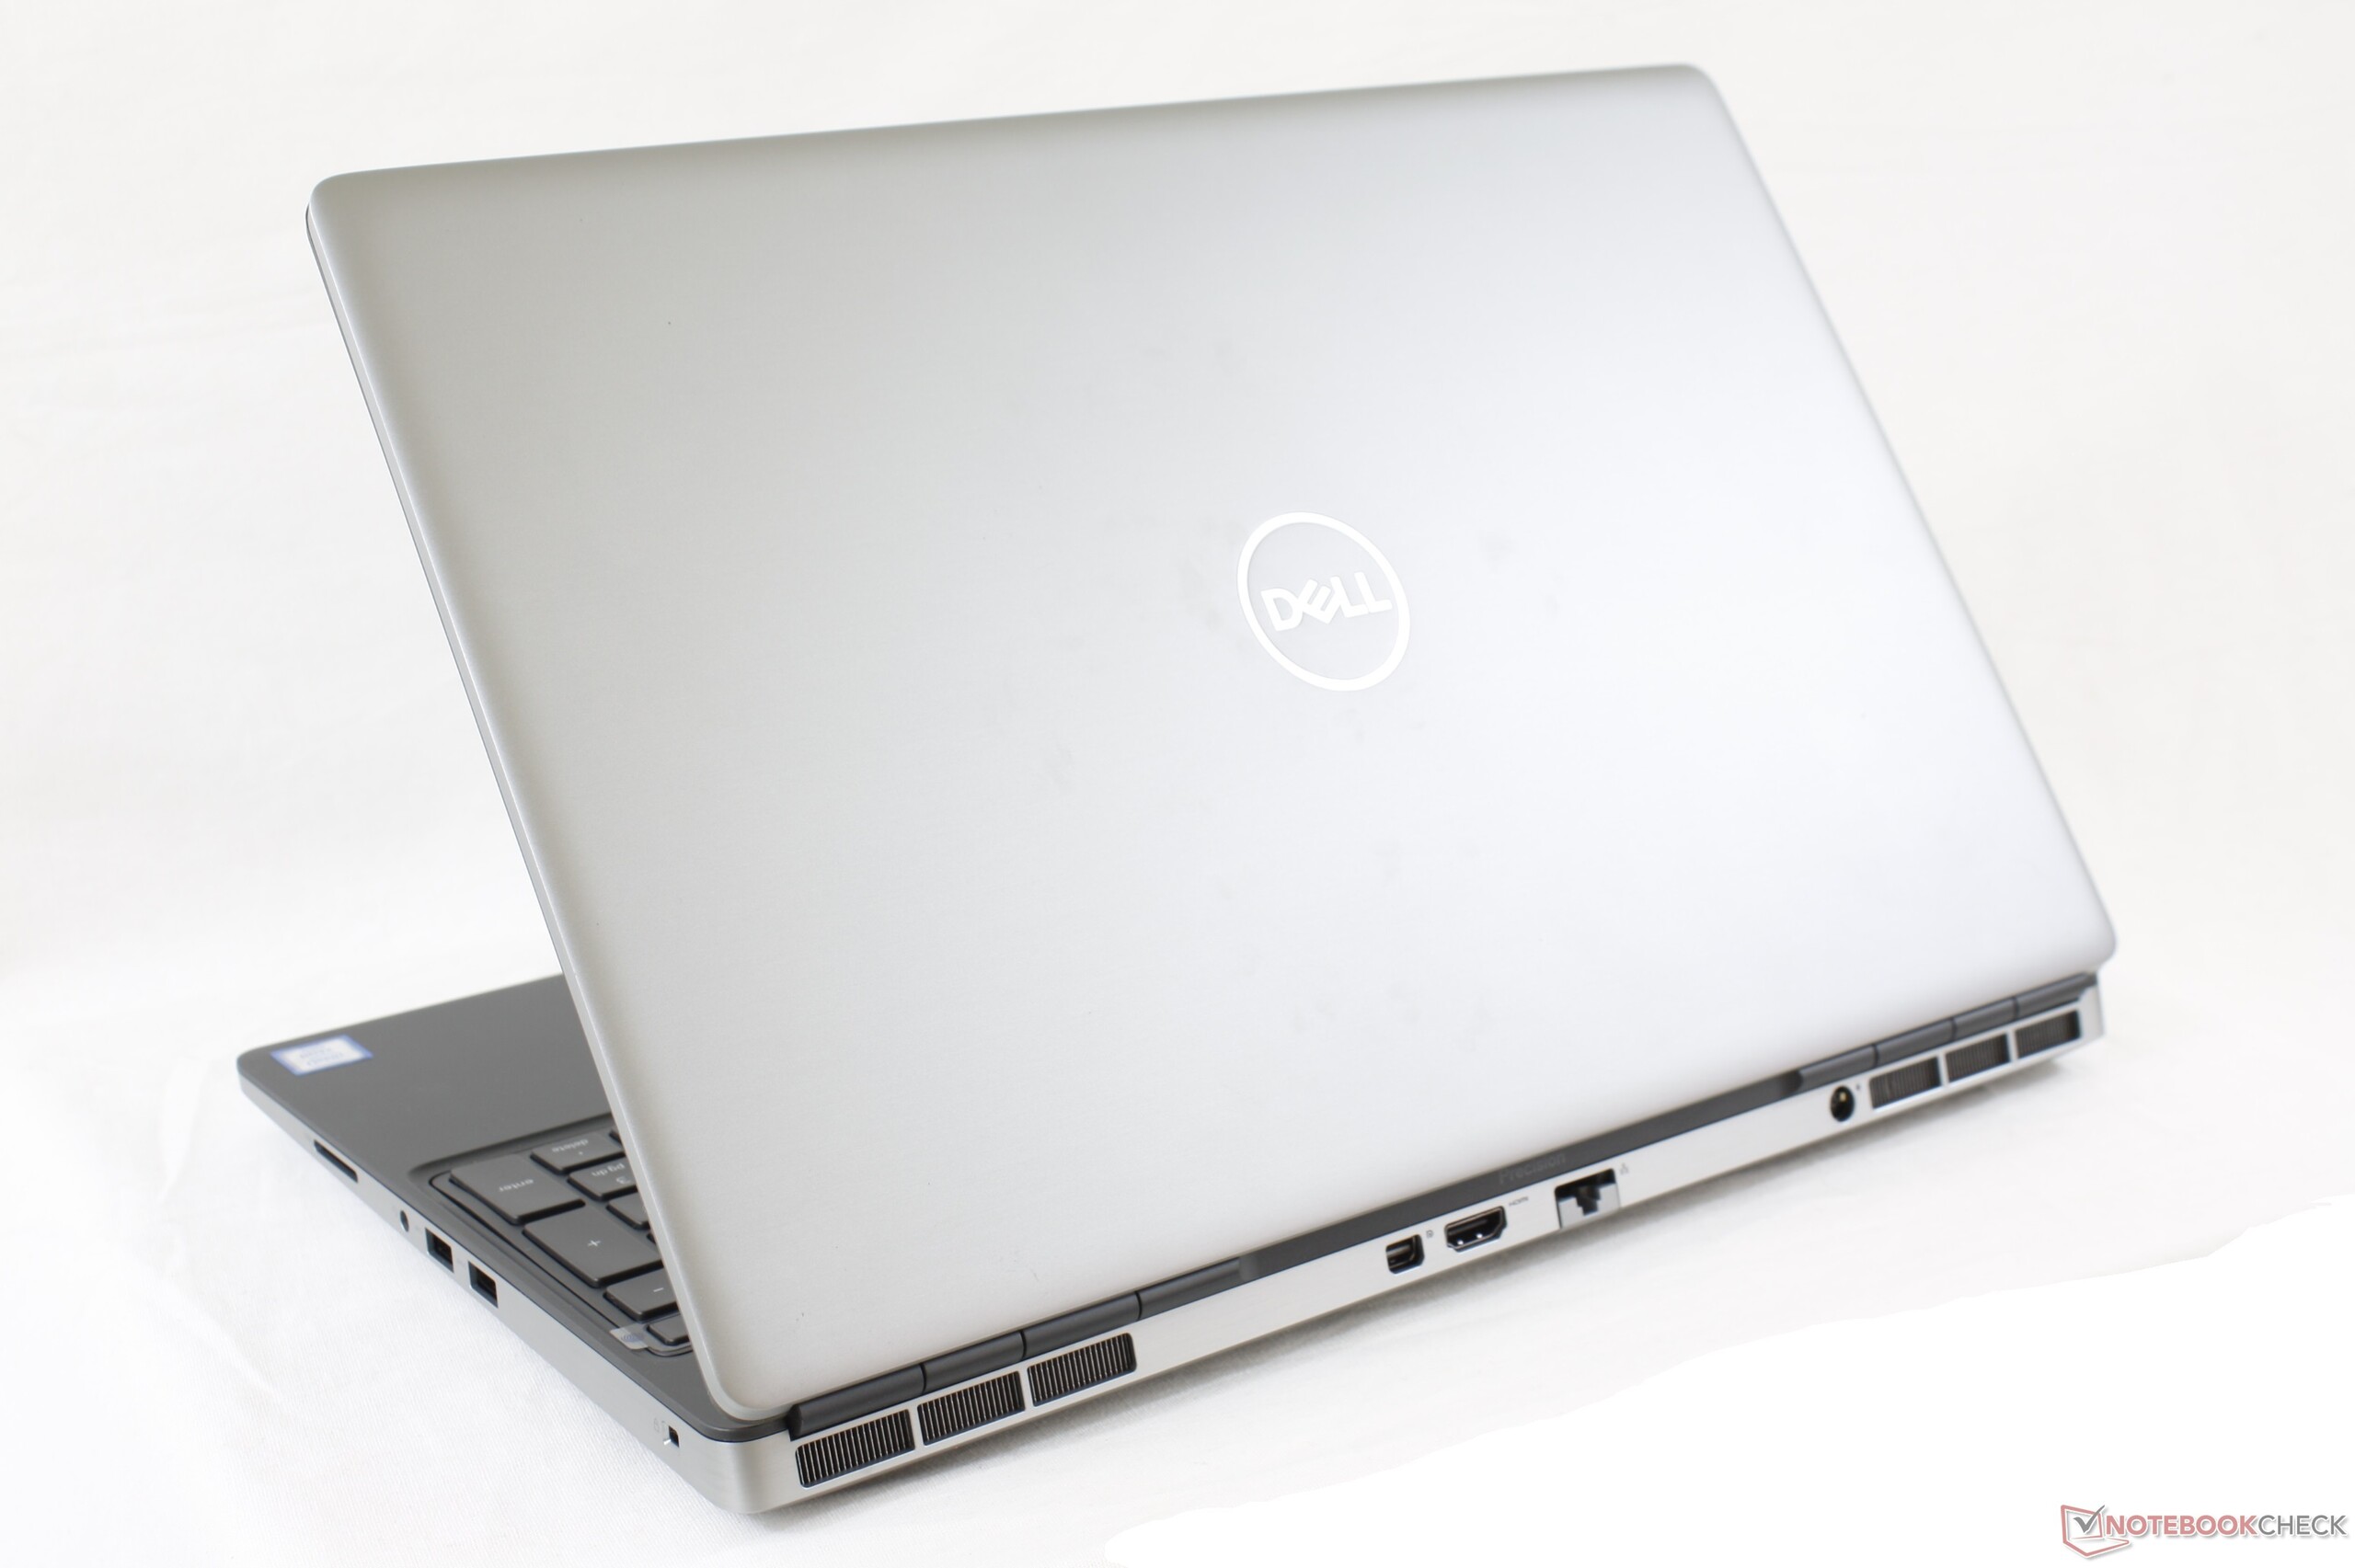
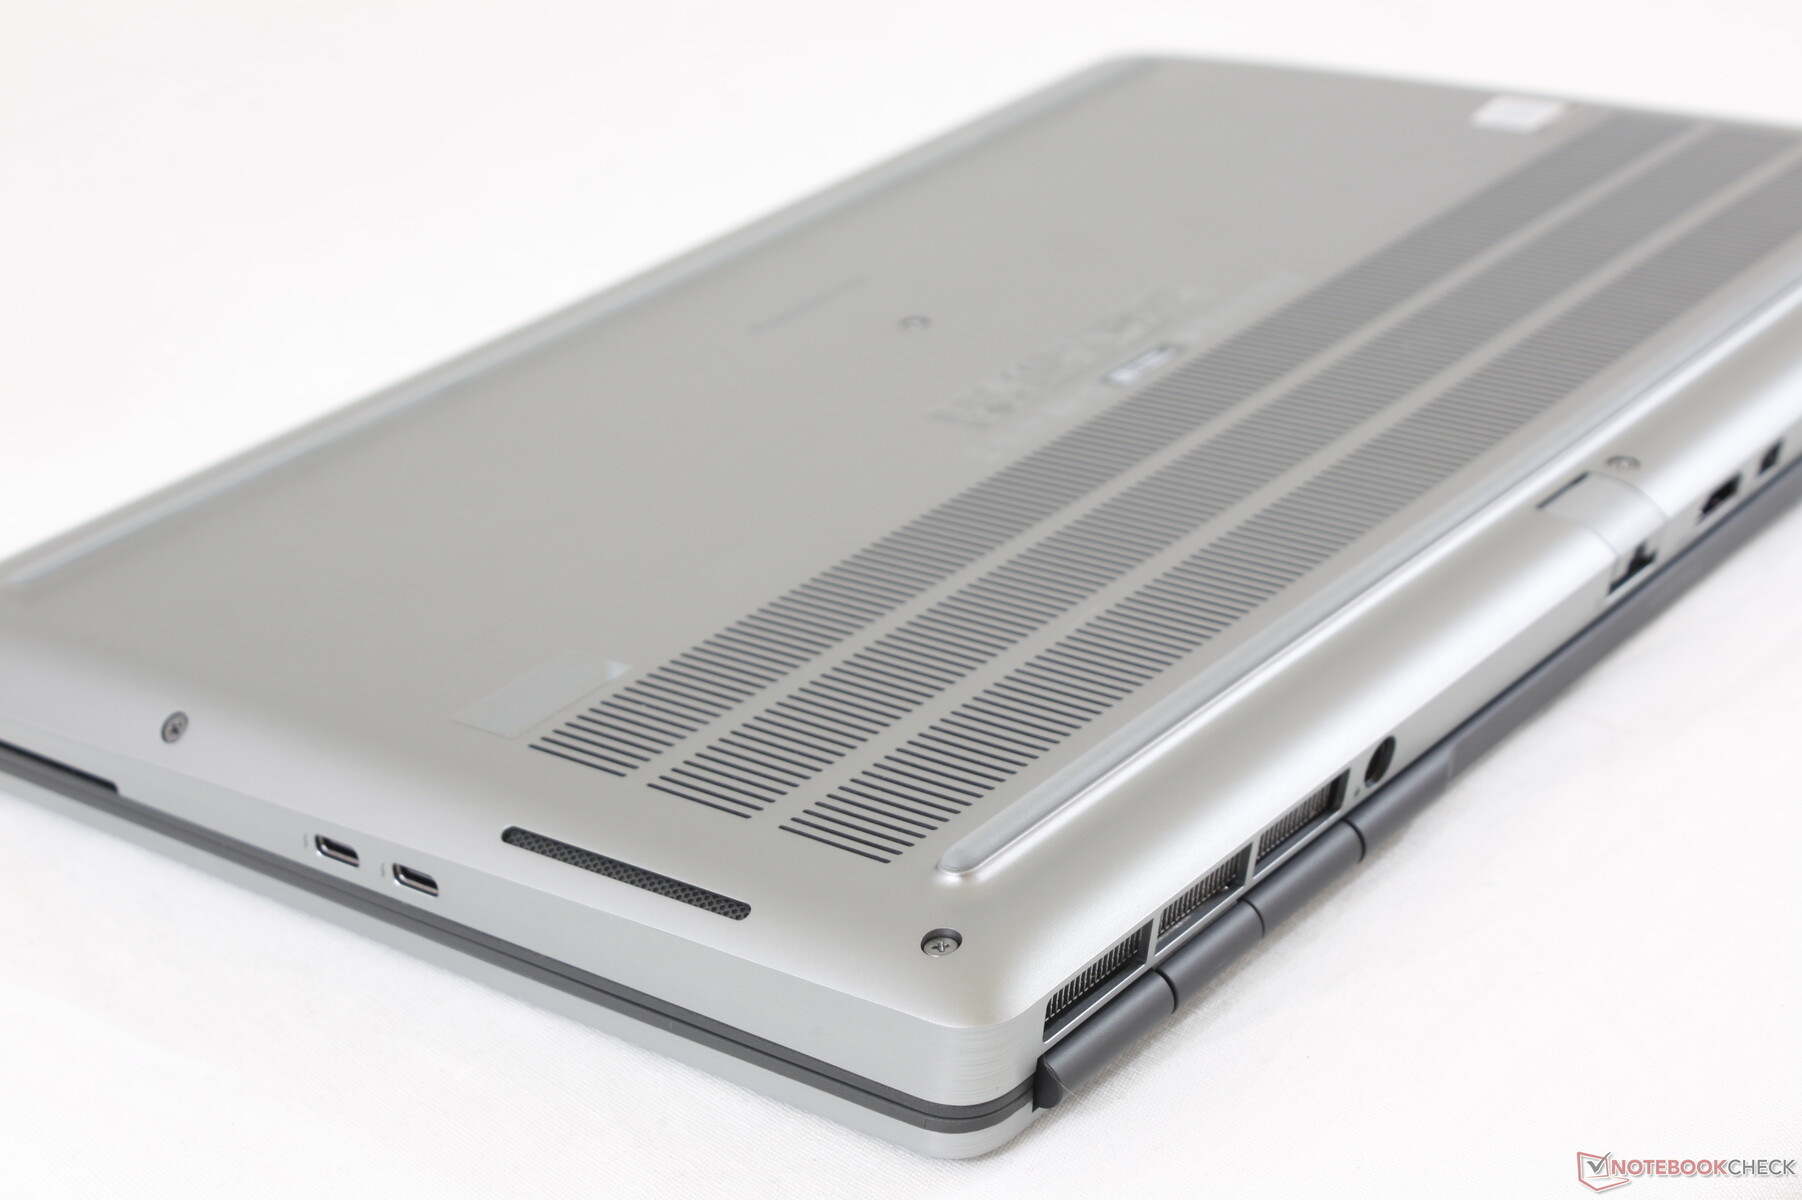
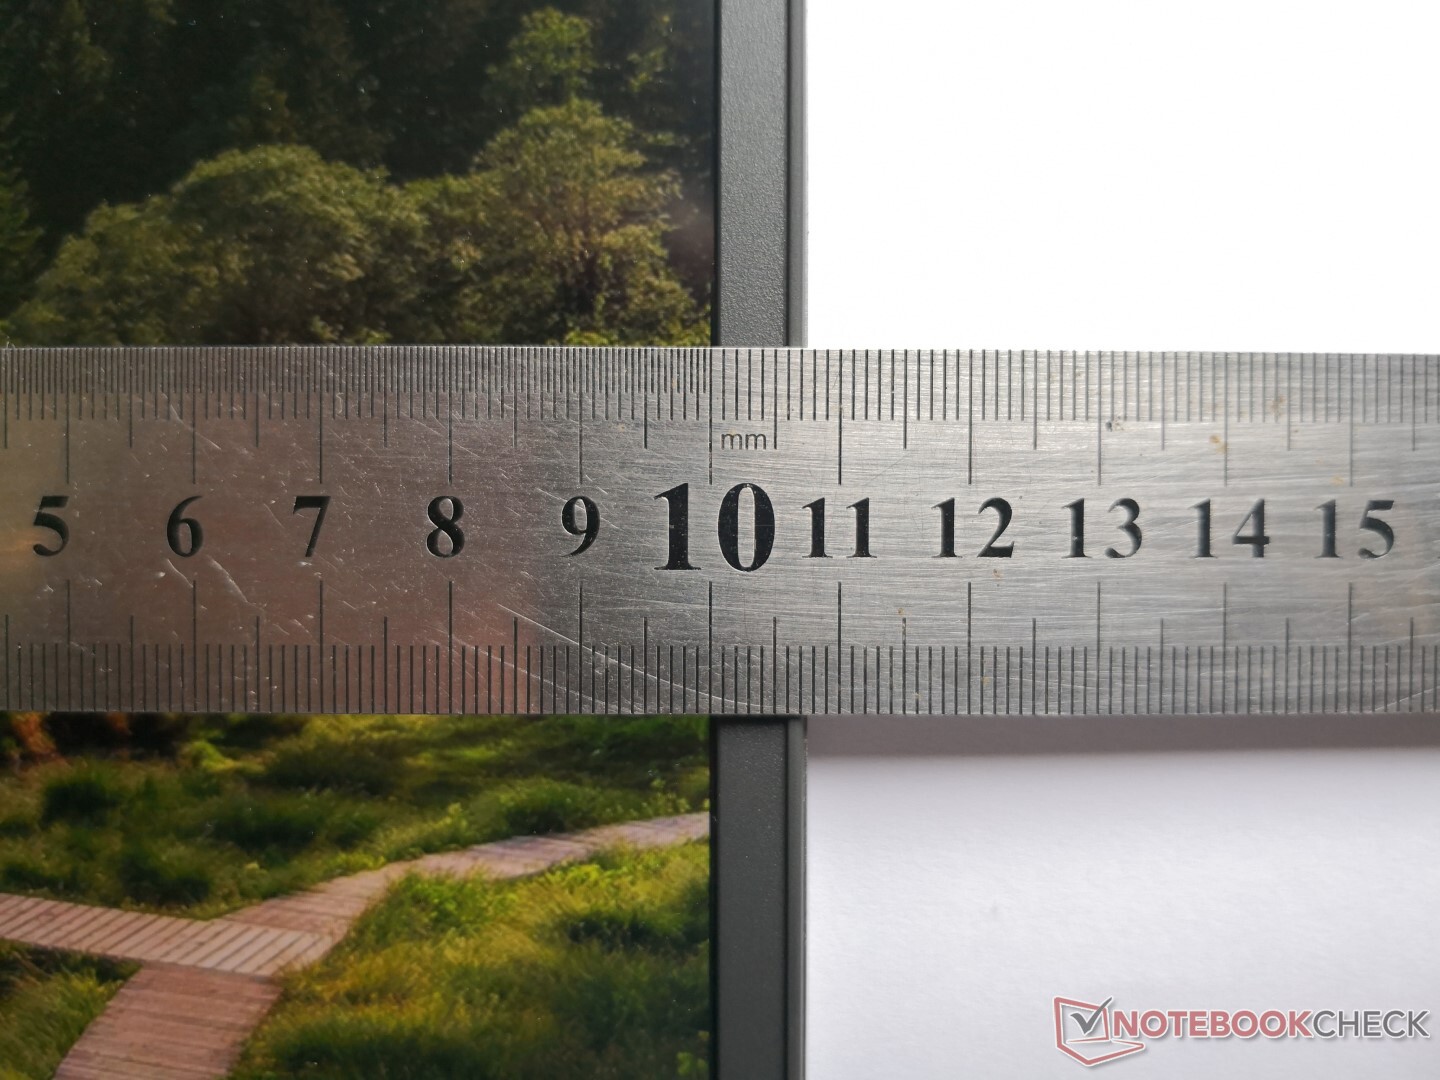
Il telaio è in realtà più spesso del Precision 7540 dell'anno scorso (27,4 mm contro 25 mm), mentre l'ingombro è inferiore grazie al nuovo design a cornice stretta. Il peso non è cambiato, tuttavia, e così il Precision 7550 rimane una delle più pesanti workstation da 15,6" a 2,8 kg. A titolo di confronto, il gaming laptop MSI GE75 da 17,3", molto più grande, arriva "solo" a 2,6 kg. Il peso pesante è una conseguenza del telaio sonoro e della base rigida.
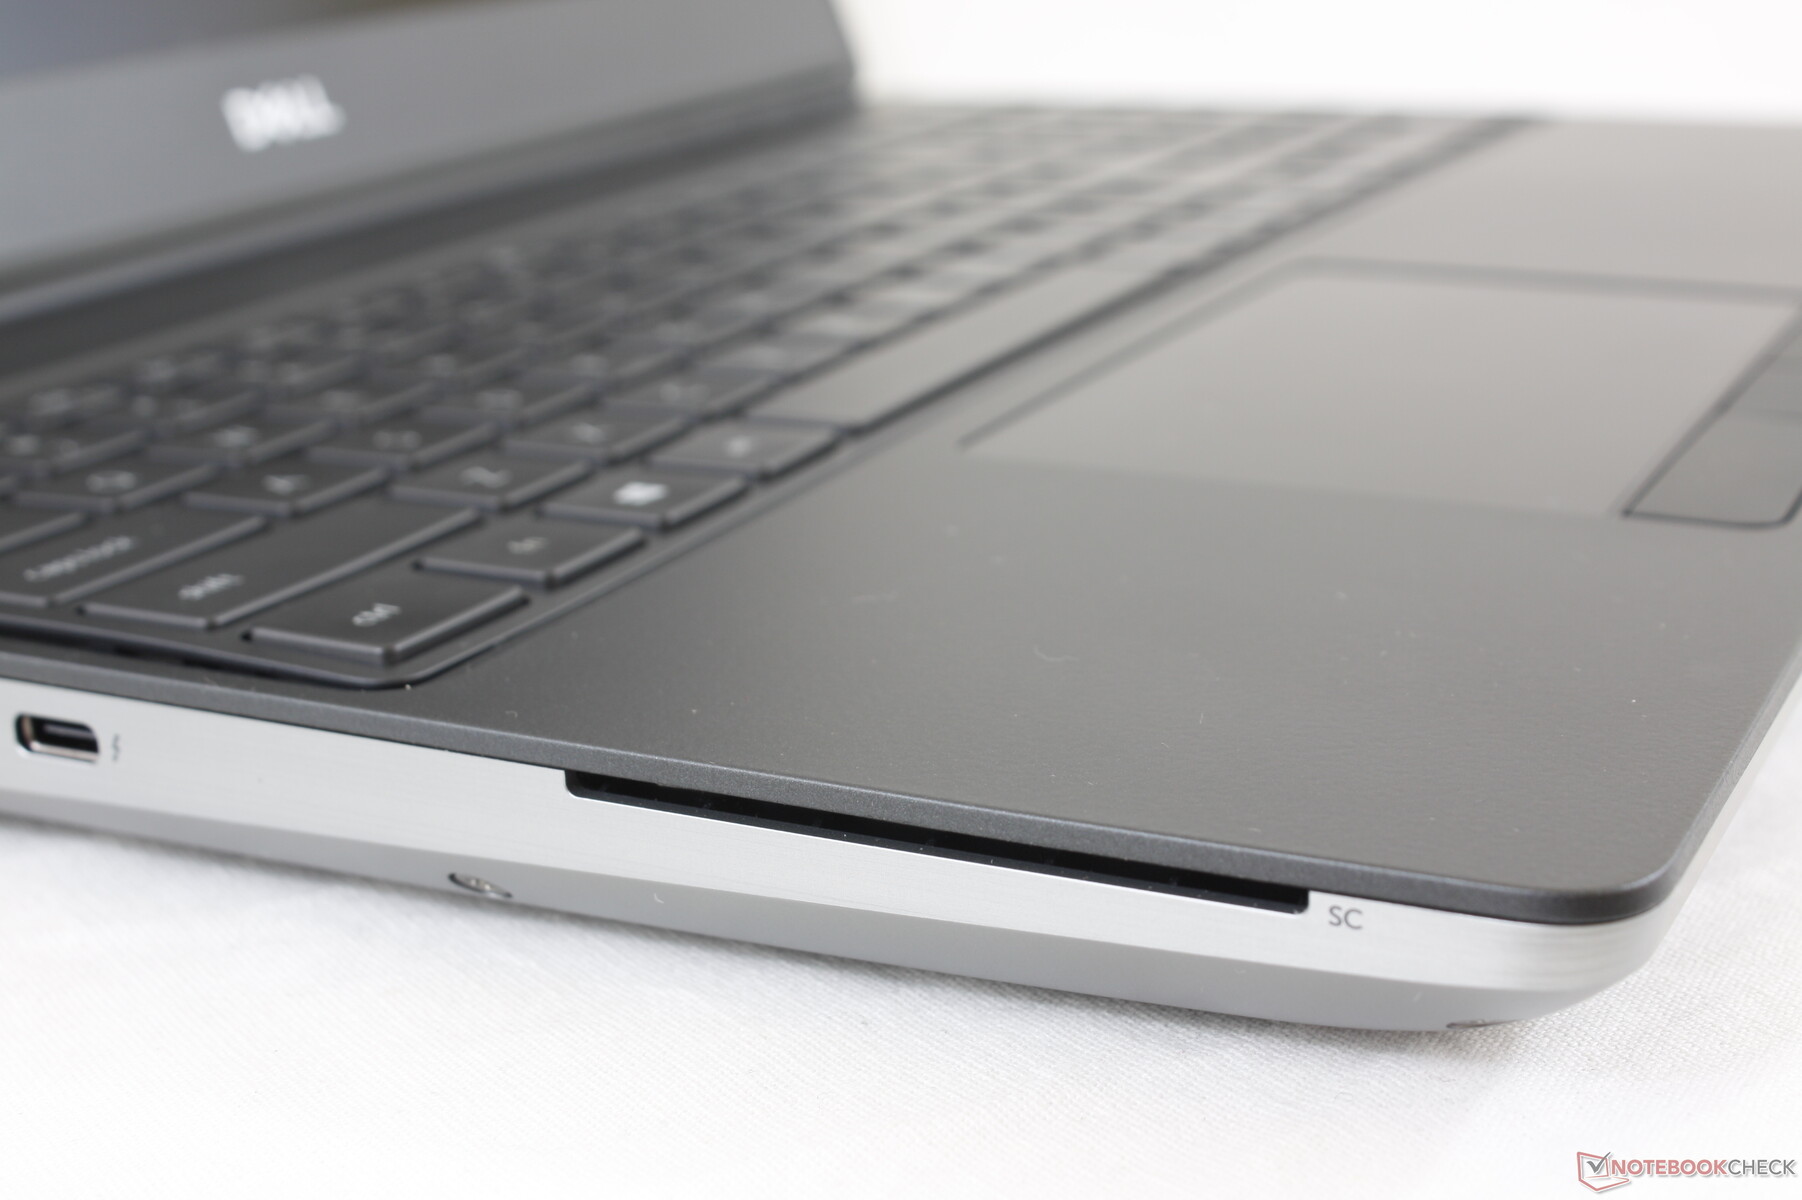
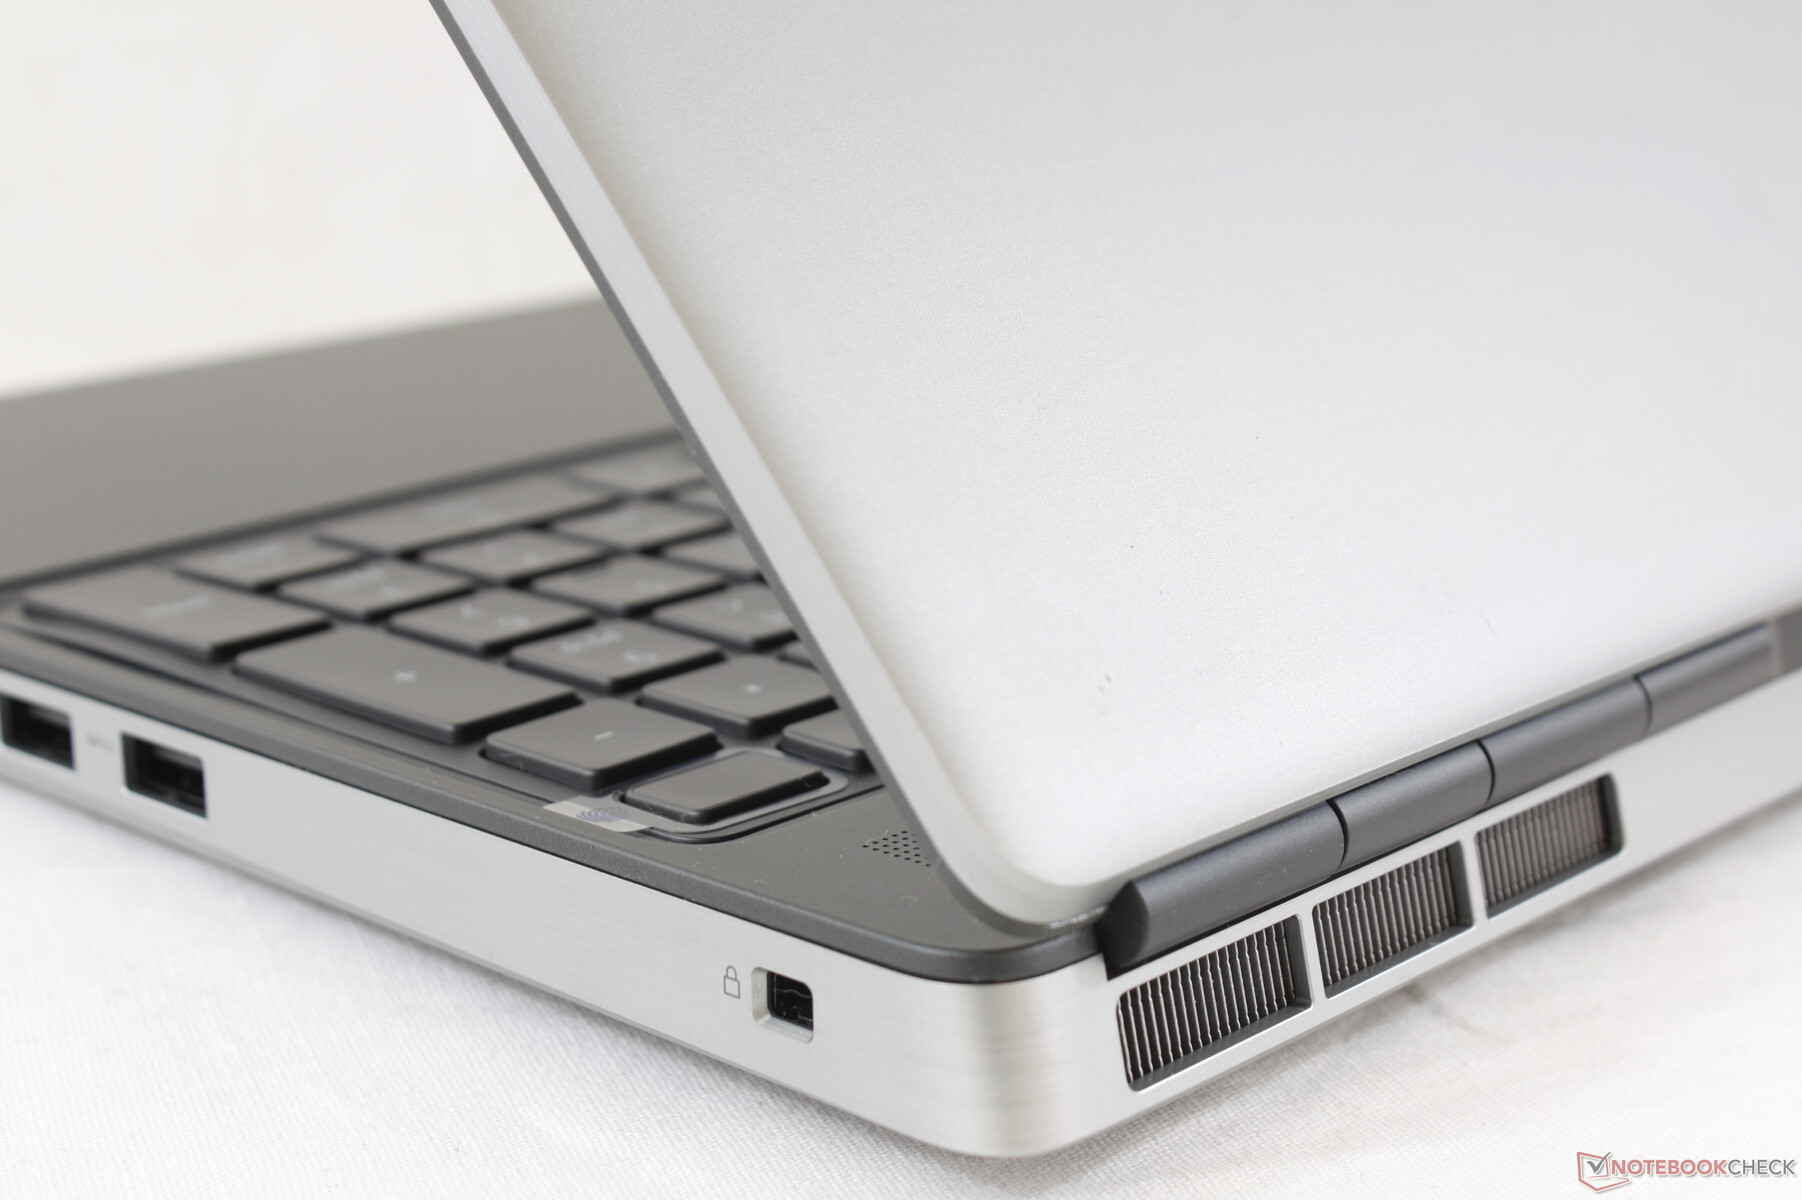
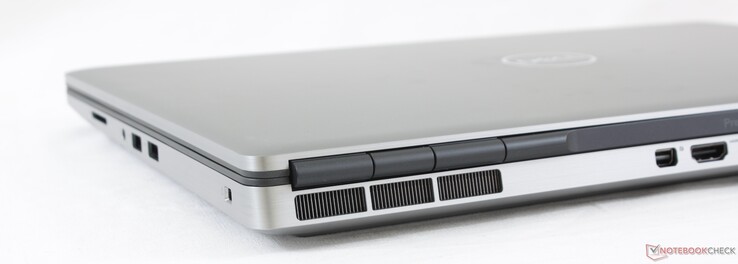
Connessioni
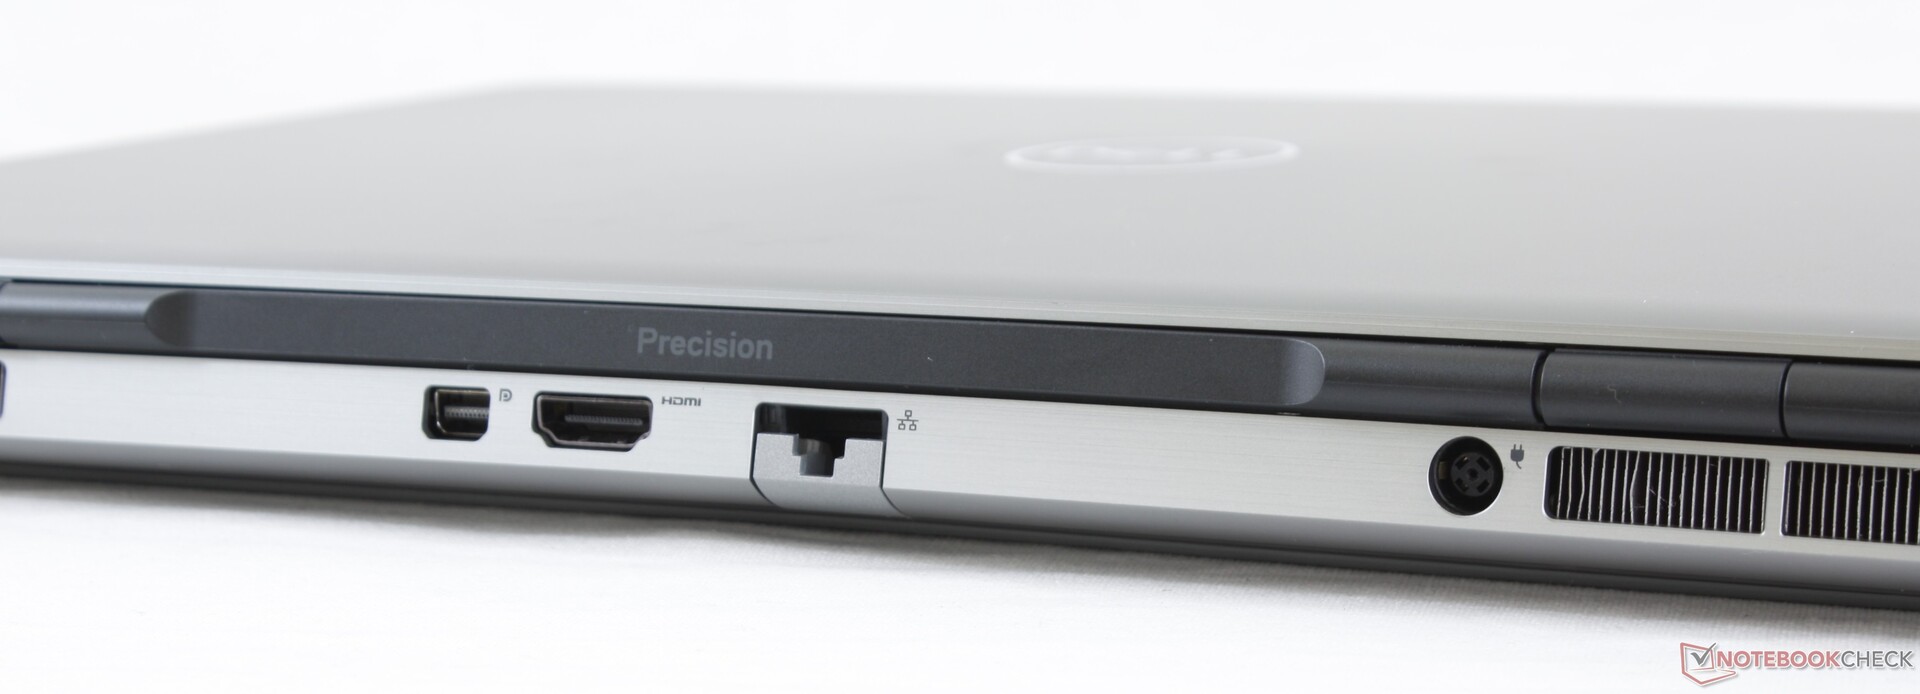
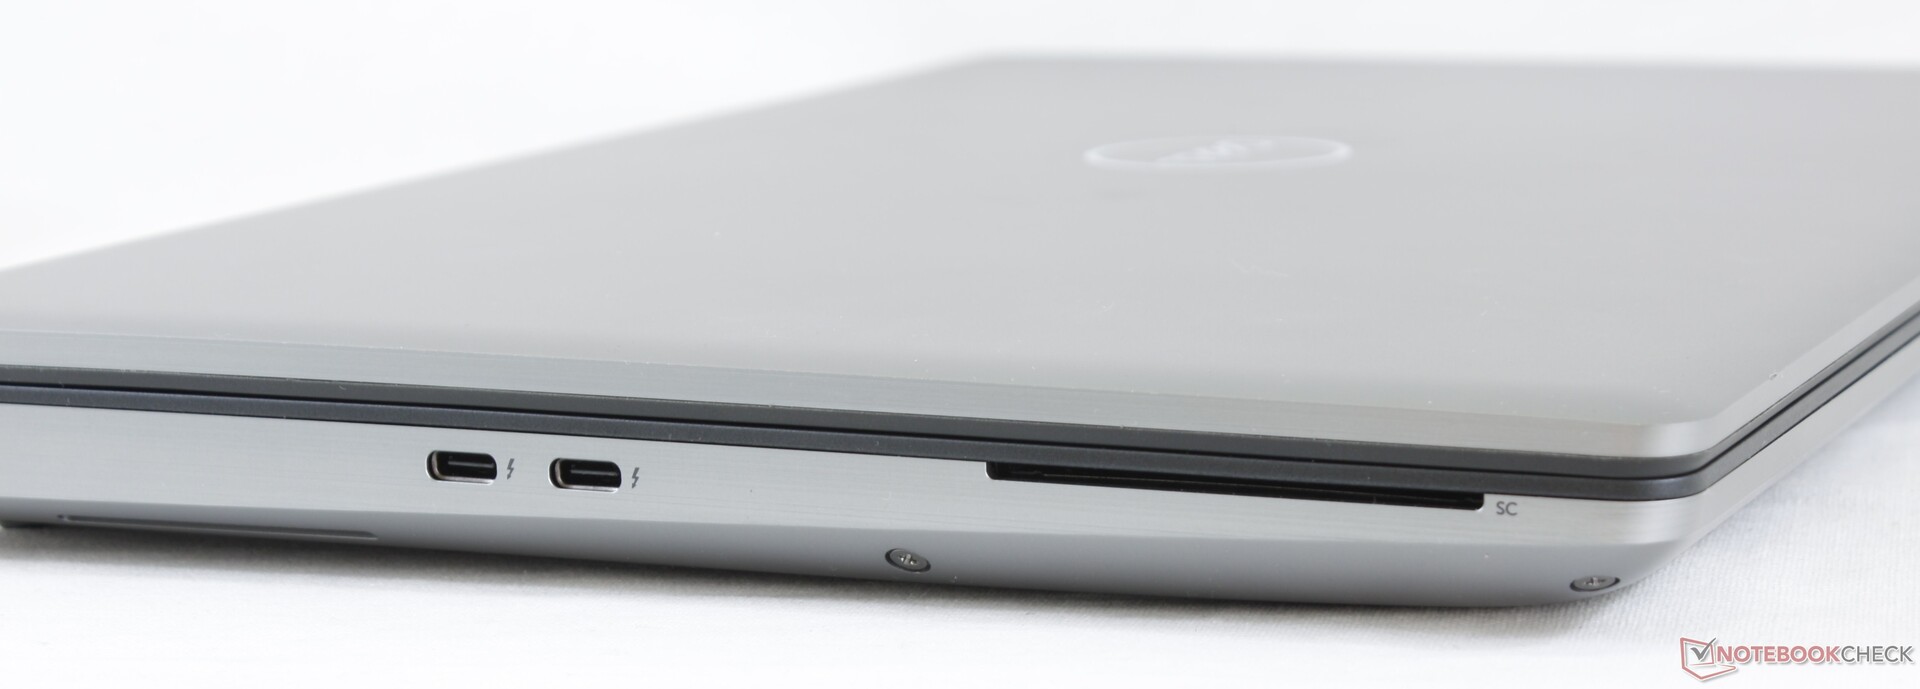
Tutte le porte del Precision 7540 dello scorso anno sono state inserite sul Precision 7550, anche se leggermente riorganizzate. Il ThinkPad P53 della concorrenza ha più porte USB di quanto Dell sia in grado di offrire qui.
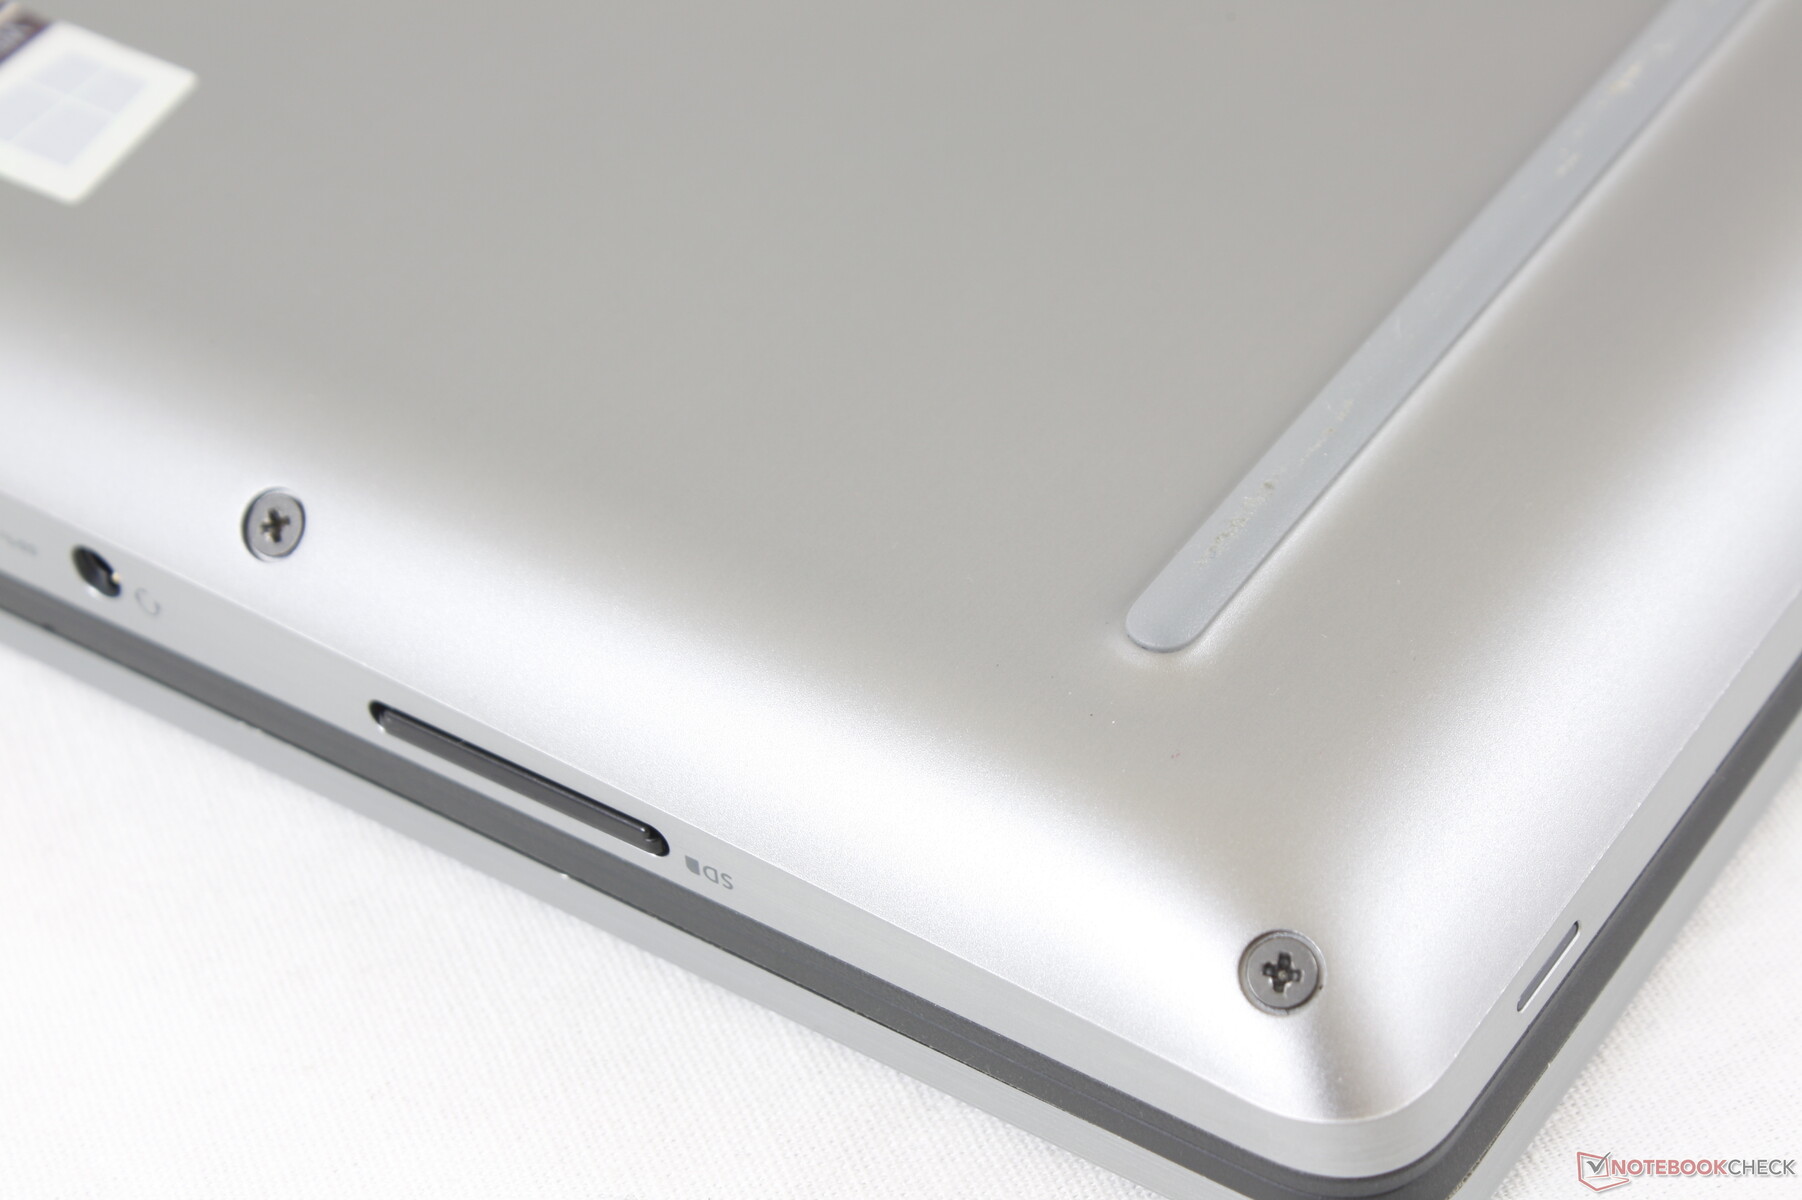
Si noti che lo slot Nano-SIM è interno e non è accessibile all'interno del primo pannello inferiore.
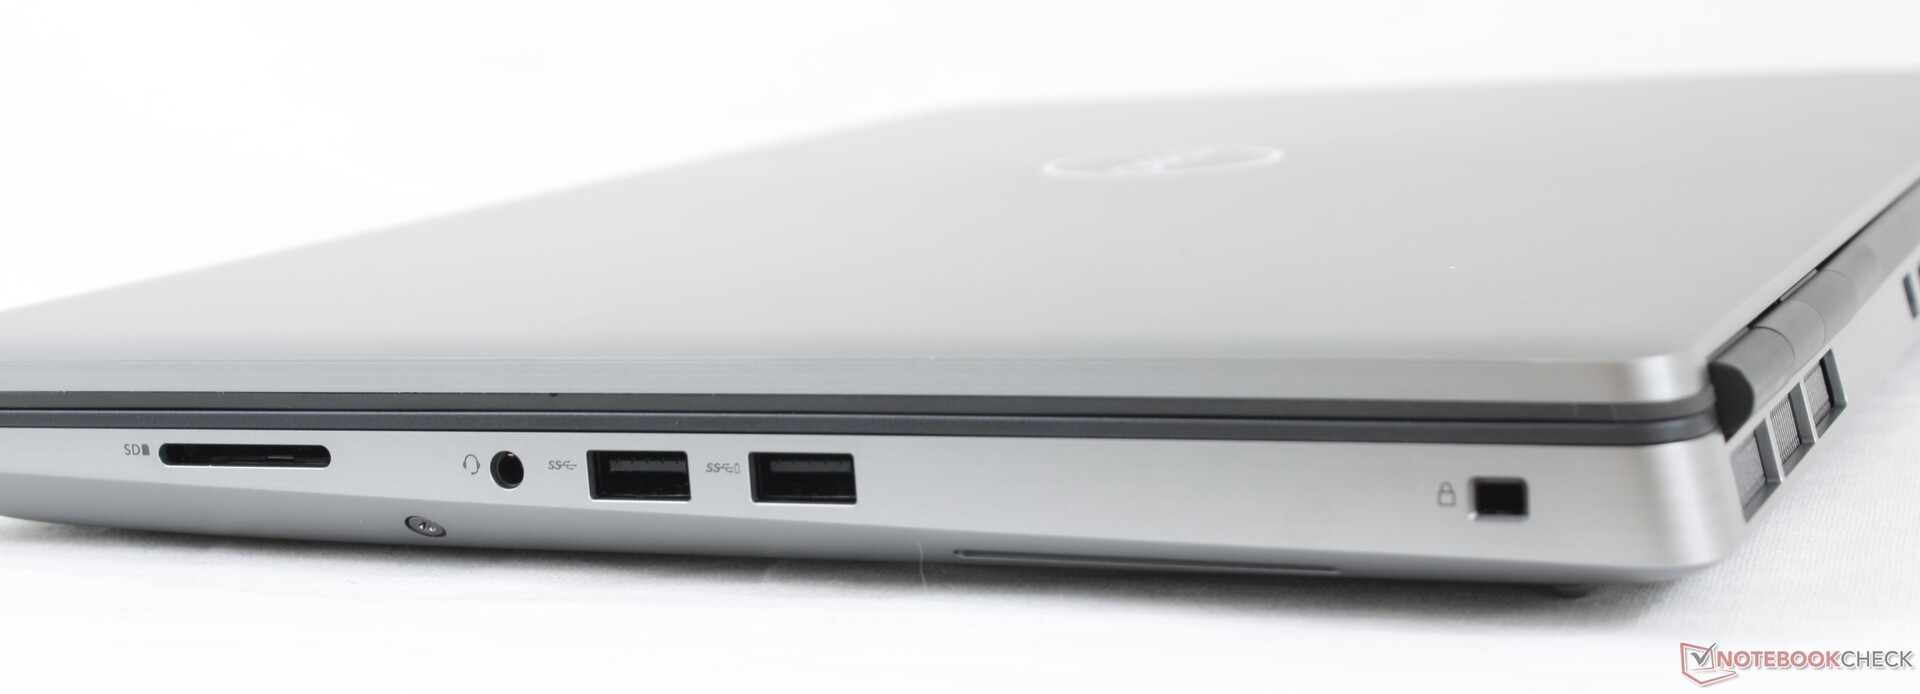
Lettore di schede
Il lettore di schede SD a molla offre velocità di trasferimento più elevate rispetto alla maggior parte dei computer portatili consumer. Lo spostamento di 1 GB di immagini dalla nostra scheda di prova UHS-II al desktop richiede solo circa 5-6 secondi.
| SD Card Reader | |
| average JPG Copy Test (av. of 3 runs) | |
| Dell Precision 5550 P91F (Toshiba Exceria Pro SDXC 64 GB UHS-II) | |
| Dell Precision 7540 (Toshiba Exceria Pro SDXC 64 GB UHS-II) | |
| Dell Precision 7550 (Toshiba Exceria Pro SDXC 64 GB UHS-II) | |
| Lenovo ThinkPad P53-20QN000YGE (Toshiba Exceria Pro SDXC 64 GB UHS-II) | |
| HP ZBook Studio G5-4QH10EA (Toshiba Exceria Pro SDXC 64 GB UHS-II) | |
| maximum AS SSD Seq Read Test (1GB) | |
| HP ZBook Studio G5-4QH10EA (Toshiba Exceria Pro SDXC 64 GB UHS-II) | |
| Lenovo ThinkPad P53-20QN000YGE (Toshiba Exceria Pro SDXC 64 GB UHS-II) | |
| Dell Precision 5550 P91F (Toshiba Exceria Pro SDXC 64 GB UHS-II) | |
| Dell Precision 7550 (Toshiba Exceria Pro SDXC 64 GB UHS-II) | |
| Dell Precision 7540 (Toshiba Exceria Pro SDXC 64 GB UHS-II) | |
Comunicazioni
L'Intel AX201 viene offerto di serie per la connettività Wi-Fi 6 e Bluetooth 5.1. Non abbiamo riscontrato alcun problema di connettività quando l'abbiamo accoppiato al nostro router di prova Netgear RAX200.
| Networking | |
| iperf3 transmit AX12 | |
| Dell Precision 7540 | |
| Dell Precision 5550 P91F | |
| Dell Precision 7550 | |
| Acer ConceptD 9 Pro | |
| Acer ConceptD 3 Pro CN315-71P-73W1 | |
| iperf3 receive AX12 | |
| Dell Precision 7540 | |
| Dell Precision 5550 P91F | |
| Dell Precision 7550 | |
| Acer ConceptD 9 Pro | |
| Acer ConceptD 3 Pro CN315-71P-73W1 | |
Webcam
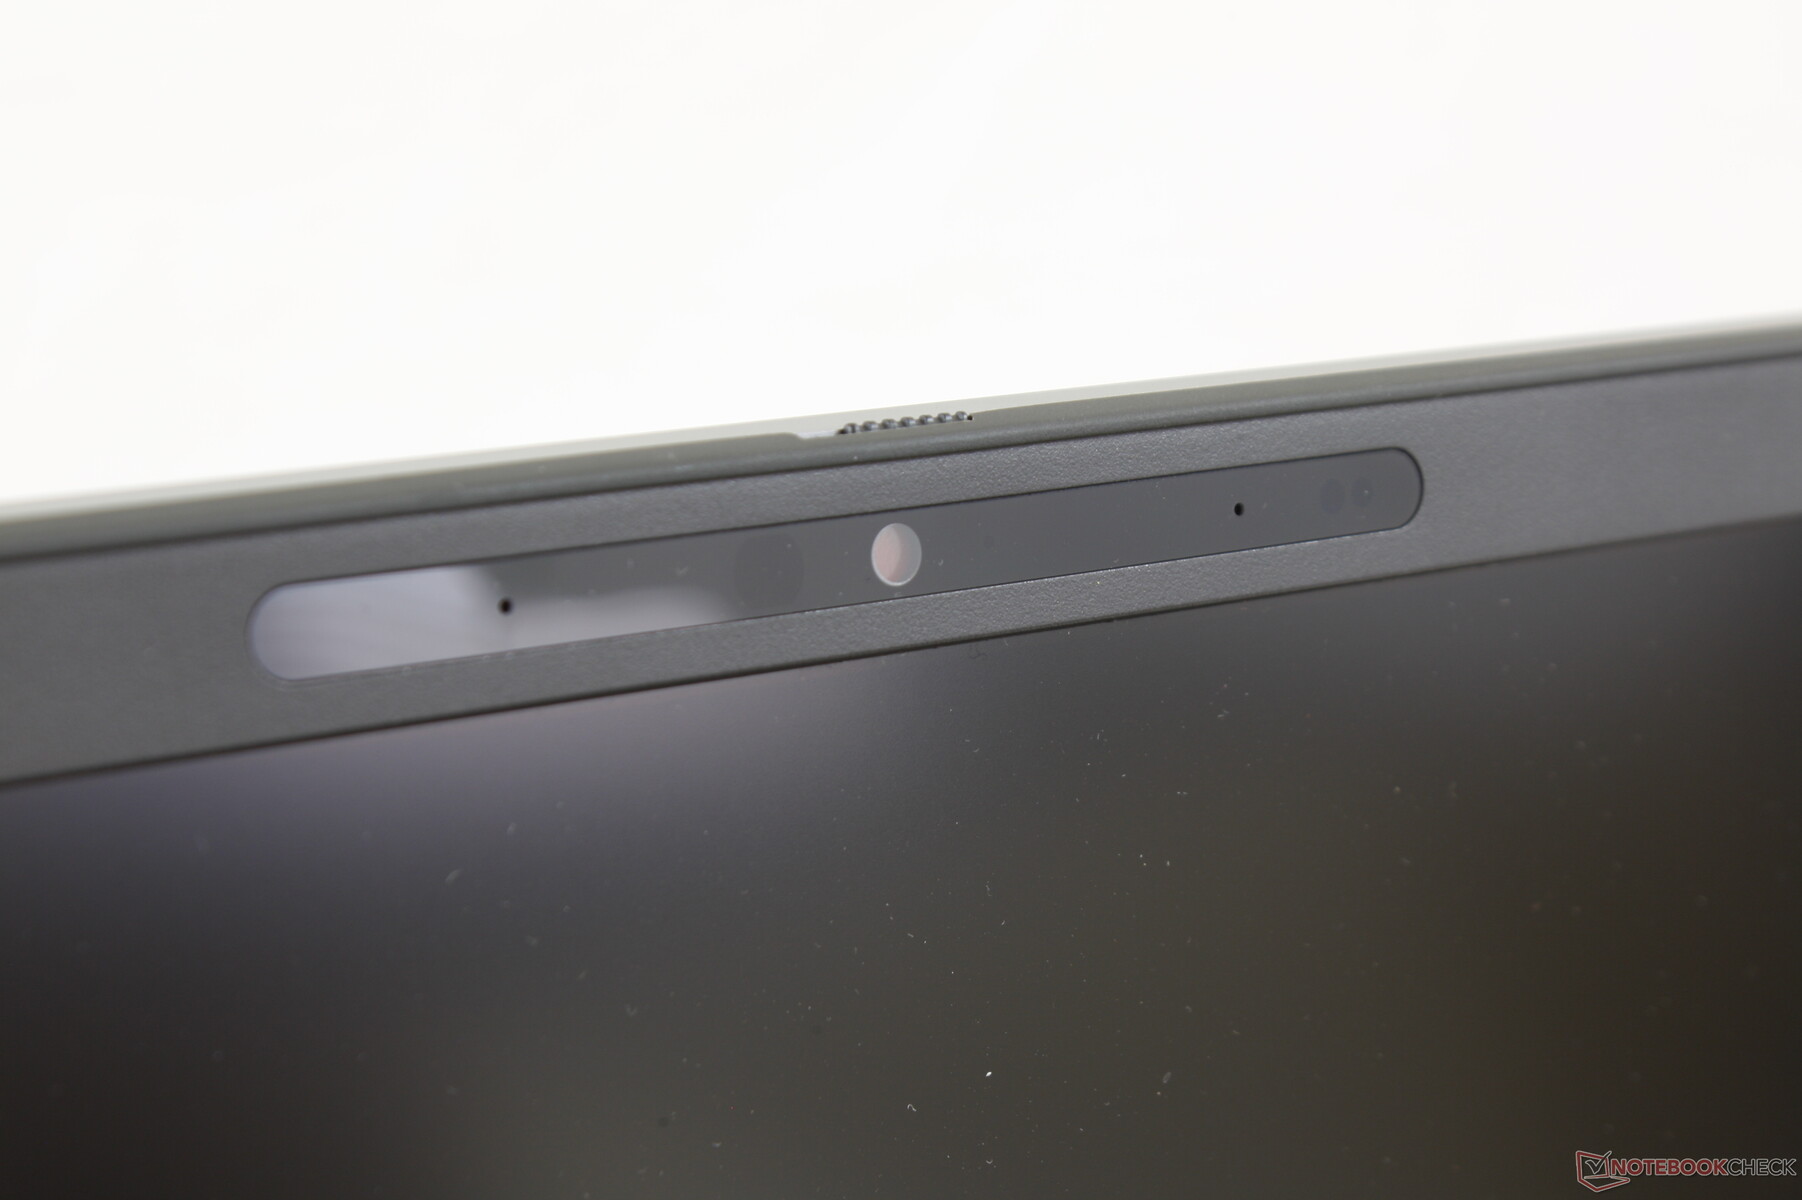
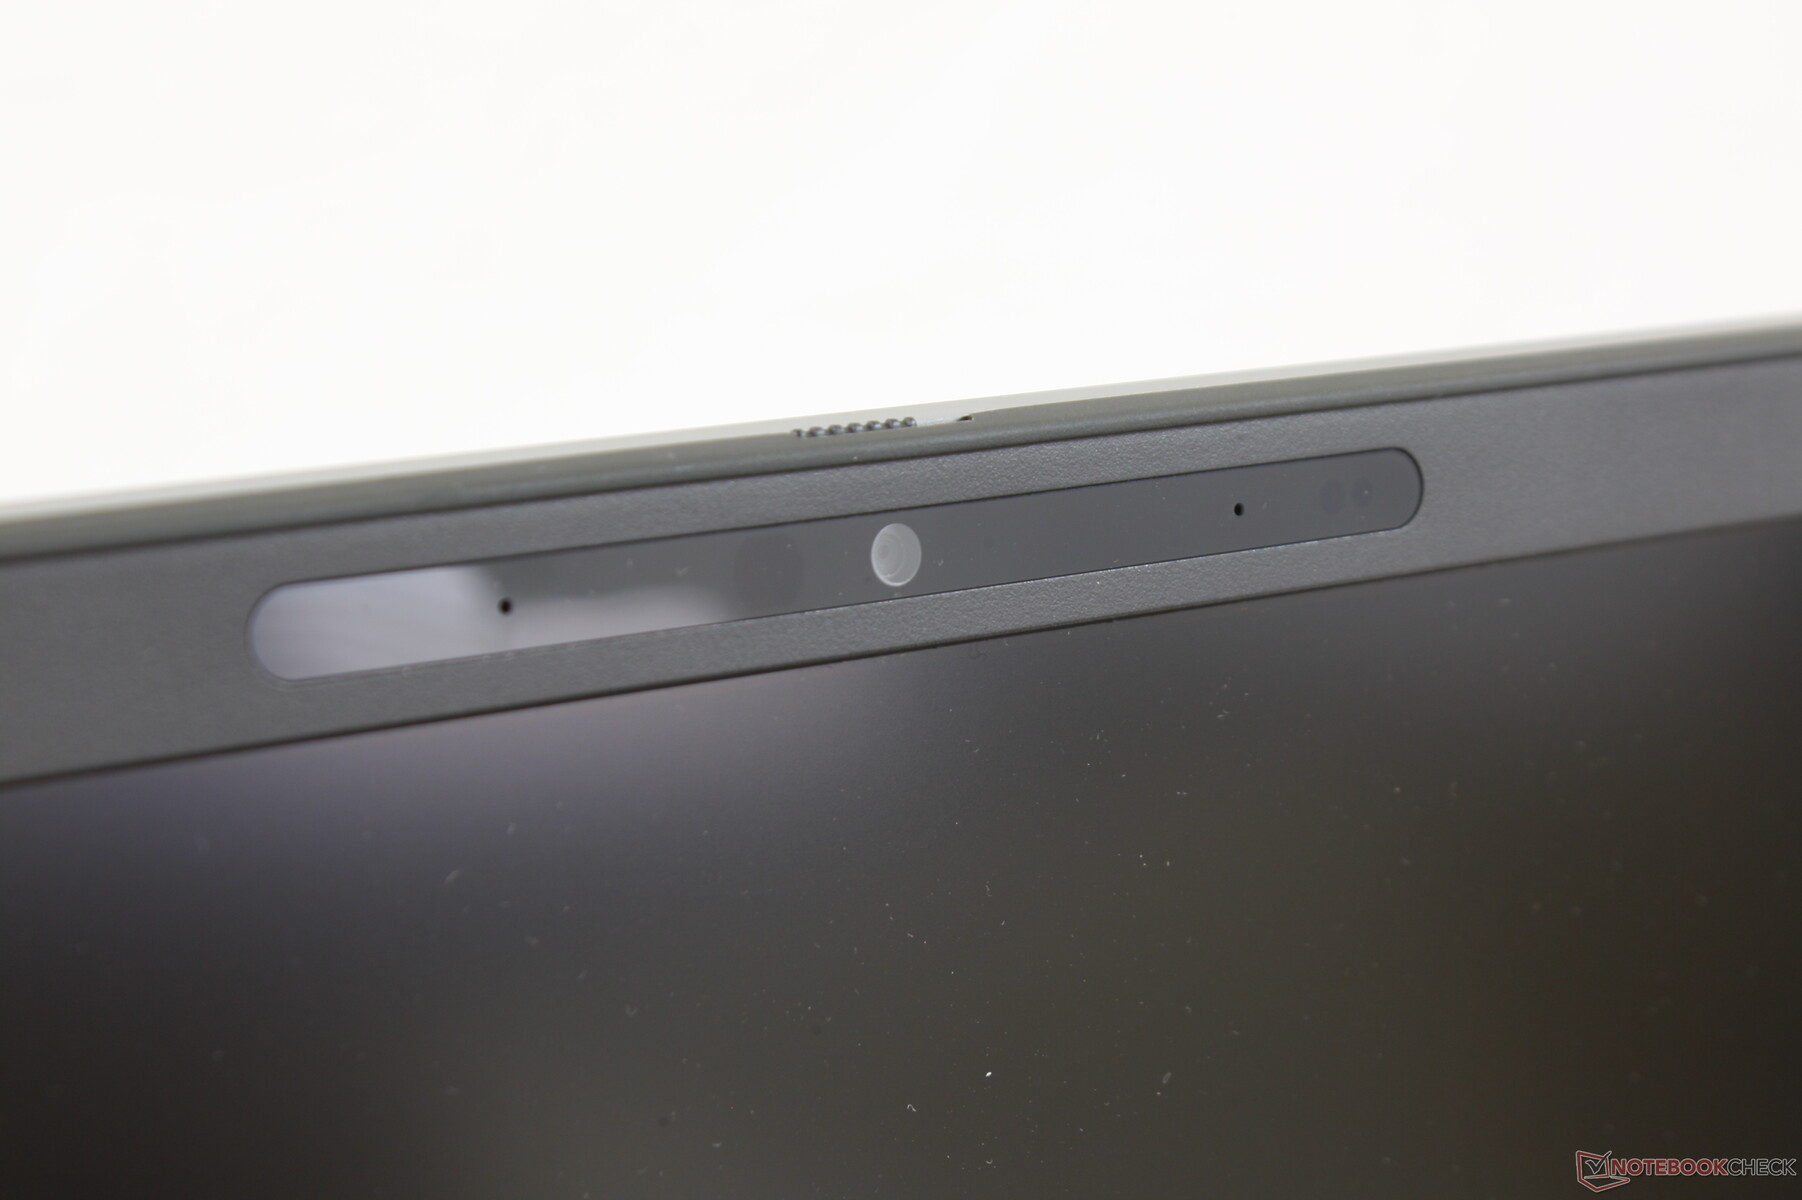


Sicurezza
Il dispositivo Dell Trusted Device, il Client Command, il lettore di impronte digitali, l'otturatore della videocamera, il blocco Noble, vPro, TPM, la videocamera IR e l'NFC sono tutti supportati per una maggiore sicurezza. Molti sono opzionali e avranno un costo aggiuntivo o saranno esclusivi per alcune configurazioni.
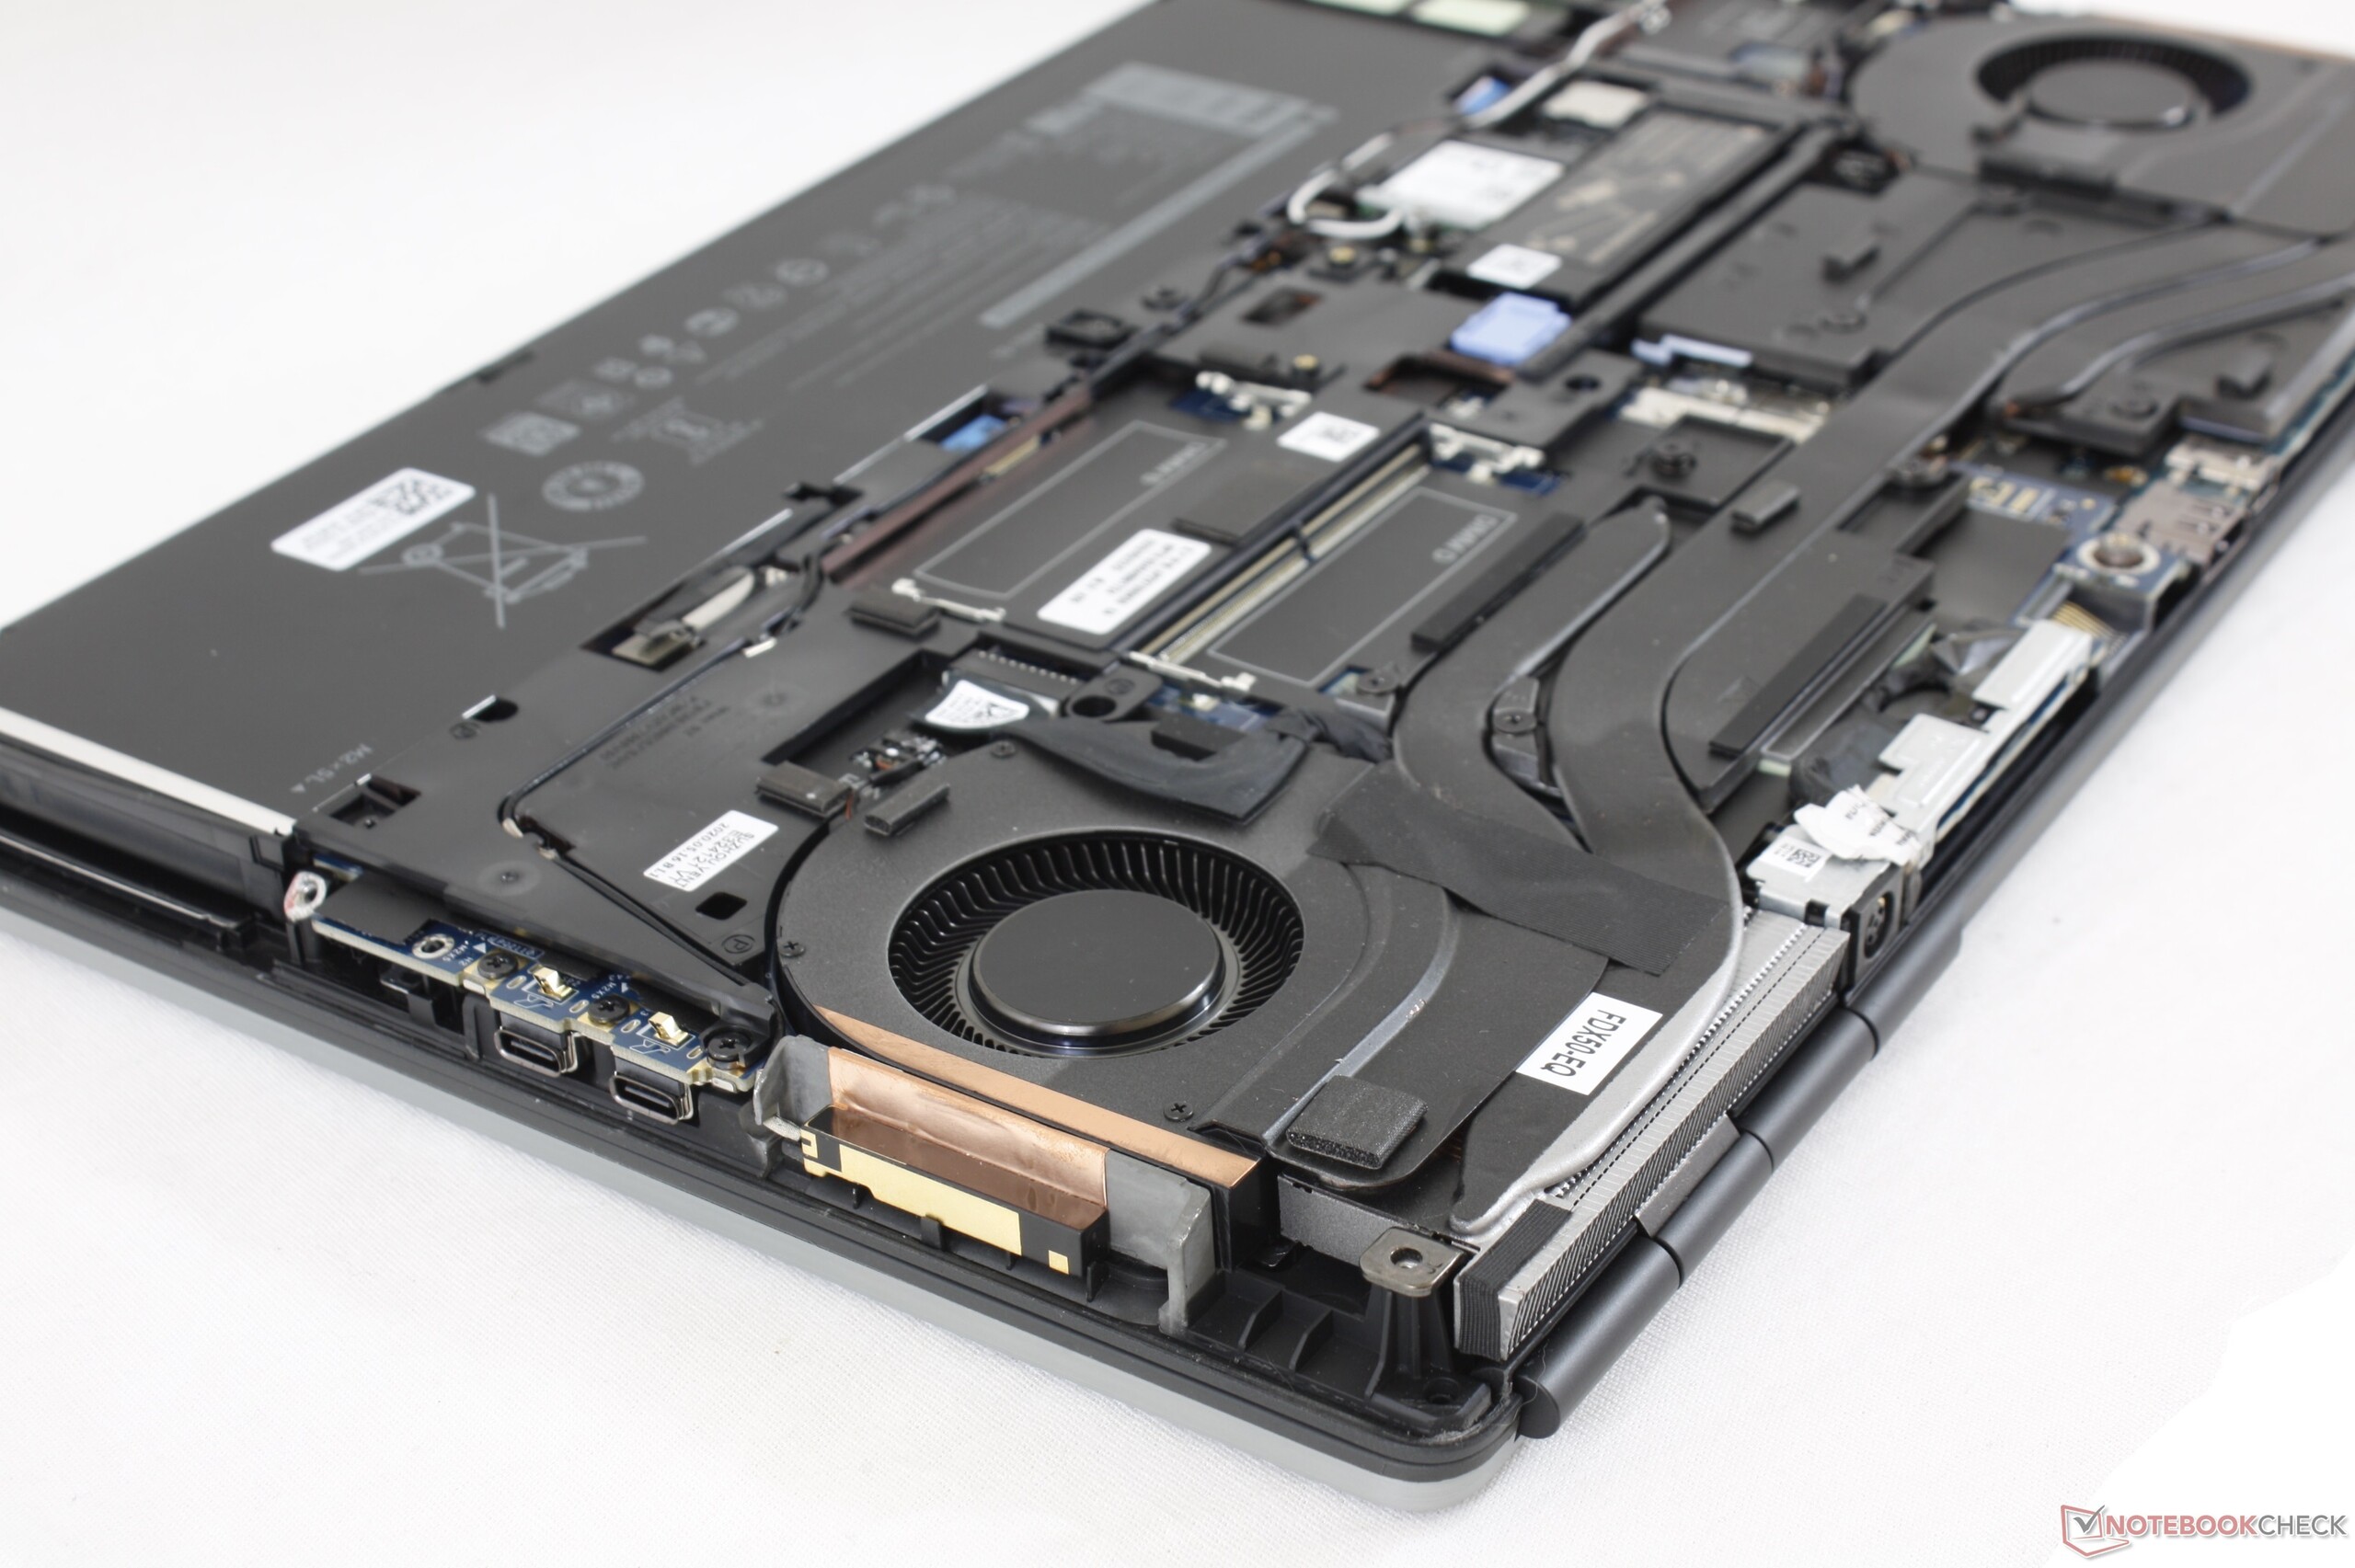
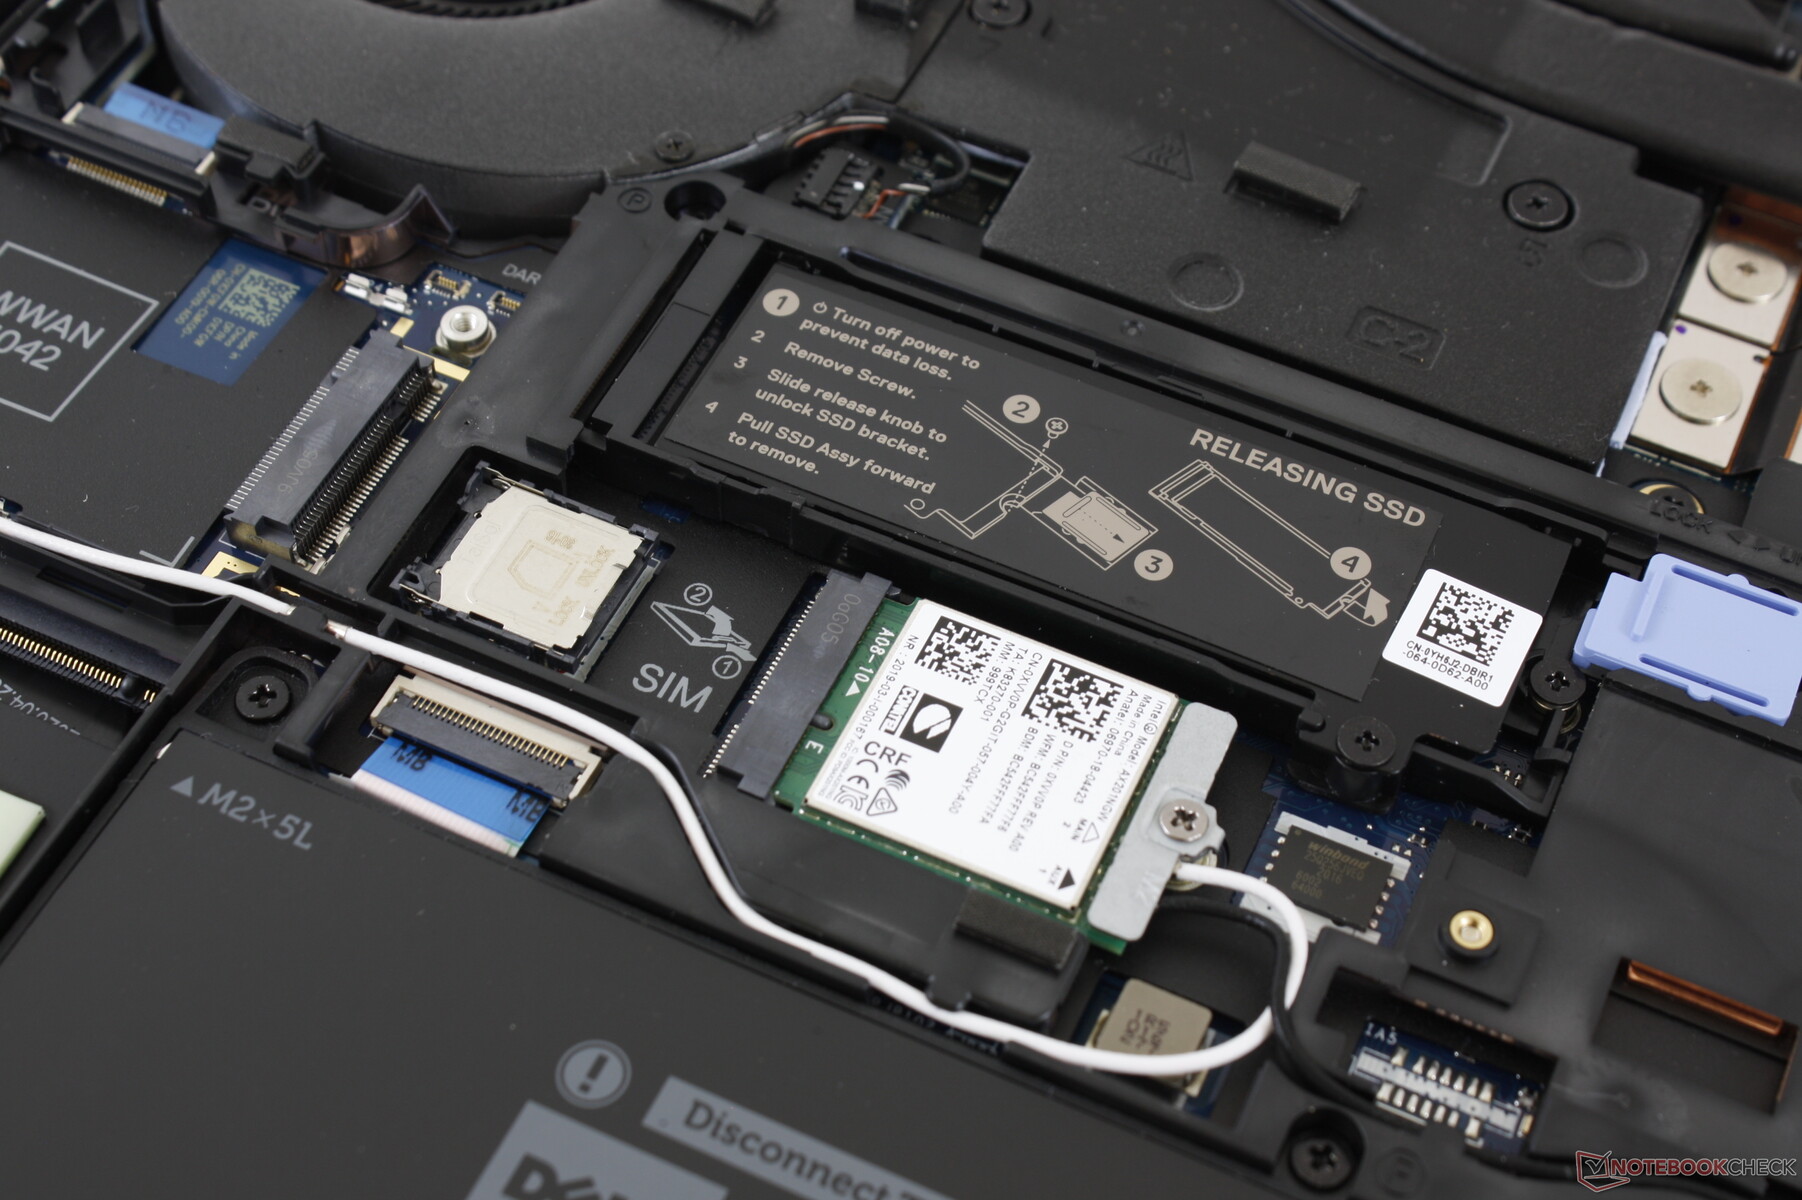
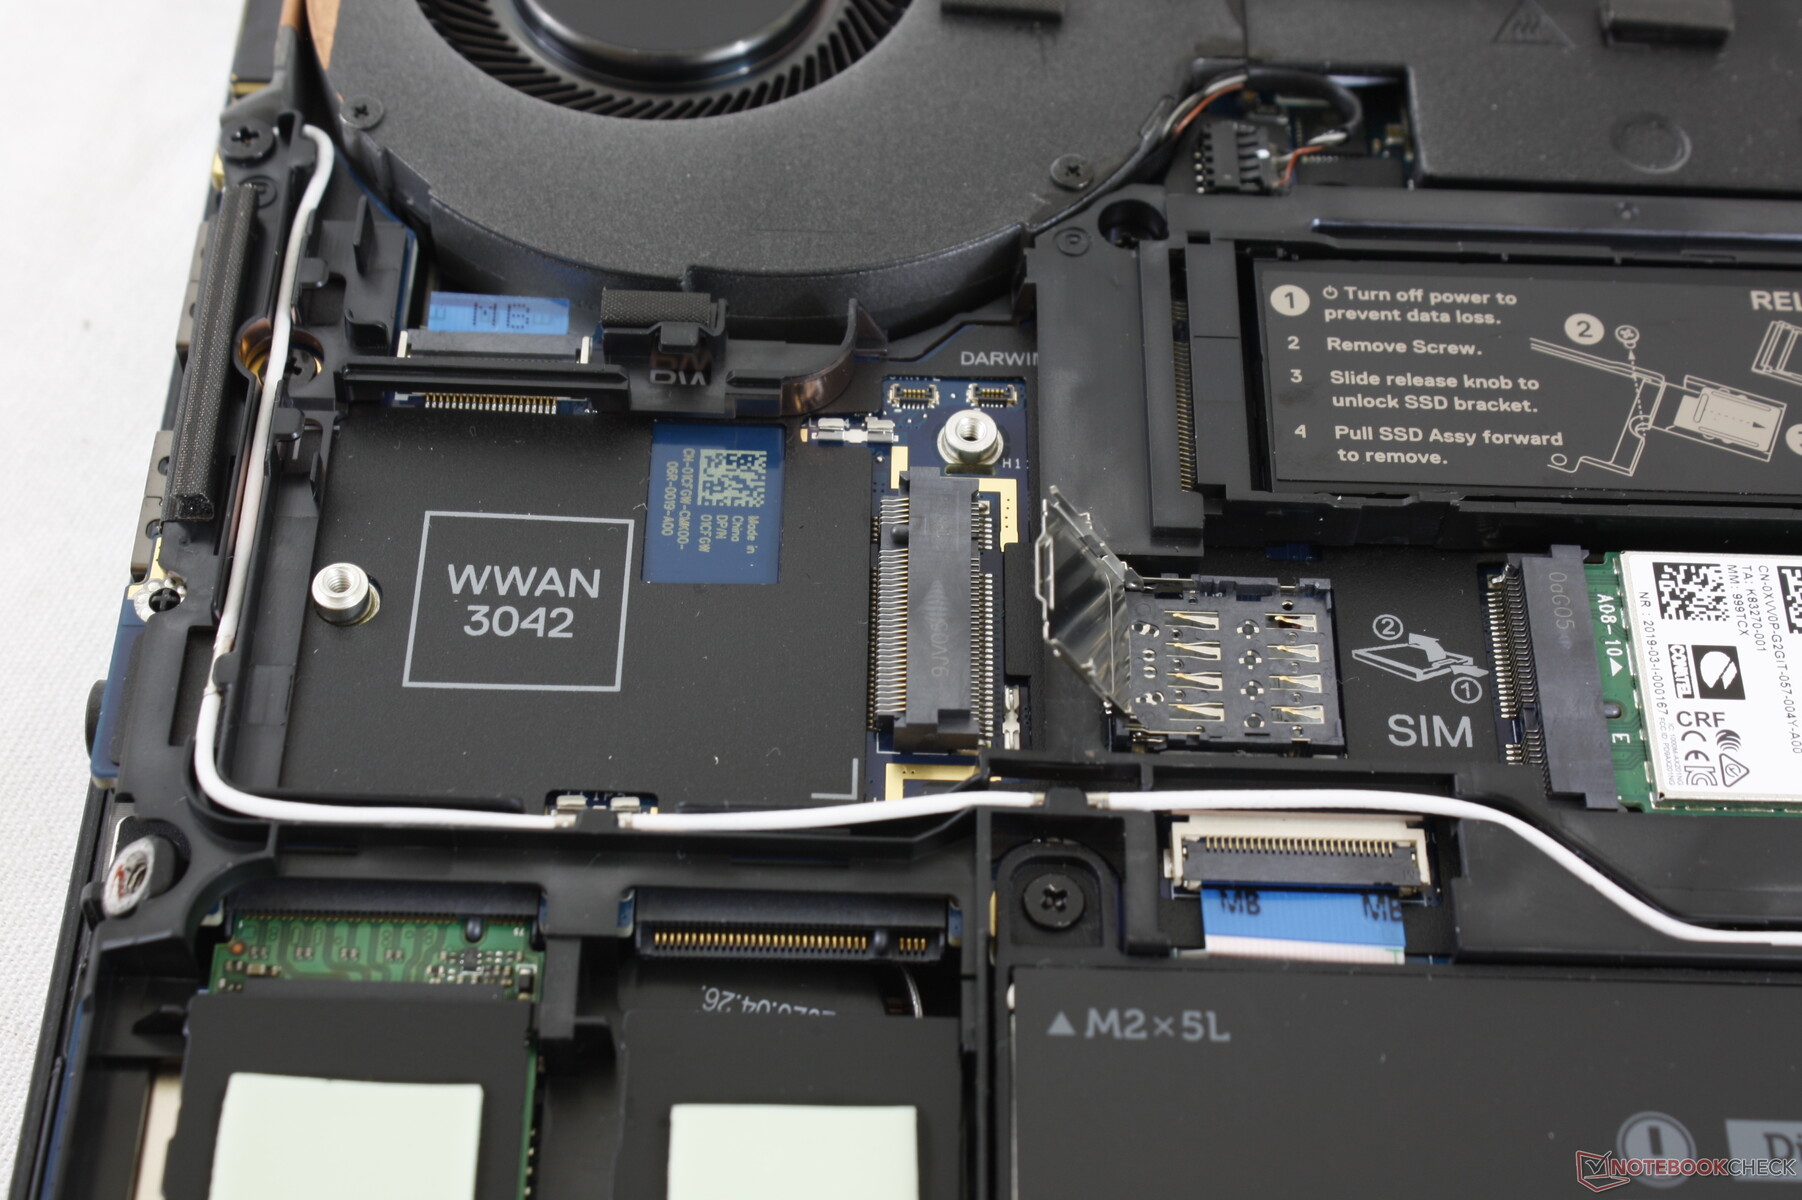
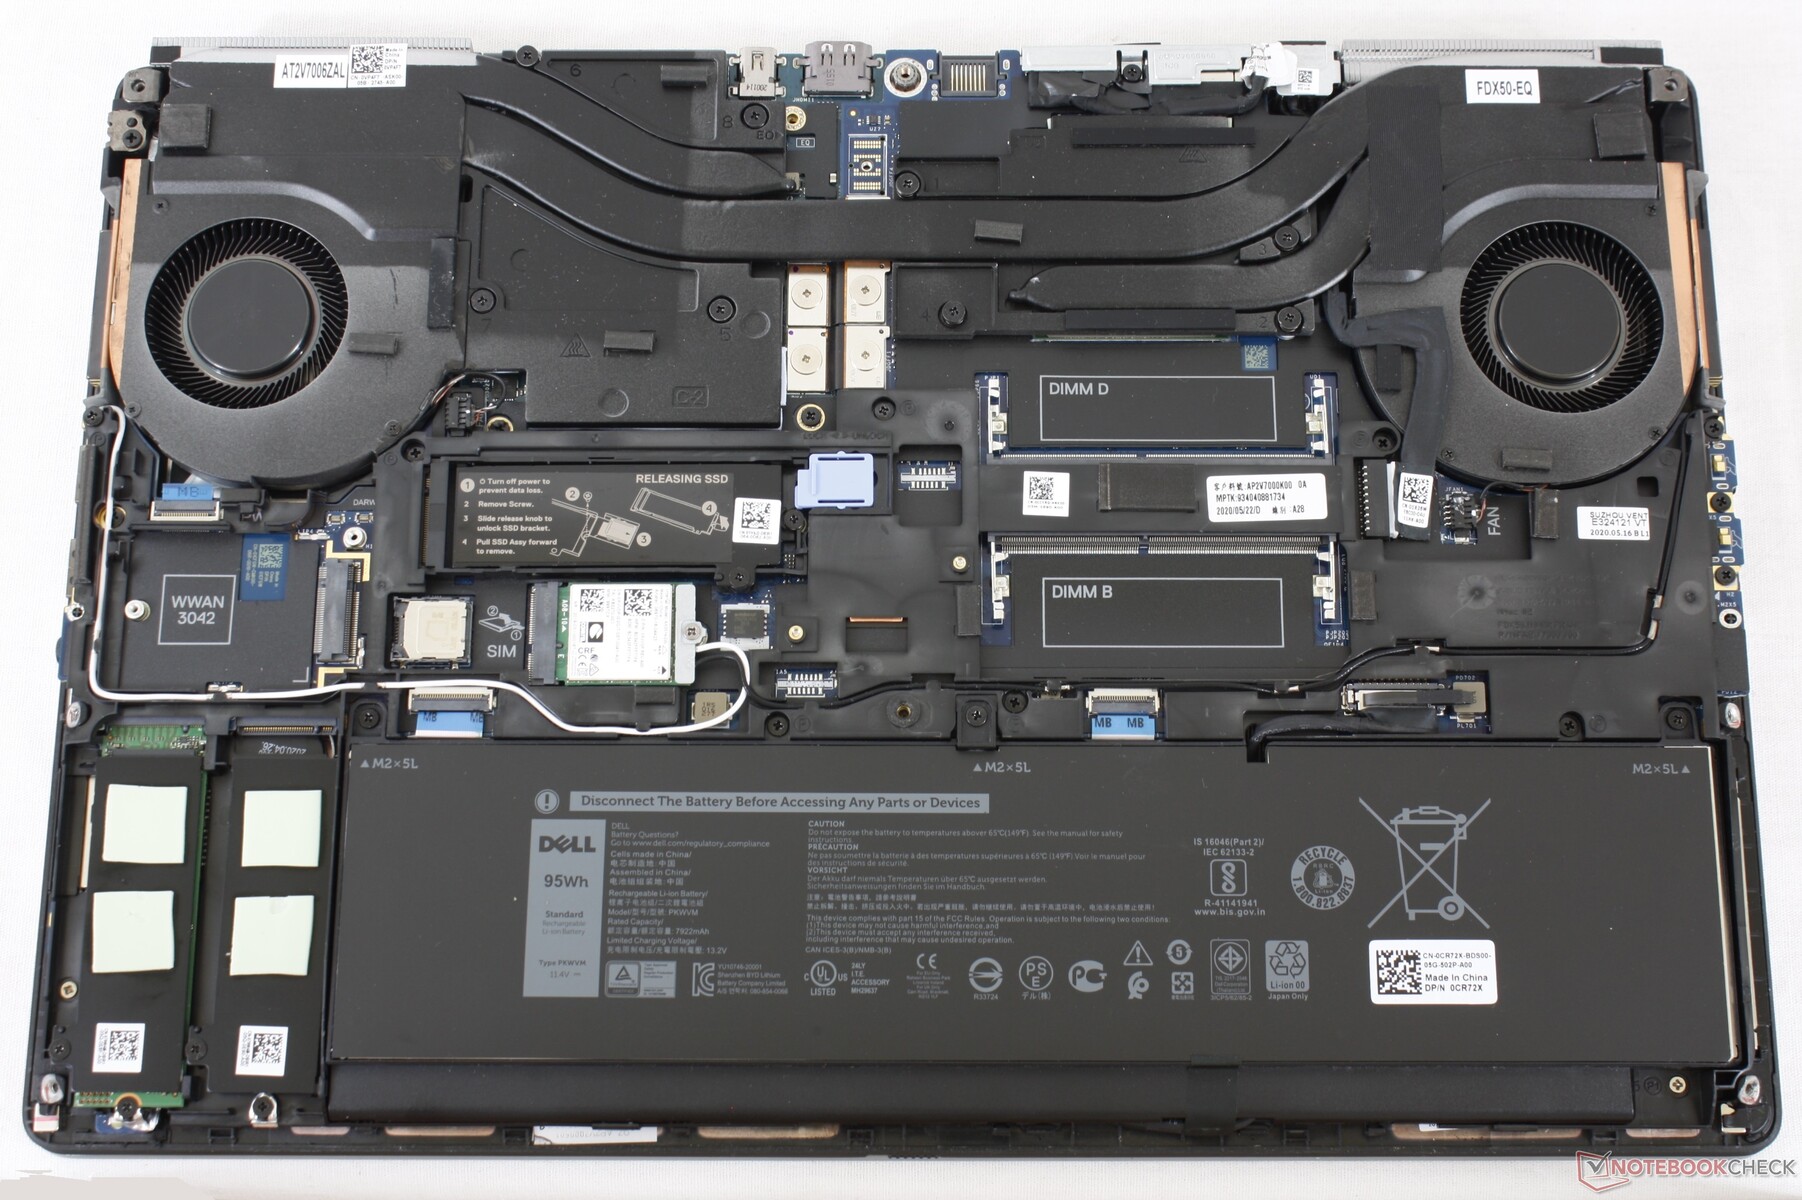
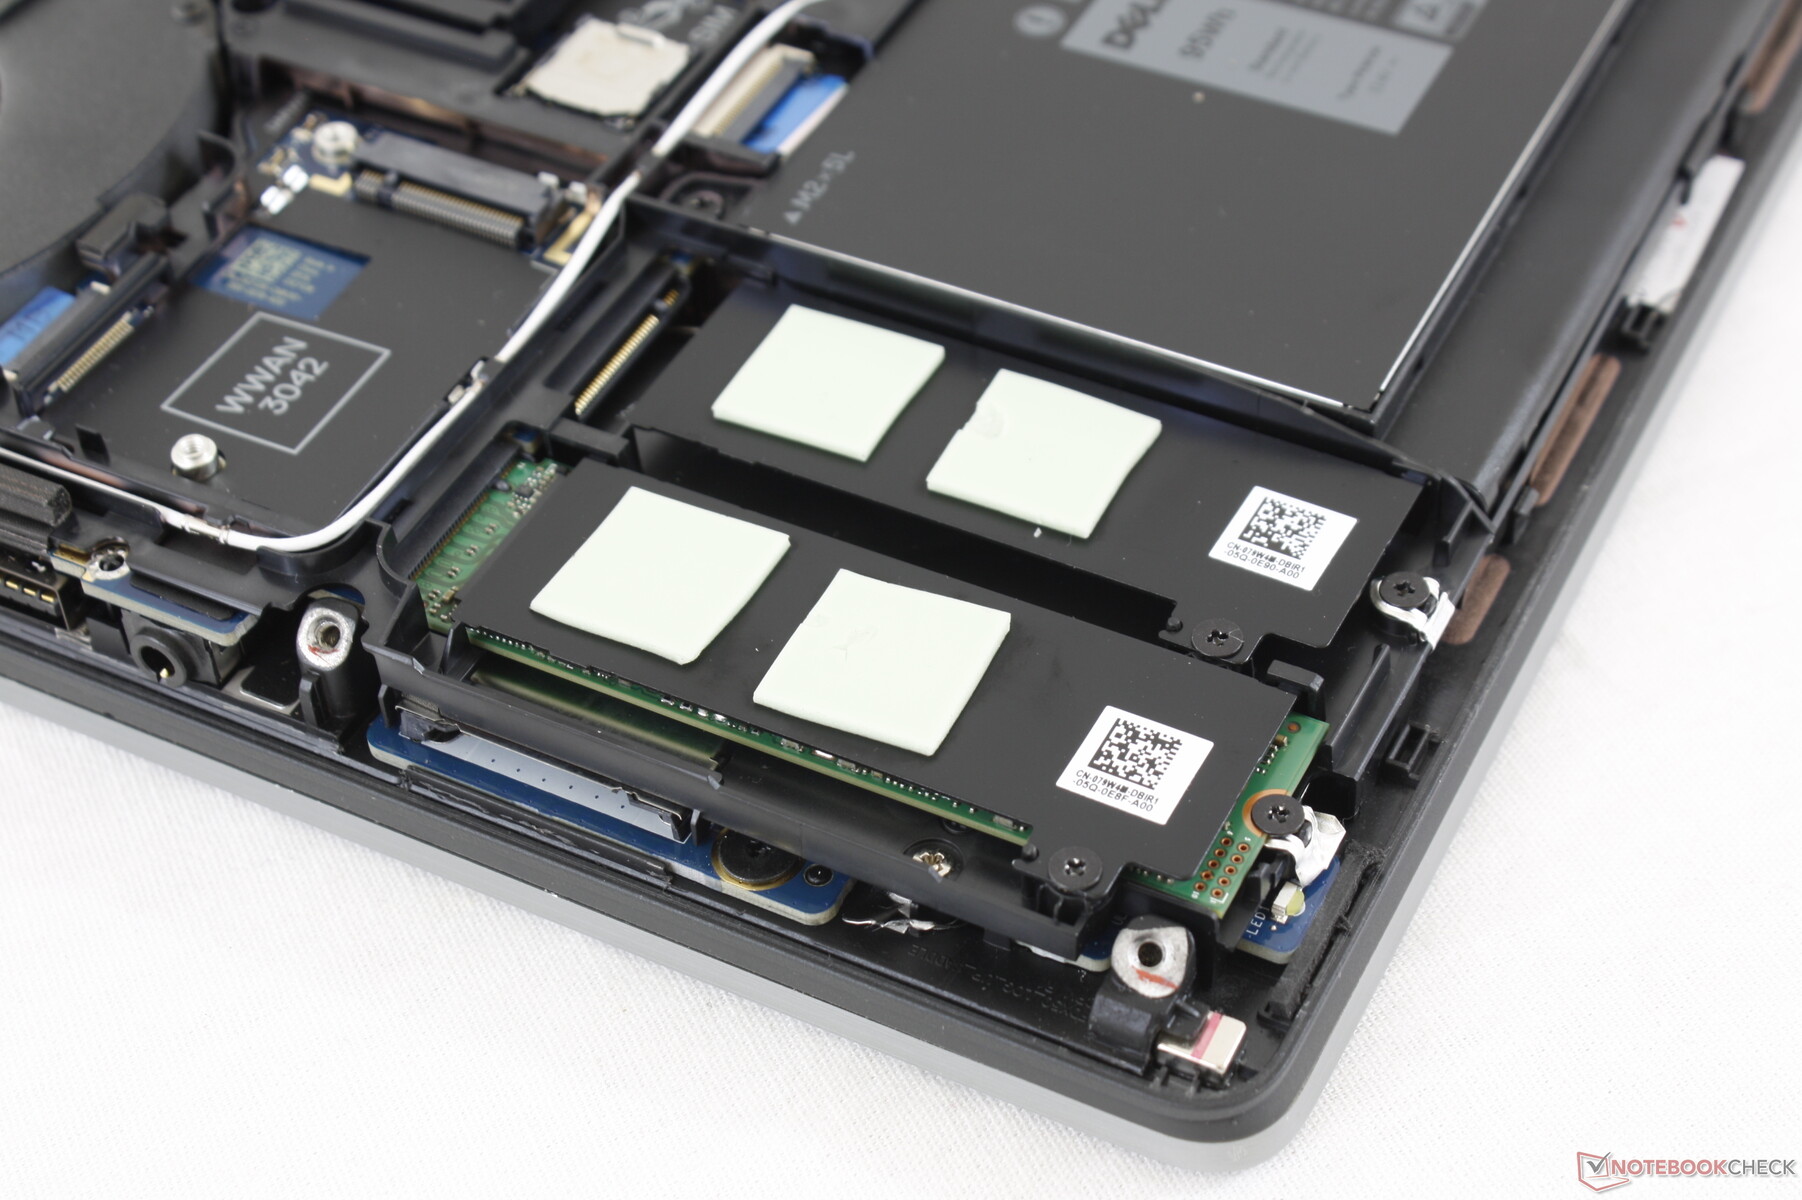
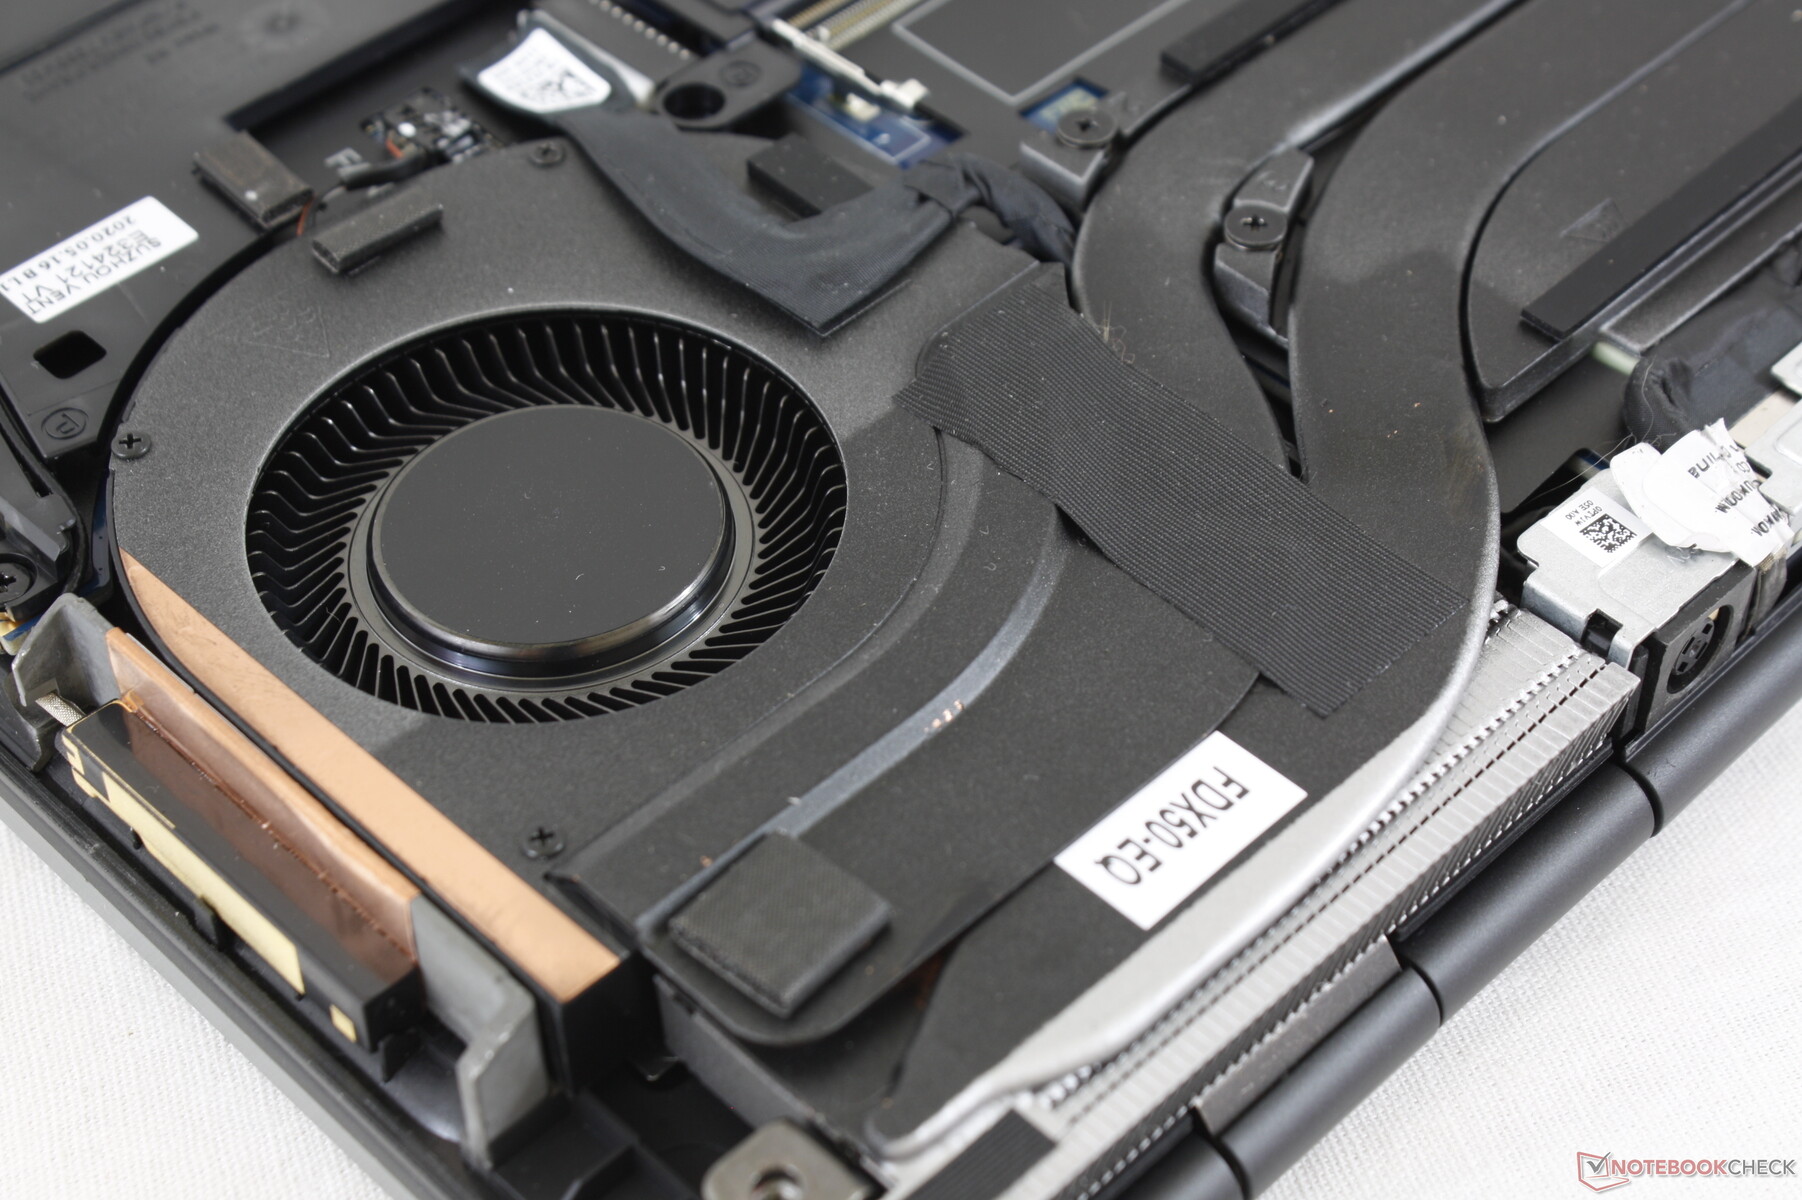
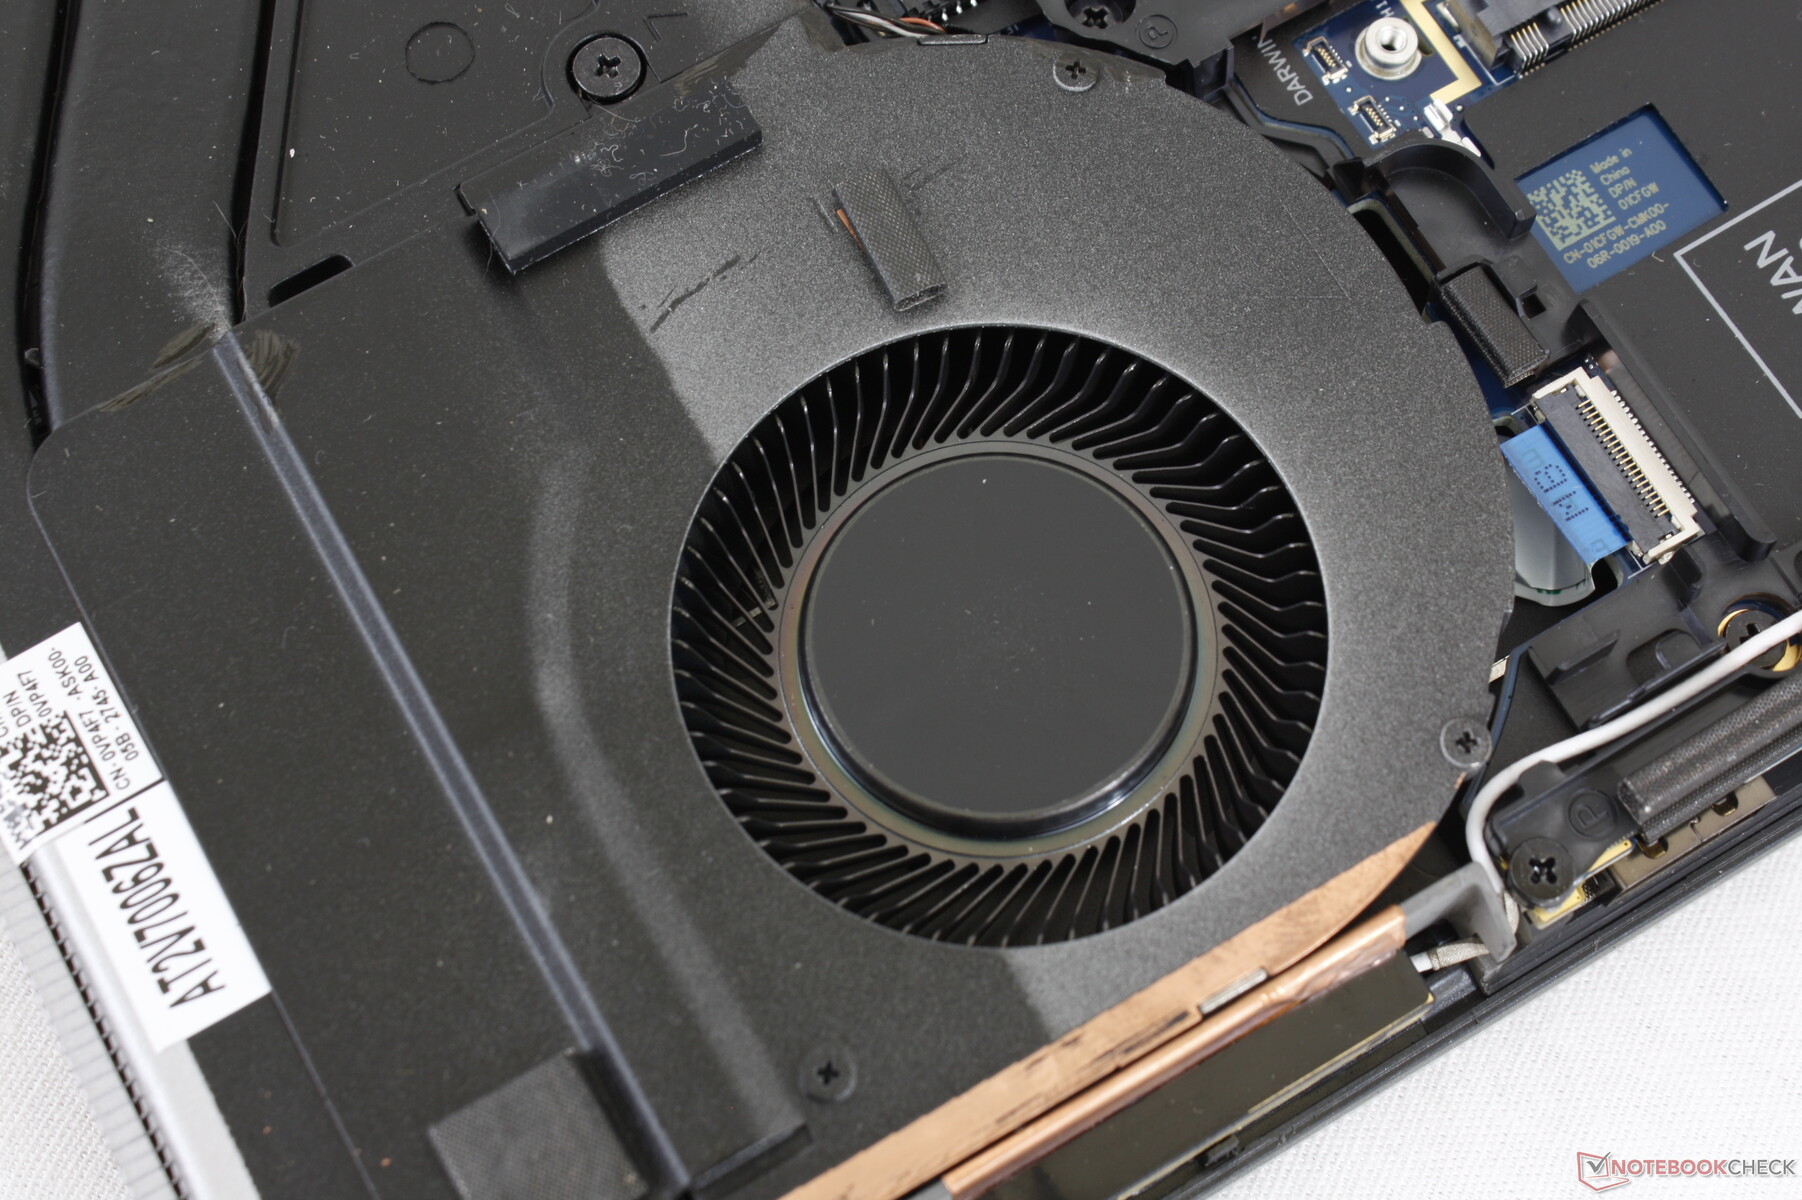
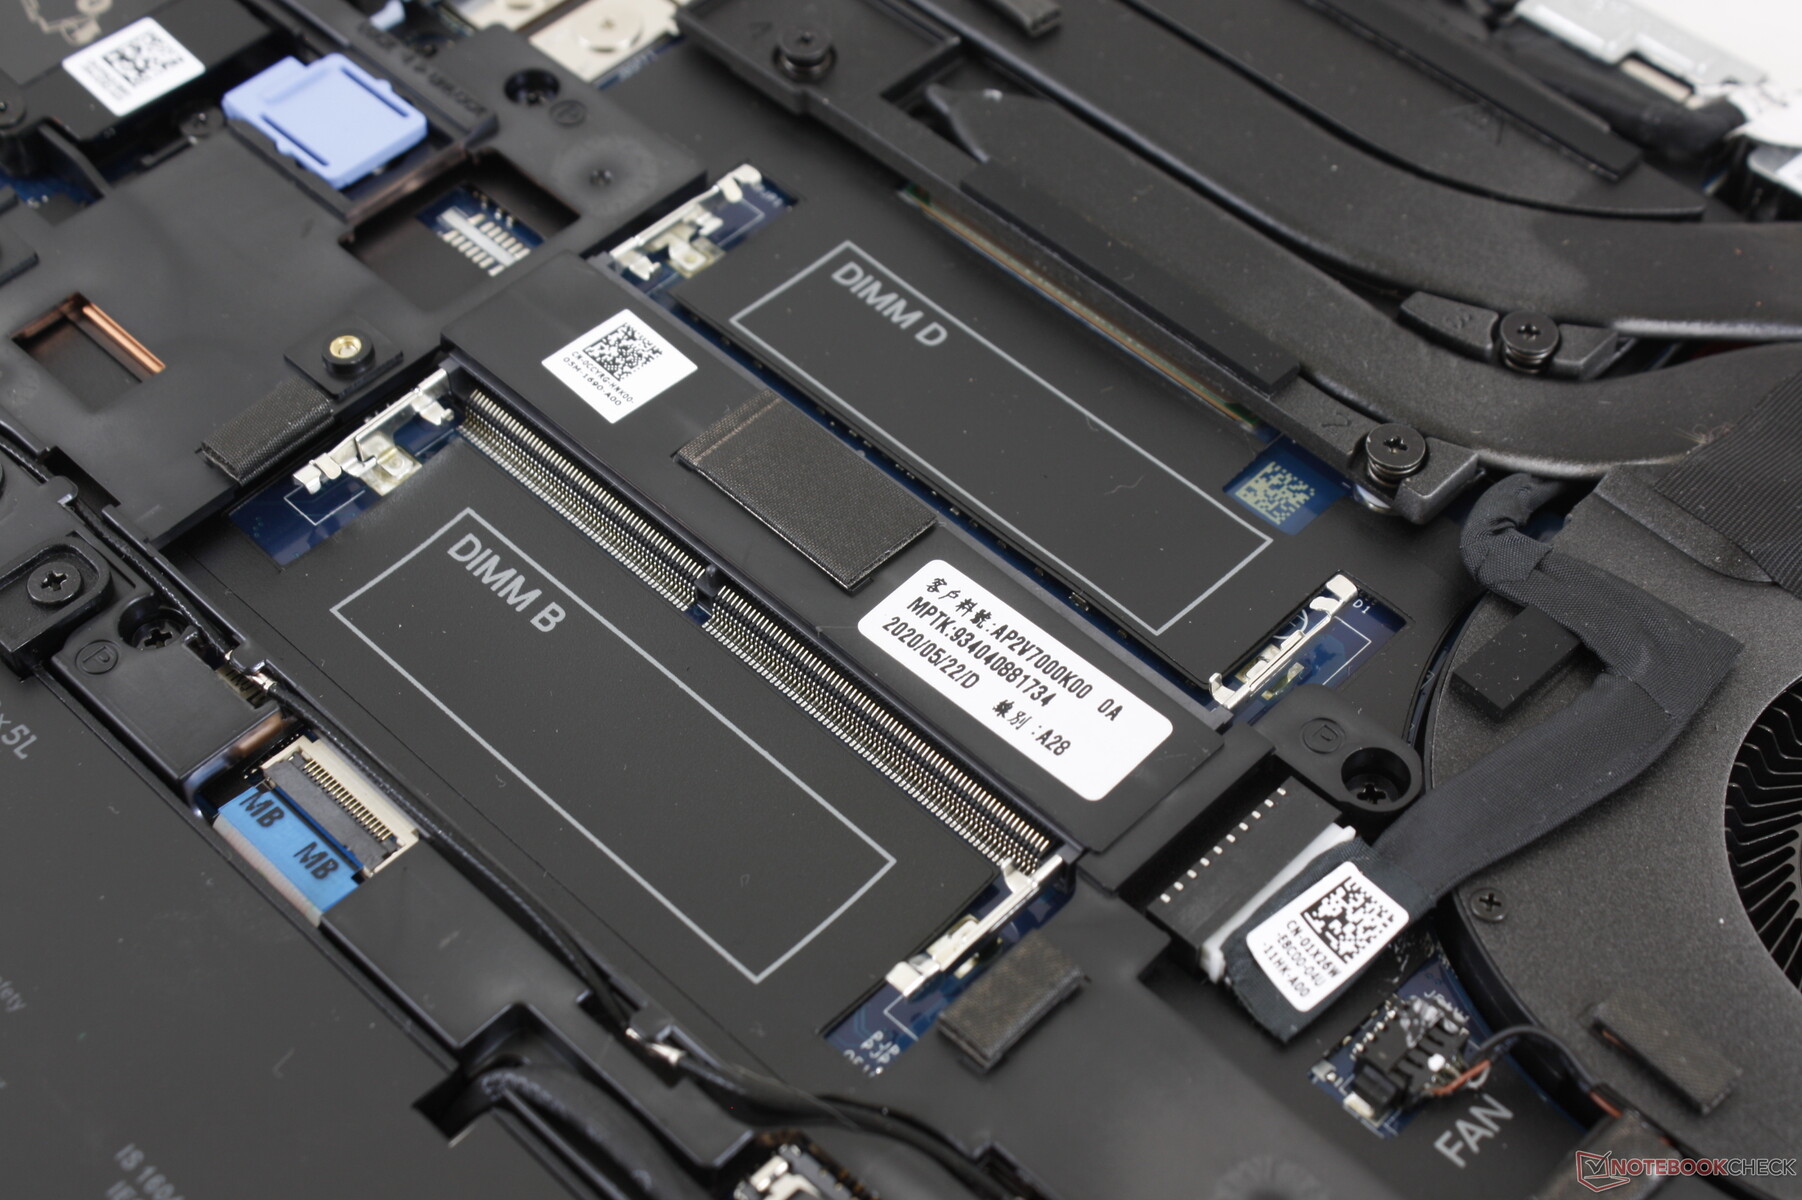
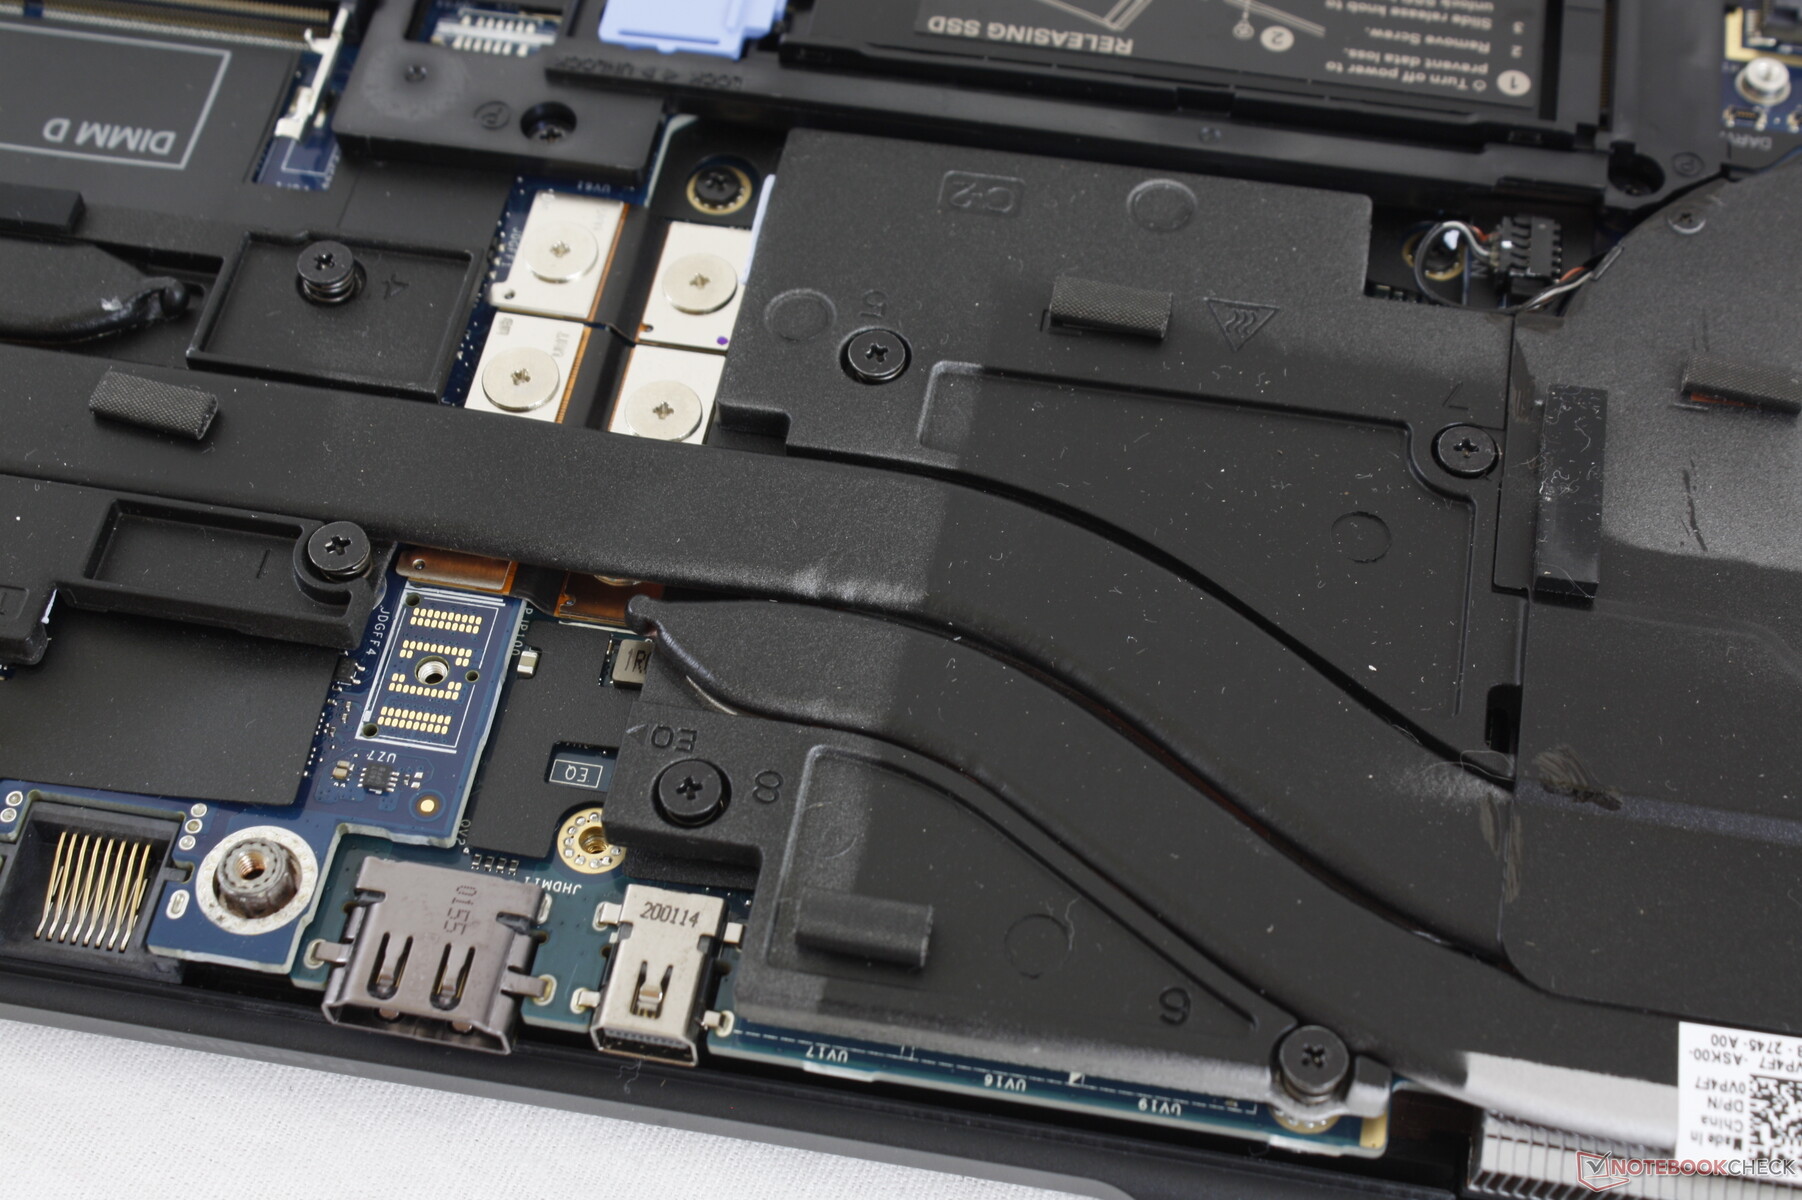
Manutenzione
Il pannello inferiore è fissato con 8 viti a croce per una facile manutenzione. Gli utenti hanno accesso allo slot WAN, al modulo WLAN, a due dei quattro slots SODIMM e a tutti e tre gli alloggiamenti. Per gli altri due slots SODIMM è necessario un ulteriore smontaggio.
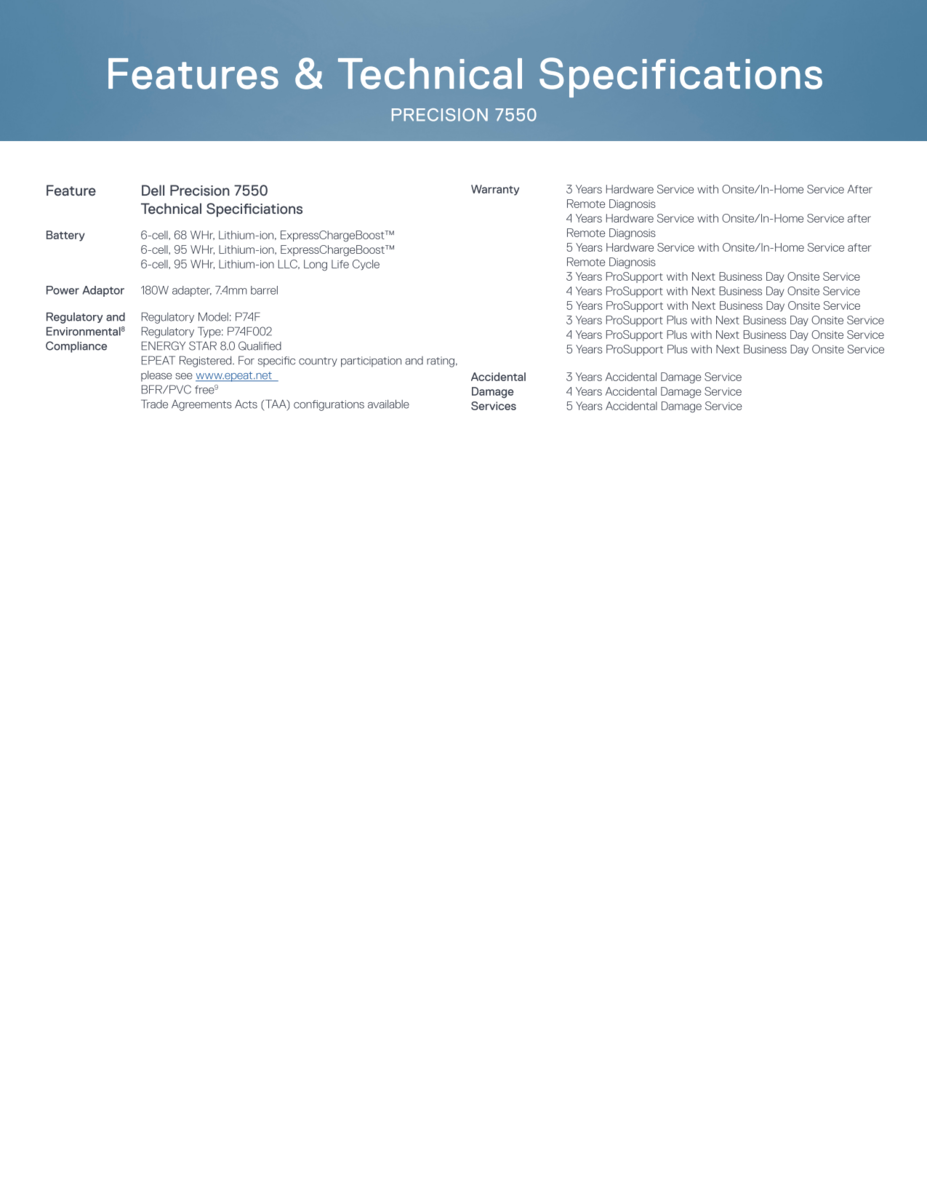
Accessori e Garanzia
Non ci sono extra nella confezione al di fuori dell'alimentatore standard e dei documenti. Una garanzia limitata di tre anni del produttore viene fornita di serie con ProSupport e opzioni di estensione.
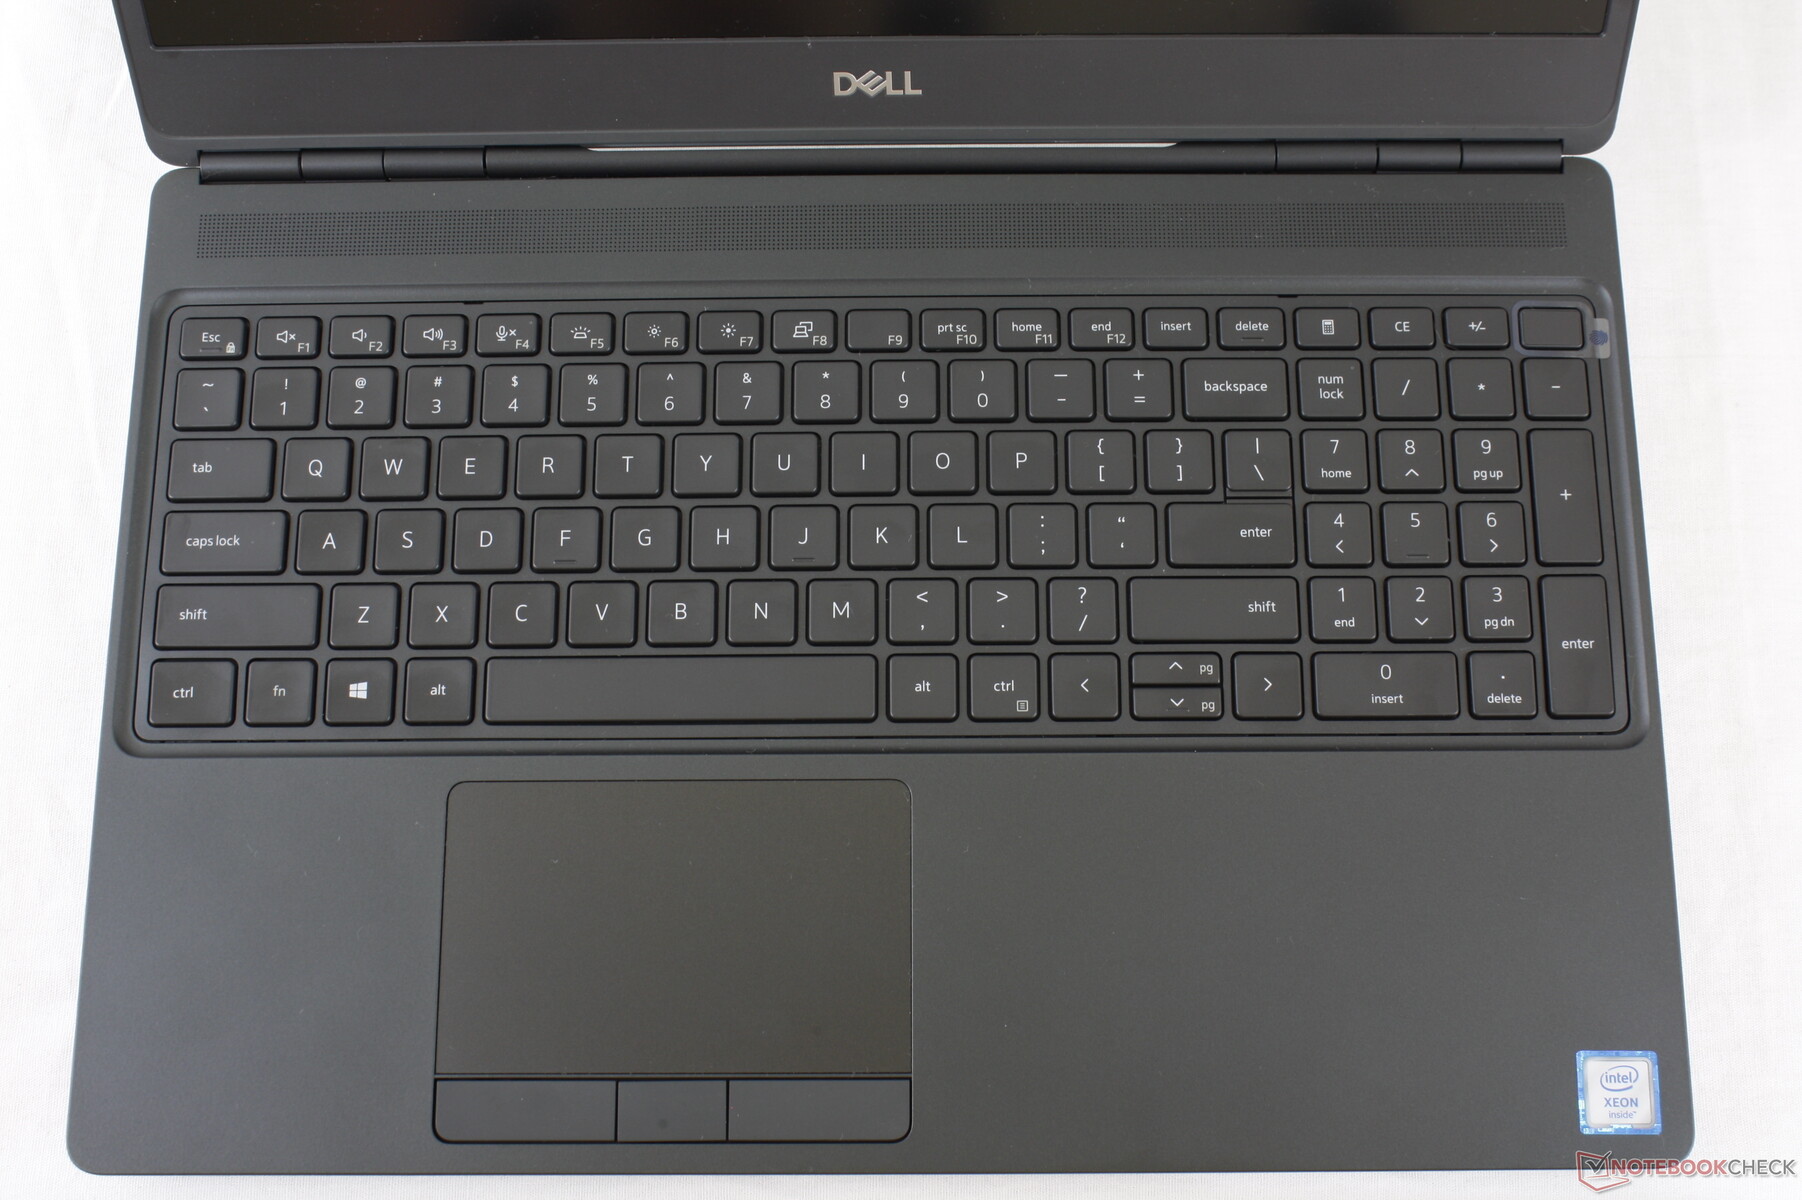
Dispositivi di Input
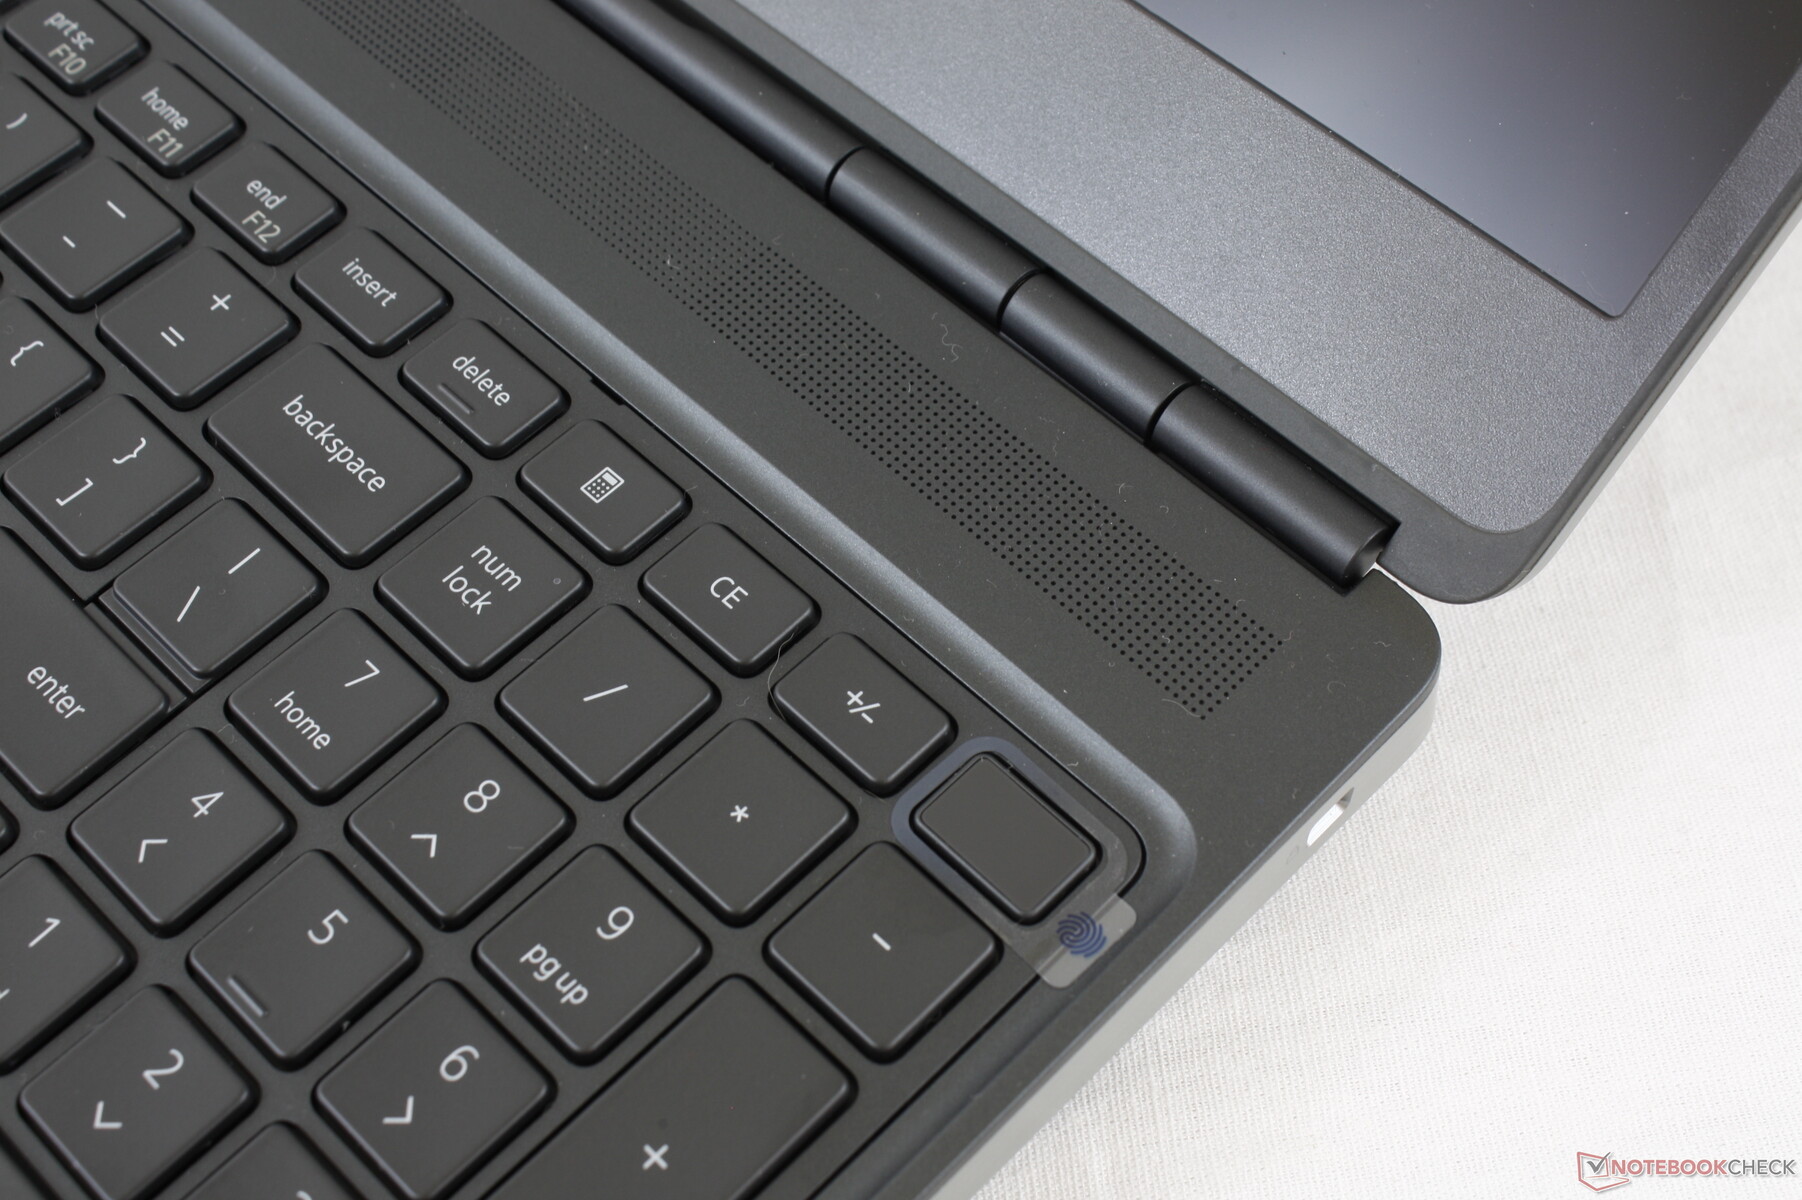
Tastiera
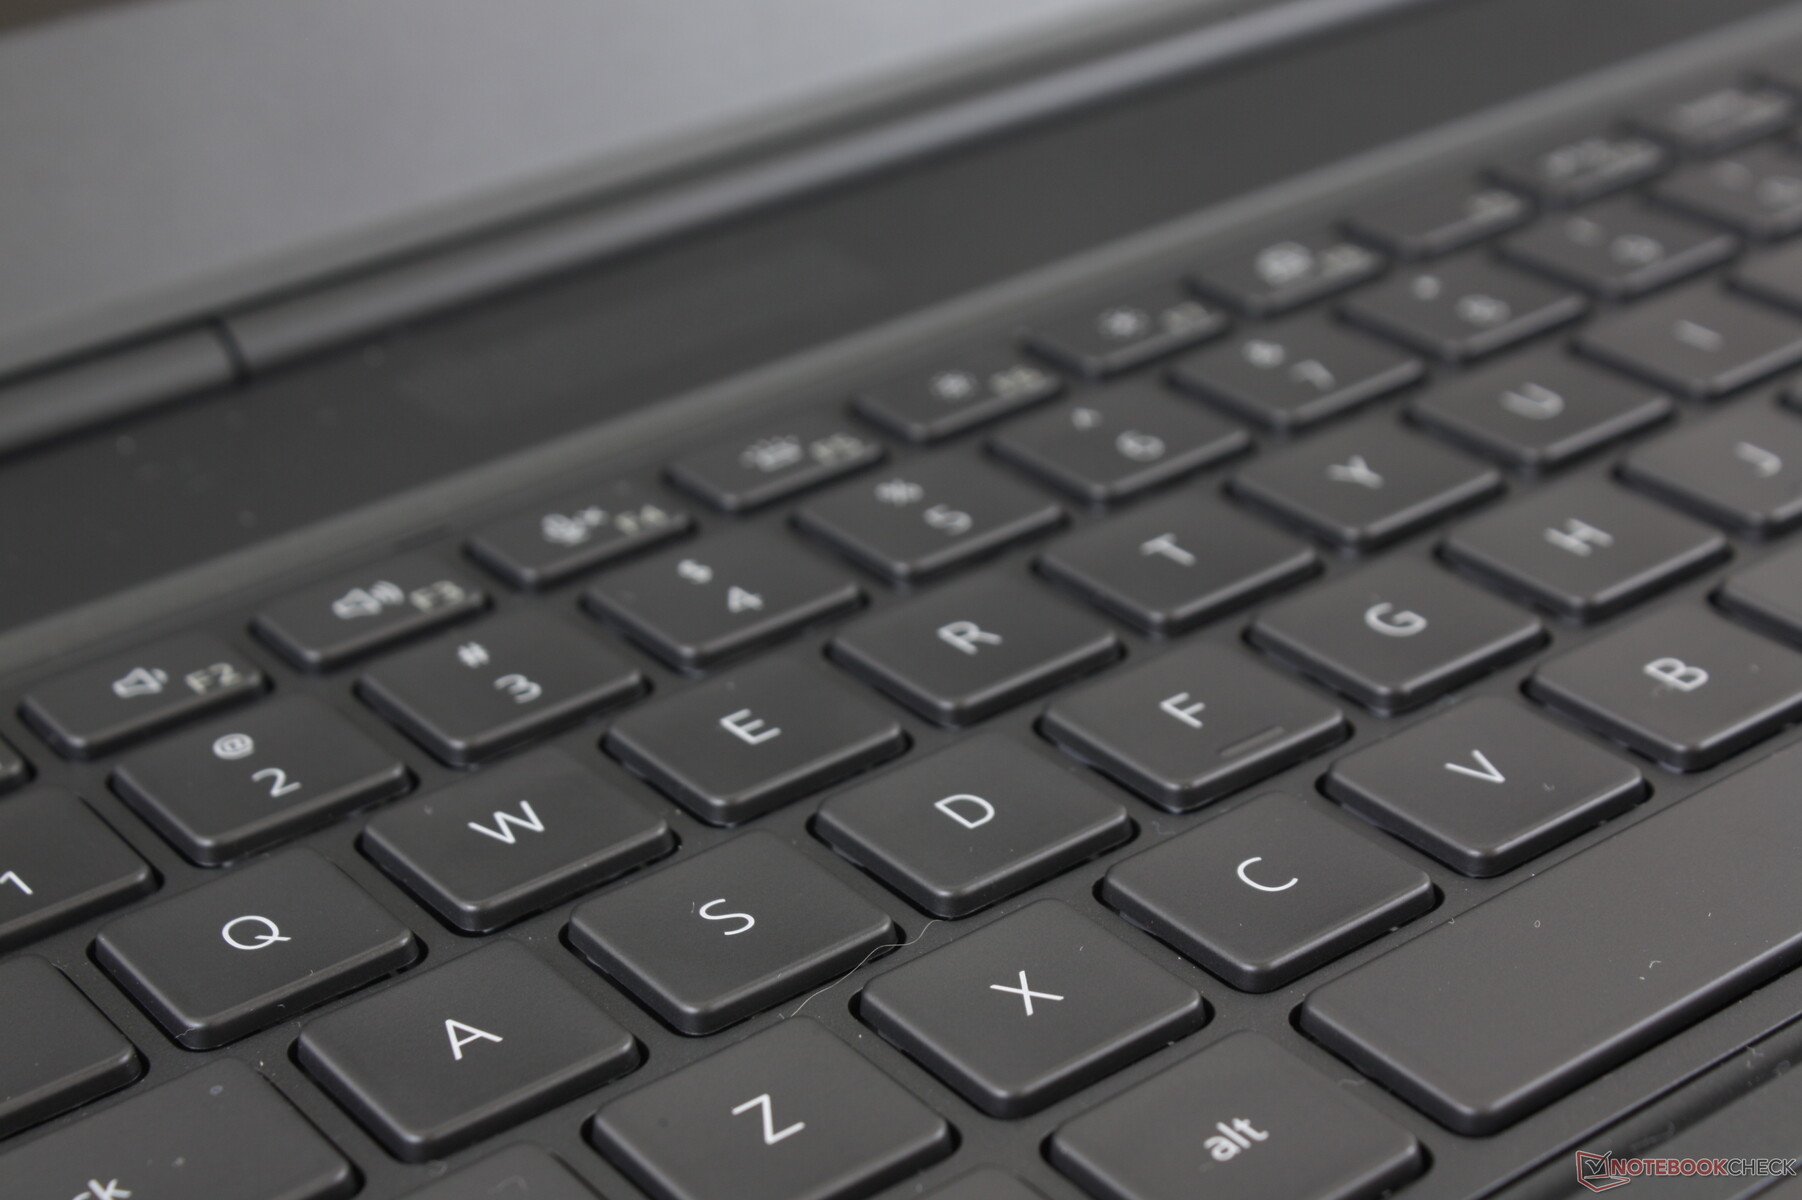
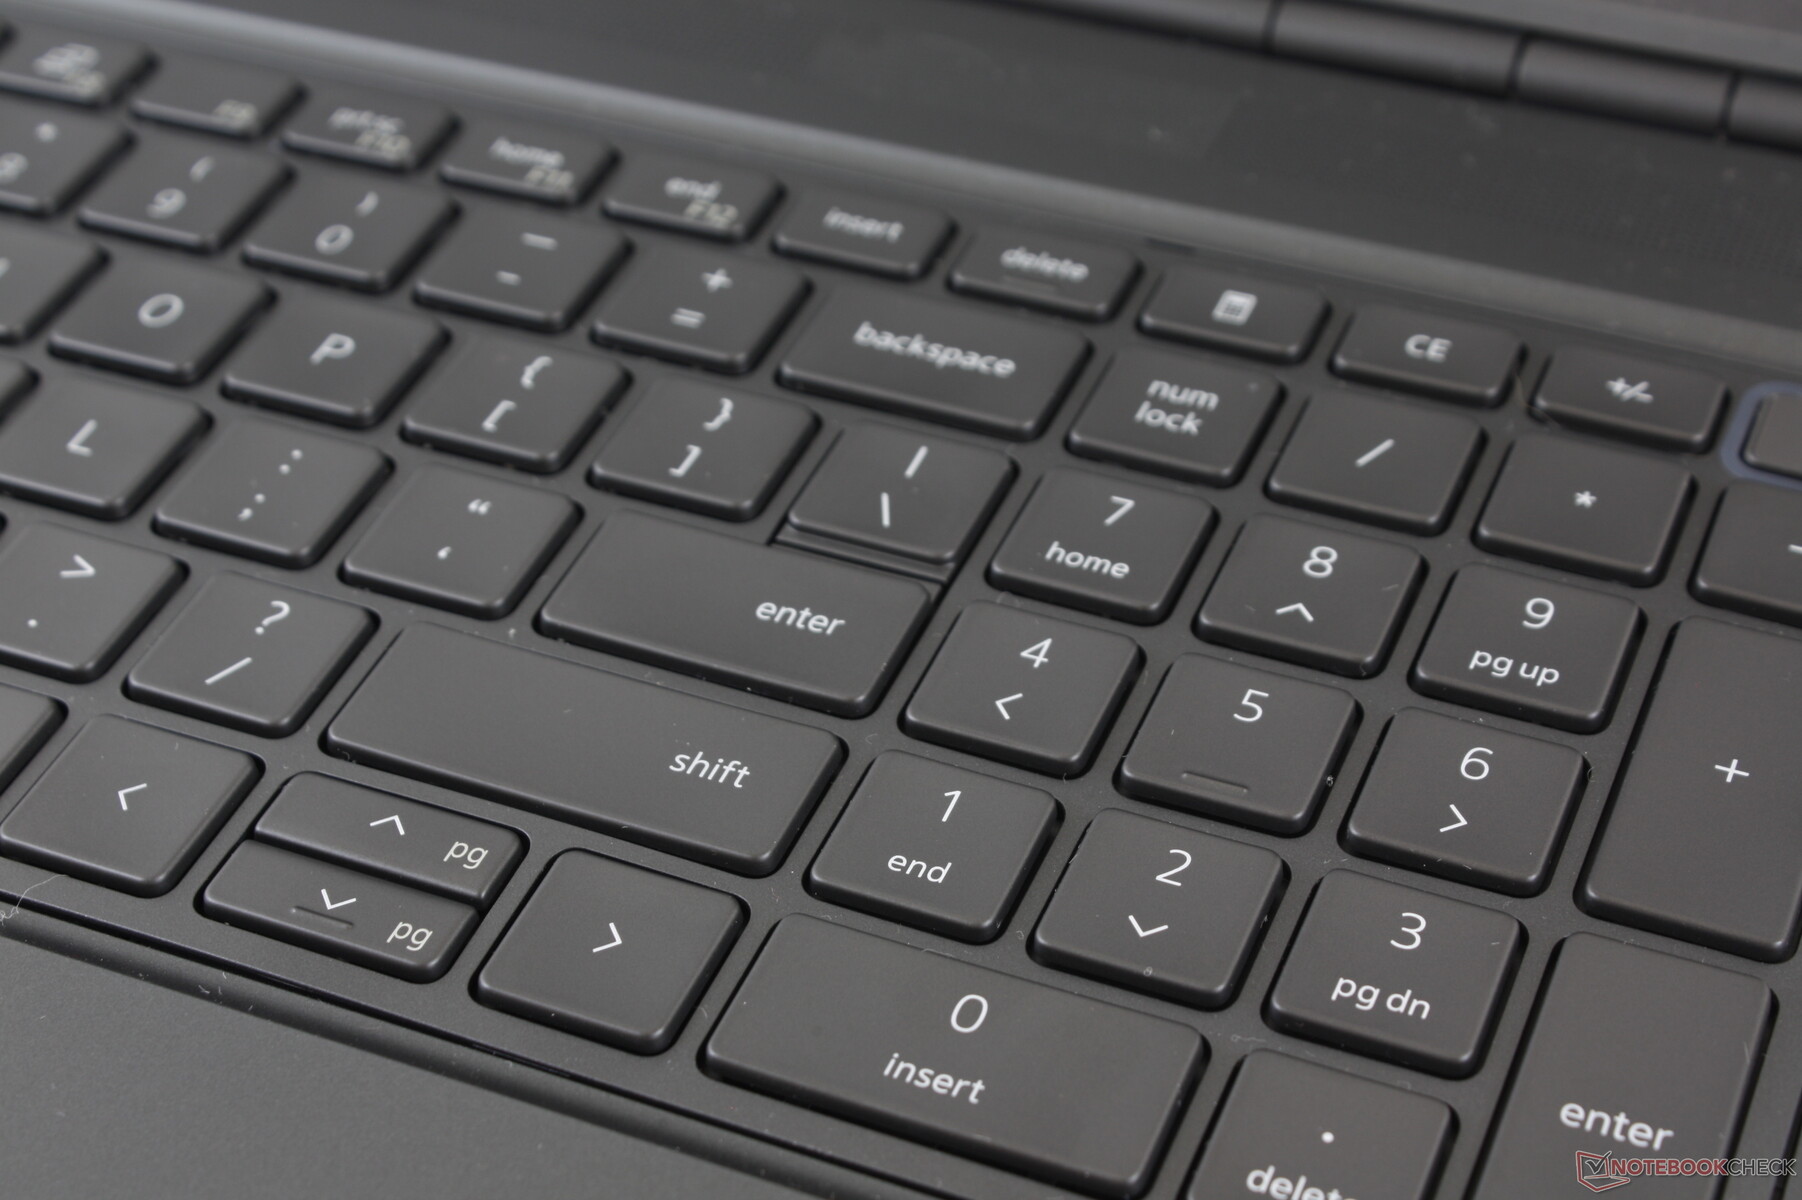
I tasti della tastiera sono relativamente silenziosi, con un feedback sia fermo che uniforme. Apprezziamo il fatto che i tasti NumPad abbiano le stesse dimensioni dei tasti QWERTY principali, cosa che non sempre avviene su molti portatili. È una piacevole esperienza di digitazione che vorremmo vedere ricreata su altri portatili Dell.
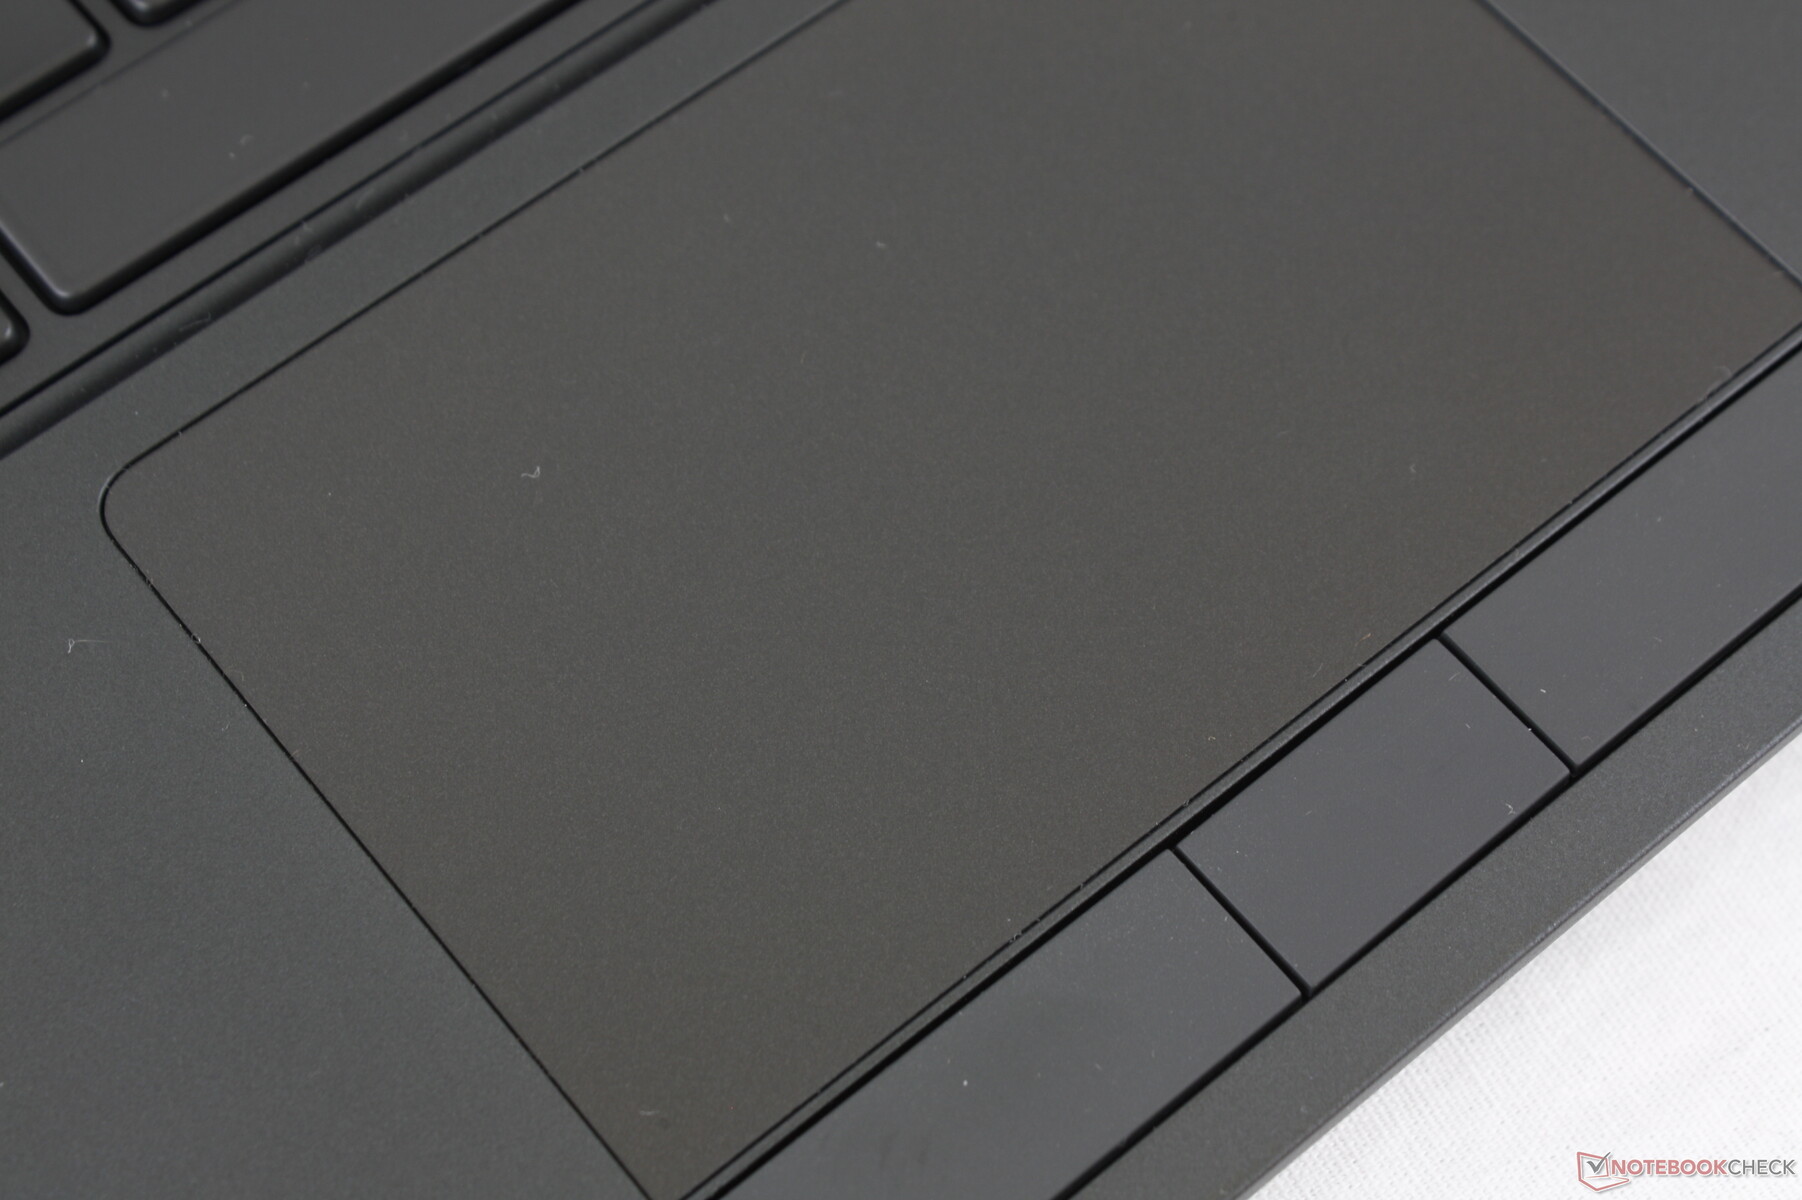
Touchpad
Il touchpad è relativamente piccolo (10 x 6,5 cm), ma compensa questo con i pulsanti del mouse dedicati in contrasto con la maggior parte delle workstation ultrasottili come la Precision 5550 o la WS66. La scorrevolezza è estremamente fluida e non crea assolutamente attrito, anche quando ci si muove a bassa velocità.
Nel contempo, i pulsanti del mouse integrati sono silenziosi e rumorosi con una corsa moderata. Il feedback è più morbido e spugnoso, soprattutto se paragonato ai pulsanti del mouse più solidi e rumorosi della serie MSI WT75.
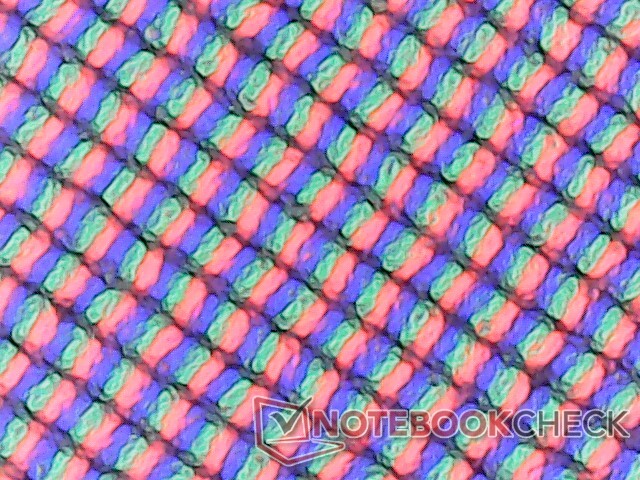
Display
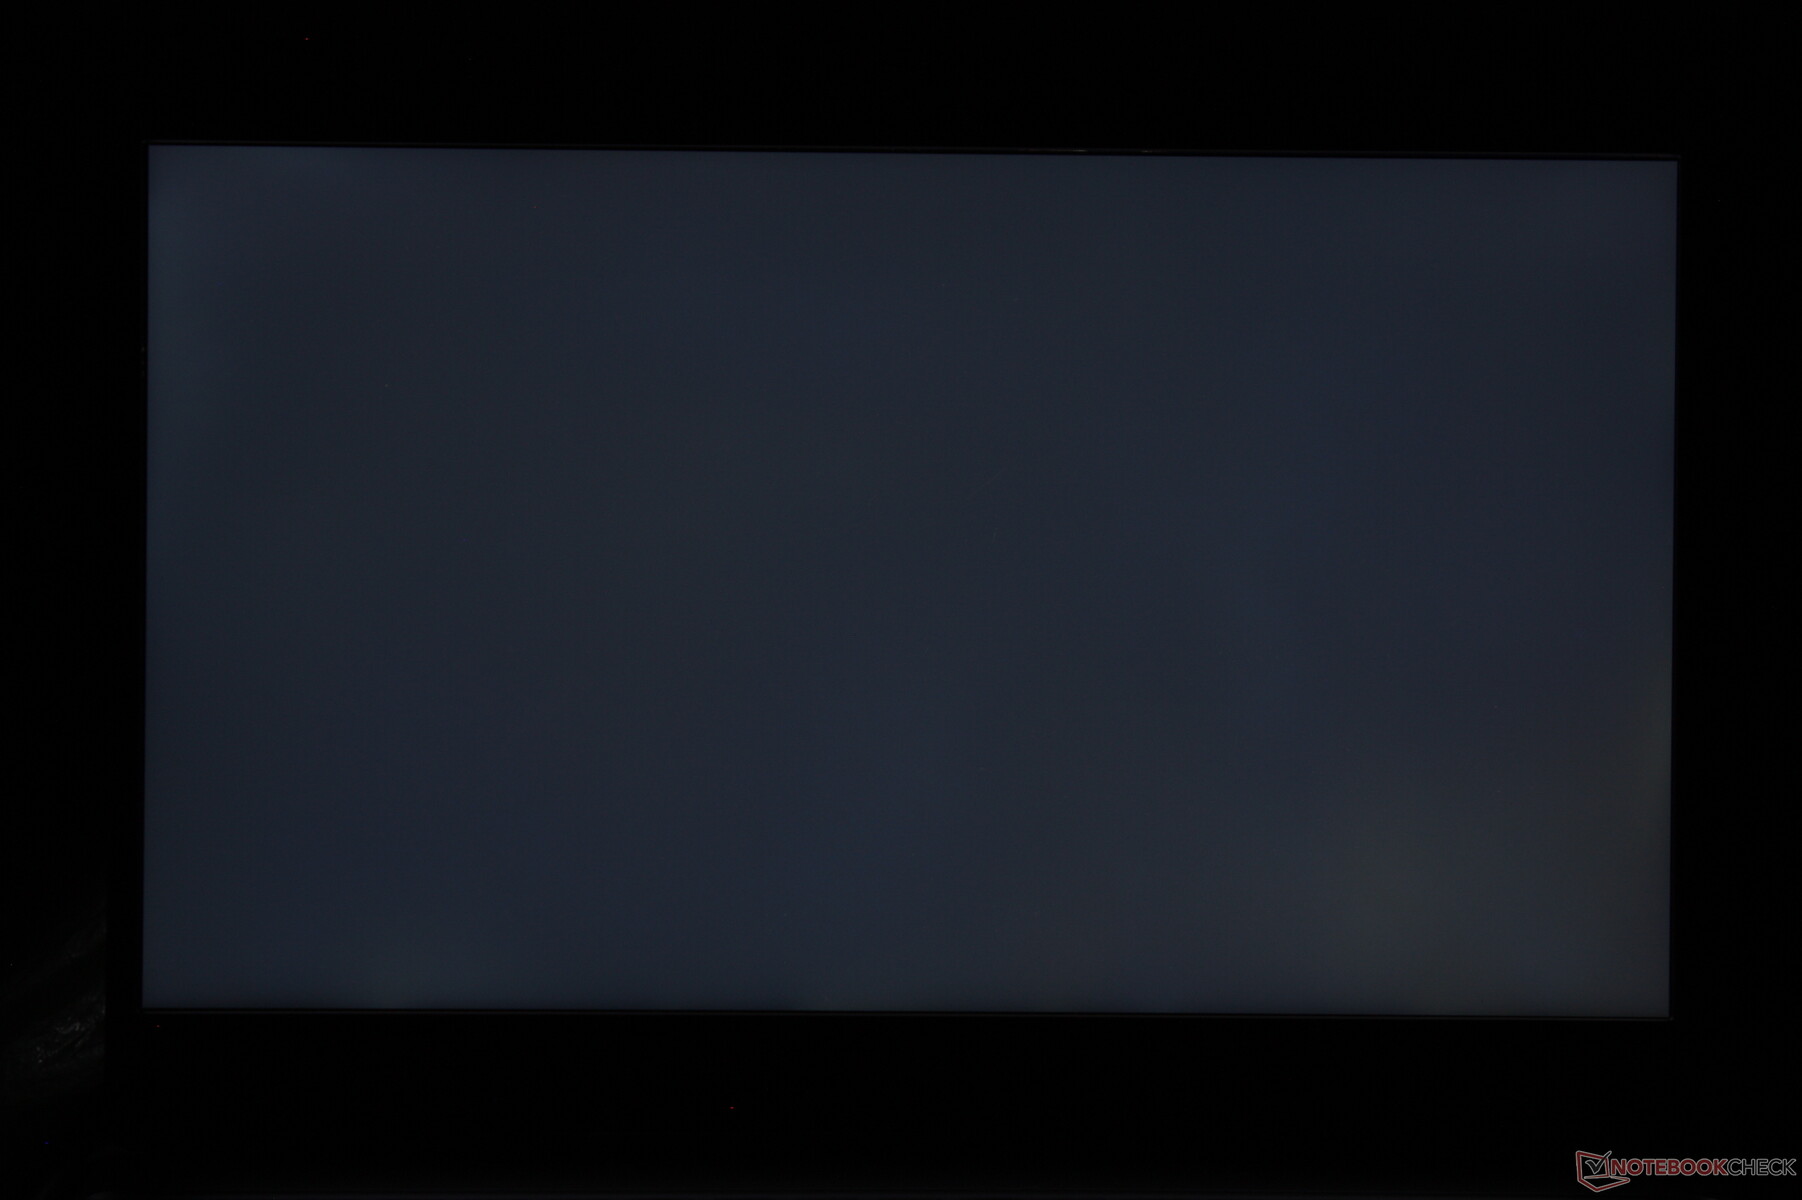
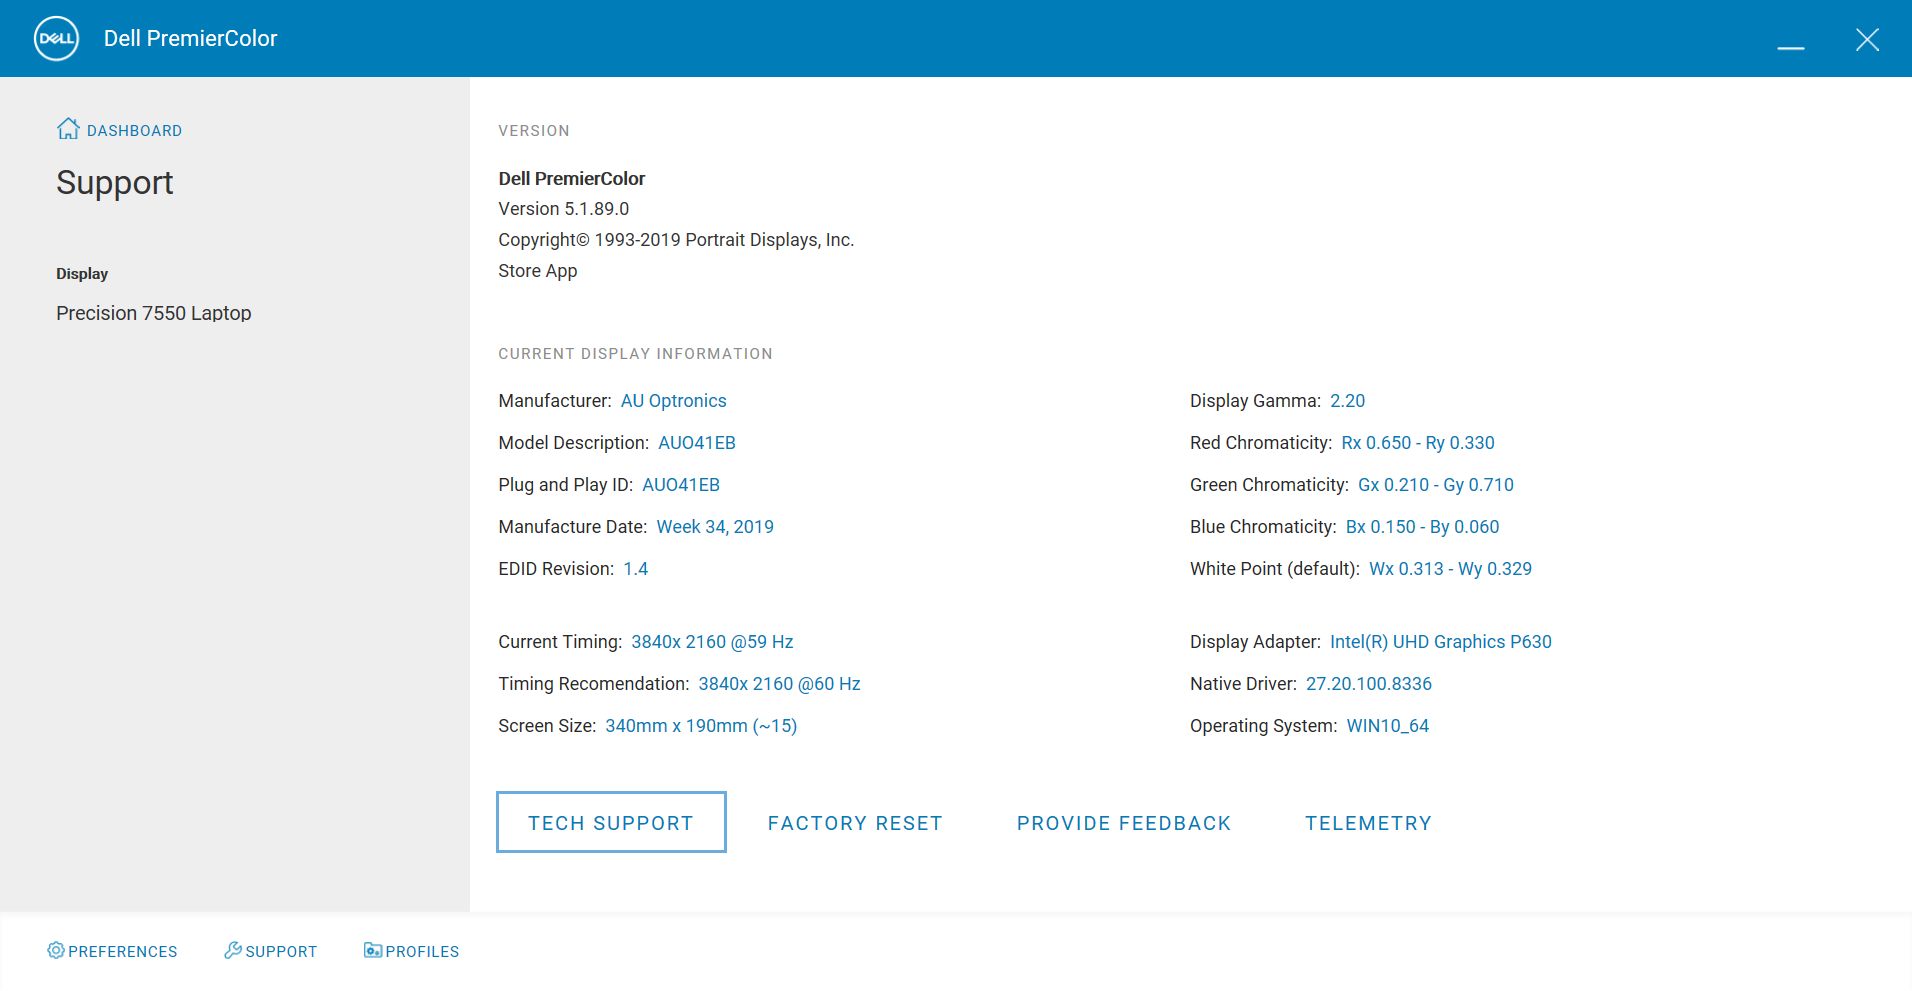
È interessante notare che il Precision 7550 utilizza un pannello IPS B156ZAN IPS UHD AU Optronics 4K simile a quello del 2018 Inspiron 15 7577, ma con miglioramenti nella luminosità e nella copertura del colore. I tempi di risposta rimangono comunque nella media, il che non dovrebbe essere un grosso problema, dato che questo non è un portatile da gioco. Il suo rapporto di contrasto ~850:1 potrebbe essere migliore se confrontato con i pannelli Innolux o Chi Mei del ThinkPad P53 o Acer ConceptD 3, rispettivamente.
Raccomandiamo di evitare l'opzione più economica di Dell da 220 nits in quanto i colori saranno molto peggiori e la retroilluminazione sarà piuttosto fioca.
| |||||||||||||||||||||||||
Distribuzione della luminosità: 90 %
Al centro con la batteria: 473.5 cd/m²
Contrasto: 861:1 (Nero: 0.55 cd/m²)
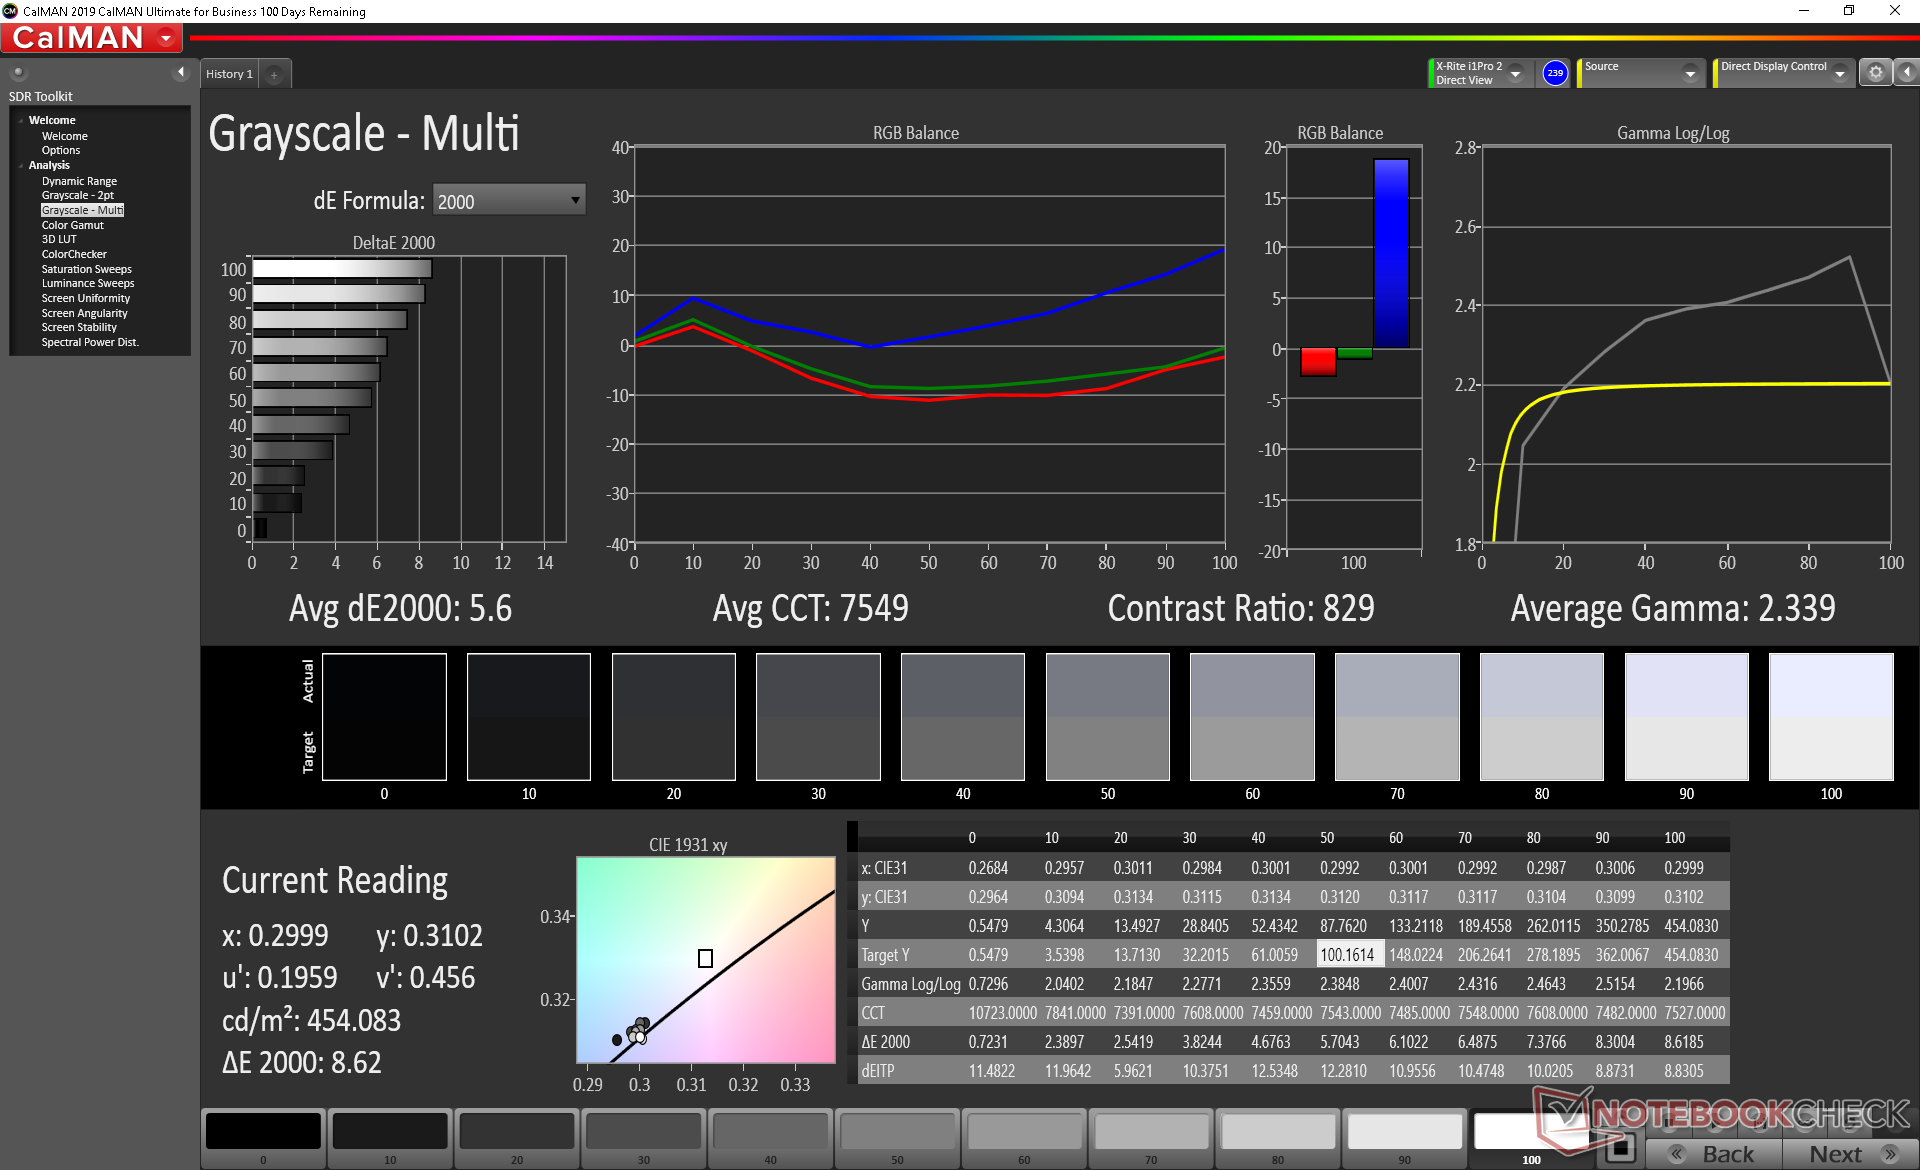
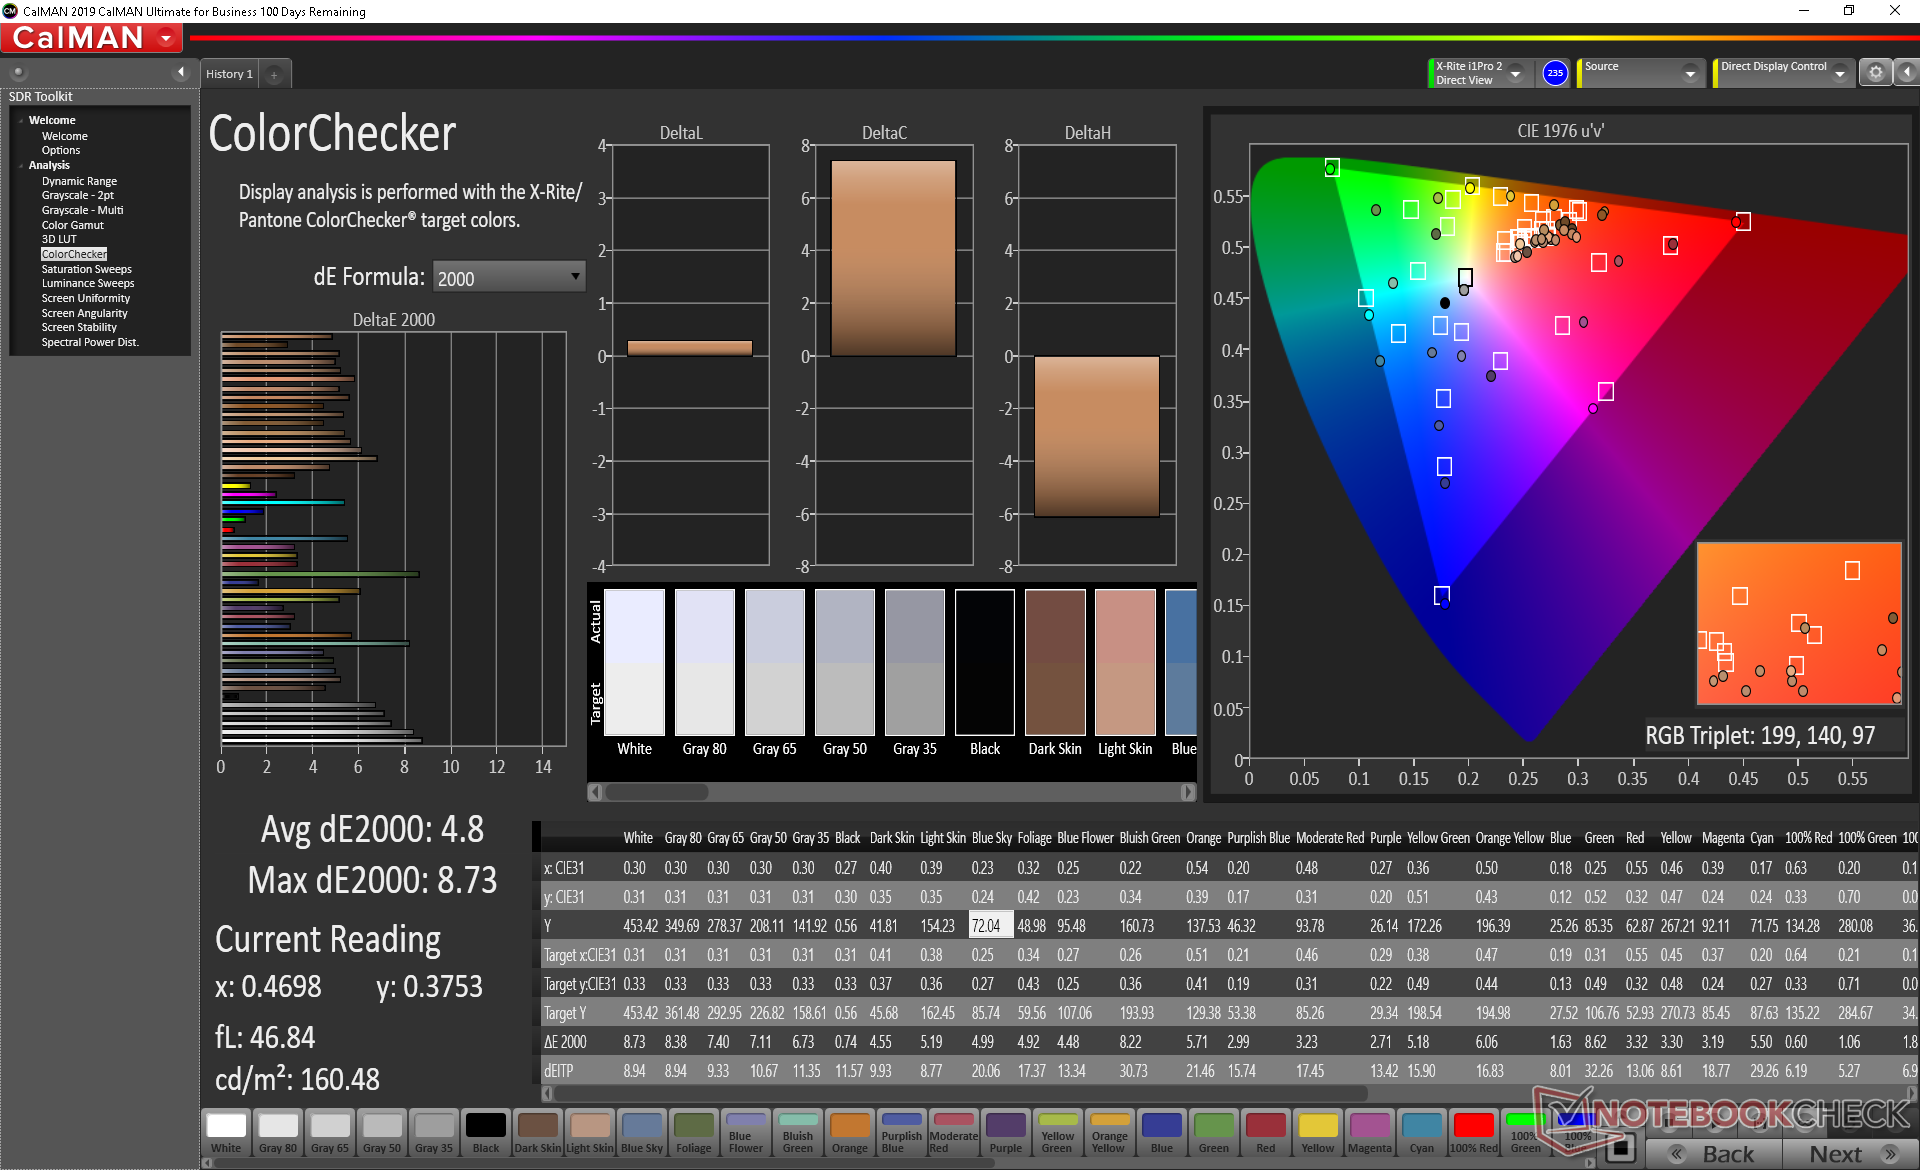
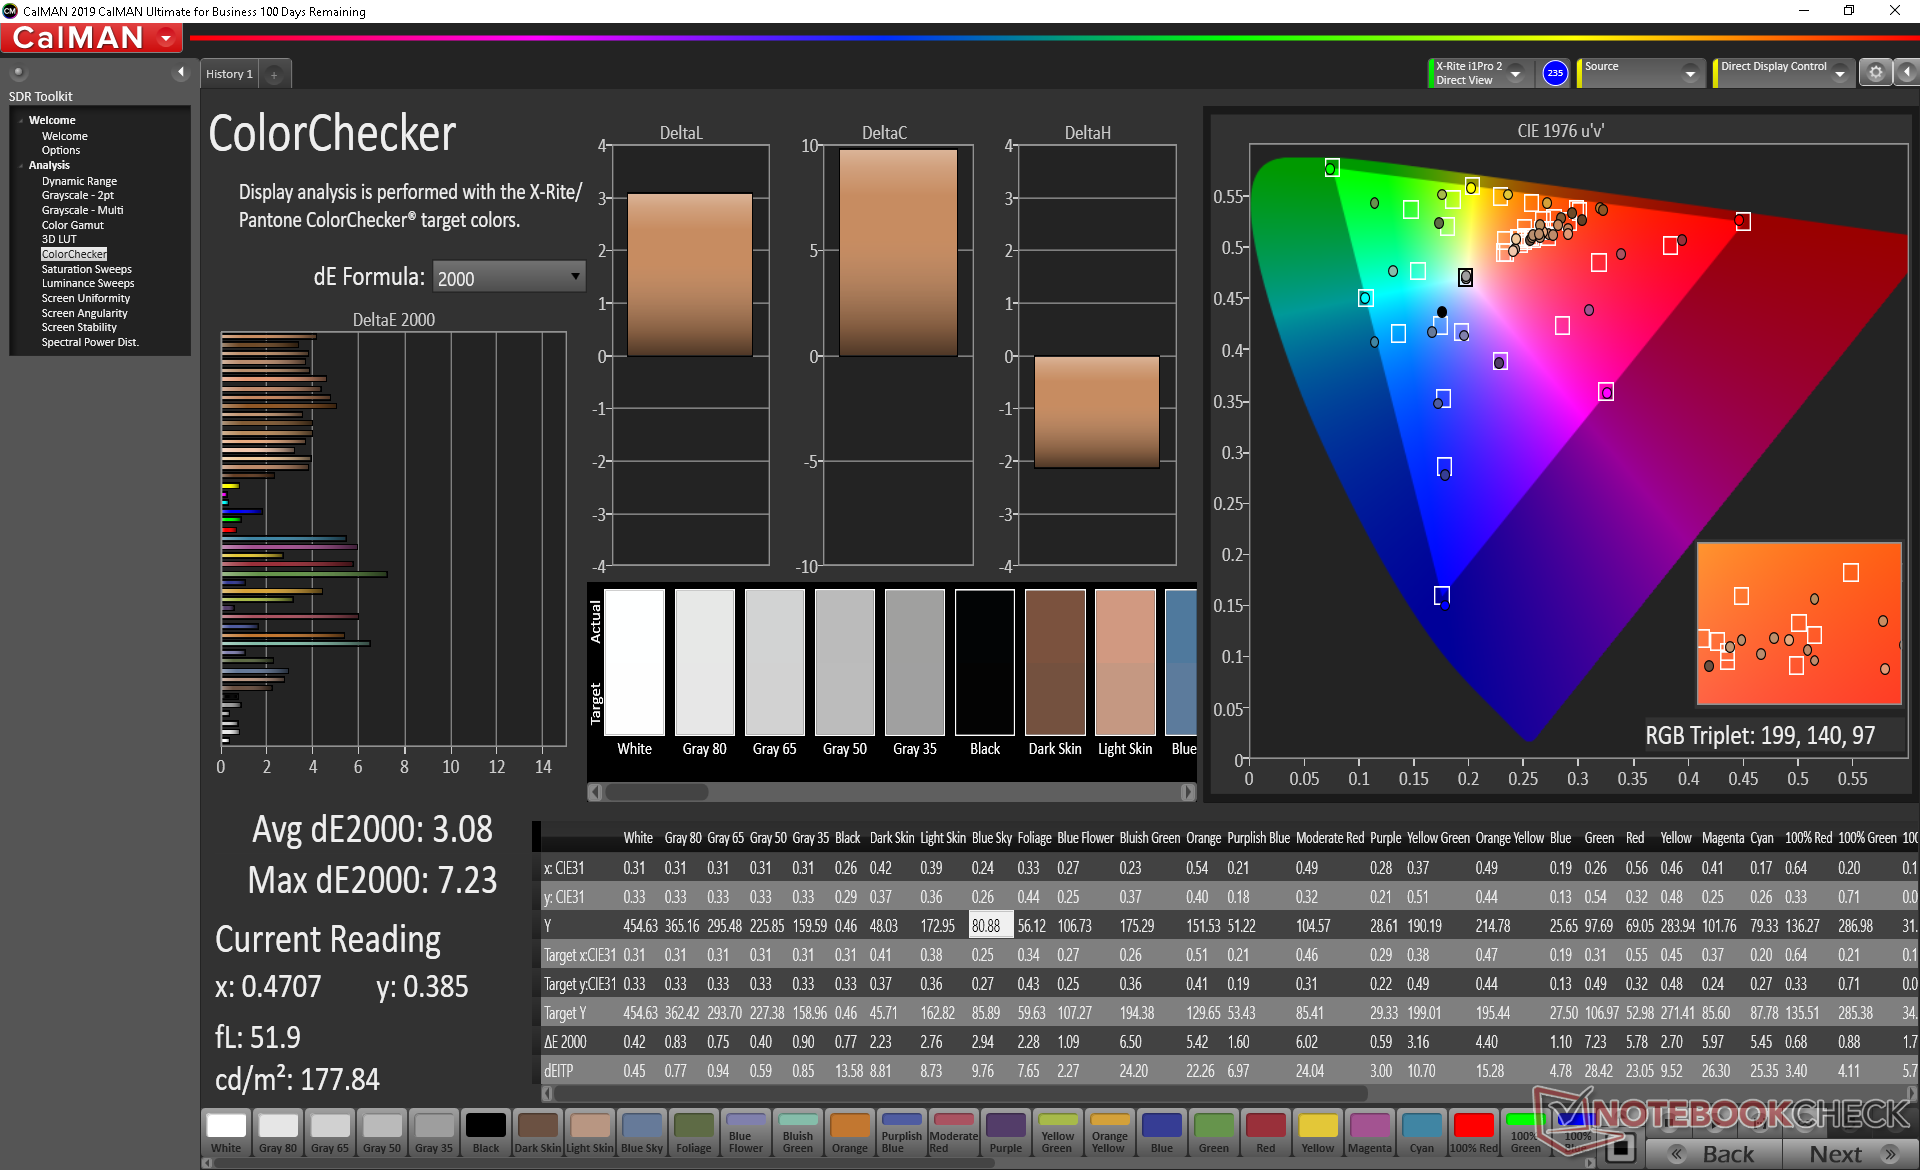
ΔE ColorChecker Calman: 4.8 | ∀{0.5-29.43 Ø4.71}
calibrated: 3.08
ΔE Greyscale Calman: 5.6 | ∀{0.09-98 Ø4.96}
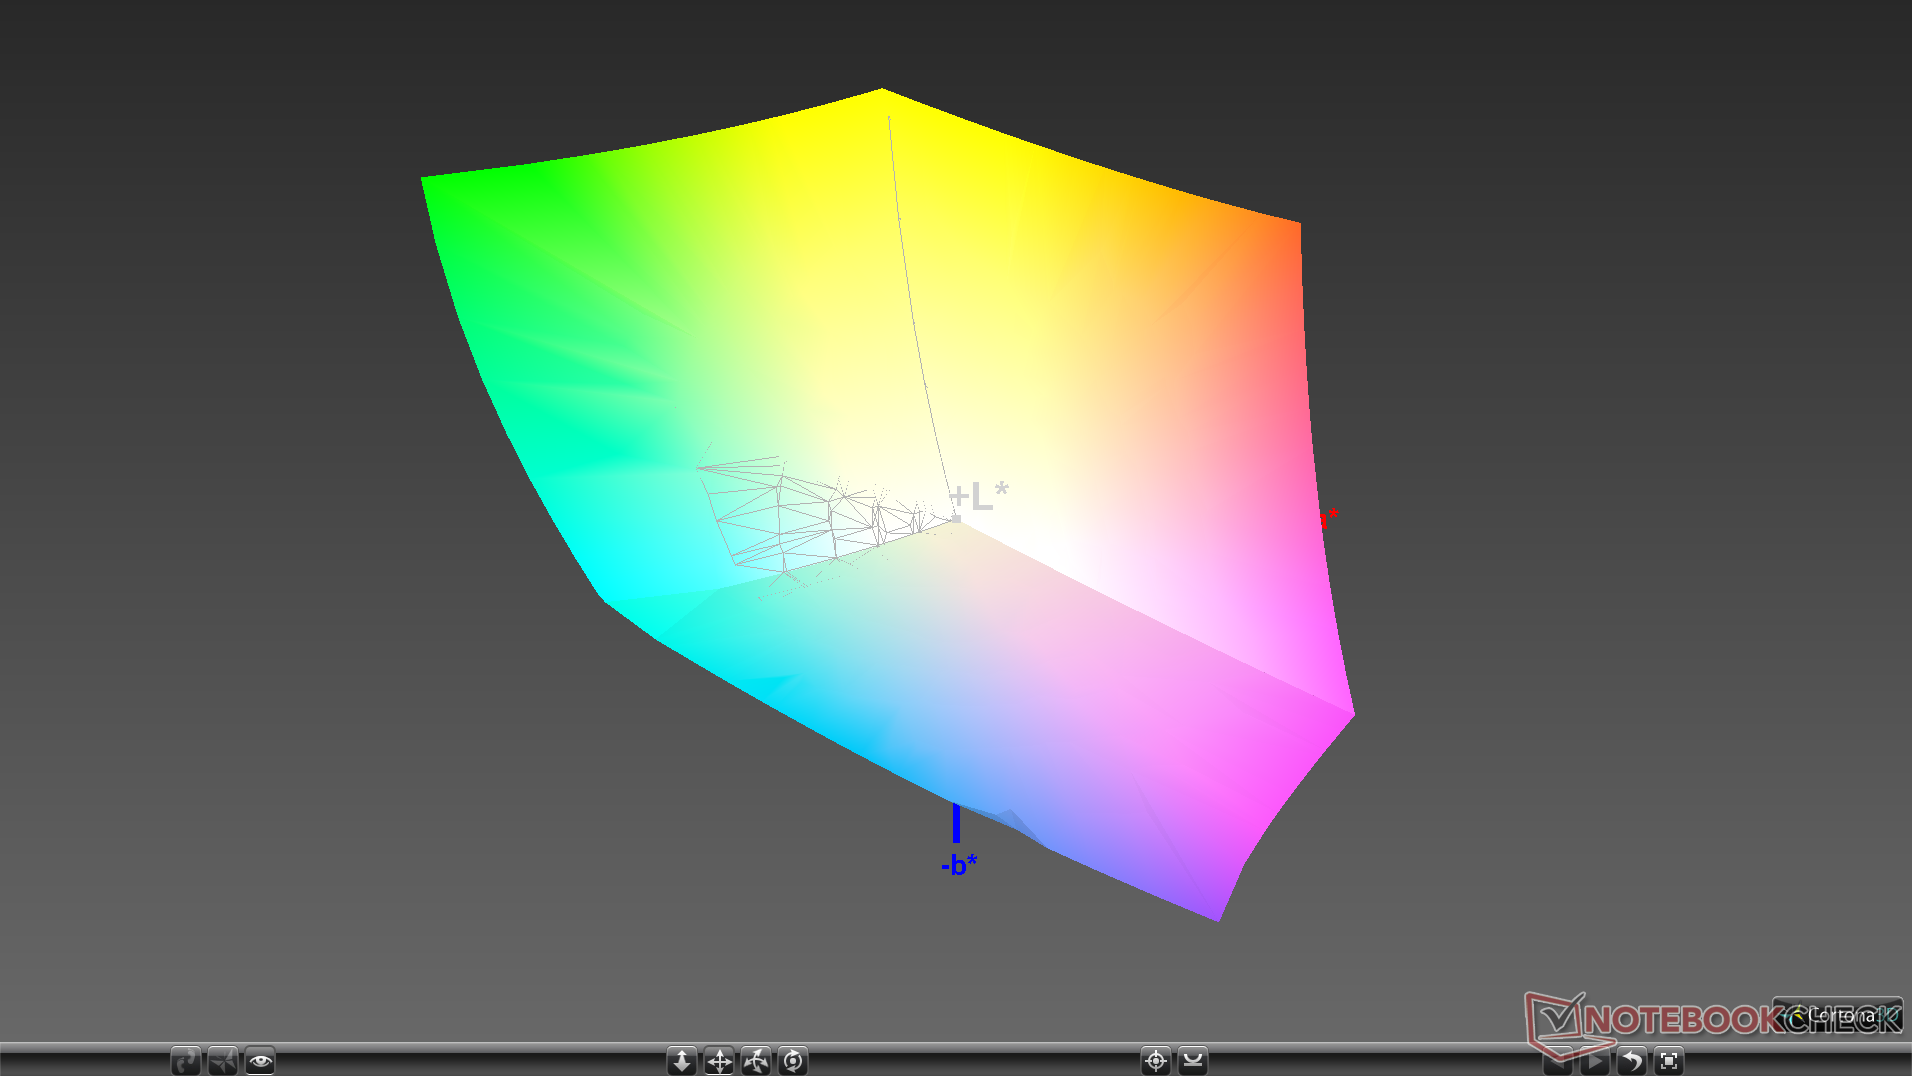
99.7% sRGB (Argyll 1.6.3 3D)
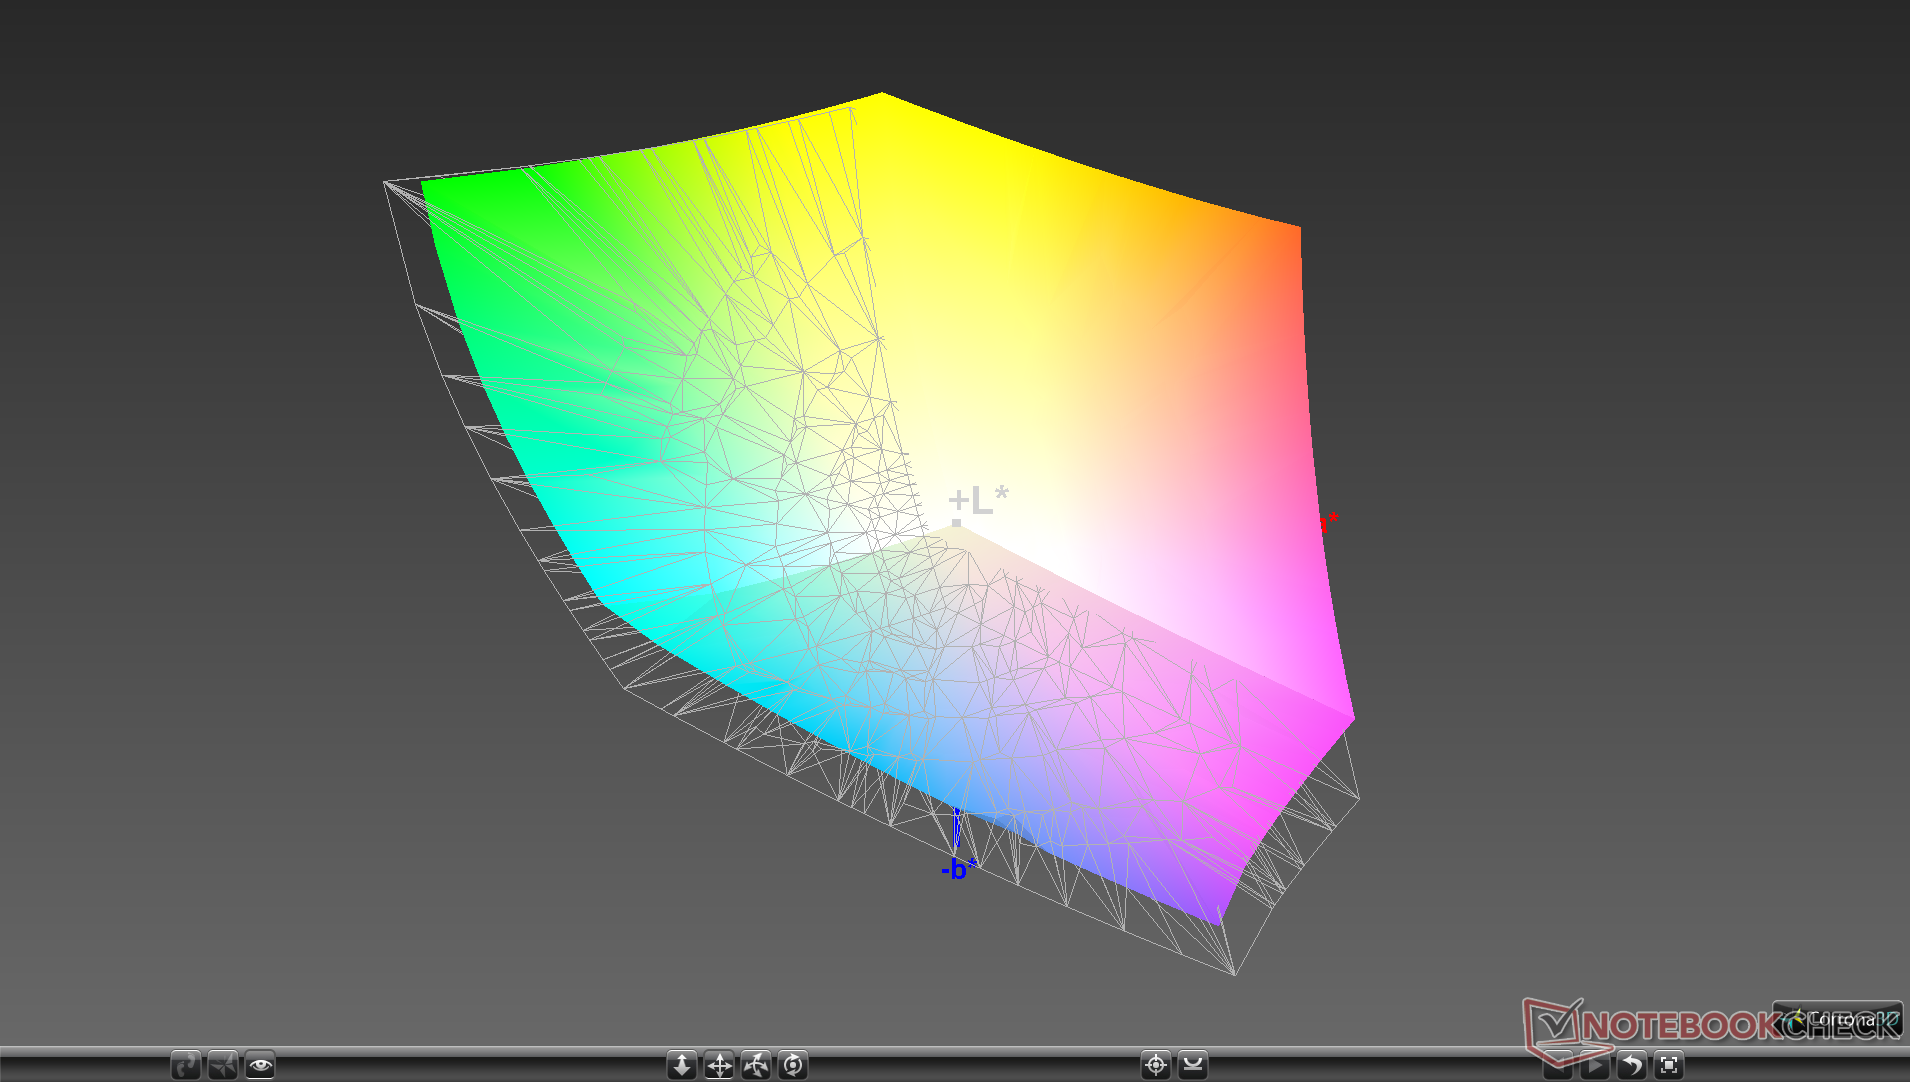
86.4% AdobeRGB 1998 (Argyll 1.6.3 3D)
96.8% AdobeRGB 1998 (Argyll 3D)
99.6% sRGB (Argyll 3D)
82.1% Display P3 (Argyll 3D)
Gamma: 2.34
CCT: 7549 K
| Dell Precision 7550 AU Optronics B156ZAN, IPS, 15.6", 3840x2160 | Dell Precision 7540 AUO41EB, , 15.6", 3840x2160 | Dell Precision 5550 P91F Sharp LQ156R1, IPS, 15.6", 3840x2400 | Acer ConceptD 3 Pro CN315-71P-73W1 Chi Mei N156HCE-EN2, IPS, 15.6", 1920x1080 | Lenovo ThinkPad P53-20QN000YGE N156HCE-GN1, IPS, 15.6", 1920x1080 | HP ZBook Studio G5-4QH10EA AUO30EB, IPS LED, 15.6", 3840x2160 | |
|---|---|---|---|---|---|---|
| Display | 3% | 4% | 3% | -21% | -16% | |
| Display P3 Coverage (%) | 82.1 | 87.1 6% | 89.9 10% | 97.9 19% | 63.2 -23% | 68.2 -17% |
| sRGB Coverage (%) | 99.6 | 100 0% | 100 0% | 99.9 0% | 92.9 -7% | 96.2 -3% |
| AdobeRGB 1998 Coverage (%) | 96.8 | 99.8 3% | 99.9 3% | 87.2 -10% | 64.3 -34% | 68.8 -29% |
| Response Times | -7% | 5% | 36% | 26% | -8% | |
| Response Time Grey 50% / Grey 80% * (ms) | 51.2 ? | 61.6 ? -20% | 46 ? 10% | 33 ? 36% | 38.4 ? 25% | 60.8 ? -19% |
| Response Time Black / White * (ms) | 34 ? | 32 ? 6% | 34 ? -0% | 22 ? 35% | 25.2 ? 26% | 32.8 ? 4% |
| PWM Frequency (Hz) | 26040 ? | |||||
| Screen | 23% | 1% | 17% | 24% | 12% | |
| Brightness middle (cd/m²) | 473.5 | 491 4% | 469.8 -1% | 343 -28% | 510 8% | 417 -12% |
| Brightness (cd/m²) | 461 | 477 3% | 464 1% | 309 -33% | 468 2% | 412 -11% |
| Brightness Distribution (%) | 90 | 92 2% | 85 -6% | 85 -6% | 89 -1% | 85 -6% |
| Black Level * (cd/m²) | 0.55 | 0.37 33% | 0.42 24% | 0.22 60% | 0.36 35% | 0.29 47% |
| Contrast (:1) | 861 | 1327 54% | 1119 30% | 1559 81% | 1417 65% | 1438 67% |
| Colorchecker dE 2000 * | 4.8 | 2.9 40% | 5.16 -8% | 3.73 22% | 2.3 52% | 4.4 8% |
| Colorchecker dE 2000 max. * | 8.73 | 5.8 34% | 9.33 -7% | 6.51 25% | 5.5 37% | 6.7 23% |
| Colorchecker dE 2000 calibrated * | 3.08 | 1.2 61% | 3.75 -22% | 1.43 54% | 1.2 61% | 1.9 38% |
| Greyscale dE 2000 * | 5.6 | 4.4 21% | 5.5 2% | 4.24 24% | 3.2 43% | 5 11% |
| Gamma | 2.34 94% | 2.03 108% | 2 110% | 2.2 100% | 2.34 94% | 2.28 96% |
| CCT | 7549 86% | 6655 98% | 6198 105% | 6329 103% | 7036 92% | 7575 86% |
| Color Space (Percent of AdobeRGB 1998) (%) | 86.4 | 88.2 2% | 89.2 3% | 78 -10% | 59.4 -31% | 62.3 -28% |
| Color Space (Percent of sRGB) (%) | 99.7 | 99.9 0% | 100 0% | 100 0% | 93.1 -7% | 96 -4% |
| Media totale (Programma / Settaggio) | 6% /
16% | 3% /
2% | 19% /
17% | 10% /
16% | -4% /
4% |
* ... Meglio usare valori piccoli
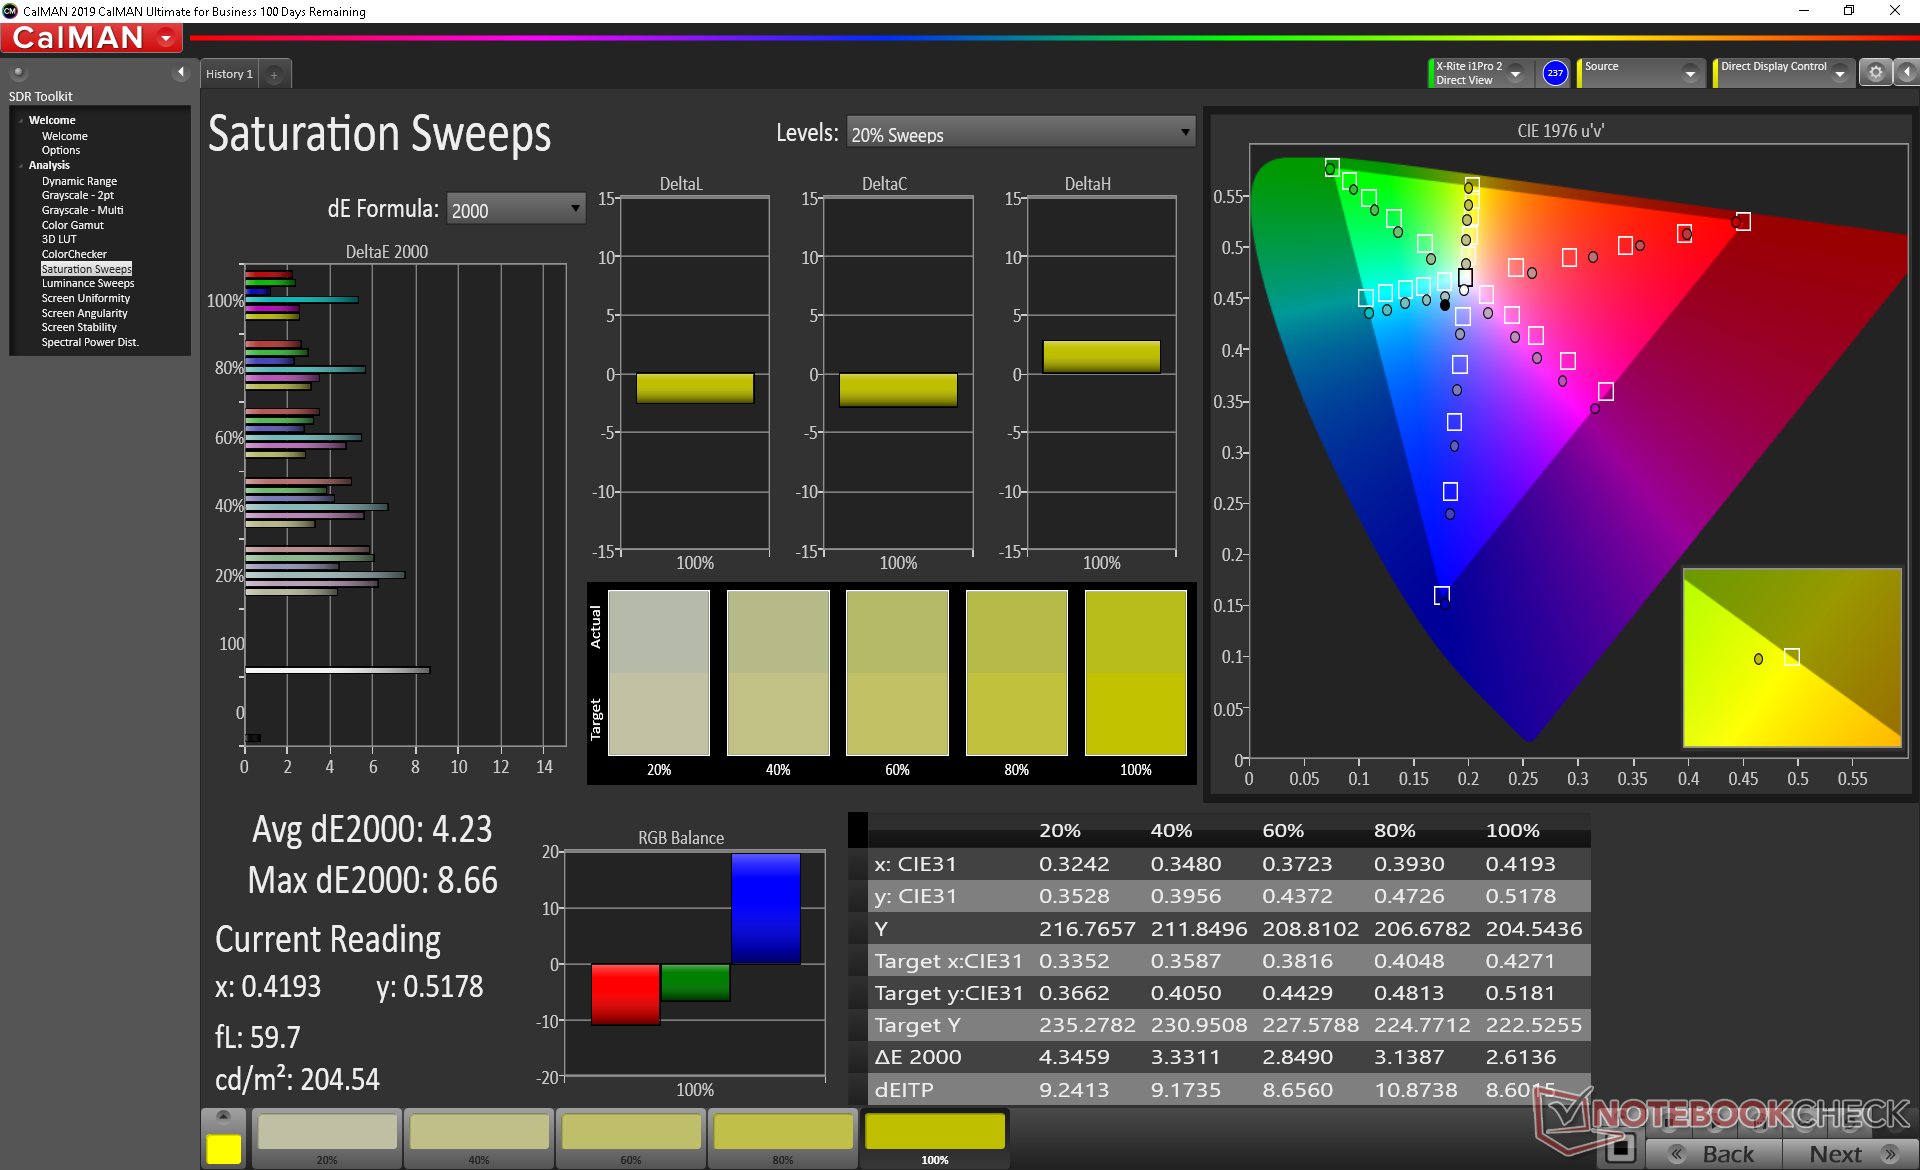
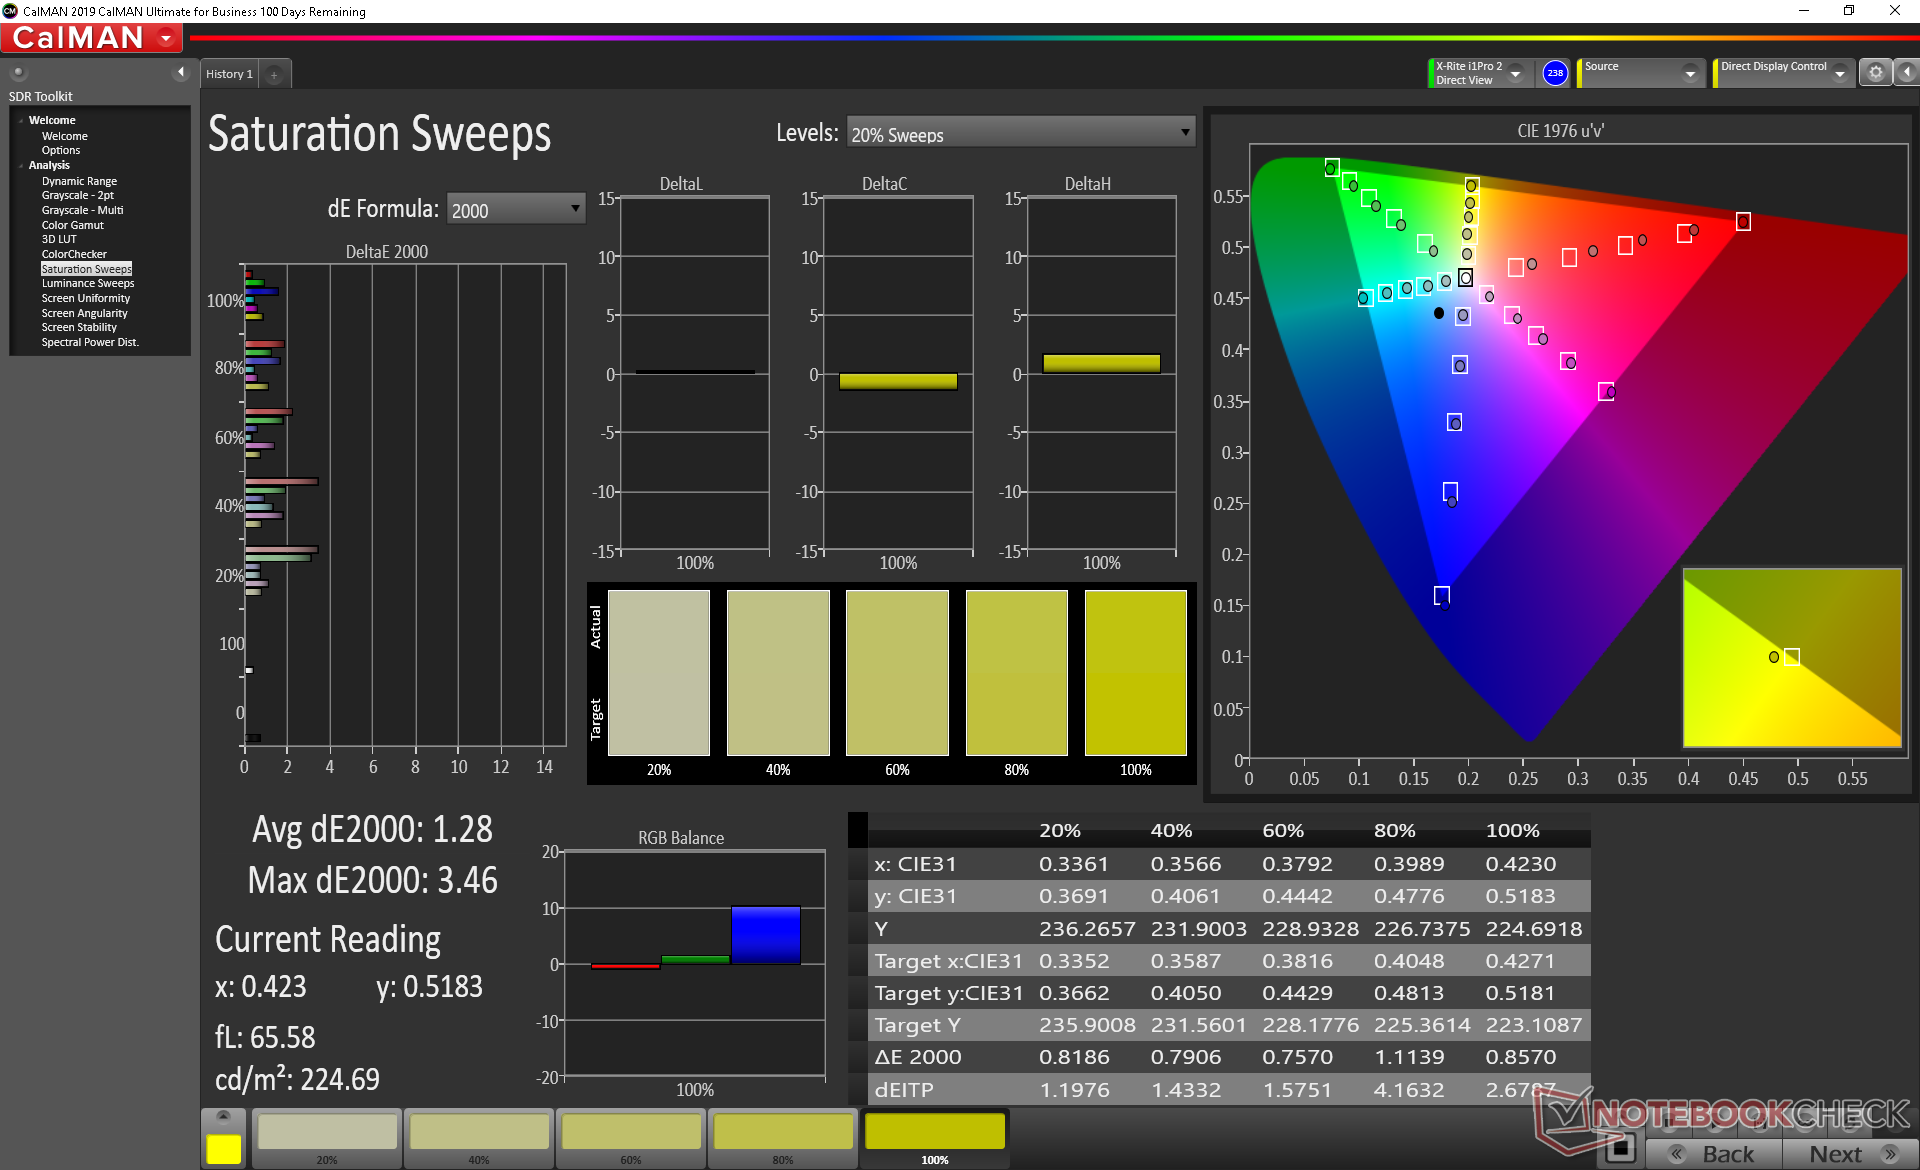
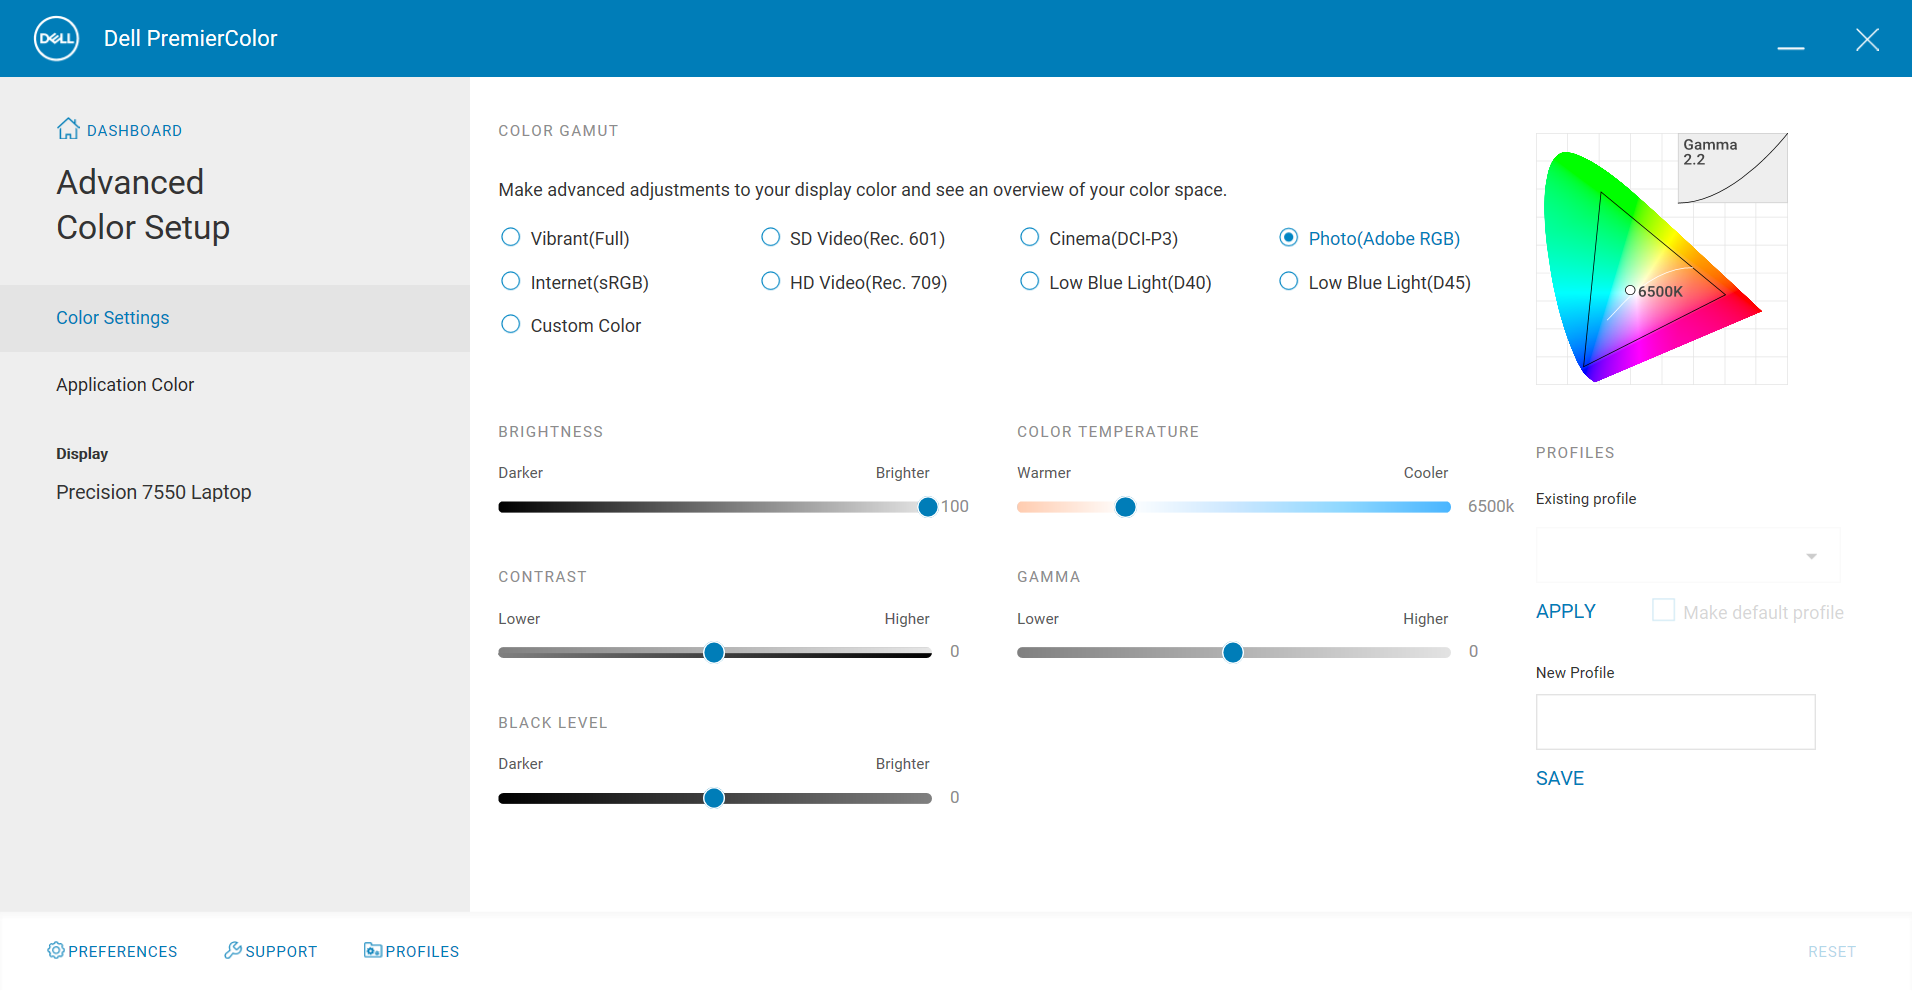
Lo spazio colore copre interamente sRGB e circa l'86% di AdobeRGB è molto simile a quello che abbiamo registrato con il Precision 5550 e la vecchia Precision 7540. Dell offre SKU con copertura DCI-P3 o anche solo il 45% di NTSC se la precisione del colore non è importante.
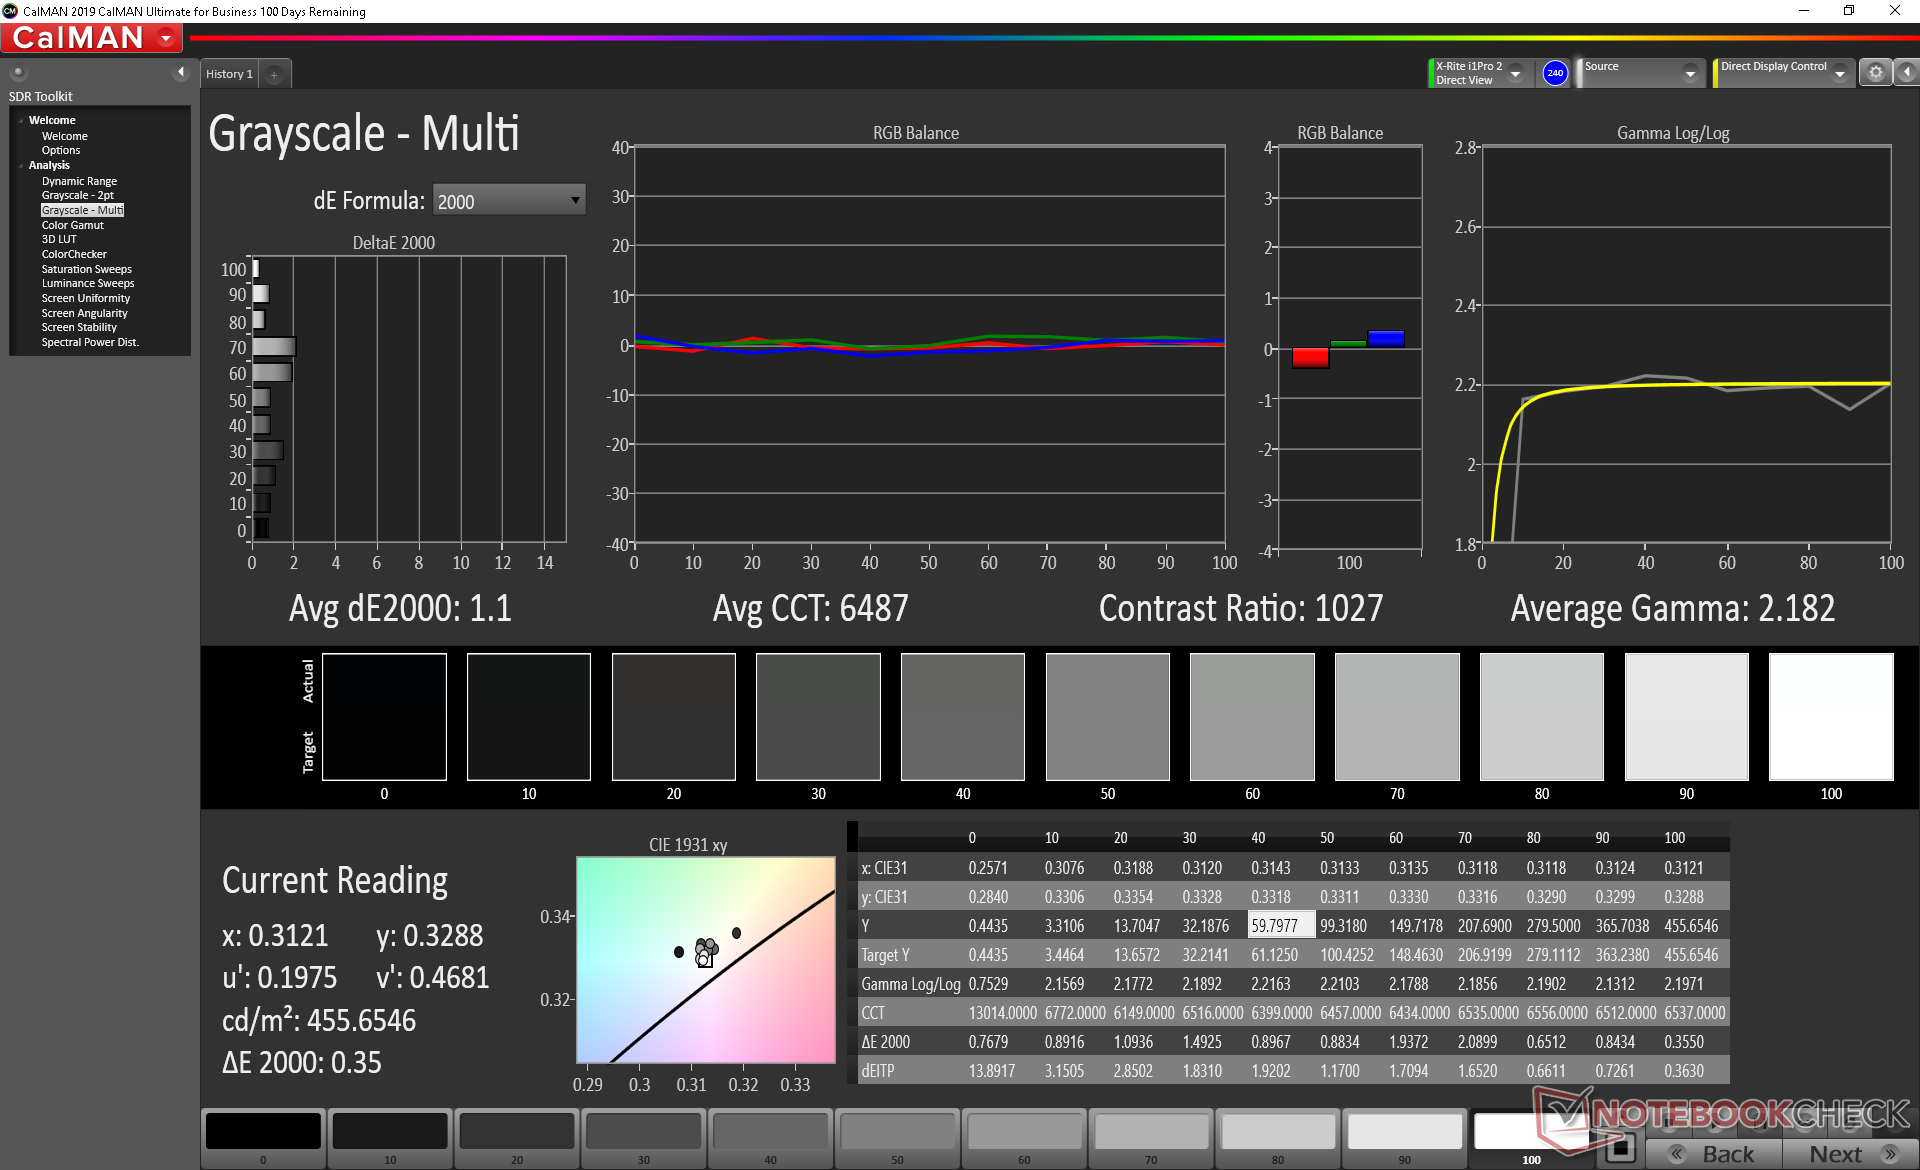
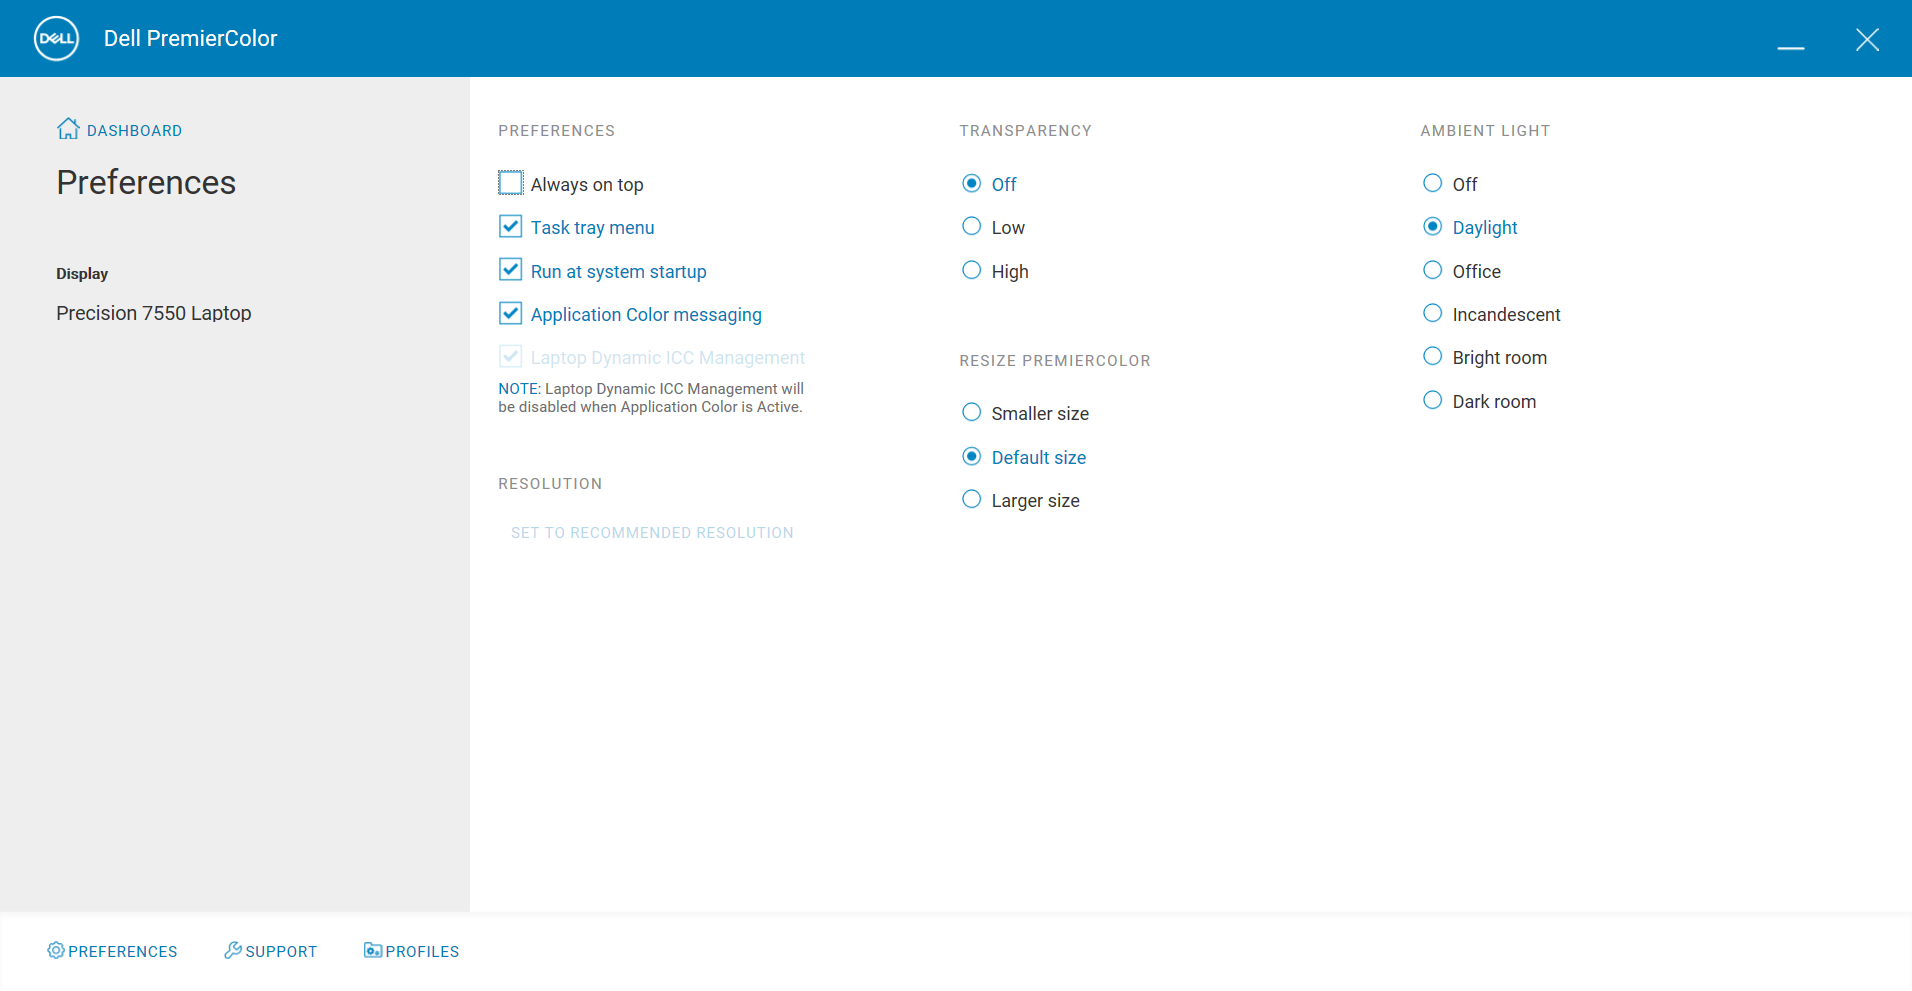
Le misure del colorimetro X-Rite mostrano una temperatura di colore troppo fredda. La calibrazione del pannello stesso affronta il problema e migliora sensibilmente il valore medio della scala di grigi DeltaE da 5,6 a 1,1. Si consiglia di applicare il nostro profilo ICM calibrato sopra o di giocare con il software Dell PremierColor preinstallato per regolare i colori.
Tempi di risposta del Display
| ↔ Tempi di risposta dal Nero al Bianco | ||
|---|---|---|
| 34 ms ... aumenta ↗ e diminuisce ↘ combinato | ↗ 20 ms Incremento | 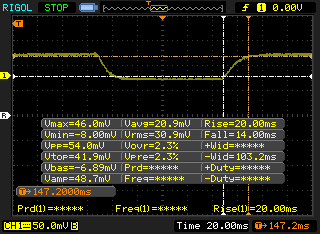 |
| ↘ 14 ms Calo | ||
| Lo schermo mostra tempi di risposta lenti nei nostri tests e sarà insoddisfacente per i gamers. In confronto, tutti i dispositivi di test variano da 0.1 (minimo) a 240 (massimo) ms. » 91 % di tutti i dispositivi è migliore. Questo significa che i tempi di risposta rilevati sono peggiori rispetto alla media di tutti i dispositivi testati (19.8 ms). | ||
| ↔ Tempo di risposta dal 50% Grigio all'80% Grigio | ||
| 51.2 ms ... aumenta ↗ e diminuisce ↘ combinato | ↗ 24.4 ms Incremento | 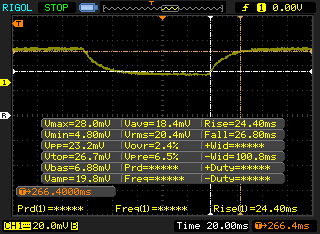 |
| ↘ 26.8 ms Calo | ||
| Lo schermo mostra tempi di risposta lenti nei nostri tests e sarà insoddisfacente per i gamers. In confronto, tutti i dispositivi di test variano da 0.165 (minimo) a 636 (massimo) ms. » 88 % di tutti i dispositivi è migliore. Questo significa che i tempi di risposta rilevati sono peggiori rispetto alla media di tutti i dispositivi testati (30.9 ms). | ||
Sfarfallio dello schermo / PWM (Pulse-Width Modulation)
| flickering dello schermo / PWM non rilevato |  | ||
In confronto: 52 % di tutti i dispositivi testati non utilizza PWM per ridurre la luminosita' del display. Se è rilevato PWM, una media di 7744 (minimo: 5 - massimo: 343500) Hz è stata rilevata. | |||
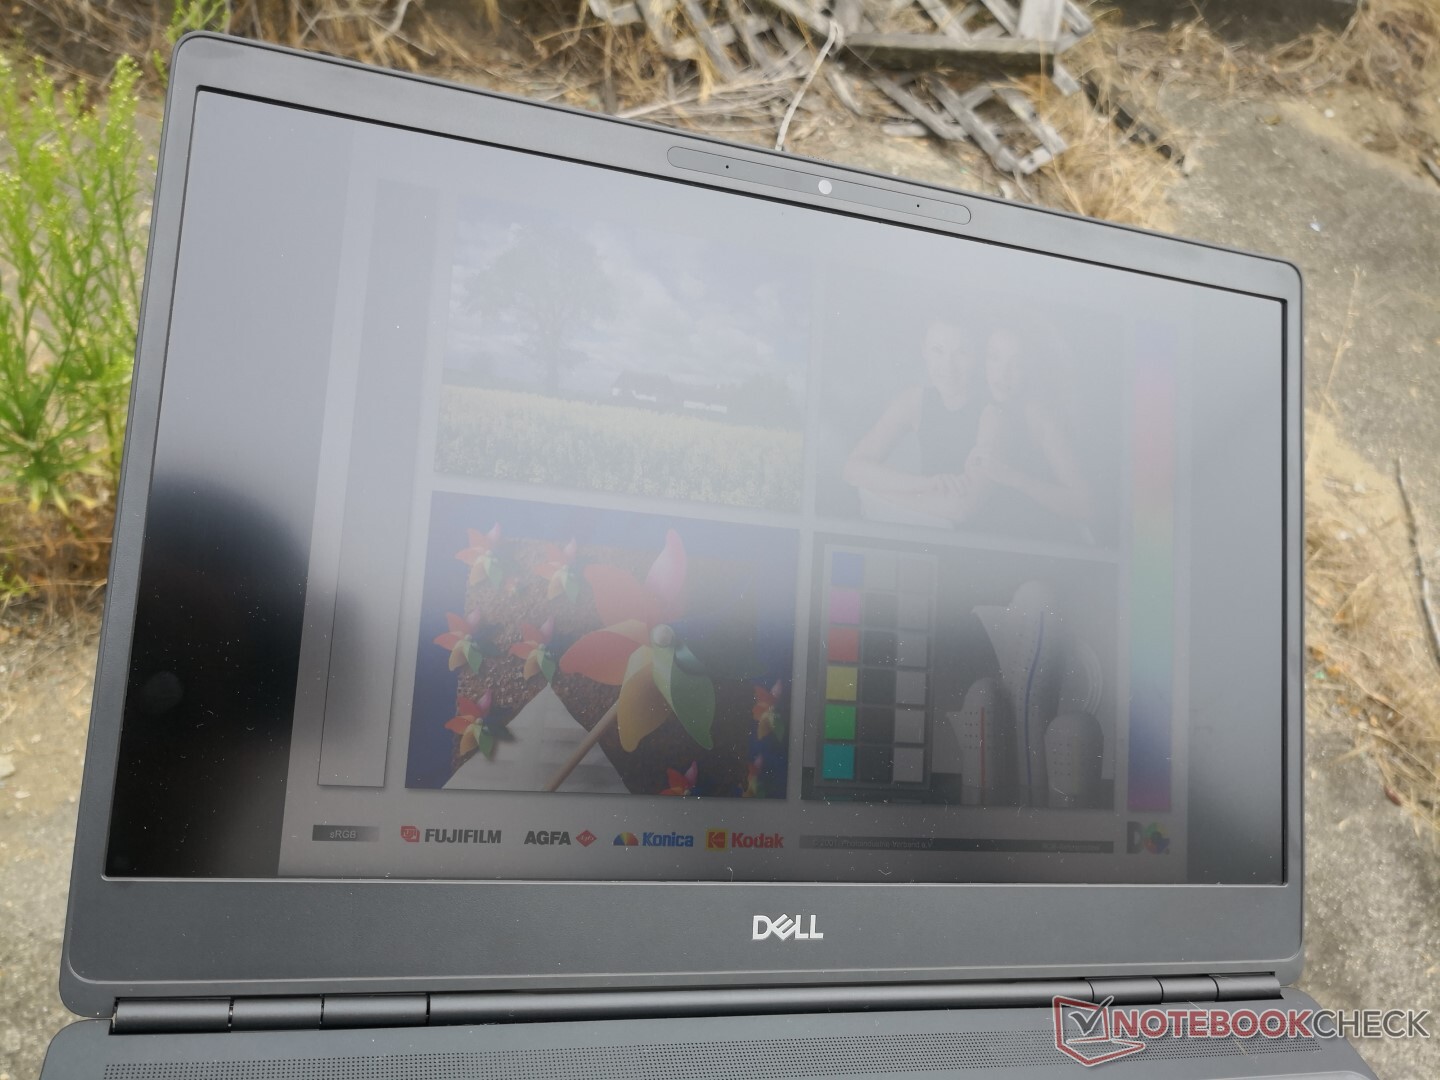
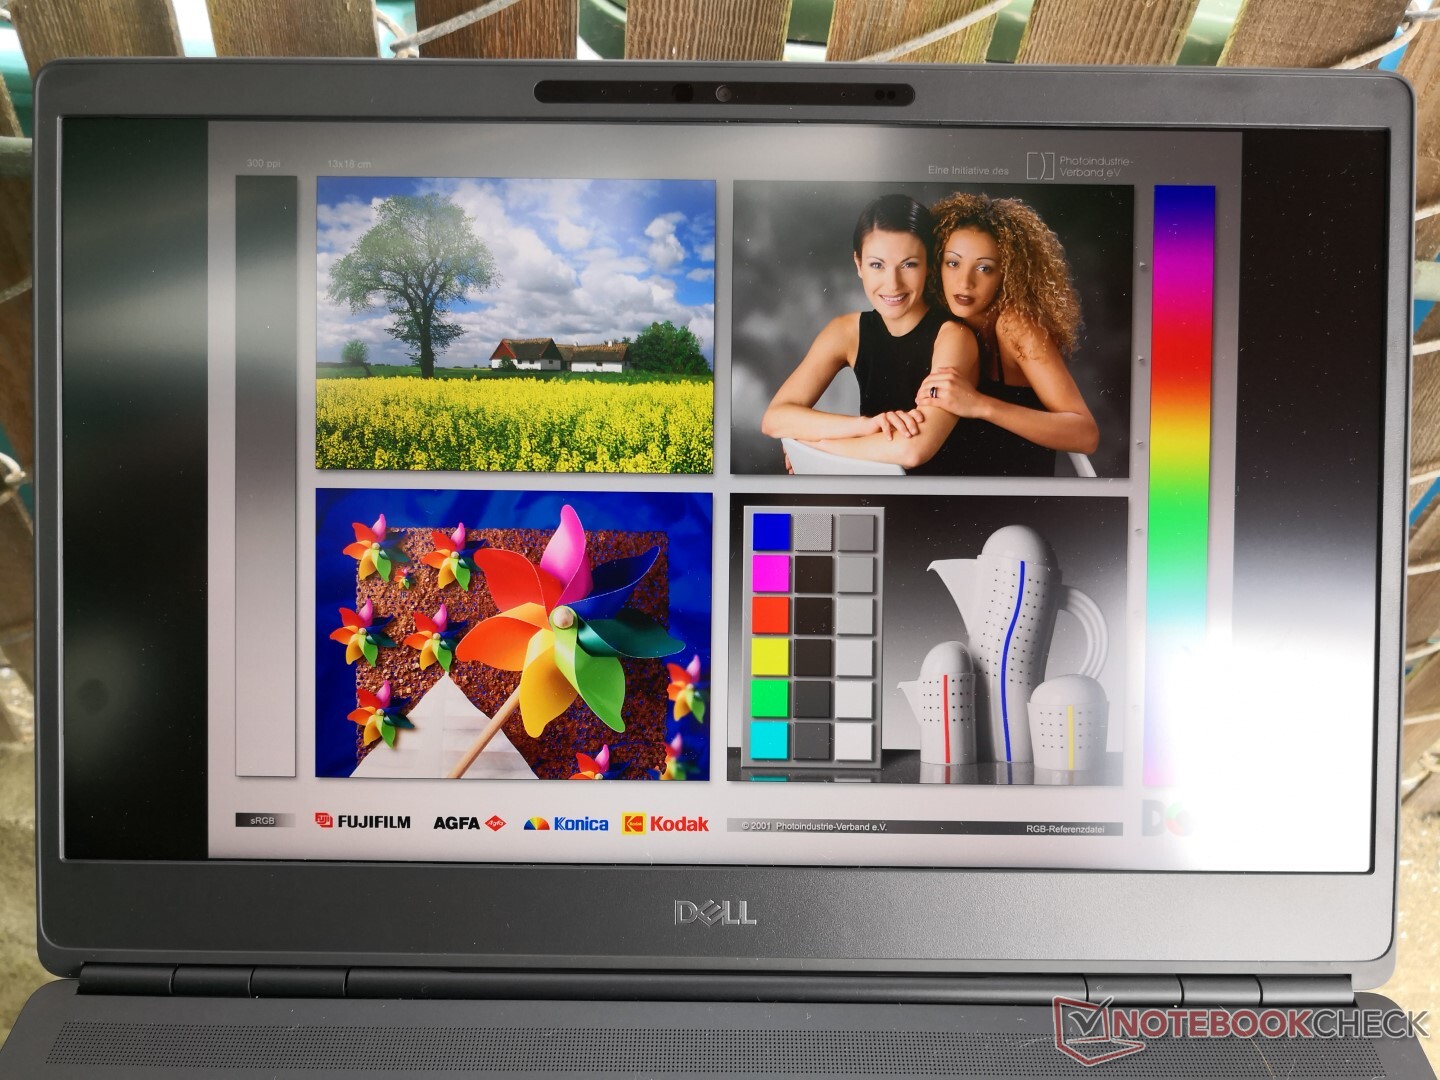
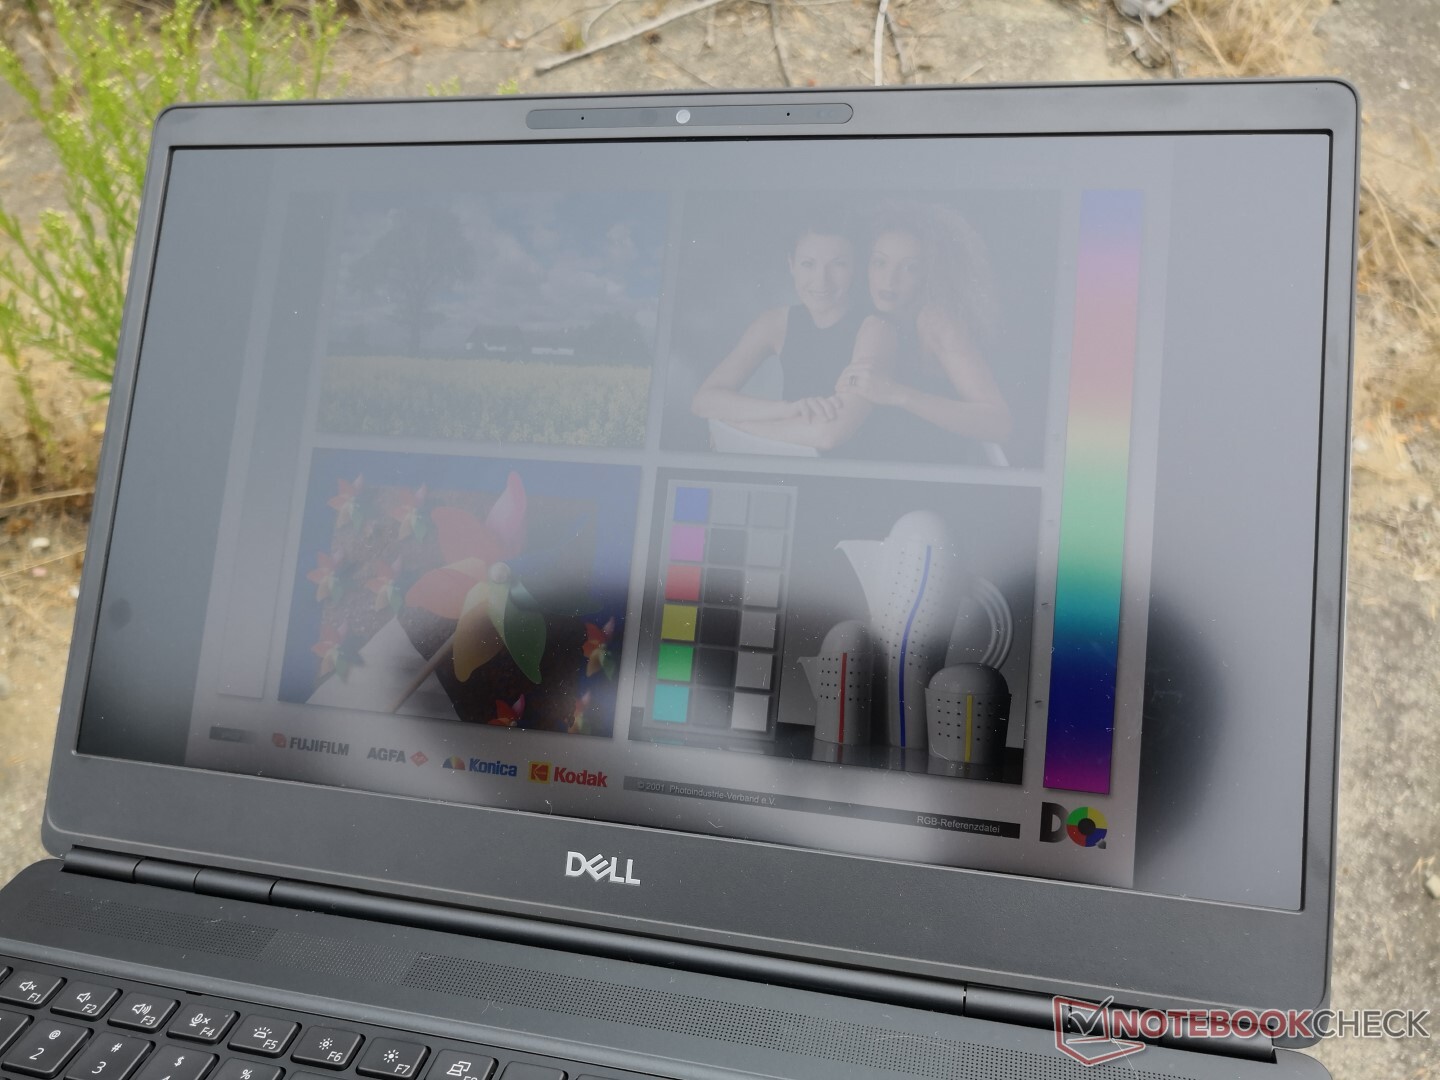
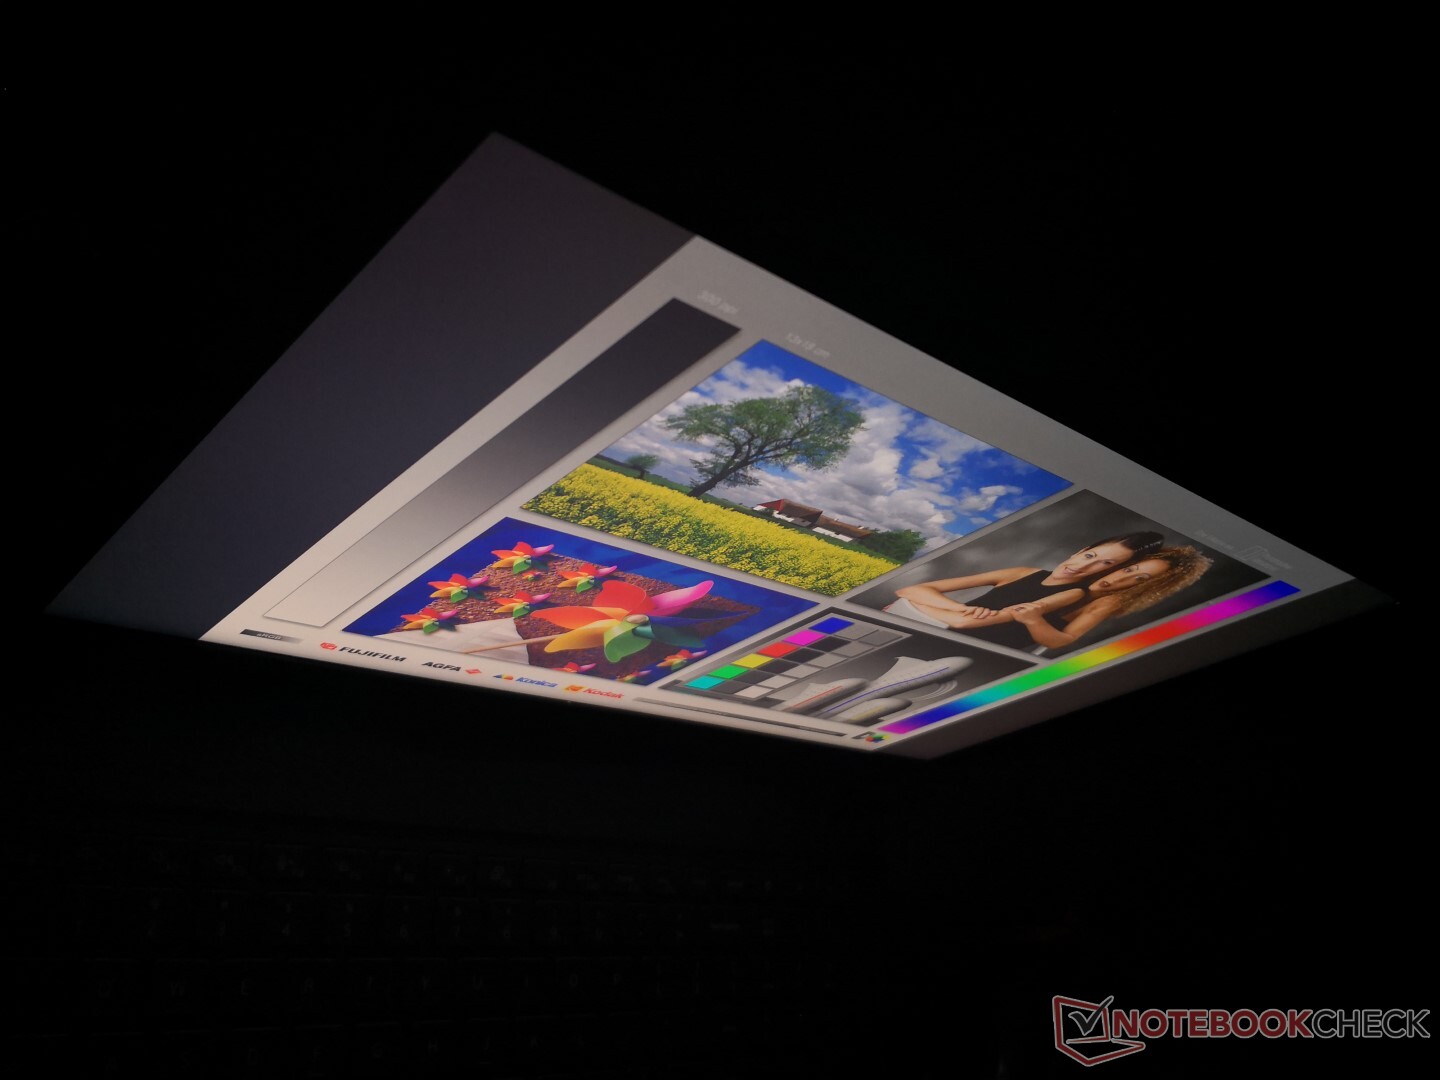
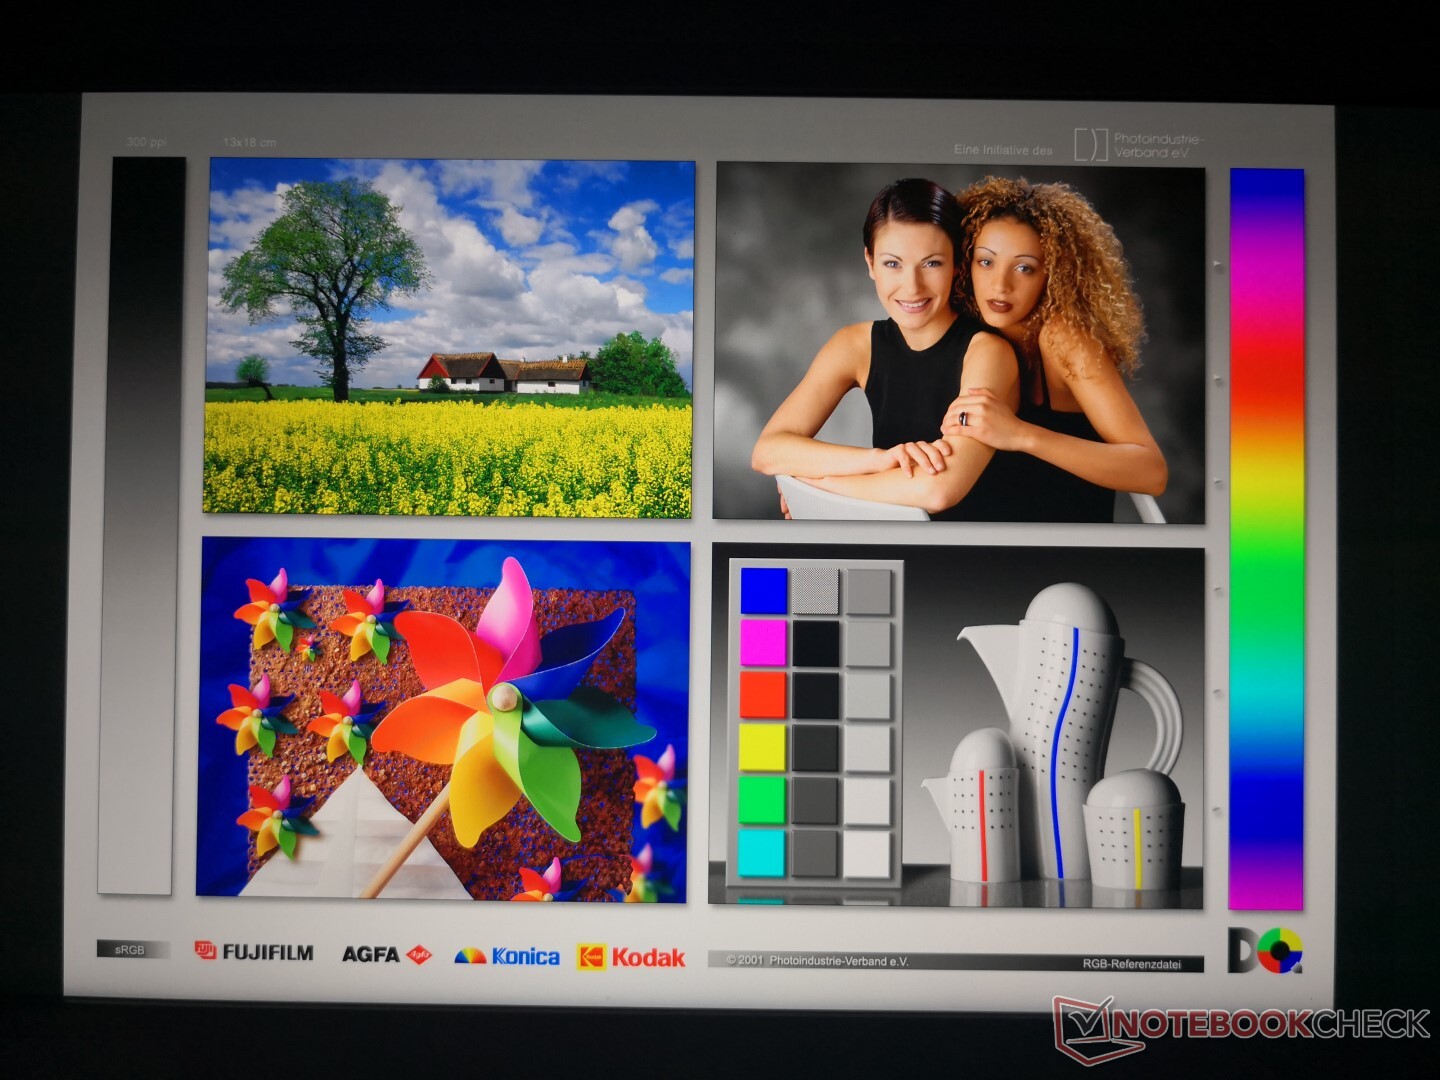
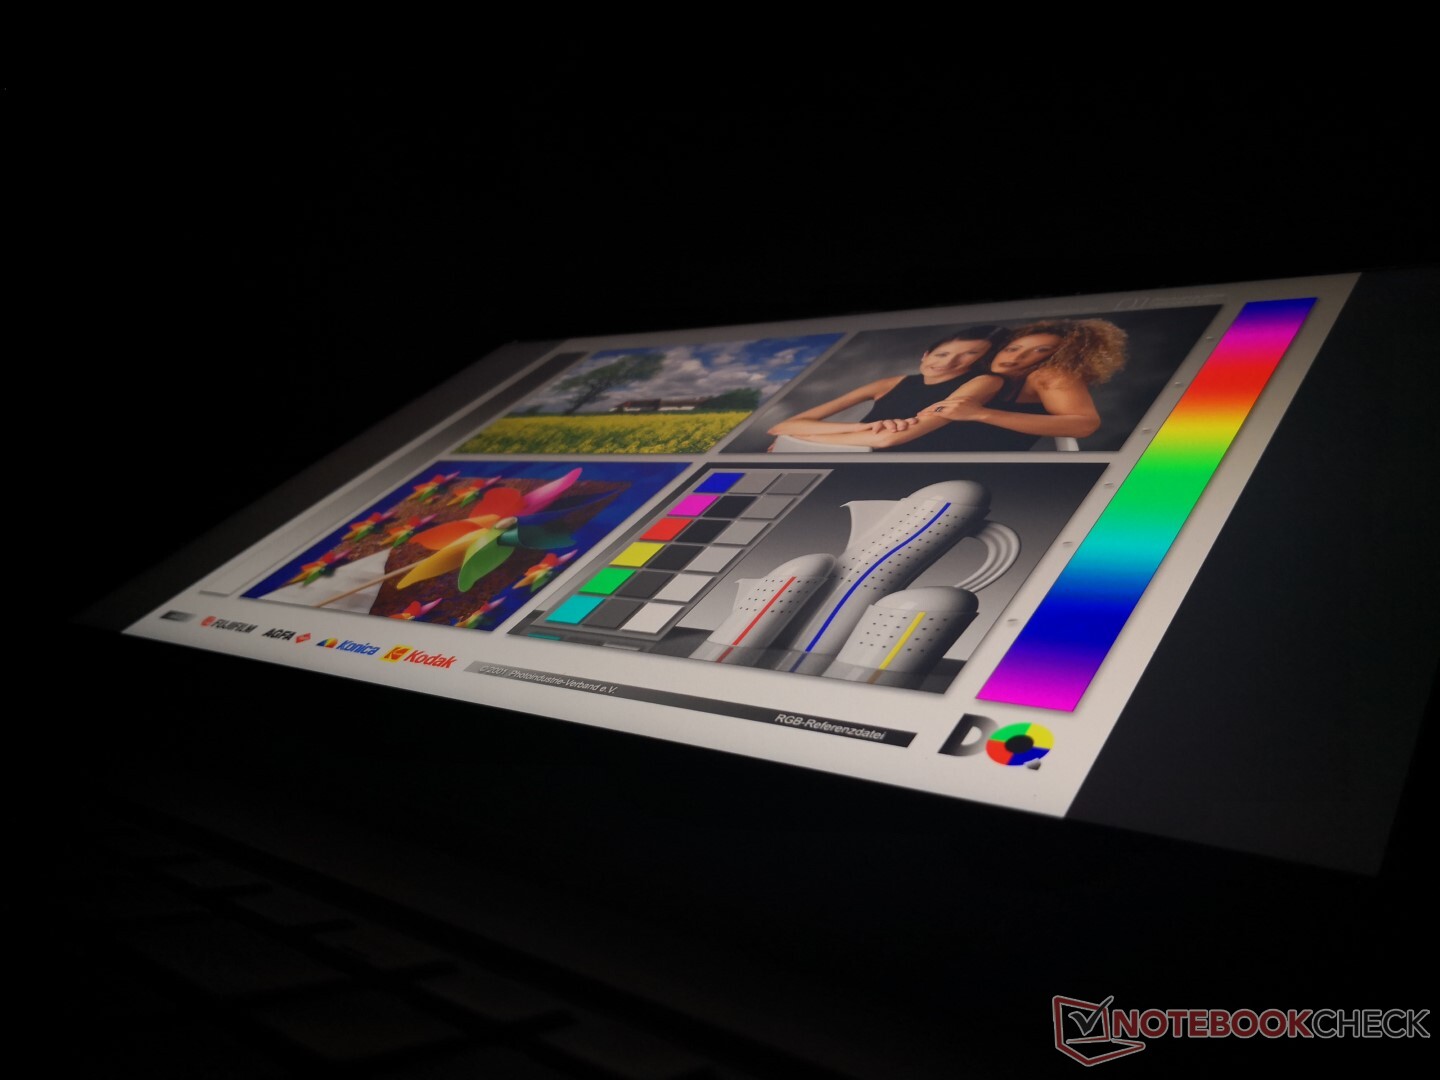
La visibilità all'aperto è accettabile quando è all'ombra, ma il display non è abbastanza luminoso per superare la luminosità ambientale. I colori si sbiadiscono anche con l'impostazione di luminosità massima come mostrato dalle nostre foto qui sotto.
Performance
Il focus sulle CPU Comet Lake-H e sulle GPU Turing Quadro RTX significa che il Precision 7550 si rivolge agli utenti di workstation ad alte prestazioni, mentre il più sottile Precision 5550 è limitato alla sola Quadro T2000 Max-Q. Nonostante ciò, è un po' deludente che la 7550 utilizzi le GPU della serie Max-Q invece della varietà a piena potenza non-Max-Q, nonostante il suo peso elevato e il suo design spesso.
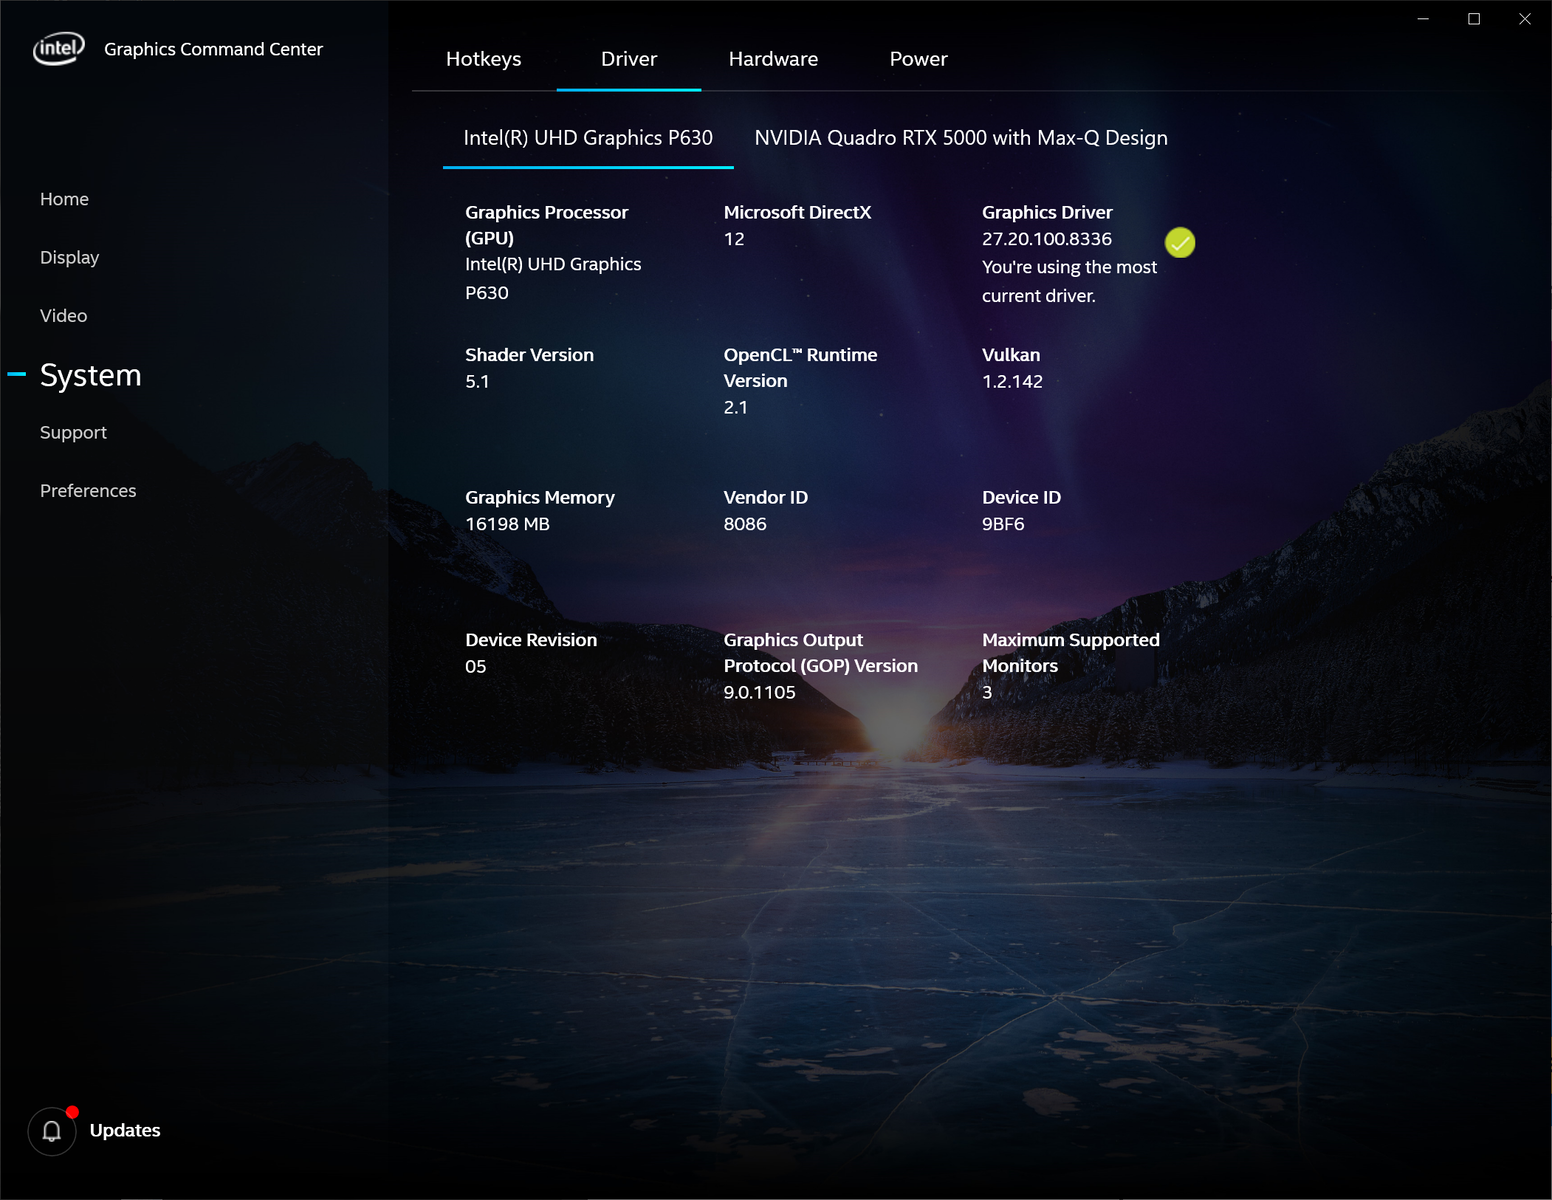
Nvidia Optimus viene fornito di serie per lo switching automatico della grafica e le CPU Xeon sono opzionali per coloro che vogliono il supporto della RAM ECC.
Abbiamo utilizzato il profilo di potenza Ultra Performance di Dell per i benchmarks riportati di seguito per ottenere i migliori punteggi possibili dal sistema. Questa modalità si trova nel software Dell Power Manager preinstallato.
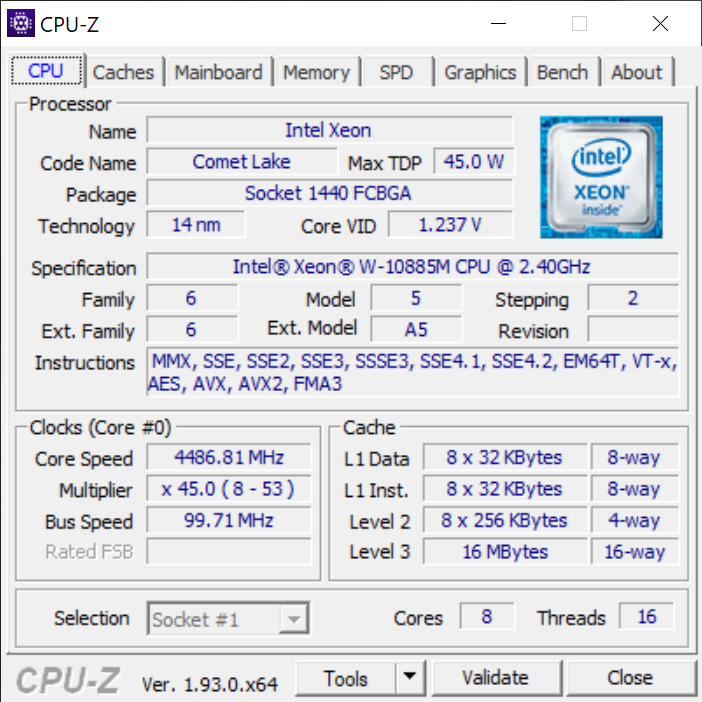

Processore
Lo Xeon W-10885M è paragonabile al Core i9-10980HK o i9-10885H in termini di prestazioni della CPU grezza. Il downgrade alle SKUs Core i7-10750H o Core i7-10875H comporterà un deficit di prestazioni multi-thread di circa il 10-20%. La stabilità delle prestazioni è eccellente, come dimostrano i risultati del nostro CineBench R15 xT loop test qui sotto, ma questo potrebbe certamente essere migliore, come dimostreremo qui di seguito nella sezione Stress Test.
Consultate la nostra pagina dedicata sullo Xeon W-10885M per maggiori informazioni tecniche e benchmarks di confronto.
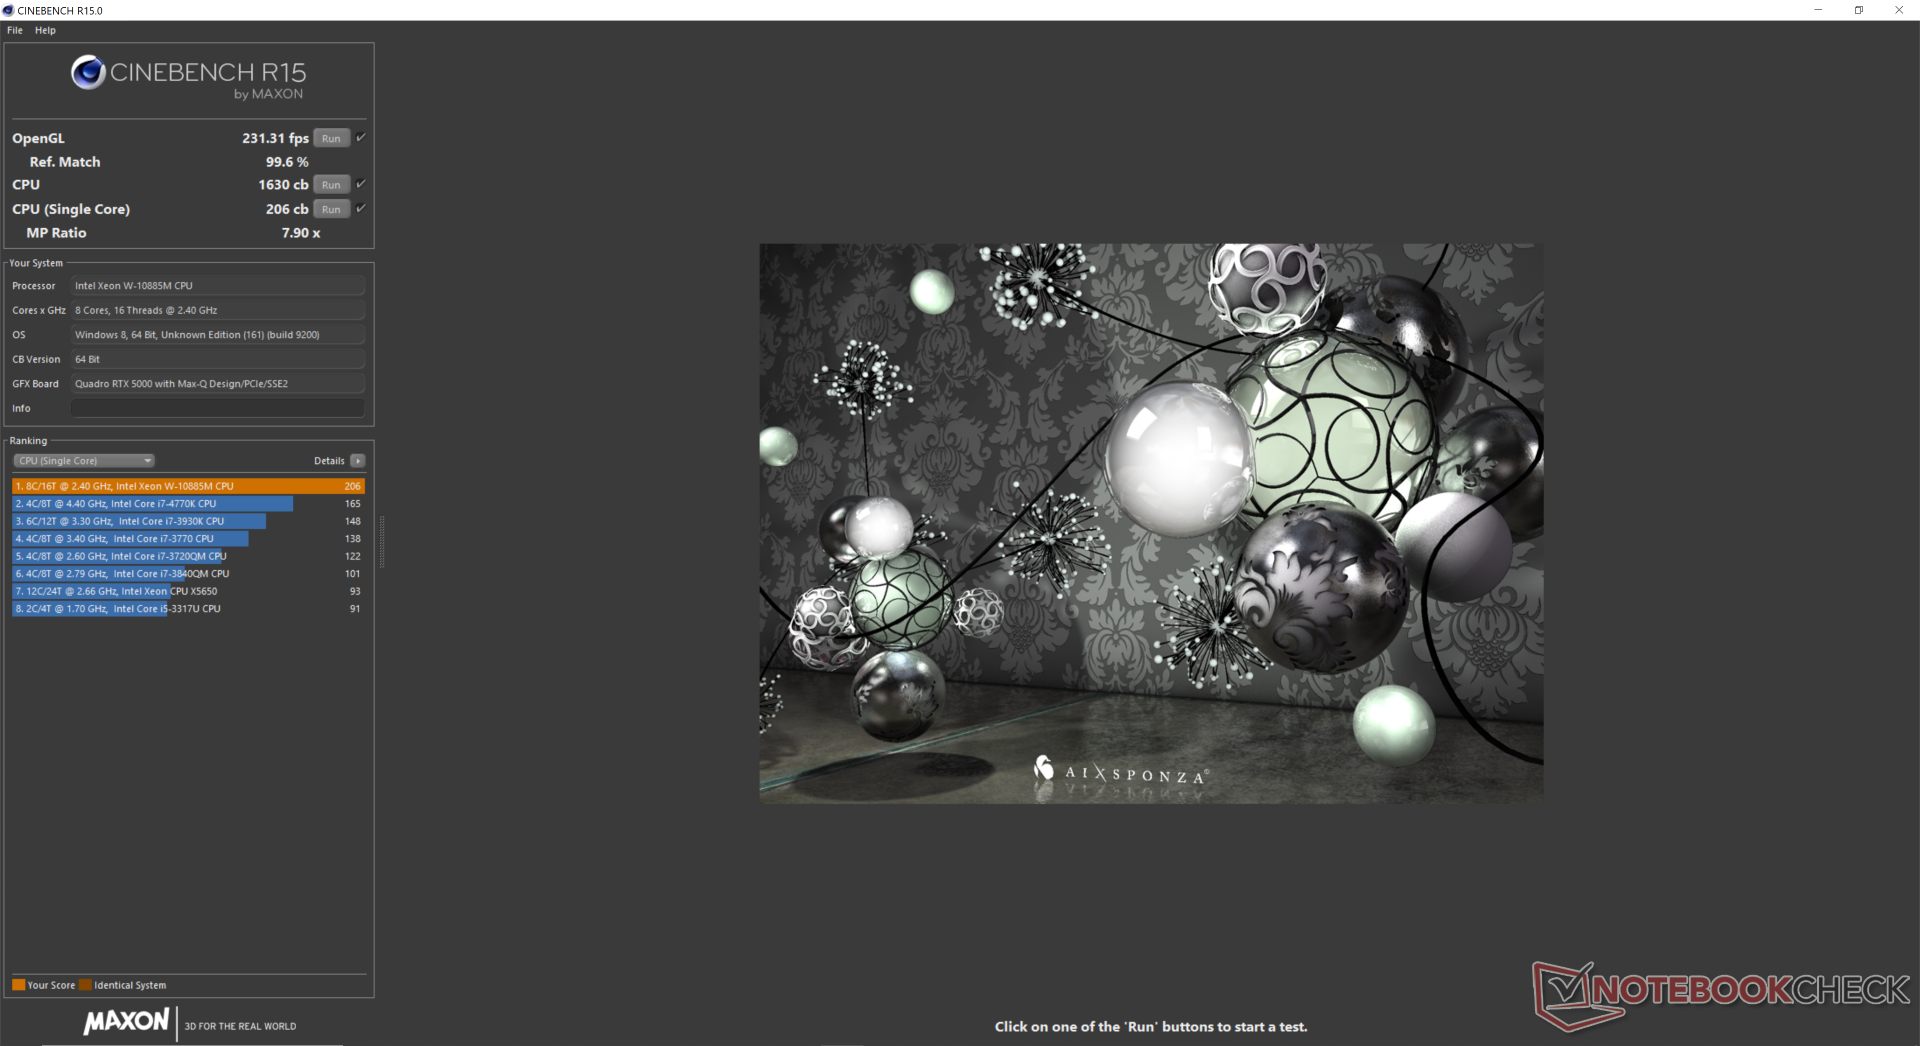
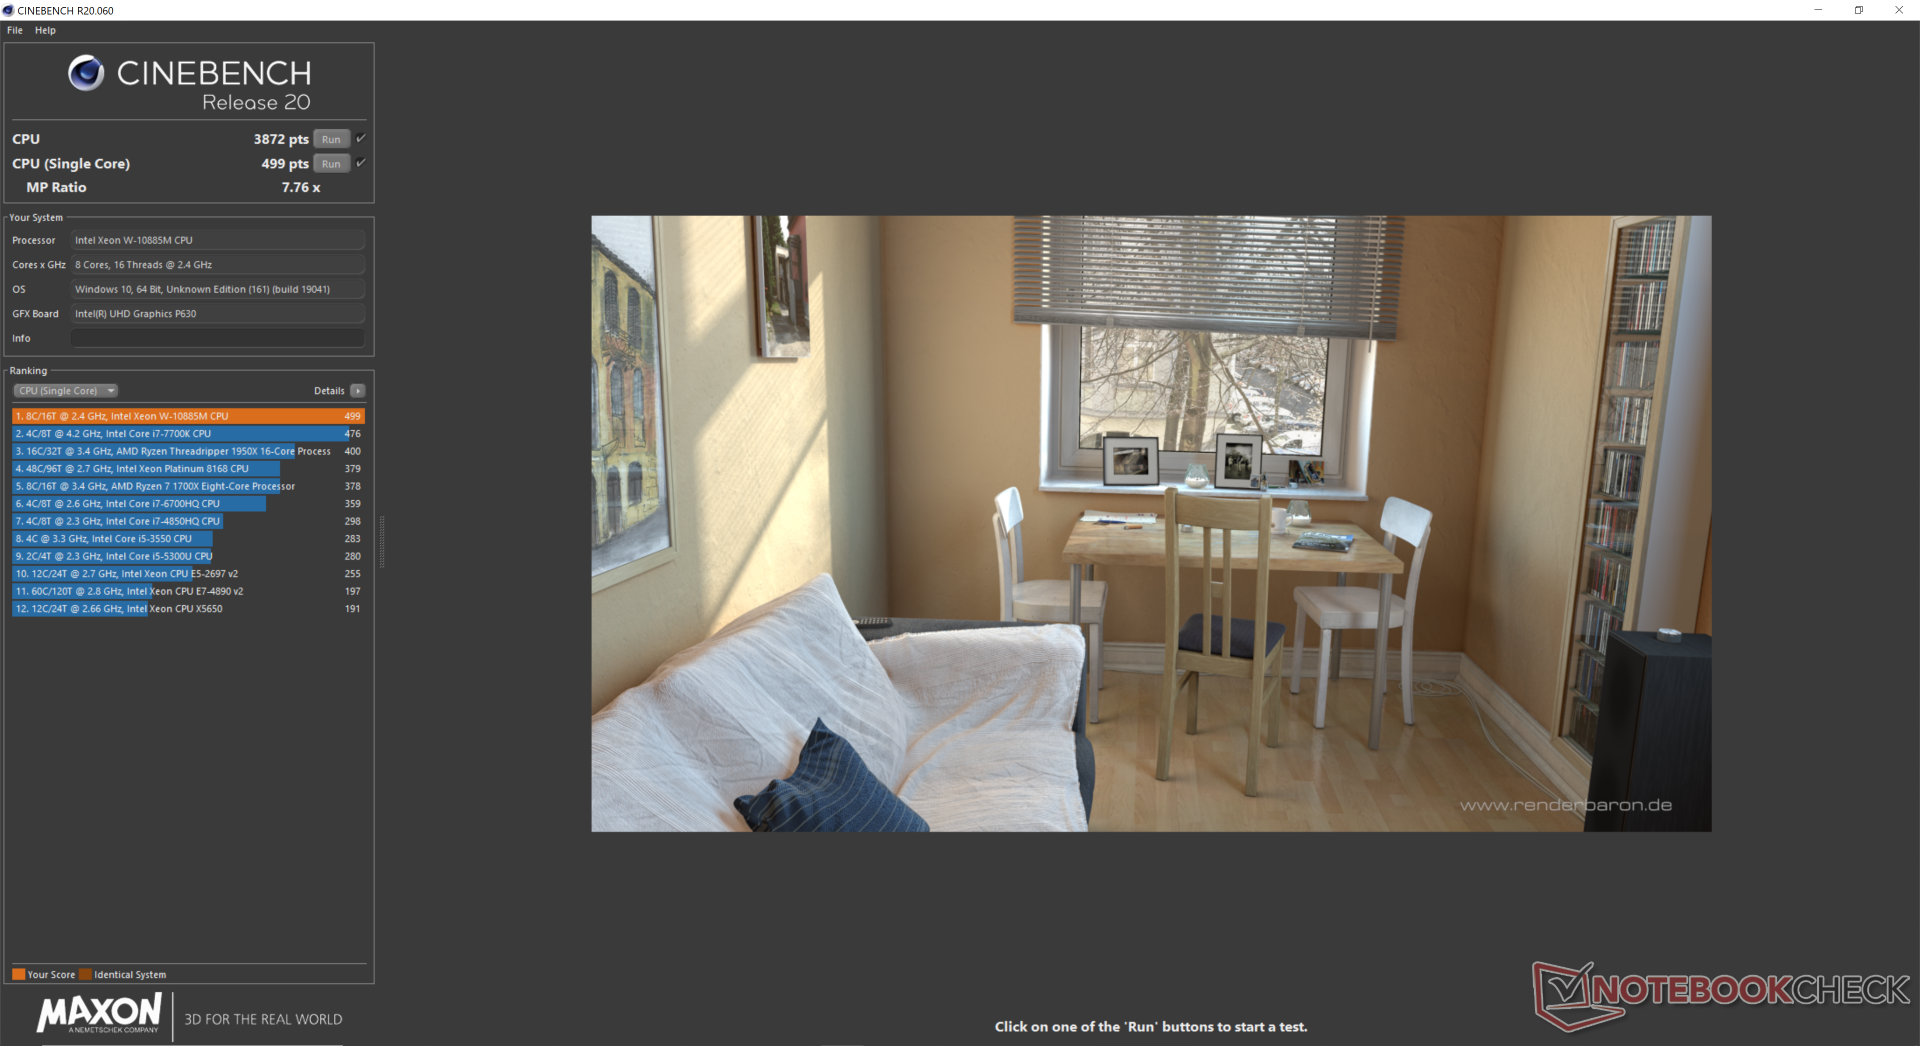
Cinebench R15: CPU Multi 64Bit | CPU Single 64Bit
Blender: v2.79 BMW27 CPU
7-Zip 18.03: 7z b 4 -mmt1 | 7z b 4
Geekbench 5.5: Single-Core | Multi-Core
HWBOT x265 Benchmark v2.2: 4k Preset
LibreOffice : 20 Documents To PDF
R Benchmark 2.5: Overall mean
| Blender / v2.79 BMW27 CPU | |
| Acer ConceptD 3 Pro CN315-71P-73W1 | |
| Dell Precision 5550 P91F | |
| Alienware m15 R3 P87F | |
| Dell Precision 7550 | |
| Asus ROG Strix Scar 15 G532LWS | |
| Intel Core i9-10900K | |
| AMD Radeon RX Vega 64 | |
| 7-Zip 18.03 / 7z b 4 -mmt1 | |
| Intel Core i9-10900K | |
| AMD Radeon RX Vega 64 | |
| Asus ROG Strix Scar 15 G532LWS | |
| Dell Precision 7550 | |
| Dell Precision 5550 P91F | |
| Acer ConceptD 3 Pro CN315-71P-73W1 | |
| Alienware m15 R3 P87F | |
| 7-Zip 18.03 / 7z b 4 | |
| AMD Radeon RX Vega 64 | |
| Intel Core i9-10900K | |
| Dell Precision 7550 | |
| Asus ROG Strix Scar 15 G532LWS | |
| Dell Precision 5550 P91F | |
| Alienware m15 R3 P87F | |
| Acer ConceptD 3 Pro CN315-71P-73W1 | |
| Geekbench 5.5 / Single-Core | |
| Intel Core i9-10900K | |
| Asus ROG Strix Scar 15 G532LWS | |
| Dell Precision 7550 | |
| Dell Precision 5550 P91F | |
| Alienware m15 R3 P87F | |
| AMD Radeon RX Vega 64 | |
| Acer ConceptD 3 Pro CN315-71P-73W1 | |
| Geekbench 5.5 / Multi-Core | |
| Intel Core i9-10900K | |
| AMD Radeon RX Vega 64 | |
| Asus ROG Strix Scar 15 G532LWS | |
| Dell Precision 5550 P91F | |
| Dell Precision 7550 | |
| Alienware m15 R3 P87F | |
| Acer ConceptD 3 Pro CN315-71P-73W1 | |
* ... Meglio usare valori piccoli
Prestazioni di sistema
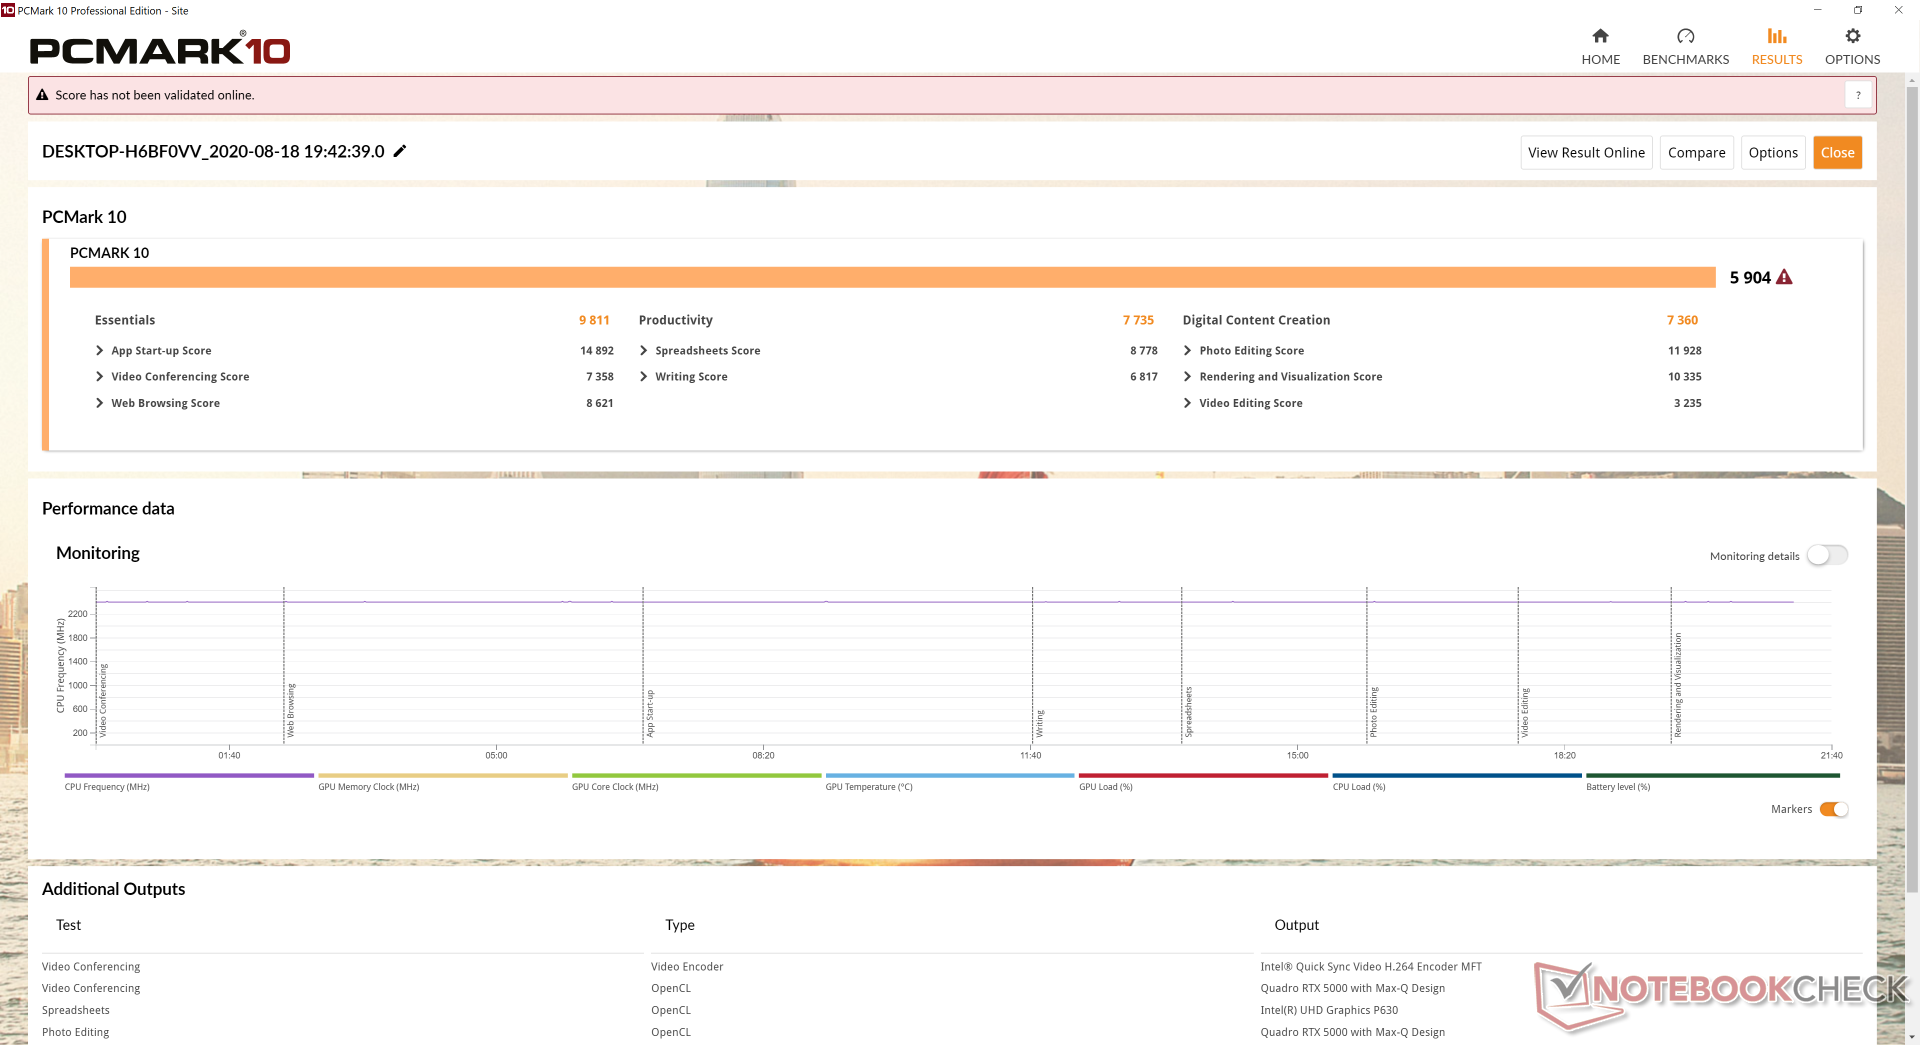
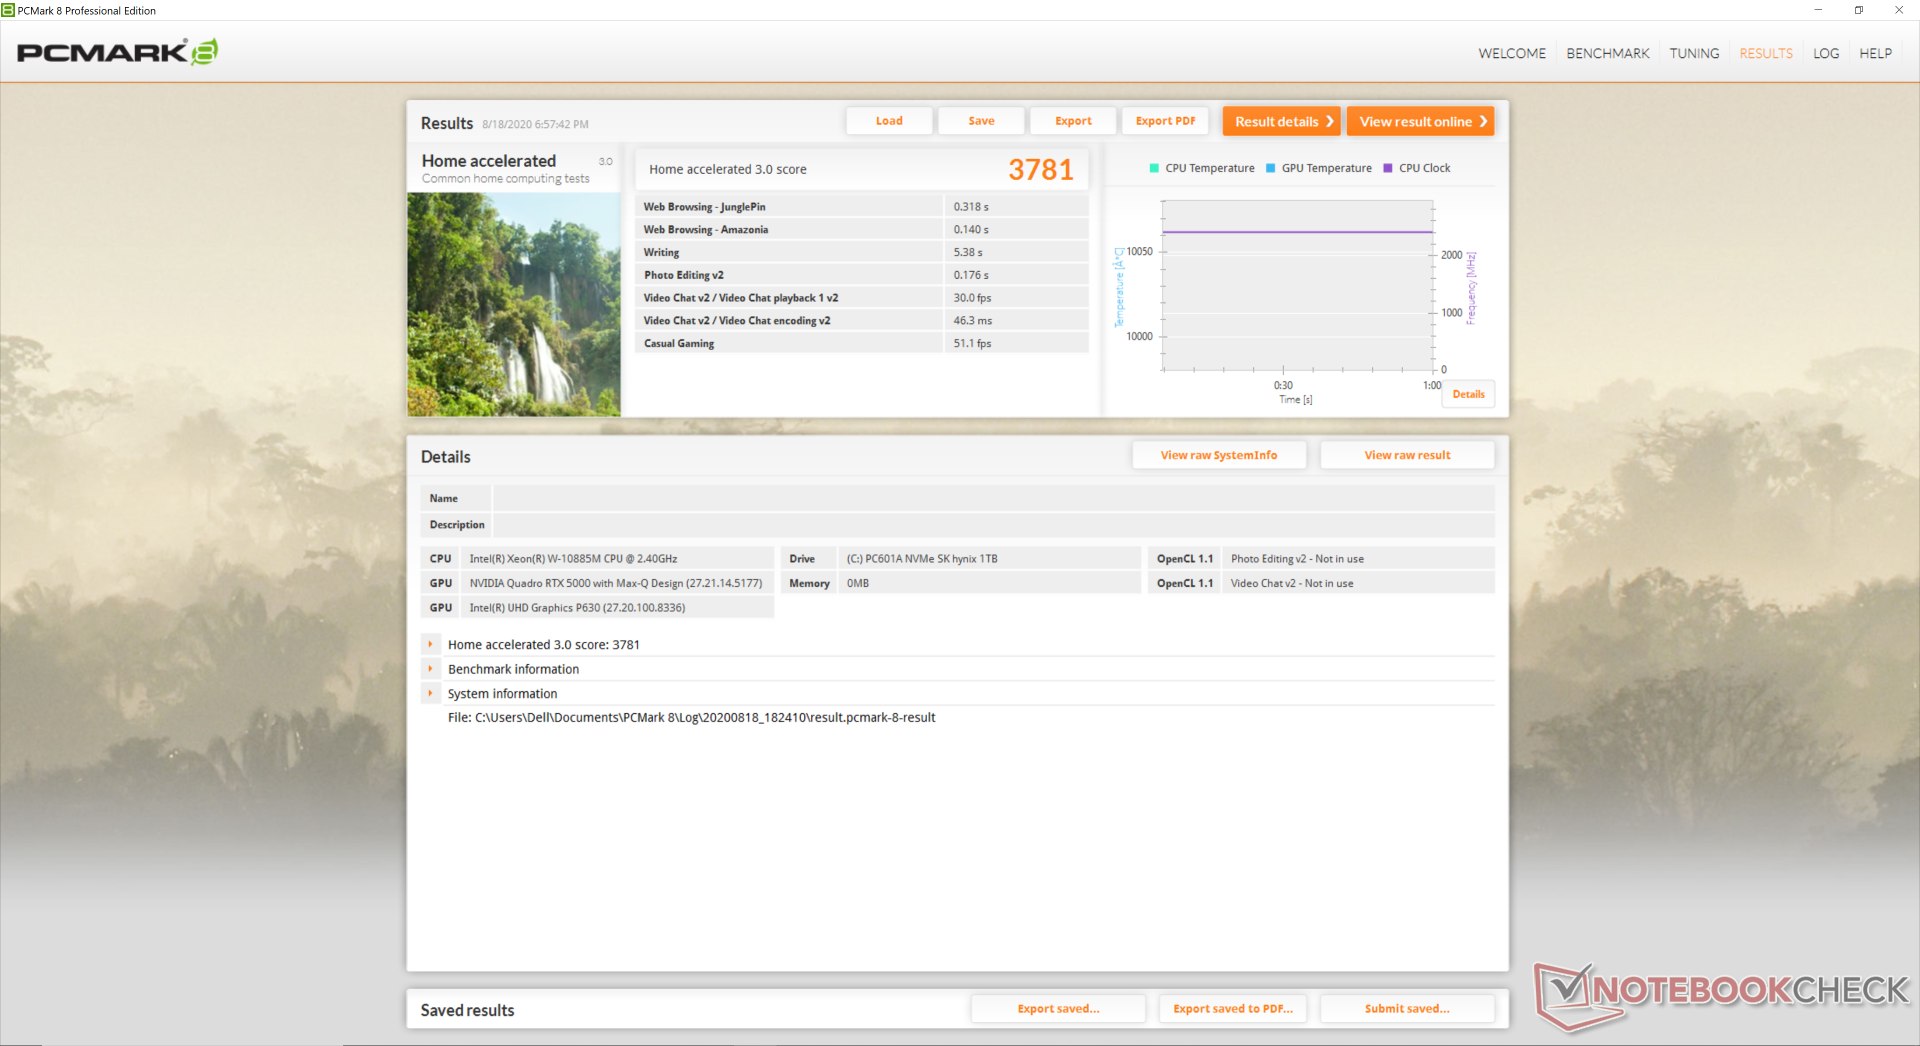
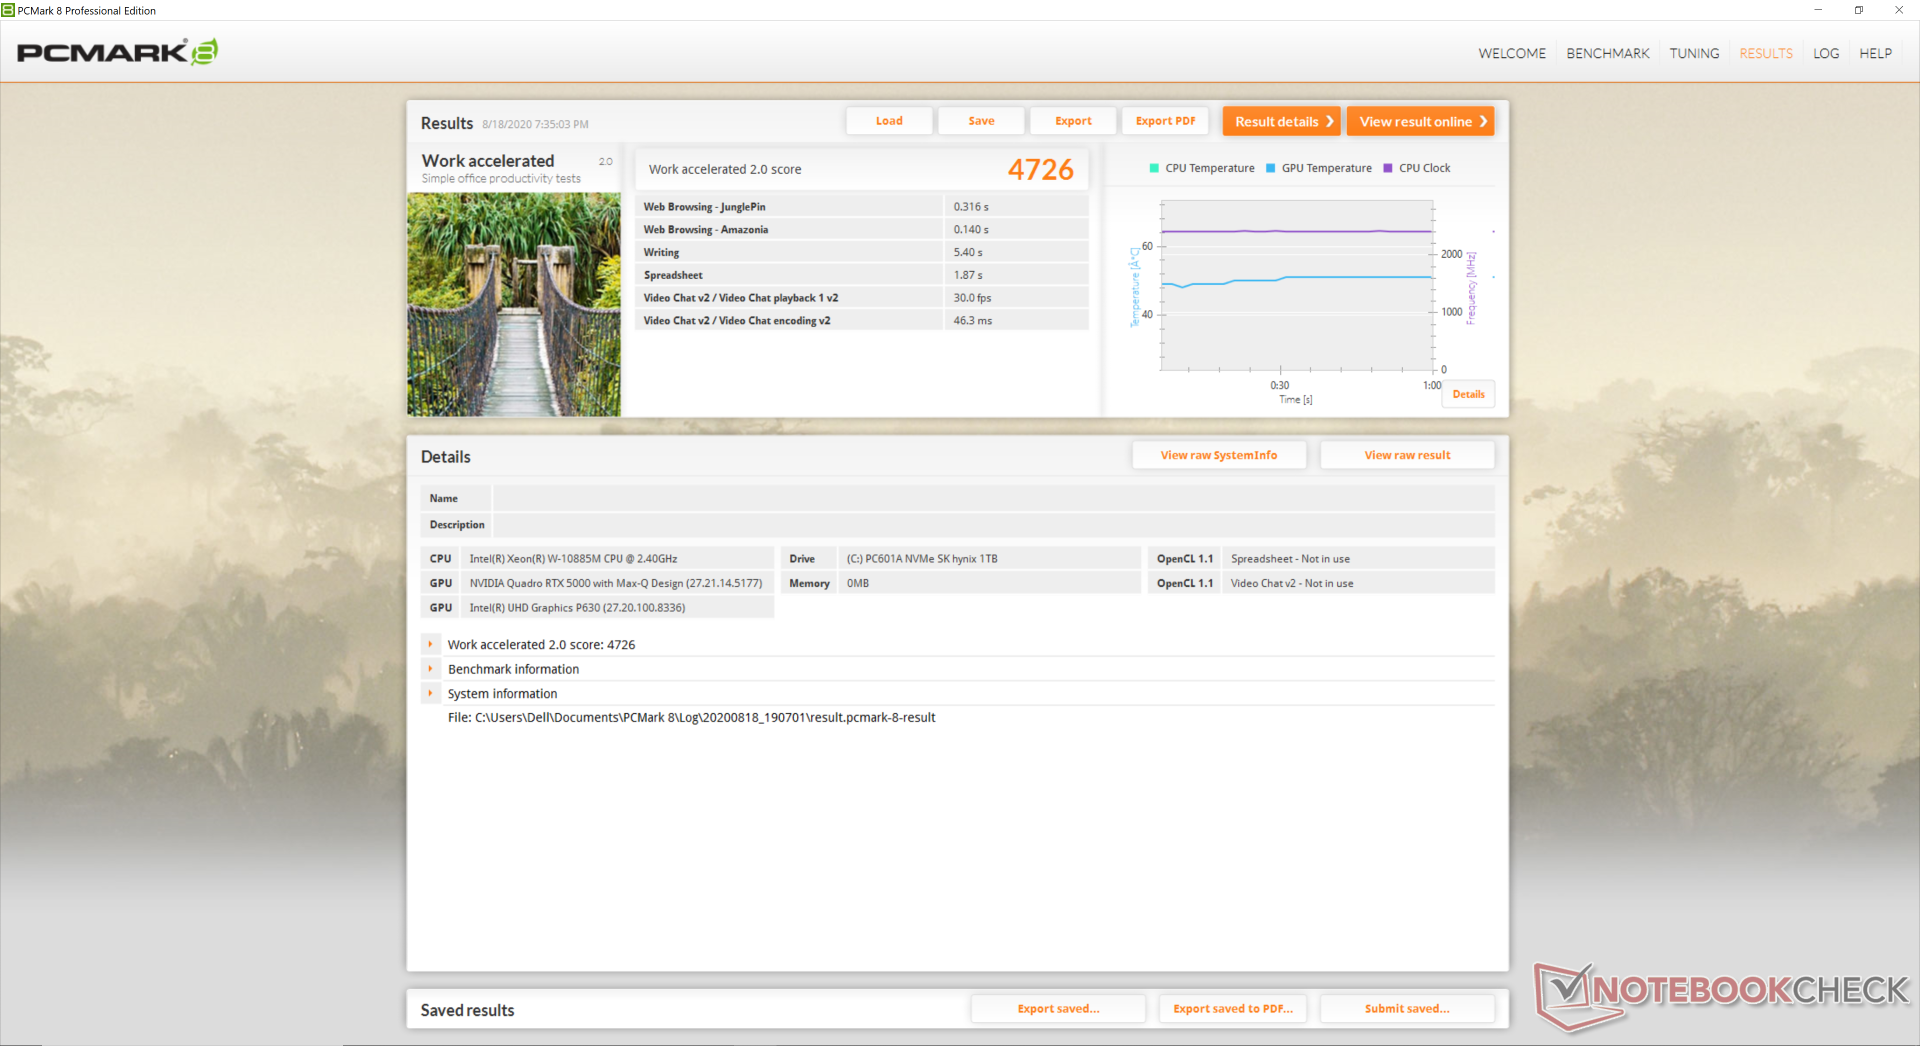
I benchmarks PCMark sono paragonabili al ThinkPad P53 Lenovo concorrente e addirittura costantemente superiori di pochi punti percentuali. Non abbiamo riscontrato alcun problema di software con la nostra unità di test.
| PCMark 10 | |
| Score | |
| Dell Precision 7540 | |
| Dell Precision 7550 | |
| Lenovo ThinkPad P53-20QN000YGE | |
| Dell Precision 5550 P91F | |
| Acer ConceptD 3 Pro CN315-71P-73W1 | |
| HP ZBook Studio G5-4QH10EA | |
| Essentials | |
| Dell Precision 5550 P91F | |
| Dell Precision 7550 | |
| Lenovo ThinkPad P53-20QN000YGE | |
| Dell Precision 7540 | |
| Acer ConceptD 3 Pro CN315-71P-73W1 | |
| HP ZBook Studio G5-4QH10EA | |
| Productivity | |
| Dell Precision 7540 | |
| Dell Precision 7550 | |
| Dell Precision 5550 P91F | |
| Lenovo ThinkPad P53-20QN000YGE | |
| Acer ConceptD 3 Pro CN315-71P-73W1 | |
| HP ZBook Studio G5-4QH10EA | |
| Digital Content Creation | |
| Dell Precision 7540 | |
| Dell Precision 7550 | |
| Lenovo ThinkPad P53-20QN000YGE | |
| Dell Precision 5550 P91F | |
| HP ZBook Studio G5-4QH10EA | |
| Acer ConceptD 3 Pro CN315-71P-73W1 | |
| PCMark 8 | |
| Home Score Accelerated v2 | |
| Dell Precision 7540 | |
| Acer ConceptD 3 Pro CN315-71P-73W1 | |
| Dell Precision 7550 | |
| Dell Precision 5550 P91F | |
| HP ZBook Studio G5-4QH10EA | |
| Work Score Accelerated v2 | |
| Acer ConceptD 3 Pro CN315-71P-73W1 | |
| Dell Precision 7550 | |
| Dell Precision 7540 | |
| Dell Precision 5550 P91F | |
| HP ZBook Studio G5-4QH10EA | |
| PCMark 8 Home Score Accelerated v2 | 3781 punti | |
| PCMark 8 Work Score Accelerated v2 | 4726 punti | |
| PCMark 10 Score | 5904 punti | |
Aiuto | ||
Latenza DPC
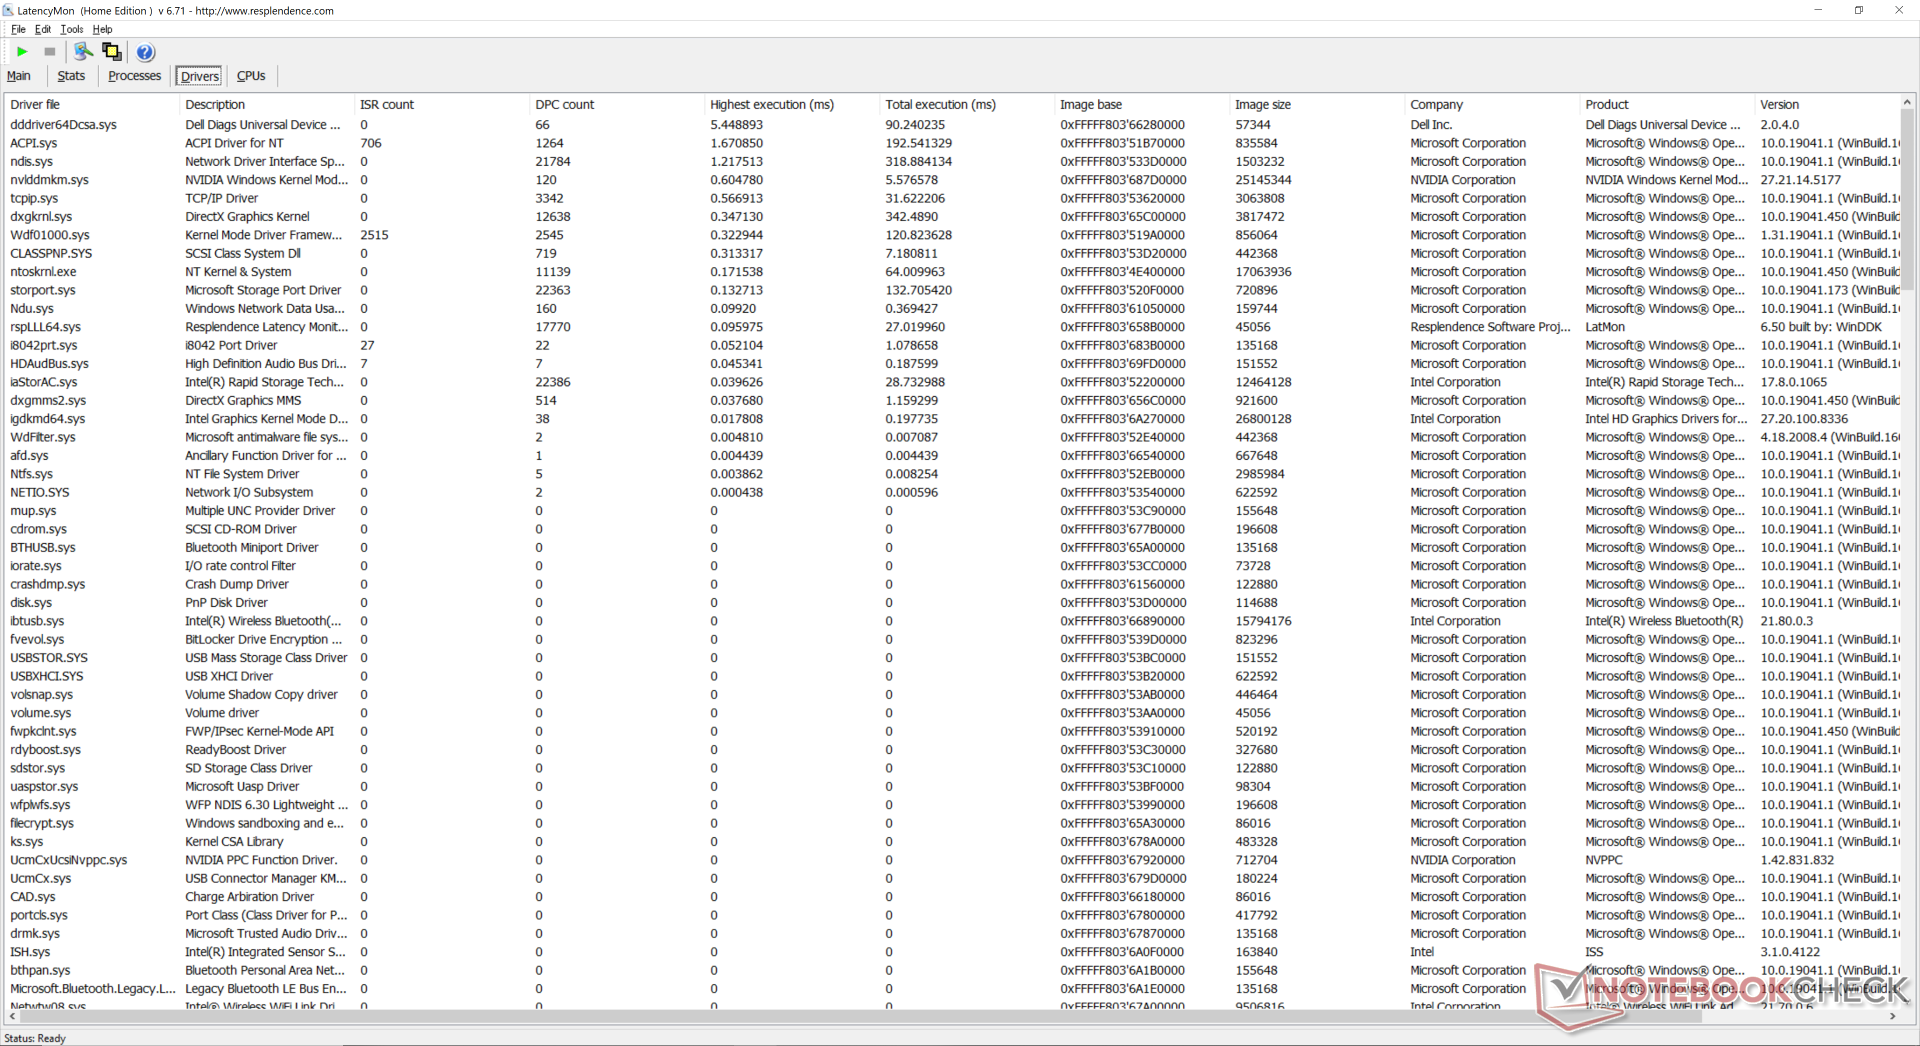
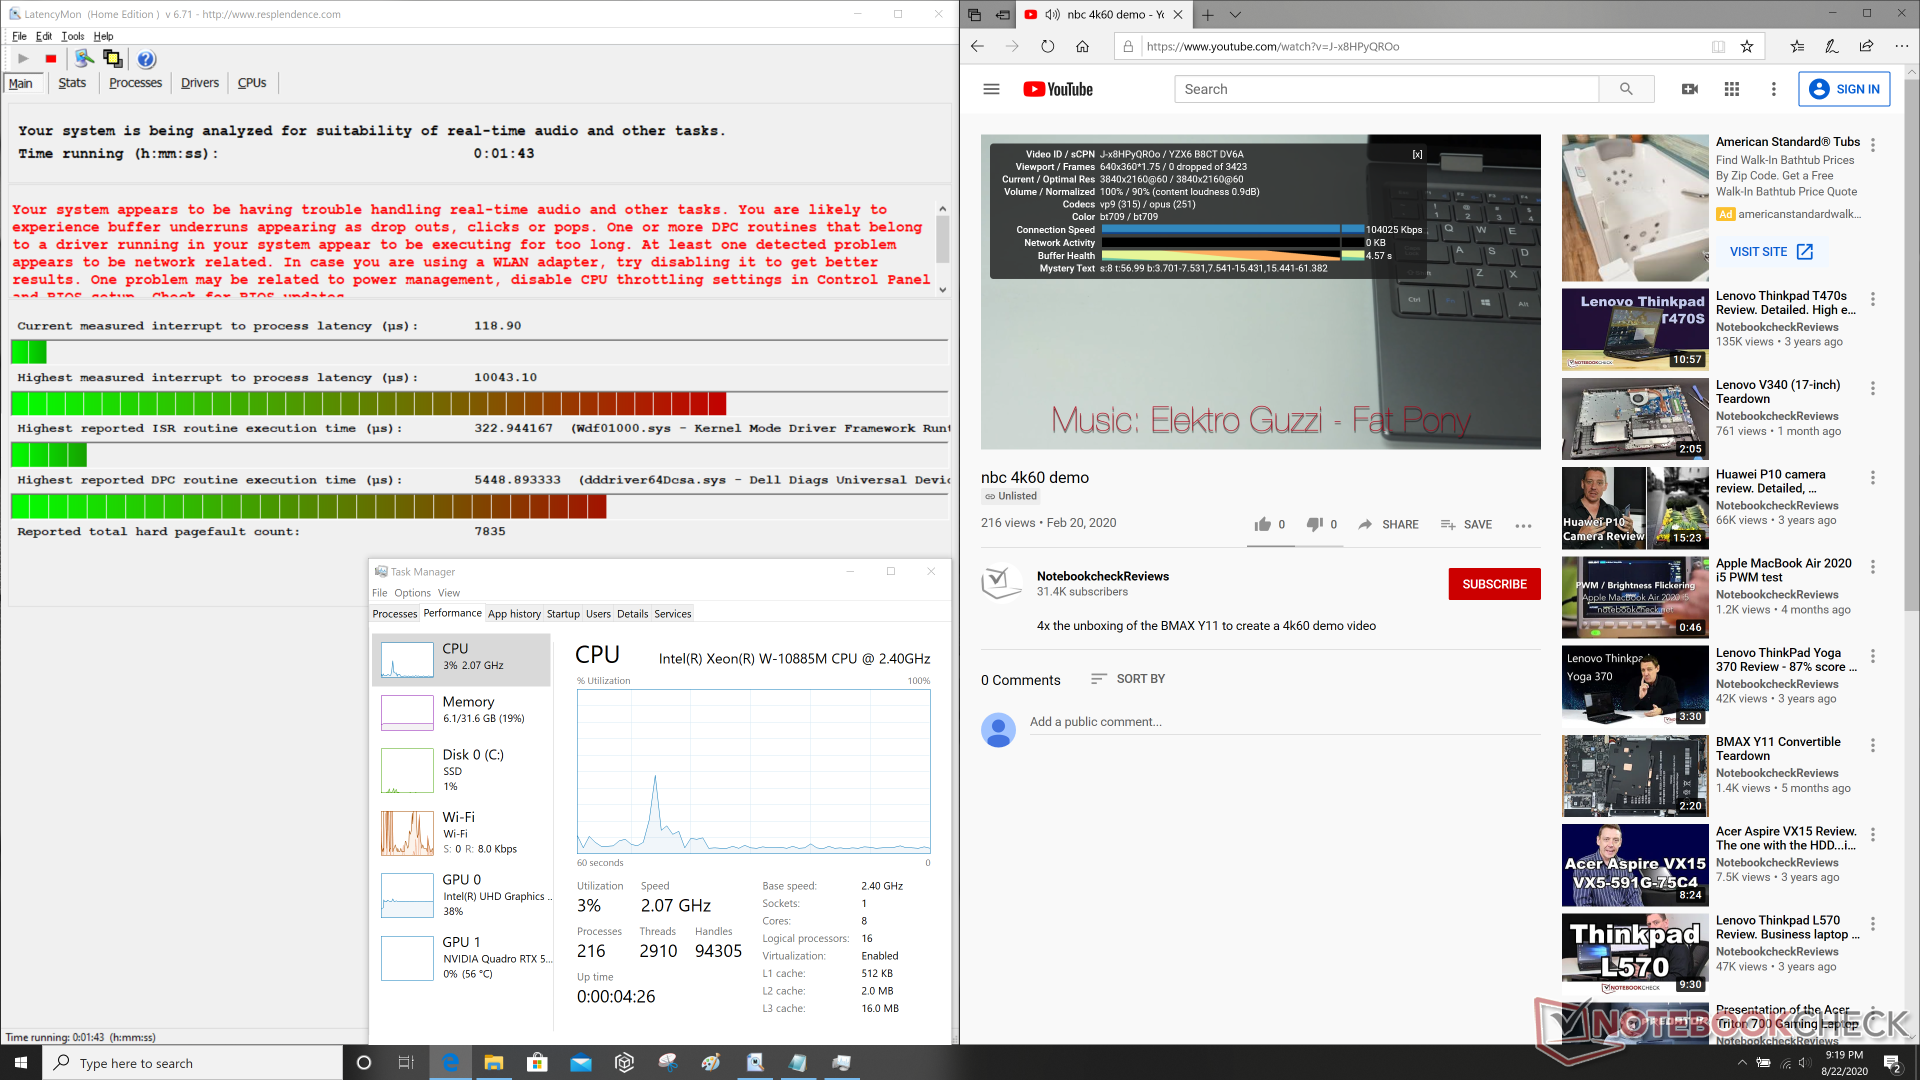
LatencyMon rivela problemi di latenza del DPC relativi a Wdf01000.sys e dddriver64Dcsa.sys che è deludente da vedere su una workstation portatile. La riproduzione video 4K UHD è per il resto fluida e senza cali di fotogrammi.
| DPC Latencies / LatencyMon - interrupt to process latency (max), Web, Youtube, Prime95 | |
| Dell Precision 7550 | |
| Asus ROG Strix Scar 15 G532LWS | |
| Alienware m15 R3 P87F | |
| MSI GE66 Raider 10SFS | |
| Acer ConceptD 3 Pro CN315-71P-73W1 | |
| Acer ConceptD 9 Pro | |
| Razer Blade 15 Studio Edition 2020 | |
| Dell Precision 5550 P91F | |
* ... Meglio usare valori piccoli
Dispositivi di archiviazione
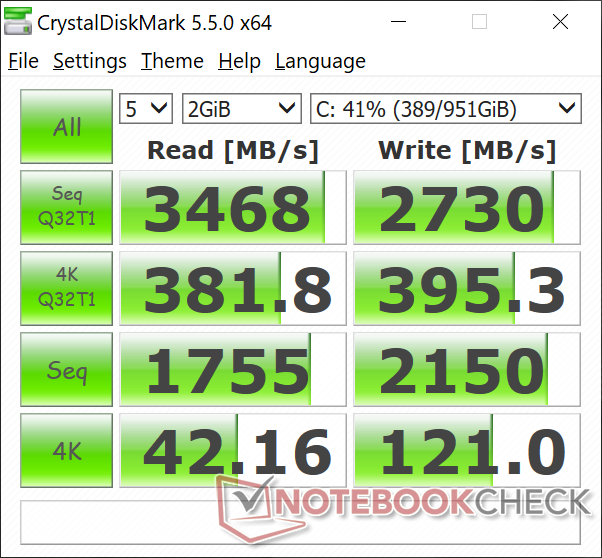
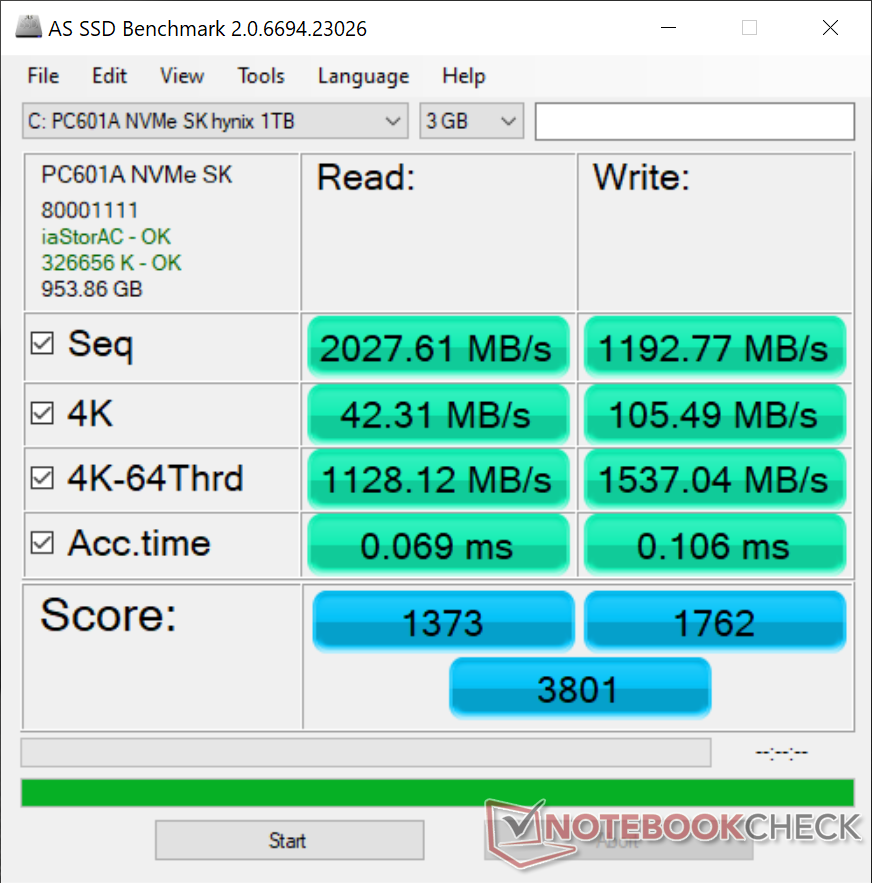
Ci sono in totale tre alloggiamenti interni M.2 2280 per un totale di 6 TB, se lo si desidera. La nostra unità di prova viene fornita con un PC601A SK Hynix PC601A da 1 TB per velocità di lettura e scrittura sequenziale teorica fino a 3400 MB/s e 2500 MB/s, rispettivamente. Le velocità di trasferimento sono approssimativamente paragonabili alla serie Samsung PM981 che si trova comunemente sui PC di fascia alta.
Vedere la nostra tabella di HDD ed SSD per ulteriori benchmarks di confronto.
| Dell Precision 7550 SK Hynix PC601A NVMe 1TB | Dell Precision 5550 P91F SK Hynix PC601A NVMe 1TB | Acer ConceptD 3 Pro CN315-71P-73W1 WDC PC SN720 SDAPNTW-512G | Lenovo ThinkPad P53-20QN000YGE Samsung PM981a MZVLB1T0HBLR | HP ZBook Studio G5-4QH10EA Samsung SSD PM981 MZVLB512HAJQ | |
|---|---|---|---|---|---|
| AS SSD | -52% | 8% | 51% | 13% | |
| Seq Read (MB/s) | 2028 | 2039 1% | 2973 47% | 2655 31% | 2379 17% |
| Seq Write (MB/s) | 1193 | 1376 15% | 2429 104% | 2454 106% | 1780 49% |
| 4K Read (MB/s) | 42.31 | 44.11 4% | 24.7 -42% | 59.1 40% | 51 21% |
| 4K Write (MB/s) | 105.5 | 113.3 7% | 115.3 9% | 138.1 31% | 109.5 4% |
| 4K-64 Read (MB/s) | 1128 | 1094 -3% | 1243 10% | 2009 78% | 1184 5% |
| 4K-64 Write (MB/s) | 1537 | 1630 6% | 835 -46% | 1907 24% | 1725 12% |
| Access Time Read * (ms) | 0.069 | 0.059 14% | 0.054 22% | 0.057 17% | |
| Access Time Write * (ms) | 0.106 | 0.99 -834% | 0.034 68% | 0.028 74% | 0.034 68% |
| Score Read (Points) | 1373 | 1342 -2% | 1565 14% | 2333 70% | 1472 7% |
| Score Write (Points) | 1762 | 1881 7% | 1193 -32% | 2291 30% | 2013 14% |
| Score Total (Points) | 3801 | 3883 2% | 3525 -7% | 5810 53% | 4217 11% |
| Copy ISO MB/s (MB/s) | 1768 | 2489 41% | 2136 21% | 1989 13% | |
| Copy Program MB/s (MB/s) | 627 | 682 9% | 489.6 -22% | 457 -27% | |
| Copy Game MB/s (MB/s) | 1477 | 1515 3% | 1163 -21% | 1121 -24% | |
| CrystalDiskMark 5.2 / 6 | -1% | -4% | 9% | -20% | |
| Write 4K (MB/s) | 121 | 122.6 1% | 113.2 -6% | 147 21% | 102.7 -15% |
| Read 4K (MB/s) | 42.16 | 42.4 1% | 31.1 -26% | 48.3 15% | 38.32 -9% |
| Write Seq (MB/s) | 2150 | 2167 1% | 2540 18% | 1402 -35% | 1417 -34% |
| Read Seq (MB/s) | 1755 | 1747 0% | 2005 14% | 1503 -14% | 1289 -27% |
| Write 4K Q32T1 (MB/s) | 395.3 | 388.8 -2% | 331.4 -16% | 475.2 20% | 278.9 -29% |
| Read 4K Q32T1 (MB/s) | 381.8 | 367.3 -4% | 368.3 -4% | 581 52% | 348.8 -9% |
| Write Seq Q32T1 (MB/s) | 2730 | 2629 -4% | 2535 -7% | 2936 8% | 1895 -31% |
| Read Seq Q32T1 (MB/s) | 3468 | 3460 0% | 3427 -1% | 3539 2% | 3352 -3% |
| Write 4K Q8T8 (MB/s) | 1575 | ||||
| Read 4K Q8T8 (MB/s) | 1607 | ||||
| Media totale (Programma / Settaggio) | -27% /
-34% | 2% /
4% | 30% /
33% | -4% /
1% |
* ... Meglio usare valori piccoli

Disk Throttling: DiskSpd Read Loop, Queue Depth 8
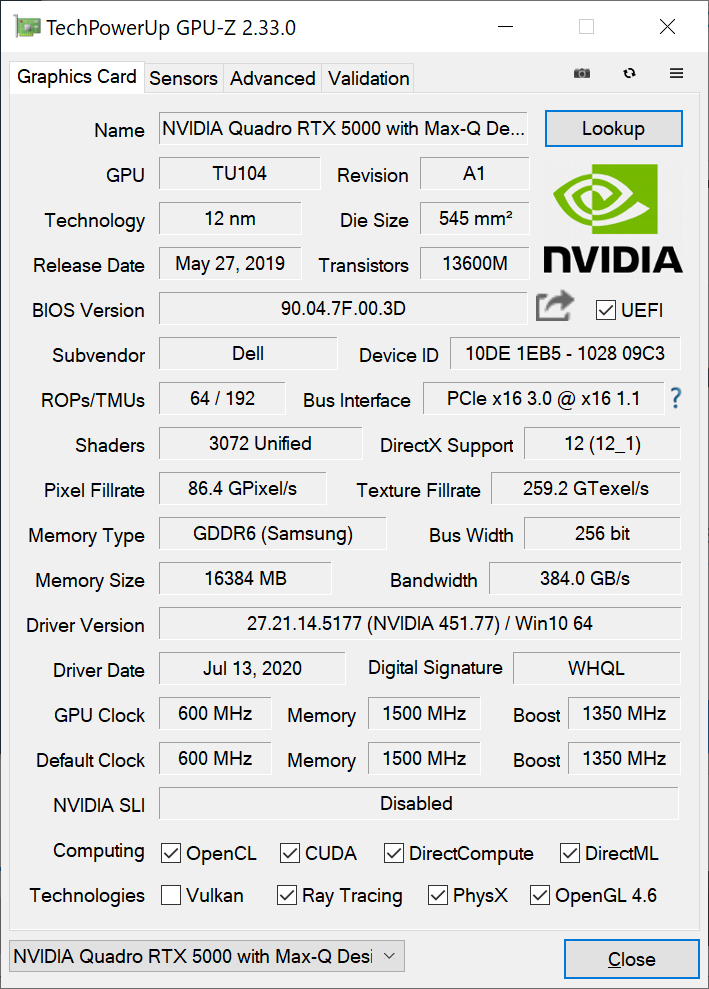
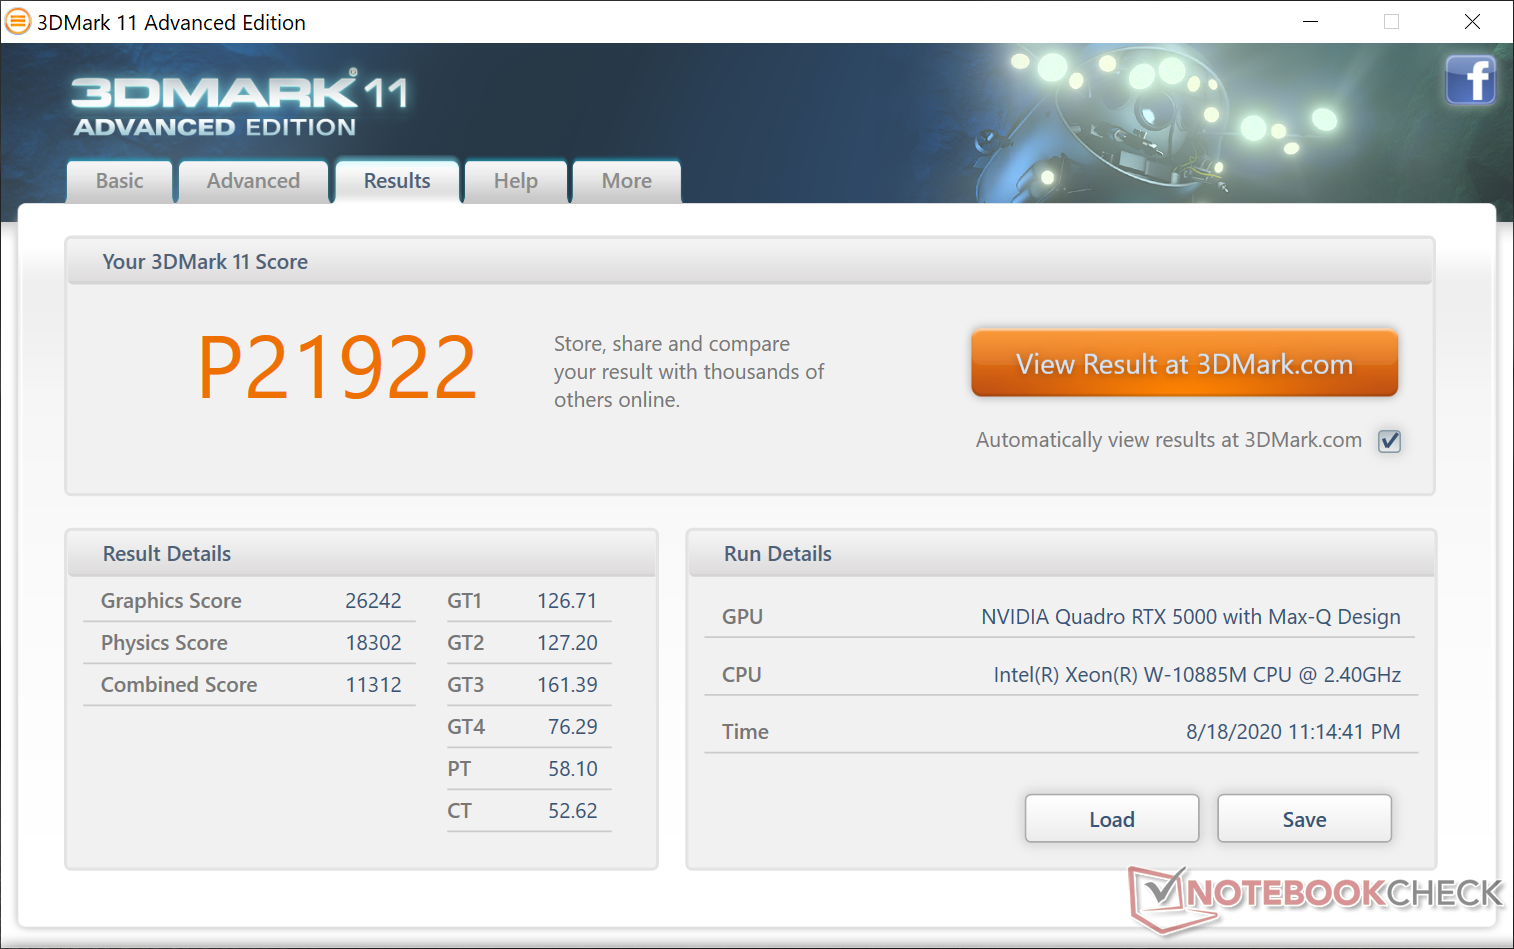
Prestazioni GPU
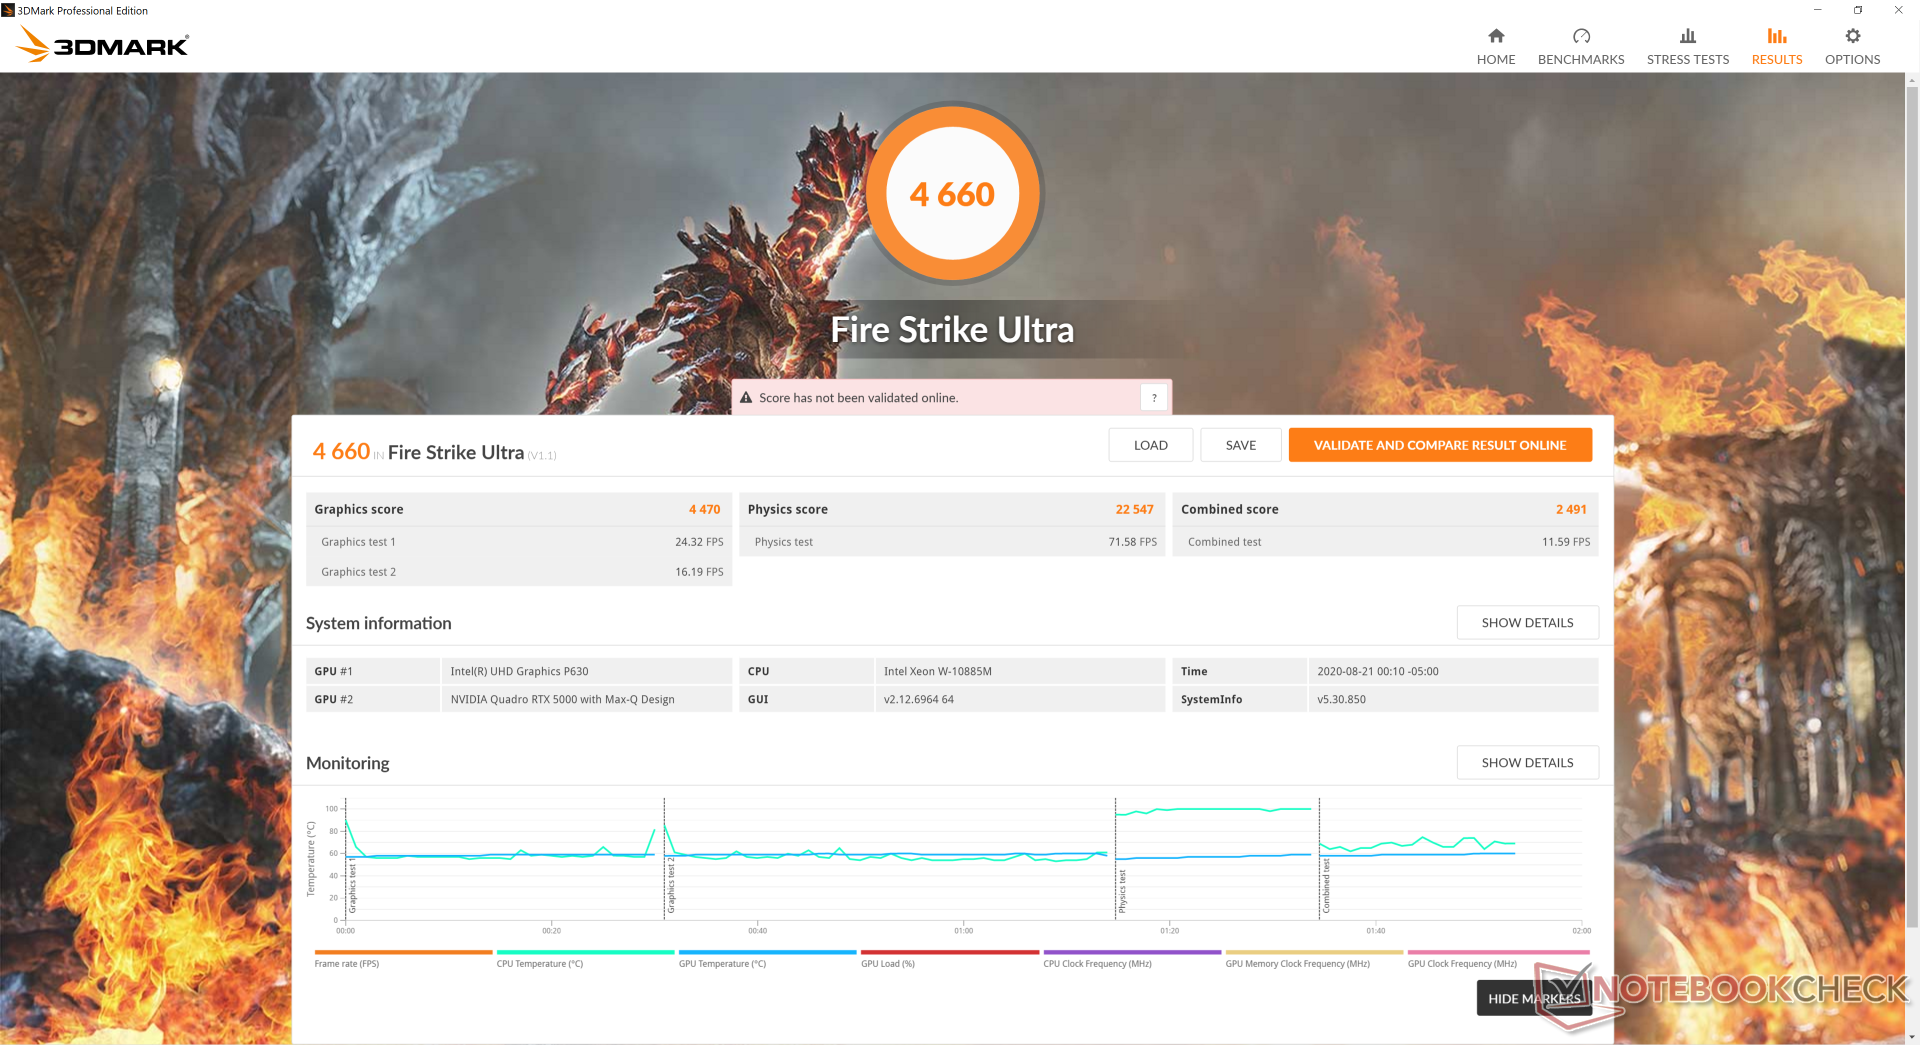
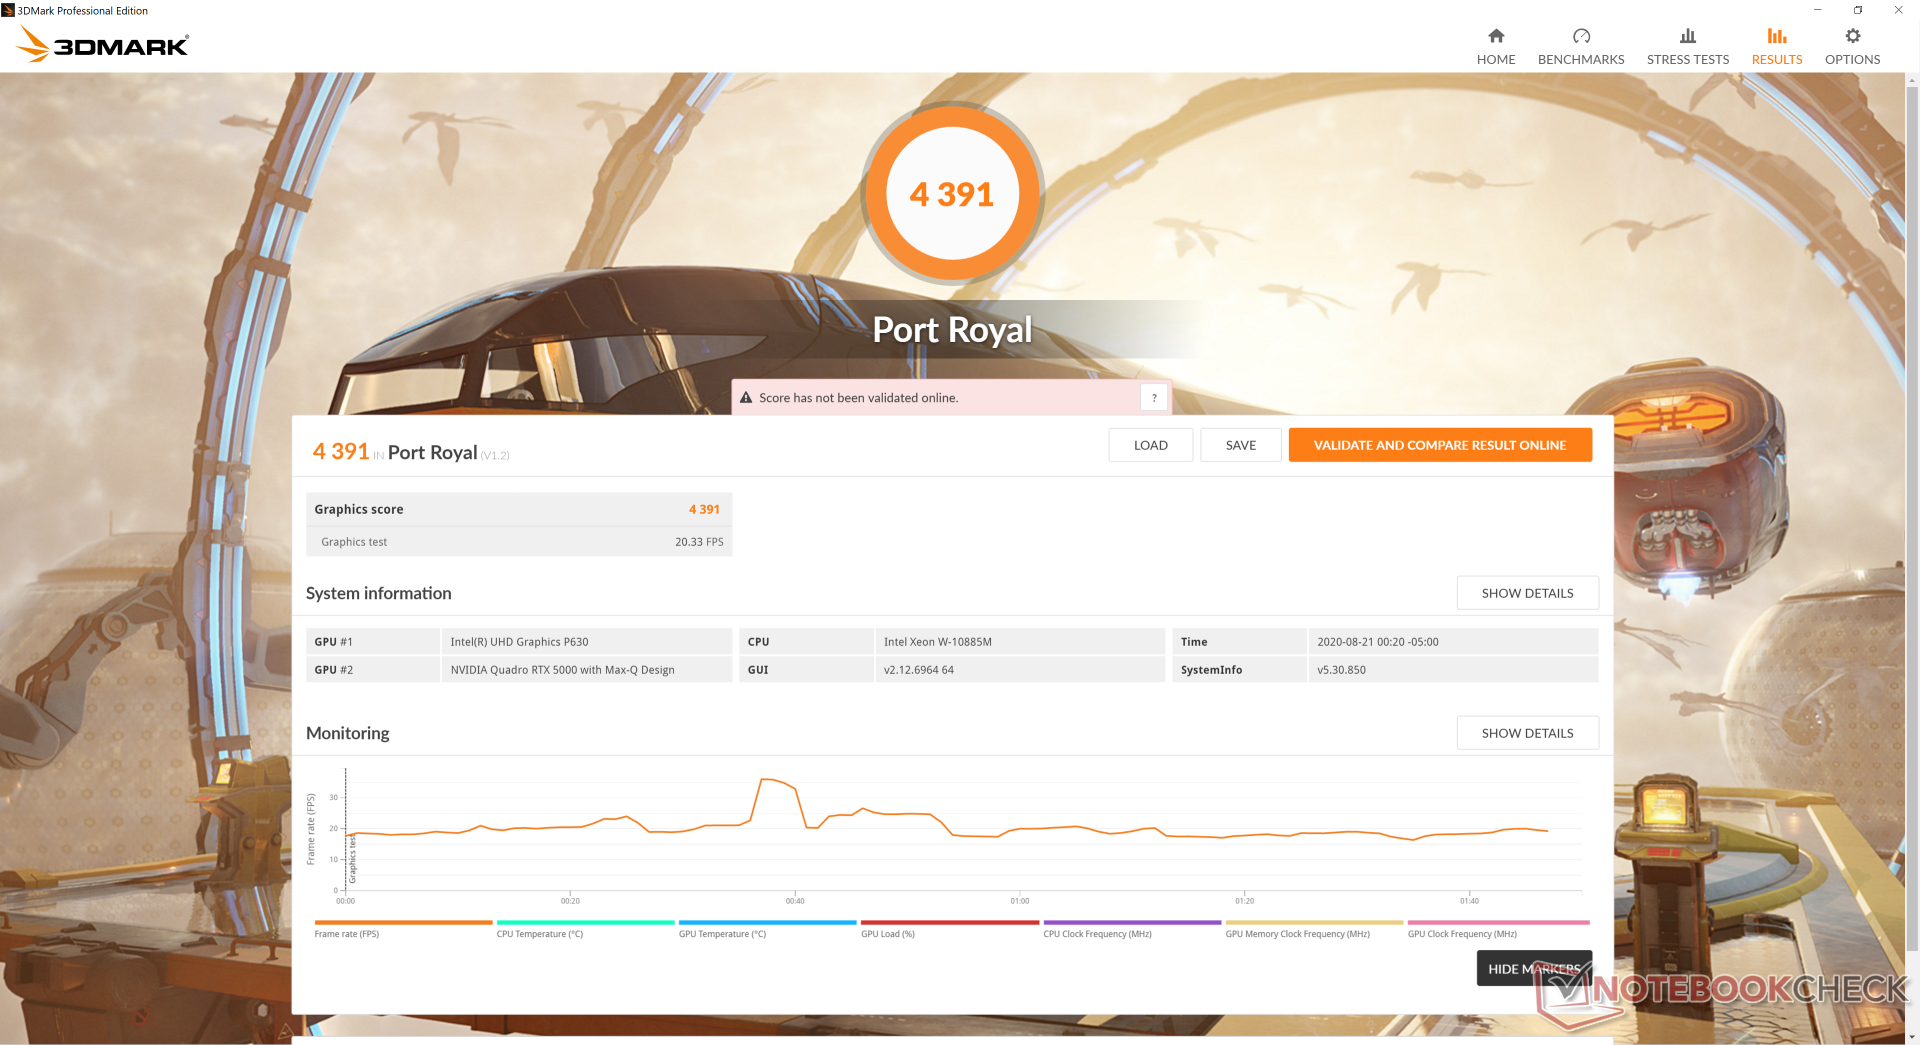
Le prestazioni grafiche pure sono molto simili a quelle della GeForce RTX 2060 desktop mentre sono circa dal 35 al 40% più lente rispetto alla non-Max-Q Quadro RTX 5000. I risultati di SpecViewPerf favoriscono significativamente la nostra Quadro RTX 5000 Max-Q rispetto alla GeForce RTX 2060 come previsto. Gli utenti che si aggiornano dall'ultima generazione di P5200 vedranno un numero maggiore di piccoli aggiornamenti delle prestazioni, tranne che per le nuove caratteristiche del tensor core Turing.
Consultate la nostra pagina sulla Quadro RTX 5000 Max-Q per maggiori informazioni tecniche e benchmarks di confronto.
| 3DMark 06 Standard Score | 42280 punti | |
| 3DMark 11 Performance | 21922 punti | |
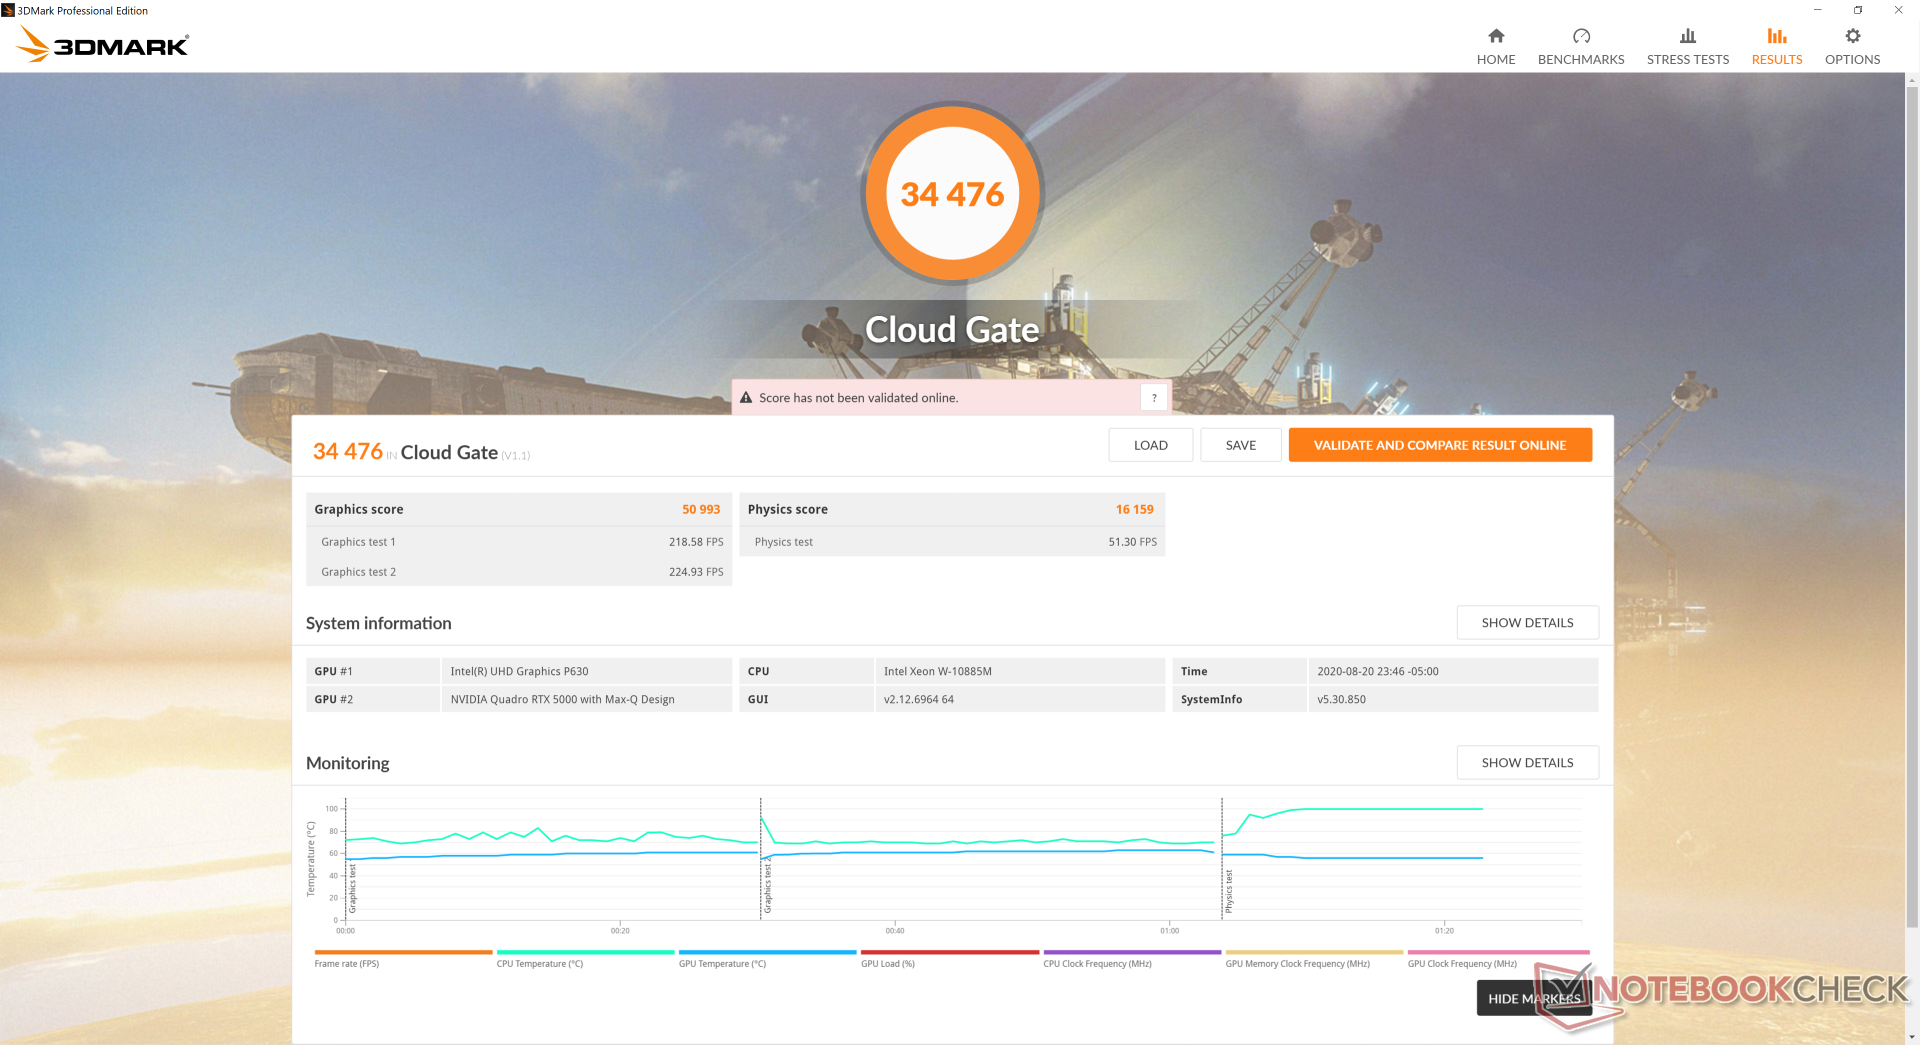
| 3DMark Cloud Gate Standard Score | 34476 punti | |
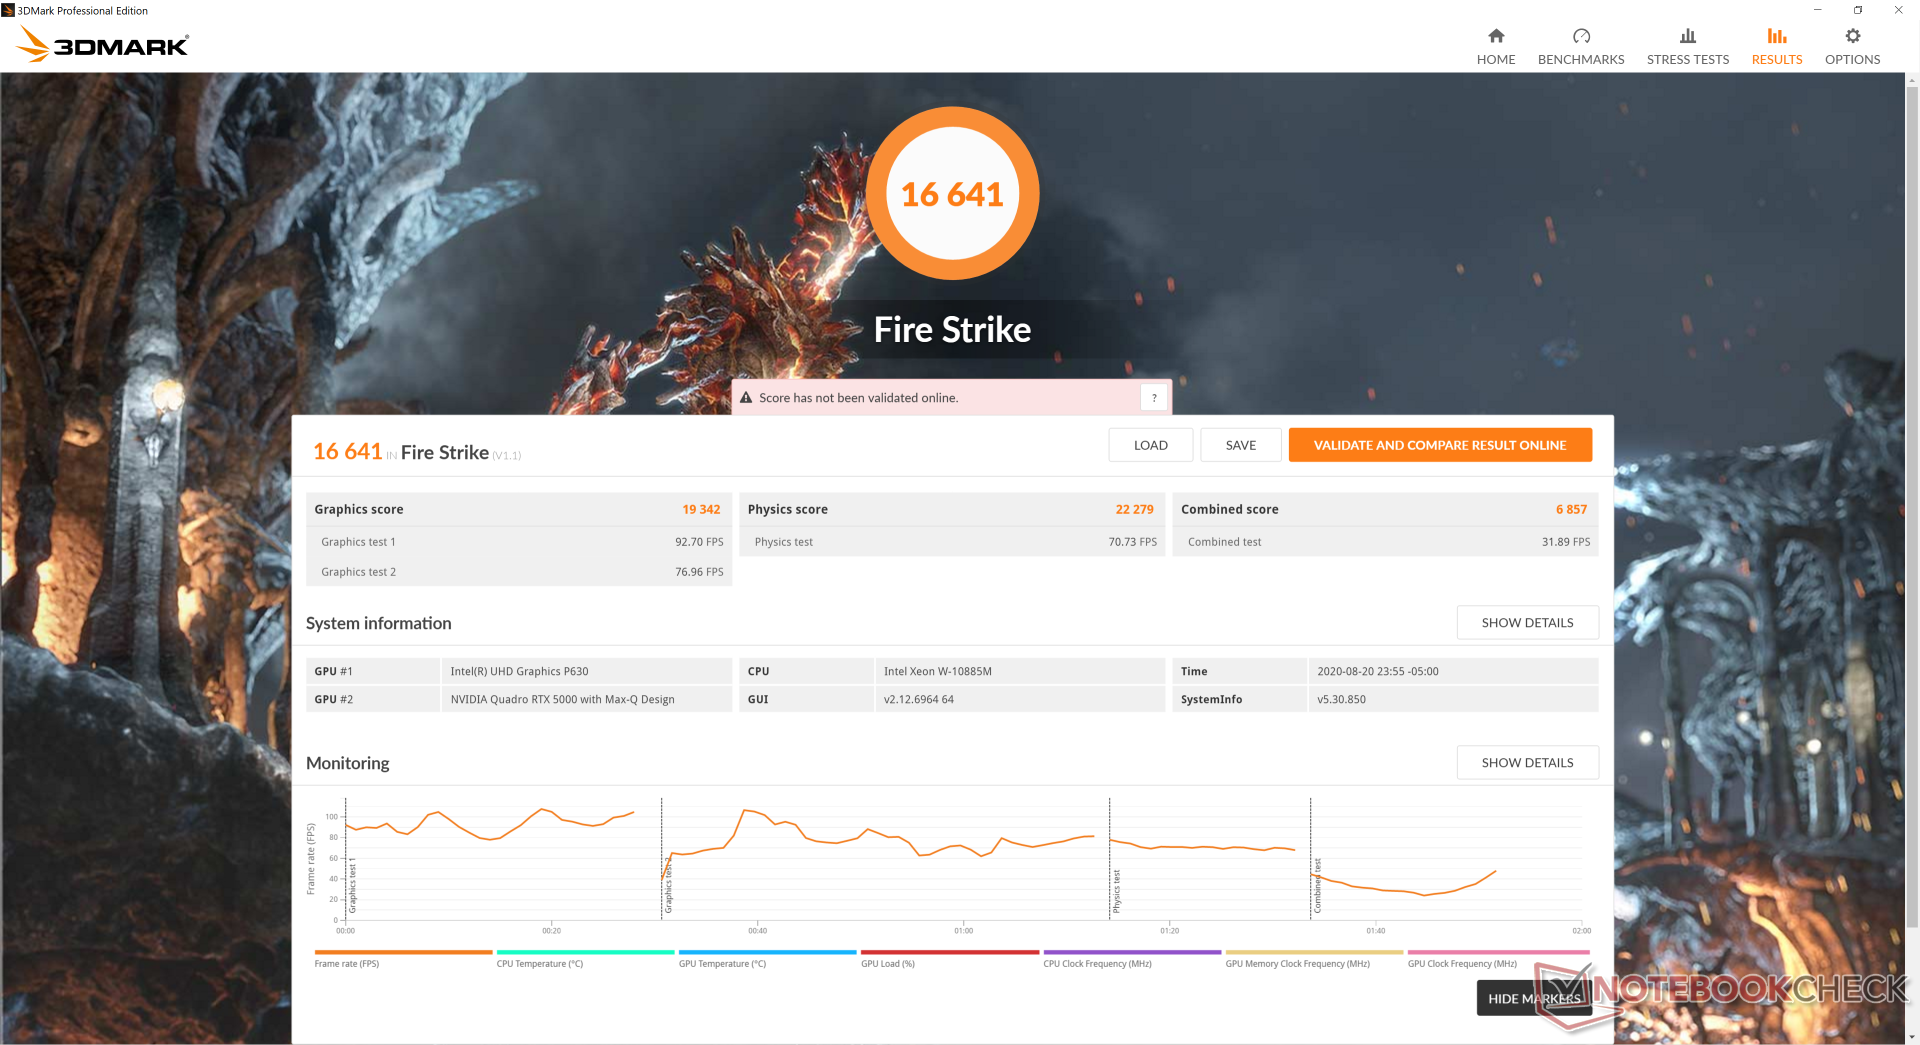
| 3DMark Fire Strike Score | 16641 punti | |
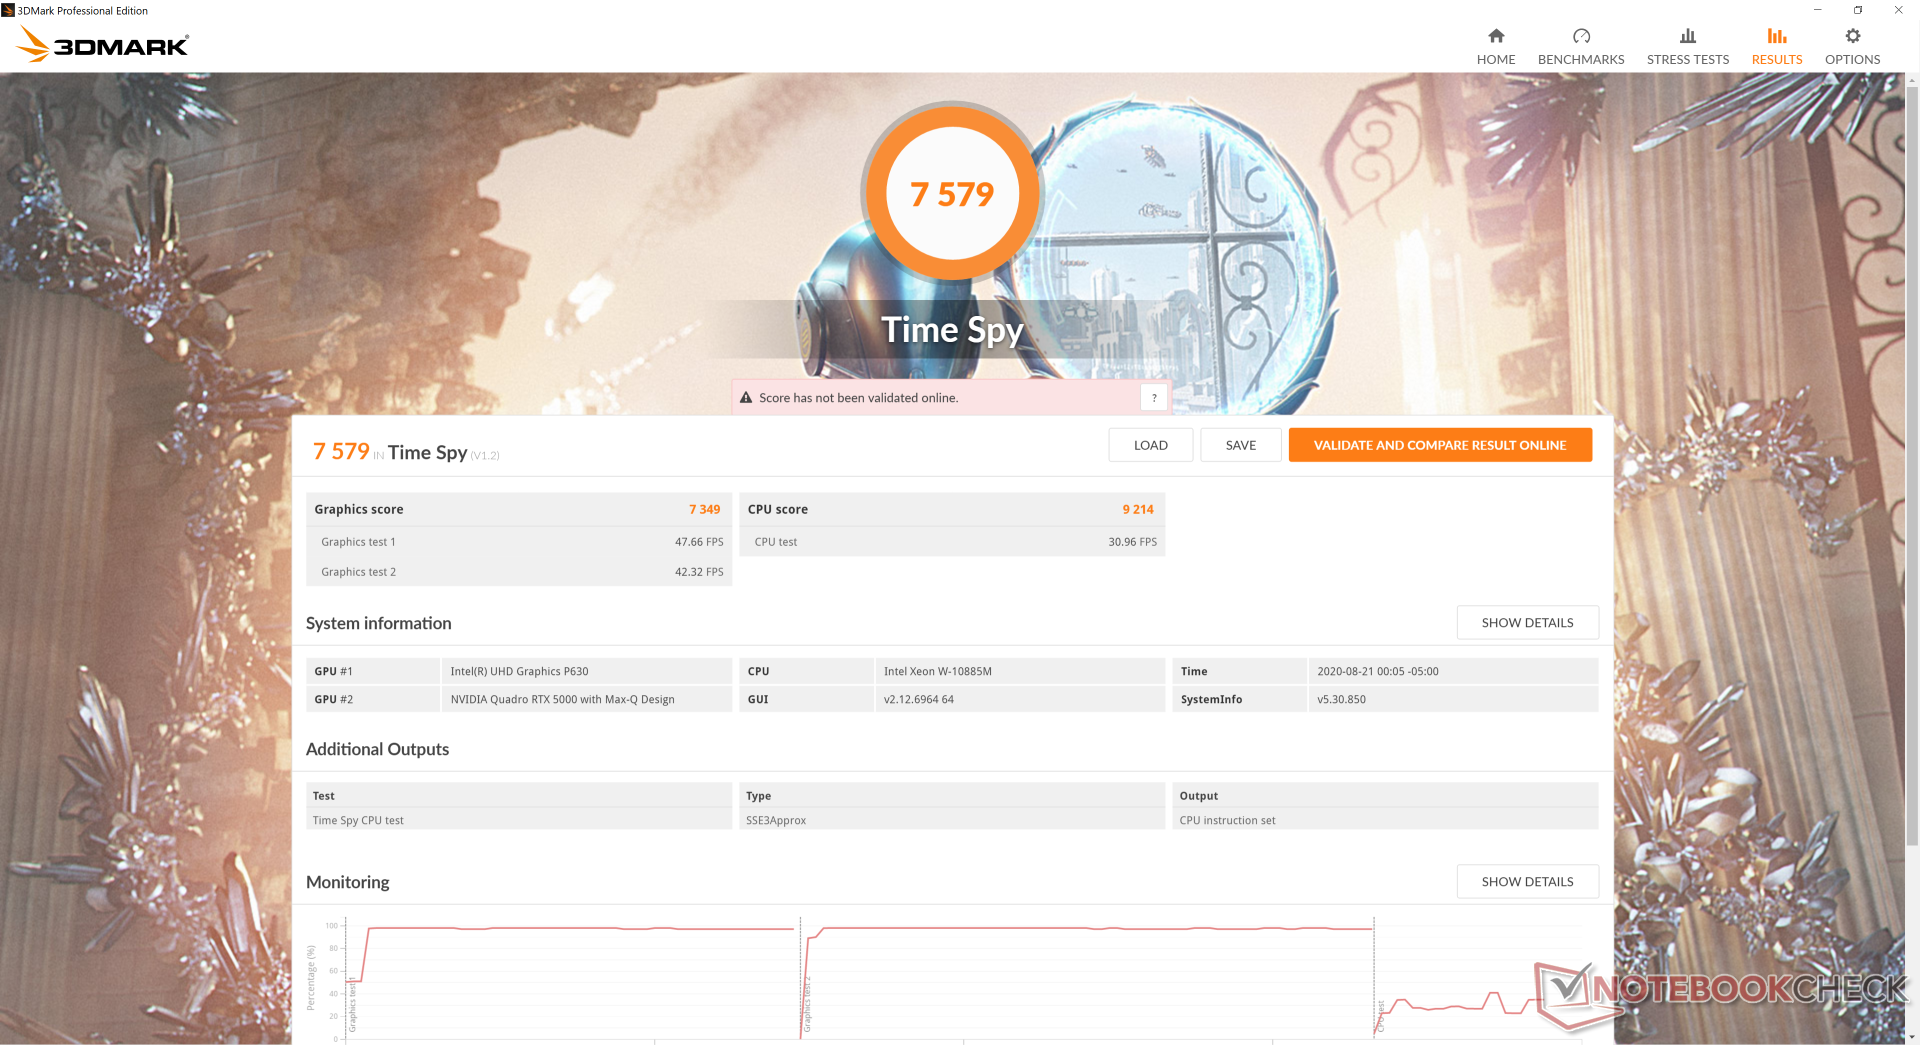
| 3DMark Time Spy Score | 7579 punti | |
Aiuto | ||
| basso | medio | alto | ultra | QHD | 4K | |
|---|---|---|---|---|---|---|
| The Witcher 3 (2015) | 299 | 249.4 | 139.1 | 77.3 | 52.5 | |
| Dota 2 Reborn (2015) | 156 | 142 | 117 | 111 | 98.7 | |
| Final Fantasy XV Benchmark (2018) | 154 | 99.7 | 77.3 | 56 | 32.8 | |
| X-Plane 11.11 (2018) | 118 | 102 | 85.7 | 48.8 |
Emissioni
Rumorosità di sistema
Il rumore della ventola è più basso del previsto durante i carichi di lavoro contenuti, come la navigazione sul web o lo streaming video, se si considerano i processori ad alta potenza all'interno. Arriva al massimo a soli 30 dB(A) quando non c'è molto sullo schermo senza un fastidioso comportamento pulsante di cui parlare.
Le ventole accelerano considerevolmente quando si eseguono carichi più alti. The Witcher 3, per esempio, induce un rumore della ventola di 51,9 dB(A) forte quanto molti portatili gaming e il Precision 7540 dell'anno scorso. Questa è una macchina rumorosa solo quando è necessario.
Si consiglia di familiarizzare con Dell Power Manager poiché il rumore della ventola è direttamente legato alle sue impostazioni.
| Dell Precision 7550 Quadro RTX 5000 Max-Q, W-10885M, SK Hynix PC601A NVMe 1TB | Dell Precision 7540 Quadro RTX 3000 (Laptop), i9-9980HK, SK hynix PC400 512 GB | Dell Precision 5550 P91F Quadro T2000 Max-Q, i7-10875H, SK Hynix PC601A NVMe 1TB | Acer ConceptD 3 Pro CN315-71P-73W1 Quadro T1000 (Laptop), i7-9750H, WDC PC SN720 SDAPNTW-512G | Lenovo ThinkPad P53-20QN000YGE Quadro RTX 5000 Max-Q, i7-9850H, Samsung PM981a MZVLB1T0HBLR | HP ZBook Studio G5-4QH10EA Quadro P1000, i7-8750H, Samsung SSD PM981 MZVLB512HAJQ | |
|---|---|---|---|---|---|---|
| Noise | 3% | 6% | -1% | 8% | 4% | |
| off /ambiente * (dB) | 25.8 | 28.7 -11% | 26.2 -2% | 31.2 -21% | 28.3 -10% | 28.6 -11% |
| Idle Minimum * (dB) | 25.8 | 28.8 -12% | 26.2 -2% | 31.2 -21% | 28.3 -10% | 28.6 -11% |
| Idle Average * (dB) | 25.8 | 28.7 -11% | 26.2 -2% | 31.2 -21% | 28.3 -10% | 28.6 -11% |
| Idle Maximum * (dB) | 25.9 | 29.1 -12% | 26.2 -1% | 31.5 -22% | 28.3 -9% | 30 -16% |
| Load Average * (dB) | 51.2 | 37.1 28% | 39.2 23% | 38.4 25% | 29.8 42% | 38.1 26% |
| Witcher 3 ultra * (dB) | 51.9 | 41.2 21% | 39 25% | 36.9 29% | 38.3 26% | 35 33% |
| Load Maximum * (dB) | 51.9 | 41.2 21% | 50.6 3% | 41.2 21% | 38.3 26% | 42.5 18% |
* ... Meglio usare valori piccoli
Rumorosità
| Idle |
| 25.8 / 25.8 / 25.9 dB(A) |
| Sotto carico |
| 51.2 / 51.9 dB(A) |
 | ||
30 dB silenzioso 40 dB(A) udibile 50 dB(A) rumoroso |
||
min: | ||
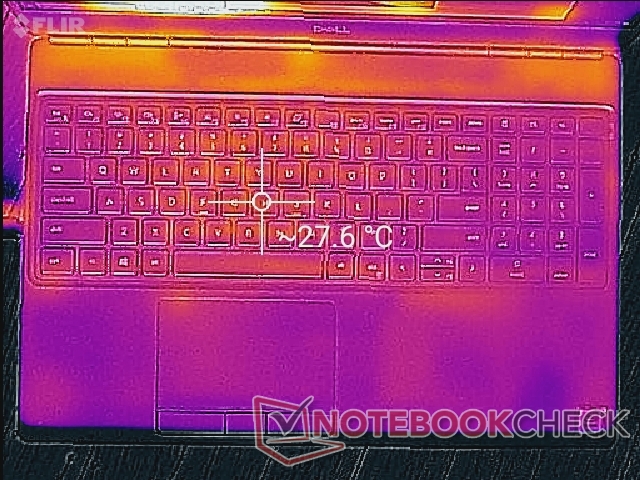
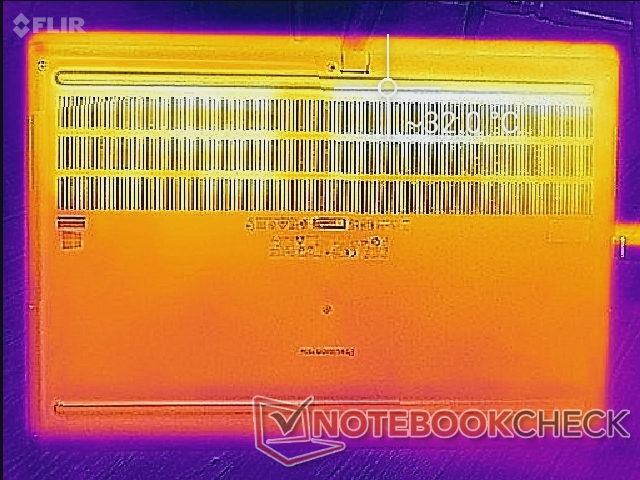
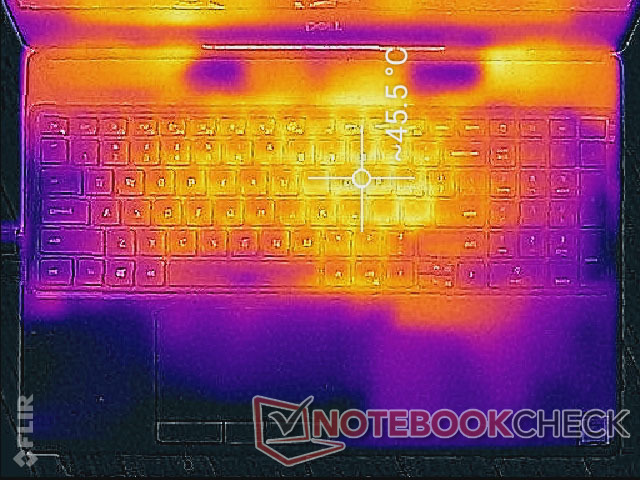
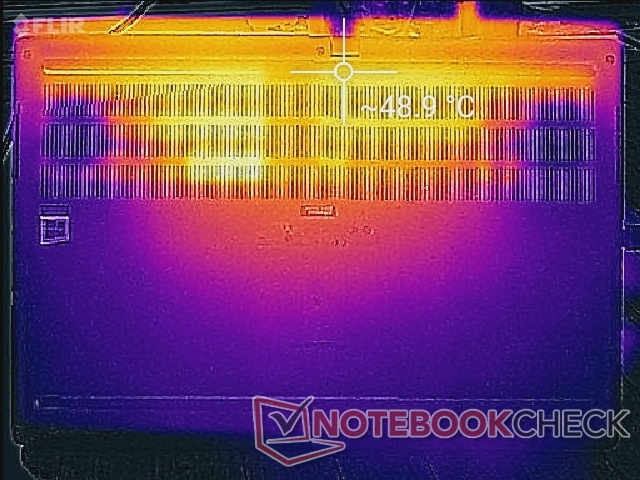
Temperature
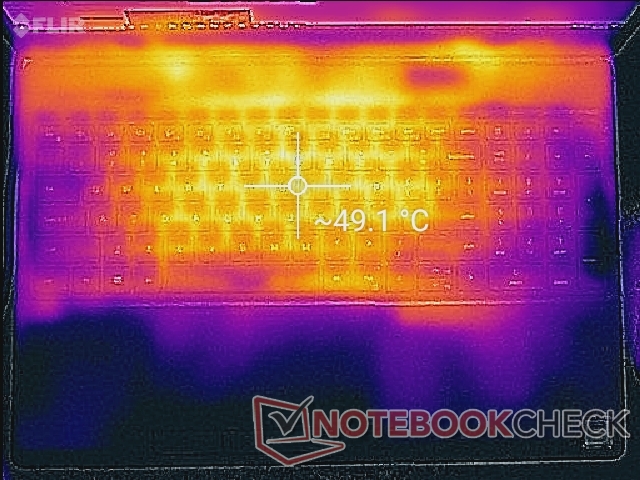
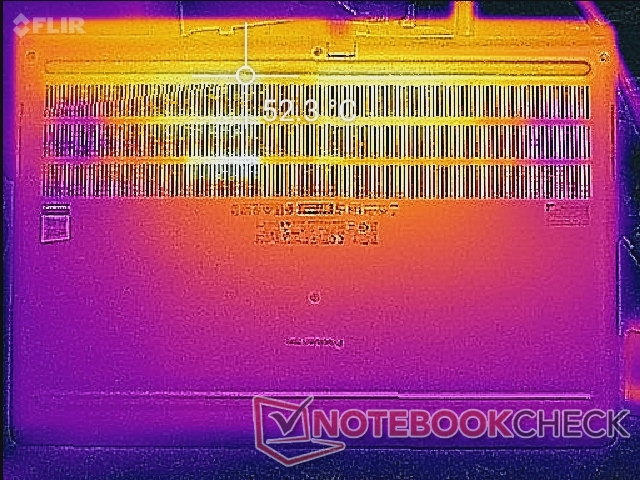
Lo sviluppo della temperatura di superficie è per lo più simmetrico con punti caldi vicino al centro del telaio. Il centro della tastiera, per esempio, può arrivare a 49 °C in caso di carichi elevati per essere ancora più caldo di quello che abbiamo registrato sul più piccolo Precision 5550. I poggiapolsi, il touchpad e i lati della tastiera rimangono molto più freddi.
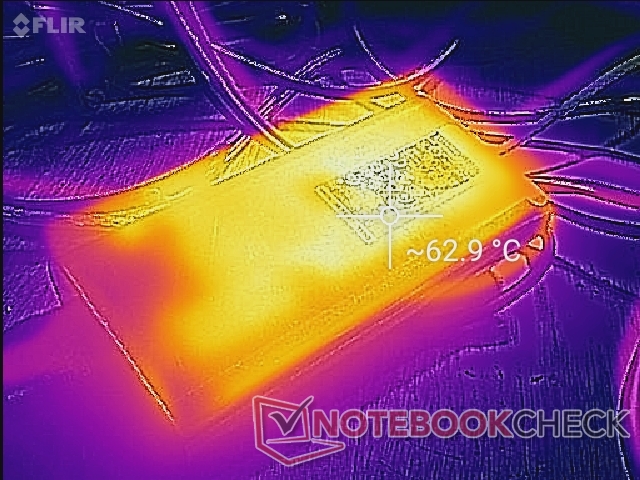
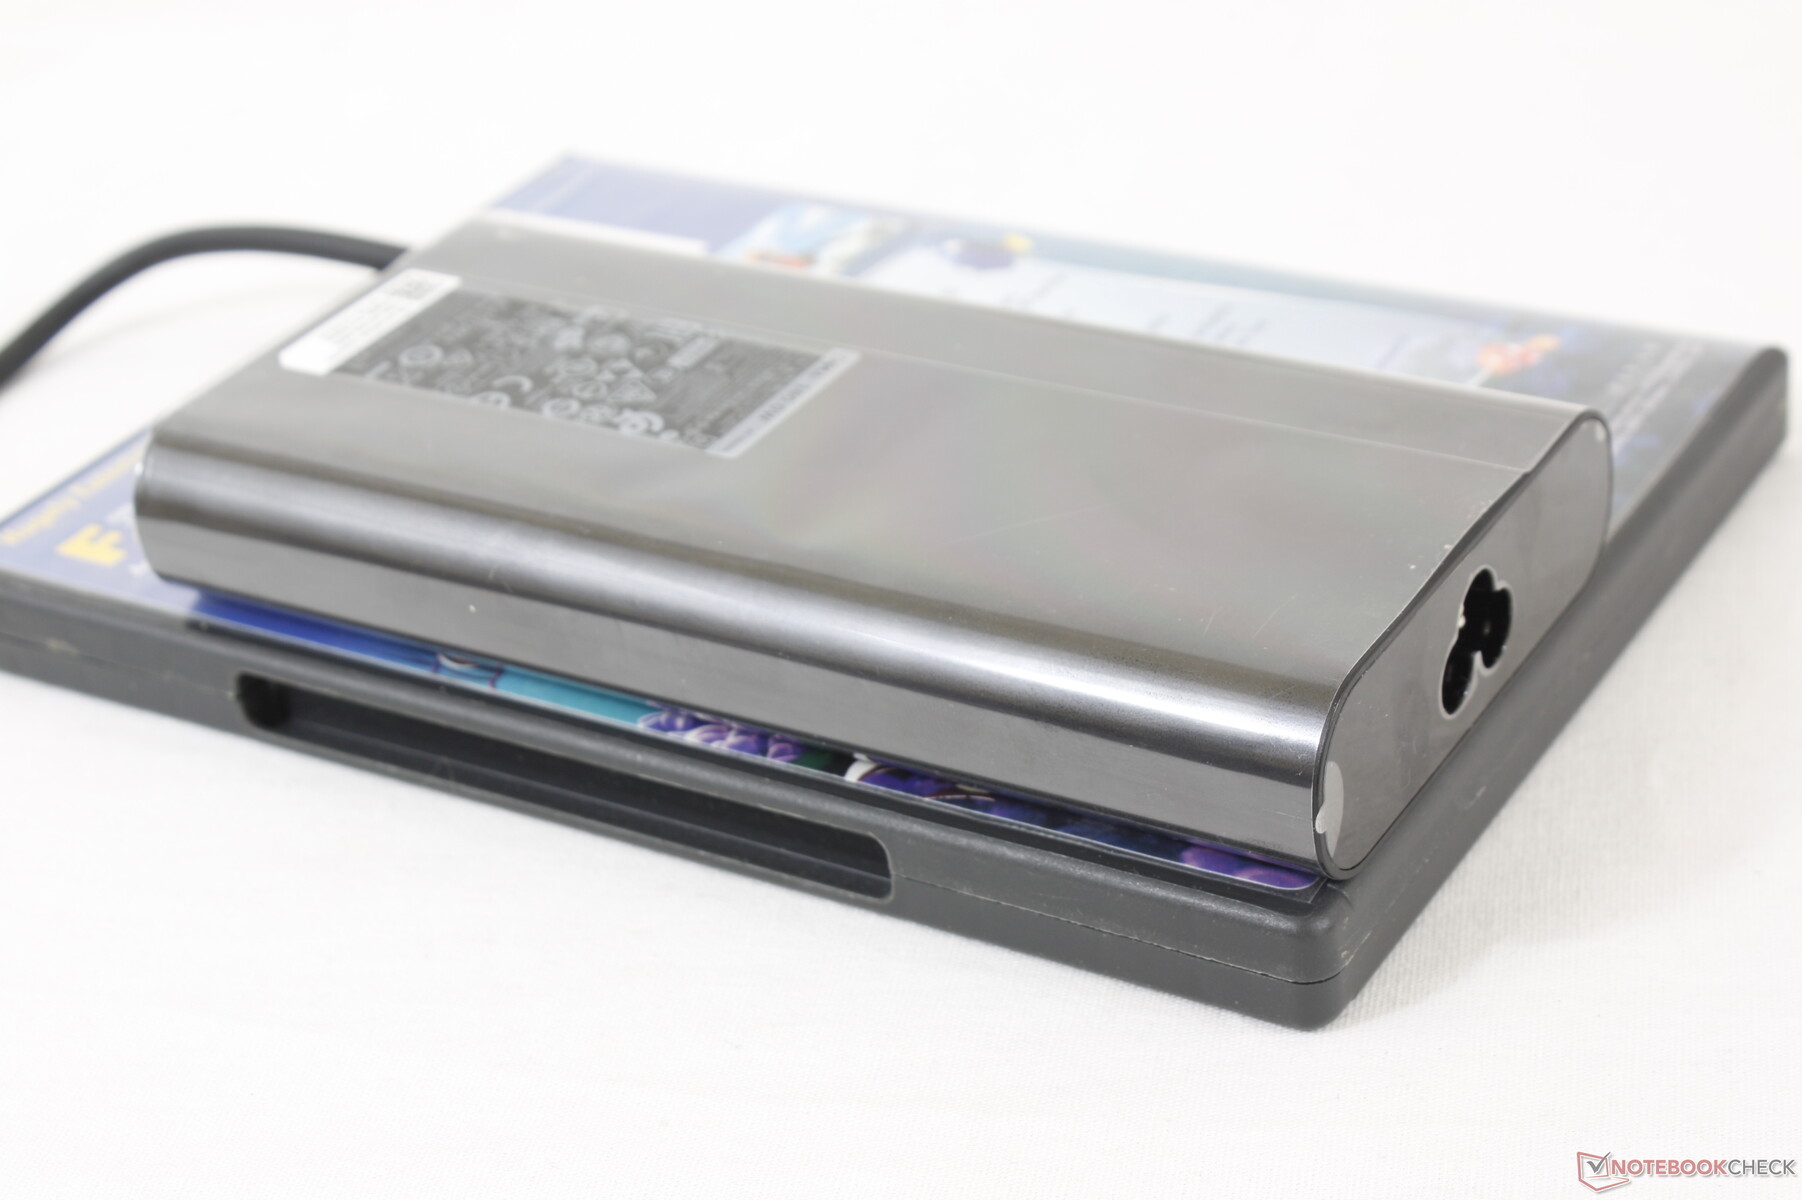
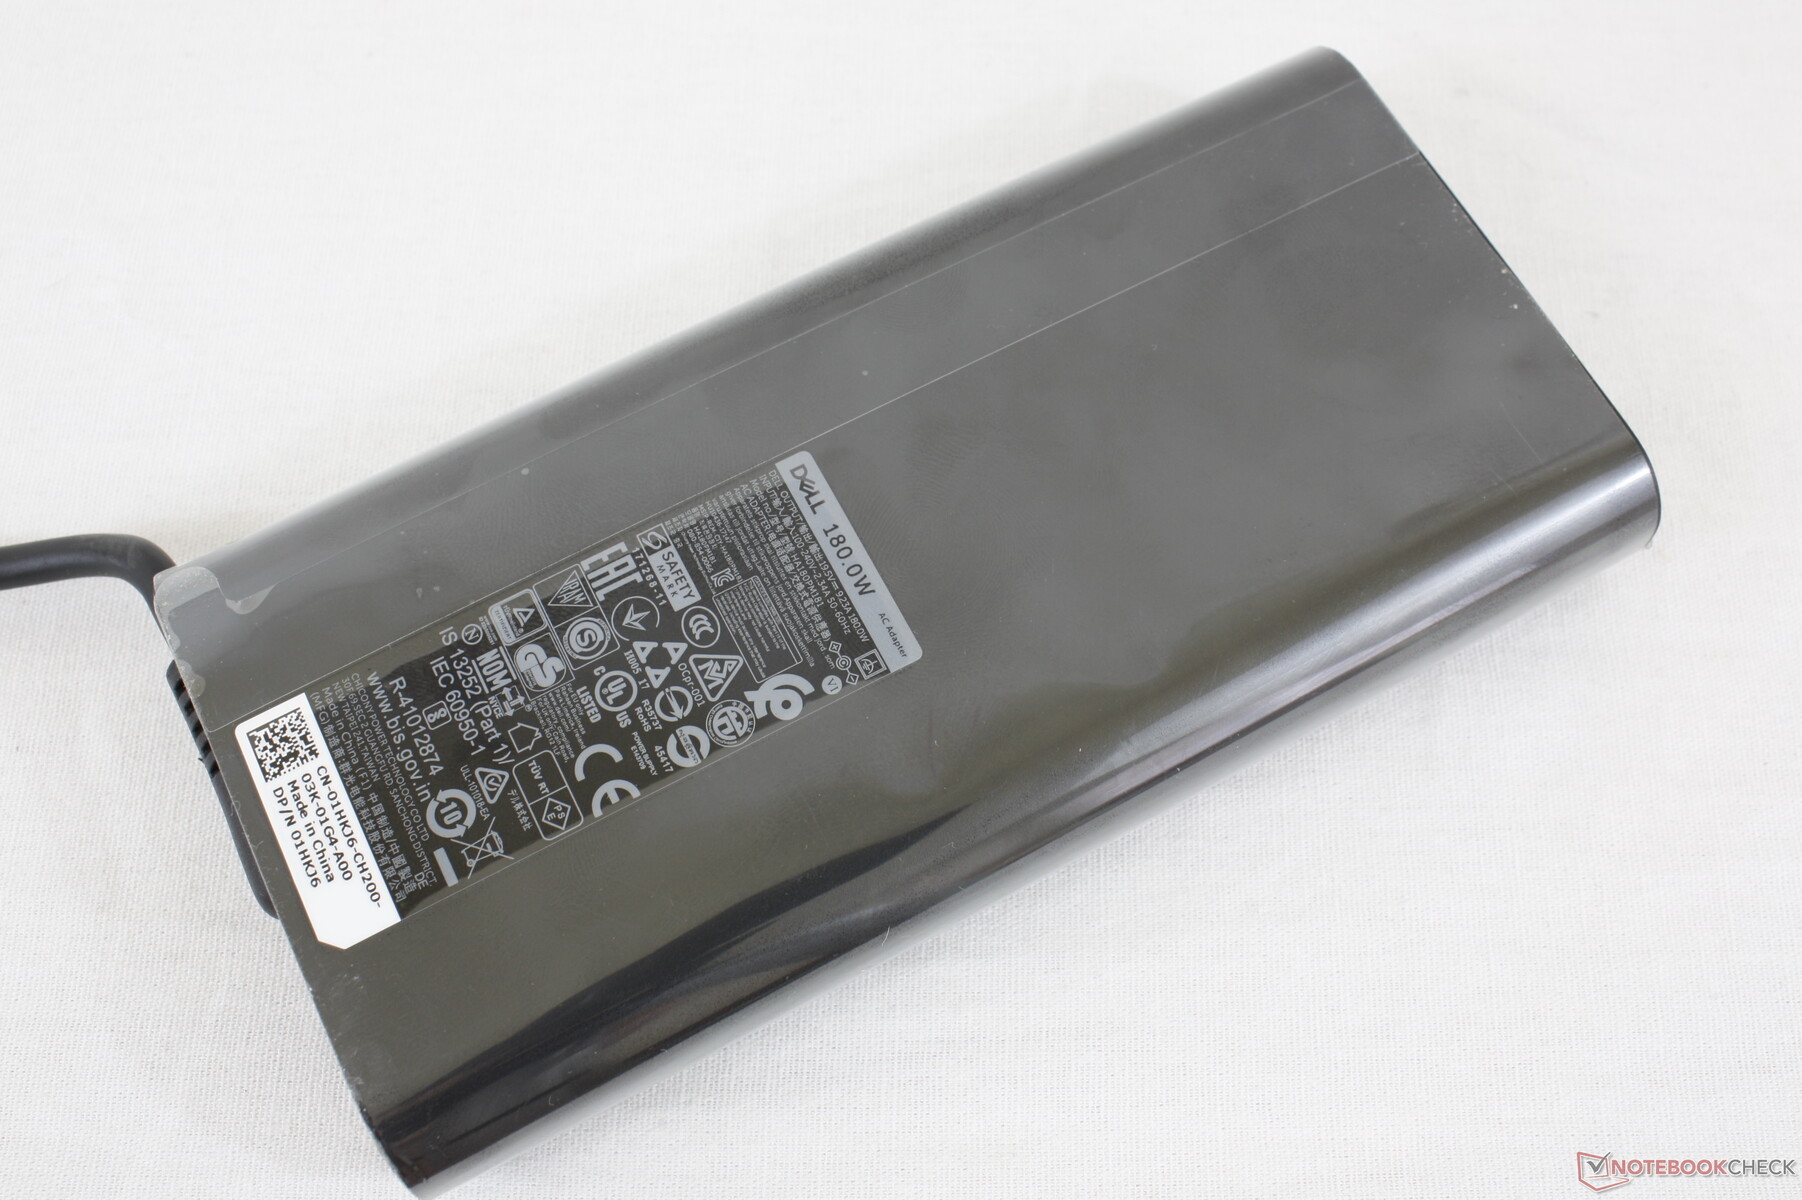
Anche l'adattatore può diventare molto caldo a oltre 60 °C quando è sottoposto a carichi elevati, grazie al suo fattore di forma compatto non dissimile dall'alimentatore per il Razer Blade Studio Edition.
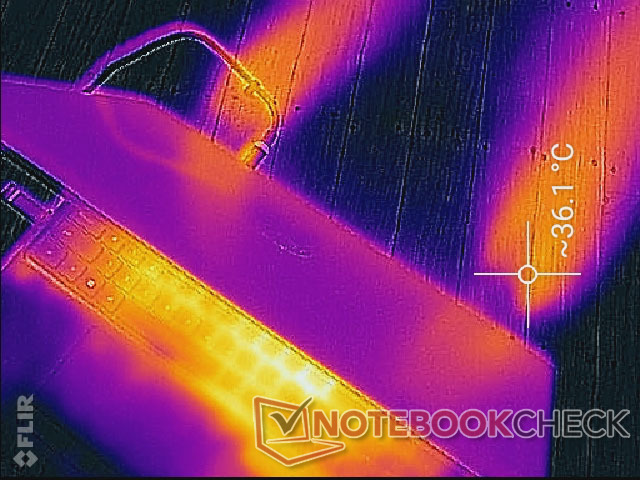
(-) La temperatura massima sul lato superiore è di 49 °C / 120 F, rispetto alla media di 38.2 °C / 101 F, che varia da 22.2 a 69.8 °C per questa classe Workstation.
(-) Il lato inferiore si riscalda fino ad un massimo di 51 °C / 124 F, rispetto alla media di 41.1 °C / 106 F
(+) In idle, la temperatura media del lato superiore è di 26.7 °C / 80 F, rispetto alla media deld ispositivo di 32 °C / 90 F.
(±) Riproducendo The Witcher 3, la temperatura media per il lato superiore e' di 37.8 °C / 100 F, rispetto alla media del dispositivo di 32 °C / 90 F.
(+) I poggiapolsi e il touchpad sono piu' freddi della temperatura della pelle con un massimo di 31 °C / 87.8 F e sono quindi freddi al tatto.
(-) La temperatura media della zona del palmo della mano di dispositivi simili e'stata di 27.8 °C / 82 F (-3.2 °C / -5.8 F).
Stress Test
Stressiamo il sistema con carichi sintetici per identificare eventuali problemi di strozzamento o di stabilità. Quando si esegue Prime95, la CPU può essere osservata aumentare a 4,3 GHz solo per i primi due secondi fino a quando la temperatura del core raggiunge i 99 °C. In seguito, le frequenze di clock si abbbassano e si stabilizzano a circa 3,6-3,7 GHz per mantenere una temperatura del core leggermente più fredda di 90 - 95 °C. Dell ama far funzionare i suoi processori a temperature più elevate rispetto alla maggior parte degli altri portatili in base a quanto abbiamo osservato sulle serie XPS e Alienware e ora sulla serie Precision.
Carichi pesanti come i videogiochi faranno sì che le temperature di CPU e GPU si stabilizzino a circa 73 °C e 67 °C, rispettivamente.
Il funzionamento a batteria limiterà le prestazioni. Un test Fire Strike effettuato usando la batteria restituirà
punteggi di Physics e Graphics di 15371 e 10249 punti, rispettivamente, rispetto a 22279 e 19342 punti ottenuti con l'alimentazione di rete.
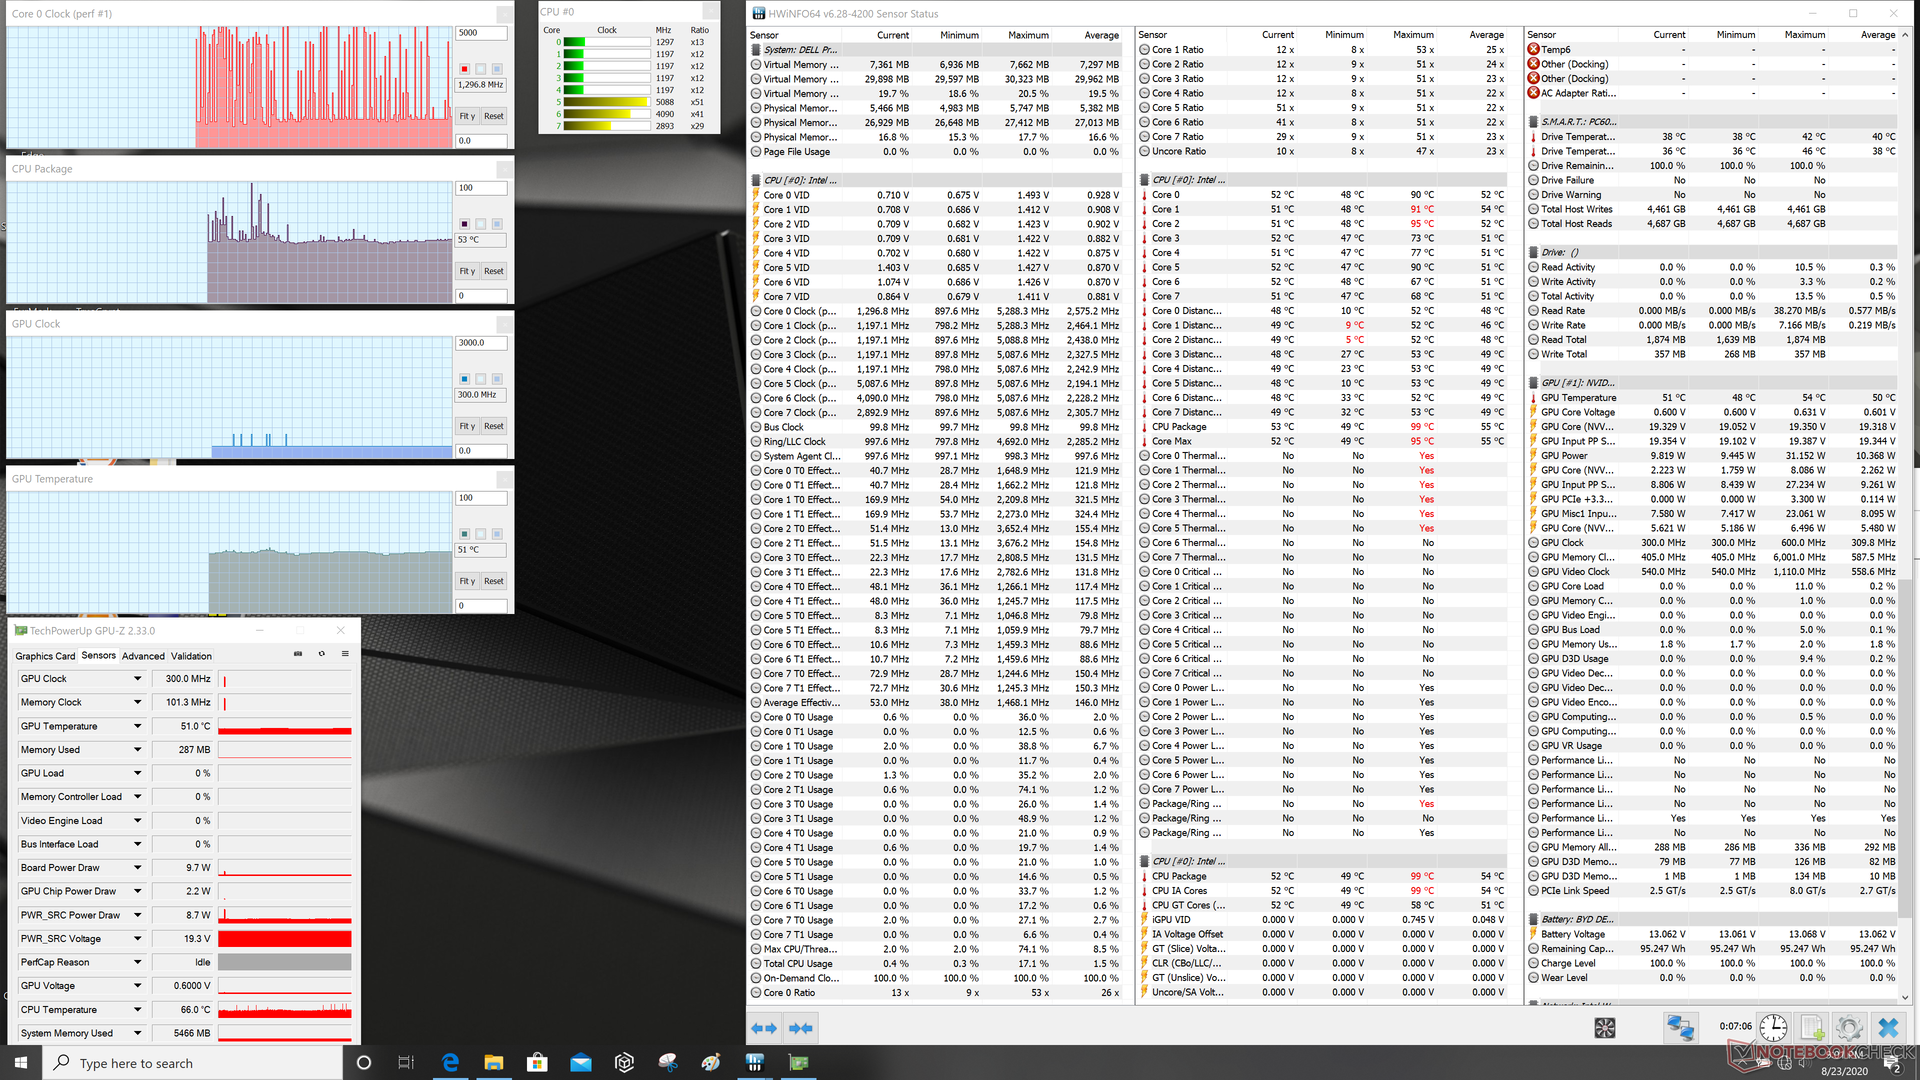
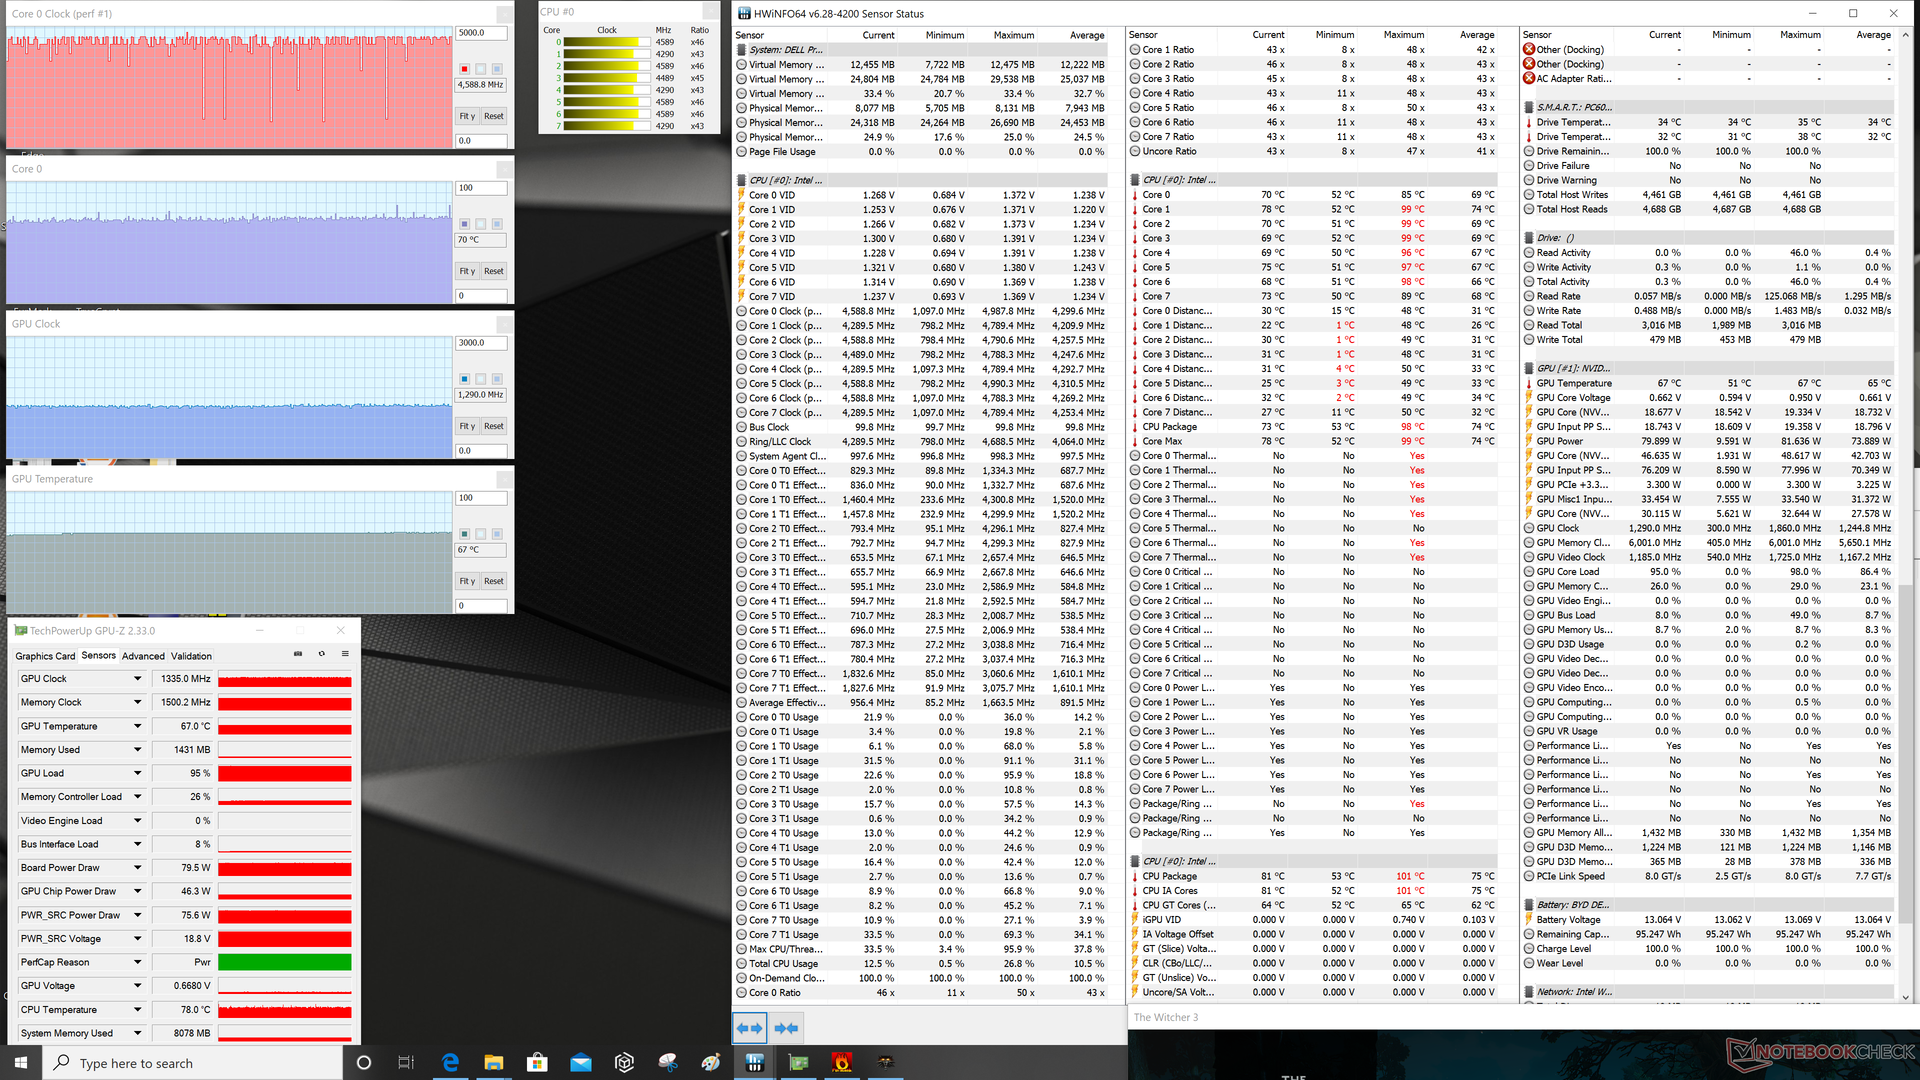
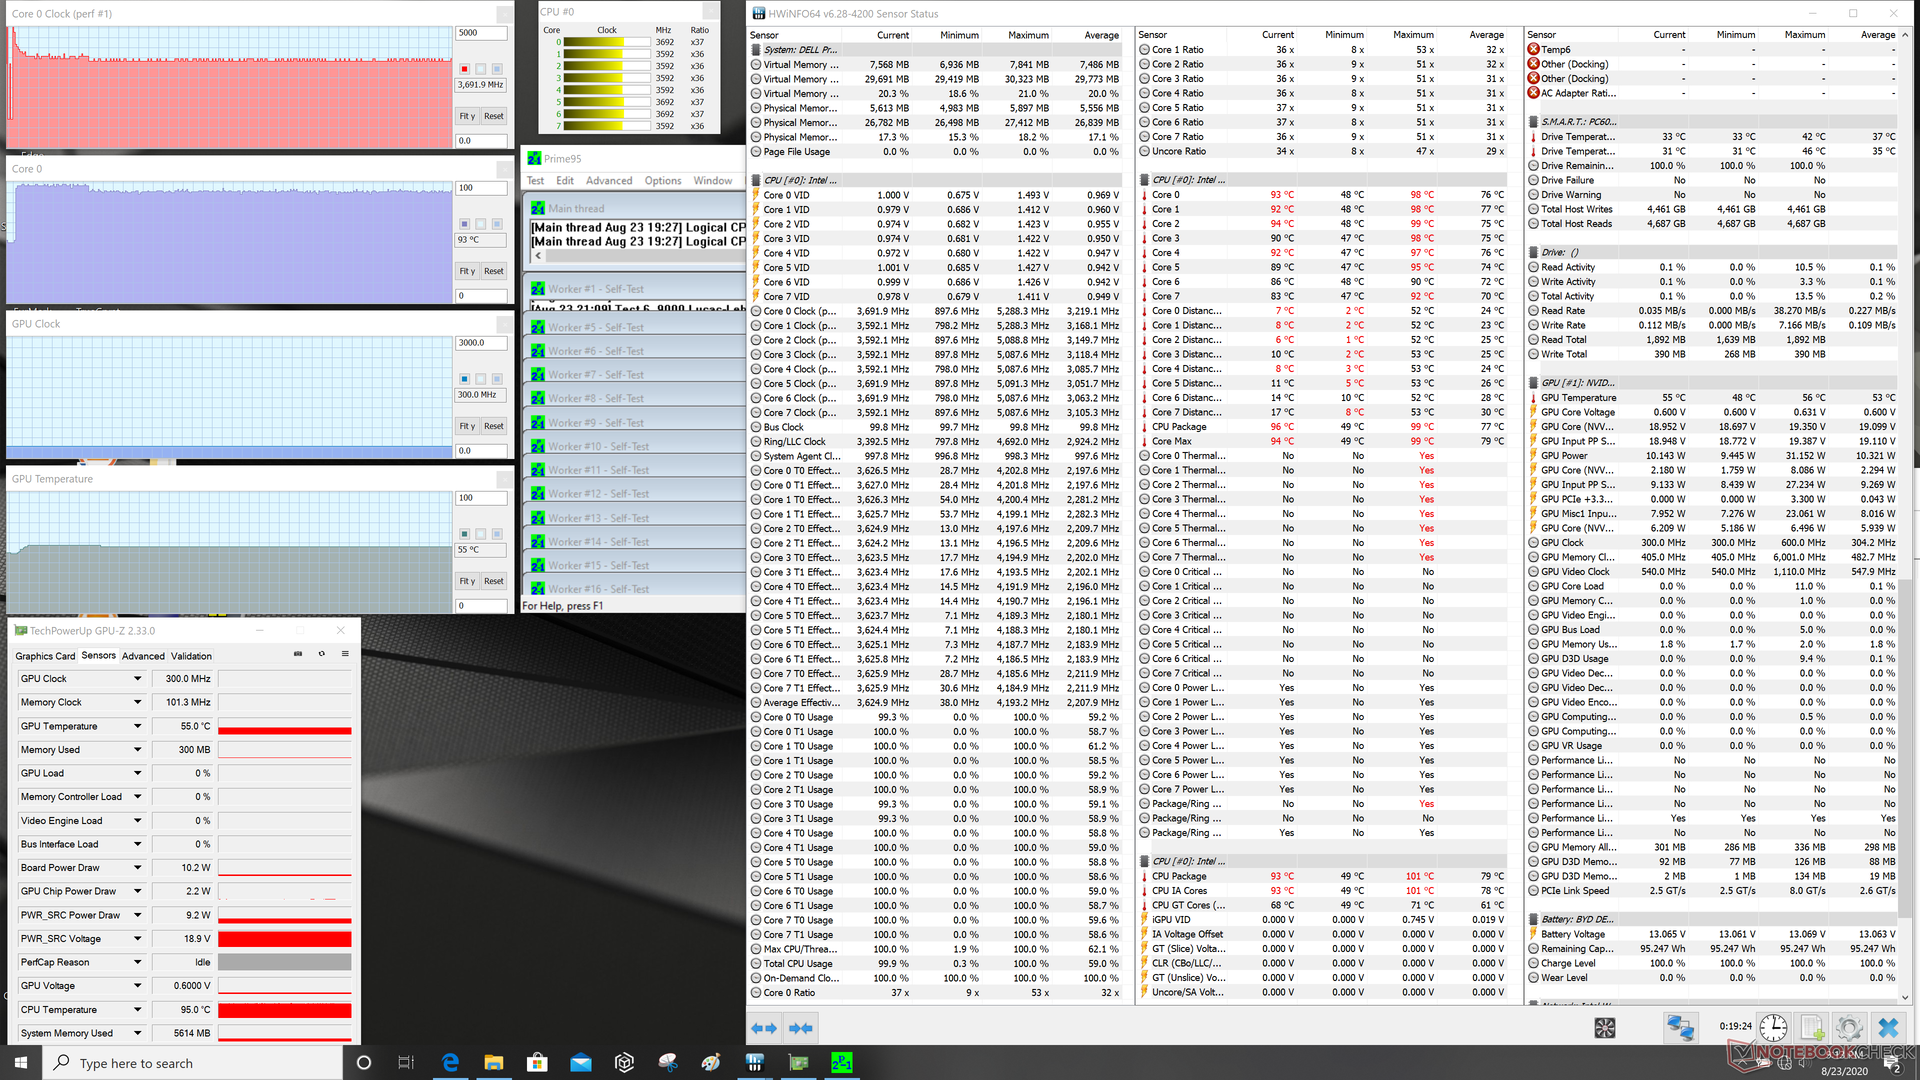
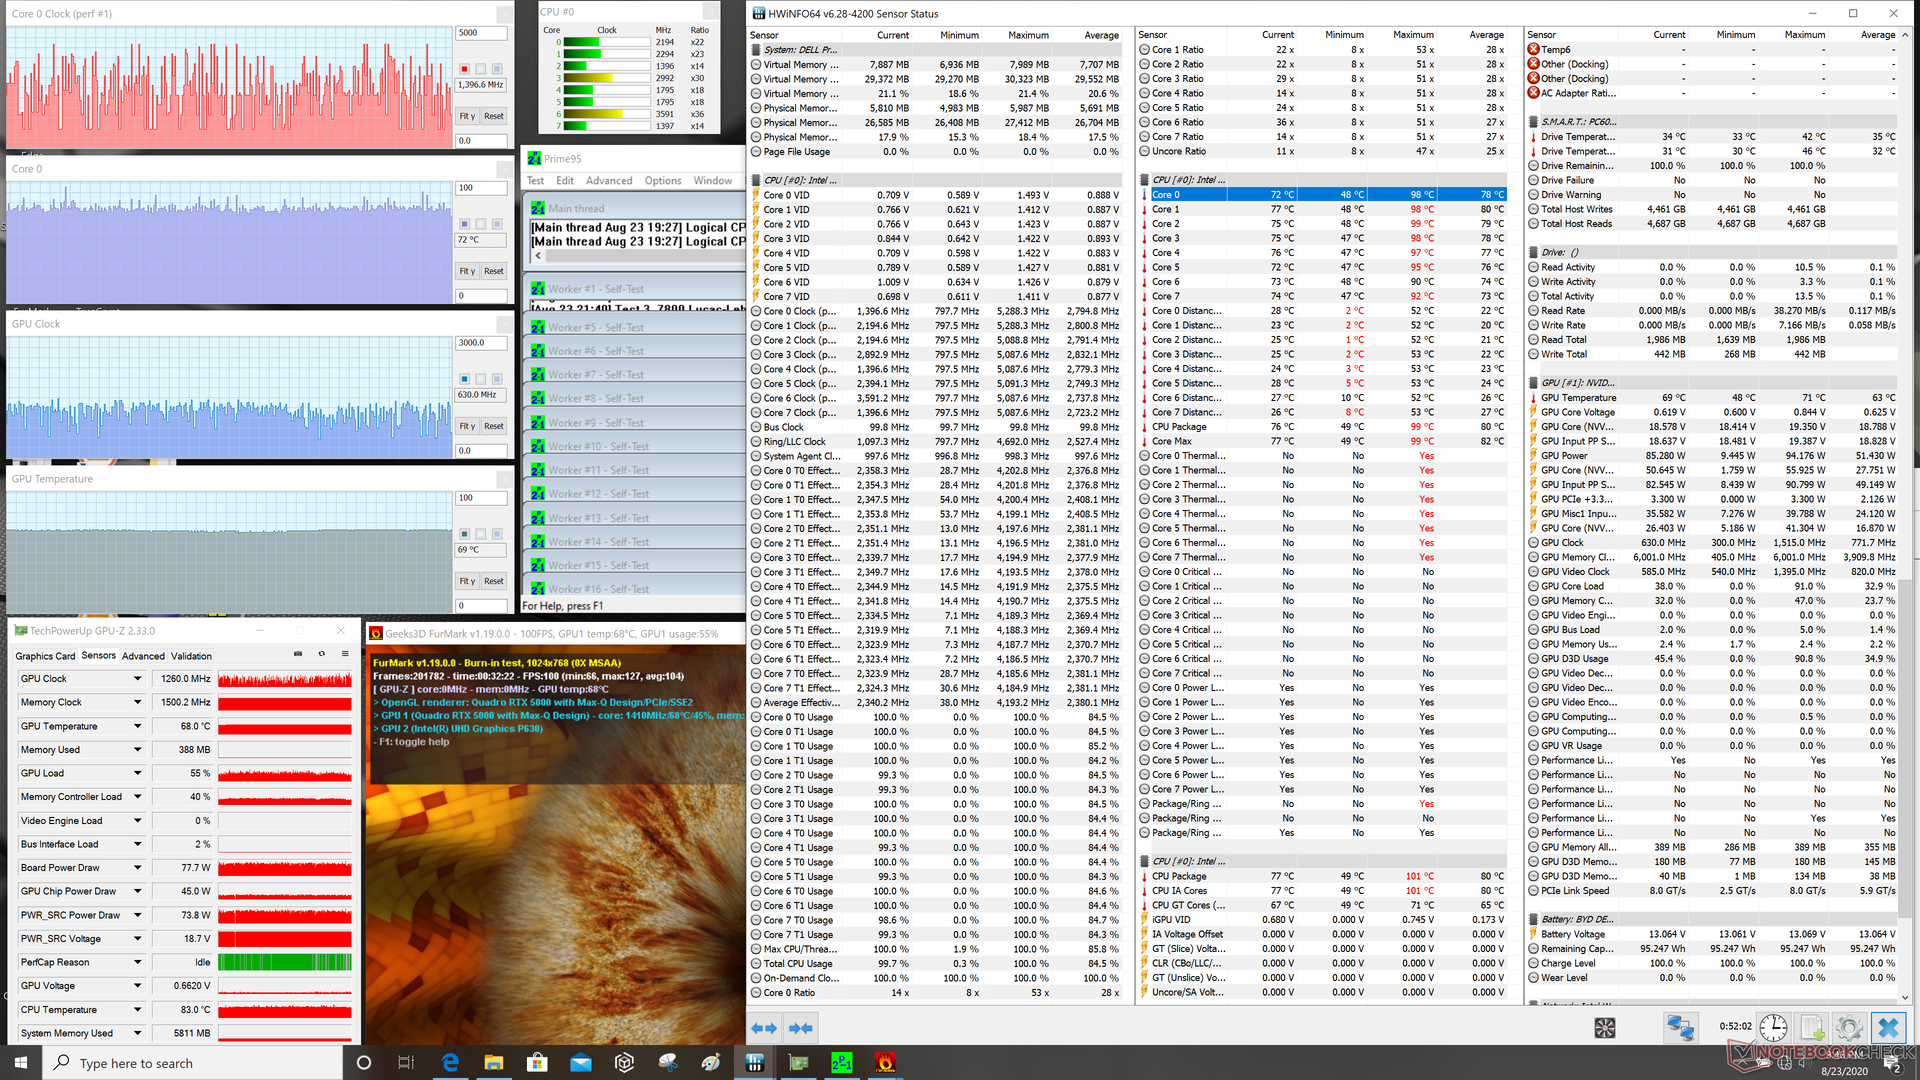
| CPU Clock (GHz) | GPU Clock (MHz) | Average CPU Temperature (°C) | Average GPU Temperature (°C) | |
| System Idle | -- | -- | 53 | 51 |
| Prime95 Stress | 3.6 - 3.7 | -- | 96 | 55 |
| Prime95 + FurMark Stress | 0.8 - 4.3 | ~630 - ~1260 | 76 | 68 |
| Witcher 3 Stress | ~4.4 | 1335 | 73 | 67 |
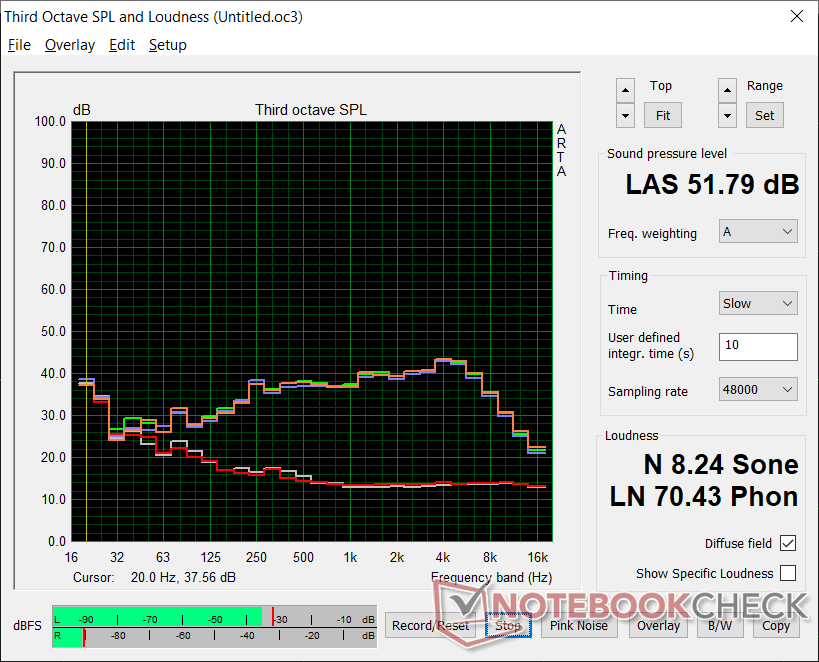
Altoparlanti

Dell Precision 7550 analisi audio
(+) | gli altoparlanti sono relativamente potenti (83.6 dB)
Bassi 100 - 315 Hz
(±) | bassi ridotti - in media 11.5% inferiori alla media
(±) | la linearità dei bassi è media (11.6% delta rispetto alla precedente frequenza)
Medi 400 - 2000 Hz
(±) | medi elevati - circa 5.7% superiore alla media
(+) | medi lineari (4.5% delta rispetto alla precedente frequenza)
Alti 2 - 16 kHz
(+) | Alti bilanciati - appena 3.2% dalla media
(+) | alti lineari (5.4% delta rispetto alla precedente frequenza)
Nel complesso 100 - 16.000 Hz
(+) | suono nel complesso lineare (12.6% differenza dalla media)
Rispetto alla stessa classe
» 21% di tutti i dispositivi testati in questa classe è stato migliore, 4% simile, 75% peggiore
» Il migliore ha avuto un delta di 7%, medio di 17%, peggiore di 35%
Rispetto a tutti i dispositivi testati
» 11% di tutti i dispositivi testati in questa classe è stato migliore, 3% similare, 86% peggiore
» Il migliore ha avuto un delta di 4%, medio di 23%, peggiore di 134%
Apple MacBook 12 (Early 2016) 1.1 GHz analisi audio
(+) | gli altoparlanti sono relativamente potenti (83.6 dB)
Bassi 100 - 315 Hz
(±) | bassi ridotti - in media 11.3% inferiori alla media
(±) | la linearità dei bassi è media (14.2% delta rispetto alla precedente frequenza)
Medi 400 - 2000 Hz
(+) | medi bilanciati - solo only 2.4% rispetto alla media
(+) | medi lineari (5.5% delta rispetto alla precedente frequenza)
Alti 2 - 16 kHz
(+) | Alti bilanciati - appena 2% dalla media
(+) | alti lineari (4.5% delta rispetto alla precedente frequenza)
Nel complesso 100 - 16.000 Hz
(+) | suono nel complesso lineare (10.2% differenza dalla media)
Rispetto alla stessa classe
» 7% di tutti i dispositivi testati in questa classe è stato migliore, 2% simile, 90% peggiore
» Il migliore ha avuto un delta di 5%, medio di 18%, peggiore di 53%
Rispetto a tutti i dispositivi testati
» 5% di tutti i dispositivi testati in questa classe è stato migliore, 1% similare, 94% peggiore
» Il migliore ha avuto un delta di 4%, medio di 23%, peggiore di 134%
Gestione Energetica
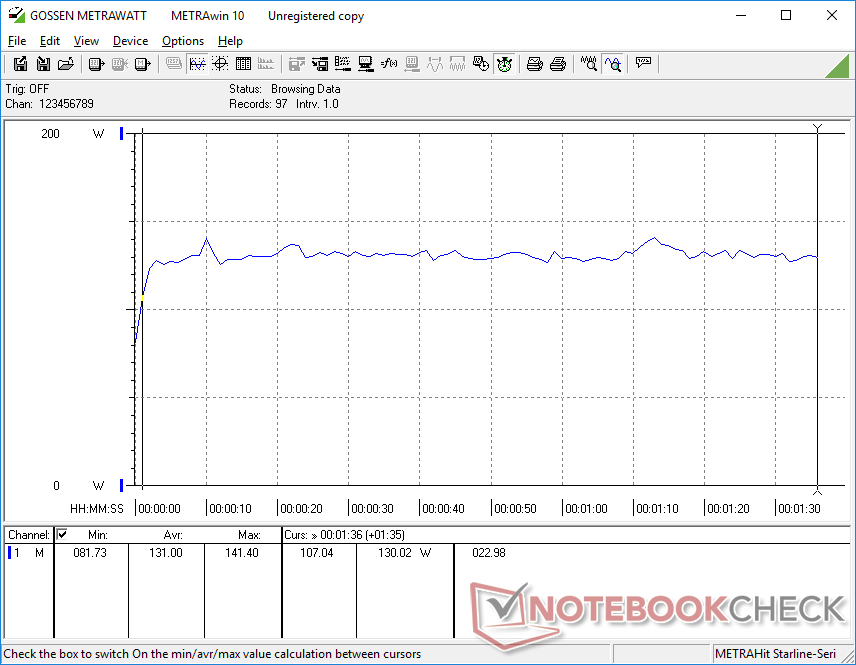
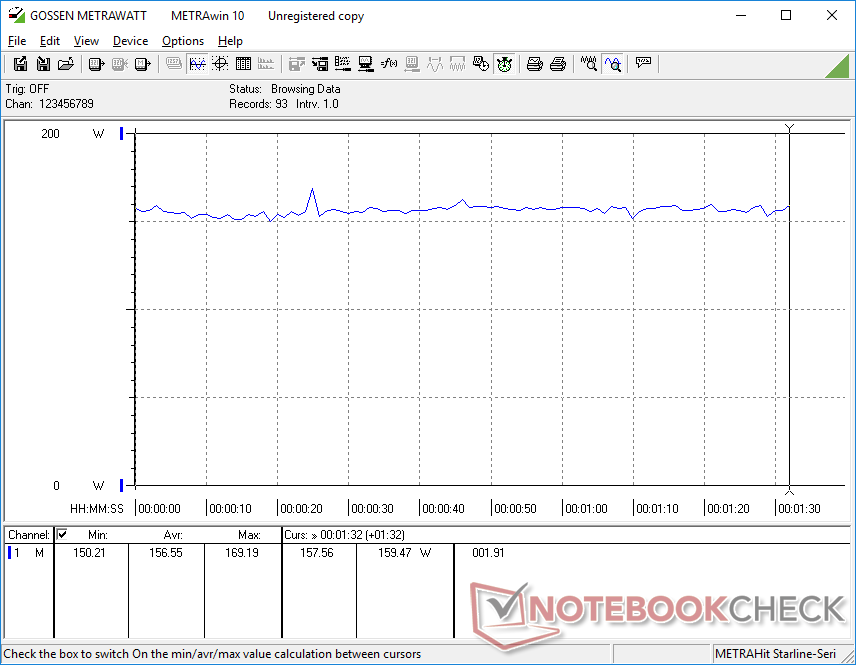
Consumo Energetico
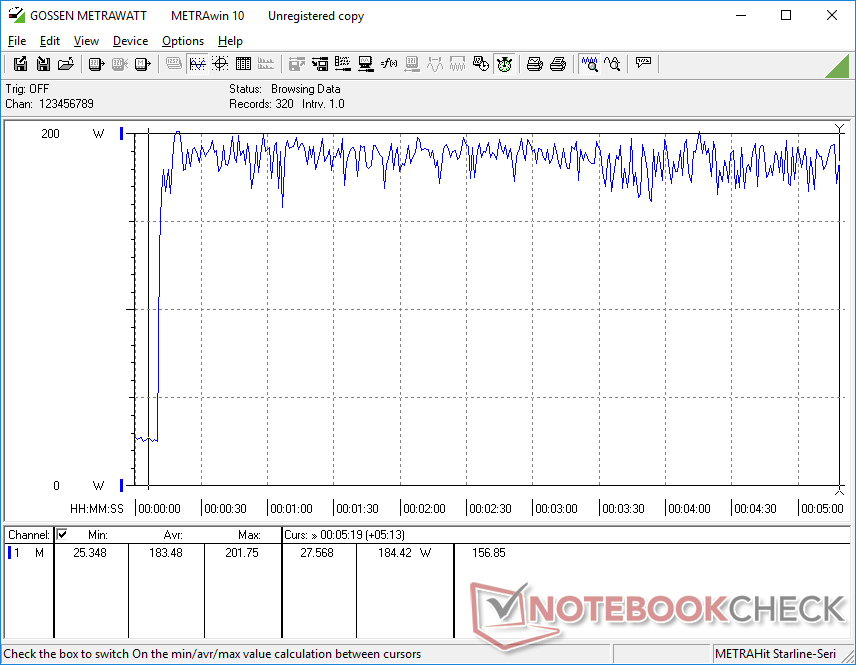
Il Precision 7550 è una macchina avida di energia. Il funzionamento a vuoto sulla scrivania assorbe circa 8 W o fino a 25 W se la GPU dedicata è attiva. Quando si eseguono carichi elevati come The Witcher 3, il consumo medio di energia risulta essere di 157 W rispetto alla metà di quello delle workstation più piccole con GPU T2000 o P1000 più lente, come mostra la tabella sottostante.
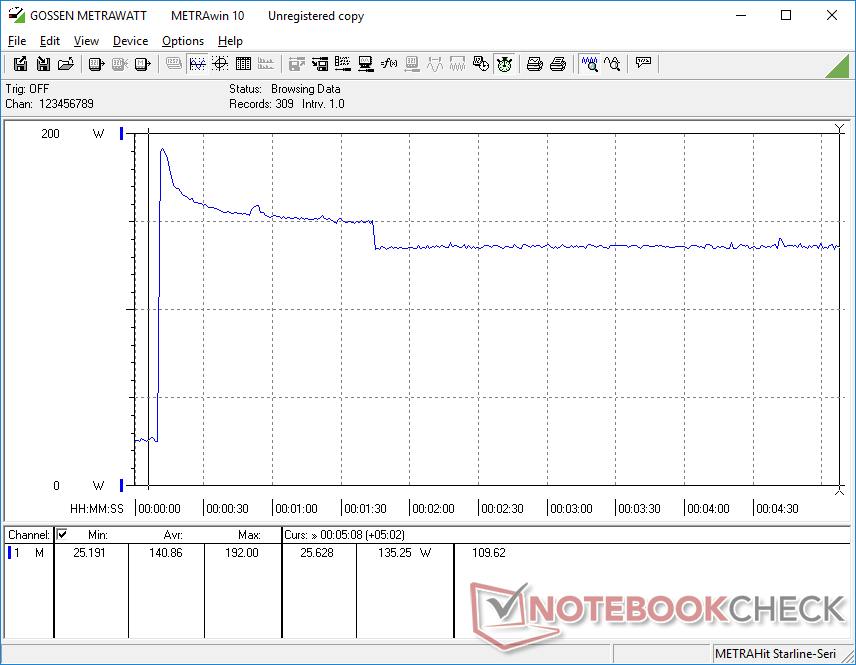
Siamo in grado di misurare un consumo massimo di 201,8 W dall'alimentatore da 180 W di piccole e medie dimensioni (~15 x 7,5 x 2,3 cm). Il consumo rimane relativamente stabile a circa 180 W quando è sottoposto a stress di elaborazione estreme, come mostra il nostro grafico qui sotto, il che significa che la velocità di ricarica rallenta se si utilizzano carichi così elevati.
| Off / Standby | |
| Idle | |
| Sotto carico |
|
Leggenda:
min: | |
| Dell Precision 7550 W-10885M, Quadro RTX 5000 Max-Q, SK Hynix PC601A NVMe 1TB, IPS, 3840x2160, 15.6" | Dell Precision 7540 i9-9980HK, Quadro RTX 3000 (Laptop), SK hynix PC400 512 GB, , 3840x2160, 15.6" | Dell Precision 5550 P91F i7-10875H, Quadro T2000 Max-Q, SK Hynix PC601A NVMe 1TB, IPS, 3840x2400, 15.6" | Acer ConceptD 3 Pro CN315-71P-73W1 i7-9750H, Quadro T1000 (Laptop), WDC PC SN720 SDAPNTW-512G, IPS, 1920x1080, 15.6" | Lenovo ThinkPad P53-20QN000YGE i7-9850H, Quadro RTX 5000 Max-Q, Samsung PM981a MZVLB1T0HBLR, IPS, 1920x1080, 15.6" | HP ZBook Studio G5-4QH10EA i7-8750H, Quadro P1000, Samsung SSD PM981 MZVLB512HAJQ, IPS LED, 3840x2160, 15.6" | Acer ConceptD 9 Pro i9-9980HK, Quadro RTX 5000 (Laptop), WDC PC SN720 SDAQNTW-1T00, IPS, 3840x2160, 17.3" | |
|---|---|---|---|---|---|---|---|
| Power Consumption | 11% | 31% | 53% | 17% | 38% | -42% | |
| Idle Minimum * (Watt) | 8.2 | 8.4 -2% | 5.6 32% | 2.9 65% | 7.9 4% | 6.8 17% | 18.8 -129% |
| Idle Average * (Watt) | 16.8 | 15.4 8% | 11.2 33% | 5.5 67% | 11.8 30% | 11.3 33% | 25 -49% |
| Idle Maximum * (Watt) | 24.4 | 17.4 29% | 18.4 25% | 10.6 57% | 14.9 39% | 14.3 41% | 30 -23% |
| Load Average * (Watt) | 131 | 126 4% | 114 13% | 86 34% | 96 27% | 78 40% | 116 11% |
| Witcher 3 ultra * (Watt) | 156.6 | 143 9% | 76.7 51% | 83 47% | 149 5% | 64 59% | 221 -41% |
| Load Maximum * (Watt) | 201.8 | 170 16% | 134.2 33% | 100.7 50% | 207.8 -3% | 126 38% | 241 -19% |
* ... Meglio usare valori piccoli
Autonomia della batteria
I tempi di autonomia della grande batteria da 95 Wh sono rispettabili con quasi 9 ore di utilizzo della WLAN nel mondo reale. L'inghippo è che gli utenti devono funzionare con la GPU Intel integrata, altrimenti la durata della batteria precipiterà. Sono disponibili SKU con batterie più piccole da 68 Wh.
La ricarica da vuota a piena capacità richiede circa 2 ore. Il sistema può anche essere ricaricato tramite USB-C.
| Dell Precision 7550 W-10885M, Quadro RTX 5000 Max-Q, 95 Wh | Dell Precision 7540 i9-9980HK, Quadro RTX 3000 (Laptop), Wh | Dell Precision 5550 P91F i7-10875H, Quadro T2000 Max-Q, 86 Wh | Acer ConceptD 3 Pro CN315-71P-73W1 i7-9750H, Quadro T1000 (Laptop), 58.7 Wh | Lenovo ThinkPad P53-20QN000YGE i7-9850H, Quadro RTX 5000 Max-Q, 90 Wh | HP ZBook Studio G5-4QH10EA i7-8750H, Quadro P1000, 97 Wh | |
|---|---|---|---|---|---|---|
| Autonomia della batteria | -19% | 48% | -9% | 63% | 62% | |
| Reader / Idle (h) | 11.1 | 22.6 104% | 17.3 56% | |||
| WiFi v1.3 (h) | 8.9 | 7.2 -19% | 9 1% | 8.1 -9% | 11.1 25% | 9.7 9% |
| Load (h) | 1 | 1.4 40% | 2 100% | 2.2 120% |
Pro
Contro
Giudizio Complessivo
A differenza di molte workstations più recenti di questi tempi, il Precision 7550 non teme di essere grande e ingombrante per poter trasportare caratteristiche e hardware maggiori di quelle che gli utenti più esigenti si aspettano da una workstation. Semplicemente non troverete utili opzioni ausiliarie come WAN, lettore di Smart Card, 4x slot SODIMM, pulsanti del mouse dedicati, tasti NumPad full-size, o tripli alloggiamenti M.2 su workstation ultrasottili come Precision 5550, MSI WS66, Razer Blade 15 Studio, o Asus StudioBook Pro 15. Per alcuni utenti, questi extra potrebbero valere il guadagno in termini di dimensioni.
Il principale svantaggio del sistema è che utilizza le GPU Quadro Max-Q al posto delle varianti non-Max-Q full-power, nonostante lo spessore del profilo del telaio e il peso elevato. Sistemi concorrenti come Acer ConceptD 9 Pro dimostrano che il sistema full-power RTX Quadro 5000 può offrire almeno il 30% di prestazioni in più rispetto alla Quadro RTX 5000 Max-Q nel nostro Dell. Sospettiamo che qui non ci sia l'opzione Quadro RTX 5000 a piena potenza perché l'alimentatore da 180 W sarebbe un fattore limitante. Quindi, le prestazioni grafiche sono più o meno le stesse del già citato MSI WS66, Razer Blade 15 Studio, o Asus che sono tutti molto più compatti del Precision 7550.
Il Precision 7550 è una workstation attraente se si apprezzano le sue caratteristiche hardware opzionali e l'espandibilità. In caso contrario, è possibile ottenere essenzialmente le stesse prestazioni grezze dalle più recenti workstation Nvidia Studio, che sono più piccole e leggere.
Dell Precision 7550
- 08/28/2020 v7 (old)
Allen Ngo
Price comparison
