Recensione del convertibile LG Gram 14T90P: Lo sfidante di Lenovo Yoga e HP Spectre
Il modello 16:10 LG Gram 14T90P succede alla vecchia generazione 16:9 Gram 14T90N introducendo opzioni di processori Intel 11th gen più veloci e un nuovo design dello chassis per essere un vero e proprio aggiornamento della serie. Come tutti gli altri modelli Gram, anche il Gram 14T90P mira a massimizzare la qualità del display e a ridurre al minimo il peso per essere uno dei portatili Core serie U più leggeri della sua categoria.
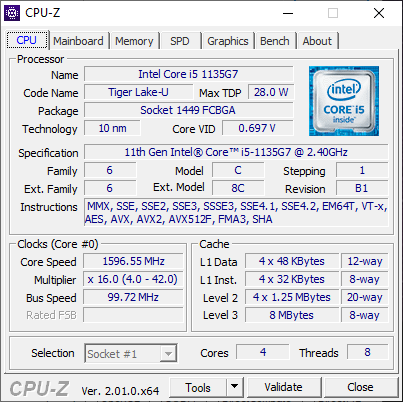
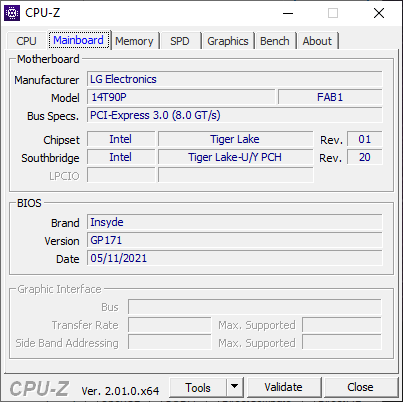
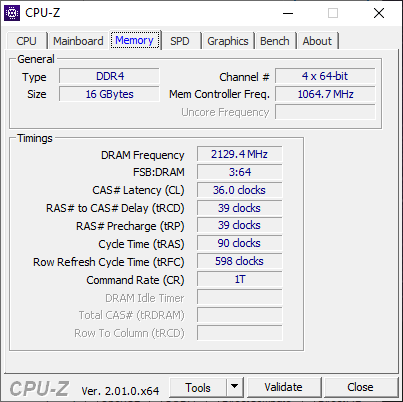
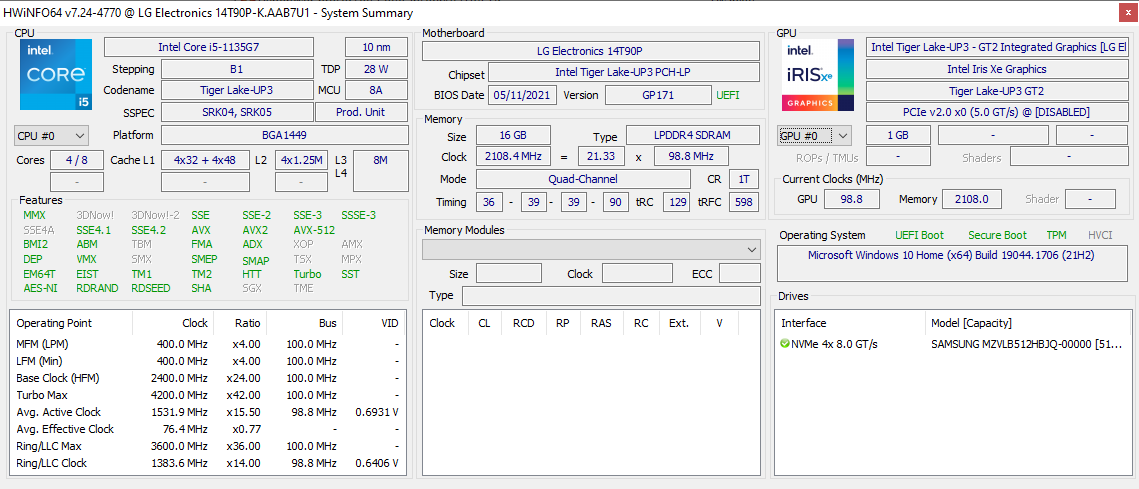
La nostra unità in prova è stata configurata con CPU Core i5-1135G7, 16 GB di RAM saldata, 512 GB di SSD NVMe e uno schermo touchscreen IPS da 14 pollici a 1200p per un prezzo al dettaglio compreso tra 1000 e 1100 dollari. Altre SKU sono disponibili con il Core i7-1165G7, ma tutte sono dotate dello stesso pannello da 1200p.
Tra i concorrenti diretti in questo spazio ci sono altri subnotebook convertibili di fascia alta come l' Asus Zenbook Flip 14, HP Spectre x360 14, Dell XPS 13 2-in-1, MSI Summit E13 Flip, o Lenovo Yoga 9 14.
Altre recensioni LG:
Potenziali concorrenti a confronto
r_totale | Data | Modello | Peso | Altezza | Dimensione | Risoluzione | Prezzo |
|---|---|---|---|---|---|---|---|
v7 (old) | 05/2022 | LG Gram 14T90P i5-1135G7, Iris Xe G7 80EUs | 1.2 kg | 17 mm | 14.00" | 1900x1200 | |
v7 (old) | 10/2021 | Dell XPS 13 9310 2-in-1 i7-1165G7, Iris Xe G7 96EUs | 1.3 kg | 14.35 mm | 13.40" | 1920x1200 | |
v7 (old) | 05/2022 | Lenovo Yoga 9 14IAP7 82LU0001US i7-1260P, Iris Xe G7 96EUs | 1.4 kg | 15.25 mm | 14.00" | 2880x1800 | |
v7 (old) | 05/2022 | Asus ZenBook Flip 14 UN5401QA-KN085W R7 5800H, Vega 8 | 1.4 kg | 15.9 mm | 14.00" | 2880x1800 | |
v7 (old) | 05/2021 | HP Spectre x360 14-ea0378ng i7-1165G7, Iris Xe G7 96EUs | 1.3 kg | 16.9 mm | 13.50" | 3000x2000 | |
v7 (old) | 04/2021 | MSI Summit E13 Flip Evo A11MT i7-1185G7, Iris Xe G7 96EUs | 1.4 kg | 14.9 mm | 13.40" | 1920x1200 |
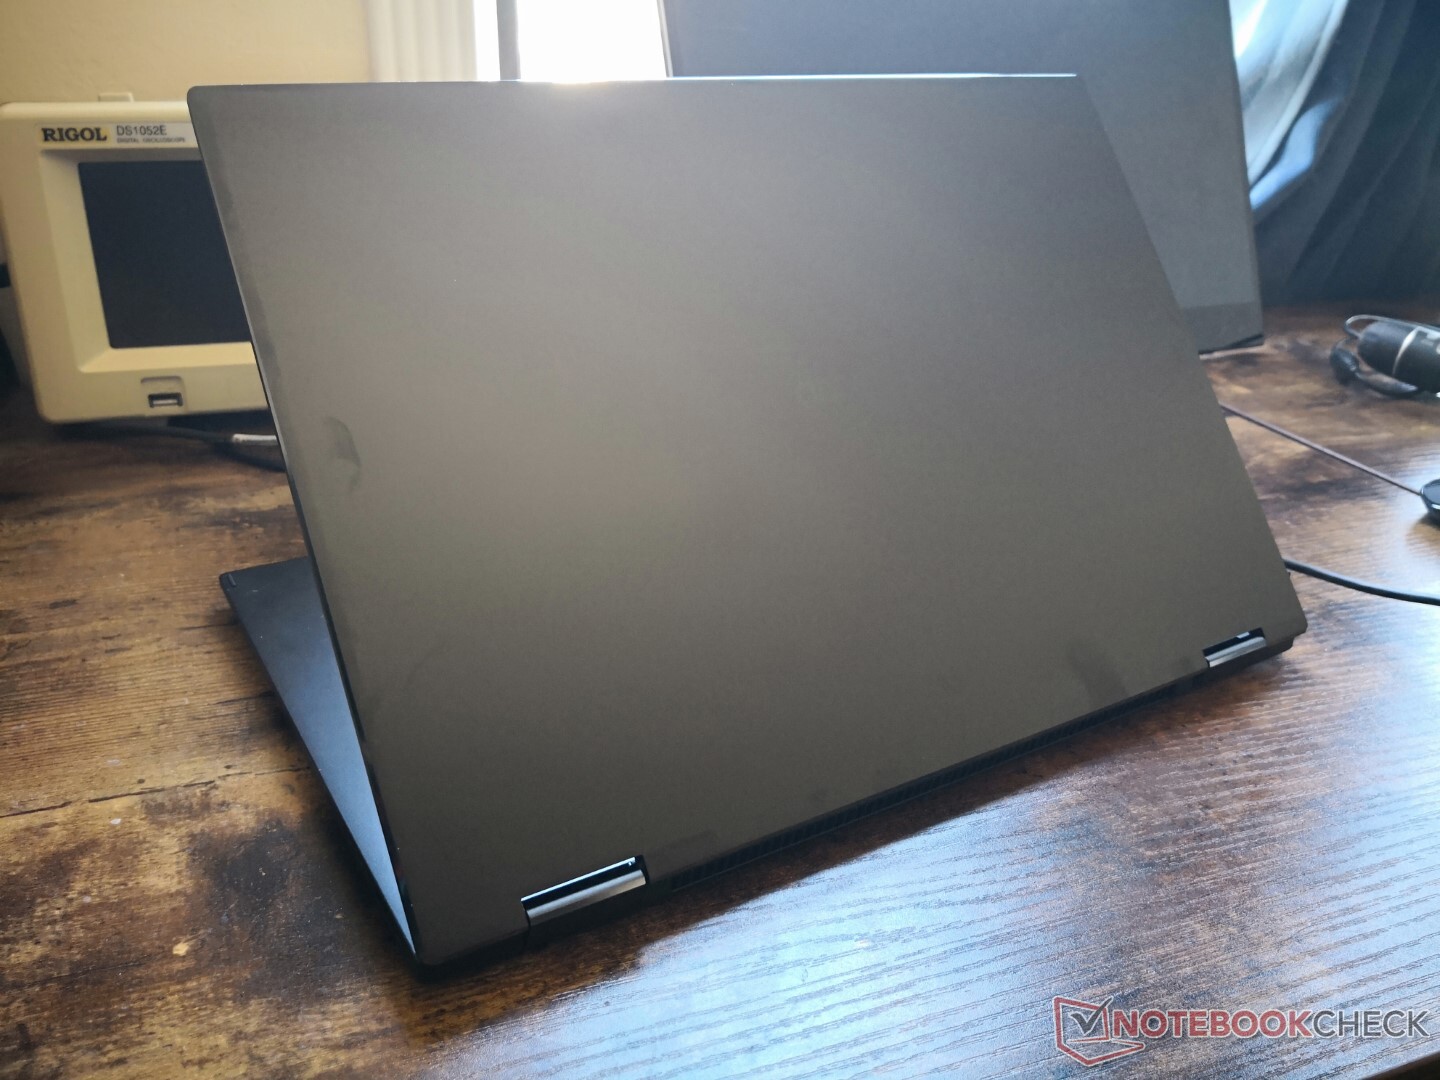
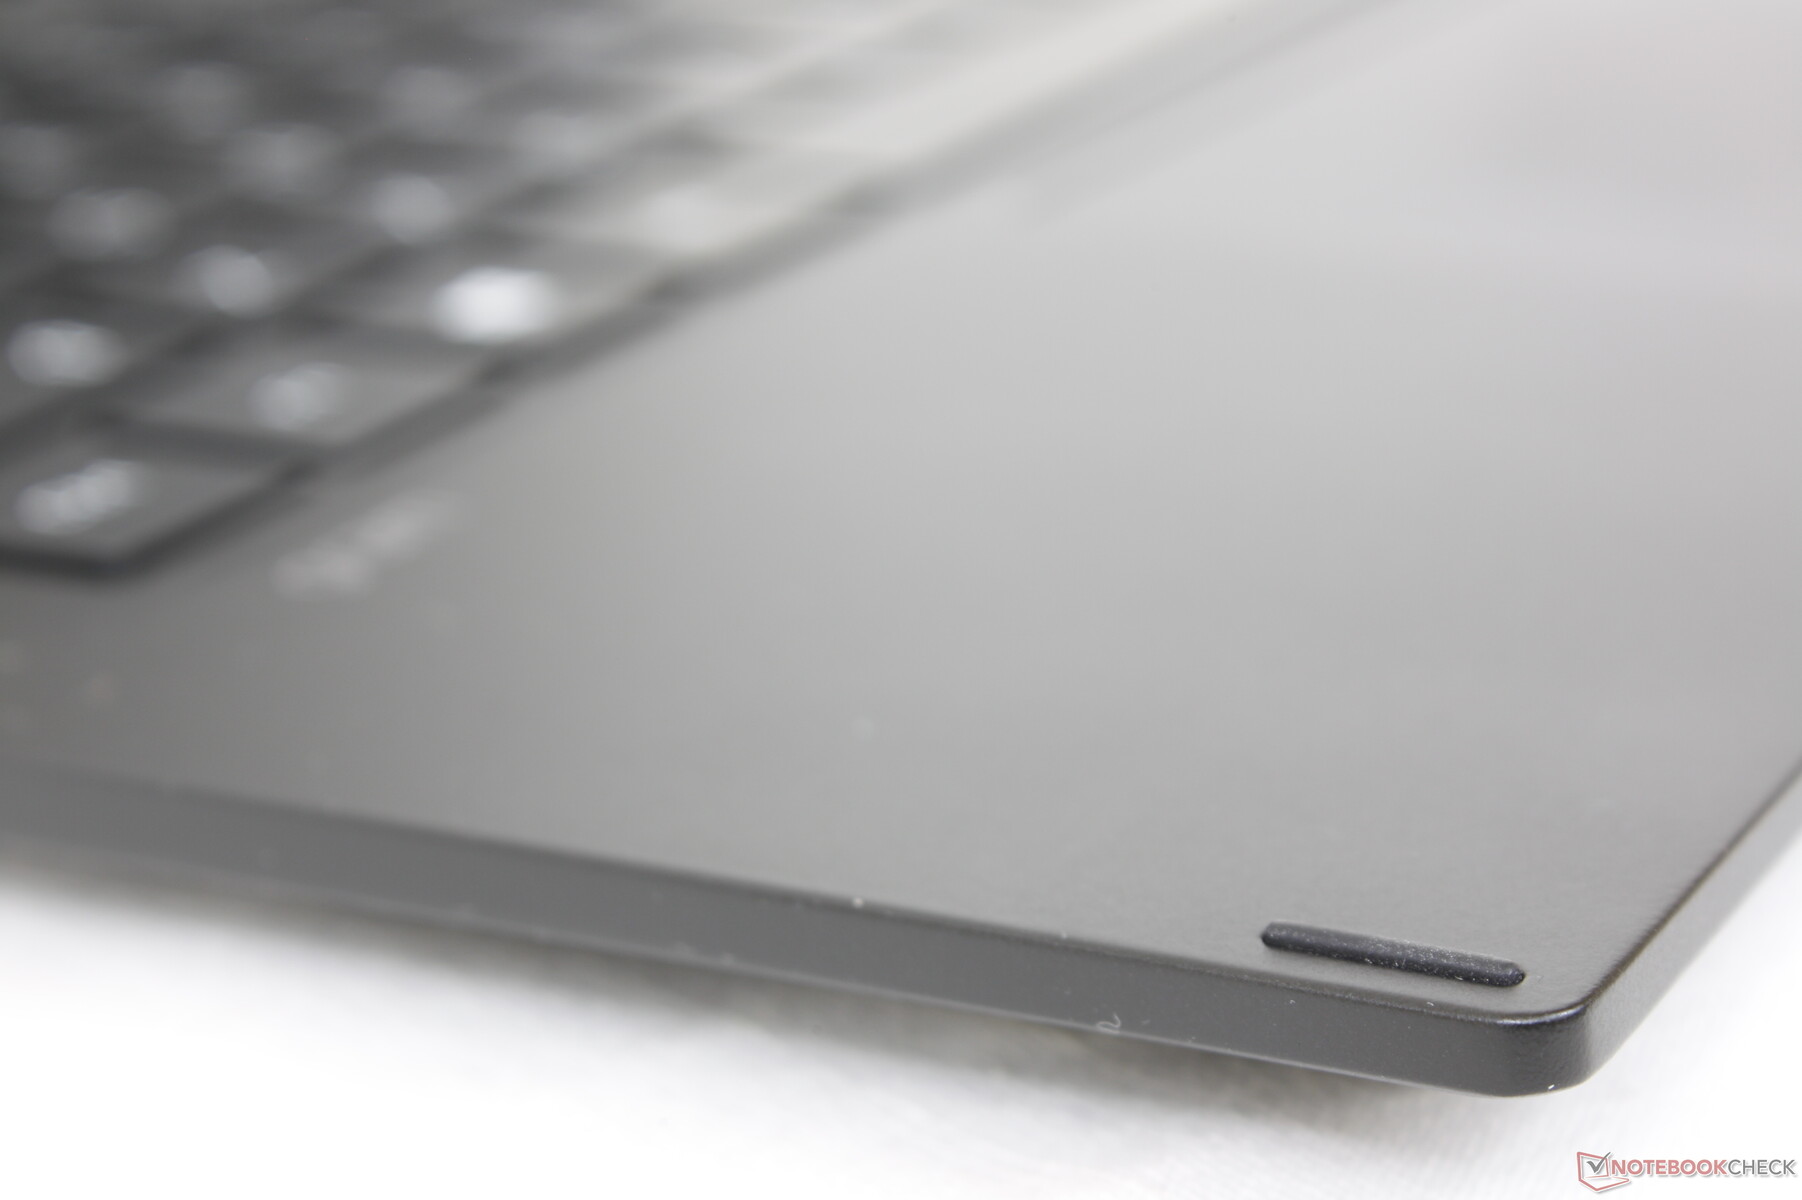
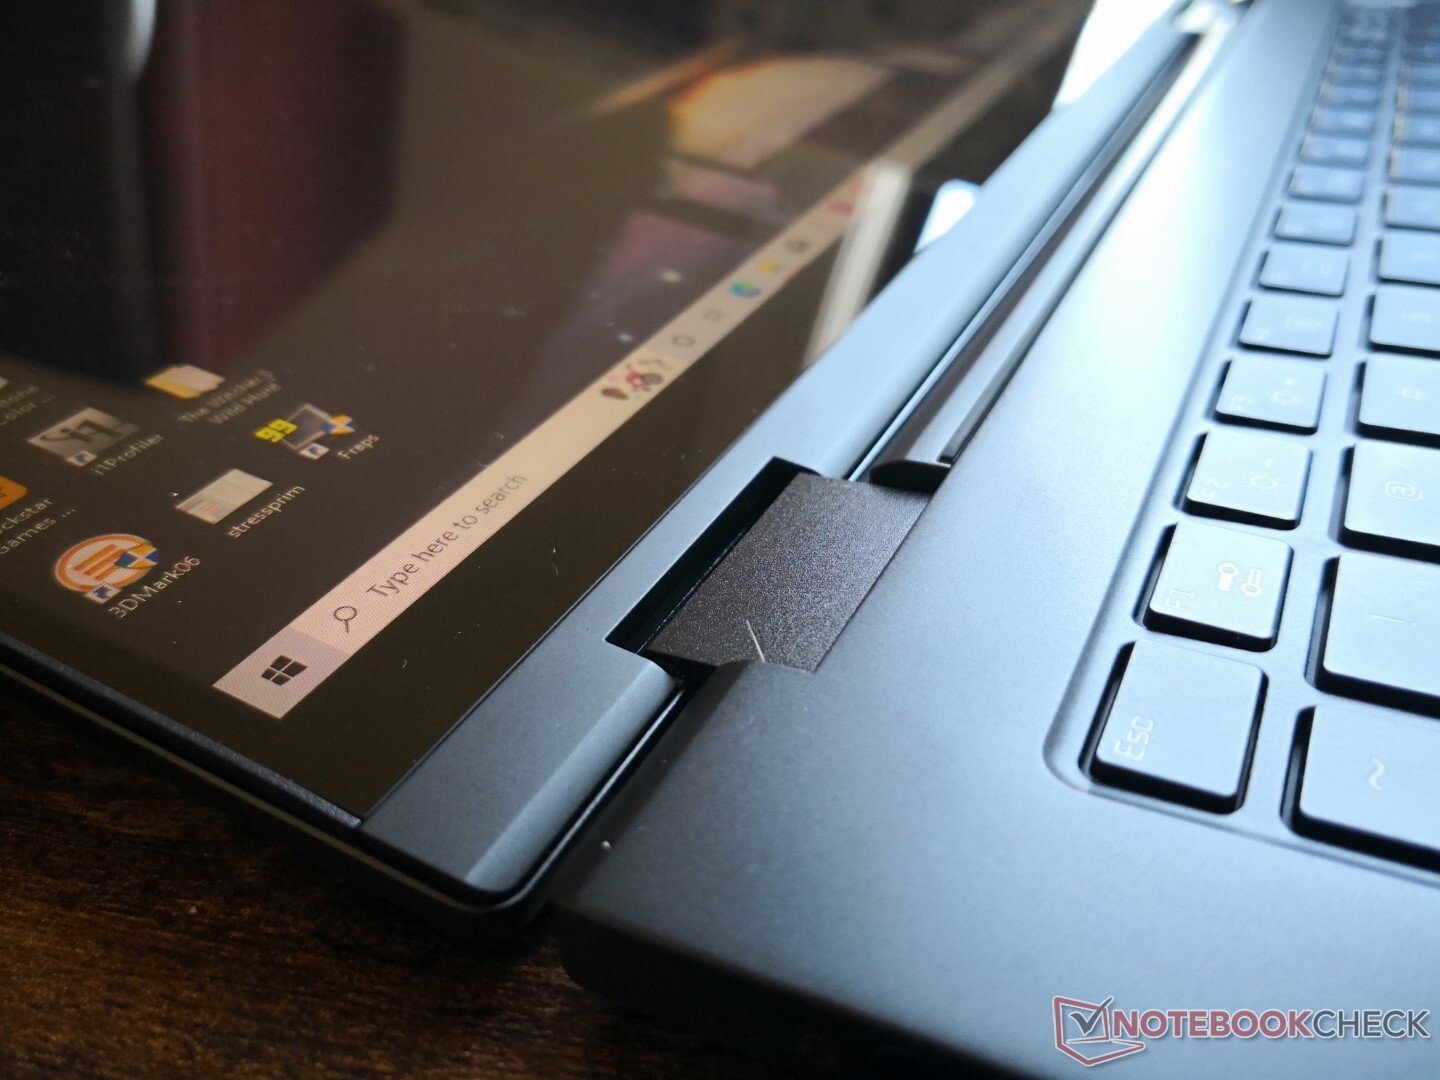
Caso - Aggiornamento significativo rispetto al design precedente
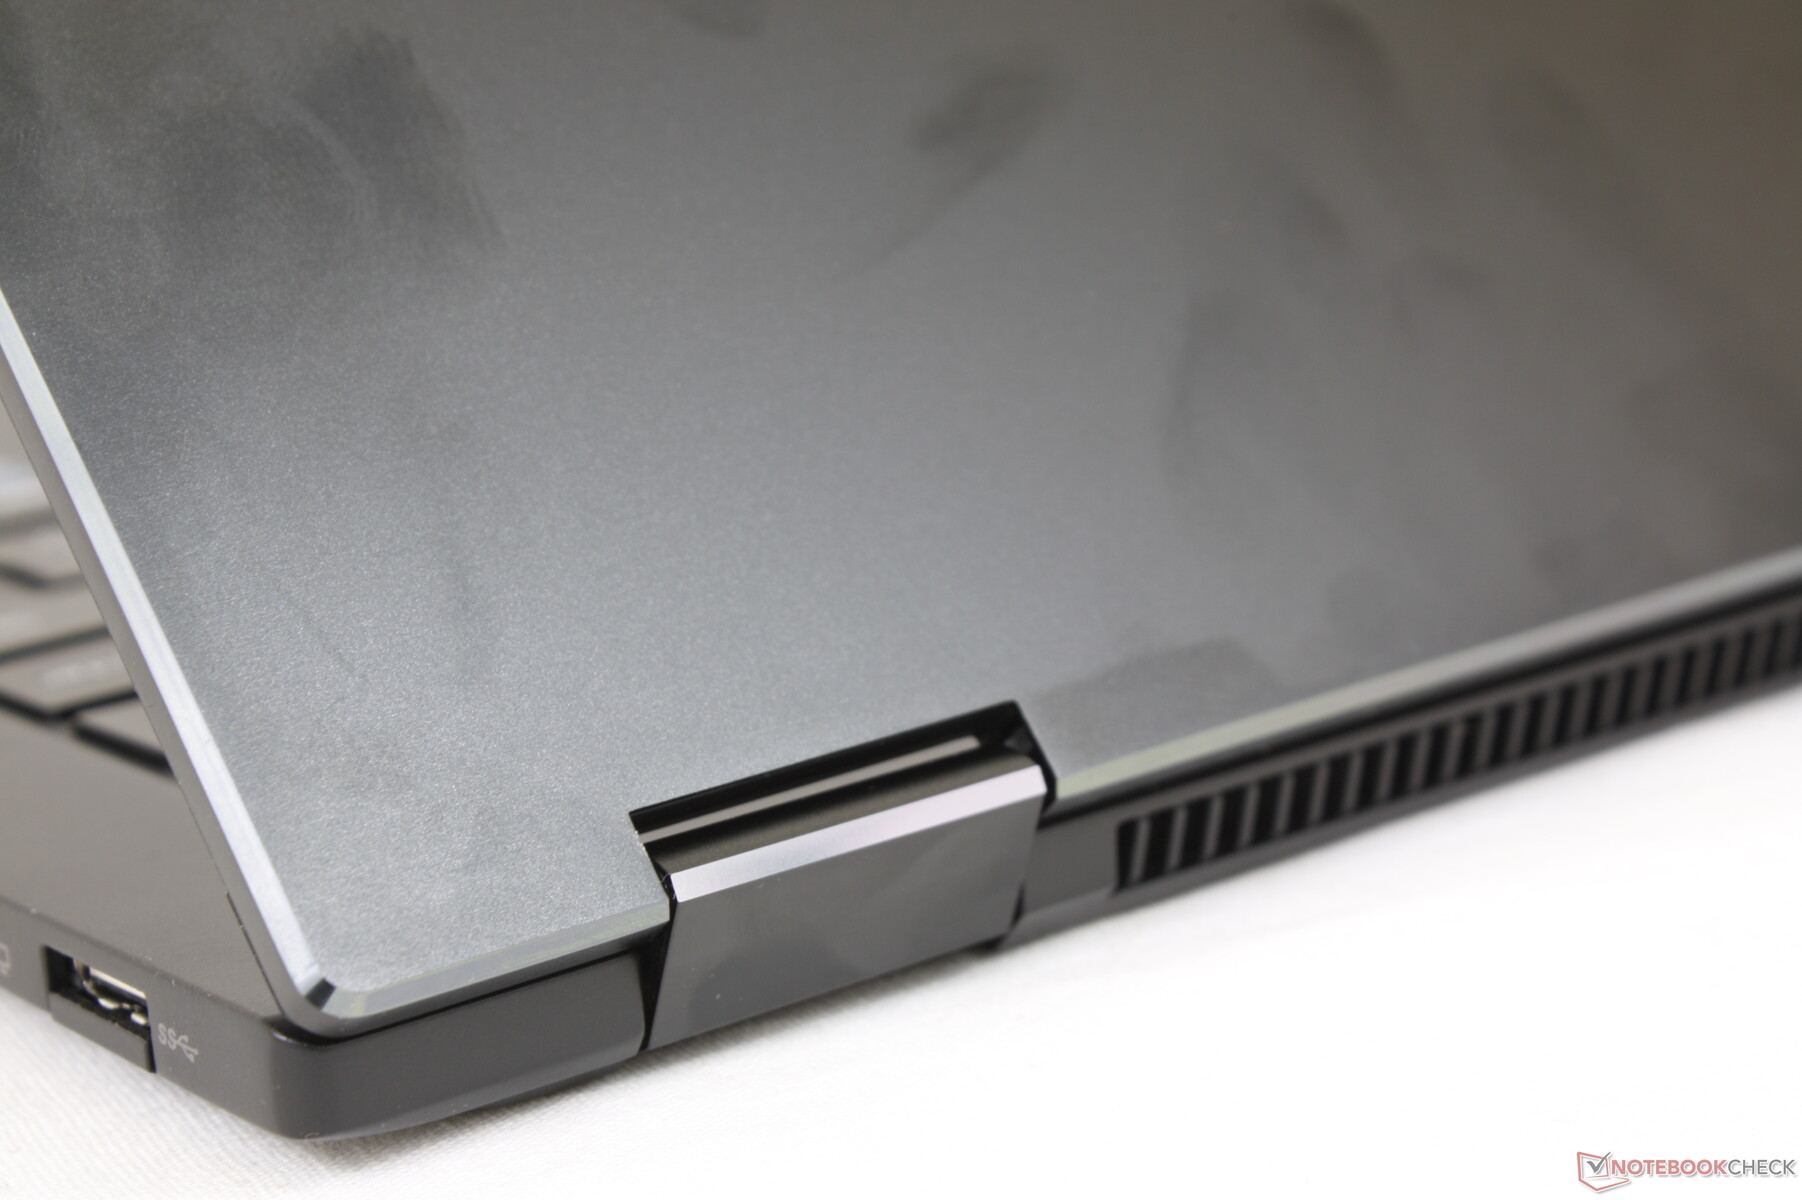
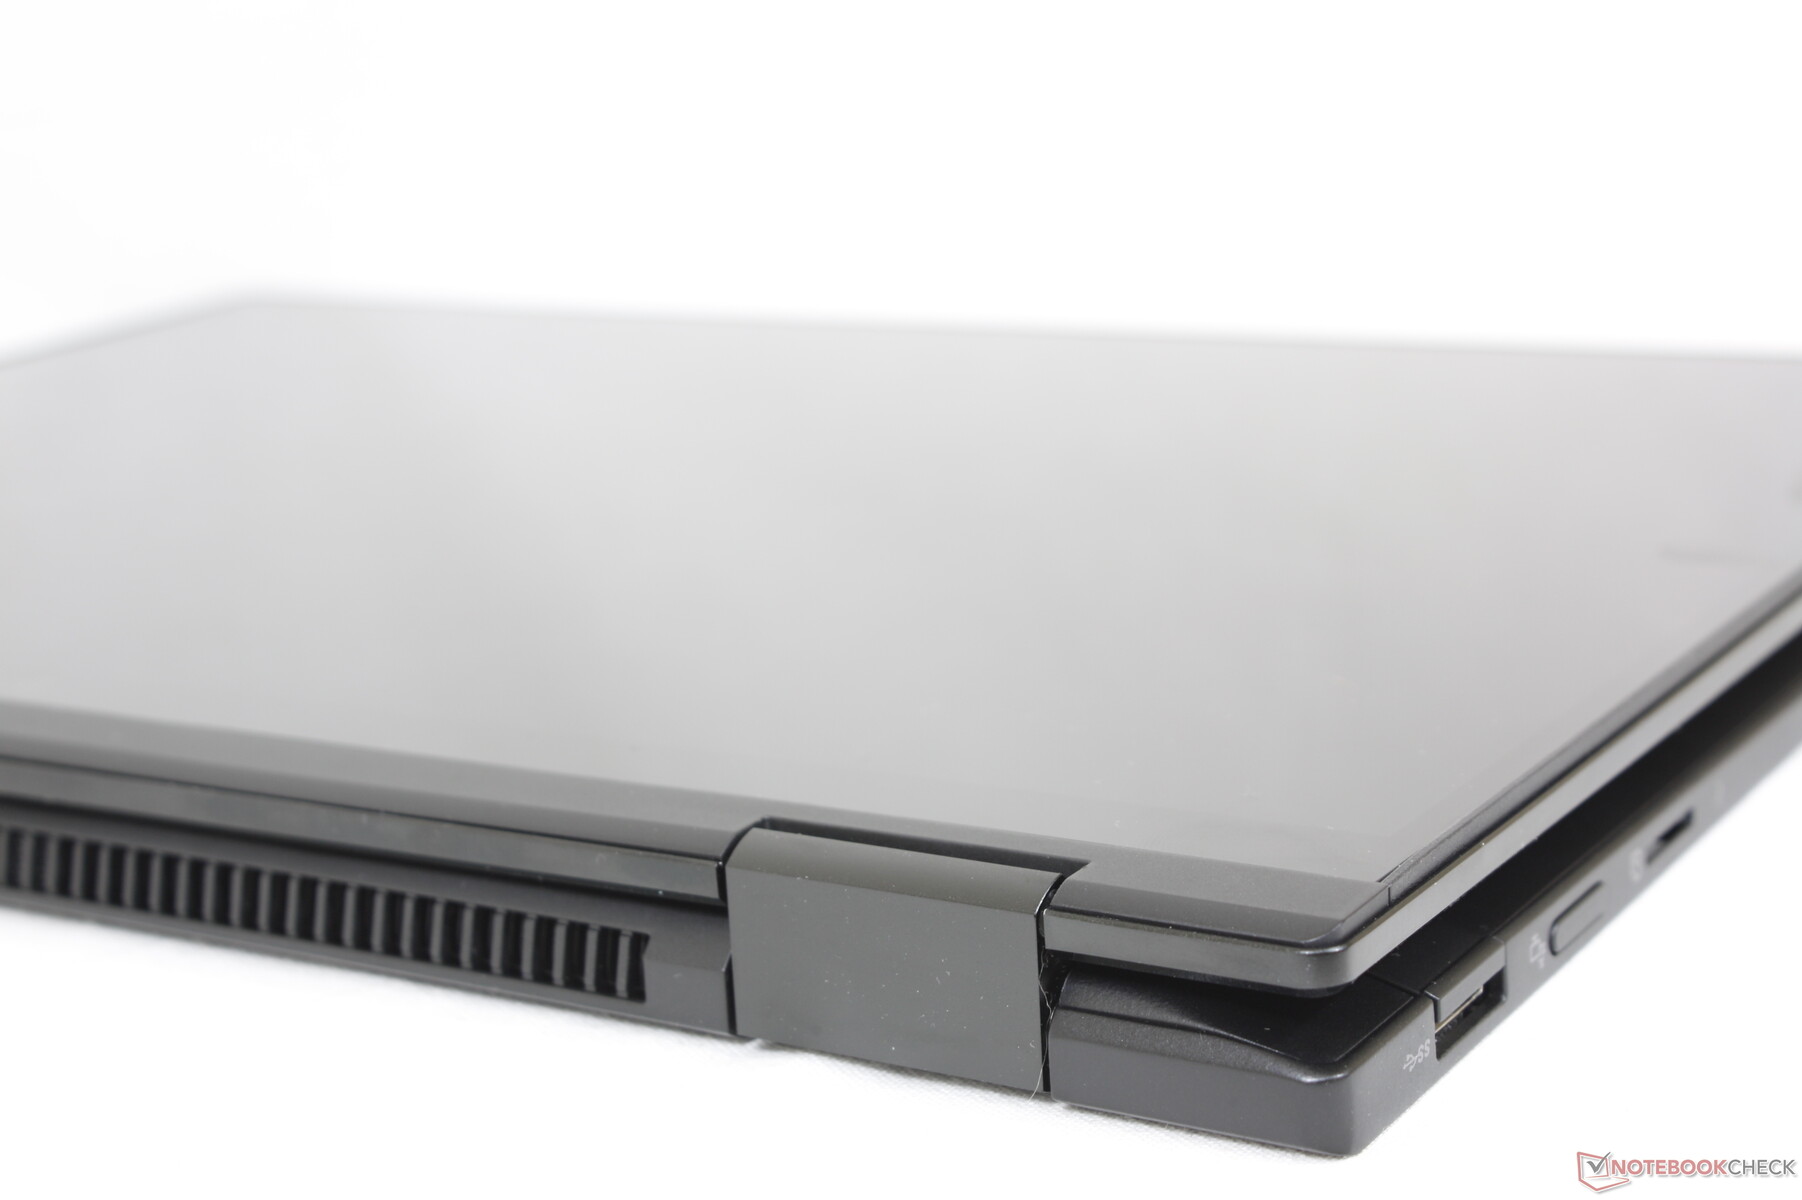
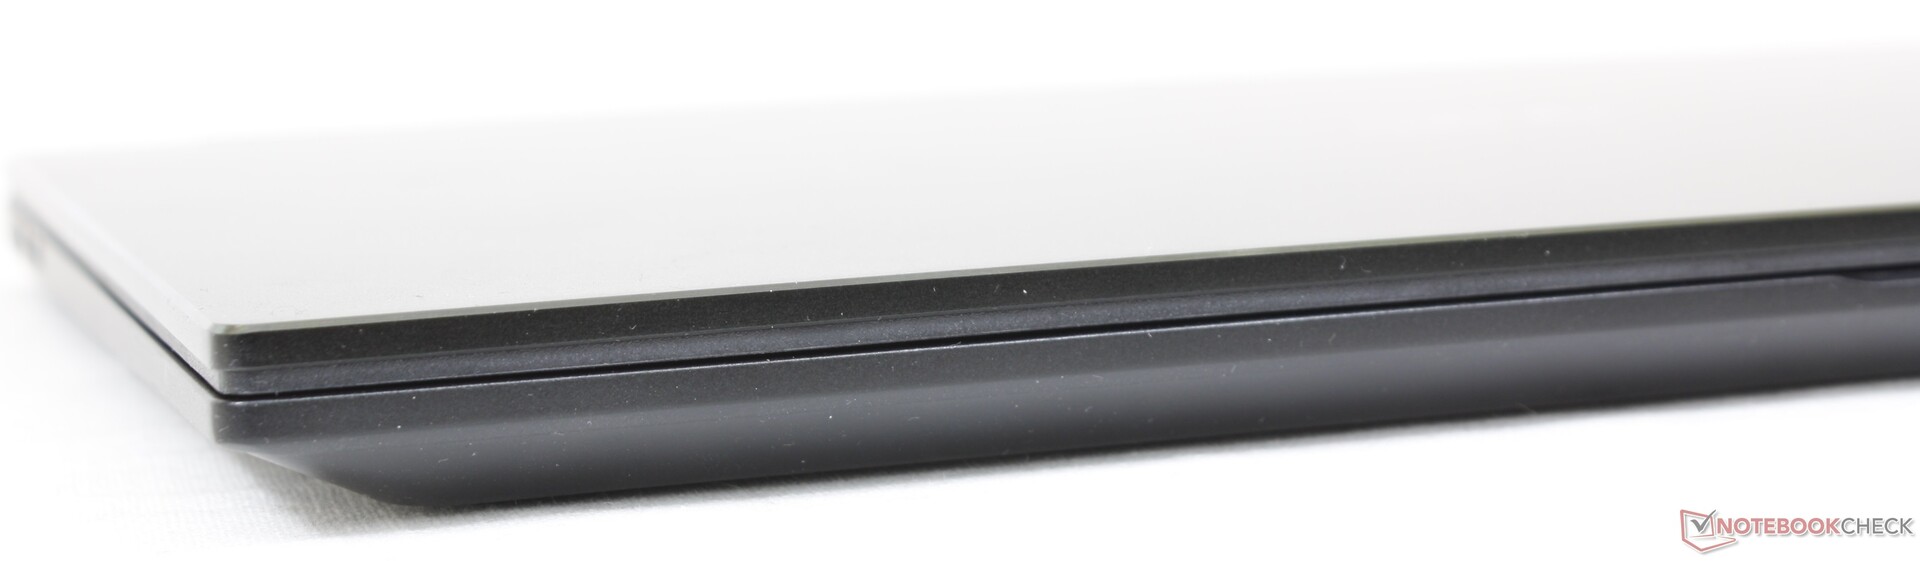
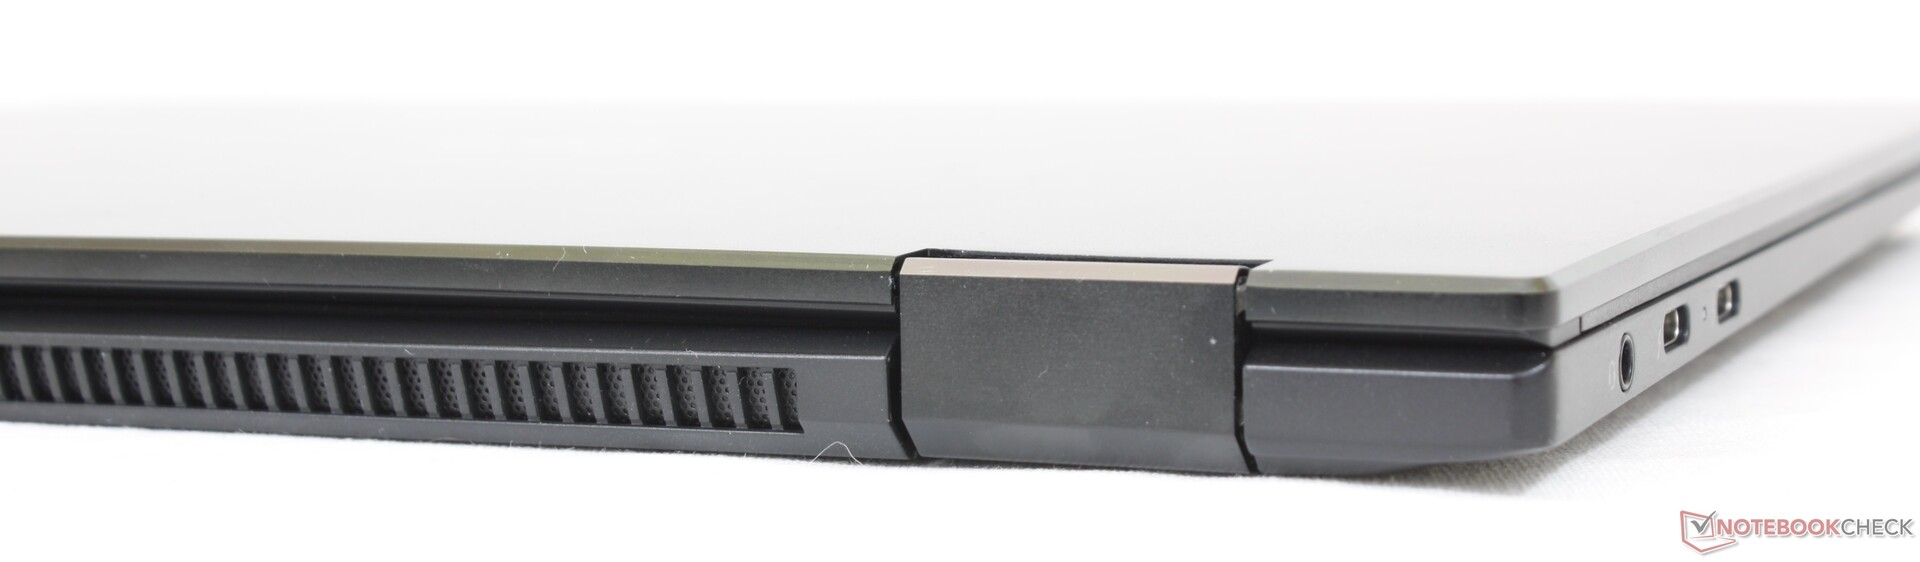
Il design del telaio è essenzialmente una versione miniaturizzata del recente 16 pollici Gram 16T90P. Forse non ha lo stesso impatto visivo delle serie Dell XPS, HP Spectre o Asus Zenbook, ma compensa con un peso inferiore e con la certificazione MIL-STD 810G. Anche la base e il coperchio sono più solidi rispetto al vecchio Gram 14T90N, con torsioni minime e assenza di scricchiolii, per essere meno soggetti a flessioni o danni rispetto alla serie Samsung Galaxy Book Pro serie 360.
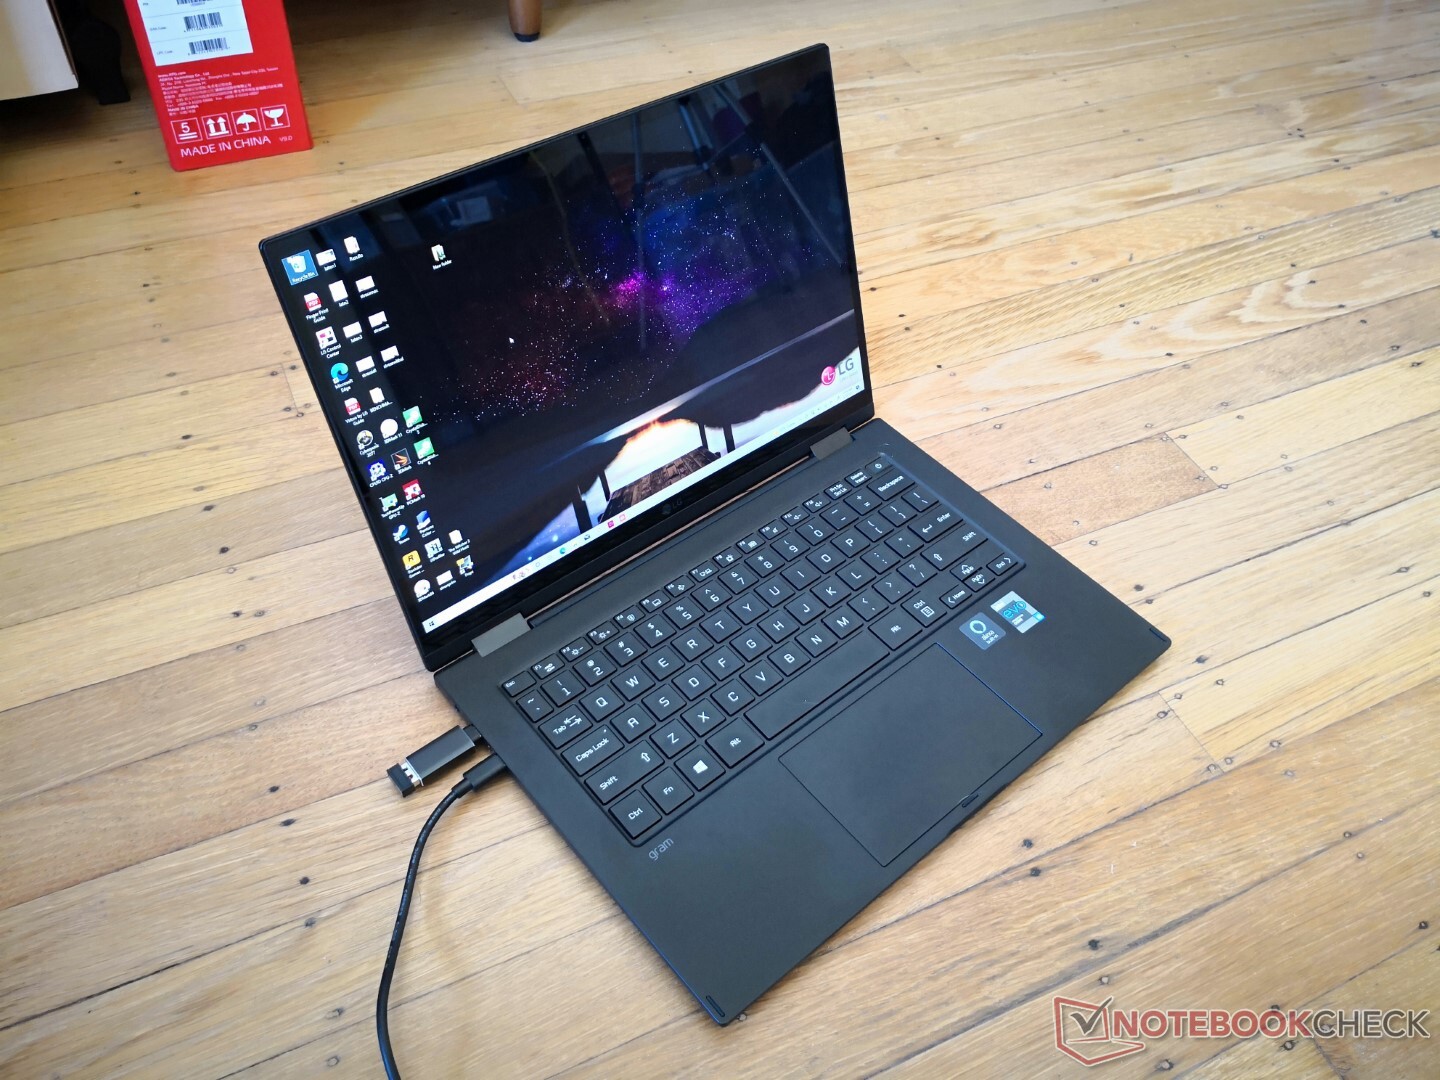
Le dimensioni sono leggermente diverse rispetto al precedente Gram 14T90N, ma il volume e il peso complessivo sono pressoché gli stessi. In questo modo, gli utenti ottengono un touchscreen 16:10 più grande senza dover ricorrere a uno chassis più grande o più pesante. Il sistema è più leggero di circa 100-200 g rispetto alla maggior parte dei convertibili concorrenti, il che si nota quando si maneggia o si viaggia.
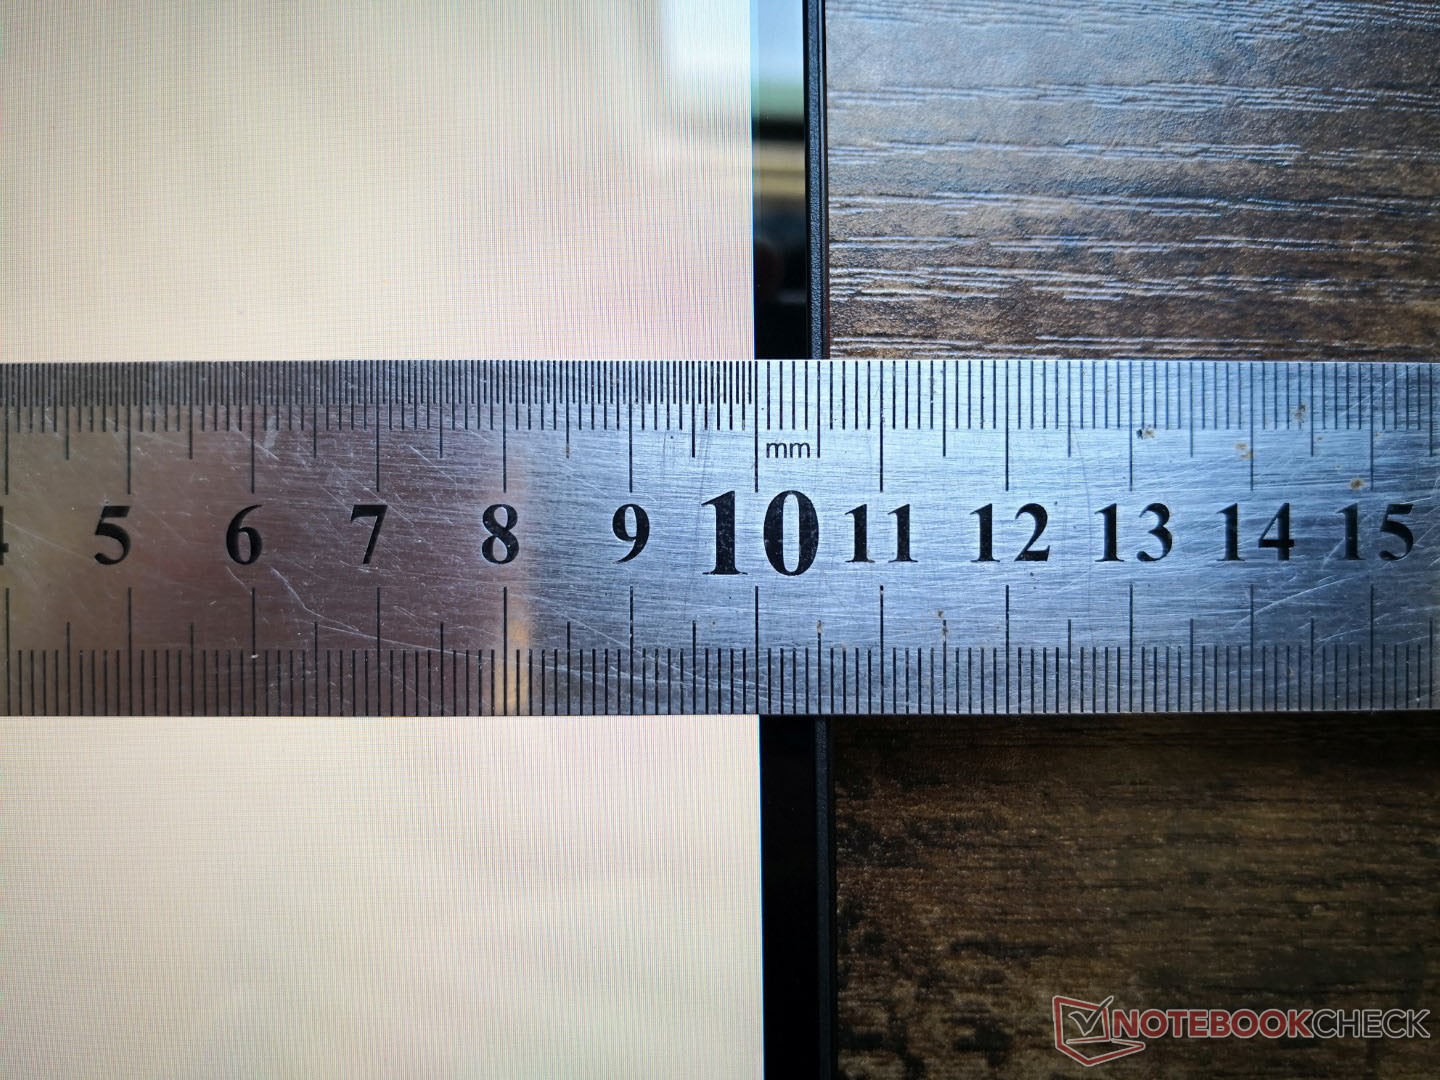
Confronto delle dimensioni
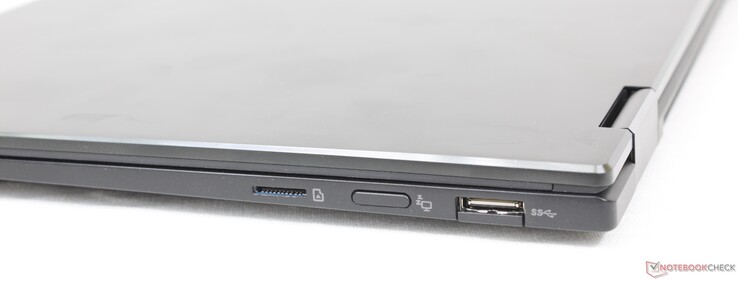
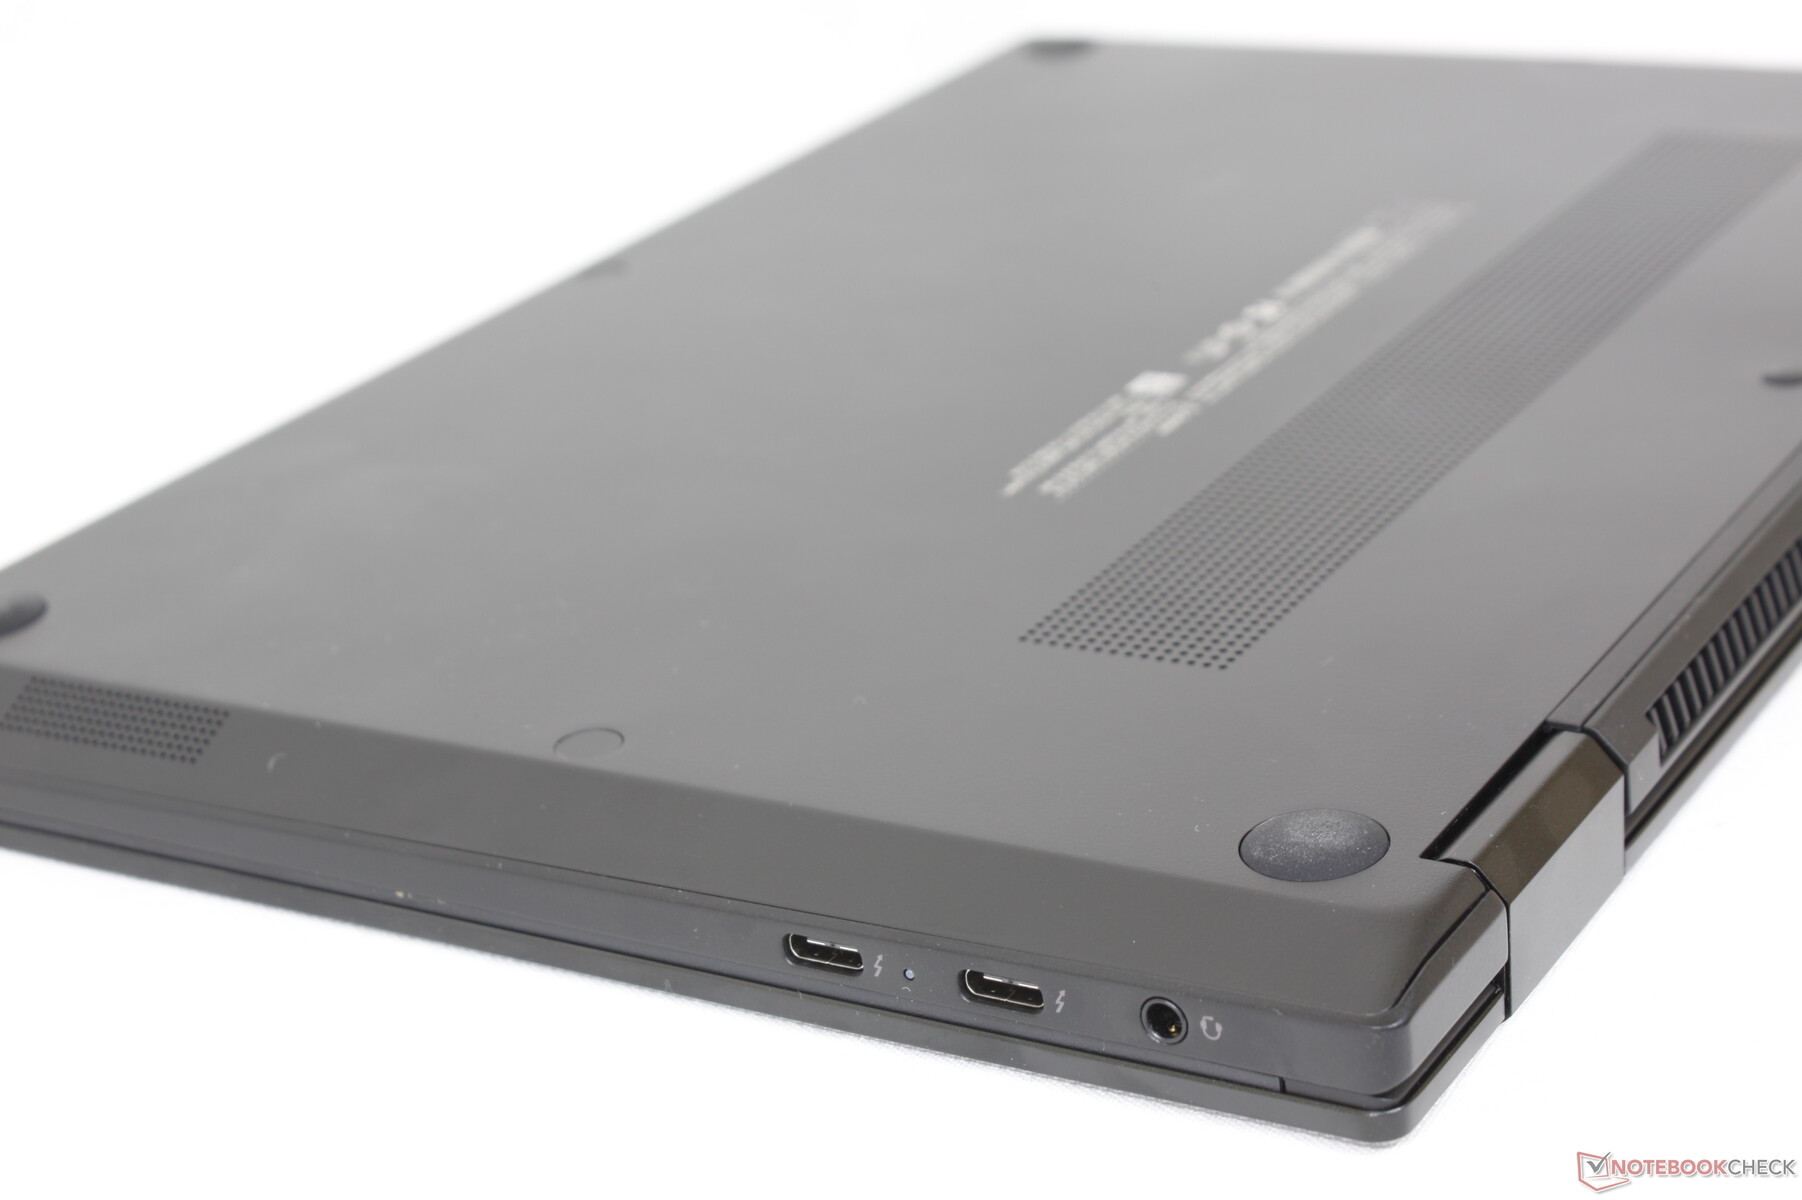
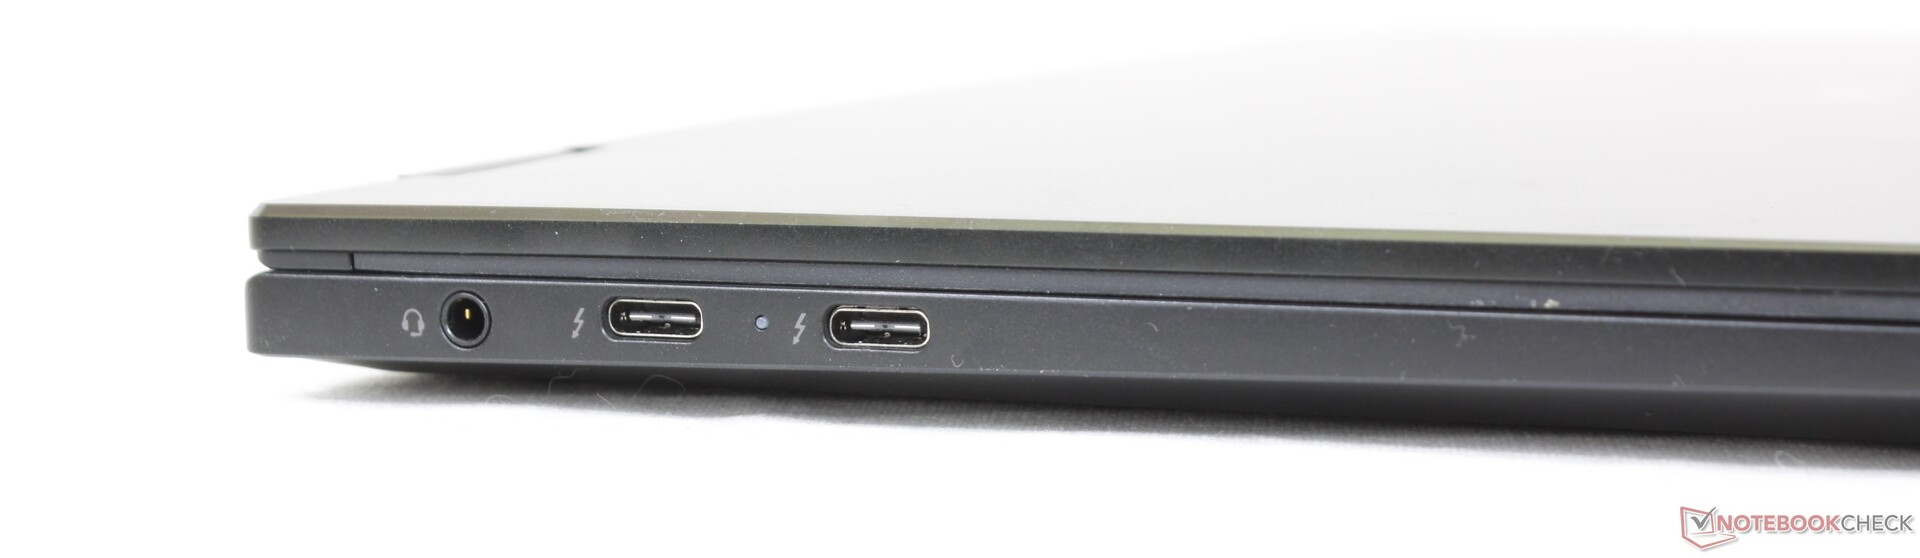
Connettività - 2x Thunderbolt 4
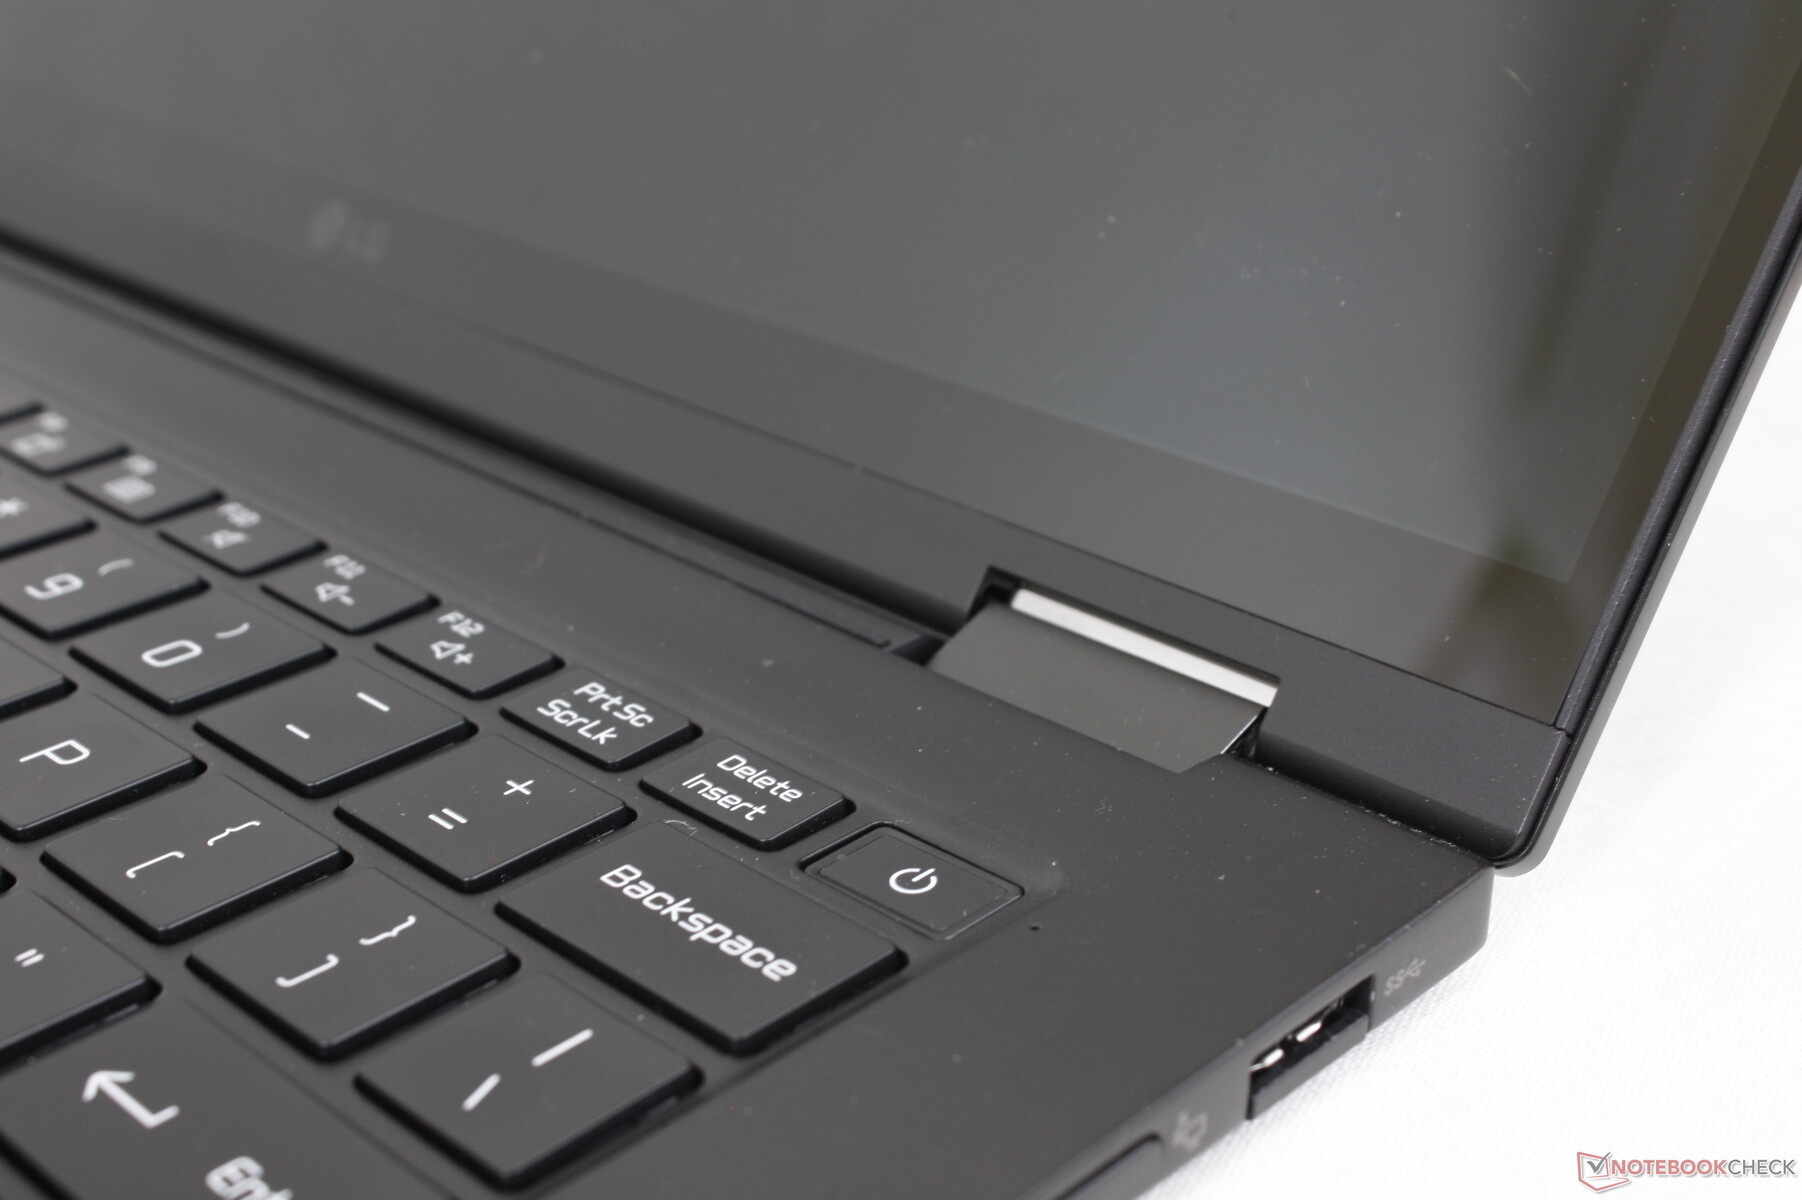
Le opzioni delle porte sono identiche a quelle del più grande Gram 16T90P. Il Gram 14T90P ha rinunciato alla porta HDMI e allo slot per il lucchetto Kensington presenti sul Gram 14Z90P o sul Gram 14T90N e offre meno opzioni rispetto al 14Z90P. Ad esempio, è presente una sola porta USB-A di dimensioni standard invece di due, il che significa che i possessori sono incoraggiati a utilizzare accessori USB-C o docking station.
Premendo il pulsante lungo il bordo destro si accende o spegne il display. Si tratta di una strana funzione che non vediamo su molti altri convertibili e che purtroppo non è personalizzabile dall'utente.
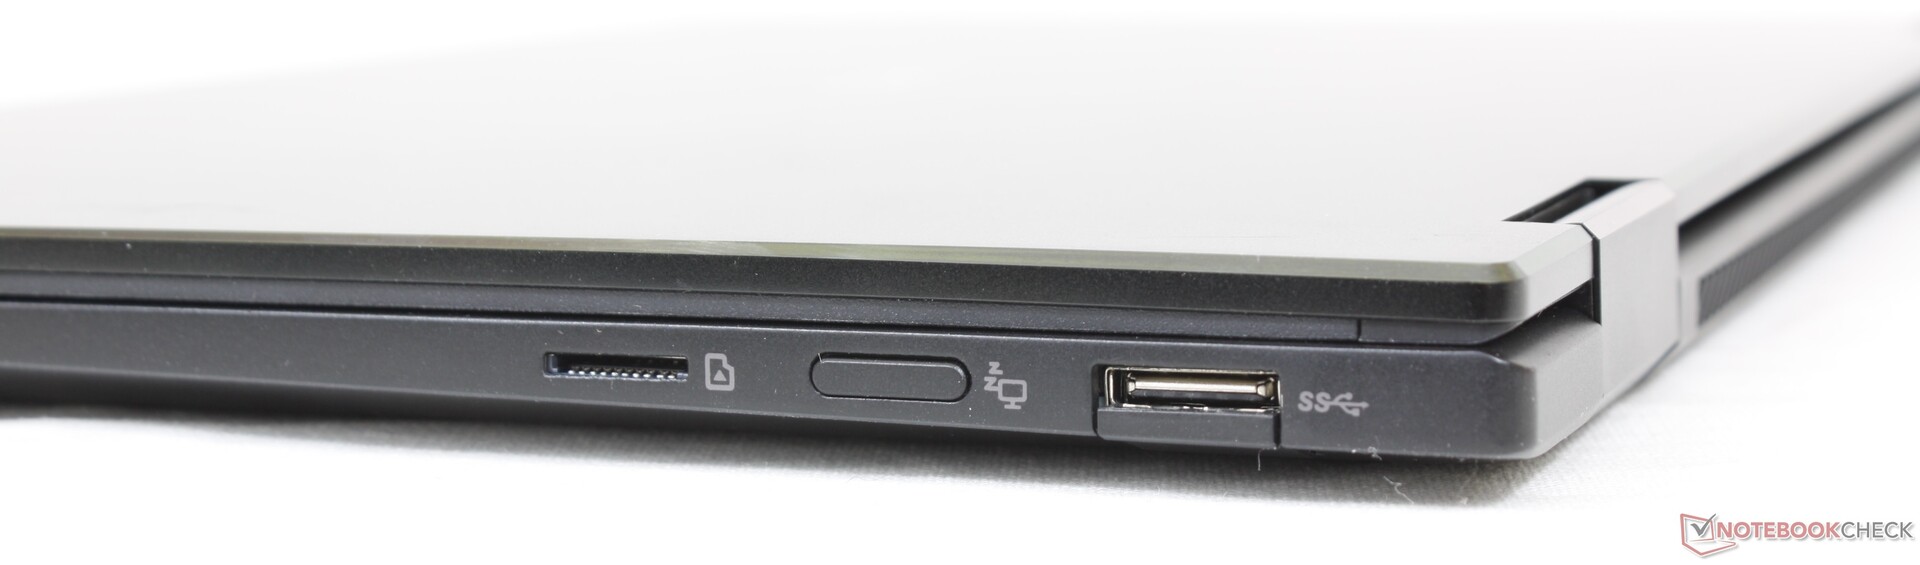
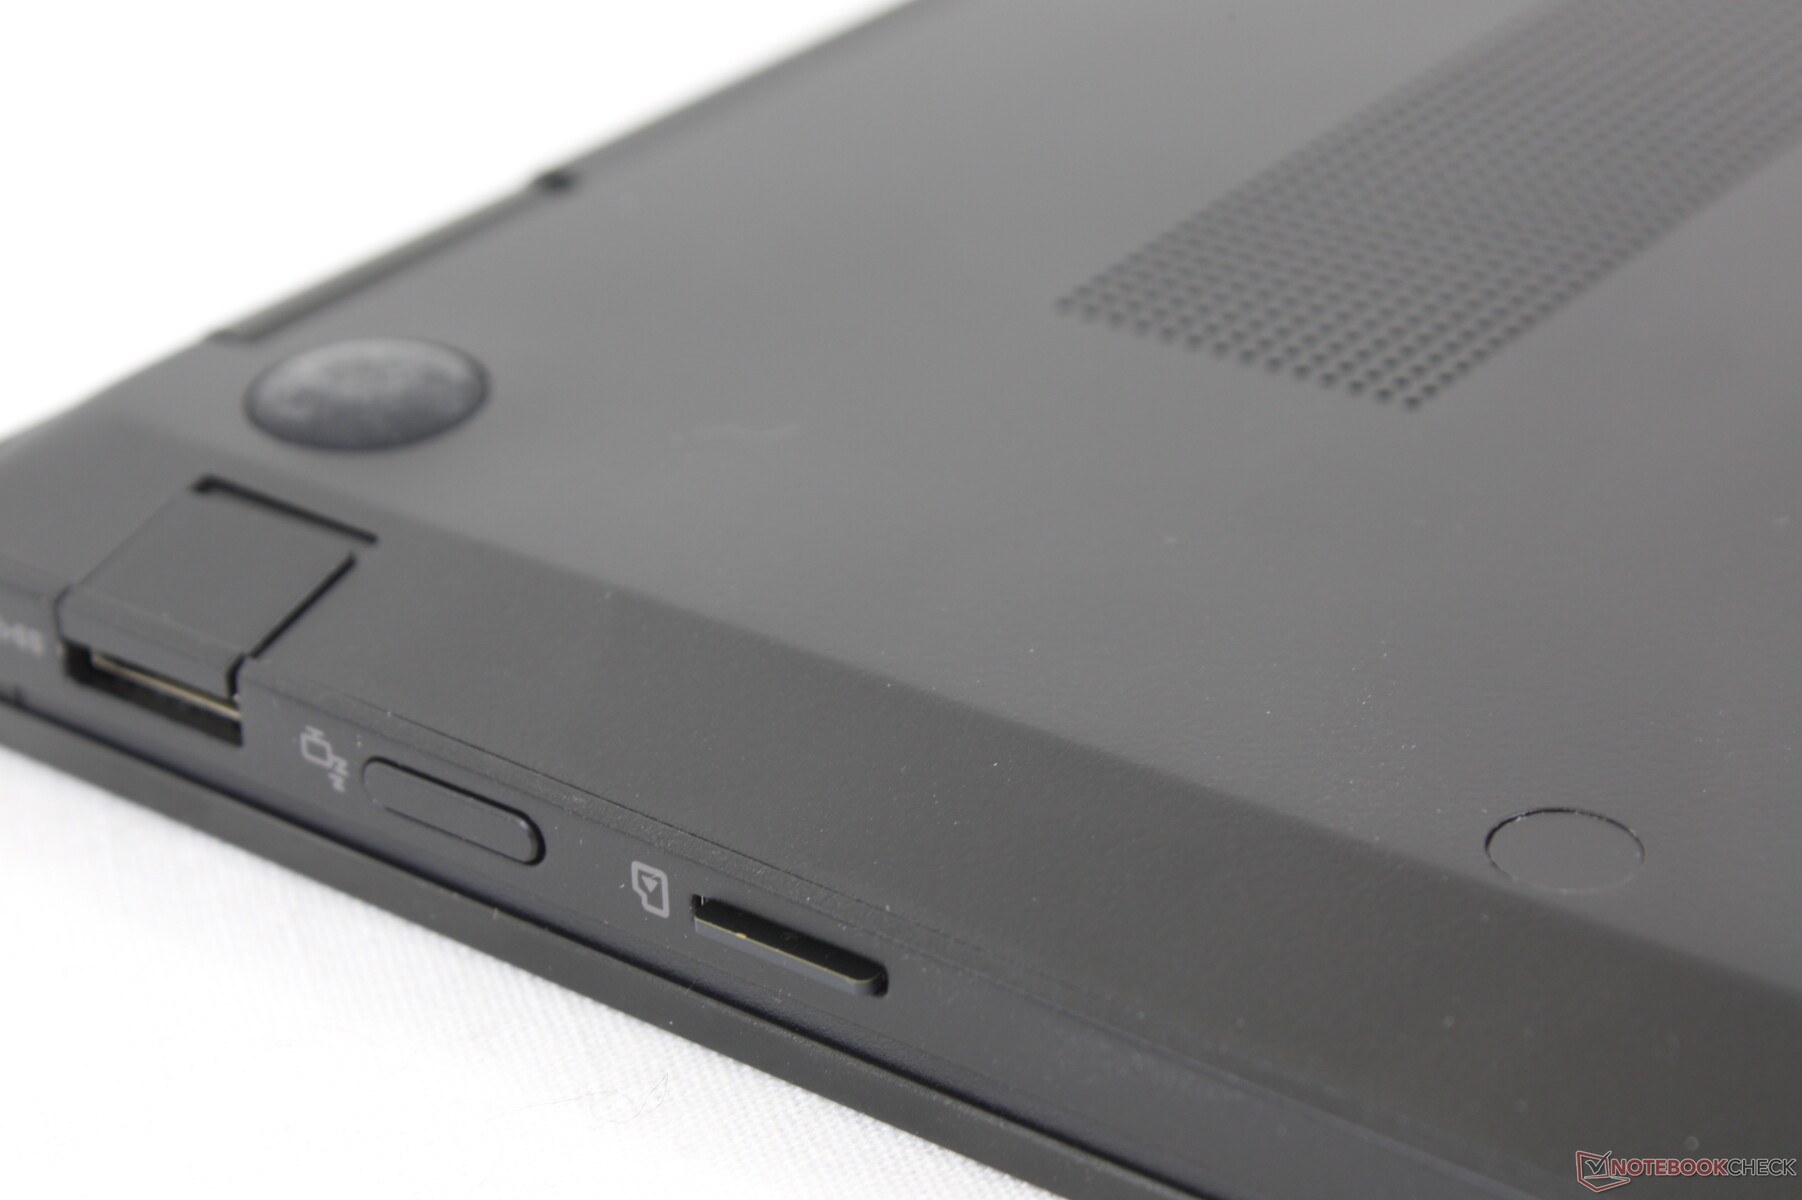
Lettore di schede SD
La velocità di trasferimento dal lettore di schede MicroSD a molla è nella media, circa 85 MB/s. Lo spostamento di 1 GB di immagini dalla nostra scheda UHS-II al desktop richiede circa 15 secondi, un tempo simile a tutti gli altri modelli Gram finora utilizzati.
| SD Card Reader | |
| average JPG Copy Test (av. of 3 runs) | |
| HP Spectre x360 14-ea0378ng (Toshiba Exceria Pro M501 microSDXC 64GB) | |
| Dell XPS 13 9310 2-in-1 (AV Pro V60) | |
| Asus ZenBook Flip 14 UN5401QA-KN085W (AV Pro SD microSD 128 GB V60) | |
| LG Gram 14T90N (Toshiba Exceria Pro M501 64 GB UHS-II) | |
| MSI Summit E13 Flip Evo A11MT (AV PRO microSD 128 GB V60) | |
| LG Gram 14T90P (AV Pro V60) | |
| maximum AS SSD Seq Read Test (1GB) | |
| HP Spectre x360 14-ea0378ng (Toshiba Exceria Pro M501 microSDXC 64GB) | |
| Dell XPS 13 9310 2-in-1 (AV Pro V60) | |
| Asus ZenBook Flip 14 UN5401QA-KN085W (AV Pro SD microSD 128 GB V60) | |
| LG Gram 14T90P (AV Pro V60) | |
| MSI Summit E13 Flip Evo A11MT (AV PRO microSD 128 GB V60) | |
| LG Gram 14T90N (Toshiba Exceria Pro M501 64 GB UHS-II) | |
Comunicazione
L'Intel AX201 è di serie per il supporto del Wi-Fi 6 e del Bluetooth 5.2. Non abbiamo riscontrato problemi di connettività quando è stato accoppiato al nostro Asus GT-AXE11000, a differenza di quanto abbiamo osservato sul recente Asus Zenbook Pro 15.
| Networking | |
| iperf3 transmit AX12 | |
| Asus ZenBook Flip 14 UN5401QA-KN085W | |
| Lenovo Yoga 9 14IAP7 82LU0001US | |
| Dell XPS 13 9310 2-in-1 | |
| HP Spectre x360 14-ea0378ng | |
| MSI Summit E13 Flip Evo A11MT | |
| LG Gram 14T90N | |
| iperf3 receive AX12 | |
| Asus ZenBook Flip 14 UN5401QA-KN085W | |
| Dell XPS 13 9310 2-in-1 | |
| Lenovo Yoga 9 14IAP7 82LU0001US | |
| MSI Summit E13 Flip Evo A11MT | |
| LG Gram 14T90N | |
| HP Spectre x360 14-ea0378ng | |
| iperf3 receive AXE11000 | |
| LG Gram 14T90P | |
| iperf3 transmit AXE11000 | |
| LG Gram 14T90P | |
Webcam
La fotocamera è solo a 720p e non supporta Windows Hello né l'otturatore per la privacy. Questo aspetto va sicuramente affrontato nei modelli futuri.


Manutenzione
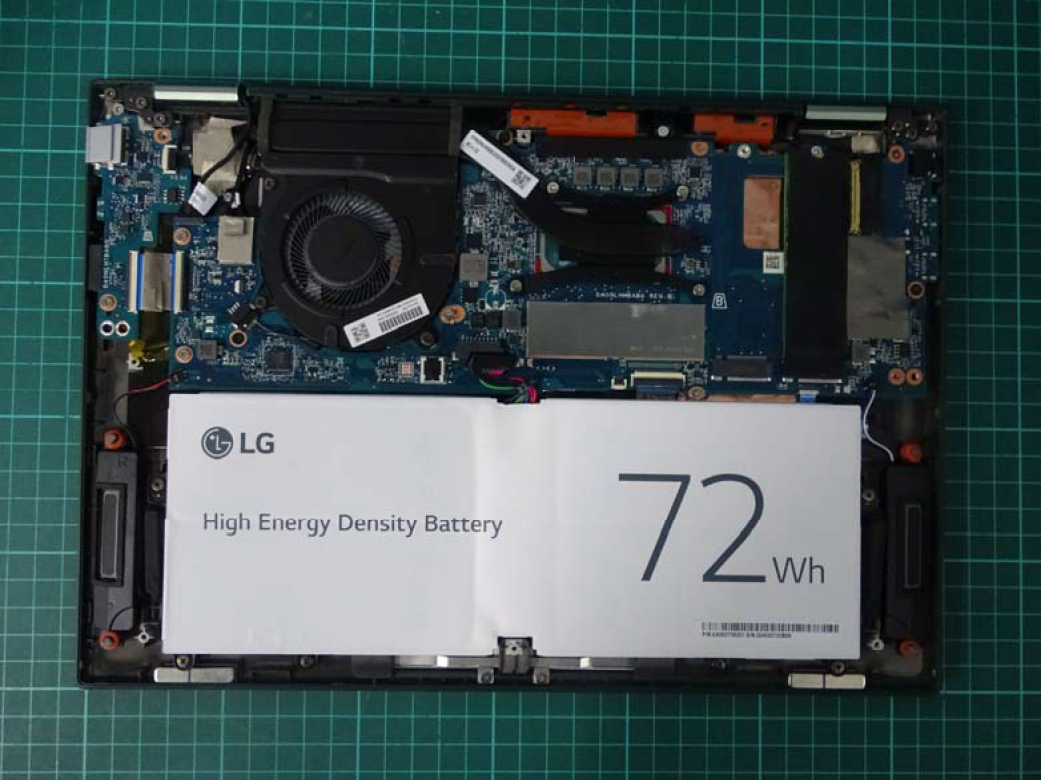
Come in tutti gli altri portatili Gram, il pannello inferiore è stato progettato per essere molto difficile da aprire, in quanto le viti sono nascoste sotto adesivi e piedini in gomma. È un peccato perché il sistema può supportare fino a due unità SSD M.2 2280 interne invece di una per aumentare lo spazio di archiviazione, ma LG ha reso fastidiosamente difficile per i proprietari aggiungere le proprie unità
Sia la RAM che la WLAN sono saldate e non possono essere aggiornate dall'utente
Poiché non siamo riusciti ad aprire la nostra unità di prova senza danneggiarla, possiamo fare riferimento alle immagini ufficiali della FCC https://fccid.io/BEJNT-14T90P.
Accessori e garanzia
La confezione di vendita include una penna stilo attiva Wacom https://www.lg.com/us/mobile-accessories/lg-aaa77804301-wacom-active-stylus-pen oltre ai consueti documenti e all'adattatore CA. Si applica la garanzia limitata standard di un anno.
Dispositivi di input - Tastiera ottima, Clickpad scarso
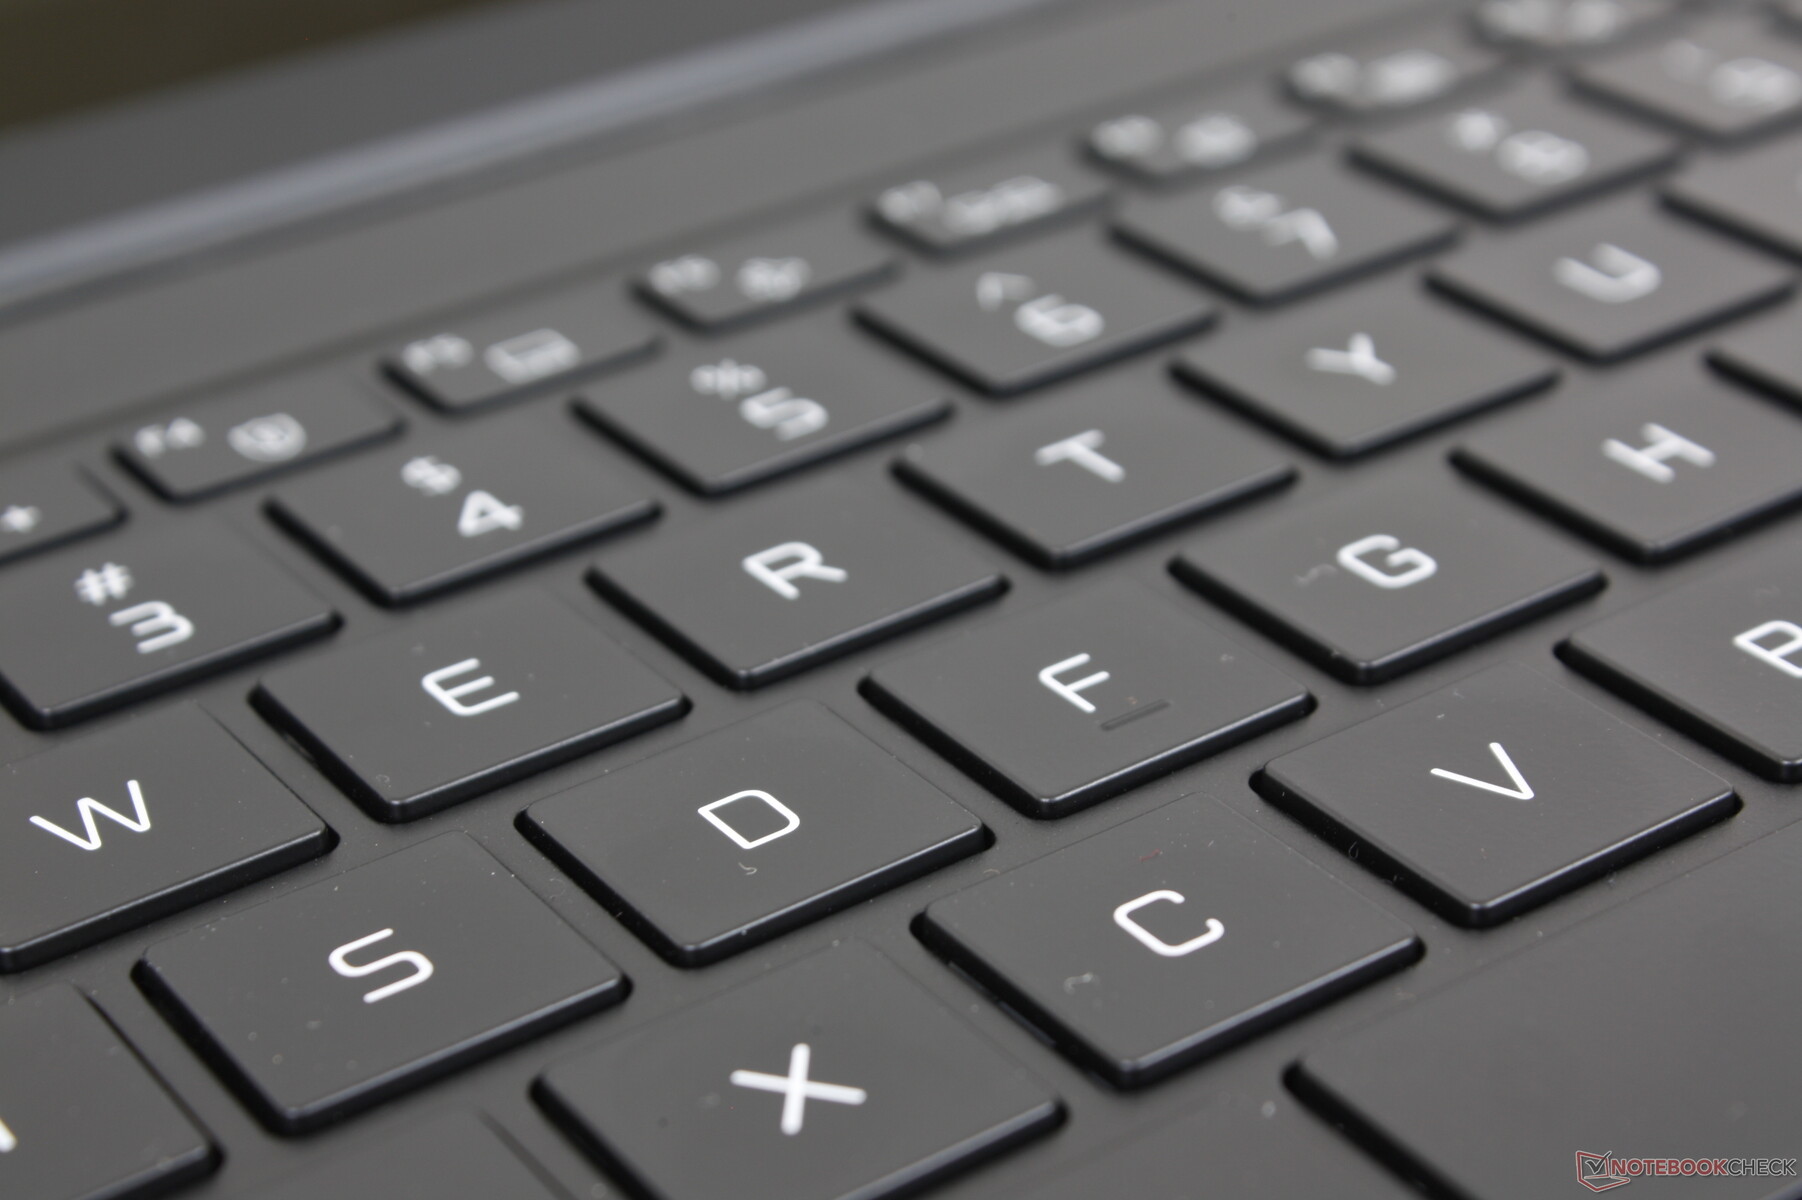
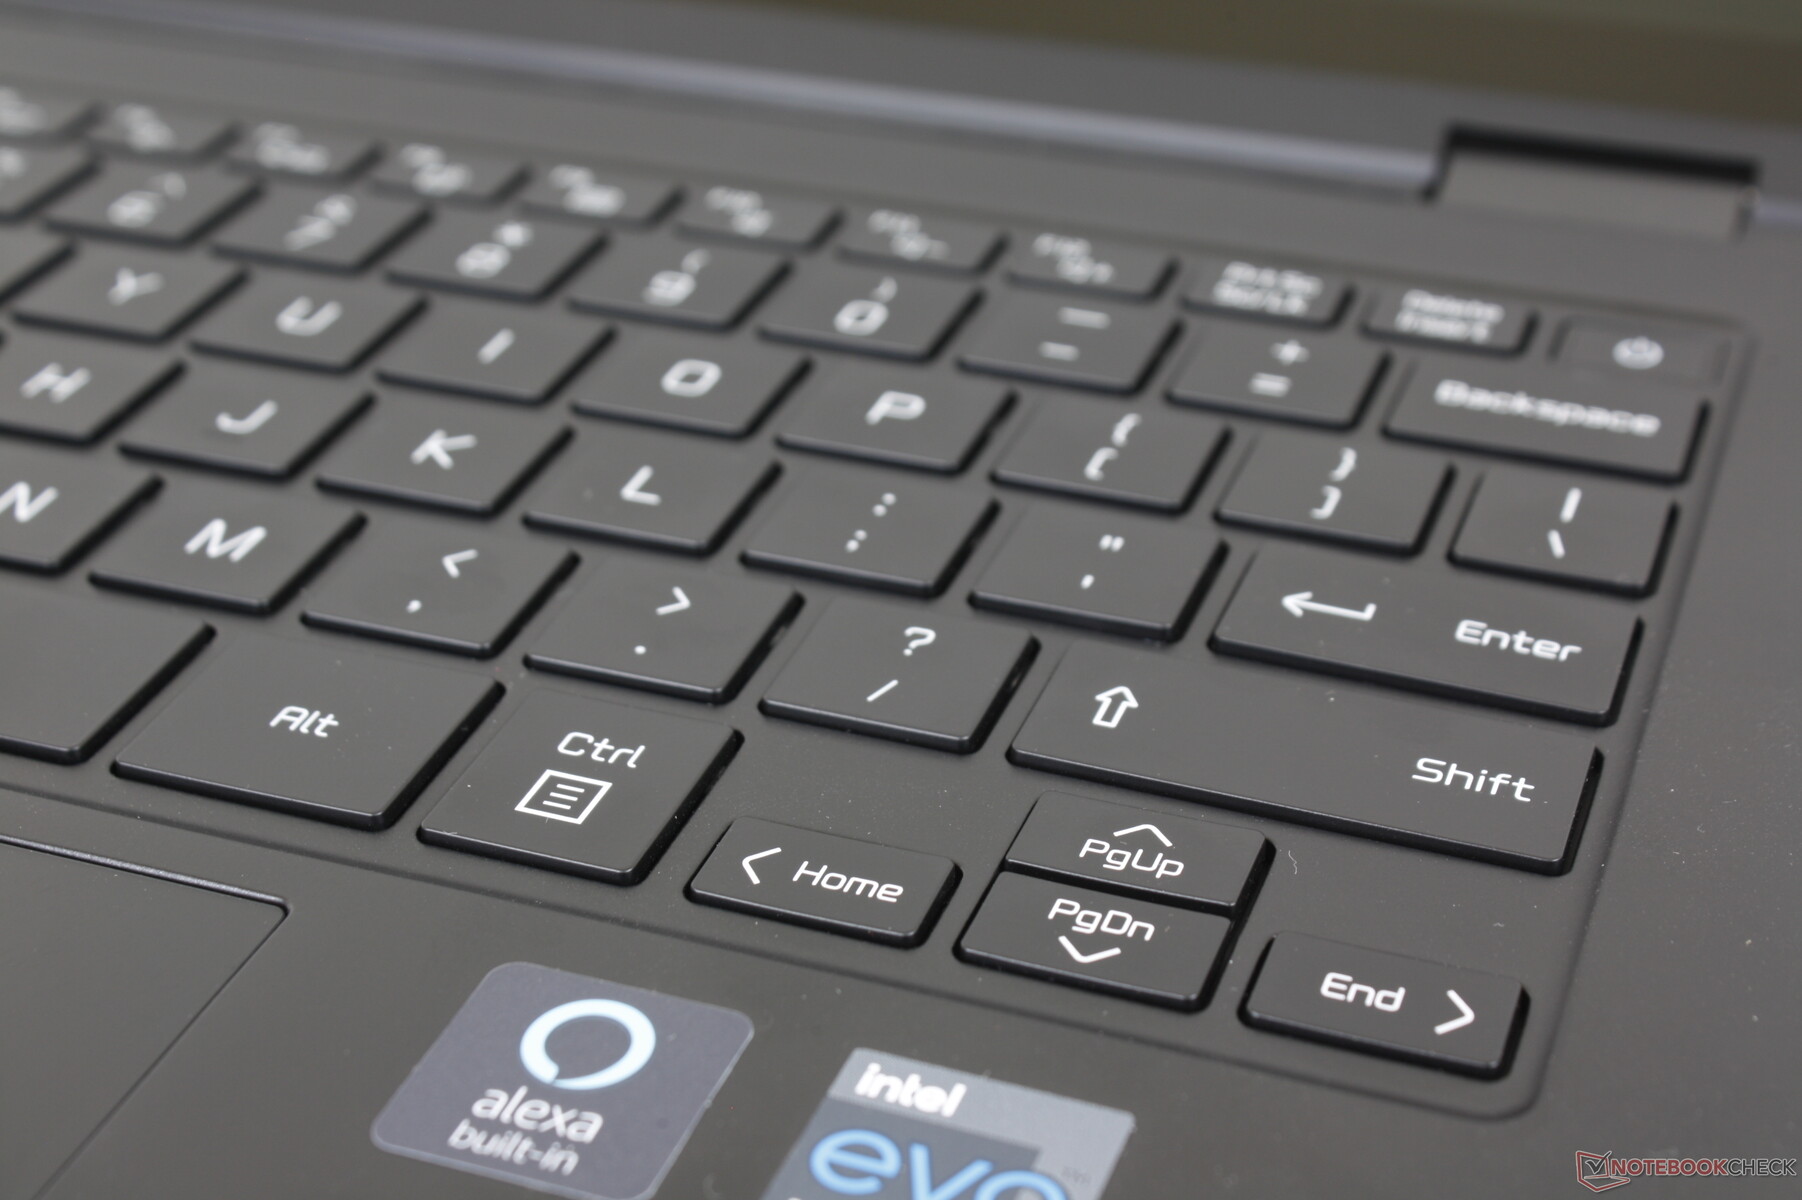
Tastiera
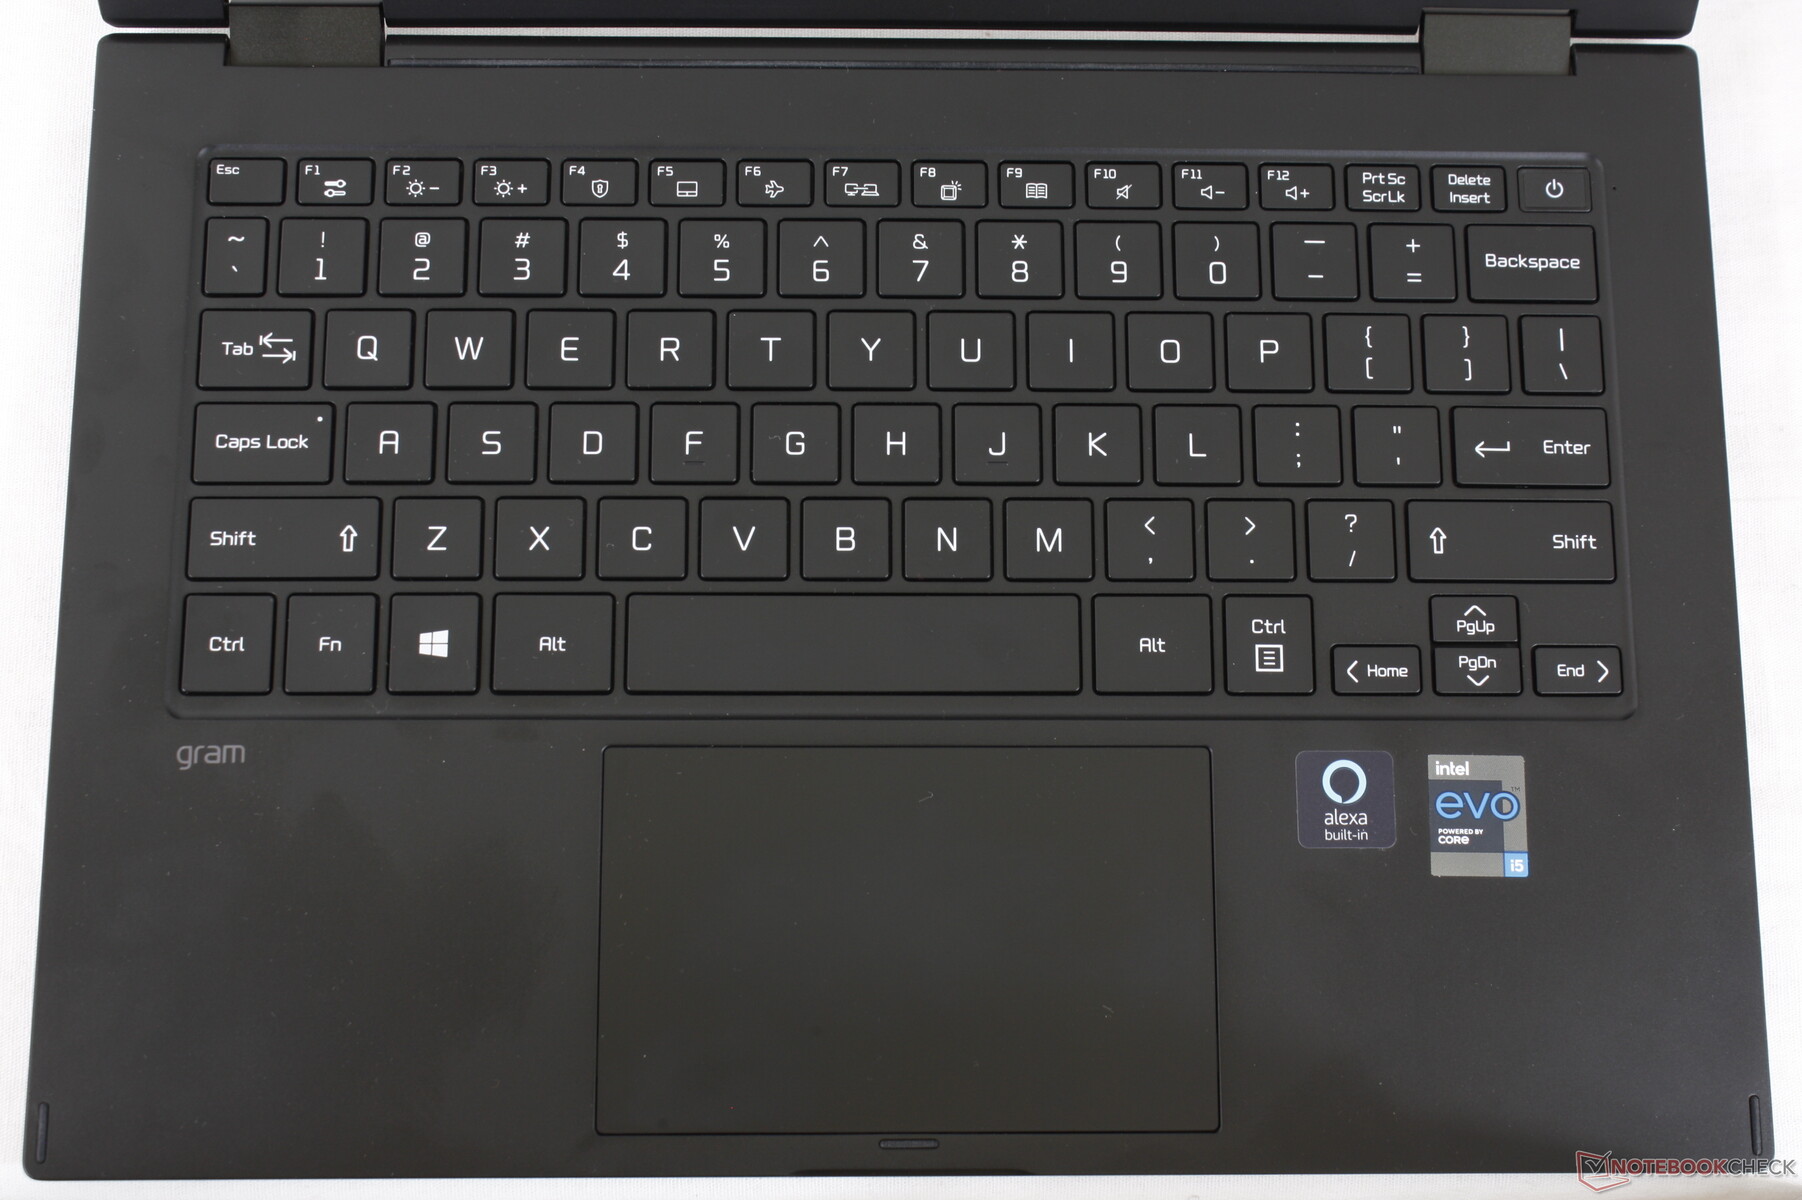
Il feedback dei tasti della tastiera è notevolmente più solido e meno spugnoso rispetto alla maggior parte degli altri Ultrabook. Se siete abituati a digitare su tasti più morbidi come quelli di un Asus Vivobook, HP Pavilion, Lenovo IdeaPad o persino Razer Blade, sarete sorpresi dalla rigidità dei tasti del Gram 14T90P. Una conseguenza dei tasti più rigidi, tuttavia, è un rumore più forte della media, per un'esperienza di digitazione leggermente più rumorosa.
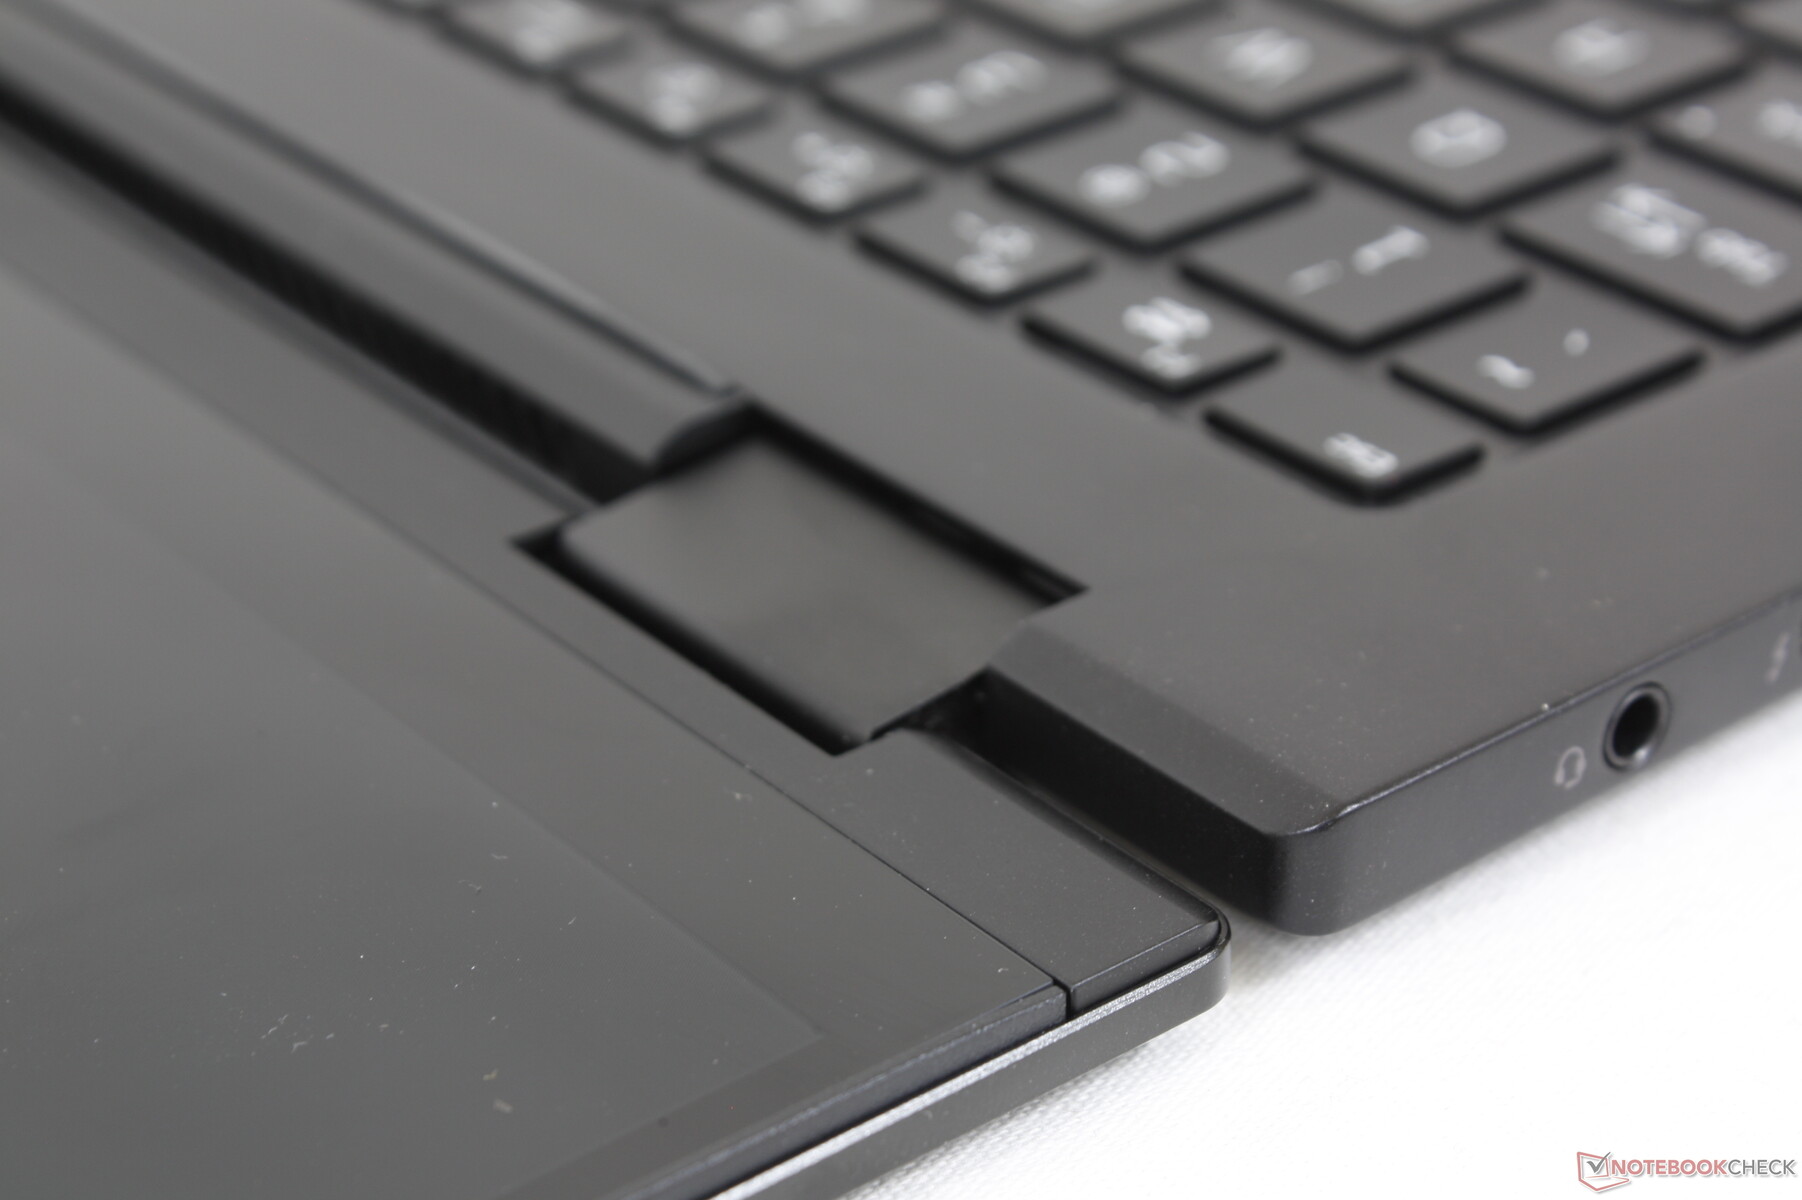
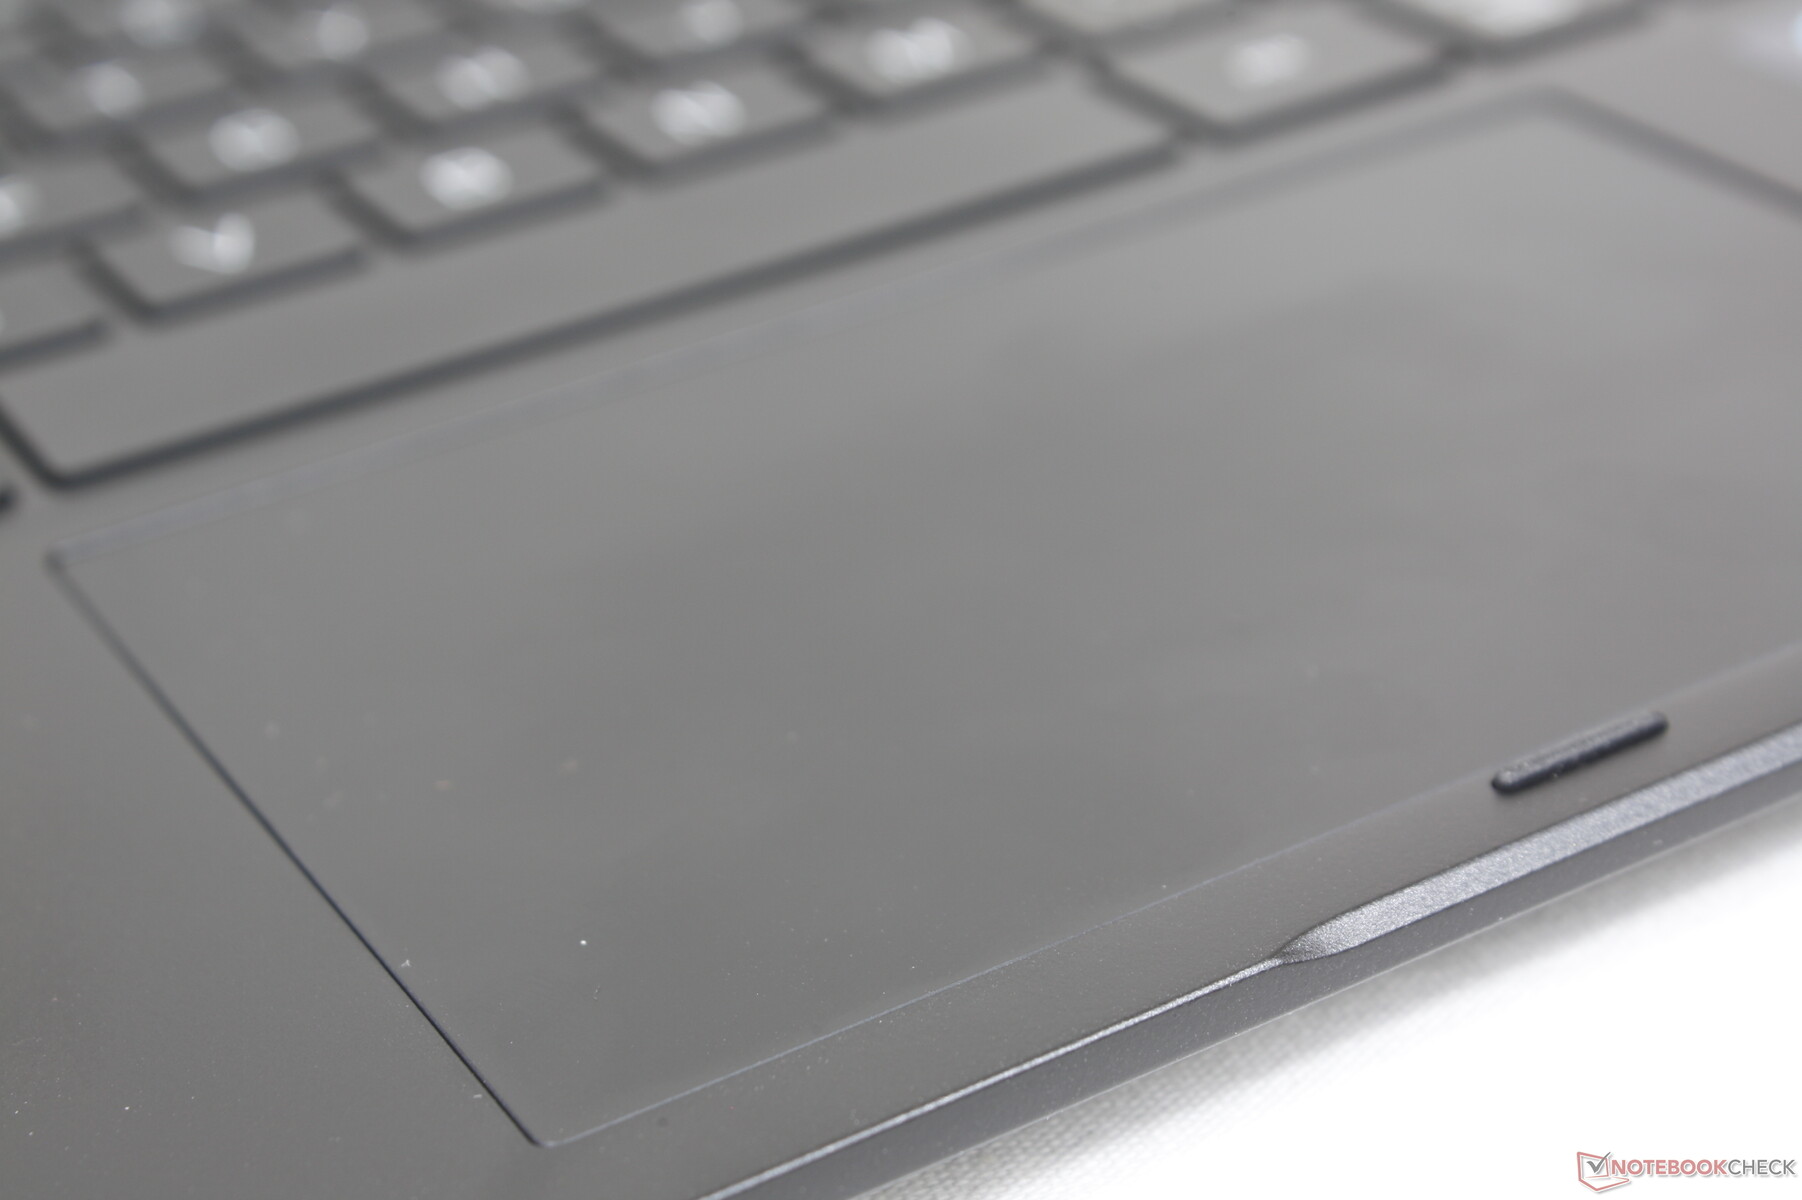
Touchpad
Il clickpad ci ha impressionato meno rispetto alla tastiera. Sebbene sia più grande del clickpad del Gram 14T90N (11,3 x 7 cm contro 10,5 x 6,5 cm) per facilitare il controllo del cursore e gli input multi-touch, il feedback dei clic è troppo morbido e silenzioso. Un feedback più deciso avrebbe reso la sensazione più soddisfacente.
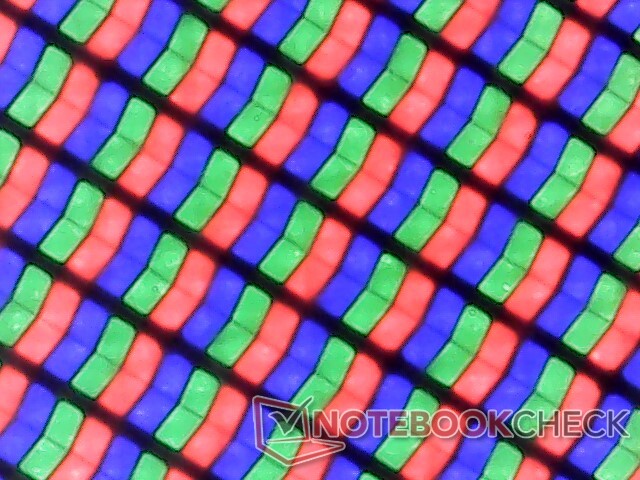
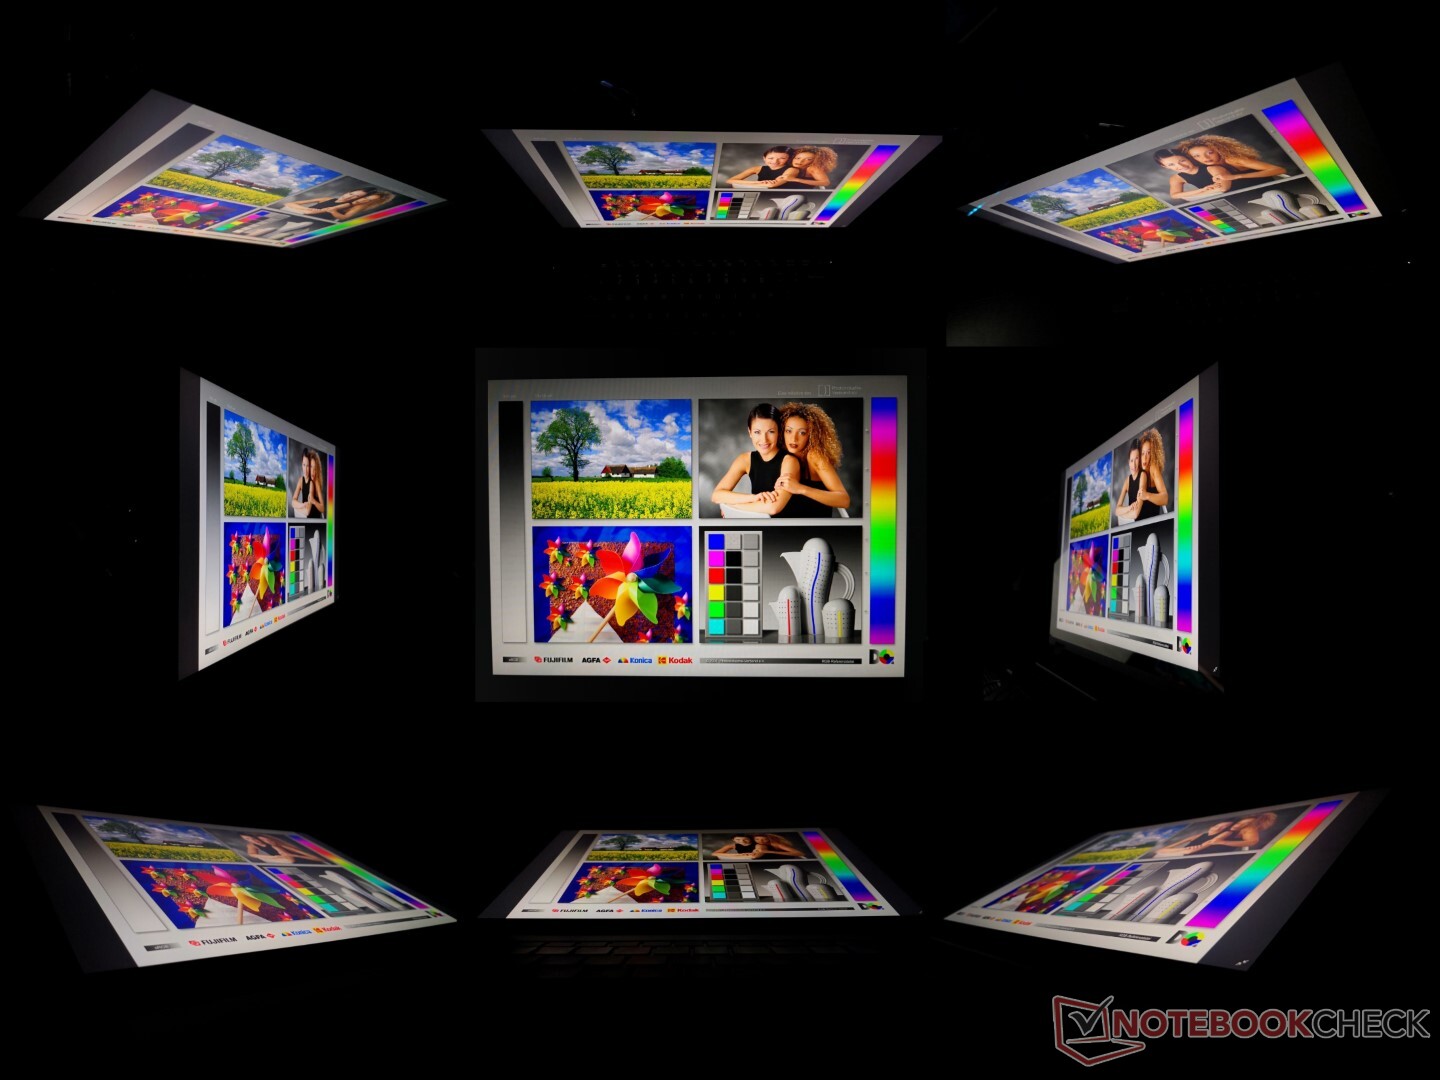
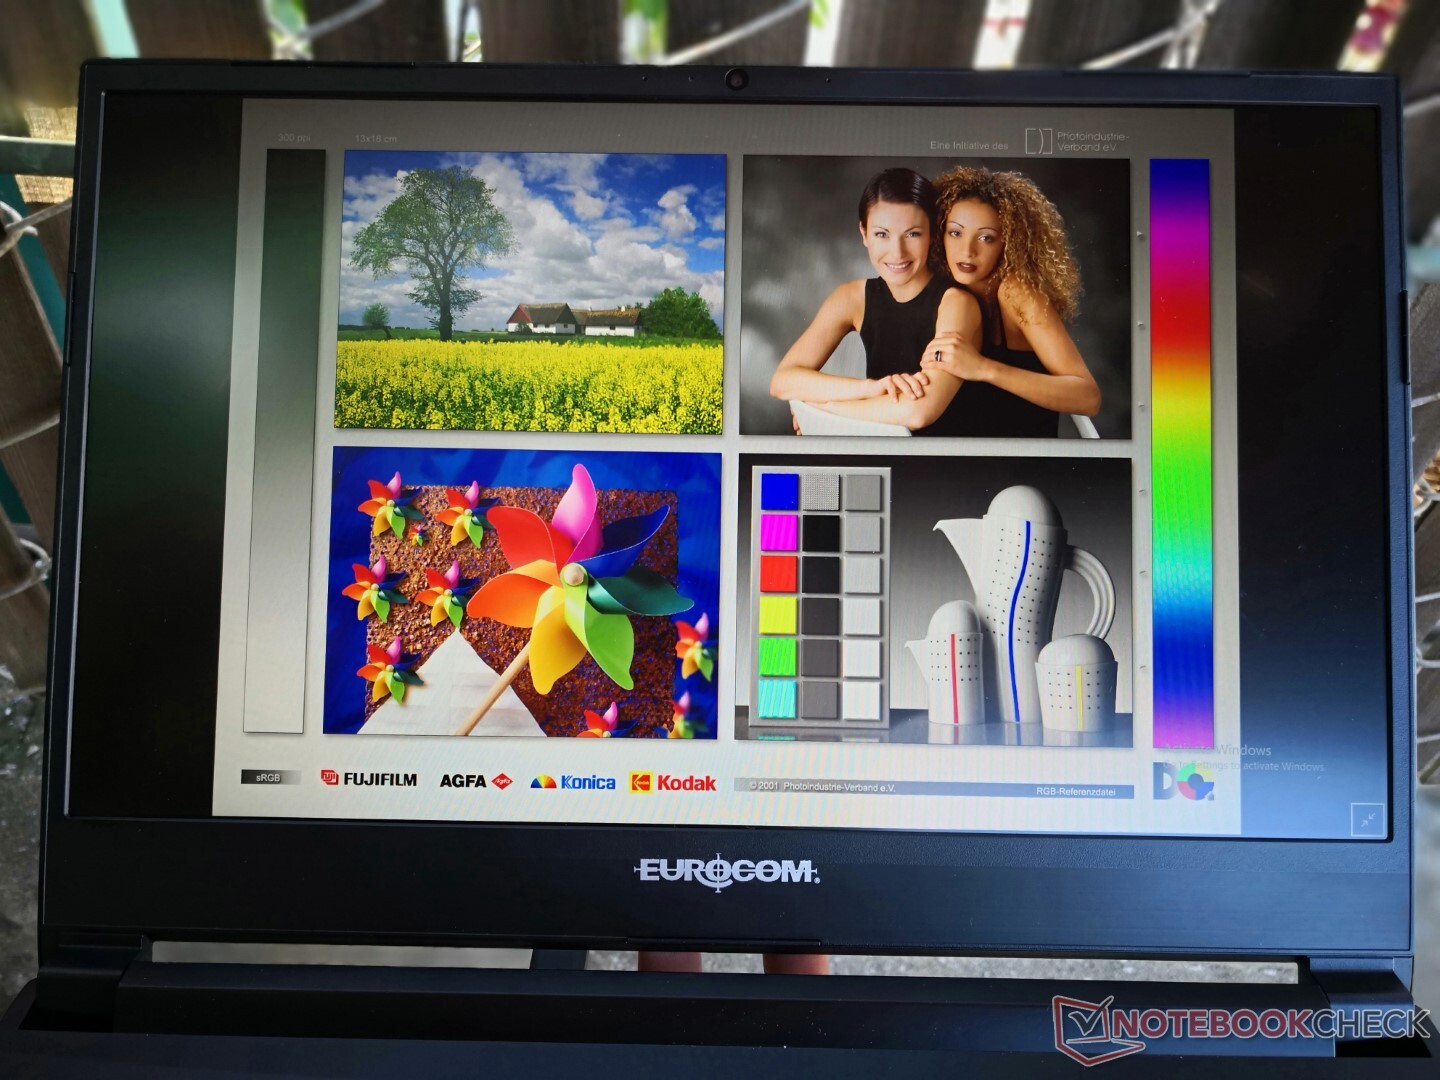
Display: nitido con colori eccellenti
LG Gram 14T90P utilizza lo stesso pannello IPS LG Philips LP140WU1-SPA1 di alta qualità presente sul modello Gram 14Z90P Gram 14Z90P. Pertanto, attributi come la riproduzione dei colori, i tempi di risposta e il contrasto sono praticamente uguali tra i due, per un'esperienza visiva molto simile.
Rispetto al display del Gram 14T90N, il nostro Gram 14T90P offre colori più intensi e tempi di risposta in bianco e nero e grigio leggermente più rapidi, senza influire sulla luminosità o sul contrasto. Tuttavia, ci piacerebbe vedere pannelli OLED e/o a 90 Hz in futuro, poiché tali caratteristiche stanno diventando la norma nei subnotebook di fascia alta, come nel caso del concorrenteAsus Zenbook Flip 14.
| |||||||||||||||||||||||||
Distribuzione della luminosità: 87 %
Al centro con la batteria: 305.5 cd/m²
Contrasto: 1131:1 (Nero: 0.27 cd/m²)
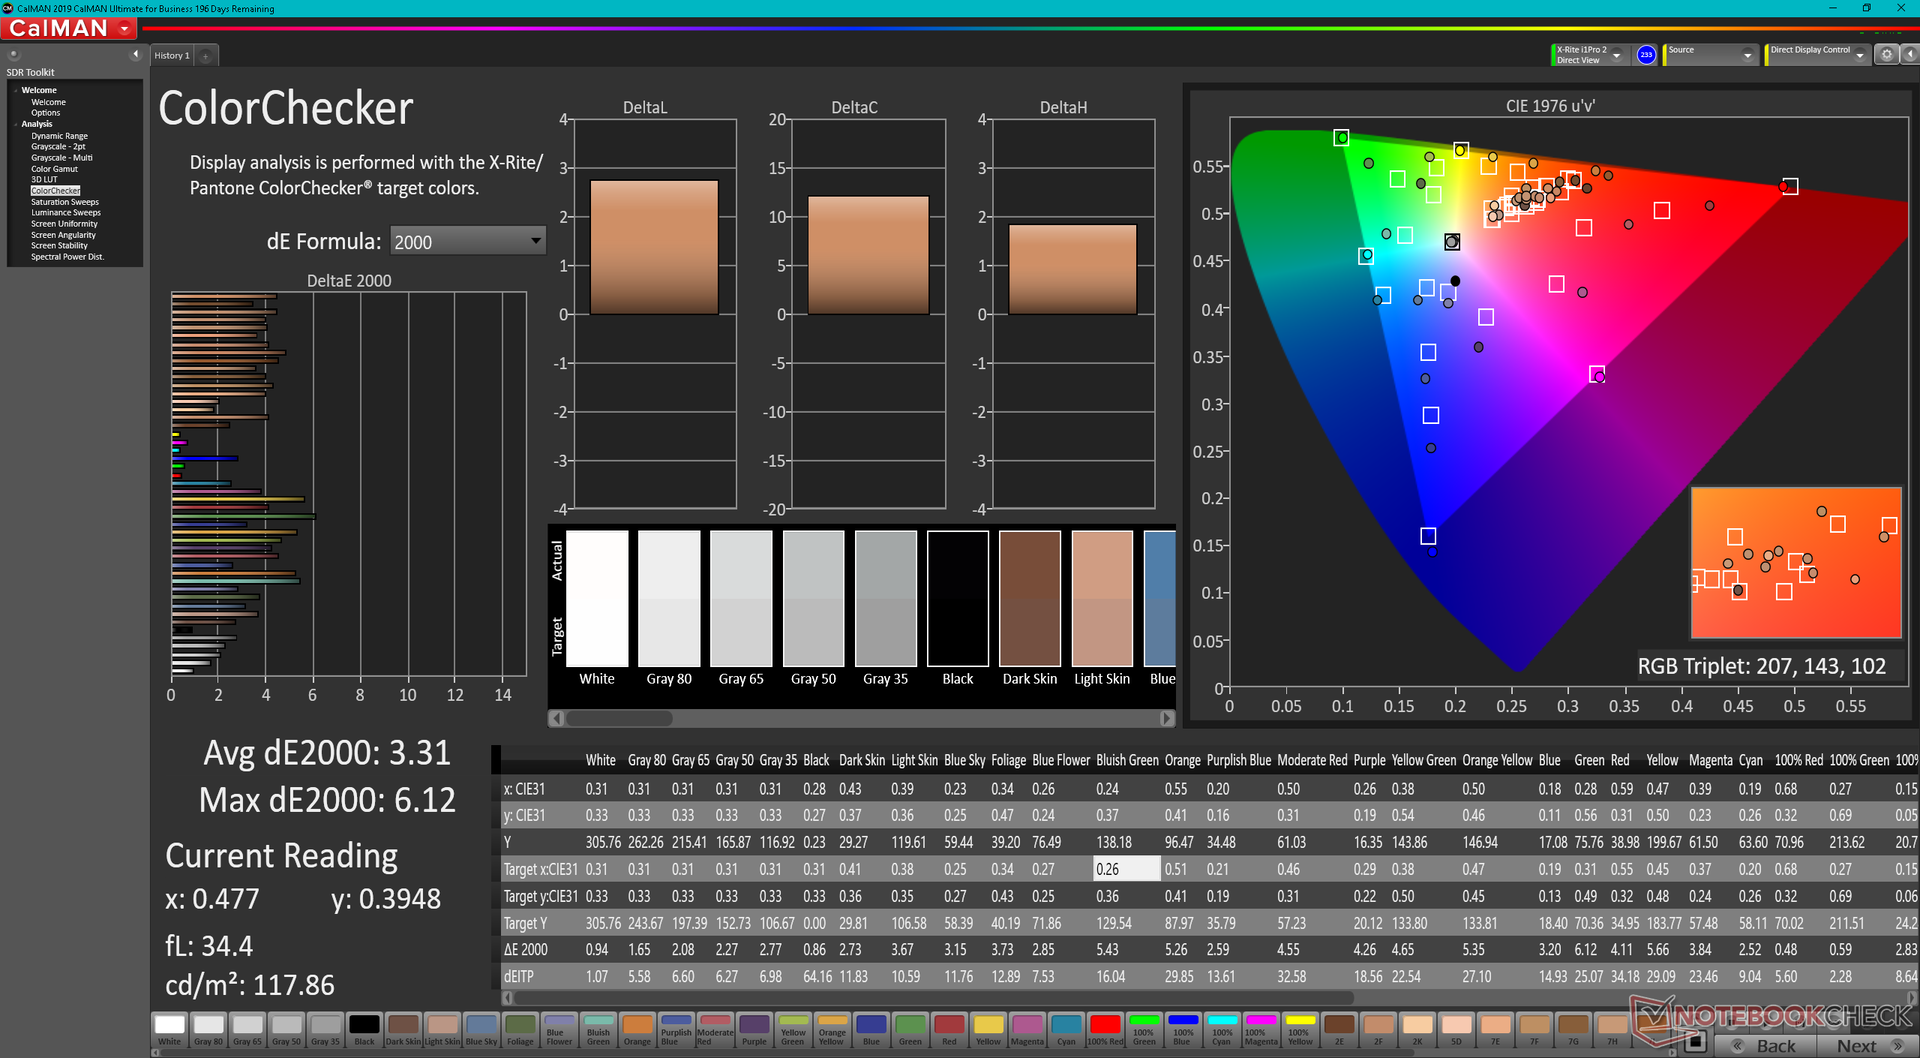
ΔE ColorChecker Calman: 3.31 | ∀{0.5-29.43 Ø4.73}
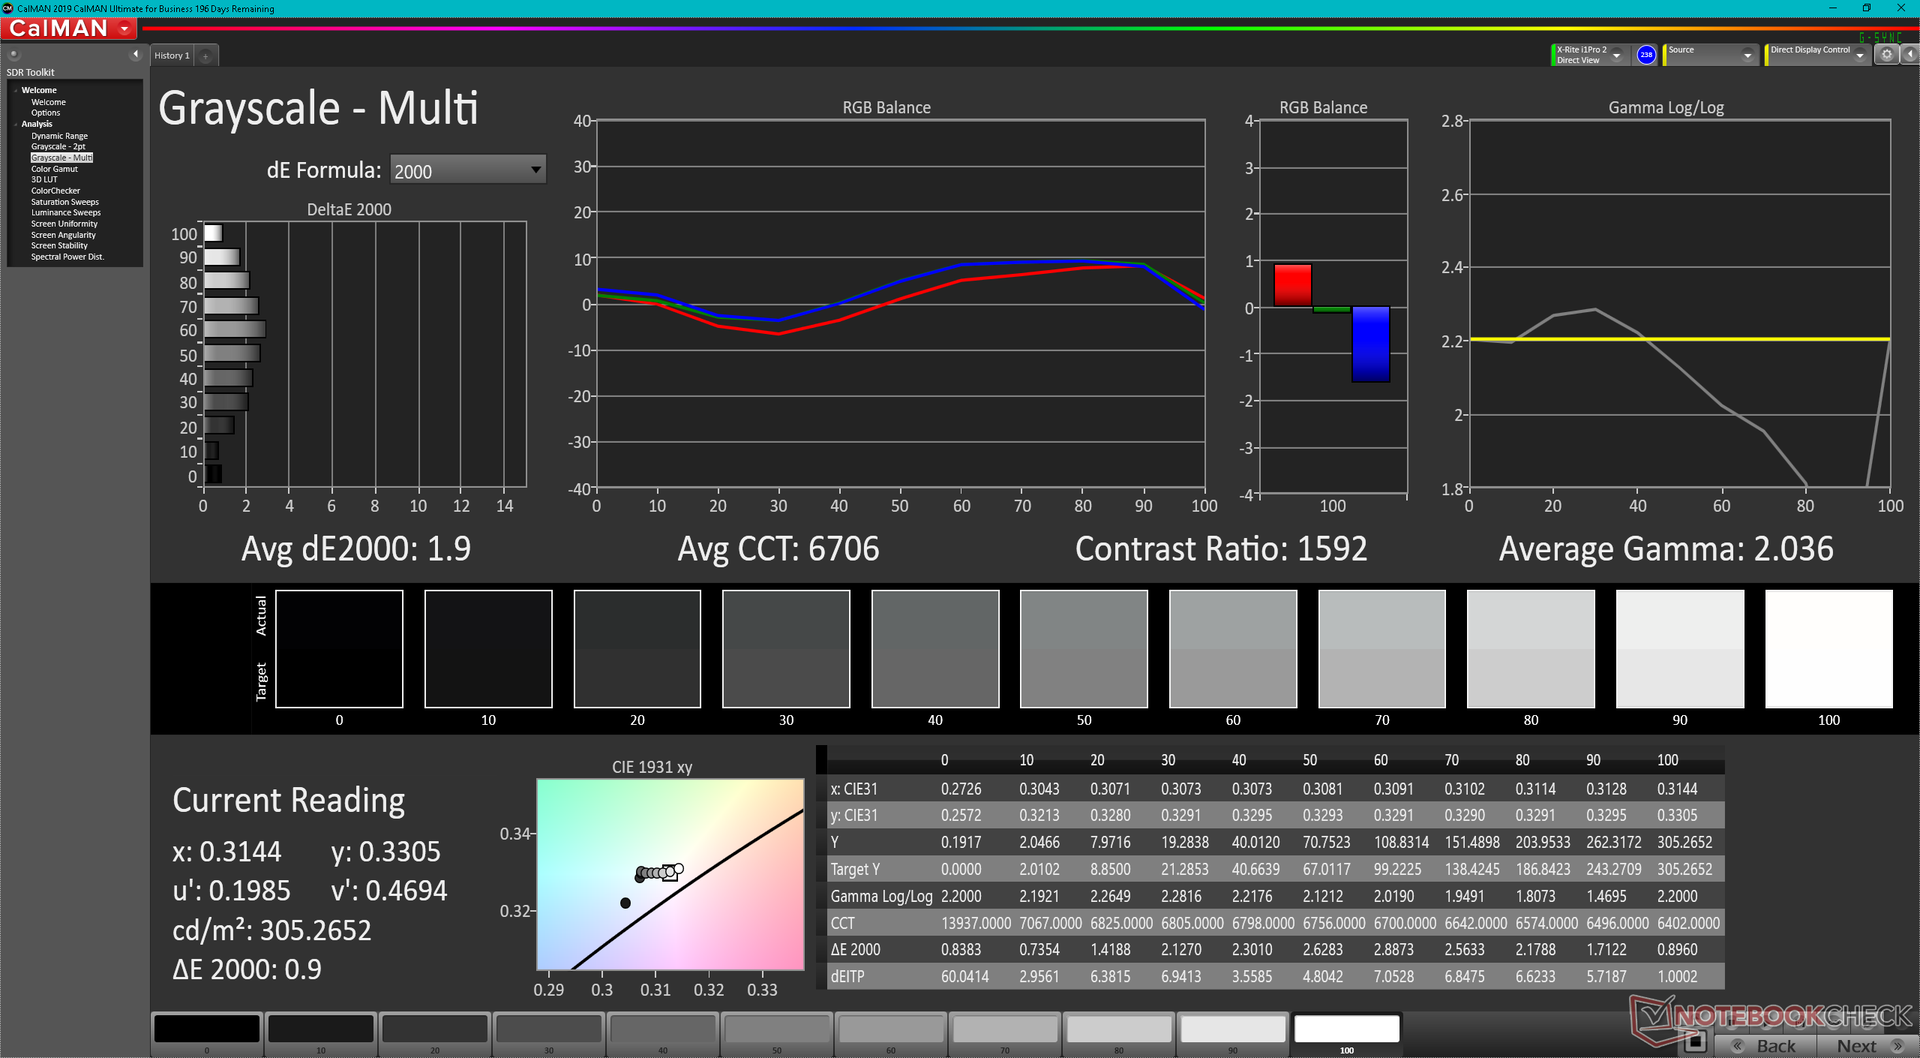
ΔE Greyscale Calman: 1.9 | ∀{0.09-98 Ø4.97}
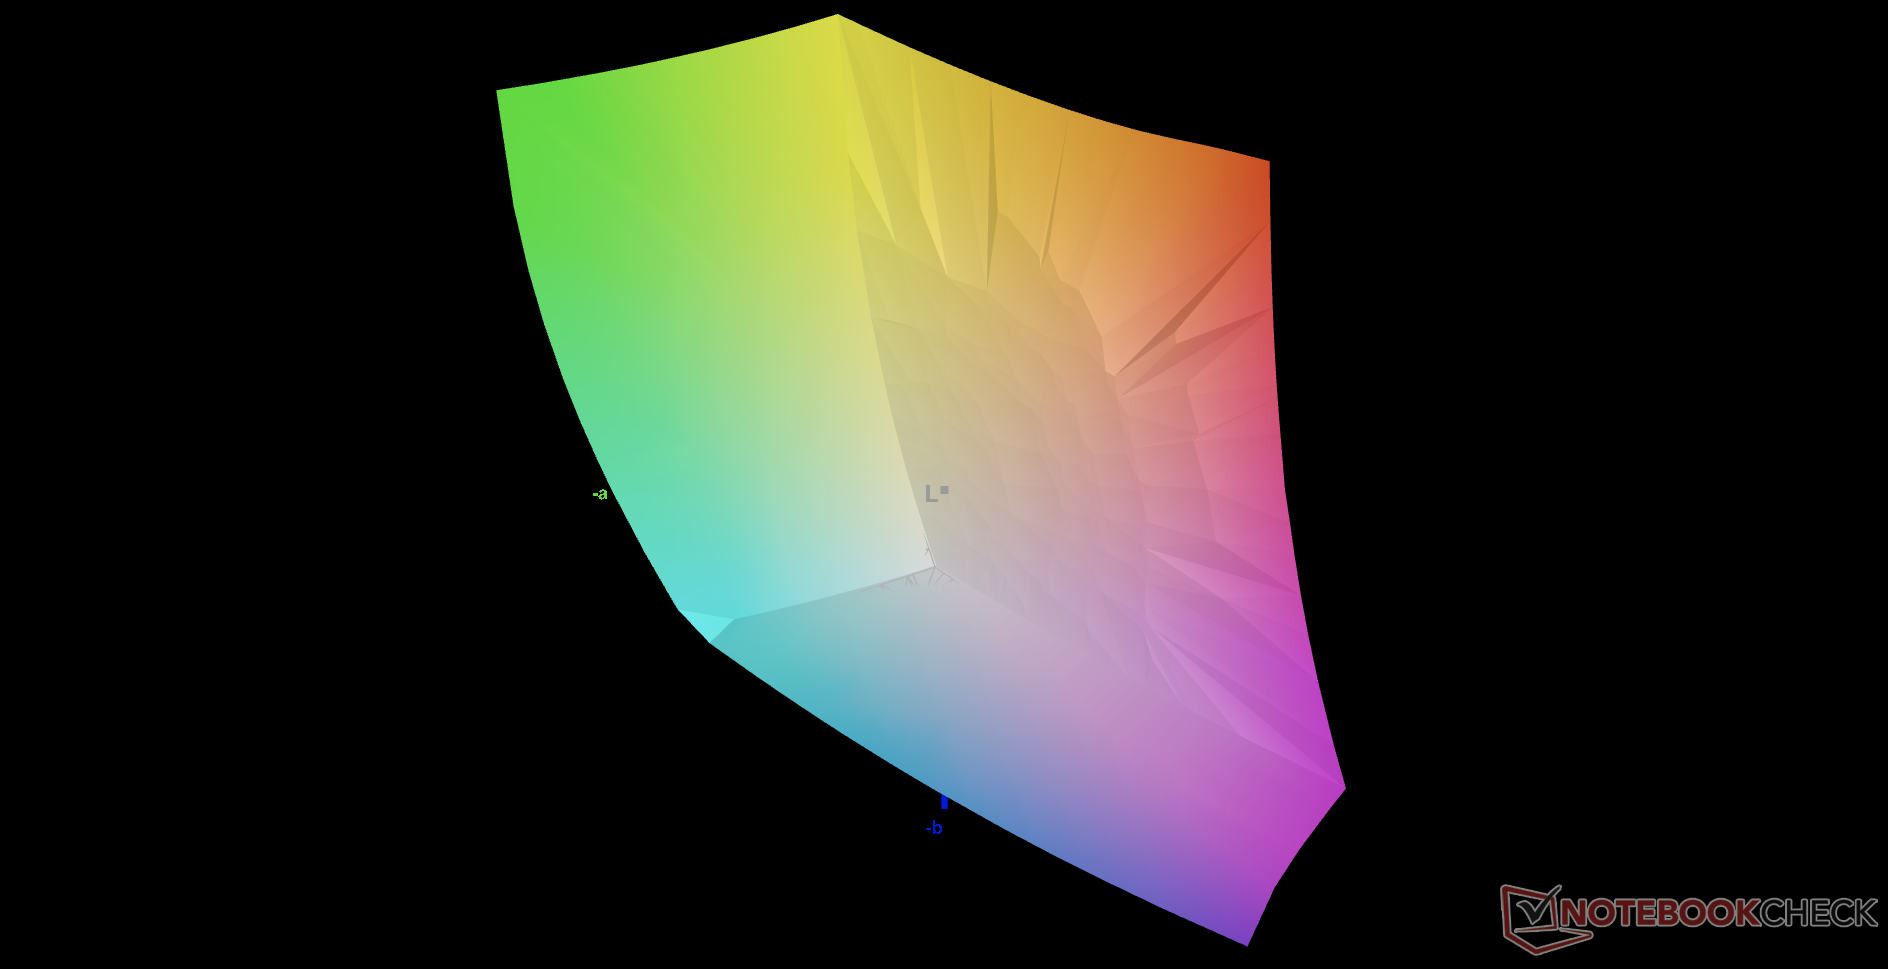
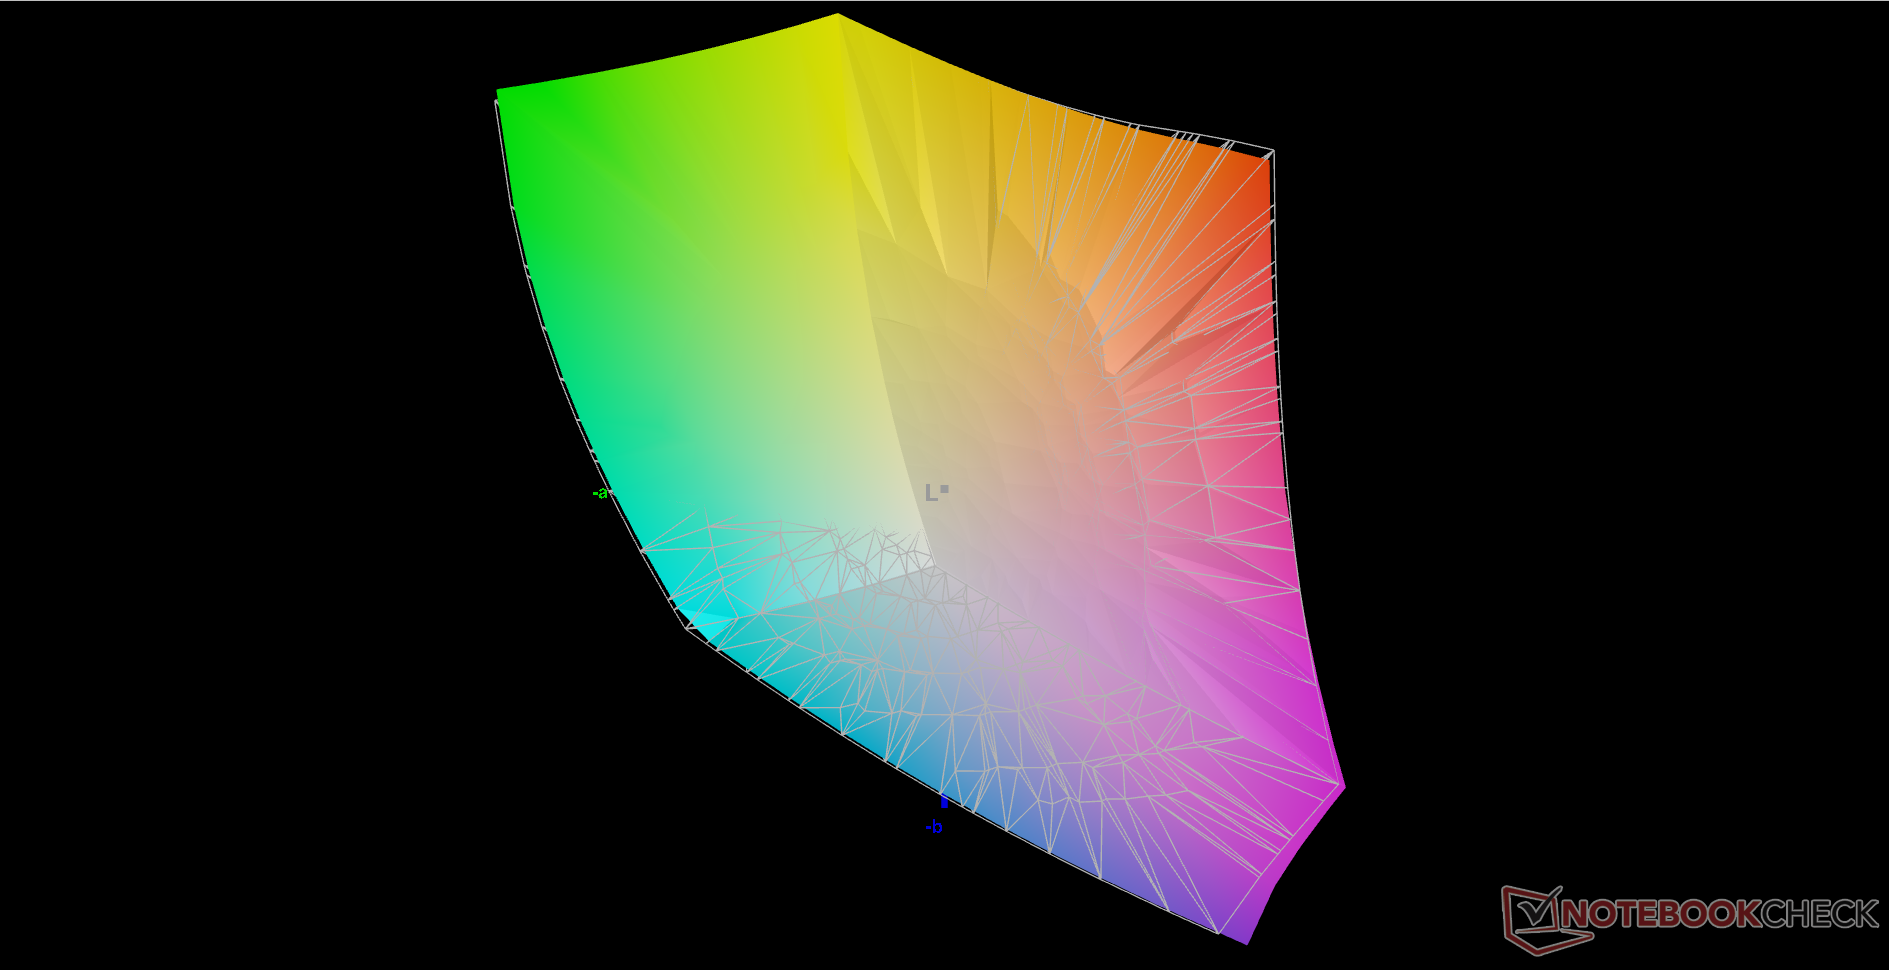
100% sRGB (Argyll 3D)
98.8% Display P3 (Argyll 3D)
Gamma: 2.04
CCT: 6706 K
| LG Gram 14T90P LG Philips LP140WU1-SPA1, IPS, 1900x1200, 14" | Dell XPS 13 9310 2-in-1 Sharp LQ134N1, IPS, 1920x1200, 13.4" | Lenovo Yoga 9 14IAP7 82LU0001US Lenovo LEN140WQ+, OLED, 2880x1800, 14" | Asus ZenBook Flip 14 UN5401QA-KN085W SDC4154, OLED, 2880x1800, 14" | HP Spectre x360 14-ea0378ng Samsung SDC4148, OLED, 3000x2000, 13.5" | MSI Summit E13 Flip Evo A11MT Sharp LQ134N1JW53, IPS, 1920x1200, 13.4" | LG Gram 14T90N LG Philips LP140WFA-SPY1, IPS, 1920x1080, 14" | |
|---|---|---|---|---|---|---|---|
| Display | -15% | 1% | 1% | 1% | -15% | -19% | |
| Display P3 Coverage (%) | 98.8 | 69.7 -29% | 99.8 1% | 99.7 1% | 99.9 1% | 69.8 -29% | 65 -34% |
| sRGB Coverage (%) | 100 | 99 -1% | 100 0% | 100 0% | 100 0% | 98.8 -1% | 95.7 -4% |
| AdobeRGB 1998 Coverage (%) | 71.7 | 98.7 | 98.6 | 96.1 | 70.6 | 66.7 | |
| Response Times | -31% | 97% | 94% | 94% | -46% | -16% | |
| Response Time Grey 50% / Grey 80% * (ms) | 44 ? | 55.6 ? -26% | 1.2 ? 97% | 2 ? 95% | 2 ? 95% | 64 ? -45% | 54 ? -23% |
| Response Time Black / White * (ms) | 30 ? | 40.4 ? -35% | 1.2 ? 96% | 2 ? 93% | 2 ? 93% | 44 ? -47% | 32.8 ? -9% |
| PWM Frequency (Hz) | 2500 ? | 347.2 ? | 250 ? | ||||
| Screen | -16% | -13% | 11% | 419% | 38% | -12% | |
| Brightness middle (cd/m²) | 305.5 | 555.7 82% | 367.3 20% | 366 20% | 370 21% | 551.3 80% | 322.2 5% |
| Brightness (cd/m²) | 289 | 528 83% | 369 28% | 369 28% | 374 29% | 517 79% | 301 4% |
| Brightness Distribution (%) | 87 | 90 3% | 97 11% | 96 10% | 90 3% | 91 5% | 86 -1% |
| Black Level * (cd/m²) | 0.27 | 0.35 -30% | 0.01 96% | 0.37 -37% | 0.25 7% | ||
| Contrast (:1) | 1131 | 1588 40% | 37000 3171% | 1490 32% | 1289 14% | ||
| Colorchecker dE 2000 * | 3.31 | 4.83 -46% | 5.2 -57% | 2.84 14% | 2.57 22% | 1.45 56% | 3.62 -9% |
| Colorchecker dE 2000 max. * | 6.12 | 8.46 -38% | 8.04 -31% | 5.29 14% | 4.52 26% | 2.86 53% | 6.9 -13% |
| Greyscale dE 2000 * | 1.9 | 6.1 -221% | 2.8 -47% | 2.32 -22% | 2.2 -16% | 1.3 32% | 3.9 -105% |
| Gamma | 2.04 108% | 1.98 111% | 2.21 100% | 2.44 90% | 2.36 93% | 2.14 103% | 2.43 91% |
| CCT | 6706 97% | 6686 97% | 5992 108% | 6170 105% | 6154 106% | 6580 99% | 6344 102% |
| Colorchecker dE 2000 calibrated * | 0.76 | 2.81 | 2.31 | 1.7 | 1.22 | ||
| Color Space (Percent of AdobeRGB 1998) (%) | 85.8 | 65 | 61.3 | ||||
| Color Space (Percent of sRGB) (%) | 100 | 99 | 95.6 | ||||
| Media totale (Programma / Settaggio) | -21% /
-18% | 28% /
12% | 35% /
25% | 171% /
295% | -8% /
15% | -16% /
-14% |
* ... Meglio usare valori piccoli
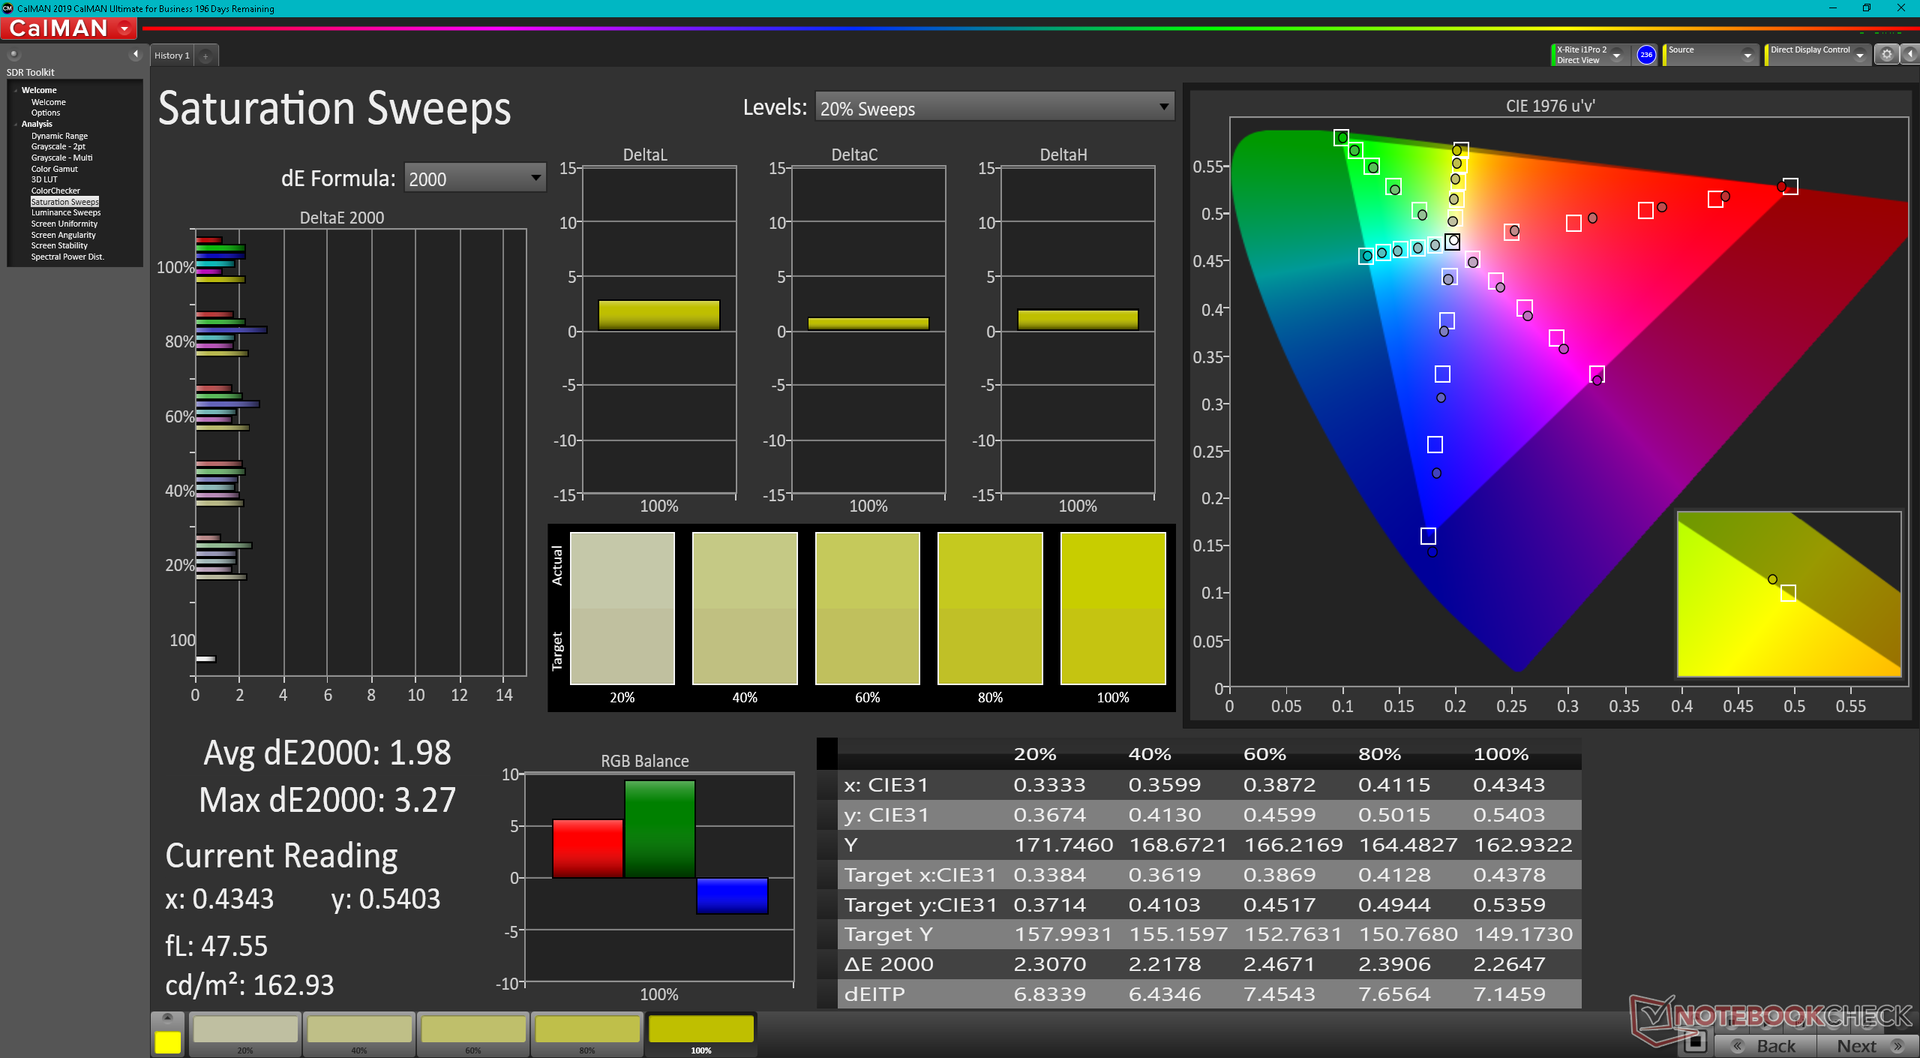
LG dichiara una copertura DCI-P3 del 99% e noi possiamo confermarlo con il nostro colorimetro X-Rite. Calcolando AdobeRGB si ottiene stranamente un errore, ma la copertura dovrebbe comunque essere molto simile al 99%. Questo è uno dei pochi pannelli IPS da 14 pollici in formato 16:10 a offrire un gamut simile a quello della maggior parte dei pannelli OLED.
Il display è calibrato in modo decente. I valori medi della scala di grigi e di ColorChecker DeltaE sono rispettivamente di 1,9 e 3,31.
Tempi di risposta del Display
| ↔ Tempi di risposta dal Nero al Bianco | ||
|---|---|---|
| 30 ms ... aumenta ↗ e diminuisce ↘ combinato | ↗ 15.2 ms Incremento | 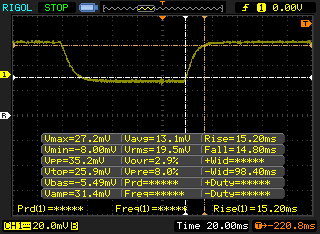 |
| ↘ 14.8 ms Calo | ||
| Lo schermo mostra tempi di risposta lenti nei nostri tests e sarà insoddisfacente per i gamers. In confronto, tutti i dispositivi di test variano da 0.1 (minimo) a 240 (massimo) ms. » 80 % di tutti i dispositivi è migliore. Questo significa che i tempi di risposta rilevati sono peggiori rispetto alla media di tutti i dispositivi testati (19.9 ms). | ||
| ↔ Tempo di risposta dal 50% Grigio all'80% Grigio | ||
| 44 ms ... aumenta ↗ e diminuisce ↘ combinato | ↗ 21.2 ms Incremento | 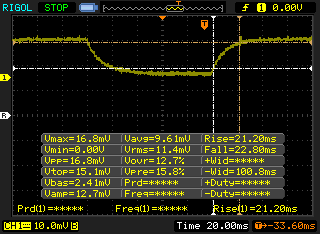 |
| ↘ 22.8 ms Calo | ||
| Lo schermo mostra tempi di risposta lenti nei nostri tests e sarà insoddisfacente per i gamers. In confronto, tutti i dispositivi di test variano da 0.165 (minimo) a 636 (massimo) ms. » 73 % di tutti i dispositivi è migliore. Questo significa che i tempi di risposta rilevati sono peggiori rispetto alla media di tutti i dispositivi testati (31.1 ms). | ||
Sfarfallio dello schermo / PWM (Pulse-Width Modulation)
| flickering dello schermo / PWM non rilevato | 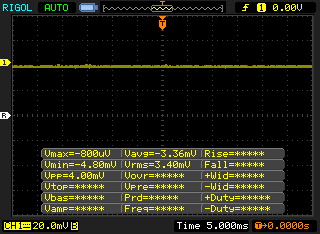 | ||
In confronto: 52 % di tutti i dispositivi testati non utilizza PWM per ridurre la luminosita' del display. Se è rilevato PWM, una media di 7801 (minimo: 5 - massimo: 343500) Hz è stata rilevata. | |||
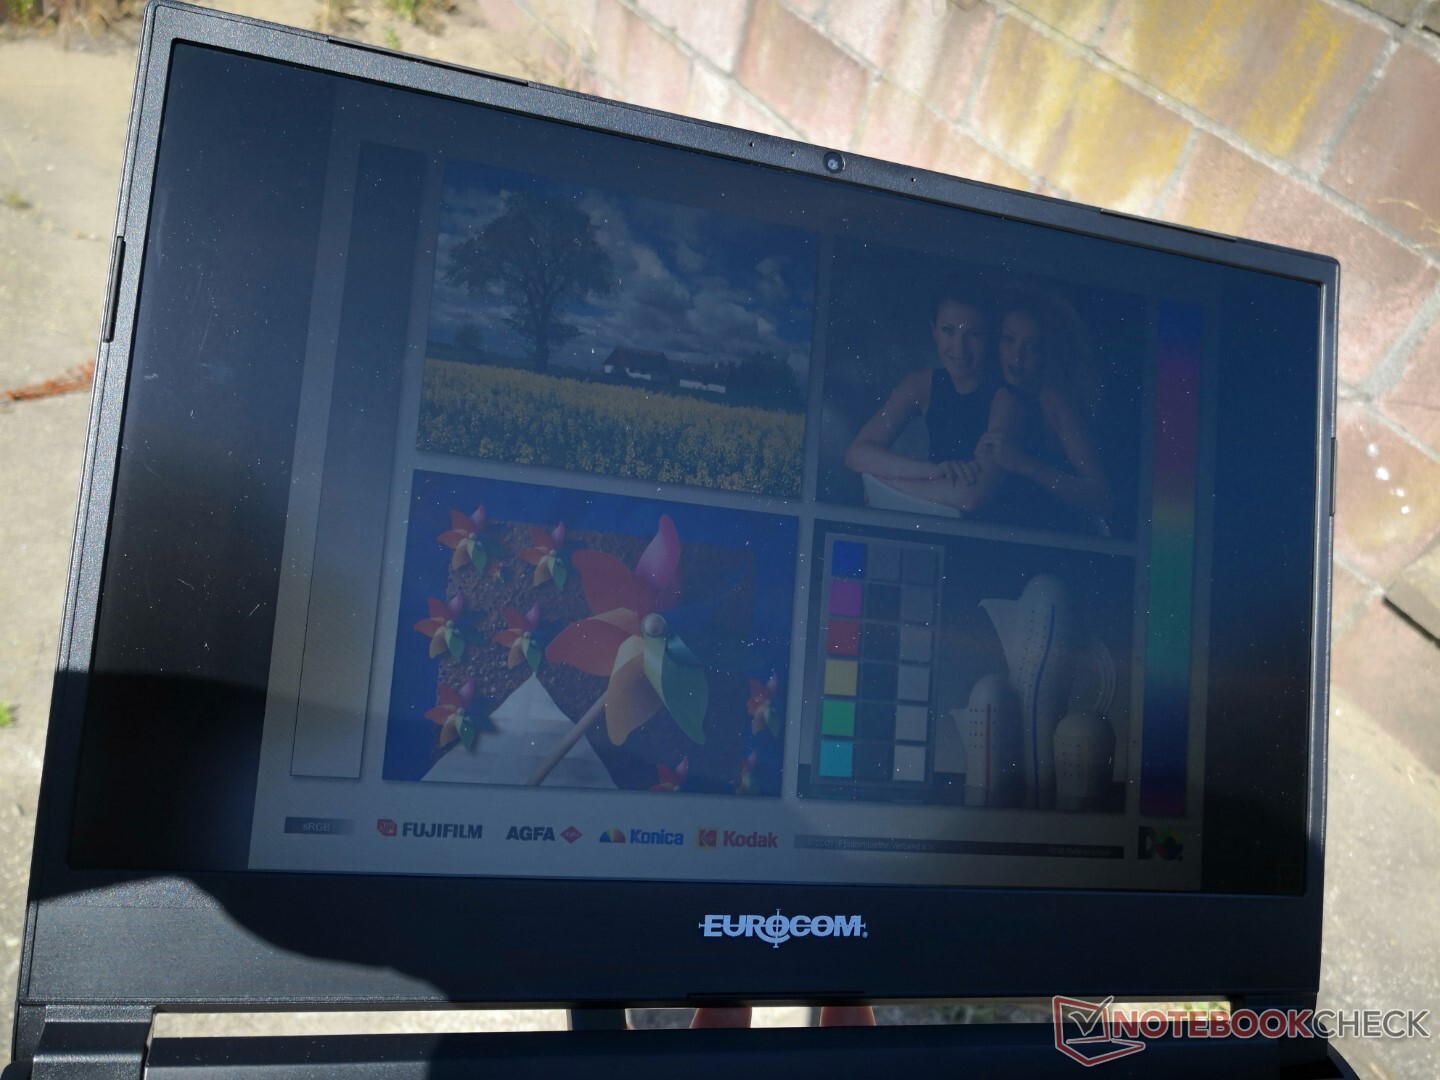
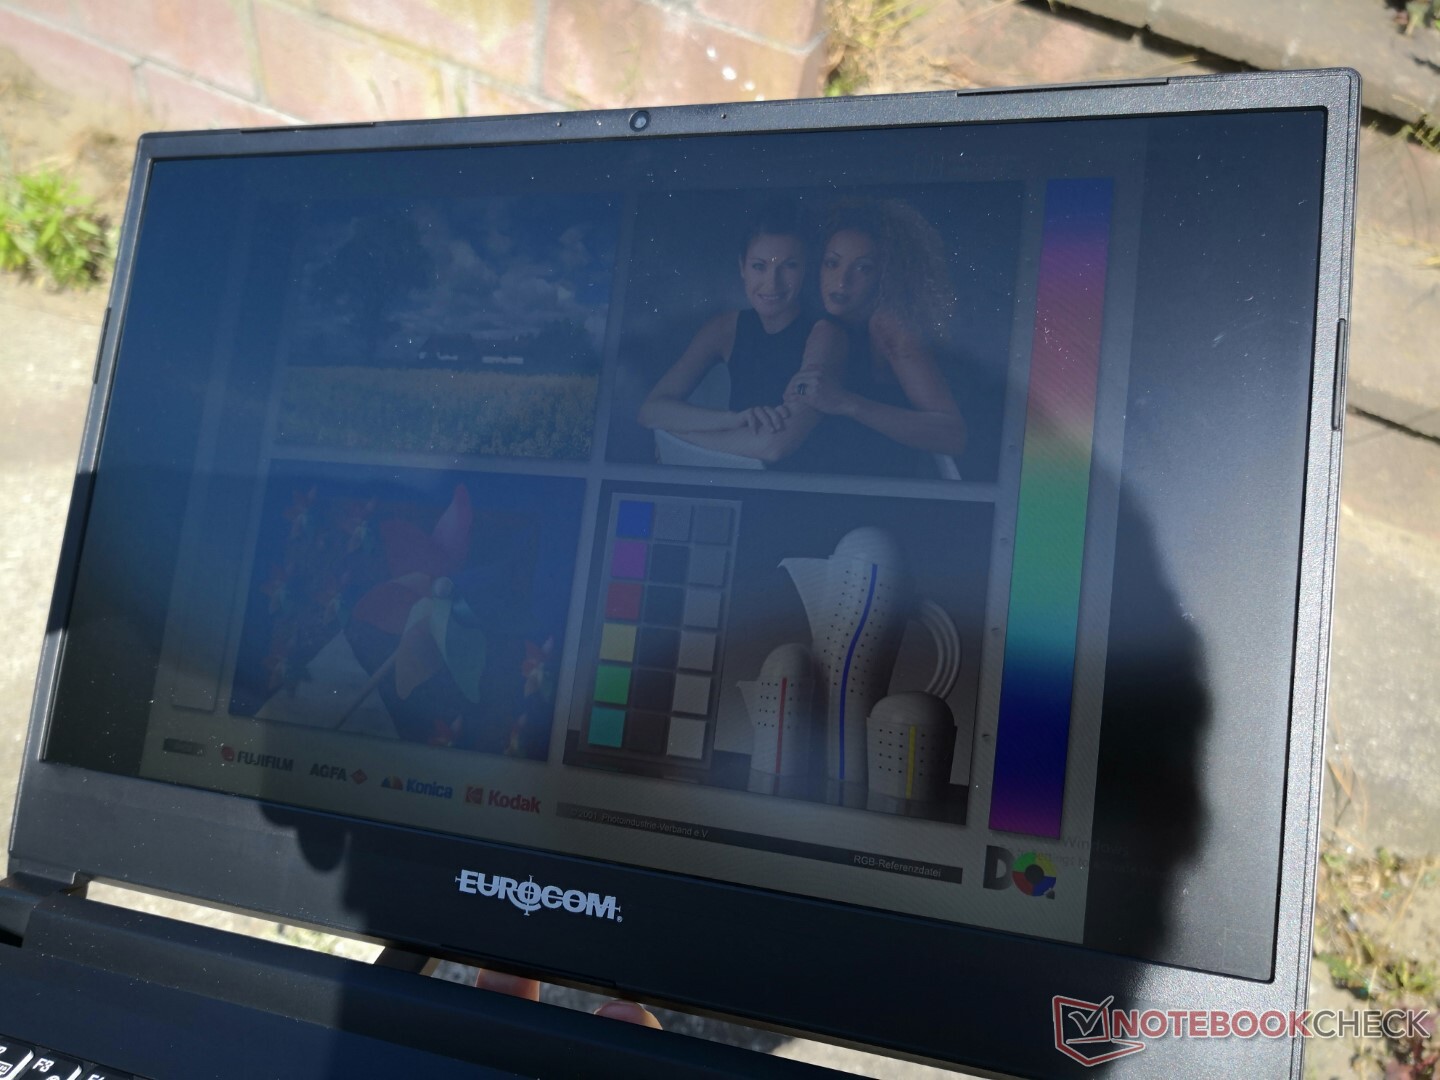
Con 300 nits, il display è sufficientemente luminoso per gli ambienti interni, ma non è nemmeno lontanamente sufficiente per una visione confortevole all'aperto. Alternative come ilDell XPS 13 9310 2-in-1 o MSI Summit E13 Flip hanno display molto più luminosi, con oltre 500 nits ciascuno, per essere più facilmente visualizzabili all'aperto.
Prestazioni - Intel di 11a generazione
Condizioni di test
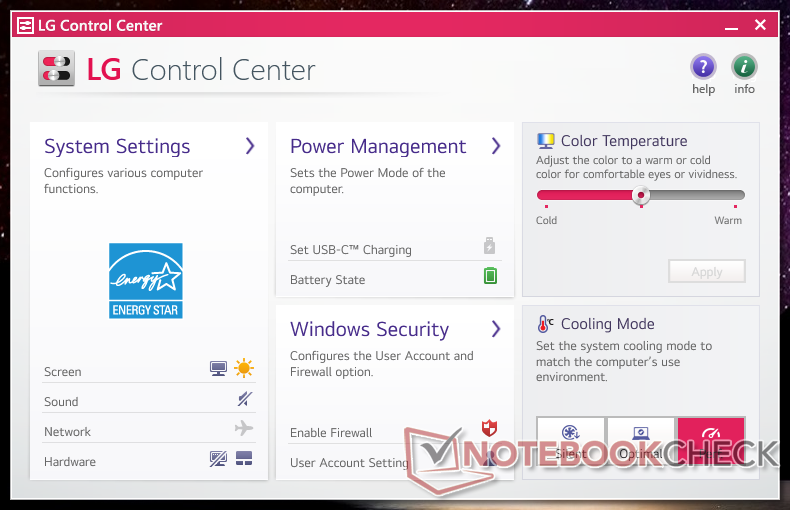
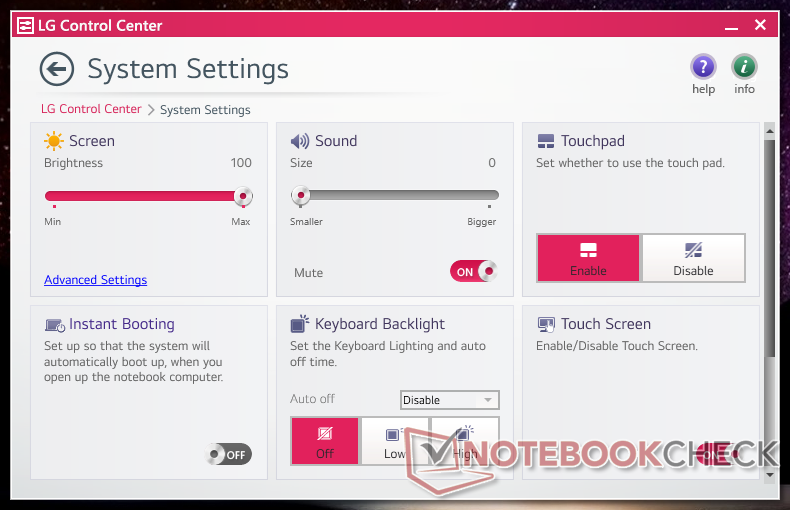
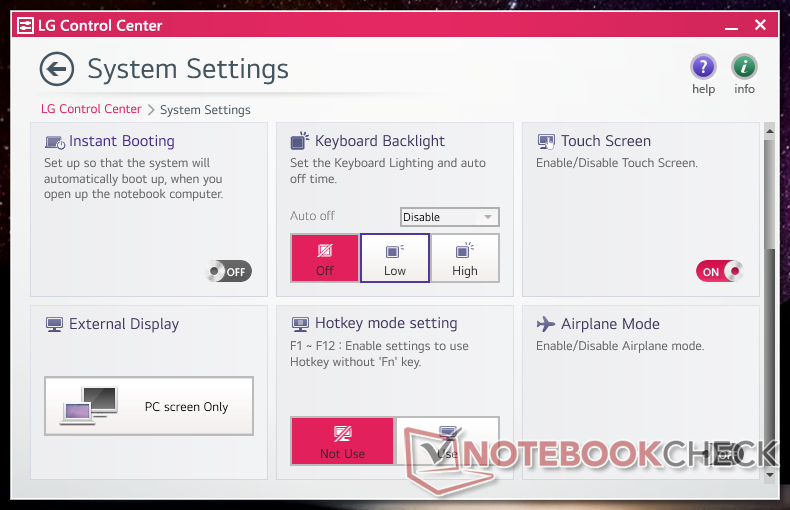
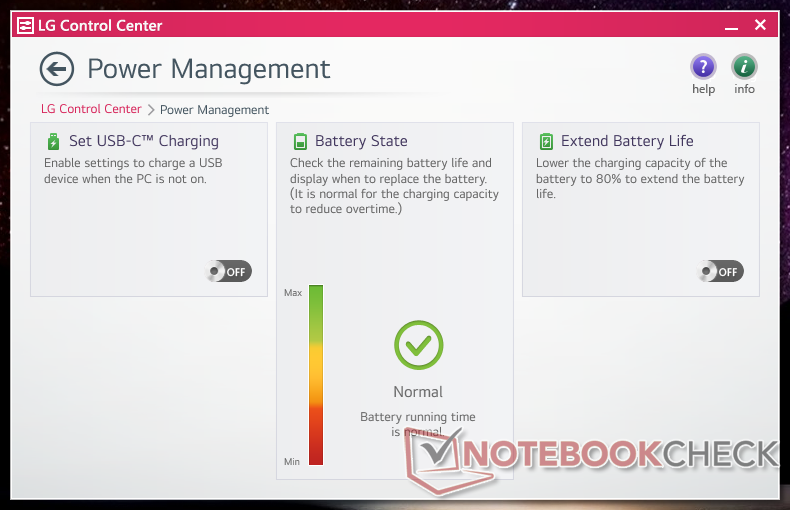
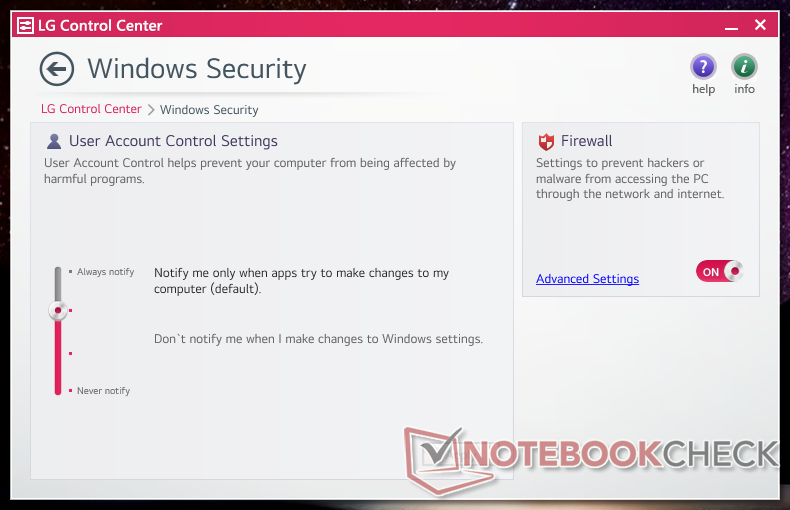
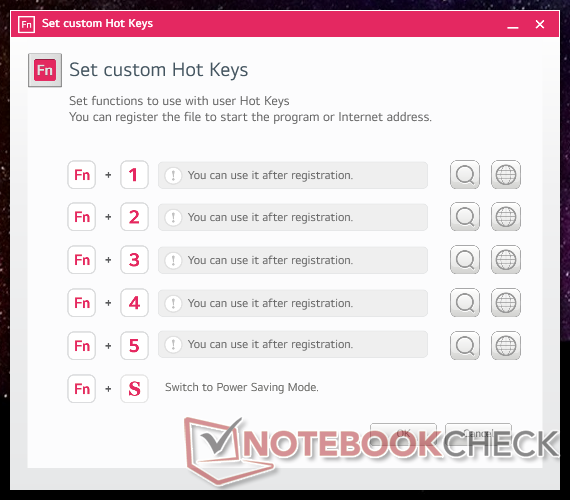
La nostra unità è stata impostata in modalità Performance prima di eseguire qualsiasi benchmark per ottenere i punteggi più alti possibili. Si consiglia vivamente di familiarizzare con il software LG Control Center preinstallato, in quanto le impostazioni e le funzioni principali vengono attivate qui, come mostrano gli screenshot qui sotto. Purtroppo l'interfaccia utente del software è molto piccola e non può essere massimizzata
Si noti che il sistema si ripristina automaticamente in modalità Bilanciata dopo ogni riavvio o spegnimento, anche se il profilo energetico è stato impostato in precedenza su Silenzioso o Prestazioni.
Processore
Le prestazioni della CPU si collocano entro pochi punti percentuali rispetto alla media dei laptop del nostro database equipaggiati con lo stesso Core i5-1135G7 core i5-1135G7. Pertanto, le prestazioni non vengono limitate troppo solo per adattarsi a un telaio convertibile ultraleggero. L'aggiornamento al Core i7-1165G7 Ha il potenziale per aumentare le prestazioni multi-thread fino al 25%, ma probabilmente sarà molto meno, dato che il Core i5 nella nostra configurazione può già raggiungere temperature superiori a 90 C
La sostenibilità del Turbo Boost è buona ma non perfetta. Eseguendo CineBench R15 xT in loop, il nostro punteggio iniziale di 796 punti alla fine scendeva e si stabilizzava a circa 666 punti, rappresentando un calo delle prestazioni del 16% nel tempo a causa delle limitazioni termiche. Sia il Dell Latitude 14 eAcer Swift 3 SF314 sono in grado di far funzionare lo stesso processore in modo costantemente più veloce, come mostra il grafico di confronto qui sotto.
Cinebench R15 Multi Loop
Cinebench R23: Multi Core | Single Core
Cinebench R15: CPU Multi 64Bit | CPU Single 64Bit
Blender: v2.79 BMW27 CPU
7-Zip 18.03: 7z b 4 | 7z b 4 -mmt1
Geekbench 5.5: Multi-Core | Single-Core
HWBOT x265 Benchmark v2.2: 4k Preset
LibreOffice : 20 Documents To PDF
R Benchmark 2.5: Overall mean
Cinebench R23: Multi Core | Single Core
Cinebench R15: CPU Multi 64Bit | CPU Single 64Bit
Blender: v2.79 BMW27 CPU
7-Zip 18.03: 7z b 4 | 7z b 4 -mmt1
Geekbench 5.5: Multi-Core | Single-Core
HWBOT x265 Benchmark v2.2: 4k Preset
LibreOffice : 20 Documents To PDF
R Benchmark 2.5: Overall mean
* ... Meglio usare valori piccoli
AIDA64: FP32 Ray-Trace | FPU Julia | CPU SHA3 | CPU Queen | FPU SinJulia | FPU Mandel | CPU AES | CPU ZLib | FP64 Ray-Trace | CPU PhotoWorxx
| Performance rating | |
| Asus ZenBook Flip 14 UN5401QA-KN085W | |
| Lenovo Yoga 9 14IAP7 82LU0001US | |
| MSI Summit E13 Flip Evo A11MT | |
| LG Gram 14T90P | |
| Dell XPS 13 9310 2-in-1 | |
| Media Intel Core i5-1135G7 | |
| HP Spectre x360 14-ea0378ng | |
| AIDA64 / FP32 Ray-Trace | |
| Asus ZenBook Flip 14 UN5401QA-KN085W | |
| MSI Summit E13 Flip Evo A11MT | |
| LG Gram 14T90P | |
| Dell XPS 13 9310 2-in-1 | |
| Media Intel Core i5-1135G7 (4313 - 7952, n=45) | |
| Lenovo Yoga 9 14IAP7 82LU0001US | |
| HP Spectre x360 14-ea0378ng | |
| AIDA64 / FPU Julia | |
| Asus ZenBook Flip 14 UN5401QA-KN085W | |
| MSI Summit E13 Flip Evo A11MT | |
| Dell XPS 13 9310 2-in-1 | |
| LG Gram 14T90P | |
| Media Intel Core i5-1135G7 (19402 - 32283, n=45) | |
| Lenovo Yoga 9 14IAP7 82LU0001US | |
| HP Spectre x360 14-ea0378ng | |
| AIDA64 / CPU SHA3 | |
| Asus ZenBook Flip 14 UN5401QA-KN085W | |
| MSI Summit E13 Flip Evo A11MT | |
| Dell XPS 13 9310 2-in-1 | |
| LG Gram 14T90P | |
| Lenovo Yoga 9 14IAP7 82LU0001US | |
| Media Intel Core i5-1135G7 (1316 - 2172, n=45) | |
| HP Spectre x360 14-ea0378ng | |
| AIDA64 / CPU Queen | |
| Asus ZenBook Flip 14 UN5401QA-KN085W | |
| Lenovo Yoga 9 14IAP7 82LU0001US | |
| MSI Summit E13 Flip Evo A11MT | |
| HP Spectre x360 14-ea0378ng | |
| Dell XPS 13 9310 2-in-1 | |
| LG Gram 14T90P | |
| Media Intel Core i5-1135G7 (39000 - 46951, n=45) | |
| AIDA64 / FPU SinJulia | |
| Asus ZenBook Flip 14 UN5401QA-KN085W | |
| Lenovo Yoga 9 14IAP7 82LU0001US | |
| MSI Summit E13 Flip Evo A11MT | |
| LG Gram 14T90P | |
| Dell XPS 13 9310 2-in-1 | |
| Media Intel Core i5-1135G7 (3497 - 4445, n=45) | |
| HP Spectre x360 14-ea0378ng | |
| AIDA64 / FPU Mandel | |
| Asus ZenBook Flip 14 UN5401QA-KN085W | |
| MSI Summit E13 Flip Evo A11MT | |
| Dell XPS 13 9310 2-in-1 | |
| LG Gram 14T90P | |
| Media Intel Core i5-1135G7 (12569 - 19635, n=45) | |
| Lenovo Yoga 9 14IAP7 82LU0001US | |
| HP Spectre x360 14-ea0378ng | |
| AIDA64 / CPU AES | |
| Asus ZenBook Flip 14 UN5401QA-KN085W | |
| MSI Summit E13 Flip Evo A11MT | |
| Dell XPS 13 9310 2-in-1 | |
| LG Gram 14T90P | |
| Media Intel Core i5-1135G7 (28988 - 67977, n=45) | |
| HP Spectre x360 14-ea0378ng | |
| Lenovo Yoga 9 14IAP7 82LU0001US | |
| AIDA64 / CPU ZLib | |
| Asus ZenBook Flip 14 UN5401QA-KN085W | |
| Lenovo Yoga 9 14IAP7 82LU0001US | |
| MSI Summit E13 Flip Evo A11MT | |
| LG Gram 14T90P | |
| Dell XPS 13 9310 2-in-1 | |
| Media Intel Core i5-1135G7 (265 - 373, n=51) | |
| HP Spectre x360 14-ea0378ng | |
| AIDA64 / FP64 Ray-Trace | |
| Asus ZenBook Flip 14 UN5401QA-KN085W | |
| MSI Summit E13 Flip Evo A11MT | |
| LG Gram 14T90P | |
| Dell XPS 13 9310 2-in-1 | |
| Media Intel Core i5-1135G7 (2226 - 4291, n=45) | |
| Lenovo Yoga 9 14IAP7 82LU0001US | |
| HP Spectre x360 14-ea0378ng | |
| AIDA64 / CPU PhotoWorxx | |
| Lenovo Yoga 9 14IAP7 82LU0001US | |
| LG Gram 14T90P | |
| MSI Summit E13 Flip Evo A11MT | |
| Dell XPS 13 9310 2-in-1 | |
| HP Spectre x360 14-ea0378ng | |
| Media Intel Core i5-1135G7 (9004 - 45366, n=45) | |
| Asus ZenBook Flip 14 UN5401QA-KN085W | |
Prestazioni del sistema
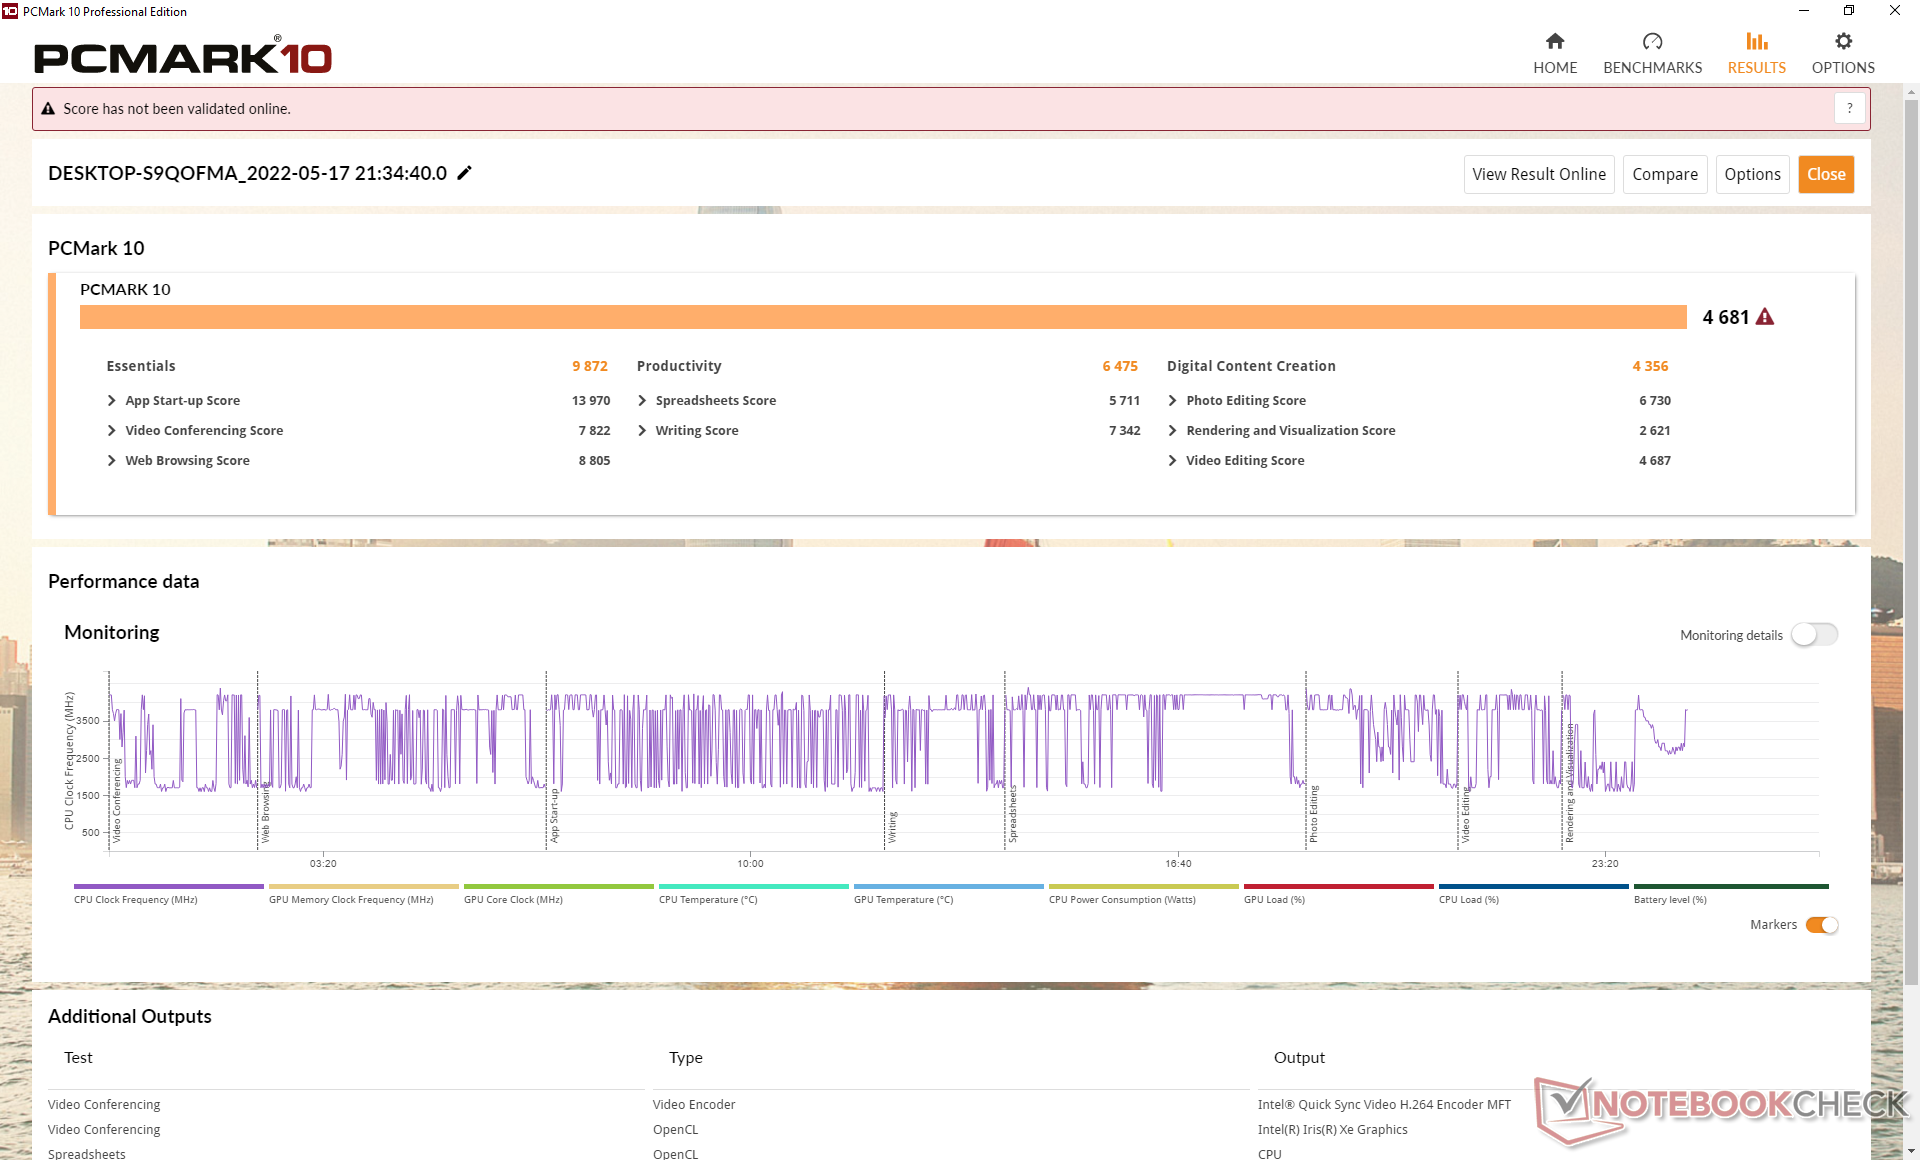
I risultati di PCMark 10 sono generalmente superiori a quelli del vecchio Gram 14T90N, soprattutto nel sottotest Creazione di contenuti digitali, dove le prestazioni della GPU sono favorite. Il nostro punteggio di produttività, tuttavia, è inferiore per ragioni sconosciute.
CrossMark: Overall | Productivity | Creativity | Responsiveness
| PCMark 10 / Score | |
| Asus ZenBook Flip 14 UN5401QA-KN085W | |
| Lenovo Yoga 9 14IAP7 82LU0001US | |
| Dell XPS 13 9310 2-in-1 | |
| MSI Summit E13 Flip Evo A11MT | |
| LG Gram 14T90P | |
| Media Intel Core i5-1135G7, Intel Iris Xe Graphics G7 80EUs (4026 - 4952, n=53) | |
| HP Spectre x360 14-ea0378ng | |
| LG Gram 14T90N | |
| PCMark 10 / Essentials | |
| Lenovo Yoga 9 14IAP7 82LU0001US | |
| Dell XPS 13 9310 2-in-1 | |
| Asus ZenBook Flip 14 UN5401QA-KN085W | |
| LG Gram 14T90P | |
| HP Spectre x360 14-ea0378ng | |
| Media Intel Core i5-1135G7, Intel Iris Xe Graphics G7 80EUs (8149 - 9917, n=53) | |
| LG Gram 14T90N | |
| MSI Summit E13 Flip Evo A11MT | |
| PCMark 10 / Productivity | |
| Asus ZenBook Flip 14 UN5401QA-KN085W | |
| LG Gram 14T90N | |
| MSI Summit E13 Flip Evo A11MT | |
| Dell XPS 13 9310 2-in-1 | |
| LG Gram 14T90P | |
| Lenovo Yoga 9 14IAP7 82LU0001US | |
| HP Spectre x360 14-ea0378ng | |
| Media Intel Core i5-1135G7, Intel Iris Xe Graphics G7 80EUs (5040 - 6619, n=53) | |
| PCMark 10 / Digital Content Creation | |
| Lenovo Yoga 9 14IAP7 82LU0001US | |
| Asus ZenBook Flip 14 UN5401QA-KN085W | |
| Dell XPS 13 9310 2-in-1 | |
| MSI Summit E13 Flip Evo A11MT | |
| Media Intel Core i5-1135G7, Intel Iris Xe Graphics G7 80EUs (3548 - 5255, n=53) | |
| LG Gram 14T90P | |
| HP Spectre x360 14-ea0378ng | |
| LG Gram 14T90N | |
| CrossMark / Overall | |
| Lenovo Yoga 9 14IAP7 82LU0001US | |
| LG Gram 14T90P | |
| Media Intel Core i5-1135G7, Intel Iris Xe Graphics G7 80EUs (1058 - 1293, n=11) | |
| CrossMark / Productivity | |
| Lenovo Yoga 9 14IAP7 82LU0001US | |
| LG Gram 14T90P | |
| Media Intel Core i5-1135G7, Intel Iris Xe Graphics G7 80EUs (1148 - 1332, n=11) | |
| CrossMark / Creativity | |
| Lenovo Yoga 9 14IAP7 82LU0001US | |
| LG Gram 14T90P | |
| Media Intel Core i5-1135G7, Intel Iris Xe Graphics G7 80EUs (895 - 1263, n=11) | |
| CrossMark / Responsiveness | |
| Lenovo Yoga 9 14IAP7 82LU0001US | |
| LG Gram 14T90P | |
| Media Intel Core i5-1135G7, Intel Iris Xe Graphics G7 80EUs (923 - 1320, n=11) | |
| PCMark 10 Score | 4681 punti | |
Aiuto | ||
| AIDA64 / Memory Copy | |
| Lenovo Yoga 9 14IAP7 82LU0001US | |
| LG Gram 14T90P | |
| Dell XPS 13 9310 2-in-1 | |
| MSI Summit E13 Flip Evo A11MT | |
| HP Spectre x360 14-ea0378ng | |
| Media Intel Core i5-1135G7 (17443 - 63889, n=45) | |
| Asus ZenBook Flip 14 UN5401QA-KN085W | |
| AIDA64 / Memory Read | |
| Lenovo Yoga 9 14IAP7 82LU0001US | |
| LG Gram 14T90P | |
| Dell XPS 13 9310 2-in-1 | |
| MSI Summit E13 Flip Evo A11MT | |
| HP Spectre x360 14-ea0378ng | |
| Media Intel Core i5-1135G7 (19716 - 63705, n=45) | |
| Asus ZenBook Flip 14 UN5401QA-KN085W | |
| AIDA64 / Memory Write | |
| LG Gram 14T90P | |
| Dell XPS 13 9310 2-in-1 | |
| Lenovo Yoga 9 14IAP7 82LU0001US | |
| MSI Summit E13 Flip Evo A11MT | |
| HP Spectre x360 14-ea0378ng | |
| Media Intel Core i5-1135G7 (18722 - 66778, n=45) | |
| Asus ZenBook Flip 14 UN5401QA-KN085W | |
| AIDA64 / Memory Latency | |
| Asus ZenBook Flip 14 UN5401QA-KN085W | |
| MSI Summit E13 Flip Evo A11MT | |
| Dell XPS 13 9310 2-in-1 | |
| HP Spectre x360 14-ea0378ng | |
| LG Gram 14T90P | |
| Media Intel Core i5-1135G7 (68.3 - 107, n=51) | |
* ... Meglio usare valori piccoli
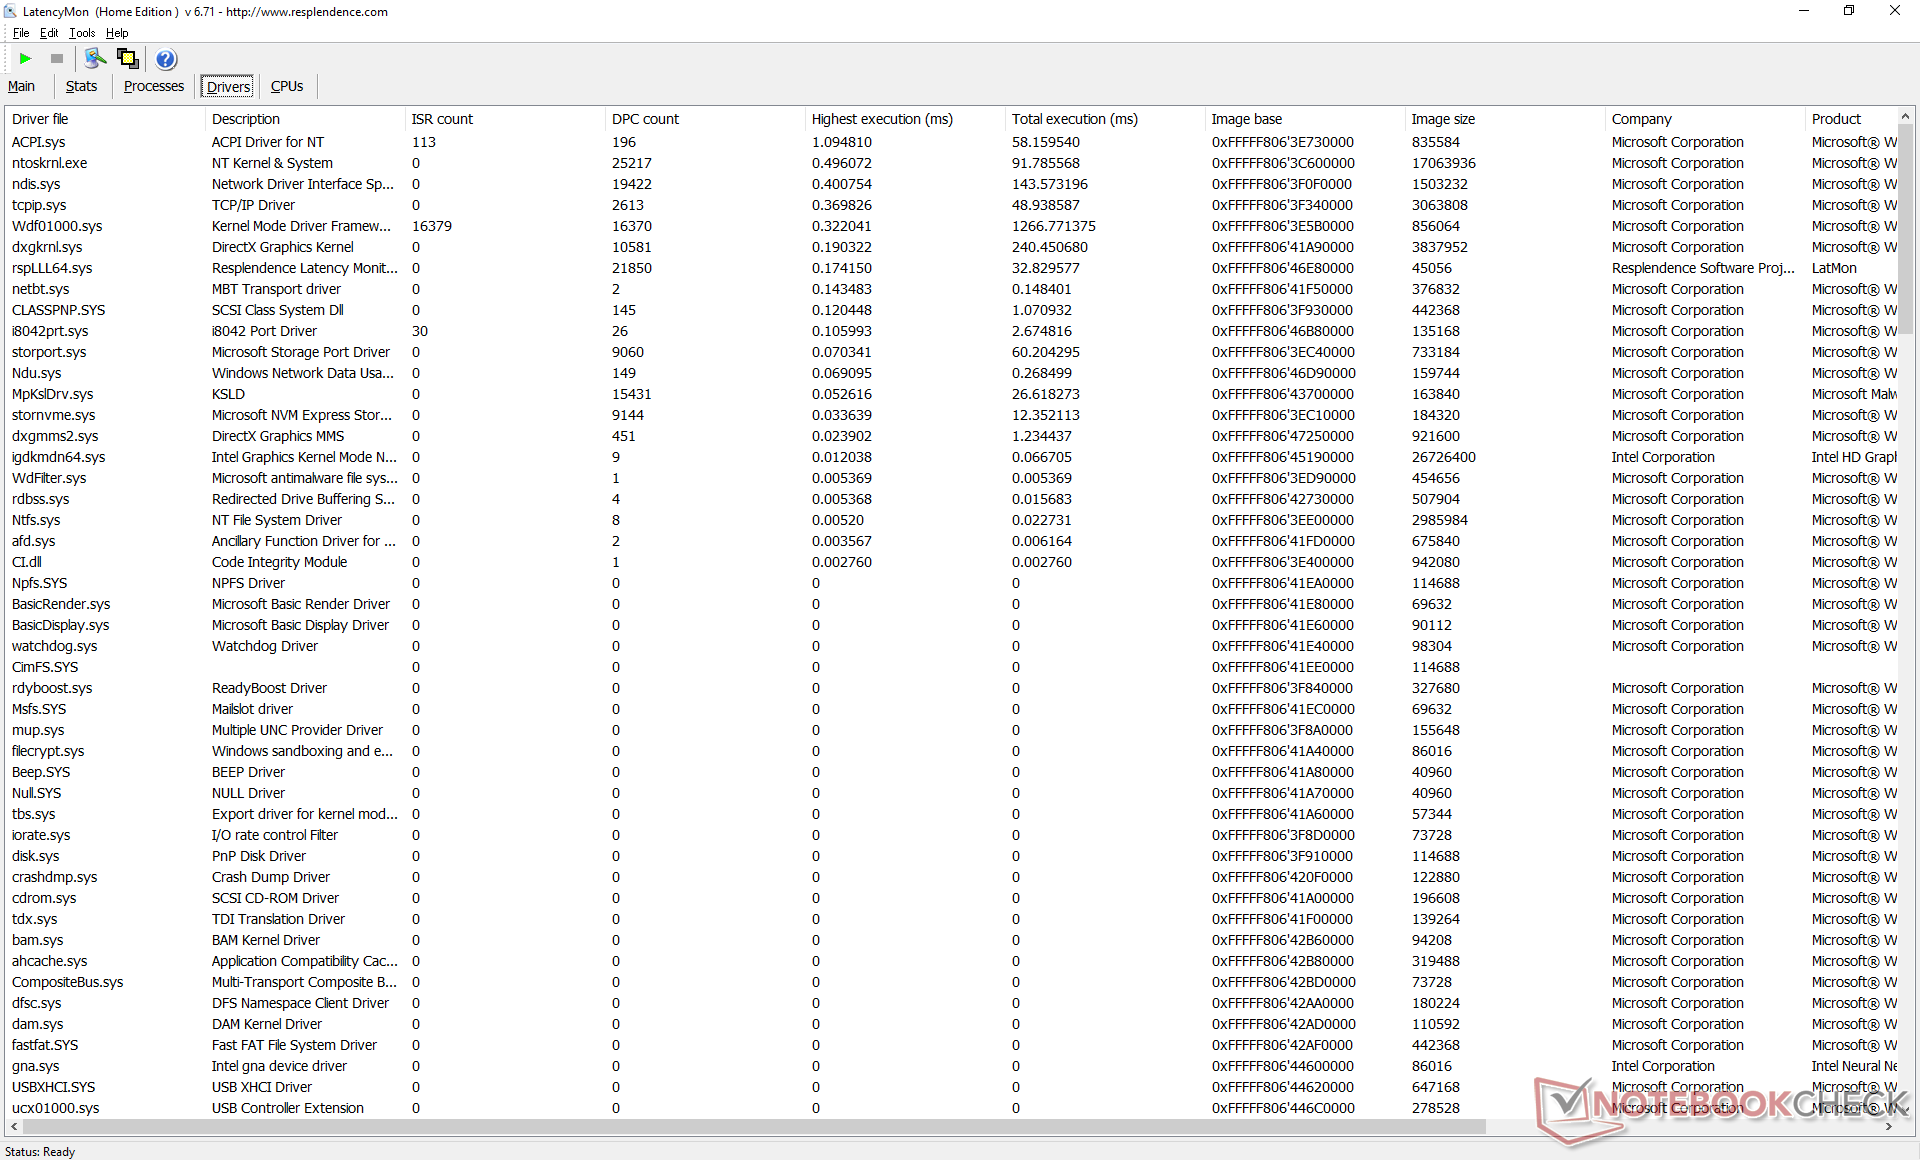
Latenza DPC
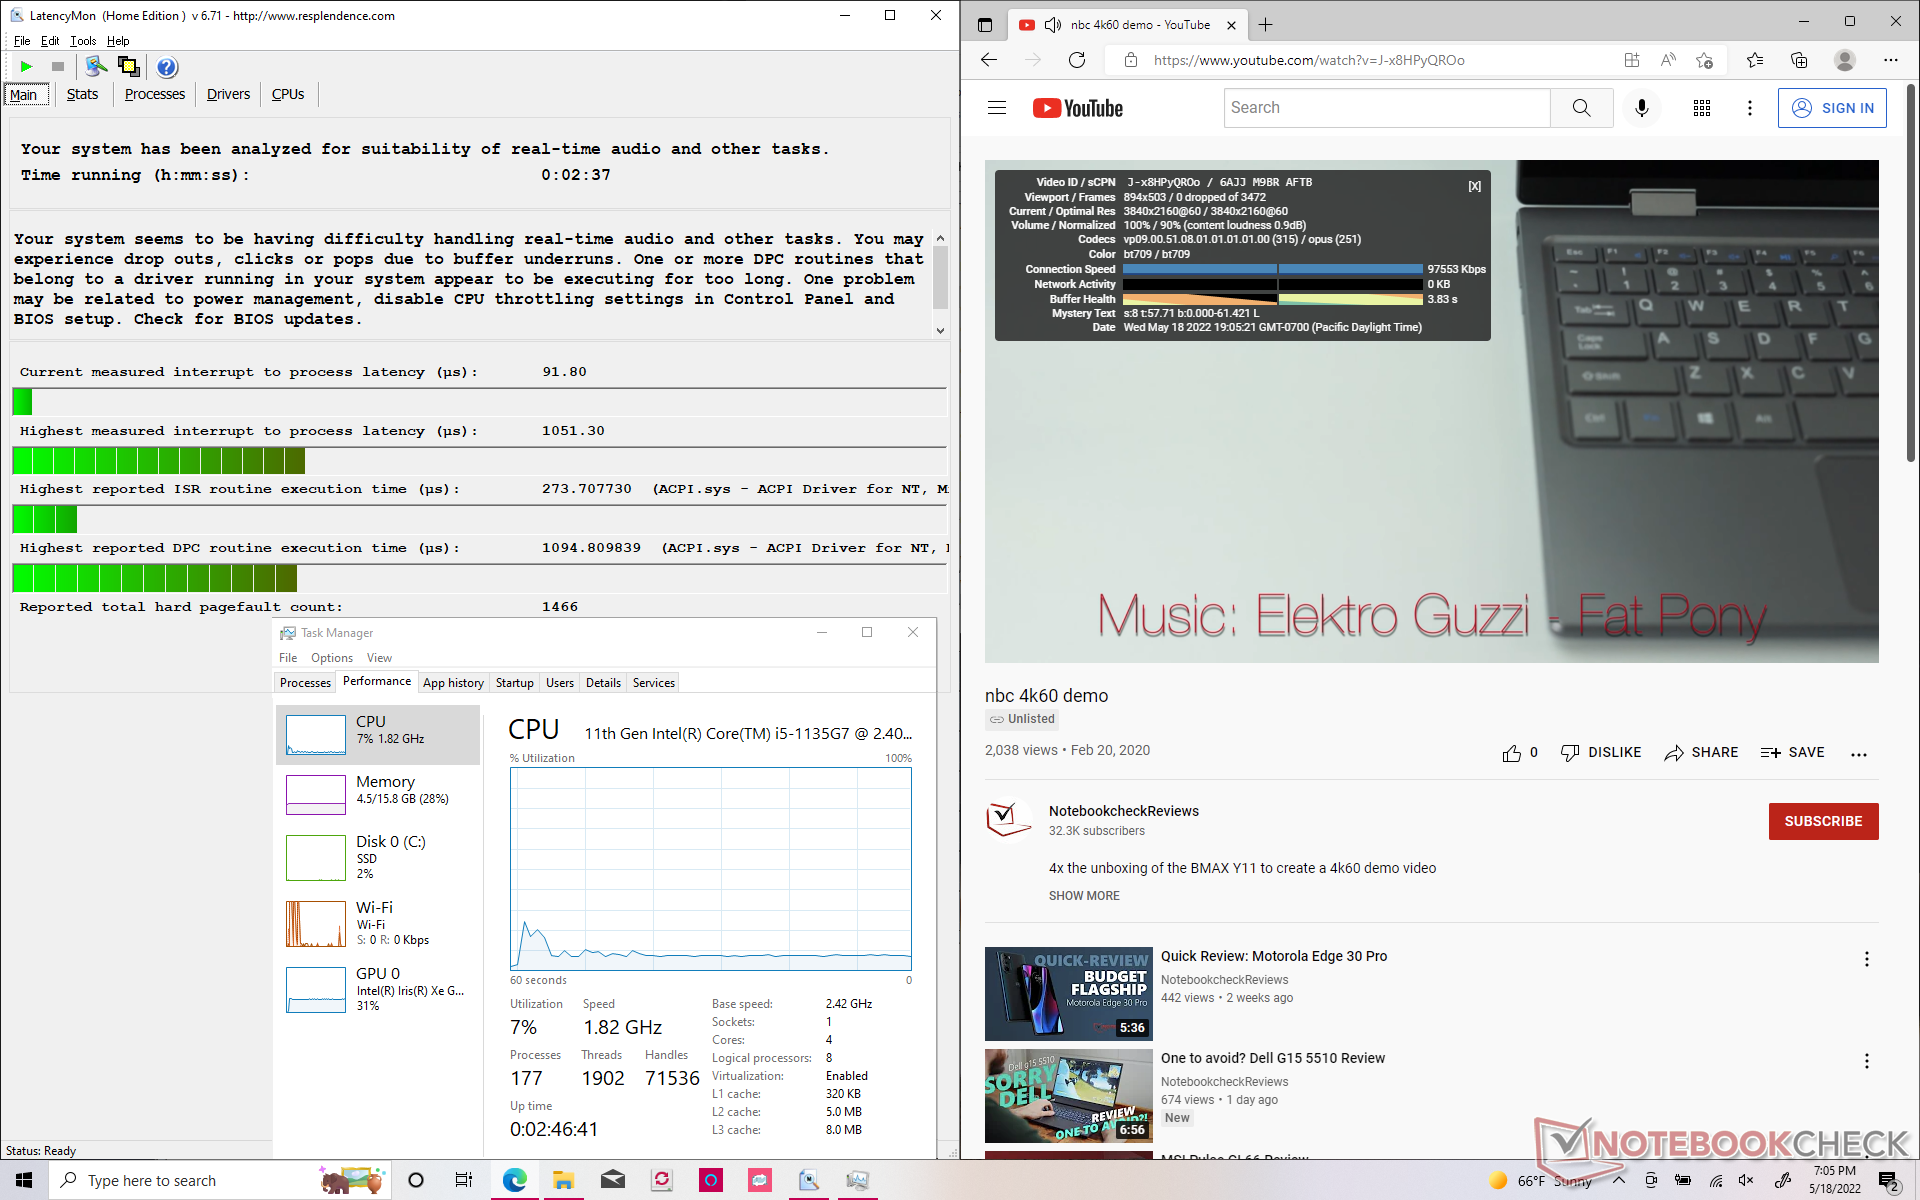
LatencyMon mostra lievi problemi di DPC quando si aprono più schede del browser sulla nostra homepage. la riproduzione di video 4K a 60 FPS è invece perfetta, senza alcuna caduta di fotogrammi.
| DPC Latencies / LatencyMon - interrupt to process latency (max), Web, Youtube, Prime95 | |
| MSI Summit E13 Flip Evo A11MT | |
| HP Spectre x360 14-ea0378ng | |
| Lenovo Yoga 9 14IAP7 82LU0001US | |
| LG Gram 14T90N | |
| LG Gram 14T90P | |
| Asus ZenBook Flip 14 UN5401QA-KN085W | |
| Dell XPS 13 9310 2-in-1 | |
* ... Meglio usare valori piccoli
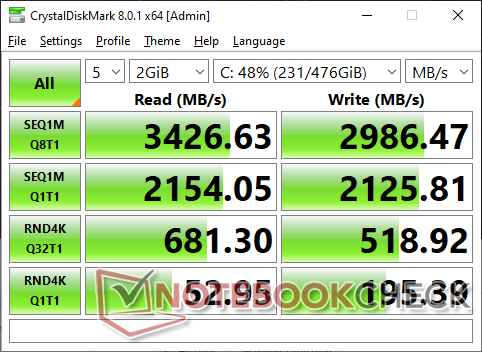
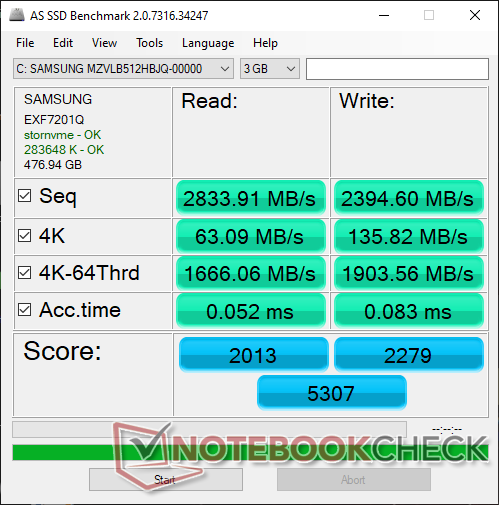
Dispositivi di archiviazione - Viene fornito con unità PCIe3
La nostra unità viene fornita con gli stessi 512 GBSamsung PM981a PCIe3 x4 NVMe del Gram 14T90N, anche se la scheda madre Tiger Lake-UP3 dovrebbe essere in grado di supportare gli aggiornamenti PCIe4 x4 dell'utente finale per ottenere velocità maggiori. Ciononostante, il PM981a non ha problemi a sostenere la sua velocità di trasferimento massima di ~3400 MB/s per periodi prolungati nei nostri test. Rimane una delle unità PCIe3 NVMe più veloci per i consumatori.

* ... Meglio usare valori piccoli
Disk Throttling: DiskSpd Read Loop, Queue Depth 8
Prestazioni della GPU
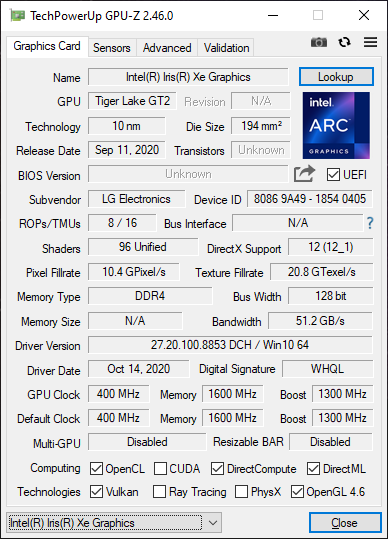
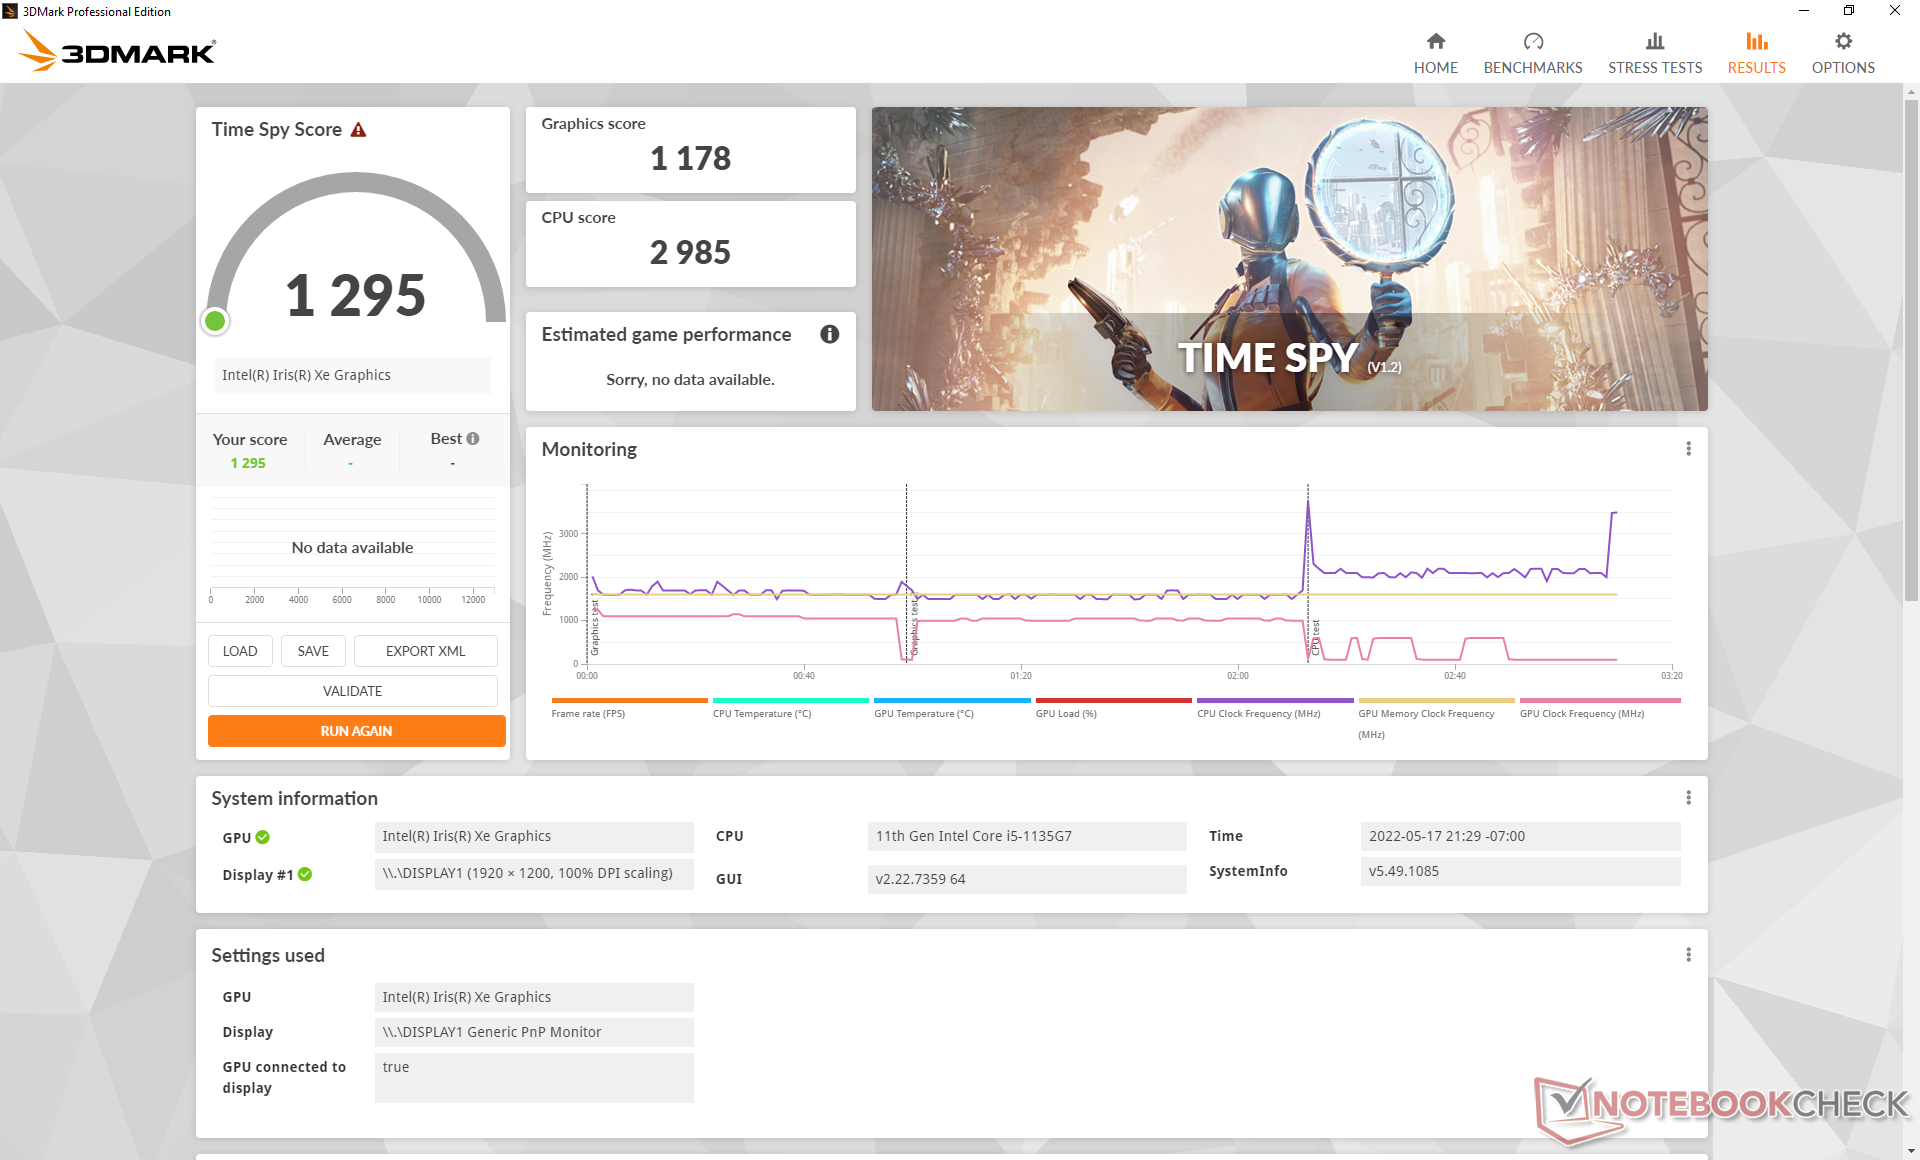
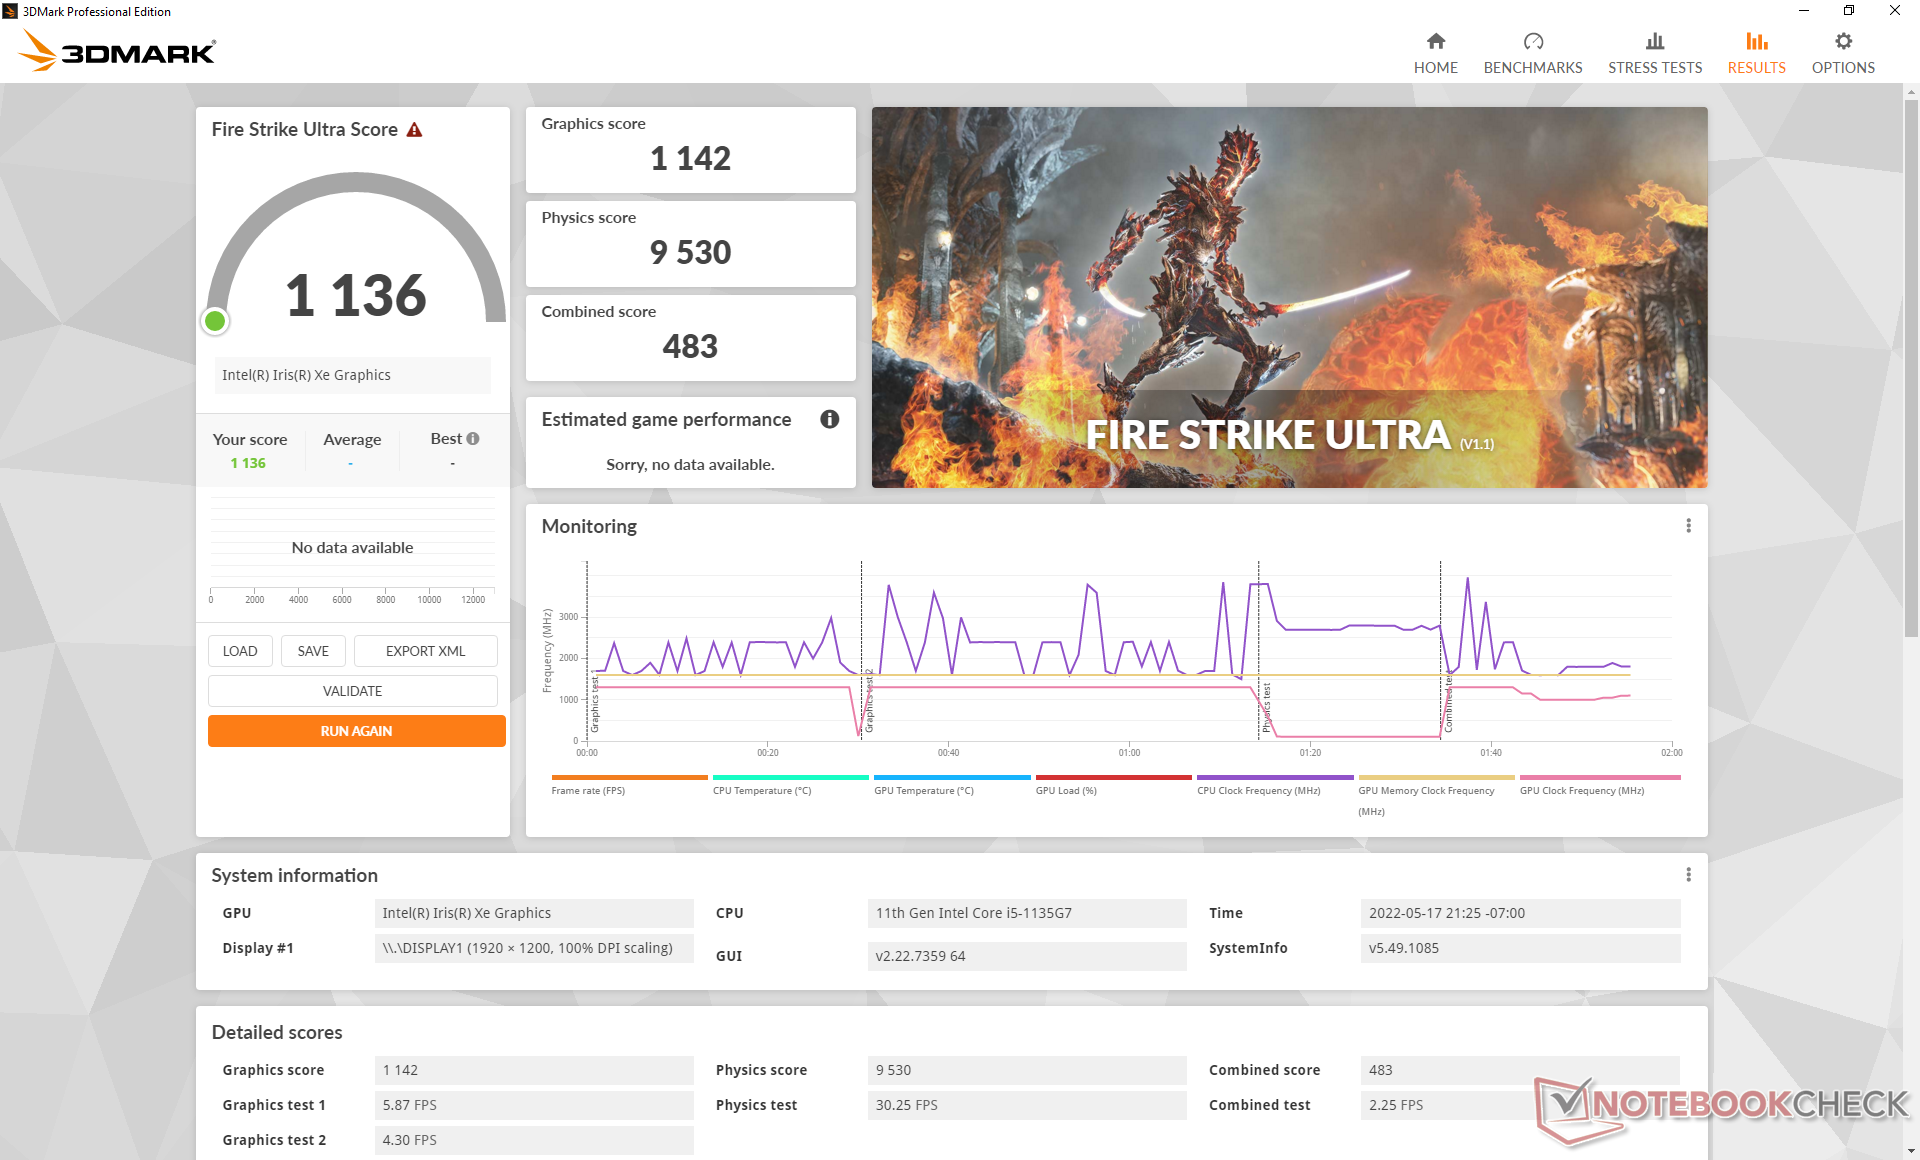
Le prestazioni grafiche delle unità integrate Iris Xe 80 EUs integrata è eccellente e più veloce rispetto alla maggior parte degli altri portatili dotati della stessa GPU. Rispetto al più comune Core i7 Iris Xe 96 EUi nostri Core i5 Iris Xe 80 EU possono essere più lenti di circa il 15-30%. Si tratta comunque di un miglioramento significativo rispetto al UHD Graphics 620 del vecchio Gram 14T90N
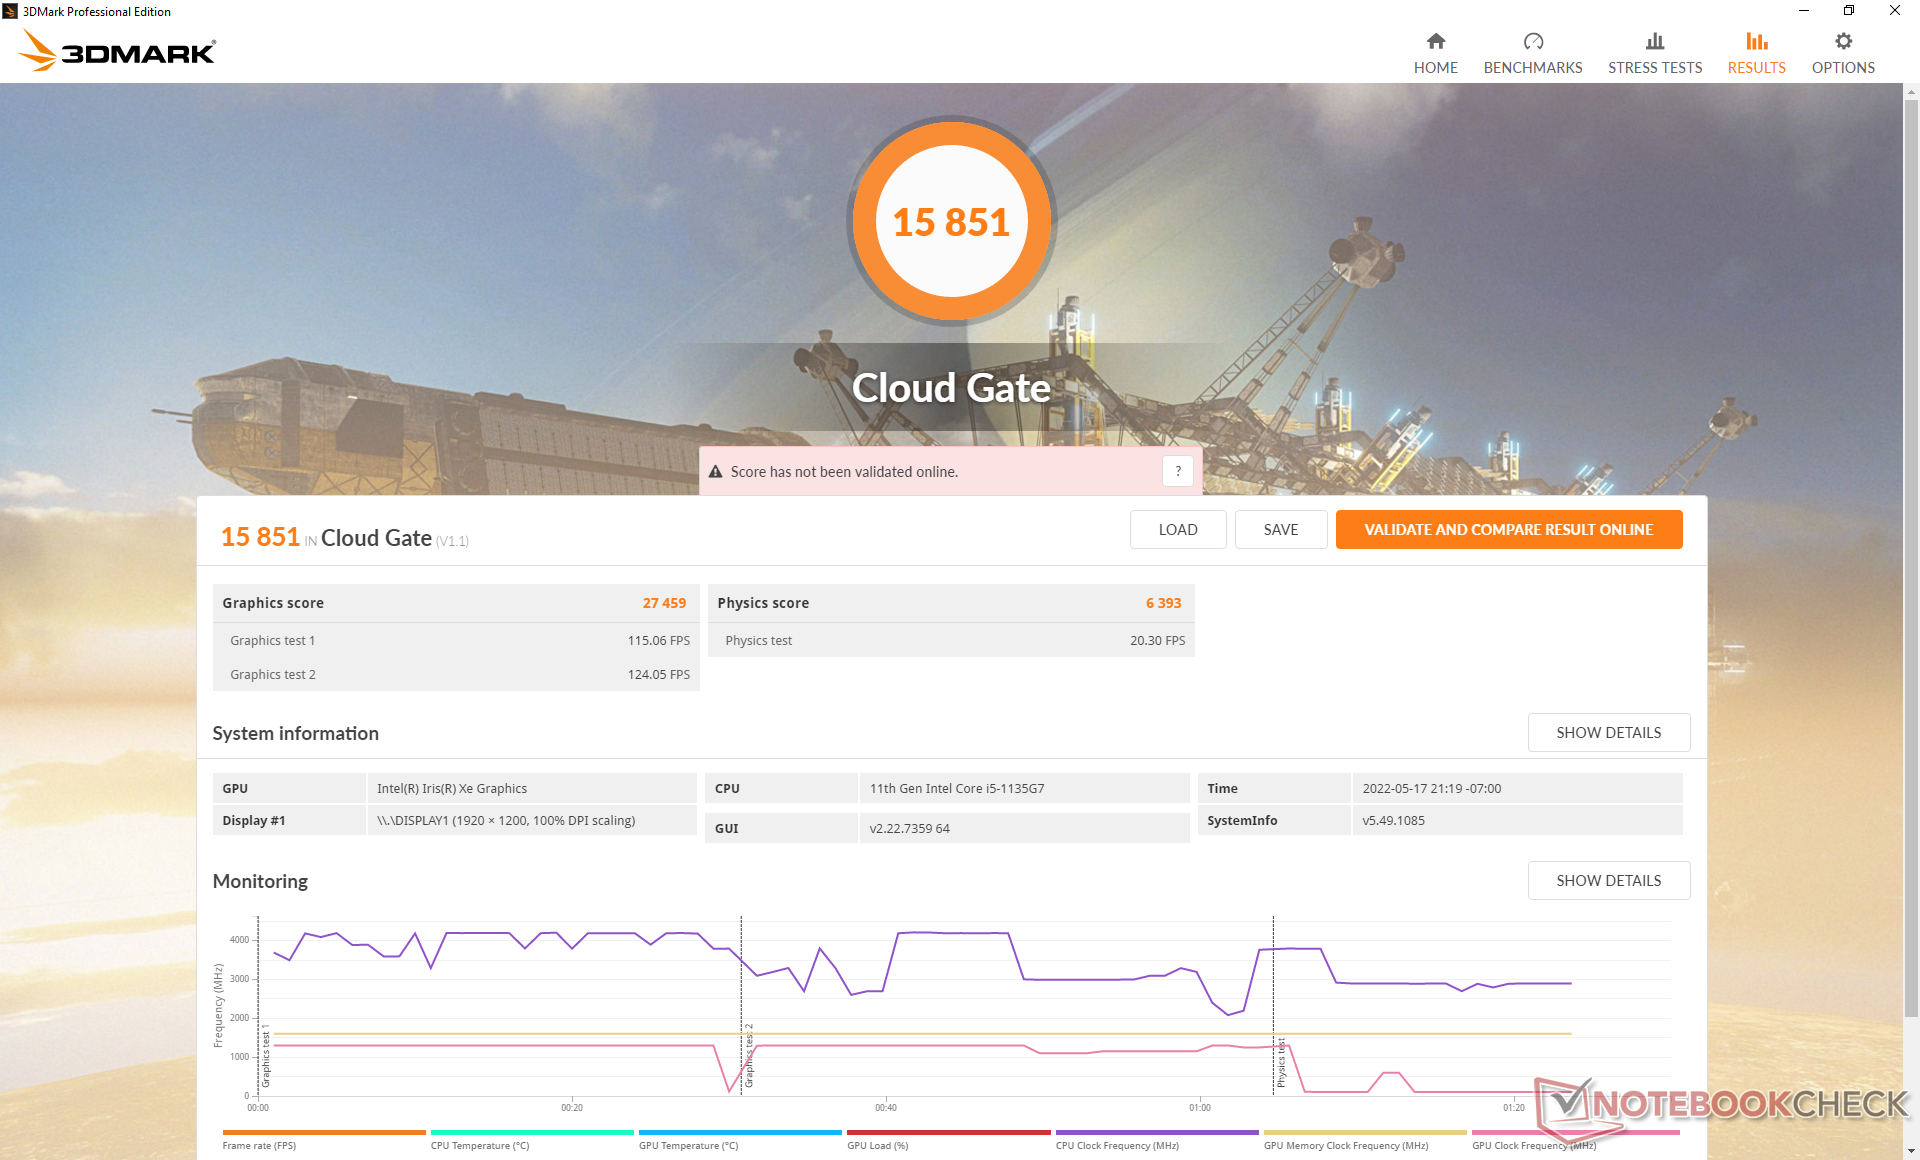
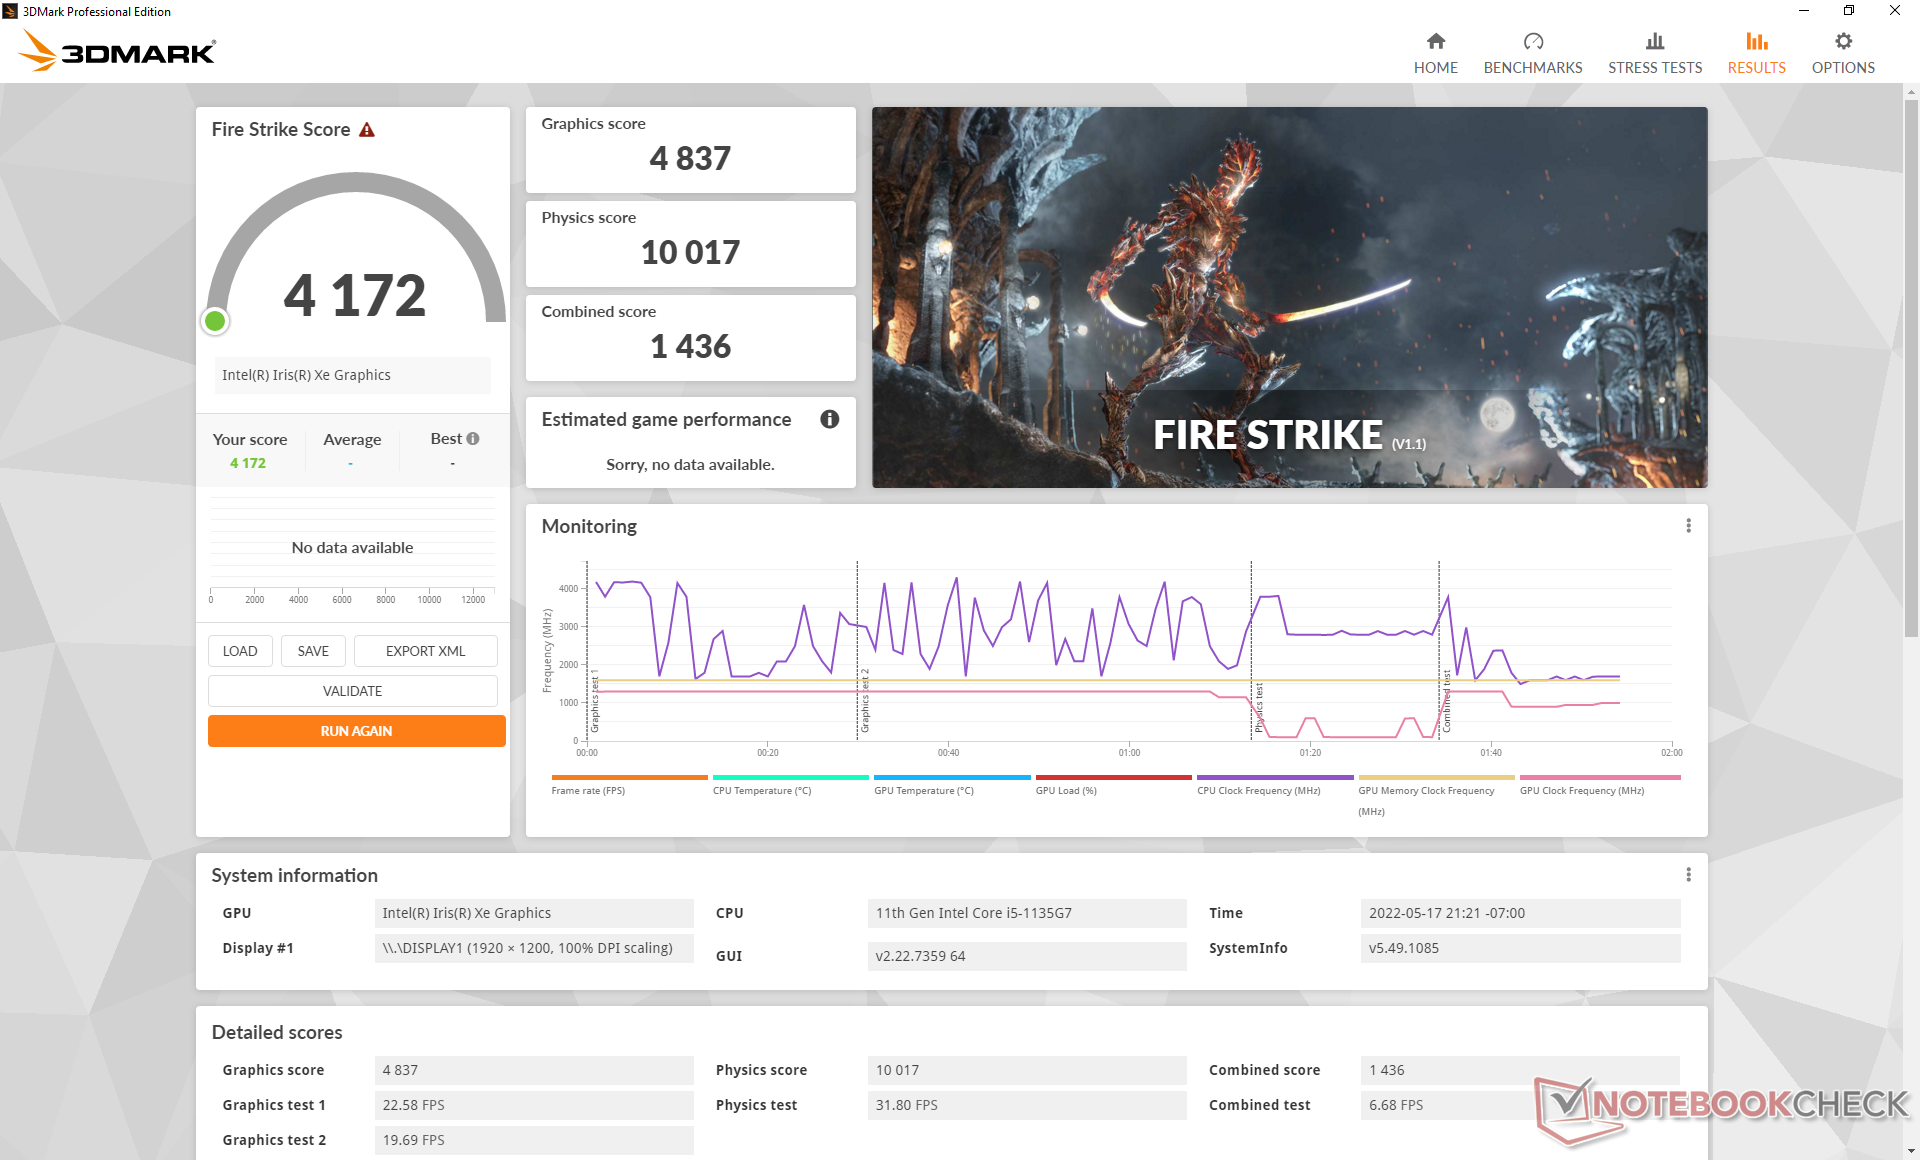
Purtroppo, le prestazioni non sono così costanti come vorremmo. Quando è al minimo con Witcher 3 a impostazioni basse a 720p, ad esempio, il frame rate oscillava tra i 75 e gli 85 FPS invece di rimanere costante come nella maggior parte degli altri portatili. L'esecuzione di Fire Strike per due volte di seguito ha portato a una discrepanza relativamente ampia nel punteggio di Fisica (10017 punti contro 11226 punti). Si consiglia di attivare il vsync per limitare il tearing dello schermo e i tempi instabili dei fotogrammi.
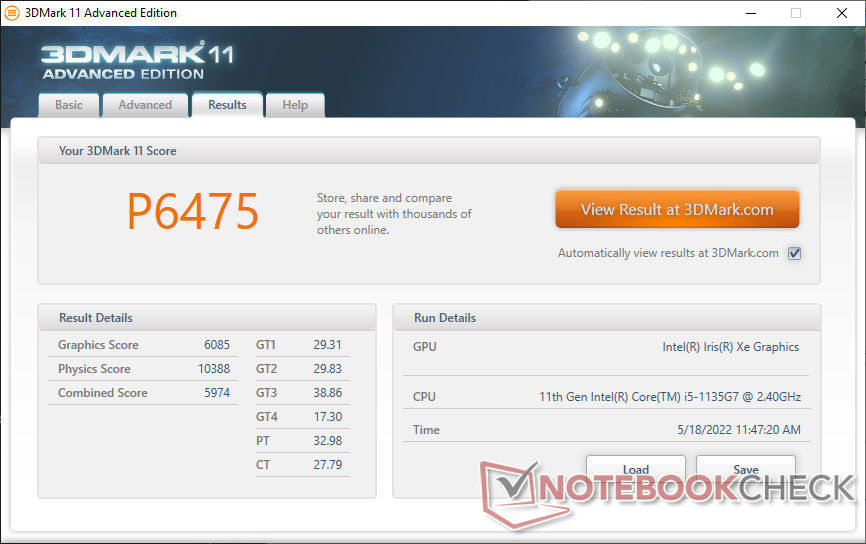
| 3DMark 11 Performance | 6475 punti | |
| 3DMark Cloud Gate Standard Score | 15851 punti | |
| 3DMark Fire Strike Score | 4172 punti | |
| 3DMark Time Spy Score | 1295 punti | |
Aiuto | ||
Witcher 3 FPS Chart
| basso | medio | alto | ultra | |
|---|---|---|---|---|
| GTA V (2015) | 83.3 | 75.1 | 25.9 | 11.4 |
| The Witcher 3 (2015) | 89.8 | 55.6 | 32.3 | 14.1 |
| Dota 2 Reborn (2015) | 85.8 | 73.3 | 46 | 42.2 |
| Final Fantasy XV Benchmark (2018) | 34.4 | 20.1 | 15.6 | |
| X-Plane 11.11 (2018) | 40.5 | 32.8 | 30.2 | |
| Strange Brigade (2018) | 88.3 | 36.3 | 28.4 | 23.2 |
Emissioni
Rumore del sistema: silenzioso nella maggior parte delle condizioni
Il comportamento della ventola è simile a quello osservato sul Gram 14T90N, che era già una macchina relativamente silenziosa. Siamo riusciti a misurare appena 28,3 dB(A) anche dopo aver eseguito la prima scena di benchmark di 3DMark 06, risultando più silenzioso del Dell XPS 13, Lenovo Yoga 9 14e Asus ZenBook Flip 14 in condizioni simili. La rumorosità della ventola sembra raggiungere i 35 dB(A) quando si gioca o se la CPU è al 100% di utilizzo.
Rumorosità
| Idle |
| 25.5 / 25.5 / 25.5 dB(A) |
| Sotto carico |
| 28.3 / 35 dB(A) |
 | ||
30 dB silenzioso 40 dB(A) udibile 50 dB(A) rumoroso |
||
min: | ||
| LG Gram 14T90P Iris Xe G7 80EUs, i5-1135G7, Samsung SSD PM981a MZVLB512HBJQ | Dell XPS 13 9310 2-in-1 Iris Xe G7 96EUs, i7-1165G7, Toshiba BG4 KBG40ZPZ512G | Lenovo Yoga 9 14IAP7 82LU0001US Iris Xe G7 96EUs, i7-1260P, Samsung PM9A1 MZVL2512HCJQ | Asus ZenBook Flip 14 UN5401QA-KN085W Vega 8, R7 5800H, Intel SSD 600p SSDPEKKW512G7 | HP Spectre x360 14-ea0378ng Iris Xe G7 96EUs, i7-1165G7, Intel Optane Memory H10 with Solid State Storage 32GB + 1TB HBRPEKNX0203AH(L/H) | MSI Summit E13 Flip Evo A11MT Iris Xe G7 96EUs, i7-1185G7, Phison 1TB SM2801T24GKBB4S-E162 | LG Gram 14T90N UHD Graphics 620, i7-10510U, Samsung SSD PM981a MZVLB512HBJQ | |
|---|---|---|---|---|---|---|---|
| Noise | -7% | -5% | -13% | -8% | -12% | -16% | |
| off /ambiente * (dB) | 25.4 | 24.3 4% | 22.9 10% | 26 -2% | 26 -2% | 24.5 4% | 29 -14% |
| Idle Minimum * (dB) | 25.5 | 24.8 3% | 23.3 9% | 26 -2% | 26 -2% | 24.7 3% | 30 -18% |
| Idle Average * (dB) | 25.5 | 24.8 3% | 23.5 8% | 26 -2% | 26 -2% | 24.7 3% | 30 -18% |
| Idle Maximum * (dB) | 25.5 | 24.8 3% | 23.5 8% | 27.3 -7% | 26 -2% | 26.4 -4% | 30 -18% |
| Load Average * (dB) | 28.3 | 38 -34% | 33.2 -17% | 39.8 -41% | 37.5 -33% | 37.8 -34% | 35.2 -24% |
| Witcher 3 ultra * (dB) | 35 | 38 -9% | 44.9 -28% | 41.4 -18% | |||
| Load Maximum * (dB) | 35 | 41.5 -19% | 44.6 -27% | 42.4 -21% | 36.3 -4% | 48.8 -39% | 37 -6% |
* ... Meglio usare valori piccoli
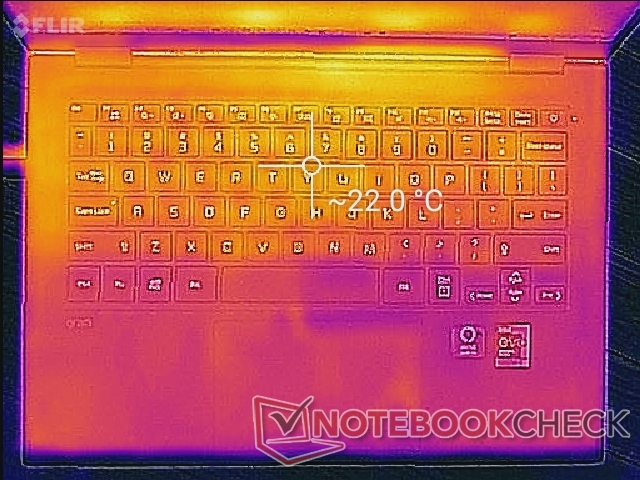
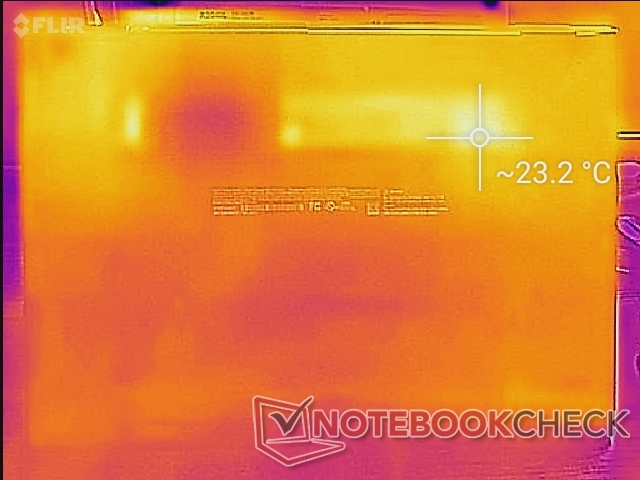
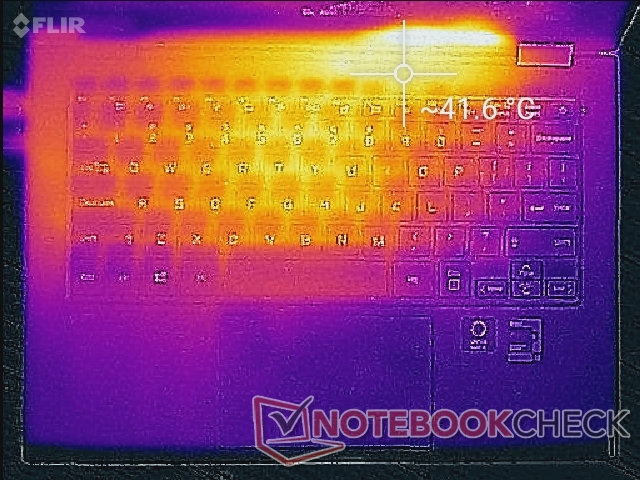
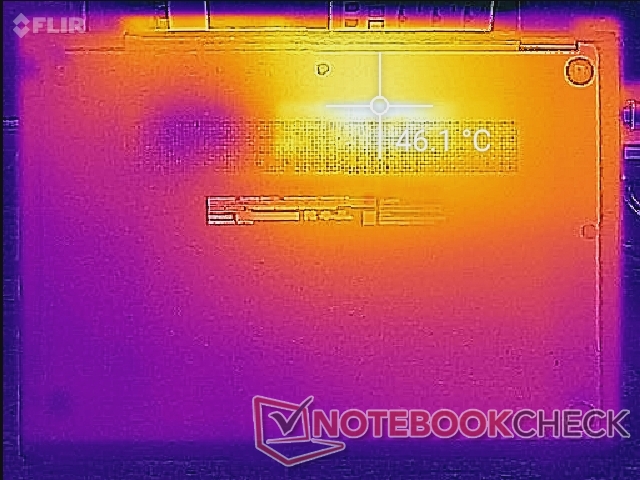
Temperatura
Le temperature di superficie sono più fresche di quelle osservate sul concorrente Lenovo Yoga 9 14IAP7 quando si eseguono carichi bassi, mentre sono più o meno uguali tra i due quando si eseguono carichi più impegnativi. I punti caldi sono quelli più vicini al centro della tastiera, dove la temperatura può raggiungere i 40 C, paragonabile a quella del Gram 14T90N o del già citato Lenovo.
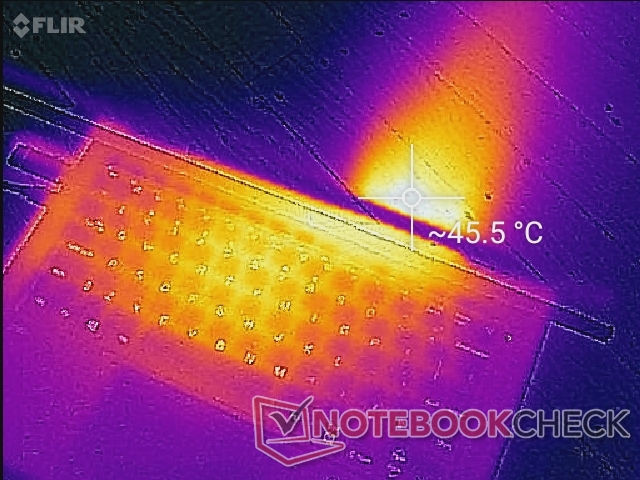
(±) La temperatura massima sul lato superiore è di 41.6 °C / 107 F, rispetto alla media di 35.4 °C / 96 F, che varia da 19.6 a 60 °C per questa classe Convertible.
(-) Il lato inferiore si riscalda fino ad un massimo di 46.2 °C / 115 F, rispetto alla media di 36.9 °C / 98 F
(+) In idle, la temperatura media del lato superiore è di 21.6 °C / 71 F, rispetto alla media deld ispositivo di 30.3 °C / 87 F.
(+) I poggiapolsi e il touchpad sono piu' freddi della temperatura della pelle con un massimo di 26.2 °C / 79.2 F e sono quindi freddi al tatto.
(±) La temperatura media della zona del palmo della mano di dispositivi simili e'stata di 28 °C / 82.4 F (+1.8 °C / 3.2 F).
| LG Gram 14T90P Intel Core i5-1135G7, Intel Iris Xe Graphics G7 80EUs | Dell XPS 13 9310 2-in-1 Intel Core i7-1165G7, Intel Iris Xe Graphics G7 96EUs | Lenovo Yoga 9 14IAP7 82LU0001US Intel Core i7-1260P, Intel Iris Xe Graphics G7 96EUs | Asus ZenBook Flip 14 UN5401QA-KN085W AMD Ryzen 7 5800H, AMD Radeon RX Vega 8 (Ryzen 4000/5000) | HP Spectre x360 14-ea0378ng Intel Core i7-1165G7, Intel Iris Xe Graphics G7 96EUs | MSI Summit E13 Flip Evo A11MT Intel Core i7-1185G7, Intel Iris Xe Graphics G7 96EUs | LG Gram 14T90N Intel Core i7-10510U, Intel UHD Graphics 620 | |
|---|---|---|---|---|---|---|---|
| Heat | -12% | -29% | -29% | -8% | -33% | -14% | |
| Maximum Upper Side * (°C) | 41.6 | 51 -23% | 43.2 -4% | 42.7 -3% | 37.1 11% | 52 -25% | 43.2 -4% |
| Maximum Bottom * (°C) | 46.2 | 45.4 2% | 45.6 1% | 53.1 -15% | 43.1 7% | 57.4 -24% | 41.6 10% |
| Idle Upper Side * (°C) | 22.6 | 24.4 -8% | 34.6 -53% | 32.9 -46% | 29 -28% | 30.4 -35% | 29.2 -29% |
| Idle Bottom * (°C) | 23.2 | 27.4 -18% | 37 -59% | 35.2 -52% | 28.6 -23% | 34.2 -47% | 30.6 -32% |
* ... Meglio usare valori piccoli
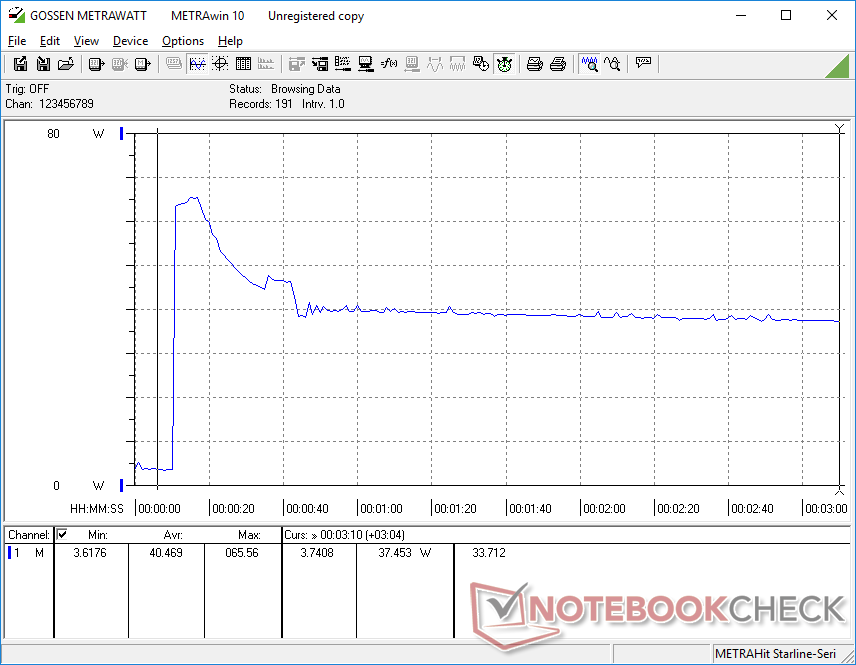
Stress test
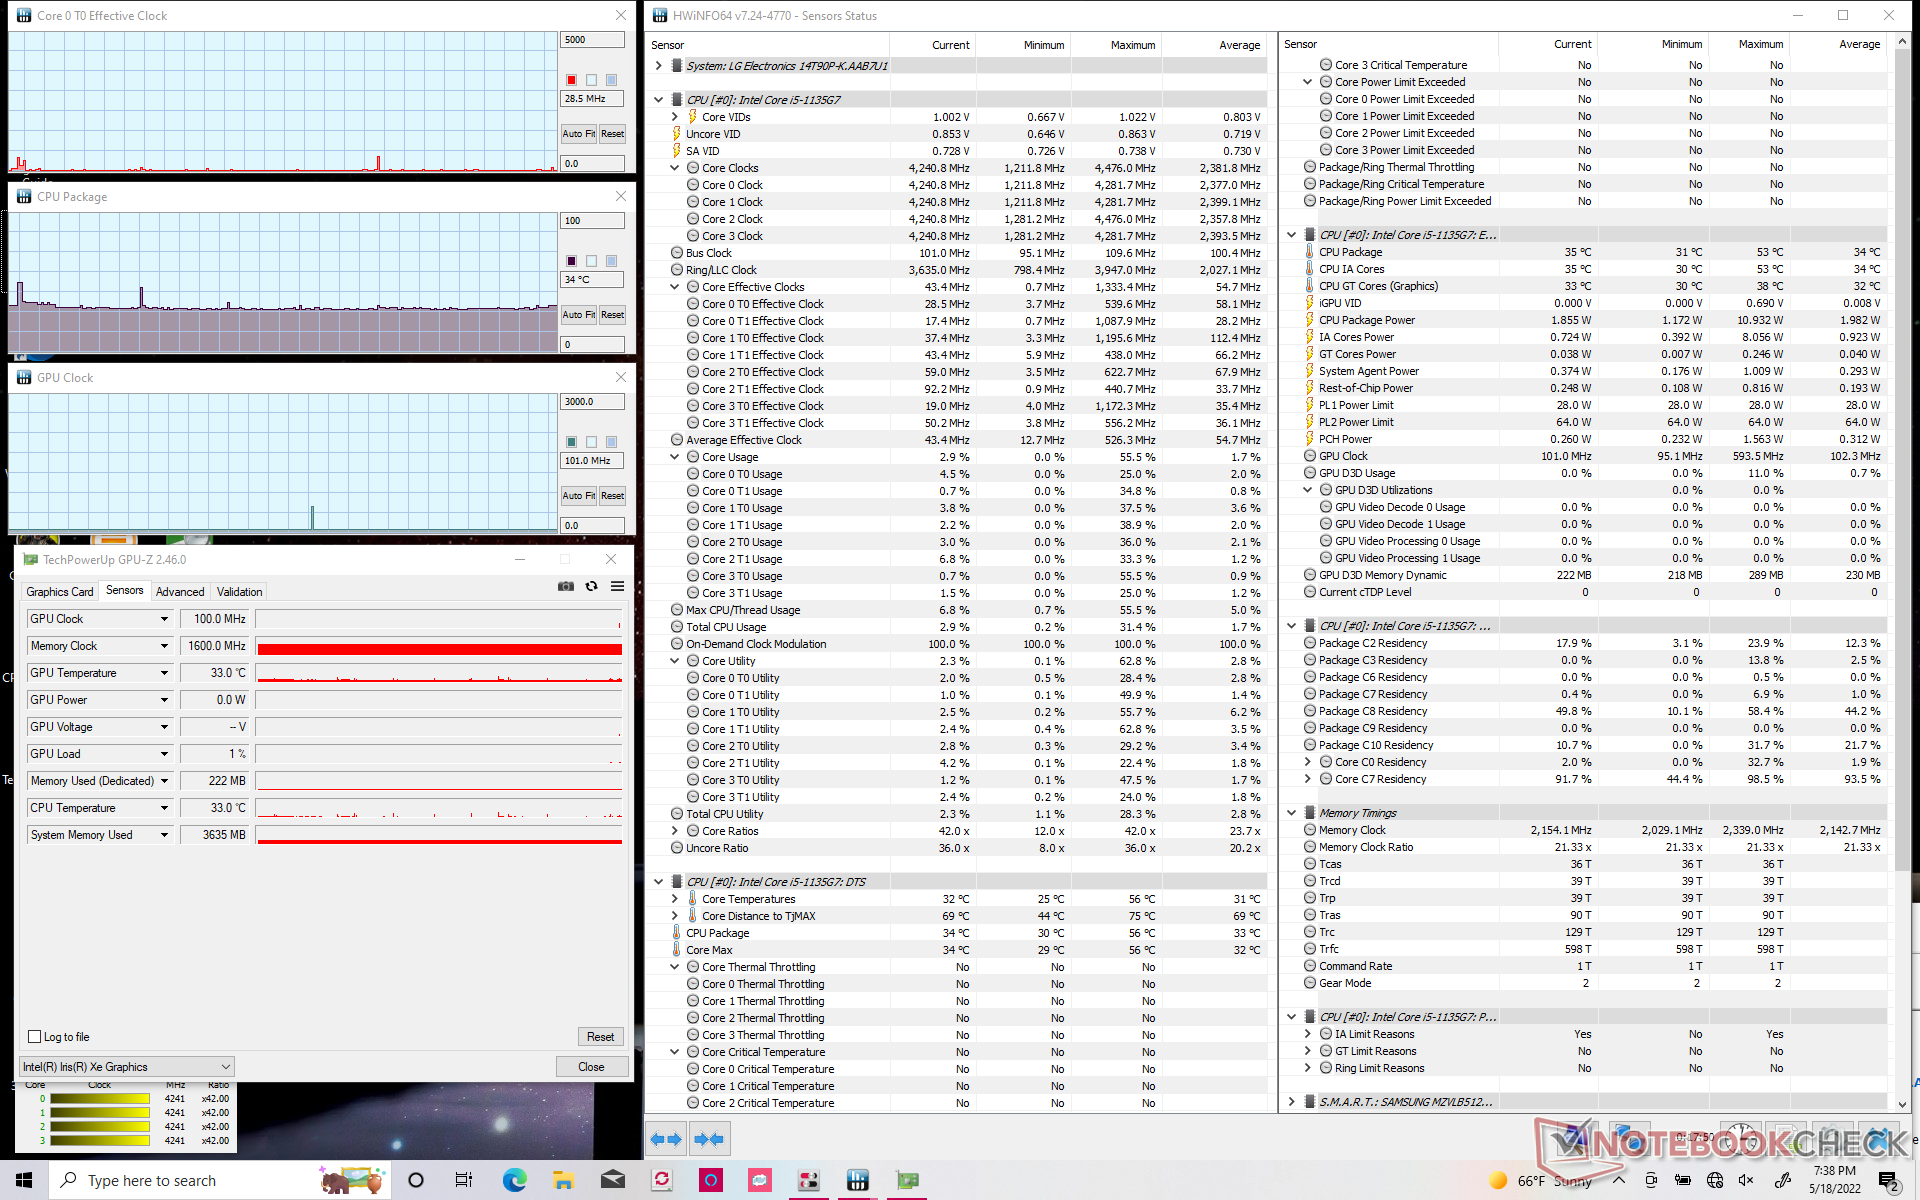
Quando è stato sottoposto a Prime95, la CPU è salita a 3,5 GHz e 95 C per alcuni secondi prima di scendere costantemente e stabilizzarsi a 2,1 GHz e 73 C. Sospettiamo che il processore non si stabilizzi a velocità di clock più elevate per tenere sotto controllo la temperatura della pelle. Il TDP della CPU ha raggiunto i 47 W all'inizio del test, prima di stabilizzarsi a soli 18 W. In confronto, eseguendo lo stesso test sul modello HP Spectre x360 14 con il Core i7-1165G7 avrebbe portato a una frequenza di clock della CPU e a una temperatura di 2,1 - 3,4 GHz e 75 - 95 C, rispettivamente, per prestazioni mediamente superiori.
L'esecuzione in modalità Performance comporta velocità di clock e temperature più elevate, come mostrano i grafici e la tabella seguenti.
Le prestazioni non saranno limitate se si utilizza l'alimentazione a batteria, poiché i punteggi di Fire Strike con alimentazione a rete e a batteria sono molto simili.
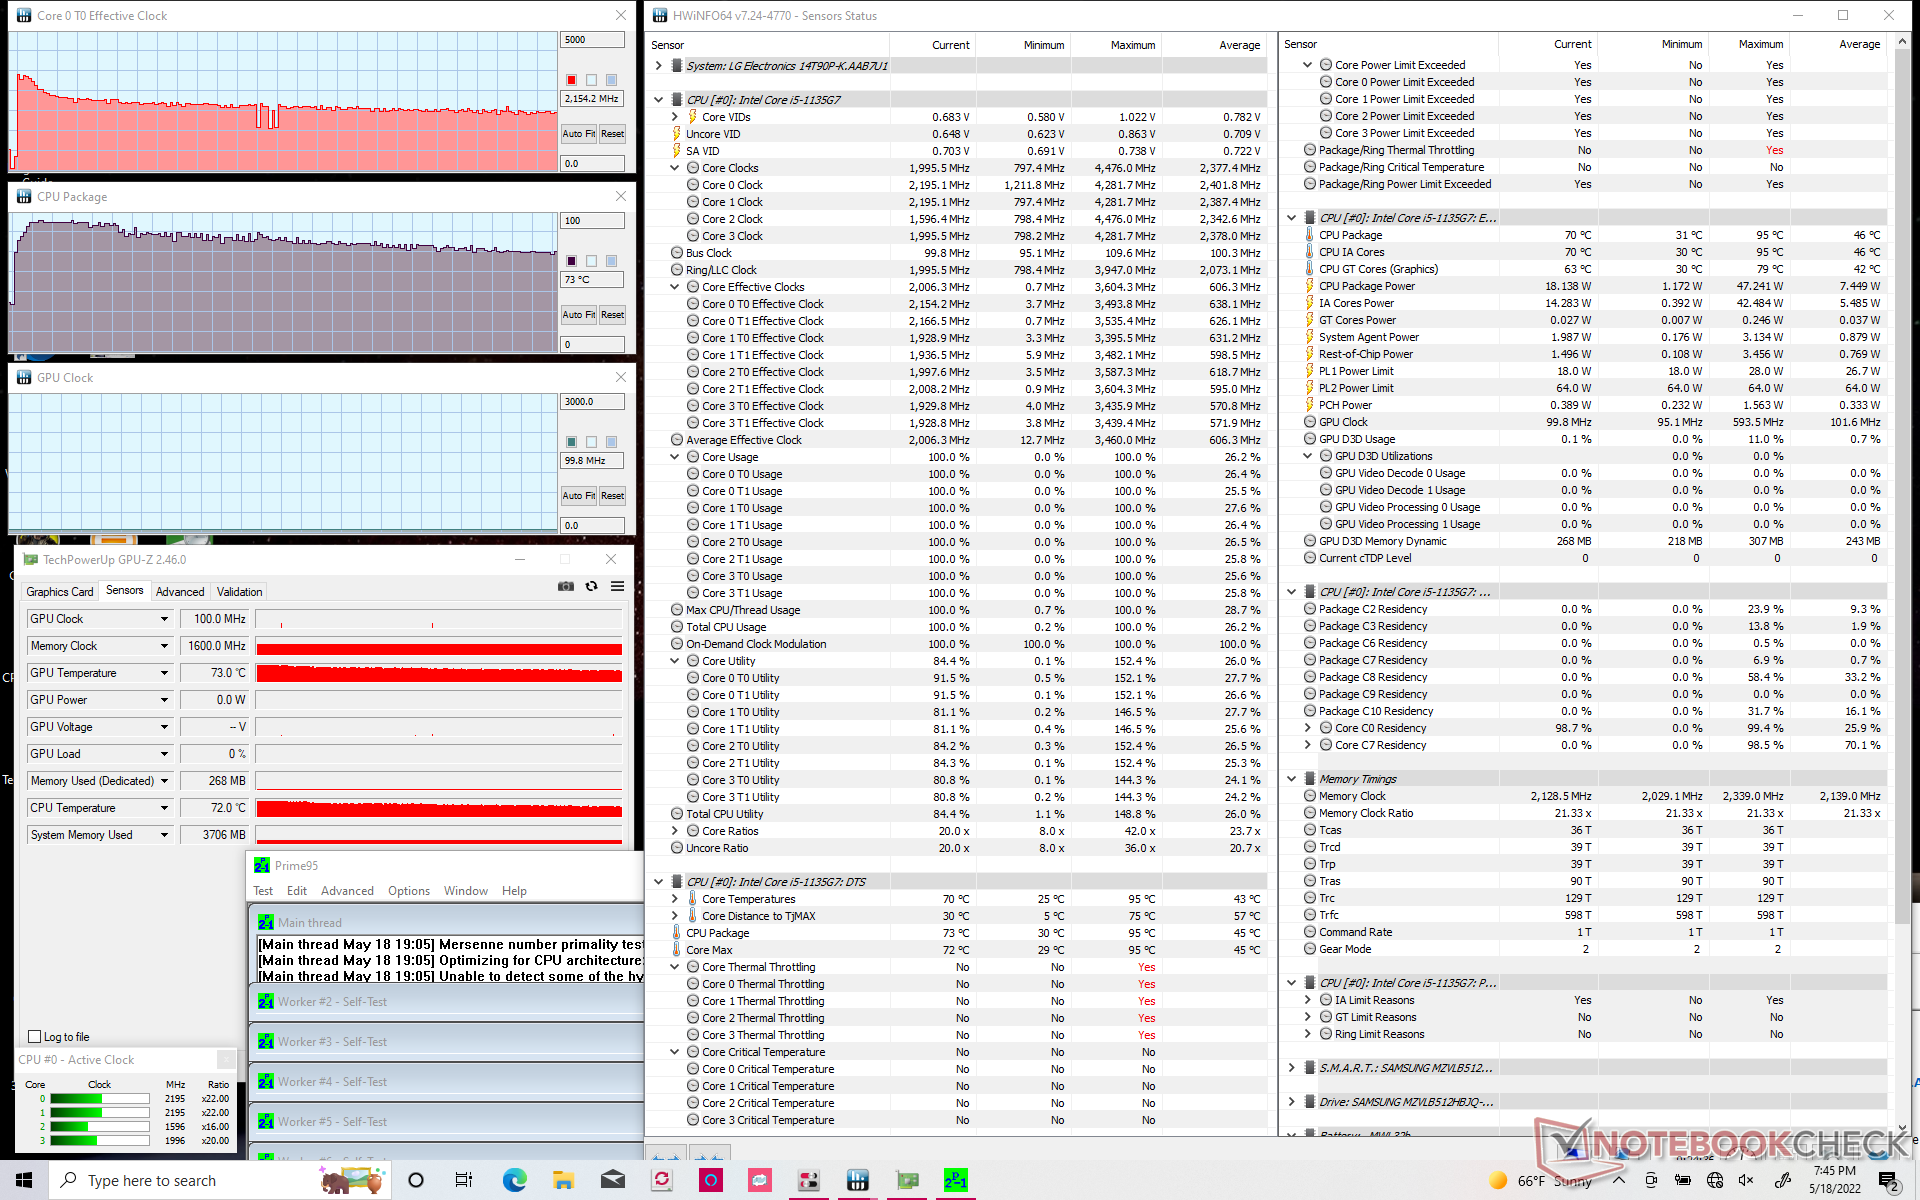
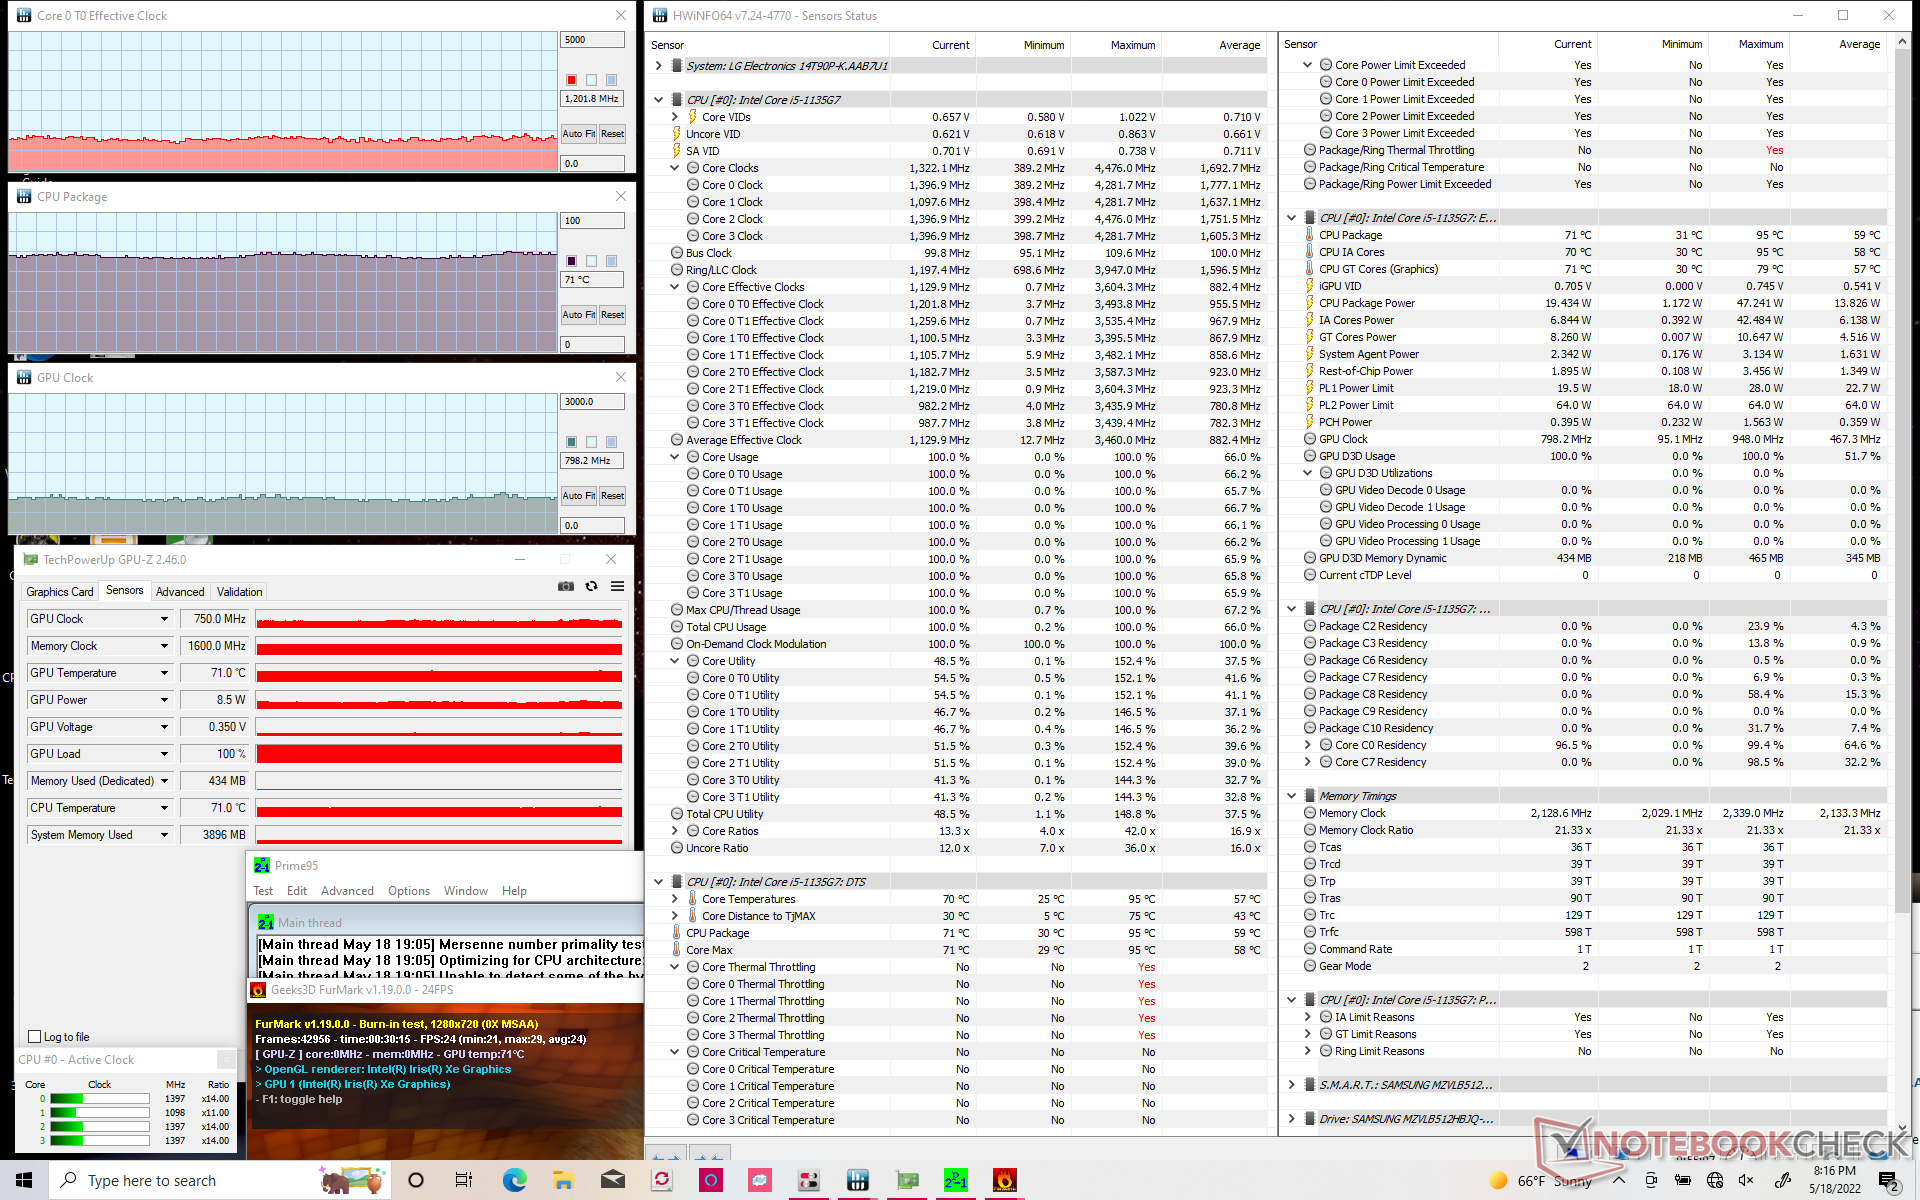
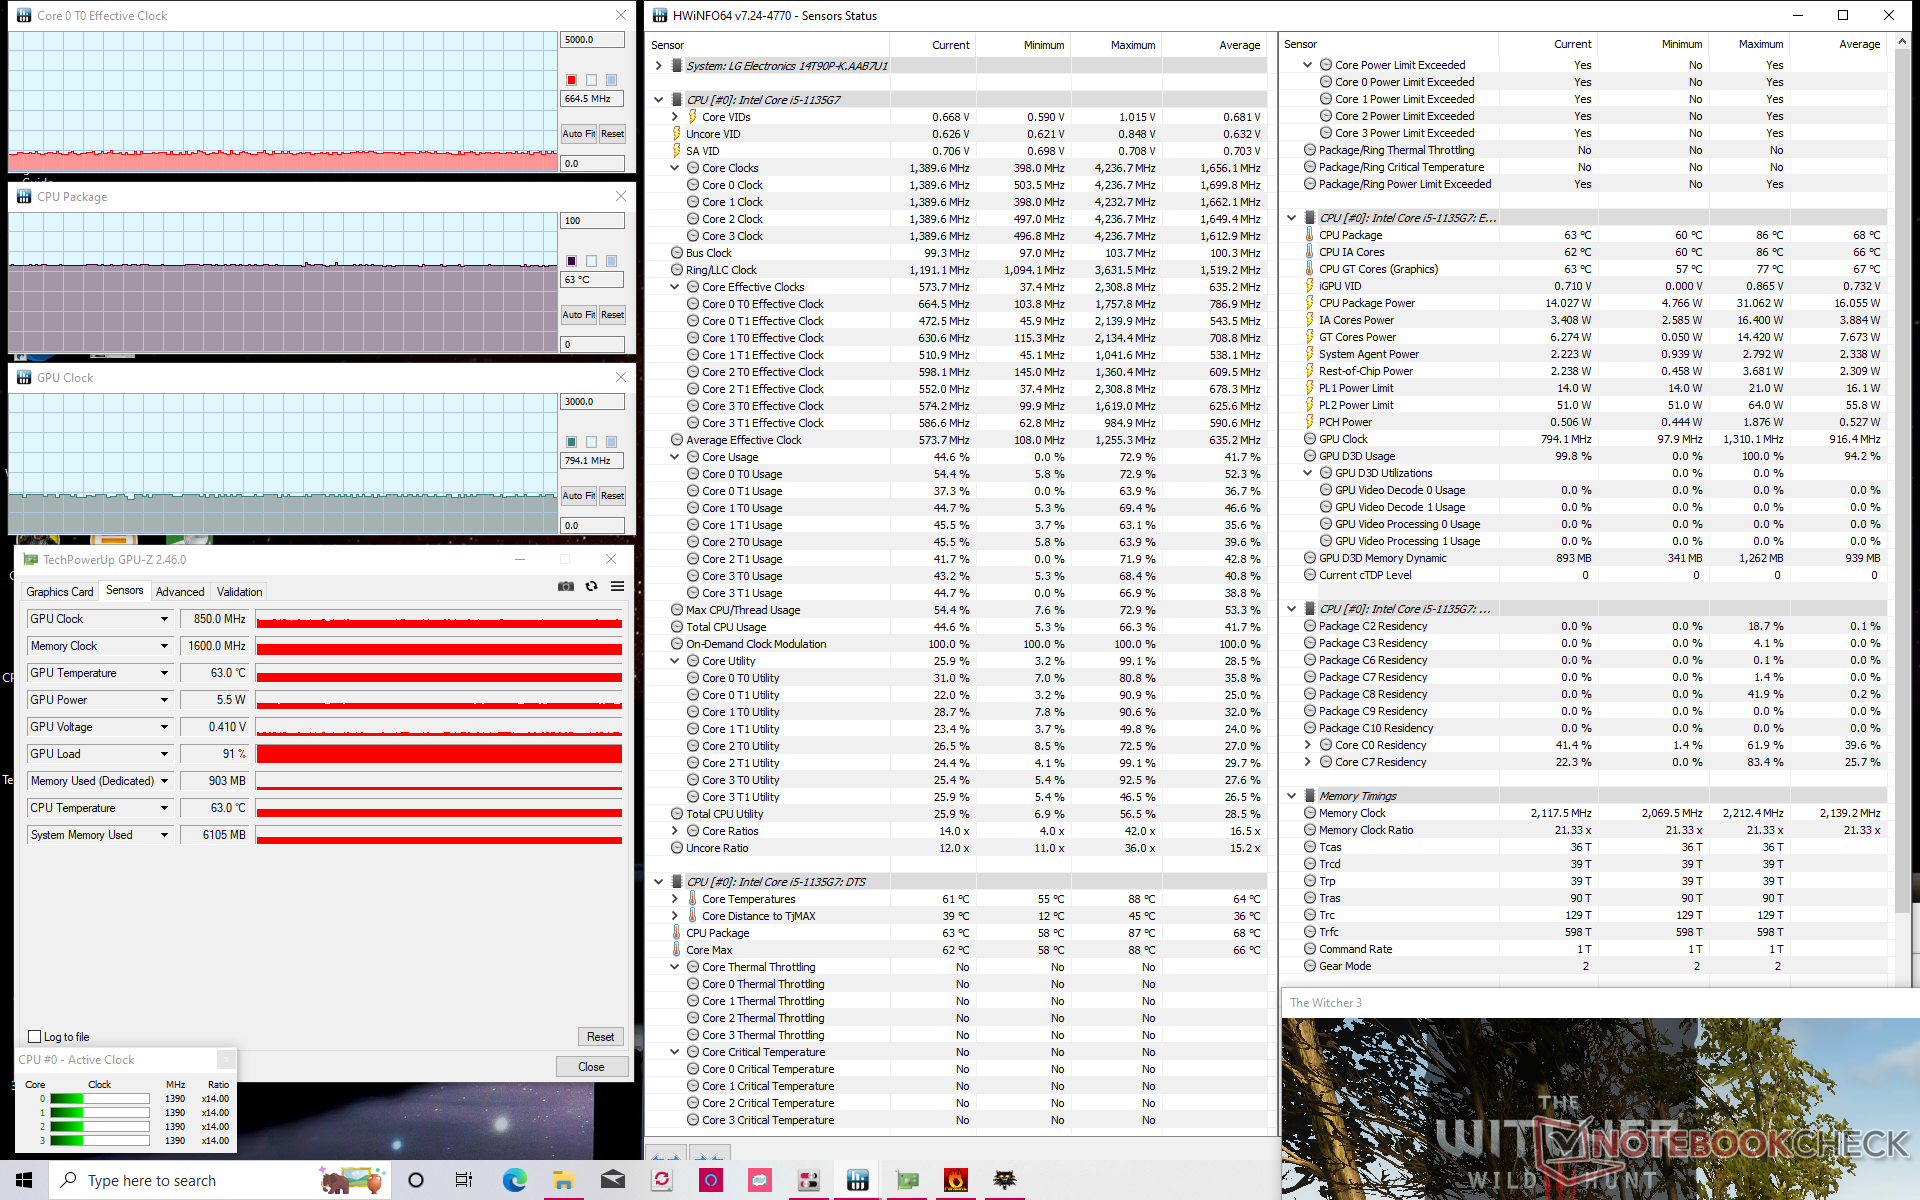
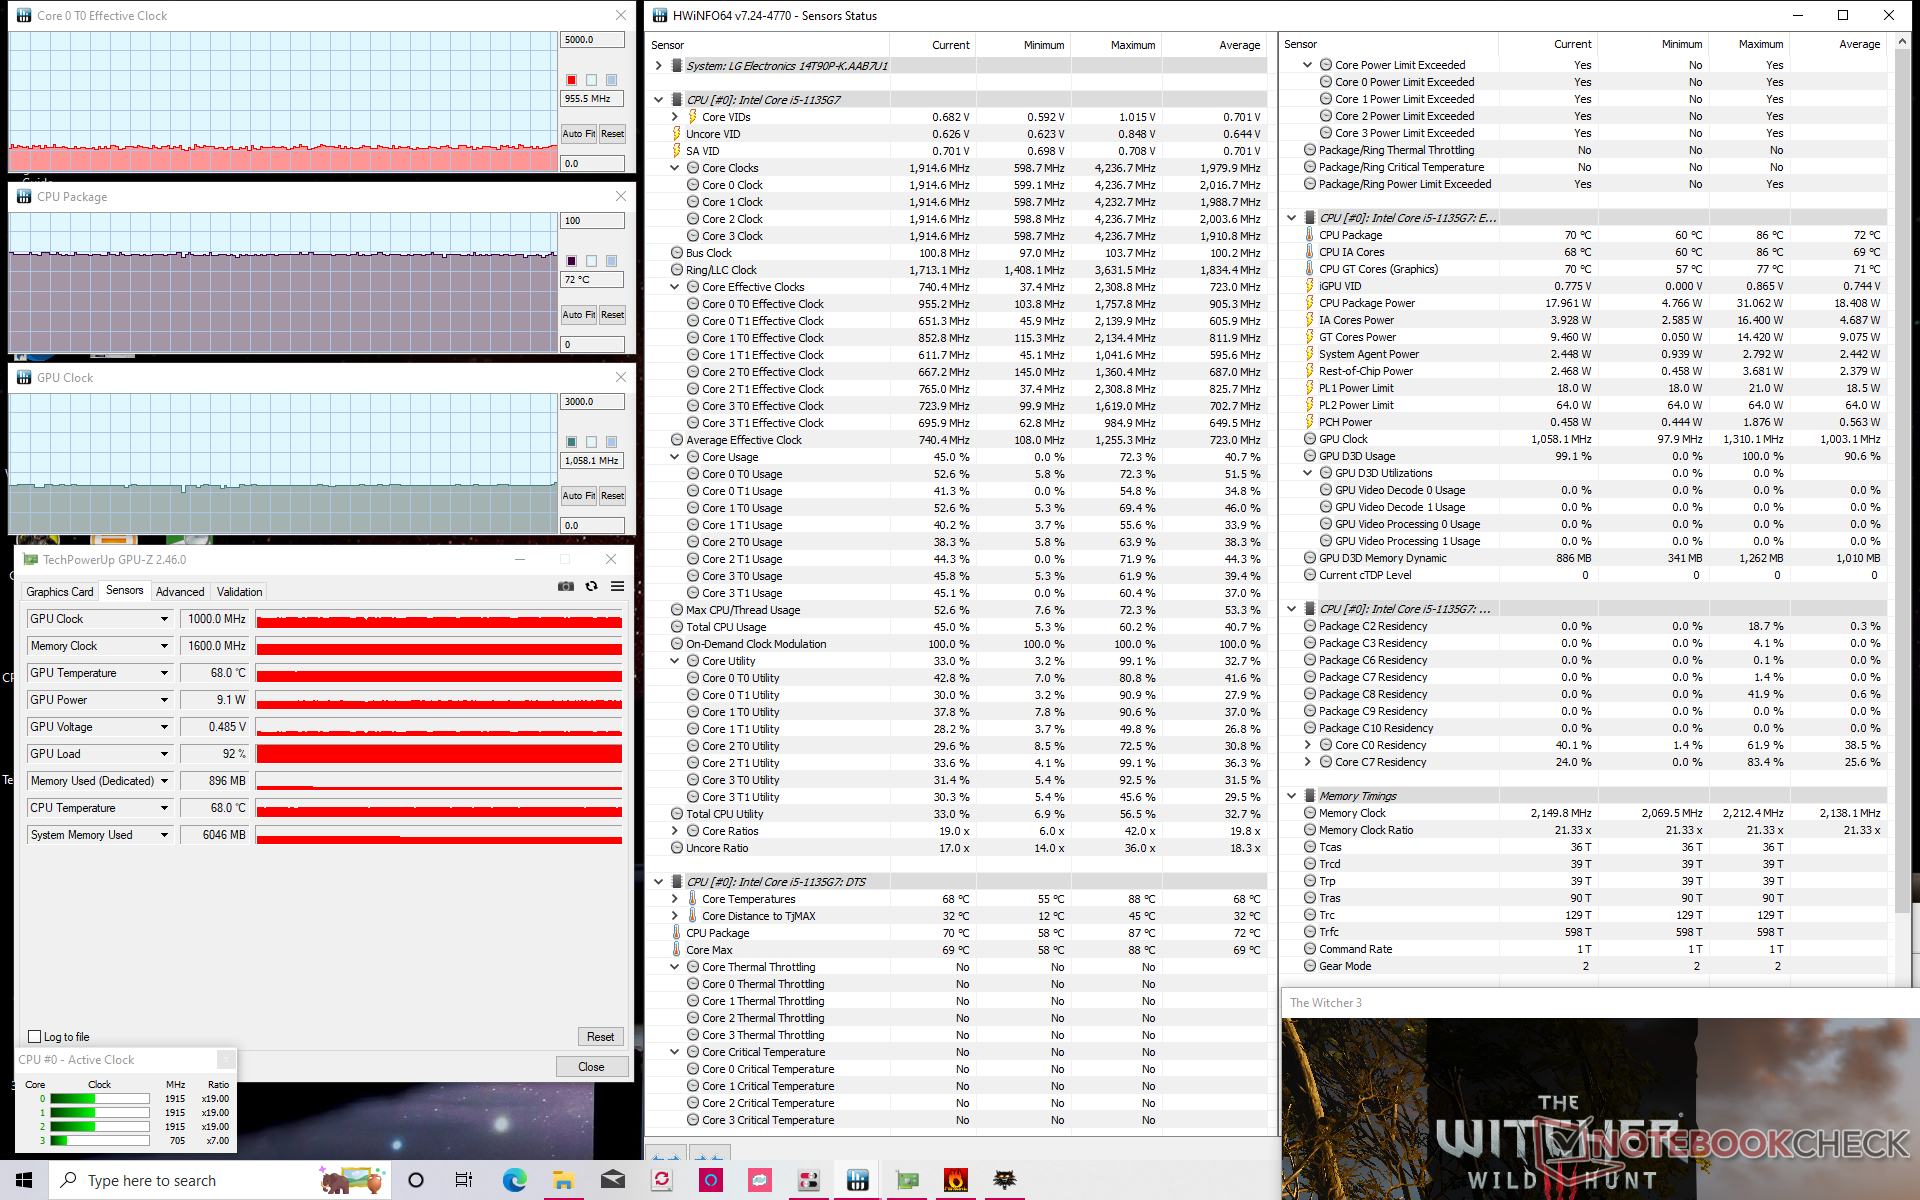
| Clock della CPU (GHz) | Clock della GPU (MHz) | Temperatura media della CPU (°C) | |
| Sistema inattivo | -- | -- | 34 |
| Stress Prime95 | 2,1 | -- | 73 |
| Stress Prime95 + FurMark | ~1,2 | 750 - 900 | 71 |
| Witcher 3 Stress (profilo di potenza bilanciato) | 0,6 | 800 | 63 |
| Witcher 3 Stress (profilo di potenza delle prestazioni) | ~1,0 | 1000 | 72 |
Altoparlanti
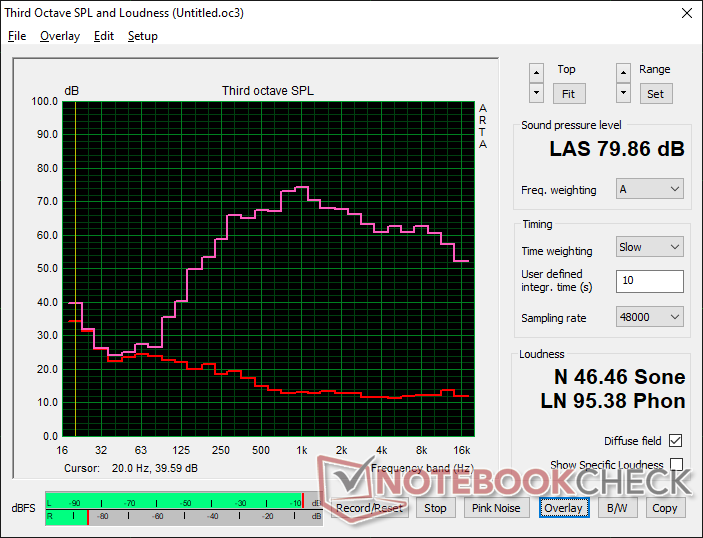
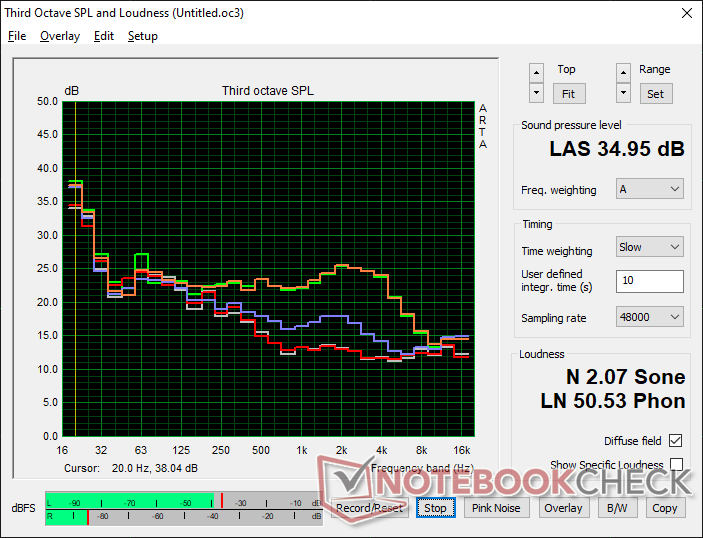
LG Gram 14T90P analisi audio
(±) | potenza degli altiparlanti media ma buona (79.9 dB)
Bassi 100 - 315 Hz
(±) | bassi ridotti - in media 13.1% inferiori alla media
(±) | la linearità dei bassi è media (13.3% delta rispetto alla precedente frequenza)
Medi 400 - 2000 Hz
(±) | medi elevati - circa 6.6% superiore alla media
(+) | medi lineari (4.3% delta rispetto alla precedente frequenza)
Alti 2 - 16 kHz
(+) | Alti bilanciati - appena 1.3% dalla media
(+) | alti lineari (3.9% delta rispetto alla precedente frequenza)
Nel complesso 100 - 16.000 Hz
(±) | la linearità complessiva del suono è media (15.3% di differenza rispetto alla media
Rispetto alla stessa classe
» 25% di tutti i dispositivi testati in questa classe è stato migliore, 4% simile, 71% peggiore
» Il migliore ha avuto un delta di 6%, medio di 20%, peggiore di 57%
Rispetto a tutti i dispositivi testati
» 22% di tutti i dispositivi testati in questa classe è stato migliore, 4% similare, 74% peggiore
» Il migliore ha avuto un delta di 4%, medio di 24%, peggiore di 134%
Apple MacBook Pro 16 2021 M1 Pro analisi audio
(+) | gli altoparlanti sono relativamente potenti (84.7 dB)
Bassi 100 - 315 Hz
(+) | bassi buoni - solo 3.8% dalla media
(+) | bassi in lineaa (5.2% delta rispetto alla precedente frequenza)
Medi 400 - 2000 Hz
(+) | medi bilanciati - solo only 1.3% rispetto alla media
(+) | medi lineari (2.1% delta rispetto alla precedente frequenza)
Alti 2 - 16 kHz
(+) | Alti bilanciati - appena 1.9% dalla media
(+) | alti lineari (2.7% delta rispetto alla precedente frequenza)
Nel complesso 100 - 16.000 Hz
(+) | suono nel complesso lineare (4.6% differenza dalla media)
Rispetto alla stessa classe
» 0% di tutti i dispositivi testati in questa classe è stato migliore, 0% simile, 100% peggiore
» Il migliore ha avuto un delta di 5%, medio di 17%, peggiore di 45%
Rispetto a tutti i dispositivi testati
» 0% di tutti i dispositivi testati in questa classe è stato migliore, 0% similare, 100% peggiore
» Il migliore ha avuto un delta di 4%, medio di 24%, peggiore di 134%
Gestione dell'energia
Consumo di energia
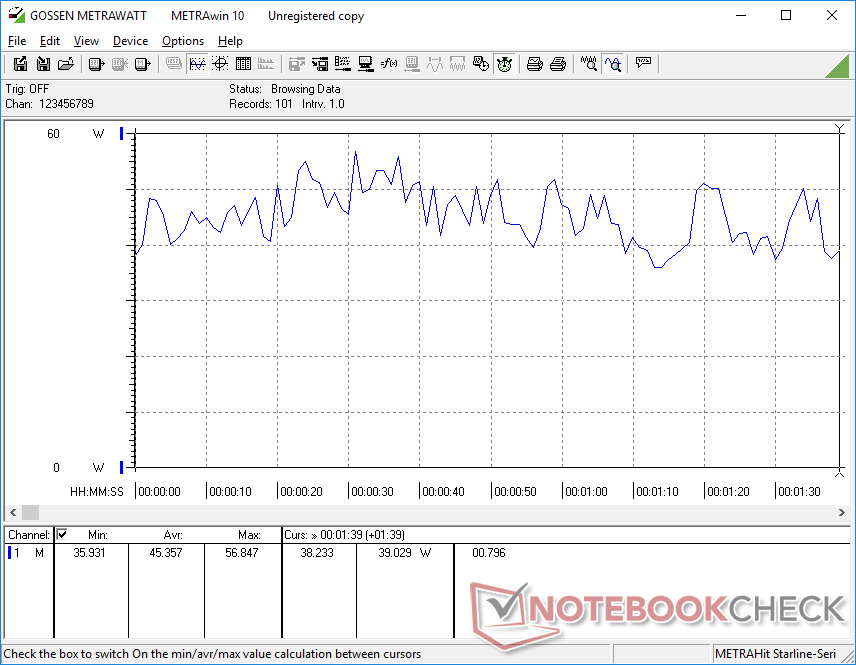
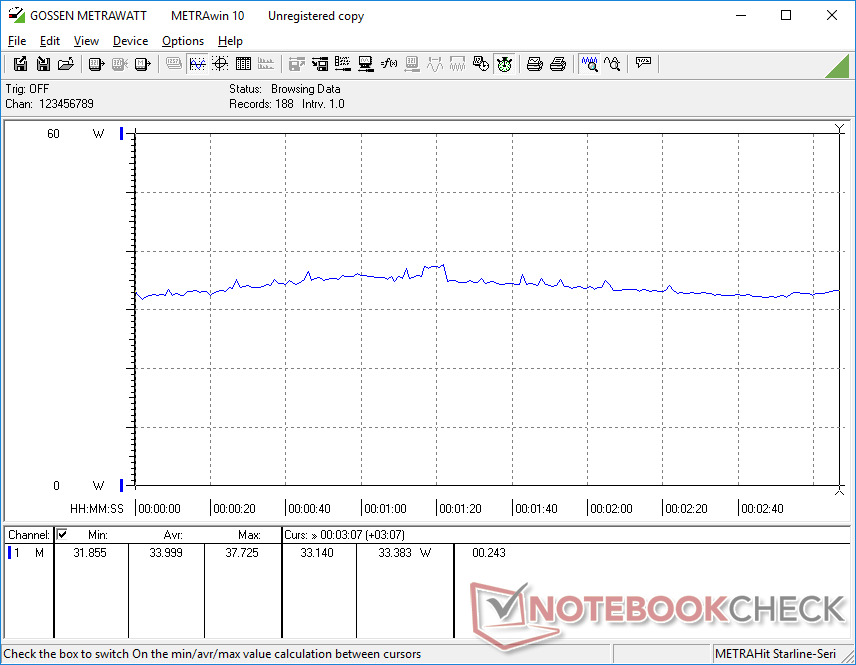
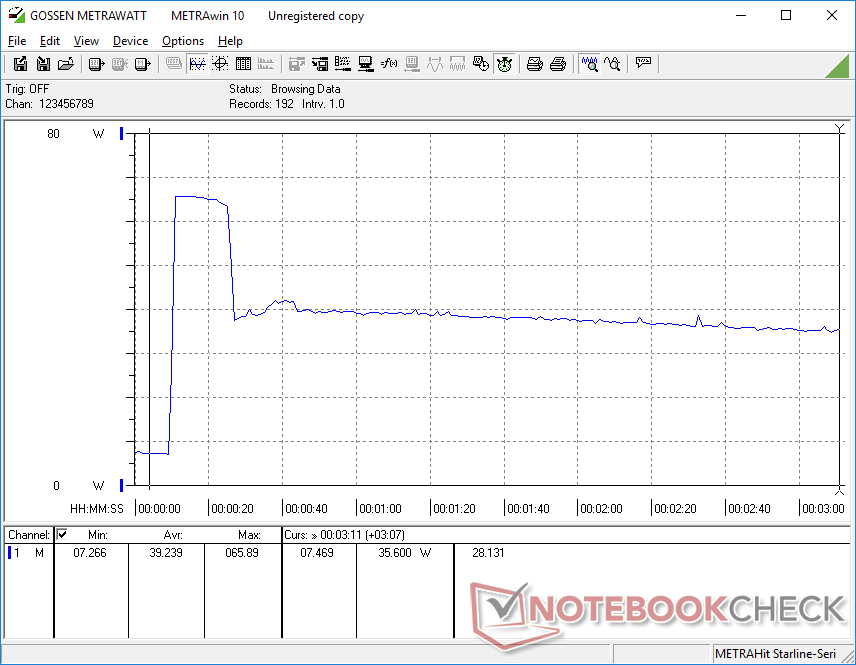
Il sistema è molto efficiente dal punto di vista energetico e consuma solo da 2 a 7 W quando è al minimo sul desktop, a seconda del profilo di alimentazione e dell'impostazione della luminosità. L'esecuzione di carichi di gioco richiede circa 45 W, ovvero circa il 36% in più di energia rispetto all'LG Gram 14T90N. Tuttavia, le prestazioni della GPU sono almeno da 2 a 3 volte più veloci e quindi il consumo energetico più elevato vale il guadagno in termini di grafica
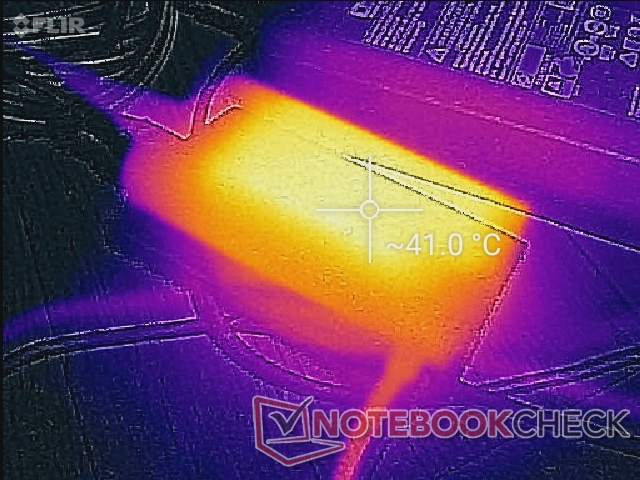
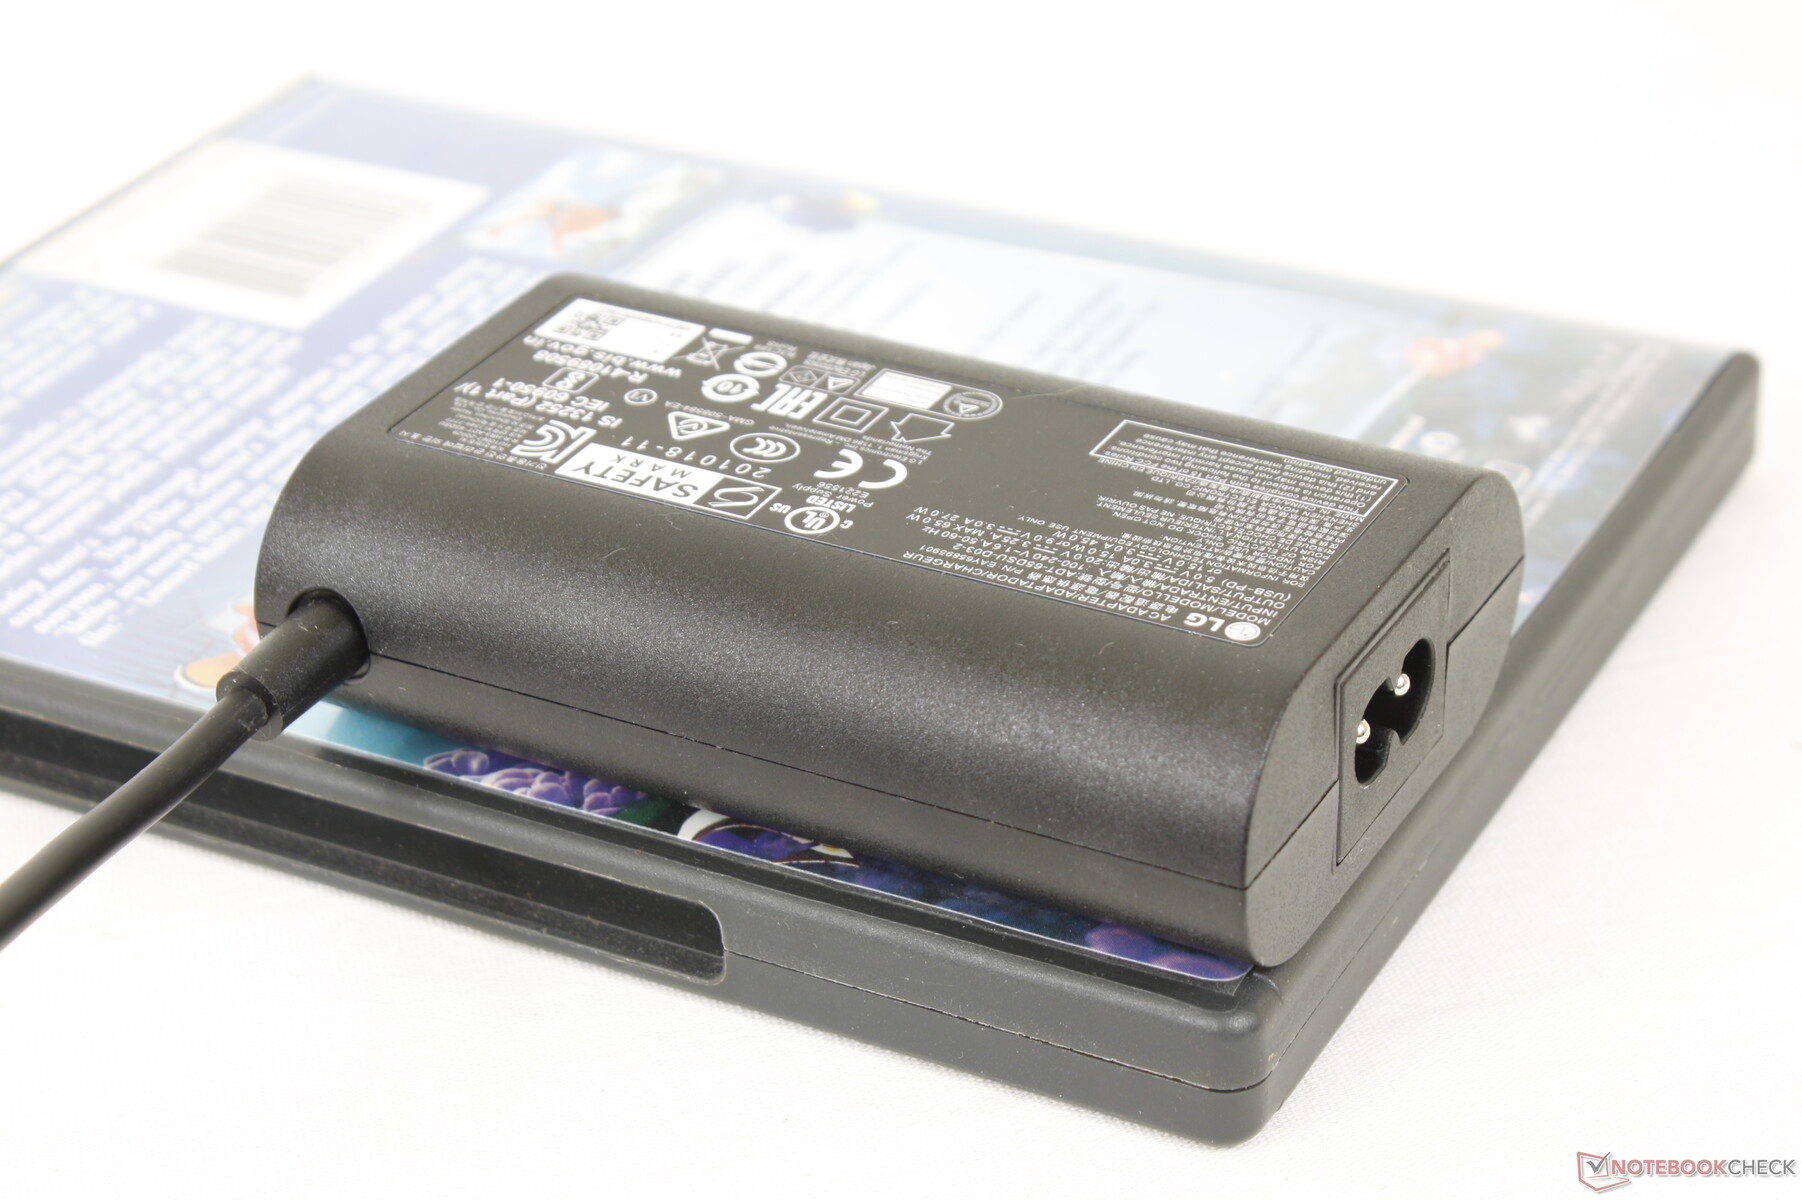
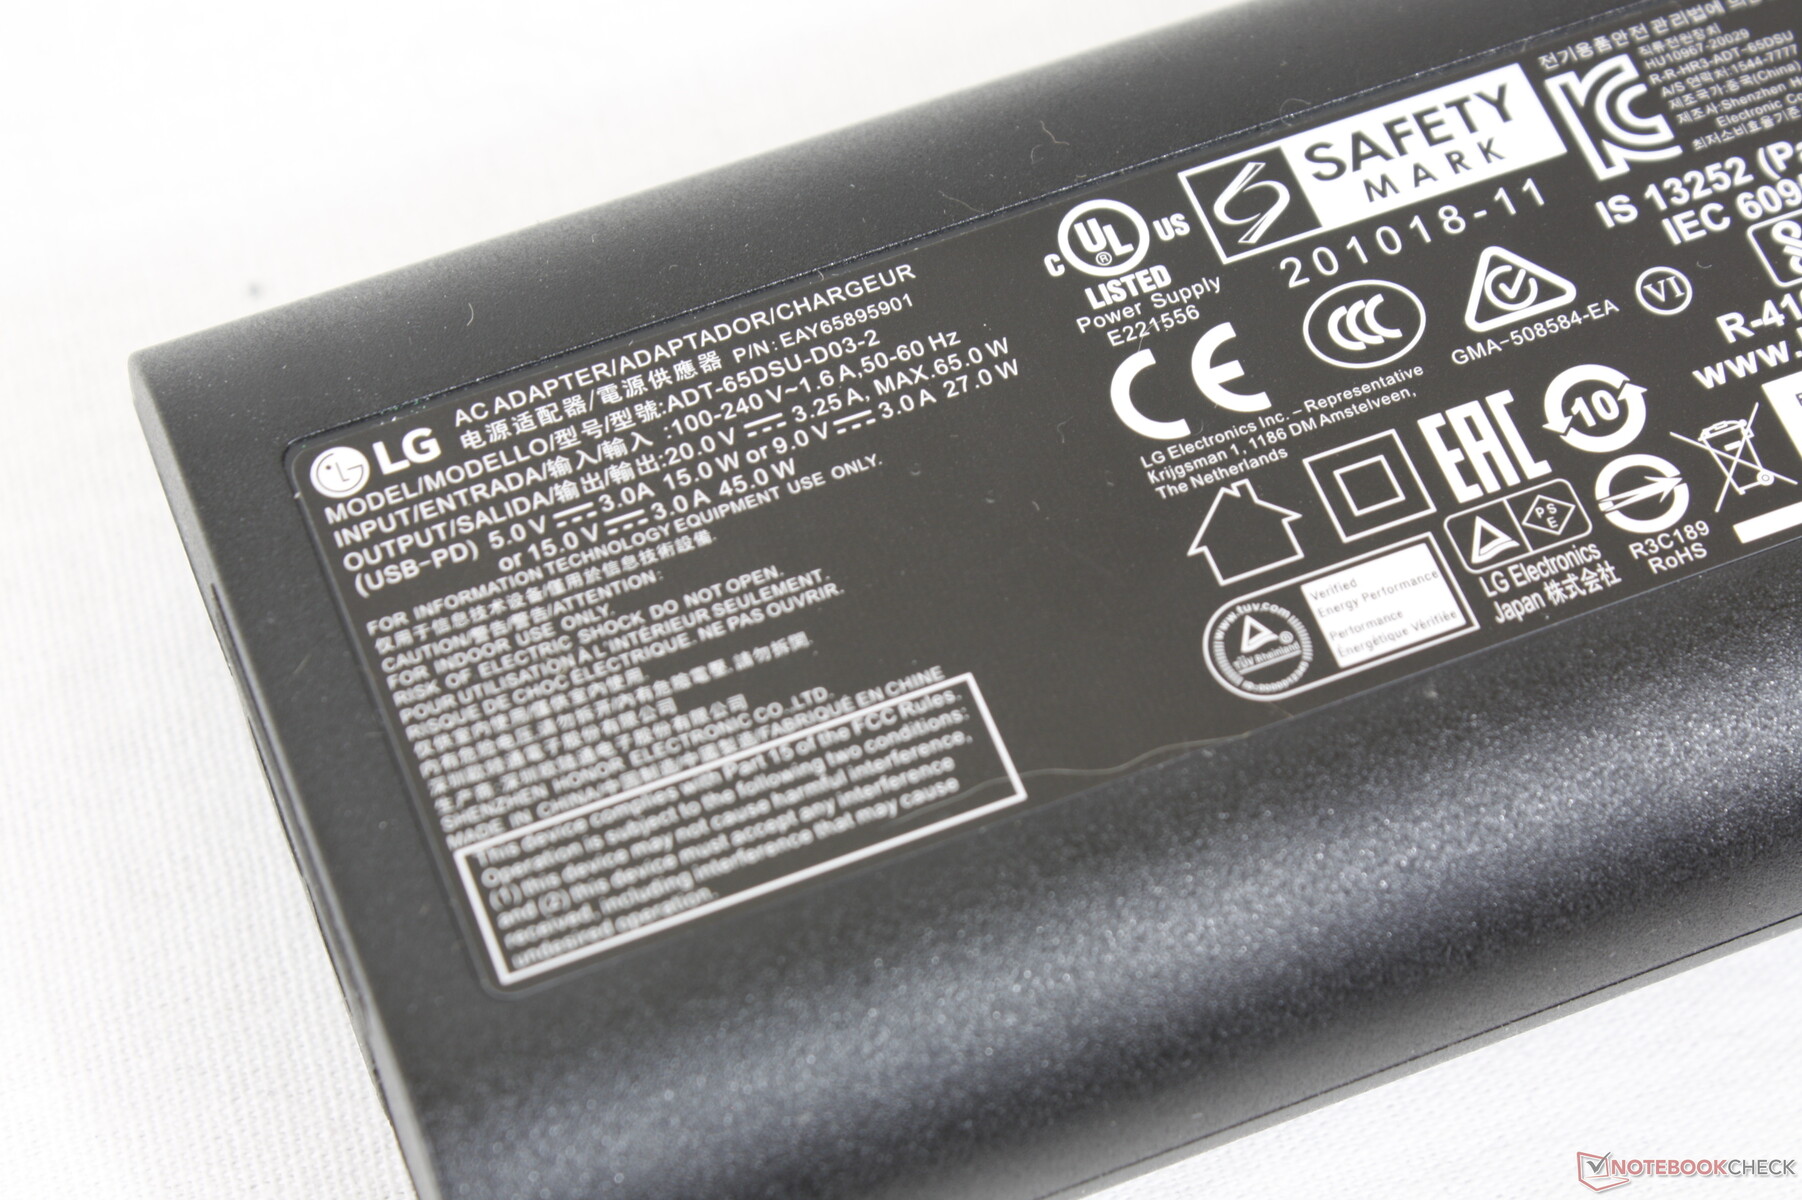
Siamo riusciti a registrare un consumo massimo temporaneo di 66 W dal piccolo (~9,8 x 6 x 2,7 cm) adattatore CA USB-C da 65 W quando la CPU è al 100% di utilizzo.
| Off / Standby | |
| Idle | |
| Sotto carico |
|
Leggenda:
min: | |
| LG Gram 14T90P i5-1135G7, Iris Xe G7 80EUs, Samsung SSD PM981a MZVLB512HBJQ, IPS, 1900x1200, 14" | Dell XPS 13 9310 2-in-1 i7-1165G7, Iris Xe G7 96EUs, Toshiba BG4 KBG40ZPZ512G, IPS, 1920x1200, 13.4" | Lenovo Yoga 9 14IAP7 82LU0001US i7-1260P, Iris Xe G7 96EUs, Samsung PM9A1 MZVL2512HCJQ, OLED, 2880x1800, 14" | Asus ZenBook Flip 14 UN5401QA-KN085W R7 5800H, Vega 8, Intel SSD 600p SSDPEKKW512G7, OLED, 2880x1800, 14" | HP Spectre x360 14-ea0378ng i7-1165G7, Iris Xe G7 96EUs, Intel Optane Memory H10 with Solid State Storage 32GB + 1TB HBRPEKNX0203AH(L/H), OLED, 3000x2000, 13.5" | MSI Summit E13 Flip Evo A11MT i7-1185G7, Iris Xe G7 96EUs, Phison 1TB SM2801T24GKBB4S-E162, IPS, 1920x1200, 13.4" | LG Gram 14T90N i7-10510U, UHD Graphics 620, Samsung SSD PM981a MZVLB512HBJQ, IPS, 1920x1080, 14" | |
|---|---|---|---|---|---|---|---|
| Power Consumption | 6% | -93% | -57% | -52% | -36% | 10% | |
| Idle Minimum * (Watt) | 2.8 | 2.6 7% | 8 -186% | 6.4 -129% | 6.3 -125% | 4.8 -71% | 2.9 -4% |
| Idle Average * (Watt) | 5.5 | 6.4 -16% | 14 -155% | 9.4 -71% | 11.2 -104% | 8.4 -53% | 5.8 -5% |
| Idle Maximum * (Watt) | 6.4 | 7.7 -20% | 14.4 -125% | 10.7 -67% | 13.3 -108% | 8.6 -34% | 6.2 3% |
| Load Average * (Watt) | 45.4 | 29.9 34% | 59.6 -31% | 52.2 -15% | 32 30% | 47.1 -4% | 32.9 28% |
| Witcher 3 ultra * (Watt) | 34 | 32.2 5% | 53.6 -58% | 53 -56% | 51.6 -52% | ||
| Load Maximum * (Watt) | 65.9 | 47.5 28% | 68.1 -3% | 69 -5% | 35.6 46% | 65.9 -0% | 48.5 26% |
* ... Meglio usare valori piccoli
Power Consumption Witcher 3 / Stresstest
Power Consumption external Monitor
Durata della batteria - Giornata intera di navigazione
La capacità della batteria è la stessa del vecchio Gram 14T90N, con 72 Wh. Forse non a caso, anche i tempi di funzionamento della WLAN sono quasi identici, con poco più di 12 ore di navigazione nel mondo reale. È positivo che la durata della batteria non abbia subito un calo, anche se le prestazioni del processore sono aumentate in modo significativo rispetto al Comet Lake-U di decima generazione
La ricarica da vuoto a pieno regime è molto lenta: 2,5 ore rispetto alle 1,5 ore o più della maggior parte degli altri Ultrabook.
| LG Gram 14T90P i5-1135G7, Iris Xe G7 80EUs, 72 Wh | Dell XPS 13 9310 2-in-1 i7-1165G7, Iris Xe G7 96EUs, 51 Wh | Lenovo Yoga 9 14IAP7 82LU0001US i7-1260P, Iris Xe G7 96EUs, 75 Wh | Asus ZenBook Flip 14 UN5401QA-KN085W R7 5800H, Vega 8, 63 Wh | HP Spectre x360 14-ea0378ng i7-1165G7, Iris Xe G7 96EUs, 66 Wh | MSI Summit E13 Flip Evo A11MT i7-1185G7, Iris Xe G7 96EUs, 70 Wh | LG Gram 14T90N i7-10510U, UHD Graphics 620, 72 Wh | |
|---|---|---|---|---|---|---|---|
| Autonomia della batteria | 18% | -44% | -19% | -12% | -15% | 8% | |
| WiFi v1.3 (h) | 12.1 | 10.7 -12% | 6.8 -44% | 8.7 -28% | 7.8 -36% | 11.2 -7% | 12.5 3% |
| Load (h) | 2.3 | 3.4 48% | 2.1 -9% | 2.6 13% | 1.8 -22% | 2.6 13% | |
| Reader / Idle (h) | 25.4 | 13.4 | 21.1 | 32.8 | |||
| H.264 (h) | 9 | 11.1 |
Pro
Contro
Verdetto - Il grammo da prendere
Il peso inferiore alla media, il nitido touchscreen 16:10 DCI-P3 e l'eccellente durata della batteria sono tutti punti di forza del Gram 14T90P. Il suo nuovo design è più robusto senza aggiungere peso, per mantenere uno dei maggiori vantaggi della serie Gram da 14 pollici rispetto a concorrenti come il più pesante Lenovo Yoga 9 14, HP Spectre x360 14, o Dell XPS 13 2-in-1. Lo chassis può essere leggermente meno rigido, ma il risparmio di peso può valere lo svantaggio per chi viaggia o studia.
Il Gram 14T90P è l'aggiornamento completo di cui la serie Gram da 14 pollici aveva bisogno.
Purtroppo, c'è un discreto elenco di insidie che vorremmo vedere migliorate. La lentezza della ricarica, la frequenza dei fotogrammi instabile durante i giochi, il clickpad spugnoso, la luminosità media del display, la mancanza del supporto a Windows Hello, la difficile manutenzione e la rigidità media delle cerniere sono tutti elementi che affossano un convertibile da 14 pollici altrimenti eccellente. Se LG riuscisse a risolvere questi inconvenienti principali mantenendo il peso ridotto, il Gram 14 potrebbe facilmente competere con le alternative più popolari di Dell, Lenovo o HP.
Prezzo e disponibilità
LG Gram 14T90P
- 05/21/2022 v7 (old)
Allen Ngo
Price comparison

