Notebookcheck Logo

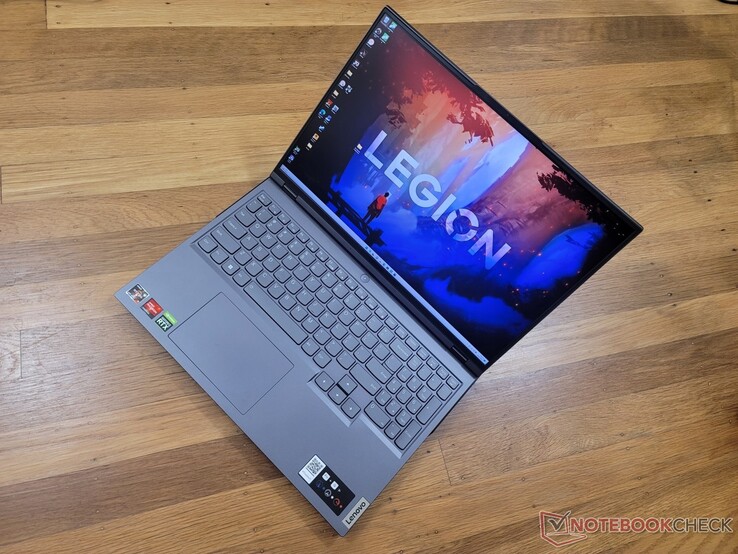
Recensione del portatile Lenovo Legion 5 Pro Gen 7: Ryzen 7 6800H o Ryzen 9 6900HX?
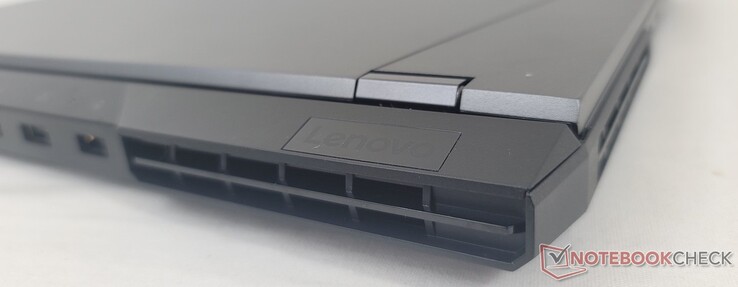
150 W TGP GeForce RTX 3070 Ti.

Lenovo ha aggiornato la CPU da AMD Zen 3 a Zen 3+ e la GPU TGP da 140 W a 150 W per questo ultimo aggiornamento da 16 pollici. Il nuovo modello è ovviamente più veloce, ma scopriamo di quanto esattamente.

Il Legion 5 Pro Gen 7 è un portatile da gioco di fascia media superiore che si colloca al di sotto della serie 7 16, ancora più costosa Legion serie 7 16. Si unisce alla sempre più diffusa schiera di portatili da gioco da 16 pollici, come l' HP Omen 16, Asus ROG Zephyrus M16, Dell G16o il Gigabyte Aero 16 tutte alternative al modello Lenovo in esame.

La nostra unità di prova viene fornita con la CPU AMD Zen 3+ Ryzen 7 6800H con grafica TGP GeForce RTX 3070 Ti da 150 W per circa 1900 dollari. Altre SKU sono disponibili con Ryzen 9 6900HX, RTX 3070, RTX 3060 o RTX 3050 Ti, ma tutte le opzioni sono dotate dello stesso display IPS 16:10 2560 x 1600 con supporto G-Sync.

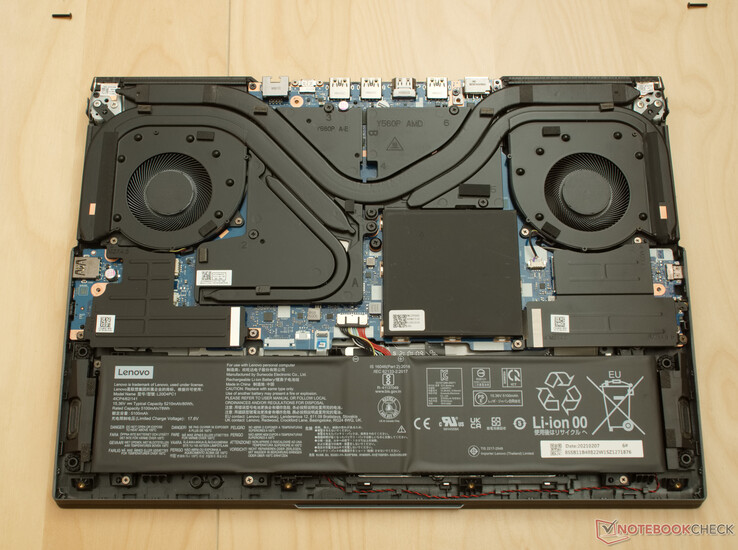
Il modello 2022 Legion 5 Pro Gen 7 condivide lo stesso design dello chassis del modello dell'anno scorso, per cui vi consigliamo di consultare la nostra recensione del modello 2021 per maggiori informazioni sulle caratteristiche fisiche del dispositivo. La versione precedente utilizza processori Zen 3 Ryzen 7 5800H e TGP GeForce RTX 3070 da 140 W, più lenti

Altre recensioni di Lenovo:

Lenovo Legion 5 Pro 16ARH7H RTX 3070 Ti (Legion 5 Pro 16 G7 Serie)
Processore
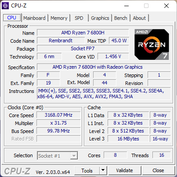
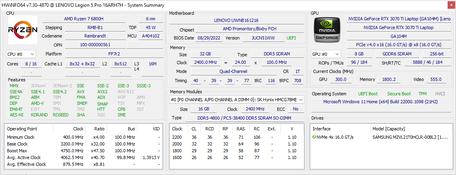
AMD Ryzen 7 6800H 8 x 3.2 - 4.7 GHz, 90 W PL2 / Short Burst, 90 W PL1 / Sustained, Rembrandt-H (Zen 3+)
Scheda grafica
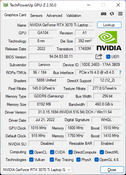
NVIDIA GeForce RTX 3070 Ti Laptop GPU - 8 GB VRAM, Core: 1510 MHz, Memoria: 1800 MHz, 150 W TDP, GDDR6, 516.94, Optimus, MUX
Memoria
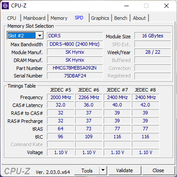
32 GB 
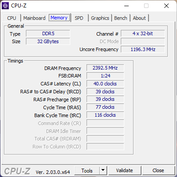
, SK Hynix, DDR5-4800, Dual-Channel, 40-39-39-77
Schermo
16.00 pollici 16:10, 2560 x 1600 pixel 189 PPI, BOE CQ NE160QDM-NY1, IPS, BOE0A9B, lucido: no, 165 Hz
Scheda madre
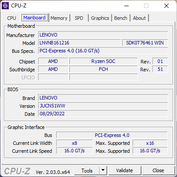
AMD Promontory/Bixby FCH
Harddisk
Samsung PM9A1 MZVL21T0HCLR, 1024 GB 
Scheda audio
AMD Zen - Audio Processor - HD Audio Controller
Porte di connessione
4 USB 3.0 / 3.1, 2 USB 3.1 Gen 2, USB-C Power Delivery (PD), 1 HDMI, 3 DisplayPort, Connessioni Audio: 3.5 mm headset
Rete
Realtek Semiconductor RTL8168/8111 PCI-E Gigabit Ethernet NIC (10/100/1000MBit/s), MediaTek RZ616 (a/b/g/n = Wi-Fi 4/ac = Wi-Fi 5/ax = Wi-Fi 6/ Wi-Fi 6E 6 GHz), Bluetooth 5.2
Dimensioni
altezza x larghezza x profondità (in mm): 26.6 x 359.9 x 264.2
Batteria
80 Wh polimeri di litio
Sistema Operativo
Microsoft Windows 11 Home
Camera
Webcam: 720p
Fotocamera Principale: 0.9 MPix
Altre caratteristiche
Casse: 2x 2 W Stereo Speakers, Tastiera: Chiclet, Illuminazione Tastiera: si, Lenovo Vantage, Smart Noise Cancellation, Hotkeys, 12 Mesi Garanzia
Peso
2.556 kg, Alimentazione: 1.116 kg
Prezzo
1800 USD
Nota: il produttore potrebbe usare componenti di fornitori diversi pannelli dei diplay, drive o banchi di memoria con specifiche simili.


Potenziali concorrenti a confronto

Punteggio
Data
Modello
Peso
Altezza
Dimensione
Risoluzione
Miglior Prezzo
87.7 %
v7 (old)
10/2022
Lenovo Legion 5 Pro 16ARH7H RTX 3070 Ti
R7 6800H, GeForce RTX 3070 Ti Laptop GPU
2.6 kg26.6 mm16.00"2560x1600
86.6 %
v7 (old)
07/2022
Lenovo Legion 5 Pro 16IAH7H
i7-12700H, GeForce RTX 3060 Laptop GPU
2.6 kg27 mm16.00"2560x1600
85.6 %
v7 (old)
07/2021
Asus ROG Zephyrus M16 GU603H
i9-11900H, GeForce RTX 3070 Laptop GPU
2 kg20 mm16.00"2560x1600
90.8 %
v7 (old)
09/2022
Lenovo Legion 7 16ARHA7
R9 6900HX, Radeon RX 6850M XT
2.6 kg19.4 mm16.00"2560x1600
82.3 %
v7 (old)
05/2022
HP Victus 16-e0145ng
R5 5600H, GeForce RTX 3050 Ti Laptop GPU
2.4 kg23.5 mm16.10"1920x1080
86.1 %
v7 (old)
10/2022
Dell G16 7620
i7-12700H, GeForce RTX 3060 Laptop GPU
2.6 kg26.9 mm16.00"2560x1600

Custodia - Coperchio esterno e base inferiore in alluminio

C'è un modo semplice per distinguere il modello 2022 Legion 5 Pro 16 da quello 2021 Legion 5 Pro 16. Il modello 2022 ha una porta USB-C in più lungo il bordo sinistro, per un totale di tre, mentre il modello 2021 ne ha solo due. Nel frattempo, il numero di porte USB-A è sceso da quattro a tre. Per il resto, i due modelli sono visivamente identici.

Confronto delle dimensioni

370 mm 260 mm 23.5 mm 2.4 kg359.9 mm 264.2 mm 26.6 mm 2.6 kg357.26 mm 272.11 mm 26.9 mm 2.6 kg358.1 mm 263.5 mm 19.4 mm 2.6 kg355 mm 243 mm 20 mm 2 kg297 mm 210 mm 1 mm 5.7 g

Comunicazione

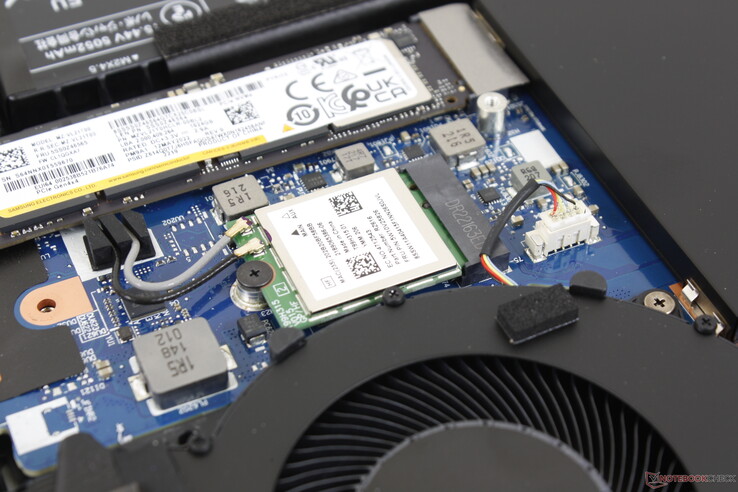
Modulo WLAN M.2 rimovibile
Networking
iperf3 transmit AX12
Asus ROG Zephyrus M16 GU603H
MediaTek MT7921
548 (470min - 602max) MBit/s
iperf3 receive AX12
Asus ROG Zephyrus M16 GU603H
MediaTek MT7921
710 (360min - 761max) MBit/s
iperf3 receive AXE11000 6GHz
Lenovo Legion 5 Pro 16ARH7H RTX 3070 Ti
MediaTek RZ616
1576 (1546min - 1644max) MBit/s
Lenovo Legion 7 16ARHA7
MediaTek RZ616
1260 (1156min - 1343max) MBit/s -20%
iperf3 receive AXE11000
Dell G16 7620
Intel Wi-Fi 6 AX201
1115 (996min - 1190max) MBit/s
HP Victus 16-e0145ng
RealTek Semiconductor RTL8852AE
787 (643min - 888max) MBit/s
iperf3 transmit AXE11000 6GHz
Lenovo Legion 7 16ARHA7
MediaTek RZ616
1646 (1468min - 1762max) MBit/s +11%
Lenovo Legion 5 Pro 16ARH7H RTX 3070 Ti
MediaTek RZ616
1483 (1373min - 1637max) MBit/s
iperf3 transmit AXE11000
Dell G16 7620
Intel Wi-Fi 6 AX201
891 (795min - 967max) MBit/s
HP Victus 16-e0145ng
RealTek Semiconductor RTL8852AE
851 (654min - 925max) MBit/s
0501001502002503003504004505005506006507007508008509009501000105011001150120012501300135014001450150015501600Tooltip
Lenovo Legion 5 Pro 16ARH7H RTX 3070 Ti; iperf3 transmit AXE11000 6GHz; iperf 3.1.3: Ø1483 (1373-1637)
Lenovo Legion 5 Pro 16ARH7H RTX 3070 Ti; iperf3 receive AXE11000 6GHz; iperf 3.1.3: Ø1575 (1546-1644)

Webcam

La webcam continua a essere solo a 720p senza IR.
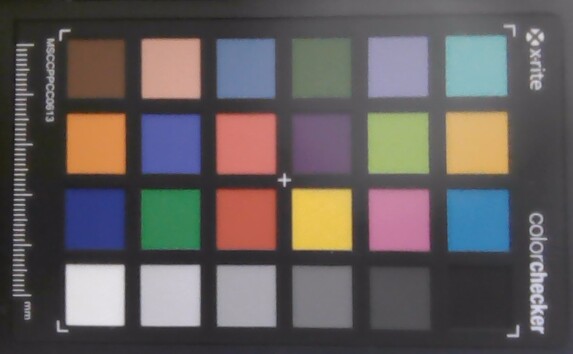
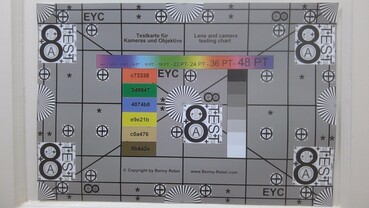
ColorChecker
2.2 ∆E
3 ∆E
4 ∆E
10.7 ∆E
10.2 ∆E
12 ∆E
4.6 ∆E
2.2 ∆E
10.8 ∆E
12.2 ∆E
8.7 ∆E
8.2 ∆E
3.2 ∆E
8.5 ∆E
11.9 ∆E
5.5 ∆E
11.5 ∆E
9.5 ∆E
4.9 ∆E
5.5 ∆E
5.8 ∆E
4.1 ∆E
2.5 ∆E
3.6 ∆E
ColorChecker Lenovo Legion 5 Pro 16ARH7H RTX 3070 Ti: 6.88 ∆E min: 2.16 - max: 12.2 ∆E
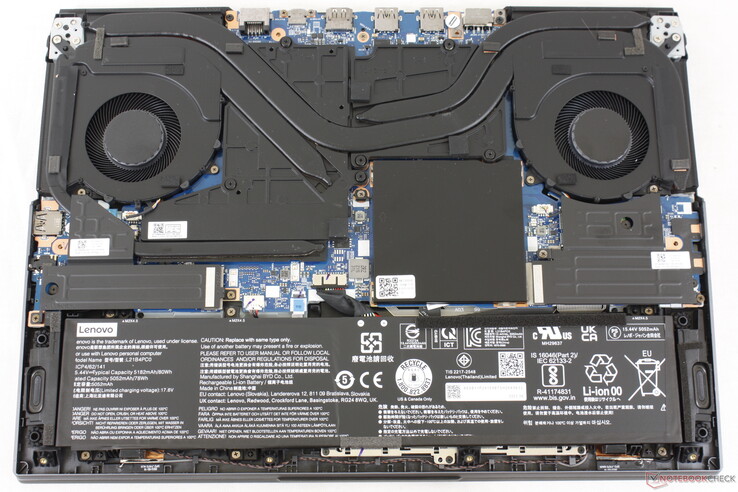
Manutenzione

Lenovo Legion 5 Pro 2022
Lenovo Legion 5 Pro 2021 a confronto

Accessori e garanzia

La confezione non contiene altri extra oltre all'adattatore CA e alla documentazione. Se acquistato negli Stati Uniti, si applica la garanzia limitata standard di un anno del produttore.

Display - Una sola opzione

Lenovo non ha cambiato nulla del pannello IPS BOE CQ NE160QDM-NY1 rispetto al modello Legion 5 Pro 16 dello scorso anno. Le nostre misurazioni mostrano attributi simili su tutta la linea, tra cui la copertura completa sRGB, i rapidi tempi di risposta bianco-nero, il rapporto di contrasto di ~1000:1 e la luminosa retroilluminazione a 500 nit.

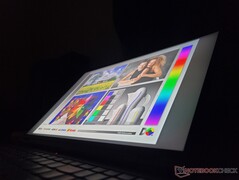
Tuttavia, la nostra unità specifica soffre di un moderato e pesante backlight bleeding, come mostra l'immagine qui sotto. La maggior parte dei pannelli IPS dovrebbe presentare un'irregolarità della luce, ma questa intensità è particolarmente fastidiosa su una macchina da gioco di fascia alta come Legion 5 Pro 16.

La sovrapposizione opaca è leggermente più granulosa rispetto all'alternativa lucida
Pesante e irregolare perdita di luminosità della retroilluminazione sulla nostra unità di prova
483.4
cd/m²
490.7
cd/m²
460.1
cd/m²
516.5
cd/m²
522.8
cd/m²
468.7
cd/m²
541.6
cd/m²
546.5
cd/m²
497.6
cd/m²
Distribuzione della luminosità
BOE CQ NE160QDM-NY1 tested with X-Rite i1Pro 2
Massima: 546.5 cd/m² (Nits) Media: 503.1 cd/m² Minimum: 3.23 cd/m²
Distribuzione della luminosità: 84 %
Al centro con la batteria: 522.8 cd/m²
Contrasto: 1275:1 (Nero: 0.41 cd/m²)
ΔE Color 2.47 | 0.5-29.43 Ø4.91, calibrated: 0.61
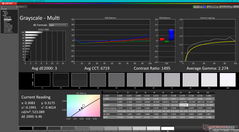
ΔE Greyscale 3 | 0.5-98 Ø5.2
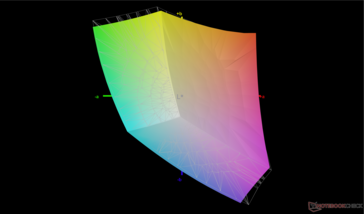
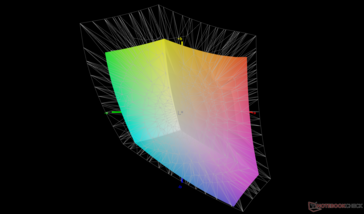
69.5% AdobeRGB 1998 (Argyll 2.2.0 3D)
96.1% sRGB (Argyll 2.2.0 3D)
67.3% Display P3 (Argyll 2.2.0 3D)
Gamma: 2.27
Lenovo Legion 5 Pro 16ARH7H RTX 3070 Ti
BOE CQ NE160QDM-NY1, IPS, 2560x1600, 16"
Lenovo Legion 5 Pro 16IAH7H
BOE CCQ_NE160QDM_NY1, IPS, 2560x1600, 16"
Asus ROG Zephyrus M16 GU603H
AU Optronics AUOC199, IPS, 2560x1600, 16"
Lenovo Legion 7 16ARHA7
BOE CQ NE160QDM-NY1, IPS, 2560x1600, 16"
HP Victus 16-e0145ng
CMN1609, IPS, 1920x1080, 16.1"
Dell G16 7620
BOE NE16QDM, IPS, 2560x1600, 16"
Display
2%
-4%
-37%
1%
Display P3 Coverage
67.3
68.53
2%
63.7
-5%
41.6
-38%
68.3
1%
sRGB Coverage
96.1
98.38
2%
95.3
-1%
61.9
-36%
98
2%
AdobeRGB 1998 Coverage
69.5
70.45
1%
65.7
-5%
43
-38%
70.5
1%
Response Times
25%
57%
25%
-90%
24%
Response Time Grey 50% / Grey 80% *
14.4 ?(7.6, 6.8)
14 ?(6, 8)
3%
4.8 ?(2, 2.8)
67%
9.2 ?(4.8, 4.4)
36%
29.6 ?(13.8, 15.8)
-106%
8.6 ?(3.4, 5.2)
40%
Response Time Black / White *
11.2 ?(6, 5.2)
6 ?(2, 4)
46%
6 ?(2, 4)
46%
9.6 ?(4.8, 4.8)
14%
19.4 ?(9.7, 9.7)
-73%
10.4 ?(5.2, 5.2)
7%
PWM Frequency
Screen
-7%
-51%
-19%
-127%
-10%
Brightness middle
522.8
515
-1%
448
-14%
478.8
-8%
257
-51%
369.4
-29%
Brightness
503
475
-6%
446
-11%
477
-5%
239
-52%
348
-31%
Brightness Distribution
84
85
1%
86
2%
90
7%
88
5%
83
-1%
Black Level *
0.41
0.45
-10%
0.48
-17%
0.43
-5%
0.25
39%
0.32
22%
Contrast
1275
1144
-10%
933
-27%
1113
-13%
1028
-19%
1154
-9%
Colorchecker dE 2000 *
2.47
2.38
4%
2.76
-12%
2.24
9%
6.91
-180%
1.78
28%
Colorchecker dE 2000 max. *
6.56
4.37
33%
7.09
-8%
4.49
32%
22.27
-239%
4.41
33%
Colorchecker dE 2000 calibrated *
0.61
1.1
-80%
2.86
-369%
1.89
-210%
3.61
-492%
1.22
-100%
Greyscale dE 2000 *
3
2.71
10%
3.1
-3%
2.3
23%
7.5
-150%
3.2
-7%
Gamma
2.27 97%
2.49 88%
2.153 102%
2.25 98%
2.125 104%
2.2 100%
CCT
6719 97%
6117 106%
6826 95%
6955 93%
6025 108%
6750 96%
Color Space (Percent of AdobeRGB 1998)
87
Color Space (Percent of sRGB)
100
Media totale (Programma / Settaggio)
7% / -0%
3% / -31%
1% / -9%
-85% / -102%
5% / -3%

* ... Meglio usare valori piccoli

rispetto a sRGB
rispetto a sRGB
contro P3
contro P3

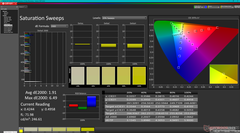
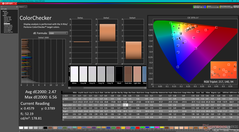
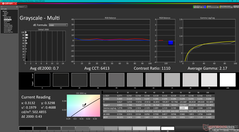
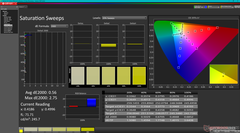
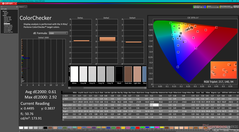
Il display viene fornito pre-calibrato con valori medi di deltaE della scala di grigi e del colore di soli 3 e 2,47, rispettivamente, sulla nostra unità specifica. La calibrazione del pannello con un colorimetro X-Rite migliorerebbe ulteriormente i valori deltaE, portandoli a soli 0,7 e 0,6. Consigliamo di applicare il nostro profilo ICM calibrato sopra per sfruttare al meglio l'intera copertura sRGB del display.

Scala di grigi prima della calibrazione
Sweep di saturazione prima della calibrazione
ColorChecker prima della calibrazione
Scala di grigi dopo la calibrazione
Sweep di saturazione dopo la calibrazione
ColorChecker dopo la calibrazione

Tempi di risposta del Display

I tempi di risposta del display mostrano quanto sia veloce lo schermo a cambaire da un colore all'altro. Tempi di risposta lenti possono creare sovrapposizioni negloi oggetti in movimento. Specialmente i giocatori patiti del 3D dovrebbero usare uno schermo con tempi di risposta bassi.
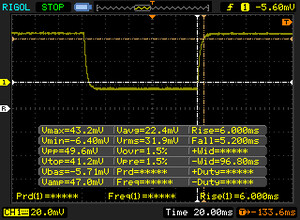
       Tempi di risposta dal Nero al Bianco
11.2 ms ... aumenta ↗ e diminuisce ↘ combinato↗ 6 ms Incremento
↘ 5.2 ms Calo
Lo schermo mostra buoni tempi di risposta durante i nostri tests, ma potrebbe essere troppo lento per i gamers competitivi.
In confronto, tutti i dispositivi di test variano da 0.1 (minimo) a 240 (massimo) ms. » 27 % di tutti i dispositivi è migliore.
Questo significa che i tempi di risposta rilevati sono migliori rispettto alla media di tutti i dispositivi testati (20.9 ms).
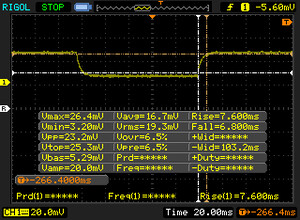
       Tempo di risposta dal 50% Grigio all'80% Grigio
14.4 ms ... aumenta ↗ e diminuisce ↘ combinato↗ 7.6 ms Incremento
↘ 6.8 ms Calo
Lo schermo mostra buoni tempi di risposta durante i nostri tests, ma potrebbe essere troppo lento per i gamers competitivi.
In confronto, tutti i dispositivi di test variano da 0.165 (minimo) a 636 (massimo) ms. » 25 % di tutti i dispositivi è migliore.
Questo significa che i tempi di risposta rilevati sono migliori rispettto alla media di tutti i dispositivi testati (32.8 ms).

Sfarfallio dello schermo / PWM (Pulse-Width Modulation)

Per ridurre la luminosità dello schermo, alcuni portatili accendono e spengono la retroilluminazione in rapida successione - un metodo chiamato Pulse Width Modulation (PWM). Questa frequenza di ciclo a livello ideale non dovrebbe essere percepibile dall'occhi umano. Se tale frequenza è troppo bassa, gli utenti con occhi sensibili potrebbero stancarsi gli occhi o avere mal di testa o anche notare uno sfarfallio.
flickering dello schermo / PWM non rilevato

In confronto: 53 % di tutti i dispositivi testati non utilizza PWM per ridurre la luminosita' del display. Se è rilevato PWM, una media di 8705 (minimo: 5 - massimo: 343500) Hz è stata rilevata.

All'aperto sotto la luce del sole
All'aperto all'ombra
All'aperto sotto la luce del sole
Ampi angoli di visione IPS. I colori e il contrasto si degradano solo in caso di angolazioni estreme

Prestazioni: un po' più veloci


Condizioni di test

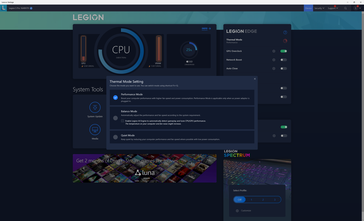
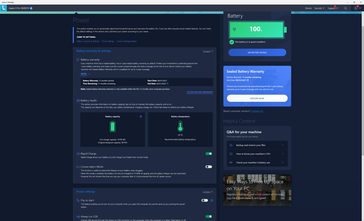
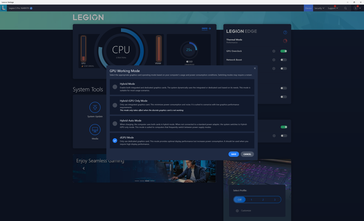
Abbiamo impostato la nostra unità in modalità Performance sia tramite Windows che tramite il software Lenovo Vantage prima di eseguire i benchmark qui sotto. Ci siamo anche assicurati di attivare l'Overclock della GPU e la modalità di lavoro della GPU su "solo dGPU" per ottenere le massime prestazioni. Gli utenti devono assolutamente familiarizzare con il software Vantage e le sue varie impostazioni, come dimostrano gli screenshot qui sotto.

Processore

Le prestazioni in single e multi-thread sono più veloci di circa il 10% e il 20% rispetto alla generazione precedente Ryzen 7 5800Hrispettivamente, in base al tempo trascorso con il HP Omen 16 e il Lenovo Legion 5 Pro 16 del 2021. Sebbene non sia insignificante, l'aumento delle prestazioni anno su anno non è così grande come il salto dall'undicesima alla dodicesima generazione di Intel. Il Core i7-12700Had esempio, è ancora più veloce del 15-30% rispetto al nostro Ryzen 7 6800H

L'aggiornamento al Ryzen 9 6900HX dal nostro Ryzen 7 6800H dovrebbe portare solo guadagni marginali, come mostrano i nostri grafici di confronto qui sotto. Pertanto, gli acquirenti attenti al budget potrebbero prendere in considerazione una SKU Ryzen 7 6800H meno costosa.

Cinebench R15 Multi Loop

01452904355807258701015116013051450159517401885203021752320246526102755Tooltip
Lenovo Legion 5 Pro 16ARH7H RTX 3070 Ti AMD Ryzen 7 6800H: Ø2351 (2324.37-2366.02)
Acer Nitro 5 AN515-46-R1A1 AMD Ryzen 7 6800H: Ø2153 (2083.98-2206.17)
Asus ROG Zephyrus G14 GA402RJ AMD Ryzen 7 6800HS: Ø1945 (1933.96-1986.89)
Lenovo Legion 7 16ARHA7 AMD Ryzen 9 6900HX: Ø2337 (2320.19-2354.74)
Lenovo Legion 5 Pro 16IAH7H Intel Core i7-12700H: Ø2831 (2783.19-2883.92)
Cinebench R20: CPU (Multi Core) | CPU (Single Core)
Cinebench R23: Multi Core | Single Core
Cinebench R15: CPU Multi 64Bit | CPU Single 64Bit
Blender: v2.79 BMW27 CPU
7-Zip 18.03: 7z b 4 | 7z b 4 -mmt1
Geekbench 5.5: Multi-Core | Single-Core
HWBOT x265 Benchmark v2.2: 4k Preset
LibreOffice : 20 Documents To PDF
R Benchmark 2.5: Overall mean
Cinebench R20 / CPU (Multi Core)
Lenovo Legion 5 Pro 16IAH7H
Intel Core i7-12700H
7230 Points +28%
Alienware x15 R2 P111F
Intel Core i9-12900H
6812 Points +20%
Dell G16 7620
Intel Core i7-12700H
6582 Points +16%
Lenovo Legion 5 Pro 16ARH7H RTX 3070 Ti
AMD Ryzen 7 6800H
5661 Points
Lenovo Legion 7 16ARHA7
AMD Ryzen 9 6900HX
5616 Points -1%
Gigabyte A5 X1
AMD Ryzen 9 5900HX
5180 Points -8%
Asus ROG Zephyrus M16 GU603H
Intel Core i9-11900H
5160 Points -9%
Media AMD Ryzen 7 6800H
  (4460 - 5661, n=9)
5101 Points -10%
HP Omen 16-c0077ng
AMD Ryzen 7 5800H
4726 Points -17%
HP Victus 16-e0145ng
AMD Ryzen 5 5600H
3767 Points -33%
Lenovo Legion C7 15IMH05 82EH0030GE
Intel Core i7-10875H
3365 Points -41%
Cinebench R20 / CPU (Single Core)
Alienware x15 R2 P111F
Intel Core i9-12900H
732 Points +22%
Lenovo Legion 5 Pro 16IAH7H
Intel Core i7-12700H
667 Points +11%
Dell G16 7620
Intel Core i7-12700H
662 Points +11%
Lenovo Legion 7 16ARHA7
AMD Ryzen 9 6900HX
612 Points +2%
Asus ROG Zephyrus M16 GU603H
Intel Core i9-11900H
603 Points +1%
Lenovo Legion 5 Pro 16ARH7H RTX 3070 Ti
AMD Ryzen 7 6800H
599 Points
Media AMD Ryzen 7 6800H
  (580 - 605, n=9)
596 Points -1%
Gigabyte A5 X1
AMD Ryzen 9 5900HX
580 Points -3%
HP Omen 16-c0077ng
AMD Ryzen 7 5800H
551 Points -8%
HP Victus 16-e0145ng
AMD Ryzen 5 5600H
532 Points -11%
Lenovo Legion C7 15IMH05 82EH0030GE
Intel Core i7-10875H
483 Points -19%
Cinebench R23 / Multi Core
Lenovo Legion 5 Pro 16IAH7H
Intel Core i7-12700H
19069 Points +30%
Dell G16 7620
Intel Core i7-12700H
17181 (15714.9min - 17181.1max) Points +17%
Alienware x15 R2 P111F
Intel Core i9-12900H
16575 Points +13%
Lenovo Legion 5 Pro 16ARH7H RTX 3070 Ti
AMD Ryzen 7 6800H
14660 (14400.8min - 14660.4max) Points
Lenovo Legion 7 16ARHA7
AMD Ryzen 9 6900HX
14455 (14309.4min - 14455.1max) Points -1%
Gigabyte A5 X1
AMD Ryzen 9 5900HX
13500 Points -8%
Media AMD Ryzen 7 6800H
  (11481 - 14660, n=11)
12957 Points -12%
HP Omen 16-c0077ng
AMD Ryzen 7 5800H
12173 Points -17%
HP Victus 16-e0145ng
AMD Ryzen 5 5600H
9724 Points -34%
Lenovo Legion C7 15IMH05 82EH0030GE
Intel Core i7-10875H
8858 Points -40%
Cinebench R23 / Single Core
Alienware x15 R2 P111F
Intel Core i9-12900H
1888 Points +22%
Lenovo Legion 5 Pro 16IAH7H
Intel Core i7-12700H
1731 Points +12%
Dell G16 7620
Intel Core i7-12700H
1726 Points +12%
Lenovo Legion 7 16ARHA7
AMD Ryzen 9 6900HX
1564 Points +1%
Lenovo Legion 5 Pro 16ARH7H RTX 3070 Ti
AMD Ryzen 7 6800H
1543 Points
Media AMD Ryzen 7 6800H
  (1500 - 1552, n=9)
1527 Points -1%
Gigabyte A5 X1
AMD Ryzen 9 5900HX
1493 Points -3%
HP Omen 16-c0077ng
AMD Ryzen 7 5800H
1415 Points -8%
HP Victus 16-e0145ng
AMD Ryzen 5 5600H
1373 Points -11%
Lenovo Legion C7 15IMH05 82EH0030GE
Intel Core i7-10875H
1252 Points -19%
Cinebench R15 / CPU Multi 64Bit
Lenovo Legion 5 Pro 16IAH7H
Intel Core i7-12700H
2884 (2783.19min - 2883.92max) Points +22%
Alienware x15 R2 P111F
Intel Core i9-12900H
2721 (2470.66min - 2721.46max) Points +15%
Dell G16 7620
Intel Core i7-12700H
2652 (2479.7min - 2651.64max) Points +12%
Lenovo Legion 5 Pro 16ARH7H RTX 3070 Ti
AMD Ryzen 7 6800H
2366 (2324.37min - 2366.02max) Points
Lenovo Legion 7 16ARHA7
AMD Ryzen 9 6900HX
2355 (2320.19min - 2354.74max) Points 0%
Asus ROG Zephyrus M16 GU603H
Intel Core i9-11900H
2211 (1875.21min - 2210.56max) Points -7%
Gigabyte A5 X1
AMD Ryzen 9 5900HX
2151 Points -9%
Media AMD Ryzen 7 6800H
  (1585 - 2366, n=10)
2090 Points -12%
HP Omen 16-c0077ng
AMD Ryzen 7 5800H
2030 (1981.18min - 2029.63max) Points -14%
Lenovo Legion C7 15IMH05 82EH0030GE
Intel Core i7-10875H
1683 Points -29%
HP Victus 16-e0145ng
AMD Ryzen 5 5600H
1621 (1599.49min - 1621.21max) Points -31%
Cinebench R15 / CPU Single 64Bit
Alienware x15 R2 P111F
Intel Core i9-12900H
275 Points +11%
Lenovo Legion 7 16ARHA7
AMD Ryzen 9 6900HX
251 Points +1%
Lenovo Legion 5 Pro 16IAH7H
Intel Core i7-12700H
250 Points +1%
Lenovo Legion 5 Pro 16ARH7H RTX 3070 Ti
AMD Ryzen 7 6800H
248 Points
Dell G16 7620
Intel Core i7-12700H
246 Points -1%
Gigabyte A5 X1
AMD Ryzen 9 5900HX
237 Points -4%
Asus ROG Zephyrus M16 GU603H
Intel Core i9-11900H
236 Points -5%
Media AMD Ryzen 7 6800H
  (182.7 - 250, n=10)
234 Points -6%
HP Omen 16-c0077ng
AMD Ryzen 7 5800H
229 Points -8%
HP Victus 16-e0145ng
AMD Ryzen 5 5600H
223 Points -10%
Lenovo Legion C7 15IMH05 82EH0030GE
Intel Core i7-10875H
204 Points -18%
Blender / v2.79 BMW27 CPU
Lenovo Legion C7 15IMH05 82EH0030GE
Intel Core i7-10875H
324 Seconds * -52%
HP Victus 16-e0145ng
AMD Ryzen 5 5600H
318 Seconds * -49%
HP Omen 16-c0077ng
AMD Ryzen 7 5800H
251.8 Seconds * -18%
Asus ROG Zephyrus M16 GU603H
Intel Core i9-11900H
243 Seconds * -14%
Media AMD Ryzen 7 6800H
  (213 - 268, n=8)
242 Seconds * -14%
Gigabyte A5 X1
AMD Ryzen 9 5900HX
231 Seconds * -8%
Lenovo Legion 7 16ARHA7
AMD Ryzen 9 6900HX
215 Seconds * -1%
Lenovo Legion 5 Pro 16ARH7H RTX 3070 Ti
AMD Ryzen 7 6800H
213 Seconds *
Alienware x15 R2 P111F
Intel Core i9-12900H
186 Seconds * +13%
Dell G16 7620
Intel Core i7-12700H
184 Seconds * +14%
Lenovo Legion 5 Pro 16IAH7H
Intel Core i7-12700H
172.4 Seconds * +19%
7-Zip 18.03 / 7z b 4
Alienware x15 R2 P111F
Intel Core i9-12900H
70549 MIPS +9%
Lenovo Legion 5 Pro 16IAH7H
Intel Core i7-12700H
69237 MIPS +7%
Dell G16 7620
Intel Core i7-12700H
65012 MIPS 0%
Lenovo Legion 5 Pro 16ARH7H RTX 3070 Ti
AMD Ryzen 7 6800H
64817 MIPS
Lenovo Legion 7 16ARHA7
AMD Ryzen 9 6900HX
62721 MIPS -3%
Gigabyte A5 X1
AMD Ryzen 9 5900HX
60371 MIPS -7%
Media AMD Ryzen 7 6800H
  (55067 - 64817, n=8)
59319 MIPS -8%
Asus ROG Zephyrus M16 GU603H
Intel Core i9-11900H
54156 MIPS -16%
HP Victus 16-e0145ng
AMD Ryzen 5 5600H
46450 MIPS -28%
Lenovo Legion C7 15IMH05 82EH0030GE
Intel Core i7-10875H
46136 MIPS -29%
7-Zip 18.03 / 7z b 4 -mmt1
Alienware x15 R2 P111F
Intel Core i9-12900H
5848 MIPS +1%
Lenovo Legion 5 Pro 16ARH7H RTX 3070 Ti
AMD Ryzen 7 6800H
5803 MIPS
Media AMD Ryzen 7 6800H
  (5521 - 5803, n=8)
5726 MIPS -1%
Gigabyte A5 X1
AMD Ryzen 9 5900HX
5720 MIPS -1%
Lenovo Legion 7 16ARHA7
AMD Ryzen 9 6900HX
5679 MIPS -2%
Asus ROG Zephyrus M16 GU603H
Intel Core i9-11900H
5582 MIPS -4%
Lenovo Legion 5 Pro 16IAH7H
Intel Core i7-12700H
5475 MIPS -6%
HP Omen 16-c0077ng
AMD Ryzen 7 5800H
5423 MIPS -7%
Lenovo Legion C7 15IMH05 82EH0030GE
Intel Core i7-10875H
5410 MIPS -7%
HP Victus 16-e0145ng
AMD Ryzen 5 5600H
5345 MIPS -8%
Dell G16 7620
Intel Core i7-12700H
5343 MIPS -8%
Geekbench 5.5 / Multi-Core
Alienware x15 R2 P111F
Intel Core i9-12900H
13844 Points +34%
Lenovo Legion 5 Pro 16IAH7H
Intel Core i7-12700H
12795 Points +24%
Dell G16 7620
Intel Core i7-12700H
11862 Points +15%
Lenovo Legion 5 Pro 16ARH7H RTX 3070 Ti
AMD Ryzen 7 6800H
10355 Points
Lenovo Legion 7 16ARHA7
AMD Ryzen 9 6900HX
10018 Points -3%
Asus ROG Zephyrus M16 GU603H
Intel Core i9-11900H
9663 Points -7%
Media AMD Ryzen 7 6800H
  (8898 - 10355, n=10)
9458 Points -9%
Gigabyte A5 X1
AMD Ryzen 9 5900HX
8616 Points -17%
Lenovo Legion C7 15IMH05 82EH0030GE
Intel Core i7-10875H
8176 Points -21%
HP Omen 16-c0077ng
AMD Ryzen 7 5800H
7326 Points -29%
HP Victus 16-e0145ng
AMD Ryzen 5 5600H
7191 Points -31%
Geekbench 5.5 / Single-Core
Alienware x15 R2 P111F
Intel Core i9-12900H
1863 Points +19%
Lenovo Legion 5 Pro 16IAH7H
Intel Core i7-12700H
1694 Points +8%
Dell G16 7620
Intel Core i7-12700H
1656 Points +6%
Asus ROG Zephyrus M16 GU603H
Intel Core i9-11900H
1624 Points +4%
Lenovo Legion 7 16ARHA7
AMD Ryzen 9 6900HX
1589 Points +1%
Lenovo Legion 5 Pro 16ARH7H RTX 3070 Ti
AMD Ryzen 7 6800H
1566 Points
Media AMD Ryzen 7 6800H
  (1518 - 1568, n=10)
1550 Points -1%
Gigabyte A5 X1
AMD Ryzen 9 5900HX
1525 Points -3%
HP Victus 16-e0145ng
AMD Ryzen 5 5600H
1444 Points -8%
HP Omen 16-c0077ng
AMD Ryzen 7 5800H
1336 Points -15%
Lenovo Legion C7 15IMH05 82EH0030GE
Intel Core i7-10875H
1315 Points -16%
HWBOT x265 Benchmark v2.2 / 4k Preset
Lenovo Legion 5 Pro 16IAH7H
Intel Core i7-12700H
21.2 fps +15%
Alienware x15 R2 P111F
Intel Core i9-12900H
20.5 fps +11%
Dell G16 7620
Intel Core i7-12700H
18.8 fps +2%
Lenovo Legion 5 Pro 16ARH7H RTX 3070 Ti
AMD Ryzen 7 6800H
18.5 fps
Lenovo Legion 7 16ARHA7
AMD Ryzen 9 6900HX
18.2 fps -2%
Gigabyte A5 X1
AMD Ryzen 9 5900HX
16.6 fps -10%
Media AMD Ryzen 7 6800H
  (14.9 - 18.5, n=9)
16.3 fps -12%
HP Omen 16-c0077ng
AMD Ryzen 7 5800H
15.2 fps -18%
Asus ROG Zephyrus M16 GU603H
Intel Core i9-11900H
15 fps -19%
HP Victus 16-e0145ng
AMD Ryzen 5 5600H
12.7 fps -31%
Lenovo Legion C7 15IMH05 82EH0030GE
Intel Core i7-10875H
11.9 fps -36%
LibreOffice / 20 Documents To PDF
HP Omen 16-c0077ng
AMD Ryzen 7 5800H
92.3 s * -75%
Gigabyte A5 X1
AMD Ryzen 9 5900HX
85.6 s * -62%
HP Victus 16-e0145ng
AMD Ryzen 5 5600H
65.7 s * -24%
Lenovo Legion C7 15IMH05 82EH0030GE
Intel Core i7-10875H
55.9 s * -6%
Media AMD Ryzen 7 6800H
  (48.7 - 79.5, n=8)
55.1 s * -4%
Lenovo Legion 7 16ARHA7
AMD Ryzen 9 6900HX
54 s * -2%
Dell G16 7620
Intel Core i7-12700H
53.8 s * -2%
Lenovo Legion 5 Pro 16ARH7H RTX 3070 Ti
AMD Ryzen 7 6800H
52.8 s *
Alienware x15 R2 P111F
Intel Core i9-12900H
47.1 s * +11%
Asus ROG Zephyrus M16 GU603H
Intel Core i9-11900H
40.5 s * +23%
Lenovo Legion 5 Pro 16IAH7H
Intel Core i7-12700H
40.2 s * +24%
R Benchmark 2.5 / Overall mean
Lenovo Legion C7 15IMH05 82EH0030GE
Intel Core i7-10875H
0.581 sec * -19%
Asus ROG Zephyrus M16 GU603H
Intel Core i9-11900H
0.544 sec * -11%
HP Victus 16-e0145ng
AMD Ryzen 5 5600H
0.527 sec * -8%
HP Omen 16-c0077ng
AMD Ryzen 7 5800H
0.516 sec * -5%
Dell G16 7620
Intel Core i7-12700H
0.505 sec * -3%
Gigabyte A5 X1
AMD Ryzen 9 5900HX
0.501 sec * -2%
Media AMD Ryzen 7 6800H
  (0.4783 - 0.515, n=8)
0.4943 sec * -1%
Lenovo Legion 7 16ARHA7
AMD Ryzen 9 6900HX
0.4907 sec * -0%
Lenovo Legion 5 Pro 16ARH7H RTX 3070 Ti
AMD Ryzen 7 6800H
0.4894 sec *
Lenovo Legion 5 Pro 16IAH7H
Intel Core i7-12700H
0.475 sec * +3%
Alienware x15 R2 P111F
Intel Core i9-12900H
0.4358 sec * +11%

* ... Meglio usare valori piccoli

Cinebench R15 CPU Multi 64Bit
2366 Points
Cinebench R15 OpenGL 64Bit
164.9 fps
Cinebench R15 Ref. Match 64Bit
99.6 %
Cinebench R15 CPU Single 64Bit
248 Points
Cinebench R20 CPU (Multi Core)
5661 Points
Cinebench R20 CPU (Single Core)
599 Points
Cinebench R23 Multi Core
14660 Points
Cinebench R23 Single Core
1543 Points
Aiuto
Performance Rating
Lenovo Legion 7 16ARHA7
AMD Ryzen 9 6900HX, Radeon RX 6850M XT
96.3 pt
Lenovo Legion 5 Pro 16ARH7H RTX 3070 Ti
AMD Ryzen 7 6800H, GeForce RTX 3070 Ti Laptop GPU
95.2 pt
Media AMD Ryzen 7 6800H
 
86.6 pt
Dell G16 7620
Intel Core i7-12700H, GeForce RTX 3060 Laptop GPU
82.1 pt
Lenovo Legion 5 Pro 16IAH7H
Intel Core i7-12700H, GeForce RTX 3060 Laptop GPU
73.5 pt
HP Victus 16-e0145ng
AMD Ryzen 5 5600H, GeForce RTX 3050 Ti Laptop GPU
62.1 pt
Asus ROG Zephyrus M16 GU603H -9!
Intel Core i9-11900H, GeForce RTX 3070 Laptop GPU
0 pt
AIDA64 / FP32 Ray-Trace
Lenovo Legion 7 16ARHA7
AMD Ryzen 9 6900HX, Radeon RX 6850M XT
17242 KRay/s +1%
Lenovo Legion 5 Pro 16ARH7H RTX 3070 Ti
AMD Ryzen 7 6800H, GeForce RTX 3070 Ti Laptop GPU
17031 KRay/s
Media AMD Ryzen 7 6800H
  (12876 - 17031, n=8)
15103 KRay/s -11%
Dell G16 7620
Intel Core i7-12700H, GeForce RTX 3060 Laptop GPU
14879 KRay/s -13%
HP Victus 16-e0145ng
AMD Ryzen 5 5600H, GeForce RTX 3050 Ti Laptop GPU
11729 KRay/s -31%
Lenovo Legion 5 Pro 16IAH7H
Intel Core i7-12700H, GeForce RTX 3060 Laptop GPU
9567 KRay/s -44%
AIDA64 / FPU Julia
Lenovo Legion 7 16ARHA7
AMD Ryzen 9 6900HX, Radeon RX 6850M XT
106387 Points 0%
Lenovo Legion 5 Pro 16ARH7H RTX 3070 Ti
AMD Ryzen 7 6800H, GeForce RTX 3070 Ti Laptop GPU
105987 Points
Media AMD Ryzen 7 6800H
  (82673 - 105987, n=8)
94742 Points -11%
Dell G16 7620
Intel Core i7-12700H, GeForce RTX 3060 Laptop GPU
78004 Points -26%
HP Victus 16-e0145ng
AMD Ryzen 5 5600H, GeForce RTX 3050 Ti Laptop GPU
72367 Points -32%
Lenovo Legion 5 Pro 16IAH7H
Intel Core i7-12700H, GeForce RTX 3060 Laptop GPU
41744 Points -61%
AIDA64 / CPU SHA3
Dell G16 7620
Intel Core i7-12700H, GeForce RTX 3060 Laptop GPU
3692 MB/s +2%
Lenovo Legion 7 16ARHA7
AMD Ryzen 9 6900HX, Radeon RX 6850M XT
3657 MB/s +1%
Lenovo Legion 5 Pro 16ARH7H RTX 3070 Ti
AMD Ryzen 7 6800H, GeForce RTX 3070 Ti Laptop GPU
3634 MB/s
Lenovo Legion 5 Pro 16IAH7H
Intel Core i7-12700H, GeForce RTX 3060 Laptop GPU
3435 MB/s -5%
Media AMD Ryzen 7 6800H
  (2886 - 3634, n=8)
3236 MB/s -11%
HP Victus 16-e0145ng
AMD Ryzen 5 5600H, GeForce RTX 3050 Ti Laptop GPU
2406 MB/s -34%
AIDA64 / CPU Queen
Lenovo Legion 5 Pro 16ARH7H RTX 3070 Ti
AMD Ryzen 7 6800H, GeForce RTX 3070 Ti Laptop GPU
106322 Points
Lenovo Legion 7 16ARHA7
AMD Ryzen 9 6900HX, Radeon RX 6850M XT
105344 Points -1%
Dell G16 7620
Intel Core i7-12700H, GeForce RTX 3060 Laptop GPU
102006 Points -4%
Lenovo Legion 5 Pro 16IAH7H
Intel Core i7-12700H, GeForce RTX 3060 Laptop GPU
98674 Points -7%
Media AMD Ryzen 7 6800H
  (75117 - 106322, n=8)
97317 Points -8%
HP Victus 16-e0145ng
AMD Ryzen 5 5600H, GeForce RTX 3050 Ti Laptop GPU
75804 Points -29%
AIDA64 / FPU SinJulia
Lenovo Legion 7 16ARHA7
AMD Ryzen 9 6900HX, Radeon RX 6850M XT
13011 Points +1%
Lenovo Legion 5 Pro 16ARH7H RTX 3070 Ti
AMD Ryzen 7 6800H, GeForce RTX 3070 Ti Laptop GPU
12842 Points
Media AMD Ryzen 7 6800H
  (11771 - 13120, n=8)
12524 Points -2%
Lenovo Legion 5 Pro 16IAH7H
Intel Core i7-12700H, GeForce RTX 3060 Laptop GPU
9927 Points -23%
Dell G16 7620
Intel Core i7-12700H, GeForce RTX 3060 Laptop GPU
9924 Points -23%
HP Victus 16-e0145ng
AMD Ryzen 5 5600H, GeForce RTX 3050 Ti Laptop GPU
8904 Points -31%
AIDA64 / FPU Mandel
Lenovo Legion 7 16ARHA7
AMD Ryzen 9 6900HX, Radeon RX 6850M XT
58428 Points 0%
Lenovo Legion 5 Pro 16ARH7H RTX 3070 Ti
AMD Ryzen 7 6800H, GeForce RTX 3070 Ti Laptop GPU
58327 Points
Media AMD Ryzen 7 6800H
  (45287 - 58327, n=8)
52044 Points -11%
HP Victus 16-e0145ng
AMD Ryzen 5 5600H, GeForce RTX 3050 Ti Laptop GPU
40003 Points -31%
Dell G16 7620
Intel Core i7-12700H, GeForce RTX 3060 Laptop GPU
35933 Points -38%
Lenovo Legion 5 Pro 16IAH7H
Intel Core i7-12700H, GeForce RTX 3060 Laptop GPU
27390 Points -53%
AIDA64 / CPU AES
Lenovo Legion 7 16ARHA7
AMD Ryzen 9 6900HX, Radeon RX 6850M XT
142360 MB/s +4%
Lenovo Legion 5 Pro 16ARH7H RTX 3070 Ti
AMD Ryzen 7 6800H, GeForce RTX 3070 Ti Laptop GPU
137383 MB/s
Media AMD Ryzen 7 6800H
  (67816 - 137383, n=8)
119730 MB/s -13%
Lenovo Legion 5 Pro 16IAH7H
Intel Core i7-12700H, GeForce RTX 3060 Laptop GPU
102069 MB/s -26%
Dell G16 7620
Intel Core i7-12700H, GeForce RTX 3060 Laptop GPU
72634 MB/s -47%
HP Victus 16-e0145ng
AMD Ryzen 5 5600H, GeForce RTX 3050 Ti Laptop GPU
46150 MB/s -66%
AIDA64 / CPU ZLib
Lenovo Legion 5 Pro 16IAH7H
Intel Core i7-12700H, GeForce RTX 3060 Laptop GPU
1171 MB/s +30%
Dell G16 7620
Intel Core i7-12700H, GeForce RTX 3060 Laptop GPU
1045 MB/s +16%
Lenovo Legion 7 16ARHA7
AMD Ryzen 9 6900HX, Radeon RX 6850M XT
905 MB/s 0%
Lenovo Legion 5 Pro 16ARH7H RTX 3070 Ti
AMD Ryzen 7 6800H, GeForce RTX 3070 Ti Laptop GPU
901 MB/s
Media AMD Ryzen 7 6800H
  (732 - 901, n=8)
819 MB/s -9%
HP Victus 16-e0145ng
AMD Ryzen 5 5600H, GeForce RTX 3050 Ti Laptop GPU
624 MB/s -31%
Asus ROG Zephyrus M16 GU603H
Intel Core i9-11900H, GeForce RTX 3070 Laptop GPU
0 MB/s -100%
AIDA64 / FP64 Ray-Trace
Lenovo Legion 7 16ARHA7
AMD Ryzen 9 6900HX, Radeon RX 6850M XT
9147 KRay/s +3%
Lenovo Legion 5 Pro 16ARH7H RTX 3070 Ti
AMD Ryzen 7 6800H, GeForce RTX 3070 Ti Laptop GPU
8856 KRay/s
Media AMD Ryzen 7 6800H
  (6917 - 8980, n=8)
8014 KRay/s -10%
Dell G16 7620
Intel Core i7-12700H, GeForce RTX 3060 Laptop GPU
7997 KRay/s -10%
HP Victus 16-e0145ng
AMD Ryzen 5 5600H, GeForce RTX 3050 Ti Laptop GPU
6167 KRay/s -30%
Lenovo Legion 5 Pro 16IAH7H
Intel Core i7-12700H, GeForce RTX 3060 Laptop GPU
5760 KRay/s -35%
AIDA64 / CPU PhotoWorxx
Dell G16 7620
Intel Core i7-12700H, GeForce RTX 3060 Laptop GPU
34982 MPixel/s +16%
Lenovo Legion 5 Pro 16IAH7H
Intel Core i7-12700H, GeForce RTX 3060 Laptop GPU
33615 MPixel/s +11%
Lenovo Legion 7 16ARHA7
AMD Ryzen 9 6900HX, Radeon RX 6850M XT
30604 MPixel/s +1%
Lenovo Legion 5 Pro 16ARH7H RTX 3070 Ti
AMD Ryzen 7 6800H, GeForce RTX 3070 Ti Laptop GPU
30182 MPixel/s
Media AMD Ryzen 7 6800H
  (26496 - 30360, n=8)
29028 MPixel/s -4%
HP Victus 16-e0145ng
AMD Ryzen 5 5600H, GeForce RTX 3050 Ti Laptop GPU
20283 MPixel/s -33%

Prestazioni del sistema

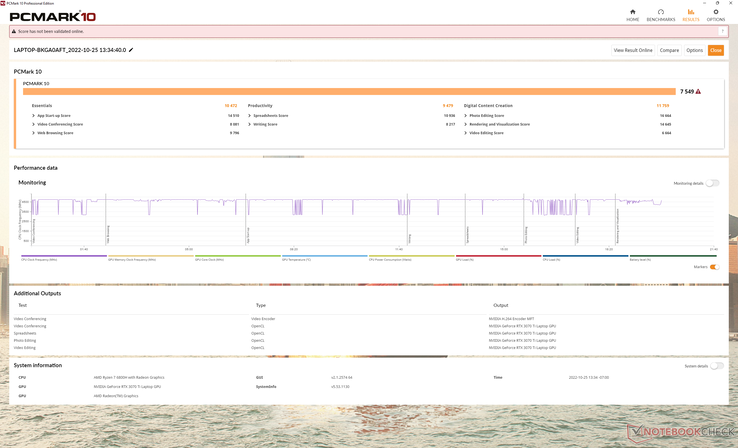
I risultati di PCMark sono a una sola cifra percentuale da quelli di altri portatili da gioco di fascia alta basati su Intel come ilDell G16 7620 anche se il Ryzen 7 6800H non riesce a tenere il passo con le ultime CPU Core di 12a generazione.

PCMark 10 standard
PCMark 10 standard
PCMark 10 / Score
Lenovo Legion 5 Pro 16ARH7H RTX 3070 Ti
GeForce RTX 3070 Ti Laptop GPU, R7 6800H, Samsung PM9A1 MZVL21T0HCLR
7549 Points
Lenovo Legion 5 Pro 16IAH7H
GeForce RTX 3060 Laptop GPU, i7-12700H, 2x Samsung PM9A1 MZVL21T0HCLR (RAID 0)
7531 Points 0%
Lenovo Legion 7 16ARHA7
Radeon RX 6850M XT, R9 6900HX, Samsung PM9A1 MZVL22T0HBLB
7377 Points -2%
Dell G16 7620
GeForce RTX 3060 Laptop GPU, i7-12700H, WDC PC SN810 512GB
7211 Points -4%
Media AMD Ryzen 7 6800H, NVIDIA GeForce RTX 3070 Ti Laptop GPU
  (6783 - 7549, n=2)
7166 Points -5%
Asus ROG Zephyrus M16 GU603H
GeForce RTX 3070 Laptop GPU, i9-11900H, Samsung PM9A1 MZVL22T0HBLB
7097 Points -6%
HP Victus 16-e0145ng
GeForce RTX 3050 Ti Laptop GPU, R5 5600H, Samsung SSD PM981a MZVLB512HBJQ
6076 Points -20%
PCMark 10 / Essentials
Lenovo Legion 5 Pro 16IAH7H
GeForce RTX 3060 Laptop GPU, i7-12700H, 2x Samsung PM9A1 MZVL21T0HCLR (RAID 0)
11053 Points +6%
Asus ROG Zephyrus M16 GU603H
GeForce RTX 3070 Laptop GPU, i9-11900H, Samsung PM9A1 MZVL22T0HBLB
10544 Points +1%
Lenovo Legion 7 16ARHA7
Radeon RX 6850M XT, R9 6900HX, Samsung PM9A1 MZVL22T0HBLB
10521 Points 0%
Lenovo Legion 5 Pro 16ARH7H RTX 3070 Ti
GeForce RTX 3070 Ti Laptop GPU, R7 6800H, Samsung PM9A1 MZVL21T0HCLR
10472 Points
Media AMD Ryzen 7 6800H, NVIDIA GeForce RTX 3070 Ti Laptop GPU
  (10343 - 10472, n=2)
10408 Points -1%
Dell G16 7620
GeForce RTX 3060 Laptop GPU, i7-12700H, WDC PC SN810 512GB
10263 Points -2%
HP Victus 16-e0145ng
GeForce RTX 3050 Ti Laptop GPU, R5 5600H, Samsung SSD PM981a MZVLB512HBJQ
9667 Points -8%
PCMark 10 / Productivity
Lenovo Legion 5 Pro 16ARH7H RTX 3070 Ti
GeForce RTX 3070 Ti Laptop GPU, R7 6800H, Samsung PM9A1 MZVL21T0HCLR
9479 Points
Lenovo Legion 5 Pro 16IAH7H
GeForce RTX 3060 Laptop GPU, i7-12700H, 2x Samsung PM9A1 MZVL21T0HCLR (RAID 0)
9358 Points -1%
Media AMD Ryzen 7 6800H, NVIDIA GeForce RTX 3070 Ti Laptop GPU
  (8991 - 9479, n=2)
9235 Points -3%
Asus ROG Zephyrus M16 GU603H
GeForce RTX 3070 Laptop GPU, i9-11900H, Samsung PM9A1 MZVL22T0HBLB
9113 Points -4%
Lenovo Legion 7 16ARHA7
Radeon RX 6850M XT, R9 6900HX, Samsung PM9A1 MZVL22T0HBLB
9097 Points -4%
Dell G16 7620
GeForce RTX 3060 Laptop GPU, i7-12700H, WDC PC SN810 512GB
8878 Points -6%
HP Victus 16-e0145ng
GeForce RTX 3050 Ti Laptop GPU, R5 5600H, Samsung SSD PM981a MZVLB512HBJQ
8276 Points -13%
PCMark 10 / Digital Content Creation
Lenovo Legion 5 Pro 16ARH7H RTX 3070 Ti
GeForce RTX 3070 Ti Laptop GPU, R7 6800H, Samsung PM9A1 MZVL21T0HCLR
11759 Points
Lenovo Legion 7 16ARHA7
Radeon RX 6850M XT, R9 6900HX, Samsung PM9A1 MZVL22T0HBLB
11385 Points -3%
Lenovo Legion 5 Pro 16IAH7H
GeForce RTX 3060 Laptop GPU, i7-12700H, 2x Samsung PM9A1 MZVL21T0HCLR (RAID 0)
11207 Points -5%
Dell G16 7620
GeForce RTX 3060 Laptop GPU, i7-12700H, WDC PC SN810 512GB
11170 Points -5%
Media AMD Ryzen 7 6800H, NVIDIA GeForce RTX 3070 Ti Laptop GPU
  (9108 - 11759, n=2)
10434 Points -11%
Asus ROG Zephyrus M16 GU603H
GeForce RTX 3070 Laptop GPU, i9-11900H, Samsung PM9A1 MZVL22T0HBLB
10097 Points -14%
HP Victus 16-e0145ng
GeForce RTX 3050 Ti Laptop GPU, R5 5600H, Samsung SSD PM981a MZVLB512HBJQ
7611 Points -35%
CrossMark / Overall
Dell G16 7620
GeForce RTX 3060 Laptop GPU, i7-12700H, WDC PC SN810 512GB
1783 Points +9%
Lenovo Legion 5 Pro 16IAH7H
GeForce RTX 3060 Laptop GPU, i7-12700H, 2x Samsung PM9A1 MZVL21T0HCLR (RAID 0)
1755 Points +7%
Lenovo Legion 5 Pro 16ARH7H RTX 3070 Ti
GeForce RTX 3070 Ti Laptop GPU, R7 6800H, Samsung PM9A1 MZVL21T0HCLR
1643 Points
Lenovo Legion 7 16ARHA7
Radeon RX 6850M XT, R9 6900HX, Samsung PM9A1 MZVL22T0HBLB
1596 Points -3%
Media AMD Ryzen 7 6800H, NVIDIA GeForce RTX 3070 Ti Laptop GPU
  (1522 - 1643, n=2)
1583 Points -4%
CrossMark / Productivity
Lenovo Legion 5 Pro 16IAH7H
GeForce RTX 3060 Laptop GPU, i7-12700H, 2x Samsung PM9A1 MZVL21T0HCLR (RAID 0)
1686 Points +5%
Dell G16 7620
GeForce RTX 3060 Laptop GPU, i7-12700H, WDC PC SN810 512GB
1682 Points +5%
Lenovo Legion 5 Pro 16ARH7H RTX 3070 Ti
GeForce RTX 3070 Ti Laptop GPU, R7 6800H, Samsung PM9A1 MZVL21T0HCLR
1600 Points
Media AMD Ryzen 7 6800H, NVIDIA GeForce RTX 3070 Ti Laptop GPU
  (1530 - 1600, n=2)
1565 Points -2%
Lenovo Legion 7 16ARHA7
Radeon RX 6850M XT, R9 6900HX, Samsung PM9A1 MZVL22T0HBLB
1551 Points -3%
CrossMark / Creativity
Dell G16 7620
GeForce RTX 3060 Laptop GPU, i7-12700H, WDC PC SN810 512GB
1948 Points +12%
Lenovo Legion 5 Pro 16IAH7H
GeForce RTX 3060 Laptop GPU, i7-12700H, 2x Samsung PM9A1 MZVL21T0HCLR (RAID 0)
1835 Points +5%
Lenovo Legion 7 16ARHA7
Radeon RX 6850M XT, R9 6900HX, Samsung PM9A1 MZVL22T0HBLB
1754 Points 0%
Lenovo Legion 5 Pro 16ARH7H RTX 3070 Ti
GeForce RTX 3070 Ti Laptop GPU, R7 6800H, Samsung PM9A1 MZVL21T0HCLR
1746 Points
Media AMD Ryzen 7 6800H, NVIDIA GeForce RTX 3070 Ti Laptop GPU
  (1589 - 1746, n=2)
1668 Points -4%
CrossMark / Responsiveness
Lenovo Legion 5 Pro 16IAH7H
GeForce RTX 3060 Laptop GPU, i7-12700H, 2x Samsung PM9A1 MZVL21T0HCLR (RAID 0)
1731 Points +17%
Dell G16 7620
GeForce RTX 3060 Laptop GPU, i7-12700H, WDC PC SN810 512GB
1627 Points +10%
Lenovo Legion 5 Pro 16ARH7H RTX 3070 Ti
GeForce RTX 3070 Ti Laptop GPU, R7 6800H, Samsung PM9A1 MZVL21T0HCLR
1481 Points
Media AMD Ryzen 7 6800H, NVIDIA GeForce RTX 3070 Ti Laptop GPU
  (1316 - 1481, n=2)
1399 Points -6%
Lenovo Legion 7 16ARHA7
Radeon RX 6850M XT, R9 6900HX, Samsung PM9A1 MZVL22T0HBLB
1310 Points -12%
PCMark 10 Score
7549 punti
Aiuto
AIDA64 / Memory Copy
Lenovo Legion 5 Pro 16IAH7H
Intel Core i7-12700H, GeForce RTX 3060 Laptop GPU
54861 MB/s +7%
Dell G16 7620
Intel Core i7-12700H, GeForce RTX 3060 Laptop GPU
54685 MB/s +7%
Lenovo Legion 5 Pro 16ARH7H RTX 3070 Ti
AMD Ryzen 7 6800H, GeForce RTX 3070 Ti Laptop GPU
51182 MB/s
Lenovo Legion 7 16ARHA7
AMD Ryzen 9 6900HX, Radeon RX 6850M XT
50837 MB/s -1%
Media AMD Ryzen 7 6800H
  (48209 - 51186, n=8)
50144 MB/s -2%
HP Victus 16-e0145ng
AMD Ryzen 5 5600H, GeForce RTX 3050 Ti Laptop GPU
41967 MB/s -18%
AIDA64 / Memory Read
Dell G16 7620
Intel Core i7-12700H, GeForce RTX 3060 Laptop GPU
65740 MB/s +27%
Lenovo Legion 5 Pro 16IAH7H
Intel Core i7-12700H, GeForce RTX 3060 Laptop GPU
63055 MB/s +22%
Lenovo Legion 7 16ARHA7
AMD Ryzen 9 6900HX, Radeon RX 6850M XT
51836 MB/s 0%
Lenovo Legion 5 Pro 16ARH7H RTX 3070 Ti
AMD Ryzen 7 6800H, GeForce RTX 3070 Ti Laptop GPU
51778 MB/s
Media AMD Ryzen 7 6800H
  (43828 - 51778, n=8)
50259 MB/s -3%
HP Victus 16-e0145ng
AMD Ryzen 5 5600H, GeForce RTX 3050 Ti Laptop GPU
47160 MB/s -9%
AIDA64 / Memory Write
Lenovo Legion 5 Pro 16IAH7H
Intel Core i7-12700H, GeForce RTX 3060 Laptop GPU
59113 MB/s +7%
Dell G16 7620
Intel Core i7-12700H, GeForce RTX 3060 Laptop GPU
57178 MB/s +3%
Lenovo Legion 5 Pro 16ARH7H RTX 3070 Ti
AMD Ryzen 7 6800H, GeForce RTX 3070 Ti Laptop GPU
55307 MB/s
Lenovo Legion 7 16ARHA7
AMD Ryzen 9 6900HX, Radeon RX 6850M XT
55214 MB/s 0%
Media AMD Ryzen 7 6800H
  (51116 - 55307, n=8)
54668 MB/s -1%
HP Victus 16-e0145ng
AMD Ryzen 5 5600H, GeForce RTX 3050 Ti Laptop GPU
44509 MB/s -20%
AIDA64 / Memory Latency
Lenovo Legion 5 Pro 16IAH7H
Intel Core i7-12700H, GeForce RTX 3060 Laptop GPU
116.5 ns * -34%
Dell G16 7620
Intel Core i7-12700H, GeForce RTX 3060 Laptop GPU
100.6 ns * -15%
Media AMD Ryzen 7 6800H
  (83.1 - 104.1, n=8)
88.6 ns * -2%
Lenovo Legion 5 Pro 16ARH7H RTX 3070 Ti
AMD Ryzen 7 6800H, GeForce RTX 3070 Ti Laptop GPU
87.1 ns *
Lenovo Legion 7 16ARHA7
AMD Ryzen 9 6900HX, Radeon RX 6850M XT
85.4 ns * +2%
HP Victus 16-e0145ng
AMD Ryzen 5 5600H, GeForce RTX 3050 Ti Laptop GPU
78.1 ns * +10%
Asus ROG Zephyrus M16 GU603H
Intel Core i9-11900H, GeForce RTX 3070 Laptop GPU
0 ns * +100%

* ... Meglio usare valori piccoli

Latenza DPC

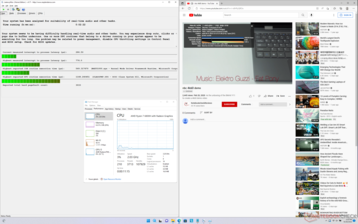
LatencyMon rivela lievi problemi di DPC quando si aprono più schede del browser della nostra homepage. la riproduzione di video 4K a 60 FPS è invece perfetta e senza cadute di fotogrammi.

DPC Latencies / LatencyMon - interrupt to process latency (max), Web, Youtube, Prime95
Lenovo Legion 7 16ARHA7
Radeon RX 6850M XT, R9 6900HX, Samsung PM9A1 MZVL22T0HBLB
1393.9 μs * -80%
Asus ROG Zephyrus M16 GU603H
GeForce RTX 3070 Laptop GPU, i9-11900H, Samsung PM9A1 MZVL22T0HBLB
960 μs * -24%
Dell G16 7620
GeForce RTX 3060 Laptop GPU, i7-12700H, WDC PC SN810 512GB
912.5 μs * -18%
HP Victus 16-e0145ng
GeForce RTX 3050 Ti Laptop GPU, R5 5600H, Samsung SSD PM981a MZVLB512HBJQ
892.8 μs * -15%
Lenovo Legion 5 Pro 16ARH7H RTX 3070 Ti
GeForce RTX 3070 Ti Laptop GPU, R7 6800H, Samsung PM9A1 MZVL21T0HCLR
776 μs *
Lenovo Legion 5 Pro 16IAH7H
GeForce RTX 3060 Laptop GPU, i7-12700H, 2x Samsung PM9A1 MZVL21T0HCLR (RAID 0)
650.7 μs * +16%

* ... Meglio usare valori piccoli

Dispositivi di archiviazione - Fino a due SSD PCIe4 NVMe

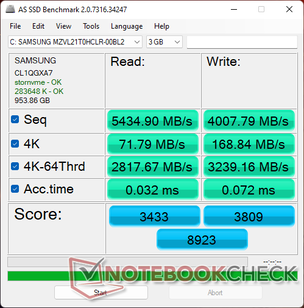
AS SSD
AS SSD
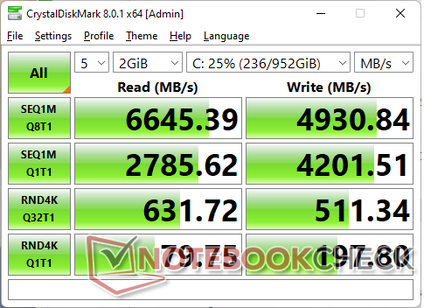
CDM 8
CDM 8
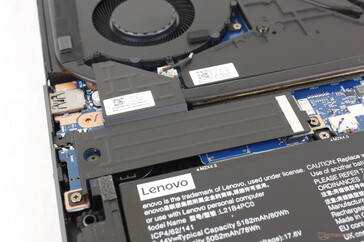
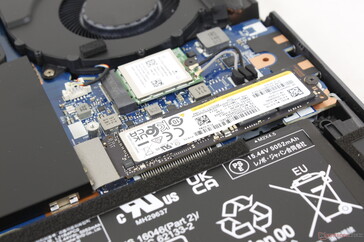
Slot secondario M.2 2280 PCIe4 x4
Slot primario M.2 2280 PCIe4 x4 con diffusore di calore rimosso
Samsung PM9A1 MZVL21T0HCLR
CDM 5/6 Read Seq Q32T1: 7113 MB/s
CDM 5/6 Write Seq Q32T1: 5280 MB/s
CDM 5/6 Read 4K Q32T1: 629.3 MB/s
CDM 5/6 Write 4K Q32T1: 504.8 MB/s
CDM 5 Read Seq: 3693 MB/s
CDM 5 Write Seq: 4214 MB/s
CDM 5/6 Read 4K: 72.6 MB/s
CDM 5/6 Write 4K: 194.3 MB/s
Drive Performance Rating - Percent
Lenovo Legion 5 Pro 16IAH7H
2x Samsung PM9A1 MZVL21T0HCLR (RAID 0)
81.2 pt
Lenovo Legion 5 Pro 16ARH7H RTX 3070 Ti
Samsung PM9A1 MZVL21T0HCLR
74.5 pt
Asus ROG Zephyrus M16 GU603H
Samsung PM9A1 MZVL22T0HBLB
73.9 pt
Dell G16 7620
WDC PC SN810 512GB
67.1 pt
Lenovo Legion 7 16ARHA7
Samsung PM9A1 MZVL22T0HBLB
55.9 pt
HP Victus 16-e0145ng
Samsung SSD PM981a MZVLB512HBJQ
46.8 pt
DiskSpd
seq read
Lenovo Legion 5 Pro 16IAH7H
2x Samsung PM9A1 MZVL21T0HCLR (RAID 0)
5544 (5525.64min - 5543.85max) MB/s +31%
Lenovo Legion 5 Pro 16ARH7H RTX 3070 Ti
Samsung PM9A1 MZVL21T0HCLR
4229 (4208.75min - 4229.47max) MB/s
Dell G16 7620
WDC PC SN810 512GB
4103 (4046.12min - 4103.29max) MB/s -3%
Asus ROG Zephyrus M16 GU603H
Samsung PM9A1 MZVL22T0HBLB
4101 (4091.33min - 4100.54max) MB/s -3%
Lenovo Legion 7 16ARHA7
Samsung PM9A1 MZVL22T0HBLB
3625 (3612.57min - 3624.81max) MB/s -14%
HP Victus 16-e0145ng
Samsung SSD PM981a MZVLB512HBJQ
2709 (2689.67min - 2709.31max) MB/s -36%
seq write
Lenovo Legion 5 Pro 16IAH7H
2x Samsung PM9A1 MZVL21T0HCLR (RAID 0)
7667 (7620.91min - 7667.19max) MB/s +84%
Dell G16 7620
WDC PC SN810 512GB
4351 (4255.54min - 4351.38max) MB/s +5%
Lenovo Legion 5 Pro 16ARH7H RTX 3070 Ti
Samsung PM9A1 MZVL21T0HCLR
4158 (4130.89min - 4157.81max) MB/s
Asus ROG Zephyrus M16 GU603H
Samsung PM9A1 MZVL22T0HBLB
4030 (4011.22min - 4030.01max) MB/s -3%
Lenovo Legion 7 16ARHA7
Samsung PM9A1 MZVL22T0HBLB
3274 (3228.15min - 3273.86max) MB/s -21%
HP Victus 16-e0145ng
Samsung SSD PM981a MZVLB512HBJQ
2805 (2768.37min - 2804.73max) MB/s -33%
seq q8 t1 read
Lenovo Legion 5 Pro 16IAH7H
2x Samsung PM9A1 MZVL21T0HCLR (RAID 0)
12143 (11574.5min - 12143max) MB/s +84%
Asus ROG Zephyrus M16 GU603H
Samsung PM9A1 MZVL22T0HBLB
7090 (6255.18min - 7089.92max) MB/s +8%
Dell G16 7620
WDC PC SN810 512GB
6835 (5788.14min - 6835.21max) MB/s +4%
Lenovo Legion 7 16ARHA7
Samsung PM9A1 MZVL22T0HBLB
6697 (4182.58min - 6697.46max) MB/s +2%
Lenovo Legion 5 Pro 16ARH7H RTX 3070 Ti
Samsung PM9A1 MZVL21T0HCLR
6593 (6284.75min - 6592.61max) MB/s
HP Victus 16-e0145ng
Samsung SSD PM981a MZVLB512HBJQ
3528 (2763.76min - 3528.04max) MB/s -46%
seq q8 t1 write
Lenovo Legion 5 Pro 16IAH7H
2x Samsung PM9A1 MZVL21T0HCLR (RAID 0)
10203 (10182.9min - 10203.3max) MB/s +105%
Asus ROG Zephyrus M16 GU603H
Samsung PM9A1 MZVL22T0HBLB
5216 (5094.91min - 5216.3max) MB/s +5%
Lenovo Legion 7 16ARHA7
Samsung PM9A1 MZVL22T0HBLB
5003 (4959.7min - 5002.55max) MB/s +1%
Lenovo Legion 5 Pro 16ARH7H RTX 3070 Ti
Samsung PM9A1 MZVL21T0HCLR
4969 (4945.26min - 4969.12max) MB/s
Dell G16 7620
WDC PC SN810 512GB
4429 (4321.97min - 4429.45max) MB/s -11%
HP Victus 16-e0145ng
Samsung SSD PM981a MZVLB512HBJQ
2988 (2975.65min - 2988.44max) MB/s -40%
4k q1 t1 read
Lenovo Legion 5 Pro 16IAH7H
2x Samsung PM9A1 MZVL21T0HCLR (RAID 0)
90.6 (90.17min - 90.55max) MB/s +14%
Lenovo Legion 5 Pro 16ARH7H RTX 3070 Ti
Samsung PM9A1 MZVL21T0HCLR
79.8 (79.31min - 79.75max) MB/s
Lenovo Legion 7 16ARHA7
Samsung PM9A1 MZVL22T0HBLB
67.6 (66.3min - 67.64max) MB/s -15%
Asus ROG Zephyrus M16 GU603H
Samsung PM9A1 MZVL22T0HBLB
59.4 (59.37min - 59.41max) MB/s -26%
Dell G16 7620
WDC PC SN810 512GB
54.4 (53.6min - 54.36max) MB/s -32%
HP Victus 16-e0145ng
Samsung SSD PM981a MZVLB512HBJQ
45.3 (45.11min - 45.34max) MB/s -43%
4k q1 t1 write
Dell G16 7620
WDC PC SN810 512GB
278 (269.55min - 278.46max) MB/s +43%
Lenovo Legion 5 Pro 16IAH7H
2x Samsung PM9A1 MZVL21T0HCLR (RAID 0)
237 (232.48min - 236.93max) MB/s +22%
Lenovo Legion 5 Pro 16ARH7H RTX 3070 Ti
Samsung PM9A1 MZVL21T0HCLR
194.2 (193.1min - 194.16max) MB/s
Asus ROG Zephyrus M16 GU603H
Samsung PM9A1 MZVL22T0HBLB
190 (189.88min - 190.32max) MB/s -2%
Lenovo Legion 7 16ARHA7
Samsung PM9A1 MZVL22T0HBLB
161 (159.24min - 160.98max) MB/s -17%
HP Victus 16-e0145ng
Samsung SSD PM981a MZVLB512HBJQ
140.2 (139.12min - 140.19max) MB/s -28%
4k q32 t16 read
Lenovo Legion 5 Pro 16ARH7H RTX 3070 Ti
Samsung PM9A1 MZVL21T0HCLR
4178 (4170.63min - 4178.12max) MB/s
Asus ROG Zephyrus M16 GU603H
Samsung PM9A1 MZVL22T0HBLB
4056 (4048.94min - 4055.97max) MB/s -3%
Dell G16 7620
WDC PC SN810 512GB
3318 (3312.29min - 3317.96max) MB/s -21%
Lenovo Legion 5 Pro 16IAH7H
2x Samsung PM9A1 MZVL21T0HCLR (RAID 0)
1982 (1800.55min - 1982.03max) MB/s -53%
Lenovo Legion 7 16ARHA7
Samsung PM9A1 MZVL22T0HBLB
1535 (1515.74min - 1535.37max) MB/s -63%
HP Victus 16-e0145ng
Samsung SSD PM981a MZVLB512HBJQ
1150 (1148.61min - 1149.67max) MB/s -72%
4k q32 t16 write
Lenovo Legion 5 Pro 16ARH7H RTX 3070 Ti
Samsung PM9A1 MZVL21T0HCLR
3559 (3517.38min - 3559.2max) MB/s
Asus ROG Zephyrus M16 GU603H
Samsung PM9A1 MZVL22T0HBLB
3478 (3468.35min - 3478.1max) MB/s -2%
Dell G16 7620
WDC PC SN810 512GB
2716 (1283.18min - 2716.43max) MB/s -24%
HP Victus 16-e0145ng
Samsung SSD PM981a MZVLB512HBJQ
2134 (2126.73min - 2134.25max) MB/s -40%
Lenovo Legion 5 Pro 16IAH7H
2x Samsung PM9A1 MZVL21T0HCLR (RAID 0)
1842 (1678.82min - 1841.75max) MB/s -48%
Lenovo Legion 7 16ARHA7
Samsung PM9A1 MZVL22T0HBLB
539 (505.45min - 539.19max) MB/s -85%
AS SSD
Score Total
Lenovo Legion 5 Pro 16ARH7H RTX 3070 Ti
Samsung PM9A1 MZVL21T0HCLR
8923 Points
Asus ROG Zephyrus M16 GU603H
Samsung PM9A1 MZVL22T0HBLB
8563 Points -4%
Dell G16 7620
WDC PC SN810 512GB
7323 Points -18%
Lenovo Legion 5 Pro 16IAH7H
2x Samsung PM9A1 MZVL21T0HCLR (RAID 0)
6691 Points -25%
Lenovo Legion 7 16ARHA7
Samsung PM9A1 MZVL22T0HBLB
6475 Points -27%
HP Victus 16-e0145ng
Samsung SSD PM981a MZVLB512HBJQ
5127 Points -43%
Score Read
Lenovo Legion 5 Pro 16ARH7H RTX 3070 Ti
Samsung PM9A1 MZVL21T0HCLR
3433 Points
Asus ROG Zephyrus M16 GU603H
Samsung PM9A1 MZVL22T0HBLB
3208 Points -7%
Dell G16 7620
WDC PC SN810 512GB
2763 Points -20%
Lenovo Legion 5 Pro 16IAH7H
2x Samsung PM9A1 MZVL21T0HCLR (RAID 0)
2728 Points -21%
Lenovo Legion 7 16ARHA7
Samsung PM9A1 MZVL22T0HBLB
1957 Points -43%
HP Victus 16-e0145ng
Samsung SSD PM981a MZVLB512HBJQ
1856 Points -46%
Score Write
Lenovo Legion 5 Pro 16ARH7H RTX 3070 Ti
Samsung PM9A1 MZVL21T0HCLR
3809 Points
Asus ROG Zephyrus M16 GU603H
Samsung PM9A1 MZVL22T0HBLB
3790 Points 0%
Lenovo Legion 7 16ARHA7
Samsung PM9A1 MZVL22T0HBLB
3614 Points -5%
Dell G16 7620
WDC PC SN810 512GB
3145 Points -17%
Lenovo Legion 5 Pro 16IAH7H
2x Samsung PM9A1 MZVL21T0HCLR (RAID 0)
2631 Points -31%
HP Victus 16-e0145ng
Samsung SSD PM981a MZVLB512HBJQ
2340 Points -39%
Seq Read
Lenovo Legion 5 Pro 16IAH7H
2x Samsung PM9A1 MZVL21T0HCLR (RAID 0)
9681.3 MB/s +78%
Asus ROG Zephyrus M16 GU603H
Samsung PM9A1 MZVL22T0HBLB
5615 MB/s +3%
Lenovo Legion 5 Pro 16ARH7H RTX 3070 Ti
Samsung PM9A1 MZVL21T0HCLR
5434.9 MB/s
Lenovo Legion 7 16ARHA7
Samsung PM9A1 MZVL22T0HBLB
4996.87 MB/s -8%
Dell G16 7620
WDC PC SN810 512GB
4223.27 MB/s -22%
HP Victus 16-e0145ng
Samsung SSD PM981a MZVLB512HBJQ
3077.97 MB/s -43%
Seq Write
Lenovo Legion 5 Pro 16IAH7H
2x Samsung PM9A1 MZVL21T0HCLR (RAID 0)
8205.5 MB/s +105%
Asus ROG Zephyrus M16 GU603H
Samsung PM9A1 MZVL22T0HBLB
4297 MB/s +7%
Dell G16 7620
WDC PC SN810 512GB
4120.02 MB/s +3%
Lenovo Legion 5 Pro 16ARH7H RTX 3070 Ti
Samsung PM9A1 MZVL21T0HCLR
4007.79 MB/s
Lenovo Legion 7 16ARHA7
Samsung PM9A1 MZVL22T0HBLB
2851.98 MB/s -29%
HP Victus 16-e0145ng
Samsung SSD PM981a MZVLB512HBJQ
2634.36 MB/s -34%
4K Read
Lenovo Legion 5 Pro 16IAH7H
2x Samsung PM9A1 MZVL21T0HCLR (RAID 0)
80.52 MB/s +12%
Dell G16 7620
WDC PC SN810 512GB
76.3 MB/s +6%
Lenovo Legion 5 Pro 16ARH7H RTX 3070 Ti
Samsung PM9A1 MZVL21T0HCLR
71.79 MB/s
Lenovo Legion 7 16ARHA7
Samsung PM9A1 MZVL22T0HBLB
63.8 MB/s -11%
Asus ROG Zephyrus M16 GU603H
Samsung PM9A1 MZVL22T0HBLB
55.3 MB/s -23%
HP Victus 16-e0145ng
Samsung SSD PM981a MZVLB512HBJQ
49.45 MB/s -31%
4K Write
Dell G16 7620
WDC PC SN810 512GB
233.93 MB/s +39%
Lenovo Legion 5 Pro 16IAH7H
2x Samsung PM9A1 MZVL21T0HCLR (RAID 0)
197.41 MB/s +17%
Asus ROG Zephyrus M16 GU603H
Samsung PM9A1 MZVL22T0HBLB
170.5 MB/s +1%
Lenovo Legion 5 Pro 16ARH7H RTX 3070 Ti
Samsung PM9A1 MZVL21T0HCLR
168.84 MB/s
Lenovo Legion 7 16ARHA7
Samsung PM9A1 MZVL22T0HBLB
160.74 MB/s -5%
HP Victus 16-e0145ng
Samsung SSD PM981a MZVLB512HBJQ
132.72 MB/s -21%
4K-64 Read
Lenovo Legion 5 Pro 16ARH7H RTX 3070 Ti
Samsung PM9A1 MZVL21T0HCLR
2817.67 MB/s
Asus ROG Zephyrus M16 GU603H
Samsung PM9A1 MZVL22T0HBLB
2591 MB/s -8%
Dell G16 7620
WDC PC SN810 512GB
2264.67 MB/s -20%
Lenovo Legion 5 Pro 16IAH7H
2x Samsung PM9A1 MZVL21T0HCLR (RAID 0)
1679.76 MB/s -40%
HP Victus 16-e0145ng
Samsung SSD PM981a MZVLB512HBJQ
1499.04 MB/s -47%
Lenovo Legion 7 16ARHA7
Samsung PM9A1 MZVL22T0HBLB
1393.84 MB/s -51%
4K-64 Write
Lenovo Legion 5 Pro 16ARH7H RTX 3070 Ti
Samsung PM9A1 MZVL21T0HCLR
3239.16 MB/s
Asus ROG Zephyrus M16 GU603H
Samsung PM9A1 MZVL22T0HBLB
3190 MB/s -2%
Lenovo Legion 7 16ARHA7
Samsung PM9A1 MZVL22T0HBLB
3168.51 MB/s -2%
Dell G16 7620
WDC PC SN810 512GB
2499.28 MB/s -23%
HP Victus 16-e0145ng
Samsung SSD PM981a MZVLB512HBJQ
1944.29 MB/s -40%
Lenovo Legion 5 Pro 16IAH7H
2x Samsung PM9A1 MZVL21T0HCLR (RAID 0)
1613.52 MB/s -50%
Access Time Read
Dell G16 7620
WDC PC SN810 512GB
0.068 ms * -113%
HP Victus 16-e0145ng
Samsung SSD PM981a MZVLB512HBJQ
0.05 ms * -56%
Asus ROG Zephyrus M16 GU603H
Samsung PM9A1 MZVL22T0HBLB
0.04 ms * -25%
Lenovo Legion 5 Pro 16ARH7H RTX 3070 Ti
Samsung PM9A1 MZVL21T0HCLR
0.032 ms *
Lenovo Legion 7 16ARHA7
Samsung PM9A1 MZVL22T0HBLB
0.028 ms * +12%
Lenovo Legion 5 Pro 16IAH7H
2x Samsung PM9A1 MZVL21T0HCLR (RAID 0)
0.021 ms * +34%
Access Time Write
Lenovo Legion 7 16ARHA7
Samsung PM9A1 MZVL22T0HBLB
0.076 ms * -6%
Lenovo Legion 5 Pro 16ARH7H RTX 3070 Ti
Samsung PM9A1 MZVL21T0HCLR
0.072 ms *
Dell G16 7620
WDC PC SN810 512GB
0.048 ms * +33%
HP Victus 16-e0145ng
Samsung SSD PM981a MZVLB512HBJQ
0.028 ms * +61%
Asus ROG Zephyrus M16 GU603H
Samsung PM9A1 MZVL22T0HBLB
0.025 ms * +65%
Lenovo Legion 5 Pro 16IAH7H
2x Samsung PM9A1 MZVL21T0HCLR (RAID 0)
0.021 ms * +71%

* ... Meglio usare valori piccoli

Disk Throttling: DiskSpd Read Loop, Queue Depth 8

033567010051340167520102345268030153350368540204355469050255360569560306365Tooltip
Lenovo Legion 5 Pro 16ARH7H RTX 3070 Ti: Ø6607 (6029.31-6634.49)

Prestazioni della GPU - Grafica da 150 W

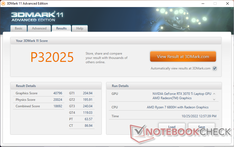
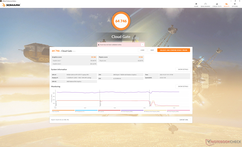
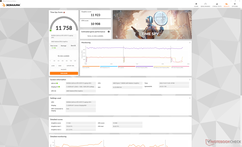
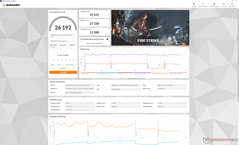
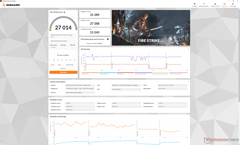
Le prestazioni grafiche sono eccellenti, con risultati 3DMark che sono quasi il 15% più veloci rispetto alla media dei laptop del nostro database con la stessa GeForce RTX 3070 Ti GPU. In effetti, supera persino la RTX 3080 Ti nel modello Alienware x15 R2.

Le prestazioni diminuiscono solo di circa il 5% se la modalità Turbo viene disattivata. Pertanto, gli utenti devono ricordarsi di attivare la modalità Turbo tramite Lenovo Vantage se vogliono utilizzare il portatile al massimo delle sue prestazioni.

Il downgrade alla scheda RTX 3070 di fascia bassa RTX 3070 o RTX 3060 Comporterà un calo delle prestazioni di circa il 10% e il 30%, rispettivamente, in base alla nostra esperienza con più laptop RTX 3070 o 3060.

3DMark 11
3DMark 11
Cloud Gate
Cloud Gate
Time Spy
Time Spy
Fire Strike (Turbo spento)
Fire Strike (Turbo on)
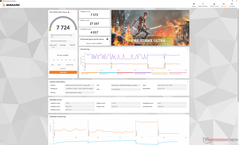
Fire Strike Ultra
Fire Strike Ultra
3DMark
1920x1080 Fire Strike Graphics
Lenovo Legion 7 16ARHA7
AMD Radeon RX 6850M XT, AMD Ryzen 9 6900HX
32853 Points +5%
Lenovo Legion 5 Pro 16ARH7H RTX 3070 Ti
NVIDIA GeForce RTX 3070 Ti Laptop GPU, AMD Ryzen 7 6800H
31289 Points
Alienware x15 R2 P111F
NVIDIA GeForce RTX 3080 Ti Laptop GPU, Intel Core i9-12900H
30521 Points -2%
Media NVIDIA GeForce RTX 3070 Ti Laptop GPU
  (22612 - 32550, n=37)
27554 Points -12%
Gigabyte A5 X1
NVIDIA GeForce RTX 3070 Laptop GPU, AMD Ryzen 9 5900HX
26713 Points -15%
HP Omen 16-c0077ng
AMD Radeon RX 6600M, AMD Ryzen 7 5800H
24460 Points -22%
Lenovo Legion 5 Pro 16IAH7H
NVIDIA GeForce RTX 3060 Laptop GPU, Intel Core i7-12700H
21792 Points -30%
Lenovo Legion C7 15IMH05 82EH0030GE
NVIDIA GeForce RTX 2070 Max-Q, Intel Core i7-10875H
18684 Points -40%
Acer Predator Triton 300 PT315-52-79LP
NVIDIA GeForce RTX 2060 Mobile, Intel Core i7-10750H
16355 Points -48%
HP Victus 16-e0145ng
NVIDIA GeForce RTX 3050 Ti Laptop GPU, AMD Ryzen 5 5600H
14486 Points -54%
2560x1440 Time Spy Graphics
Alienware x15 R2 P111F
NVIDIA GeForce RTX 3080 Ti Laptop GPU, Intel Core i9-12900H
12253 Points +3%
Lenovo Legion 5 Pro 16ARH7H RTX 3070 Ti
NVIDIA GeForce RTX 3070 Ti Laptop GPU, AMD Ryzen 7 6800H
11923 Points
Lenovo Legion 7 16ARHA7
AMD Radeon RX 6850M XT, AMD Ryzen 9 6900HX
11762 Points -1%
Gigabyte A5 X1
NVIDIA GeForce RTX 3070 Laptop GPU, AMD Ryzen 9 5900HX
10648 Points -11%
Media NVIDIA GeForce RTX 3070 Ti Laptop GPU
  (8142 - 12324, n=37)
10478 Points -12%
Lenovo Legion 5 Pro 16IAH7H
NVIDIA GeForce RTX 3060 Laptop GPU, Intel Core i7-12700H
9235 Points -23%
HP Omen 16-c0077ng
AMD Radeon RX 6600M, AMD Ryzen 7 5800H
8207 Points -31%
Lenovo Legion C7 15IMH05 82EH0030GE
NVIDIA GeForce RTX 2070 Max-Q, Intel Core i7-10875H
7093 Points -41%
Acer Predator Triton 300 PT315-52-79LP
NVIDIA GeForce RTX 2060 Mobile, Intel Core i7-10750H
6012 Points -50%
HP Victus 16-e0145ng
NVIDIA GeForce RTX 3050 Ti Laptop GPU, AMD Ryzen 5 5600H
5723 Points -52%
2560x1440 Time Spy Score
Alienware x15 R2 P111F
NVIDIA GeForce RTX 3080 Ti Laptop GPU, Intel Core i9-12900H
12393 Points +5%
Lenovo Legion 5 Pro 16ARH7H RTX 3070 Ti
NVIDIA GeForce RTX 3070 Ti Laptop GPU, AMD Ryzen 7 6800H
11758 Points
Lenovo Legion 7 16ARHA7
AMD Radeon RX 6850M XT, AMD Ryzen 9 6900HX
11633 Points -1%
Media NVIDIA GeForce RTX 3070 Ti Laptop GPU
  (7369 - 12239, n=37)
10556 Points -10%
Gigabyte A5 X1
NVIDIA GeForce RTX 3070 Laptop GPU, AMD Ryzen 9 5900HX
10535 Points -10%
Lenovo Legion 5 Pro 16IAH7H
NVIDIA GeForce RTX 3060 Laptop GPU, Intel Core i7-12700H
9640 Points -18%
HP Omen 16-c0077ng
AMD Radeon RX 6600M, AMD Ryzen 7 5800H
8353 Points -29%
Lenovo Legion C7 15IMH05 82EH0030GE
NVIDIA GeForce RTX 2070 Max-Q, Intel Core i7-10875H
7411 Points -37%
Acer Predator Triton 300 PT315-52-79LP
NVIDIA GeForce RTX 2060 Mobile, Intel Core i7-10750H
6124 Points -48%
HP Victus 16-e0145ng
NVIDIA GeForce RTX 3050 Ti Laptop GPU, AMD Ryzen 5 5600H
5910 Points -50%
3DMark 11 - 1280x720 Performance GPU
Lenovo Legion 7 16ARHA7
AMD Radeon RX 6850M XT, AMD Ryzen 9 6900HX
42089 Points +3%
Lenovo Legion 5 Pro 16ARH7H RTX 3070 Ti
NVIDIA GeForce RTX 3070 Ti Laptop GPU, AMD Ryzen 7 6800H
40796 Points
Alienware x15 R2 P111F
NVIDIA GeForce RTX 3080 Ti Laptop GPU, Intel Core i9-12900H
39325 Points -4%
Media NVIDIA GeForce RTX 3070 Ti Laptop GPU
  (13799 - 42569, n=36)
35944 Points -12%
Gigabyte A5 X1
NVIDIA GeForce RTX 3070 Laptop GPU, AMD Ryzen 9 5900HX
35787 Points -12%
HP Omen 16-c0077ng
AMD Radeon RX 6600M, AMD Ryzen 7 5800H
31859 Points -22%
Lenovo Legion 5 Pro 16IAH7H
NVIDIA GeForce RTX 3060 Laptop GPU, Intel Core i7-12700H
29824 Points -27%
Lenovo Legion C7 15IMH05 82EH0030GE
NVIDIA GeForce RTX 2070 Max-Q, Intel Core i7-10875H
24040 Points -41%
Acer Predator Triton 300 PT315-52-79LP
NVIDIA GeForce RTX 2060 Mobile, Intel Core i7-10750H
21338 Points -48%
HP Victus 16-e0145ng
NVIDIA GeForce RTX 3050 Ti Laptop GPU, AMD Ryzen 5 5600H
19124 Points -53%
3DMark 11 Performance
32025 punti
3DMark Cloud Gate Standard Score
64746 punti
3DMark Fire Strike Score
27014 punti
3DMark Time Spy Score
11758 punti
Aiuto
Blender
v3.3 Classroom OPTIX/RTX
Lenovo Legion 5 Pro 16IAH7H
NVIDIA GeForce RTX 3060 Laptop GPU, Intel Core i7-12700H
32 Seconds * -45%
Lenovo Legion 5 Pro 16IAH7H
NVIDIA GeForce RTX 3060 Laptop GPU, Intel Core i7-12700H
30 Seconds * -36%
Dell G16 7620
NVIDIA GeForce RTX 3060 Laptop GPU, Intel Core i7-12700H
31 Seconds * -41%
Media NVIDIA GeForce RTX 3070 Ti Laptop GPU
  (22 - 30, n=15)
25.3 Seconds * -15%
Lenovo Legion 5 Pro 16ARH7H RTX 3070 Ti
NVIDIA GeForce RTX 3070 Ti Laptop GPU, AMD Ryzen 7 6800H
22 Seconds *
v3.3 Classroom CUDA
Lenovo Legion 5 Pro 16IAH7H
NVIDIA GeForce RTX 3060 Laptop GPU, Intel Core i7-12700H
55 Seconds * -53%
Lenovo Legion 5 Pro 16IAH7H
NVIDIA GeForce RTX 3060 Laptop GPU, Intel Core i7-12700H
52 Seconds * -44%
Dell G16 7620
NVIDIA GeForce RTX 3060 Laptop GPU, Intel Core i7-12700H
52 Seconds * -44%
Media NVIDIA GeForce RTX 3070 Ti Laptop GPU
  (36 - 46, n=16)
41.4 Seconds * -15%
Lenovo Legion 5 Pro 16ARH7H RTX 3070 Ti
NVIDIA GeForce RTX 3070 Ti Laptop GPU, AMD Ryzen 7 6800H
36 Seconds *
v3.3 Classroom CPU
Lenovo Legion 5 Pro 16IAH7H
NVIDIA GeForce RTX 3060 Laptop GPU, Intel Core i7-12700H
377 Seconds * -6%
Lenovo Legion 5 Pro 16IAH7H
NVIDIA GeForce RTX 3060 Laptop GPU, Intel Core i7-12700H
299 Seconds * +16%
Media NVIDIA GeForce RTX 3070 Ti Laptop GPU
  (285 - 459, n=16)
376 Seconds * -6%
Lenovo Legion 7 16ARHA7
AMD Radeon RX 6850M XT, AMD Ryzen 9 6900HX
372 Seconds * -5%
Lenovo Legion 5 Pro 16ARH7H RTX 3070 Ti
NVIDIA GeForce RTX 3070 Ti Laptop GPU, AMD Ryzen 7 6800H
355 Seconds *
Dell G16 7620
NVIDIA GeForce RTX 3060 Laptop GPU, Intel Core i7-12700H
326 Seconds * +8%

* ... Meglio usare valori piccoli

The Witcher 3
1024x768 Low Graphics & Postprocessing
Alienware x15 R2 P111F
Intel Core i9-12900H, NVIDIA GeForce RTX 3080 Ti Laptop GPU
391 (344min, 345.14P1) fps +6%
Lenovo Legion 5 Pro 16IAH7H
Intel Core i7-12700H, NVIDIA GeForce RTX 3060 Laptop GPU
389 (29.3min, 147.1P0.1, 225.8P1) fps +5%
Media NVIDIA GeForce RTX 3070 Ti Laptop GPU
  (284 - 492, n=20)
388 fps +5%
Lenovo Legion 7 16ARHA7
AMD Ryzen 9 6900HX, AMD Radeon RX 6850M XT
384.5 (348min) fps +4%
Lenovo Legion 5 Pro 16ARH7H RTX 3070 Ti
AMD Ryzen 7 6800H, NVIDIA GeForce RTX 3070 Ti Laptop GPU
370.5 (360min) fps
Gigabyte A5 X1
AMD Ryzen 9 5900HX, NVIDIA GeForce RTX 3070 Laptop GPU
309 (14.2min, 63.8P0.1, 201P1) fps -17%
Lenovo Legion C7 15IMH05 82EH0030GE
Intel Core i7-10875H, NVIDIA GeForce RTX 2070 Max-Q
301 (13.9min, 54.9P0.1, 167P1) fps -19%
1366x768 Medium Graphics & Postprocessing
Alienware x15 R2 P111F
Intel Core i9-12900H, NVIDIA GeForce RTX 3080 Ti Laptop GPU
345 (307min, 312.13P1) fps +12%
Lenovo Legion 5 Pro 16ARH7H RTX 3070 Ti
AMD Ryzen 7 6800H, NVIDIA GeForce RTX 3070 Ti Laptop GPU
308.8 (292min) fps
Media NVIDIA GeForce RTX 3070 Ti Laptop GPU
  (237 - 360, n=23)
294 fps -5%
Lenovo Legion 5 Pro 16IAH7H
Intel Core i7-12700H, NVIDIA GeForce RTX 3060 Laptop GPU
276.8 (34.2min, 51.9P0.1, 140P1) fps -10%
Gigabyte A5 X1
AMD Ryzen 9 5900HX, NVIDIA GeForce RTX 3070 Laptop GPU
261 (20.3min, 76.7P0.1, 170P1) fps -15%
Lenovo Legion 7 16ARHA7
AMD Ryzen 9 6900HX, AMD Radeon RX 6850M XT
251.6 (236min) fps -19%
Lenovo Legion C7 15IMH05 82EH0030GE
Intel Core i7-10875H, NVIDIA GeForce RTX 2070 Max-Q
221 (38min, 72.3P0.1, 144P1) fps -28%
HP Victus 16-e0145ng
AMD Ryzen 5 5600H, NVIDIA GeForce RTX 3050 Ti Laptop GPU
176 (147min) fps -43%
1920x1080 High Graphics & Postprocessing (Nvidia HairWorks Off)
Alienware x15 R2 P111F
Intel Core i9-12900H, NVIDIA GeForce RTX 3080 Ti Laptop GPU
229 (193min, 195.32P1) fps +1%
Lenovo Legion 5 Pro 16ARH7H RTX 3070 Ti
AMD Ryzen 7 6800H, NVIDIA GeForce RTX 3070 Ti Laptop GPU
226 (209min) fps
Lenovo Legion 7 16ARHA7
AMD Ryzen 9 6900HX, AMD Radeon RX 6850M XT
208.1 (192min) fps -8%
Media NVIDIA GeForce RTX 3070 Ti Laptop GPU
  (139.7 - 226, n=27)
188.8 fps -16%
Lenovo Legion 5 Pro 16IAH7H
Intel Core i7-12700H, NVIDIA GeForce RTX 3060 Laptop GPU
184.6 (38min, 87.3P0.1, 119.1P1) fps -18%
Gigabyte A5 X1
AMD Ryzen 9 5900HX, NVIDIA GeForce RTX 3070 Laptop GPU
171 (44.9min, 70.4P0.1, 112P1) fps -24%
HP Omen 16-c0077ng
AMD Ryzen 7 5800H, AMD Radeon RX 6600M
135 fps -40%
Lenovo Legion C7 15IMH05 82EH0030GE
Intel Core i7-10875H, NVIDIA GeForce RTX 2070 Max-Q
130 (43.6min, 49.6P0.1, 88.7P1) fps -42%
HP Victus 16-e0145ng
AMD Ryzen 5 5600H, NVIDIA GeForce RTX 3050 Ti Laptop GPU
104 (87min) fps -54%
1920x1080 Ultra Graphics & Postprocessing (HBAO+)
Lenovo Legion 7 16ARHA7
AMD Ryzen 9 6900HX, AMD Radeon RX 6850M XT
118.1 (112min) fps +1%
Lenovo Legion 5 Pro 16ARH7H RTX 3070 Ti
AMD Ryzen 7 6800H, NVIDIA GeForce RTX 3070 Ti Laptop GPU
117 (106min) fps
Alienware x15 R2 P111F
Intel Core i9-12900H, NVIDIA GeForce RTX 3080 Ti Laptop GPU
116 (100min, 101.71P1) fps -1%
Media NVIDIA GeForce RTX 3070 Ti Laptop GPU
  (76.8 - 124.1, n=39)
102.4 fps -12%
Gigabyte A5 X1
AMD Ryzen 9 5900HX, NVIDIA GeForce RTX 3070 Laptop GPU
101 (44min, 47.1P0.1, 70.8P1) fps -14%
Lenovo Legion 5 Pro 16IAH7H
Intel Core i7-12700H, NVIDIA GeForce RTX 3060 Laptop GPU
88.2 (84min, 85P1) fps -25%
HP Omen 16-c0077ng
AMD Ryzen 7 5800H, AMD Radeon RX 6600M
84 fps -28%
Lenovo Legion C7 15IMH05 82EH0030GE
Intel Core i7-10875H, NVIDIA GeForce RTX 2070 Max-Q
72.4 (35.2min, 38.5P0.1, 48.2P1) fps -38%
Acer Predator Triton 300 PT315-52-79LP
Intel Core i7-10750H, NVIDIA GeForce RTX 2060 Mobile
59.1 (49min) fps -49%
HP Victus 16-e0145ng
AMD Ryzen 5 5600H, NVIDIA GeForce RTX 3050 Ti Laptop GPU
54.9 (46min) fps -53%
GTA V
1024x768 Lowest Settings possible
Lenovo Legion 5 Pro 16IAH7H
Intel Core i7-12700H, NVIDIA GeForce RTX 3060 Laptop GPU
185.4 (1.884min, 125P1) fps +2%
Lenovo Legion 5 Pro 16ARH7H RTX 3070 Ti
AMD Ryzen 7 6800H, NVIDIA GeForce RTX 3070 Ti Laptop GPU
181.5 (2.22min, 142.9P1) fps
Lenovo Legion 7 16ARHA7
AMD Ryzen 9 6900HX, AMD Radeon RX 6850M XT
179.2 (2.25min, 111.1P1) fps -1%
Gigabyte A5 X1
AMD Ryzen 9 5900HX, NVIDIA GeForce RTX 3070 Laptop GPU
179 (5.04min, 125P1) fps -1%
Media NVIDIA GeForce RTX 3070 Ti Laptop GPU
  (101 - 187.2, n=20)
179 fps -1%
1920x1080 Lowest Settings possible
Media NVIDIA GeForce RTX 3070 Ti Laptop GPU
  (173.1 - 187.3, n=18)
182 fps +1%
Lenovo Legion 5 Pro 16ARH7H RTX 3070 Ti
AMD Ryzen 7 6800H, NVIDIA GeForce RTX 3070 Ti Laptop GPU
180.8 (2.41min, 125P1) fps
Lenovo Legion 7 16ARHA7
AMD Ryzen 9 6900HX, AMD Radeon RX 6850M XT
180.1 (4.05min, 142.9P1) fps 0%
Gigabyte A5 X1
AMD Ryzen 9 5900HX, NVIDIA GeForce RTX 3070 Laptop GPU
176 (5.02min, 125P1) fps -3%
1366x768 Normal/Off AF:4x
Lenovo Legion 5 Pro 16IAH7H
Intel Core i7-12700H, NVIDIA GeForce RTX 3060 Laptop GPU
181.3 (2.21min, 125P1) fps +3%
Lenovo Legion 5 Pro 16ARH7H RTX 3070 Ti
AMD Ryzen 7 6800H, NVIDIA GeForce RTX 3070 Ti Laptop GPU
176.5 (3.27min, 125P1) fps
Media NVIDIA GeForce RTX 3070 Ti Laptop GPU
  (95.5 - 186.4, n=26)
176 fps 0%
Lenovo Legion 7 16ARHA7
AMD Ryzen 9 6900HX, AMD Radeon RX 6850M XT
173.4 (5.02min, 125P1) fps -2%
Gigabyte A5 X1
AMD Ryzen 9 5900HX, NVIDIA GeForce RTX 3070 Laptop GPU
172 (7.01min, 125P1) fps -3%
HP Victus 16-e0145ng
AMD Ryzen 5 5600H, NVIDIA GeForce RTX 3050 Ti Laptop GPU
167.7 (3.96min, 111.1P1) fps -5%
1920x1080 Normal/Off AF:4x
Lenovo Legion 5 Pro 16IAH7H
Intel Core i7-12700H, NVIDIA GeForce RTX 3060 Laptop GPU
178.3 (2.51min, 125P1) fps +1%
Lenovo Legion 5 Pro 16ARH7H RTX 3070 Ti
AMD Ryzen 7 6800H, NVIDIA GeForce RTX 3070 Ti Laptop GPU
176 (0.878min, 125P1) fps
Media NVIDIA GeForce RTX 3070 Ti Laptop GPU
  (97.2 - 186.2, n=21)
173.6 fps -1%
Lenovo Legion 7 16ARHA7
AMD Ryzen 9 6900HX, AMD Radeon RX 6850M XT
173.4 (3.32min, 125P1) fps -1%
Gigabyte A5 X1
AMD Ryzen 9 5900HX, NVIDIA GeForce RTX 3070 Laptop GPU
172 (6.63min, 125P1) fps -2%
HP Victus 16-e0145ng
AMD Ryzen 5 5600H, NVIDIA GeForce RTX 3050 Ti Laptop GPU
166.2 (4.37min, 111.1P1) fps -6%
1920x1080 High/On (Advanced Graphics Off) AA:2xMSAA + FX AF:8x
Lenovo Legion 5 Pro 16ARH7H RTX 3070 Ti
AMD Ryzen 7 6800H, NVIDIA GeForce RTX 3070 Ti Laptop GPU
167.6 (3.33min, 125P1) fps
Media NVIDIA GeForce RTX 3070 Ti Laptop GPU
  (80 - 181.9, n=28)
165.5 fps -1%
Lenovo Legion 7 16ARHA7
AMD Ryzen 9 6900HX, AMD Radeon RX 6850M XT
162.4 (8.03min, 90.9P1) fps -3%
Lenovo Legion 5 Pro 16IAH7H
Intel Core i7-12700H, NVIDIA GeForce RTX 3060 Laptop GPU
161.8 (52.2min, 111.1P1) fps -3%
Gigabyte A5 X1
AMD Ryzen 9 5900HX, NVIDIA GeForce RTX 3070 Laptop GPU
155 (6.1min, 111P1) fps -8%
HP Omen 16-c0077ng
AMD Ryzen 7 5800H, AMD Radeon RX 6600M
146 (4.16min, 83.3P1) fps -13%
HP Victus 16-e0145ng
AMD Ryzen 5 5600H, NVIDIA GeForce RTX 3050 Ti Laptop GPU
131.4 (38.8min, 100P1) fps -22%
1920x1080 Highest Settings possible AA:4xMSAA + FX AF:16x
Lenovo Legion 5 Pro 16IAH7H
Intel Core i7-12700H, NVIDIA GeForce RTX 3060 Laptop GPU
107.8 (9.09min, 66.7P1) fps +4%
Media NVIDIA GeForce RTX 3070 Ti Laptop GPU
  (44 - 123.9, n=36)
106.7 fps +3%
Lenovo Legion 5 Pro 16ARH7H RTX 3070 Ti
AMD Ryzen 7 6800H, NVIDIA GeForce RTX 3070 Ti Laptop GPU
104 (6.17min, 71.4P1) fps
Lenovo Legion 7 16ARHA7
AMD Ryzen 9 6900HX, AMD Radeon RX 6850M XT
96.9 (7.1min, 62.5P1) fps -7%
Gigabyte A5 X1
AMD Ryzen 9 5900HX, NVIDIA GeForce RTX 3070 Laptop GPU
94.7 (24.6min, 66.7P1) fps -9%
HP Victus 16-e0145ng
AMD Ryzen 5 5600H, NVIDIA GeForce RTX 3050 Ti Laptop GPU
73.7 (21min, 52.6P1) fps -29%
HP Omen 16-c0077ng
AMD Ryzen 7 5800H, AMD Radeon RX 6600M
71 (9.84min, 50P1) fps -32%
2560x1440 Highest Settings possible AA:4xMSAA + FX AF:16x
Lenovo Legion 5 Pro 16ARH7H RTX 3070 Ti
AMD Ryzen 7 6800H, NVIDIA GeForce RTX 3070 Ti Laptop GPU
98.8 (4.96min, 66.7P1) fps
Media NVIDIA GeForce RTX 3070 Ti Laptop GPU
  (72.7 - 108.7, n=22)
92.9 fps -6%
Lenovo Legion 7 16ARHA7
AMD Ryzen 9 6900HX, AMD Radeon RX 6850M XT
90 (6.98min, 62.5P1) fps -9%
Lenovo Legion 5 Pro 16IAH7H
Intel Core i7-12700H, NVIDIA GeForce RTX 3060 Laptop GPU
83.1 (17.1min, 55.6P1) fps -16%
HP Omen 16-c0077ng
AMD Ryzen 7 5800H, AMD Radeon RX 6600M
49.3 (8.22min, 35.7P1) fps -50%
Dota 2 Reborn
1280x720 min (0/3) fastest
Alienware x15 R2 P111F
Intel Core i9-12900H, NVIDIA GeForce RTX 3080 Ti Laptop GPU
174.7 (155.9min) fps +16%
Lenovo Legion 5 Pro 16IAH7H
Intel Core i7-12700H, NVIDIA GeForce RTX 3060 Laptop GPU
172.1 (152.3min) fps +14%
Media NVIDIA GeForce RTX 3070 Ti Laptop GPU
  (89.3 - 199, n=37)
166.1 fps +10%
Lenovo Legion C7 15IMH05 82EH0030GE
Intel Core i7-10875H, NVIDIA GeForce RTX 2070 Max-Q
155 (134.3min) fps +3%
Gigabyte A5 X1
AMD Ryzen 9 5900HX, NVIDIA GeForce RTX 3070 Laptop GPU
152 (135.4min) fps +1%
Lenovo Legion 5 Pro 16ARH7H RTX 3070 Ti
AMD Ryzen 7 6800H, NVIDIA GeForce RTX 3070 Ti Laptop GPU
150.4 (132.5min) fps
Lenovo Legion 7 16ARHA7
AMD Ryzen 9 6900HX, AMD Radeon RX 6850M XT