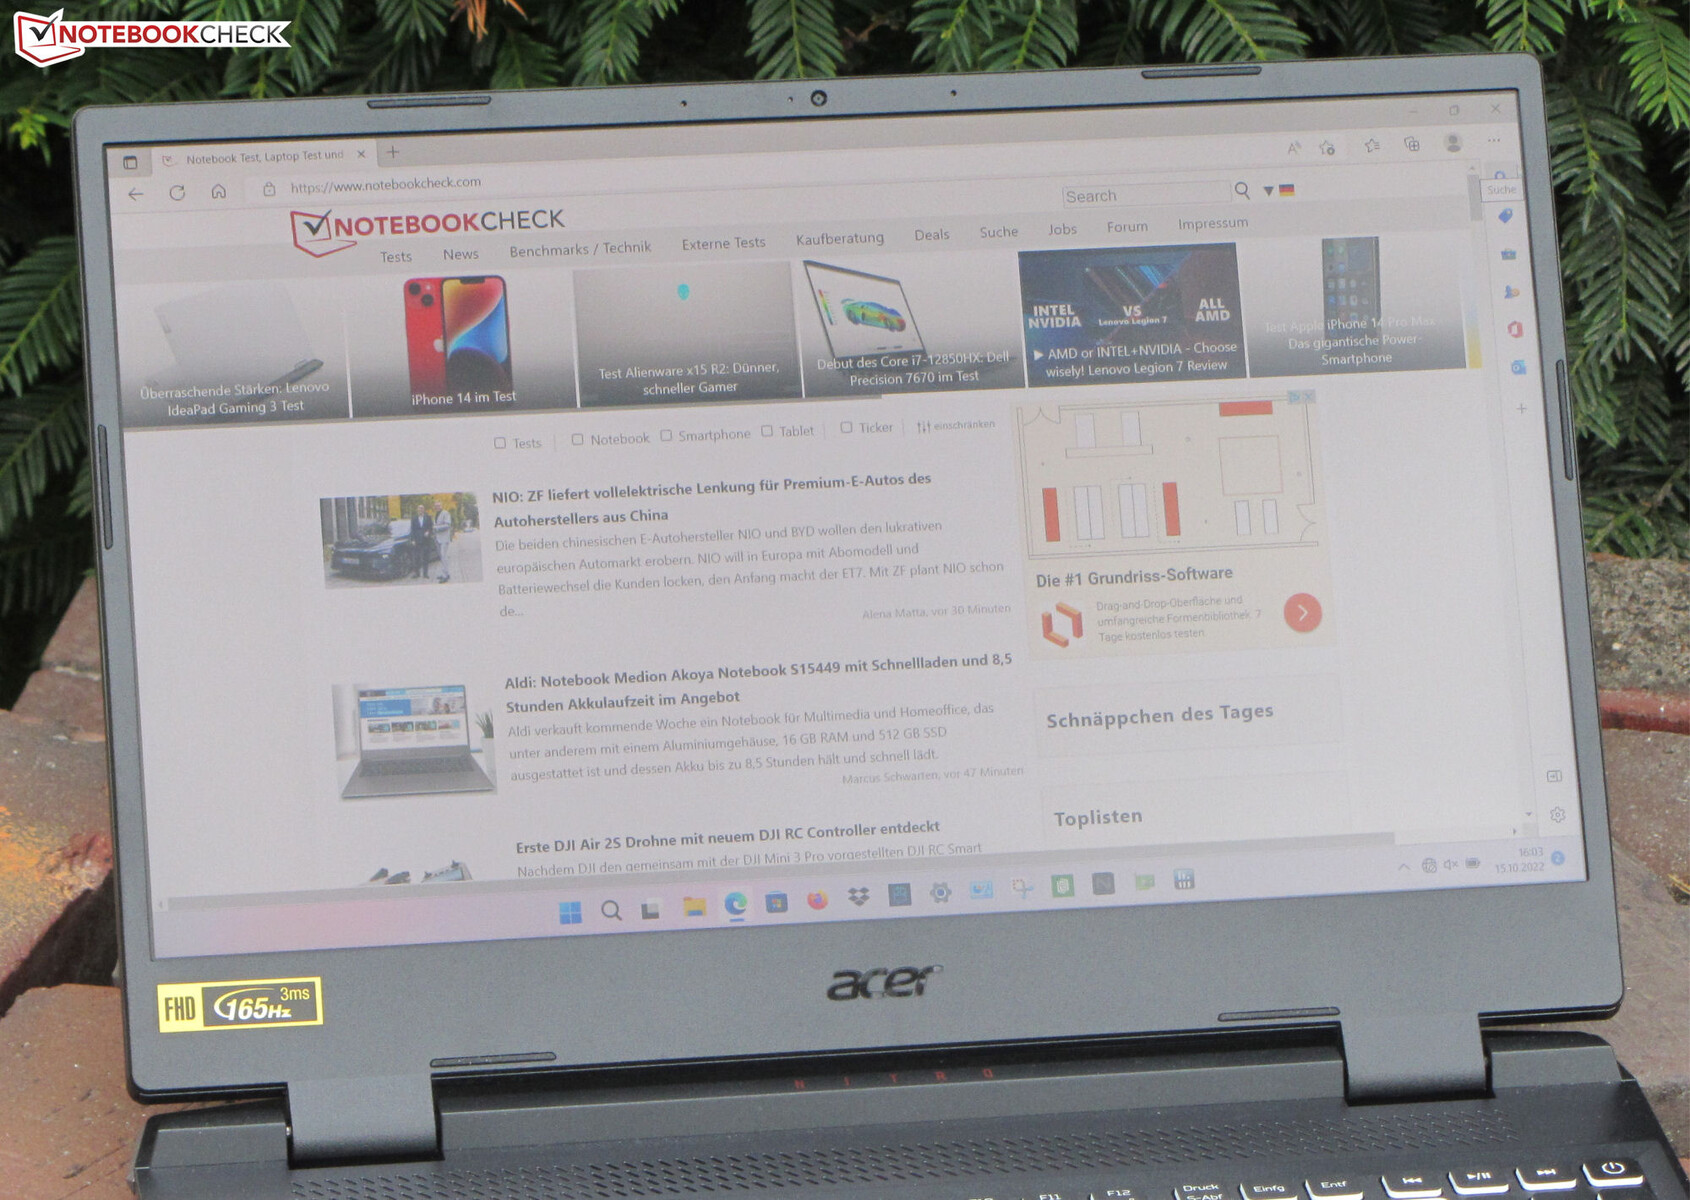
Recensione dell'Acer Nitro 5 AN515-46: potente gming FHD con USB 4
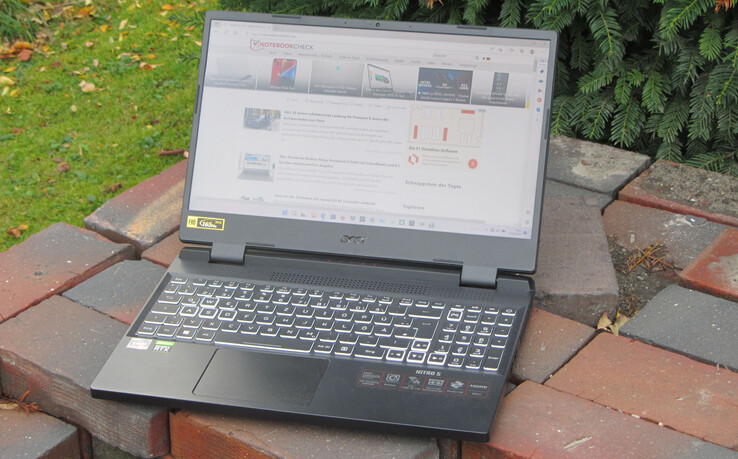
La serie Nitro 5 di Acer è composta da dispositivi di gioco entry-level e di fascia media. I portatili si posizionano al di sotto della serie Predator, con prezzi che raggiungono i 2.500 euro. L'unità di prova di oggi è disponibile a partire da 1.750 euro. Per questo modello Acer ha abbinato un'APU Ryzen 7-6800H ad alta efficienza energetica con una GPU RTX 3070-Ti di GeForce (TGP di 150 watt). In teoria, questo potrebbe essere un notebook potente con emissioni ridotte e una lunga durata della batteria. I concorrenti di questo dispositivo sonoSchenker XMG Fusion 15 (Mid 22), ilMSI Katana GF66 12UGSe ilAsus TUF Dash F15 FX517ZR.
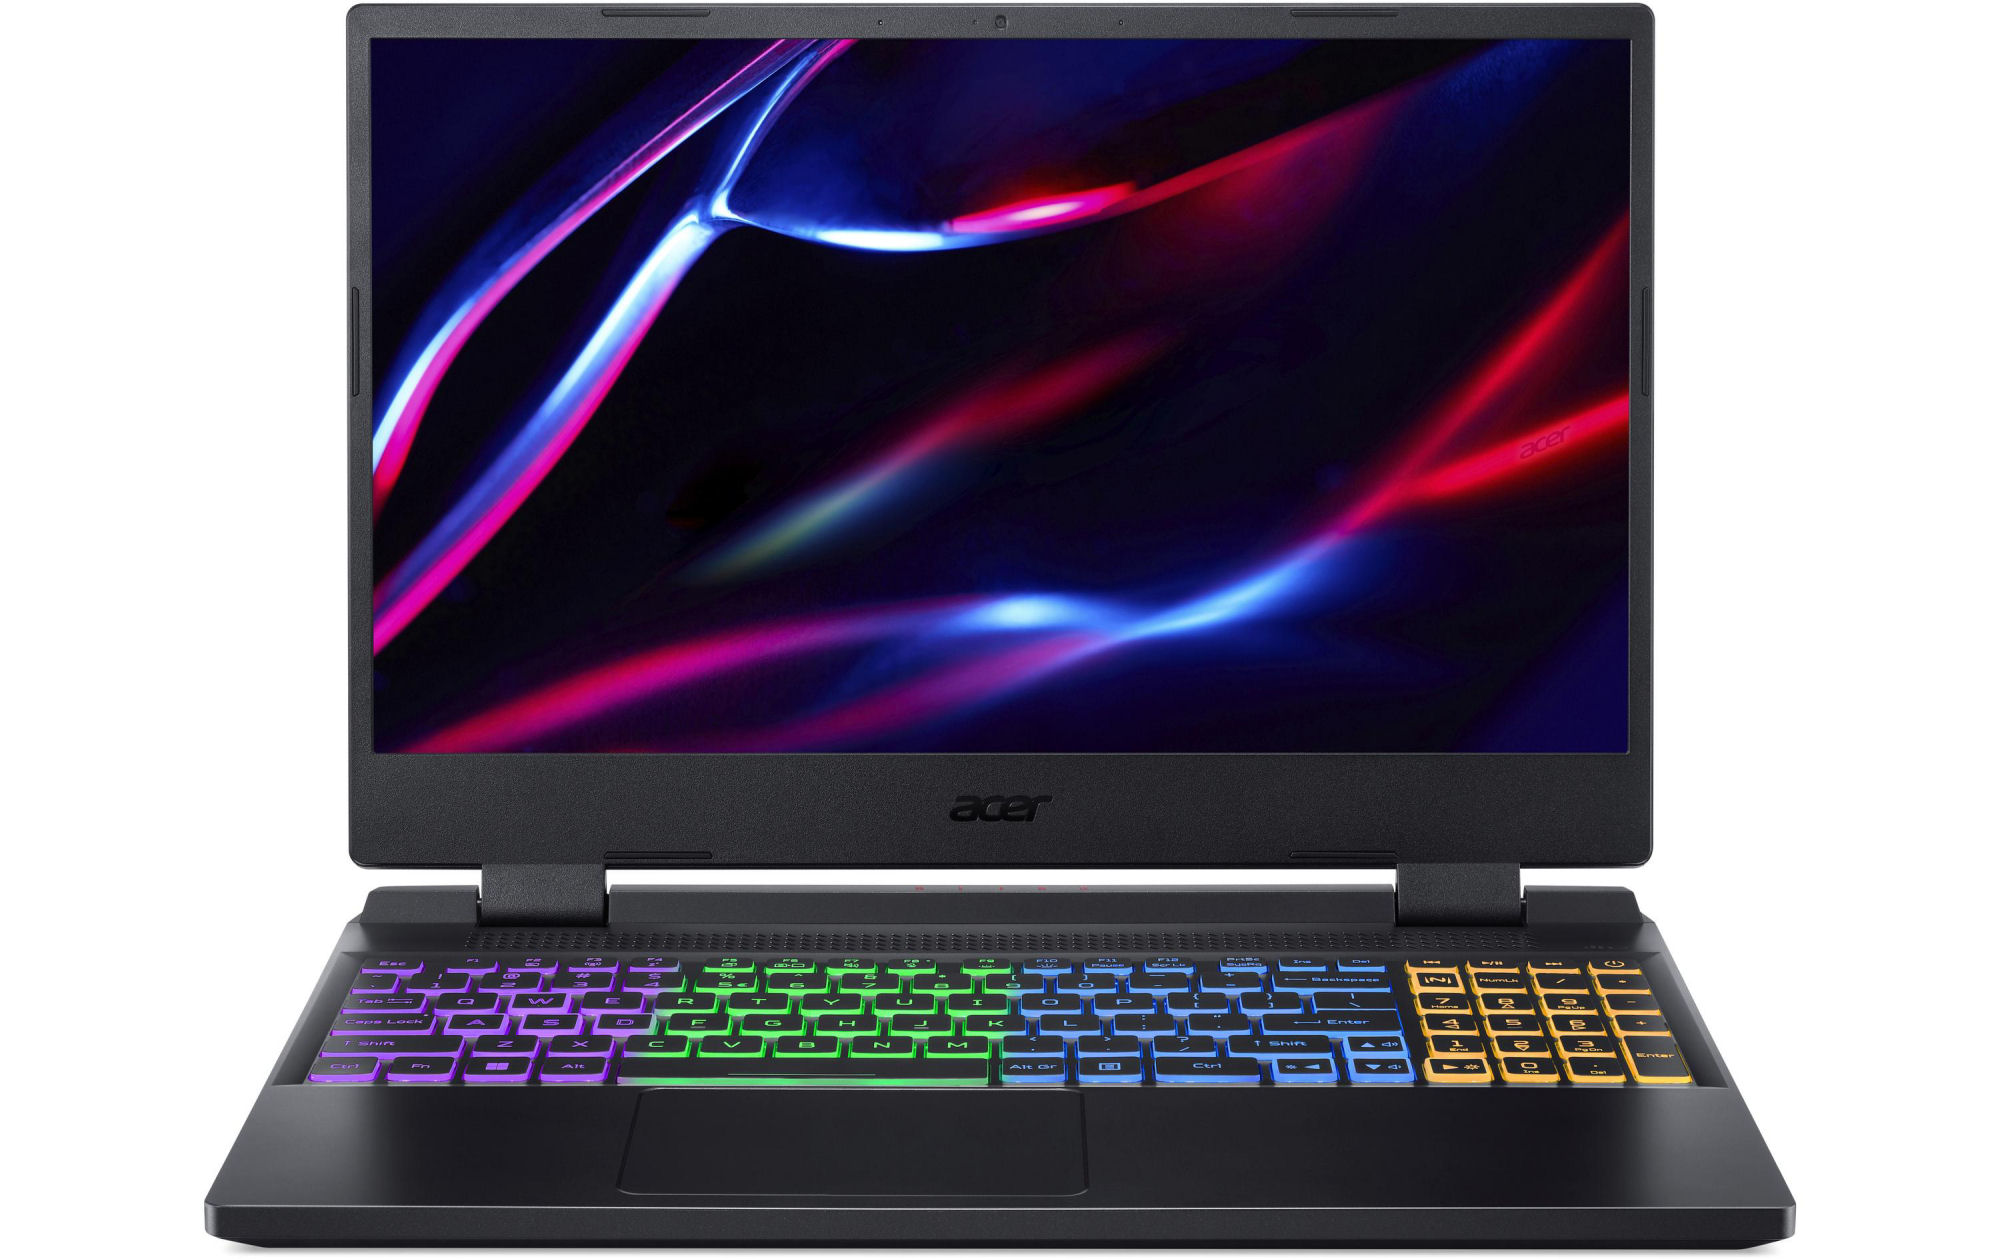
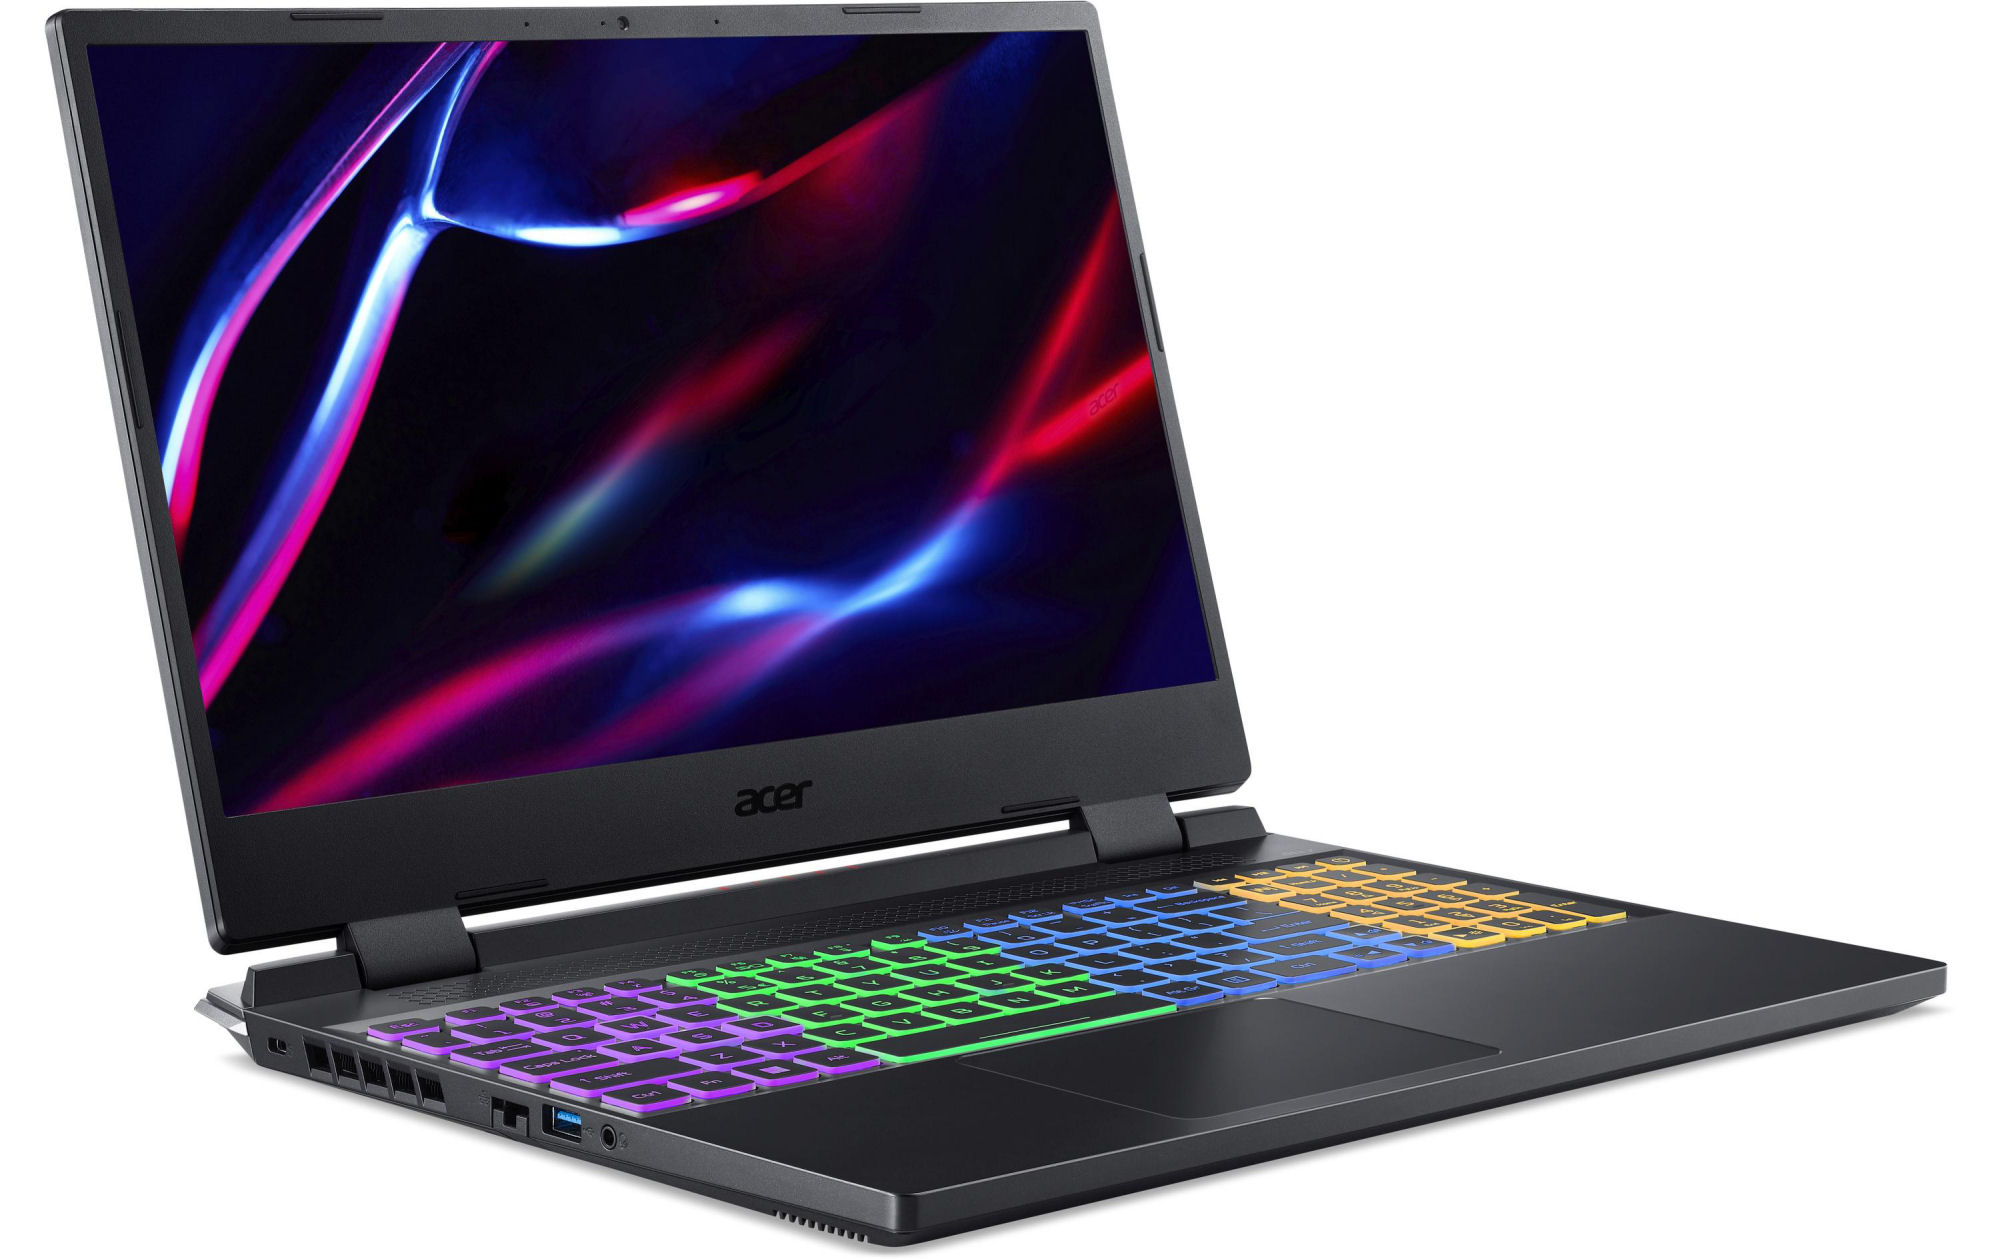
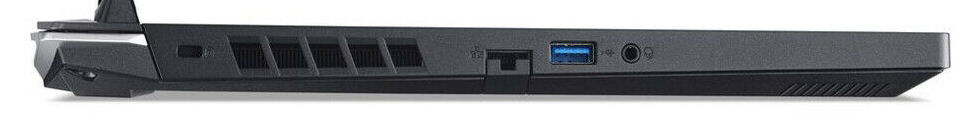
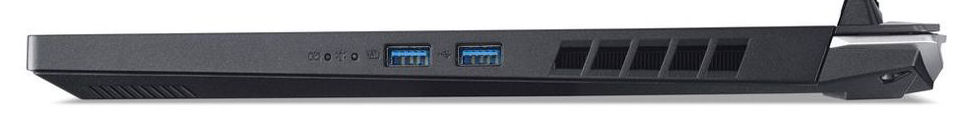
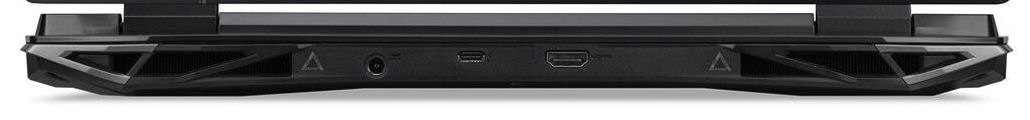
L'AN515-58 è stato inserito nello stesso case del suo fratello basato su Intel, che abbiamo già testato. Per saperne di più sul case, sulla connettività e sui dispositivi di input, vi invitiamo a consultare la nostra recensione del modelloNitro 5 AN515-58(Core i7, QHD).
Potenziali concorrenti a confronto
Punteggio | Data | Modello | Peso | Altezza | Dimensione | Risoluzione | Prezzo |
|---|---|---|---|---|---|---|---|
| 83.9 % v7 (old) | 11/2022 | Acer Nitro 5 AN515-46-R1A1 R7 6800H, GeForce RTX 3070 Ti Laptop GPU | 2.5 kg | 26.8 mm | 15.60" | 1920x1080 | |
| 80.3 % v7 (old) | 06/2022 | MSI Katana GF66 12UGS i7-12700H, GeForce RTX 3070 Ti Laptop GPU | 2.3 kg | 27.5 mm | 15.60" | 1920x1080 | |
| 87.4 % v7 (old) | 08/2022 | Schenker XMG Fusion 15 (Mid 22) i7-11800H, GeForce RTX 3070 Laptop GPU | 1.9 kg | 21.65 mm | 15.60" | 2560x1440 | |
| 85.8 % v7 (old) | 07/2022 | Asus TUF Dash F15 FX517ZR i7-12650H, GeForce RTX 3070 Laptop GPU | 2 kg | 20.7 mm | 15.60" | 2560x1440 |
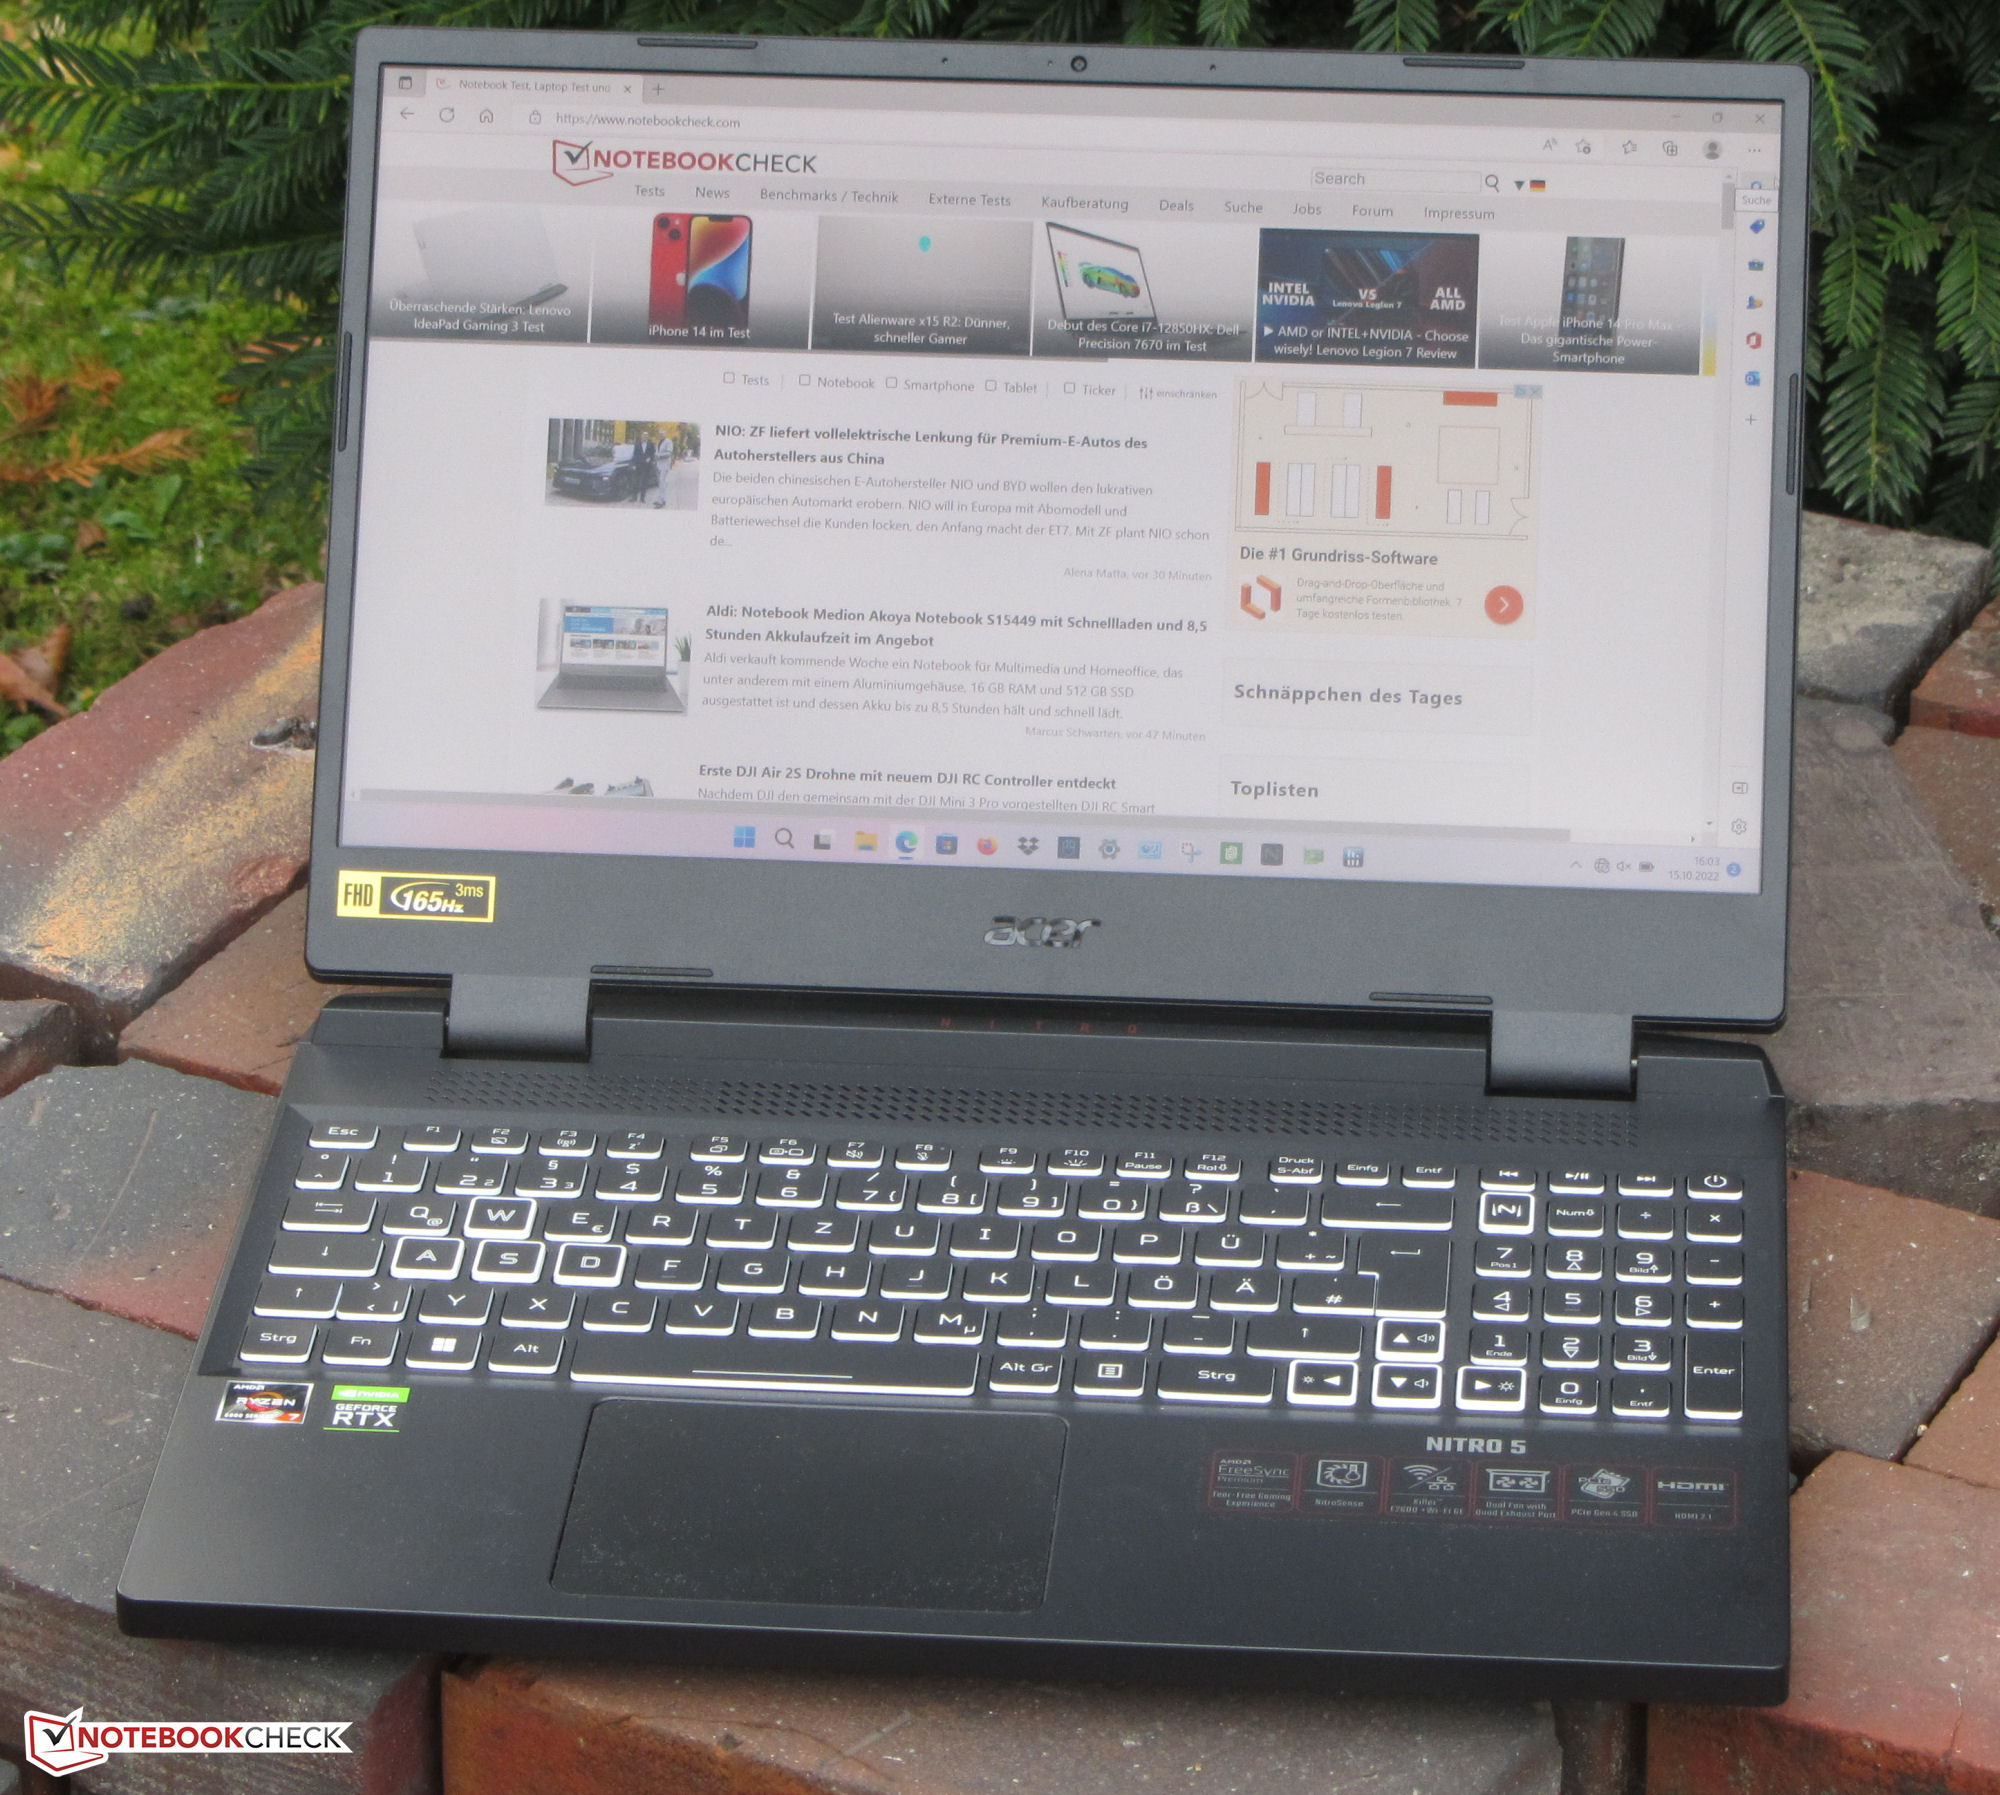
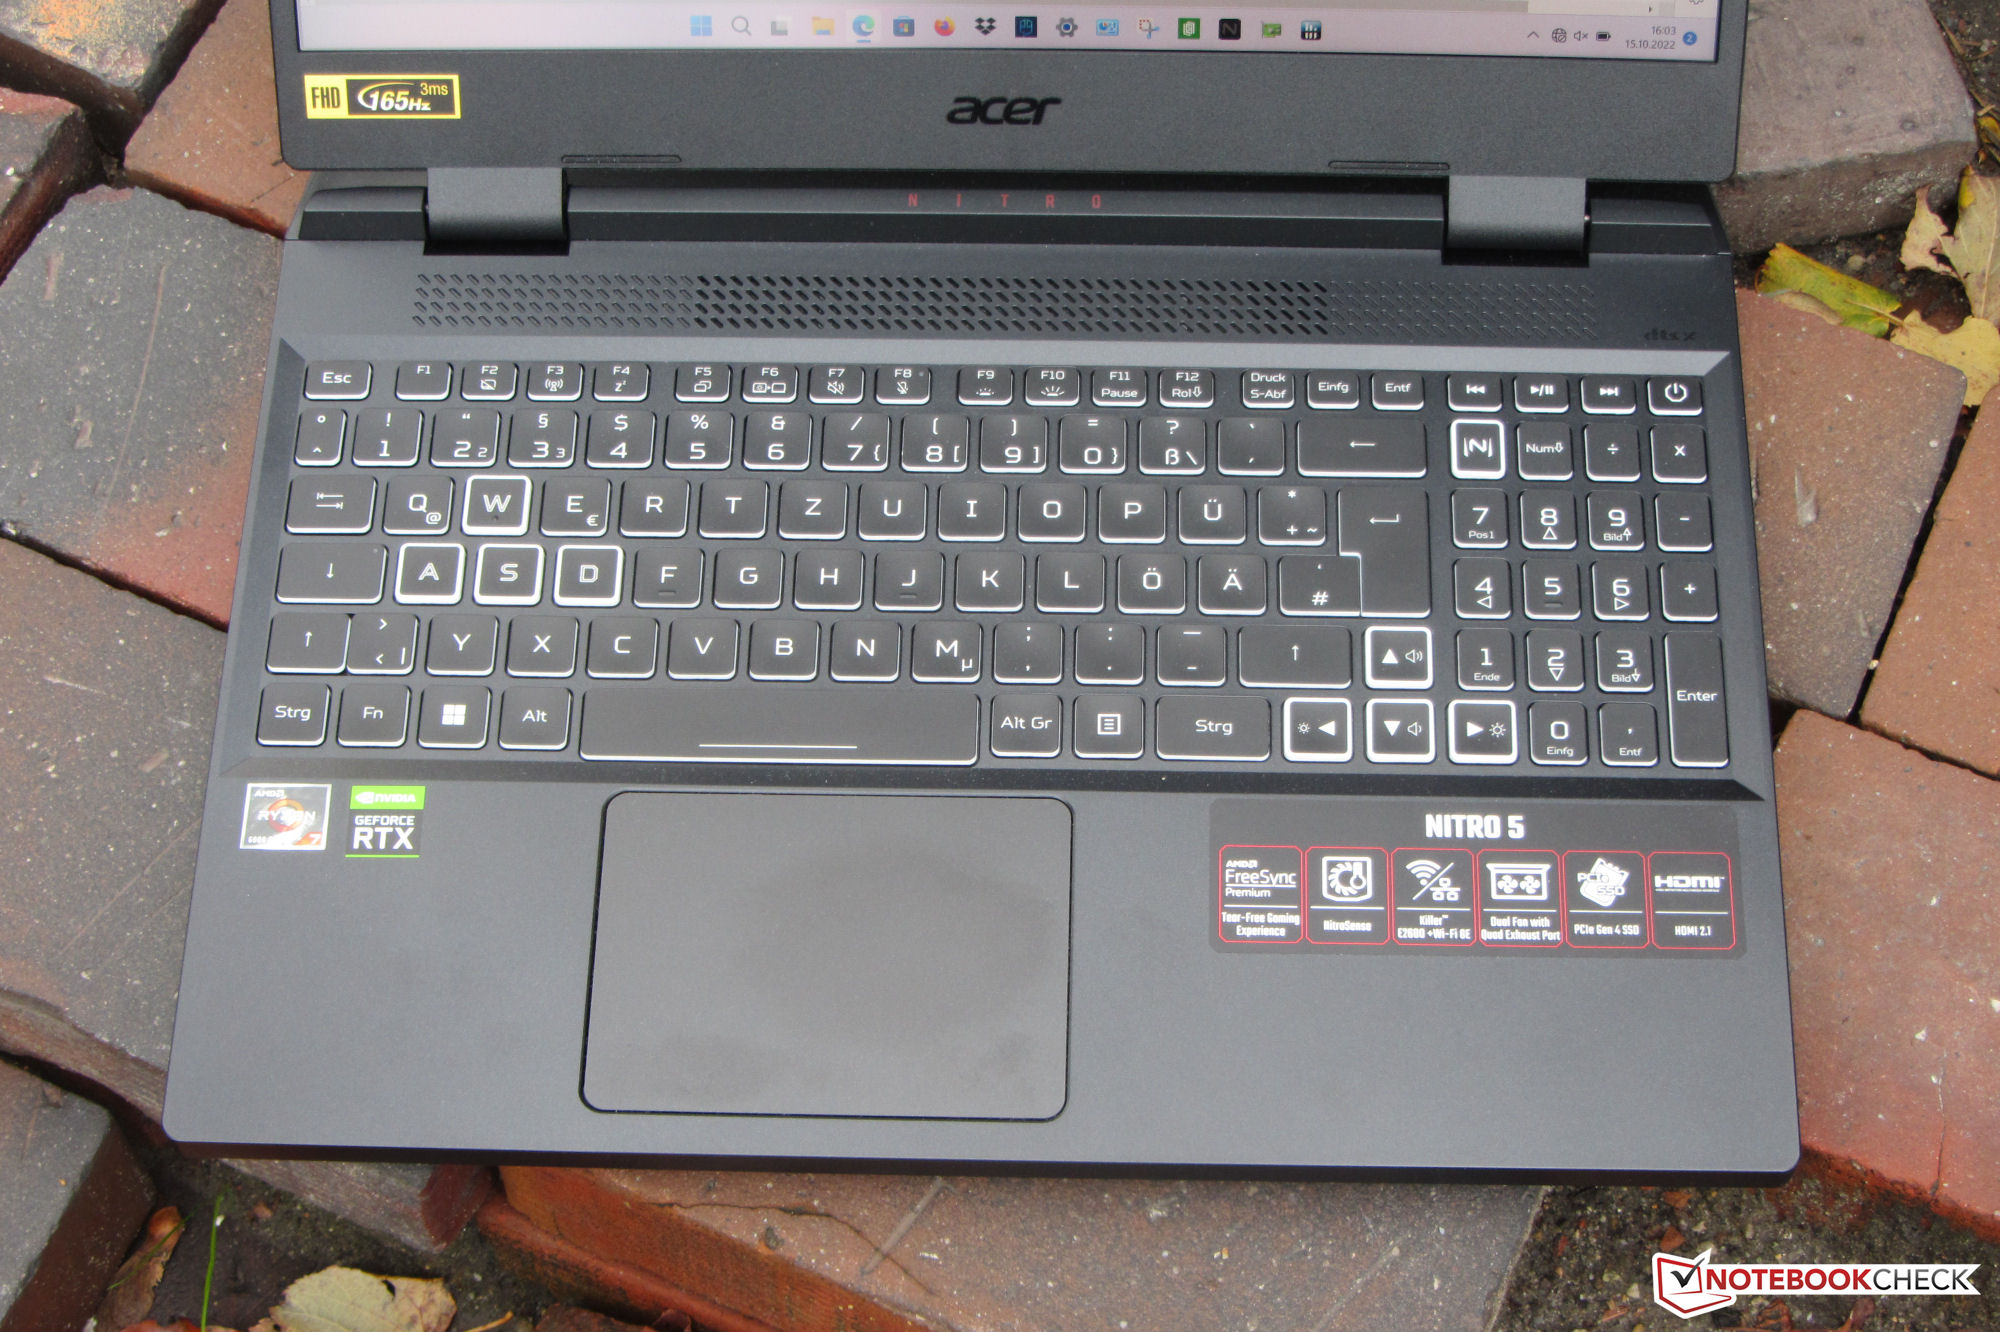


Display - Notebook Acer con pannello a 165 Hz

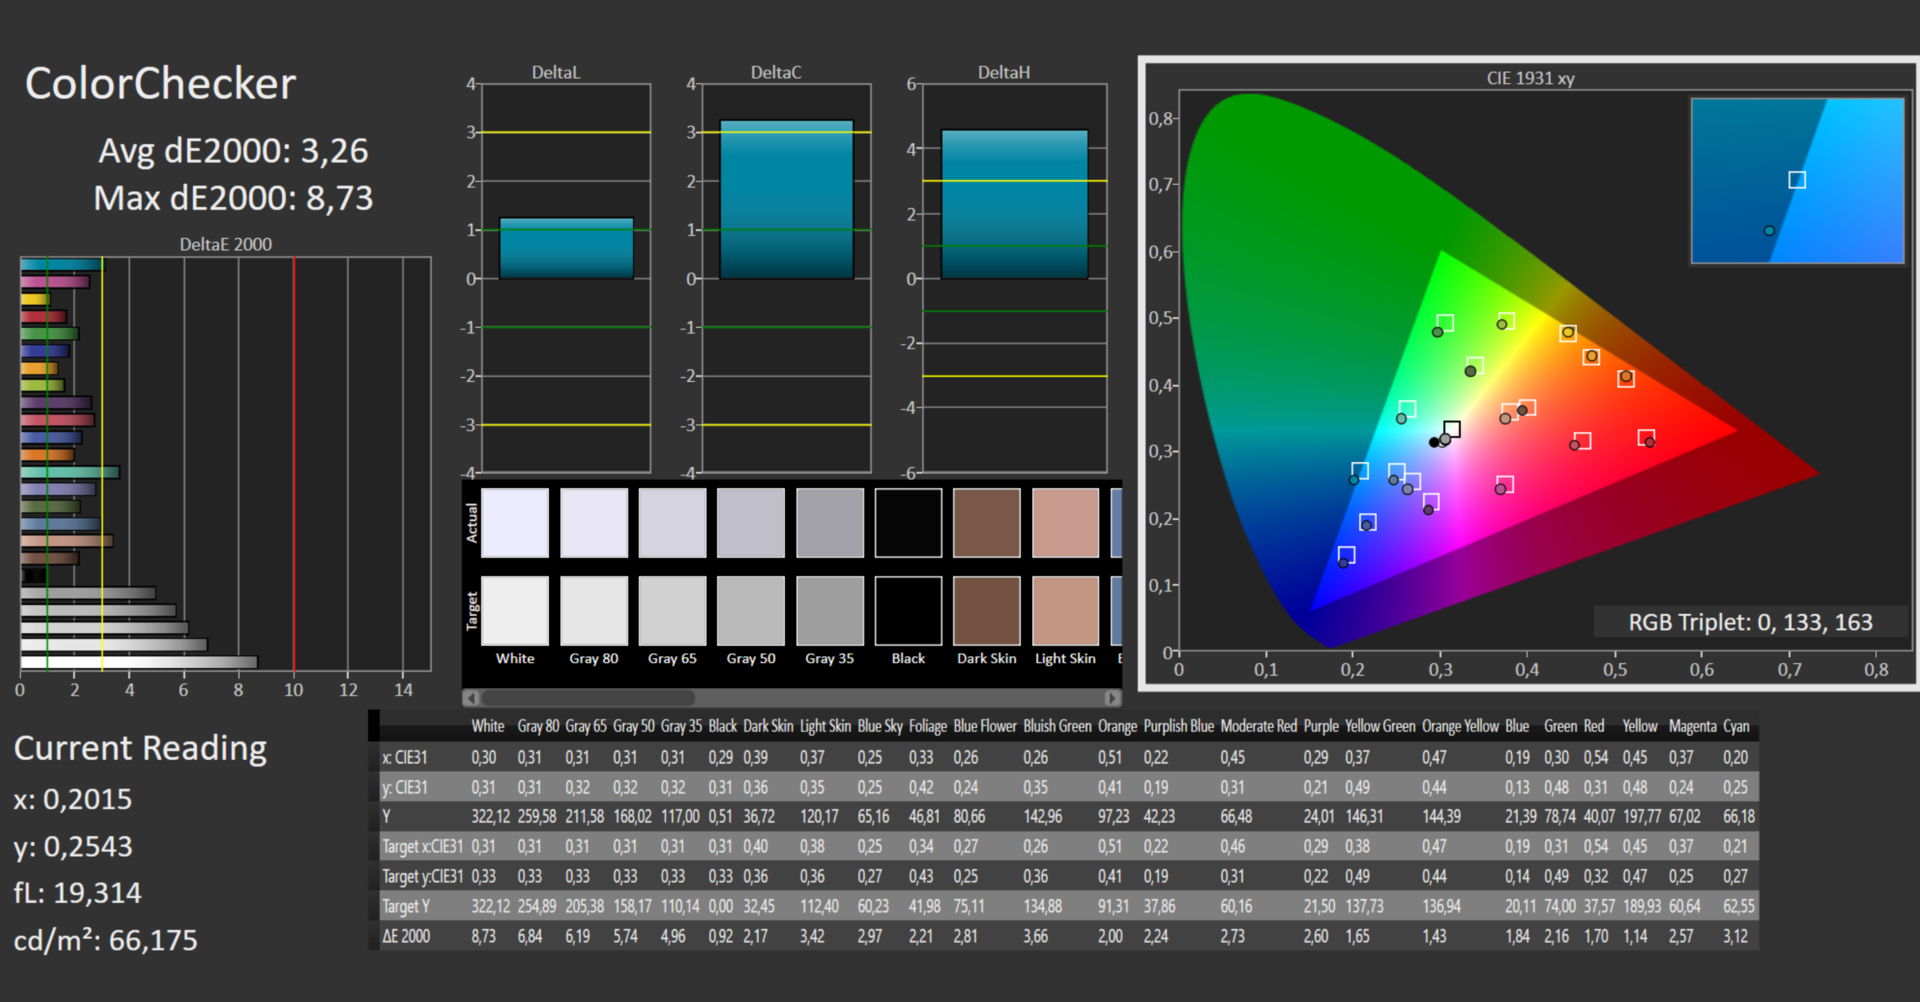
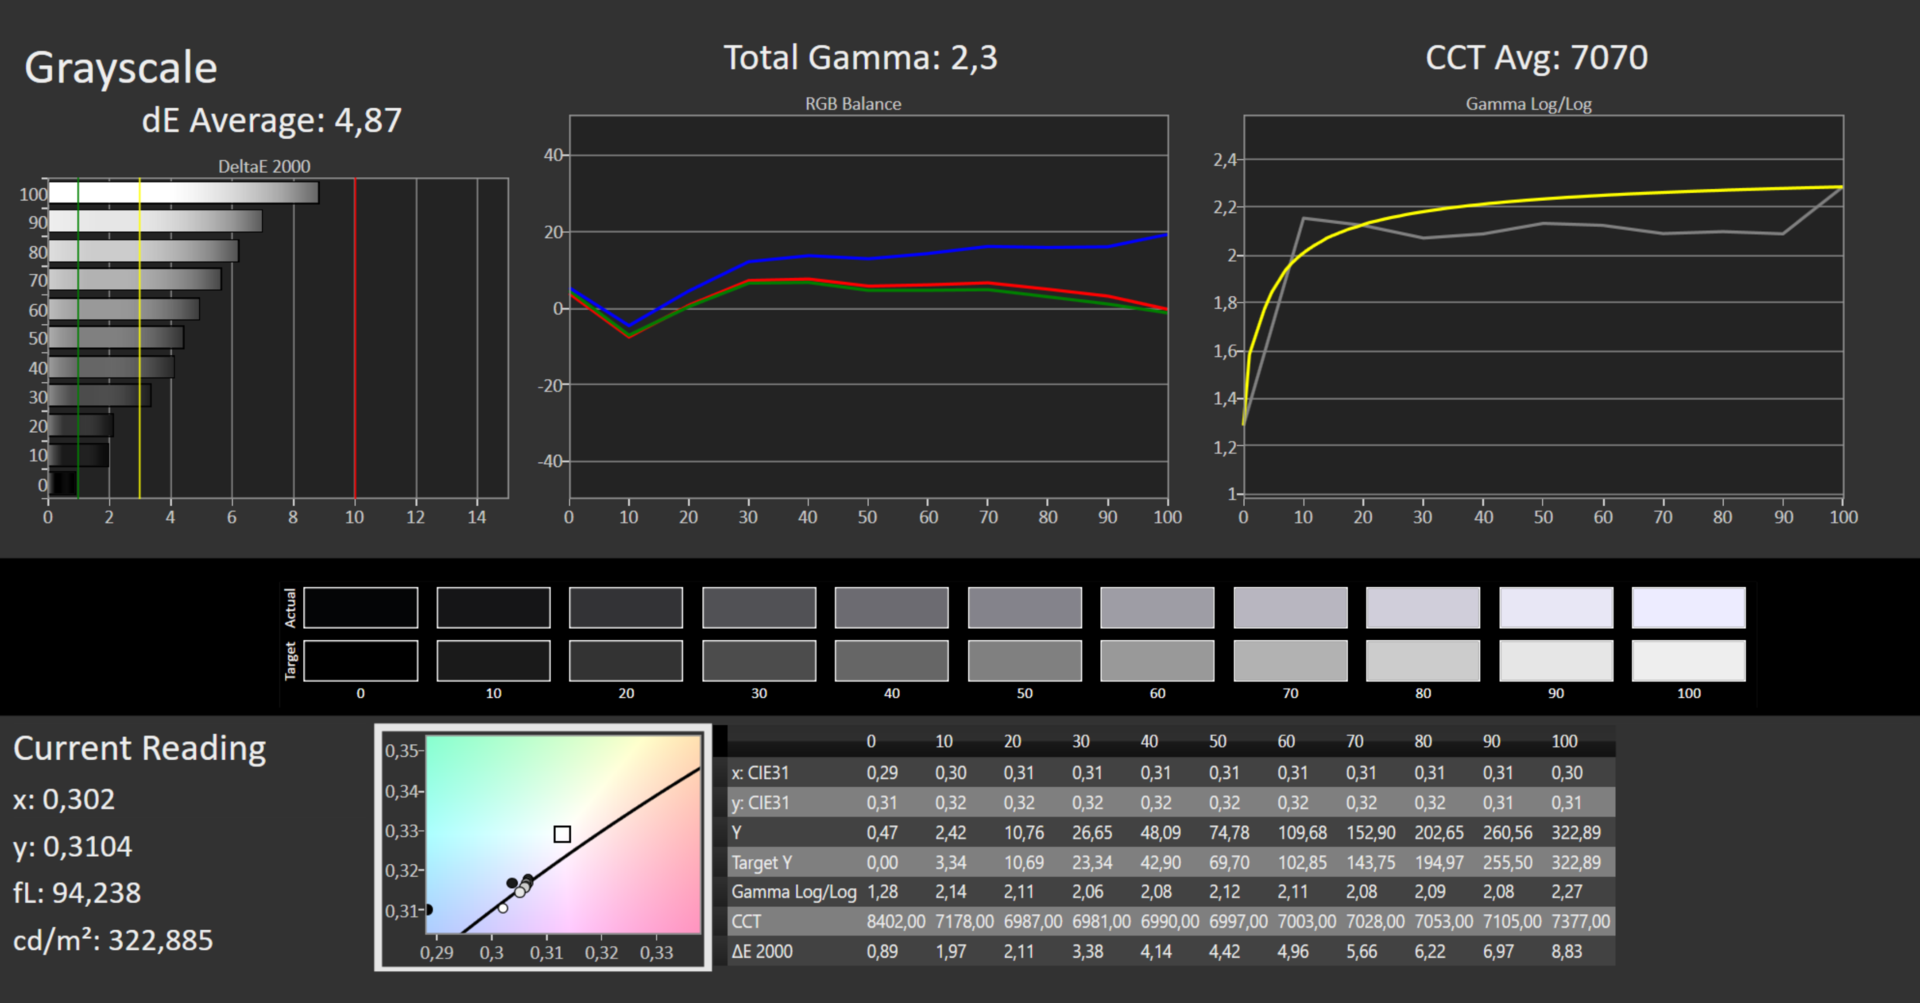
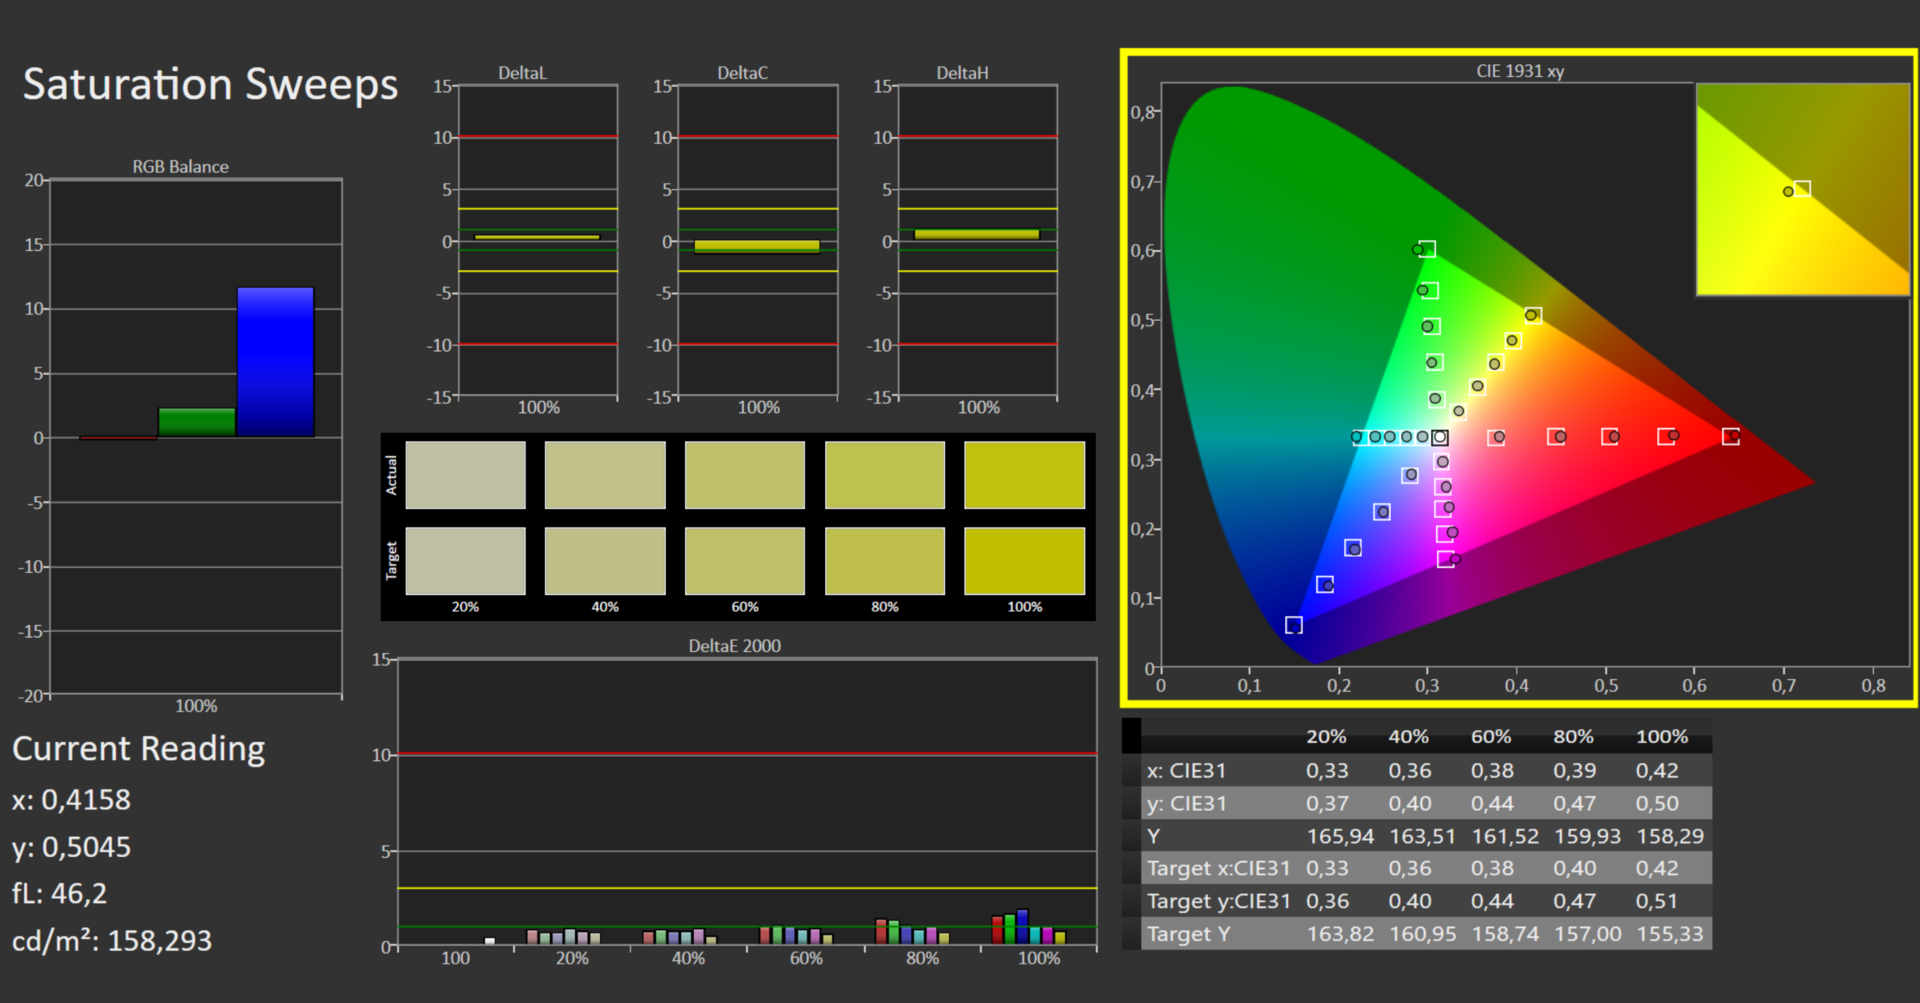
La luminosità del display opaco da 15,6 pollici (1.920 x 1.080 pixel) di 320,2 cd/m² soddisfa i nostri requisiti minimi (> 300 cd/m²). Il rapporto di contrasto di 1.363:1 è più che adeguato e batte facilmente la concorrenza. Il pannello a 165 Hz ha tempi di risposta brevi e non utilizza il PWM a nessun livello di luminosità.
Il display supporta la tecnologia FreeSync di AMD. Questa tecnologia abbina dinamicamente la frequenza di aggiornamento del display con quella della GPU, con l'obiettivo di creare un'immagine il più fluida possibile, soprattutto nei giochi per computer.
| |||||||||||||||||||||||||
Distribuzione della luminosità: 93 %
Al centro con la batteria: 334 cd/m²
Contrasto: 1363:1 (Nero: 0.24 cd/m²)
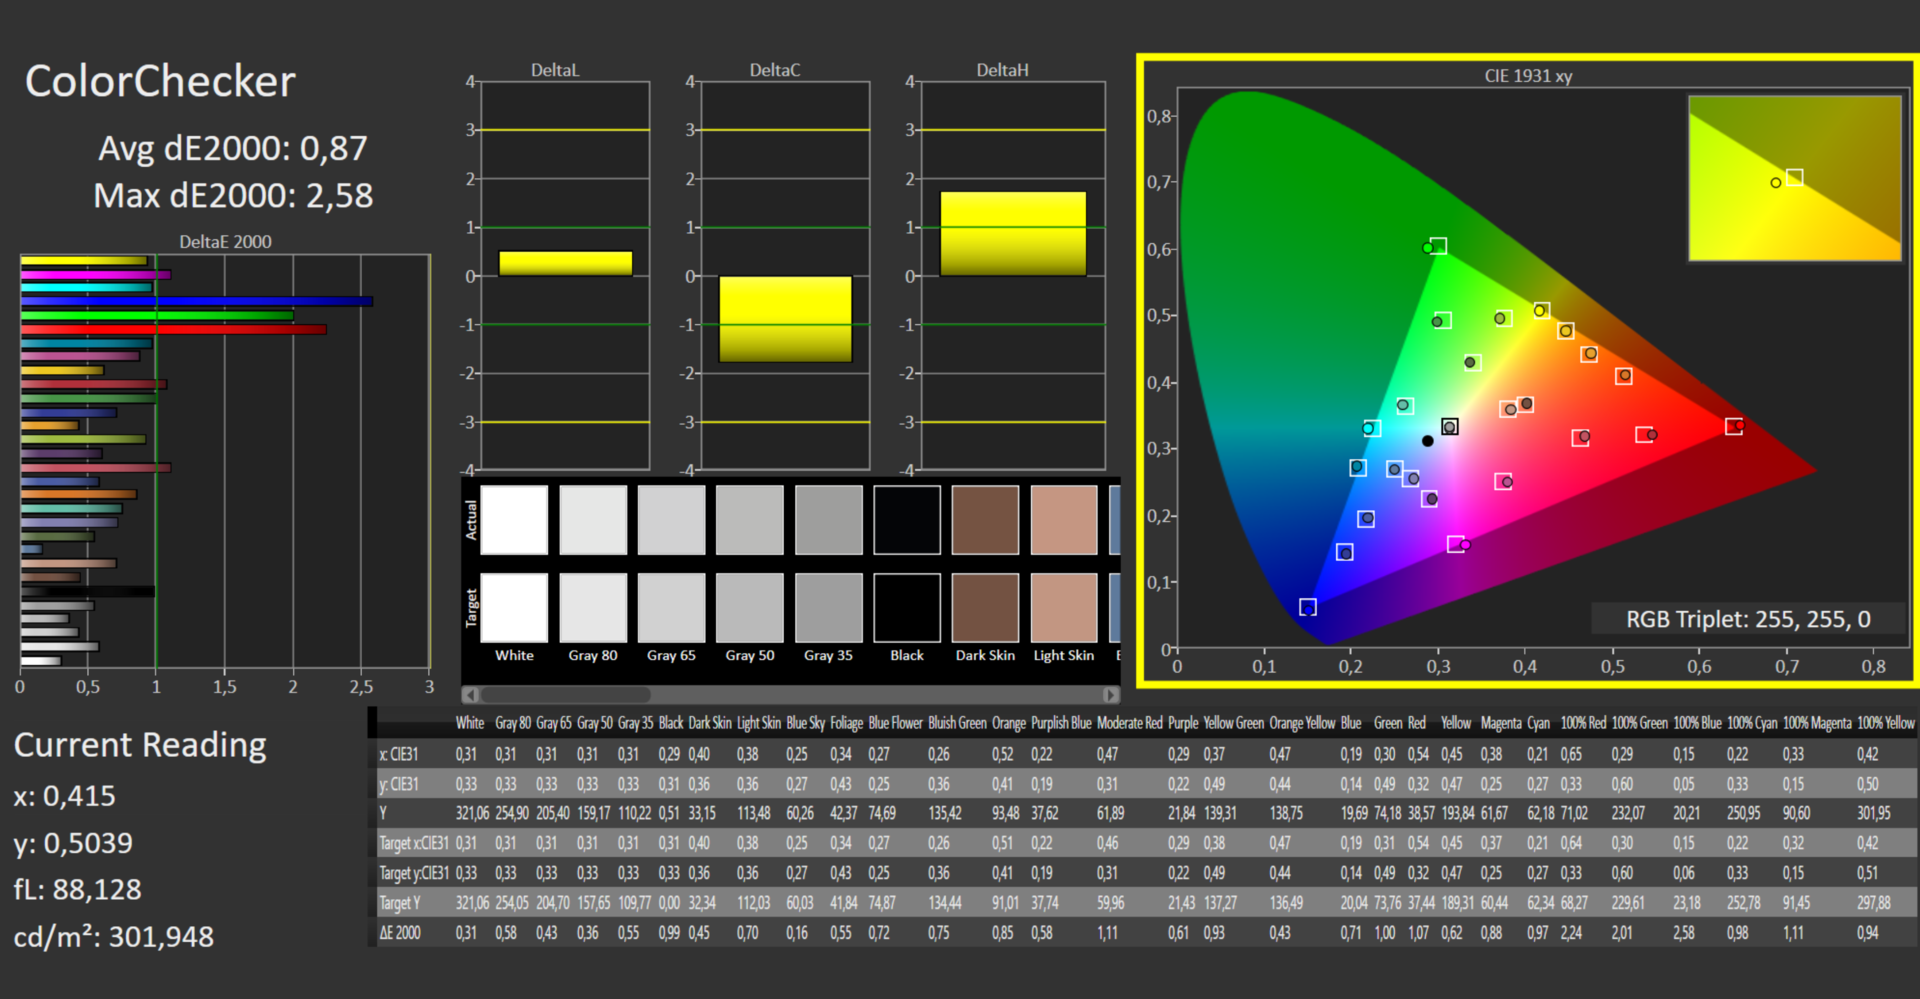
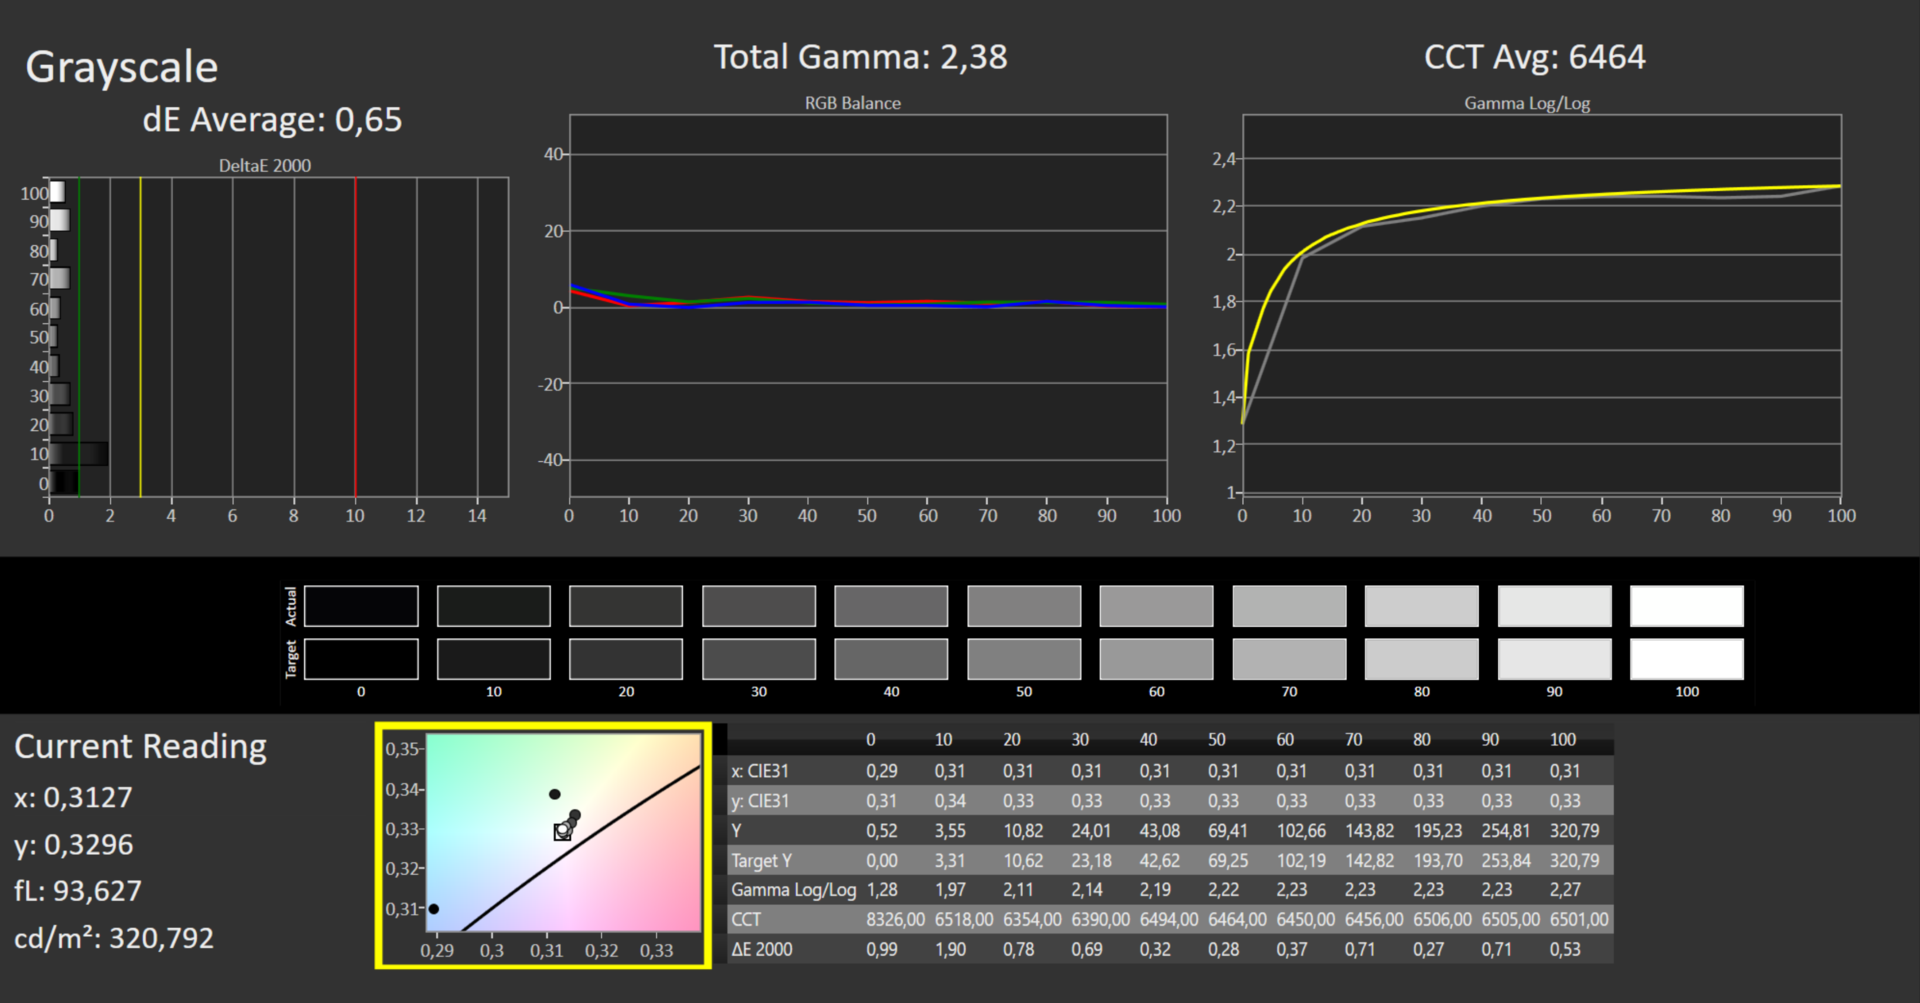
ΔE ColorChecker Calman: 3.26 | ∀{0.5-29.43 Ø4.72}
calibrated: 0.87
ΔE Greyscale Calman: 4.87 | ∀{0.09-98 Ø4.97}
69.7% AdobeRGB 1998 (Argyll 3D)
98.1% sRGB (Argyll 3D)
68.8% Display P3 (Argyll 3D)
Gamma: 2.3
CCT: 7070 K
| Acer Nitro 5 AN515-46-R1A1 AU Optronics B156HAN12.H, IPS, 1920x1080, 15.6" | MSI Katana GF66 12UGS AU Optronics AUOAF90, IPS, 1920x1080, 15.6" | Schenker XMG Fusion 15 (Mid 22) BOE CQ NE156QHM-NY2, IPS, 2560x1440, 15.6" | Asus TUF Dash F15 FX517ZR BOE CQ NE156QHM-NY1, IPS, 2560x1440, 15.6" | Acer Nitro 5 AN515-58-72QR Chi Mei N156KME-GNA, IPS, 2560x1440, 15.6" | |
|---|---|---|---|---|---|
| Display | -42% | -2% | 23% | 21% | |
| Display P3 Coverage (%) | 68.8 | 39.1 -43% | 67.3 -2% | 98.4 43% | 95.6 39% |
| sRGB Coverage (%) | 98.1 | 58.3 -41% | 96.7 -1% | 99.9 2% | 99.8 2% |
| AdobeRGB 1998 Coverage (%) | 69.7 | 40.4 -42% | 68.2 -2% | 85.9 23% | 85.2 22% |
| Response Times | -232% | 12% | 20% | -24% | |
| Response Time Grey 50% / Grey 80% * (ms) | 13 ? | 40 ? -208% | 11.6 ? 11% | 5.6 ? 57% | 15.7 ? -21% |
| Response Time Black / White * (ms) | 8 ? | 28.4 ? -255% | 7 ? 12% | 9.4 ? -18% | 10.2 ? -27% |
| PWM Frequency (Hz) | |||||
| Screen | -55% | -15% | 9% | -2% | |
| Brightness middle (cd/m²) | 327 | 227 -31% | 326 0% | 286 -13% | 332 2% |
| Brightness (cd/m²) | 320 | 225 -30% | 303 -5% | 266 -17% | 303 -5% |
| Brightness Distribution (%) | 93 | 90 -3% | 89 -4% | 87 -6% | 86 -8% |
| Black Level * (cd/m²) | 0.24 | 0.21 12% | 0.33 -38% | 0.25 -4% | 0.29 -21% |
| Contrast (:1) | 1363 | 1081 -21% | 988 -28% | 1144 -16% | 1145 -16% |
| Colorchecker dE 2000 * | 3.26 | 4.19 -29% | 2.73 16% | 2.14 34% | 3.61 -11% |
| Colorchecker dE 2000 max. * | 8.73 | 17.45 -100% | 9.54 -9% | 5.22 40% | 7.71 12% |
| Colorchecker dE 2000 calibrated * | 0.87 | 3.81 -338% | 1.36 -56% | 0.67 23% | 0.59 32% |
| Greyscale dE 2000 * | 4.87 | 2.7 45% | 5.2 -7% | 2.8 43% | 5.2 -7% |
| Gamma | 2.3 96% | 2.208 100% | 2.074 106% | 2.23 99% | 2.155 102% |
| CCT | 7070 92% | 6176 105% | 6911 94% | 7092 92% | 6724 97% |
| Media totale (Programma / Settaggio) | -110% /
-77% | -2% /
-8% | 17% /
14% | -2% /
-1% |
* ... Meglio usare valori piccoli
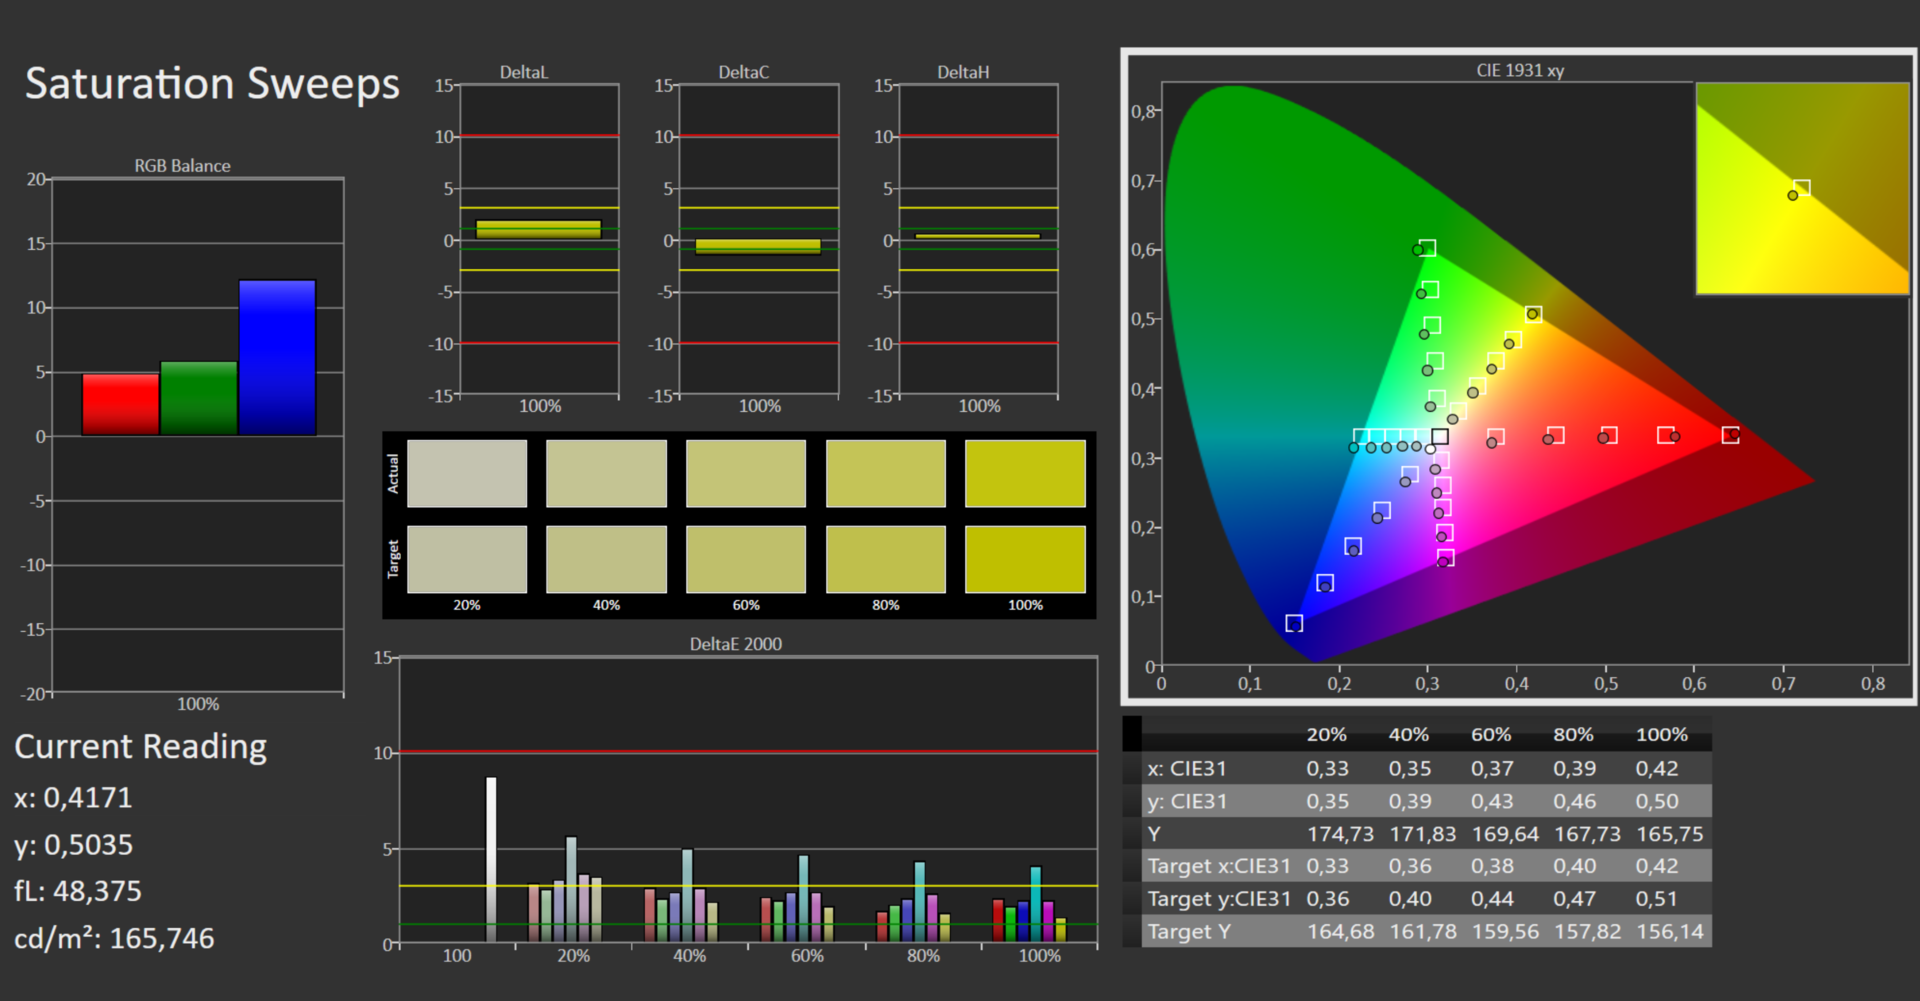
Lo schermo visualizza i colori abbastanza bene. Abbiamo misurato una deviazione dei colori di 3,26, appena superiore al valore ideale (DeltaE < 3). La calibrazione del display riduce la deviazione a 0,87 e fa apparire le scale di grigio più uniformi. Il pannello è in grado di visualizzare quasi l'intero spazio colore sRGB (98,1%) e copre il 70% di AdobeRGB e il 69% di DCI-P3. Il pannello QHD del modello gemello raggiunge una migliore copertura dello spazio colore complessivo.
È possibile scaricare e utilizzare gratuitamente il profilo colore che abbiamo creato. Il link si trova nel riquadro informativo qui sopra.
Tempi di risposta del Display
| ↔ Tempi di risposta dal Nero al Bianco | ||
|---|---|---|
| 8 ms ... aumenta ↗ e diminuisce ↘ combinato | ↗ 4 ms Incremento |  |
| ↘ 4 ms Calo | ||
| Lo schermo mostra veloci tempi di risposta durante i nostri tests e dovrebbe esere adatto al gaming In confronto, tutti i dispositivi di test variano da 0.1 (minimo) a 240 (massimo) ms. » 22 % di tutti i dispositivi è migliore. Questo significa che i tempi di risposta rilevati sono migliori rispettto alla media di tutti i dispositivi testati (19.8 ms). | ||
| ↔ Tempo di risposta dal 50% Grigio all'80% Grigio | ||
| 13 ms ... aumenta ↗ e diminuisce ↘ combinato | ↗ 6 ms Incremento |  |
| ↘ 7 ms Calo | ||
| Lo schermo mostra buoni tempi di risposta durante i nostri tests, ma potrebbe essere troppo lento per i gamers competitivi. In confronto, tutti i dispositivi di test variano da 0.165 (minimo) a 636 (massimo) ms. » 27 % di tutti i dispositivi è migliore. Questo significa che i tempi di risposta rilevati sono migliori rispettto alla media di tutti i dispositivi testati (31 ms). | ||
Sfarfallio dello schermo / PWM (Pulse-Width Modulation)
| flickering dello schermo / PWM non rilevato |  | ||
In confronto: 52 % di tutti i dispositivi testati non utilizza PWM per ridurre la luminosita' del display. Se è rilevato PWM, una media di 7769 (minimo: 5 - massimo: 343500) Hz è stata rilevata. | |||


Il pannello IPS ha angoli di visione stabili e può essere letto da qualsiasi posizione. Può essere utilizzato anche all'aperto, purché il sole non sia troppo forte.

Performance - Quaderno Nitro con Ampere e Rembrandt
L'Acer Nitro 5 AN515 - un notebook da gioco da 15,6 pollici - è disponibile in un'ampia gamma di configurazioni e può essere equipaggiato con un processore Intel o AMD. La configurazione entry-level è attualmente disponibile a circa 800 euro (Core i5-11400H, RTX 3050, 8 GB di RAM, SSD da 512 GB, senza Windows). Il modello più costoso (Ryzen 9 6900HX, RTX 3070 Ti, 32 GB di RAM, SSD da 1 TB) ha un prezzo di 2.400 euro.

Condizioni di test
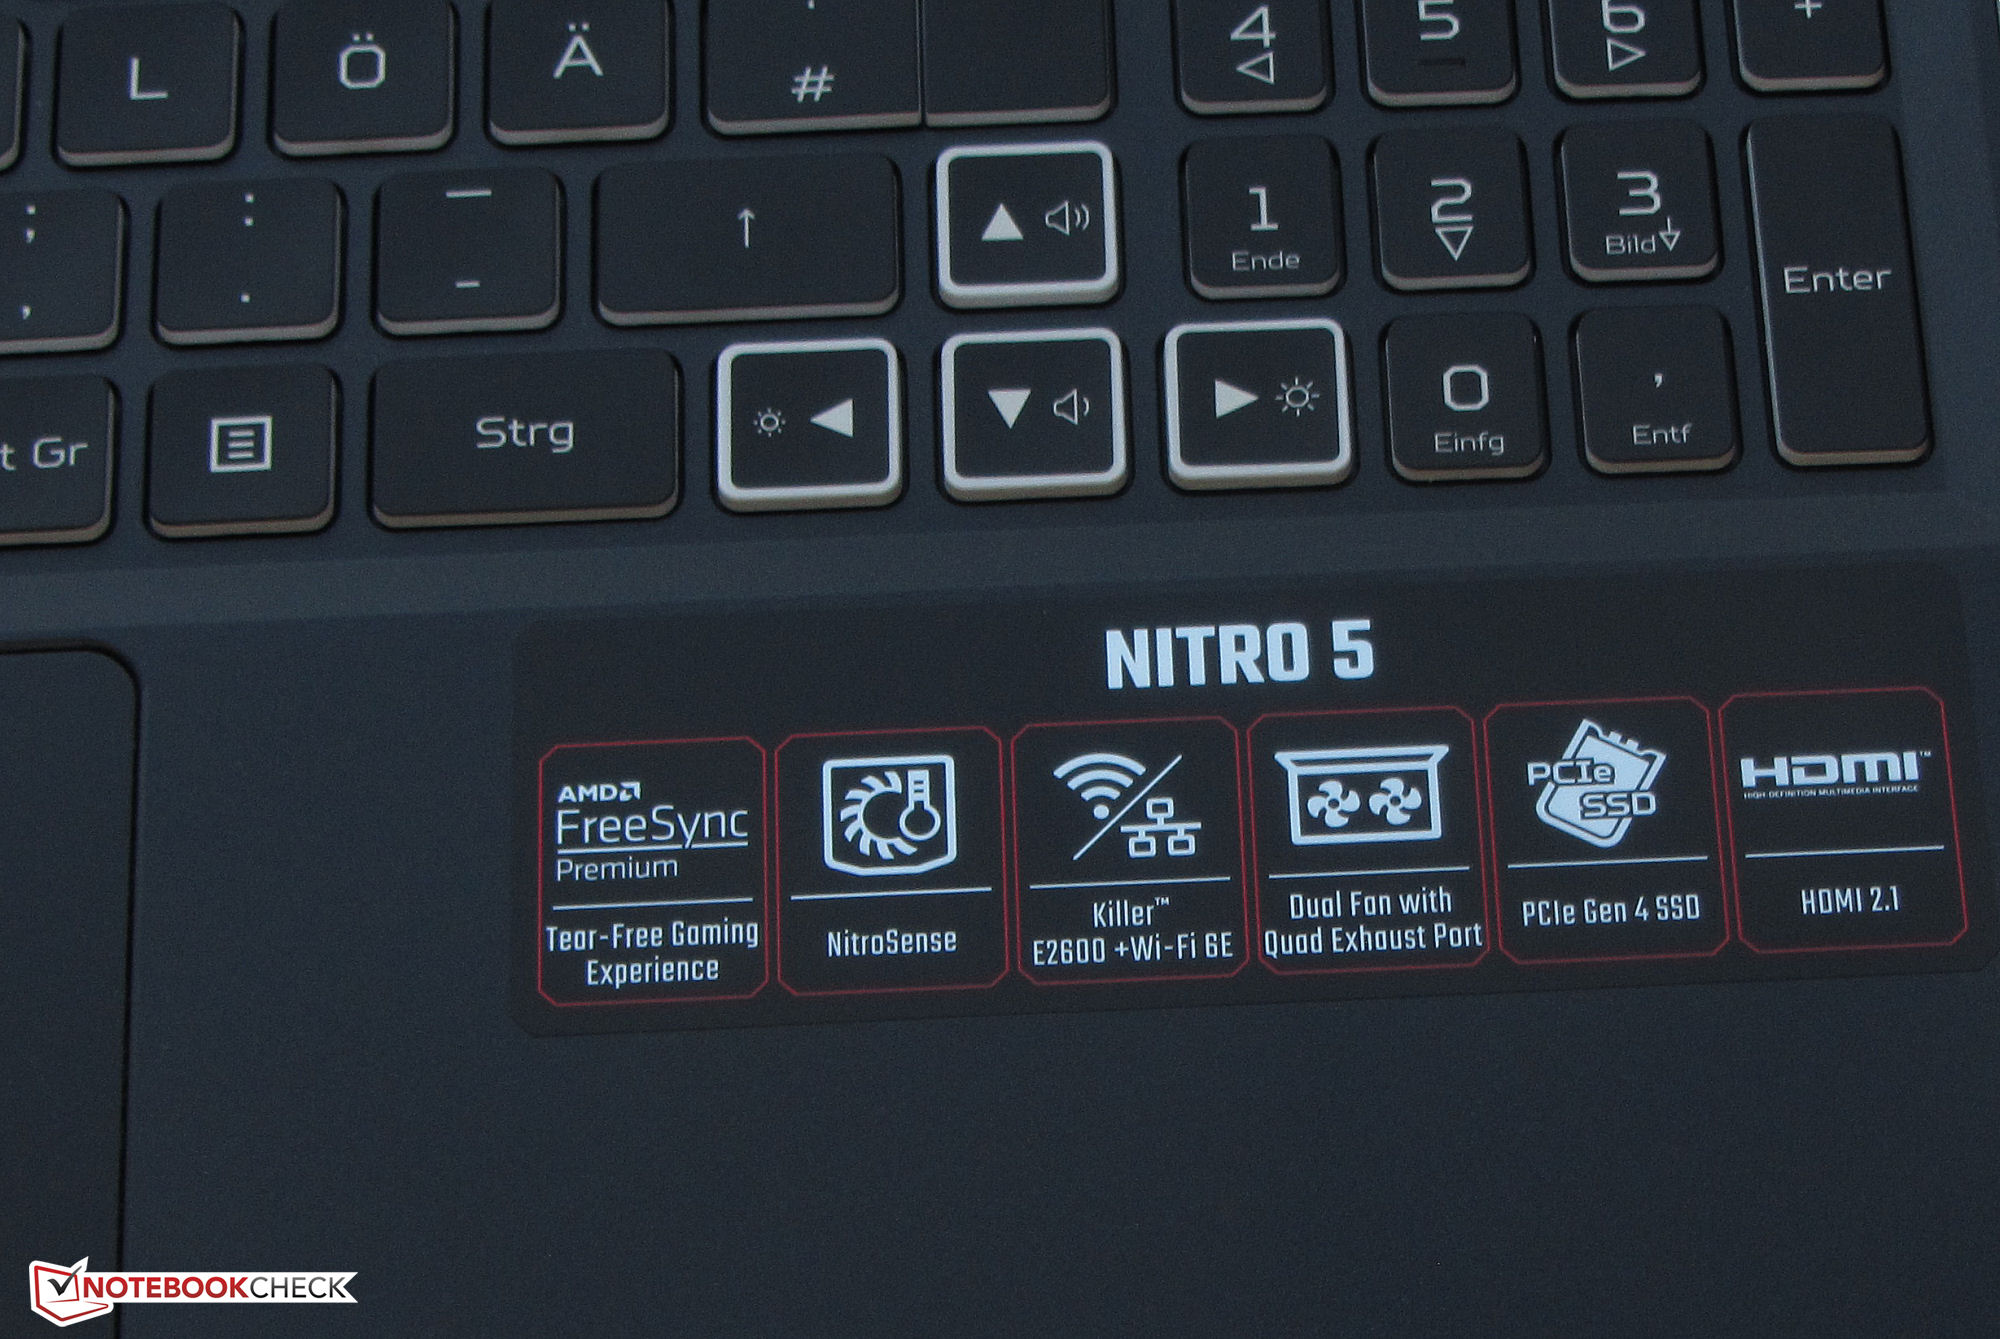
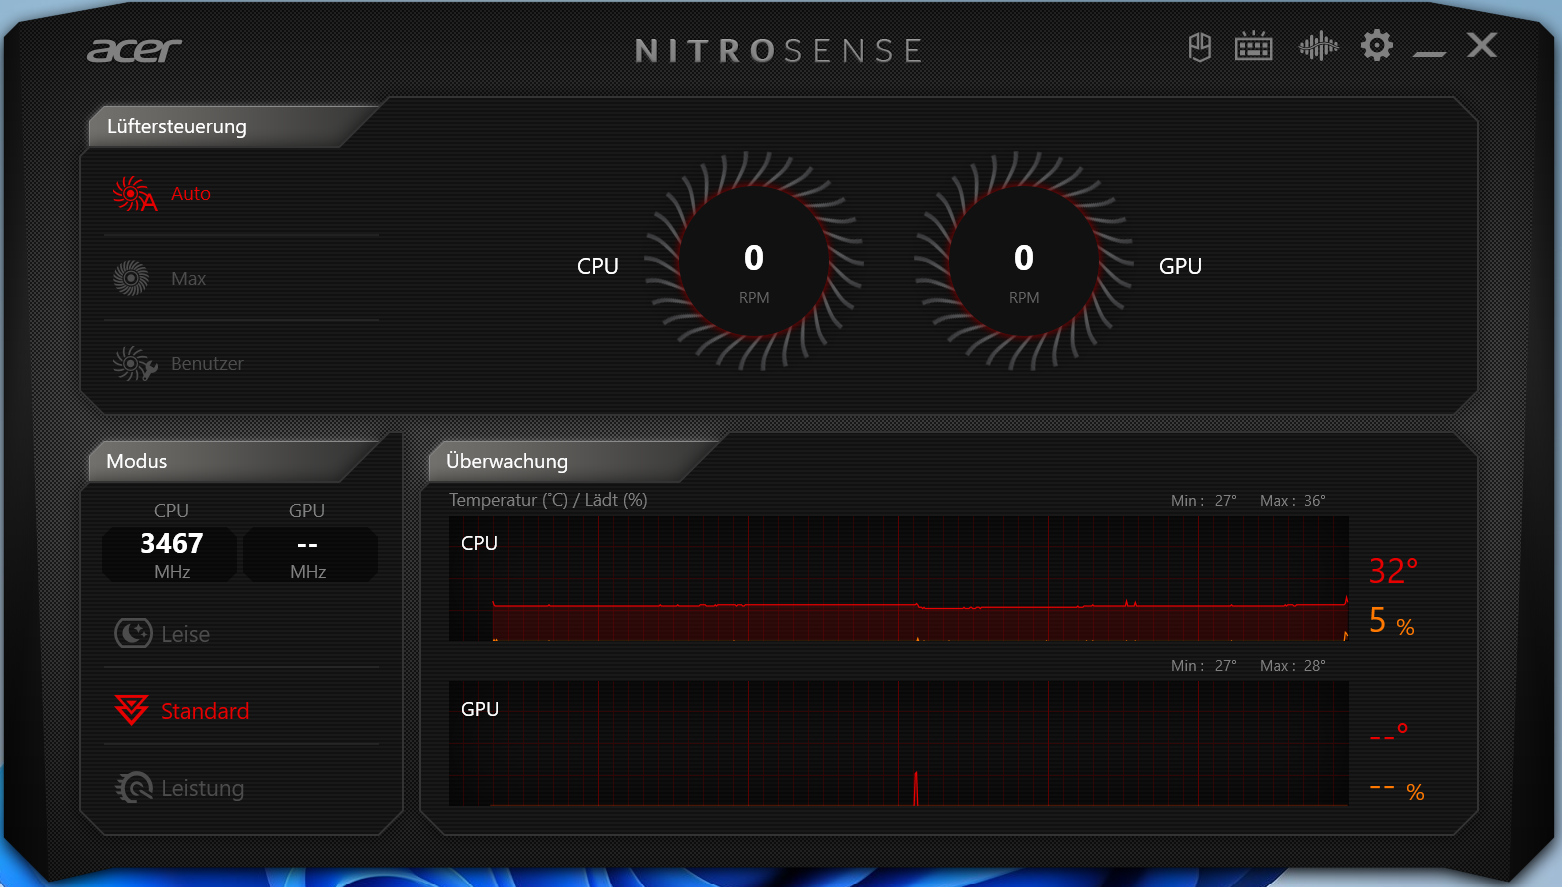
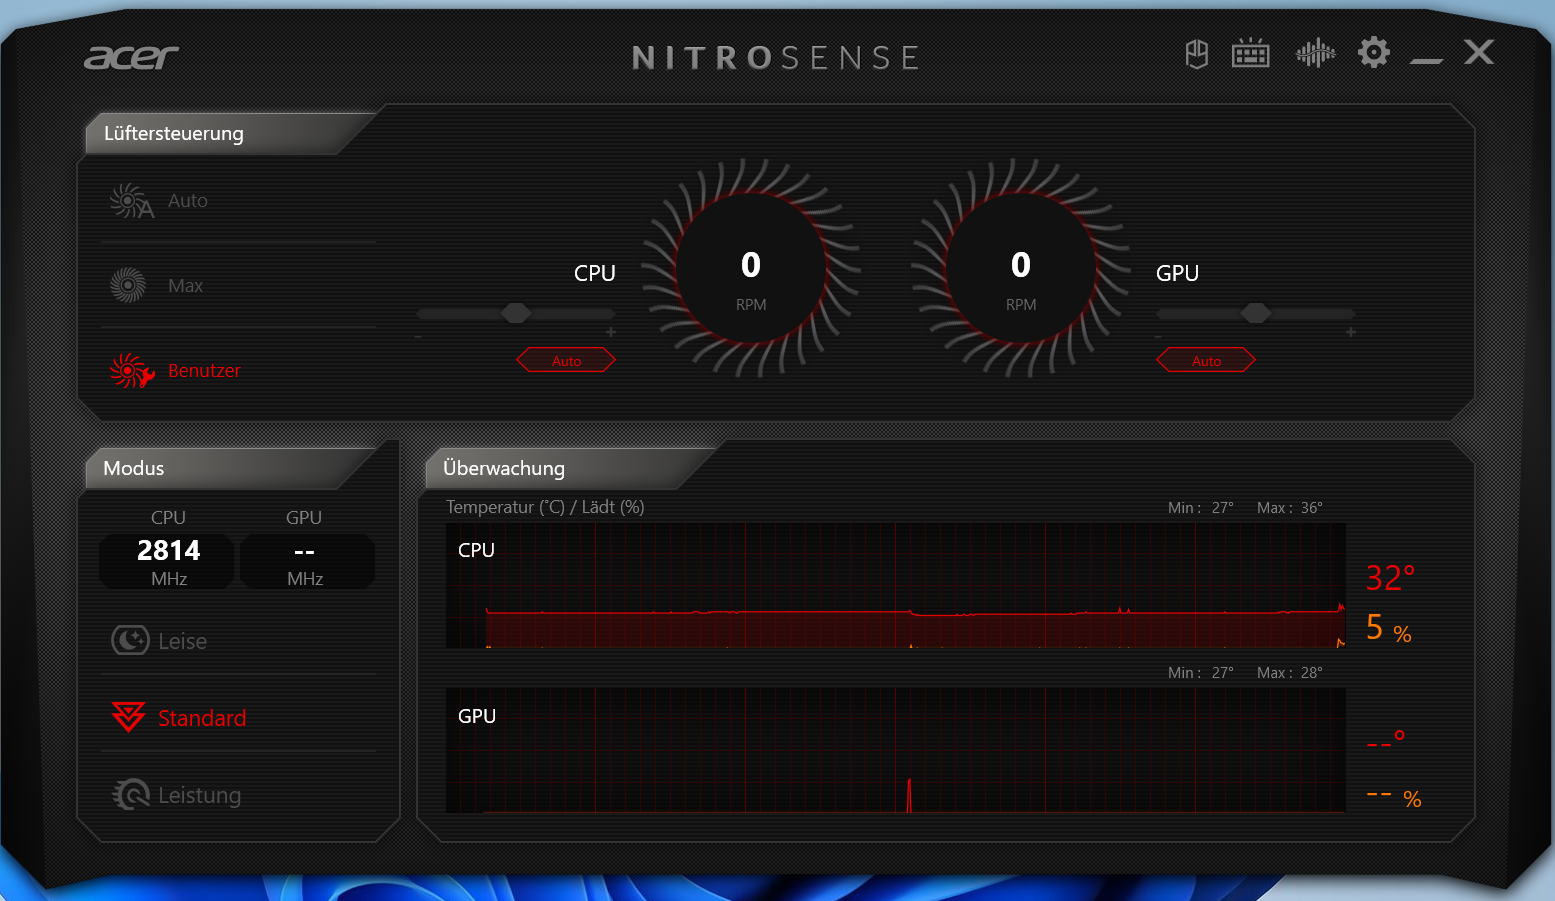
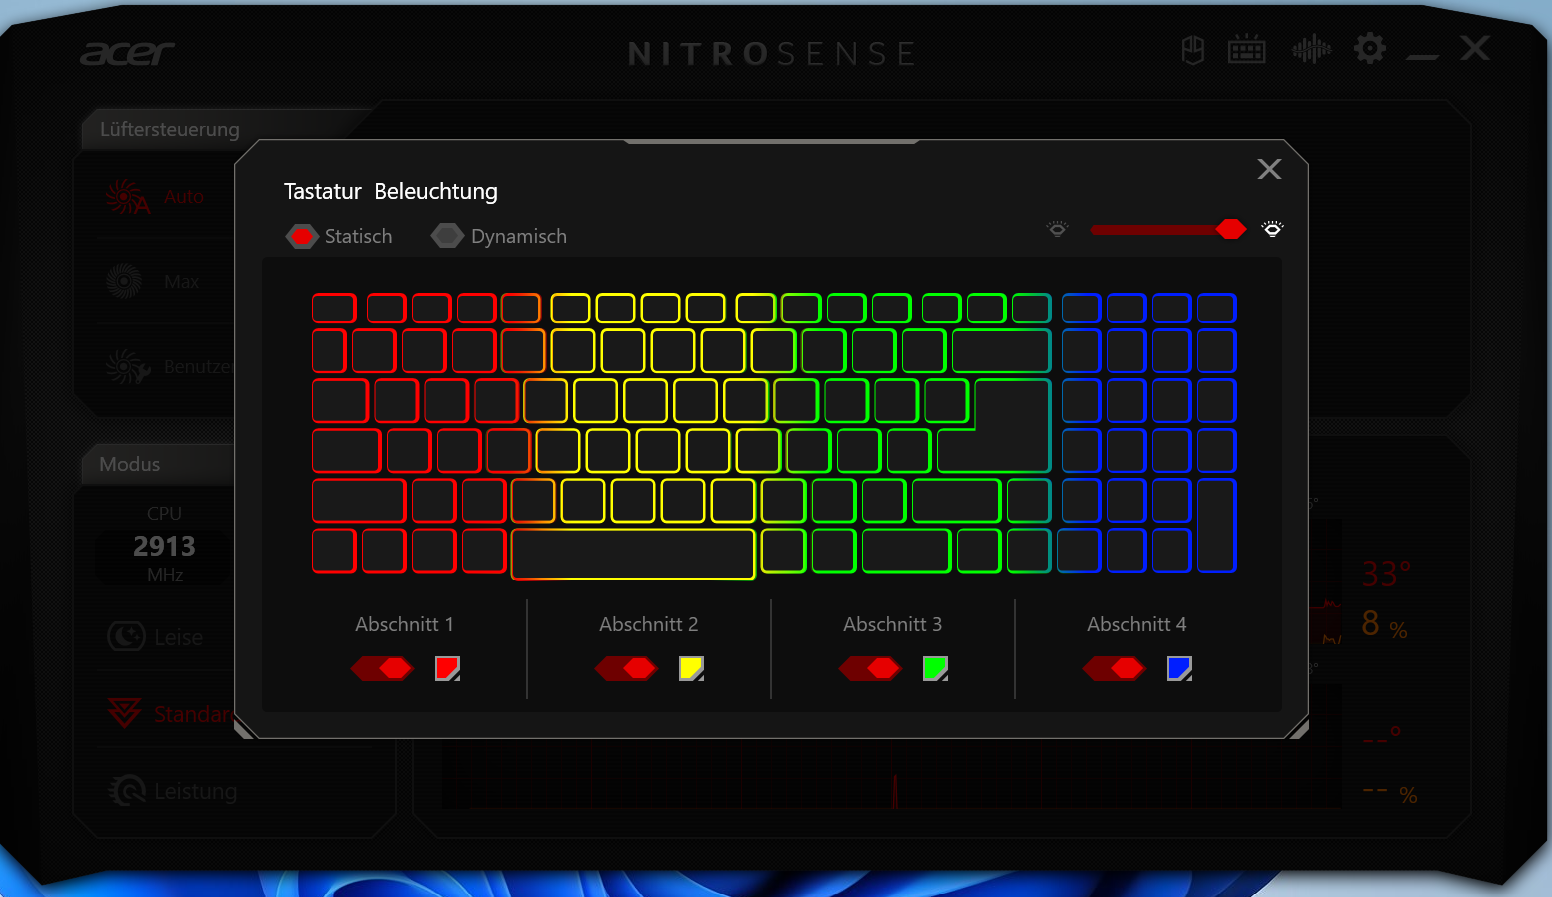
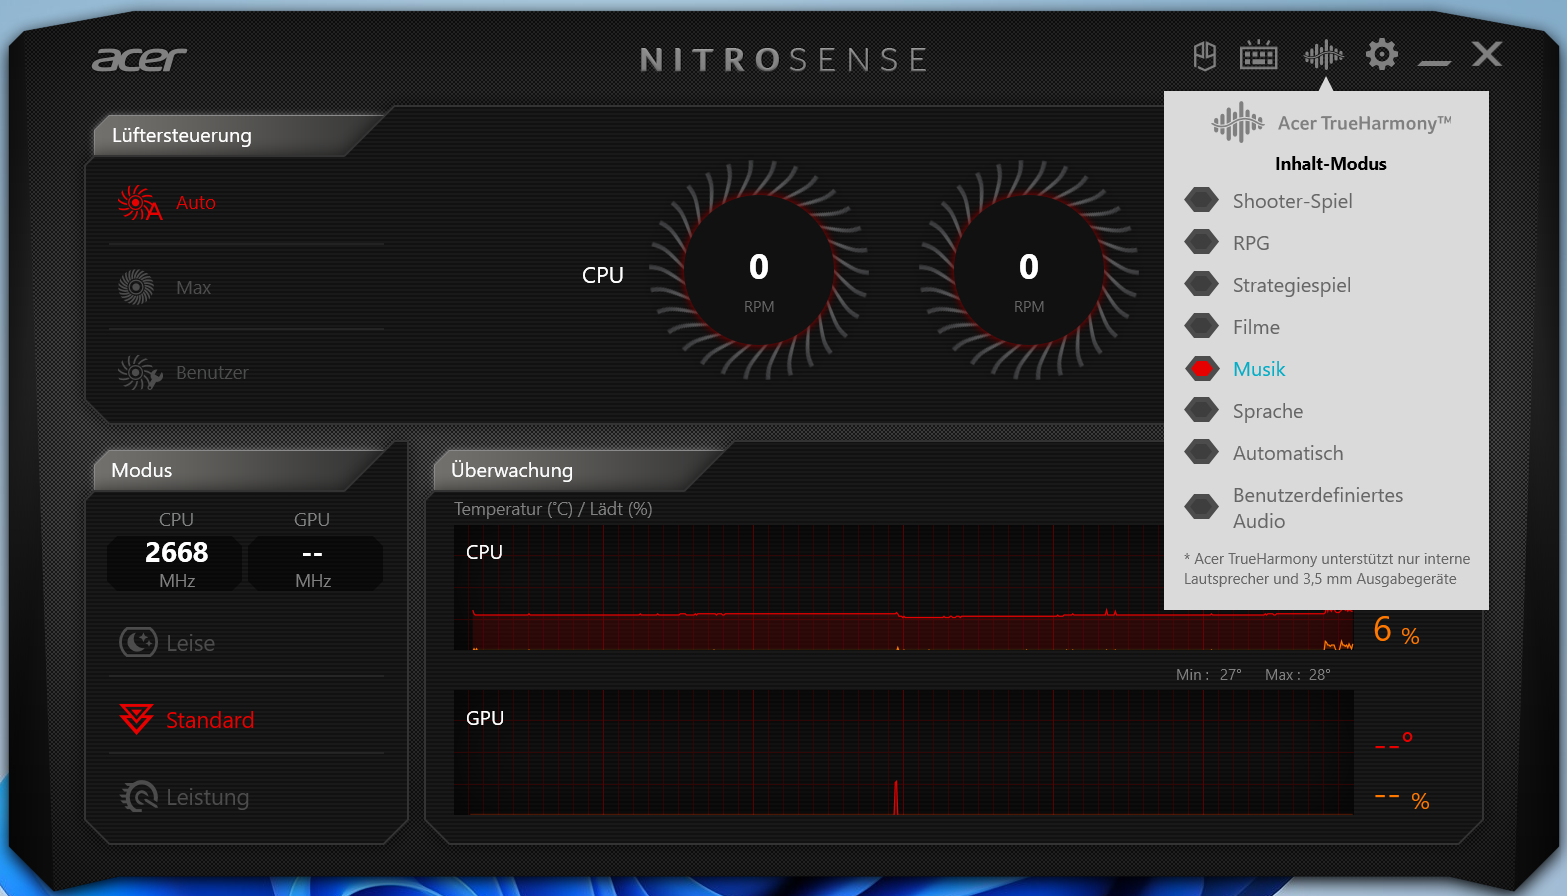
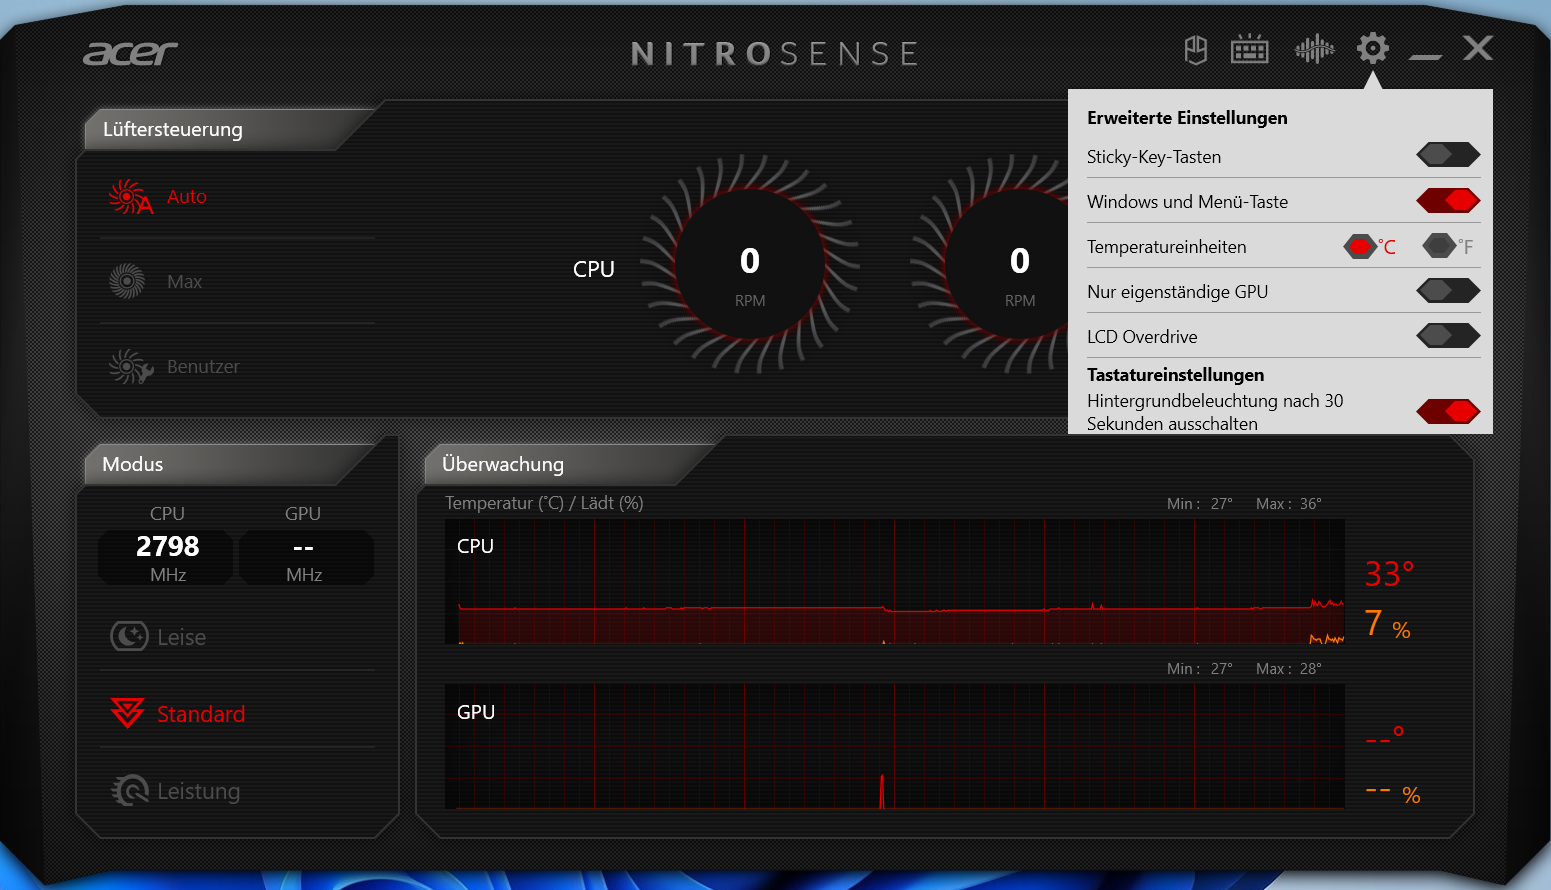
Il software NitroSense preinstallato (il centro di controllo del portatile, vedi immagini) può essere utilizzato per passare tra i profili di prestazioni impostati dal produttore ("performance", "standard" e "quiet"). Abbiamo eseguito tutti i nostri test con il profilo "standard" e con il controllo della ventola impostato su automatico. Le prestazioni della CPU sono identiche in tutti i profili di prestazioni; le prestazioni della GPU variano leggermente.
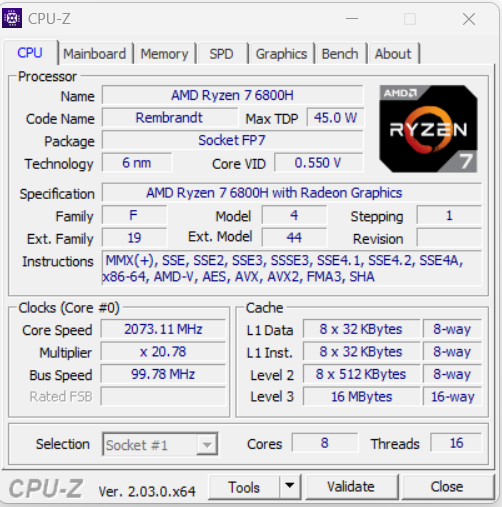
Processore
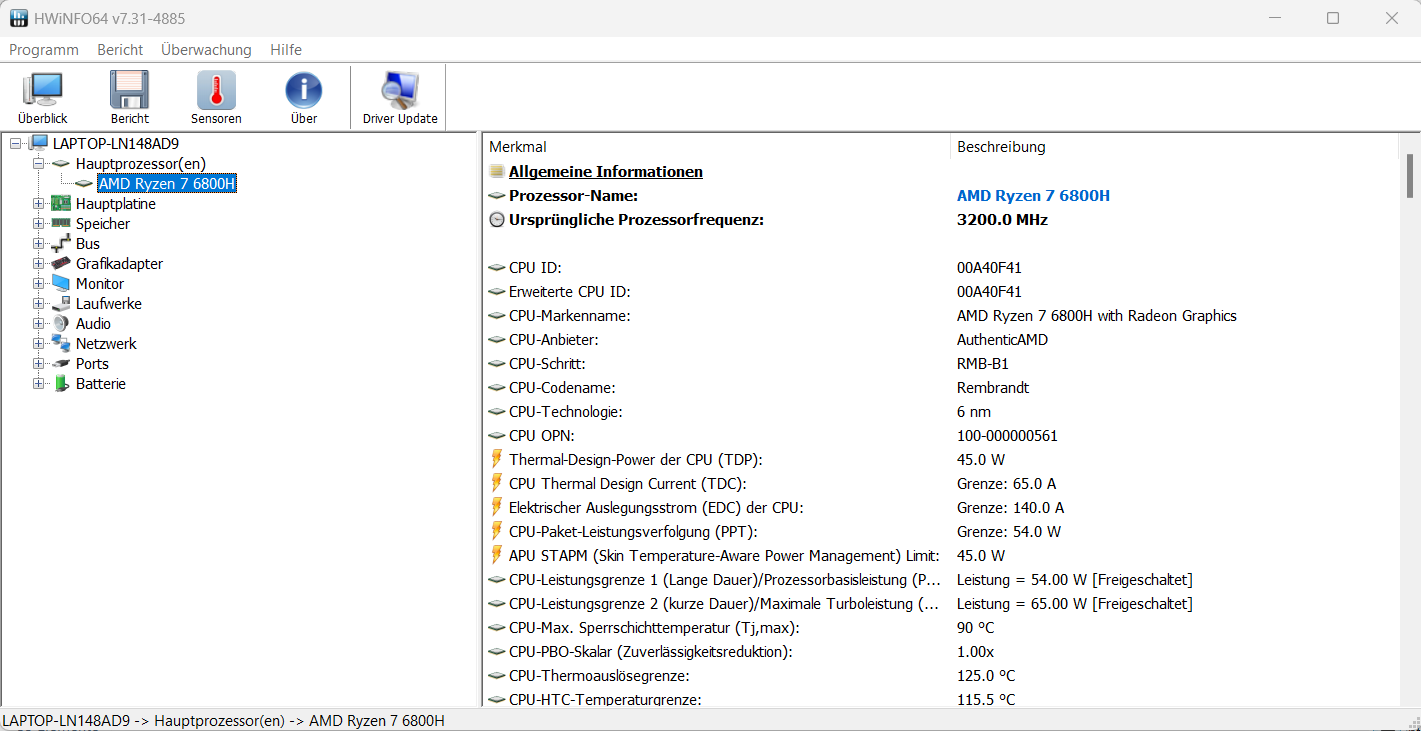
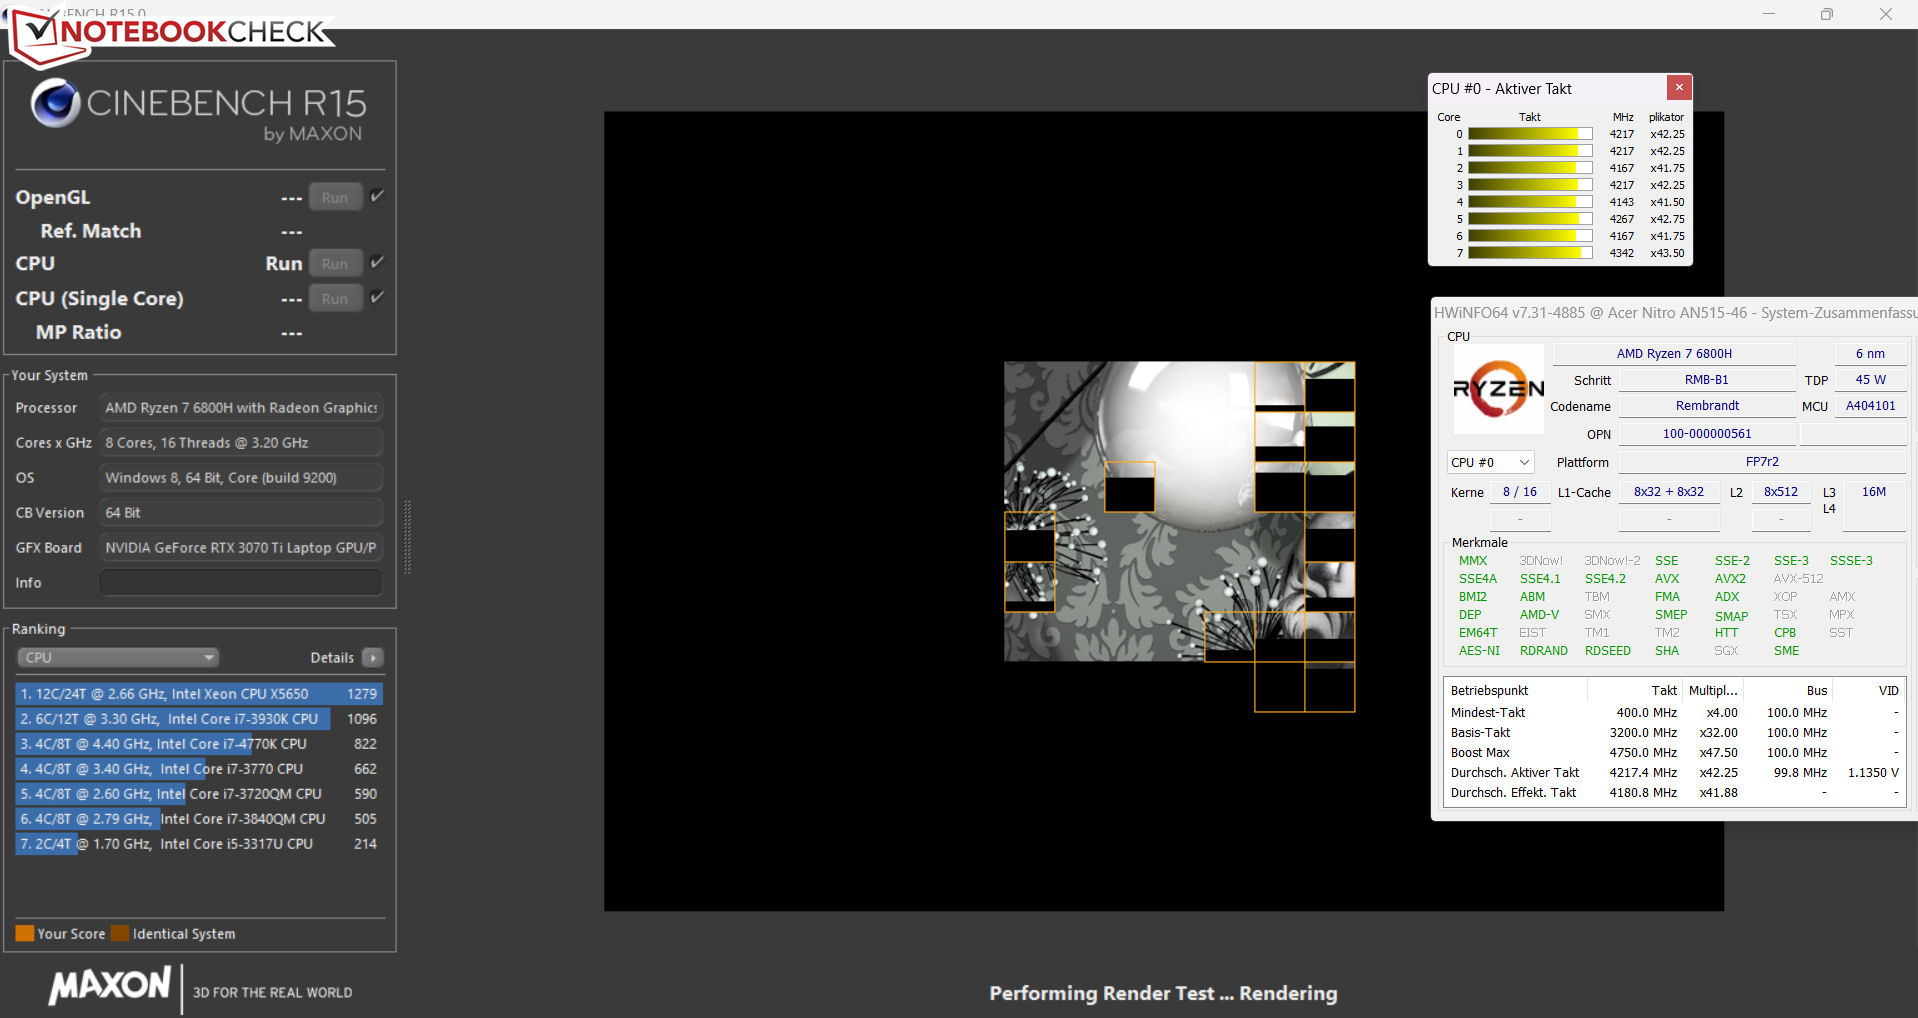
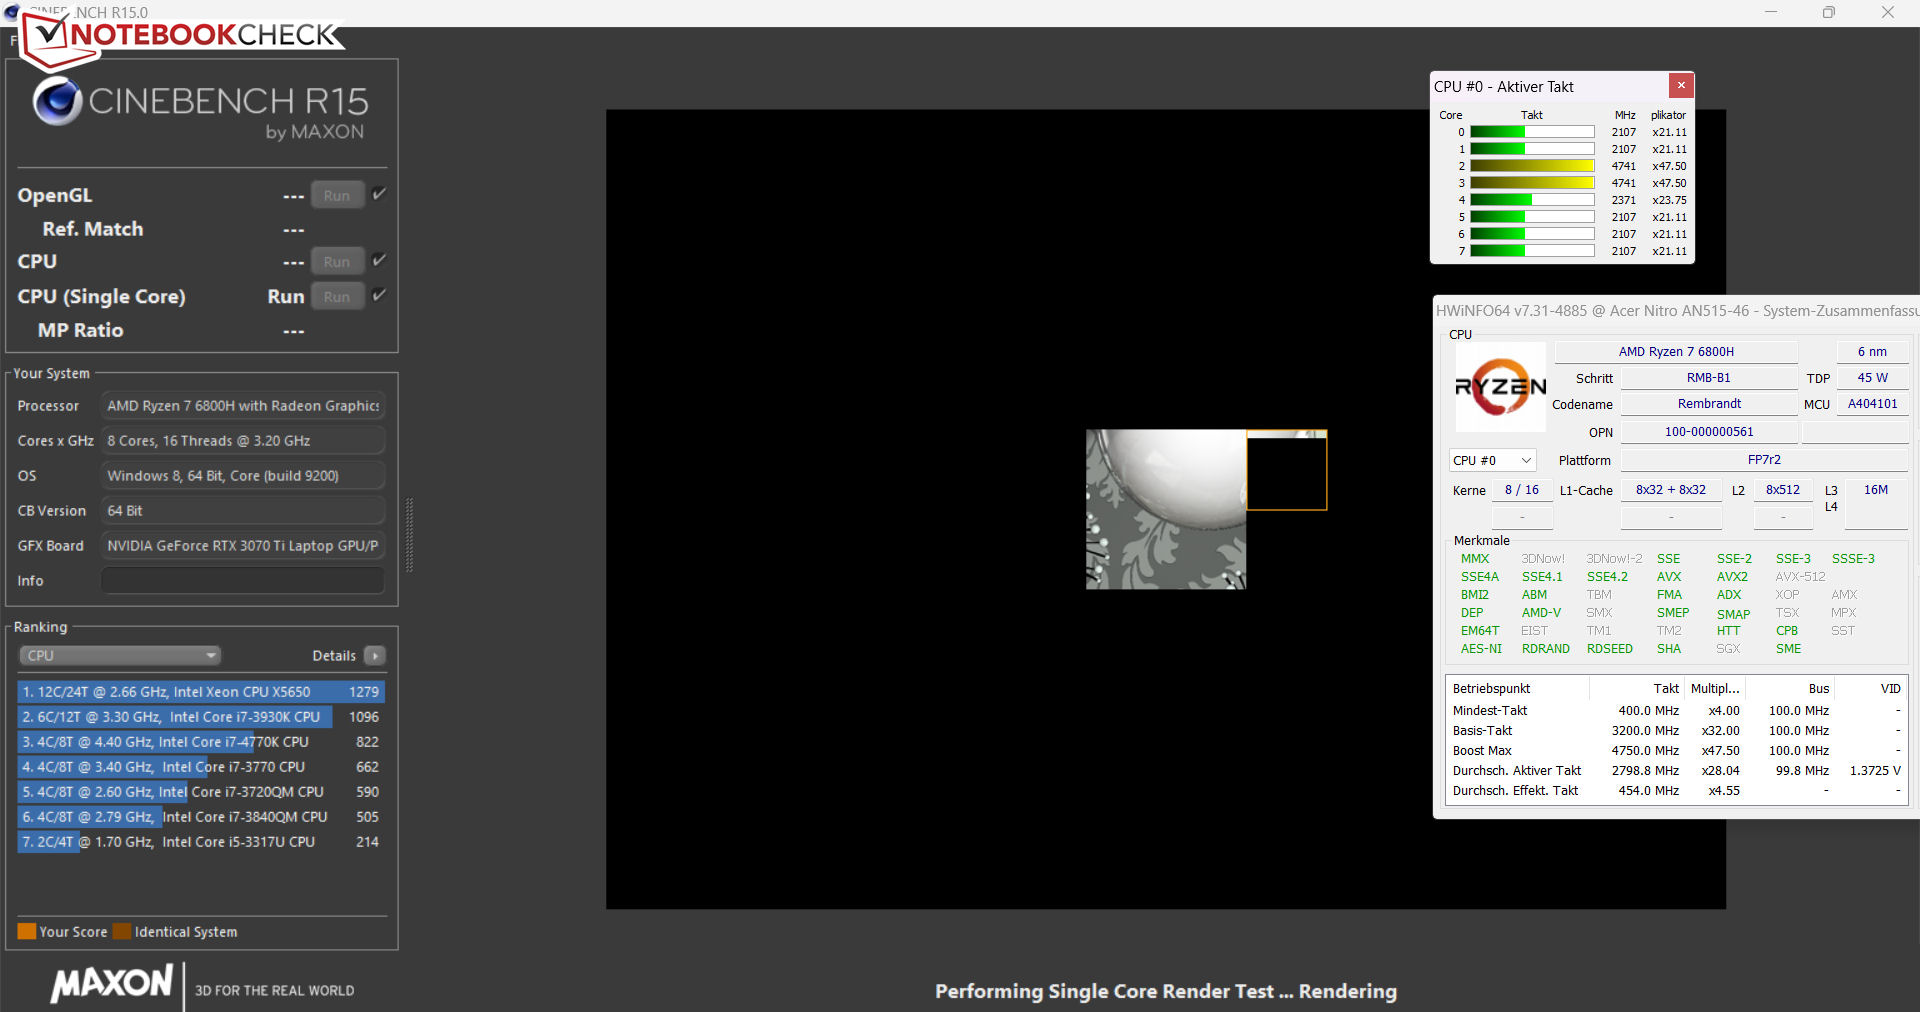
La parte CPU dell'APU Ryzen 7 6800H (Rembrandt) è costituita da un processore octa-core con una frequenza di clock di base di 3,2 GHz. La frequenza di clock può aumentare fino a 4,75 GHz grazie al turbo. Il chip supporta il multi-threading simultaneo (due thread per core). I risultati dei benchmark della CPU sono gli stessi in tutti e tre i profili di prestazioni.
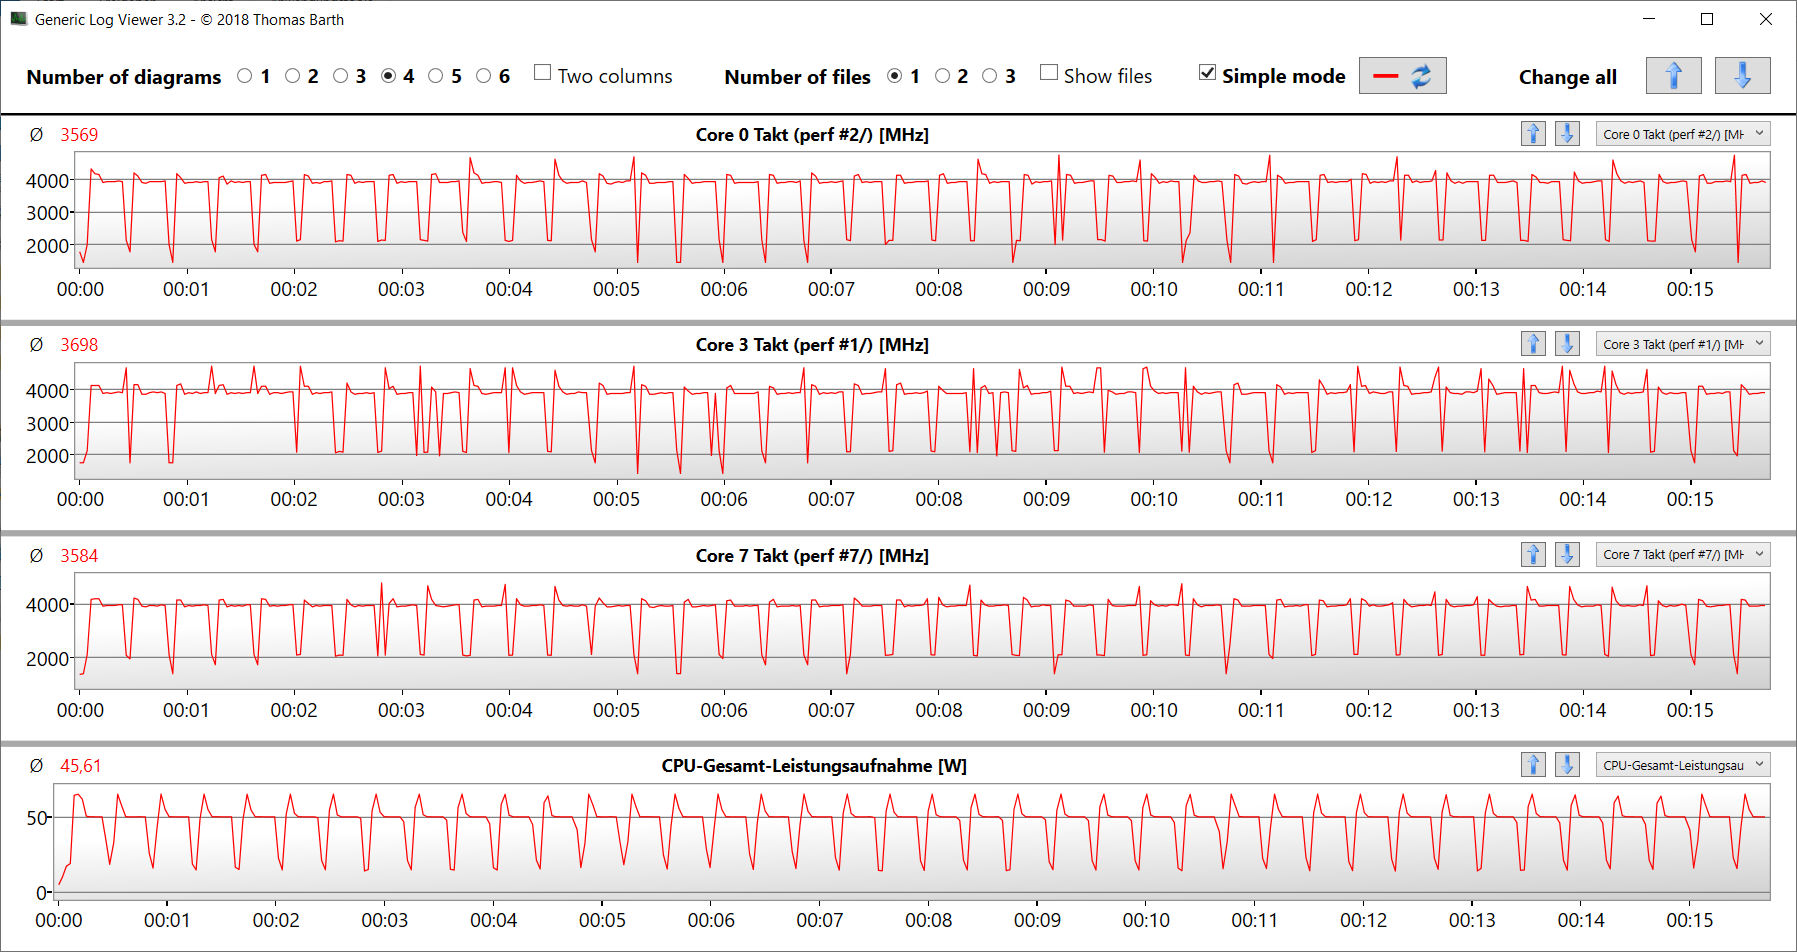
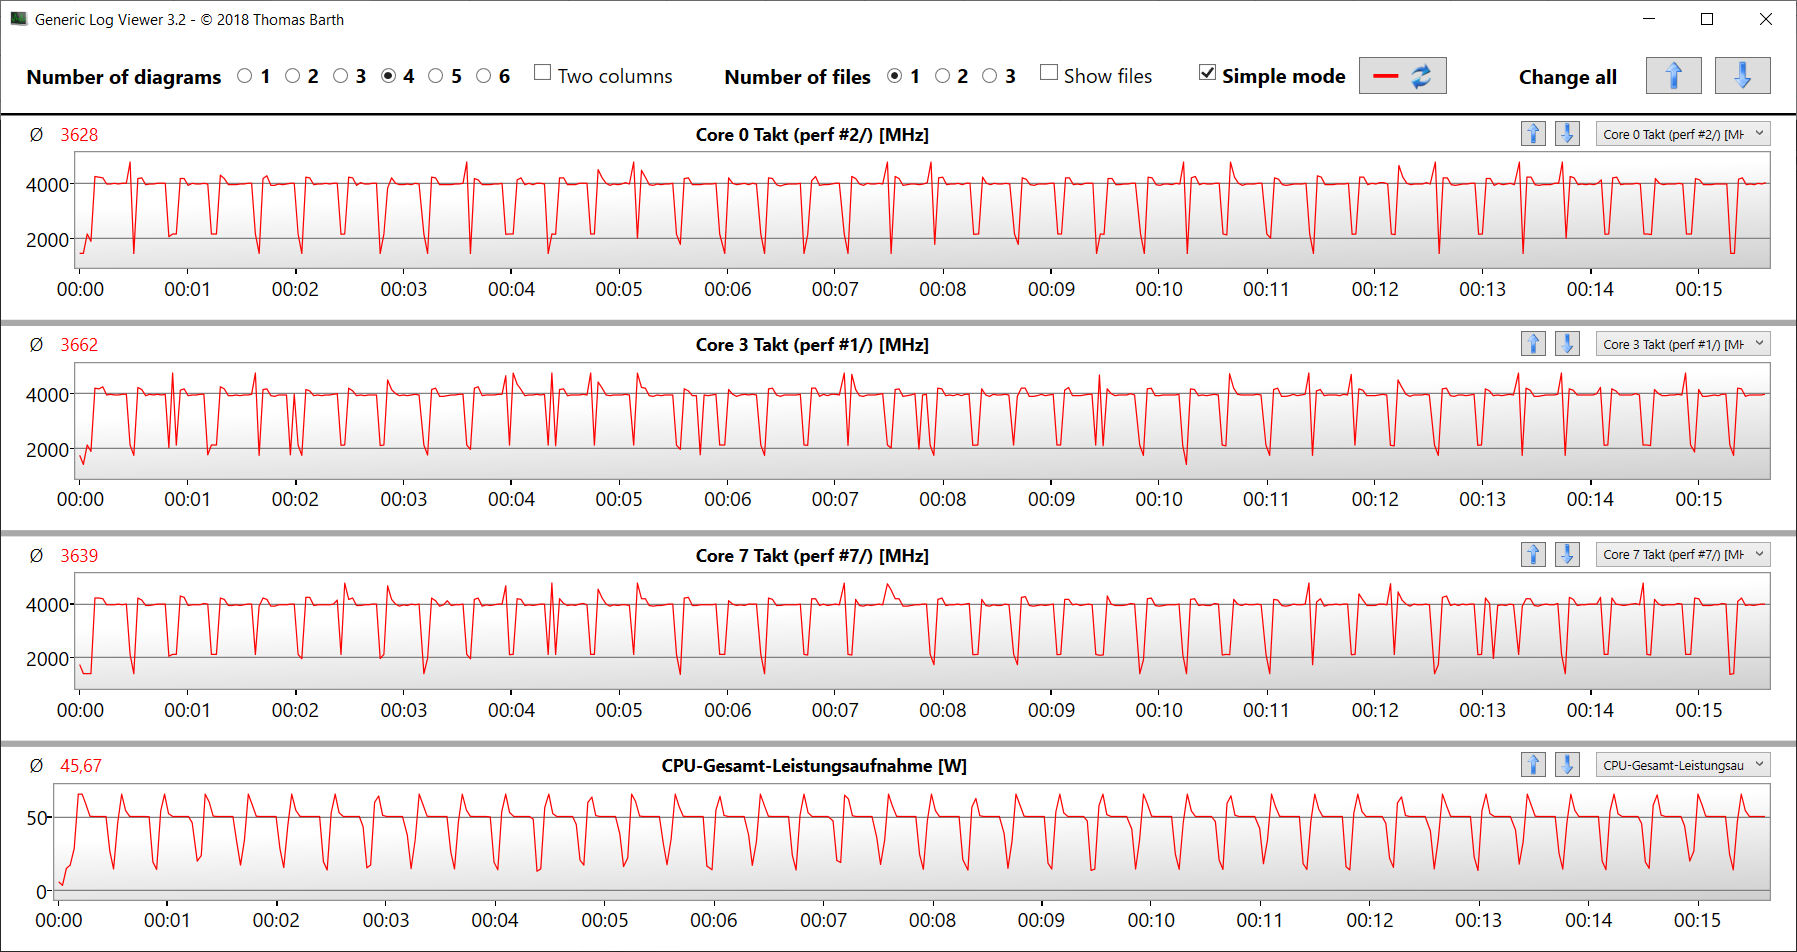
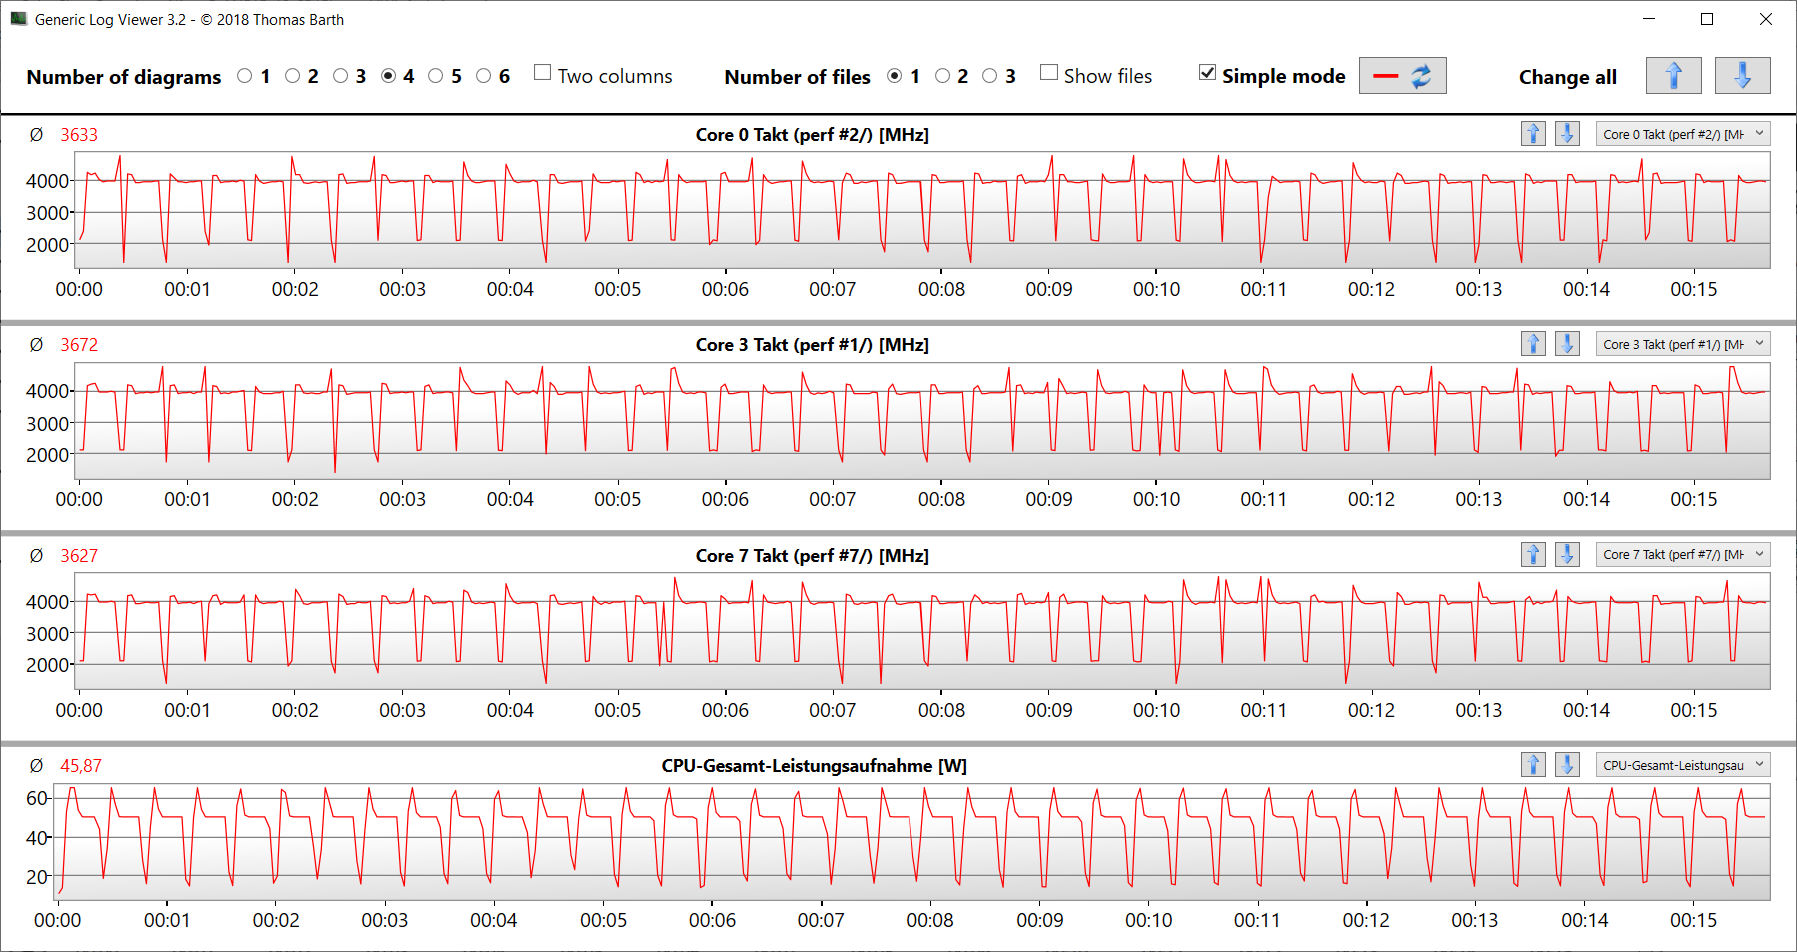
Il test Cinebench R15 multi-thread ha portato a velocità di clock comprese tra 4 e 4,2 GHz. Il test single-thread è stato completato da 2 a 4,75 GHz. A batteria, la CPU ha registrato un clock di 2,5 GHz (multi-thread) e da 1,2 a 2,5 GHz (single-thread). Il benchmark CB15 ha confermato che il turbo della CPU può essere utilizzato in modo continuo.
Nel complesso, il processore offre buone prestazioni. Di tanto in tanto rimane indietro rispetto alle CPU Intel Alder Lake, soprattutto quando possono sfruttare i core aggiuntivi della CPU.
Cinebench R15 Multi Loop
* ... Meglio usare valori piccoli
AIDA64: FP32 Ray-Trace | FPU Julia | CPU SHA3 | CPU Queen | FPU SinJulia | FPU Mandel | CPU AES | CPU ZLib | FP64 Ray-Trace | CPU PhotoWorxx
| Performance rating | |
| Media della classe Gaming | |
| Acer Nitro 5 AN515-46-R1A1 | |
| Media AMD Ryzen 7 6800H | |
| Schenker XMG Fusion 15 (Mid 22) | |
| Asus TUF Dash F15 FX517ZR | |
| MSI Katana GF66 12UGS | |
| Acer Nitro 5 AN515-58-72QR | |
| AIDA64 / FP32 Ray-Trace | |
| Media della classe Gaming (10227 - 85542, n=107, ultimi 2 anni) | |
| Acer Nitro 5 AN515-46-R1A1 | |
| Media AMD Ryzen 7 6800H (12876 - 17031, n=8) | |
| Asus TUF Dash F15 FX517ZR | |
| Schenker XMG Fusion 15 (Mid 22) | |
| MSI Katana GF66 12UGS | |
| Acer Nitro 5 AN515-58-72QR | |
| AIDA64 / FPU Julia | |
| Media della classe Gaming (51376 - 238426, n=107, ultimi 2 anni) | |
| Acer Nitro 5 AN515-46-R1A1 | |
| Media AMD Ryzen 7 6800H (82673 - 105987, n=8) | |
| Asus TUF Dash F15 FX517ZR | |
| Schenker XMG Fusion 15 (Mid 22) | |
| Acer Nitro 5 AN515-58-72QR | |
| MSI Katana GF66 12UGS | |
| AIDA64 / CPU SHA3 | |
| Media della classe Gaming (2180 - 9817, n=107, ultimi 2 anni) | |
| Schenker XMG Fusion 15 (Mid 22) | |
| Acer Nitro 5 AN515-46-R1A1 | |
| Media AMD Ryzen 7 6800H (2886 - 3634, n=8) | |
| MSI Katana GF66 12UGS | |
| Acer Nitro 5 AN515-58-72QR | |
| Asus TUF Dash F15 FX517ZR | |
| AIDA64 / CPU Queen | |
| Media della classe Gaming (49785 - 173351, n=95, ultimi 2 anni) | |
| Acer Nitro 5 AN515-46-R1A1 | |
| MSI Katana GF66 12UGS | |
| Acer Nitro 5 AN515-58-72QR | |
| Media AMD Ryzen 7 6800H (75117 - 106322, n=8) | |
| Asus TUF Dash F15 FX517ZR | |
| Schenker XMG Fusion 15 (Mid 22) | |
| AIDA64 / FPU SinJulia | |
| Media della classe Gaming (4424 - 33636, n=107, ultimi 2 anni) | |
| Acer Nitro 5 AN515-46-R1A1 | |
| Media AMD Ryzen 7 6800H (11771 - 13120, n=8) | |
| Acer Nitro 5 AN515-58-72QR | |
| MSI Katana GF66 12UGS | |
| Schenker XMG Fusion 15 (Mid 22) | |
| Asus TUF Dash F15 FX517ZR | |
| AIDA64 / FPU Mandel | |
| Media della classe Gaming (25115 - 128721, n=107, ultimi 2 anni) | |
| Acer Nitro 5 AN515-46-R1A1 | |
| Media AMD Ryzen 7 6800H (45287 - 58327, n=8) | |
| Schenker XMG Fusion 15 (Mid 22) | |
| Asus TUF Dash F15 FX517ZR | |
| Acer Nitro 5 AN515-58-72QR | |
| MSI Katana GF66 12UGS | |
| AIDA64 / CPU AES | |
| Schenker XMG Fusion 15 (Mid 22) | |
| Acer Nitro 5 AN515-46-R1A1 | |
| Media AMD Ryzen 7 6800H (67816 - 137383, n=8) | |
| Media della classe Gaming (39258 - 247074, n=107, ultimi 2 anni) | |
| MSI Katana GF66 12UGS | |
| Asus TUF Dash F15 FX517ZR | |
| Acer Nitro 5 AN515-58-72QR | |
| AIDA64 / CPU ZLib | |
| Media della classe Gaming (574 - 2531, n=107, ultimi 2 anni) | |
| Acer Nitro 5 AN515-58-72QR | |
| MSI Katana GF66 12UGS | |
| Asus TUF Dash F15 FX517ZR | |
| Acer Nitro 5 AN515-46-R1A1 | |
| Media AMD Ryzen 7 6800H (732 - 901, n=8) | |
| Schenker XMG Fusion 15 (Mid 22) | |
| AIDA64 / FP64 Ray-Trace | |
| Media della classe Gaming (5509 - 45446, n=107, ultimi 2 anni) | |
| Acer Nitro 5 AN515-46-R1A1 | |
| Media AMD Ryzen 7 6800H (6917 - 8980, n=8) | |
| Asus TUF Dash F15 FX517ZR | |
| Schenker XMG Fusion 15 (Mid 22) | |
| Acer Nitro 5 AN515-58-72QR | |
| MSI Katana GF66 12UGS | |
| AIDA64 / CPU PhotoWorxx | |
| Media della classe Gaming (12271 - 89891, n=107, ultimi 2 anni) | |
| Asus TUF Dash F15 FX517ZR | |
| Media AMD Ryzen 7 6800H (26496 - 30360, n=8) | |
| Acer Nitro 5 AN515-46-R1A1 | |
| MSI Katana GF66 12UGS | |
| Schenker XMG Fusion 15 (Mid 22) | |
| Acer Nitro 5 AN515-58-72QR | |
Prestazioni del sistema
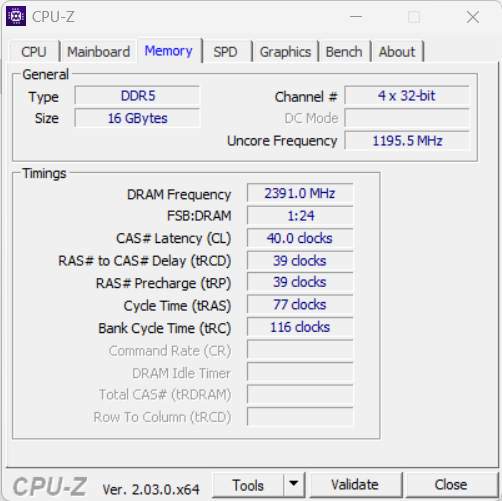
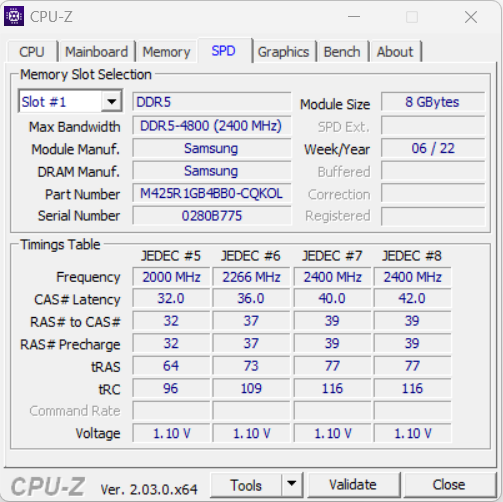
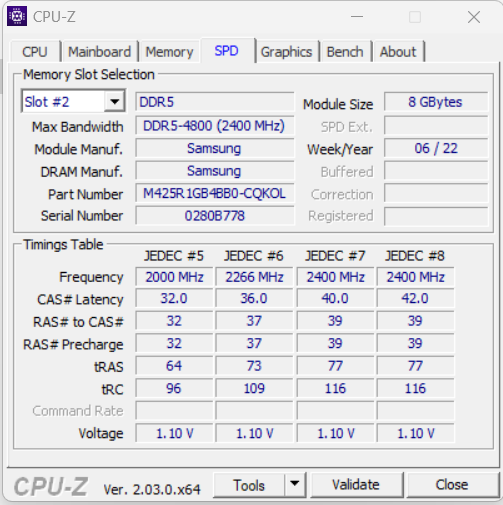
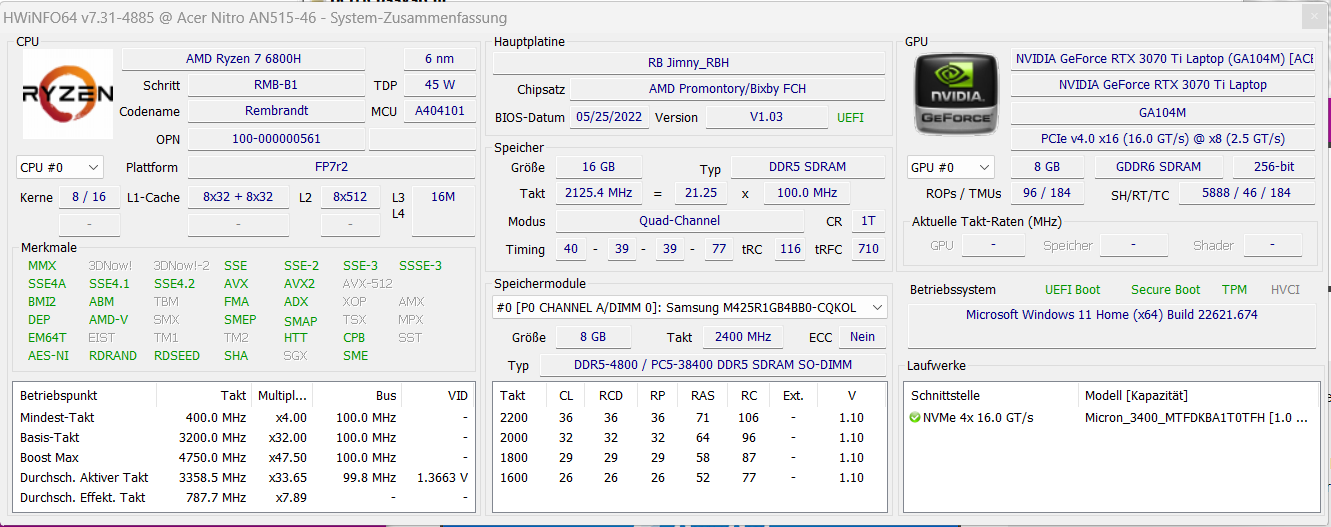
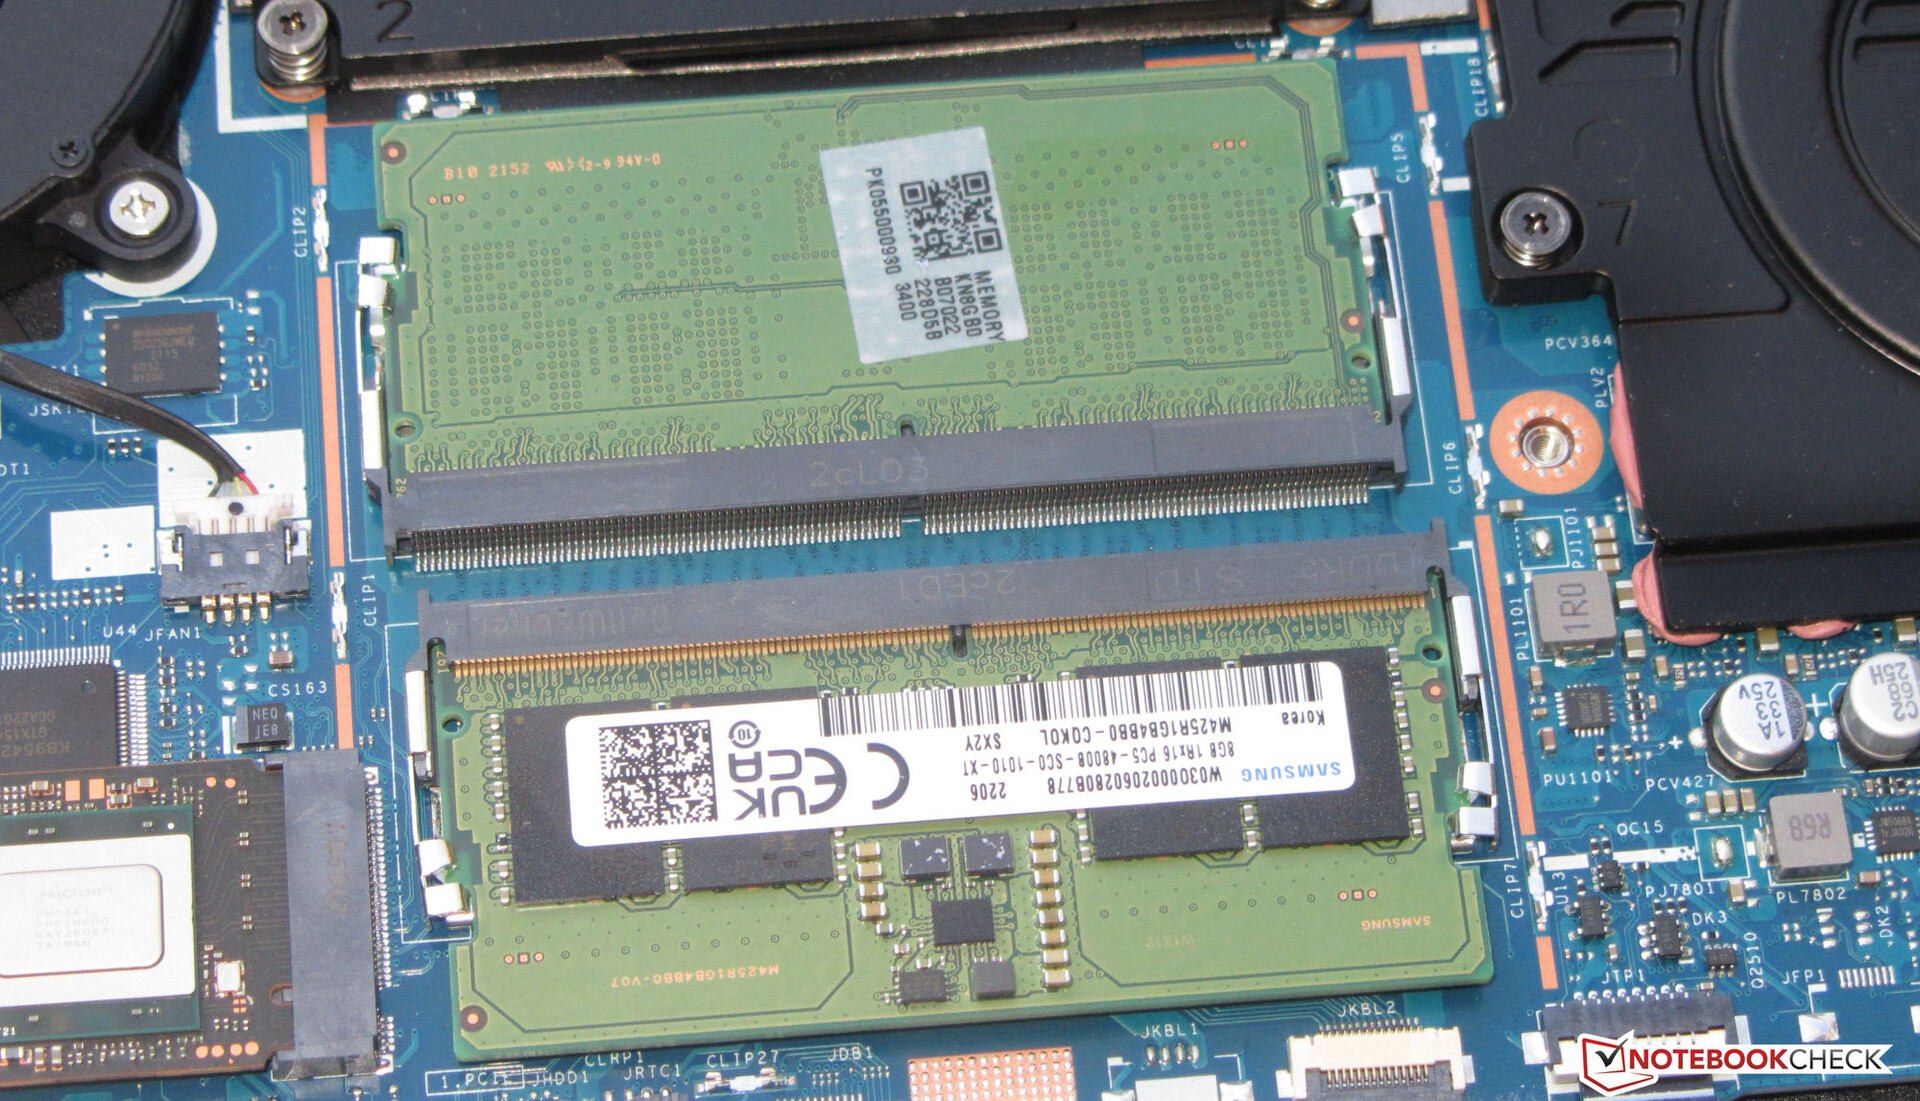
Il sistema, completo e fluido, offre una potenza di calcolo sufficiente per applicazioni impegnative come il rendering, l'elaborazione video e i giochi. I risultati di PCMark sono buoni. Le velocità di trasferimento della RAM (DDR5-4800) sono leggermente inferiori a quelle di notebook analoghi come l'Asus TUF Dash F15.
CrossMark: Overall | Productivity | Creativity | Responsiveness
| PCMark 10 / Score | |
| Media della classe Gaming (5828 - 11574, n=95, ultimi 2 anni) | |
| MSI Katana GF66 12UGS | |
| Media AMD Ryzen 7 6800H, NVIDIA GeForce RTX 3070 Ti Laptop GPU (6783 - 7549, n=2) | |
| Acer Nitro 5 AN515-58-72QR | |
| Asus TUF Dash F15 FX517ZR | |
| Acer Nitro 5 AN515-46-R1A1 | |
| Schenker XMG Fusion 15 (Mid 22) | |
| PCMark 10 / Essentials | |
| Media della classe Gaming (8810 - 12600, n=99, ultimi 2 anni) | |
| Media AMD Ryzen 7 6800H, NVIDIA GeForce RTX 3070 Ti Laptop GPU (10343 - 10472, n=2) | |
| MSI Katana GF66 12UGS | |
| Acer Nitro 5 AN515-46-R1A1 | |
| Asus TUF Dash F15 FX517ZR | |
| Acer Nitro 5 AN515-58-72QR | |
| Schenker XMG Fusion 15 (Mid 22) | |
| PCMark 10 / Productivity | |
| Media della classe Gaming (6845 - 21327, n=97, ultimi 2 anni) | |
| MSI Katana GF66 12UGS | |
| Asus TUF Dash F15 FX517ZR | |
| Media AMD Ryzen 7 6800H, NVIDIA GeForce RTX 3070 Ti Laptop GPU (8991 - 9479, n=2) | |
| Acer Nitro 5 AN515-58-72QR | |
| Acer Nitro 5 AN515-46-R1A1 | |
| Schenker XMG Fusion 15 (Mid 22) | |
| PCMark 10 / Digital Content Creation | |
| Media della classe Gaming (7602 - 19657, n=97, ultimi 2 anni) | |
| MSI Katana GF66 12UGS | |
| Media AMD Ryzen 7 6800H, NVIDIA GeForce RTX 3070 Ti Laptop GPU (9108 - 11759, n=2) | |
| Acer Nitro 5 AN515-58-72QR | |
| Asus TUF Dash F15 FX517ZR | |
| Acer Nitro 5 AN515-46-R1A1 | |
| Schenker XMG Fusion 15 (Mid 22) | |
| CrossMark / Overall | |
| Media della classe Gaming (1366 - 2409, n=95, ultimi 2 anni) | |
| MSI Katana GF66 12UGS | |
| Asus TUF Dash F15 FX517ZR | |
| Acer Nitro 5 AN515-58-72QR | |
| Schenker XMG Fusion 15 (Mid 22) | |
| Media AMD Ryzen 7 6800H, NVIDIA GeForce RTX 3070 Ti Laptop GPU (1522 - 1643, n=2) | |
| Acer Nitro 5 AN515-46-R1A1 | |
| CrossMark / Productivity | |
| MSI Katana GF66 12UGS | |
| Media della classe Gaming (1386 - 2254, n=95, ultimi 2 anni) | |
| Acer Nitro 5 AN515-58-72QR | |
| Asus TUF Dash F15 FX517ZR | |
| Schenker XMG Fusion 15 (Mid 22) | |
| Media AMD Ryzen 7 6800H, NVIDIA GeForce RTX 3070 Ti Laptop GPU (1530 - 1600, n=2) | |
| Acer Nitro 5 AN515-46-R1A1 | |
| CrossMark / Creativity | |
| Media della classe Gaming (1343 - 2729, n=95, ultimi 2 anni) | |
| Asus TUF Dash F15 FX517ZR | |
| MSI Katana GF66 12UGS | |
| Acer Nitro 5 AN515-58-72QR | |
| Schenker XMG Fusion 15 (Mid 22) | |
| Media AMD Ryzen 7 6800H, NVIDIA GeForce RTX 3070 Ti Laptop GPU (1589 - 1746, n=2) | |
| Acer Nitro 5 AN515-46-R1A1 | |
| CrossMark / Responsiveness | |
| MSI Katana GF66 12UGS | |
| Media della classe Gaming (1226 - 2334, n=95, ultimi 2 anni) | |
| Acer Nitro 5 AN515-58-72QR | |
| Schenker XMG Fusion 15 (Mid 22) | |
| Asus TUF Dash F15 FX517ZR | |
| Media AMD Ryzen 7 6800H, NVIDIA GeForce RTX 3070 Ti Laptop GPU (1316 - 1481, n=2) | |
| Acer Nitro 5 AN515-46-R1A1 | |
| PCMark 8 Home Score Accelerated v2 | 5074 punti | |
| PCMark 8 Work Score Accelerated v2 | 5934 punti | |
| PCMark 10 Score | 6783 punti | |
Aiuto | ||
| AIDA64 / Memory Copy | |
| Media della classe Gaming (21750 - 129946, n=107, ultimi 2 anni) | |
| Asus TUF Dash F15 FX517ZR | |
| Media AMD Ryzen 7 6800H (48209 - 51186, n=8) | |
| Acer Nitro 5 AN515-46-R1A1 | |
| Schenker XMG Fusion 15 (Mid 22) | |
| MSI Katana GF66 12UGS | |
| Acer Nitro 5 AN515-58-72QR | |
| AIDA64 / Memory Read | |
| Media della classe Gaming (22956 - 118858, n=107, ultimi 2 anni) | |
| Asus TUF Dash F15 FX517ZR | |
| Acer Nitro 5 AN515-46-R1A1 | |
| Media AMD Ryzen 7 6800H (43828 - 51778, n=8) | |
| Schenker XMG Fusion 15 (Mid 22) | |
| MSI Katana GF66 12UGS | |
| Acer Nitro 5 AN515-58-72QR | |
| AIDA64 / Memory Write | |
| Media della classe Gaming (22297 - 135096, n=107, ultimi 2 anni) | |
| Asus TUF Dash F15 FX517ZR | |
| Acer Nitro 5 AN515-46-R1A1 | |
| Media AMD Ryzen 7 6800H (51116 - 55307, n=8) | |
| MSI Katana GF66 12UGS | |
| Schenker XMG Fusion 15 (Mid 22) | |
| Acer Nitro 5 AN515-58-72QR | |
| AIDA64 / Memory Latency | |
| Media della classe Gaming (75.3 - 259, n=107, ultimi 2 anni) | |
| MSI Katana GF66 12UGS | |
| Asus TUF Dash F15 FX517ZR | |
| Schenker XMG Fusion 15 (Mid 22) | |
| Acer Nitro 5 AN515-46-R1A1 | |
| Media AMD Ryzen 7 6800H (83.1 - 104.1, n=8) | |
| Acer Nitro 5 AN515-58-72QR | |
| Acer Nitro 5 AN515-58-72QR | |
* ... Meglio usare valori piccoli
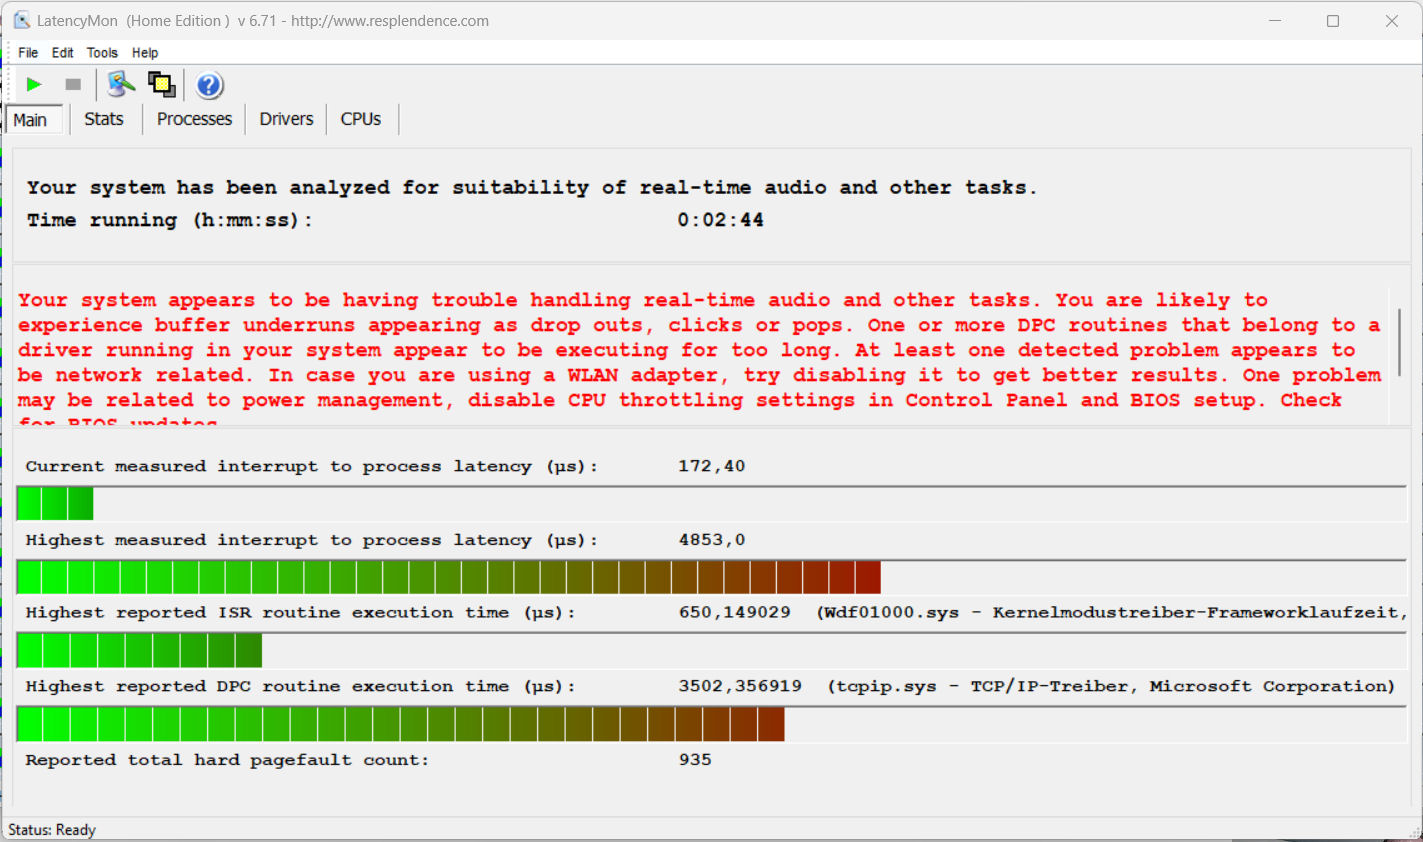
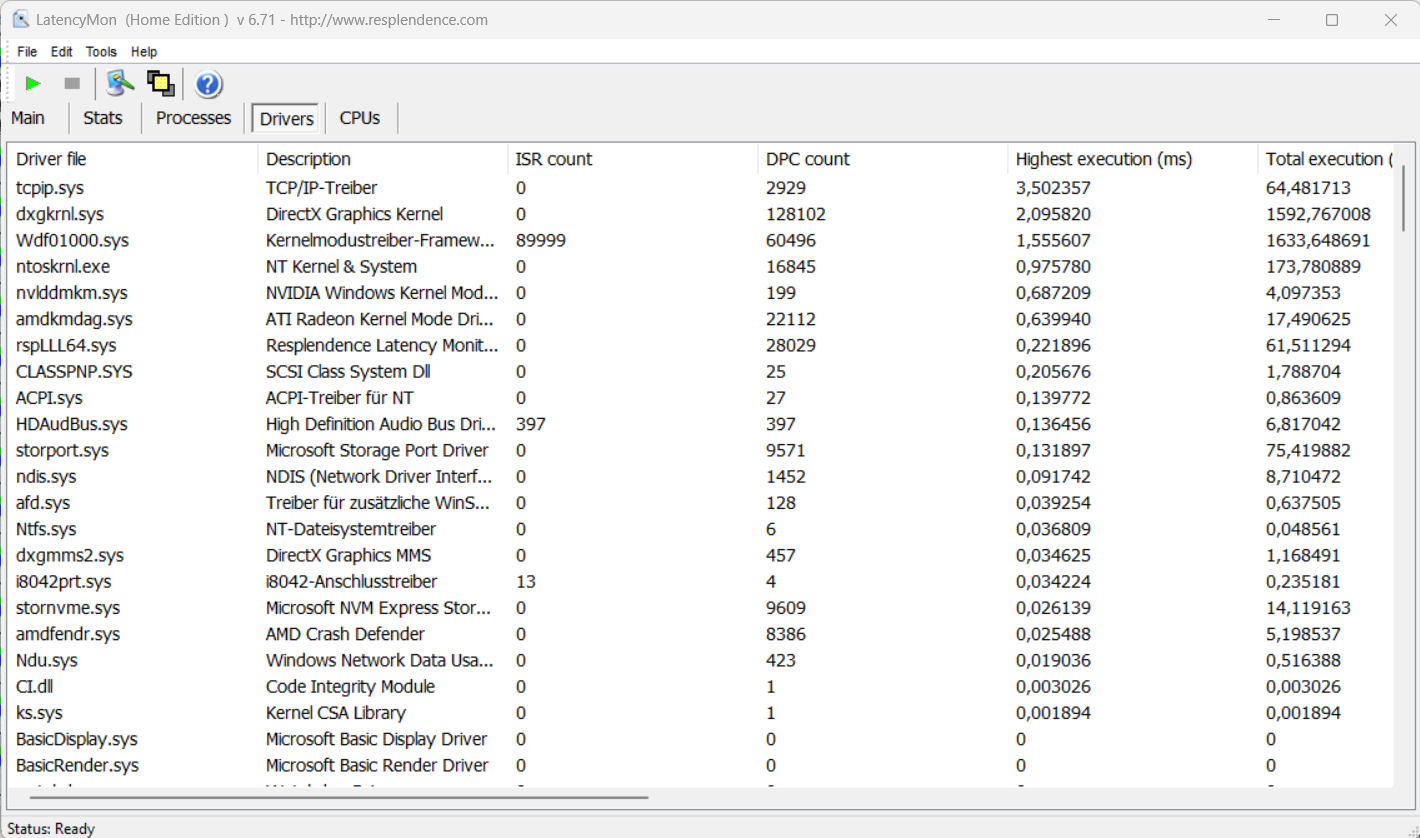
Latenze DPC
Il test standardizzato Latency Monitor (navigazione, riproduzione di video 4K, esecuzione di Prime95 High Load) ha mostrato alcuni punti deboli in termini di latenze DPC. Il sistema non sembra essere adatto all'elaborazione di video e audio in tempo reale. I futuri aggiornamenti del software potrebbero migliorare o addirittura peggiorare la situazione.
| DPC Latencies / LatencyMon - interrupt to process latency (max), Web, Youtube, Prime95 | |
| Acer Nitro 5 AN515-46-R1A1 | |
| Schenker XMG Fusion 15 (Mid 22) | |
| Acer Nitro 5 AN515-58-72QR | |
| MSI Katana GF66 12UGS | |
| Asus TUF Dash F15 FX517ZR | |
* ... Meglio usare valori piccoli
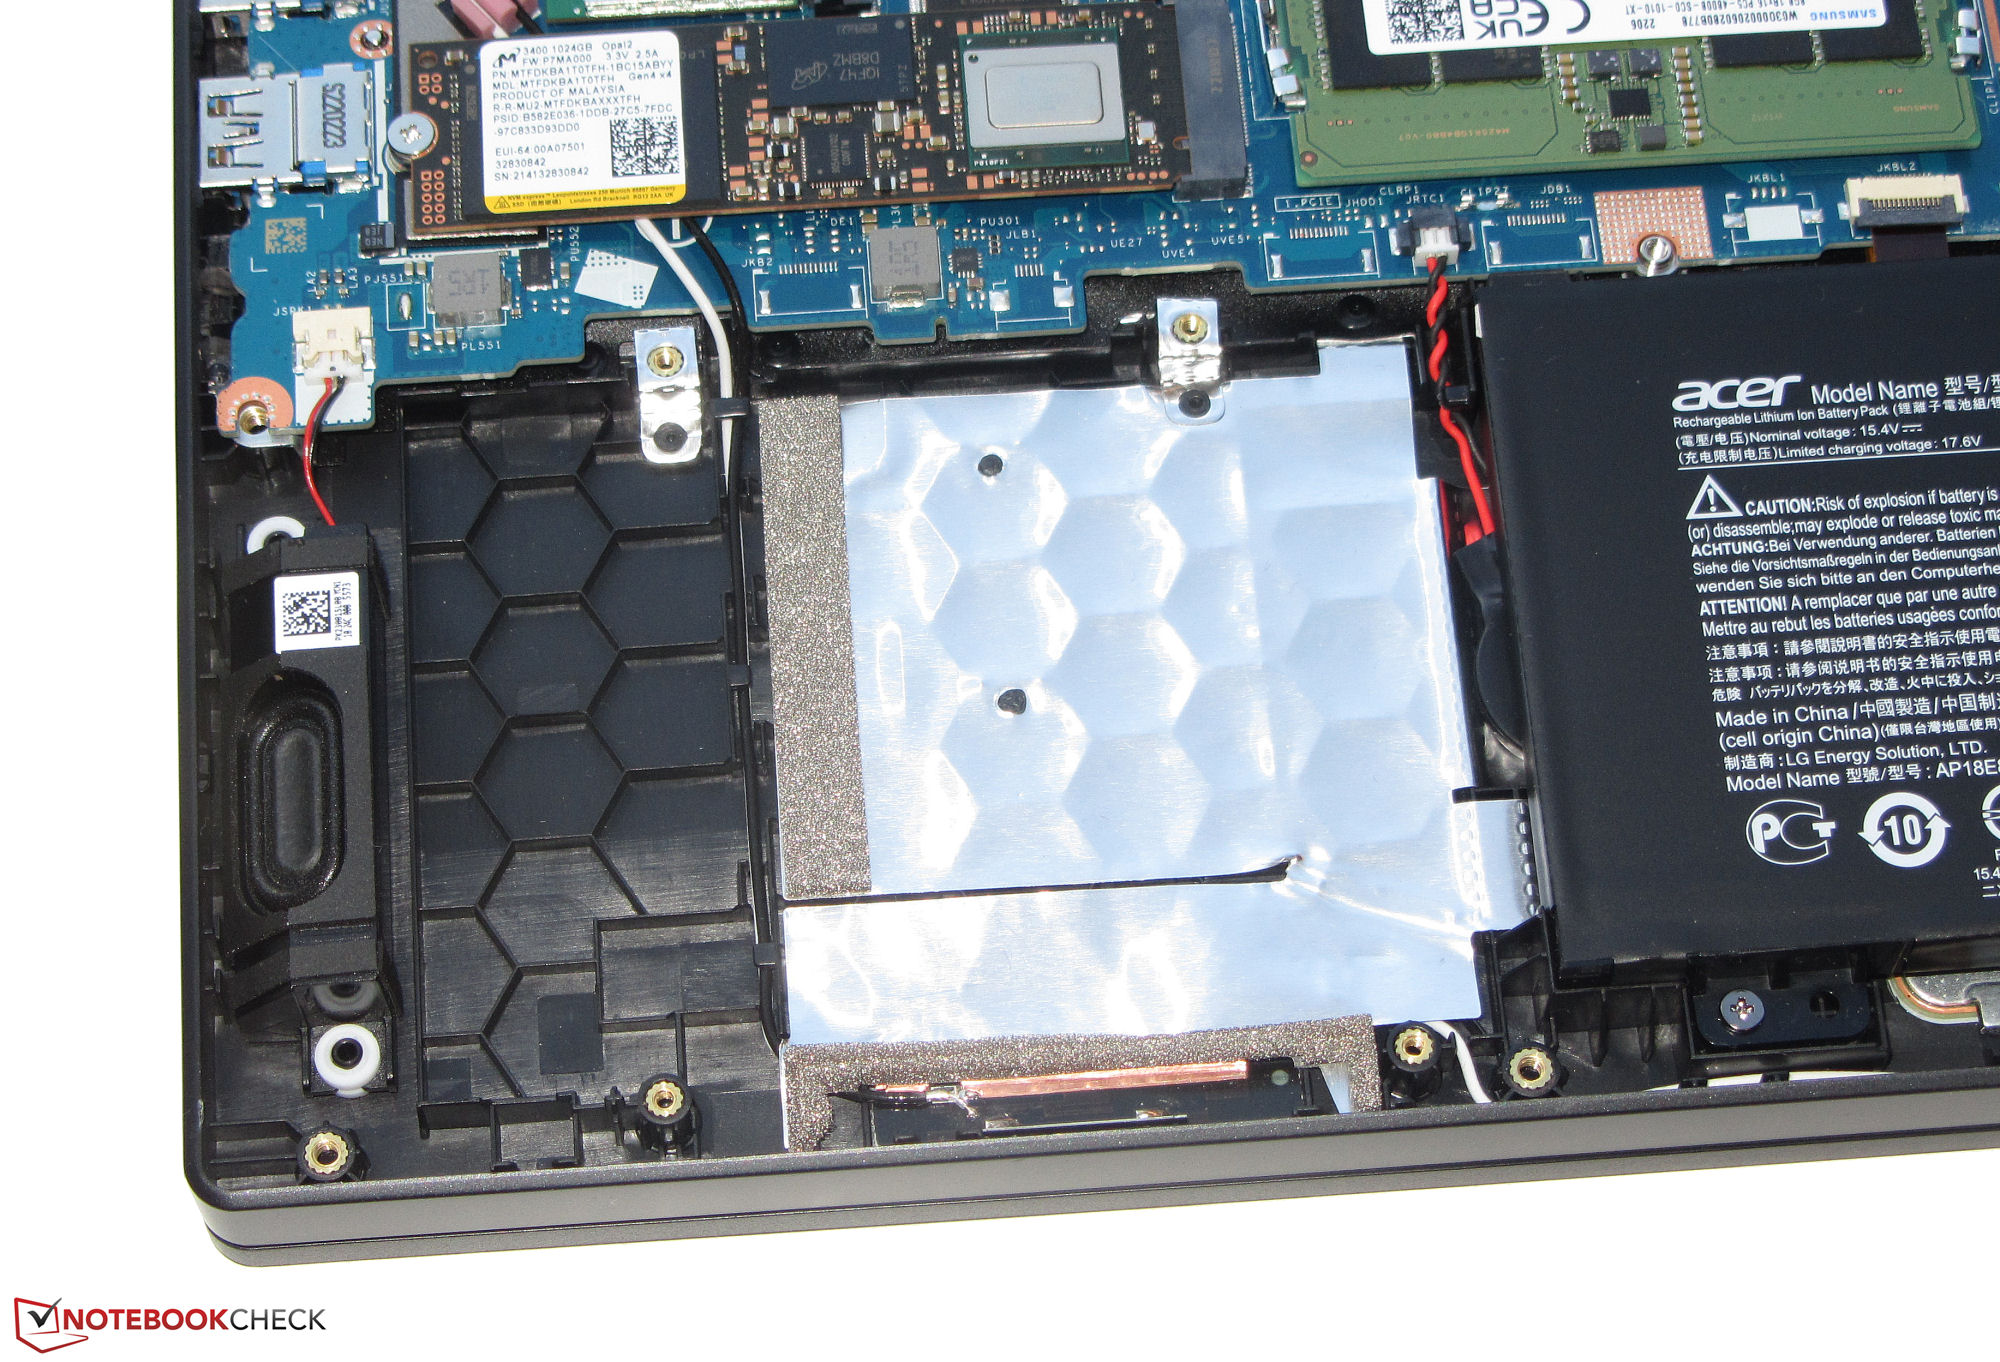
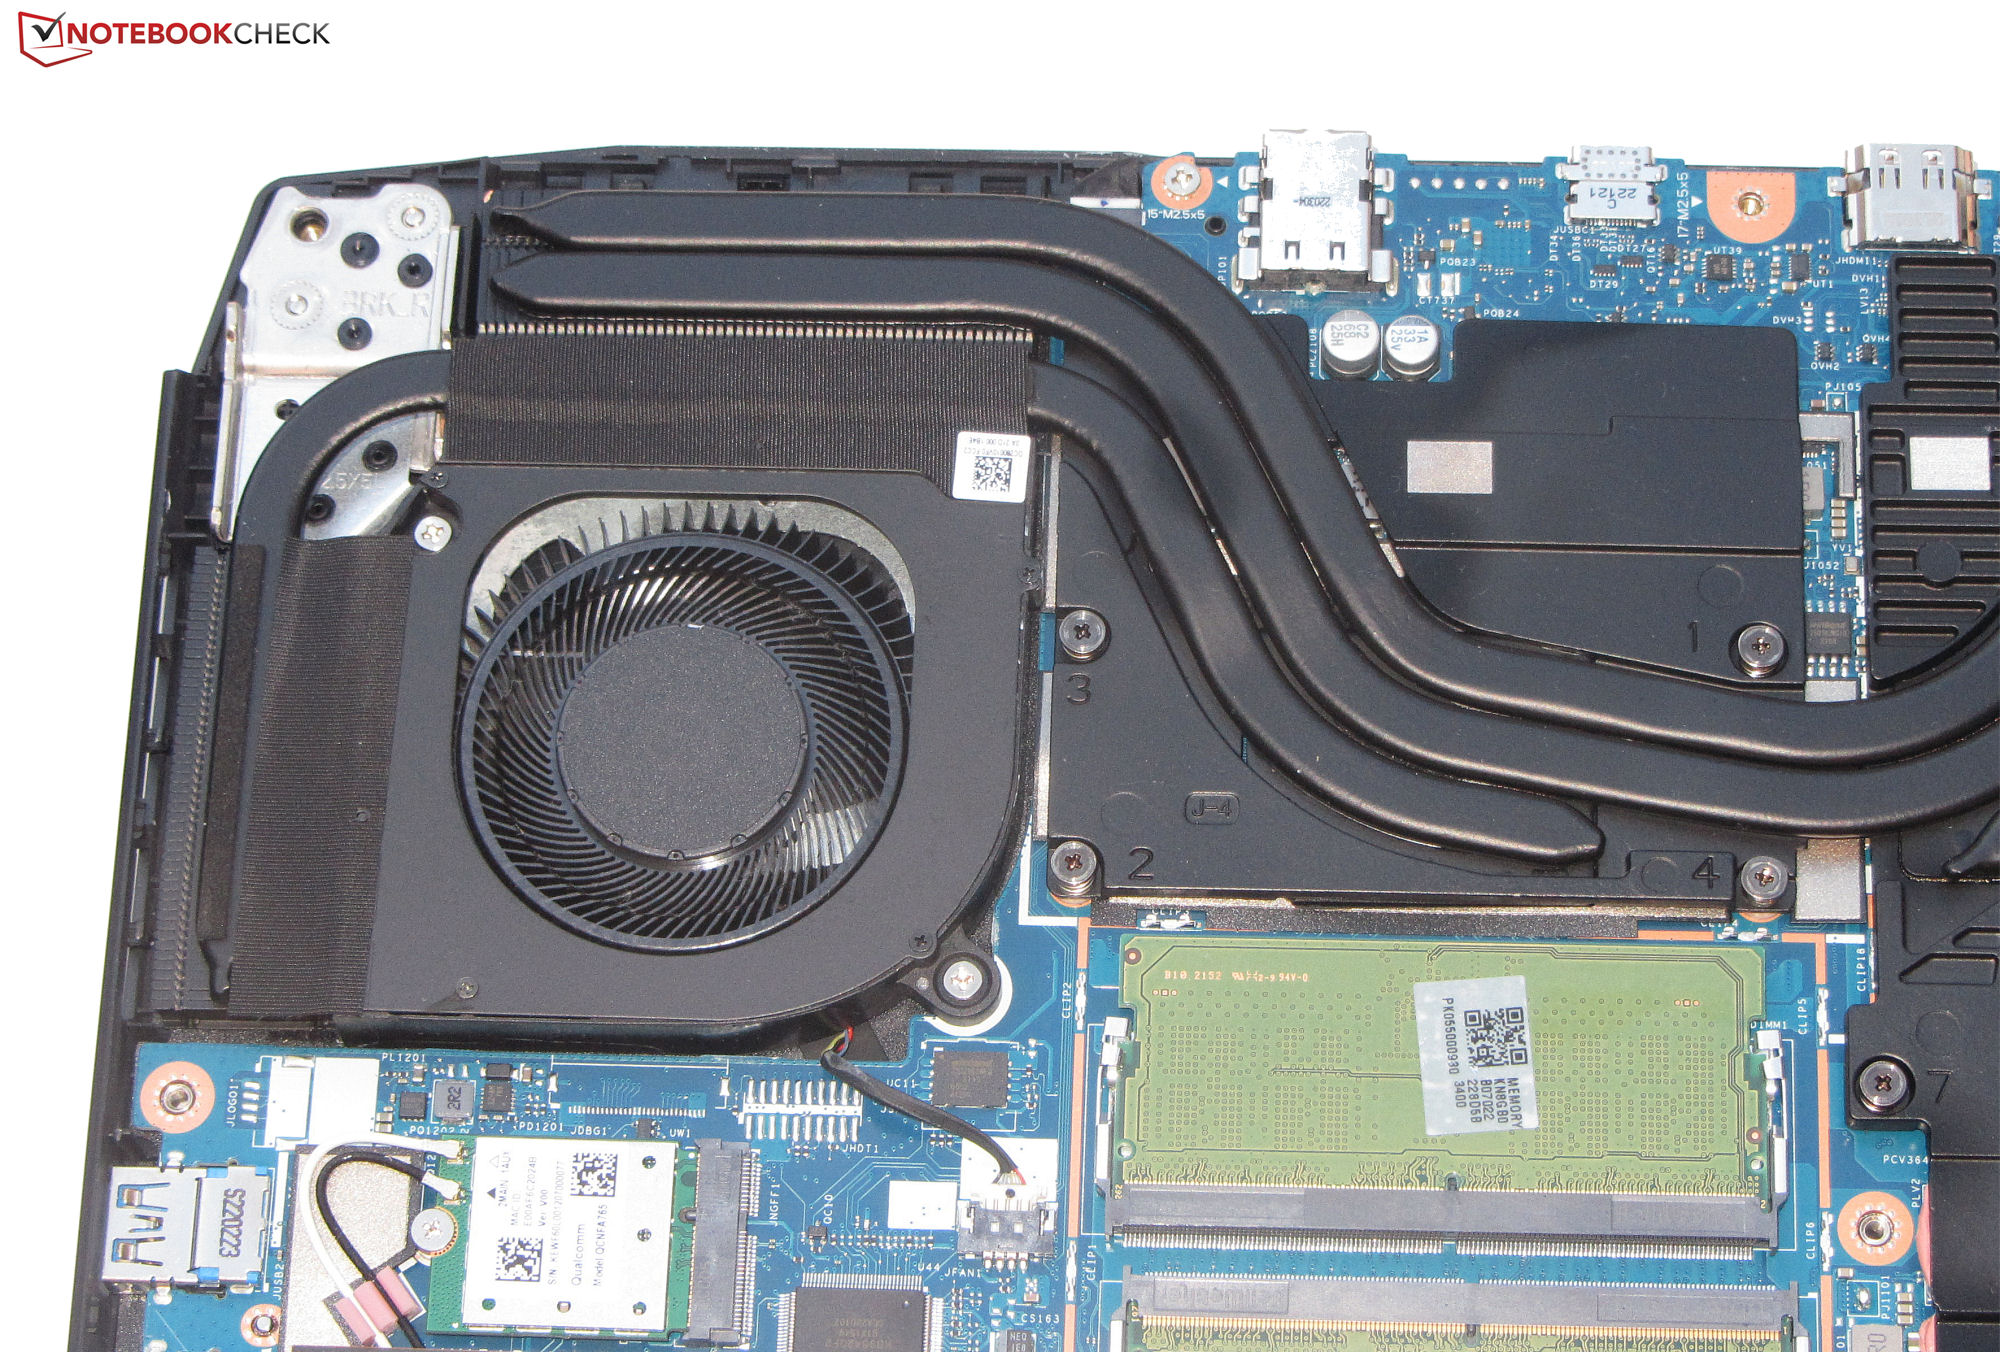
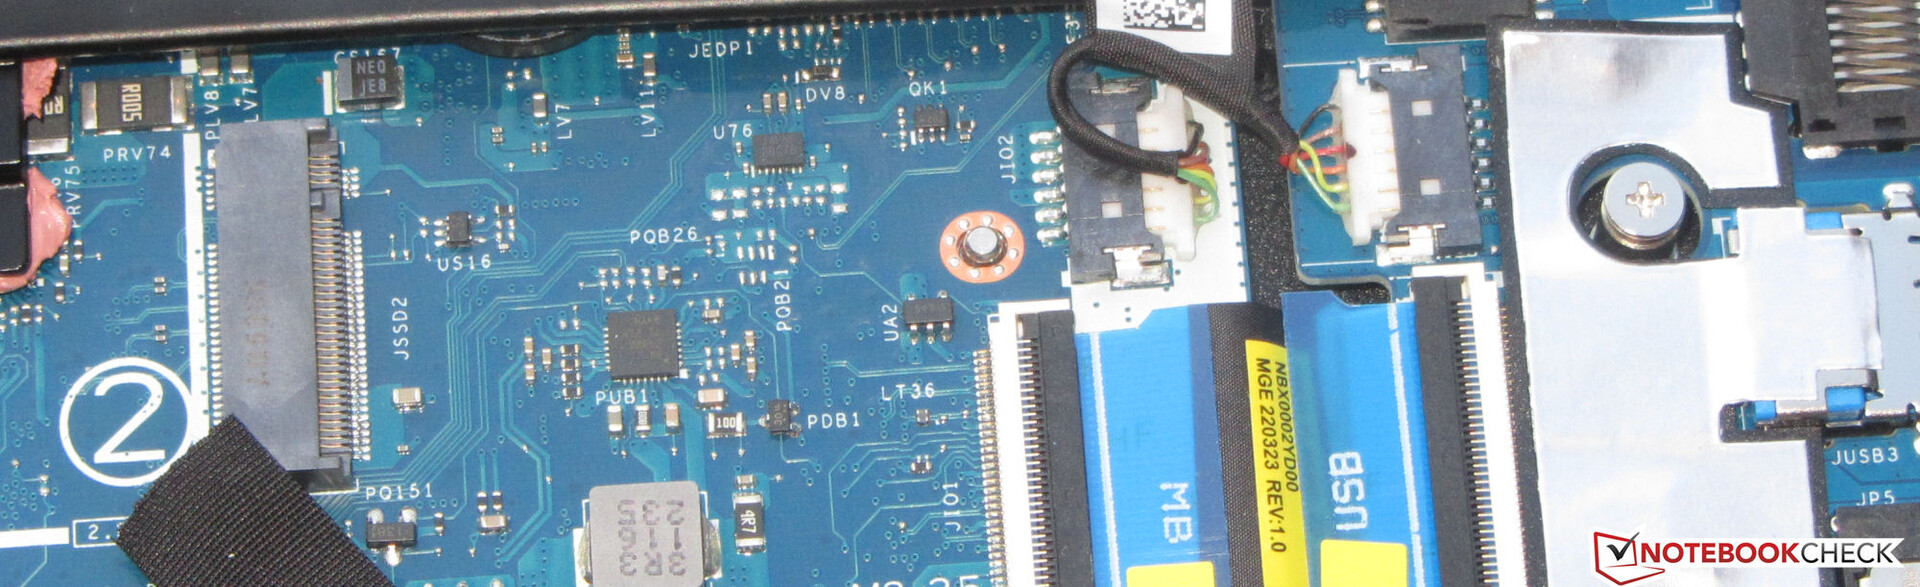
Dispositivo di archiviazione
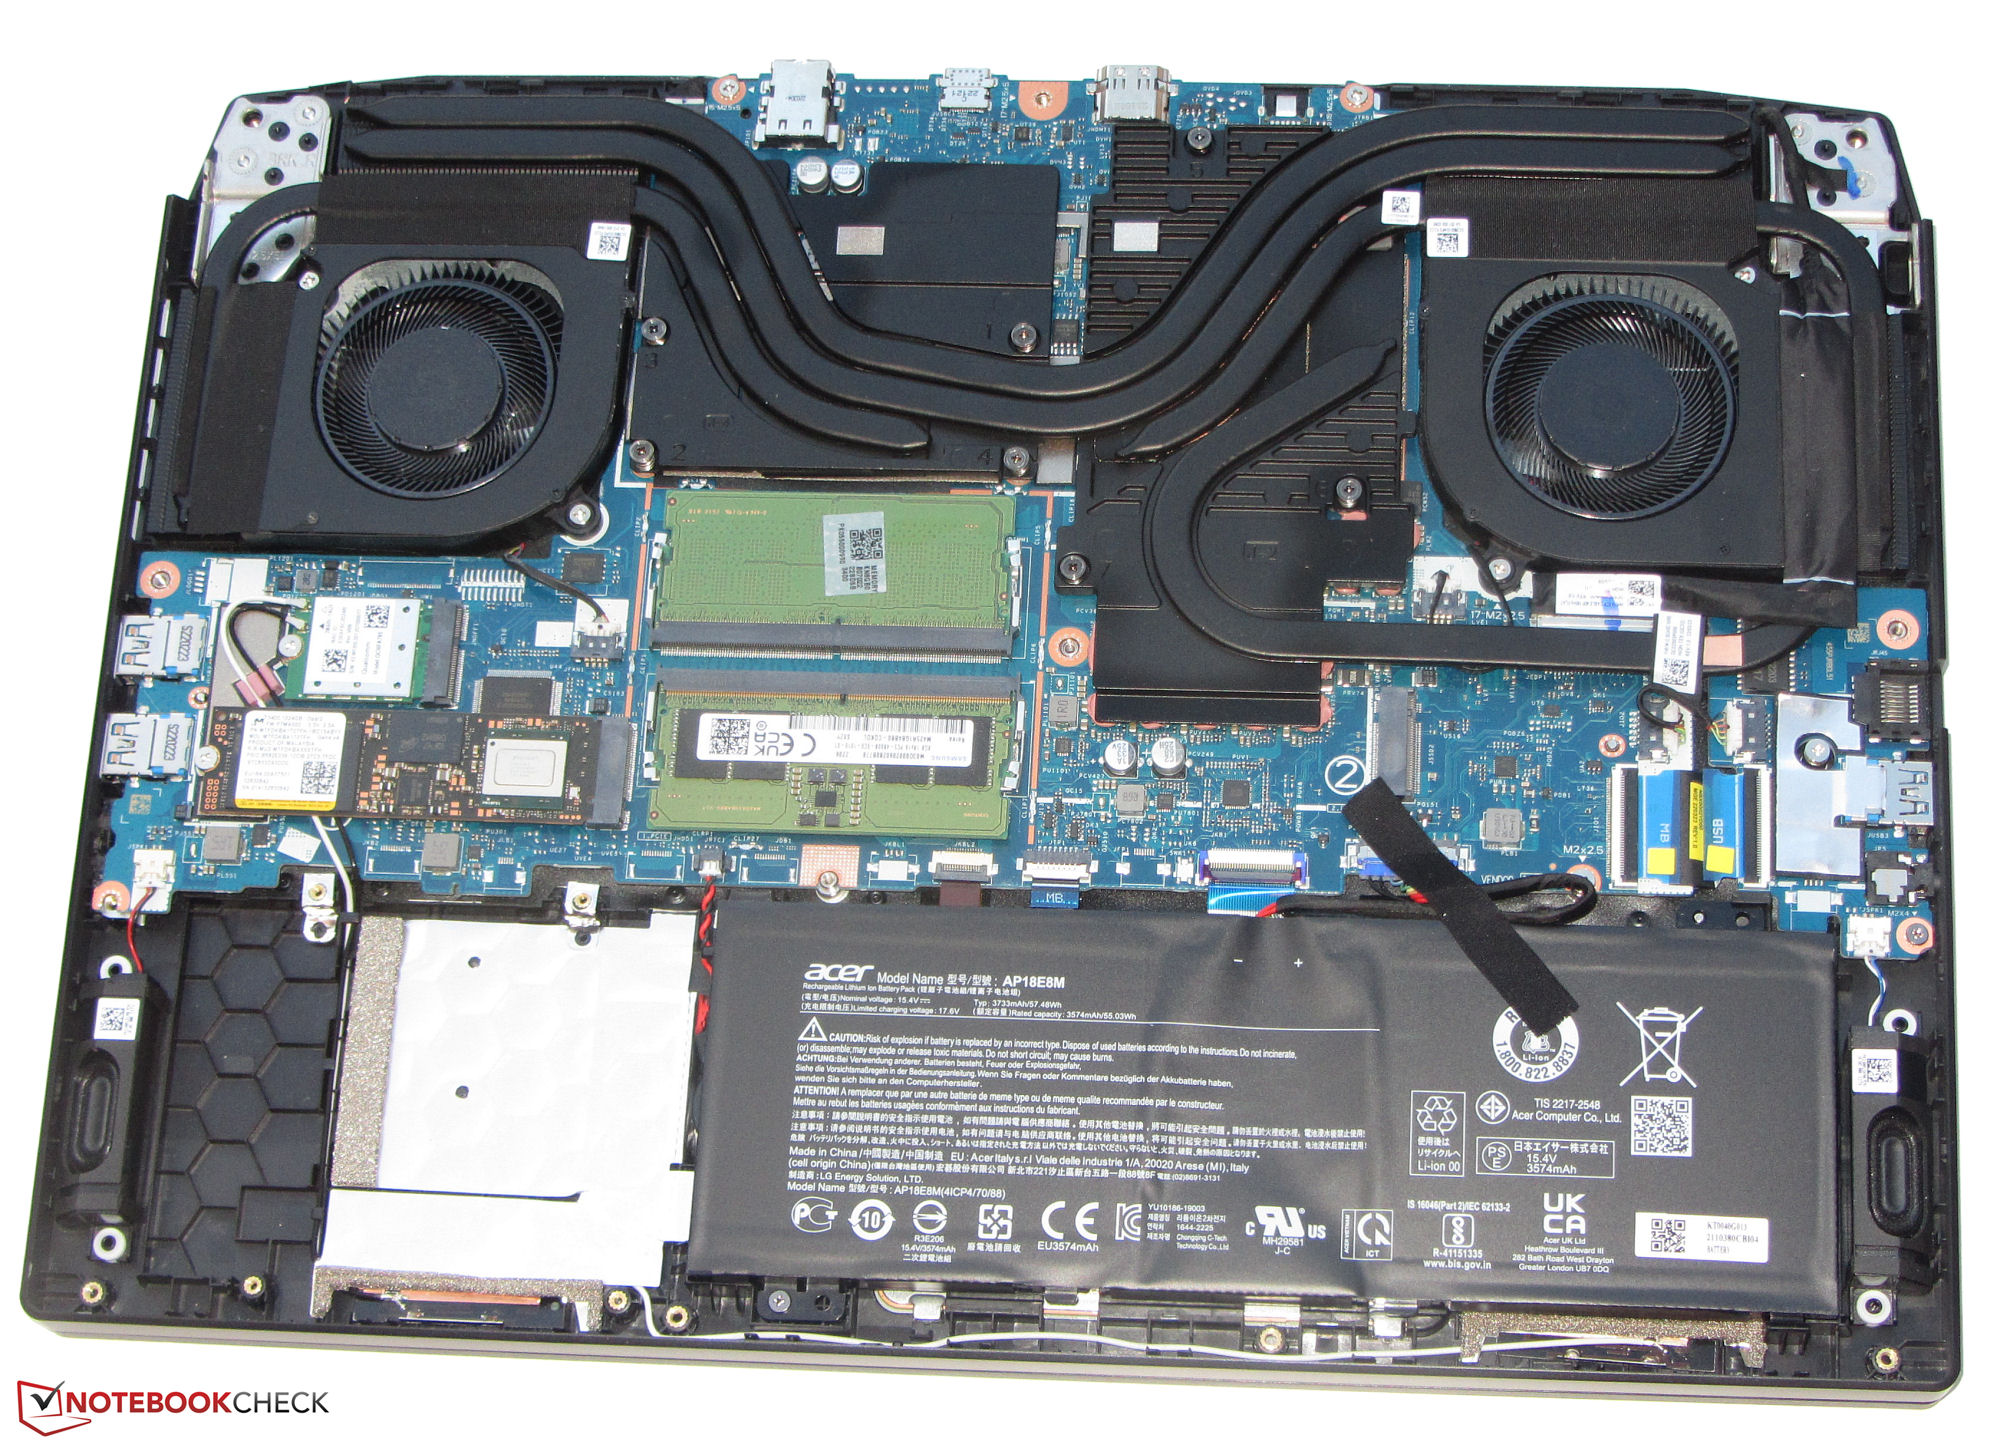
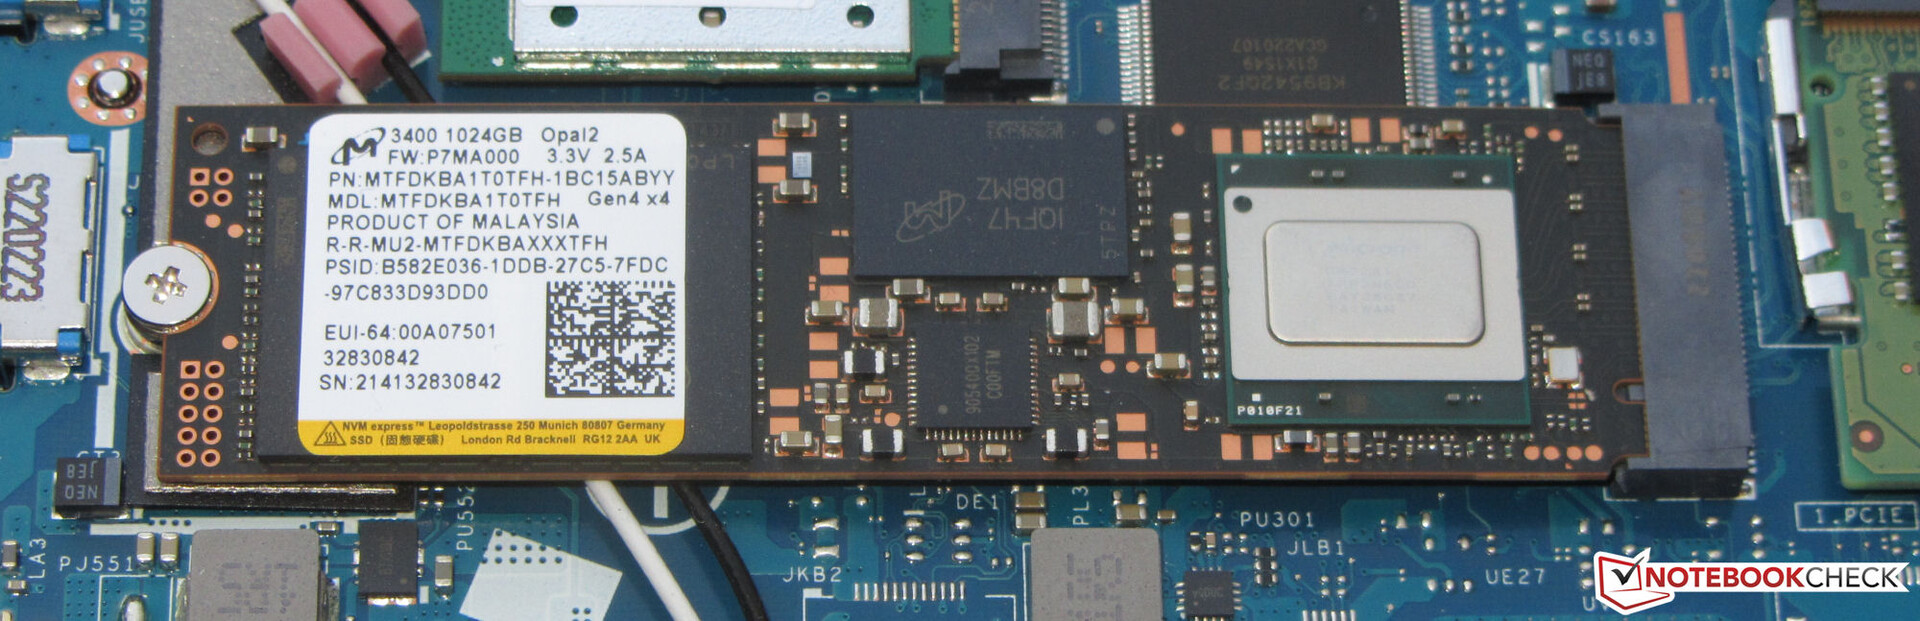
L'unità SSD da 1 TB (PCIe 4, M.2-2280) di Micron ha ottime velocità di trasferimento, ma soffre di cali di prestazioni dovuti al thermal throttling. L'AN515 dispone di un altro slot per una seconda SSD PCIe 4. In teoria, il notebook potrebbe essere equipaggiato anche con un dispositivo di archiviazione da 2,5 pollici, ma il dispositivo non è dotato dello slot SATA necessario né di un caddy adatto.

* ... Meglio usare valori piccoli
Disk Throttling: DiskSpd Read Loop, Queue Depth 8
Grafica
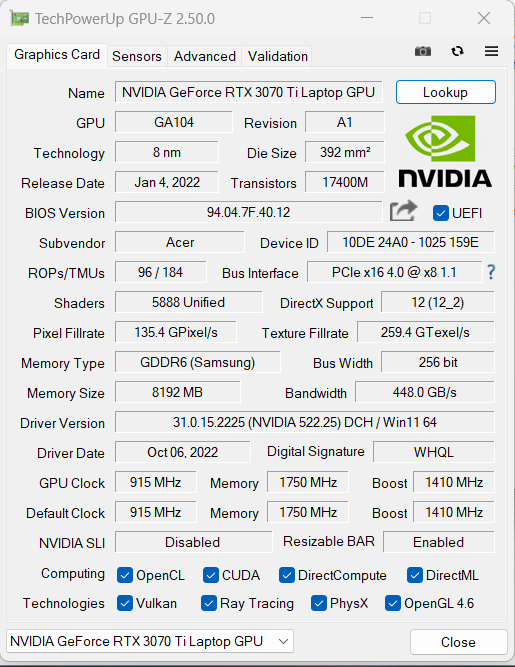
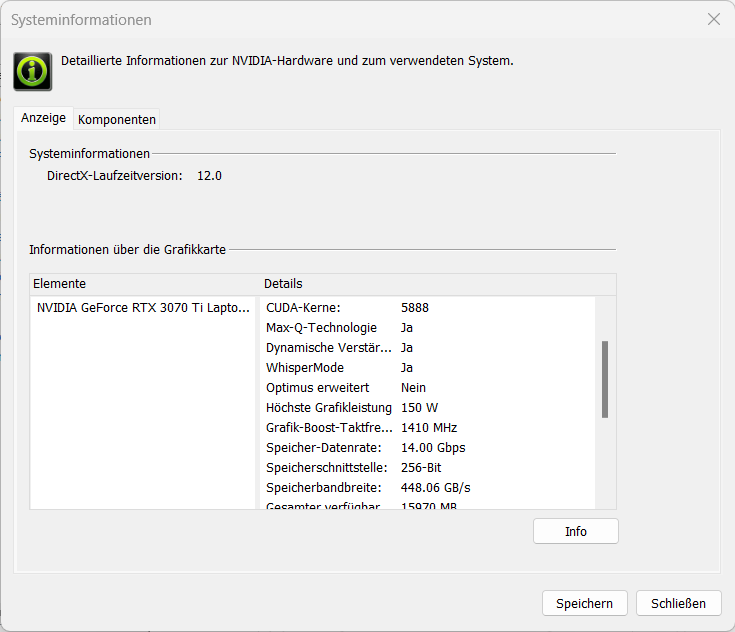
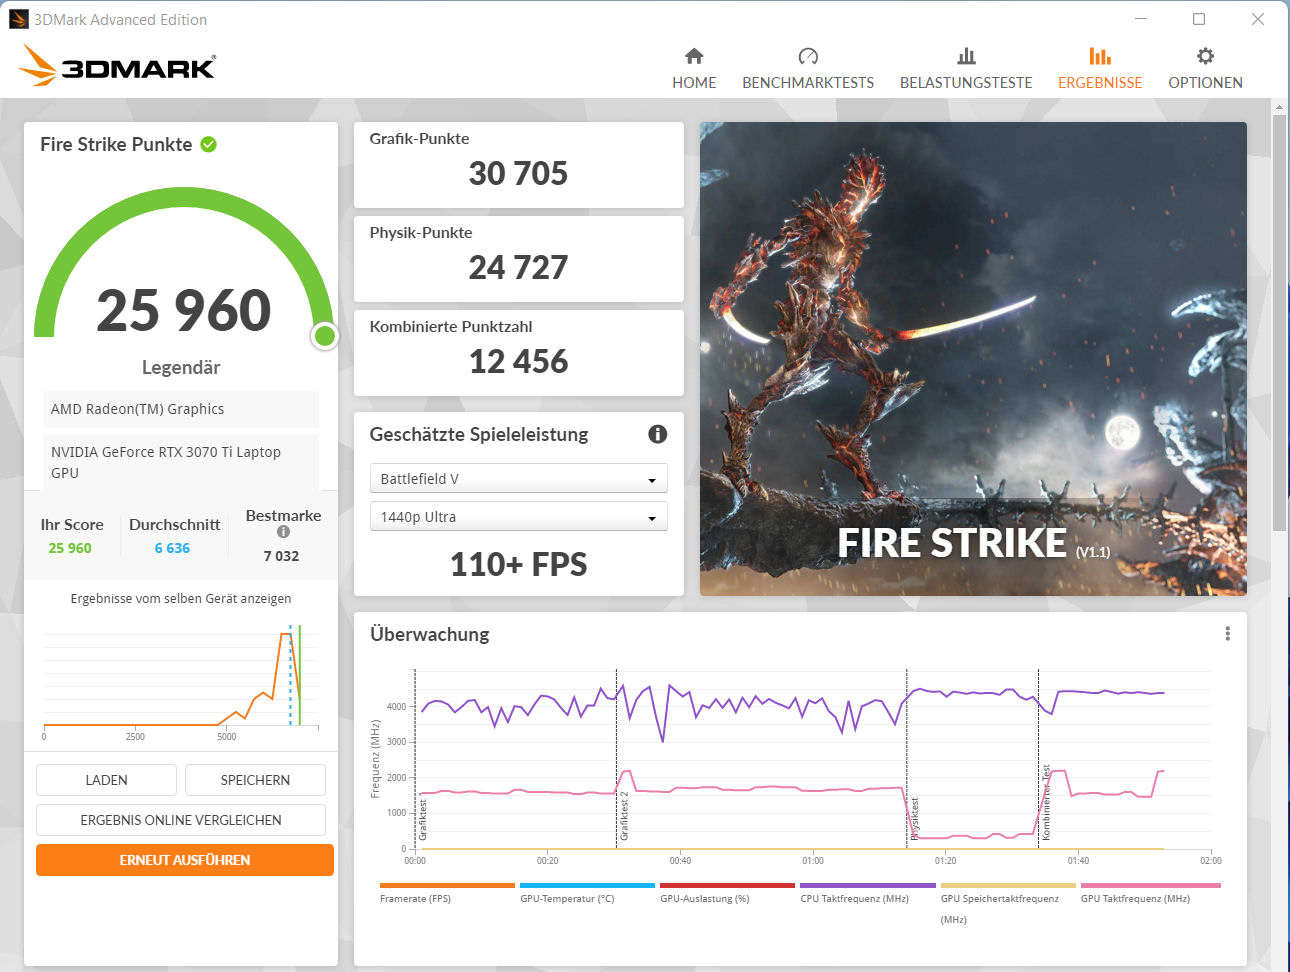
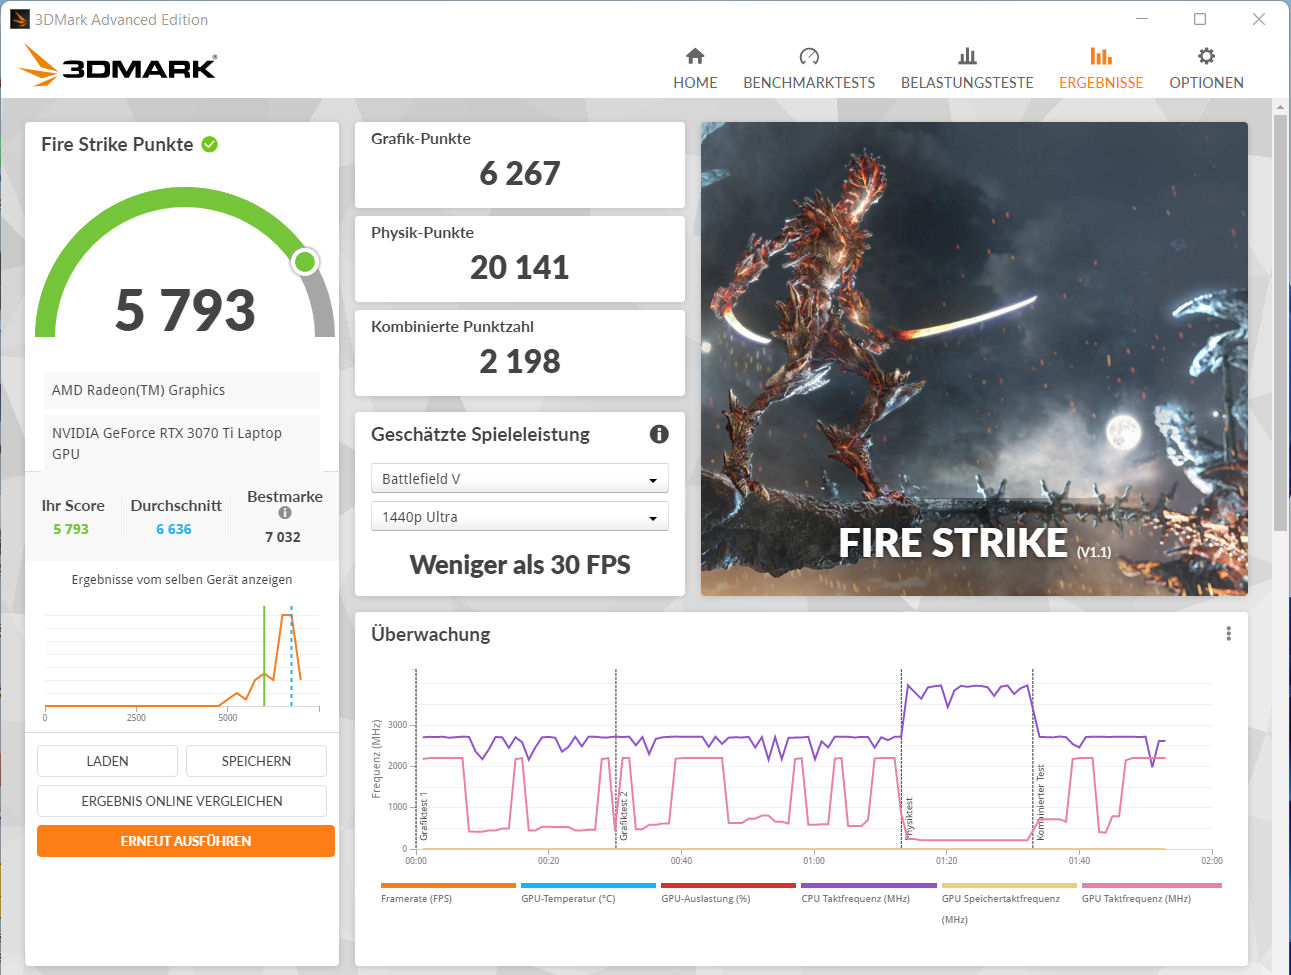
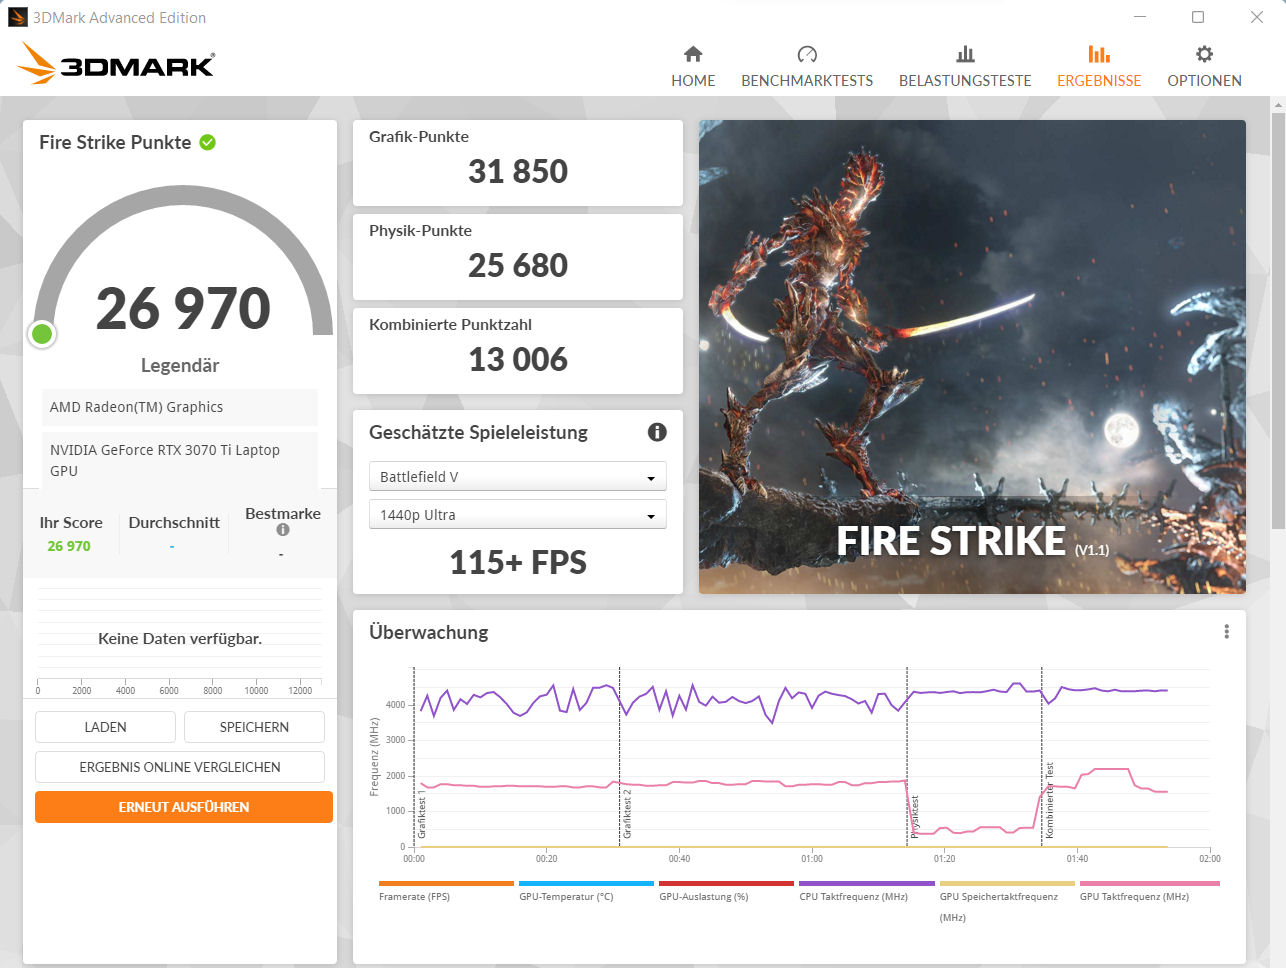
Acer ha assegnato alla GeForce RTX 3070 Ti (VRAM: 8.192 MB GDDR6) un TGP massimo di 150 watt (125 watt + 25 watt di Dynamic Boost). I risultati di 3DMark sono superiori alla media misurata finora per le GPU RTX 3070 Ti. Le differenze tra i profili di prestazioni sono minime (vedere gli screenshot di Fire Strike ). Il dispositivo sfrutta il Dynamic Boost, come si può vedere nel nostro test Witcher 3.
Le prestazioni grafiche possono essere leggermente migliorate impostando l'uscita diretta delle immagini dalla GPU GeForce. Questo interruttore può essere effettuato nel BIOS o tramite il software NitroSense (fare clic sul simbolo delle impostazioni). Acer utilizza MUX Switch e il dispositivo non supporta Advanced Optimus.

| 3DMark Performance rating - Percent | |
| Media della classe Gaming | |
| Acer Nitro 5 AN515-46-R1A1 | |
| Acer Nitro 5 AN515-46-R1A1 | |
| Media NVIDIA GeForce RTX 3070 Ti Laptop GPU | |
| Acer Nitro 5 AN515-58-72QR | |
| MSI Katana GF66 12UGS | |
| Schenker XMG Fusion 15 (Mid 22) | |
| Asus TUF Dash F15 FX517ZR | |
| 3DMark 11 - 1280x720 Performance GPU | |
| Media della classe Gaming (21841 - 80022, n=106, ultimi 2 anni) | |
| Acer Nitro 5 AN515-46-R1A1 (dGPU) | |
| Acer Nitro 5 AN515-46-R1A1 | |
| Acer Nitro 5 AN515-58-72QR | |
| Media NVIDIA GeForce RTX 3070 Ti Laptop GPU (13799 - 42569, n=36) | |
| MSI Katana GF66 12UGS | |
| Schenker XMG Fusion 15 (Mid 22) | |
| Asus TUF Dash F15 FX517ZR | |
| 3DMark | |
| 1920x1080 Fire Strike Graphics | |
| Media della classe Gaming (12242 - 62849, n=118, ultimi 2 anni) | |
| Acer Nitro 5 AN515-46-R1A1 (dGPU) | |
| Acer Nitro 5 AN515-46-R1A1 | |
| Media NVIDIA GeForce RTX 3070 Ti Laptop GPU (22612 - 32550, n=37) | |
| Acer Nitro 5 AN515-58-72QR | |
| MSI Katana GF66 12UGS | |
| Schenker XMG Fusion 15 (Mid 22) | |
| Asus TUF Dash F15 FX517ZR | |
| 2560x1440 Time Spy Graphics | |
| Media della classe Gaming (5012 - 26212, n=117, ultimi 2 anni) | |
| Acer Nitro 5 AN515-46-R1A1 (dGPU) | |
| Acer Nitro 5 AN515-46-R1A1 | |
| Media NVIDIA GeForce RTX 3070 Ti Laptop GPU (8142 - 12324, n=37) | |
| Acer Nitro 5 AN515-58-72QR | |
| MSI Katana GF66 12UGS | |
| Schenker XMG Fusion 15 (Mid 22) | |
| Asus TUF Dash F15 FX517ZR | |
| 2560x1440 Port Royal Graphics | |
| Media della classe Gaming (4395 - 17286, n=71, ultimi 2 anni) | |
| Acer Nitro 5 AN515-46-R1A1 (dGPU) | |
| Acer Nitro 5 AN515-46-R1A1 | |
| Media NVIDIA GeForce RTX 3070 Ti Laptop GPU (5091 - 7510, n=23) | |
| Acer Nitro 5 AN515-58-72QR | |
| MSI Katana GF66 12UGS | |
| Schenker XMG Fusion 15 (Mid 22) | |
| Asus TUF Dash F15 FX517ZR | |
| 3DMark 06 Standard Score | 43453 punti | |
| 3DMark 11 Performance | 28137 punti | |
| 3DMark Cloud Gate Standard Score | 56030 punti | |
| 3DMark Fire Strike Score | 25960 punti | |
| 3DMark Time Spy Score | 11042 punti | |
Aiuto | ||
| Blender | |
| v3.3 Classroom OPTIX/RTX | |
| Asus TUF Dash F15 FX517ZR | |
| Acer Nitro 5 AN515-46-R1A1 (3.3.0) | |
| Acer Nitro 5 AN515-46-R1A1 (3.3.0, dGPU) | |
| Media della classe Gaming (9 - 32, n=109, ultimi 2 anni) | |
| v3.3 Classroom CUDA | |
| Asus TUF Dash F15 FX517ZR | |
| Acer Nitro 5 AN515-46-R1A1 (3.3.0) | |
| Acer Nitro 5 AN515-46-R1A1 (3.3.0, dGPU) | |
| Media della classe Gaming (15 - 233, n=110, ultimi 2 anni) | |
| v3.3 Classroom CPU | |
| Schenker XMG Fusion 15 (Mid 22) | |
| Asus TUF Dash F15 FX517ZR | |
| Acer Nitro 5 AN515-46-R1A1 (3.3.0) | |
| Acer Nitro 5 AN515-46-R1A1 (3.3.0, dGPU) | |
| Media della classe Gaming (122 - 565, n=105, ultimi 2 anni) | |
* ... Meglio usare valori piccoli
Prestazioni di gioco
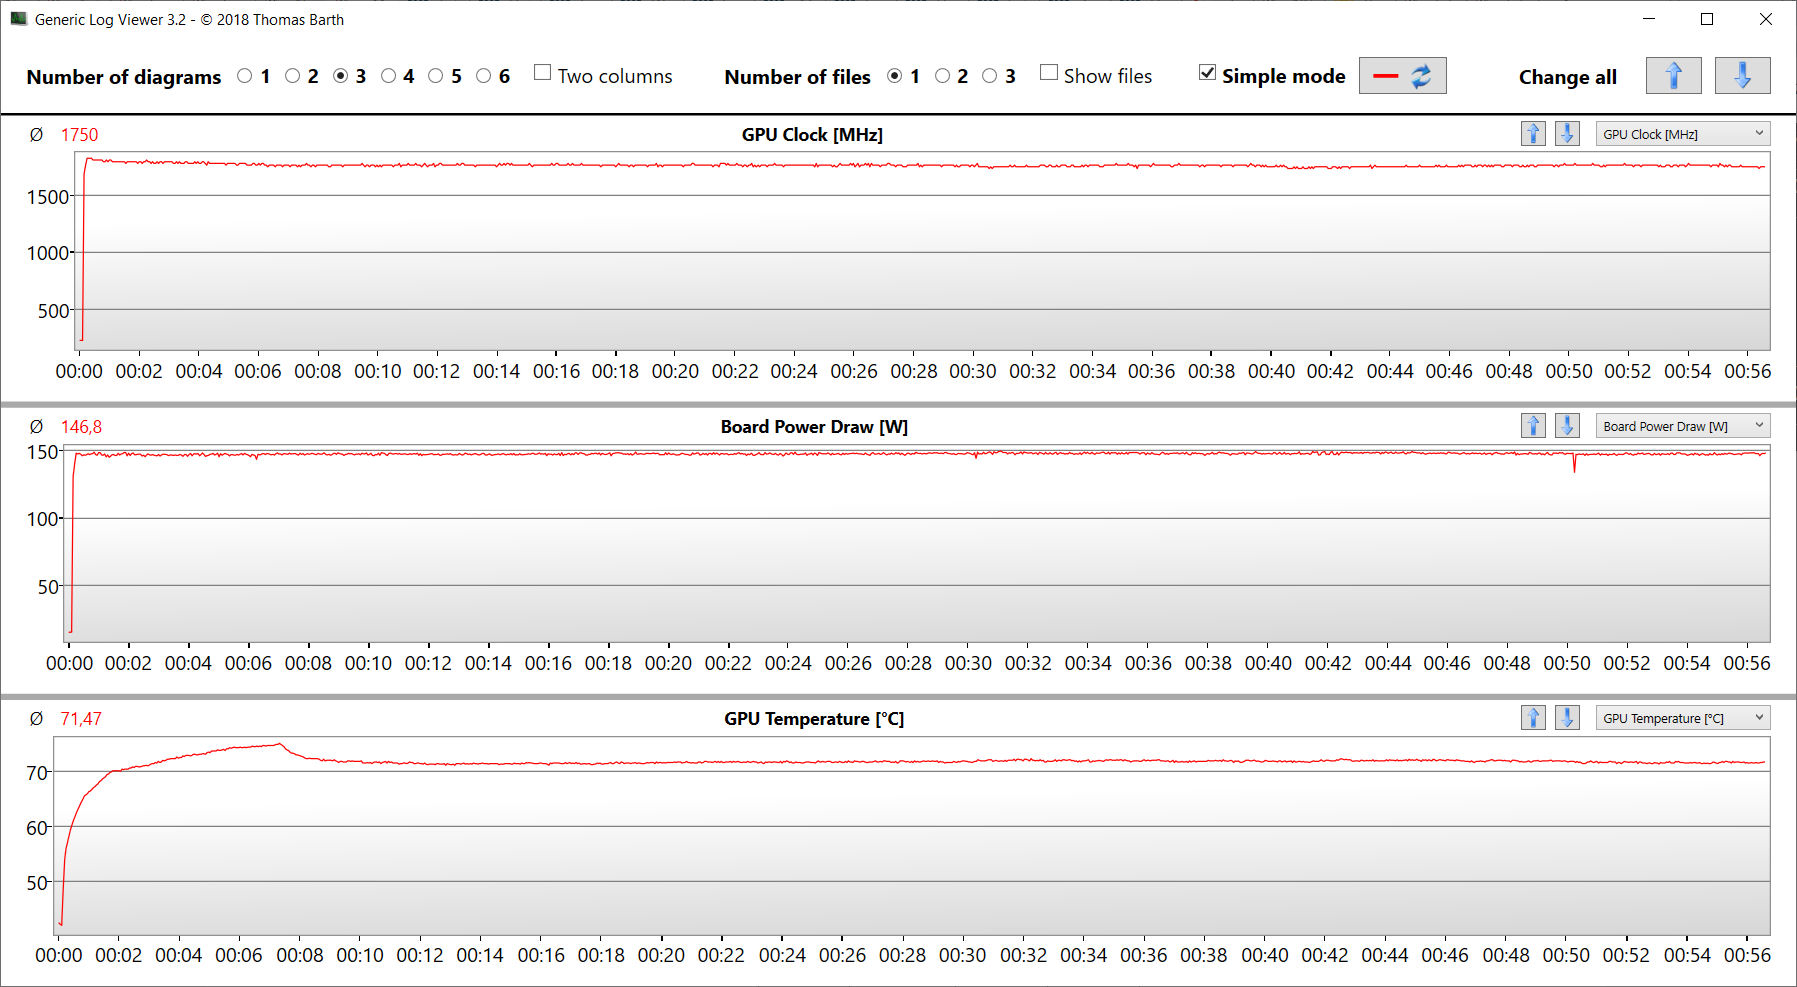
L'hardware supporta i giochi in FHD con le impostazioni massime. Le frequenze di aggiornamento dei titoli testati sono spesso superiori alla media per la RTX 3070 Ti. L'output di immagini tramite la GPU GeForce aumenta i frame rate. Il test Witcher 3 conferma che le frequenze di aggiornamento rimangono stabili per un lungo periodo.
| The Witcher 3 - 1920x1080 Ultra Graphics & Postprocessing (HBAO+) | |
| Media della classe Gaming (95 - 240, n=8, ultimi 2 anni) | |
| Acer Nitro 5 AN515-46-R1A1 (dGPU) | |
| Acer Nitro 5 AN515-46-R1A1 | |
| Media NVIDIA GeForce RTX 3070 Ti Laptop GPU (76.8 - 124.1, n=39) | |
| Acer Nitro 5 AN515-58-72QR | |
| MSI Katana GF66 12UGS | |
| Schenker XMG Fusion 15 (Mid 22) | |
| Asus TUF Dash F15 FX517ZR | |
| Dota 2 Reborn - 1920x1080 ultra (3/3) best looking | |
| Media della classe Gaming (84.8 - 248, n=110, ultimi 2 anni) | |
| MSI Katana GF66 12UGS | |
| Media NVIDIA GeForce RTX 3070 Ti Laptop GPU (68.7 - 160.5, n=38) | |
| Acer Nitro 5 AN515-58-72QR | |
| Schenker XMG Fusion 15 (Mid 22) | |
| Acer Nitro 5 AN515-46-R1A1 (dGPU) | |
| Asus TUF Dash F15 FX517ZR | |
| Acer Nitro 5 AN515-46-R1A1 | |
| X-Plane 11.11 - 1920x1080 high (fps_test=3) | |
| MSI Katana GF66 12UGS | |
| Asus TUF Dash F15 FX517ZR | |
| Media della classe Gaming (52.1 - 143.5, n=113, ultimi 2 anni) | |
| Media NVIDIA GeForce RTX 3070 Ti Laptop GPU (51.6 - 116.9, n=37) | |
| Acer Nitro 5 AN515-58-72QR | |
| Schenker XMG Fusion 15 (Mid 22) | |
| Acer Nitro 5 AN515-46-R1A1 (dGPU) | |
| Acer Nitro 5 AN515-46-R1A1 | |
| Final Fantasy XV Benchmark - 1920x1080 High Quality | |
| Media della classe Gaming (41 - 215, n=99, ultimi 2 anni) | |
| Acer Nitro 5 AN515-46-R1A1 (1.3, dGPU) | |
| Acer Nitro 5 AN515-46-R1A1 (1.3) | |
| Media NVIDIA GeForce RTX 3070 Ti Laptop GPU (49.5 - 122.4, n=35) | |
| Schenker XMG Fusion 15 (Mid 22) (1.3) | |
| MSI Katana GF66 12UGS (1.3) | |
| Acer Nitro 5 AN515-58-72QR (1.3) | |
| Asus TUF Dash F15 FX517ZR (1.3) | |
| GTA V - 1920x1080 Highest AA:4xMSAA + FX AF:16x | |
| Media della classe Gaming (48.3 - 186.9, n=98, ultimi 2 anni) | |
| Media NVIDIA GeForce RTX 3070 Ti Laptop GPU (44 - 123.9, n=36) | |
| Asus TUF Dash F15 FX517ZR | |
| MSI Katana GF66 12UGS | |
| Schenker XMG Fusion 15 (Mid 22) | |
| Acer Nitro 5 AN515-58-72QR | |
| Acer Nitro 5 AN515-46-R1A1 | |
| Acer Nitro 5 AN515-46-R1A1 (dGPU) | |
| Strange Brigade - 1920x1080 ultra AA:ultra AF:16 | |
| Media della classe Gaming (76.3 - 456, n=89, ultimi 2 anni) | |
| Acer Nitro 5 AN515-46-R1A1 (1.47.22.14 D3D12, dGPU) | |
| Media NVIDIA GeForce RTX 3070 Ti Laptop GPU (109 - 221, n=37) | |
| Acer Nitro 5 AN515-58-72QR (1.47.22.14 D3D12) | |
| Acer Nitro 5 AN515-46-R1A1 (1.47.22.14 D3D12) | |
| MSI Katana GF66 12UGS (1.47.22.14 D3D12) | |
| Schenker XMG Fusion 15 (Mid 22) (1.47.22.14 D3D12) | |
| Asus TUF Dash F15 FX517ZR (1.47.22.14 D3D12) | |
| F1 22 - 1920x1080 Ultra High Preset AA:T AF:16x | |
| Acer Nitro 5 AN515-46-R1A1 (923650, dGPU) | |
| Media della classe Gaming (40.1 - 121.2, n=5, ultimi 2 anni) | |
| Acer Nitro 5 AN515-46-R1A1 (923662) | |
| Media NVIDIA GeForce RTX 3070 Ti Laptop GPU (58.1 - 80, n=8) | |
| Far Cry 5 - 1920x1080 Ultra Preset AA:T | |
| Media NVIDIA GeForce RTX 3070 Ti Laptop GPU (91 - 138, n=25) | |
| Media della classe Gaming (70 - 151, n=9, ultimi 2 anni) | |
| MSI Katana GF66 12UGS | |
| Acer Nitro 5 AN515-46-R1A1 (dGPU) | |
| Schenker XMG Fusion 15 (Mid 22) | |
| Acer Nitro 5 AN515-46-R1A1 | |
| Asus TUF Dash F15 FX517ZR | |
| Acer Nitro 5 AN515-58-72QR | |
| Hitman 3 - 1920x1080 Maximum Settings AF:16x | |
| Acer Nitro 5 AN515-46-R1A1 | |
| Media NVIDIA GeForce RTX 3070 Ti Laptop GPU (138 - 157.7, n=3) | |
| God of War - 1920x1080 Ultra Preset | |
| Acer Nitro 5 AN515-46-R1A1 | |
| Media NVIDIA GeForce RTX 3070 Ti Laptop GPU (55.1 - 64.3, n=5) | |
| Tiny Tina's Wonderlands - 1920x1080 Badass Preset (DX12) | |
| Media della classe Gaming (55 - 159.4, n=5, ultimi 2 anni) | |
| Acer Nitro 5 AN515-46-R1A1 | |
| Media NVIDIA GeForce RTX 3070 Ti Laptop GPU (89.8 - 93.7, n=4) | |
| Asus TUF Dash F15 FX517ZR | |
| Vampire Bloodhunt - 1920x1080 Ultra Preset | |
| Media NVIDIA GeForce RTX 3070 Ti Laptop GPU (168.6 - 189.9, n=2) | |
| Acer Nitro 5 AN515-46-R1A1 | |
| The Quarry - 1920x1080 Ultra Preset | |
| Acer Nitro 5 AN515-46-R1A1 | |
| Media NVIDIA GeForce RTX 3070 Ti Laptop GPU (80 - 81.5, n=2) | |
Witcher 3 FPS diagram
| basso | medio | alto | ultra | |
|---|---|---|---|---|
| GTA V (2015) | 174.2 | 167.3 | 149.5 | 92.5 |
| The Witcher 3 (2015) | 284 | 237 | 179.4 | 108.5 |
| Dota 2 Reborn (2015) | 130.9 | 120 | 112.1 | 108.5 |
| Final Fantasy XV Benchmark (2018) | 171.8 | 139.9 | 108.6 | |
| X-Plane 11.11 (2018) | 100.3 | 89.3 | 72.3 | |
| Far Cry 5 (2018) | 134 | 116 | 112 | 106 |
| Strange Brigade (2018) | 289 | 212 | 190.3 | 177 |
| Hitman 3 (2021) | 207.9 | 169.1 | 162.1 | 157.7 |
| God of War (2022) | 117.3 | 104.8 | 88.7 | 64.3 |
| Tiny Tina's Wonderlands (2022) | 183.3 | 159.8 | 118.3 | 93.7 |
| Vampire Bloodhunt (2022) | 197.6 | 185.1 | 172.7 | 168.6 |
| F1 22 (2022) | 207 | 205 | 192.3 | 73.2 |
| The Quarry (2022) | 149.6 | 120.7 | 101.5 | 81.5 |
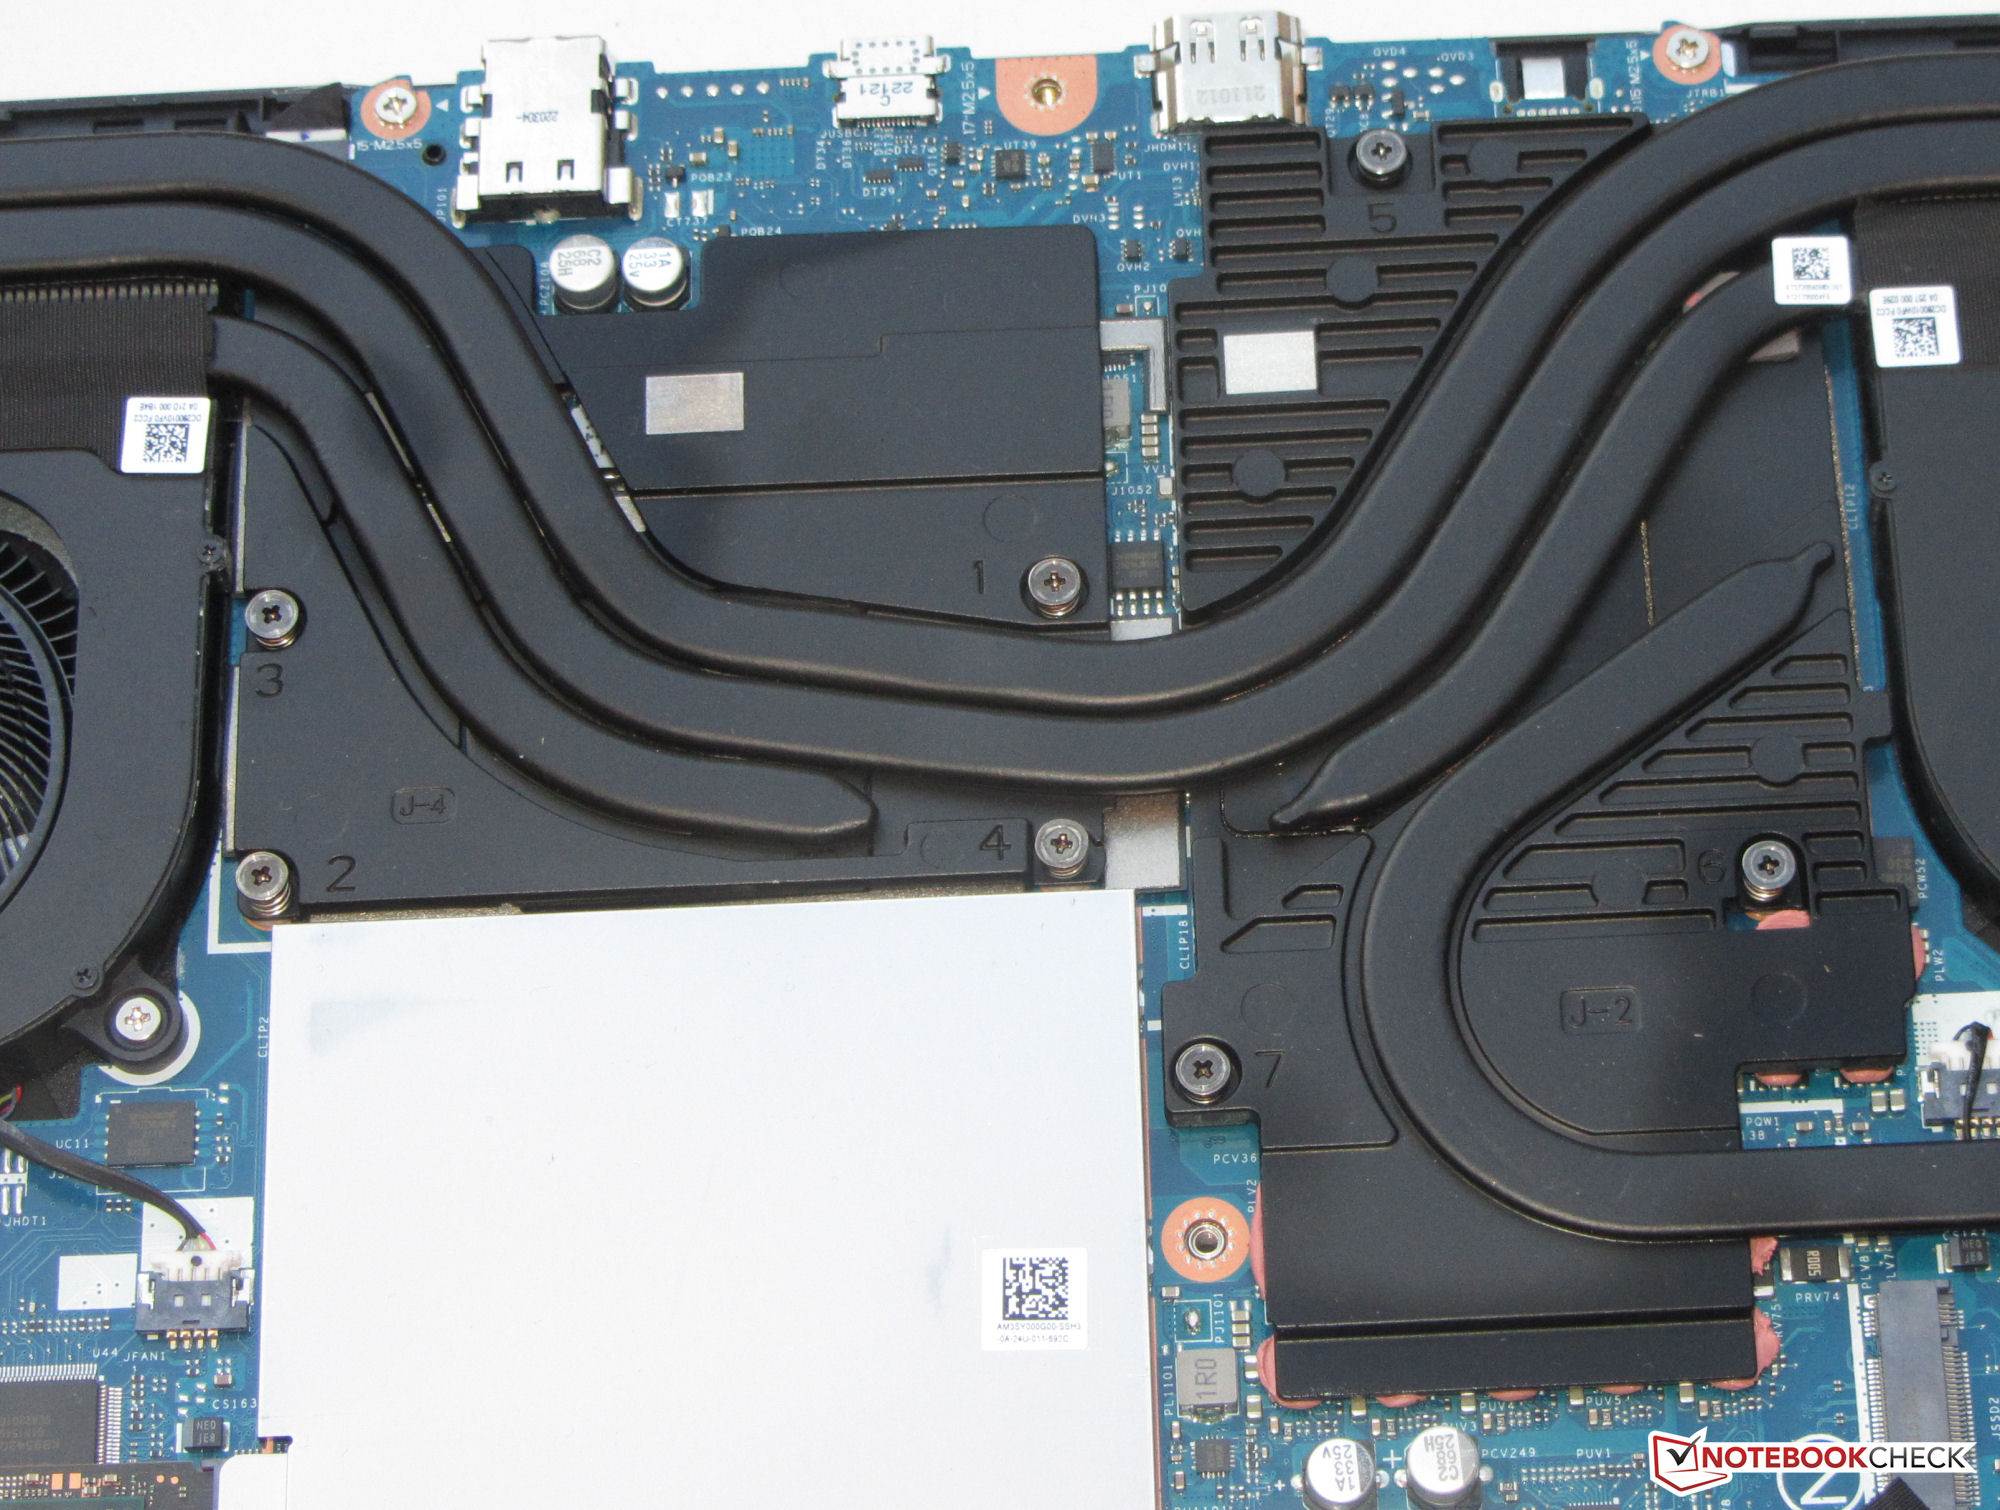
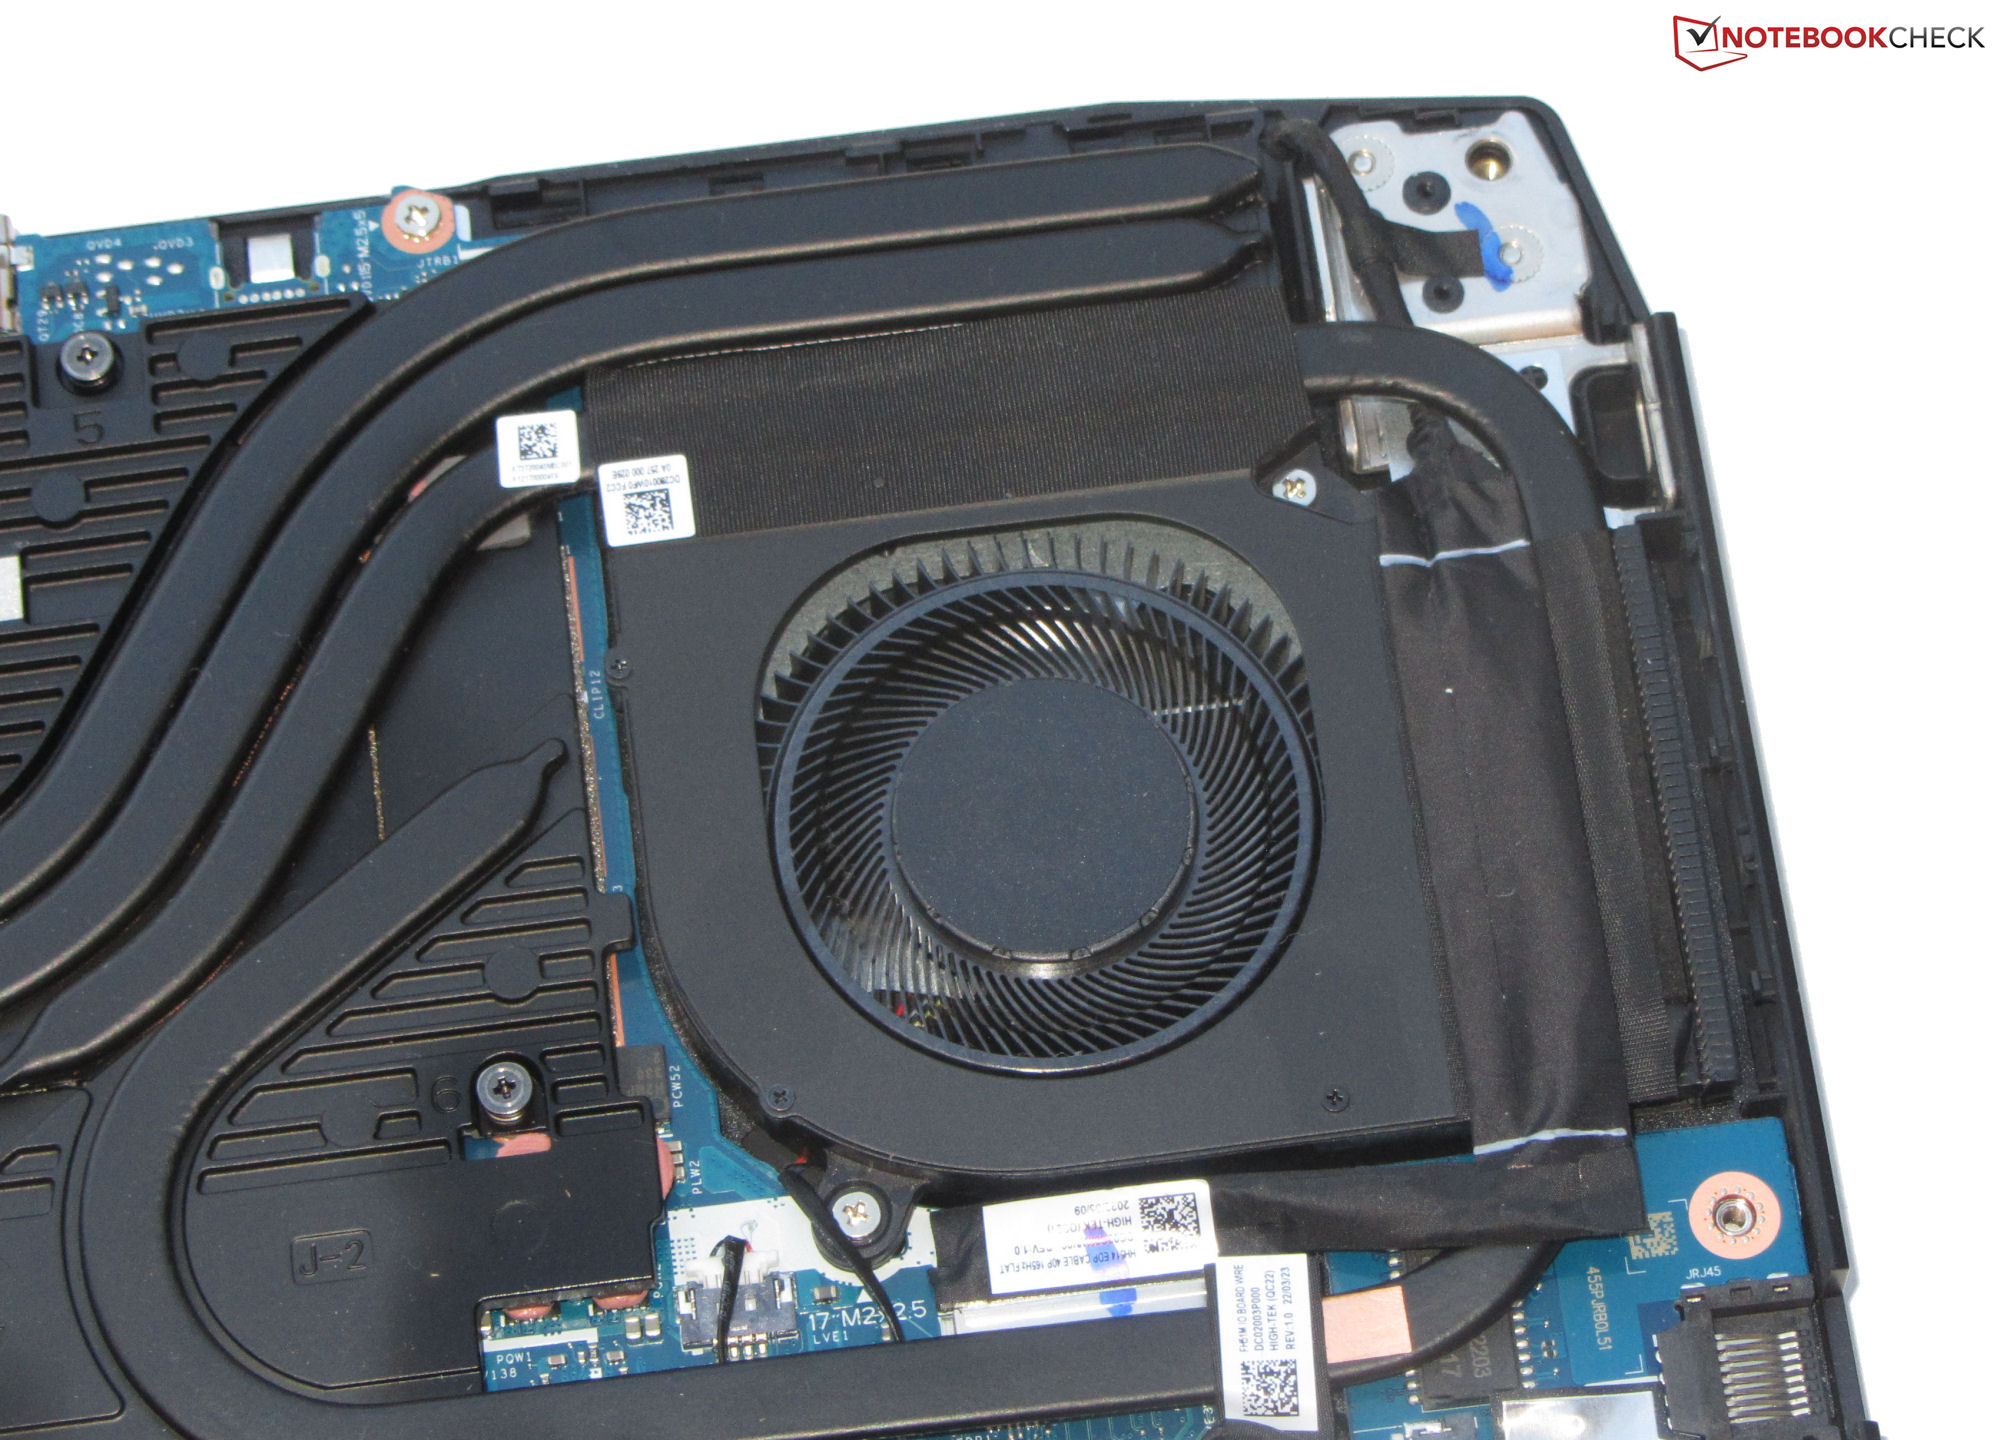
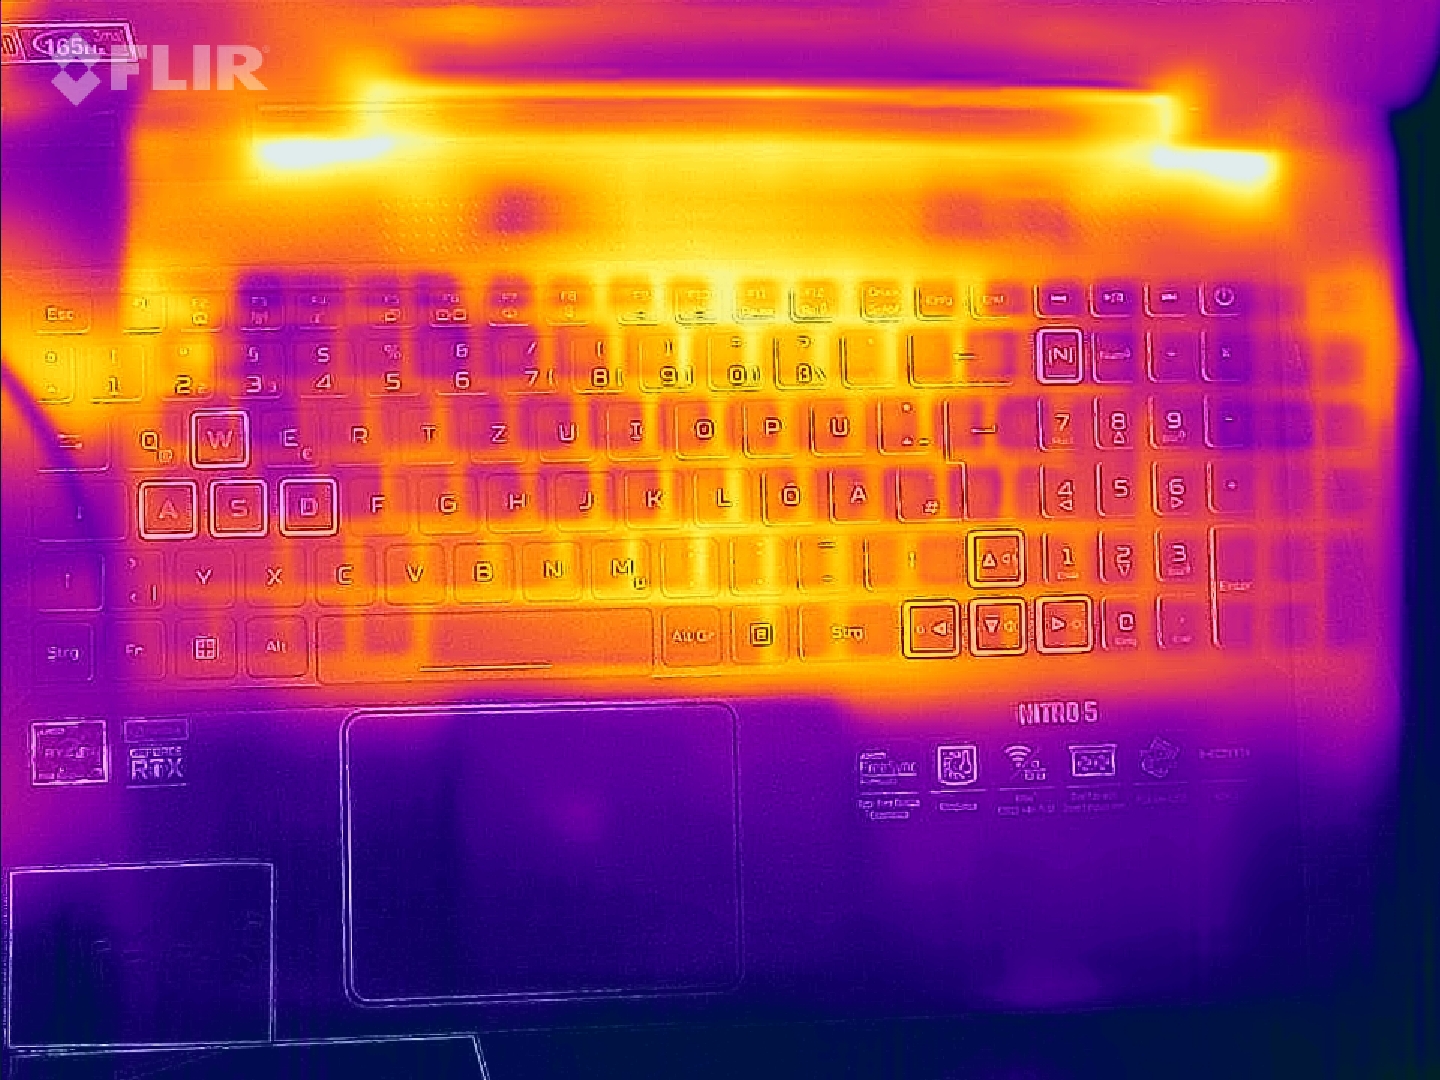
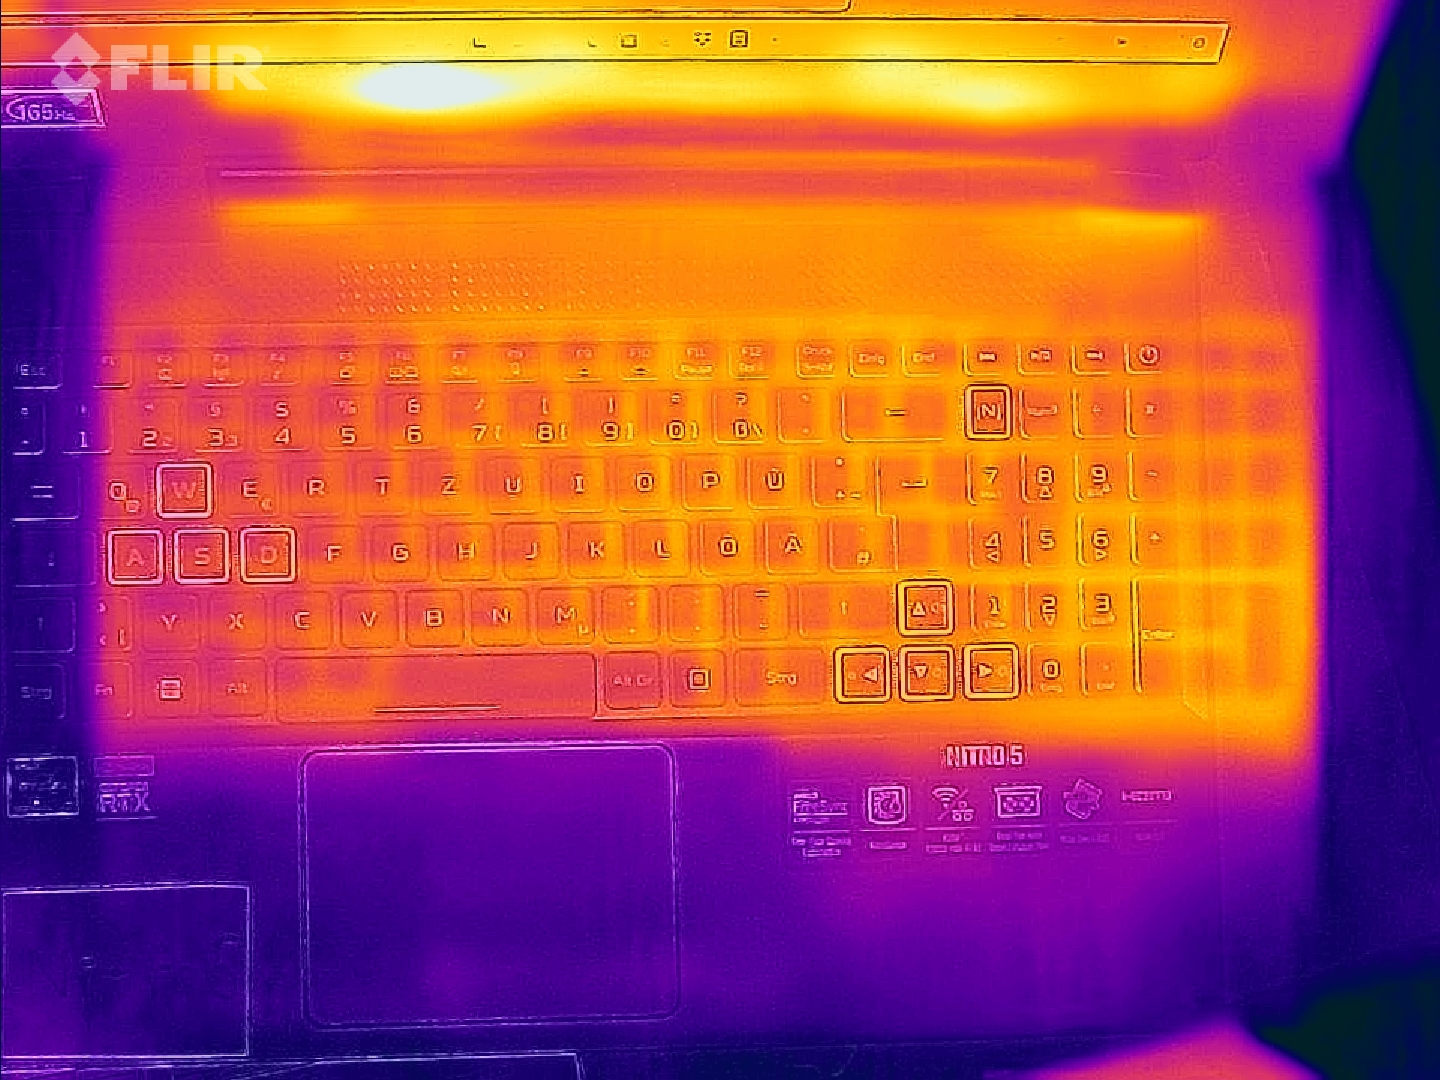
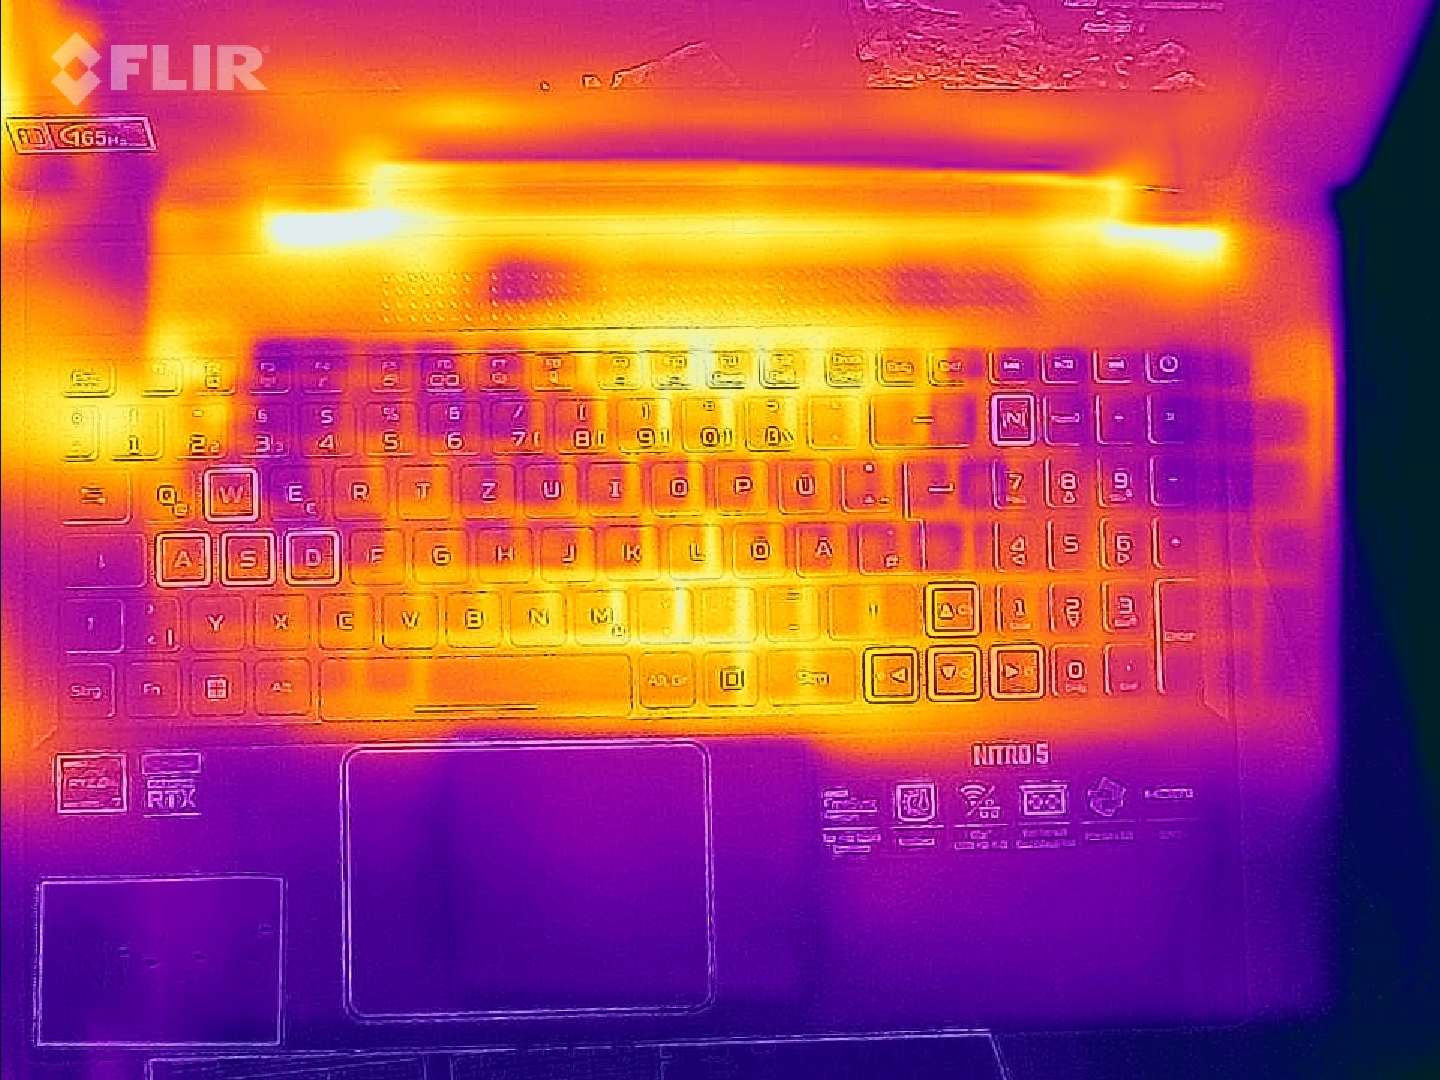
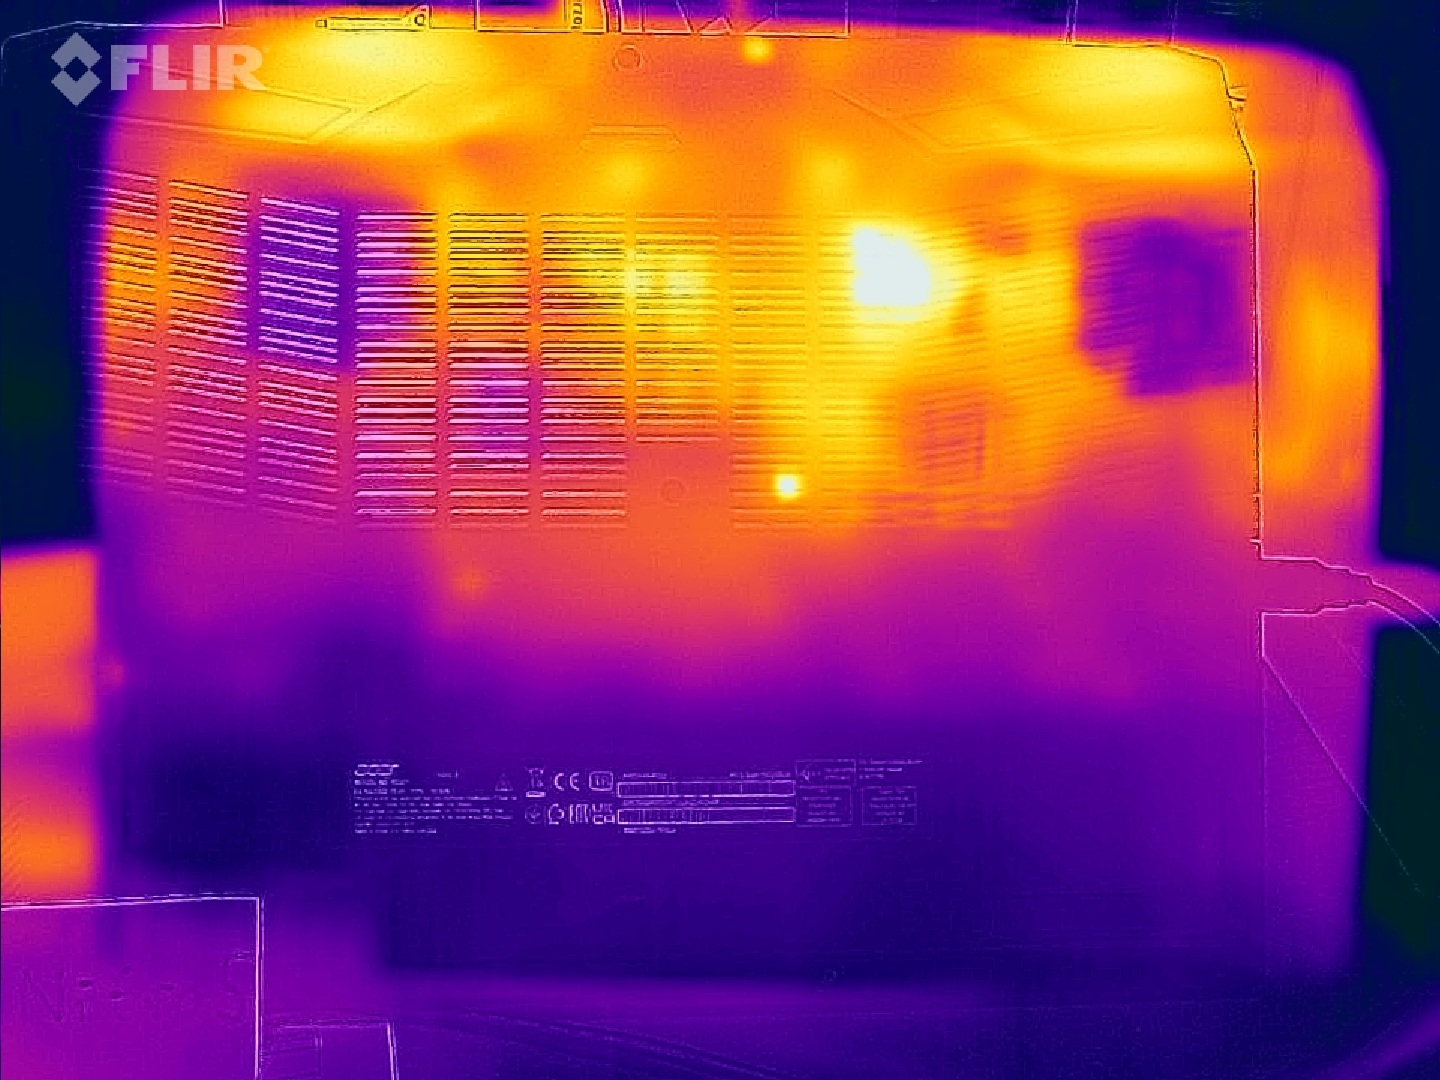
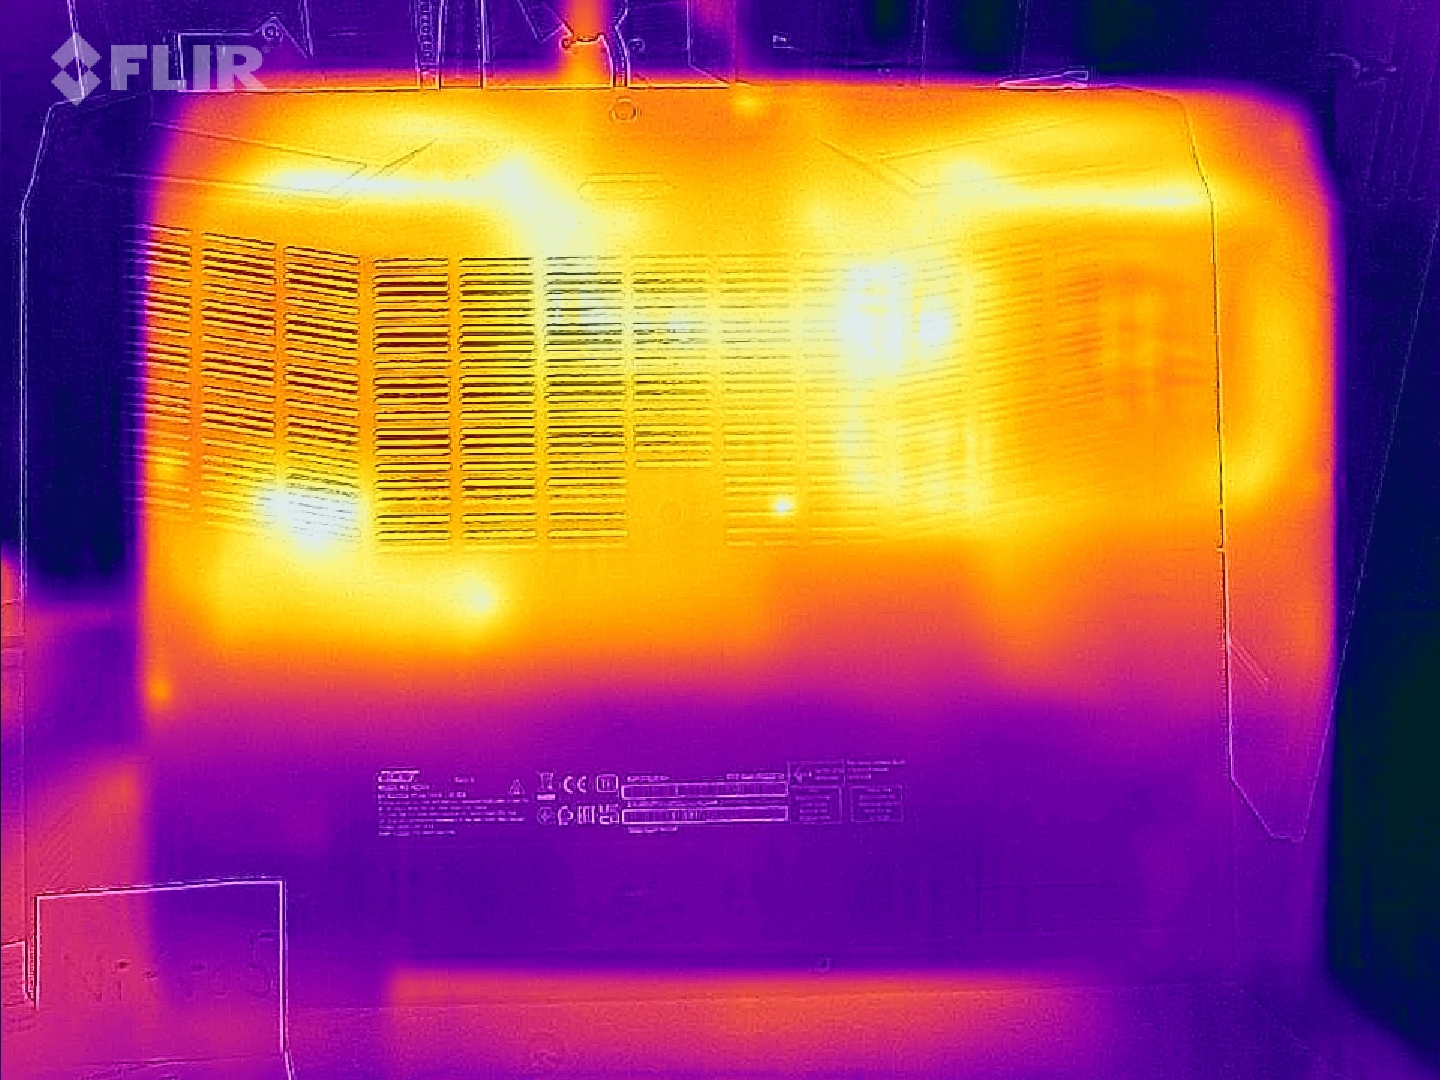
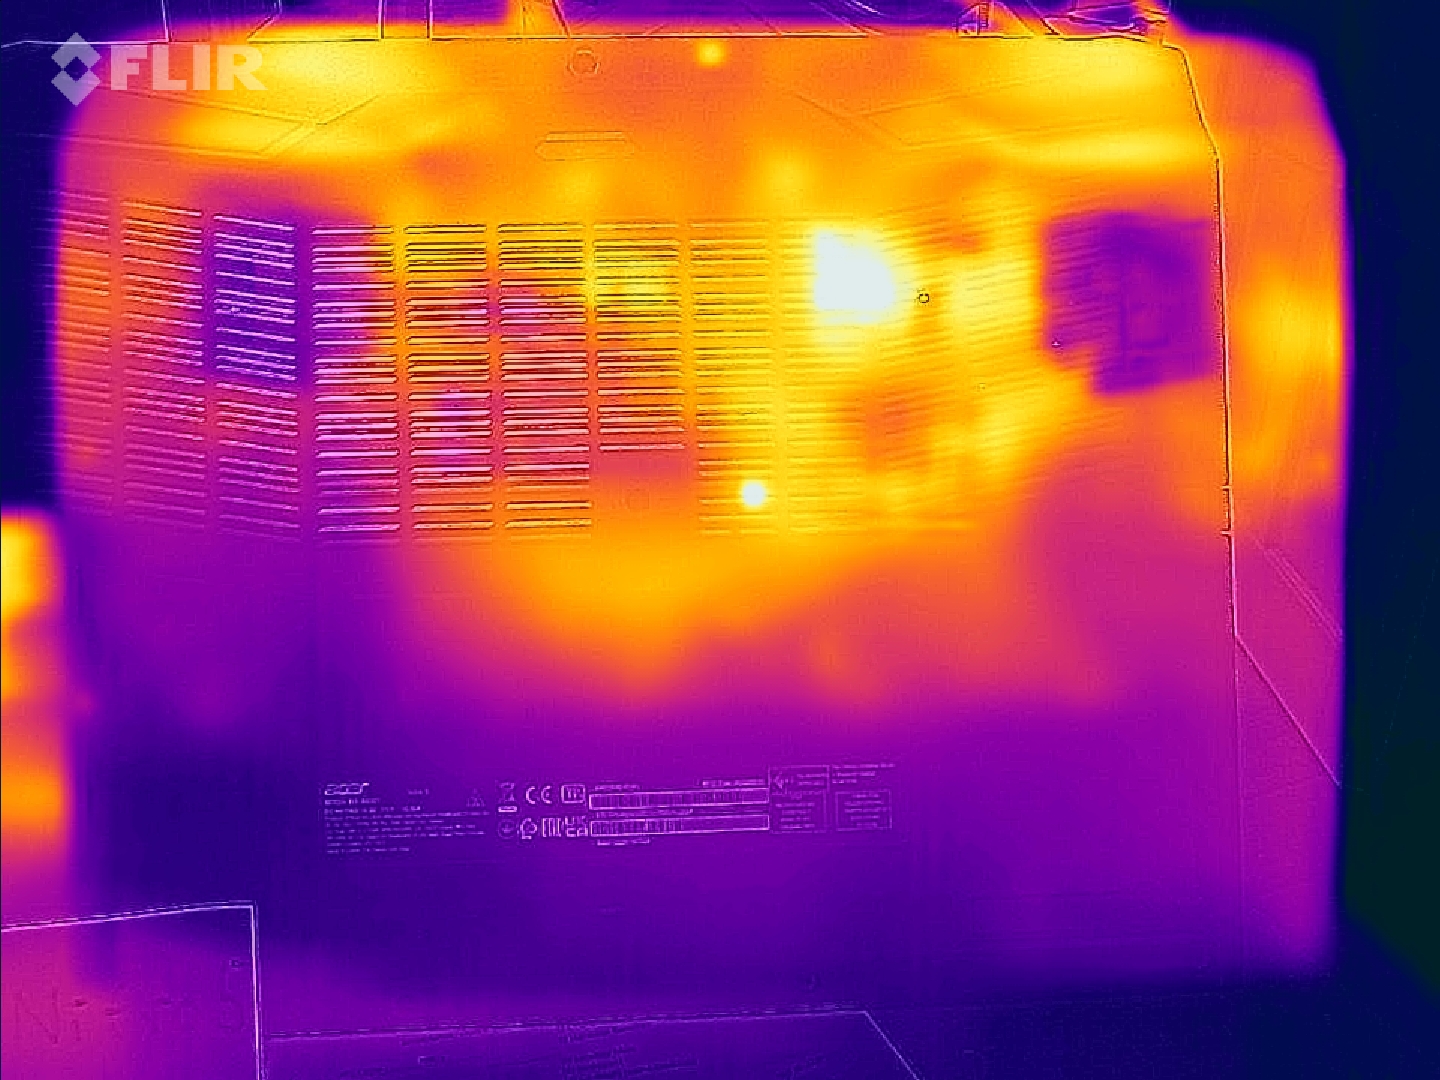
Emissioni - l'AN515 si riscalda solo moderatamente
Emissioni sonore
Durante l'uso quotidiano (ufficio, internet) e al minimo, le due ventole rimangono abbastanza silenziose e possono anche smettere di funzionare occasionalmente. Tuttavia, sono piuttosto imprevedibili e il livello di rumore può aumentare fino a 44,3 dB(A). Sotto carico, abbiamo misurato un massimo di 53,6 dB(A), un valore piuttosto elevato.
La velocità della ventola può essere rallentata con l'aiuto del software NitroSense del dispositivo, ma la curva della ventola non può essere regolata. Lo sviluppo del rumore è molto simile nei profili "silenzioso" e "standard".
Rumorosità
| Idle |
| 25 / 28.6 / 44.3 dB(A) |
| Sotto carico |
| 47.6 / 53.6 dB(A) |
 | ||
30 dB silenzioso 40 dB(A) udibile 50 dB(A) rumoroso |
||
min: | ||
| Acer Nitro 5 AN515-46-R1A1 GeForce RTX 3070 Ti Laptop GPU, R7 6800H, Micron 3400 1TB MTFDKBA1T0TFH | MSI Katana GF66 12UGS GeForce RTX 3070 Ti Laptop GPU, i7-12700H, Micron 2450 1TB MTFDKBA1T0TFK | Schenker XMG Fusion 15 (Mid 22) GeForce RTX 3070 Laptop GPU, i7-11800H, Samsung SSD 980 Pro 1TB MZ-V8P1T0BW | Asus TUF Dash F15 FX517ZR GeForce RTX 3070 Laptop GPU, i7-12650H, Samsung PM991a MZVLQ1T0HBLB | Acer Nitro 5 AN515-58-72QR GeForce RTX 3070 Ti Laptop GPU, i7-12700H, Samsung PM9A1 MZVL21T0HCLR | |
|---|---|---|---|---|---|
| Noise | 7% | 7% | 2% | 3% | |
| off /ambiente * (dB) | 25 | 26 -4% | 26 -4% | 26 -4% | 26 -4% |
| Idle Minimum * (dB) | 25 | 27 -8% | 26 -4% | 26 -4% | 26 -4% |
| Idle Average * (dB) | 28.6 | 28 2% | 28 2% | 32 -12% | 29 -1% |
| Idle Maximum * (dB) | 44.3 | 31 30% | 31 30% | 33 26% | 33 26% |
| Load Average * (dB) | 47.6 | 44 8% | 45 5% | 48 -1% | 47 1% |
| Load Maximum * (dB) | 53.6 | 45 16% | 48 10% | 49 9% | 53 1% |
| Witcher 3 ultra * (dB) | 44 | 46 | 47 | 53 |
* ... Meglio usare valori piccoli
Temperatura
Le temperature superficiali rimangono accettabili durante l'uso quotidiano (ufficio, internet) e aumentano solo moderatamente sotto carico (stress test, Witcher 3). Questo è molto diverso dal modello gemello.
(-) La temperatura massima sul lato superiore è di 48.1 °C / 119 F, rispetto alla media di 40.4 °C / 105 F, che varia da 21.2 a 68.8 °C per questa classe Gaming.
(-) Il lato inferiore si riscalda fino ad un massimo di 49.7 °C / 121 F, rispetto alla media di 43.2 °C / 110 F
(+) In idle, la temperatura media del lato superiore è di 26.4 °C / 80 F, rispetto alla media deld ispositivo di 33.9 °C / 93 F.
(+) Riproducendo The Witcher 3, la temperatura media per il lato superiore e' di 31.8 °C / 89 F, rispetto alla media del dispositivo di 33.9 °C / 93 F.
(+) I poggiapolsi e il touchpad sono piu' freddi della temperatura della pelle con un massimo di 25.2 °C / 77.4 F e sono quindi freddi al tatto.
(+) La temperatura media della zona del palmo della mano di dispositivi simili e'stata di 28.8 °C / 83.8 F (+3.6 °C / 6.4 F).
| Acer Nitro 5 AN515-46-R1A1 AMD Ryzen 7 6800H, NVIDIA GeForce RTX 3070 Ti Laptop GPU | MSI Katana GF66 12UGS Intel Core i7-12700H, NVIDIA GeForce RTX 3070 Ti Laptop GPU | Schenker XMG Fusion 15 (Mid 22) Intel Core i7-11800H, NVIDIA GeForce RTX 3070 Laptop GPU | Asus TUF Dash F15 FX517ZR Intel Core i7-12650H, NVIDIA GeForce RTX 3070 Laptop GPU | Acer Nitro 5 AN515-58-72QR Intel Core i7-12700H, NVIDIA GeForce RTX 3070 Ti Laptop GPU | |
|---|---|---|---|---|---|
| Heat | -25% | -20% | -9% | -5% | |
| Maximum Upper Side * (°C) | 48.1 | 61 -27% | 52 -8% | 52 -8% | 48 -0% |
| Maximum Bottom * (°C) | 49.7 | 55 -11% | 63 -27% | 52 -5% | 51 -3% |
| Idle Upper Side * (°C) | 30 | 43 -43% | 37 -23% | 33 -10% | 34 -13% |
| Idle Bottom * (°C) | 31.7 | 38 -20% | 38 -20% | 36 -14% | 33 -4% |
* ... Meglio usare valori piccoli
Test da sforzo
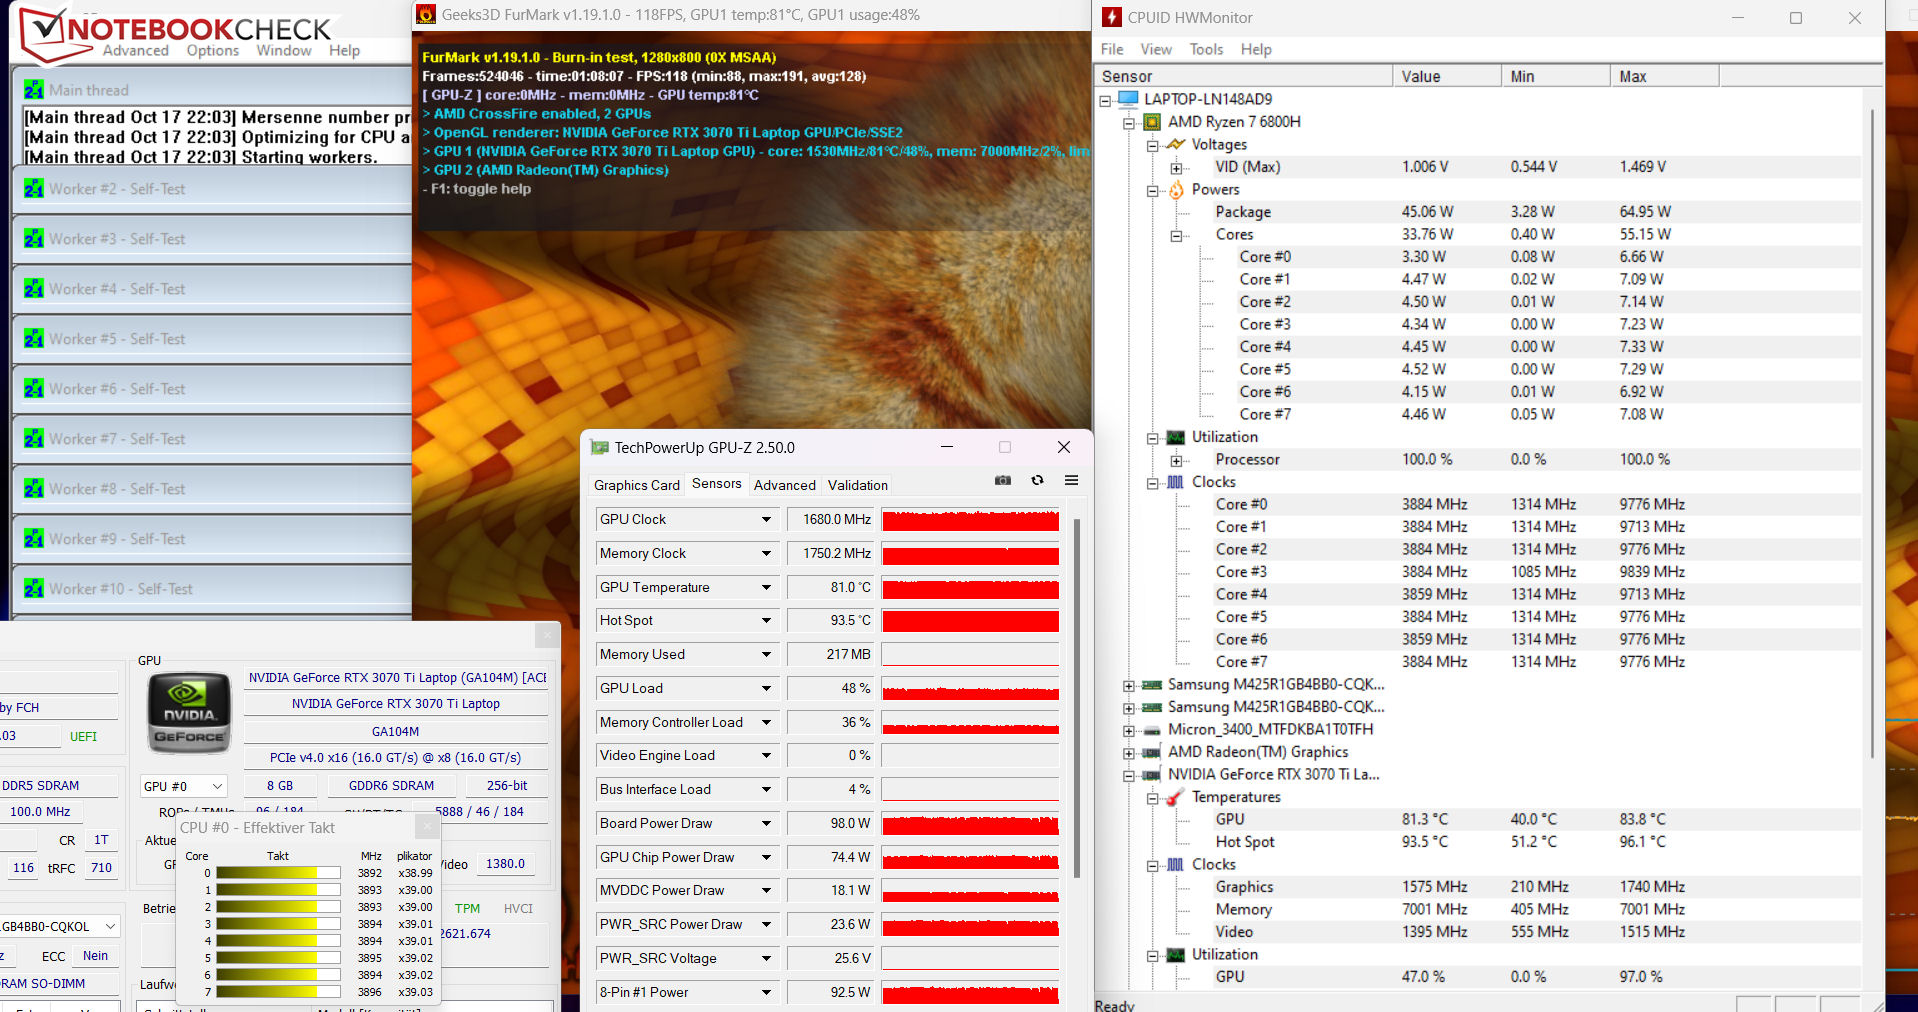
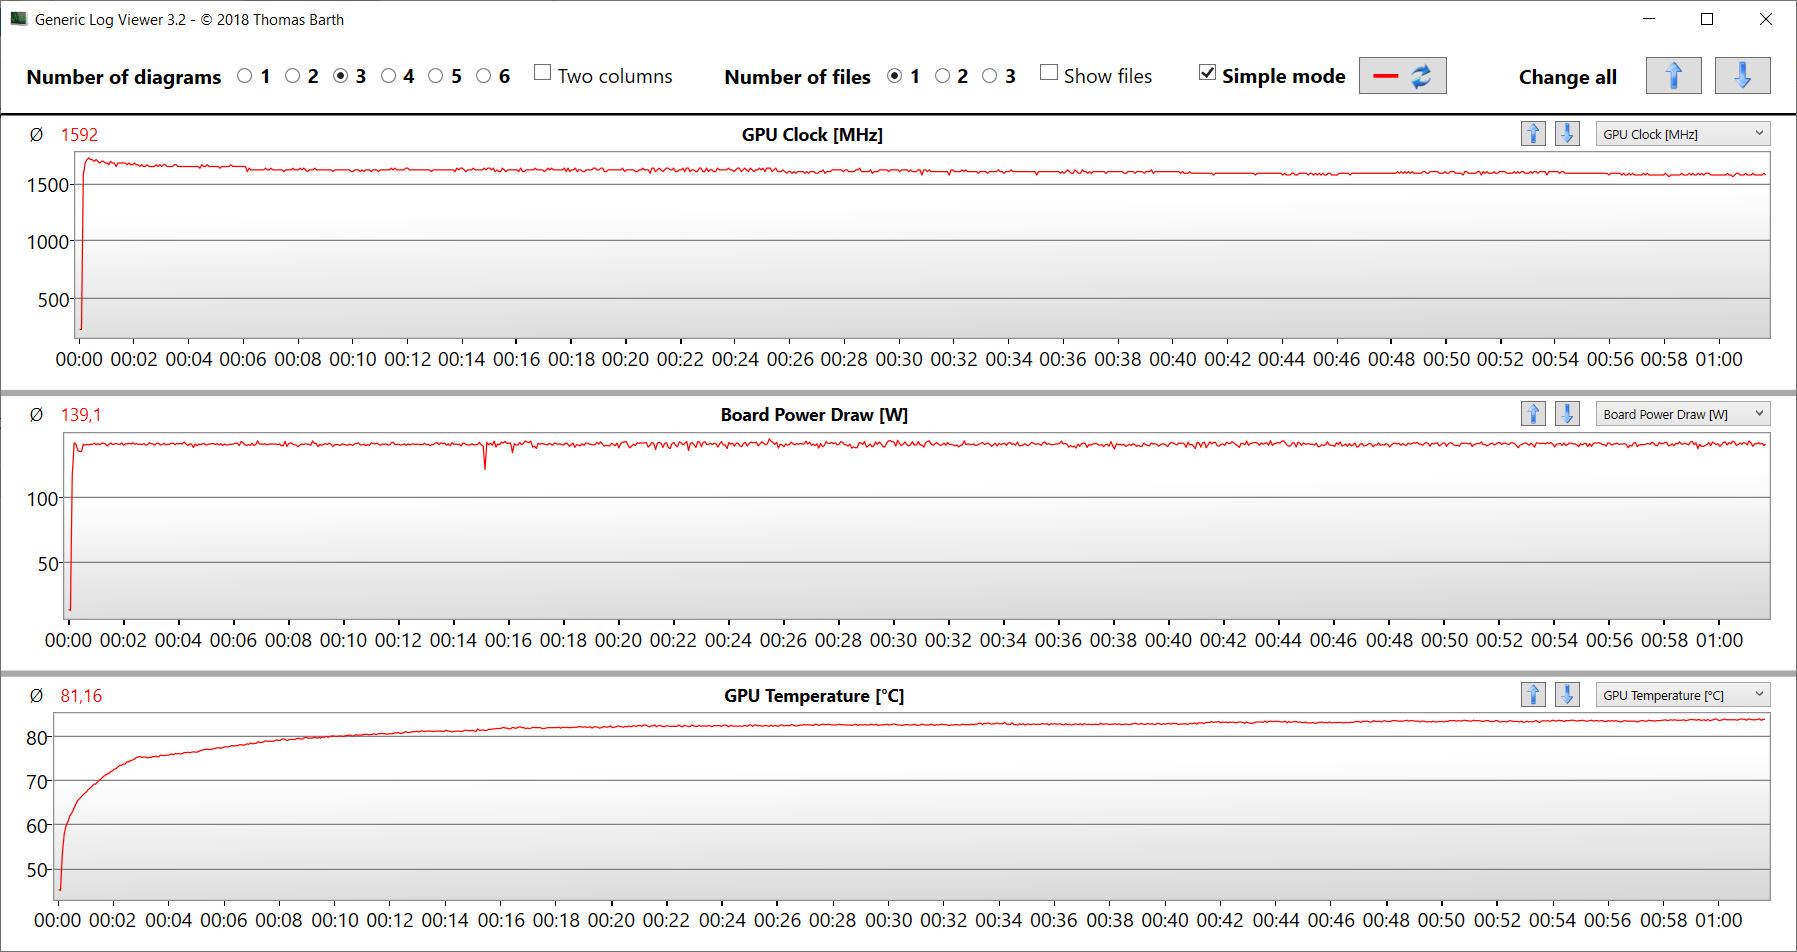
Lo stress test (Prime95 e FurMark sono attivati continuamente) è uno scenario estremo che ci permette di esaminare la stabilità del sistema sotto carico massimo. La CPU (da 4,2 a 4,3 GHz) e la GPU (da 1.000 a 1.600 MHz) iniziano il test con velocità di clock elevate. Mentre la velocità di clock della CPU scende leggermente nel corso del test, la velocità di clock della GPU si stabilizza a un livello elevato.
Altoparlanti
Il suono prodotto dagli altoparlanti stereo è adeguato, ma potrebbe beneficiare di maggiori bassi.
Acer Nitro 5 AN515-46-R1A1 analisi audio
(±) | potenza degli altiparlanti media ma buona (76.3 dB)
Bassi 100 - 315 Hz
(-) | quasi nessun basso - in media 23% inferiori alla media
(±) | la linearità dei bassi è media (14.2% delta rispetto alla precedente frequenza)
Medi 400 - 2000 Hz
(+) | medi bilanciati - solo only 3.1% rispetto alla media
(+) | medi lineari (6.9% delta rispetto alla precedente frequenza)
Alti 2 - 16 kHz
(+) | Alti bilanciati - appena 3.4% dalla media
(+) | alti lineari (6.3% delta rispetto alla precedente frequenza)
Nel complesso 100 - 16.000 Hz
(±) | la linearità complessiva del suono è media (19.7% di differenza rispetto alla media
Rispetto alla stessa classe
» 69% di tutti i dispositivi testati in questa classe è stato migliore, 6% simile, 25% peggiore
» Il migliore ha avuto un delta di 6%, medio di 18%, peggiore di 132%
Rispetto a tutti i dispositivi testati
» 50% di tutti i dispositivi testati in questa classe è stato migliore, 7% similare, 43% peggiore
» Il migliore ha avuto un delta di 4%, medio di 24%, peggiore di 134%
Schenker XMG Fusion 15 (Mid 22) analisi audio
(+) | gli altoparlanti sono relativamente potenti (82 dB)
Bassi 100 - 315 Hz
(-) | quasi nessun basso - in media 17.6% inferiori alla media
(±) | la linearità dei bassi è media (12.1% delta rispetto alla precedente frequenza)
Medi 400 - 2000 Hz
(+) | medi bilanciati - solo only 3% rispetto alla media
(+) | medi lineari (3.9% delta rispetto alla precedente frequenza)
Alti 2 - 16 kHz
(+) | Alti bilanciati - appena 2.8% dalla media
(+) | alti lineari (5.5% delta rispetto alla precedente frequenza)
Nel complesso 100 - 16.000 Hz
(+) | suono nel complesso lineare (13.3% differenza dalla media)
Rispetto alla stessa classe
» 19% di tutti i dispositivi testati in questa classe è stato migliore, 5% simile, 76% peggiore
» Il migliore ha avuto un delta di 6%, medio di 18%, peggiore di 132%
Rispetto a tutti i dispositivi testati
» 14% di tutti i dispositivi testati in questa classe è stato migliore, 3% similare, 83% peggiore
» Il migliore ha avuto un delta di 4%, medio di 24%, peggiore di 134%
Gestione dell'energia - Computer Acer con una durata della batteria decente
Consumo di energia
Non abbiamo notato alcuna incongruenza per quanto riguarda il consumo energetico dell'AN515. Il consumo è aumentato fino a 230 watt e a una media di 203 watt durante lo stress test e il testWitcher 3, ma è rimasto costante durante entrambi i test. L'adattatore CA (potenza nominale: 280 watt) è sufficientemente grande per coprire le esigenze di questo dispositivo.
| Off / Standby | |
| Idle | |
| Sotto carico |
|
Leggenda:
min: | |
| Acer Nitro 5 AN515-46-R1A1 R7 6800H, GeForce RTX 3070 Ti Laptop GPU, Micron 3400 1TB MTFDKBA1T0TFH, IPS, 1920x1080, 15.6" | MSI Katana GF66 12UGS i7-12700H, GeForce RTX 3070 Ti Laptop GPU, Micron 2450 1TB MTFDKBA1T0TFK, IPS, 1920x1080, 15.6" | Schenker XMG Fusion 15 (Mid 22) i7-11800H, GeForce RTX 3070 Laptop GPU, Samsung SSD 980 Pro 1TB MZ-V8P1T0BW, IPS, 2560x1440, 15.6" | Asus TUF Dash F15 FX517ZR i7-12650H, GeForce RTX 3070 Laptop GPU, Samsung PM991a MZVLQ1T0HBLB, IPS, 2560x1440, 15.6" | Acer Nitro 5 AN515-58-72QR i7-12700H, GeForce RTX 3070 Ti Laptop GPU, Samsung PM9A1 MZVL21T0HCLR, IPS, 2560x1440, 15.6" | Media NVIDIA GeForce RTX 3070 Ti Laptop GPU | Media della classe Gaming | |
|---|---|---|---|---|---|---|---|
| Power Consumption | -5% | -25% | -8% | -15% | -56% | -47% | |
| Idle Minimum * (Watt) | 7 | 9 -29% | 12 -71% | 10 -43% | 7 -0% | 14.2 ? -103% | 13.2 ? -89% |
| Idle Average * (Watt) | 8.9 | 13 -46% | 17 -91% | 14 -57% | 15 -69% | 19.9 ? -124% | 18.9 ? -112% |
| Idle Maximum * (Watt) | 14.4 | 20 -39% | 24 -67% | 20 -39% | 24 -67% | 26.2 ? -82% | 24.5 ? -70% |
| Load Average * (Watt) | 202 | 100 50% | 106 48% | 122 40% | 124 39% | 125.8 ? 38% | 108.8 ? 46% |
| Witcher 3 ultra * (Watt) | 203 | 149 27% | 159.9 21% | 138.6 32% | 195.1 4% | ||
| Load Maximum * (Watt) | 230 | 212 8% | 208 10% | 189 18% | 220 4% | 248 ? -8% | 254 ? -10% |
* ... Meglio usare valori piccoli
Power consumption Witcher 3 / stress test
Power consumption with an external screen
Durata della batteria
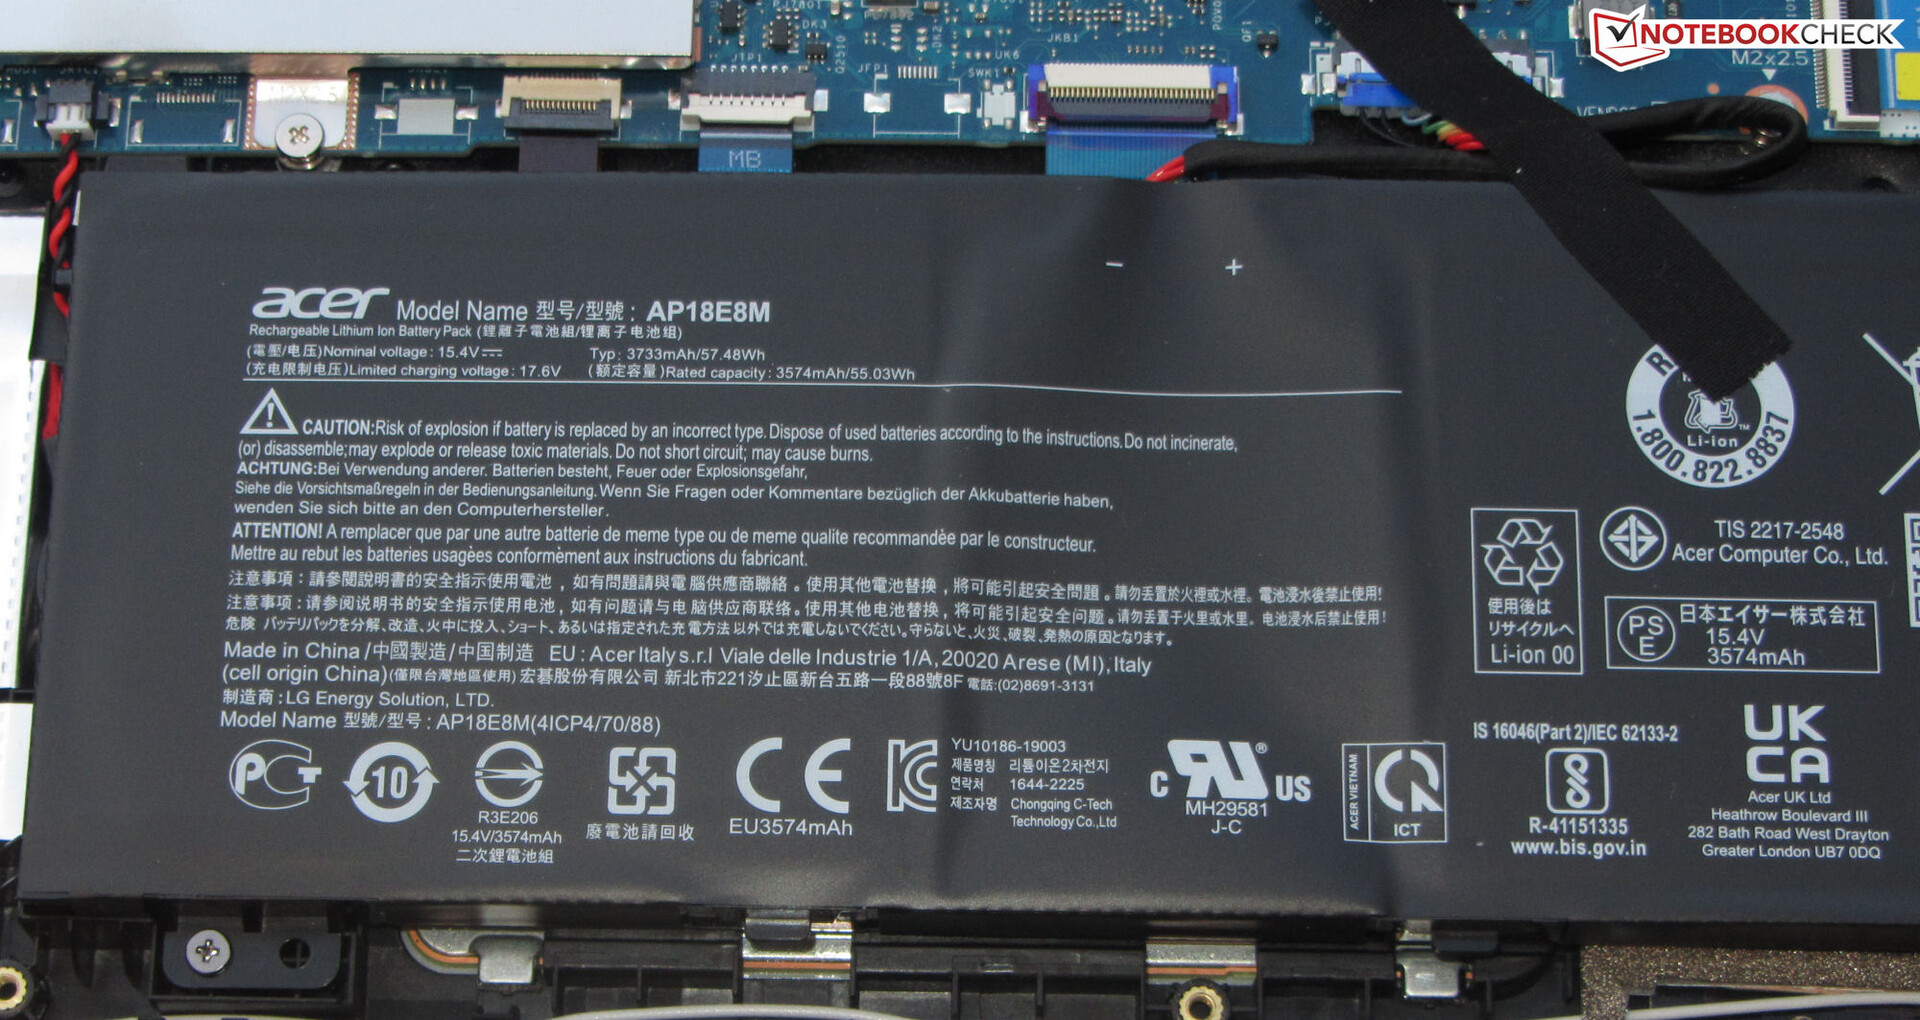
Dopo l'MSI Katana (52 Wh), il Nitro ha la capacità della batteria più bassa del nostro confronto (57,5 Wh). Riesce comunque a raggiungere un'autonomia decente e a tenere il passo con alcuni dei suoi concorrenti dotati di una dotazione più generosa. È nettamente superiore al modello gemello basato su Intel, grazie al processore AMD più parsimonioso e alla risoluzione dello schermo inferiore.
| Acer Nitro 5 AN515-46-R1A1 R7 6800H, GeForce RTX 3070 Ti Laptop GPU, 57.5 Wh | MSI Katana GF66 12UGS i7-12700H, GeForce RTX 3070 Ti Laptop GPU, 52 Wh | Schenker XMG Fusion 15 (Mid 22) i7-11800H, GeForce RTX 3070 Laptop GPU, 93.48 Wh | Asus TUF Dash F15 FX517ZR i7-12650H, GeForce RTX 3070 Laptop GPU, 76 Wh | Acer Nitro 5 AN515-58-72QR i7-12700H, GeForce RTX 3070 Ti Laptop GPU, 57.5 Wh | Media della classe Gaming | |
|---|---|---|---|---|---|---|
| Autonomia della batteria | -26% | 37% | 26% | -26% | 15% | |
| Reader / Idle (h) | 10.5 | 15.5 48% | 10.8 3% | 5.7 -46% | 8.71 ? -17% | |
| H.264 (h) | 5.7 | 7.5 32% | 5.8 2% | 4.7 -18% | 8.28 ? 45% | |
| WiFi v1.3 (h) | 5.8 | 2.4 -59% | 7.4 28% | 7 21% | 3.9 -33% | 6.96 ? 20% |
| Load (h) | 1.3 | 1.4 8% | 1.8 38% | 2.3 77% | 1.2 -8% | 1.47 ? 13% |
Pro
Contro
Verdetto - Un notebook da gioco completo
Il Nitro 5 è fatto per i giochi in FHD a impostazioni massime - grazie a unRyzen 7-6800He a unaGeForce RTX 3070-Ti Laptop(TGP: 150 W). Il veloce SSD PCIe-4 (1 TB) fornisce lo spazio di archiviazione necessario e garantisce tempi di caricamento ridotti.
Il Nitro 5 AN515-46 di Acer è un notebook da gioco FHD veloce che non presenta gravi punti deboli.
La CPU e la GPU sono in grado di fornire velocità di clock costantemente elevate. Il dispositivo si riscalda solo moderatamente sotto carico. Purtroppo, le emissioni acustiche non sono migliori del solito: il Nitro 5 può essere piuttosto rumoroso. Il pannello opaco da 15,6 pollici (FHD, IPS, 165 Hz) ci ha dato una buona impressione.
La durata della batteria del notebook è decente, ma niente di eccezionale. La batteria può essere ricaricata con un adattatore universale USB-C (min. 65 watt, 20 V) poiché la porta USB 4 supporta Power Delivery (e DisplayPort). Ciò significa che gli utenti non dovranno necessariamente portarsi dietro il pesante alimentatore da 280 W.
Quale modello Nitro 5 è la scelta migliore? Dipende dalle vostre esigenze. La versione AMD ha una memoria DDR5, bassi valori di consumo energetico e una migliore durata della batteria. Inoltre, si riscalda meno. Il modelloModello Inteloffre prestazioni più elevate della CPU a thread singolo, Thunderbolt 4 e un display migliore. Ma ricordate: entrambe le versioni del Nitro sono disponibili con un pannello FHD o QHD
Tra le alternative al Nitro troviamo il modelloSchenker XMG Fusion 15 (Mid 22)e l'Asus TUF Dash F15. Entrambi i dispositivi offrono prestazioni inferiori della GPU e si riscaldano notevolmente sotto carico. D'altra parte, sono più compatti, pesano meno e hanno una maggiore durata della batteria. Il Fusion offre di gran lunga i tempi di esecuzione più lunghi.
Prezzo e disponibilità
L'Acer Nitro 5 AN515-46 è disponibile sul sito web del produttore al prezzo di 2.200 dollari.
Acer Nitro 5 AN515-46-R1A1
- 10/28/2022 v7 (old)
Sascha Mölck
Price comparison

