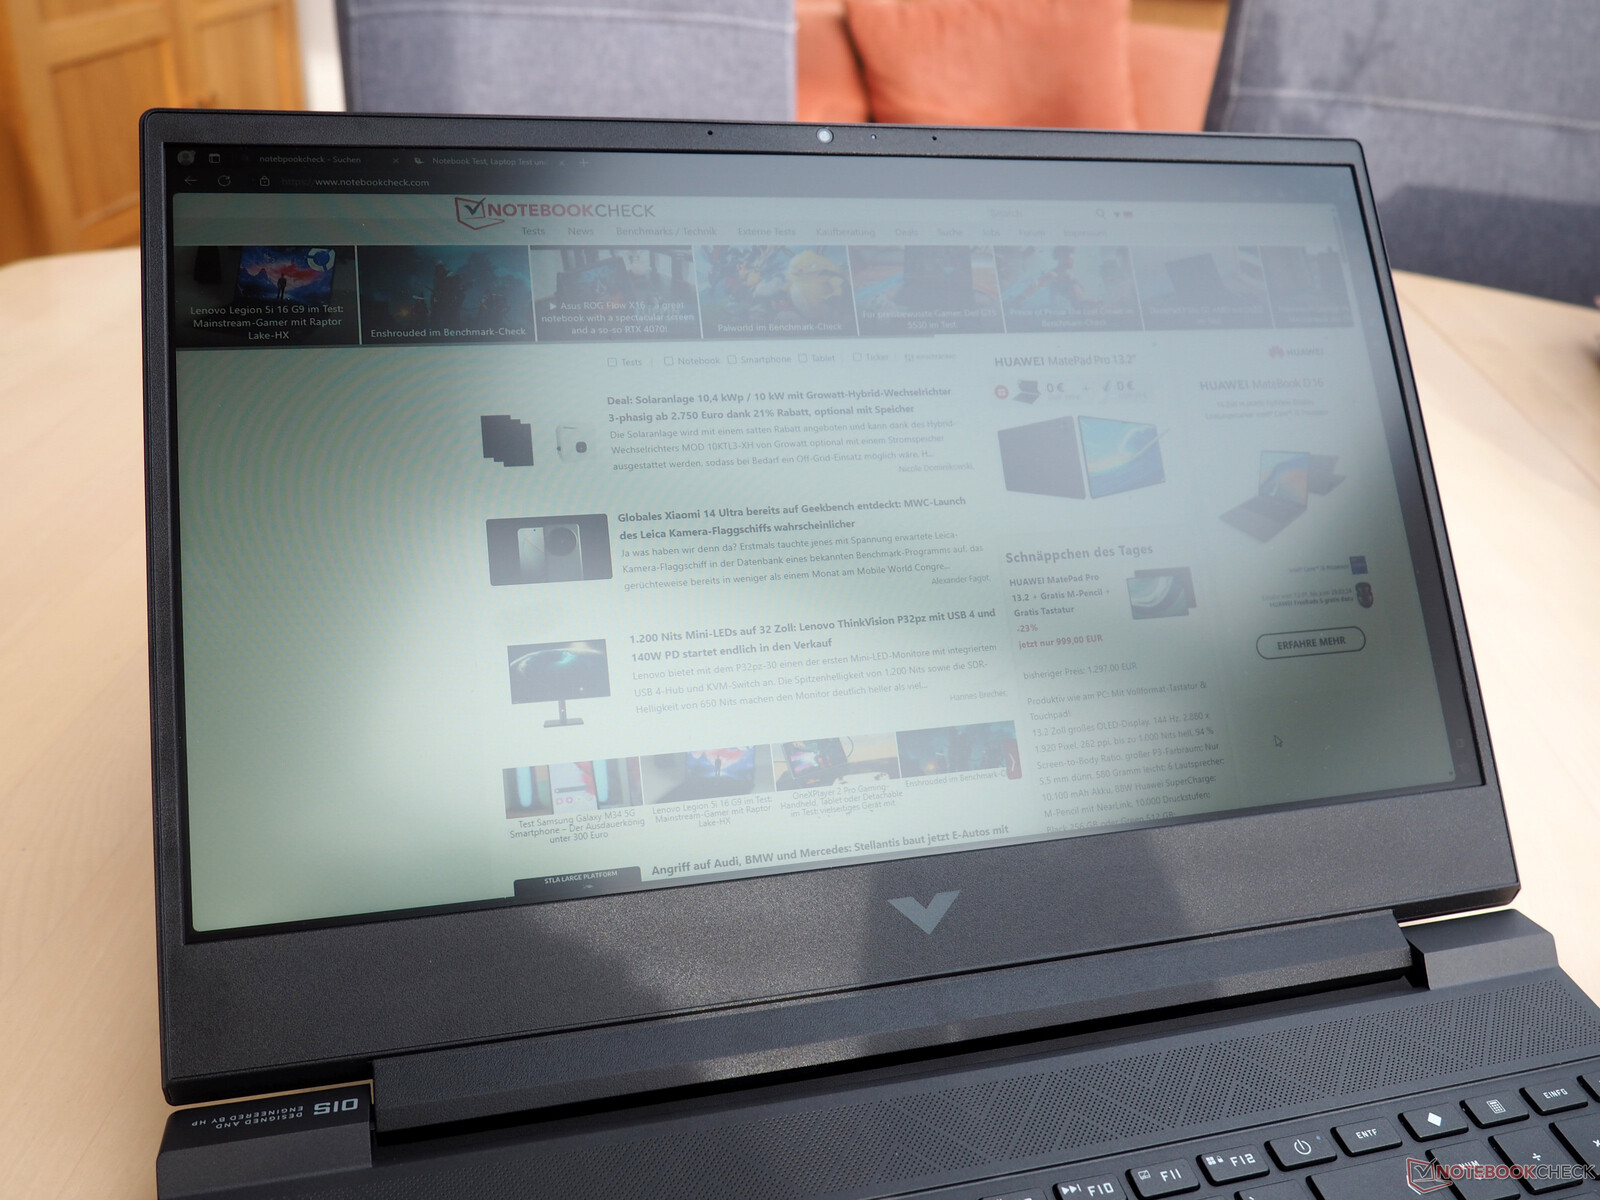
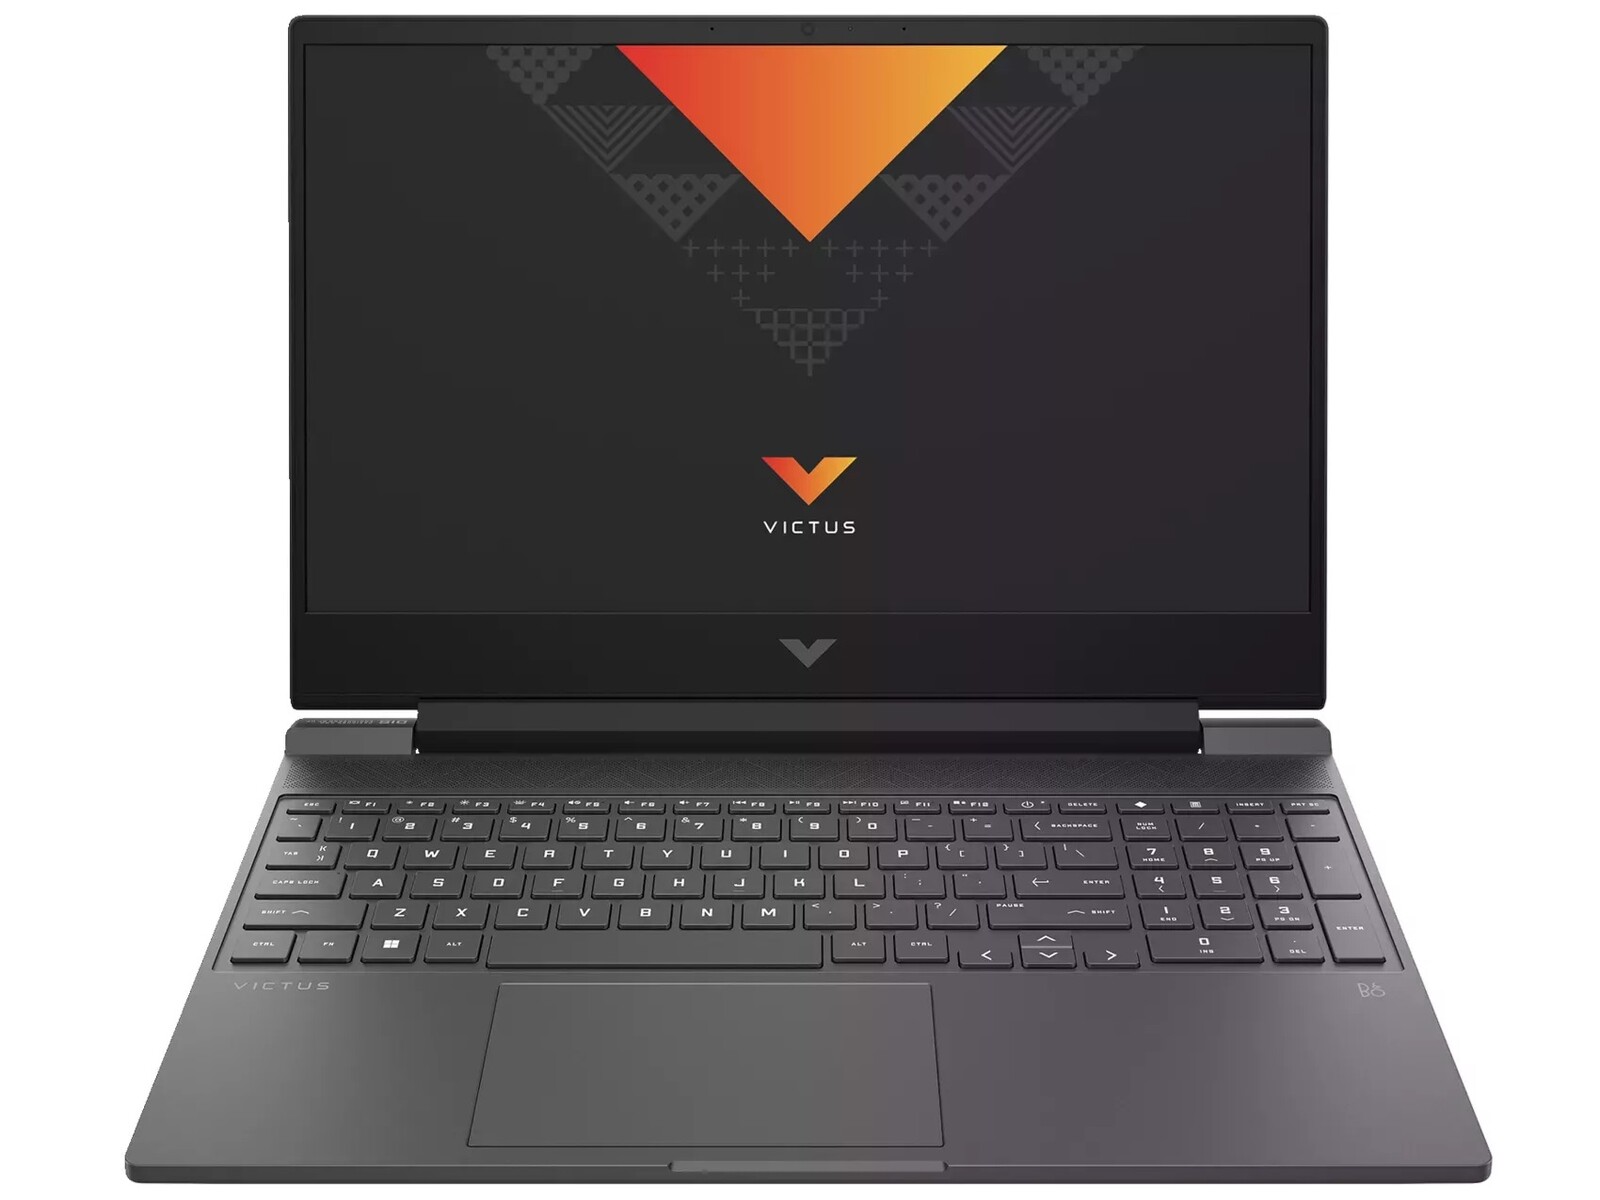
Recensione del laptop gaming HP Victus 15 con Raptor Lake e Ada Lovelace

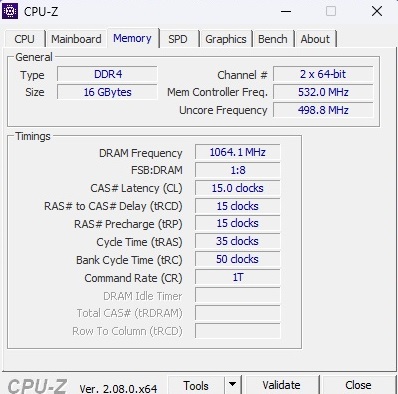
Mentre i computer portatili premium continuano a diventare più costosi ogni anno, il segmento economico nel 2024 offre una pletora di prodotti interessanti. Un esempio è Victus 15-fa1057ng, disponibile a meno di 1.000 dollari. Distinguendosi da molti concorrenti, presenta una RTX 4050 di GeForce con 6 GB di VRAM GDDR6. A completare il tutto c'è un Core i5-13500H (12 core, 16 thread), 16 GB di RAM DDR4-3.200 (2x 8 GB SO-DIMM) e un SSD M.2 basato su PCIe da 512 GB. A gestire la resa visiva è un display IPS Full HD opaco a 144 Hz, sebbene sia specificato con 250 nits e 45% NTSC - valori che consideriamo obsoleti, anche per il settore economico. Il pacchetto è completato da Windows 11 Home come sistema operativo (sono disponibili anche versioni più economiche con FreeDOS).
Tra i rivali del Victus 15 ci sono altri portatili da gioco dotati di RTX 4050 e delle CPU più recenti, come ad esempio il modello Dell G15 5530e l' Acer Nitro V 15 ANV15-51 o l' Asus TUF A15 FA507, tutti elencati nelle tabelle di confronto.
Poiché il case è per lo più identico al predecessore con il Core i7-12700H e GeForce RTX 3050 Ti questo articolo includerà una breve spiegazione dell'involucro, delle caratteristiche e delle categorie di dispositivi di input.
Potenziali concorrenti a confrontos
Punteggio | Data | Modello | Peso | Altezza | Dimensione | Risoluzione | Prezzo |
|---|---|---|---|---|---|---|---|
| 84 % v7 (old) | 02/2024 | HP Victus 15-fa1057ng i5-13500H, GeForce RTX 4050 Laptop GPU | 2.3 kg | 24 mm | 15.60" | 1920x1080 | |
| 81 % v7 (old) | 01/2023 | HP Victus 15 fa0020nr i7-12700H, GeForce RTX 3050 Ti Laptop GPU | 2.3 kg | 23.6 mm | 15.60" | 1920x1080 | |
| 84.7 % v7 (old) | 01/2024 | Dell G15 5530, i5-13450HX RTX 4050 i5-13450HX, GeForce RTX 4050 Laptop GPU | 2.7 kg | 27 mm | 15.60" | 1920x1080 | |
| 82.8 % v7 (old) | 01/2024 | Acer Nitro V 15 ANV15-51-582S i5-13420H, GeForce RTX 4050 Laptop GPU | 2.1 kg | 23.5 mm | 15.60" | 1920x1080 | |
| 86.3 % v7 (old) | 06/2023 | Asus TUF A15 FA507 R7 7735HS, GeForce RTX 4050 Laptop GPU | 2.2 kg | 24.9 mm | 15.60" | 1920x1080 |
Caso
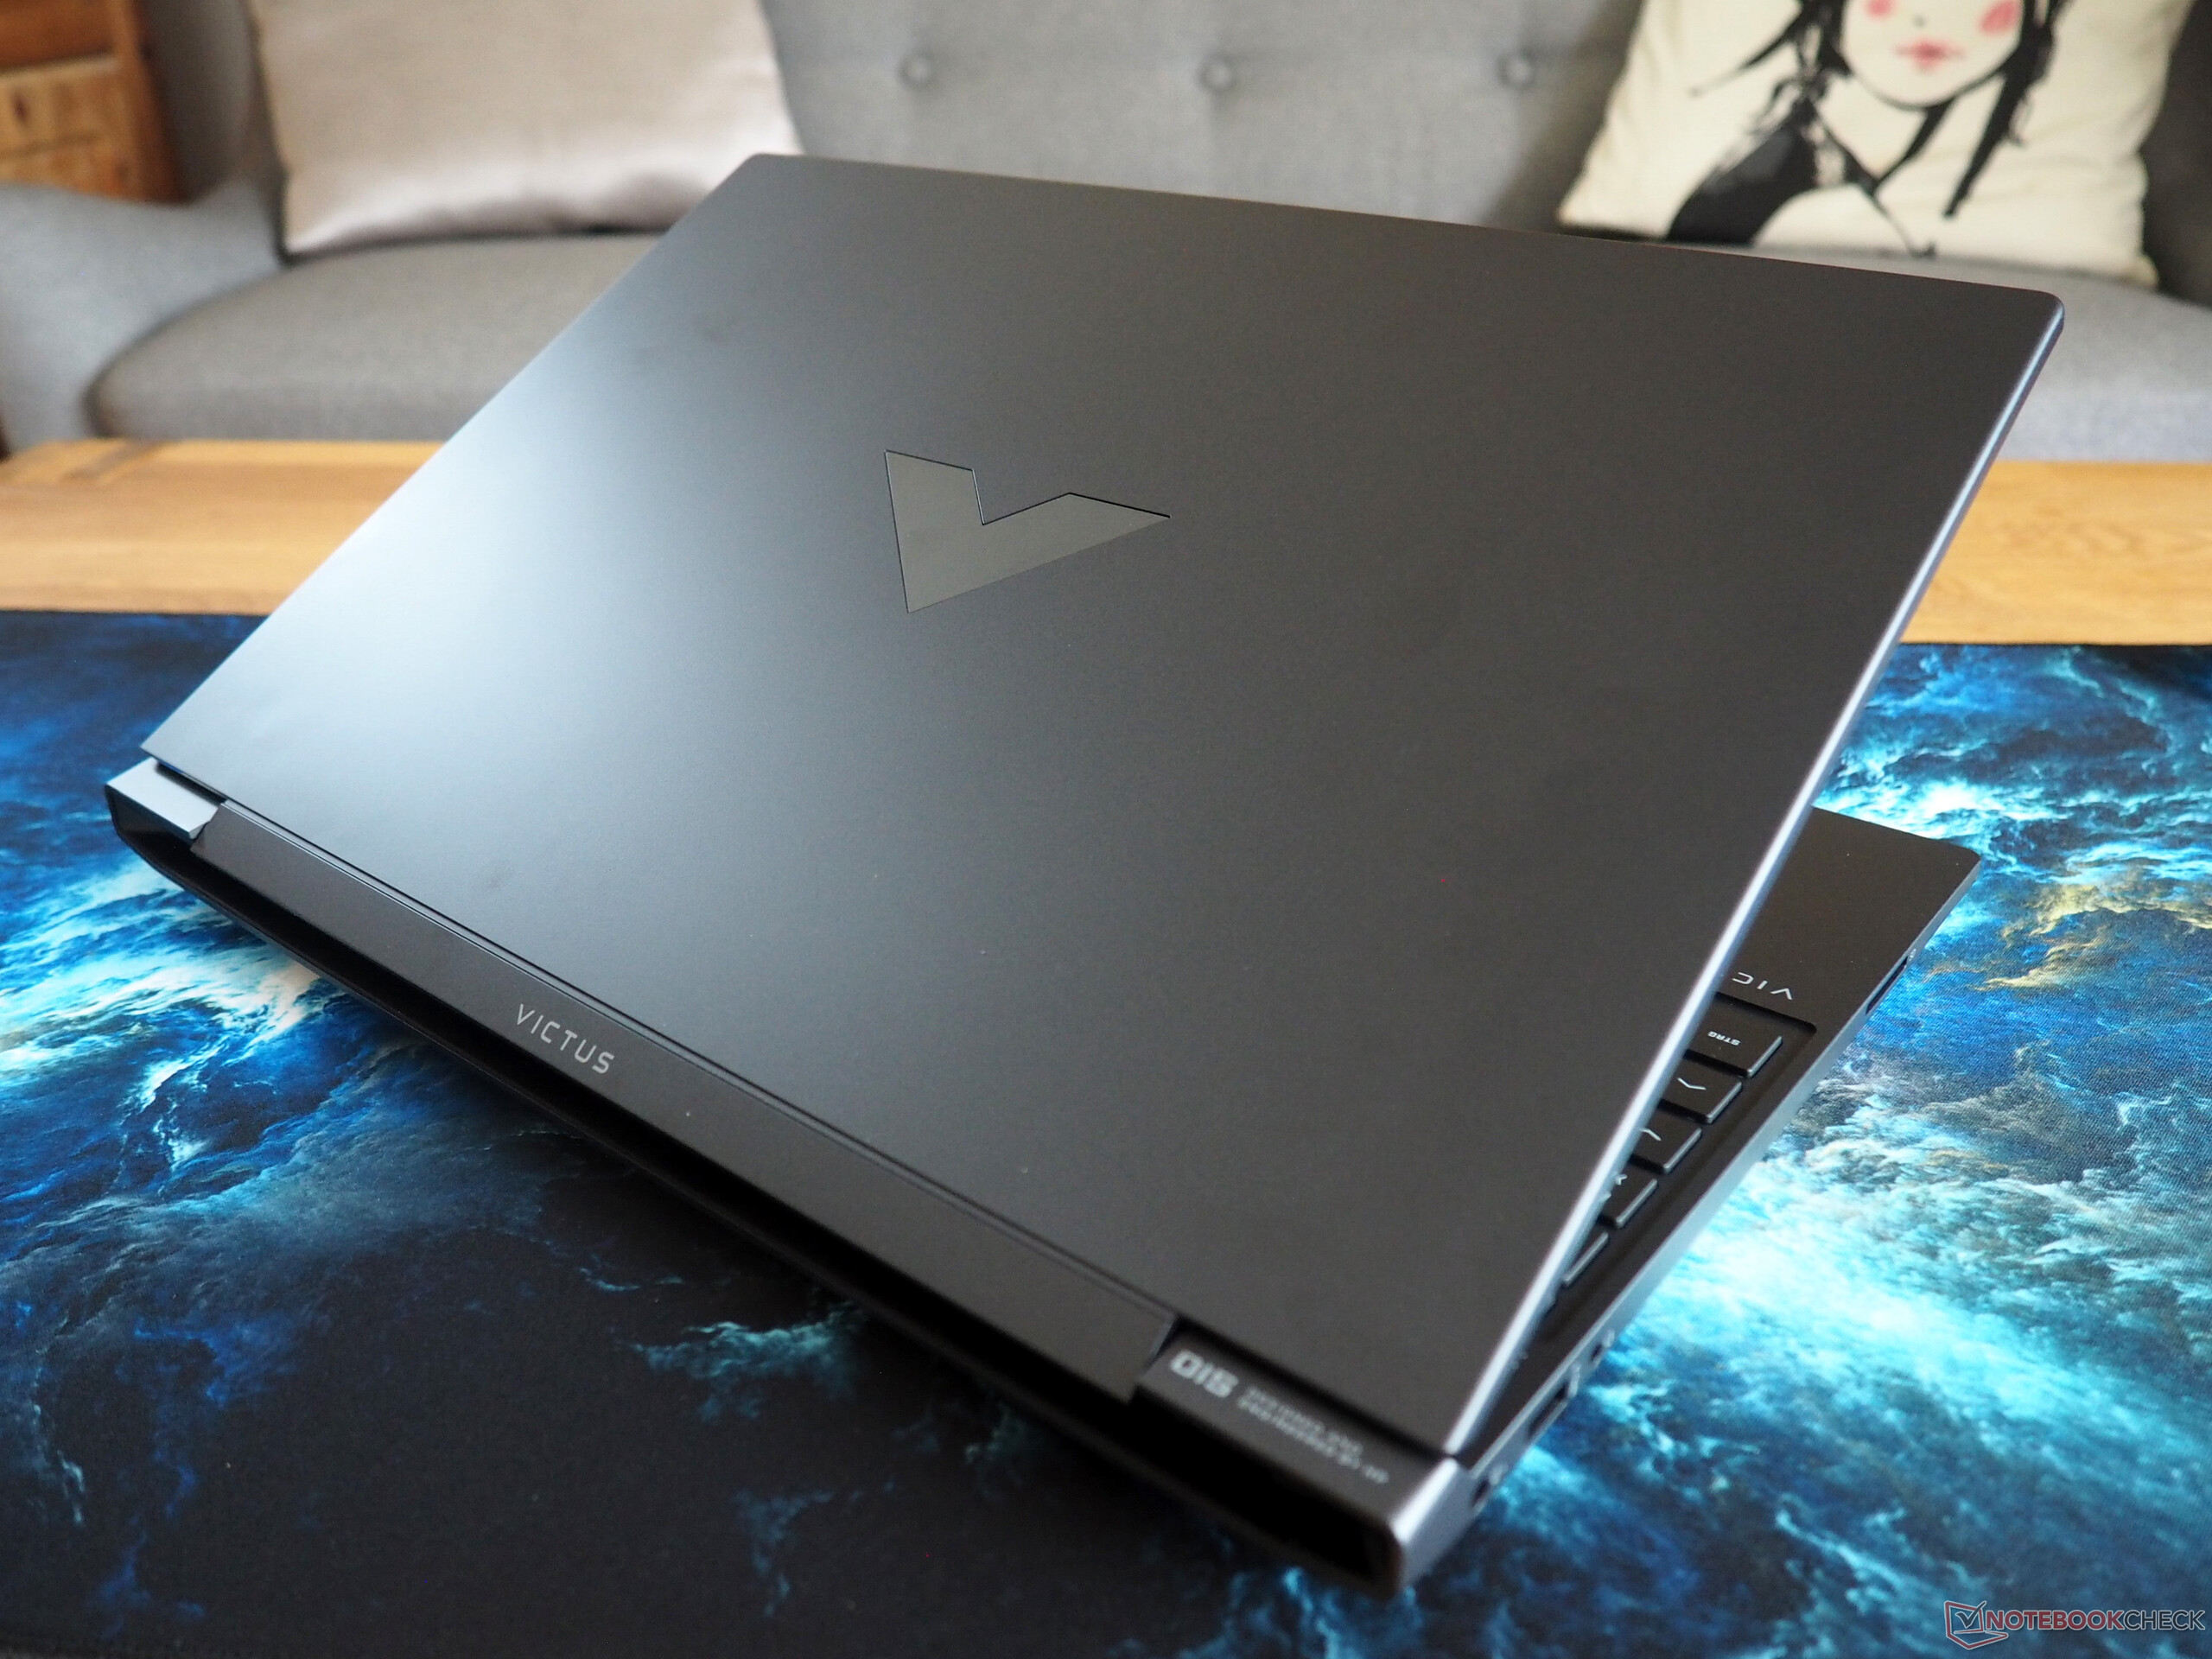
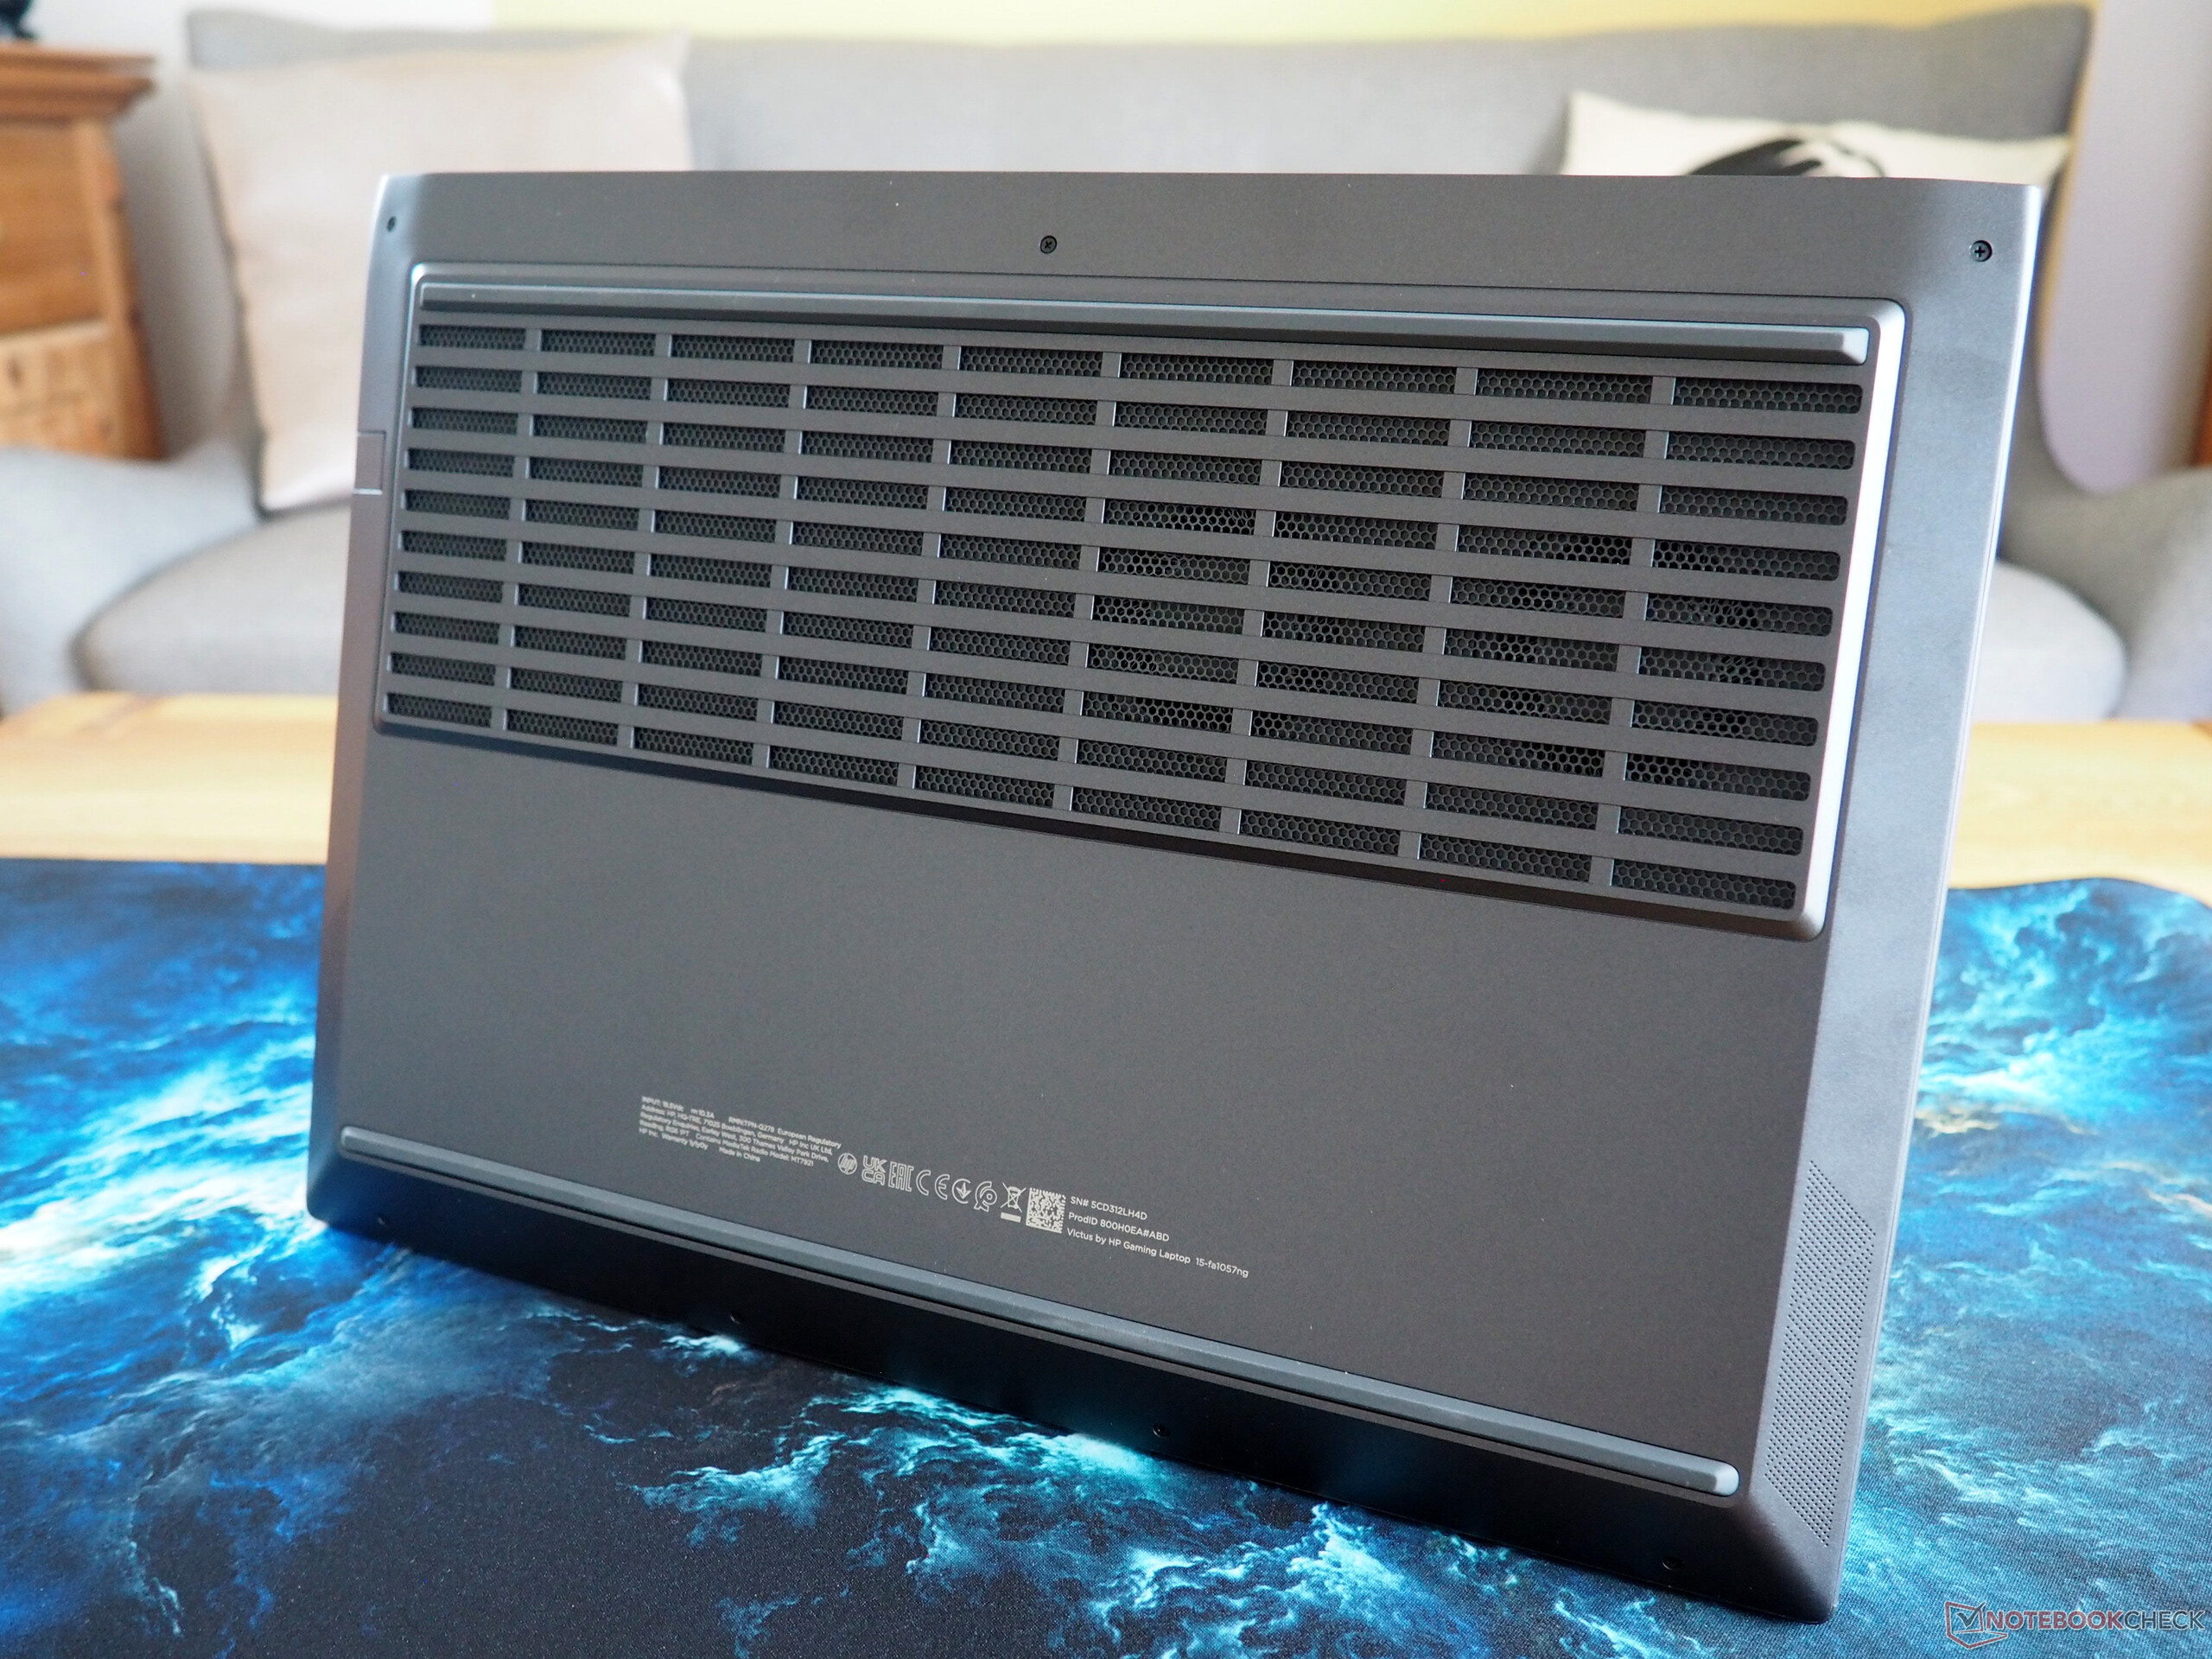
I clienti ricevono un involucro di plastica robusto, come è comune in questa categoria di prezzo, anche se può presentare qualche tintinnio in alcune aree e manca il suono e la sensazione premium. Una riprogettazione o un'ottimizzazione potrebbe essere utile per le cerniere leggermente traballanti. La stabilità complessiva è simile. In particolare, quando si esercita una maggiore pressione, il poggiapolsi potrebbe incurvarsi in modo sostanziale. Il Victus 15 ha una bella estetica che combina caratteristiche di design sottili e divertenti. Le dimensioni e il peso rientrano nella media, anche se non sono particolarmente degni di nota rispetto ai concorrenti.
Connettività
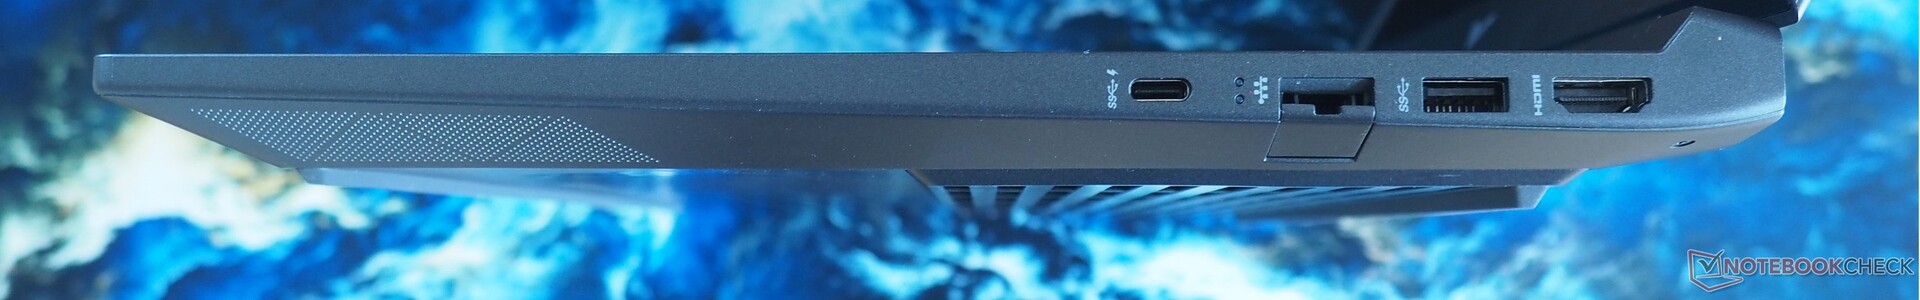
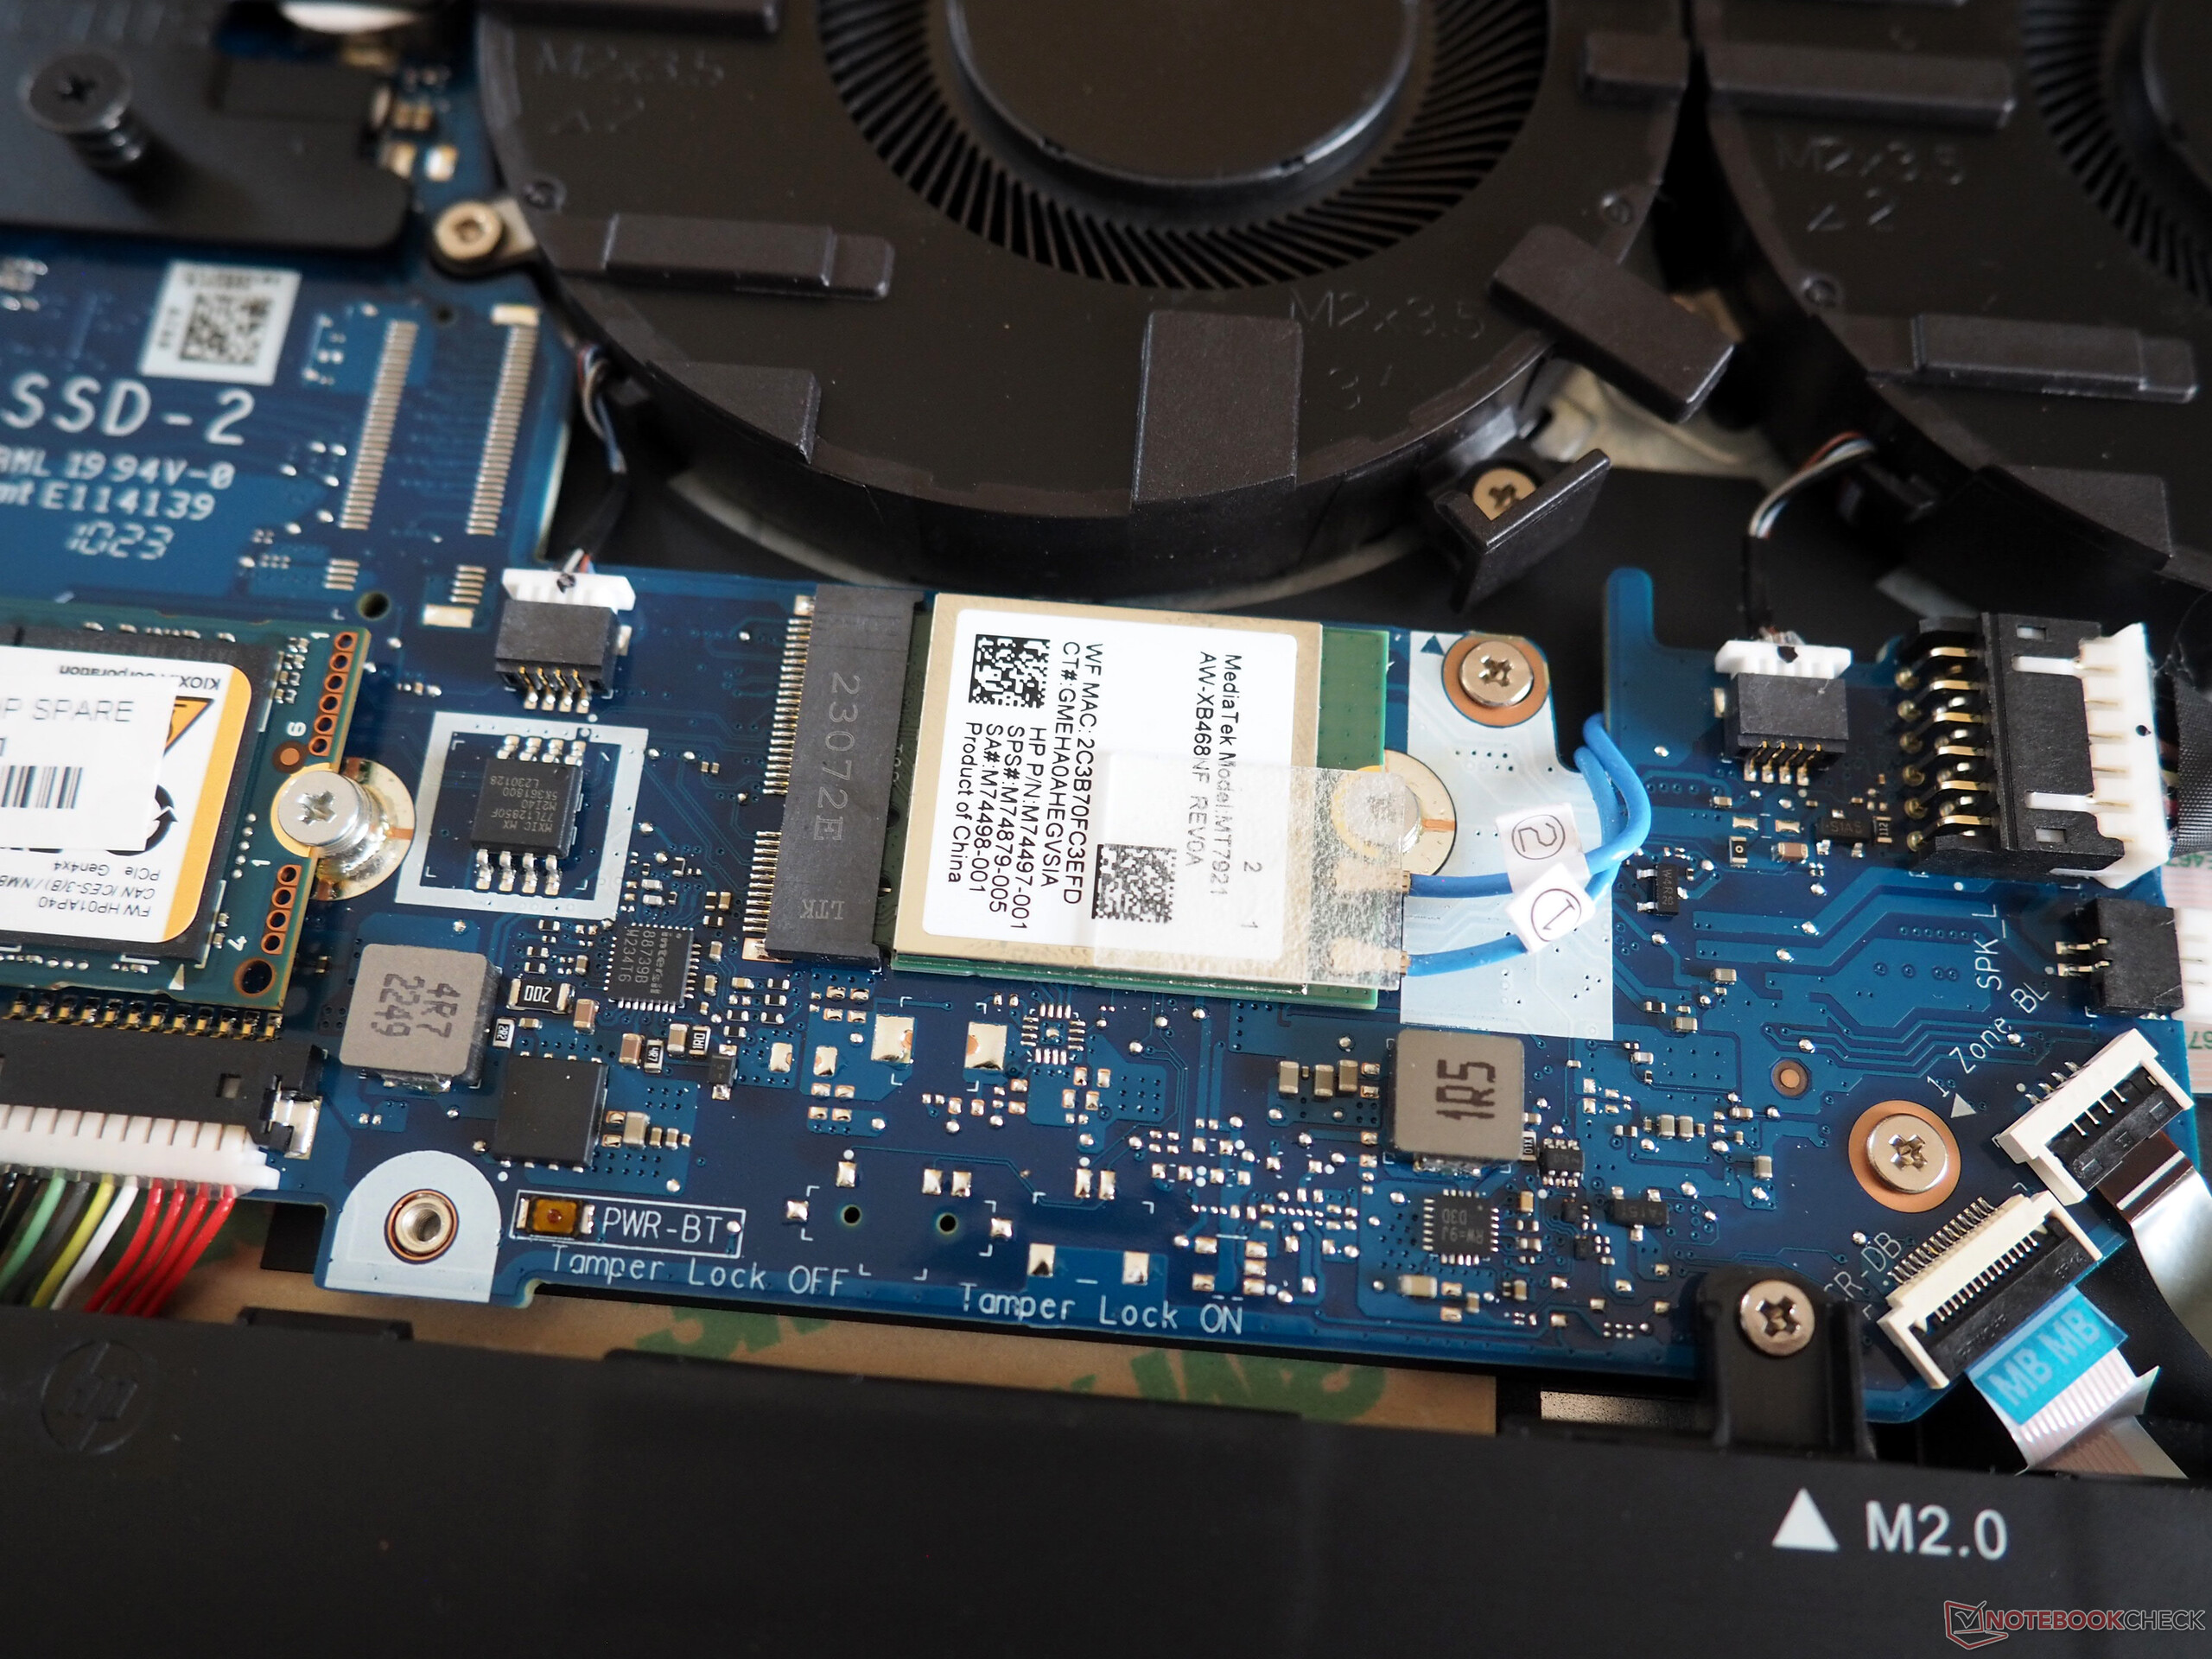
La gamma di connettività suscita reazioni diverse. Mentre l'assenza di un lettore di schede è notevole, HP scende a compromessi sulle porte USB contemporanee. Le porte USB disponibili (2x Tipo-A, 1x Tipo-C incl. DisplayPort) sono limitate a 5 Gbit/s. Fortunatamente, la porta HDMI è specificata come versione 2.1 dal produttore. Inoltre, sono presenti una presa audio e una porta RJ45 (limitata a 1 Gbit LAN anziché 2.5). Con la maggior parte delle connessioni situate nella parte posteriore del case, non ci sono difficoltà nell'utilizzo del mouse.
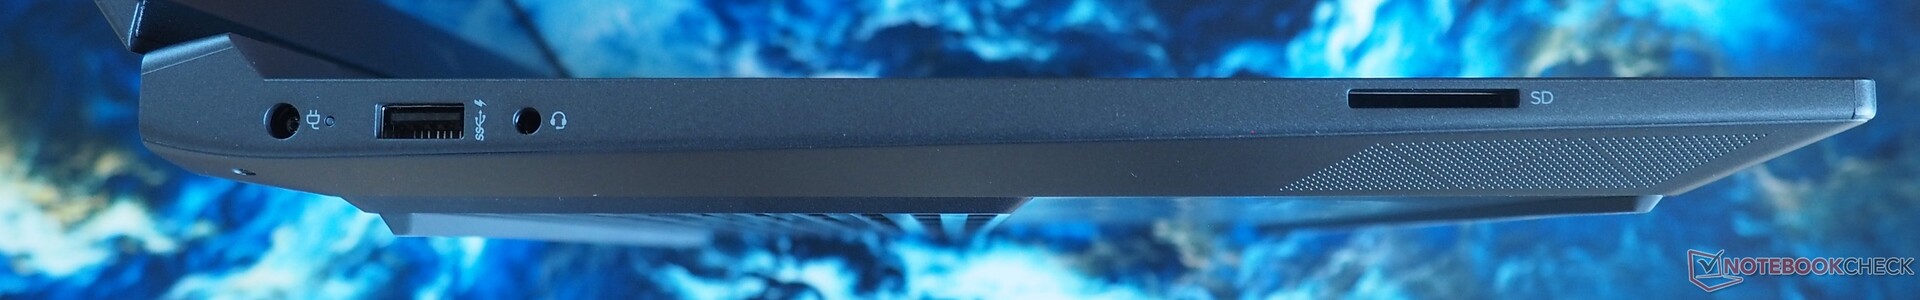
Lettore di schede SD
La velocità del lettore di schede rientra nella fascia media. Abbiamo registrato un affidabile 80 MB/s durante il trasferimento di più immagini jpg.
| SD Card Reader - average JPG Copy Test (av. of 3 runs) | |
| Media della classe Gaming (20.9 - 210, n=54, ultimi 2 anni) | |
| HP Victus 15-fa1057ng (AV PRO microSD 128 GB V60) | |
| HP Victus 15 fa0020nr (Toshiba Exceria Pro SDXC 64 GB UHS-II) | |
Comunicazione
Le prestazioni Wi-Fi sono un po' carenti. Durante il nostro test di portata, a 3,28 piedi di distanza dal router di riferimento, il modulo MediaTek integrato si è classificato all'ultimo posto nel campo di confronto.
Webcam
Le prestazioni della webcam 720p non sono eccezionali e lasciano spazio a miglioramenti, soprattutto in termini di nitidezza dell'immagine.


Accessori
Il portatile viene fornito con alcuni opuscoli informativi e un alimentatore da 200 watt non troppo ingombrante.
Manutenzione
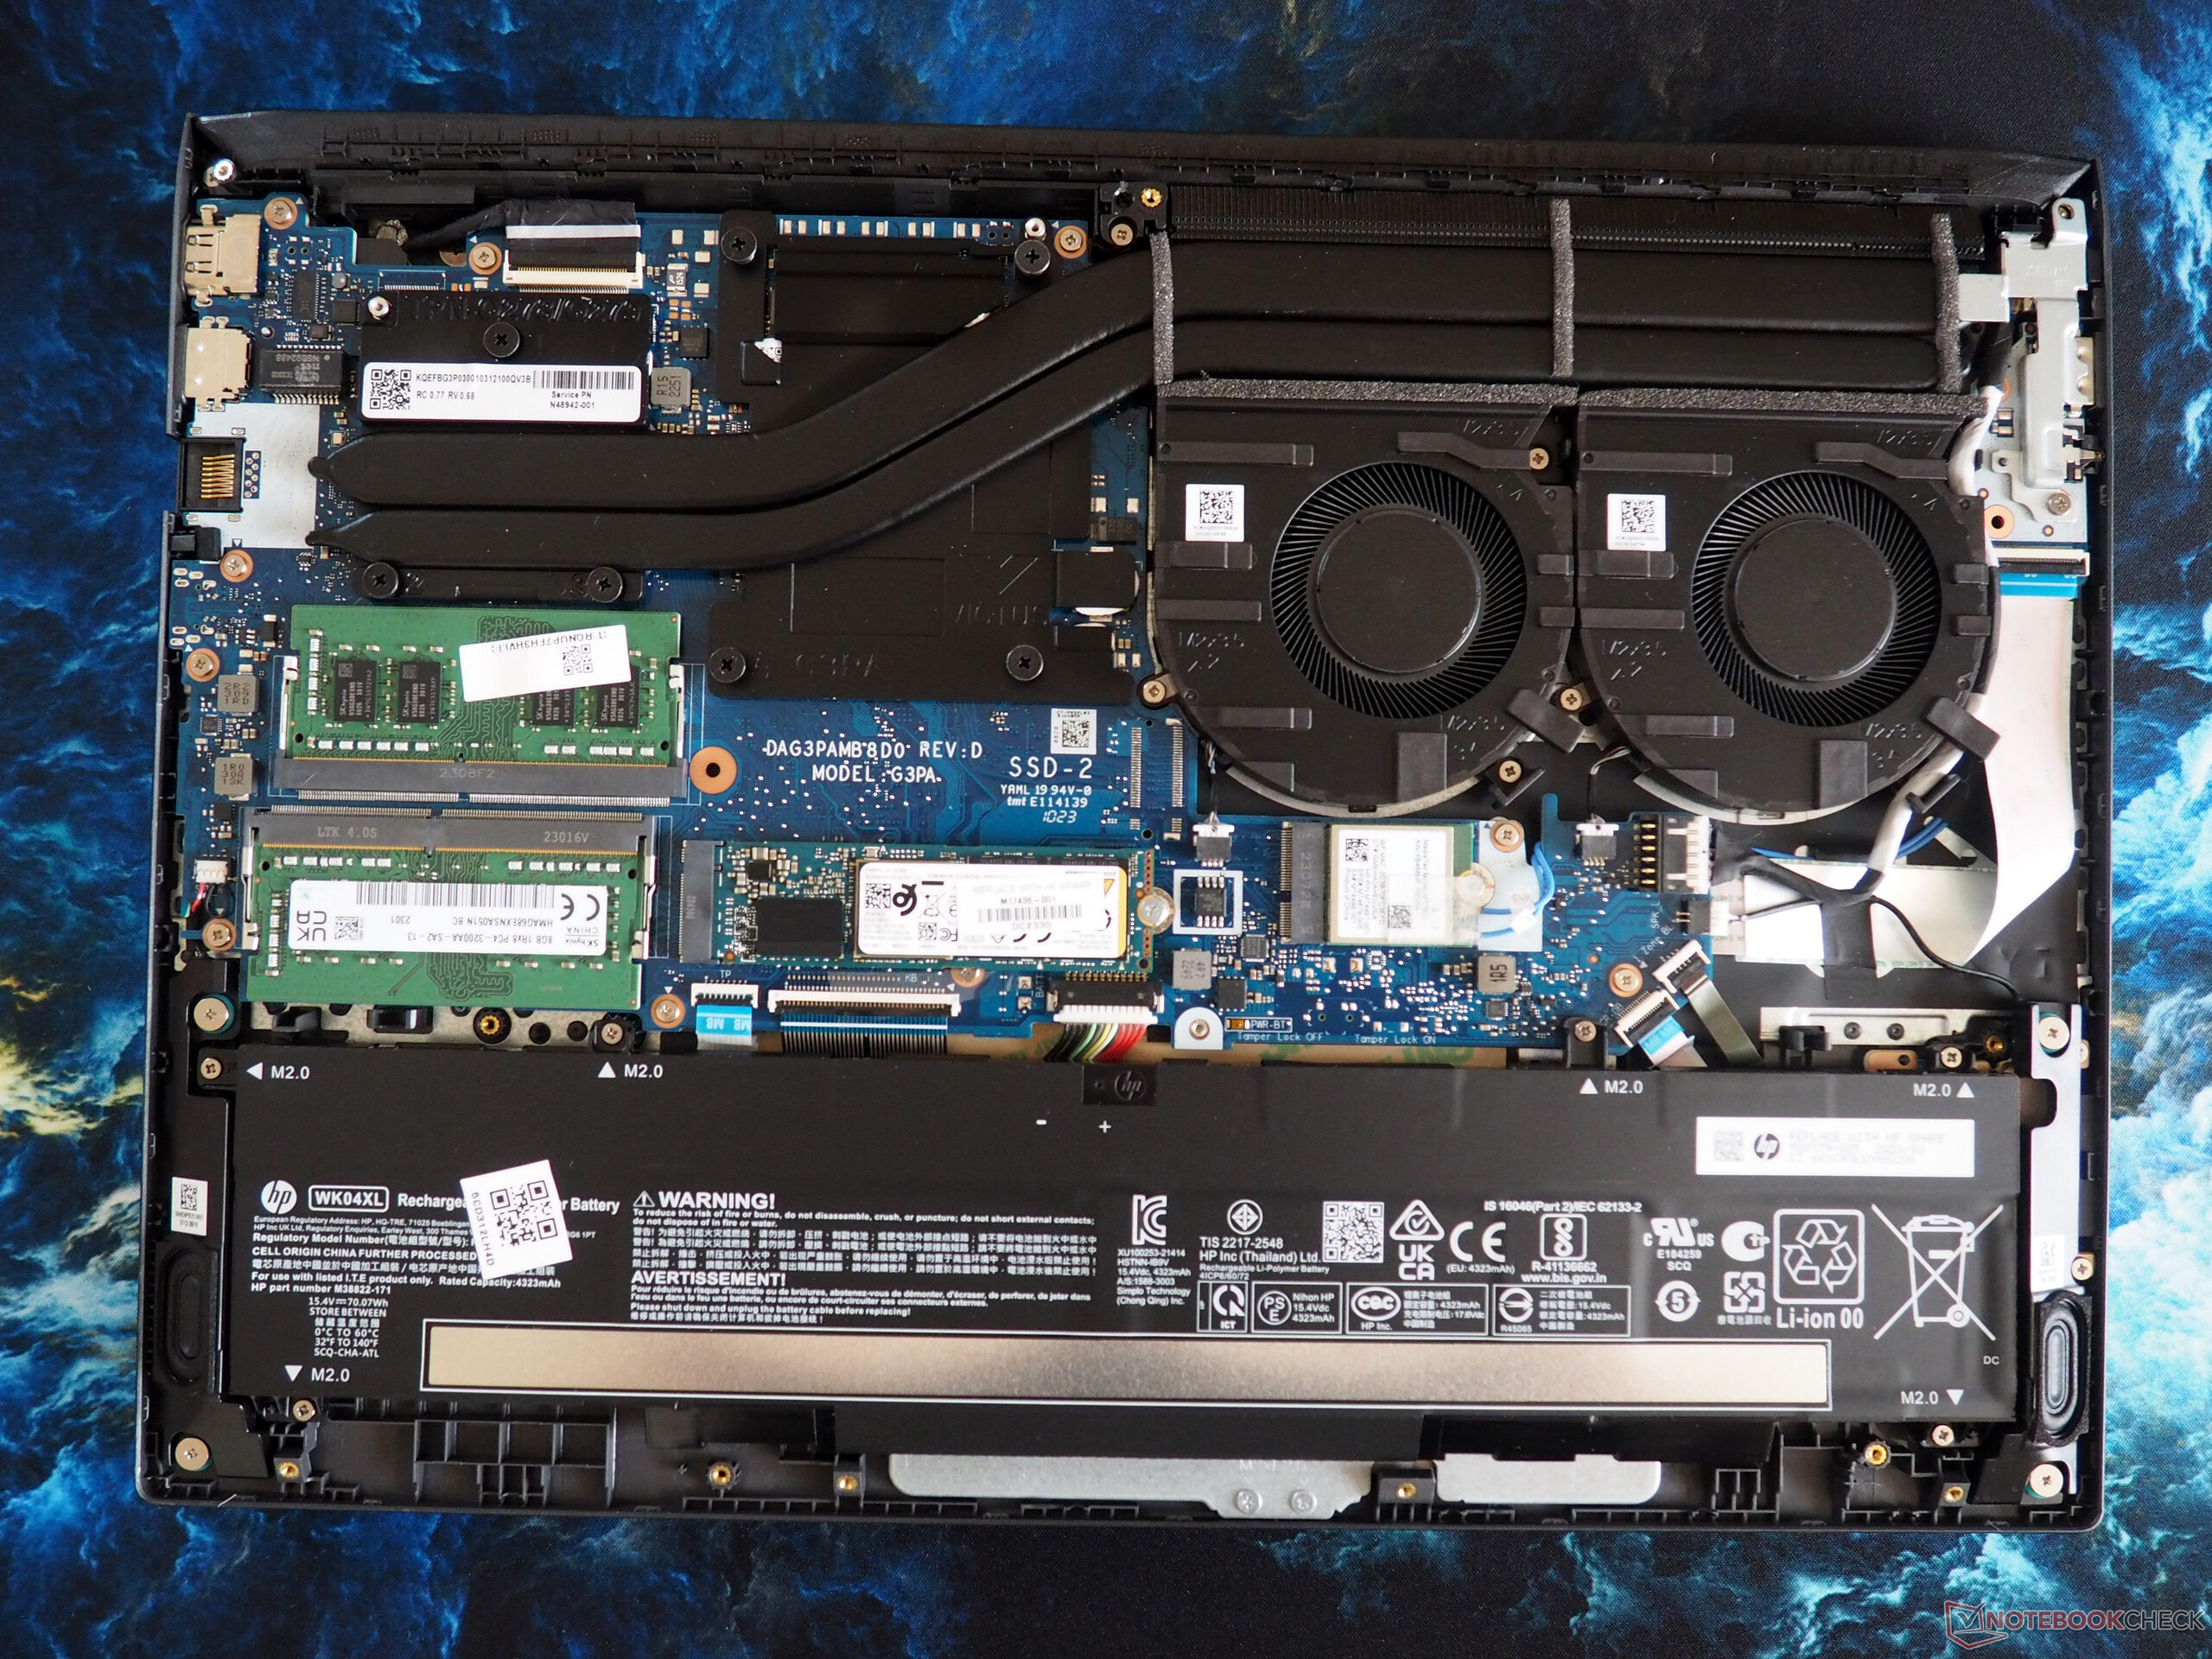
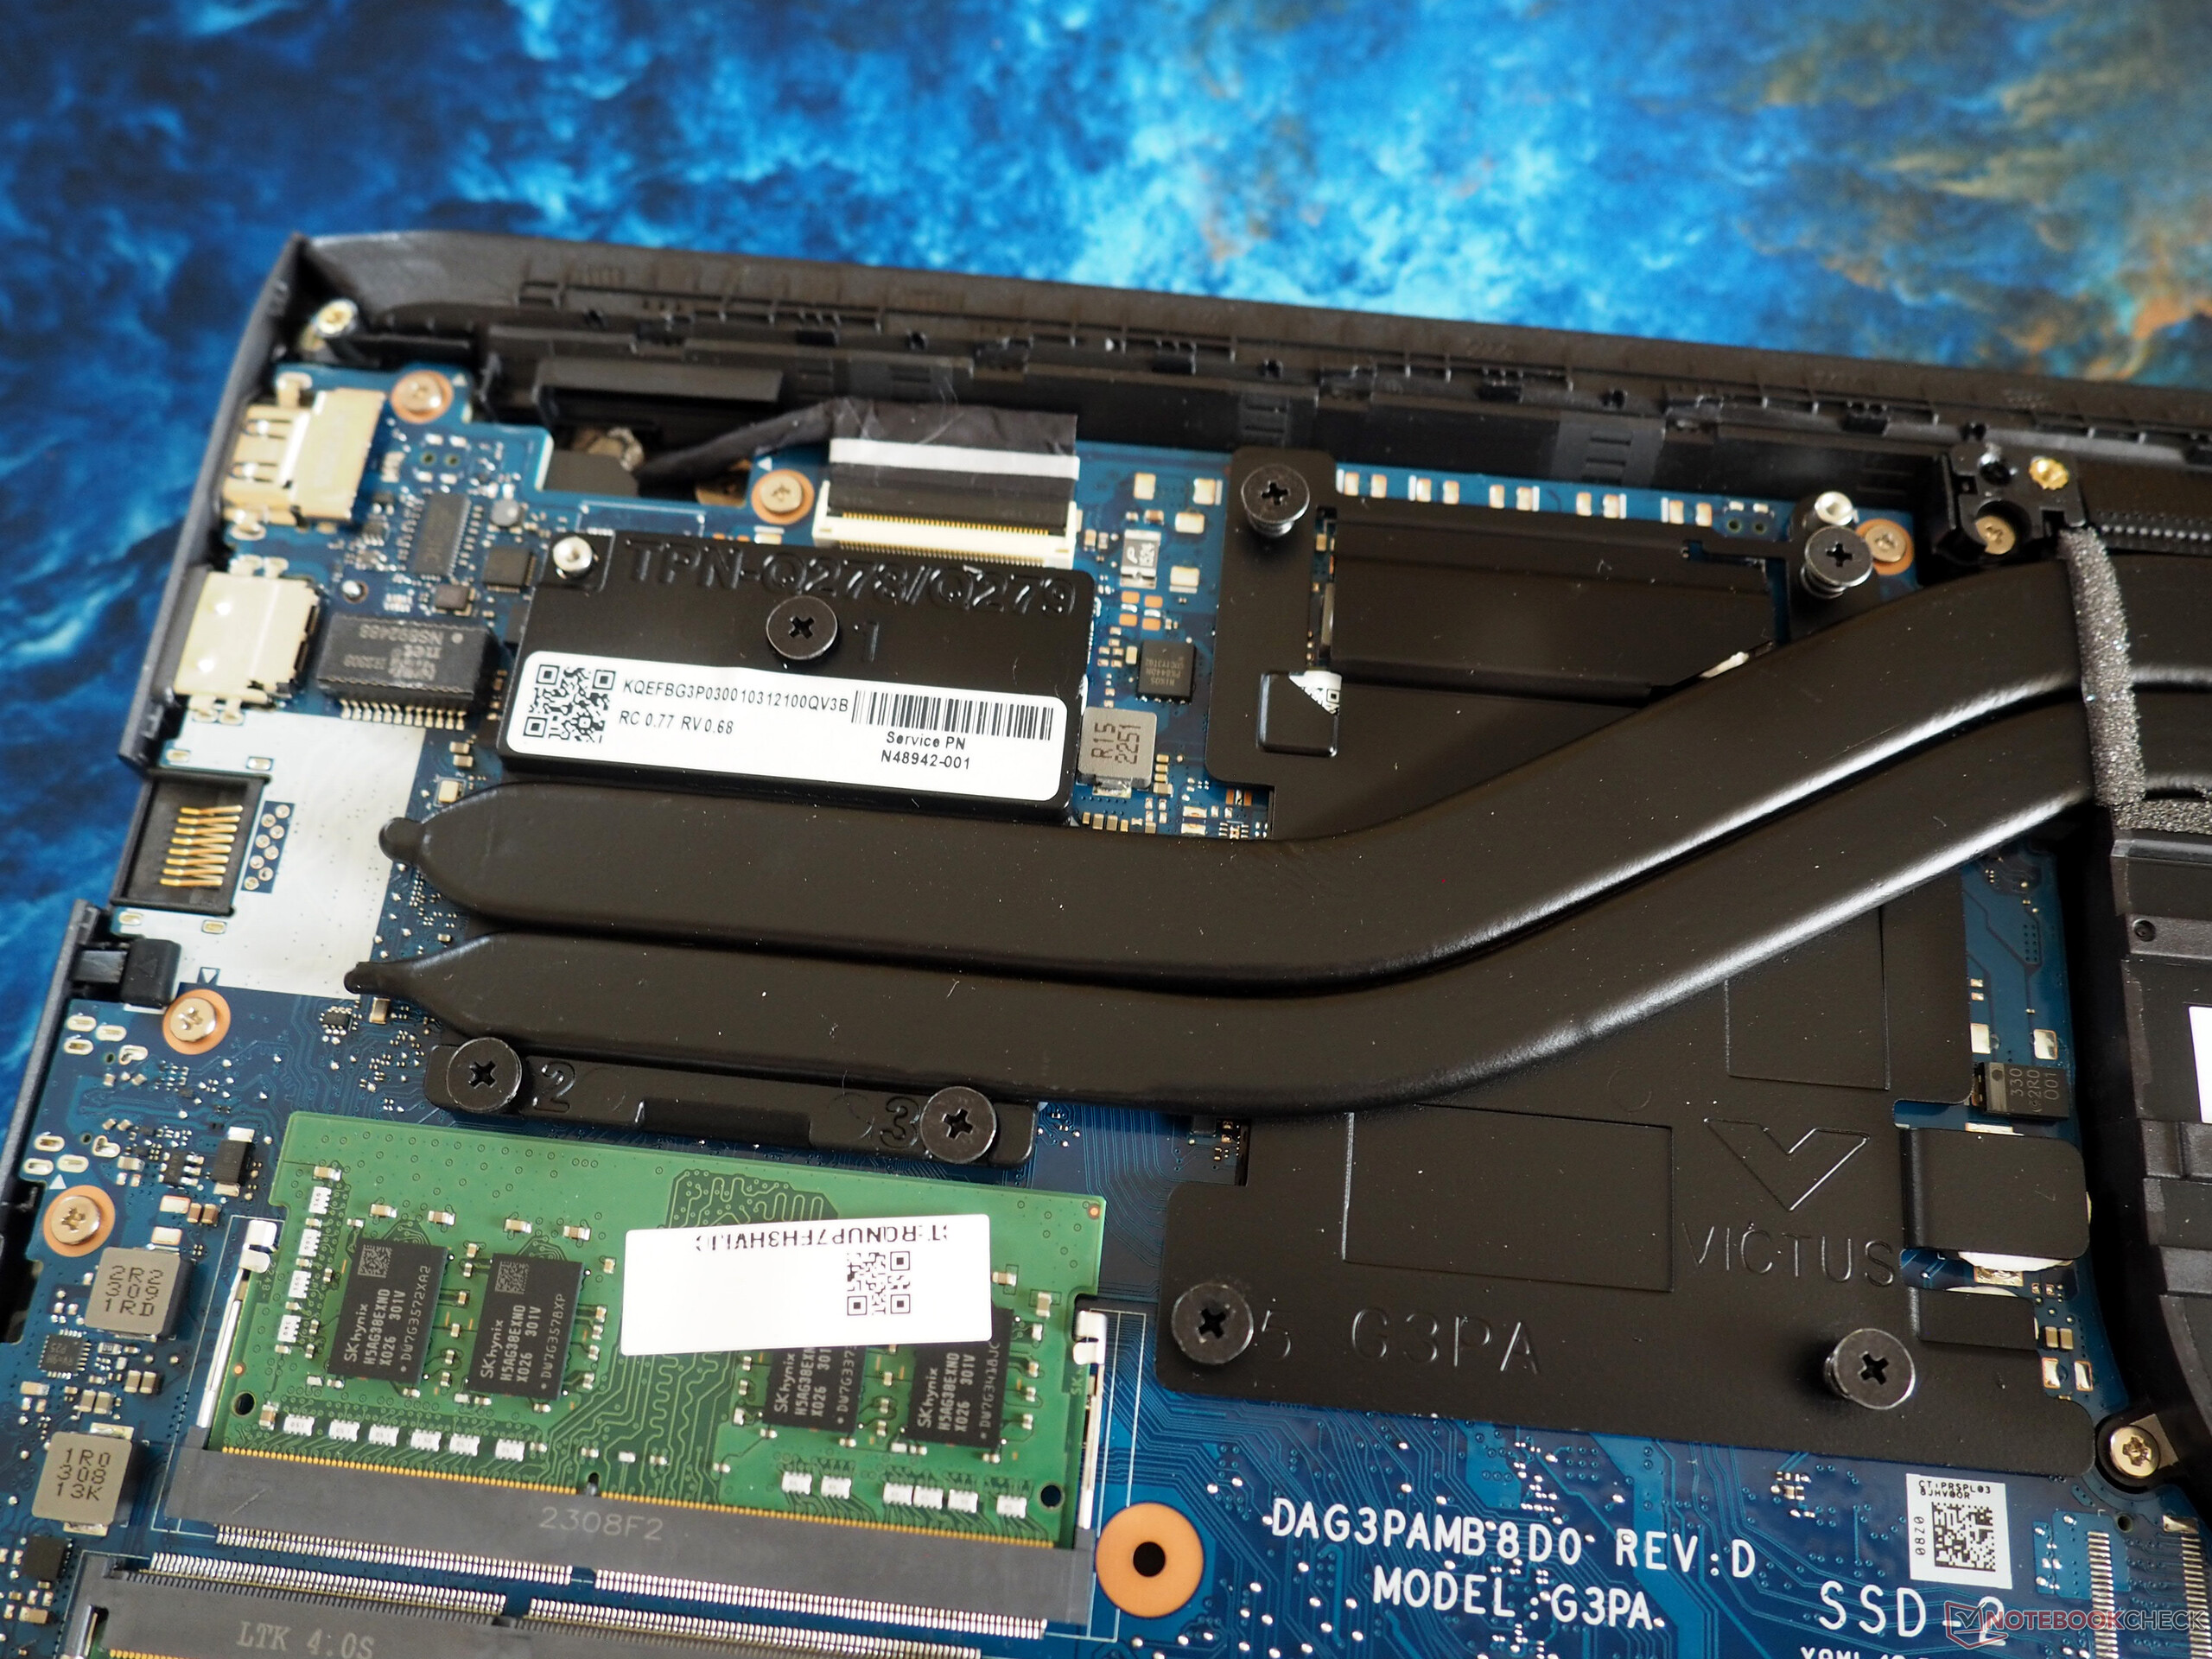
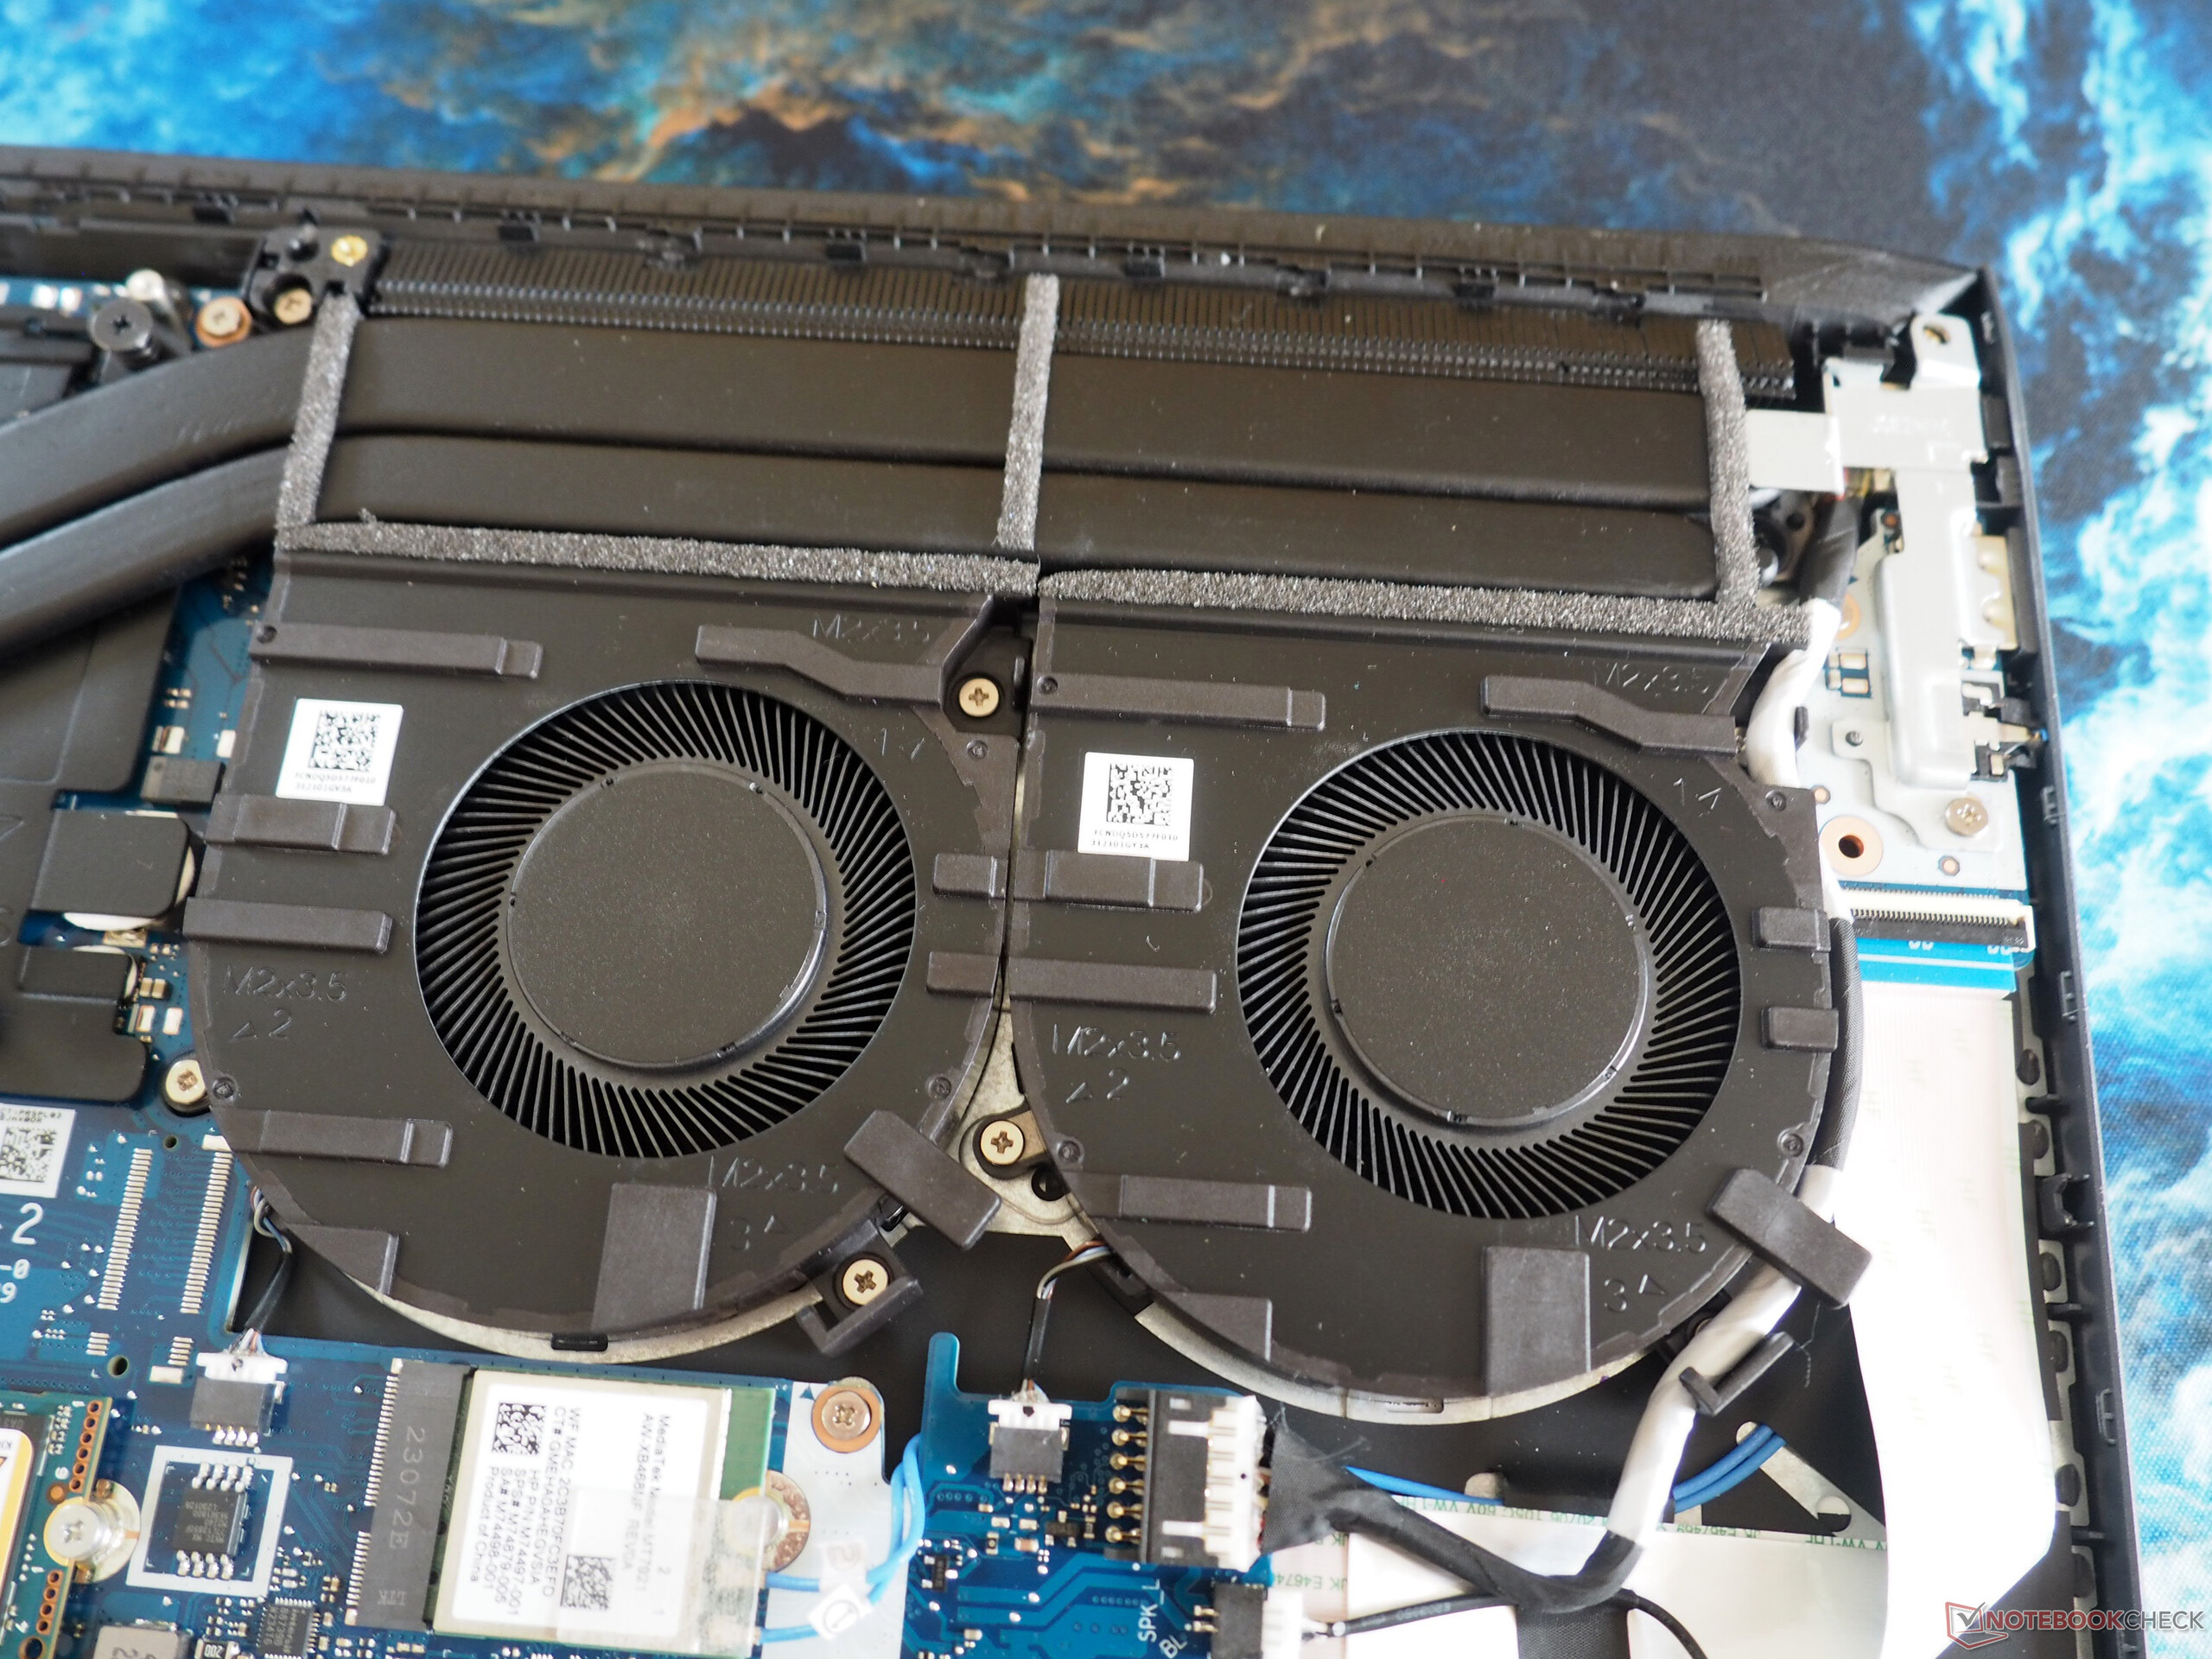
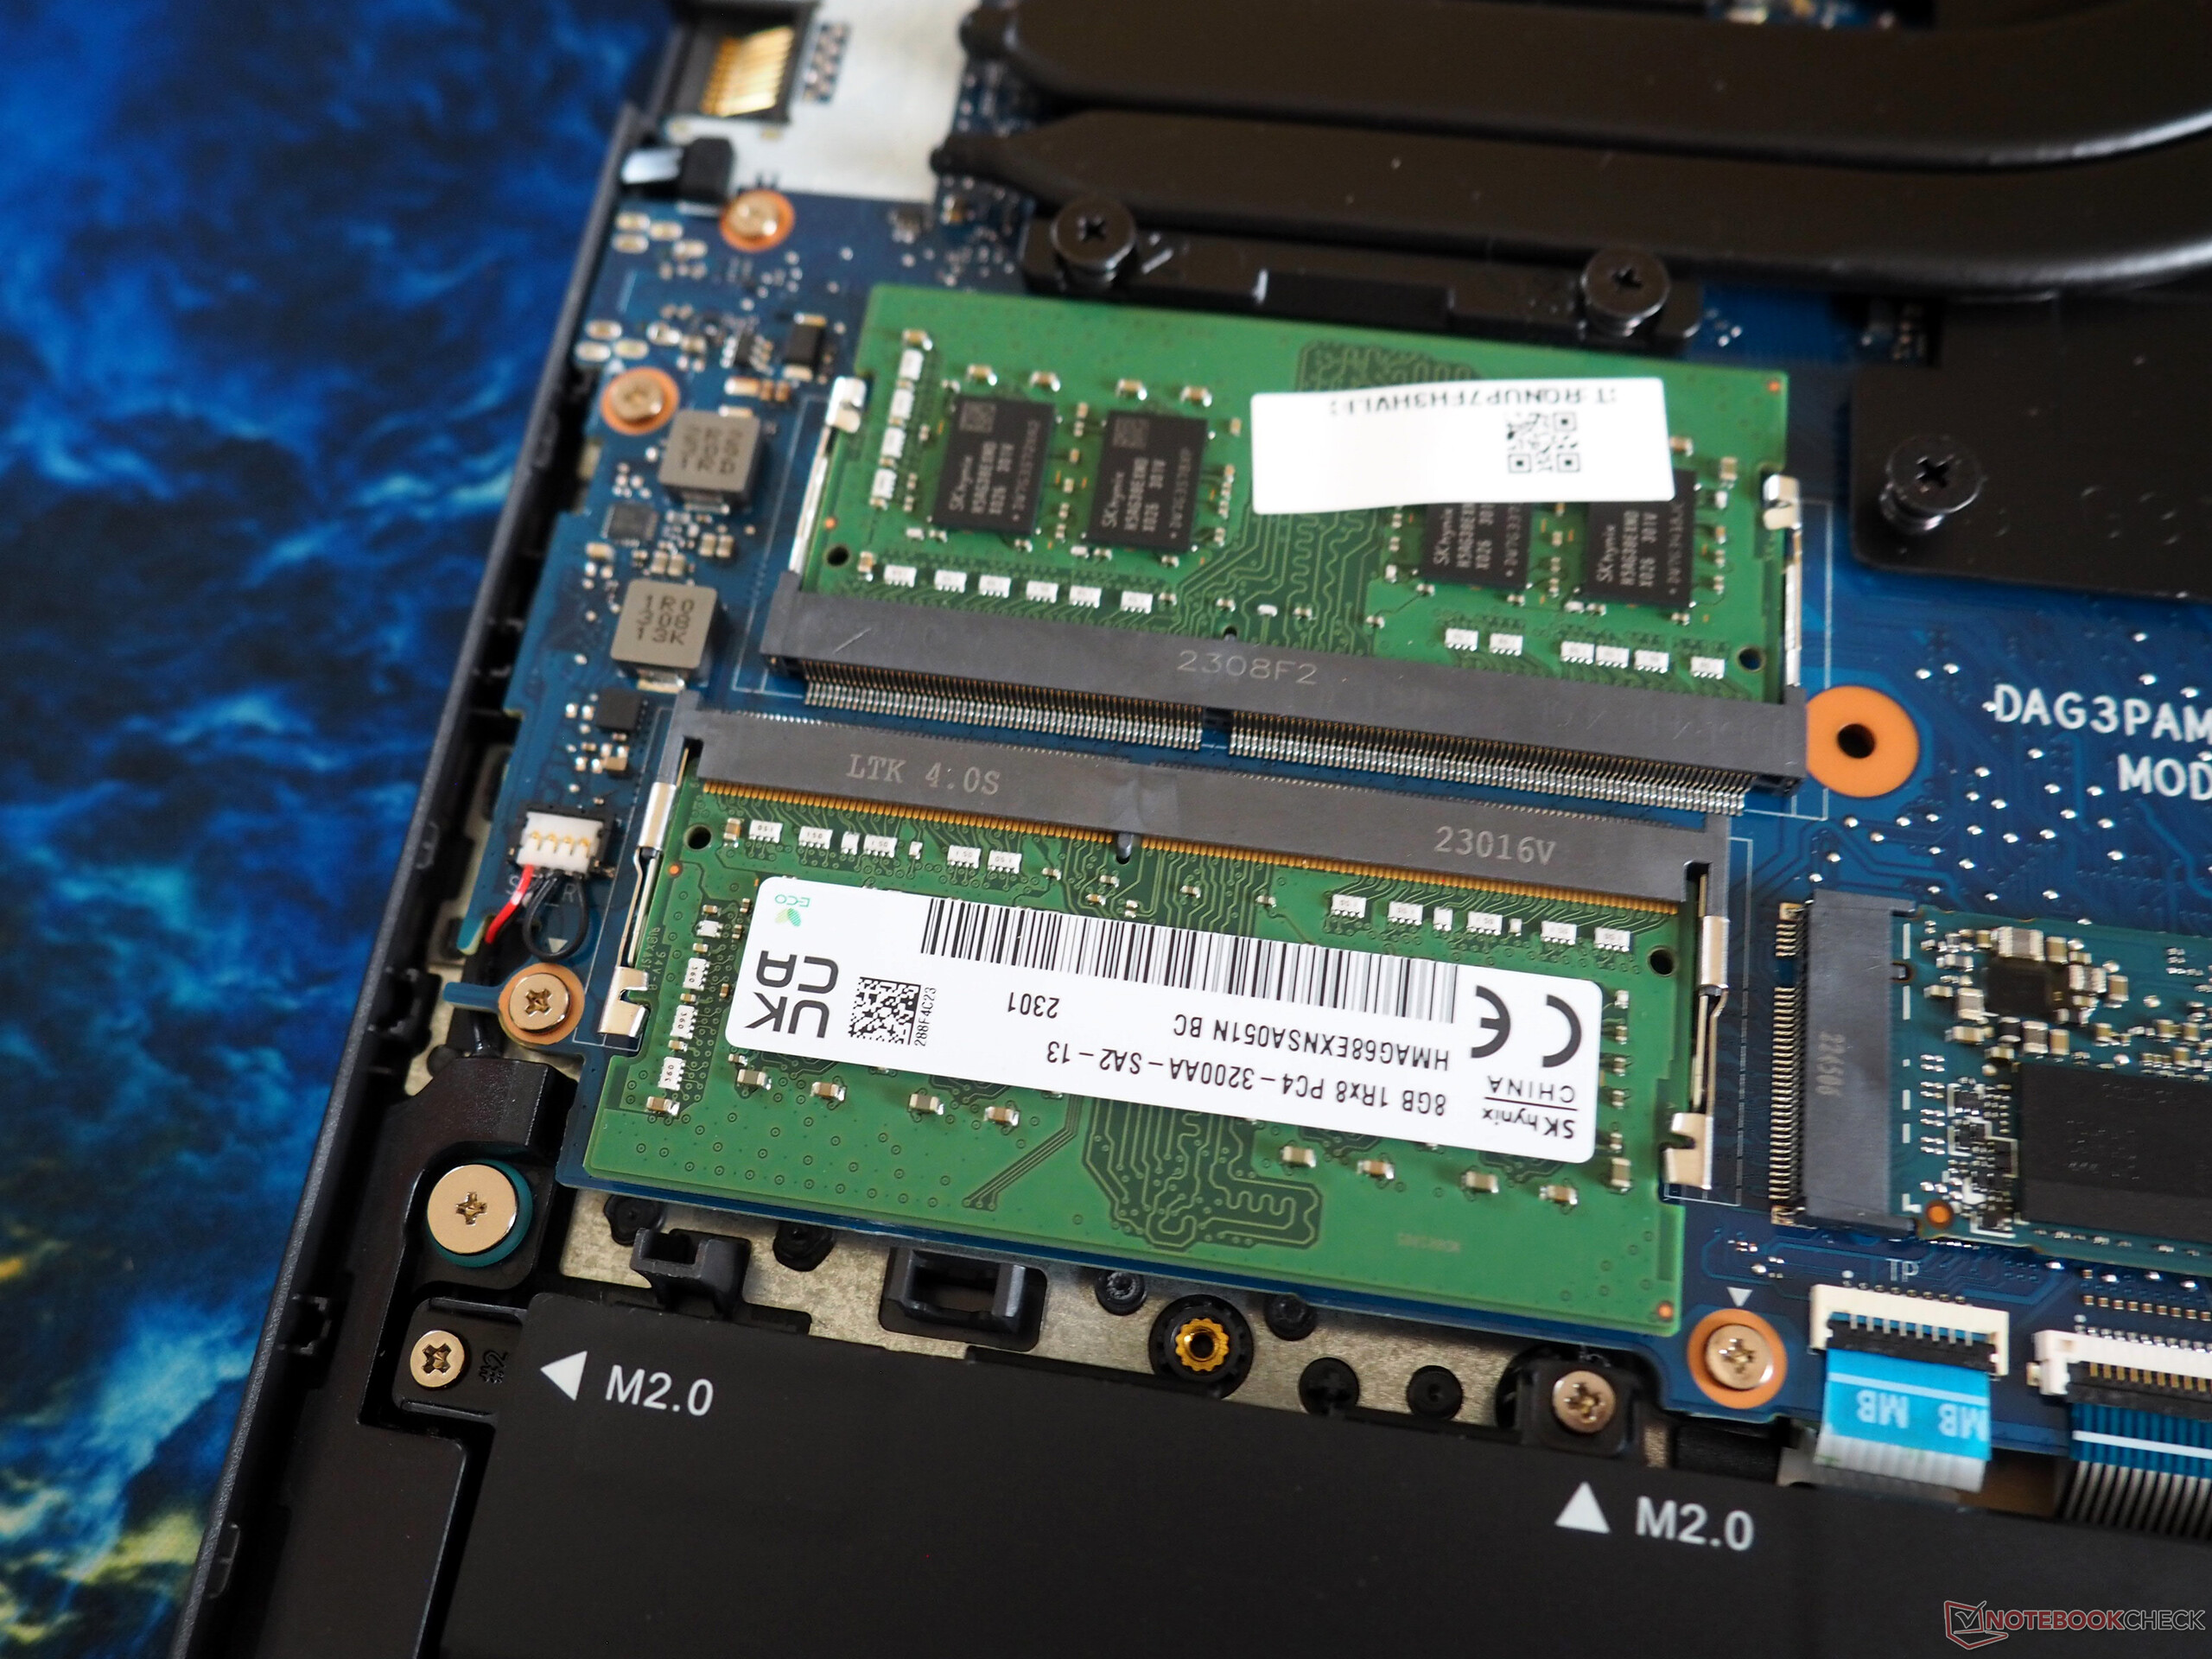
È necessaria una certa cautela durante la manutenzione. Mentre le viti Phillips sulla piastra di base possono essere rimosse in modo relativamente rapido, l'allentamento delle clip di fissaggio si rivela un po' impegnativo, anche con un attrezzo adatto. Le immagini mostrano l'interno dell'involucro e che tutti i componenti essenziali sono accessibili.
Garanzia
La garanzia copre solo 12 mesi.
Dispositivi di ingresso
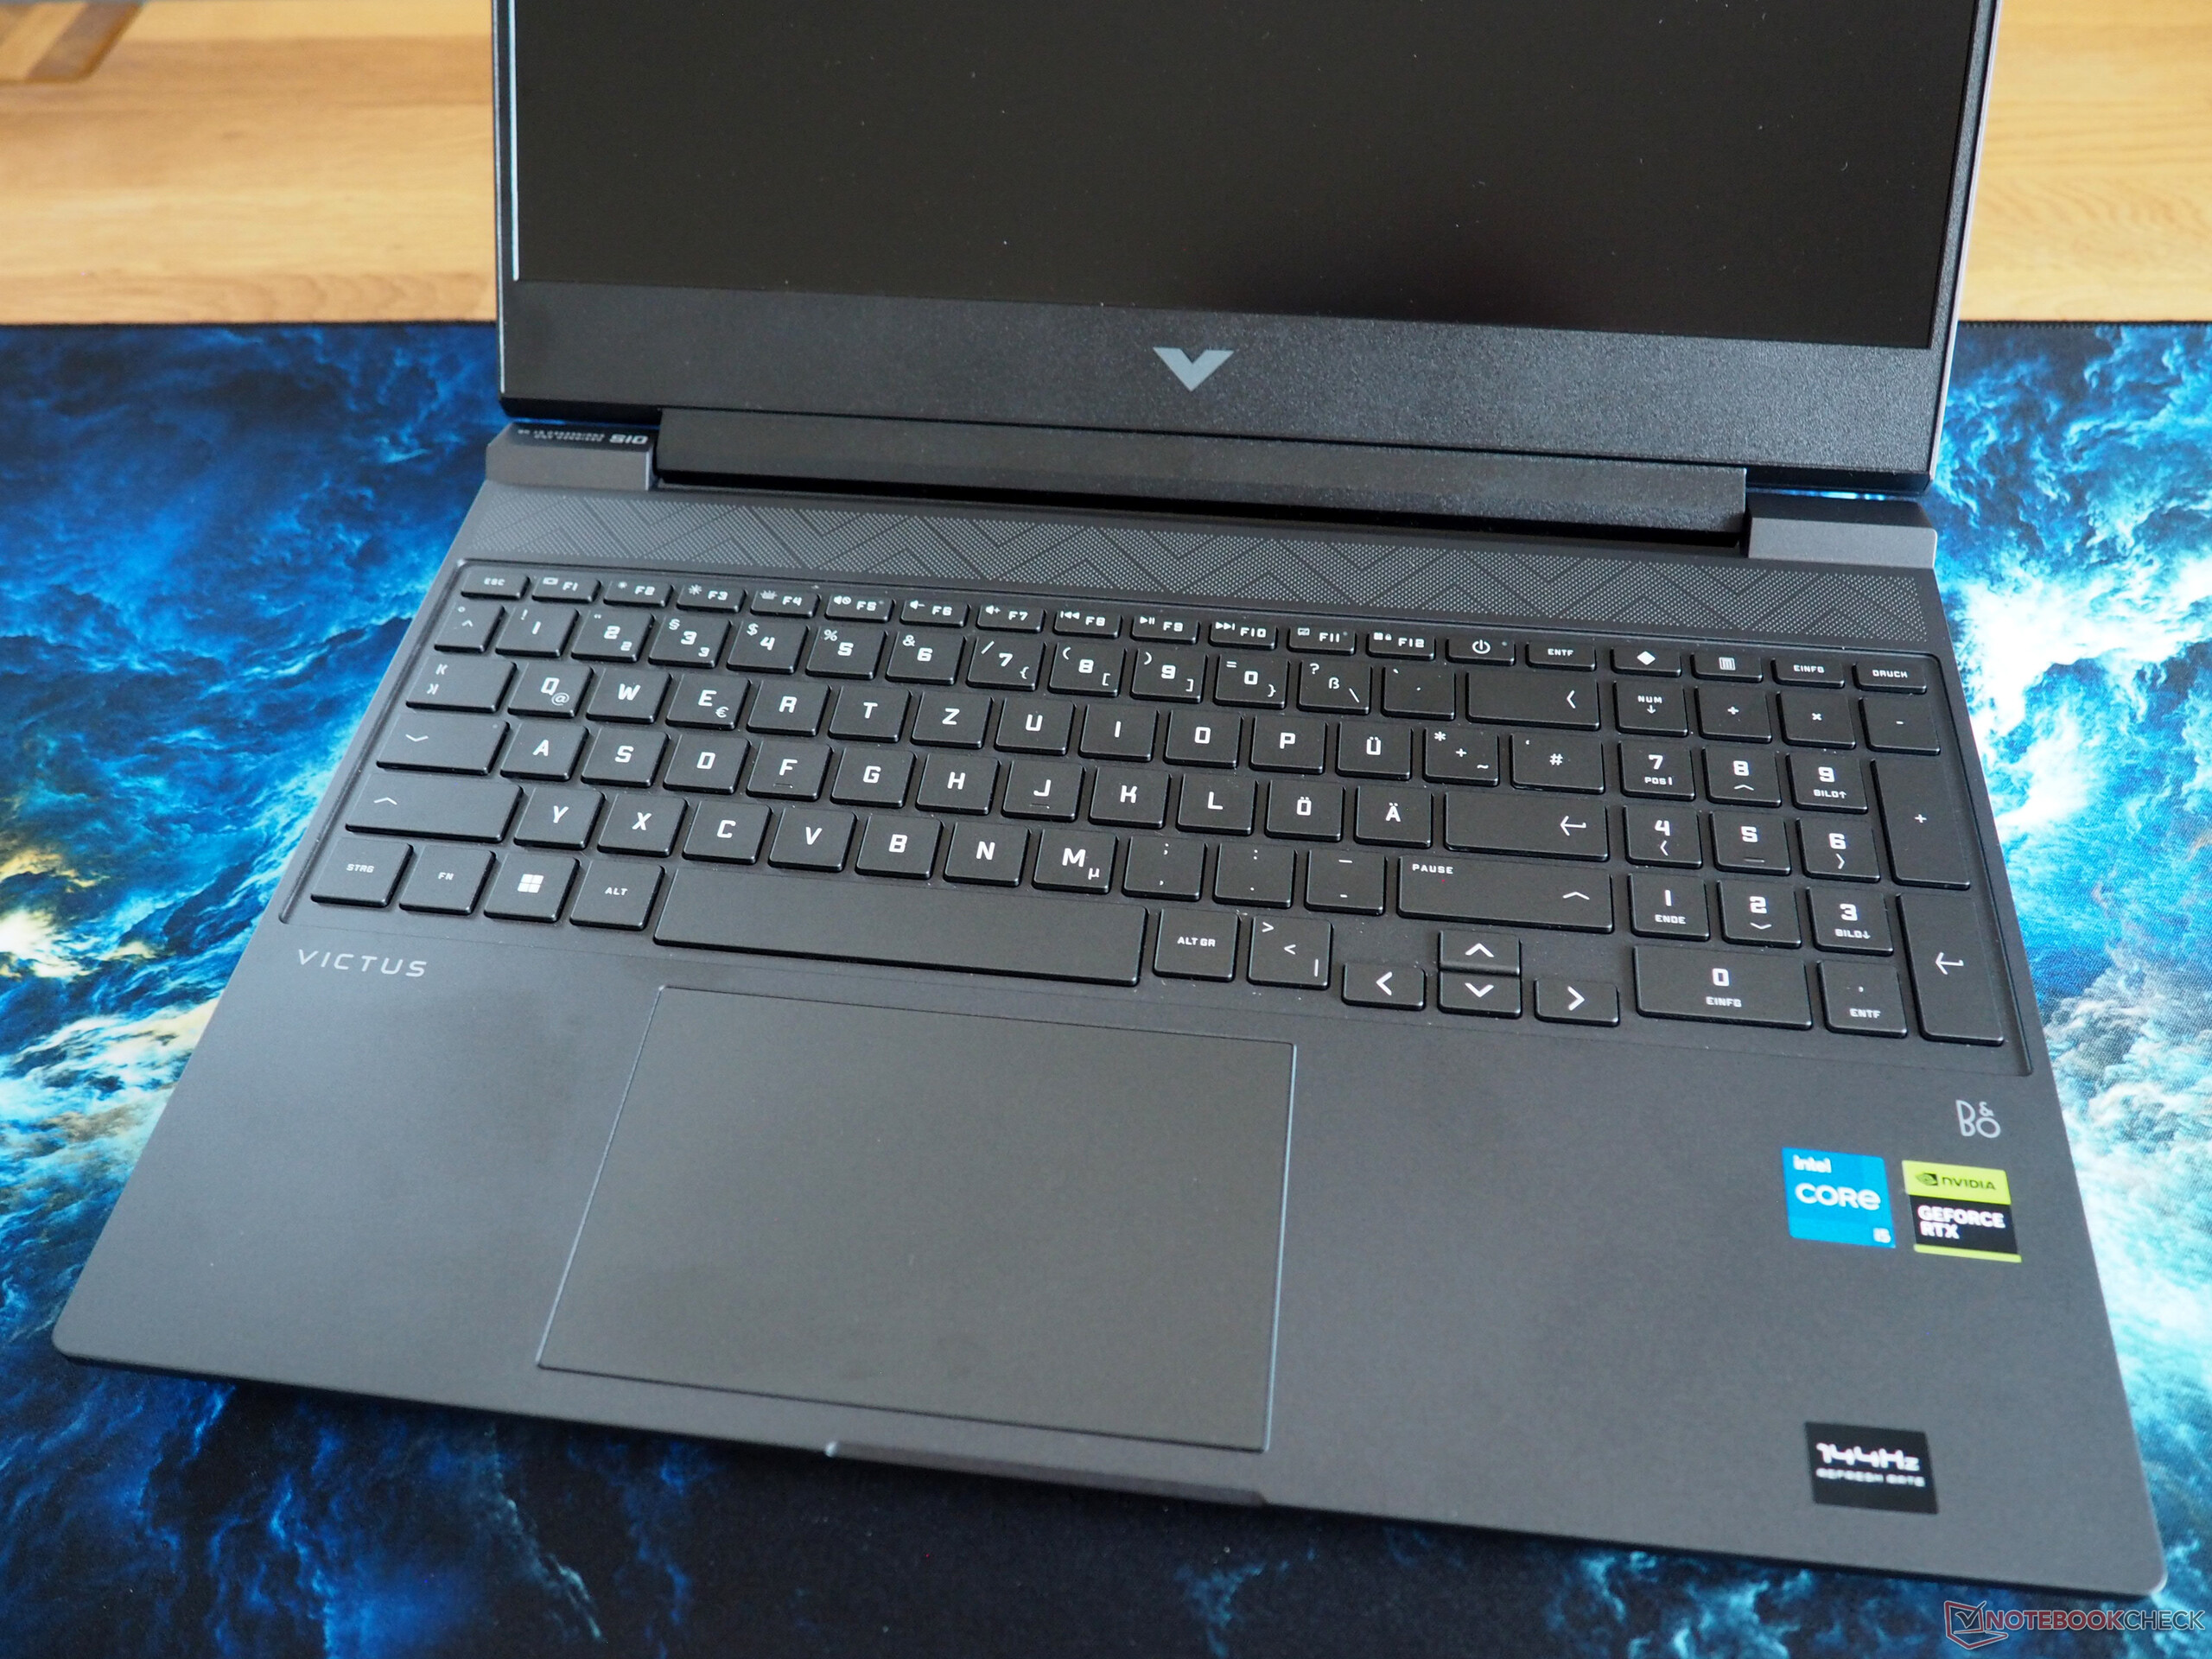
Tastiera
Per quanto riguarda la tastiera, il layout richiede un certo adattamento. Le frecce direzionali compatte e la disposizione non convenzionale della riga F (pulsante di accensione non sul bordo esterno, Ins e Del non adiacenti, ecc. Tuttavia, la tastiera offre un'esperienza di digitazione soddisfacente. L'illuminazione bianca ha solo due impostazioni: on o off, senza livelli di luminosità regolabili.
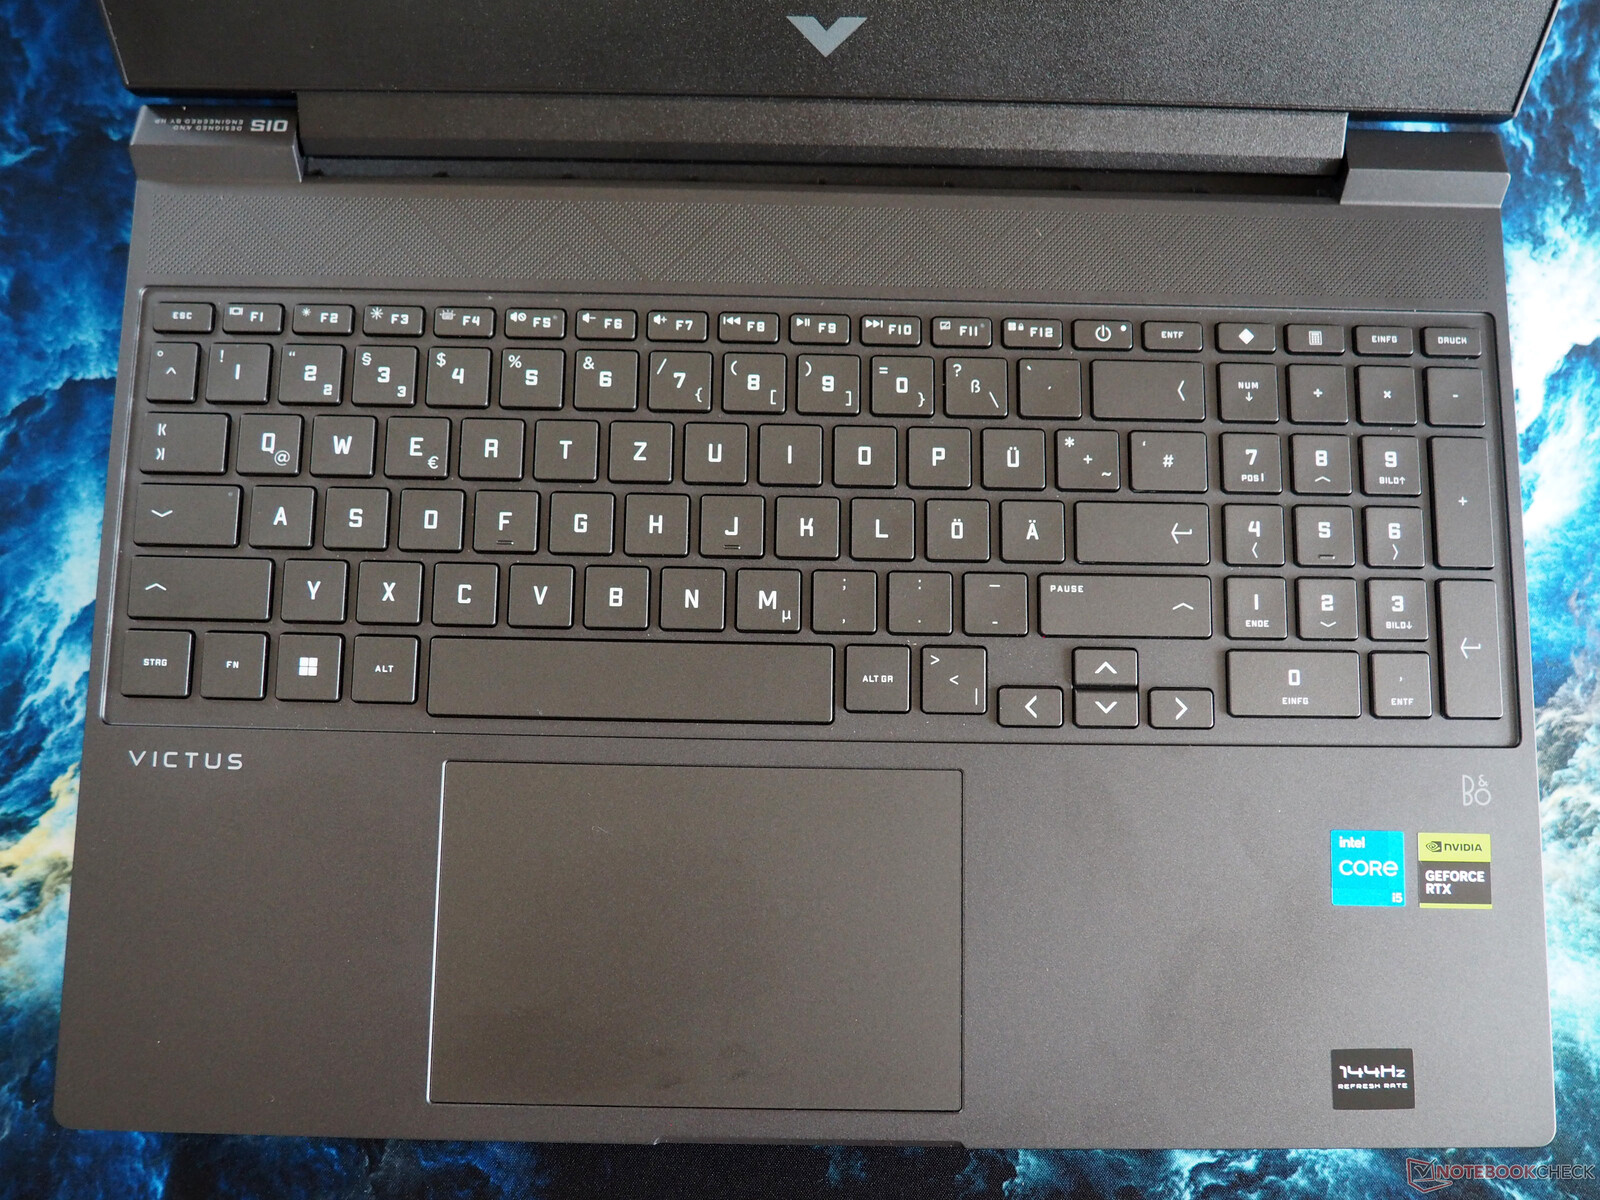
Touchpad
La qualità del touchpad è in linea con quella della concorrenza. Le proprietà di scorrimento e la funzionalità delle superfici di clic non sono né scarse né eccezionalmente buone. Non sono stati riscontrati problemi evidenti con il supporto dei gesti. Le dimensioni sono discrete, circa 4,92 x 3,15 pollici.
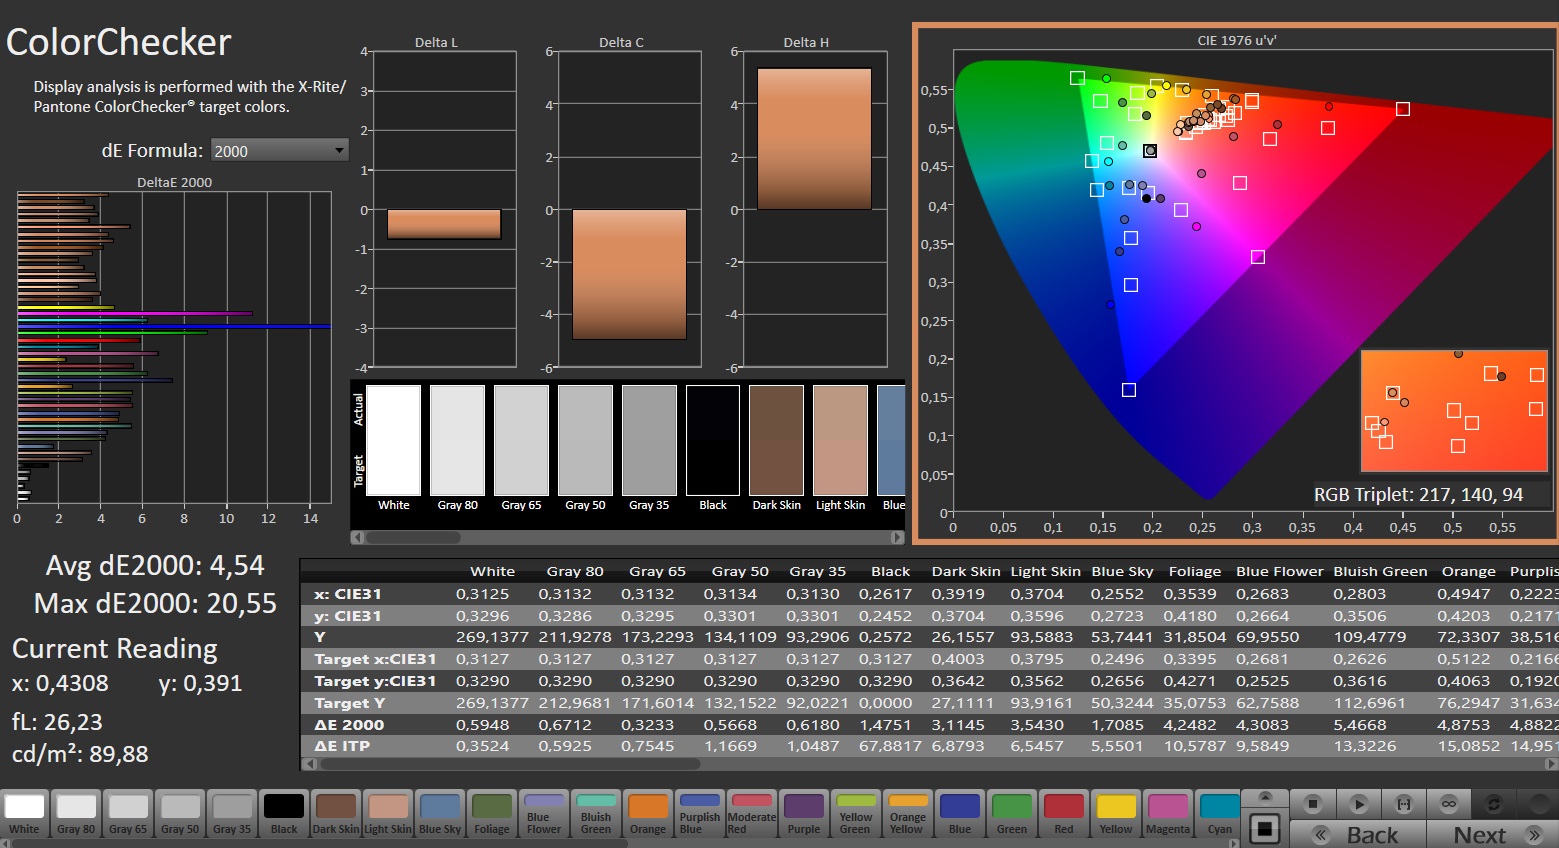
Display
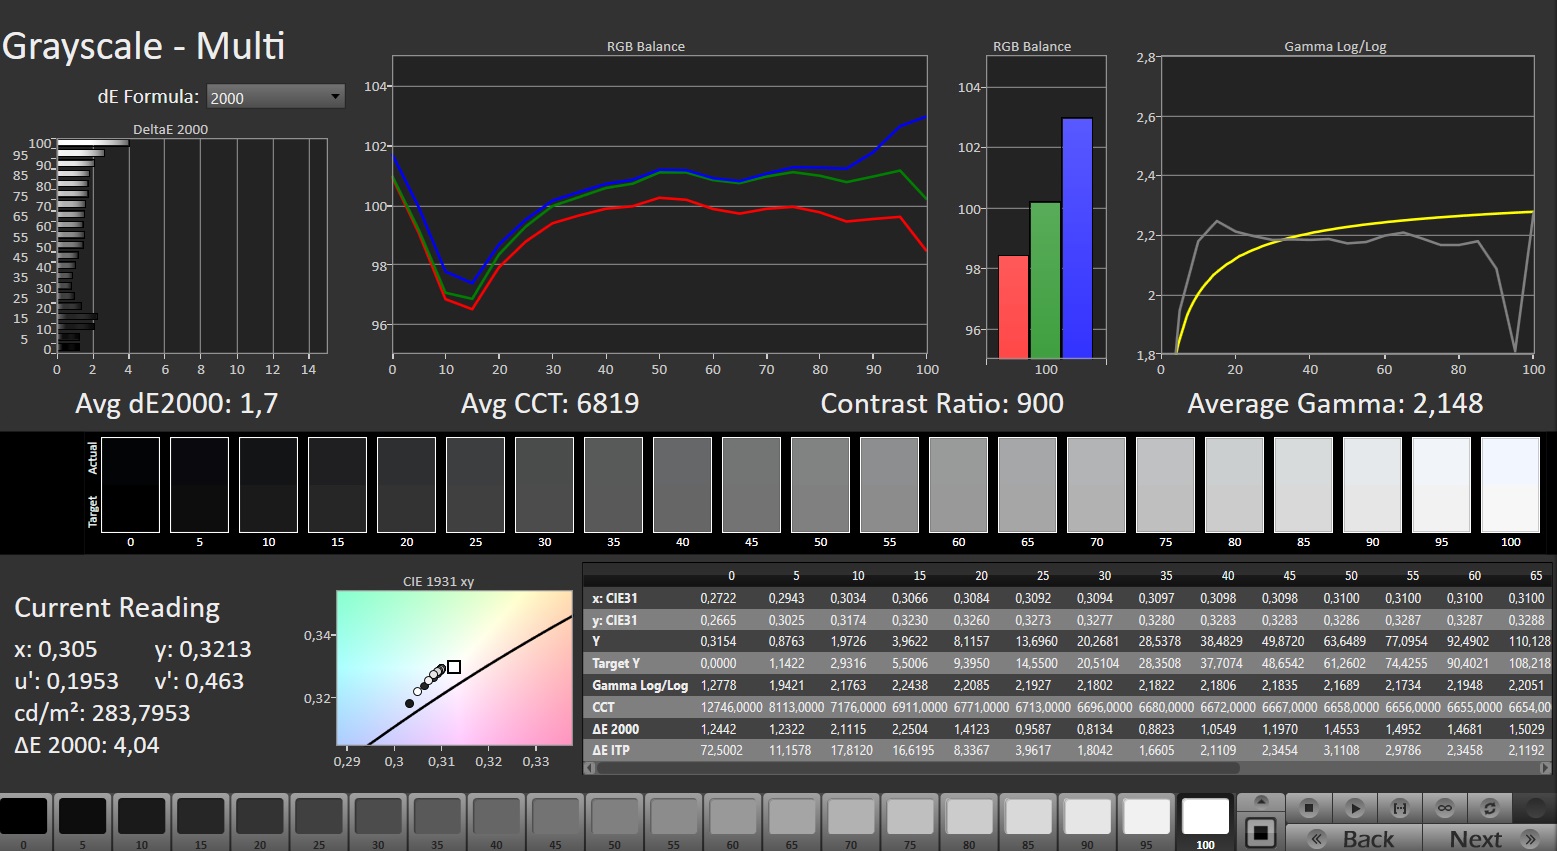
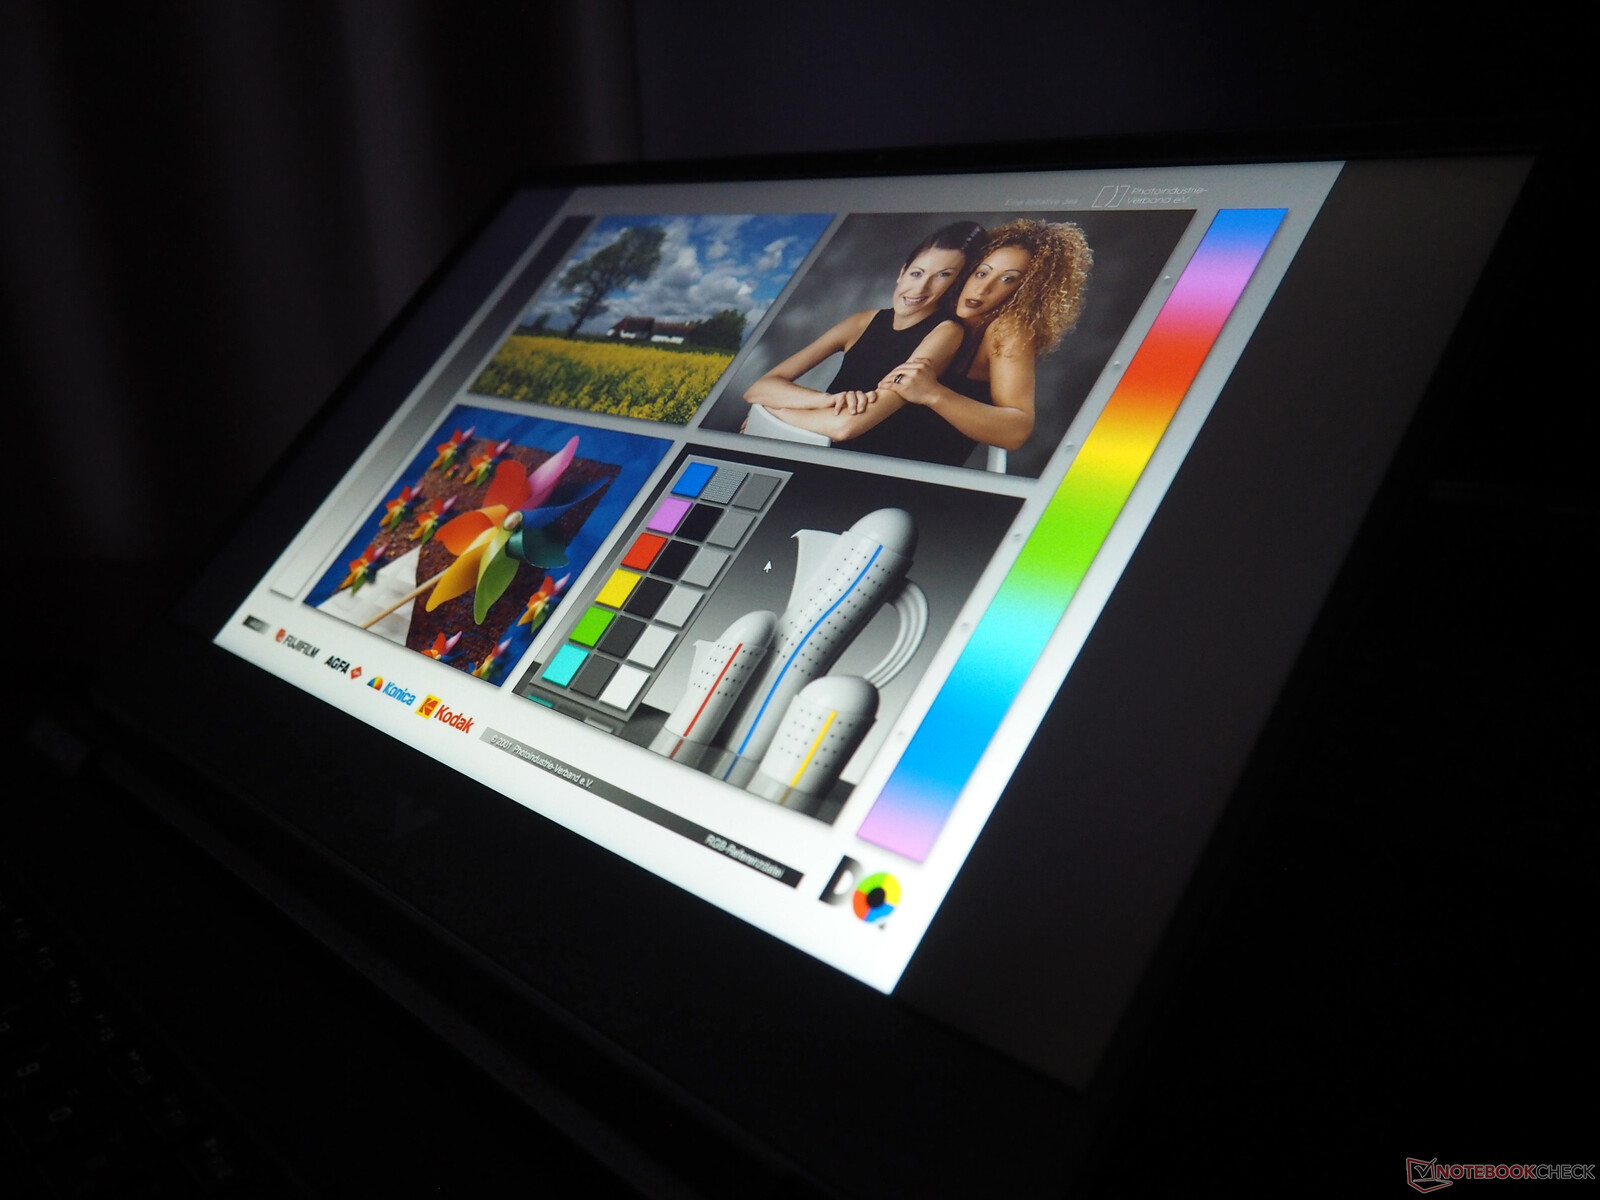
Il display di qualità inferiore si rivela lo svantaggio più significativo. Mentre il livello di nero (0,28 cd/m²) e il contrasto (975:1) sono ancora decenti, la luminosità lascia molto a desiderare. Una media di 249 cd/m² può essere problematica anche in ambienti chiusi. Il Victus 15 è del tutto inadatto all'uso esterno.
| |||||||||||||||||||||||||
Distribuzione della luminosità: 84 %
Al centro con la batteria: 273 cd/m²
Contrasto: 975:1 (Nero: 0.28 cd/m²)
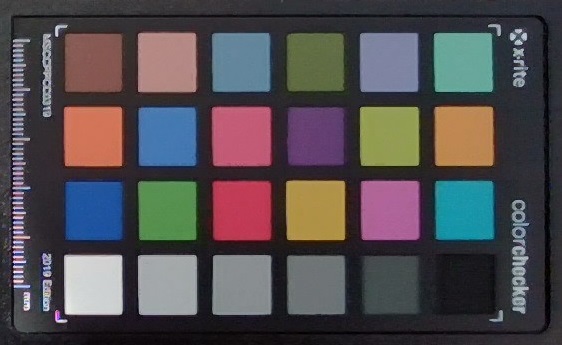
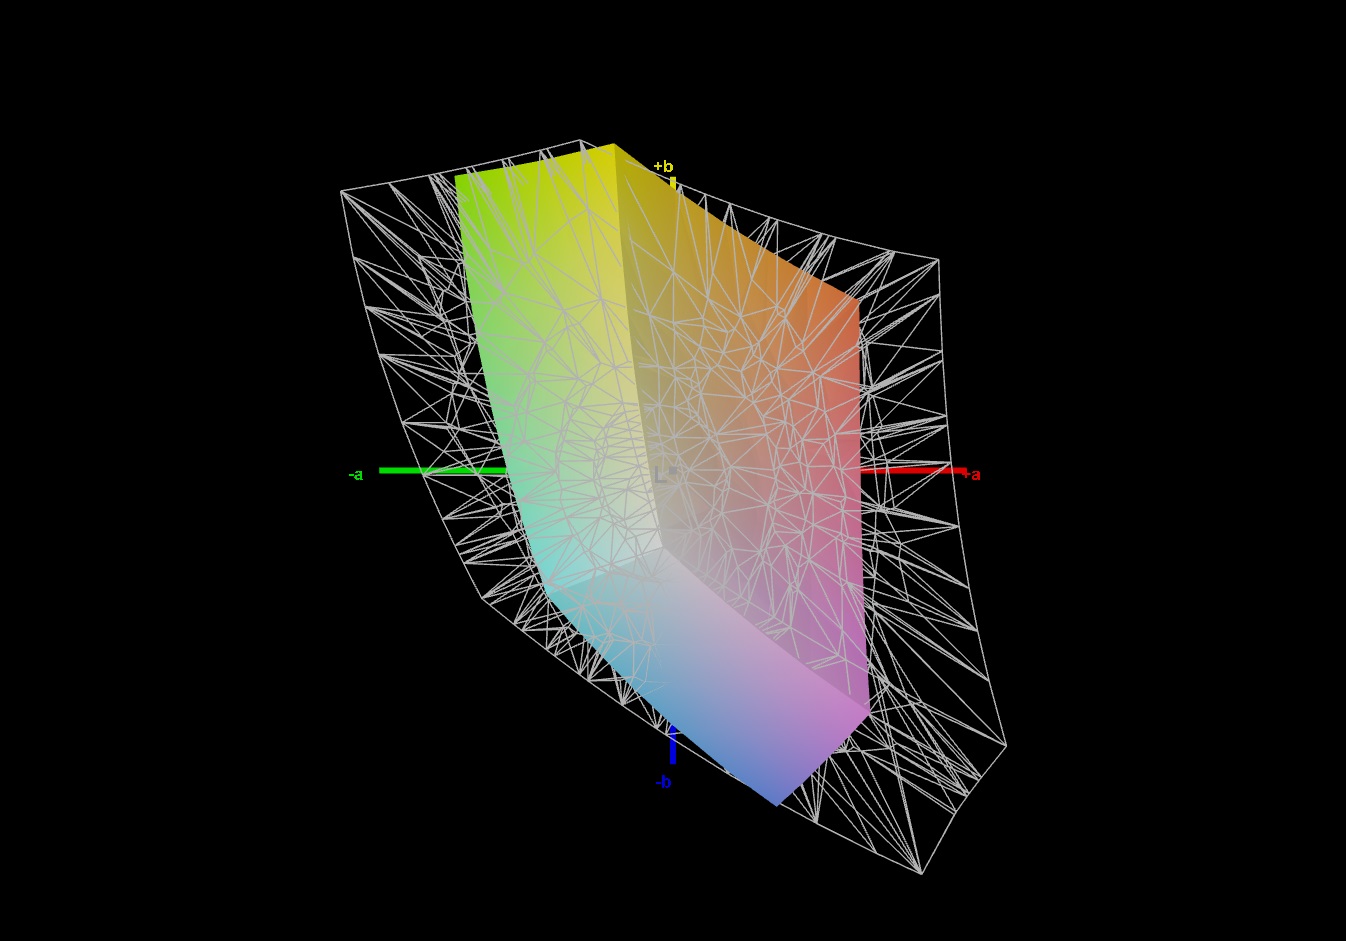
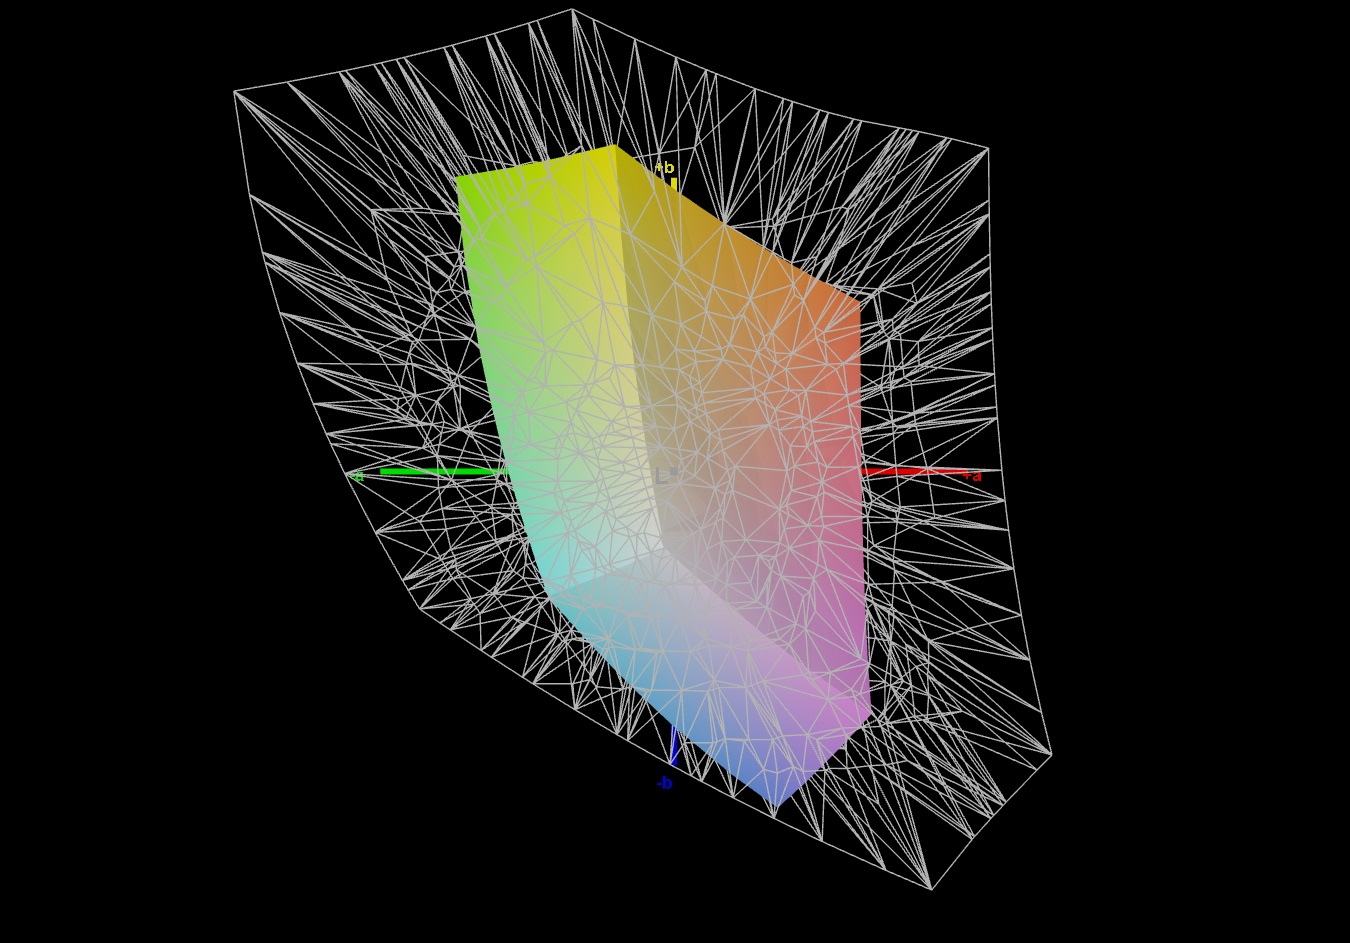
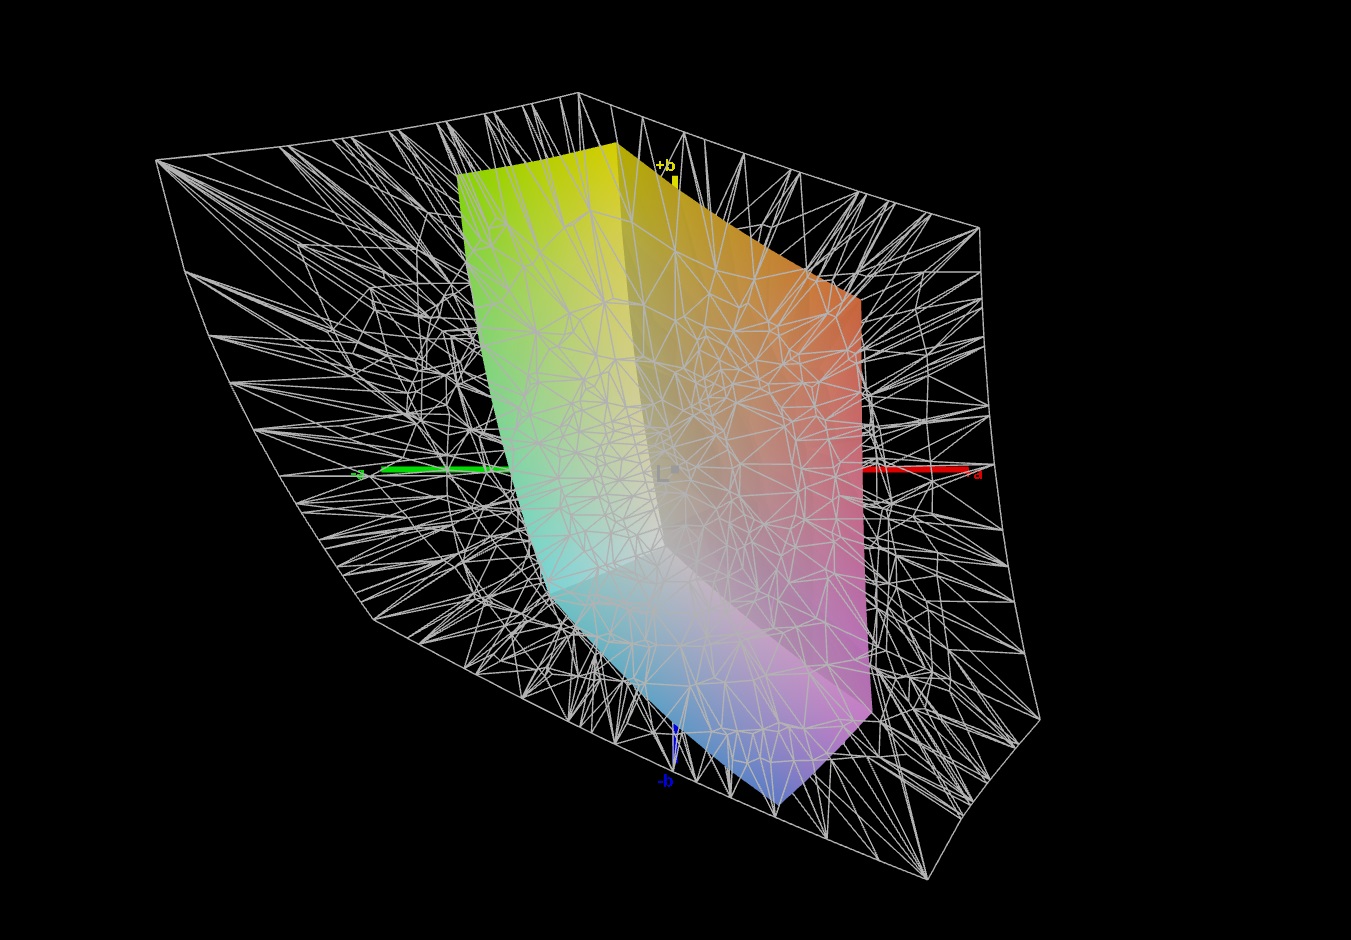
ΔE ColorChecker Calman: 5.19 | ∀{0.5-29.43 Ø4.71}
calibrated: 4.54
ΔE Greyscale Calman: 1.7 | ∀{0.09-98 Ø4.96}
40.5% AdobeRGB 1998 (Argyll 3D)
57.9% sRGB (Argyll 3D)
39.2% Display P3 (Argyll 3D)
Gamma: 2.148
CCT: 6819 K
| HP Victus 15-fa1057ng BOE094D, IPS, 1920x1080, 15.6" | HP Victus 15 fa0020nr CMN1521, IPS, 1920x1080, 15.6" | Dell G15 5530, i5-13450HX RTX 4050 BOEhydis NV15NY9 (Dell 18PJX), IPS, 1920x1080, 15.6" | Acer Nitro V 15 ANV15-51-582S LG LP156WFJ-SPB4 (LGD0742), IPS, 1920x1080, 15.6" | Asus TUF A15 FA507 N156HMA-GA1, IPS, 1920x1080, 15.6" | |
|---|---|---|---|---|---|
| Display | 7% | 76% | 3% | 66% | |
| Display P3 Coverage (%) | 39.2 | 42 7% | 71.1 81% | 40 2% | 64.9 66% |
| sRGB Coverage (%) | 57.9 | 62.7 8% | 99.3 72% | 60 4% | 96.5 67% |
| AdobeRGB 1998 Coverage (%) | 40.5 | 43.4 7% | 71.4 76% | 41.4 2% | 66.6 64% |
| Response Times | -58% | 62% | -51% | -28% | |
| Response Time Grey 50% / Grey 80% * (ms) | 23.8 ? | 35.2 ? -48% | 8.5 ? 64% | 34.2 ? -44% | 30.4 ? -28% |
| Response Time Black / White * (ms) | 16.3 ? | 27.2 ? -67% | 6.7 ? 59% | 25.8 ? -58% | 20.8 ? -28% |
| PWM Frequency (Hz) | |||||
| Screen | 8% | 13% | -17% | 34% | |
| Brightness middle (cd/m²) | 273 | 284.3 4% | 389 42% | 292 7% | 288 5% |
| Brightness (cd/m²) | 249 | 262 5% | 374 50% | 263 6% | 271 9% |
| Brightness Distribution (%) | 84 | 87 4% | 89 6% | 80 -5% | 91 8% |
| Black Level * (cd/m²) | 0.28 | 0.17 39% | 0.35 -25% | 0.25 11% | 0.17 39% |
| Contrast (:1) | 975 | 1672 71% | 1111 14% | 1168 20% | 1694 74% |
| Colorchecker dE 2000 * | 5.19 | 4.52 13% | 3.08 41% | 7.15 -38% | 1.9 63% |
| Colorchecker dE 2000 max. * | 21.16 | 18.67 12% | 5.44 74% | 15.51 27% | 3.3 84% |
| Colorchecker dE 2000 calibrated * | 4.54 | 1.55 66% | 1.17 74% | 4.13 9% | 0.9 80% |
| Greyscale dE 2000 * | 1.7 | 4.1 -141% | 4.4 -159% | 4.9 -188% | 2.7 -59% |
| Gamma | 2.148 102% | 2.3 96% | 2.409 91% | 2.014 109% | 2.32 95% |
| CCT | 6819 95% | 6529 100% | 6350 102% | 7178 91% | 6535 99% |
| Media totale (Programma / Settaggio) | -14% /
-1% | 50% /
34% | -22% /
-18% | 24% /
32% |
* ... Meglio usare valori piccoli
Il dispositivo da 15 pollici deve affrontare critiche sostanziali per quanto riguarda lo spazio colore. Con il 58% di sRGB, il risultato è un'immagine piuttosto scadente, che limita il fascino visivo di film, immagini e giochi. Alcuni concorrenti, come il Dell G15 o l'Asus TUF A15, hanno prestazioni nettamente migliori sotto questo aspetto.

Nel frattempo, la stabilità dell'angolo di visione e il tempo di risposta sono conformi al tipico standard IPS.
Tempi di risposta del Display
| ↔ Tempi di risposta dal Nero al Bianco | ||
|---|---|---|
| 16.3 ms ... aumenta ↗ e diminuisce ↘ combinato | ↗ 7.6 ms Incremento | 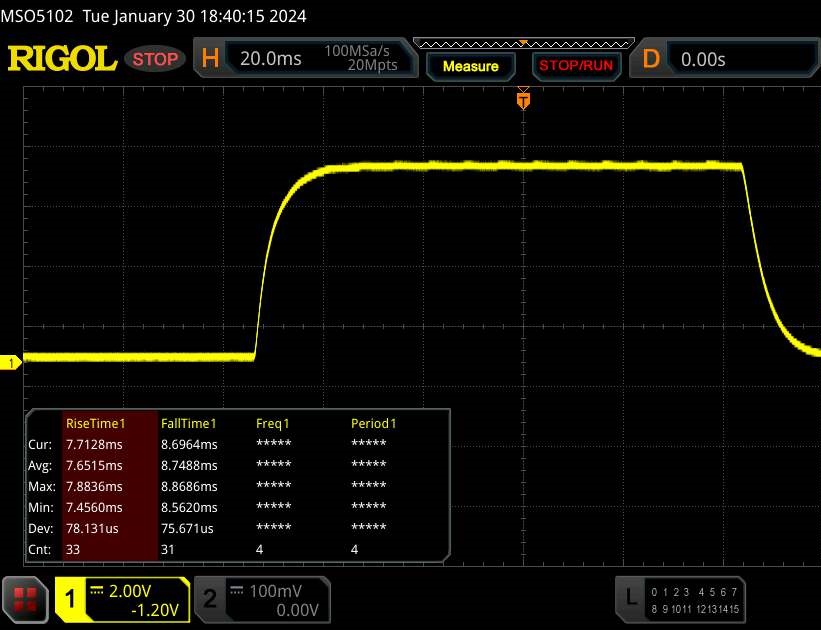 |
| ↘ 8.7 ms Calo | ||
| Lo schermo mostra buoni tempi di risposta durante i nostri tests, ma potrebbe essere troppo lento per i gamers competitivi. In confronto, tutti i dispositivi di test variano da 0.1 (minimo) a 240 (massimo) ms. » 38 % di tutti i dispositivi è migliore. Questo significa che i tempi di risposta rilevati sono migliori rispettto alla media di tutti i dispositivi testati (19.8 ms). | ||
| ↔ Tempo di risposta dal 50% Grigio all'80% Grigio | ||
| 23.8 ms ... aumenta ↗ e diminuisce ↘ combinato | ↗ 11.1 ms Incremento | 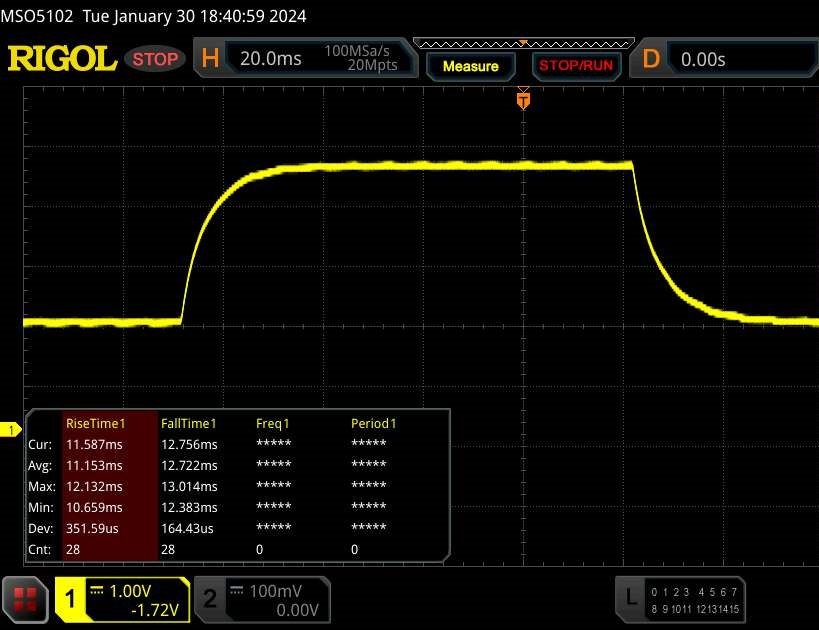 |
| ↘ 12.7 ms Calo | ||
| Lo schermo mostra buoni tempi di risposta durante i nostri tests, ma potrebbe essere troppo lento per i gamers competitivi. In confronto, tutti i dispositivi di test variano da 0.165 (minimo) a 636 (massimo) ms. » 35 % di tutti i dispositivi è migliore. Questo significa che i tempi di risposta rilevati sono migliori rispettto alla media di tutti i dispositivi testati (31 ms). | ||
Sfarfallio dello schermo / PWM (Pulse-Width Modulation)
| flickering dello schermo / PWM non rilevato | 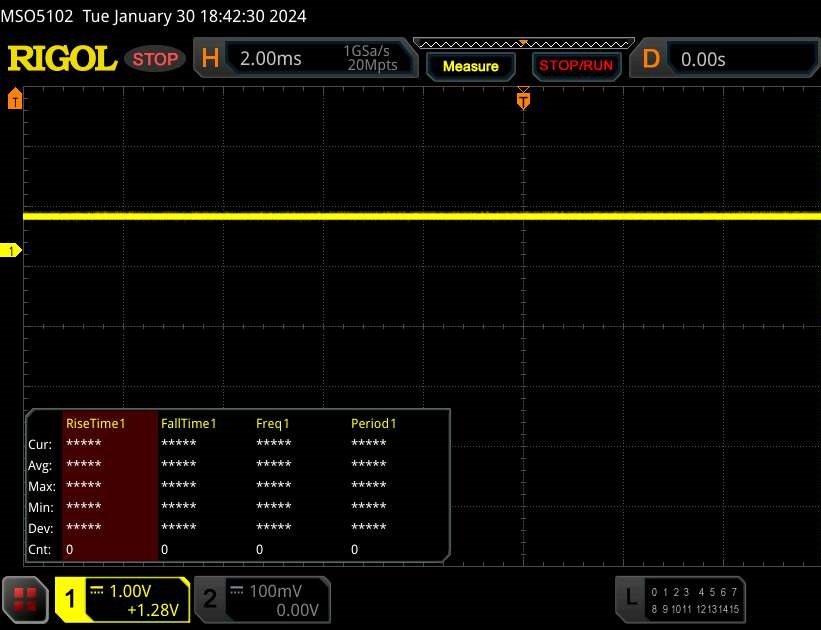 | ||
In confronto: 52 % di tutti i dispositivi testati non utilizza PWM per ridurre la luminosita' del display. Se è rilevato PWM, una media di 7757 (minimo: 5 - massimo: 343500) Hz è stata rilevata. | |||
Prestazioni
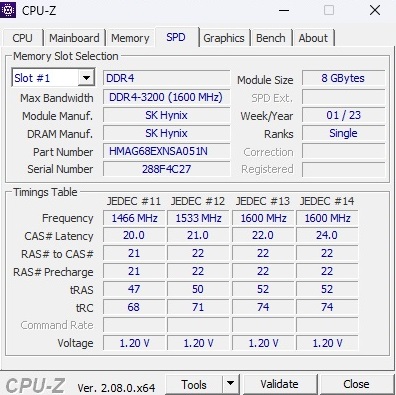
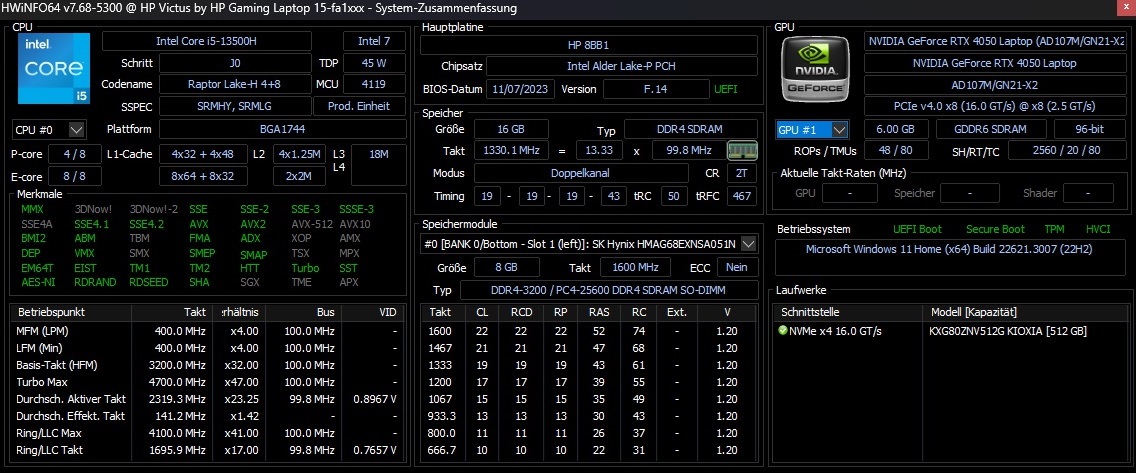
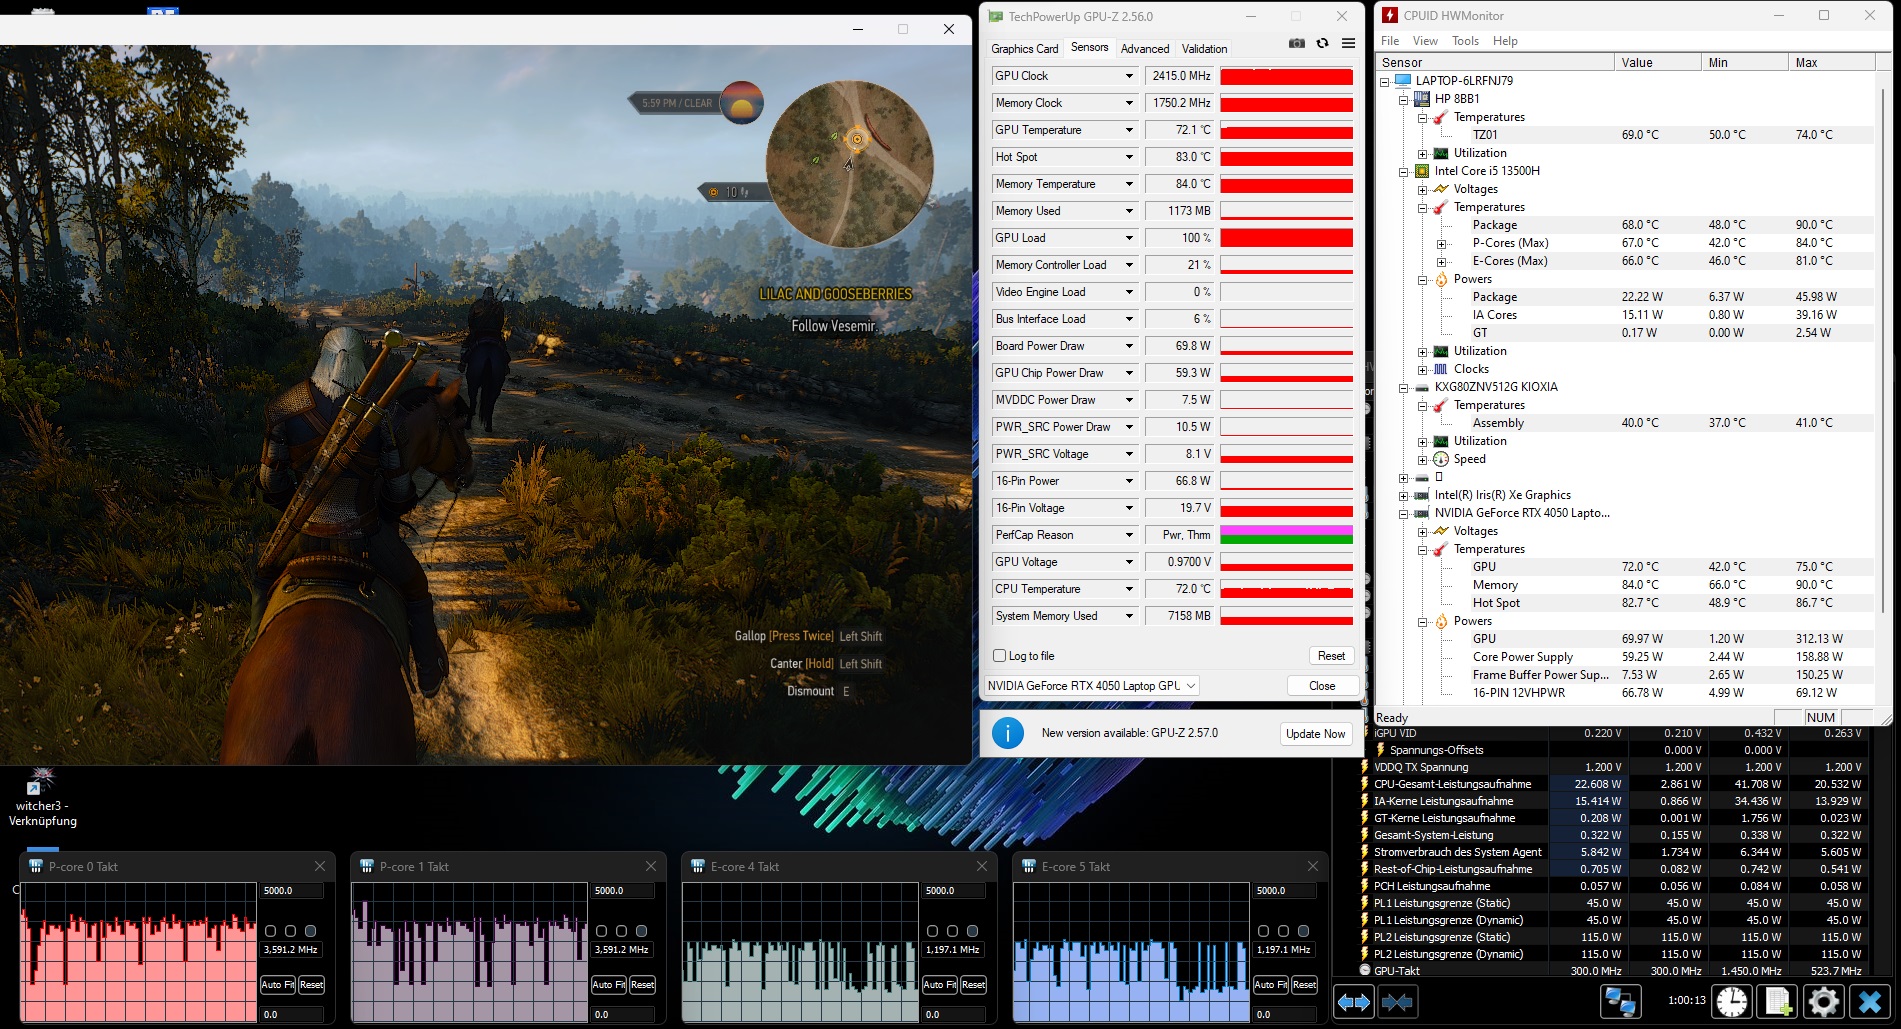
In questa configurazione, Victus 15 è chiaramente un notebook di fascia media. Mentre 16 GB di RAM sono attualmente sufficienti per i giochi, l'unica unità SSD da 512 GB può diventare rapidamente angusta, soprattutto perché il modello da 15 pollici non offre un secondo slot M.2.
Condizioni di test
Omen Gaming Hub consente agli utenti di influenzare il comportamento del sistema. Le varie modalità di controllo dell'alimentazione non solo influenzano il volume, ma anche le prestazioni (vedere tabella). I nostri test sono stati condotti tutti in modalità "Standard", poiché l'aumento della frequenza dei fotogrammi in modalità "Prestazioni" è, come spesso accade, sproporzionato rispetto all'aumento del rumore. È interessante notare che la modalità "Silenzioso" ha prodotto emissioni di rumore più elevate rispetto alla modalità "Standard" sul dispositivo di prova, nonostante i valori FPS più bassi.
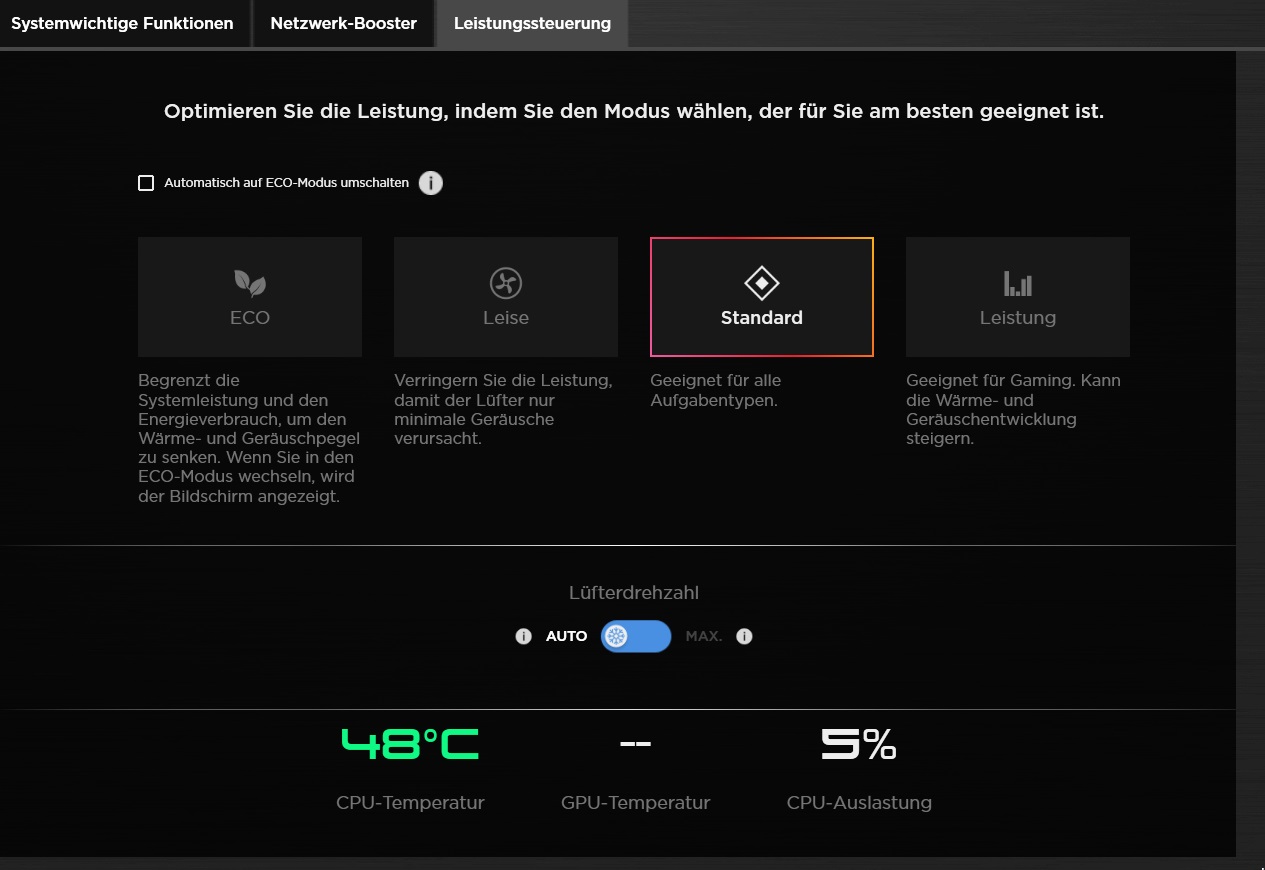
| Witcher 3 (FHD/Ultra) | Eco | Silenzioso | Standard | Prestazioni |
| Rumore | 36 dB(A) | 46 dB(A) | 42 dB(A) | 48 dB(A) |
| Prestazioni | 60 fps lock | 54 fps | 78 fps | 80 fps |
Processore
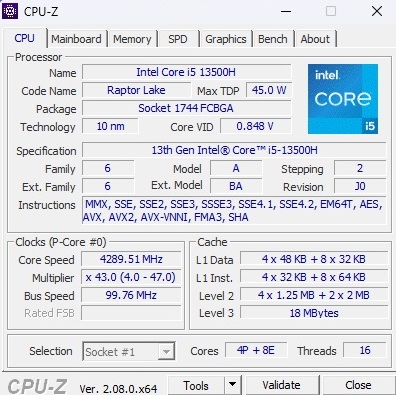
Il Core i5-13500H fa parte della generazione Raptor Lake di Intel, con quattro core di prestazioni con Hyper-Threading e otto core di efficienza senza HT. La sua velocità nei risultati dei benchmark si colloca tra il Core i5-13420H dell'Acer Nitro V 15 Core i5-13420H e il Core i5-13420H del Dell G15 Core i5-13450HX di Dell G15. Il Ryzen 7 7735HS è all'incirca alla pari inizialmente, ma il Core i5 perde più punti e presenta prestazioni meno costanti nel loop test. Il confronto con il predecessore è un po' ingiusto, poiché il Core i7 del vecchio Victus appartiene più alla fascia alta.
Cinebench R15 Multi continuous test
| CPU Performance rating - Percent | |
| Media della classe Gaming | |
| Dell G15 5530, i5-13450HX RTX 4050 | |
| Media Intel Core i5-13500H | |
| HP Victus 15 fa0020nr -2! | |
| Asus TUF A15 FA507 -2! | |
| Acer Nitro V 15 ANV15-51-582S | |
| HP Victus 15-fa1057ng -4! | |
* ... Meglio usare valori piccoli
AIDA64: FP32 Ray-Trace | FPU Julia | CPU SHA3 | CPU Queen | FPU SinJulia | FPU Mandel | CPU AES | CPU ZLib | FP64 Ray-Trace | CPU PhotoWorxx
| Performance rating | |
| Media della classe Gaming | |
| Asus TUF A15 FA507 | |
| Dell G15 5530, i5-13450HX RTX 4050 | |
| Media Intel Core i5-13500H | |
| HP Victus 15 fa0020nr | |
| HP Victus 15-fa1057ng | |
| Acer Nitro V 15 ANV15-51-582S | |
| AIDA64 / FP32 Ray-Trace | |
| Media della classe Gaming (10227 - 85542, n=105, ultimi 2 anni) | |
| Dell G15 5530, i5-13450HX RTX 4050 | |
| Asus TUF A15 FA507 | |
| Media Intel Core i5-13500H (11081 - 15390, n=6) | |
| HP Victus 15 fa0020nr | |
| HP Victus 15-fa1057ng | |
| Acer Nitro V 15 ANV15-51-582S | |
| AIDA64 / FPU Julia | |
| Media della classe Gaming (51376 - 238426, n=105, ultimi 2 anni) | |
| Asus TUF A15 FA507 | |
| Dell G15 5530, i5-13450HX RTX 4050 | |
| Media Intel Core i5-13500H (56813 - 74251, n=6) | |
| HP Victus 15 fa0020nr | |
| Acer Nitro V 15 ANV15-51-582S | |
| HP Victus 15-fa1057ng | |
| AIDA64 / CPU SHA3 | |
| Media della classe Gaming (2180 - 10115, n=105, ultimi 2 anni) | |
| Dell G15 5530, i5-13450HX RTX 4050 | |
| Asus TUF A15 FA507 | |
| Media Intel Core i5-13500H (2621 - 3623, n=6) | |
| HP Victus 15 fa0020nr | |
| Acer Nitro V 15 ANV15-51-582S | |
| HP Victus 15-fa1057ng | |
| AIDA64 / CPU Queen | |
| Media della classe Gaming (49785 - 173351, n=90, ultimi 2 anni) | |
| Asus TUF A15 FA507 | |
| HP Victus 15 fa0020nr | |
| Dell G15 5530, i5-13450HX RTX 4050 | |
| Media Intel Core i5-13500H (77835 - 85727, n=6) | |
| HP Victus 15-fa1057ng | |
| Acer Nitro V 15 ANV15-51-582S | |
| AIDA64 / FPU SinJulia | |
| Media della classe Gaming (4424 - 33636, n=105, ultimi 2 anni) | |
| Asus TUF A15 FA507 | |
| Dell G15 5530, i5-13450HX RTX 4050 | |
| HP Victus 15 fa0020nr | |
| Media Intel Core i5-13500H (7249 - 8086, n=6) | |
| HP Victus 15-fa1057ng | |
| Acer Nitro V 15 ANV15-51-582S | |
| AIDA64 / FPU Mandel | |
| Media della classe Gaming (25115 - 128721, n=105, ultimi 2 anni) | |
| Asus TUF A15 FA507 | |
| Dell G15 5530, i5-13450HX RTX 4050 | |
| Media Intel Core i5-13500H (27820 - 38336, n=6) | |
| HP Victus 15 fa0020nr | |
| HP Victus 15-fa1057ng | |
| Acer Nitro V 15 ANV15-51-582S | |
| AIDA64 / CPU AES | |
| Media della classe Gaming (39258 - 247074, n=105, ultimi 2 anni) | |
| Acer Nitro V 15 ANV15-51-582S | |
| Media Intel Core i5-13500H (62657 - 120493, n=6) | |
| Dell G15 5530, i5-13450HX RTX 4050 | |
| Asus TUF A15 FA507 | |
| HP Victus 15-fa1057ng | |
| HP Victus 15 fa0020nr | |
| AIDA64 / CPU ZLib | |
| Media della classe Gaming (574 - 2531, n=105, ultimi 2 anni) | |
| Dell G15 5530, i5-13450HX RTX 4050 | |
| HP Victus 15-fa1057ng | |
| Media Intel Core i5-13500H (782 - 992, n=6) | |
| HP Victus 15 fa0020nr | |
| Acer Nitro V 15 ANV15-51-582S | |
| Asus TUF A15 FA507 | |
| AIDA64 / FP64 Ray-Trace | |
| Media della classe Gaming (5509 - 45446, n=105, ultimi 2 anni) | |
| Dell G15 5530, i5-13450HX RTX 4050 | |
| Asus TUF A15 FA507 | |
| Media Intel Core i5-13500H (5955 - 8495, n=6) | |
| HP Victus 15 fa0020nr | |
| HP Victus 15-fa1057ng | |
| Acer Nitro V 15 ANV15-51-582S | |
| AIDA64 / CPU PhotoWorxx | |
| Media della classe Gaming (12271 - 89891, n=105, ultimi 2 anni) | |
| Dell G15 5530, i5-13450HX RTX 4050 | |
| Media Intel Core i5-13500H (20212 - 37618, n=6) | |
| Asus TUF A15 FA507 | |
| HP Victus 15-fa1057ng | |
| Acer Nitro V 15 ANV15-51-582S | |
| HP Victus 15 fa0020nr | |
Prestazioni del sistema
Per quanto riguarda le prestazioni del sistema, i concorrenti non hanno quasi nulla in comune. Il punteggio complessivo di PCMark 10 è molto simile in tutti i casi, con differenze più evidenti nella velocità della RAM.
CrossMark: Overall | Productivity | Creativity | Responsiveness
WebXPRT 3: Overall
WebXPRT 4: Overall
Mozilla Kraken 1.1: Total
| PCMark 10 / Score | |
| Media della classe Gaming (5828 - 12414, n=93, ultimi 2 anni) | |
| Asus TUF A15 FA507 | |
| Media Intel Core i5-13500H, NVIDIA GeForce RTX 4050 Laptop GPU (6812 - 7228, n=2) | |
| Dell G15 5530, i5-13450HX RTX 4050 | |
| HP Victus 15 fa0020nr | |
| HP Victus 15-fa1057ng | |
| Acer Nitro V 15 ANV15-51-582S | |
| PCMark 10 / Essentials | |
| Media della classe Gaming (8810 - 11935, n=97, ultimi 2 anni) | |
| Asus TUF A15 FA507 | |
| HP Victus 15 fa0020nr | |
| Media Intel Core i5-13500H, NVIDIA GeForce RTX 4050 Laptop GPU (9521 - 10019, n=2) | |
| Dell G15 5530, i5-13450HX RTX 4050 | |
| HP Victus 15-fa1057ng | |
| Acer Nitro V 15 ANV15-51-582S | |
| PCMark 10 / Productivity | |
| Media della classe Gaming (6845 - 25323, n=95, ultimi 2 anni) | |
| Asus TUF A15 FA507 | |
| HP Victus 15 fa0020nr | |
| Media Intel Core i5-13500H, NVIDIA GeForce RTX 4050 Laptop GPU (8890 - 8968, n=2) | |
| HP Victus 15-fa1057ng | |
| Dell G15 5530, i5-13450HX RTX 4050 | |
| Acer Nitro V 15 ANV15-51-582S | |
| PCMark 10 / Digital Content Creation | |
| Media della classe Gaming (7602 - 19954, n=95, ultimi 2 anni) | |
| Media Intel Core i5-13500H, NVIDIA GeForce RTX 4050 Laptop GPU (10134 - 11405, n=2) | |
| Dell G15 5530, i5-13450HX RTX 4050 | |
| Asus TUF A15 FA507 | |
| HP Victus 15-fa1057ng | |
| HP Victus 15 fa0020nr | |
| Acer Nitro V 15 ANV15-51-582S | |
| CrossMark / Overall | |
| Media della classe Gaming (1366 - 2409, n=94, ultimi 2 anni) | |
| Media Intel Core i5-13500H, NVIDIA GeForce RTX 4050 Laptop GPU (n=1) | |
| HP Victus 15 fa0020nr | |
| Asus TUF A15 FA507 | |
| CrossMark / Productivity | |
| Media della classe Gaming (1386 - 2254, n=94, ultimi 2 anni) | |
| Media Intel Core i5-13500H, NVIDIA GeForce RTX 4050 Laptop GPU (n=1) | |
| HP Victus 15 fa0020nr | |
| Asus TUF A15 FA507 | |
| CrossMark / Creativity | |
| Media della classe Gaming (1343 - 2786, n=94, ultimi 2 anni) | |
| Media Intel Core i5-13500H, NVIDIA GeForce RTX 4050 Laptop GPU (n=1) | |
| HP Victus 15 fa0020nr | |
| Asus TUF A15 FA507 | |
| CrossMark / Responsiveness | |
| Media Intel Core i5-13500H, NVIDIA GeForce RTX 4050 Laptop GPU (n=1) | |
| Media della classe Gaming (1226 - 2334, n=94, ultimi 2 anni) | |
| HP Victus 15 fa0020nr | |
| Asus TUF A15 FA507 | |
| WebXPRT 3 / Overall | |
| Media della classe Gaming (220 - 532, n=98, ultimi 2 anni) | |
| HP Victus 15 fa0020nr | |
| Asus TUF A15 FA507 | |
| Dell G15 5530, i5-13450HX RTX 4050 | |
| Dell G15 5530, i5-13450HX RTX 4050 | |
| HP Victus 15-fa1057ng | |
| Media Intel Core i5-13500H, NVIDIA GeForce RTX 4050 Laptop GPU (267 - 267, n=2) | |
| Acer Nitro V 15 ANV15-51-582S | |
| WebXPRT 4 / Overall | |
| Media della classe Gaming (165 - 354, n=98, ultimi 2 anni) | |
| HP Victus 15 fa0020nr | |
| Acer Nitro V 15 ANV15-51-582S | |
| Media Intel Core i5-13500H, NVIDIA GeForce RTX 4050 Laptop GPU (n=1) | |
| Asus TUF A15 FA507 | |
| Mozilla Kraken 1.1 / Total | |
| Asus TUF A15 FA507 | |
| Acer Nitro V 15 ANV15-51-582S | |
| HP Victus 15-fa1057ng | |
| Media Intel Core i5-13500H, NVIDIA GeForce RTX 4050 Laptop GPU (530 - 545, n=2) | |
| HP Victus 15 fa0020nr | |
| Dell G15 5530, i5-13450HX RTX 4050 | |
| Dell G15 5530, i5-13450HX RTX 4050 | |
| Media della classe Gaming (391 - 590, n=100, ultimi 2 anni) | |
* ... Meglio usare valori piccoli
| PCMark 10 Score | 6812 punti | |
Aiuto | ||
| AIDA64 / Memory Copy | |
| Media della classe Gaming (21750 - 129946, n=105, ultimi 2 anni) | |
| Dell G15 5530, i5-13450HX RTX 4050 | |
| Media Intel Core i5-13500H (36916 - 57830, n=6) | |
| Asus TUF A15 FA507 | |
| HP Victus 15-fa1057ng | |
| HP Victus 15 fa0020nr | |
| Acer Nitro V 15 ANV15-51-582S | |
| AIDA64 / Memory Read | |
| Media della classe Gaming (22956 - 118858, n=105, ultimi 2 anni) | |
| Dell G15 5530, i5-13450HX RTX 4050 | |
| Media Intel Core i5-13500H (41676 - 65633, n=6) | |
| Asus TUF A15 FA507 | |
| HP Victus 15 fa0020nr | |
| HP Victus 15-fa1057ng | |
| Acer Nitro V 15 ANV15-51-582S | |
| AIDA64 / Memory Write | |
| Media della classe Gaming (22297 - 135096, n=105, ultimi 2 anni) | |
| Dell G15 5530, i5-13450HX RTX 4050 | |
| Asus TUF A15 FA507 | |
| Media Intel Core i5-13500H (36826 - 60523, n=6) | |
| HP Victus 15-fa1057ng | |
| HP Victus 15 fa0020nr | |
| Acer Nitro V 15 ANV15-51-582S | |
| AIDA64 / Memory Latency | |
| Media della classe Gaming (75.3 - 259, n=105, ultimi 2 anni) | |
| Dell G15 5530, i5-13450HX RTX 4050 | |
| Media Intel Core i5-13500H (86.2 - 96.1, n=6) | |
| Acer Nitro V 15 ANV15-51-582S | |
| HP Victus 15-fa1057ng | |
| Asus TUF A15 FA507 | |
| HP Victus 15 fa0020nr | |
* ... Meglio usare valori piccoli
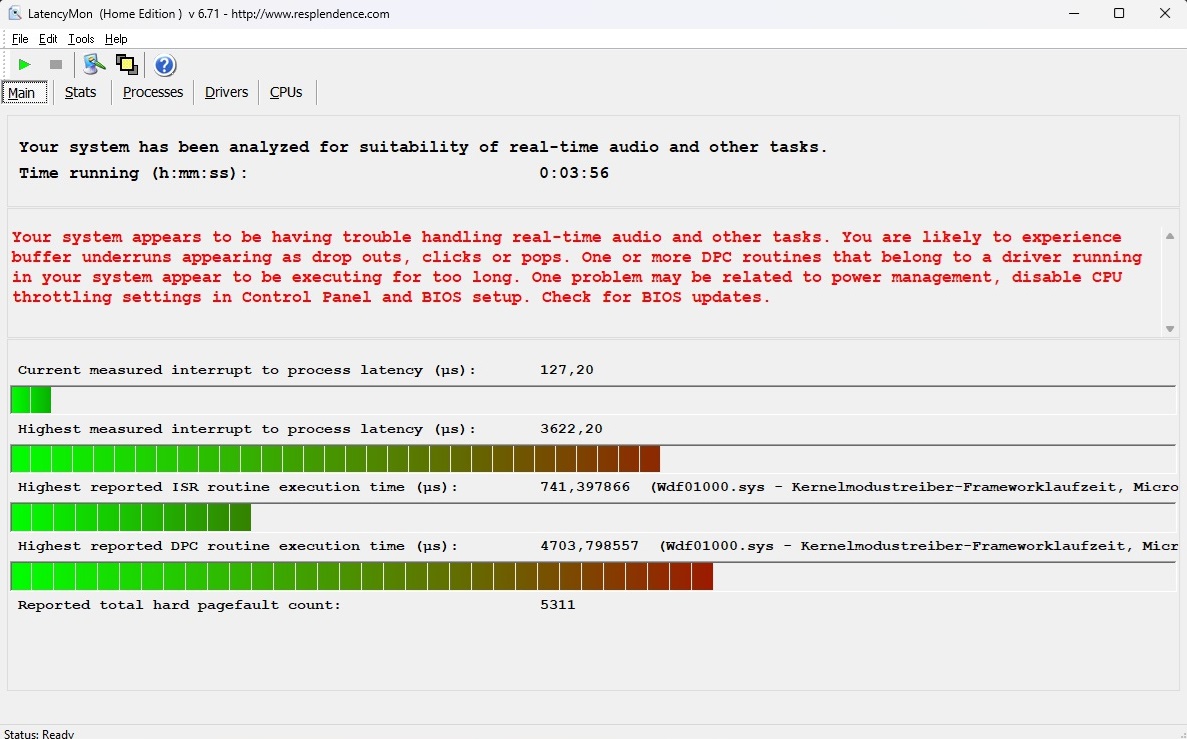
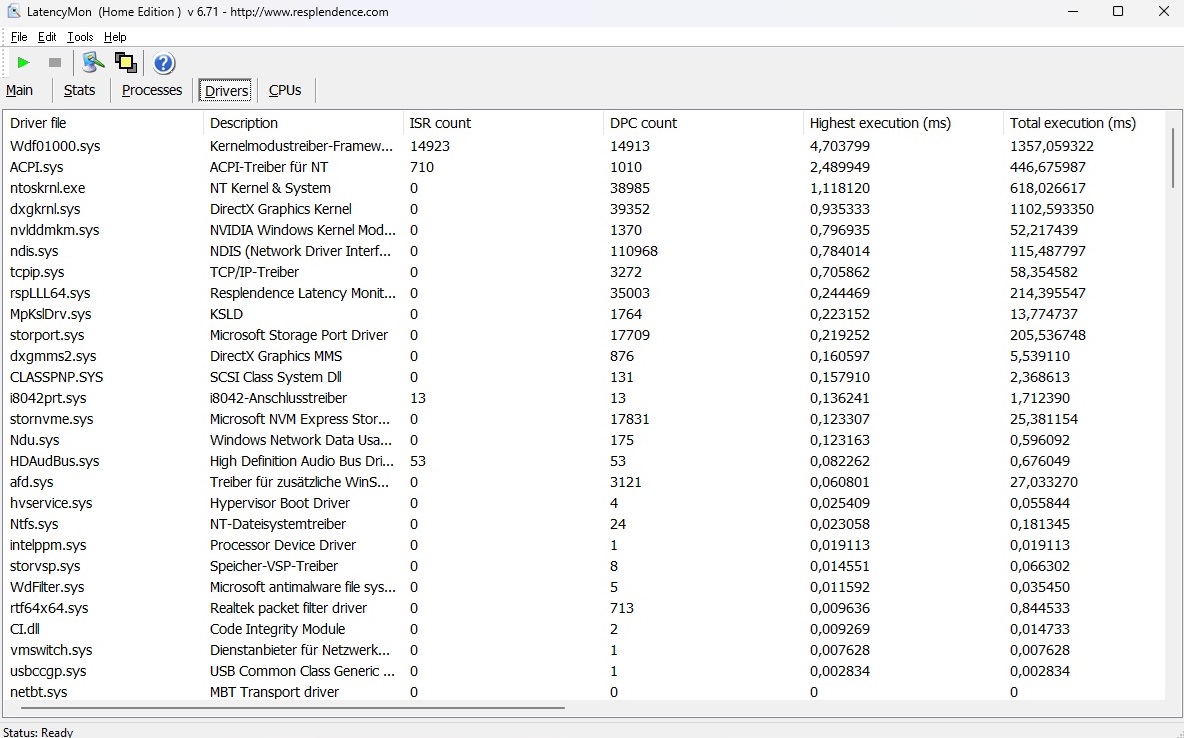
Latenza DPC
Se intende utilizzare il sistema per l'editing audio e video in tempo reale, potrebbe prendere in considerazione delle alternative. Secondo lo strumento LatencyMon, le latenze nello stato di fabbrica sono piuttosto modeste, il che potrebbe causare problemi con alcune attività.
| DPC Latencies / LatencyMon - interrupt to process latency (max), Web, Youtube, Prime95 | |
| HP Victus 15-fa1057ng | |
| Dell G15 5530, i5-13450HX RTX 4050 | |
| HP Victus 15 fa0020nr | |
| Acer Nitro V 15 ANV15-51-582S | |
* ... Meglio usare valori piccoli
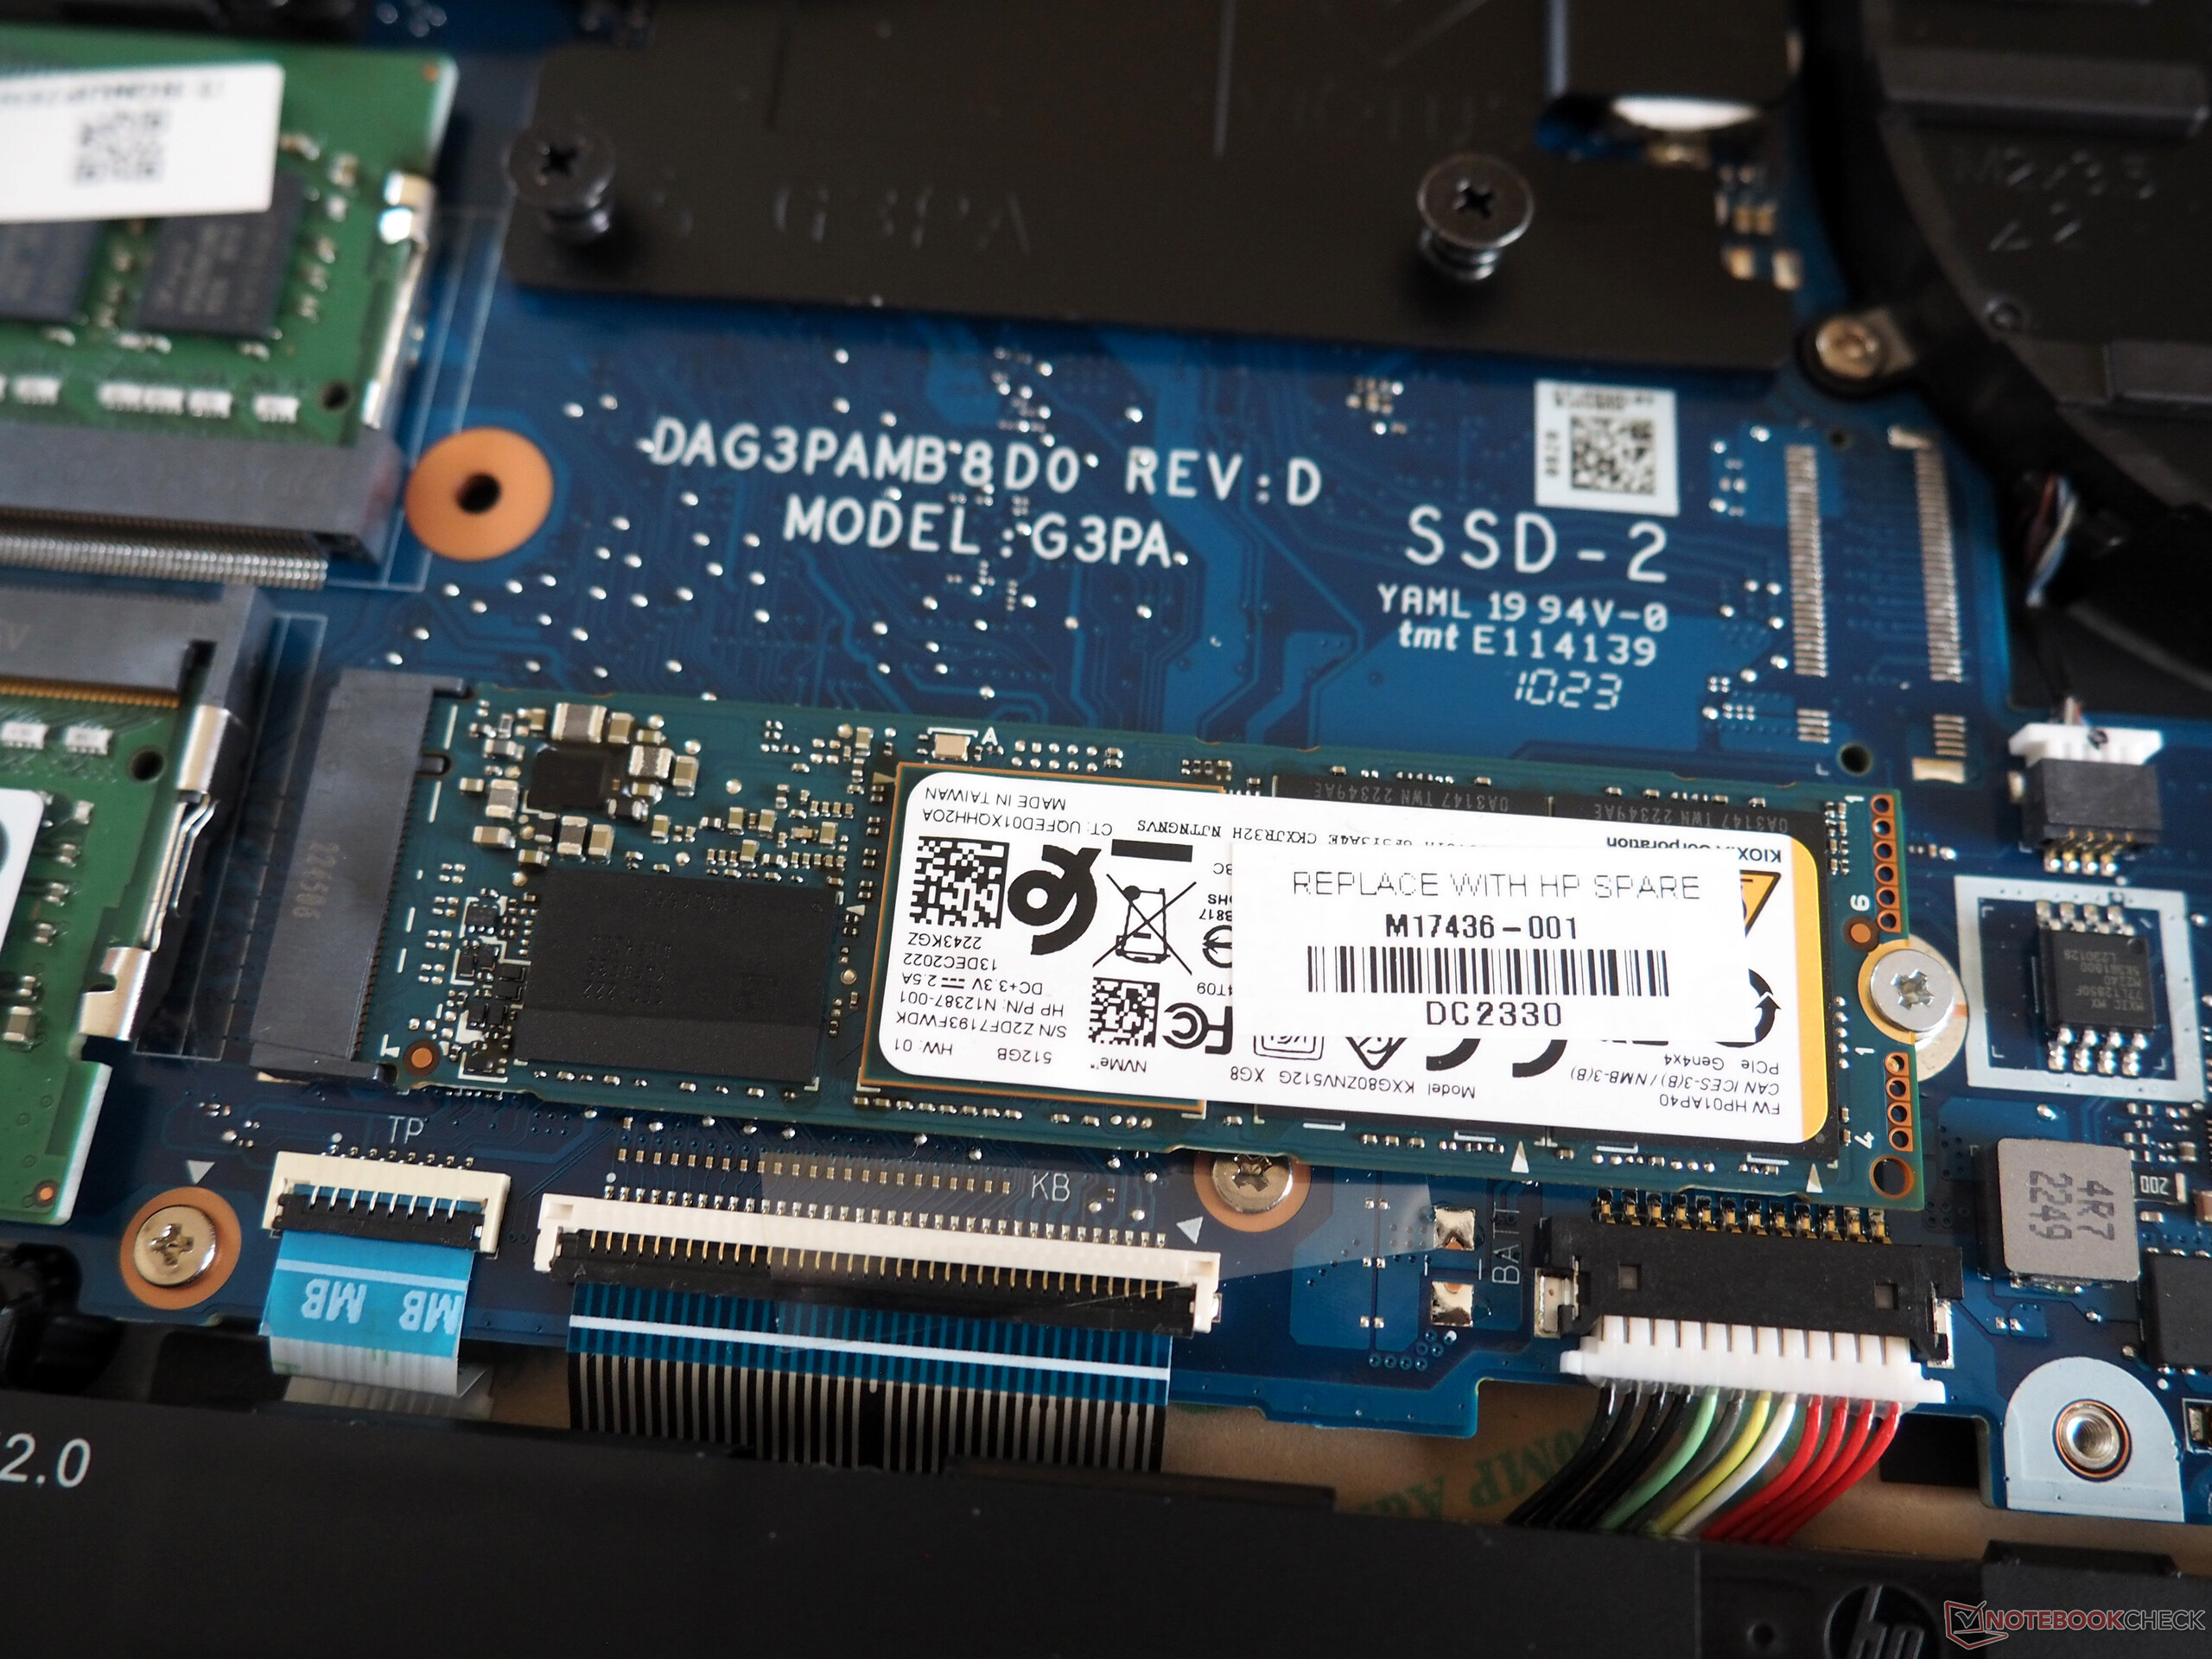
Dispositivi di archiviazione
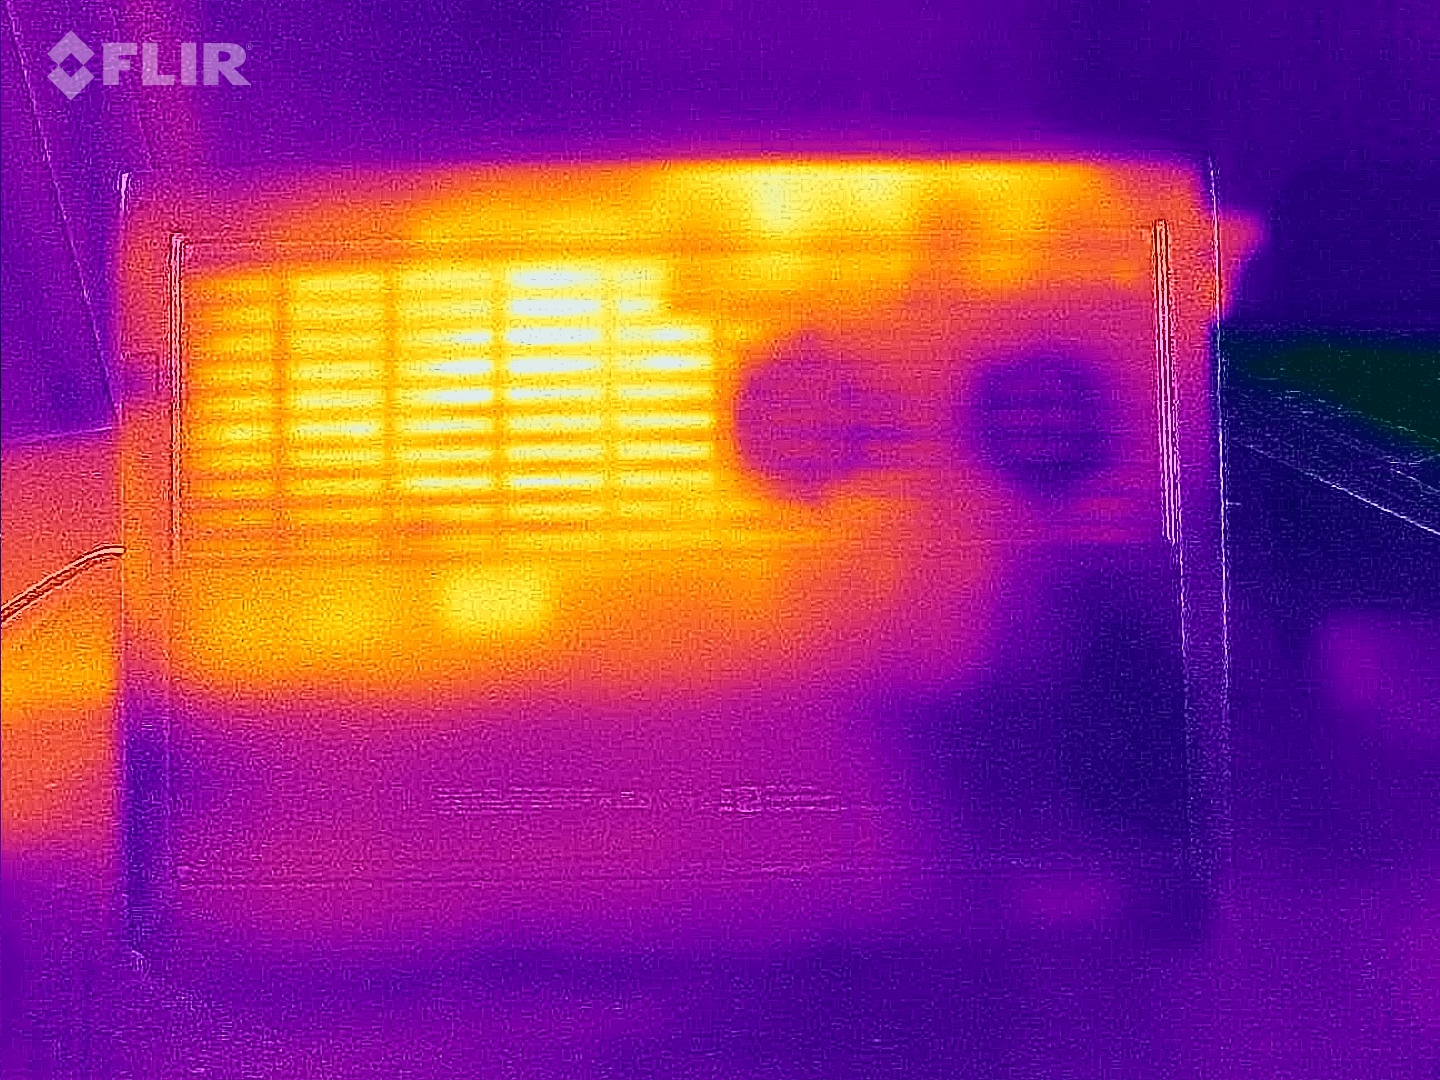
Anche il raffreddamento dell'SSD è subottimale. Sebbene l'unità Kioxia installata all'inizio offra risultati lodevoli nelle prime prove, con il passare del tempo subisce un throttling significativo, come dimostrato nel nostro loop test.

* ... Meglio usare valori piccoli
Reading continuous performance: DiskSpd Read Loop, Queue Depth 8
Scheda grafica
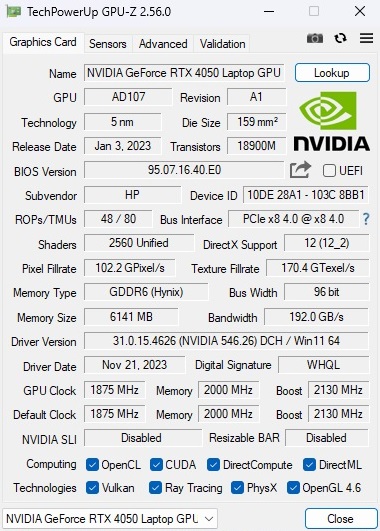
Le prestazioni delle attuali schede grafiche Nvidia dipendono molto dal TDP scelto. HP ha scelto 75 watt (incluso Dynamic Boost) per il Victus 15, che è relativamente basso per la RTX 4050, ma si riflette solo in misura limitata in molti benchmark. Nel complesso, le prestazioni 3D si allineano alla media di questa scheda grafica. La resistenza al futuro della RTX 4050 non è troppo promettente, poiché 6 GB di VRAM e un'interfaccia a 96 bit possono già diventare fattori limitanti nei titoli più esigenti.
| 3DMark 11 Performance | 25418 punti | |
| 3DMark Ice Storm Standard Score | 189586 punti | |
| 3DMark Cloud Gate Standard Score | 55024 punti | |
| 3DMark Fire Strike Score | 19211 punti | |
| 3DMark Time Spy Score | 8149 punti | |
Aiuto | ||
* ... Meglio usare valori piccoli
Prestazioni di gioco
Ciononostante, Victus 15 è abbastanza veloce da far girare senza problemi la maggior parte dei giochi attuali alla risoluzione nativa di 1.920 x 1.080 con impostazioni alte o massime. Affronta le sfide solo in singoli casi, come ad esempio Enshrouded. Il fatto che la RTX 4050 operi con un TDP massimo di 75 watt non ha effetti evidenti rispetto ai computer portatili con un TGP superiore, come nei test sintetici.
| The Witcher 3 - 1920x1080 Ultra Graphics & Postprocessing (HBAO+) | |
| Media della classe Gaming (104.7 - 240, n=7, ultimi 2 anni) | |
| Dell G15 5530, i5-13450HX RTX 4050 | |
| Asus TUF A15 FA507 | |
| Acer Nitro V 15 ANV15-51-582S | |
| HP Victus 15-fa1057ng | |
| Media NVIDIA GeForce RTX 4050 Laptop GPU (18.5 - 94.7, n=40) | |
| HP Victus 15 fa0020nr | |
| Enshrouded - 1920x1080 Max. Quality AA:FX | |
| Medion Erazer Scout E20 | |
| Media NVIDIA GeForce RTX 4050 Laptop GPU (37.3 - 37.7, n=2) | |
| HP Victus 15-fa1057ng | |
| Media della classe Gaming (n=1ultimi 2 anni) | |
| Palworld - 1920x1080 Epic Preset AA:TSR | |
| Medion Erazer Scout E20 | |
| Media NVIDIA GeForce RTX 4050 Laptop GPU (71.9 - 74.9, n=2) | |
| HP Victus 15-fa1057ng | |
| Media della classe Gaming (n=1ultimi 2 anni) | |
| Prince of Persia The Lost Crown - 1920x1080 Ultra Preset AA:SM | |
| Medion Erazer Scout E20 | |
| Media della classe Gaming (337 - 357, n=5, ultimi 2 anni) | |
| Media NVIDIA GeForce RTX 4050 Laptop GPU (349 - 353, n=2) | |
| HP Victus 15-fa1057ng | |
Abbiamo testato il comportamento delle prestazioni 3D in un periodo di tempo più lungo, in particolare 60 minuti con il gioco di ruolo Il Witcher 3 (FHD/Ultra). La frequenza dei fotogrammi è rimasta abbastanza stabile nel lungo periodo.
Witcher 3 FPS diagram
| basso | medio | alto | ultra | |
|---|---|---|---|---|
| GTA V (2015) | 172.4 | 160.7 | 89.1 | |
| The Witcher 3 (2015) | 78 | |||
| Dota 2 Reborn (2015) | 159.7 | 141.1 | 130.7 | 122.5 |
| Final Fantasy XV Benchmark (2018) | 105.1 | 80.3 | ||
| X-Plane 11.11 (2018) | 113 | 101.1 | 81.5 | |
| Strange Brigade (2018) | 197.1 | 159 | 139.1 | |
| Prince of Persia The Lost Crown (2024) | 352 | 350 | 349 | |
| Palworld (2024) | 93.3 | 72.5 | 71.9 | |
| Enshrouded (2024) | 45.8 | 45.1 | 37.3 |
Emissioni
Rumore del sistema
Descriviamo lo sviluppo del rumore come previsto. Con 29-31 dB (inattivo) e 40-48 dB (carico), il portatile da 15 pollici non è né molto silenzioso né molto rumoroso in modalità "Standard", ma raggiunge un livello medio che dovrebbe essere accettabile per la maggior parte degli acquirenti, anche senza cuffie.
Rumorosità
| Idle |
| 29 / 30 / 31 dB(A) |
| Sotto carico |
| 40 / 48 dB(A) |
 | ||
30 dB silenzioso 40 dB(A) udibile 50 dB(A) rumoroso |
||
min: | ||
| HP Victus 15-fa1057ng GeForce RTX 4050 Laptop GPU, i5-13500H | HP Victus 15 fa0020nr GeForce RTX 3050 Ti Laptop GPU, i7-12700H | Dell G15 5530, i5-13450HX RTX 4050 GeForce RTX 4050 Laptop GPU, i5-13450HX | Acer Nitro V 15 ANV15-51-582S GeForce RTX 4050 Laptop GPU, i5-13420H | Asus TUF A15 FA507 GeForce RTX 4050 Laptop GPU, R7 7735HS | |
|---|---|---|---|---|---|
| Noise | 7% | 4% | -4% | 15% | |
| off /ambiente * (dB) | 25 | 24.8 1% | 25 -0% | 25 -0% | 23.3 7% |
| Idle Minimum * (dB) | 29 | 26.2 10% | 25 14% | 25 14% | 23.3 20% |
| Idle Average * (dB) | 30 | 29.2 3% | 26 13% | 29 3% | 23.3 22% |
| Idle Maximum * (dB) | 31 | 29.4 5% | 30 3% | 30 3% | 23.3 25% |
| Load Average * (dB) | 40 | 29.9 25% | 38 5% | 49 -23% | 29.6 26% |
| Witcher 3 ultra * (dB) | 42 | 41.1 2% | 44 -5% | 49 -17% | 43 -2% |
| Load Maximum * (dB) | 48 | 45.5 5% | 50 -4% | 51 -6% | 43 10% |
* ... Meglio usare valori piccoli
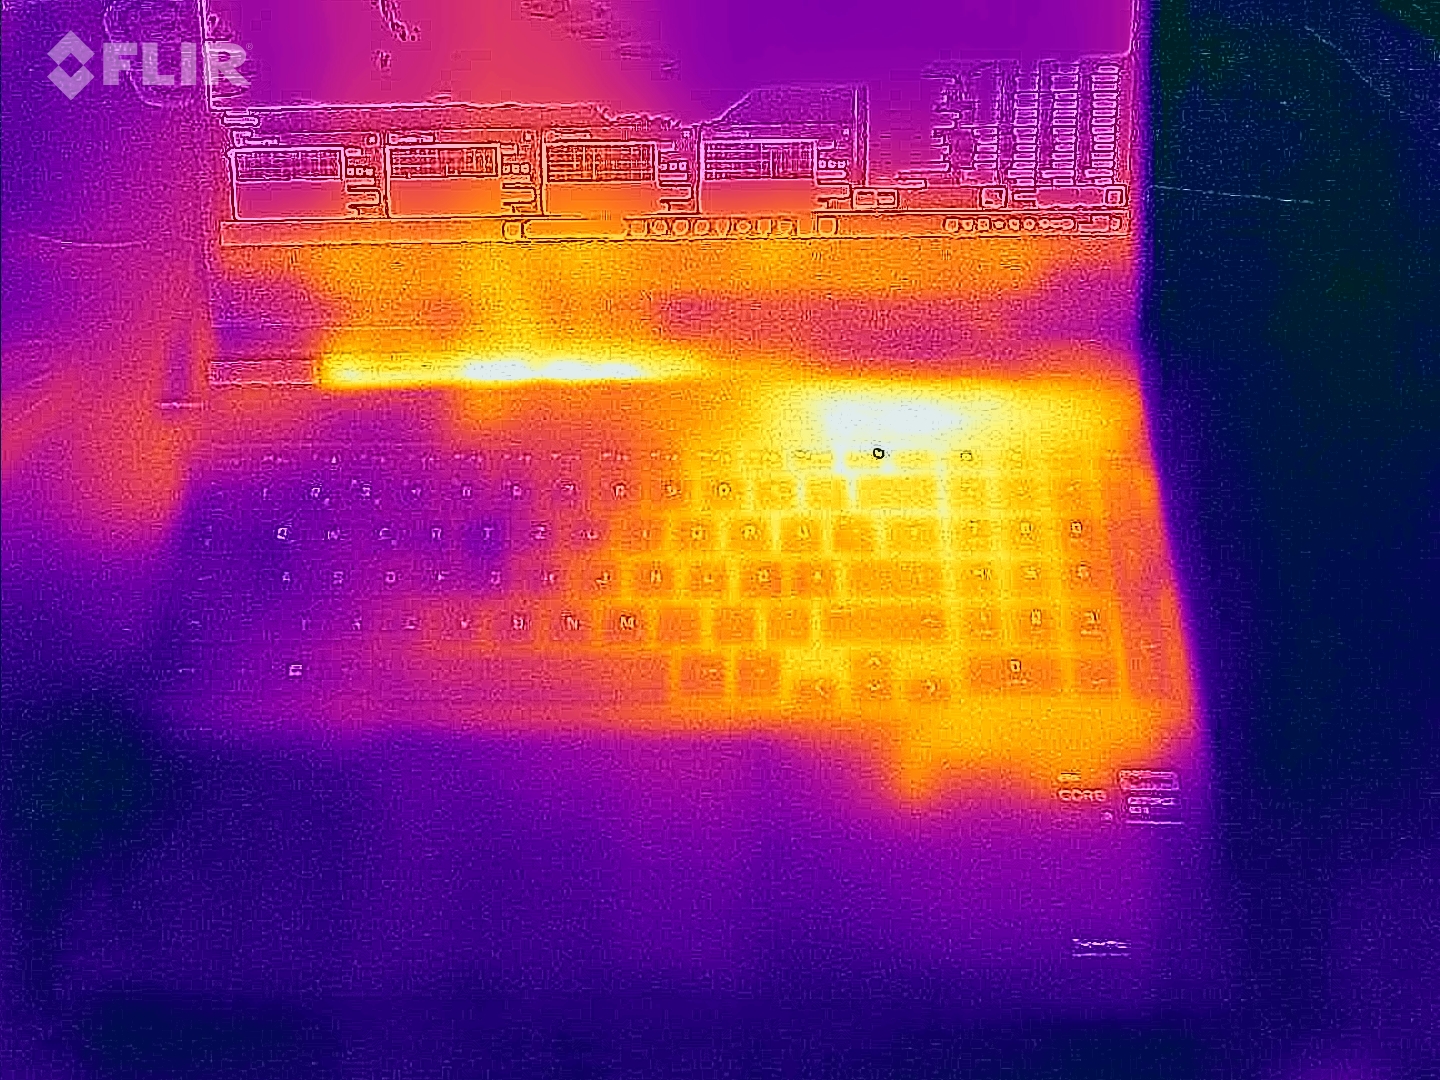
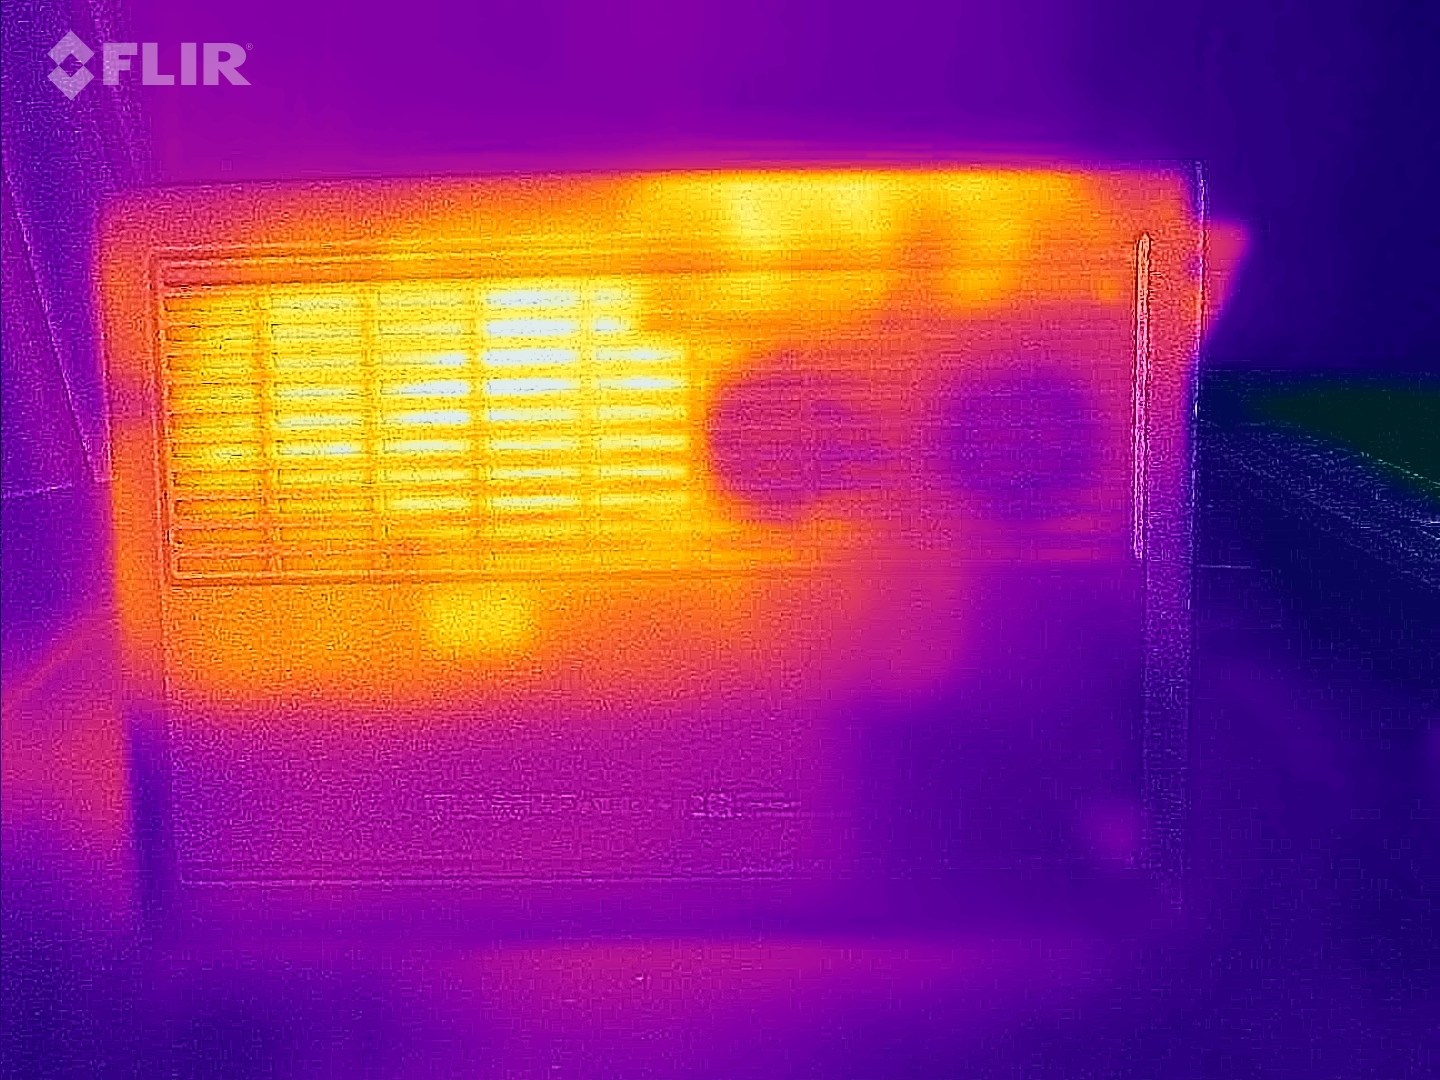
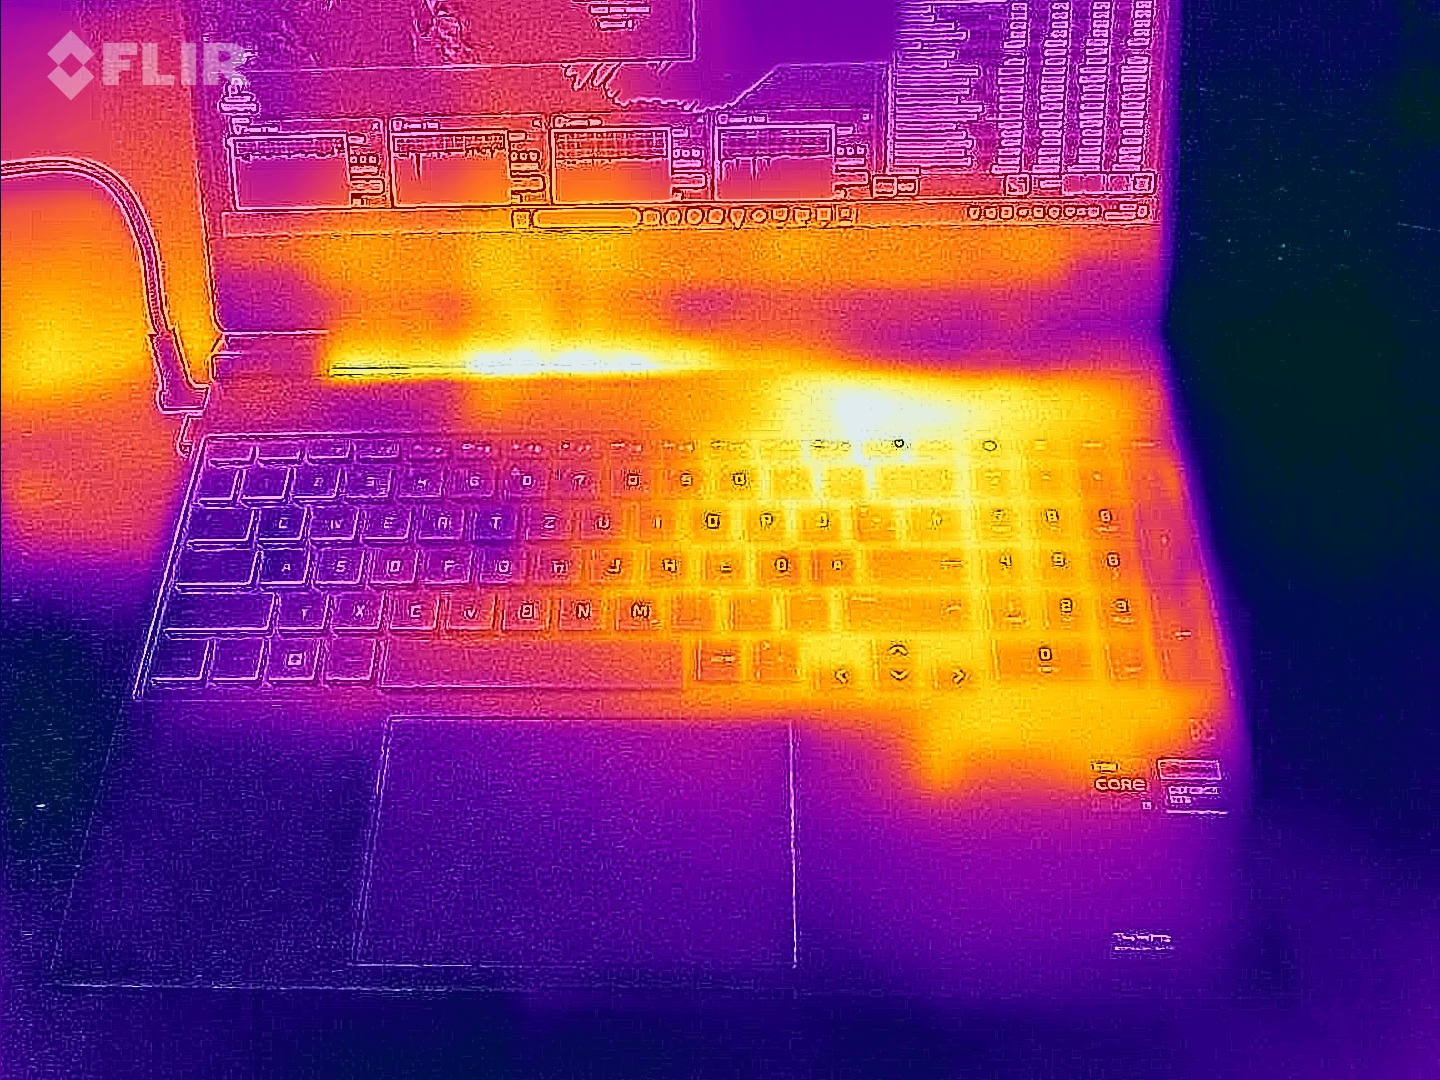
Temperatura
Le temperature del case sono sorprendentemente basse. Anche dopo un'ora di stress test con gli strumenti Furmark e Prime95, il case raggiunge una temperatura di soli 107,6 °F. Ciò significa che Victus 15 può essere facilmente appoggiato sulle ginocchia mentre si gioca. La concorrenza diventa sensibilmente più calda in alcuni casi.
(±) La temperatura massima sul lato superiore è di 42 °C / 108 F, rispetto alla media di 40.4 °C / 105 F, che varia da 21.2 a 68.8 °C per questa classe Gaming.
(±) Il lato inferiore si riscalda fino ad un massimo di 42 °C / 108 F, rispetto alla media di 43.2 °C / 110 F
(+) In idle, la temperatura media del lato superiore è di 23.6 °C / 74 F, rispetto alla media deld ispositivo di 33.9 °C / 93 F.
(±) Riproducendo The Witcher 3, la temperatura media per il lato superiore e' di 33.8 °C / 93 F, rispetto alla media del dispositivo di 33.9 °C / 93 F.
(+) I poggiapolsi e il touchpad raggiungono la temperatura massima della pelle (33 °C / 91.4 F) e quindi non sono caldi.
(-) La temperatura media della zona del palmo della mano di dispositivi simili e'stata di 28.8 °C / 83.8 F (-4.2 °C / -7.6 F).
| HP Victus 15-fa1057ng GeForce RTX 4050 Laptop GPU, i5-13500H | HP Victus 15 fa0020nr GeForce RTX 3050 Ti Laptop GPU, i7-12700H | Dell G15 5530, i5-13450HX RTX 4050 GeForce RTX 4050 Laptop GPU, i5-13450HX | Acer Nitro V 15 ANV15-51-582S GeForce RTX 4050 Laptop GPU, i5-13420H | Asus TUF A15 FA507 GeForce RTX 4050 Laptop GPU, R7 7735HS | |
|---|---|---|---|---|---|
| Heat | 10% | -30% | -14% | -13% | |
| Maximum Upper Side * (°C) | 42 | 37.2 11% | 58 -38% | 46 -10% | 48.9 -16% |
| Maximum Bottom * (°C) | 42 | 35.4 16% | 57 -36% | 48 -14% | 44.6 -6% |
| Idle Upper Side * (°C) | 24 | 22.4 7% | 30 -25% | 27 -13% | 27.1 -13% |
| Idle Bottom * (°C) | 24 | 22.6 6% | 29 -21% | 28 -17% | 27.5 -15% |
* ... Meglio usare valori piccoli
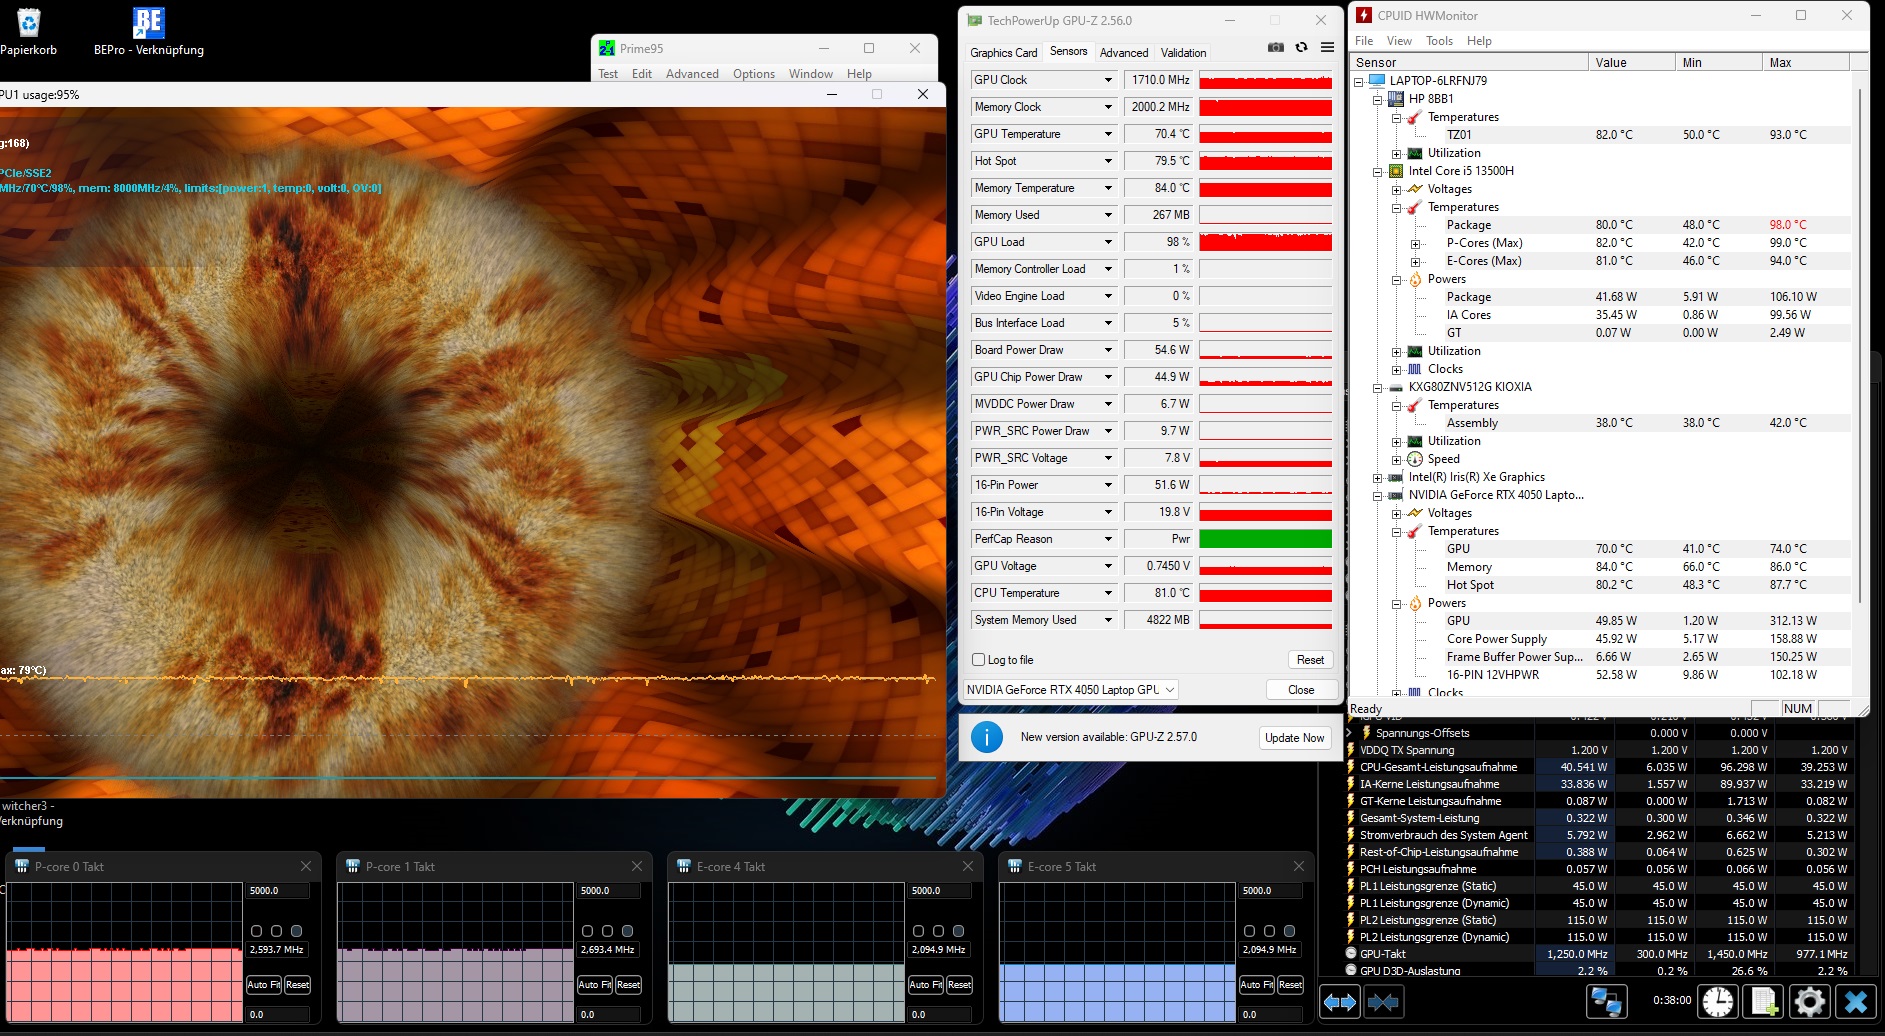
Test da sforzo
I componenti non hanno riservato sorprese sgradite. Dopo un periodo prolungato di pieno carico, la CPU si è stabilizzata a circa 176 °F, mentre la GPU ha mantenuto una media di 158 °F, che è del tutto accettabile per questo scenario.
Altoparlanti
Se possibile, è necessario collegare una cuffia o degli altoparlanti esterni per godere dei media. Il sistema audio 2.0 del Victus 15 ha ottenuto solo un punteggio mediocre nell'analisi audio, con carenze evidenti nella riproduzione dei bassi e nel volume massimo.
HP Victus 15-fa1057ng analisi audio
(±) | potenza degli altiparlanti media ma buona (79 dB)
Bassi 100 - 315 Hz
(-) | quasi nessun basso - in media 26.2% inferiori alla media
(±) | la linearità dei bassi è media (12.8% delta rispetto alla precedente frequenza)
Medi 400 - 2000 Hz
(+) | medi bilanciati - solo only 1.7% rispetto alla media
(+) | medi lineari (4.1% delta rispetto alla precedente frequenza)
Alti 2 - 16 kHz
(+) | Alti bilanciati - appena 3% dalla media
(+) | alti lineari (3.7% delta rispetto alla precedente frequenza)
Nel complesso 100 - 16.000 Hz
(±) | la linearità complessiva del suono è media (18.4% di differenza rispetto alla media
Rispetto alla stessa classe
» 59% di tutti i dispositivi testati in questa classe è stato migliore, 9% simile, 32% peggiore
» Il migliore ha avuto un delta di 6%, medio di 18%, peggiore di 132%
Rispetto a tutti i dispositivi testati
» 41% di tutti i dispositivi testati in questa classe è stato migliore, 8% similare, 51% peggiore
» Il migliore ha avuto un delta di 4%, medio di 23%, peggiore di 134%
HP Victus 15 fa0020nr analisi audio
(±) | potenza degli altiparlanti media ma buona (81 dB)
Bassi 100 - 315 Hz
(-) | quasi nessun basso - in media 24.6% inferiori alla media
(±) | la linearità dei bassi è media (12.8% delta rispetto alla precedente frequenza)
Medi 400 - 2000 Hz
(+) | medi bilanciati - solo only 2.5% rispetto alla media
(+) | medi lineari (3.4% delta rispetto alla precedente frequenza)
Alti 2 - 16 kHz
(+) | Alti bilanciati - appena 3.7% dalla media
(+) | alti lineari (4.9% delta rispetto alla precedente frequenza)
Nel complesso 100 - 16.000 Hz
(±) | la linearità complessiva del suono è media (19.7% di differenza rispetto alla media
Rispetto alla stessa classe
» 69% di tutti i dispositivi testati in questa classe è stato migliore, 6% simile, 25% peggiore
» Il migliore ha avuto un delta di 6%, medio di 18%, peggiore di 132%
Rispetto a tutti i dispositivi testati
» 50% di tutti i dispositivi testati in questa classe è stato migliore, 7% similare, 43% peggiore
» Il migliore ha avuto un delta di 4%, medio di 23%, peggiore di 134%
Gestione dell'energia
Consumo di energia
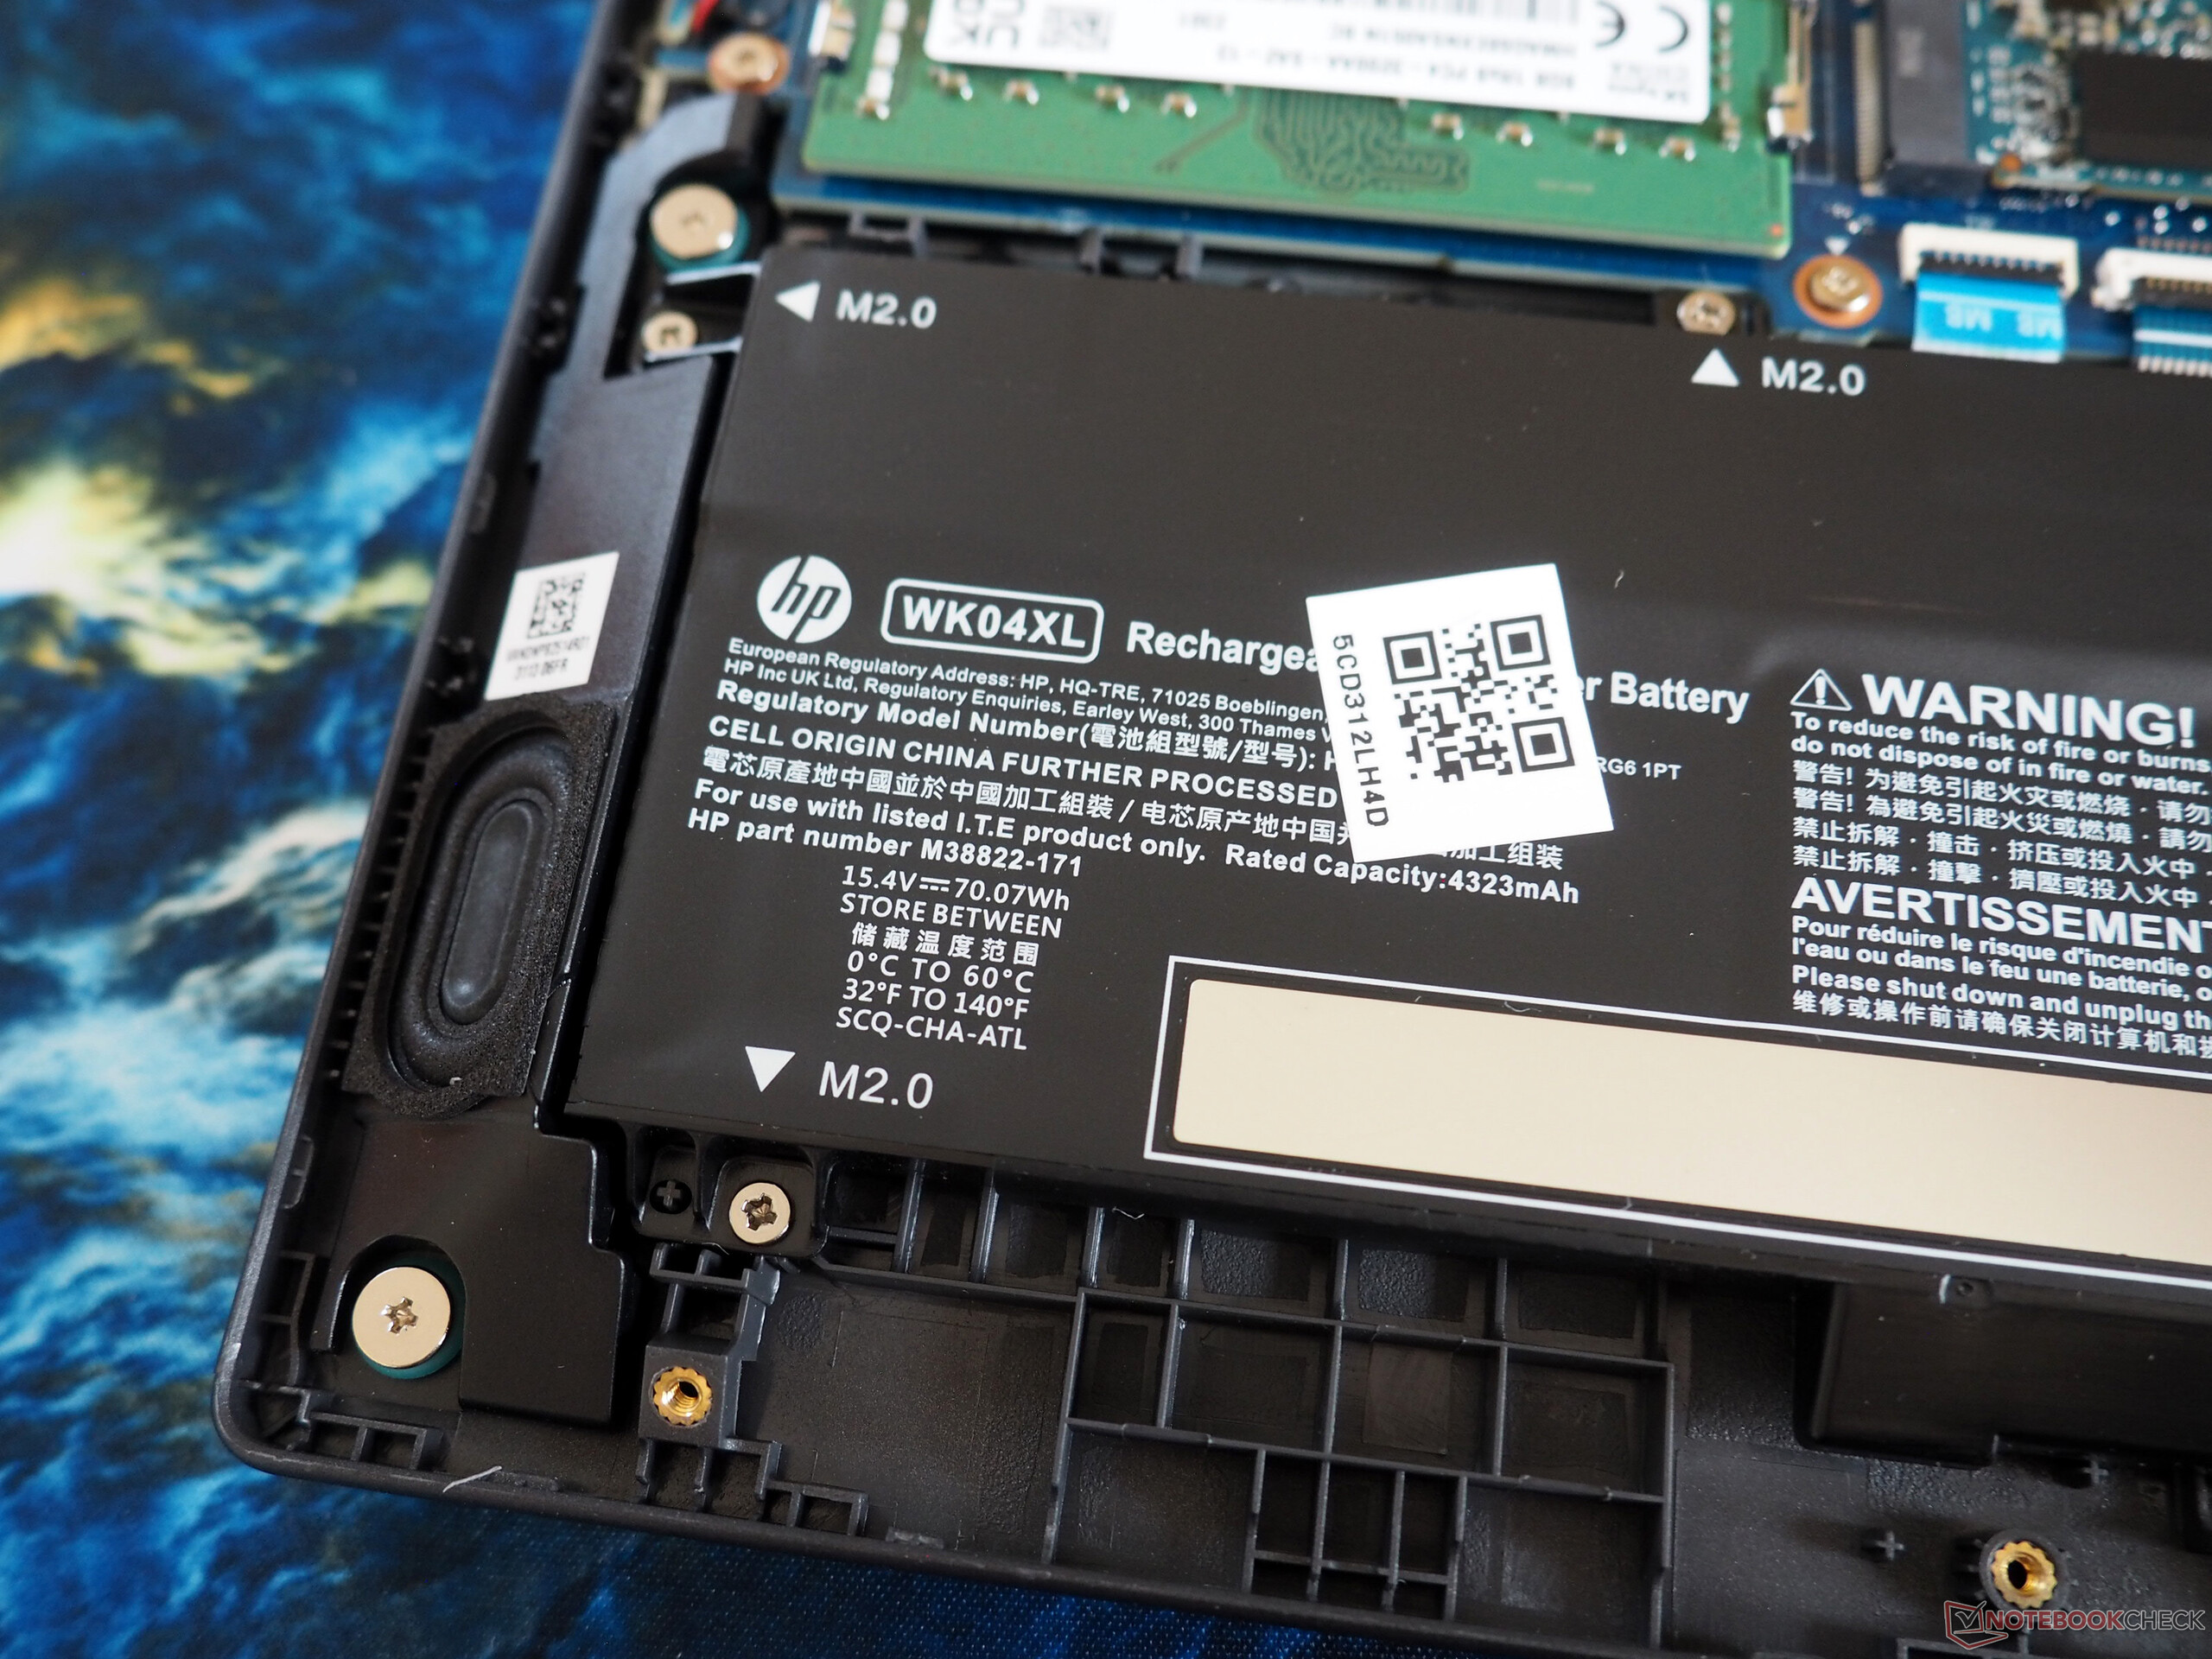
Il consumo energetico moderato è apprezzato. Considerando le prestazioni disponibili, i consumi di 5-9 watt al minimo e di 72-176 watt al carico sono ragionevoli. L'alimentatore è adeguatamente dimensionato.
| Off / Standby | |
| Idle | |
| Sotto carico |
|
Leggenda:
min: | |
| HP Victus 15-fa1057ng i5-13500H, GeForce RTX 4050 Laptop GPU | HP Victus 15 fa0020nr i7-12700H, GeForce RTX 3050 Ti Laptop GPU | Dell G15 5530, i5-13450HX RTX 4050 i5-13450HX, GeForce RTX 4050 Laptop GPU | Acer Nitro V 15 ANV15-51-582S i5-13420H, GeForce RTX 4050 Laptop GPU | Asus TUF A15 FA507 R7 7735HS, GeForce RTX 4050 Laptop GPU | Media della classe Gaming | |
|---|---|---|---|---|---|---|
| Power Consumption | -18% | -21% | 9% | -14% | -77% | |
| Idle Minimum * (Watt) | 5 | 5.1 -2% | 2 60% | 7 -40% | 8 -60% | 13 ? -160% |
| Idle Average * (Watt) | 9 | 15.1 -68% | 12 -33% | 8 11% | 12.1 -34% | 19 ? -111% |
| Idle Maximum * (Watt) | 22 | 18.9 14% | 27 -23% | 11 50% | 12.5 43% | 24.6 ? -12% |
| Load Average * (Watt) | 72 | 114.5 -59% | 100 -39% | 76 -6% | 74.9 -4% | 110.7 ? -54% |
| Witcher 3 ultra * (Watt) | 113 | 113.9 -1% | 161.9 -43% | 98.2 13% | 136.6 -21% | |
| Load Maximum * (Watt) | 176 | 165.8 6% | 262 -49% | 136 23% | 185 -5% | 259 ? -47% |
* ... Meglio usare valori piccoli
Power consumption Witcher 3 / stress test
Power consumption with external monitor
Tempi di esecuzione
Il notebook da 15 pollici non deve nascondersi dietro la concorrenza nemmeno in termini di autonomia, anzi. La versione HP è durata circa 7,5 ore nel nostro test WLAN con la luminosità ridotta a 150 cd/m² - un buon risultato per un notebook da gioco. I valori del predecessore sono probabilmente significativamente peggiori a causa di un bug.
| HP Victus 15-fa1057ng i5-13500H, GeForce RTX 4050 Laptop GPU, 70 Wh | HP Victus 15 fa0020nr i7-12700H, GeForce RTX 3050 Ti Laptop GPU, 70 Wh | Dell G15 5530, i5-13450HX RTX 4050 i5-13450HX, GeForce RTX 4050 Laptop GPU, 86 Wh | Acer Nitro V 15 ANV15-51-582S i5-13420H, GeForce RTX 4050 Laptop GPU, 57 Wh | Asus TUF A15 FA507 R7 7735HS, GeForce RTX 4050 Laptop GPU, 90 Wh | Media della classe Gaming | |
|---|---|---|---|---|---|---|
| Autonomia della batteria | -72% | -5% | 25% | 56% | -5% | |
| WiFi v1.3 (h) | 7.5 | 2.1 -72% | 7.1 -5% | 9.4 25% | 11.7 56% | 7.11 ? -5% |
| Reader / Idle (h) | 2.6 | 21.5 | 8.27 ? | |||
| Load (h) | 1.1 | 1.7 | 1 | 1.502 ? | ||
| H.264 (h) | 12.5 | 8.32 ? |
Pro
Contro
Il verdetto
Victus 15-fa1057ng si presenta come un tipico notebook da gioco economico, adatto ai giocatori attenti al prezzo.
L'involucro in plastica, sebbene non trasudi un'alta qualità artigianale, svolge in modo affidabile la sua funzione, così come i dispositivi di input. L'hardware si allinea bene con la risoluzione Full HD, offrendo un'esperienza di gioco decente per la maggior parte dei titoli, anche se il display a 144 Hz non viene sfruttato appieno. Le emissioni del Core i5-13500H e GeForce RTX 4050 rimangono gestibili.
Un vantaggio è la durata della batteria notevolmente prolungata.
Tuttavia, gli utenti devono accettare un display con una precisione del colore e una luminosità limitate. Per coloro che danno priorità alla qualità dell'immagine, possono valere le alternative come Dell G15 5530 o Asus TUF A15 FA507 in una fascia di prezzo simile. Di conseguenza, una migliore qualità del display sarebbe un miglioramento significativo per il successore.
Prezzo e disponibilità
L'HP Victus 15, dotato di Core i5-13500H, è disponibile a circa 690 dollari presso vari rivenditori online (ad esempio, Amazon).
HP Victus 15-fa1057ng
- 01/31/2024 v7 (old)
Florian Glaser
Transparency
La selezione dei dispositivi da recensire viene effettuata dalla nostra redazione. Il campione di prova è stato fornito all'autore come prestito dal produttore o dal rivenditore ai fini di questa recensione. L'istituto di credito non ha avuto alcuna influenza su questa recensione, né il produttore ne ha ricevuto una copia prima della pubblicazione. Non vi era alcun obbligo di pubblicare questa recensione. In quanto società mediatica indipendente, Notebookcheck non è soggetta all'autorità di produttori, rivenditori o editori.
Ecco come Notebookcheck esegue i test
Ogni anno, Notebookcheck esamina in modo indipendente centinaia di laptop e smartphone utilizzando procedure standardizzate per garantire che tutti i risultati siano comparabili. Da circa 20 anni sviluppiamo continuamente i nostri metodi di prova e nel frattempo stabiliamo gli standard di settore. Nei nostri laboratori di prova, tecnici ed editori esperti utilizzano apparecchiature di misurazione di alta qualità. Questi test comportano un processo di validazione in più fasi. Il nostro complesso sistema di valutazione si basa su centinaia di misurazioni e parametri di riferimento ben fondati, che mantengono l'obiettività.Price comparison

