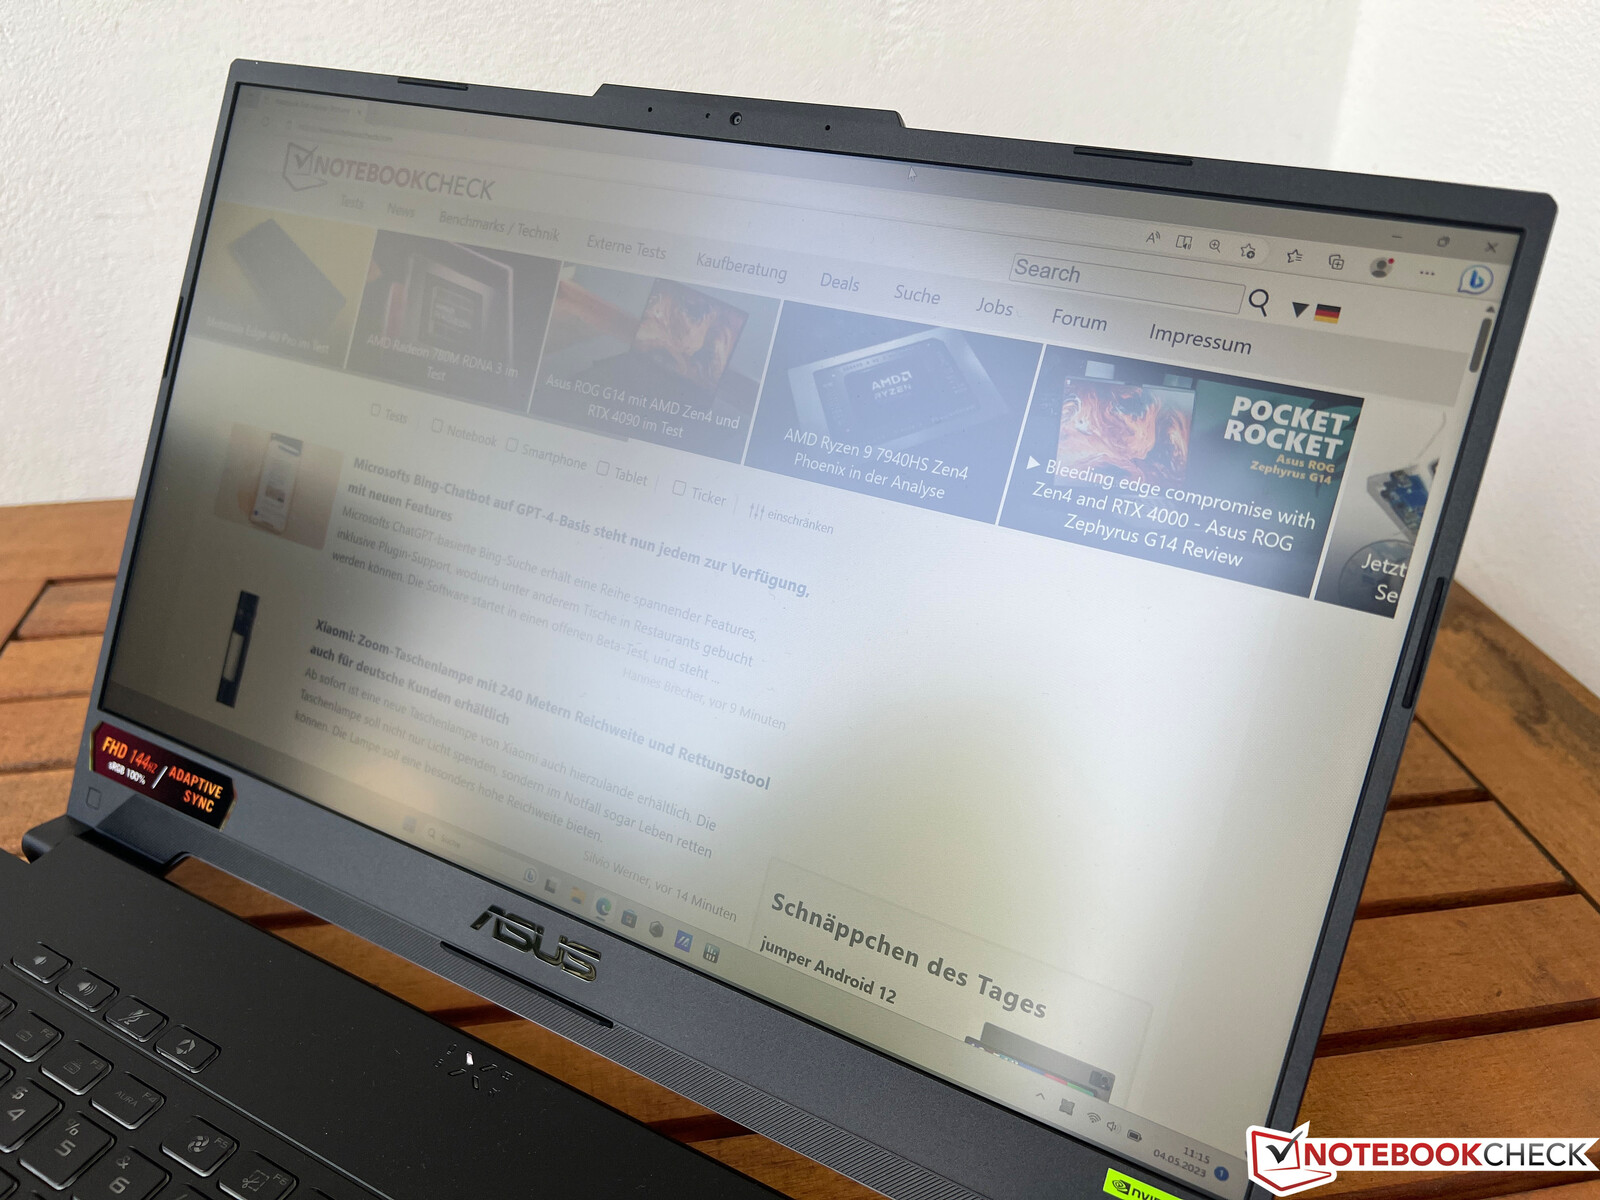
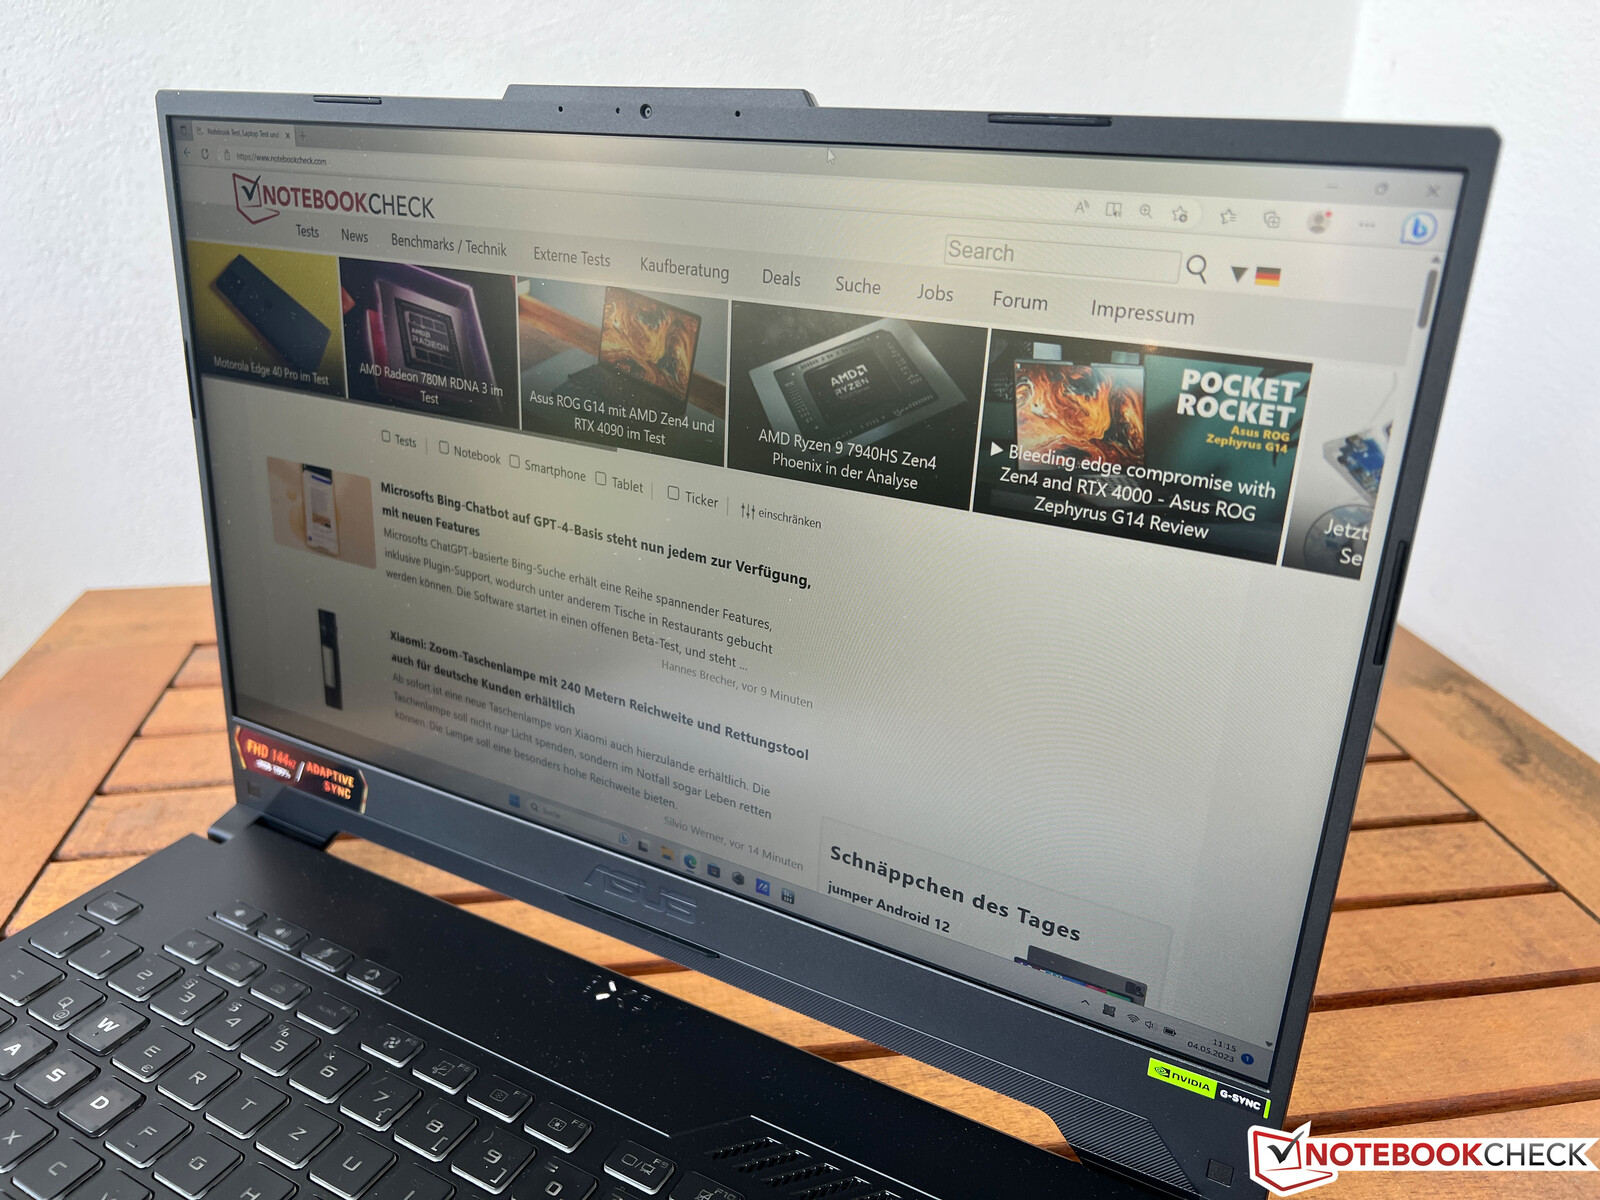
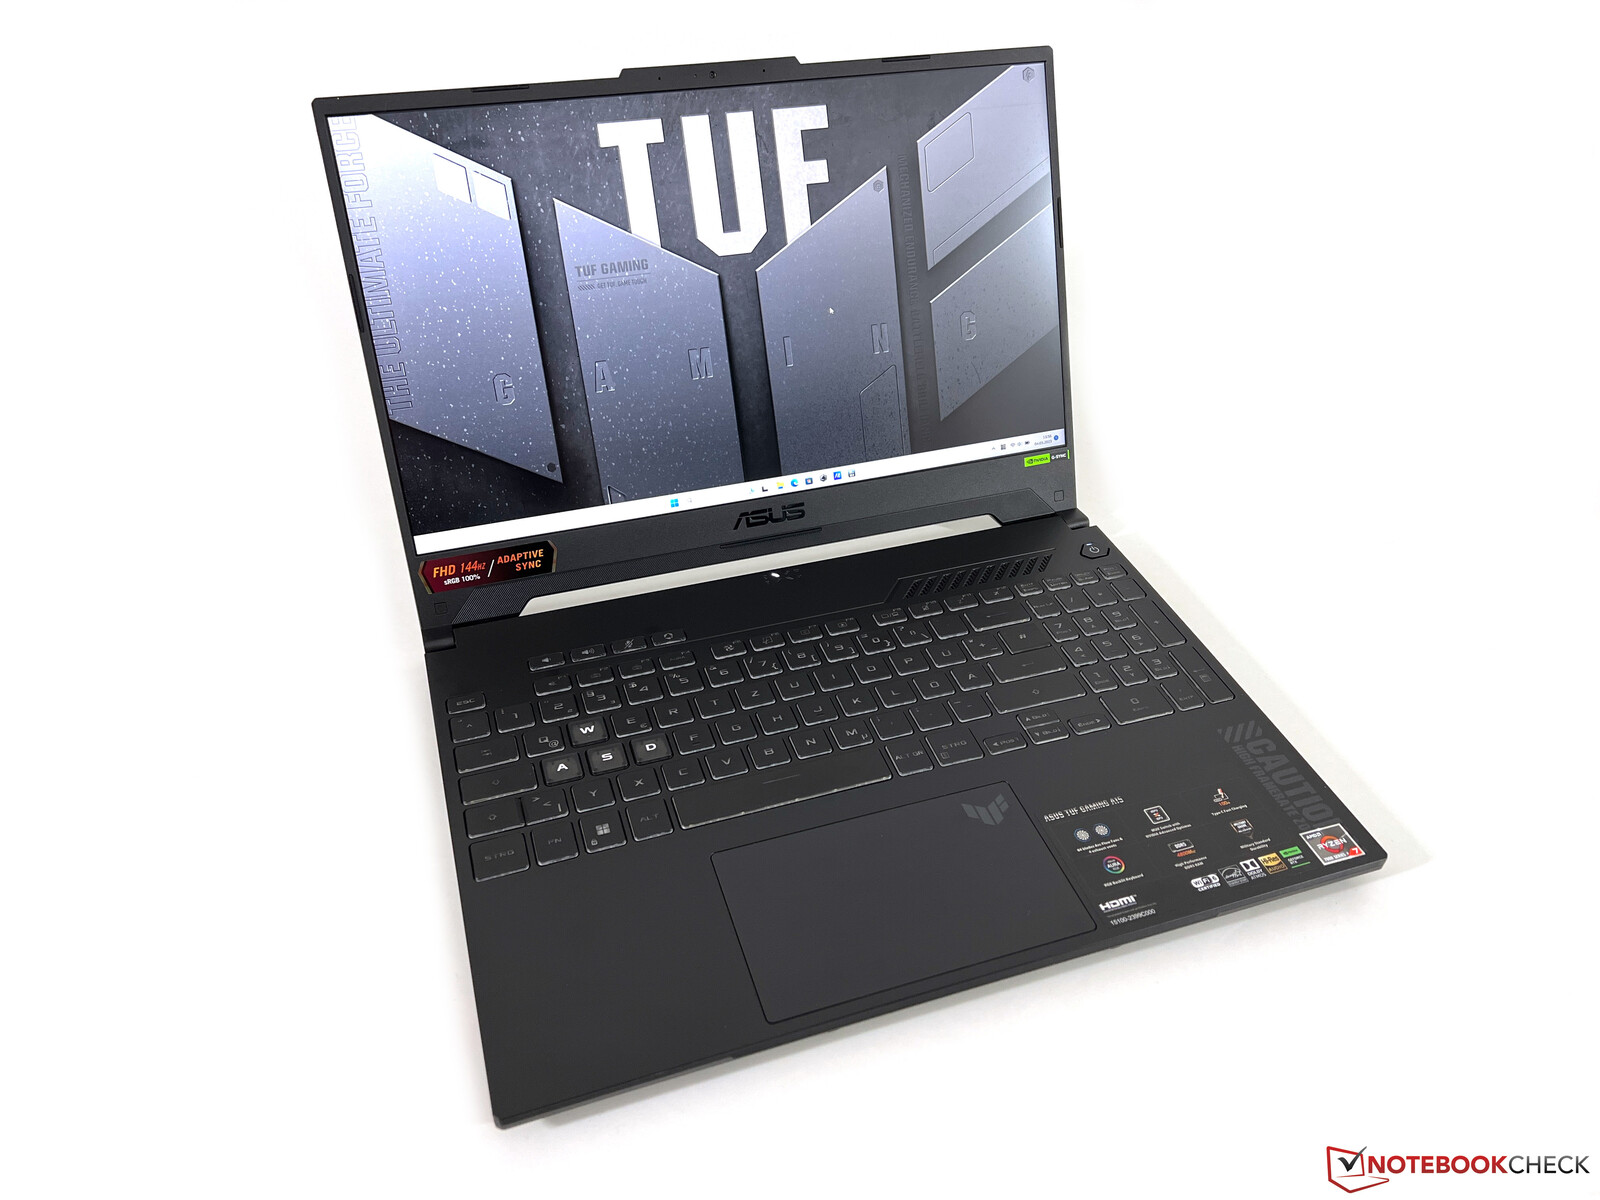
Recensione del portatile Asus TUF Gaming A15 - Un computer economico con RTX 4050 e schermo a 144 Hz
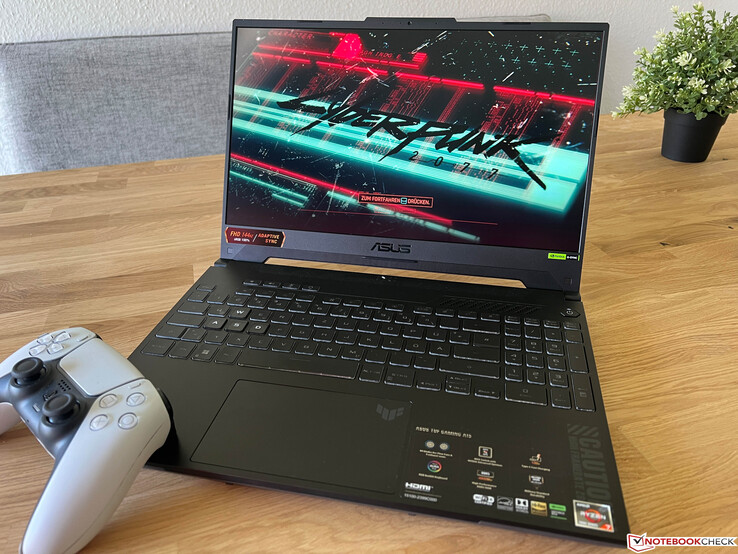
Situata al di sotto della serie ROG, la serie TUF Gaming di Asus si propone di fornire un'opzione di laptop più economica per i giocatori. Abbiamo recentemente testato il modellomodello da 16 pollici con hardware AMDe ora è il momento di dare un'occhiata alla versione da 15 pollici: il TUF Gaming A15 con processore AMD (Ryzen 7 7735HS) e scheda grafica Nvidia (GeForce RTX 4050 Laptop). Ha un MRSP di circa 1.300 dollari e attualmente si può trovare online a 1.169 dollari. Inoltre, il dispositivo ha un pannello IPS opaco con una frequenza di aggiornamento di 144 Hz, 16 GB di RAM e un SSD NVMe da 512 GB. La versione retail del FA507NU-LP031 viene fornita senza sistema operativo, ma il nostro aveva già installato Windows 11 Home quando l'abbiamo ricevuto.
Potenziali concorrenti a confronto
Punteggio | Data | Modello | Peso | Altezza | Dimensione | Risoluzione | Prezzo |
|---|---|---|---|---|---|---|---|
| 86.3 % v7 (old) | 06/2023 | Asus TUF A15 FA507 R7 7735HS, GeForce RTX 4050 Laptop GPU | 2.2 kg | 24.9 mm | 15.60" | 1920x1080 | |
| 81.8 % v7 (old) | 04/2023 | Gigabyte G5 KE i5-12500H, GeForce RTX 3060 Laptop GPU | 2 kg | 23.9 mm | 15.60" | 1920x1080 | |
| 87.9 % v7 (old) | 01/2023 | Schenker XMG Core 15 (M22) R7 6800H, GeForce RTX 3060 Laptop GPU | 2.1 kg | 23 mm | 15.60" | 2560x1440 | |
| 82.9 % v7 (old) | 03/2023 | MSI Katana 15 B12VEK i7-12650H, GeForce RTX 4050 Laptop GPU | 2.3 kg | 24.9 mm | 15.60" | 1920x1080 | |
| 81 % v7 (old) | 01/2023 | HP Victus 15 fa0020nr i7-12700H, GeForce RTX 3050 Ti Laptop GPU | 2.3 kg | 23.6 mm | 15.60" | 1920x1080 | |
| 82.8 % v7 (old) | 10/2022 | Lenovo IdeaPad Gaming 3 15IAH7 i5-12500H, GeForce RTX 3050 Ti Laptop GPU | 2.4 kg | 26 mm | 15.60" | 1920x1080 | |
| 87.2 % v7 (old) | 03/2022 | Asus TUF Gaming F15 FX507ZM i7-12700H, GeForce RTX 3060 Laptop GPU | 2.1 kg | 24.95 mm | 15.60" | 1920x1080 |
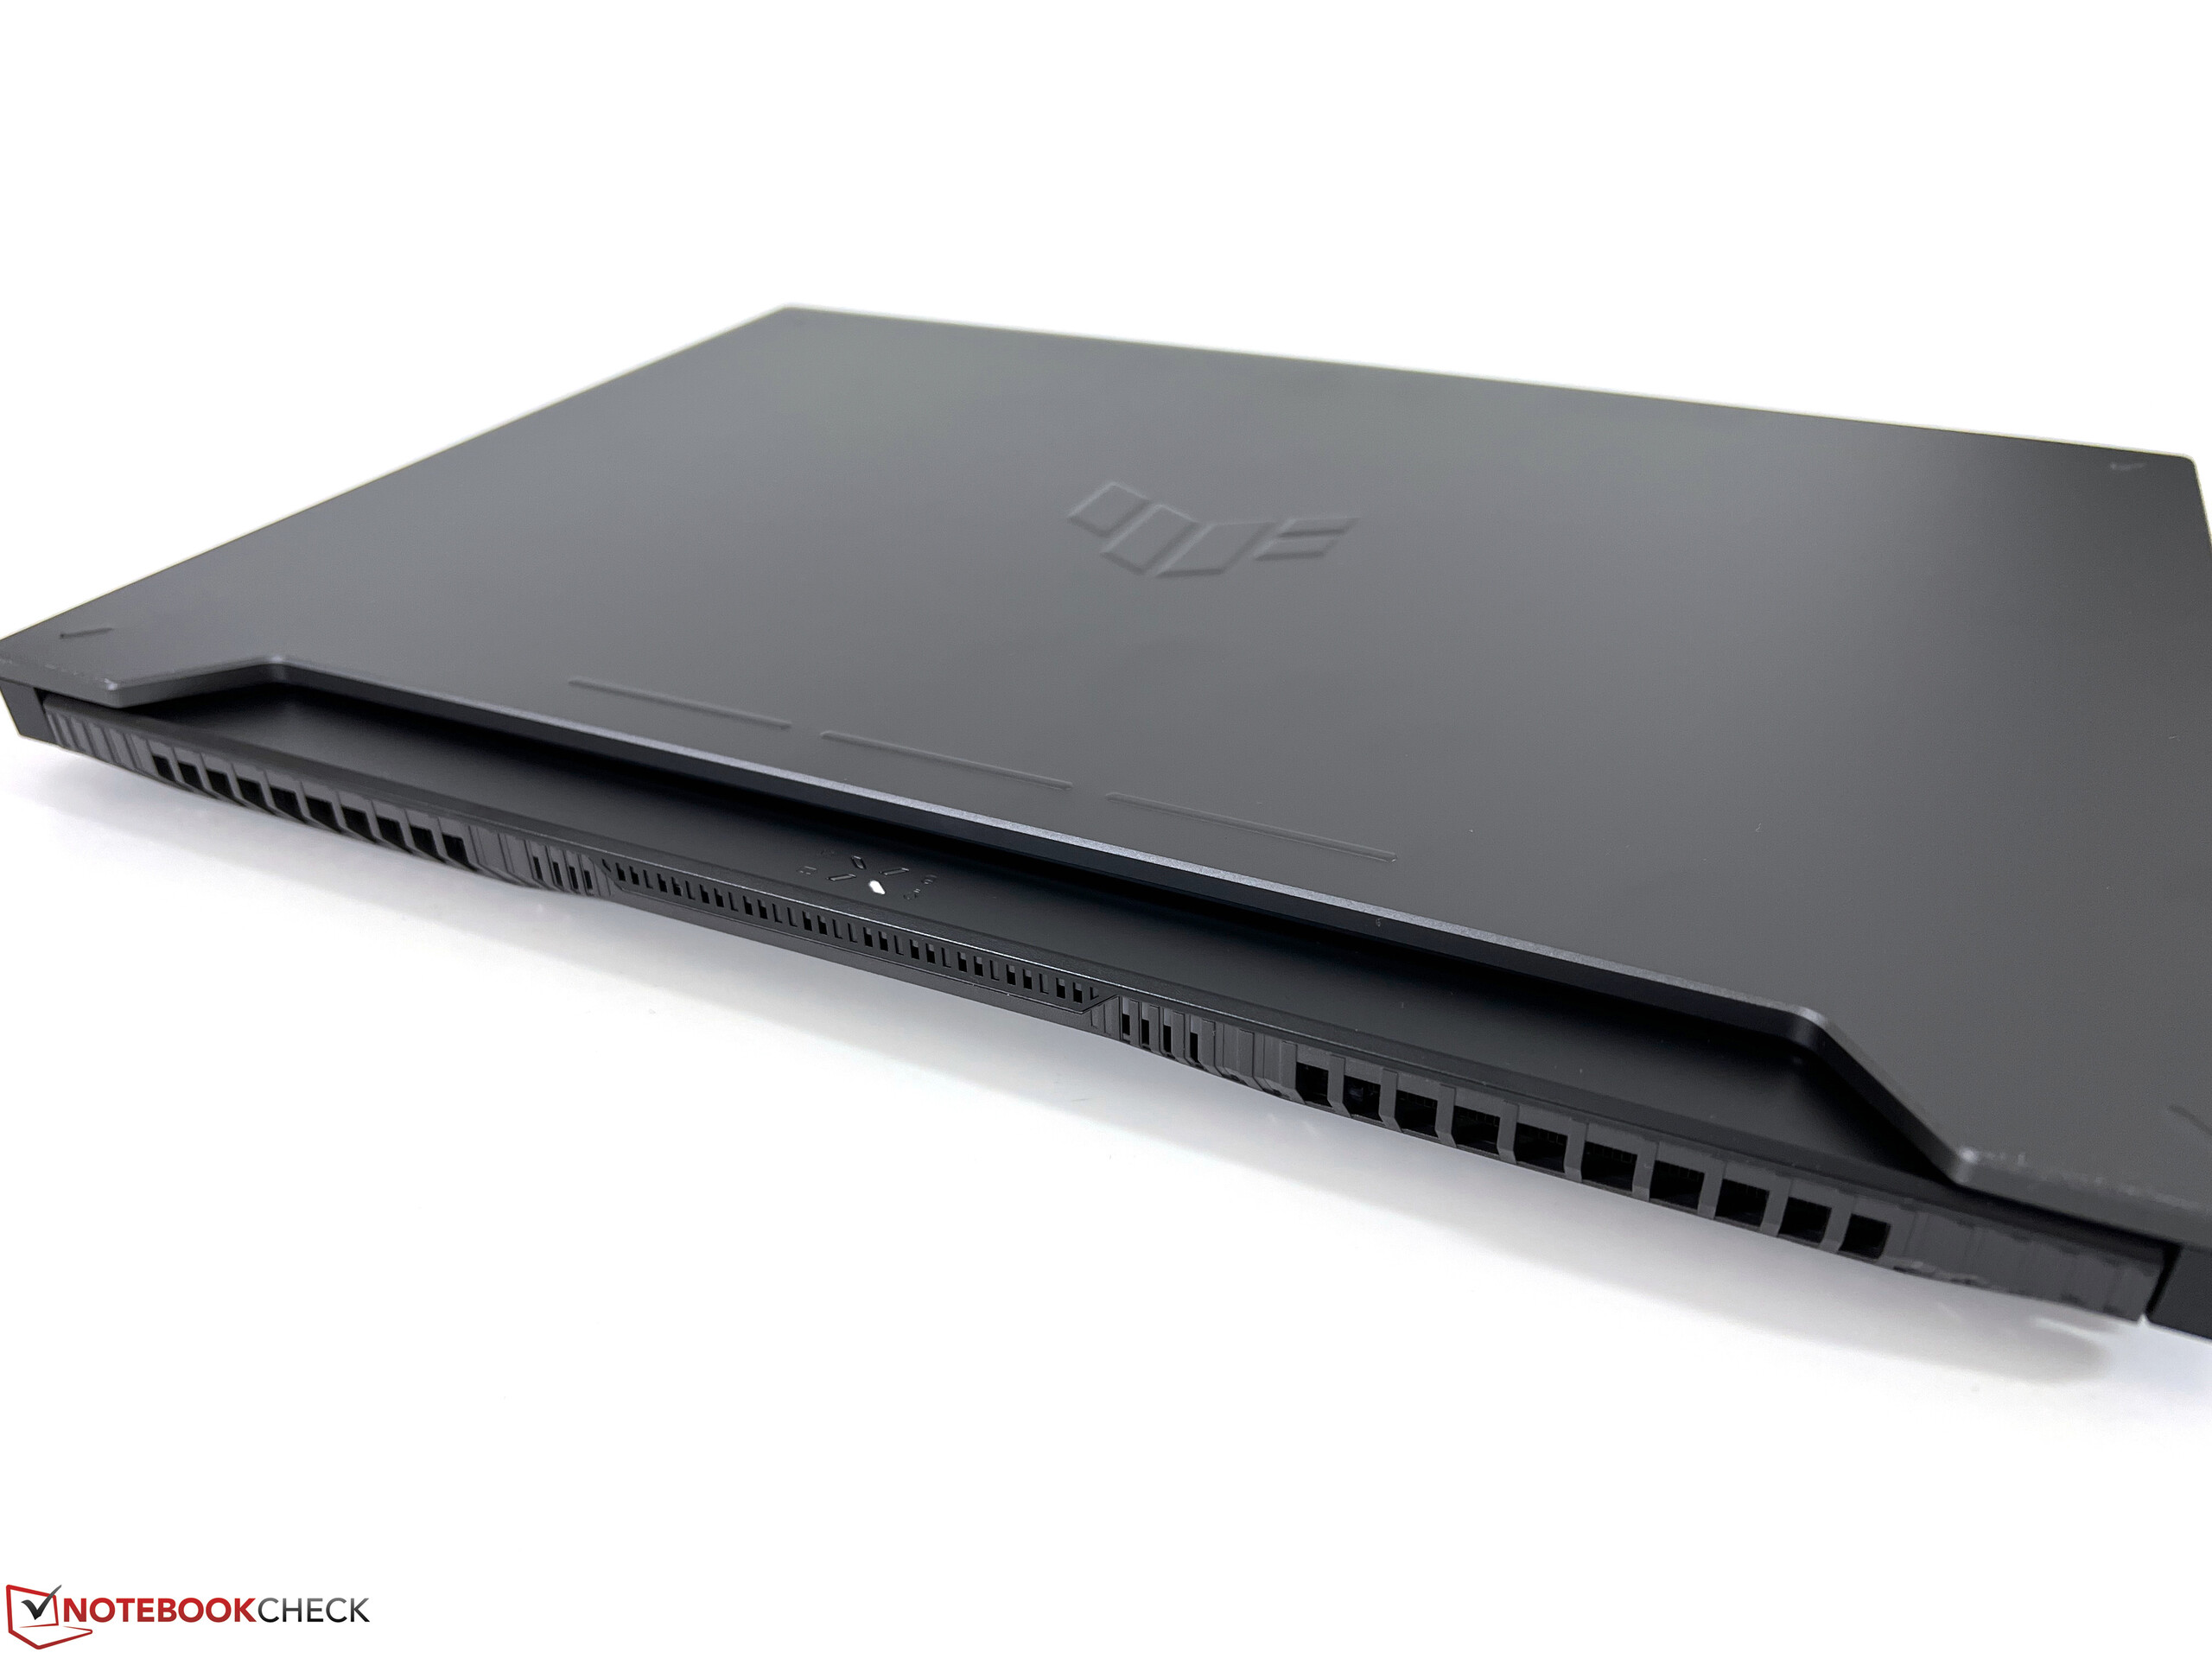
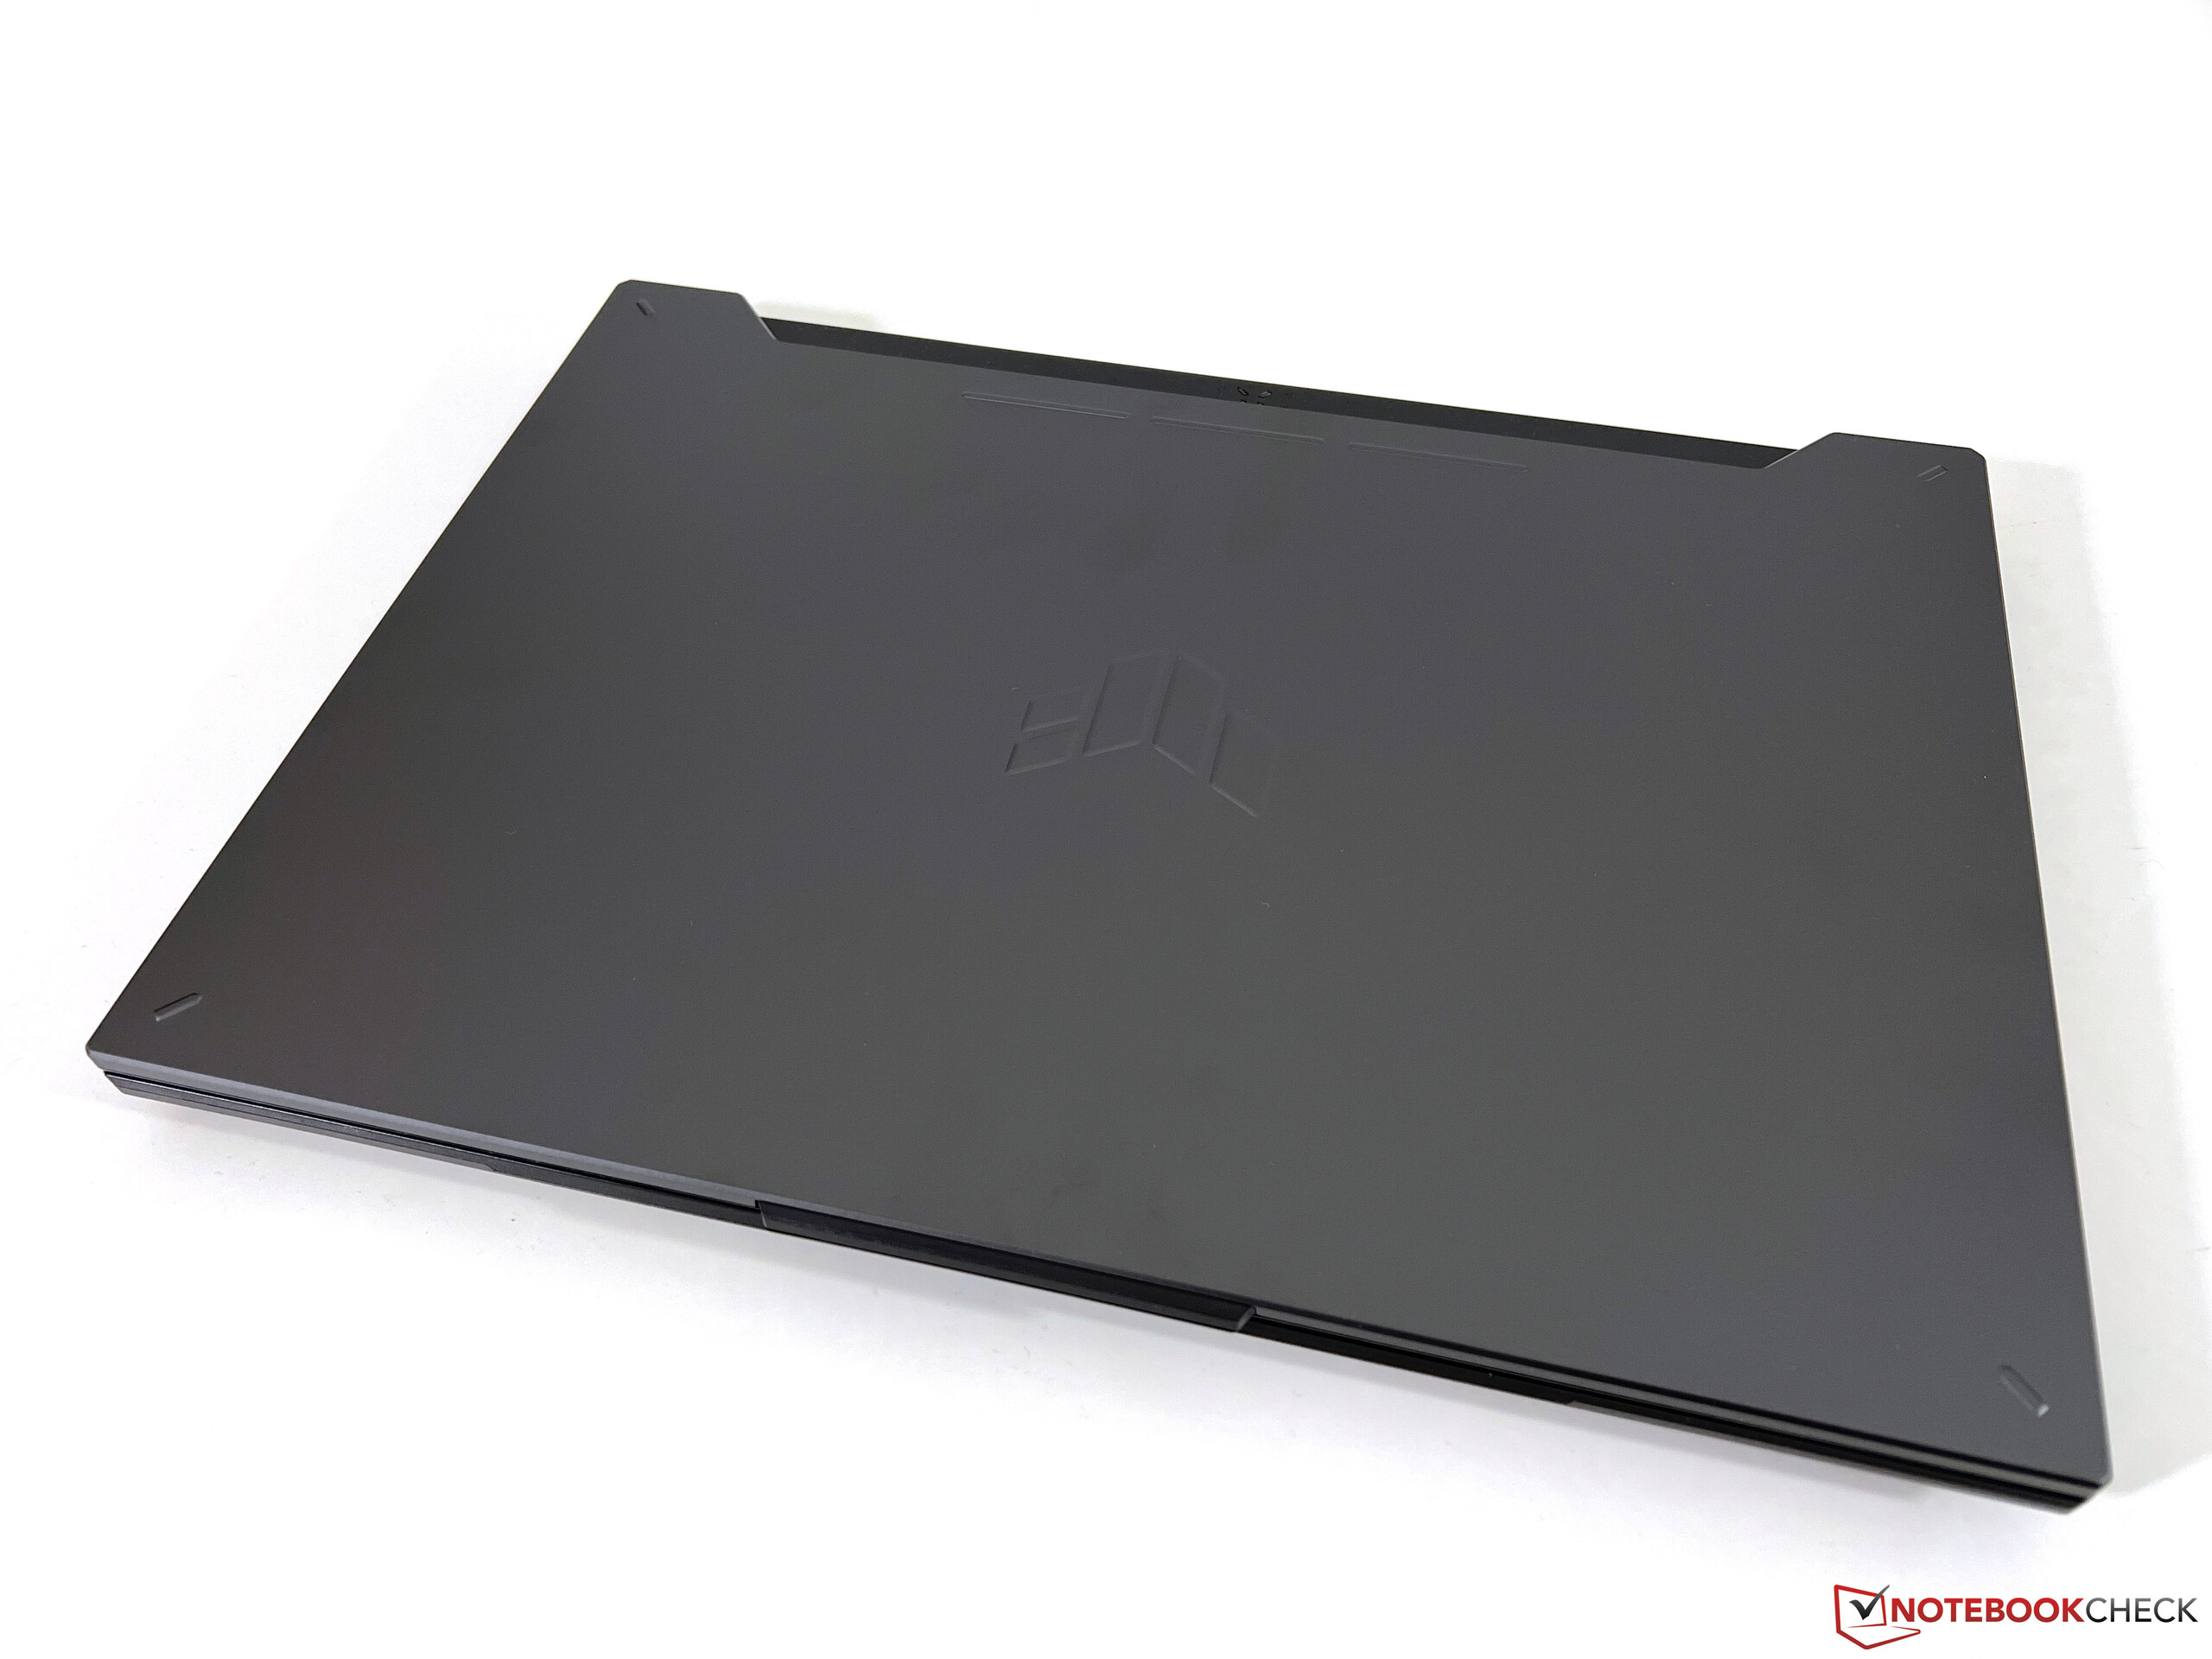
Custodia - Un portatile da gioco sobrio e senza illuminazione
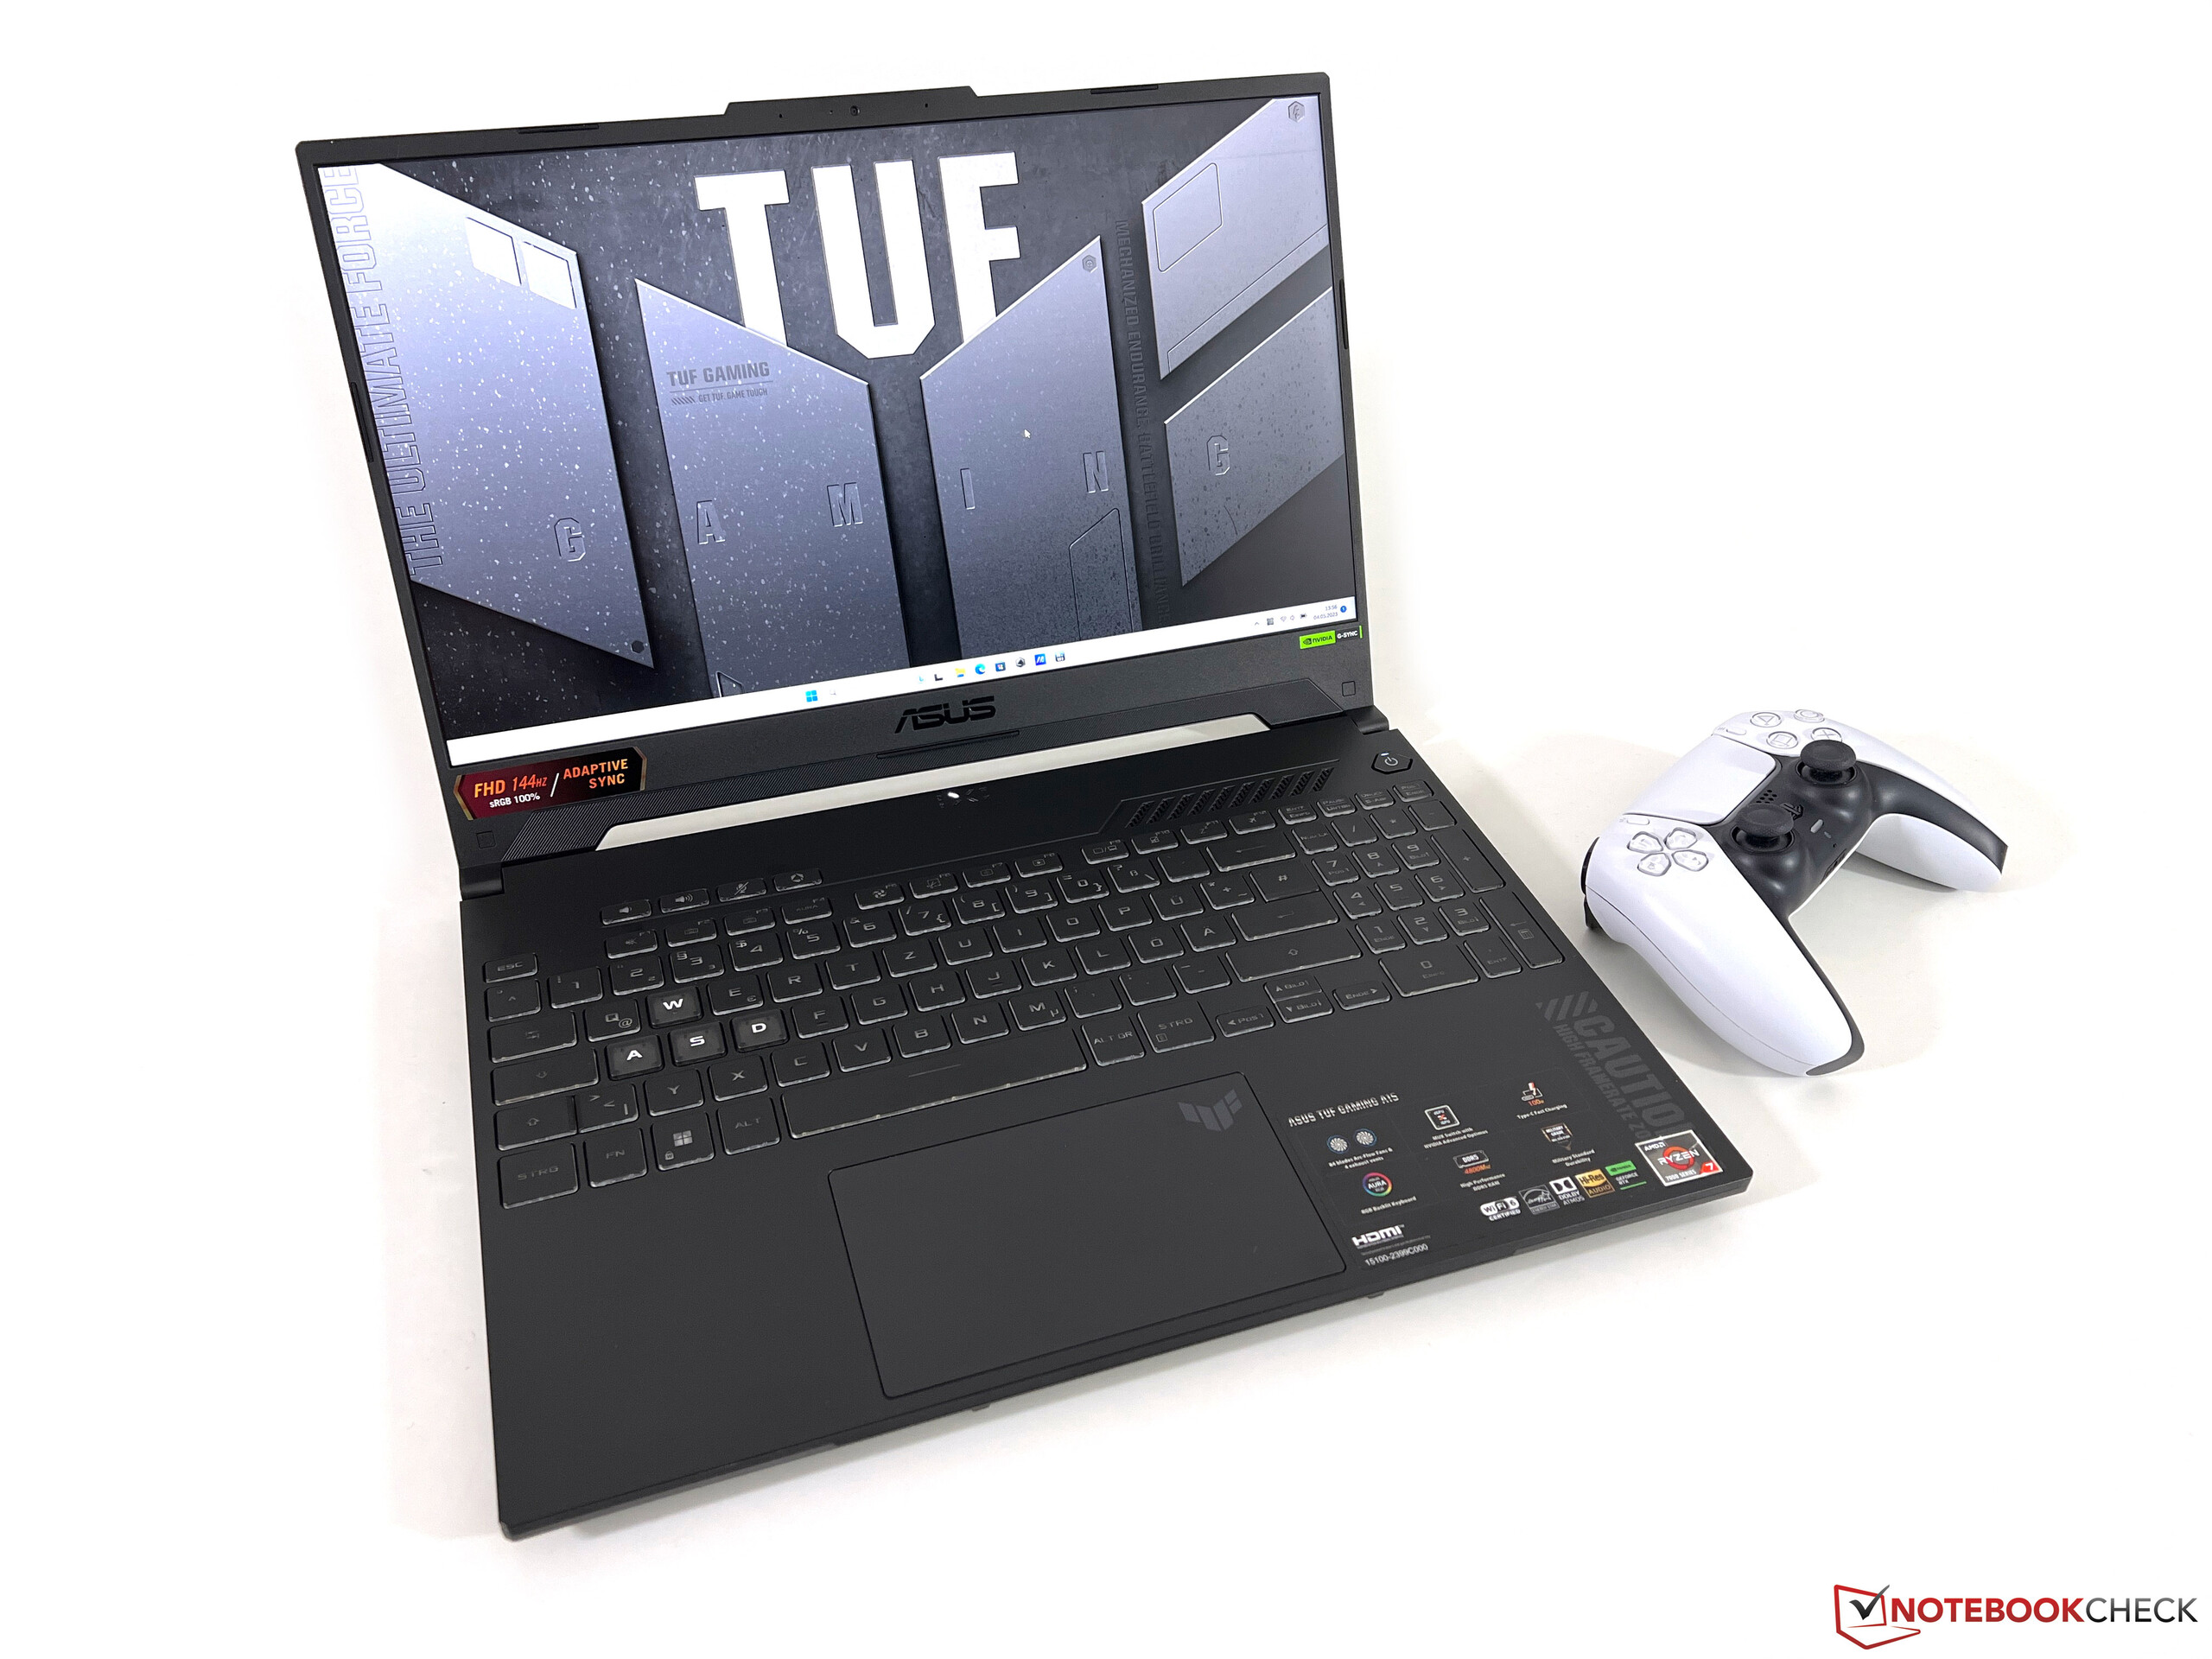
Rispetto al suo predecessore con processore Intel, il modelloTUF Gaming F15il design del case di questo portatile rimane praticamente invariato. Ci sono solo piccole differenze, come i tasti WASD che non sono più bianchi e i quattro angoli del coperchio che ora presentano piccole barre invece di cerchi. Il modello attuale non presenta ancora alcuna caratteristica di illuminazione e, in generale, il portatile ha assunto un aspetto piuttosto sobrio con il suo colore grigio scuro. Soprattutto il bordo inferiore dello schermo è piuttosto grande, in quanto il portatile utilizza ancora un rapporto di 16:9. È probabile che sia necessario pulire le superfici scure con una certa frequenza, poiché sono inclini a raccogliere le impronte digitali.
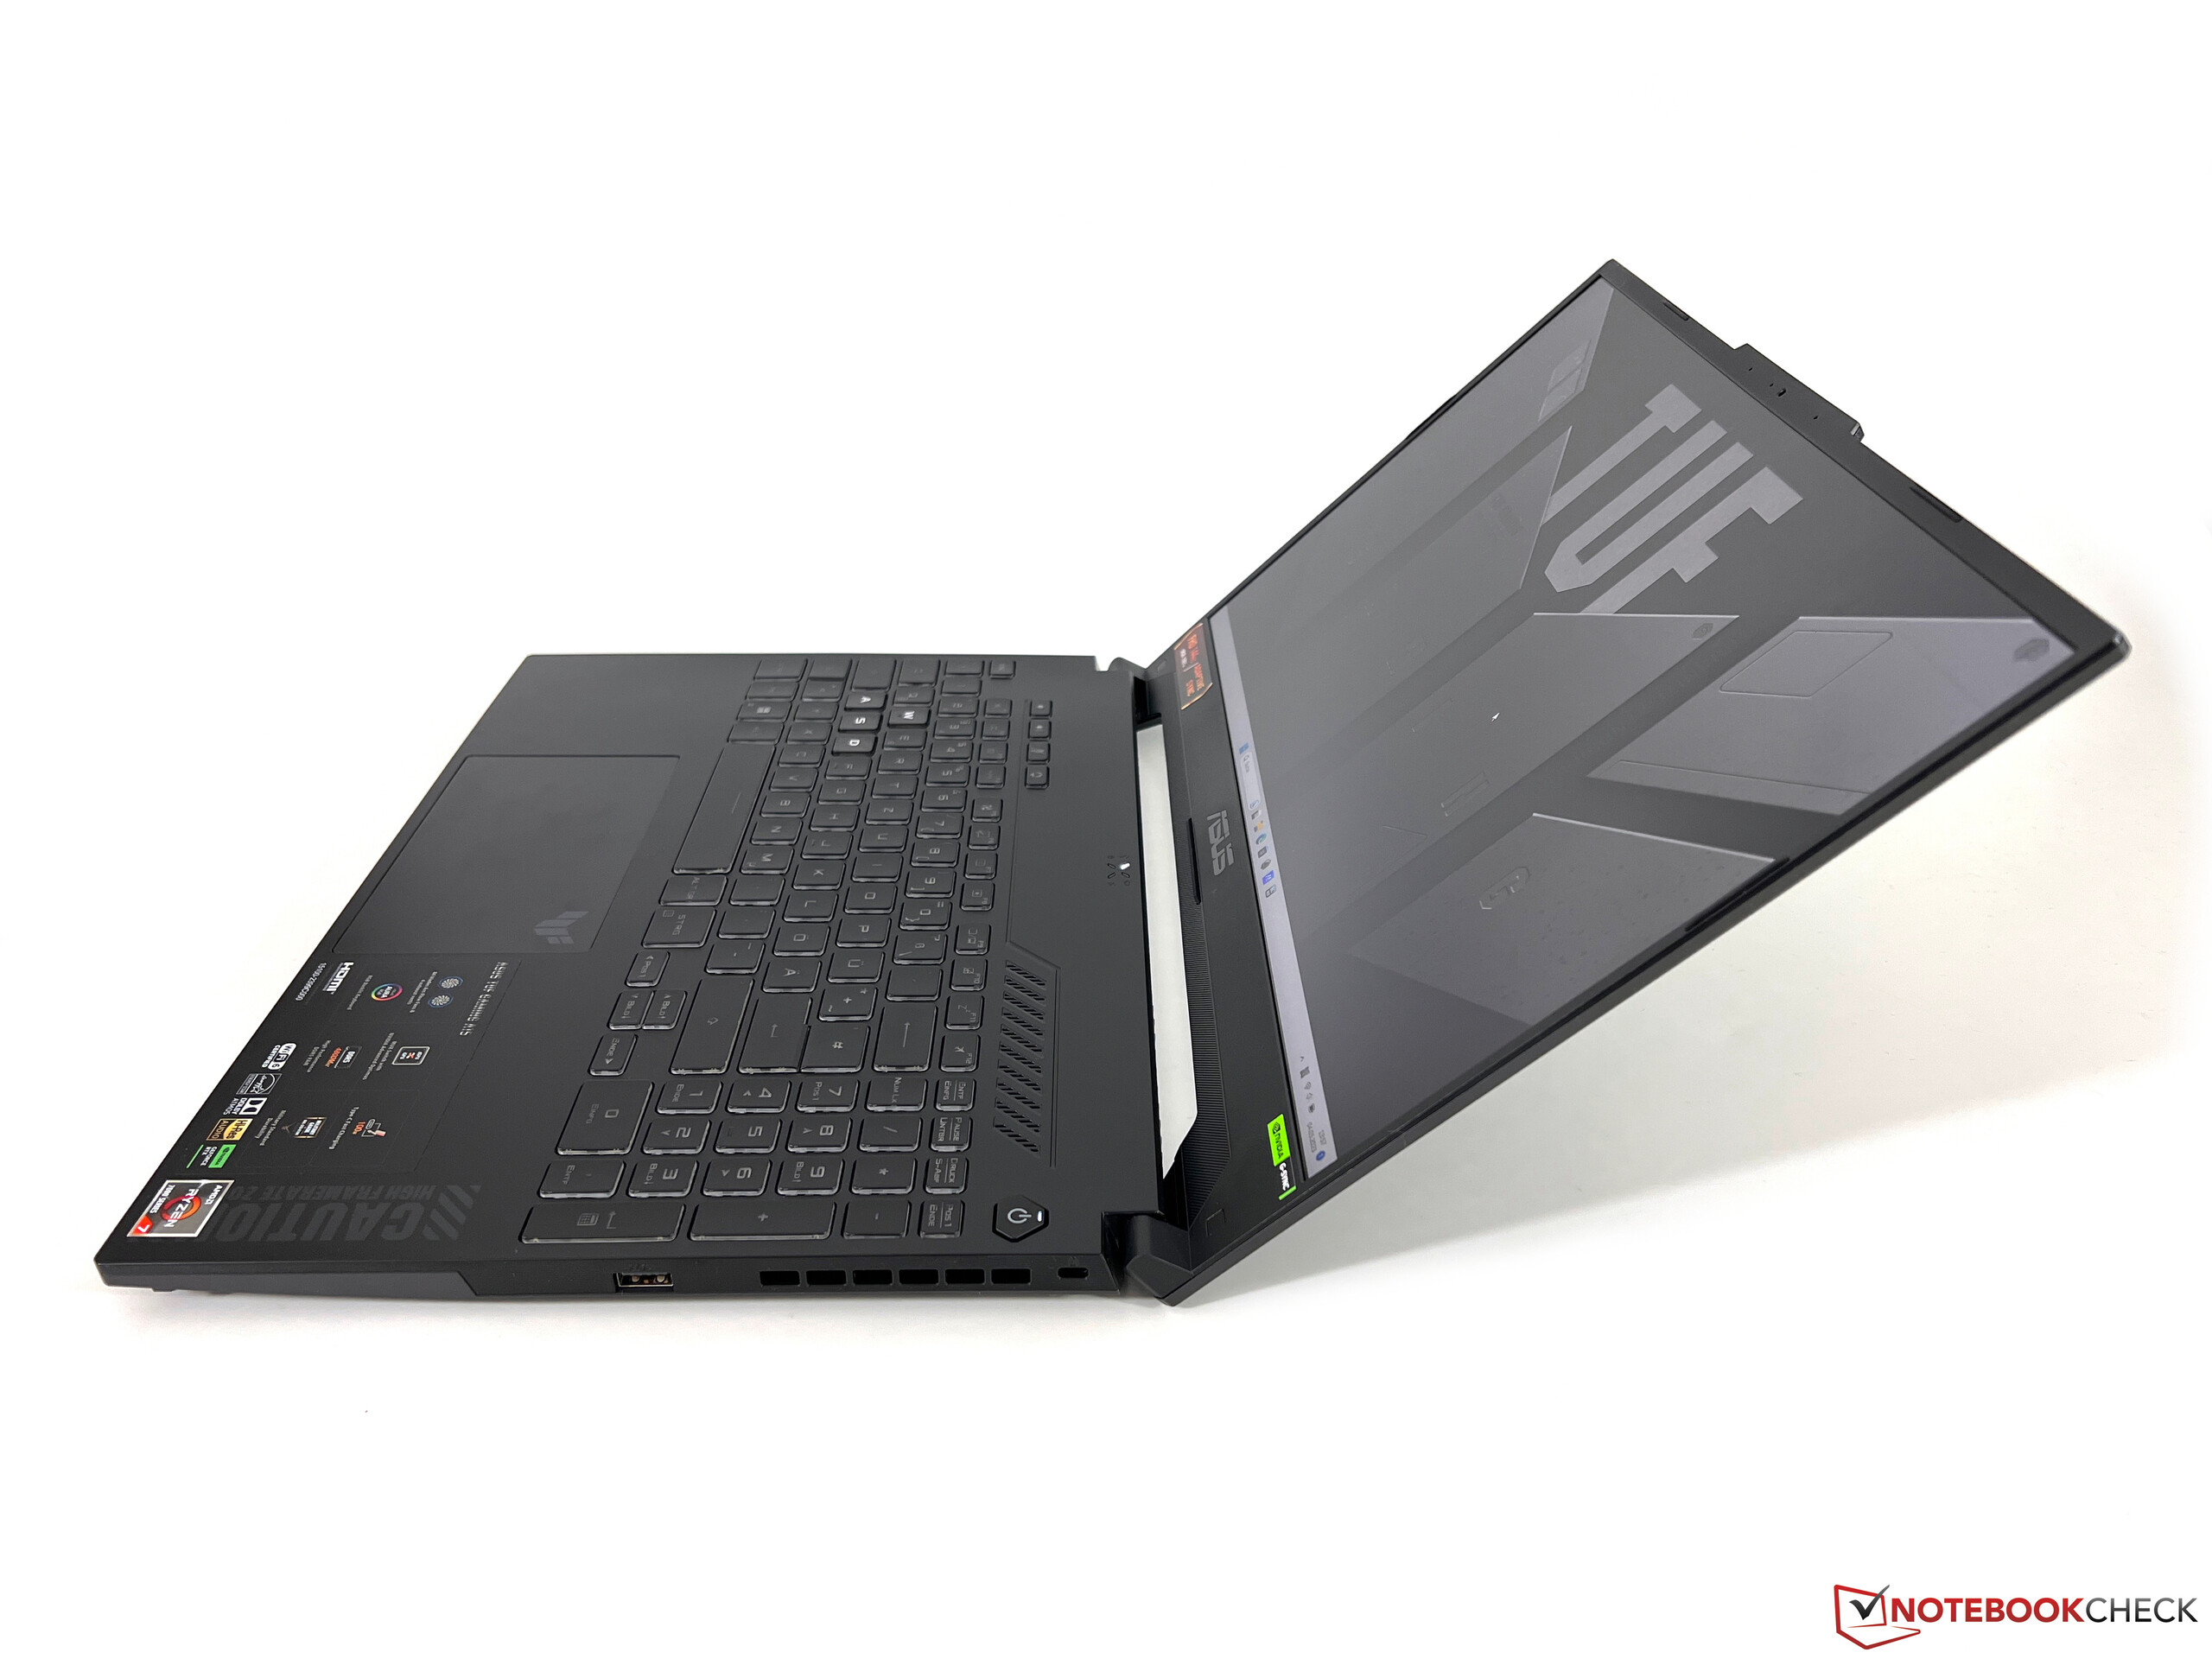
Il coperchio del portatile è in metallo, mentre il resto del case è in plastica. L'unità di base è abbastanza stabile, ma è possibile spingere al centro della tastiera con una certa facilità. Tuttavia, non produce alcuno scricchiolio quando si cerca di ruotare e piegare il dispositivo. Il suo coperchio sottile non è il massimo, in quanto lo schermo inizia già a presentare disturbi quando si preme con poca pressione o si cerca di modificare l'angolo di apertura (massimo ~ 135 gradi).
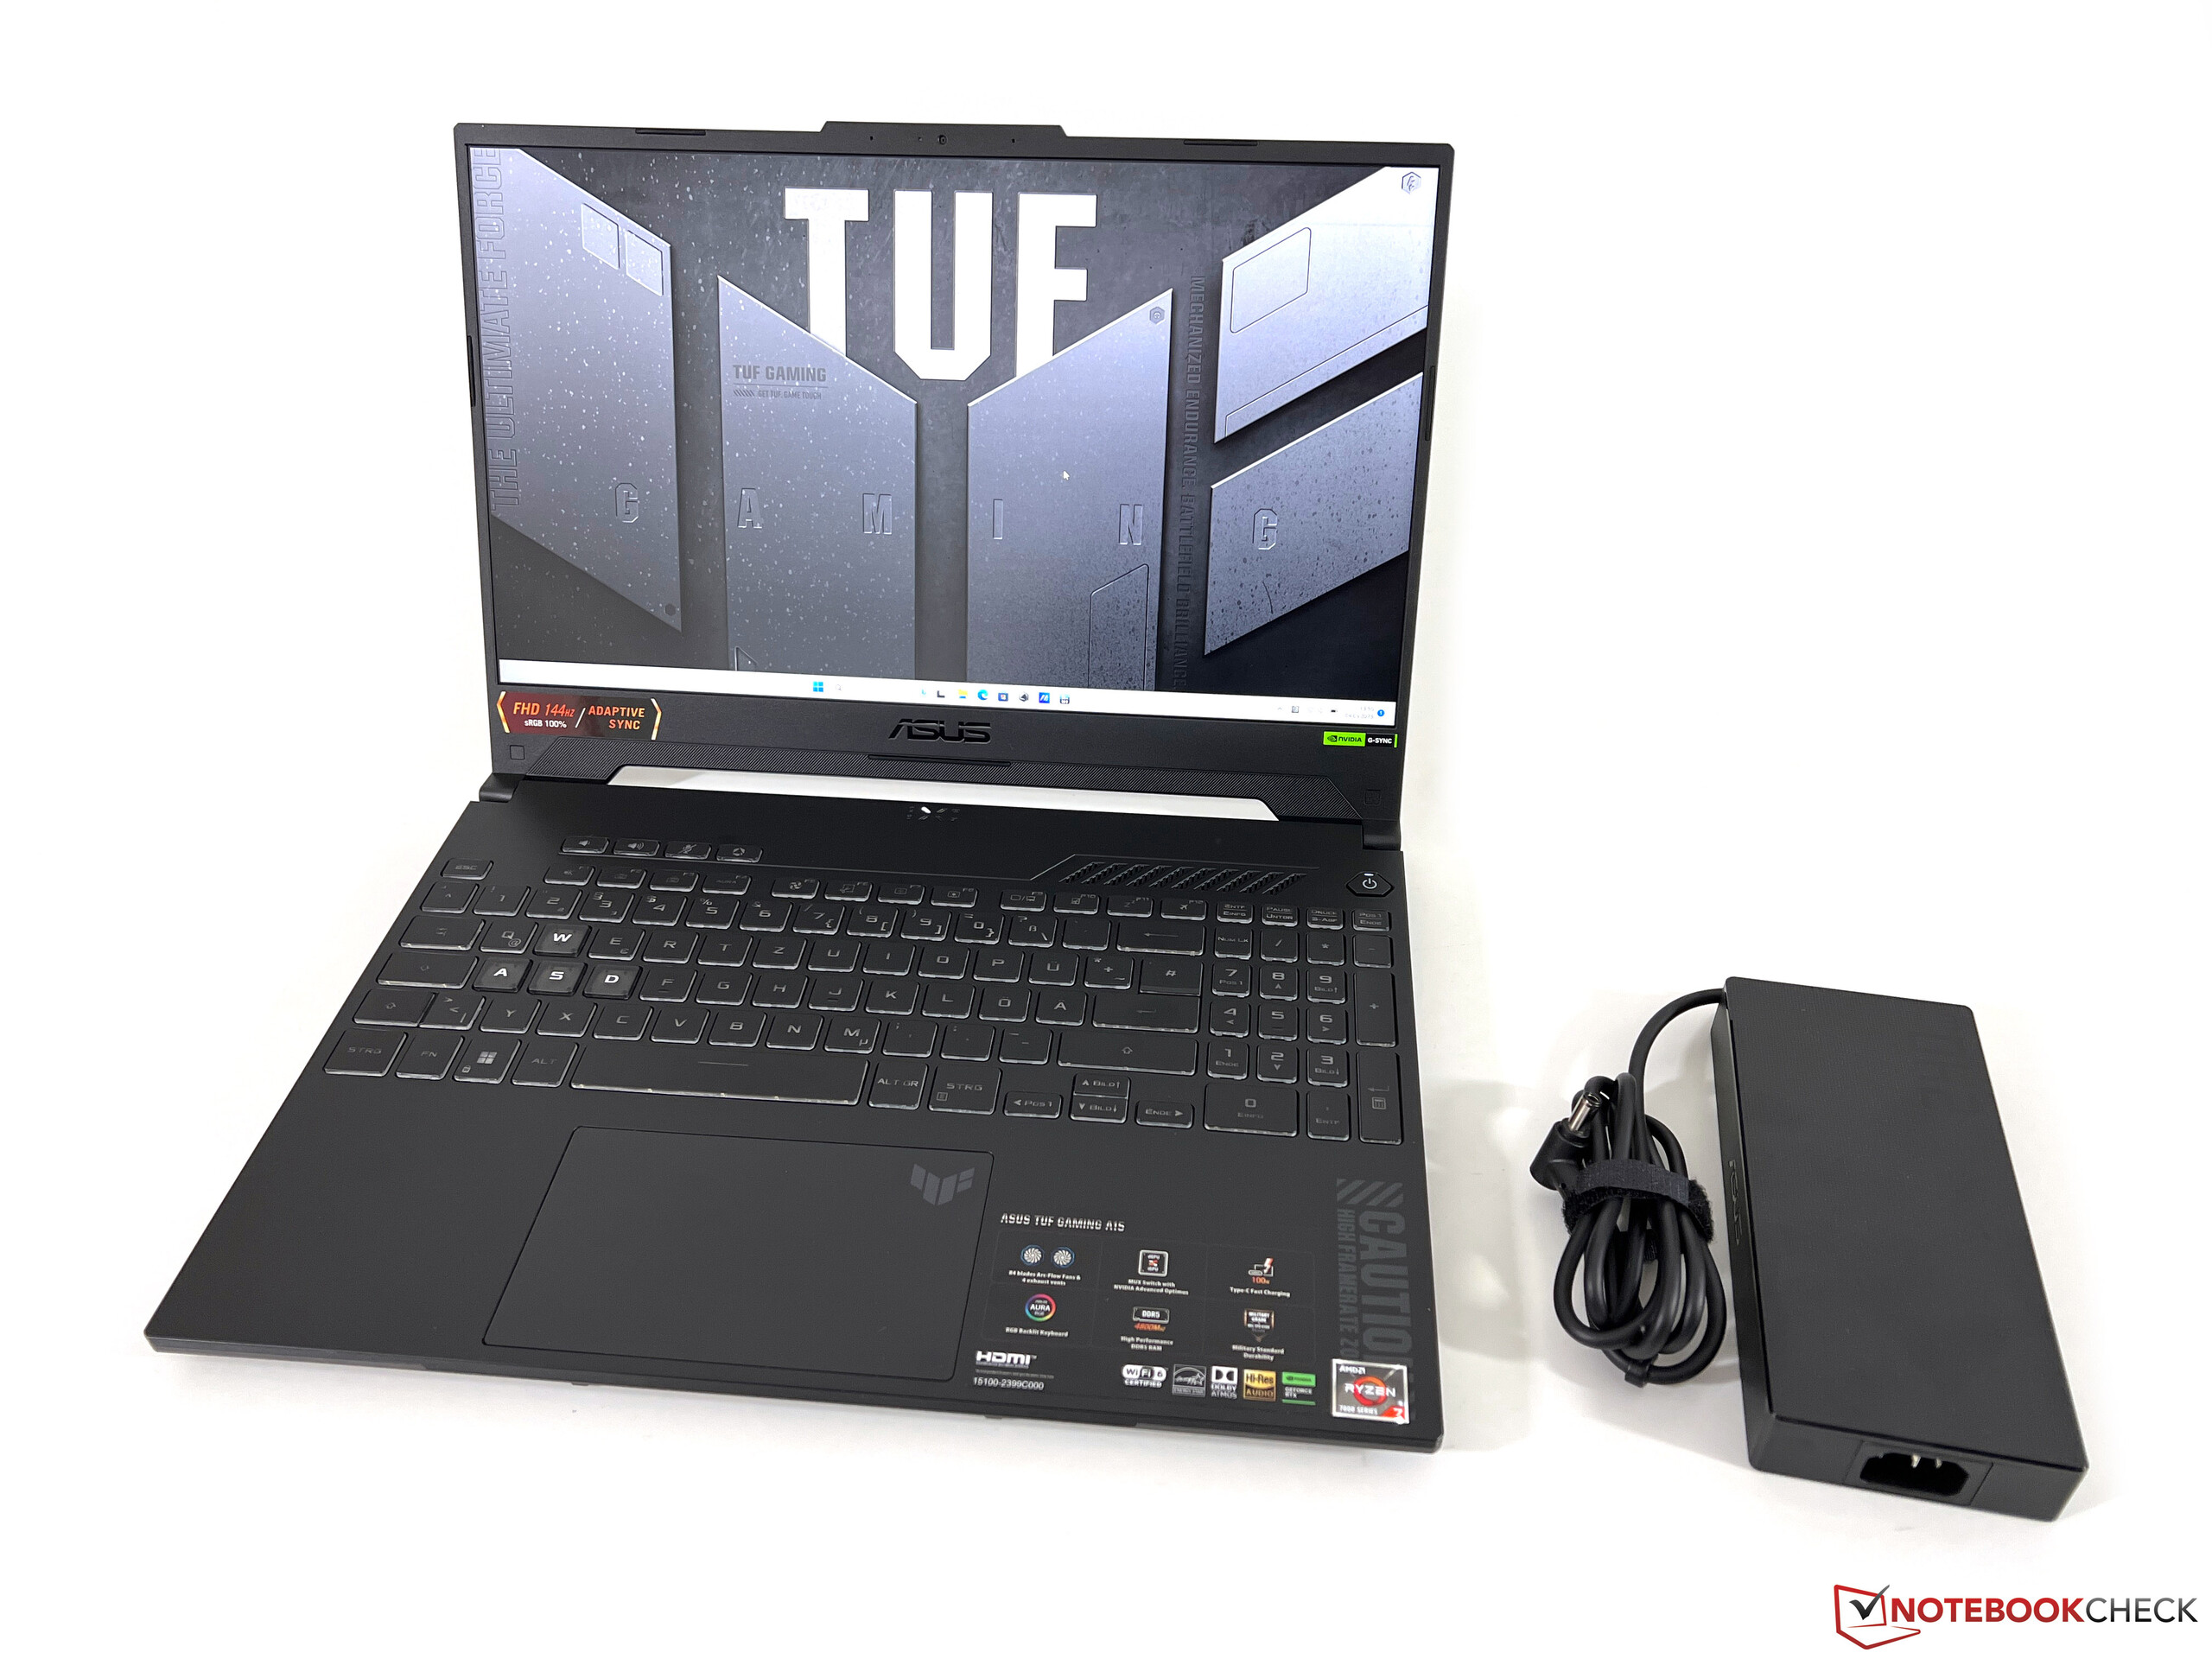
Dal punto di vista delle dimensioni, tutti i concorrenti sono abbastanza simili, ma il TUF Gaming A15 ha il design più piccolo. Il peso di poco più di 2,1 kg rende il portatile relativamente portatile e molto probabilmente sarà possibile inserirlo nella maggior parte degli zaini o delle borse. L'alimentatore da 240 watt in dotazione pesa altri 735 grammi.
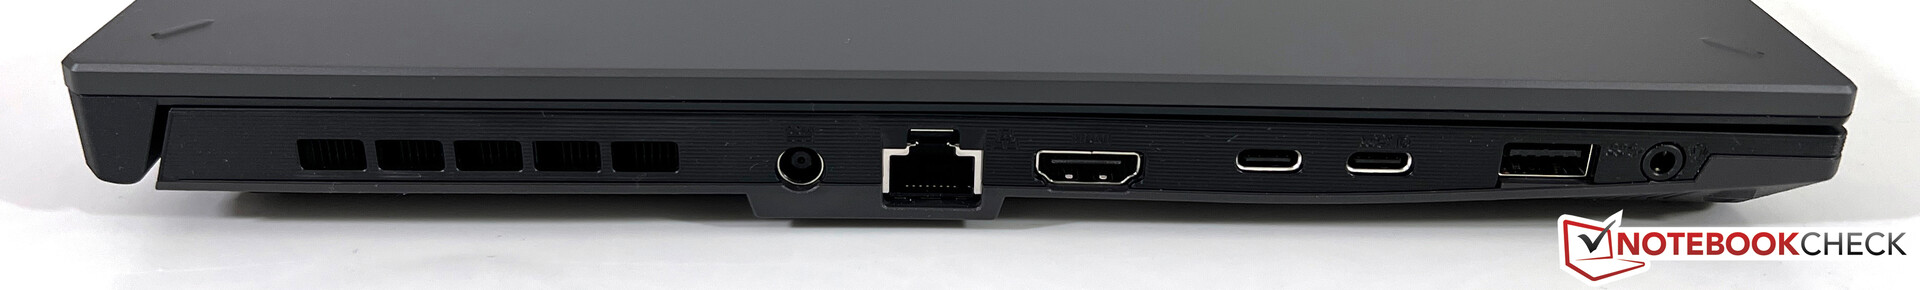
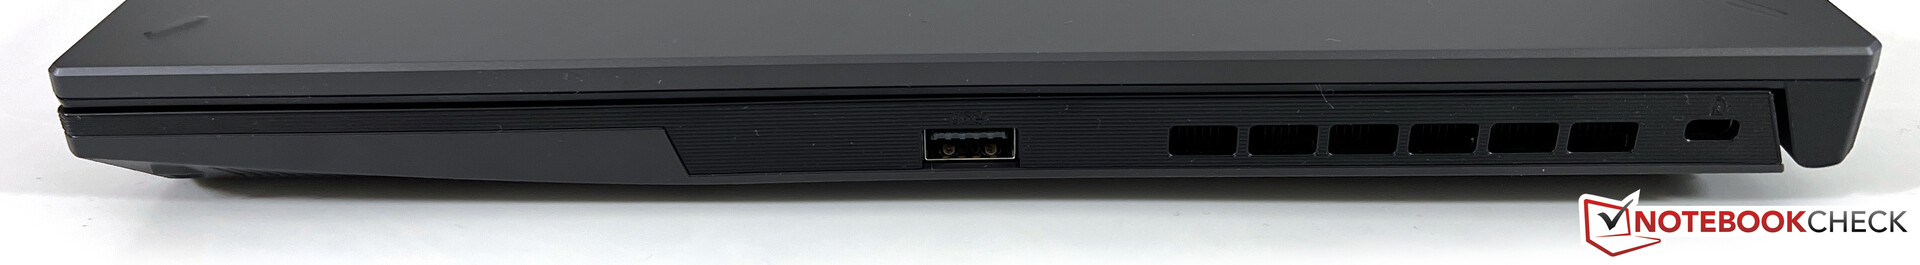
Connettività - Asus ha incluso la porta USB 4
La parte posteriore dell'unità di base è occupata dall'unità di raffreddamento e quasi tutte le porte sono situate sul lato sinistro del dispositivo. Solo una porta USB si trova sul lato destro. Se si utilizzano tutte le porte, lo spazio potrebbe essere un po' ridotto. Sono presenti due porte USB-C di cui una supporta USB 4.0 e l'altra supporta G-Sync se si collega un monitor corrispondente.
Comunicazione
Oltre a una porta Gigabit Ethernet, il portatile utilizza anche un modulo WLAN MediaTek MT7921 che supporta connessioni Wi-Fi 6 e banda 160-MHz. Tuttavia, la velocità massima di trasferimento è di 1.200 bit/s. Nel nostro test utilizzando un router di riferimento di Asus, queste velocità sono state confermate e, sebbene siano decenti, ci sono sicuramente moduli WLAN più veloci sul mercato. In fin dei conti, questo non dovrebbe causare alcun problema nell'uso quotidiano (ad esempio, quando si scaricano contenuti).
| Networking | |
| Asus TUF A15 FA507 | |
| iperf3 transmit AXE11000 | |
| iperf3 receive AXE11000 | |
| Gigabyte G5 KE | |
| iperf3 transmit AXE11000 | |
| iperf3 receive AXE11000 | |
| Schenker XMG Core 15 (M22) | |
| iperf3 transmit AXE11000 | |
| iperf3 receive AXE11000 | |
| iperf3 transmit AXE11000 6GHz | |
| iperf3 receive AXE11000 6GHz | |
| MSI Katana 15 B12VEK | |
| iperf3 transmit AXE11000 | |
| iperf3 receive AXE11000 | |
| HP Victus 15 fa0020nr | |
| iperf3 transmit AXE11000 | |
| iperf3 receive AXE11000 | |
| Lenovo IdeaPad Gaming 3 15IAH7 | |
| iperf3 receive AXE11000 | |
| Asus TUF Gaming F15 FX507ZM | |
| iperf3 transmit AX12 | |
| iperf3 receive AX12 | |
Webcam
Nonostante la fotocamera del TUF Gaming A15 abbia un bump, è capace solo di 720p e fatica a scattare foto decenti anche in buone condizioni di luce. La nitidezza è minima e anche i colori non sono rappresentati in modo molto accurato.


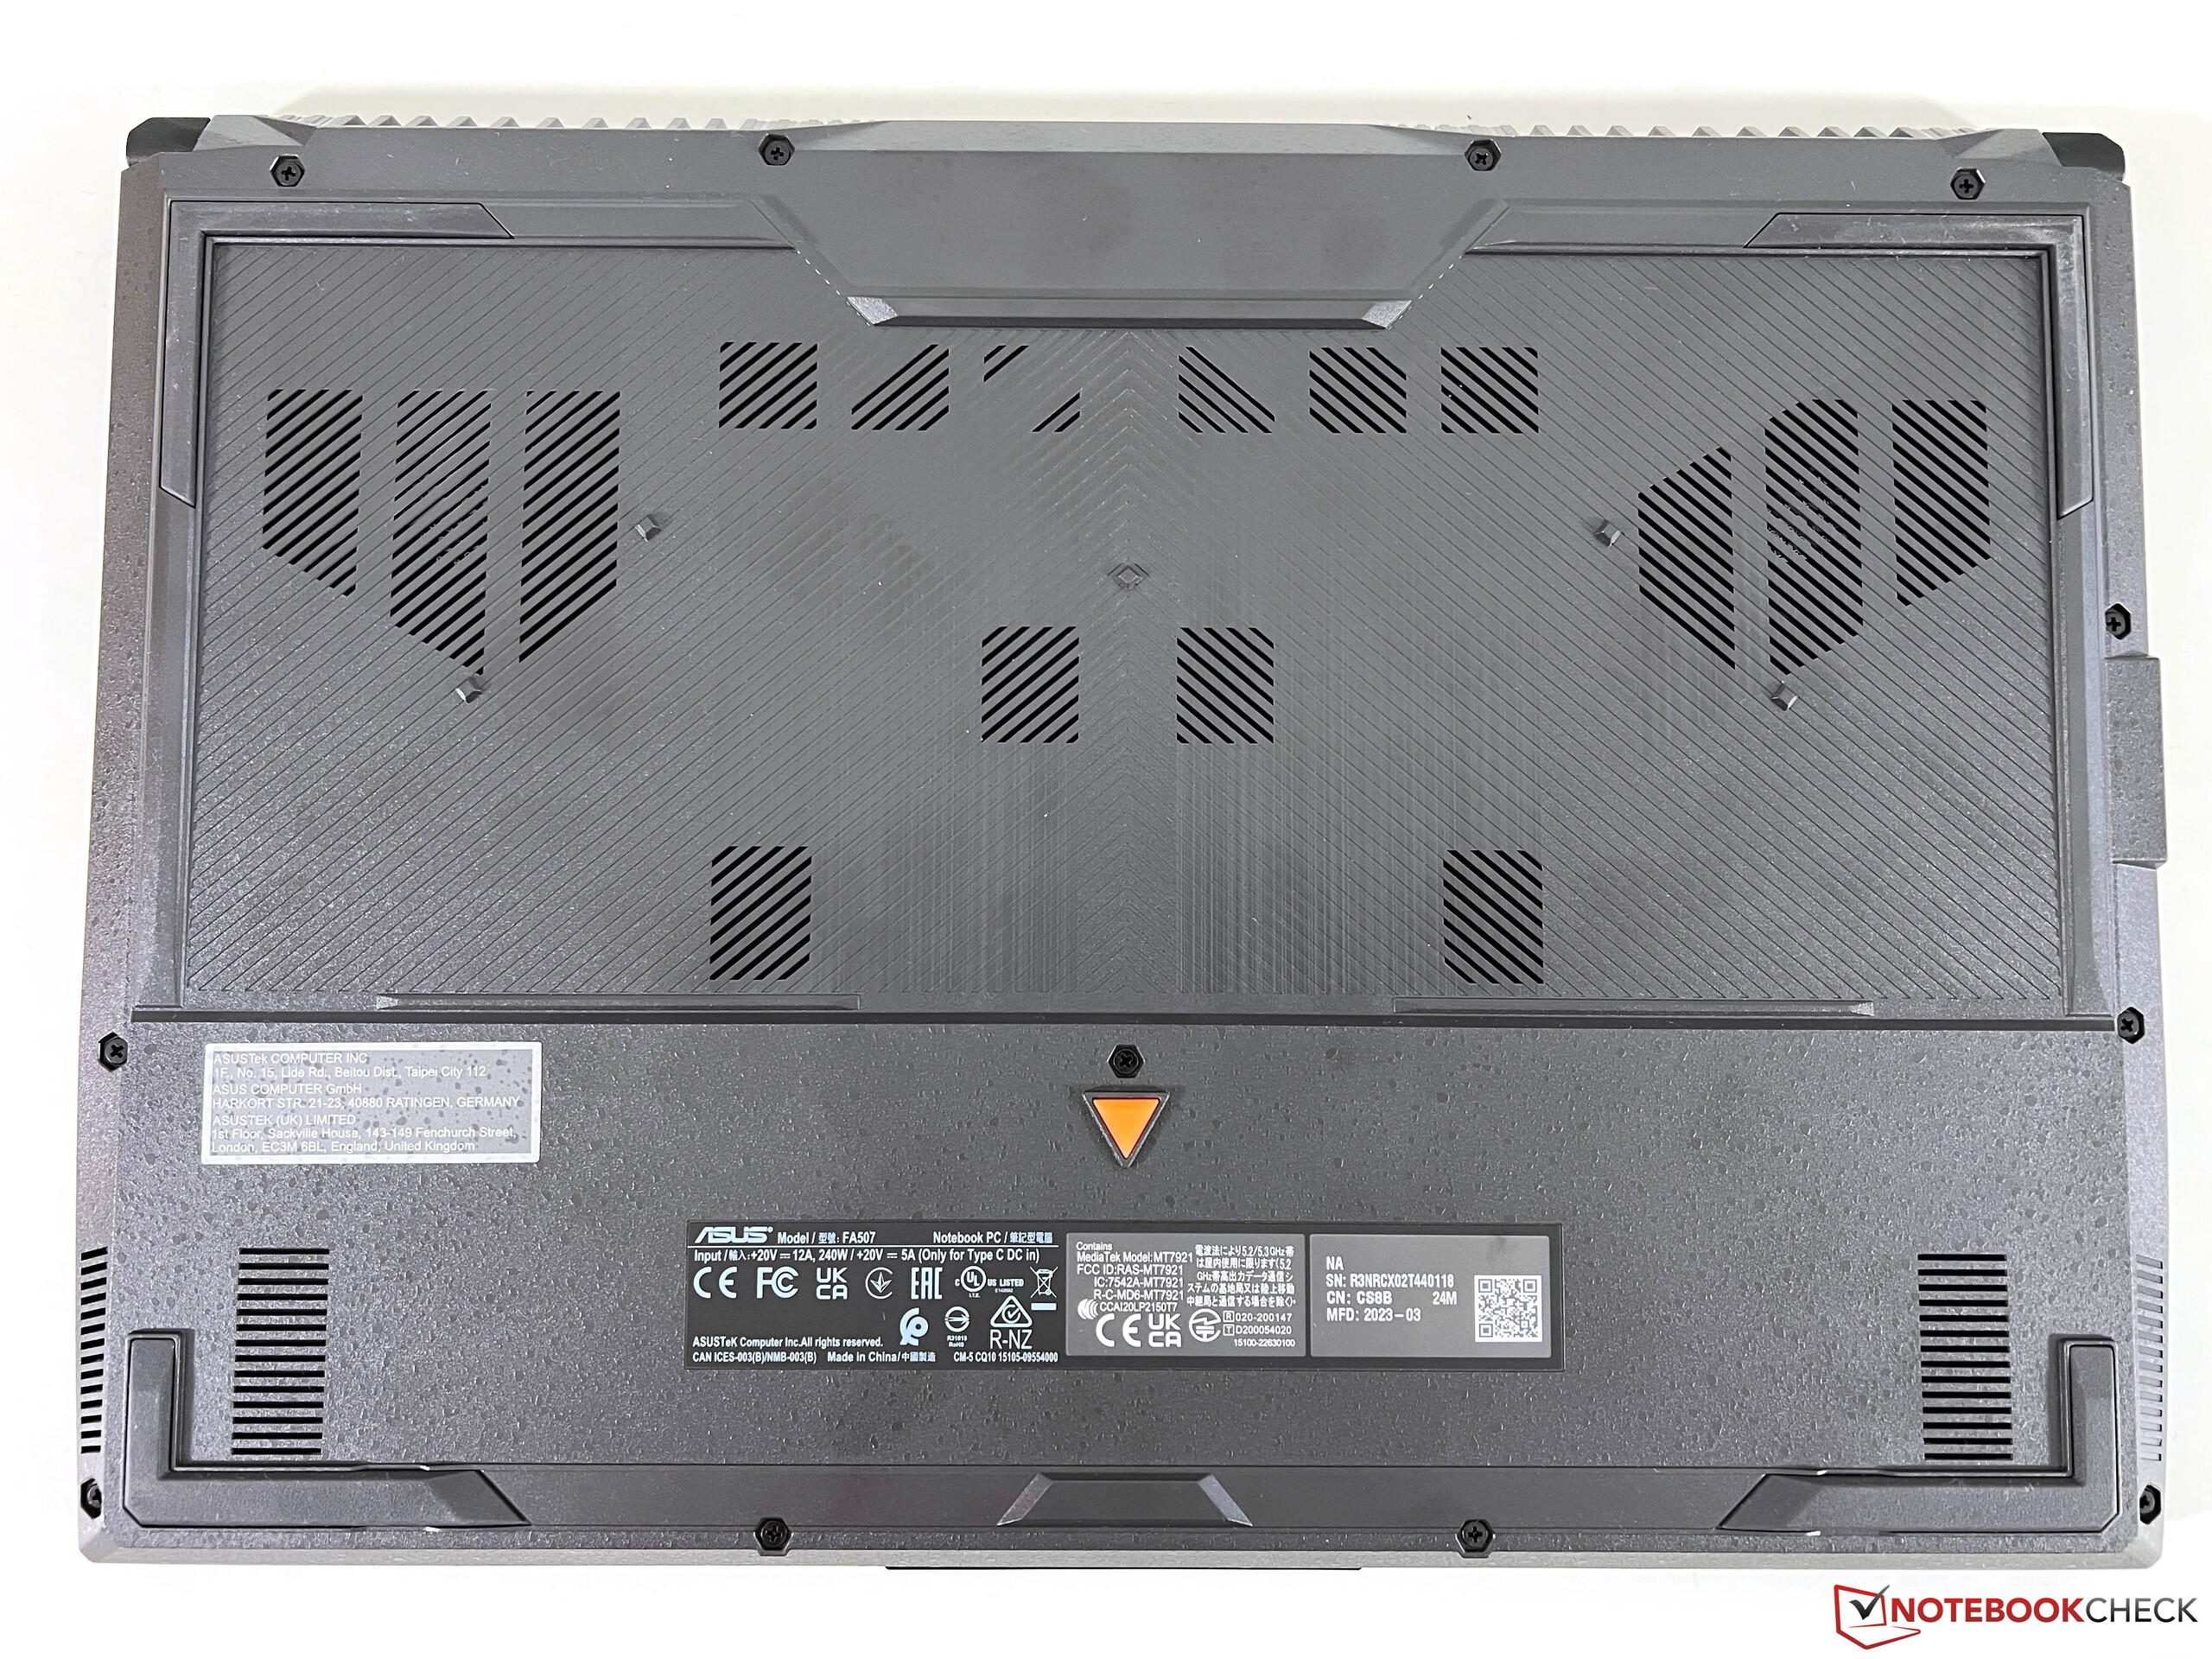
Manutenzione
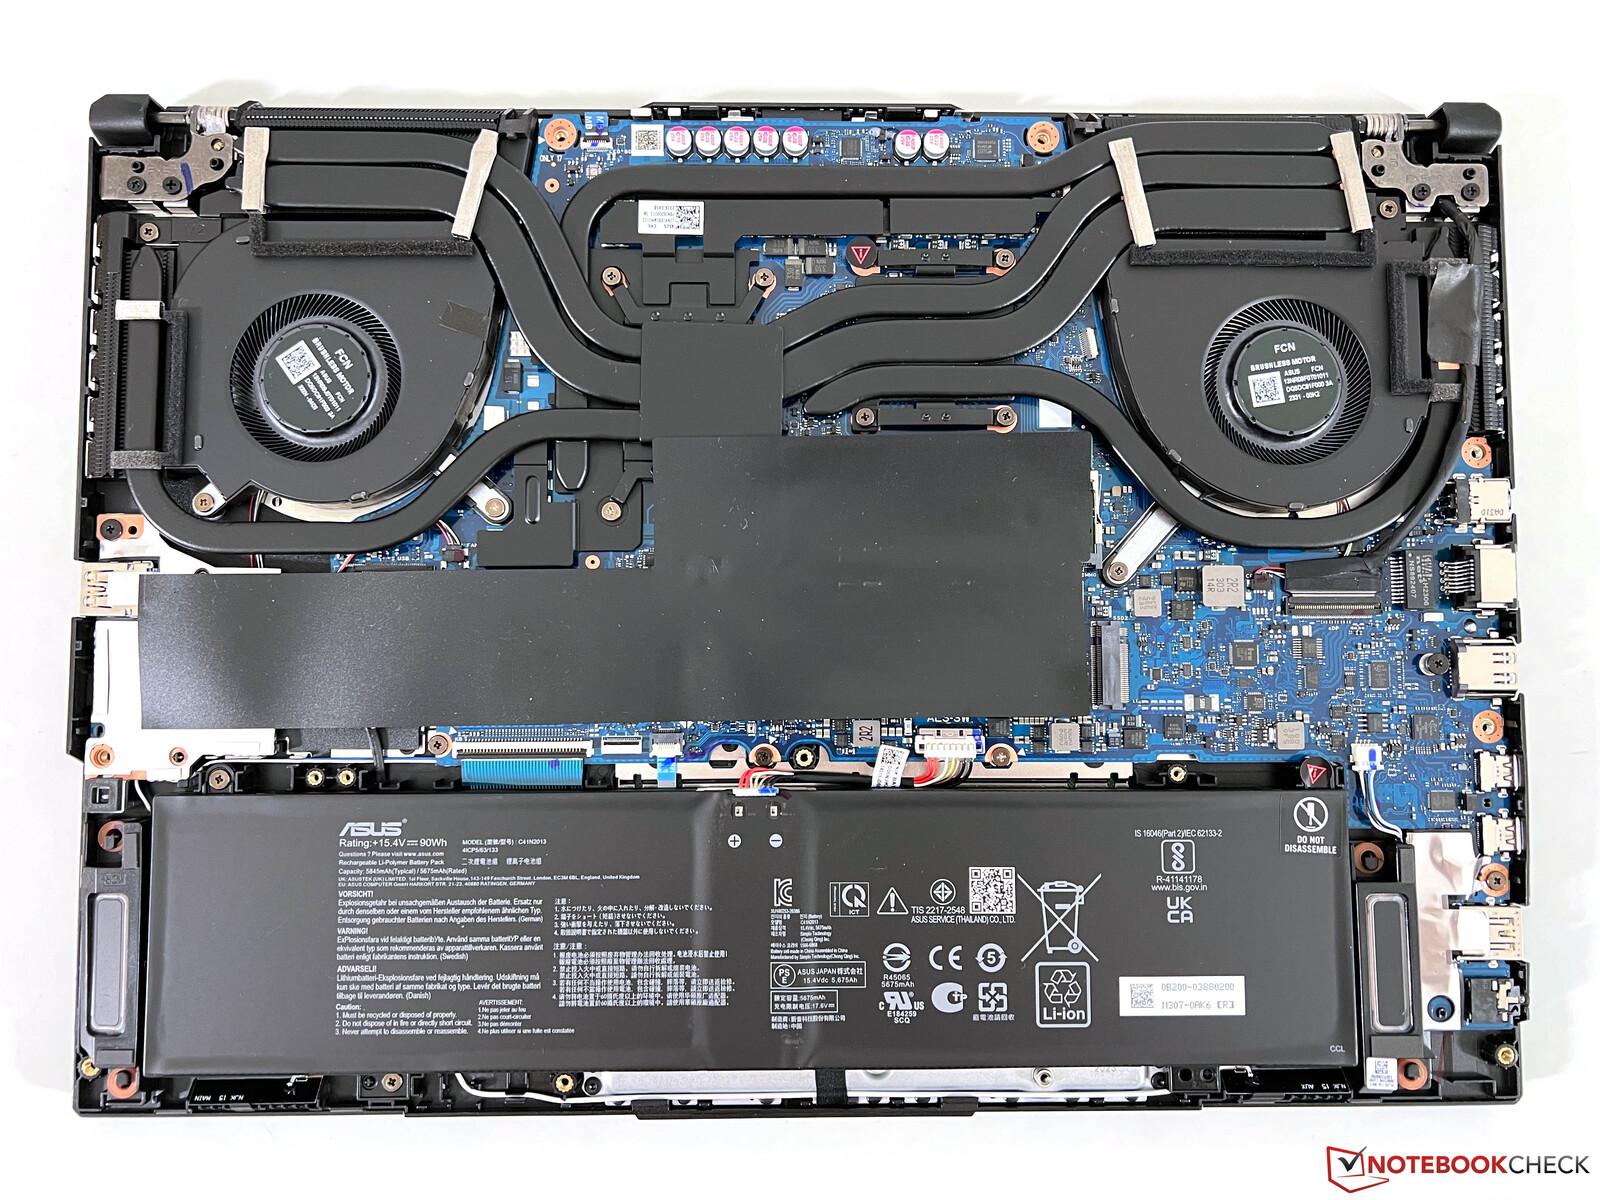
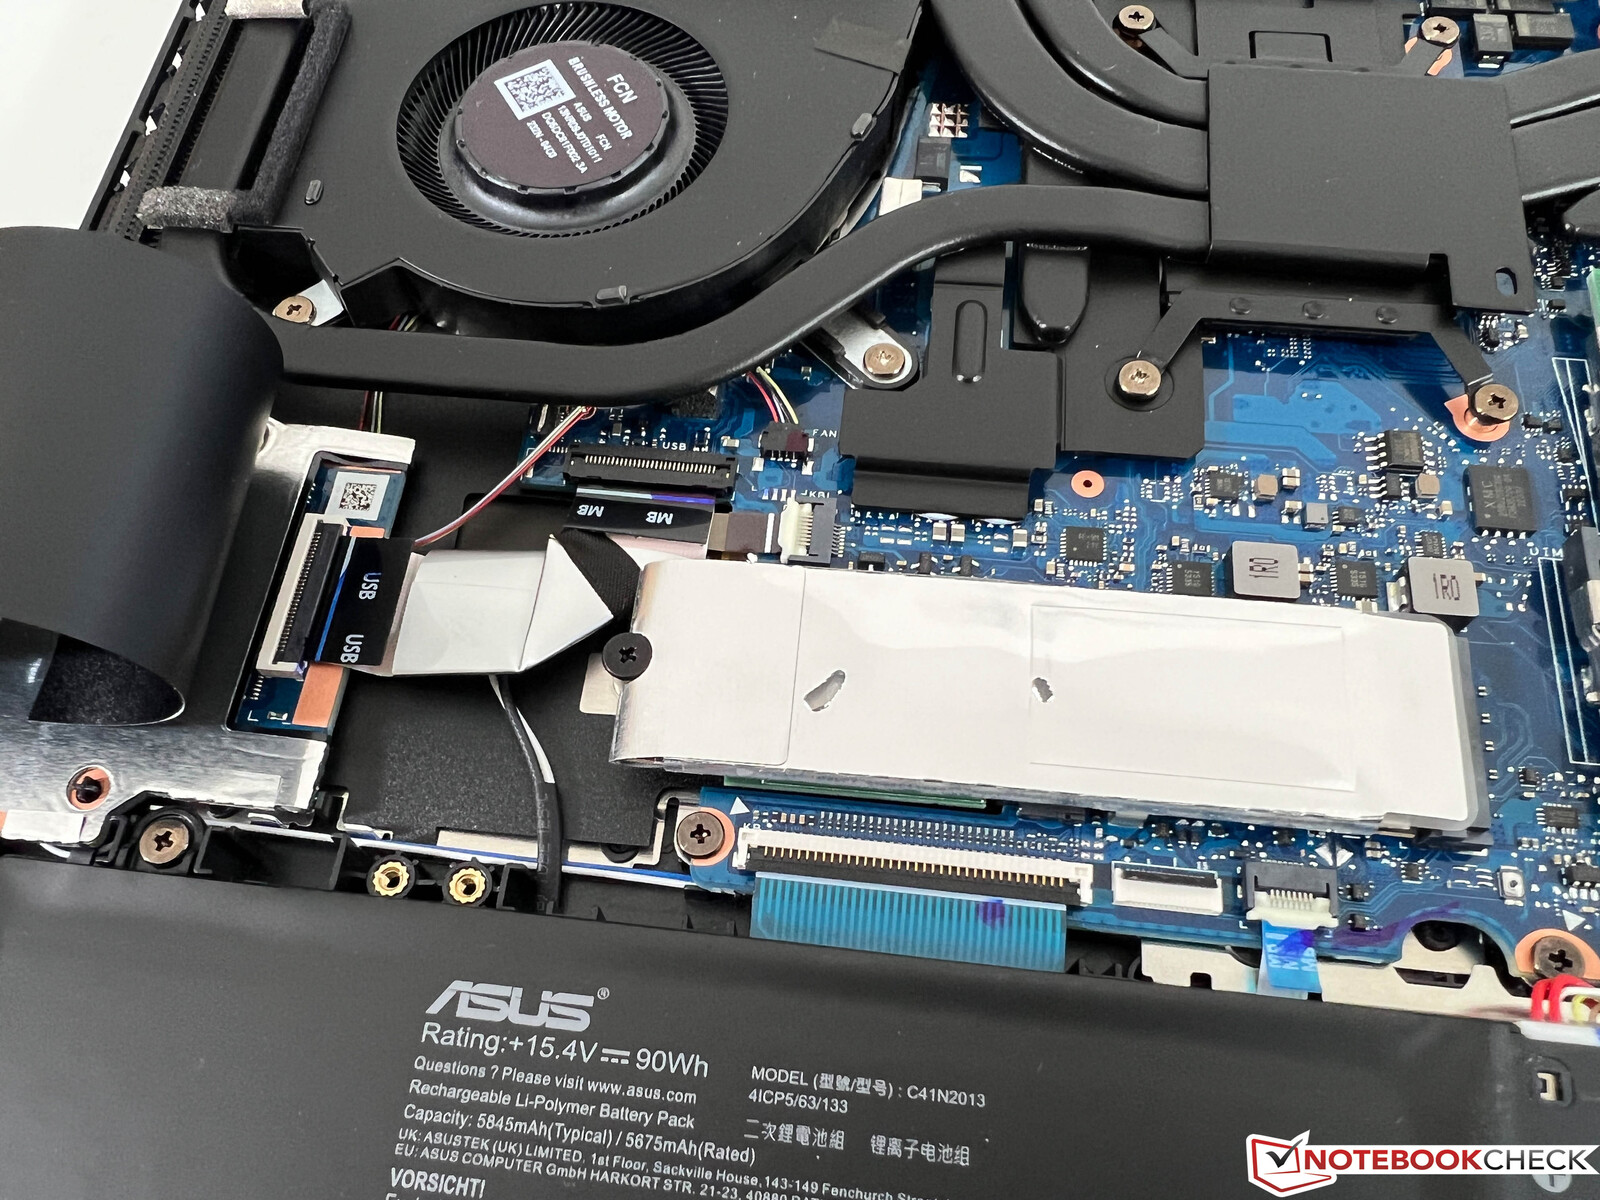
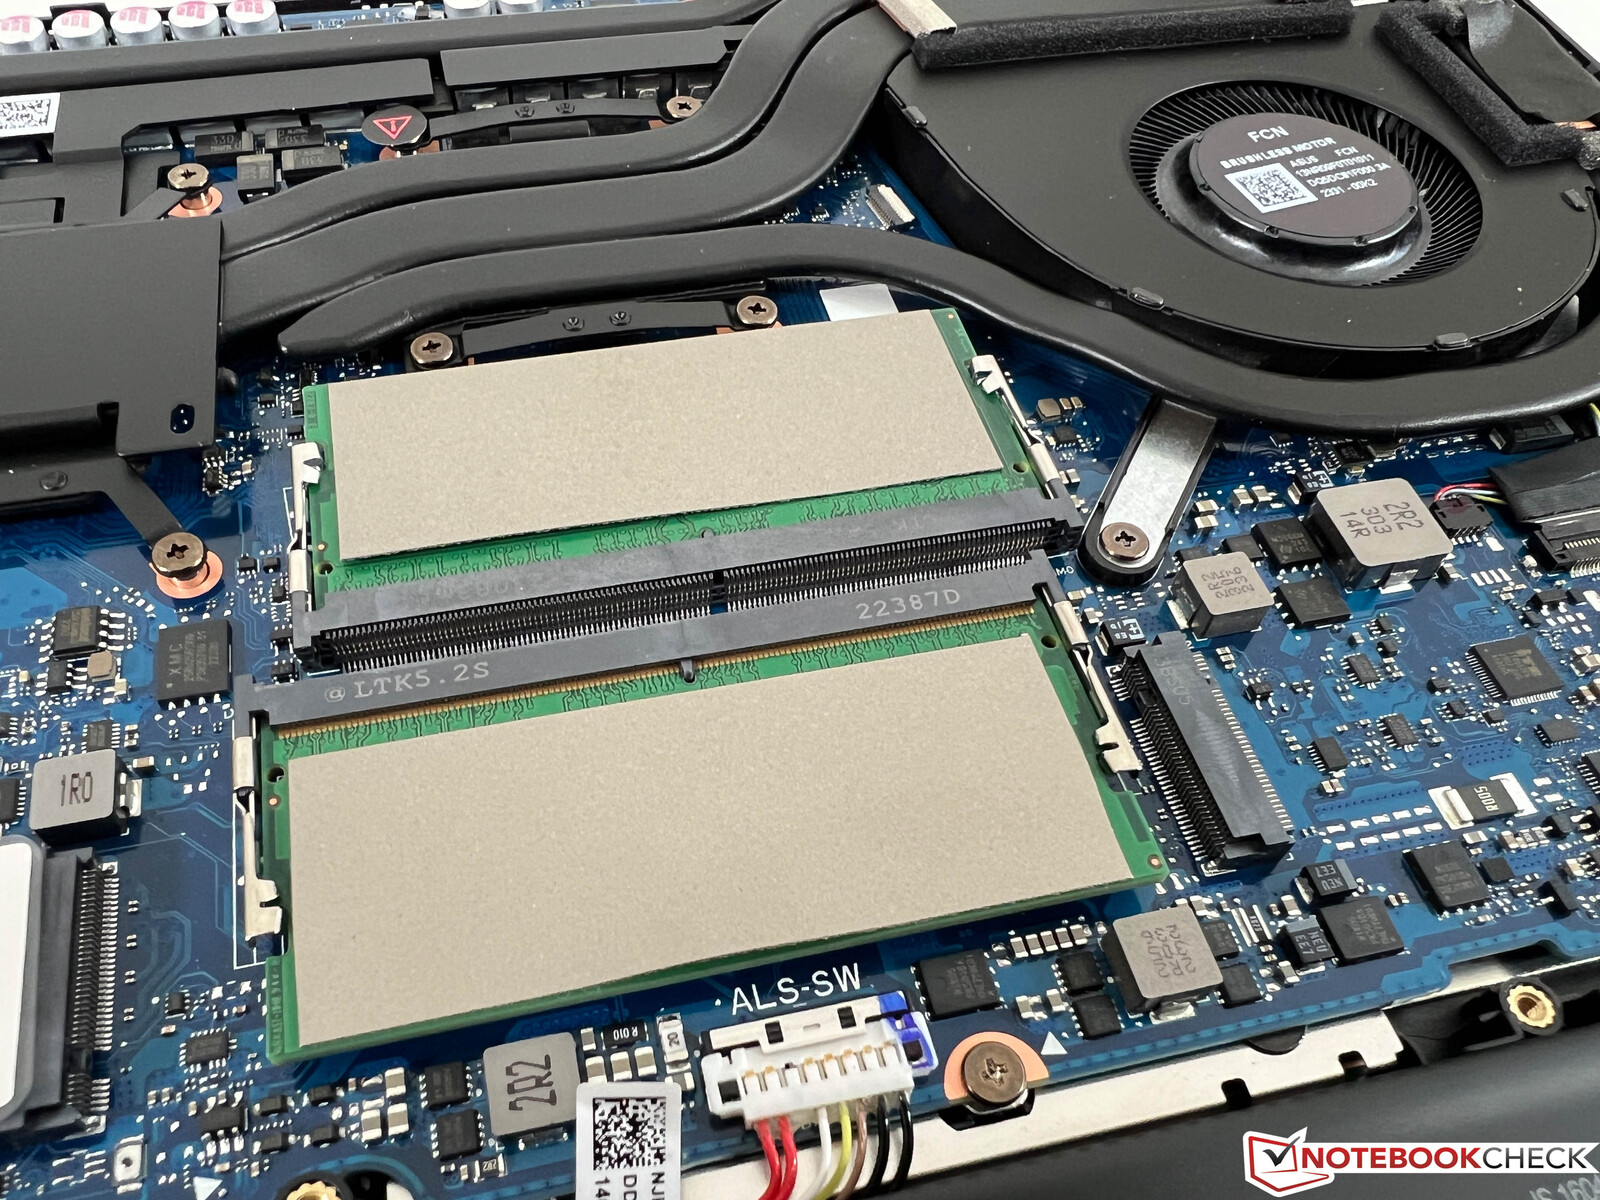
Il coperchio inferiore del case è abbastanza attaccato al resto del dispositivo, anche dopo aver tolto le viti. La rimozione di questa parte del case si rivela un po' complicata. Una volta fatto, è possibile accedere a entrambi gli slot della RAM, alla batteria, alle ventole e all'unità SSD M.2 2280.
Dispositivi di input - Tastiera grande con tastierino numerico
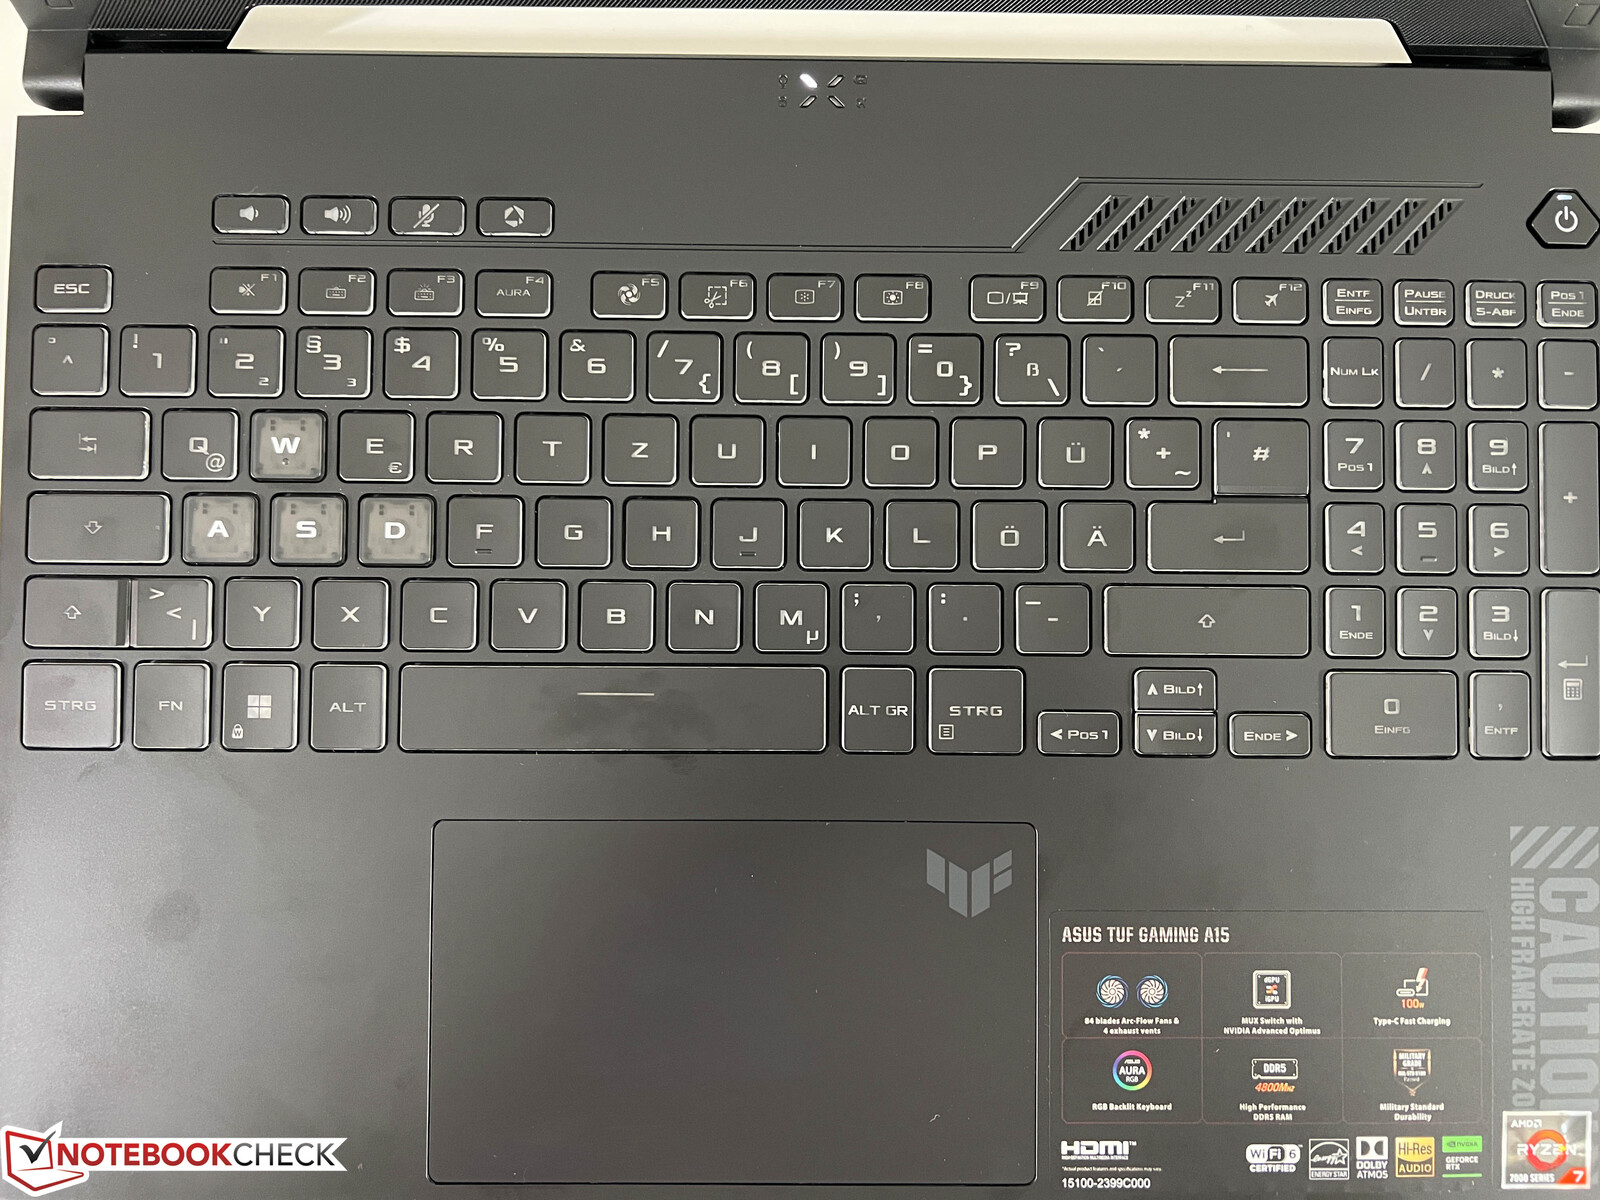
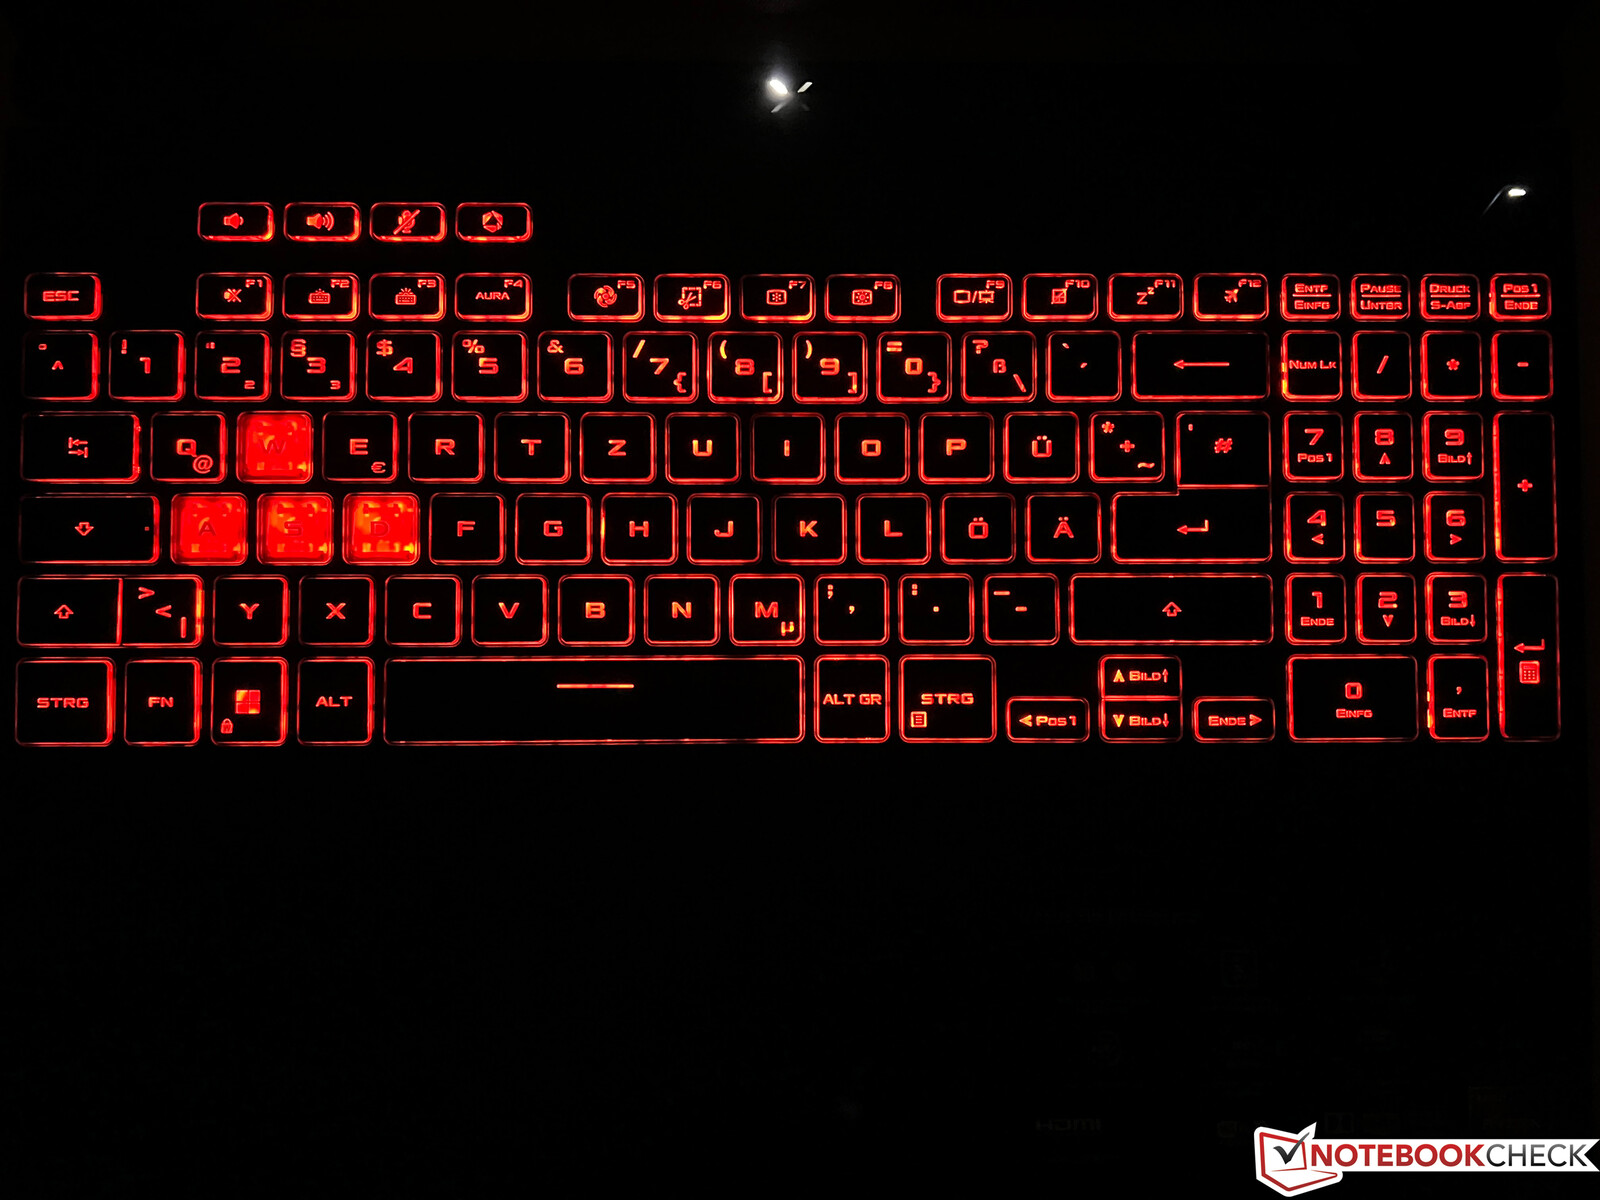
La tastiera è dotata di un tastierino numerico dedicato ed è comoda da digitare. Il problema, tuttavia, risiede nell'etichettatura della tastiera. A parte i tasti WASD, che sono bianchi, tutti gli altri tasti hanno un'etichetta trasparente. Anche in condizioni di luce decenti, spesso è più comodo attivare la retroilluminazione. Ci sono tre livelli di illuminazione e si può anche scegliere il proprio colore - all'interno di una zona. Il layout è buono, ma bisogna abituarsi al tasto di invio su una sola riga. Sopra la tastiera normale, ci sono anche quattro tasti speciali: Tre servono per controllare il volume e uno può essere assegnato personalmente. Va detto che i tasti freccia sono particolarmente piccoli per un portatile da gioco.
Il touchpad funziona bene: i normali movimenti delle dita vengono immessi senza problemi e la sua superficie è piacevole al tatto. Il rumore del clic è piacevole e silenzioso. In totale, una prestazione solida e, naturalmente, la maggior parte degli utenti utilizzerà comunque un mouse esterno o un controller.
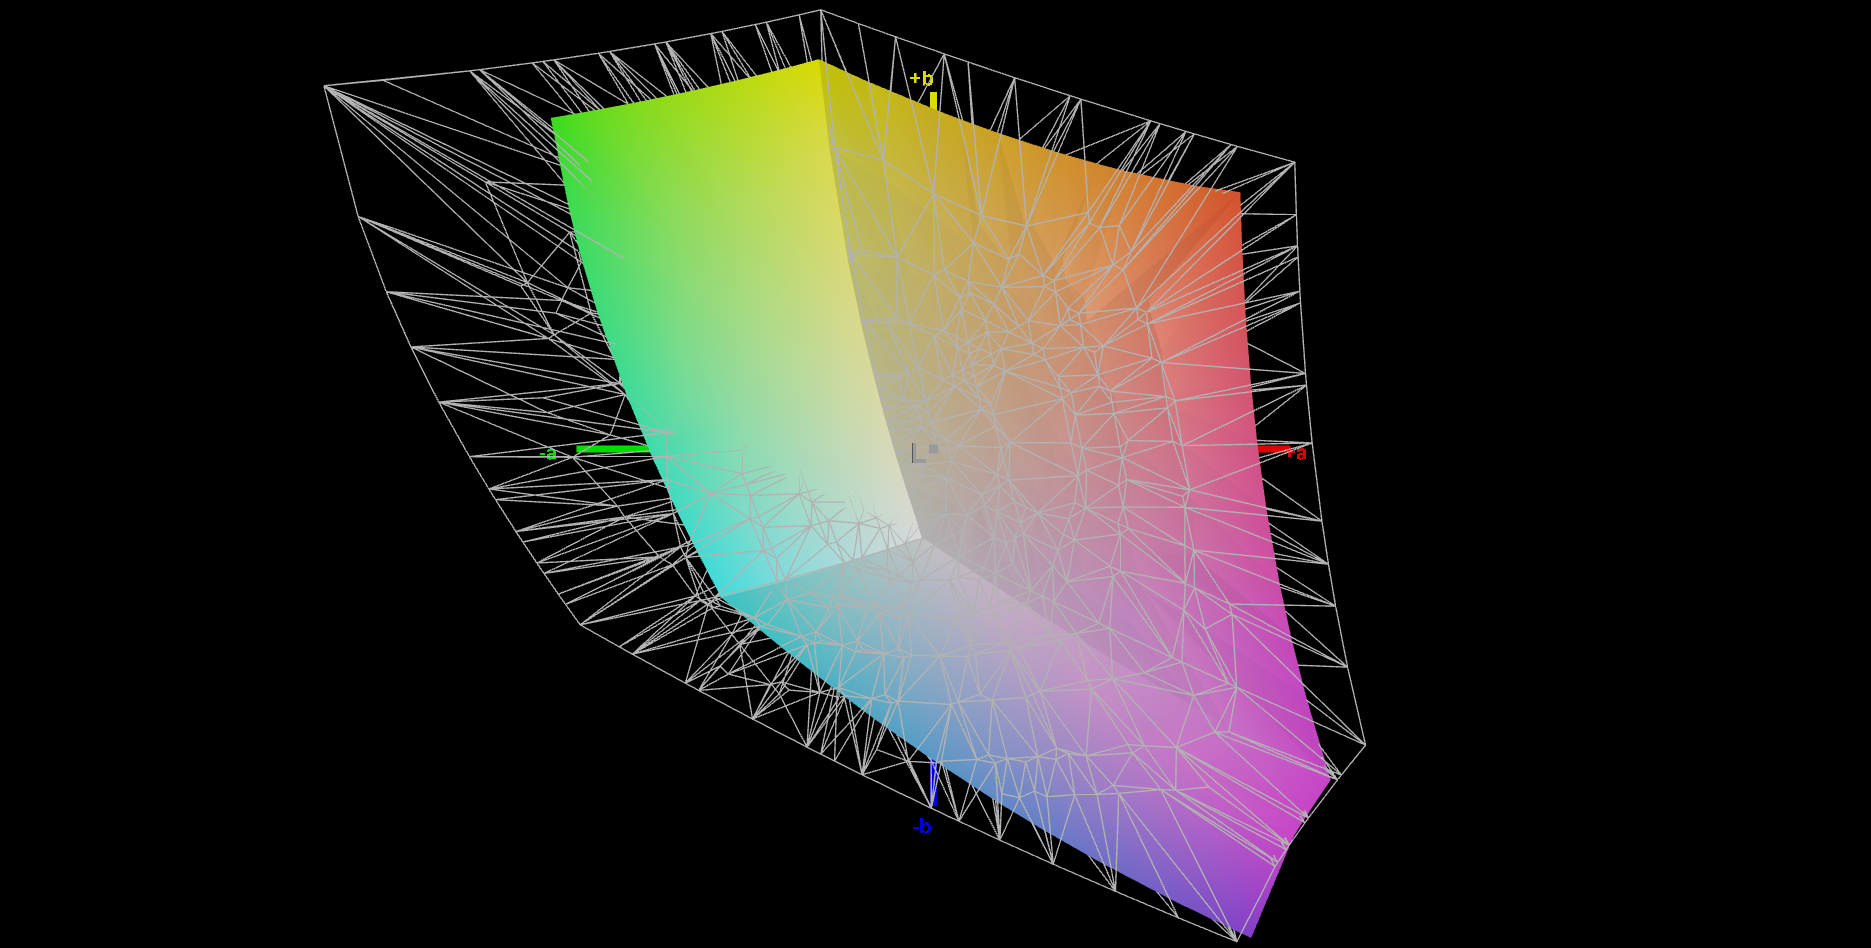
Display: un pannello IPS a 144 Hz
Il portatile è dotato di un pannello IPS opaco relativamente semplice con risoluzione Full HD (1.920 x 1.080 pixel) e in formato 16:9. Soggettivamente, ci ha lasciato una buona impressione: i contenuti sono stati rappresentati in modo sufficientemente nitido e le aree più chiare non sono apparse sgranate. La frequenza di aggiornamento di 144 Hz aiuta a gestire i movimenti veloci e non c'è sfarfallio PWM, ma nel complesso lo schermo non ha nulla da far notare.
La luminosità dello schermo pubblicizzata è di 250 cd/m², ma noi abbiamo misurato 270 cd/m² (in media). Naturalmente non è il massimo, ma è sufficiente per l'uso in interni e all'aperto se non c'è troppo sole. A sua volta, il valore del nero è mediocre, il che significa che i livelli di contrasto misurano solo ~1.700:1 nel migliore dei casi. La velocità di reazione del dispositivo è un po' lenta per un portatile da gioco e, quando lo schermo è completamente buio, è possibile notare un visibile bleeding della retroilluminazione. Nell'uso quotidiano, questo non dovrebbe essere un grosso problema.
| |||||||||||||||||||||||||
Distribuzione della luminosità: 91 %
Al centro con la batteria: 288 cd/m²
Contrasto: 1694:1 (Nero: 0.17 cd/m²)
ΔE ColorChecker Calman: 1.9 | ∀{0.5-29.43 Ø4.71}
calibrated: 0.9
ΔE Greyscale Calman: 2.7 | ∀{0.09-98 Ø4.96}
66.6% AdobeRGB 1998 (Argyll 3D)
96.5% sRGB (Argyll 3D)
64.9% Display P3 (Argyll 3D)
Gamma: 2.32
CCT: 6535 K
| Asus TUF A15 FA507 N156HMA-GA1, IPS, 1920x1080, 15.6" | Gigabyte G5 KE Chi Mei N156HRA-EA1, IPS, 1920x1080, 15.6" | Schenker XMG Core 15 (M22) CSOT MNF601CA1-1, IPS, 2560x1440, 15.6" | MSI Katana 15 B12VEK AUOAF90 (B156HAN08.4), IPS, 1920x1080, 15.6" | HP Victus 15 fa0020nr CMN1521, IPS, 1920x1080, 15.6" | Lenovo IdeaPad Gaming 3 15IAH7 Lenovo LEN156FHD, IPS, 1920x1080, 15.6" | Asus TUF Gaming F15 FX507ZM TL156VDXP0101, IPS, 1920x1080, 15.6" | |
|---|---|---|---|---|---|---|---|
| Display | -37% | 5% | -41% | -35% | 5% | 2% | |
| Display P3 Coverage (%) | 64.9 | 40.7 -37% | 68.8 6% | 38.1 -41% | 42 -35% | 69.1 6% | 66.4 2% |
| sRGB Coverage (%) | 96.5 | 61 -37% | 99.3 3% | 56.8 -41% | 62.7 -35% | 99.2 3% | 97 1% |
| AdobeRGB 1998 Coverage (%) | 66.6 | 42.1 -37% | 69.9 5% | 39.3 -41% | 43.4 -35% | 69.9 5% | 68.5 3% |
| Response Times | 11% | 55% | -29% | -24% | 59% | 60% | |
| Response Time Grey 50% / Grey 80% * (ms) | 30.4 ? | 26.64 ? 12% | 16 ? 47% | 38.8 ? -28% | 35.2 ? -16% | 13 ? 57% | 5.6 ? 82% |
| Response Time Black / White * (ms) | 20.8 ? | 18.65 ? 10% | 7.6 ? 63% | 26.8 ? -29% | 27.2 ? -31% | 8.4 ? 60% | 12.8 ? 38% |
| PWM Frequency (Hz) | |||||||
| Screen | -129% | -48% | -133% | -82% | -45% | -3% | |
| Brightness middle (cd/m²) | 288 | 269 -7% | 378 31% | 261 -9% | 284.3 -1% | 338 17% | 353.7 23% |
| Brightness (cd/m²) | 271 | 248 -8% | 371 37% | 258 -5% | 262 -3% | 329 21% | 340 25% |
| Brightness Distribution (%) | 91 | 85 -7% | 93 2% | 92 1% | 87 -4% | 92 1% | 89 -2% |
| Black Level * (cd/m²) | 0.17 | 0.5 -194% | 0.33 -94% | 0.19 -12% | 0.17 -0% | 0.27 -59% | 0.34 -100% |
| Contrast (:1) | 1694 | 538 -68% | 1145 -32% | 1374 -19% | 1672 -1% | 1252 -26% | 1040 -39% |
| Colorchecker dE 2000 * | 1.9 | 4.54 -139% | 2.84 -49% | 5.57 -193% | 4.52 -138% | 2.88 -52% | 1.74 8% |
| Colorchecker dE 2000 max. * | 3.3 | 17.28 -424% | 5.51 -67% | 20.6 -524% | 18.67 -466% | 9.35 -183% | 3.63 -10% |
| Colorchecker dE 2000 calibrated * | 0.9 | 3.34 -271% | 2.75 -206% | 4.63 -414% | 1.55 -72% | 1.22 -36% | 0.5 44% |
| Greyscale dE 2000 * | 2.7 | 3.8 -41% | 4.08 -51% | 3.19 -18% | 4.1 -52% | 5 -85% | 2.1 22% |
| Gamma | 2.32 95% | 2.17 101% | 2.4 92% | 2.45 90% | 2.3 96% | 2.162 102% | 2.3 96% |
| CCT | 6535 99% | 7408 88% | 5841 111% | 6146 106% | 6529 100% | 7497 87% | 6257 104% |
| Media totale (Programma / Settaggio) | -52% /
-89% | 4% /
-22% | -68% /
-98% | -47% /
-64% | 6% /
-19% | 20% /
7% |
* ... Meglio usare valori piccoli
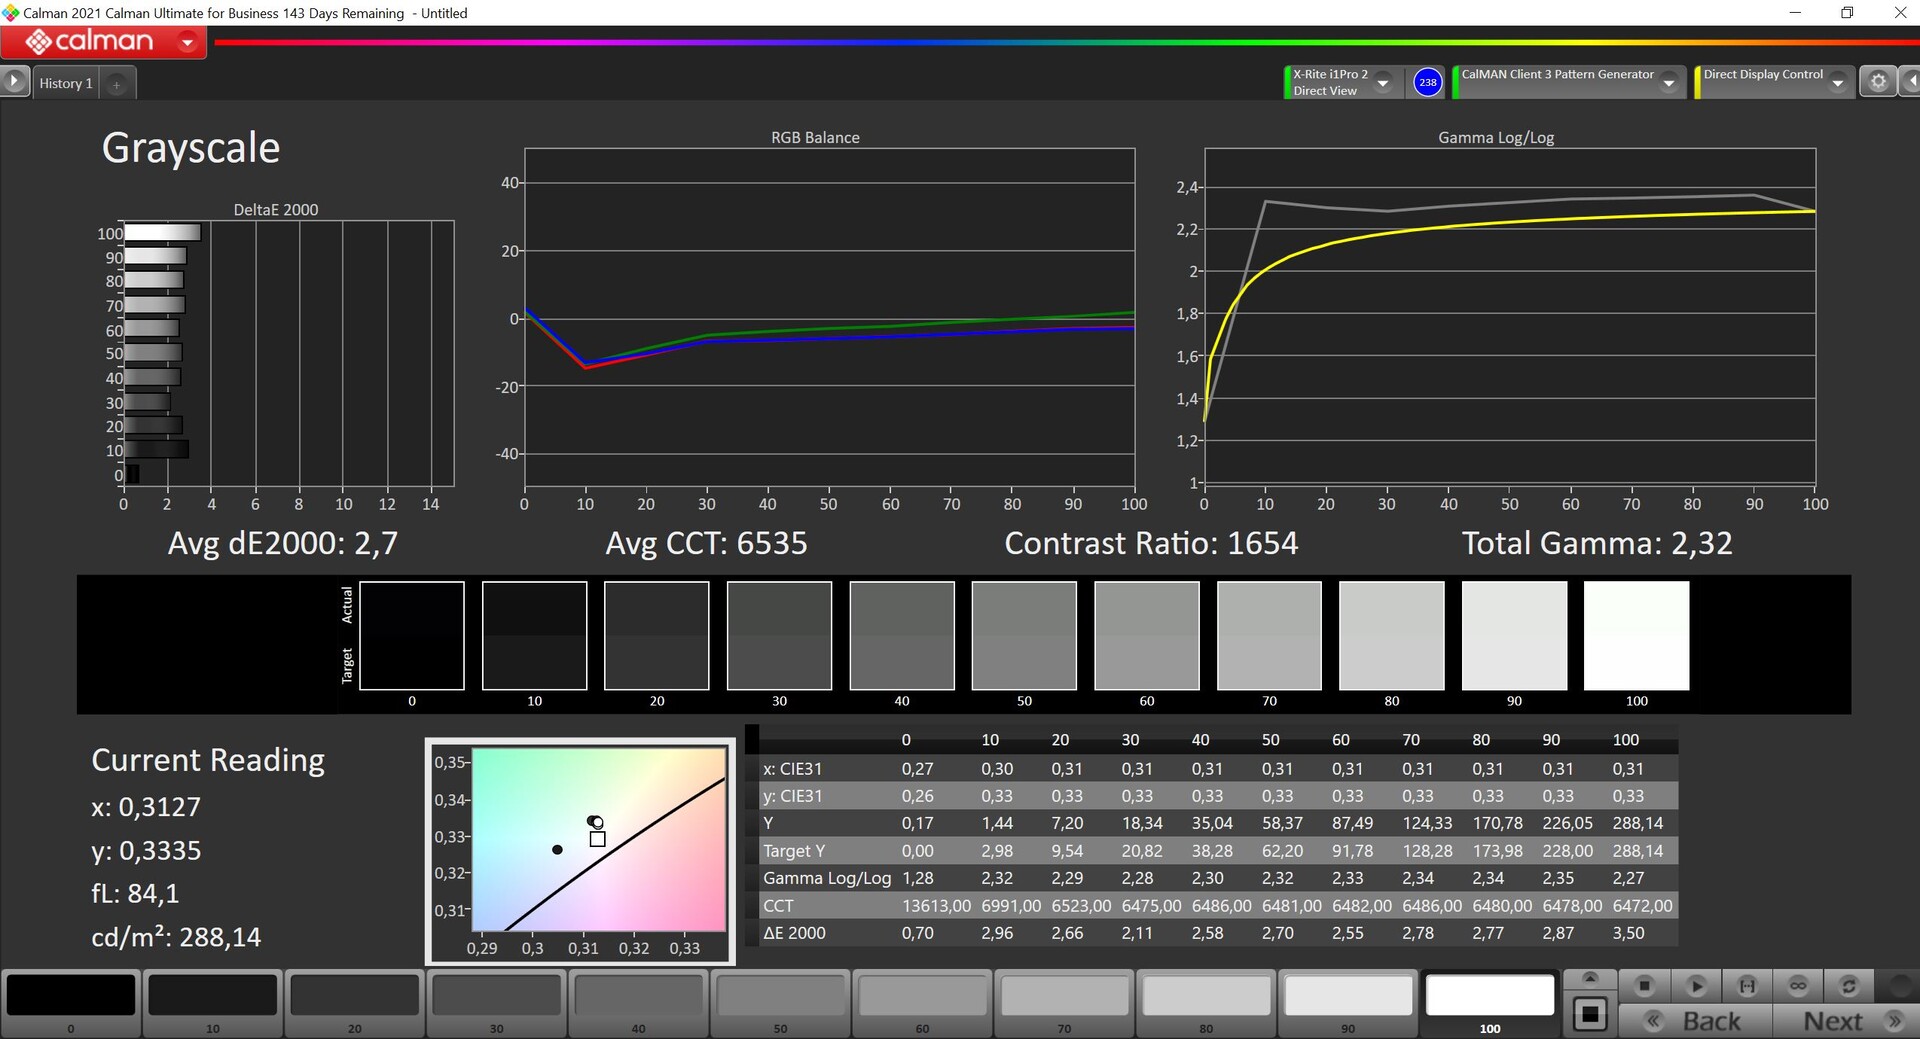
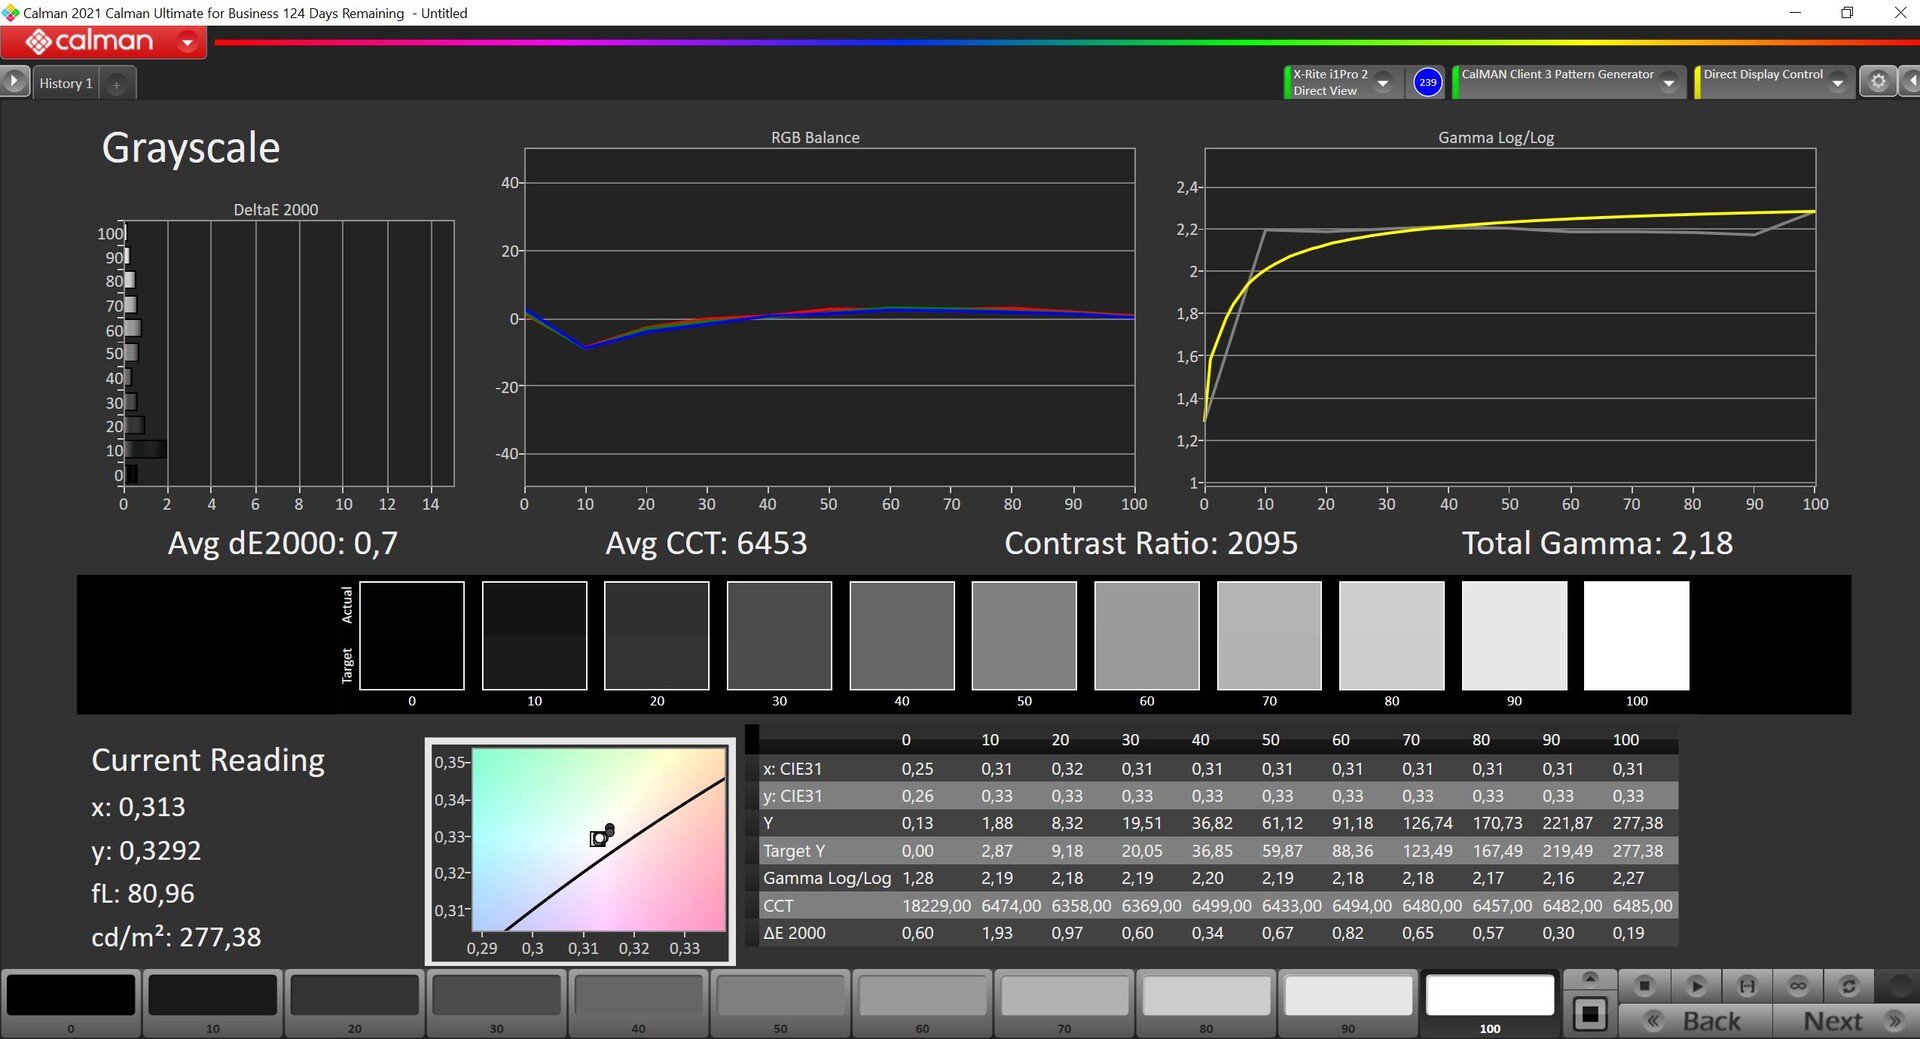

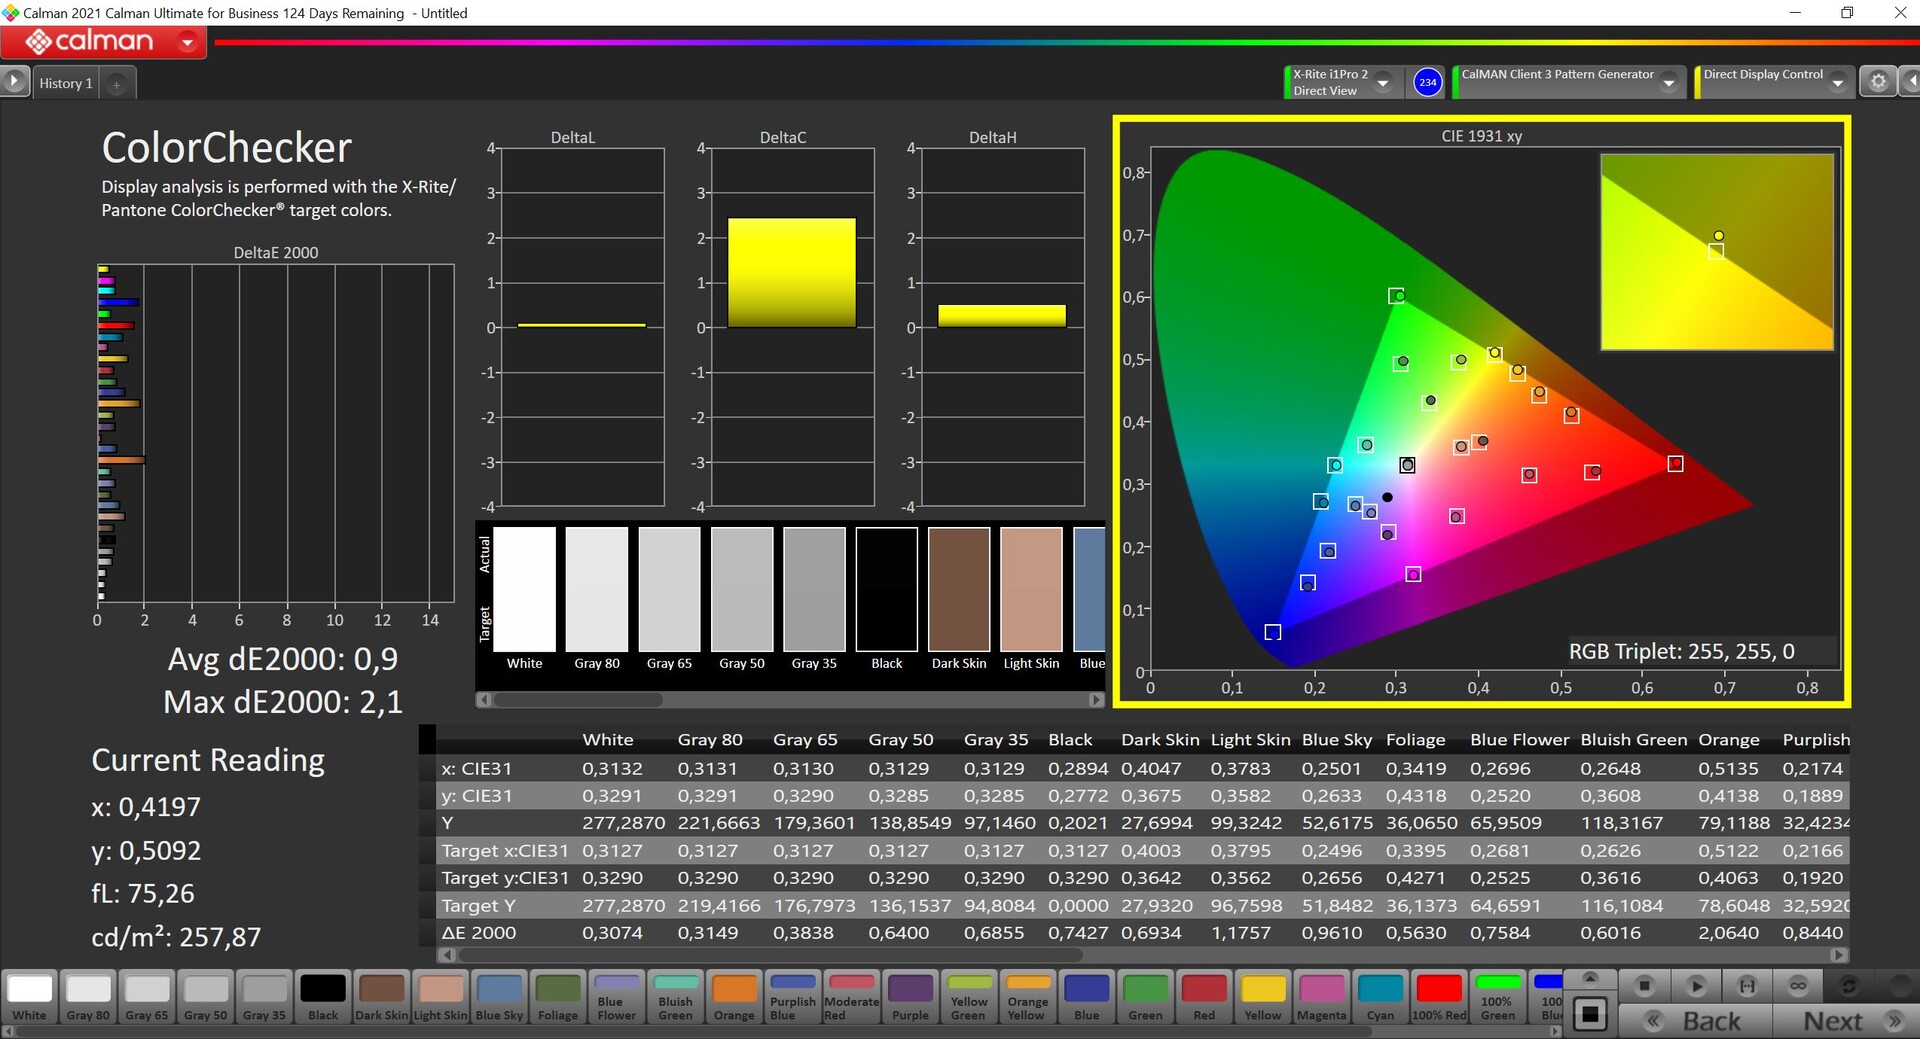
Utilizzando il software professionale CalMAN (X-Rite i1 Pro 2), abbiamo misurato il pannello e le sue prestazioni sono risultate eccellenti fin dall'inizio. Non c'era alcuna sfumatura di colore e la sua rappresentazione cromatica era già molto accurata, il che significa che è possibile lavorare subito all'editing delle immagini (almeno all'interno del piccolo spazio colore sRGB). Dopo la nostra calibrazione (potete scaricare gratuitamente il profilo qui sopra), siamo riusciti a migliorare leggermente questo aspetto, ma non è necessario, soprattutto per i giochi.
Tempi di risposta del Display
| ↔ Tempi di risposta dal Nero al Bianco | ||
|---|---|---|
| 20.8 ms ... aumenta ↗ e diminuisce ↘ combinato | ↗ 11.7 ms Incremento | 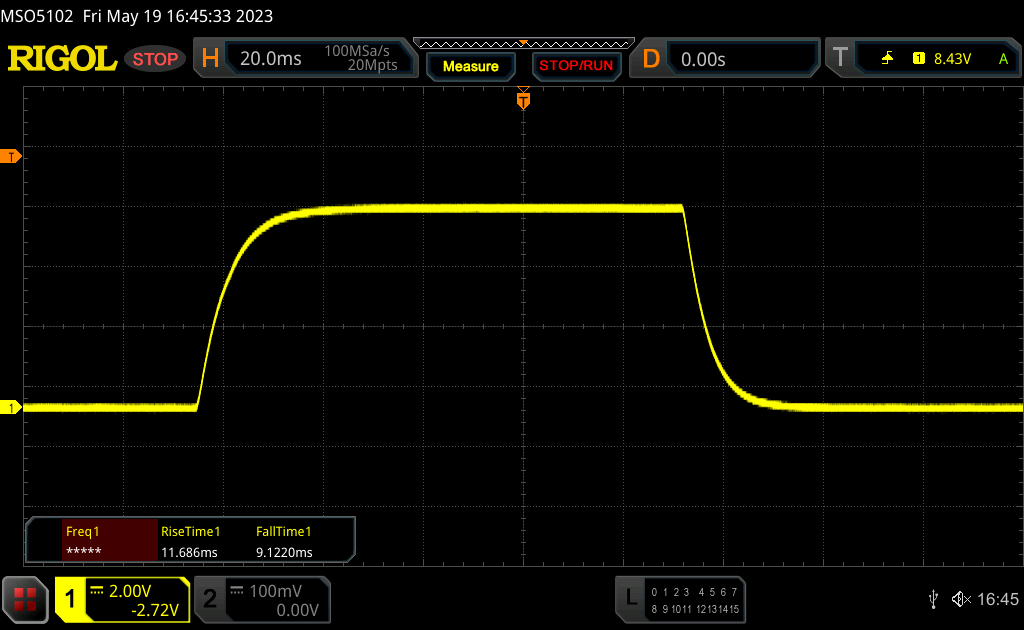 |
| ↘ 9.1 ms Calo | ||
| Lo schermo mostra buoni tempi di risposta durante i nostri tests, ma potrebbe essere troppo lento per i gamers competitivi. In confronto, tutti i dispositivi di test variano da 0.1 (minimo) a 240 (massimo) ms. » 46 % di tutti i dispositivi è migliore. Questo significa che i tempi di risposta rilevati sono simili alla media di tutti i dispositivi testati (19.8 ms). | ||
| ↔ Tempo di risposta dal 50% Grigio all'80% Grigio | ||
| 30.4 ms ... aumenta ↗ e diminuisce ↘ combinato | ↗ 14.8 ms Incremento | 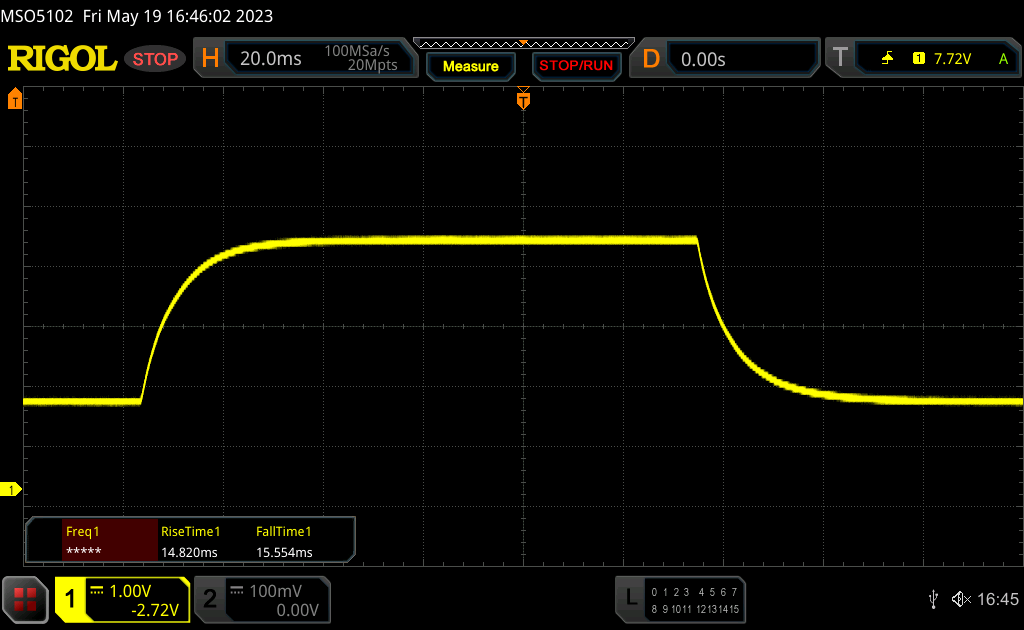 |
| ↘ 15.6 ms Calo | ||
| Lo schermo mostra tempi di risposta lenti nei nostri tests e sarà insoddisfacente per i gamers. In confronto, tutti i dispositivi di test variano da 0.165 (minimo) a 636 (massimo) ms. » 41 % di tutti i dispositivi è migliore. Questo significa che i tempi di risposta rilevati sono simili alla media di tutti i dispositivi testati (31 ms). | ||
Sfarfallio dello schermo / PWM (Pulse-Width Modulation)
| flickering dello schermo / PWM non rilevato |  | ||
In confronto: 52 % di tutti i dispositivi testati non utilizza PWM per ridurre la luminosita' del display. Se è rilevato PWM, una media di 7757 (minimo: 5 - massimo: 343500) Hz è stata rilevata. | |||

All'aperto, lo schermo è sicuramente opaco, ma se la luce è troppo forte, si fa fatica a vedere i contenuti sullo schermo. La luminosità dello schermo potrebbe essere migliorata. La stabilità dell'angolo di visione del pannello IPS è buona, ma da alcune angolazioni lo schermo appare a volte troppo chiaro (soprattutto dall'alto e dai lati).

Prestazioni - Il TUF Gaming combina un Ryzen 7 con una RTX 4050
La nostra configurazione di prova è il modello più debole della serie - in opzione, l'Asus TUF Gaming A15 può essere equipaggiato con un più recenteRyzen 9 7940HSe unaGeForce RTX 4070 Laptopnella migliore delle ipotesi. Naturalmente, in questa configurazione il portatile costerà molto di più.
Condizioni di prova
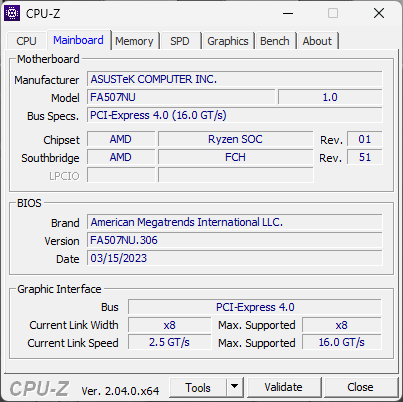
Asus utilizza il software Armoury Crate per i suoi portatili da gioco, in cui sono presenti anche diversi profili energetici. Tuttavia, la modalità Turbo opzionale non porta a un aumento delle prestazioni nella nostra configurazione, motivo per cui abbiamo eseguito tutte le misurazioni e i benchmark in modalità Performance. Inoltre, Advanced Optimus era attivo, il che, tuttavia, porta a leggeri balbettii quando si cambia grafica (ad esempio, quando si avviano i giochi). Se non si desidera questo problema, è possibile disattivare l'iGPU in modo permanente o utilizzare la normale funzione Optimus.
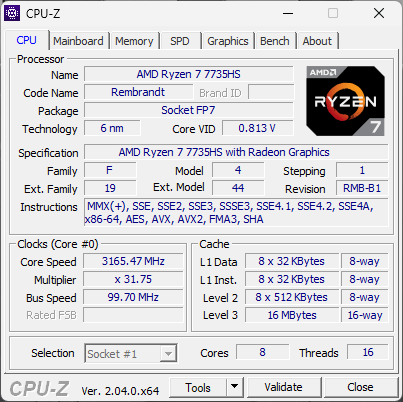
Processore - Ryzen 7 7735HS
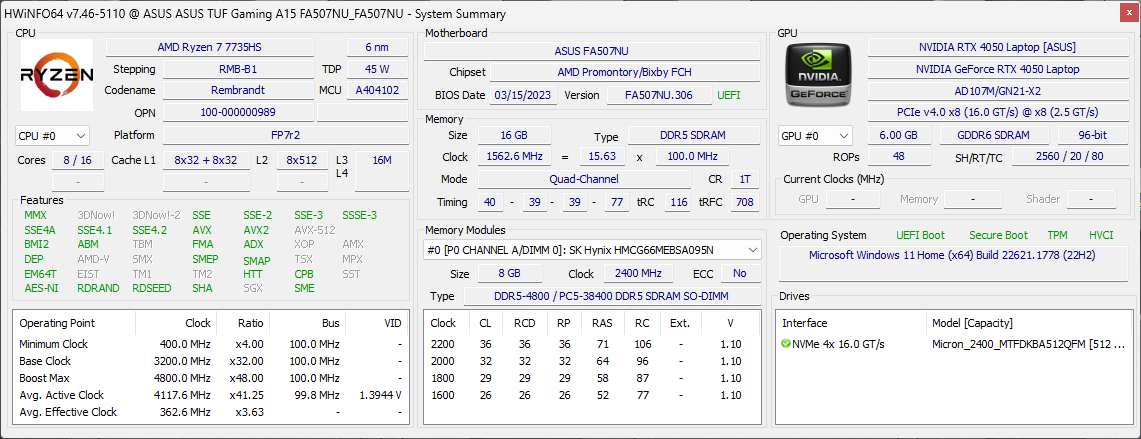
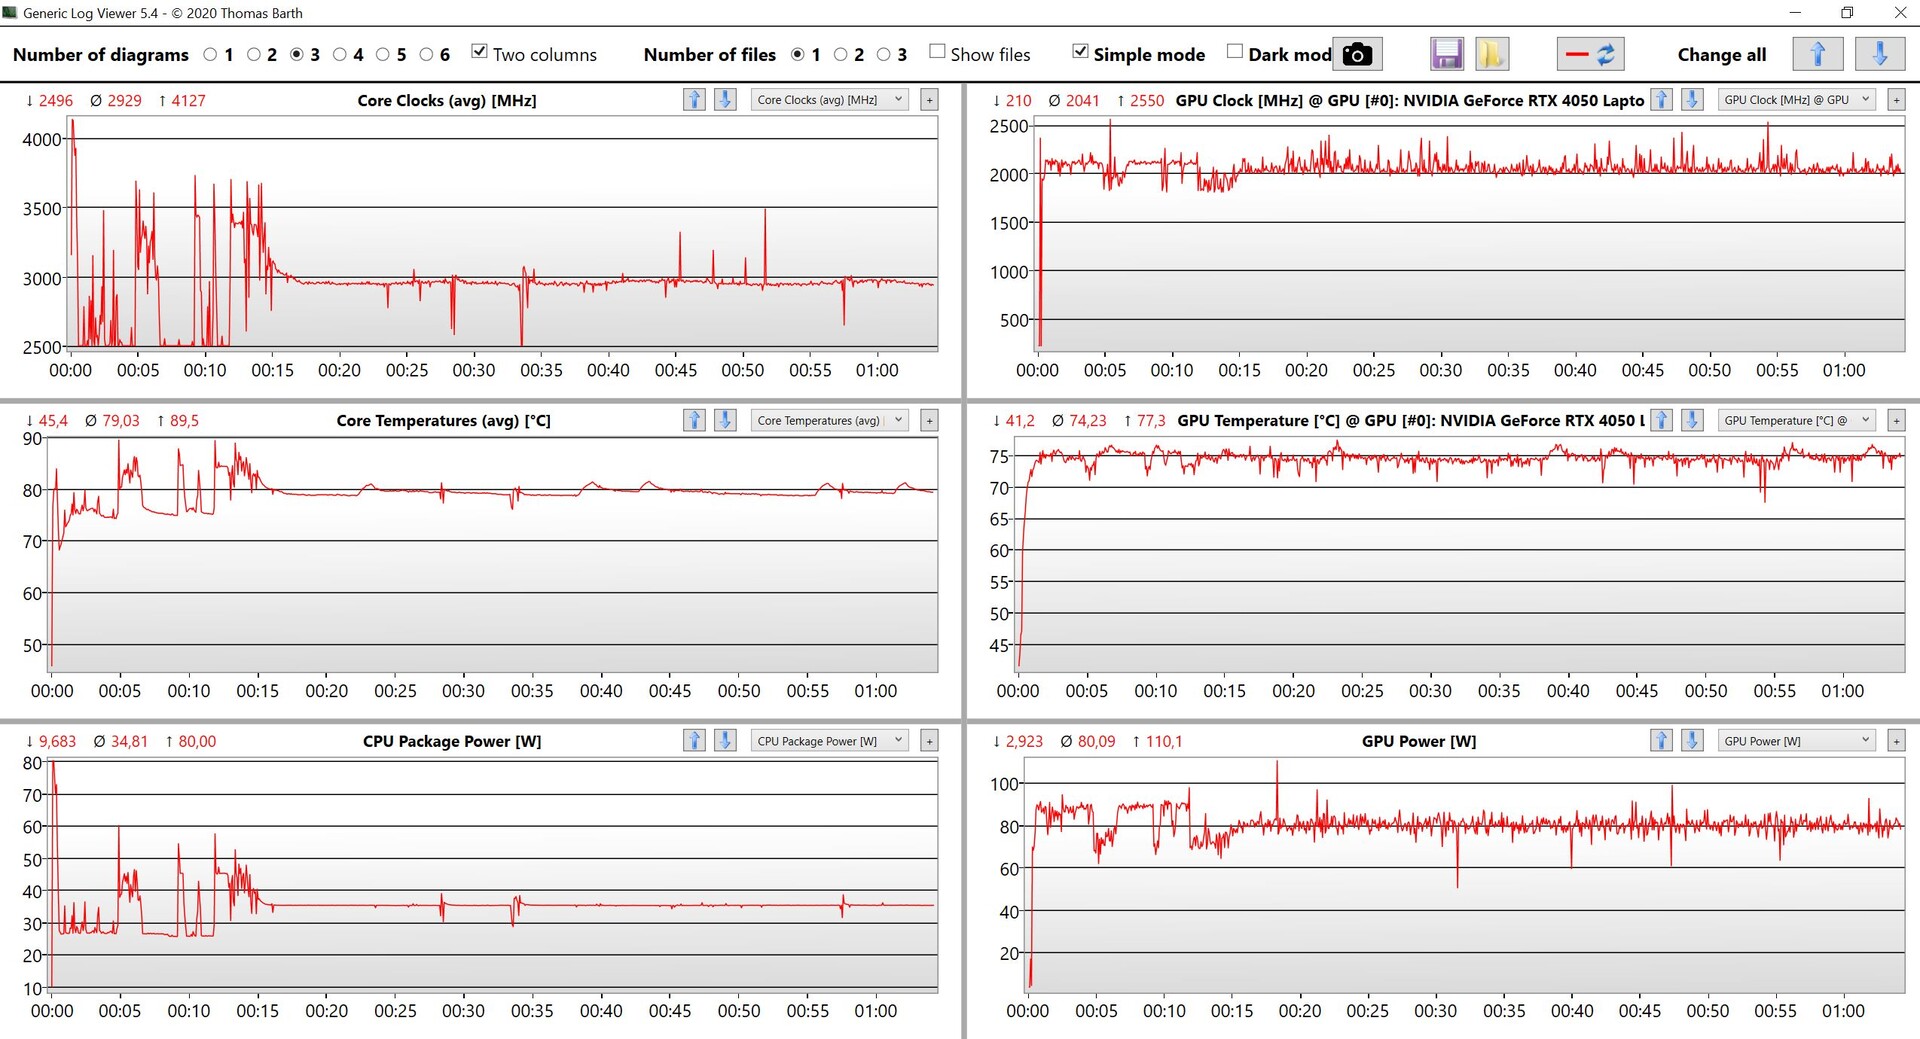
IlAMD Ryzen 7 7735HS è utilizzato come processore del portatile, che è in pratica il vecchioRyzen 7 6800HS ma con un clock massimo superiore di 50 MHz. Il chip Zen3+ ha 8 core e può elaborare 16 thread contemporaneamente. I limiti di potenza del TUF Gaming A15 sono di 80/65 watt, il che consente di ottenere prestazioni multi-core decenti, spesso superiori ai concorrenti con CPU Alder Lake. Nei test single-core, tuttavia, i chip Intel con i core più performanti hanno avuto un chiaro vantaggio. Non sorprende che il 7735HS sia alla pari con loSchenker XMG Core 15'sRyzen 7 6800H. Nel complesso, la CPU è una scelta decente per un portatile da gioco economico. A batteria, la CPU consuma brevemente 45 watt e poi scende a 32 watt, motivo per cui le prestazioni multi-core calano del 20%. Altri benchmark della CPU sono disponibili qui.
Cinebench R15 Multi continuous test
Cinebench R23: Multi Core | Single Core
Cinebench R20: CPU (Multi Core) | CPU (Single Core)
Cinebench R15: CPU Multi 64Bit | CPU Single 64Bit
Blender: v2.79 BMW27 CPU
7-Zip 18.03: 7z b 4 | 7z b 4 -mmt1
Geekbench 5.5: Multi-Core | Single-Core
HWBOT x265 Benchmark v2.2: 4k Preset
LibreOffice : 20 Documents To PDF
R Benchmark 2.5: Overall mean
| CPU Performance rating | |
| Media della classe Gaming | |
| Asus TUF Gaming F15 FX507ZM | |
| HP Victus 15 fa0020nr | |
| MSI Katana 15 B12VEK | |
| Asus TUF A15 FA507 | |
| Schenker XMG Core 15 (M22) | |
| Lenovo IdeaPad Gaming 3 15IAH7 | |
| Gigabyte G5 KE | |
| Media AMD Ryzen 7 7735HS | |
| Cinebench R23 / Multi Core | |
| Media della classe Gaming (10488 - 42661, n=107, ultimi 2 anni) | |
| Asus TUF Gaming F15 FX507ZM | |
| MSI Katana 15 B12VEK | |
| HP Victus 15 fa0020nr | |
| Lenovo IdeaPad Gaming 3 15IAH7 | |
| Schenker XMG Core 15 (M22) | |
| Asus TUF A15 FA507 | |
| Gigabyte G5 KE | |
| Media AMD Ryzen 7 7735HS (10283 - 14131, n=15) | |
| Cinebench R23 / Single Core | |
| Media della classe Gaming (1166 - 2415, n=107, ultimi 2 anni) | |
| Asus TUF Gaming F15 FX507ZM | |
| HP Victus 15 fa0020nr | |
| MSI Katana 15 B12VEK | |
| Lenovo IdeaPad Gaming 3 15IAH7 | |
| Gigabyte G5 KE | |
| Schenker XMG Core 15 (M22) | |
| Asus TUF A15 FA507 | |
| Media AMD Ryzen 7 7735HS (1288 - 1570, n=15) | |
| Cinebench R20 / CPU (Multi Core) | |
| Media della classe Gaming (4029 - 16433, n=106, ultimi 2 anni) | |
| Asus TUF Gaming F15 FX507ZM | |
| MSI Katana 15 B12VEK | |
| HP Victus 15 fa0020nr | |
| Lenovo IdeaPad Gaming 3 15IAH7 | |
| Schenker XMG Core 15 (M22) | |
| Asus TUF A15 FA507 | |
| Gigabyte G5 KE | |
| Media AMD Ryzen 7 7735HS (3968 - 5502, n=15) | |
| Cinebench R20 / CPU (Single Core) | |
| Media della classe Gaming (442 - 913, n=106, ultimi 2 anni) | |
| HP Victus 15 fa0020nr | |
| Asus TUF Gaming F15 FX507ZM | |
| Lenovo IdeaPad Gaming 3 15IAH7 | |
| MSI Katana 15 B12VEK | |
| Gigabyte G5 KE | |
| Schenker XMG Core 15 (M22) | |
| Asus TUF A15 FA507 | |
| Media AMD Ryzen 7 7735HS (502 - 613, n=15) | |
| Cinebench R15 / CPU Multi 64Bit | |
| Media della classe Gaming (1578 - 6330, n=105, ultimi 2 anni) | |
| Asus TUF Gaming F15 FX507ZM | |
| HP Victus 15 fa0020nr | |
| Schenker XMG Core 15 (M22) | |
| Asus TUF A15 FA507 | |
| Lenovo IdeaPad Gaming 3 15IAH7 | |
| MSI Katana 15 B12VEK | |
| Media AMD Ryzen 7 7735HS (1758 - 2355, n=17) | |
| Gigabyte G5 KE | |
| Cinebench R15 / CPU Single 64Bit | |
| Media della classe Gaming (188.8 - 350, n=106, ultimi 2 anni) | |
| HP Victus 15 fa0020nr | |
| Asus TUF Gaming F15 FX507ZM | |
| Schenker XMG Core 15 (M22) | |
| Asus TUF A15 FA507 | |
| Lenovo IdeaPad Gaming 3 15IAH7 | |
| MSI Katana 15 B12VEK | |
| Media AMD Ryzen 7 7735HS (206 - 255, n=16) | |
| Gigabyte G5 KE | |
| Blender / v2.79 BMW27 CPU | |
| Media AMD Ryzen 7 7735HS (214 - 351, n=15) | |
| HP Victus 15 fa0020nr | |
| MSI Katana 15 B12VEK | |
| Gigabyte G5 KE | |
| Lenovo IdeaPad Gaming 3 15IAH7 | |
| Asus TUF A15 FA507 | |
| Schenker XMG Core 15 (M22) | |
| Asus TUF Gaming F15 FX507ZM | |
| Media della classe Gaming (79 - 330, n=104, ultimi 2 anni) | |
| 7-Zip 18.03 / 7z b 4 | |
| Media della classe Gaming (33491 - 148086, n=105, ultimi 2 anni) | |
| Asus TUF Gaming F15 FX507ZM | |
| Schenker XMG Core 15 (M22) | |
| Asus TUF A15 FA507 | |
| MSI Katana 15 B12VEK | |
| Media AMD Ryzen 7 7735HS (43455 - 63698, n=15) | |
| Gigabyte G5 KE | |
| HP Victus 15 fa0020nr | |
| Lenovo IdeaPad Gaming 3 15IAH7 | |
| 7-Zip 18.03 / 7z b 4 -mmt1 | |
| Media della classe Gaming (4199 - 7436, n=105, ultimi 2 anni) | |
| HP Victus 15 fa0020nr | |
| Asus TUF A15 FA507 | |
| Schenker XMG Core 15 (M22) | |
| Media AMD Ryzen 7 7735HS (4779 - 5849, n=15) | |
| MSI Katana 15 B12VEK | |
| Lenovo IdeaPad Gaming 3 15IAH7 | |
| Gigabyte G5 KE | |
| Asus TUF Gaming F15 FX507ZM | |
| Geekbench 5.5 / Multi-Core | |
| Media della classe Gaming (6460 - 28263, n=105, ultimi 2 anni) | |
| Asus TUF Gaming F15 FX507ZM | |
| MSI Katana 15 B12VEK | |
| HP Victus 15 fa0020nr | |
| Gigabyte G5 KE | |
| Schenker XMG Core 15 (M22) | |
| Asus TUF A15 FA507 | |
| Media AMD Ryzen 7 7735HS (7151 - 10258, n=15) | |
| Lenovo IdeaPad Gaming 3 15IAH7 | |
| Geekbench 5.5 / Single-Core | |
| Media della classe Gaming (986 - 2474, n=105, ultimi 2 anni) | |
| HP Victus 15 fa0020nr | |
| Asus TUF Gaming F15 FX507ZM | |
| MSI Katana 15 B12VEK | |
| Gigabyte G5 KE | |
| Lenovo IdeaPad Gaming 3 15IAH7 | |
| Schenker XMG Core 15 (M22) | |
| Media AMD Ryzen 7 7735HS (1327 - 1615, n=15) | |
| Asus TUF A15 FA507 | |
| HWBOT x265 Benchmark v2.2 / 4k Preset | |
| Media della classe Gaming (11.5 - 44.4, n=105, ultimi 2 anni) | |
| Asus TUF Gaming F15 FX507ZM | |
| Schenker XMG Core 15 (M22) | |
| MSI Katana 15 B12VEK | |
| Asus TUF A15 FA507 | |
| Gigabyte G5 KE | |
| HP Victus 15 fa0020nr | |
| Lenovo IdeaPad Gaming 3 15IAH7 | |
| Media AMD Ryzen 7 7735HS (10.8 - 17.9, n=15) | |
| LibreOffice / 20 Documents To PDF | |
| Schenker XMG Core 15 (M22) | |
| Gigabyte G5 KE | |
| Media AMD Ryzen 7 7735HS (44.3 - 63.9, n=15) | |
| Asus TUF A15 FA507 | |
| Asus TUF Gaming F15 FX507ZM | |
| Media della classe Gaming (33.2 - 88.8, n=105, ultimi 2 anni) | |
| HP Victus 15 fa0020nr | |
| Lenovo IdeaPad Gaming 3 15IAH7 | |
| MSI Katana 15 B12VEK | |
| R Benchmark 2.5 / Overall mean | |
| Lenovo IdeaPad Gaming 3 15IAH7 | |
| Media AMD Ryzen 7 7735HS (0.4822 - 0.585, n=15) | |
| Asus TUF A15 FA507 | |
| MSI Katana 15 B12VEK | |
| Gigabyte G5 KE | |
| Schenker XMG Core 15 (M22) | |
| HP Victus 15 fa0020nr | |
| Asus TUF Gaming F15 FX507ZM | |
| Media della classe Gaming (0.3439 - 0.759, n=106, ultimi 2 anni) | |
* ... Meglio usare valori piccoli
AIDA64: FP32 Ray-Trace | FPU Julia | CPU SHA3 | CPU Queen | FPU SinJulia | FPU Mandel | CPU AES | CPU ZLib | FP64 Ray-Trace | CPU PhotoWorxx
| Performance rating | |
| Media della classe Gaming | |
| Schenker XMG Core 15 (M22) | |
| Asus TUF A15 FA507 | |
| Media AMD Ryzen 7 7735HS | |
| MSI Katana 15 B12VEK | |
| Gigabyte G5 KE | |
| Asus TUF Gaming F15 FX507ZM | |
| Lenovo IdeaPad Gaming 3 15IAH7 | |
| HP Victus 15 fa0020nr | |
| AIDA64 / FP32 Ray-Trace | |
| Media della classe Gaming (10227 - 85542, n=105, ultimi 2 anni) | |
| Schenker XMG Core 15 (M22) | |
| Asus TUF A15 FA507 | |
| MSI Katana 15 B12VEK | |
| Media AMD Ryzen 7 7735HS (11831 - 17161, n=16) | |
| Lenovo IdeaPad Gaming 3 15IAH7 | |
| HP Victus 15 fa0020nr | |
| Gigabyte G5 KE | |
| Asus TUF Gaming F15 FX507ZM | |
| AIDA64 / FPU Julia | |
| Media della classe Gaming (51376 - 238426, n=105, ultimi 2 anni) | |
| Schenker XMG Core 15 (M22) | |
| Asus TUF A15 FA507 | |
| Media AMD Ryzen 7 7735HS (75370 - 105483, n=16) | |
| MSI Katana 15 B12VEK | |
| Lenovo IdeaPad Gaming 3 15IAH7 | |
| Gigabyte G5 KE | |
| HP Victus 15 fa0020nr | |
| Asus TUF Gaming F15 FX507ZM | |
| AIDA64 / CPU SHA3 | |
| Media della classe Gaming (2180 - 10115, n=105, ultimi 2 anni) | |
| Schenker XMG Core 15 (M22) | |
| Asus TUF A15 FA507 | |
| Lenovo IdeaPad Gaming 3 15IAH7 | |
| Asus TUF Gaming F15 FX507ZM | |
| MSI Katana 15 B12VEK | |
| Gigabyte G5 KE | |
| Media AMD Ryzen 7 7735HS (2499 - 3494, n=16) | |
| HP Victus 15 fa0020nr | |
| AIDA64 / CPU Queen | |
| Media della classe Gaming (49785 - 173351, n=90, ultimi 2 anni) | |
| Asus TUF A15 FA507 | |
| HP Victus 15 fa0020nr | |
| Media AMD Ryzen 7 7735HS (87486 - 108729, n=15) | |
| Asus TUF Gaming F15 FX507ZM | |
| Schenker XMG Core 15 (M22) | |
| MSI Katana 15 B12VEK | |
| Lenovo IdeaPad Gaming 3 15IAH7 | |
| Gigabyte G5 KE | |
| AIDA64 / FPU SinJulia | |
| Media della classe Gaming (4424 - 33636, n=105, ultimi 2 anni) | |
| Schenker XMG Core 15 (M22) | |
| Asus TUF A15 FA507 | |
| Media AMD Ryzen 7 7735HS (11233 - 13097, n=16) | |
| Asus TUF Gaming F15 FX507ZM | |
| MSI Katana 15 B12VEK | |
| HP Victus 15 fa0020nr | |
| Gigabyte G5 KE | |
| Lenovo IdeaPad Gaming 3 15IAH7 | |
| AIDA64 / FPU Mandel | |
| Media della classe Gaming (25115 - 128721, n=105, ultimi 2 anni) | |
| Schenker XMG Core 15 (M22) | |
| Asus TUF A15 FA507 | |
| Media AMD Ryzen 7 7735HS (41400 - 58232, n=16) | |
| MSI Katana 15 B12VEK | |
| Lenovo IdeaPad Gaming 3 15IAH7 | |
| Gigabyte G5 KE | |
| HP Victus 15 fa0020nr | |
| Asus TUF Gaming F15 FX507ZM | |
| AIDA64 / CPU AES | |
| Lenovo IdeaPad Gaming 3 15IAH7 | |
| Gigabyte G5 KE | |
| Media della classe Gaming (39258 - 247074, n=105, ultimi 2 anni) | |
| Media AMD Ryzen 7 7735HS (44013 - 137629, n=16) | |
| Schenker XMG Core 15 (M22) | |
| MSI Katana 15 B12VEK | |
| Asus TUF Gaming F15 FX507ZM | |
| Asus TUF A15 FA507 | |
| HP Victus 15 fa0020nr | |
| AIDA64 / CPU ZLib | |
| Media della classe Gaming (574 - 2531, n=105, ultimi 2 anni) | |
| Asus TUF Gaming F15 FX507ZM | |
| Gigabyte G5 KE | |
| Lenovo IdeaPad Gaming 3 15IAH7 | |
| Schenker XMG Core 15 (M22) | |
| MSI Katana 15 B12VEK | |
| HP Victus 15 fa0020nr | |
| Media AMD Ryzen 7 7735HS (651 - 906, n=16) | |
| Asus TUF A15 FA507 | |
| AIDA64 / FP64 Ray-Trace | |
| Media della classe Gaming (5509 - 45446, n=105, ultimi 2 anni) | |
| Schenker XMG Core 15 (M22) | |
| Asus TUF A15 FA507 | |
| MSI Katana 15 B12VEK | |
| Media AMD Ryzen 7 7735HS (1459 - 9094, n=16) | |
| Lenovo IdeaPad Gaming 3 15IAH7 | |
| Gigabyte G5 KE | |
| HP Victus 15 fa0020nr | |
| Asus TUF Gaming F15 FX507ZM | |
| AIDA64 / CPU PhotoWorxx | |
| Media della classe Gaming (12271 - 89891, n=105, ultimi 2 anni) | |
| MSI Katana 15 B12VEK | |
| Asus TUF Gaming F15 FX507ZM | |
| Schenker XMG Core 15 (M22) | |
| Gigabyte G5 KE | |
| Asus TUF A15 FA507 | |
| Media AMD Ryzen 7 7735HS (17524 - 30542, n=16) | |
| HP Victus 15 fa0020nr | |
| Lenovo IdeaPad Gaming 3 15IAH7 | |
Prestazioni del sistema
Il TUF Gaming A15 si è comportato bene nei benchmark di sistema sintetici ed è stato in grado di posizionarsi nella parte alta della classifica durante il test PCMark 10. Nel complesso, non c'è molto tra i due contendenti e, soggettivamente, tutti ci hanno lasciato una buona impressione in termini di prestazioni. A parte i già citati leggeri balbettii durante la commutazione della GPU (che sono normali), il sistema ha sempre funzionato senza problemi nei test.
CrossMark: Overall | Productivity | Creativity | Responsiveness
| PCMark 10 / Score | |
| Media della classe Gaming (5828 - 12414, n=93, ultimi 2 anni) | |
| Asus TUF Gaming F15 FX507ZM | |
| Schenker XMG Core 15 (M22) | |
| Asus TUF A15 FA507 | |
| Media AMD Ryzen 7 7735HS, NVIDIA GeForce RTX 4050 Laptop GPU (n=1) | |
| Gigabyte G5 KE | |
| HP Victus 15 fa0020nr | |
| MSI Katana 15 B12VEK | |
| Lenovo IdeaPad Gaming 3 15IAH7 | |
| PCMark 10 / Essentials | |
| Gigabyte G5 KE | |
| Schenker XMG Core 15 (M22) | |
| Media della classe Gaming (8810 - 11935, n=97, ultimi 2 anni) | |
| Asus TUF A15 FA507 | |
| Media AMD Ryzen 7 7735HS, NVIDIA GeForce RTX 4050 Laptop GPU (n=1) | |
| Asus TUF Gaming F15 FX507ZM | |
| HP Victus 15 fa0020nr | |
| MSI Katana 15 B12VEK | |
| Lenovo IdeaPad Gaming 3 15IAH7 | |
| PCMark 10 / Productivity | |
| Media della classe Gaming (6845 - 25323, n=95, ultimi 2 anni) | |
| MSI Katana 15 B12VEK | |
| Schenker XMG Core 15 (M22) | |
| Lenovo IdeaPad Gaming 3 15IAH7 | |
| Gigabyte G5 KE | |
| Asus TUF A15 FA507 | |
| Media AMD Ryzen 7 7735HS, NVIDIA GeForce RTX 4050 Laptop GPU (n=1) | |
| Asus TUF Gaming F15 FX507ZM | |
| HP Victus 15 fa0020nr | |
| PCMark 10 / Digital Content Creation | |
| Media della classe Gaming (7602 - 19954, n=95, ultimi 2 anni) | |
| Asus TUF Gaming F15 FX507ZM | |
| Asus TUF A15 FA507 | |
| Media AMD Ryzen 7 7735HS, NVIDIA GeForce RTX 4050 Laptop GPU (n=1) | |
| Schenker XMG Core 15 (M22) | |
| Gigabyte G5 KE | |
| HP Victus 15 fa0020nr | |
| MSI Katana 15 B12VEK | |
| Lenovo IdeaPad Gaming 3 15IAH7 | |
| CrossMark / Overall | |
| Media della classe Gaming (1366 - 2409, n=94, ultimi 2 anni) | |
| Gigabyte G5 KE | |
| MSI Katana 15 B12VEK | |
| HP Victus 15 fa0020nr | |
| Schenker XMG Core 15 (M22) | |
| Asus TUF A15 FA507 | |
| Media AMD Ryzen 7 7735HS, NVIDIA GeForce RTX 4050 Laptop GPU (n=1) | |
| CrossMark / Productivity | |
| Media della classe Gaming (1386 - 2254, n=94, ultimi 2 anni) | |
| Gigabyte G5 KE | |
| MSI Katana 15 B12VEK | |
| HP Victus 15 fa0020nr | |
| Schenker XMG Core 15 (M22) | |
| Asus TUF A15 FA507 | |
| Media AMD Ryzen 7 7735HS, NVIDIA GeForce RTX 4050 Laptop GPU (n=1) | |
| CrossMark / Creativity | |
| Media della classe Gaming (1343 - 2786, n=94, ultimi 2 anni) | |
| MSI Katana 15 B12VEK | |
| HP Victus 15 fa0020nr | |
| Gigabyte G5 KE | |
| Schenker XMG Core 15 (M22) | |
| Asus TUF A15 FA507 | |
| Media AMD Ryzen 7 7735HS, NVIDIA GeForce RTX 4050 Laptop GPU (n=1) | |
| CrossMark / Responsiveness | |
| Gigabyte G5 KE | |
| Media della classe Gaming (1226 - 2334, n=94, ultimi 2 anni) | |
| MSI Katana 15 B12VEK | |
| HP Victus 15 fa0020nr | |
| Schenker XMG Core 15 (M22) | |
| Asus TUF A15 FA507 | |
| Media AMD Ryzen 7 7735HS, NVIDIA GeForce RTX 4050 Laptop GPU (n=1) | |
| PCMark 10 Score | 7210 punti | |
Aiuto | ||
| AIDA64 / Memory Copy | |
| Media della classe Gaming (21750 - 129946, n=105, ultimi 2 anni) | |
| MSI Katana 15 B12VEK | |
| Asus TUF Gaming F15 FX507ZM | |
| Schenker XMG Core 15 (M22) | |
| Asus TUF A15 FA507 | |
| Media AMD Ryzen 7 7735HS (30324 - 52012, n=16) | |
| Gigabyte G5 KE | |
| HP Victus 15 fa0020nr | |
| Lenovo IdeaPad Gaming 3 15IAH7 | |
| AIDA64 / Memory Read | |
| Media della classe Gaming (22956 - 118858, n=105, ultimi 2 anni) | |
| MSI Katana 15 B12VEK | |
| Asus TUF Gaming F15 FX507ZM | |
| Schenker XMG Core 15 (M22) | |
| Asus TUF A15 FA507 | |
| Gigabyte G5 KE | |
| HP Victus 15 fa0020nr | |
| Media AMD Ryzen 7 7735HS (33938 - 51856, n=16) | |
| Lenovo IdeaPad Gaming 3 15IAH7 | |
| AIDA64 / Memory Write | |
| Media della classe Gaming (22297 - 135096, n=105, ultimi 2 anni) | |
| Asus TUF Gaming F15 FX507ZM | |
| MSI Katana 15 B12VEK | |
| Schenker XMG Core 15 (M22) | |
| Asus TUF A15 FA507 | |
| Media AMD Ryzen 7 7735HS (33175 - 55284, n=16) | |
| Gigabyte G5 KE | |
| HP Victus 15 fa0020nr | |
| Lenovo IdeaPad Gaming 3 15IAH7 | |
| AIDA64 / Memory Latency | |
| Media della classe Gaming (75.3 - 259, n=105, ultimi 2 anni) | |
| Gigabyte G5 KE | |
| MSI Katana 15 B12VEK | |
| Lenovo IdeaPad Gaming 3 15IAH7 | |
| Media AMD Ryzen 7 7735HS (78.2 - 109.8, n=16) | |
| Schenker XMG Core 15 (M22) | |
| Asus TUF A15 FA507 | |
| HP Victus 15 fa0020nr | |
| Asus TUF Gaming F15 FX507ZM | |
* ... Meglio usare valori piccoli
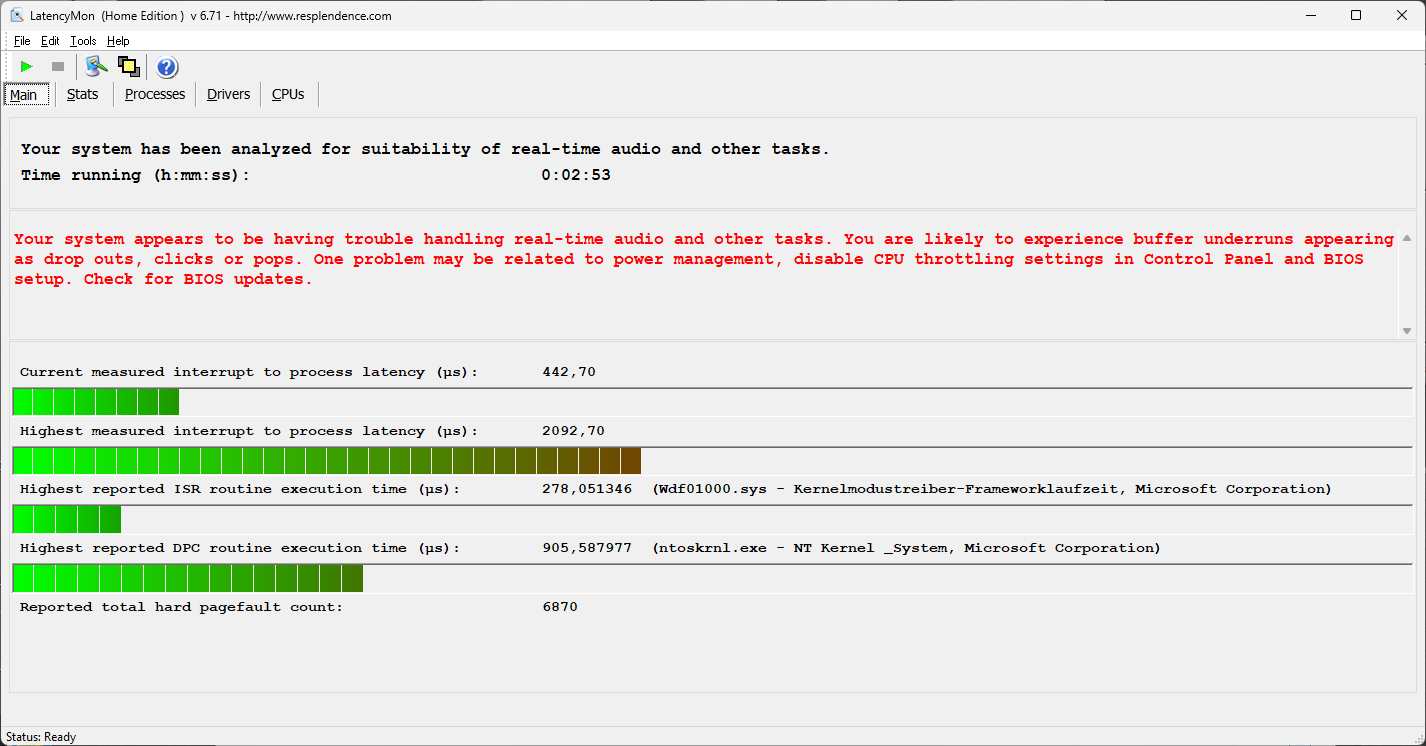
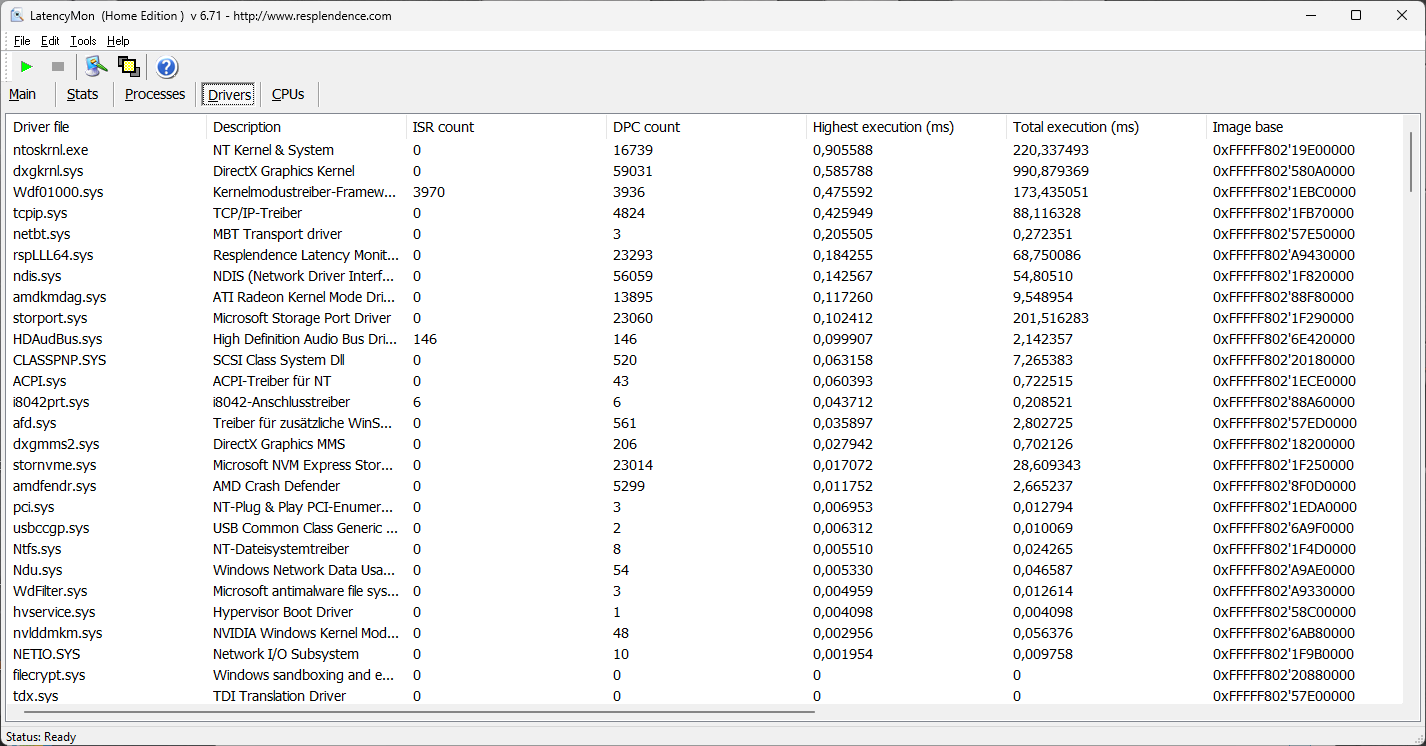
Latenza DPC
Nel nostro test di latenza standardizzato (navigazione web, riproduzione di YouTube in 4K, carico della CPU), il dispositivo di prova ha mostrato alcune limitazioni con l'attuale versione del BIOS e non è quindi adatto a software audio in tempo reale senza restrizioni.
| DPC Latencies / LatencyMon - interrupt to process latency (max), Web, Youtube, Prime95 | |
| MSI Katana 15 B12VEK | |
| Schenker XMG Core 15 (M22) | |
| HP Victus 15 fa0020nr | |
| Lenovo IdeaPad Gaming 3 15IAH7 | |
| Gigabyte G5 KE | |
| Asus TUF Gaming F15 FX507ZM | |
* ... Meglio usare valori piccoli
Dispositivi di archiviazione
L'unità SSD installata è un'unità PCIe 4.0 di Micron (2400). L'unità M.2 2280 ha una capacità di archiviazione di 512 GB, con 420 GB disponibili dopo il primo avvio. La velocità di trasferimento massima dell'unità QLC-SSD è di 4.200 MB/s, che corrisponde anche alle velocità dei nostri benchmark. Nel complesso, le prestazioni sono buone e stabili anche sotto carico prolungato. Altri benchmark sulle SSD sono elencati qui.

* ... Meglio usare valori piccoli
reading continuous performance: DiskSpd Read Loop, Queue Depth 8
Scheda grafica - GeForce RTX 4050 Laptop
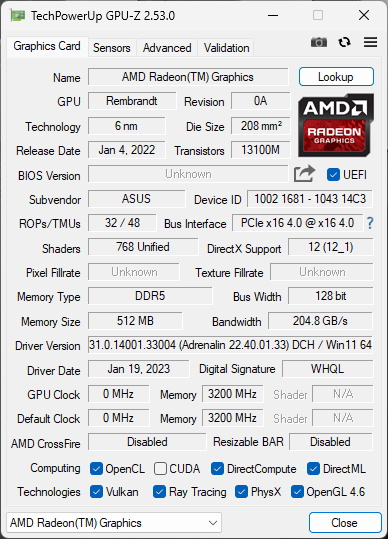
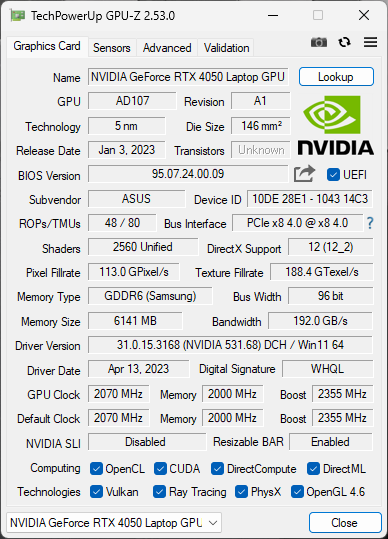
Nell'uso quotidiano, l'elaborazione grafica è affidata alla scheda integrataAMD Radeon 680M- in caso di sforzi maggiori, passa automaticamente alla scheda dedicataNvidia GeForce RTX 4050 Laptop. Quest'ultima ha 6 GB di RAM e, secondo il driver, è la versione da 140 watt. Tuttavia, questa specifica è un po' fuorviante, poiché la nuova GPU consuma comunque un massimo di ~95 watt durante il gioco. Si tratta quindi della versione più veloce del portatile RTX 4050. Questo si riflette anche nei benchmark, dove il TUF Gaming A15 ha ottenuto una velocità media di circa il 10% superiore ai valori medi che abbiamo per questa GPU nel nostro database.
Ciò significa che anche il portatile RTX 4050 si avvicina molto alla vecchia RTX 3060che consuma anche molta più energia nei dispositivi di confronto (tra 115 e 140 watt TGP). Nel complesso, le prestazioni sono molto buone e non si sono verificati cali di prestazioni nemmeno sotto carico permanente - lo stress test Time Spy è stato eseguito senza problemi con una percentuale di superamento del 99,3%. In modalità batteria, il consumo energetico della GPU è limitato a circa 50 watt, motivo per cui le prestazioni grafiche calano di circa il 30%. AltroBenchmark della GPU sono elencati nella nostra sezione dedicata alla tecnologia.
| 3DMark Performance rating - Percent | |
| Media della classe Gaming | |
| Asus TUF Gaming F15 FX507ZM -4! | |
| MSI Katana 15 B12VEK -3! | |
| Gigabyte G5 KE -3! | |
| Asus TUF A15 FA507 | |
| Schenker XMG Core 15 (M22) -1! | |
| Media NVIDIA GeForce RTX 4050 Laptop GPU | |
| Lenovo IdeaPad Gaming 3 15IAH7 -3! | |
| HP Victus 15 fa0020nr -2! | |
| Geekbench 6.0 - GPU OpenCL 6.0 | |
| Media della classe Gaming (155885 - 241981, n=3, ultimi 2 anni) | |
| Asus TUF A15 FA507 | |
| Media NVIDIA GeForce RTX 4050 Laptop GPU (66574 - 84452, n=13) | |
| 3DMark 11 Performance | 26692 punti | |
| 3DMark Fire Strike Score | 20183 punti | |
| 3DMark Time Spy Score | 8902 punti | |
Aiuto | ||
| Blender / v3.3 Classroom HIP/AMD | |
| Schenker XMG Core 15 (M22) | |
| Asus TUF A15 FA507 | |
| Asus TUF A15 FA507 | |
| Media NVIDIA GeForce RTX 4050 Laptop GPU (345 - 345, n=2) | |
| Blender / v3.3 Classroom OPTIX/RTX | |
| Lenovo IdeaPad Gaming 3 15IAH7 | |
| HP Victus 15 fa0020nr | |
| Schenker XMG Core 15 (M22) | |
| Gigabyte G5 KE | |
| Media NVIDIA GeForce RTX 4050 Laptop GPU (25 - 37, n=40) | |
| MSI Katana 15 B12VEK | |
| Asus TUF A15 FA507 | |
| Asus TUF A15 FA507 | |
| Media della classe Gaming (9 - 32, n=106, ultimi 2 anni) | |
| Blender / v3.3 Classroom CUDA | |
| Lenovo IdeaPad Gaming 3 15IAH7 | |
| HP Victus 15 fa0020nr | |
| Media NVIDIA GeForce RTX 4050 Laptop GPU (47 - 68, n=39) | |
| Schenker XMG Core 15 (M22) | |
| MSI Katana 15 B12VEK | |
| Gigabyte G5 KE | |
| Asus TUF A15 FA507 | |
| Asus TUF A15 FA507 | |
| Media della classe Gaming (15 - 228, n=106, ultimi 2 anni) | |
| Blender / v3.3 Classroom CPU | |
| MSI Katana 15 B12VEK | |
| Gigabyte G5 KE | |
| HP Victus 15 fa0020nr | |
| Media NVIDIA GeForce RTX 4050 Laptop GPU (243 - 907, n=40) | |
| Lenovo IdeaPad Gaming 3 15IAH7 | |
| Asus TUF A15 FA507 | |
| Asus TUF A15 FA507 | |
| Schenker XMG Core 15 (M22) | |
| Media della classe Gaming (122 - 565, n=102, ultimi 2 anni) | |
* ... Meglio usare valori piccoli
Prestazioni di gioco
Le prestazioni di gioco della nostra variante base del TUF Gaming A15 sono state molto buone, più che sufficienti per la risoluzione nativa di 1080p anche quando si gioca a giochi moderni come Hogwarts Legacy o Cyberpunk 2077 con le impostazioni di dettaglio massime. Se si desidera utilizzare il ray tracing, tuttavia, è necessario utilizzare l'upscaling DLSS. Ad esempio, Cyberpunk 2077 ha funzionato solo a 24 FPS in 1080p con il ray tracing su Ultra, mentre ha funzionato a 74 FPS con DLSS. Tuttavia, la differenza può essere minore in altri giochi. In pratica, tutti i giochi moderni possono essere eseguiti e i 6 GB di VRAM sono attualmente del tutto sufficienti per i 1080p. Il Witcher 3 test mostra anche che le prestazioni di gioco rimangono stabili anche durante le sessioni più lunghe.
| The Witcher 3 - 1920x1080 Ultra Graphics & Postprocessing (HBAO+) | |
| Media della classe Gaming (104.7 - 240, n=7, ultimi 2 anni) | |
| Asus TUF Gaming F15 FX507ZM | |
| Gigabyte G5 KE | |
| MSI Katana 15 B12VEK | |
| Asus TUF A15 FA507 | |
| Schenker XMG Core 15 (M22) | |
| Lenovo IdeaPad Gaming 3 15IAH7 | |
| HP Victus 15 fa0020nr | |
| Final Fantasy XV Benchmark - 1920x1080 High Quality | |
| Media della classe Gaming (41 - 215, n=95, ultimi 2 anni) | |
| Asus TUF Gaming F15 FX507ZM | |
| Schenker XMG Core 15 (M22) | |
| Gigabyte G5 KE | |
| MSI Katana 15 B12VEK | |
| Asus TUF A15 FA507 | |
| Lenovo IdeaPad Gaming 3 15IAH7 | |
| HP Victus 15 fa0020nr | |
| Dota 2 Reborn - 1920x1080 ultra (3/3) best looking | |
| Media della classe Gaming (84.8 - 248, n=107, ultimi 2 anni) | |
| Asus TUF Gaming F15 FX507ZM | |
| MSI Katana 15 B12VEK | |
| Gigabyte G5 KE | |
| HP Victus 15 fa0020nr | |
| Asus TUF A15 FA507 | |
| Schenker XMG Core 15 (M22) | |
| Lenovo IdeaPad Gaming 3 15IAH7 | |
| The Witcher 3 - 1920x1080 Ultra Graphics & Postprocessing (HBAO+) | |
| Media della classe Gaming (104.7 - 240, n=7, ultimi 2 anni) | |
| Asus TUF Gaming F15 FX507ZM | |
| Gigabyte G5 KE | |
| MSI Katana 15 B12VEK | |
| Asus TUF A15 FA507 | |
| Schenker XMG Core 15 (M22) | |
| Media NVIDIA GeForce RTX 4050 Laptop GPU (18.5 - 94.7, n=40) | |
| Lenovo IdeaPad Gaming 3 15IAH7 | |
| HP Victus 15 fa0020nr | |
| F1 22 | |
| 1920x1080 High Preset AA:T AF:16x | |
| Media della classe Gaming (99.3 - 271, n=4, ultimi 2 anni) | |
| Asus TUF A15 FA507 | |
| Gigabyte G5 KE | |
| Media NVIDIA GeForce RTX 4050 Laptop GPU (94.4 - 174.7, n=22) | |
| Lenovo IdeaPad Gaming 3 15IAH7 | |
| 1920x1080 Ultra High Preset AA:T AF:16x | |
| Media della classe Gaming (40.1 - 121.2, n=4, ultimi 2 anni) | |
| Asus TUF A15 FA507 | |
| Gigabyte G5 KE | |
| Media NVIDIA GeForce RTX 4050 Laptop GPU (10.9 - 56.4, n=24) | |
| Lenovo IdeaPad Gaming 3 15IAH7 | |
| Cyberpunk 2077 1.6 | |
| 1920x1080 High Preset | |
| Gigabyte G5 KE | |
| Asus TUF A15 FA507 | |
| Media NVIDIA GeForce RTX 4050 Laptop GPU (48 - 91.3, n=14) | |
| HP Victus 15 fa0020nr | |
| 1920x1080 Ultra Preset | |
| Gigabyte G5 KE | |
| Asus TUF A15 FA507 | |
| Media NVIDIA GeForce RTX 4050 Laptop GPU (44.4 - 79.4, n=14) | |
| HP Victus 15 fa0020nr | |
| Hogwarts Legacy | |
| 1920x1080 High Preset AA:High T | |
| Asus TUF A15 FA507 | |
| Media NVIDIA GeForce RTX 4050 Laptop GPU (44.8 - 93.6, n=8) | |
| 1920x1080 Ultra Preset AA:High T | |
| Media della classe Gaming (n=1ultimi 2 anni) | |
| Media NVIDIA GeForce RTX 4050 Laptop GPU (39 - 77.3, n=8) | |
| Asus TUF A15 FA507 | |
Witcher 3 FPS diagram
| basso | medio | alto | ultra | |
|---|---|---|---|---|
| GTA V (2015) | 168.6 | 153.1 | 83.5 | |
| The Witcher 3 (2015) | 171 | 82.2 | ||
| Dota 2 Reborn (2015) | 137.4 | 127.2 | 115.8 | |
| Final Fantasy XV Benchmark (2018) | 178.9 | 115.5 | 81.5 | |
| X-Plane 11.11 (2018) | 103.5 | 97 | 77.8 | |
| Far Cry 5 (2018) | 111 | 105 | 99 | |
| Strange Brigade (2018) | 211 | 171 | 147 | |
| F1 2021 (2021) | 283 | 260 | 209 | 110.3 |
| Cyberpunk 2077 1.6 (2022) | 103 | 82 | 71 | 66 |
| F1 22 (2022) | 192.7 | 191.4 | 161.2 | 56.4 |
| Hogwarts Legacy (2023) | 122 | 109 | 89 | 49 |
Emissions - Un portatile da gioco con una tastiera di grande effetto
Emissioni acustiche
Per essere un portatile da gioco, il nostro dispositivo di prova era relativamente silenzioso. Durante le attività più semplici, il dissipatore era spesso completamente silenzioso e anche sotto carico ci ha sorpreso positivamente: Durante lo stress test, le ventole hanno raggiunto un livello di rumore massimo di 43 dB(A). Durante il gioco, abbiamo misurato tra 40-43 dB(A), il che significa che il TUF Gaming A15 è ancora più silenzioso dei suoi concorrenti. Presumiamo che le configurazioni più potenti avranno ventole leggermente più rumorose. Non abbiamo notato altri rumori elettronici.
Rumorosità
| Idle |
| 23.3 / 23.3 / 23.3 dB(A) |
| Sotto carico |
| 29.6 / 43 dB(A) |
 | ||
30 dB silenzioso 40 dB(A) udibile 50 dB(A) rumoroso |
||
min: | ||
| Asus TUF A15 FA507 GeForce RTX 4050 Laptop GPU, R7 7735HS, Micron 2400 MTFDKBA512QFM | Gigabyte G5 KE GeForce RTX 3060 Laptop GPU, i5-12500H, Gigabyte AG4512G-SI B10 | Schenker XMG Core 15 (M22) GeForce RTX 3060 Laptop GPU, R7 6800H, Samsung SSD 980 Pro 1TB MZ-V8P1T0BW | MSI Katana 15 B12VEK GeForce RTX 4050 Laptop GPU, i7-12650H, Micron 2400 MTFDKBA1T0QFM | HP Victus 15 fa0020nr GeForce RTX 3050 Ti Laptop GPU, i7-12700H, Samsung PM9A1 MZVL2512HCJQ | Lenovo IdeaPad Gaming 3 15IAH7 GeForce RTX 3050 Ti Laptop GPU, i5-12500H, Intel SSD 660p SSDPEKNW512G8 | Asus TUF Gaming F15 FX507ZM GeForce RTX 3060 Laptop GPU, i7-12700H, SK Hynix HFM001TD3JX013N | |
|---|---|---|---|---|---|---|---|
| Noise | -33% | -13% | -10% | -10% | -25% | -14% | |
| off /ambiente * (dB) | 23.3 | 19.52 16% | 23 1% | 24 -3% | 24.8 -6% | 25 -7% | 23.2 -0% |
| Idle Minimum * (dB) | 23.3 | 31.05 -33% | 23 1% | 24 -3% | 26.2 -12% | 29 -24% | 23.6 -1% |
| Idle Average * (dB) | 23.3 | 31.05 -33% | 23 1% | 24 -3% | 29.2 -25% | 30 -29% | 23.6 -1% |
| Idle Maximum * (dB) | 23.3 | 31.05 -33% | 23 1% | 24 -3% | 29.4 -26% | 32 -37% | 25.4 -9% |
| Load Average * (dB) | 29.6 | 55.66 -88% | 42.41 -43% | 37.71 -27% | 29.9 -1% | 42 -42% | 38 -28% |
| Witcher 3 ultra * (dB) | 43 | 55.7 -30% | 54.71 -27% | 45.75 -6% | 41.1 4% | 46 -7% | 54.1 -26% |
| Load Maximum * (dB) | 43 | 55.51 -29% | 55.05 -28% | 54.55 -27% | 45.5 -6% | 54 -26% | 57.2 -33% |
* ... Meglio usare valori piccoli
Temperatura
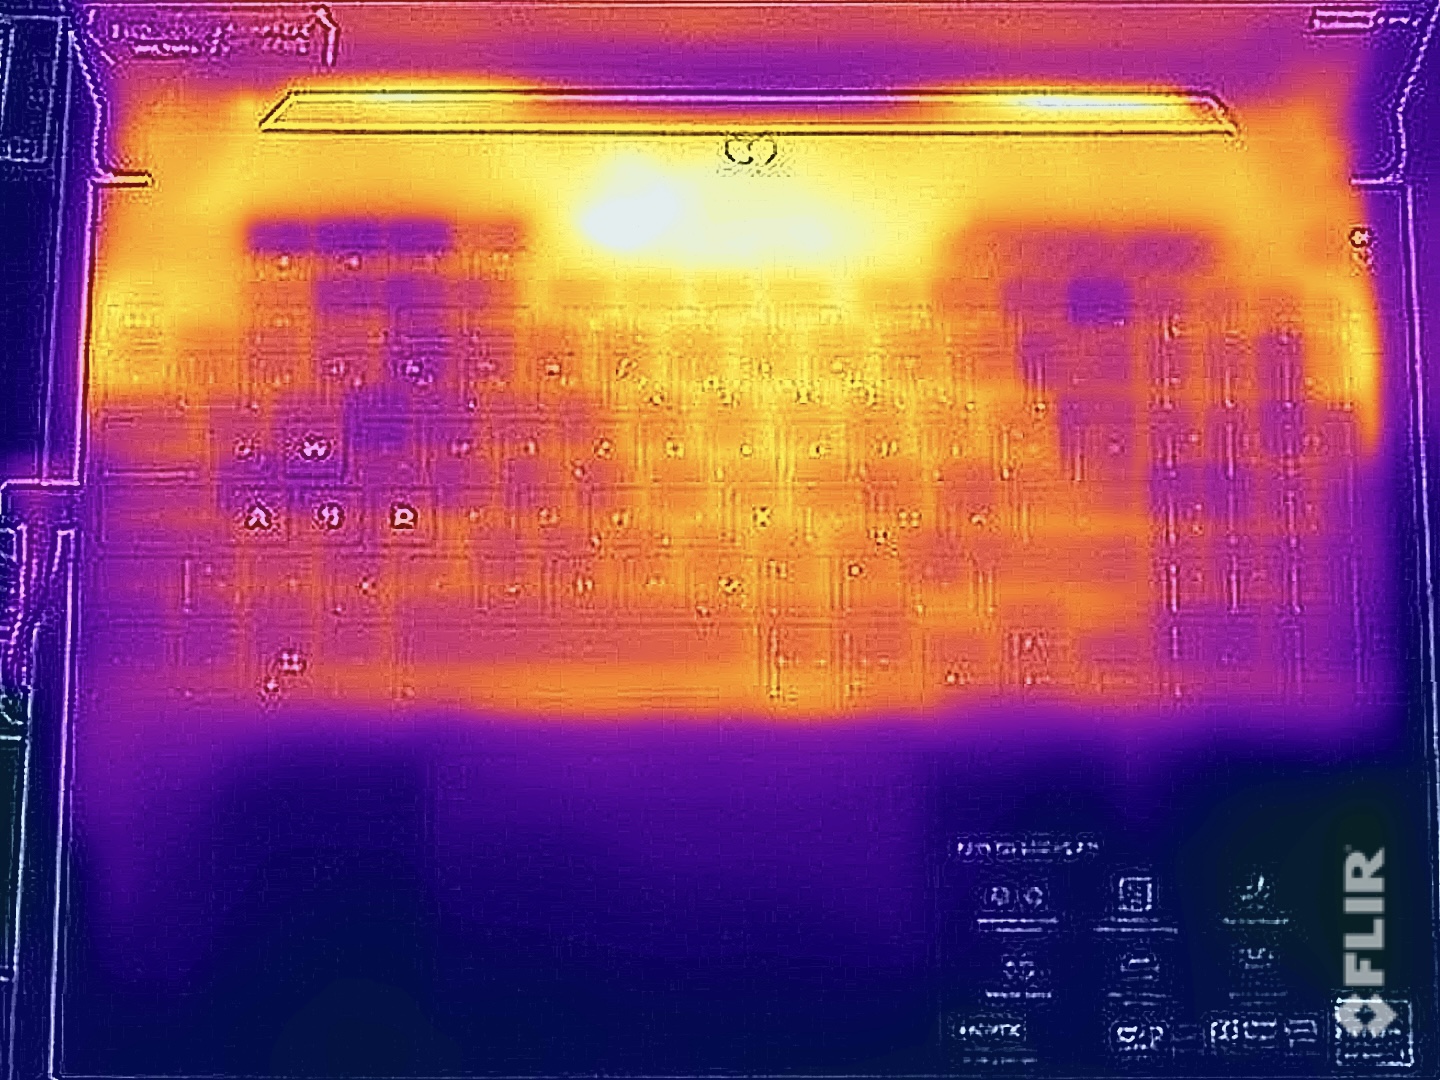
Non ci sono stati problemi di temperatura durante le attività quotidiane e anche sotto carico il portatile Asus ha tenuto sotto controllo le temperature di superficie. L'area centrale superiore dell'unità di base si è riscaldata molto, sfiorando i 50 °C, ma questo punto caldo si trova sopra la tastiera e soprattutto l'area dei tasti WASD è rimasta molto fresca, il che è importante quando si gioca. Sul lato inferiore, abbiamo misurato un massimo di 44 °C nell'area posteriore, e si può anche appoggiare il portatile sulle cosce senza problemi.
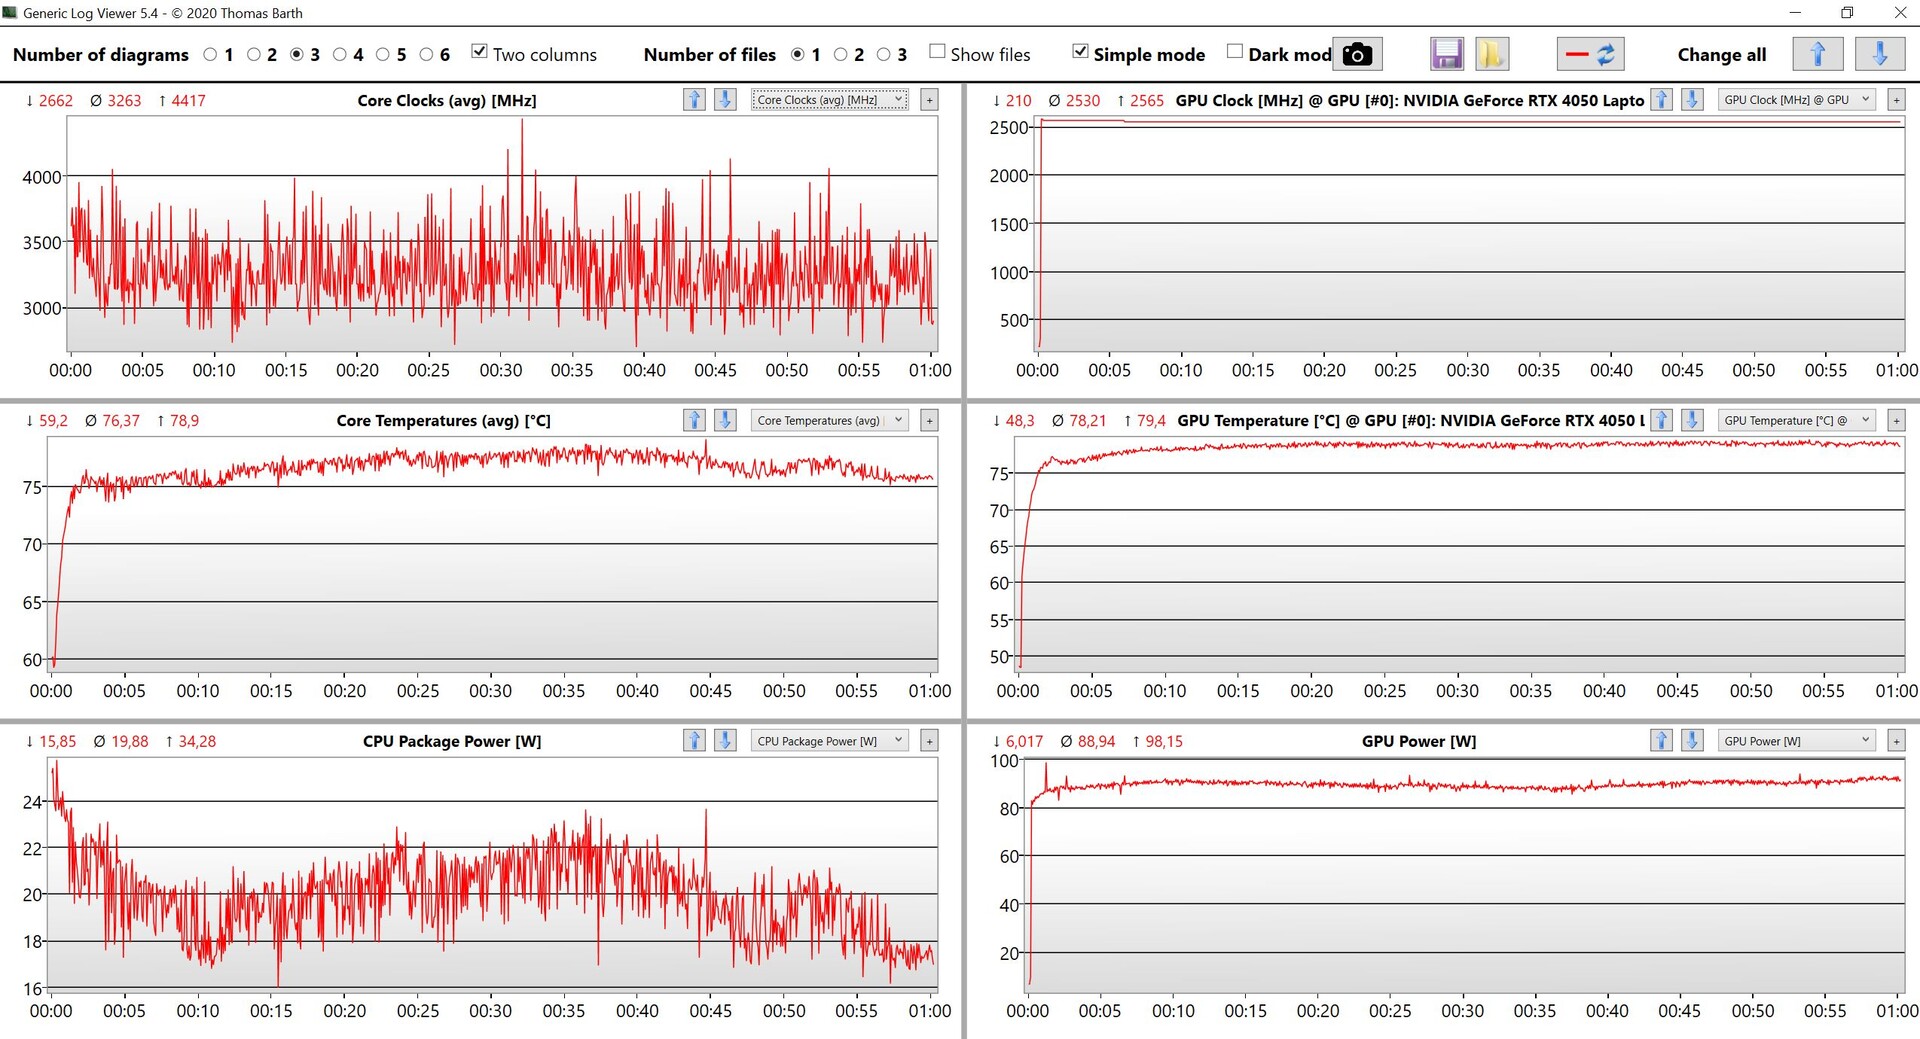
Come previsto, la dGPU è stata favorita durante lo stress test. Nei primi 15 minuti si sono verificate leggere fluttuazioni prima che il processore e la scheda grafica si stabilizzassero rispettivamente a 35 e 80 watt.
(-) La temperatura massima sul lato superiore è di 48.9 °C / 120 F, rispetto alla media di 40.4 °C / 105 F, che varia da 21.2 a 68.8 °C per questa classe Gaming.
(±) Il lato inferiore si riscalda fino ad un massimo di 44.6 °C / 112 F, rispetto alla media di 43.2 °C / 110 F
(+) In idle, la temperatura media del lato superiore è di 26.2 °C / 79 F, rispetto alla media deld ispositivo di 33.9 °C / 93 F.
(±) Riproducendo The Witcher 3, la temperatura media per il lato superiore e' di 36.9 °C / 98 F, rispetto alla media del dispositivo di 33.9 °C / 93 F.
(+) I poggiapolsi e il touchpad sono piu' freddi della temperatura della pelle con un massimo di 30.6 °C / 87.1 F e sono quindi freddi al tatto.
(±) La temperatura media della zona del palmo della mano di dispositivi simili e'stata di 28.8 °C / 83.8 F (-1.8 °C / -3.3 F).
| Asus TUF A15 FA507 AMD Ryzen 7 7735HS, NVIDIA GeForce RTX 4050 Laptop GPU | Gigabyte G5 KE Intel Core i5-12500H, NVIDIA GeForce RTX 3060 Laptop GPU | Schenker XMG Core 15 (M22) AMD Ryzen 7 6800H, NVIDIA GeForce RTX 3060 Laptop GPU | MSI Katana 15 B12VEK Intel Core i7-12650H, NVIDIA GeForce RTX 4050 Laptop GPU | HP Victus 15 fa0020nr Intel Core i7-12700H, NVIDIA GeForce RTX 3050 Ti Laptop GPU | Lenovo IdeaPad Gaming 3 15IAH7 Intel Core i5-12500H, NVIDIA GeForce RTX 3050 Ti Laptop GPU | Asus TUF Gaming F15 FX507ZM Intel Core i7-12700H, NVIDIA GeForce RTX 3060 Laptop GPU | |
|---|---|---|---|---|---|---|---|
| Heat | -25% | -9% | -18% | 20% | 2% | -21% | |
| Maximum Upper Side * (°C) | 48.9 | 52.6 -8% | 48 2% | 47 4% | 37.2 24% | 47 4% | 44.4 9% |
| Maximum Bottom * (°C) | 44.6 | 62.4 -40% | 51 -14% | 48 -8% | 35.4 21% | 52 -17% | 48.8 -9% |
| Idle Upper Side * (°C) | 27.1 | 33.6 -24% | 28 -3% | 35 -29% | 22.4 17% | 25 8% | 37.8 -39% |
| Idle Bottom * (°C) | 27.5 | 34.8 -27% | 33 -20% | 38 -38% | 22.6 18% | 24 13% | 39.6 -44% |
* ... Meglio usare valori piccoli
Altoparlanti
Il TUF Gaming A15 non può certo vantare un audio straordinario e i due altoparlanti stereo sono piuttosto nella media - ma questo è spesso il caso dei portatili da gioco economici. La musica e i film non sono molto divertenti da ascoltare e da guardare - consigliamo comunque di usare le cuffie quando si gioca, perché altrimenti le ventole possono essere fastidiose.
Asus TUF A15 FA507 analisi audio
(±) | potenza degli altiparlanti media ma buona (79.3 dB)
Bassi 100 - 315 Hz
(±) | bassi ridotti - in media 13.7% inferiori alla media
(+) | bassi in lineaa (6.2% delta rispetto alla precedente frequenza)
Medi 400 - 2000 Hz
(±) | medi elevati - circa 7.6% superiore alla media
(±) | linearità dei medi adeguata (7.3% delta rispetto alla precedente frequenza)
Alti 2 - 16 kHz
(+) | Alti bilanciati - appena 2.1% dalla media
(±) | la linearità degli alti è media (7.5% delta rispetto alla precedente frequenza)
Nel complesso 100 - 16.000 Hz
(±) | la linearità complessiva del suono è media (17.2% di differenza rispetto alla media
Rispetto alla stessa classe
» 47% di tutti i dispositivi testati in questa classe è stato migliore, 11% simile, 42% peggiore
» Il migliore ha avuto un delta di 6%, medio di 18%, peggiore di 132%
Rispetto a tutti i dispositivi testati
» 32% di tutti i dispositivi testati in questa classe è stato migliore, 8% similare, 60% peggiore
» Il migliore ha avuto un delta di 4%, medio di 23%, peggiore di 134%
Schenker XMG Core 15 (M22) analisi audio
(±) | potenza degli altiparlanti media ma buona (81.28 dB)
Bassi 100 - 315 Hz
(-) | quasi nessun basso - in media 19.8% inferiori alla media
(+) | bassi in lineaa (6.4% delta rispetto alla precedente frequenza)
Medi 400 - 2000 Hz
(±) | medi elevati - circa 6.2% superiore alla media
(±) | linearità dei medi adeguata (7.9% delta rispetto alla precedente frequenza)
Alti 2 - 16 kHz
(+) | Alti bilanciati - appena 1.8% dalla media
(+) | alti lineari (4.8% delta rispetto alla precedente frequenza)
Nel complesso 100 - 16.000 Hz
(±) | la linearità complessiva del suono è media (17.1% di differenza rispetto alla media
Rispetto alla stessa classe
» 46% di tutti i dispositivi testati in questa classe è stato migliore, 12% simile, 43% peggiore
» Il migliore ha avuto un delta di 6%, medio di 18%, peggiore di 132%
Rispetto a tutti i dispositivi testati
» 31% di tutti i dispositivi testati in questa classe è stato migliore, 8% similare, 61% peggiore
» Il migliore ha avuto un delta di 4%, medio di 23%, peggiore di 134%
Gestione dell'energia - Lunga autonomia grazie alla batteria di grandi dimensioni
Consumo di energia
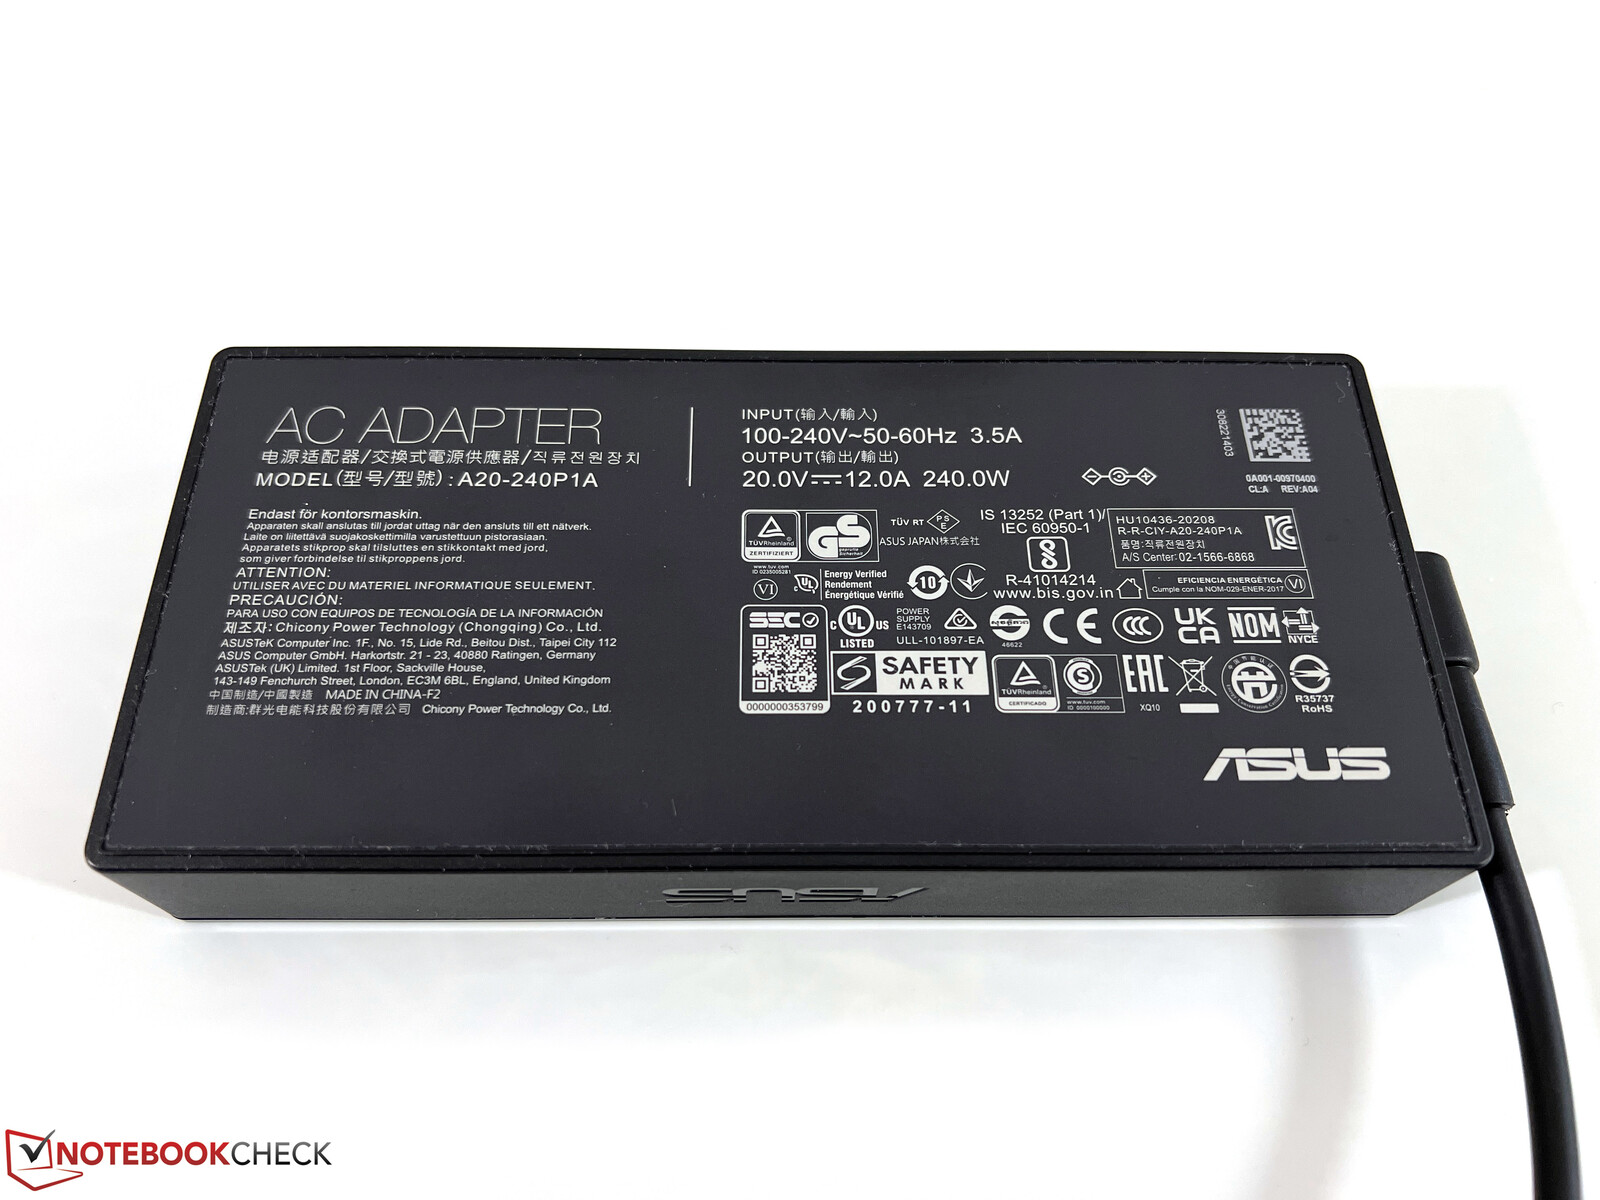
Nelle nostre misurazioni dei consumi, l'esemplare in esame è rimasto molto parsimonioso e anche durante i giochi, l'A15 è rimasto molto più efficiente dei portatili RTX-3060, che non offrono nemmeno molta più potenza. Abbiamo determinato un massimo di 185 watt nello stress test, che poi si è rapidamente assestato a circa 155 watt. Alla luce di queste percentuali, l'alimentatore da 240 watt in dotazione è quasi sovradimensionato per la variante base e il modulo più compatto da 200 watt dell'attualeZenbook Pro 14 sarebbe stato perfettamente sufficiente.
| Off / Standby | |
| Idle | |
| Sotto carico |
|
Leggenda:
min: | |
| Asus TUF A15 FA507 R7 7735HS, GeForce RTX 4050 Laptop GPU, Micron 2400 MTFDKBA512QFM, IPS, 1920x1080, 15.6" | Gigabyte G5 KE i5-12500H, GeForce RTX 3060 Laptop GPU, Gigabyte AG4512G-SI B10, IPS, 1920x1080, 15.6" | Schenker XMG Core 15 (M22) R7 6800H, GeForce RTX 3060 Laptop GPU, Samsung SSD 980 Pro 1TB MZ-V8P1T0BW, IPS, 2560x1440, 15.6" | MSI Katana 15 B12VEK i7-12650H, GeForce RTX 4050 Laptop GPU, Micron 2400 MTFDKBA1T0QFM, IPS, 1920x1080, 15.6" | HP Victus 15 fa0020nr i7-12700H, GeForce RTX 3050 Ti Laptop GPU, Samsung PM9A1 MZVL2512HCJQ, IPS, 1920x1080, 15.6" | Lenovo IdeaPad Gaming 3 15IAH7 i5-12500H, GeForce RTX 3050 Ti Laptop GPU, Intel SSD 660p SSDPEKNW512G8, IPS, 1920x1080, 15.6" | Asus TUF Gaming F15 FX507ZM i7-12700H, GeForce RTX 3060 Laptop GPU, SK Hynix HFM001TD3JX013N, IPS, 1920x1080, 15.6" | Media NVIDIA GeForce RTX 4050 Laptop GPU | Media della classe Gaming | |
|---|---|---|---|---|---|---|---|---|---|
| Power Consumption | -19% | -31% | 2% | -11% | -7% | -30% | -26% | -61% | |
| Idle Minimum * (Watt) | 8 | 7.66 4% | 11.8 -48% | 8.5 -6% | 5.1 36% | 8 -0% | 6.3 21% | 9.95 ? -24% | 13 ? -63% |
| Idle Average * (Watt) | 12.1 | 10.3 15% | 14.7 -21% | 10.2 16% | 15.1 -25% | 10 17% | 9.8 19% | 15.8 ? -31% | 19 ? -57% |
| Idle Maximum * (Watt) | 12.5 | 16.05 -28% | 15 -20% | 11.3 10% | 18.9 -51% | 16 -28% | 26.5 -112% | 20.1 ? -61% | 24.6 ? -97% |
| Load Average * (Watt) | 74.9 | 115.8 -55% | 100 -34% | 84 -12% | 114.5 -53% | 99 -32% | 103.8 -39% | 88 ? -17% | 110.7 ? -48% |
| Witcher 3 ultra * (Watt) | 136.6 | 168.7 -23% | 184 -35% | 128 6% | 113.9 17% | 144.6 -6% | 189 -38% | ||
| Load Maximum * (Watt) | 185 | 234.6 -27% | 237 -28% | 189 -2% | 165.8 10% | 168 9% | 241.9 -31% | 176.3 ? 5% | 259 ? -40% |
* ... Meglio usare valori piccoli
power consumption Witcher 3 / stress test
power consumption with external monitor
Tempi di esecuzione
La batteria da 90 Wh del portatile garantisce un'ottima autonomia. A parte qualche minuto, nei nostri test non ha fatto differenza se il display era in modalità 60 Hz o 144 Hz. Nel test WLAN a 150 cd/m² (che corrisponde al 73% della luminosità massima), abbiamo registrato poco più di 11,5 ore e alla massima luminosità ancora un po' più di 9,5 ore. Nel test video a 150 cd/m², abbiamo misurato più di 12,5 ore. Un processo di ricarica completo richiede 106 minuti all'accensione del dispositivo. La curva di carica si stabilizza solo al 70%, ovvero dopo circa 44 minuti.
| Asus TUF A15 FA507 R7 7735HS, GeForce RTX 4050 Laptop GPU, 90 Wh | Gigabyte G5 KE i5-12500H, GeForce RTX 3060 Laptop GPU, 54 Wh | Schenker XMG Core 15 (M22) R7 6800H, GeForce RTX 3060 Laptop GPU, 62 Wh | MSI Katana 15 B12VEK i7-12650H, GeForce RTX 4050 Laptop GPU, 53.5 Wh | HP Victus 15 fa0020nr i7-12700H, GeForce RTX 3050 Ti Laptop GPU, 70 Wh | Lenovo IdeaPad Gaming 3 15IAH7 i5-12500H, GeForce RTX 3050 Ti Laptop GPU, 60 Wh | Asus TUF Gaming F15 FX507ZM i7-12700H, GeForce RTX 3060 Laptop GPU, 90 Wh | Media della classe Gaming | |
|---|---|---|---|---|---|---|---|---|
| Autonomia della batteria | -44% | -12% | -26% | -36% | -50% | -25% | -7% | |
| H.264 (h) | 12.5 | 2.2 -82% | 4.4 -65% | 8.32 ? -33% | ||||
| WiFi v1.3 (h) | 11.7 | 5.7 -51% | 7.8 -33% | 4.3 -63% | 2.1 -82% | 5.9 -50% | 4.8 -59% | 7.11 ? -39% |
| Load (h) | 1 | 1 0% | 1.1 10% | 1.5 50% | 1.1 10% | 1.1 10% | 1.502 ? 50% | |
| Witcher 3 ultra (h) | 1.3 | |||||||
| Reader / Idle (h) | 2.6 | 15.8 | 8.27 ? |
Pro
Contro
Verdetto - Un buon portatile per i giochi a 1080p
Con il rilascio del TUF Gaming A15, Asos si è concentrata sull'essenziale: le prestazioni di gioco. La nostra versione base, che può essere acquistata per circa 1.169 dollari, offriva già una potenza sufficiente per giocare ai giochi attuali in modo fluido con una risoluzione nativa di 1080p e con il massimo dei dettagli, grazie alla nuovaNvidia GeForce RTX 4050 Laptop. Se si utilizza l'upscaling, si può persino eseguire il ray tracing. Il suo processore Zen3+ è un vecchio amico, ma riesce comunque a offrire prestazioni solide. La RAM e l'SSD possono essere espansi, anche se 16 GB e 512 GB dovrebbero andare bene per iniziare.
La qualità del case del portatile è buona; non presenta alcun tipo di illuminazione di fantasia (il che non è necessariamente un male). Le etichette sulla tastiera hanno un contrasto un po' basso e spesso bisogna affidarsi alla retroilluminazione per poterle vedere chiaramente. Tuttavia, la tastiera riesce a rimanere bella fresca mentre si gioca e le ventole non sono troppo rumorose.
La versione base del nuovo Asus TUF Gaming A15 è un buon portatile da gioco e la sua RTX 4050 Laptop offre prestazioni sufficienti per il display a 1080p.
Lo schermo fa quello che deve fare. Il suo pannello IPS opaco 16:9 ha una frequenza di aggiornamento di 144 Hz e una buona precisione dei colori, ma i tempi di reazione e la luminosità potrebbero essere leggermente migliori. Per quest'ultima abbiamo misurato 300 cd/m². Le opzioni di connettività includono anche USB 4.0 e la possibilità di collegare un monitor G-Sync. L'unico problema è che quasi tutte le porte del portatile si trovano nella parte anteriore sinistra e centrale del dispositivo.
Il portatile non ha evidenziato alcun punto debole, ma bisogna tenere presente che la versione base viene fornita senza sistema operativo installato. In molte aree il dispositivo offre caratteristiche standard (WLAN, altoparlanti, webcam), ma in tutte le aree principali le sue prestazioni sono soddisfacenti. Anche il prezzo di circa 1.169 dollari è abbastanza competitivo.
Prezzo e disponibilità
Il dispositivo che abbiamo testato può essere acquistato a circa 1.169 dollari su Amazon.
Asus TUF A15 FA507
- 06/13/2023 v7 (old)
Andreas Osthoff
Transparency
La selezione dei dispositivi da recensire viene effettuata dalla nostra redazione. Il campione di prova è stato fornito all'autore come prestito dal produttore o dal rivenditore ai fini di questa recensione. L'istituto di credito non ha avuto alcuna influenza su questa recensione, né il produttore ne ha ricevuto una copia prima della pubblicazione. Non vi era alcun obbligo di pubblicare questa recensione. In quanto società mediatica indipendente, Notebookcheck non è soggetta all'autorità di produttori, rivenditori o editori.
Ecco come Notebookcheck esegue i test
Ogni anno, Notebookcheck esamina in modo indipendente centinaia di laptop e smartphone utilizzando procedure standardizzate per garantire che tutti i risultati siano comparabili. Da circa 20 anni sviluppiamo continuamente i nostri metodi di prova e nel frattempo stabiliamo gli standard di settore. Nei nostri laboratori di prova, tecnici ed editori esperti utilizzano apparecchiature di misurazione di alta qualità. Questi test comportano un processo di validazione in più fasi. Il nostro complesso sistema di valutazione si basa su centinaia di misurazioni e parametri di riferimento ben fondati, che mantengono l'obiettività.Price comparison

