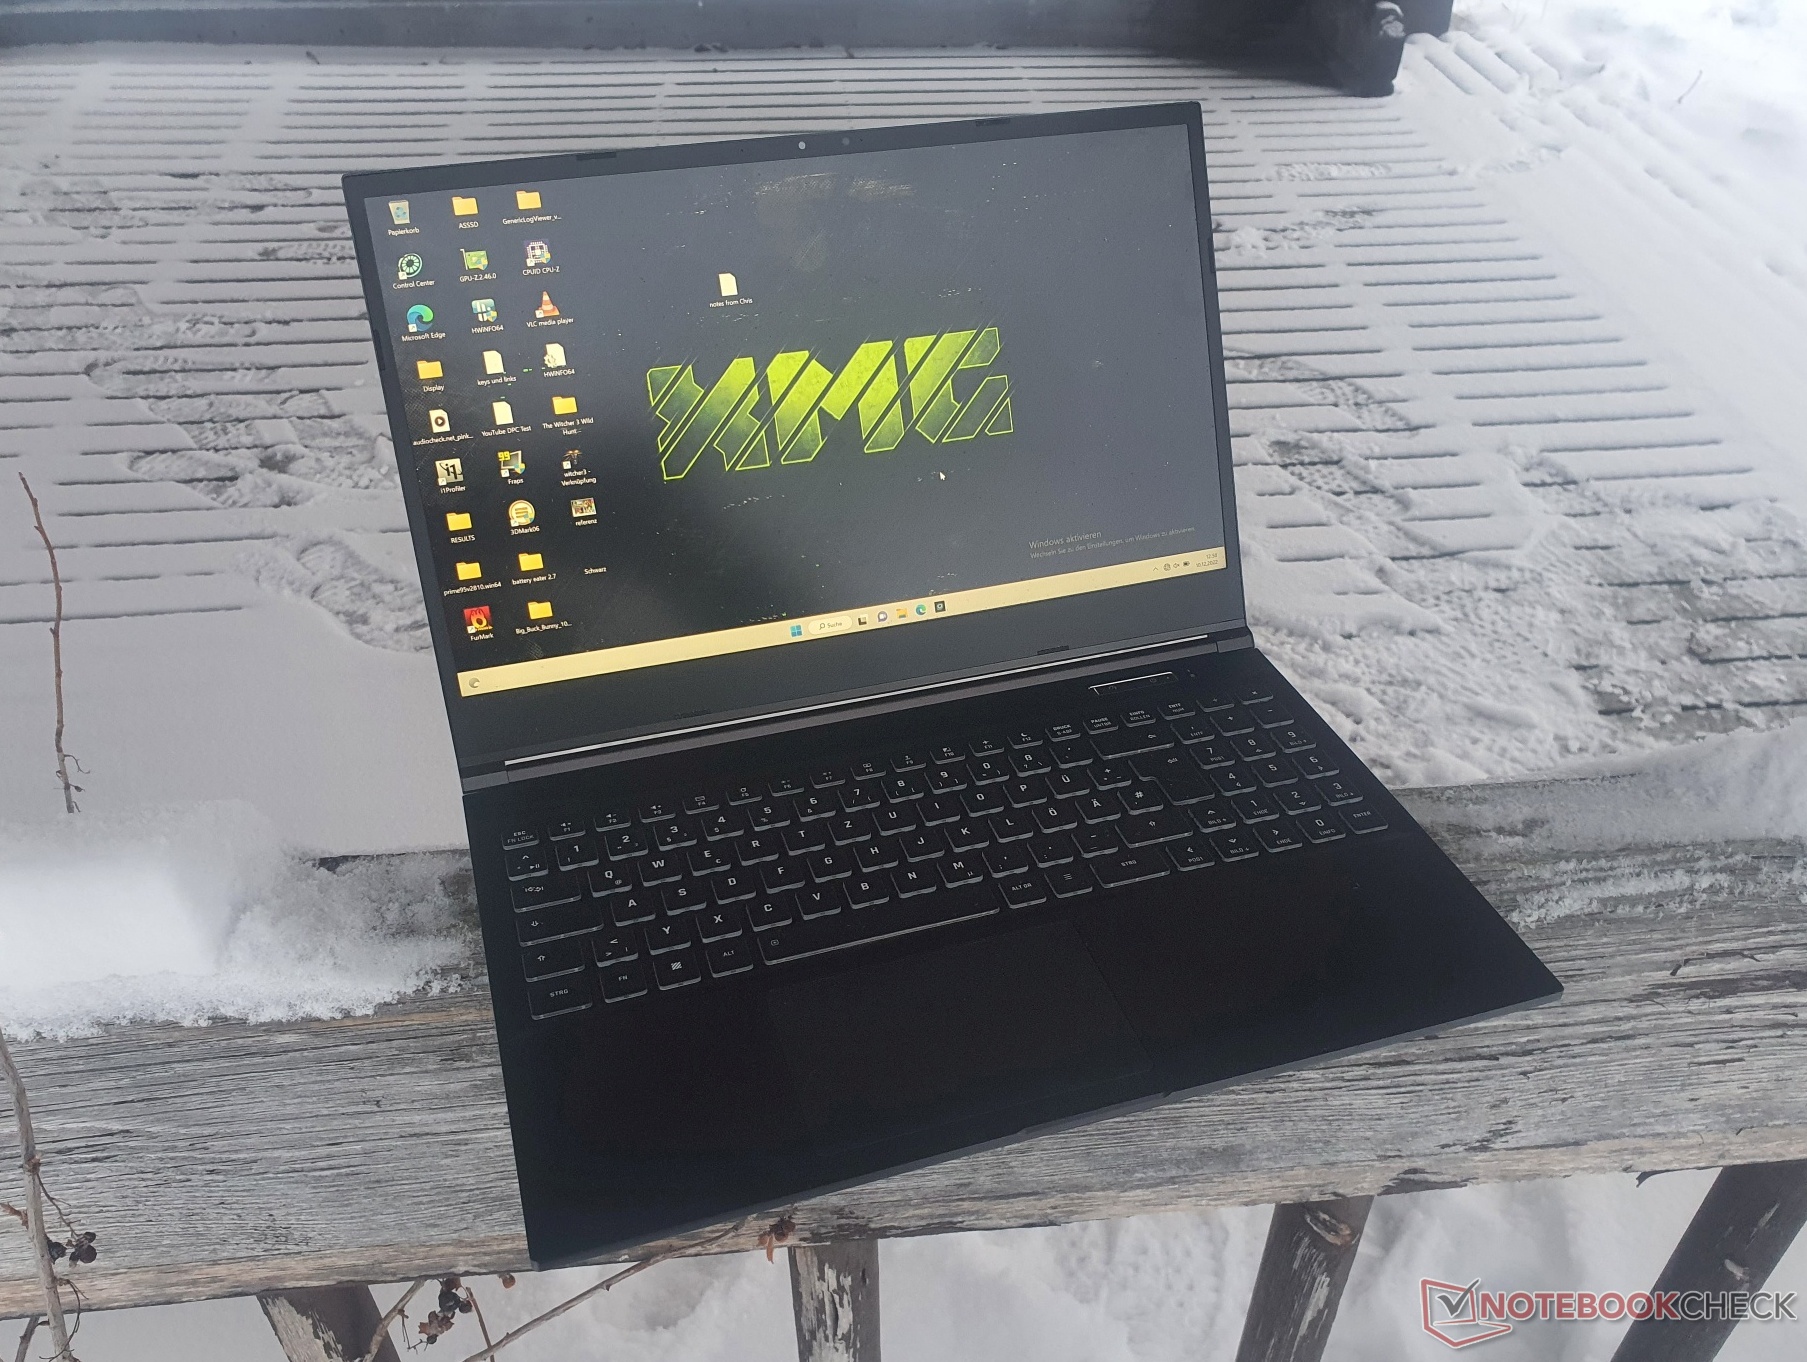
Recensione dello Schenker XMG Core 15 M22: dispositivo gaming di fascia media
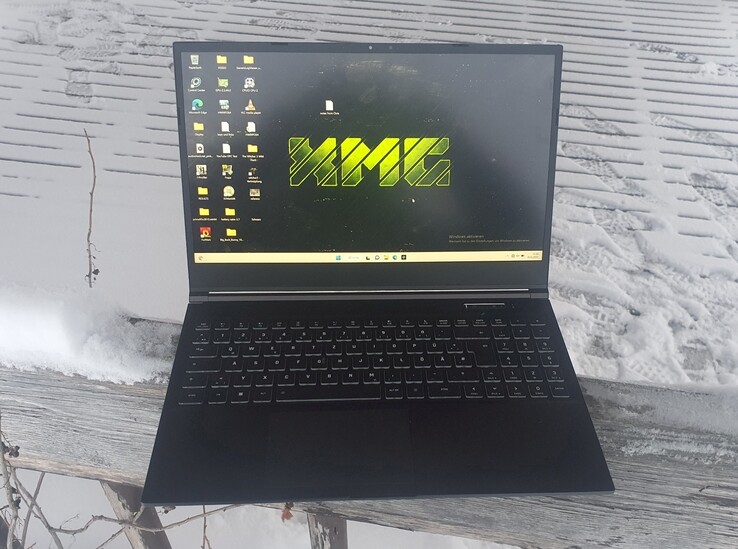
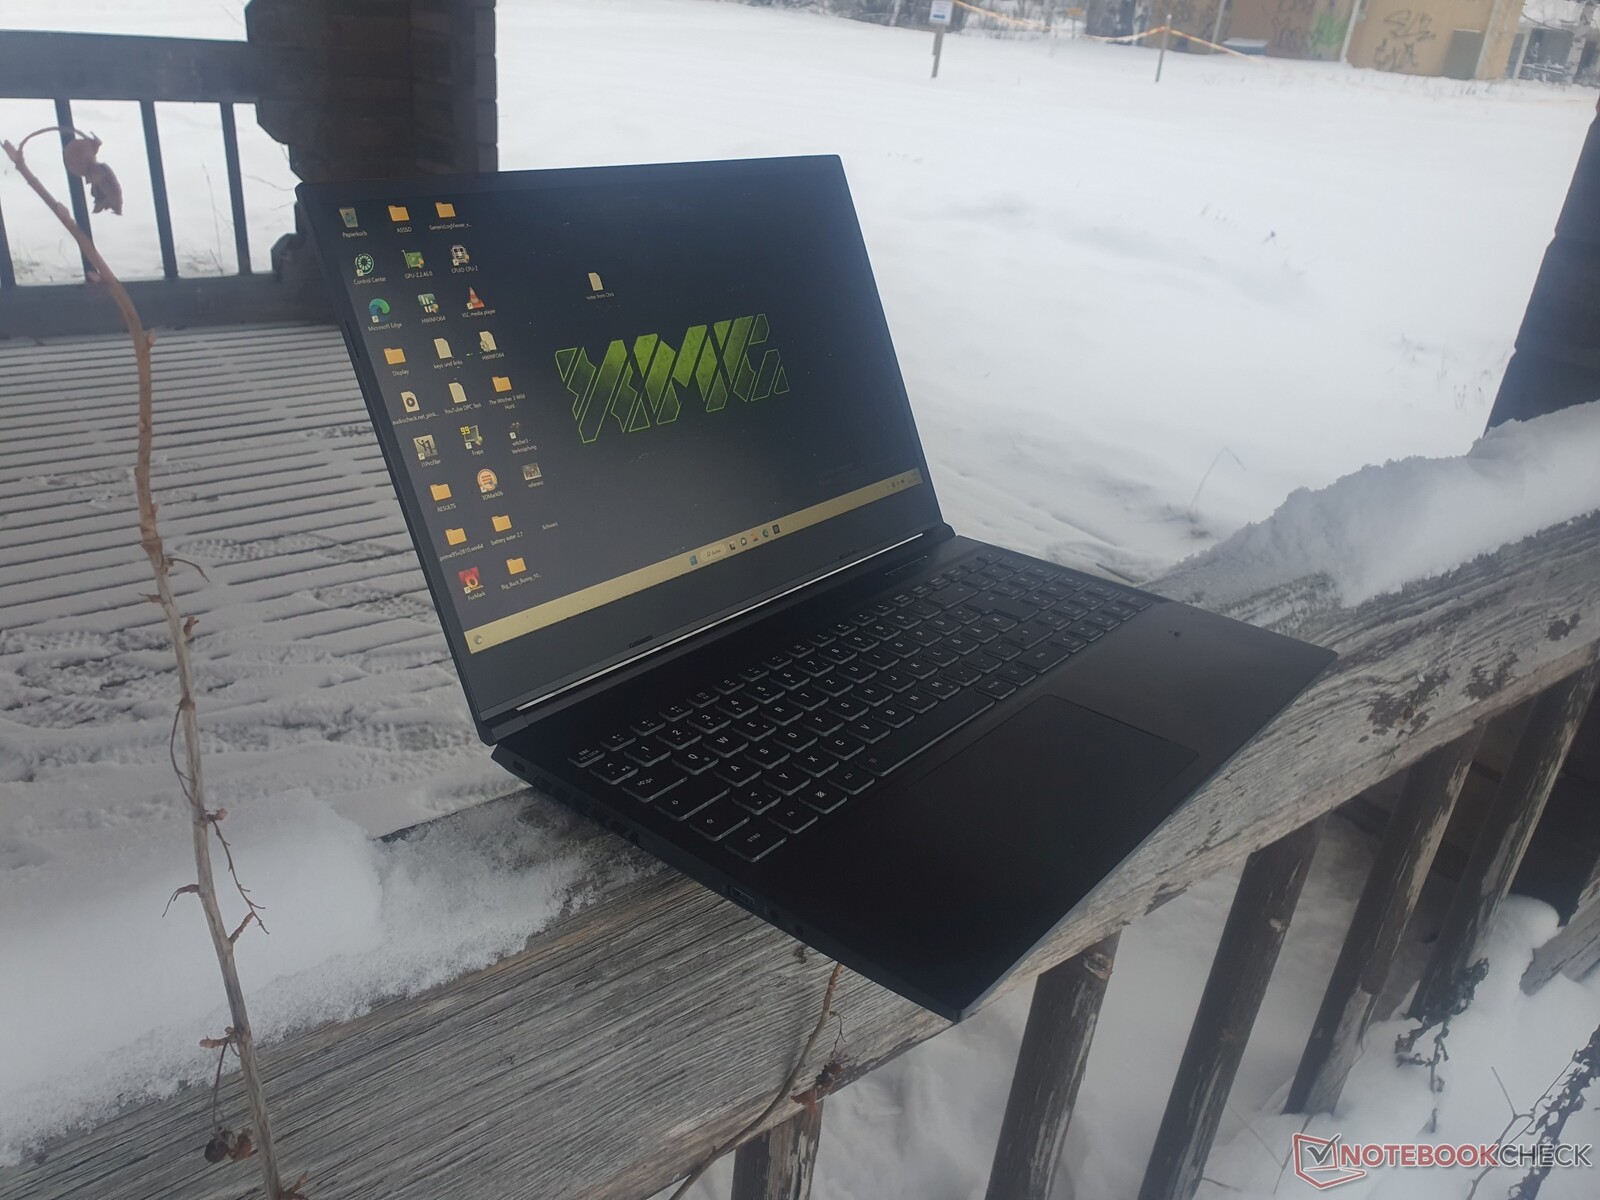
Con l'XMG Core 15 (M22), Schenker si è posta l'obiettivo di fornire un portatile da gioco di fascia medio-alta. Non solo offre il TGP massimo di 140 W della scheda Nvidia GeForce RTX 3060 incluso lo switch MUX, ma anche un veloce AMD Ryzen 7 6800H.
Si ottiene un pannello WQHD veloce a 165 Hz e il supporto di un raffreddamento ad acqua esterno, che altrimenti viene utilizzato solo nella classe superiore assoluta di Schenker, come abbiamo visto ad esempio nell' XMG Neo 15che abbiamo già testato in dettaglio. Tutto questo è disponibile per 1.817 Euro (~$1935). Il Core 15 si colloca tra Apex 15 e Neo 15.
C'è molta concorrenza nel segmento di fascia media, come ad esempio il modelloTUF Gaming F15, il modello Lenovo Legion 5e l' Alienware m15. Anche il Fusion 15 di XMG è interessante per il nostro confronto.
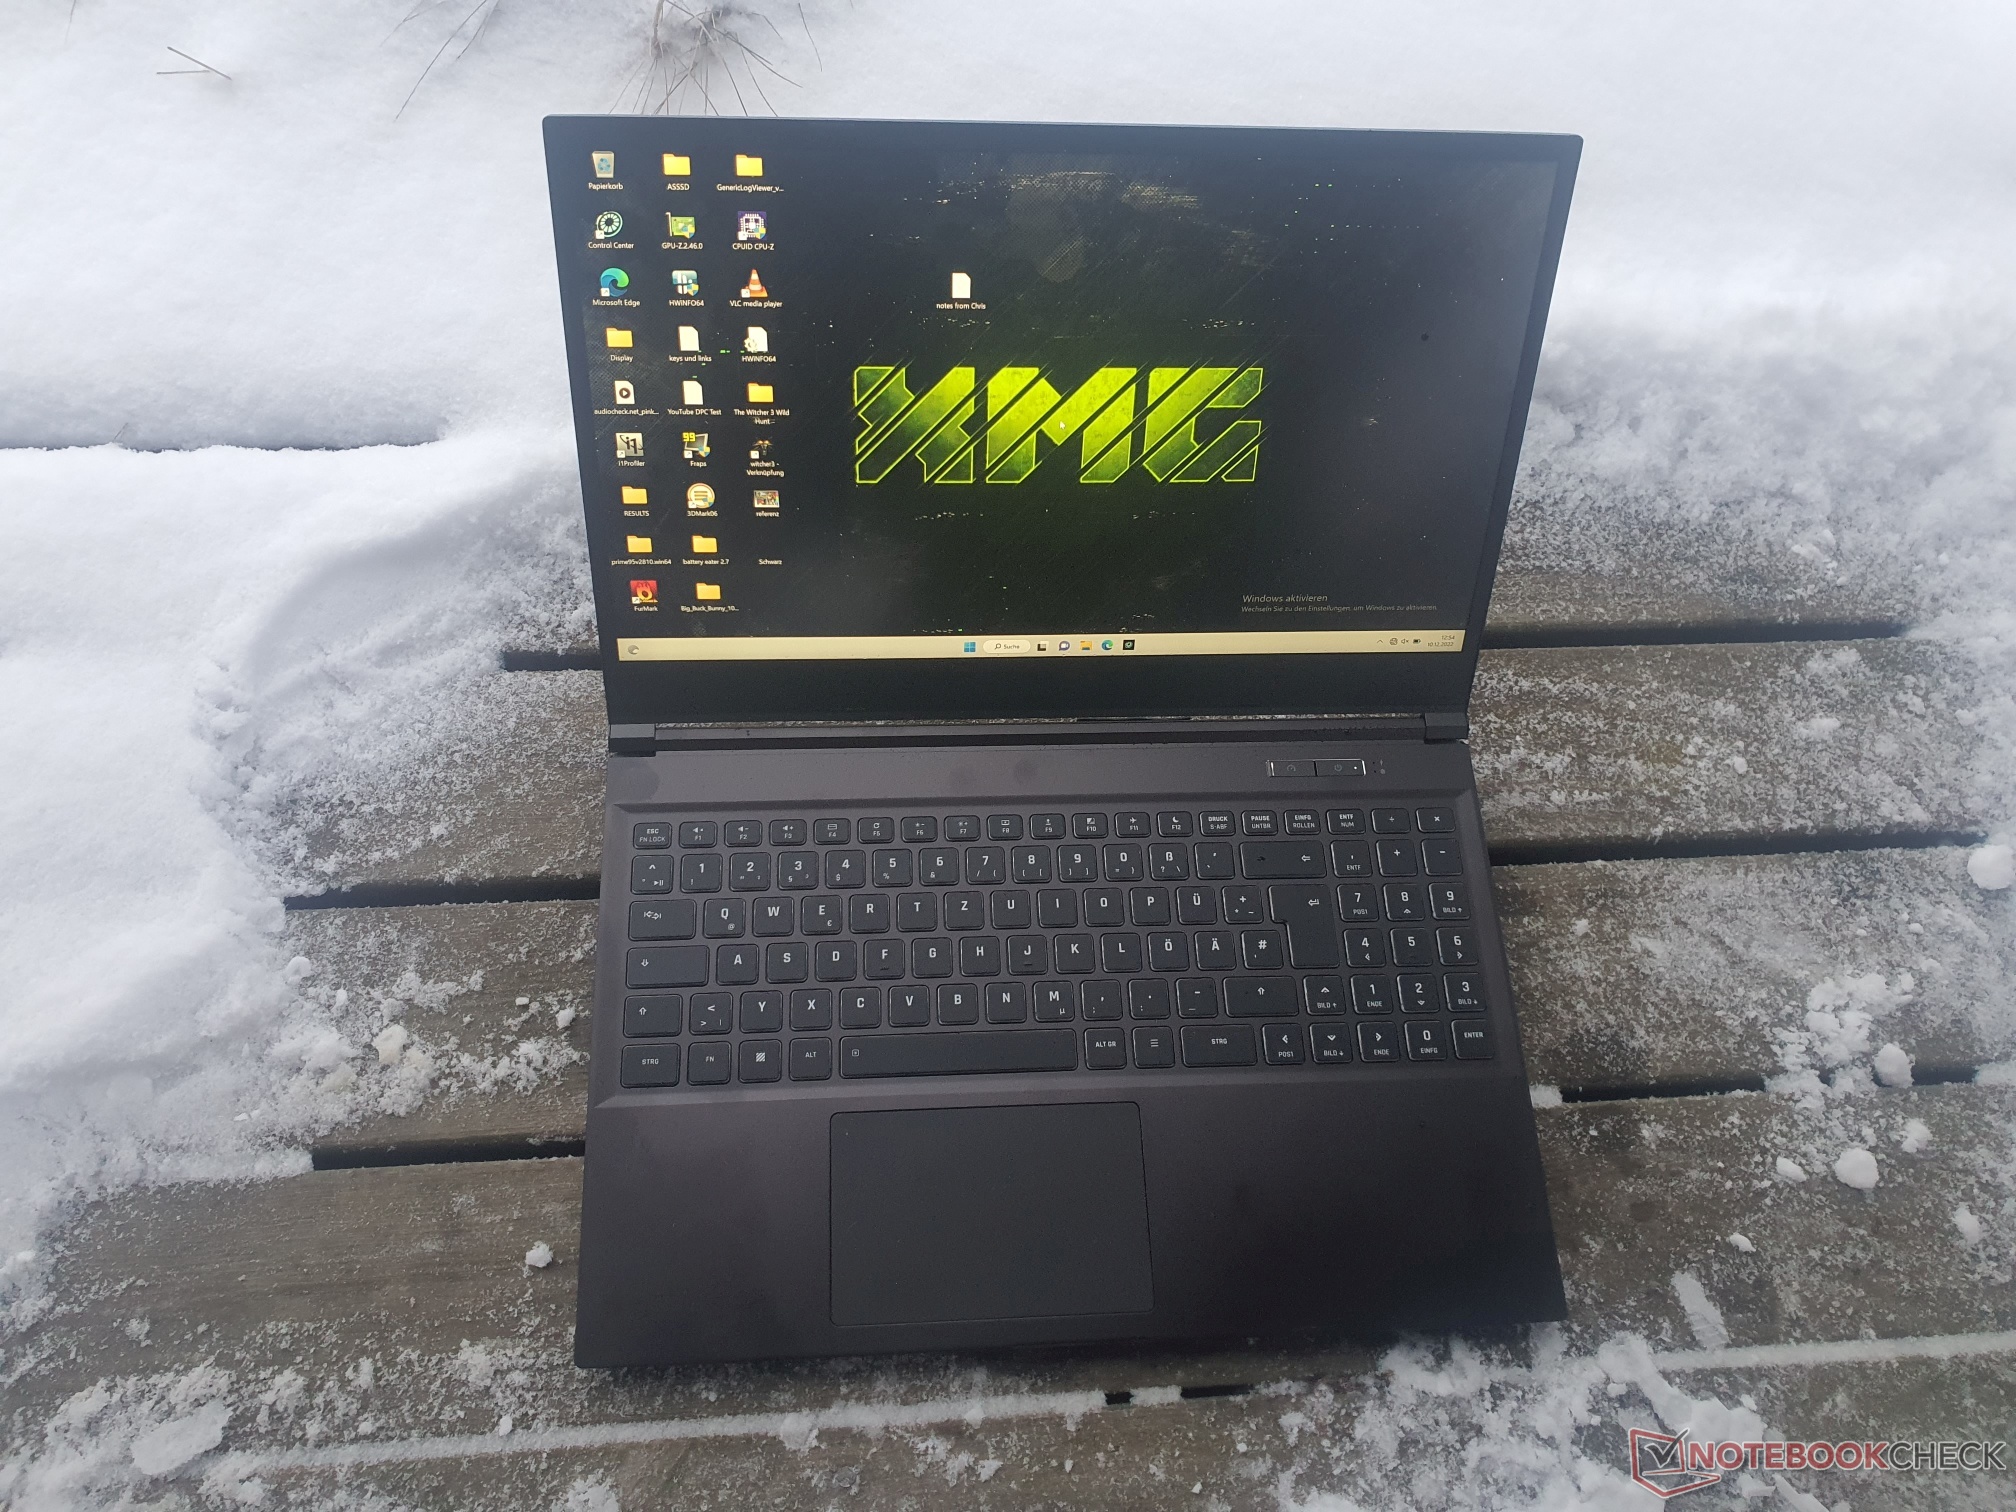
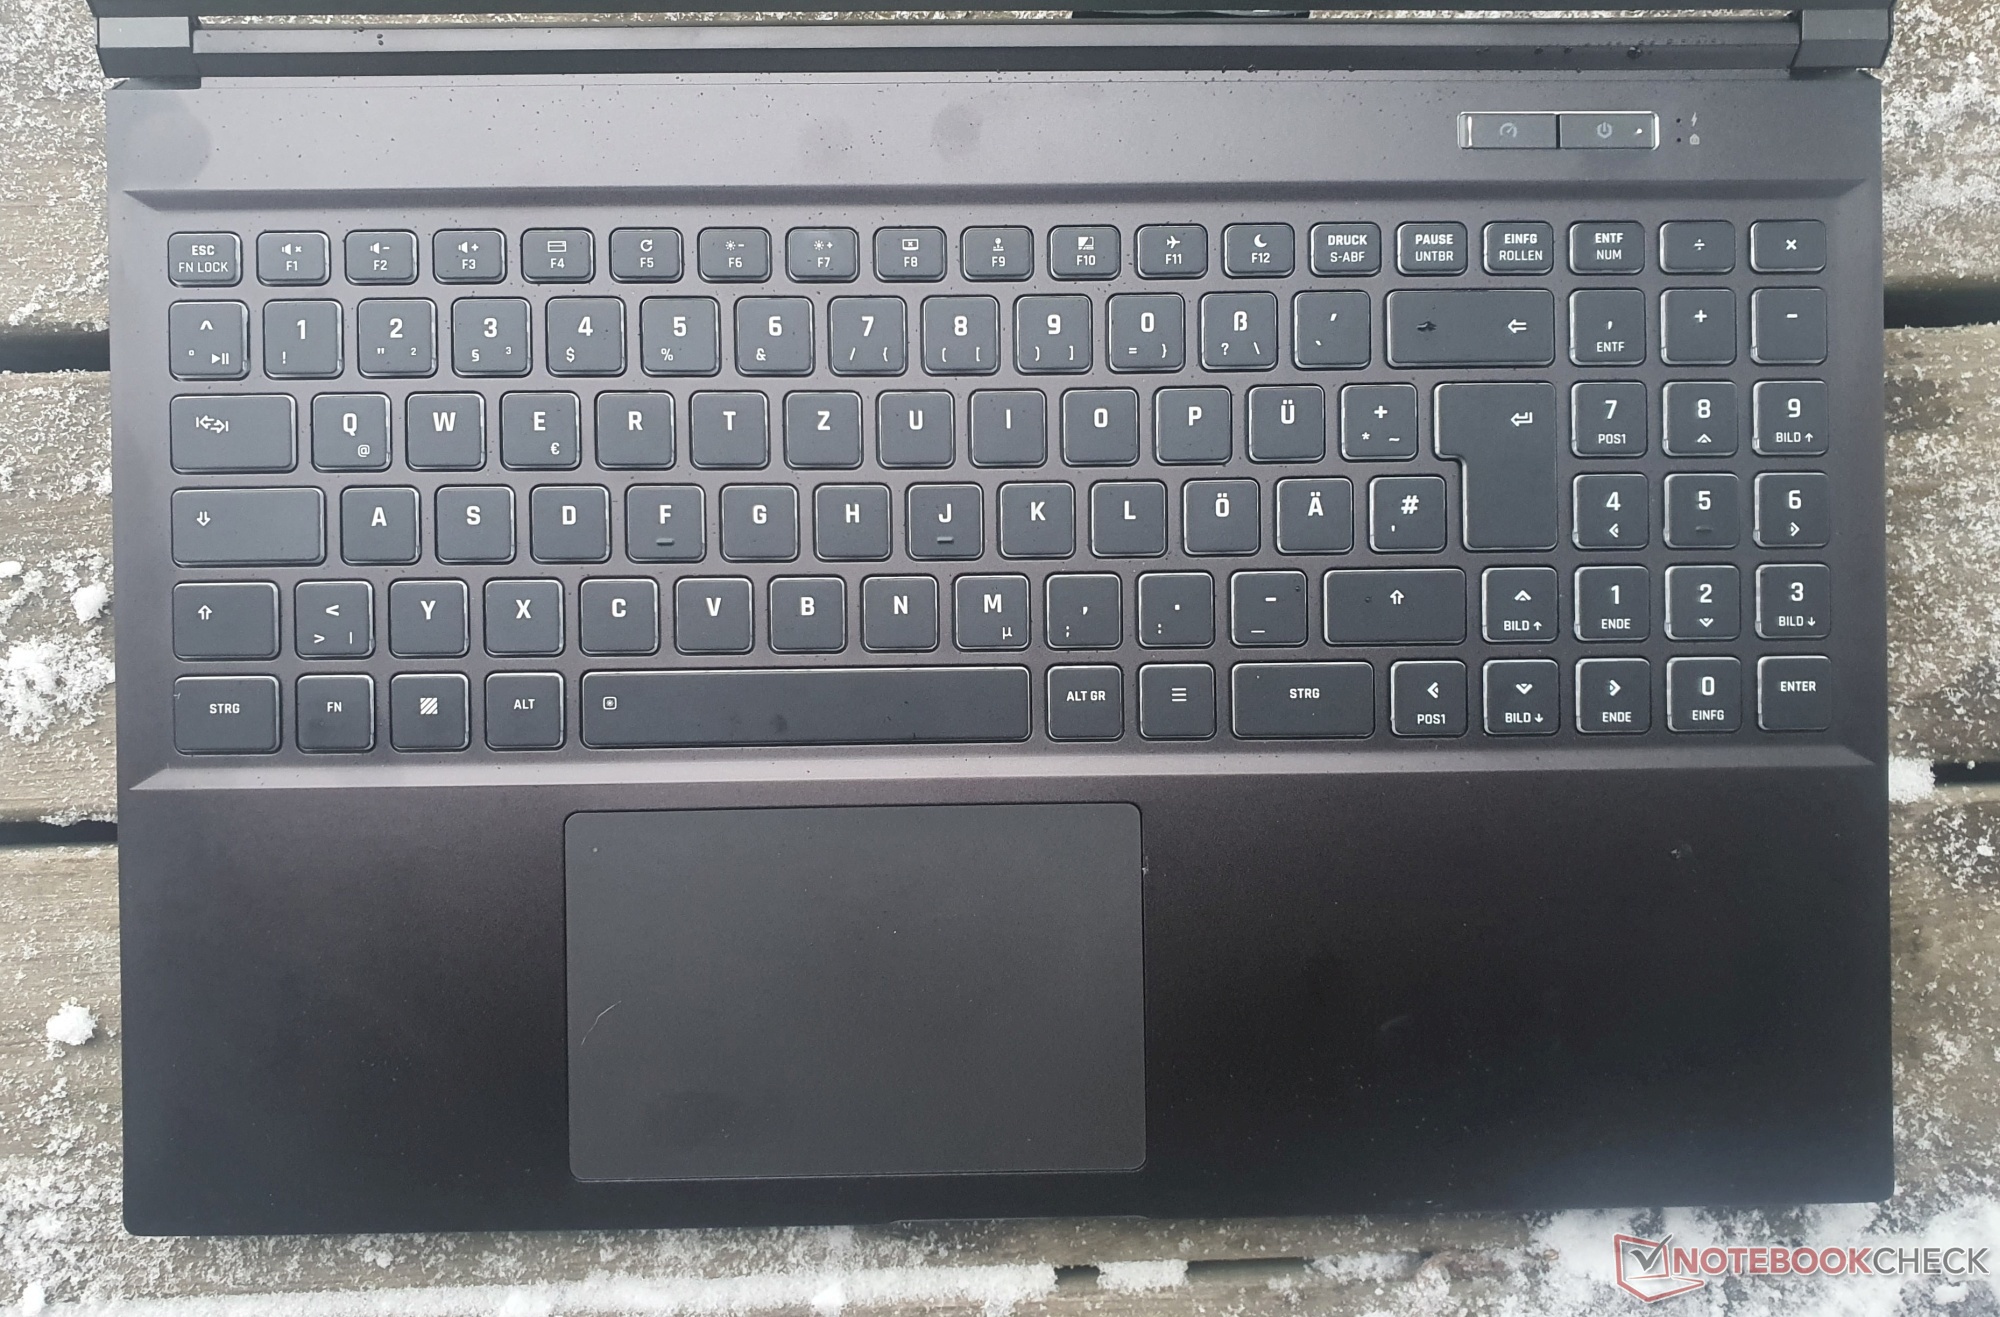
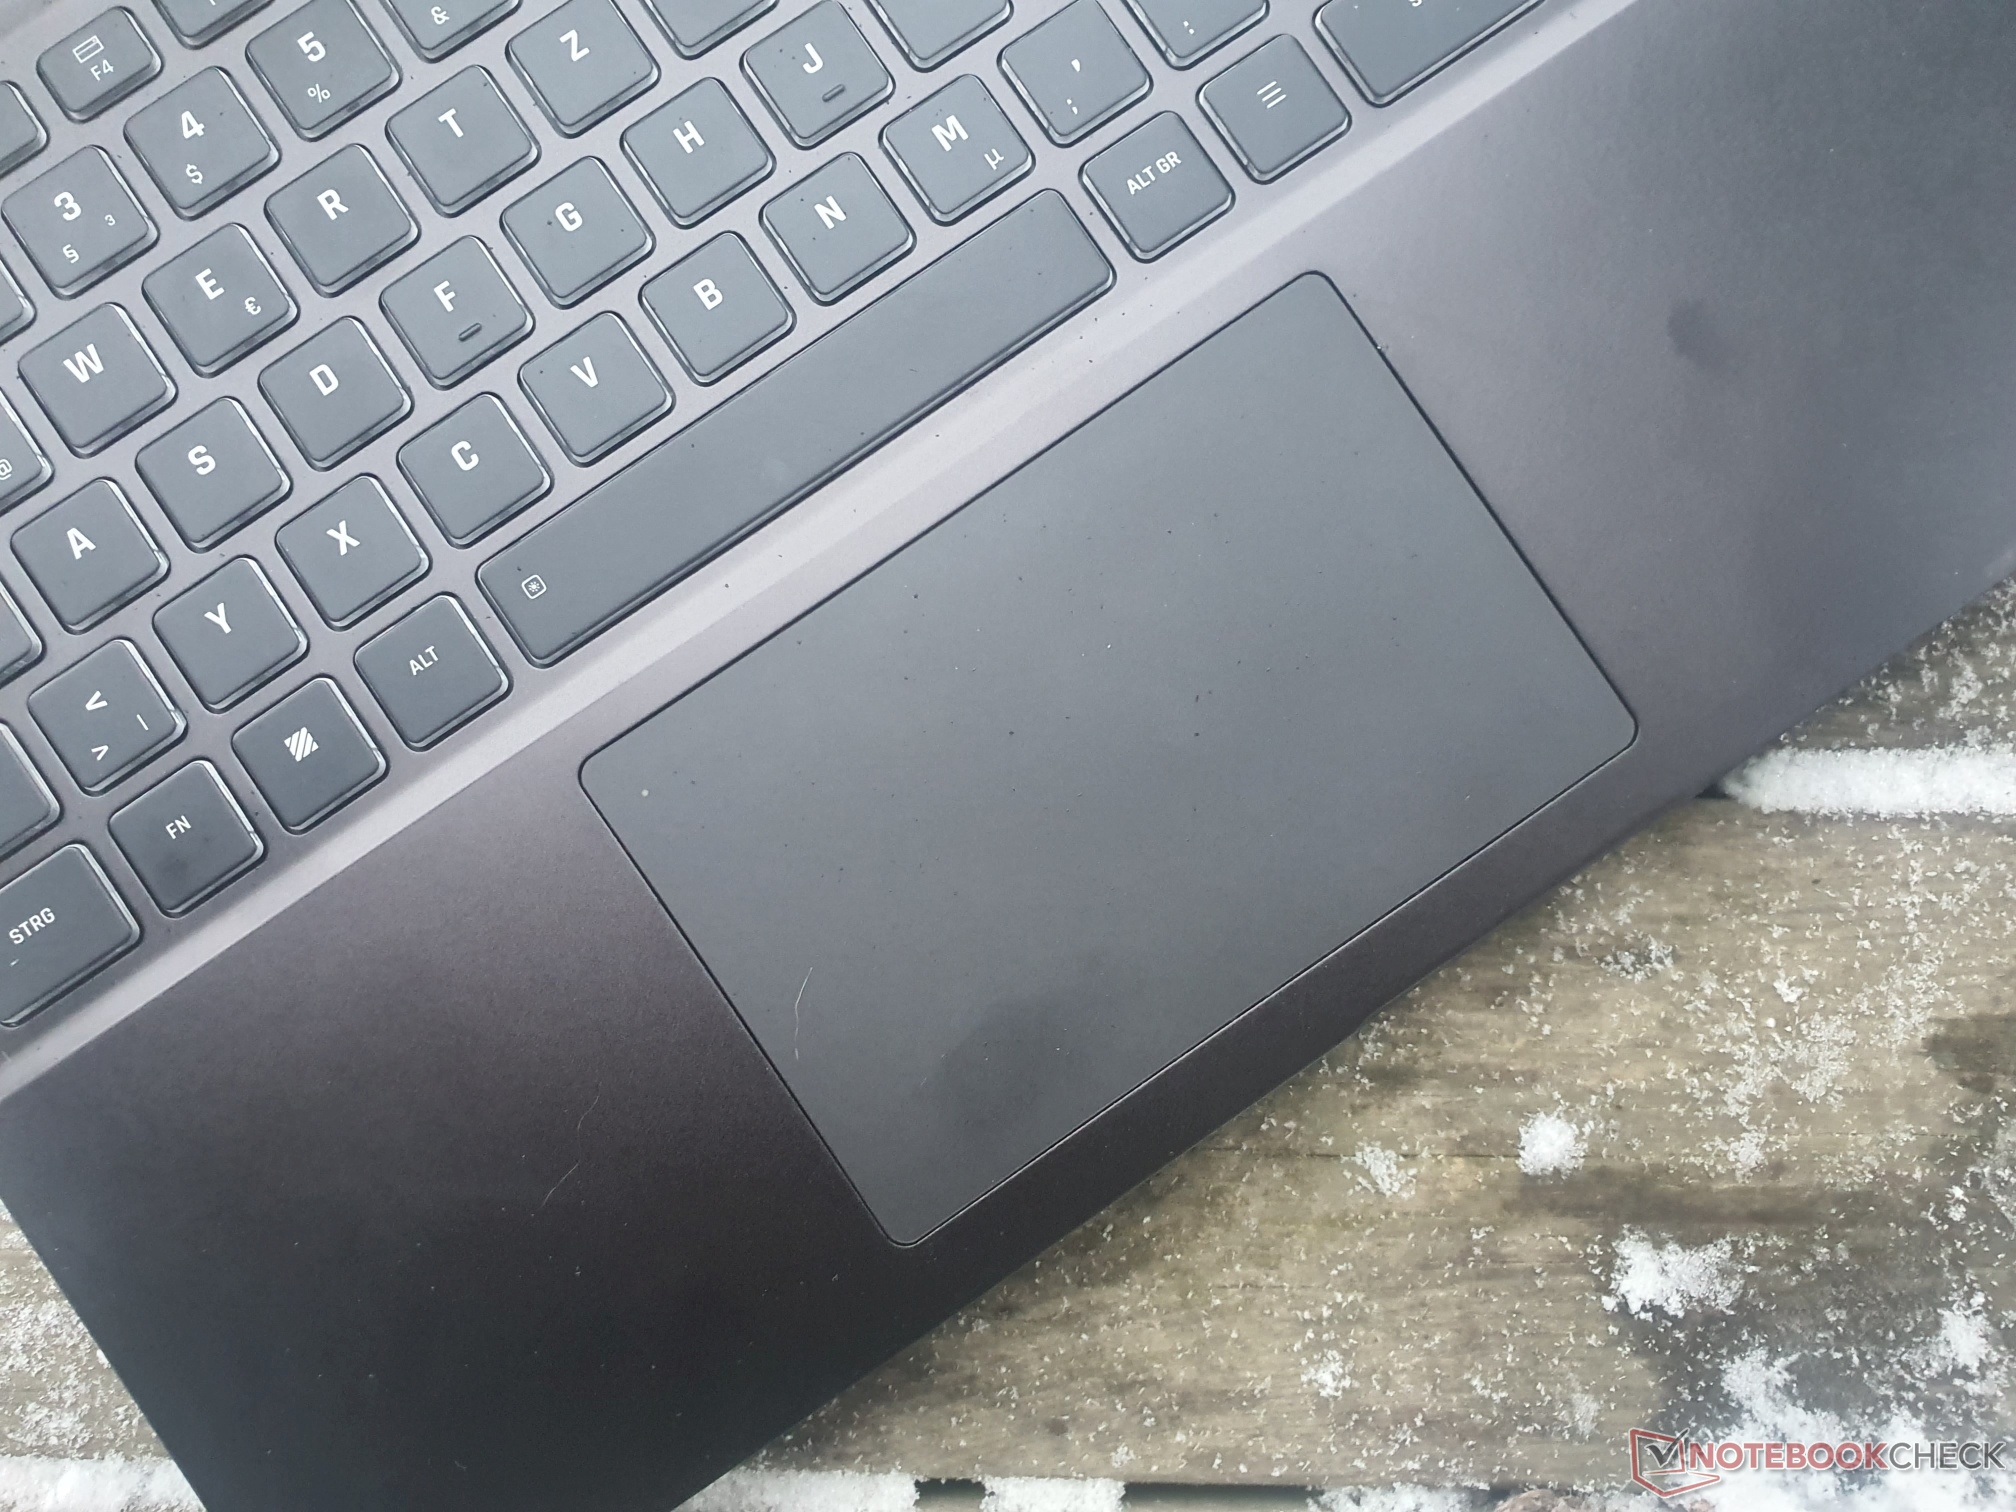
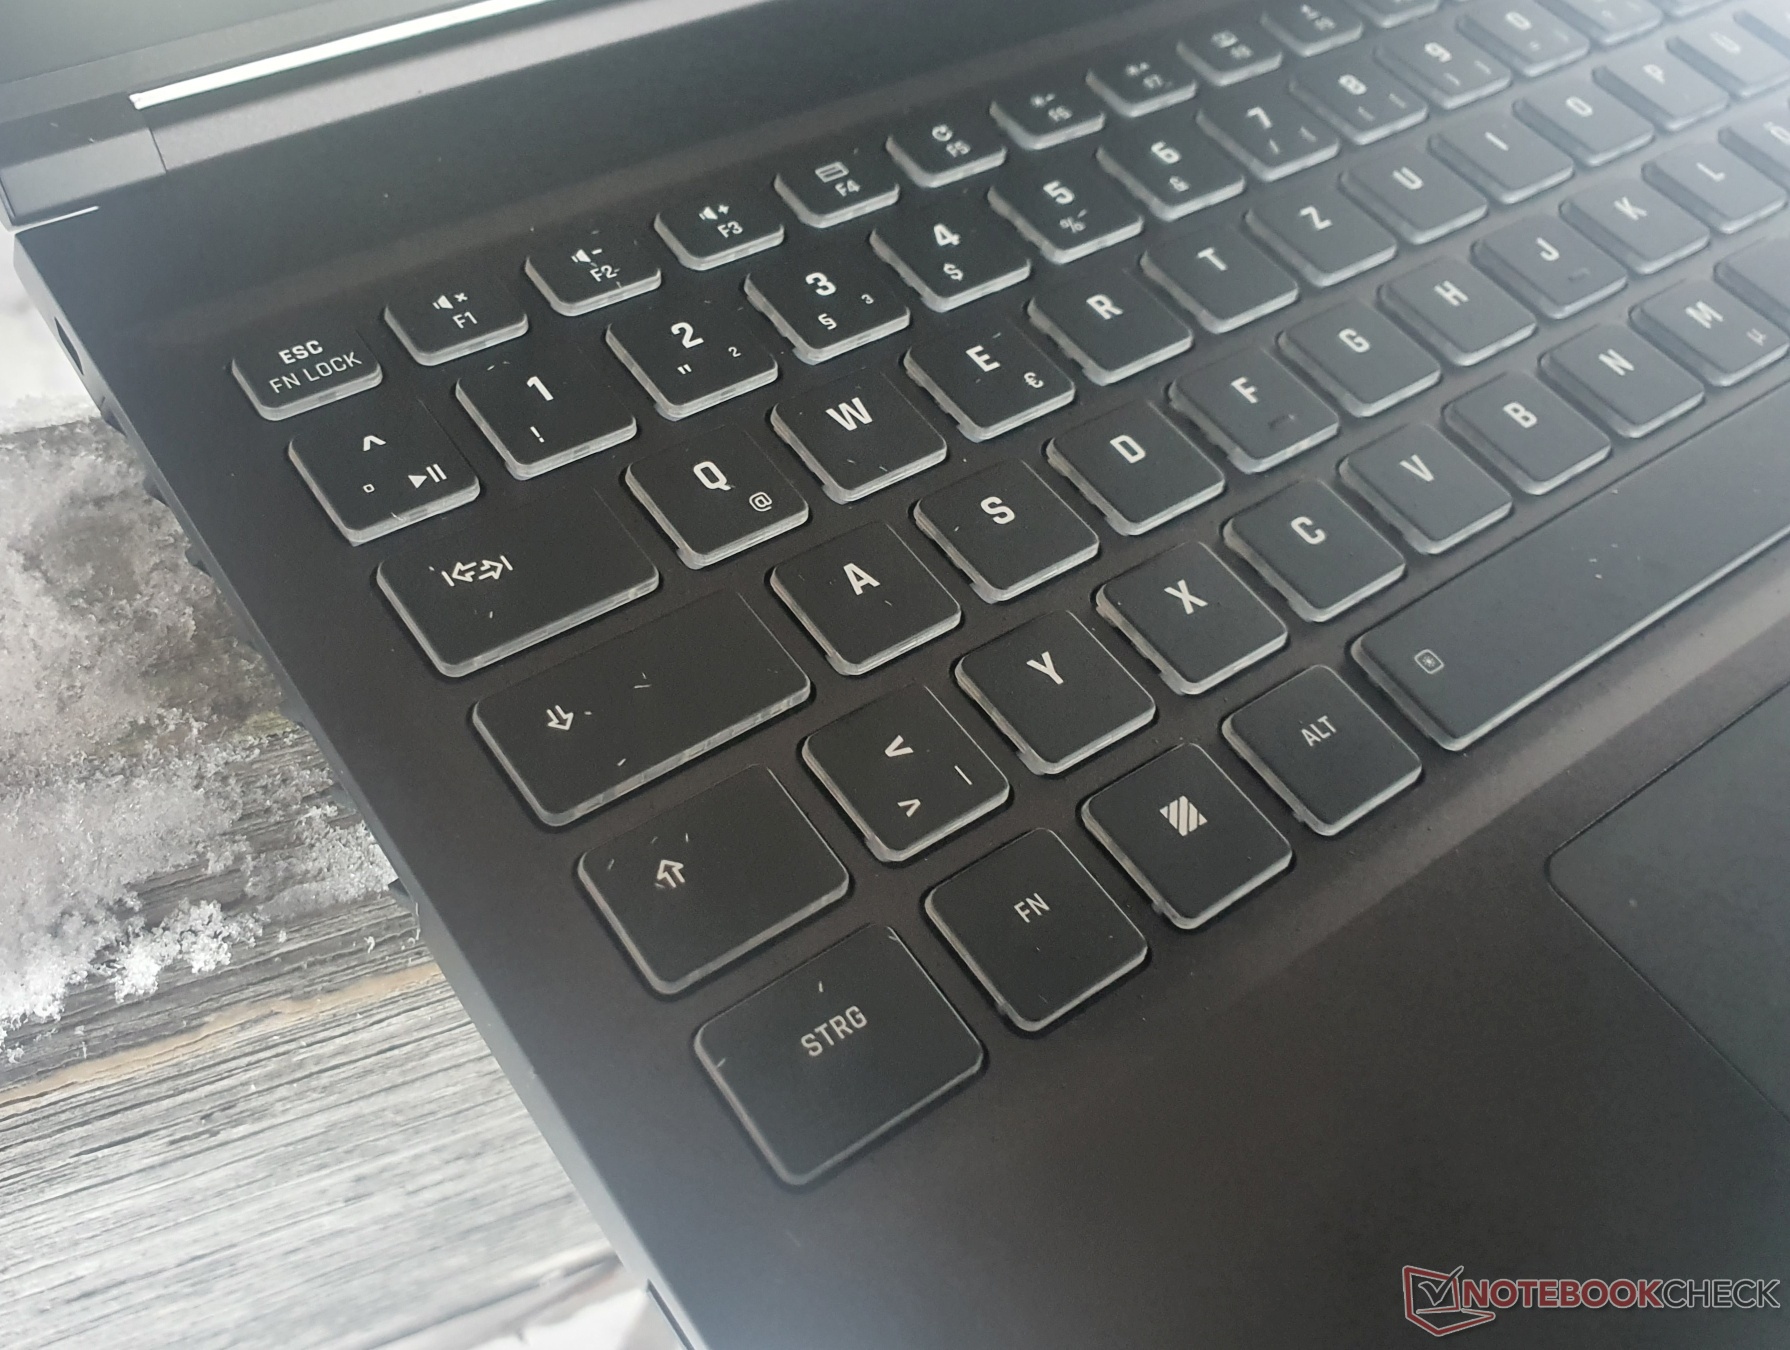
Il case del Core 15 è rimasto sostanzialmente lo stesso, quindi potete leggere i dettagli e i dispositivi di input nella nostra Recensione del modello precedente.
Altre recensioni Schenker:
XMG Neo 15(Ryzen 9 6900HX, RTX 3070 Ti, tastiera meccanizzata, XMG Oasis)
XMG Neo 17 (Ryzen 9 6900HX, RTX 3080 Ti, tastiera meccanizzata, XMG Oasis)
XMG Fusion 15(Core i7-11800H, RTX 3070, tastiera meccanizzata)
XMG Pro 15(Core i7-12700H, RTX 3080 Ti)
XMG Pro 17(Core i9-12900H, RTX 3080 Ti)
XMG Apex 15 Max(Ryzen 9 5900XcPU desktop, RTX 3070)
Potenziali concorrenti a confronto
Punteggio | Data | Modello | Peso | Altezza | Dimensione | Risoluzione | Prezzo |
|---|---|---|---|---|---|---|---|
| 87.9 % v7 (old) | 01/2023 | Schenker XMG Core 15 (M22) R7 6800H, GeForce RTX 3060 Laptop GPU | 2.1 kg | 23 mm | 15.60" | 2560x1440 | |
| 87.5 % v7 (old) | 11/2022 | Lenovo Legion 5 15IAH7H 82RB i7-12700H, GeForce RTX 3060 Laptop GPU | 2.4 kg | 19.99 mm | 15.60" | 1920x1080 | |
| 87.4 % v7 (old) | 08/2022 | Schenker XMG Fusion 15 (Mid 22) i7-11800H, GeForce RTX 3070 Laptop GPU | 1.9 kg | 21.65 mm | 15.60" | 2560x1440 | |
| 87.2 % v7 (old) | 03/2022 | Asus TUF Gaming F15 FX507ZM i7-12700H, GeForce RTX 3060 Laptop GPU | 2.1 kg | 24.95 mm | 15.60" | 1920x1080 | |
| 84.7 % v7 (old) | 06/2021 | Alienware m15 R5 Ryzen Edition R7 5800H, GeForce RTX 3060 Laptop GPU | 2.5 kg | 22.85 mm | 15.60" | 1920x1080 | |
| 84.9 % v7 (old) | 03/2021 | Schenker XMG Core 15 Ampere R7 4800H, GeForce RTX 3060 Laptop GPU | 2 kg | 22.9 mm | 15.60" | 2560x1440 |
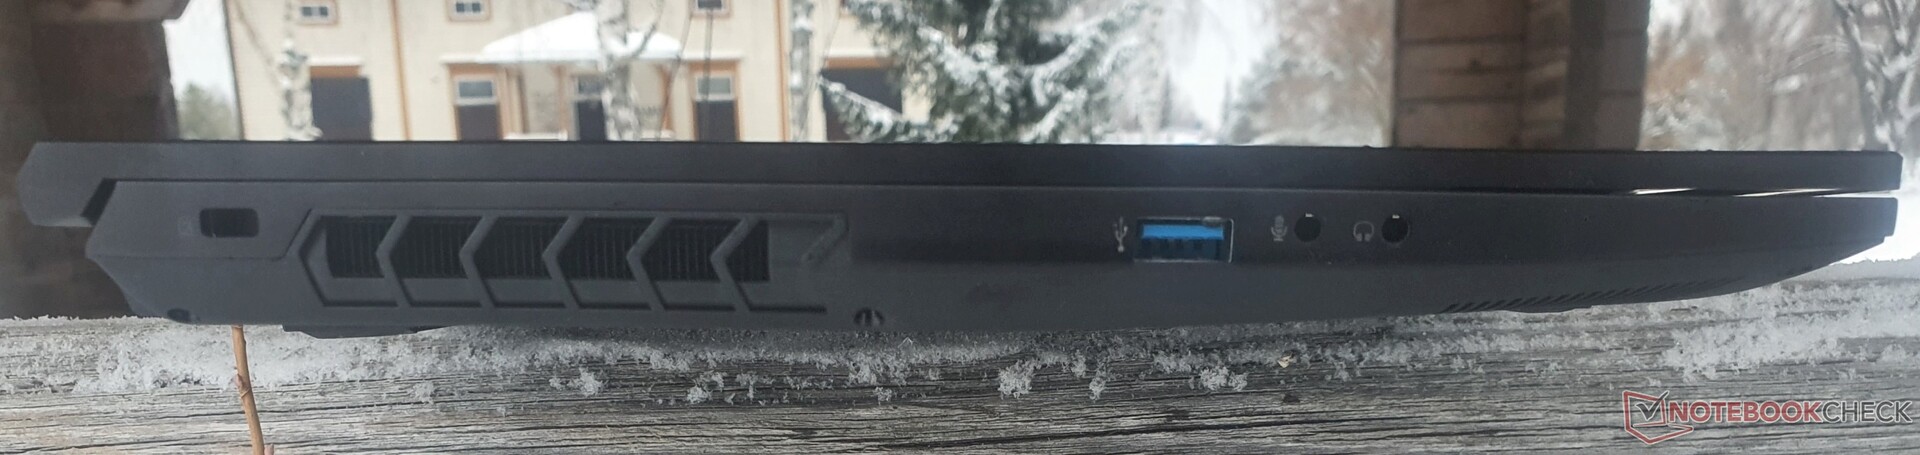
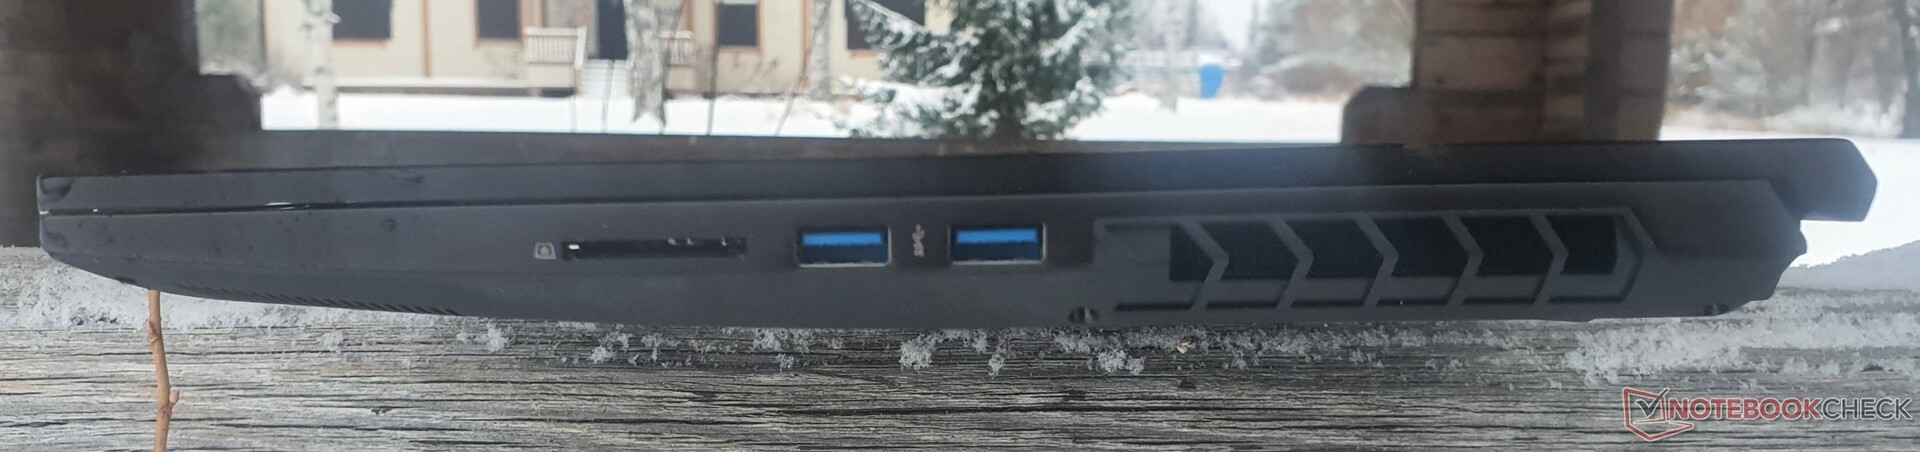
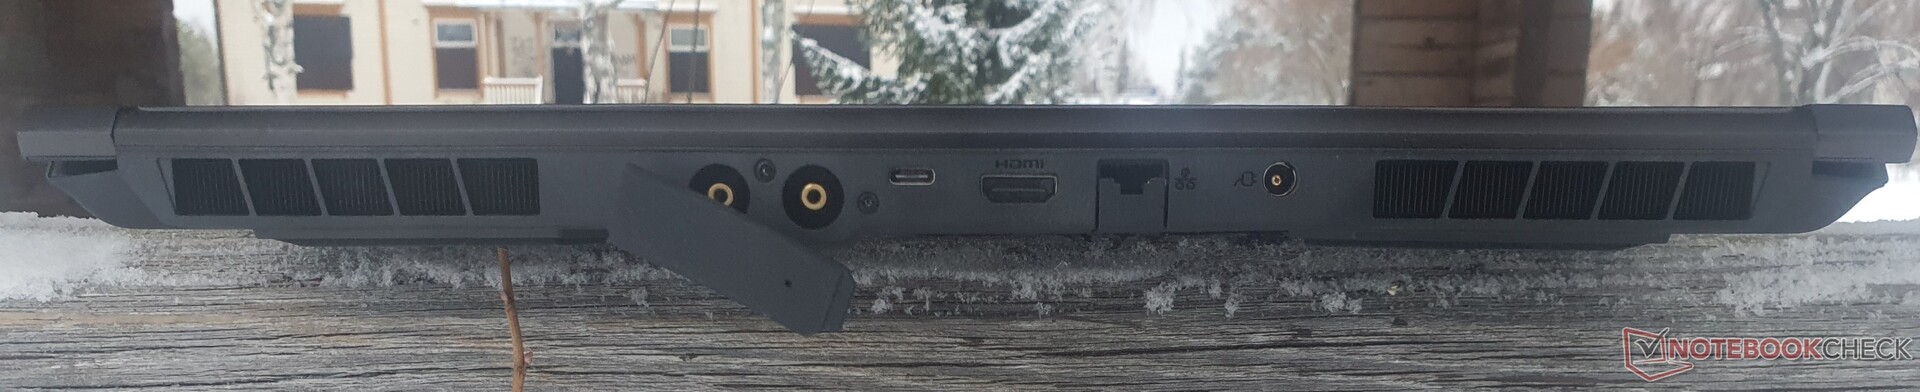
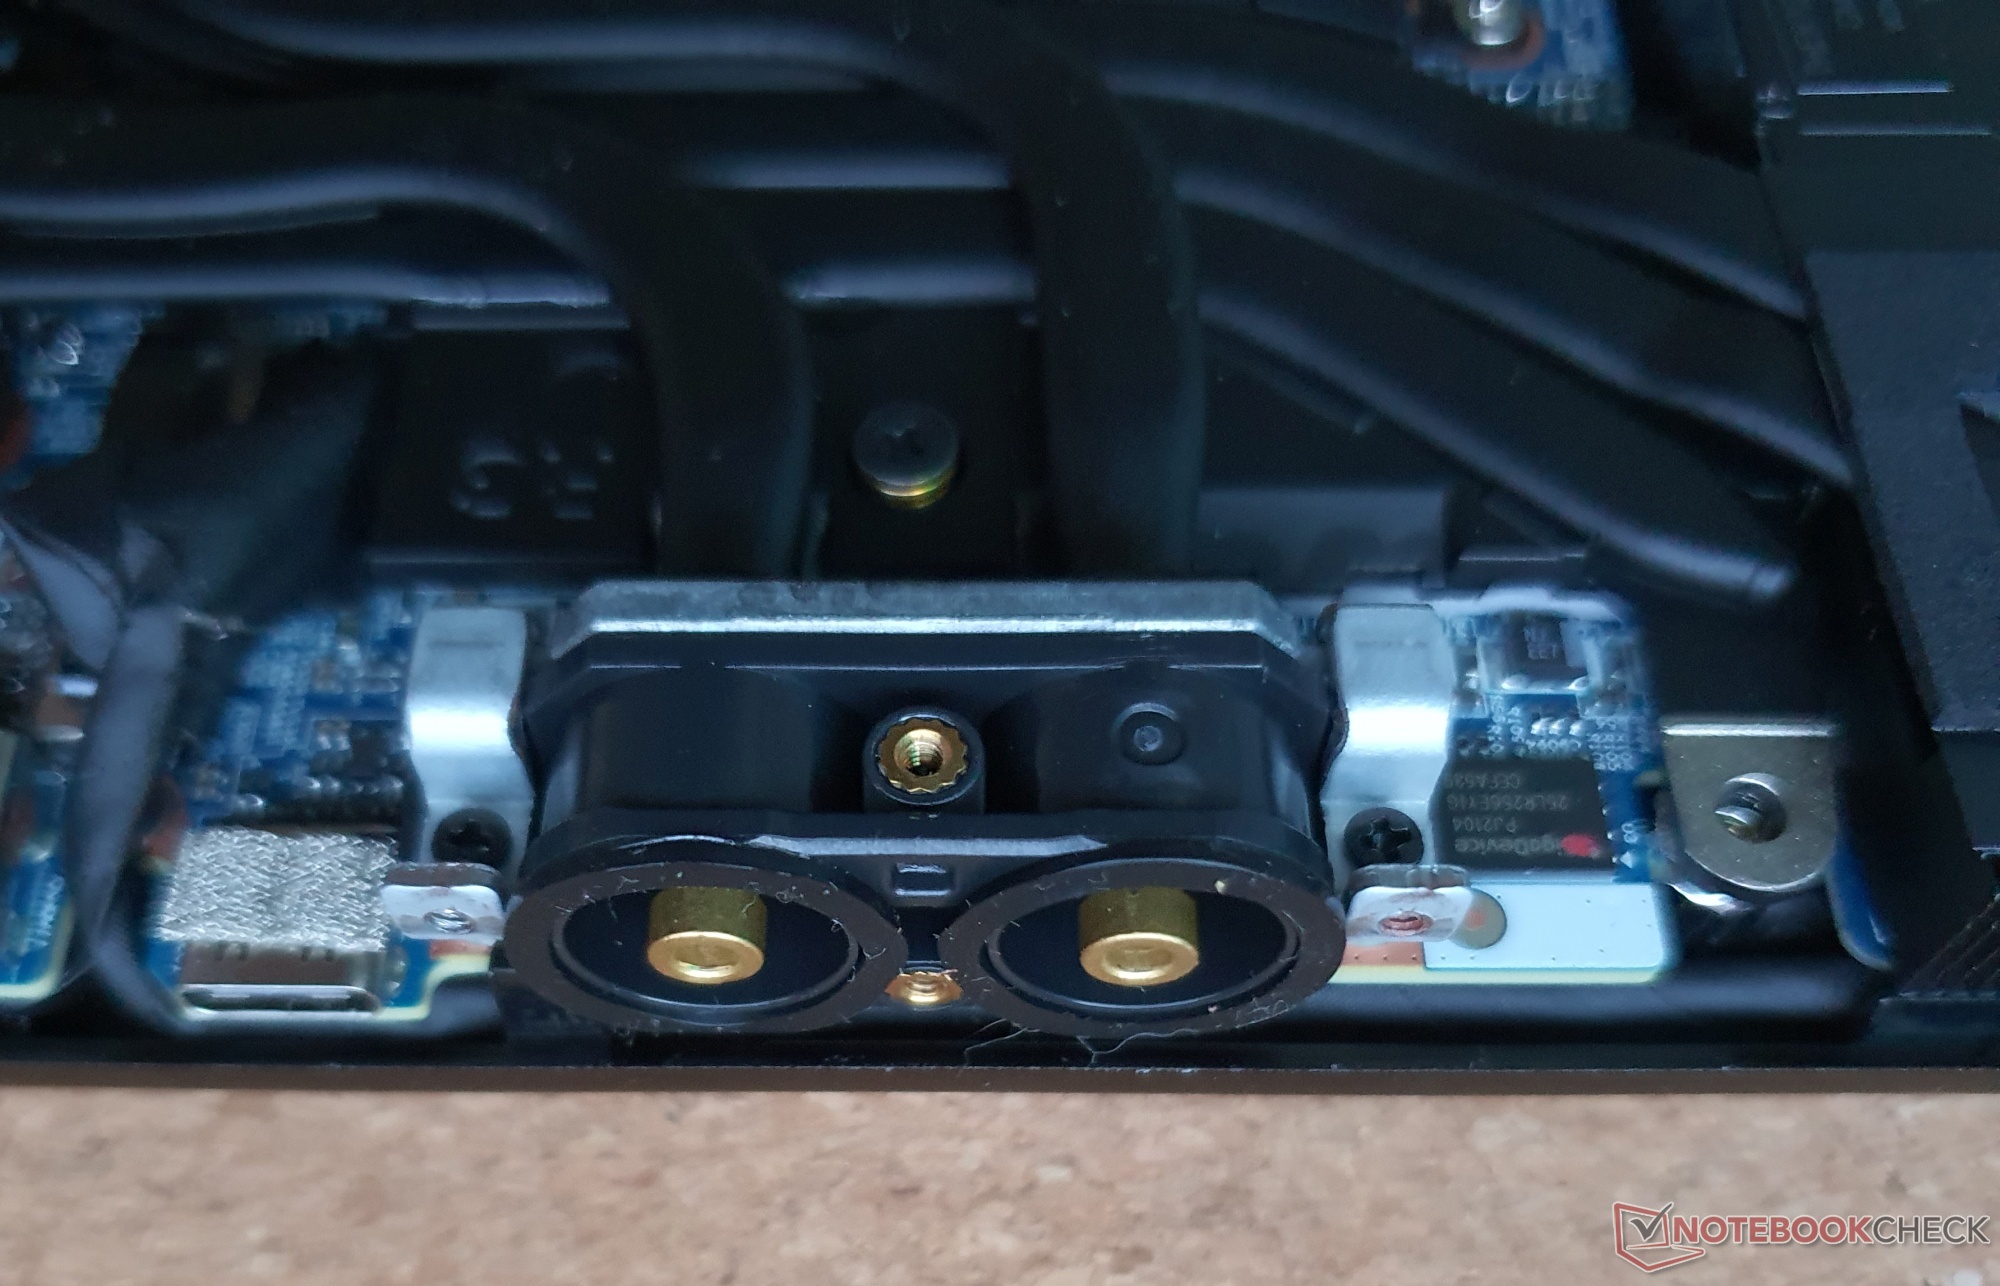
Caratteristiche: porta per l'acqua, ma non USB4 e USB-C-PD
Rispetto al predecessore, la porta per il raffreddamento a liquido esterno XMG Oasis è una novità interessante e utile. La porta USB 2.0 sul lato sinistro lascia il posto a una più veloce USB-A 3.2 Gen2, mentre mancano ancora la USB4 e la ricarica tramite USB-C.
Lettore di schede SD
| SD Card Reader | |
| average JPG Copy Test (av. of 3 runs) | |
| Media della classe Gaming (20.9 - 210, n=54, ultimi 2 anni) | |
| Schenker XMG Core 15 Ampere (Toshiba Exceria Pro SDXC 64 GB UHS-II) | |
| Schenker XMG Apex 15 Max (AV PRO microSD 128 GB V60) | |
| Schenker XMG Fusion 15 (Mid 22) (AV PRO microSD 128 GB V60) | |
| Schenker XMG Core 15 (M22) (AV PRO microSD 128 GB V60) | |
| maximum AS SSD Seq Read Test (1GB) | |
| Media della classe Gaming (25.5 - 261, n=51, ultimi 2 anni) | |
| Schenker XMG Apex 15 Max (AV PRO microSD 128 GB V60) | |
| Schenker XMG Core 15 Ampere (Toshiba Exceria Pro SDXC 64 GB UHS-II) | |
| Schenker XMG Core 15 (M22) (AV PRO microSD 128 GB V60) | |
Comunicazione
| Networking | |
| iperf3 receive AXE11000 6GHz | |
| Lenovo Legion 5 15IAH7H 82RB | |
| Schenker XMG Core 15 (M22) | |
| Media MediaTek RZ608 (430 - 961, n=16) | |
| iperf3 receive AXE11000 | |
| Schenker XMG Fusion 15 (Mid 22) | |
| Lenovo Legion 5 15IAH7H 82RB | |
| Schenker XMG Core 15 (M22) | |
| Media MediaTek RZ608 (430 - 975, n=20) | |
| iperf3 transmit AXE11000 6GHz | |
| Lenovo Legion 5 15IAH7H 82RB | |
| Schenker XMG Core 15 (M22) | |
| Media MediaTek RZ608 (572 - 980, n=16) | |
| iperf3 transmit AXE11000 | |
| Lenovo Legion 5 15IAH7H 82RB | |
| Schenker XMG Fusion 15 (Mid 22) | |
| Schenker XMG Core 15 (M22) | |
| Media MediaTek RZ608 (572 - 979, n=20) | |
| iperf3 receive AX12 | |
| Asus TUF Gaming F15 FX507ZM | |
| Schenker XMG Core 15 Ampere | |
| Alienware m15 R5 Ryzen Edition | |
| Media MediaTek RZ608 (837 - 880, n=2) | |
| iperf3 transmit AX12 | |
| Schenker XMG Core 15 Ampere | |
| Alienware m15 R5 Ryzen Edition | |
| Asus TUF Gaming F15 FX507ZM | |
| Media MediaTek RZ608 (657 - 821, n=2) | |

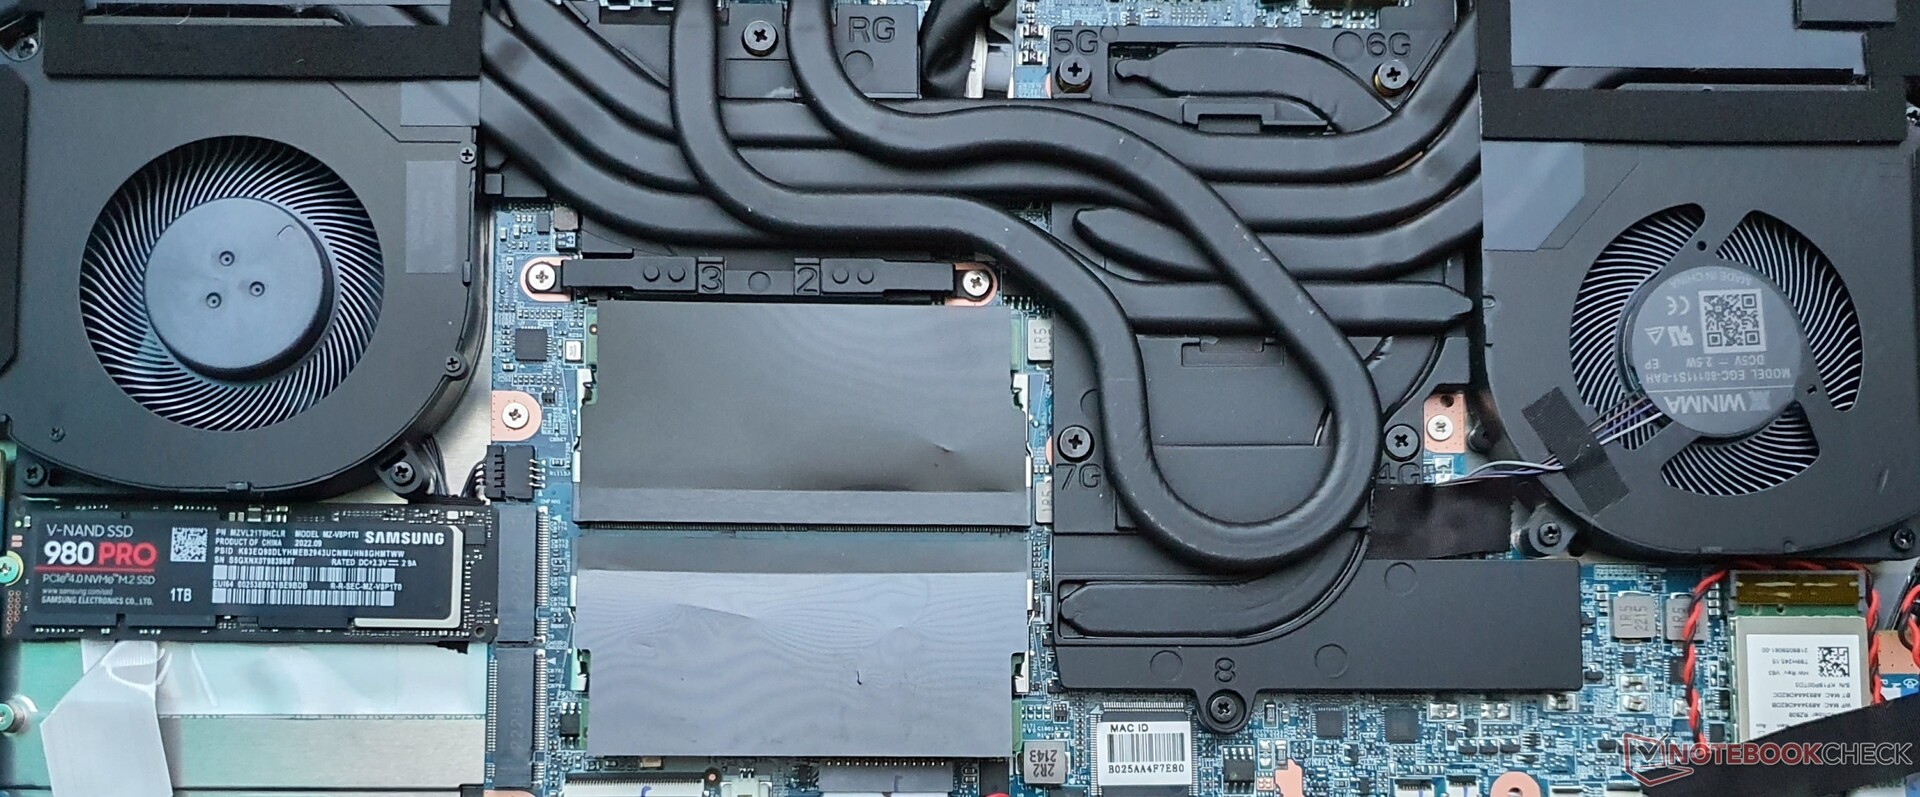
 GeForce RTX 3060 Laptop GPU, R7 6800H, Samsung SSD 980 Pro 1TB MZ-V8P1T0BW")
 GeForce RTX 3060 Laptop GPU, R7 6800H, Samsung SSD 980 Pro 1TB MZ-V8P1T0BW")
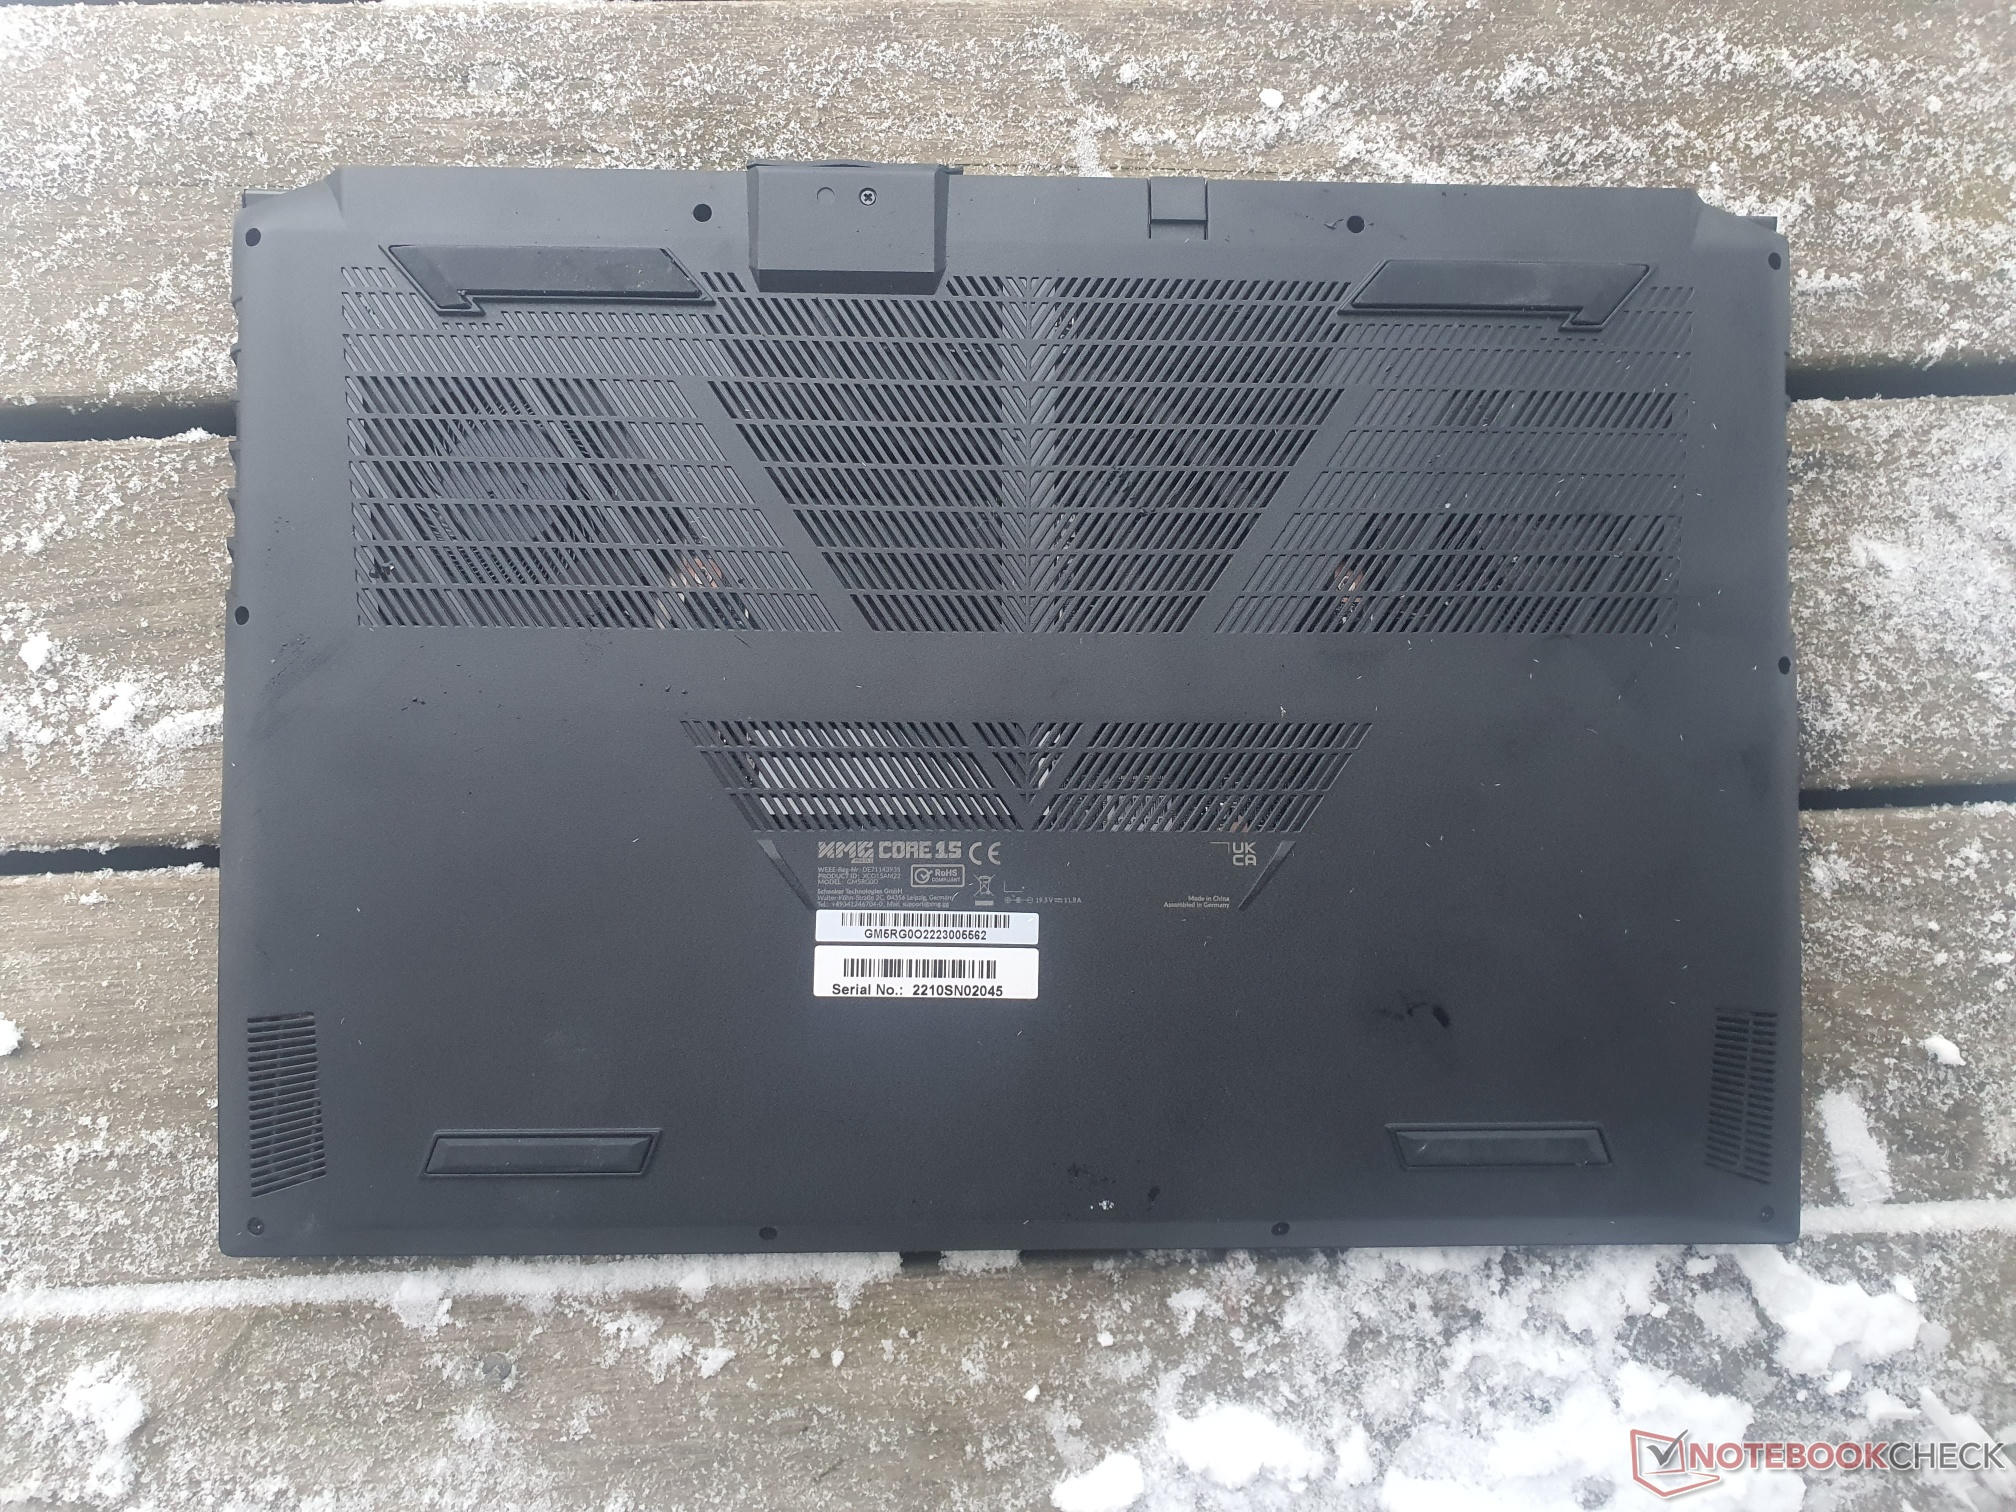
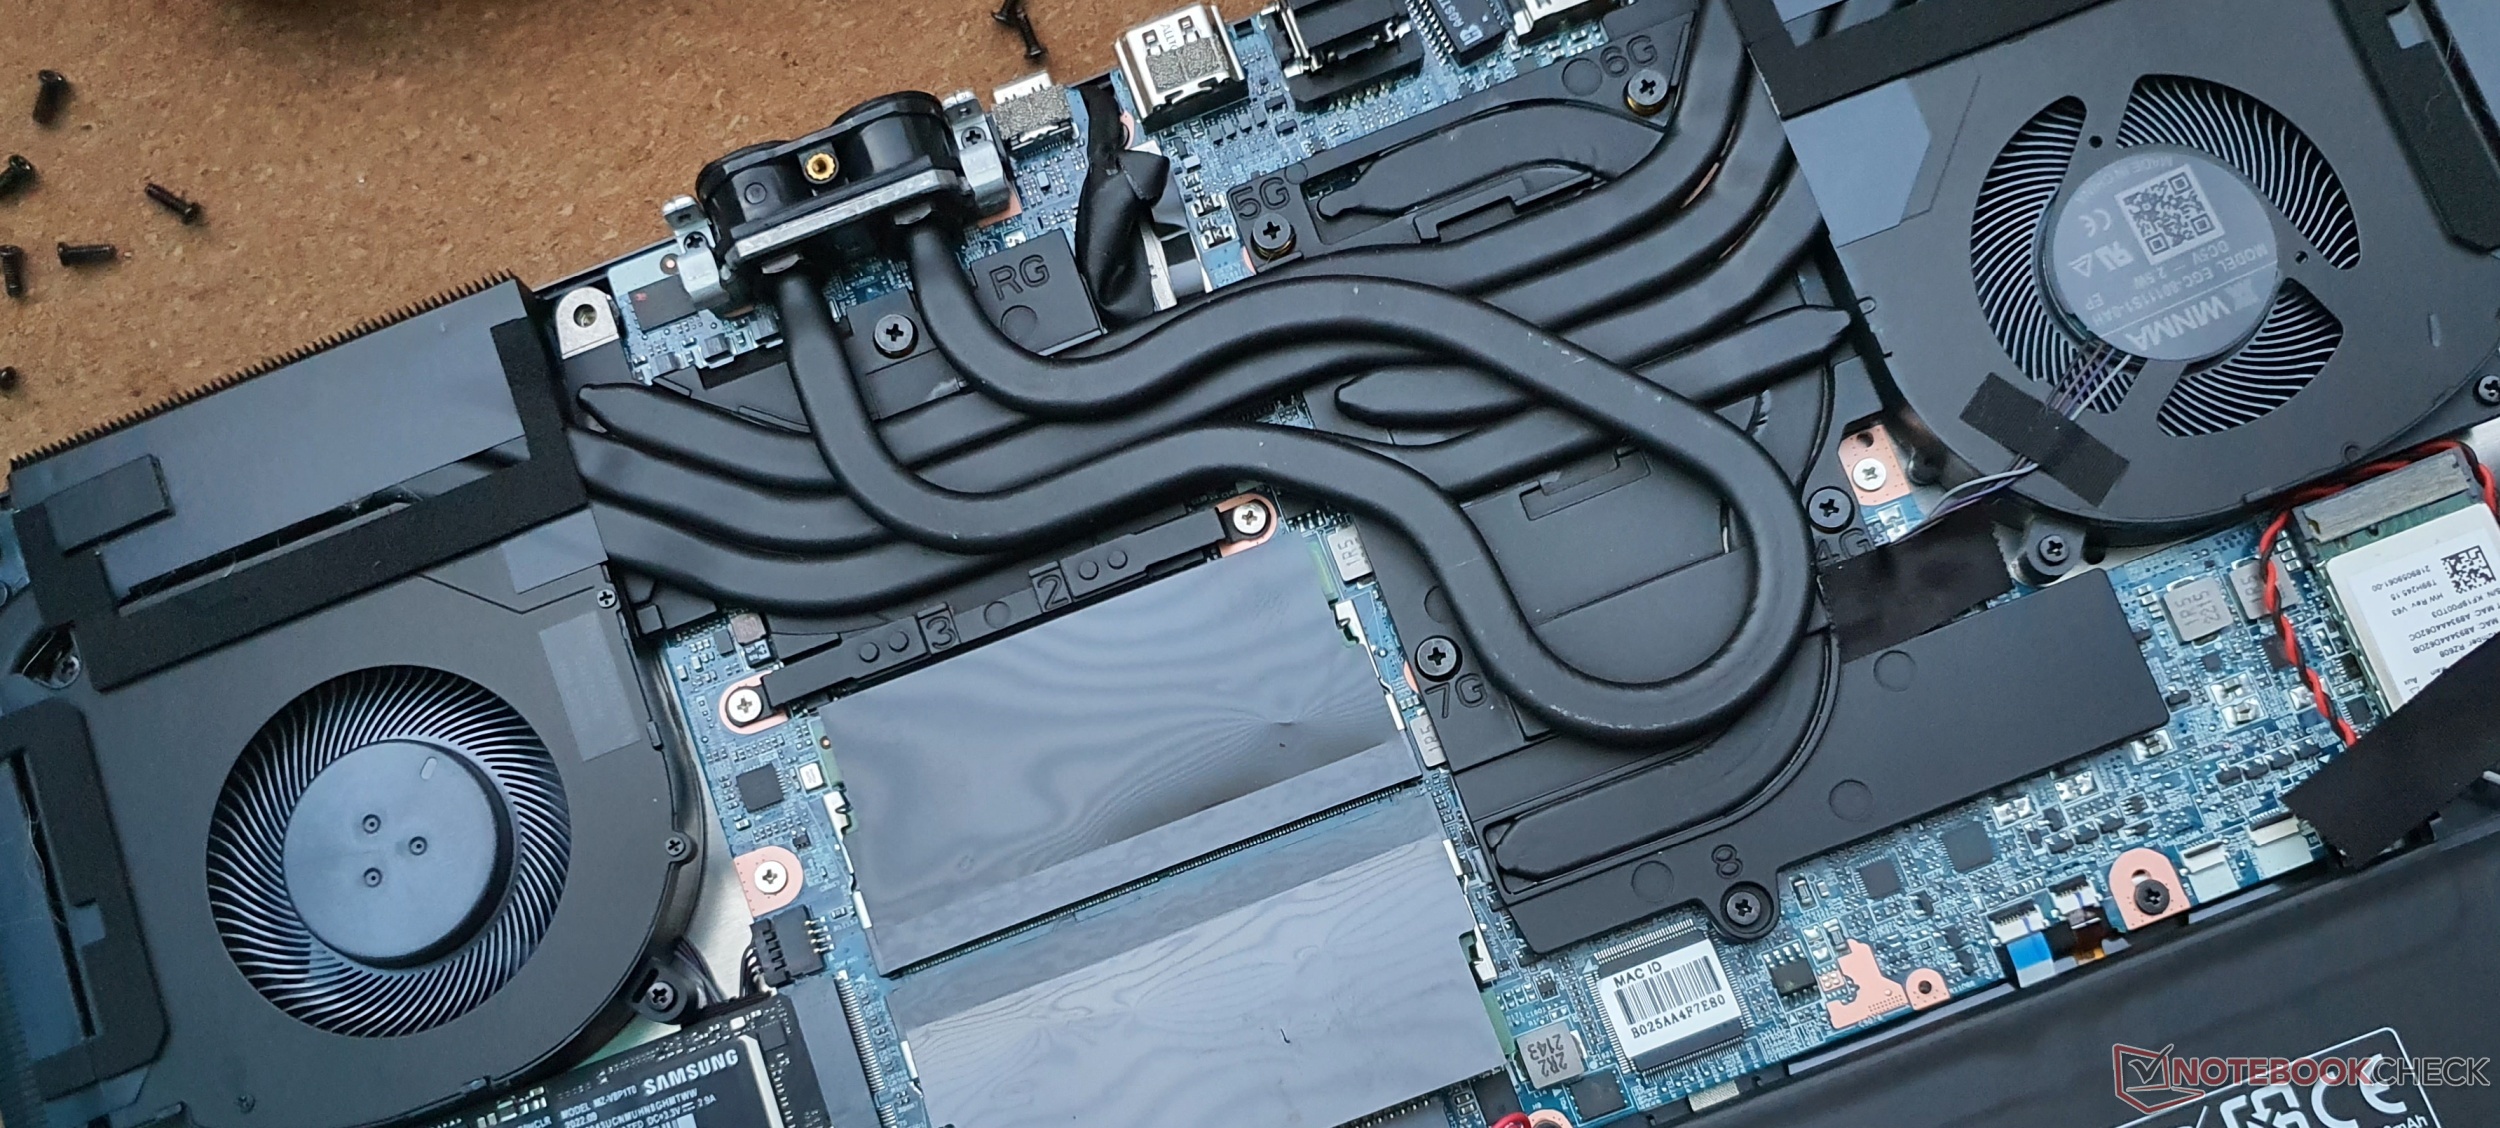
Manutenzione


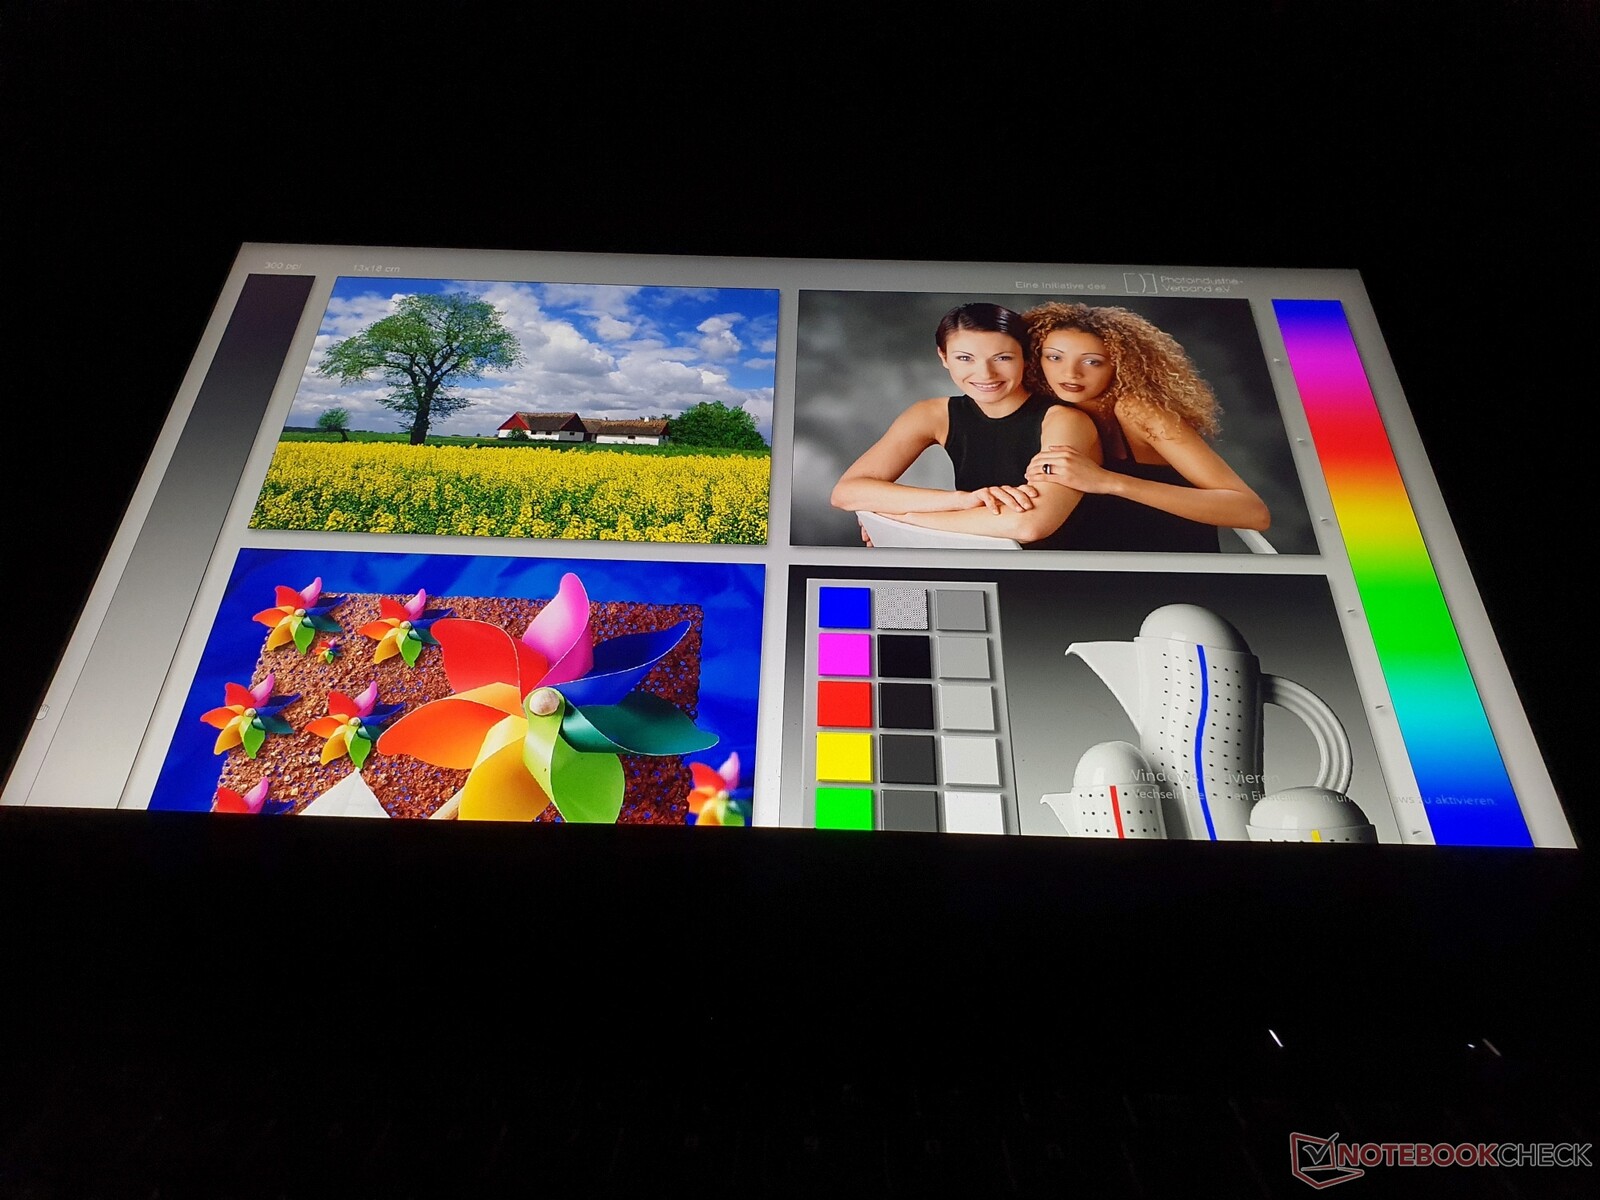
Display: WQHD 165 Hz con tempi di risposta rapidi
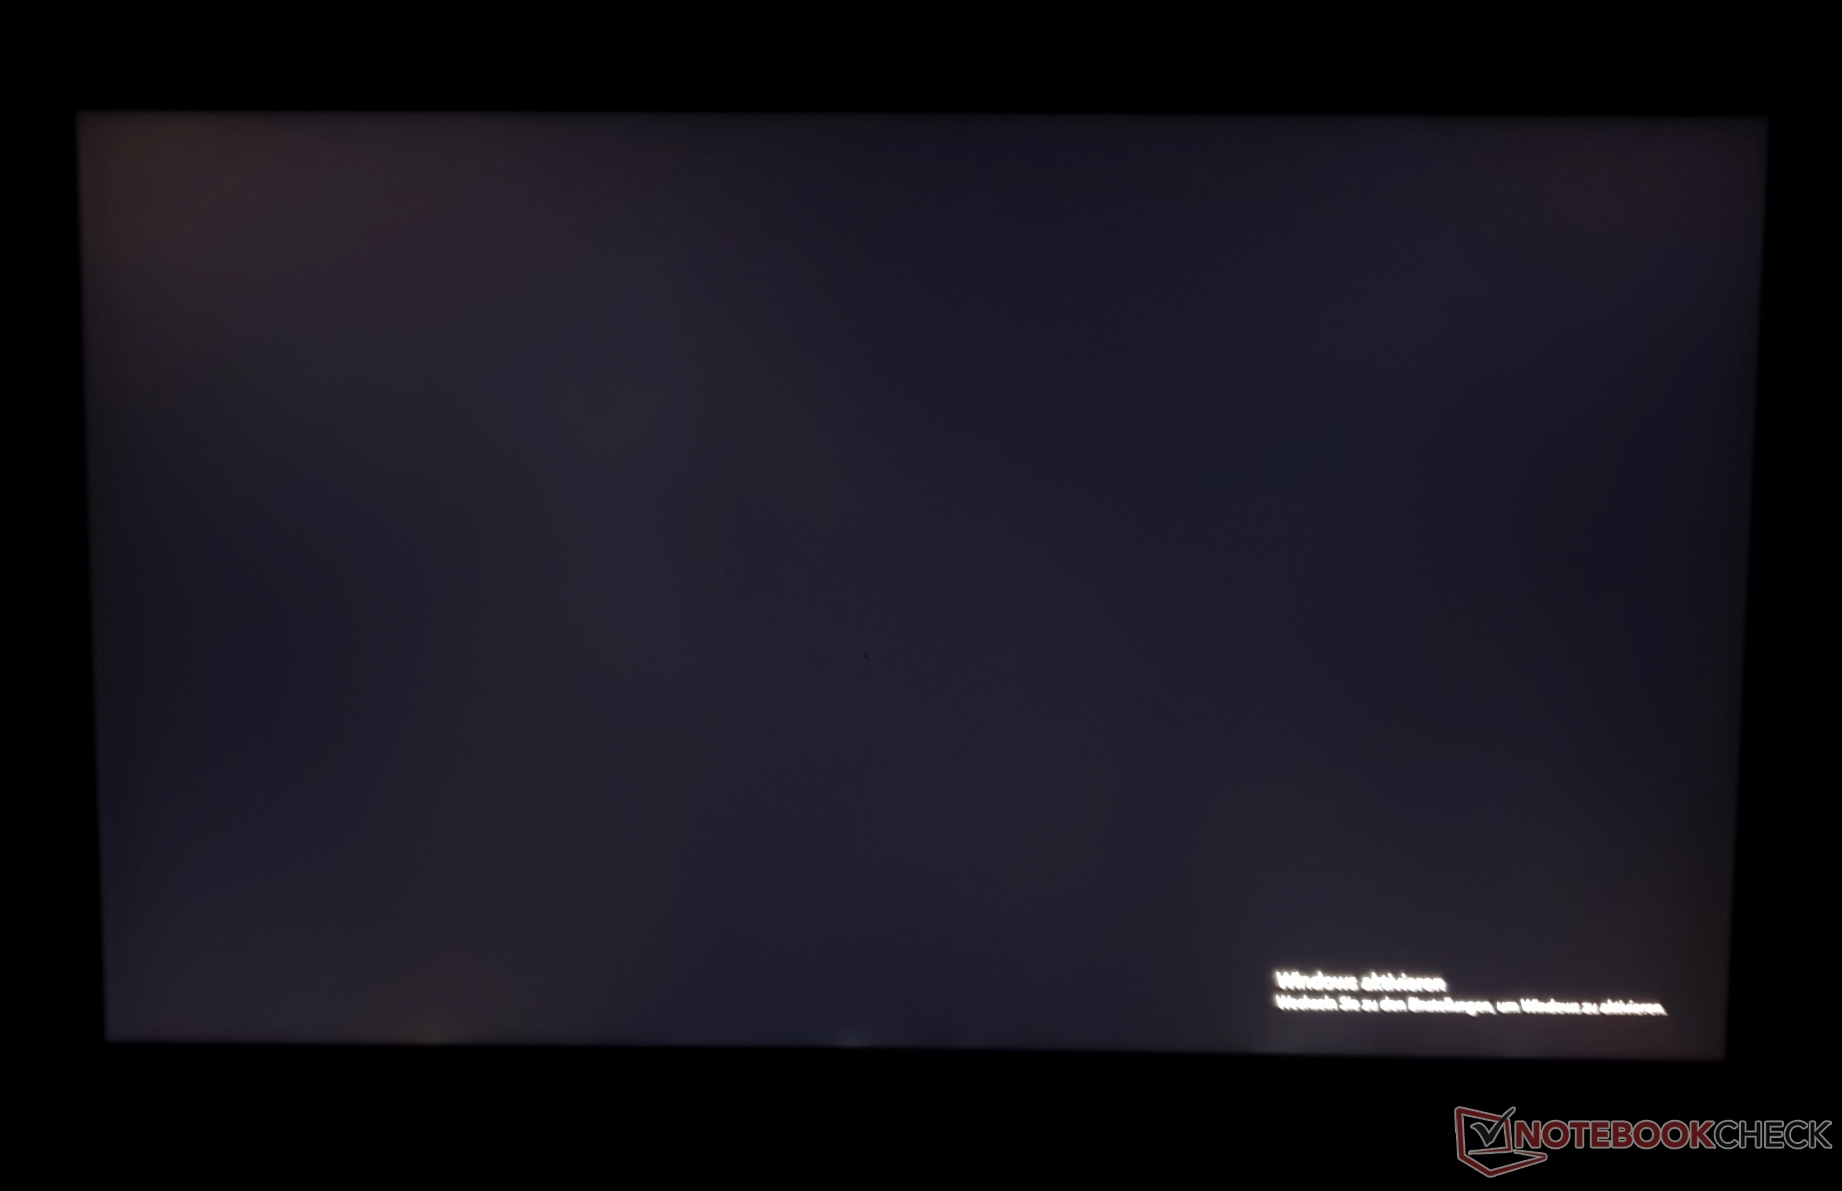
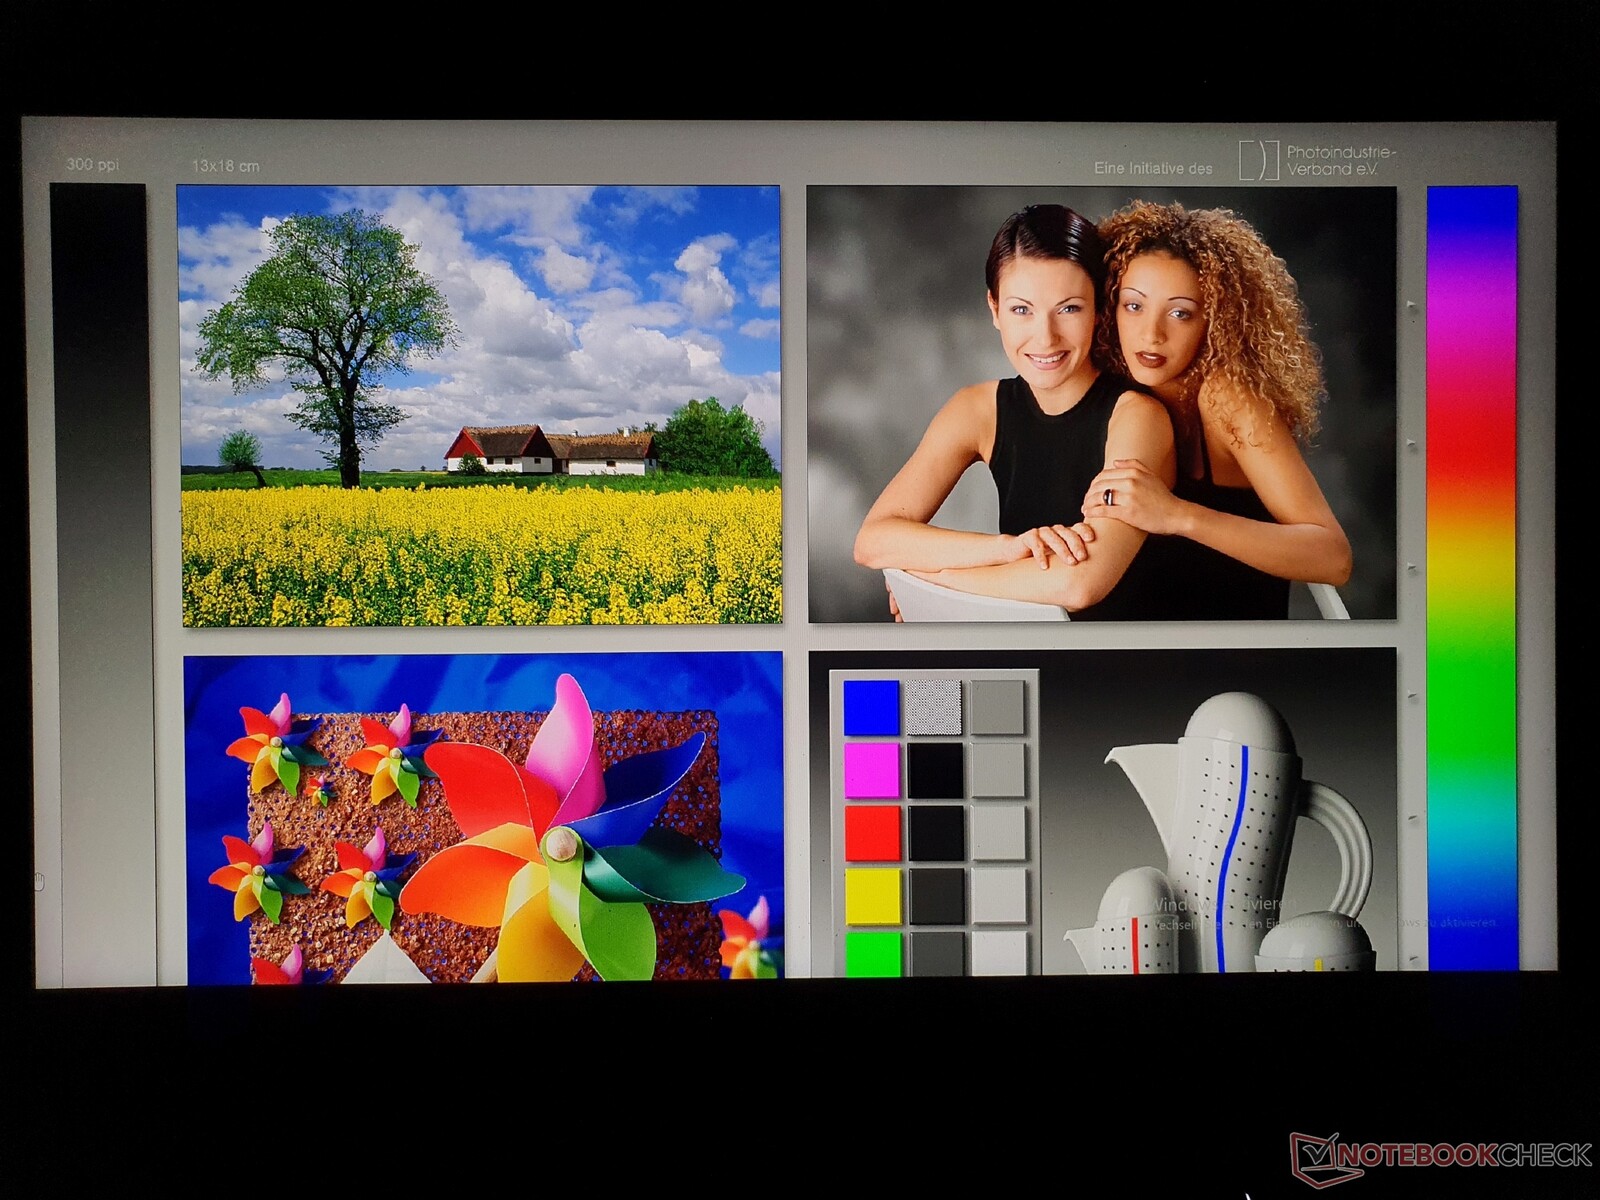
Schenker offre due opzioni di display per l'XMG Core 15: FHD 144 Hz con 300 cd/m² e 90% sRGB e il pannello WQHD (2.560 x 1.440) installato nel dispositivo testato con 165 Hz (83-165 Hz dinamico), specificato 350 cd/m² e 95% sRGB. Le specifiche di luminosità del display opaco 16:9 vengono superate con una media di 371 cd/m². Il Legion 5 Proè più luminoso con 500 cd/m², utile nell'uso all'aperto.
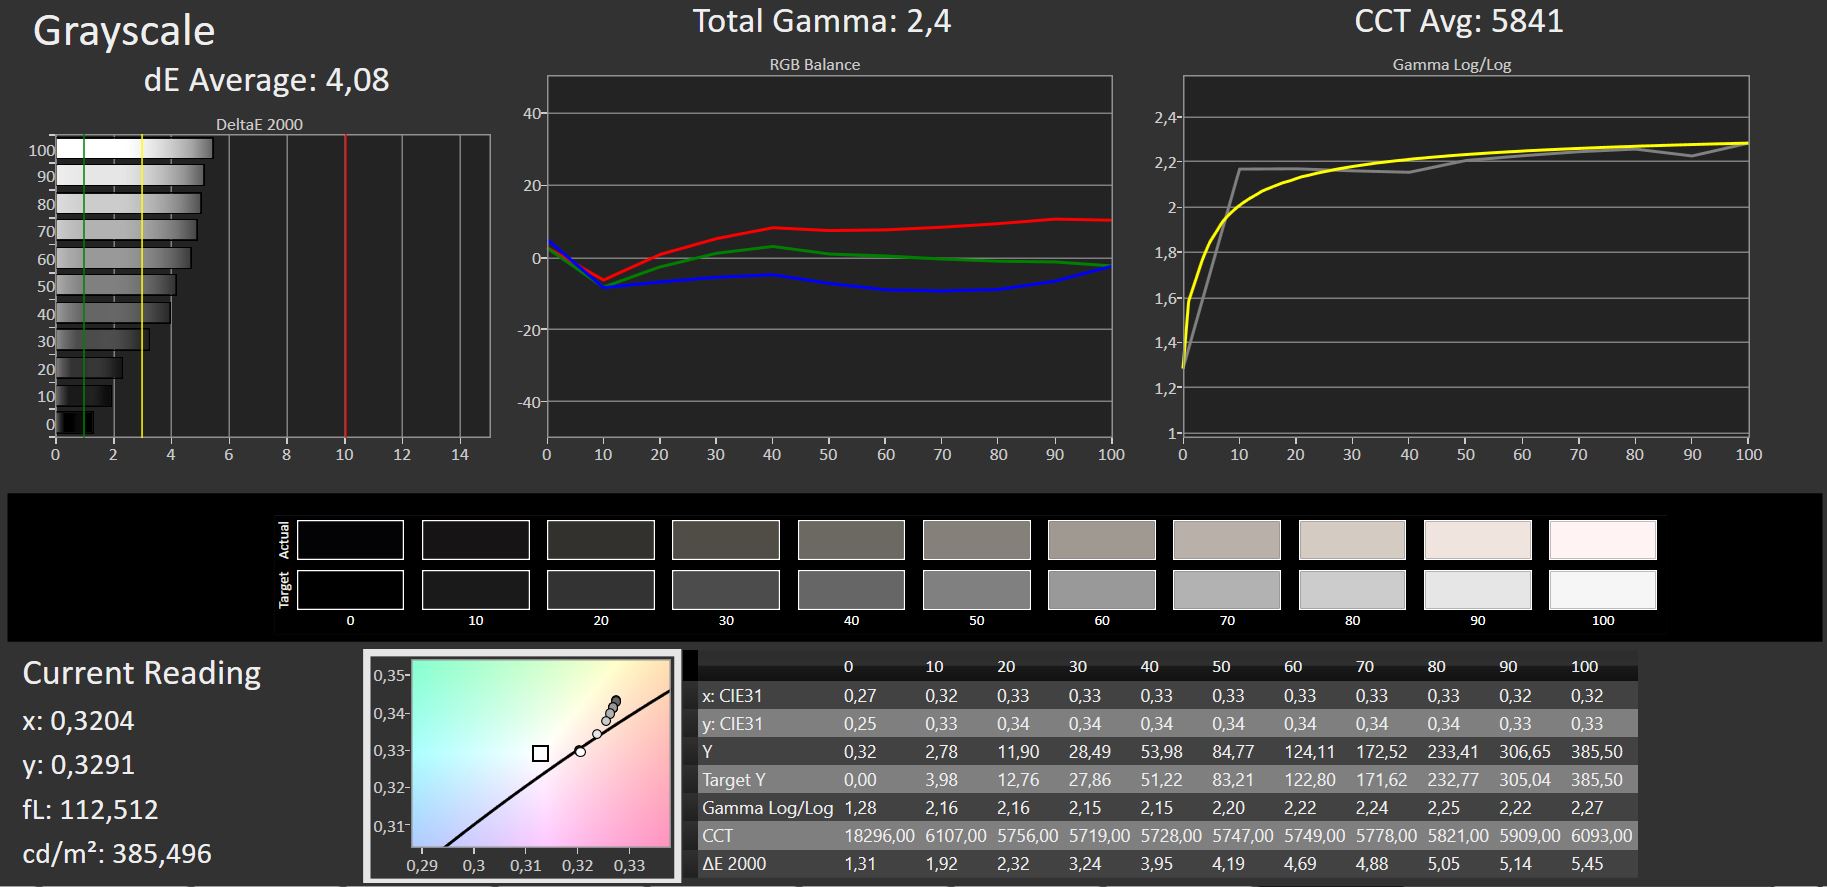
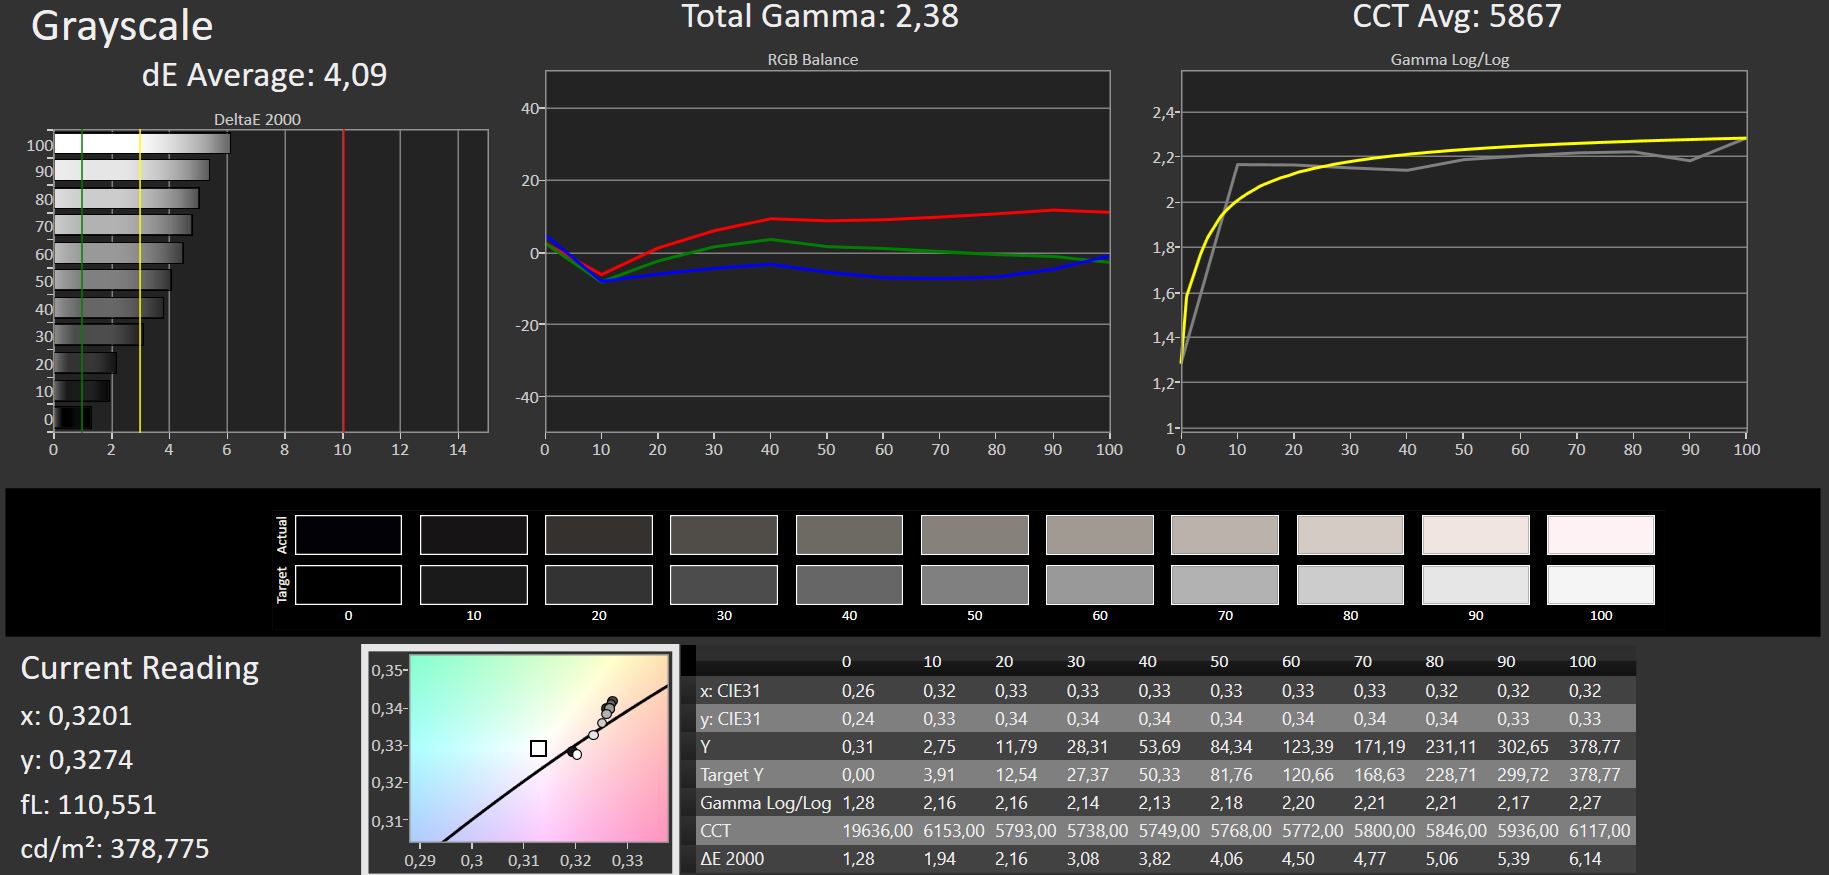
Il contrasto e il livello del nero sono di buon livello, rispettivamente 1.145:1 e 0,32 cd/m², mentre l'illuminazione è abbastanza uniforme. Il valore del bianco di 5.841K è un po' lontano da quello ottimale (6.500K).
I tempi di risposta sono da brevi a molto brevi, con 16 ms (GtG) e 7,6 ms (BtW), mentre solo l'Alienware m15 di
raggiunge un vantaggio significativo in quest'area. Non abbiamo riscontrato alcuno sfarfallio PWM.<br>
| |||||||||||||||||||||||||
Distribuzione della luminosità: 93 %
Al centro con la batteria: 384 cd/m²
Contrasto: 1145:1 (Nero: 0.33 cd/m²)
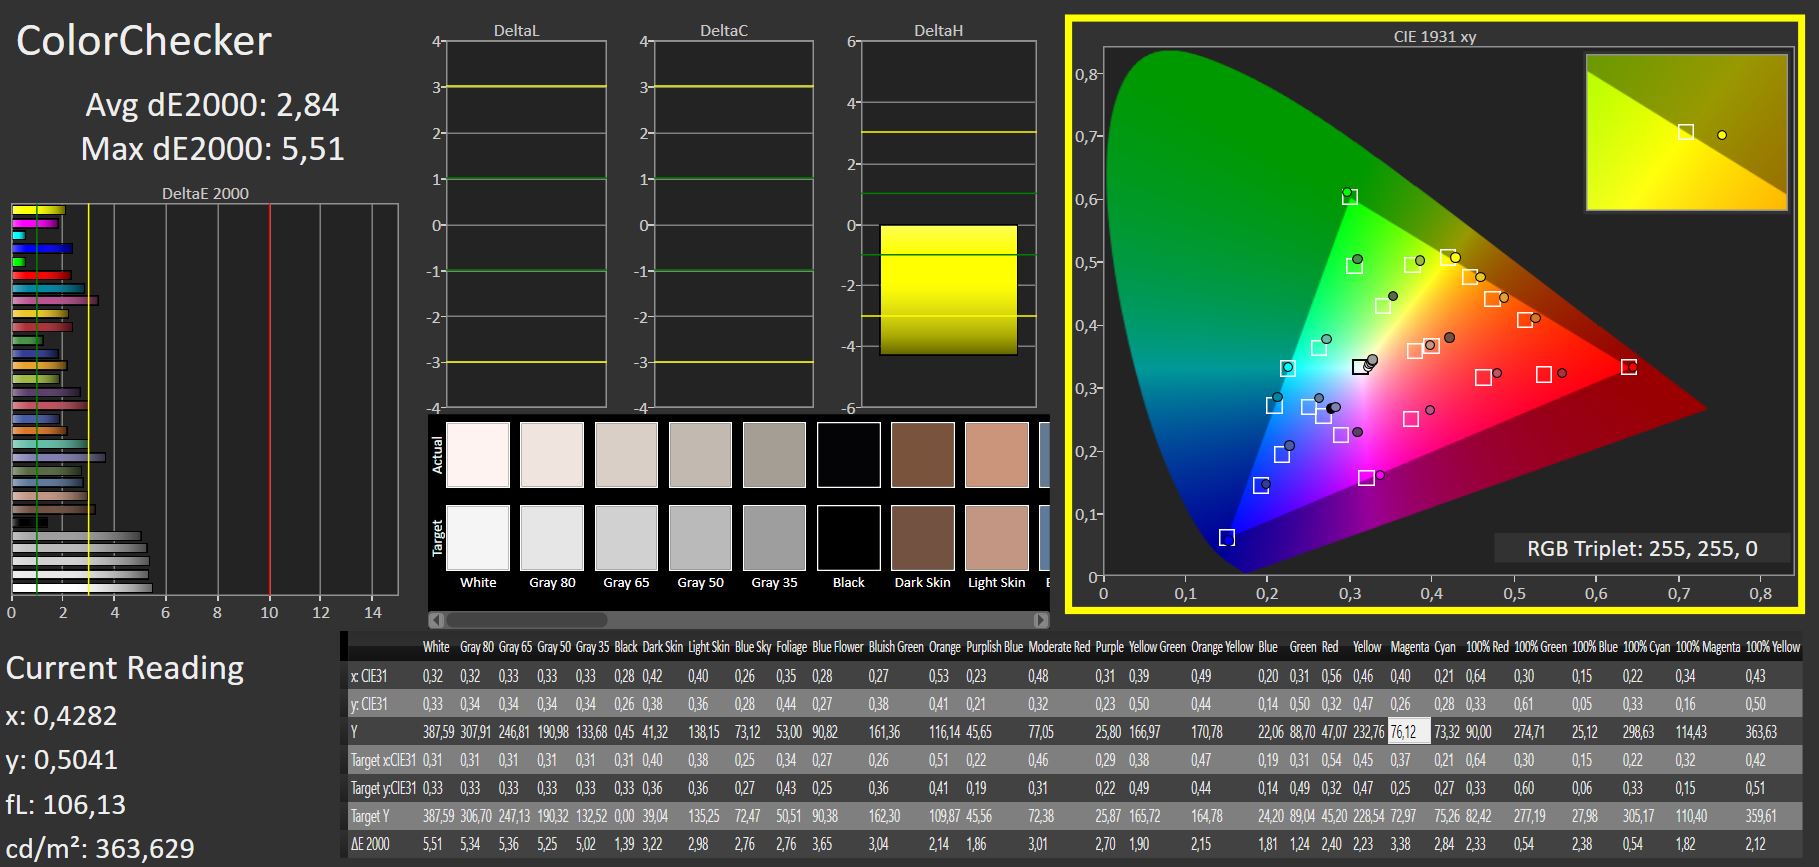
ΔE ColorChecker Calman: 2.84 | ∀{0.5-29.43 Ø4.71}
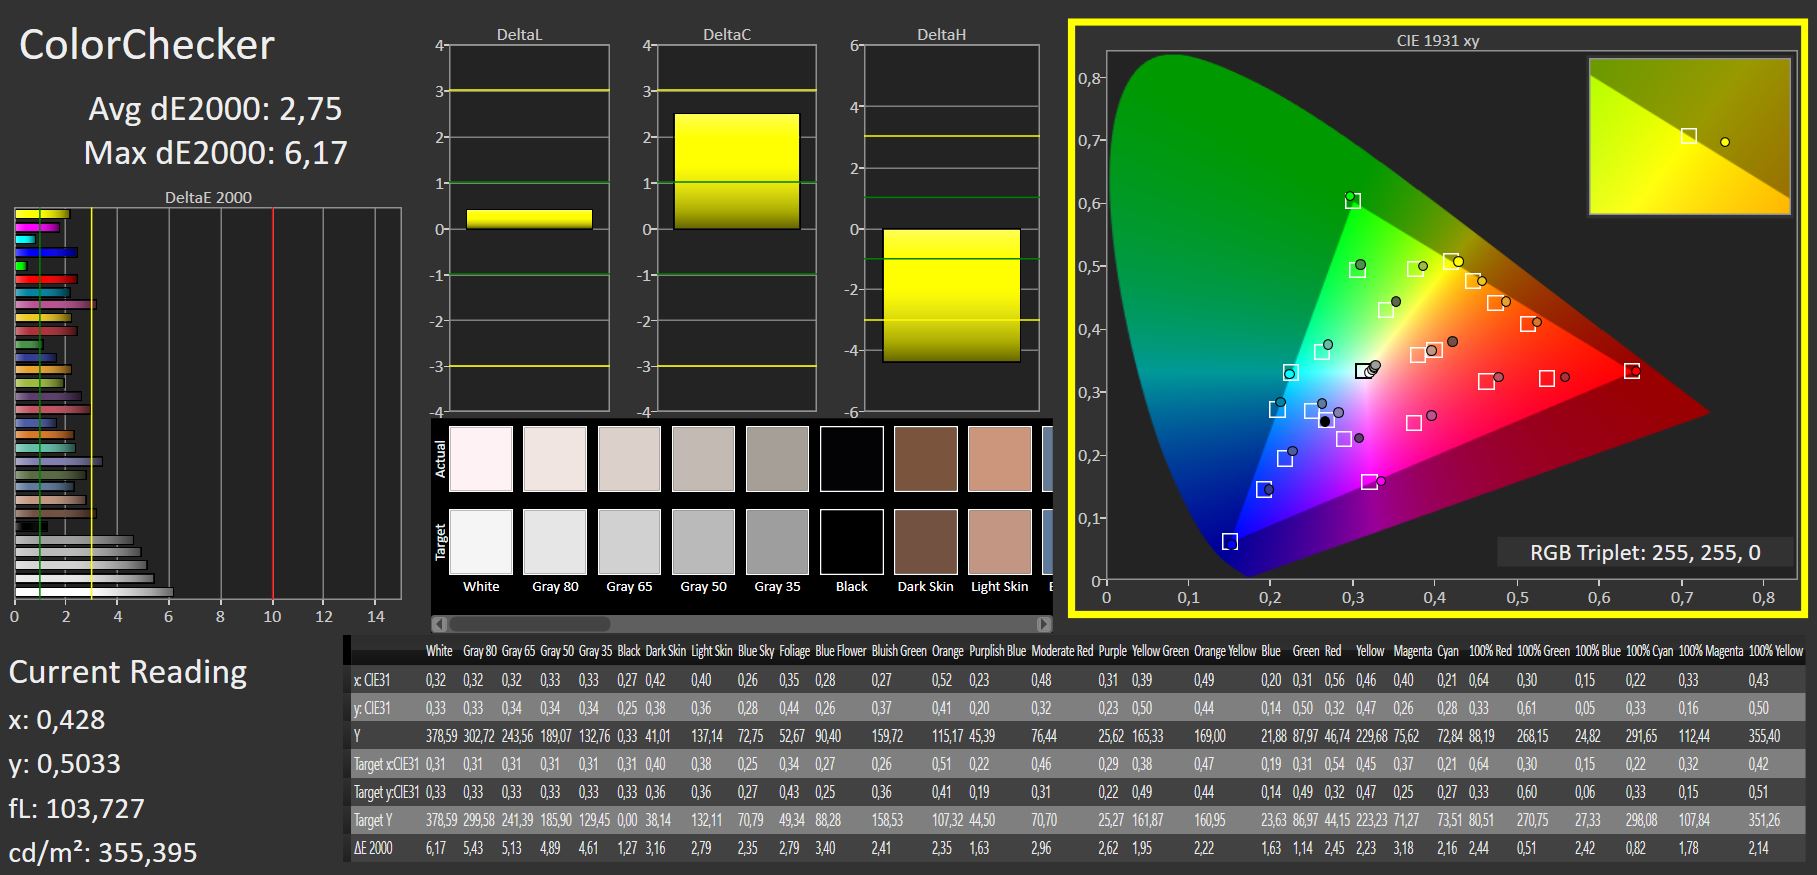
calibrated: 2.75
ΔE Greyscale Calman: 4.08 | ∀{0.09-98 Ø4.96}
69.9% AdobeRGB 1998 (Argyll 3D)
99.3% sRGB (Argyll 3D)
68.8% Display P3 (Argyll 3D)
Gamma: 2.4
CCT: 5841 K
| Schenker XMG Core 15 (M22) CSOT MNF601CA1-1, IPS, 2560x1440, 15.6" | Schenker XMG Fusion 15 (Mid 22) BOE CQ NE156QHM-NY2, IPS, 2560x1440, 15.6" | Lenovo Legion 5 15IAH7H 82RB CSOT MNF601CA1-3, IPS, 1920x1080, 15.6" | Asus TUF Gaming F15 FX507ZM TL156VDXP0101, IPS, 1920x1080, 15.6" | Alienware m15 R5 Ryzen Edition B156HAN, IPS, 1920x1080, 15.6" | Schenker XMG Core 15 Ampere BOE CQ NE156QHM-NY2, IPS, 2560x1440, 15.6" | |
|---|---|---|---|---|---|---|
| Display | -2% | 0% | -2% | 0% | ||
| Display P3 Coverage (%) | 68.8 | 67.3 -2% | 69.1 0% | 66.4 -3% | 69.8 1% | |
| sRGB Coverage (%) | 99.3 | 96.7 -3% | 99.5 0% | 97 -2% | 98.8 -1% | |
| AdobeRGB 1998 Coverage (%) | 69.9 | 68.2 -2% | 70 0% | 68.5 -2% | 70.7 1% | |
| Response Times | 18% | -26% | -2% | 32% | -15% | |
| Response Time Grey 50% / Grey 80% * (ms) | 16 ? | 11.6 ? 27% | 14.8 ? 7% | 5.6 ? 65% | 4 ? 75% | 14.8 ? 7% |
| Response Time Black / White * (ms) | 7.6 ? | 7 ? 8% | 12 ? -58% | 12.8 ? -68% | 8.4 ? -11% | 10.4 ? -37% |
| PWM Frequency (Hz) | ||||||
| Screen | -11% | -13% | 19% | 10% | 23% | |
| Brightness middle (cd/m²) | 378 | 326 -14% | 363.5 -4% | 353.7 -6% | 329 -13% | 347 -8% |
| Brightness (cd/m²) | 371 | 303 -18% | 350 -6% | 340 -8% | 321 -13% | 328 -12% |
| Brightness Distribution (%) | 93 | 89 -4% | 89 -4% | 89 -4% | 92 -1% | 89 -4% |
| Black Level * (cd/m²) | 0.33 | 0.33 -0% | 0.39 -18% | 0.34 -3% | 0.27 18% | 0.27 18% |
| Contrast (:1) | 1145 | 988 -14% | 932 -19% | 1040 -9% | 1219 6% | 1285 12% |
| Colorchecker dE 2000 * | 2.84 | 2.73 4% | 3.68 -30% | 1.74 39% | 2.78 2% | 1.66 42% |
| Colorchecker dE 2000 max. * | 5.51 | 9.54 -73% | 8.92 -62% | 3.63 34% | 4.88 11% | 3.03 45% |
| Colorchecker dE 2000 calibrated * | 2.75 | 1.36 51% | 0.53 81% | 0.5 82% | 1.63 41% | 1.23 55% |
| Greyscale dE 2000 * | 4.08 | 5.2 -27% | 6.5 -59% | 2.1 49% | 2.5 39% | 1.6 61% |
| Gamma | 2.4 92% | 2.074 106% | 2.2 100% | 2.3 96% | 2.106 104% | 2.278 97% |
| CCT | 5841 111% | 6911 94% | 5995 108% | 6257 104% | 6201 105% | 6430 101% |
| Color Space (Percent of AdobeRGB 1998) (%) | 76 | 71 | ||||
| Color Space (Percent of sRGB) (%) | 99 | 94 | ||||
| Media totale (Programma / Settaggio) | 2% /
-5% | -13% /
-12% | 5% /
12% | 21% /
14% | 3% /
13% |
* ... Meglio usare valori piccoli
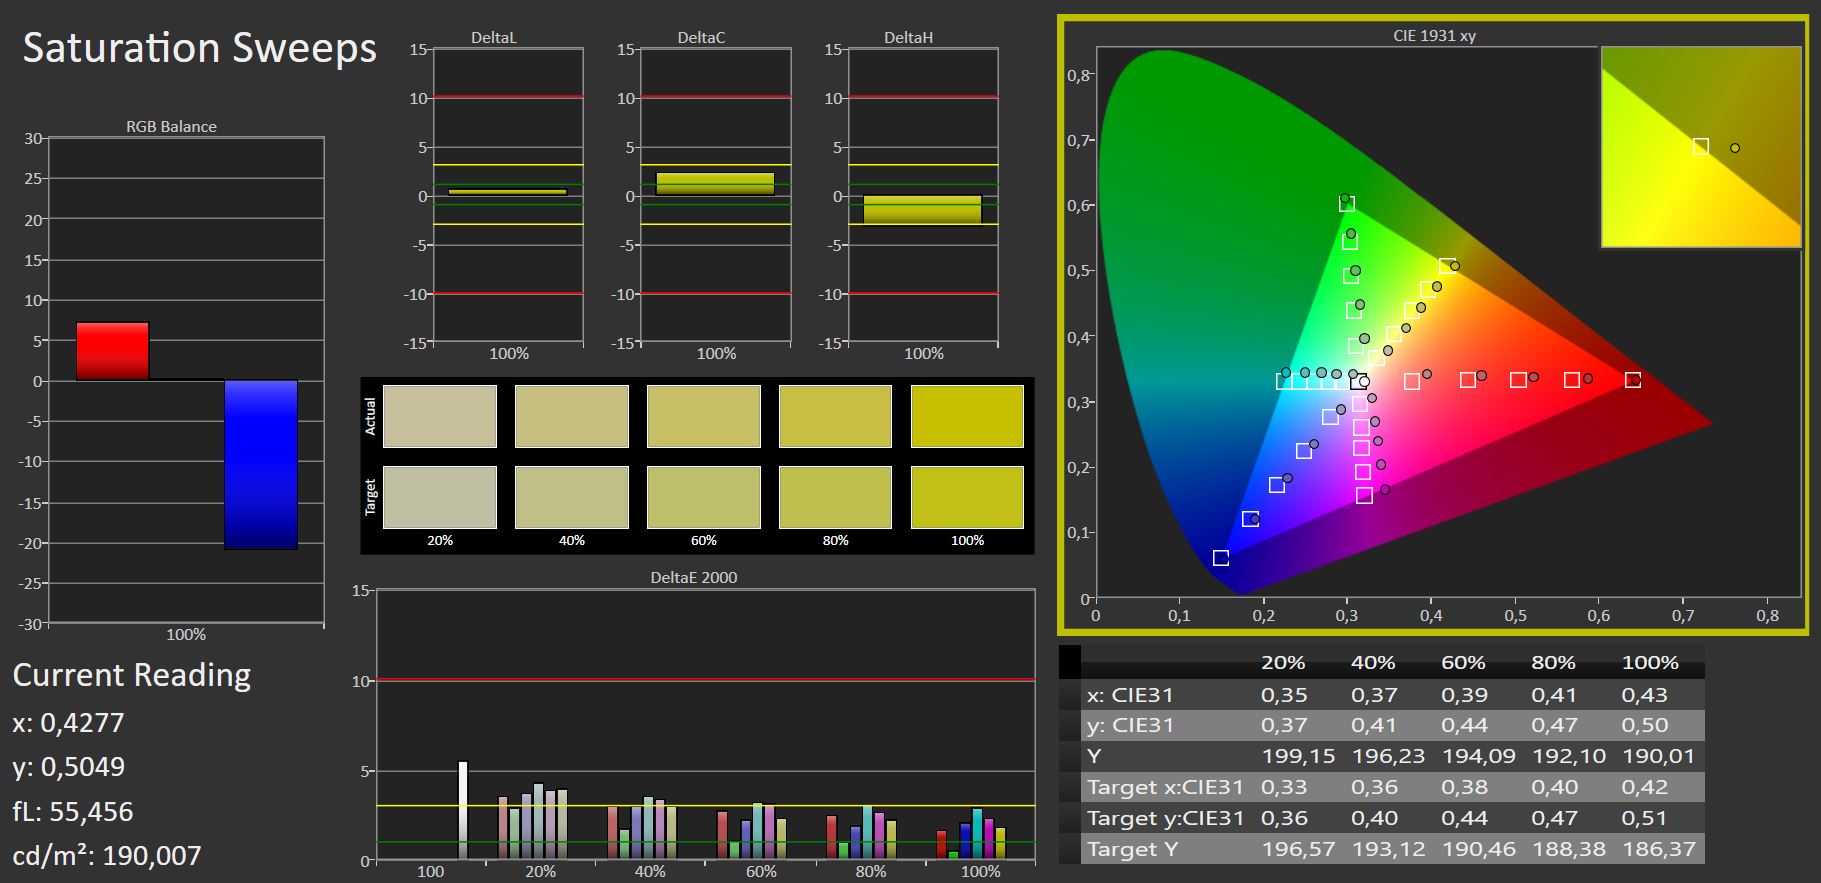
Lo spazio colore sRGB è coperto al 99,3% e consente l'editing professionale delle immagini in campo digitale. Tuttavia, gli spazi di colore più ampi, come DCI-P3 per l'editing video e AdobeRGB per la stampa professionale delle immagini modificate, sono coperti solo dalla percentuale del 99,3% Alienware m15 e dall'Alienware HP Envy 16 li copre quasi completamente.
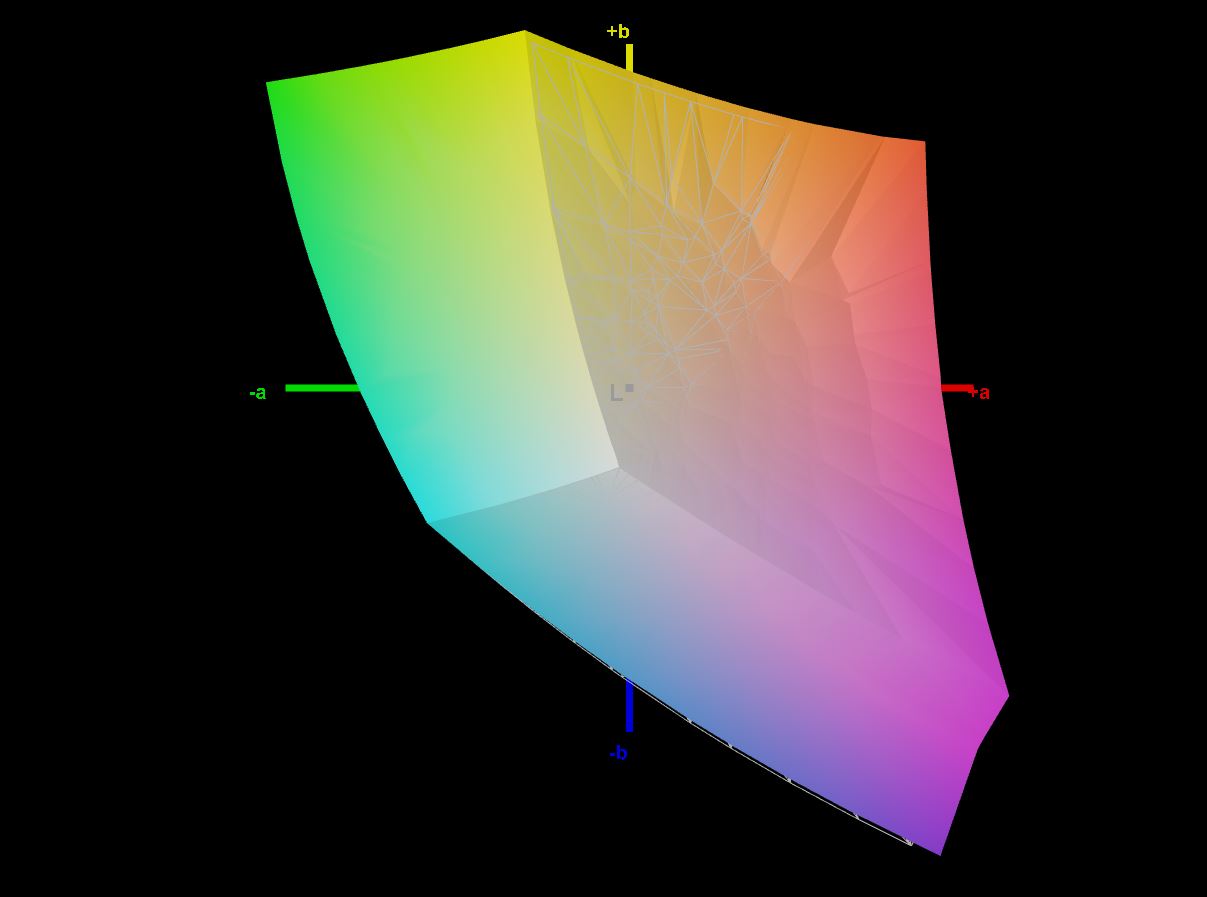
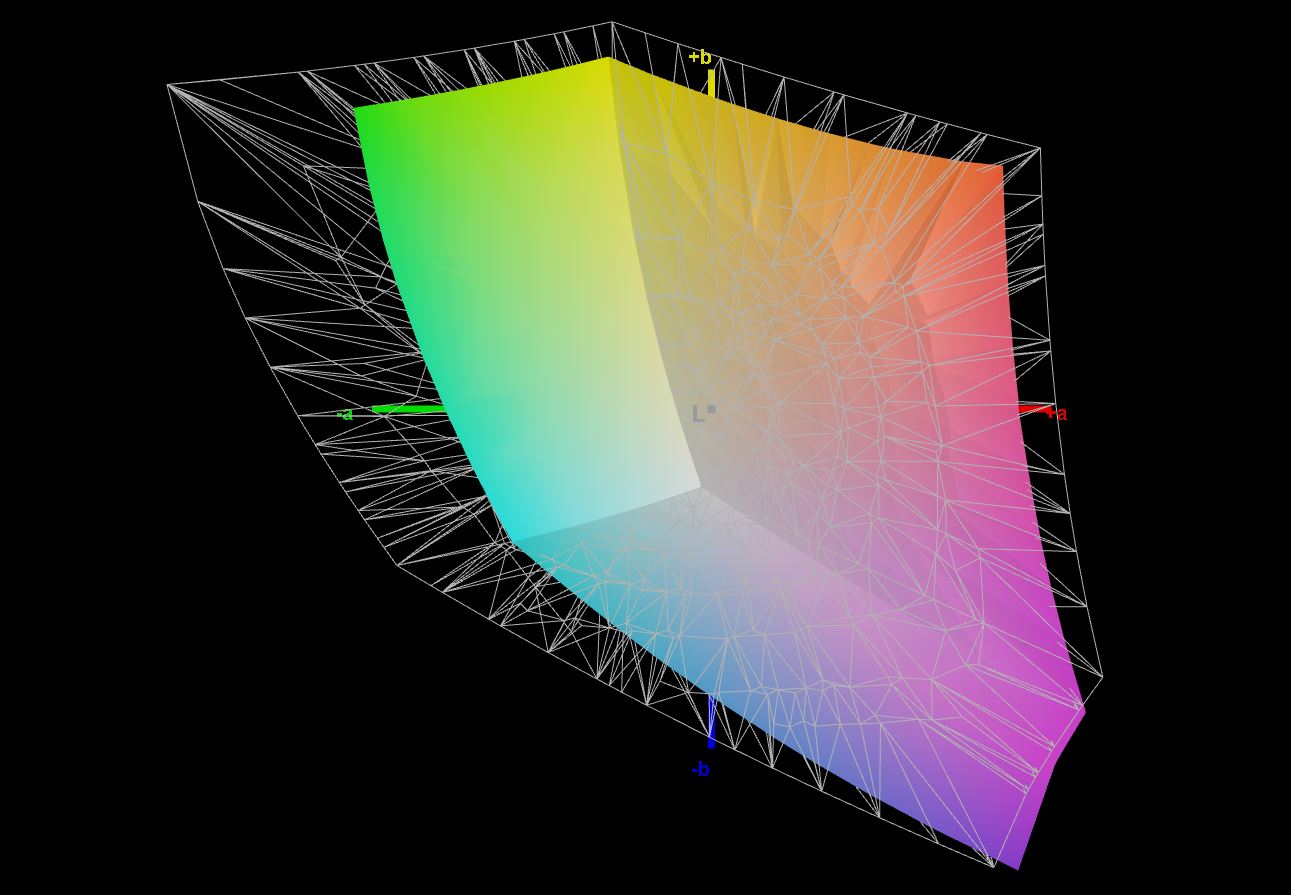
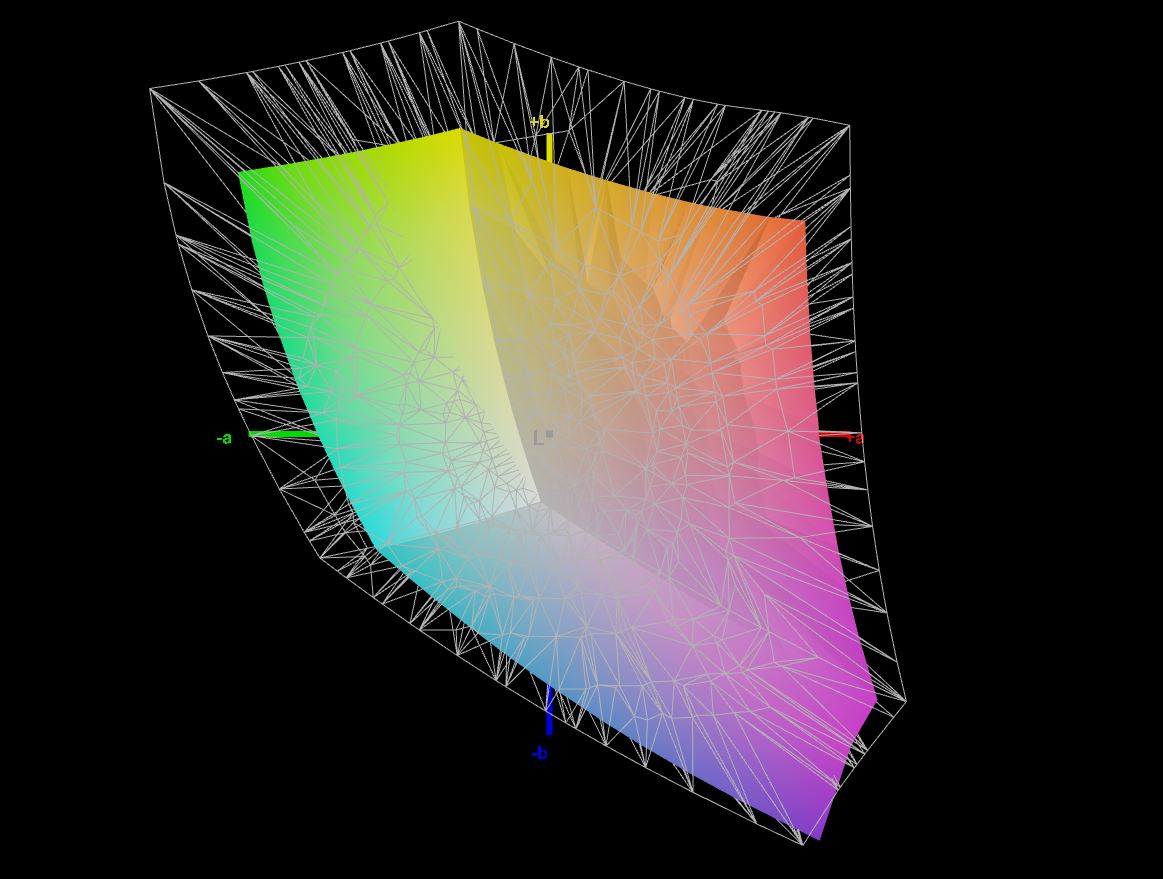
Quasi tutti i colori rimangono al di sotto della soglia di DeltaE 3. Tuttavia, è visibile un leggero colore rosso ex fabbrica, che non scompare nemmeno dopo la nostra calibrazione. Il nostro profilo colore calibrato può essere scaricatoqui.

Tempi di risposta del Display
| ↔ Tempi di risposta dal Nero al Bianco | ||
|---|---|---|
| 7.6 ms ... aumenta ↗ e diminuisce ↘ combinato | ↗ 3 ms Incremento | 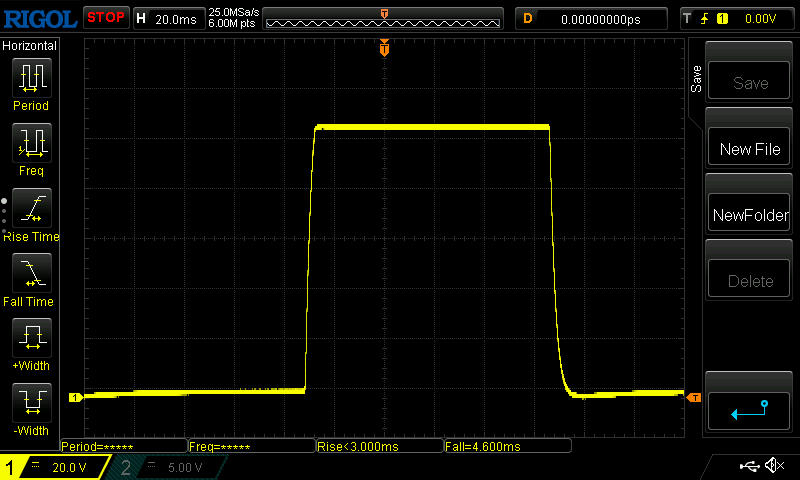 |
| ↘ 4.6 ms Calo | ||
| Lo schermo ha mostrato valori di risposta molto veloci nei nostri tests ed è molto adatto per i gaming veloce. In confronto, tutti i dispositivi di test variano da 0.1 (minimo) a 240 (massimo) ms. » 22 % di tutti i dispositivi è migliore. Questo significa che i tempi di risposta rilevati sono migliori rispettto alla media di tutti i dispositivi testati (19.8 ms). | ||
| ↔ Tempo di risposta dal 50% Grigio all'80% Grigio | ||
| 16 ms ... aumenta ↗ e diminuisce ↘ combinato | ↗ 7 ms Incremento | 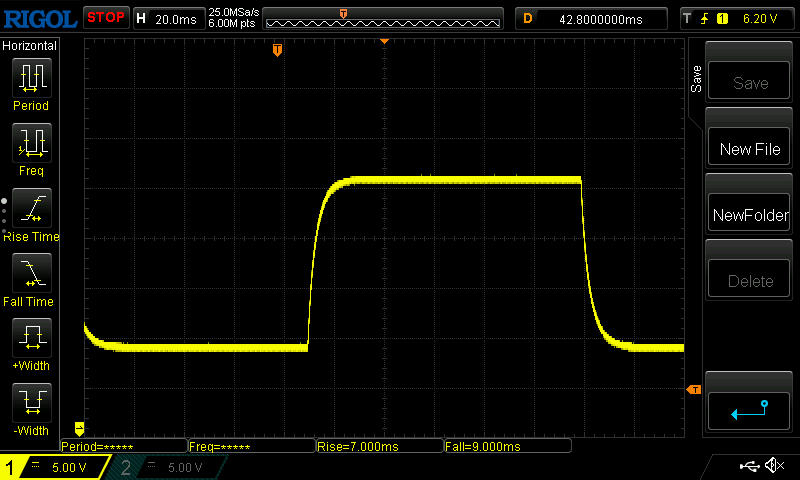 |
| ↘ 9 ms Calo | ||
| Lo schermo mostra buoni tempi di risposta durante i nostri tests, ma potrebbe essere troppo lento per i gamers competitivi. In confronto, tutti i dispositivi di test variano da 0.165 (minimo) a 636 (massimo) ms. » 30 % di tutti i dispositivi è migliore. Questo significa che i tempi di risposta rilevati sono migliori rispettto alla media di tutti i dispositivi testati (31 ms). | ||
Sfarfallio dello schermo / PWM (Pulse-Width Modulation)
| flickering dello schermo / PWM non rilevato | 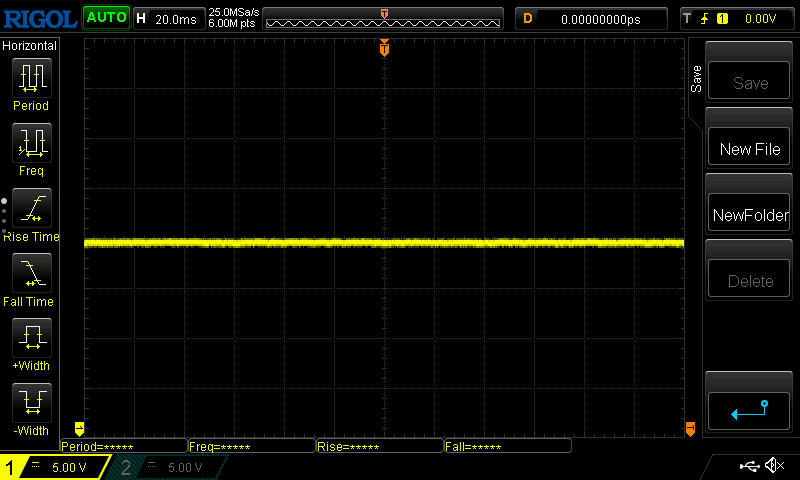 | ||
In confronto: 52 % di tutti i dispositivi testati non utilizza PWM per ridurre la luminosita' del display. Se è rilevato PWM, una media di 7747 (minimo: 5 - massimo: 343500) Hz è stata rilevata. | |||
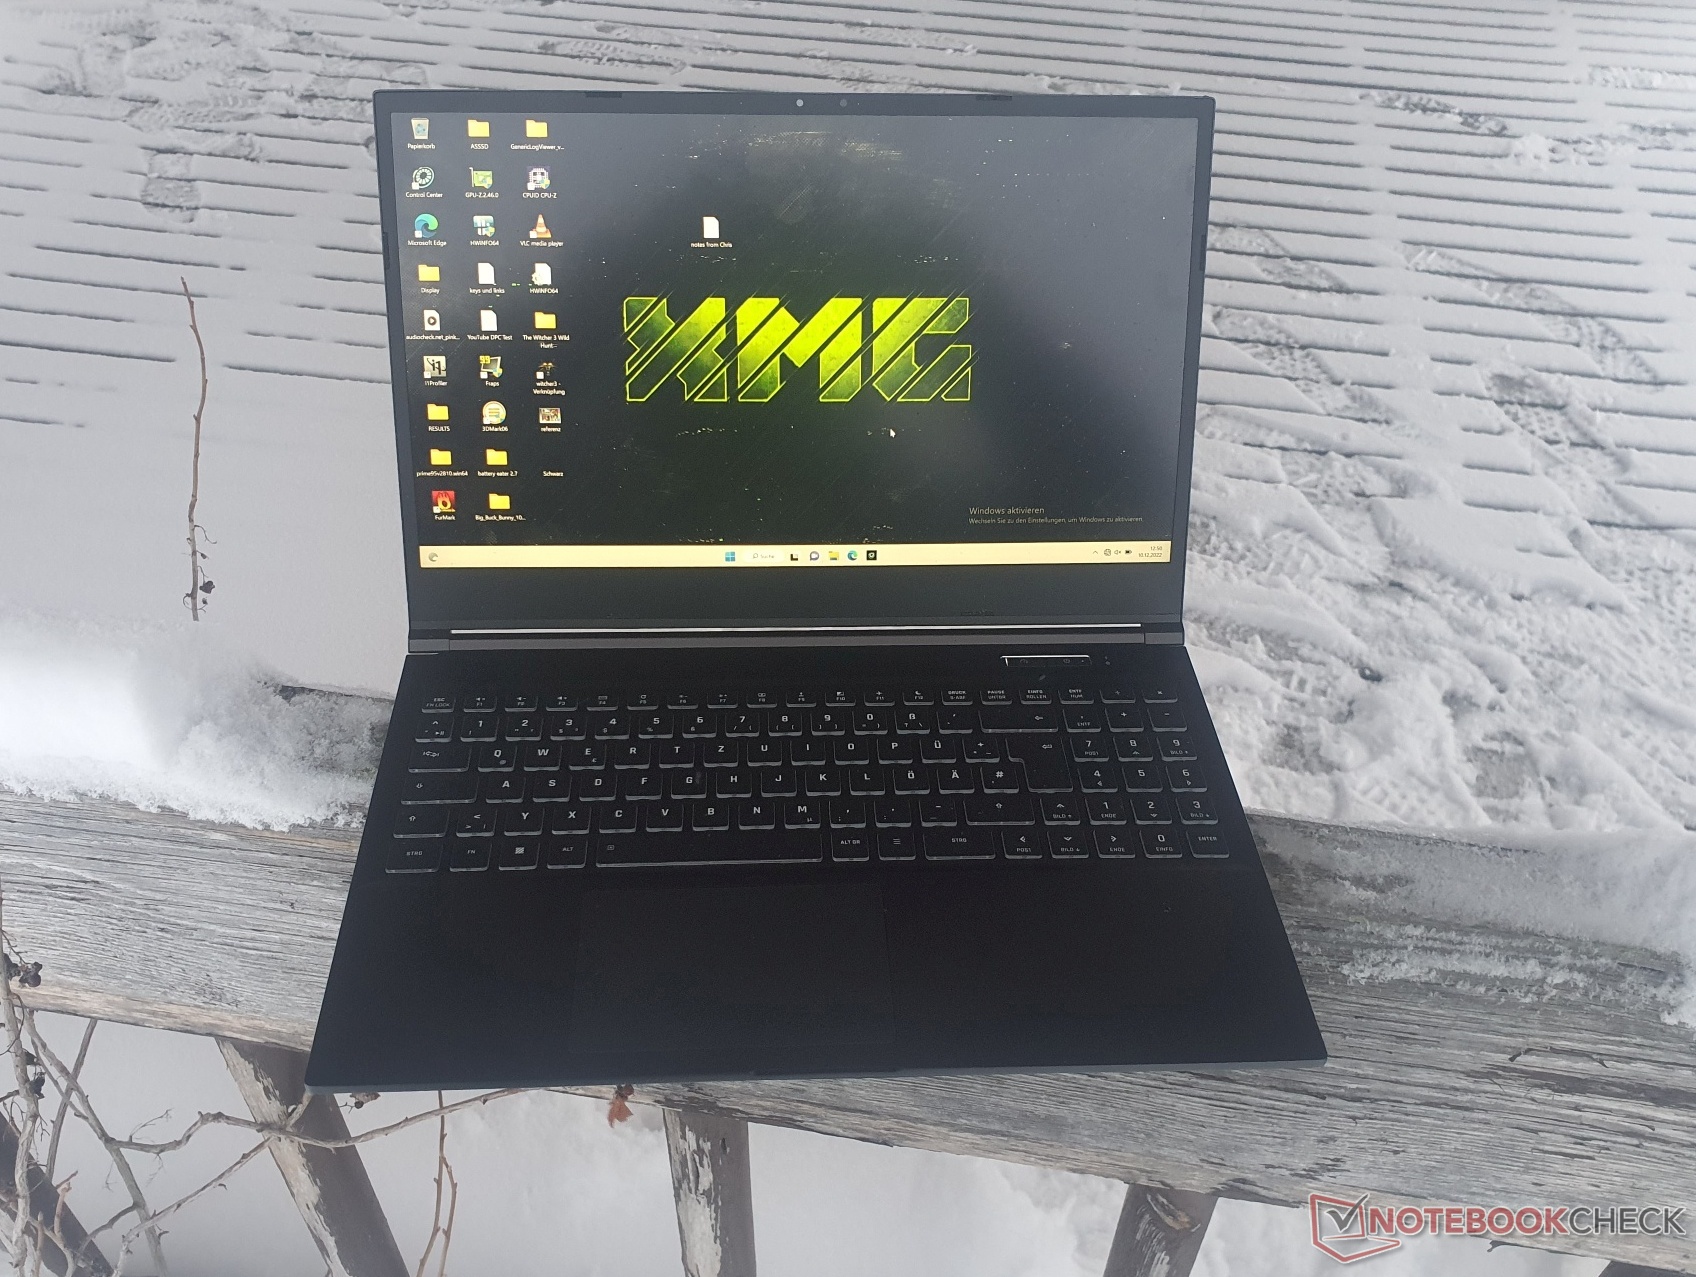
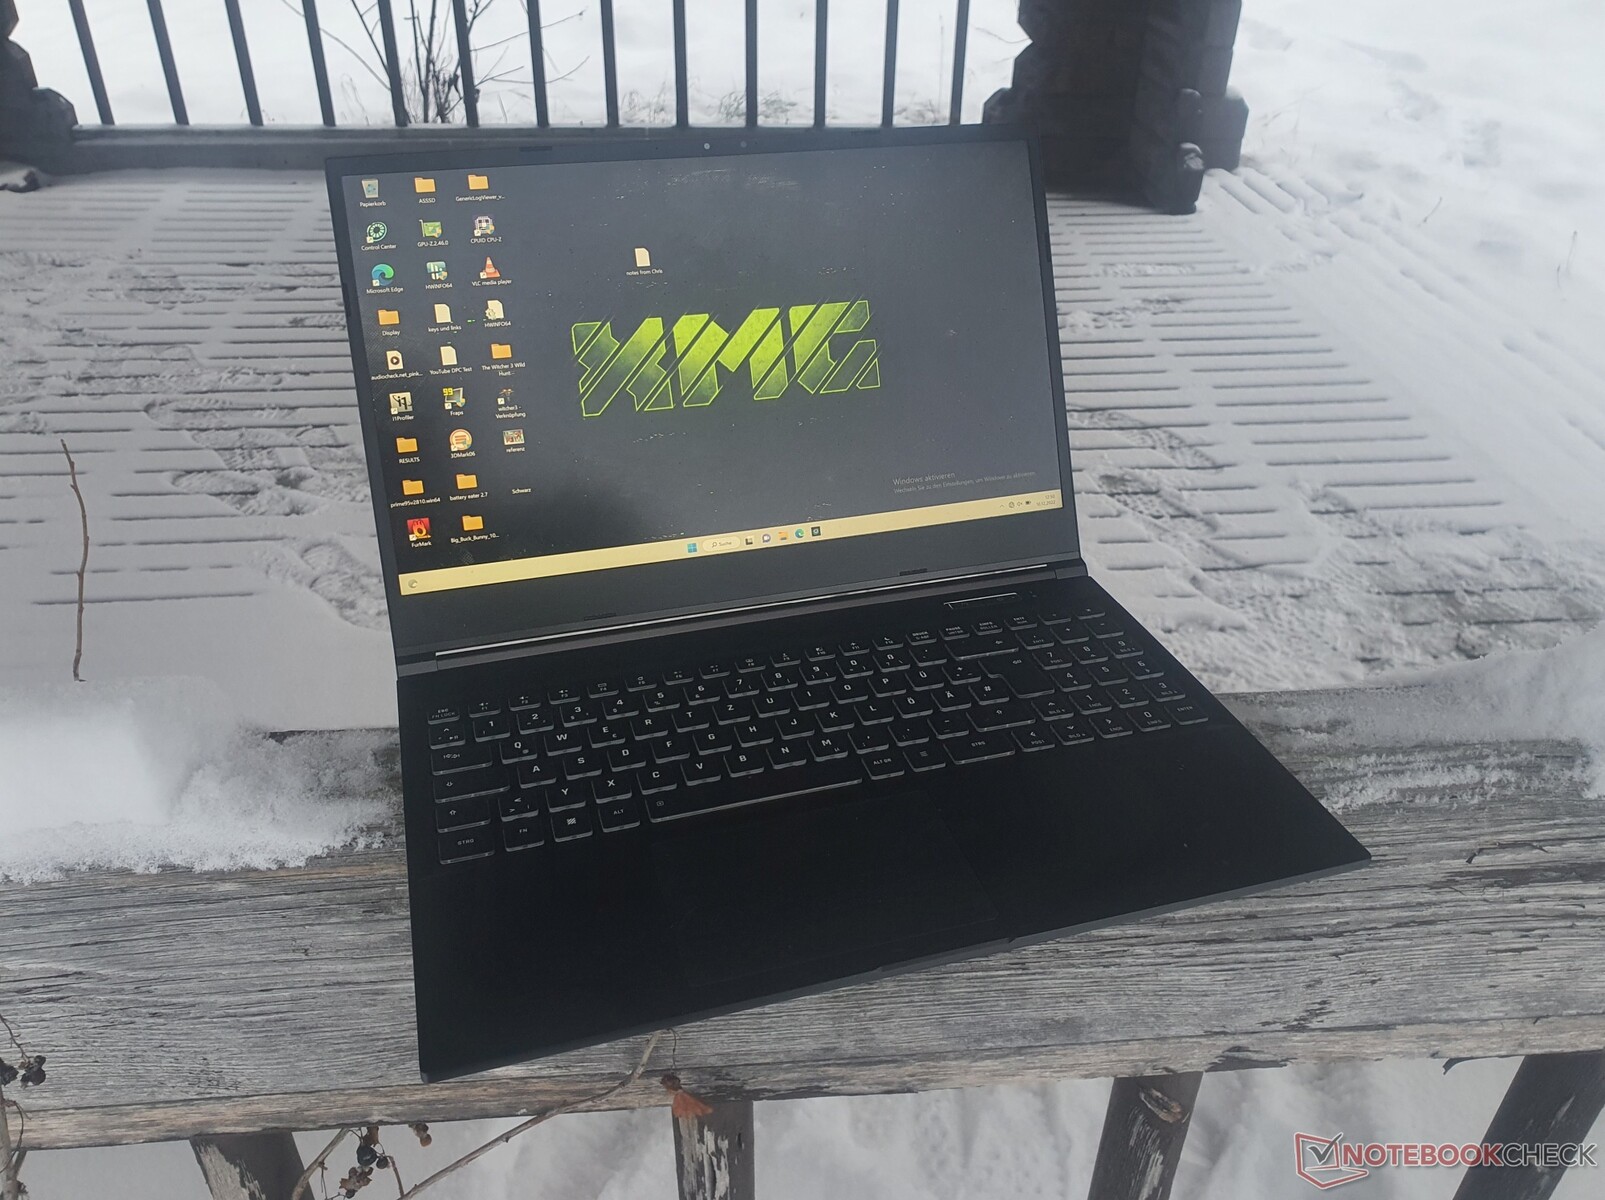
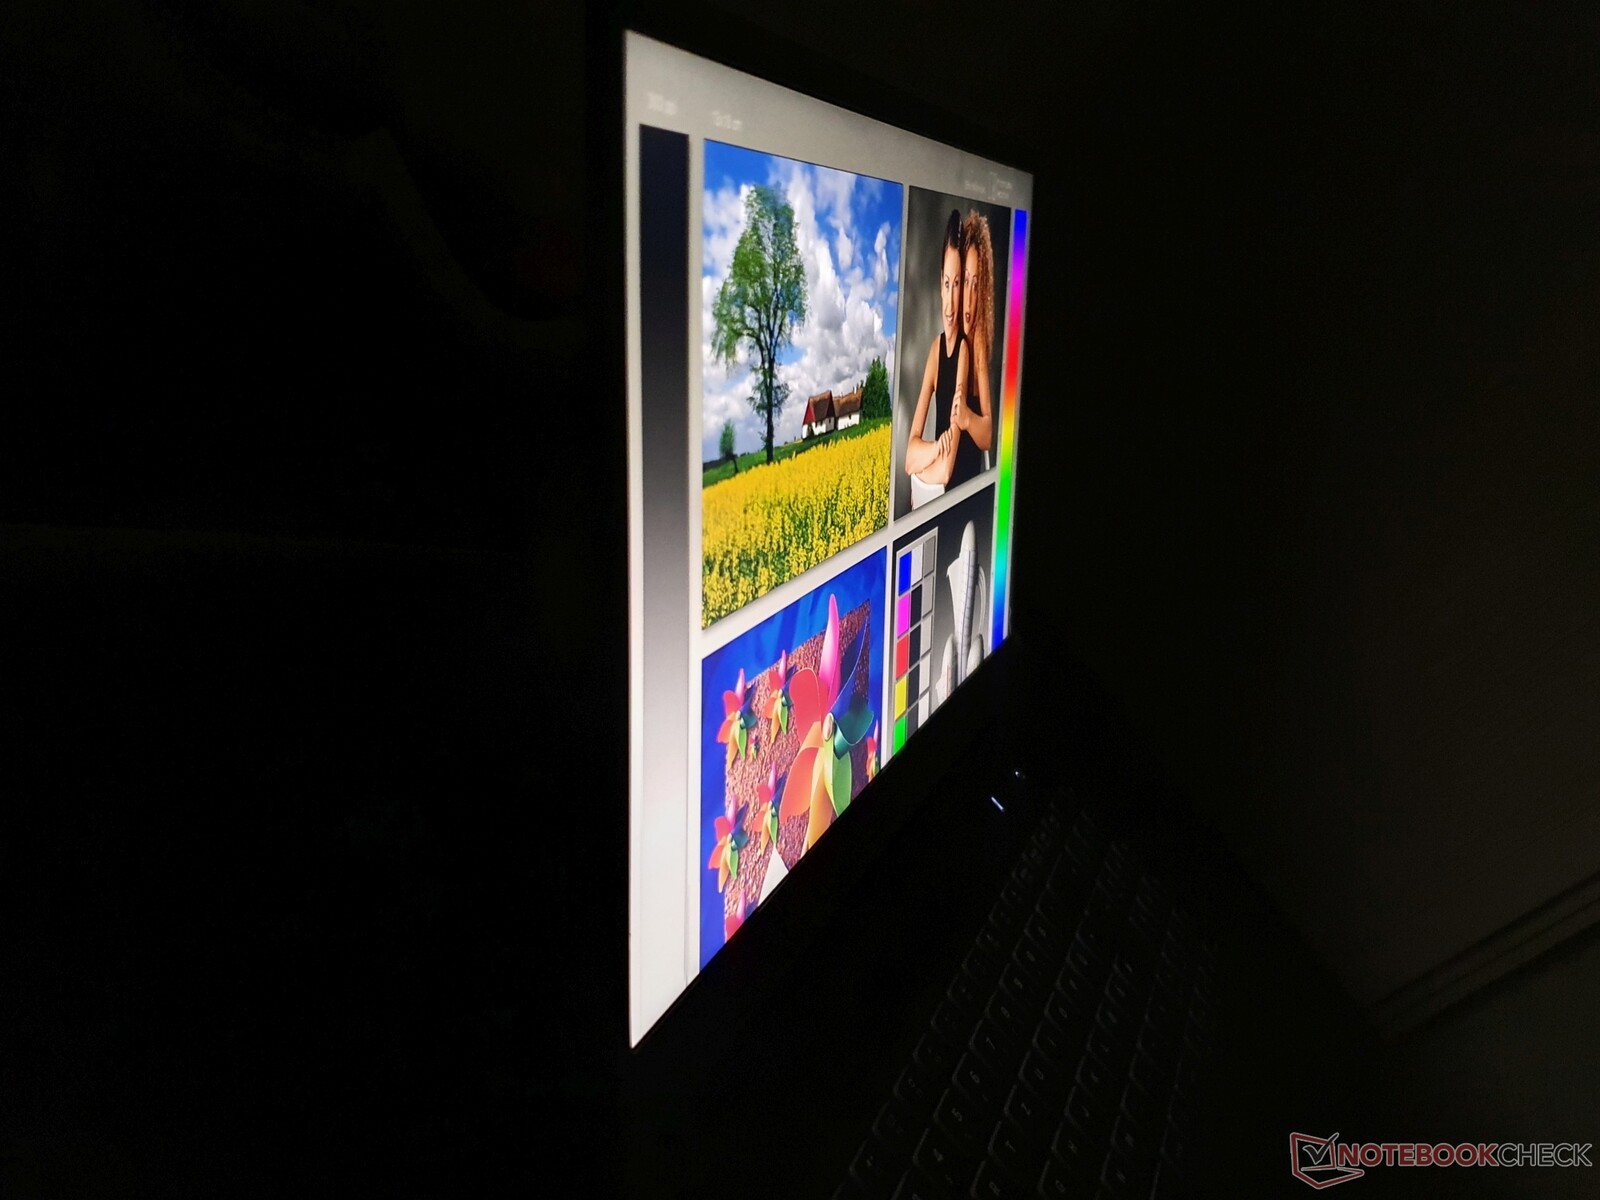
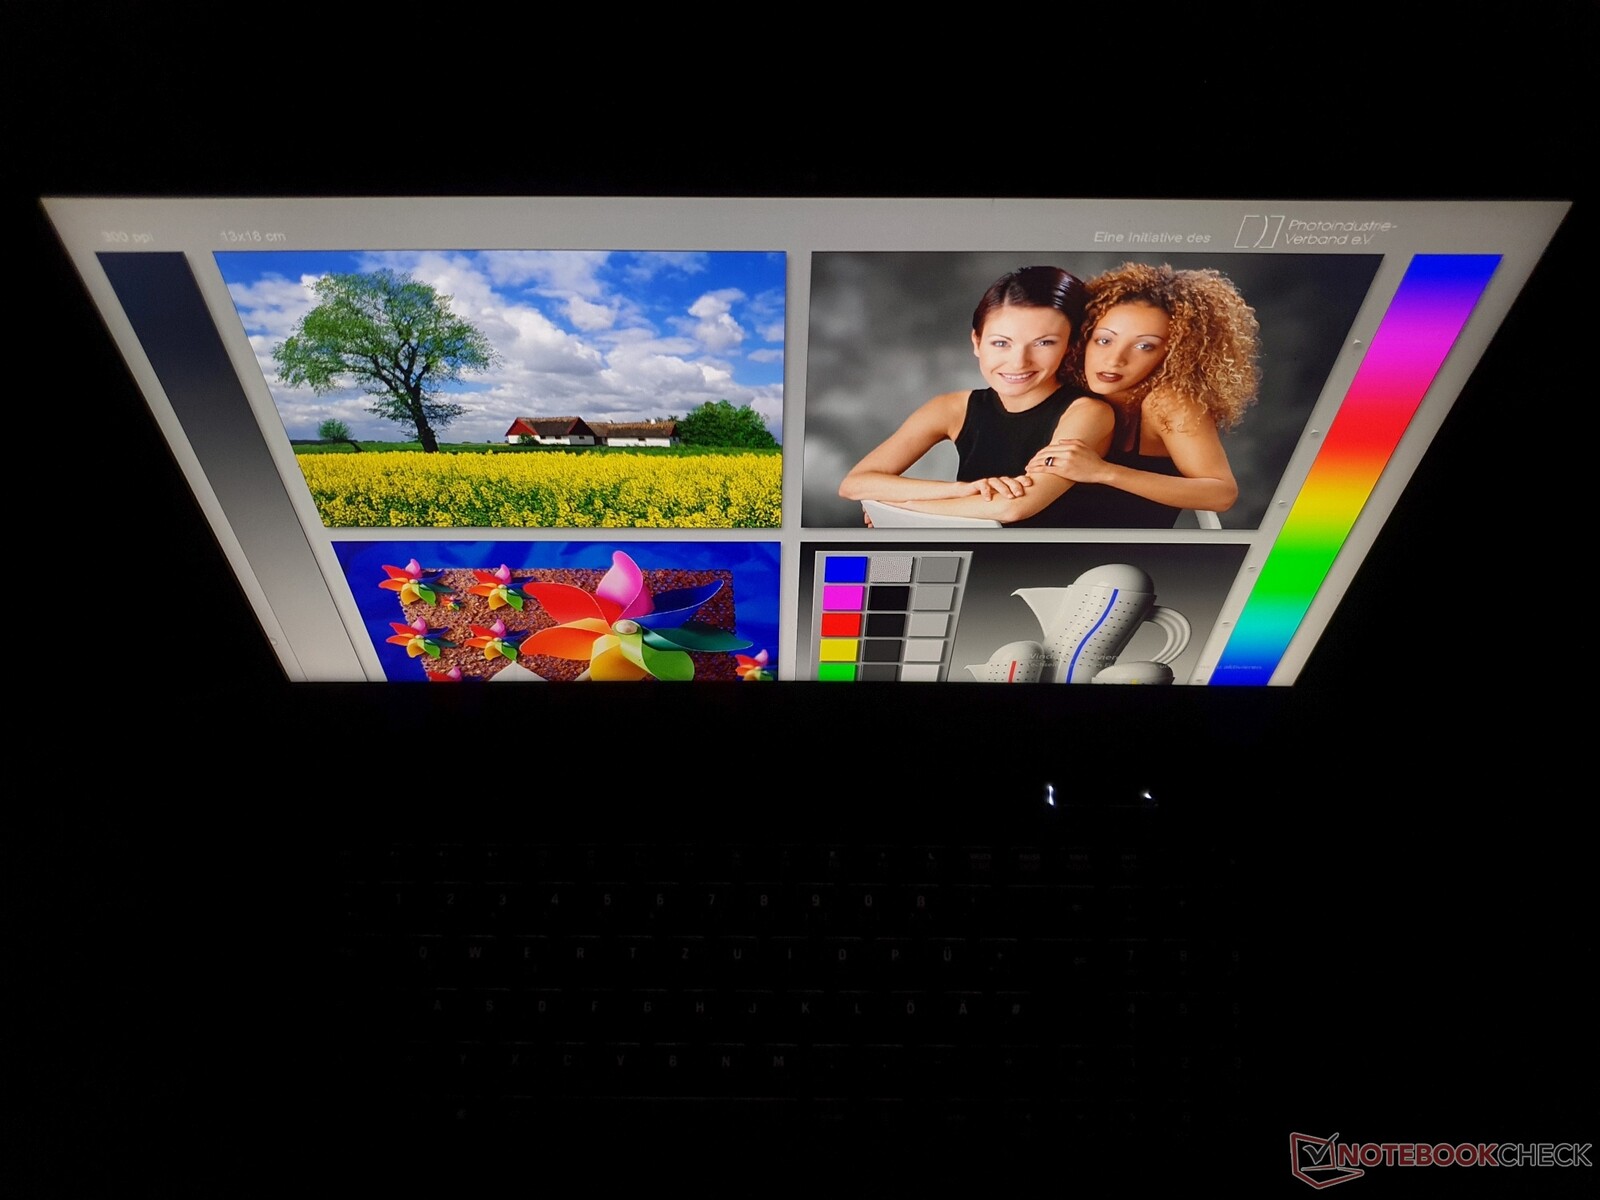
Il display da 371 cd/m² è ben leggibile solo se esposto alla luce diretta del sole, nonostante la finitura opaca.

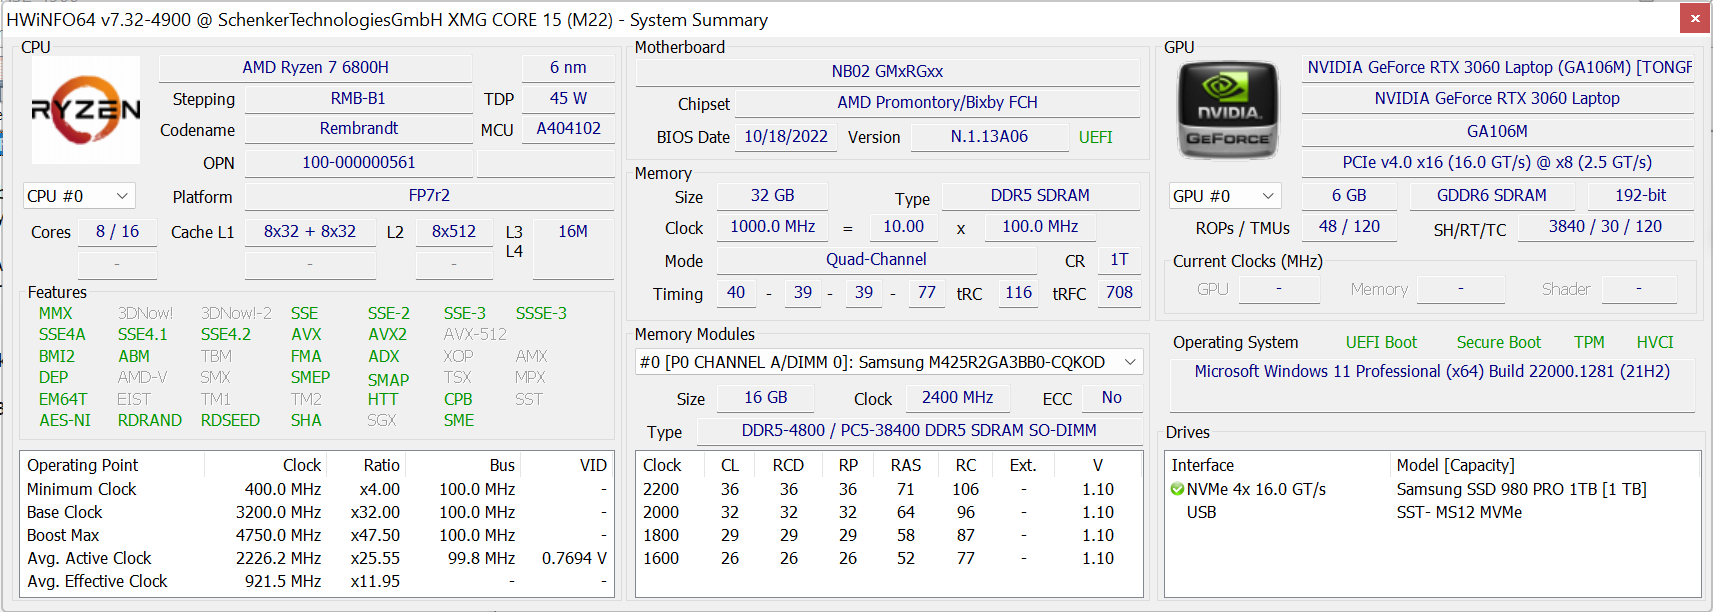
Prestazioni: RTX 3060 con il massimo TGP, ma ce ne sono di più veloci
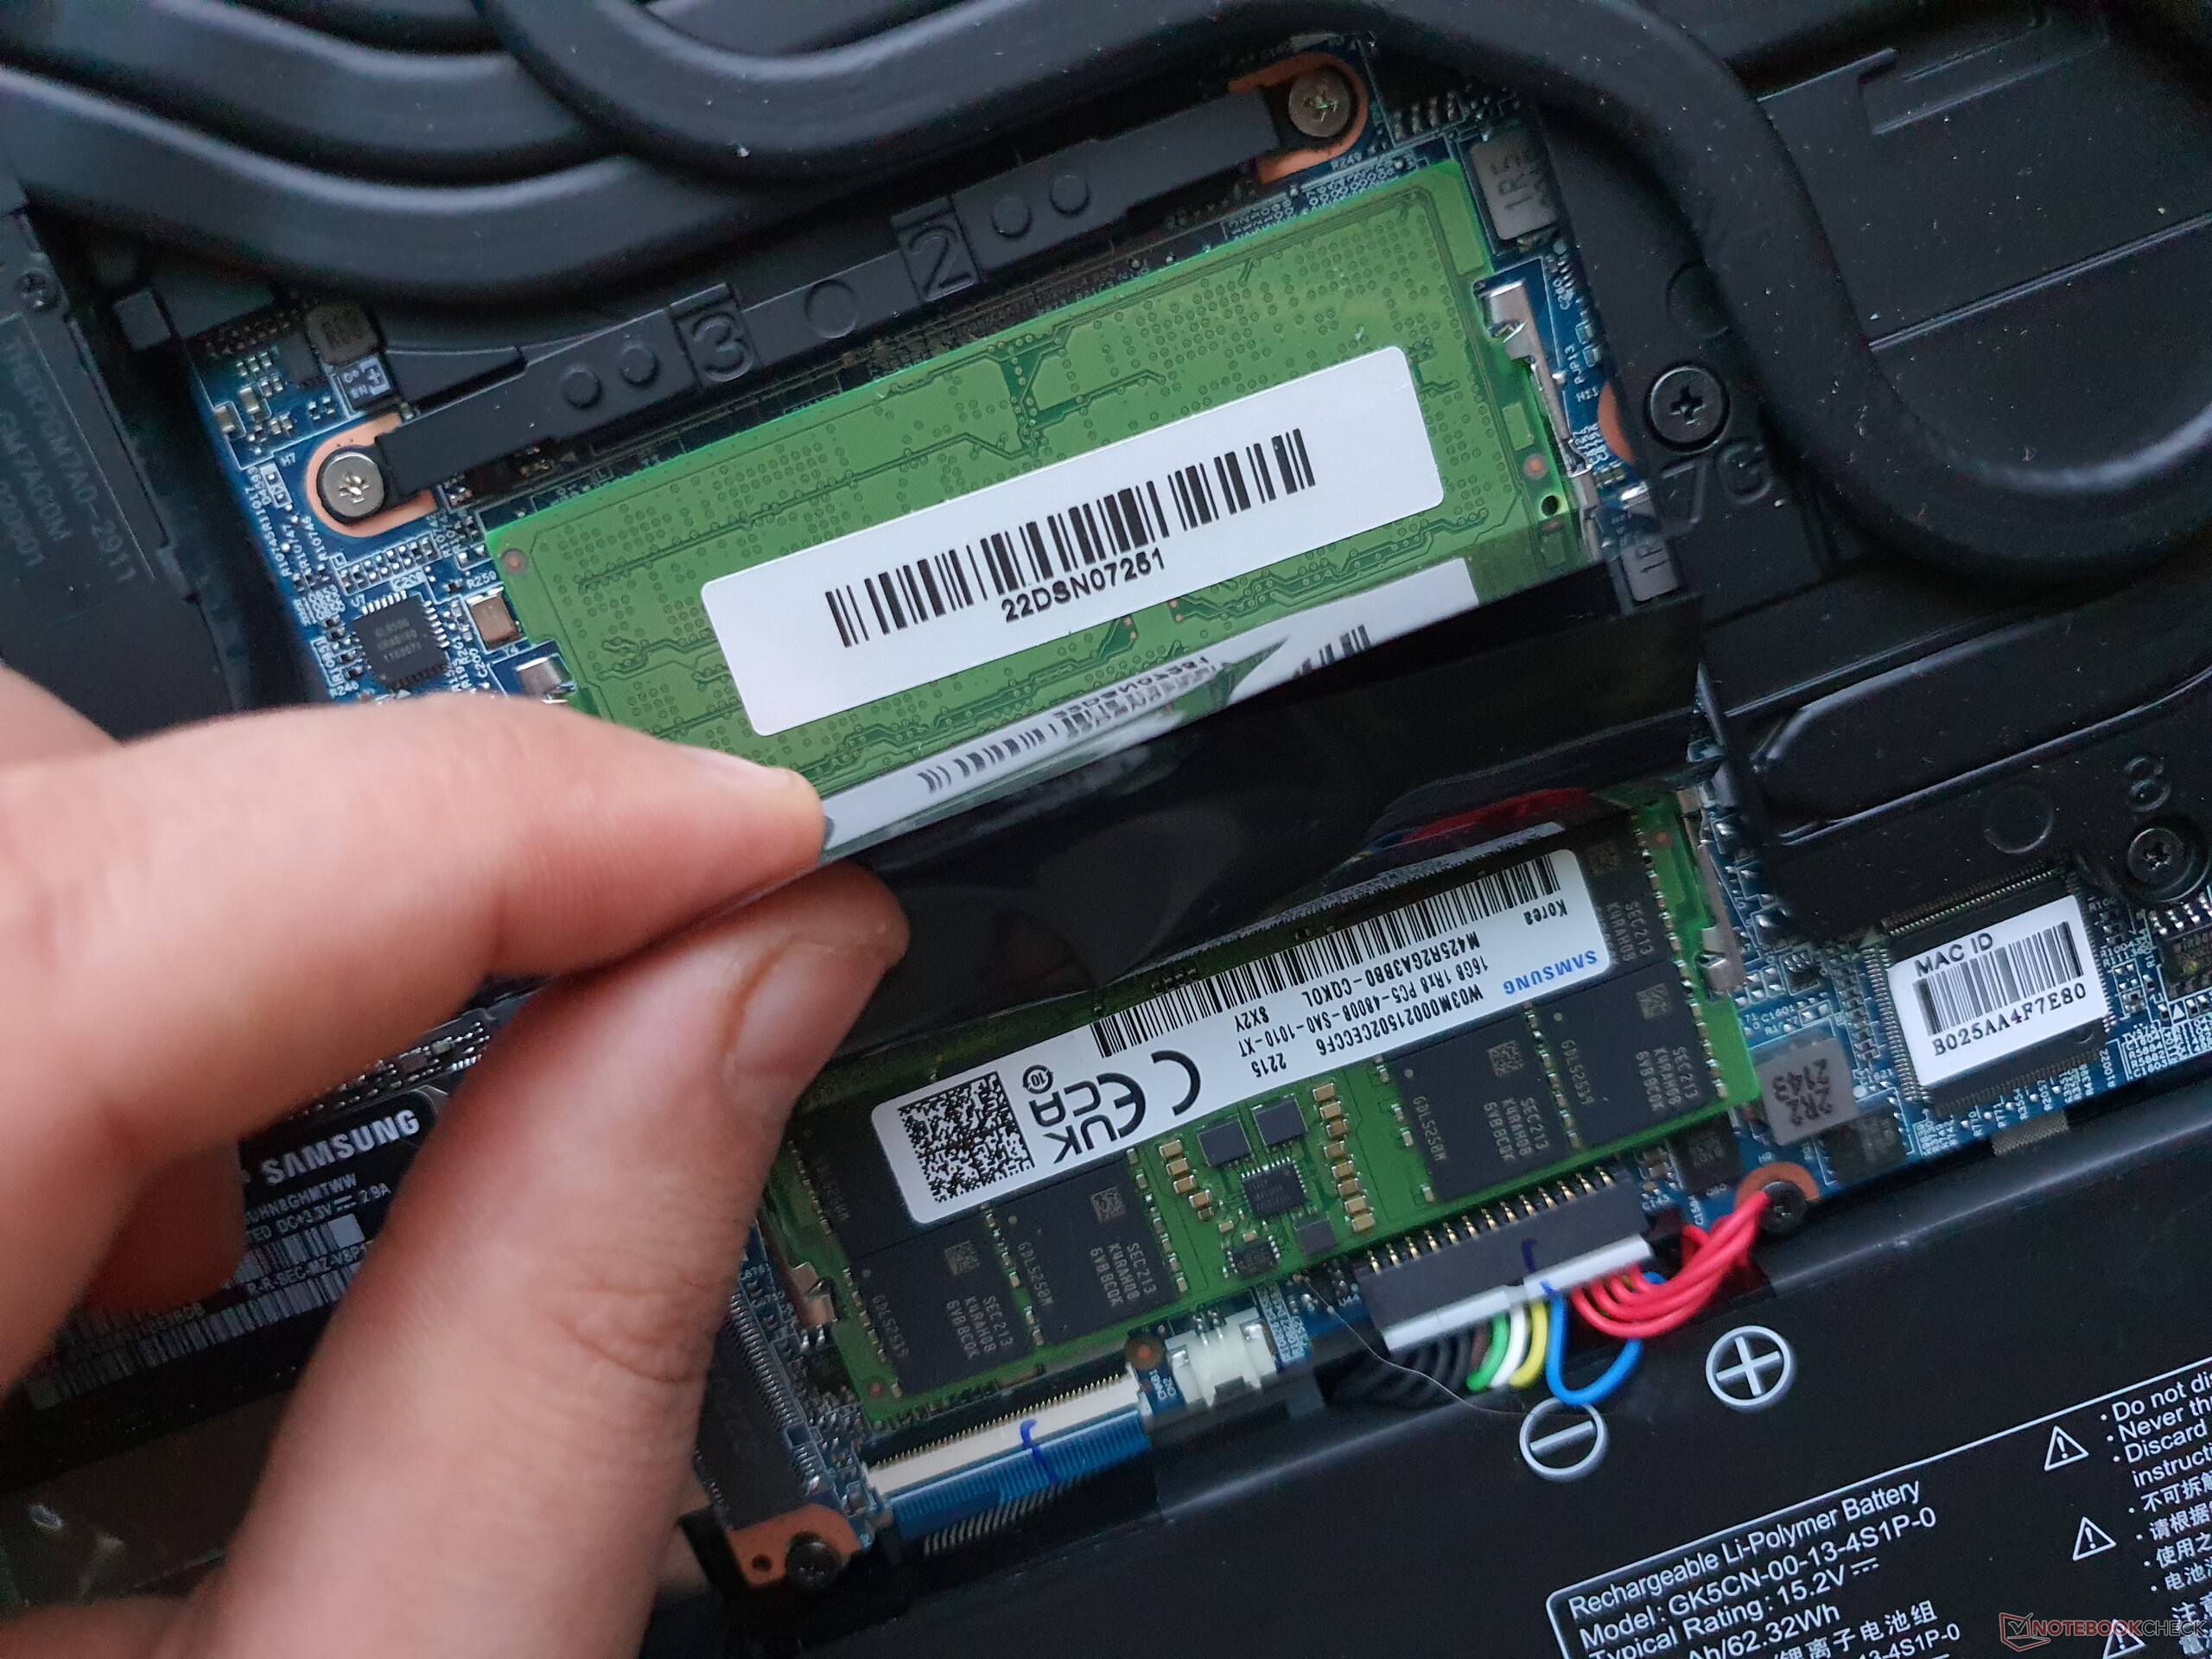
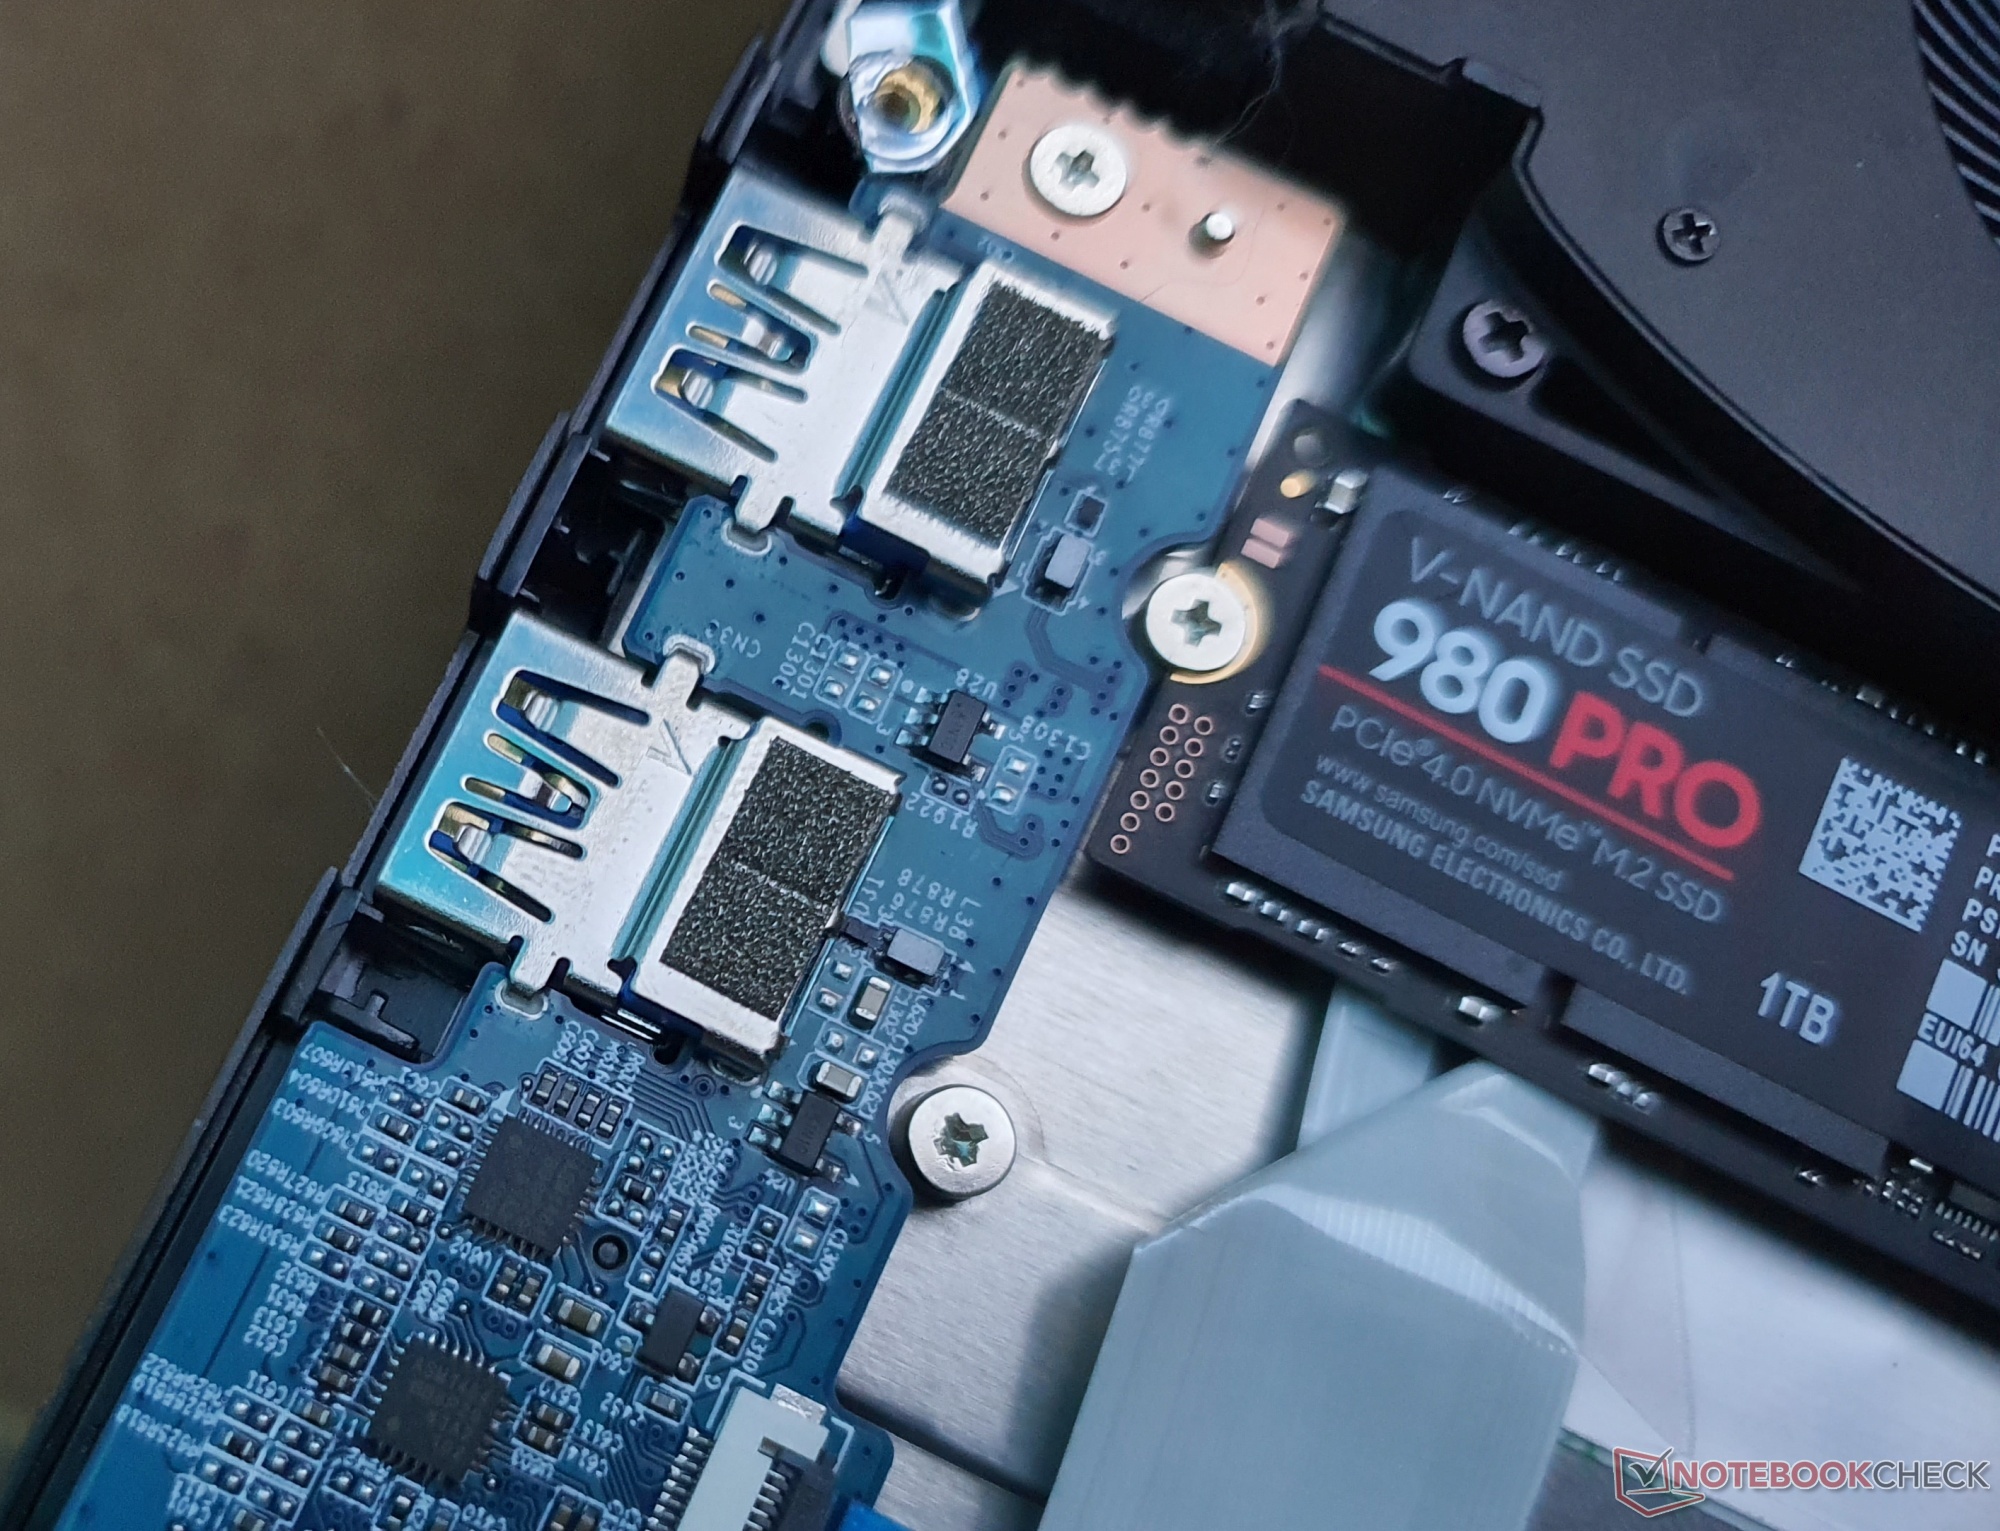
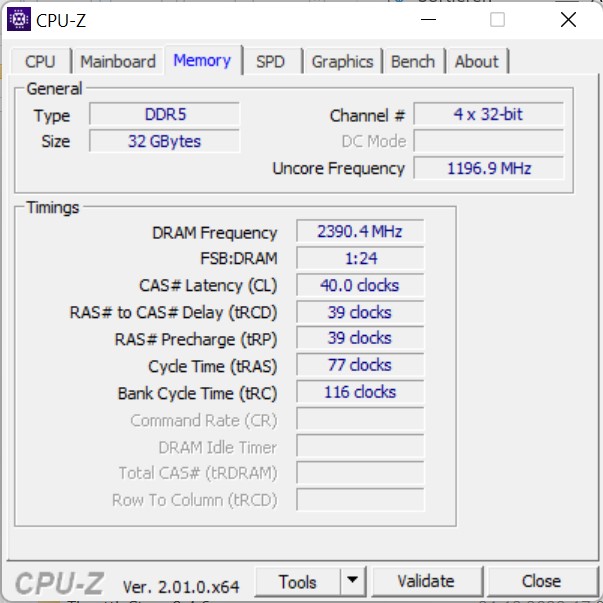
Il portatile da gioco da 15,6 pollici è molto potente grazie alla sua Nvidia RTX 3060 con 140 W TGP progettata per i giochi attuali, non c'è altra opzione GPU. Anche il processore Ryzen 7 6800H è molto potente ed è l'unica scelta possibile. La RAM e la memoria di massa sono generose, rispettivamente con 32 GB DDR5-4800 (massimo 64 GB) e un'unità SSD PCIe 4.0 da 1 TB. Anche le attività di workstation e il lavoro video vengono completati rapidamente e producono emissioni molto basse quando si utilizza il raffreddamento ad acqua esterno.
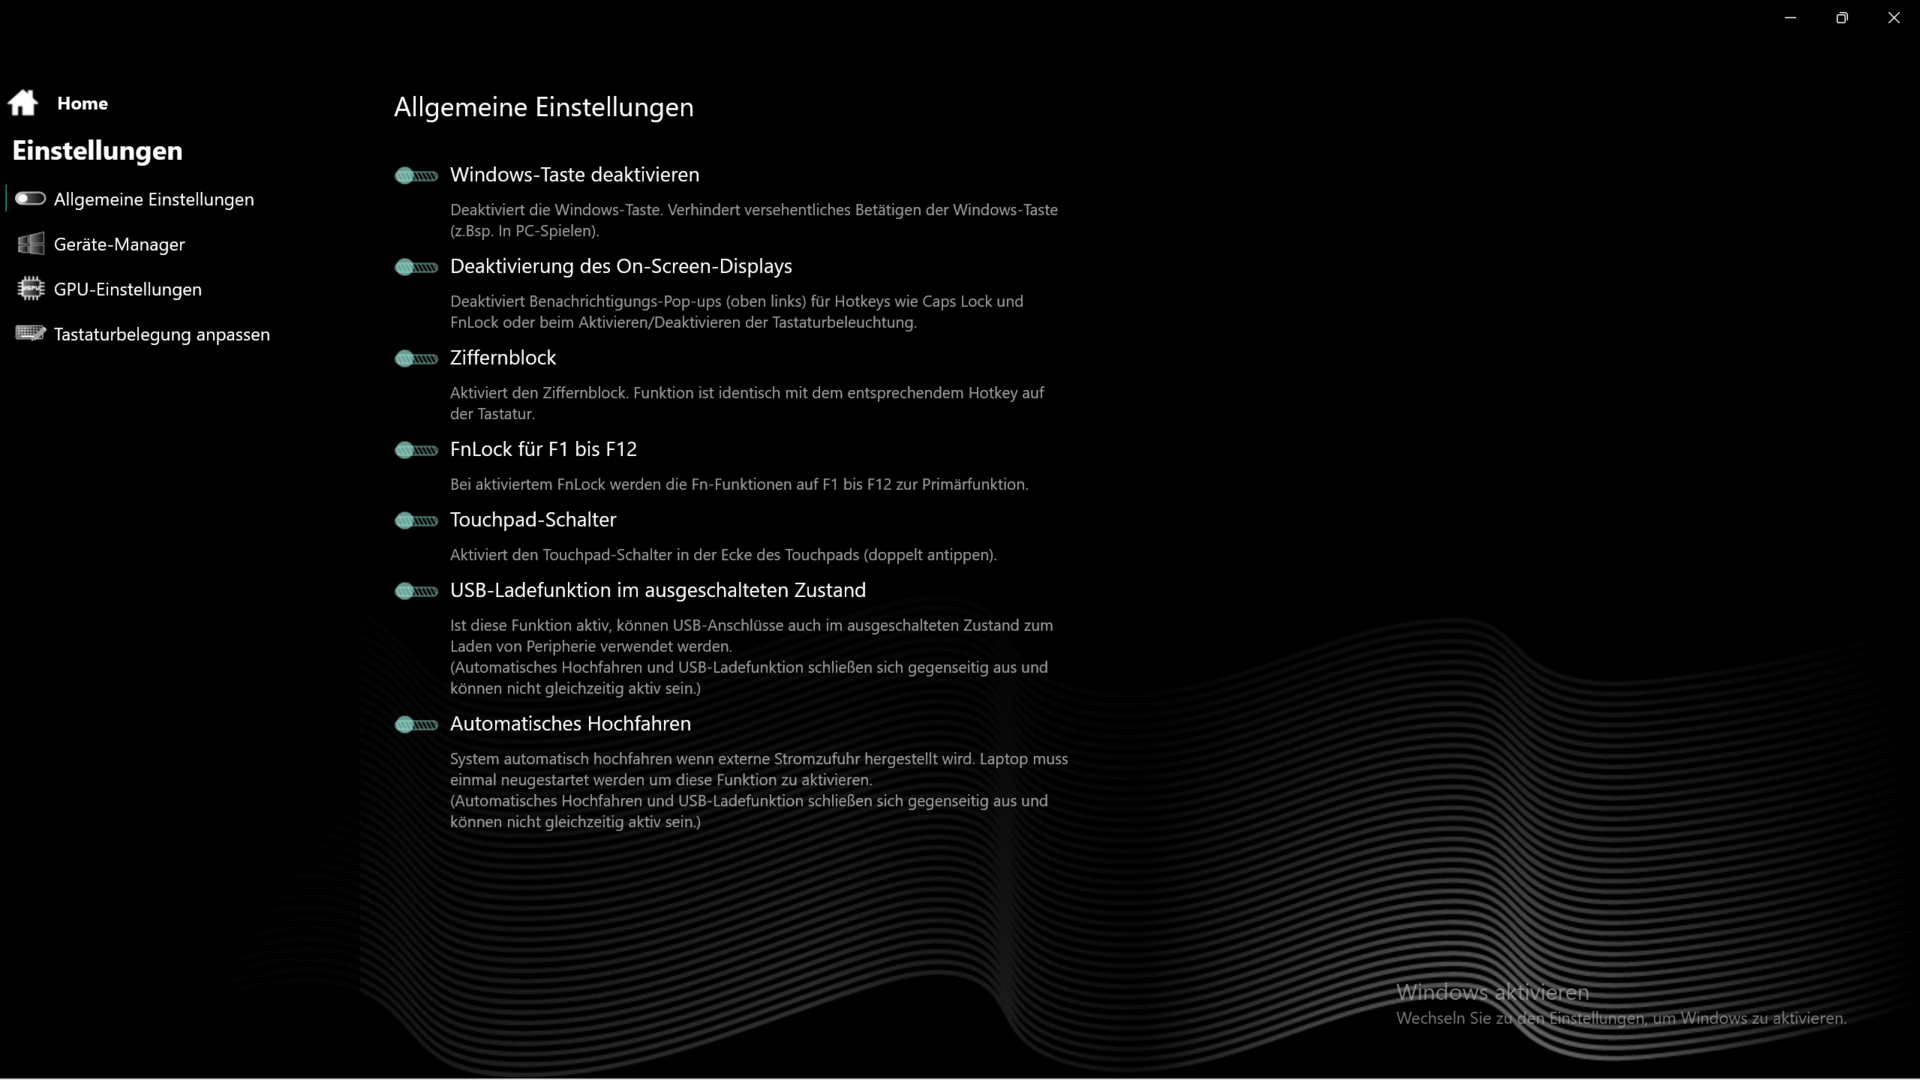
Condizioni di prova
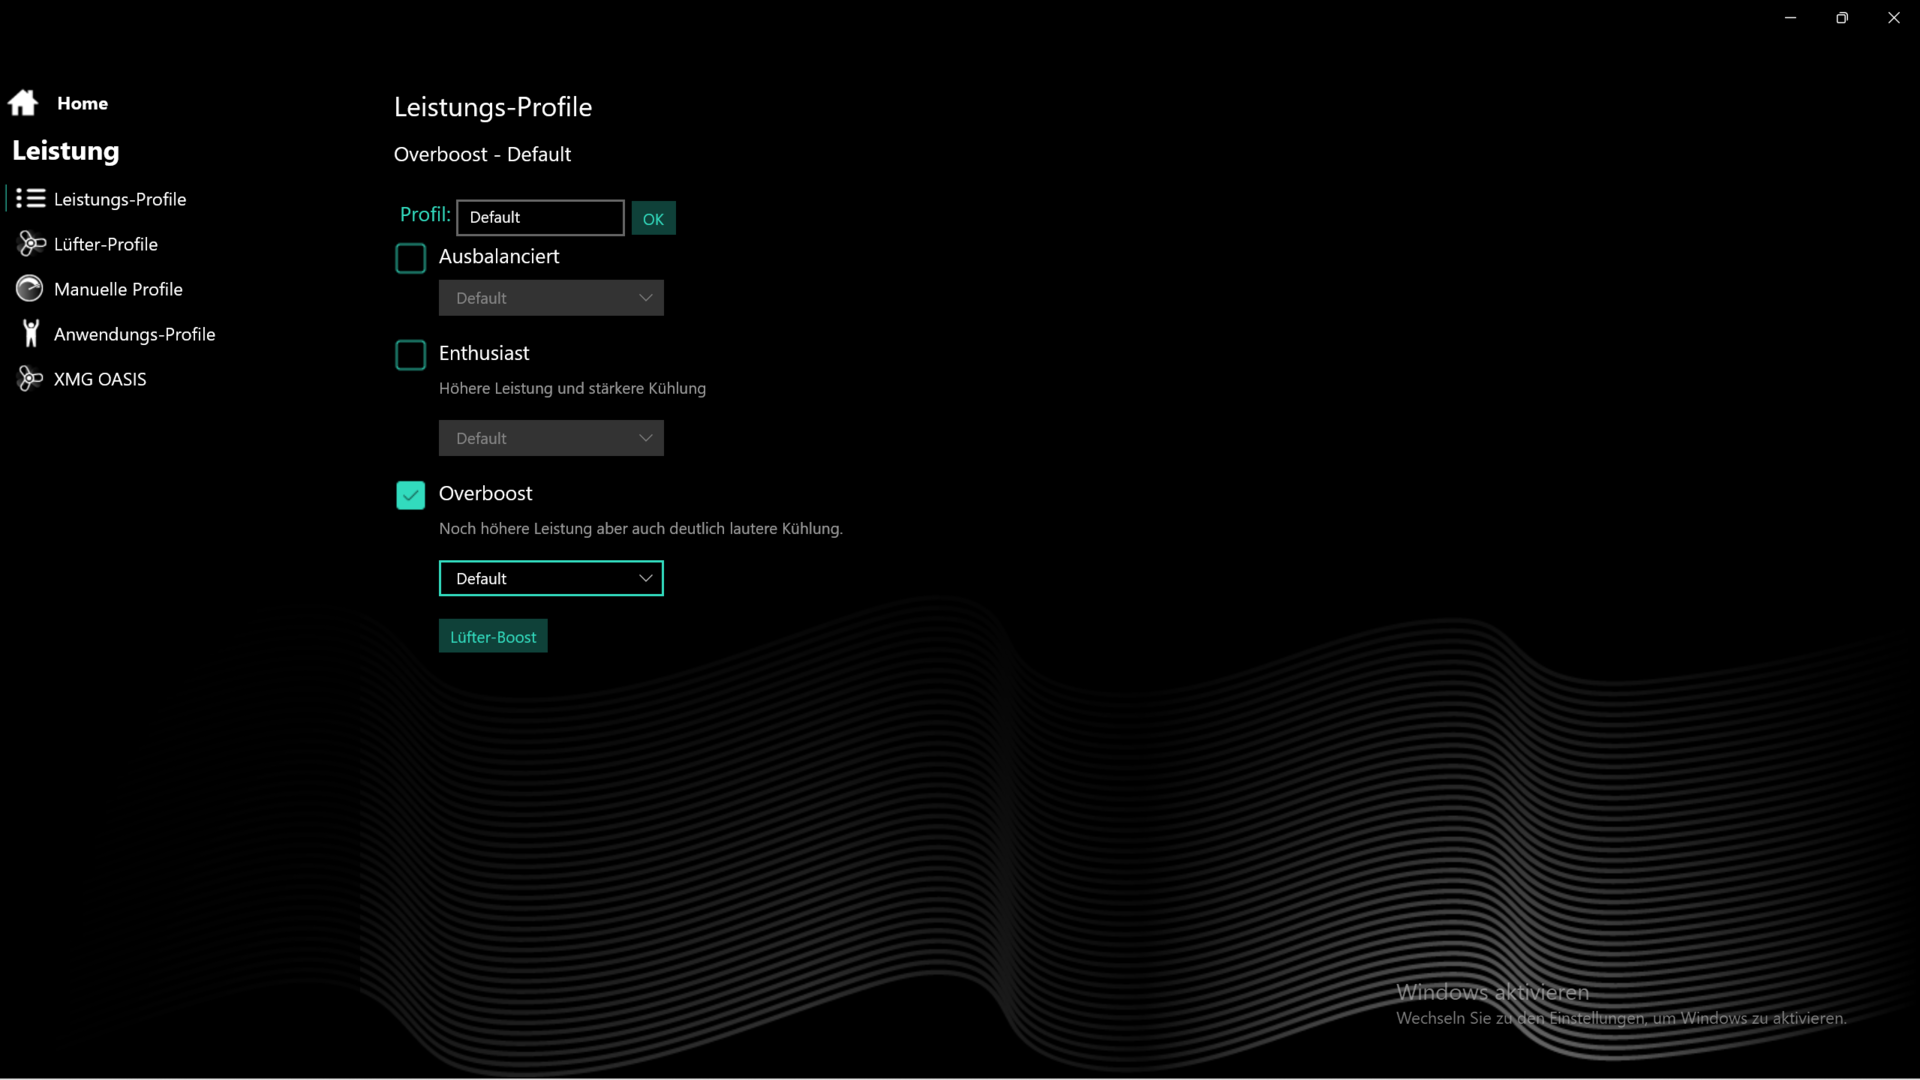
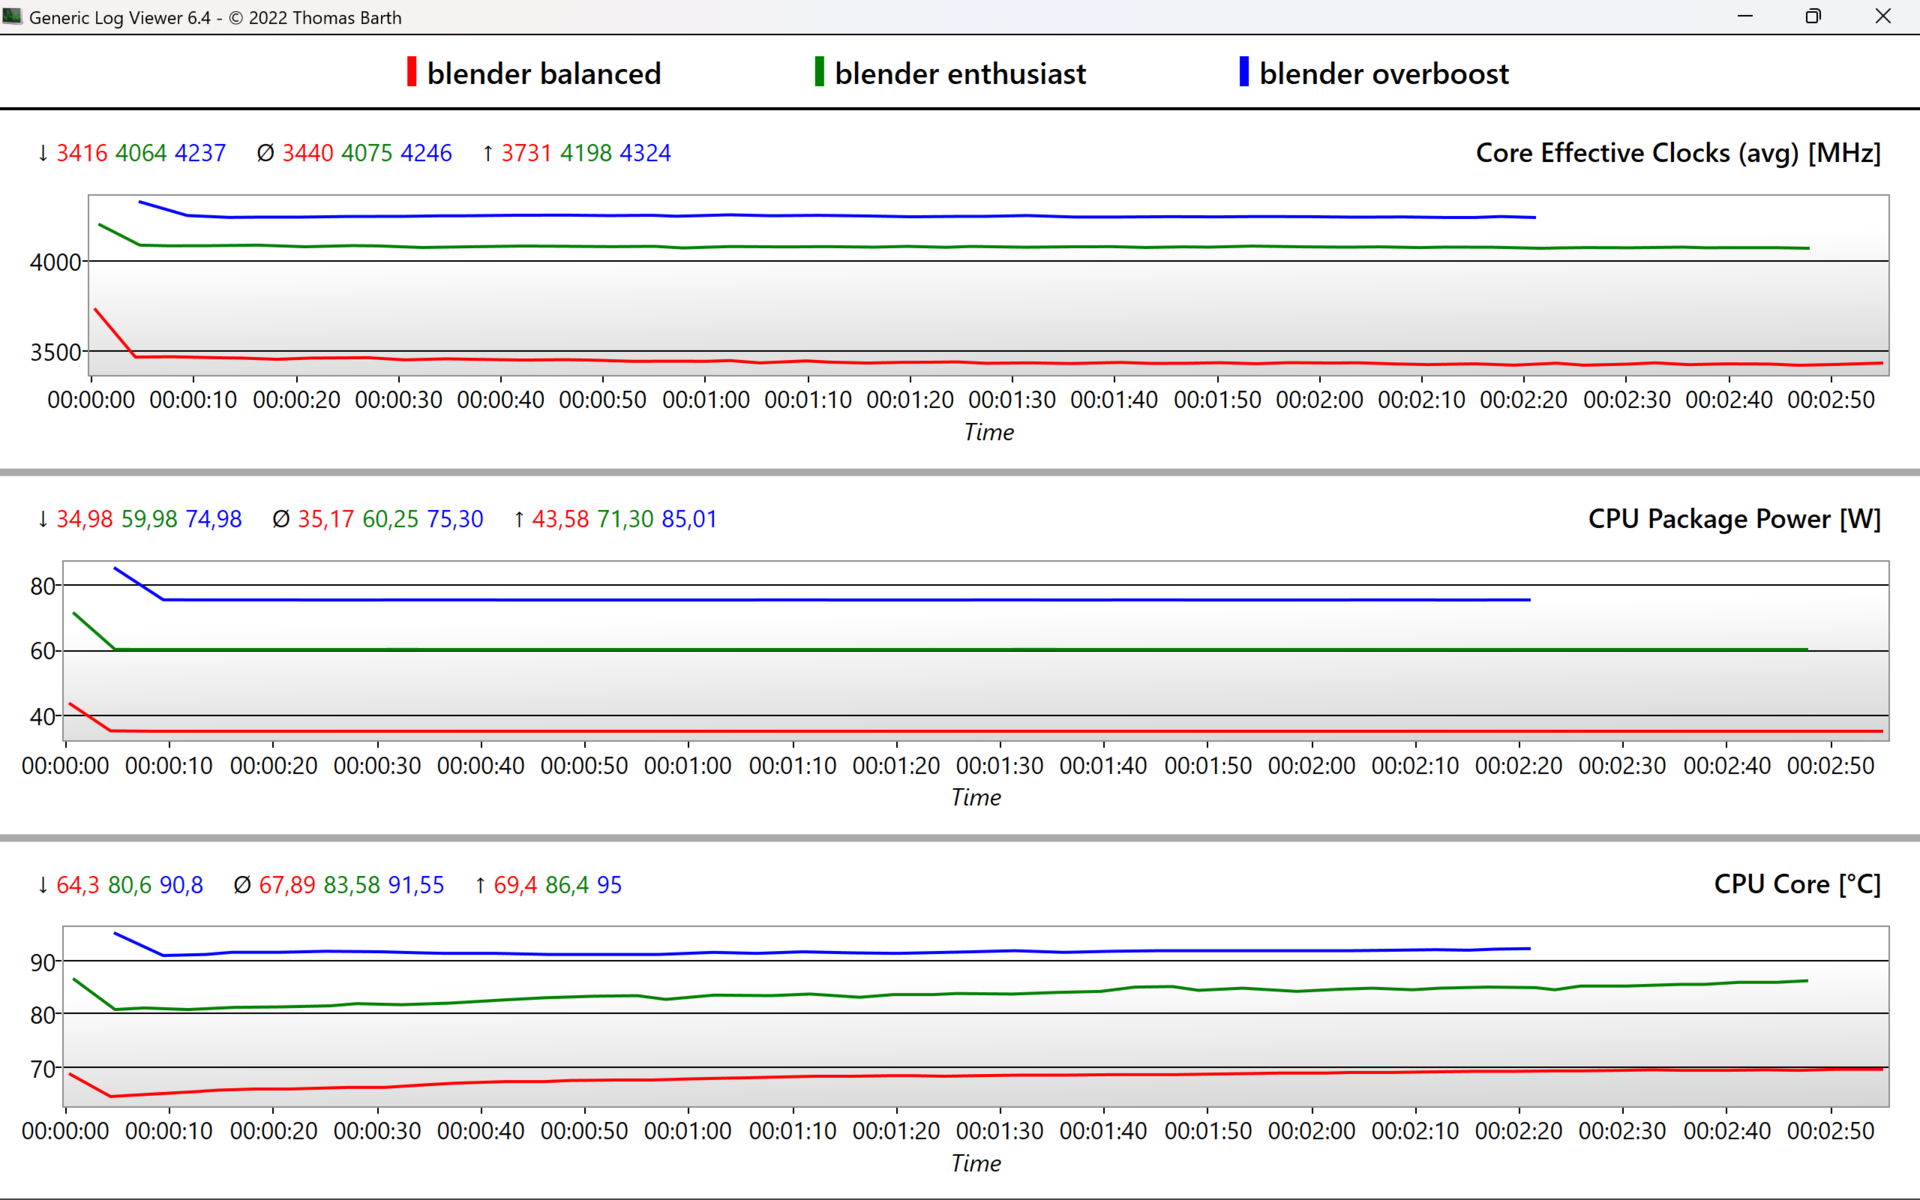
Schenker offre tre modalità di alimentazione nel Core 15, ma anche profili individuali. Il pulsante a sinistra del tasto di accensione può essere utilizzato per (de)attivare un profilo, che può essere utile per molti scenari. Overboost consente un limite di potenza permanente di 75 W per la CPU, 60 W in modalità Enthusiast e 35 watt in modalità Balanced. C'è anche la funzione Fan Boost, che mantiene la CPU più fredda di circa 5 °C con un livello di rumore molto più elevato.
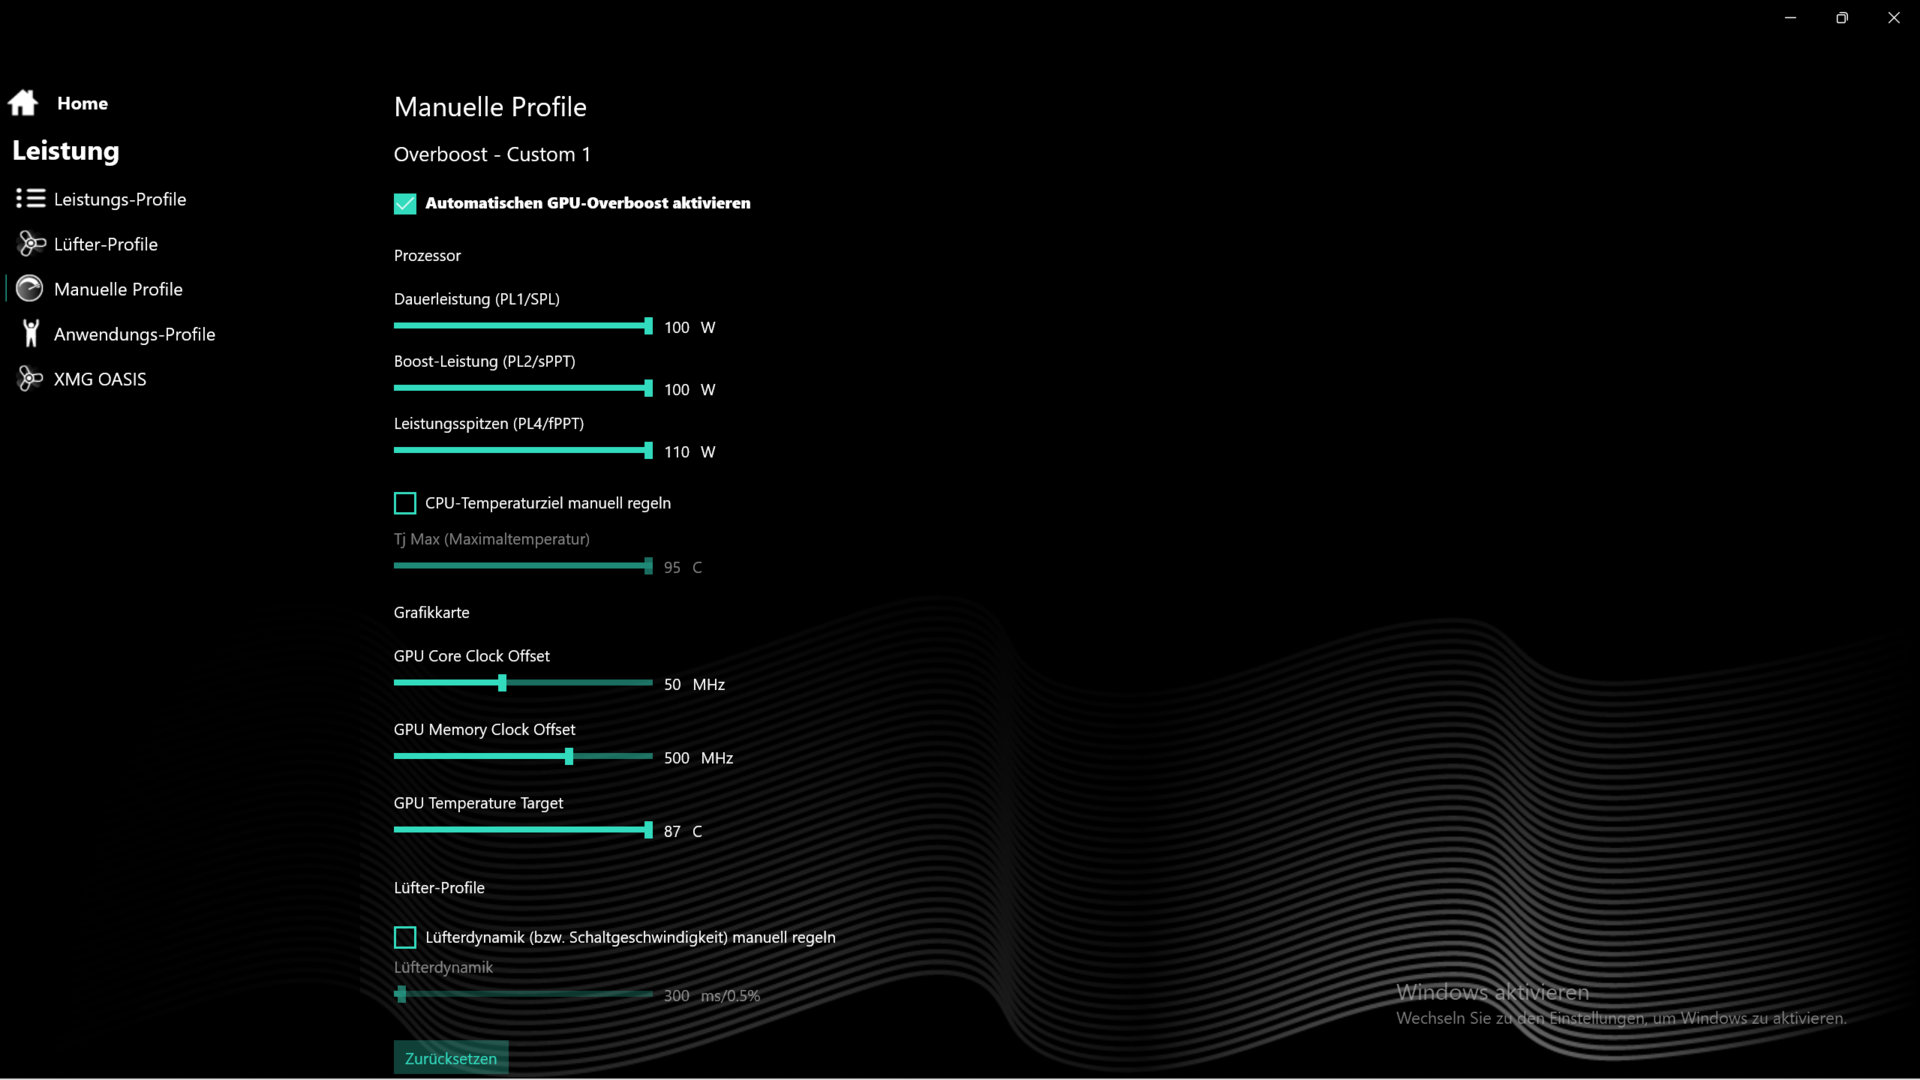
I benchmark delle prestazioni sono stati eseguiti con l'impostazione Overboost, ma raccomandiamo comunque Enthusiast, che offre sostanzialmente le stesse prestazioni con un rumore più contenuto. Spostando i cursori del TDP a 100 W si sono aggiunti solo 5 W al limite di potenza, mentre overcloccando la GPU ai valori raccomandati (vedere la schermata "Impostazioni GPU") si sono aggiunte alcune percentuali in più.
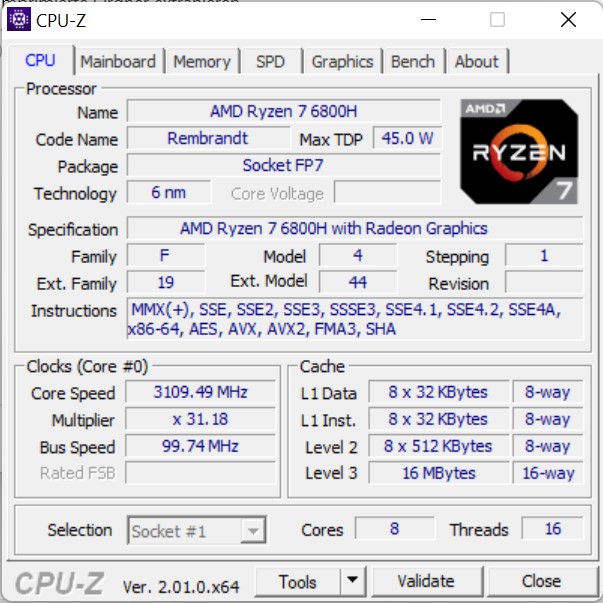
Processore
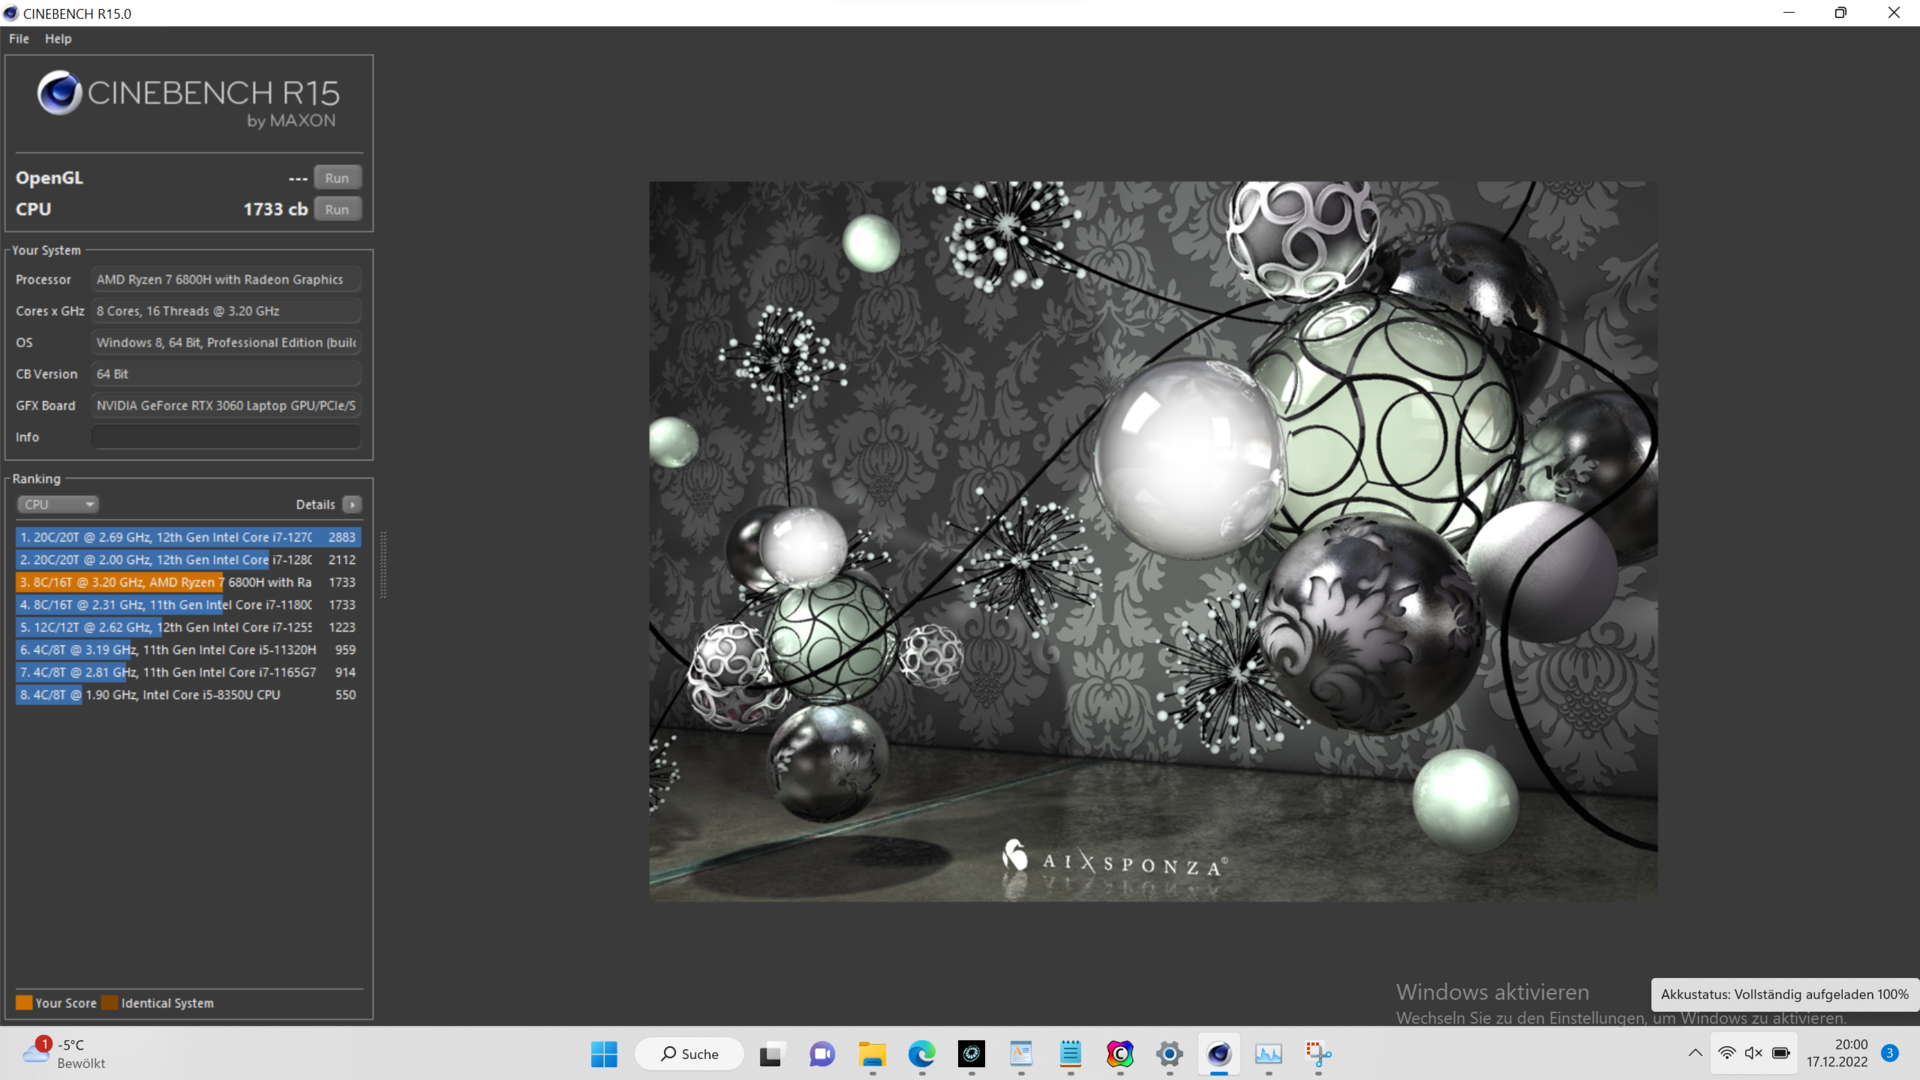
Ryzen 7 6800H di AMD è una CPU da 45 W e funziona permanentemente con 75 W nell'XMG Core 15, in modo da mantenere un clock di 4,3 GHz per tutti gli otto core a circa 92 °C (~198 °F). Per alcuni secondi, il processore viene alimentato con 85 W.
Il nostro ciclo Cinebench R15 mostra che il Core i7-12700H lavora in modo significativamente più veloce nei Legion 5 e TUF Gaming F15 , anche se XMG sfrutta il potenziale del Ryzen 7 6800H. Con un limite di potenza di 35 W (modalità bilanciata), le prestazioni dell'efficiente CPU Ryzen diminuiscono solo del 20%
In modalità batteria, le prestazioni si riducono di circa il 25% nonostante l'Overboost.
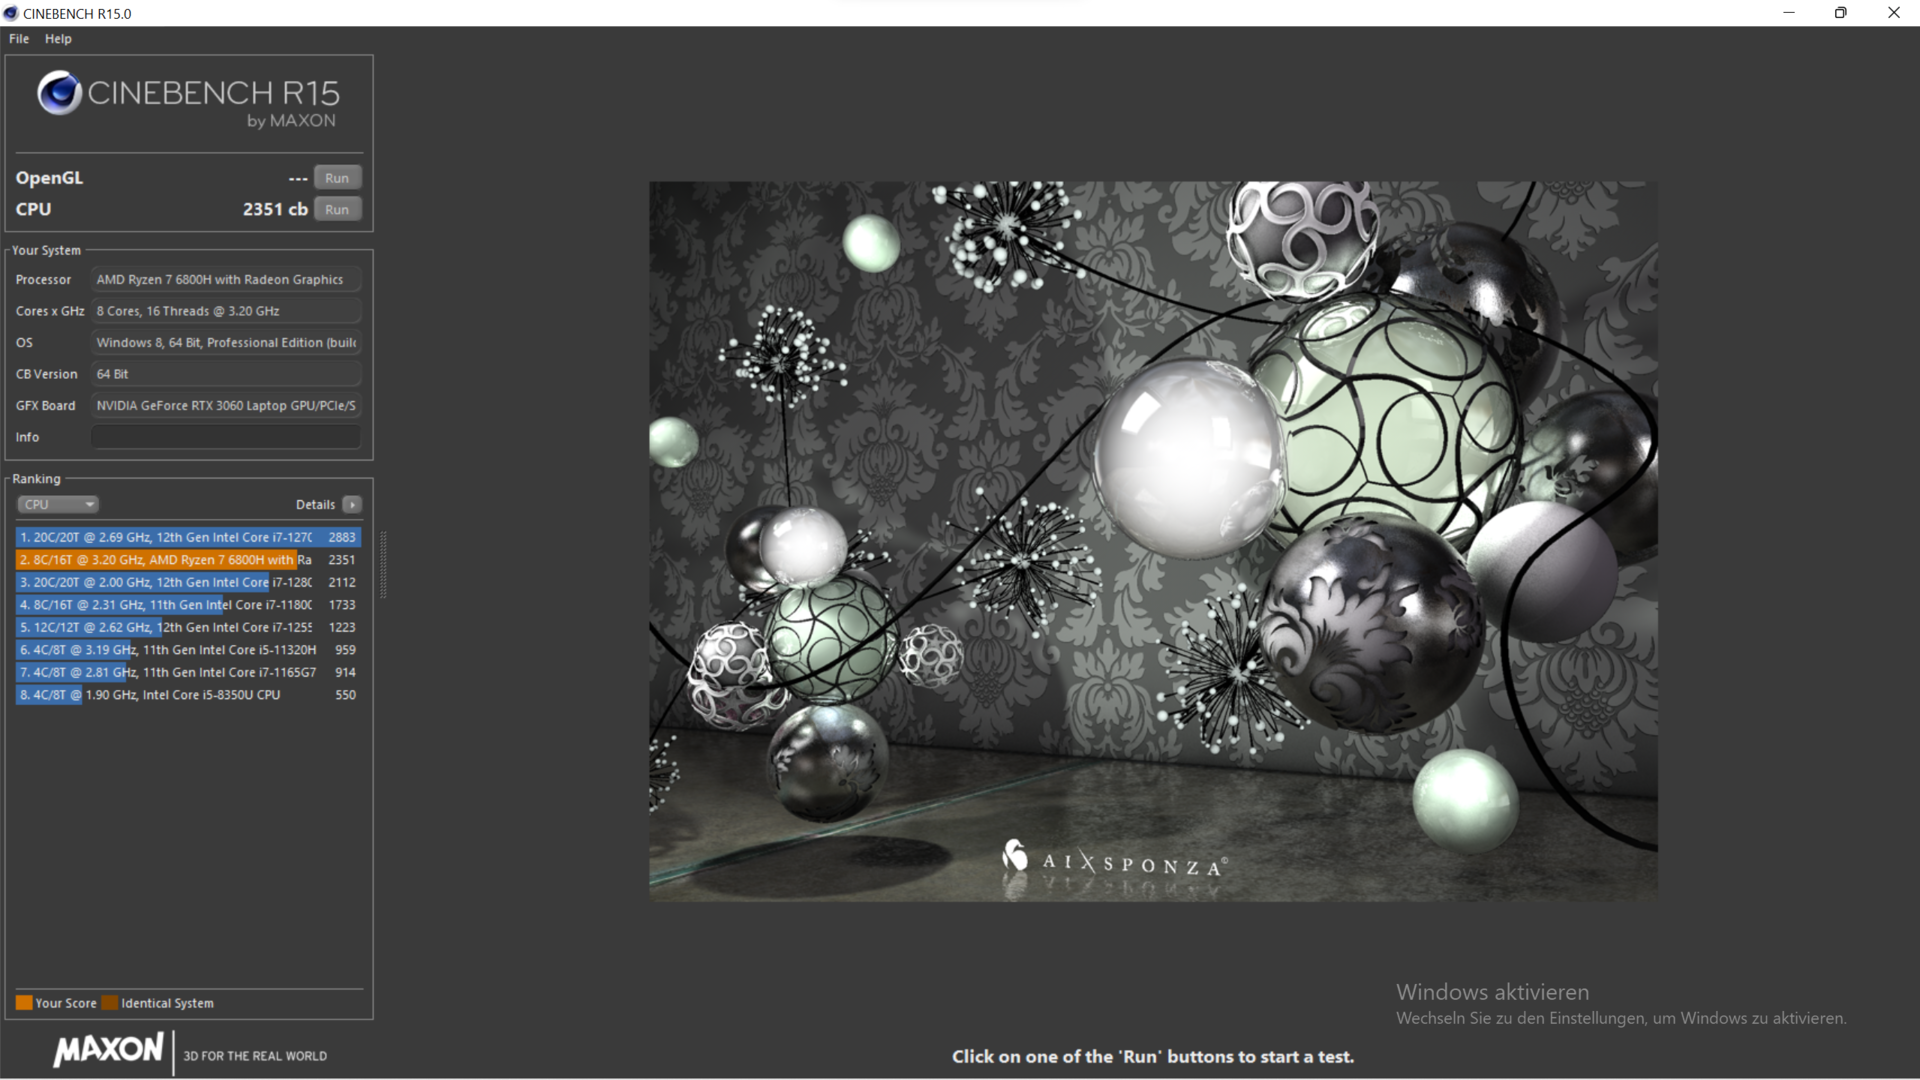
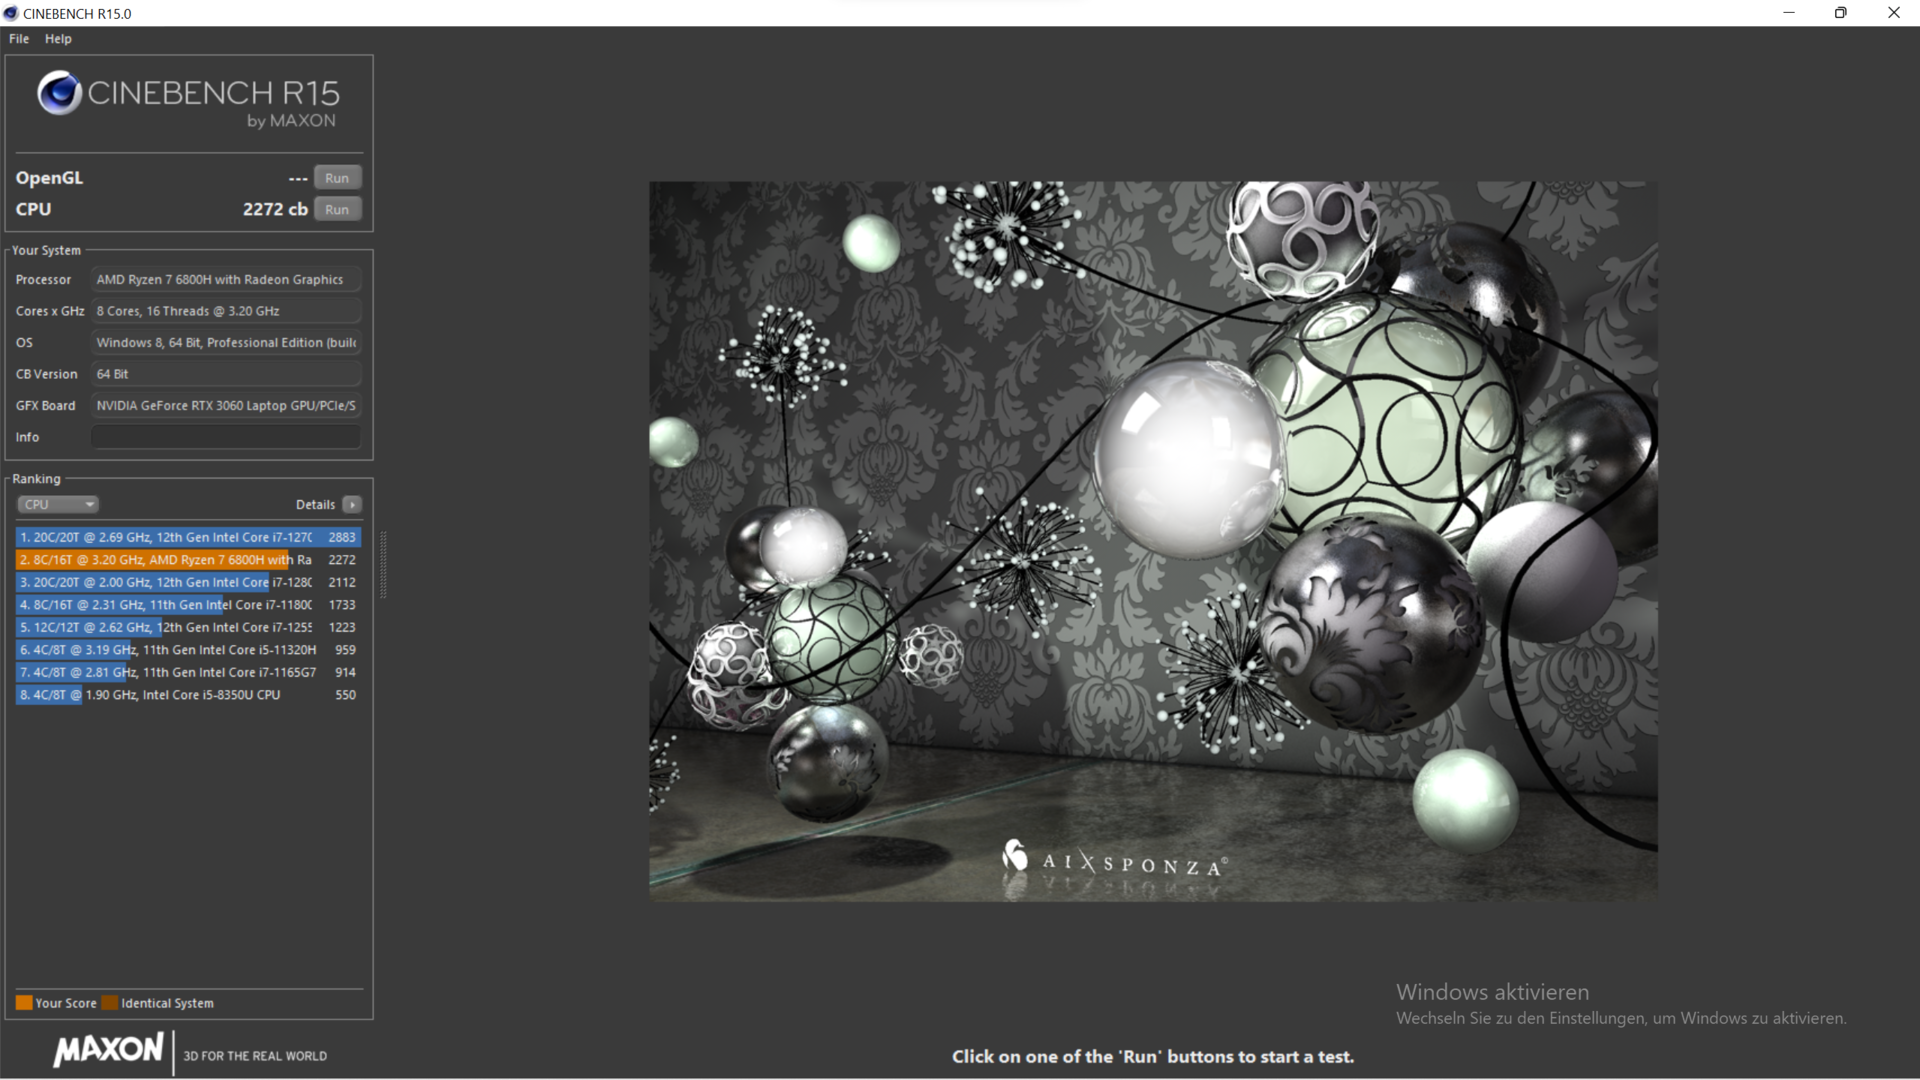

Cinebench R15 Multi endurance test
Cinebench R23: Multi Core | Single Core
Cinebench R20: CPU (Multi Core) | CPU (Single Core)
Cinebench R15: CPU Multi 64Bit | CPU Single 64Bit
Blender: v2.79 BMW27 CPU
7-Zip 18.03: 7z b 4 | 7z b 4 -mmt1
Geekbench 5.5: Multi-Core | Single-Core
HWBOT x265 Benchmark v2.2: 4k Preset
LibreOffice : 20 Documents To PDF
R Benchmark 2.5: Overall mean
| CPU Performance rating | |
| Media della classe Gaming | |
| Lenovo Legion 5 15IAH7H 82RB | |
| Asus TUF Gaming F15 FX507ZM | |
| Schenker XMG Core 15 (M22) | |
| Media AMD Ryzen 7 6800H | |
| Alienware m15 R5 Ryzen Edition | |
| Schenker XMG Fusion 15 (Mid 22) | |
| Schenker XMG Core 15 Ampere | |
| Cinebench R23 / Multi Core | |
| Media della classe Gaming (10488 - 42661, n=107, ultimi 2 anni) | |
| Lenovo Legion 5 15IAH7H 82RB | |
| Asus TUF Gaming F15 FX507ZM | |
| Schenker XMG Core 15 (M22) | |
| Media AMD Ryzen 7 6800H (11481 - 14660, n=11) | |
| Alienware m15 R5 Ryzen Edition | |
| Schenker XMG Core 15 Ampere | |
| Schenker XMG Fusion 15 (Mid 22) | |
| Cinebench R23 / Single Core | |
| Media della classe Gaming (1166 - 2415, n=107, ultimi 2 anni) | |
| Lenovo Legion 5 15IAH7H 82RB | |
| Asus TUF Gaming F15 FX507ZM | |
| Schenker XMG Core 15 (M22) | |
| Media AMD Ryzen 7 6800H (1500 - 1552, n=9) | |
| Schenker XMG Fusion 15 (Mid 22) | |
| Alienware m15 R5 Ryzen Edition | |
| Schenker XMG Core 15 Ampere | |
| Cinebench R20 / CPU (Multi Core) | |
| Media della classe Gaming (4029 - 16433, n=106, ultimi 2 anni) | |
| Lenovo Legion 5 15IAH7H 82RB | |
| Asus TUF Gaming F15 FX507ZM | |
| Schenker XMG Core 15 (M22) | |
| Media AMD Ryzen 7 6800H (4460 - 5661, n=9) | |
| Alienware m15 R5 Ryzen Edition | |
| Schenker XMG Core 15 Ampere | |
| Schenker XMG Fusion 15 (Mid 22) | |
| Cinebench R20 / CPU (Single Core) | |
| Media della classe Gaming (442 - 913, n=106, ultimi 2 anni) | |
| Lenovo Legion 5 15IAH7H 82RB | |
| Asus TUF Gaming F15 FX507ZM | |
| Schenker XMG Core 15 (M22) | |
| Media AMD Ryzen 7 6800H (580 - 605, n=9) | |
| Schenker XMG Fusion 15 (Mid 22) | |
| Alienware m15 R5 Ryzen Edition | |
| Schenker XMG Core 15 Ampere | |
| Cinebench R15 / CPU Multi 64Bit | |
| Media della classe Gaming (1578 - 6330, n=105, ultimi 2 anni) | |
| Lenovo Legion 5 15IAH7H 82RB | |
| Asus TUF Gaming F15 FX507ZM | |
| Schenker XMG Core 15 (M22) | |
| Media AMD Ryzen 7 6800H (1585 - 2366, n=10) | |
| Alienware m15 R5 Ryzen Edition | |
| Schenker XMG Core 15 Ampere | |
| Schenker XMG Fusion 15 (Mid 22) | |
| Cinebench R15 / CPU Single 64Bit | |
| Media della classe Gaming (188.8 - 350, n=106, ultimi 2 anni) | |
| Lenovo Legion 5 15IAH7H 82RB | |
| Asus TUF Gaming F15 FX507ZM | |
| Schenker XMG Core 15 (M22) | |
| Media AMD Ryzen 7 6800H (182.7 - 250, n=10) | |
| Alienware m15 R5 Ryzen Edition | |
| Schenker XMG Fusion 15 (Mid 22) | |
| Schenker XMG Core 15 Ampere | |
| Blender / v2.79 BMW27 CPU | |
| Schenker XMG Fusion 15 (Mid 22) | |
| Alienware m15 R5 Ryzen Edition | |
| Schenker XMG Core 15 Ampere | |
| Media AMD Ryzen 7 6800H (213 - 268, n=8) | |
| Schenker XMG Core 15 (M22) | |
| Asus TUF Gaming F15 FX507ZM | |
| Lenovo Legion 5 15IAH7H 82RB | |
| Media della classe Gaming (79 - 330, n=104, ultimi 2 anni) | |
| 7-Zip 18.03 / 7z b 4 | |
| Media della classe Gaming (33491 - 148086, n=105, ultimi 2 anni) | |
| Lenovo Legion 5 15IAH7H 82RB | |
| Asus TUF Gaming F15 FX507ZM | |
| Schenker XMG Core 15 (M22) | |
| Media AMD Ryzen 7 6800H (55067 - 64817, n=8) | |
| Alienware m15 R5 Ryzen Edition | |
| Schenker XMG Core 15 Ampere | |
| Schenker XMG Fusion 15 (Mid 22) | |
| 7-Zip 18.03 / 7z b 4 -mmt1 | |
| Media della classe Gaming (4199 - 7436, n=105, ultimi 2 anni) | |
| Lenovo Legion 5 15IAH7H 82RB | |
| Schenker XMG Core 15 (M22) | |
| Media AMD Ryzen 7 6800H (5521 - 5803, n=8) | |
| Alienware m15 R5 Ryzen Edition | |
| Schenker XMG Fusion 15 (Mid 22) | |
| Asus TUF Gaming F15 FX507ZM | |
| Schenker XMG Core 15 Ampere | |
| Geekbench 5.5 / Multi-Core | |
| Media della classe Gaming (6460 - 28263, n=105, ultimi 2 anni) | |
| Lenovo Legion 5 15IAH7H 82RB | |
| Asus TUF Gaming F15 FX507ZM | |
| Schenker XMG Core 15 (M22) | |
| Media AMD Ryzen 7 6800H (8898 - 10355, n=10) | |
| Schenker XMG Fusion 15 (Mid 22) | |
| Schenker XMG Core 15 Ampere | |
| Alienware m15 R5 Ryzen Edition | |
| Geekbench 5.5 / Single-Core | |
| Media della classe Gaming (986 - 2474, n=105, ultimi 2 anni) | |
| Lenovo Legion 5 15IAH7H 82RB | |
| Asus TUF Gaming F15 FX507ZM | |
| Schenker XMG Fusion 15 (Mid 22) | |
| Schenker XMG Core 15 (M22) | |
| Media AMD Ryzen 7 6800H (1518 - 1568, n=10) | |
| Alienware m15 R5 Ryzen Edition | |
| Schenker XMG Core 15 Ampere | |
| HWBOT x265 Benchmark v2.2 / 4k Preset | |
| Media della classe Gaming (11.5 - 44.4, n=105, ultimi 2 anni) | |
| Lenovo Legion 5 15IAH7H 82RB | |
| Asus TUF Gaming F15 FX507ZM | |
| Schenker XMG Core 15 (M22) | |
| Media AMD Ryzen 7 6800H (14.9 - 18.5, n=9) | |
| Alienware m15 R5 Ryzen Edition | |
| Schenker XMG Core 15 Ampere | |
| Schenker XMG Fusion 15 (Mid 22) | |
| LibreOffice / 20 Documents To PDF | |
| Schenker XMG Core 15 (M22) | |
| Schenker XMG Core 15 Ampere | |
| Alienware m15 R5 Ryzen Edition | |
| Media AMD Ryzen 7 6800H (48.7 - 79.5, n=8) | |
| Asus TUF Gaming F15 FX507ZM | |
| Media della classe Gaming (33.2 - 88.8, n=105, ultimi 2 anni) | |
| Schenker XMG Fusion 15 (Mid 22) | |
| Lenovo Legion 5 15IAH7H 82RB | |
| R Benchmark 2.5 / Overall mean | |
| Schenker XMG Core 15 Ampere | |
| Schenker XMG Fusion 15 (Mid 22) | |
| Alienware m15 R5 Ryzen Edition | |
| Media AMD Ryzen 7 6800H (0.4783 - 0.515, n=8) | |
| Schenker XMG Core 15 (M22) | |
| Asus TUF Gaming F15 FX507ZM | |
| Lenovo Legion 5 15IAH7H 82RB | |
| Media della classe Gaming (0.3439 - 0.759, n=106, ultimi 2 anni) | |
* ... Meglio usare valori piccoli
AIDA64: FP32 Ray-Trace | FPU Julia | CPU SHA3 | CPU Queen | FPU SinJulia | FPU Mandel | CPU AES | CPU ZLib | FP64 Ray-Trace | CPU PhotoWorxx
| Performance rating | |
| Media della classe Gaming | |
| Lenovo Legion 5 15IAH7H 82RB | |
| Schenker XMG Core 15 (M22) | |
| Media AMD Ryzen 7 6800H | |
| Alienware m15 R5 Ryzen Edition | |
| Schenker XMG Core 15 Ampere | |
| Schenker XMG Fusion 15 (Mid 22) | |
| Asus TUF Gaming F15 FX507ZM | |
| AIDA64 / FP32 Ray-Trace | |
| Media della classe Gaming (10227 - 85542, n=105, ultimi 2 anni) | |
| Lenovo Legion 5 15IAH7H 82RB | |
| Schenker XMG Core 15 (M22) | |
| Media AMD Ryzen 7 6800H (12876 - 17031, n=8) | |
| Schenker XMG Core 15 Ampere | |
| Alienware m15 R5 Ryzen Edition | |
| Schenker XMG Fusion 15 (Mid 22) | |
| Asus TUF Gaming F15 FX507ZM | |
| AIDA64 / FPU Julia | |
| Media della classe Gaming (51376 - 238426, n=105, ultimi 2 anni) | |
| Schenker XMG Core 15 (M22) | |
| Media AMD Ryzen 7 6800H (82673 - 105987, n=8) | |
| Alienware m15 R5 Ryzen Edition | |
| Lenovo Legion 5 15IAH7H 82RB | |
| Schenker XMG Core 15 Ampere | |
| Schenker XMG Fusion 15 (Mid 22) | |
| Asus TUF Gaming F15 FX507ZM | |
| AIDA64 / CPU SHA3 | |
| Media della classe Gaming (2180 - 10115, n=105, ultimi 2 anni) | |
| Lenovo Legion 5 15IAH7H 82RB | |
| Schenker XMG Fusion 15 (Mid 22) | |
| Schenker XMG Core 15 (M22) | |
| Asus TUF Gaming F15 FX507ZM | |
| Media AMD Ryzen 7 6800H (2886 - 3634, n=8) | |
| Alienware m15 R5 Ryzen Edition | |
| Schenker XMG Core 15 Ampere | |
| AIDA64 / CPU Queen | |
| Media della classe Gaming (49785 - 173351, n=90, ultimi 2 anni) | |
| Lenovo Legion 5 15IAH7H 82RB | |
| Asus TUF Gaming F15 FX507ZM | |
| Schenker XMG Core 15 Ampere | |
| Media AMD Ryzen 7 6800H (75117 - 106322, n=8) | |
| Alienware m15 R5 Ryzen Edition | |
| Schenker XMG Core 15 (M22) | |
| Schenker XMG Fusion 15 (Mid 22) | |
| AIDA64 / FPU SinJulia | |
| Media della classe Gaming (4424 - 33636, n=105, ultimi 2 anni) | |
| Schenker XMG Core 15 Ampere | |
| Schenker XMG Core 15 (M22) | |
| Media AMD Ryzen 7 6800H (11771 - 13120, n=8) | |
| Alienware m15 R5 Ryzen Edition | |
| Lenovo Legion 5 15IAH7H 82RB | |
| Asus TUF Gaming F15 FX507ZM | |
| Schenker XMG Fusion 15 (Mid 22) | |
| AIDA64 / FPU Mandel | |
| Media della classe Gaming (25115 - 128721, n=105, ultimi 2 anni) | |
| Schenker XMG Core 15 (M22) | |
| Media AMD Ryzen 7 6800H (45287 - 58327, n=8) | |
| Alienware m15 R5 Ryzen Edition | |
| Lenovo Legion 5 15IAH7H 82RB | |
| Schenker XMG Core 15 Ampere | |
| Schenker XMG Fusion 15 (Mid 22) | |
| Asus TUF Gaming F15 FX507ZM | |
| AIDA64 / CPU AES | |
| Lenovo Legion 5 15IAH7H 82RB | |
| Schenker XMG Fusion 15 (Mid 22) | |
| Alienware m15 R5 Ryzen Edition | |
| Media AMD Ryzen 7 6800H (67816 - 137383, n=8) | |
| Media della classe Gaming (39258 - 247074, n=105, ultimi 2 anni) | |
| Schenker XMG Core 15 Ampere | |
| Schenker XMG Core 15 (M22) | |
| Asus TUF Gaming F15 FX507ZM | |
| AIDA64 / CPU ZLib | |
| Media della classe Gaming (574 - 2531, n=105, ultimi 2 anni) | |
| Asus TUF Gaming F15 FX507ZM | |
| Lenovo Legion 5 15IAH7H 82RB | |
| Schenker XMG Core 15 (M22) | |
| Schenker XMG Core 15 Ampere | |
| Media AMD Ryzen 7 6800H (732 - 901, n=8) | |
| Alienware m15 R5 Ryzen Edition | |
| Schenker XMG Fusion 15 (Mid 22) | |
| AIDA64 / FP64 Ray-Trace | |
| Media della classe Gaming (5509 - 45446, n=105, ultimi 2 anni) | |
| Lenovo Legion 5 15IAH7H 82RB | |
| Schenker XMG Core 15 (M22) | |
| Media AMD Ryzen 7 6800H (6917 - 8980, n=8) | |
| Schenker XMG Core 15 Ampere | |
| Alienware m15 R5 Ryzen Edition | |
| Schenker XMG Fusion 15 (Mid 22) | |
| Asus TUF Gaming F15 FX507ZM | |
| AIDA64 / CPU PhotoWorxx | |
| Media della classe Gaming (12271 - 89891, n=105, ultimi 2 anni) | |
| Lenovo Legion 5 15IAH7H 82RB | |
| Asus TUF Gaming F15 FX507ZM | |
| Schenker XMG Core 15 (M22) | |
| Media AMD Ryzen 7 6800H (26496 - 30360, n=8) | |
| Schenker XMG Core 15 Ampere | |
| Schenker XMG Fusion 15 (Mid 22) | |
| Alienware m15 R5 Ryzen Edition | |
Prestazioni del sistema
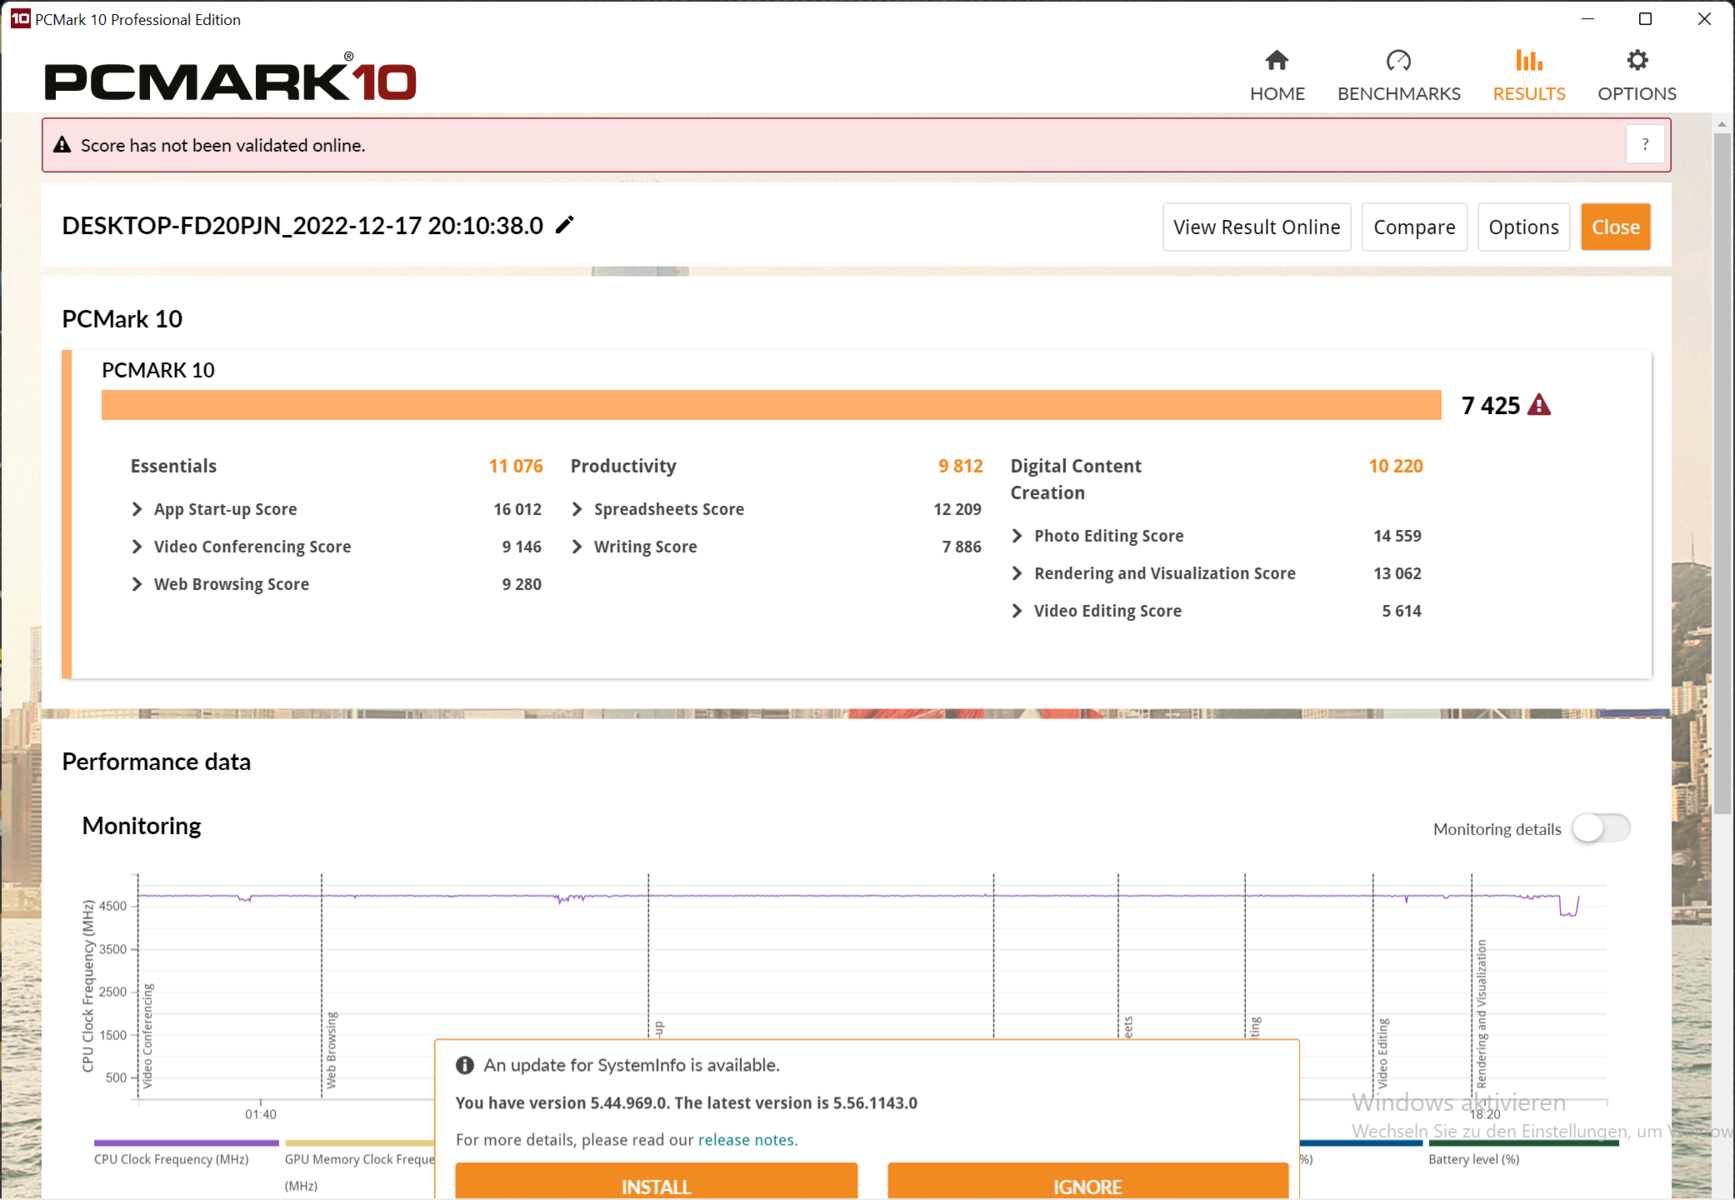
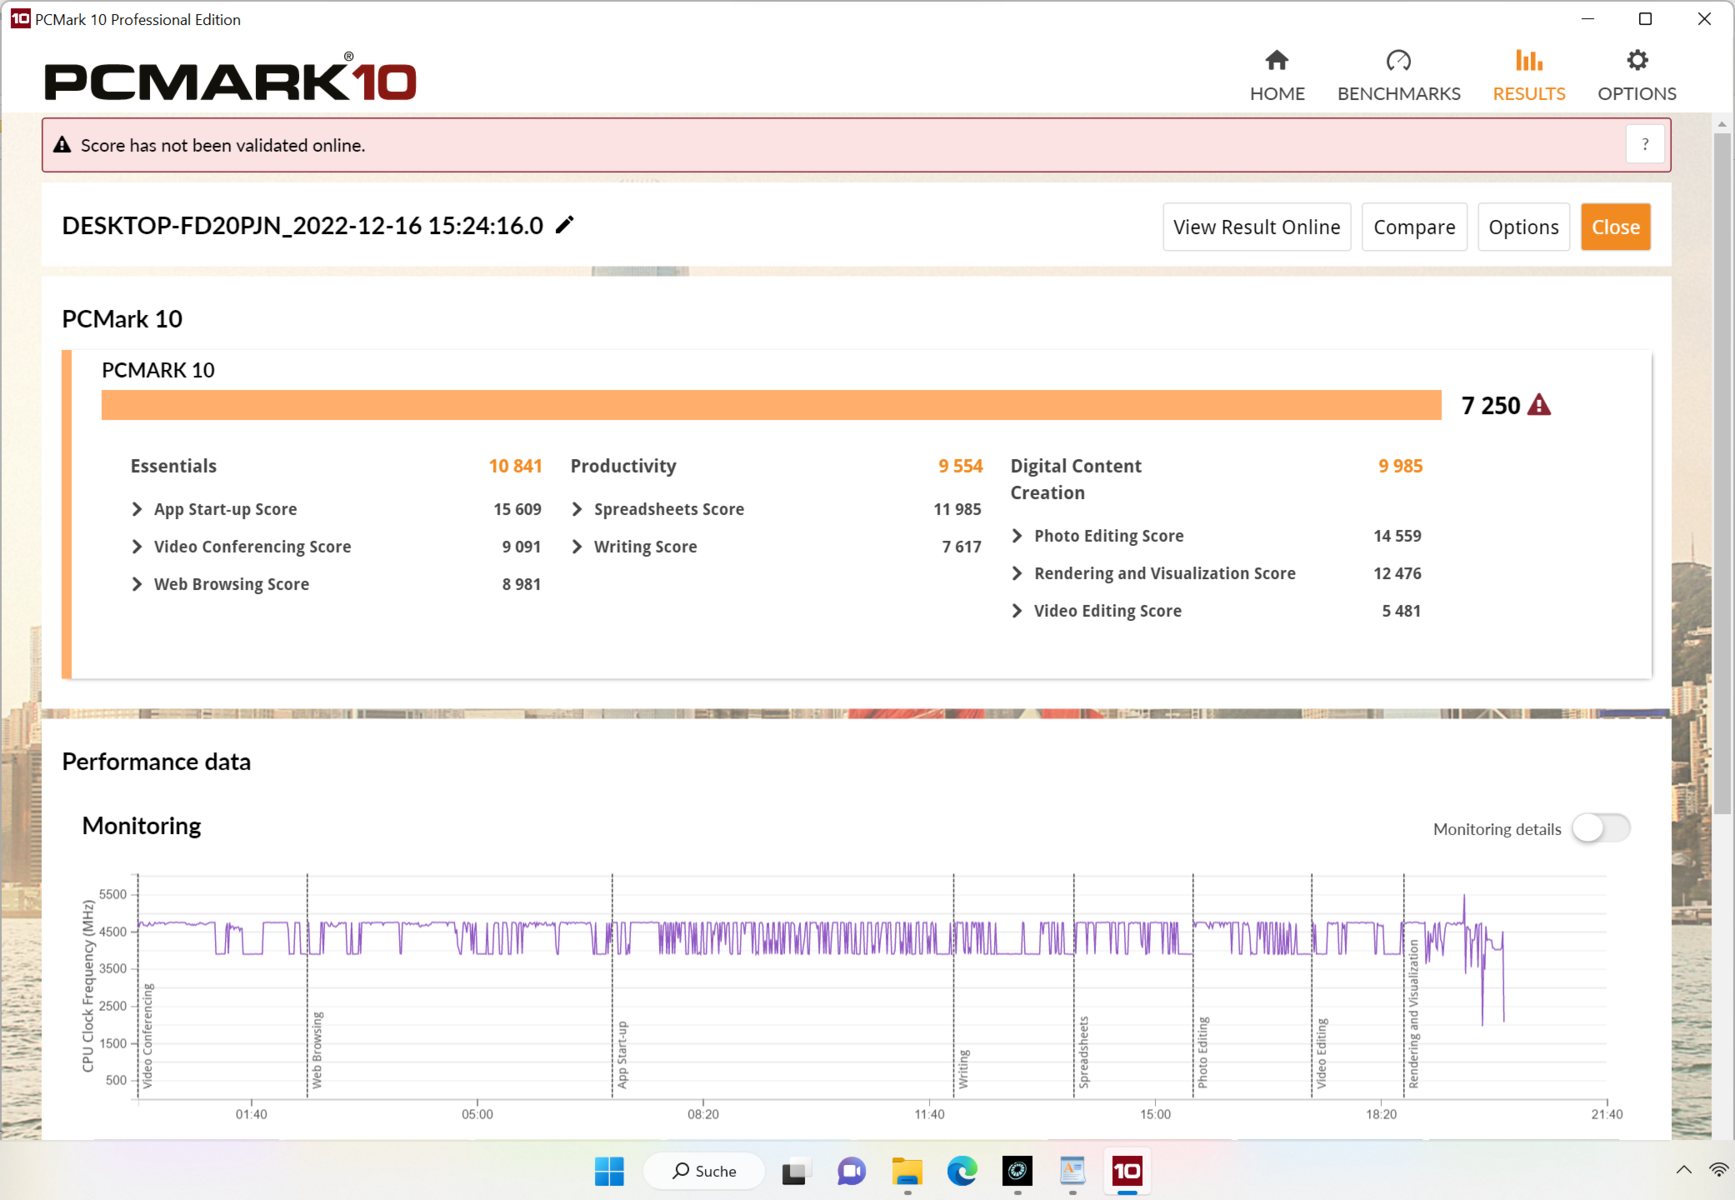
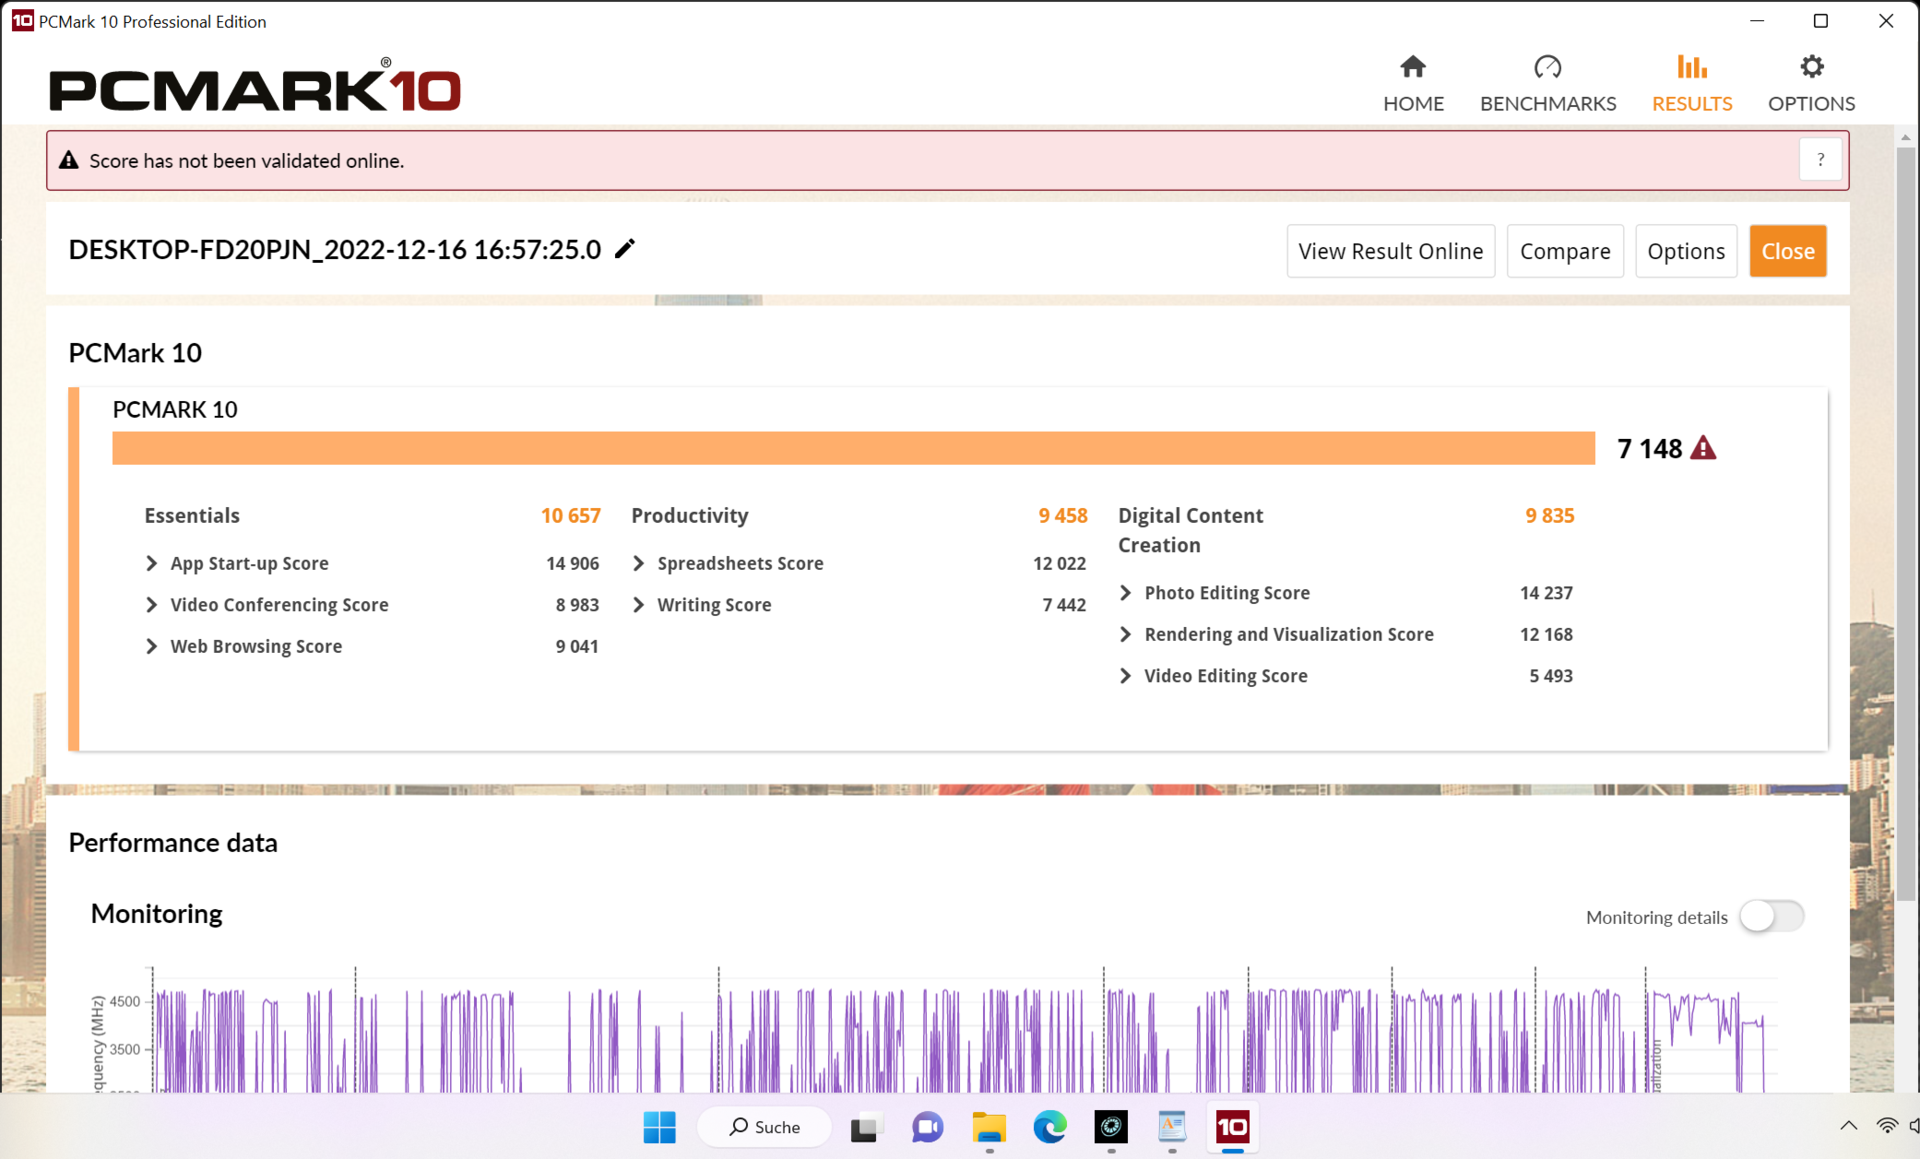
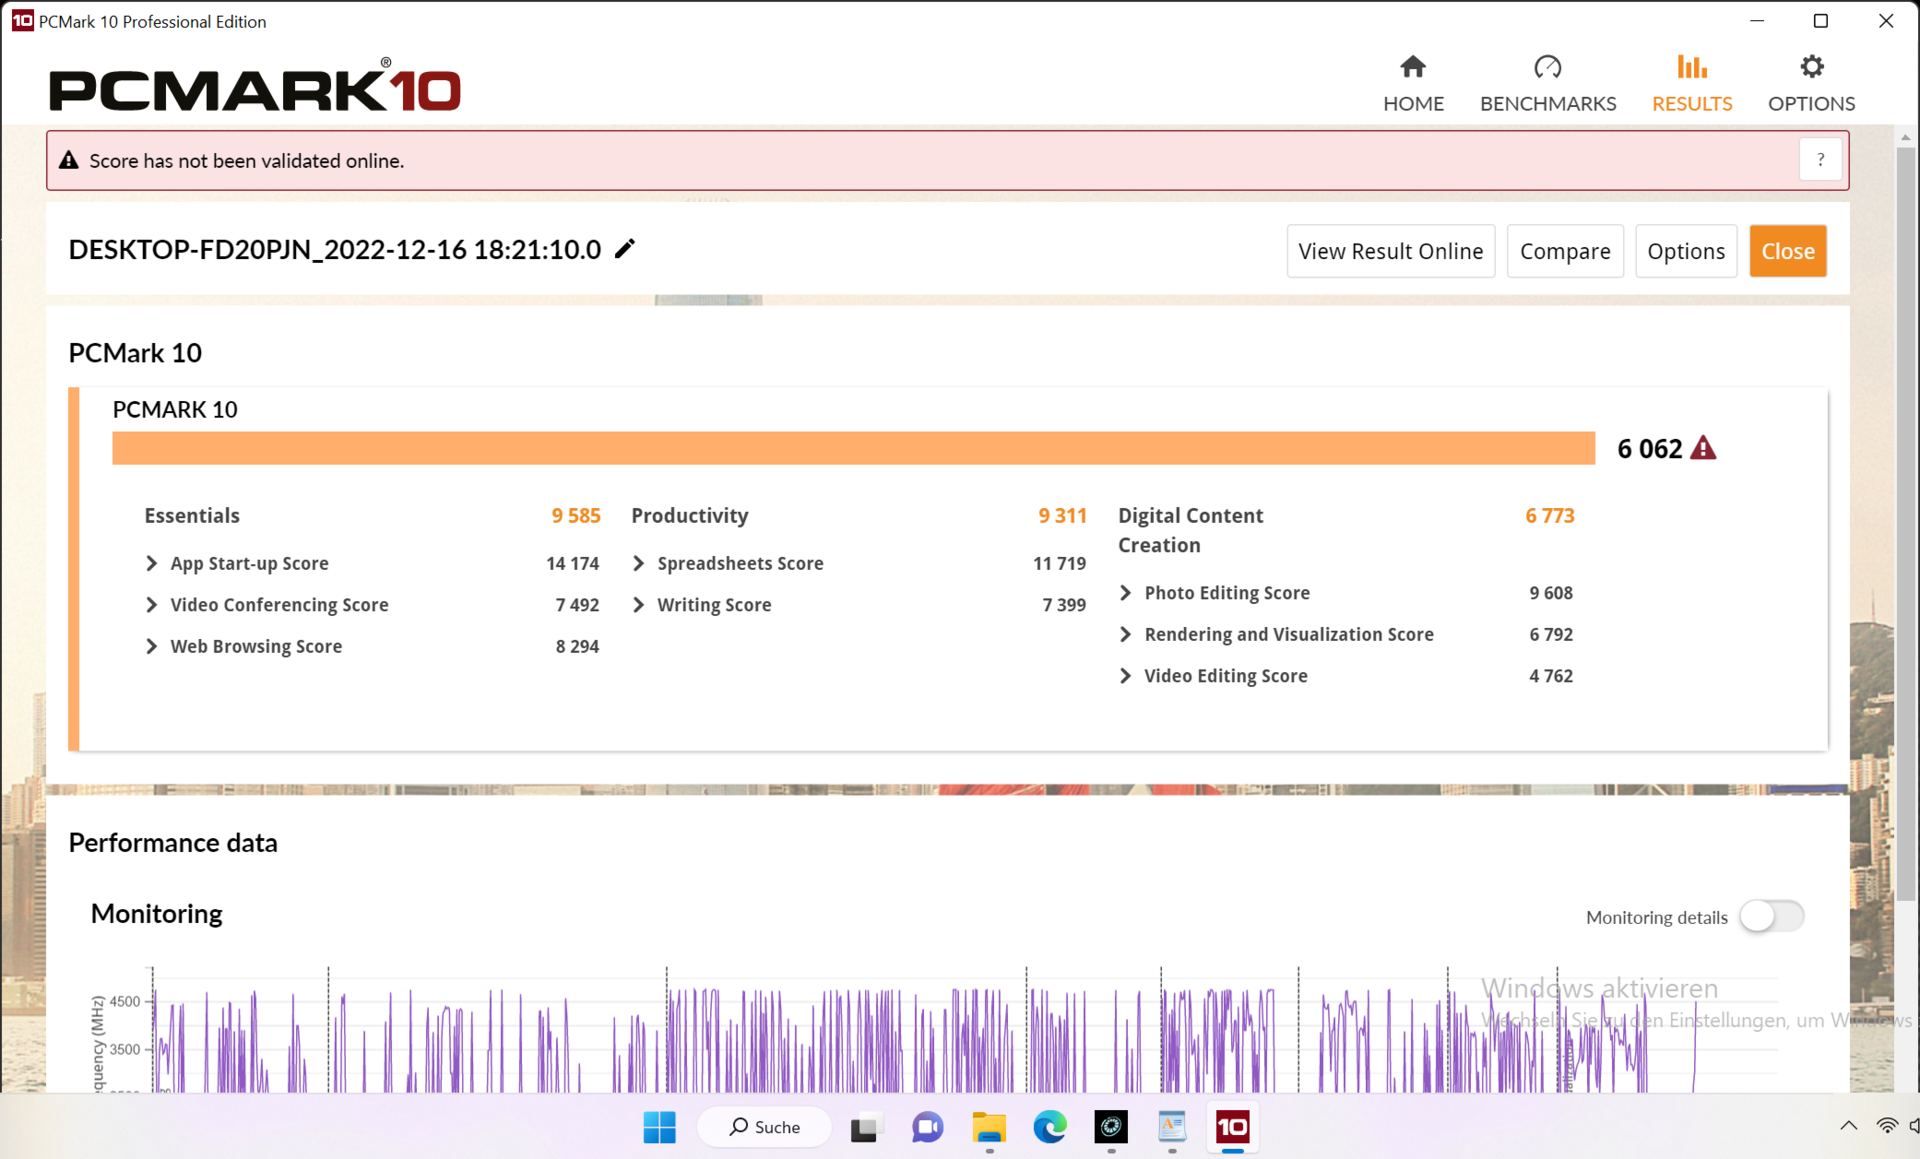
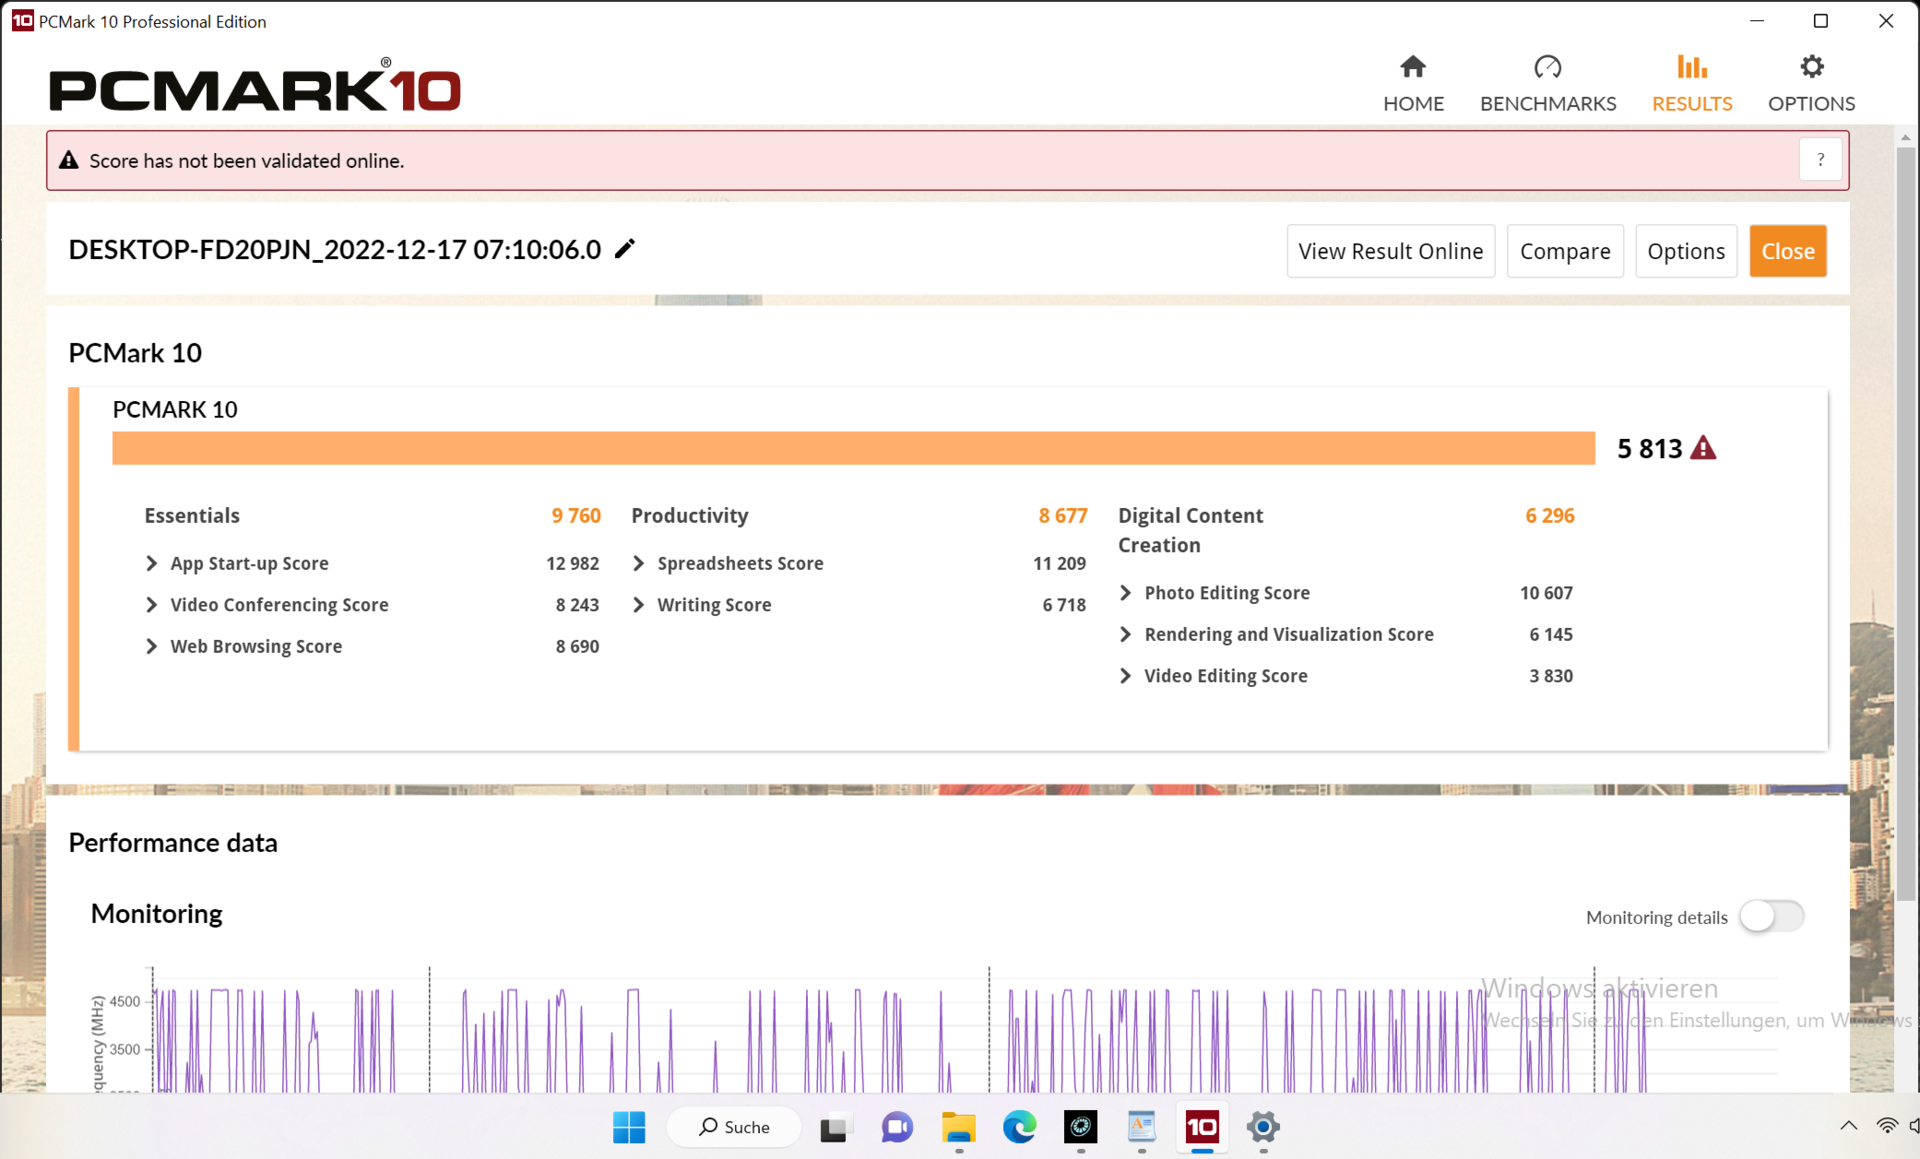
Il benchmark PCMark 10 rivela un risultato al livello previsto per la configurazione del sistema. Le attività quotidiane vengono eseguite rapidamente e senza ritardi.
La navigazione web è un po' più veloce sui sistemi Intel grazie al Turbo più potente e alle prestazioni single-core, ma la differenza è difficilmente percepibile nella pratica.
CrossMark: Overall | Productivity | Creativity | Responsiveness
Mozilla Kraken 1.1: Total
Speedometer 2.0: Result 2.0
Octane V2: Total Score
Jetstream 2: 2.0 Total
WebXPRT 3: Overall
WebXPRT 4: Overall
| PCMark 10 / Score | |
| Media della classe Gaming (5828 - 12414, n=93, ultimi 2 anni) | |
| Lenovo Legion 5 15IAH7H 82RB | |
| Asus TUF Gaming F15 FX507ZM | |
| Schenker XMG Core 15 (M22) | |
| Media AMD Ryzen 7 6800H, NVIDIA GeForce RTX 3060 Laptop GPU (n=1) | |
| Alienware m15 R5 Ryzen Edition | |
| Schenker XMG Fusion 15 (Mid 22) | |
| Schenker XMG Core 15 Ampere | |
| PCMark 10 / Essentials | |
| Lenovo Legion 5 15IAH7H 82RB | |
| Schenker XMG Core 15 (M22) | |
| Media AMD Ryzen 7 6800H, NVIDIA GeForce RTX 3060 Laptop GPU (n=1) | |
| Media della classe Gaming (8810 - 11935, n=97, ultimi 2 anni) | |
| Asus TUF Gaming F15 FX507ZM | |
| Alienware m15 R5 Ryzen Edition | |
| Schenker XMG Fusion 15 (Mid 22) | |
| Schenker XMG Core 15 Ampere | |
| PCMark 10 / Productivity | |
| Media della classe Gaming (6845 - 25323, n=95, ultimi 2 anni) | |
| Lenovo Legion 5 15IAH7H 82RB | |
| Schenker XMG Core 15 (M22) | |
| Media AMD Ryzen 7 6800H, NVIDIA GeForce RTX 3060 Laptop GPU (n=1) | |
| Asus TUF Gaming F15 FX507ZM | |
| Alienware m15 R5 Ryzen Edition | |
| Schenker XMG Fusion 15 (Mid 22) | |
| Schenker XMG Core 15 Ampere | |
| PCMark 10 / Digital Content Creation | |
| Media della classe Gaming (7602 - 19954, n=95, ultimi 2 anni) | |
| Lenovo Legion 5 15IAH7H 82RB | |
| Asus TUF Gaming F15 FX507ZM | |
| Schenker XMG Core 15 (M22) | |
| Media AMD Ryzen 7 6800H, NVIDIA GeForce RTX 3060 Laptop GPU (n=1) | |
| Alienware m15 R5 Ryzen Edition | |
| Schenker XMG Core 15 Ampere | |
| Schenker XMG Fusion 15 (Mid 22) | |
| CrossMark / Overall | |
| Lenovo Legion 5 15IAH7H 82RB | |
| Media della classe Gaming (1366 - 2409, n=94, ultimi 2 anni) | |
| Schenker XMG Fusion 15 (Mid 22) | |
| Schenker XMG Core 15 (M22) | |
| Media AMD Ryzen 7 6800H, NVIDIA GeForce RTX 3060 Laptop GPU (n=1) | |
| CrossMark / Productivity | |
| Lenovo Legion 5 15IAH7H 82RB | |
| Media della classe Gaming (1386 - 2254, n=94, ultimi 2 anni) | |
| Schenker XMG Fusion 15 (Mid 22) | |
| Schenker XMG Core 15 (M22) | |
| Media AMD Ryzen 7 6800H, NVIDIA GeForce RTX 3060 Laptop GPU (n=1) | |
| CrossMark / Creativity | |
| Media della classe Gaming (1343 - 2786, n=94, ultimi 2 anni) | |
| Lenovo Legion 5 15IAH7H 82RB | |
| Schenker XMG Core 15 (M22) | |
| Media AMD Ryzen 7 6800H, NVIDIA GeForce RTX 3060 Laptop GPU (n=1) | |
| Schenker XMG Fusion 15 (Mid 22) | |
| CrossMark / Responsiveness | |
| Lenovo Legion 5 15IAH7H 82RB | |
| Media della classe Gaming (1226 - 2334, n=94, ultimi 2 anni) | |
| Schenker XMG Fusion 15 (Mid 22) | |
| Schenker XMG Core 15 (M22) | |
| Media AMD Ryzen 7 6800H, NVIDIA GeForce RTX 3060 Laptop GPU (n=1) | |
| Mozilla Kraken 1.1 / Total | |
| Schenker XMG Core 15 Ampere | |
| Schenker XMG Fusion 15 (Mid 22) | |
| Alienware m15 R5 Ryzen Edition | |
| Schenker XMG Core 15 (M22) | |
| Media AMD Ryzen 7 6800H, NVIDIA GeForce RTX 3060 Laptop GPU (n=1) | |
| Asus TUF Gaming F15 FX507ZM | |
| Lenovo Legion 5 15IAH7H 82RB | |
| Media della classe Gaming (391 - 590, n=100, ultimi 2 anni) | |
| Speedometer 2.0 / Result 2.0 | |
| Media della classe Gaming (29 - 736, n=27, ultimi 2 anni) | |
| Schenker XMG Core 15 (M22) | |
| Media AMD Ryzen 7 6800H, NVIDIA GeForce RTX 3060 Laptop GPU (n=1) | |
| Alienware m15 R5 Ryzen Edition | |
| Octane V2 / Total Score | |
| Media della classe Gaming (93292 - 139447, n=27, ultimi 2 anni) | |
| Schenker XMG Core 15 (M22) | |
| Media AMD Ryzen 7 6800H, NVIDIA GeForce RTX 3060 Laptop GPU (n=1) | |
| Alienware m15 R5 Ryzen Edition | |
| Jetstream 2 / 2.0 Total | |
| Media della classe Gaming (334 - 516, n=27, ultimi 2 anni) | |
| Lenovo Legion 5 15IAH7H 82RB | |
| Asus TUF Gaming F15 FX507ZM | |
| Schenker XMG Core 15 (M22) | |
| Media AMD Ryzen 7 6800H, NVIDIA GeForce RTX 3060 Laptop GPU (n=1) | |
| Alienware m15 R5 Ryzen Edition | |
| WebXPRT 3 / Overall | |
| Lenovo Legion 5 15IAH7H 82RB | |
| Media della classe Gaming (220 - 532, n=98, ultimi 2 anni) | |
| Asus TUF Gaming F15 FX507ZM | |
| Schenker XMG Core 15 (M22) | |
| Media AMD Ryzen 7 6800H, NVIDIA GeForce RTX 3060 Laptop GPU (n=1) | |
| Alienware m15 R5 Ryzen Edition | |
| Schenker XMG Fusion 15 (Mid 22) | |
| Schenker XMG Core 15 Ampere | |
| WebXPRT 4 / Overall | |
| Media della classe Gaming (165 - 354, n=98, ultimi 2 anni) | |
| Lenovo Legion 5 15IAH7H 82RB | |
| Schenker XMG Core 15 (M22) | |
| Media AMD Ryzen 7 6800H, NVIDIA GeForce RTX 3060 Laptop GPU (n=1) | |
| Schenker XMG Fusion 15 (Mid 22) | |
* ... Meglio usare valori piccoli
| PCMark 10 Score | 7250 punti | |
Aiuto | ||
| AIDA64 / Memory Copy | |
| Media della classe Gaming (21750 - 129946, n=105, ultimi 2 anni) | |
| Asus TUF Gaming F15 FX507ZM | |
| Lenovo Legion 5 15IAH7H 82RB | |
| Schenker XMG Core 15 (M22) | |
| Media AMD Ryzen 7 6800H (48209 - 51186, n=8) | |
| Schenker XMG Fusion 15 (Mid 22) | |
| Schenker XMG Core 15 Ampere | |
| Alienware m15 R5 Ryzen Edition | |
| AIDA64 / Memory Read | |
| Media della classe Gaming (22956 - 118858, n=105, ultimi 2 anni) | |
| Lenovo Legion 5 15IAH7H 82RB | |
| Asus TUF Gaming F15 FX507ZM | |
| Schenker XMG Core 15 (M22) | |
| Media AMD Ryzen 7 6800H (43828 - 51778, n=8) | |
| Schenker XMG Fusion 15 (Mid 22) | |
| Schenker XMG Core 15 Ampere | |
| Alienware m15 R5 Ryzen Edition | |
| AIDA64 / Memory Write | |
| Media della classe Gaming (22297 - 135096, n=105, ultimi 2 anni) | |
| Lenovo Legion 5 15IAH7H 82RB | |
| Asus TUF Gaming F15 FX507ZM | |
| Schenker XMG Core 15 (M22) | |
| Media AMD Ryzen 7 6800H (51116 - 55307, n=8) | |
| Schenker XMG Fusion 15 (Mid 22) | |
| Schenker XMG Core 15 Ampere | |
| Alienware m15 R5 Ryzen Edition | |
| AIDA64 / Memory Latency | |
| Media della classe Gaming (75.3 - 259, n=105, ultimi 2 anni) | |
| Lenovo Legion 5 15IAH7H 82RB | |
| Schenker XMG Fusion 15 (Mid 22) | |
| Media AMD Ryzen 7 6800H (83.1 - 104.1, n=8) | |
| Schenker XMG Core 15 (M22) | |
| Schenker XMG Core 15 Ampere | |
| Alienware m15 R5 Ryzen Edition | |
| Asus TUF Gaming F15 FX507ZM | |
* ... Meglio usare valori piccoli
Latenze DPC
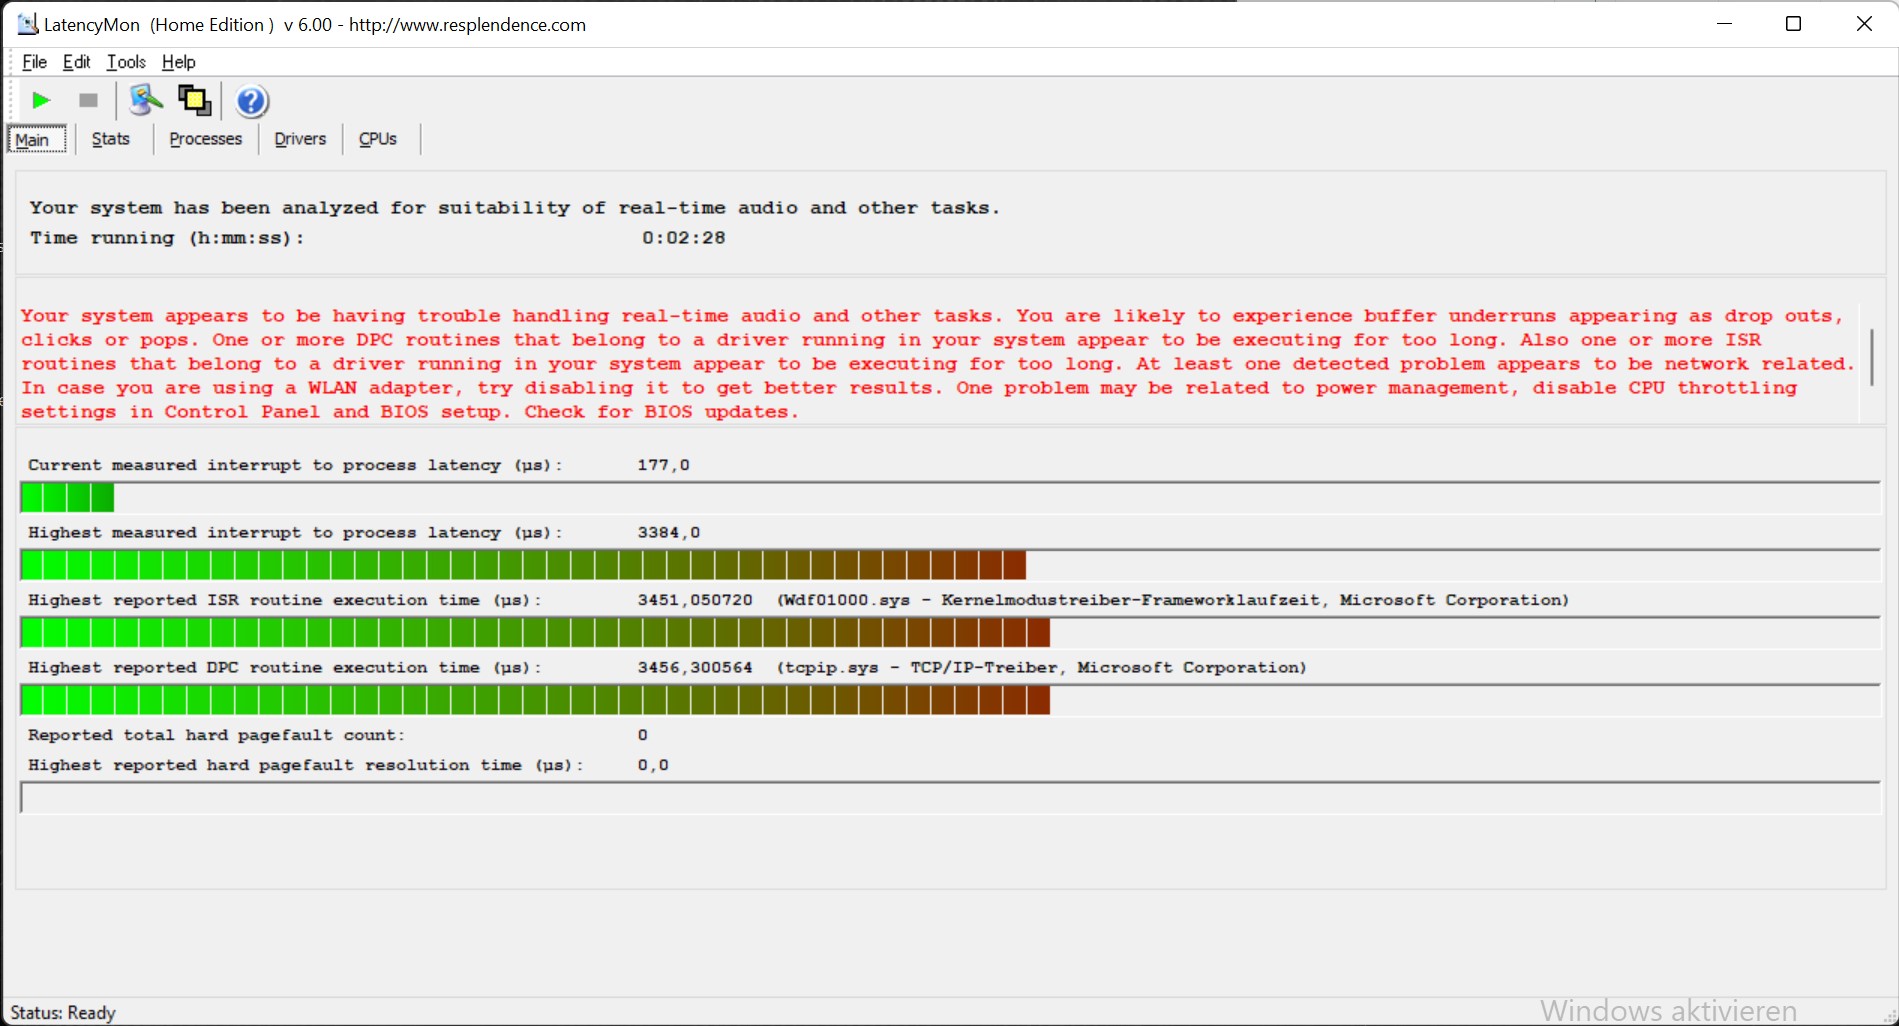
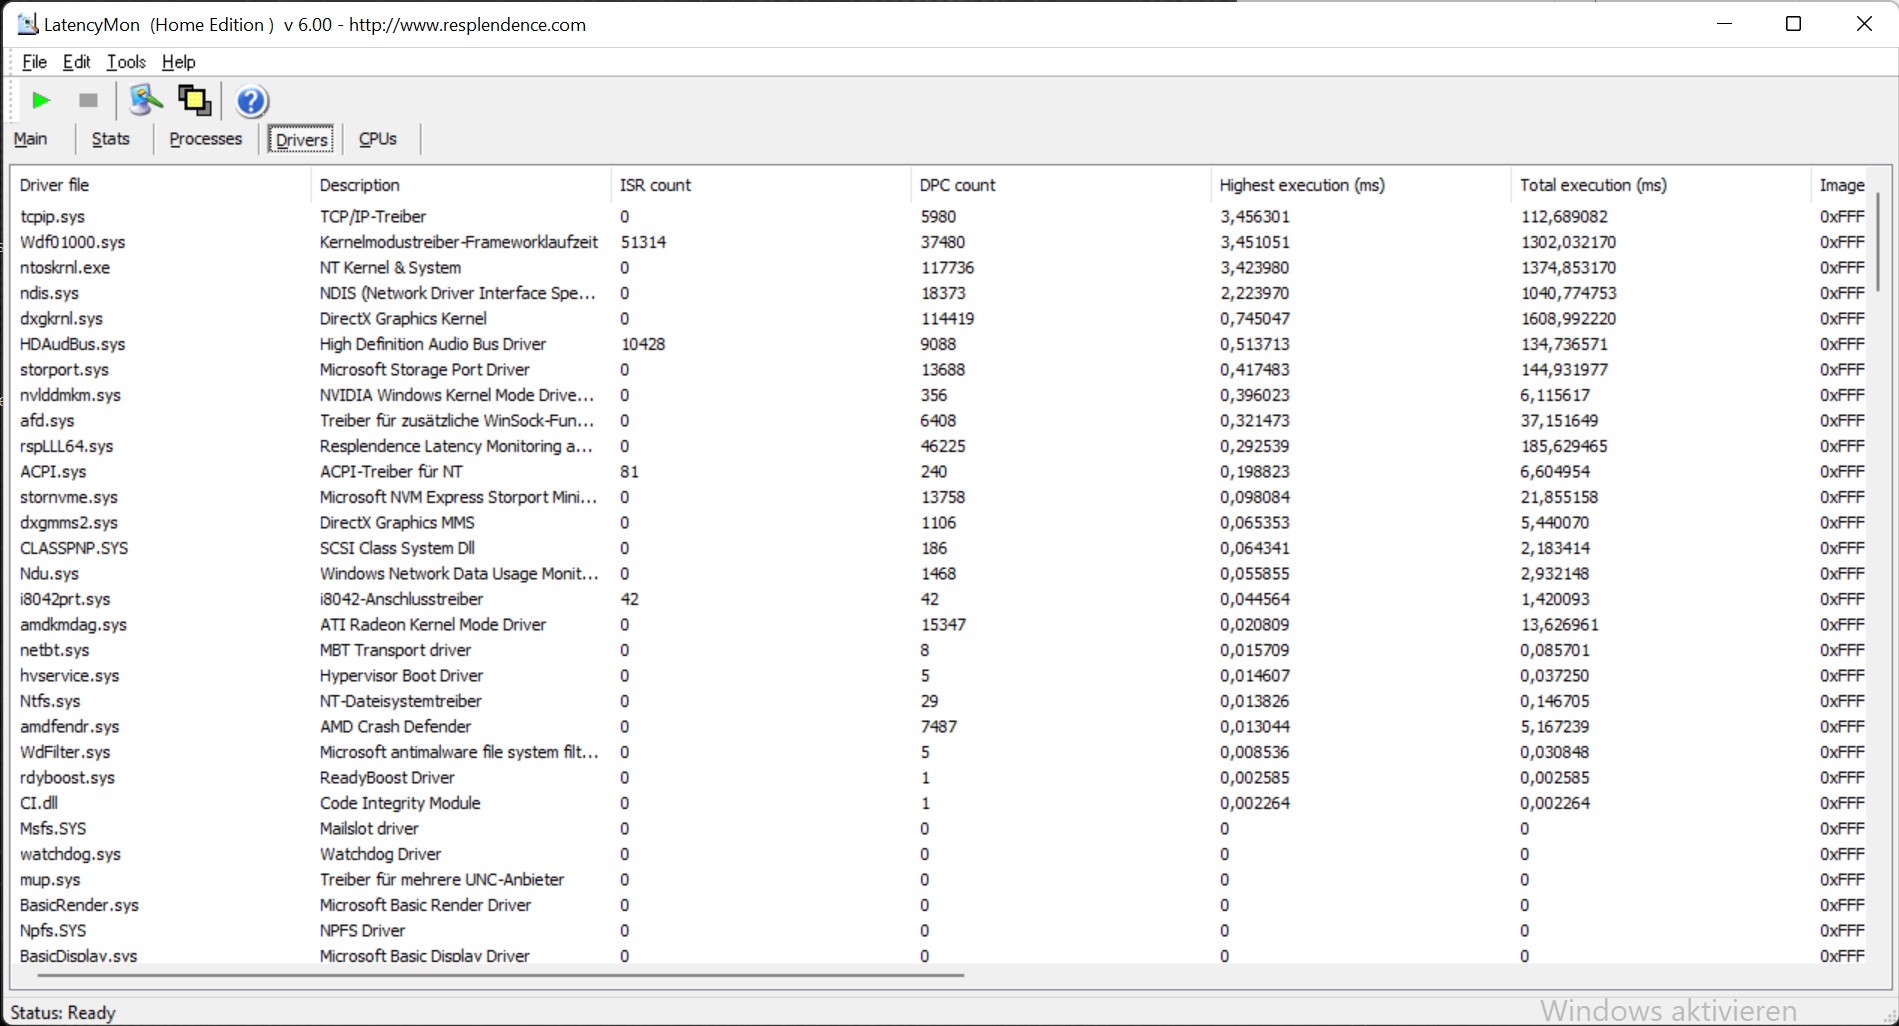
| DPC Latencies / LatencyMon - interrupt to process latency (max), Web, Youtube, Prime95 | |
| Schenker XMG Core 15 (M22) | |
| Schenker XMG Fusion 15 (Mid 22) | |
| Lenovo Legion 5 15IAH7H 82RB | |
| Asus TUF Gaming F15 FX507ZM | |
| Schenker XMG Core 15 Ampere | |
| Alienware m15 R5 Ryzen Edition | |
* ... Meglio usare valori piccoli
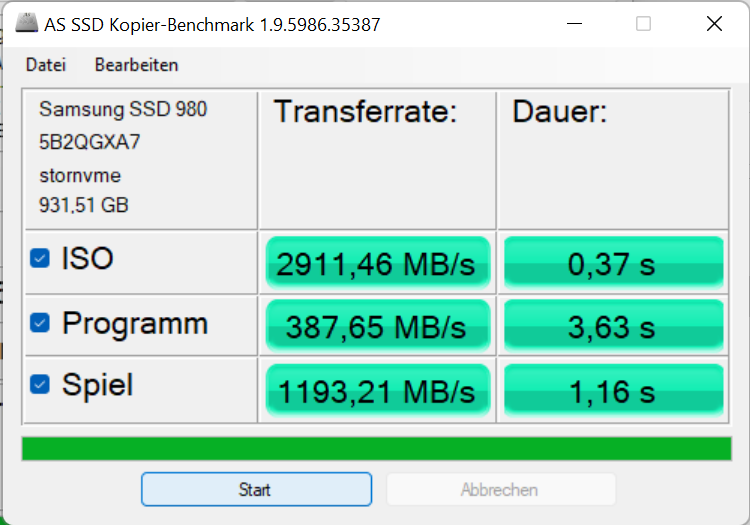
Memoria di massa
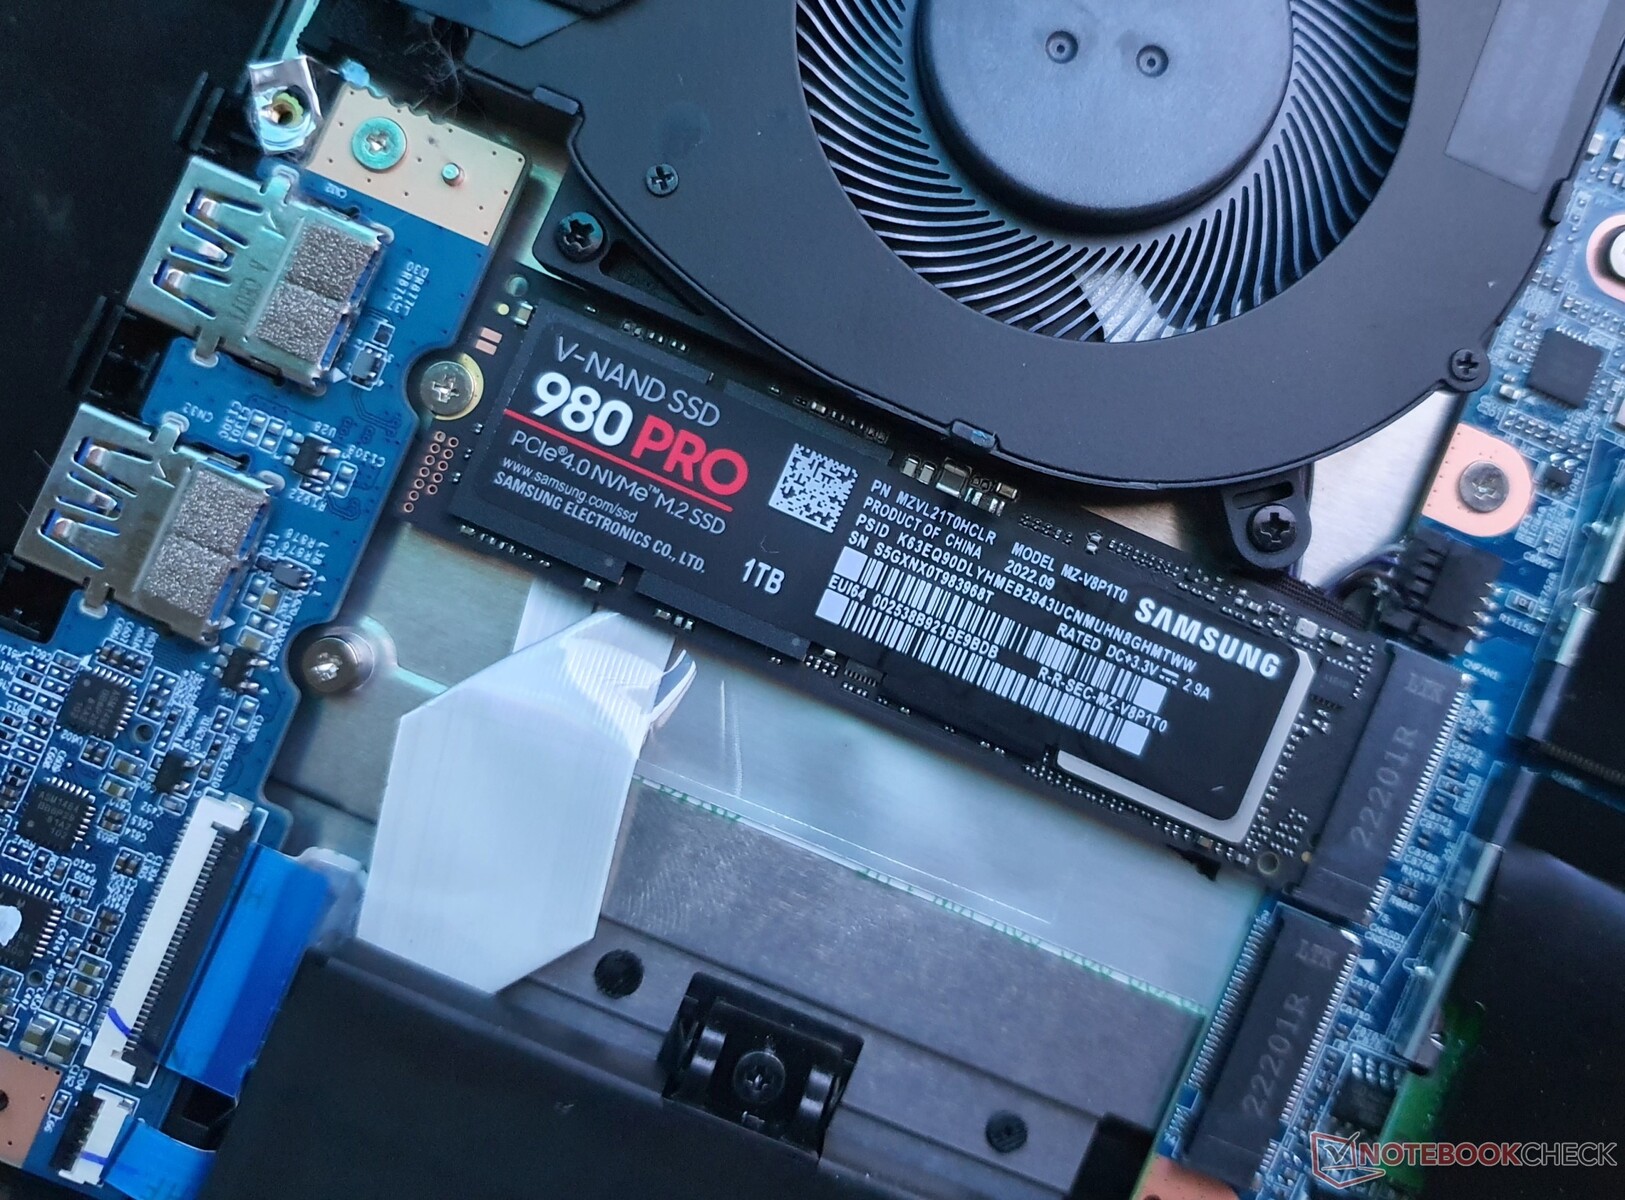
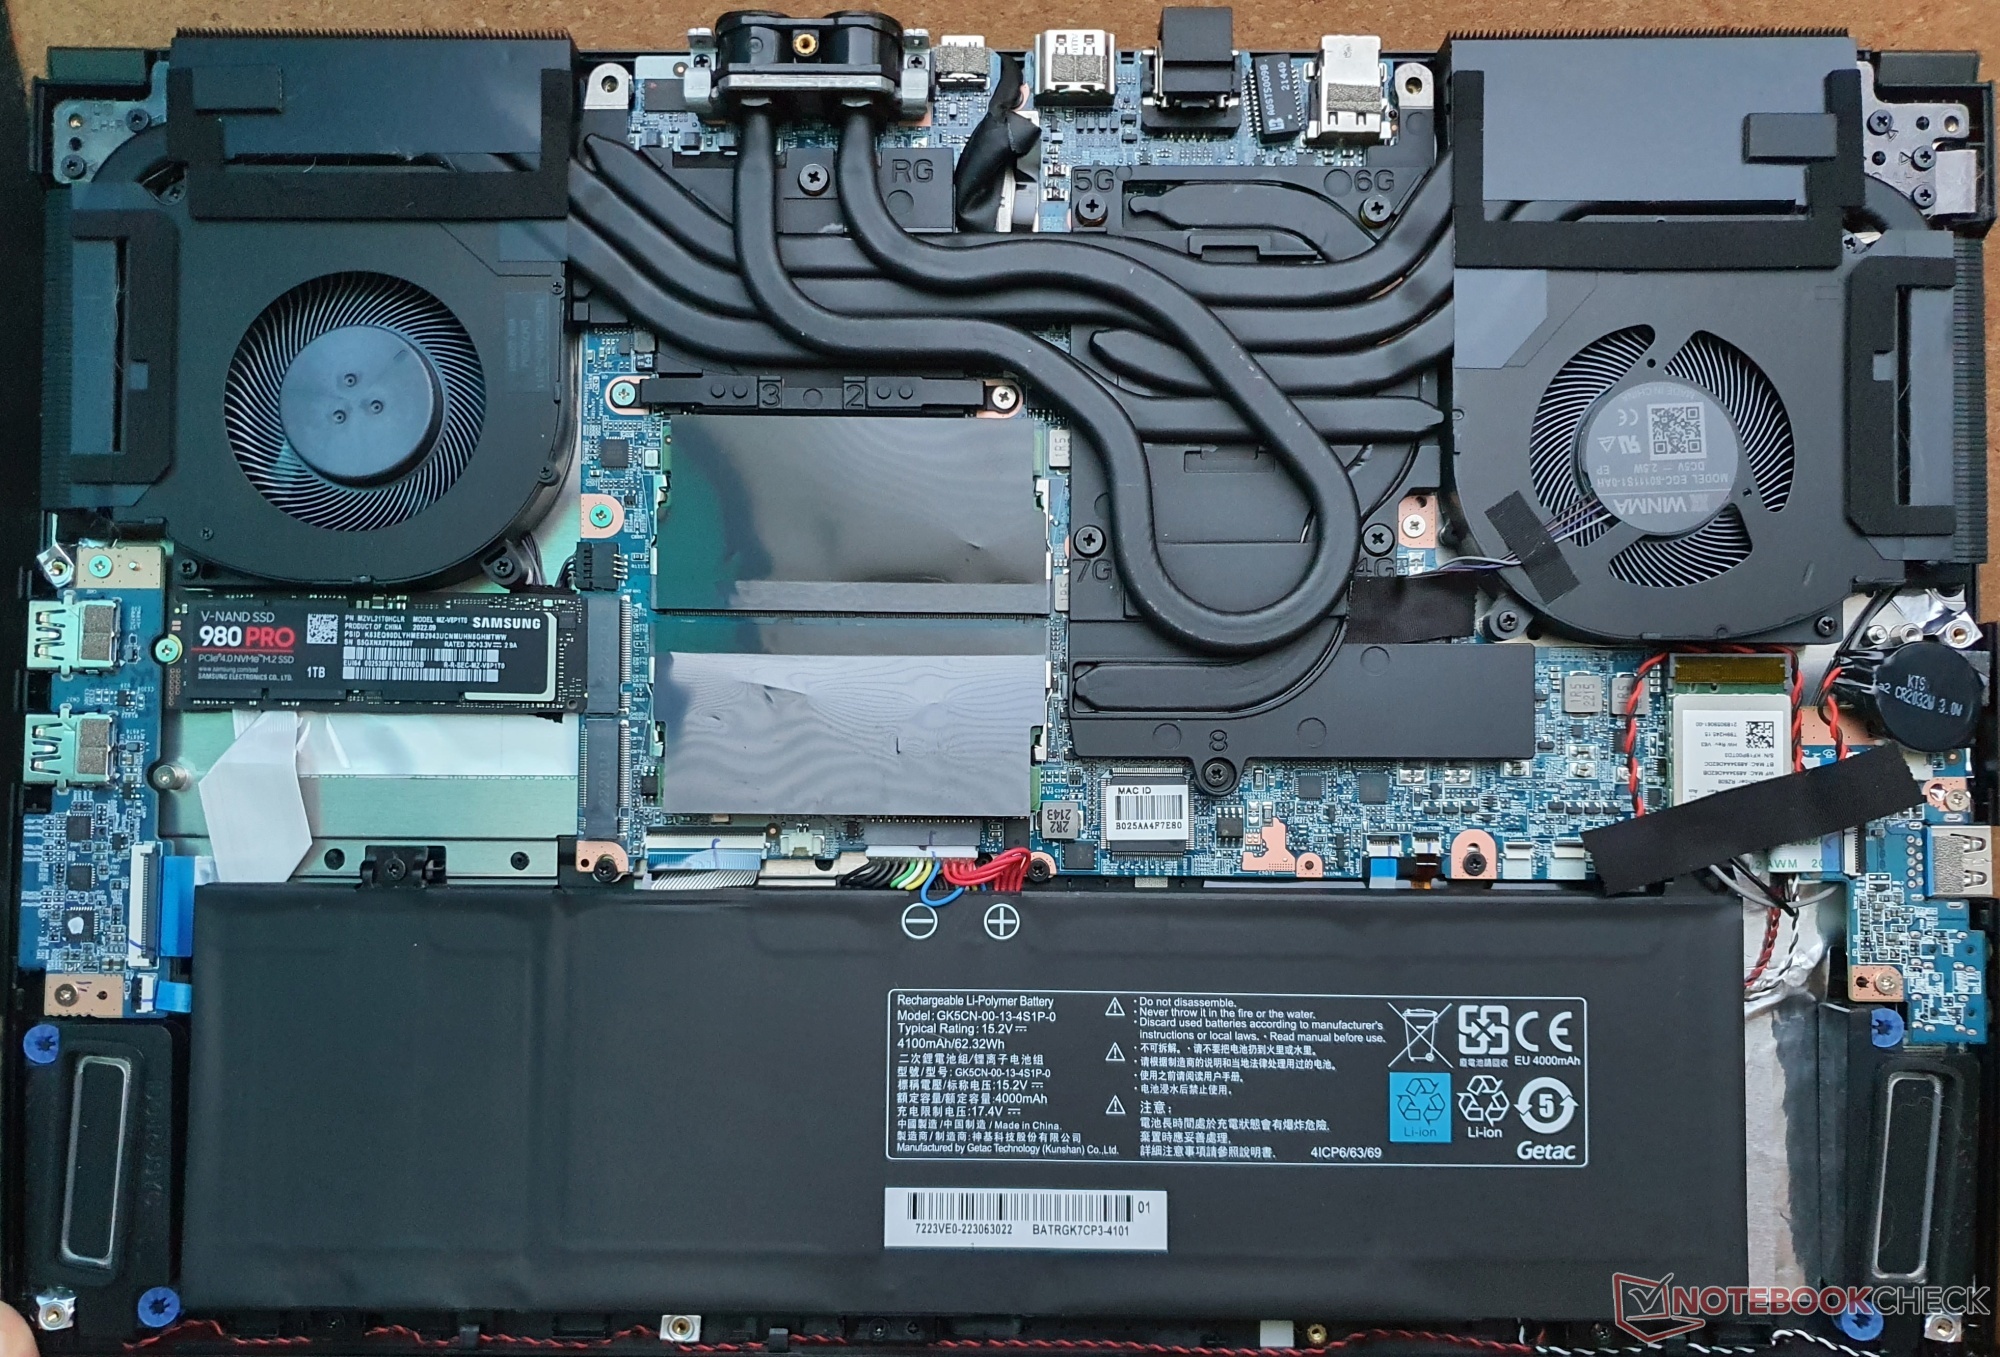
Il Samsung 980 Pro 1 TB installato raggiunge velocità PCIe 4.0 anche sotto carico permanente, ma fatica con 32-64 processi simultanei di lettura/scrittura 4K nel portatile XMG, il che è rilevante soprattutto per i server. La stessa unità SSD è più veloce nell'XMG Fusion 15, quindi il suo potenziale non viene sfruttato appieno dal Core 15.
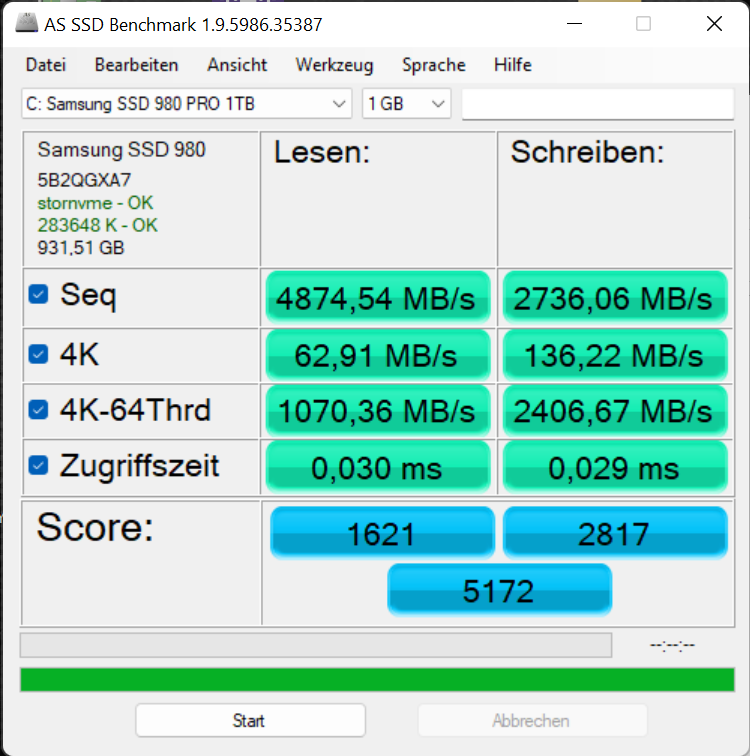
| Schenker XMG Core 15 (M22) Samsung SSD 980 Pro 1TB MZ-V8P1T0BW | Lenovo Legion 5 15IAH7H 82RB | Schenker XMG Fusion 15 (Mid 22) Samsung SSD 980 Pro 1TB MZ-V8P1T0BW | Asus TUF Gaming F15 FX507ZM SK Hynix HFM001TD3JX013N | Alienware m15 R5 Ryzen Edition Toshiba KBG40ZNS512G NVMe | Schenker XMG Core 15 Ampere Samsung SSD 970 EVO Plus 1TB | |
|---|---|---|---|---|---|---|
| AS SSD | 37% | 21% | 7% | -78% | 5% | |
| Seq Read (MB/s) | 4874 | 5844.9 20% | 5171.96 6% | 3013 -38% | 2082 -57% | 2829 -42% |
| Seq Write (MB/s) | 2711 | 2038.42 -25% | 3881.37 43% | 2768 2% | 825 -70% | 2646 -2% |
| 4K Read (MB/s) | 63 | 71.99 14% | 66.29 5% | 66.9 6% | 42.41 -33% | 54.8 -13% |
| 4K Write (MB/s) | 136 | 310.54 128% | 189.98 40% | 184.8 36% | 98.3 -28% | 179.1 32% |
| 4K-64 Read (MB/s) | 1070 | 2771.98 159% | 2539.3 137% | 1923 80% | 1255 17% | 1734 62% |
| 4K-64 Write (MB/s) | 2407 | 4007.67 67% | 3144.88 31% | 2198 -9% | 738 -69% | 2396 0% |
| Access Time Read * (ms) | 0.03 | 0.037 -23% | 0.07 -133% | 0.03 -0% | 0.109 -263% | 0.033 -10% |
| Access Time Write * (ms) | 0.029 | 0.053 -83% | 0.022 24% | 0.081 -179% | 0.17 -486% | 0.021 28% |
| Score Read (Points) | 1621 | 3428 111% | 3123 93% | 2291 41% | 1506 -7% | 2072 28% |
| Score Write (Points) | 2814 | 4522 61% | 3723 32% | 2660 -5% | 918 -67% | 2839 1% |
| Score Total (Points) | 5168 | 9510 84% | 8376 62% | 6117 18% | 3136 -39% | 5965 15% |
| Copy ISO MB/s (MB/s) | 2911 | 2320.82 -20% | 2364.44 -19% | 2143 -26% | 1391 -52% | 2119 -27% |
| Copy Program MB/s (MB/s) | 388 | 429.5 11% | 329.45 -15% | 871 124% | 645 66% | 406.1 5% |
| Copy Game MB/s (MB/s) | 1193 | 1290.19 8% | 1079.59 -10% | 1840 54% | 1101 -8% | 1086 -9% |
| DiskSpd | 135% | 174% | 80% | -24% | 84% | |
| seq read (MB/s) | 3429 | 5217 52% | 4199 22% | 2383 -31% | 1726 -50% | 2367 -31% |
| seq write (MB/s) | 3148 | 4897 56% | 4299 37% | 2894 -8% | 1520 -52% | 2601 -17% |
| seq q8 t1 read (MB/s) | 6850 | 7087 3% | 6847 0% | 3554 -48% | 2314 -66% | 3347 -51% |
| seq q8 t1 write (MB/s) | 4927 | 1498 -70% | 4999 1% | 2869 -42% | 1449 -71% | 3263 -34% |
| 4k q1 t1 read (MB/s) | 61.1 | 74.8 22% | 77.9 27% | 69.4 14% | 48.3 -21% | 52.3 -14% |
| 4k q1 t1 write (MB/s) | 132.2 | 369 179% | 239 81% | 211 60% | 121 -8% | 204 54% |
| 4k q32 t16 read (MB/s) | 1010 | 4443 340% | 4309 327% | 2217 120% | 1301 29% | 1853 83% |
| 4k q32 t16 write (MB/s) | 345 | 2050 494% | 3435 896% | 2314 571% | 497 44% | 2683 678% |
| Media totale (Programma / Settaggio) | 86% /
72% | 98% /
77% | 44% /
34% | -51% /
-59% | 45% /
33% |
* ... Meglio usare valori piccoli
* ... Meglio usare valori piccoli
Continuous: DiskSpd Read Loop, Queue Depth 8
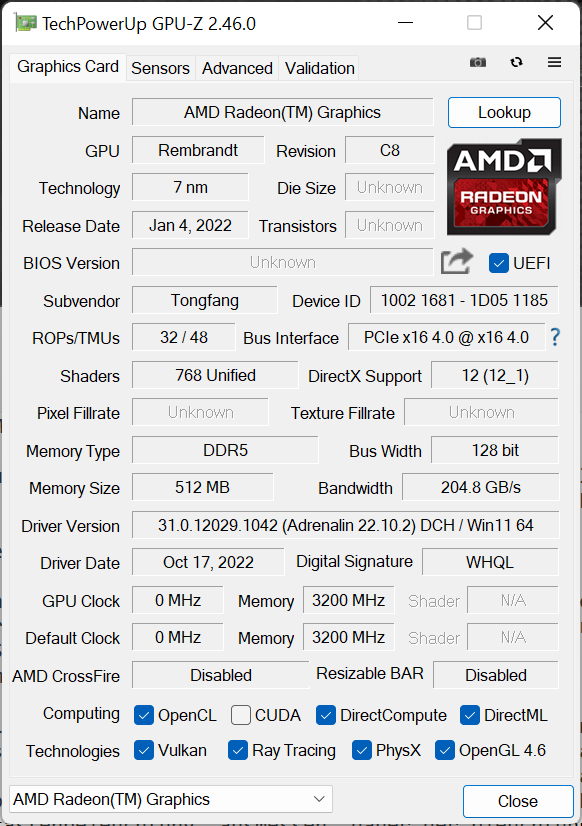
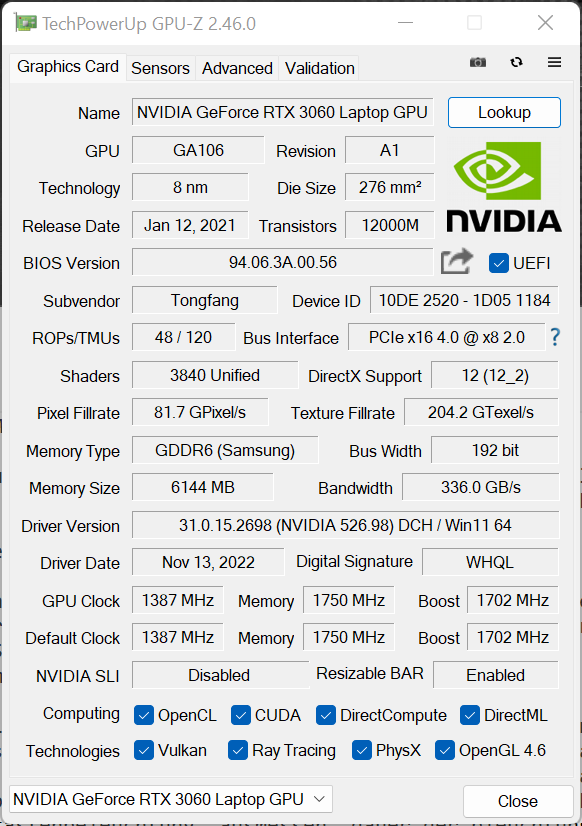
Scheda grafica
Oltre a una Radeon 680M integrata, il portatile da gioco dispone naturalmente di un'unità grafica dedicata - nel caso dell'XMG Core 15, una GeForce RTX 3060 con TGP da 140-W.
Molti giochi più recenti possono essere renderizzati senza problemi con la risoluzione nativa WQHD, ma i giochi molto esigenti in termini di prestazioni dovranno probabilmente essere goduti in FullHD o a livelli di dettaglio inferiori.
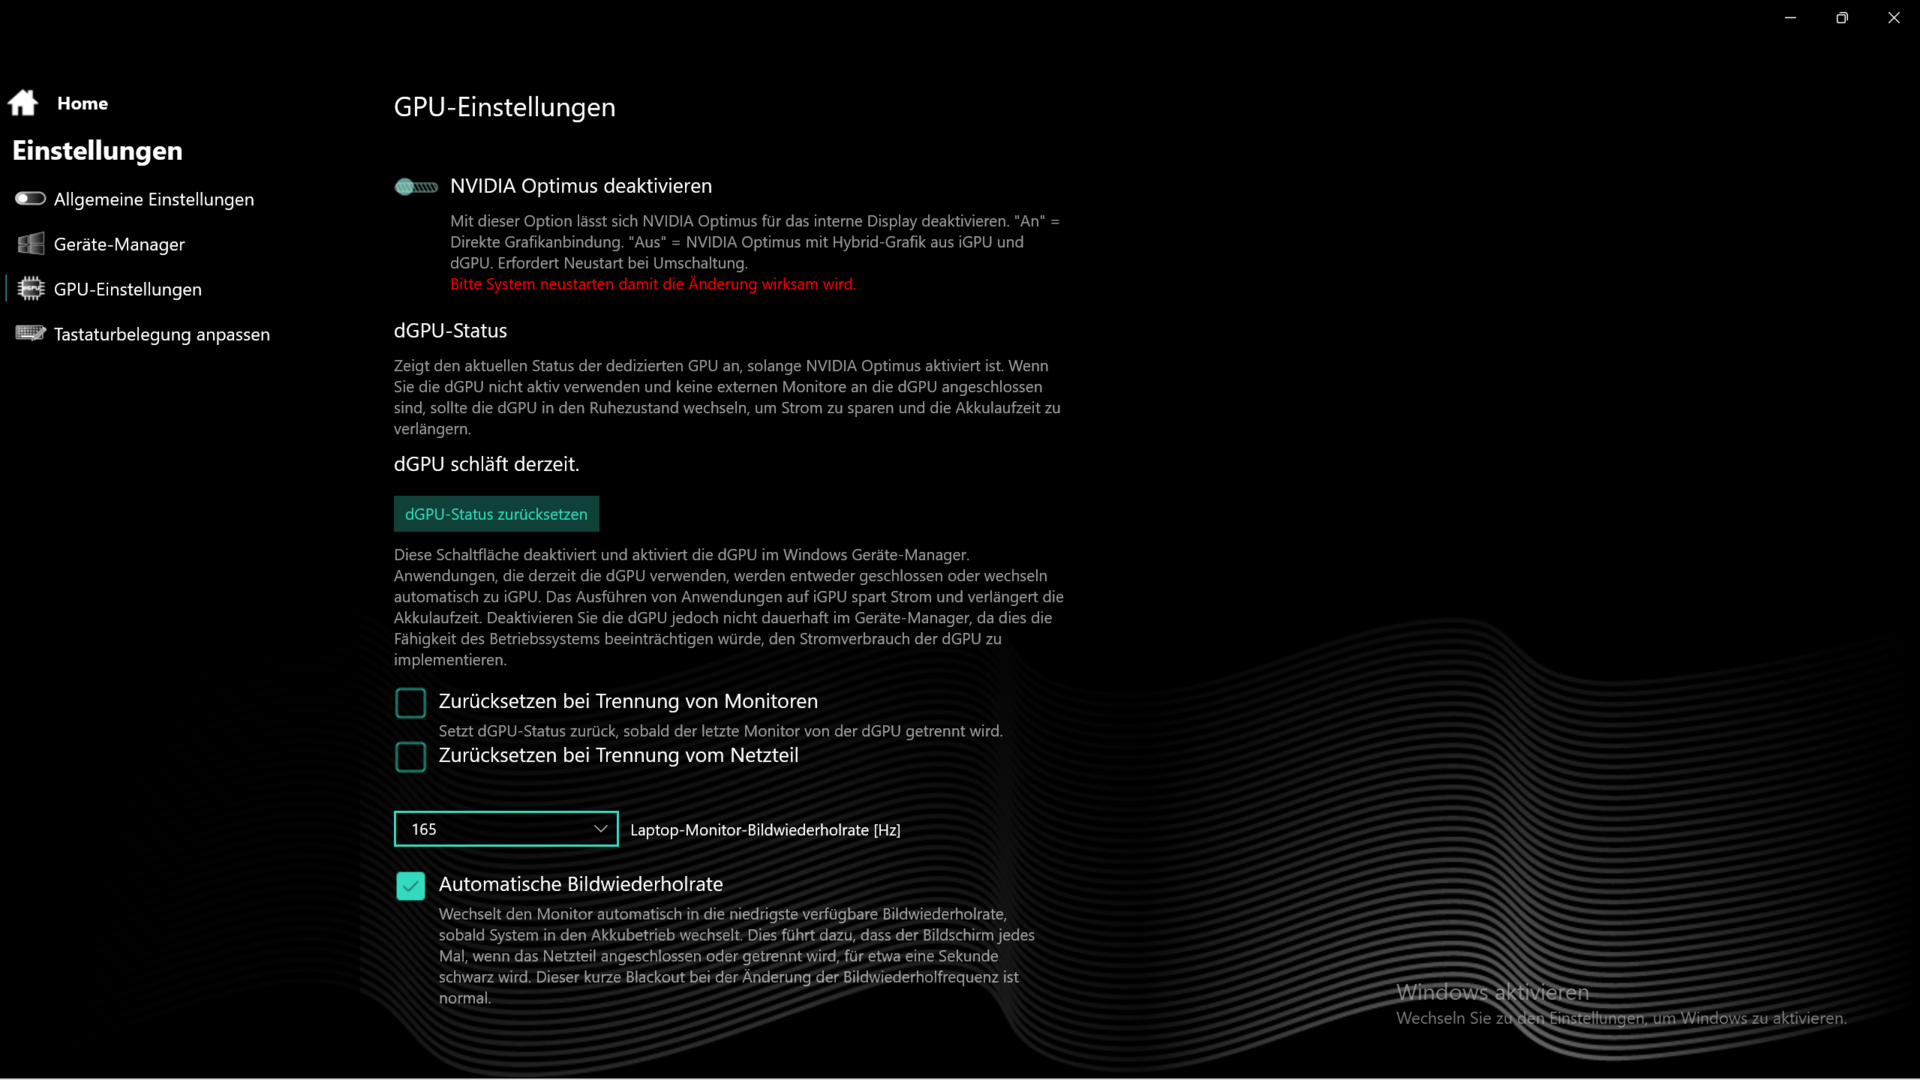
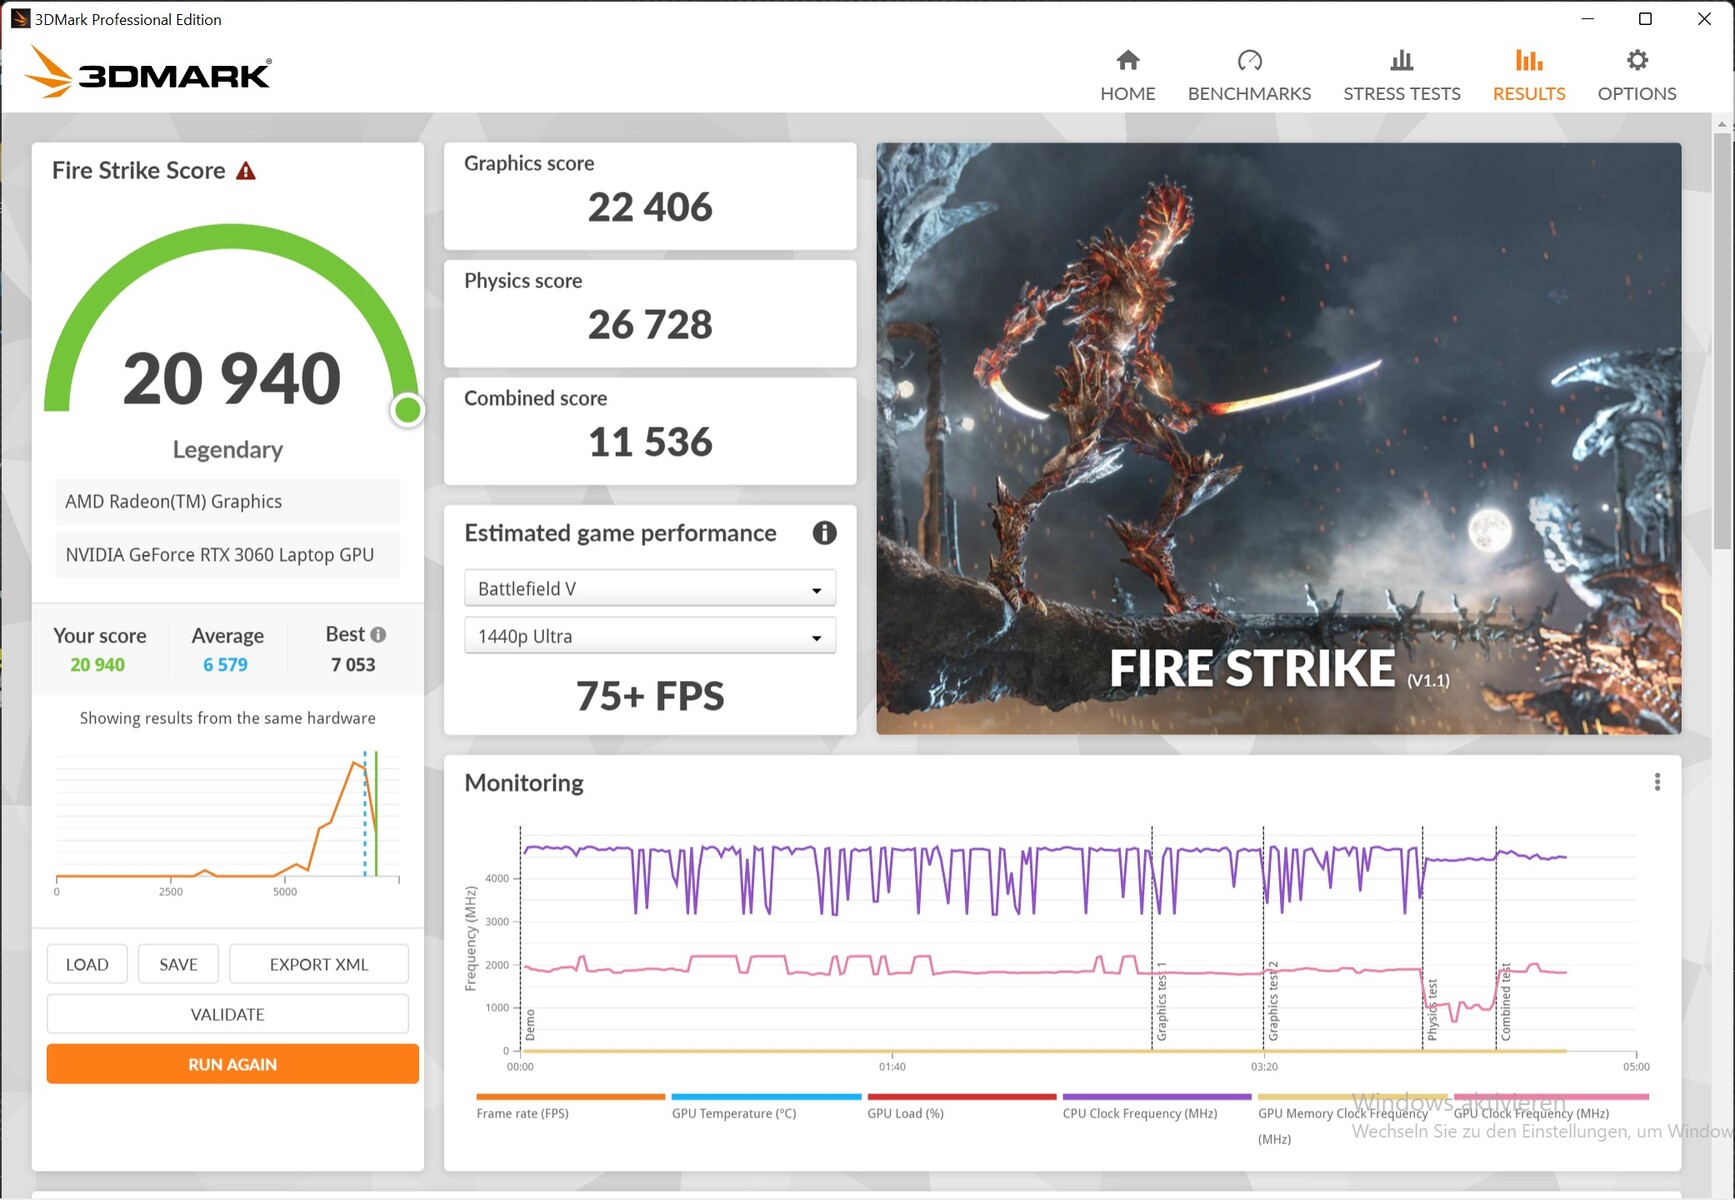
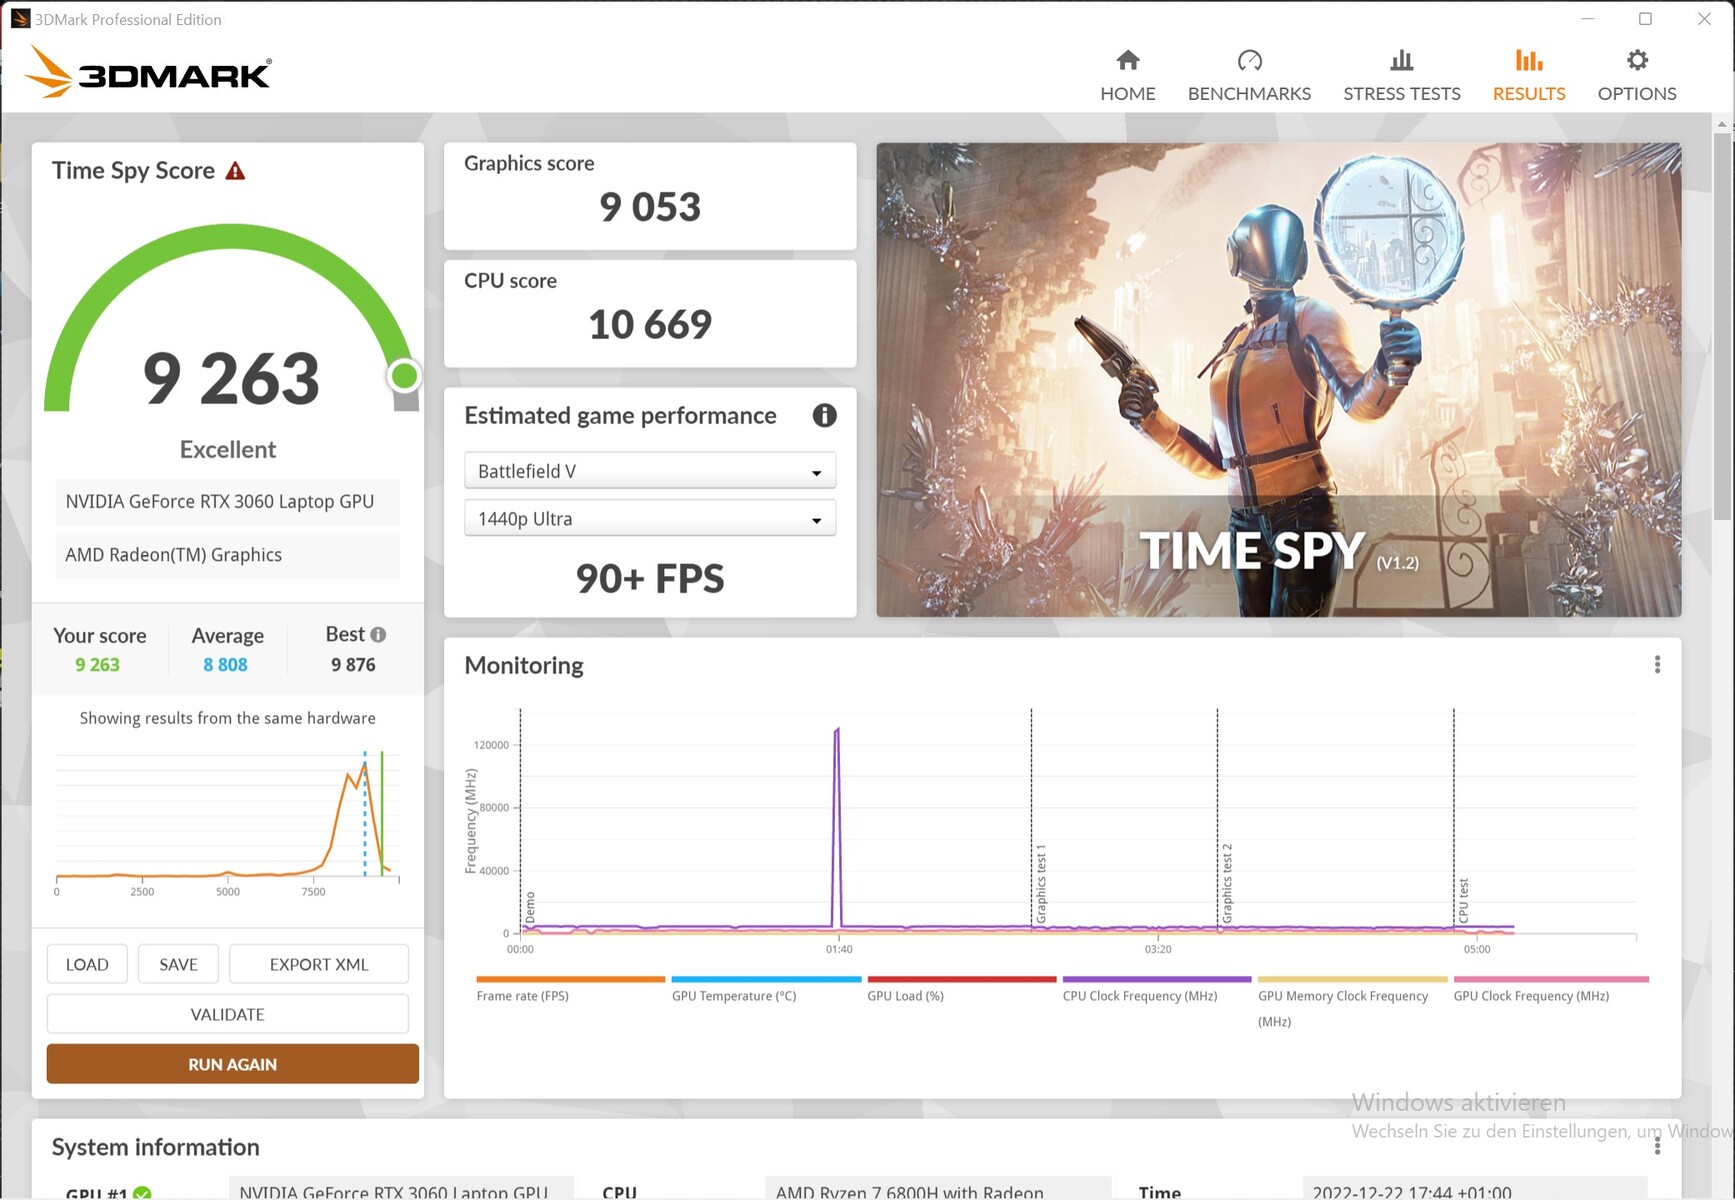
La funzione di overclock del Centro di Controllo XMG può aumentare le prestazioni del 3-4% a seconda dell'applicazione 3D, mentre l'interruttore MUX (necessario per il riavvio) aggiunge circa il 5%. Ciononostante, il Core 15 deve ammettere la sconfitta contro gli altri giocatori RTX 3060, anche se il divario non è molto grande.
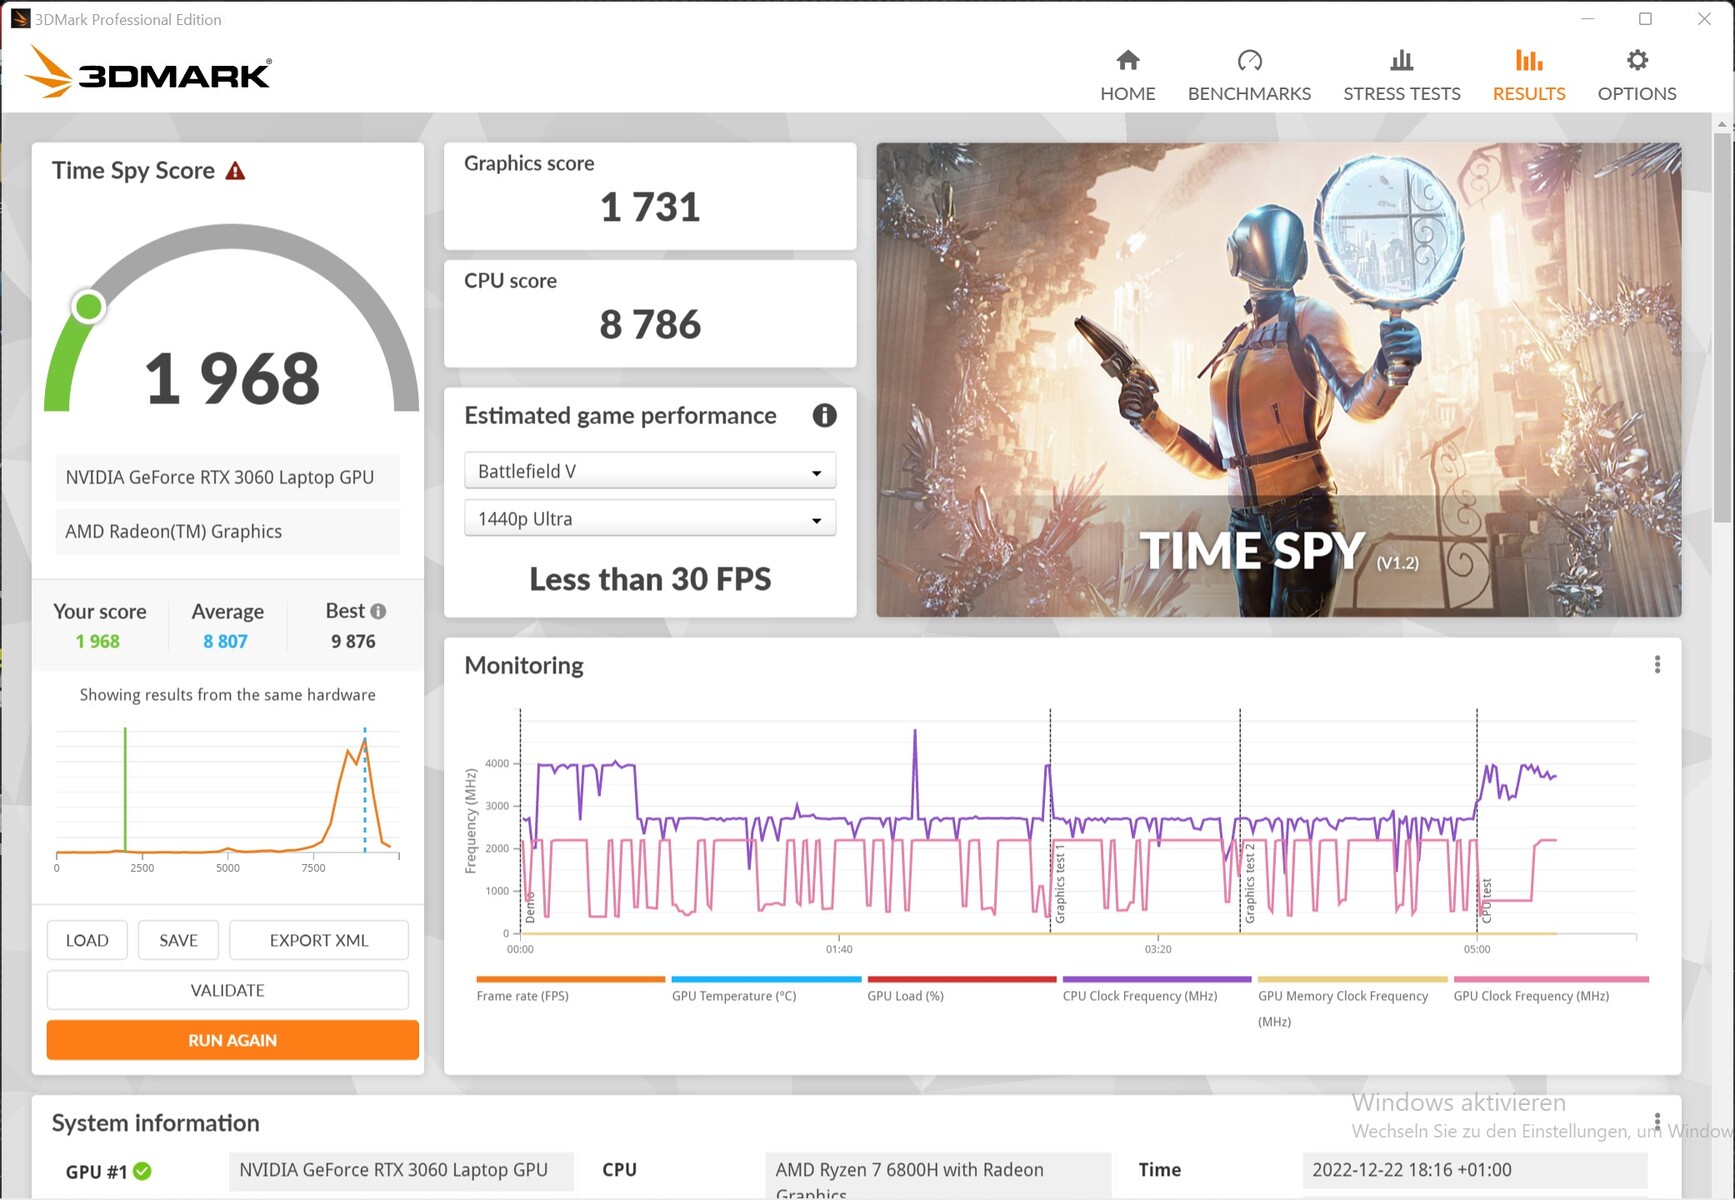
Le prestazioni grafiche calano notevolmente con l'alimentazione a batteria, per cui rimane solo il 25% delle prestazioni originali. Questo è in parte dovuto alla piccola batteria da 62 Wh, che altrimenti si scaricherebbe troppo rapidamente.
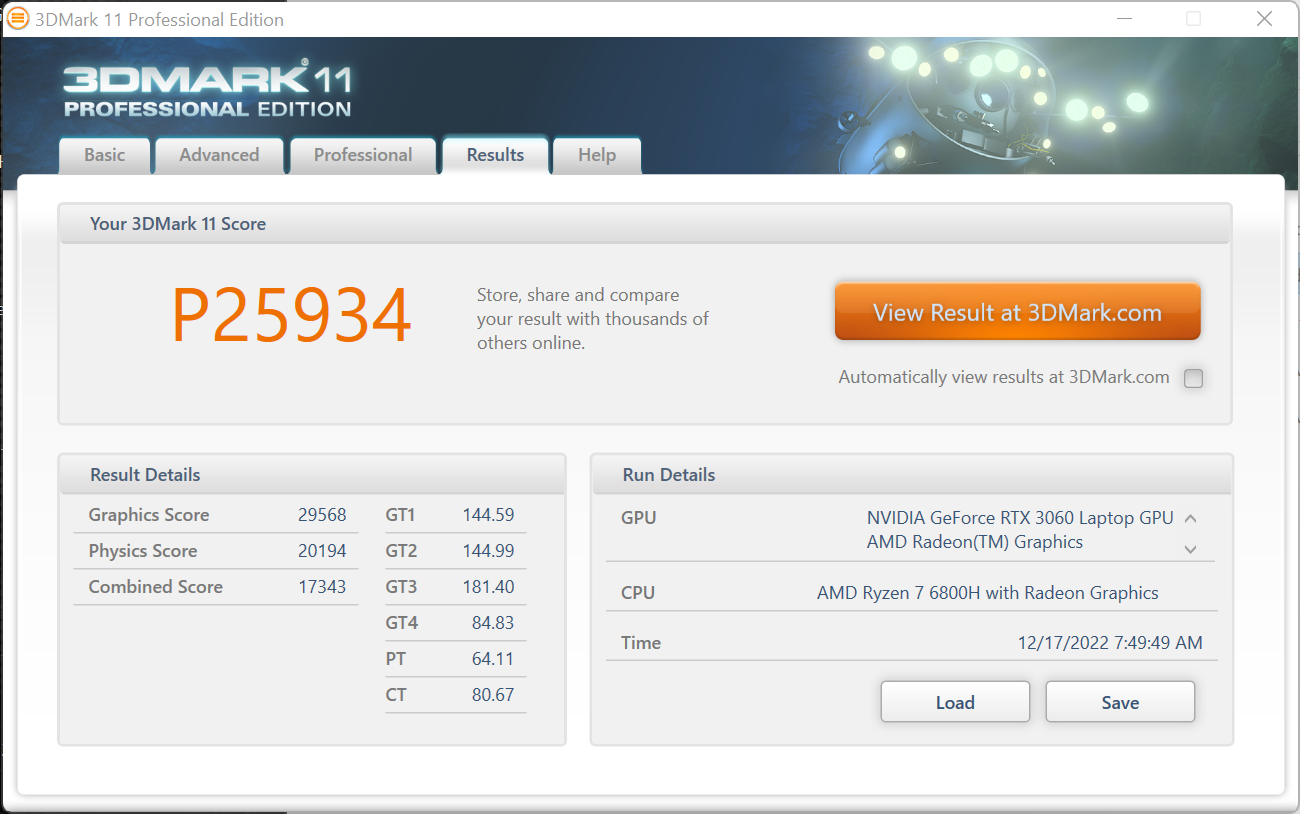
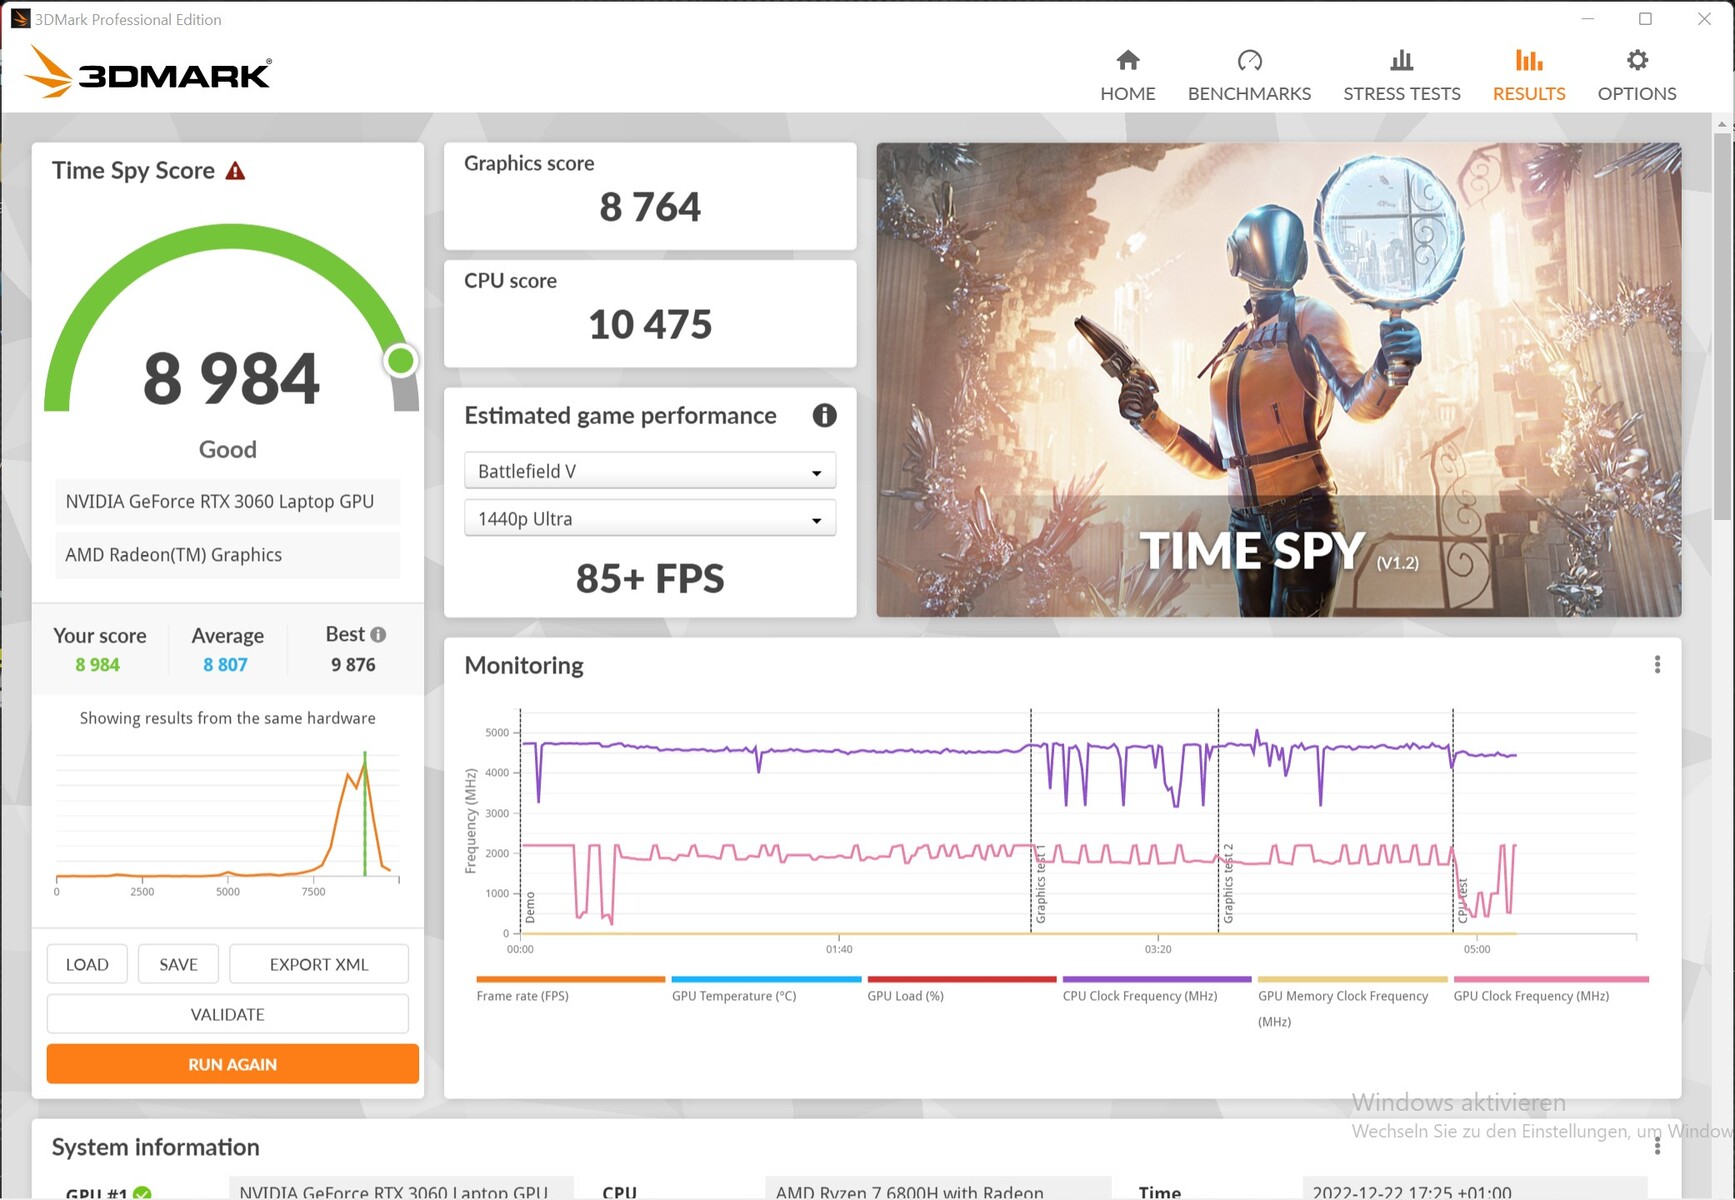
| 3DMark 11 Performance | 25934 punti | |
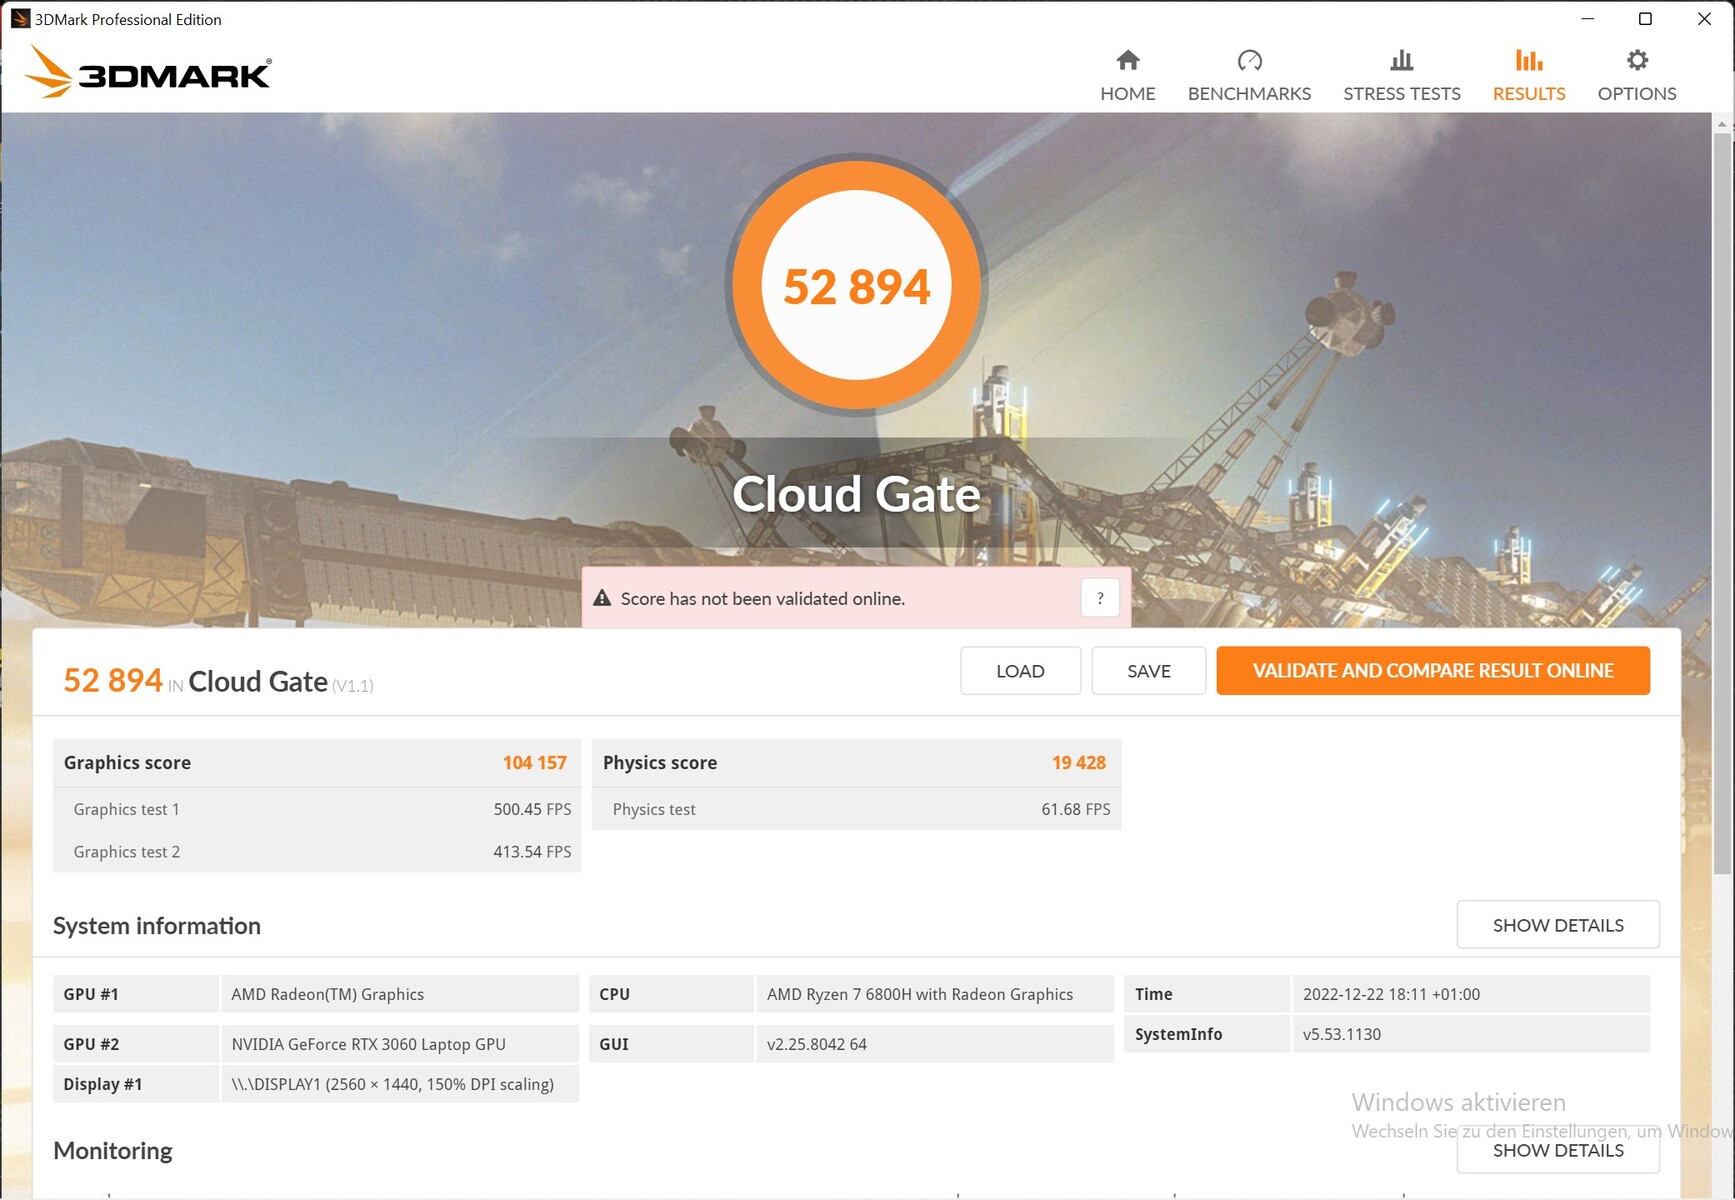
| 3DMark Cloud Gate Standard Score | 52894 punti | |
| 3DMark Fire Strike Score | 20940 punti | |
| 3DMark Time Spy Score | 8984 punti | |
Aiuto | ||
* ... Meglio usare valori piccoli
Prestazioni di gioco
La concorrenza con la stessa unità grafica supera l'XMG Core 15 fino al 13% nei giochi nonostante l'elevato TGP, che misuriamo a 134 W, mentre almeno non si scalda troppo a 84 °C (~183 °F). Il clock del core di ~1.800 MHz è già superiore alle specifiche di 1.702 MHz. Le prestazioni corrispondono alla fascia media superiore.
Le frequenze di clock rimangono stabili anche dopo un'ora in The Witcher 3 e quindi anche gli FPS, come mostrano i due grafici seguenti.
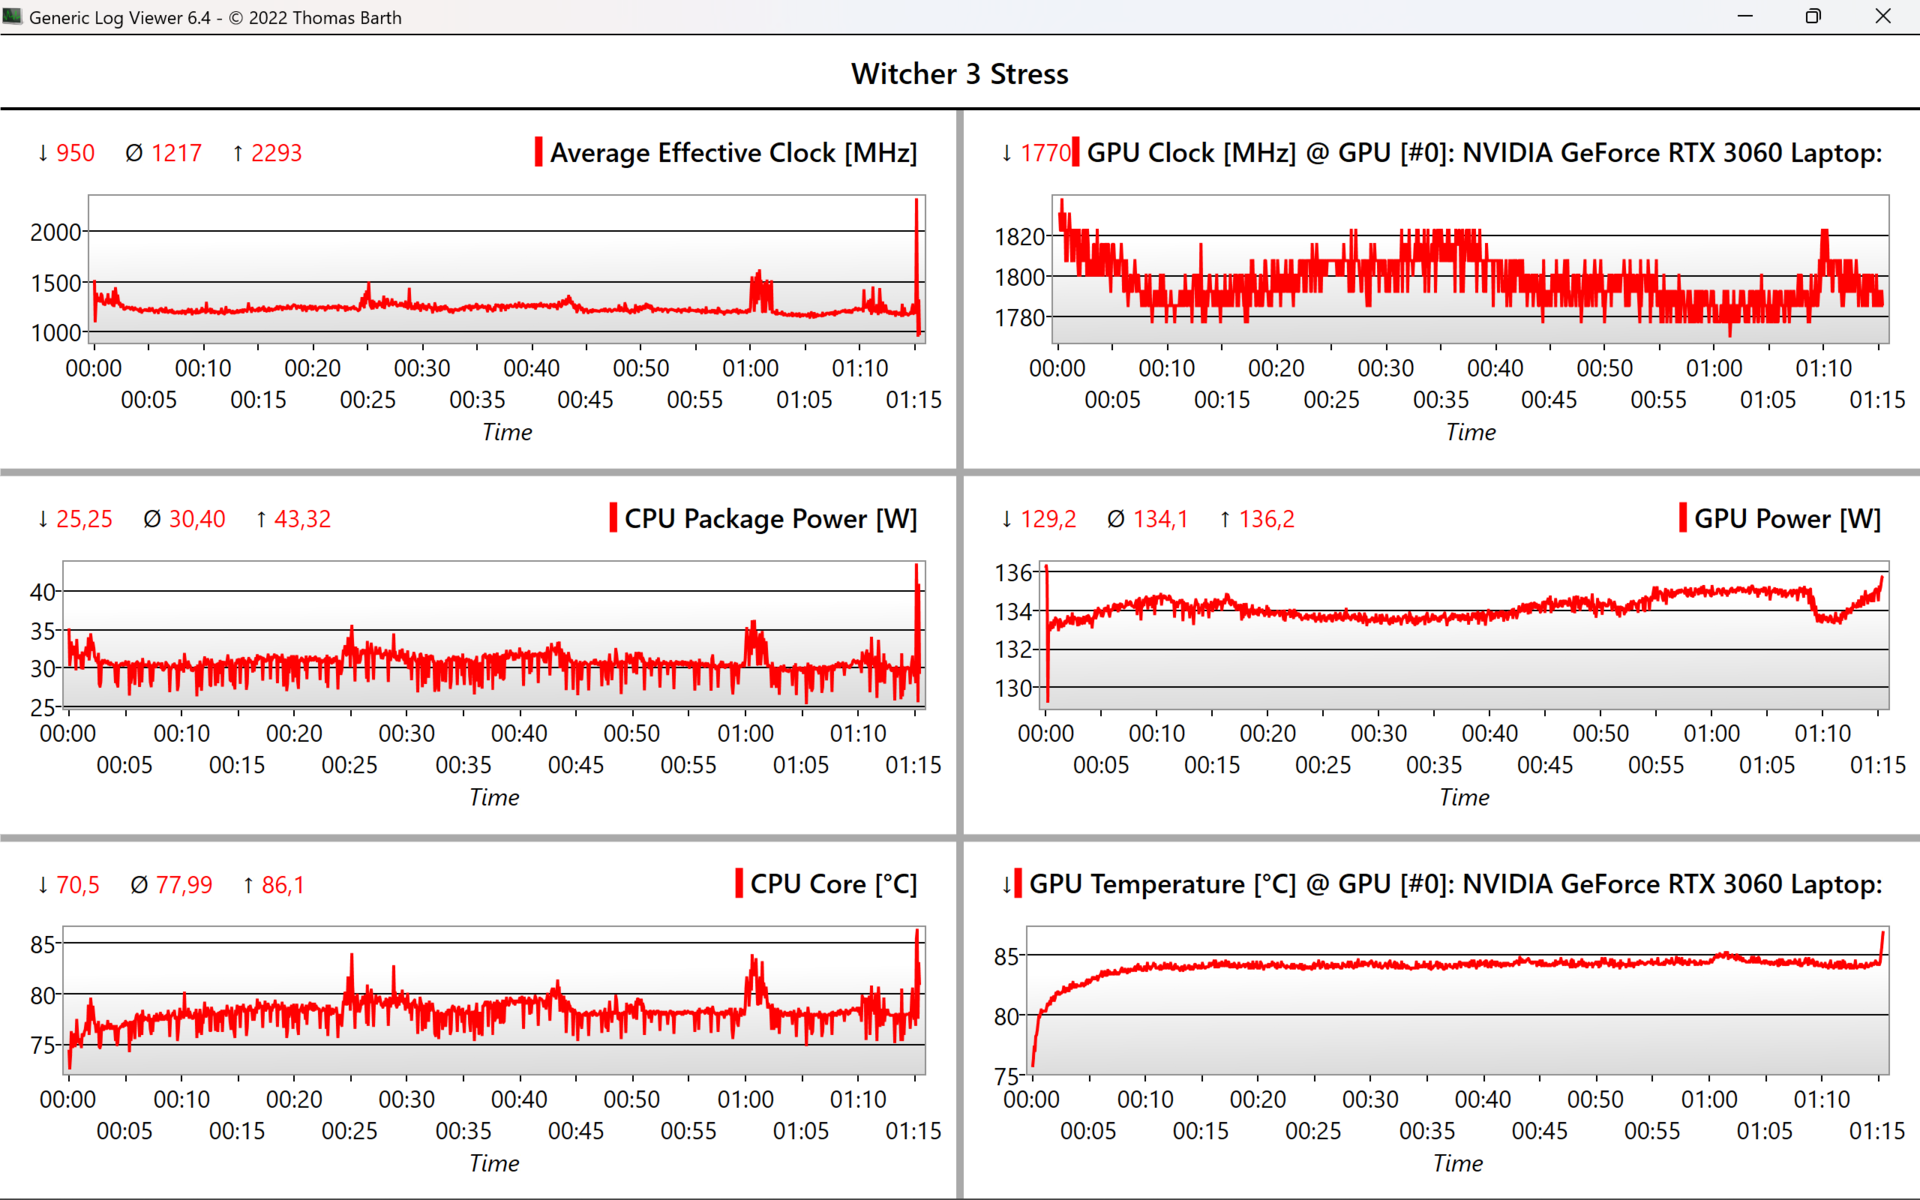
Witcher 3 FPS-Diagram
| basso | medio | alto | ultra | QHD | |
|---|---|---|---|---|---|
| GTA V (2015) | 178.7 | 172.1 | 158.4 | 97.3 | 86.5 |
| The Witcher 3 (2015) | 303 | 253 | 159.7 | 81.5 | |
| Dota 2 Reborn (2015) | 136.8 | 126.5 | 117.6 | 112.3 | |
| Final Fantasy XV Benchmark (2018) | 178.4 | 119.5 | 91.9 | 67.5 | |
| X-Plane 11.11 (2018) | 104.8 | 93.3 | 74.2 | ||
| Far Cry 5 (2018) | 118 | 107 | 90 | ||
| Strange Brigade (2018) | 273 | 200 | 171.7 | 152.7 | |
| God of War (2022) | 92.6 | 73.1 | 51.5 | 44 |
Emissioni: Giochi silenziosi con FPS elevati possibili con XMG Core 15
Emissioni acustiche
Le ventole rimangono per lo più spente durante il funzionamento al minimo e durante la navigazione web. Il rumore di 42 dB(A) a pieno carico della CPU può essere contenuto soprattutto grazie alla modalità bilanciata, che offre ancora molta potenza.
Durante i giochi il volume diventa molto alto, con 55 dB(A), ma il rumore a bassa frequenza rimane relativamente piacevole. Anche in questo caso, la modalità bilanciata fornisce un chiaro rimedio, mentre gli FPS sono scesi solo del 5% in GTA V, ad esempio, il che è un ottimo risultato. Ex fabbrica, il XMG Fusion 15 e il Alienware m15 rimangono significativamente più silenziosi quando si gioca, rispettivamente con 46 e 48 dB(A).
.
Rumorosità
| Idle |
| 23 / 23 / 23 dB(A) |
| Sotto carico |
| 42.41 / 55.05 dB(A) |
 | ||
30 dB silenzioso 40 dB(A) udibile 50 dB(A) rumoroso |
||
min: | ||
| Schenker XMG Core 15 (M22) R7 6800H, GeForce RTX 3060 Laptop GPU | Lenovo Legion 5 15IAH7H 82RB i7-12700H, GeForce RTX 3060 Laptop GPU | Schenker XMG Fusion 15 (Mid 22) i7-11800H, GeForce RTX 3070 Laptop GPU | Asus TUF Gaming F15 FX507ZM i7-12700H, GeForce RTX 3060 Laptop GPU | Alienware m15 R5 Ryzen Edition R7 5800H, GeForce RTX 3060 Laptop GPU | Schenker XMG Core 15 Ampere R7 4800H, GeForce RTX 3060 Laptop GPU | |
|---|---|---|---|---|---|---|
| Noise | 3% | -9% | -1% | -7% | -8% | |
| off /ambiente * (dB) | 23 | 23.3 -1% | 26 -13% | 23.2 -1% | 24 -4% | 24 -4% |
| Idle Minimum * (dB) | 23 | 23.5 -2% | 26 -13% | 23.6 -3% | 24 -4% | 26 -13% |
| Idle Average * (dB) | 23 | 23.5 -2% | 28 -22% | 23.6 -3% | 25 -9% | 28 -22% |
| Idle Maximum * (dB) | 23 | 26.8 -17% | 31 -35% | 25.4 -10% | 35 -52% | 30 -30% |
| Load Average * (dB) | 42.41 | 29.3 31% | 45 -6% | 38 10% | 44 -4% | 42 1% |
| Witcher 3 ultra * (dB) | 54.71 | 51.4 6% | 46 16% | 54.1 1% | 48 12% | 50 9% |
| Load Maximum * (dB) | 55.05 | 53 4% | 48 13% | 57.2 -4% | 50 9% | 52 6% |
* ... Meglio usare valori piccoli
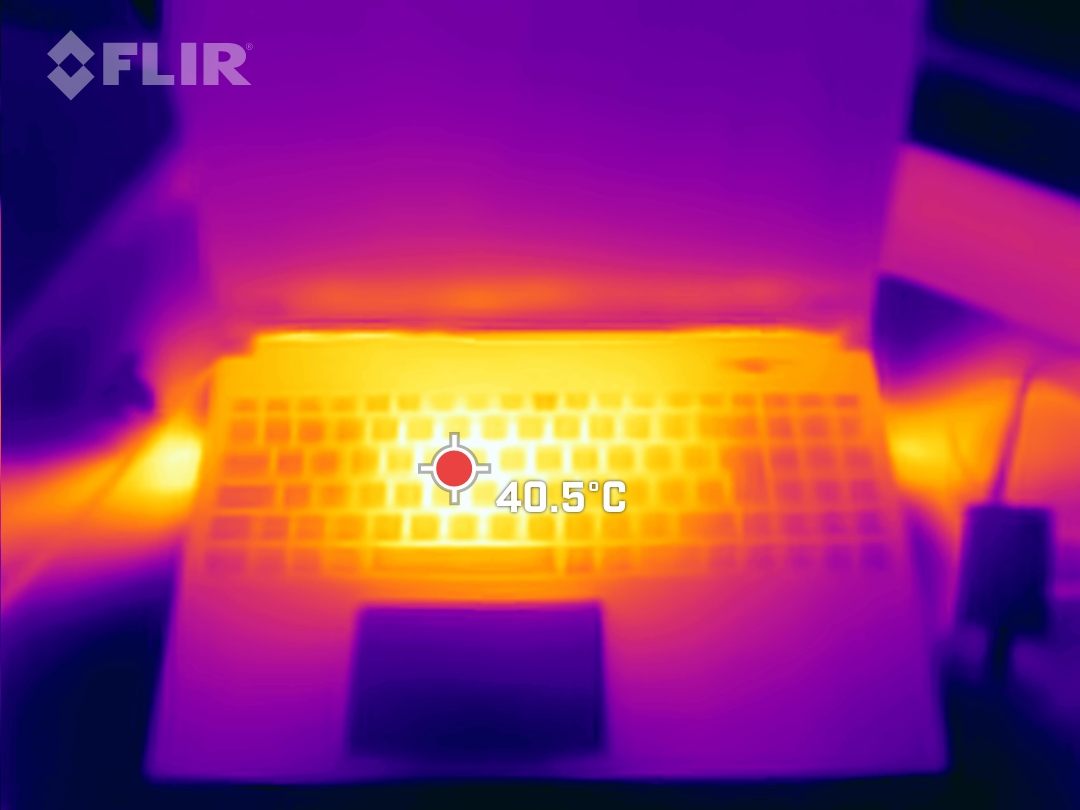
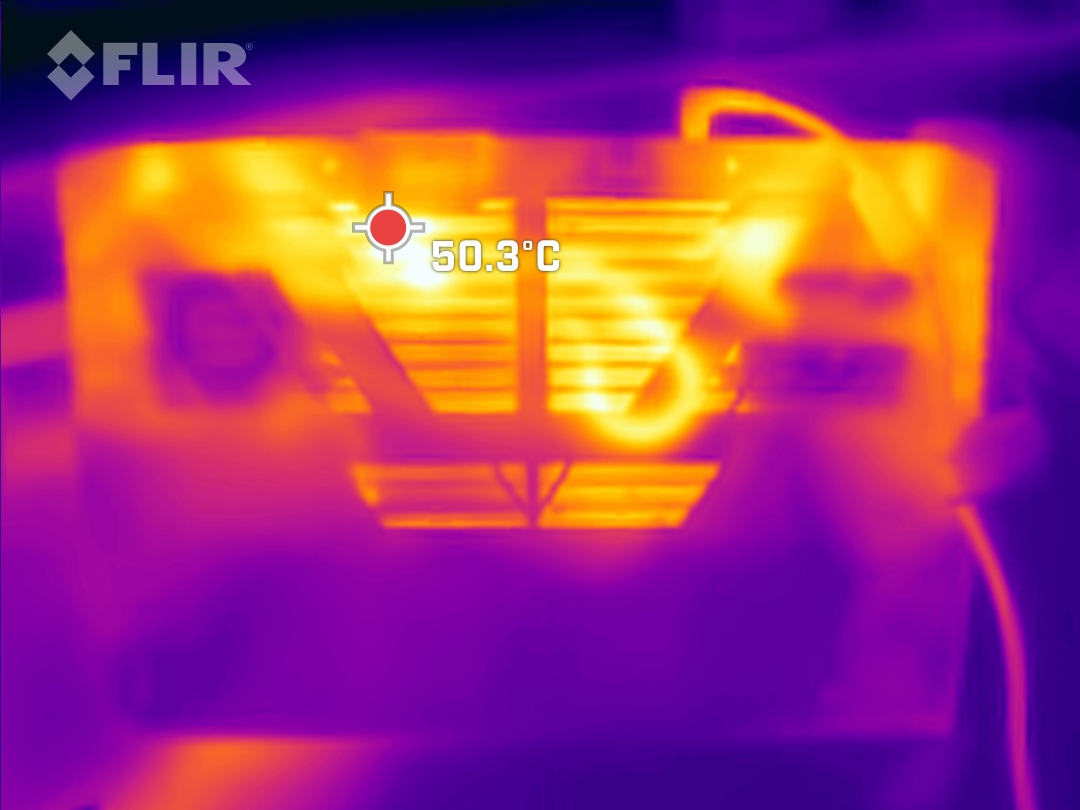
Temperatura
Le temperature non sono mai elevate, nemmeno durante il gioco. Sotto carico massimo, c'è un hotspot di 51 °C (~124 °F) sulla parte inferiore del dispositivo, mentre l'Alienware m15 e lo Schenker XMG Fusion 15 si scaldano molto di più, rispettivamente a 61 °C e 63 °C (~142 e ~145 °F).
(-) La temperatura massima sul lato superiore è di 48 °C / 118 F, rispetto alla media di 40.4 °C / 105 F, che varia da 21.2 a 68.8 °C per questa classe Gaming.
(-) Il lato inferiore si riscalda fino ad un massimo di 51 °C / 124 F, rispetto alla media di 43.2 °C / 110 F
(+) In idle, la temperatura media del lato superiore è di 25.6 °C / 78 F, rispetto alla media deld ispositivo di 33.9 °C / 93 F.
(±) Riproducendo The Witcher 3, la temperatura media per il lato superiore e' di 34.9 °C / 95 F, rispetto alla media del dispositivo di 33.9 °C / 93 F.
(+) I poggiapolsi e il touchpad sono piu' freddi della temperatura della pelle con un massimo di 28 °C / 82.4 F e sono quindi freddi al tatto.
(±) La temperatura media della zona del palmo della mano di dispositivi simili e'stata di 28.8 °C / 83.8 F (+0.8 °C / 1.4 F).
| Schenker XMG Core 15 (M22) AMD Ryzen 7 6800H, NVIDIA GeForce RTX 3060 Laptop GPU | Lenovo Legion 5 15IAH7H 82RB Intel Core i7-12700H, NVIDIA GeForce RTX 3060 Laptop GPU | Schenker XMG Fusion 15 (Mid 22) Intel Core i7-11800H, NVIDIA GeForce RTX 3070 Laptop GPU | Asus TUF Gaming F15 FX507ZM Intel Core i7-12700H, NVIDIA GeForce RTX 3060 Laptop GPU | Alienware m15 R5 Ryzen Edition AMD Ryzen 7 5800H, NVIDIA GeForce RTX 3060 Laptop GPU | Schenker XMG Core 15 Ampere AMD Ryzen 7 4800H, NVIDIA GeForce RTX 3060 Laptop GPU | |
|---|---|---|---|---|---|---|
| Heat | 11% | -20% | -11% | -20% | 2% | |
| Maximum Upper Side * (°C) | 48 | 37.8 21% | 52 -8% | 44.4 7% | 62 -29% | 48 -0% |
| Maximum Bottom * (°C) | 51 | 51 -0% | 63 -24% | 48.8 4% | 61 -20% | 50 2% |
| Idle Upper Side * (°C) | 28 | 25.8 8% | 37 -32% | 37.8 -35% | 36 -29% | 28 -0% |
| Idle Bottom * (°C) | 33 | 28.8 13% | 38 -15% | 39.6 -20% | 33 -0% | 31 6% |
* ... Meglio usare valori piccoli
Test da sforzo
Anche nello stress test combinato, la CPU calcola ancora leggermente al di sopra del clock di base di 3,2 GHz, mentre si scalda a 86 °C (~187 °F) nei primi 40 minuti e a 93 °C (~199 °F) in seguito, quando il TDP combinato si sposta a favore della CPU e questa recupera quindi a 4 GHz. La temperatura della GPU è di 86 °C mentre il clock è ancora di ~1.400 MHz.
Un benchmark della GPU eseguito subito dopo è stato eseguito senza perdite di prestazioni.
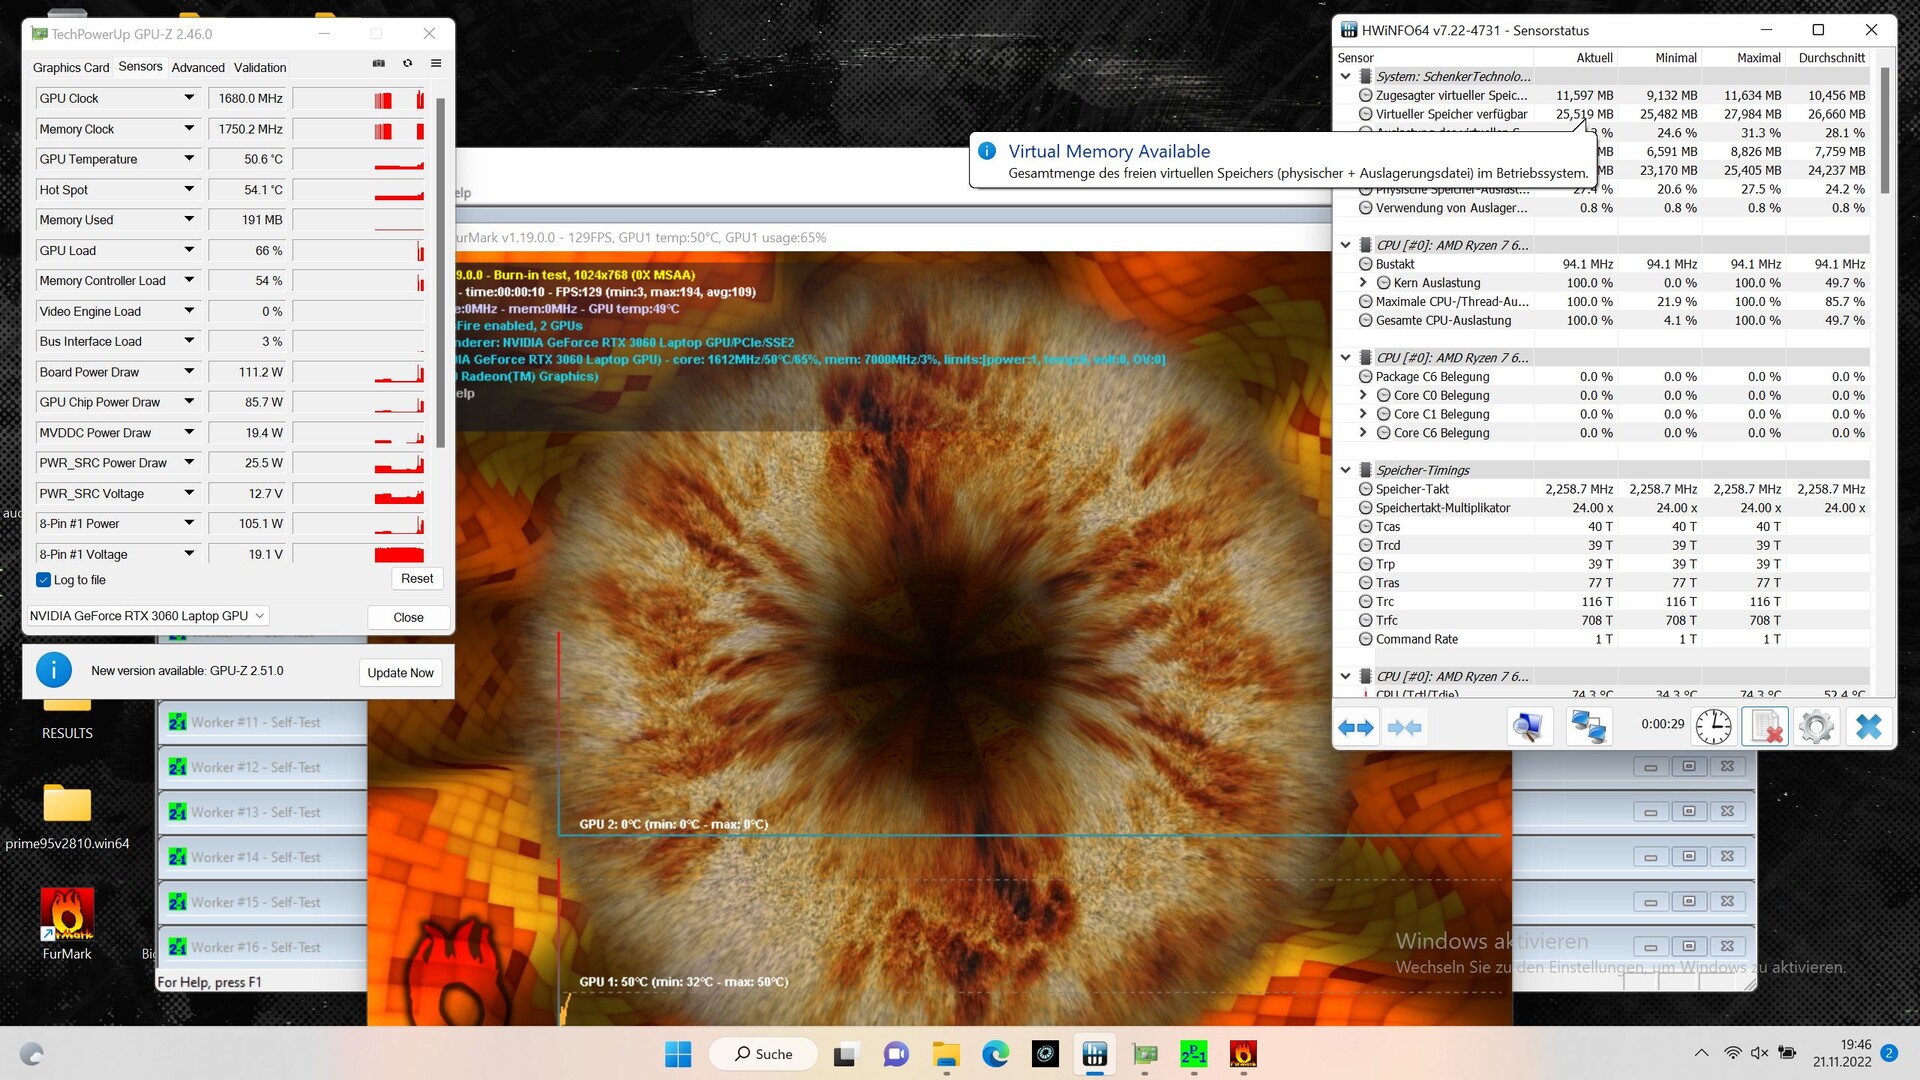
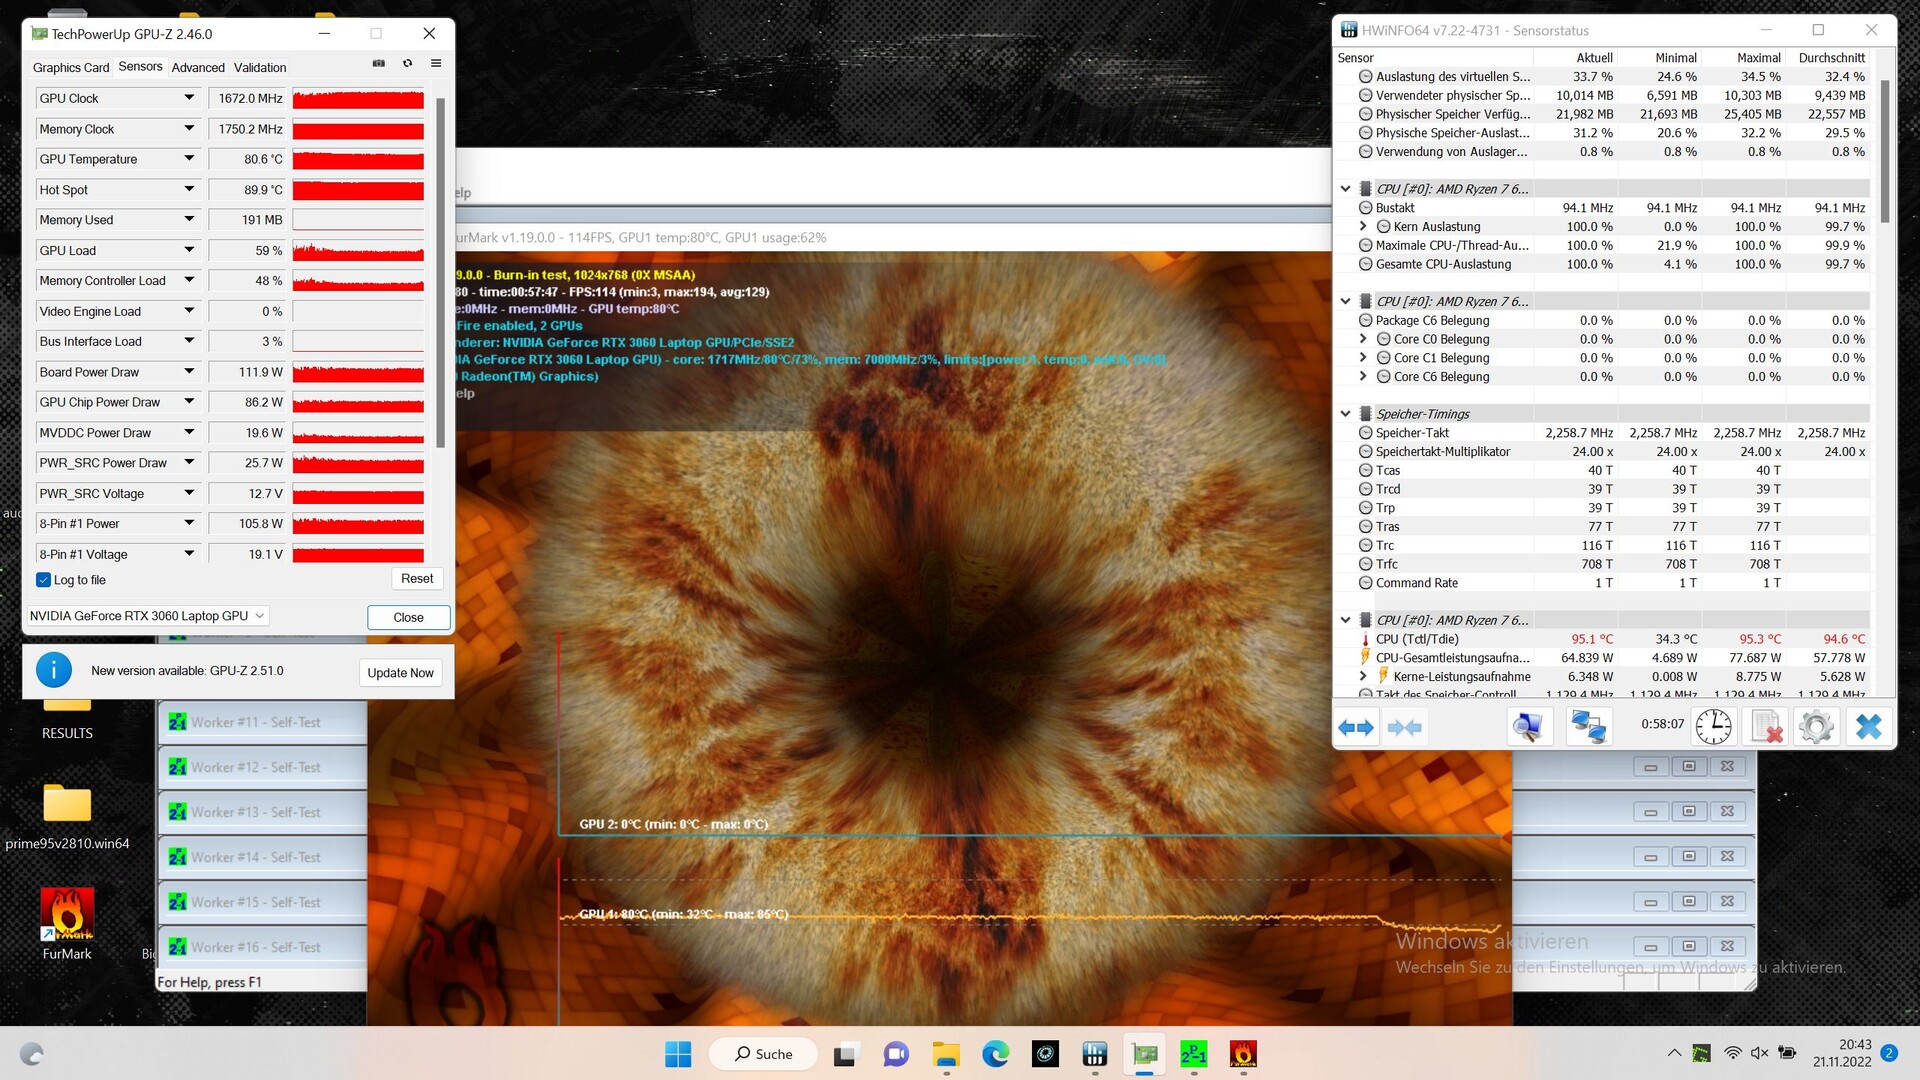
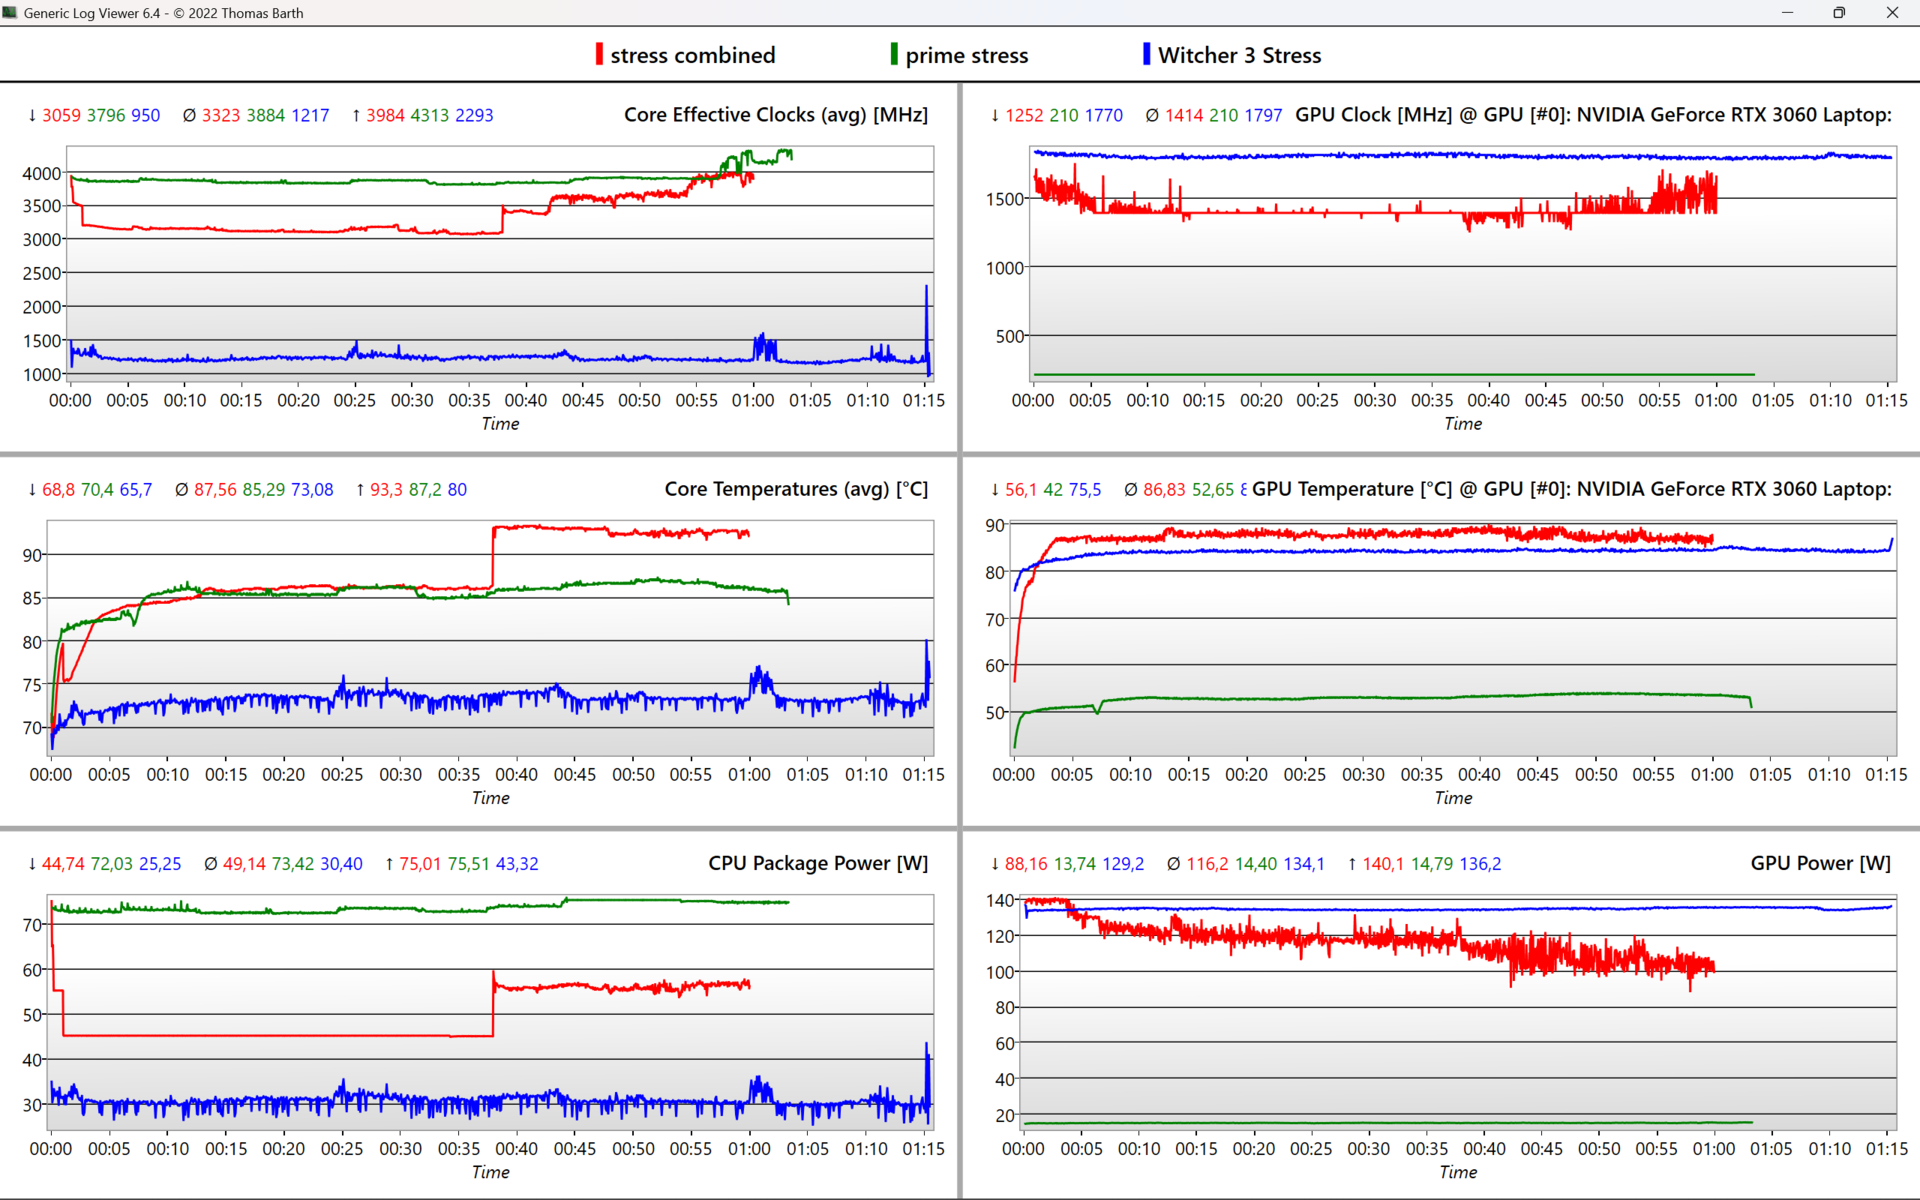
| Clock della CPU (GHz) | Clock della GPU (MHz) | Temperatura media della CPU (°C) | Temperatura media della GPU (°C) | |
| Sistema inattivo | 0,15 | 200 | 34 | 42 |
| Prime95, Stress | 3,9 | 200 | 85 | 53 |
| Prime95 + FurMark, Stress | 3,3 | 1.400 | 93 | 87 |
| Witcher 3, Stress | 1,2 | 1.800 | 73 | 84 |
Altoparlante
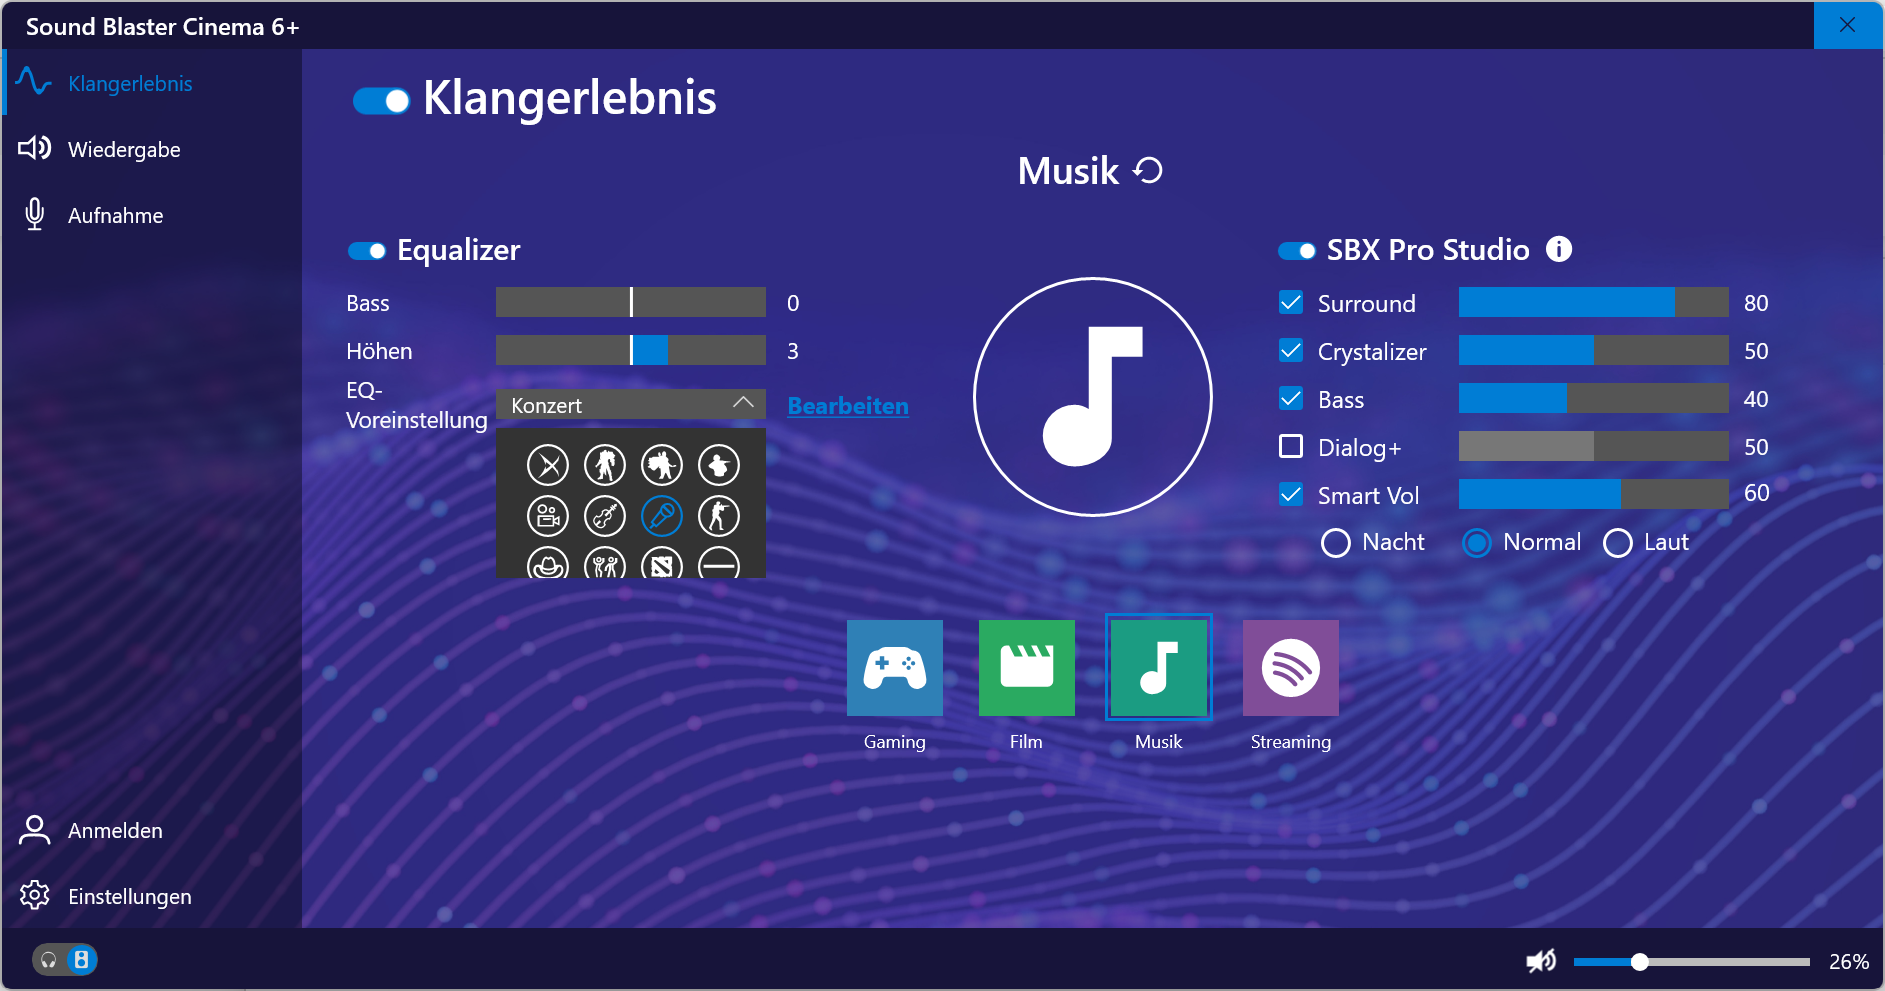
Il sistema audio stereo offre alti lineari e bilanciati e persino bassi impliciti. Il software Sound Blaster Cinema 6+ migliora il suono selezionando diverse modalità. Per un'esperienza sonora migliore, è comunque necessario collegare le cuffie o un sistema audio esterno tramite jack o Bluetooth.
Schenker XMG Core 15 (M22) analisi audio
(±) | potenza degli altiparlanti media ma buona (81.28 dB)
Bassi 100 - 315 Hz
(-) | quasi nessun basso - in media 19.8% inferiori alla media
(+) | bassi in lineaa (6.4% delta rispetto alla precedente frequenza)
Medi 400 - 2000 Hz
(±) | medi elevati - circa 6.2% superiore alla media
(±) | linearità dei medi adeguata (7.9% delta rispetto alla precedente frequenza)
Alti 2 - 16 kHz
(+) | Alti bilanciati - appena 1.8% dalla media
(+) | alti lineari (4.8% delta rispetto alla precedente frequenza)
Nel complesso 100 - 16.000 Hz
(±) | la linearità complessiva del suono è media (17.1% di differenza rispetto alla media
Rispetto alla stessa classe
» 46% di tutti i dispositivi testati in questa classe è stato migliore, 12% simile, 43% peggiore
» Il migliore ha avuto un delta di 6%, medio di 18%, peggiore di 132%
Rispetto a tutti i dispositivi testati
» 31% di tutti i dispositivi testati in questa classe è stato migliore, 8% similare, 61% peggiore
» Il migliore ha avuto un delta di 4%, medio di 23%, peggiore di 134%
Lenovo Legion Slim 7-16IAH 82TF004YGE analisi audio
(±) | potenza degli altiparlanti media ma buona (73.4 dB)
Bassi 100 - 315 Hz
(±) | bassi ridotti - in media 10% inferiori alla media
(±) | la linearità dei bassi è media (13.4% delta rispetto alla precedente frequenza)
Medi 400 - 2000 Hz
(+) | medi bilanciati - solo only 1.2% rispetto alla media
(+) | medi lineari (3.3% delta rispetto alla precedente frequenza)
Alti 2 - 16 kHz
(±) | alti elevati - circa 5.5% superiori alla media
(±) | la linearità degli alti è media (10.6% delta rispetto alla precedente frequenza)
Nel complesso 100 - 16.000 Hz
(+) | suono nel complesso lineare (13% differenza dalla media)
Rispetto alla stessa classe
» 18% di tutti i dispositivi testati in questa classe è stato migliore, 3% simile, 79% peggiore
» Il migliore ha avuto un delta di 6%, medio di 18%, peggiore di 132%
Rispetto a tutti i dispositivi testati
» 13% di tutti i dispositivi testati in questa classe è stato migliore, 3% similare, 85% peggiore
» Il migliore ha avuto un delta di 4%, medio di 23%, peggiore di 134%
Gestione dell'energia: Computer portatile da gioco AMD con un'autonomia utilizzabile
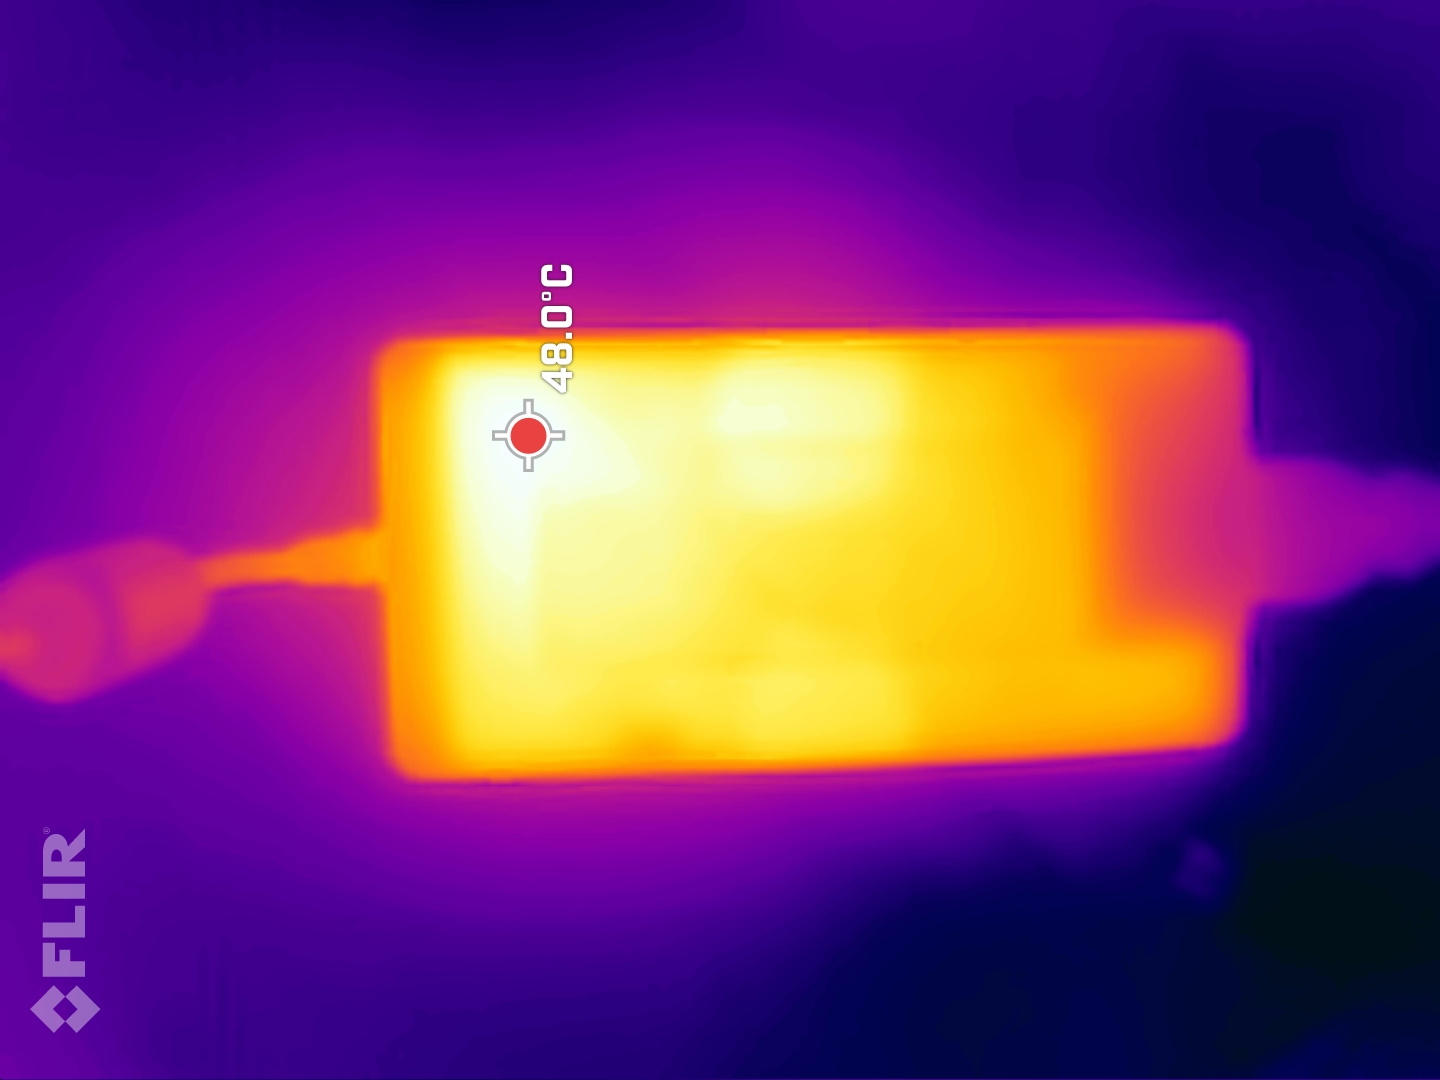
Consumo di energia
Il consumo di energia è sostanzialmente in linea con le aspettative ed è all'incirca pari a quello della concorrenza nel nostro campo di confronto. Solo il modello Legion 5 assorbe molto di più dalla presa di corrente in idle, mentre il TUF Gaming F15 è il più frugale in idle nel nostro confronto. L'alimentatore da 230 W è all'altezza del suo compito, poiché raramente raggiunge i 236 W di picco.
| Idle | |
| Sotto carico |
|
Leggenda:
min: | |
| Schenker XMG Core 15 (M22) R7 6800H, GeForce RTX 3060 Laptop GPU, Samsung SSD 980 Pro 1TB MZ-V8P1T0BW, IPS, 2560x1440, 15.6" | Lenovo Legion 5 15IAH7H 82RB i7-12700H, GeForce RTX 3060 Laptop GPU, , IPS, 1920x1080, 15.6" | Schenker XMG Fusion 15 (Mid 22) i7-11800H, GeForce RTX 3070 Laptop GPU, Samsung SSD 980 Pro 1TB MZ-V8P1T0BW, IPS, 2560x1440, 15.6" | Asus TUF Gaming F15 FX507ZM i7-12700H, GeForce RTX 3060 Laptop GPU, SK Hynix HFM001TD3JX013N, IPS, 1920x1080, 15.6" | Alienware m15 R5 Ryzen Edition R7 5800H, GeForce RTX 3060 Laptop GPU, Toshiba KBG40ZNS512G NVMe, IPS, 1920x1080, 15.6" | Schenker XMG Core 15 Ampere R7 4800H, GeForce RTX 3060 Laptop GPU, Samsung SSD 970 EVO Plus 1TB, IPS, 2560x1440, 15.6" | Media NVIDIA GeForce RTX 3060 Laptop GPU | Media della classe Gaming | |
|---|---|---|---|---|---|---|---|---|
| Power Consumption | -64% | -10% | -1% | -12% | -2% | -5% | -24% | |
| Idle Minimum * (Watt) | 11.8 | 19.8 -68% | 12 -2% | 6.3 47% | 11 7% | 11 7% | 10.4 ? 12% | 13 ? -10% |
| Idle Average * (Watt) | 14.7 | 26.2 -78% | 17 -16% | 9.8 33% | 14 5% | 14 5% | 14.5 ? 1% | 18.7 ? -27% |
| Idle Maximum * (Watt) | 15 | 48.2 -221% | 24 -60% | 26.5 -77% | 25 -67% | 20 -33% | 21.4 ? -43% | 24.3 ? -62% |
| Load Average * (Watt) | 100 | 102.9 -3% | 106 -6% | 103.8 -4% | 123 -23% | 94 6% | 109.3 ? -9% | 110.2 ? -10% |
| Witcher 3 ultra * (Watt) | 184 | 186.7 -1% | 159.9 13% | 189 -3% | 176 4% | 167 9% | ||
| Load Maximum * (Watt) | 237 | 268 -13% | 208 12% | 241.9 -2% | 226 5% | 251 -6% | 206 ? 13% | 258 ? -9% |
* ... Meglio usare valori piccoli
Energy consumption Witcher 3 / Stress test
Energy consumption with external monitor
Durata della batteria
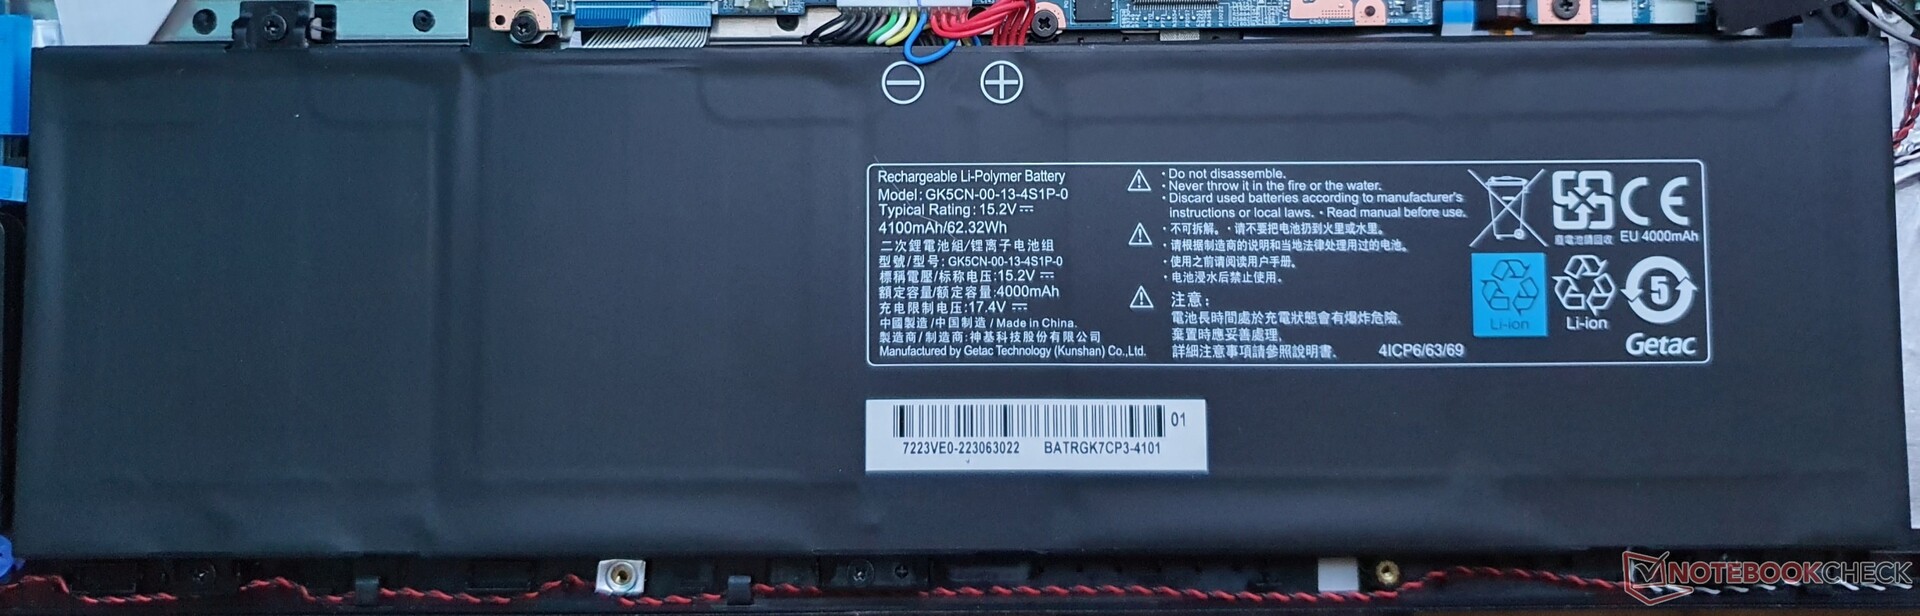
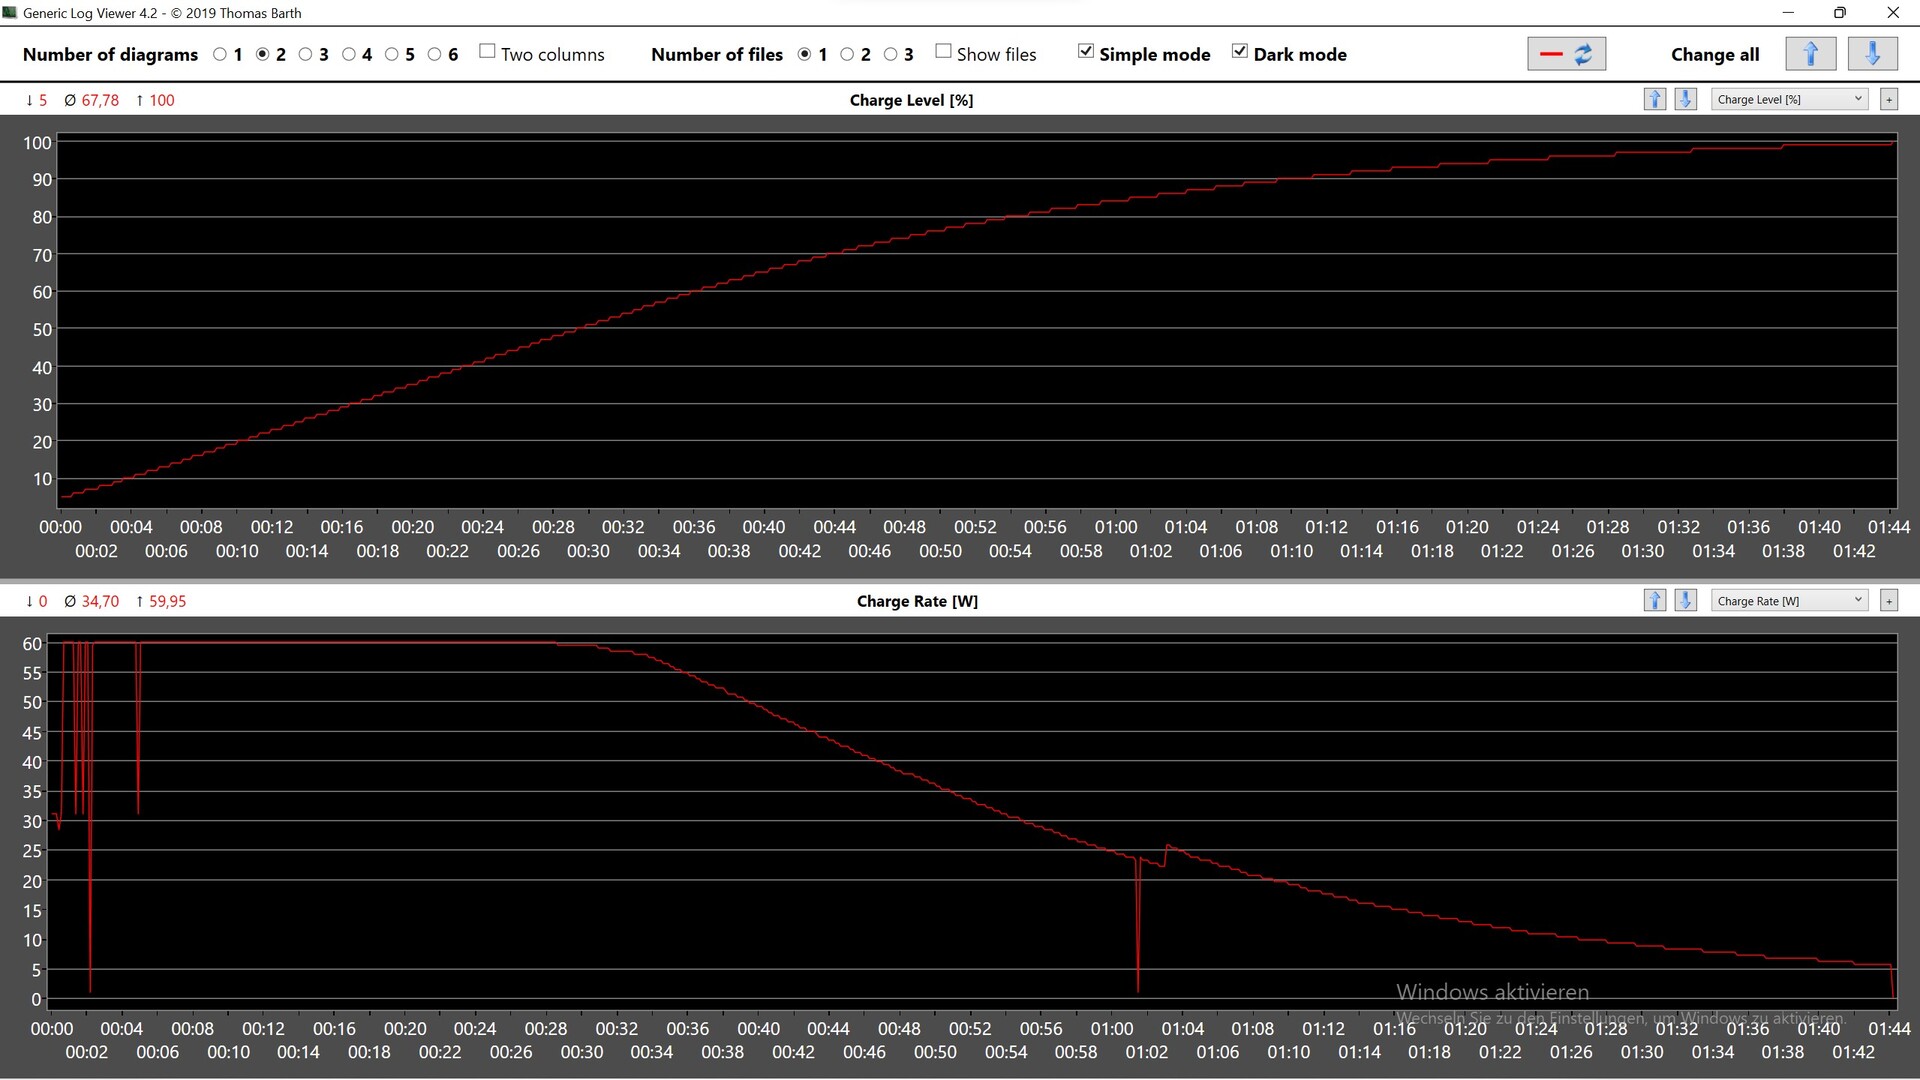
Nonostante la piccola batteria da 62 Wh, l'autonomia di 7:45 ore, ad esempio durante la navigazione web a 150 cd/m², è abbastanza decente. Abbiamo effettuato il test in modalità Enthusiast , mentre la frequenza di aggiornamento viene automaticamente ridotta a 60 Hz a batteria.
L'XMG Core 15 è quindi quello che dura di più nel nostro campo di confronto ed è un gamer efficiente, dato che la concorrenza si affida a batterie ancora più grandi, da 80 a 93 Wh. La batteria si ricarica a metà in 30 minuti.
| Schenker XMG Core 15 (M22) R7 6800H, GeForce RTX 3060 Laptop GPU, 62 Wh | Lenovo Legion 5 15IAH7H 82RB i7-12700H, GeForce RTX 3060 Laptop GPU, 80 Wh | Schenker XMG Fusion 15 (Mid 22) i7-11800H, GeForce RTX 3070 Laptop GPU, 93.48 Wh | Asus TUF Gaming F15 FX507ZM i7-12700H, GeForce RTX 3060 Laptop GPU, 90 Wh | Alienware m15 R5 Ryzen Edition R7 5800H, GeForce RTX 3060 Laptop GPU, 86 Wh | Schenker XMG Core 15 Ampere R7 4800H, GeForce RTX 3060 Laptop GPU, 62 Wh | Media della classe Gaming | |
|---|---|---|---|---|---|---|---|
| Autonomia della batteria | -18% | 30% | -19% | -27% | -9% | 14% | |
| WiFi v1.3 (h) | 7.8 | 5 -36% | 7.4 -5% | 4.8 -38% | 5.1 -35% | 5.8 -26% | 7.11 ? -9% |
| Load (h) | 1.1 | 1.1 0% | 1.8 64% | 1.1 0% | 0.9 -18% | 1.2 9% | 1.502 ? 37% |
| H.264 (h) | 7.5 | 8.8 | 6 | 8.32 ? | |||
| Witcher 3 ultra (h) | 1.6 |
Pro
Contro
Verdetto: Laptop da gioco veloce Schenker con RTX 3060
Nel complesso, l'XMG Core 15 di Schenker si rivela un solido gamer di fascia media. Le prestazioni 3D sono di livello superiore alla media, ma alcuni modelli con lo stesso TGP, come l'Asus TUF Gaming o l'Asus ROG Strix Scar, sono ancora più veloci. Il processore AMD Ryzen 7 6800H contribuisce almeno a un funzionamento frugale, anche se è in ritardo (minimo) rispetto ai rivali Intel con i7-12700H.
Nonostante la piccola batteria da 62 Wh, il portatile da gioco compatto raggiunge la più lunga autonomia di 7:45 ore nel nostro campo di confronto, mentre il display WQHD opaco con 165 Hz e tempi di risposta rapidi è più che rispettabile. Il gioco silenzioso è possibile senza grandi perdite di prestazioni grazie alla modalità Bilanciata , ma il piacere di giocare è molto limitato lontano dalla presa di corrente.
Coloro che possono fare a meno di USB4, Power Delivery e giocare a batteria avranno un solido e potenzialmente silenzioso computer di fascia media con raffreddamento ad acqua opzionale per 1.817 Euro (~$1935).
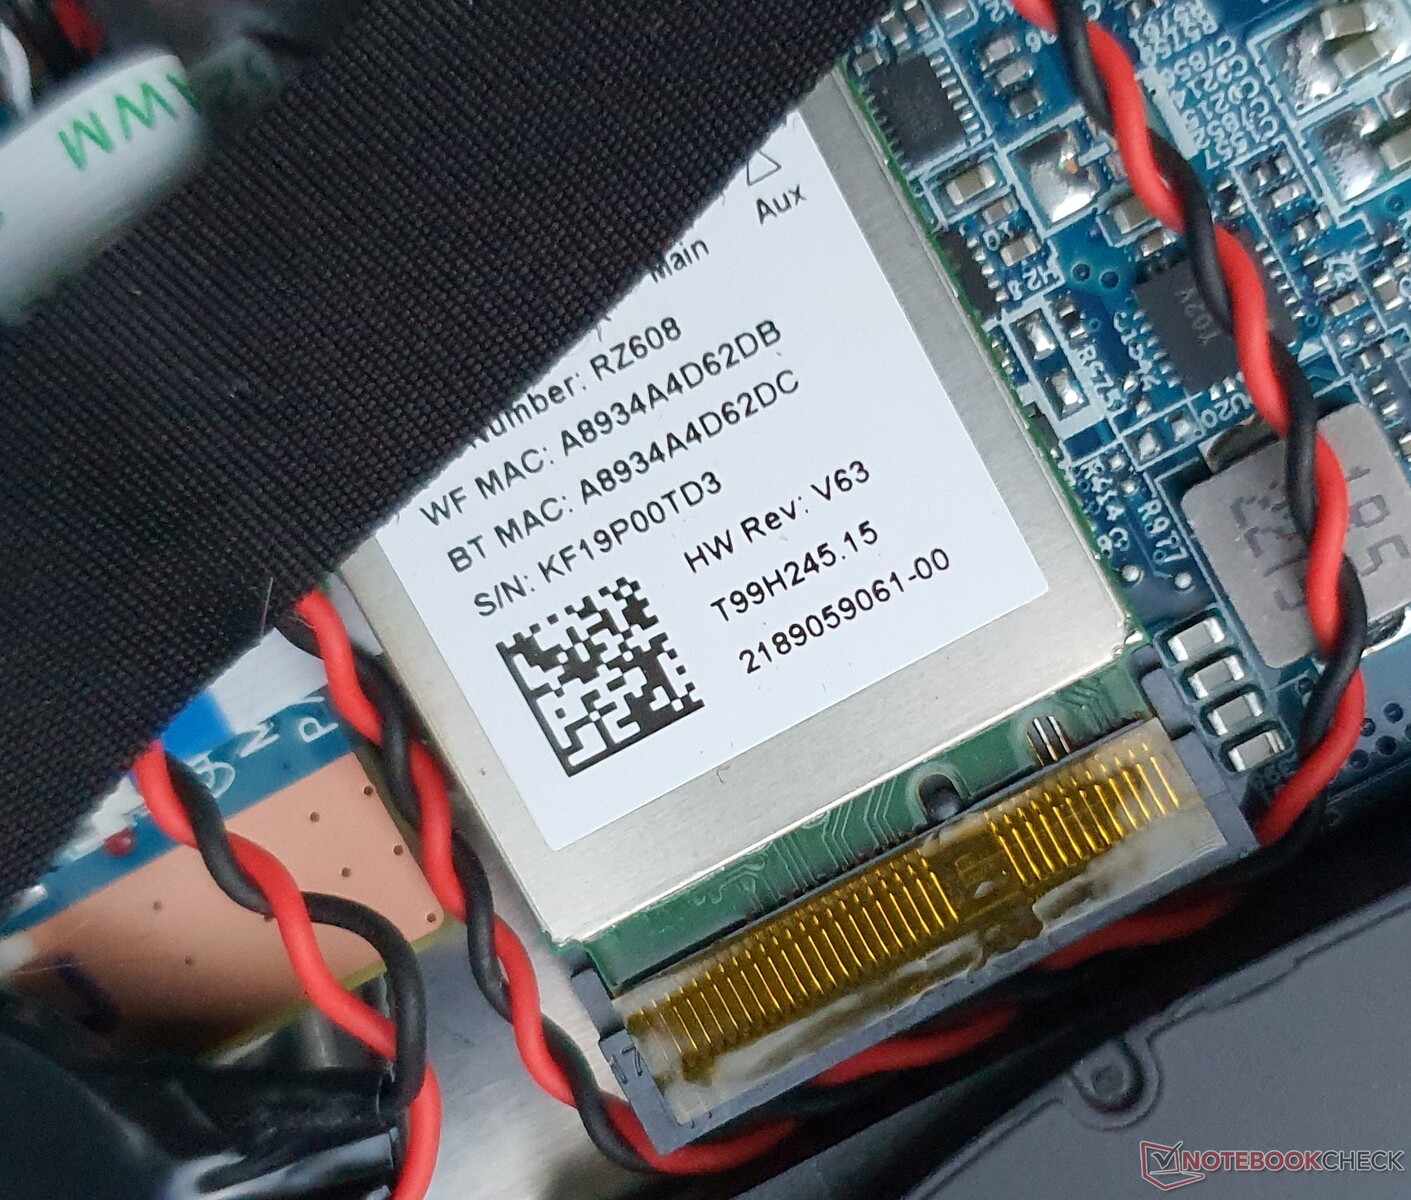
La manutenzione è facilitata dalla presenza di due slot M.2-2280 per SSD PCIe 4.0, oltre a due slot per la RAM e alla possibilità di cambiare il modulo WiFi, un po' lento. Si deve rinunciare a Per-Key RGB e Advanced Optimus, ma è disponibile uno switch MUX e la possibilità di overcloccare la GPU.
Lenovo Legion 5 Pro offre una RTX 3070 potenzialmente più veloce, un display 16:10 più luminoso e più grande e una tastiera migliore a un prezzo simile. XMG Fusion 15 di Lenovo offre una tastiera ancora migliore, poiché è meccanica. Anche il Legion Slim 7i è da consigliare, dato che è già disponibile a 1.529 Euro (~$1629) in una configurazione simile al momento di questa recensione.
.
Prezzo e disponibilità
L'XMG Core 15 (M22) di Schenker è attualmente offerto nella configurazione testata per 1.817 Euro (~$1935) presso Bestware. Il modello attualmente più economico con la stessa CPU+GPU, ma meno memoria e pannello FHD 144 Hz è disponibile a soli 1.492 Euro (~$1589).
Schenker XMG Core 15 (M22)
- 01/02/2023 v7 (old)
Marvin Gollor
Price comparison
