Recensione dell'Asus ROG Strix Scar 15 G533zm: Moderno portatile gaming RTX 3060 con molti punti di forza
Attualmente abbiamo a disposizione due modelli di Asus ROG Strix Scar 15 da testare. Questo articolo si concentrerà sul modello RTX 3060 mentre la recensione della versione RTX 3070 Ti sarà pubblicata in parallelo. Oltre alla RTX 3060, la nostra SKU è dotata di un potente Alder Lake i9-12900H 16 GB di RAM e un display QHD a 240 Hz.
L'anno scorso, abbiamo recensito il precedente Scar 15 con una RTX 3080quindi ha più senso confrontare la nostra unità di recensione con il suo fratello RTX 3070 Ti. Inoltre, abbiamo scelto di includere nel nostro confronto altri computer portatili da gioco da 15 pollici con la stessa GPU, come ad esempio il modello Asus TUF Gaming F15e l'MSI Pulse GL66 MSI Pulse GL66 e l' Alienware m15 R5. Anche se il confronto presenta anche il Lenovo Legion 5 con una Radeon RX6600Mquesto portatile non si trova nella stessa fascia di prezzo dello Strix Scar, dato che la nostra configurazione di recensione ha un prezzo di circa 2.000 euro (2.170 dollari), mentre il Legion costa poco più di 1.000 euro (1.085 dollari).
Per le sezioni relative al telaio, alla manutenzione, ai dispositivi di input e altro ancora, la invitiamo a consultare la nostra recensione principale di Asus ROG Strix Scar con RTX 3070 Ti.
Possibili alternative a confronto
Punteggio | Data | Modello | Peso | Altezza | Dimensione | Risoluzione | Prezzo |
|---|---|---|---|---|---|---|---|
| 89.2 % v7 (old) | 11/2024 | Asus ROG Strix Scar 15 G533zm i9-12900H, GeForce RTX 3060 Laptop GPU | 2.3 kg | 27.2 mm | 15.60" | 2560x1440 | |
| 86.3 % v7 (old) | 06/2022 | Asus ROG Strix Scar 15 G533ZW-LN106WS i9-12900H, GeForce RTX 3070 Ti Laptop GPU | 2.3 kg | 27.2 mm | 15.60" | 2560x1440 | |
| 87.2 % v7 (old) | 03/2022 | Asus TUF Gaming F15 FX507ZM i7-12700H, GeForce RTX 3060 Laptop GPU | 2.1 kg | 24.95 mm | 15.60" | 1920x1080 | |
| 80.7 % v7 (old) | 04/2022 | MSI Pulse GL66 12UEK i9-12900H, GeForce RTX 3060 Laptop GPU | 2.3 kg | 25 mm | 15.60" | 1920x1080 | |
| 84.7 % v7 (old) | 06/2021 | Alienware m15 R5 Ryzen Edition R7 5800H, GeForce RTX 3060 Laptop GPU | 2.5 kg | 22.85 mm | 15.60" | 1920x1080 | |
| 82.6 % v7 (old) | 05/2022 | Lenovo Legion 5 15ACH6A-82NW0010GE R5 5600H, Radeon RX 6600M | 2.5 kg | 25.75 mm | 15.60" | 1920x1080 |
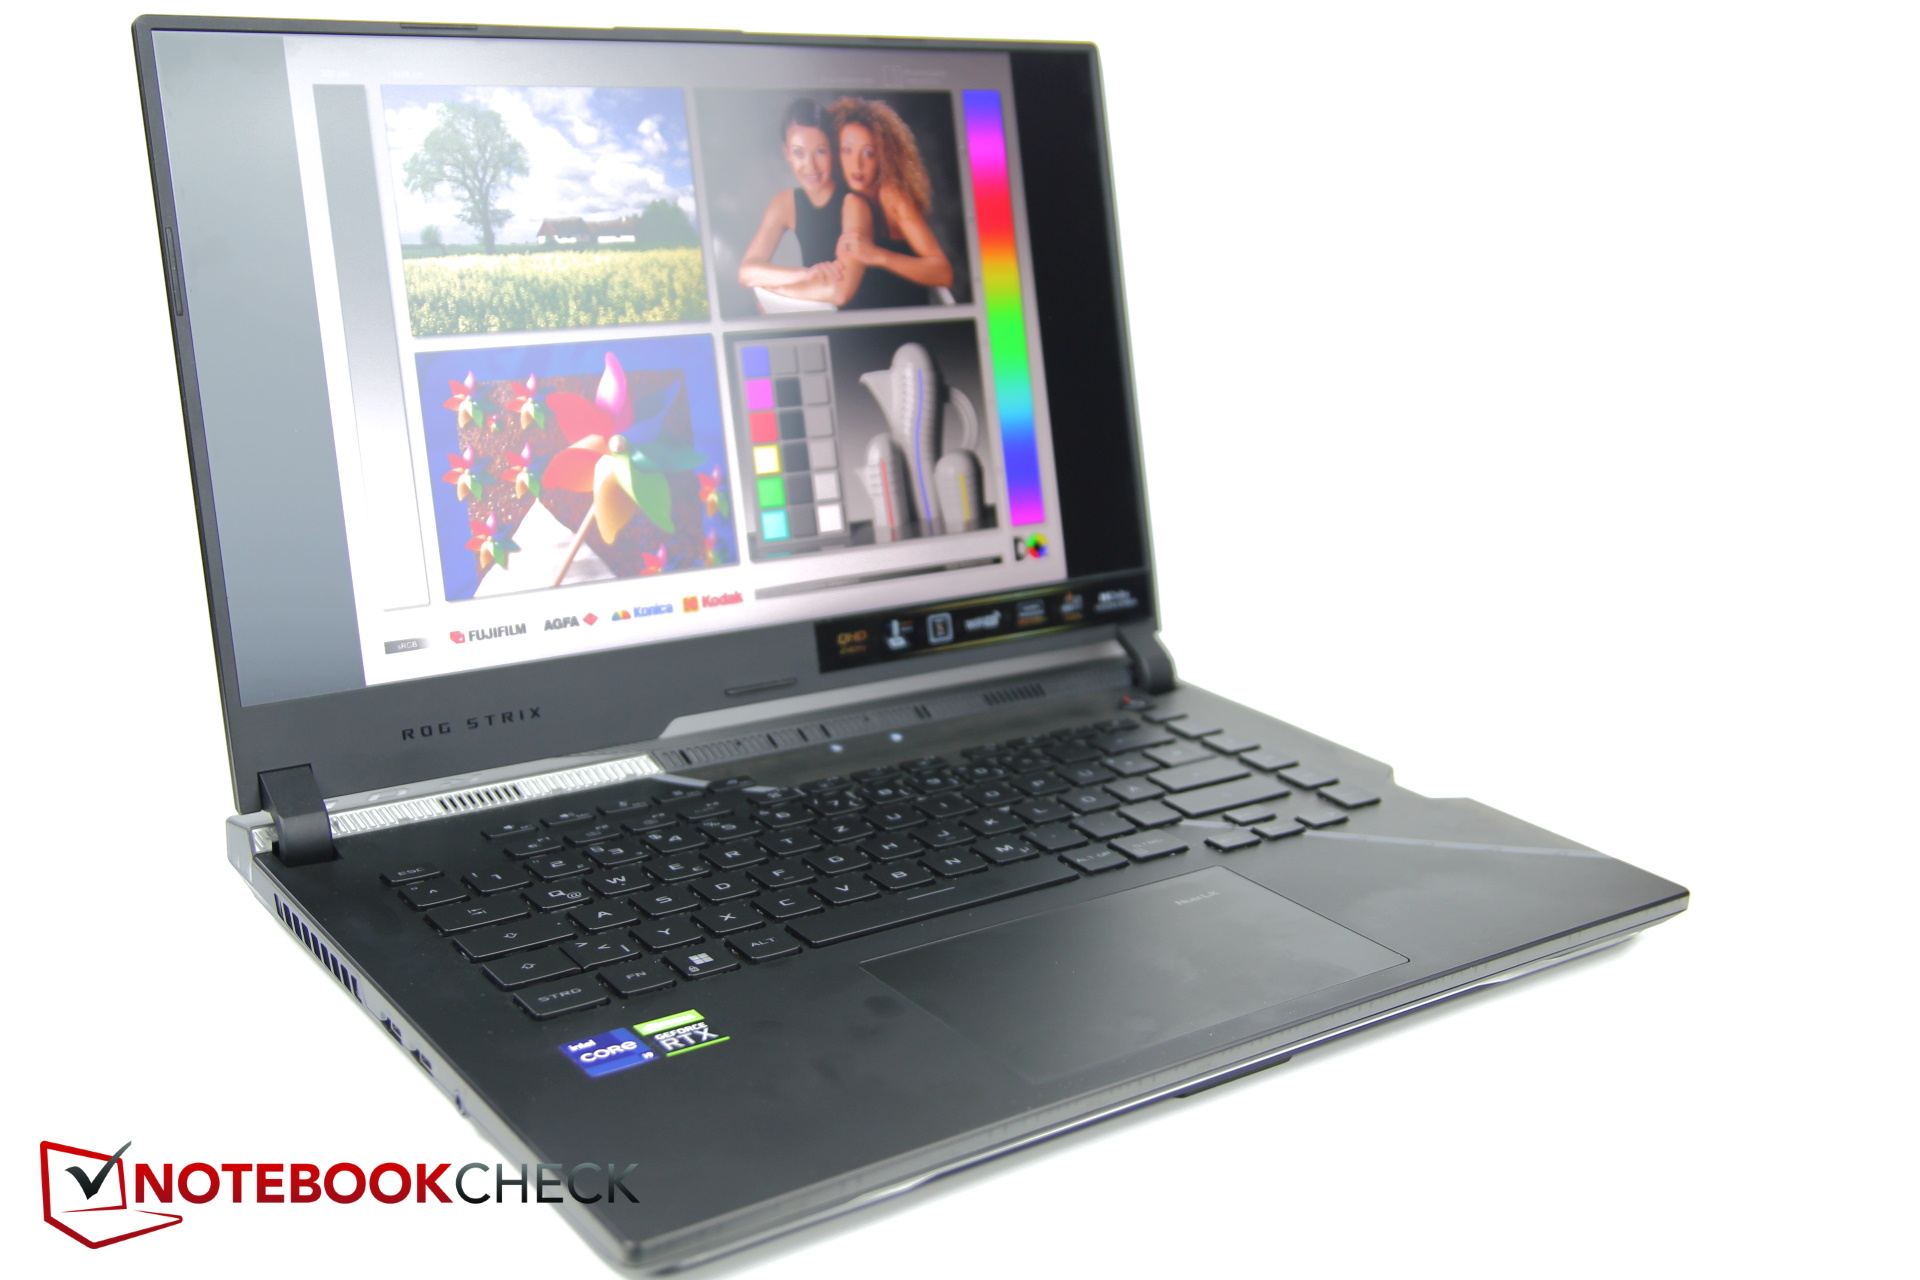
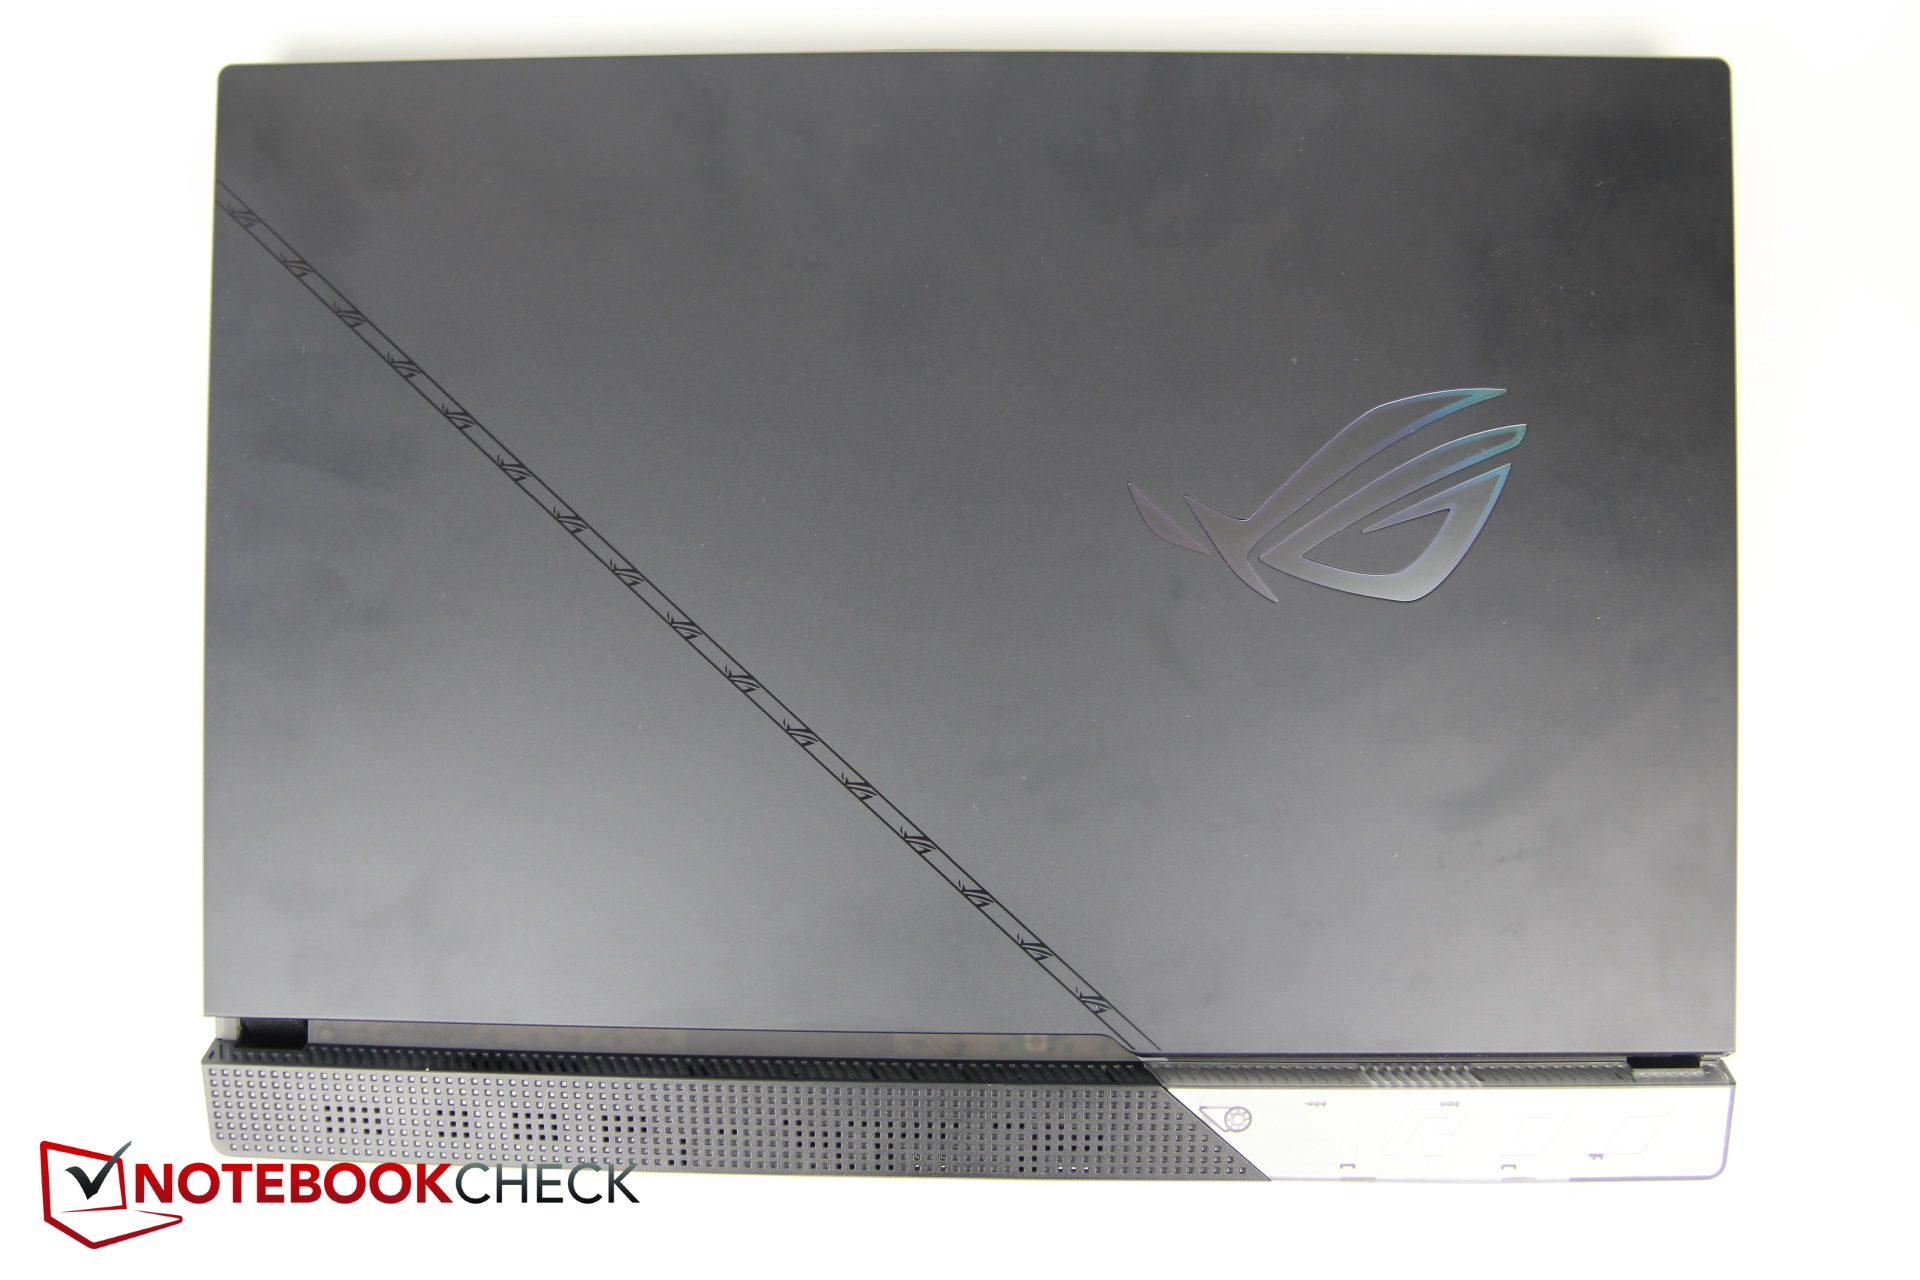
Custodia - Design accattivante del portatile da gioco
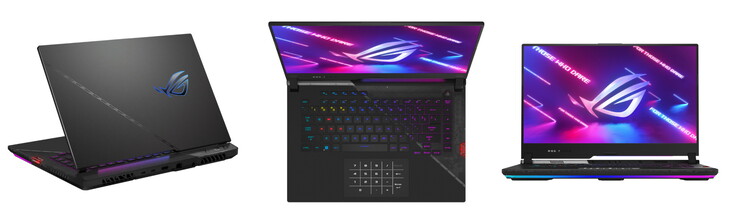
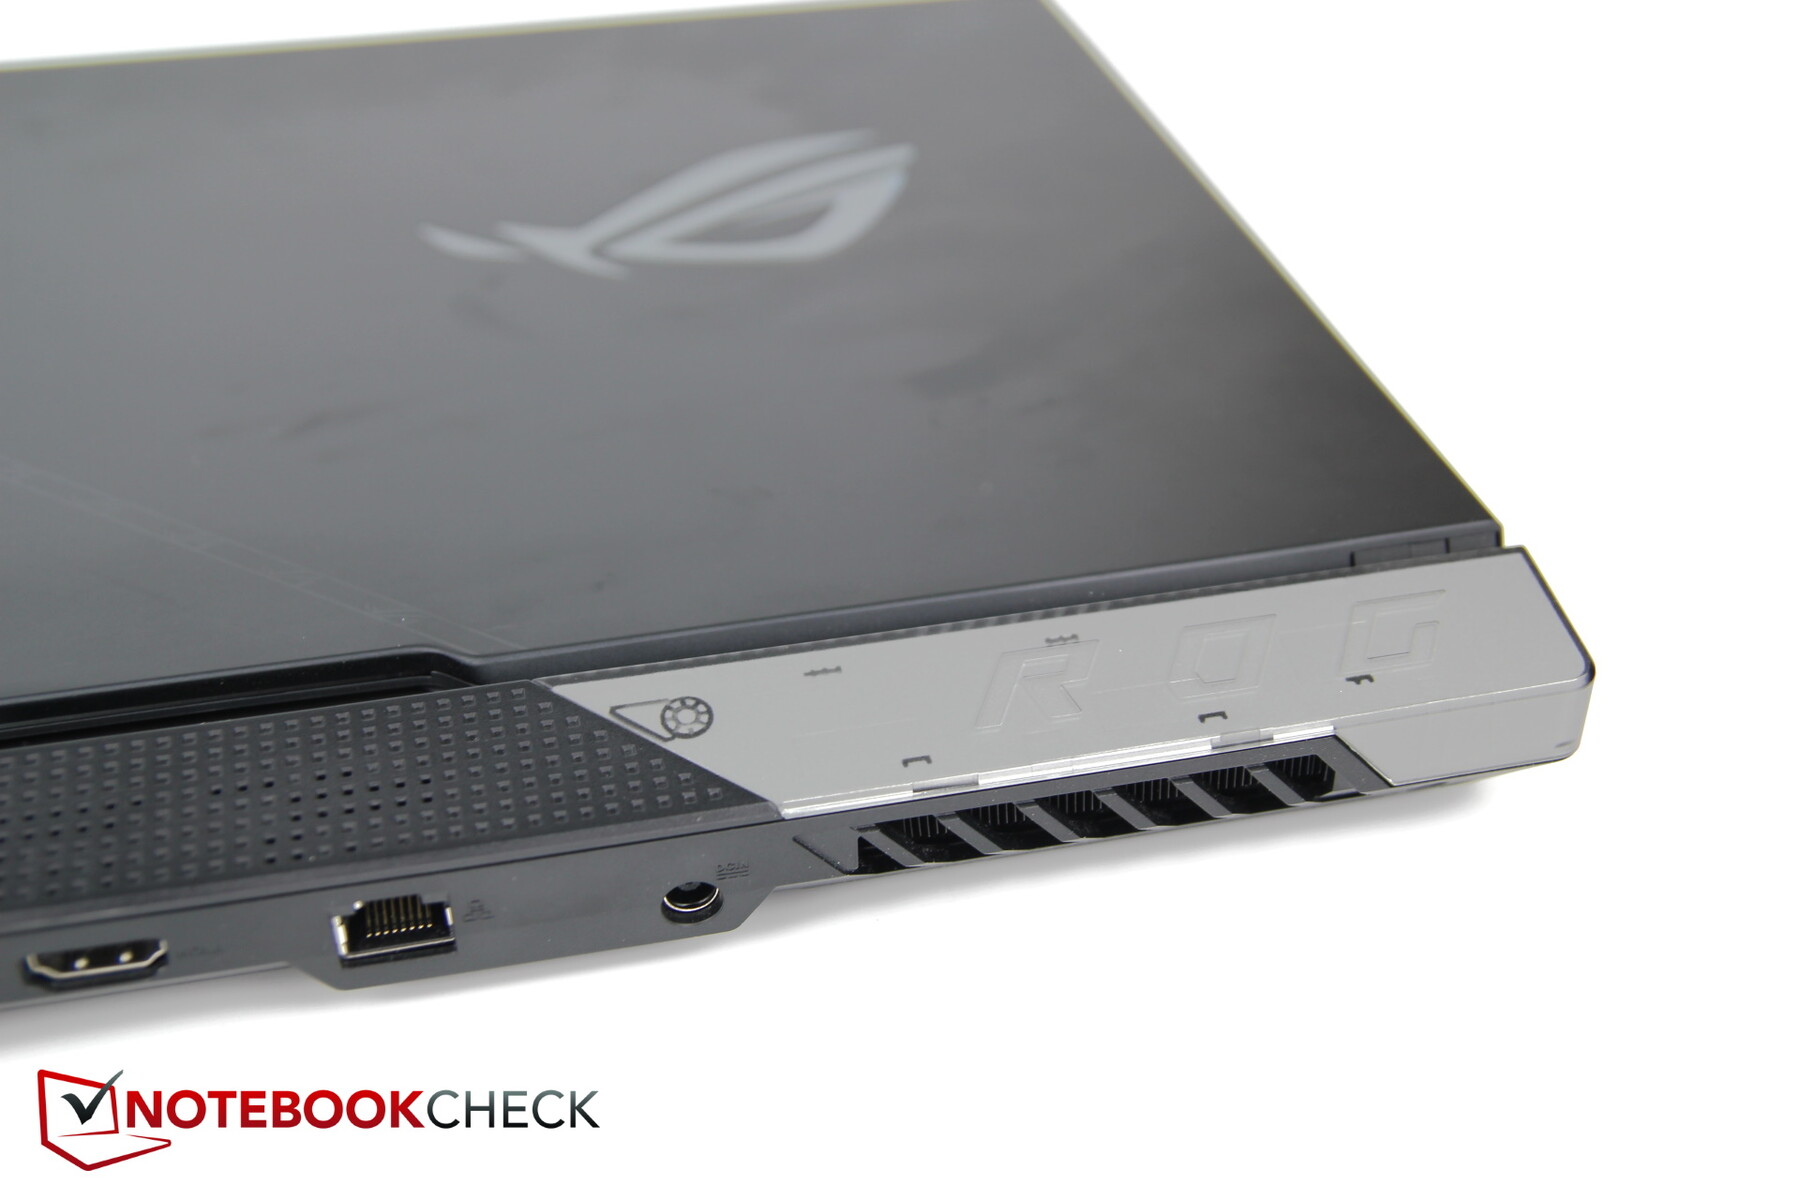
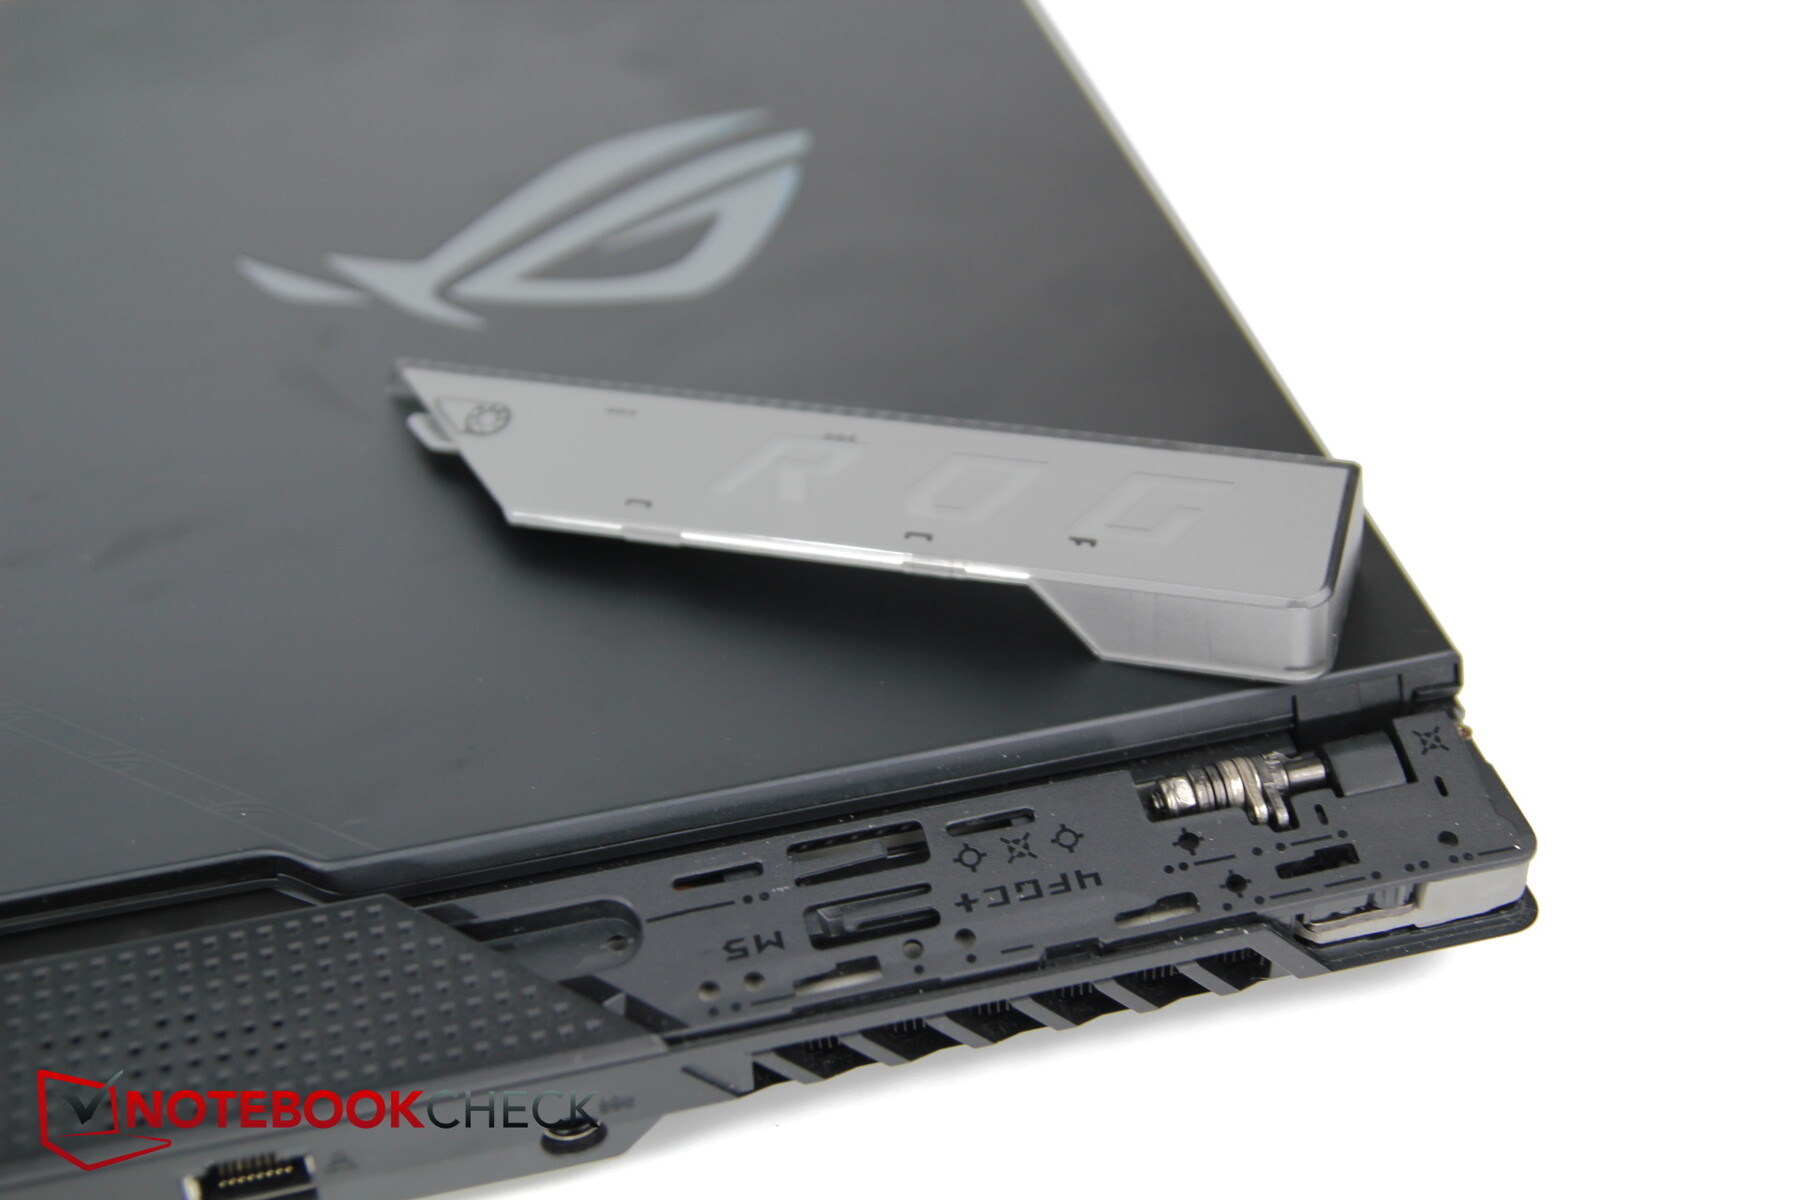
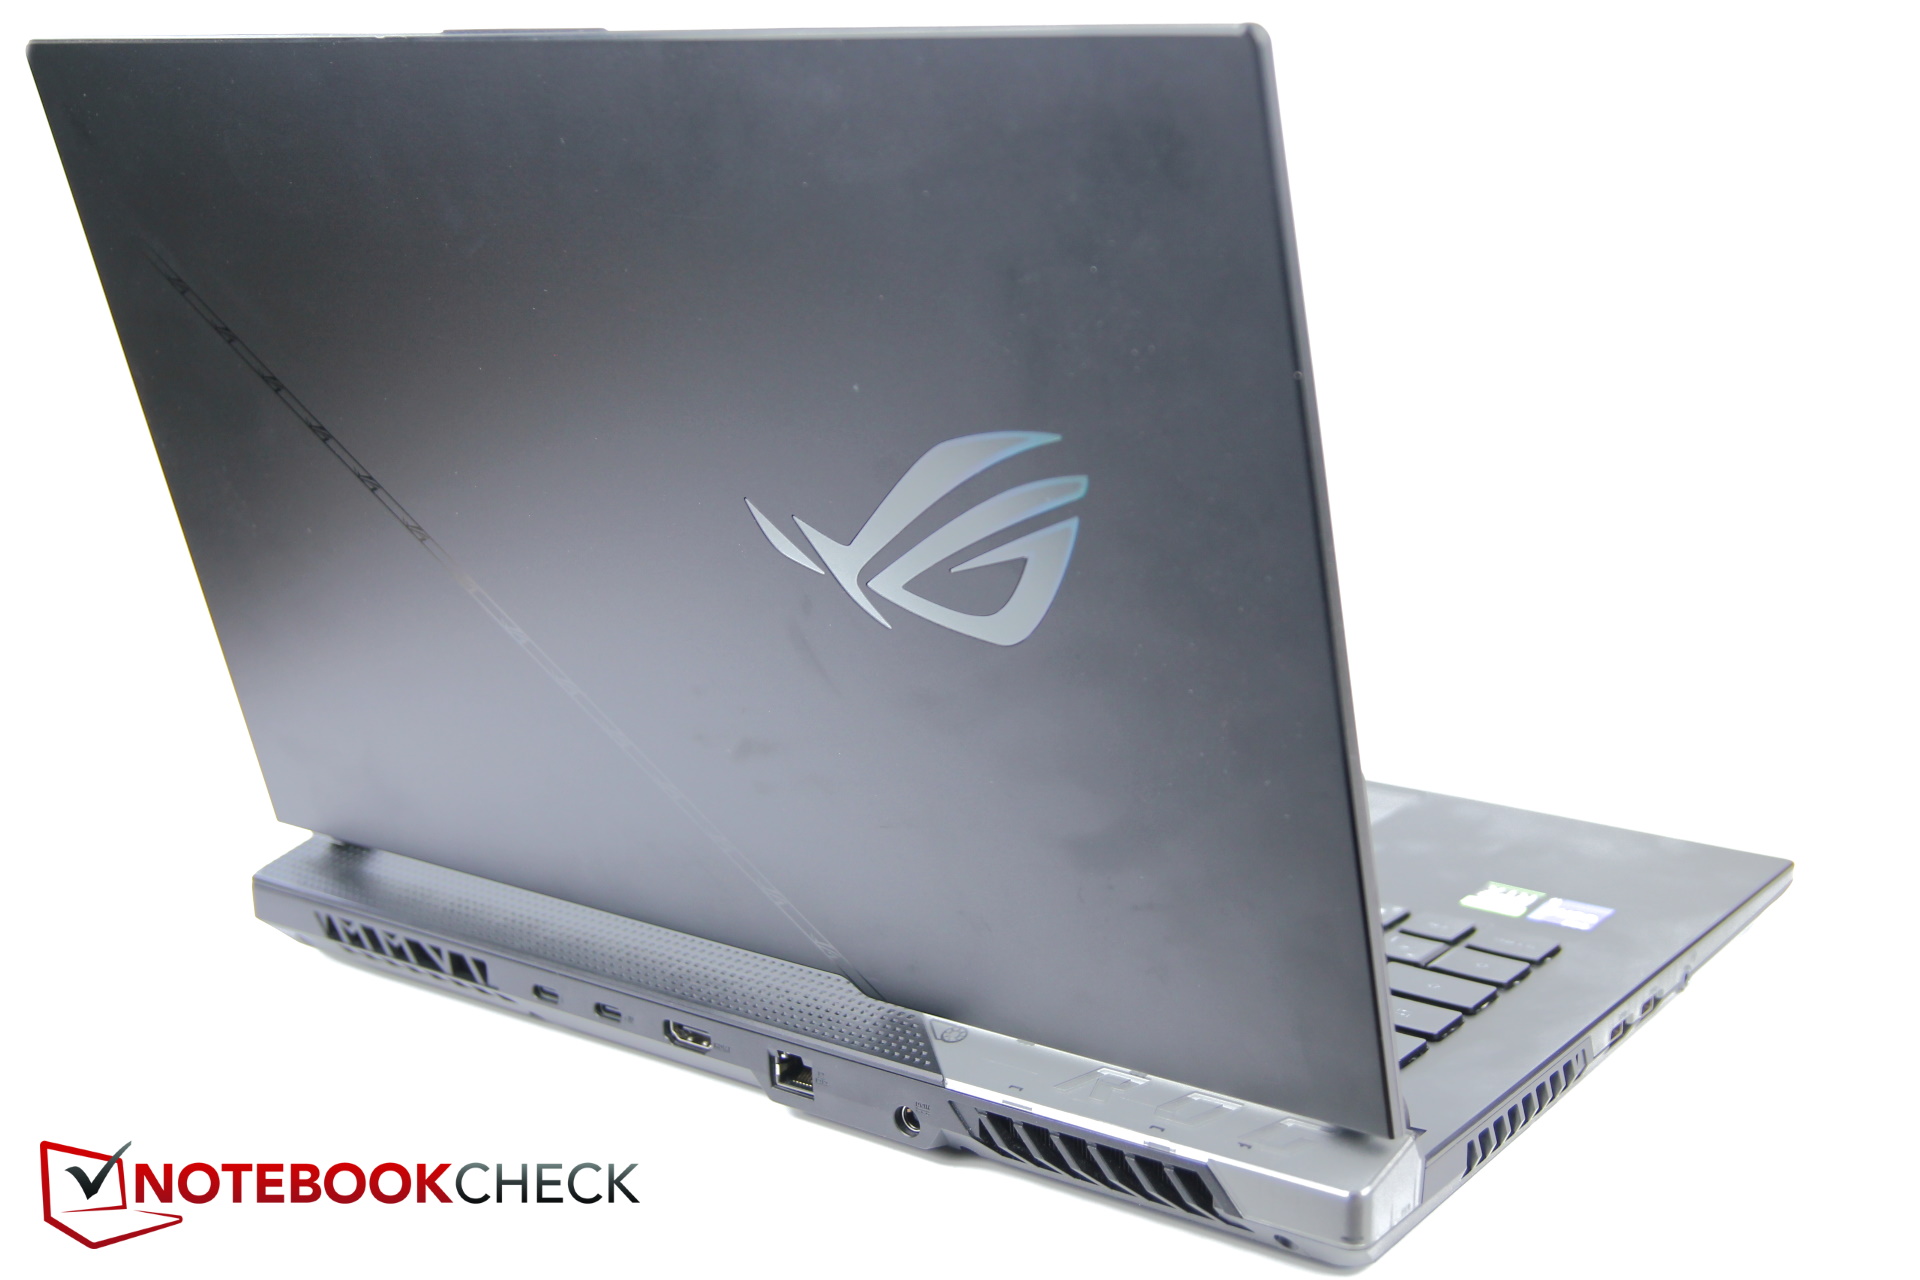
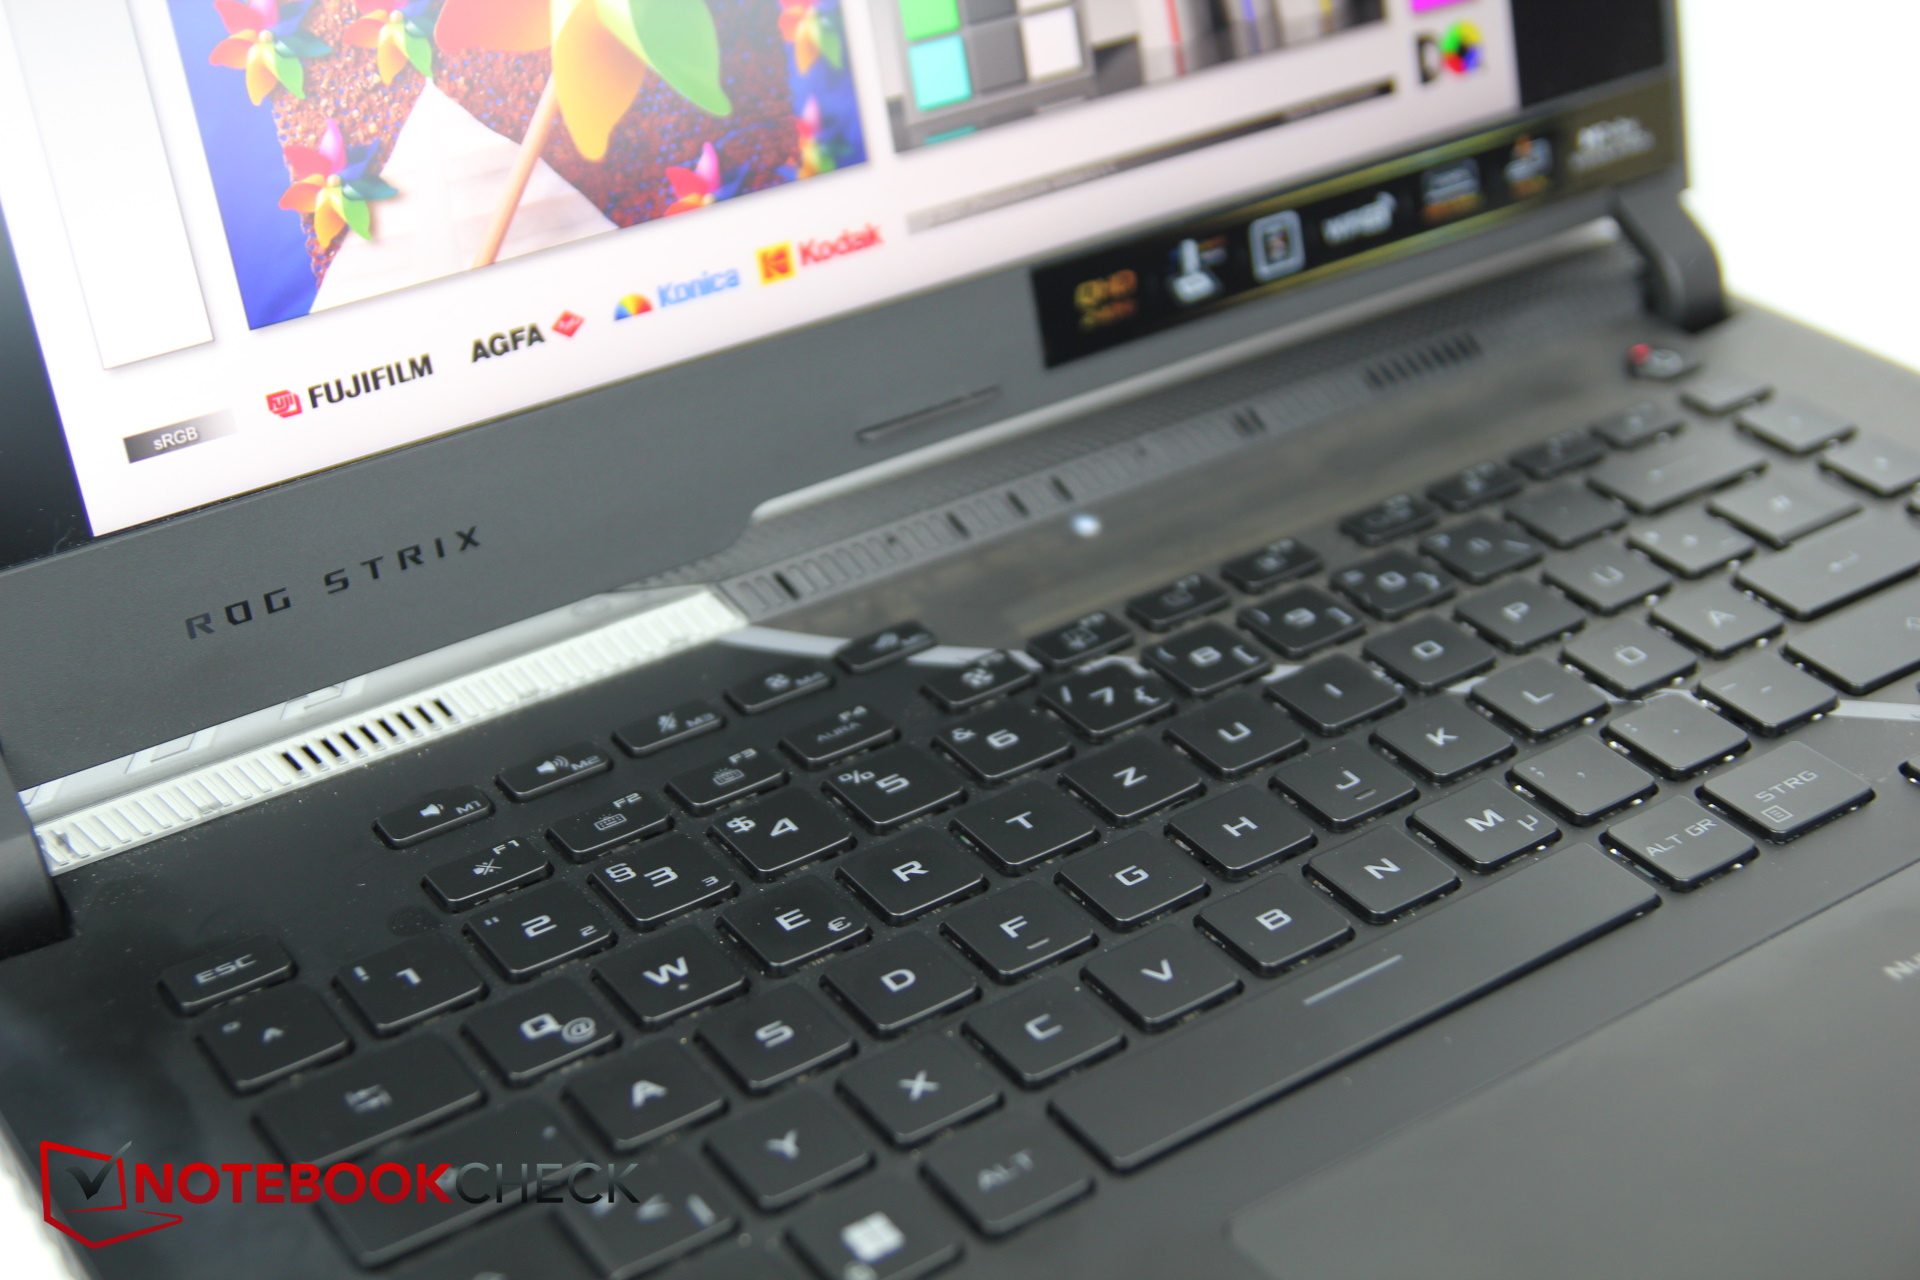
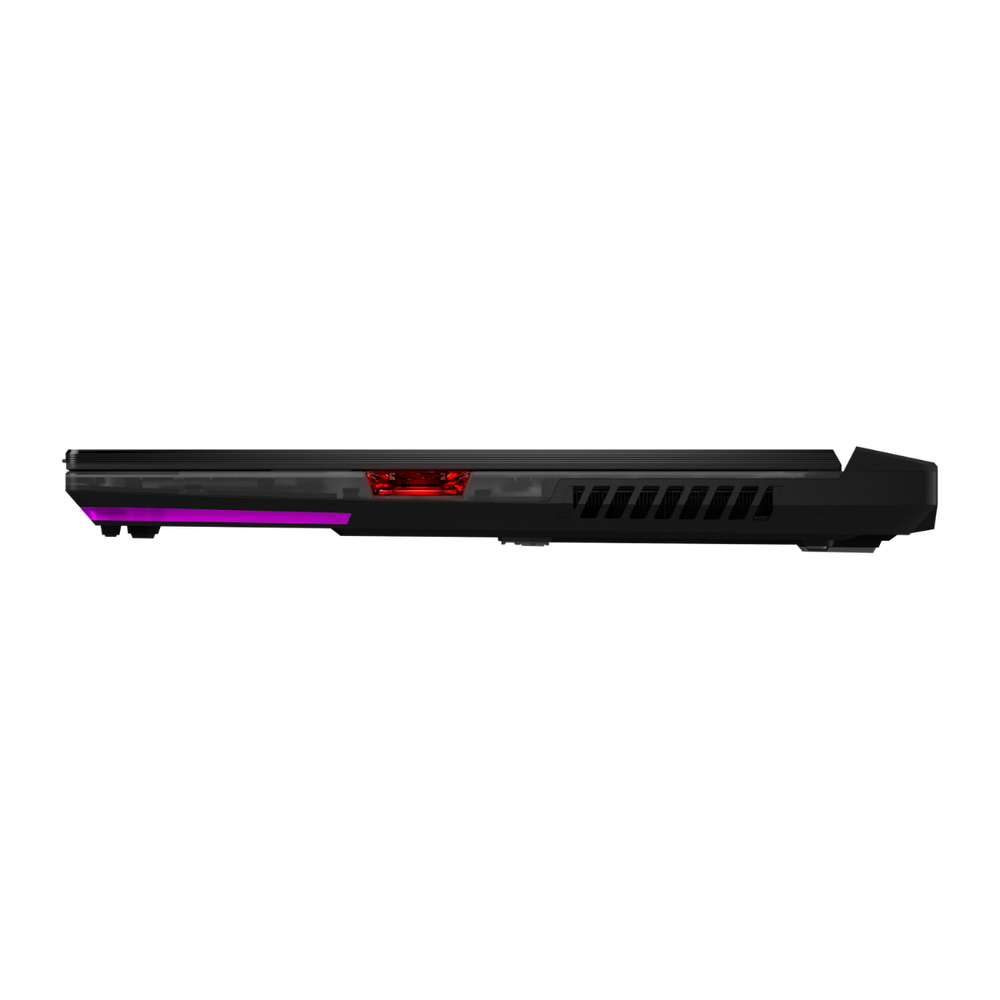
Una filosofia di design piuttosto unica permea l'intero ROG Scar, rendendolo un notebook interessante per i giocatori. Con linee diagonali, una piastra sostituibile sul coperchio posteriore, sottili accenti di colore ed elementi RGB, il produttore ha creato uno stile di gioco distinto senza un'illuminazione troppo sgargiante che lampeggia e si illumina.
Ad esempio, c'è una striscia luminosa che attraversa l'intera parte anteriore, ma è leggermente incassata, il che la rende meno evidente. Questa striscia luminosa può anche essere sincronizzata con la tastiera e il logo ROG sul lato superiore.
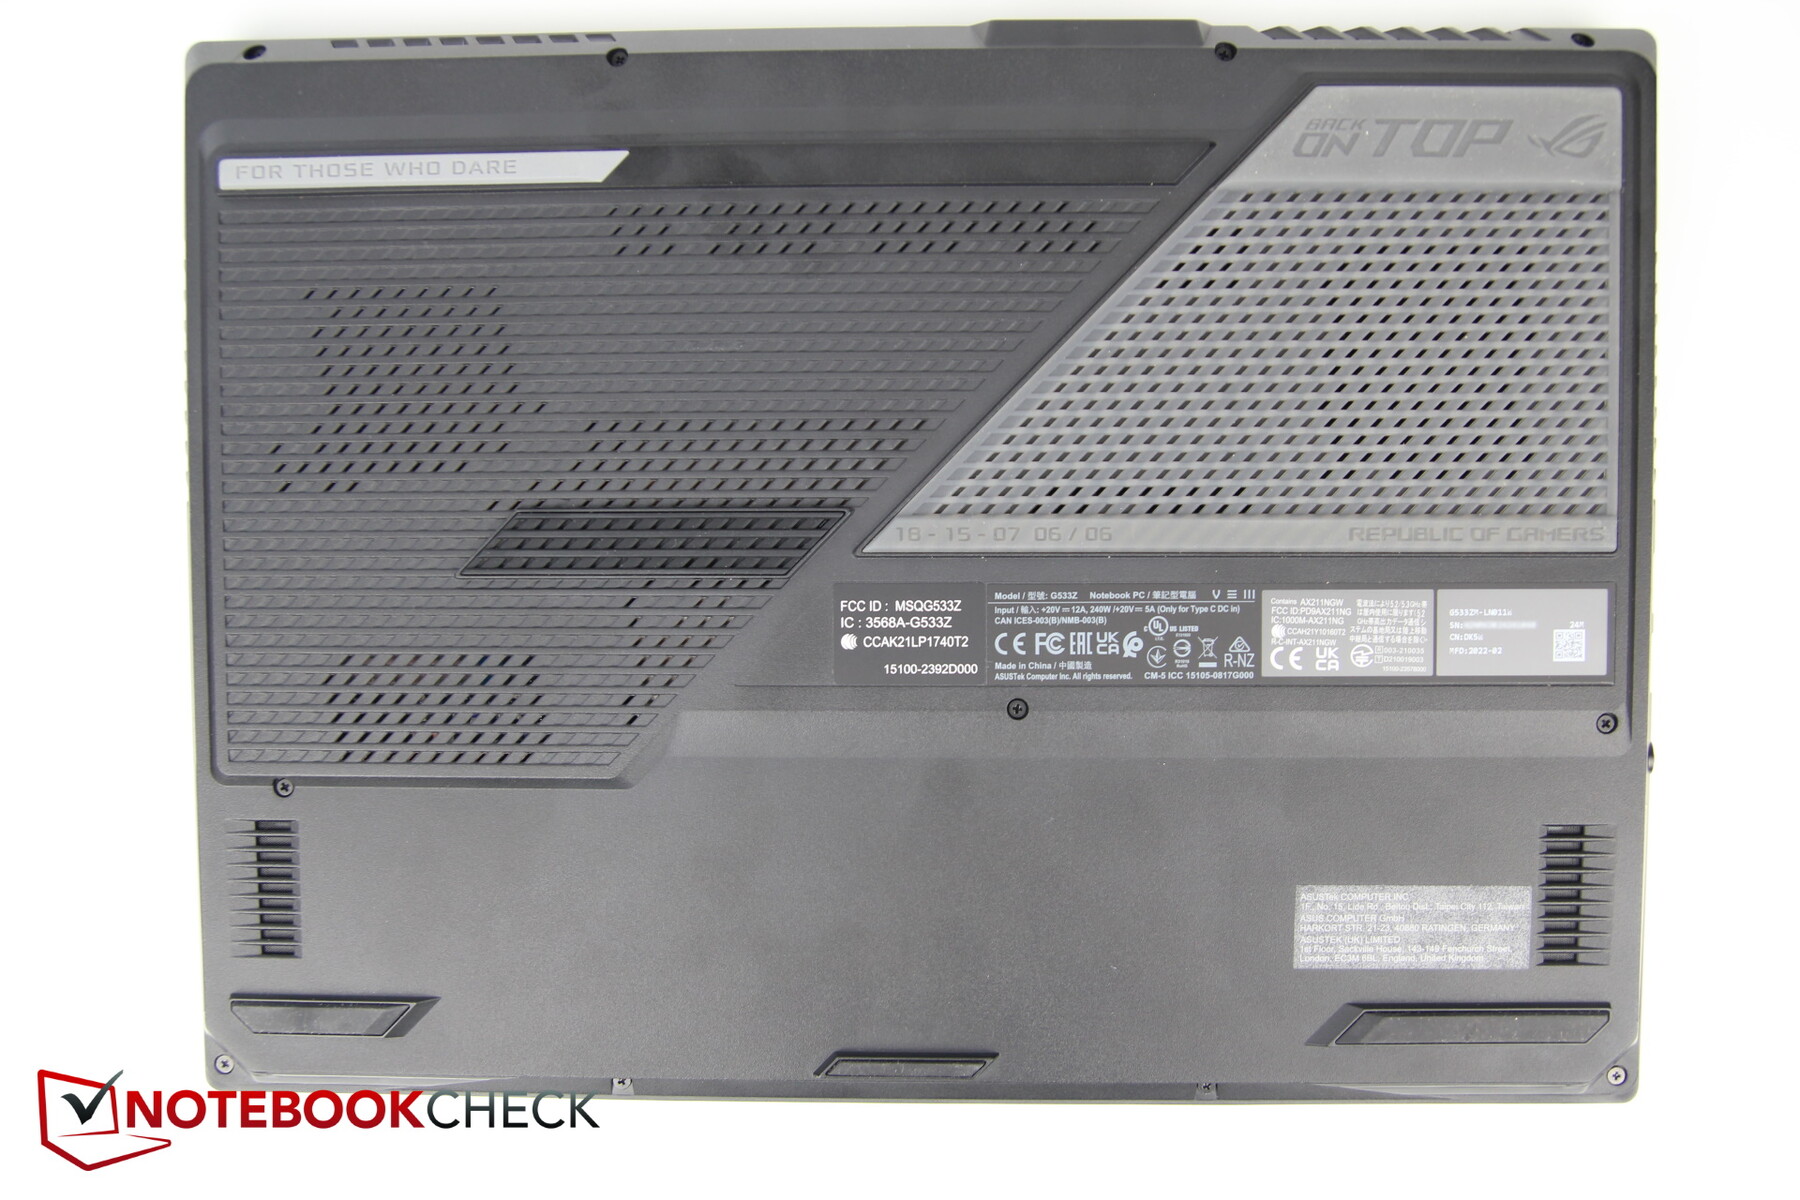
Sul fondo si trovano ampi piedini in gomma dai colori vivaci, che aggiungono contrasto al telaio prevalentemente nero.
Nonostante la costruzione quasi interamente in plastica, lo Strix Scar 15 sembra piuttosto robusto. Il display non fa alcun rumore quando viene ruotato, mentre la sezione della base scricchiola solo leggermente.
Il display è tenuto saldamente in posizione da due cerniere, e non presenta quasi alcuna oscillazione quando viene spostato.
Confronto delle dimensioni
Nel complesso, lo Scar 15 è marginalmente più spesso ma un po' più piccolo di alcuni dei suoi concorrenti. È anche relativamente leggero; ad esempio, i modelli Alienware e Legion sono più pesanti e solo il TUF Gaming F15 è leggermente più leggero.
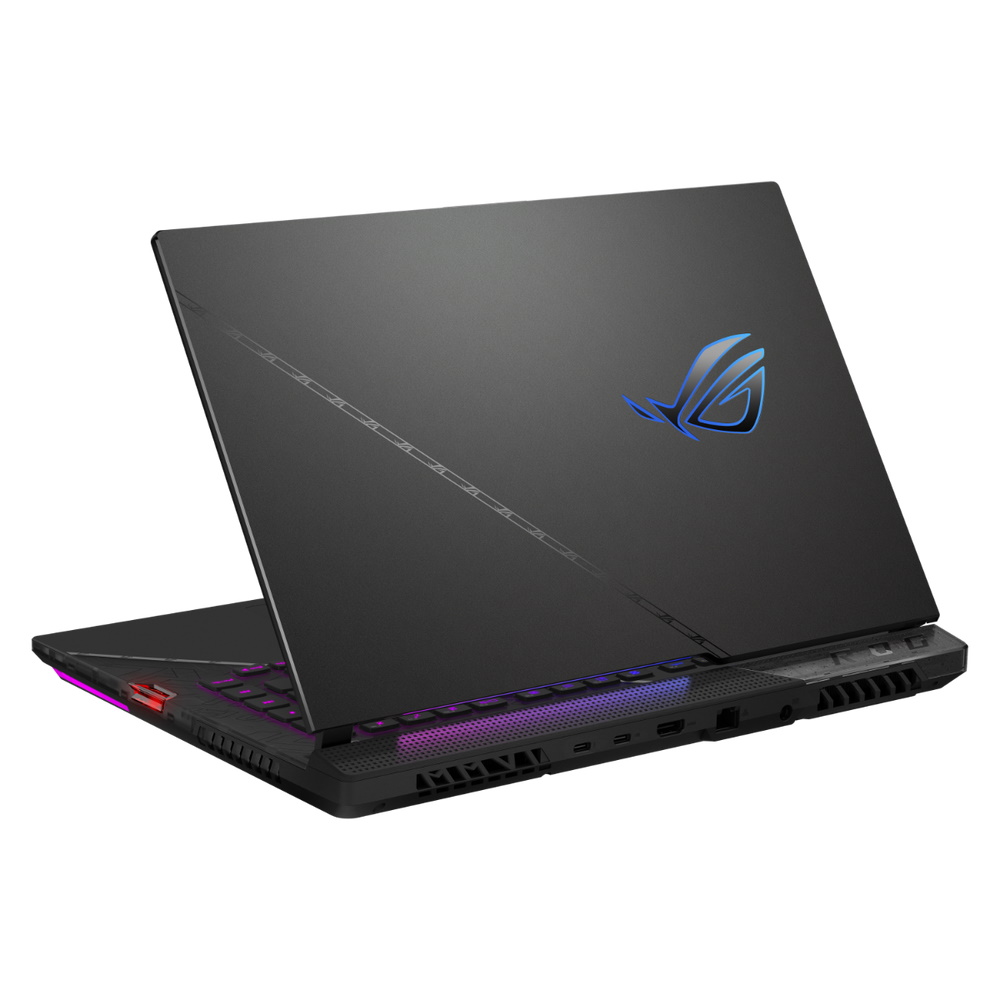
Specifiche - Thunderbolt 4, Keystone, ma niente webcam
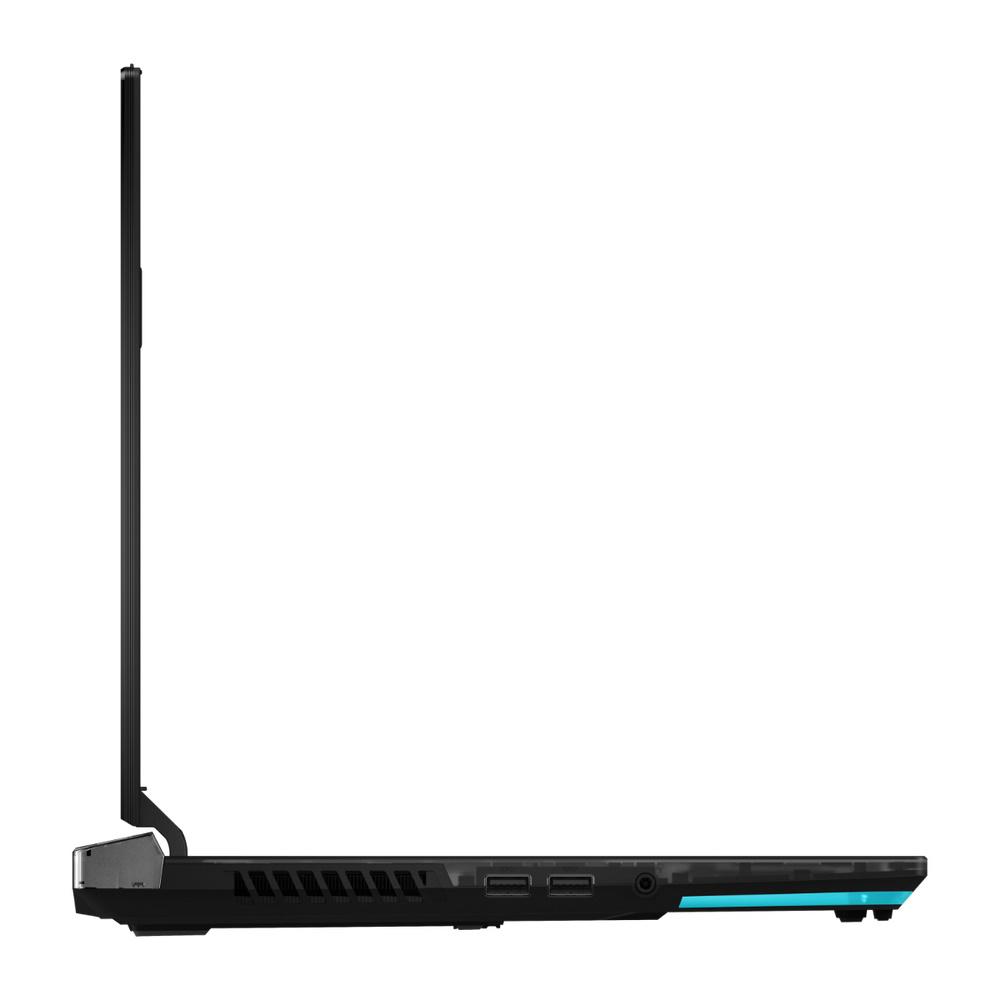
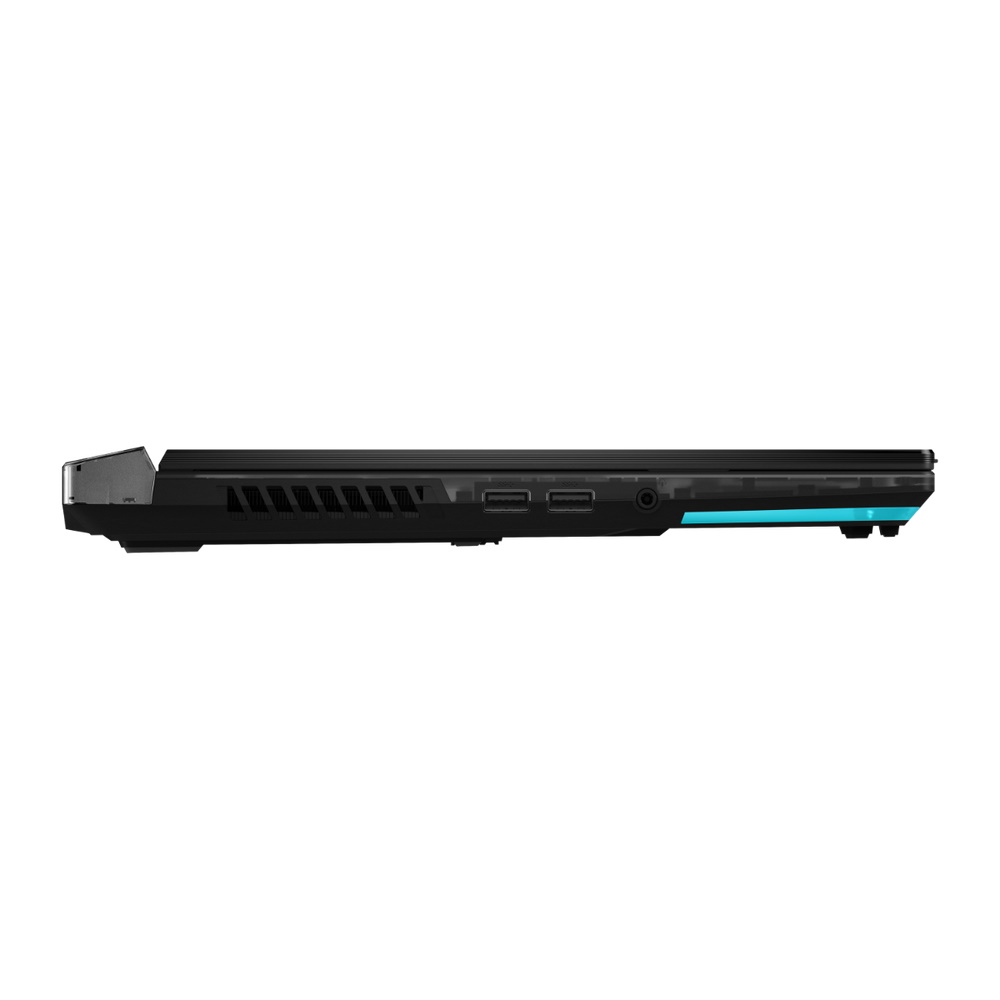
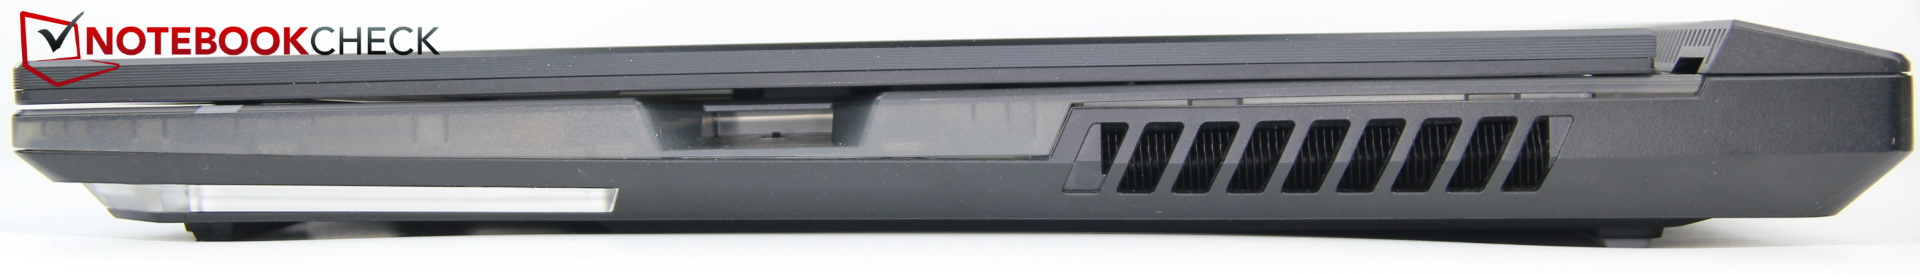
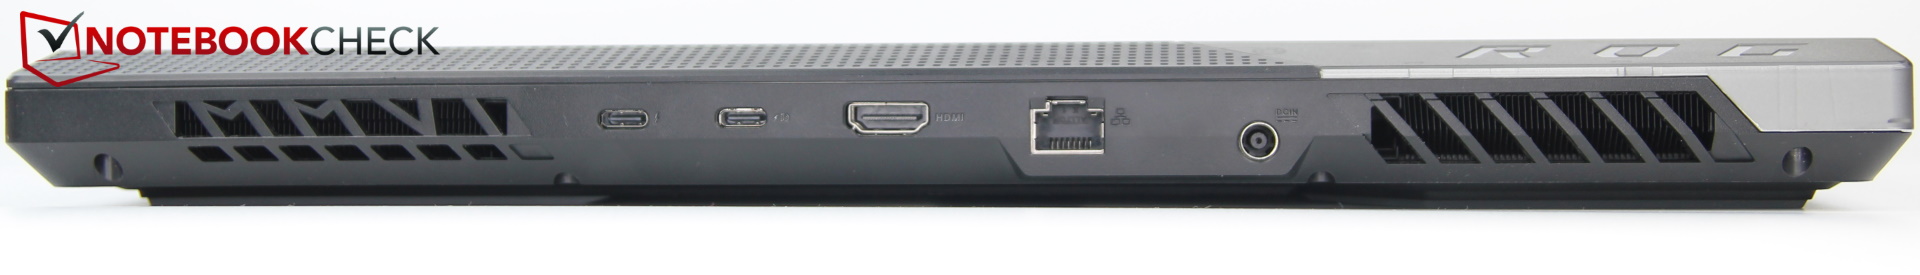
Strix è dotato di due porte USB-C, una delle quali supporta Thunderbolt 4 e l'altra è in grado di raggiungere la velocità di USB 3.2 Gen 2; entrambe offrono la funzionalità DisplayPort. Questo dimostra che il portatile ha caratteristiche abbastanza moderne. Gli I/O sono ben distribuiti sul lato sinistro e sul retro del dispositivo.
Il lato destro presenta solo uno slot Keystone. Il Keystone è una sorta di piccolo dispositivo di archiviazione e interruttore in uno. Ad esempio, può essere utilizzato per memorizzare le impostazioni e trasferirle ai computer portatili che supportano questa funzione (un elenco di modelli compatibili è fornito da Asus). Può anche funzionare come chiave di sicurezza su Strix Scar: una volta configurato, il portatile si accenderà solo con la Keystone inserita. Un'altra applicazione è quella di consentire l'accesso rapido ai programmi. Gli utenti possono istruire il laptop affinché apra automaticamente un determinato programma, ad esempio un gioco, quando la Keystone è inserita. Il portatile può anche essere programmato per eseguire una combinazione di azioni, come ad esempio passare alla modalità ventola ad alte prestazioni e lanciare Cyberpunk contemporaneamente. La scelta è nelle mani dell'utente.
Tuttavia, sul dispositivo Asus manca una cosa: una webcam. Questo rende lo Scar Strix uno dei pochi computer portatili (da gioco) senza webcam.
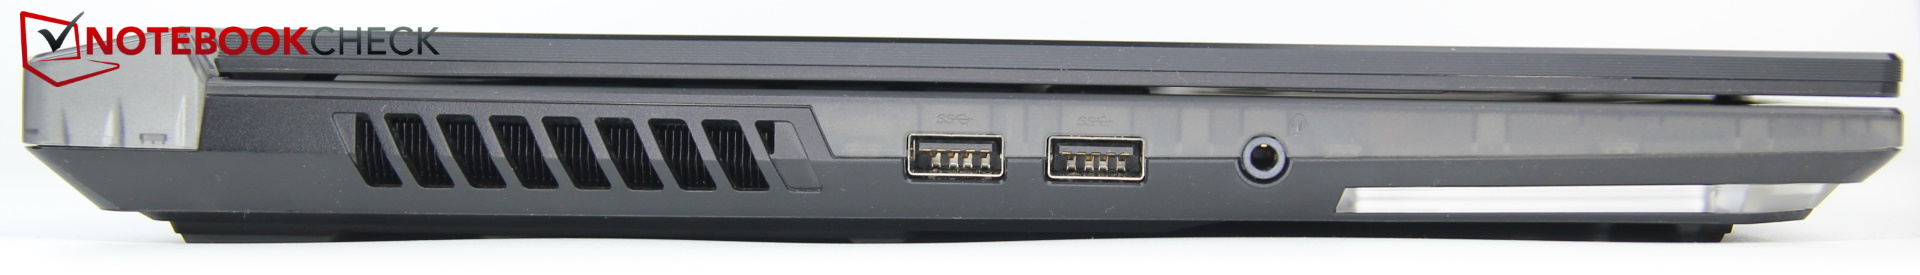
Connettività
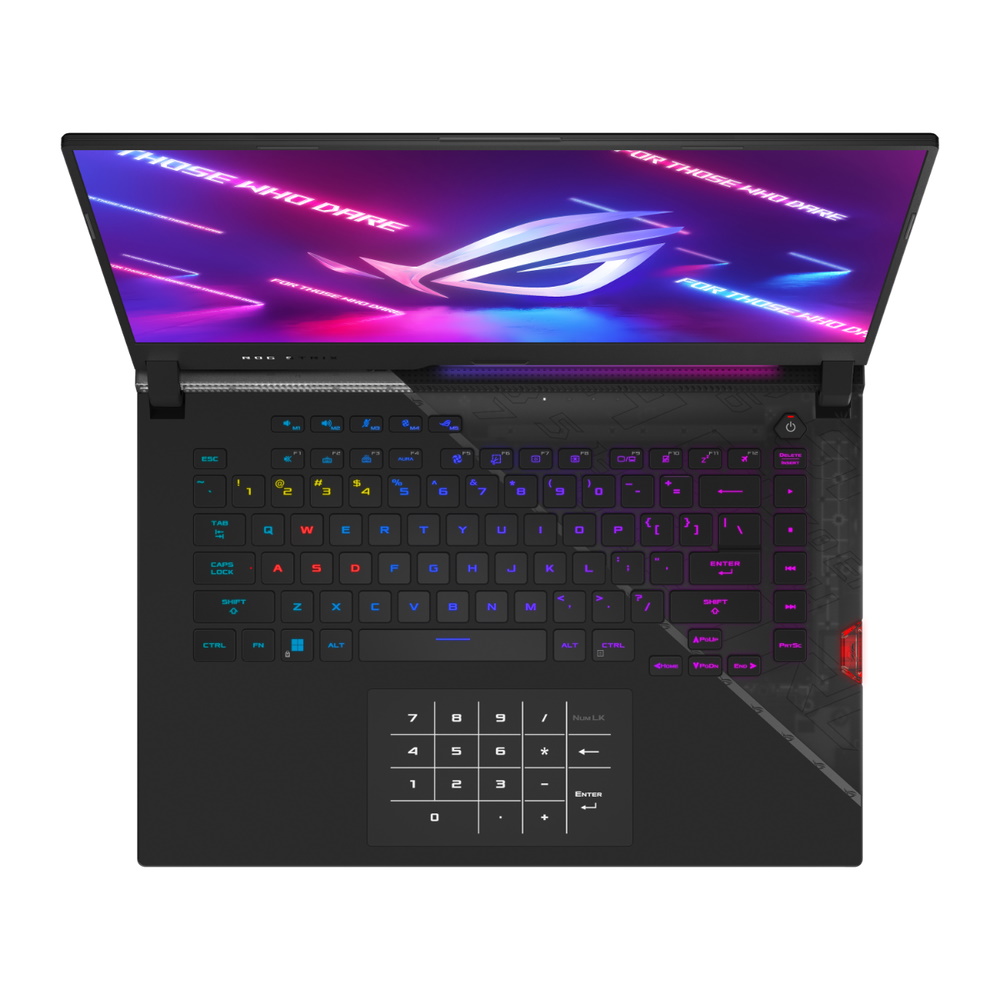
Dispositivi di input - Il pulsante del touchpad può bloccarsi leggermente
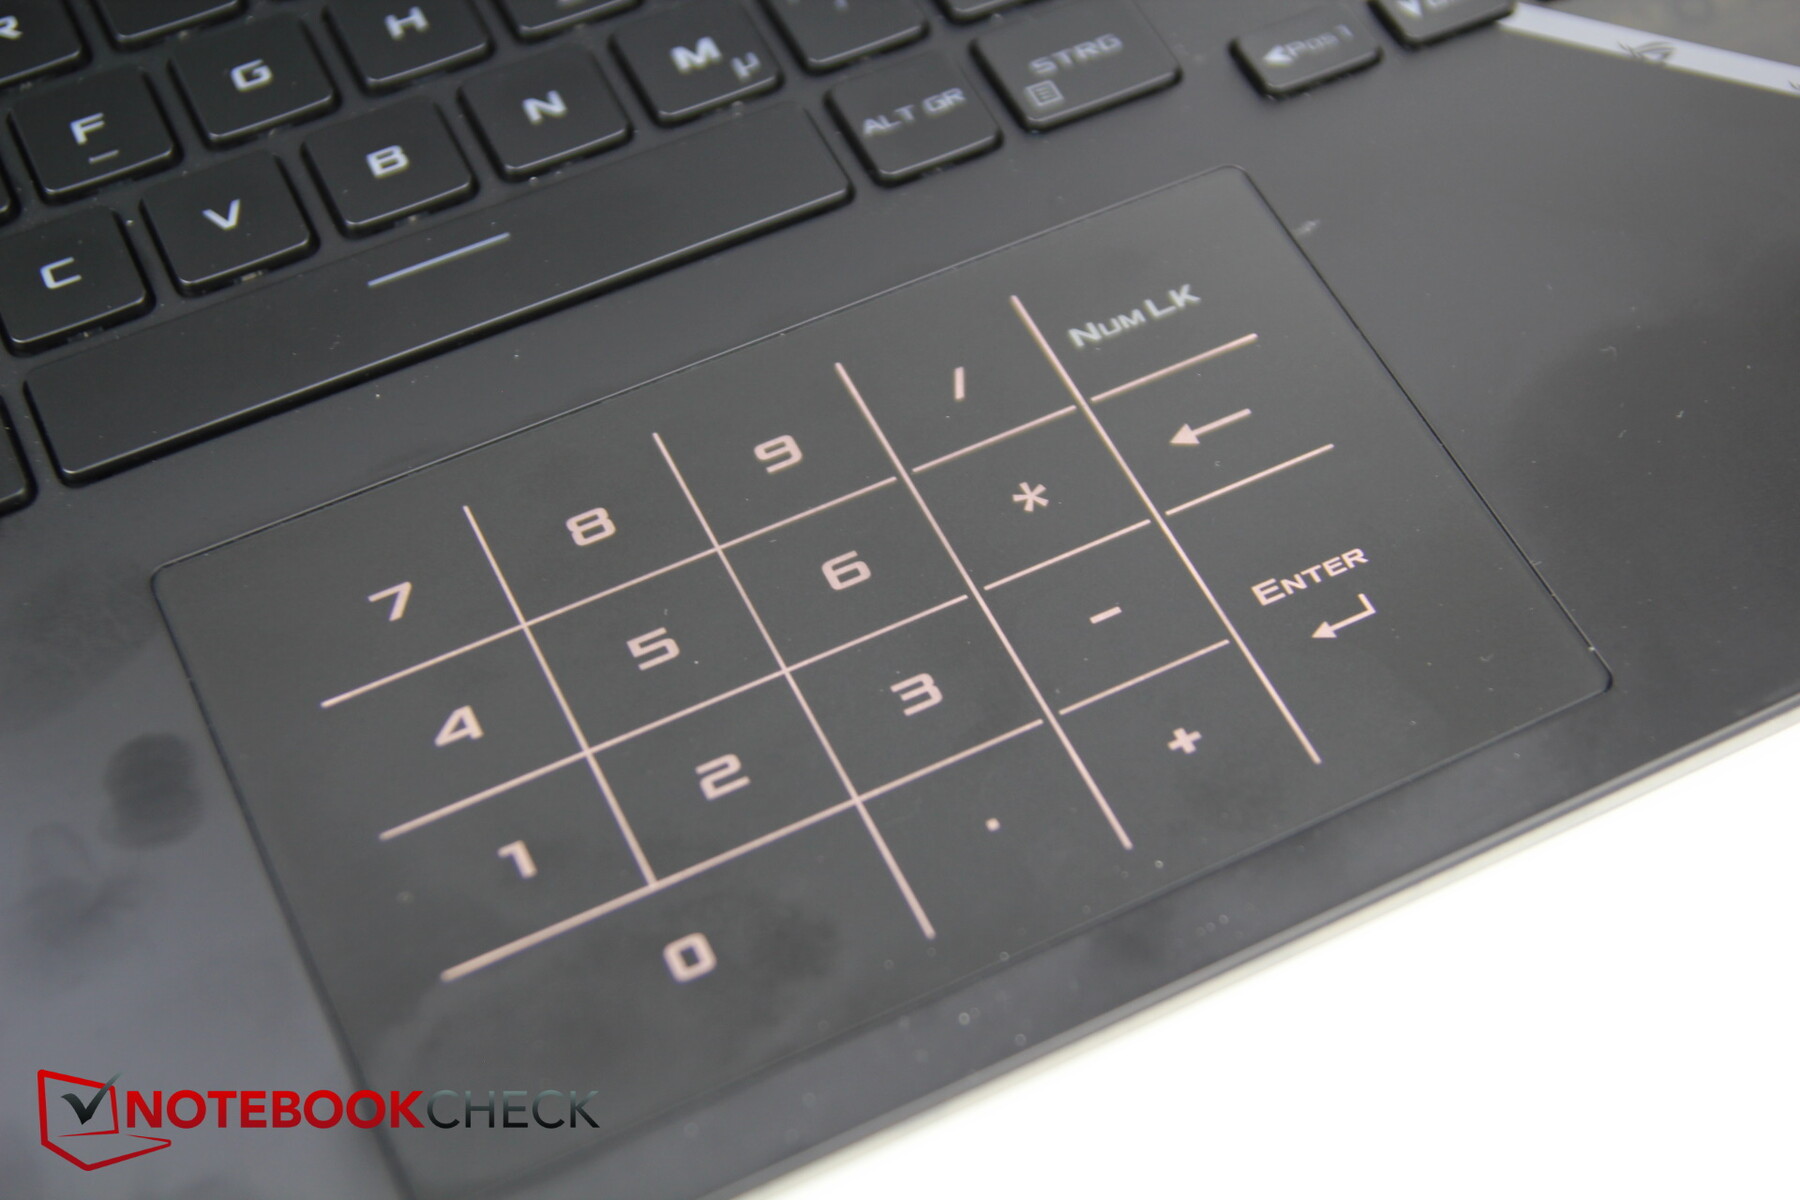
Touchpad
L'enorme touchpad ha un trucco interessante: può visualizzare un tastierino numerico. Detto questo, i pulsanti integrati nella nostra unità di recensione a volte si bloccano leggermente, soprattutto il pulsante sinistro, che abbiamo trovato molto fastidioso.
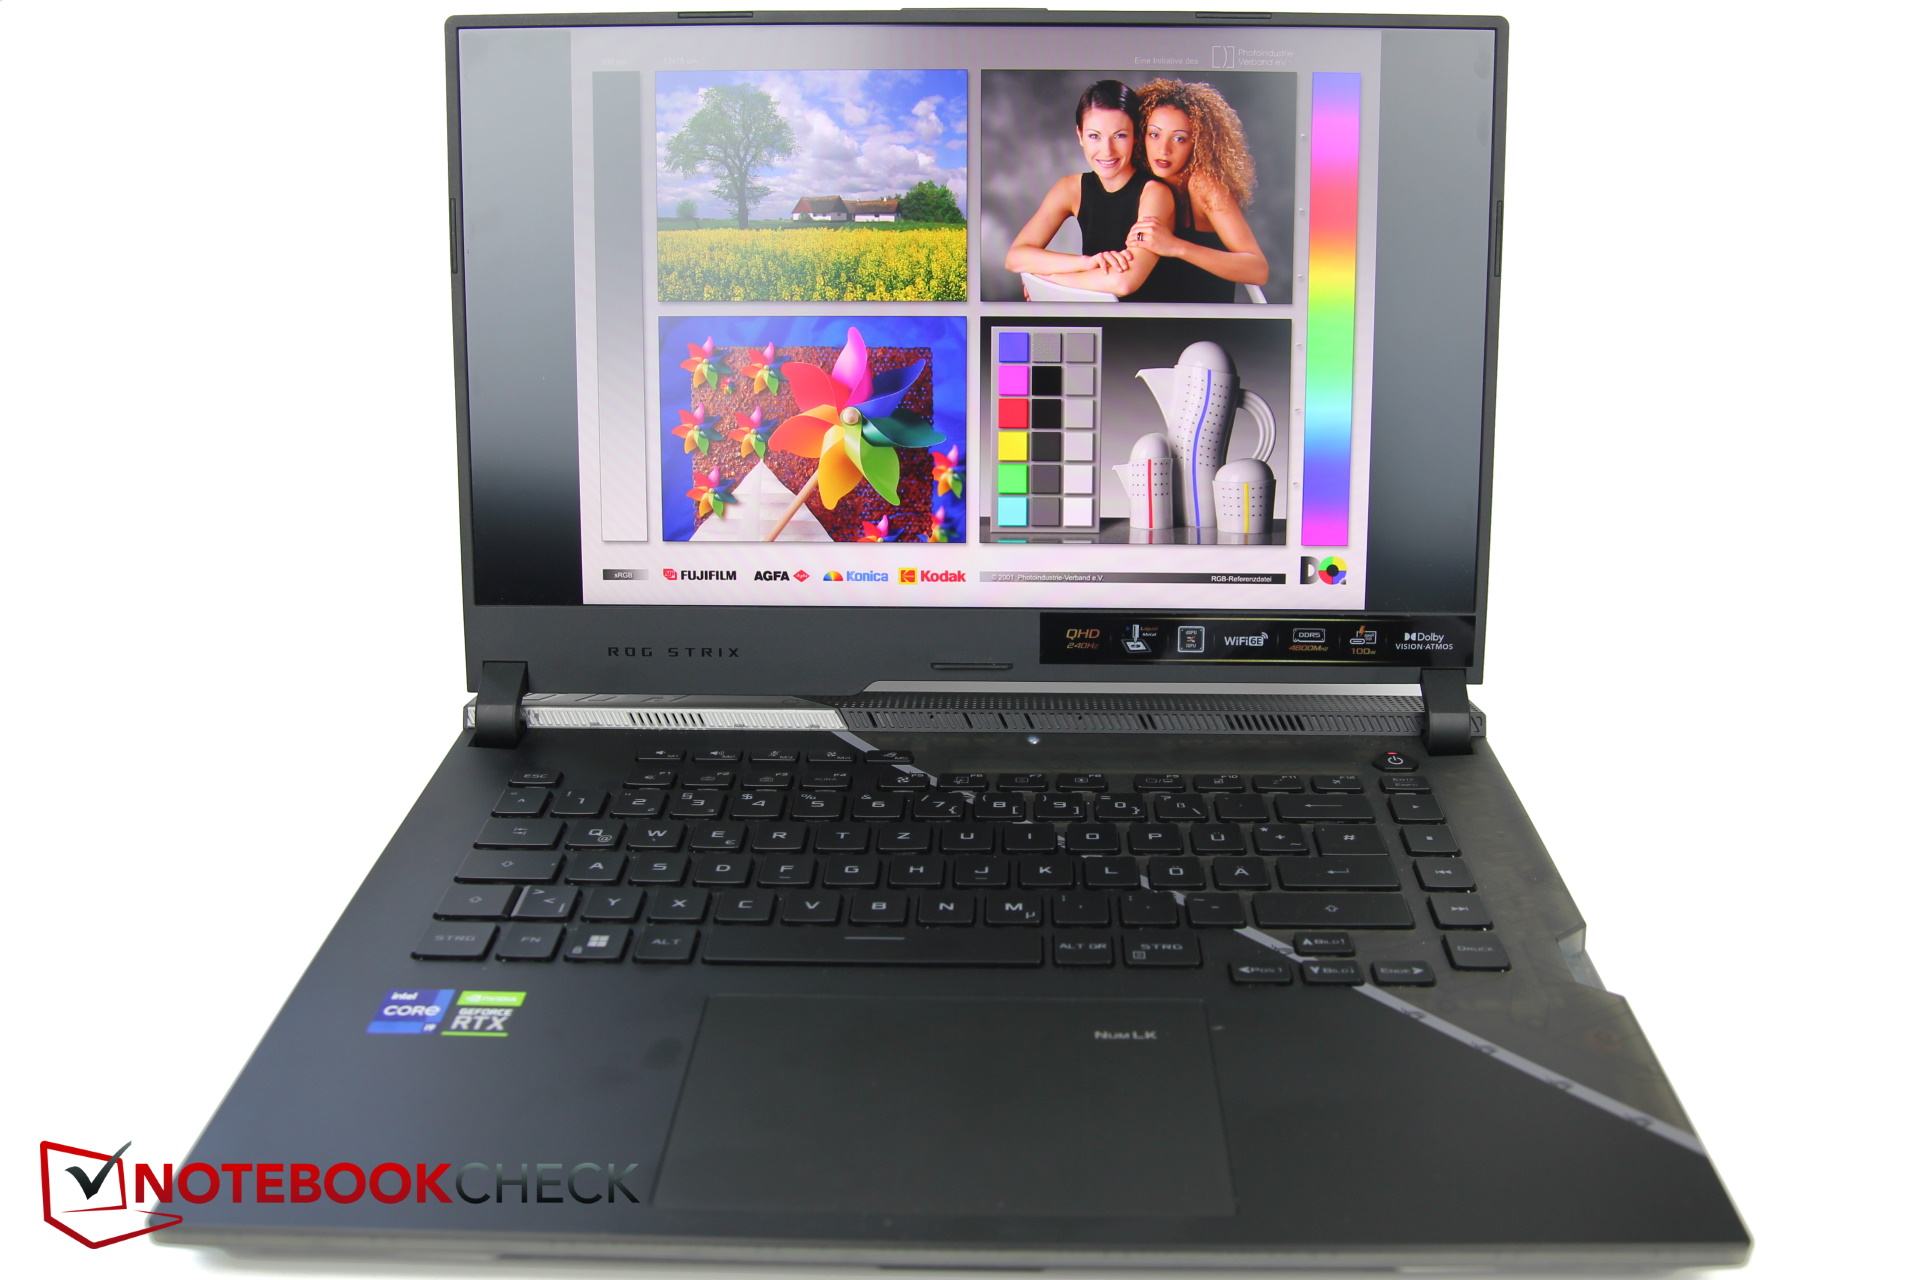
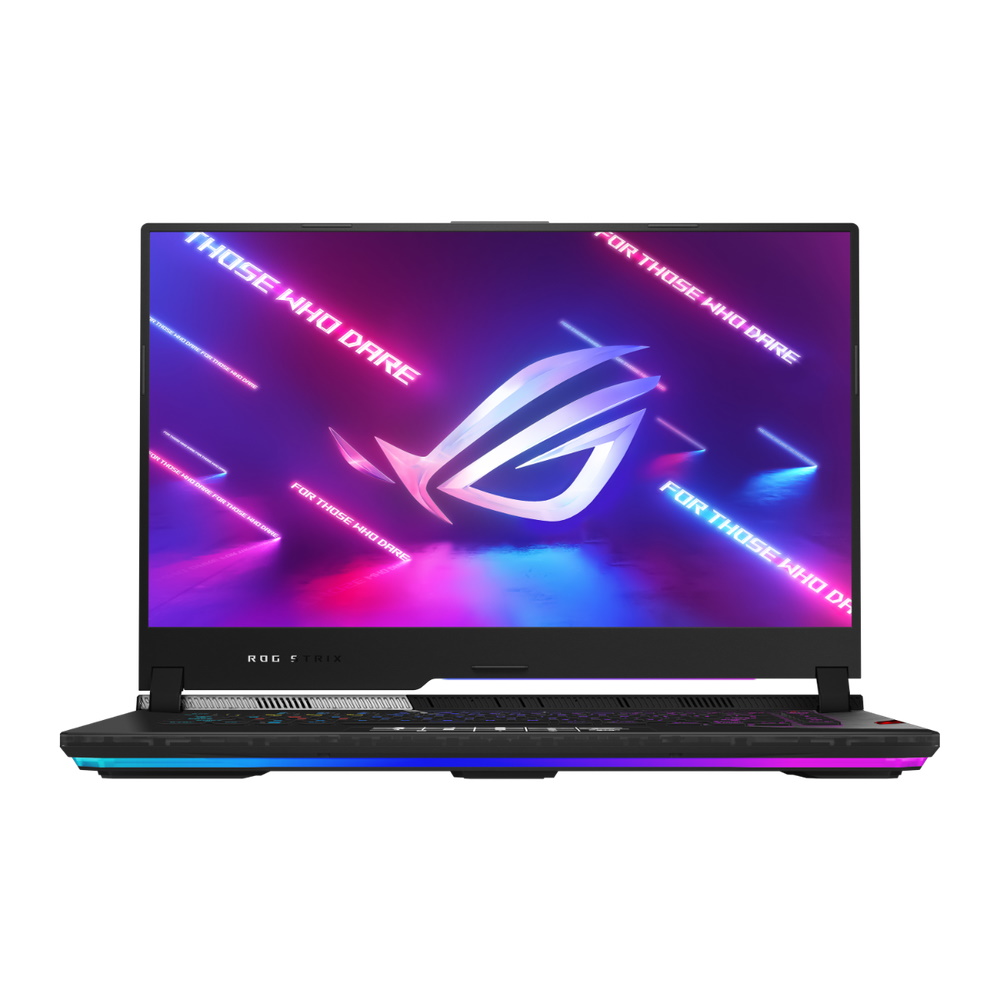
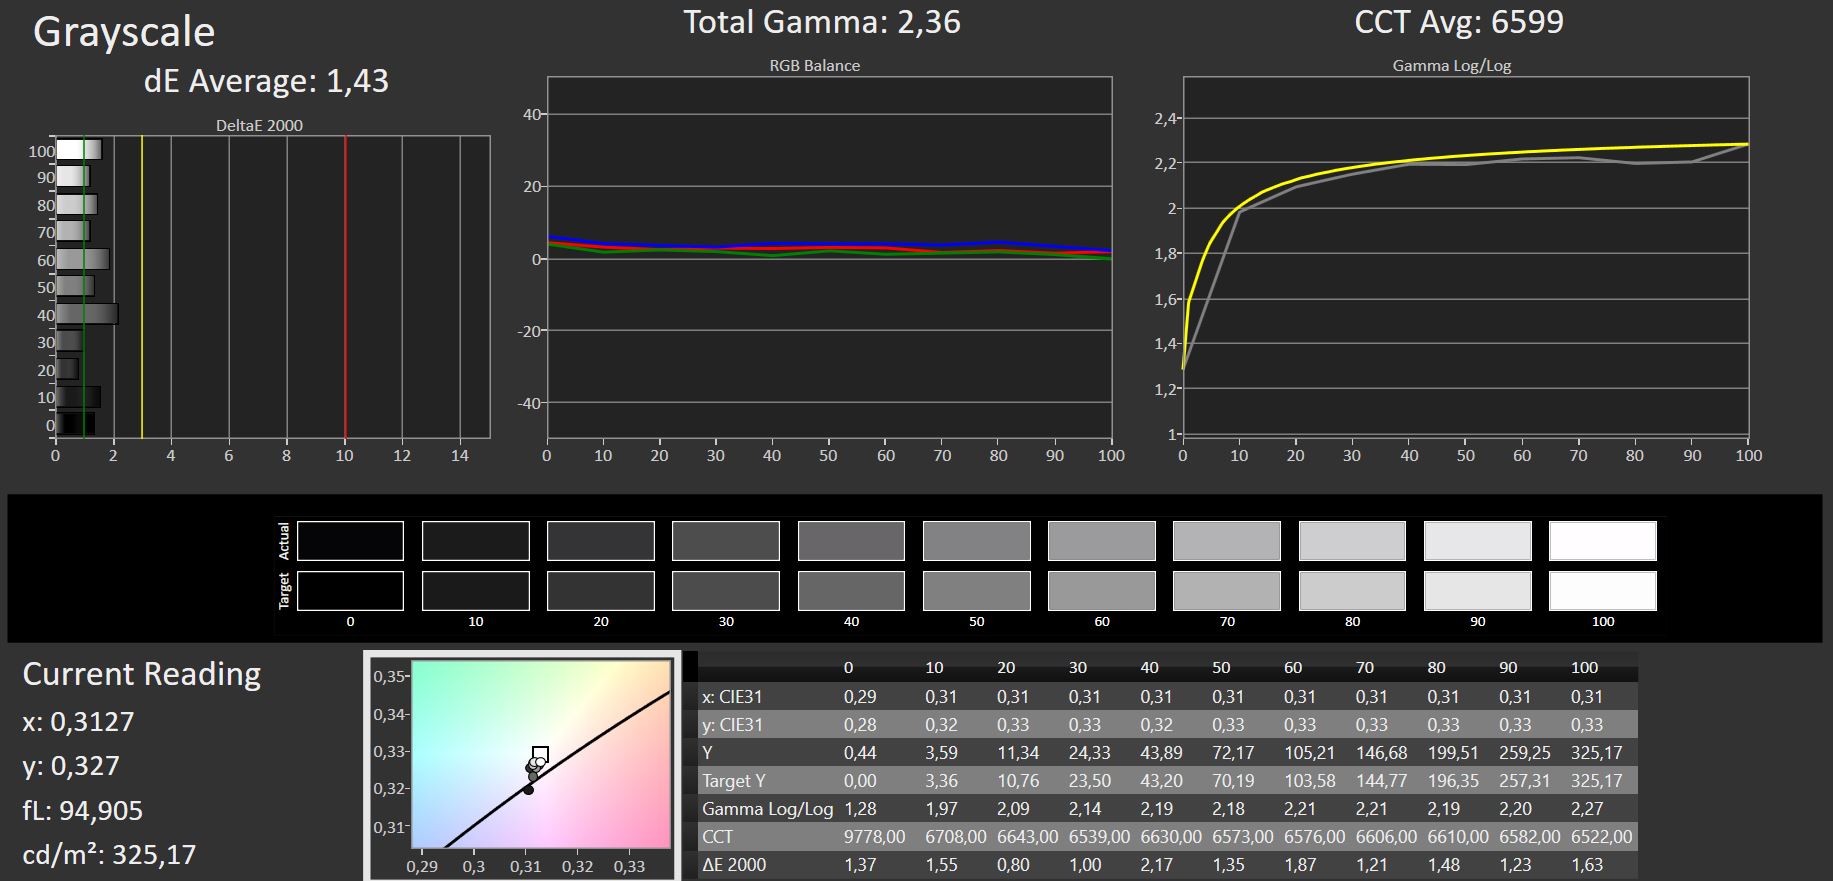
Display - QHD con 240 Hz e Dolby Vision Atmos
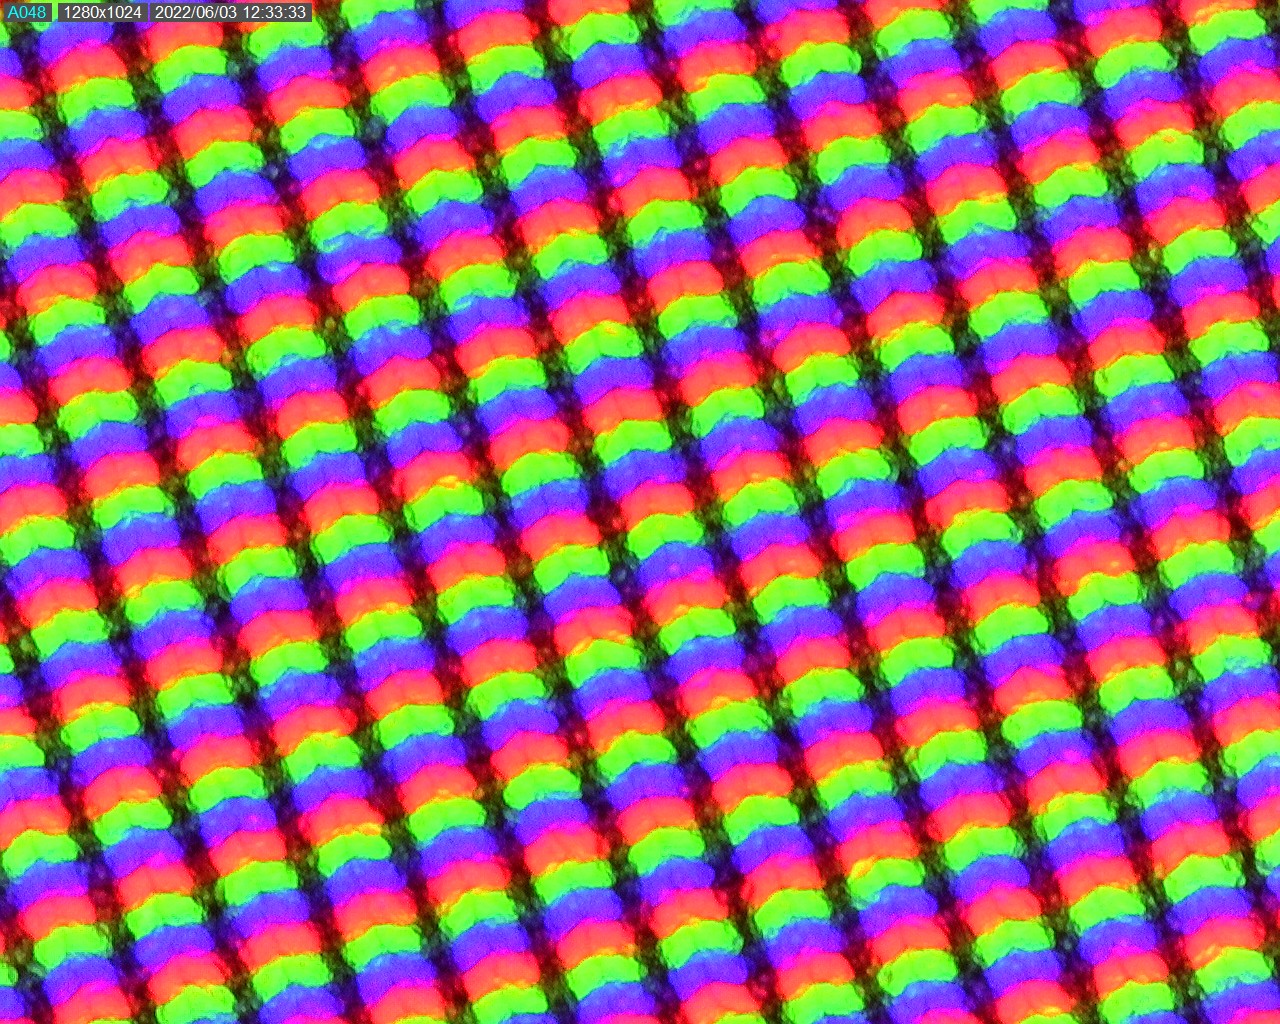

Il display IPS QHD (2.560 x 1.440 pixel) realizzato da BOE vanta tempi di risposta abbastanza rapidi, un'elevata frequenza di aggiornamento di 240 Hz e un'eccellente copertura cromatica, in grado di riprodurre quasi l'intera gamma sRGB e AdobeRGB.
Il pannello ha una luminosità di picco media di 300 nit e una distribuzione della luminosità piuttosto buona, pari all'89%. Tuttavia, il livello di nero e il contrasto sono piuttosto nella media.
Il portatile non utilizza il PWM per la regolazione della luminosità e c'è solo una minima quantità di screen bleeding.
| |||||||||||||||||||||||||
Distribuzione della luminosità: 89 %
Al centro con la batteria: 357 cd/m²
Contrasto: 1026:1 (Nero: 0.34 cd/m²)
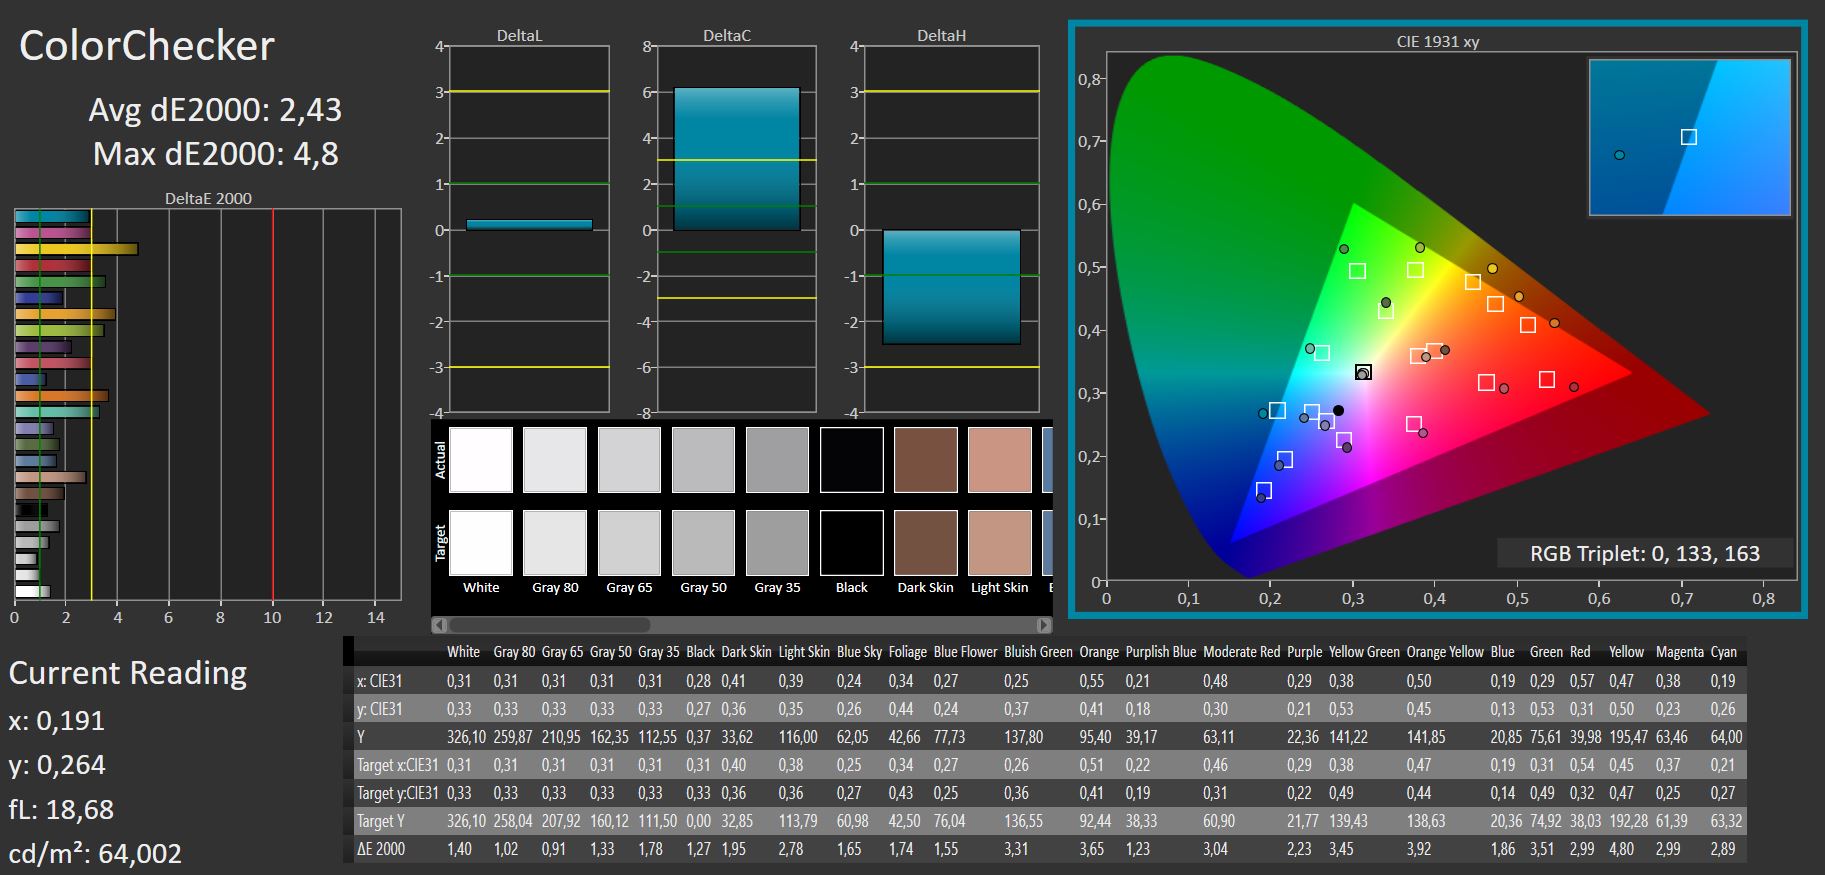
ΔE ColorChecker Calman: 3.44 | ∀{0.5-29.43 Ø4.72}
calibrated: 2.43
ΔE Greyscale Calman: 3.34 | ∀{0.09-98 Ø4.97}
84.1% AdobeRGB 1998 (Argyll 3D)
99.6% sRGB (Argyll 3D)
95% Display P3 (Argyll 3D)
Gamma: 2.5
CCT: 6641 K
| Asus ROG Strix Scar 15 G533zm BOE CQ NE156QHM-NZ2 (BOE0A55), IPS, 2560x1440, 15.6" | Asus ROG Strix Scar 15 G533ZW-LN106WS BOE CQ NE156QHM-NZ2, IPS-level, 2560x1440, 15.6" | Asus TUF Gaming F15 FX507ZM TL156VDXP0101, IPS, 1920x1080, 15.6" | MSI Pulse GL66 12UEK AU Optronics B156HAN08.4 (AUOAF90), IPS, 1920x1080, 15.6" | Alienware m15 R5 Ryzen Edition B156HAN, IPS, 1920x1080, 15.6" | Lenovo Legion 5 15ACH6A-82NW0010GE LGD06A5, IPS, 1920x1080, 15.6" | |
|---|---|---|---|---|---|---|
| Display | 0% | -17% | -51% | -13% | ||
| Display P3 Coverage (%) | 95 | 96.2 1% | 66.4 -30% | 39 -59% | 71.1 -25% | |
| sRGB Coverage (%) | 99.6 | 99.9 0% | 97 -3% | 58.4 -41% | 99.1 -1% | |
| AdobeRGB 1998 Coverage (%) | 84.1 | 84.5 0% | 68.5 -19% | 40.3 -52% | 72.3 -14% | |
| Response Times | 14% | -3% | -333% | 30% | -45% | |
| Response Time Grey 50% / Grey 80% * (ms) | 6.4 ? | 7.86 ? -23% 4.21 ? 34% | 5.6 ? 13% | 38.8 ? -506% | 4 ? 37% | 15 ? -134% |
| Response Time Black / White * (ms) | 10.8 ? | 7.5 ? 31% | 12.8 ? -19% | 28 ? -159% | 8.4 ? 22% | 6 ? 44% |
| PWM Frequency (Hz) | ||||||
| Screen | -14% | 23% | 15% | 14% | 2% | |
| Brightness middle (cd/m²) | 349 | 346 -1% | 353.7 1% | 248 -29% | 329 -6% | 371 6% |
| Brightness (cd/m²) | 333 | 329 -1% | 340 2% | 245 -26% | 321 -4% | 328 -2% |
| Brightness Distribution (%) | 89 | 91 2% | 89 0% | 86 -3% | 92 3% | 85 -4% |
| Black Level * (cd/m²) | 0.34 | 0.59 -74% | 0.34 -0% | 0.13 62% | 0.27 21% | 0.32 6% |
| Contrast (:1) | 1026 | 586 -43% | 1040 1% | 1908 86% | 1219 19% | 1159 13% |
| Colorchecker dE 2000 * | 3.44 | 3.06 11% | 1.74 49% | 3.14 9% | 2.78 19% | 3.25 6% |
| Colorchecker dE 2000 max. * | 5.78 | 5.81 -1% | 3.63 37% | 5.82 -1% | 4.88 16% | 6.33 -10% |
| Colorchecker dE 2000 calibrated * | 2.43 | 2.57 -6% | 0.5 79% | 3.14 -29% | 1.63 33% | 1.11 54% |
| Greyscale dE 2000 * | 3.34 | 2.1 37% | 1.2 64% | 2.5 25% | 4.94 -48% | |
| Gamma | 2.5 88% | 2.12 104% | 2.3 96% | 2.49 88% | 2.106 104% | 2.45 90% |
| CCT | 6641 98% | 7021 93% | 6257 104% | 6468 100% | 6201 105% | 6064 107% |
| Color Space (Percent of AdobeRGB 1998) (%) | 76 | |||||
| Color Space (Percent of sRGB) (%) | 99 | |||||
| Media totale (Programma / Settaggio) | 0% /
-5% | 1% /
11% | -123% /
-49% | 22% /
17% | -19% /
-8% |
* ... Meglio usare valori piccoli
Utilizzando lo strumento di calibrazione del colore Calman di Portrait Displays, abbiamo misurato differenze di colore da normali a moderate fin dall'inizio, con il display che presentava una tonalità più arancione. Grazie alla nostra calibrazione, siamo riusciti a ridurre le differenze di colore in modo sostanziale.


Tempi di risposta del Display
| ↔ Tempi di risposta dal Nero al Bianco | ||
|---|---|---|
| 10.8 ms ... aumenta ↗ e diminuisce ↘ combinato | ↗ 5.7 ms Incremento | 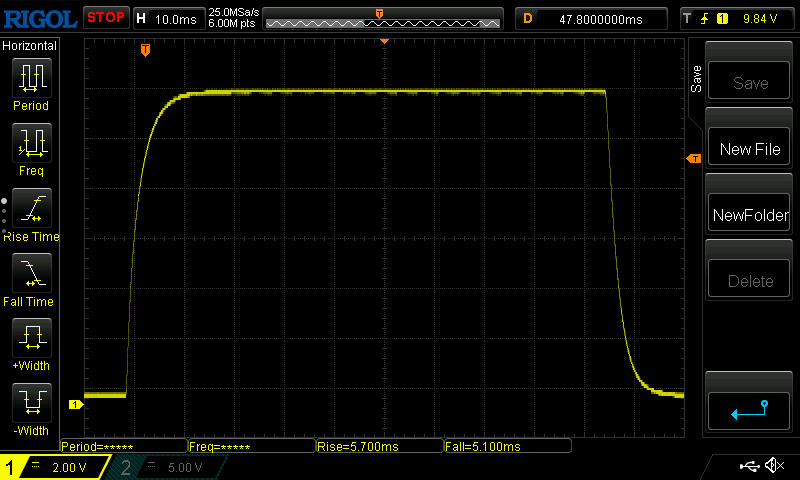 |
| ↘ 5.1 ms Calo | ||
| Lo schermo mostra buoni tempi di risposta durante i nostri tests, ma potrebbe essere troppo lento per i gamers competitivi. In confronto, tutti i dispositivi di test variano da 0.1 (minimo) a 240 (massimo) ms. » 29 % di tutti i dispositivi è migliore. Questo significa che i tempi di risposta rilevati sono migliori rispettto alla media di tutti i dispositivi testati (19.8 ms). | ||
| ↔ Tempo di risposta dal 50% Grigio all'80% Grigio | ||
| 6.4 ms ... aumenta ↗ e diminuisce ↘ combinato | ↗ 3 ms Incremento | 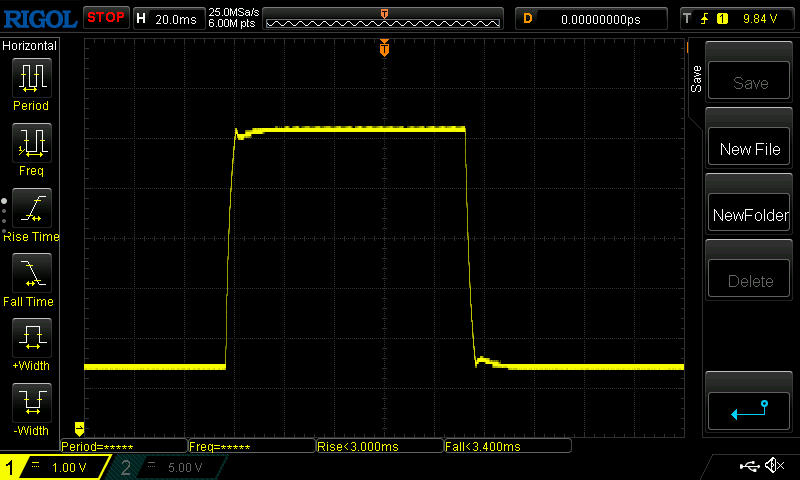 |
| ↘ 3.4 ms Calo | ||
| Lo schermo ha mostrato valori di risposta molto veloci nei nostri tests ed è molto adatto per i gaming veloce. In confronto, tutti i dispositivi di test variano da 0.165 (minimo) a 636 (massimo) ms. » 19 % di tutti i dispositivi è migliore. Questo significa che i tempi di risposta rilevati sono migliori rispettto alla media di tutti i dispositivi testati (31 ms). | ||
Sfarfallio dello schermo / PWM (Pulse-Width Modulation)
| flickering dello schermo / PWM non rilevato |  | ||
In confronto: 52 % di tutti i dispositivi testati non utilizza PWM per ridurre la luminosita' del display. Se è rilevato PWM, una media di 7750 (minimo: 5 - massimo: 343500) Hz è stata rilevata. | |||
Grazie alla superficie opaca del display e ai solidi livelli di luminosità, i contenuti dello schermo rimangono leggibili all'ombra all'aperto. Tuttavia, l'ideale sarebbe evitare la luce diretta del sole e cercare di vedere il display a testa in giù.

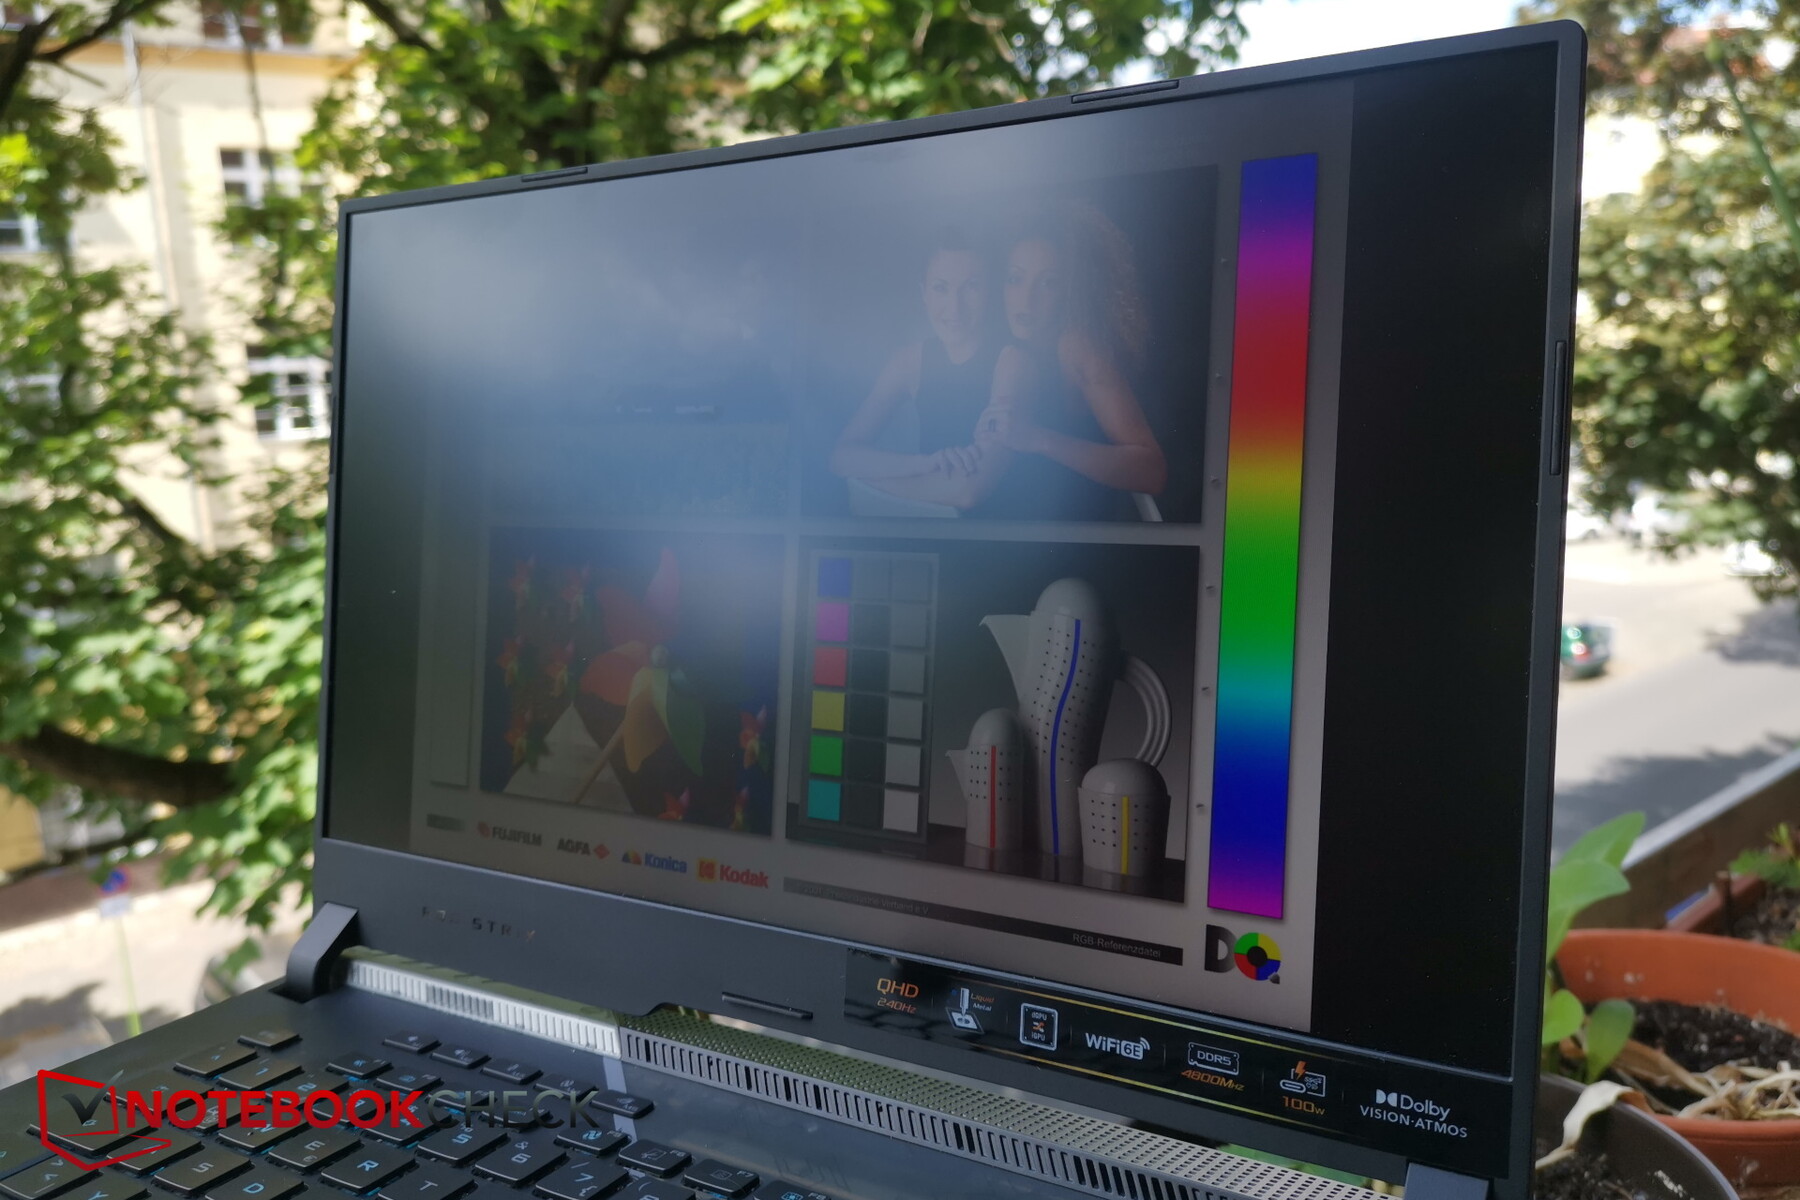
L'angolo di visione è abbastanza buono, tipico di un pannello IPS. La distorsione del colore e il roll-off della luminosità diventano evidenti solo quando il display viene visto da un'angolazione estrema.

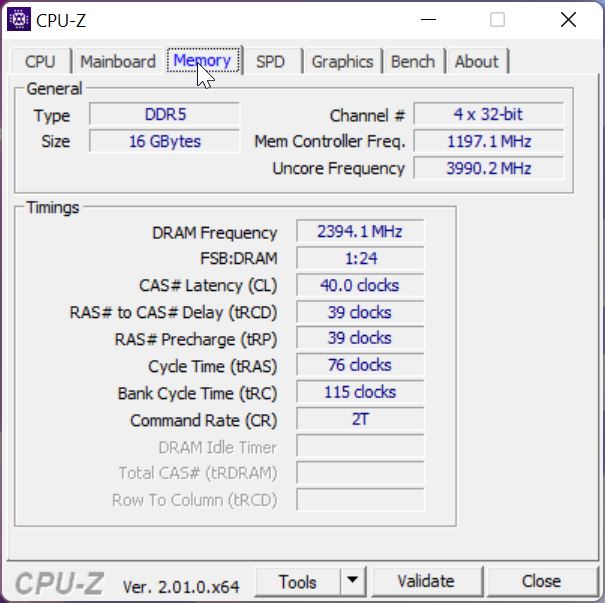
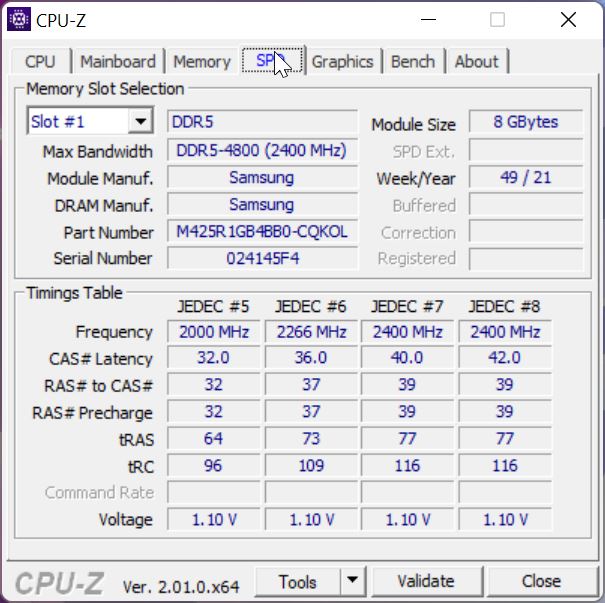
Prestazioni - Buone prestazioni di gioco con una RTX 3060 da 140W
Il Core i9-12900H è tra i migliori nella sua classe hardware. Anche se la RTX 3060 dovrebbe essere in grado di gestire tutti i giochi in FHD, potrebbe avere difficoltà con i giochi molto impegnativi alla risoluzione QHD nativa del display. Asus ha anche incluso una RAM DDR5 ad alta velocità. Nel complesso, Strix Scar è un computer portatile da gioco di fascia medio-alta, che anche alcuni editor di foto e video potrebbero trovare interessante.


Condizioni del test
A nostro avviso, Asus ha esagerato con il software. I notebook da gioco Asus vengono forniti con il software Armoury Crate in aggiunta al programma MyASUS, che è preinstallato anche sui portatili normali. Armoury Crate consente di regolare i profili delle ventole e delle prestazioni, e noi abbiamo utilizzato la modalità Turbo per ottenere i migliori risultati possibili nei nostri test. D'altra parte, MyASUS include impostazioni per il comportamento di ricarica della batteria, opzioni Wi-Fi e modalità di contatto con l'assistenza clienti. Potrebbe essere utile che Asus consideri la possibilità di combinare i due programmi per evitare di appesantire inutilmente il software dei suoi clienti.


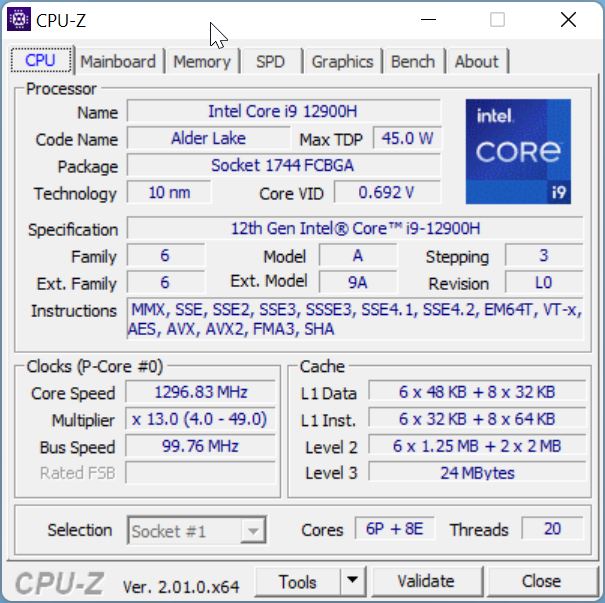
Processore
Asus ha scelto di equipaggiare la maggior parte dei modelli con il modello di fascia alta Intel Core i9-12900Hche presenta 6 core Performance (P) e 8 core Efficiency (E), in grado di gestire 20 thread contemporaneamente. Ogni core P può funzionare fino a 5 GHz. Sia Strix G533zm che G533zw sono disponibili con il modello leggermente meno potente i7-12700H.
Nel nostro test Cinebench R15, la CPU ha fornito ottime prestazioni come previsto, superando sia l'i7-12700H dell'Asus TUF Gaming F15 che i chip Ryzen della generazione precedente. È rimasta indietro in modo riproducibile solo in Cinebench R20.
Passando all'alimentazione a batteria, il punteggio di Cinebench R15 è sceso a 1.752.
Cinebench R15 Multi sustained load
Cinebench R23: Multi Core | Single Core
Cinebench R20: CPU (Multi Core) | CPU (Single Core)
Cinebench R15: CPU Multi 64Bit | CPU Single 64Bit
Blender: v2.79 BMW27 CPU
7-Zip 18.03: 7z b 4 | 7z b 4 -mmt1
Geekbench 5.5: Multi-Core | Single-Core
HWBOT x265 Benchmark v2.2: 4k Preset
LibreOffice : 20 Documents To PDF
R Benchmark 2.5: Overall mean
| CPU Performance rating | |
| Media della classe Gaming | |
| Asus ROG Strix Scar 15 G533ZW-LN106WS | |
| Asus ROG Strix Scar 15 G533zm | |
| MSI Pulse GL66 12UEK | |
| Asus TUF Gaming F15 FX507ZM | |
| Media Intel Core i9-12900H | |
| Alienware m15 R5 Ryzen Edition | |
| Lenovo Legion 5 15ACH6A-82NW0010GE | |
| Cinebench R23 / Multi Core | |
| Media della classe Gaming (10488 - 40970, n=106, ultimi 2 anni) | |
| Asus ROG Strix Scar 15 G533ZW-LN106WS | |
| Asus TUF Gaming F15 FX507ZM | |
| MSI Pulse GL66 12UEK | |
| Asus ROG Strix Scar 15 G533zm | |
| Media Intel Core i9-12900H (7359 - 19648, n=28) | |
| Alienware m15 R5 Ryzen Edition | |
| Lenovo Legion 5 15ACH6A-82NW0010GE | |
| Cinebench R23 / Single Core | |
| Media della classe Gaming (1166 - 2387, n=106, ultimi 2 anni) | |
| Asus ROG Strix Scar 15 G533ZW-LN106WS | |
| MSI Pulse GL66 12UEK | |
| Media Intel Core i9-12900H (1634 - 1930, n=28) | |
| Asus ROG Strix Scar 15 G533zm | |
| Asus TUF Gaming F15 FX507ZM | |
| Alienware m15 R5 Ryzen Edition | |
| Lenovo Legion 5 15ACH6A-82NW0010GE | |
| Cinebench R20 / CPU (Multi Core) | |
| Media della classe Gaming (4029 - 16108, n=105, ultimi 2 anni) | |
| Asus ROG Strix Scar 15 G533ZW-LN106WS | |
| Asus TUF Gaming F15 FX507ZM | |
| MSI Pulse GL66 12UEK | |
| Media Intel Core i9-12900H (2681 - 7471, n=28) | |
| Asus ROG Strix Scar 15 G533zm | |
| Alienware m15 R5 Ryzen Edition | |
| Lenovo Legion 5 15ACH6A-82NW0010GE | |
| Cinebench R20 / CPU (Single Core) | |
| Media della classe Gaming (442 - 904, n=105, ultimi 2 anni) | |
| MSI Pulse GL66 12UEK | |
| Asus ROG Strix Scar 15 G533zm | |
| Asus ROG Strix Scar 15 G533ZW-LN106WS | |
| Media Intel Core i9-12900H (624 - 738, n=28) | |
| Asus TUF Gaming F15 FX507ZM | |
| Alienware m15 R5 Ryzen Edition | |
| Lenovo Legion 5 15ACH6A-82NW0010GE | |
| Cinebench R15 / CPU Multi 64Bit | |
| Media della classe Gaming (1578 - 6271, n=104, ultimi 2 anni) | |
| Asus ROG Strix Scar 15 G533zm | |
| Asus ROG Strix Scar 15 G533ZW-LN106WS | |
| Asus TUF Gaming F15 FX507ZM | |
| MSI Pulse GL66 12UEK | |
| Media Intel Core i9-12900H (1395 - 3077, n=28) | |
| Alienware m15 R5 Ryzen Edition | |
| Lenovo Legion 5 15ACH6A-82NW0010GE | |
| Cinebench R15 / CPU Single 64Bit | |
| Media della classe Gaming (188.8 - 344, n=105, ultimi 2 anni) | |
| MSI Pulse GL66 12UEK | |
| Asus ROG Strix Scar 15 G533zm | |
| Asus ROG Strix Scar 15 G533ZW-LN106WS | |
| Media Intel Core i9-12900H (235 - 277, n=29) | |
| Asus TUF Gaming F15 FX507ZM | |
| Alienware m15 R5 Ryzen Edition | |
| Lenovo Legion 5 15ACH6A-82NW0010GE | |
| Blender / v2.79 BMW27 CPU | |
| Lenovo Legion 5 15ACH6A-82NW0010GE | |
| Alienware m15 R5 Ryzen Edition | |
| Media Intel Core i9-12900H (160 - 451, n=28) | |
| MSI Pulse GL66 12UEK | |
| Asus TUF Gaming F15 FX507ZM | |
| Asus ROG Strix Scar 15 G533ZW-LN106WS | |
| Asus ROG Strix Scar 15 G533zm | |
| Media della classe Gaming (80 - 330, n=103, ultimi 2 anni) | |
| 7-Zip 18.03 / 7z b 4 | |
| Media della classe Gaming (33491 - 148086, n=104, ultimi 2 anni) | |
| Asus ROG Strix Scar 15 G533zm | |
| Asus ROG Strix Scar 15 G533ZW-LN106WS | |
| Asus TUF Gaming F15 FX507ZM | |
| MSI Pulse GL66 12UEK | |
| Media Intel Core i9-12900H (34684 - 76677, n=28) | |
| Alienware m15 R5 Ryzen Edition | |
| Lenovo Legion 5 15ACH6A-82NW0010GE | |
| 7-Zip 18.03 / 7z b 4 -mmt1 | |
| Media della classe Gaming (4199 - 7436, n=104, ultimi 2 anni) | |
| MSI Pulse GL66 12UEK | |
| Asus ROG Strix Scar 15 G533zm | |
| Asus ROG Strix Scar 15 G533ZW-LN106WS | |
| Media Intel Core i9-12900H (5302 - 6289, n=28) | |
| Alienware m15 R5 Ryzen Edition | |
| Asus TUF Gaming F15 FX507ZM | |
| Lenovo Legion 5 15ACH6A-82NW0010GE | |
| Geekbench 5.5 / Multi-Core | |
| Media della classe Gaming (6460 - 27010, n=104, ultimi 2 anni) | |
| Asus ROG Strix Scar 15 G533ZW-LN106WS | |
| Asus ROG Strix Scar 15 G533zm | |
| Asus TUF Gaming F15 FX507ZM | |
| Media Intel Core i9-12900H (8519 - 14376, n=31) | |
| MSI Pulse GL66 12UEK | |
| Alienware m15 R5 Ryzen Edition | |
| Lenovo Legion 5 15ACH6A-82NW0010GE | |
| Geekbench 5.5 / Single-Core | |
| Media della classe Gaming (986 - 2474, n=104, ultimi 2 anni) | |
| Asus ROG Strix Scar 15 G533ZW-LN106WS | |
| MSI Pulse GL66 12UEK | |
| Asus ROG Strix Scar 15 G533zm | |
| Media Intel Core i9-12900H (1631 - 1897, n=31) | |
| Asus TUF Gaming F15 FX507ZM | |
| Alienware m15 R5 Ryzen Edition | |
| Lenovo Legion 5 15ACH6A-82NW0010GE | |
| HWBOT x265 Benchmark v2.2 / 4k Preset | |
| Media della classe Gaming (11.5 - 44.3, n=104, ultimi 2 anni) | |
| Asus ROG Strix Scar 15 G533zm | |
| Asus ROG Strix Scar 15 G533ZW-LN106WS | |
| Asus TUF Gaming F15 FX507ZM | |
| MSI Pulse GL66 12UEK | |
| Media Intel Core i9-12900H (8.05 - 22.5, n=28) | |
| Alienware m15 R5 Ryzen Edition | |
| Lenovo Legion 5 15ACH6A-82NW0010GE | |
| LibreOffice / 20 Documents To PDF | |
| Alienware m15 R5 Ryzen Edition | |
| Lenovo Legion 5 15ACH6A-82NW0010GE | |
| Asus TUF Gaming F15 FX507ZM | |
| Media della classe Gaming (33.2 - 88.8, n=104, ultimi 2 anni) | |
| Media Intel Core i9-12900H (36.8 - 59.8, n=28) | |
| MSI Pulse GL66 12UEK | |
| Asus ROG Strix Scar 15 G533zm | |
| Asus ROG Strix Scar 15 G533ZW-LN106WS | |
| R Benchmark 2.5 / Overall mean | |
| Lenovo Legion 5 15ACH6A-82NW0010GE | |
| Alienware m15 R5 Ryzen Edition | |
| Asus TUF Gaming F15 FX507ZM | |
| Media Intel Core i9-12900H (0.4218 - 0.506, n=28) | |
| Asus ROG Strix Scar 15 G533zm | |
| Asus ROG Strix Scar 15 G533ZW-LN106WS | |
| Media della classe Gaming (0.3439 - 0.759, n=105, ultimi 2 anni) | |
| MSI Pulse GL66 12UEK | |
* ... Meglio usare valori piccoli
AIDA64: FP32 Ray-Trace | FPU Julia | CPU SHA3 | CPU Queen | FPU SinJulia | FPU Mandel | CPU AES | CPU ZLib | FP64 Ray-Trace | CPU PhotoWorxx
| Performance rating | |
| Media della classe Gaming | |
| Alienware m15 R5 Ryzen Edition | |
| Asus ROG Strix Scar 15 G533zm | |
| Asus ROG Strix Scar 15 G533ZW-LN106WS | |
| Media Intel Core i9-12900H | |
| MSI Pulse GL66 12UEK | |
| Asus TUF Gaming F15 FX507ZM | |
| Lenovo Legion 5 15ACH6A-82NW0010GE | |
| AIDA64 / FP32 Ray-Trace | |
| Media della classe Gaming (10227 - 85542, n=103, ultimi 2 anni) | |
| Alienware m15 R5 Ryzen Edition | |
| Lenovo Legion 5 15ACH6A-82NW0010GE | |
| Media Intel Core i9-12900H (4074 - 18289, n=29) | |
| Asus ROG Strix Scar 15 G533zm | |
| Asus ROG Strix Scar 15 G533ZW-LN106WS | |
| Asus TUF Gaming F15 FX507ZM | |
| MSI Pulse GL66 12UEK | |
| AIDA64 / FPU Julia | |
| Media della classe Gaming (51376 - 238426, n=103, ultimi 2 anni) | |
| Alienware m15 R5 Ryzen Edition | |
| Lenovo Legion 5 15ACH6A-82NW0010GE | |
| Media Intel Core i9-12900H (22307 - 93236, n=29) | |
| Asus ROG Strix Scar 15 G533zm | |
| Asus ROG Strix Scar 15 G533ZW-LN106WS | |
| Asus TUF Gaming F15 FX507ZM | |
| MSI Pulse GL66 12UEK | |
| AIDA64 / CPU SHA3 | |
| Media della classe Gaming (2180 - 9817, n=103, ultimi 2 anni) | |
| Asus ROG Strix Scar 15 G533zm | |
| Asus ROG Strix Scar 15 G533ZW-LN106WS | |
| Asus TUF Gaming F15 FX507ZM | |
| MSI Pulse GL66 12UEK | |
| Alienware m15 R5 Ryzen Edition | |
| Media Intel Core i9-12900H (1378 - 4215, n=29) | |
| Lenovo Legion 5 15ACH6A-82NW0010GE | |
| AIDA64 / CPU Queen | |
| Media della classe Gaming (49785 - 173351, n=89, ultimi 2 anni) | |
| Asus ROG Strix Scar 15 G533zm | |
| MSI Pulse GL66 12UEK | |
| Asus ROG Strix Scar 15 G533ZW-LN106WS | |
| Media Intel Core i9-12900H (78172 - 111241, n=28) | |
| Asus TUF Gaming F15 FX507ZM | |
| Alienware m15 R5 Ryzen Edition | |
| Lenovo Legion 5 15ACH6A-82NW0010GE | |
| AIDA64 / FPU SinJulia | |
| Media della classe Gaming (4424 - 33636, n=103, ultimi 2 anni) | |
| Alienware m15 R5 Ryzen Edition | |
| Asus ROG Strix Scar 15 G533zm | |
| Asus ROG Strix Scar 15 G533ZW-LN106WS | |
| MSI Pulse GL66 12UEK | |
| Asus TUF Gaming F15 FX507ZM | |
| Media Intel Core i9-12900H (5709 - 10410, n=29) | |
| Lenovo Legion 5 15ACH6A-82NW0010GE | |
| AIDA64 / FPU Mandel | |
| Media della classe Gaming (25115 - 128721, n=103, ultimi 2 anni) | |
| Alienware m15 R5 Ryzen Edition | |
| Lenovo Legion 5 15ACH6A-82NW0010GE | |
| Media Intel Core i9-12900H (11257 - 45581, n=29) | |
| Asus ROG Strix Scar 15 G533zm | |
| Asus TUF Gaming F15 FX507ZM | |
| Asus ROG Strix Scar 15 G533ZW-LN106WS | |
| MSI Pulse GL66 12UEK | |
| AIDA64 / CPU AES | |
| Alienware m15 R5 Ryzen Edition | |
| Asus ROG Strix Scar 15 G533zm | |
| Media della classe Gaming (39258 - 247074, n=103, ultimi 2 anni) | |
| Asus ROG Strix Scar 15 G533ZW-LN106WS | |
| MSI Pulse GL66 12UEK | |
| Lenovo Legion 5 15ACH6A-82NW0010GE | |
| Media Intel Core i9-12900H (31935 - 151546, n=29) | |
| Asus TUF Gaming F15 FX507ZM | |
| AIDA64 / CPU ZLib | |
| Media della classe Gaming (574 - 2531, n=103, ultimi 2 anni) | |
| Asus ROG Strix Scar 15 G533ZW-LN106WS | |
| Asus ROG Strix Scar 15 G533zm | |
| Asus TUF Gaming F15 FX507ZM | |
| MSI Pulse GL66 12UEK | |
| Media Intel Core i9-12900H (449 - 1193, n=29) | |
| Alienware m15 R5 Ryzen Edition | |
| Lenovo Legion 5 15ACH6A-82NW0010GE | |
| AIDA64 / FP64 Ray-Trace | |
| Media della classe Gaming (5509 - 45446, n=103, ultimi 2 anni) | |
| Alienware m15 R5 Ryzen Edition | |
| Lenovo Legion 5 15ACH6A-82NW0010GE | |
| Media Intel Core i9-12900H (2235 - 10511, n=29) | |
| Asus ROG Strix Scar 15 G533zm | |
| Asus ROG Strix Scar 15 G533ZW-LN106WS | |
| Asus TUF Gaming F15 FX507ZM | |
| MSI Pulse GL66 12UEK | |
| AIDA64 / CPU PhotoWorxx | |
| Media della classe Gaming (12271 - 89891, n=103, ultimi 2 anni) | |
| Asus ROG Strix Scar 15 G533ZW-LN106WS | |
| Media Intel Core i9-12900H (20960 - 48269, n=30) | |
| Asus ROG Strix Scar 15 G533zm | |
| Asus TUF Gaming F15 FX507ZM | |
| MSI Pulse GL66 12UEK | |
| Lenovo Legion 5 15ACH6A-82NW0010GE | |
| Alienware m15 R5 Ryzen Edition | |
Prestazioni del sistema
L'Asus Strix ha conquistato il primo posto in PCMark 10 e ha fornito prestazioni leggermente superiori a quelle che la stessa combinazione CPU/GPU offre in media, in base al nostro database.

CrossMark: Overall | Productivity | Creativity | Responsiveness
| PCMark 10 / Score | |
| Media della classe Gaming (5828 - 11730, n=92, ultimi 2 anni) | |
| Asus ROG Strix Scar 15 G533ZW-LN106WS | |
| Asus ROG Strix Scar 15 G533zm | |
| Media Intel Core i9-12900H, NVIDIA GeForce RTX 3060 Laptop GPU (7135 - 7861, n=4) | |
| Asus TUF Gaming F15 FX507ZM | |
| MSI Pulse GL66 12UEK | |
| Lenovo Legion 5 15ACH6A-82NW0010GE | |
| Alienware m15 R5 Ryzen Edition | |
| PCMark 10 / Essentials | |
| Asus ROG Strix Scar 15 G533zm | |
| Media Intel Core i9-12900H, NVIDIA GeForce RTX 3060 Laptop GPU (10380 - 11198, n=4) | |
| Asus ROG Strix Scar 15 G533ZW-LN106WS | |
| Media della classe Gaming (8810 - 11935, n=96, ultimi 2 anni) | |
| Lenovo Legion 5 15ACH6A-82NW0010GE | |
| Asus TUF Gaming F15 FX507ZM | |
| MSI Pulse GL66 12UEK | |
| Alienware m15 R5 Ryzen Edition | |
| PCMark 10 / Productivity | |
| Media della classe Gaming (6845 - 21327, n=94, ultimi 2 anni) | |
| Asus ROG Strix Scar 15 G533zm | |
| Asus ROG Strix Scar 15 G533ZW-LN106WS | |
| Media Intel Core i9-12900H, NVIDIA GeForce RTX 3060 Laptop GPU (9751 - 10486, n=4) | |
| MSI Pulse GL66 12UEK | |
| Lenovo Legion 5 15ACH6A-82NW0010GE | |
| Asus TUF Gaming F15 FX507ZM | |
| Alienware m15 R5 Ryzen Edition | |
| PCMark 10 / Digital Content Creation | |
| Media della classe Gaming (7602 - 19954, n=94, ultimi 2 anni) | |
| Asus ROG Strix Scar 15 G533ZW-LN106WS | |
| Asus TUF Gaming F15 FX507ZM | |
| Asus ROG Strix Scar 15 G533zm | |
| Media Intel Core i9-12900H, NVIDIA GeForce RTX 3060 Laptop GPU (9741 - 11226, n=4) | |
| Lenovo Legion 5 15ACH6A-82NW0010GE | |
| MSI Pulse GL66 12UEK | |
| Alienware m15 R5 Ryzen Edition | |
| CrossMark / Overall | |
| MSI Pulse GL66 12UEK | |
| Asus ROG Strix Scar 15 G533ZW-LN106WS | |
| Asus ROG Strix Scar 15 G533zm | |
| Media della classe Gaming (1366 - 2409, n=93, ultimi 2 anni) | |
| Media Intel Core i9-12900H, NVIDIA GeForce RTX 3060 Laptop GPU (1789 - 2096, n=4) | |
| CrossMark / Productivity | |
| MSI Pulse GL66 12UEK | |
| Asus ROG Strix Scar 15 G533ZW-LN106WS | |
| Asus ROG Strix Scar 15 G533zm | |
| Media Intel Core i9-12900H, NVIDIA GeForce RTX 3060 Laptop GPU (1677 - 2062, n=4) | |
| Media della classe Gaming (1386 - 2254, n=93, ultimi 2 anni) | |
| CrossMark / Creativity | |
| Media della classe Gaming (1343 - 2729, n=93, ultimi 2 anni) | |
| Asus ROG Strix Scar 15 G533zm | |
| Asus ROG Strix Scar 15 G533ZW-LN106WS | |
| Media Intel Core i9-12900H, NVIDIA GeForce RTX 3060 Laptop GPU (2032 - 2125, n=4) | |
| MSI Pulse GL66 12UEK | |
| CrossMark / Responsiveness | |
| MSI Pulse GL66 12UEK | |
| Asus ROG Strix Scar 15 G533ZW-LN106WS | |
| Asus ROG Strix Scar 15 G533zm | |
| Media Intel Core i9-12900H, NVIDIA GeForce RTX 3060 Laptop GPU (1486 - 2230, n=4) | |
| Media della classe Gaming (1226 - 2334, n=93, ultimi 2 anni) | |
| PCMark 10 Score | 7861 punti | |
Aiuto | ||
| AIDA64 / Memory Copy | |
| Media della classe Gaming (21750 - 129946, n=103, ultimi 2 anni) | |
| Asus ROG Strix Scar 15 G533ZW-LN106WS | |
| Media Intel Core i9-12900H (34438 - 74264, n=29) | |
| Asus TUF Gaming F15 FX507ZM | |
| Asus ROG Strix Scar 15 G533zm | |
| MSI Pulse GL66 12UEK | |
| Alienware m15 R5 Ryzen Edition | |
| Lenovo Legion 5 15ACH6A-82NW0010GE | |
| AIDA64 / Memory Read | |
| Media della classe Gaming (22956 - 118858, n=103, ultimi 2 anni) | |
| Asus ROG Strix Scar 15 G533ZW-LN106WS | |
| Media Intel Core i9-12900H (36365 - 74642, n=29) | |
| Asus TUF Gaming F15 FX507ZM | |
| Asus ROG Strix Scar 15 G533zm | |
| MSI Pulse GL66 12UEK | |
| Alienware m15 R5 Ryzen Edition | |
| Lenovo Legion 5 15ACH6A-82NW0010GE | |
| AIDA64 / Memory Write | |
| Media della classe Gaming (22297 - 135096, n=103, ultimi 2 anni) | |
| Asus ROG Strix Scar 15 G533ZW-LN106WS | |
| Media Intel Core i9-12900H (32276 - 67858, n=29) | |
| Asus ROG Strix Scar 15 G533zm | |
| Asus TUF Gaming F15 FX507ZM | |
| MSI Pulse GL66 12UEK | |
| Alienware m15 R5 Ryzen Edition | |
| Lenovo Legion 5 15ACH6A-82NW0010GE | |
| AIDA64 / Memory Latency | |
| Media della classe Gaming (75.3 - 259, n=103, ultimi 2 anni) | |
| Asus ROG Strix Scar 15 G533zm | |
| Asus ROG Strix Scar 15 G533ZW-LN106WS | |
| MSI Pulse GL66 12UEK | |
| Lenovo Legion 5 15ACH6A-82NW0010GE | |
| Media Intel Core i9-12900H (74.7 - 118.1, n=28) | |
| Alienware m15 R5 Ryzen Edition | |
| Asus TUF Gaming F15 FX507ZM | |
* ... Meglio usare valori piccoli
Latenza DPC
LatencyMon ha segnalato immediatamente i problemi una volta avviato un browser. L'apertura di più schede ha peggiorato i problemi. I valori di latenza sono aumentati ulteriormente durante la riproduzione del nostro video di test di YouTube a 4K e 60 fps. Tuttavia, il video è stato eseguito senza alcuna caduta di fotogrammi.
| DPC Latencies / LatencyMon - interrupt to process latency (max), Web, Youtube, Prime95 | |
| Asus ROG Strix Scar 15 G533zm | |
| MSI Pulse GL66 12UEK | |
| Asus ROG Strix Scar 15 G533ZW-LN106WS | |
| Lenovo Legion 5 15ACH6A-82NW0010GE | |
| Asus TUF Gaming F15 FX507ZM | |
| Alienware m15 R5 Ryzen Edition | |
* ... Meglio usare valori piccoli
Memoria di massa
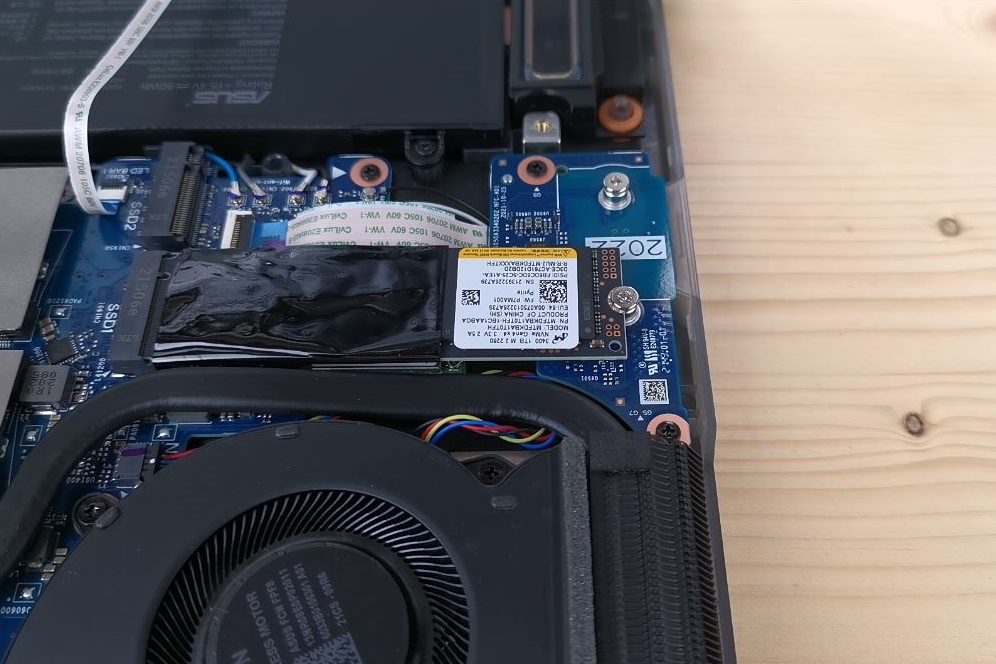
Asus ha montato un'unità SSD PCIe 4.0 NVMe da 1 TB piuttosto nuova, prodotta da Micron. Nonostante fornisca velocità di trasferimento eccellenti, l'unità non ha sfruttato appieno le velocità offerte dallo standard relativamente nuovo. Detto questo, nella maggior parte dei casi ha fornito le migliori prestazioni rispetto alle unità di archiviazione dei computer portatili della concorrenza. Le sue prestazioni sono eccellenti anche sotto carico sostenuto.

* ... Meglio usare valori piccoli
Sustained load Read: DiskSpd Read Loop, Queue Depth 8
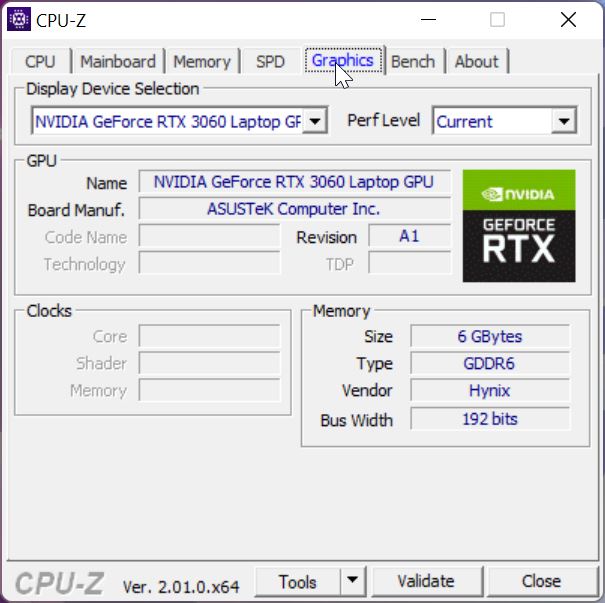
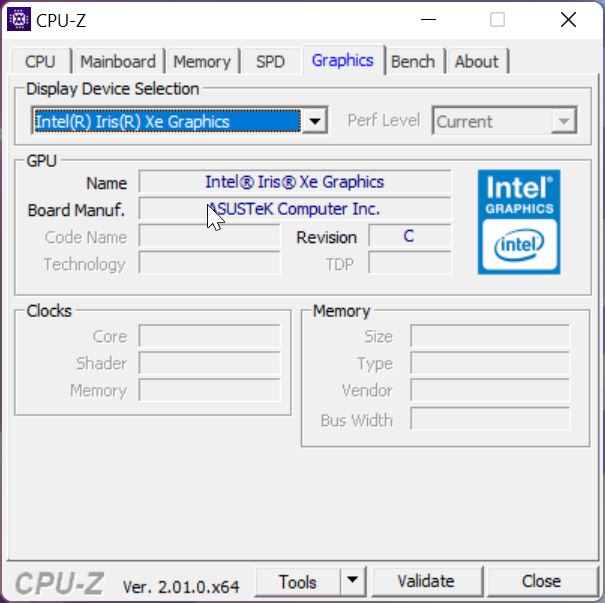
Scheda grafica
La Nividia GeForce RTX 3060 occupa lo spazio tra la fascia media e la fascia alta. Il suo TGP può variare da 60 a 115 watt, e la configurazione energetica ha un impatto duraturo sulle prestazioni 3D della scheda. La RTX 3060 nella Strix Scar ha accesso a tutti i 115 watt e può arrivare a 140 watt con un Dynamic Boost da 25 watt.
Nei benchmark 3D sintetici, la GPU si è comportata leggermente meglio di una RTX 3060 media del nostro database, ma la Lenovo Legion 5 e la Asus TUF Gaming F15 sono marginalmente più veloci della Strix Scar. La RTX 3070 Ti nello Scar 15 G533zw è più potente del 35% circa.
Con l'alimentazione a batteria, le prestazioni 3D del portatile sono crollate di circa il 67% in un nuovo test di Fire Strike, ottenendo un punteggio grafico di soli 7.168 invece dei soliti 21.671.


| 3DMark 11 Performance | 27156 punti | |
| 3DMark Fire Strike Score | 19296 punti | |
| 3DMark Time Spy Score | 8606 punti | |
Aiuto | ||
Prestazioni di gioco
Purtroppo, Optimus limita lo Strix a far girare i giochi DirectX 11 a soli 60 fps. Si tratta di un problema generale che riguarda alcuni computer portatili con Optimus. Oltre a giocare a questi giochi su un monitor esterno, l'unica soluzione è attivare l'interruttore MUX e utilizzare direttamente la dGPU.
Lo Strix 15 offre per lo più le migliori prestazioni tra i dispositivi del nostro confronto. Solo il TUF Gaming F15 è marginalmente più veloce in alcuni giochi.
Scollegando lo Strix, le frequenze dei fotogrammi si sono stabilizzate a 30 fps in Witcher 3 in esecuzione a Ultra, e le ventole sono rimaste piacevolmente silenziose per tutto il tempo.
Witcher 3 ha funzionato in modo stabile per tutta la durata del test di un'ora, con solo un leggero calo della frequenza dei fotogrammi.
Witcher 3 FPS chart
| basso | medio | alto | ultra | QHD | |
|---|---|---|---|---|---|
| GTA V (2015) | 186.2 | 181.6 | 166.9 | 105 | 80.5 |
| The Witcher 3 (2015) | 400 | 290 | 165 | 88.7 | |
| Dota 2 Reborn (2015) | 182.6 | 167.7 | 159.1 | 151.4 | |
| Final Fantasy XV Benchmark (2018) | 178.9 | 117.2 | 87.5 | 65.1 | |
| X-Plane 11.11 (2018) | 145.8 | 123.9 | 99.8 | ||
| Far Cry 5 (2018) | 160 | 129 | 123 | 117 | 92 |
| Strange Brigade (2018) | 398 | 216 | 176.4 | 153 | |
| Cyberpunk 2077 1.6 (2022) | 120 | 118 | 63 | 63 |
Emissioni - Fresco, ma non necessariamente silenzioso
Emissioni di rumore
In modalità Turbo, le ventole all'interno girano regolarmente ad alto volume per alcuni secondi, prima di tornare al minimo. Asus potrebbe considerare di rendere il sistema di raffreddamento meno aggressivo in un aggiornamento futuro. Detto questo, le ventole di solito non girano in modalità Silenziosa.
L'Asus Strix Scar non è necessariamente silenzioso sotto carico. Durante il gioco e lo stress test, Asus TUF e MSI Pulse erano altrettanto rumorosi, mentre Lenovo Legion e Alienware rimanevano più silenziosi.
All'avvio di alcuni carichi (ad es. Witcher 3), abbiamo notato anche dei tenui bip elettronici provenienti dal dispositivo, ma erano presenti solo temporaneamente.
Rumorosità
| Idle |
| 23 / 23 / 37.75 dB(A) |
| Sotto carico |
| 45.35 / 56.22 dB(A) |
 | ||
30 dB silenzioso 40 dB(A) udibile 50 dB(A) rumoroso |
||
min: | ||
| Asus ROG Strix Scar 15 G533zm GeForce RTX 3060 Laptop GPU, i9-12900H | Asus ROG Strix Scar 15 G533ZW-LN106WS GeForce RTX 3070 Ti Laptop GPU, i9-12900H, Samsung PM9A1 MZVL22T0HBLB | Asus TUF Gaming F15 FX507ZM GeForce RTX 3060 Laptop GPU, i7-12700H, SK Hynix HFM001TD3JX013N | MSI Pulse GL66 12UEK GeForce RTX 3060 Laptop GPU, i9-12900H, Micron 2450 512GB MTFDKBA512TFK | Alienware m15 R5 Ryzen Edition GeForce RTX 3060 Laptop GPU, R7 5800H, Toshiba KBG40ZNS512G NVMe | Lenovo Legion 5 15ACH6A-82NW0010GE Radeon RX 6600M, R5 5600H, Micron 2210 MTFDHBA512QFD | |
|---|---|---|---|---|---|---|
| Noise | -26% | 6% | 0% | 2% | -4% | |
| off /ambiente * (dB) | 23 | 26.86 -17% | 23.2 -1% | 23 -0% | 24 -4% | 25 -9% |
| Idle Minimum * (dB) | 23 | 39.07 -70% | 23.6 -3% | 23 -0% | 24 -4% | 25 -9% |
| Idle Average * (dB) | 23 | 39.07 -70% | 23.6 -3% | 27 -17% | 25 -9% | 25 -9% |
| Idle Maximum * (dB) | 37.75 | 39.07 -3% | 25.4 33% | 27 28% | 35 7% | 34.5 9% |
| Load Average * (dB) | 45.35 | 53.34 -18% | 38 16% | 48.2 -6% | 44 3% | 51.1 -13% |
| Witcher 3 ultra * (dB) | 55.48 | 56.6 -2% | 54.1 2% | 56.9 -3% | 48 13% | |
| Load Maximum * (dB) | 56.22 | 56.6 -1% | 57.2 -2% | 56.94 -1% | 50 11% | 51.3 9% |
* ... Meglio usare valori piccoli
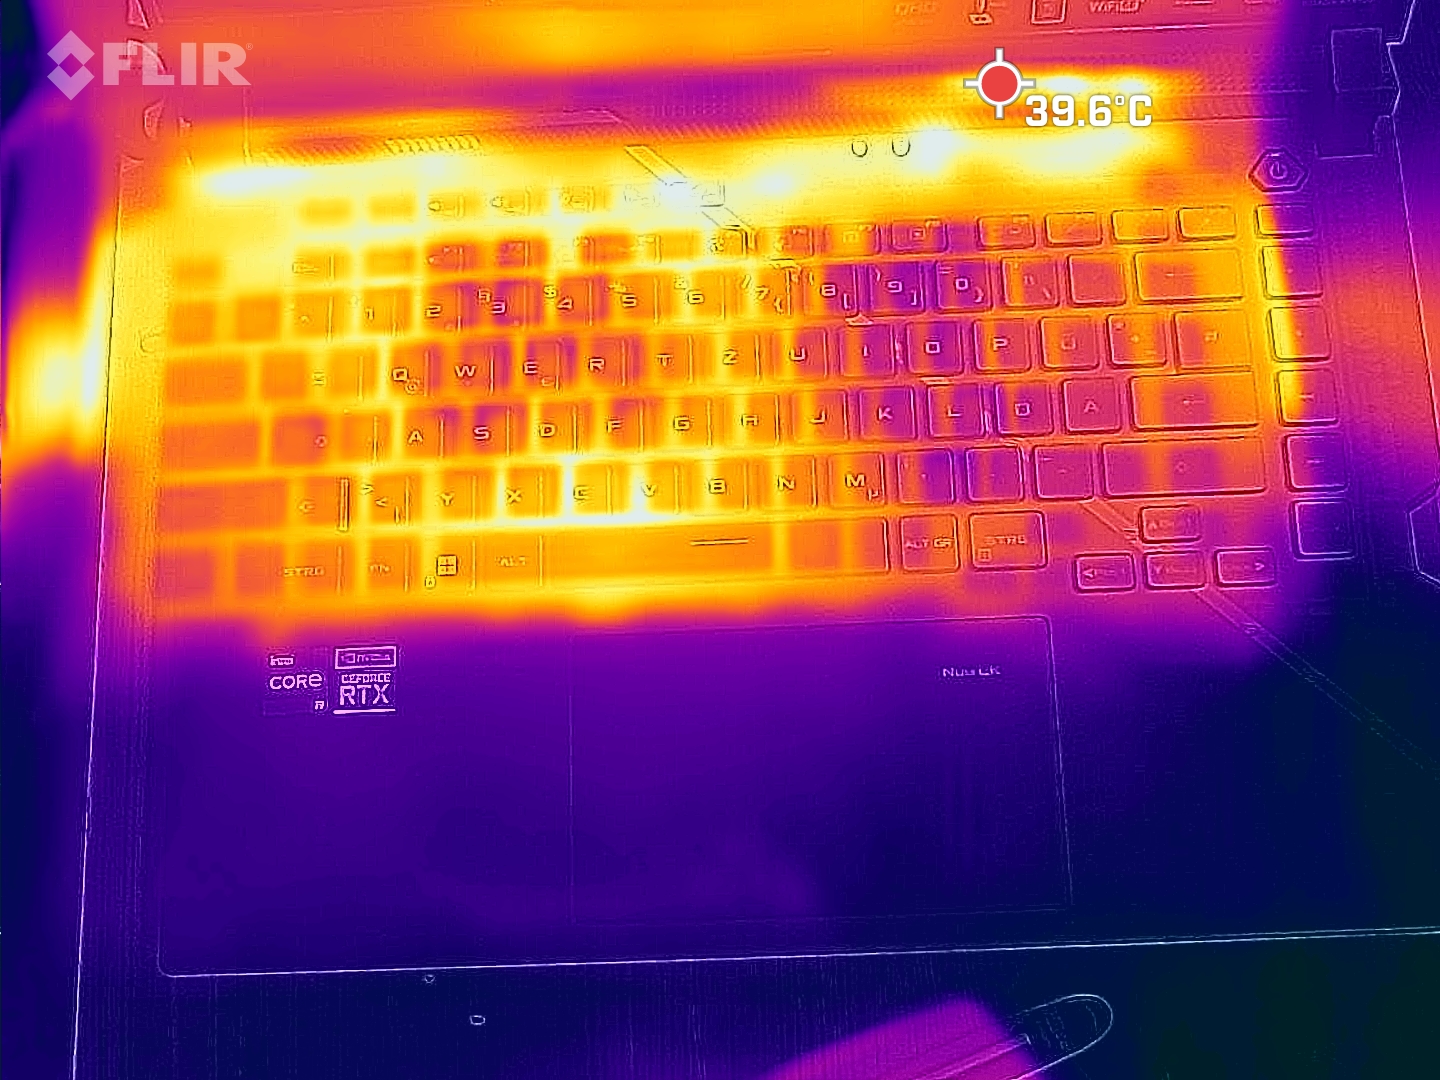
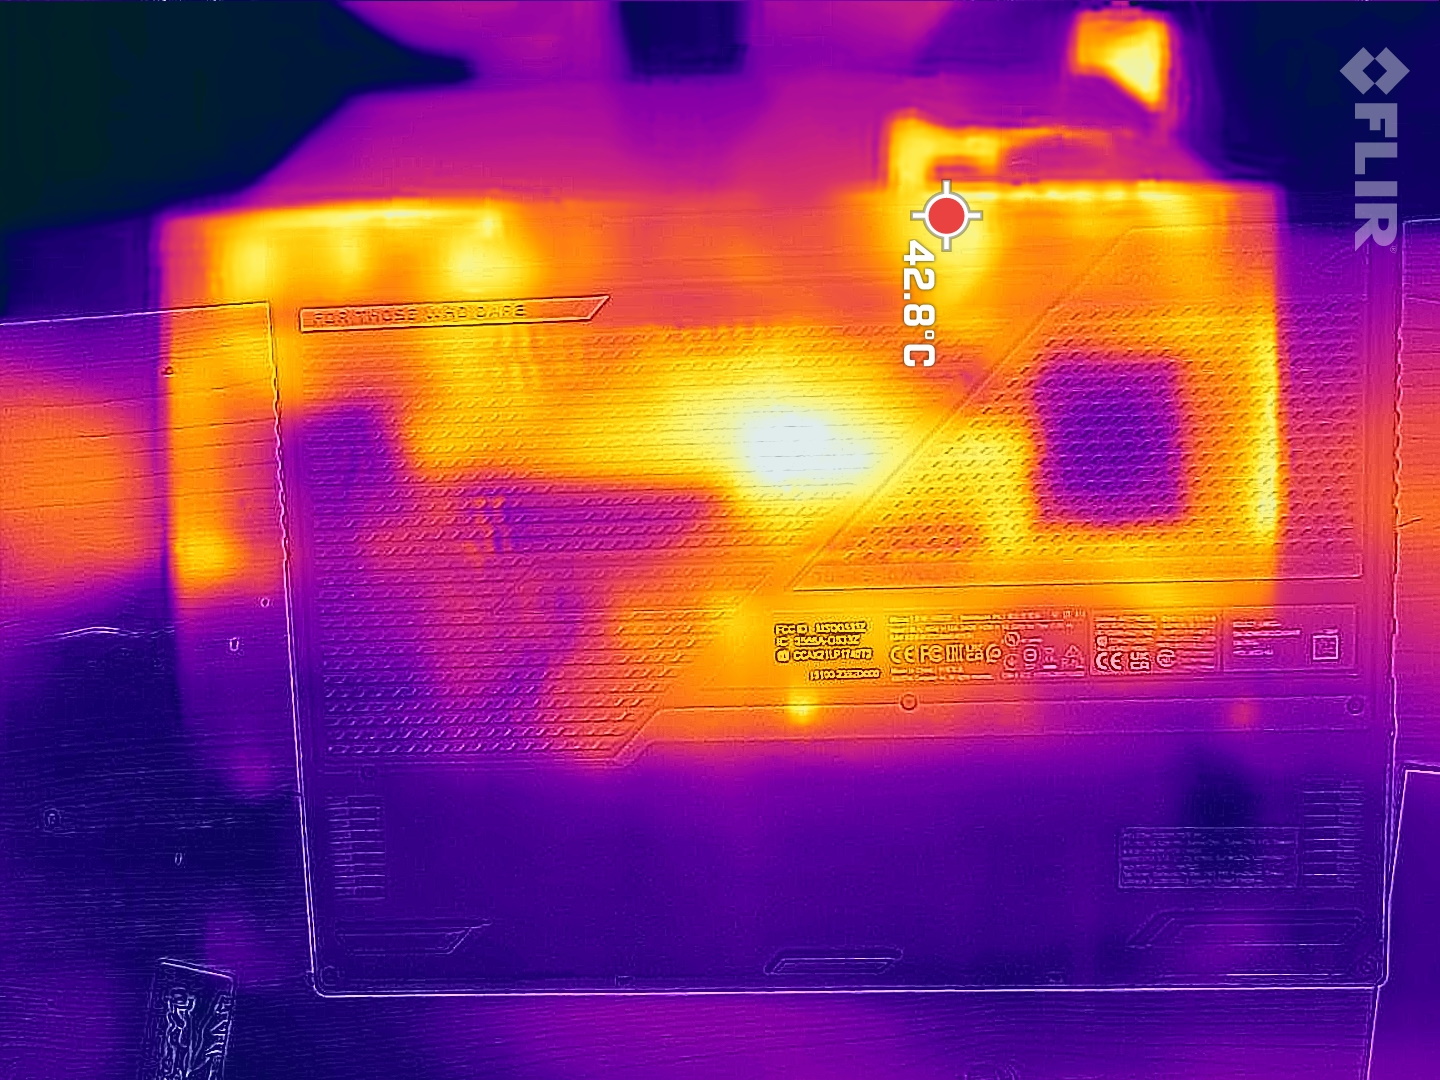
Temperatura
Il portatile da gioco Asus è in grado di rimanere relativamente fresco sia al minimo che sotto carico. Ad esempio, l'Alienware è molto più caldo nonostante il suo sistema di raffreddamento sporgente. Lo Strix Scar ha una curva della ventola più aggressiva, che aiuta le temperature di superficie a rimanere a un livello ragionevole.
(±) La temperatura massima sul lato superiore è di 43 °C / 109 F, rispetto alla media di 40.4 °C / 105 F, che varia da 21.2 a 68.8 °C per questa classe Gaming.
(-) Il lato inferiore si riscalda fino ad un massimo di 47 °C / 117 F, rispetto alla media di 43.2 °C / 110 F
(+) In idle, la temperatura media del lato superiore è di 29.2 °C / 85 F, rispetto alla media deld ispositivo di 33.9 °C / 93 F.
(±) Riproducendo The Witcher 3, la temperatura media per il lato superiore e' di 32.9 °C / 91 F, rispetto alla media del dispositivo di 33.9 °C / 93 F.
(+) I poggiapolsi e il touchpad sono piu' freddi della temperatura della pelle con un massimo di 25 °C / 77 F e sono quindi freddi al tatto.
(+) La temperatura media della zona del palmo della mano di dispositivi simili e'stata di 28.8 °C / 83.8 F (+3.8 °C / 6.8 F).
| Asus ROG Strix Scar 15 G533zm Intel Core i9-12900H, NVIDIA GeForce RTX 3060 Laptop GPU | Asus ROG Strix Scar 15 G533ZW-LN106WS Intel Core i9-12900H, NVIDIA GeForce RTX 3070 Ti Laptop GPU | Asus TUF Gaming F15 FX507ZM Intel Core i7-12700H, NVIDIA GeForce RTX 3060 Laptop GPU | MSI Pulse GL66 12UEK Intel Core i9-12900H, NVIDIA GeForce RTX 3060 Laptop GPU | Alienware m15 R5 Ryzen Edition AMD Ryzen 7 5800H, NVIDIA GeForce RTX 3060 Laptop GPU | Lenovo Legion 5 15ACH6A-82NW0010GE AMD Ryzen 5 5600H, AMD Radeon RX 6600M | |
|---|---|---|---|---|---|---|
| Heat | -10% | -11% | -11% | -22% | 3% | |
| Maximum Upper Side * (°C) | 43 | 42.6 1% | 44.4 -3% | 50 -16% | 62 -44% | 39.9 7% |
| Maximum Bottom * (°C) | 47 | 50.2 -7% | 48.8 -4% | 47 -0% | 61 -30% | 43.8 7% |
| Idle Upper Side * (°C) | 32 | 36.2 -13% | 37.8 -18% | 36 -13% | 36 -13% | 34.1 -7% |
| Idle Bottom * (°C) | 33 | 40.2 -22% | 39.6 -20% | 38 -15% | 33 -0% | 31.7 4% |
* ... Meglio usare valori piccoli
Test da sforzo
Durante lo stress test, il TDP ha raggiunto circa 95 watt per alcuni secondi, prima di scendere ai 45 watt nominali. Allo stesso tempo, la velocità di clock della CPU è scesa a circa 2,3 GHz in media, con temperature del core intorno ai 76°C (168,8°F).
Il clock della GPU ha funzionato a circa 1,6 GHz con fluttuazioni minime. Il clock della memoria ha funzionato a 1.750 MHz, assolutamente costante. Tuttavia, le temperature della GPU erano relativamente alte, a circa 81°C (177,8°F), il che rientra comunque in un intervallo di sicurezza e indica che l'headroom è stato ben utilizzato. L'intera scheda ha assorbito una media di 109 watt.


| Clock CPU (GHz) | Clock GPU (MHz) | Temperatura media CPU (°C) | Temperatura media GPU (°C) | |
| Prime95 + FurMark Stress | 2,3 | 1,600 | 76 | 81 |
Altoparlanti
Gli altoparlanti non raggiungono un volume sufficiente anche al massimo. Detto questo, sono almeno in grado di produrre dei bassi decenti per essere degli altoparlanti di un computer portatile. D'altra parte, gli alti non sono così impressionanti come nei dispositivi concorrenti.
C'è un jack audio combinato che consente agli utenti di collegare dispositivi audio analogici esterni.
Asus ROG Strix Scar 15 G533zm analisi audio
(±) | potenza degli altiparlanti media ma buona (79.48 dB)
Bassi 100 - 315 Hz
(+) | bassi buoni - solo 3.5% dalla media
(+) | bassi in lineaa (4.6% delta rispetto alla precedente frequenza)
Medi 400 - 2000 Hz
(±) | medi elevati - circa 5.6% superiore alla media
(+) | medi lineari (4.8% delta rispetto alla precedente frequenza)
Alti 2 - 16 kHz
(±) | alti ridotti - circa 6.8% inferiori alla media
(±) | la linearità degli alti è media (8.2% delta rispetto alla precedente frequenza)
Nel complesso 100 - 16.000 Hz
(+) | suono nel complesso lineare (14.7% differenza dalla media)
Rispetto alla stessa classe
» 29% di tutti i dispositivi testati in questa classe è stato migliore, 7% simile, 64% peggiore
» Il migliore ha avuto un delta di 6%, medio di 18%, peggiore di 132%
Rispetto a tutti i dispositivi testati
» 19% di tutti i dispositivi testati in questa classe è stato migliore, 4% similare, 77% peggiore
» Il migliore ha avuto un delta di 4%, medio di 23%, peggiore di 134%
Asus TUF Gaming F15 FX507ZM analisi audio
(±) | potenza degli altiparlanti media ma buona (76.7 dB)
Bassi 100 - 315 Hz
(±) | bassi ridotti - in media 13.7% inferiori alla media
(±) | la linearità dei bassi è media (10.1% delta rispetto alla precedente frequenza)
Medi 400 - 2000 Hz
(±) | medi elevati - circa 5.2% superiore alla media
(+) | medi lineari (4.9% delta rispetto alla precedente frequenza)
Alti 2 - 16 kHz
(+) | Alti bilanciati - appena 4.1% dalla media
(±) | la linearità degli alti è media (8.6% delta rispetto alla precedente frequenza)
Nel complesso 100 - 16.000 Hz
(±) | la linearità complessiva del suono è media (15.9% di differenza rispetto alla media
Rispetto alla stessa classe
» 38% di tutti i dispositivi testati in questa classe è stato migliore, 7% simile, 56% peggiore
» Il migliore ha avuto un delta di 6%, medio di 18%, peggiore di 132%
Rispetto a tutti i dispositivi testati
» 25% di tutti i dispositivi testati in questa classe è stato migliore, 5% similare, 70% peggiore
» Il migliore ha avuto un delta di 4%, medio di 23%, peggiore di 134%
Gestione dell'energia - Durata della batteria decente
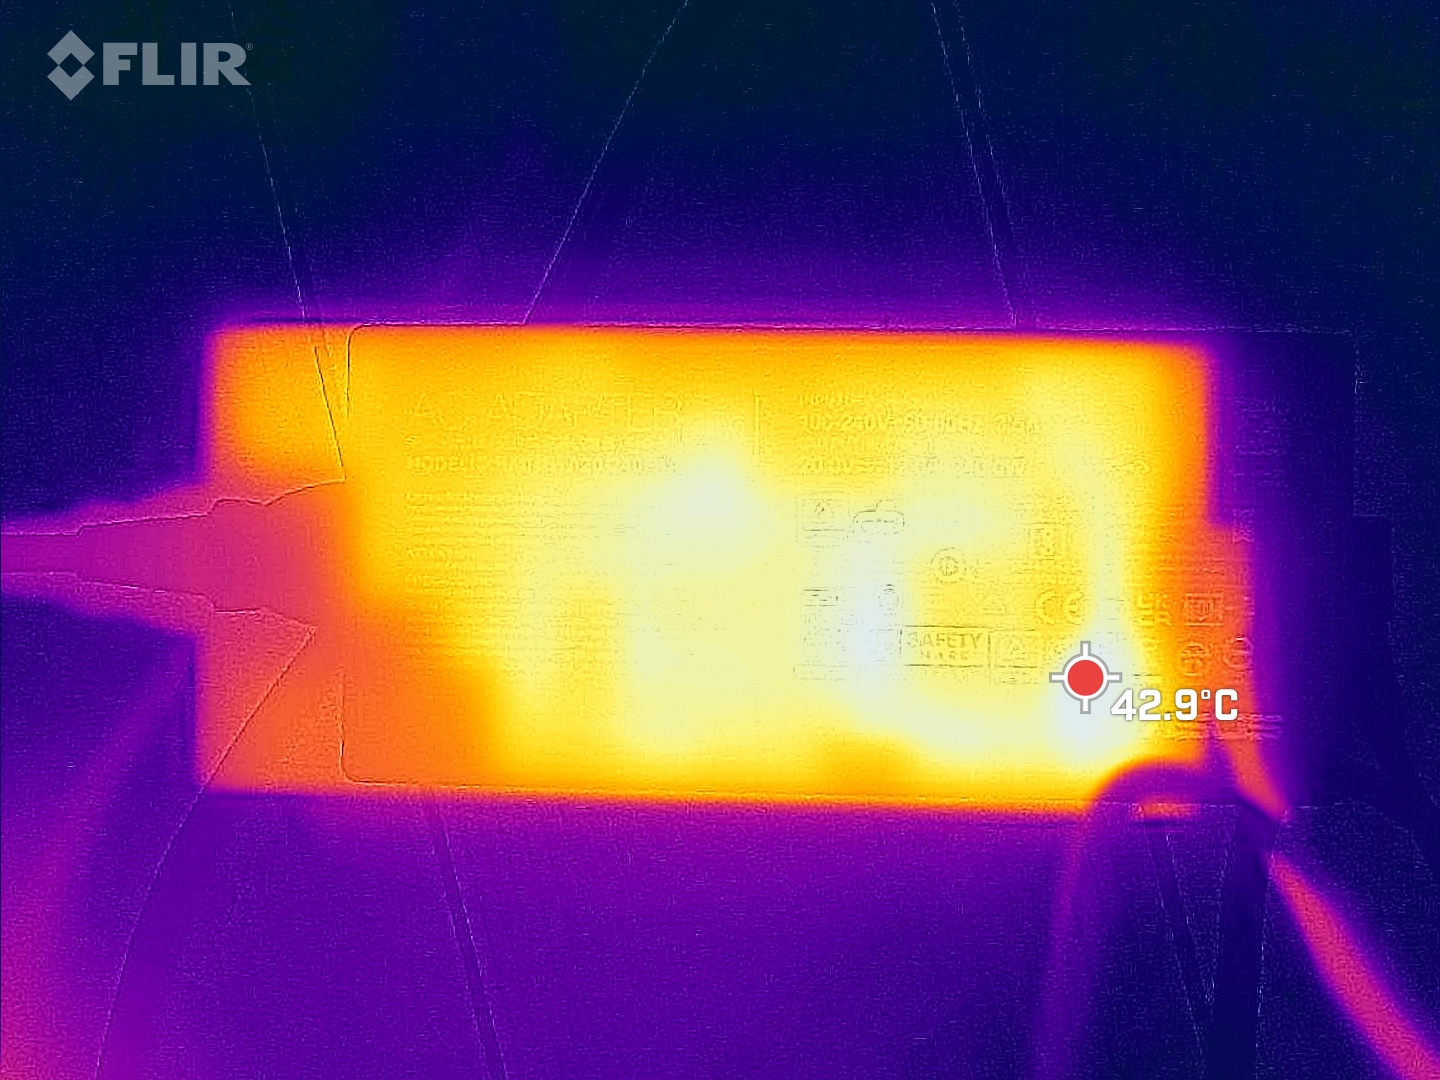
Consumo di energia
Nel complesso, nonostante non sia particolarmente efficiente dal punto di vista energetico, l'Asus Strix Scar 15 non è troppo problematico da questo punto di vista. Consuma un po' più di energia rispetto ai suoi concorrenti nella modalità idle a risparmio energetico e durante il gioco. Tuttavia, il suo consumo di picco transitorio di 221 watt non è superiore a quello dei suoi rivali e rientra nei limiti del caricatore da 240 watt.
| Idle | |
| Sotto carico |
|
Leggenda:
min: | |
| Asus ROG Strix Scar 15 G533zm i9-12900H, GeForce RTX 3060 Laptop GPU, , IPS, 2560x1440, 15.6" | Asus ROG Strix Scar 15 G533ZW-LN106WS i9-12900H, GeForce RTX 3070 Ti Laptop GPU, Samsung PM9A1 MZVL22T0HBLB, IPS-level, 2560x1440, 15.6" | Asus TUF Gaming F15 FX507ZM i7-12700H, GeForce RTX 3060 Laptop GPU, SK Hynix HFM001TD3JX013N, IPS, 1920x1080, 15.6" | MSI Pulse GL66 12UEK i9-12900H, GeForce RTX 3060 Laptop GPU, Micron 2450 512GB MTFDKBA512TFK, IPS, 1920x1080, 15.6" | Alienware m15 R5 Ryzen Edition R7 5800H, GeForce RTX 3060 Laptop GPU, Toshiba KBG40ZNS512G NVMe, IPS, 1920x1080, 15.6" | Lenovo Legion 5 15ACH6A-82NW0010GE R5 5600H, Radeon RX 6600M, Micron 2210 MTFDHBA512QFD, IPS, 1920x1080, 15.6" | Media NVIDIA GeForce RTX 3060 Laptop GPU | Media della classe Gaming | |
|---|---|---|---|---|---|---|---|---|
| Power Consumption | 7% | 9% | 28% | 1% | 8% | 7% | -10% | |
| Idle Minimum * (Watt) | 13 | 7.56 42% | 6.3 52% | 7 46% | 11 15% | 10 23% | 10.4 ? 20% | 13 ? -0% |
| Idle Average * (Watt) | 17 | 13.5 21% | 9.8 42% | 13 24% | 14 18% | 13.2 22% | 14.5 ? 15% | 18.7 ? -10% |
| Idle Maximum * (Watt) | 17 | 16.87 1% | 26.5 -56% | 13.7 19% | 25 -47% | 15.6 8% | 21.4 ? -26% | 24.3 ? -43% |
| Load Average * (Watt) | 135 | 128.9 5% | 103.8 23% | 48.4 64% | 123 9% | 178 -32% | 109.3 ? 19% | 110.2 ? 18% |
| Witcher 3 ultra * (Watt) | 195 | 196.2 -1% | 189 3% | 148 24% | 176 10% | 181 7% | ||
| Load Maximum * (Watt) | 221 | 274.86 -24% | 241.9 -9% | 244 -10% | 226 -2% | 180 19% | 206 ? 7% | 258 ? -17% |
* ... Meglio usare valori piccoli
Power consumption Witcher 3 / stress test
Power consumption with external monitor
Durata della batteria
Asus ha dotato il portatile di una grande batteria da 90Wh, in grado di offrire un'eccezionale durata di 8,5 ore di riproduzione video e 9 ore di navigazione in Internet nei nostri test, eseguiti con una luminosità dello schermo ridotta.
| Asus ROG Strix Scar 15 G533zm i9-12900H, GeForce RTX 3060 Laptop GPU, 90 Wh | Asus ROG Strix Scar 15 G533ZW-LN106WS i9-12900H, GeForce RTX 3070 Ti Laptop GPU, 90 Wh | Asus TUF Gaming F15 FX507ZM i7-12700H, GeForce RTX 3060 Laptop GPU, 90 Wh | MSI Pulse GL66 12UEK i9-12900H, GeForce RTX 3060 Laptop GPU, 53.5 Wh | Alienware m15 R5 Ryzen Edition R7 5800H, GeForce RTX 3060 Laptop GPU, 86 Wh | Lenovo Legion 5 15ACH6A-82NW0010GE R5 5600H, Radeon RX 6600M, 80 Wh | Media della classe Gaming | |
|---|---|---|---|---|---|---|---|
| Autonomia della batteria | -16% | -40% | -17% | -16% | 13% | -9% | |
| H.264 (h) | 8.6 | 8.5 -1% | 4 -53% | 8.8 2% | 8.64 ? 0% | ||
| WiFi v1.3 (h) | 9.2 | 8.4 -9% | 4.8 -48% | 5.1 -45% | 9.2 0% | 7.15 ? -22% | |
| Witcher 3 ultra (h) | 1.3 | 1.2 -8% | 1.6 23% | ||||
| Load (h) | 1.6 | 0.9 -44% | 1.1 -31% | 1.9 19% | 0.9 -44% | 2 25% | 1.502 ? -6% |
| Reader / Idle (h) | 15.8 | 14.7 | 12.8 | 8.71 ? |
Pro
Contro
Verdetto - Un portatile da gioco impressionante per 1.999 euro

Dotato di RTX 3060, il modello G533zm di Asus ROG Strix Scar 15 è un computer portatile da gioco altamente competente e di grande qualità costruttiva. Offre I/O moderni, una fantastica esperienza di digitazione, hardware potente e opzioni di personalizzazione. Inoltre, il suo display si distingue per l'ottimo tempo di risposta, l'eccellente copertura del colore e il solido contrasto e luminosità. Rispetto al modello RTX 3070 Ti (G533zw) e ai concorrenti diretti, il G533zm funziona in modo relativamente fresco.
Non abbiamo alcuna lamentela reale sul portatile. Il suo livello di rumore potrebbe essere ottimizzato, ma per il resto è abbastanza ragionevole. A questo proposito, ci si può chiedere se sia necessario abbinare una RTX 3060 al veloce ma caldo i9-12900H, quando un i7-12700H probabilmente farebbe bene il suo lavoro. Nella nostra unità di recensione, il pulsante del touchpad sinistro si è occasionalmente bloccato, anche se l'altro modello Scar non ha avuto questo problema.
Per circa 2.000 euro (2.170 dollari), i giocatori ottengono un eccellente computer portatile con ottime prestazioni, molti punti di forza e pochi svantaggi.
Sebbene non si tratti di un furto per un portatile da gioco con RTX 3060, il prezzo di 2.000 euro (2.170 dollari) è piuttosto ragionevole, visti i numerosi aspetti positivi e gli svantaggi quasi inesistenti. Coloro che desiderano investire meno denaro possono anche prendere in considerazione l'Asus TUF Gaming F15. Questo computer portatile ha meno funzioni ma offre prestazioni eccellenti pur costando circa 400 euro (U
Prezzo e disponibilità
La configurazione oggetto della recensione è attualmente disponibile presso Cyberport al prezzo di 1.999 euro (2.166 dollari). Può anche trovare un modello di fascia più bassa con meno memoria e un display FHD su Amazon per circa 1.600 dollari.
Asus ROG Strix Scar 15 G533zm
- 04/30/2024 v7 (old)
Christian Hintze
Price comparison

