Recensioni per il Intel Core i9-12900H processore
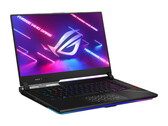
Recensione dell'Asus ROG Strix Scar 15 G533zm: Moderno portatile gaming RTX 3060 con molti punti di forza
Dopo aver provato lo Scar 15 G533zw con una RTX 3070 Ti, ora abbiamo messo le mani anche sul G533zm con una RTX 3060. Il laptop Scar è personalizzabile e offre molte caratteristiche moderne, come il Wi-Fi 6E, la RAM DDR5 e la Thunderbolt 4. Nella nostra recensione, discuteremo se queste caratteristiche sono sufficienti a giustificare il prezzo piuttosto elevato di 1.999 euro (2.166 dollari) per un laptop da gioco RTX 3060.
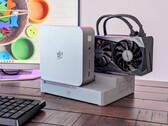
Intel Core i9-12900H, NVIDIA GeForce RTX 3060 Laptop GPU, 15.6", 2.3 kgRecensione del mini PC Beelink GTI12 Ultra EX Docking Station: Più conveniente del previsto
Le docking station per mini PC eGPU erano poco comuni e costose solo qualche anno fa, ma il dock Beelink EX è una delle opzioni meno costose finora, senza dover sacrificare le caratteristiche o la qualità.
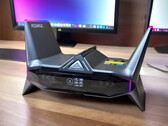
Intel Core i9-12900H, NVIDIA GeForce RTX 3070, 1.3 kgRecensione dell'Acemagic M2A Starship: Il PC per il gaming con look da astronave futuristica si affida a Intel Core i9-12900H e alla GPU per laptop Nvidia GeForce RTX 3080
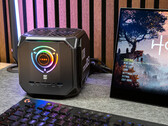
Con M2A Starship, Acemagic ha un PC da gioco molto accattivante nel suo portafoglio. Il design insolito del mini-PC, simile a un'astronave, attira l'attenzione, ma l'hardware è familiare e già utilizzato nel Tank03 di Acemagic. In questa recensione, abbiamo analizzato le prestazioni pratiche dell'Intel Core i9-12900H e della GPU per laptop NvidiaGeForce-RTX-3080 nell'esclusivo alloggiamento.
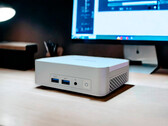
Intel Core i9-12900H, NVIDIA GeForce RTX 3080 Laptop GPU, 2.1 kgRecensione del Geekom XT12 Pro: Elegante alternativa al mini-PC NUC con Intel Core i9-12900H, 32 GB di RAM DDR4 e 1 TB SSD
Geekom ha presentato qualche giorno fa XT12 Pro, un mini-PC NUC potente ed efficiente. Tuttavia, basandosi su un Intel Core i9-12900H, deve accontentarsi di un processore leggermente più vecchio. Utilizzando numerose misurazioni e benchmark, abbiamo analizzato se Geekom è in grado di mantenere la sua promessa di efficienza e come si comporta l'XT12 Pro rispetto alla concorrenza.
Intel Core i9-12900H, Iris Xe G7 96EUs, 545 grRecensione del PC da gioco Acemagic Tank 03: Il piccolo mini PC con Intel Core i9-12900H e GPU Nvidia GeForce RTX 3080 padroneggia anche i giochi attuali
Con il Tank 03, Acemagic offre un mini PC molto speciale nel suo portafoglio, che si distingue per le enormi prestazioni racchiuse nel minimo spazio. Almeno, questo è ciò che viene promesso dalle specifiche tecniche. Scopra in questa recensione cosa può fare in pratica l'Intel Core i9-12900H in combinazione con la GPU Nvidia GeForce RTX-3080 Laptop. Come caratteristica speciale, il mini PC offre anche tre diversi profili di prestazioni che esaminiamo in dettaglio.
Intel Core i9-12900H, NVIDIA GeForce RTX 3080 Laptop GPU, 2.2 kgAcemagic Tank03: NVIDIA GeForce RTX 3080 Laptop GPU
recensione » Recensione del PC da gioco Acemagic Tank 03: Il piccolo mini PC con Intel Core i9-12900H e GPU Nvidia GeForce RTX 3080 padroneggia anche i giochi attuali
recensione » Recensione del PC da gioco Acemagic Tank 03: Il piccolo mini PC con Intel Core i9-12900H e GPU Nvidia GeForce RTX 3080 padroneggia anche i giochi attuali
Razer Blade 15 OLED (Early 2022): NVIDIA GeForce RTX 3070 Ti Laptop GPU, 15.60", 2 kg
recensione » Recensione del Razer Blade 15 OLED (inizio 2022): Un portatile per il gaming compatto con RTX 3070 Ti
Asus ProArt StudioBook 16 H7600ZW: NVIDIA GeForce RTX 3070 Ti Laptop GPU, 16.00", 2.4 kg
recensione » Recensione dell'Asus ProArt StudioBook 16 H7600ZW: L'alternativa definitiva al MacBook Pro per i creatori di contenuti
Asus ROG Zephyrus M16 GU603Z: NVIDIA GeForce RTX 3070 Ti Laptop GPU, 16.00", 2.1 kg
recensione » Recensione del portatile Asus ROG Zephyrus M16: Un dispositivo gaming completo
Minisforum Neptune Series NAD9: Intel Iris Xe Graphics G7 96EUs, 1.2 kg
recensione » Recensione del PC desktop Neptune Series NAD9 di Minisforum: Potenza compatta con Intel Core i9-12900H
Asus ZenBook Pro 16X OLED UX7602ZM-ME115W: NVIDIA GeForce RTX 3060 Laptop GPU, 16.00", 2.4 kg
recensione » Recensione dell'Asus Zenbook Pro 16X OLED - Un portatile estremo con un trucco speciale
Acer Predator Triton 300 SE: NVIDIA GeForce RTX 3060 Laptop GPU, 14.00", 1.7 kg
recensione » Recensione dell'Acer Predator Triton 300 SE PT314: Raffreddamento a metallo liquido per un portatile da 14"
Uniwell Technology GM7AG8N Liquid Cooling Box: NVIDIA GeForce RTX 3080 Ti Laptop GPU, 17.00", 2.7 kg
recensione » Recensione del portatile Uniwell Technology GM7AG8N: il sistema di raffreddamento a liquido è più silenzioso del previsto
Alienware x15 R2 P111F: NVIDIA GeForce RTX 3080 Ti Laptop GPU, 15.60", 2.4 kg
recensione » Recensione del portatile Alienware x15 R2: L'UFO simile a un ultrabook vola con Core i9-12900H e RTX 3080 Ti da 140 W
MSI Creator Z17 A12UGST-054: NVIDIA GeForce RTX 3070 Ti Laptop GPU, 17.00", 2.5 kg
recensione » Recensione del portatile MSI Creator Z17: Cosa possono aspettarsi creators e gamers per circa 4.000 euro?
Dell Precision 5000 5470: NVIDIA RTX A1000 Laptop GPU, 14.00", 1.6 kg
recensione » Recensione della workstation Dell Precision 5470: Debutto della Nvidia RTX A1000
Schenker XMG Pro 17 E22: NVIDIA GeForce RTX 3080 Ti Laptop GPU, 17.30", 2.8 kg
recensione » Recensione dello Schenker XMG Pro 17 E22: Il portatile gaming con RTX 3080 Ti è all'altezza della situazione
Razer Blade 17 Early 2022: NVIDIA GeForce RTX 3080 Ti Laptop GPU, 17.30", 2.8 kg
recensione » Recensione del Razer Blade 17 (inizio 2022): Elegante portatile gaming 4k con schermo luminoso
MSI Creator Z16P B12UHST: NVIDIA GeForce RTX 3080 Ti Laptop GPU, 16.00", 2.4 kg
recensione » Recensione del portatile MSI Creator Z16P: Lavoro creativo con un i9 e la RTX 3080 Ti
Asus ROG Strix Scar 15 G533ZW-LN106WS: NVIDIA GeForce RTX 3070 Ti Laptop GPU, 15.60", 2.3 kg
recensione » Recensione del portatile Asus ROG Strix Scar 15 G533ZW: un computer potente per i giochi a 1440p 240 Hz con Core i9 Alder Lake e RTX 3070 Ti da 150 W
MSI Pulse GL66 12UEK: NVIDIA GeForce RTX 3060 Laptop GPU, 15.60", 2.3 kg
recensione » Recensione dell'MSI Pulse GL66: L'i9-12900H migliora questo portatile gaming RTX-3060 o lo rende solo più costoso?
MSI Vector GP66 12UGS: NVIDIA GeForce RTX 3070 Ti Laptop GPU, 15.60", 2.3 kg
recensione » Recensione del portatile MSI Vector GP66 12UGS: 150 W TGP GeForce RTX 3070 Ti sweet spot
Asus ROG Flow Z13 GZ301ZE: NVIDIA GeForce RTX 3050 Ti Laptop GPU, 13.40", 1.2 kg
recensione » Recensione dell'Asus ROG Flow Z13: Tablet gaming con potente CPU Alder Lake i9
Schenker Uniwill Technology GM7AG8P: NVIDIA GeForce RTX 3080 Ti Laptop GPU, 17.30", 2.3 kg
recensione » Debutto di Intel Core i9-12900H: Recensione del portatile Uniwill Technology GM7AG8P
Acer Nitro 5 AN515-58, i9-12900H RTX 4060: NVIDIA GeForce RTX 4060 Laptop GPU, 15.60", 2.6 kg
Recensioni esterne » Acer Nitro 5 AN515-58, i9-12900H RTX 4060
Acer Nitro 5 AN517-55-96S6: NVIDIA GeForce RTX 4060 Laptop GPU, 17.30", 3 kg
Recensioni esterne » Acer Nitro 5 AN517-55-96S6
Asus ZenBook Pro 16X OLED UX7602ZM-ME115W: NVIDIA GeForce RTX 3060 Laptop GPU, 16.00", 2.4 kg
Recensioni esterne » Asus ZenBook Pro 16X OLED UX7602ZM-ME115W
MSI Crosshair 15 B12UEZ, i9-12900H: NVIDIA GeForce RTX 3060 Laptop GPU, 15.60", 2.3 kg
Recensioni esterne » MSI Crosshair 15 B12UEZ, i9-12900H
Acer Predator Helios 300 PH315-55-98R7: NVIDIA GeForce RTX 3070 Ti Laptop GPU, 15.60", 2.6 kg
Recensioni esterne » Acer Predator Helios 300 PH315-55-98R7
Razer Blade 15 OLED (Early 2022): NVIDIA GeForce RTX 3070 Ti Laptop GPU, 15.60", 2 kg
Recensioni esterne » Razer Blade 15 OLED (Early 2022)
Alienware x15 R2 P111F: NVIDIA GeForce RTX 3080 Ti Laptop GPU, 15.60", 2.4 kg
Recensioni esterne » Alienware x15 R2 P111F
HP ZBook Studio 16 G9, i9-12900H RTX 3080 Ti: NVIDIA GeForce RTX 3080 Ti Laptop GPU, 16.00", 1.7 kg
Recensioni esterne » HP ZBook Studio 16 G9, i9-12900H RTX 3080 Ti
HP Omen 16-k0097ng: NVIDIA GeForce RTX 3070 Ti Laptop GPU, 16.10", 2.4 kg
Recensioni esterne » HP Omen 16-k0097ng
Acer Predator Helios 300 PH315-55s-98TX: NVIDIA GeForce RTX 3080 Laptop GPU, 15.60", 2.6 kg
Recensioni esterne » Acer Predator Helios 300 PH315-55s-98TX
Acer Predator Helios 300 PH317-56-94RD: NVIDIA GeForce RTX 3080 Laptop GPU, 17.30", 3 kg
Recensioni esterne » Acer Predator Helios 300 PH317-56-94RD
Asus ROG Strix SCAR 15 G533ZX-LN060W: NVIDIA GeForce RTX 3080 Ti Laptop GPU, 15.60", 2.4 kg
Recensioni esterne » Asus ROG Strix SCAR 15 G533ZX-LN060W
HP ZBook Studio 16 G9 62U30EA: NVIDIA RTX A3000 Laptop GPU, 16.00", 1.7 kg
Recensioni esterne » HP ZBook Studio 16 G9 62U30EA
Asus ProArt StudioBook 16 H7600ZM-L2038X: NVIDIA GeForce RTX 3060 Laptop GPU, 16.00", 2.4 kg
Recensioni esterne » Asus ProArt StudioBook 16 H7600ZM-L2038X
Lenovo Legion 5 Pro 16IAH7H, i9-12900H RTX 3070 Ti: NVIDIA GeForce RTX 3070 Ti Laptop GPU, 16.00", 2.5 kg
Recensioni esterne » Lenovo Legion 5 Pro 16IAH7H, i9-12900H RTX 3070 Ti
Razer Blade 15 2022 RZ09-0421NGG3-R3G1: NVIDIA GeForce RTX 3070 Ti Laptop GPU, 15.60", 2 kg
Recensioni esterne » Razer Blade 15 2022 RZ09-0421NGG3-R3G1
Acer Predator Helios 300 PH315-55-902L: NVIDIA GeForce RTX 3070 Ti Laptop GPU, 15.60", 2.6 kg
Recensioni esterne » Acer Predator Helios 300 PH315-55-902L
HP Envy 16-h0795ng: NVIDIA GeForce RTX 3060 Laptop GPU, 16.00", 2.7 kg
Recensioni esterne » HP Envy 16-h0795ng
Dell Precision 5000 5470: NVIDIA RTX A1000 Laptop GPU, 14.00", 1.6 kg
Recensioni esterne » Dell Precision 5000 5470
MSI Pulse GL76 12UGK-091UK: NVIDIA GeForce RTX 3070 Laptop GPU, 17.30", 2.6 kg
Recensioni esterne » MSI Pulse GL76 12UGK-091UK
Acer Predator Triton 300SE PT314-52s-99PC: NVIDIA GeForce RTX 3060 Laptop GPU, 14.00", 1.7 kg
Recensioni esterne » Acer Predator Triton 300SE PT314-52s-99PC
MSI Creator Pro Z17 A12UMST: NVIDIA RTX A5500 Laptop GPU, 17.00", 2.5 kg
Recensioni esterne » MSI Creator Pro Z17 A12UMST
MSI Creator Z16P B12UGST: NVIDIA GeForce RTX 3070 Ti Laptop GPU, 16.00", 2.4 kg
Recensioni esterne » MSI Creator Z16P B12UGST
Dell XPS 15 9520, i9-12900H 3050 Ti: NVIDIA GeForce RTX 3050 Ti Laptop GPU, 15.60", 1.9 kg
Recensioni esterne » Dell XPS 15 9520, i9-12900H 3050 Ti
Dell Precision 15 3571, 12900H RTX A1000: NVIDIA RTX A1000 Laptop GPU, 15.60", 1.8 kg
Recensioni esterne » Dell Precision 15 3571, 12900H RTX A1000
MSI Pulse GL66 12UEK: NVIDIA GeForce RTX 3060 Laptop GPU, 15.60", 2.3 kg
Recensioni esterne » MSI Pulse GL66 12UEK
MSI Stealth GS66 12UGS-025: NVIDIA GeForce RTX 3070 Ti Laptop GPU, 15.60", 2.1 kg
Recensioni esterne » MSI Stealth GS66 12UGS-025
Origin PC EVO17-S 2022, i9 3080 Ti: NVIDIA GeForce RTX 3080 Ti Laptop GPU, 17.30", 2.7 kg
Recensioni esterne » Origin PC EVO17-S 2022, i9 3080 Ti
MSI Creator Z17 A12UHST-052: NVIDIA GeForce RTX 3080 Ti Laptop GPU, 17.30", 2.5 kg
Recensioni esterne » MSI Creator Z17 A12UHST-052
Asus Zenbook Pro 14 Duo UX8402ZE-M3030W: NVIDIA GeForce RTX 3050 Ti Laptop GPU, 14.50", 1.8 kg
Recensioni esterne » Asus Zenbook Pro Duo 14 UX8402ZE-M3030W
Asus Zenbook Pro 16X UX7602ZM-ME023W: NVIDIA GeForce RTX 3060 Laptop GPU, 16.00", 2.4 kg
Recensioni esterne » Asus Zenbook Pro 16X UX7602ZM-ME023W
Asus ROG Strix G17 G733ZM-LL034W: NVIDIA GeForce RTX 3060 Laptop GPU, 17.30", 2.9 kg
Recensioni esterne » Asus ROG Strix G17 G733ZM-LL034W
Asus ZenBook 14X UX5401ZA-L7078W: Intel Iris Xe Graphics G7 96EUs, 14.00", 1.4 kg
Recensioni esterne » Asus ZenBook 14X UX5401ZA-L7078W
Asus ROG Strix Scar 15 G533ZW-AS94: NVIDIA GeForce RTX 3070 Ti Laptop GPU, 15.60", 2.4 kg
Recensioni esterne » Asus ROG Strix Scar 15 G533ZW-AS94
Acer Predator Triton 500SE PT516-52s-98LC: NVIDIA GeForce RTX 3080 Ti Laptop GPU, 16.00", 2.4 kg
Recensioni esterne » Acer Predator Triton 500SE PT516-52s-98LC
Razer Blade 17 Early 2022: NVIDIA GeForce RTX 3080 Ti Laptop GPU, 17.30", 2.8 kg
Recensioni esterne » Razer Blade 17 Early 2022
Asus ROG Zephyrus M16 GU603ZX-K8001W: NVIDIA GeForce RTX 3080 Ti Laptop GPU, 16.00", 1.9 kg
Recensioni esterne » Asus ROG Zephyrus M16 GU603ZX-K8001W
MSI Stealth GS66 12UHS-091: NVIDIA GeForce RTX 3080 Ti Laptop GPU, 15.60", 2.1 kg
Recensioni esterne » MSI Stealth GS66 12UHS-091
MSI Creator Z16P B12UHST-046: NVIDIA GeForce RTX 3080 Ti Laptop GPU, 16.00", 2.3 kg
Recensioni esterne » MSI Creator Z16P B12UHST-046
Asus ROG Zephyrus M16 GU603ZW-K8062W: NVIDIA GeForce RTX 3070 Ti Laptop GPU, 16.00", 1.9 kg
Recensioni esterne » Asus ROG Zephyrus M16 GU603ZW-K8062W
Asus ROG Strix G17 G733ZX-LL009W: NVIDIA GeForce RTX 3080 Ti Laptop GPU, 17.30", 2.9 kg
Recensioni esterne » Asus ROG Strix G17 G733ZX-LL009W
Asus ROG Strix Scar 15 G533zm: NVIDIA GeForce RTX 3060 Laptop GPU, 15.60", 2.3 kg
Recensioni esterne » Asus ROG Strix Scar 15 G533zm
Asus ROG Strix Scar 15 G533ZW-LN106WS: NVIDIA GeForce RTX 3070 Ti Laptop GPU, 15.60", 2.3 kg
Recensioni esterne » Asus ROG Strix Scar 15 G533ZW-LN106WS
Asus ROG Strix Scar 15 G533ZW-LN017W: NVIDIA GeForce RTX 3070 Ti Laptop GPU, 15.60", 2.4 kg
Recensioni esterne » Asus ROG Strix Scar 15 G533ZW-LN017W
Asus ROG Strix Scar 15 G533ZX-XS96: NVIDIA GeForce RTX 3080 Ti Laptop GPU, 15.60", 2.4 kg
Recensioni esterne » Asus ROG Strix Scar 15 G533ZX-XS96
Asus ROG Strix G17 G733ZW-LL103W: NVIDIA GeForce RTX 3070 Ti Laptop GPU, 17.30", 2.9 kg
Recensioni esterne » Asus ROG Strix G17 G733ZW-LL103W
MSI Stealth GS77 12UHS-063: NVIDIA GeForce RTX 3080 Ti Laptop GPU, 17.30", 2.8 kg
Recensioni esterne » MSI Stealth GS77 12UHS-063
Asus ROG Flow Z13 GZ301ZE: NVIDIA GeForce RTX 3050 Ti Laptop GPU, 13.40", 1.2 kg
Recensioni esterne » Asus ROG Flow Z13 GZ301ZE
Acemagic M2A: NVIDIA GeForce RTX 3080 Laptop GPU, 2.1 kg
» Anniversario Acemagic 2026: grande campagna di sconti su mini PC, computer portatili e sistemi NAS
Acemagic Tank03: NVIDIA GeForce RTX 3080 Laptop GPU, 2.2 kg
» Anniversario Acemagic 2026: grande campagna di sconti su mini PC, computer portatili e sistemi NAS
Beelink GTI12 Ultra EX Docking Station: NVIDIA GeForce RTX 3070, 1.3 kg
» La dock eGPU per mini PC di Beelink con slot PCIe full-size diventa open-source
MSI Pulse GL66 12UEK: NVIDIA GeForce RTX 3060 Laptop GPU, 15.60", 2.3 kg
» Test MSI Pulse GL66: RTX-3060 gamer con Alder Lake i9 in necessità di ottimizzazione
MSI Vector GP66 12UGS: NVIDIA GeForce RTX 3070 Ti Laptop GPU, 15.60", 2.3 kg
» MSI GP66 Leopard vs. Vector GP66: qual è la differenza?
Schenker Uniwill Technology GM7AG8P: NVIDIA GeForce RTX 3080 Ti Laptop GPU, 17.30", 2.3 kg
» 27 PC AMD Ryzen 9 5900HX contro il Core i9-12900H: Intel ha la meglio, ma c'è un problema