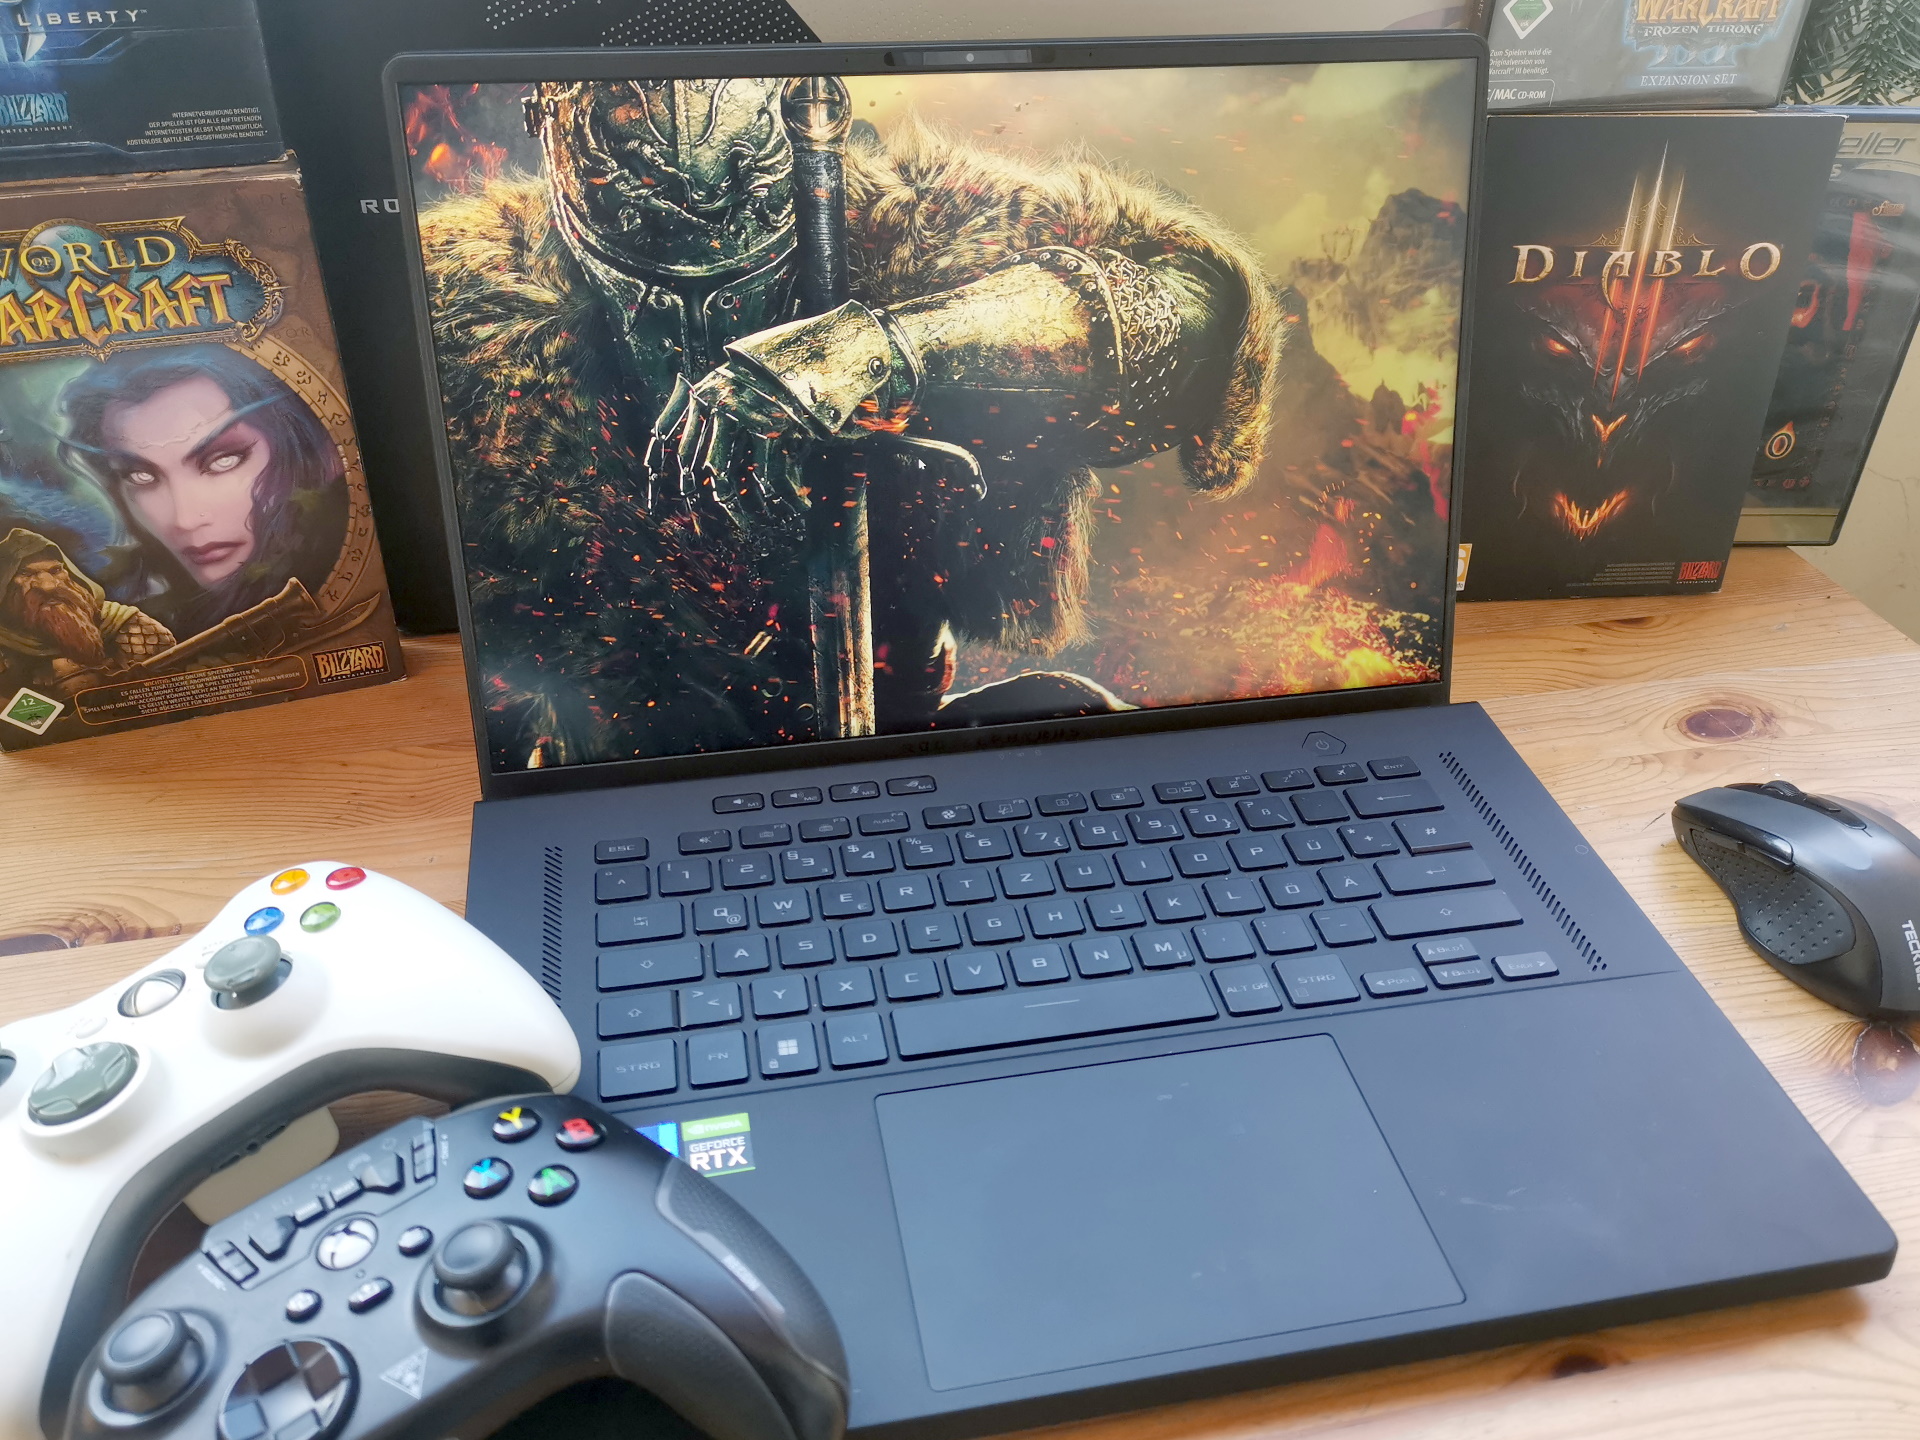
Recensione del portatile Asus ROG Zephyrus M16: Un dispositivo gaming completo

L'M16 (2022) GU603zw eredita dal suo predecessore omonimo, aggiornando il pacchetto con una potente CPU i9 Alder Lake e una scheda video RTX70 Ti RTX 3070 Ti. Il tutto in un formato da 16 pollici abbastanza sottile e compatto con un display 16:10 (2.560 x 1.500 pixel) che manca di poco la nostra lista dei migliori portatili da gioco, poiché pesa solo 75 grammi (~2,6 oz) di troppo (>2 kg = 4,4 lb). Sarebbe stato il primo dispositivo da 16 pollici dell'elenco.
Poiché i portatili da gioco da 16 pollici con display 16:10 sono ancora una minoranza, nel nostro confronto includiamo anche dispositivi "convenzionali" 16:9 con hardware simile. Oltre alpredecessorequesti sono in particolare loSchenker Vision 16 Proe ilLenovo Legion 5 Proma anche il Schenker XMG Focus 16e il Corsair Voyager a1600.
Potenziali concorrenti a confronto
Punteggio | Data | Modello | Peso | Altezza | Dimensione | Risoluzione | Prezzo |
|---|---|---|---|---|---|---|---|
| 87.8 % v7 (old) | 02/2023 | Asus ROG Zephyrus M16 GU603Z i9-12900H, GeForce RTX 3070 Ti Laptop GPU | 2.1 kg | 19.9 mm | 16.00" | 2560x1600 | |
| 85.6 % v7 (old) | 07/2021 | Asus ROG Zephyrus M16 GU603H i9-11900H, GeForce RTX 3070 Laptop GPU | 2 kg | 20 mm | 16.00" | 2560x1600 | |
| 87.8 % v7 (old) | 11/2022 | Schenker Vision 16 Pro RTX 3070 Ti i7-12700H, GeForce RTX 3070 Ti Laptop GPU | 1.7 kg | 17.1 mm | 16.00" | 2560x1600 | |
| 87.7 % v7 (old) | 10/2022 | Lenovo Legion 5 Pro 16ARH7H RTX 3070 Ti R7 6800H, GeForce RTX 3070 Ti Laptop GPU | 2.6 kg | 26.6 mm | 16.00" | 2560x1600 | |
| 87 % v7 (old) | 01/2023 | Schenker XMG Focus 16 (i7-12700H, RTX 3060) i7-12700H, GeForce RTX 3060 Laptop GPU | 2.2 kg | 24.3 mm | 16.00" | 2560x1600 | |
| 86.6 % v7 (old) | 12/2022 | Corsair Voyager a1600 R9 6900HS, Radeon RX 6800M | 2.4 kg | 19.9 mm | 16.00" | 2560x1600 |
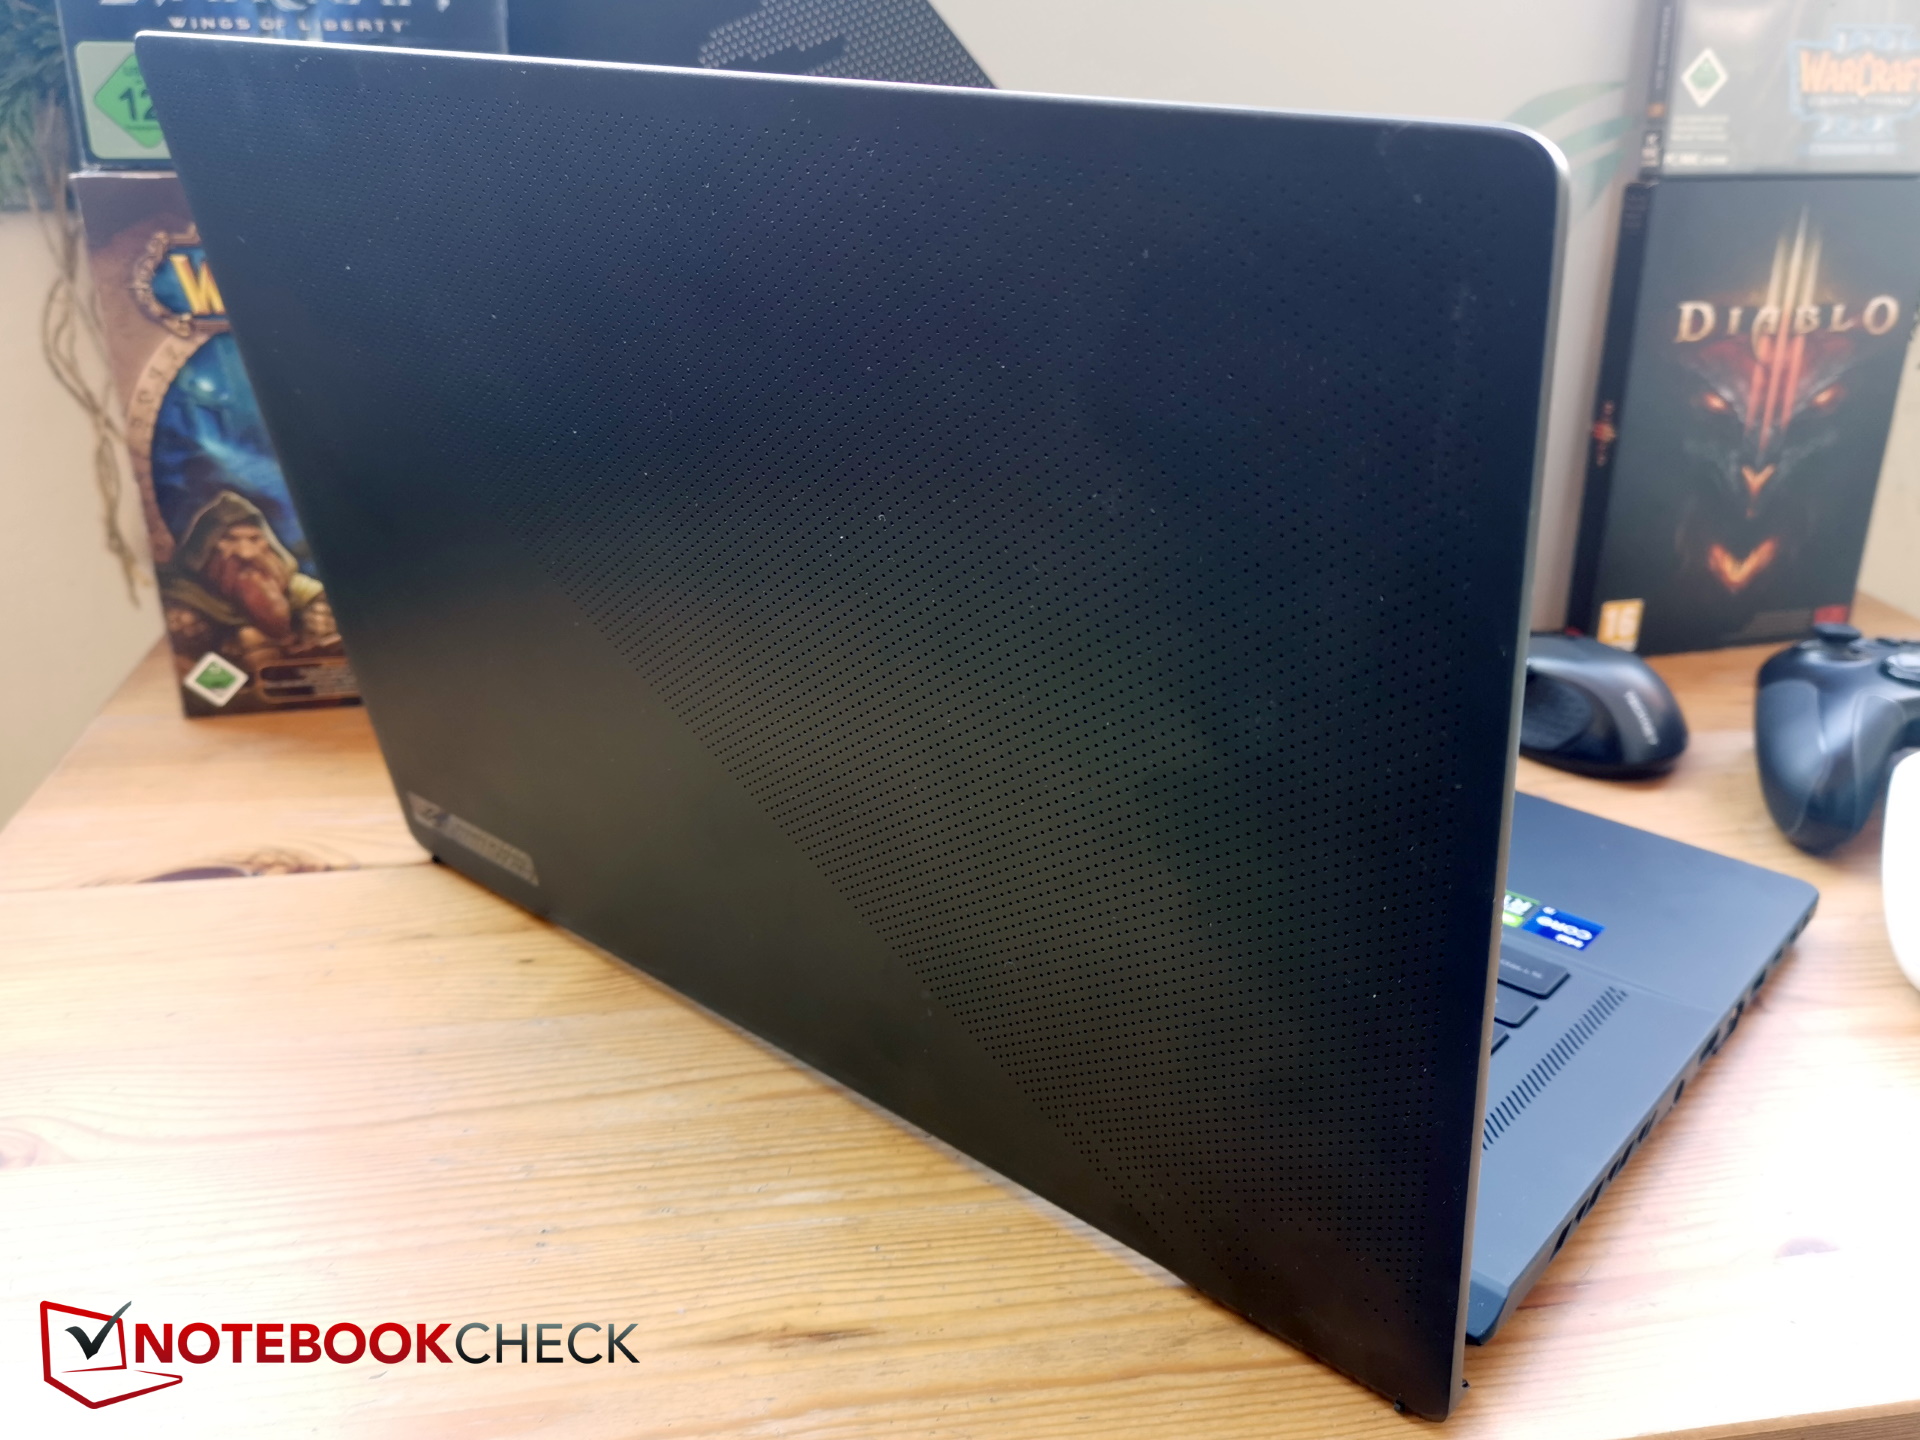
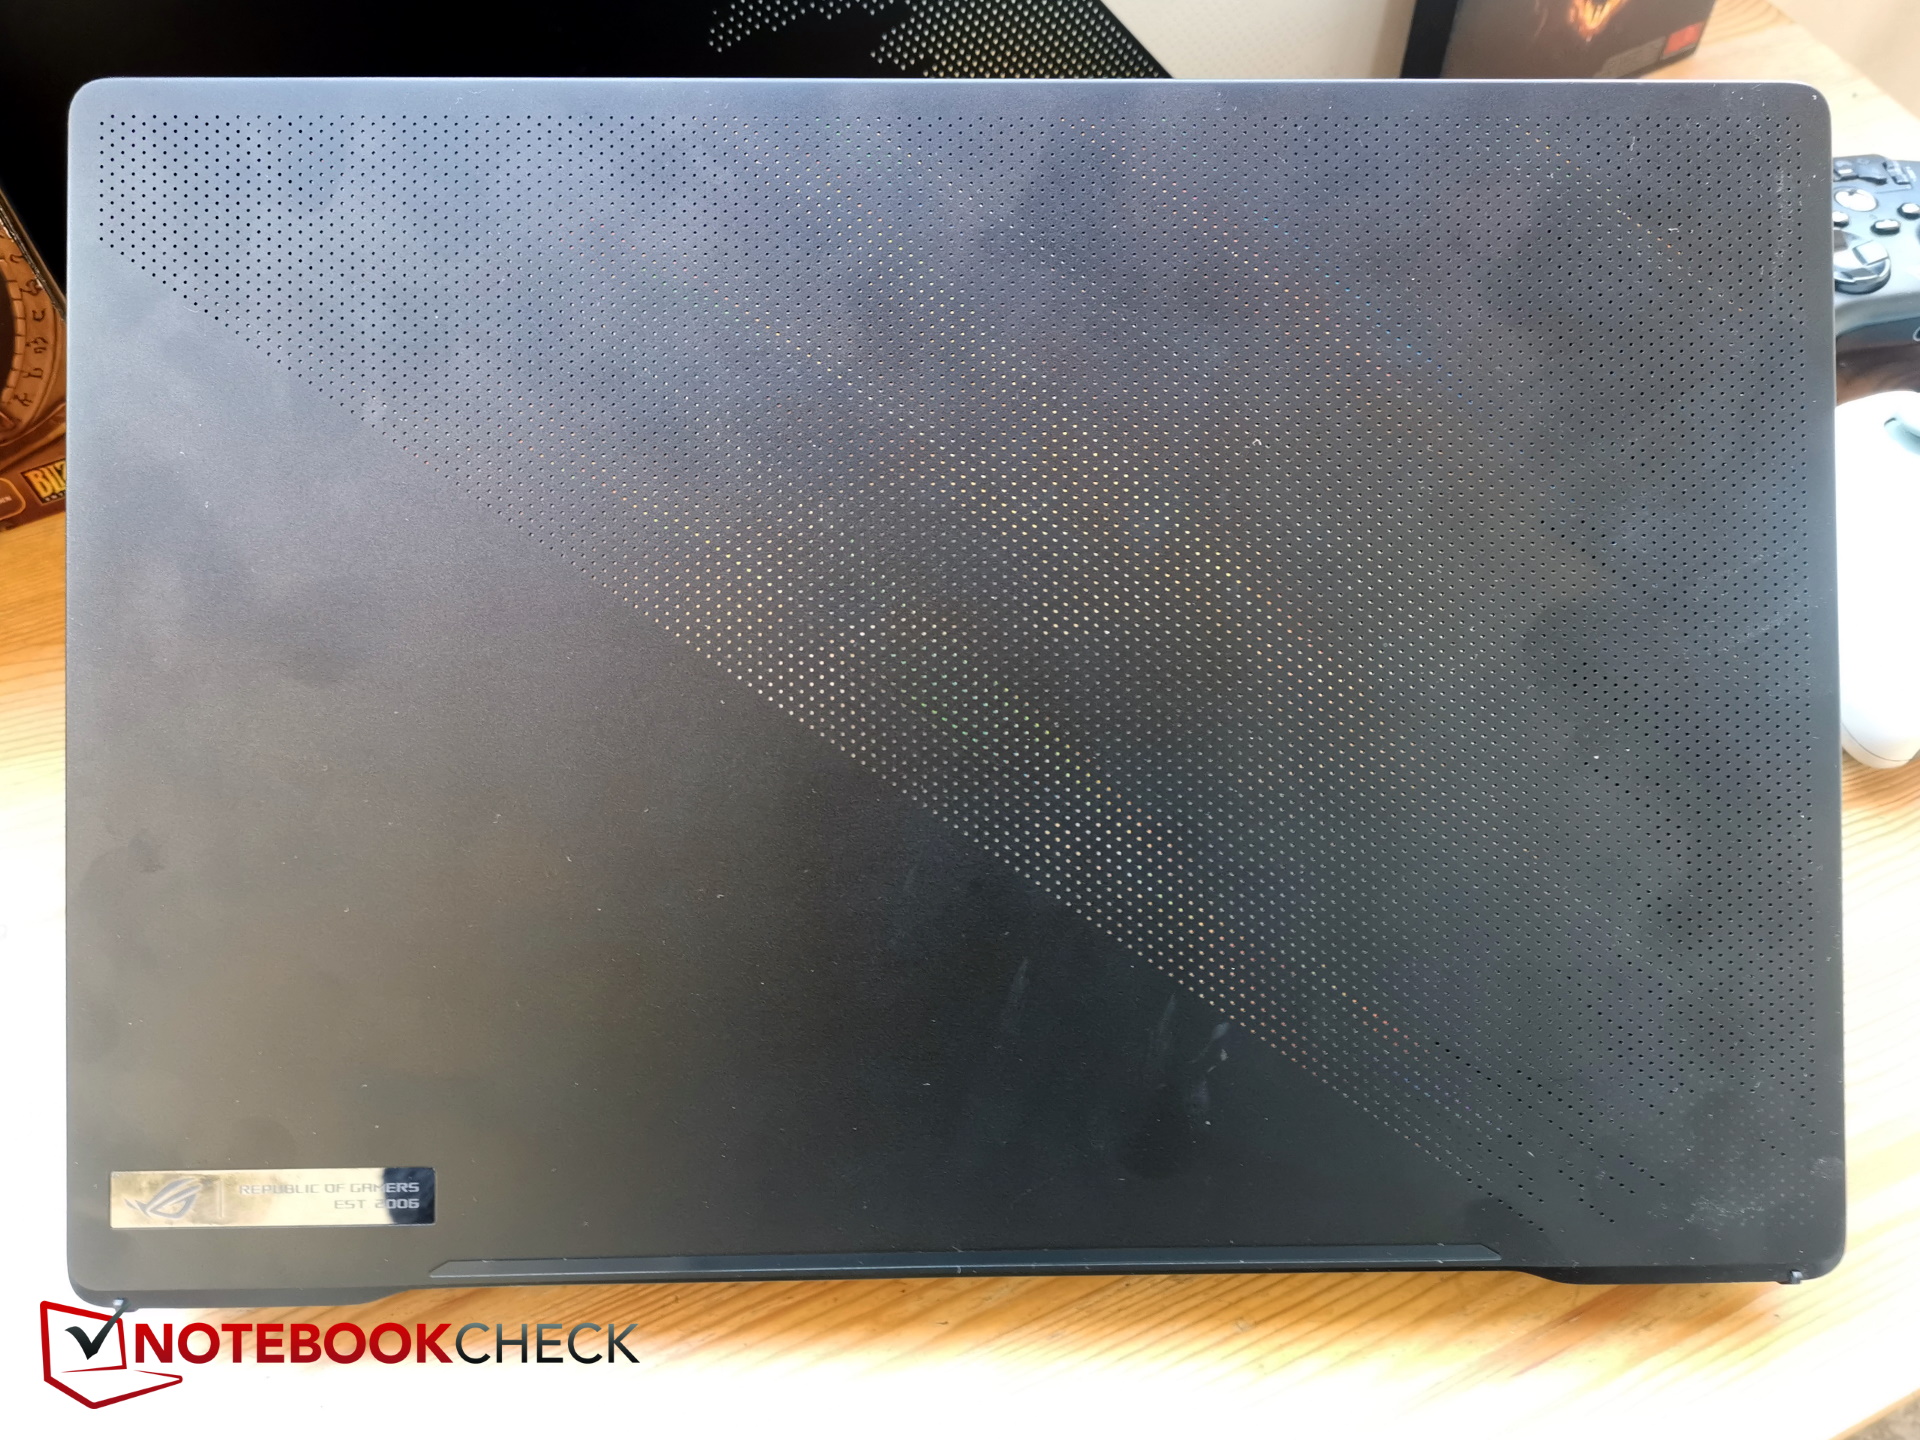
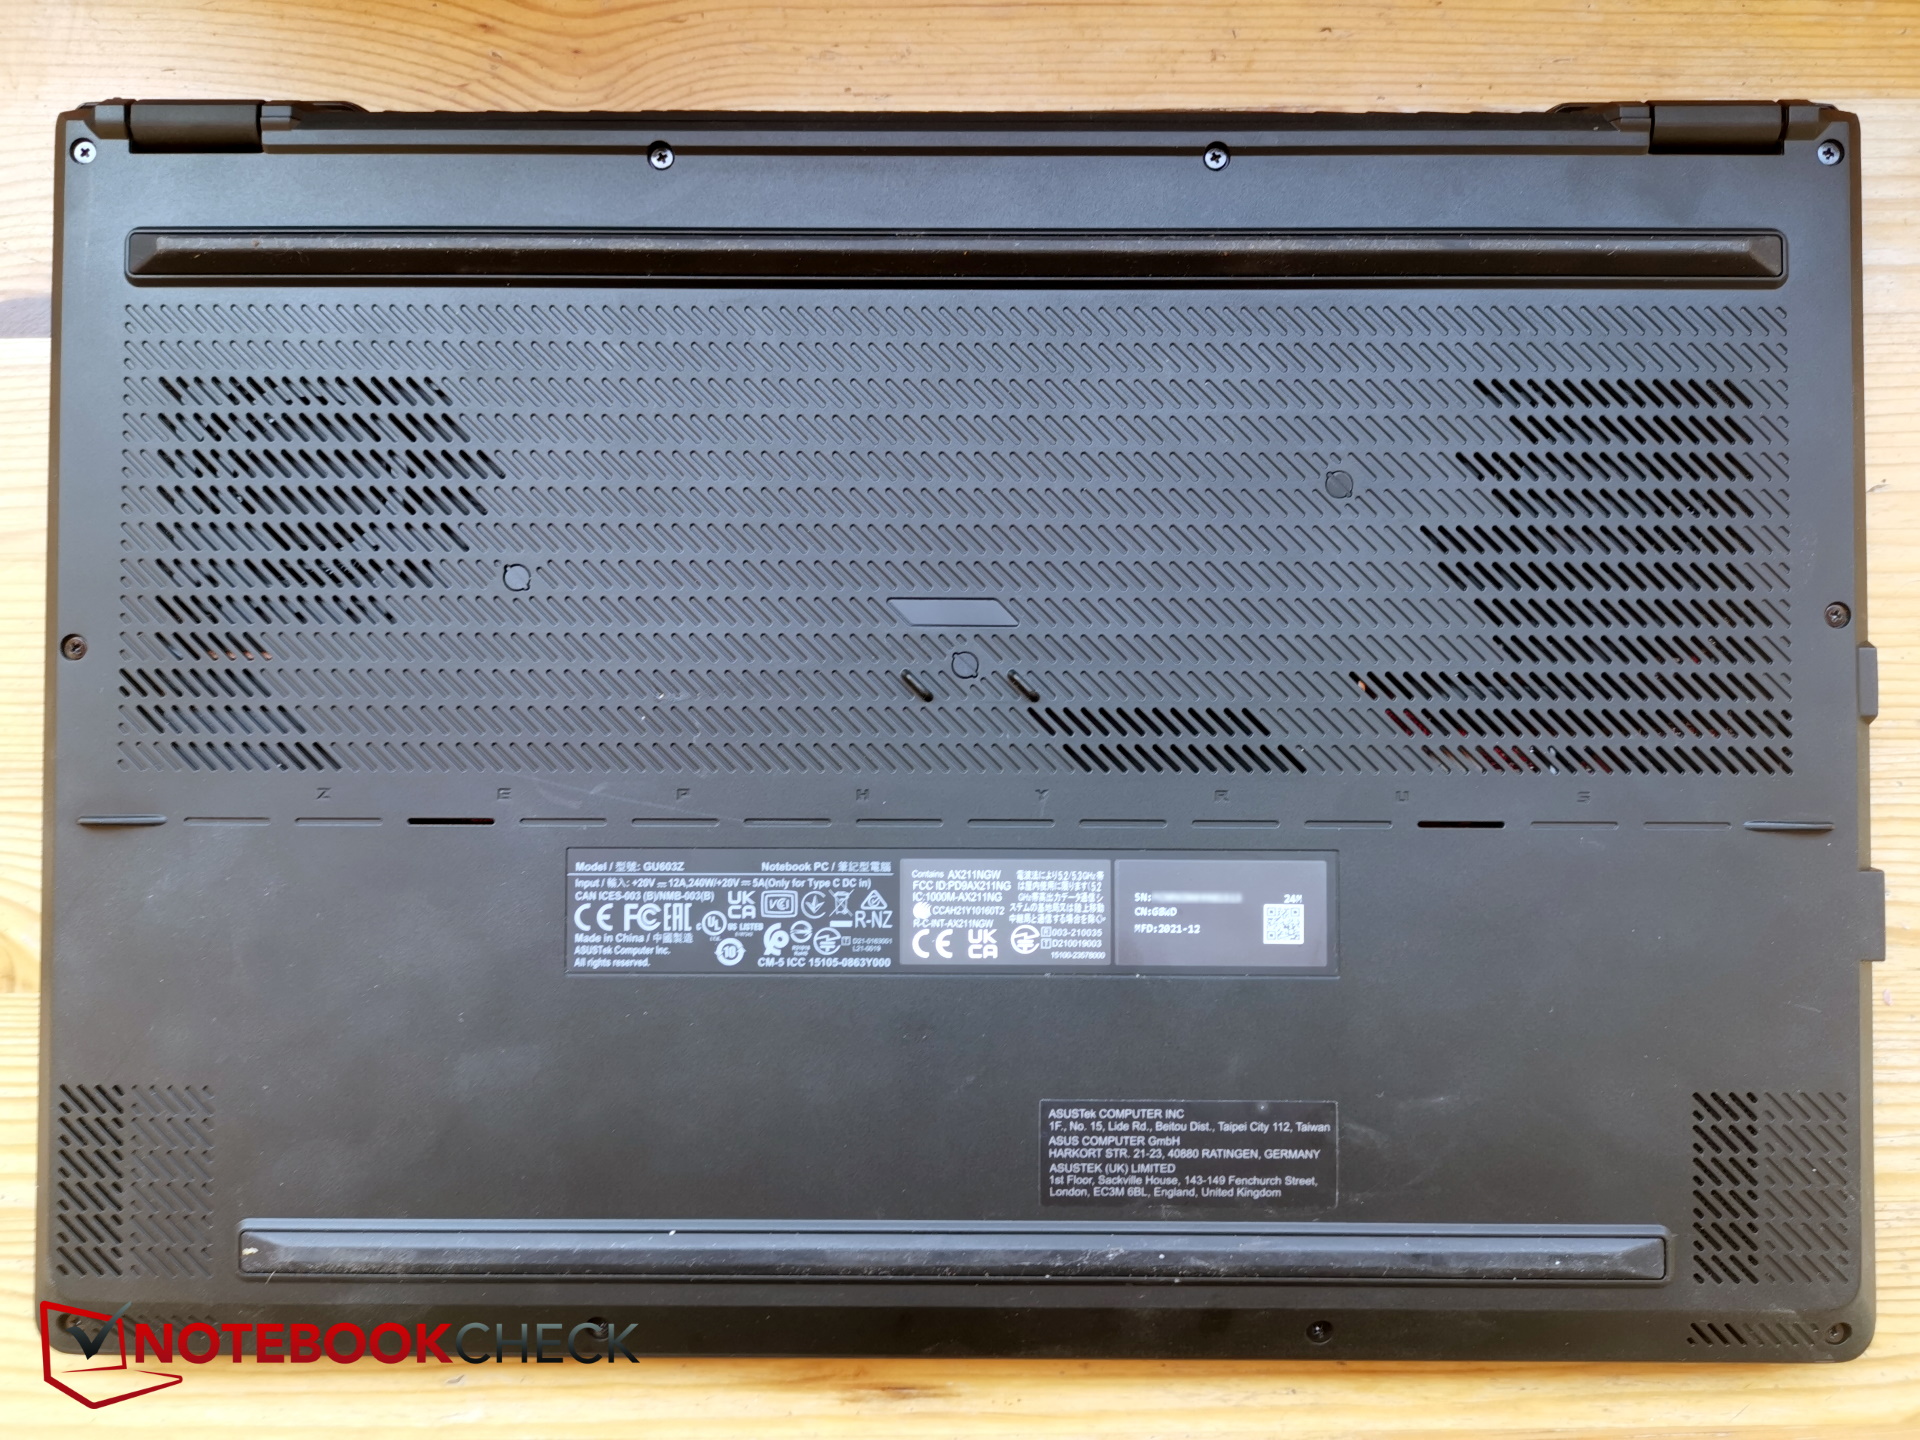
Custodia - Laptop da gioco sottile da 16 pollici
Poiché non è cambiato praticamente nulla nel caso, vi rimandiamo al al nostro test dell'M16 del 2021che fornisce descrizioni dettagliate della cassa, delle opzioni di manutenzione e dei dispositivi di input.
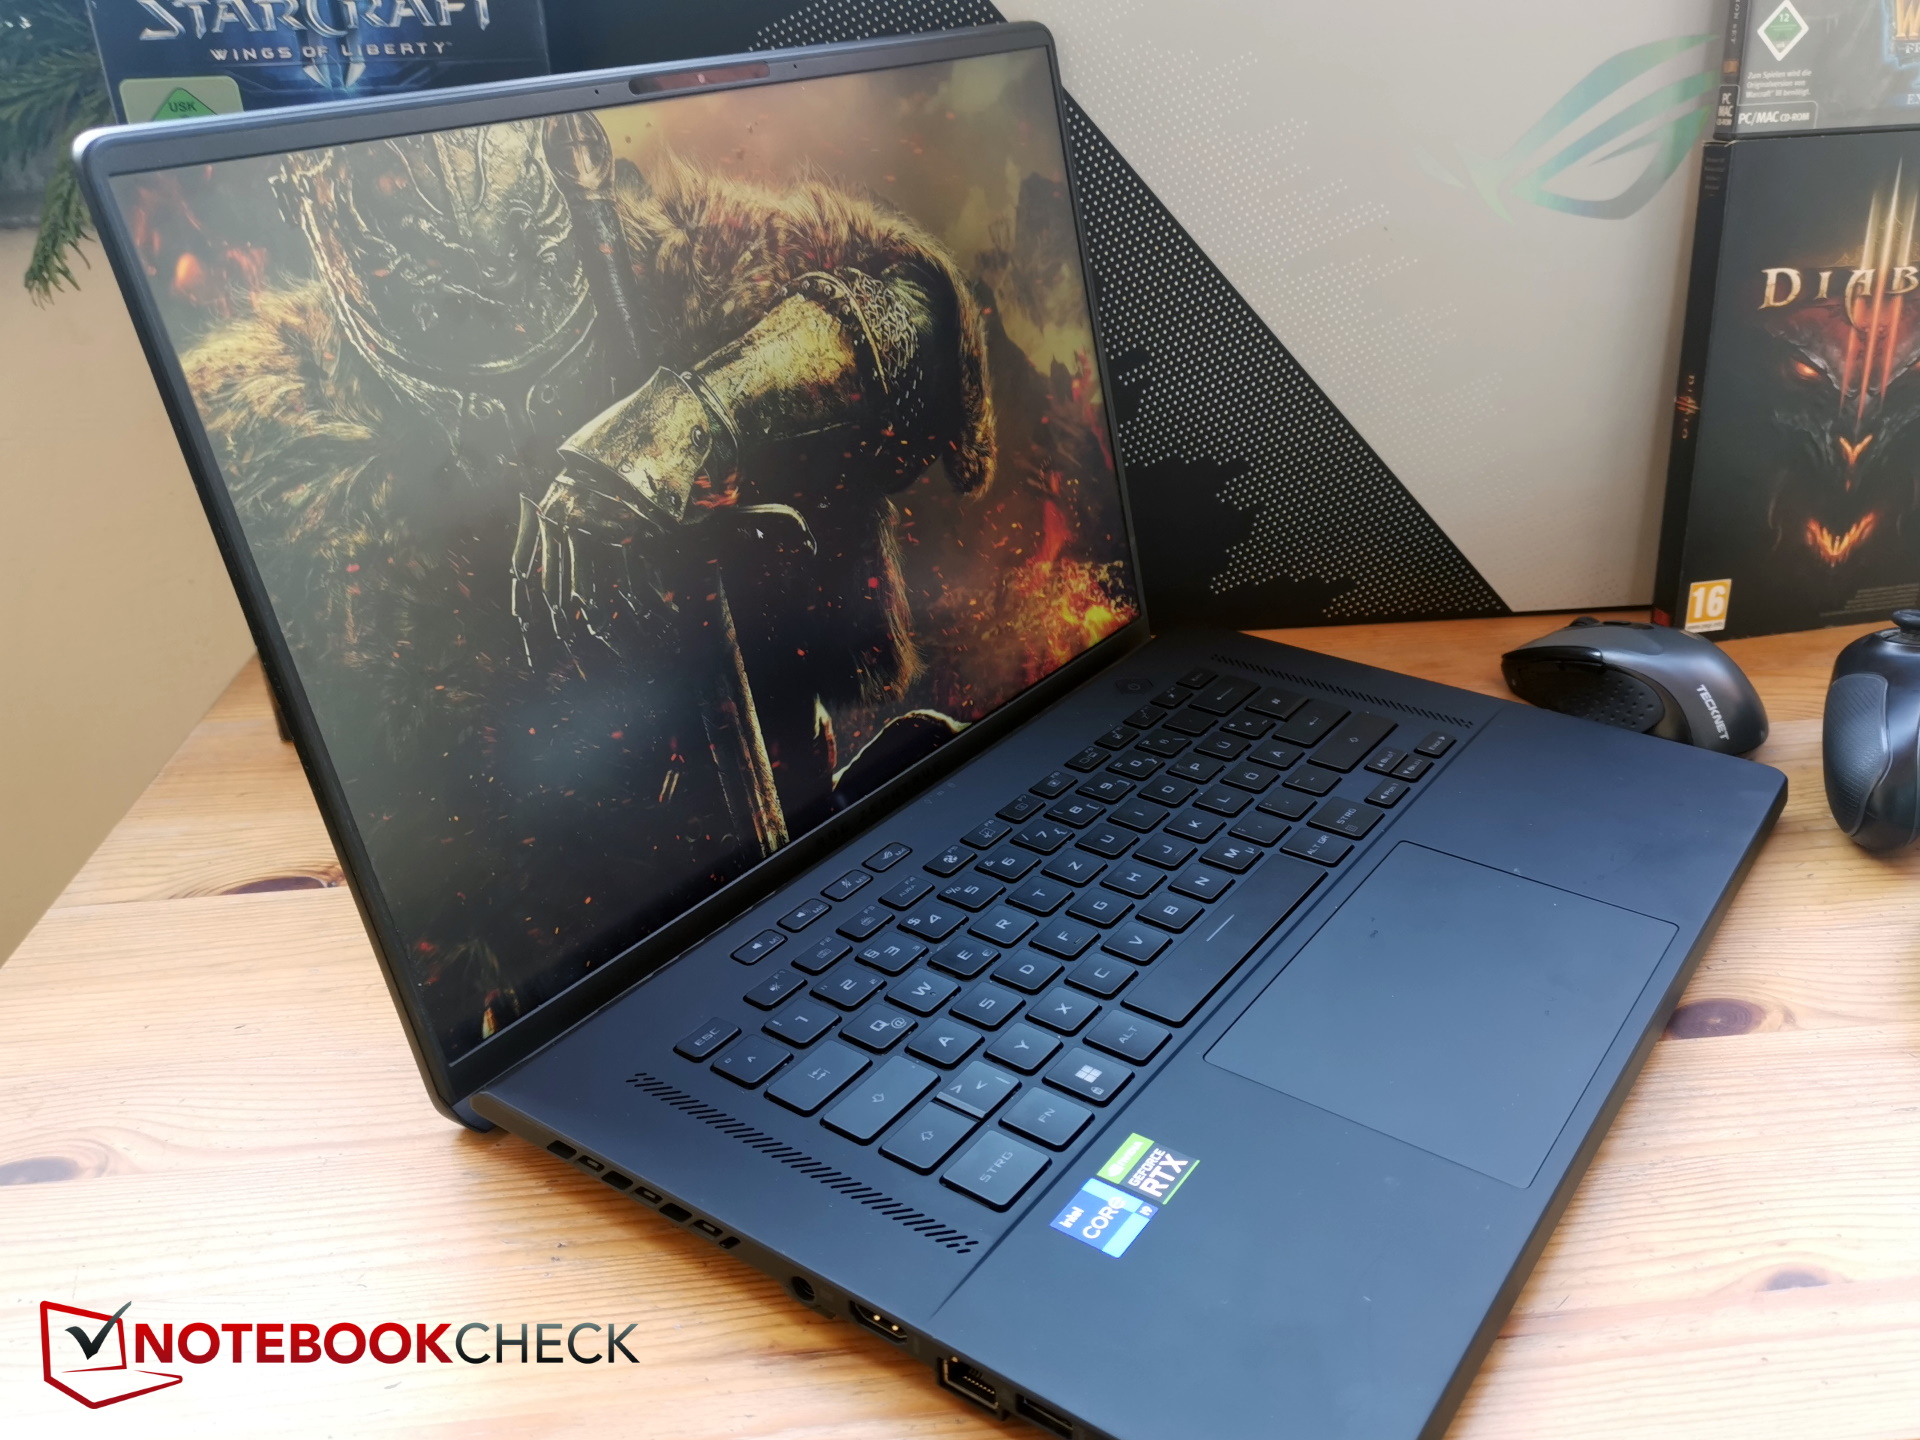
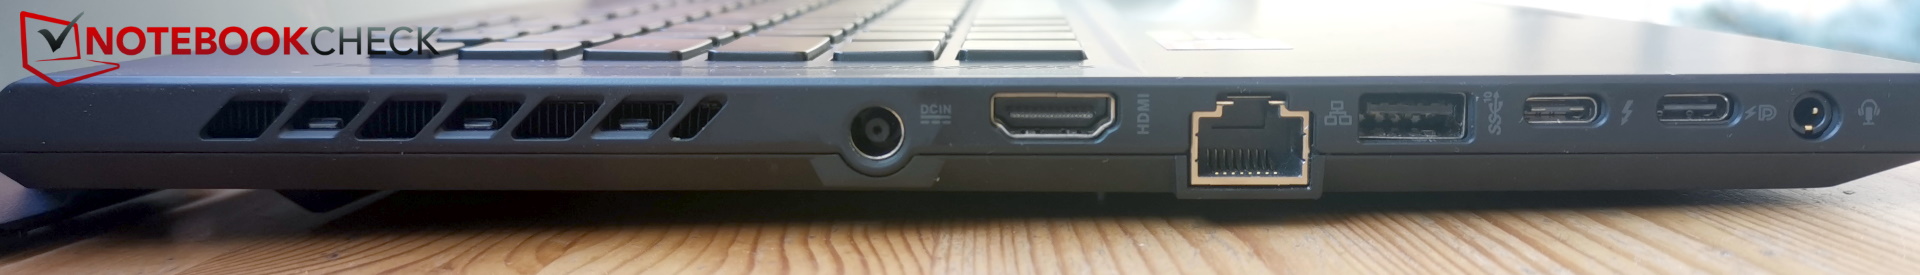
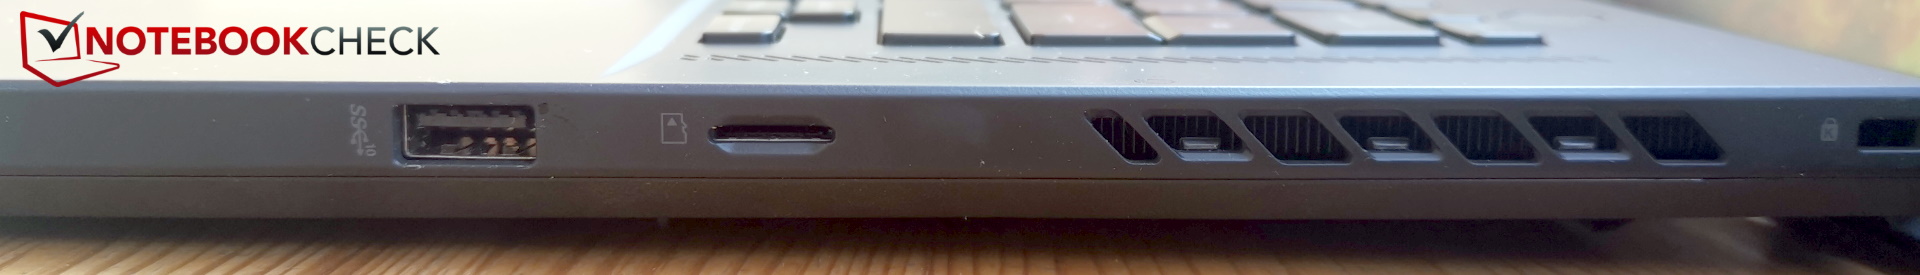
Apparecchiature di connessione - HDMI 2.1 e Thunderbolt 4
Lettore di schede SD
Il lettore di schede SC è limitato alle schede microSD, ma almeno la nostra AV PRO microSD 128 GB V60 si adatta perfettamente senza sporgere. Rispetto al predecessore, che già si comportava bene, la velocità è di nuovo leggermente aumentata.
| SD Card Reader | |
| average JPG Copy Test (av. of 3 runs) | |
| Asus ROG Zephyrus M16 GU603Z | |
| Media della classe Gaming (20.9 - 210, n=54, ultimi 2 anni) | |
| Asus ROG Zephyrus M16 GU603H (AV PRO microSD 128 GB V60) | |
| Corsair Voyager a1600 (AV Pro SD microSD 128 GB V60) | |
| Schenker Vision 16 Pro RTX 3070 Ti (AV Pro V60) | |
| Schenker XMG Focus 16 (i7-12700H, RTX 3060) (AV Pro SD microSD 128 GB V60) | |
| maximum AS SSD Seq Read Test (1GB) | |
| Asus ROG Zephyrus M16 GU603Z | |
| Asus ROG Zephyrus M16 GU603H (AV PRO microSD 128 GB V60) | |
| Media della classe Gaming (25.5 - 261, n=51, ultimi 2 anni) | |
| Corsair Voyager a1600 (AV Pro SD microSD 128 GB V60) | |
| Schenker XMG Focus 16 (i7-12700H, RTX 3060) (AV Pro SD microSD 128 GB V60) | |
| Schenker Vision 16 Pro RTX 3070 Ti (AV Pro V60) | |
Comunicazione
Asus utilizza il modulo Intel AX211, che supporta anche la rete a 6 Ghz. Rispetto al modulo MediaTek del predecessore, le velocità di trasferimento aumentano notevolmente. Le prestazioni sono molto costanti.
Webcam


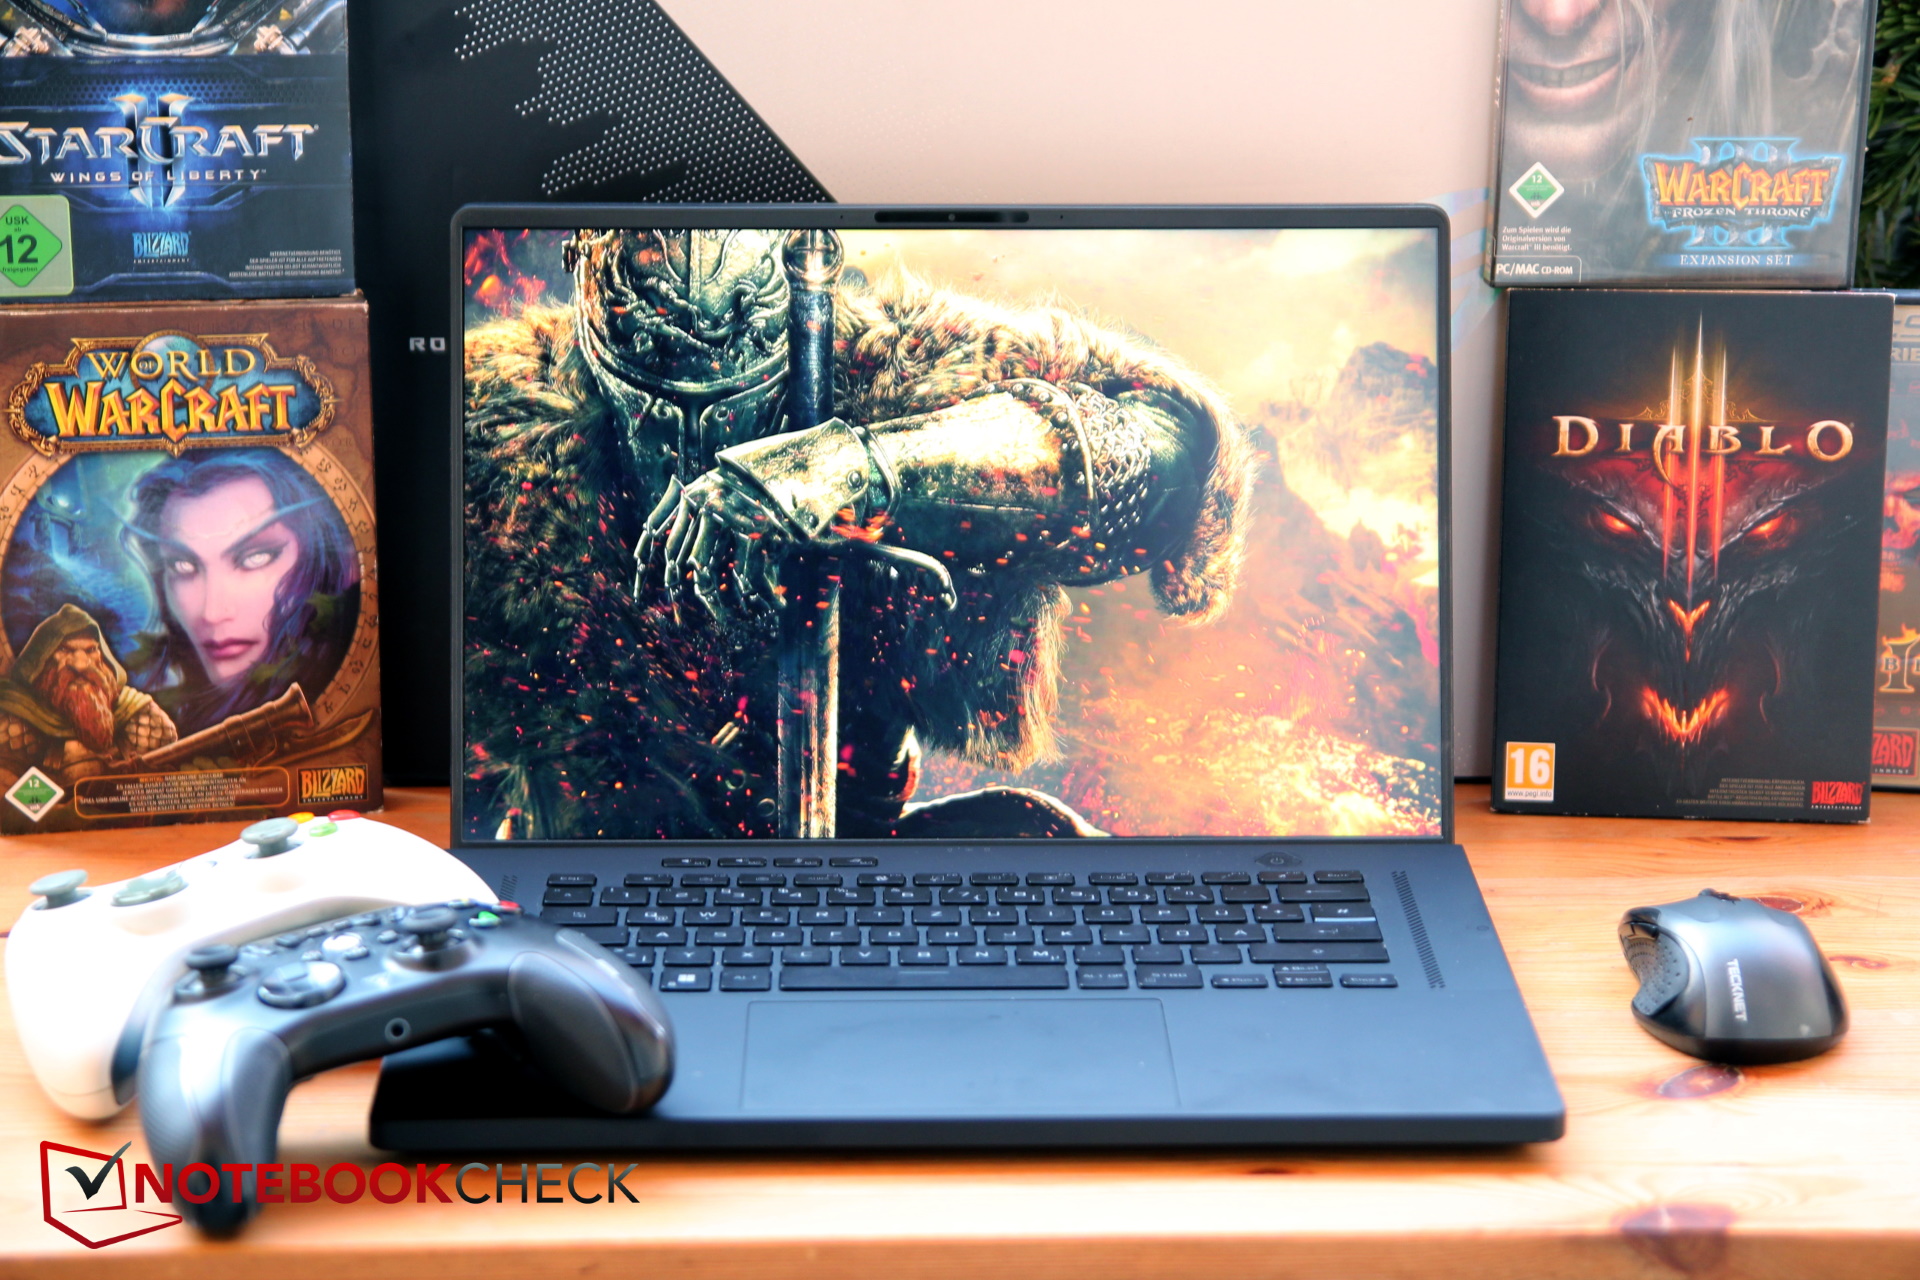
Display - 16 pollici con risoluzione QHD+ e 165 Hz
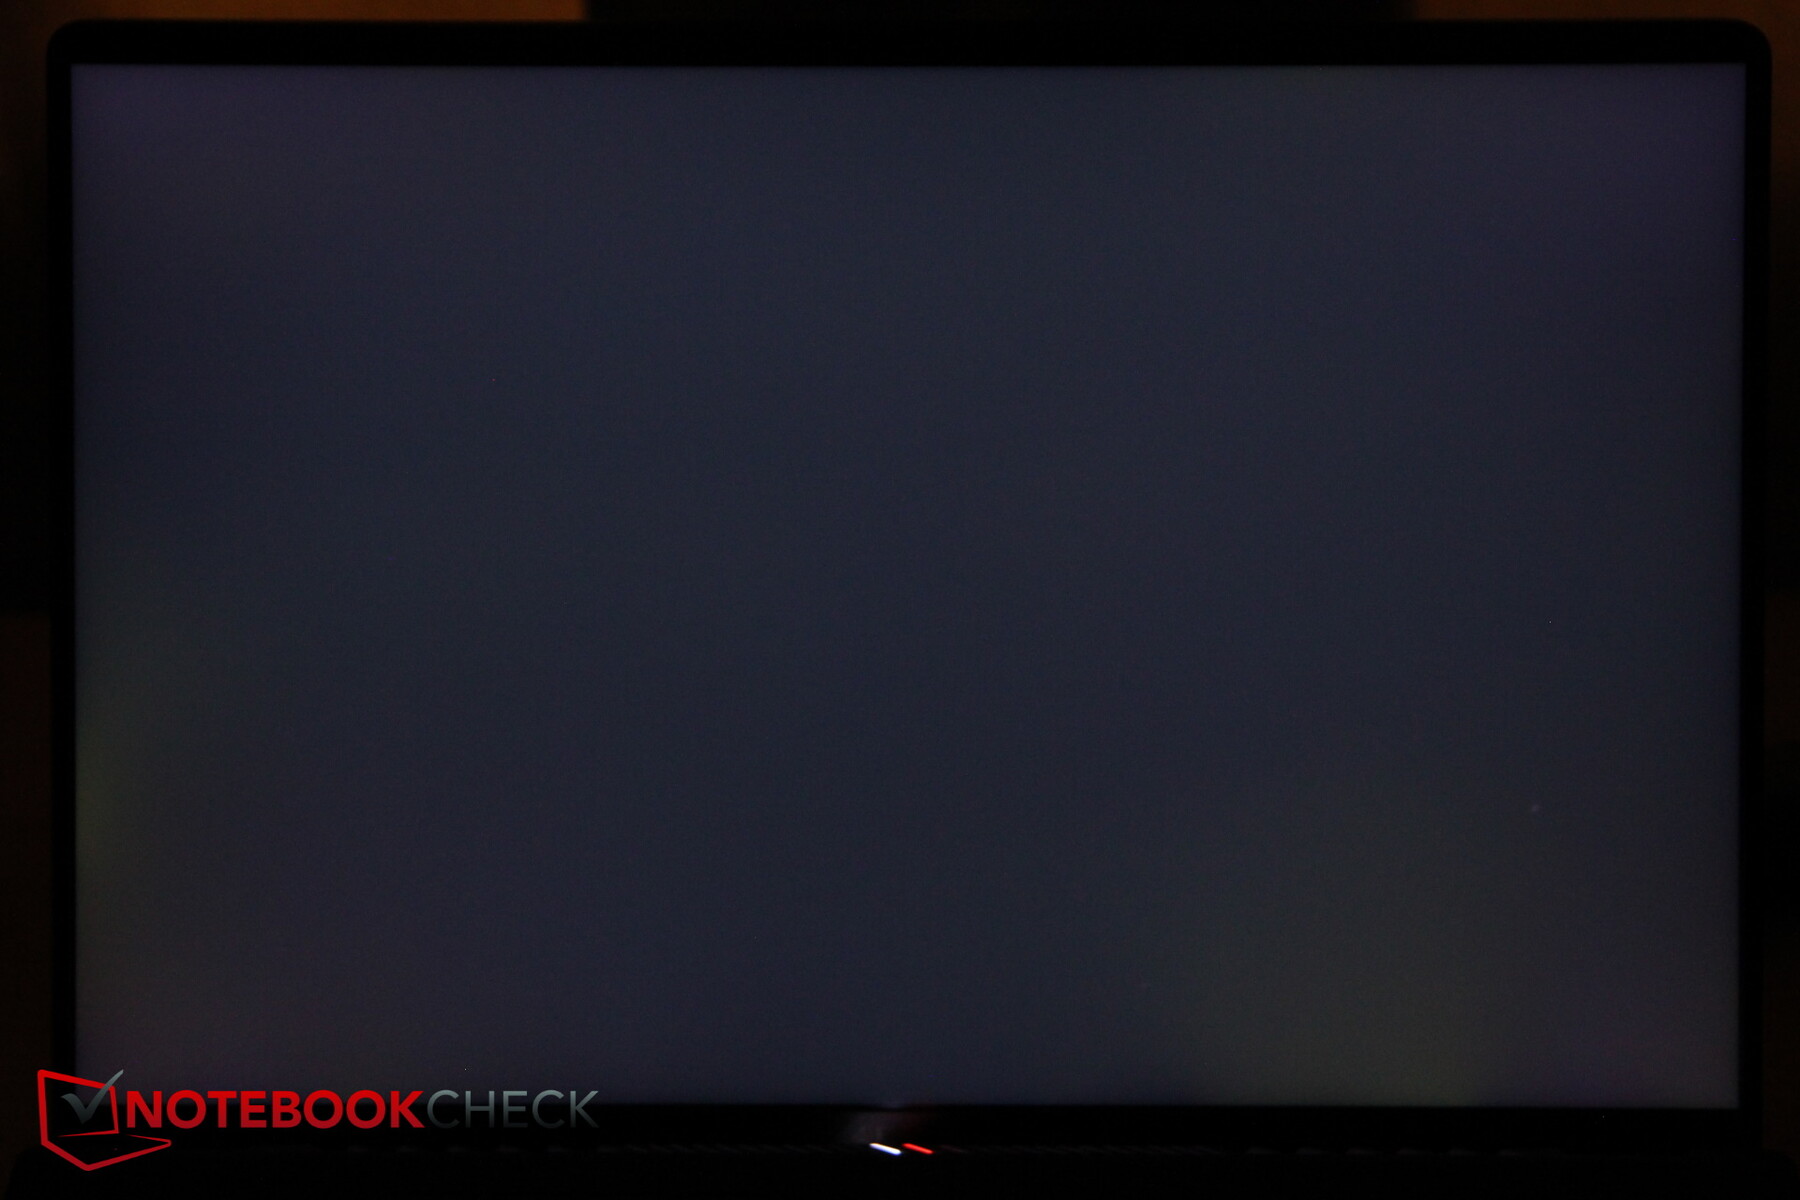
Anche se condivide le stesse specifiche di base (16 pollici, IPS, 16:10, 2.560 x 1.600, 165 Hz) con il predecessore, Asus utilizza ora un pannello diverso. Invece di utilizzare un pannello di AU Optronics, questa volta lo utilizza BOE. Sebbene il pannello sia leggermente più luminoso (481 nits), la distribuzione della luminosità è più disomogenea e la luminosità diminuisce notevolmente soprattutto verso l'angolo inferiore sinistro. Grazie a un valore del nero notevolmente migliorato, il valore del contrasto aumenta positivamente.
I tempi di risposta sono relativamente rapidi, anche se in questo caso il predecessore rispondeva ancora più velocemente. Il PWM non viene utilizzato per il controllo della luminosità e un leggero bleeding dello schermo è evidente solo nelle scene scure.
| |||||||||||||||||||||||||
Distribuzione della luminosità: 82 %
Al centro con la batteria: 484 cd/m²
Contrasto: 2367:1 (Nero: 0.21 cd/m²)
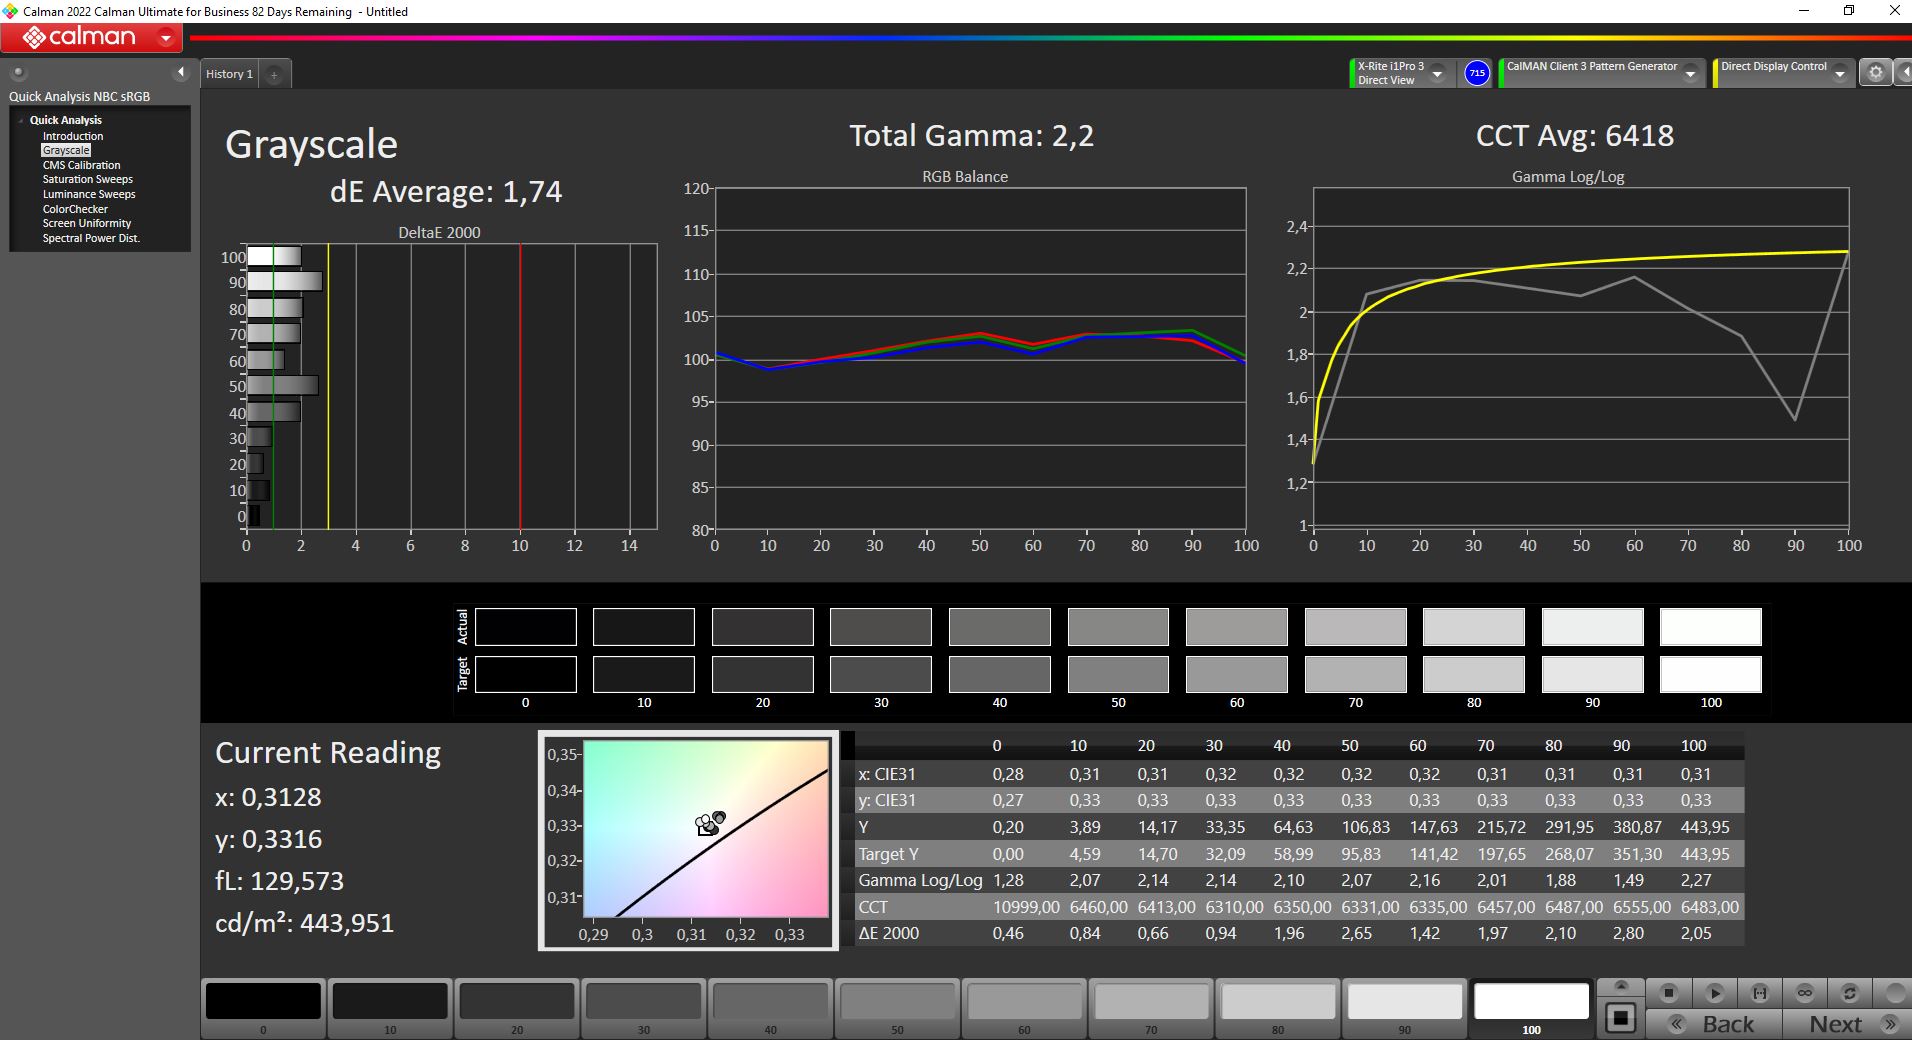
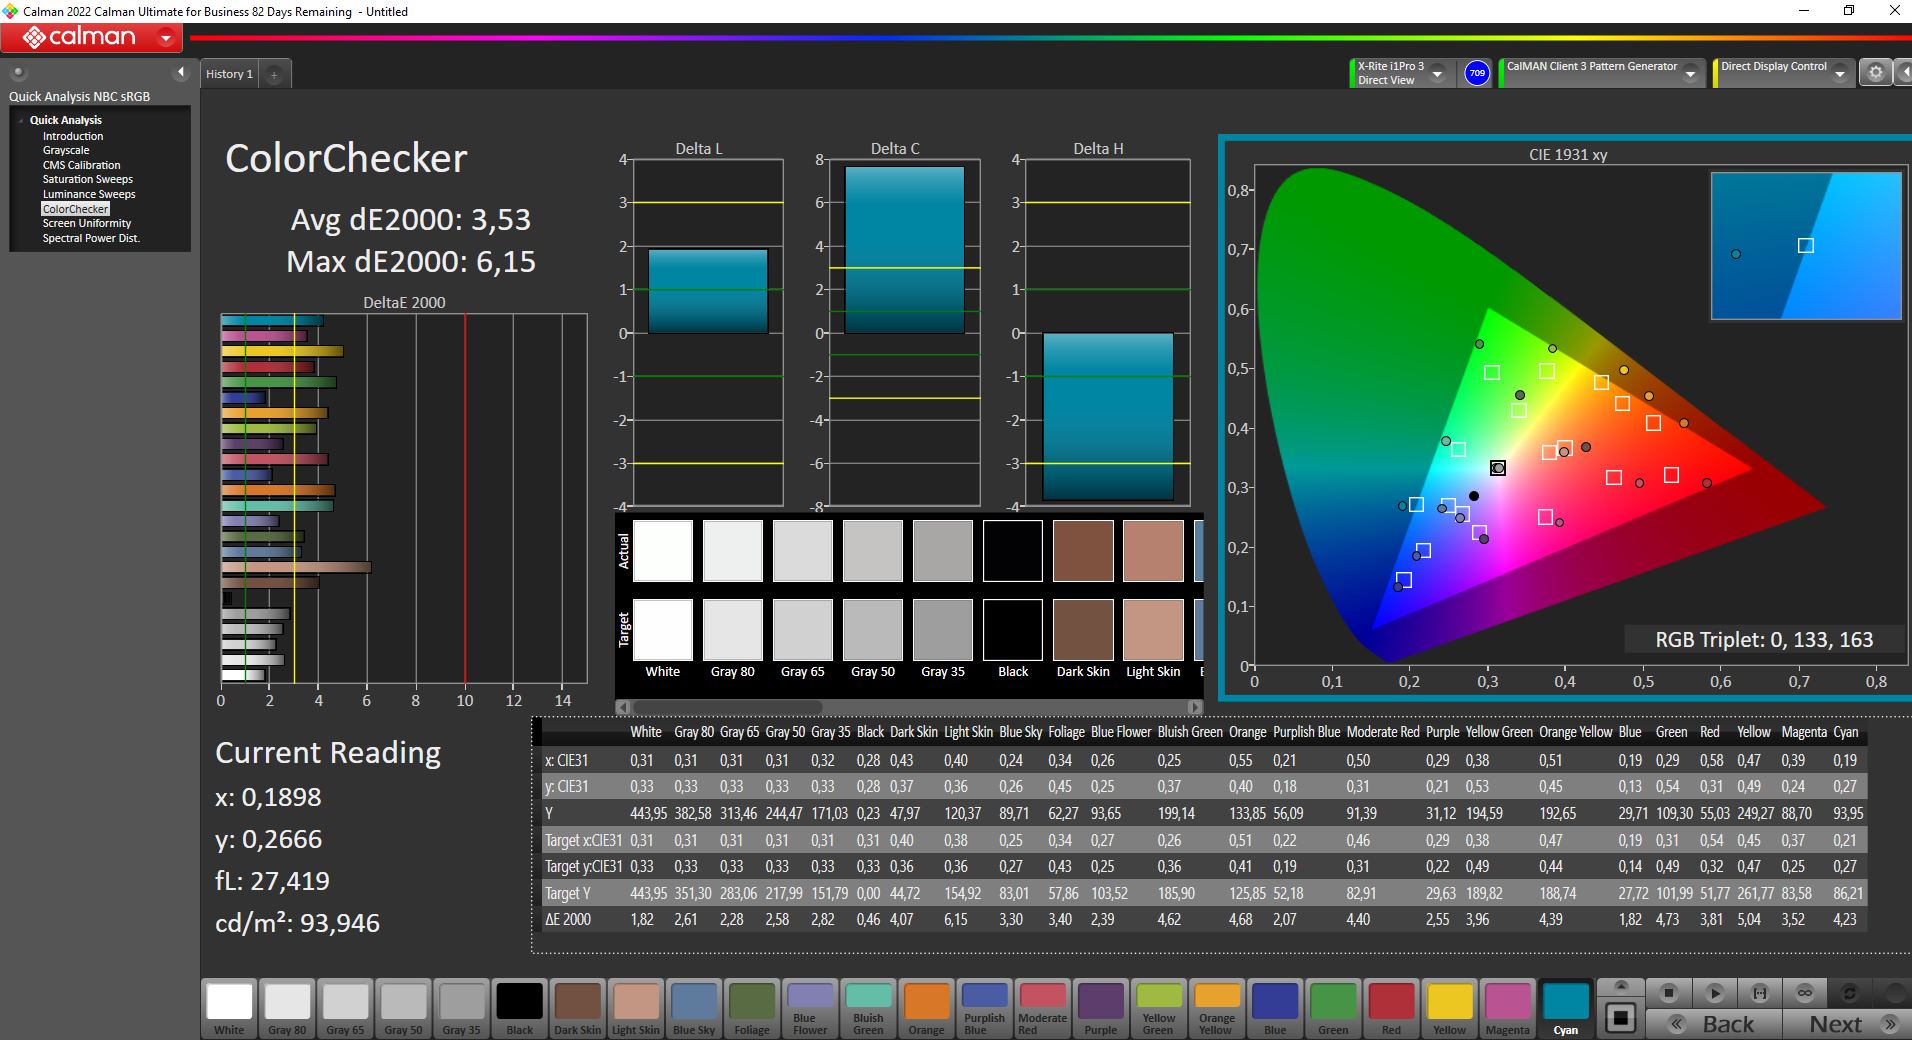
ΔE ColorChecker Calman: 3.53 | ∀{0.5-29.43 Ø4.71}
calibrated: 3.53
ΔE Greyscale Calman: 1.74 | ∀{0.09-98 Ø4.96}
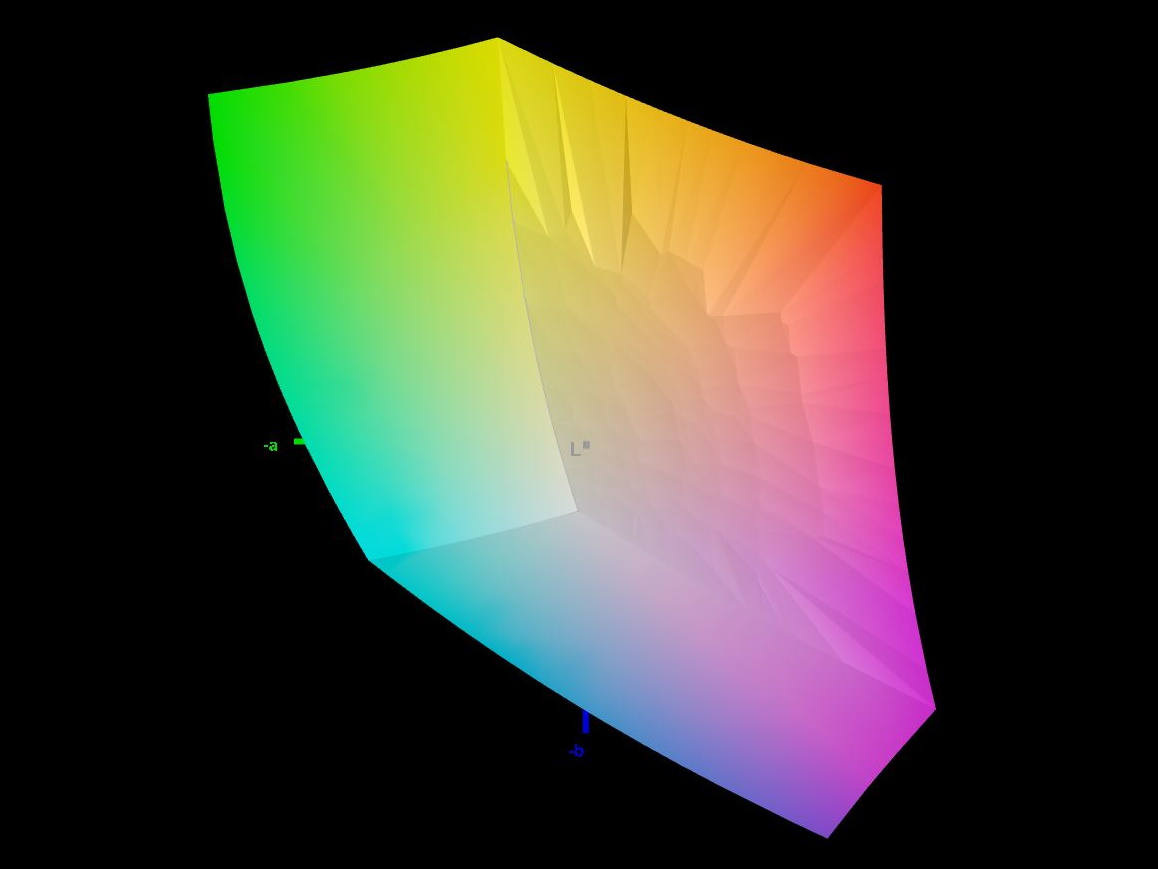
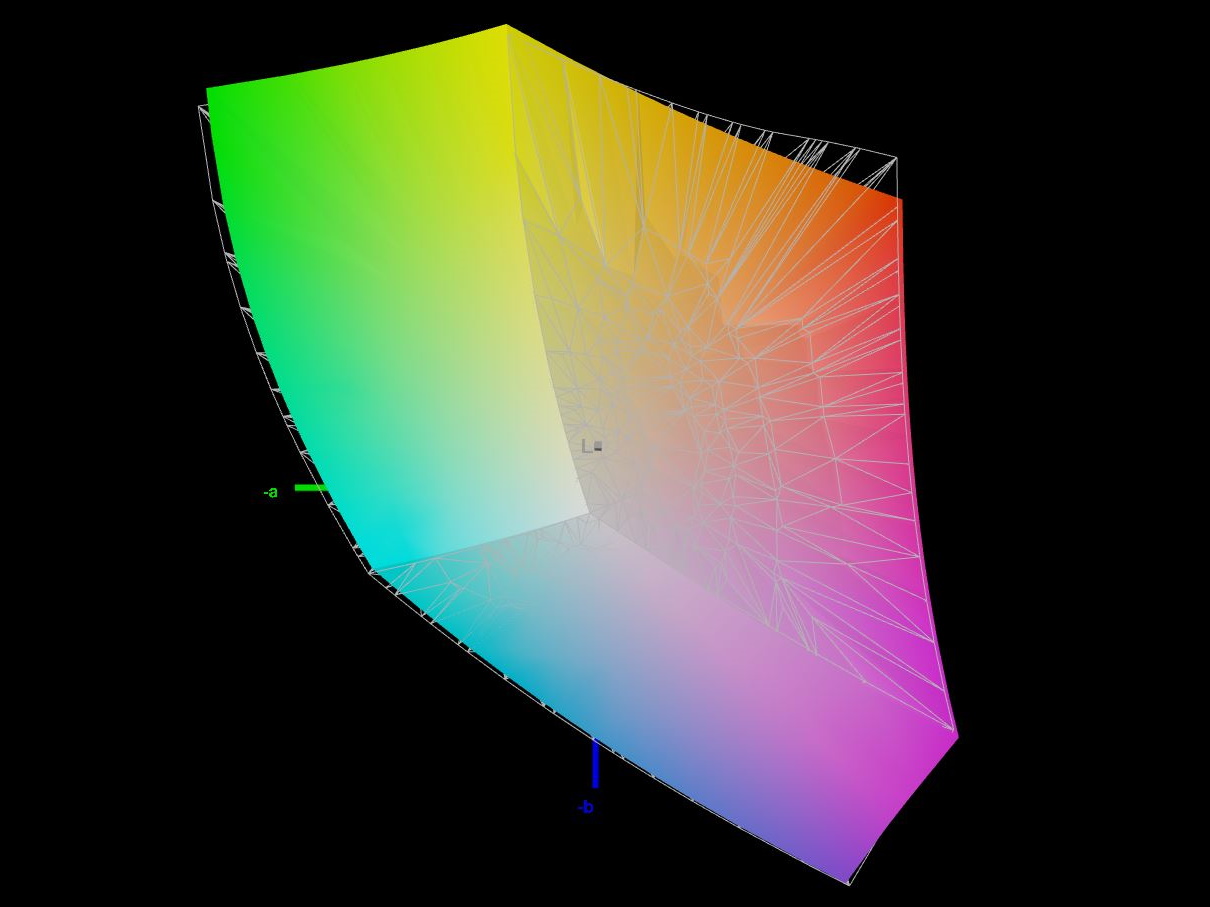
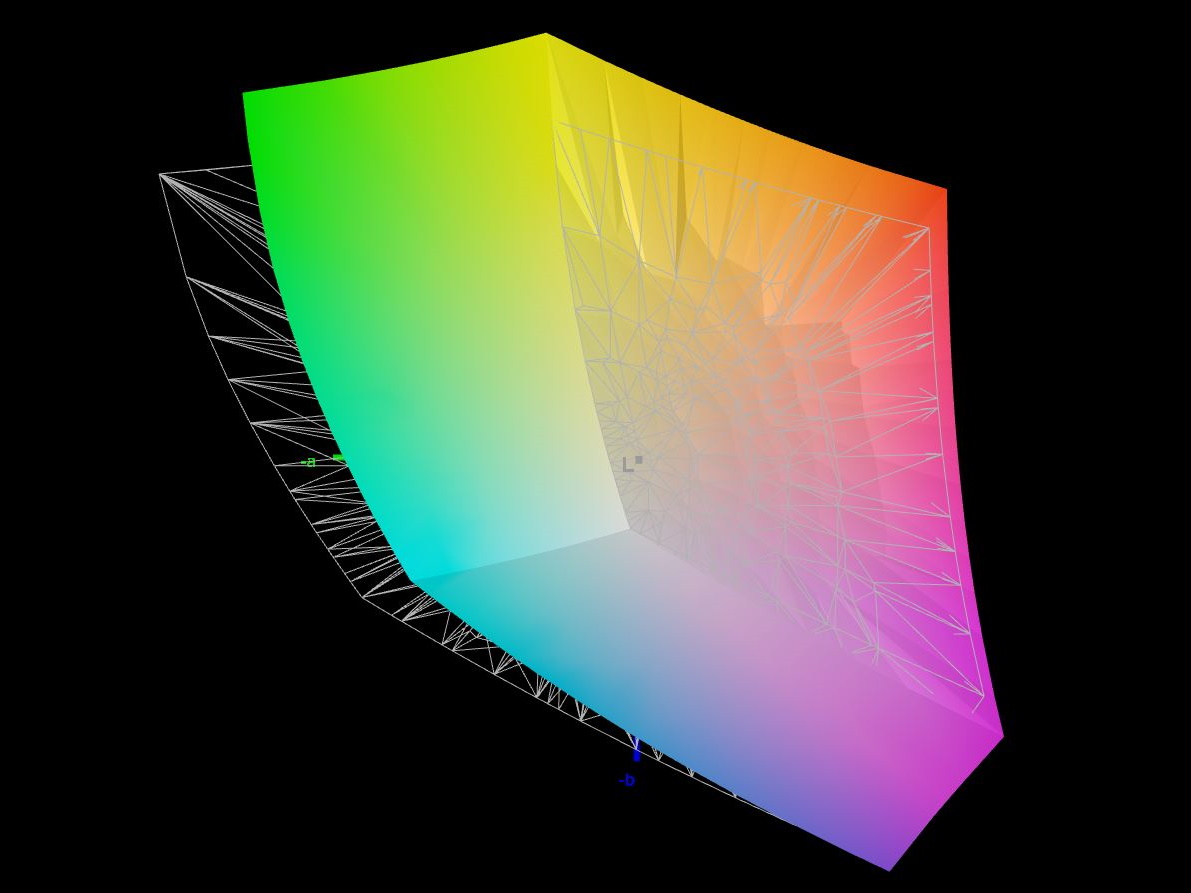
83.1% AdobeRGB 1998 (Argyll 3D)
98.5% sRGB (Argyll 3D)
92.8% Display P3 (Argyll 3D)
Gamma: 2.2
CCT: 6418 K
| Asus ROG Zephyrus M16 GU603Z BOE0A0B (BOE CQ NE160QDM-NY3), IPS, 2560x1600, 16" | Asus ROG Zephyrus M16 GU603H AU Optronics AUOC199, IPS, 2560x1600, 16" | Schenker Vision 16 Pro RTX 3070 Ti N160QDM-NZ1, IPS, 2560x1600, 16" | Lenovo Legion 5 Pro 16ARH7H RTX 3070 Ti BOE CQ NE160QDM-NY1, IPS, 2560x1600, 16" | Schenker XMG Focus 16 (i7-12700H, RTX 3060) BOE NE16oQDM-NY1, IPS, 2560x1600, 16" | Corsair Voyager a1600 BOE0A3B, IPS, 2560x1600, 16" | |
|---|---|---|---|---|---|---|
| Display | -15% | -15% | -14% | -14% | ||
| Display P3 Coverage (%) | 92.8 | 68.7 -26% | 67.3 -27% | 68.3 -26% | 68.7 -26% | |
| sRGB Coverage (%) | 98.5 | 96.7 -2% | 96.1 -2% | 96.6 -2% | 98.2 0% | |
| AdobeRGB 1998 Coverage (%) | 83.1 | 70 -16% | 69.5 -16% | 70.6 -15% | 70.1 -16% | |
| Response Times | 39% | -37% | -51% | -62% | -36% | |
| Response Time Grey 50% / Grey 80% * (ms) | 7.6 ? | 4.8 ? 37% | 14.3 ? -88% | 14.4 ? -89% | 16.4 ? -116% | 13 ? -71% |
| Response Time Black / White * (ms) | 10 ? | 6 ? 40% | 8.6 ? 14% | 11.2 ? -12% | 10.8 ? -8% | 10 ? -0% |
| PWM Frequency (Hz) | ||||||
| Screen | -28% | -34% | -11% | -40% | -21% | |
| Brightness middle (cd/m²) | 497 | 448 -10% | 364 -27% | 522.8 5% | 460 -7% | 355 -29% |
| Brightness (cd/m²) | 481 | 446 -7% | 347 -28% | 503 5% | 442 -8% | 340 -29% |
| Brightness Distribution (%) | 82 | 86 5% | 89 9% | 84 2% | 89 9% | 91 11% |
| Black Level * (cd/m²) | 0.21 | 0.48 -129% | 0.3 -43% | 0.41 -95% | 0.32 -52% | 0.53 -152% |
| Contrast (:1) | 2367 | 933 -61% | 1213 -49% | 1275 -46% | 1438 -39% | 670 -72% |
| Colorchecker dE 2000 * | 3.53 | 2.76 22% | 3.3 7% | 2.47 30% | 3.65 -3% | 2.43 31% |
| Colorchecker dE 2000 max. * | 6.15 | 7.09 -15% | 6.6 -7% | 6.56 -7% | 7.49 -22% | 4.31 30% |
| Colorchecker dE 2000 calibrated * | 3.53 | 2.86 19% | 2.5 29% | 0.61 83% | 3.65 -3% | 1.14 68% |
| Greyscale dE 2000 * | 1.74 | 3.1 -78% | 5.2 -199% | 3 -72% | 5.87 -237% | 2.62 -51% |
| Gamma | 2.2 100% | 2.153 102% | 2.14 103% | 2.27 97% | 2.42 91% | 2.28 96% |
| CCT | 6418 101% | 6826 95% | 6331 103% | 6719 97% | 6711 97% | 6909 94% |
| Color Space (Percent of AdobeRGB 1998) (%) | 87 | |||||
| Color Space (Percent of sRGB) (%) | 100 | |||||
| Media totale (Programma / Settaggio) | 6% /
-16% | -29% /
-30% | -26% /
-17% | -39% /
-38% | -24% /
-22% |
* ... Meglio usare valori piccoli
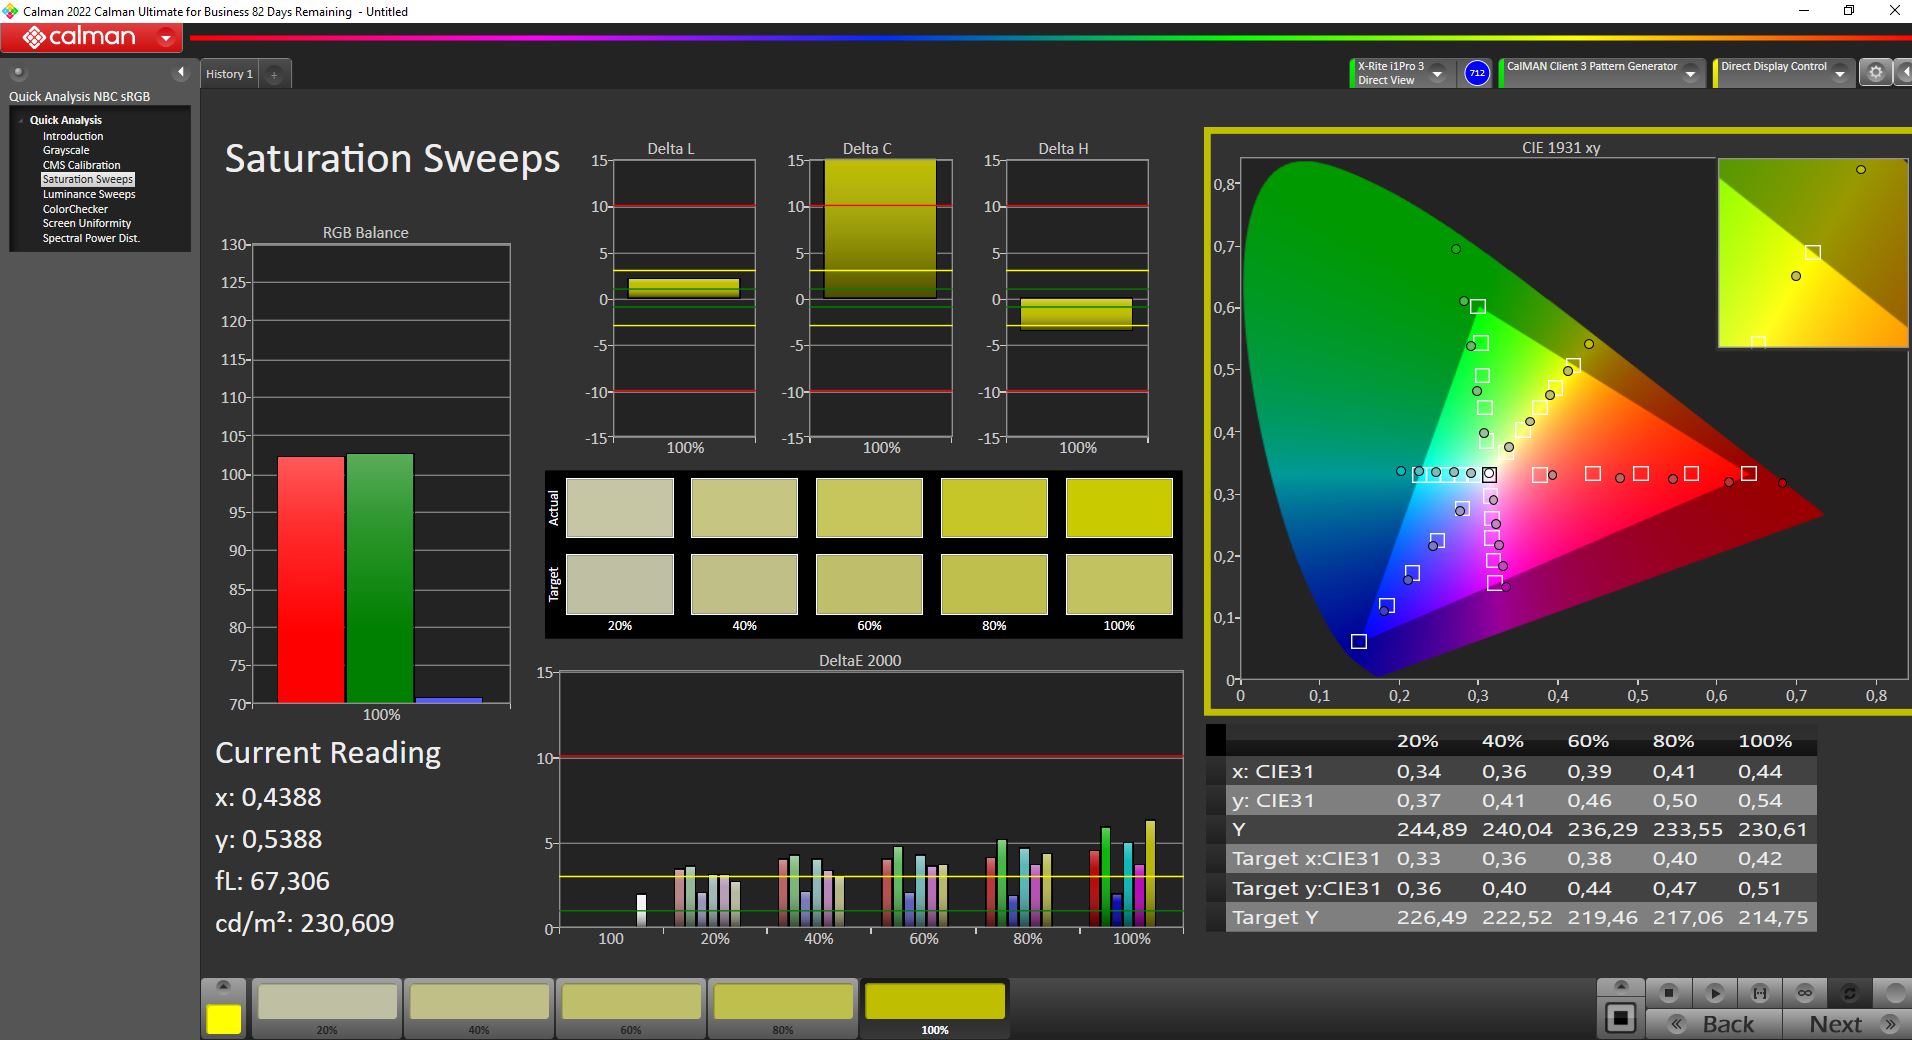
Asus pubblicizza una copertura del 100% dello spazio colore DCI-P3, ma noi misuriamo "solo" il 92,8%. Lo spazio colore AdobeRGB è ancora coperto all'83%. Almeno nel campo di prova dei nostri concorrenti selezionati, questo risulta ancora in prima posizione. Nel complesso, il display è adatto anche per l'editing professionale di immagini e video.
In fase di consegna, il pannello è già ben calibrato. Con solo 1,74, il valore DeltaE della scala di grigi è particolarmente basso. Nel ColorChecker, il nostro strumento di calibrazione del colore Portrait Display Calman misura deviazioni leggermente superiori. Un'ulteriore calibrazione non migliora ulteriormente questi valori, ma piuttosto incasina la scala di grigi che è già molto buona.
Tempi di risposta del Display
| ↔ Tempi di risposta dal Nero al Bianco | ||
|---|---|---|
| 10 ms ... aumenta ↗ e diminuisce ↘ combinato | ↗ 4.6 ms Incremento | 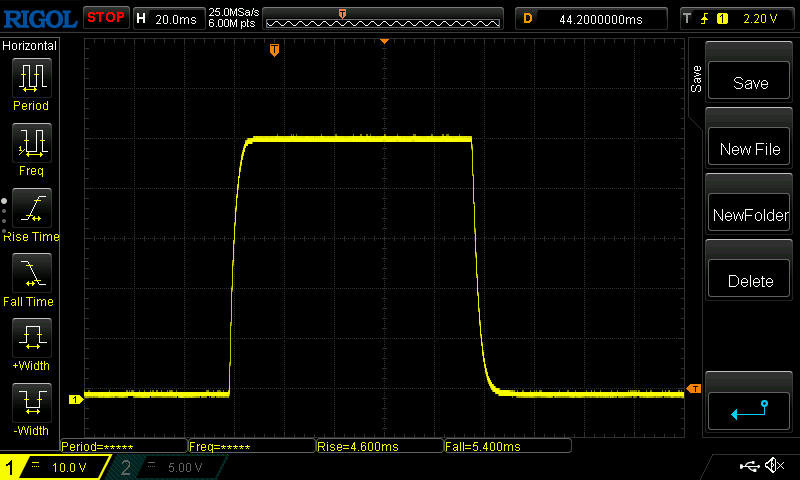 |
| ↘ 5.4 ms Calo | ||
| Lo schermo mostra buoni tempi di risposta durante i nostri tests, ma potrebbe essere troppo lento per i gamers competitivi. In confronto, tutti i dispositivi di test variano da 0.1 (minimo) a 240 (massimo) ms. » 27 % di tutti i dispositivi è migliore. Questo significa che i tempi di risposta rilevati sono migliori rispettto alla media di tutti i dispositivi testati (19.8 ms). | ||
| ↔ Tempo di risposta dal 50% Grigio all'80% Grigio | ||
| 7.6 ms ... aumenta ↗ e diminuisce ↘ combinato | ↗ 3.4 ms Incremento | 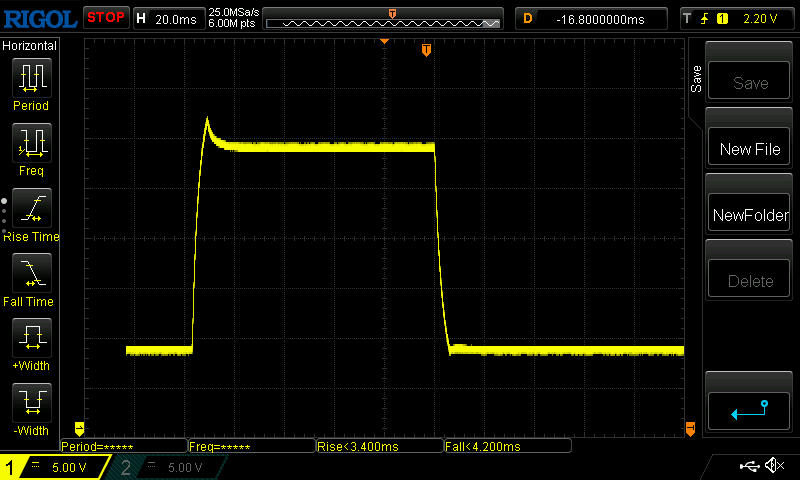 |
| ↘ 4.2 ms Calo | ||
| Lo schermo ha mostrato valori di risposta molto veloci nei nostri tests ed è molto adatto per i gaming veloce. In confronto, tutti i dispositivi di test variano da 0.165 (minimo) a 636 (massimo) ms. » 20 % di tutti i dispositivi è migliore. Questo significa che i tempi di risposta rilevati sono migliori rispettto alla media di tutti i dispositivi testati (31 ms). | ||
Sfarfallio dello schermo / PWM (Pulse-Width Modulation)
| flickering dello schermo / PWM non rilevato | 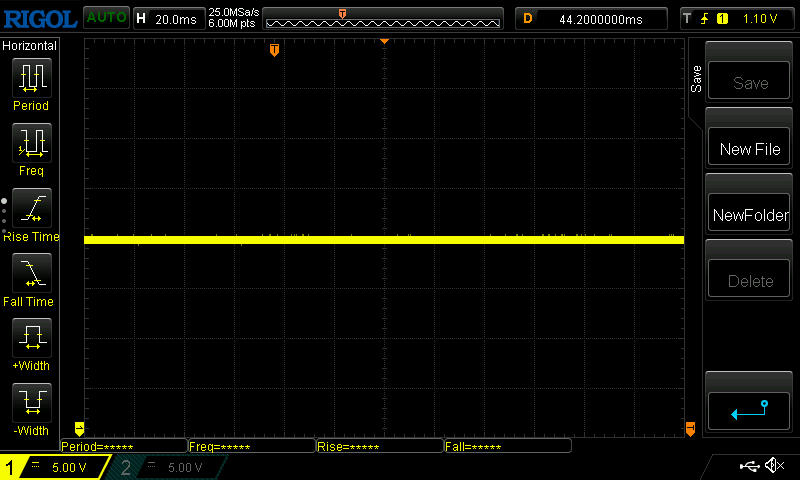 | ||
In confronto: 52 % di tutti i dispositivi testati non utilizza PWM per ridurre la luminosita' del display. Se è rilevato PWM, una media di 7747 (minimo: 5 - massimo: 343500) Hz è stata rilevata. | |||
Nonostante la buona luminosità del display, bisogna comunque evitare la luce diretta del sole all'aperto e assicurarsi di guardare lo schermo direttamente dalla parte anteriore, perché altrimenti la visibilità diminuisce rapidamente.

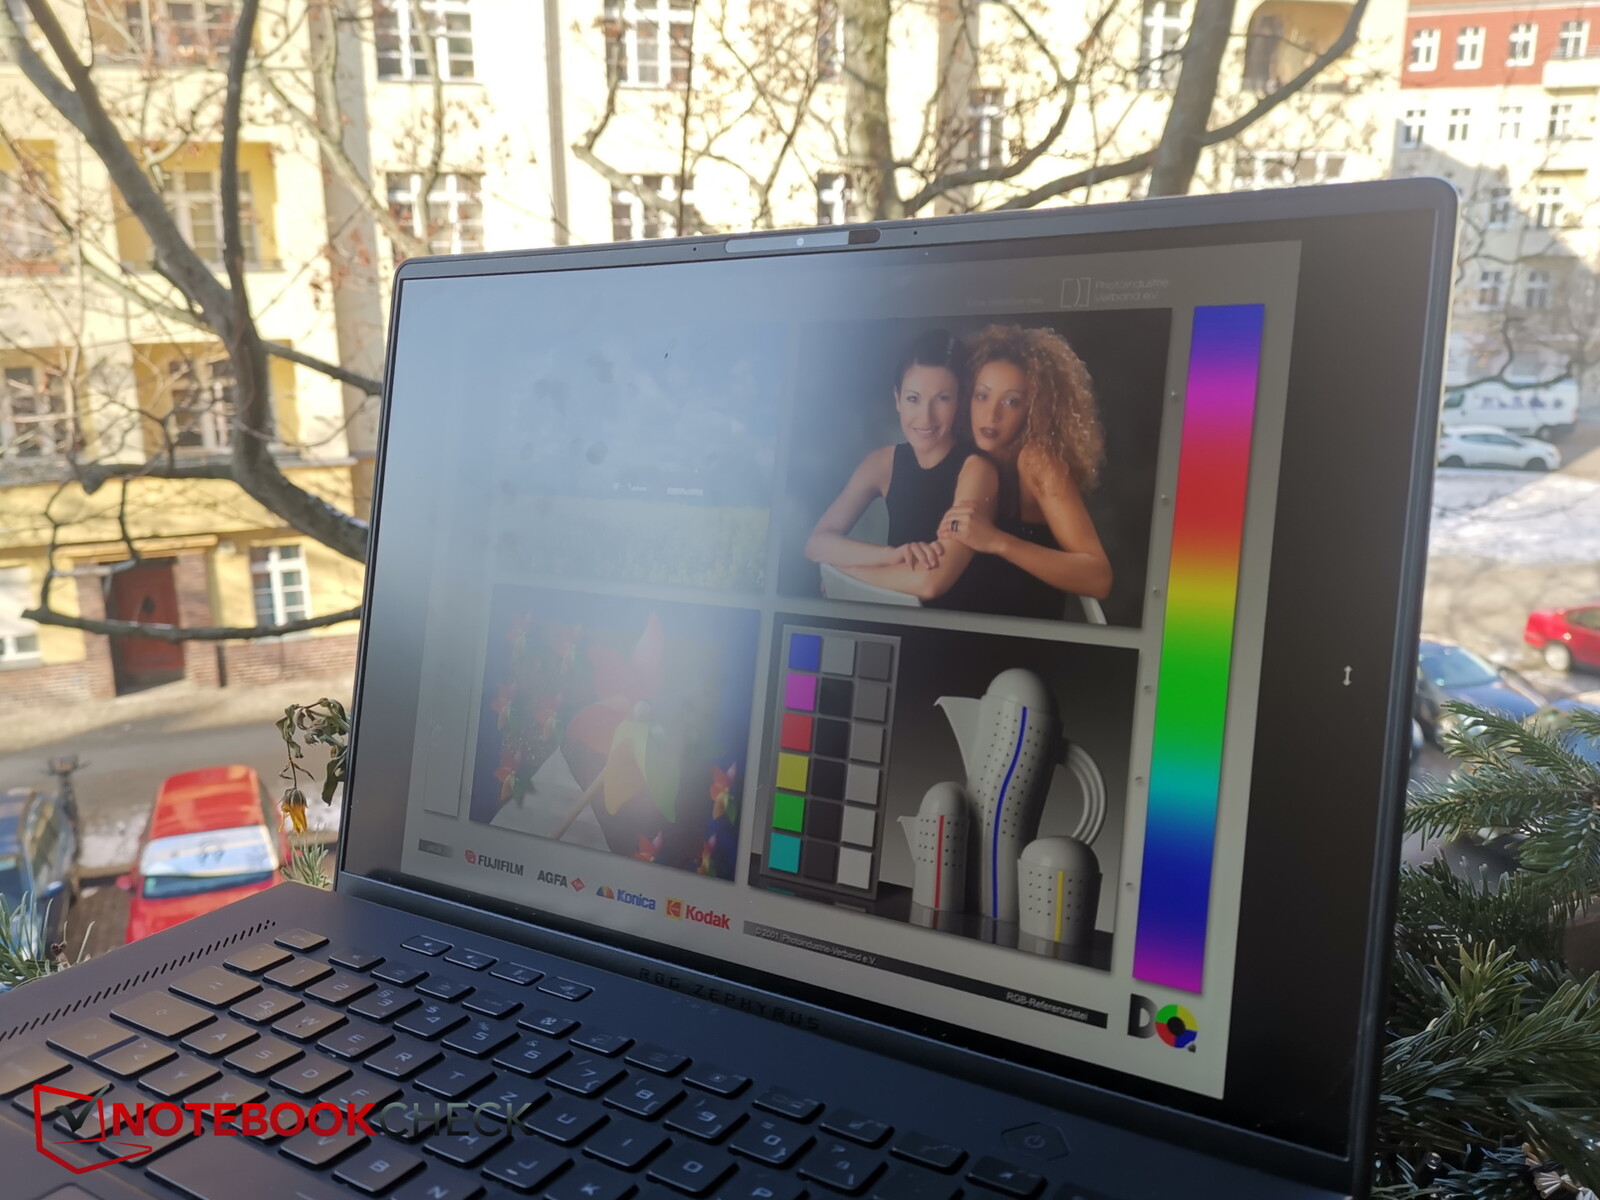
I contenuti del display possono essere letti facilmente anche da angolazioni estreme. Quando si guarda lo schermo dai lati, la luminosità è inferiore rispetto a quando si guarda dall'alto o dal basso.

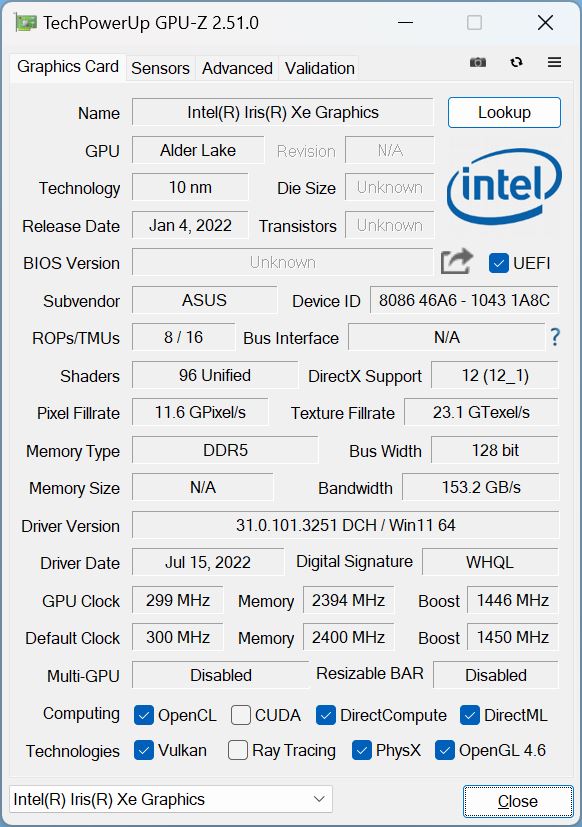
Prestazioni - RTX 3070-Ti da 120 watt leggermente sotto la media
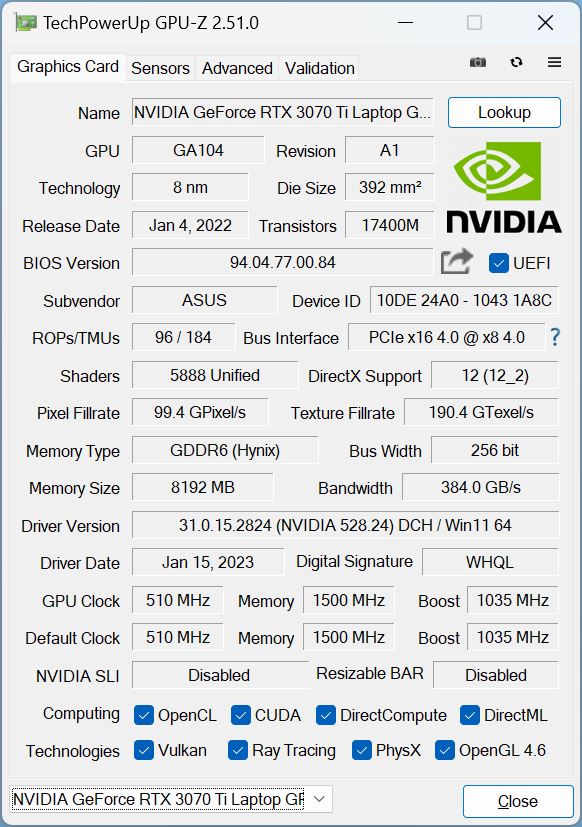
Il ROG Zephyrus è disponibile in diverse configurazioni di equipaggiamento. L'M16 dovrebbe essere presto disponibile anche con una CPU Intel di 13a generazione e RTX 40xx, mentre la nostra unità di prova utilizza ancora unCore i9-12900HeRTX 3070 Ti.
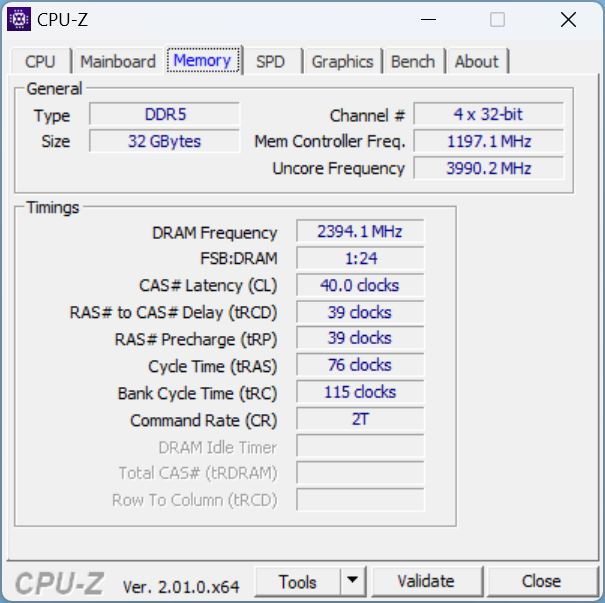
In alternativa, quasi tutto è possibile a partire dallaRTX 3050 Tifino alla RTX 3080 Ti. Per quanto riguarda il processore, attualmente è possibile scegliere tra il modello i7-12700He il nostro modello di punta. La dotazione è completata da 32 GB di RAM, ma anche qui sono disponibili numerose opzioni.
Condizioni di prova
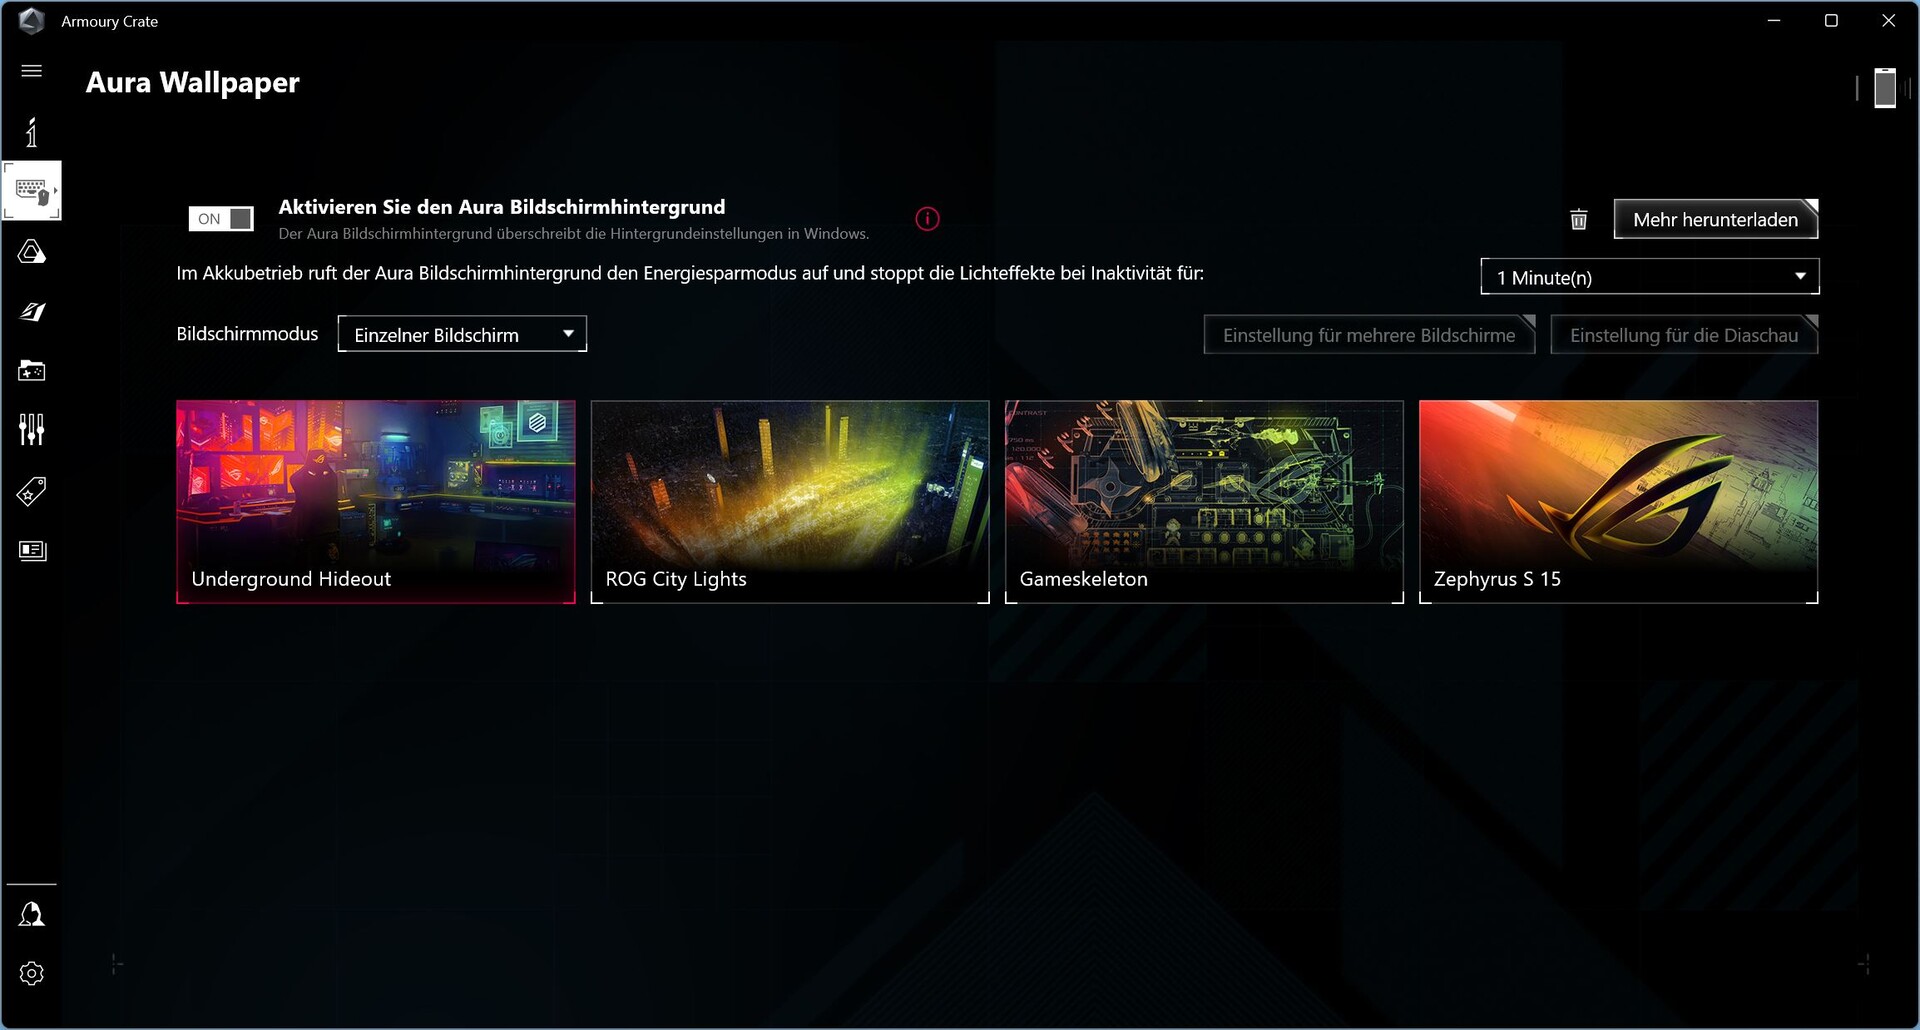
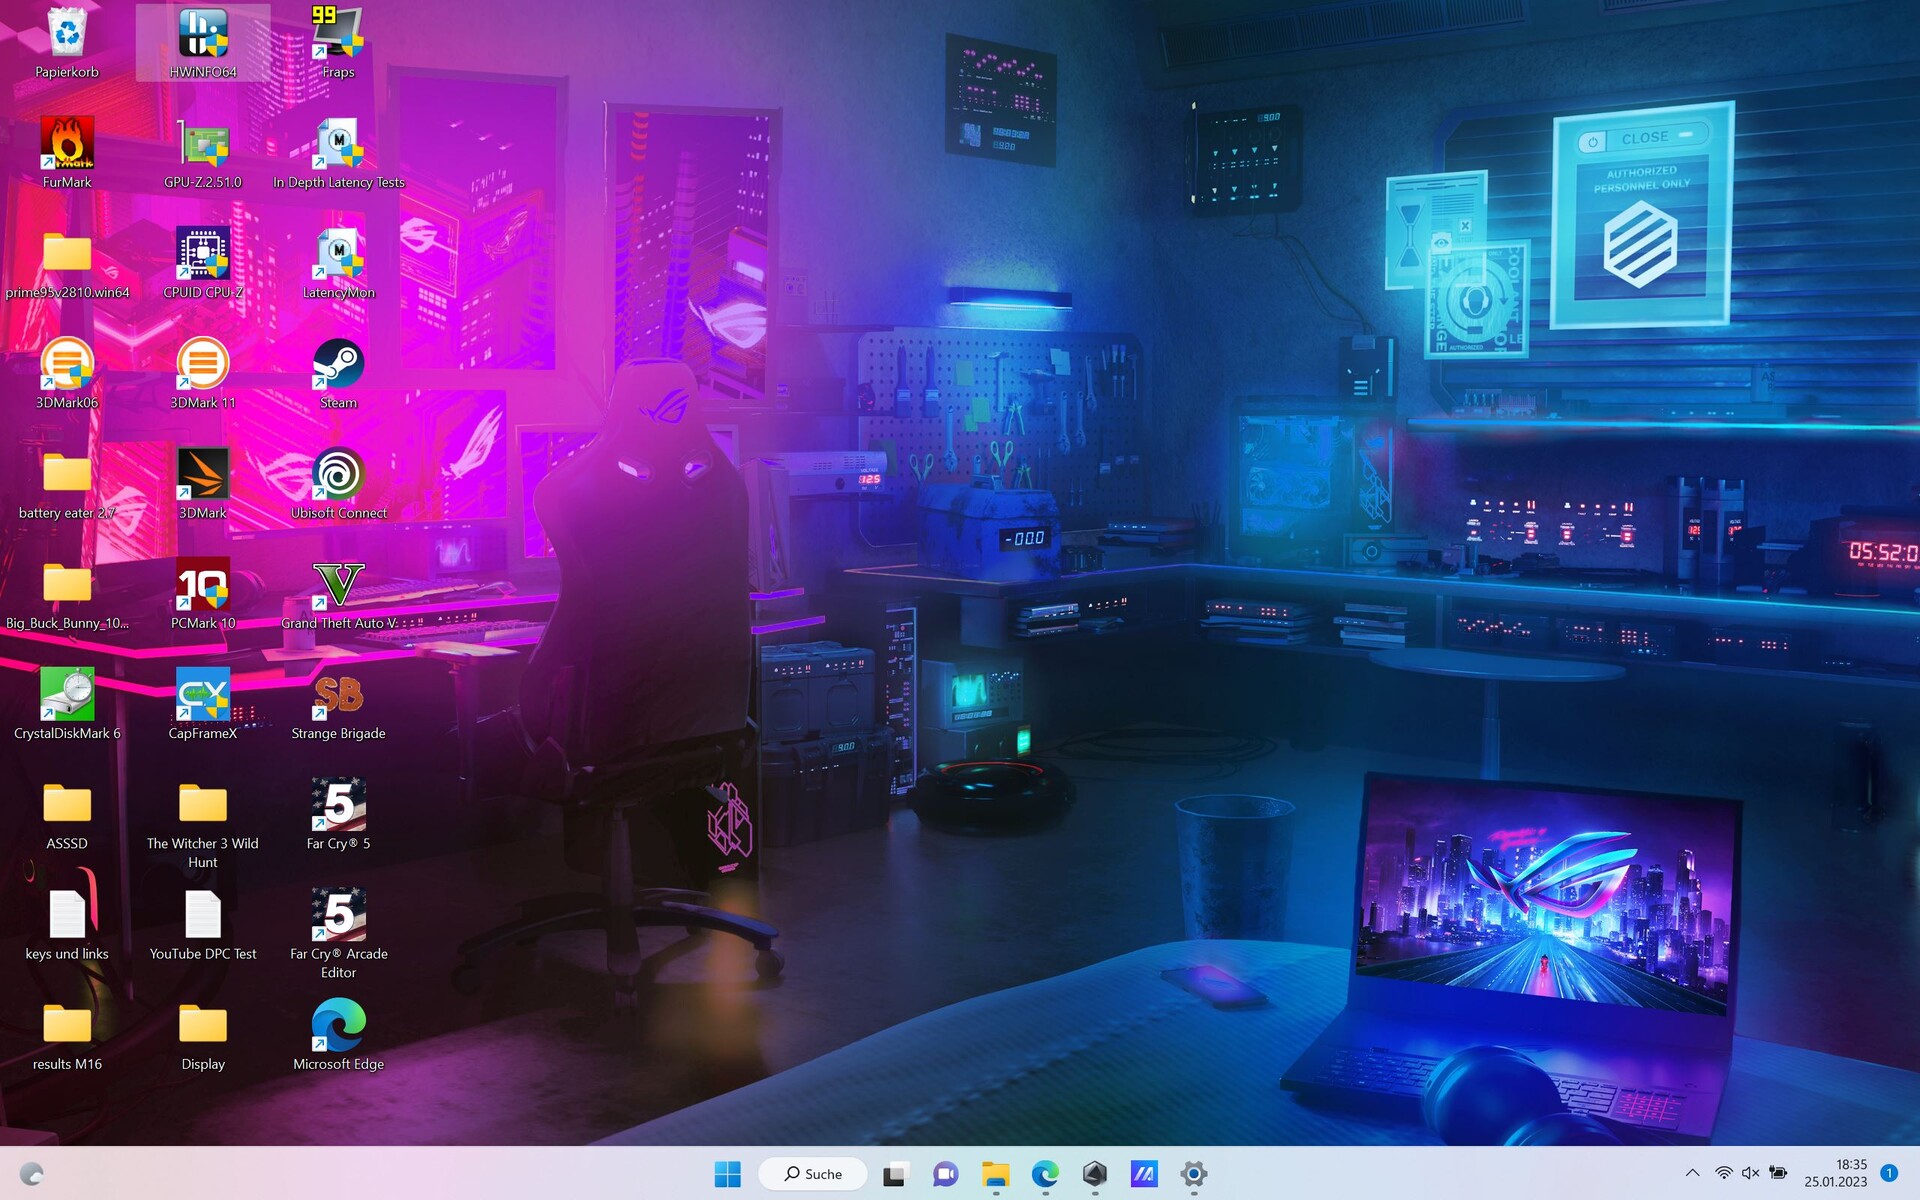
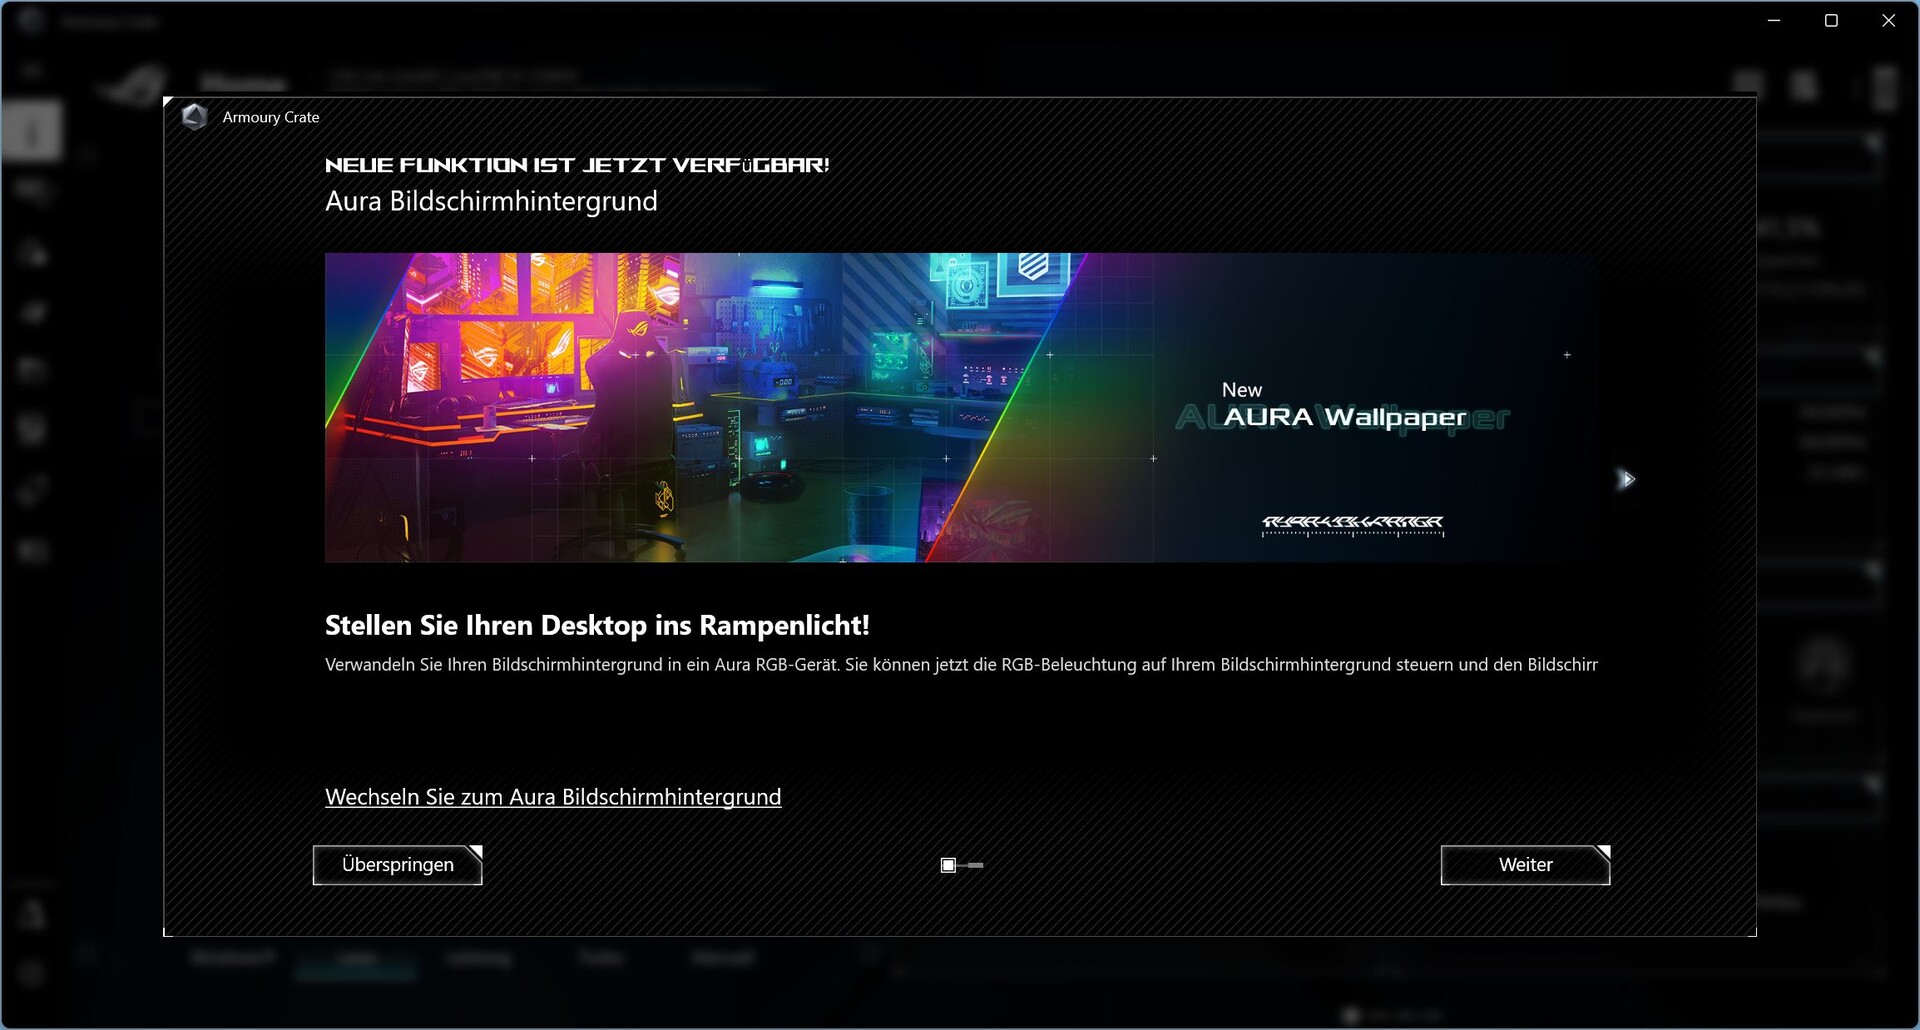
Il software Asus Armoury Crate consente di regolare varie impostazioni del portatile, per cui l'utente dovrebbe acquisire familiarità con esso. Offre la possibilità di cercare gli aggiornamenti del dispositivo, di selezionare sfondi Aura colorati e dinamici o di controllare le prestazioni.
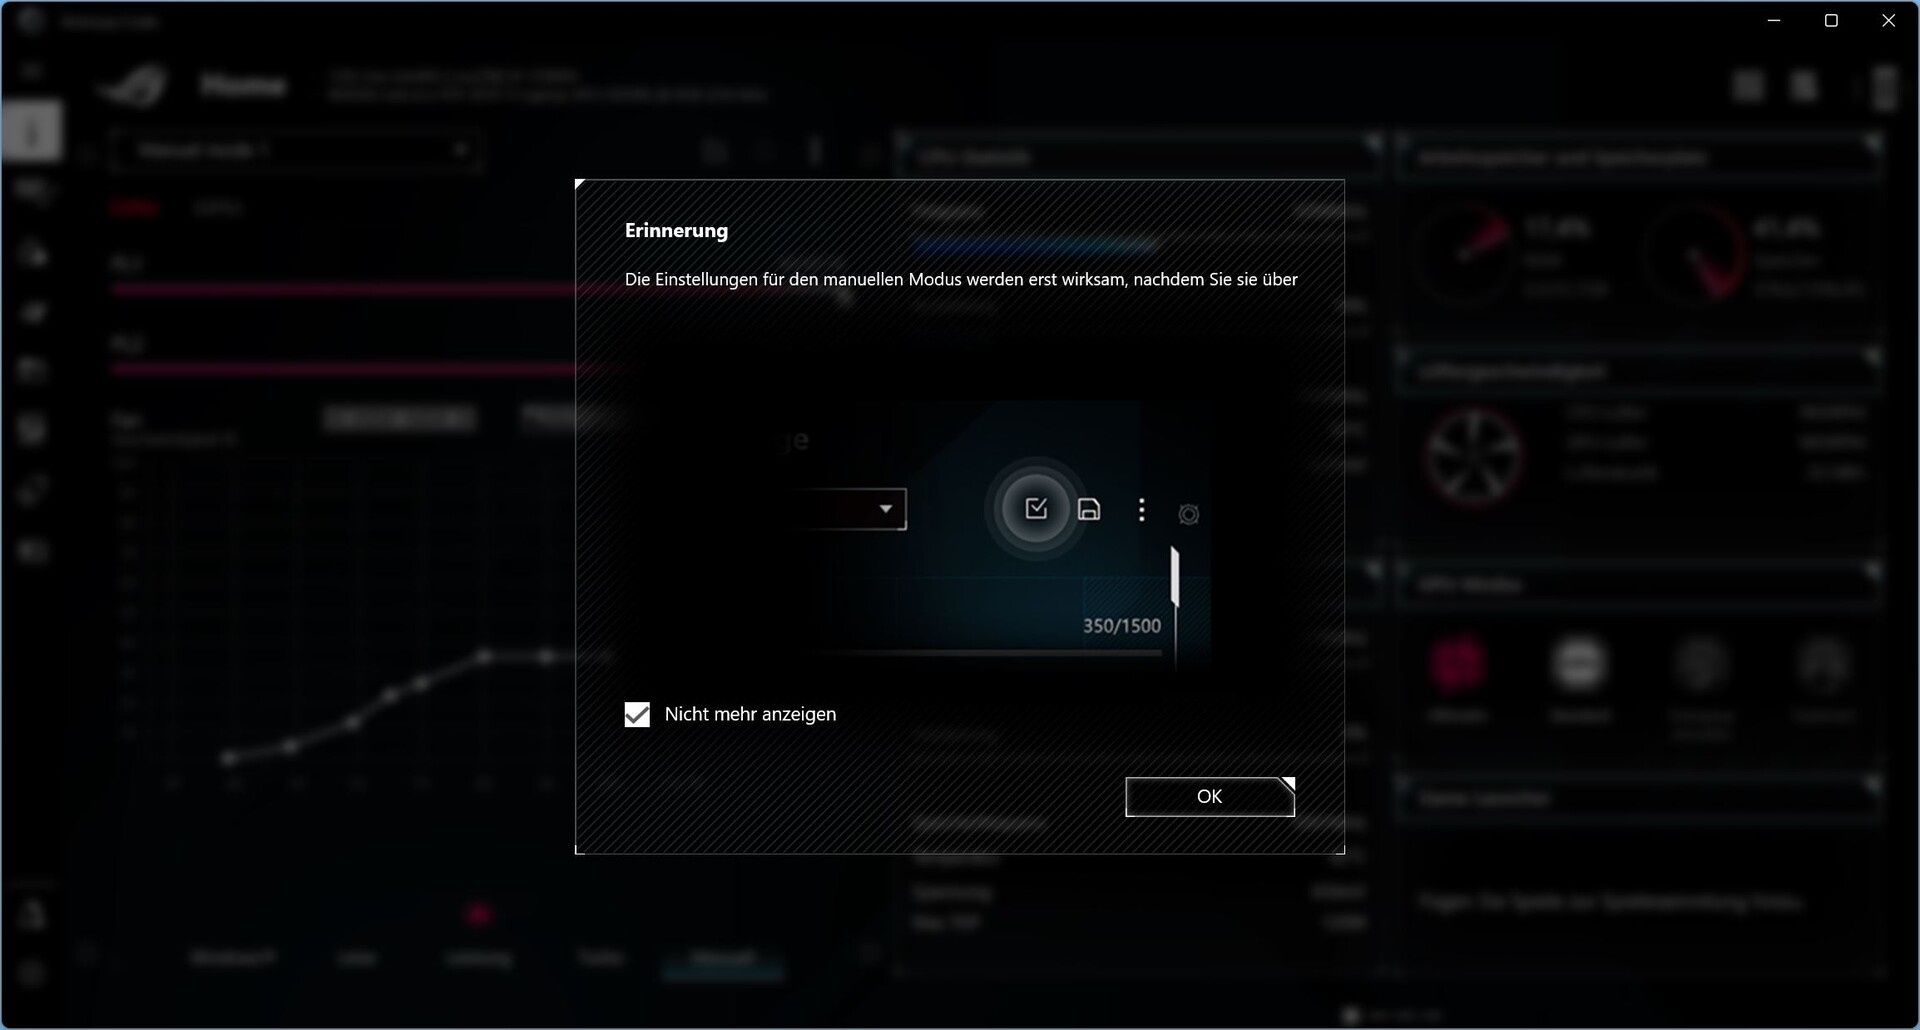
Il produttore offre tre modalità di prestazioni (Quiet, Performance e Turbo) e offre anche la possibilità di controllare le prestazioni utilizzando le modalità di prestazioni di Windows o addirittura di impostare autonomamente diversi limiti di potenza in modalità manuale, opzioni che mancano a molti altri produttori.
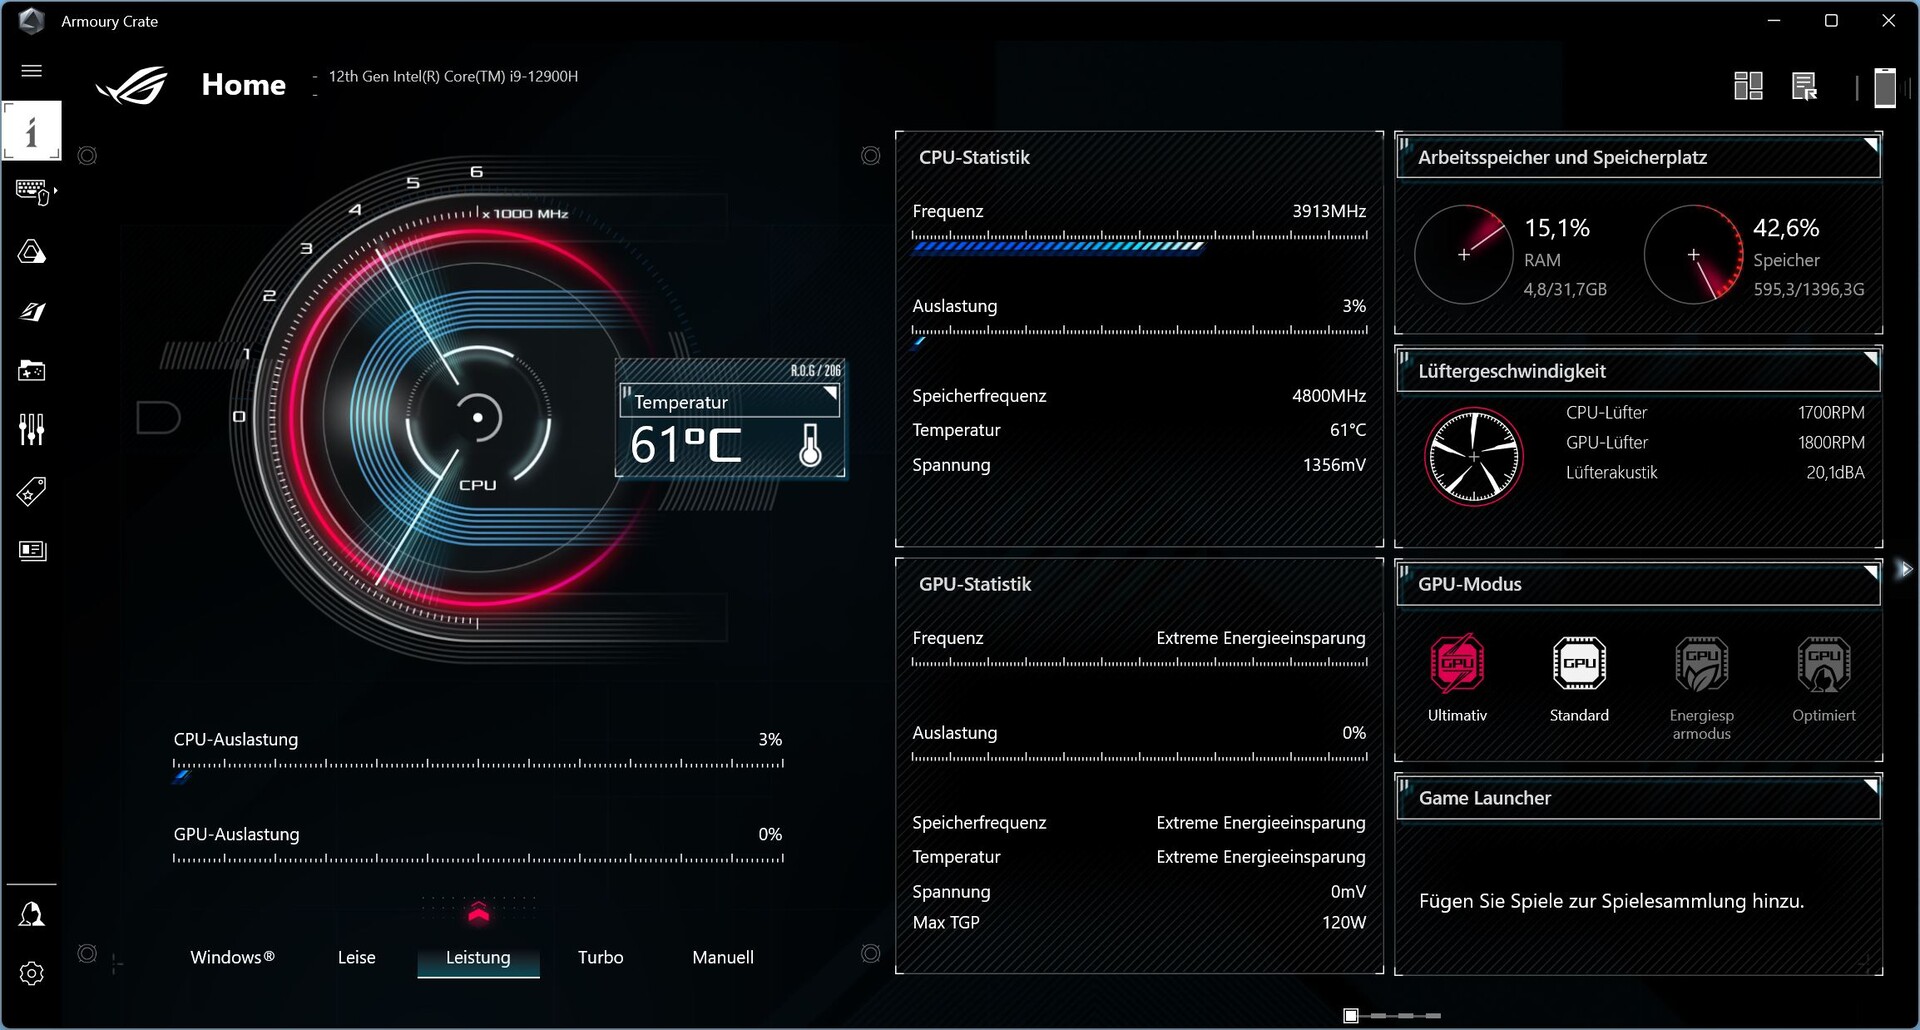
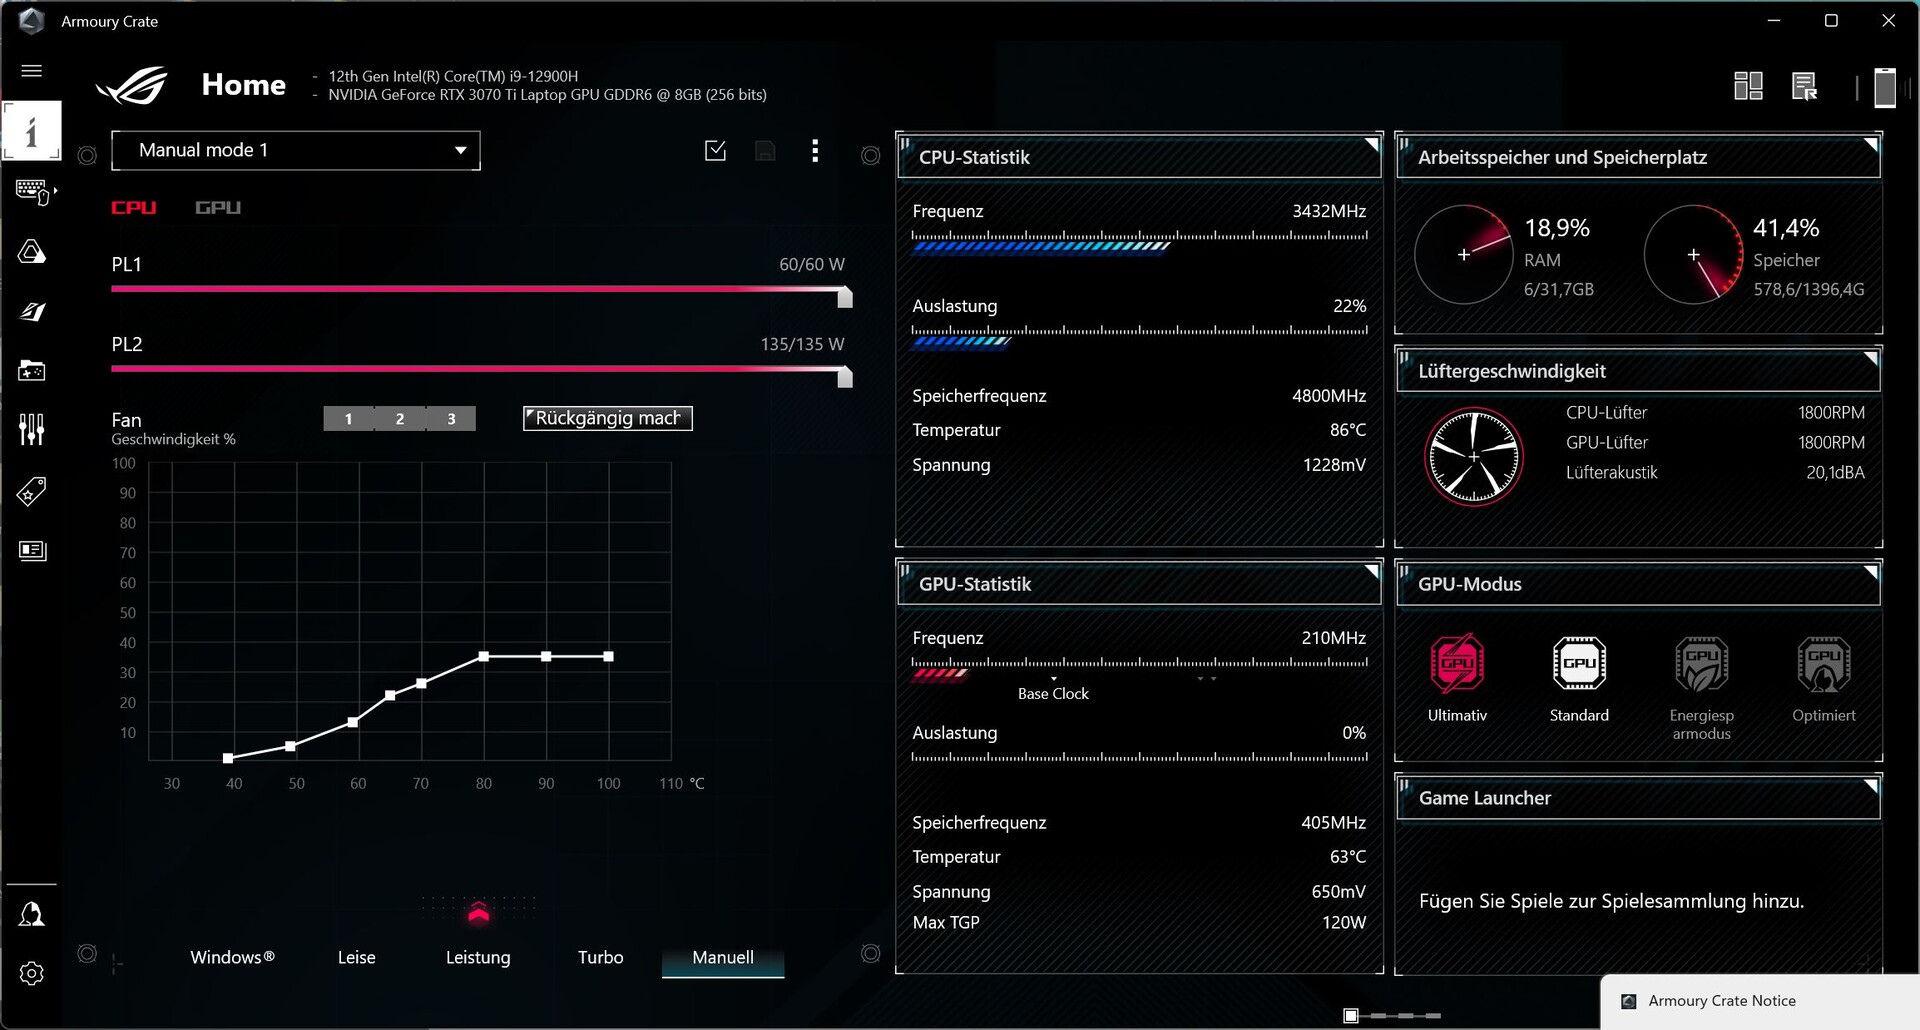
Poiché in modalità Turbo il portatile è già molto rumoroso durante il funzionamento inattivo, abbiamo eseguito tutti i benchmark in modalità "Prestazioni". La modalità "Quiet" viene utilizzata solo per i test della batteria - non esiste una modalità di risparmio energetico separata.
Anche se il software è ben organizzato, diversi errori di traduzione o frasi incomplete (nella versione in lingua tedesca) impediscono una buona impressione generale.
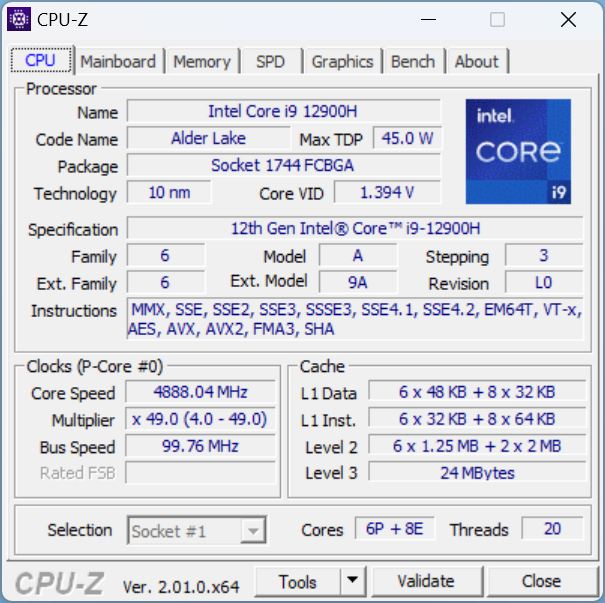
Processore

Asus ha già annunciato l'M16 con Intel Gen13. Fino a quando non sarà disponibile, attualmente stiamo ancora utilizzando un Intel Core i9-12900Hnella nostra unità di test. La CPU di fascia alta offre 6 core Performance e 8 core Efficiency. I core Performance hanno una velocità di clock fino a 5 GHz, mentre la velocità di clock di base dei core Efficiency è di 1,8 GHz. Poiché solo i core P supportano l'hyperthreading, abbiamo un totale di 12 thread.
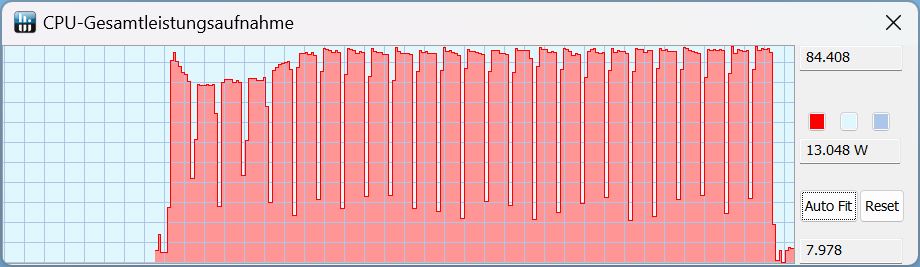
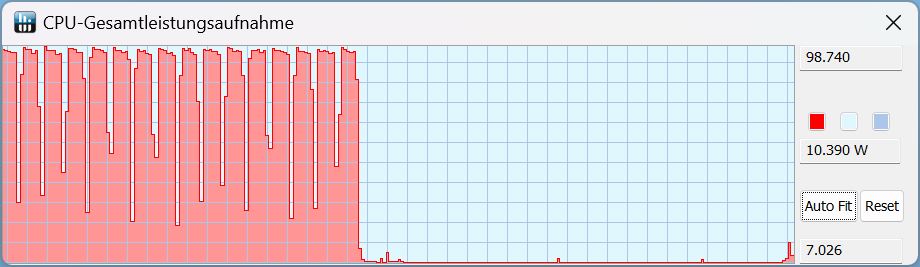
Nel ciclo Cinebench, le prestazioni costanti sono molto stabili, con un TDP massimo di circa 84 watt in modalità Performance. Le prestazioni deli7-12700H nel potentissimoXMG Focus 16si rivelano anche leggermente migliori all'inizio. Ma dopo l'ultimo quarto run, le sue prestazioni scendono al di sotto di quelle del nostro M16, che batte anche ilRyzen 7 6800 nellaLegion 5.
Tra l'altro, invece di 84 watt, in modalità Turbo sono disponibili ben 99 watt! Durante il funzionamento a batteria, si tratta solo di circa 40 watt, con un corrispondente calo delle prestazioni.
In tutti i test, il 2022 M16 è più veloce di circa il 20% rispetto al predecessore con uni9-11900H.
Cinebench R15 Multi Constant Load Test
Cinebench R23: Multi Core | Single Core
Cinebench R20: CPU (Multi Core) | CPU (Single Core)
Cinebench R15: CPU Multi 64Bit | CPU Single 64Bit
Blender: v2.79 BMW27 CPU
7-Zip 18.03: 7z b 4 | 7z b 4 -mmt1
Geekbench 5.5: Multi-Core | Single-Core
HWBOT x265 Benchmark v2.2: 4k Preset
LibreOffice : 20 Documents To PDF
R Benchmark 2.5: Overall mean
| CPU Performance rating | |
| Media della classe Gaming | |
| Asus ROG Zephyrus M16 GU603Z | |
| Schenker XMG Focus 16 (i7-12700H, RTX 3060) | |
| Media Intel Core i9-12900H | |
| Schenker Vision 16 Pro RTX 3070 Ti | |
| Lenovo Legion 5 Pro 16ARH7H RTX 3070 Ti | |
| Corsair Voyager a1600 | |
| Asus ROG Zephyrus M16 GU603H -2! | |
| Cinebench R23 / Multi Core | |
| Media della classe Gaming (10488 - 42661, n=107, ultimi 2 anni) | |
| Schenker XMG Focus 16 (i7-12700H, RTX 3060) | |
| Asus ROG Zephyrus M16 GU603Z | |
| Media Intel Core i9-12900H (7359 - 19648, n=28) | |
| Lenovo Legion 5 Pro 16ARH7H RTX 3070 Ti | |
| Corsair Voyager a1600 | |
| Schenker Vision 16 Pro RTX 3070 Ti | |
| Cinebench R23 / Single Core | |
| Media della classe Gaming (1166 - 2415, n=107, ultimi 2 anni) | |
| Asus ROG Zephyrus M16 GU603Z | |
| Media Intel Core i9-12900H (1634 - 1930, n=28) | |
| Schenker Vision 16 Pro RTX 3070 Ti | |
| Schenker XMG Focus 16 (i7-12700H, RTX 3060) | |
| Corsair Voyager a1600 | |
| Lenovo Legion 5 Pro 16ARH7H RTX 3070 Ti | |
| Cinebench R20 / CPU (Multi Core) | |
| Media della classe Gaming (4029 - 16433, n=106, ultimi 2 anni) | |
| Schenker XMG Focus 16 (i7-12700H, RTX 3060) | |
| Asus ROG Zephyrus M16 GU603Z | |
| Media Intel Core i9-12900H (2681 - 7471, n=28) | |
| Lenovo Legion 5 Pro 16ARH7H RTX 3070 Ti | |
| Asus ROG Zephyrus M16 GU603H | |
| Corsair Voyager a1600 | |
| Schenker Vision 16 Pro RTX 3070 Ti | |
| Cinebench R20 / CPU (Single Core) | |
| Media della classe Gaming (442 - 913, n=106, ultimi 2 anni) | |
| Asus ROG Zephyrus M16 GU603Z | |
| Media Intel Core i9-12900H (624 - 738, n=28) | |
| Schenker Vision 16 Pro RTX 3070 Ti | |
| Schenker XMG Focus 16 (i7-12700H, RTX 3060) | |
| Asus ROG Zephyrus M16 GU603H | |
| Lenovo Legion 5 Pro 16ARH7H RTX 3070 Ti | |
| Corsair Voyager a1600 | |
| Cinebench R15 / CPU Multi 64Bit | |
| Media della classe Gaming (1578 - 6330, n=105, ultimi 2 anni) | |
| Schenker Vision 16 Pro RTX 3070 Ti | |
| Schenker Vision 16 Pro RTX 3070 Ti | |
| Schenker XMG Focus 16 (i7-12700H, RTX 3060) | |
| Asus ROG Zephyrus M16 GU603Z | |
| Media Intel Core i9-12900H (1395 - 3077, n=28) | |
| Lenovo Legion 5 Pro 16ARH7H RTX 3070 Ti | |
| Asus ROG Zephyrus M16 GU603H | |
| Corsair Voyager a1600 | |
| Cinebench R15 / CPU Single 64Bit | |
| Media della classe Gaming (188.8 - 350, n=106, ultimi 2 anni) | |
| Asus ROG Zephyrus M16 GU603Z | |
| Media Intel Core i9-12900H (235 - 277, n=29) | |
| Schenker Vision 16 Pro RTX 3070 Ti | |
| Schenker XMG Focus 16 (i7-12700H, RTX 3060) | |
| Lenovo Legion 5 Pro 16ARH7H RTX 3070 Ti | |
| Corsair Voyager a1600 | |
| Asus ROG Zephyrus M16 GU603H | |
| Blender / v2.79 BMW27 CPU | |
| Schenker Vision 16 Pro RTX 3070 Ti | |
| Asus ROG Zephyrus M16 GU603H | |
| Media Intel Core i9-12900H (160 - 451, n=28) | |
| Corsair Voyager a1600 | |
| Lenovo Legion 5 Pro 16ARH7H RTX 3070 Ti | |
| Schenker XMG Focus 16 (i7-12700H, RTX 3060) | |
| Asus ROG Zephyrus M16 GU603Z | |
| Media della classe Gaming (79 - 330, n=104, ultimi 2 anni) | |
| 7-Zip 18.03 / 7z b 4 | |
| Media della classe Gaming (33491 - 148086, n=105, ultimi 2 anni) | |
| Asus ROG Zephyrus M16 GU603Z | |
| Lenovo Legion 5 Pro 16ARH7H RTX 3070 Ti | |
| Schenker XMG Focus 16 (i7-12700H, RTX 3060) | |
| Corsair Voyager a1600 | |
| Media Intel Core i9-12900H (34684 - 76677, n=28) | |
| Asus ROG Zephyrus M16 GU603H | |
| Schenker Vision 16 Pro RTX 3070 Ti | |
| 7-Zip 18.03 / 7z b 4 -mmt1 | |
| Media della classe Gaming (4199 - 7436, n=105, ultimi 2 anni) | |
| Asus ROG Zephyrus M16 GU603Z | |
| Schenker Vision 16 Pro RTX 3070 Ti | |
| Media Intel Core i9-12900H (5302 - 6289, n=28) | |
| Corsair Voyager a1600 | |
| Lenovo Legion 5 Pro 16ARH7H RTX 3070 Ti | |
| Schenker XMG Focus 16 (i7-12700H, RTX 3060) | |
| Asus ROG Zephyrus M16 GU603H | |
| Geekbench 5.5 / Multi-Core | |
| Media della classe Gaming (6460 - 28263, n=105, ultimi 2 anni) | |
| Asus ROG Zephyrus M16 GU603Z | |
| Schenker XMG Focus 16 (i7-12700H, RTX 3060) | |
| Media Intel Core i9-12900H (8519 - 14376, n=31) | |
| Schenker Vision 16 Pro RTX 3070 Ti | |
| Lenovo Legion 5 Pro 16ARH7H RTX 3070 Ti | |
| Corsair Voyager a1600 | |
| Asus ROG Zephyrus M16 GU603H | |
| Geekbench 5.5 / Single-Core | |
| Media della classe Gaming (986 - 2474, n=105, ultimi 2 anni) | |
| Asus ROG Zephyrus M16 GU603Z | |
| Schenker Vision 16 Pro RTX 3070 Ti | |
| Media Intel Core i9-12900H (1631 - 1897, n=31) | |
| Schenker XMG Focus 16 (i7-12700H, RTX 3060) | |
| Asus ROG Zephyrus M16 GU603H | |
| Lenovo Legion 5 Pro 16ARH7H RTX 3070 Ti | |
| Corsair Voyager a1600 | |
| HWBOT x265 Benchmark v2.2 / 4k Preset | |
| Media della classe Gaming (11.5 - 44.4, n=105, ultimi 2 anni) | |
| Asus ROG Zephyrus M16 GU603Z | |
| Lenovo Legion 5 Pro 16ARH7H RTX 3070 Ti | |
| Schenker XMG Focus 16 (i7-12700H, RTX 3060) | |
| Media Intel Core i9-12900H (8.05 - 22.5, n=28) | |
| Corsair Voyager a1600 | |
| Asus ROG Zephyrus M16 GU603H | |
| Schenker Vision 16 Pro RTX 3070 Ti | |
| LibreOffice / 20 Documents To PDF | |
| Corsair Voyager a1600 | |
| Lenovo Legion 5 Pro 16ARH7H RTX 3070 Ti | |
| Media della classe Gaming (33.2 - 88.8, n=105, ultimi 2 anni) | |
| Schenker XMG Focus 16 (i7-12700H, RTX 3060) | |
| Schenker Vision 16 Pro RTX 3070 Ti | |
| Media Intel Core i9-12900H (36.8 - 59.8, n=28) | |
| Asus ROG Zephyrus M16 GU603Z | |
| Asus ROG Zephyrus M16 GU603H | |
| R Benchmark 2.5 / Overall mean | |
| Asus ROG Zephyrus M16 GU603H | |
| Corsair Voyager a1600 | |
| Lenovo Legion 5 Pro 16ARH7H RTX 3070 Ti | |
| Schenker XMG Focus 16 (i7-12700H, RTX 3060) | |
| Schenker Vision 16 Pro RTX 3070 Ti | |
| Media Intel Core i9-12900H (0.4218 - 0.506, n=28) | |
| Asus ROG Zephyrus M16 GU603Z | |
| Media della classe Gaming (0.3439 - 0.759, n=106, ultimi 2 anni) | |
* ... Meglio usare valori piccoli
AIDA64: FP32 Ray-Trace | FPU Julia | CPU SHA3 | CPU Queen | FPU SinJulia | FPU Mandel | CPU AES | CPU ZLib | FP64 Ray-Trace | CPU PhotoWorxx
| Performance rating | |
| Media della classe Gaming | |
| Lenovo Legion 5 Pro 16ARH7H RTX 3070 Ti | |
| Corsair Voyager a1600 | |
| Asus ROG Zephyrus M16 GU603Z | |
| Schenker XMG Focus 16 (i7-12700H, RTX 3060) | |
| Media Intel Core i9-12900H | |
| Schenker Vision 16 Pro RTX 3070 Ti | |
| Asus ROG Zephyrus M16 GU603H -9! | |
| AIDA64 / FP32 Ray-Trace | |
| Media della classe Gaming (10227 - 85542, n=105, ultimi 2 anni) | |
| Lenovo Legion 5 Pro 16ARH7H RTX 3070 Ti | |
| Corsair Voyager a1600 | |
| Asus ROG Zephyrus M16 GU603Z | |
| Schenker XMG Focus 16 (i7-12700H, RTX 3060) | |
| Schenker Vision 16 Pro RTX 3070 Ti | |
| Media Intel Core i9-12900H (4074 - 18289, n=29) | |
| AIDA64 / FPU Julia | |
| Media della classe Gaming (51376 - 238426, n=105, ultimi 2 anni) | |
| Lenovo Legion 5 Pro 16ARH7H RTX 3070 Ti | |
| Corsair Voyager a1600 | |
| Schenker XMG Focus 16 (i7-12700H, RTX 3060) | |
| Asus ROG Zephyrus M16 GU603Z | |
| Schenker Vision 16 Pro RTX 3070 Ti | |
| Media Intel Core i9-12900H (22307 - 93236, n=29) | |
| AIDA64 / CPU SHA3 | |
| Media della classe Gaming (2180 - 10115, n=105, ultimi 2 anni) | |
| Schenker XMG Focus 16 (i7-12700H, RTX 3060) | |
| Lenovo Legion 5 Pro 16ARH7H RTX 3070 Ti | |
| Asus ROG Zephyrus M16 GU603Z | |
| Corsair Voyager a1600 | |
| Media Intel Core i9-12900H (1378 - 4215, n=29) | |
| Schenker Vision 16 Pro RTX 3070 Ti | |
| AIDA64 / CPU Queen | |
| Media della classe Gaming (49785 - 173351, n=90, ultimi 2 anni) | |
| Lenovo Legion 5 Pro 16ARH7H RTX 3070 Ti | |
| Asus ROG Zephyrus M16 GU603Z | |
| Corsair Voyager a1600 | |
| Schenker XMG Focus 16 (i7-12700H, RTX 3060) | |
| Media Intel Core i9-12900H (78172 - 111241, n=28) | |
| Schenker Vision 16 Pro RTX 3070 Ti | |
| AIDA64 / FPU SinJulia | |
| Media della classe Gaming (4424 - 33636, n=105, ultimi 2 anni) | |
| Corsair Voyager a1600 | |
| Lenovo Legion 5 Pro 16ARH7H RTX 3070 Ti | |
| Schenker XMG Focus 16 (i7-12700H, RTX 3060) | |
| Asus ROG Zephyrus M16 GU603Z | |
| Media Intel Core i9-12900H (5709 - 10410, n=29) | |
| Schenker Vision 16 Pro RTX 3070 Ti | |
| AIDA64 / FPU Mandel | |
| Media della classe Gaming (25115 - 128721, n=105, ultimi 2 anni) | |
| Lenovo Legion 5 Pro 16ARH7H RTX 3070 Ti | |
| Corsair Voyager a1600 | |
| Schenker XMG Focus 16 (i7-12700H, RTX 3060) | |
| Asus ROG Zephyrus M16 GU603Z | |
| Schenker Vision 16 Pro RTX 3070 Ti | |
| Media Intel Core i9-12900H (11257 - 45581, n=29) | |
| AIDA64 / CPU AES | |
| Lenovo Legion 5 Pro 16ARH7H RTX 3070 Ti | |
| Corsair Voyager a1600 | |
| Asus ROG Zephyrus M16 GU603Z | |
| Media della classe Gaming (39258 - 247074, n=105, ultimi 2 anni) | |
| Media Intel Core i9-12900H (31935 - 151546, n=29) | |
| Schenker XMG Focus 16 (i7-12700H, RTX 3060) | |
| Schenker Vision 16 Pro RTX 3070 Ti | |
| AIDA64 / CPU ZLib | |
| Media della classe Gaming (574 - 2531, n=105, ultimi 2 anni) | |
| Schenker XMG Focus 16 (i7-12700H, RTX 3060) | |
| Asus ROG Zephyrus M16 GU603Z | |
| Media Intel Core i9-12900H (449 - 1193, n=29) | |
| Lenovo Legion 5 Pro 16ARH7H RTX 3070 Ti | |
| Corsair Voyager a1600 | |
| Schenker Vision 16 Pro RTX 3070 Ti | |
| Asus ROG Zephyrus M16 GU603H | |
| AIDA64 / FP64 Ray-Trace | |
| Media della classe Gaming (5509 - 45446, n=105, ultimi 2 anni) | |
| Lenovo Legion 5 Pro 16ARH7H RTX 3070 Ti | |
| Corsair Voyager a1600 | |
| Asus ROG Zephyrus M16 GU603Z | |
| Schenker XMG Focus 16 (i7-12700H, RTX 3060) | |
| Schenker Vision 16 Pro RTX 3070 Ti | |
| Media Intel Core i9-12900H (2235 - 10511, n=29) | |
| AIDA64 / CPU PhotoWorxx | |
| Media della classe Gaming (12271 - 89891, n=105, ultimi 2 anni) | |
| Schenker Vision 16 Pro RTX 3070 Ti | |
| Asus ROG Zephyrus M16 GU603Z | |
| Media Intel Core i9-12900H (20960 - 48269, n=30) | |
| Lenovo Legion 5 Pro 16ARH7H RTX 3070 Ti | |
| Schenker XMG Focus 16 (i7-12700H, RTX 3060) | |
| Corsair Voyager a1600 | |
Prestazioni del sistema
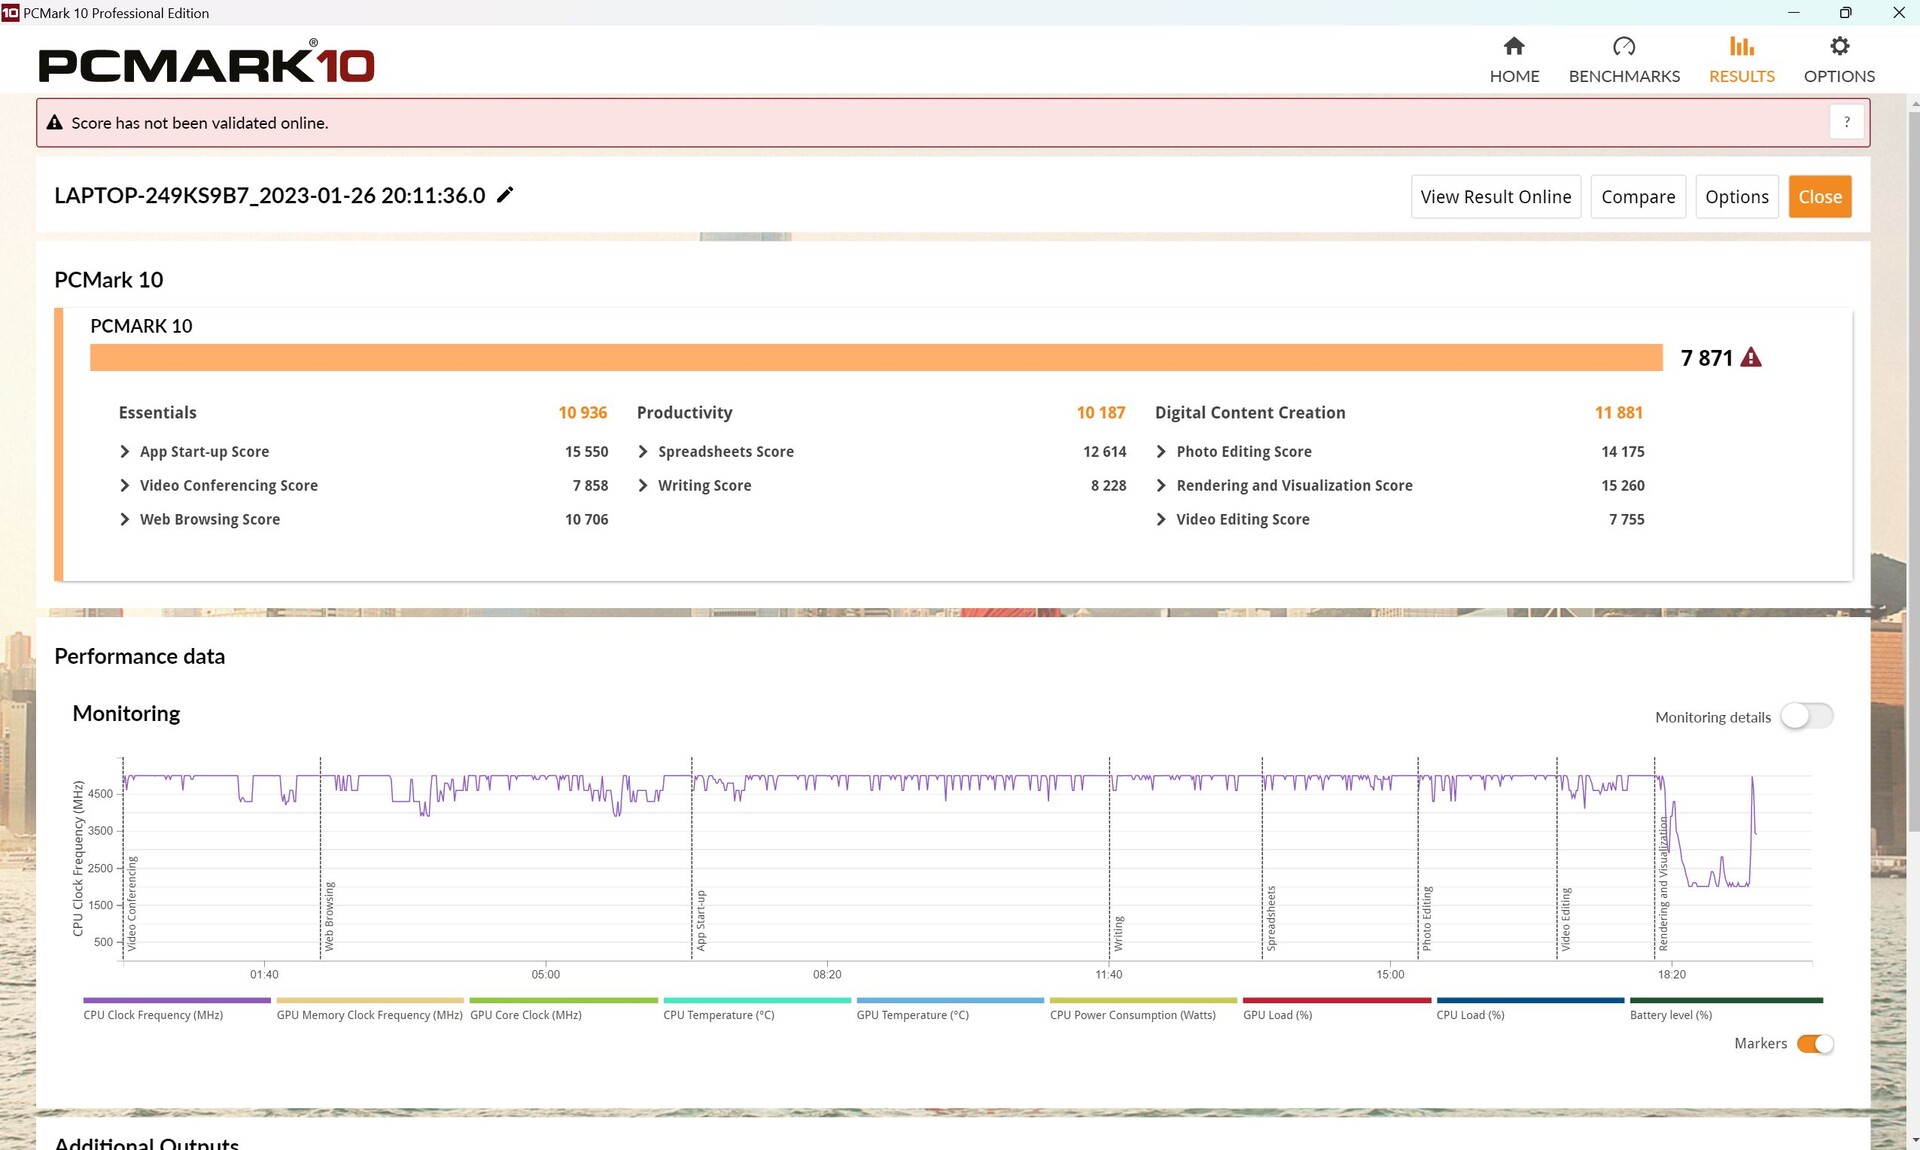
Nel PCMark, la combinazione di i9 e RTX 3070 Tiè in testa in tutti i benchmark, ma questo è anche il livello di prestazioni che ci si aspetta. Lo stesso vale per i benchmark CrossMark.
CrossMark: Overall | Productivity | Creativity | Responsiveness
| PCMark 10 / Score | |
| Media della classe Gaming (5828 - 12414, n=93, ultimi 2 anni) | |
| Asus ROG Zephyrus M16 GU603Z | |
| Media Intel Core i9-12900H, NVIDIA GeForce RTX 3070 Ti Laptop GPU (7087 - 8072, n=6) | |
| Lenovo Legion 5 Pro 16ARH7H RTX 3070 Ti | |
| Corsair Voyager a1600 | |
| Schenker XMG Focus 16 (i7-12700H, RTX 3060) | |
| Asus ROG Zephyrus M16 GU603H | |
| PCMark 10 / Essentials | |
| Asus ROG Zephyrus M16 GU603Z | |
| Media Intel Core i9-12900H, NVIDIA GeForce RTX 3070 Ti Laptop GPU (10266 - 11663, n=6) | |
| Media della classe Gaming (8810 - 11935, n=97, ultimi 2 anni) | |
| Asus ROG Zephyrus M16 GU603H | |
| Lenovo Legion 5 Pro 16ARH7H RTX 3070 Ti | |
| Schenker XMG Focus 16 (i7-12700H, RTX 3060) | |
| Corsair Voyager a1600 | |
| PCMark 10 / Productivity | |
| Media della classe Gaming (6845 - 25323, n=95, ultimi 2 anni) | |
| Asus ROG Zephyrus M16 GU603Z | |
| Media Intel Core i9-12900H, NVIDIA GeForce RTX 3070 Ti Laptop GPU (9402 - 10742, n=6) | |
| Schenker XMG Focus 16 (i7-12700H, RTX 3060) | |
| Lenovo Legion 5 Pro 16ARH7H RTX 3070 Ti | |
| Asus ROG Zephyrus M16 GU603H | |
| Corsair Voyager a1600 | |
| PCMark 10 / Digital Content Creation | |
| Media della classe Gaming (7602 - 19954, n=95, ultimi 2 anni) | |
| Asus ROG Zephyrus M16 GU603Z | |
| Lenovo Legion 5 Pro 16ARH7H RTX 3070 Ti | |
| Media Intel Core i9-12900H, NVIDIA GeForce RTX 3070 Ti Laptop GPU (10009 - 12541, n=6) | |
| Corsair Voyager a1600 | |
| Asus ROG Zephyrus M16 GU603H | |
| Schenker XMG Focus 16 (i7-12700H, RTX 3060) | |
| CrossMark / Overall | |
| Media della classe Gaming (1366 - 2409, n=94, ultimi 2 anni) | |
| Asus ROG Zephyrus M16 GU603Z | |
| Media Intel Core i9-12900H, NVIDIA GeForce RTX 3070 Ti Laptop GPU (1664 - 2044, n=6) | |
| Schenker XMG Focus 16 (i7-12700H, RTX 3060) | |
| Schenker Vision 16 Pro RTX 3070 Ti | |
| Lenovo Legion 5 Pro 16ARH7H RTX 3070 Ti | |
| Corsair Voyager a1600 | |
| CrossMark / Productivity | |
| Media della classe Gaming (1386 - 2254, n=94, ultimi 2 anni) | |
| Asus ROG Zephyrus M16 GU603Z | |
| Media Intel Core i9-12900H, NVIDIA GeForce RTX 3070 Ti Laptop GPU (1591 - 1968, n=6) | |
| Lenovo Legion 5 Pro 16ARH7H RTX 3070 Ti | |
| Schenker XMG Focus 16 (i7-12700H, RTX 3060) | |
| Schenker Vision 16 Pro RTX 3070 Ti | |
| Corsair Voyager a1600 | |
| CrossMark / Creativity | |
| Media della classe Gaming (1343 - 2786, n=94, ultimi 2 anni) | |
| Asus ROG Zephyrus M16 GU603Z | |
| Media Intel Core i9-12900H, NVIDIA GeForce RTX 3070 Ti Laptop GPU (1797 - 2148, n=6) | |
| Schenker Vision 16 Pro RTX 3070 Ti | |
| Schenker XMG Focus 16 (i7-12700H, RTX 3060) | |
| Lenovo Legion 5 Pro 16ARH7H RTX 3070 Ti | |
| Corsair Voyager a1600 | |
| CrossMark / Responsiveness | |
| Asus ROG Zephyrus M16 GU603Z | |
| Media Intel Core i9-12900H, NVIDIA GeForce RTX 3070 Ti Laptop GPU (1514 - 2069, n=6) | |
| Media della classe Gaming (1226 - 2334, n=94, ultimi 2 anni) | |
| Lenovo Legion 5 Pro 16ARH7H RTX 3070 Ti | |
| Schenker XMG Focus 16 (i7-12700H, RTX 3060) | |
| Schenker Vision 16 Pro RTX 3070 Ti | |
| Corsair Voyager a1600 | |
| PCMark 10 Score | 7871 punti | |
Aiuto | ||
| AIDA64 / Memory Copy | |
| Media della classe Gaming (21750 - 129946, n=105, ultimi 2 anni) | |
| Asus ROG Zephyrus M16 GU603Z | |
| Schenker Vision 16 Pro RTX 3070 Ti | |
| Media Intel Core i9-12900H (34438 - 74264, n=29) | |
| Lenovo Legion 5 Pro 16ARH7H RTX 3070 Ti | |
| Corsair Voyager a1600 | |
| Schenker XMG Focus 16 (i7-12700H, RTX 3060) | |
| AIDA64 / Memory Read | |
| Media della classe Gaming (22956 - 118858, n=105, ultimi 2 anni) | |
| Asus ROG Zephyrus M16 GU603Z | |
| Schenker Vision 16 Pro RTX 3070 Ti | |
| Media Intel Core i9-12900H (36365 - 74642, n=29) | |
| Lenovo Legion 5 Pro 16ARH7H RTX 3070 Ti | |
| Corsair Voyager a1600 | |
| Schenker XMG Focus 16 (i7-12700H, RTX 3060) | |
| AIDA64 / Memory Write | |
| Media della classe Gaming (22297 - 135096, n=105, ultimi 2 anni) | |
| Asus ROG Zephyrus M16 GU603Z | |
| Schenker Vision 16 Pro RTX 3070 Ti | |
| Media Intel Core i9-12900H (32276 - 67858, n=29) | |
| Lenovo Legion 5 Pro 16ARH7H RTX 3070 Ti | |
| Corsair Voyager a1600 | |
| Schenker XMG Focus 16 (i7-12700H, RTX 3060) | |
| AIDA64 / Memory Latency | |
| Media della classe Gaming (75.3 - 259, n=105, ultimi 2 anni) | |
| Corsair Voyager a1600 | |
| Schenker Vision 16 Pro RTX 3070 Ti | |
| Schenker XMG Focus 16 (i7-12700H, RTX 3060) | |
| Asus ROG Zephyrus M16 GU603Z | |
| Lenovo Legion 5 Pro 16ARH7H RTX 3070 Ti | |
| Media Intel Core i9-12900H (74.7 - 118.1, n=28) | |
| Asus ROG Zephyrus M16 GU603H | |
* ... Meglio usare valori piccoli
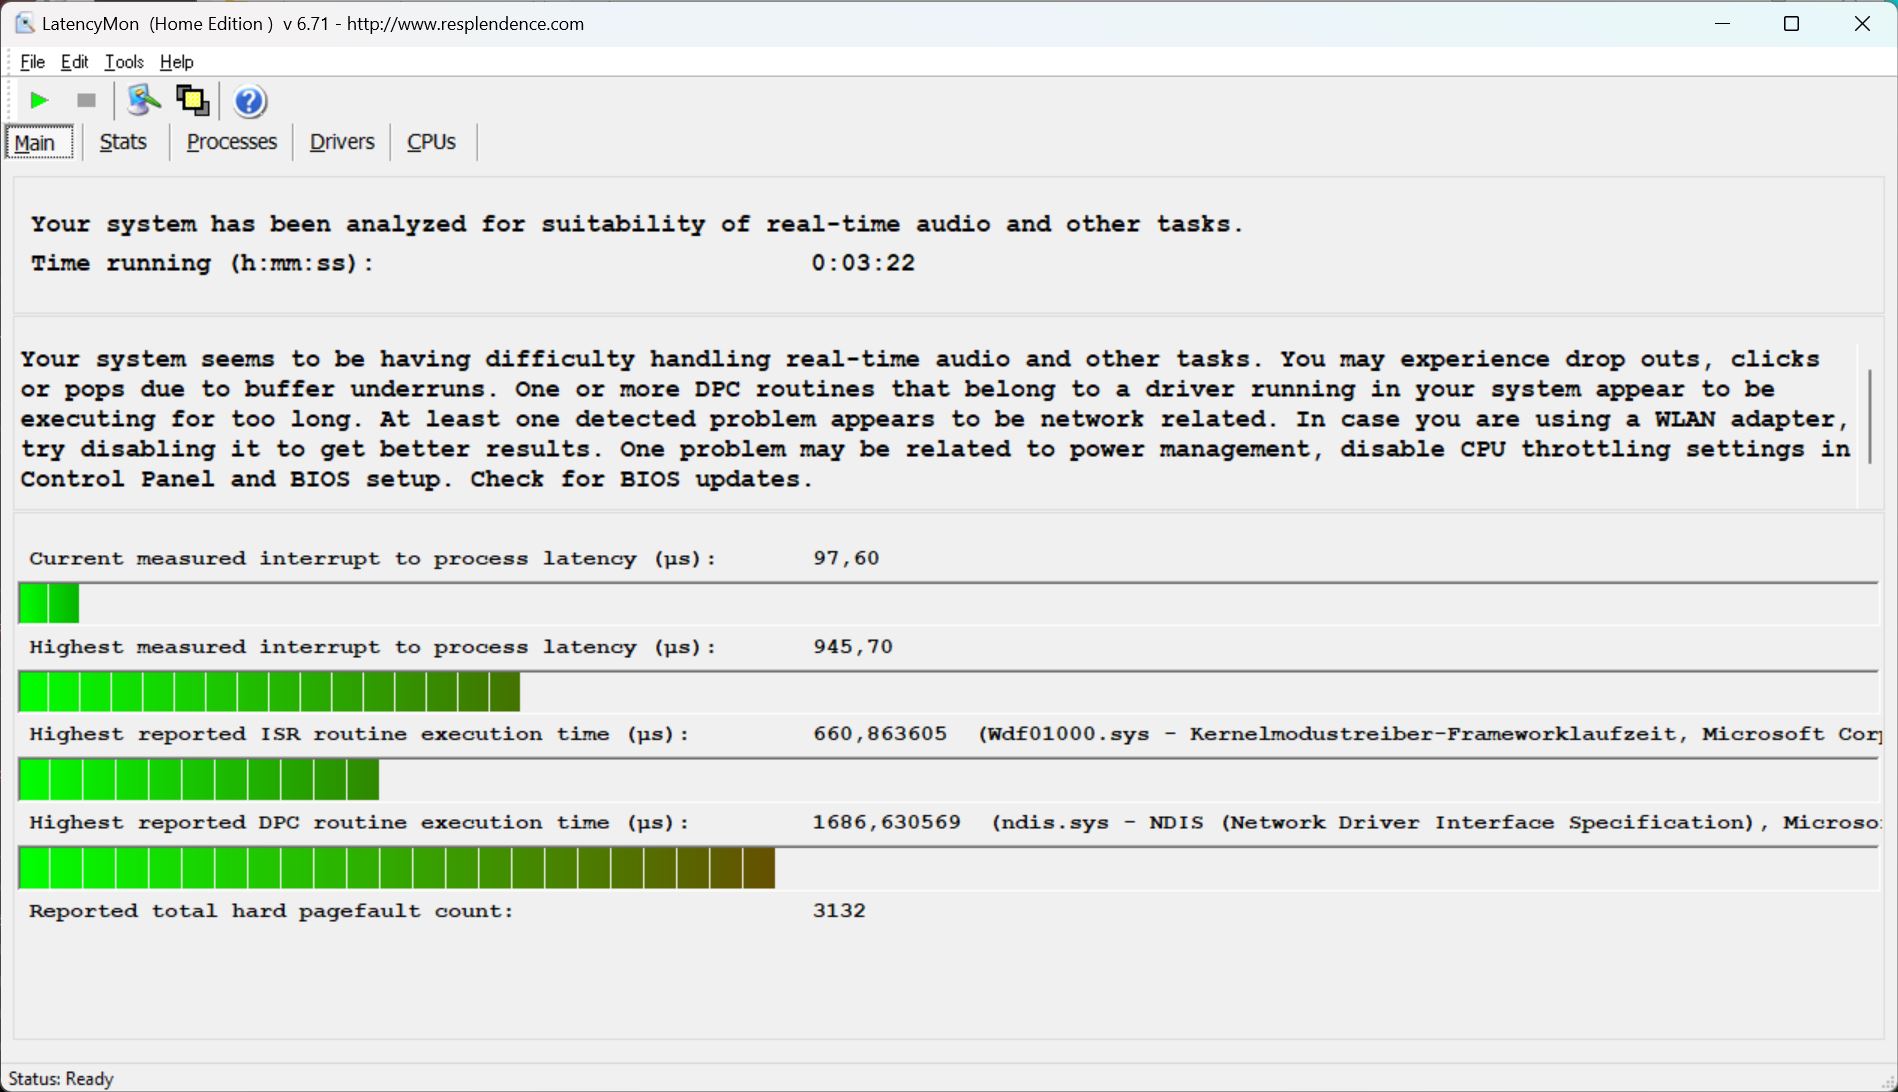
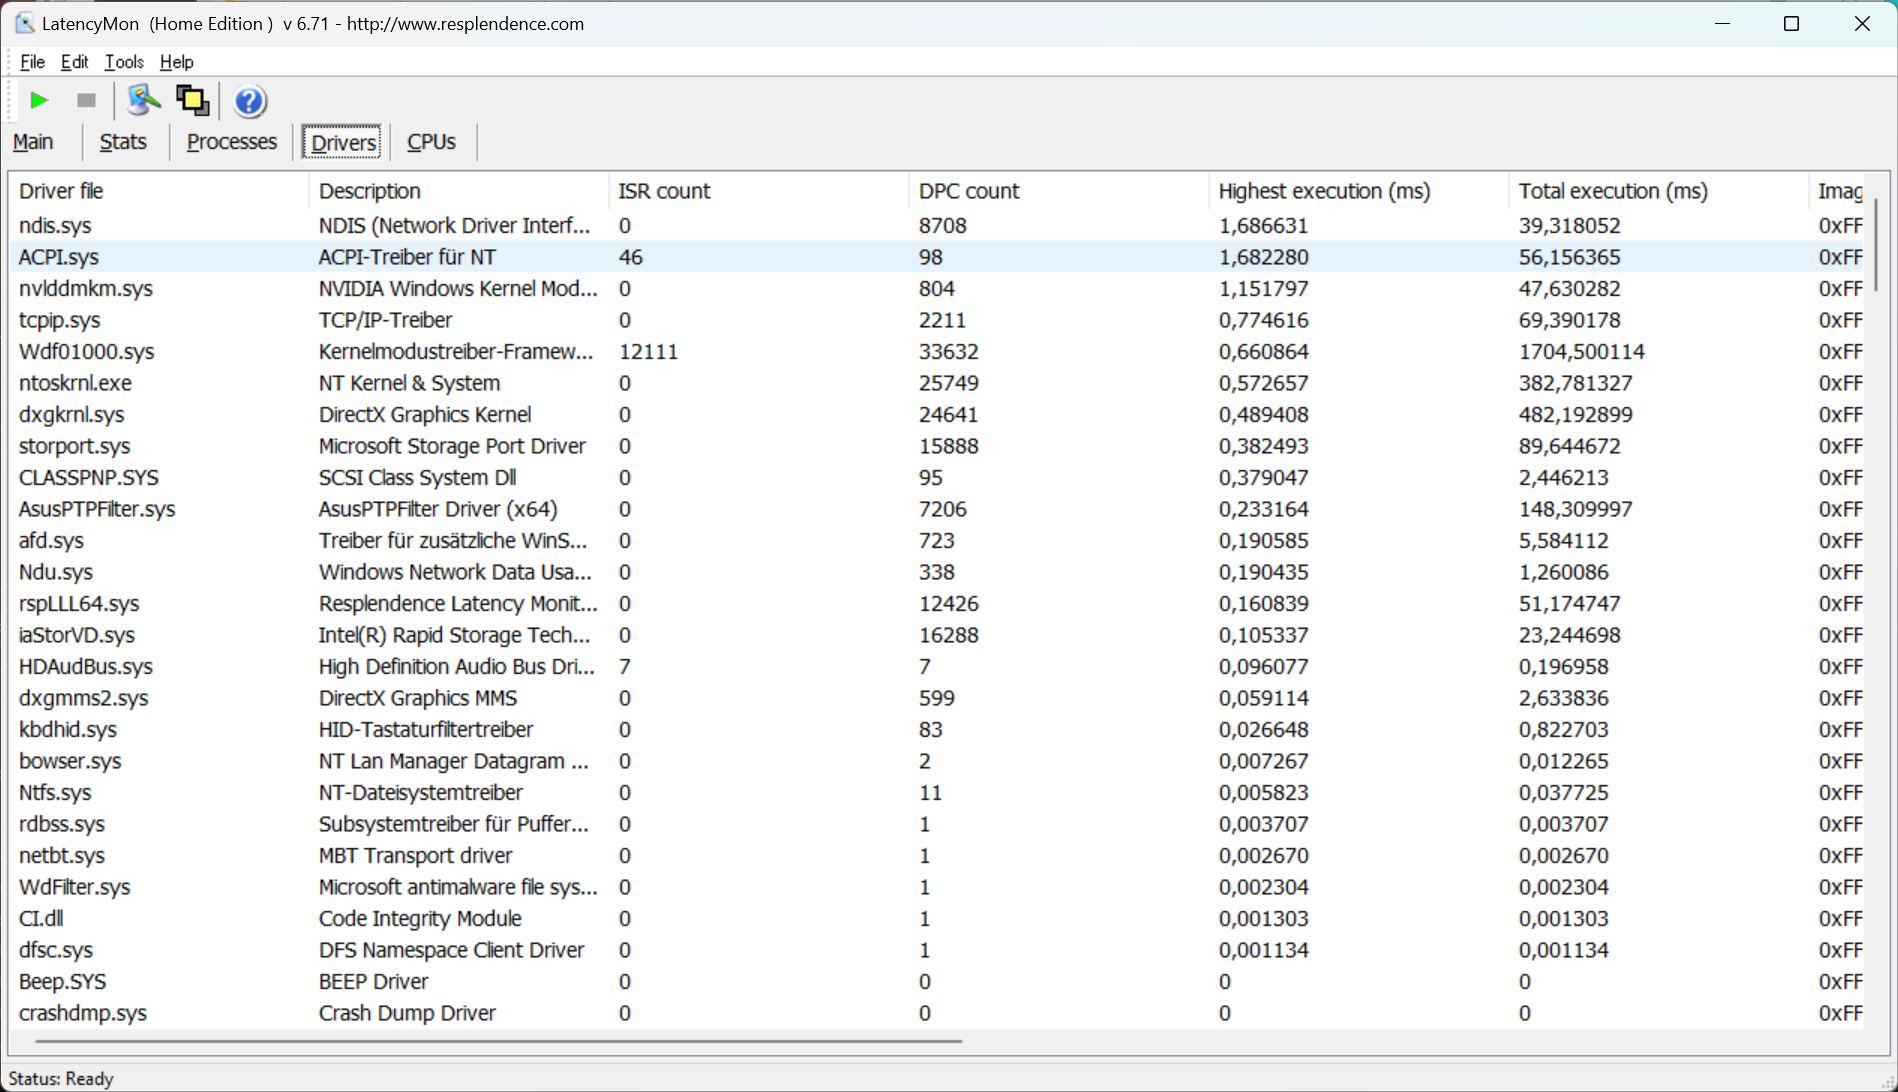
Latenze DPC
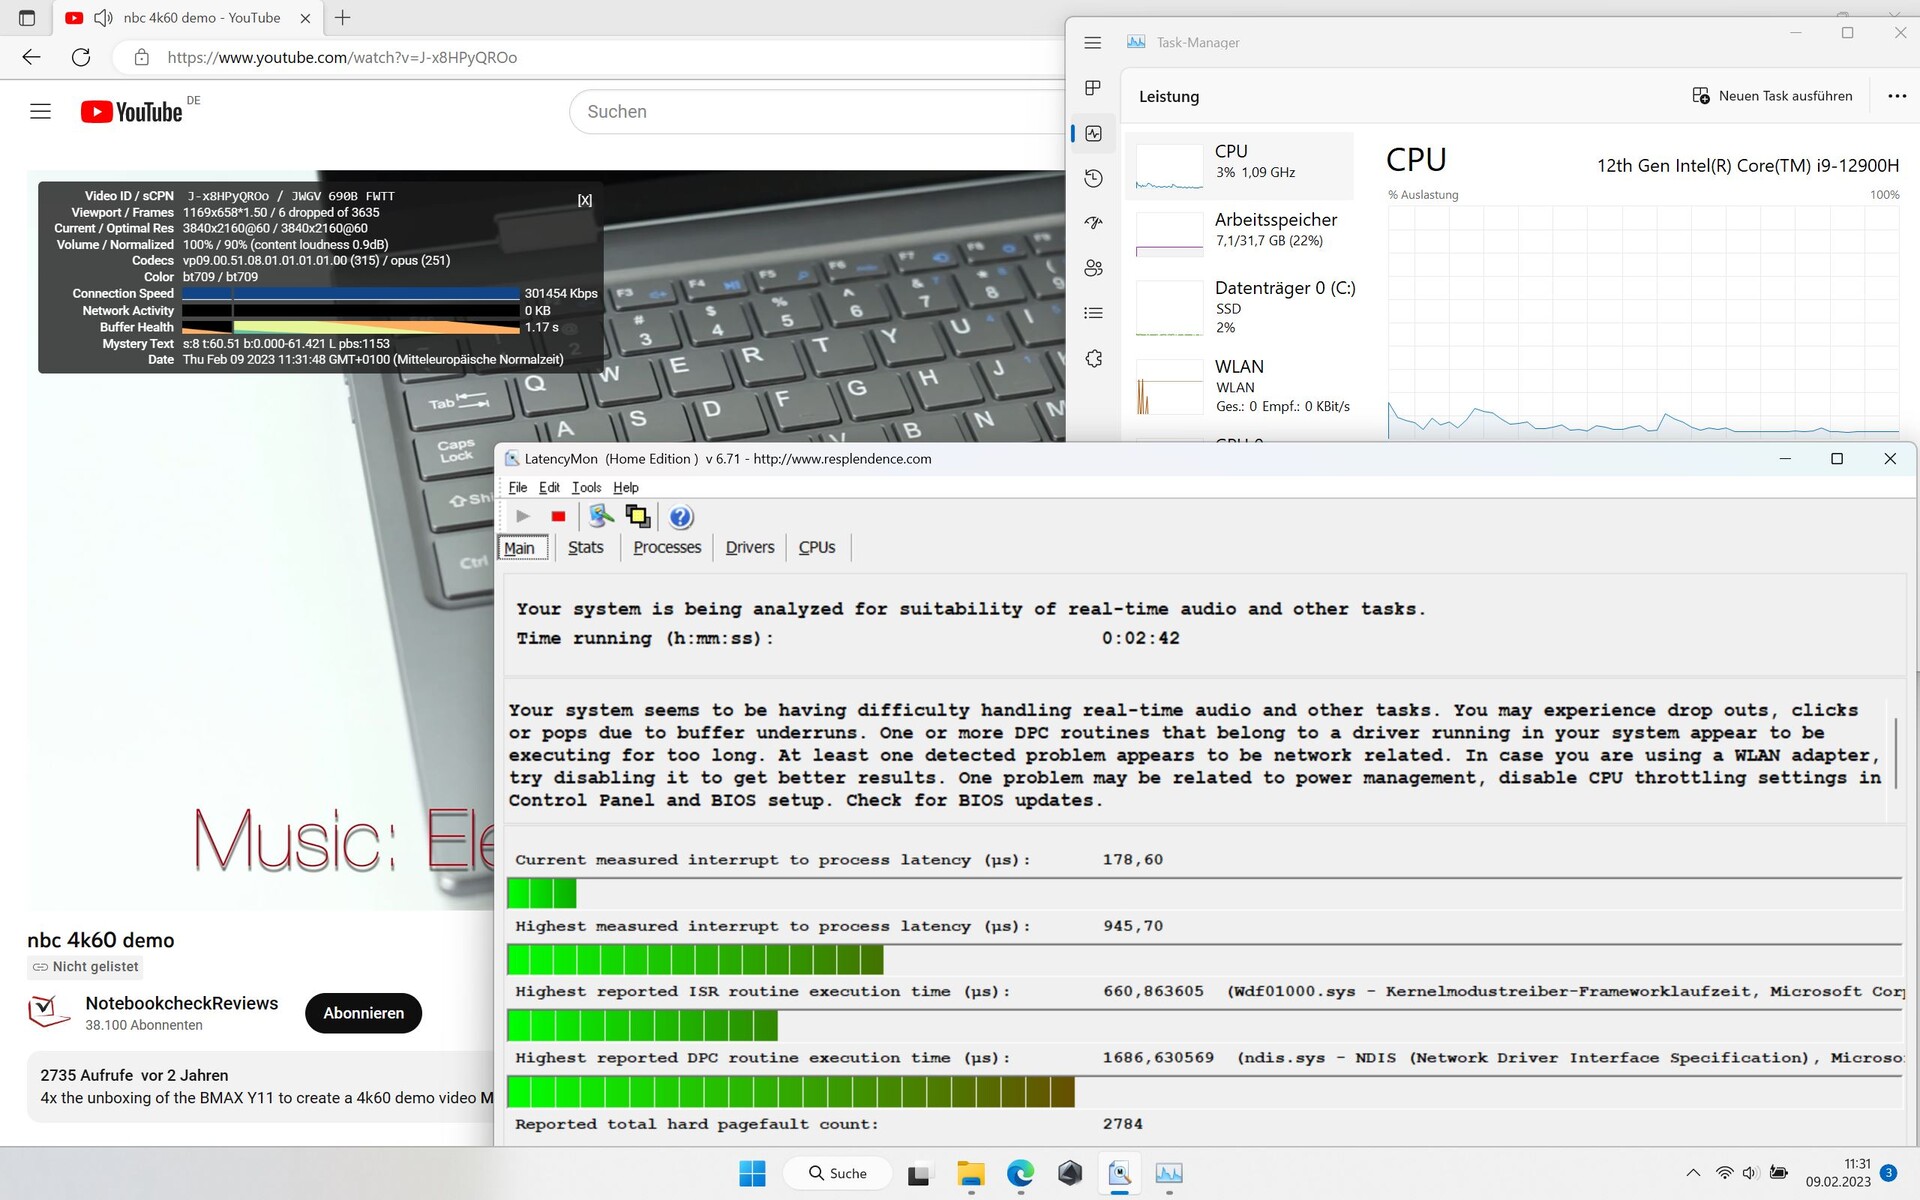
Purtroppo LatencyMon rileva le prime latenze già all'avvio del software, anche se non ci sono azioni aggiuntive. Quando si apre il browser con più schede, le latenze aumentano ulteriormente.
Anche il nostro video YouTube a 4K/60 fps non viene riprodotto senza cadute di fotogrammi (6). Tuttavia, i valori di latenza non sono particolarmente elevati nel complesso e sono inferiori a quelli dell' XMG Focus 16, ad esempio. D'altra parte, diventano evidenti prima.
| DPC Latencies / LatencyMon - interrupt to process latency (max), Web, Youtube, Prime95 | |
| Schenker XMG Focus 16 (i7-12700H, RTX 3060) | |
| Asus ROG Zephyrus M16 GU603H | |
| Asus ROG Zephyrus M16 GU603Z | |
| Lenovo Legion 5 Pro 16ARH7H RTX 3070 Ti | |
| Corsair Voyager a1600 | |
| Schenker Vision 16 Pro RTX 3070 Ti | |
* ... Meglio usare valori piccoli
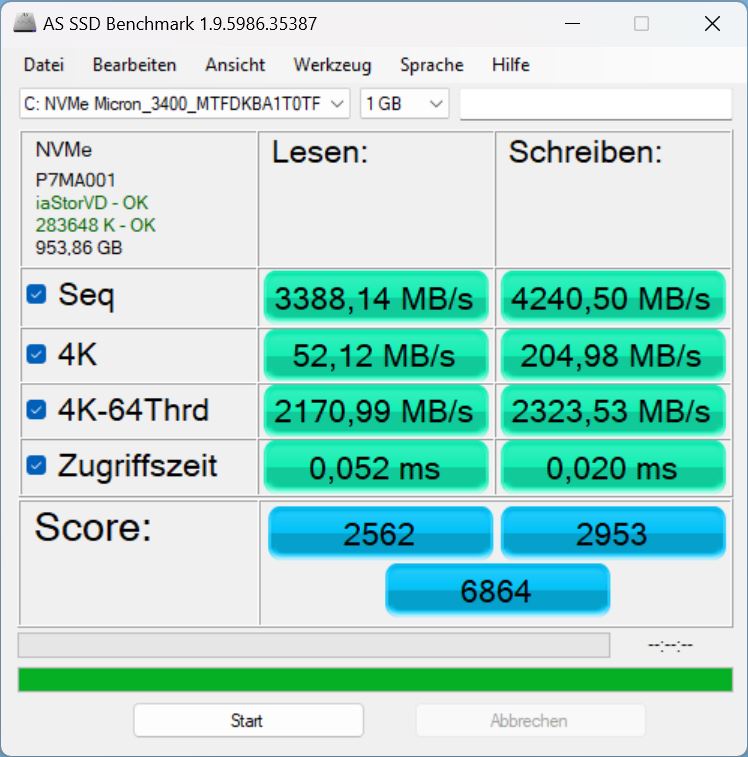
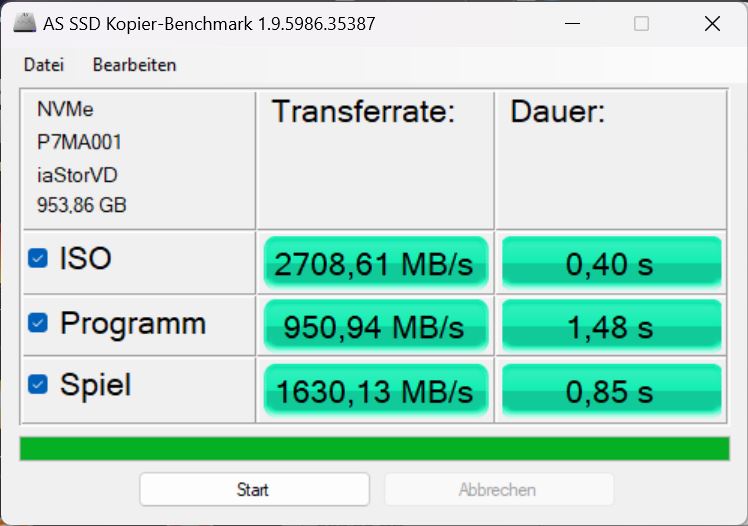
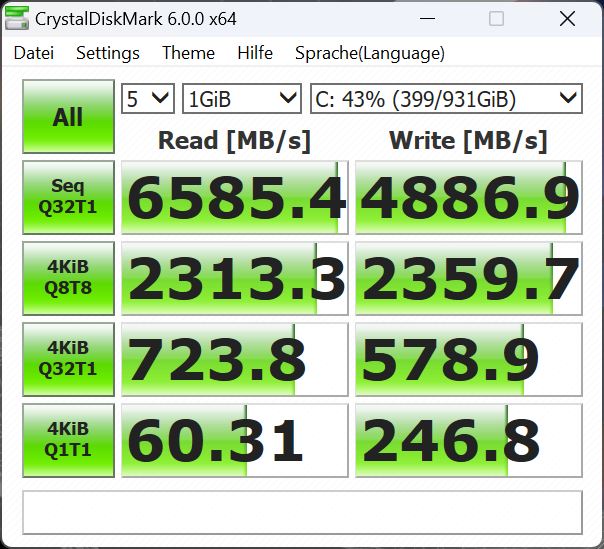
Soluzione di stoccaggio
Il nostro modello di prova utilizza un'unità SSD PCIe Gen4 di Micron con 1 TB di memoria. Nel nostro elenco delle migliori unità SSDsi posiziona al 74° posto, quindi ci sono anche molti modelli più veloci. I benchmark confermano valori decenti per la soluzione di archiviazione. Tuttavia, i valori misurati dell'unità di archiviazione Samsung nel predecessore o nel modello Legion 5sono più veloci.
L'SSD non è in grado di mantenere le sue prestazioni a lungo termine, ma il calo di prestazioni è minimo.

* ... Meglio usare valori piccoli
Disk Throttling: DiskSpd Read Loop, Queue Depth 8
Scheda grafica
Il nostro sistema di prova utilizza unaRTX 3070 Tianche se si tratta di una delle GPU per laptop più potenti, è possibile utilizzare "solo" 100 W più 20 W di Dynamic Boost nell'M16. Non è sorprendente che, quando si possono utilizzare 150 W, la stessa GPU sia più veloce nel sistema M16.Legion 5 Proanche del 27%!
Almeno, il predecessore con RTX 3070 (senza "Ti") è superato del 38%. IlXMG Vision 16 Proconsente solo un massimo di 95 W per la GPU, quindi rimane significativamente indietro rispetto all'M16.
Complessivamente, la velocità della scheda grafica 120-W è più lenta di circa il 7-12% rispetto alla RTX 3070 Ti media del nostro database.
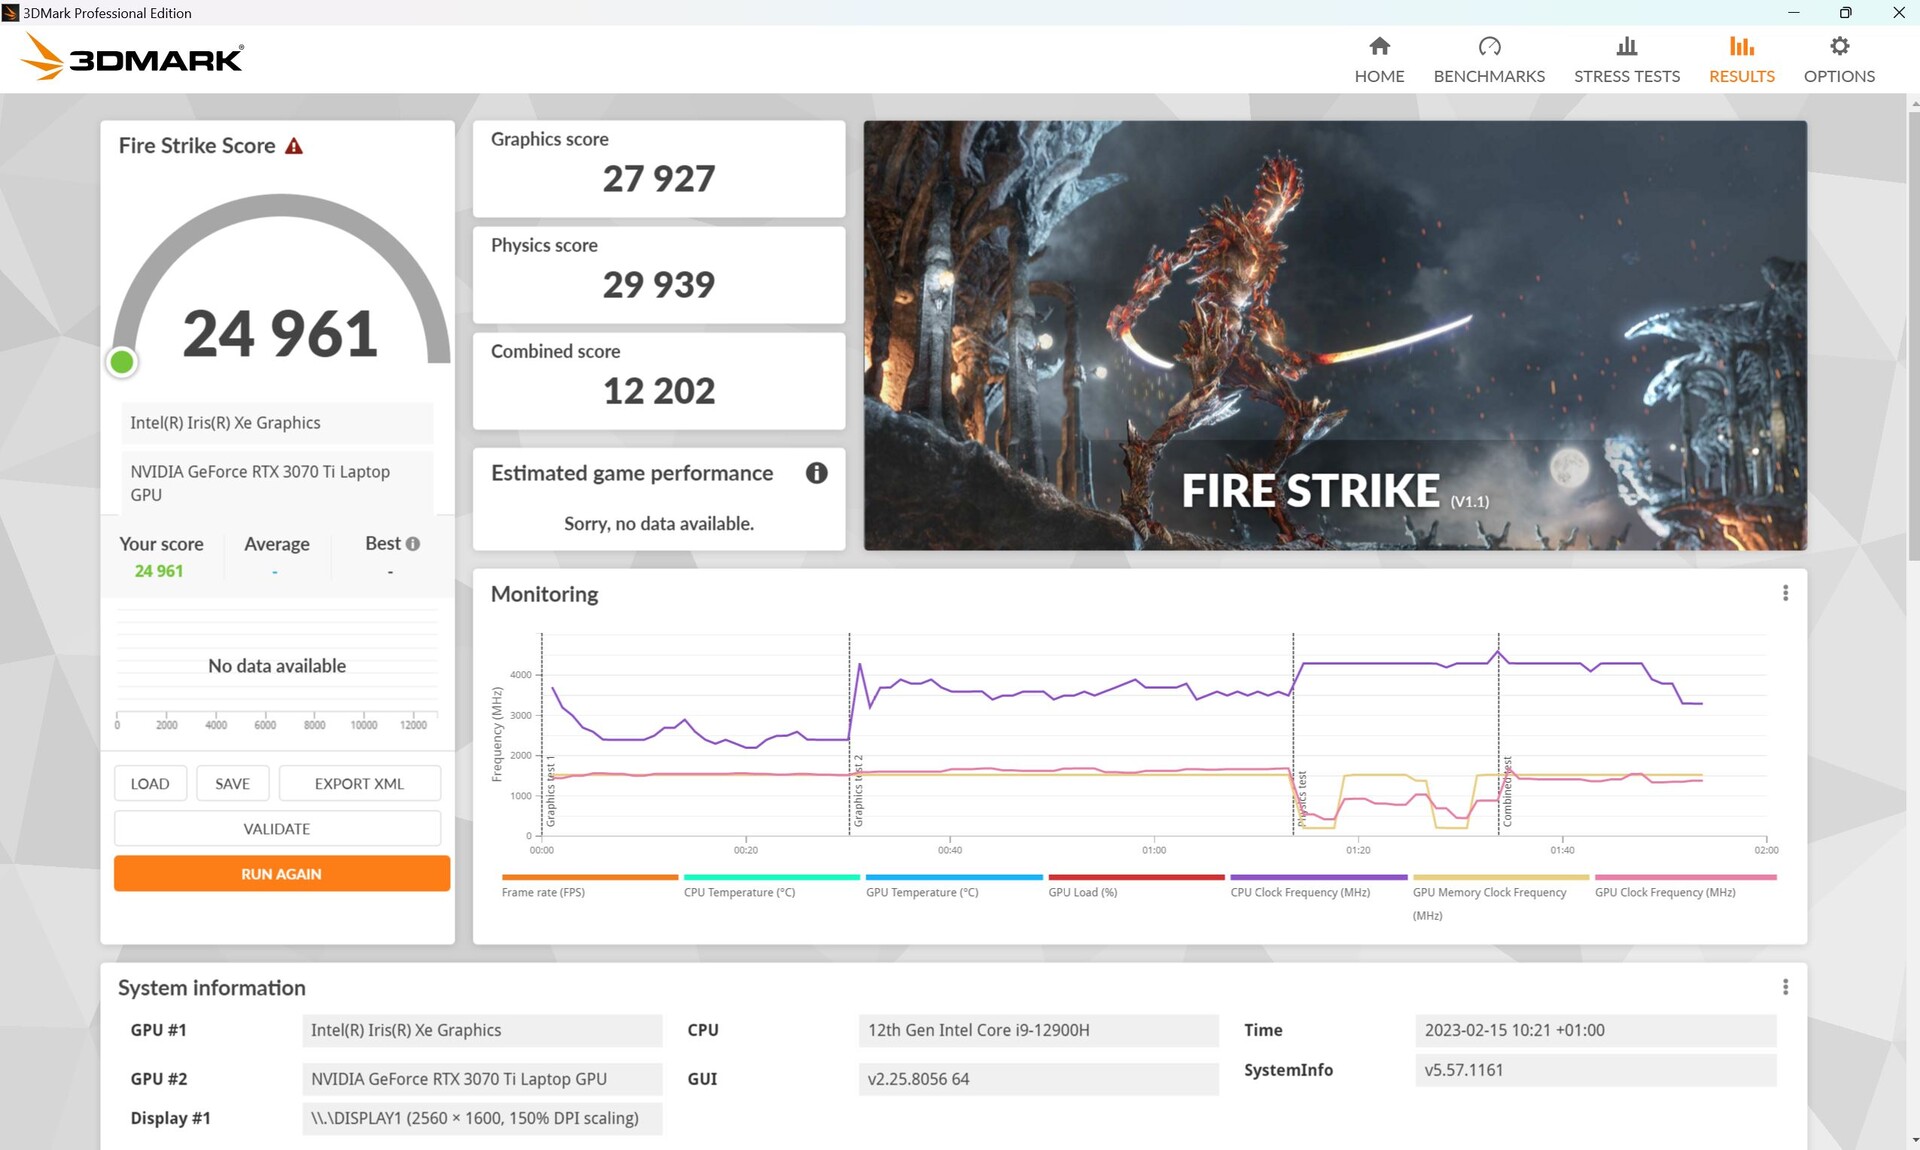
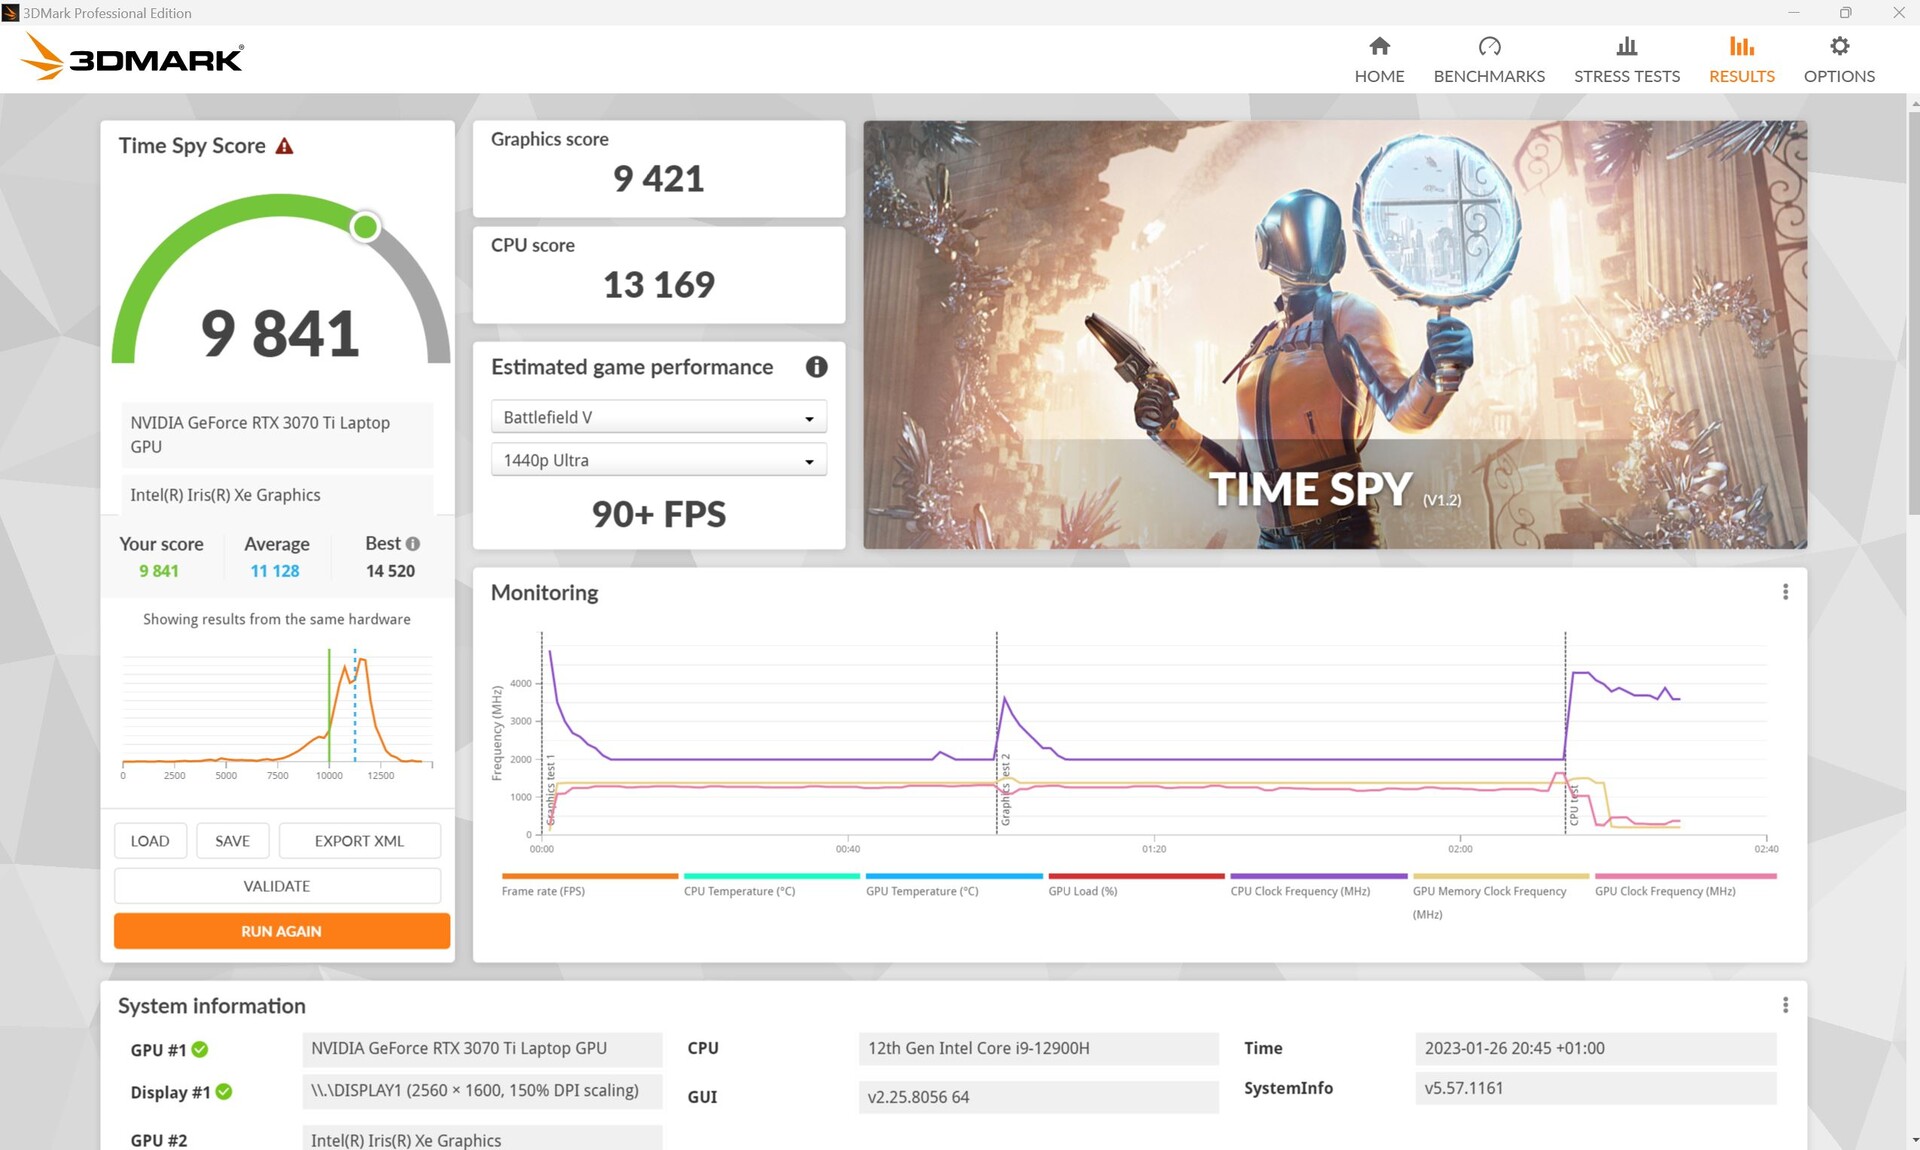
In modalità Turbo, le prestazioni e il consumo aumentano leggermente e un altro test Fire-Strike porta a un punteggio grafico superiore di circa il 13%.
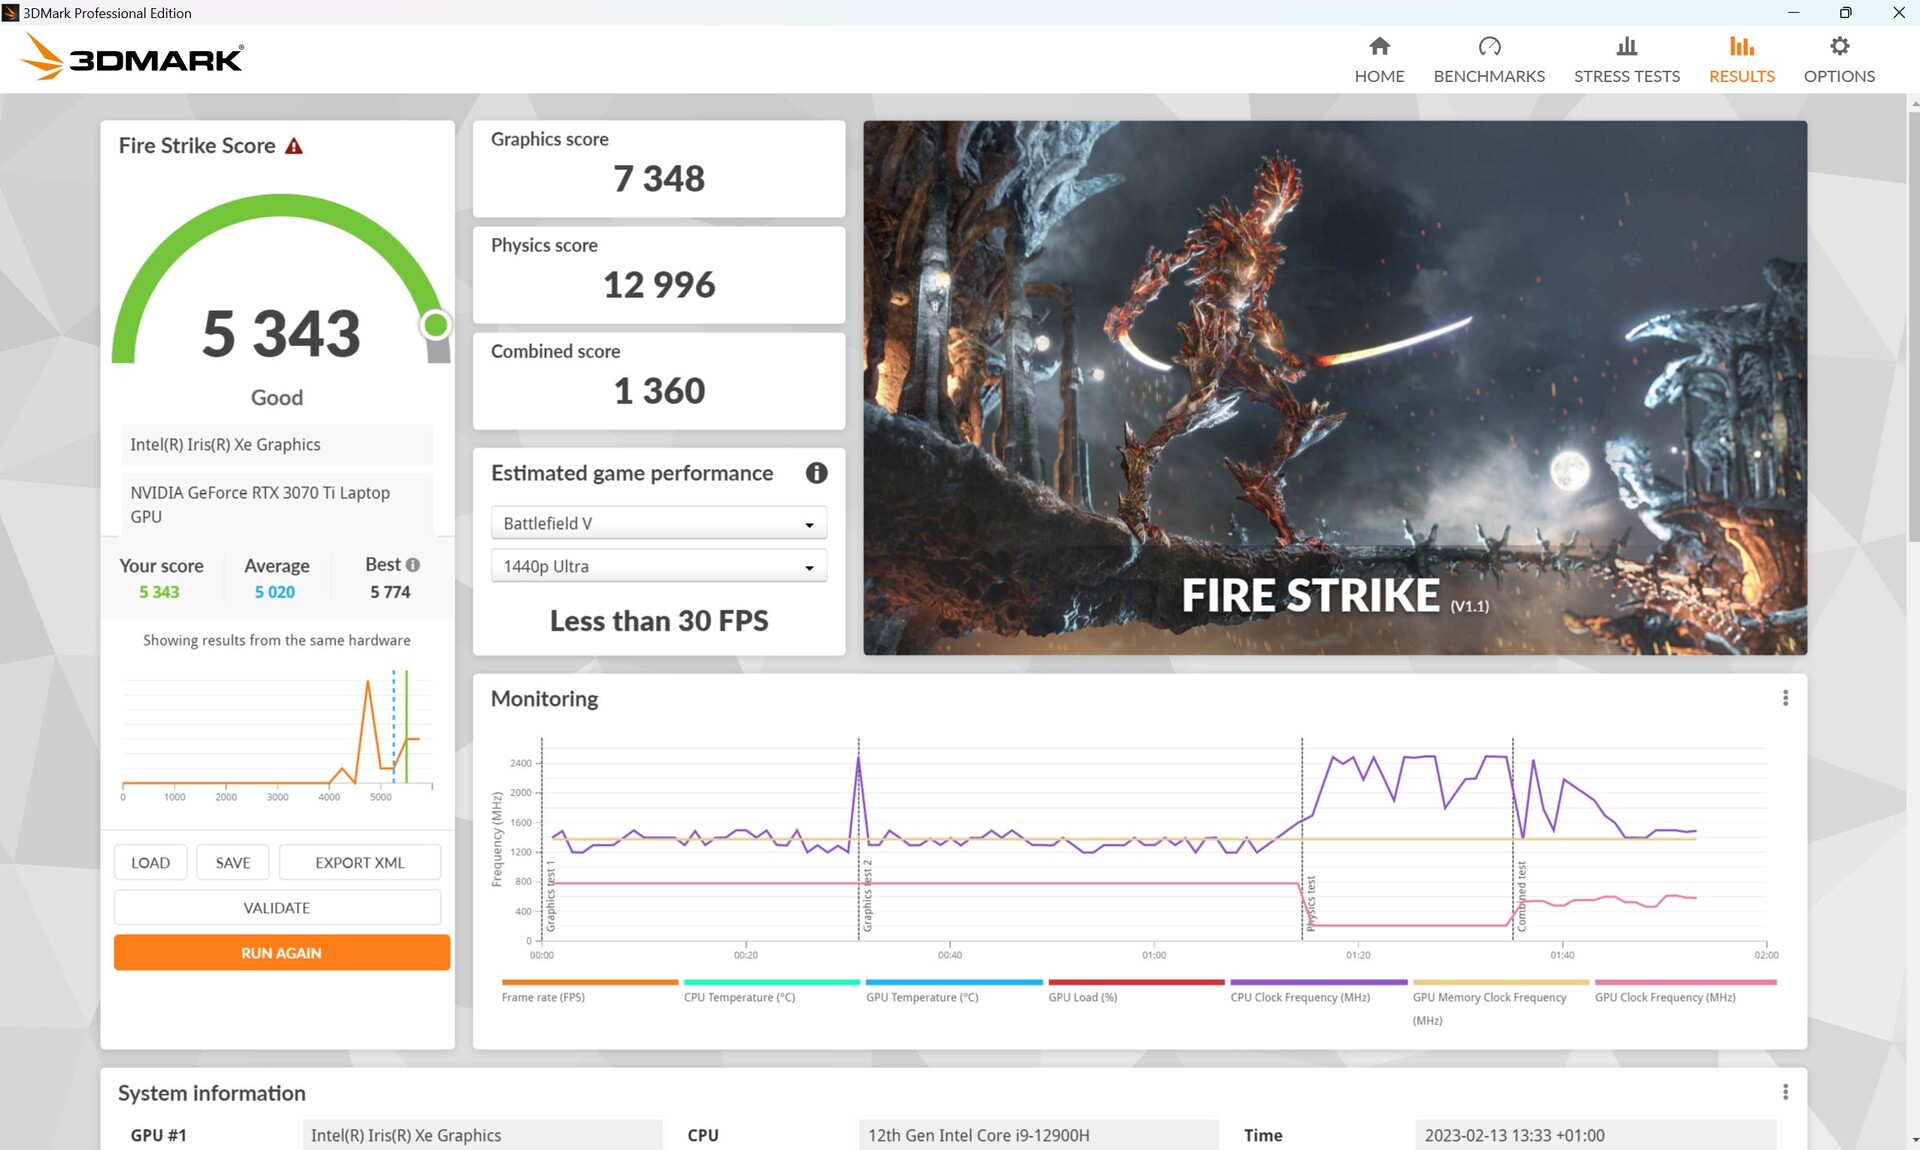
Durante il funzionamento a batteria, le prestazioni 3D calano notevolmente. Rispetto ai 24.618 punti grafici di Fire Strike durante il funzionamento a rete, rimangono solo 7.348 punti 3D durante il funzionamento a batteria, il che corrisponde a un calo del 70%!
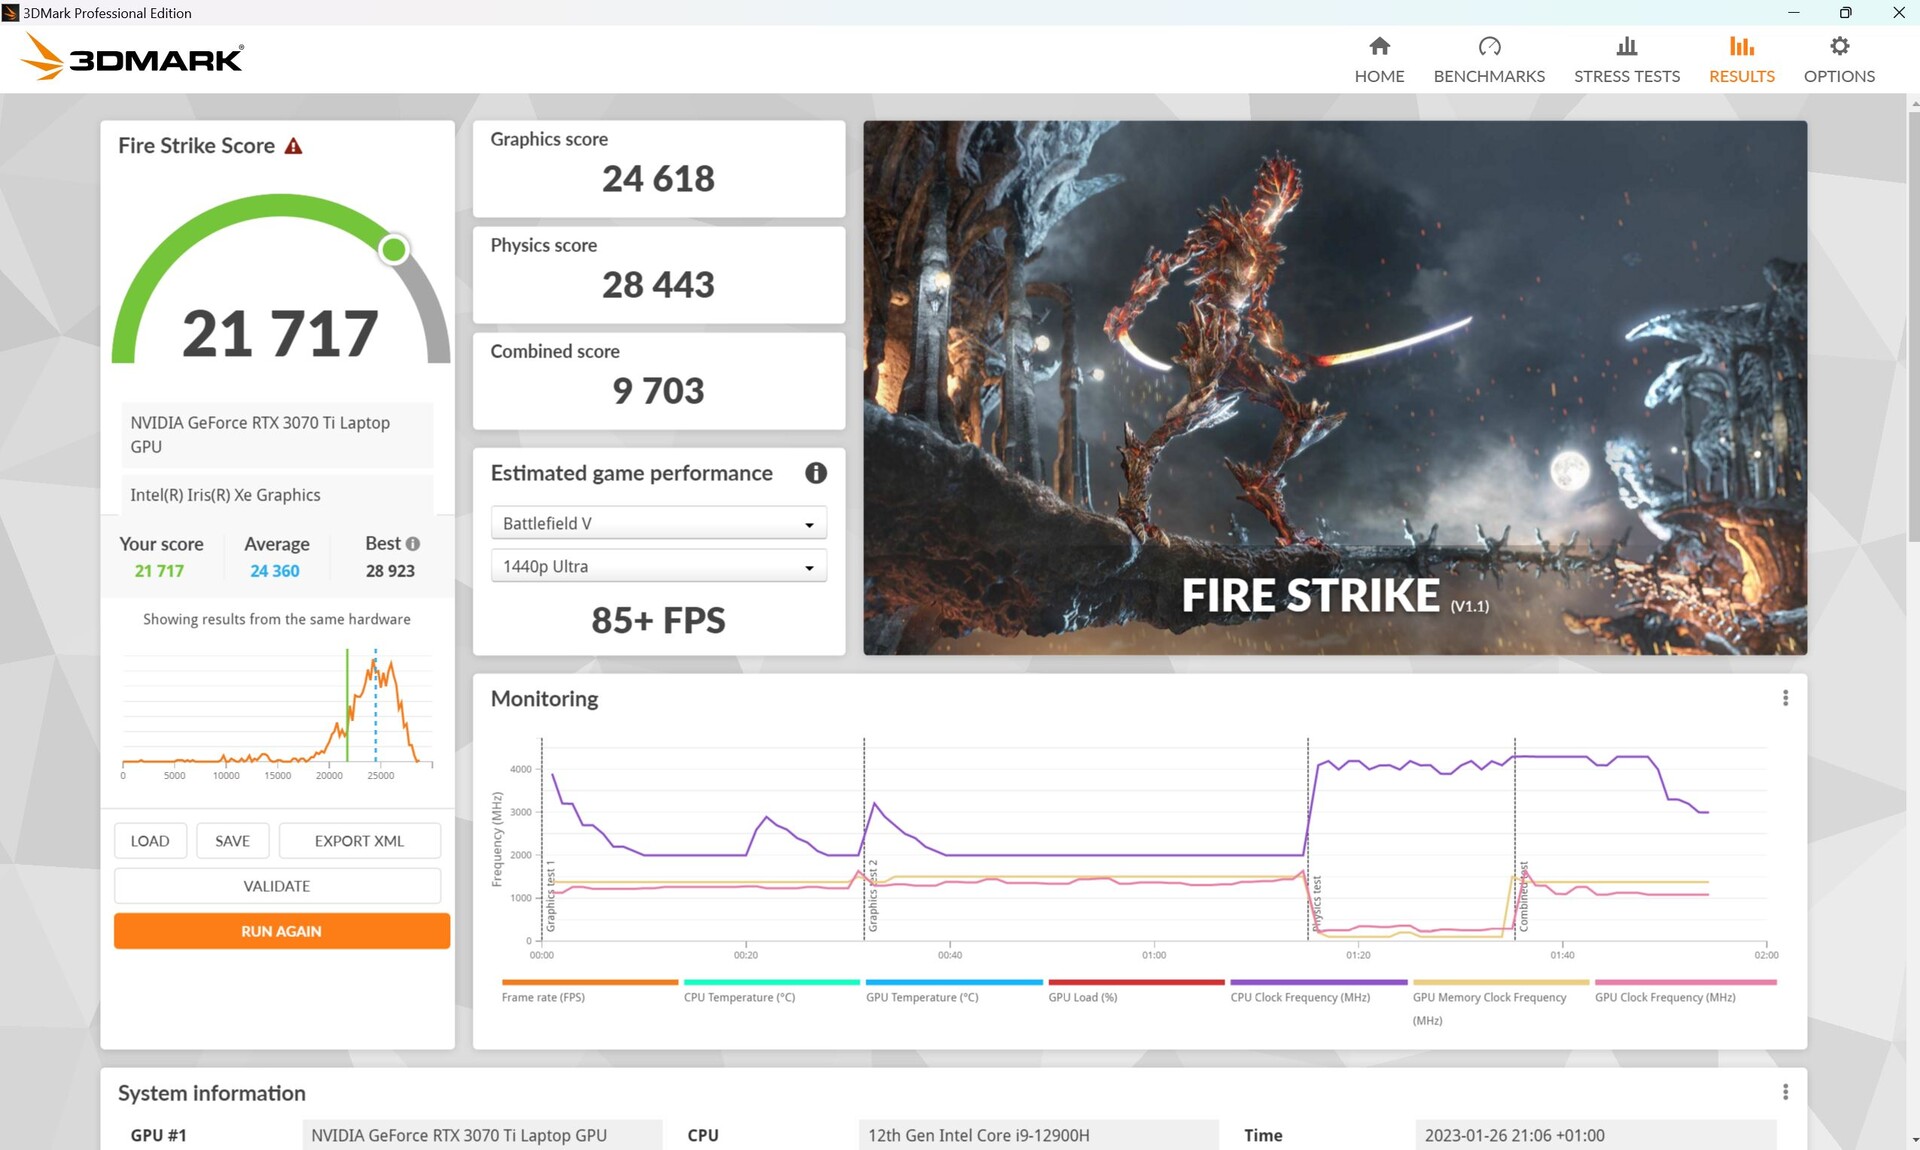
| 3DMark 11 Performance | 29169 punti | |
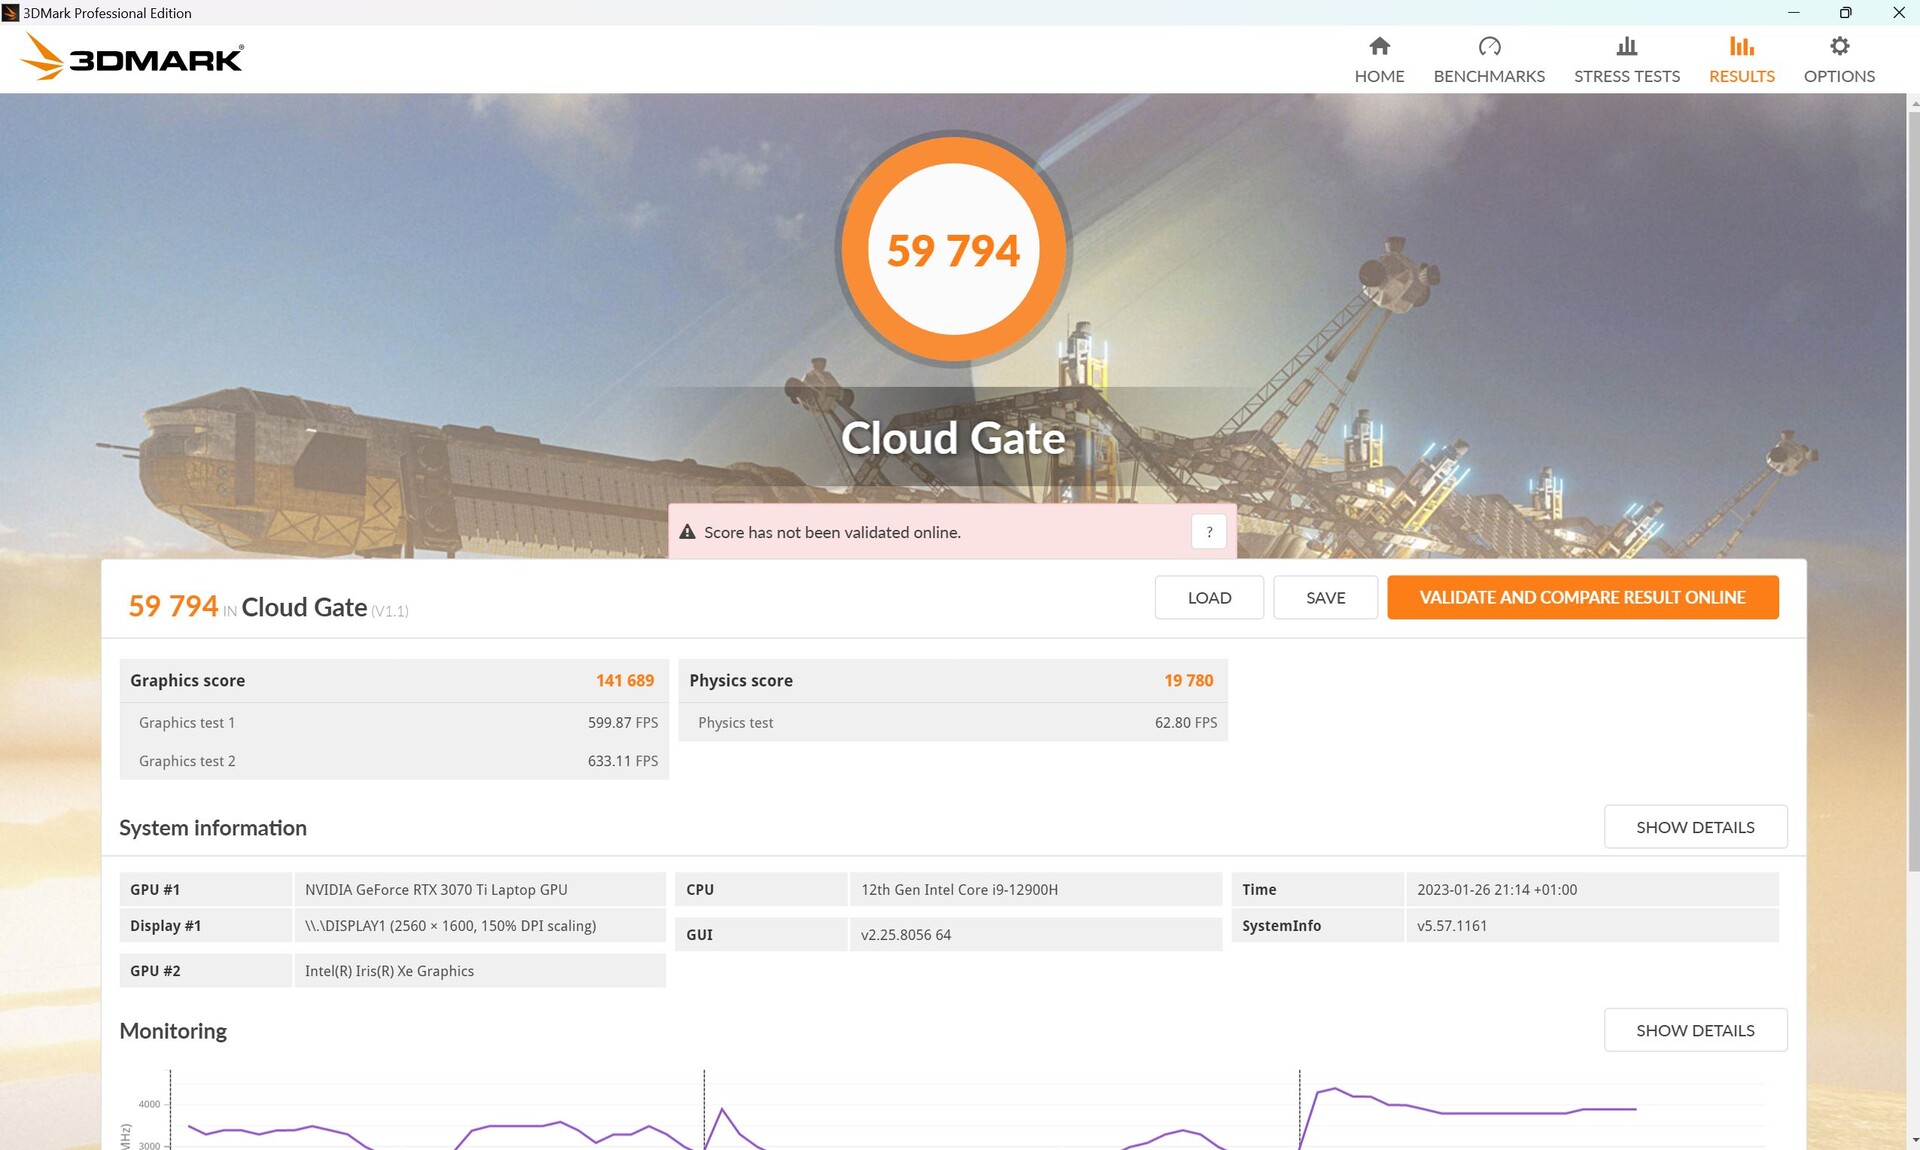
| 3DMark Cloud Gate Standard Score | 59794 punti | |
| 3DMark Fire Strike Score | 21717 punti | |
| 3DMark Time Spy Score | 9841 punti | |
Aiuto | ||
* ... Meglio usare valori piccoli
Prestazioni di gioco
Quando si gioca, la differenza complessiva non è così grande, anche perché la potente CPU è in grado di recuperare nei giochi più pesanti per la CPU. Nei giochi che richiedono un uso intensivo della GPU, come The Witcher 3 o Strange Brigade, ilLegion 5 Procon la sua RTX 3070-Ti da 150 W è chiaramente in vantaggio. In DOTA 2 Reborn o X-Plane 11.11, l'M16 è in grado di piazzarsi al primo posto.
| The Witcher 3 - 1920x1080 Ultra Graphics & Postprocessing (HBAO+) | |
| Media della classe Gaming (104.7 - 240, n=6, ultimi 2 anni) | |
| Lenovo Legion 5 Pro 16ARH7H RTX 3070 Ti | |
| Corsair Voyager a1600 | |
| Asus ROG Zephyrus M16 GU603Z | |
| Asus ROG Zephyrus M16 GU603H | |
| Schenker Vision 16 Pro RTX 3070 Ti | |
| Schenker XMG Focus 16 (i7-12700H, RTX 3060) | |
Il portatile non supporta l'Advanced Optimus ma il normale Optimus e offre anche uno switch MUX, che consente di passare attivamente dalla GPU integrata (o modalità ibrida) a quella dedicata.
Il nostro ciclo Witcher 3 si traduce in frame rate relativamente costanti. Le differenze di prestazioni tra i concorrenti diventano facilmente evidenti in questo caso: mentreLegion 5 Pro è significativamente più veloce, lo Schenker Vision 16 Proè appena superato.
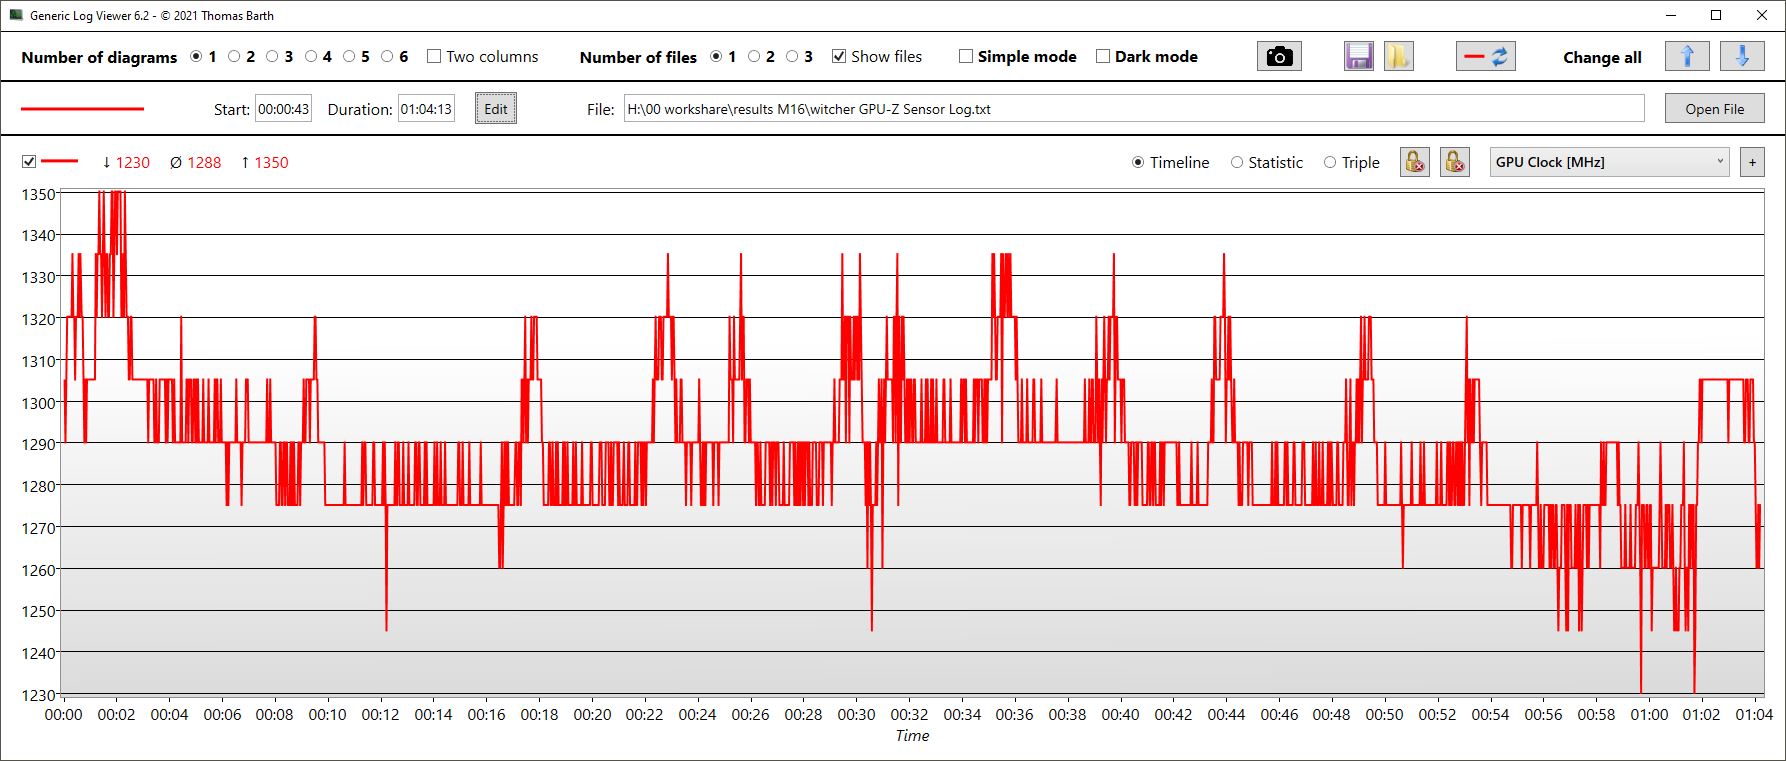
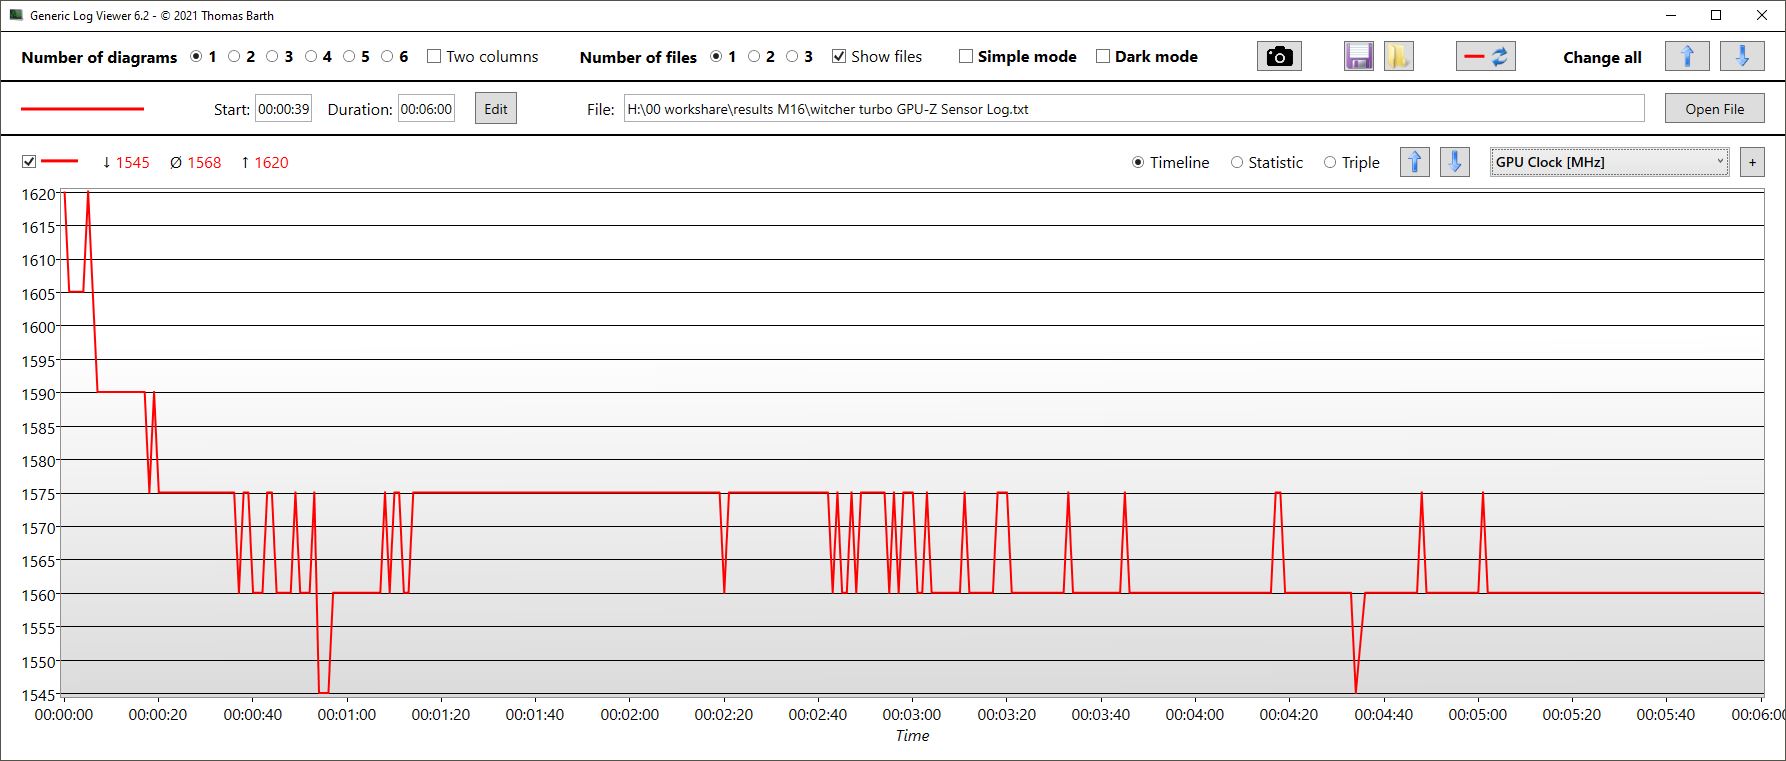
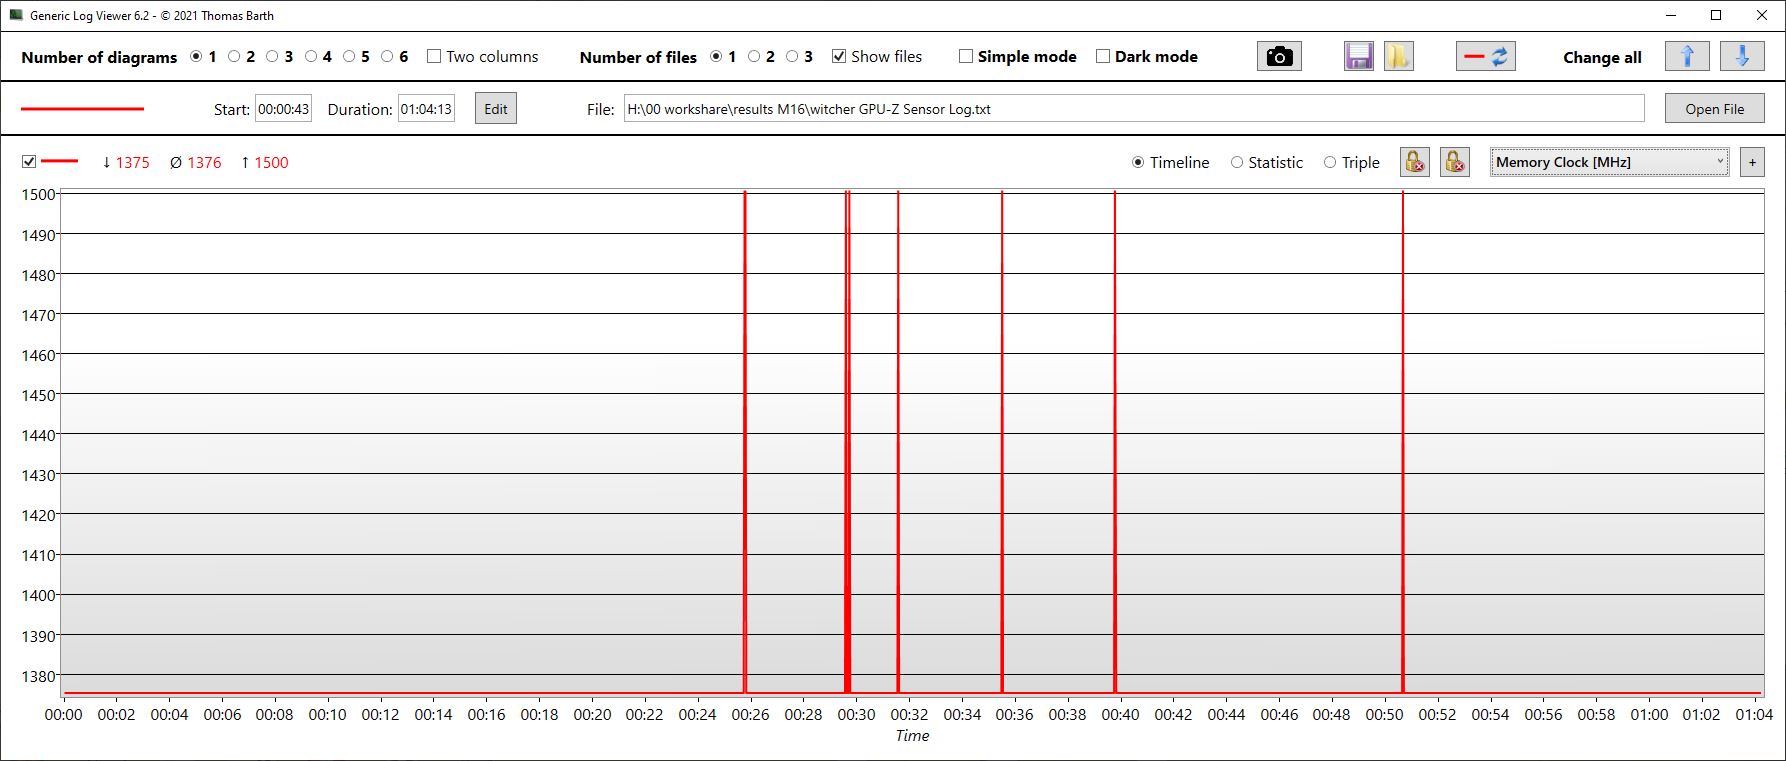
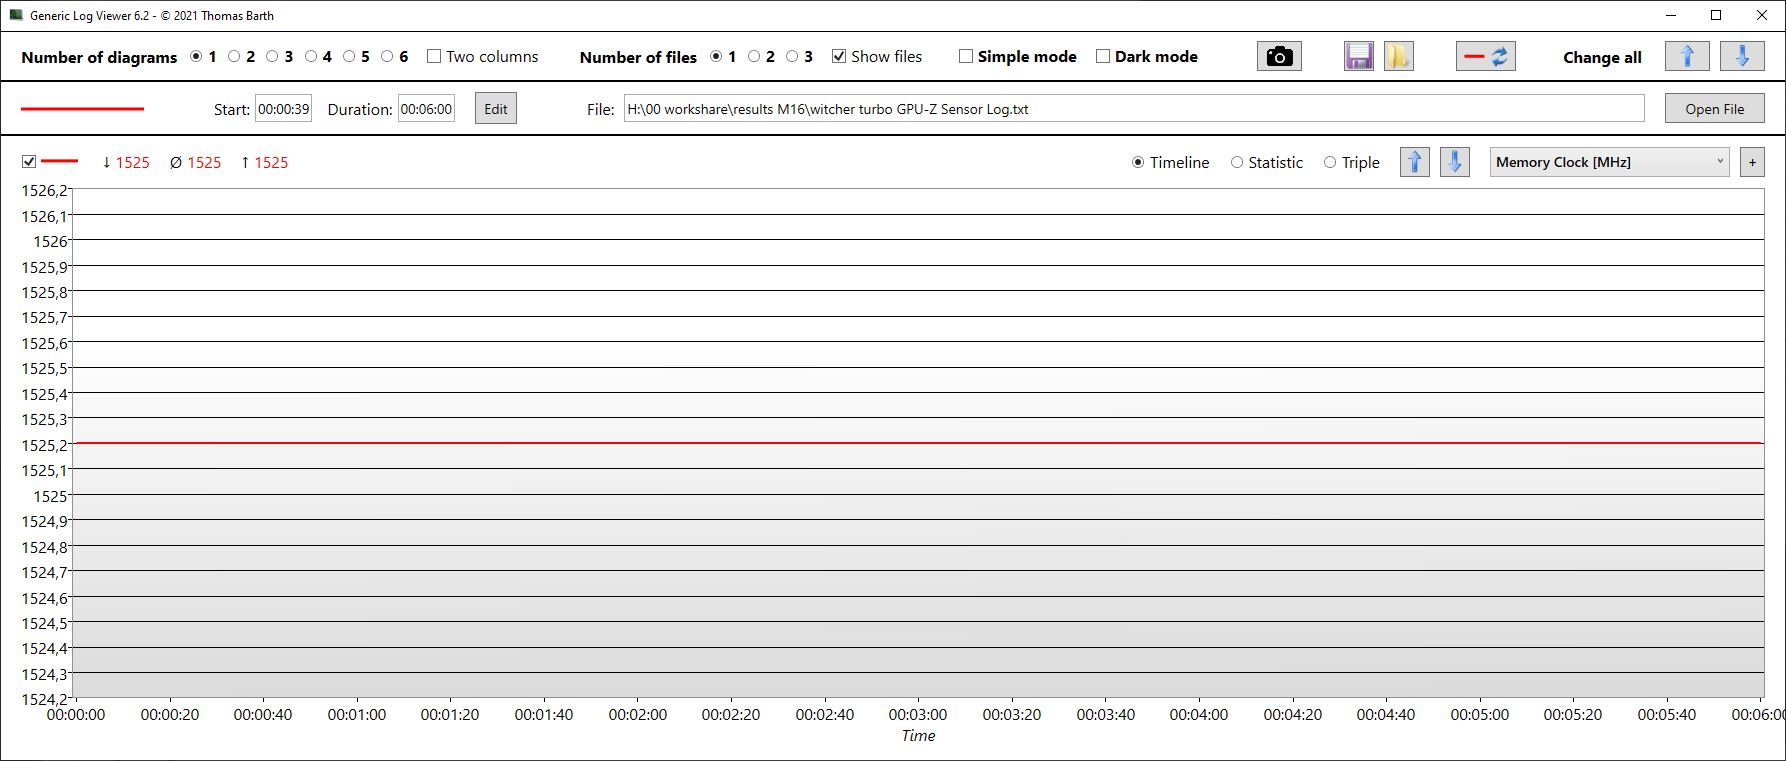
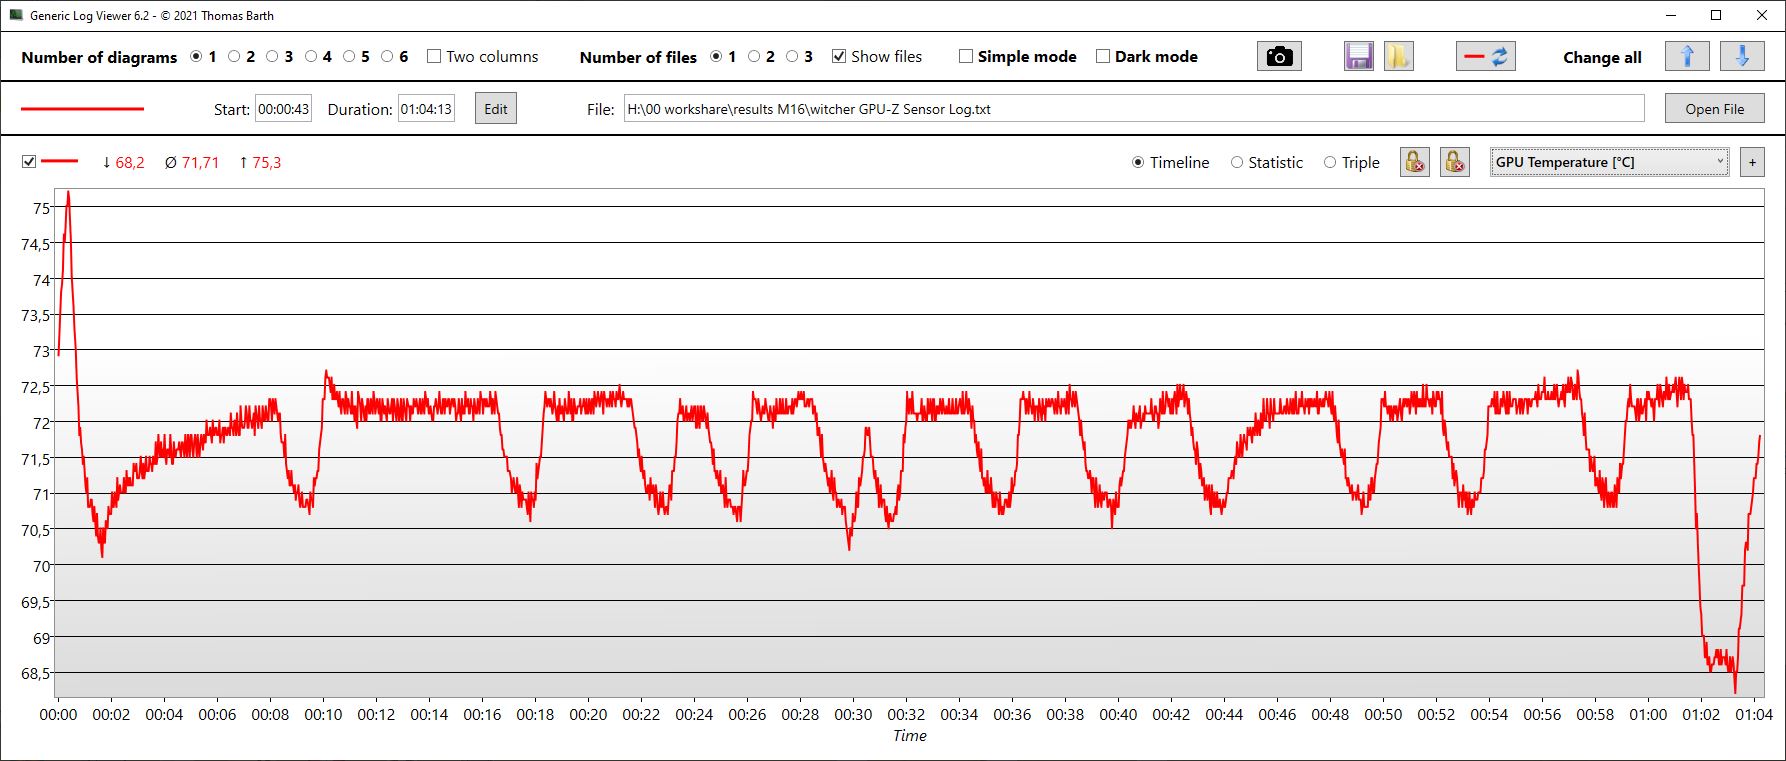
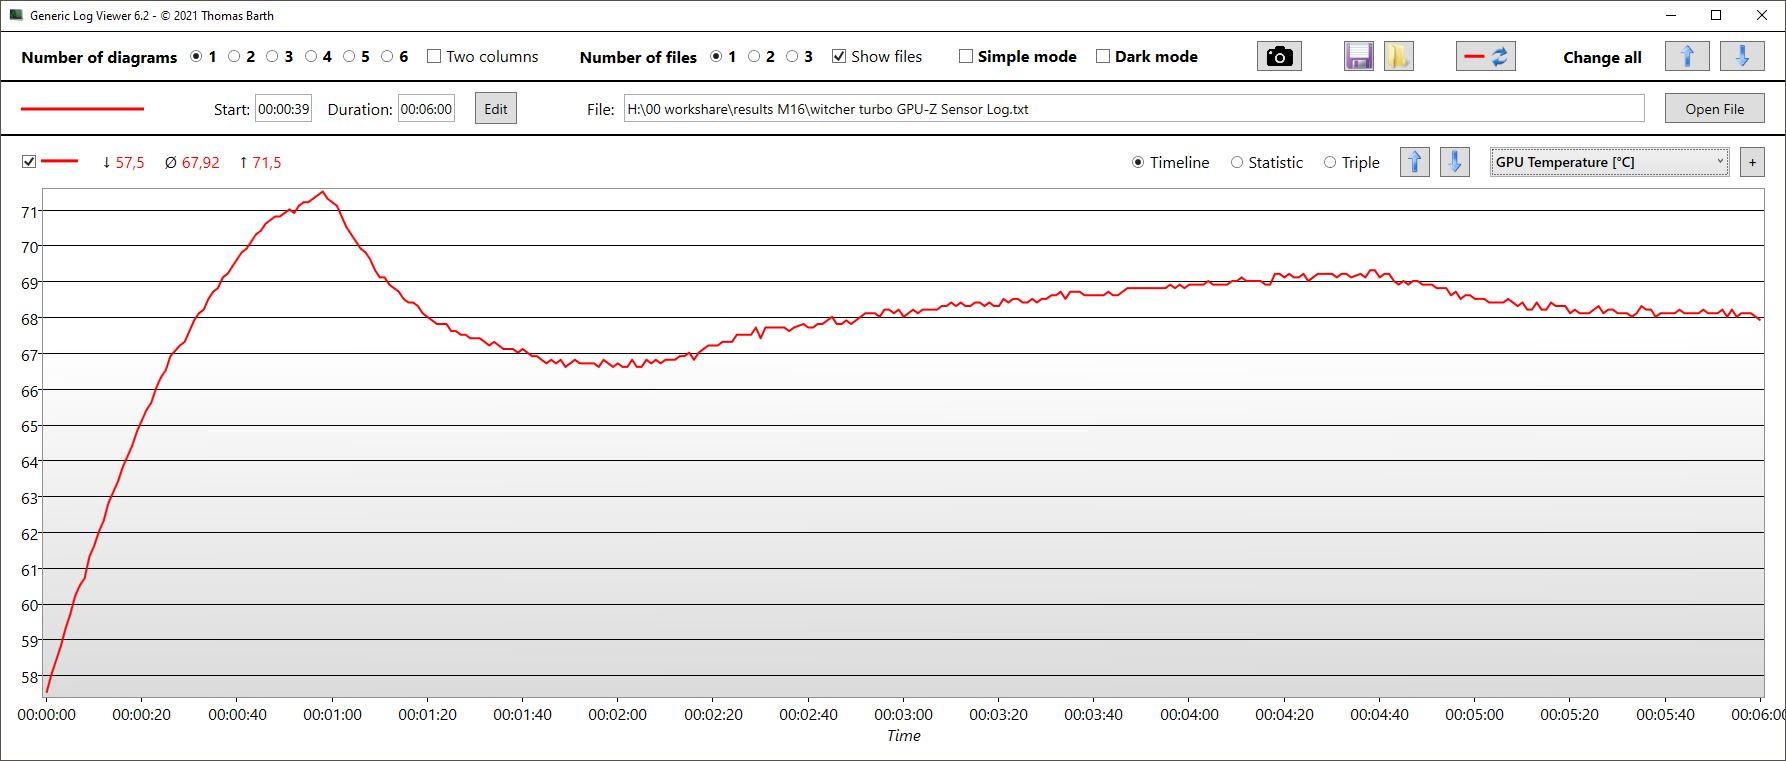
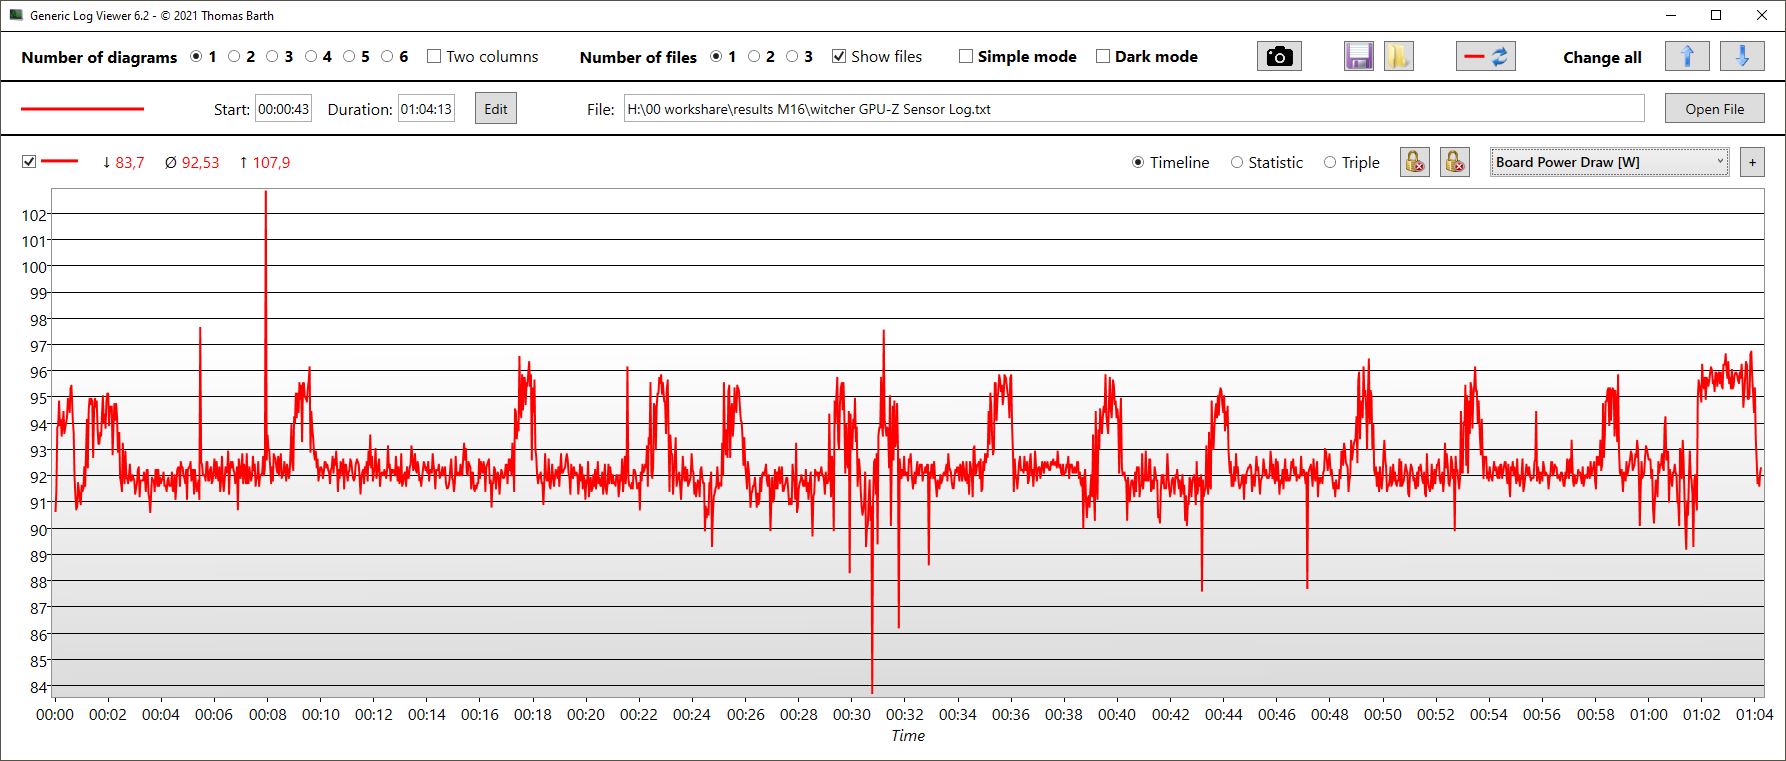
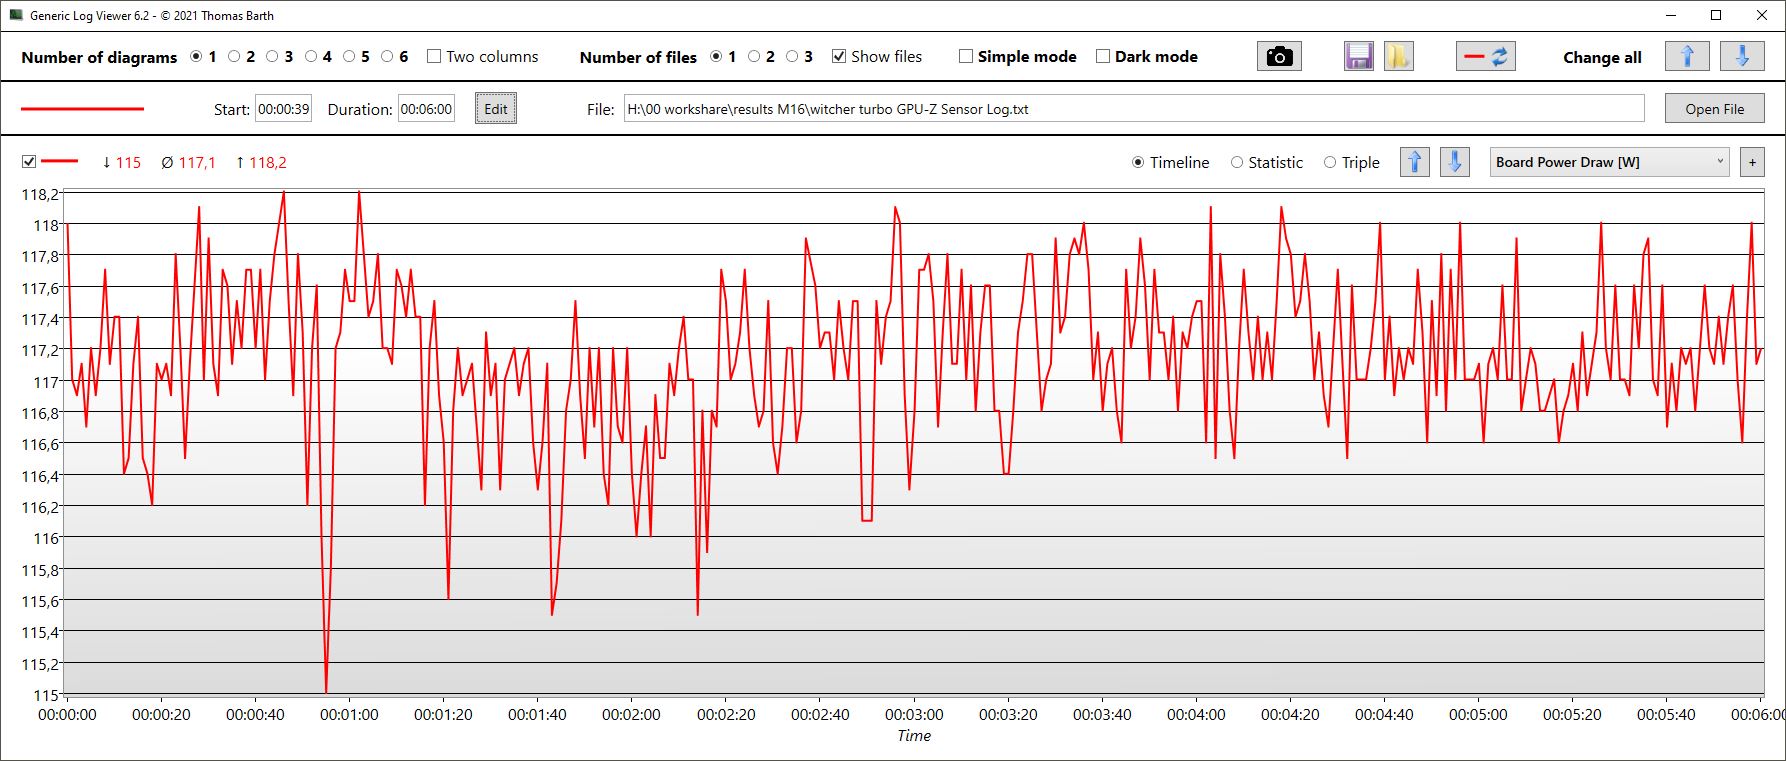
In modalità Turbo (grafico blu, misurato per 6 minuti), le prestazioni aumentano notevolmente, avvicinandosi in alcune parti a quelle del Legion 5 Pro. Il rumore prodotto dal portatile è altrettanto forte, come si può vedere anche nella sezione Emissioni qui sotto. La velocità della GPU e dell'archiviazione aumentano e il consumo di energia sale a quasi 120 W.
Con il passare del tempo, la velocità di clock della GPU diminuisce ancora leggermente, arrivando in media a 1.288 MHz. La scheda si riscalda fino a circa 72 °C (162 °F), mentre il consumo medio è di soli 93 W, ancora lontano dal valore target TGP.
The Witcher 3 FPS Chart
| basso | medio | alto | ultra | QHD | 4K | |
|---|---|---|---|---|---|---|
| GTA V (2015) | 184.6 | 171.4 | 108.1 | |||
| The Witcher 3 (2015) | 370.2 | 273.2 | 171 | 99.5 | ||
| Dota 2 Reborn (2015) | 195.2 | 174.7 | 170.2 | 160.5 | ||
| Final Fantasy XV Benchmark (2018) | 123.8 | 94.8 | 72.1 | 43 | ||
| X-Plane 11.11 (2018) | 166.8 | 145.7 | 115 | |||
| Far Cry 5 (2018) | 174 | 128 | 128 | 124 | 90 | |
| Strange Brigade (2018) | 376 | 227 | 187.9 | 163.8 | ||
| Dying Light 2 (2022) | 98.5 | 79 | 66 | 46.7 |
Emissioni - Un Asus M16 moderato
Livelli di rumore
Durante il funzionamento inattivo, le ventole sono spesso spente, ma non in modo costante. Di tanto in tanto, possono facilmente raggiungere i 47 dB, ad esempio subito dopo il riavvio, all'avvio di Windows.
Durante la prima scena del benchmark 3DMark 06, le ventole rimangono per lo più silenziose, con 34 dB, e il rumore delle ventole aumenta a 47 dB solo prima della fine. Il Schenker Vision 16 Pro e il Legion 5 Pro riescono a rimanere silenziosi anche più a lungo.
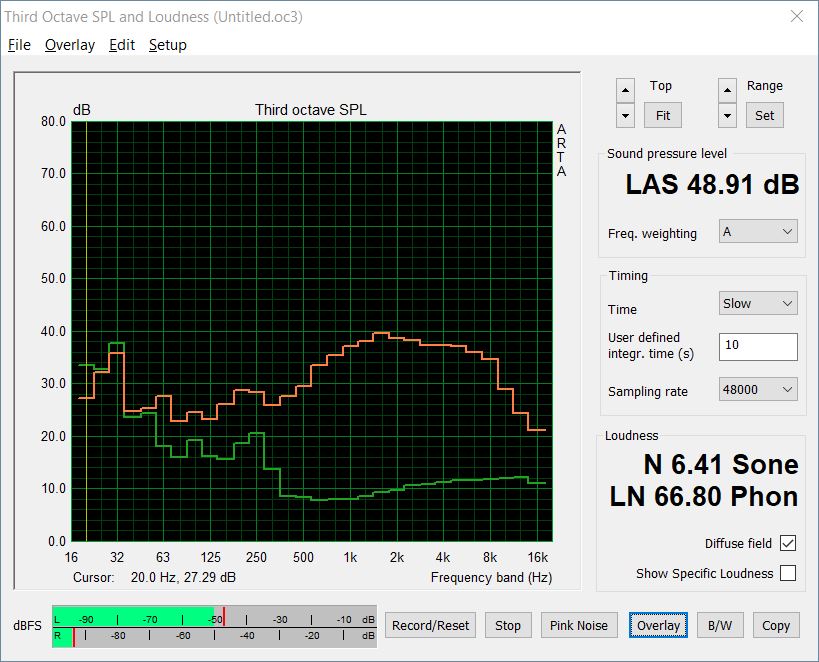
Quando si gioca, il funzionamento dell'M16 rimane piuttosto silenzioso rispetto ai suoi concorrenti, alcuni dei quali producono un livello di rumore significativamente superiore a 50 dB, mentre quello dell'M16 rimane inferiore. Tuttavia, questo vale solo per la modalità Performance. Se si utilizza la modalità Turbo, le ventole raggiungono quasi 55 dB, un livello pari a quello di Legion 5 Pro e significativamente superiore a quello di Vision 16 Pro.
Rumorosità
| Idle |
| 23 / 24 / 47 dB(A) |
| Sotto carico |
| 47.91 / 50.25 dB(A) |
 | ||
30 dB silenzioso 40 dB(A) udibile 50 dB(A) rumoroso |
||
min: | ||
| Asus ROG Zephyrus M16 GU603Z GeForce RTX 3070 Ti Laptop GPU, i9-12900H, Micron 3400 1TB MTFDKBA1T0TFH | Asus ROG Zephyrus M16 GU603H GeForce RTX 3070 Laptop GPU, i9-11900H, Samsung PM9A1 MZVL22T0HBLB | Schenker Vision 16 Pro RTX 3070 Ti GeForce RTX 3070 Ti Laptop GPU, i7-12700H, Samsung SSD 980 Pro 1TB MZ-V8P1T0BW | Lenovo Legion 5 Pro 16ARH7H RTX 3070 Ti GeForce RTX 3070 Ti Laptop GPU, R7 6800H, Samsung PM9A1 MZVL21T0HCLR | Schenker XMG Focus 16 (i7-12700H, RTX 3060) GeForce RTX 3060 Laptop GPU, i7-12700H, Samsung SSD 980 Pro 1TB MZ-V8P1T0BW | Corsair Voyager a1600 Radeon RX 6800M, R9 6900HS, Samsung PM9A1 MZVL22T0HBLB | |
|---|---|---|---|---|---|---|
| Noise | -8% | 8% | -1% | 0% | -9% | |
| off /ambiente * (dB) | 23 | 25 -9% | 22.9 -0% | 23.5 -2% | 23 -0% | 29.9 -30% |
| Idle Minimum * (dB) | 23 | 25 -9% | 24.3 -6% | 23.7 -3% | 23 -0% | 30.5 -33% |
| Idle Average * (dB) | 24 | 31 -29% | 24.3 -1% | 31.1 -30% | 23 4% | 30.6 -28% |
| Idle Maximum * (dB) | 47 | 42 11% | 24.3 48% | 32.2 31% | 32.07 32% | 30.7 35% |
| Load Average * (dB) | 47.91 | 48 -0% | 38.5 20% | 38.4 20% | 53.7 -12% | 44.5 7% |
| Witcher 3 ultra * (dB) | 48.91 | 52 -6% | 51 -4% | 54.8 -12% | 54.58 -12% | |
| Load Maximum * (dB) | 50.25 | 56 -11% | 51 -1% | 54.8 -9% | 54.58 -9% | 51.1 -2% |
* ... Meglio usare valori piccoli
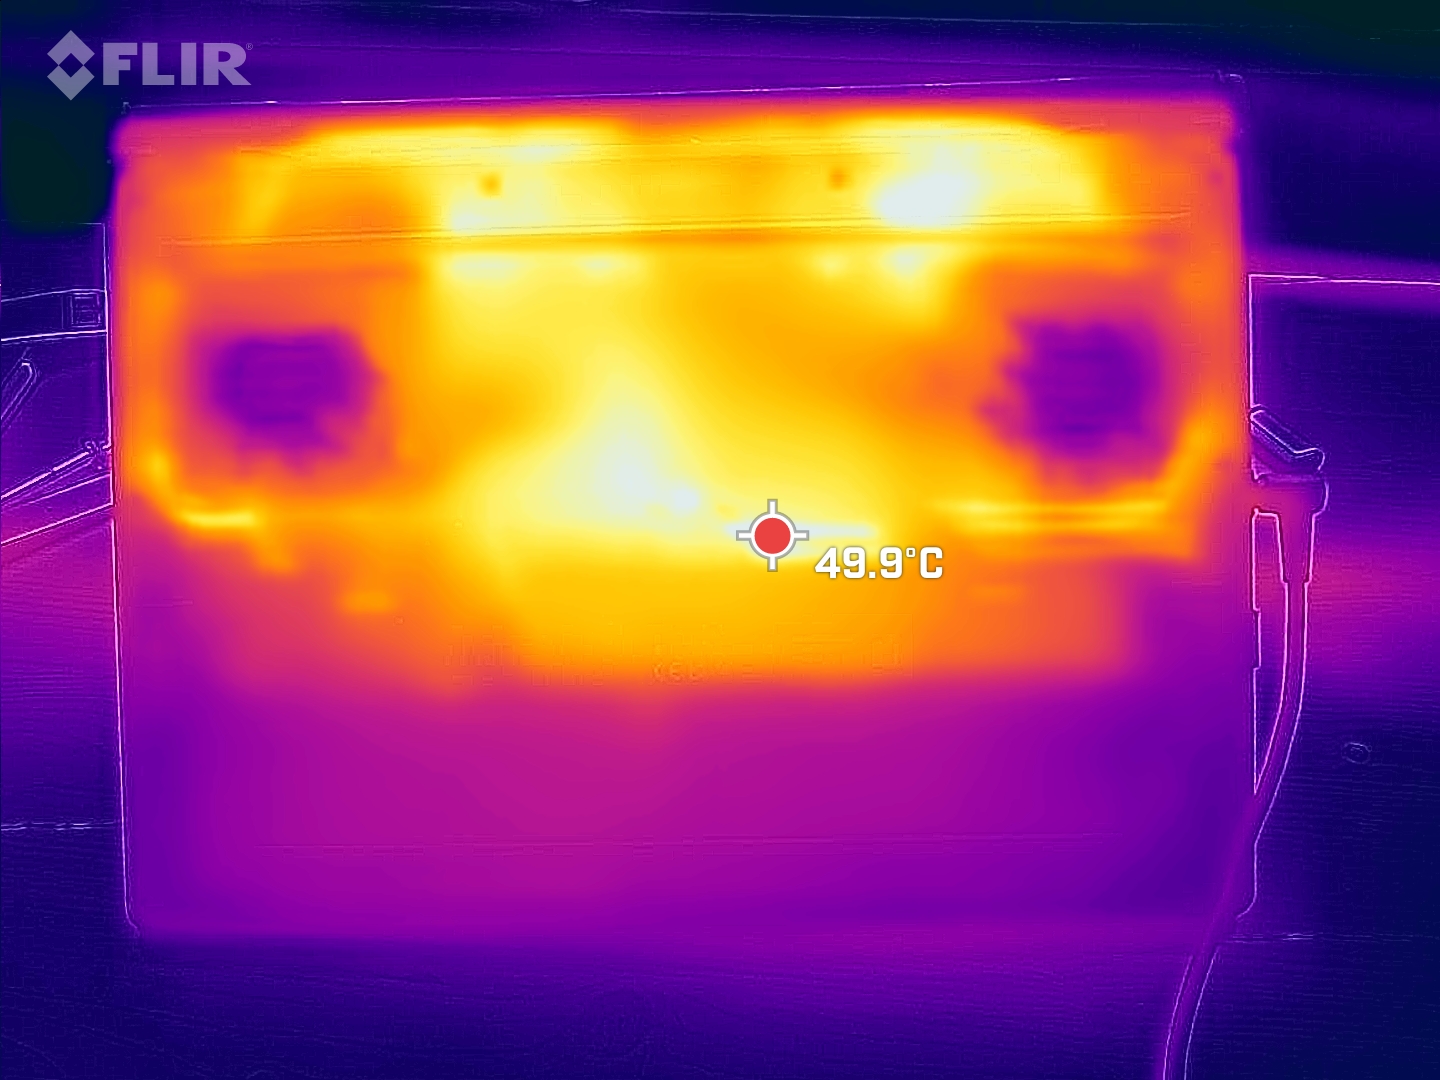
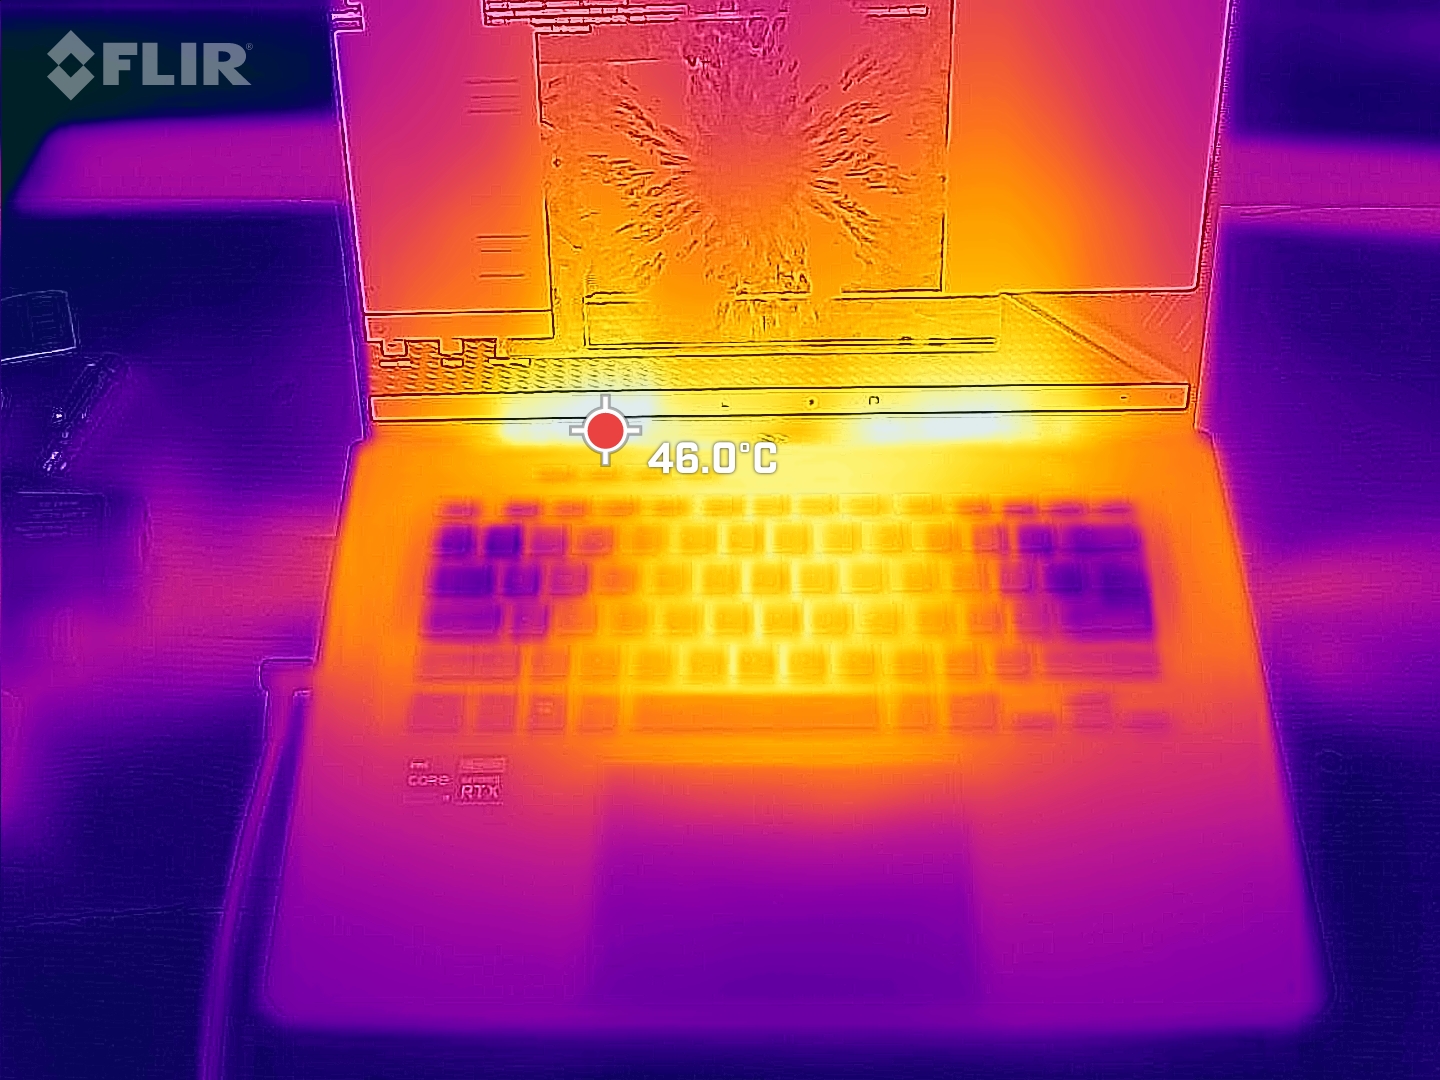
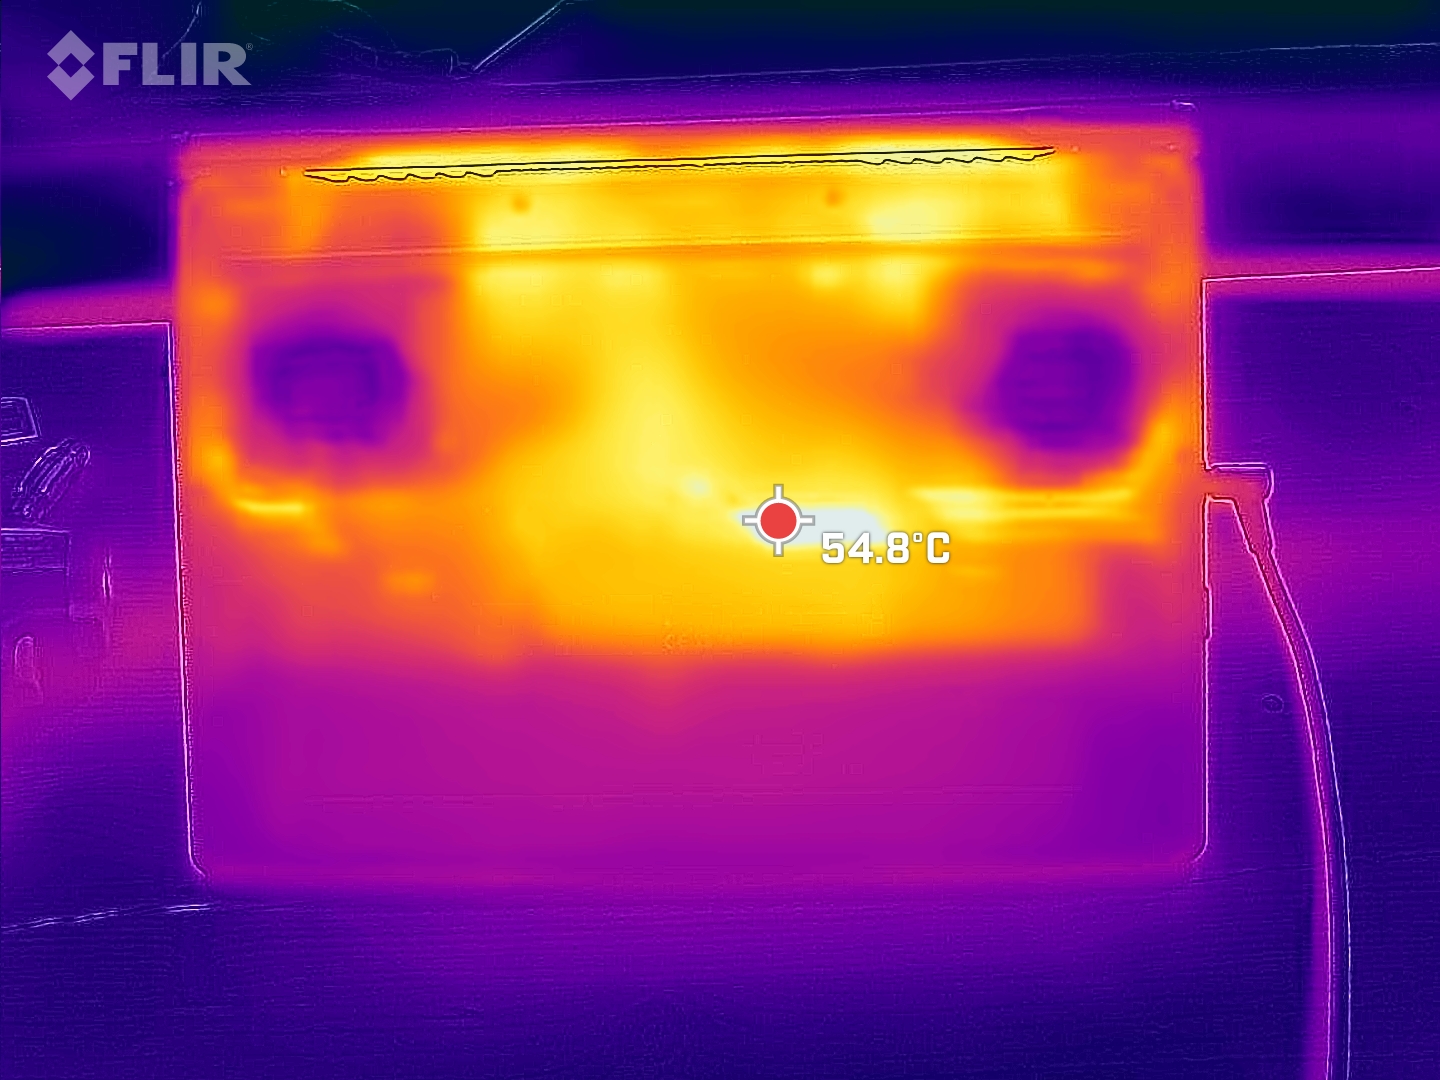
Temperature
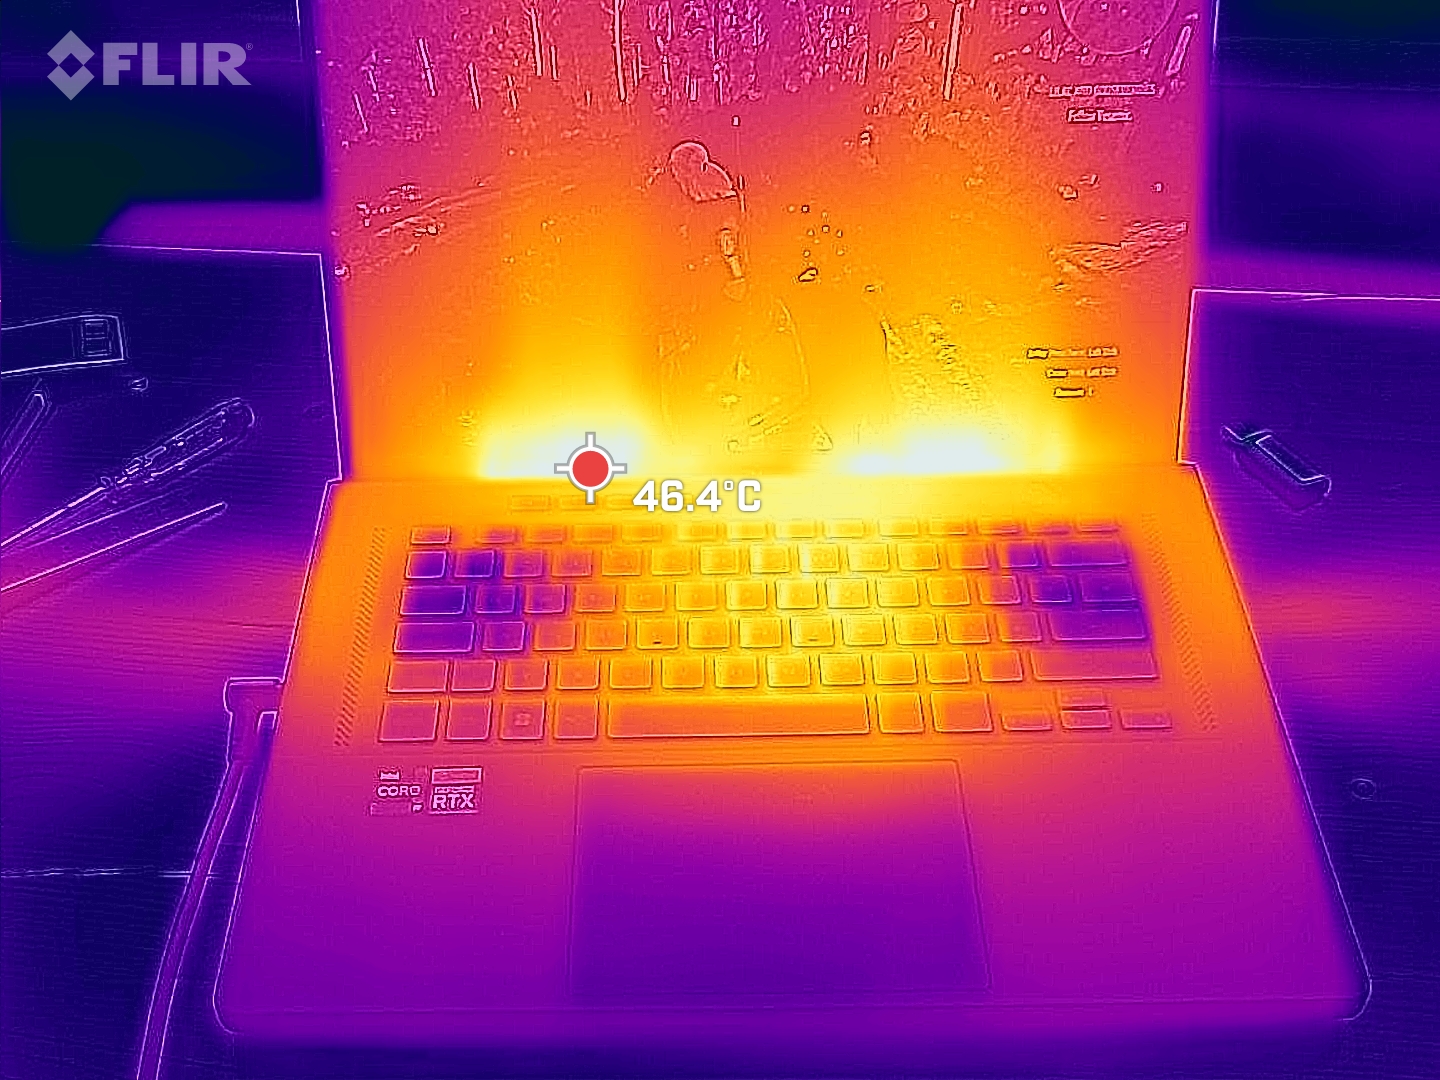
In condizioni di carico elevato, la parte superiore e inferiore del case si riscaldano fino a superare di poco i 50 °C (122 °F). Questo valore rimane entro i limiti abituali ed è persino leggermente migliore rispetto al predecessore. Il Legion 5 Pro rimane leggermente più freddo nella parte superiore, mentre il Vision 16 Pro è leggermente più fresco nella parte inferiore.
(-) La temperatura massima sul lato superiore è di 52 °C / 126 F, rispetto alla media di 40.4 °C / 105 F, che varia da 21.2 a 68.8 °C per questa classe Gaming.
(-) Il lato inferiore si riscalda fino ad un massimo di 51 °C / 124 F, rispetto alla media di 43.2 °C / 110 F
(+) In idle, la temperatura media del lato superiore è di 26.4 °C / 80 F, rispetto alla media deld ispositivo di 33.9 °C / 93 F.
(-) Riproducendo The Witcher 3, la temperatura media per il lato superiore e' di 40.2 °C / 104 F, rispetto alla media del dispositivo di 33.9 °C / 93 F.
(+) I poggiapolsi e il touchpad raggiungono la temperatura massima della pelle (32 °C / 89.6 F) e quindi non sono caldi.
(-) La temperatura media della zona del palmo della mano di dispositivi simili e'stata di 28.8 °C / 83.8 F (-3.2 °C / -5.8 F).
| Asus ROG Zephyrus M16 GU603Z Intel Core i9-12900H, NVIDIA GeForce RTX 3070 Ti Laptop GPU | Asus ROG Zephyrus M16 GU603H Intel Core i9-11900H, NVIDIA GeForce RTX 3070 Laptop GPU | Schenker Vision 16 Pro RTX 3070 Ti Intel Core i7-12700H, NVIDIA GeForce RTX 3070 Ti Laptop GPU | Lenovo Legion 5 Pro 16ARH7H RTX 3070 Ti AMD Ryzen 7 6800H, NVIDIA GeForce RTX 3070 Ti Laptop GPU | Schenker XMG Focus 16 (i7-12700H, RTX 3060) Intel Core i7-12700H, NVIDIA GeForce RTX 3060 Laptop GPU | Corsair Voyager a1600 AMD Ryzen 9 6900HS, AMD Radeon RX 6800M | |
|---|---|---|---|---|---|---|
| Heat | -15% | 9% | 3% | 4% | -7% | |
| Maximum Upper Side * (°C) | 52 | 52 -0% | 50.8 2% | 43.8 16% | 50 4% | 50.7 2% |
| Maximum Bottom * (°C) | 51 | 53 -4% | 46.3 9% | 53 -4% | 48 6% | 54.2 -6% |
| Idle Upper Side * (°C) | 29 | 38 -31% | 27.2 6% | 30 -3% | 28 3% | 35.8 -23% |
| Idle Bottom * (°C) | 33 | 41 -24% | 26.6 19% | 31.8 4% | 32 3% | 33 -0% |
* ... Meglio usare valori piccoli
Stress test
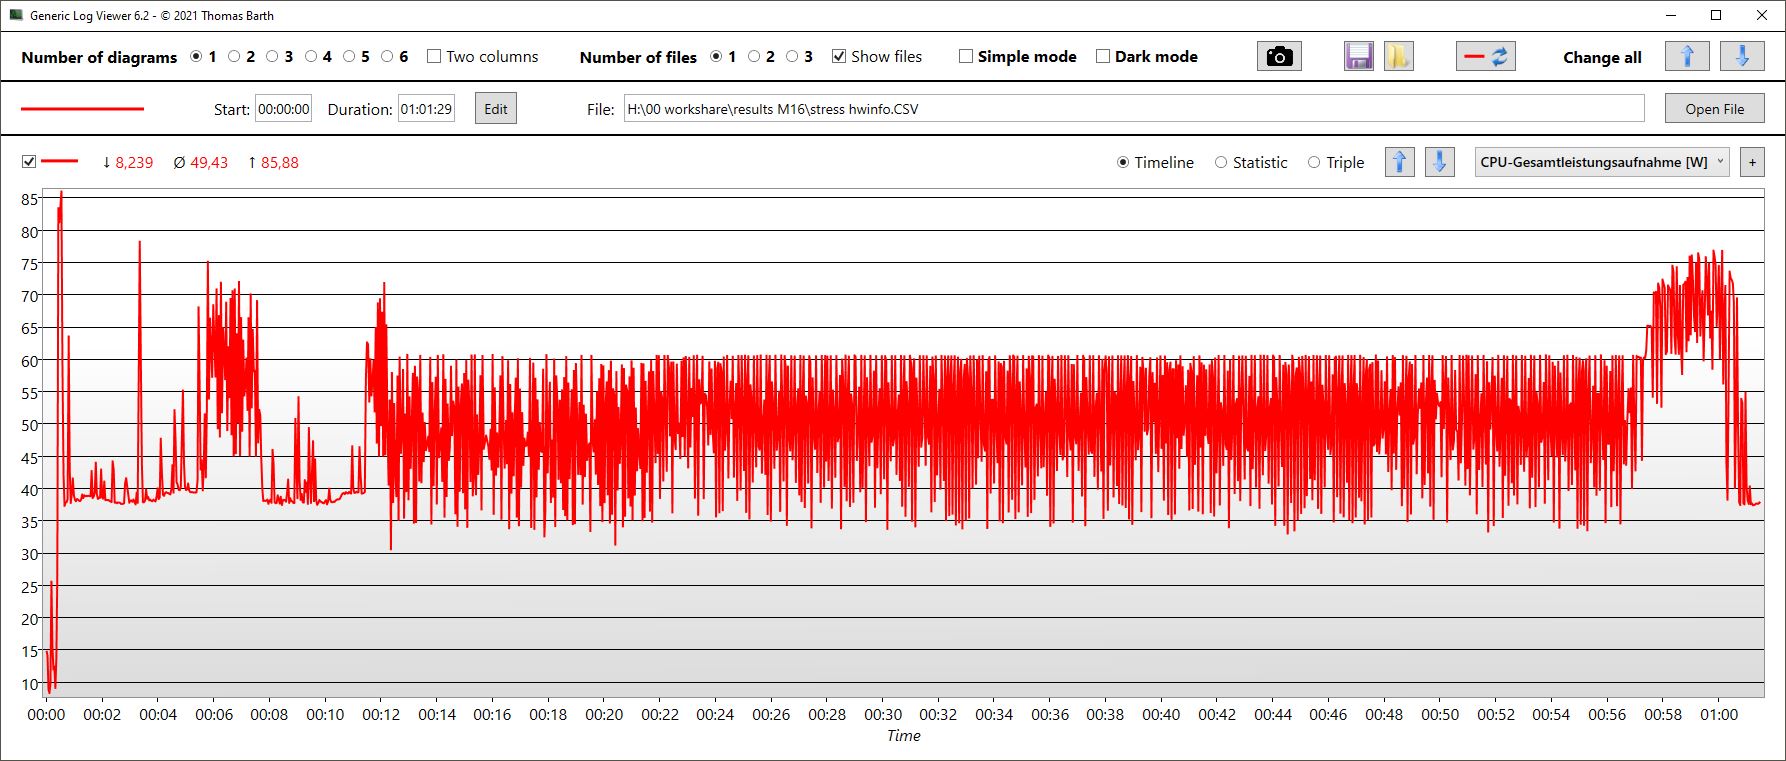
I core della CPU iniziano il nostro stress test a 3,5 GHz. Dopo pochi secondi, la velocità di clock inizia a scendere, stabilizzandosi intorno ai 2,4 GHz. La temperatura varia con un massimo di 97 °C (207 °F) e 83 °C (181 °F) in media. Il TDP della CPU è di 44 W in media.
La velocità grafica varia significativamente tra 500 e 1.600 MHz, con una media di 838 MHz. La velocità di archiviazione si aggira intorno a 1,4 GHz, con la GPU che si riscalda a circa 70 °C (158 °F). Il consumo energetico è di circa 66 W.
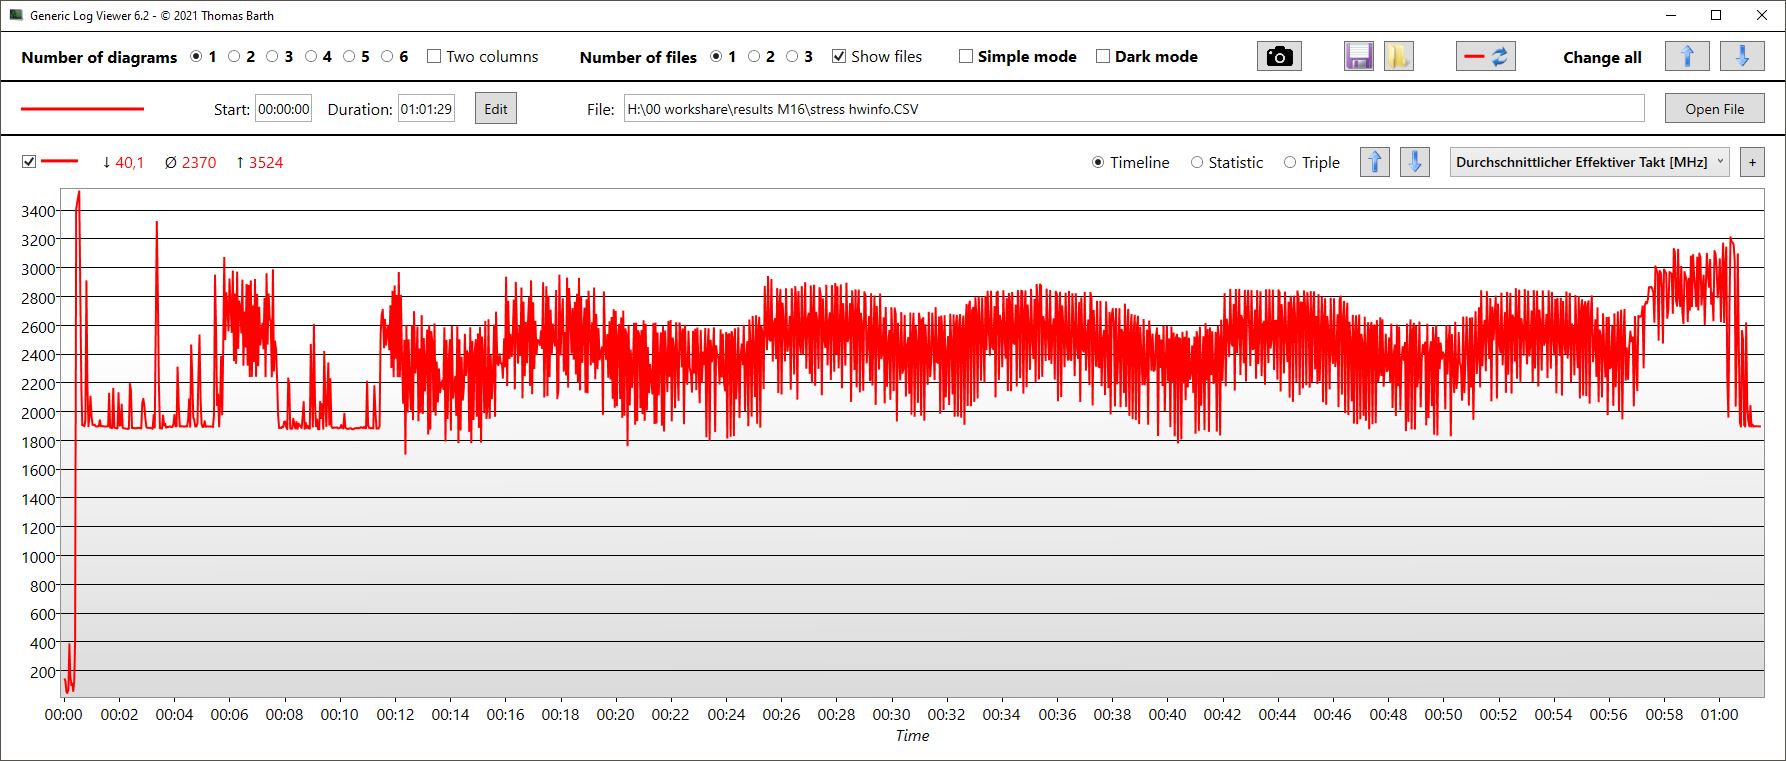
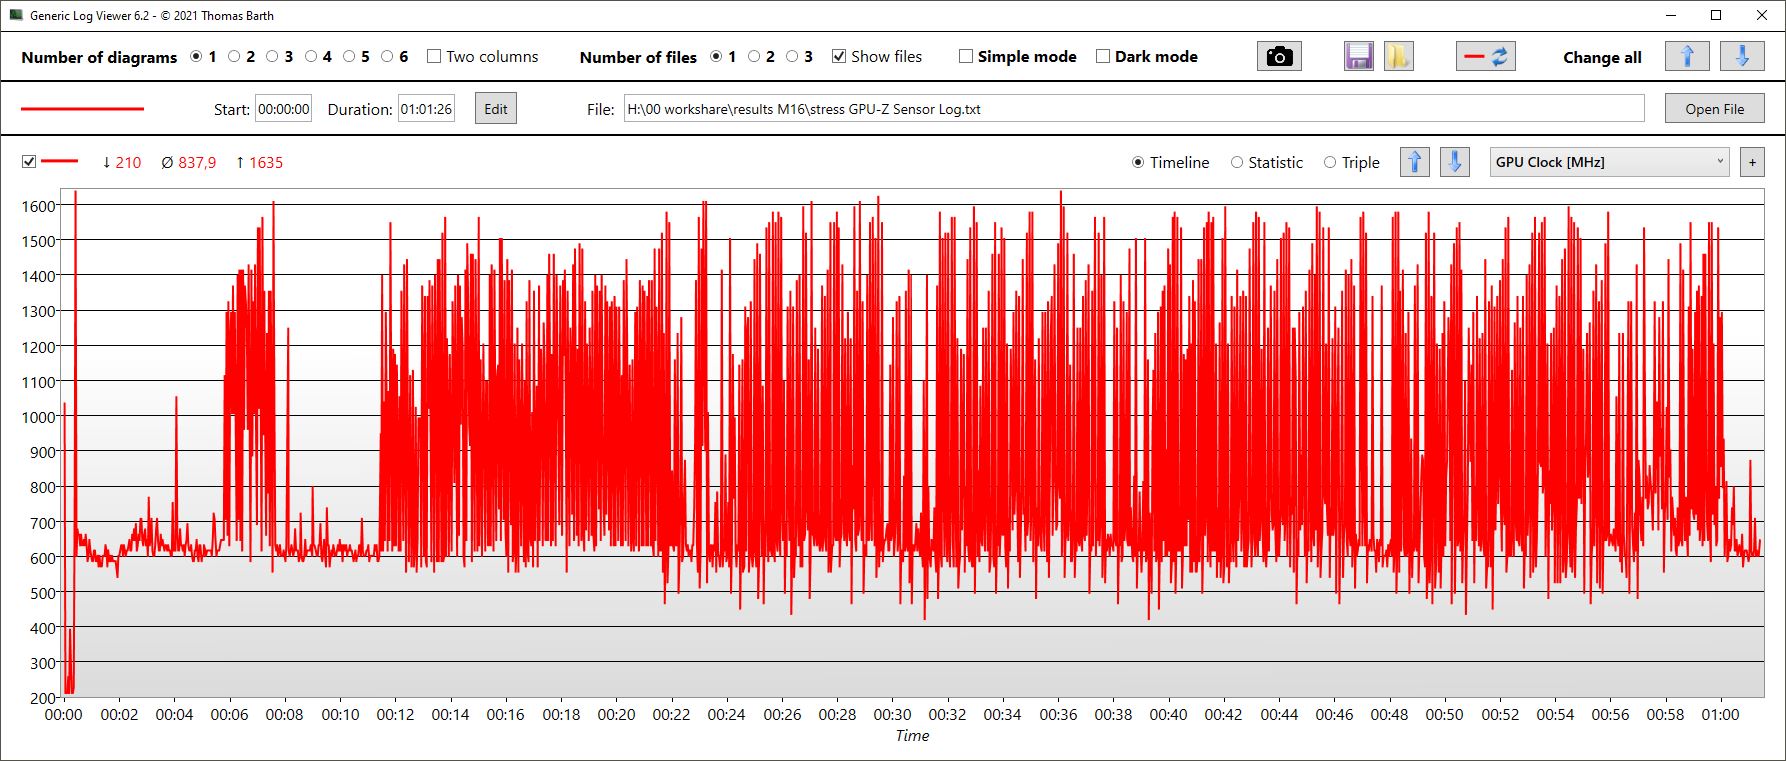
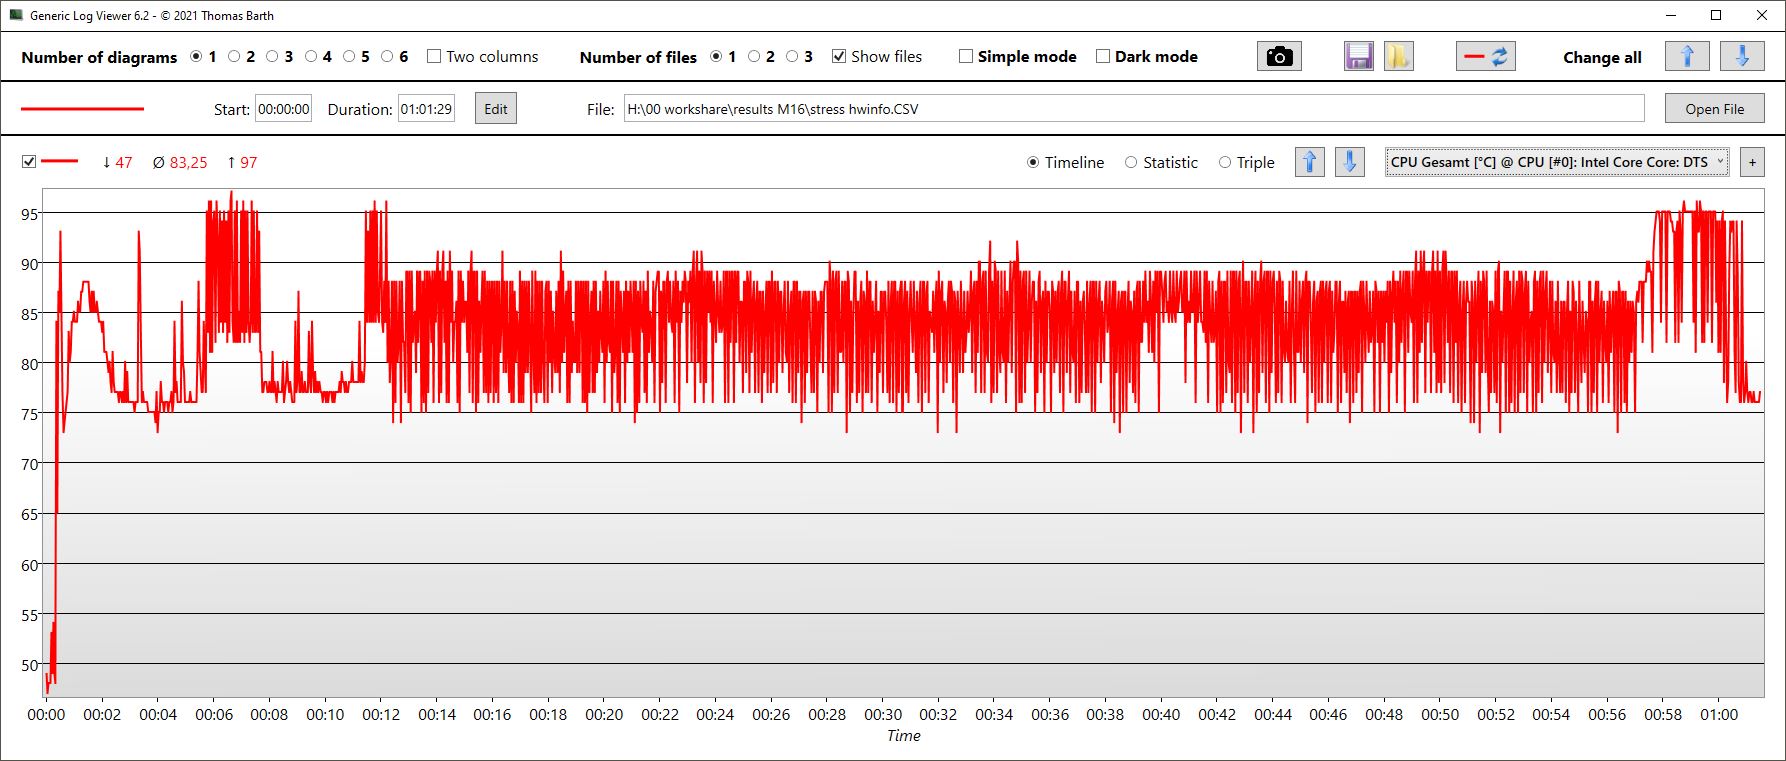
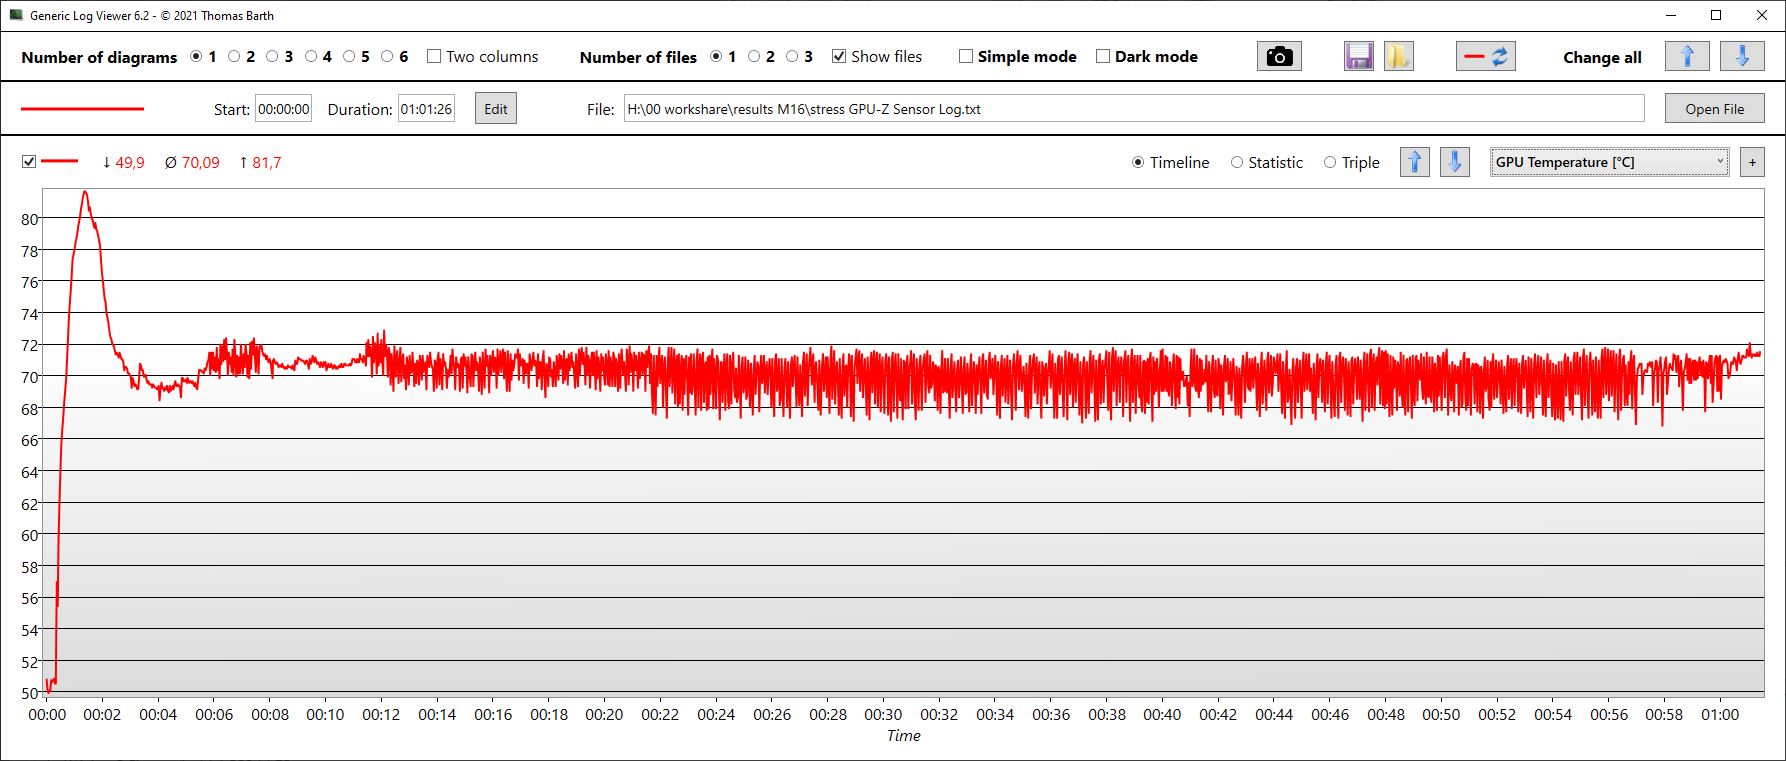
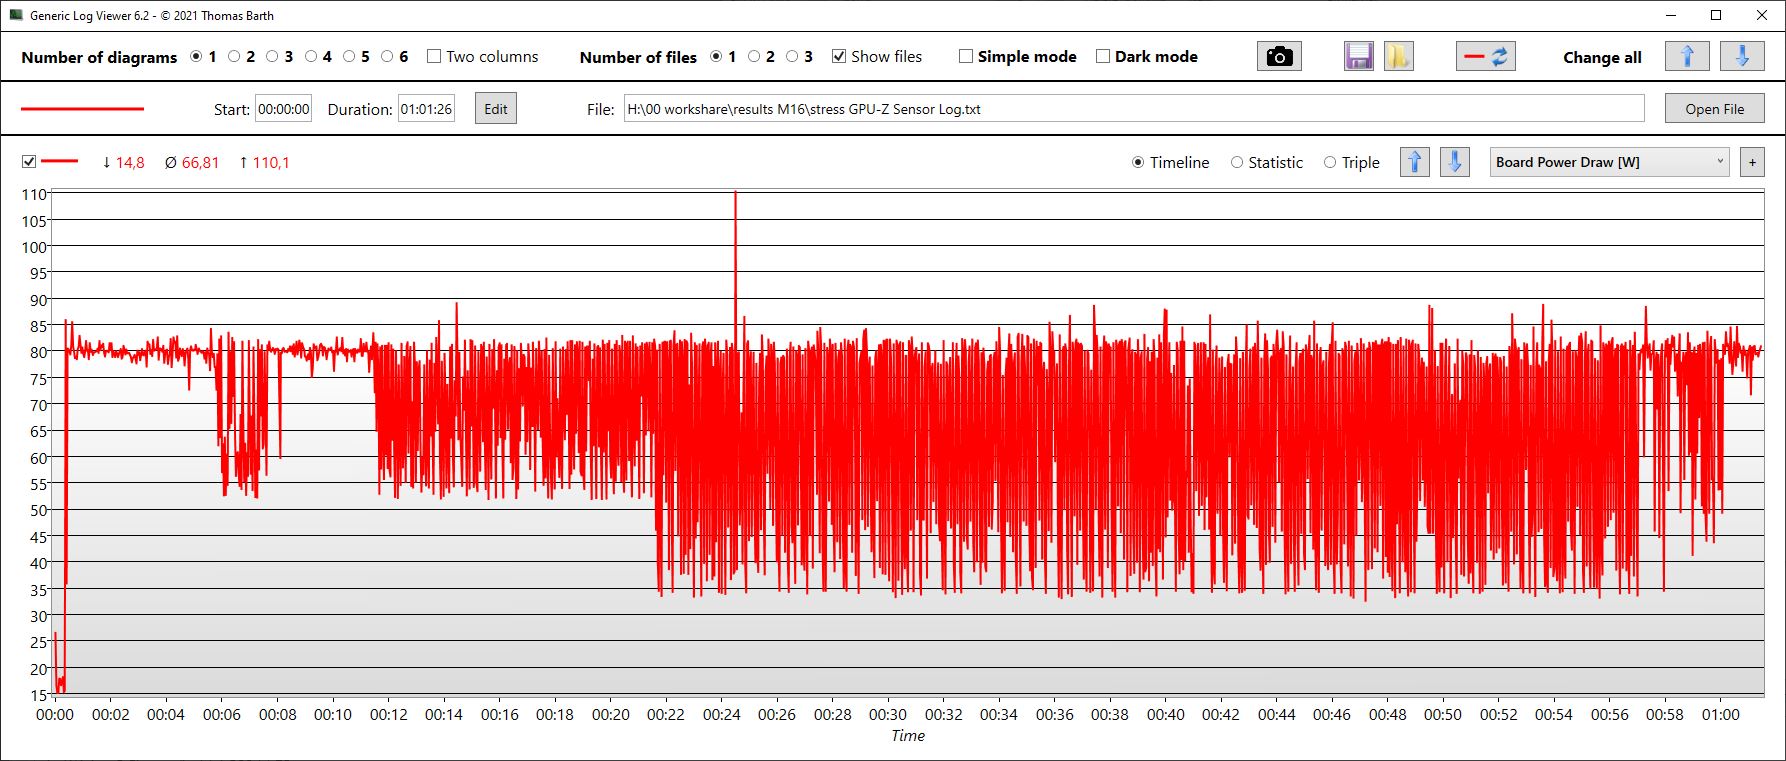
| Clock della CPU (GHz) | Clock della GPU (MHz) | Temperatura media della CPU (°C) | Temperatura media della GPU (°C) | |
| Prime95 + FurMark Stress | 2,4 | 838 | 83 | 70 |
| Lo stress Witcher 3 | 1,1 | 1.288 | 68 | 72 |
Altoparlanti
Asus ha intrapreso una strada speciale con gli altoparlanti dell'M16: invece dei soliti altoparlanti stereo, il produttore utilizza quattro altoparlanti da 2 W ciascuno, due per le frequenze alte e due per i toni bassi. Questo si fa notare e gli altoparlanti non solo sono relativamente forti, ma offrono anche medi e alti equilibrati e persino i bassi non sono così poco rappresentati come in molti concorrenti.
Tuttavia, non sono ancora in grado di sostituire diffusori esterni di qualità mediamente decente. Per il collegamento di dispositivi audio analogici, è possibile utilizzare una porta audio combinata.
Asus ROG Zephyrus M16 GU603Z analisi audio
(+) | gli altoparlanti sono relativamente potenti (82.96 dB)
Bassi 100 - 315 Hz
(±) | bassi ridotti - in media 11.6% inferiori alla media
(±) | la linearità dei bassi è media (9.2% delta rispetto alla precedente frequenza)
Medi 400 - 2000 Hz
(+) | medi bilanciati - solo only 4.3% rispetto alla media
(+) | medi lineari (5.7% delta rispetto alla precedente frequenza)
Alti 2 - 16 kHz
(+) | Alti bilanciati - appena 1.6% dalla media
(+) | alti lineari (3.9% delta rispetto alla precedente frequenza)
Nel complesso 100 - 16.000 Hz
(+) | suono nel complesso lineare (10.1% differenza dalla media)
Rispetto alla stessa classe
» 5% di tutti i dispositivi testati in questa classe è stato migliore, 2% simile, 93% peggiore
» Il migliore ha avuto un delta di 6%, medio di 18%, peggiore di 132%
Rispetto a tutti i dispositivi testati
» 5% di tutti i dispositivi testati in questa classe è stato migliore, 2% similare, 94% peggiore
» Il migliore ha avuto un delta di 4%, medio di 23%, peggiore di 134%
Lenovo Legion 5 Pro 16ARH7H RTX 3070 Ti analisi audio
(±) | potenza degli altiparlanti media ma buona (72.5 dB)
Bassi 100 - 315 Hz
(-) | quasi nessun basso - in media 22.3% inferiori alla media
(-) | bassi non lineari (15.4% delta rispetto alla precedente frequenza)
Medi 400 - 2000 Hz
(±) | medi elevati - circa 7.1% superiore alla media
(±) | linearità dei medi adeguata (9.5% delta rispetto alla precedente frequenza)
Alti 2 - 16 kHz
(+) | Alti bilanciati - appena 1.9% dalla media
(+) | alti lineari (3.6% delta rispetto alla precedente frequenza)
Nel complesso 100 - 16.000 Hz
(-) | suono nel complesso non lineare (30.3% di differenza rispetto alla media
Rispetto alla stessa classe
» 96% di tutti i dispositivi testati in questa classe è stato migliore, 2% simile, 3% peggiore
» Il migliore ha avuto un delta di 6%, medio di 18%, peggiore di 132%
Rispetto a tutti i dispositivi testati
» 89% di tutti i dispositivi testati in questa classe è stato migliore, 3% similare, 9% peggiore
» Il migliore ha avuto un delta di 4%, medio di 23%, peggiore di 134%
Gestione del consumo energetico - Efficiente quando si gioca ma inconsistente in idle
Consumo di energia
Sfortunatamente, il consumo inattivo varia fortemente e diventa piuttosto elevato, anche se il task manager non mostra alcun processo ostativo. Questo accade anche dopo un funzionamento prolungato. Saremmo lieti di ricevere da Asus qualche aggiornamento dei driver.
Durante il gioco, il consumo dell'M16 è sorprendentemente basso (144 W). Il Vision 16 Pro consuma circa l'8% in più, e il più potente Legion 5 Pro addirittura il 45%! Considerando le prestazioni aggiuntive del Legion 5, questo non è molto sorprendente, ma lo è l'entità della differenza, dato che anche il predecessore Recensione del Laptop Gaming Asus ROG Zephyrus M16: videogiochi in 16:10 , significativamente più debole, consumava più energia durante i giochi.
Se selezioniamo la modalità Turbo per l'M16, questo consuma 175 W durante ilgioco (Il Witcher 3 )invece di 144 W (grafico blu). Si tratta di un consumo leggermente superiore a quello del Vision 16 Pro, ma comunque inferiore ai 209 W del Legion 5 Pro.
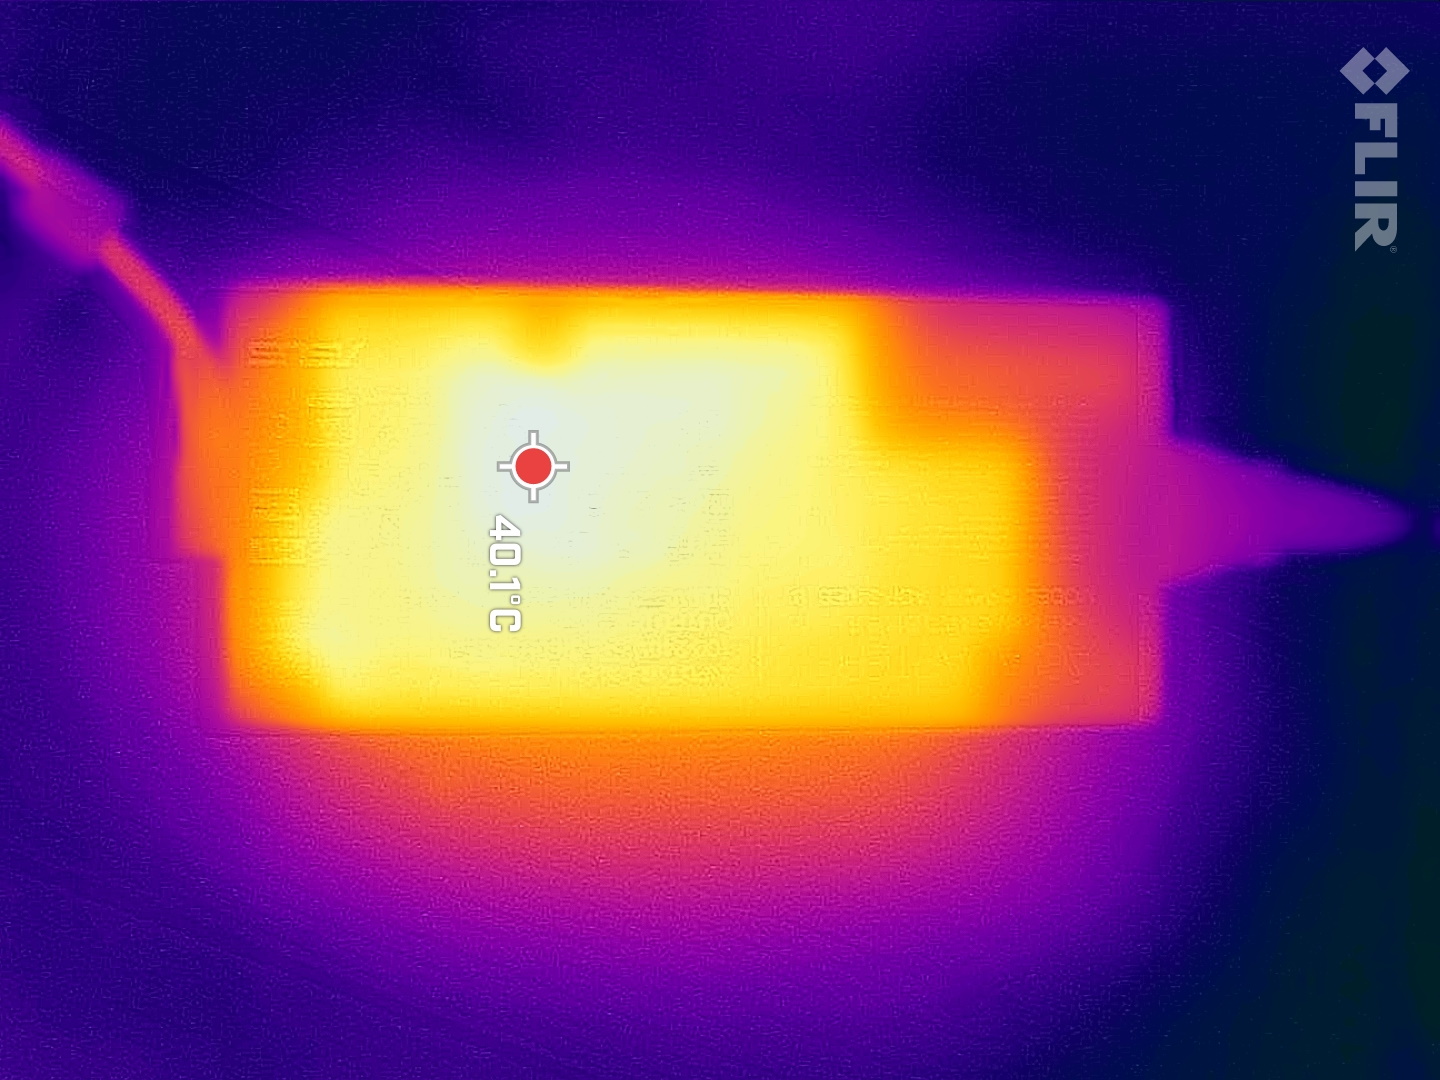
Abbiamo misurato picchi di carico temporanei fino a 220 W dall'alimentatore da 240 W, quindi dovrebbe essere sufficientemente equipaggiato per tutti gli scenari di utilizzo.
| Off / Standby | |
| Idle | |
| Sotto carico |
|
Leggenda:
min: | |
| Asus ROG Zephyrus M16 GU603Z i9-12900H, GeForce RTX 3070 Ti Laptop GPU, Micron 3400 1TB MTFDKBA1T0TFH, IPS, 2560x1600, 16" | Asus ROG Zephyrus M16 GU603H i9-11900H, GeForce RTX 3070 Laptop GPU, Samsung PM9A1 MZVL22T0HBLB, IPS, 2560x1600, 16" | Schenker Vision 16 Pro RTX 3070 Ti i7-12700H, GeForce RTX 3070 Ti Laptop GPU, Samsung SSD 980 Pro 1TB MZ-V8P1T0BW, IPS, 2560x1600, 16" | Lenovo Legion 5 Pro 16ARH7H RTX 3070 Ti R7 6800H, GeForce RTX 3070 Ti Laptop GPU, Samsung PM9A1 MZVL21T0HCLR, IPS, 2560x1600, 16" | Schenker XMG Focus 16 (i7-12700H, RTX 3060) i7-12700H, GeForce RTX 3060 Laptop GPU, Samsung SSD 980 Pro 1TB MZ-V8P1T0BW, IPS, 2560x1600, 16" | Corsair Voyager a1600 R9 6900HS, Radeon RX 6800M, Samsung PM9A1 MZVL22T0HBLB, IPS, 2560x1600, 16" | Media NVIDIA GeForce RTX 3070 Ti Laptop GPU | Media della classe Gaming | |
|---|---|---|---|---|---|---|---|---|
| Power Consumption | -14% | 14% | -30% | -16% | -32% | -23% | -16% | |
| Idle Minimum * (Watt) | 10.8 | 11 -2% | 9 17% | 9.7 10% | 14.7 -36% | 16.9 -56% | 14.2 ? -31% | 13 ? -20% |
| Idle Average * (Watt) | 17 | 20 -18% | 13.3 22% | 14.8 13% | 18.6 -9% | 20.3 -19% | 19.9 ? -17% | 18.7 ? -10% |
| Idle Maximum * (Watt) | 17.8 | 30 -69% | 14.3 20% | 45.8 -157% | 21.2 -19% | 22.2 -25% | 26.2 ? -47% | 24.3 ? -37% |
| Load Average * (Watt) | 116 | 111 4% | 107 8% | 87.2 25% | 121 -4% | 133.4 -15% | 125.8 ? -8% | 110.2 ? 5% |
| Witcher 3 ultra * (Watt) | 144 | 156 -8% | 155.2 -8% | 209 -45% | 174 -21% | 206 -43% | ||
| Load Maximum * (Watt) | 220 | 197 10% | 172 22% | 275.3 -25% | 235 -7% | 248 ? -13% | 258 ? -17% |
* ... Meglio usare valori piccoli
Power Consumption The Witcher 3 / Stress Test
Power Consumption with External Monitor
Durata della batteria
Asus non elenca alcuna modalità di risparmio energetico nelle opzioni delle prestazioni. Se si stacca la spina, l'M16 passa automaticamente alla modalità silenziosa.
La capacità della batteria è di 90 Wh, un valore decente in confronto. Il Vision 16 Pro e il Legion 5 offrono solo una capacità di 80 Wh. In questo modo l'M16 dura di conseguenza più a lungo.
A seconda della luminosità del display, i tempi di autonomia variano in modo significativo. Nel nostro test WiFi, l'M16 dura tra le 5 ore (a piena luminosità) e le 7,5 ore circa (a 150 nits).
Lo stesso vale per la visione di film.
| Asus ROG Zephyrus M16 GU603Z i9-12900H, GeForce RTX 3070 Ti Laptop GPU, 90 Wh | Asus ROG Zephyrus M16 GU603H i9-11900H, GeForce RTX 3070 Laptop GPU, 90 Wh | Schenker Vision 16 Pro RTX 3070 Ti i7-12700H, GeForce RTX 3070 Ti Laptop GPU, 80 Wh | Lenovo Legion 5 Pro 16ARH7H RTX 3070 Ti R7 6800H, GeForce RTX 3070 Ti Laptop GPU, 80 Wh | Schenker XMG Focus 16 (i7-12700H, RTX 3060) i7-12700H, GeForce RTX 3060 Laptop GPU, 54 Wh | Corsair Voyager a1600 R9 6900HS, Radeon RX 6800M, 99 Wh | Media della classe Gaming | |
|---|---|---|---|---|---|---|---|
| Autonomia della batteria | 9% | -14% | -41% | -18% | 3% | 7% | |
| H.264 (h) | 7.3 | 6.1 -16% | 6 -18% | 8.64 ? 18% | |||
| WiFi v1.3 (h) | 7.4 | 7.7 4% | 6 -19% | 4.4 -41% | 4.8 -35% | 5.8 -22% | 7.11 ? -4% |
| Load (h) | 1.4 | 1.6 14% | 1.3 -7% | 1.4 0% | 2.1 50% | 1.502 ? 7% | |
| Reader / Idle (h) | 13.3 | 7 | 8.71 ? |
Pro
Contro
Verdetto - Un portatile da gioco completo con un display 16:10
L'Asus ROG Zephyrus M16 è un portatile da gioco complessivamente ben ottimizzato, senza alcun problema significativo. Oltre alle ottime prestazioni della CPU e alla discreta durata della batteria, anche l'ampio display QHD+ da 16 pollici in formato 16:10 sa come piacere grazie ai suoi potenti contrasti e alla copertura dello spazio colore piuttosto elevata.
Considerando il fatto che molti concorrenti sono completamente sprovvisti di lettore di schede SD, possiamo perdonare il fatto che Asus utilizzi solo un lettore di schede microSD, soprattutto perché il dispositivo utilizzato è abbastanza veloce. LaRTX 3070 Tiha un TGP di soli 120 W, ma questo significa anche che il portatile non si scalda troppo e anche la rumorosità rimane nei limiti. D'altra parte, Asus potrebbe ottimizzare il controllo delle ventole, dato che di tanto in tanto le ventole possono aumentare improvvisamente fino a 47 dB anche durante il funzionamento inattivo.
L'M16 si presenta soprattutto come un pacchetto di gioco completo. Anche se non offre le massime prestazioni, il pacchetto è coerente con temperature e livelli di rumore moderati.
Chi ha bisogno di prestazioni più elevate può dare un'occhiata al modello Lenovo Legion 5 Proche è più veloce durante il gioco, ma anche significativamente più rumoroso. Oppure si può semplicemente attivare la modalità Turbo, altrettanto rumorosa, dell'M16, che porta a un aumento delle prestazioni notevole e misurabile anche in questo caso.
Prezzo e disponibilità
Amazon elenca varie configurazioni dell'Asus ROG Zephyrus M16 2022 a partire da 2249 dollari.
Asus ROG Zephyrus M16 GU603Z
- 02/14/2023 v7 (old)
Christian Hintze
Transparency
La selezione dei dispositivi da recensire viene effettuata dalla nostra redazione. Il campione di prova è stato fornito all'autore come prestito dal produttore o dal rivenditore ai fini di questa recensione. L'istituto di credito non ha avuto alcuna influenza su questa recensione, né il produttore ne ha ricevuto una copia prima della pubblicazione. Non vi era alcun obbligo di pubblicare questa recensione. In quanto società mediatica indipendente, Notebookcheck non è soggetta all'autorità di produttori, rivenditori o editori.
Ecco come Notebookcheck esegue i test
Ogni anno, Notebookcheck esamina in modo indipendente centinaia di laptop e smartphone utilizzando procedure standardizzate per garantire che tutti i risultati siano comparabili. Da circa 20 anni sviluppiamo continuamente i nostri metodi di prova e nel frattempo stabiliamo gli standard di settore. Nei nostri laboratori di prova, tecnici ed editori esperti utilizzano apparecchiature di misurazione di alta qualità. Questi test comportano un processo di validazione in più fasi. Il nostro complesso sistema di valutazione si basa su centinaia di misurazioni e parametri di riferimento ben fondati, che mantengono l'obiettività.Price comparison

