Recensione del portatile Schenker XMG Focus 16: Un dispositivo gaming assemblato in Germania
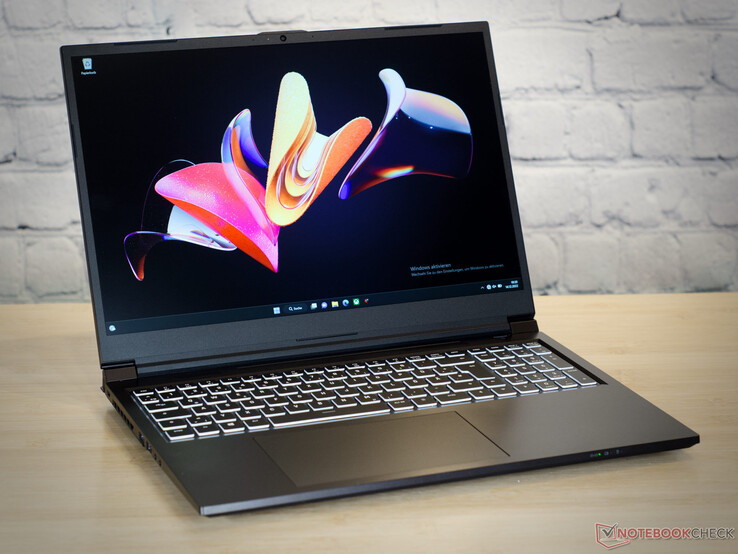
I computer portatili di Lipsia sono disponibili presso il produttore tedesco di computer Schenker. Il modello XMG Focus 16 è un portatile da gioco di fascia media con schermo da 16 pollici. Il portatile è affidabile, solido e possiede il design tipico di Schenker. Il dispositivo ha un aspetto un po' squadrato e anticonvenzionale, senza dare troppo nell'occhio. Schenker ha dotato l'XMG Focus 16 di un hardware potente e di uno schermo con rapporto di aspetto 16:10.
I nostri concorrenti sono stati selezionati principalmente dalla categoria di prezzo dei portatili da gioco di fascia media, come il Dell G16 7620 o ilLenovo Legion 5 Pro. Tuttavia, un portatile multimediale sottile con specifiche simili, l'Asus Zenbook Pro 16Xè notevolmente più sottile dei tipici portatili da gioco, ma offre livelli di prestazioni altrettanto elevati.
Potenziali concorrenti a confronto
Punteggio | Data | Modello | Peso | Altezza | Dimensione | Risoluzione | Prezzo |
|---|---|---|---|---|---|---|---|
| 87 % v7 (old) | 01/2023 | Schenker XMG Focus 16 (i7-12700H, RTX 3060) i7-12700H, GeForce RTX 3060 Laptop GPU | 2.2 kg | 24.3 mm | 16.00" | 2560x1600 | |
| 88.4 % v7 (old) | 12/2022 | Asus ZenBook Pro 16X OLED UX7602ZM-ME115W i9-12900H, GeForce RTX 3060 Laptop GPU | 2.4 kg | 19.5 mm | 16.00" | 3840x2400 | |
| 86.1 % v7 (old) | 10/2022 | Dell G16 7620 i7-12700H, GeForce RTX 3060 Laptop GPU | 2.6 kg | 26.9 mm | 16.00" | 2560x1600 | |
| 89.5 % v7 (old) | 08/2022 | Asus ROG Flow X16 GV601RW-M5082W R9 6900HS, GeForce RTX 3070 Ti Laptop GPU | 2.1 kg | 19.4 mm | 16.10" | 2560x1600 | |
| 88.7 % v7 (old) | 12/2022 | Lenovo ThinkPad X1 Extreme G5-21DE003RGE i7-12700H, GeForce RTX 3060 Laptop GPU | 2.1 kg | 17.9 mm | 16.00" | 3840x2400 | |
| 87.9 % v7 (old) | 11/2022 | Lenovo Legion Slim 7-16IAH 82TF004YGE i7-12700H, GeForce RTX 3060 Laptop GPU | 2.2 kg | 16.9 mm | 16.00" | 2560x1600 | |
| 86.6 % v7 (old) | 07/2022 | Lenovo Legion 5 Pro 16IAH7H i7-12700H, GeForce RTX 3060 Laptop GPU | 2.6 kg | 27 mm | 16.00" | 2560x1600 |
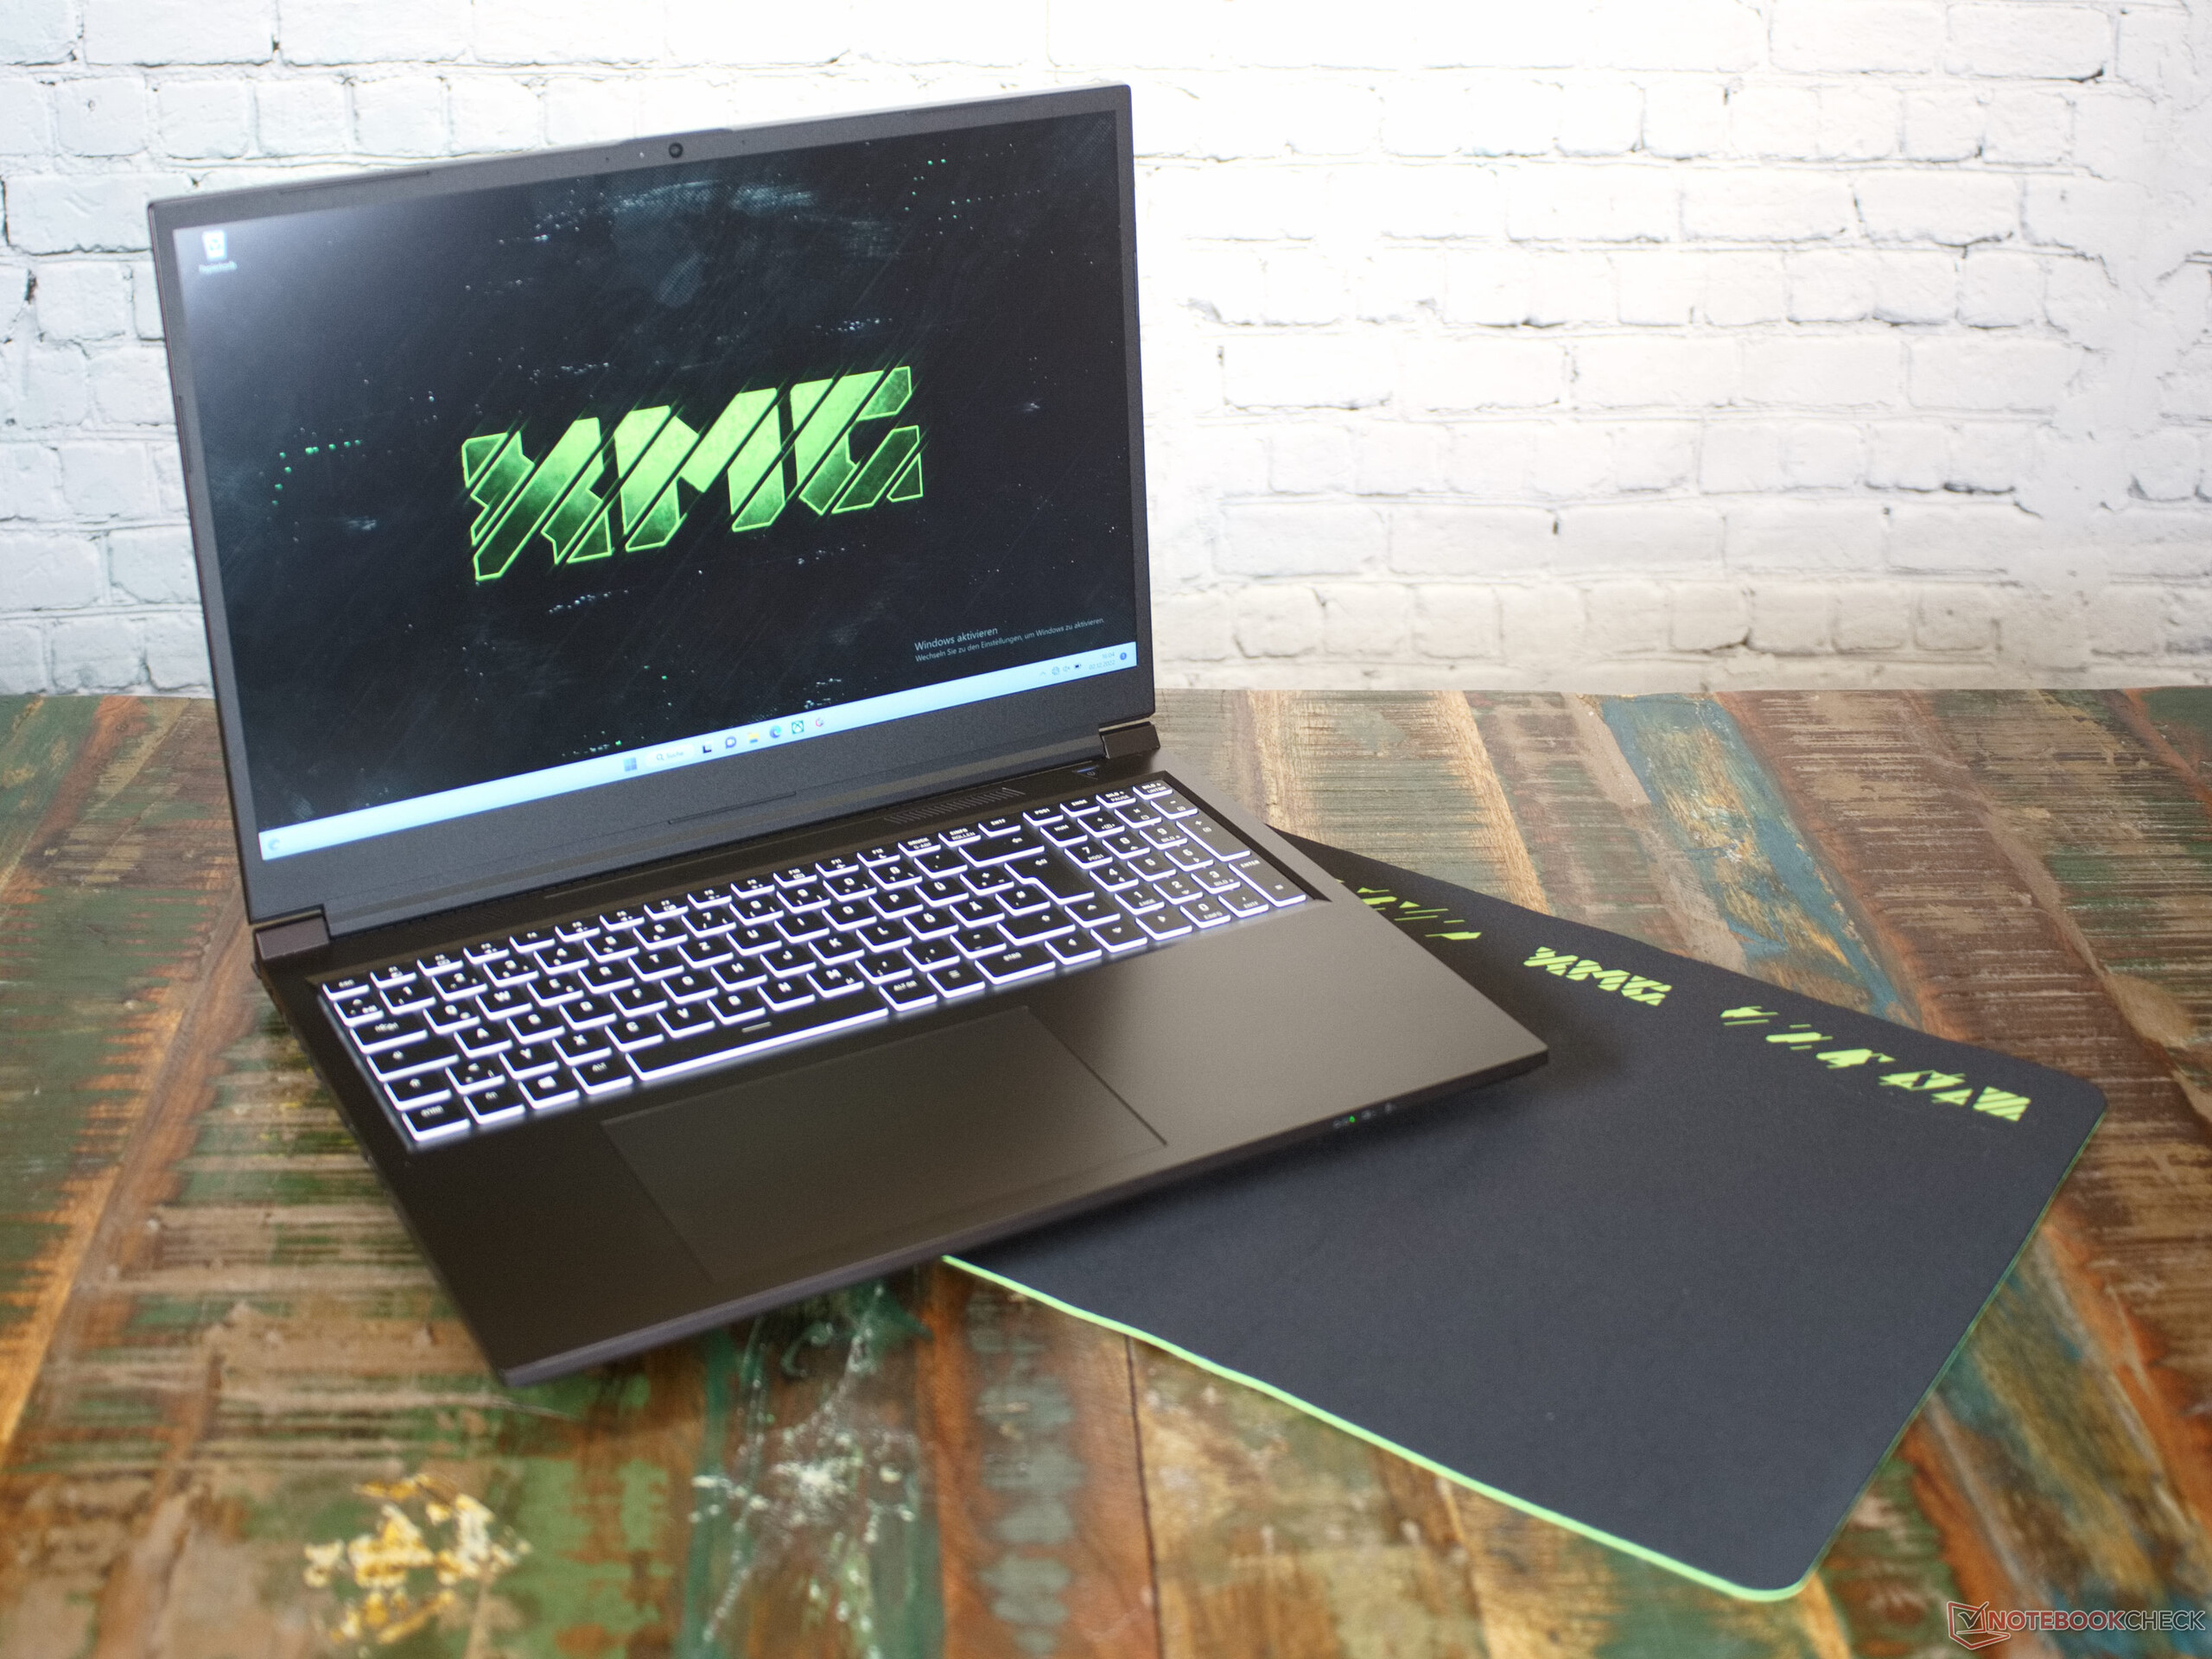
Custodia - nera, squadrata e con molto alluminio
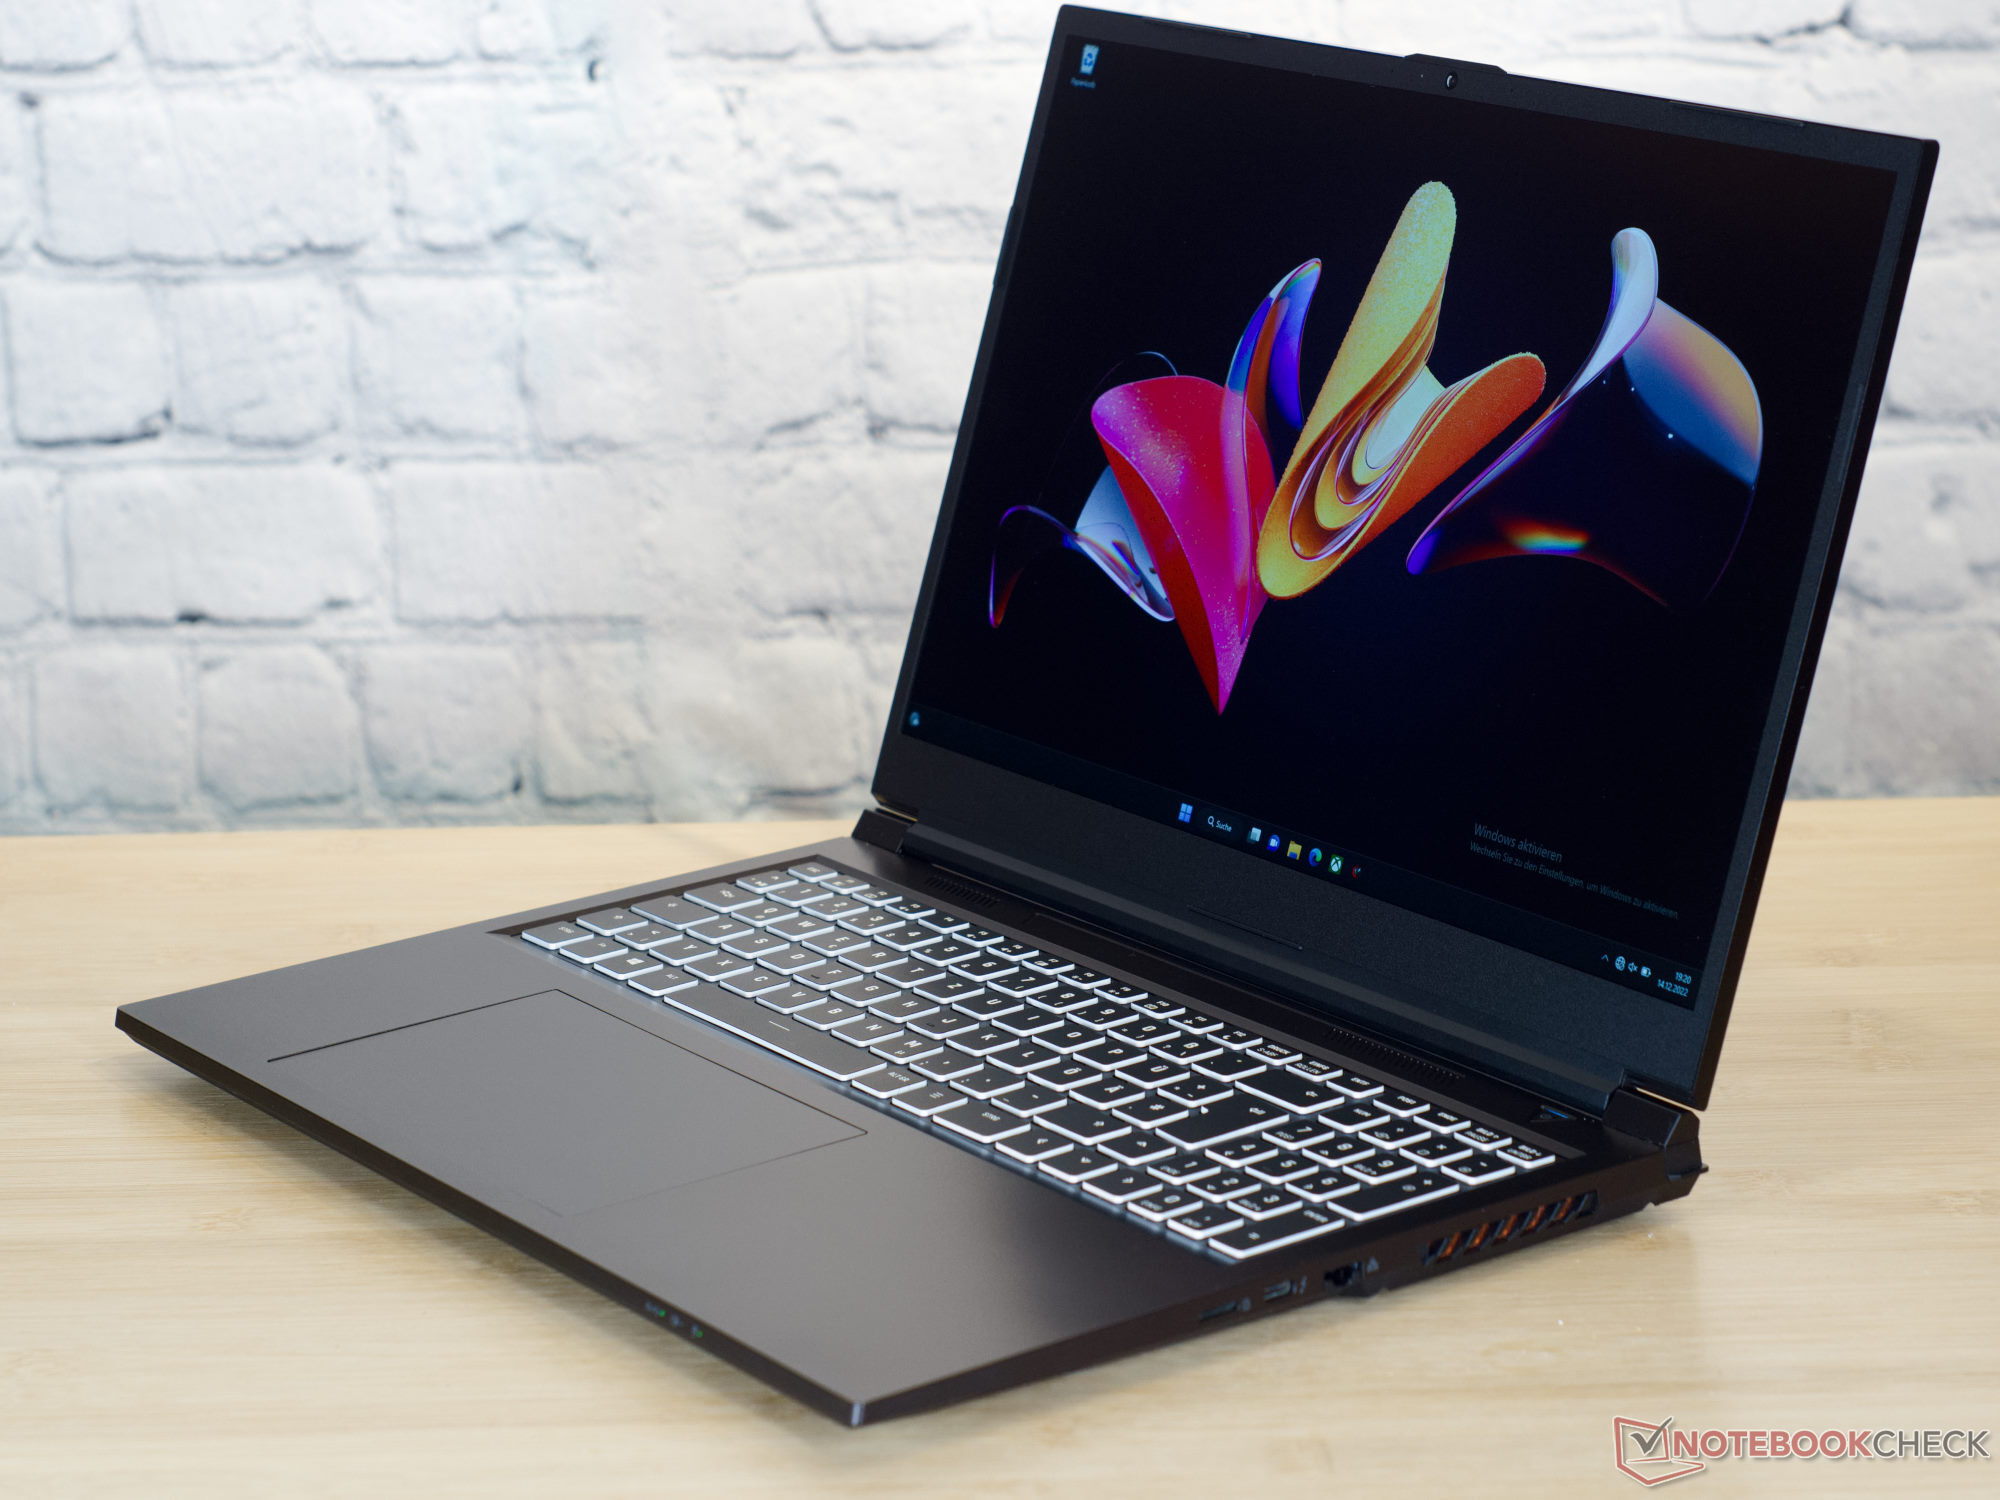
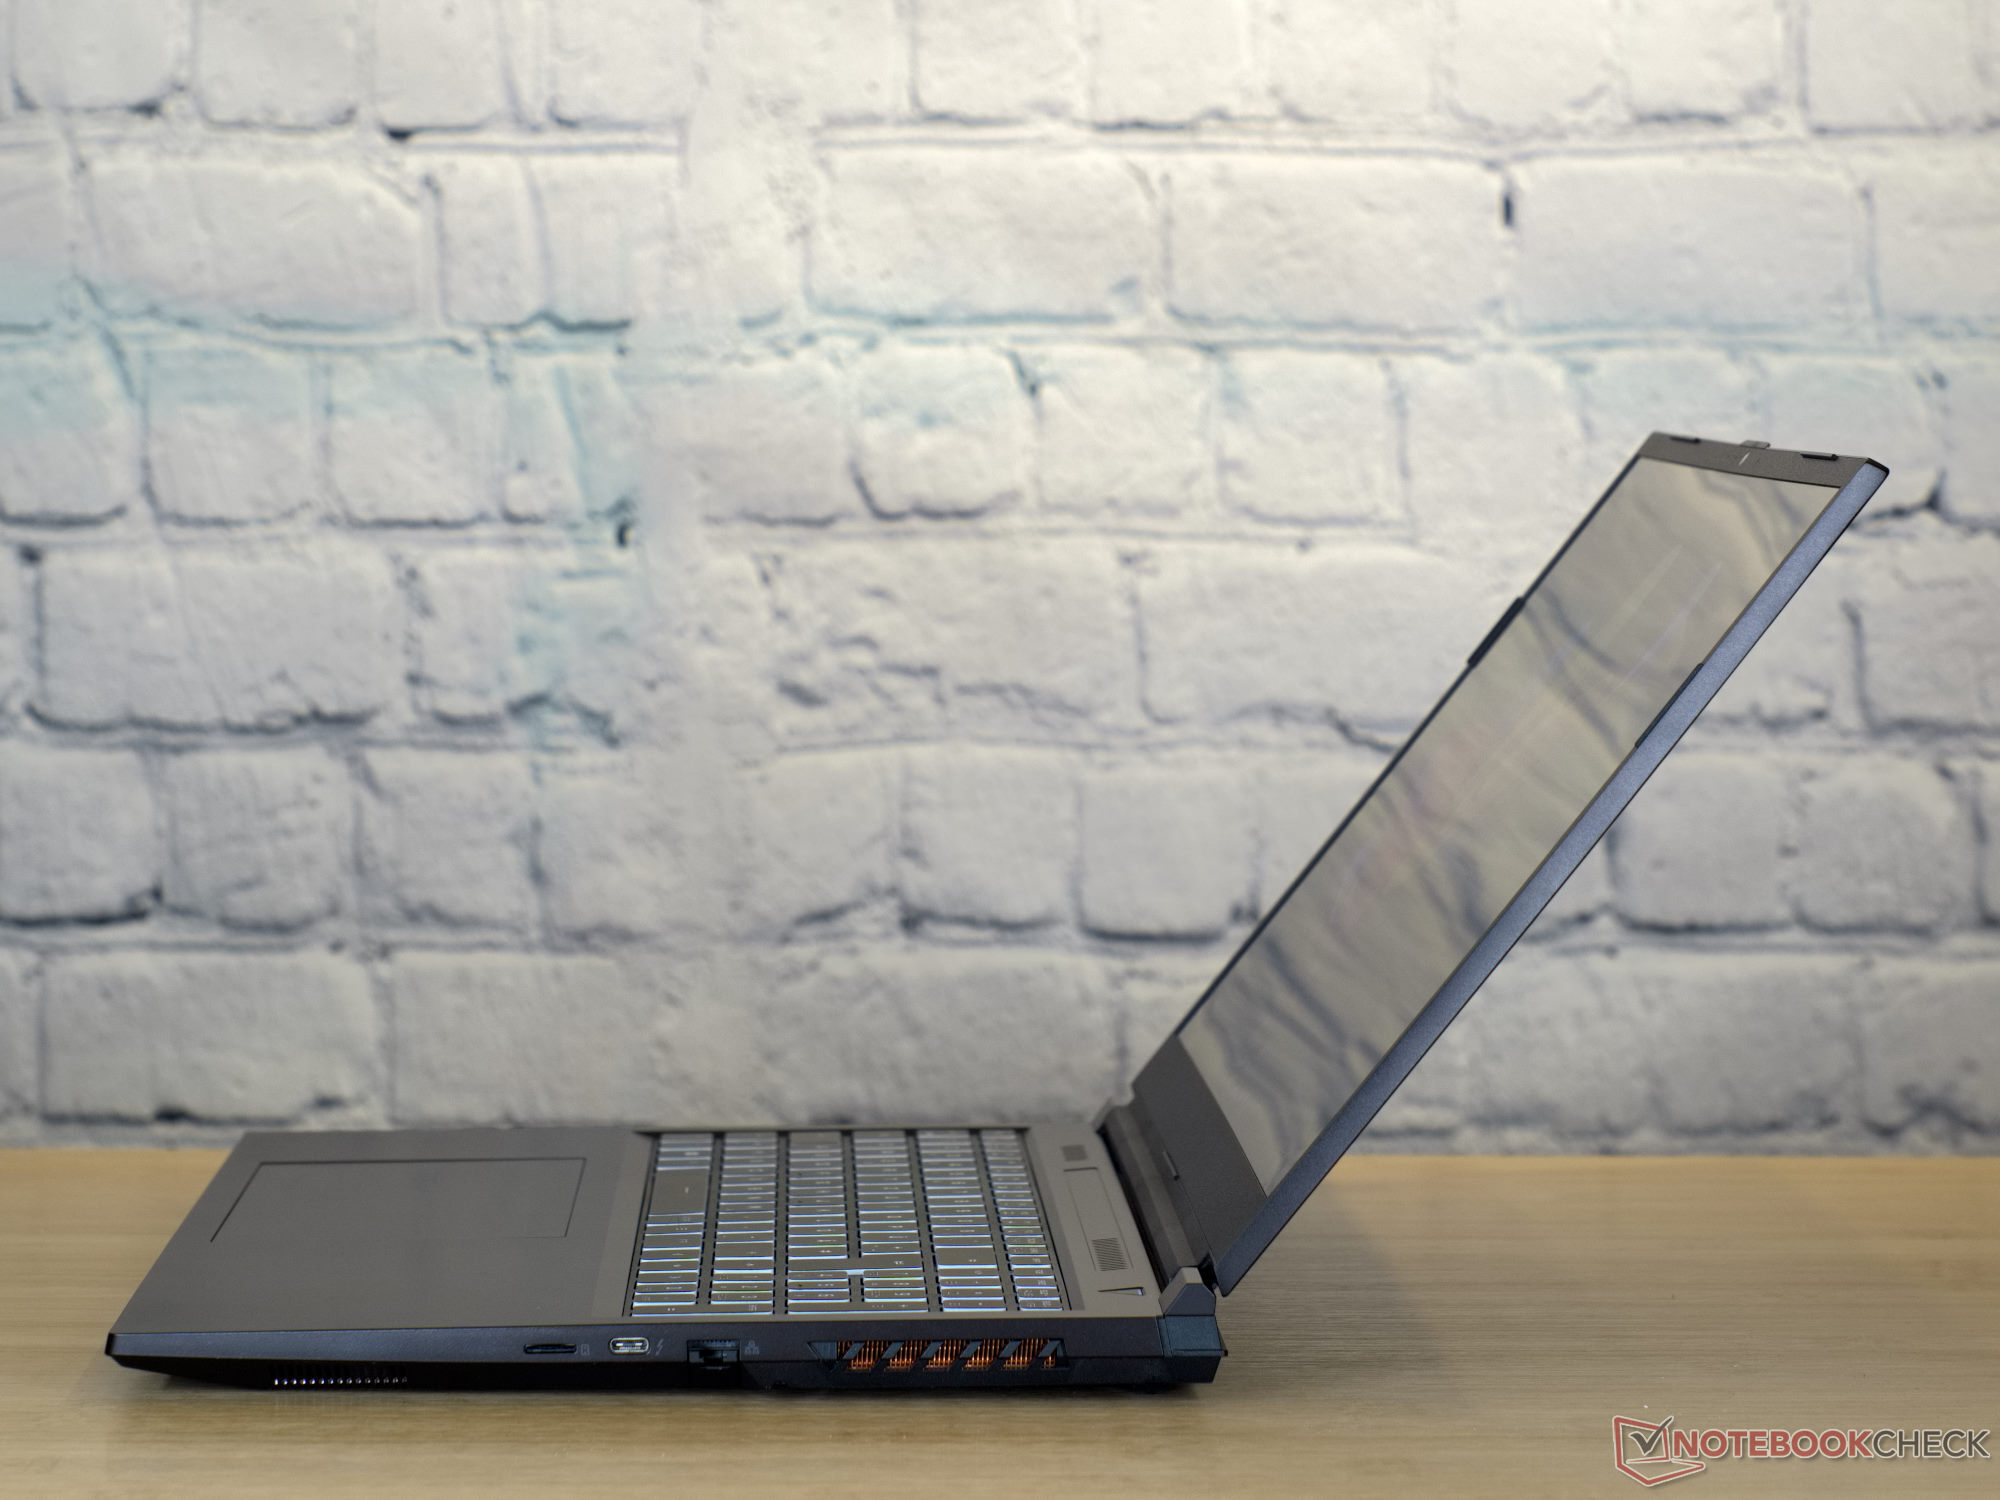
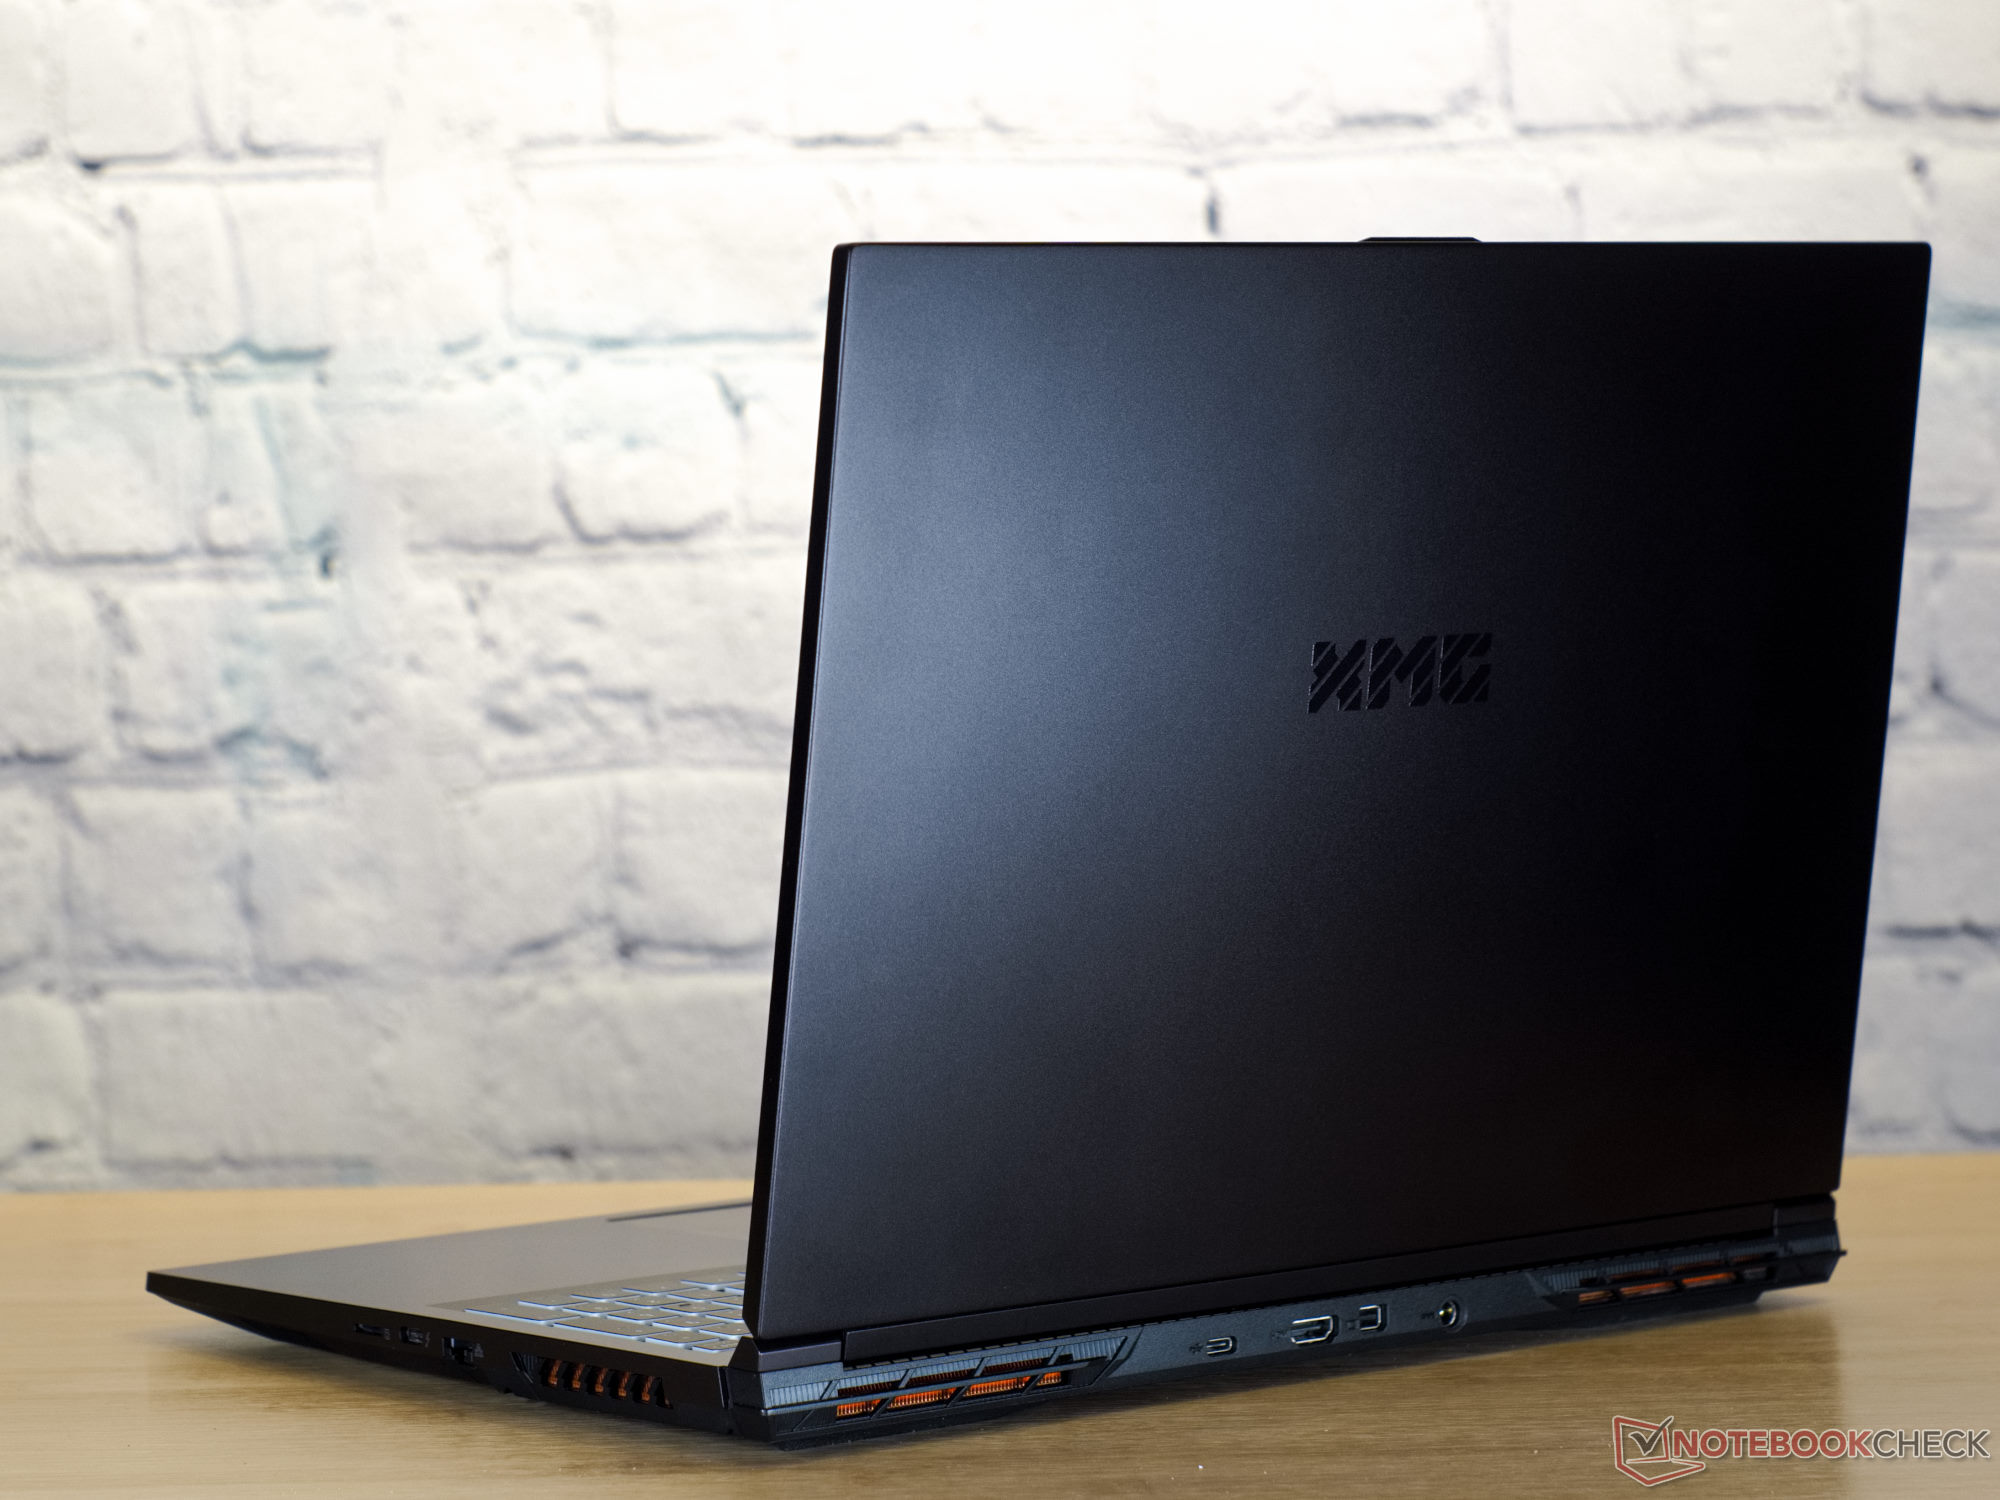
L'XMG Schenker Focus 16 è di colore bianco e nero e si basa su un NP60PNP barebone di Clevo. Sia il coperchio del display - che può essere aperto con un angolo di 130° - che la parte superiore della base sono in alluminio rivestito di nero, a differenza del coperchio della base che è in plastica nera. Aprendo il dispositivo, si trova il tipo di tastiera tipica di molti computer portatili Schenker e Clevo. I singoli tasti hanno bordi bianchi e superfici di digitazione nere. Come quasi tutti i portatili Schenker, l'XMG Focus 16 ha un design piuttosto squadrato ed essenziale, ma una buona qualità costruttiva. Abbiamo tra le mani un dispositivo confortevole che non mostra segni di scricchiolio e vanta una cerniera stabile.
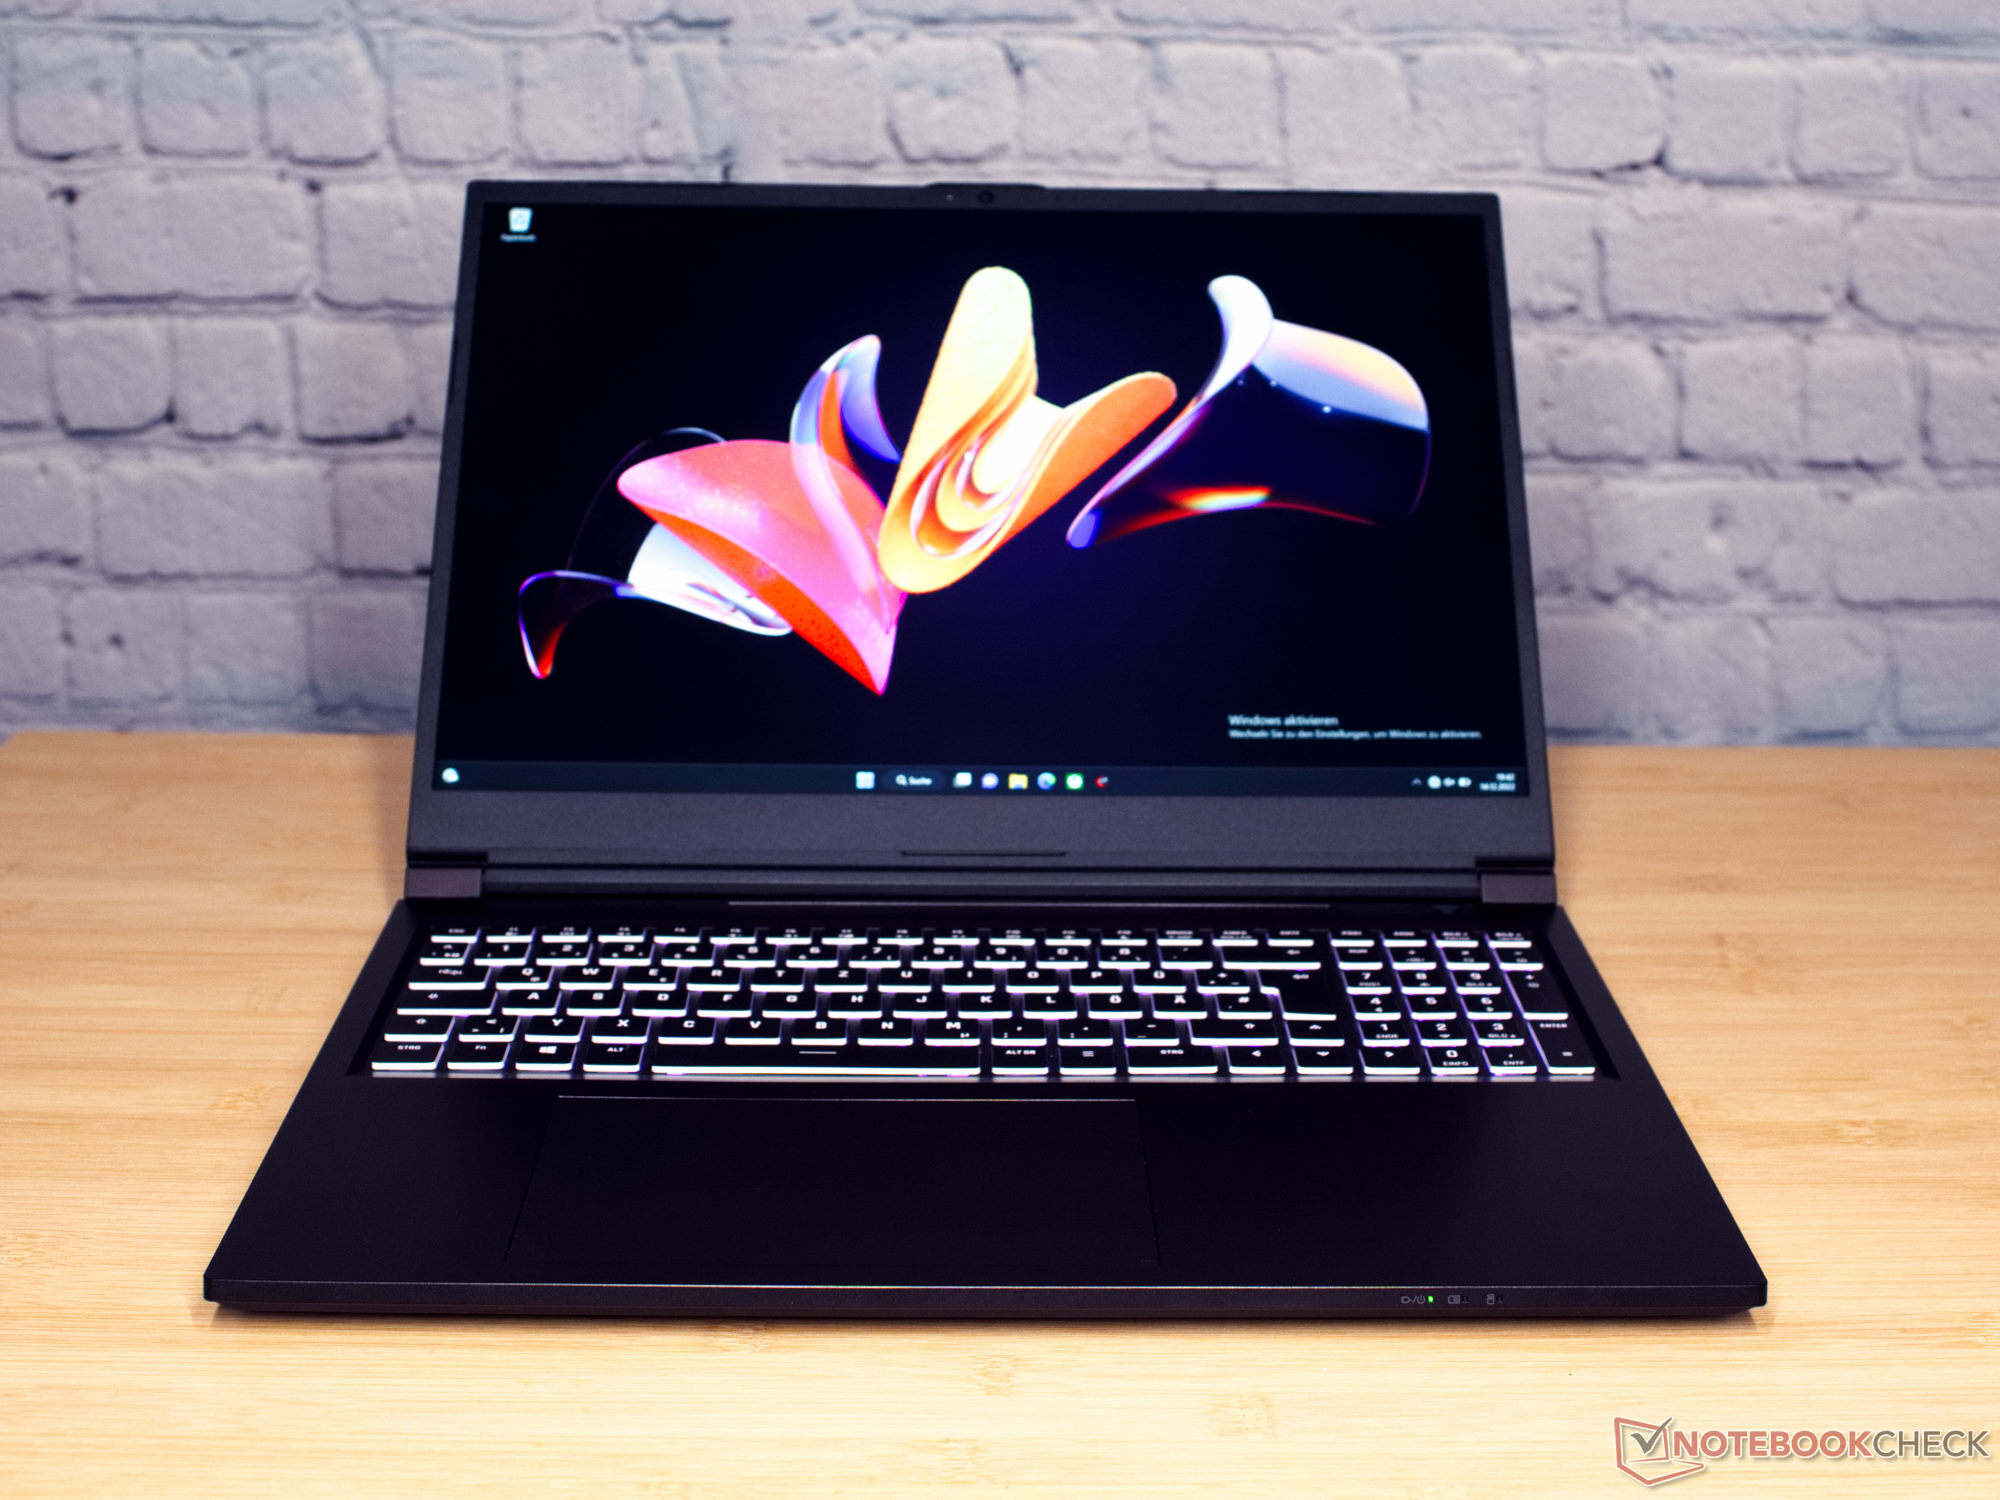
Con un peso di 2,3 kg e uno spessore di 2,4 cm, il portatile da gioco non si distingue dai suoi diretti concorrenti.
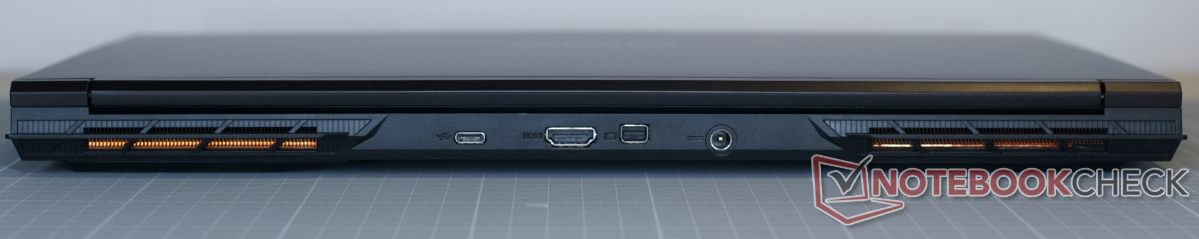
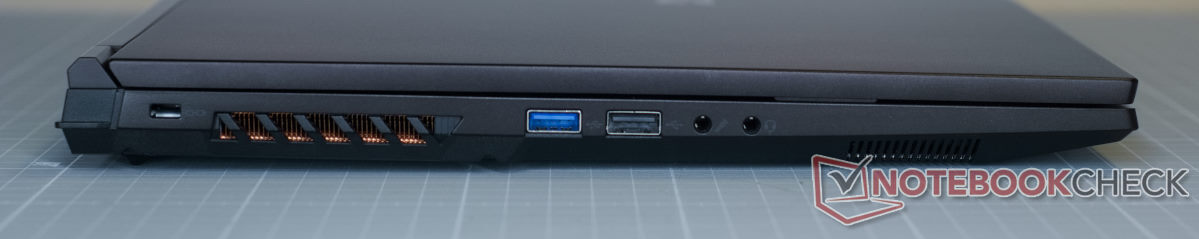
Caratteristiche: molte porte, alta velocità di trasferimento e WiFi 6E
Schenker ha posizionato le porte in vari punti del Focus. Le porte del display, la presa di alimentazione e una porta USB-C si trovano sul retro del portatile. In questo modo i cavi rimangono fuori dai giochi.
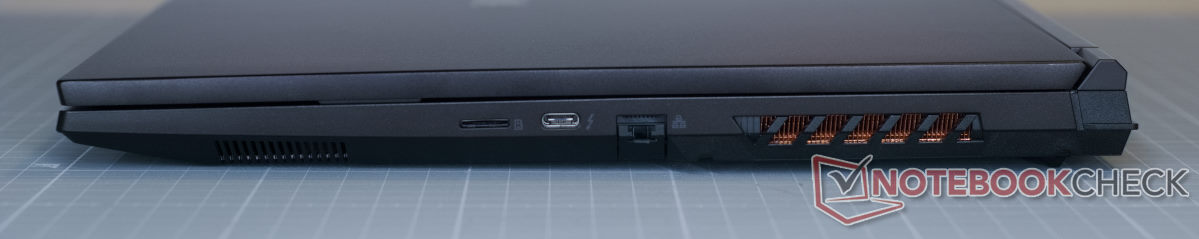
Lettore di schede SD
Il portatile da gioco è dotato di un lettore di schede microSD.
In media offre velocità di trasferimento elevate per le connessioni USB-3.0 all'hardware. La connessione alla nostra AV PRO microSD 128 GB V60potrebbe essere più veloce, come dimostra il modelloAsus Rog Flow.
| SD Card Reader | |
| average JPG Copy Test (av. of 3 runs) | |
| Asus ROG Flow X16 GV601RW-M5082W (AV Pro SD microSD 128 GB V60) | |
| Media della classe Gaming (20.9 - 210, n=54, ultimi 2 anni) | |
| Schenker XMG Focus 16 (i7-12700H, RTX 3060) (AV Pro SD microSD 128 GB V60) | |
| Asus ZenBook Pro 16X OLED UX7602ZM-ME115W (AV Pro SD microSD 128 GB V60) | |
| Lenovo ThinkPad X1 Extreme G5-21DE003RGE (AV Pro V60) | |
| Lenovo Legion Slim 7-16IAH 82TF004YGE | |
| maximum AS SSD Seq Read Test (1GB) | |
| Asus ROG Flow X16 GV601RW-M5082W (AV Pro SD microSD 128 GB V60) | |
| Media della classe Gaming (25.5 - 261, n=51, ultimi 2 anni) | |
| Lenovo Legion Slim 7-16IAH 82TF004YGE | |
| Schenker XMG Focus 16 (i7-12700H, RTX 3060) (AV Pro SD microSD 128 GB V60) | |
| Asus ZenBook Pro 16X OLED UX7602ZM-ME115W (AV Pro SD microSD 128 GB V60) | |
| Lenovo ThinkPad X1 Extreme G5-21DE003RGE (AV Pro V60) | |
Comunicazione
La connessione WiFi è superiore alla media in termini di velocità e stabilità. Il modulo LAN Intel X211 mostra tutto il suo potenziale.
Webcam
All'interno del portatile Schenker si trova una tipica webcam da 720p. Al massimo, siamo stati in grado di determinare deviazioni di colore relativamente piccole. Per il resto, la qualità dell'immagine della webcam è di livello tipico.


 GeForce RTX 3060 Laptop GPU, i7-12700H, Samsung SSD 980 Pro 1TB MZ-V8P1T0BW")
 GeForce RTX 3060 Laptop GPU, i7-12700H, Samsung SSD 980 Pro 1TB MZ-V8P1T0BW")
Sicurezza
Lo Schenker XMG Focus 16 è dotato di uno slot di sicurezza Kensington. Per il resto, tutti gli standard sono rispettati. È presente il TPM 2.0 (tramite Intel PTT).
Extra
Schenker fornisce un'ampia documentazione per tutti i suoi portatili. Nella confezione abbiamo trovato un CD con i driver, una chiavetta USB con Windows preconfigurato e un grande mousepad con il logo XMG.
Servizio
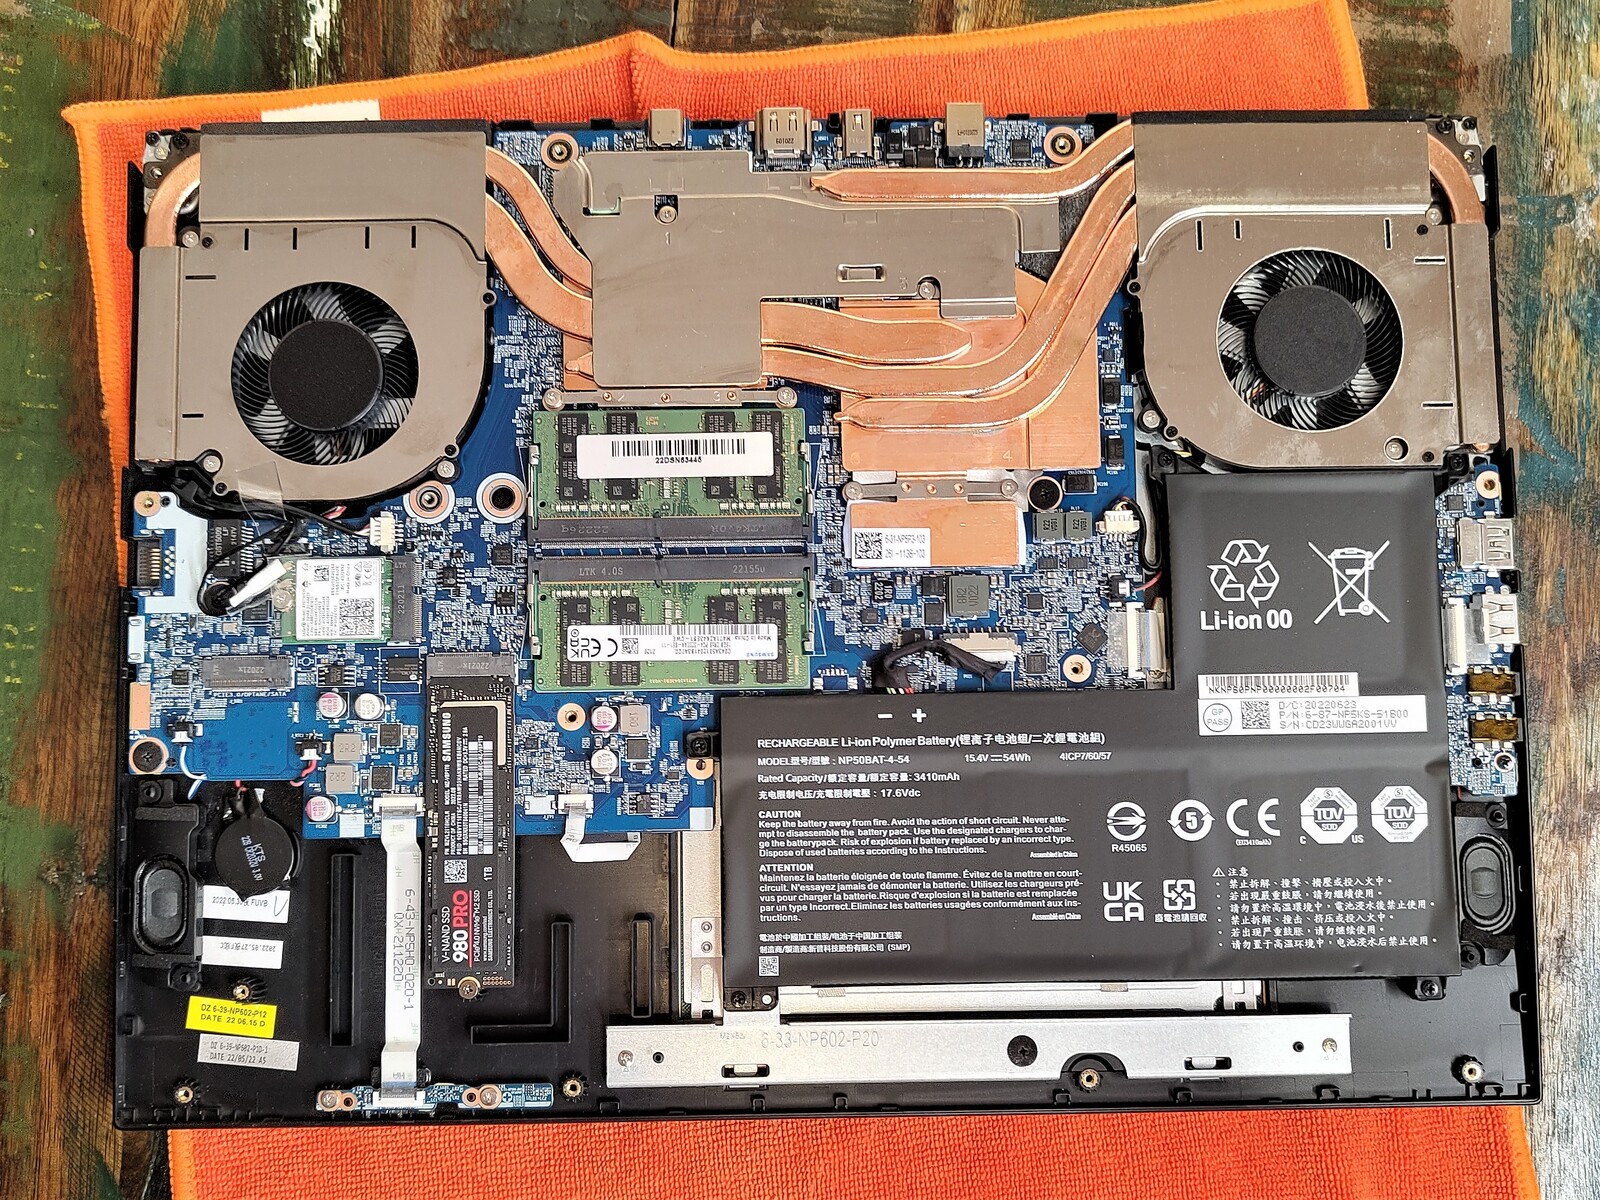
Tredici viti a croce tengono saldamente in posizione il coperchio della base. Una volta rimosse, la piastra di copertura può essere facilmente sollevata. All'interno del portatile troviamo due slot per la RAM (già occupati) e due slot M.2 (uno occupato). Tutte le altre parti sono avvitate ma non incollate.
Garanzia
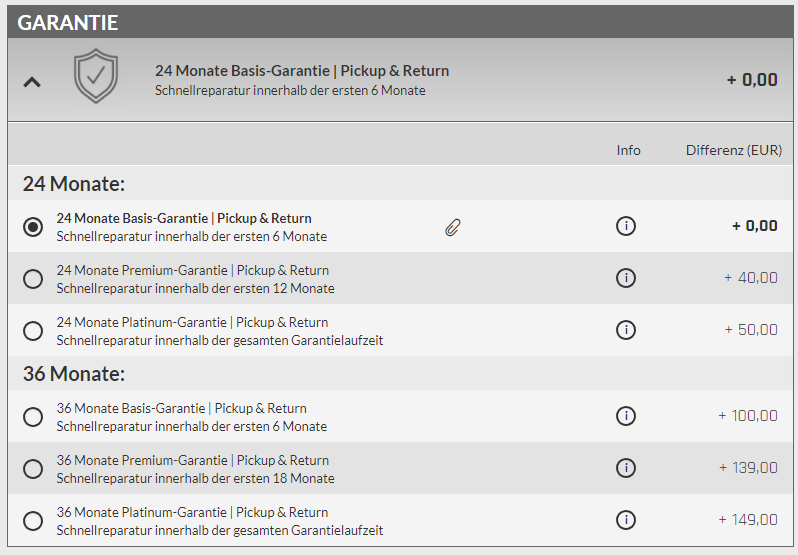
I servizi di garanzia offerti da Schenker dipendono dalle scelte individuali fatte al momento dell'acquisto del dispositivo. La garanzia di base è di 24 mesi e comprende i servizi di ritiro e restituzione e di riparazione rapida nei primi sei mesi.
Dispositivi di input - corsa lunga dei tasti
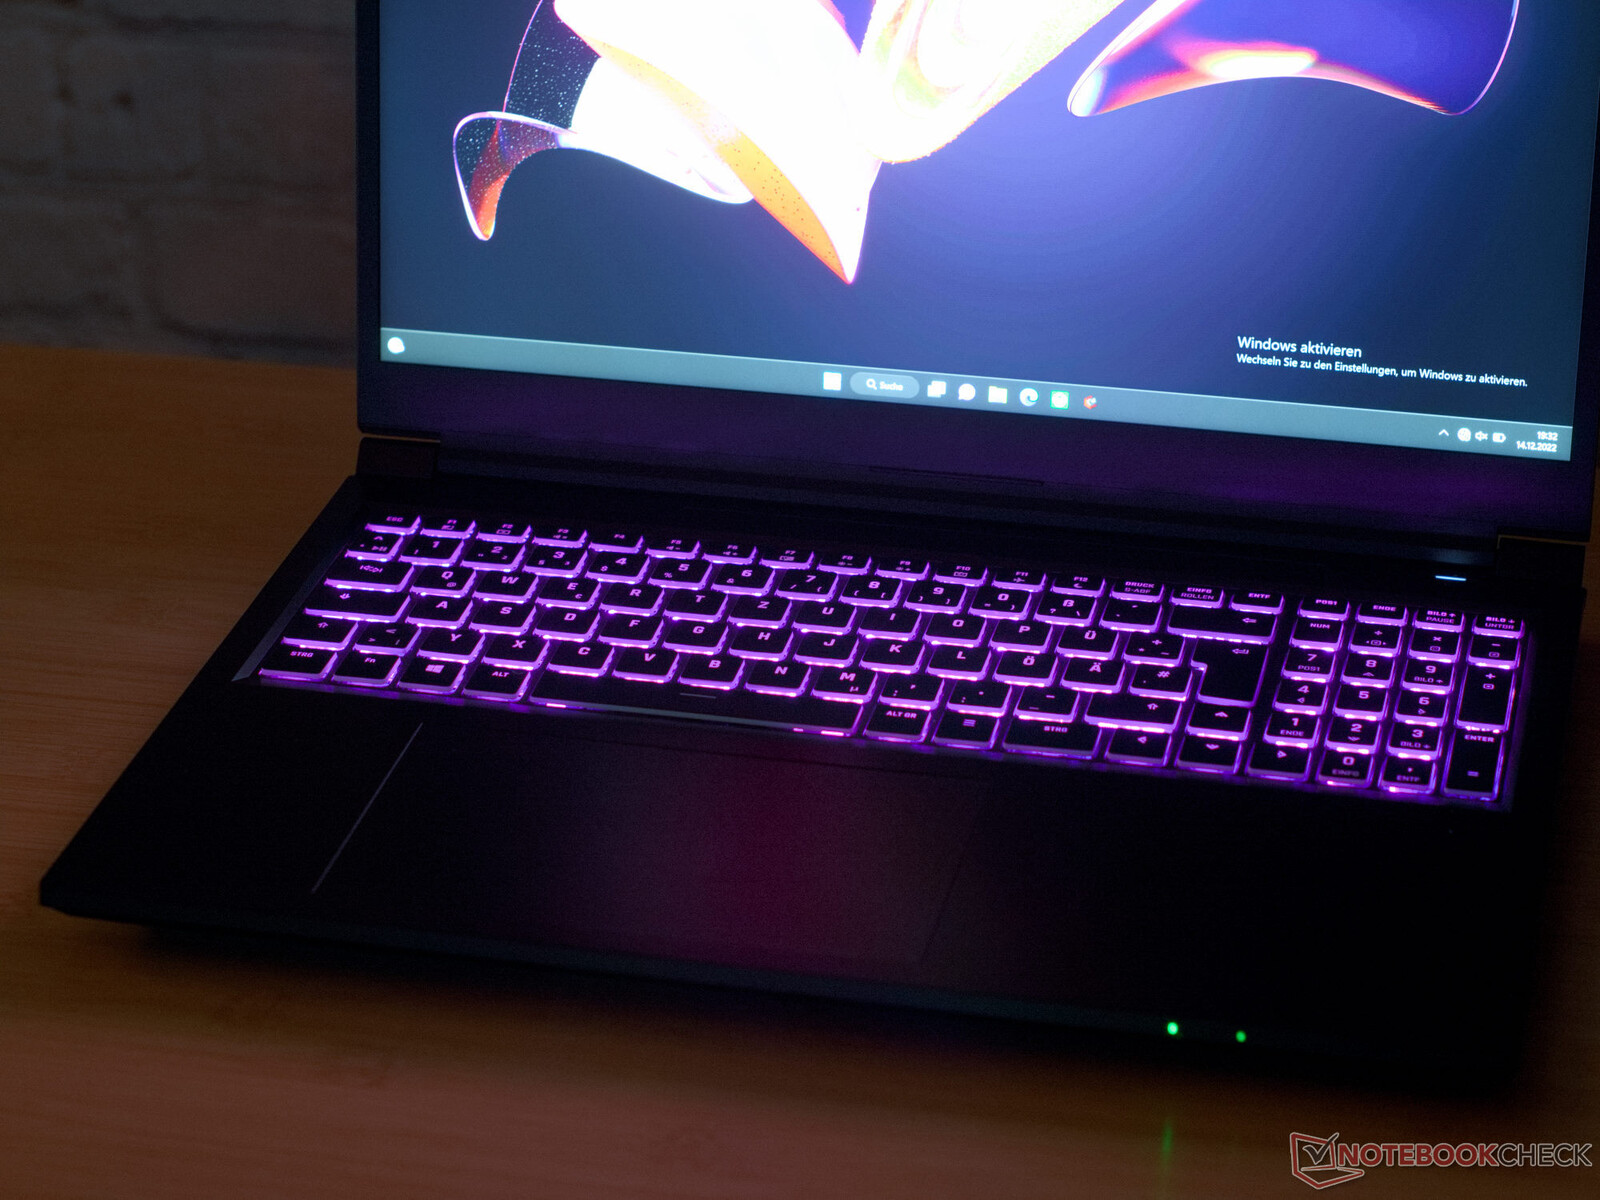
Le scritte stampate al laser della tastiera sono facili da leggere, con una corsa dei tasti di quasi 2 mm, tasti freccia a grandezza naturale, illuminazione RGB e tastierino numerico. Su richiesta, Schenker stampa al laser ogni possibile layout di tastiera.
Con 15 × 9 cm, il trackpad del portatile è molto grande. Imbarazzante per Schenker: al momento della consegna, il cavo a nastro del trackpad non era collegato correttamente, il che significa che inizialmente abbiamo dovuto lottare con un trackpad poco reattivo. Una volta sistemato questo passo falso, il dispositivo di input ha funzionato ai massimi livelli.
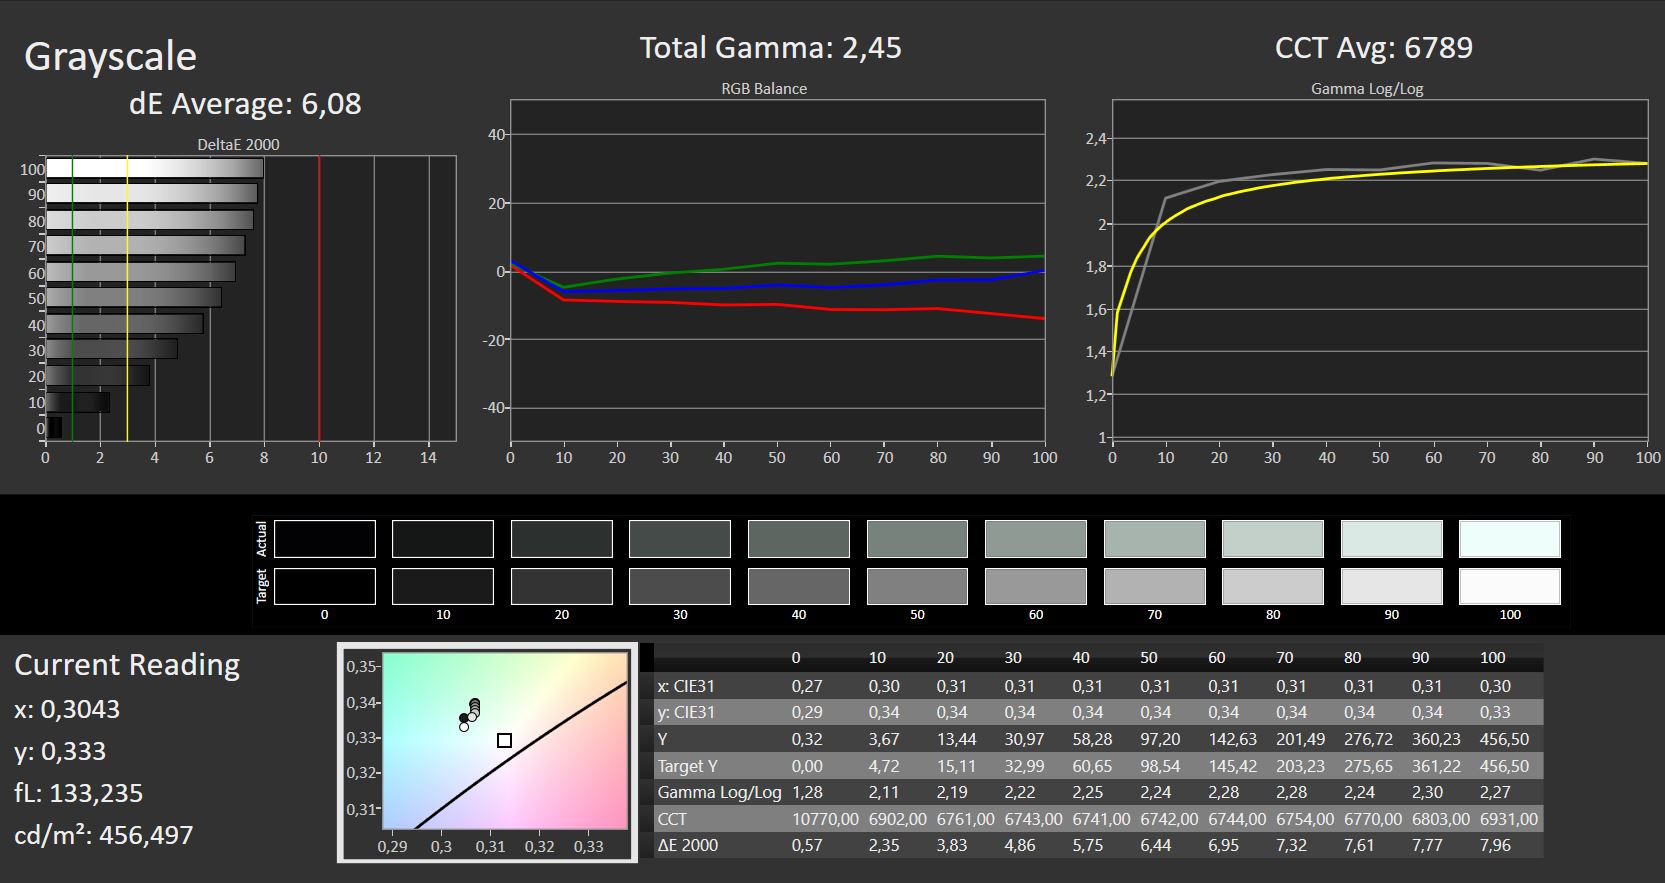
Display - Display 16:10 con risoluzione QHD+
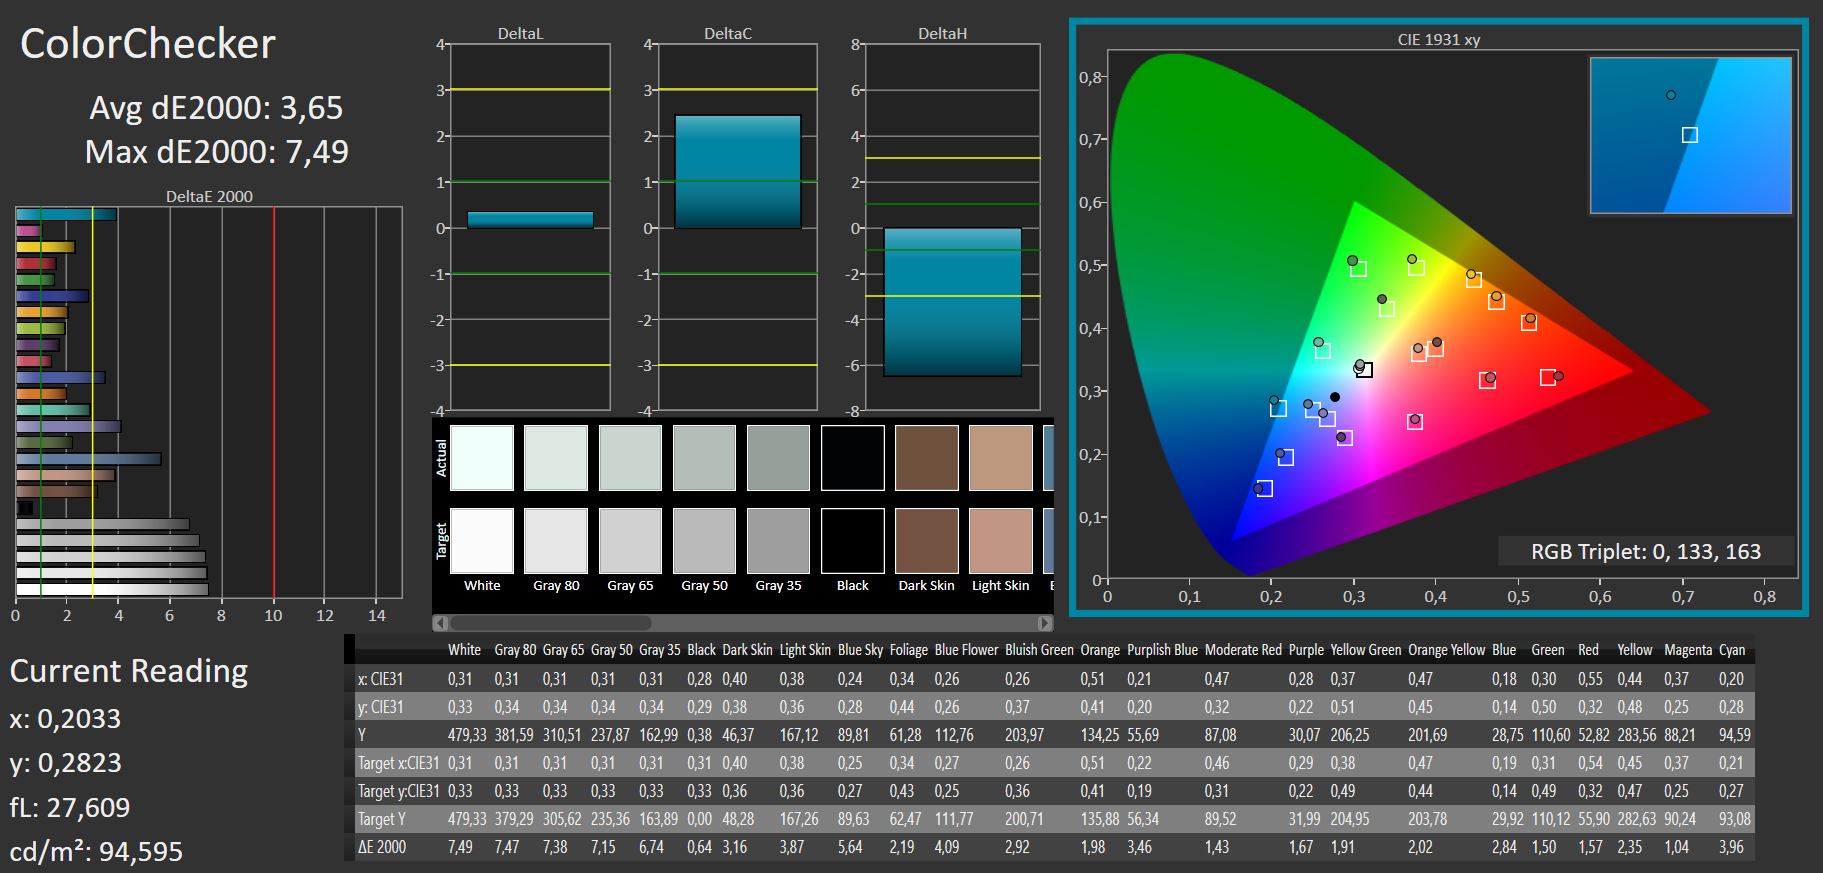
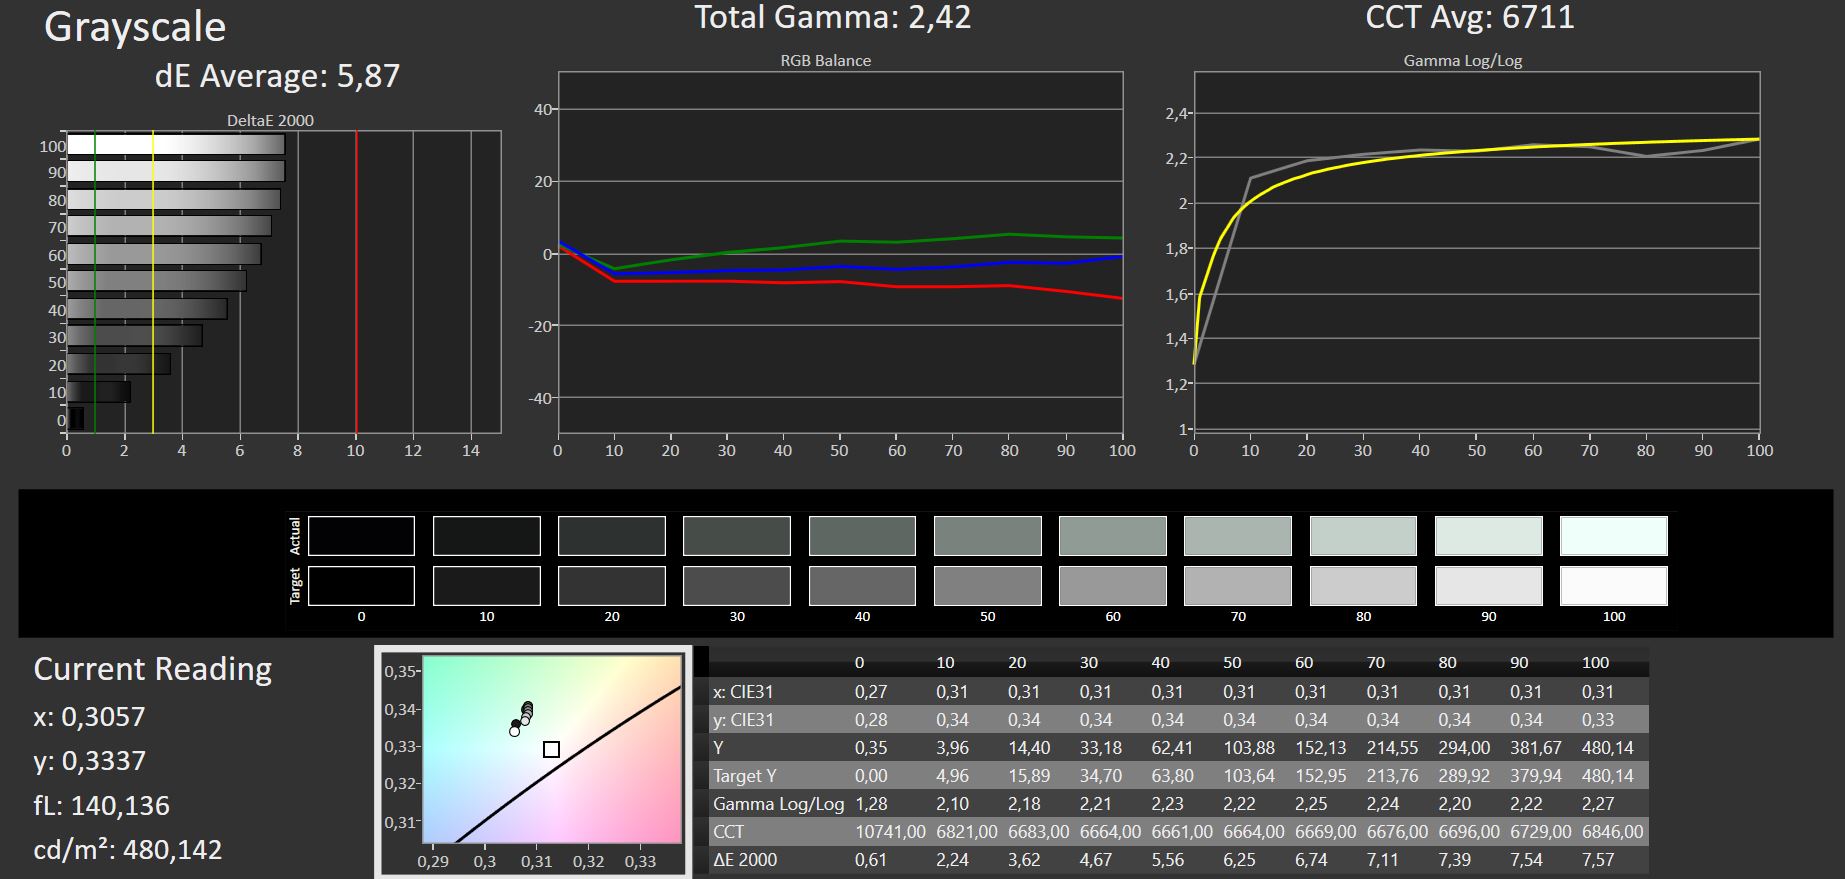
Con un rapporto d'aspetto di 16:10, il display XMG Focus 16 non è esattamente tipico. Sebbene offra una risoluzione elevata di 2560 × 1600 pixel e una frequenza di aggiornamento di 165 Hz, il tempo di risposta di questo schermo luminoso da 450 cd/m² non è così basso come ci si aspetterebbe da un portatile da gioco. I livelli di contrasto, la copertura dei colori, i livelli di nero e l'illuminazione possono essere definiti buoni. Non siamo riusciti a rilevare alcuna perdita di luminosità.
| |||||||||||||||||||||||||
Distribuzione della luminosità: 89 %
Al centro con la batteria: 455 cd/m²
Contrasto: 1438:1 (Nero: 0.32 cd/m²)
ΔE ColorChecker Calman: 3.65 | ∀{0.5-29.43 Ø4.71}
calibrated: 3.65
ΔE Greyscale Calman: 5.87 | ∀{0.09-98 Ø4.96}
70.6% AdobeRGB 1998 (Argyll 3D)
96.6% sRGB (Argyll 3D)
68.3% Display P3 (Argyll 3D)
Gamma: 2.42
CCT: 6711 K
| Schenker XMG Focus 16 (i7-12700H, RTX 3060) BOE NE16oQDM-NY1, IPS, 2560x1600, 16" | Dell G16 7620 BOE NE16QDM, IPS, 2560x1600, 16" | Asus ZenBook Pro 16X OLED UX7602ZM-ME115W Samsung SDC415D, OLED, 3840x2400, 16" | Asus ROG Flow X16 GV601RW-M5082W AUO B160QAN02.S, Mini LED, 2560x1600, 16.1" | Lenovo ThinkPad X1 Extreme G5-21DE003RGE LP160UQ1-SPB1, IPS, 3840x2400, 16" | Lenovo Legion Slim 7-16IAH 82TF004YGE MNG007DA1-G , IPS LED, 2560x1600, 16" | Lenovo Legion 5 Pro 16IAH7H BOE CCQ_NE160QDM_NY1, IPS, 2560x1600, 16" | |
|---|---|---|---|---|---|---|---|
| Display | 0% | 25% | 26% | 22% | 3% | 1% | |
| Display P3 Coverage (%) | 68.3 | 68.3 0% | 99.84 46% | 99.82 46% | 84.6 24% | 70.5 3% | 68.53 0% |
| sRGB Coverage (%) | 96.6 | 98 1% | 99.99 4% | 99.99 4% | 99.2 3% | 99.1 3% | 98.38 2% |
| AdobeRGB 1998 Coverage (%) | 70.6 | 70.5 0% | 88.9 26% | 90.21 28% | 97.7 38% | 72.8 3% | 70.45 0% |
| Response Times | 26% | 85% | 16% | -129% | 31% | 30% | |
| Response Time Grey 50% / Grey 80% * (ms) | 16.4 ? | 8.6 ? 48% | 2 ? 88% | 11 ? 33% | 46 ? -180% | 12 ? 27% | 14 ? 15% |
| Response Time Black / White * (ms) | 10.8 ? | 10.4 ? 4% | 2 ? 81% | 11 ? -2% | 19.2 ? -78% | 7 ? 35% | 6 ? 44% |
| PWM Frequency (Hz) | 59 ? | 7400 ? | |||||
| Screen | 15% | 21% | 52% | 23% | 19% | 17% | |
| Brightness middle (cd/m²) | 460 | 369.4 -20% | 346 -25% | 498 8% | 476 3% | 523 14% | 515 12% |
| Brightness (cd/m²) | 442 | 348 -21% | 354 -20% | 502 14% | 470 6% | 494 12% | 475 7% |
| Brightness Distribution (%) | 89 | 83 -7% | 96 8% | 94 6% | 90 1% | 90 1% | 85 -4% |
| Black Level * (cd/m²) | 0.32 | 0.32 -0% | 0.11 66% | 0.35 -9% | 0.4 -25% | 0.45 -41% | |
| Contrast (:1) | 1438 | 1154 -20% | 4527 215% | 1360 -5% | 1308 -9% | 1144 -20% | |
| Colorchecker dE 2000 * | 3.65 | 1.78 51% | 2.28 38% | 1.87 49% | 1.9 48% | 2.6 29% | 2.38 35% |
| Colorchecker dE 2000 max. * | 7.49 | 4.41 41% | 4.94 34% | 6.15 18% | 4.7 37% | 5 33% | 4.37 42% |
| Colorchecker dE 2000 calibrated * | 3.65 | 1.22 67% | 2.16 41% | 1.94 47% | 1.3 64% | 1 73% | 1.1 70% |
| Greyscale dE 2000 * | 5.87 | 3.2 45% | 1.64 72% | 3.15 46% | 2.4 59% | 3.3 44% | 2.71 54% |
| Gamma | 2.42 91% | 2.2 100% | 2.37 93% | 330.95 1% | 2.24 98% | 2.17 101% | 2.49 88% |
| CCT | 6711 97% | 6750 96% | 6384 102% | 7294 89% | 6377 102% | 6013 108% | 6117 106% |
| Media totale (Programma / Settaggio) | 14% /
14% | 44% /
33% | 31% /
41% | -28% /
1% | 18% /
17% | 16% /
15% |
* ... Meglio usare valori piccoli
Il display del portatile da gioco Schenker copre il 95% di sRGB, mentre AdobeRGB e DisplayP3 si attestano intorno al 70%. La riproduzione dei colori è buona, anche se non proprio perfetta. Sarebbe auspicabile un ΔΕ inferiore a 3, ma il Focus 16 riesce a ottenere un ΔΕ medio di 3,65. Pertanto, le devozioni cromatiche ex-lavoro sono accettabili. Il nostro profilo ICC non ha prodotto alcun miglioramento nella riproduzione dei colori.

Tempi di risposta del Display
| ↔ Tempi di risposta dal Nero al Bianco | ||
|---|---|---|
| 10.8 ms ... aumenta ↗ e diminuisce ↘ combinato | ↗ 5 ms Incremento | 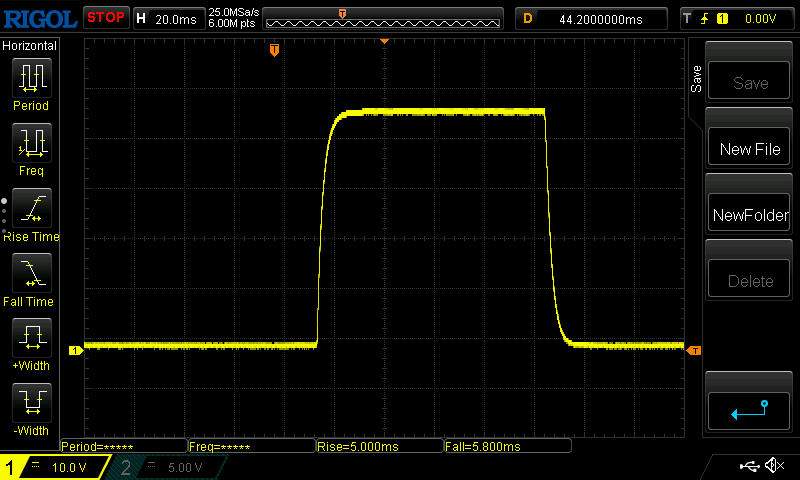 |
| ↘ 5.8 ms Calo | ||
| Lo schermo mostra buoni tempi di risposta durante i nostri tests, ma potrebbe essere troppo lento per i gamers competitivi. In confronto, tutti i dispositivi di test variano da 0.1 (minimo) a 240 (massimo) ms. » 29 % di tutti i dispositivi è migliore. Questo significa che i tempi di risposta rilevati sono migliori rispettto alla media di tutti i dispositivi testati (19.8 ms). | ||
| ↔ Tempo di risposta dal 50% Grigio all'80% Grigio | ||
| 16.4 ms ... aumenta ↗ e diminuisce ↘ combinato | ↗ 7.4 ms Incremento | 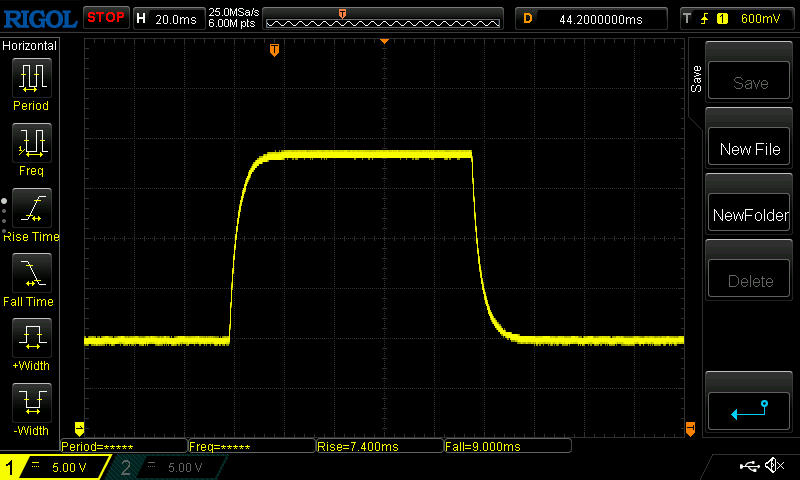 |
| ↘ 9 ms Calo | ||
| Lo schermo mostra buoni tempi di risposta durante i nostri tests, ma potrebbe essere troppo lento per i gamers competitivi. In confronto, tutti i dispositivi di test variano da 0.165 (minimo) a 636 (massimo) ms. » 31 % di tutti i dispositivi è migliore. Questo significa che i tempi di risposta rilevati sono migliori rispettto alla media di tutti i dispositivi testati (31 ms). | ||
Sfarfallio dello schermo / PWM (Pulse-Width Modulation)
| flickering dello schermo / PWM non rilevato | 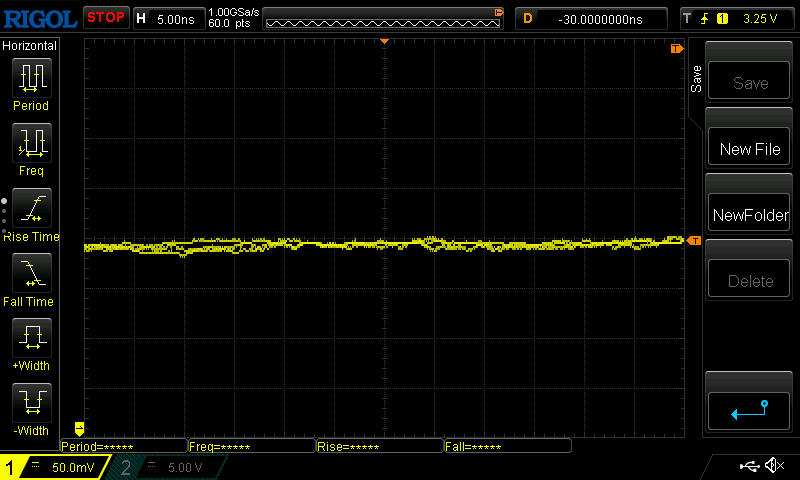 | ||
In confronto: 52 % di tutti i dispositivi testati non utilizza PWM per ridurre la luminosita' del display. Se è rilevato PWM, una media di 7757 (minimo: 5 - massimo: 343500) Hz è stata rilevata. | |||
Il pannello IPS privo di sfarfallio ha fatto una buona impressione nell'uso all'aperto e quando è stato osservato da diverse angolazioni. Solo quando il sole ha illuminato il display opaco con un'angolazione sfavorevole abbiamo riscontrato difficoltà di leggibilità.

Prestazioni: un po' sopra la media
Come tutti i portatili Schenker, anche l'XMG Focus 16 è altamente personalizzabile. Pertanto, è possibile selezionare la RAM, i vari dischi rigidi e altre opzioni nel configuratore XMG Focus 16configuratore. Al momento non è possibile scegliere CPU e GPU diverse. Tutti i dispositivi XMG Focus 16 sono dotati di un processoreIntel Core i7-12700He unaNvidia GeForce RTX 3060. Inoltre, il nostro dispositivo in prova era dotato di 2×16 GB di RAM DDR4 e di un'unità SSD Samsung NVMe da 1 TB.
Tutto questo significa che abbiamo un portatile in grado di gestire la maggior parte dei giochi moderni. Tuttavia, la RTX 3060 non riesce sempre a superare i 60 fps con le impostazioni grafiche più elevate e alla risoluzione nativa del dispositivo.
Controllo delle prestazioni e condizioni di prova
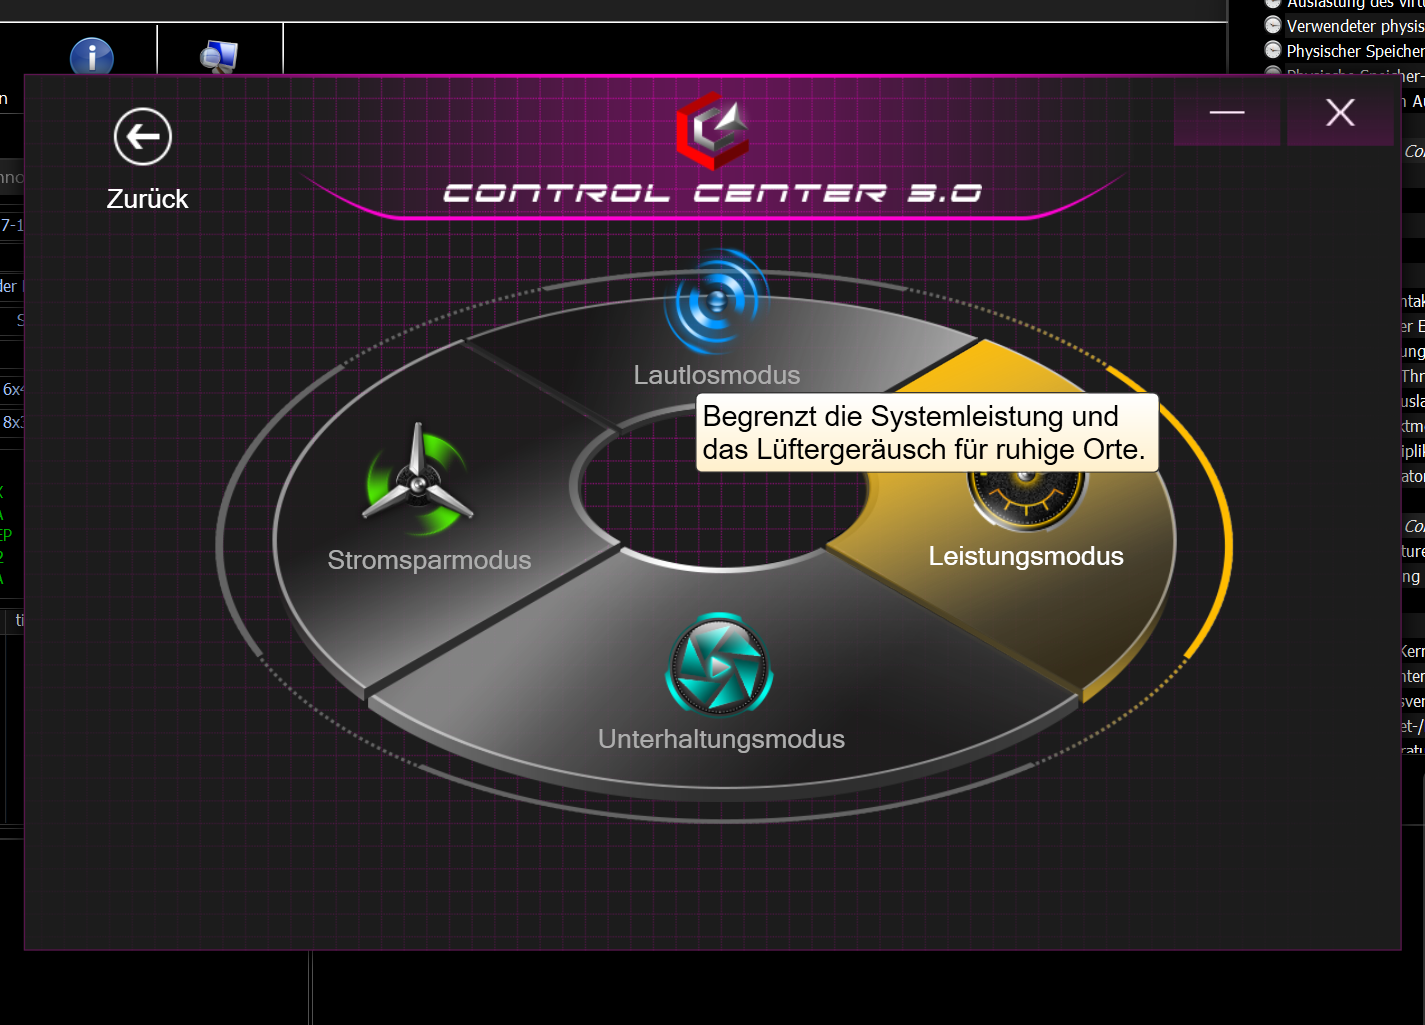
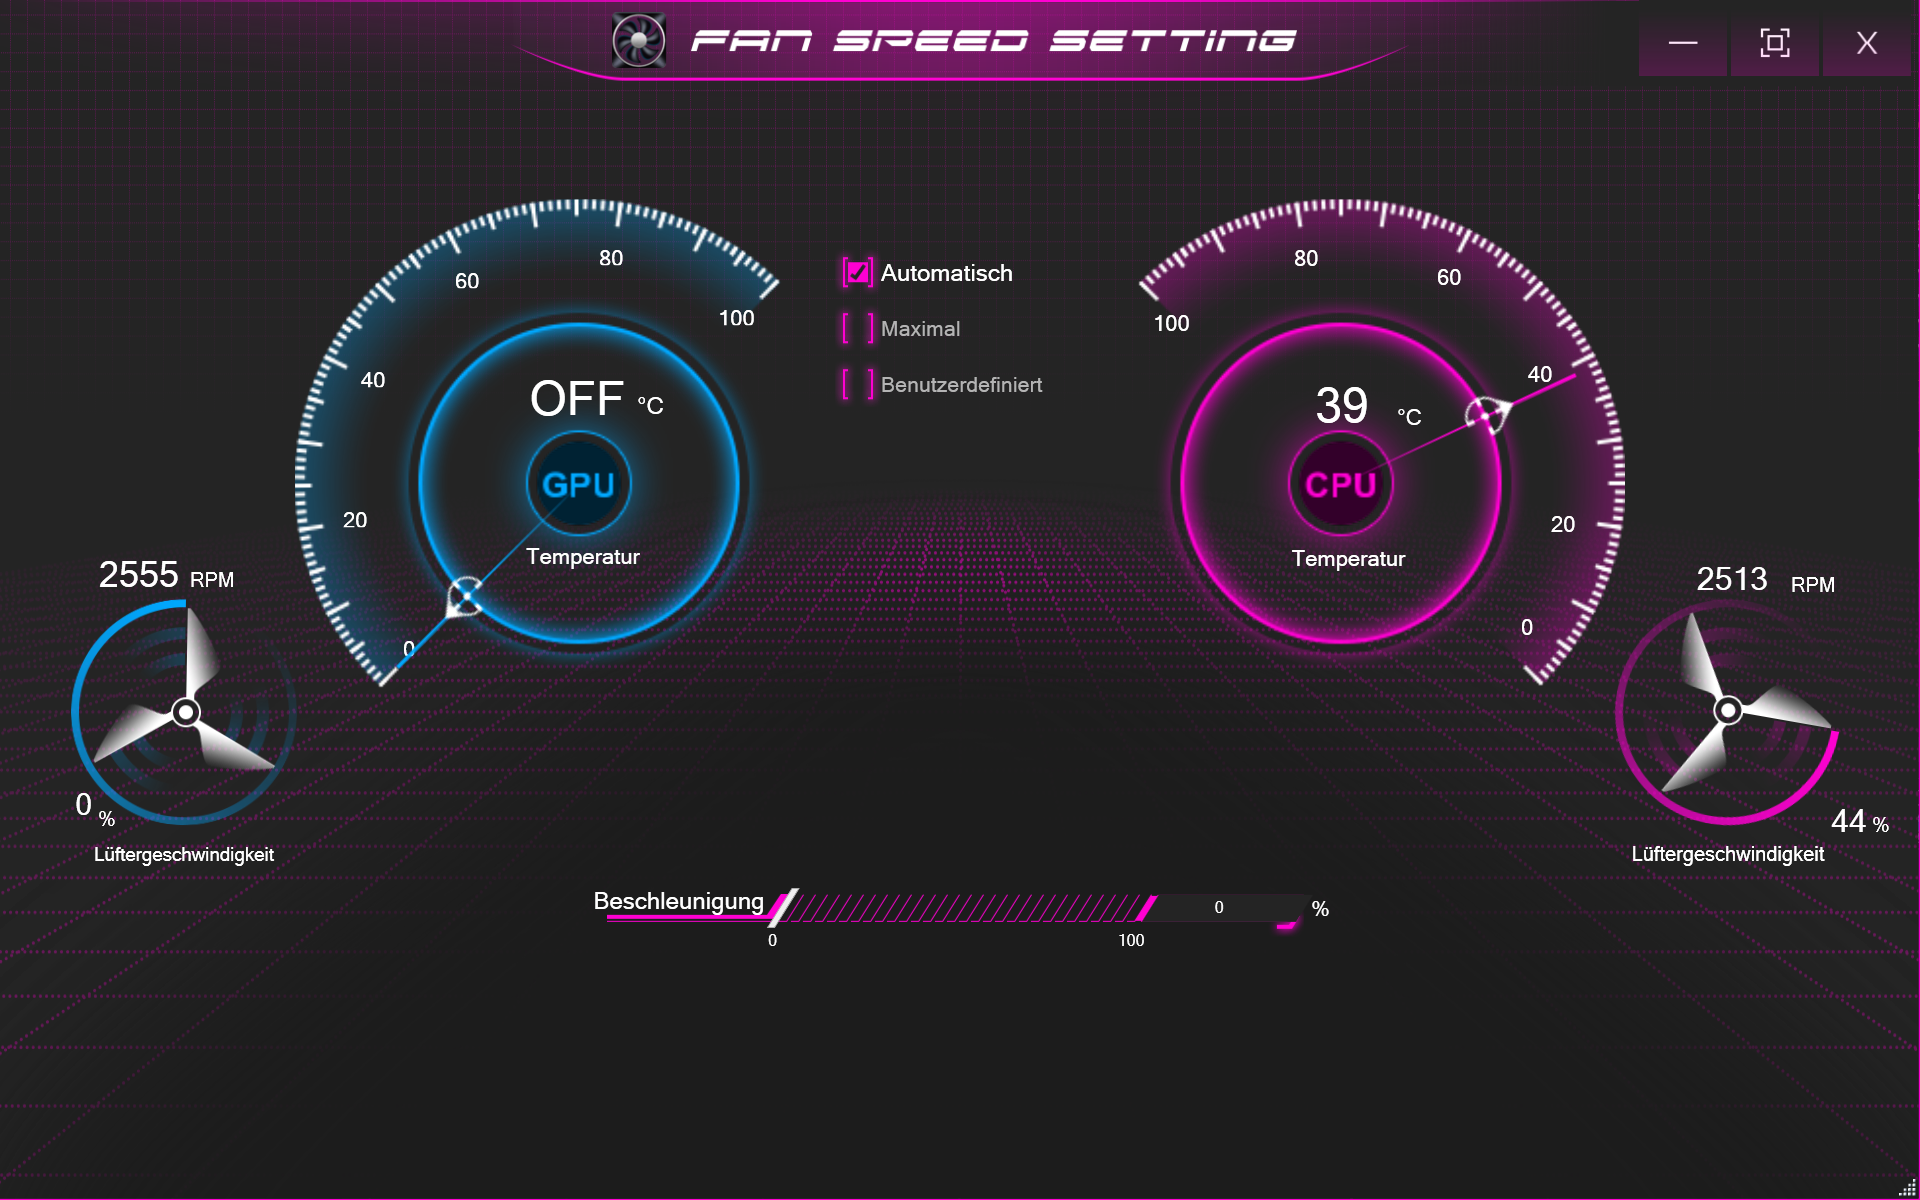
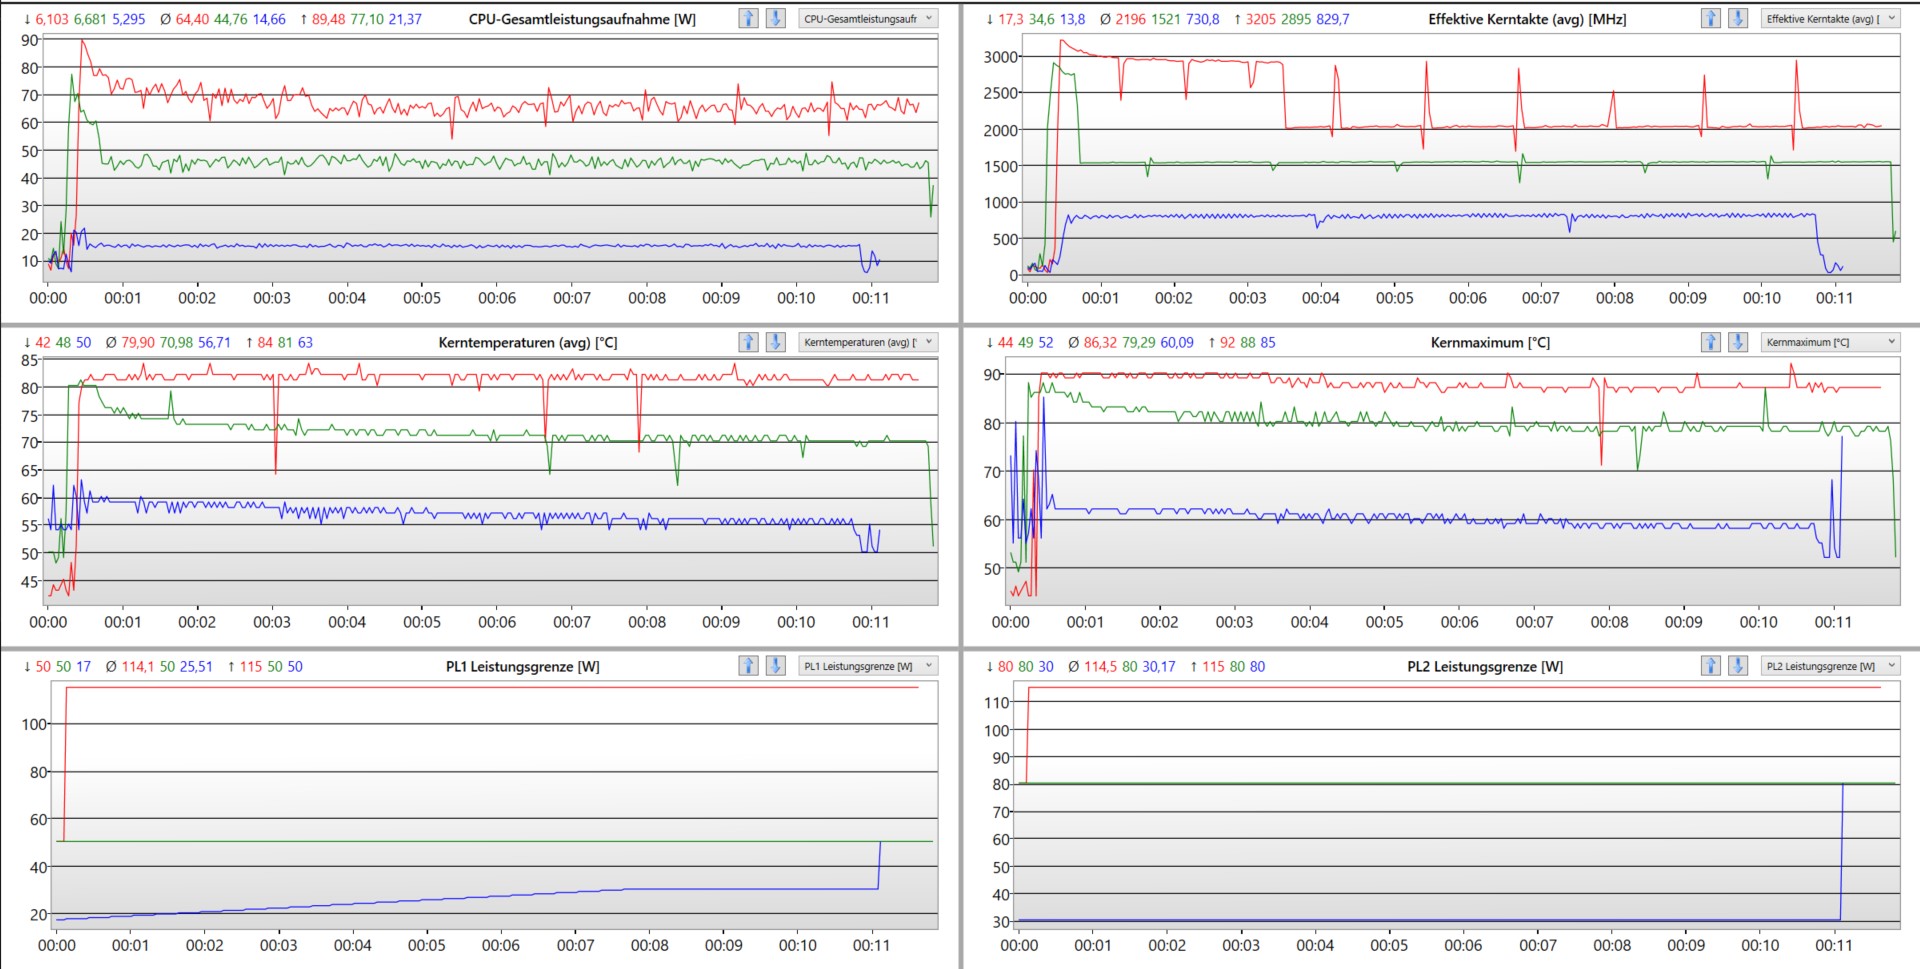
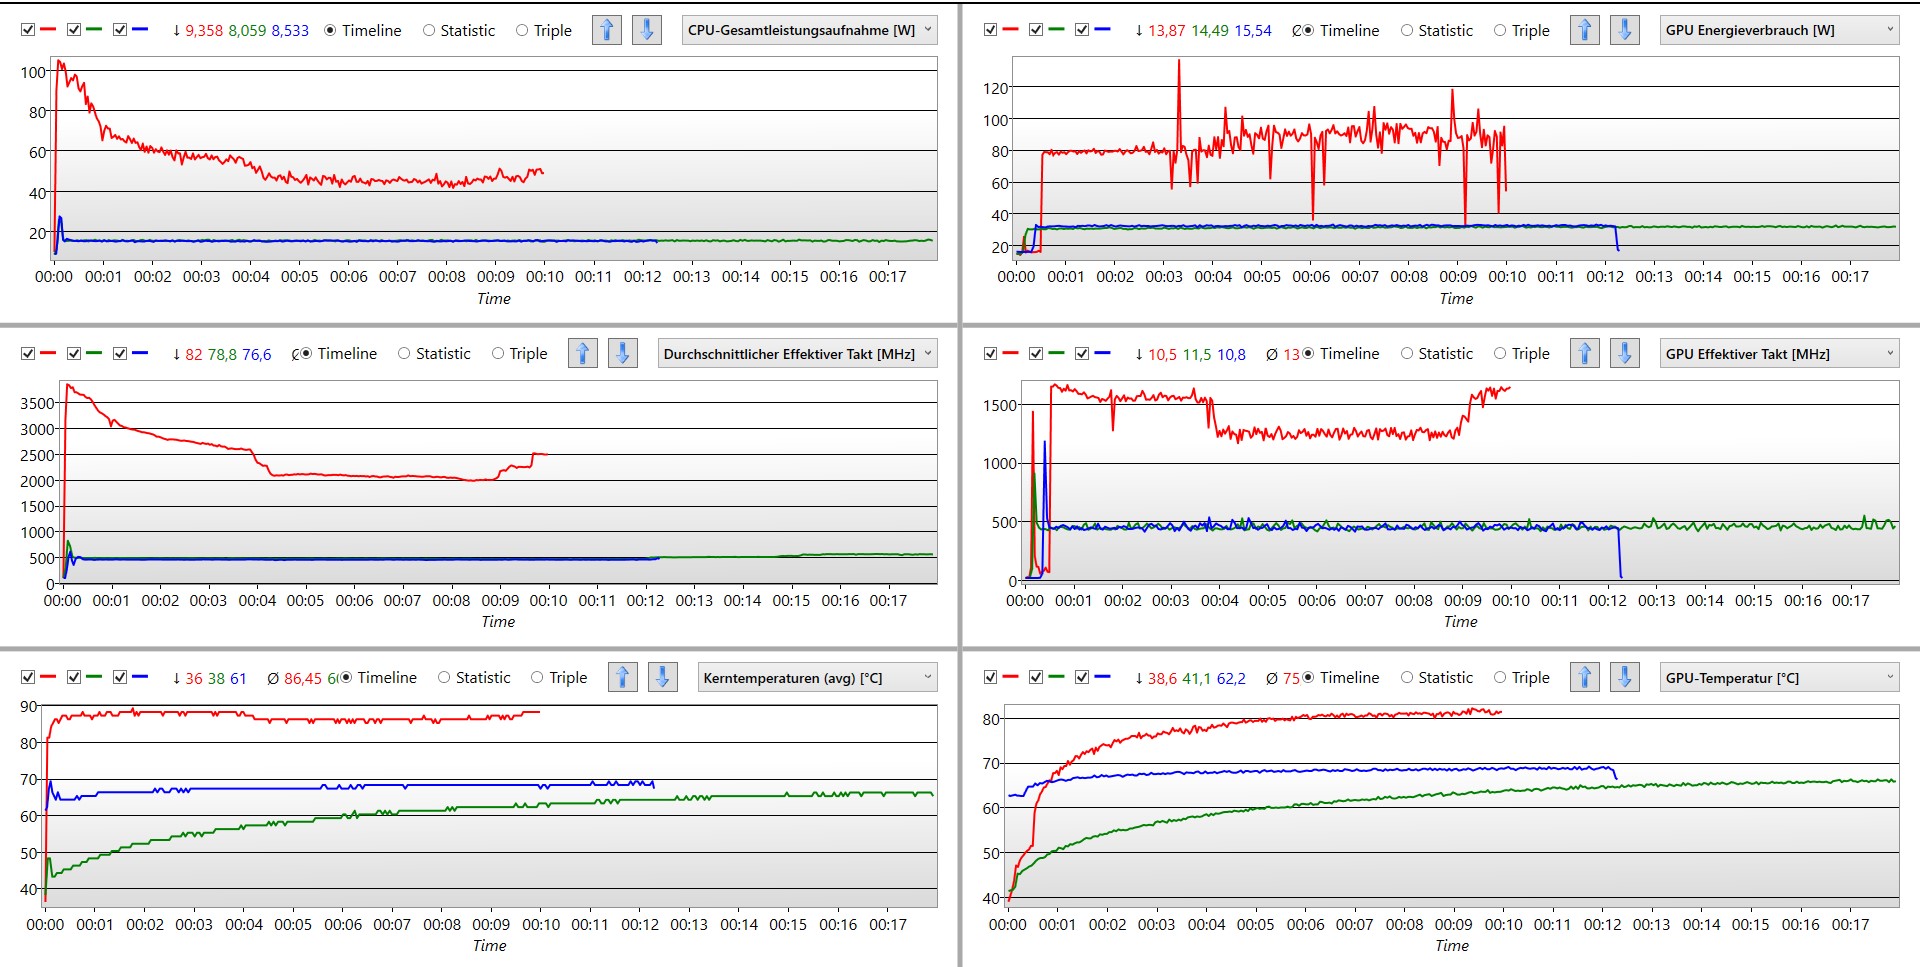
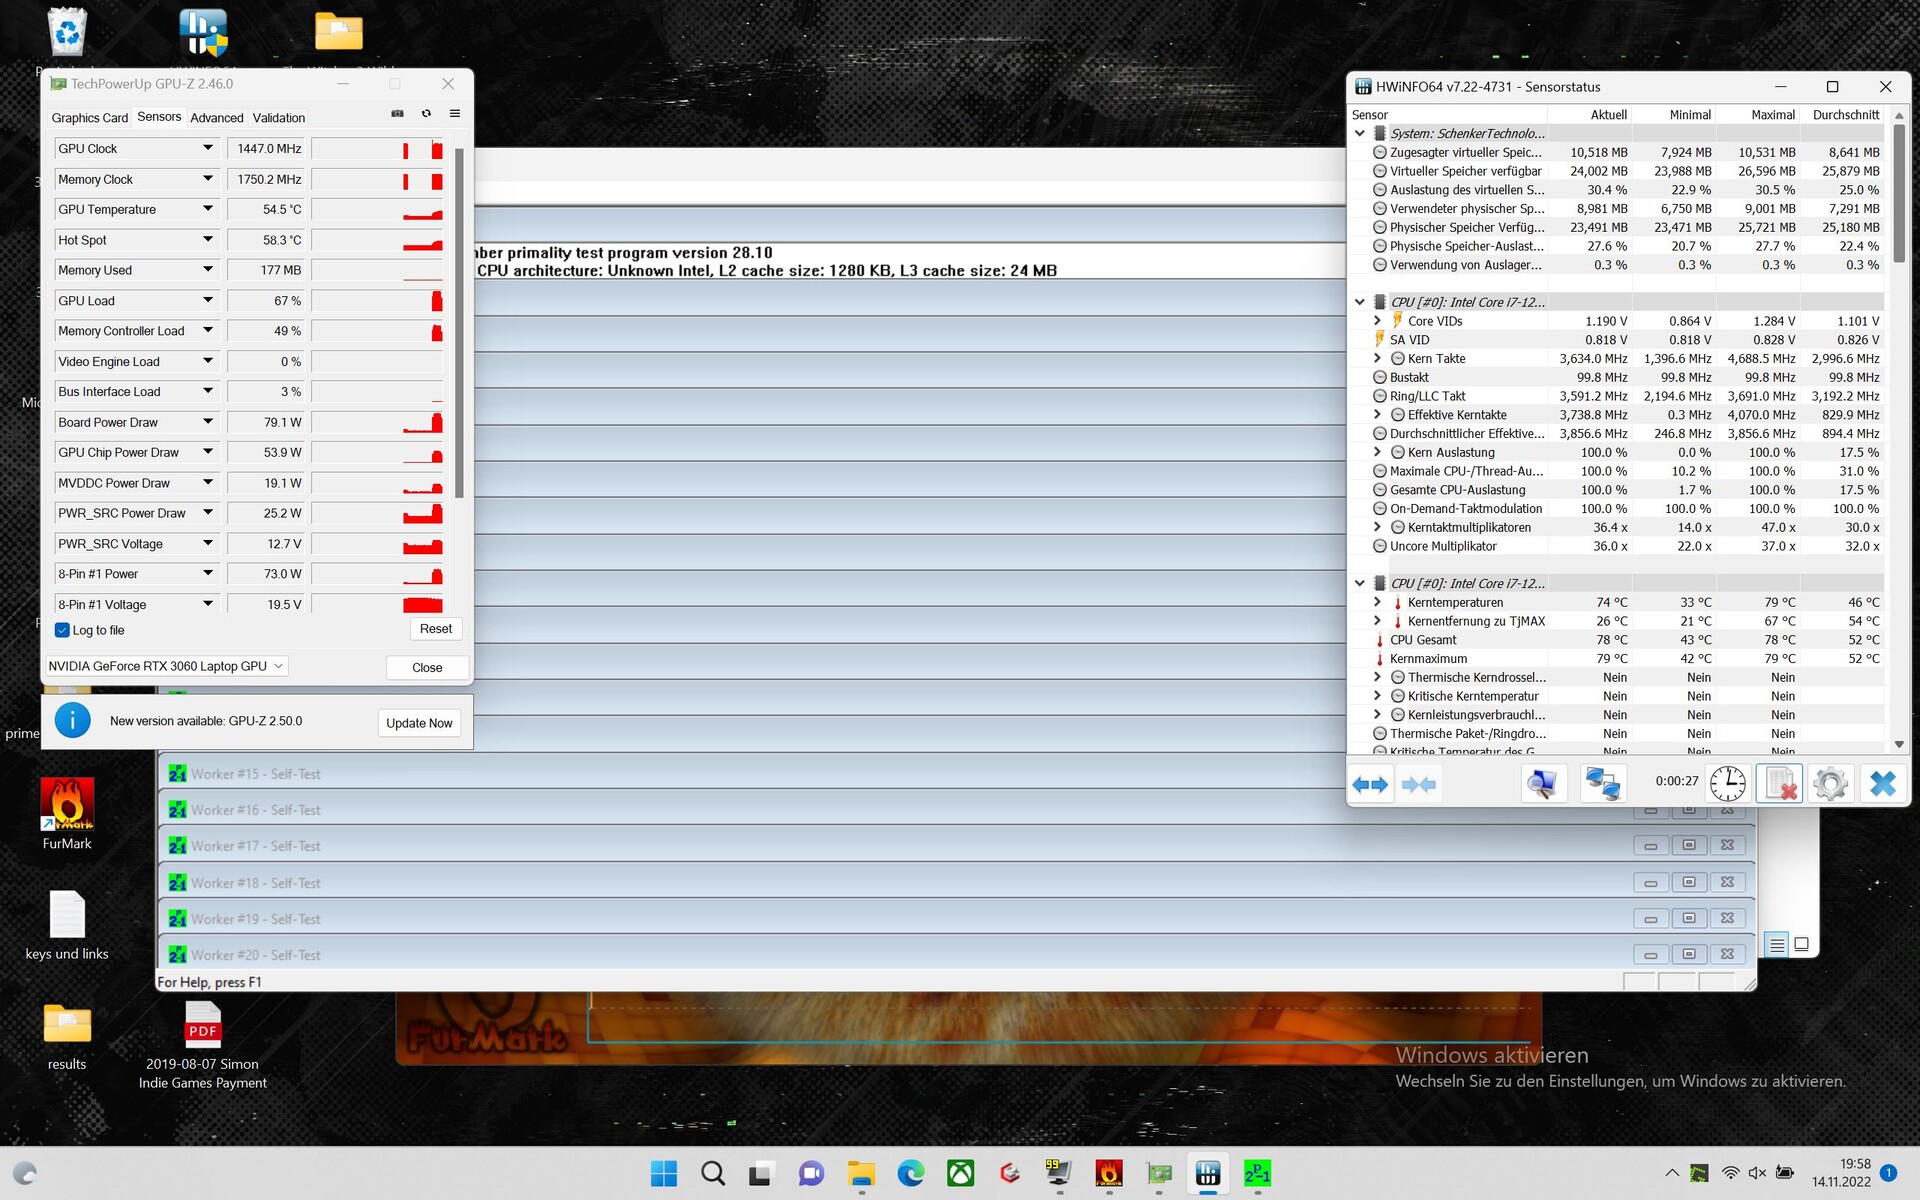
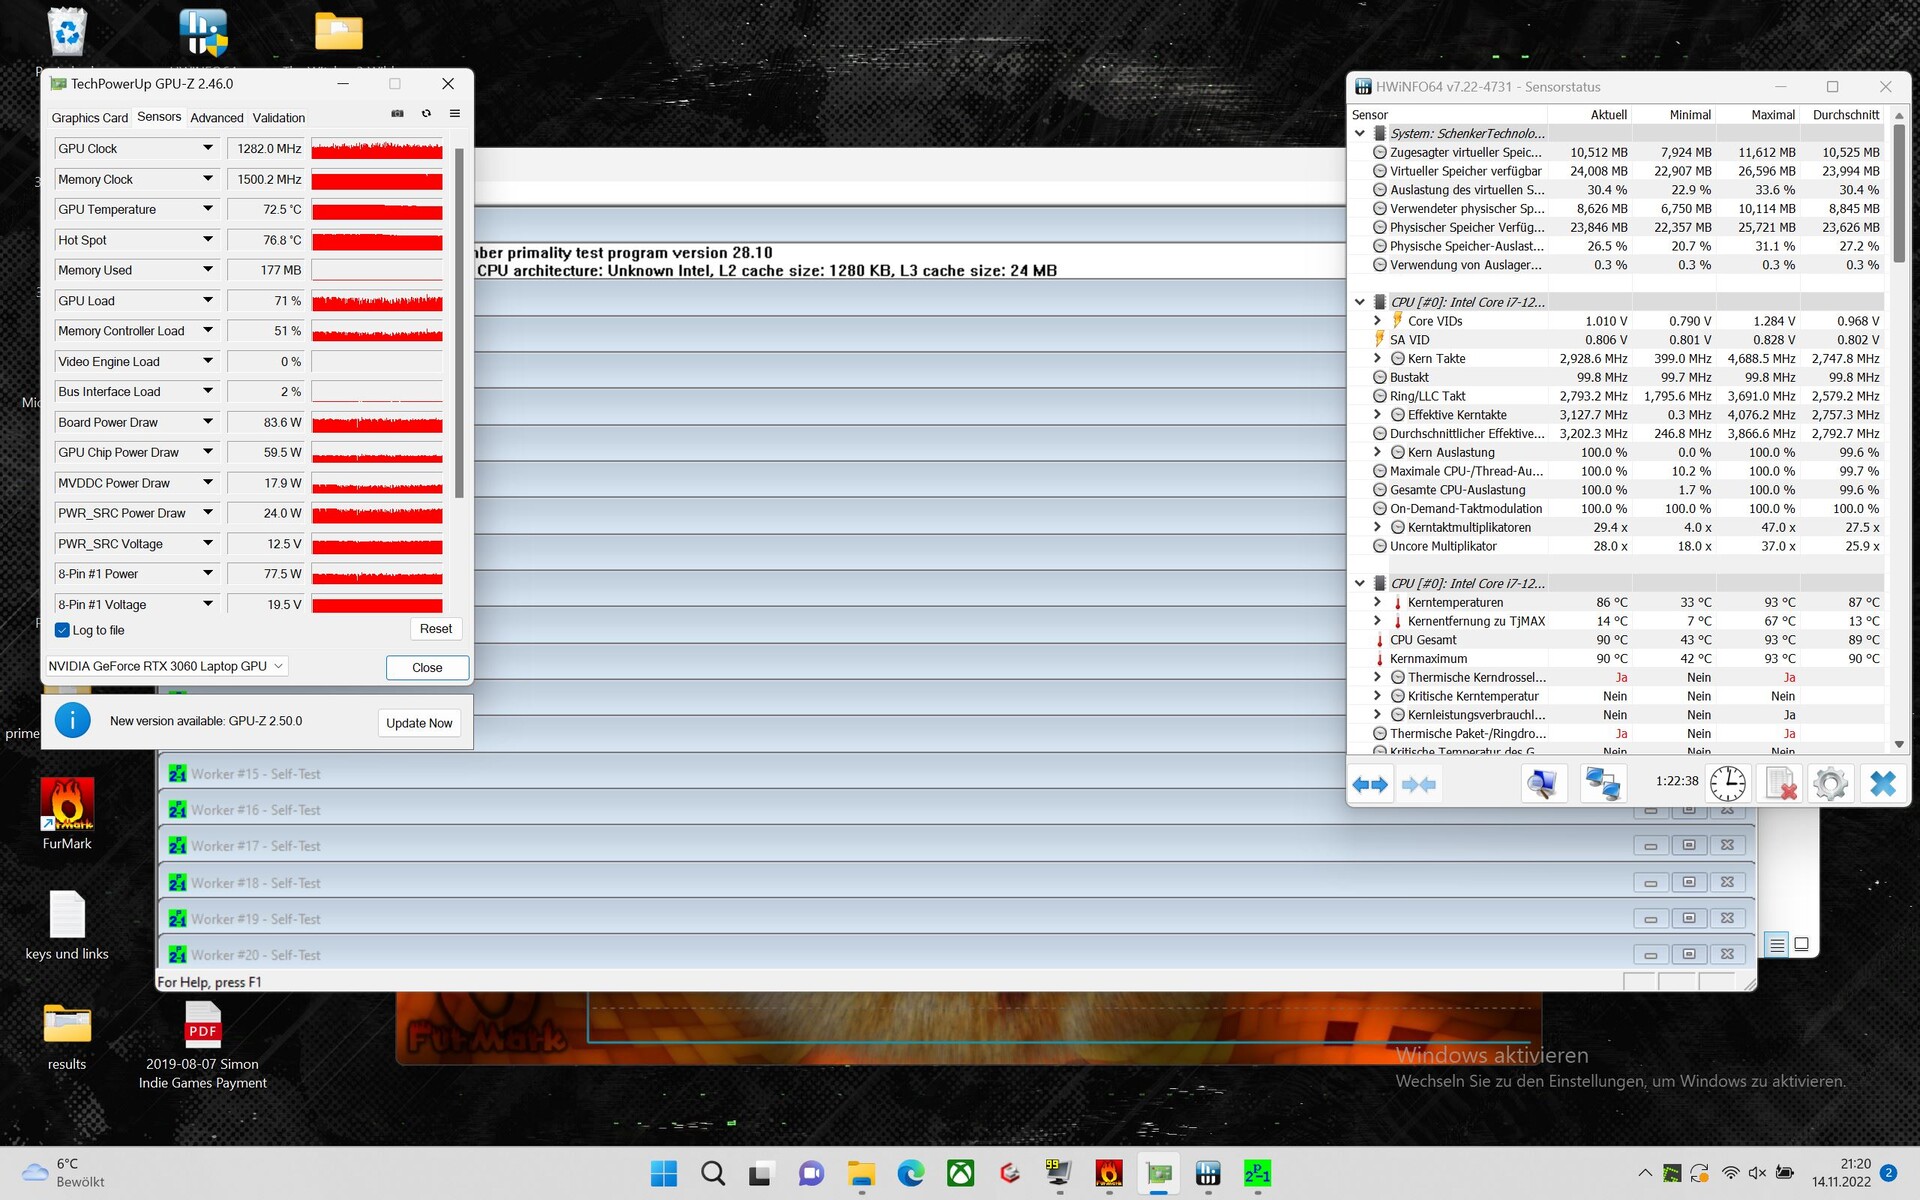
Il livello di prestazioni dei portatili Schenker attuali si imposta tramite il Control Center 3.0. Qui sono disponibili quattro scelte per le prestazioni: dalla modalità whisper alla modalità performance. Qui vengono specificate le velocità delle ventole, i limiti delle prestazioni e le temperature target. Per tutti coloro che amano gestire queste impostazioni, il Control Center offre anche diverse opzioni per regolare e monitorare la velocità della ventola.
Questa influisce pesantemente sulle prestazioni del portatile. In modalità prestazioni, 140 watt sono disponibili per la CPU e la GPU. Durante i test, abbiamo osservato un incremento dinamico di circa 25 watt. Il processore da solo può lavorare a ben 65 watt. In modalità whisper o risparmio energetico, il consumo energetico combinato dell'Intel Core i7 e della Nvidia RTX 3060 si aggira intorno ai 45 watt. Grazie alle varie opzioni di impostazione della ventola, in modalità di risparmio energetico la temperatura dell'hardware aumenta molto più lentamente. Allo stesso modo, in modalità batteria, abbiamo misurato un consumo energetico combinato di circa 25 watt.
Analisi dei log
Processore
IlIntel Core i7-12700Happartiene ai processori più potenti della generazione Alder Lake di Intel. Nello Schenker XMG Focus 16, il processore si comporta relativamente bene senza raggiungere i suoi livelli migliori. A lungo termine, il portatile non è stato in grado di gestire la pressione, poiché le prestazioni nel ciclo Cinbench sono diminuite nel tempo di oltre 100 punti.
Inoltre, i punteggi della CPU mostrano che l'i7 del portatile da gioco si colloca a metà del gruppo rispetto ai suoi concorrenti. Tuttavia, le sue prestazioni sono superiori a quelle medie di unIntel Core i7-12700H. Tuttavia, il 12700H dà il meglio di sé nel Lenovo Legion 5 Pro. In nessun portatile del nostro database l'i7 si comporta meglio di quello presente nel Legion. Abbiamo determinato un valore relativamente alto di 105 watt per il PL2 nello Schenker Laptop, ma solo 65 watt per il PL1.
Cinebench R15 Multi sustained load
Cinebench R23: Multi Core | Single Core
Cinebench R20: CPU (Multi Core) | CPU (Single Core)
Cinebench R15: CPU Multi 64Bit | CPU Single 64Bit
Blender: v2.79 BMW27 CPU
7-Zip 18.03: 7z b 4 | 7z b 4 -mmt1
Geekbench 5.5: Multi-Core | Single-Core
HWBOT x265 Benchmark v2.2: 4k Preset
LibreOffice : 20 Documents To PDF
R Benchmark 2.5: Overall mean
| CPU Performance rating | |
| Media della classe Gaming | |
| Lenovo Legion 5 Pro 16IAH7H | |
| Asus ZenBook Pro 16X OLED UX7602ZM-ME115W | |
| Lenovo ThinkPad X1 Extreme G5-21DE003RGE | |
| Lenovo Legion Slim 7-16IAH 82TF004YGE | |
| Schenker XMG Focus 16 (i7-12700H, RTX 3060) | |
| Dell G16 7620 | |
| Media Intel Core i7-12700H | |
| Asus ROG Flow X16 GV601RW-M5082W | |
| Cinebench R23 / Multi Core | |
| Media della classe Gaming (10488 - 42661, n=107, ultimi 2 anni) | |
| Lenovo Legion 5 Pro 16IAH7H | |
| Lenovo Legion Slim 7-16IAH 82TF004YGE | |
| Lenovo ThinkPad X1 Extreme G5-21DE003RGE | |
| Schenker XMG Focus 16 (i7-12700H, RTX 3060) | |
| Dell G16 7620 | |
| Asus ZenBook Pro 16X OLED UX7602ZM-ME115W | |
| Media Intel Core i7-12700H (4032 - 19330, n=64) | |
| Asus ROG Flow X16 GV601RW-M5082W | |
| Cinebench R23 / Single Core | |
| Media della classe Gaming (1166 - 2415, n=107, ultimi 2 anni) | |
| Lenovo ThinkPad X1 Extreme G5-21DE003RGE | |
| Schenker XMG Focus 16 (i7-12700H, RTX 3060) | |
| Media Intel Core i7-12700H (778 - 1826, n=63) | |
| Lenovo Legion Slim 7-16IAH 82TF004YGE | |
| Lenovo Legion 5 Pro 16IAH7H | |
| Dell G16 7620 | |
| Asus ZenBook Pro 16X OLED UX7602ZM-ME115W | |
| Asus ROG Flow X16 GV601RW-M5082W | |
| Cinebench R20 / CPU (Multi Core) | |
| Media della classe Gaming (4029 - 16433, n=106, ultimi 2 anni) | |
| Lenovo Legion 5 Pro 16IAH7H | |
| Lenovo ThinkPad X1 Extreme G5-21DE003RGE | |
| Lenovo Legion Slim 7-16IAH 82TF004YGE | |
| Dell G16 7620 | |
| Schenker XMG Focus 16 (i7-12700H, RTX 3060) | |
| Asus ZenBook Pro 16X OLED UX7602ZM-ME115W | |
| Media Intel Core i7-12700H (1576 - 7407, n=64) | |
| Asus ROG Flow X16 GV601RW-M5082W | |
| Cinebench R20 / CPU (Single Core) | |
| Media della classe Gaming (442 - 913, n=106, ultimi 2 anni) | |
| Lenovo ThinkPad X1 Extreme G5-21DE003RGE | |
| Schenker XMG Focus 16 (i7-12700H, RTX 3060) | |
| Asus ZenBook Pro 16X OLED UX7602ZM-ME115W | |
| Media Intel Core i7-12700H (300 - 704, n=64) | |
| Lenovo Legion Slim 7-16IAH 82TF004YGE | |
| Lenovo Legion 5 Pro 16IAH7H | |
| Dell G16 7620 | |
| Asus ROG Flow X16 GV601RW-M5082W | |
| Cinebench R15 / CPU Multi 64Bit | |
| Media della classe Gaming (1578 - 6330, n=105, ultimi 2 anni) | |
| Lenovo Legion 5 Pro 16IAH7H | |
| Lenovo Legion Slim 7-16IAH 82TF004YGE | |
| Lenovo ThinkPad X1 Extreme G5-21DE003RGE | |
| Schenker XMG Focus 16 (i7-12700H, RTX 3060) | |
| Dell G16 7620 | |
| Asus ZenBook Pro 16X OLED UX7602ZM-ME115W | |
| Media Intel Core i7-12700H (1379 - 2916, n=70) | |
| Asus ROG Flow X16 GV601RW-M5082W | |
| Cinebench R15 / CPU Single 64Bit | |
| Media della classe Gaming (188.8 - 350, n=106, ultimi 2 anni) | |
| Asus ZenBook Pro 16X OLED UX7602ZM-ME115W | |
| Asus ZenBook Pro 16X OLED UX7602ZM-ME115W | |
| Lenovo ThinkPad X1 Extreme G5-21DE003RGE | |
| Schenker XMG Focus 16 (i7-12700H, RTX 3060) | |
| Lenovo Legion Slim 7-16IAH 82TF004YGE | |
| Media Intel Core i7-12700H (113 - 263, n=65) | |
| Lenovo Legion 5 Pro 16IAH7H | |
| Dell G16 7620 | |
| Asus ROG Flow X16 GV601RW-M5082W | |
| Blender / v2.79 BMW27 CPU | |
| Media Intel Core i7-12700H (168 - 732, n=63) | |
| Asus ROG Flow X16 GV601RW-M5082W | |
| Schenker XMG Focus 16 (i7-12700H, RTX 3060) | |
| Lenovo ThinkPad X1 Extreme G5-21DE003RGE | |
| Asus ZenBook Pro 16X OLED UX7602ZM-ME115W | |
| Dell G16 7620 | |
| Lenovo Legion Slim 7-16IAH 82TF004YGE | |
| Lenovo Legion 5 Pro 16IAH7H | |
| Media della classe Gaming (79 - 330, n=104, ultimi 2 anni) | |
| 7-Zip 18.03 / 7z b 4 | |
| Media della classe Gaming (33491 - 148086, n=105, ultimi 2 anni) | |
| Asus ZenBook Pro 16X OLED UX7602ZM-ME115W | |
| Lenovo Legion 5 Pro 16IAH7H | |
| Lenovo ThinkPad X1 Extreme G5-21DE003RGE | |
| Lenovo Legion Slim 7-16IAH 82TF004YGE | |
| Dell G16 7620 | |
| Schenker XMG Focus 16 (i7-12700H, RTX 3060) | |
| Asus ROG Flow X16 GV601RW-M5082W | |
| Media Intel Core i7-12700H (22844 - 73067, n=63) | |
| 7-Zip 18.03 / 7z b 4 -mmt1 | |
| Media della classe Gaming (4199 - 7436, n=105, ultimi 2 anni) | |
| Lenovo ThinkPad X1 Extreme G5-21DE003RGE | |
| Asus ZenBook Pro 16X OLED UX7602ZM-ME115W | |
| Schenker XMG Focus 16 (i7-12700H, RTX 3060) | |
| Asus ROG Flow X16 GV601RW-M5082W | |
| Media Intel Core i7-12700H (2743 - 5972, n=63) | |
| Lenovo Legion 5 Pro 16IAH7H | |
| Lenovo Legion Slim 7-16IAH 82TF004YGE | |
| Dell G16 7620 | |
| Geekbench 5.5 / Multi-Core | |
| Media della classe Gaming (6460 - 28263, n=105, ultimi 2 anni) | |
| Asus ZenBook Pro 16X OLED UX7602ZM-ME115W | |
| Lenovo Legion 5 Pro 16IAH7H | |
| Lenovo Legion Slim 7-16IAH 82TF004YGE | |
| Schenker XMG Focus 16 (i7-12700H, RTX 3060) | |
| Dell G16 7620 | |
| Lenovo ThinkPad X1 Extreme G5-21DE003RGE | |
| Media Intel Core i7-12700H (5144 - 13745, n=64) | |
| Asus ROG Flow X16 GV601RW-M5082W | |
| Geekbench 5.5 / Single-Core | |
| Media della classe Gaming (986 - 2474, n=105, ultimi 2 anni) | |
| Asus ZenBook Pro 16X OLED UX7602ZM-ME115W | |
| Lenovo ThinkPad X1 Extreme G5-21DE003RGE | |
| Schenker XMG Focus 16 (i7-12700H, RTX 3060) | |
| Media Intel Core i7-12700H (803 - 1851, n=64) | |
| Lenovo Legion Slim 7-16IAH 82TF004YGE | |
| Lenovo Legion 5 Pro 16IAH7H | |
| Dell G16 7620 | |
| Asus ROG Flow X16 GV601RW-M5082W | |
| HWBOT x265 Benchmark v2.2 / 4k Preset | |
| Media della classe Gaming (11.5 - 44.4, n=105, ultimi 2 anni) | |
| Lenovo Legion 5 Pro 16IAH7H | |
| Asus ZenBook Pro 16X OLED UX7602ZM-ME115W | |
| Dell G16 7620 | |
| Lenovo Legion Slim 7-16IAH 82TF004YGE | |
| Schenker XMG Focus 16 (i7-12700H, RTX 3060) | |
| Lenovo ThinkPad X1 Extreme G5-21DE003RGE | |
| Media Intel Core i7-12700H (4.67 - 21.8, n=64) | |
| Asus ROG Flow X16 GV601RW-M5082W | |
| LibreOffice / 20 Documents To PDF | |
| Asus ROG Flow X16 GV601RW-M5082W | |
| Dell G16 7620 | |
| Media della classe Gaming (33.2 - 88.8, n=105, ultimi 2 anni) | |
| Media Intel Core i7-12700H (34.2 - 95.3, n=63) | |
| Schenker XMG Focus 16 (i7-12700H, RTX 3060) | |
| Lenovo ThinkPad X1 Extreme G5-21DE003RGE | |
| Lenovo Legion 5 Pro 16IAH7H | |
| Lenovo Legion Slim 7-16IAH 82TF004YGE | |
| Asus ZenBook Pro 16X OLED UX7602ZM-ME115W | |
| R Benchmark 2.5 / Overall mean | |
| Dell G16 7620 | |
| Asus ROG Flow X16 GV601RW-M5082W | |
| Lenovo Legion 5 Pro 16IAH7H | |
| Media Intel Core i7-12700H (0.4441 - 1.052, n=63) | |
| Lenovo Legion Slim 7-16IAH 82TF004YGE | |
| Schenker XMG Focus 16 (i7-12700H, RTX 3060) | |
| Lenovo ThinkPad X1 Extreme G5-21DE003RGE | |
| Asus ZenBook Pro 16X OLED UX7602ZM-ME115W | |
| Media della classe Gaming (0.3439 - 0.759, n=106, ultimi 2 anni) | |
* ... Meglio usare valori piccoli
AIDA64: FP32 Ray-Trace | FPU Julia | CPU SHA3 | CPU Queen | FPU SinJulia | FPU Mandel | CPU AES | CPU ZLib | FP64 Ray-Trace | CPU PhotoWorxx
| Performance rating | |
| Media della classe Gaming | |
| Asus ROG Flow X16 GV601RW-M5082W | |
| Lenovo Legion Slim 7-16IAH 82TF004YGE | |
| Asus ZenBook Pro 16X OLED UX7602ZM-ME115W | |
| Schenker XMG Focus 16 (i7-12700H, RTX 3060) | |
| Dell G16 7620 | |
| Lenovo ThinkPad X1 Extreme G5-21DE003RGE | |
| Lenovo Legion 5 Pro 16IAH7H | |
| Media Intel Core i7-12700H | |
| AIDA64 / FP32 Ray-Trace | |
| Media della classe Gaming (10227 - 85542, n=105, ultimi 2 anni) | |
| Lenovo Legion Slim 7-16IAH 82TF004YGE | |
| Lenovo ThinkPad X1 Extreme G5-21DE003RGE | |
| Asus ROG Flow X16 GV601RW-M5082W | |
| Schenker XMG Focus 16 (i7-12700H, RTX 3060) | |
| Dell G16 7620 | |
| Lenovo Legion 5 Pro 16IAH7H | |
| Lenovo Legion 5 Pro 16IAH7H | |
| Asus ZenBook Pro 16X OLED UX7602ZM-ME115W | |
| Media Intel Core i7-12700H (2585 - 17957, n=64) | |
| AIDA64 / CPU Queen | |
| Media della classe Gaming (49785 - 173351, n=90, ultimi 2 anni) | |
| Asus ZenBook Pro 16X OLED UX7602ZM-ME115W | |
| Asus ROG Flow X16 GV601RW-M5082W | |
| Lenovo Legion Slim 7-16IAH 82TF004YGE | |
| Schenker XMG Focus 16 (i7-12700H, RTX 3060) | |
| Lenovo ThinkPad X1 Extreme G5-21DE003RGE | |
| Dell G16 7620 | |
| Lenovo Legion 5 Pro 16IAH7H | |
| Media Intel Core i7-12700H (57923 - 103202, n=63) | |
| AIDA64 / FPU SinJulia | |
| Media della classe Gaming (4424 - 33636, n=105, ultimi 2 anni) | |
| Asus ROG Flow X16 GV601RW-M5082W | |
| Lenovo Legion 5 Pro 16IAH7H | |
| Lenovo Legion 5 Pro 16IAH7H | |
| Dell G16 7620 | |
| Lenovo ThinkPad X1 Extreme G5-21DE003RGE | |
| Lenovo Legion Slim 7-16IAH 82TF004YGE | |
| Schenker XMG Focus 16 (i7-12700H, RTX 3060) | |
| Asus ZenBook Pro 16X OLED UX7602ZM-ME115W | |
| Media Intel Core i7-12700H (3249 - 9939, n=64) | |
| AIDA64 / FP64 Ray-Trace | |
| Media della classe Gaming (5509 - 45446, n=105, ultimi 2 anni) | |
| Asus ROG Flow X16 GV601RW-M5082W | |
| Lenovo ThinkPad X1 Extreme G5-21DE003RGE | |
| Lenovo Legion Slim 7-16IAH 82TF004YGE | |
| Schenker XMG Focus 16 (i7-12700H, RTX 3060) | |
| Asus ZenBook Pro 16X OLED UX7602ZM-ME115W | |
| Dell G16 7620 | |
| Lenovo Legion 5 Pro 16IAH7H | |
| Lenovo Legion 5 Pro 16IAH7H | |
| Media Intel Core i7-12700H (1437 - 9692, n=64) | |
| AIDA64 / CPU PhotoWorxx | |
| Asus ZenBook Pro 16X OLED UX7602ZM-ME115W | |
| Media della classe Gaming (12271 - 89891, n=105, ultimi 2 anni) | |
| Lenovo Legion Slim 7-16IAH 82TF004YGE | |
| Dell G16 7620 | |
| Lenovo Legion 5 Pro 16IAH7H | |
| Lenovo Legion 5 Pro 16IAH7H | |
| Media Intel Core i7-12700H (12863 - 52207, n=64) | |
| Schenker XMG Focus 16 (i7-12700H, RTX 3060) | |
| Asus ROG Flow X16 GV601RW-M5082W | |
| Lenovo ThinkPad X1 Extreme G5-21DE003RGE | |
Prestazioni del sistema
Sebbene il portatile Schenker non possa essere accusato di debolezza nell'uso normale, un confronto con altri potenti portatili da gioco mostra che è possibile fare di più. I risultati dei benchmark PCMark10 e Crossmark sono leggermente inferiori alla media. Poiché entrambi i programmi di benchmark non sottopongono l'SSD a stress a lungo termine in nessuno dei sub-test, è più probabile che i colpevoli siano la memoria DDR4 un po' più lenta e le prestazioni del processore relativamente basse.
CrossMark: Overall | Productivity | Creativity | Responsiveness
| PCMark 10 / Score | |
| Media della classe Gaming (5828 - 12414, n=93, ultimi 2 anni) | |
| Lenovo Legion 5 Pro 16IAH7H | |
| Asus ZenBook Pro 16X OLED UX7602ZM-ME115W | |
| Lenovo Legion Slim 7-16IAH 82TF004YGE | |
| Lenovo ThinkPad X1 Extreme G5-21DE003RGE | |
| Media Intel Core i7-12700H, NVIDIA GeForce RTX 3060 Laptop GPU (5986 - 8156, n=12) | |
| Dell G16 7620 | |
| Schenker XMG Focus 16 (i7-12700H, RTX 3060) | |
| Asus ROG Flow X16 GV601RW-M5082W | |
| PCMark 10 / Essentials | |
| Lenovo Legion 5 Pro 16IAH7H | |
| Asus ZenBook Pro 16X OLED UX7602ZM-ME115W | |
| Lenovo Legion Slim 7-16IAH 82TF004YGE | |
| Media della classe Gaming (8810 - 11935, n=97, ultimi 2 anni) | |
| Media Intel Core i7-12700H, NVIDIA GeForce RTX 3060 Laptop GPU (9289 - 12144, n=12) | |
| Lenovo ThinkPad X1 Extreme G5-21DE003RGE | |
| Dell G16 7620 | |
| Schenker XMG Focus 16 (i7-12700H, RTX 3060) | |
| Asus ROG Flow X16 GV601RW-M5082W | |
| PCMark 10 / Productivity | |
| Media della classe Gaming (6845 - 25323, n=95, ultimi 2 anni) | |
| Asus ZenBook Pro 16X OLED UX7602ZM-ME115W | |
| Schenker XMG Focus 16 (i7-12700H, RTX 3060) | |
| Asus ROG Flow X16 GV601RW-M5082W | |
| Lenovo Legion Slim 7-16IAH 82TF004YGE | |
| Lenovo Legion 5 Pro 16IAH7H | |
| Lenovo ThinkPad X1 Extreme G5-21DE003RGE | |
| Media Intel Core i7-12700H, NVIDIA GeForce RTX 3060 Laptop GPU (6161 - 10362, n=12) | |
| Dell G16 7620 | |
| PCMark 10 / Digital Content Creation | |
| Media della classe Gaming (7602 - 19954, n=95, ultimi 2 anni) | |
| Lenovo Legion 5 Pro 16IAH7H | |
| Dell G16 7620 | |
| Lenovo Legion Slim 7-16IAH 82TF004YGE | |
| Media Intel Core i7-12700H, NVIDIA GeForce RTX 3060 Laptop GPU (8950 - 12554, n=12) | |
| Lenovo ThinkPad X1 Extreme G5-21DE003RGE | |
| Asus ZenBook Pro 16X OLED UX7602ZM-ME115W | |
| Schenker XMG Focus 16 (i7-12700H, RTX 3060) | |
| Asus ROG Flow X16 GV601RW-M5082W | |
| CrossMark / Overall | |
| Media della classe Gaming (1366 - 2409, n=94, ultimi 2 anni) | |
| Lenovo Legion Slim 7-16IAH 82TF004YGE | |
| Media Intel Core i7-12700H, NVIDIA GeForce RTX 3060 Laptop GPU (1649 - 2017, n=11) | |
| Asus ZenBook Pro 16X OLED UX7602ZM-ME115W | |
| Dell G16 7620 | |
| Lenovo Legion 5 Pro 16IAH7H | |
| Lenovo ThinkPad X1 Extreme G5-21DE003RGE | |
| Asus ROG Flow X16 GV601RW-M5082W | |
| Schenker XMG Focus 16 (i7-12700H, RTX 3060) | |
| CrossMark / Productivity | |
| Media della classe Gaming (1386 - 2254, n=94, ultimi 2 anni) | |
| Lenovo Legion Slim 7-16IAH 82TF004YGE | |
| Media Intel Core i7-12700H, NVIDIA GeForce RTX 3060 Laptop GPU (1536 - 1958, n=11) | |
| Lenovo Legion 5 Pro 16IAH7H | |
| Dell G16 7620 | |
| Asus ZenBook Pro 16X OLED UX7602ZM-ME115W | |
| Lenovo ThinkPad X1 Extreme G5-21DE003RGE | |
| Asus ROG Flow X16 GV601RW-M5082W | |
| Schenker XMG Focus 16 (i7-12700H, RTX 3060) | |
| CrossMark / Creativity | |
| Media della classe Gaming (1343 - 2786, n=94, ultimi 2 anni) | |
| Asus ZenBook Pro 16X OLED UX7602ZM-ME115W | |
| Lenovo Legion Slim 7-16IAH 82TF004YGE | |
| Media Intel Core i7-12700H, NVIDIA GeForce RTX 3060 Laptop GPU (1816 - 2084, n=11) | |
| Dell G16 7620 | |
| Lenovo ThinkPad X1 Extreme G5-21DE003RGE | |
| Lenovo Legion 5 Pro 16IAH7H | |
| Schenker XMG Focus 16 (i7-12700H, RTX 3060) | |
| Asus ROG Flow X16 GV601RW-M5082W | |
| CrossMark / Responsiveness | |
| Lenovo Legion Slim 7-16IAH 82TF004YGE | |
| Lenovo Legion 5 Pro 16IAH7H | |
| Media della classe Gaming (1226 - 2334, n=94, ultimi 2 anni) | |
| Media Intel Core i7-12700H, NVIDIA GeForce RTX 3060 Laptop GPU (1210 - 2207, n=11) | |
| Dell G16 7620 | |
| Asus ZenBook Pro 16X OLED UX7602ZM-ME115W | |
| Lenovo ThinkPad X1 Extreme G5-21DE003RGE | |
| Asus ROG Flow X16 GV601RW-M5082W | |
| Schenker XMG Focus 16 (i7-12700H, RTX 3060) | |
| PCMark 10 Score | 7134 punti | |
Aiuto | ||
| AIDA64 / Memory Write | |
| Media della classe Gaming (22297 - 135096, n=105, ultimi 2 anni) | |
| Asus ZenBook Pro 16X OLED UX7602ZM-ME115W | |
| Lenovo Legion 5 Pro 16IAH7H | |
| Lenovo Legion 5 Pro 16IAH7H | |
| Lenovo Legion Slim 7-16IAH 82TF004YGE | |
| Dell G16 7620 | |
| Asus ROG Flow X16 GV601RW-M5082W | |
| Media Intel Core i7-12700H (23679 - 88660, n=64) | |
| Schenker XMG Focus 16 (i7-12700H, RTX 3060) | |
| Lenovo ThinkPad X1 Extreme G5-21DE003RGE | |
| AIDA64 / Memory Latency | |
| Lenovo Legion 5 Pro 16IAH7H | |
| Lenovo Legion 5 Pro 16IAH7H | |
| Asus ZenBook Pro 16X OLED UX7602ZM-ME115W | |
| Media della classe Gaming (75.3 - 259, n=105, ultimi 2 anni) | |
| Dell G16 7620 | |
| Lenovo Legion Slim 7-16IAH 82TF004YGE | |
| Asus ROG Flow X16 GV601RW-M5082W | |
| Schenker XMG Focus 16 (i7-12700H, RTX 3060) | |
| Lenovo ThinkPad X1 Extreme G5-21DE003RGE | |
| Media Intel Core i7-12700H (76.2 - 133.9, n=62) | |
* ... Meglio usare valori piccoli
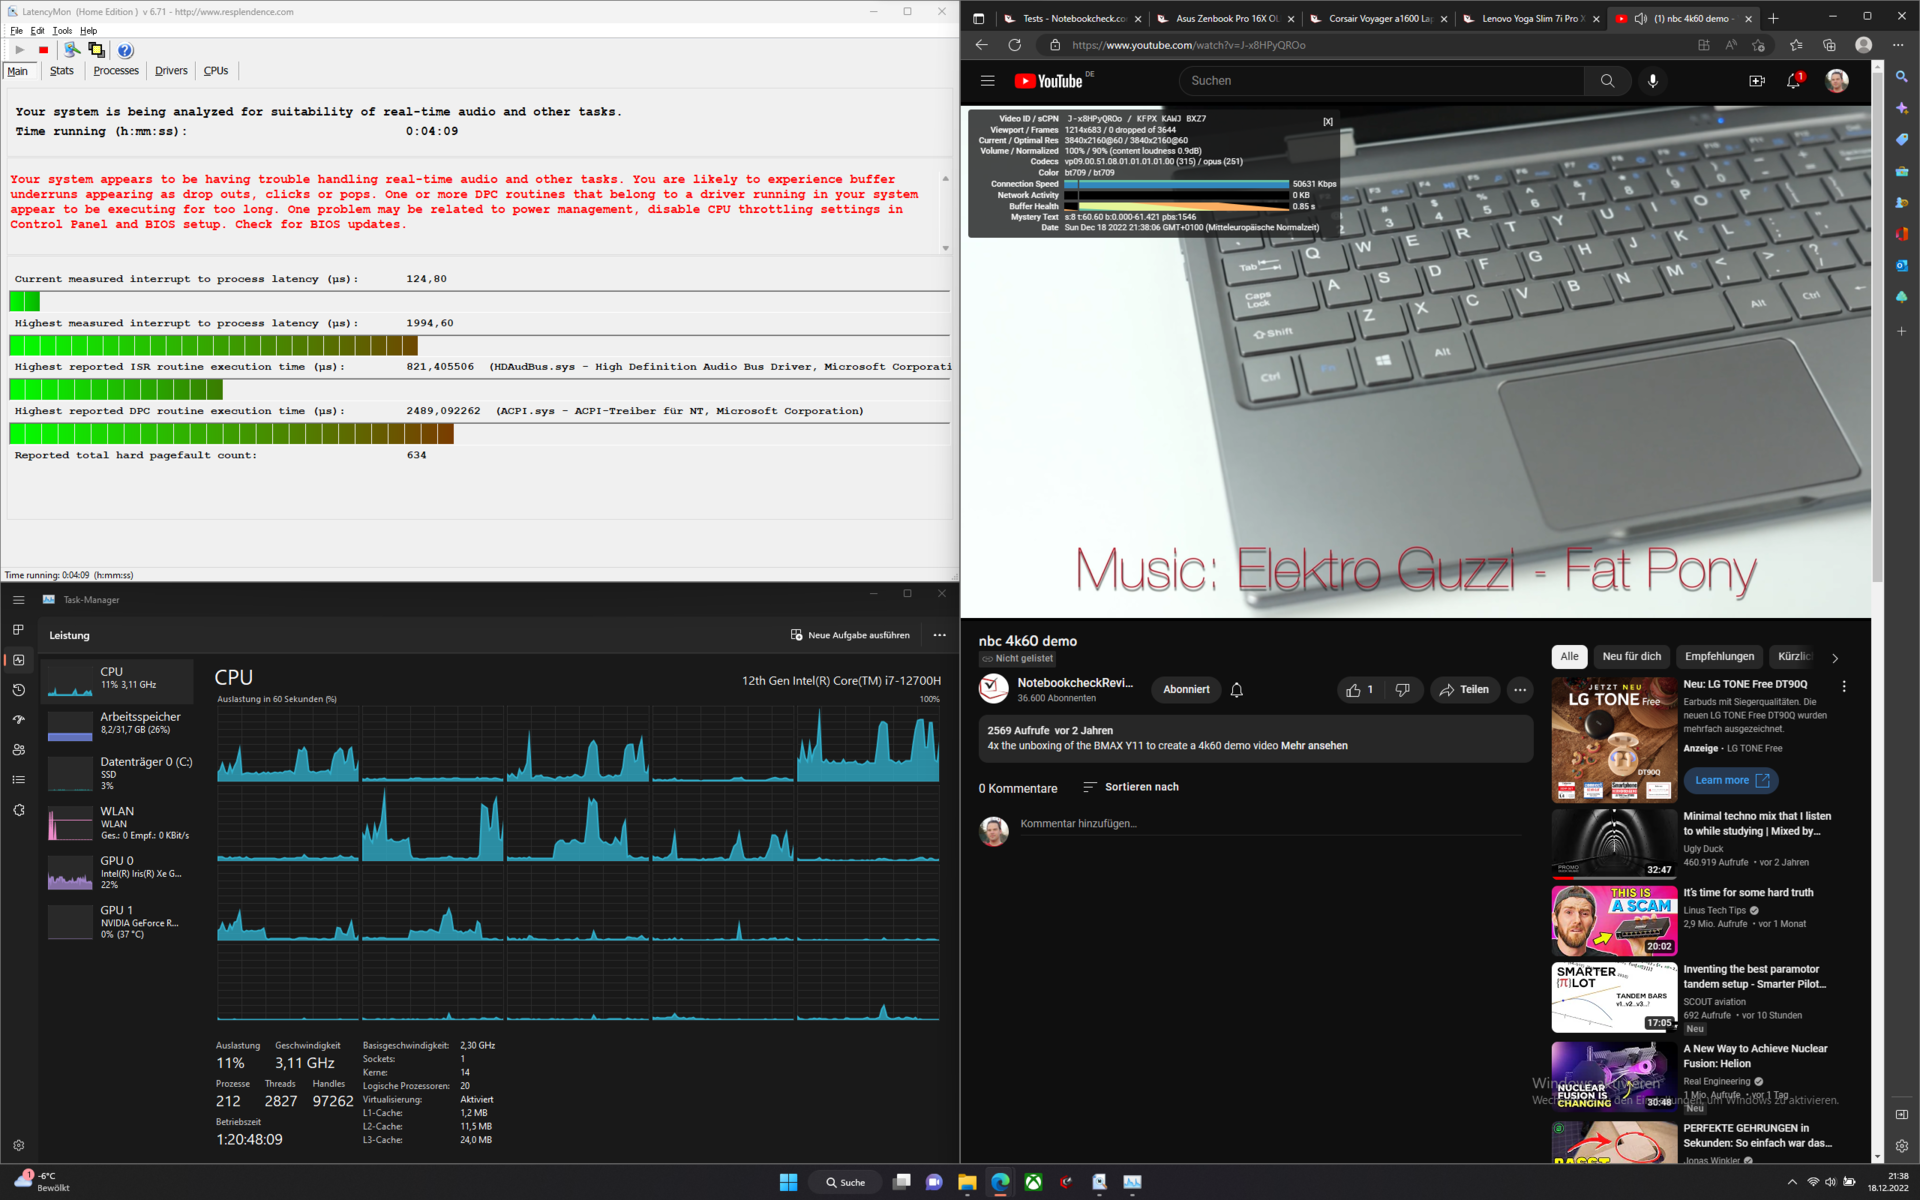
Latenze DPC
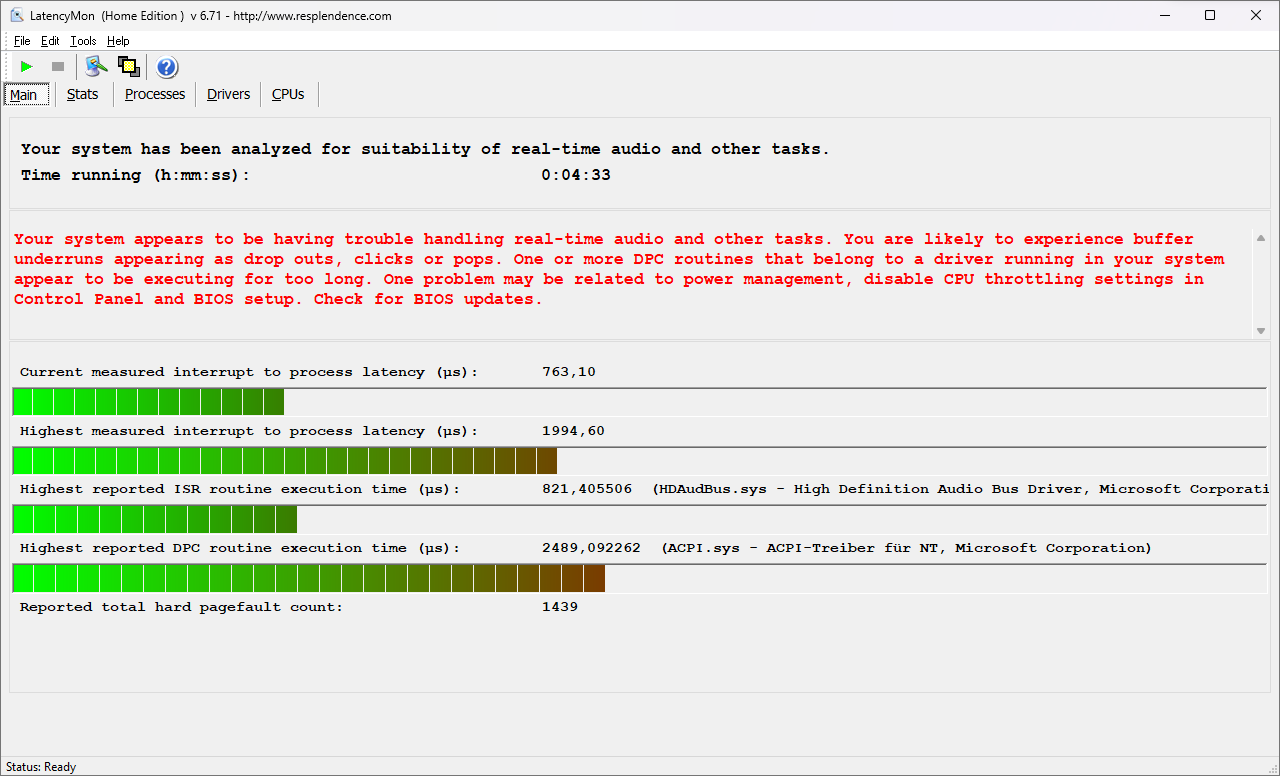
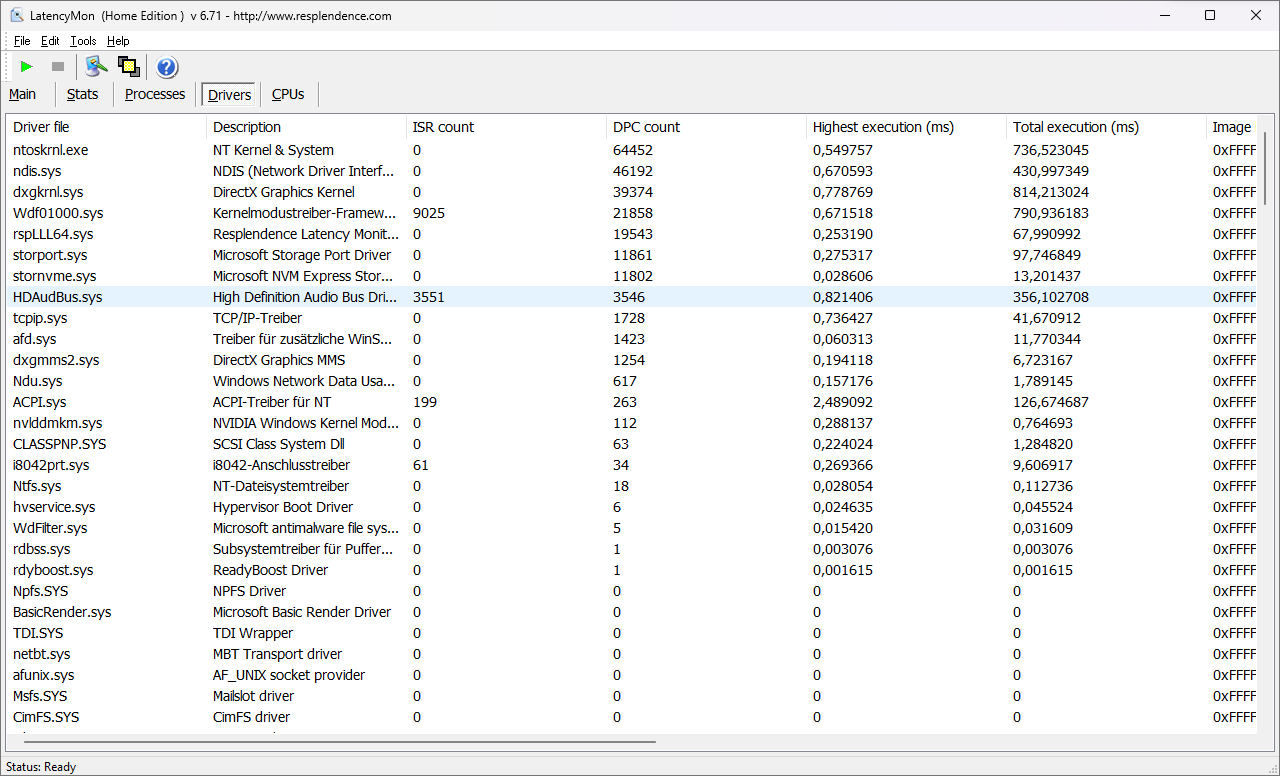
L'XMG Focus 16 non è l'unico in termini di latenze DPC elevate. Con l'attuale combinazione di driver, il portatile da gioco ha registrato livelli elevati ed è quindi inadatto per le applicazioni in tempo reale. Nessun fotogramma è stato saltato durante il test di YouTube 4K 60Hz.
| DPC Latencies / LatencyMon - interrupt to process latency (max), Web, Youtube, Prime95 | |
| Schenker XMG Focus 16 (i7-12700H, RTX 3060) | |
| Asus ROG Flow X16 GV601RW-M5082W | |
| Lenovo ThinkPad X1 Extreme G5-21DE003RGE | |
| Dell G16 7620 | |
| Lenovo Legion 5 Pro 16IAH7H | |
| Lenovo Legion Slim 7-16IAH 82TF004YGE | |
| Asus ZenBook Pro 16X OLED UX7602ZM-ME115W | |
* ... Meglio usare valori piccoli
Memoria di massa
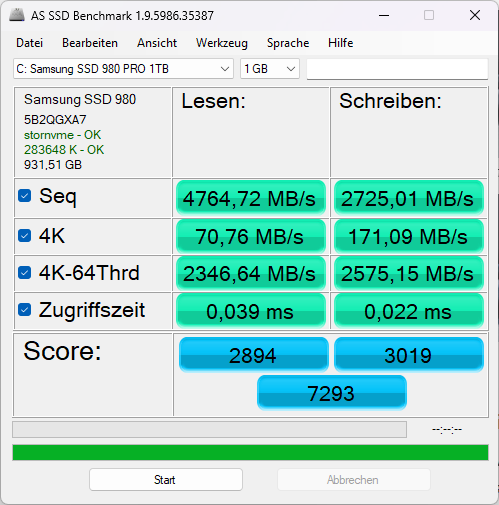
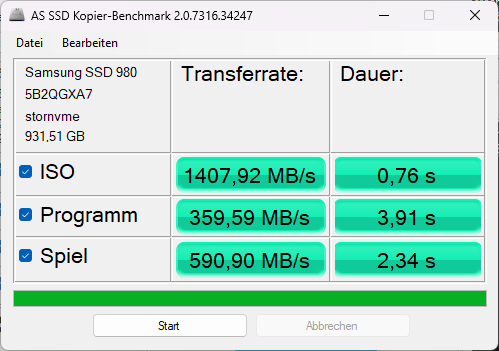
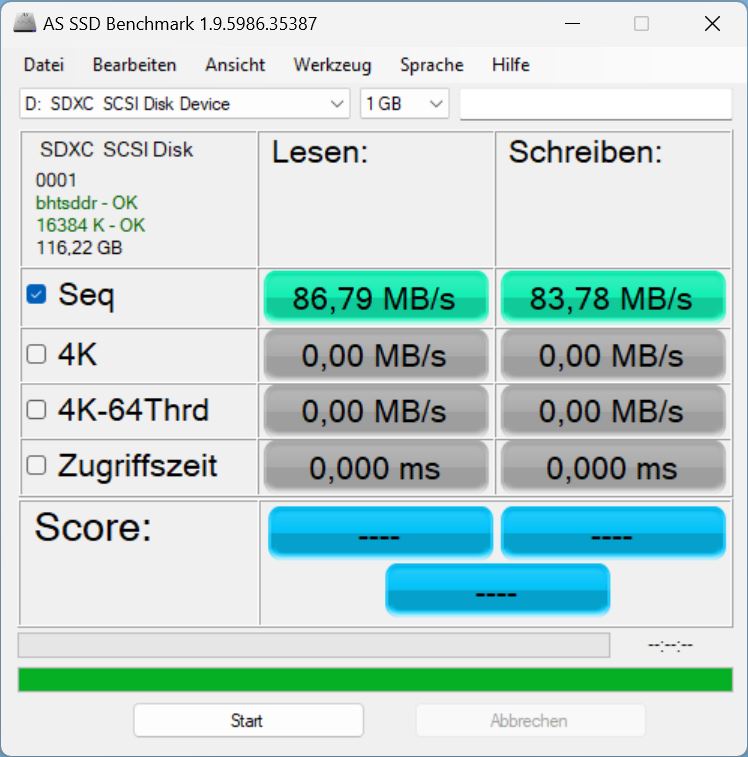
Il portatile da gioco Schenker possiede un SSD 980 Pro da 1 TB di Samsung. Questo potente SSD è vicino ai primi posti nella nostra tabella di benchmark di SSD e HDD. Anche l'unità di archiviazione NVMe del portatile da gioco ha prestazioni elevate. Tuttavia, dopo alcuni cicli di DiskSpd, l'unità SSD NVMe ha subito un notevole rallentamento. Questo comportamento indica una scarsa dissipazione del calore. Mentre molti altri produttori hanno iniziato a implementare pad termici sopra o sotto gli SSD, per dissipare il calore operativo, questo non si può dire del portatile di Schenker.

* ... Meglio usare valori piccoli
Continuous performance read: DiskSpd Read Loop, Queue Depth 8
Scheda grafica
UnNvidia GeForce RTX 3060fa il suo lavoro con l'XMG Focus 16. A seconda dei requisiti di qualità, la scheda grafica è adatta per giochi Full HD o QHD. La 3060 del portatile Schenker dovrebbe essere in grado di eseguire la maggior parte dei titoli attuali a oltre 60 fps alla massima risoluzione dello schermo. Solo alcuni giochi richiedono una potenza maggiore.
Dopo risultati poco entusiasmanti sulle prestazioni del sistema, la scheda grafica del dispositivo Schenker ci ha sorpreso con prestazioni eccellenti. Nella maggior parte dei benchmark, la 3060 di Schenker ha ottenuto punteggi elevati. Il punteggio molto alto nel benchmark 3DMark Cloud Gate indica un accesso rapido alla memoria grafica.
| 3DMark 11 Performance | 26508 punti | |
| 3DMark Ice Storm Standard Score | 147494 punti | |
| 3DMark Cloud Gate Standard Score | 57261 punti | |
| 3DMark Fire Strike Score | 19951 punti | |
| 3DMark Time Spy Score | 8675 punti | |
Aiuto | ||
* ... Meglio usare valori piccoli
Prestazioni di gioco
La Nvidia GeForce RTX 3060 dovrebbe essere sufficientemente potente per giocare alla maggior parte dei giochi attuali a 60 fps con le impostazioni più alte, utilizzando la risoluzione QHD del display. Tuttavia, questo display offre una frequenza di aggiornamento di 165 Hz. I risultati dei benchmark mostrano che è possibile ottenere 165 fps in Full HD con impostazioni di qualità media.
Rispetto ad altri portatili da gioco, XMG Focus 16 ha ottenuto risultati moderatamente buoni. Tuttavia, ilLenovo Legion 5 Proe ilDell G16sono leggermente più potenti.
Witcher 3 la frequenza dei fotogrammi ha mostrato il tipico comportamento giorno/notte del gioco. Durante il gioco, la frequenza dei fotogrammi cambia a seconda dell'aumento o della diminuzione della distanza di estrazione.
Witcher 3 fps-diagram
| basso | medio | alto | ultra | QHD | 4K | |
|---|---|---|---|---|---|---|
| GTA V (2015) | 183.8 | 179.1 | 167.9 | 94.7 | 80.9 | |
| The Witcher 3 (2015) | 80 | |||||
| Dota 2 Reborn (2015) | 165.8 | 151.7 | 143.4 | 135.7 | 103.4 | |
| Final Fantasy XV Benchmark (2018) | 111.4 | 84.5 | 64.3 | 37.8 | ||
| X-Plane 11.11 (2018) | 137.6 | 123.9 | 99.5 | 89 | ||
| Strange Brigade (2018) | 340 | 210 | 171.2 | 150.1 | ||
| F1 22 (2022) | 168 | 166.1 | 141.8 | 53.5 | 34.8 |
Emissioni - le ventole possono essere regolate grazie al Control Center
Emissioni acustiche
In un confronto diretto, 54 dB(A) sotto carico non sono esattamente silenziosi. Se il portatile deve essere silenzioso come un mouse, Control Center 3.0 offre una modalità silenziosa.
Rumorosità
| Idle |
| 23 / 23 / 32.07 dB(A) |
| Sotto carico |
| 53.7 / 54.58 dB(A) |
 | ||
30 dB silenzioso 40 dB(A) udibile 50 dB(A) rumoroso |
||
min: | ||
| Schenker XMG Focus 16 (i7-12700H, RTX 3060) GeForce RTX 3060 Laptop GPU, i7-12700H, Samsung SSD 980 Pro 1TB MZ-V8P1T0BW | Asus ZenBook Pro 16X OLED UX7602ZM-ME115W GeForce RTX 3060 Laptop GPU, i9-12900H, Samsung PM9A1 MZVL21T0HCLR | Dell G16 7620 GeForce RTX 3060 Laptop GPU, i7-12700H, WDC PC SN810 512GB | Asus ROG Flow X16 GV601RW-M5082W GeForce RTX 3070 Ti Laptop GPU, R9 6900HS, Micron 3400 1TB MTFDKBA1T0TFH | Lenovo ThinkPad X1 Extreme G5-21DE003RGE GeForce RTX 3060 Laptop GPU, i7-12700H, Micron 3400 1TB MTFDKBA1T0TFH | Lenovo Legion Slim 7-16IAH 82TF004YGE GeForce RTX 3060 Laptop GPU, i7-12700H, SK Hynix HFS001TEJ9X115N | Lenovo Legion 5 Pro 16IAH7H GeForce RTX 3060 Laptop GPU, i7-12700H, 2x Samsung PM9A1 MZVL21T0HCLR (RAID 0) | |
|---|---|---|---|---|---|---|---|
| Noise | -2% | 4% | -2% | 11% | 8% | -9% | |
| off /ambiente * (dB) | 23 | 26 -13% | 23.2 -1% | 25.5 -11% | 23.2 -1% | 23 -0% | 24.6 -7% |
| Idle Minimum * (dB) | 23 | 26 -13% | 28.3 -23% | 25.5 -11% | 23.2 -1% | 23 -0% | 28.7 -25% |
| Idle Average * (dB) | 23 | 26 -13% | 28.8 -25% | 25.5 -11% | 23.2 -1% | 23 -0% | 32 -39% |
| Idle Maximum * (dB) | 32.07 | 26 19% | 28.9 10% | 27.4 15% | 23.2 28% | 23 28% | 32 -0% |
| Load Average * (dB) | 53.7 | 48 11% | 32.4 40% | 49.9 7% | 45.5 15% | 43.7 19% | 45.2 16% |
| Witcher 3 ultra * (dB) | 54.58 | 48.3 12% | 45.5 17% | 51.7 5% | |||
| Load Maximum * (dB) | 54.58 | 54.6 -0% | 48.1 12% | 55 -1% | 45.5 17% | 52 5% | 54.4 -0% |
* ... Meglio usare valori piccoli
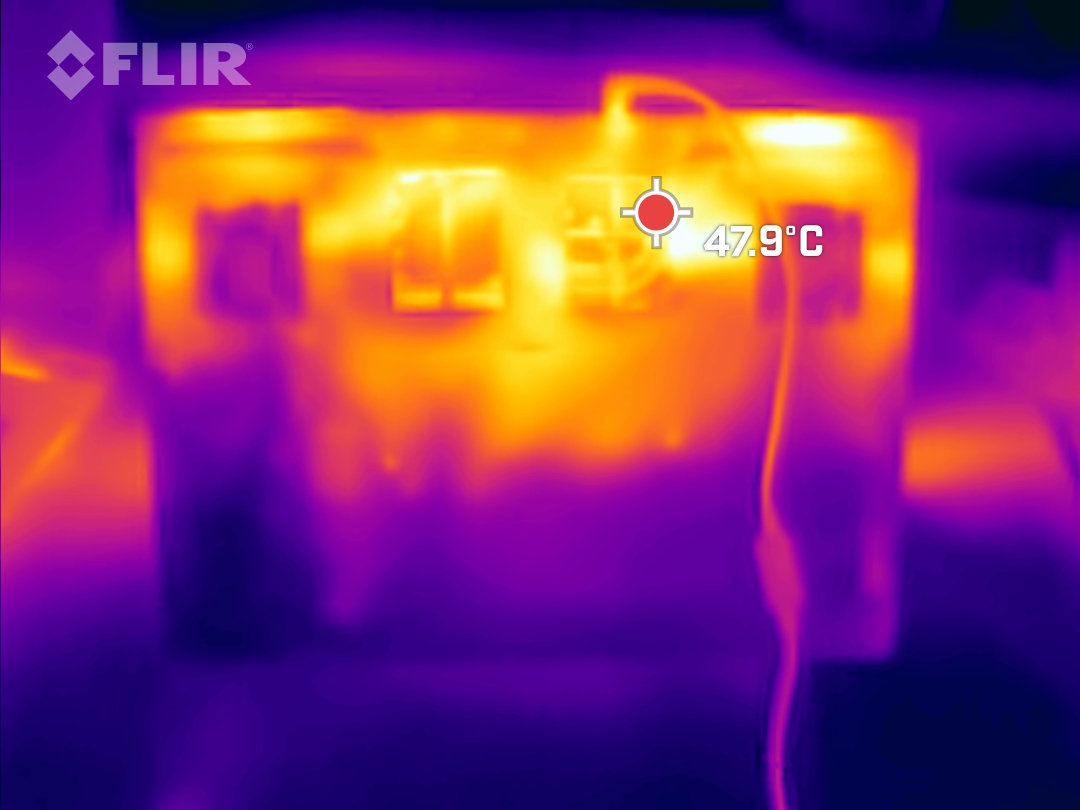
Temperatura
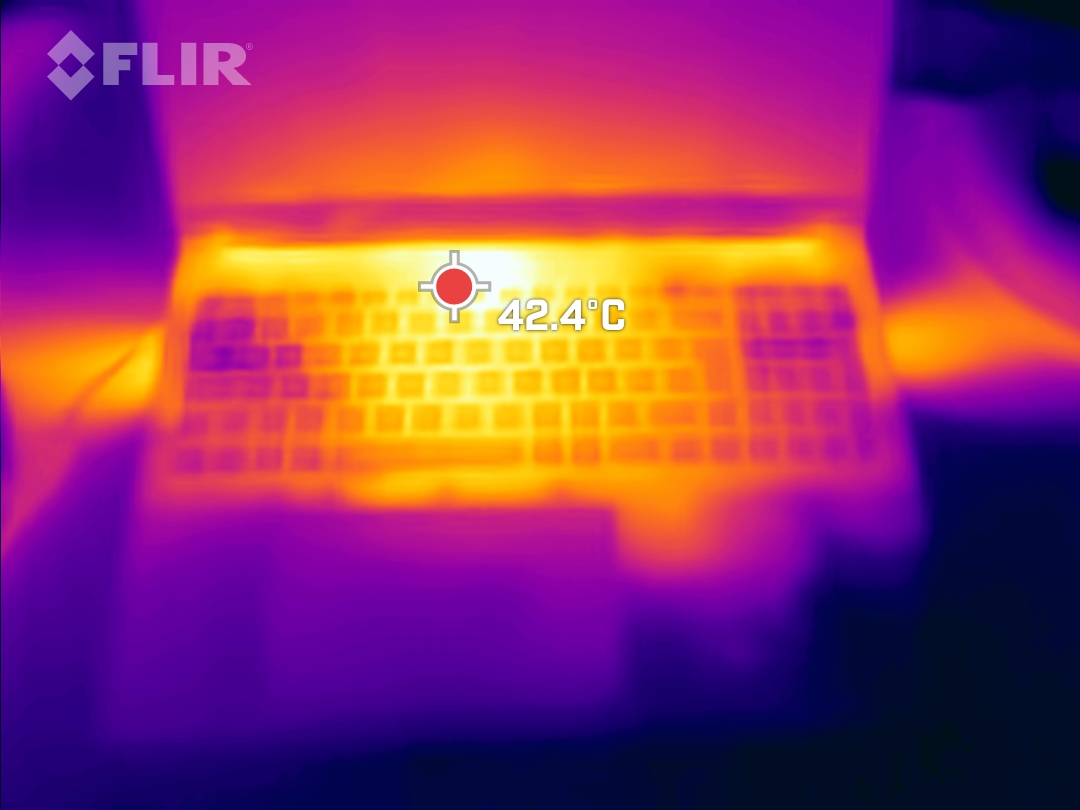
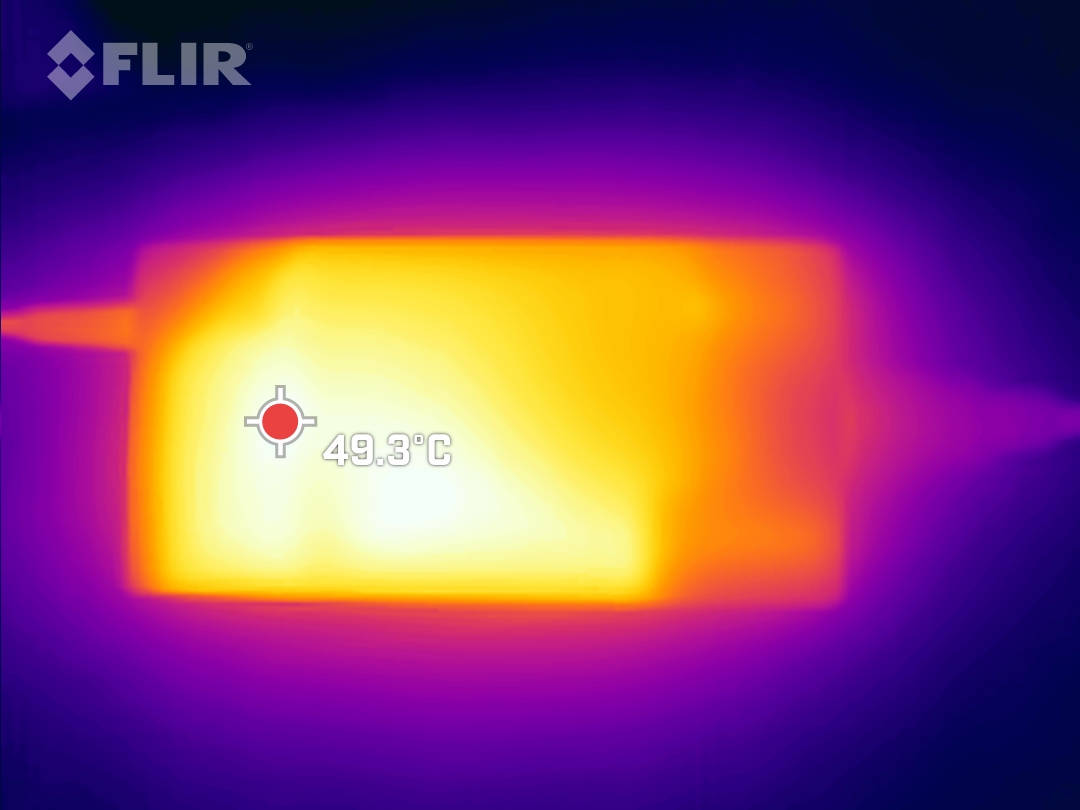
In definitiva, il livello di prestazioni elevate dei portatili da gioco va sempre di pari passo con il calore. Anche il Focus 16 si scalda relativamente, ma senza bruciare le dita sulla tastiera. Oltre al portatile stesso, anche l'alimentatore si scalda durante il funzionamento. A volte può raggiungere temperature superiori a 50 °C.
(-) La temperatura massima sul lato superiore è di 50 °C / 122 F, rispetto alla media di 40.4 °C / 105 F, che varia da 21.2 a 68.8 °C per questa classe Gaming.
(-) Il lato inferiore si riscalda fino ad un massimo di 48 °C / 118 F, rispetto alla media di 43.2 °C / 110 F
(+) In idle, la temperatura media del lato superiore è di 25.3 °C / 78 F, rispetto alla media deld ispositivo di 33.9 °C / 93 F.
(±) Riproducendo The Witcher 3, la temperatura media per il lato superiore e' di 37.1 °C / 99 F, rispetto alla media del dispositivo di 33.9 °C / 93 F.
(+) I poggiapolsi e il touchpad sono piu' freddi della temperatura della pelle con un massimo di 30 °C / 86 F e sono quindi freddi al tatto.
(±) La temperatura media della zona del palmo della mano di dispositivi simili e'stata di 28.8 °C / 83.8 F (-1.2 °C / -2.2 F).
| Schenker XMG Focus 16 (i7-12700H, RTX 3060) Intel Core i7-12700H, NVIDIA GeForce RTX 3060 Laptop GPU | Asus ZenBook Pro 16X OLED UX7602ZM-ME115W Intel Core i9-12900H, NVIDIA GeForce RTX 3060 Laptop GPU | Dell G16 7620 Intel Core i7-12700H, NVIDIA GeForce RTX 3060 Laptop GPU | Asus ROG Flow X16 GV601RW-M5082W AMD Ryzen 9 6900HS, NVIDIA GeForce RTX 3070 Ti Laptop GPU | Lenovo ThinkPad X1 Extreme G5-21DE003RGE Intel Core i7-12700H, NVIDIA GeForce RTX 3060 Laptop GPU | Lenovo Legion Slim 7-16IAH 82TF004YGE Intel Core i7-12700H, NVIDIA GeForce RTX 3060 Laptop GPU | Lenovo Legion 5 Pro 16IAH7H Intel Core i7-12700H, NVIDIA GeForce RTX 3060 Laptop GPU | |
|---|---|---|---|---|---|---|---|
| Heat | 5% | 8% | -14% | -0% | -15% | -9% | |
| Maximum Upper Side * (°C) | 50 | 32 36% | 47.6 5% | 55.1 -10% | 52 -4% | 48.3 3% | 45.8 8% |
| Maximum Bottom * (°C) | 48 | 41.6 13% | 54 -13% | 50.3 -5% | 56.4 -18% | 55.3 -15% | 66.3 -38% |
| Idle Upper Side * (°C) | 28 | 32.6 -16% | 23 18% | 35.5 -27% | 26.4 6% | 35.7 -28% | 30.4 -9% |
| Idle Bottom * (°C) | 32 | 36 -13% | 24.6 23% | 36.1 -13% | 27.2 15% | 37.6 -18% | 30.4 5% |
* ... Meglio usare valori piccoli
Test da sforzo
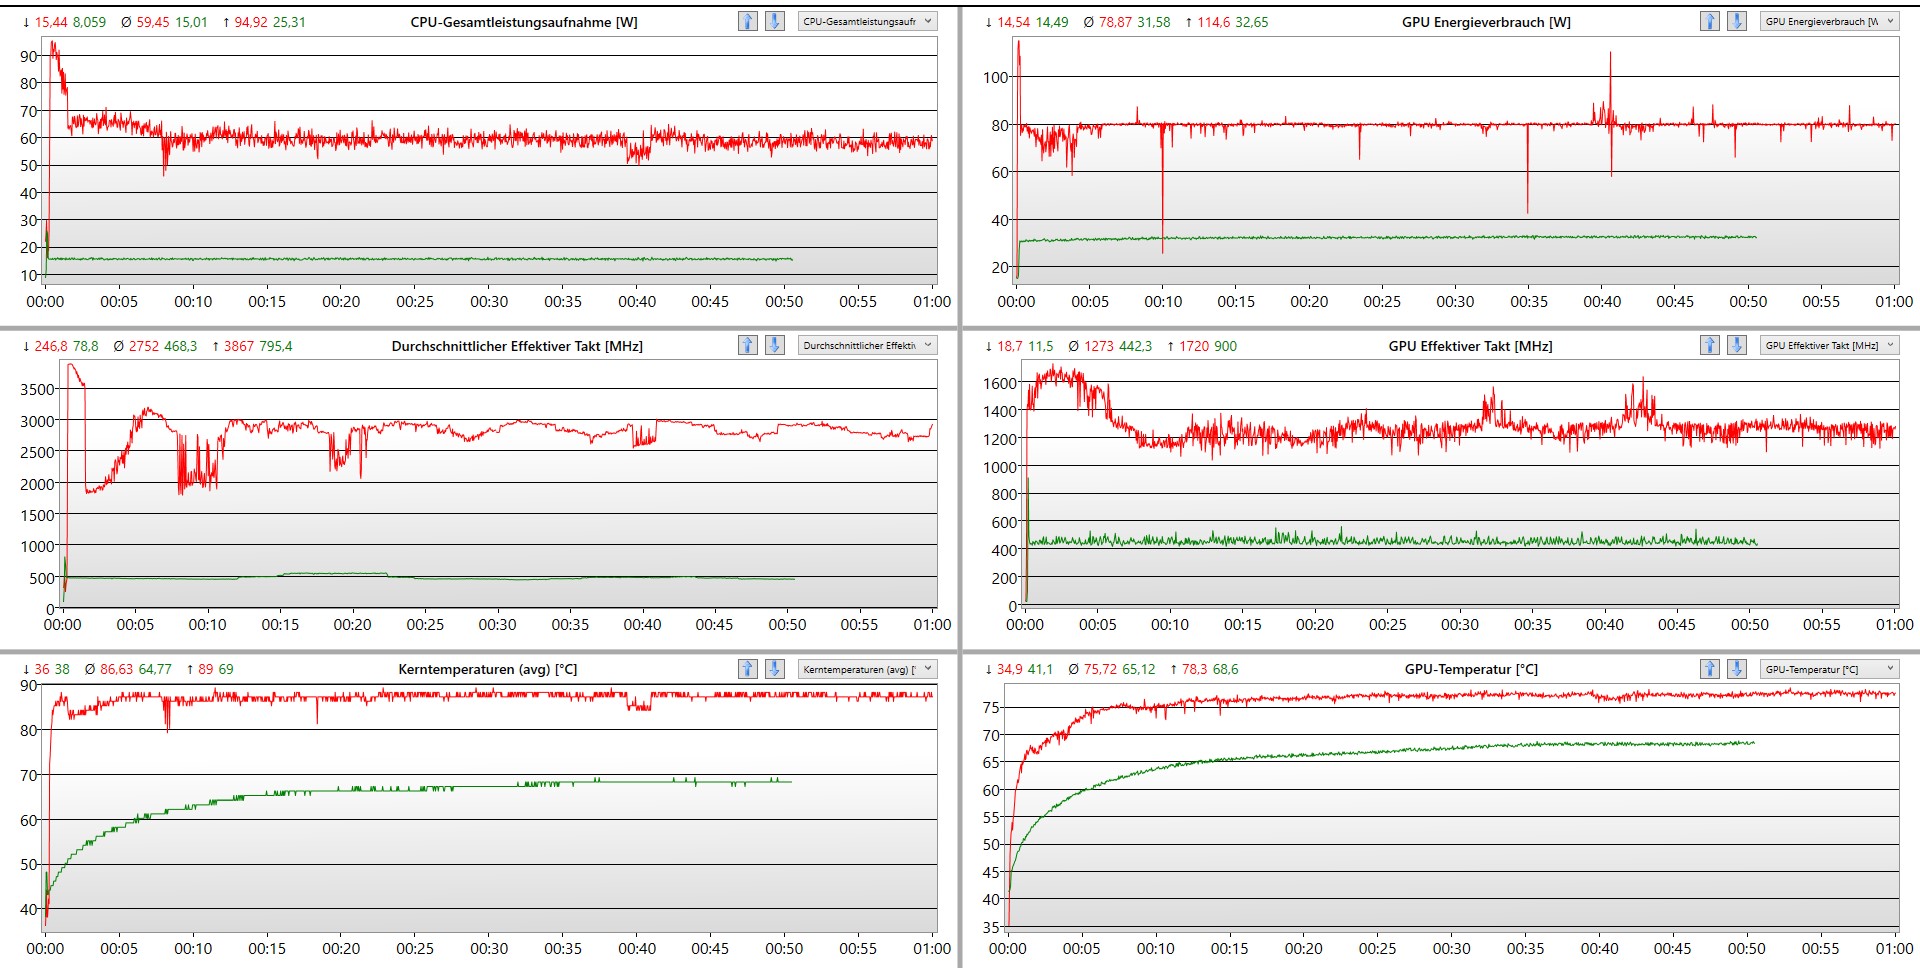
Durante lo stress test, le velocità della CPU e della GPU dello Schenker XMG Focus 16 si riducono non appena le temperature raggiungono rispettivamente gli 80° e i 90°.
Altoparlanti
Lo Schenker XMG Focus 16 è dotato di due piccoli altoparlanti con poca gamma dinamica. Il volume si alza solo sui medi e riesce a malapena a soffocare le ventole del portatile. Gli altoparlanti esterni collegati tramite il jack audio da 3,5 mm o il Bluetooth sono quasi d'obbligo. Il portatile Schenker è dotato dell'applicazione Sound Blaster Cinema 6+. Questo garantisce un'eccellente qualità del suono in cuffia.
Schenker XMG Focus 16 (i7-12700H, RTX 3060) analisi audio
(±) | potenza degli altiparlanti media ma buona (79.2 dB)
Bassi 100 - 315 Hz
(-) | quasi nessun basso - in media 24.4% inferiori alla media
(±) | la linearità dei bassi è media (8.1% delta rispetto alla precedente frequenza)
Medi 400 - 2000 Hz
(±) | medi elevati - circa 10.6% superiore alla media
(±) | linearità dei medi adeguata (13.1% delta rispetto alla precedente frequenza)
Alti 2 - 16 kHz
(+) | Alti bilanciati - appena 4.7% dalla media
(±) | la linearità degli alti è media (10.4% delta rispetto alla precedente frequenza)
Nel complesso 100 - 16.000 Hz
(-) | suono nel complesso non lineare (30.1% di differenza rispetto alla media
Rispetto alla stessa classe
» 96% di tutti i dispositivi testati in questa classe è stato migliore, 2% simile, 3% peggiore
» Il migliore ha avuto un delta di 6%, medio di 18%, peggiore di 132%
Rispetto a tutti i dispositivi testati
» 88% di tutti i dispositivi testati in questa classe è stato migliore, 3% similare, 9% peggiore
» Il migliore ha avuto un delta di 4%, medio di 23%, peggiore di 134%
Asus ROG Flow X16 GV601RW-M5082W analisi audio
(±) | potenza degli altiparlanti media ma buona (80.7 dB)
Bassi 100 - 315 Hz
(±) | bassi ridotti - in media 12.7% inferiori alla media
(±) | la linearità dei bassi è media (13.8% delta rispetto alla precedente frequenza)
Medi 400 - 2000 Hz
(+) | medi bilanciati - solo only 1.3% rispetto alla media
(+) | medi lineari (4.7% delta rispetto alla precedente frequenza)
Alti 2 - 16 kHz
(±) | alti elevati - circa 6.4% superiori alla media
(+) | alti lineari (6.8% delta rispetto alla precedente frequenza)
Nel complesso 100 - 16.000 Hz
(+) | suono nel complesso lineare (12.9% differenza dalla media)
Rispetto alla stessa classe
» 17% di tutti i dispositivi testati in questa classe è stato migliore, 4% simile, 79% peggiore
» Il migliore ha avuto un delta di 6%, medio di 18%, peggiore di 132%
Rispetto a tutti i dispositivi testati
» 12% di tutti i dispositivi testati in questa classe è stato migliore, 3% similare, 85% peggiore
» Il migliore ha avuto un delta di 4%, medio di 23%, peggiore di 134%
Gestione dell'alimentazione - Consumo tipico di un portatile da gioco
Consumo di energia
Il portatile è dotato di un alimentatore da 180 watt di Lite-ON (PA-1181-76). Durante lo stress test, abbiamo misurato un consumo energetico a lungo termine di 190 watt. Nel complesso, l'alimentatore appare debole se si considera la configurazione del portatile. I dispositivi di confronto di Dell e Lenovo, con una configurazione simile a quella dello Schenker Laptop, sono dotati di un alimentatore da almeno 230 watt. E questi portatili ne approfittano.
Quando è al minimo, il portatile consuma 3 watt in più rispetto ai dispositivi di confronto e quindi si pone a pari merito con gli altri portatili da gioco per quanto riguarda i requisiti energetici. In definitiva, lo Schenker XMG Focus 16 non è un vero e proprio prodigio del risparmio energetico, nonostante il piccolo alimentatore.
| Off / Standby | |
| Idle | |
| Sotto carico |
|
Leggenda:
min: | |
| Schenker XMG Focus 16 (i7-12700H, RTX 3060) i7-12700H, GeForce RTX 3060 Laptop GPU, Samsung SSD 980 Pro 1TB MZ-V8P1T0BW, IPS, 2560x1600, 16" | Asus ZenBook Pro 16X OLED UX7602ZM-ME115W i9-12900H, GeForce RTX 3060 Laptop GPU, Samsung PM9A1 MZVL21T0HCLR, OLED, 3840x2400, 16" | Dell G16 7620 i7-12700H, GeForce RTX 3060 Laptop GPU, WDC PC SN810 512GB, IPS, 2560x1600, 16" | Asus ROG Flow X16 GV601RW-M5082W R9 6900HS, GeForce RTX 3070 Ti Laptop GPU, Micron 3400 1TB MTFDKBA1T0TFH, Mini LED, 2560x1600, 16.1" | Lenovo ThinkPad X1 Extreme G5-21DE003RGE i7-12700H, GeForce RTX 3060 Laptop GPU, Micron 3400 1TB MTFDKBA1T0TFH, IPS, 3840x2400, 16" | Lenovo Legion Slim 7-16IAH 82TF004YGE i7-12700H, GeForce RTX 3060 Laptop GPU, SK Hynix HFS001TEJ9X115N, IPS LED, 2560x1600, 16" | Lenovo Legion 5 Pro 16IAH7H i7-12700H, GeForce RTX 3060 Laptop GPU, 2x Samsung PM9A1 MZVL21T0HCLR (RAID 0), IPS, 2560x1600, 16" | Media NVIDIA GeForce RTX 3060 Laptop GPU | Media della classe Gaming | |
|---|---|---|---|---|---|---|---|---|---|
| Power Consumption | 20% | -5% | -21% | 1% | 7% | -44% | 14% | -1% | |
| Idle Minimum * (Watt) | 14.7 | 11.1 24% | 14.4 2% | 12.2 17% | 11.8 20% | 13.3 10% | 22.8 -55% | 10.4 ? 29% | 13 ? 12% |
| Idle Average * (Watt) | 18.6 | 11.4 39% | 17.8 4% | 25.5 -37% | 22.4 -20% | 17.5 6% | 26.5 -42% | 14.5 ? 22% | 18.7 ? -1% |
| Idle Maximum * (Watt) | 21.2 | 14.4 32% | 31.5 -49% | 29.8 -41% | 23.1 -9% | 18.4 13% | 41 -93% | 21.4 ? -1% | 24.3 ? -15% |
| Load Average * (Watt) | 121 | 137.4 -14% | 101.2 16% | 183 -51% | 138 -14% | 122.8 -1% | 191 -58% | 109.3 ? 10% | 110.2 ? 9% |
| Witcher 3 ultra * (Watt) | 174 | 136 22% | 176.9 -2% | 183.6 -6% | 129.9 25% | 154.7 11% | 194.7 -12% | ||
| Load Maximum * (Watt) | 235 | 197 16% | 242.9 -3% | 253 -8% | 225.6 4% | 232.6 1% | 238 -1% | 206 ? 12% | 258 ? -10% |
* ... Meglio usare valori piccoli
Power consumption Witcher 3 / stress test
Power consumption with an external monitor
Durata della batteria
Il Focus 16 è dotato di una piccola batteria da 54 Wh. Per questo motivo, non deve sorprendere che la durata della batteria sia meno della metà rispetto ai dispositivi di confronto. Tuttavia, la modalità di risparmio energetico del Control Center è molto efficace. Il test di navigazione internet WiFi con luminosità a schermo intero è stato condotto utilizzando l'impostazione della modalità di intrattenimento, mentre il test da 150 cd/m² è stato effettuato utilizzando l'impostazione di risparmio energetico e una frequenza di aggiornamento di 60 Hz. Impostando questa modalità, la batteria dura molto di più.
| Schenker XMG Focus 16 (i7-12700H, RTX 3060) i7-12700H, GeForce RTX 3060 Laptop GPU, 54 Wh | Asus ZenBook Pro 16X OLED UX7602ZM-ME115W i9-12900H, GeForce RTX 3060 Laptop GPU, 96 Wh | Dell G16 7620 i7-12700H, GeForce RTX 3060 Laptop GPU, 84 Wh | Asus ROG Flow X16 GV601RW-M5082W R9 6900HS, GeForce RTX 3070 Ti Laptop GPU, 90 Wh | Lenovo ThinkPad X1 Extreme G5-21DE003RGE i7-12700H, GeForce RTX 3060 Laptop GPU, 90 Wh | Lenovo Legion Slim 7-16IAH 82TF004YGE i7-12700H, GeForce RTX 3060 Laptop GPU, 99.99 Wh | Lenovo Legion 5 Pro 16IAH7H i7-12700H, GeForce RTX 3060 Laptop GPU, 80 Wh | Media della classe Gaming | |
|---|---|---|---|---|---|---|---|---|
| Autonomia della batteria | 86% | -23% | -9% | 31% | 1% | -41% | 28% | |
| WiFi v1.3 (h) | 4.8 | 8.9 85% | 5 4% | 5.7 19% | 6.7 40% | 5.2 8% | 3.6 -25% | 7.11 ? 48% |
| Load (h) | 1.4 | 2.6 86% | 0.7 -50% | 0.9 -36% | 1.7 21% | 1.3 -7% | 0.6 -57% | 1.502 ? 7% |
| Reader / Idle (h) | 12.7 | 7.1 | 8.16 ? | |||||
| Witcher 3 ultra (h) | 0.9 | 1.5 | 2.1 | |||||
| H.264 (h) | 7.3 | 9.5 | 4.1 | 8.32 ? |
Pro
Contro
Verdetto - un portatile da gioco nella media con un servizio superiore alla media
Lo Schenker XMG Focus 16 ha fornito un numero di fps costantemente elevato nei giochi testati. Nel complesso, il portatile da gioco Nvidia RTX 3060 offre prestazioni superiori alla media. Tuttavia, la concorrenza sotto forma di Dell G16 o Lenovo Legion 5 Pro offre una potenza maggiore a un prezzo quasi identico. Nonostante ciò, il guadagno in termini di prestazioni è piuttosto marginale.
Tuttavia, il portatile Schenker vanta maggiori doti di morbidezza rispetto alla concorrenza di Dell e Lenovo. La tastiera del portatile Schenker convince per l'elevata corsa dei tasti e il buon feedback aptico. L'XMG Focus 16 gode anche di una buona selezione di porte ben posizionate. Anche l'assistenza clienti di Schenker è notevole. Come già accaduto in passato, le richieste di informazioni sono state risposte in modo rapido e competente, spesso nel giro di poche ore. Questo ha permesso a Schenker di raggiungere il primo posto per la terza volta consecutiva nel nostro sondaggio sull'assistenza clienti di laptop e smartphone sondaggio sul servizio e l'assistenza ai clienti di computer portatili e smartphone. Il design dell'XMG Focus 16 è una questione di gusti. Per essere un portatile da gioco, il dispositivo è poco appariscente, nero e squadrato.
L'XMG Focus 16 assorbe molta potenza dall'hardware senza raggiungere i limiti del suo potenziale.
Nel complesso, il portatile Schenker è solido, ma non è in grado di raggiungere prestazioni di alto livello. In nessuna area dei nostri benchmark e delle nostre analisi il portatile da gioco è riuscito a dominare la concorrenza. Le migliori prestazioni della scheda grafica si trovano nel Asus ROG Flow X16, mentre il Lenovo Legion 5 Pro ha ottenuto le migliori prestazioni della CPU. Inoltre, Asus Zenbook Pro 16X OLED ha lo schermo più reattivo. In ognuna di queste aree, il portatile Schenker offre prestazioni adeguate o superiori alla media.
Prezzo e disponibilità
Bestware.com è il negozio online di Schenker dove è possibile configurare e ordinare il portatile da gioco. Al momento della recensione, le specifiche del nostro test XMG Focus 16può essere acquistato per circa 1800 dollari USA. Con soli 8 GB di RAM e senza un'unità SSD NVMe, il prezzo base del portatile si aggira intorno ai 1600 dollari.
Schenker XMG Focus 16 (i7-12700H, RTX 3060)
- 12/21/2022 v7 (old)
Marc Herter
Price comparison

