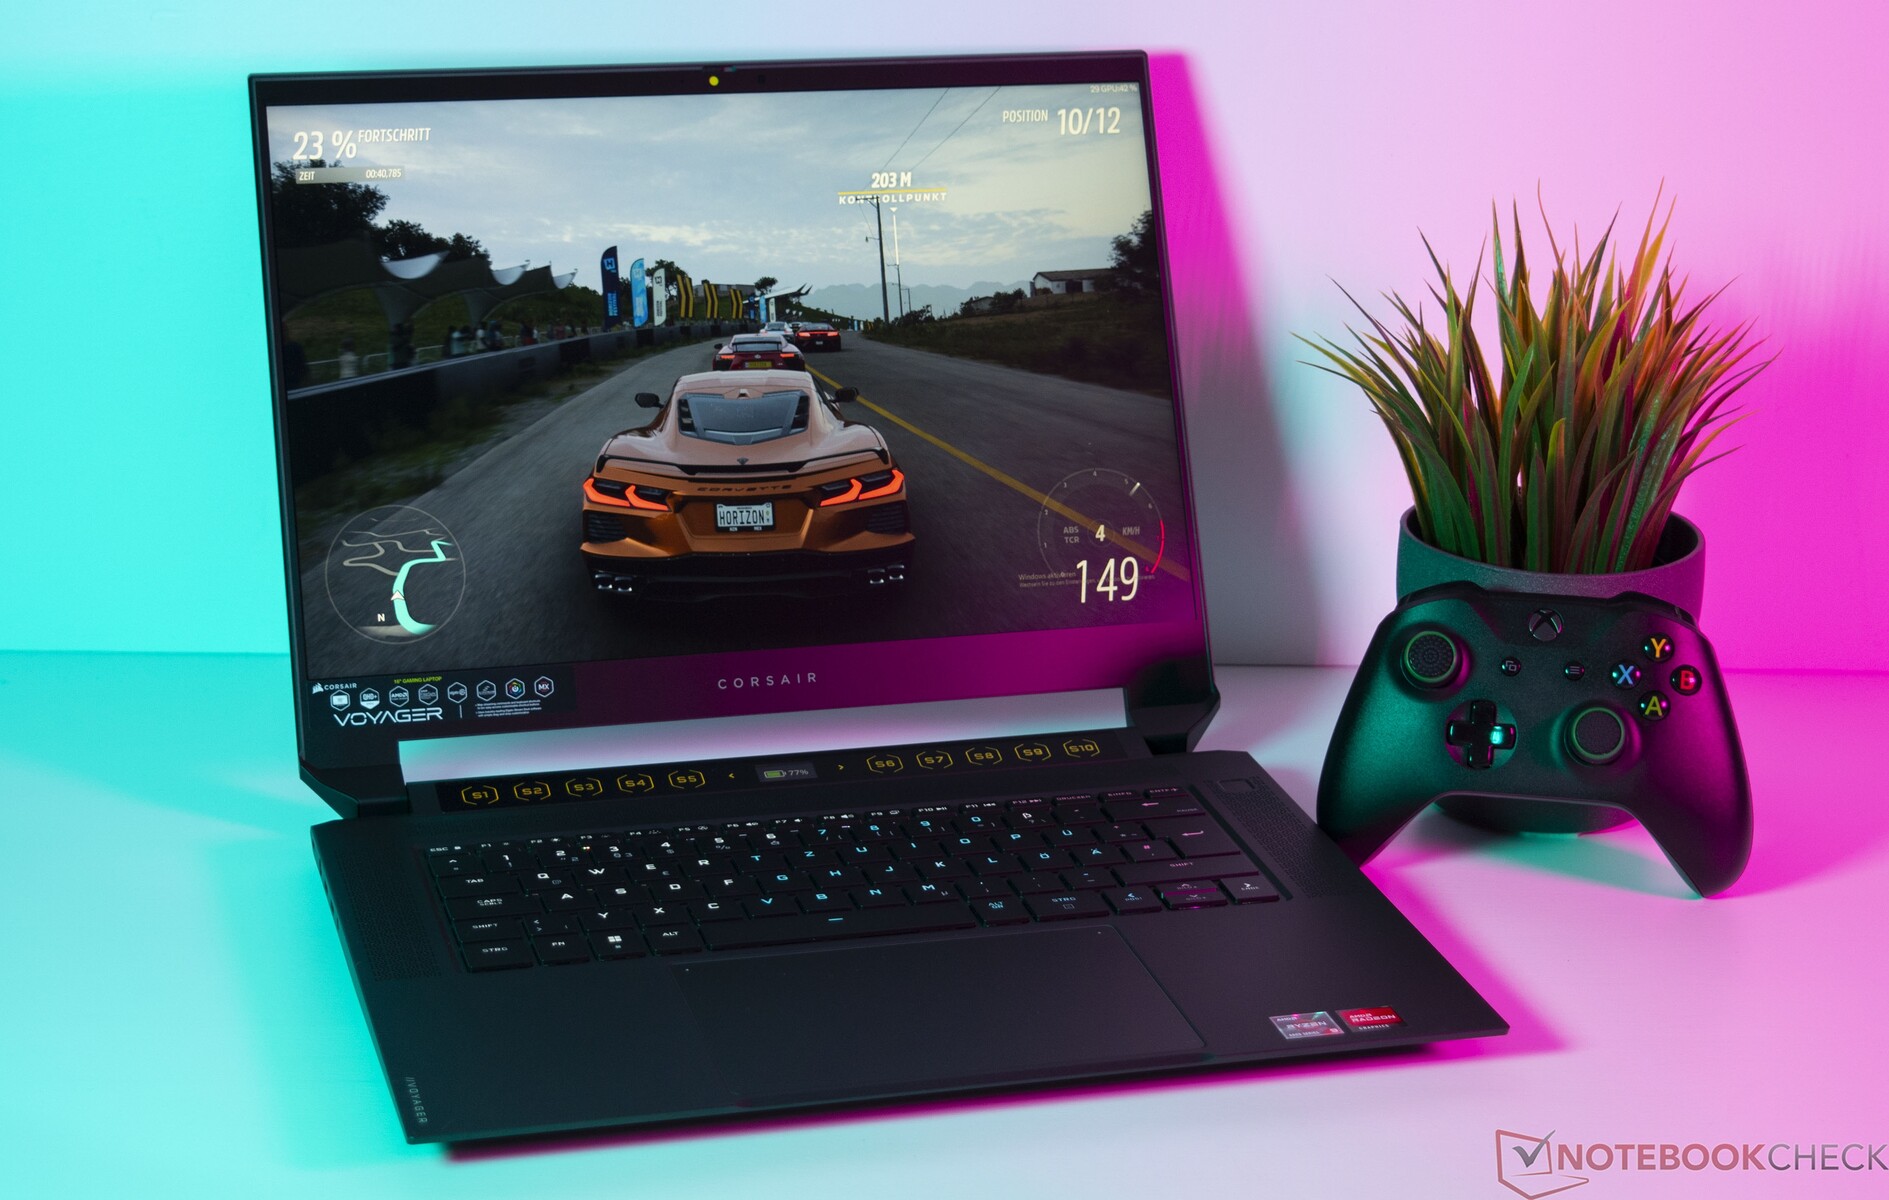
Recensione del laptop Corsair Voyager a1600: Tutta la potenza di AMD per giocatori, streamer e creativi

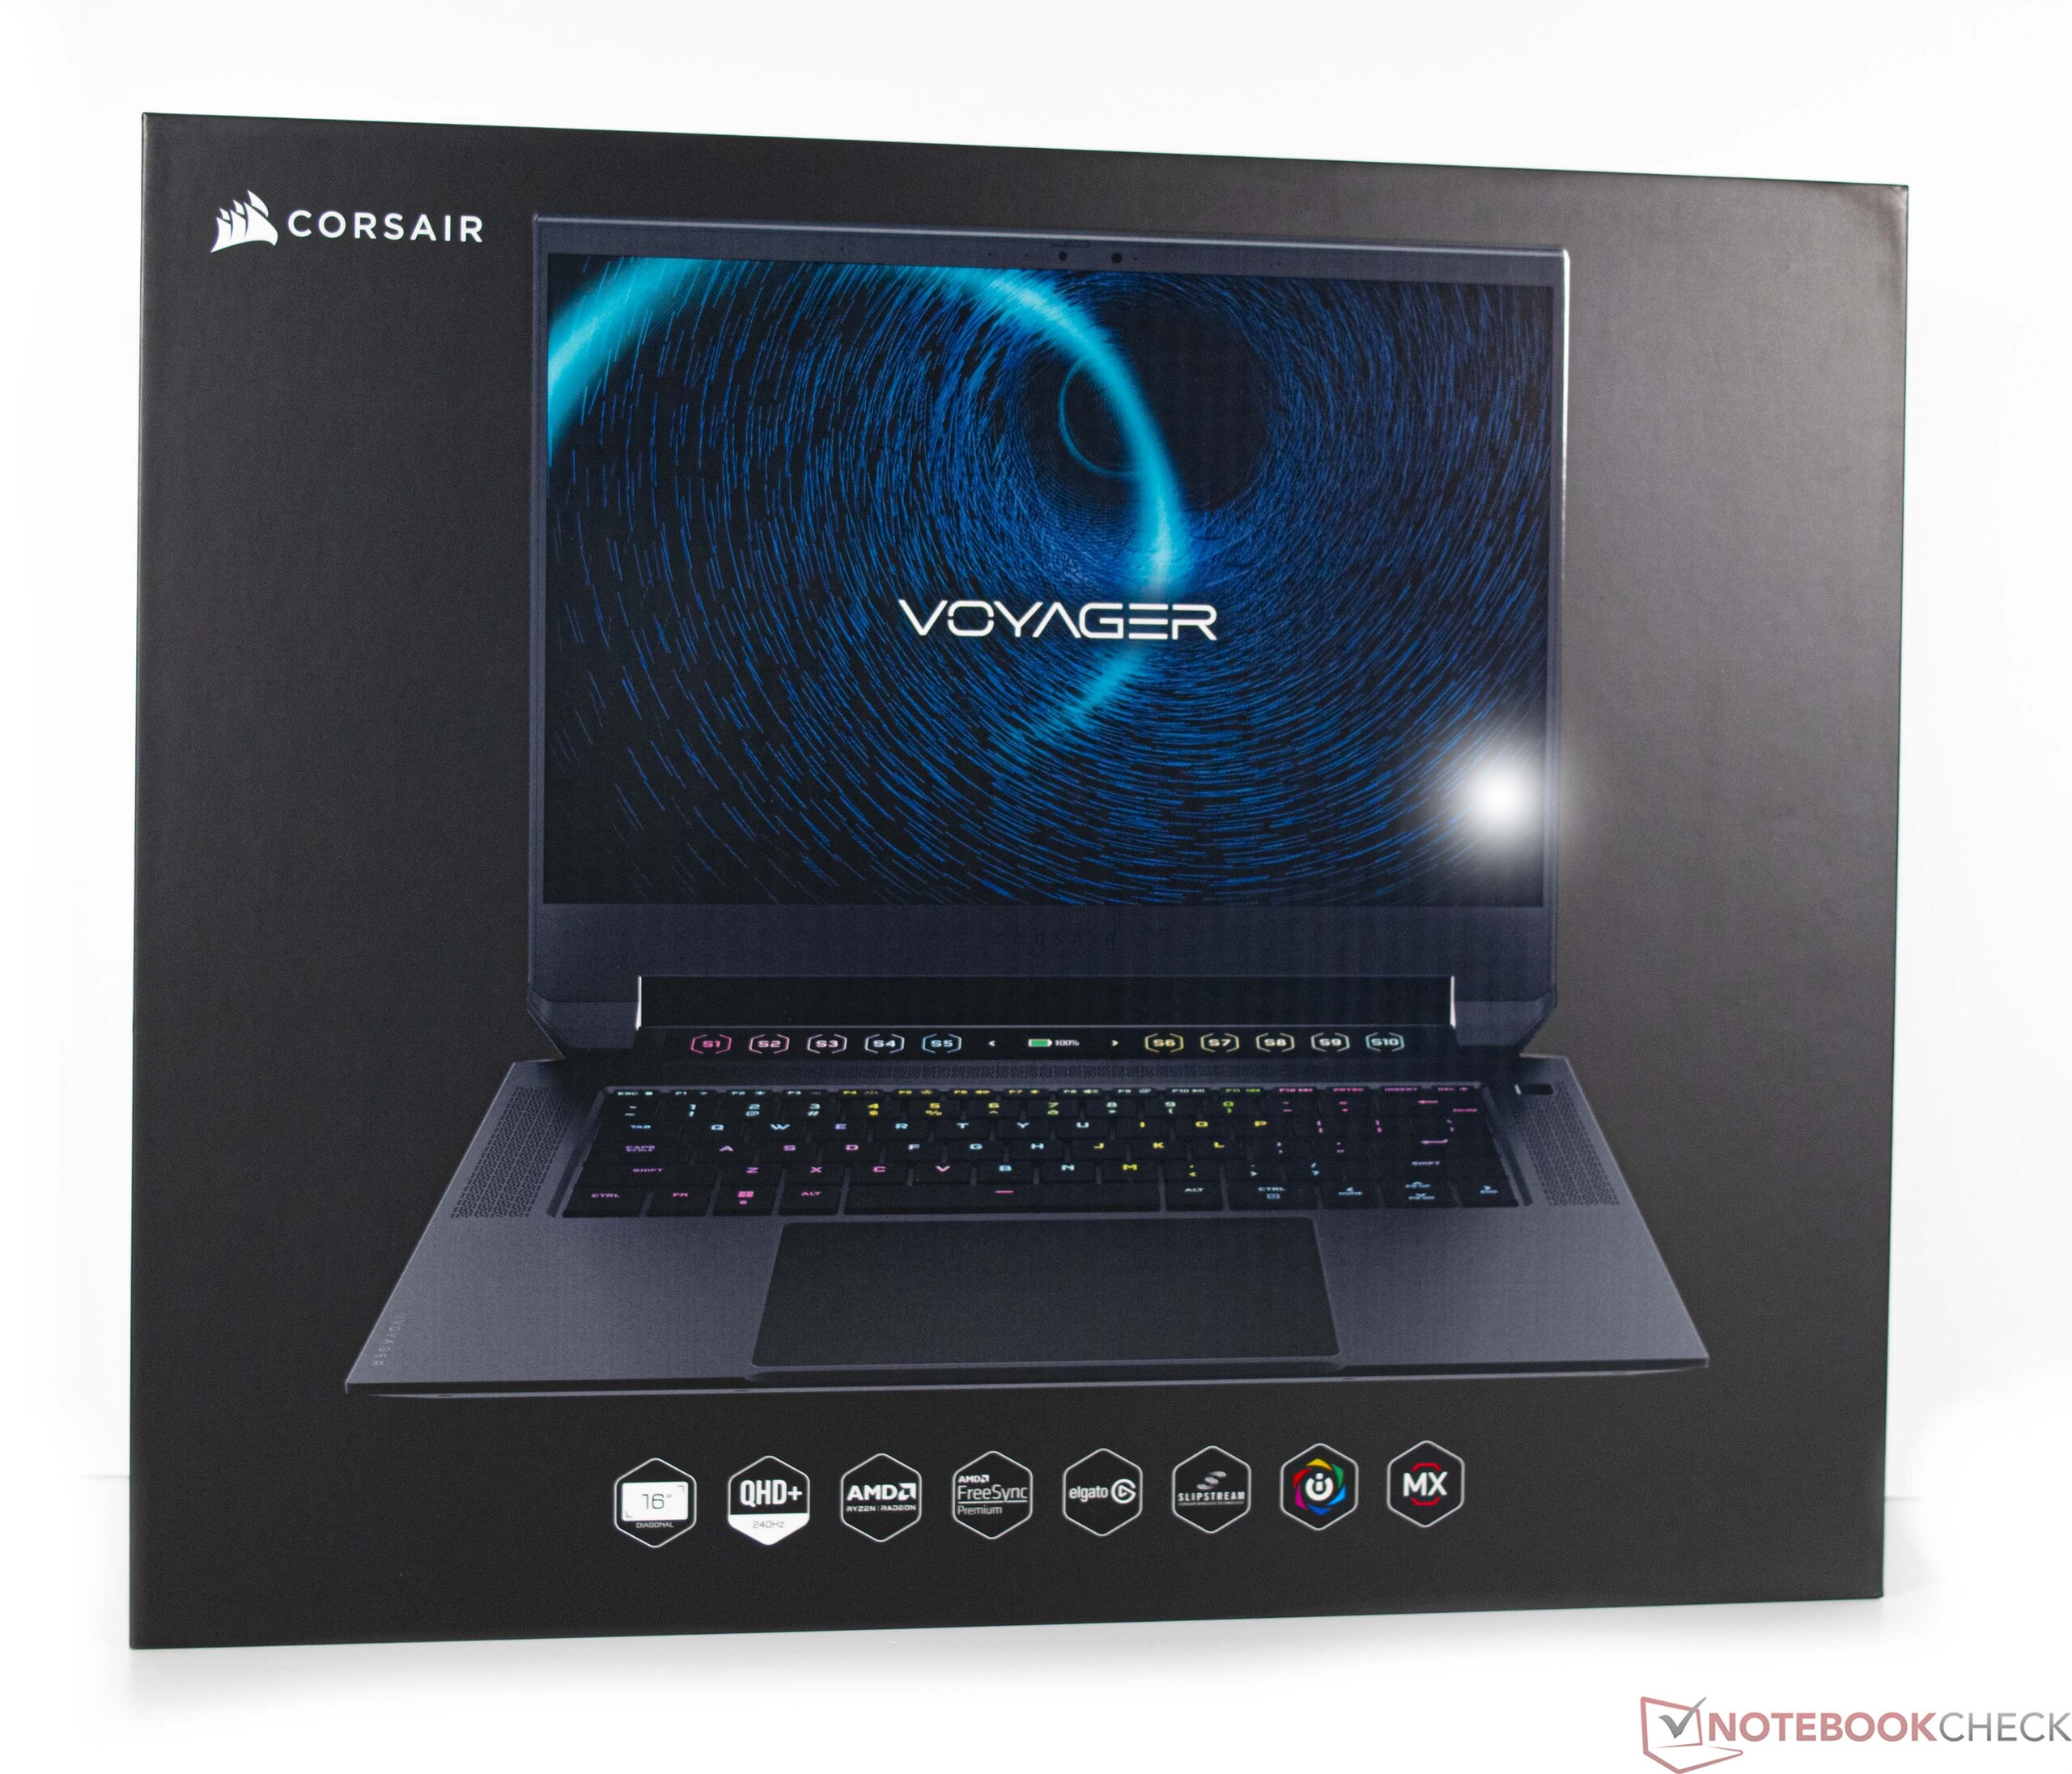
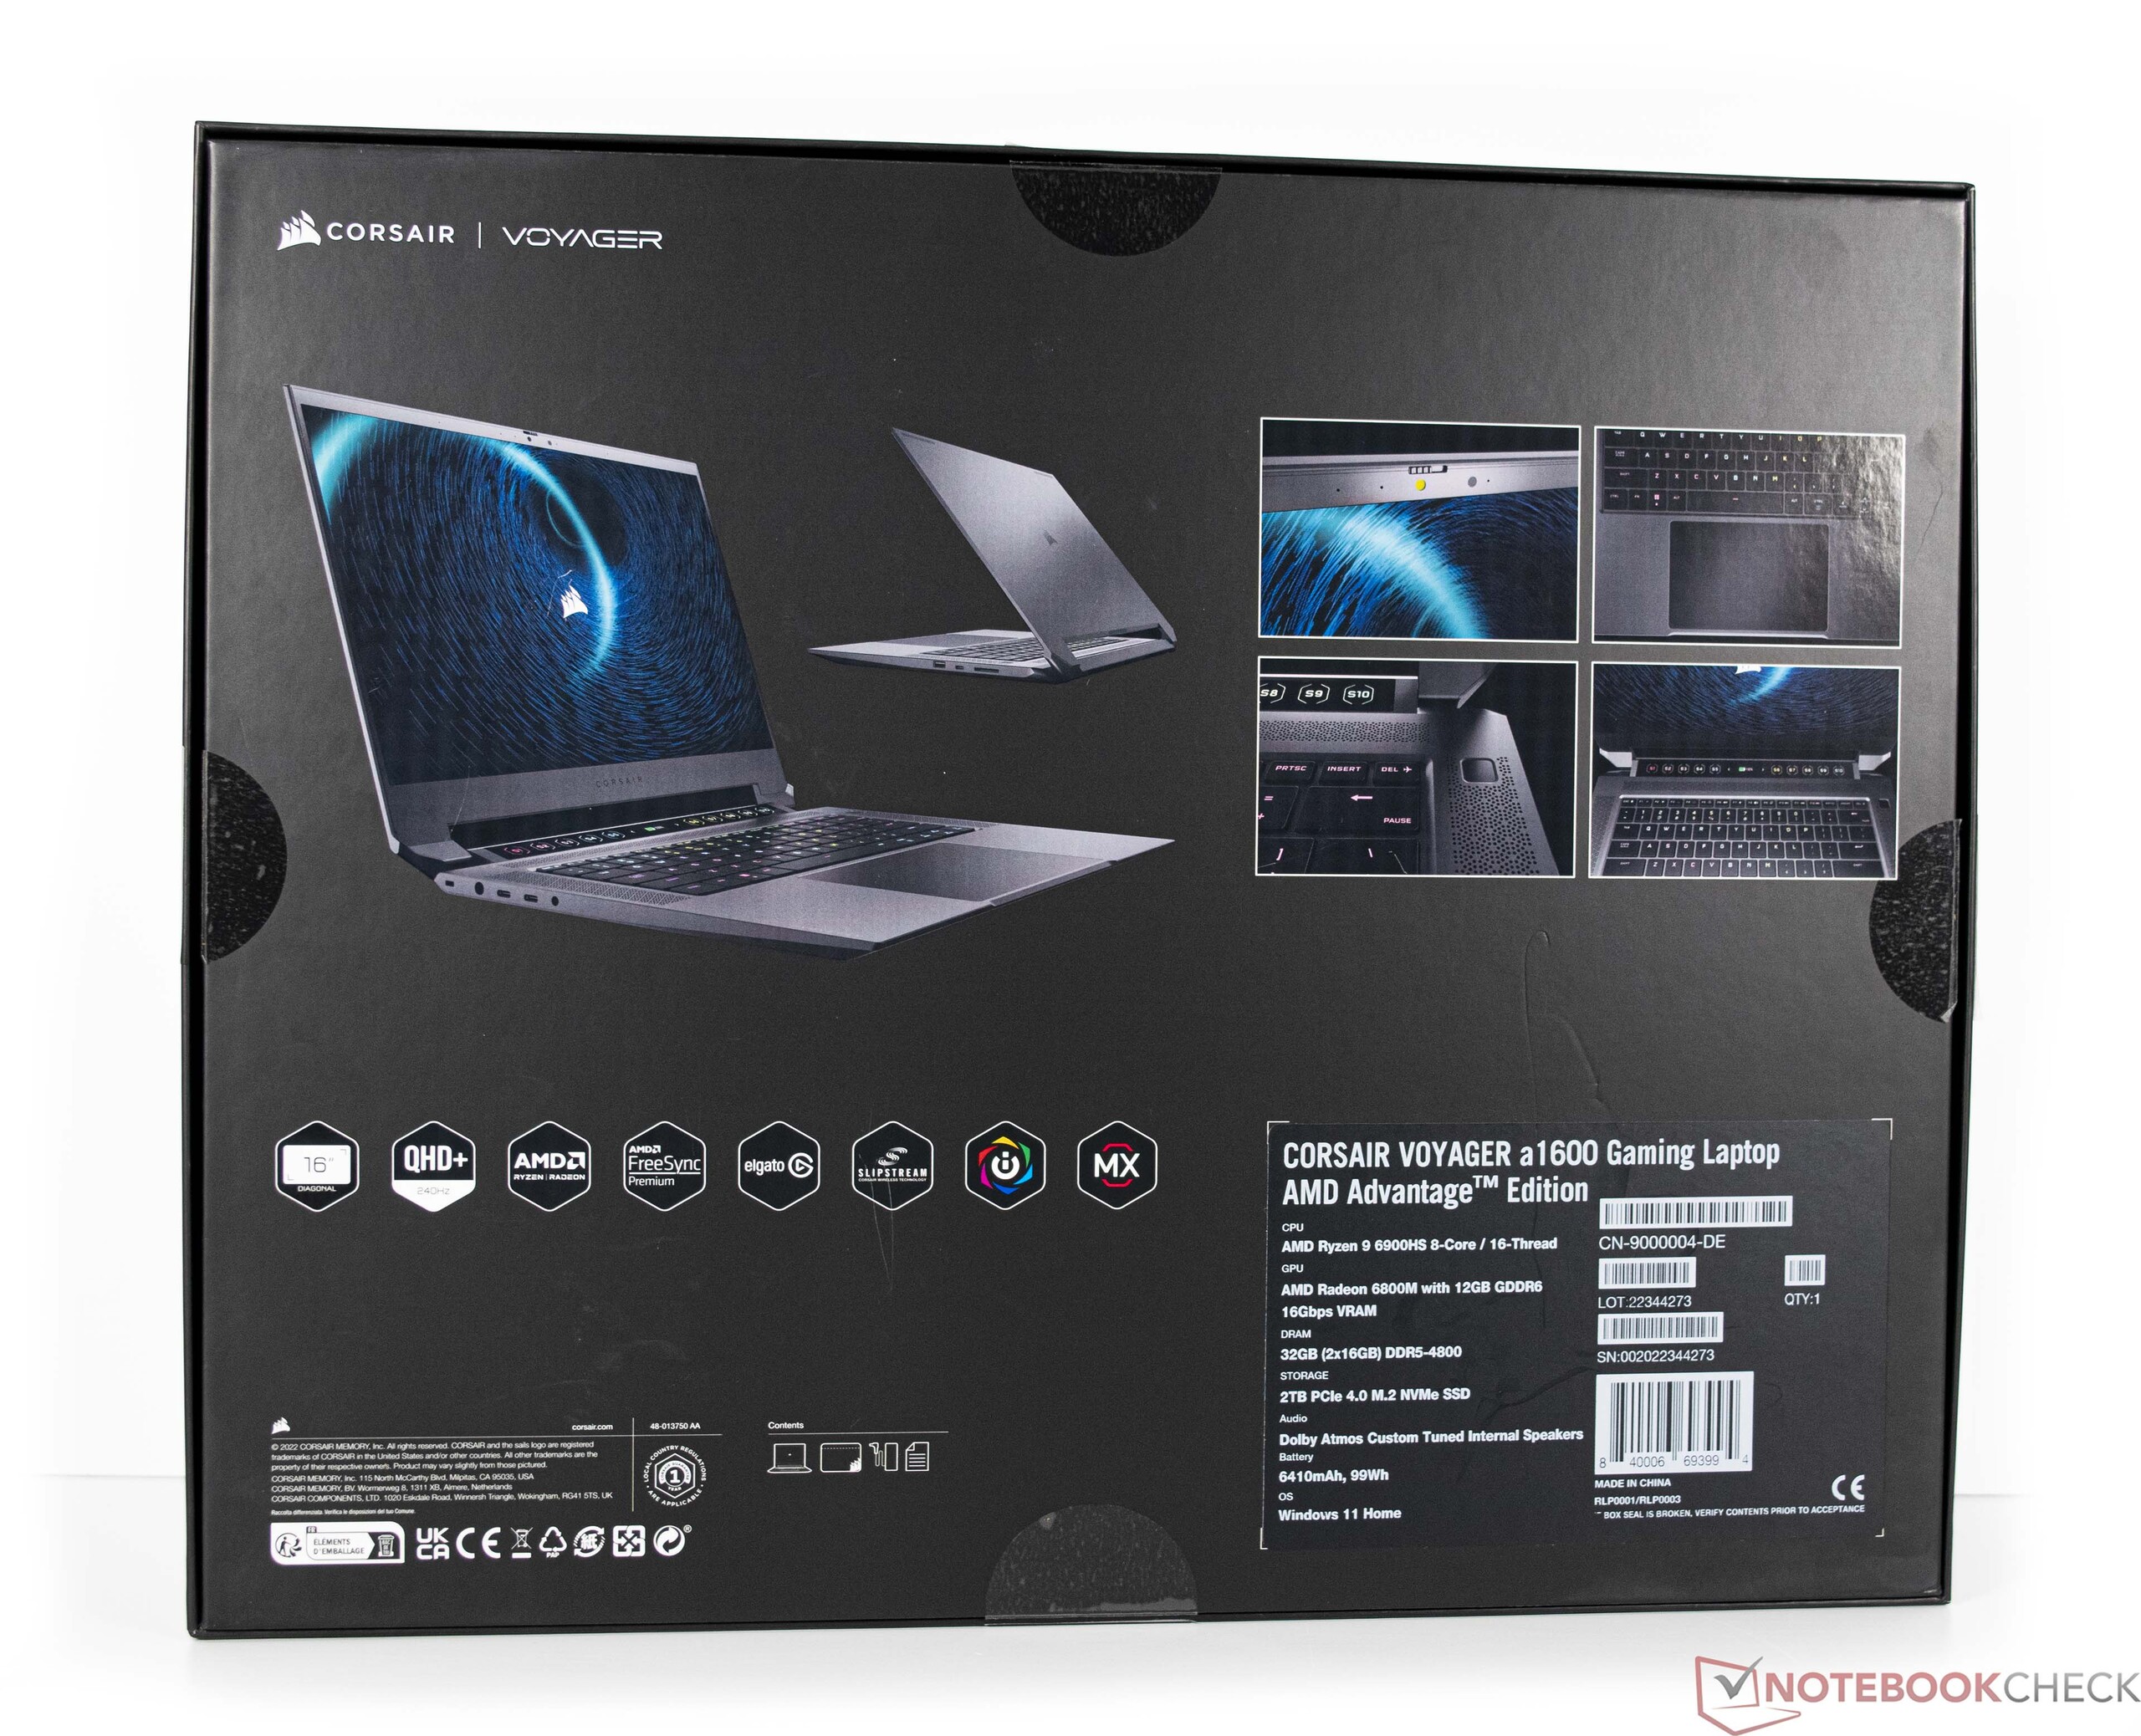
Corsair è un nome noto quando si parla di accessori nel settore dei PC: periferiche, alimentatori, SSD, case, monitor e anche sistemi desktop precostruiti, alcuni dei quali abbiamo già testato, fanno parte dell'attuale lineup del produttore. Con la serie Voyager, Corsair entra ora anche nel segmento dei notebook e vuole partecipare al settore dei giochi con il Voyager a1600. La posizione di partenza non è affatto male, perché con il AMD Ryzen 9 6900HS e una scheda dedicata AMD Radeon RX 6800M c'è una base promettente. Inoltre, nella configurazione top, è possibile contare su 32 GB di RAM DDR5 e su un'unità SSD con 2 TB di spazio di archiviazione. Il pannello QHD a 240 Hz, invece, è sempre un must. Tuttavia, il prezzo di 3.550 euro è di fascia alta.
Può essere più economico se si opta per un AMD Ryzen 7 6800HScon 16 GB di RAM e un'unità SSD da 1 TB. In questo caso, il prezzo attuale è di 2.600 euro. Nel test, il Corsair Voyager a1600 compete con forti rivali nel campo degli attuali notebook da gioco. Maggiori dettagli sono riportati nella tabella seguente.
Potenziali concorrenti a confronto
Punteggio | Data | Modello | Peso | Altezza | Dimensione | Risoluzione | Prezzo |
|---|---|---|---|---|---|---|---|
| 86.6 % v7 (old) | 12/2022 | Corsair Voyager a1600 R9 6900HS, Radeon RX 6800M | 2.4 kg | 19.9 mm | 16.00" | 2560x1600 | |
| 89.5 % v7 (old) | 08/2022 | Asus ROG Flow X16 GV601RW-M5082W R9 6900HS, GeForce RTX 3070 Ti Laptop GPU | 2.1 kg | 19.4 mm | 16.10" | 2560x1600 | |
| 90.8 % v7 (old) | 09/2022 | Lenovo Legion 7 16ARHA7 R9 6900HX, Radeon RX 6850M XT | 2.6 kg | 19.4 mm | 16.00" | 2560x1600 | |
| 87.2 % v7 (old) | 06/2022 | Acer Predator Triton 500 SE PT516-52s-70KX i7-12700H, GeForce RTX 3080 Ti Laptop GPU | 2.3 kg | 19.9 mm | 16.00" | 2560x1600 | |
| 85.5 % v7 (old) | 05/2022 | HP Omen 16-b1090ng i7-12700H, GeForce RTX 3070 Ti Laptop GPU | 2.3 kg | 23 mm | 16.10" | 2560x1440 | |
| 88.9 % v7 (old) | 09/2022 | Lenovo Legion 7 16IAX7-82TD004SGE i9-12900HX, GeForce RTX 3080 Ti Laptop GPU | 2.6 kg | 20 mm | 16.00" | 2560x1600 |
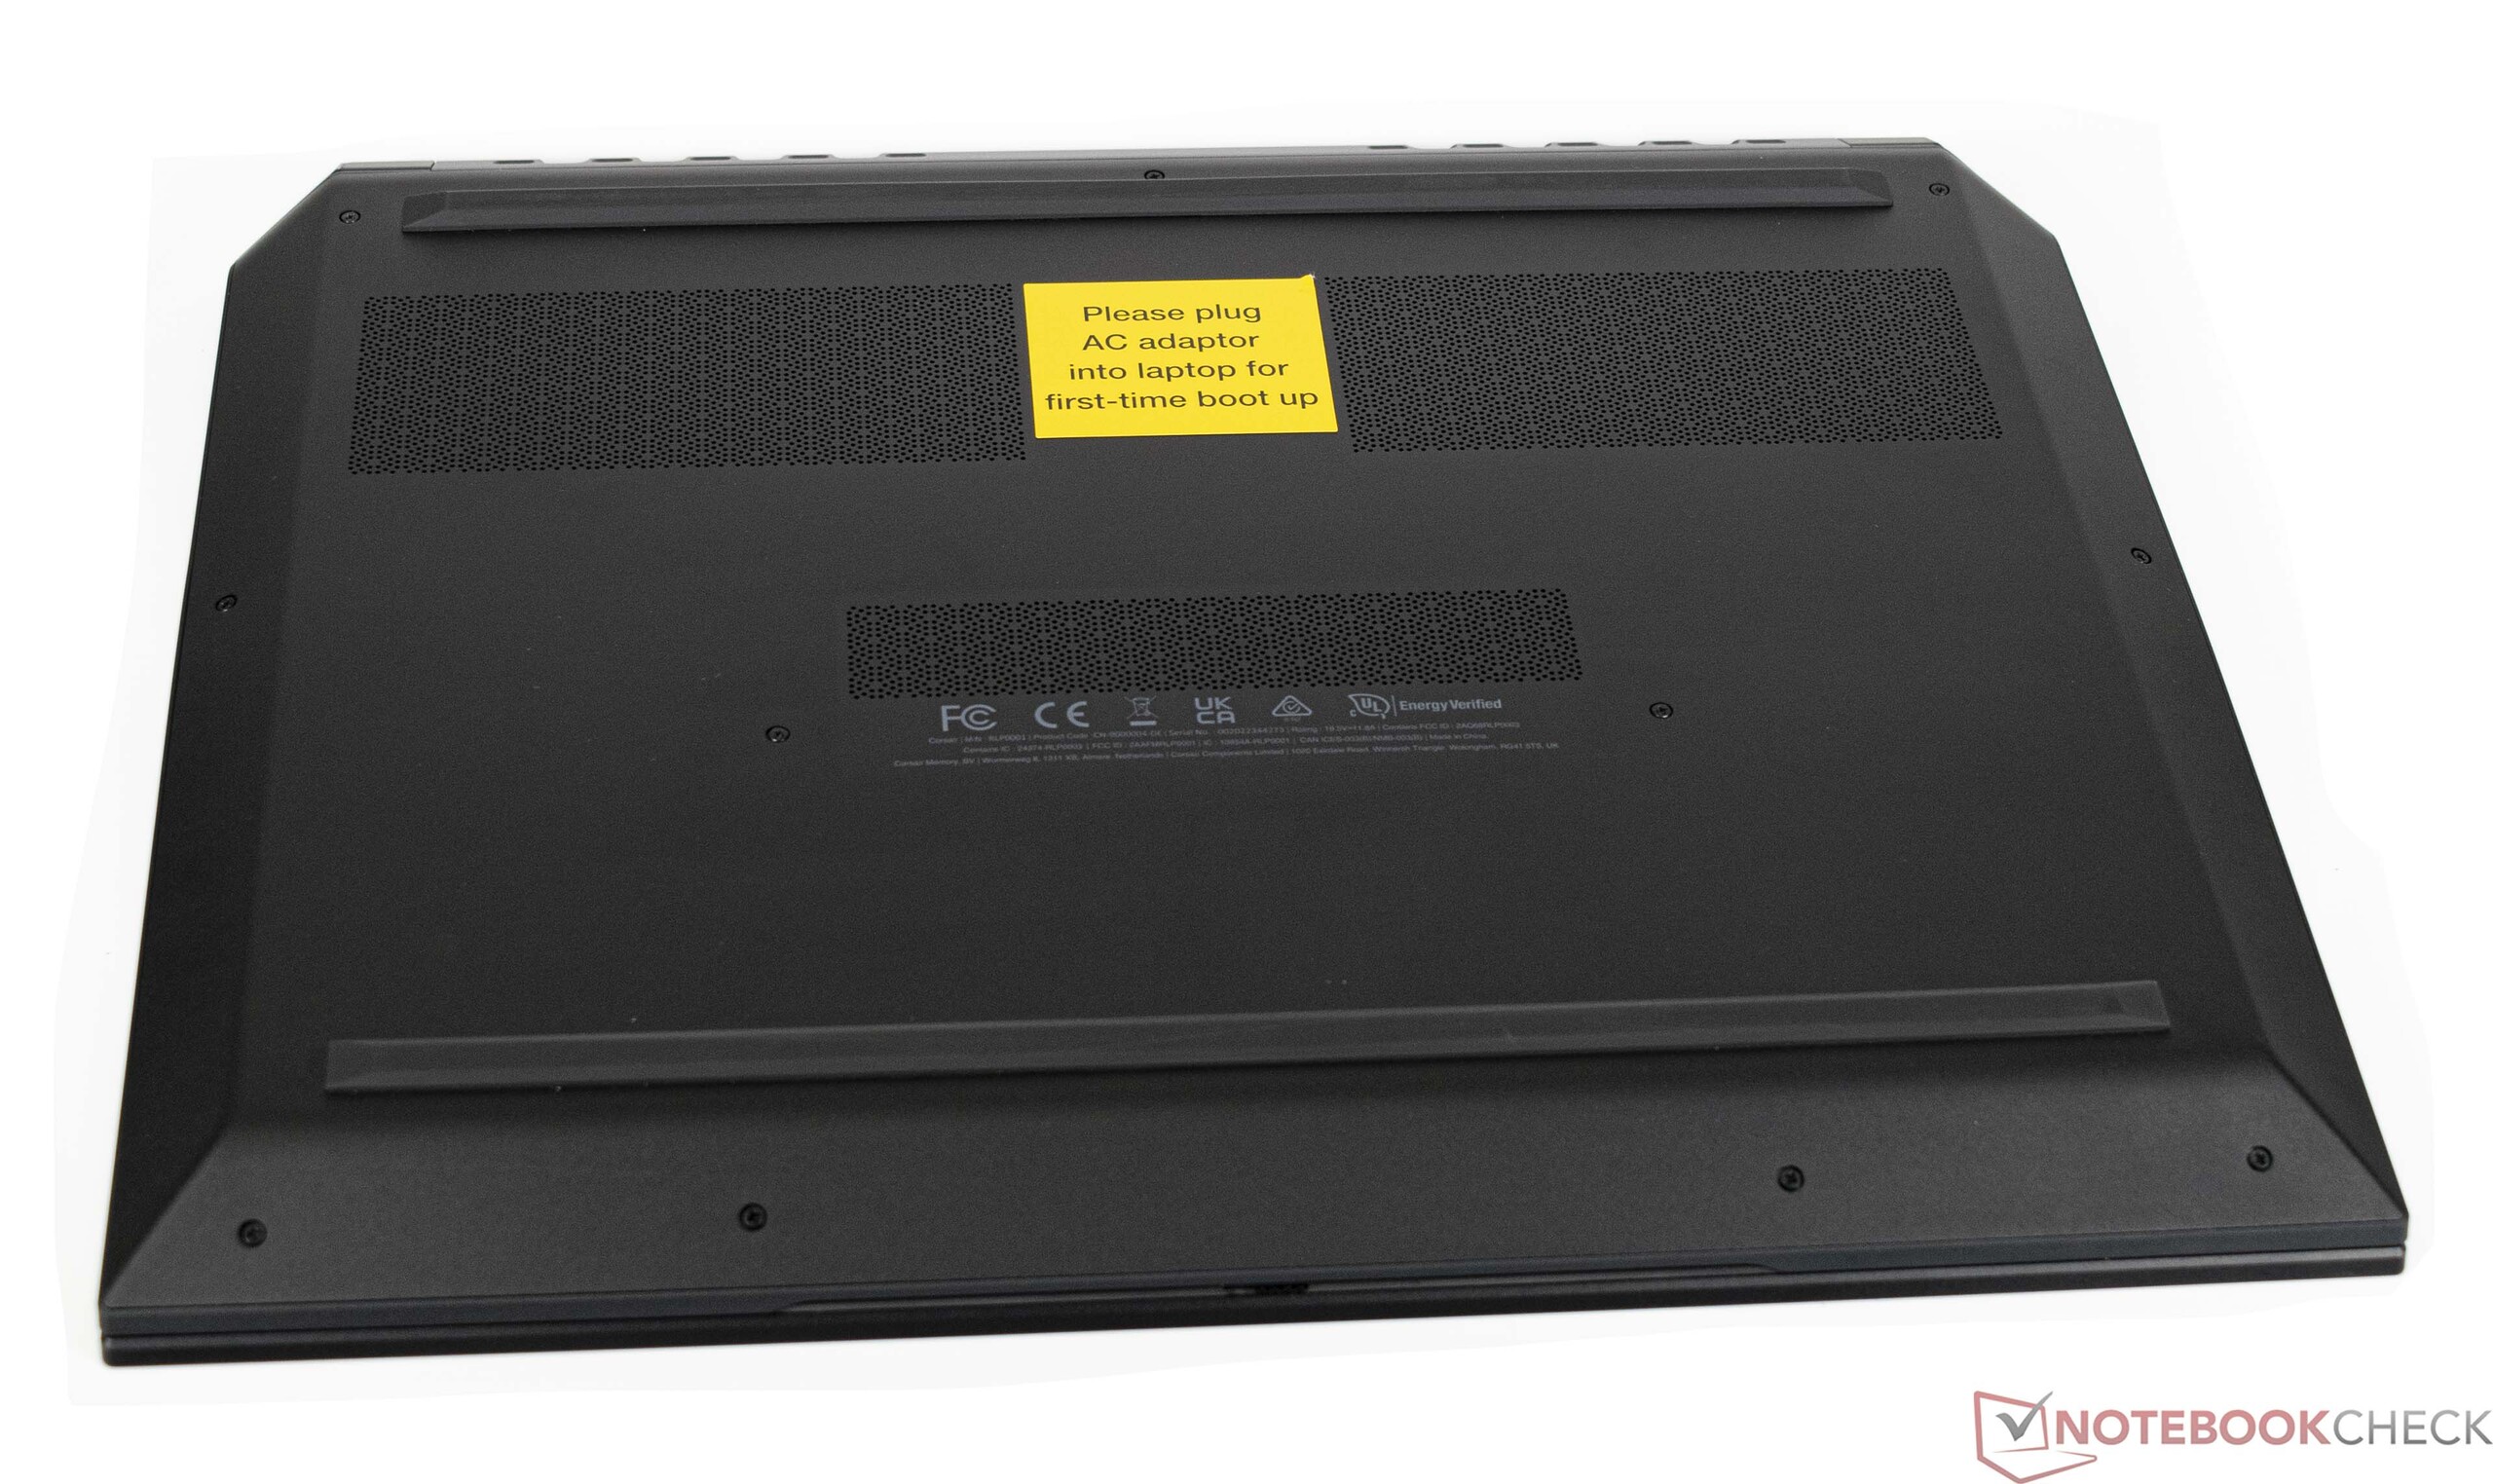
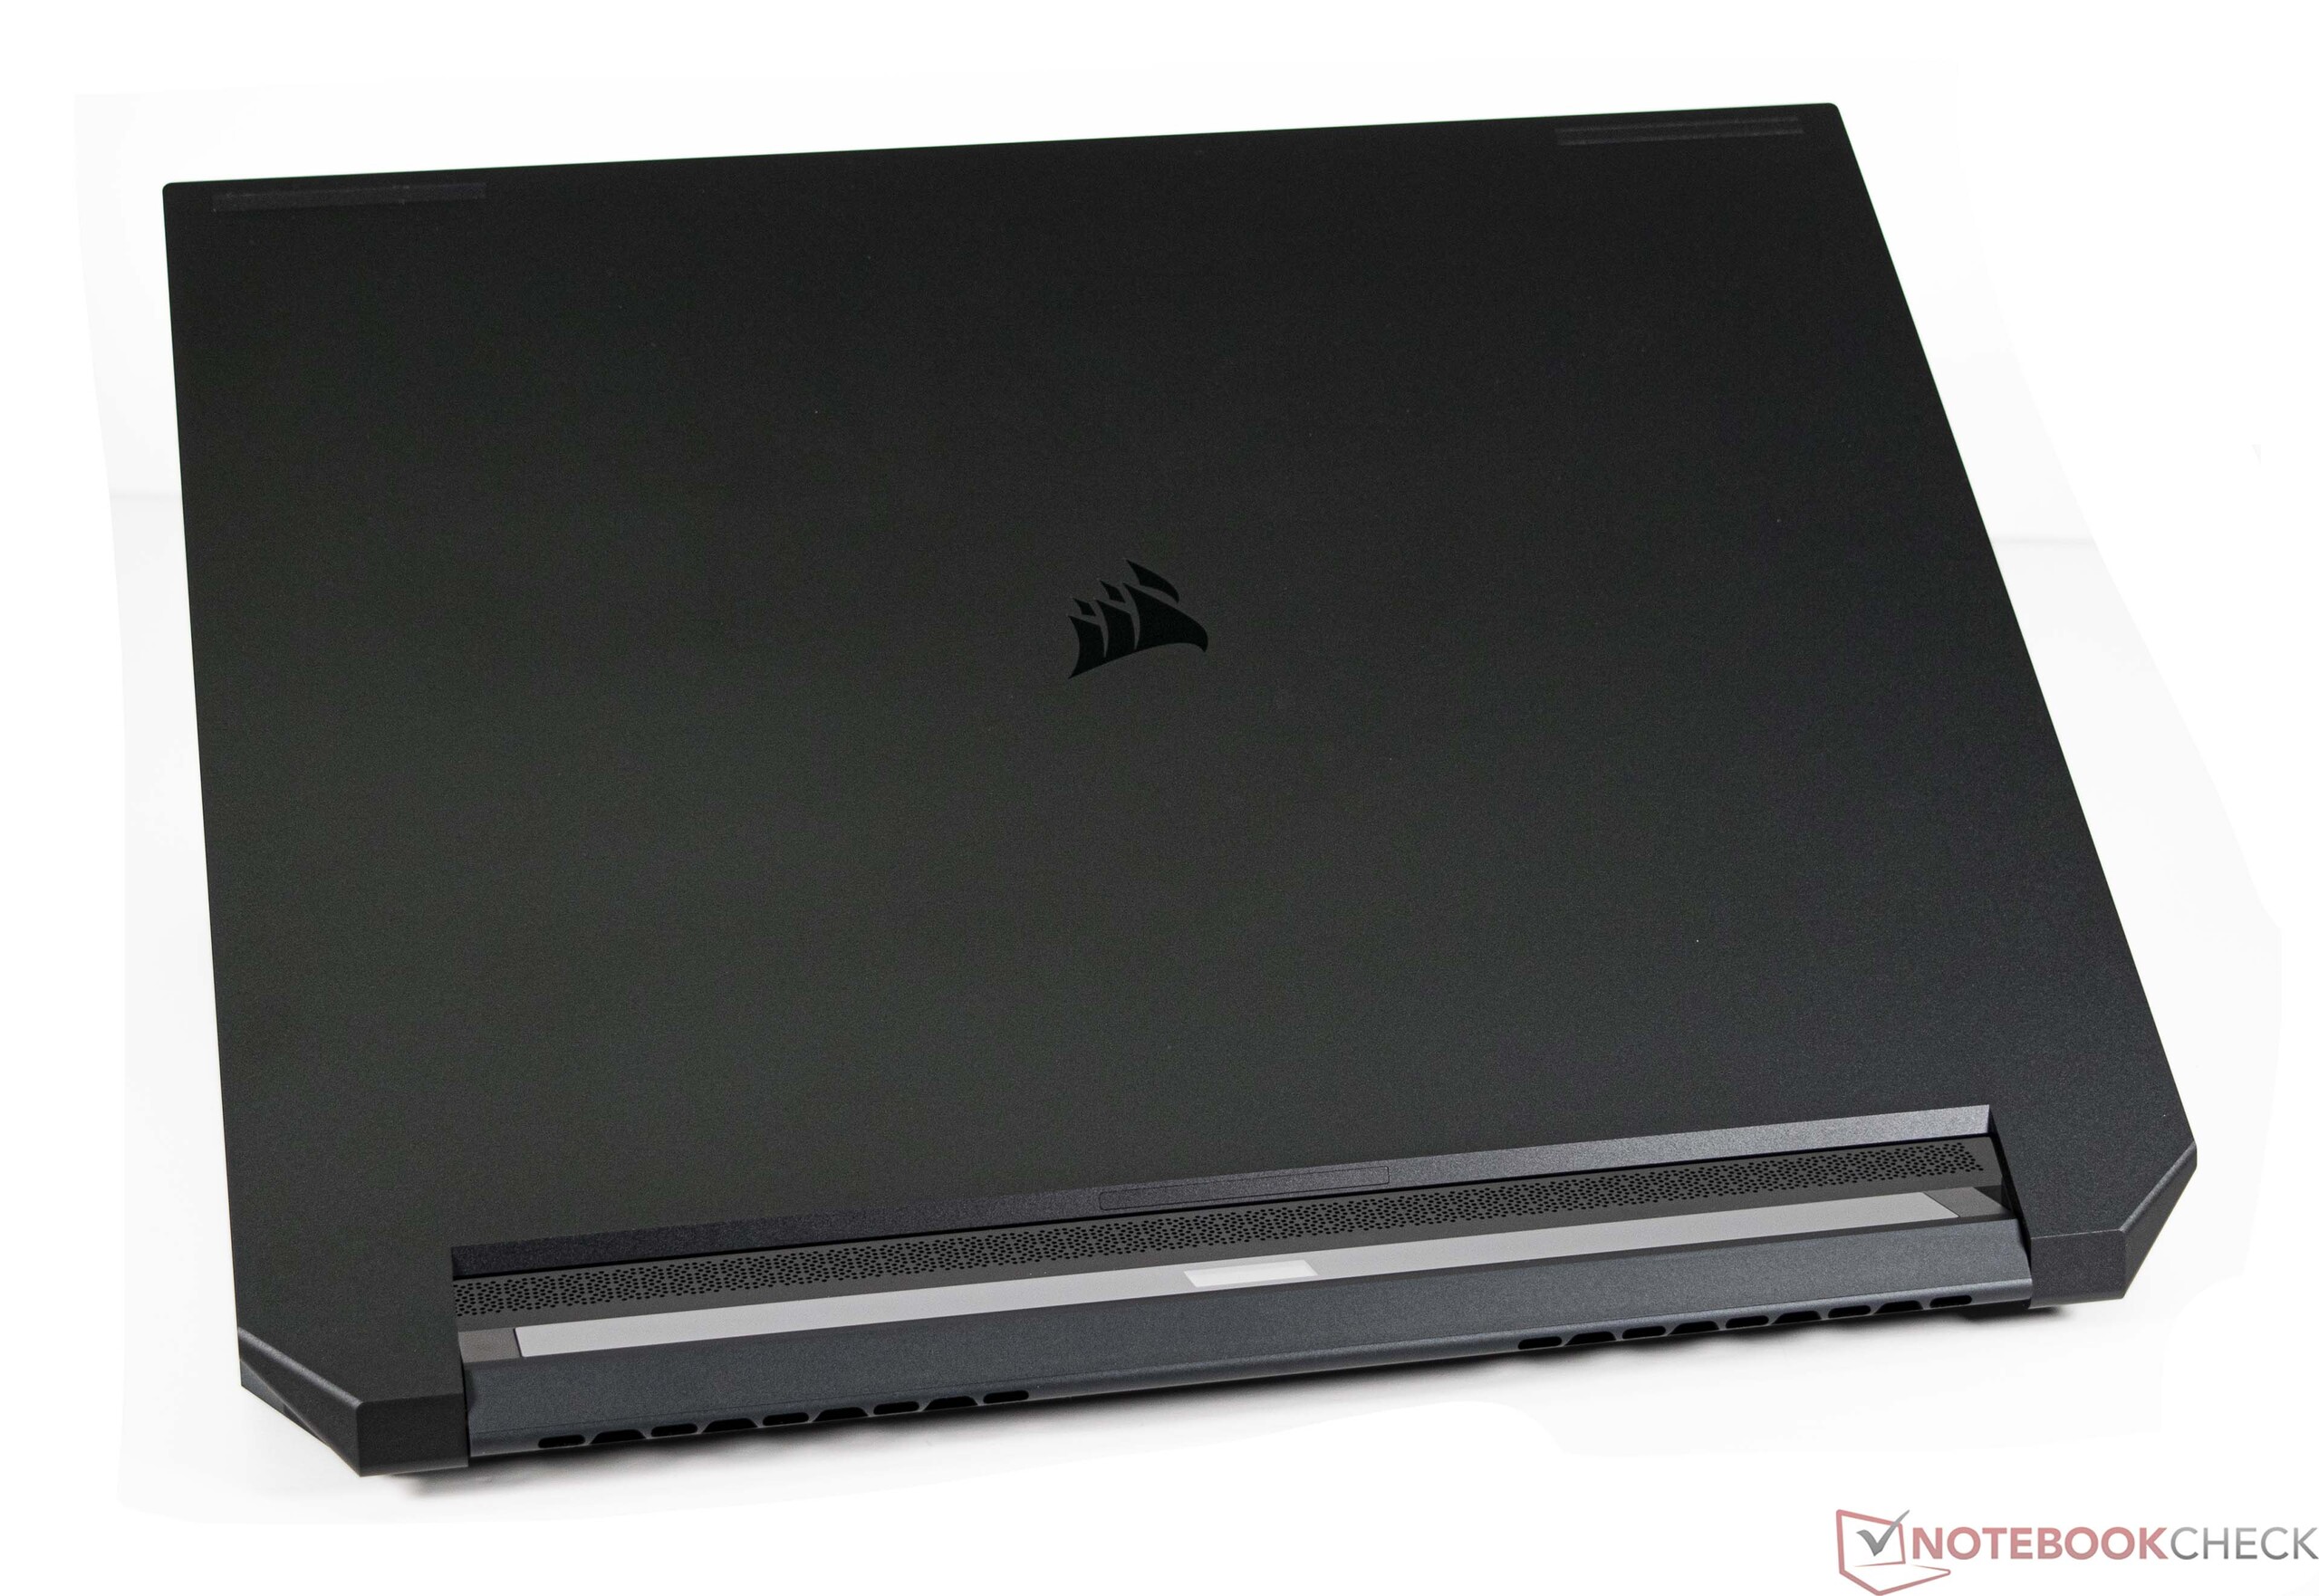
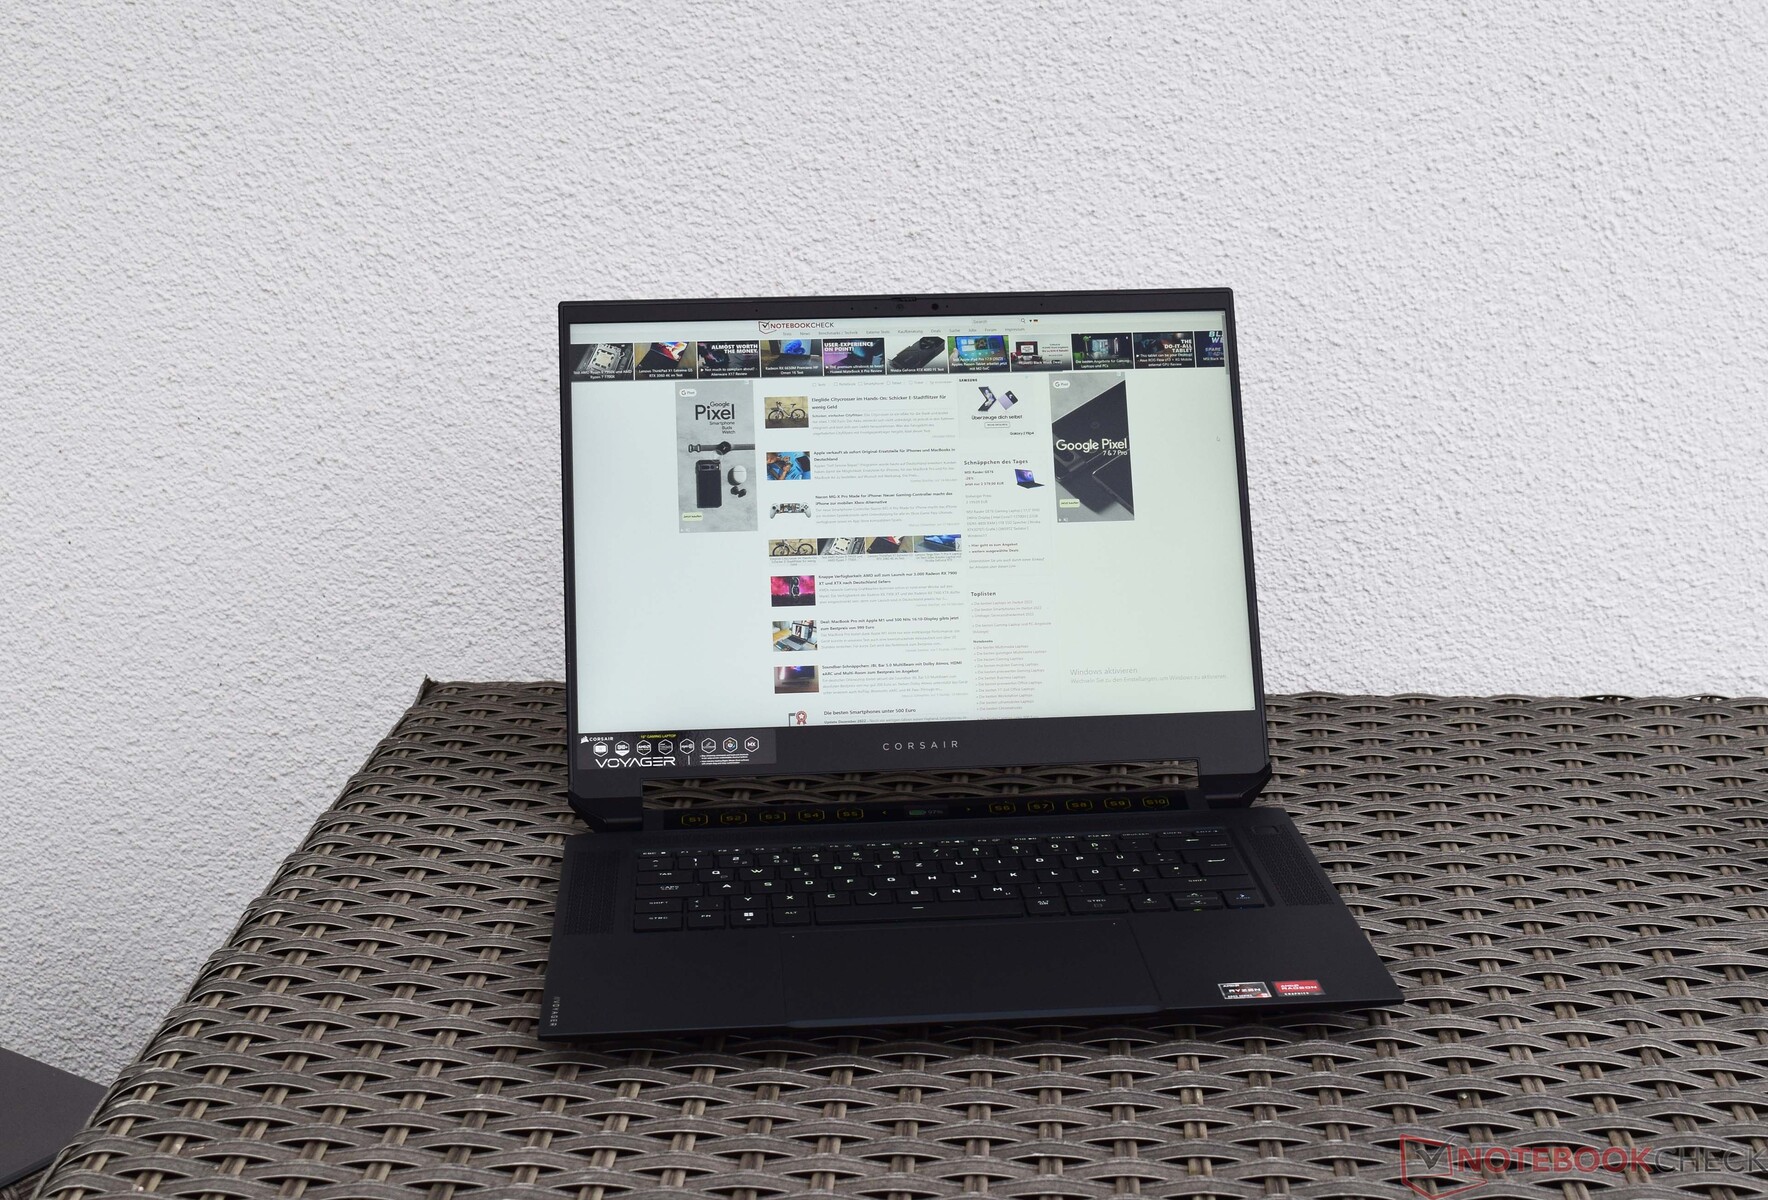
Custodia e caratteristiche - Sottile ma robusto
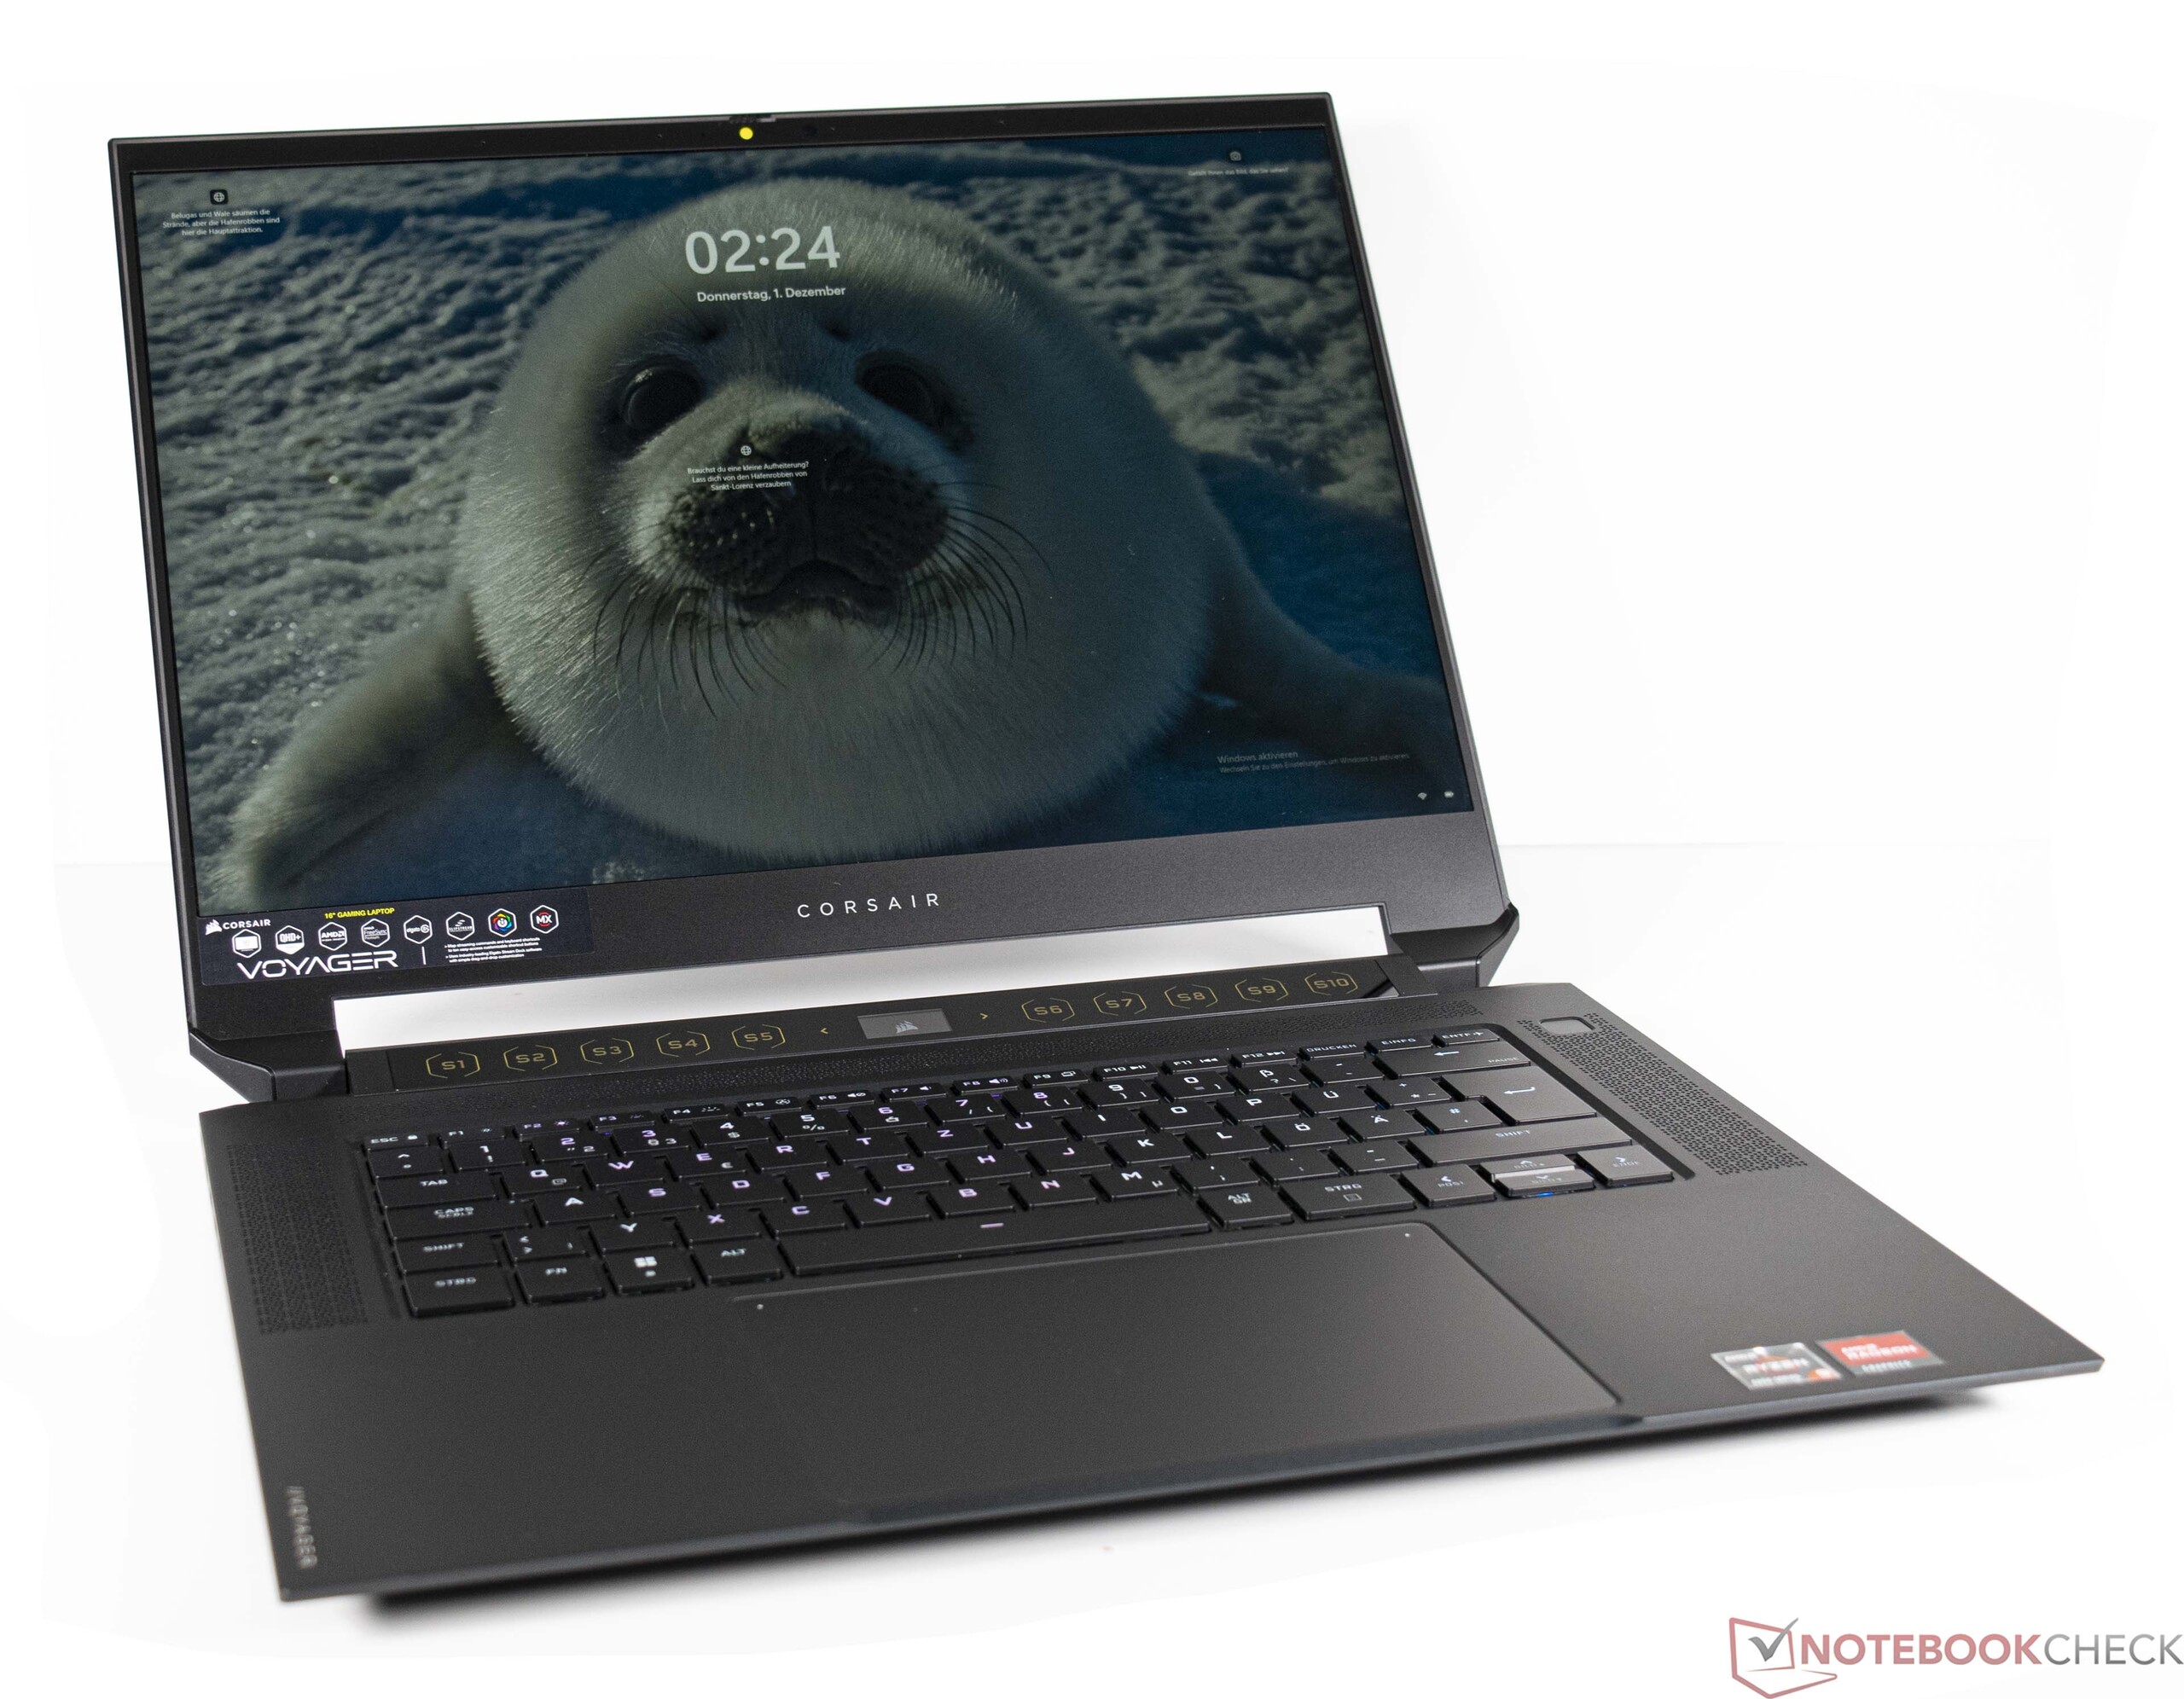
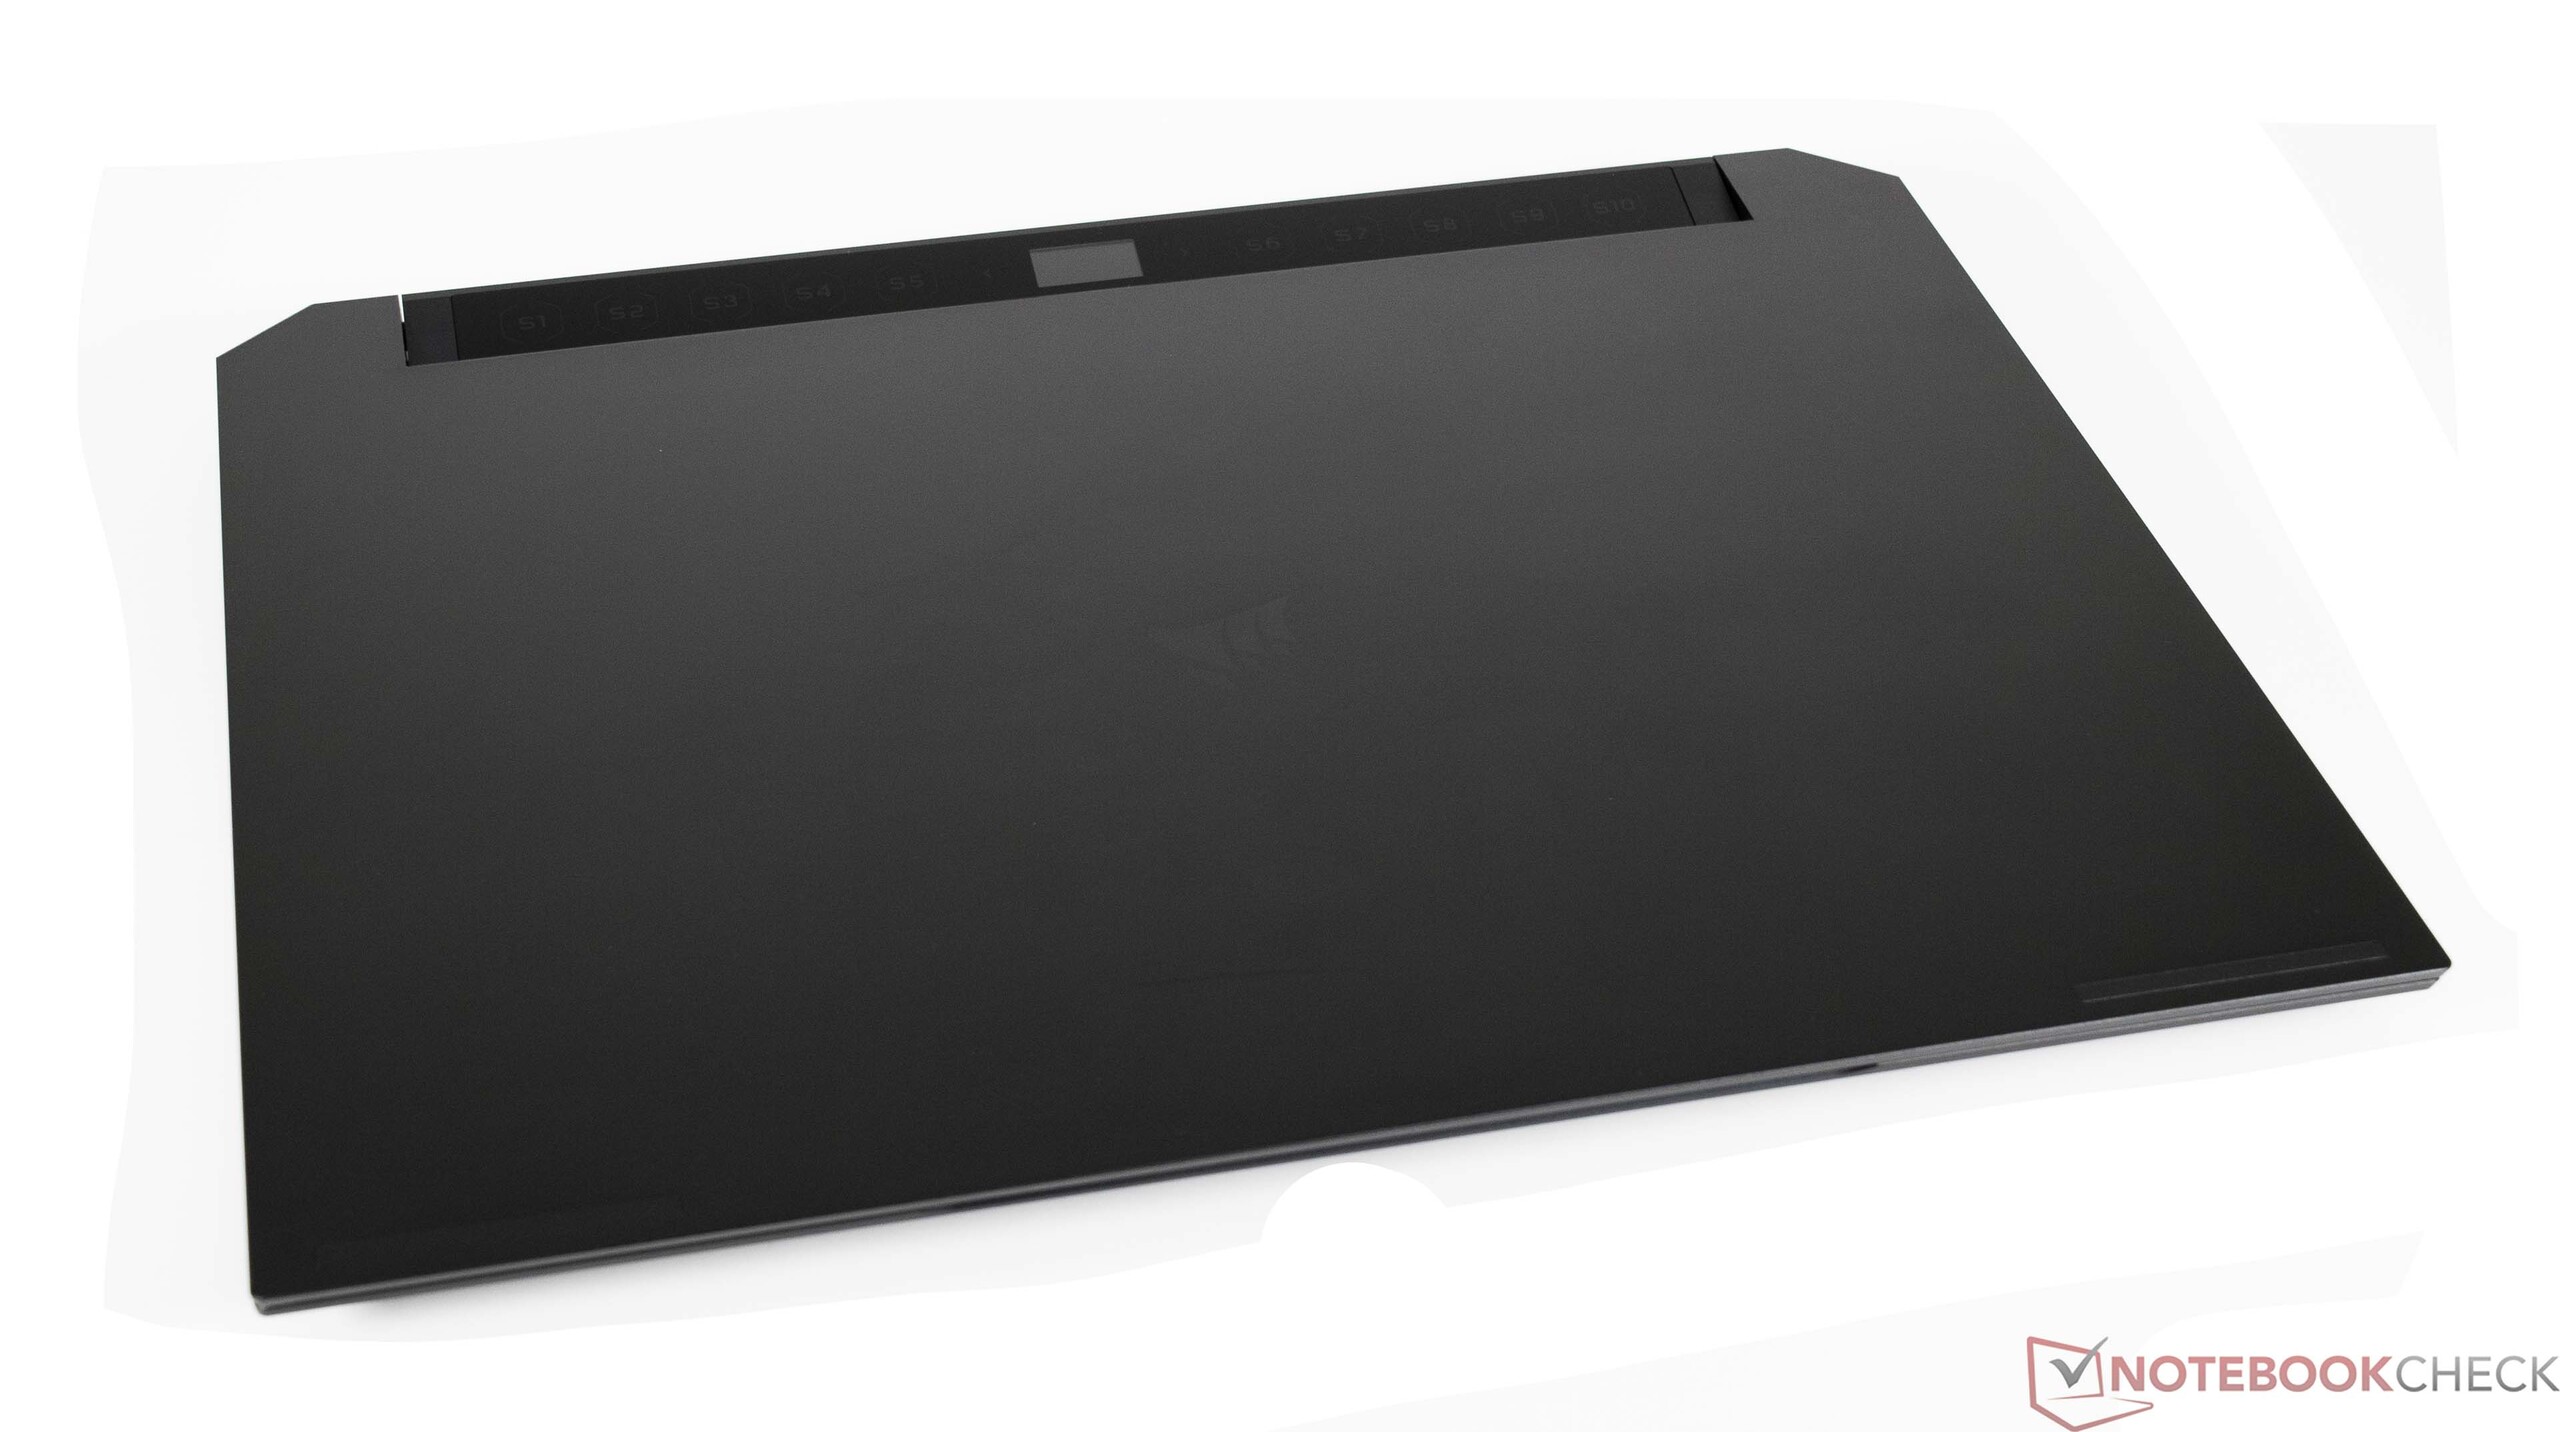
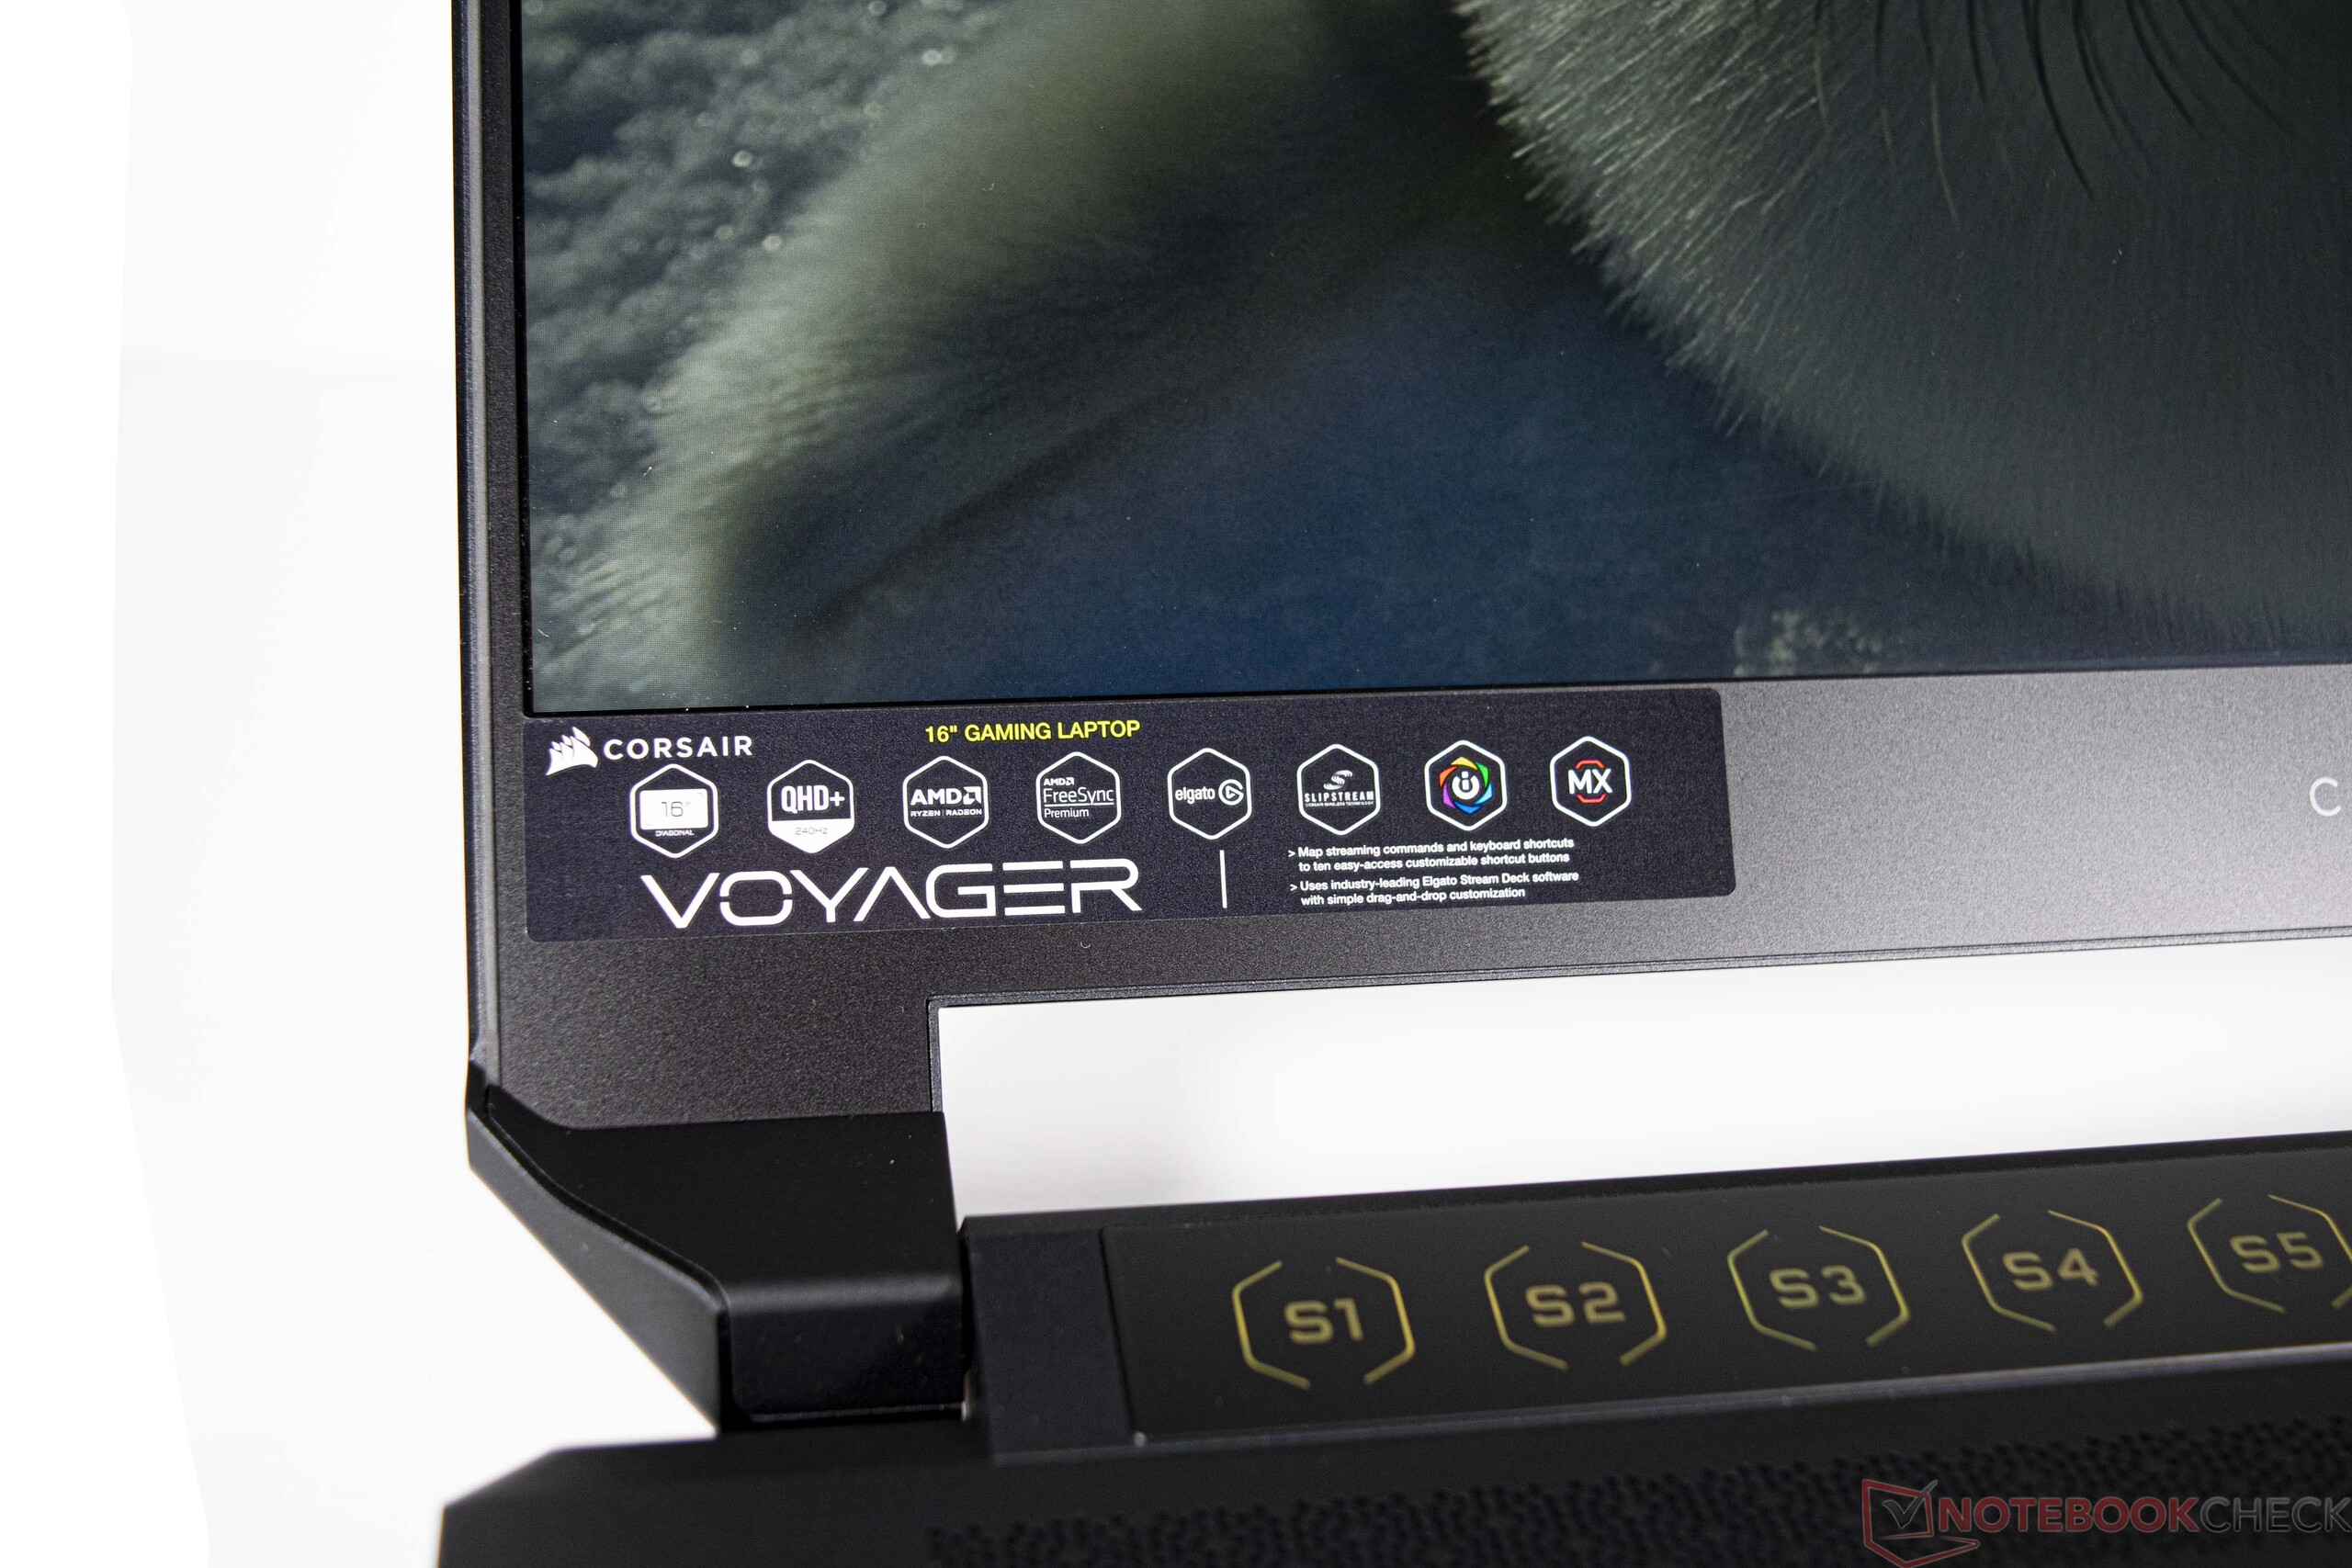
Il case del Corsair Voyager a1600 è realizzato in alluminio e conferisce al dispositivo un'ottima stabilità. Solo il coperchio del display si è leggermente deformato durante i nostri test di torsione. Per il resto, il notebook da gioco ha un aspetto relativamente modesto e non dispone di illuminazione RGB, il che va bene. Il display è sostenuto da due piccole cerniere, che non possono impedire completamente i rimbalzi.
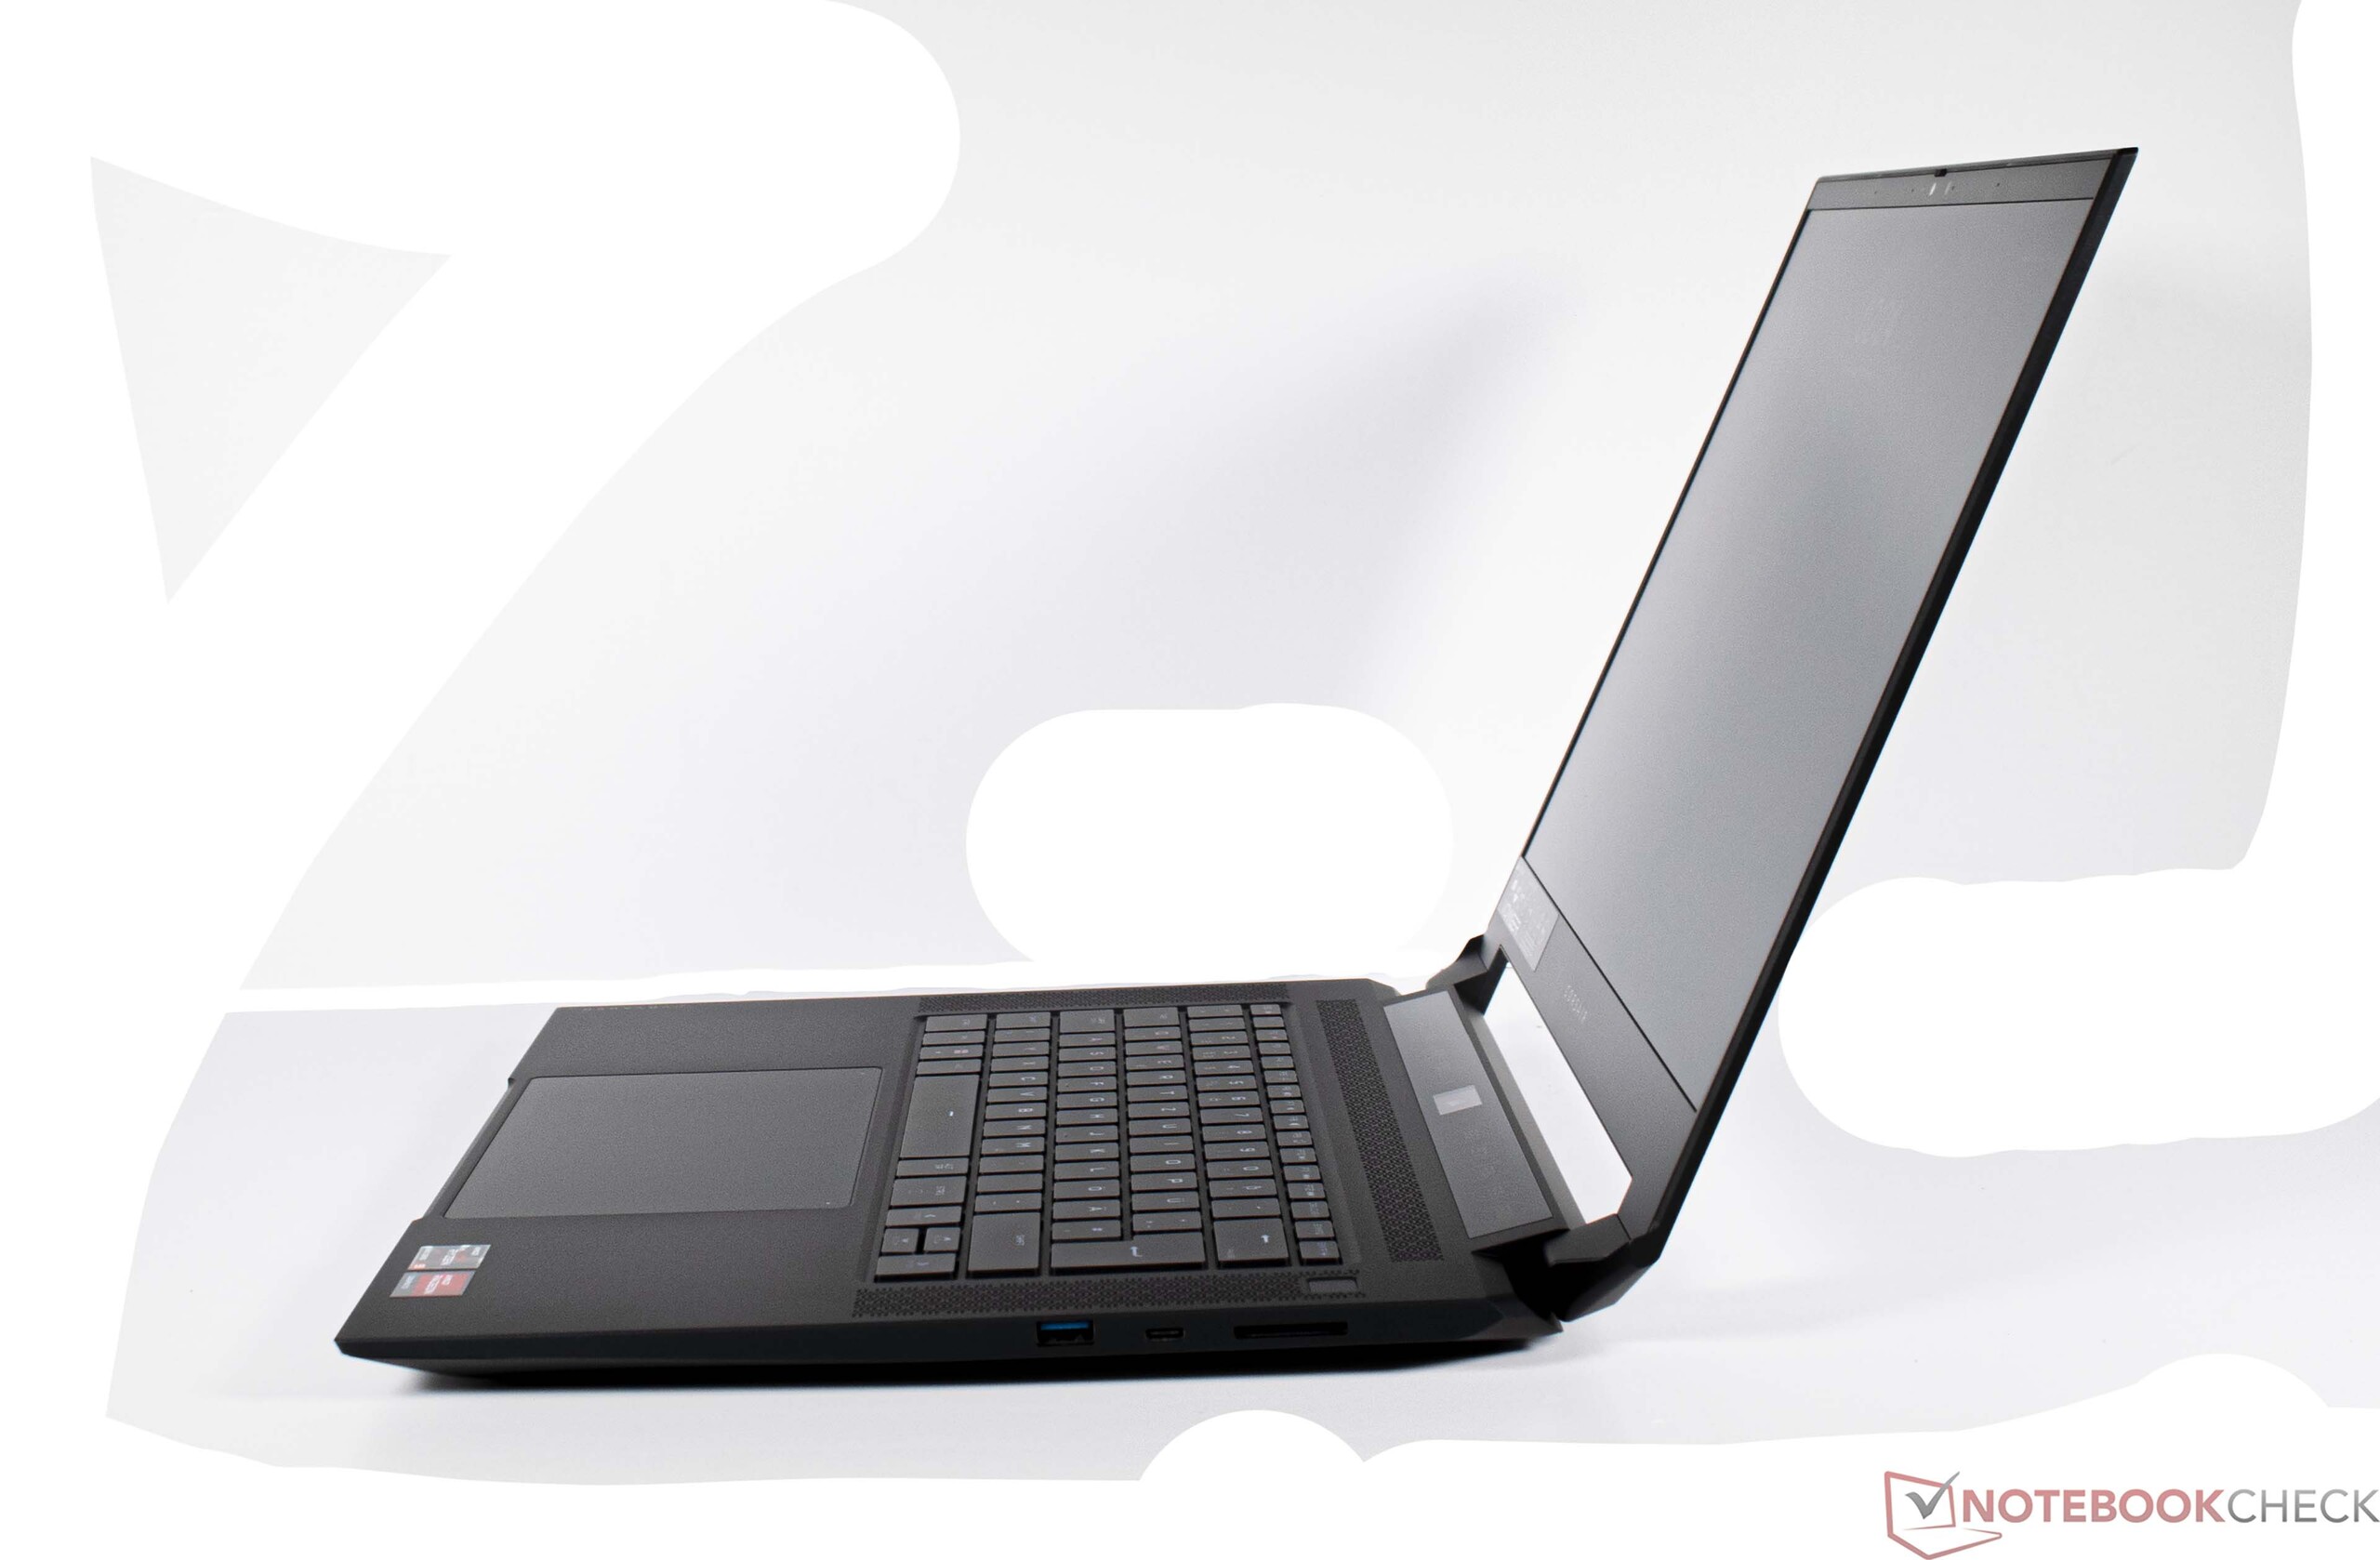
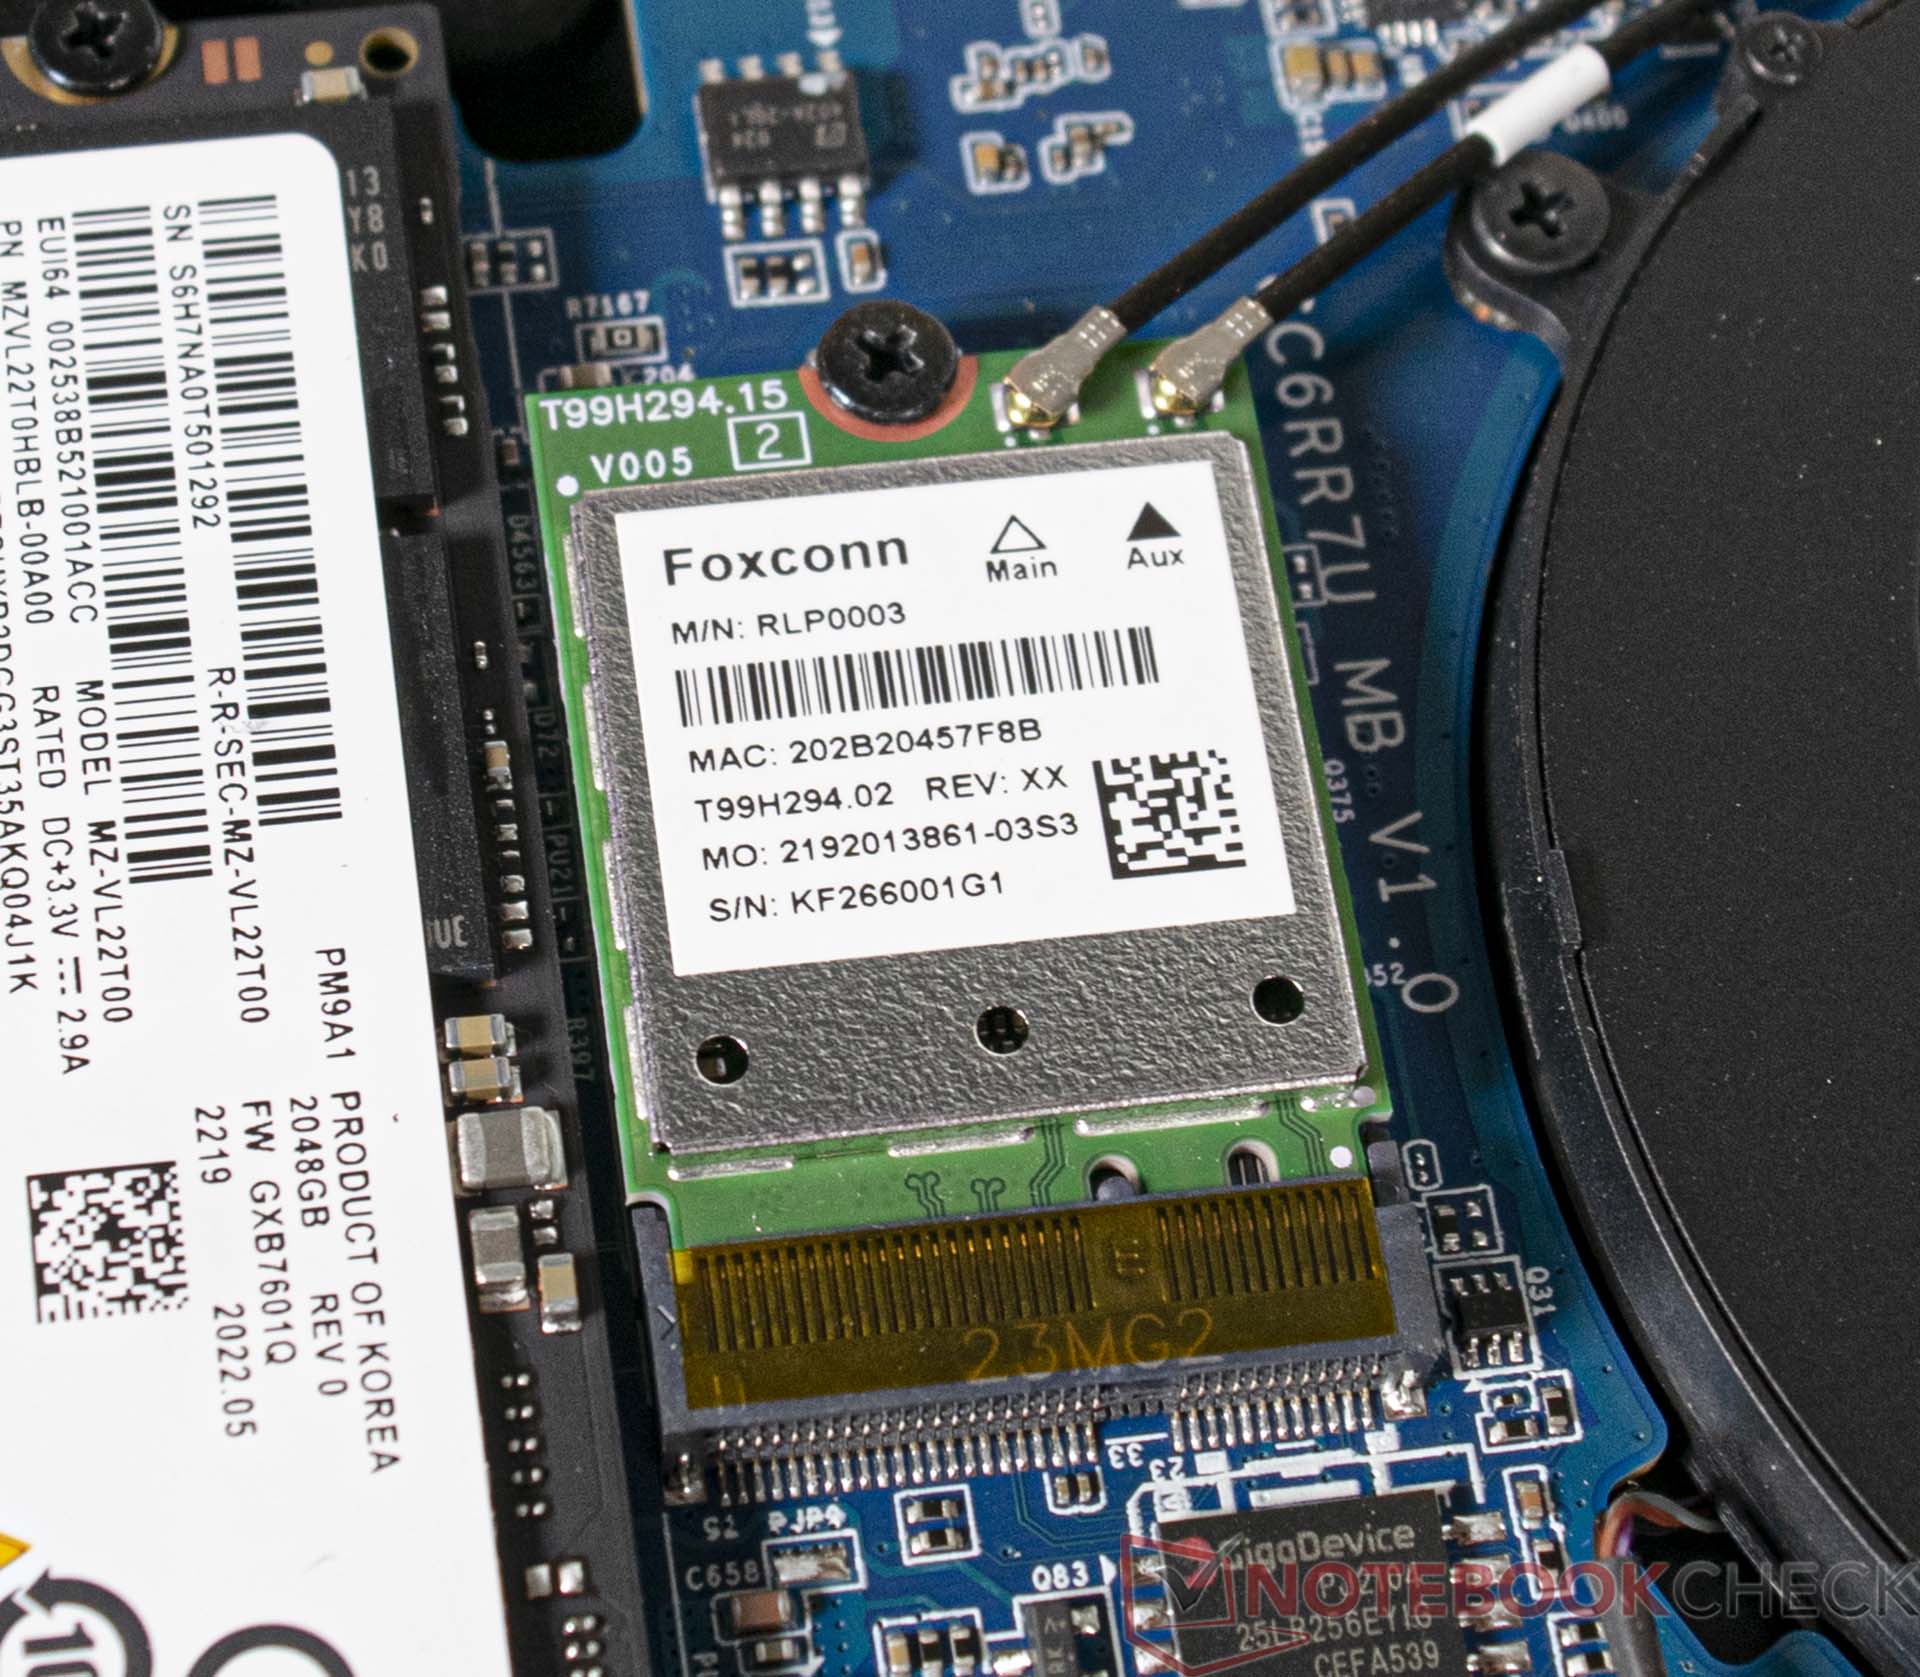
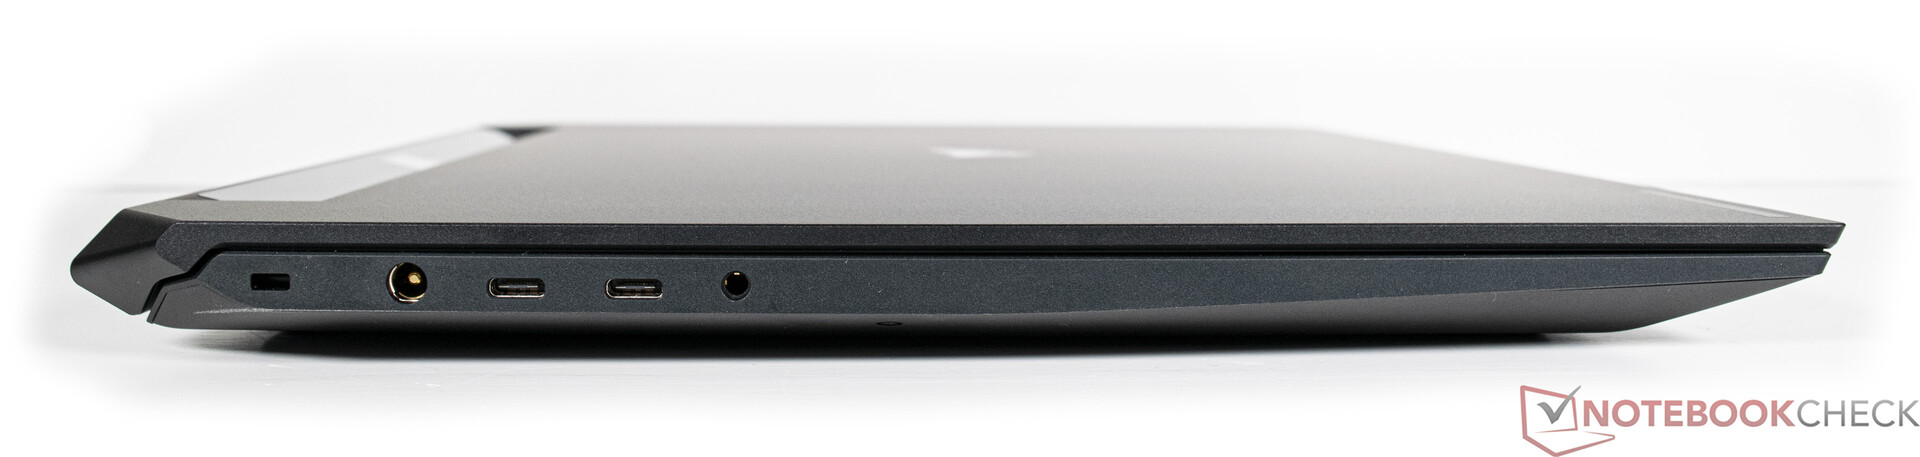
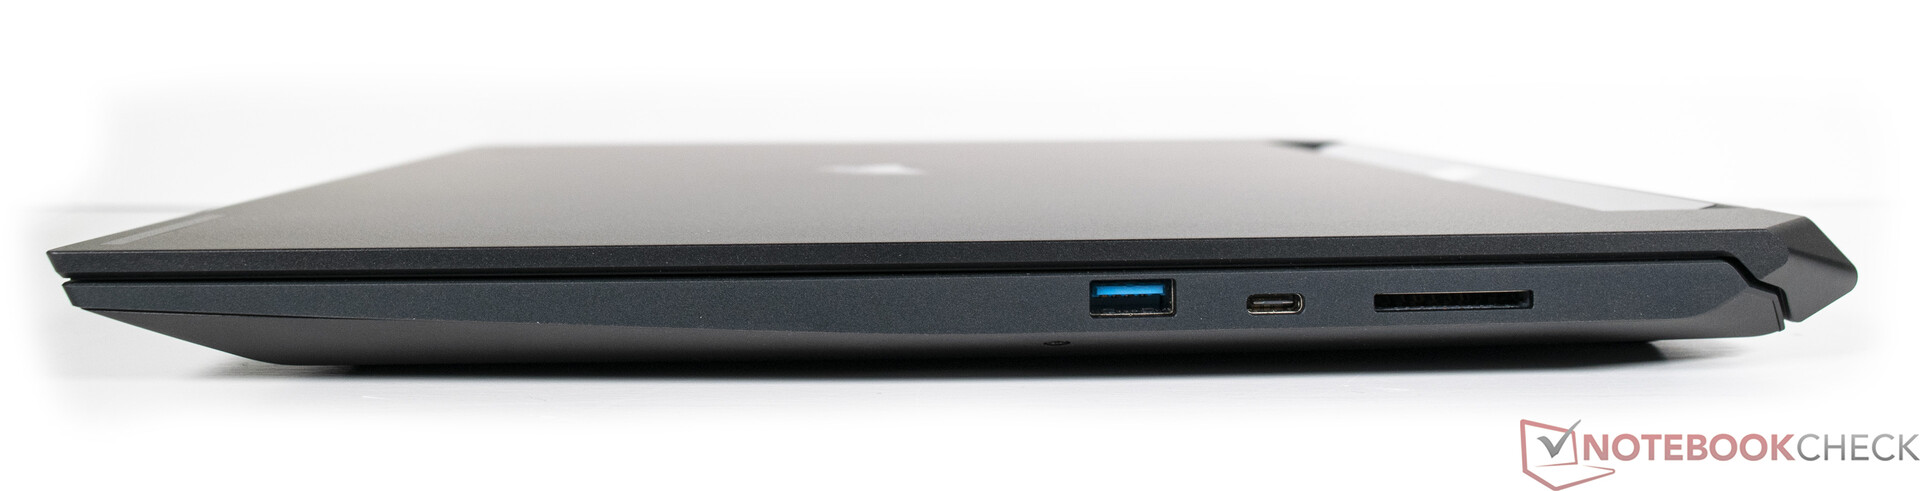
In termini di connettività, Corsair offre interfacce moderne, anche se il numero è molto gestibile. È un peccato avere solo una USB Type-A, ma ci sono tre porte USB-C con supporto Thunderbolt. Pertanto, il portatile è ben preparato per il futuro. Il numero di interfacce è probabilmente così scarso grazie alla funzione Slipstream, perché vari accessori possono essere collegati direttamente al notebook tramite questa tecnologia wireless senza un dongle aggiuntivo. Corsair stessa offre i propri mouse, tastiere e cuffie. Il modulo Wi-Fi viene fornito da Foxconn e offre l'attuale standard Wi-Fi 6E.
L'uso previsto come portatile per lo streaming richiede una buona webcam. Il test mostra che la fotocamera integrata da 1080p ha prestazioni migliori rispetto alla concorrenza. Tuttavia, si consiglia di utilizzare una fotocamera esterna per l'uso fisso. Per l'uso mobile, si può fare affidamento su quella integrata.
| SD Card Reader | |
| average JPG Copy Test (av. of 3 runs) | |
| Asus ROG Flow X16 GV601RW-M5082W (AV Pro SD microSD 128 GB V60) | |
| Media della classe Gaming (20.9 - 210, n=54, ultimi 2 anni) | |
| Corsair Voyager a1600 (AV Pro SD microSD 128 GB V60) | |
| Acer Predator Triton 500 SE PT516-52s-70KX (AV PRO microSD 128 GB V60) | |
| HP Omen 16-b1090ng (AV PRO microSD 128 GB V60) | |
| maximum AS SSD Seq Read Test (1GB) | |
| Asus ROG Flow X16 GV601RW-M5082W (AV Pro SD microSD 128 GB V60) | |
| Media della classe Gaming (25.5 - 261, n=51, ultimi 2 anni) | |
| Corsair Voyager a1600 (AV Pro SD microSD 128 GB V60) | |
| Acer Predator Triton 500 SE PT516-52s-70KX (AV PRO microSD 128 GB V60) | |


Dispositivi di ingresso
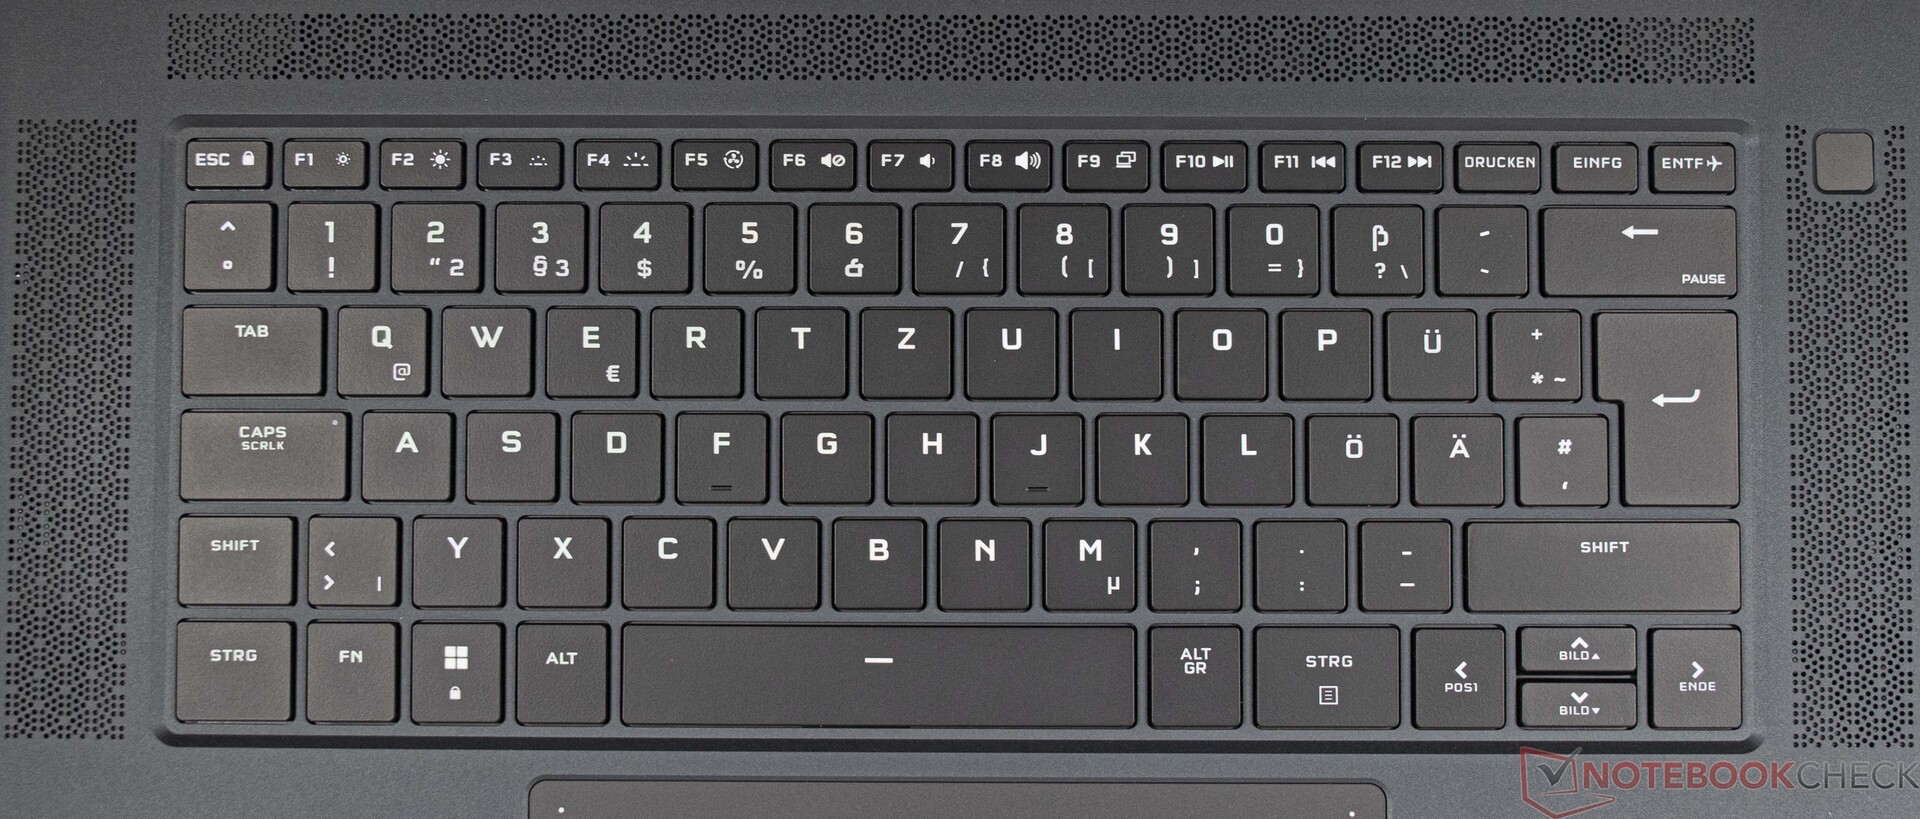
Corsair offre al Voyager a1600 una tastiera meccanica basata su interruttori Cherry MX. Questi sono molto robusti e progettati per una longevità estrema. La corsa molto breve e il punto di pressione ben visibile offrono all'utente un buon feedback tattile. Inoltre, la corsa non è smorzata, il che impedisce una sensazione di spugnosità dell'input.
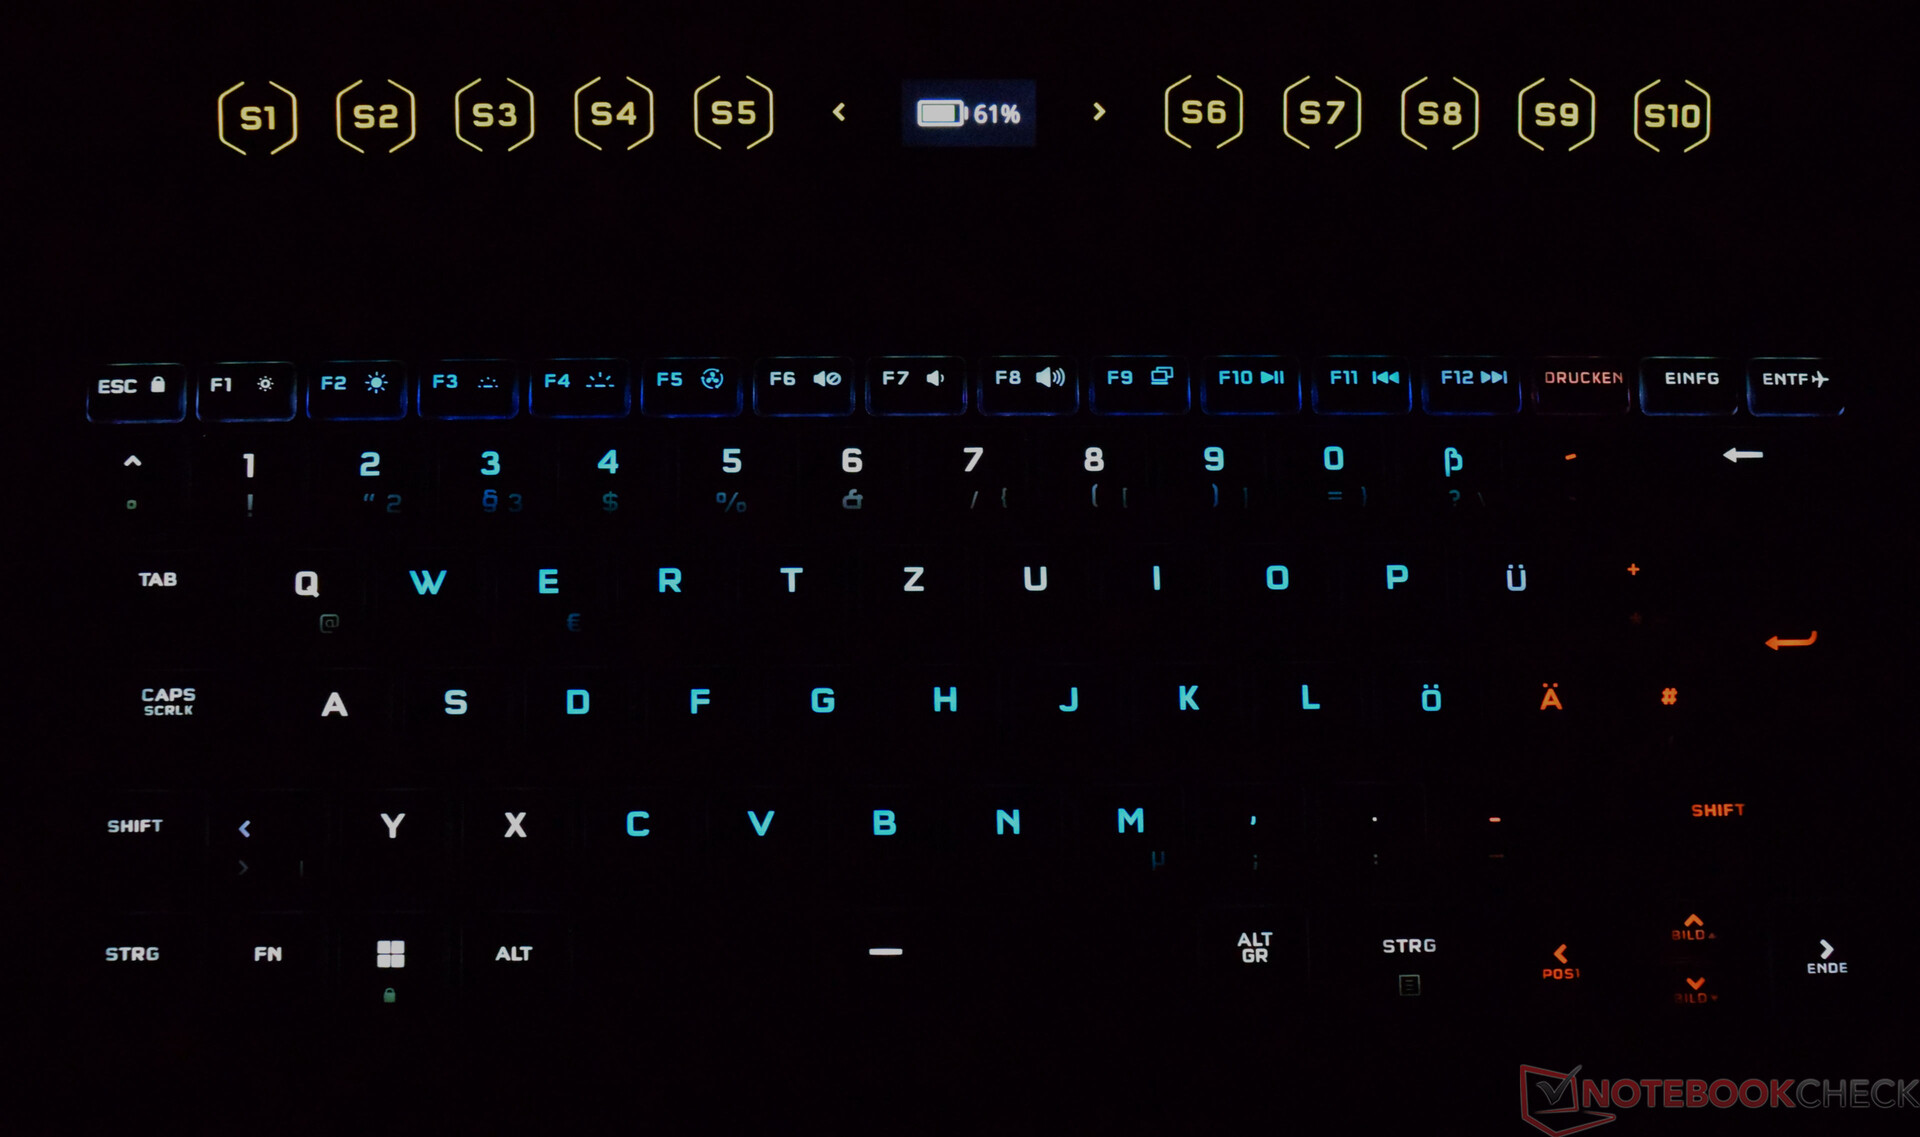
L'illuminazione della tastiera può essere configurata a piacere tramite il software iCUE. L'utente ha a disposizione diversi effetti e una tavolozza di colori completa. Inoltre, tutti i tasti possono essere configurati individualmente.
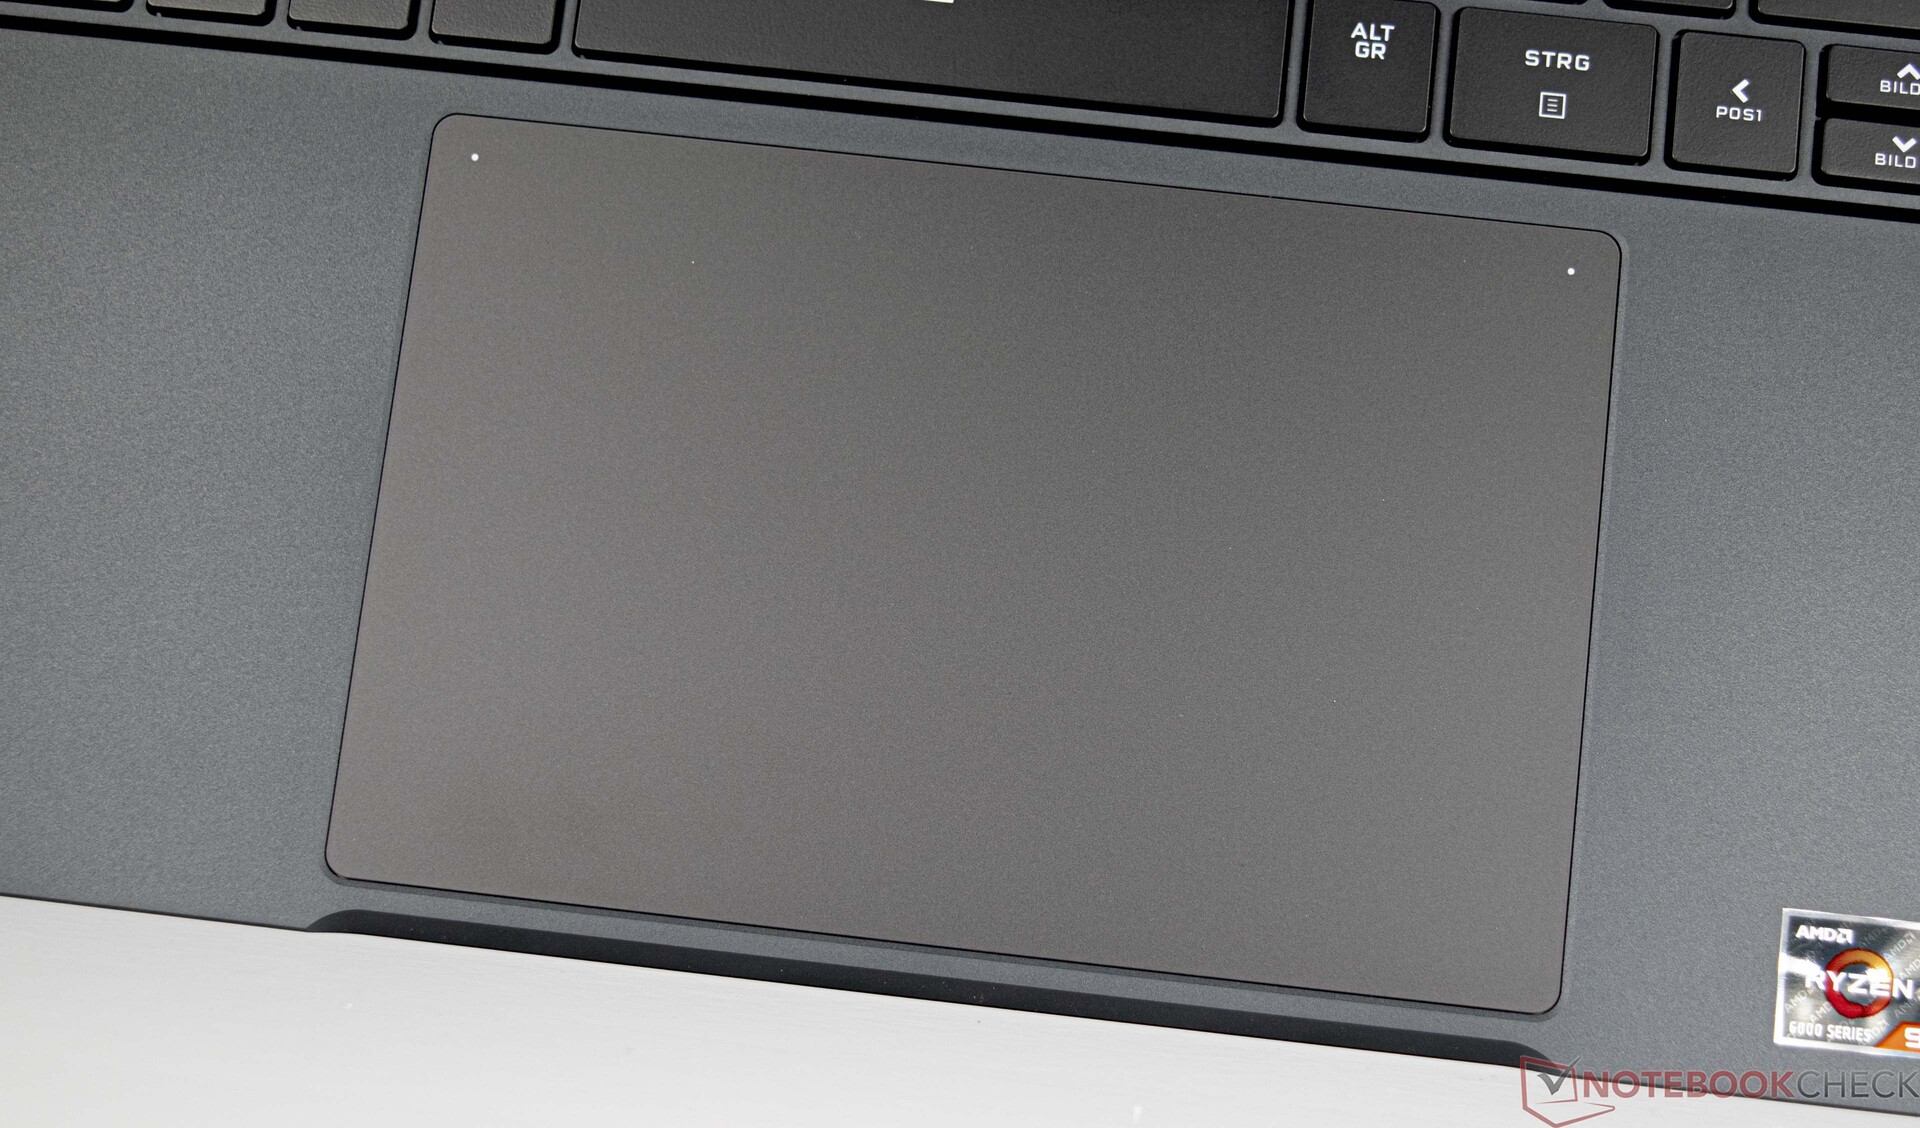
Il touchpad misura ben 15,5 centimetri in larghezza e 10 centimetri in profondità. Il ClickPad è quindi molto grande e nella pratica è più adatto a sostituire il mouse. Se l'area di input attiva è troppo grande, è possibile disattivare il lato destro toccando due volte il punto bianco nell'angolo superiore sinistro. Non c'è però alcuna indicazione ottica o aptica per questa funzione. La superficie in vetro ha una sottile finitura satinata, comoda da usare anche con le dita un po' sudate. I due tasti di input nell'area inferiore funzionano bene e sono abbastanza silenziosi quando vengono premuti.
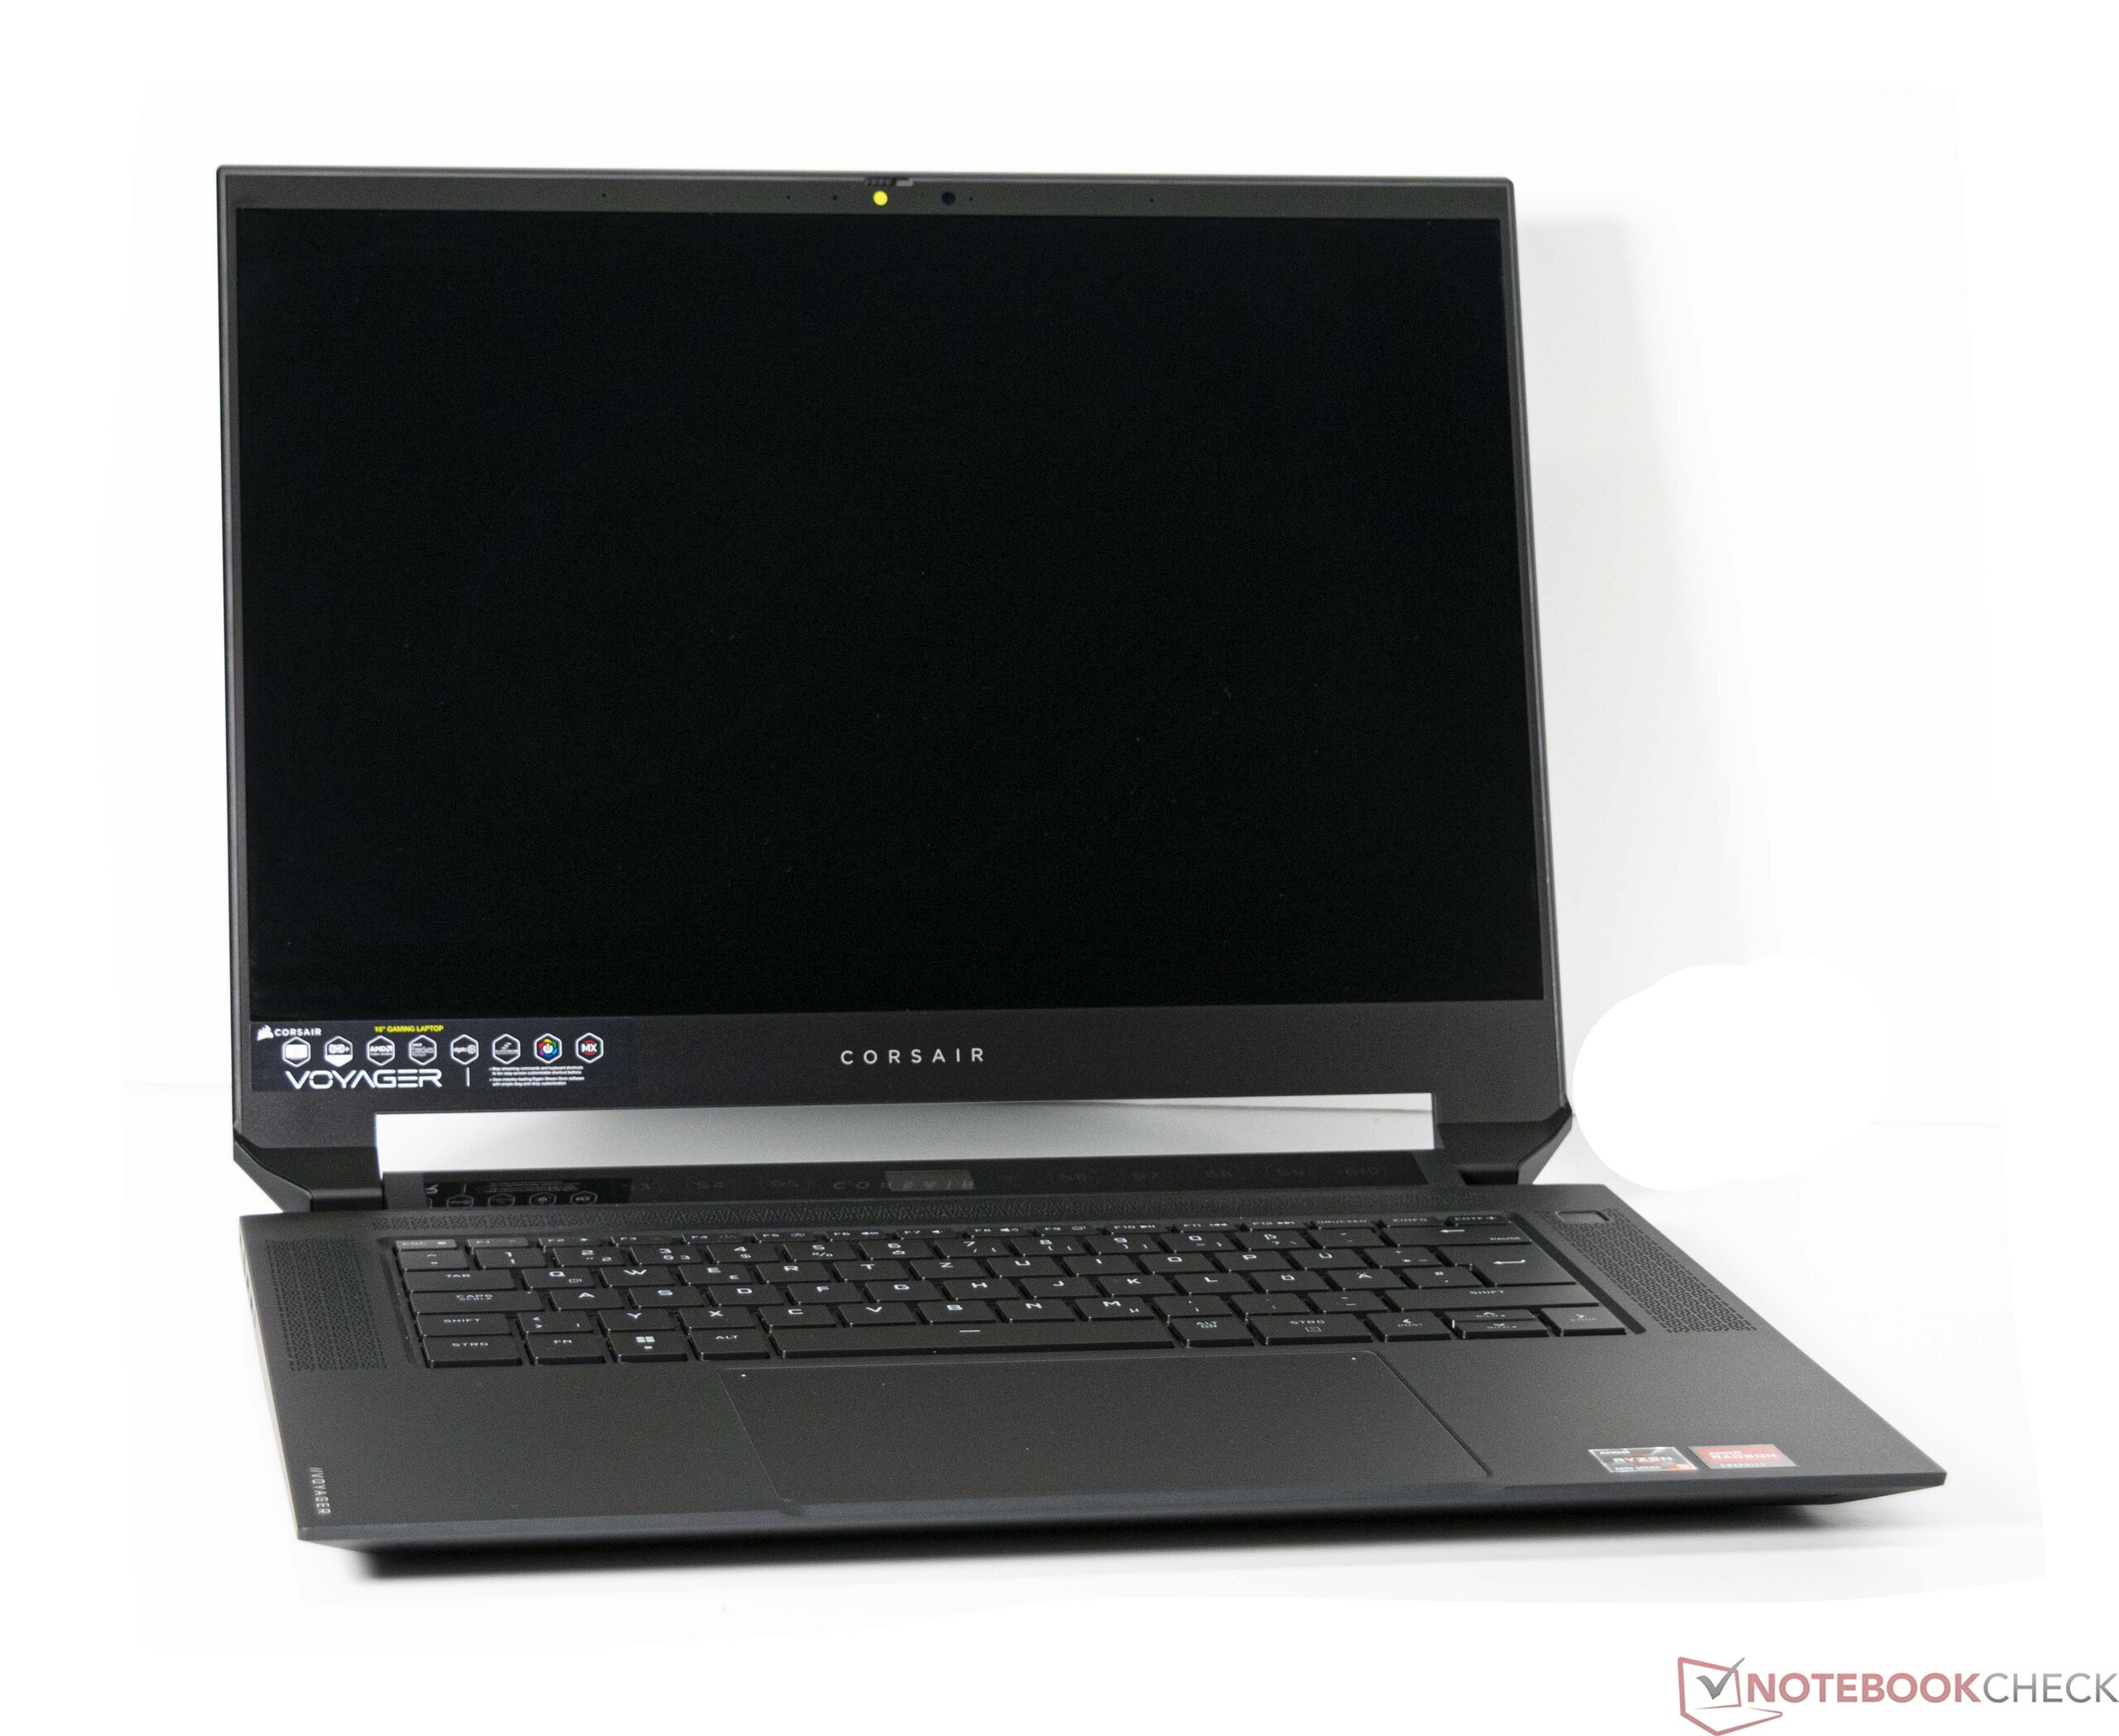
Display - Pannello veloce 16:10
Il display del Corsair Voyager a1600 è un pannello IPS da 16 pollici con 240 Hz. Il formato 16:10, con una risoluzione di 2.560 x 1.600 pixel, offre un'ampia superficie di lavoro. Per il Voyager a1600 non sono previste varianti di display alternative.
Nei nostri test, il pannello installato raggiunge una buona luminosità di 340 cd/m². Tuttavia, i concorrenti offrono chiaramente display più luminosi. A causa del valore del nero relativamente alto, il rapporto di contrasto ne risente notevolmente. Nel nostro test, il Voyager a1600 raggiunge un contrasto di soli 670:1.
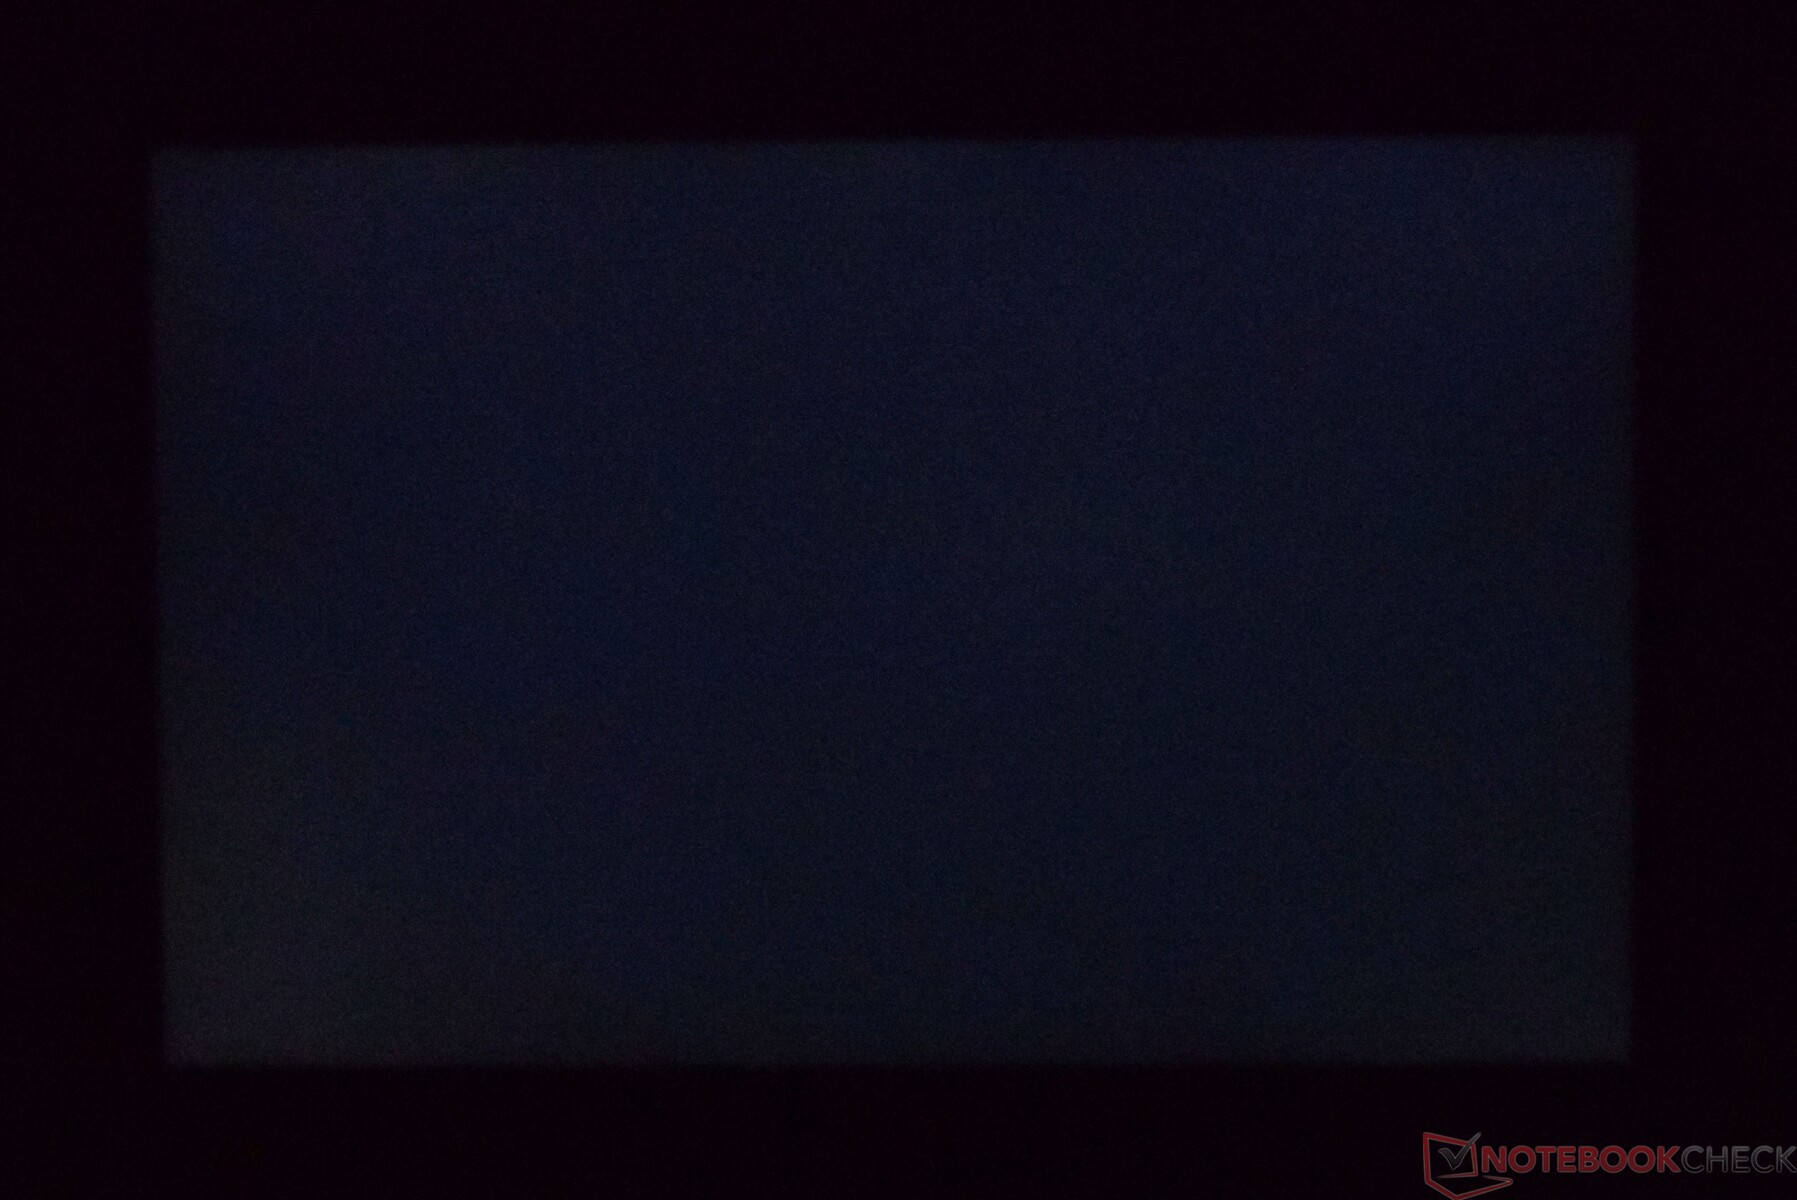
L'affaticamento degli occhi dovuto al PWM non dovrebbe essere un problema con il Corsair Voyager a1600. Il bleeding della retroilluminazione non è stato un problema con il nostro dispositivo.
| |||||||||||||||||||||||||
Distribuzione della luminosità: 91 %
Al centro con la batteria: 328 cd/m²
Contrasto: 670:1 (Nero: 0.53 cd/m²)
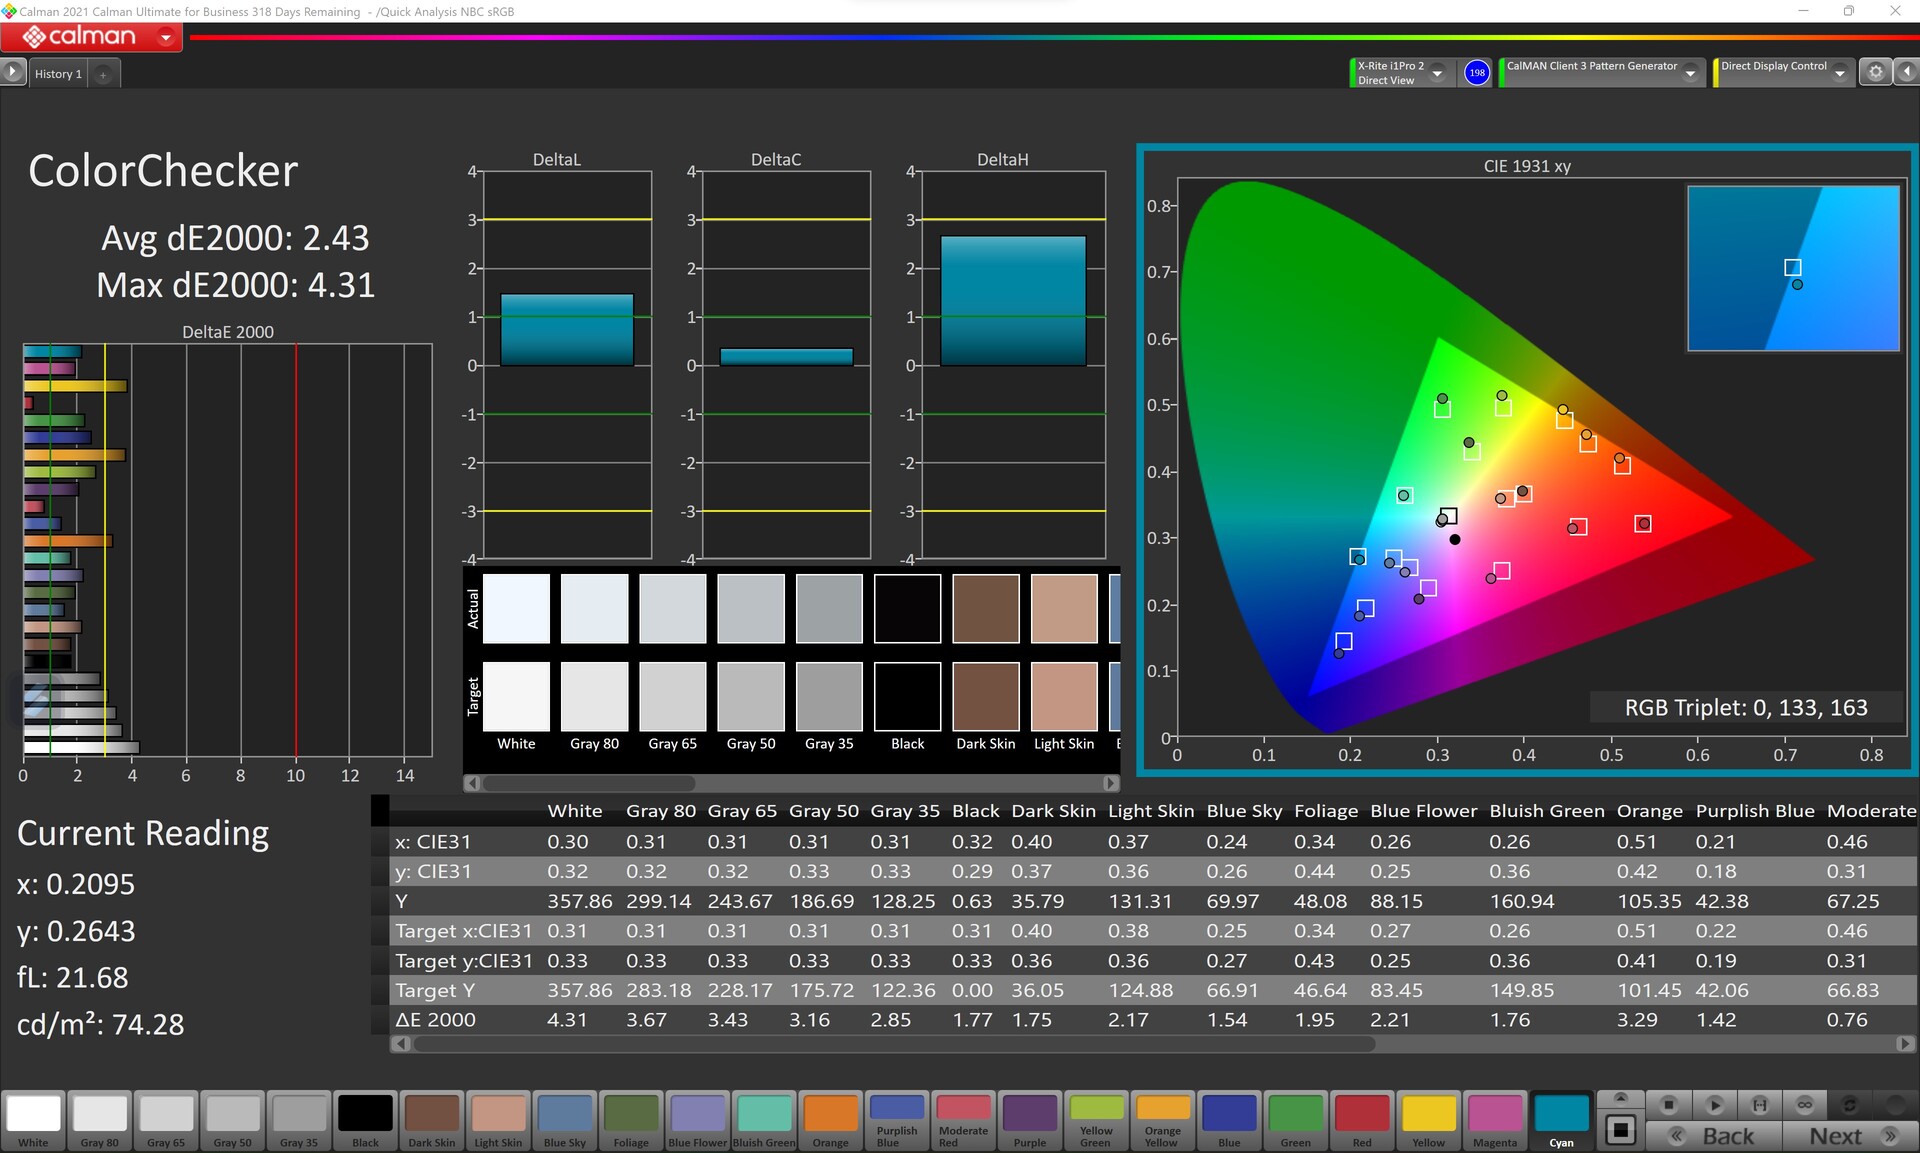
ΔE ColorChecker Calman: 2.43 | ∀{0.5-29.43 Ø4.71}
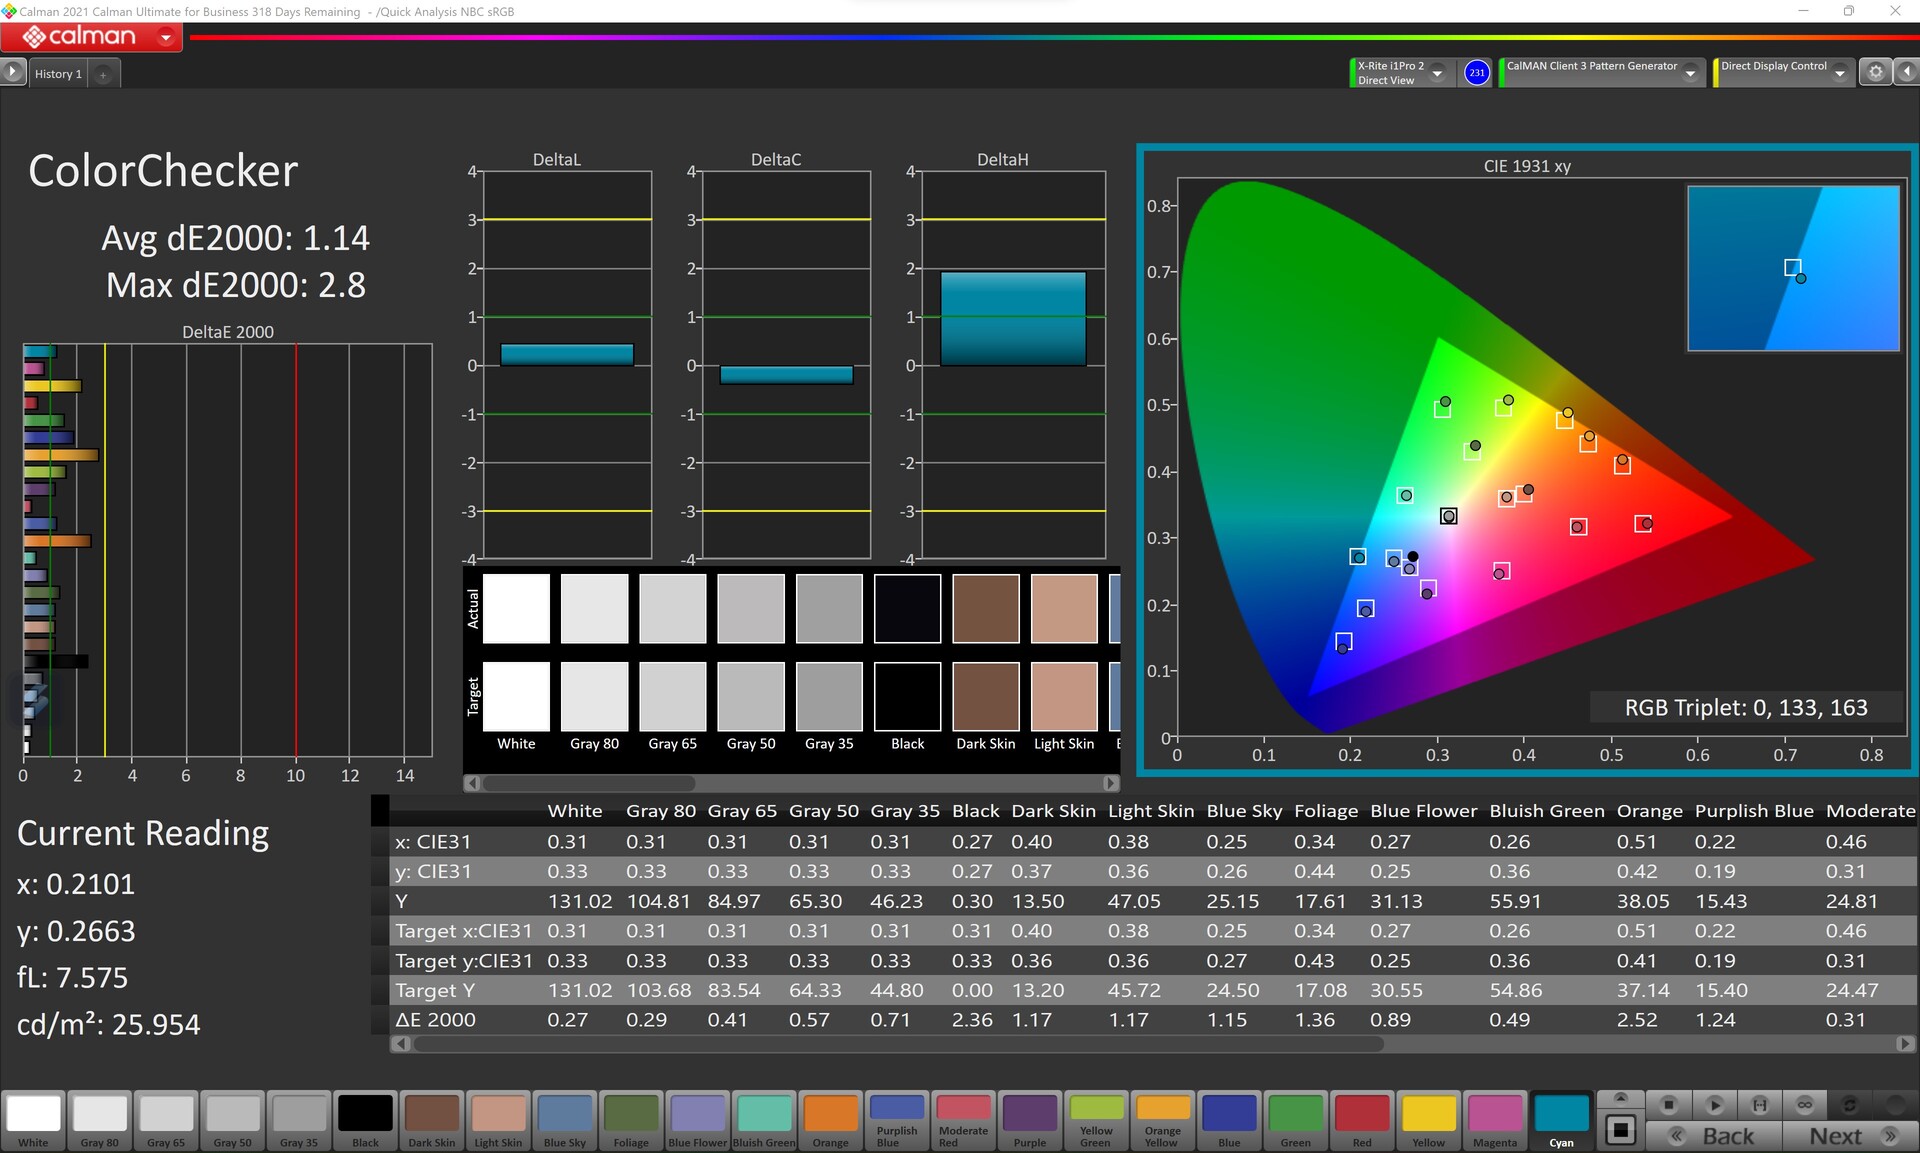
calibrated: 1.14
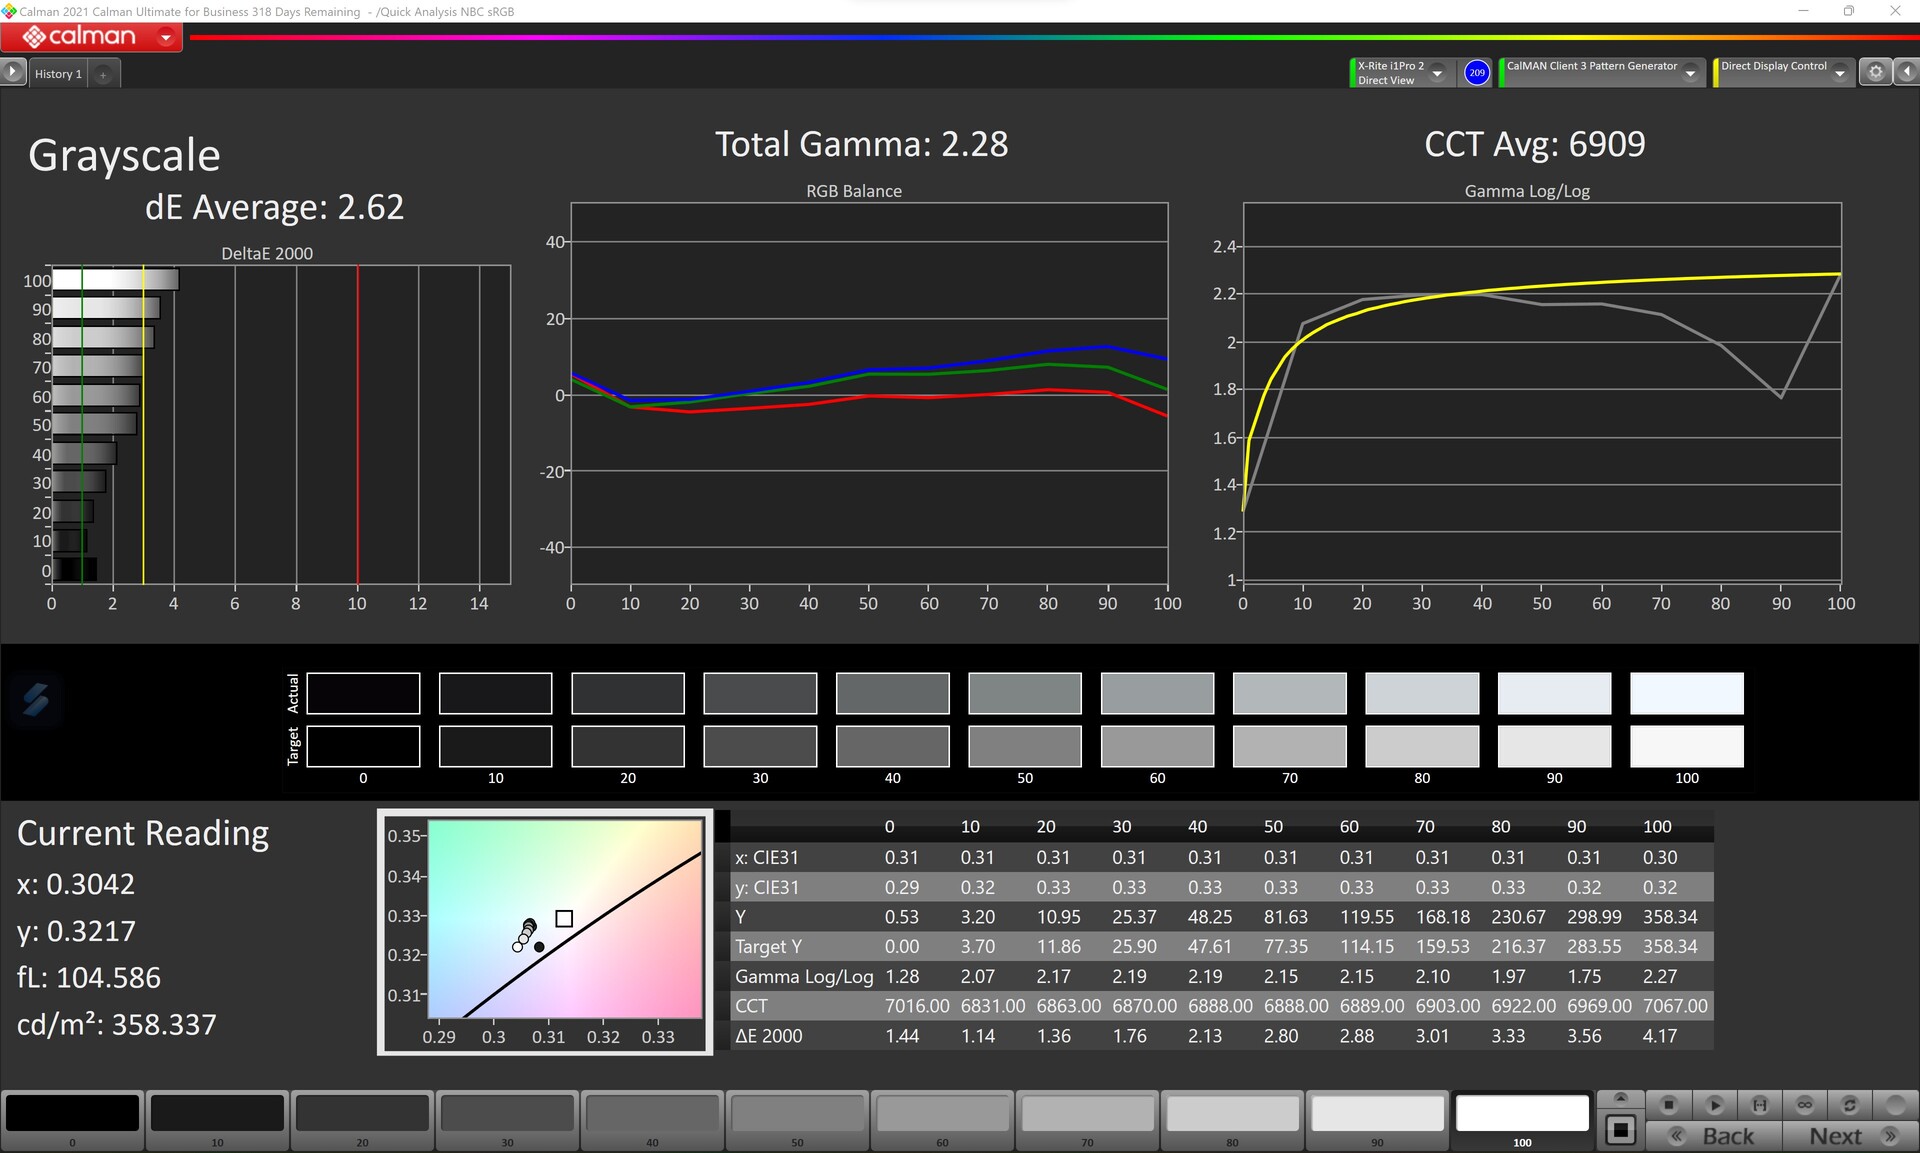
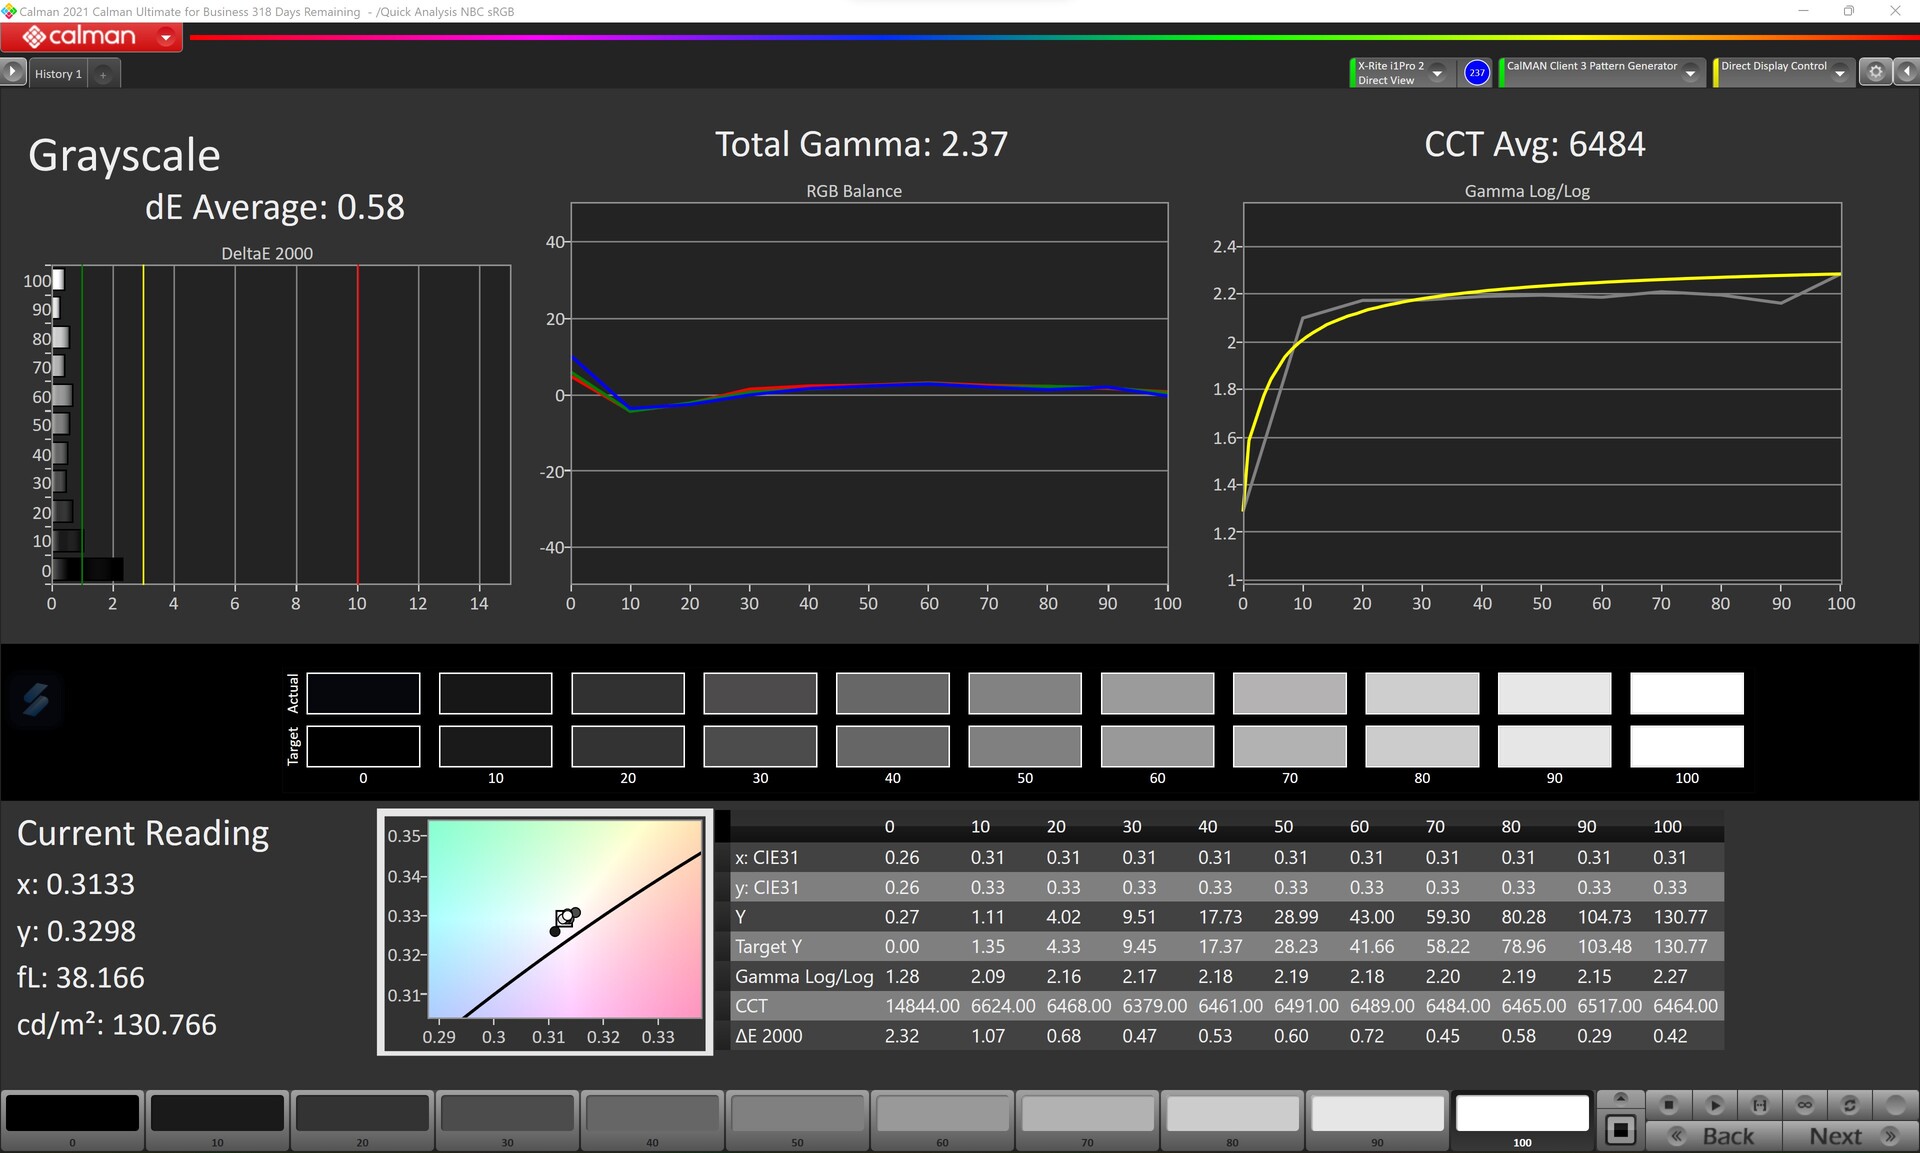
ΔE Greyscale Calman: 2.62 | ∀{0.09-98 Ø4.96}
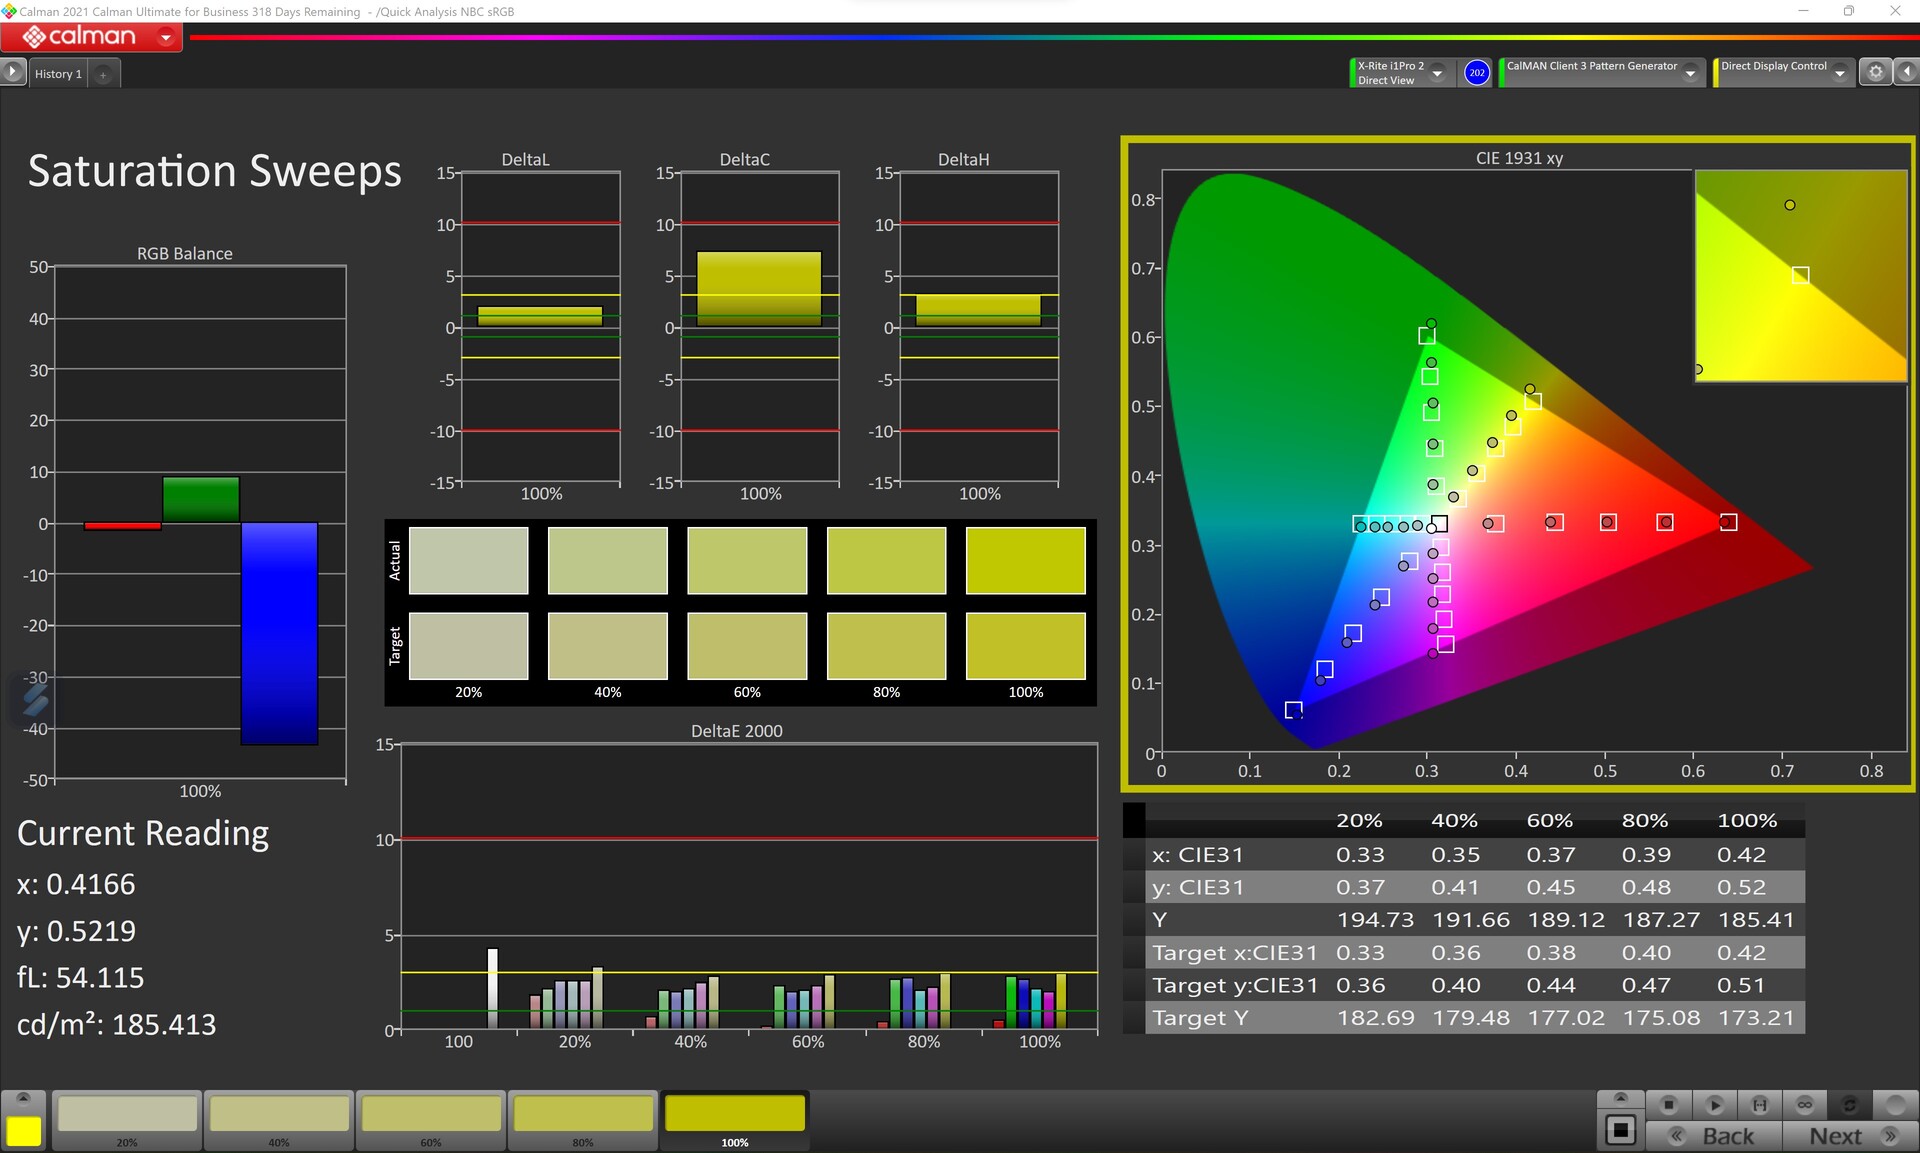
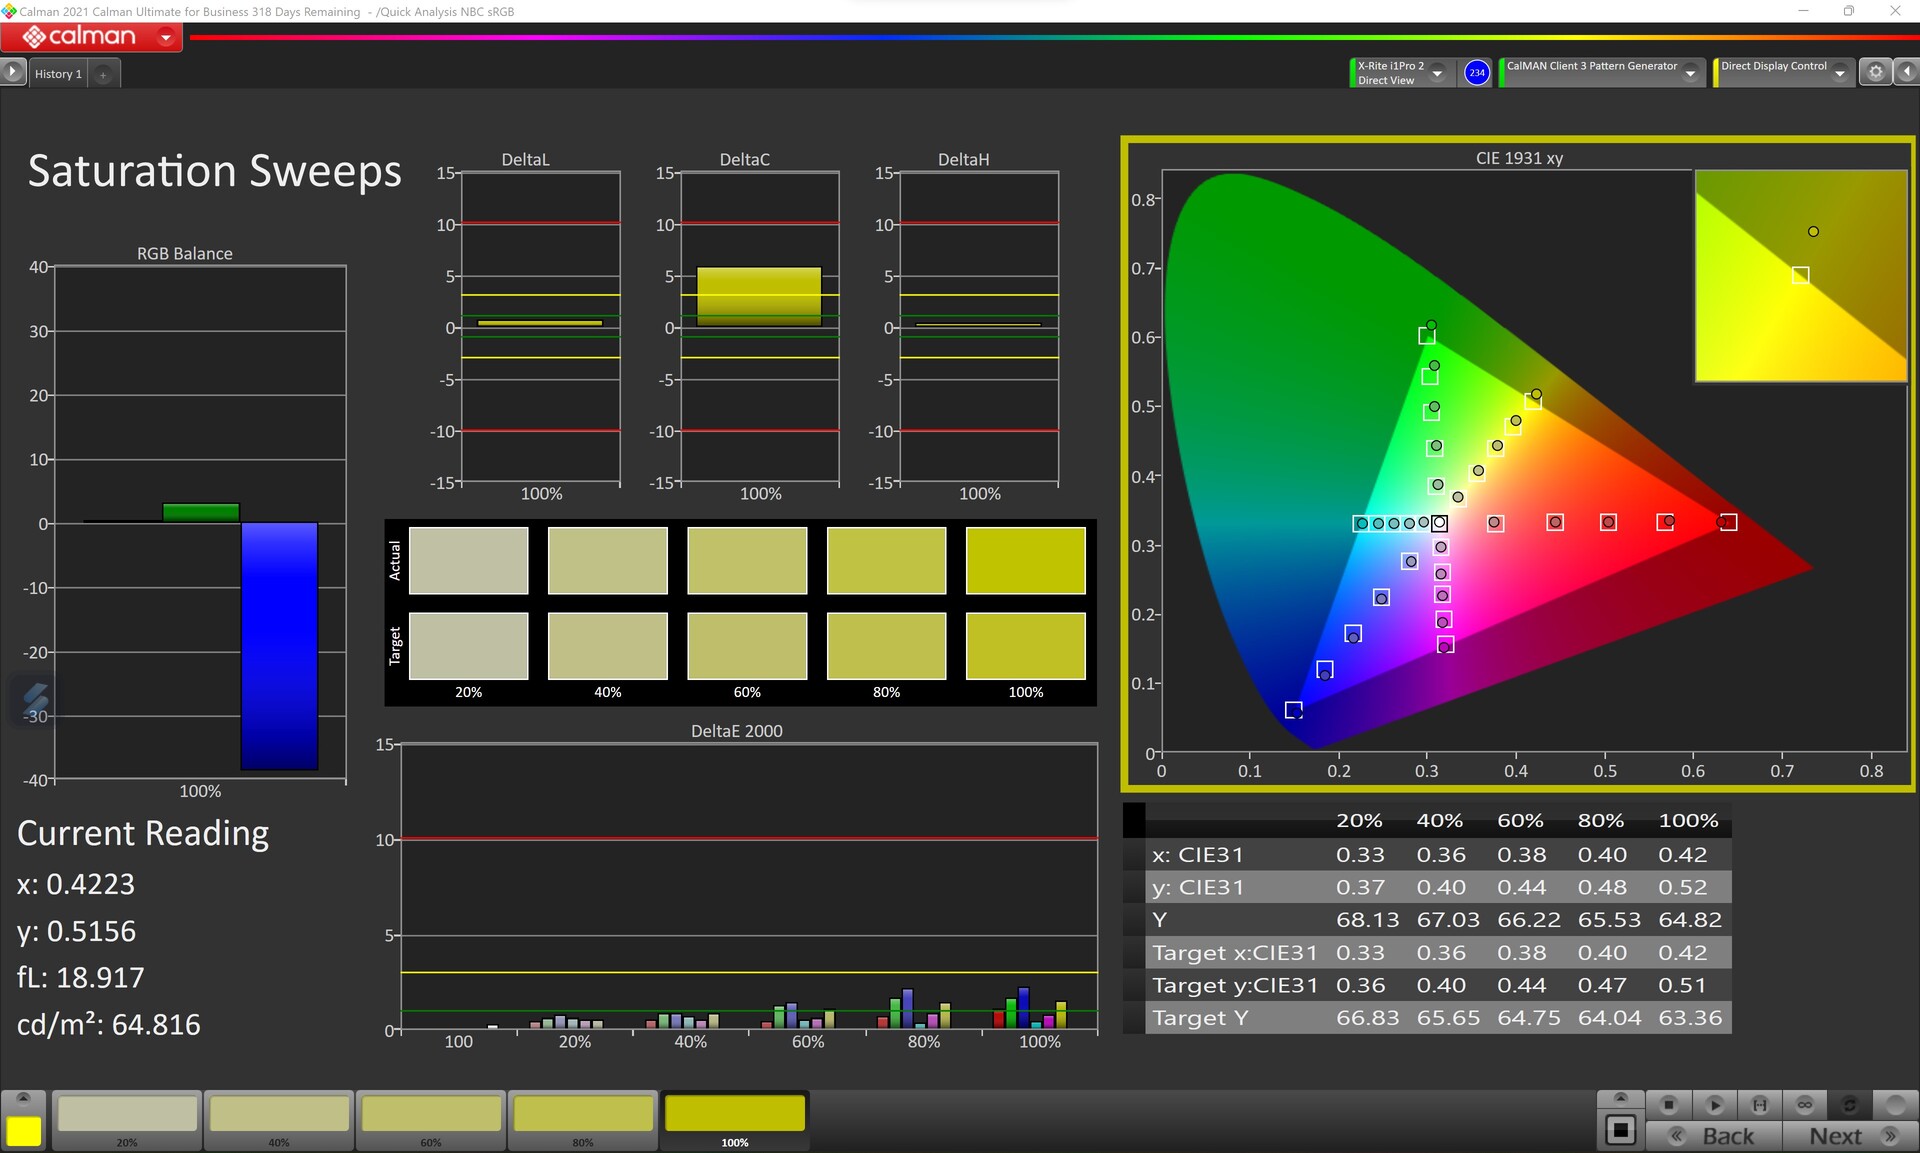
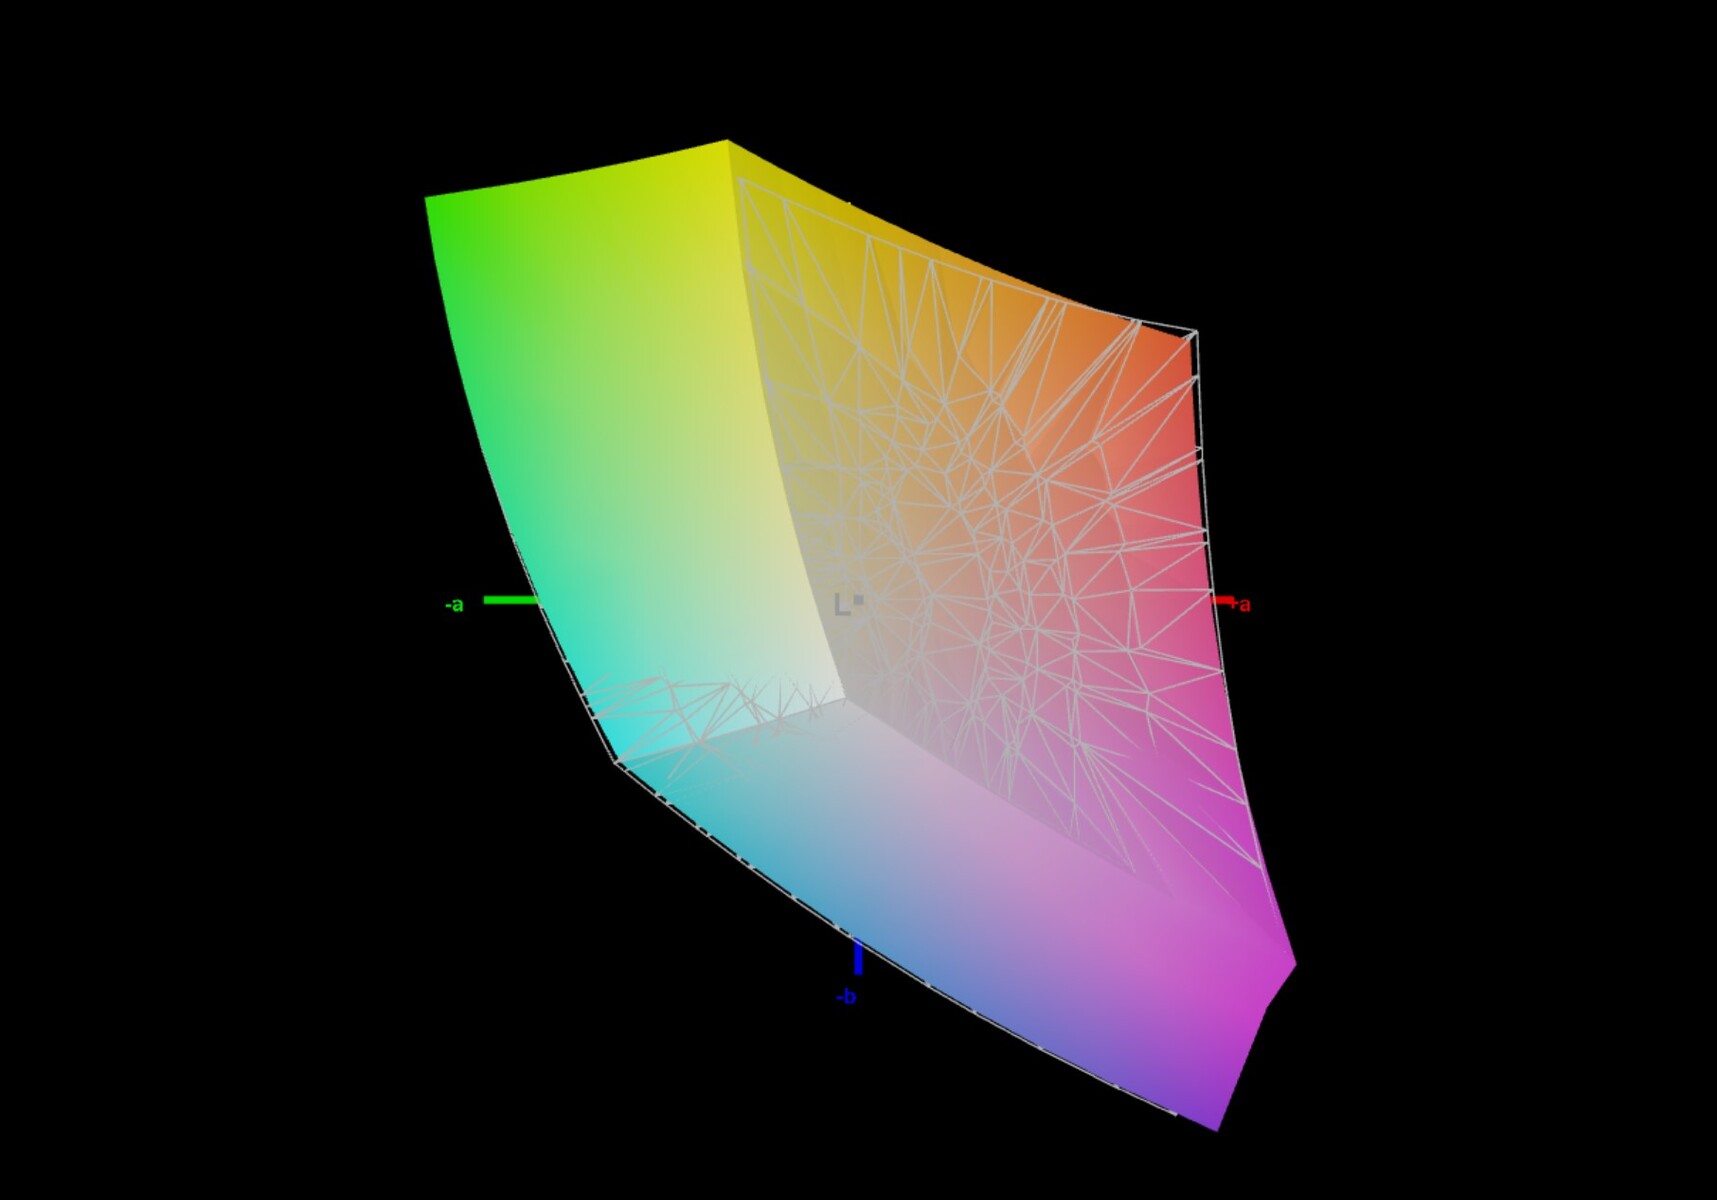
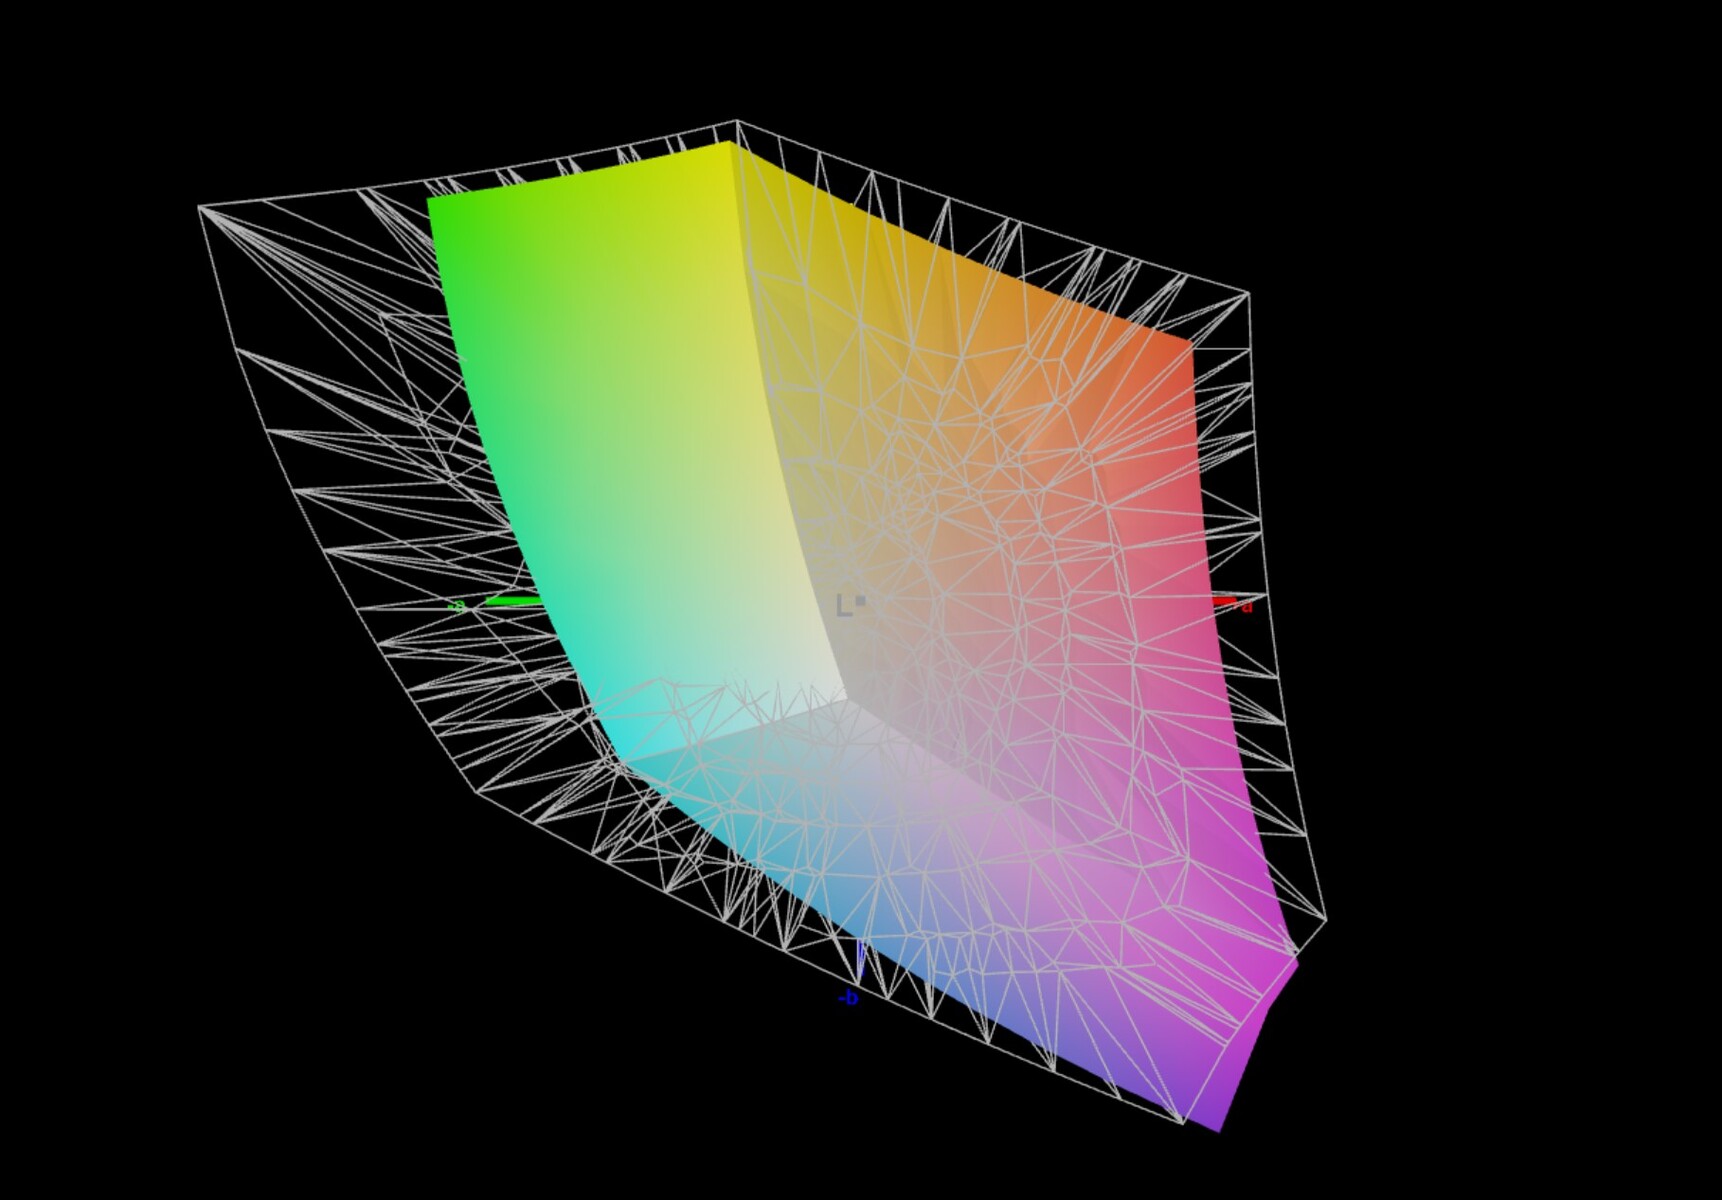
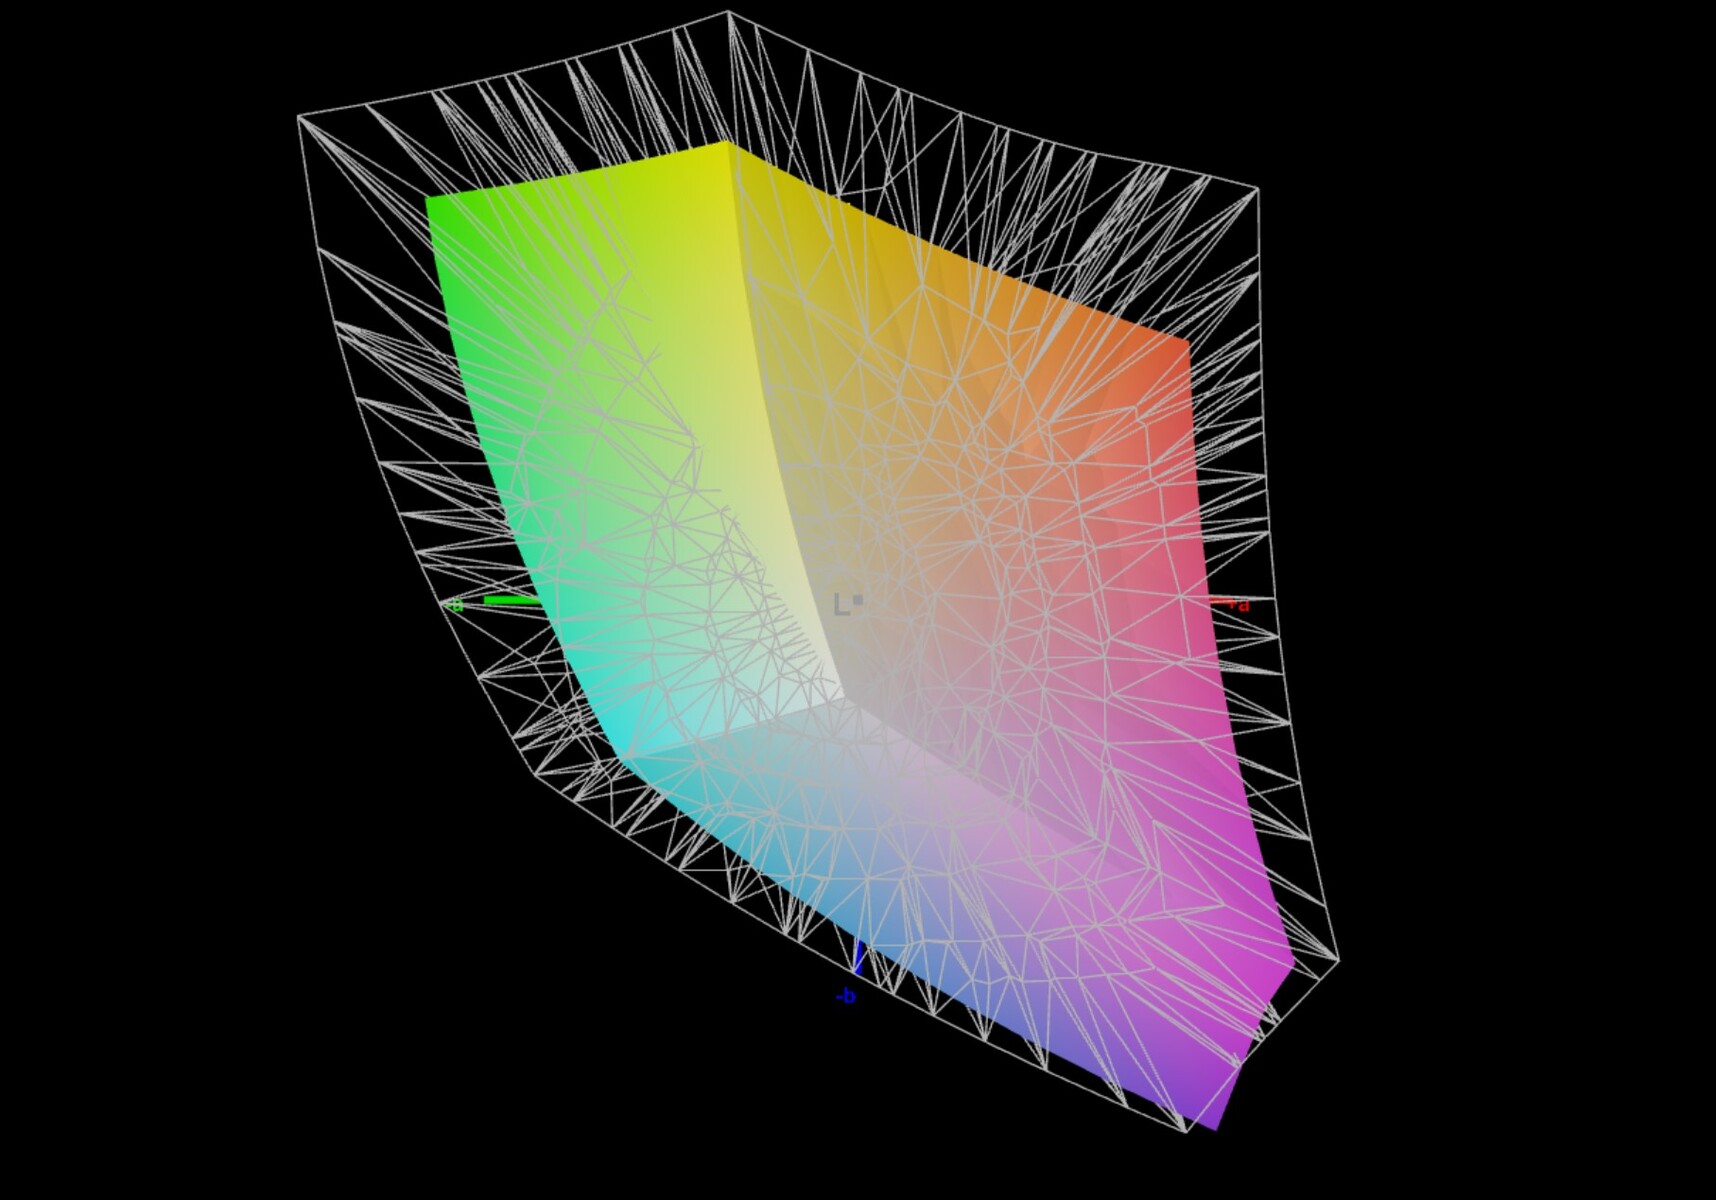
70.1% AdobeRGB 1998 (Argyll 3D)
98.2% sRGB (Argyll 3D)
68.7% Display P3 (Argyll 3D)
Gamma: 2.28
CCT: 6909 K
| Corsair Voyager a1600 BOE0A3B, IPS, 2560x1600, 16" | Asus ROG Flow X16 GV601RW-M5082W AUO B160QAN02.S, Mini LED, 2560x1600, 16.1" | Lenovo Legion 7 16ARHA7 BOE CQ NE160QDM-NY1, IPS, 2560x1600, 16" | Acer Predator Triton 500 SE PT516-52s-70KX NE160QDM-NZ2, IPS LED, 2560x1600, 16" | HP Omen 16-b1090ng BOE09E5, IPS, 2560x1440, 16.1" | Lenovo Legion 7 16IAX7-82TD004SGE NE160QDM-NY1, IPS, 2560x1600, 16" | |
|---|---|---|---|---|---|---|
| Display | 25% | -5% | 22% | 3% | 1% | |
| Display P3 Coverage (%) | 68.7 | 99.82 45% | 63.7 -7% | 97.3 42% | 71 3% | 69.3 1% |
| sRGB Coverage (%) | 98.2 | 99.99 2% | 95.3 -3% | 100 2% | 97.9 0% | 98.2 0% |
| AdobeRGB 1998 Coverage (%) | 70.1 | 90.21 29% | 65.7 -6% | 84.9 21% | 73.3 5% | 70.8 1% |
| Response Times | 3% | 17% | 15% | -3% | 24% | |
| Response Time Grey 50% / Grey 80% * (ms) | 13 ? | 11 ? 15% | 9.2 ? 29% | 13.8 ? -6% | 14.5 ? -12% | 12.6 ? 3% |
| Response Time Black / White * (ms) | 10 ? | 11 ? -10% | 9.6 ? 4% | 6.4 ? 36% | 9.4 ? 6% | 5.6 ? 44% |
| PWM Frequency (Hz) | 7400 ? | |||||
| Screen | 71% | 12% | 29% | -30% | 18% | |
| Brightness middle (cd/m²) | 355 | 498 40% | 478.8 35% | 498 40% | 335 -6% | 547 54% |
| Brightness (cd/m²) | 340 | 502 48% | 477 40% | 468 38% | 319 -6% | 523 54% |
| Brightness Distribution (%) | 91 | 94 3% | 90 -1% | 80 -12% | 90 -1% | 88 -3% |
| Black Level * (cd/m²) | 0.53 | 0.11 79% | 0.43 19% | 0.36 32% | 0.28 47% | 0.44 17% |
| Contrast (:1) | 670 | 4527 576% | 1113 66% | 1383 106% | 1196 79% | 1243 86% |
| Colorchecker dE 2000 * | 2.43 | 1.87 23% | 2.24 8% | 1.77 27% | 4.38 -80% | 2.1 14% |
| Colorchecker dE 2000 max. * | 4.31 | 6.15 -43% | 4.49 -4% | 5.24 -22% | 9.48 -120% | 7 -62% |
| Colorchecker dE 2000 calibrated * | 1.14 | 1.94 -70% | 1.89 -66% | 0.63 45% | 1.33 -17% | 0.9 21% |
| Greyscale dE 2000 * | 2.62 | 3.15 -20% | 2.3 12% | 2.4 8% | 7 -167% | 3.2 -22% |
| Gamma | 2.28 96% | 330.95 1% | 2.25 98% | 2.14 103% | 2.103 105% | 2.23 99% |
| CCT | 6909 94% | 7294 89% | 6955 93% | 7046 92% | 6244 104% | 6979 93% |
| Media totale (Programma / Settaggio) | 33% /
51% | 8% /
9% | 22% /
26% | -10% /
-19% | 14% /
15% |
* ... Meglio usare valori piccoli
La qualità del display è buona e anche la copertura dello spazio colore è notevole. Tuttavia, la concorrenza offre spesso tariffe migliori anche in questo confronto. Il nostro esemplare in prova può solo battere il Legion 7 di Lenovo in questa disciplina. A causa dei buoni valori Delta E-2000 della scala di grigi e dei colori rispetto allo spazio colore sRGB, presumiamo che Corsair fornisca il dispositivo con un display calibrato. Una calibrazione manuale migliora ancora leggermente i valori Delta E-2000. Tuttavia, la luminosità massima del display ne risente. Si consiglia di lasciare il display allo stato di consegna. La copertura dello spazio colore è sufficiente per l'editing semi-professionale di foto e video.
Tempi di risposta del Display
| ↔ Tempi di risposta dal Nero al Bianco | ||
|---|---|---|
| 10 ms ... aumenta ↗ e diminuisce ↘ combinato | ↗ 5 ms Incremento | 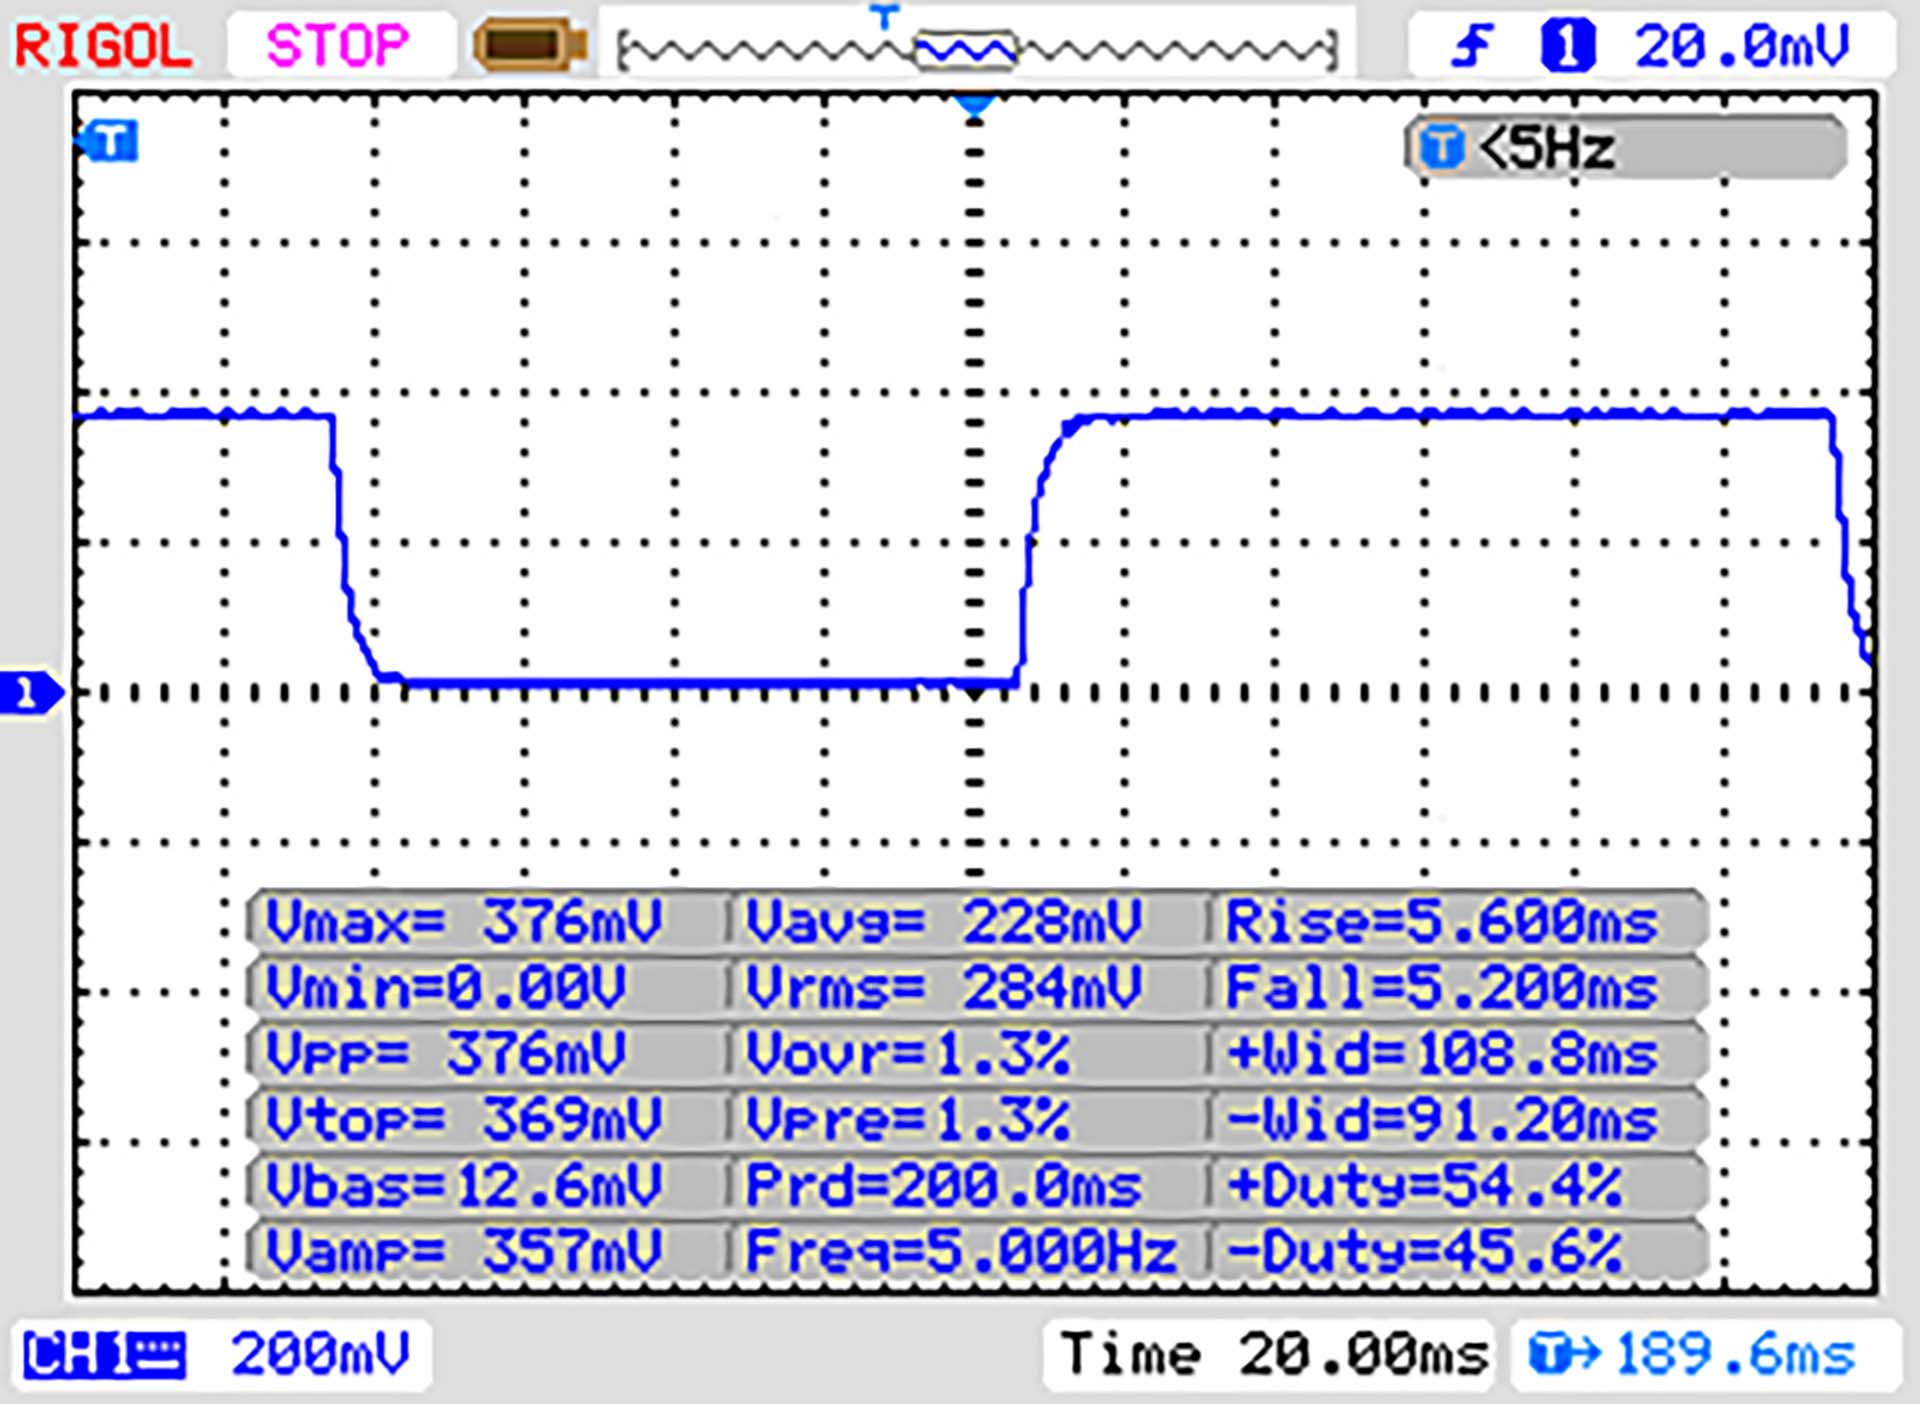 |
| ↘ 5 ms Calo | ||
| Lo schermo mostra buoni tempi di risposta durante i nostri tests, ma potrebbe essere troppo lento per i gamers competitivi. In confronto, tutti i dispositivi di test variano da 0.1 (minimo) a 240 (massimo) ms. » 27 % di tutti i dispositivi è migliore. Questo significa che i tempi di risposta rilevati sono migliori rispettto alla media di tutti i dispositivi testati (19.8 ms). | ||
| ↔ Tempo di risposta dal 50% Grigio all'80% Grigio | ||
| 13 ms ... aumenta ↗ e diminuisce ↘ combinato | ↗ 7 ms Incremento | 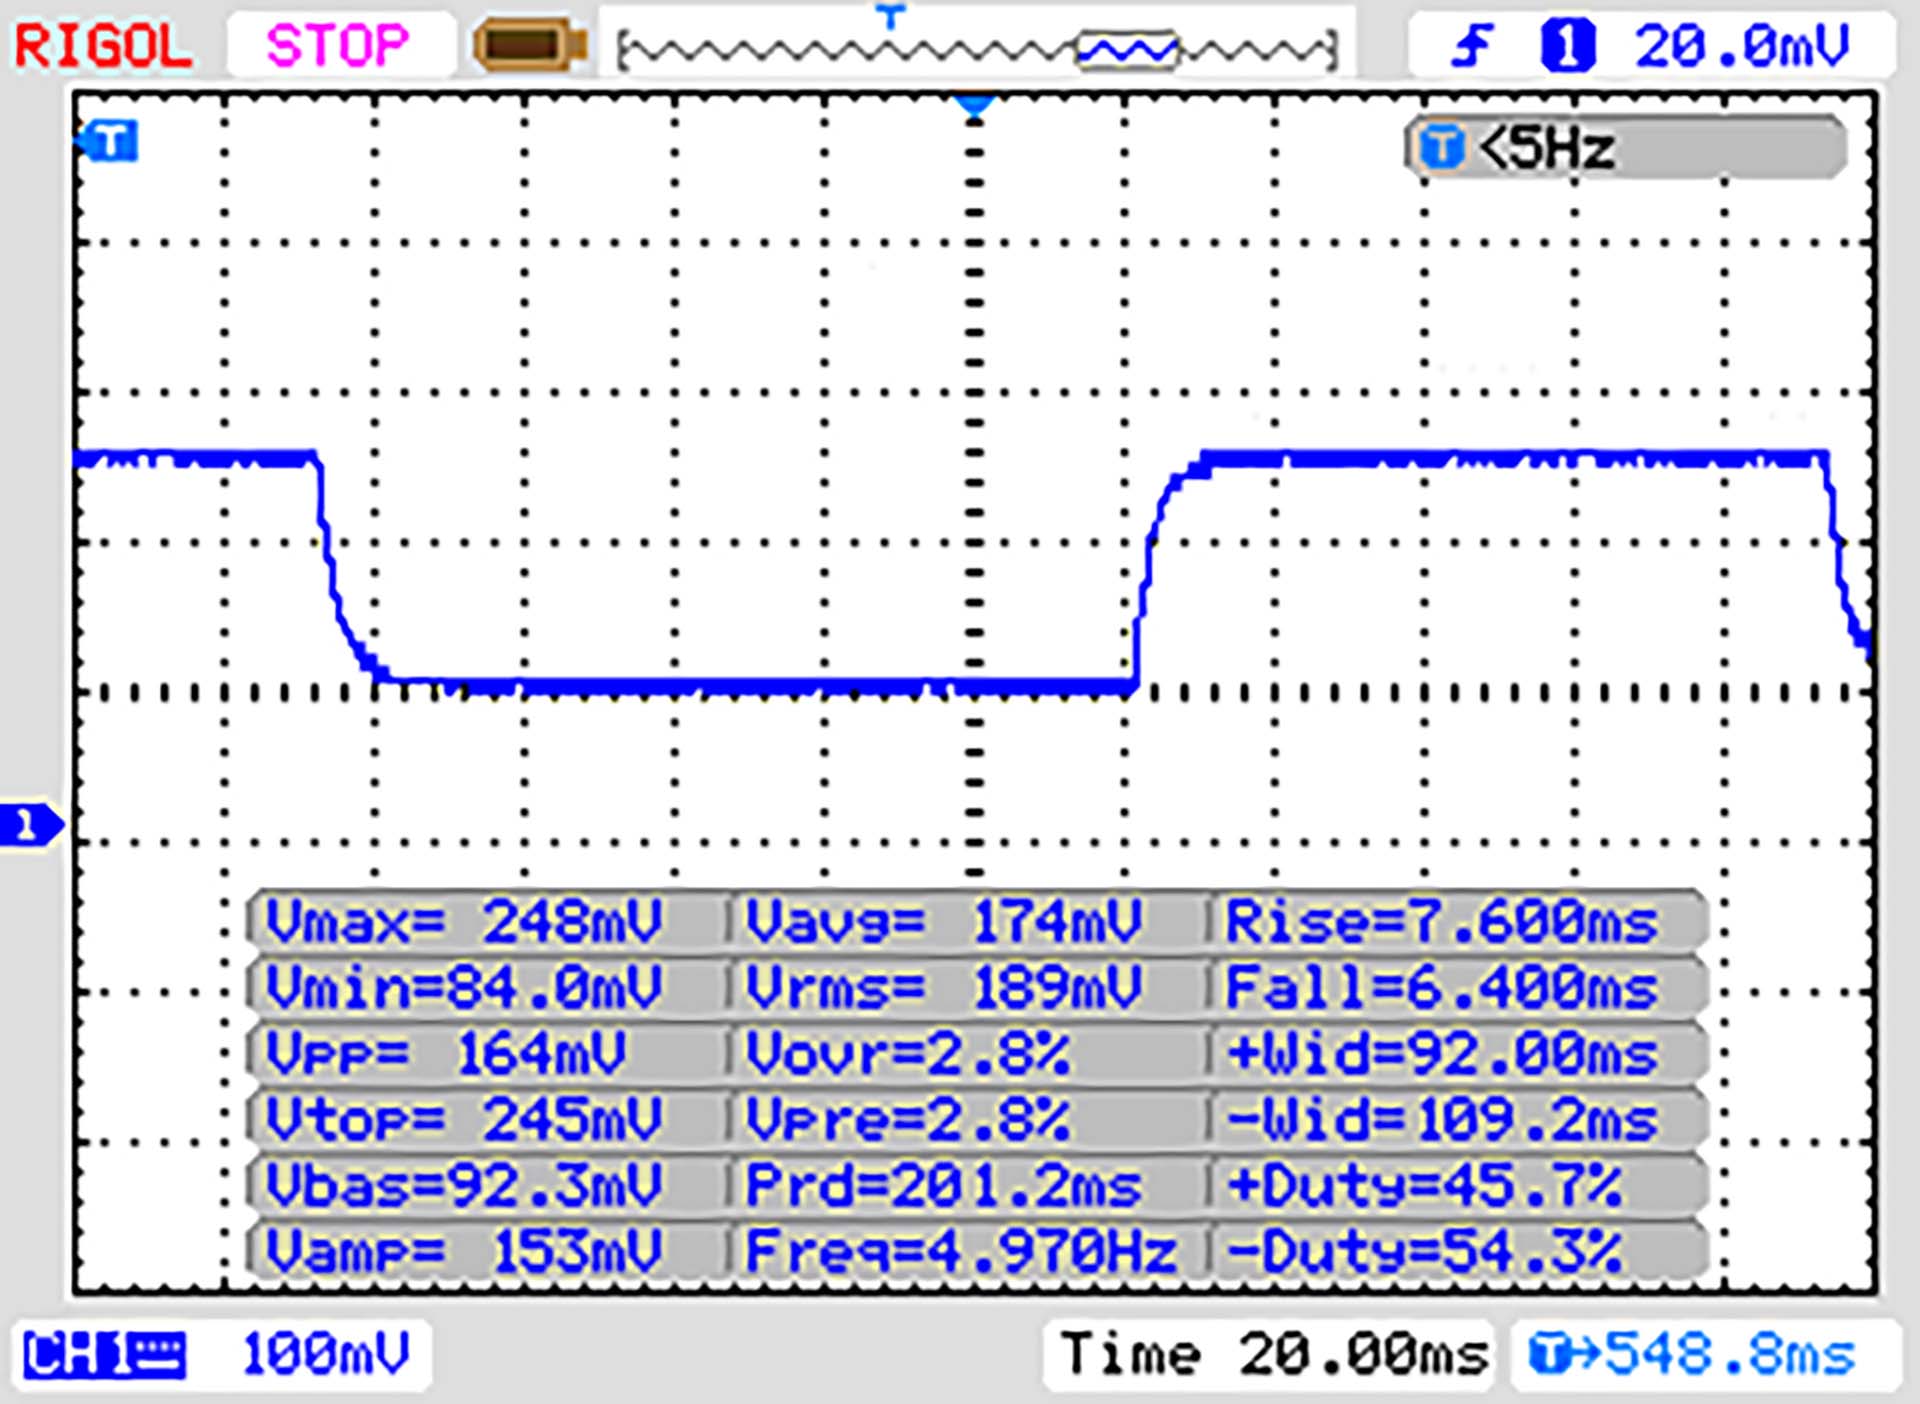 |
| ↘ 6 ms Calo | ||
| Lo schermo mostra buoni tempi di risposta durante i nostri tests, ma potrebbe essere troppo lento per i gamers competitivi. In confronto, tutti i dispositivi di test variano da 0.165 (minimo) a 636 (massimo) ms. » 27 % di tutti i dispositivi è migliore. Questo significa che i tempi di risposta rilevati sono migliori rispettto alla media di tutti i dispositivi testati (31 ms). | ||
Sfarfallio dello schermo / PWM (Pulse-Width Modulation)
| flickering dello schermo / PWM non rilevato | 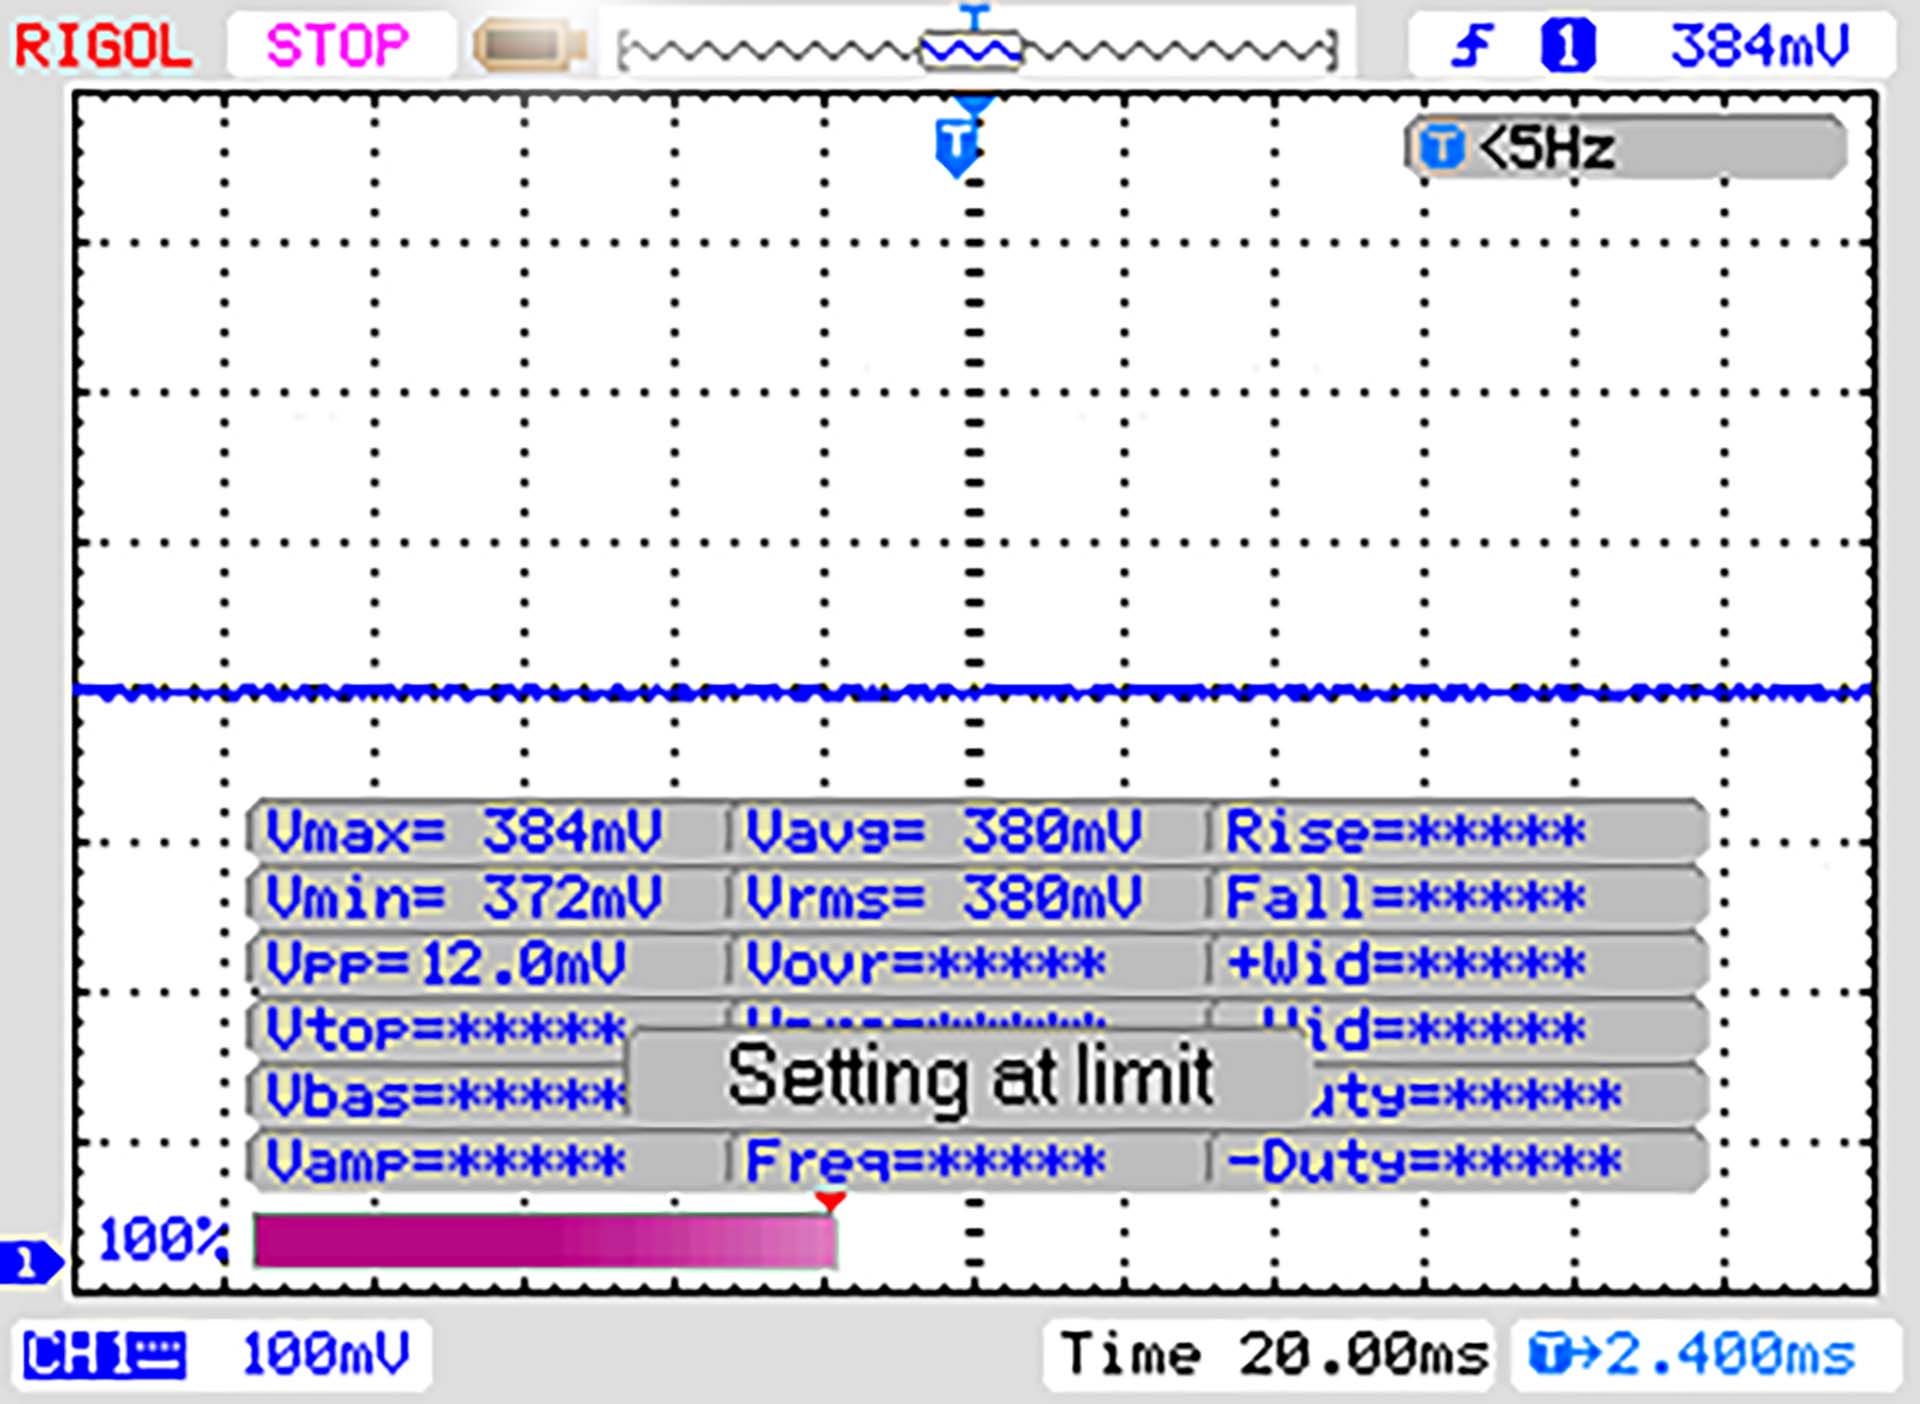 | ||
In confronto: 52 % di tutti i dispositivi testati non utilizza PWM per ridurre la luminosita' del display. Se è rilevato PWM, una media di 7747 (minimo: 5 - massimo: 343500) Hz è stata rilevata. | |||
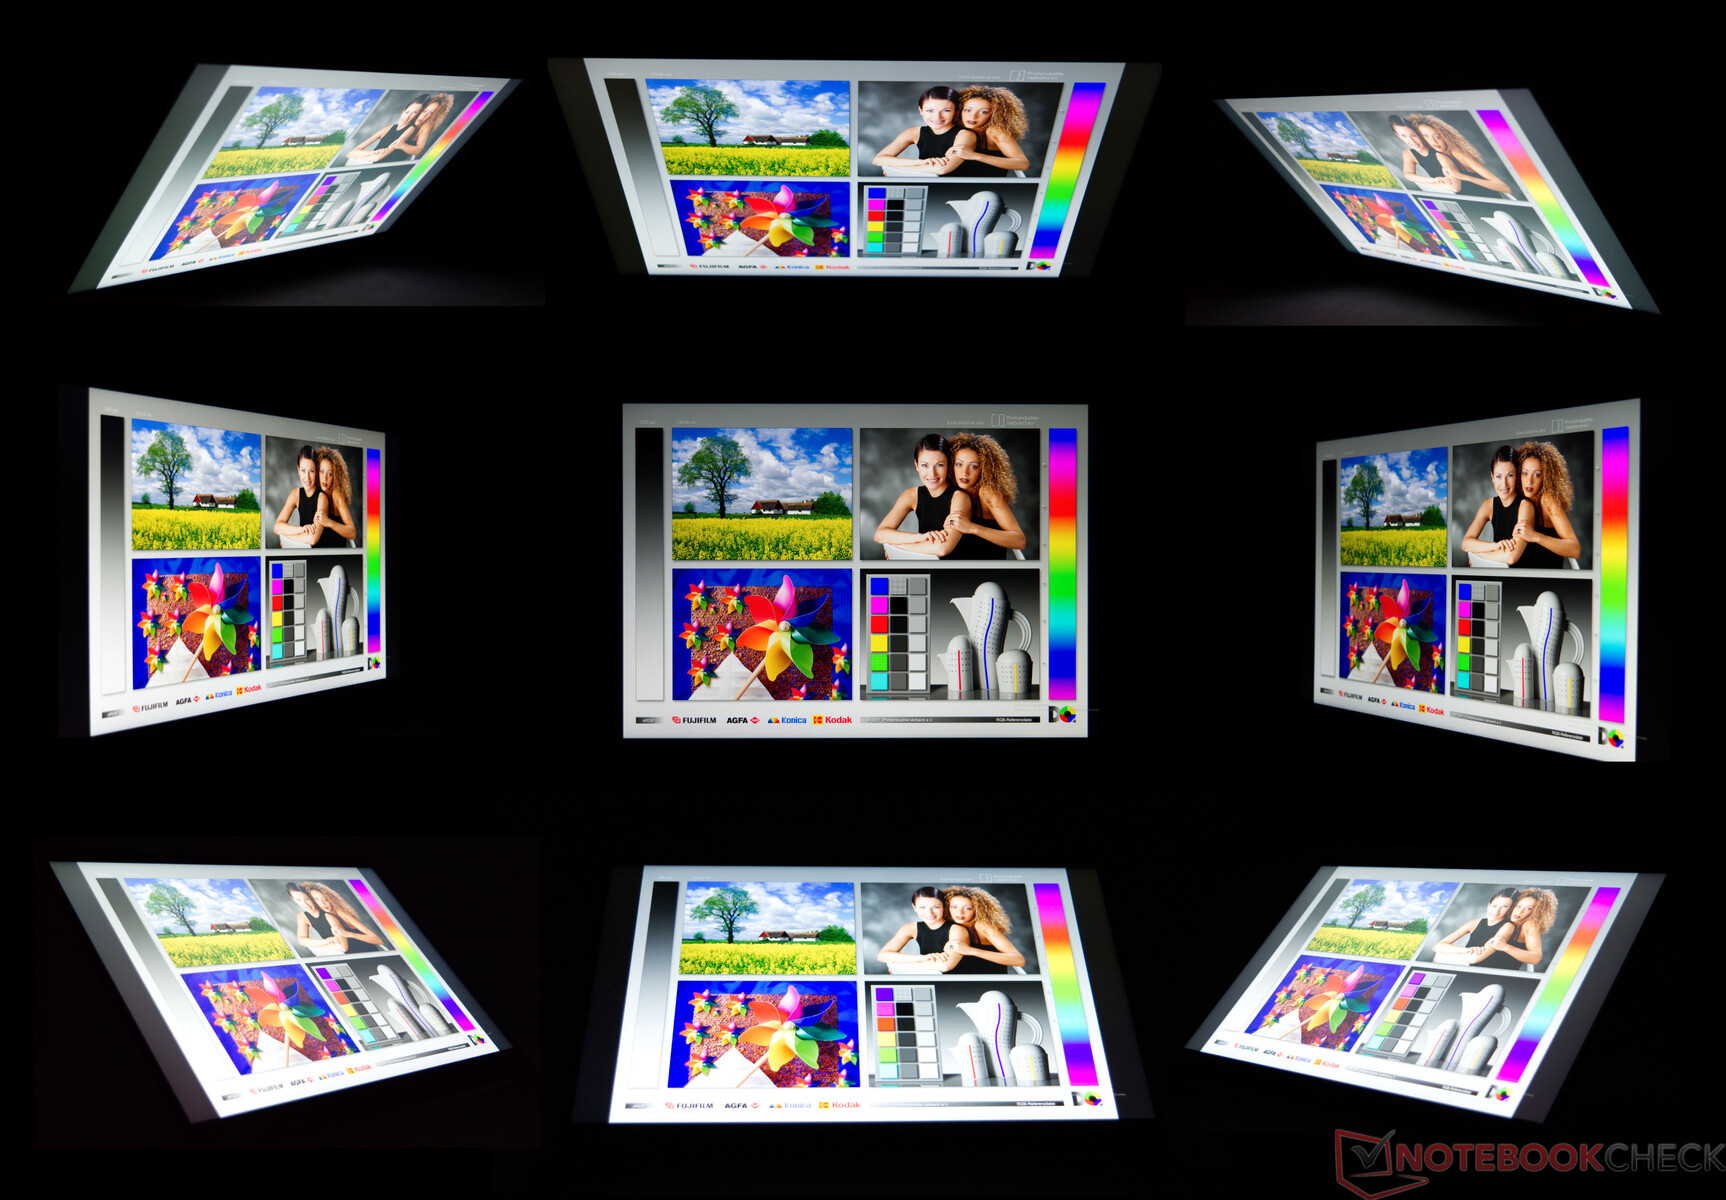
In linea di principio, la superficie opaca del display è adatta all'uso all'aperto. Tuttavia, la luminosità del display è relativamente bassa.
Il test dell'angolo di visione mostra il risultato di un tipico pannello IPS. Nelle immagini dei quattro angoli sono visibili lievi variazioni di colore, che non comportano alcuna limitazione nell'uso normale.
Prestazioni - Base Rembrandt con molta RAM e spazio di archiviazione
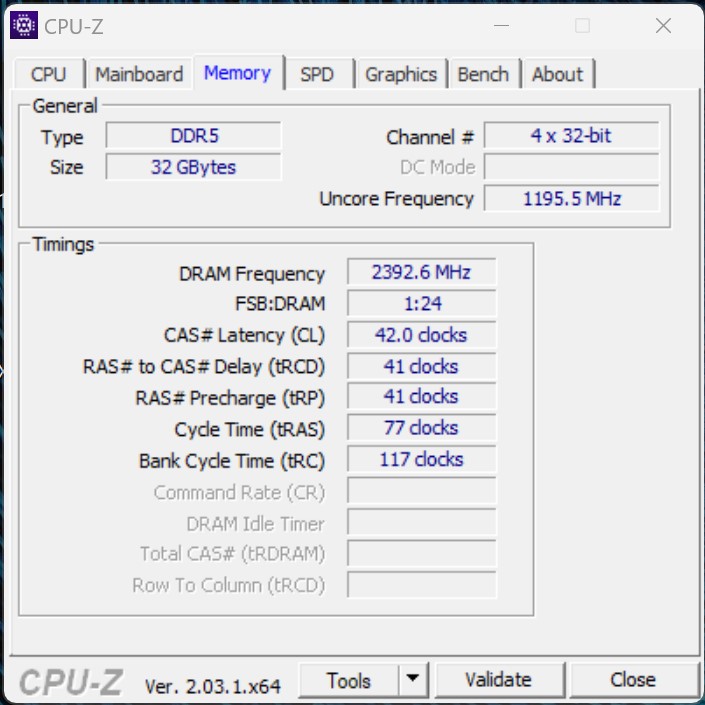
Il Corsair Voyager a1600 con la combinazione diAMD Ryzen 9 6900HSe la AMD Radeon RX 6800Moffre un'ottima base per giocare ai giochi attuali con il massimo dei dettagli su un portatile. Grazie alla memoria di lavoro da 32 GB e all'unità SSD da 2 TB, l'utente ottiene prestazioni decenti.
Condizioni di prova
Corsair offre la possibilità di utilizzare il dispositivo in tre diverse modalità, selezionabili tramite il software iCUE. Le opzioni sono Quiet
, Balanced
ed Extreme.
Le differenze risiedono nelle prestazioni massime disponibili per la CPU e la GPU anche in combinazione con la tecnologia Smart Shift. Tutti i test sulle prestazioni sono stati eseguiti con il profilo Extreme
.
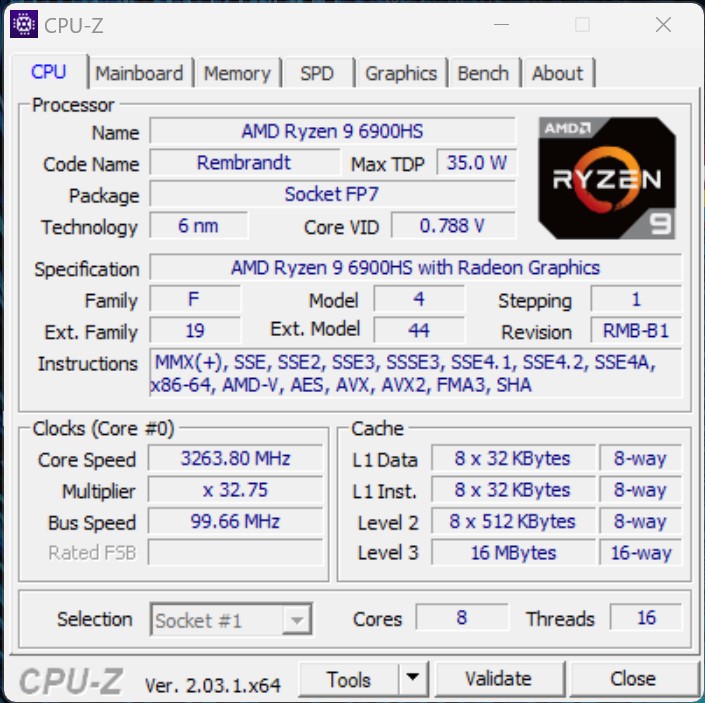
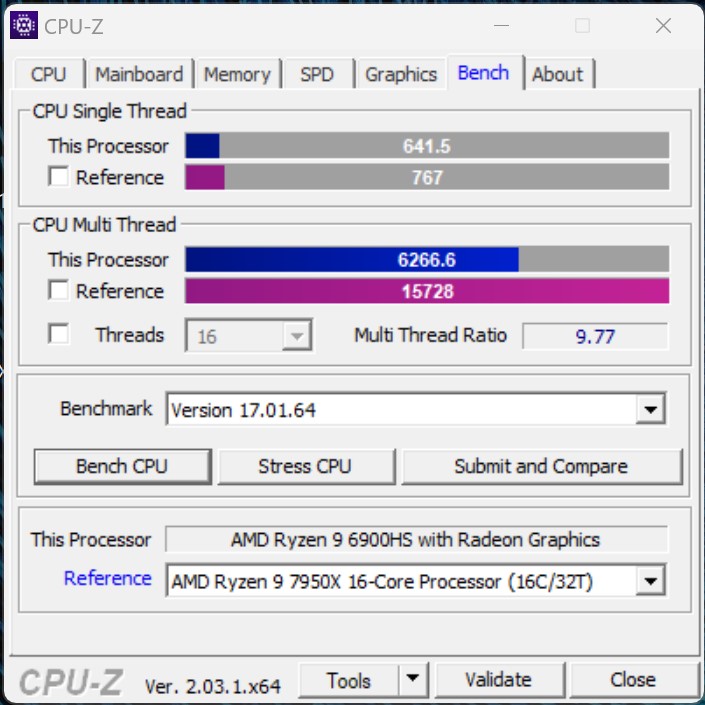
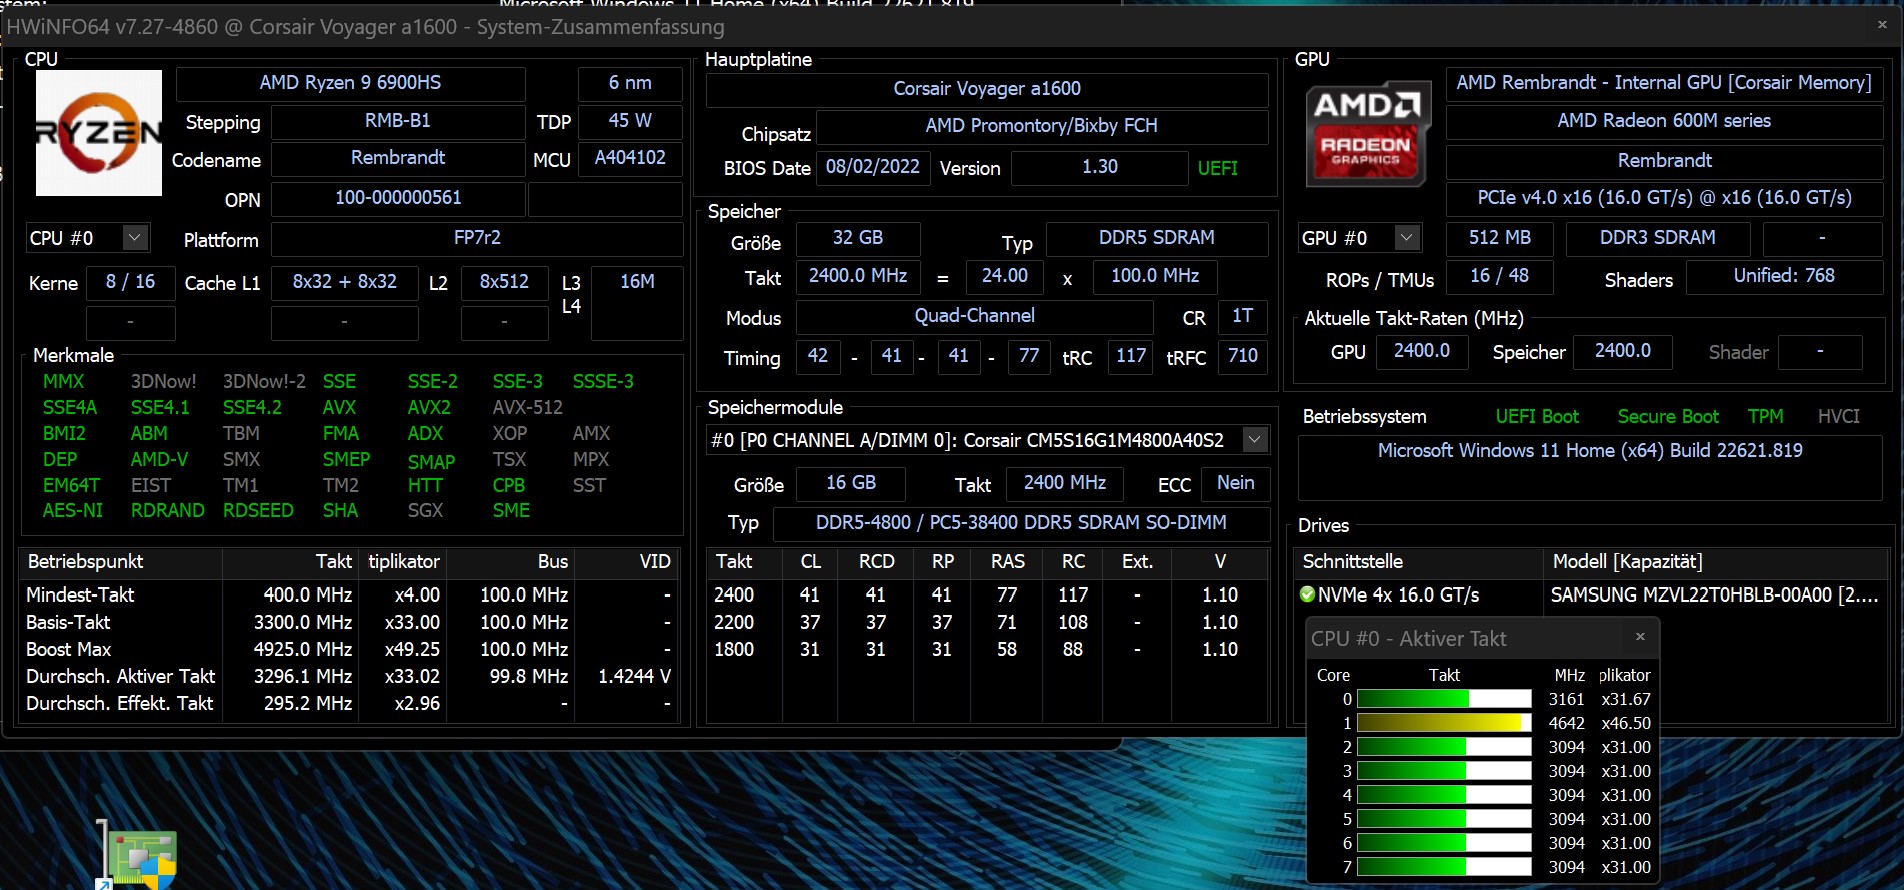
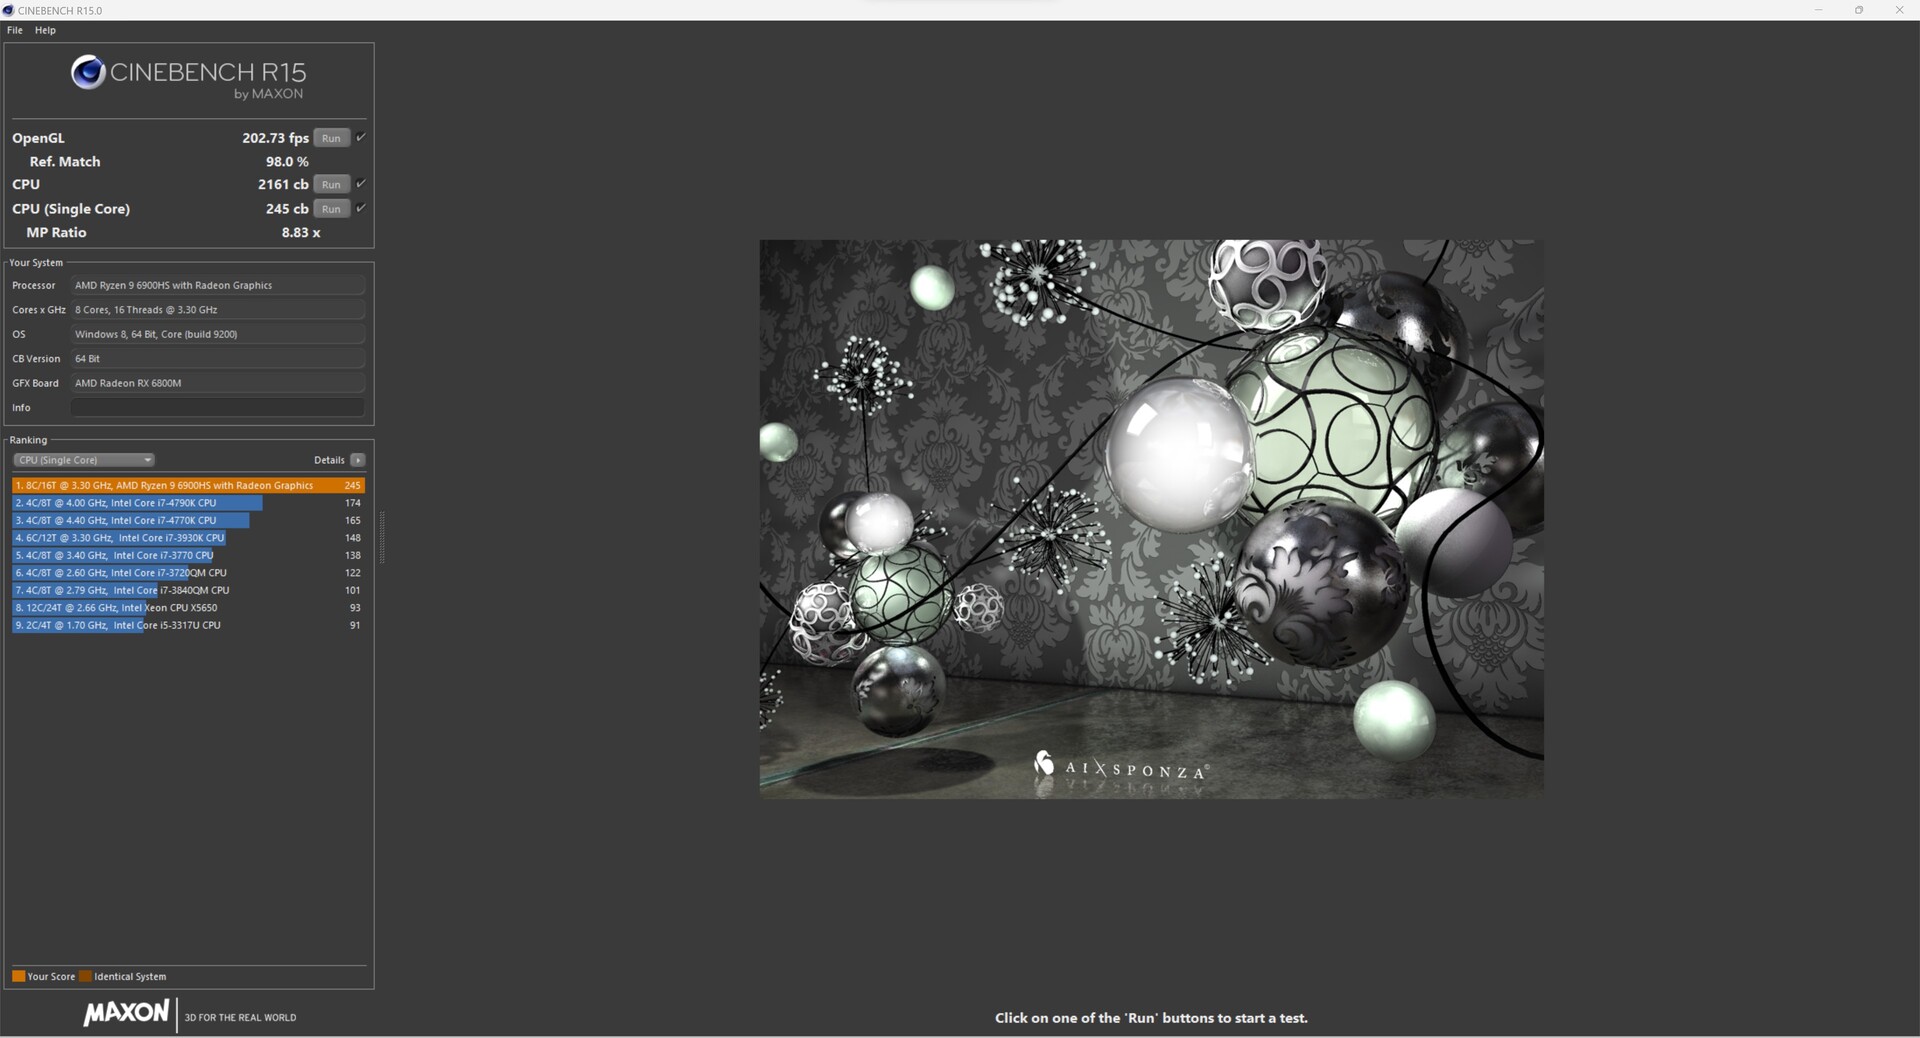
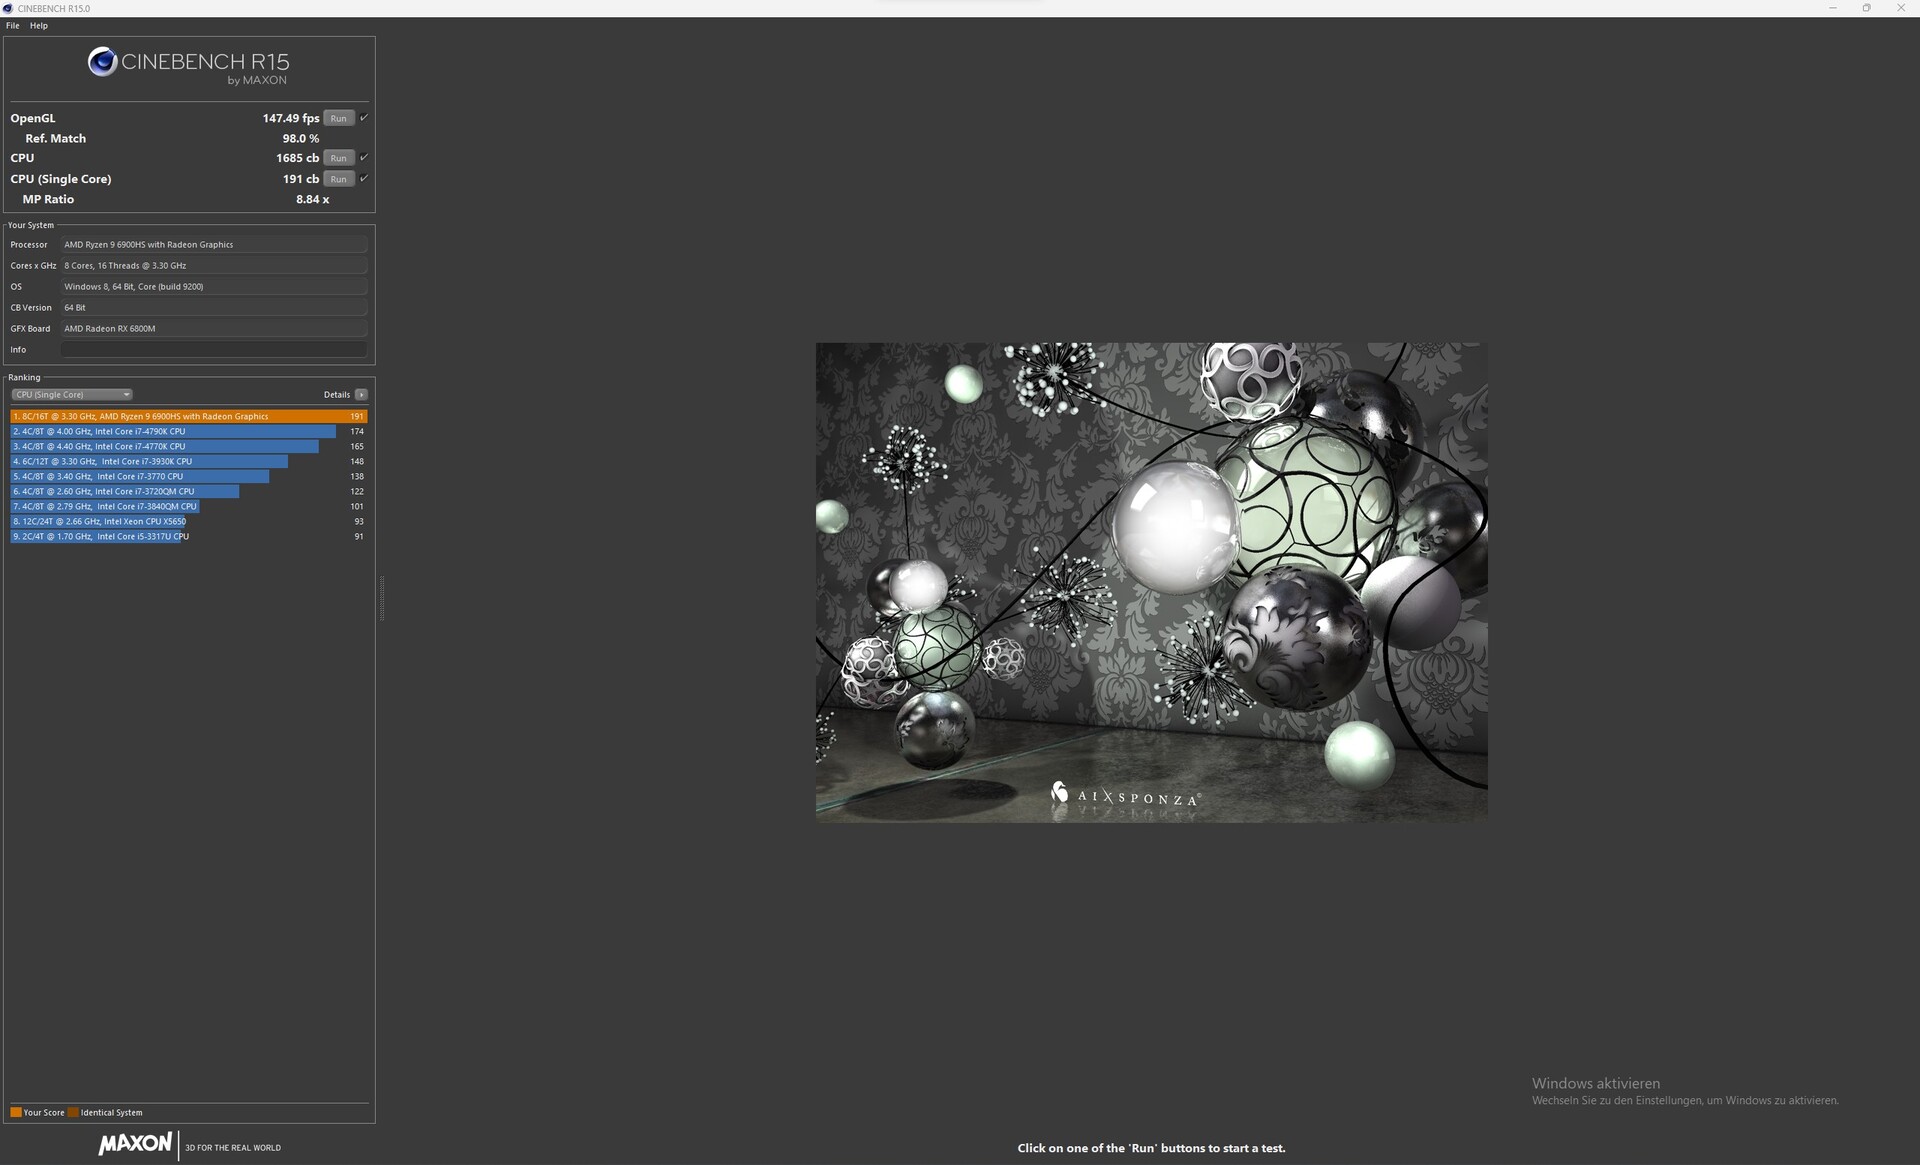
Processore
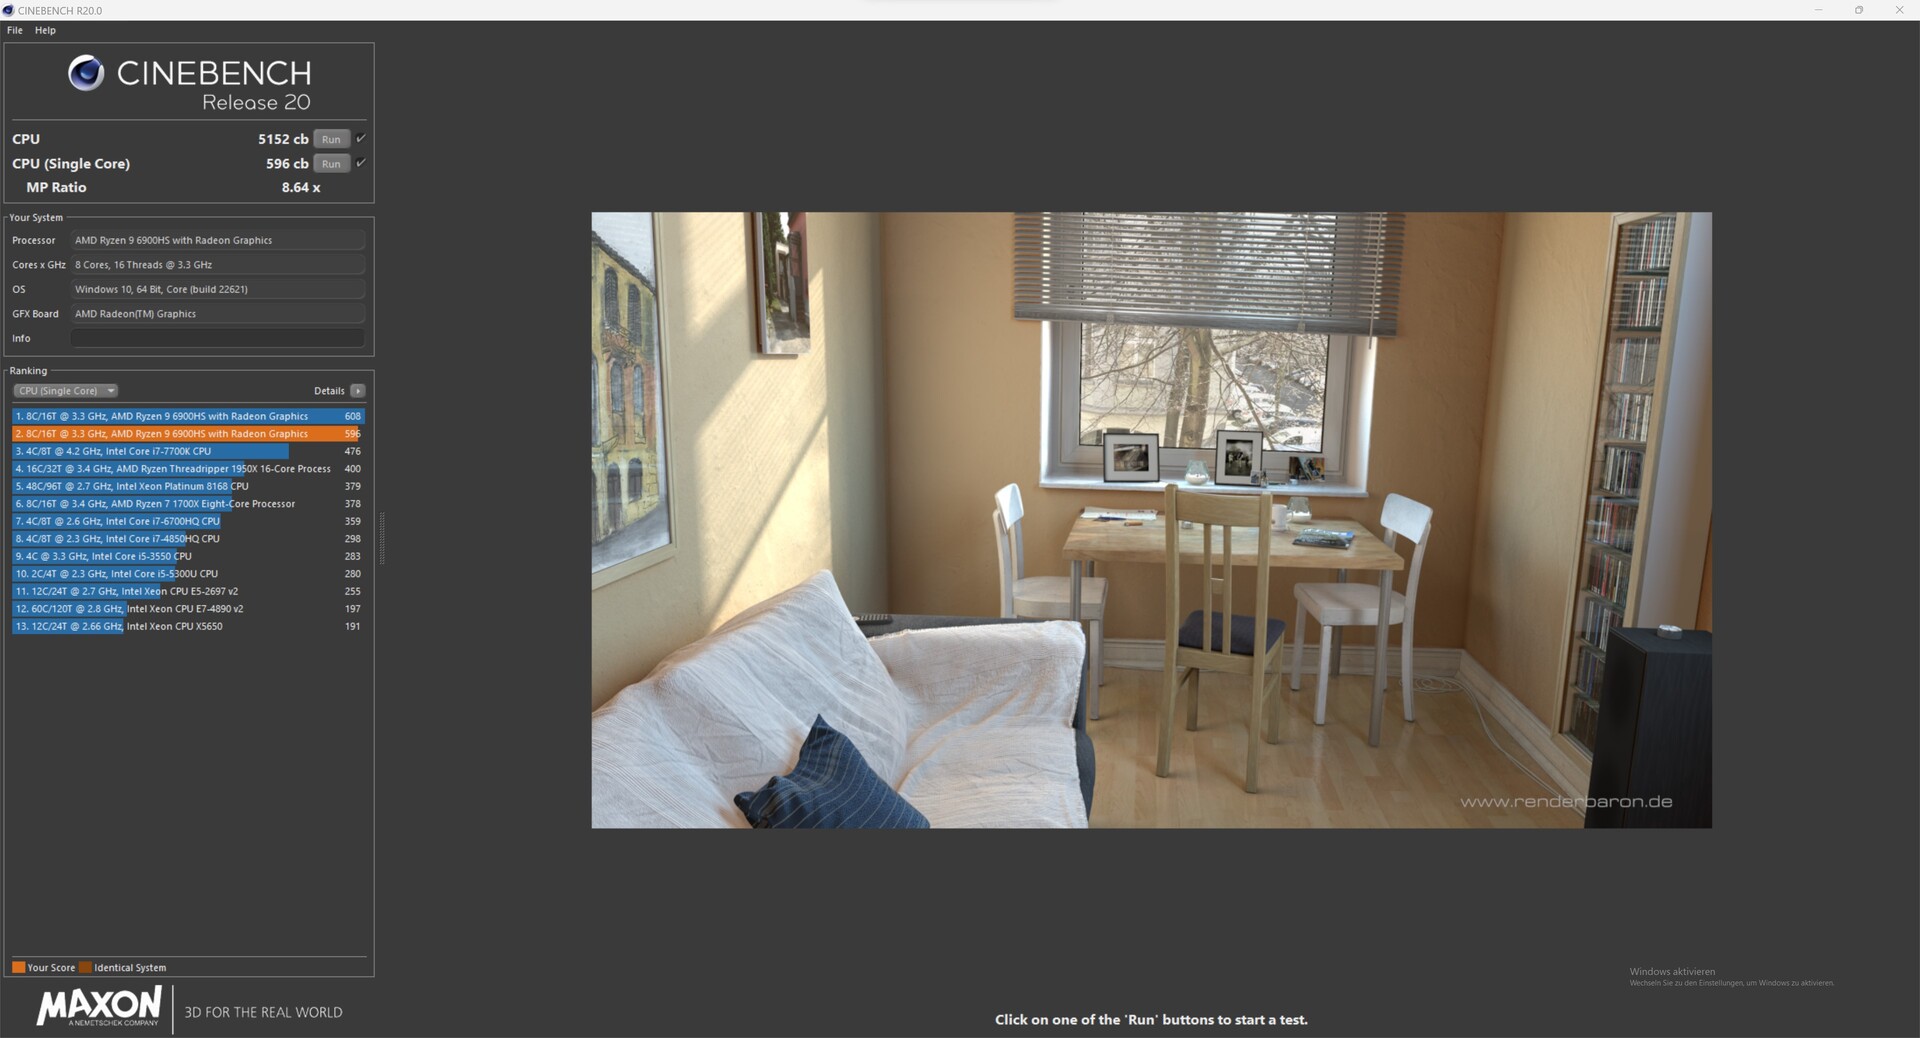
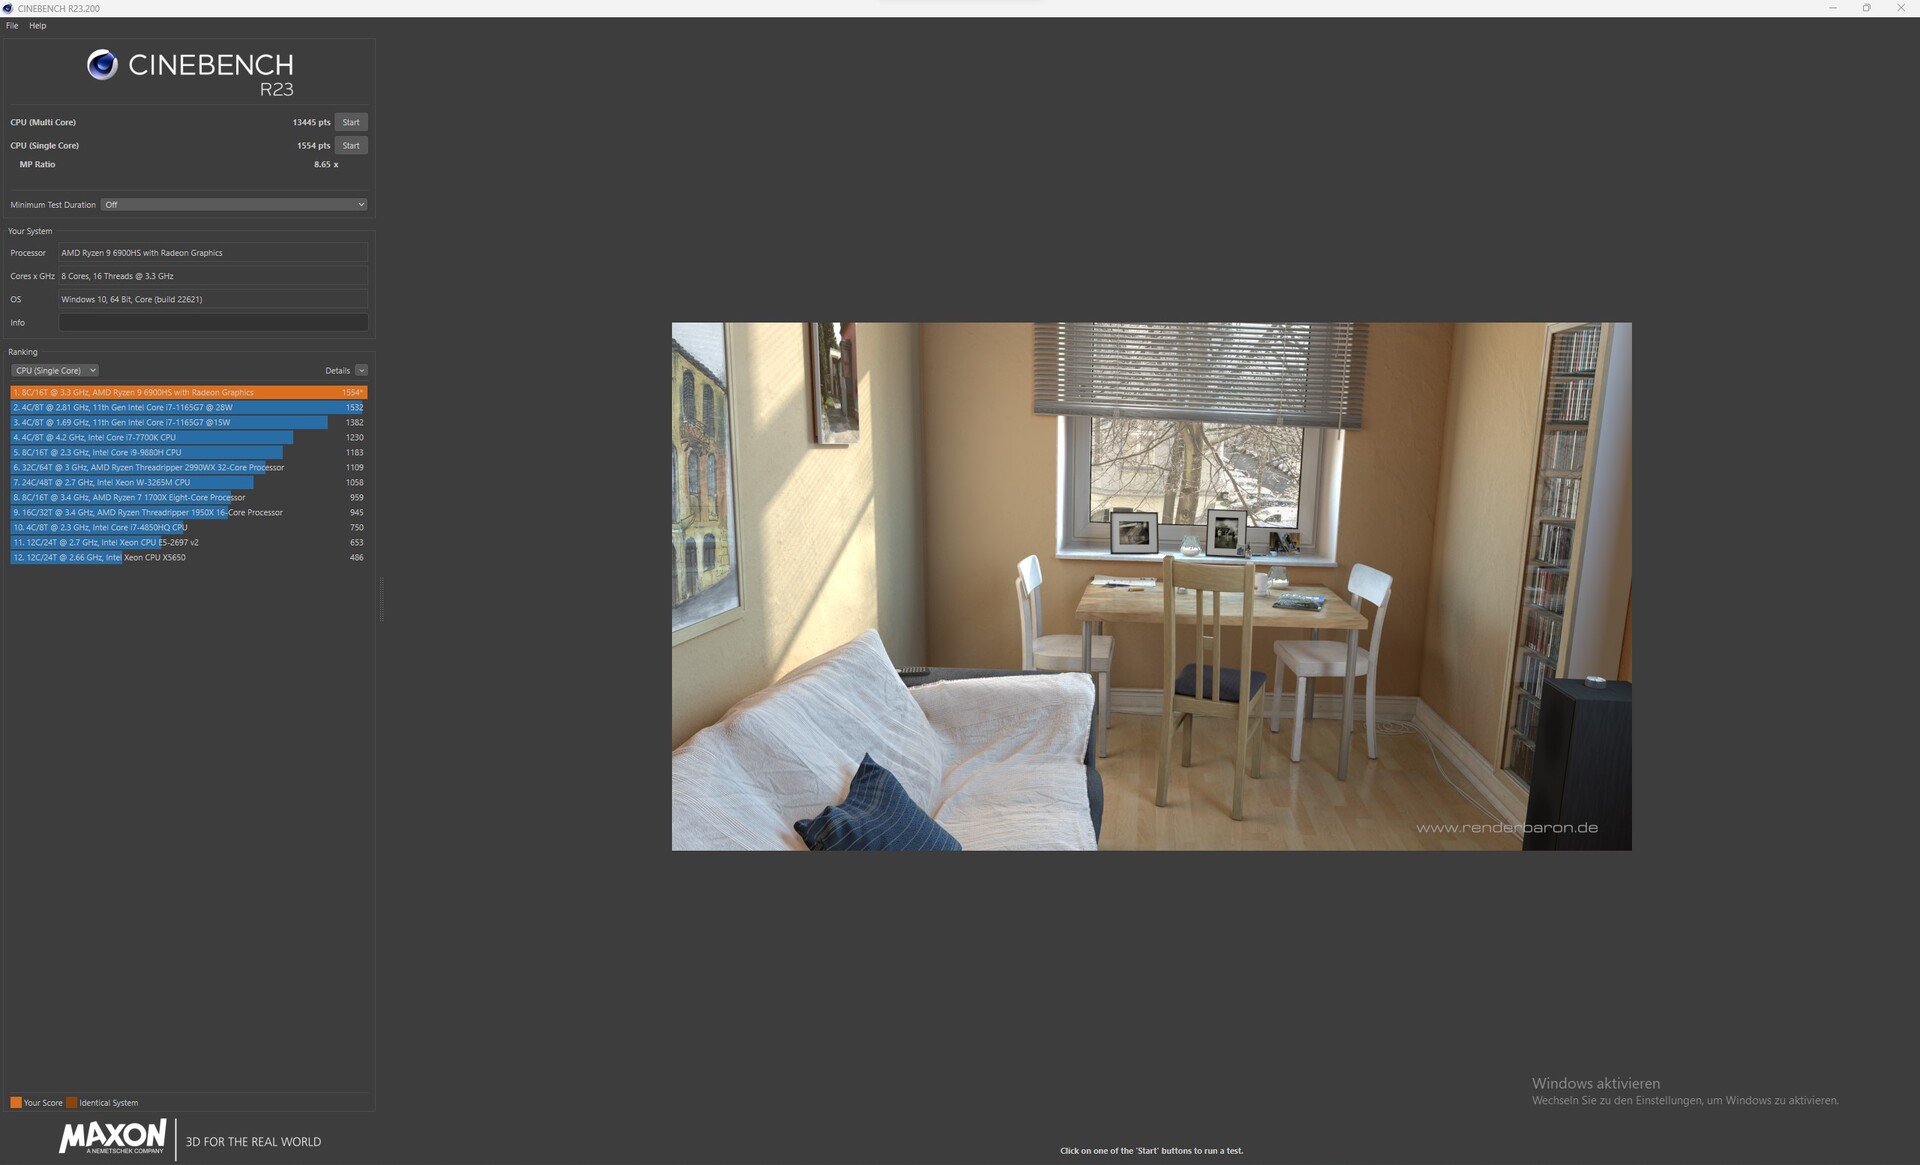
IlAMD Ryzen 9 6900HS è un processore a otto core ed è basato sull'attuale architettura Rembrandt. Il SoC ha una frequenza di clock di 3,3-4,9 GHz in Boost e supporta SMT, che fornisce all'utente un totale di 16 thread. Nel confronto diretto con la concorrenza Intel, l'AMD Ryzen 9 6900HS ha difficoltà a reggere il confronto. Tuttavia, l'esemplare in prova riesce a superare i test AIDA64 un po' meglio e si piazza al terzo posto della classifica.
Per ulteriori benchmark, vi rimandiamo alla nostraTabella di confronto delle CPU.
Cinebench R15 Multi loop
Cinebench R23: Multi Core | Single Core
Cinebench R20: CPU (Multi Core) | CPU (Single Core)
Cinebench R15: CPU Multi 64Bit | CPU Single 64Bit
Blender: v2.79 BMW27 CPU
7-Zip 18.03: 7z b 4 | 7z b 4 -mmt1
Geekbench 5.5: Multi-Core | Single-Core
HWBOT x265 Benchmark v2.2: 4k Preset
LibreOffice : 20 Documents To PDF
R Benchmark 2.5: Overall mean
| CPU Performance rating | |
| Media della classe Gaming | |
| Lenovo Legion 7 16IAX7-82TD004SGE | |
| HP Omen 16-b1090ng | |
| Acer Predator Triton 500 SE PT516-52s-70KX | |
| Lenovo Legion 7 16ARHA7 | |
| Asus ROG Flow X16 GV601RW-M5082W | |
| Media AMD Ryzen 9 6900HS | |
| Corsair Voyager a1600 | |
| Cinebench R23 / Multi Core | |
| Media della classe Gaming (10488 - 42661, n=107, ultimi 2 anni) | |
| Lenovo Legion 7 16IAX7-82TD004SGE | |
| Acer Predator Triton 500 SE PT516-52s-70KX | |
| HP Omen 16-b1090ng | |
| Lenovo Legion 7 16ARHA7 | |
| Asus ROG Flow X16 GV601RW-M5082W | |
| Corsair Voyager a1600 | |
| Media AMD Ryzen 9 6900HS (12606 - 14403, n=5) | |
| Cinebench R23 / Single Core | |
| Media della classe Gaming (1166 - 2415, n=107, ultimi 2 anni) | |
| Lenovo Legion 7 16IAX7-82TD004SGE | |
| HP Omen 16-b1090ng | |
| Acer Predator Triton 500 SE PT516-52s-70KX | |
| Lenovo Legion 7 16ARHA7 | |
| Corsair Voyager a1600 | |
| Media AMD Ryzen 9 6900HS (1526 - 1570, n=5) | |
| Asus ROG Flow X16 GV601RW-M5082W | |
| Cinebench R20 / CPU (Multi Core) | |
| Media della classe Gaming (4029 - 16433, n=106, ultimi 2 anni) | |
| Lenovo Legion 7 16IAX7-82TD004SGE | |
| Acer Predator Triton 500 SE PT516-52s-70KX | |
| HP Omen 16-b1090ng | |
| Lenovo Legion 7 16ARHA7 | |
| Asus ROG Flow X16 GV601RW-M5082W | |
| Media AMD Ryzen 9 6900HS (4829 - 5552, n=5) | |
| Corsair Voyager a1600 | |
| Cinebench R20 / CPU (Single Core) | |
| Media della classe Gaming (442 - 913, n=106, ultimi 2 anni) | |
| Lenovo Legion 7 16IAX7-82TD004SGE | |
| HP Omen 16-b1090ng | |
| Acer Predator Triton 500 SE PT516-52s-70KX | |
| Lenovo Legion 7 16ARHA7 | |
| Media AMD Ryzen 9 6900HS (596 - 620, n=5) | |
| Asus ROG Flow X16 GV601RW-M5082W | |
| Corsair Voyager a1600 | |
| Cinebench R15 / CPU Multi 64Bit | |
| Media della classe Gaming (1578 - 6330, n=105, ultimi 2 anni) | |
| Lenovo Legion 7 16IAX7-82TD004SGE | |
| HP Omen 16-b1090ng | |
| Acer Predator Triton 500 SE PT516-52s-70KX | |
| Lenovo Legion 7 16ARHA7 | |
| Asus ROG Flow X16 GV601RW-M5082W | |
| Media AMD Ryzen 9 6900HS (2054 - 2342, n=5) | |
| Corsair Voyager a1600 | |
| Cinebench R15 / CPU Single 64Bit | |
| Media della classe Gaming (188.8 - 350, n=106, ultimi 2 anni) | |
| Lenovo Legion 7 16IAX7-82TD004SGE | |
| HP Omen 16-b1090ng | |
| Lenovo Legion 7 16ARHA7 | |
| Corsair Voyager a1600 | |
| Media AMD Ryzen 9 6900HS (218 - 254, n=5) | |
| Asus ROG Flow X16 GV601RW-M5082W | |
| Acer Predator Triton 500 SE PT516-52s-70KX | |
| Blender / v2.79 BMW27 CPU | |
| Media AMD Ryzen 9 6900HS (220 - 277, n=5) | |
| Corsair Voyager a1600 | |
| Asus ROG Flow X16 GV601RW-M5082W | |
| Lenovo Legion 7 16ARHA7 | |
| Acer Predator Triton 500 SE PT516-52s-70KX | |
| HP Omen 16-b1090ng | |
| Media della classe Gaming (79 - 330, n=104, ultimi 2 anni) | |
| Lenovo Legion 7 16IAX7-82TD004SGE | |
| 7-Zip 18.03 / 7z b 4 | |
| Media della classe Gaming (33491 - 148086, n=105, ultimi 2 anni) | |
| Lenovo Legion 7 16IAX7-82TD004SGE | |
| HP Omen 16-b1090ng | |
| Acer Predator Triton 500 SE PT516-52s-70KX | |
| Lenovo Legion 7 16ARHA7 | |
| Corsair Voyager a1600 | |
| Asus ROG Flow X16 GV601RW-M5082W | |
| Media AMD Ryzen 9 6900HS (52948 - 63591, n=5) | |
| 7-Zip 18.03 / 7z b 4 -mmt1 | |
| Media della classe Gaming (4199 - 7436, n=105, ultimi 2 anni) | |
| Lenovo Legion 7 16IAX7-82TD004SGE | |
| HP Omen 16-b1090ng | |
| Corsair Voyager a1600 | |
| Media AMD Ryzen 9 6900HS (5538 - 5958, n=5) | |
| Asus ROG Flow X16 GV601RW-M5082W | |
| Lenovo Legion 7 16ARHA7 | |
| Acer Predator Triton 500 SE PT516-52s-70KX | |
| Geekbench 5.5 / Multi-Core | |
| Media della classe Gaming (6460 - 28263, n=105, ultimi 2 anni) | |
| Lenovo Legion 7 16IAX7-82TD004SGE | |
| HP Omen 16-b1090ng | |
| Acer Predator Triton 500 SE PT516-52s-70KX | |
| Corsair Voyager a1600 | |
| Lenovo Legion 7 16ARHA7 | |
| Media AMD Ryzen 9 6900HS (8381 - 10040, n=5) | |
| Asus ROG Flow X16 GV601RW-M5082W | |
| Geekbench 5.5 / Single-Core | |
| Media della classe Gaming (986 - 2474, n=105, ultimi 2 anni) | |
| Lenovo Legion 7 16IAX7-82TD004SGE | |
| HP Omen 16-b1090ng | |
| Acer Predator Triton 500 SE PT516-52s-70KX | |
| Lenovo Legion 7 16ARHA7 | |
| Media AMD Ryzen 9 6900HS (1480 - 1614, n=5) | |
| Asus ROG Flow X16 GV601RW-M5082W | |
| Corsair Voyager a1600 | |
| HWBOT x265 Benchmark v2.2 / 4k Preset | |
| Media della classe Gaming (11.5 - 44.4, n=105, ultimi 2 anni) | |
| Lenovo Legion 7 16IAX7-82TD004SGE | |
| HP Omen 16-b1090ng | |
| Acer Predator Triton 500 SE PT516-52s-70KX | |
| Lenovo Legion 7 16ARHA7 | |
| Corsair Voyager a1600 | |
| Asus ROG Flow X16 GV601RW-M5082W | |
| Media AMD Ryzen 9 6900HS (14.2 - 17.9, n=5) | |
| LibreOffice / 20 Documents To PDF | |
| Corsair Voyager a1600 | |
| Asus ROG Flow X16 GV601RW-M5082W | |
| Lenovo Legion 7 16ARHA7 | |
| Media AMD Ryzen 9 6900HS (47.6 - 57.2, n=5) | |
| Media della classe Gaming (33.2 - 88.8, n=105, ultimi 2 anni) | |
| Acer Predator Triton 500 SE PT516-52s-70KX | |
| HP Omen 16-b1090ng | |
| Lenovo Legion 7 16IAX7-82TD004SGE | |
| R Benchmark 2.5 / Overall mean | |
| Asus ROG Flow X16 GV601RW-M5082W | |
| Lenovo Legion 7 16ARHA7 | |
| Corsair Voyager a1600 | |
| Media AMD Ryzen 9 6900HS (0.4672 - 0.502, n=5) | |
| Acer Predator Triton 500 SE PT516-52s-70KX | |
| HP Omen 16-b1090ng | |
| Media della classe Gaming (0.3439 - 0.759, n=106, ultimi 2 anni) | |
| Lenovo Legion 7 16IAX7-82TD004SGE | |
* ... Meglio usare valori piccoli
AIDA64: FP32 Ray-Trace | FPU Julia | CPU SHA3 | CPU Queen | FPU SinJulia | FPU Mandel | CPU AES | CPU ZLib | FP64 Ray-Trace | CPU PhotoWorxx
| Performance rating | |
| Media della classe Gaming | |
| Lenovo Legion 7 16ARHA7 | |
| Asus ROG Flow X16 GV601RW-M5082W | |
| Corsair Voyager a1600 | |
| Lenovo Legion 7 16IAX7-82TD004SGE | |
| Media AMD Ryzen 9 6900HS | |
| Acer Predator Triton 500 SE PT516-52s-70KX | |
| HP Omen 16-b1090ng | |
| AIDA64 / FP32 Ray-Trace | |
| Media della classe Gaming (10227 - 85542, n=105, ultimi 2 anni) | |
| Lenovo Legion 7 16ARHA7 | |
| Asus ROG Flow X16 GV601RW-M5082W | |
| Corsair Voyager a1600 | |
| Media AMD Ryzen 9 6900HS (14212 - 16072, n=5) | |
| Lenovo Legion 7 16IAX7-82TD004SGE | |
| Acer Predator Triton 500 SE PT516-52s-70KX | |
| HP Omen 16-b1090ng | |
| AIDA64 / FPU Julia | |
| Media della classe Gaming (51376 - 238426, n=105, ultimi 2 anni) | |
| Lenovo Legion 7 16ARHA7 | |
| Asus ROG Flow X16 GV601RW-M5082W | |
| Corsair Voyager a1600 | |
| Media AMD Ryzen 9 6900HS (90523 - 102881, n=5) | |
| Lenovo Legion 7 16IAX7-82TD004SGE | |
| Acer Predator Triton 500 SE PT516-52s-70KX | |
| HP Omen 16-b1090ng | |
| AIDA64 / CPU SHA3 | |
| Media della classe Gaming (2180 - 10115, n=105, ultimi 2 anni) | |
| Lenovo Legion 7 16IAX7-82TD004SGE | |
| Lenovo Legion 7 16ARHA7 | |
| Asus ROG Flow X16 GV601RW-M5082W | |
| Corsair Voyager a1600 | |
| Acer Predator Triton 500 SE PT516-52s-70KX | |
| Media AMD Ryzen 9 6900HS (3035 - 3614, n=5) | |
| HP Omen 16-b1090ng | |
| AIDA64 / CPU Queen | |
| Media della classe Gaming (49785 - 173351, n=90, ultimi 2 anni) | |
| Lenovo Legion 7 16ARHA7 | |
| Corsair Voyager a1600 | |
| Asus ROG Flow X16 GV601RW-M5082W | |
| Media AMD Ryzen 9 6900HS (97461 - 105203, n=5) | |
| Lenovo Legion 7 16IAX7-82TD004SGE | |
| HP Omen 16-b1090ng | |
| Acer Predator Triton 500 SE PT516-52s-70KX | |
| AIDA64 / FPU SinJulia | |
| Media della classe Gaming (4424 - 33636, n=105, ultimi 2 anni) | |
| Lenovo Legion 7 16IAX7-82TD004SGE | |
| Corsair Voyager a1600 | |
| Lenovo Legion 7 16ARHA7 | |
| Asus ROG Flow X16 GV601RW-M5082W | |
| Media AMD Ryzen 9 6900HS (12548 - 13039, n=5) | |
| Acer Predator Triton 500 SE PT516-52s-70KX | |
| HP Omen 16-b1090ng | |
| AIDA64 / FPU Mandel | |
| Media della classe Gaming (25115 - 128721, n=105, ultimi 2 anni) | |
| Lenovo Legion 7 16ARHA7 | |
| Asus ROG Flow X16 GV601RW-M5082W | |
| Corsair Voyager a1600 | |
| Media AMD Ryzen 9 6900HS (49657 - 56486, n=5) | |
| Lenovo Legion 7 16IAX7-82TD004SGE | |
| Acer Predator Triton 500 SE PT516-52s-70KX | |
| HP Omen 16-b1090ng | |
| AIDA64 / CPU AES | |
| Asus ROG Flow X16 GV601RW-M5082W | |
| Lenovo Legion 7 16ARHA7 | |
| Corsair Voyager a1600 | |
| Lenovo Legion 7 16IAX7-82TD004SGE | |
| Media AMD Ryzen 9 6900HS (51791 - 142686, n=5) | |
| Media della classe Gaming (39258 - 247074, n=105, ultimi 2 anni) | |
| Acer Predator Triton 500 SE PT516-52s-70KX | |
| HP Omen 16-b1090ng | |
| AIDA64 / CPU ZLib | |
| Media della classe Gaming (574 - 2531, n=105, ultimi 2 anni) | |
| Lenovo Legion 7 16IAX7-82TD004SGE | |
| Acer Predator Triton 500 SE PT516-52s-70KX | |
| HP Omen 16-b1090ng | |
| Lenovo Legion 7 16ARHA7 | |
| Asus ROG Flow X16 GV601RW-M5082W | |
| Corsair Voyager a1600 | |
| Media AMD Ryzen 9 6900HS (737 - 888, n=5) | |
| AIDA64 / FP64 Ray-Trace | |
| Media della classe Gaming (5509 - 45446, n=105, ultimi 2 anni) | |
| Lenovo Legion 7 16ARHA7 | |
| Asus ROG Flow X16 GV601RW-M5082W | |
| Corsair Voyager a1600 | |
| Media AMD Ryzen 9 6900HS (7530 - 8981, n=5) | |
| Lenovo Legion 7 16IAX7-82TD004SGE | |
| Acer Predator Triton 500 SE PT516-52s-70KX | |
| HP Omen 16-b1090ng | |
| AIDA64 / CPU PhotoWorxx | |
| Media della classe Gaming (12271 - 89891, n=105, ultimi 2 anni) | |
| HP Omen 16-b1090ng | |
| Lenovo Legion 7 16IAX7-82TD004SGE | |
| Acer Predator Triton 500 SE PT516-52s-70KX | |
| Lenovo Legion 7 16ARHA7 | |
| Corsair Voyager a1600 | |
| Asus ROG Flow X16 GV601RW-M5082W | |
| Media AMD Ryzen 9 6900HS (25757 - 30291, n=5) | |
Prestazioni del sistema
I risultati dei benchmark mostrano buone prestazioni di sistema, anche se si nota ancora una volta una netta differenza rispetto ai notebook basati su Intel. Soggettivamente, tuttavia, il Corsair Voyager a1600 offre ottime prestazioni di sistema senza latenze evidenti nell'uso quotidiano.
CrossMark: Overall | Productivity | Creativity | Responsiveness
| PCMark 10 / Score | |
| Lenovo Legion 7 16IAX7-82TD004SGE | |
| Media della classe Gaming (5828 - 12414, n=93, ultimi 2 anni) | |
| Acer Predator Triton 500 SE PT516-52s-70KX | |
| Lenovo Legion 7 16ARHA7 | |
| HP Omen 16-b1090ng | |
| Corsair Voyager a1600 | |
| Media AMD Ryzen 9 6900HS, AMD Radeon RX 6800M (n=1) | |
| Asus ROG Flow X16 GV601RW-M5082W | |
| PCMark 10 / Essentials | |
| Lenovo Legion 7 16IAX7-82TD004SGE | |
| Acer Predator Triton 500 SE PT516-52s-70KX | |
| Media della classe Gaming (8810 - 11935, n=97, ultimi 2 anni) | |
| Lenovo Legion 7 16ARHA7 | |
| HP Omen 16-b1090ng | |
| Corsair Voyager a1600 | |
| Media AMD Ryzen 9 6900HS, AMD Radeon RX 6800M (n=1) | |
| Asus ROG Flow X16 GV601RW-M5082W | |
| PCMark 10 / Productivity | |
| Media della classe Gaming (6845 - 25323, n=95, ultimi 2 anni) | |
| Lenovo Legion 7 16IAX7-82TD004SGE | |
| Asus ROG Flow X16 GV601RW-M5082W | |
| Acer Predator Triton 500 SE PT516-52s-70KX | |
| HP Omen 16-b1090ng | |
| Lenovo Legion 7 16ARHA7 | |
| Corsair Voyager a1600 | |
| Media AMD Ryzen 9 6900HS, AMD Radeon RX 6800M (n=1) | |
| PCMark 10 / Digital Content Creation | |
| Lenovo Legion 7 16IAX7-82TD004SGE | |
| Media della classe Gaming (7602 - 19954, n=95, ultimi 2 anni) | |
| Lenovo Legion 7 16ARHA7 | |
| Corsair Voyager a1600 | |
| Media AMD Ryzen 9 6900HS, AMD Radeon RX 6800M (n=1) | |
| Acer Predator Triton 500 SE PT516-52s-70KX | |
| HP Omen 16-b1090ng | |
| Asus ROG Flow X16 GV601RW-M5082W | |
| CrossMark / Overall | |
| Lenovo Legion 7 16IAX7-82TD004SGE | |
| Media della classe Gaming (1366 - 2409, n=94, ultimi 2 anni) | |
| Acer Predator Triton 500 SE PT516-52s-70KX | |
| Asus ROG Flow X16 GV601RW-M5082W | |
| Lenovo Legion 7 16ARHA7 | |
| Corsair Voyager a1600 | |
| Media AMD Ryzen 9 6900HS, AMD Radeon RX 6800M (n=1) | |
| CrossMark / Productivity | |
| Lenovo Legion 7 16IAX7-82TD004SGE | |
| Media della classe Gaming (1386 - 2254, n=94, ultimi 2 anni) | |
| Acer Predator Triton 500 SE PT516-52s-70KX | |
| Asus ROG Flow X16 GV601RW-M5082W | |
| Lenovo Legion 7 16ARHA7 | |
| Corsair Voyager a1600 | |
| Media AMD Ryzen 9 6900HS, AMD Radeon RX 6800M (n=1) | |
| CrossMark / Creativity | |
| Lenovo Legion 7 16IAX7-82TD004SGE | |
| Media della classe Gaming (1343 - 2786, n=94, ultimi 2 anni) | |
| Acer Predator Triton 500 SE PT516-52s-70KX | |
| Asus ROG Flow X16 GV601RW-M5082W | |
| Lenovo Legion 7 16ARHA7 | |
| Corsair Voyager a1600 | |
| Media AMD Ryzen 9 6900HS, AMD Radeon RX 6800M (n=1) | |
| CrossMark / Responsiveness | |
| Lenovo Legion 7 16IAX7-82TD004SGE | |
| Acer Predator Triton 500 SE PT516-52s-70KX | |
| Media della classe Gaming (1226 - 2334, n=94, ultimi 2 anni) | |
| Asus ROG Flow X16 GV601RW-M5082W | |
| Lenovo Legion 7 16ARHA7 | |
| Corsair Voyager a1600 | |
| Media AMD Ryzen 9 6900HS, AMD Radeon RX 6800M (n=1) | |
| PCMark 10 Score | 7208 punti | |
Aiuto | ||
| AIDA64 / Memory Copy | |
| Media della classe Gaming (21750 - 129946, n=105, ultimi 2 anni) | |
| Lenovo Legion 7 16IAX7-82TD004SGE | |
| HP Omen 16-b1090ng | |
| Acer Predator Triton 500 SE PT516-52s-70KX | |
| Lenovo Legion 7 16ARHA7 | |
| Media AMD Ryzen 9 6900HS (49150 - 51517, n=5) | |
| Corsair Voyager a1600 | |
| Asus ROG Flow X16 GV601RW-M5082W | |
| AIDA64 / Memory Read | |
| Media della classe Gaming (22956 - 118858, n=105, ultimi 2 anni) | |
| Lenovo Legion 7 16IAX7-82TD004SGE | |
| Acer Predator Triton 500 SE PT516-52s-70KX | |
| HP Omen 16-b1090ng | |
| Lenovo Legion 7 16ARHA7 | |
| Corsair Voyager a1600 | |
| Asus ROG Flow X16 GV601RW-M5082W | |
| Media AMD Ryzen 9 6900HS (43646 - 51838, n=5) | |
| AIDA64 / Memory Write | |
| Media della classe Gaming (22297 - 135096, n=105, ultimi 2 anni) | |
| HP Omen 16-b1090ng | |
| Lenovo Legion 7 16IAX7-82TD004SGE | |
| Lenovo Legion 7 16ARHA7 | |
| Corsair Voyager a1600 | |
| Asus ROG Flow X16 GV601RW-M5082W | |
| Acer Predator Triton 500 SE PT516-52s-70KX | |
| Media AMD Ryzen 9 6900HS (15975 - 55235, n=5) | |
| AIDA64 / Memory Latency | |
| Acer Predator Triton 500 SE PT516-52s-70KX | |
| Media della classe Gaming (75.3 - 259, n=105, ultimi 2 anni) | |
| Corsair Voyager a1600 | |
| Asus ROG Flow X16 GV601RW-M5082W | |
| Media AMD Ryzen 9 6900HS (79.2 - 110.9, n=5) | |
| HP Omen 16-b1090ng | |
| Lenovo Legion 7 16IAX7-82TD004SGE | |
| Lenovo Legion 7 16ARHA7 | |
* ... Meglio usare valori piccoli
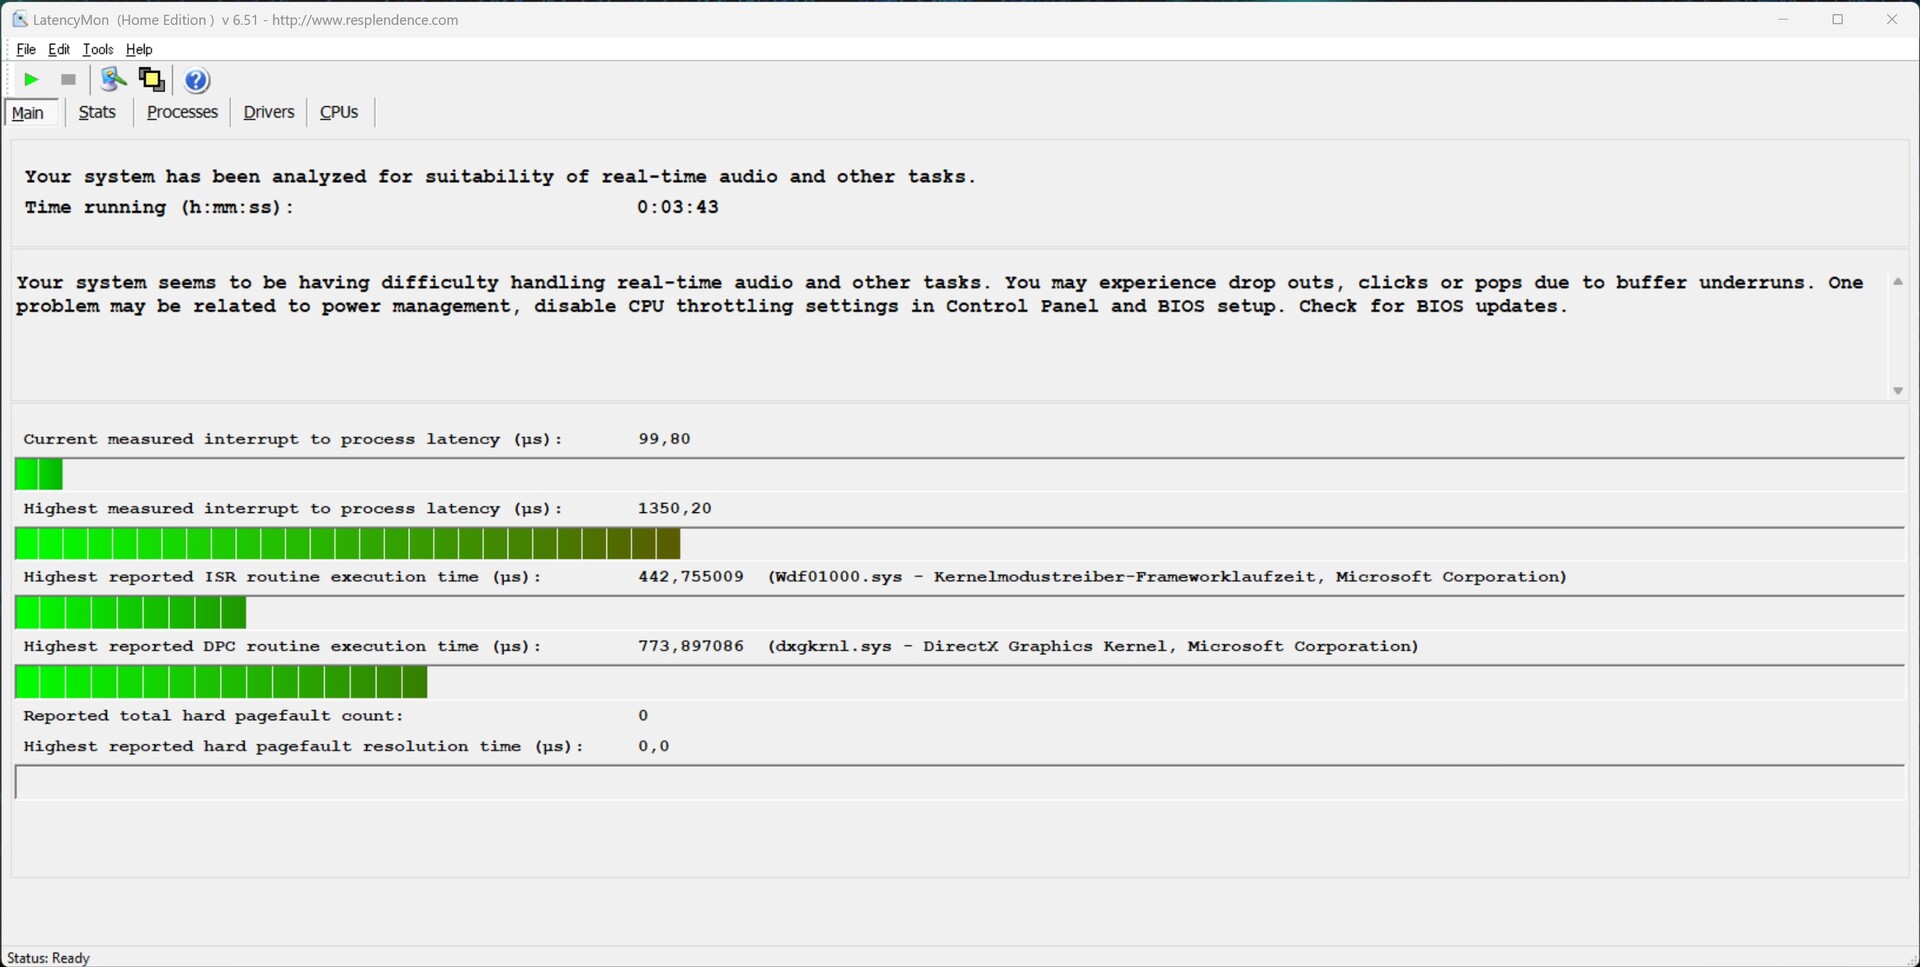
Latenze DPC
Le latenze documentate non aumentano quando si aprono più schede del browser in Edge. Il Voyager a1600 riesce a riprodurre senza problemi anche i video 4K di YouTube. Si nota solo un leggero aumento delle latenze dopo l'avvio di Prime95.
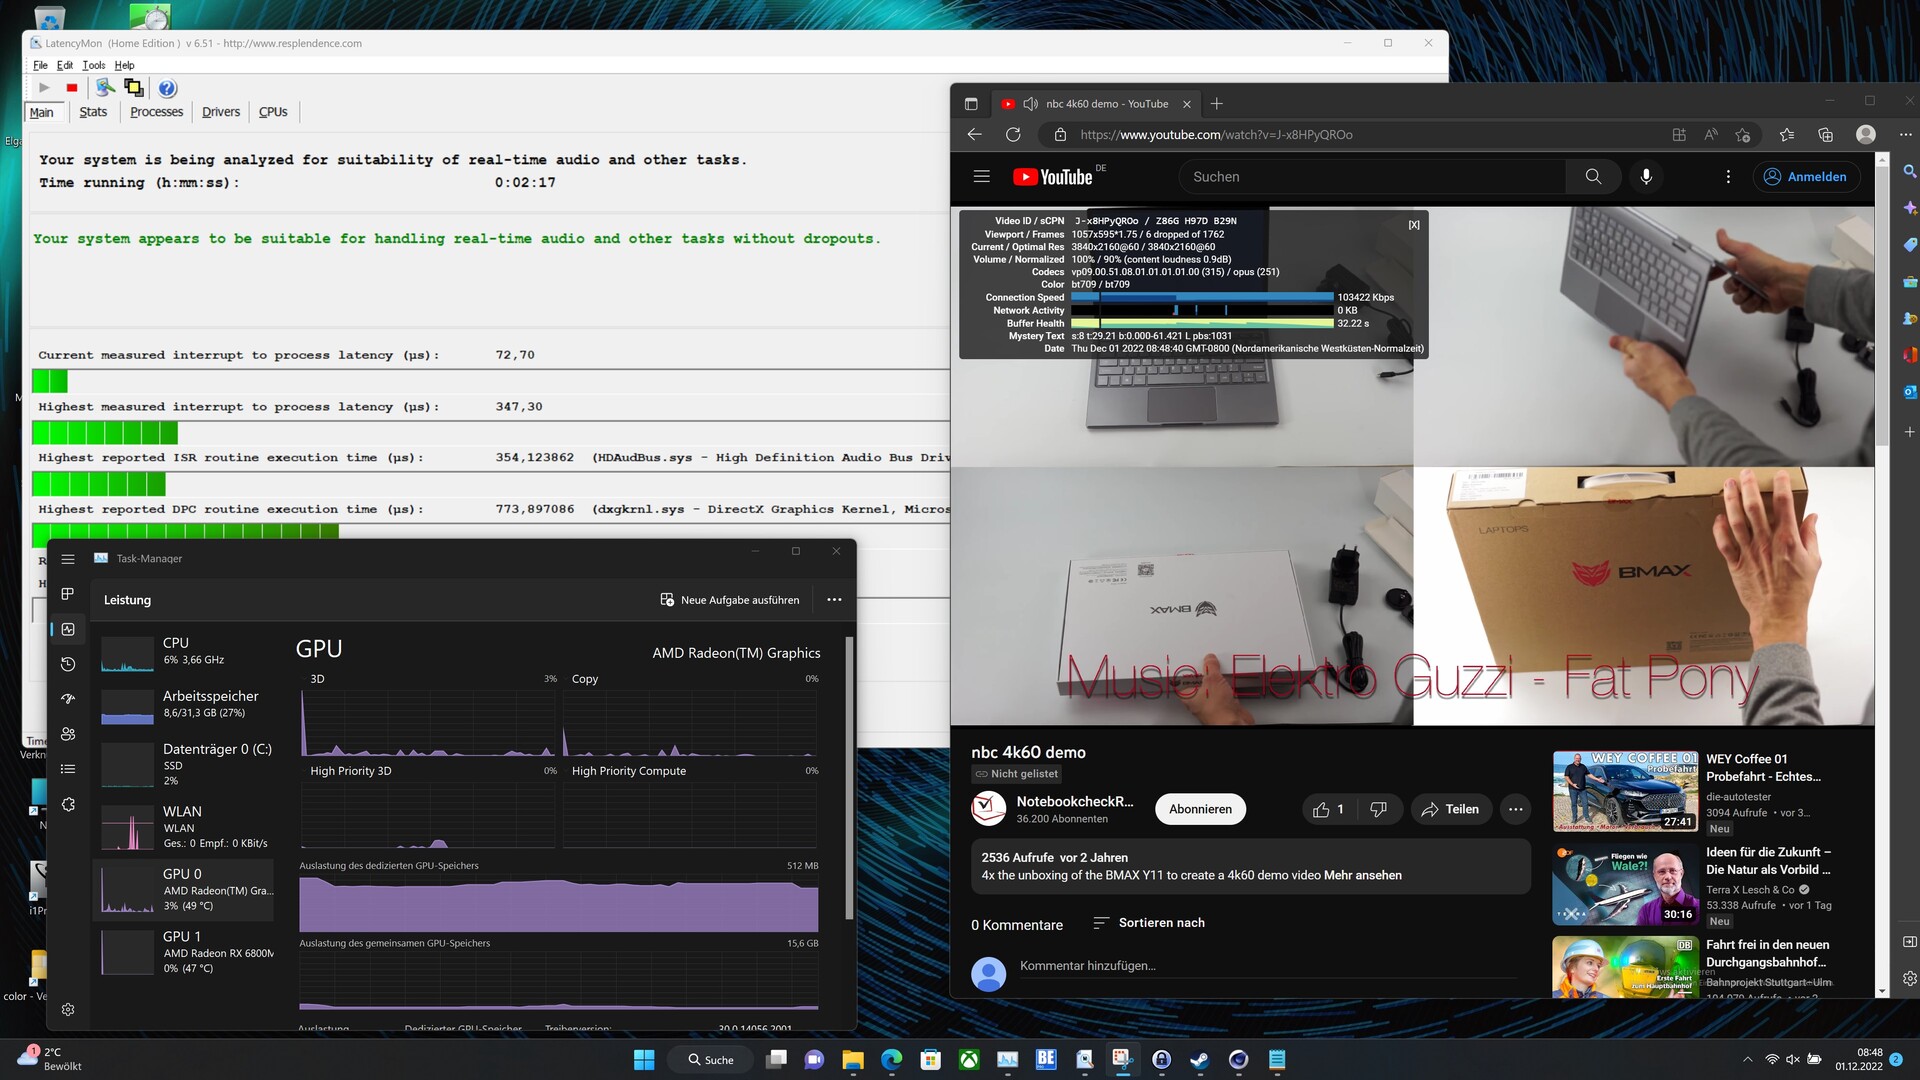
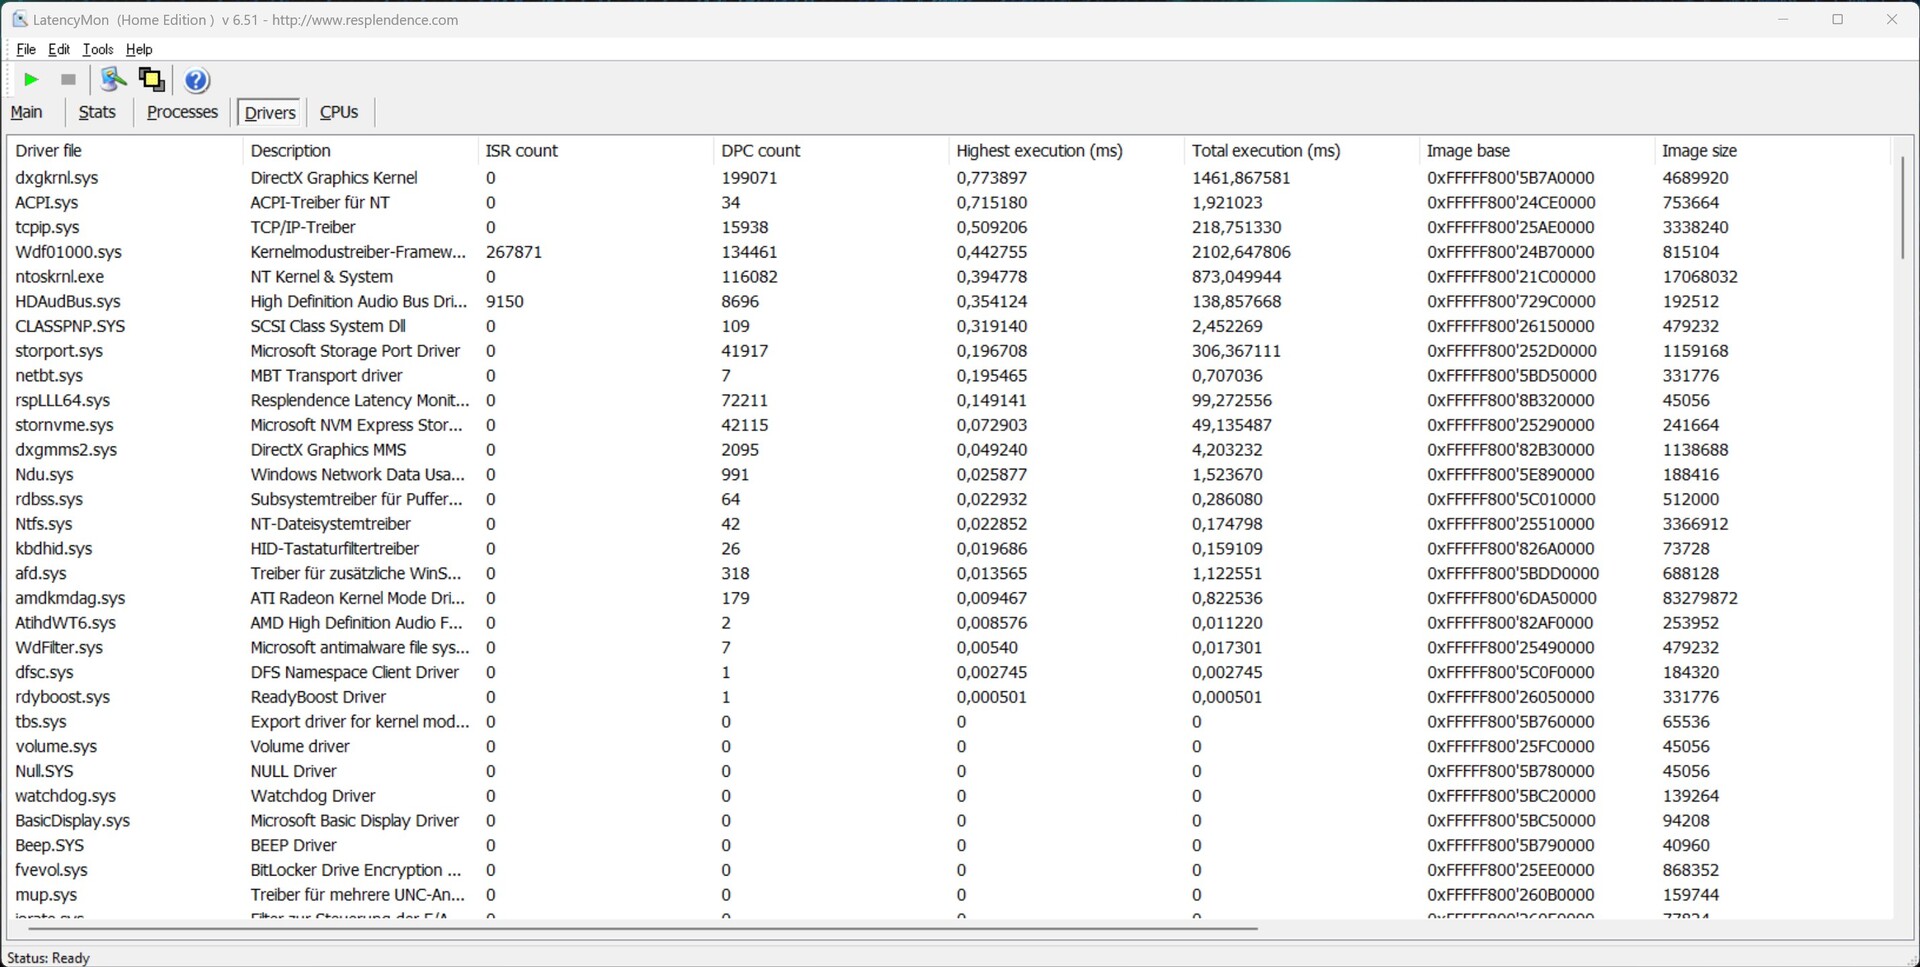
| DPC Latencies / LatencyMon - interrupt to process latency (max), Web, Youtube, Prime95 | |
| Acer Predator Triton 500 SE PT516-52s-70KX | |
| Lenovo Legion 7 16ARHA7 | |
| Asus ROG Flow X16 GV601RW-M5082W | |
| Lenovo Legion 7 16IAX7-82TD004SGE | |
| Corsair Voyager a1600 | |
| HP Omen 16-b1090ng | |
* ... Meglio usare valori piccoli
Memoria di massa
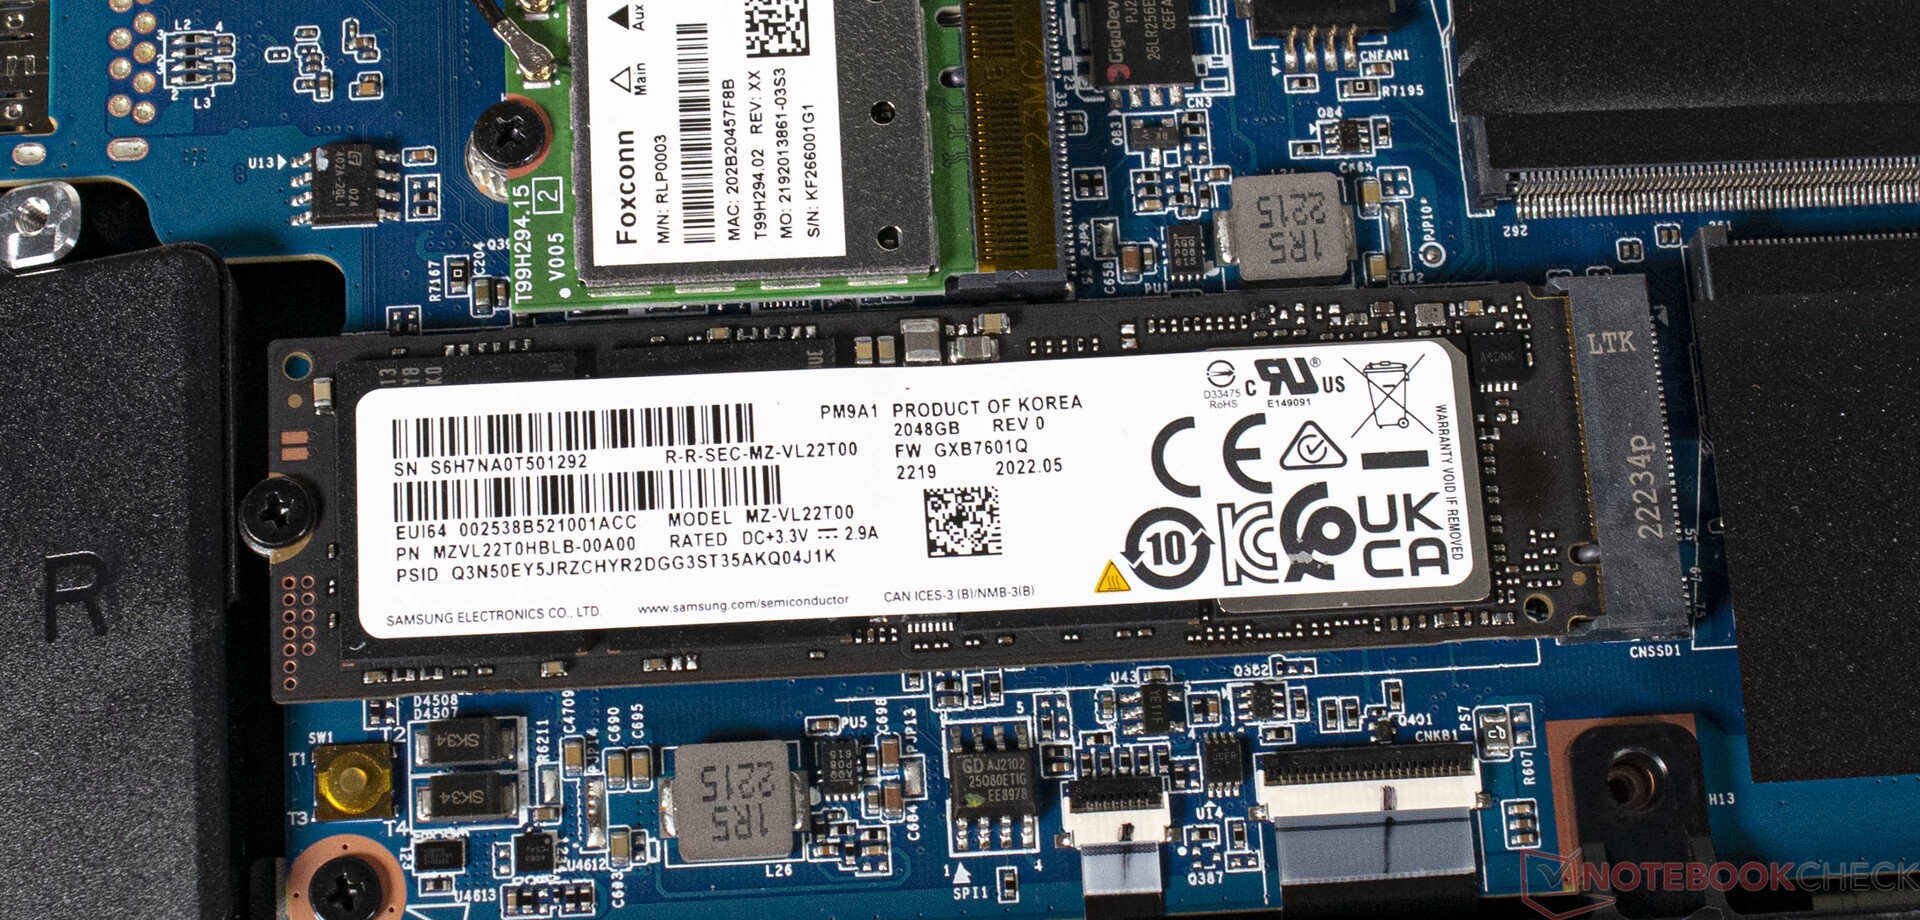
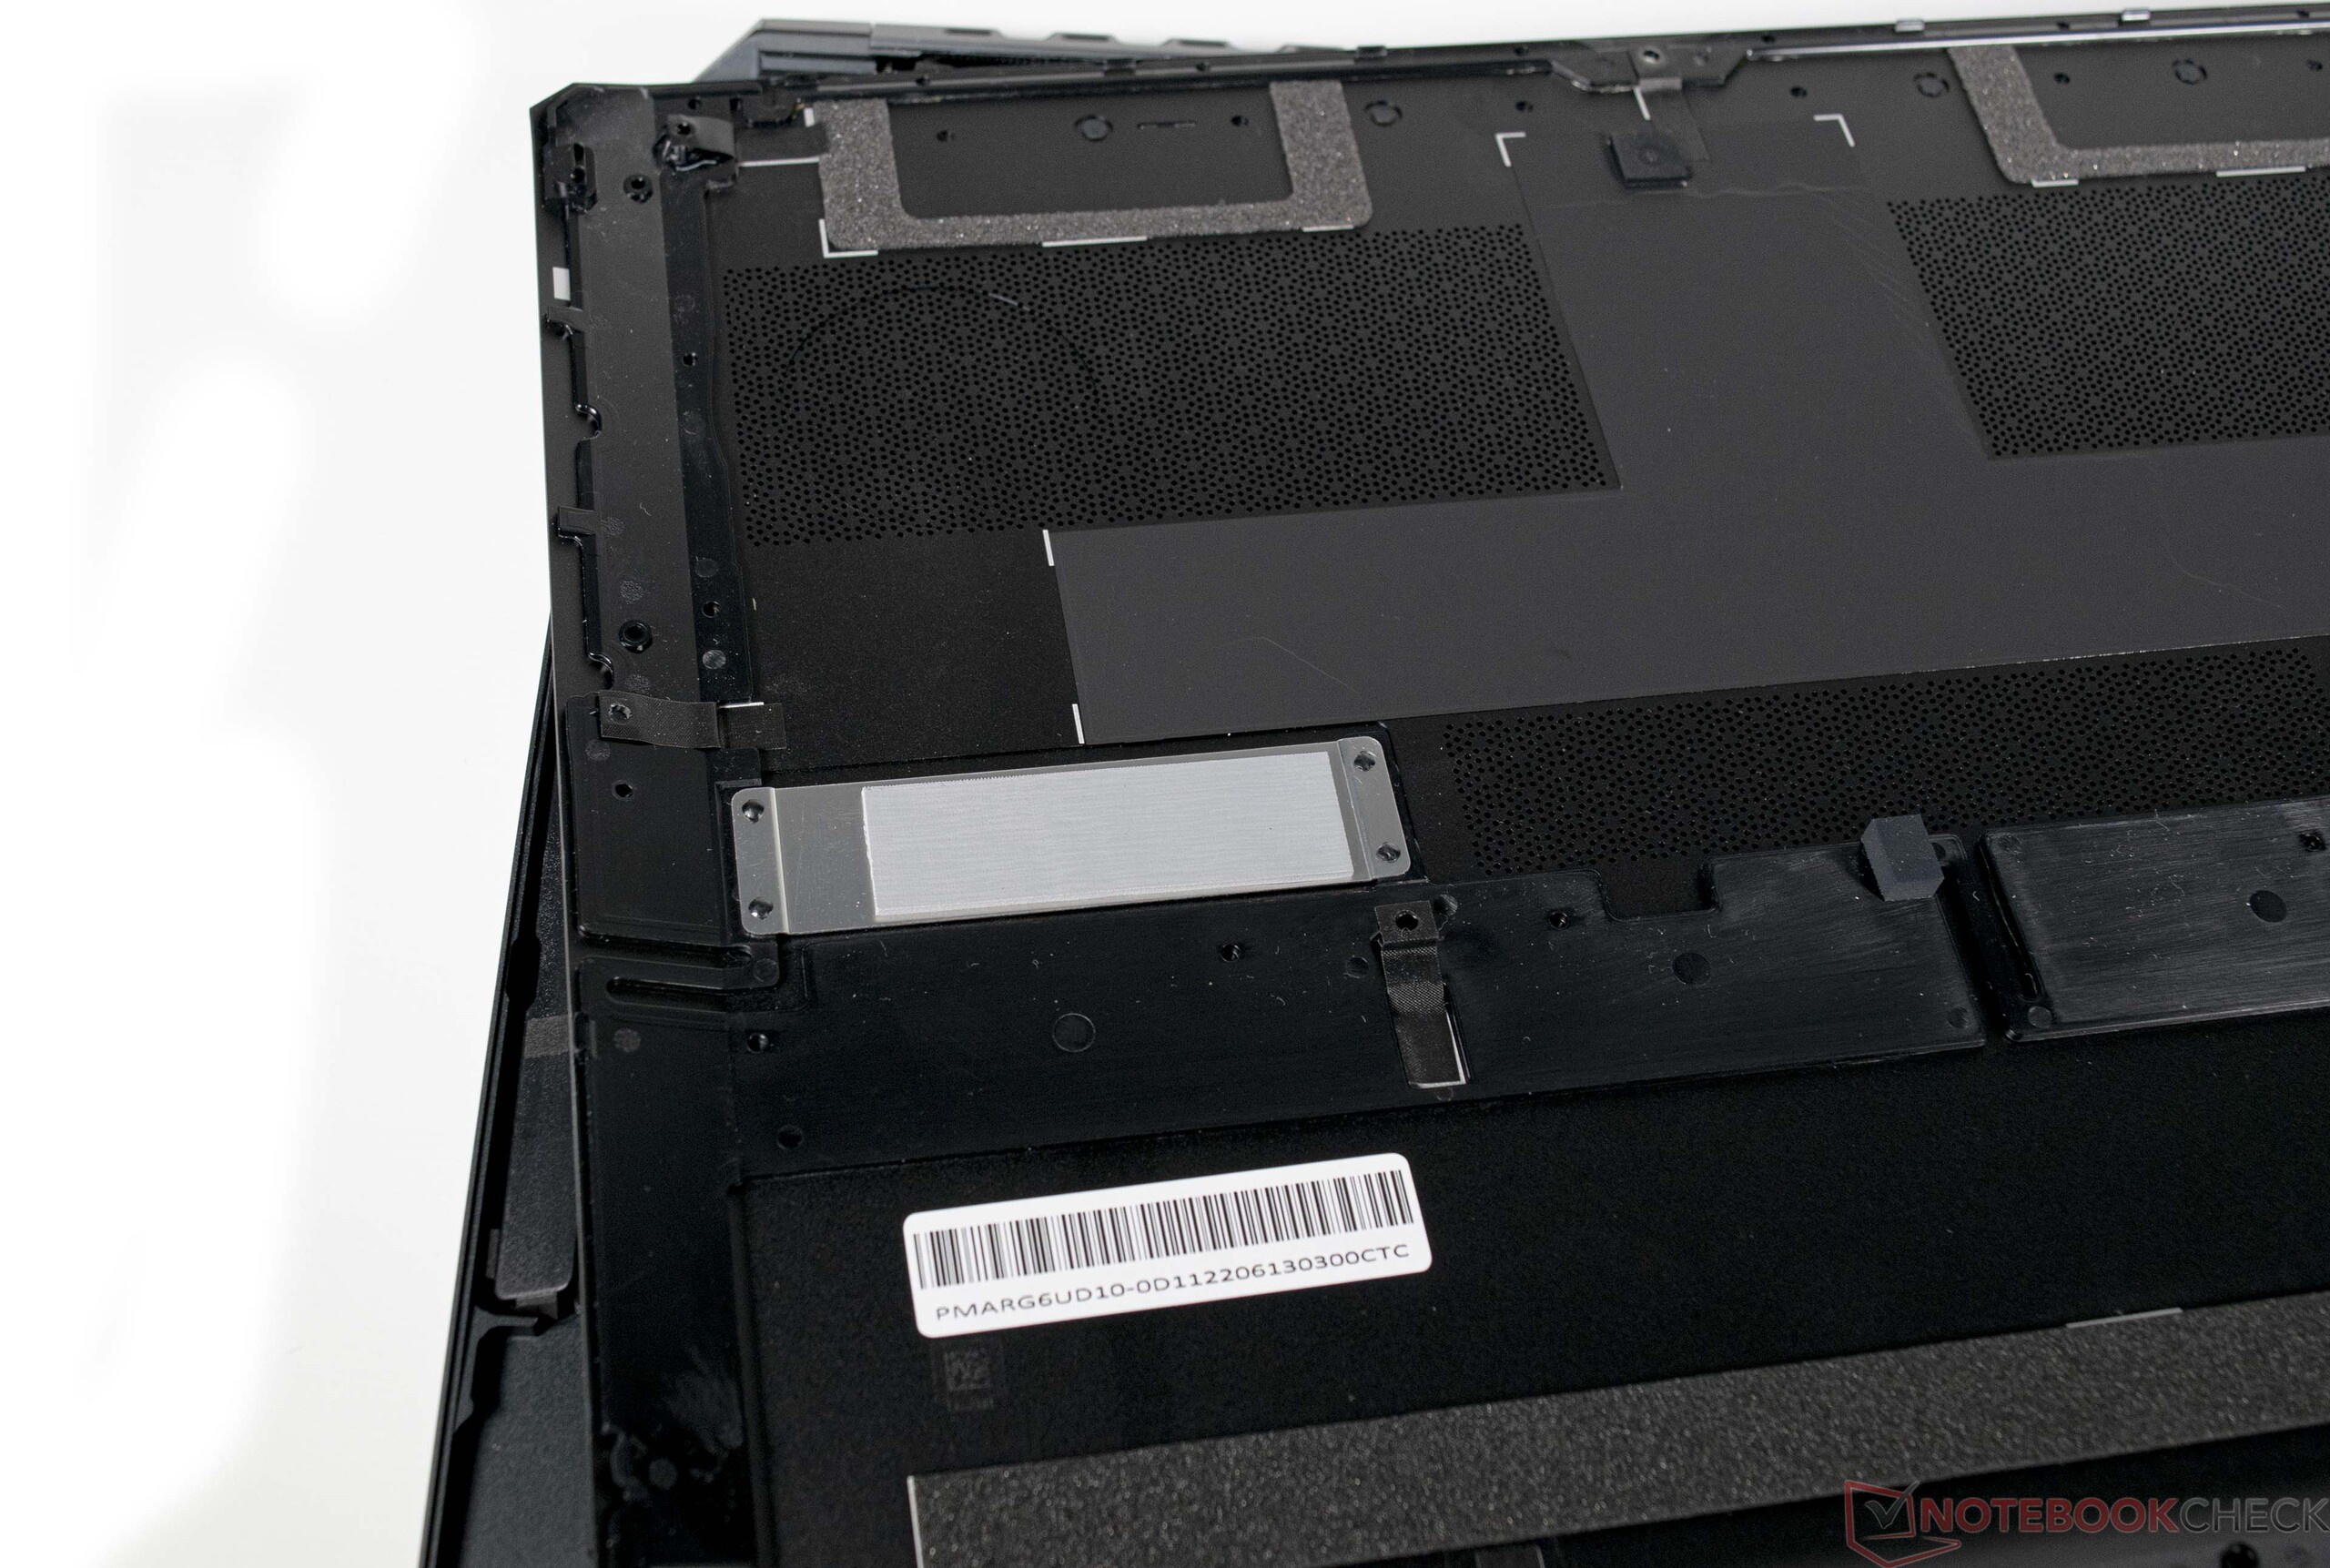
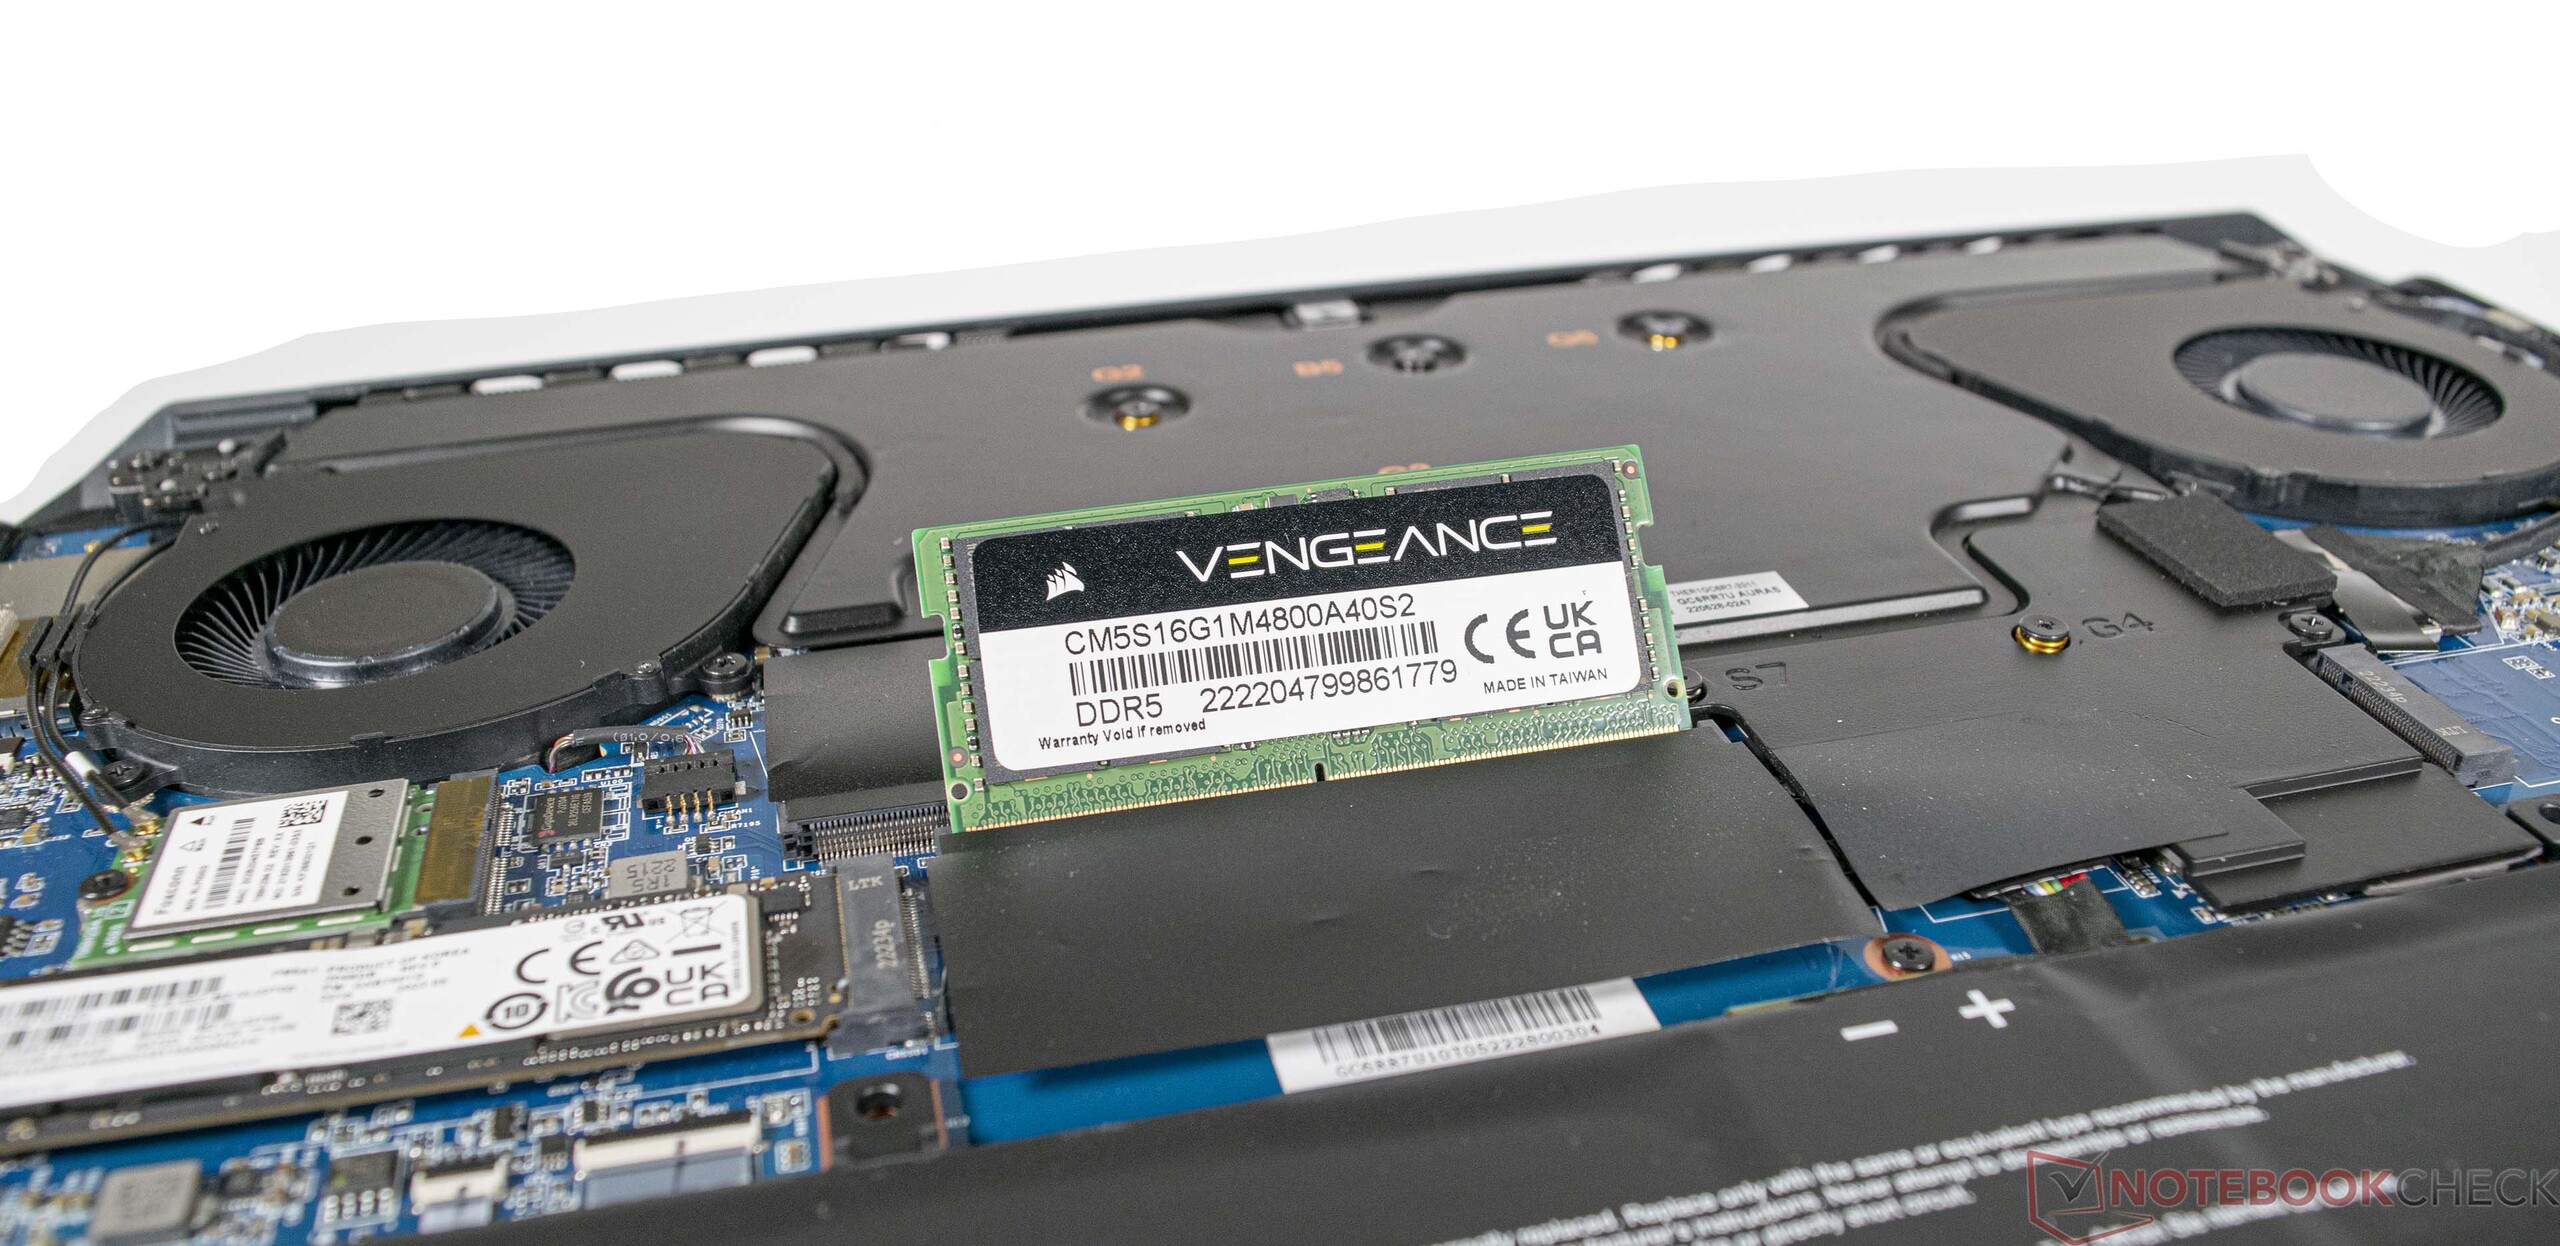
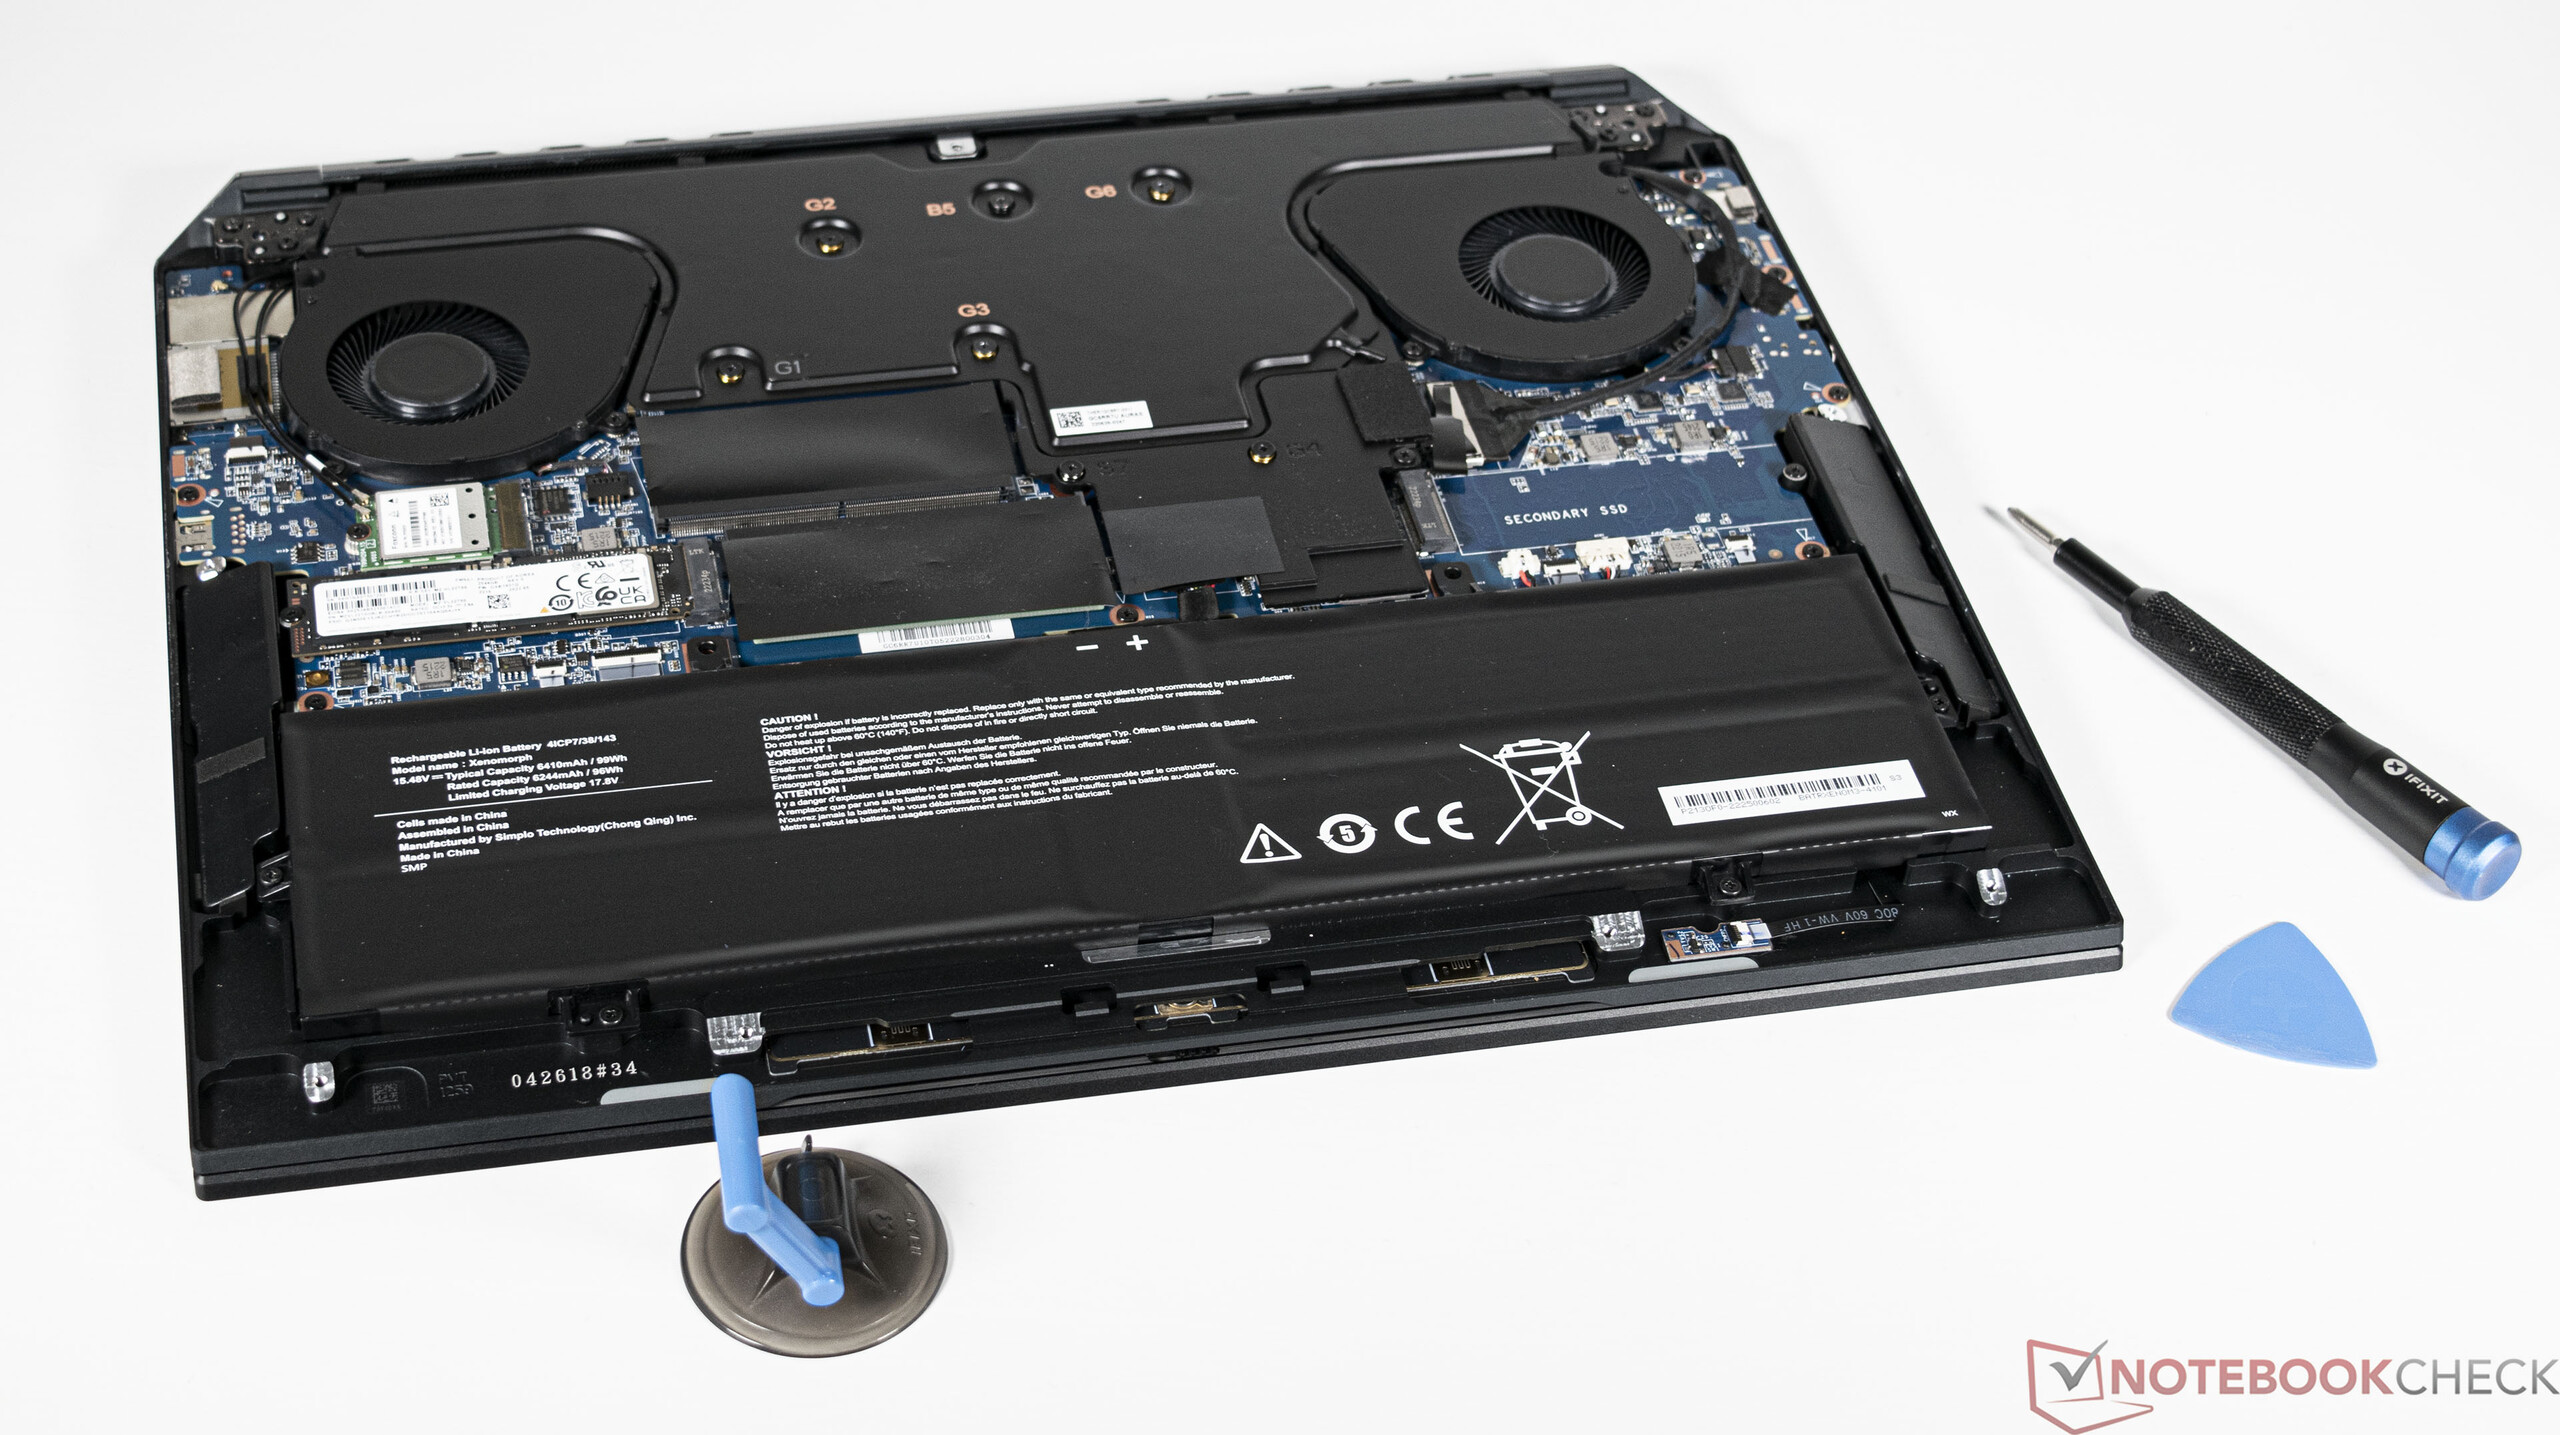
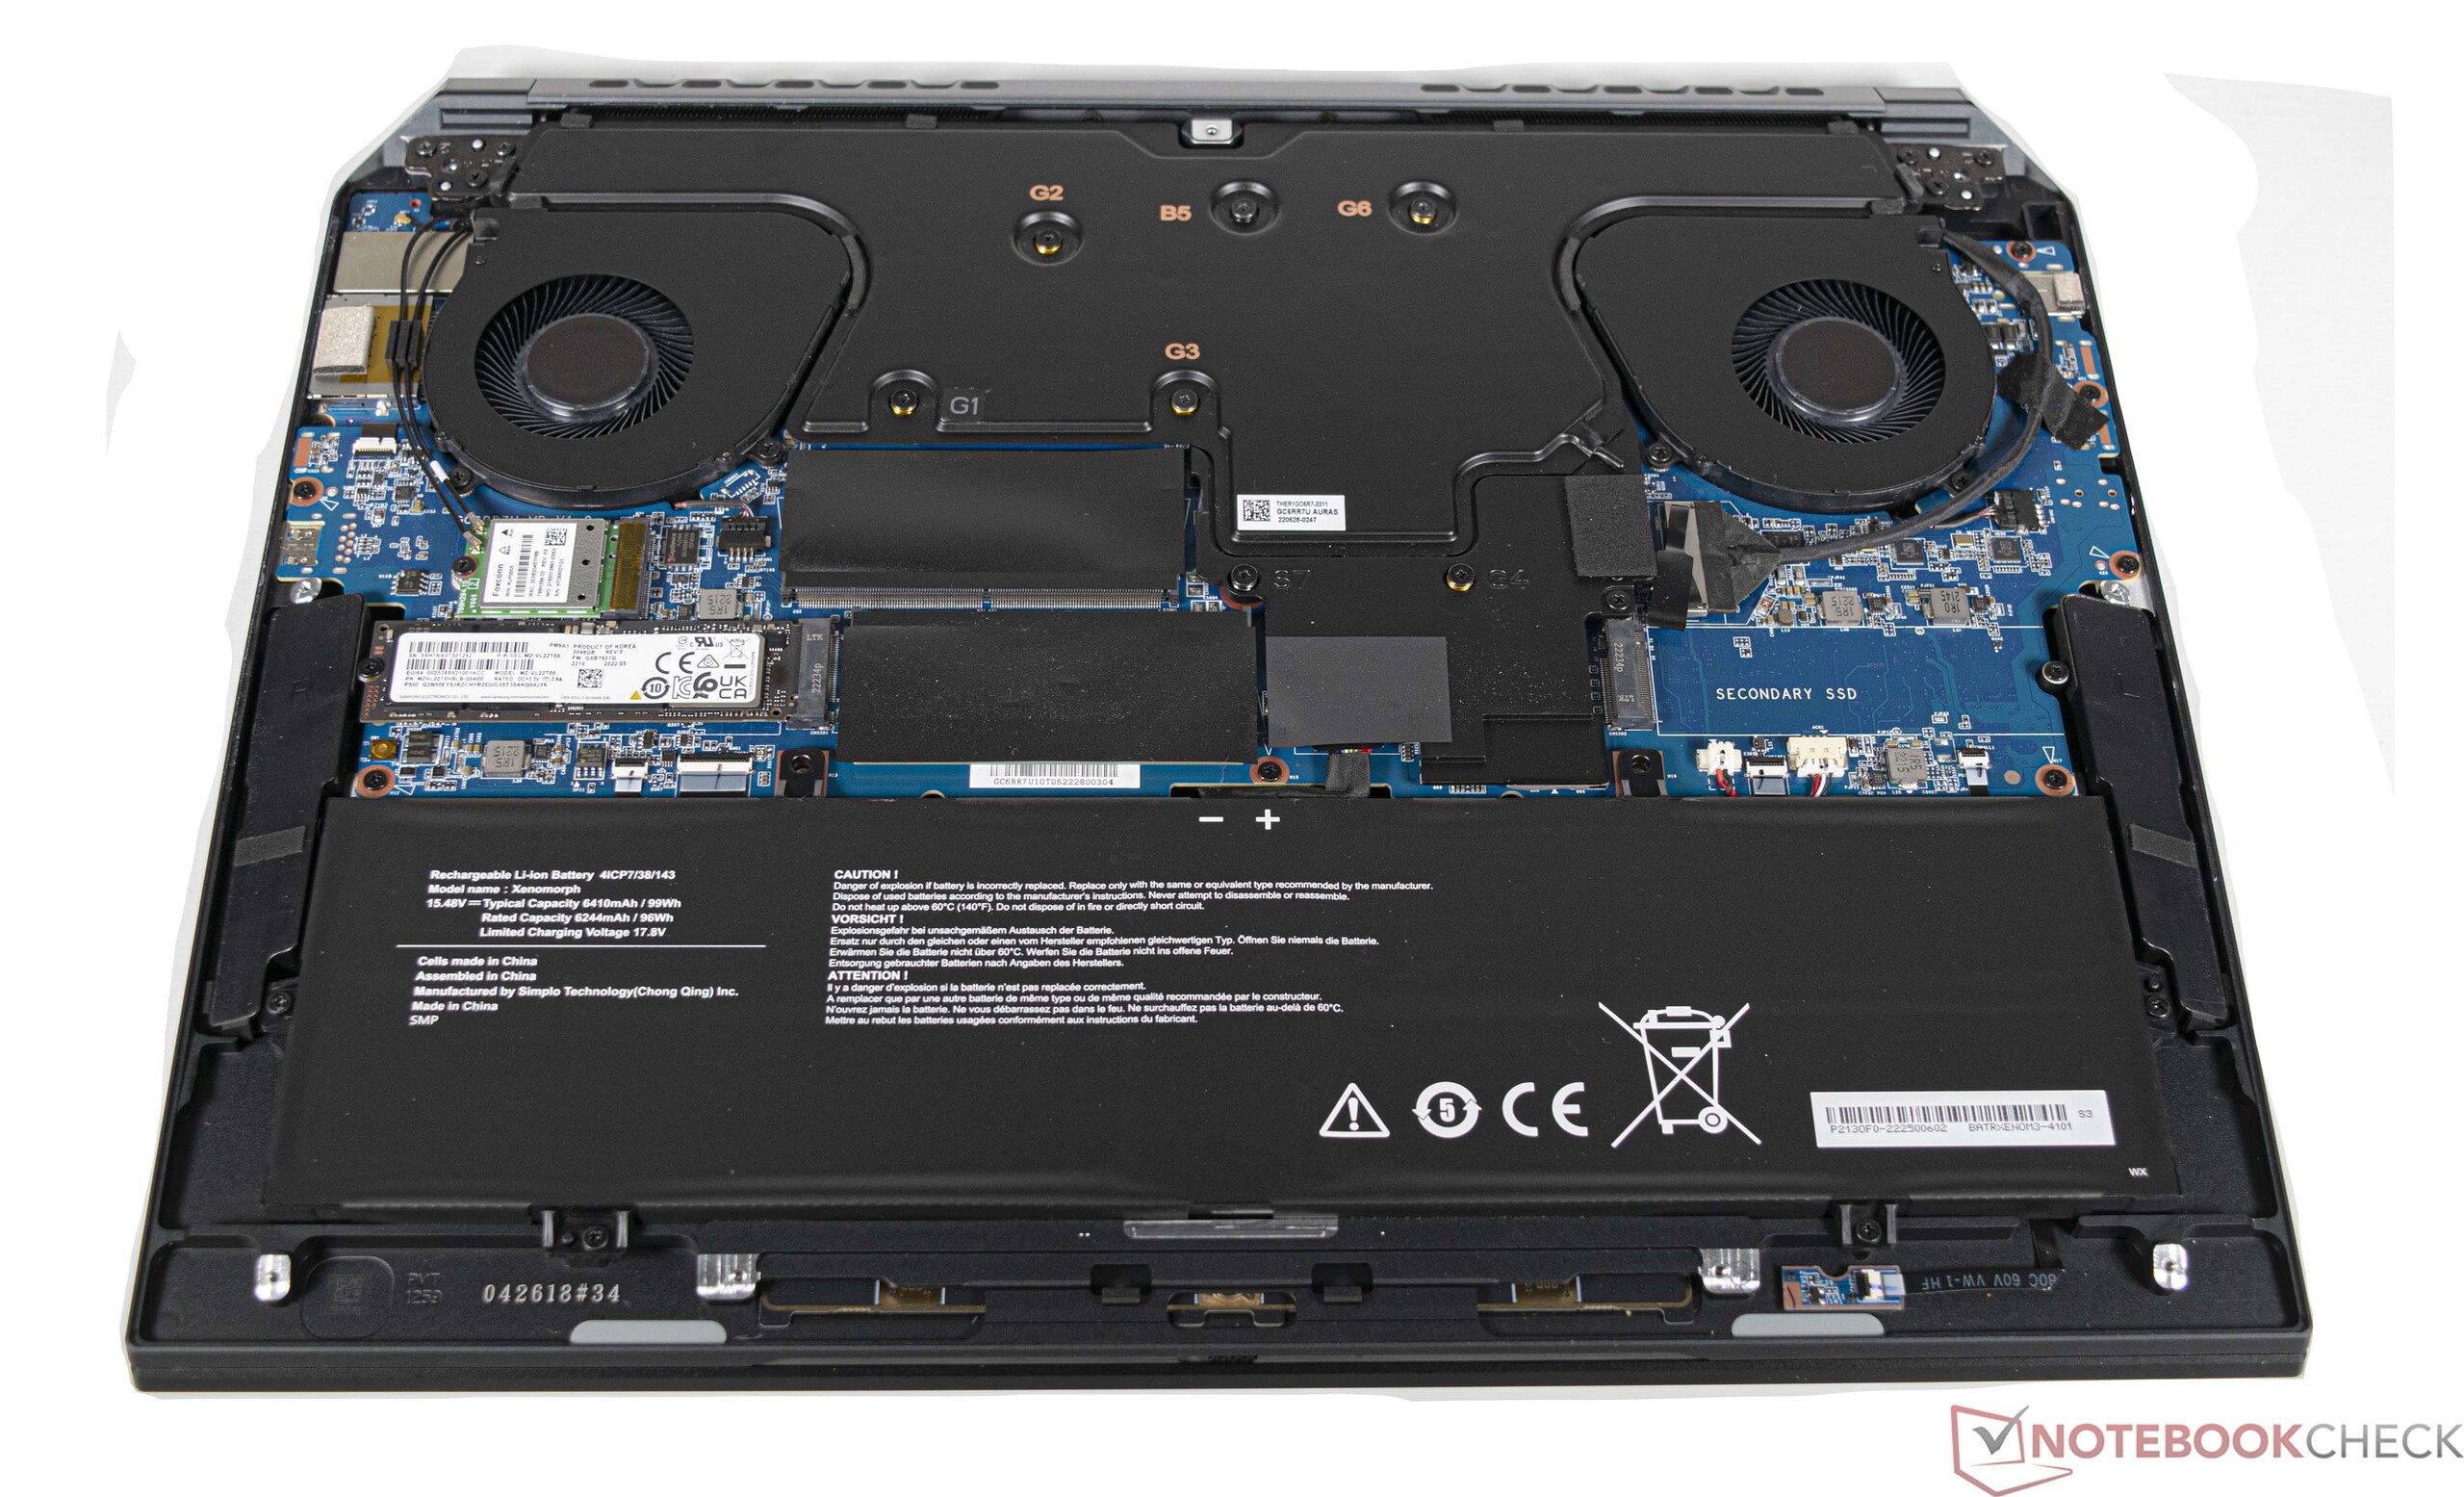
Con un'unità SSD da 2 TB, il Corsair Voyager a1600 offre molto spazio di archiviazione, che è sicuramente necessario per l'uso previsto. Il modello installato non riesce a tenere il passo con la concorrenza nei benchmark. Tuttavia, le velocità di trasferimento sono più che sufficienti per la maggior parte degli utenti. Nel test di carico, le prestazioni dell'SSD sono costantemente disponibili senza limitazioni. Tra l'altro, la piastra di base del notebook serve a dissipare il calore. È possibile installare un totale di due dispositivi di archiviazione di massa in formato M.2-2280.
Per ulteriori confronti e benchmark, consultare la nostra tabella di confronto SSD/HDD confronto tra SSD e HDD.

* ... Meglio usare valori piccoli
Continuous Read: DiskSpd Read Loop, Queue Depth 8
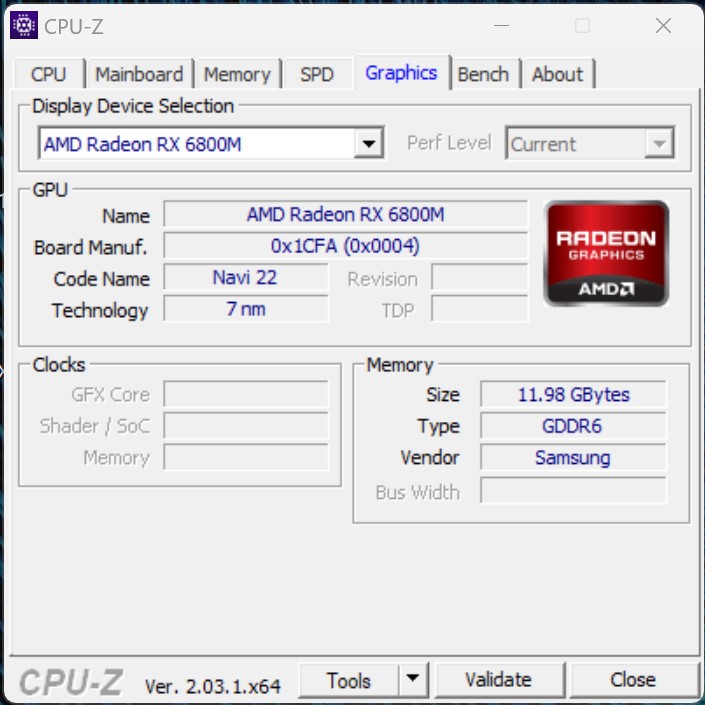
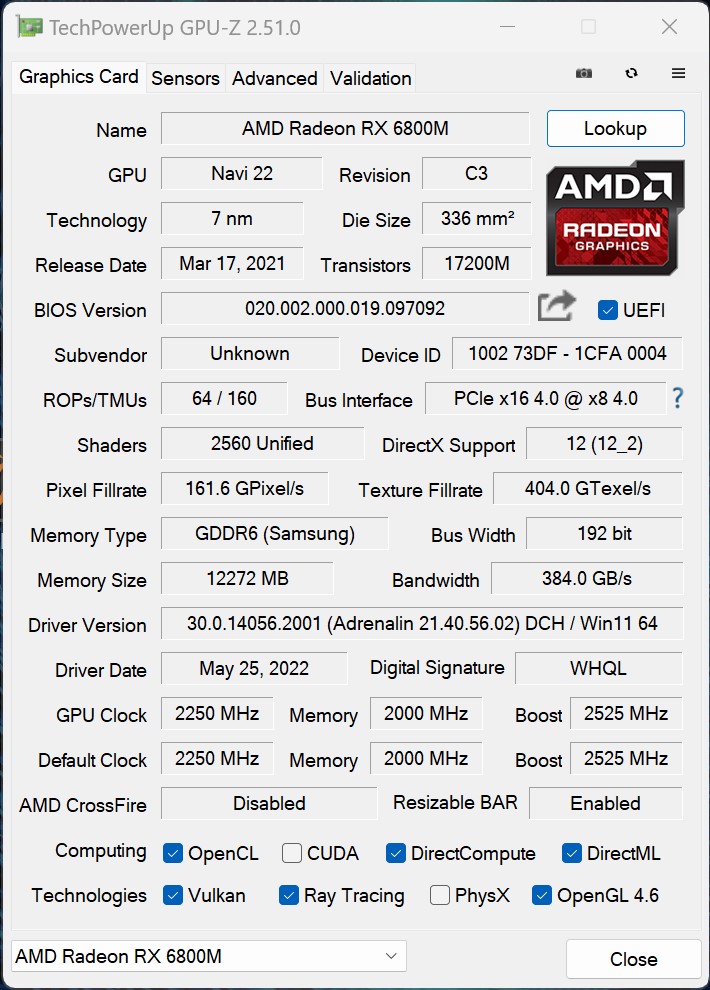
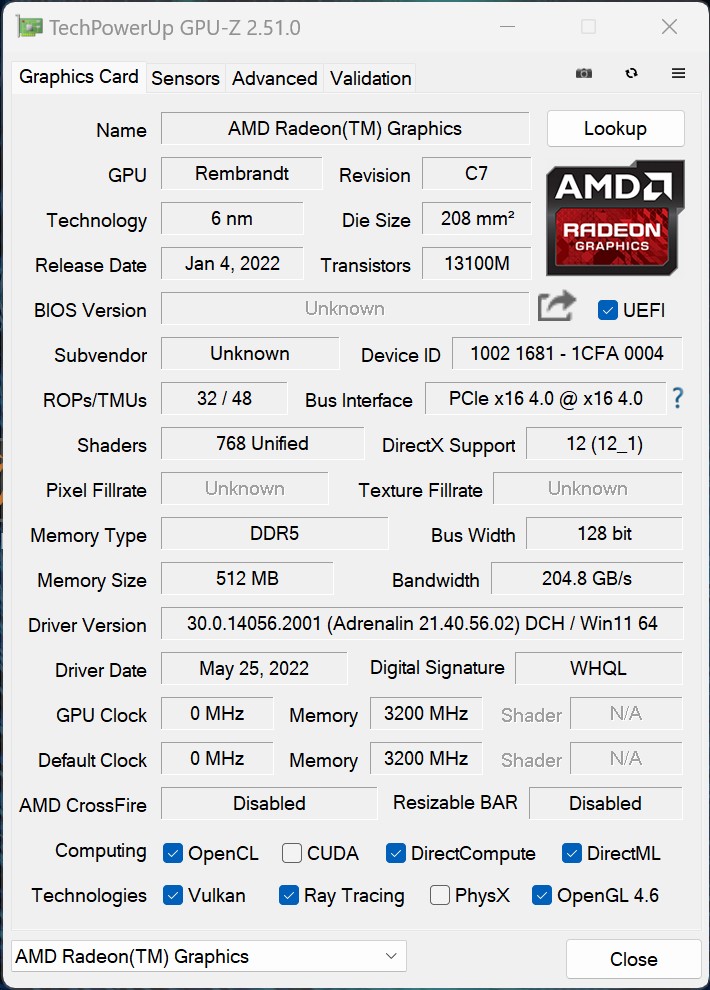
Scheda grafica
AMD Radeon RX 6800M è una veloce scheda grafica dedicata dotata di 12 GB di VRAM. L'attuale serie 6000 di AMD per notebook offre anche core RT separati per i calcoli di ray tracing grazie a RDNA2. Nel test, la Corsair Voyager a1600 è in grado di offrire buone prestazioni 3D. Il divario rispetto ai concorrenti con chip grafico GeForce RTX 3080 Ti è in parte ridotto. In sostanza, il Corsair Voyager a1600 offre prestazioni sufficienti, attualmente sufficienti per portare sullo schermo molti giochi moderni in modo fluido. La CPU ottiene sempre le prestazioni ottimali dalla GPU grazie alla tecnologia Smart Shift di AMD.
In modalità 2D, l'iGPU dell'AMD Ryzen 9 6900HS svolge il lavoro e quindi risparmia energia.
Per ulteriori confronti e benchmark, consultate il nostro sitoGPU a confronto.
| 3DMark 05 Standard | 57639 punti | |
| 3DMark 06 Standard Score | 46732 punti | |
| 3DMark Vantage P Result | 77244 punti | |
| 3DMark 11 Performance | 30013 punti | |
| 3DMark Ice Storm Standard Score | 209564 punti | |
| 3DMark Cloud Gate Standard Score | 59585 punti | |
| 3DMark Fire Strike Score | 25639 punti | |
| 3DMark Fire Strike Extreme Score | 13599 punti | |
| 3DMark Time Spy Score | 10391 punti | |
Aiuto | ||
* ... Meglio usare valori piccoli
| The Witcher 3 | |
| 1920x1080 High Graphics & Postprocessing (Nvidia HairWorks Off) | |
| Media della classe Gaming (n=1ultimi 2 anni) | |
| Lenovo Legion 7 16IAX7-82TD004SGE | |
| Lenovo Legion 7 16ARHA7 | |
| Asus ROG Flow X16 GV601RW-M5082W | |
| Media AMD Radeon RX 6800M (177.8 - 199, n=2) | |
| HP Omen 16-b1090ng | |
| Acer Predator Triton 500 SE PT516-52s-70KX | |
| Corsair Voyager a1600 | |
| 1920x1080 Ultra Graphics & Postprocessing (HBAO+) | |
| Media della classe Gaming (104.7 - 240, n=6, ultimi 2 anni) | |
| Lenovo Legion 7 16ARHA7 | |
| Lenovo Legion 7 16IAX7-82TD004SGE | |
| Media AMD Radeon RX 6800M (108 - 110, n=2) | |
| Corsair Voyager a1600 | |
| Acer Predator Triton 500 SE PT516-52s-70KX | |
| Asus ROG Flow X16 GV601RW-M5082W | |
| HP Omen 16-b1090ng | |
| F1 2021 | |
| 1920x1080 High Preset AA:T AF:16x | |
| Lenovo Legion 7 16ARHA7 | |
| Acer Predator Triton 500 SE PT516-52s-70KX | |
| Corsair Voyager a1600 | |
| Media AMD Radeon RX 6800M (187 - 231, n=2) | |
| Lenovo Legion 7 16IAX7-82TD004SGE | |
| 1920x1080 Ultra High Preset + Raytracing AA:T AF:16x | |
| Lenovo Legion 7 16ARHA7 | |
| Corsair Voyager a1600 | |
| Acer Predator Triton 500 SE PT516-52s-70KX | |
| Media AMD Radeon RX 6800M (114 - 124.1, n=2) | |
| Lenovo Legion 7 16IAX7-82TD004SGE | |
Witcher 3 FPS diagram
| basso | medio | alto | ultra | QHD | 4K | |
|---|---|---|---|---|---|---|
| GTA V (2015) | 177.1 | 172 | 156.2 | 92.8 | 84 | 85.4 |
| The Witcher 3 (2015) | 309 | 236 | 177.8 | 108 | 59.5 | |
| Dota 2 Reborn (2015) | 146.1 | 126.2 | 125.5 | 114.8 | 95.2 | |
| Final Fantasy XV Benchmark (2018) | 160.8 | 125.6 | 97.5 | 71 | 41.3 | |
| X-Plane 11.11 (2018) | 60 | 50.7 | 45.3 | 28.8 | ||
| Far Cry 5 (2018) | 129 | 113 | 109 | 101 | 100 | 61 |
| Strange Brigade (2018) | 394 | 258 | 229 | 206 | 145 | 77.2 |
| Shadow of the Tomb Raider (2018) | 143.9 | 119.7 | 112.8 | 106.1 | 80.5 | 43.2 |
| Far Cry New Dawn (2019) | 111 | 97 | 94 | 86 | 82 | 62 |
| Metro Exodus (2019) | 205 | 137.4 | 99.8 | 78.7 | 61.4 | 37.1 |
| Borderlands 3 (2019) | 116.1 | 100.1 | 89.2 | 77.6 | 57 | 30.3 |
| F1 2020 (2020) | 305 | 247 | 228 | 172.4 | 127.4 | 70.2 |
| Dirt 5 (2020) | 242 | 154 | 121 | 95 | 76 | 47 |
| F1 2021 (2021) | 342 | 277 | 231 | 124.1 | 88.2 | 47.6 |
| New World (2021) | 122.5 | 103 | 83.7 | 66.2 | 34.1 | |
| Forza Horizon 5 (2021) | 213 | 165 | 159 | 97 | 79 | 50 |
| God of War (2022) | 88.6 | 88.3 | 85.4 | 68.4 | 53 | 33.8 |
| GRID Legends (2022) | 233 | 205 | 171.2 | 144.1 | 115.8 | 72.8 |
| Cyberpunk 2077 1.6 (2022) | 122.5 | 95.5 | 82 | 76.9 | 48.1 | 22.1 |
| Tiny Tina's Wonderlands (2022) | 196.7 | 161.5 | 104.6 | 80.5 | 54.9 | 28.2 |
| F1 22 (2022) | 226 | 226 | 192.3 | 49.7 | 29.9 | 13.8 |
| A Plague Tale Requiem (2022) | 104.9 | 82.5 | 61.4 | 46 | 32.8 | 17.9 |
| Uncharted Legacy of Thieves Collection (2022) | 93.4 | 87.9 | 80.7 | 76.3 | 59.2 | 33.7 |
| Spider-Man Miles Morales (2022) | 90.8 | 94.2 | 88.6 | 82.5 | 63.2 | 38.1 |
Emissioni ed energia - da non ignorare
Emissioni acustiche
Le emissioni acustiche misurate mostrano quasi un risultato tipico per un portatile da gioco. Tuttavia, i 51,1 dB(A) misurati sono forti e soggettivamente percepiti come significativamente più forti. Il motivo è il rumore della ventola ad alta frequenza. L'unico rimedio è selezionare il profilo Balanced
o Quiet
. Il livello di rumore scende rispettivamente a 46 e 36 dB(A) nello stress test.
Rumorosità
| Idle |
| 30.5 / 30.6 / 30.7 dB(A) |
| Sotto carico |
| 44.5 / 51.1 dB(A) |
 | ||
30 dB silenzioso 40 dB(A) udibile 50 dB(A) rumoroso |
||
min: | ||
| Corsair Voyager a1600 Radeon RX 6800M, R9 6900HS, Samsung PM9A1 MZVL22T0HBLB | Asus ROG Flow X16 GV601RW-M5082W GeForce RTX 3070 Ti Laptop GPU, R9 6900HS, Micron 3400 1TB MTFDKBA1T0TFH | Lenovo Legion 7 16ARHA7 Radeon RX 6850M XT, R9 6900HX, Samsung PM9A1 MZVL22T0HBLB | Acer Predator Triton 500 SE PT516-52s-70KX GeForce RTX 3080 Ti Laptop GPU, i7-12700H, Micron 3400 1TB MTFDKBA1T0TFH | HP Omen 16-b1090ng GeForce RTX 3070 Ti Laptop GPU, i7-12700H, WDC PC SN810 1TB | Lenovo Legion 7 16IAX7-82TD004SGE GeForce RTX 3080 Ti Laptop GPU, i9-12900HX, Micron 3400 1TB MTFDKBA1T0TFH | |
|---|---|---|---|---|---|---|
| Noise | 7% | 22% | 0% | -3% | 5% | |
| off /ambiente * (dB) | 29.9 | 25.5 15% | 22.8 24% | 26 13% | 26 13% | 24.5 18% |
| Idle Minimum * (dB) | 30.5 | 25.5 16% | 23 25% | 26 15% | 30 2% | 24.5 20% |
| Idle Average * (dB) | 30.6 | 25.5 17% | 23 25% | 29 5% | 31 -1% | 30 2% |
| Idle Maximum * (dB) | 30.7 | 27.4 11% | 23 25% | 34 -11% | 33 -7% | 32.5 -6% |
| Load Average * (dB) | 44.5 | 49.9 -12% | 26.8 40% | 50 -12% | 49 -10% | 43.9 1% |
| Load Maximum * (dB) | 51.1 | 55 -8% | 54.2 -6% | 56 -10% | 57 -12% | 54.2 -6% |
| Witcher 3 ultra * (dB) | 54.3 | 53 | 53 | 48.8 |
* ... Meglio usare valori piccoli
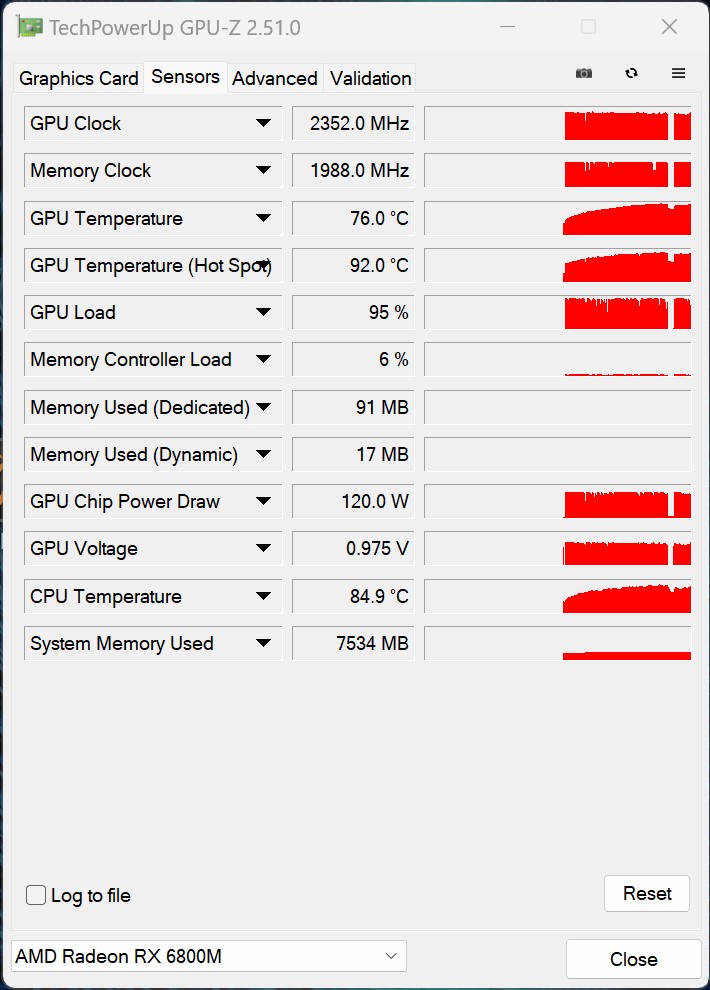
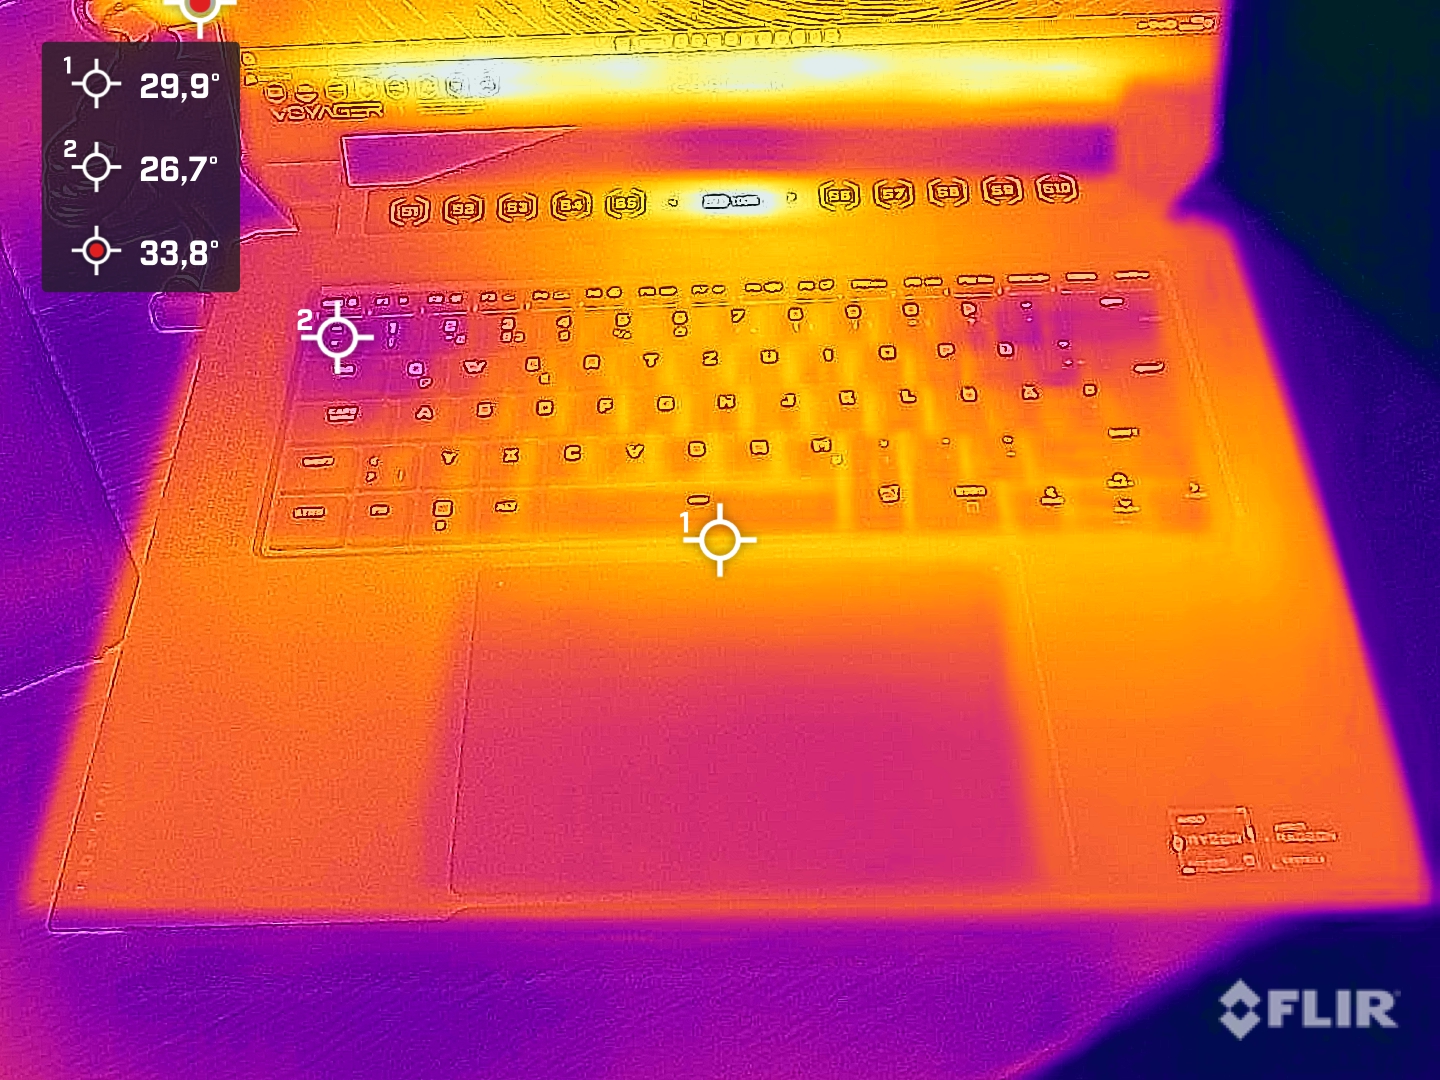
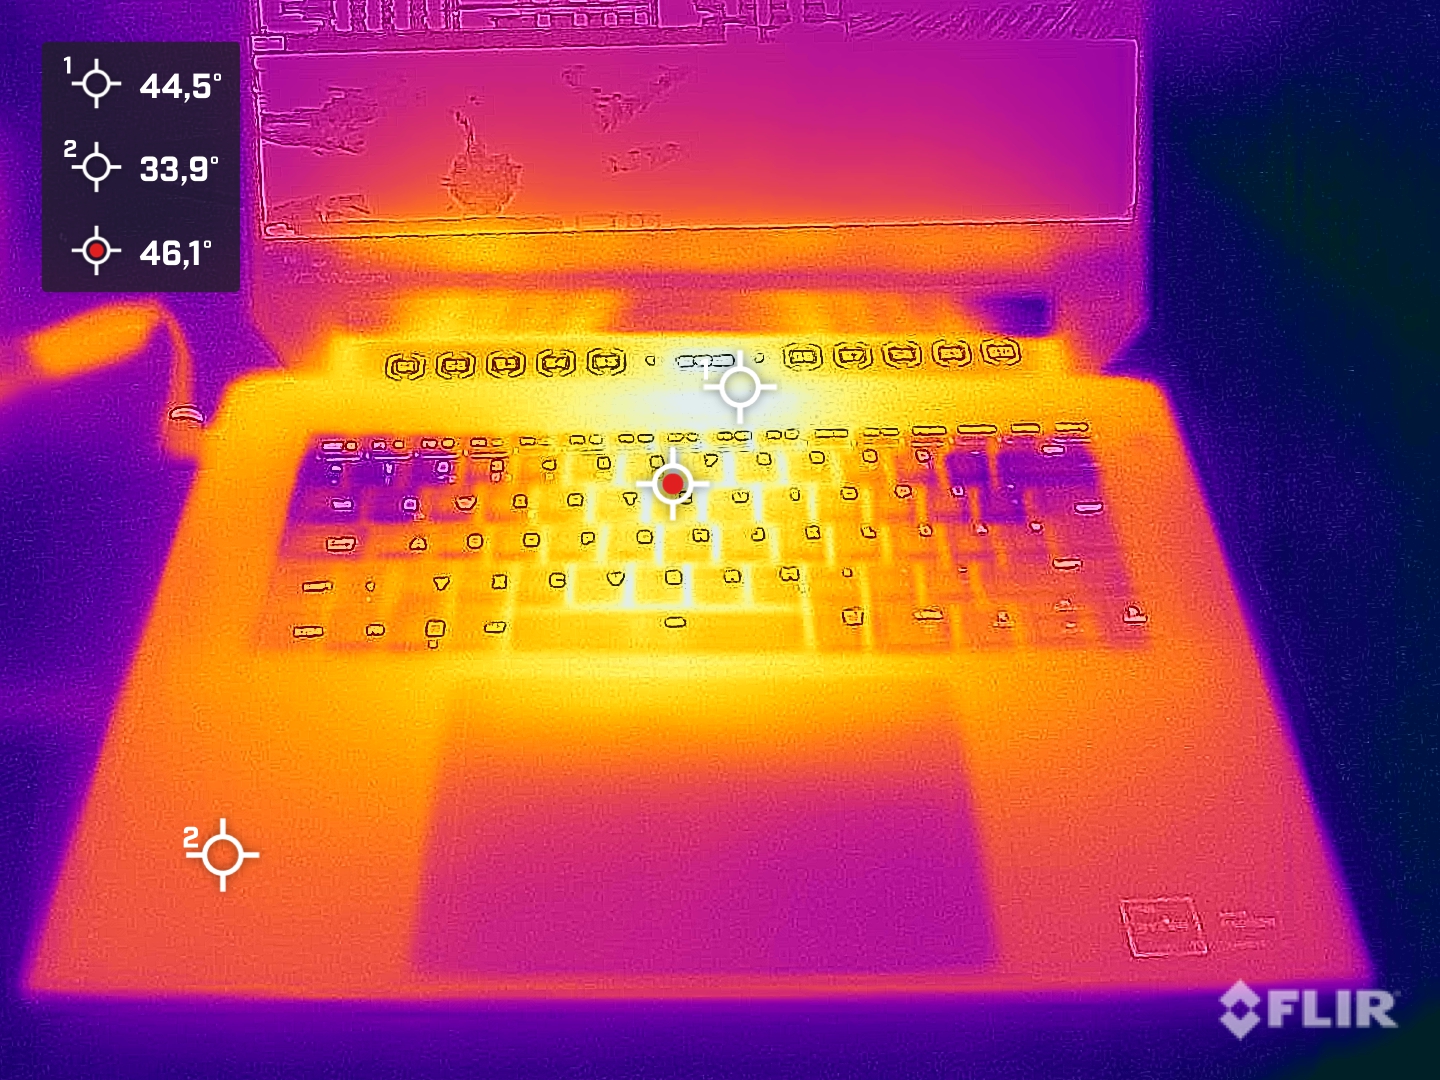
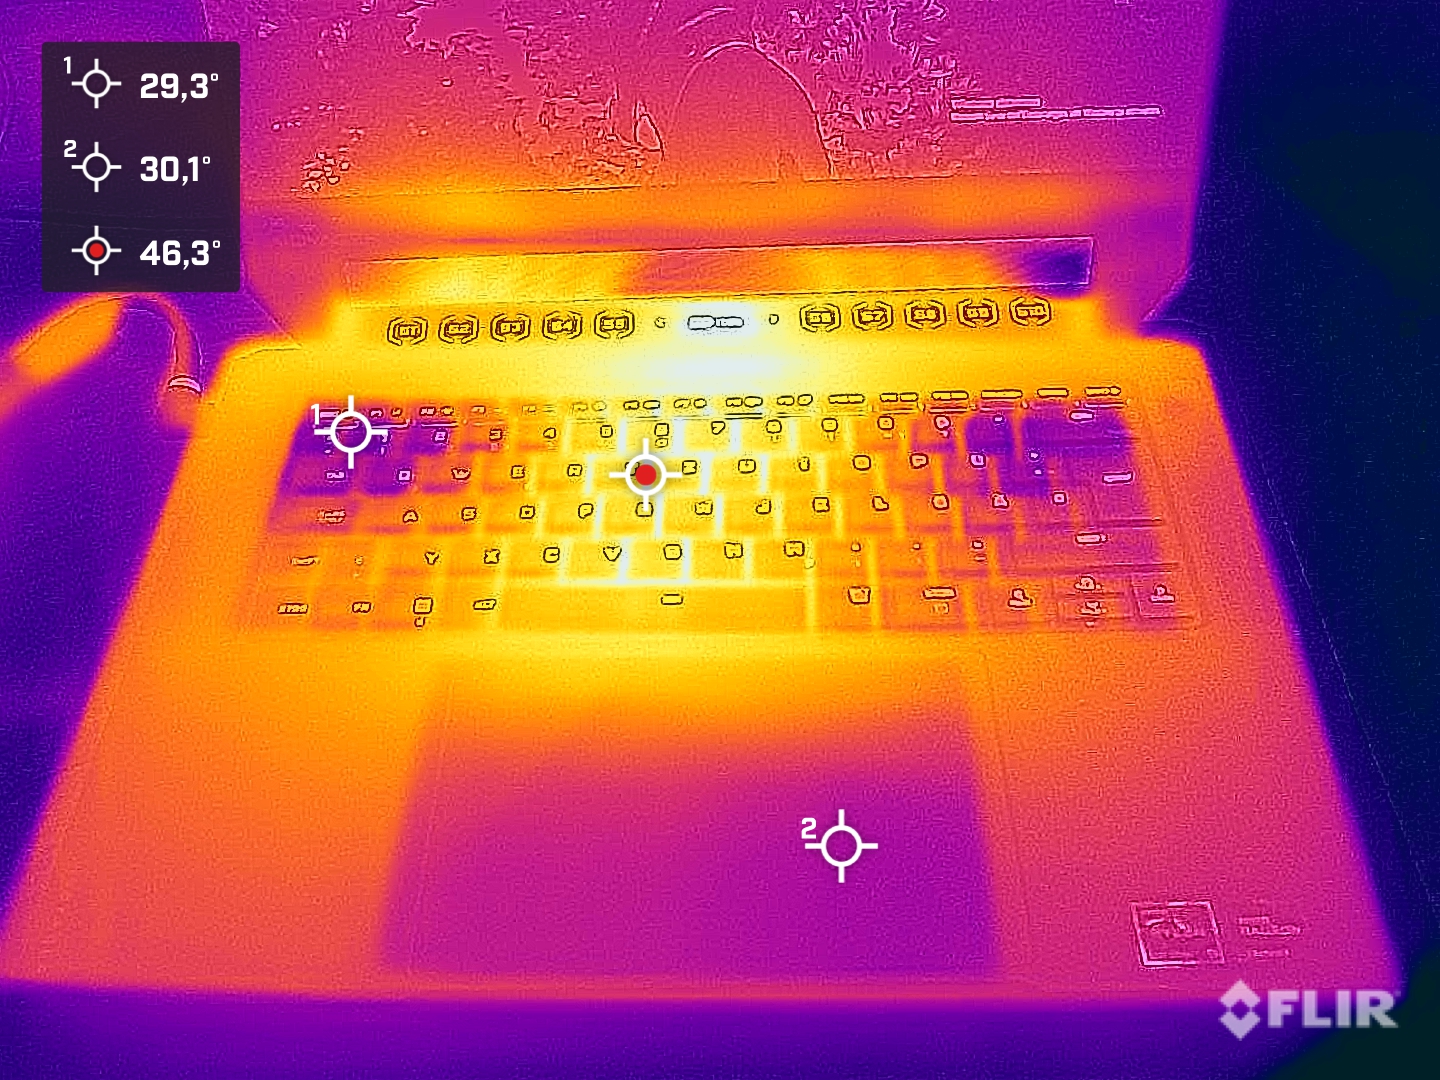
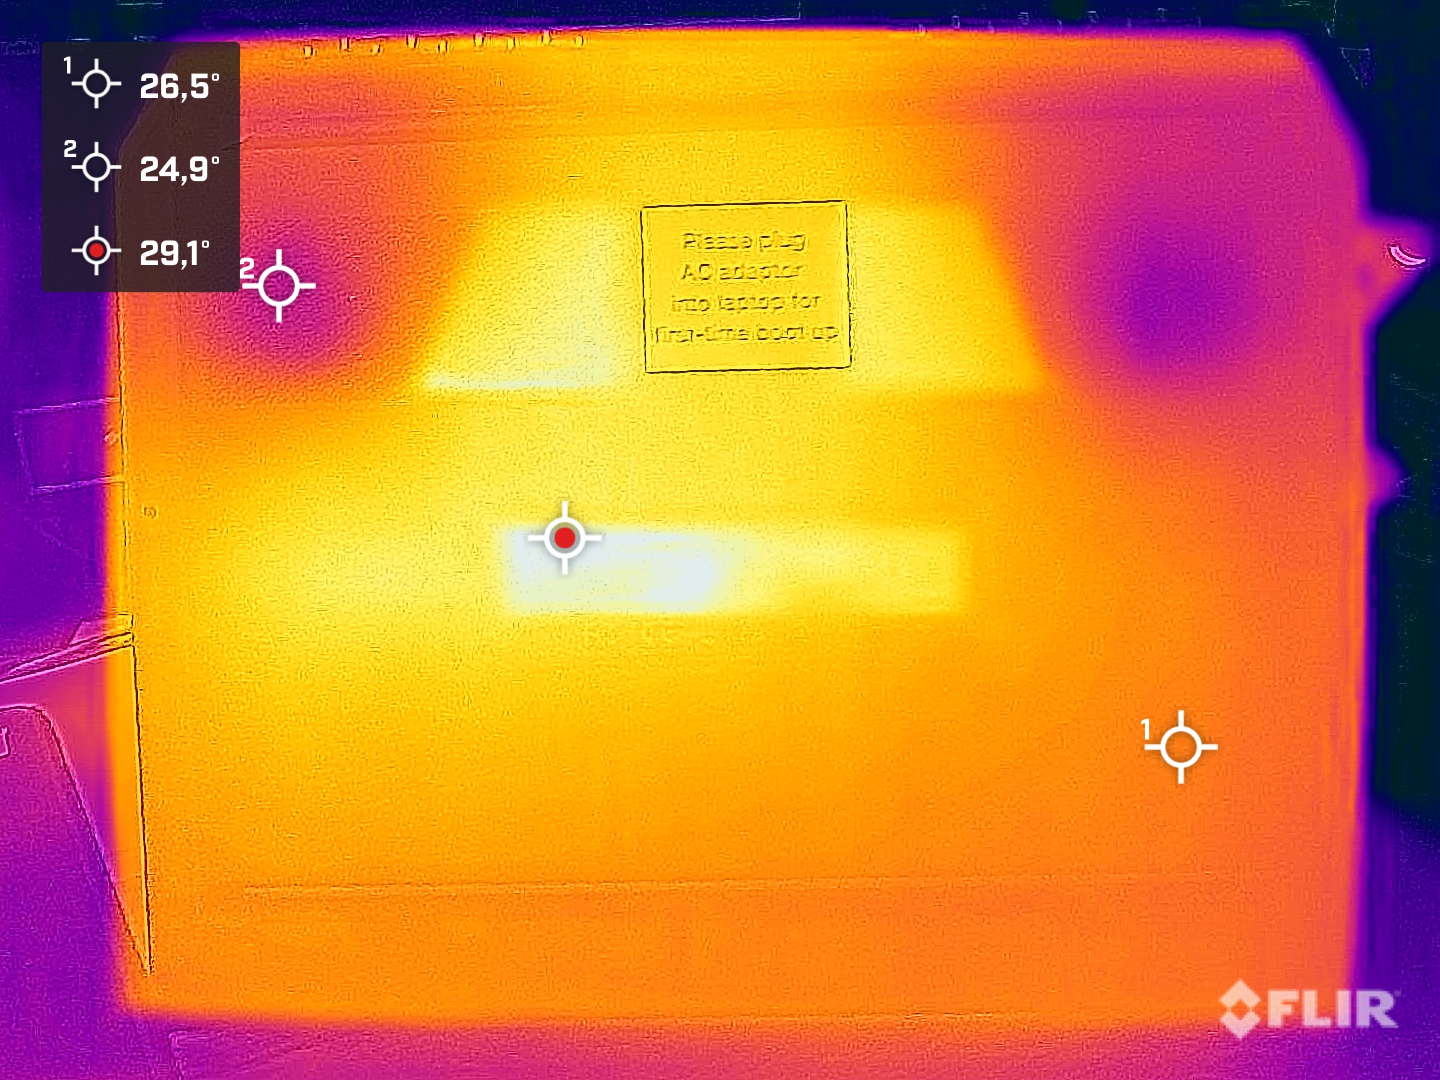
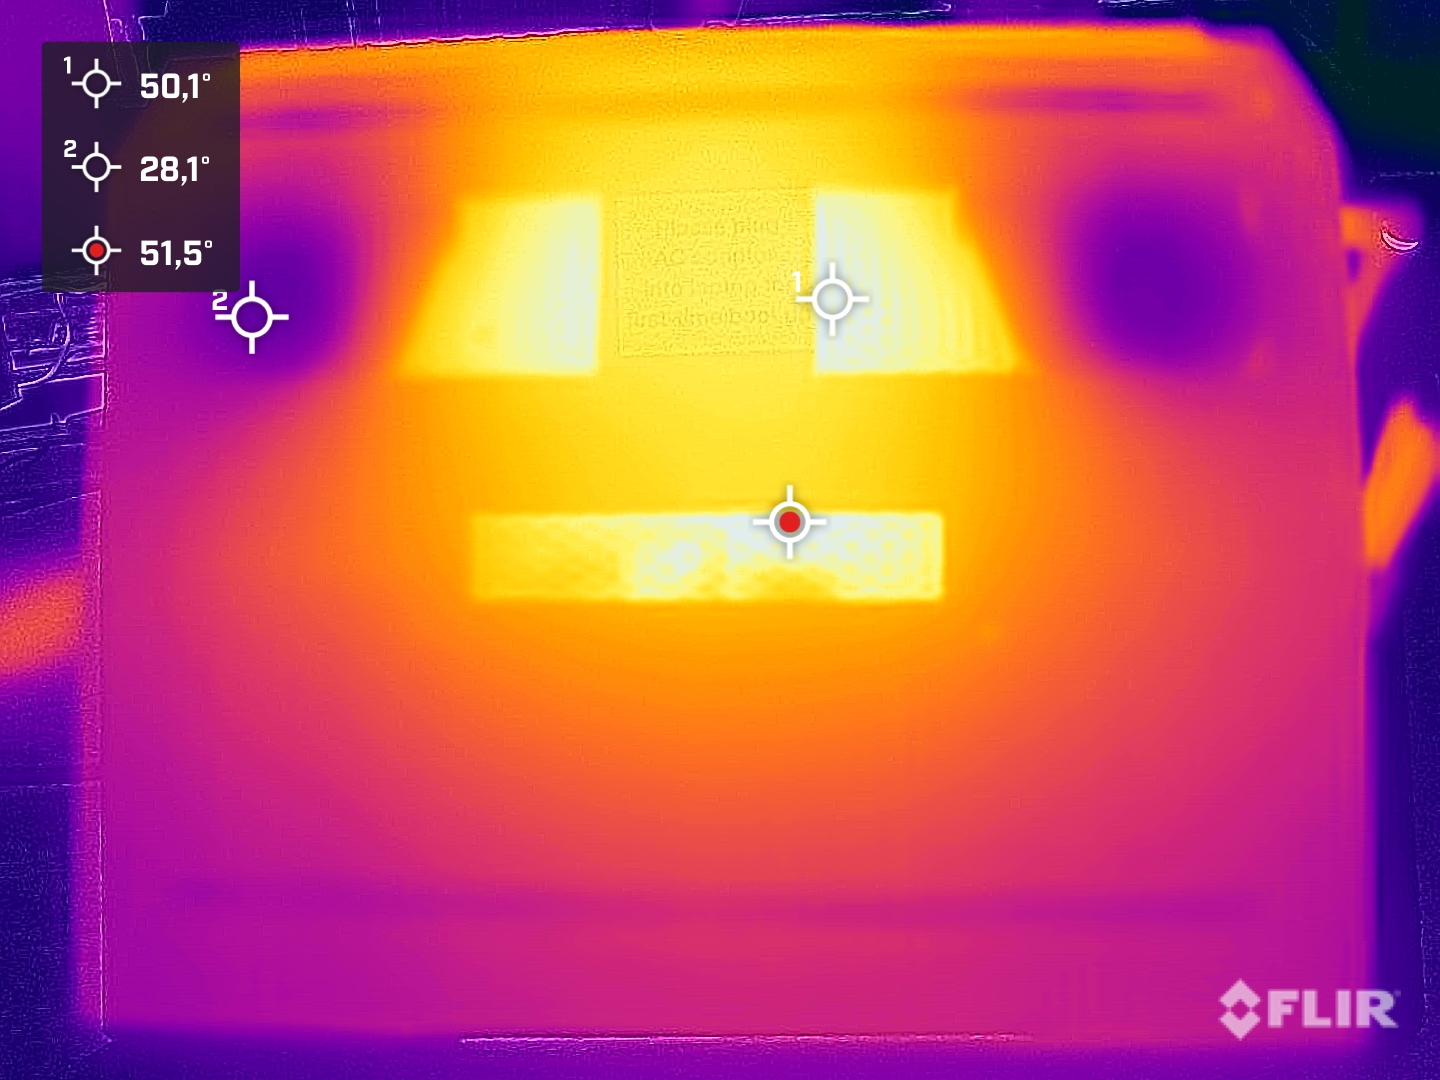
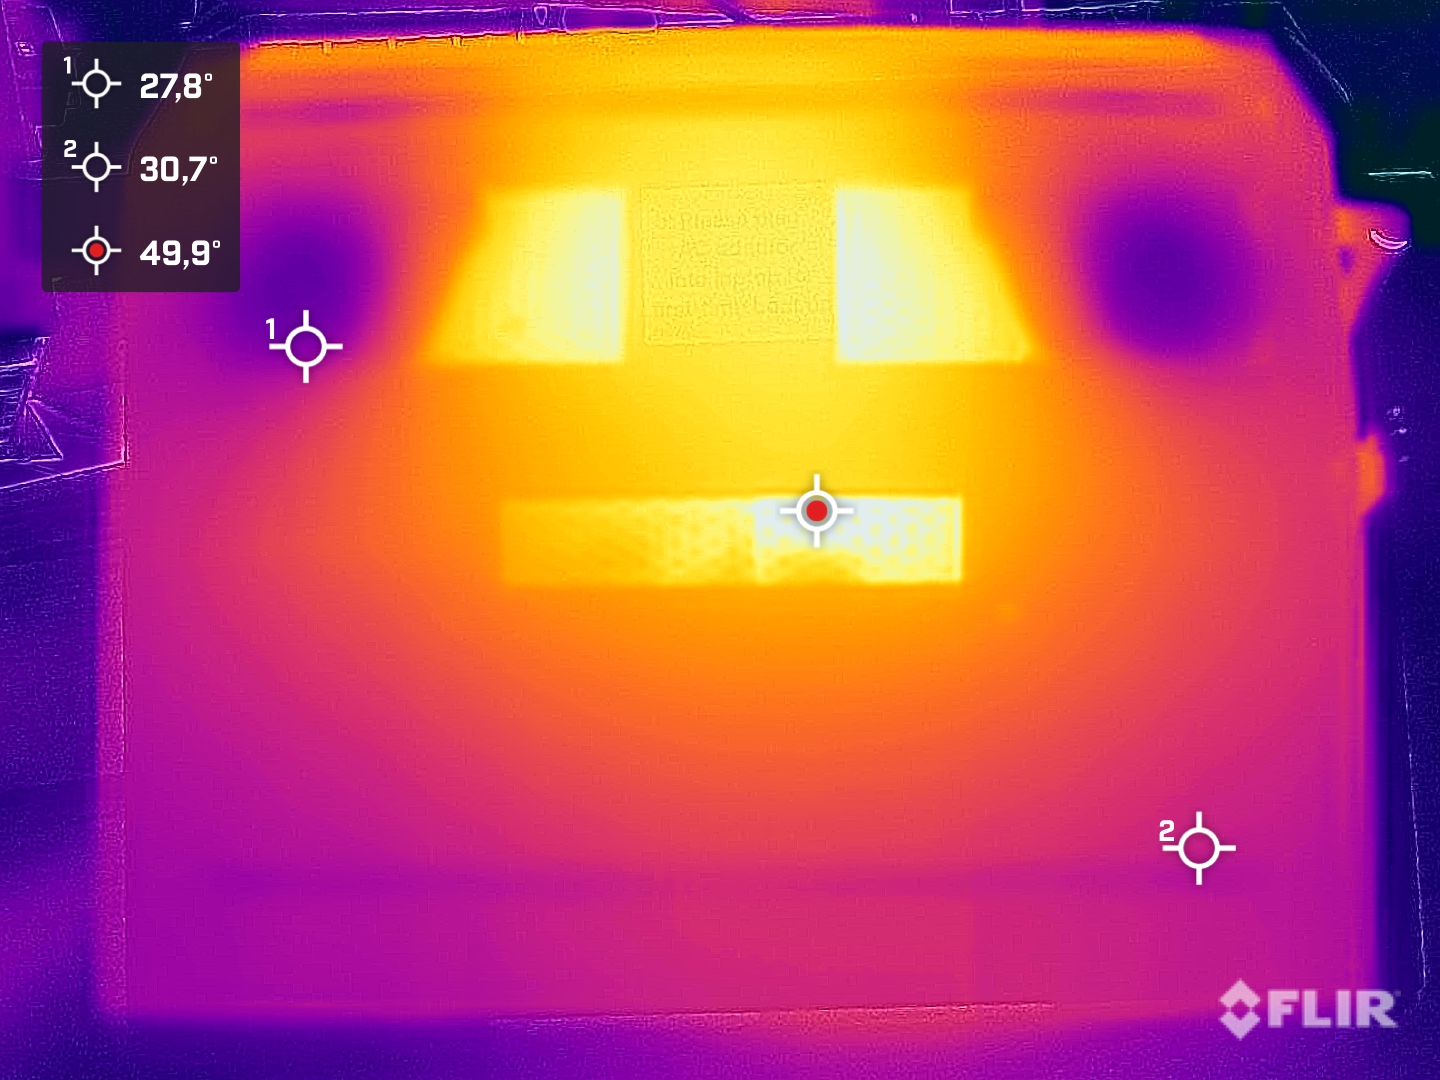
Temperatura
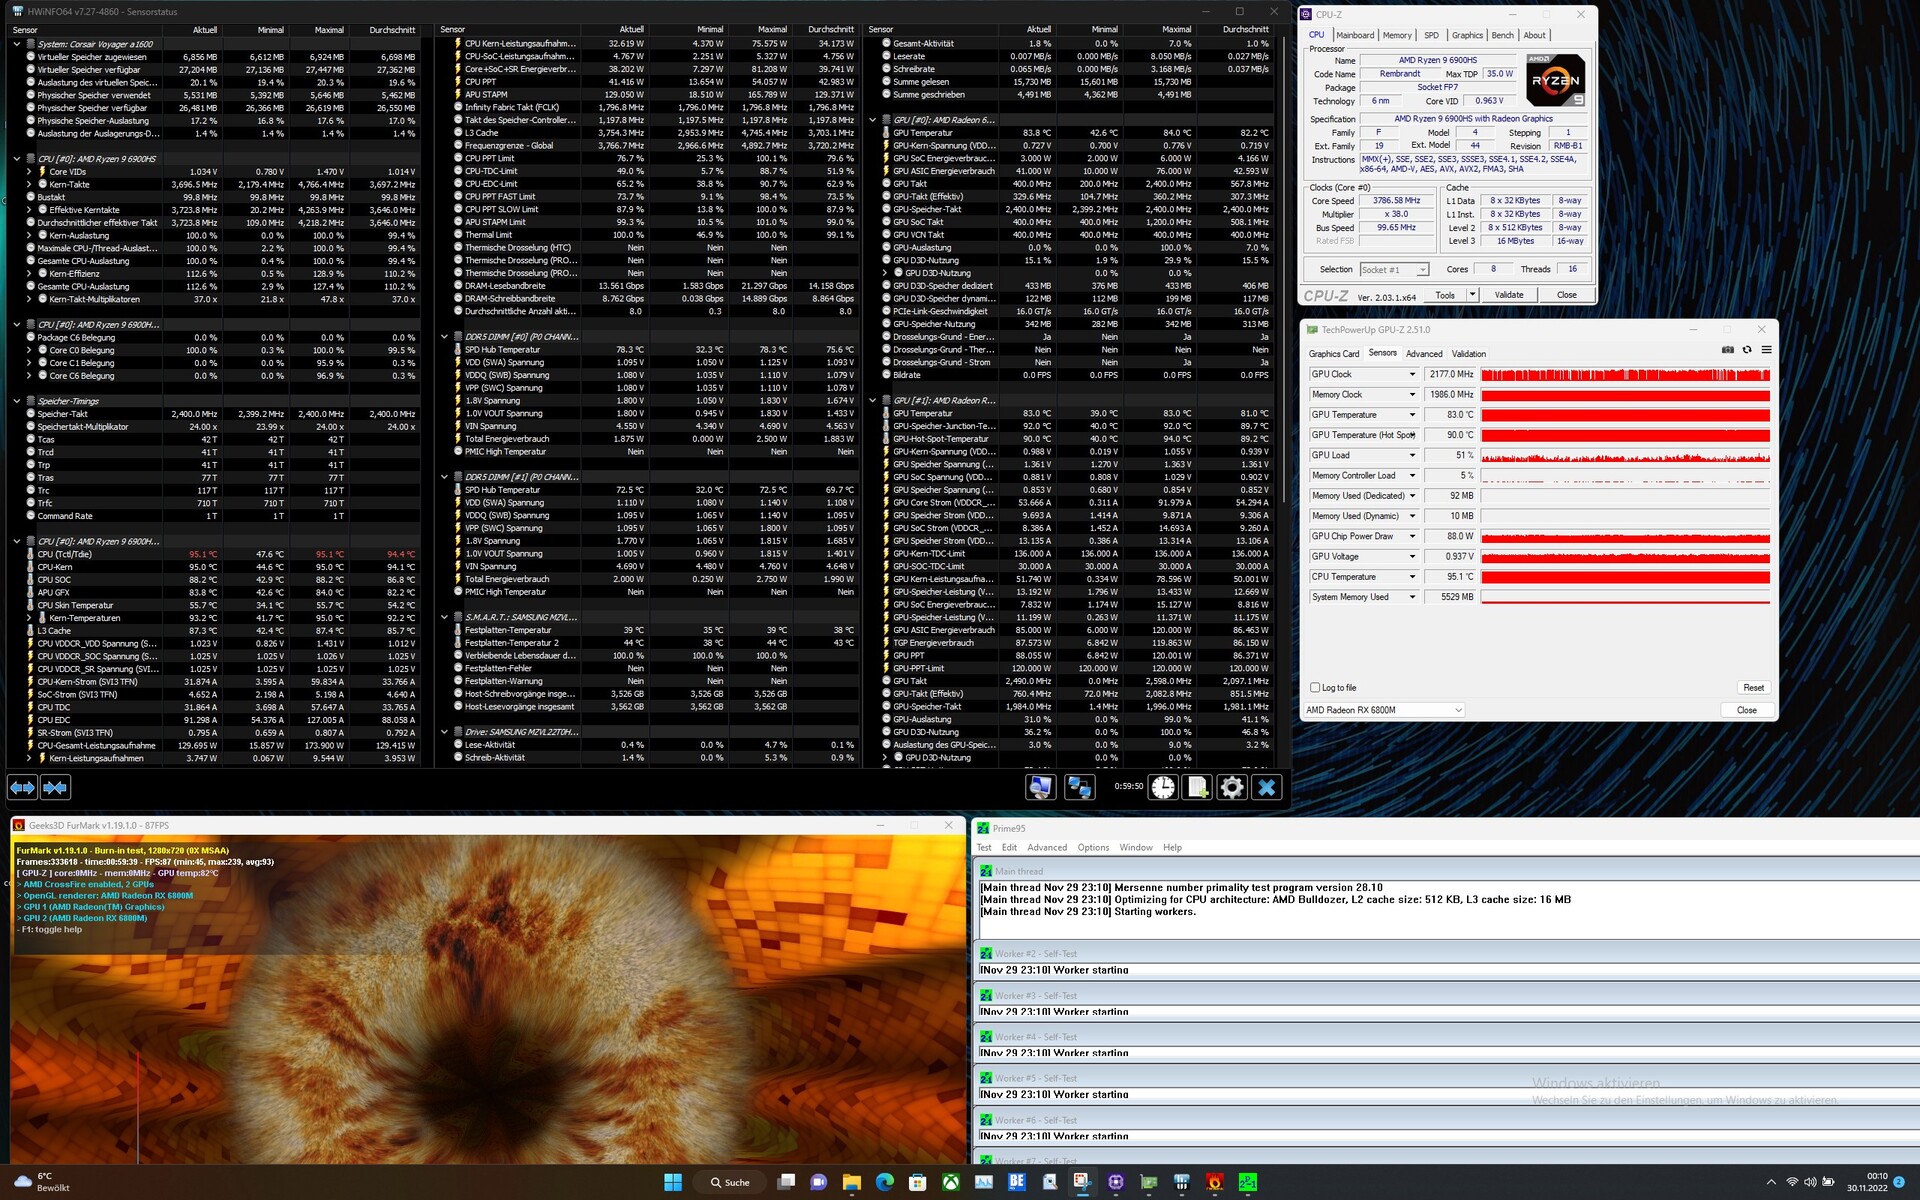
Il punto più caldo è stato misurato sul fondo del case, con 54 °C nello stress test. Tuttavia, il case si scalda anche sul lato superiore, con poco più di 50 °C. La temperatura del case scende solo leggermente di 1-2 °C durante il gioco.
Durante lo stress test, le temperature della CPU e della GPU salgono a 95 e 83 °C, rispettivamente. Tuttavia, il SoC continua ad avere un clock medio di 3,7 GHz. Anche la GPU AMD raggiunge frequenze di clock elevate con poco meno di 2,2 GHz. Corsair utilizza un ampio sistema di raffreddamento con una camera di vapore e due ventole.
(-) La temperatura massima sul lato superiore è di 50.7 °C / 123 F, rispetto alla media di 40.4 °C / 105 F, che varia da 21.2 a 68.8 °C per questa classe Gaming.
(-) Il lato inferiore si riscalda fino ad un massimo di 54.2 °C / 130 F, rispetto alla media di 43.2 °C / 110 F
(+) In idle, la temperatura media del lato superiore è di 31.5 °C / 89 F, rispetto alla media deld ispositivo di 33.9 °C / 93 F.
(±) Riproducendo The Witcher 3, la temperatura media per il lato superiore e' di 36.6 °C / 98 F, rispetto alla media del dispositivo di 33.9 °C / 93 F.
(+) I poggiapolsi e il touchpad raggiungono la temperatura massima della pelle (34 °C / 93.2 F) e quindi non sono caldi.
(-) La temperatura media della zona del palmo della mano di dispositivi simili e'stata di 28.8 °C / 83.8 F (-5.2 °C / -9.4 F).
| Corsair Voyager a1600 AMD Ryzen 9 6900HS, AMD Radeon RX 6800M | Asus ROG Flow X16 GV601RW-M5082W AMD Ryzen 9 6900HS, NVIDIA GeForce RTX 3070 Ti Laptop GPU | Lenovo Legion 7 16ARHA7 AMD Ryzen 9 6900HX, AMD Radeon RX 6850M XT | Acer Predator Triton 500 SE PT516-52s-70KX Intel Core i7-12700H, NVIDIA GeForce RTX 3080 Ti Laptop GPU | HP Omen 16-b1090ng Intel Core i7-12700H, NVIDIA GeForce RTX 3070 Ti Laptop GPU | Lenovo Legion 7 16IAX7-82TD004SGE Intel Core i9-12900HX, NVIDIA GeForce RTX 3080 Ti Laptop GPU | |
|---|---|---|---|---|---|---|
| Heat | -3% | 14% | 8% | 14% | -3% | |
| Maximum Upper Side * (°C) | 50.7 | 55.1 -9% | 37.2 27% | 47 7% | 41 19% | 44.4 12% |
| Maximum Bottom * (°C) | 54.2 | 50.3 7% | 43 21% | 49 10% | 62 -14% | 60.8 -12% |
| Idle Upper Side * (°C) | 35.8 | 35.5 1% | 34 5% | 31 13% | 25 30% | 33.8 6% |
| Idle Bottom * (°C) | 33 | 36.1 -9% | 32.8 1% | 32 3% | 26 21% | 38.8 -18% |
* ... Meglio usare valori piccoli
Altoparlante
I due altoparlanti si trovano sotto i poggiapolsi. Tuttavia, il suono è diretto verso l'alto dalle griglie dei diffusori accanto alla tastiera. Come spesso accade, i due altoparlanti sono privi di bassi, quindi i medi e gli alti predominano nettamente. Tuttavia, si consiglia di utilizzare una cuffia per il gioco. Queste possono essere collegate al portatile tramite USB utilizzando il jack da 3,5 mm o tramite Slipstream.
Corsair Voyager a1600 analisi audio
(-) | altoparlanti non molto potenti (69 dB)
Bassi 100 - 315 Hz
(±) | bassi ridotti - in media 10.2% inferiori alla media
(±) | la linearità dei bassi è media (13.7% delta rispetto alla precedente frequenza)
Medi 400 - 2000 Hz
(±) | medi elevati - circa 7.8% superiore alla media
(±) | linearità dei medi adeguata (7% delta rispetto alla precedente frequenza)
Alti 2 - 16 kHz
(+) | Alti bilanciati - appena 1.8% dalla media
(±) | la linearità degli alti è media (11.4% delta rispetto alla precedente frequenza)
Nel complesso 100 - 16.000 Hz
(±) | la linearità complessiva del suono è media (25.5% di differenza rispetto alla media
Rispetto alla stessa classe
» 91% di tutti i dispositivi testati in questa classe è stato migliore, 2% simile, 7% peggiore
» Il migliore ha avuto un delta di 6%, medio di 18%, peggiore di 132%
Rispetto a tutti i dispositivi testati
» 78% di tutti i dispositivi testati in questa classe è stato migliore, 4% similare, 17% peggiore
» Il migliore ha avuto un delta di 4%, medio di 23%, peggiore di 134%
Asus ROG Flow X16 GV601RW-M5082W analisi audio
(±) | potenza degli altiparlanti media ma buona (80.7 dB)
Bassi 100 - 315 Hz
(±) | bassi ridotti - in media 12.7% inferiori alla media
(±) | la linearità dei bassi è media (13.8% delta rispetto alla precedente frequenza)
Medi 400 - 2000 Hz
(+) | medi bilanciati - solo only 1.3% rispetto alla media
(+) | medi lineari (4.7% delta rispetto alla precedente frequenza)
Alti 2 - 16 kHz
(±) | alti elevati - circa 6.4% superiori alla media
(+) | alti lineari (6.8% delta rispetto alla precedente frequenza)
Nel complesso 100 - 16.000 Hz
(+) | suono nel complesso lineare (12.9% differenza dalla media)
Rispetto alla stessa classe
» 17% di tutti i dispositivi testati in questa classe è stato migliore, 4% simile, 79% peggiore
» Il migliore ha avuto un delta di 6%, medio di 18%, peggiore di 132%
Rispetto a tutti i dispositivi testati
» 12% di tutti i dispositivi testati in questa classe è stato migliore, 3% similare, 85% peggiore
» Il migliore ha avuto un delta di 4%, medio di 23%, peggiore di 134%
Consumo di energia
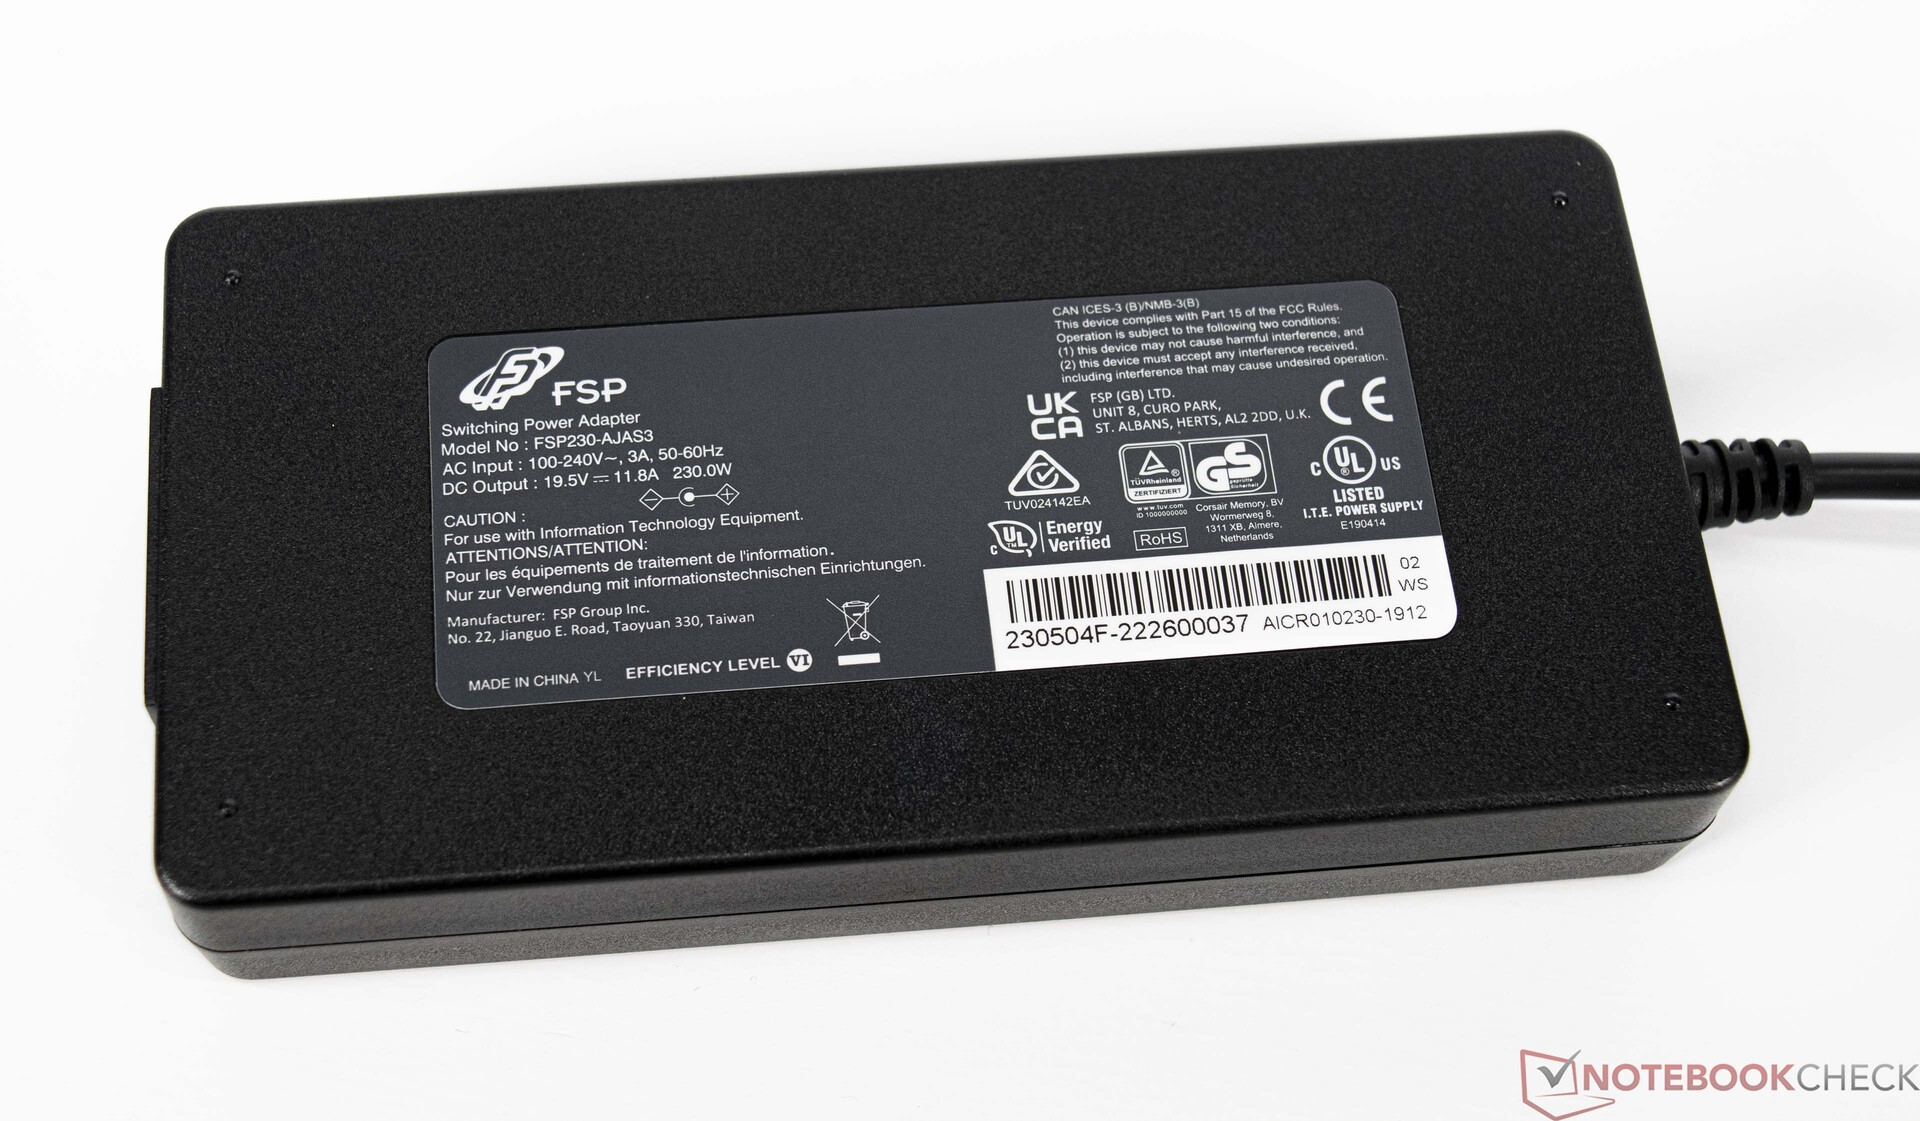
In termini di consumo energetico, abbiamo misurato circa 16-22 watt al minimo. Sotto carico medio, abbiamo registrato circa 133 watt, anche se si raggiungono picchi fino a 258 watt. Secondo le specifiche, l'alimentatore può fornire 230 watt. Tuttavia, i picchi di carico più elevati non hanno causato problemi durante il test. La batteria non si è scaricata ulteriormente durante lo stress test.
| Off / Standby | |
| Idle | |
| Sotto carico |
|
Leggenda:
min: | |
Energy consumption Witcher 3 / stress test
Energy consumption with an external monitor
Durata della batteria
Con 99 Wh, Corsair raggiunge il massimo in termini di capacità della batteria. A causa del consumo energetico relativamente elevato in idle, il dispositivo è in ritardo rispetto alla concorrenza. Tuttavia, Legion 7 di Lenovo ottiene un punteggio ancora peggiore. Detto questo, il Voyager a1600 raggiunge un'autonomia passabile di poco meno di 6 ore nel test WLAN. La luminosità del display è stata del 52% in questo test, che corrisponde alle condizioni generali di 150 cd/m². Corsair riduce notevolmente le prestazioni della CPU e della GPU in modalità batteria.

| Corsair Voyager a1600 R9 6900HS, Radeon RX 6800M, 99 Wh | Asus ROG Flow X16 GV601RW-M5082W R9 6900HS, GeForce RTX 3070 Ti Laptop GPU, 90 Wh | Lenovo Legion 7 16ARHA7 R9 6900HX, Radeon RX 6850M XT, 99 Wh | Acer Predator Triton 500 SE PT516-52s-70KX i7-12700H, GeForce RTX 3080 Ti Laptop GPU, 99.98 Wh | HP Omen 16-b1090ng i7-12700H, GeForce RTX 3070 Ti Laptop GPU, 83 Wh | Lenovo Legion 7 16IAX7-82TD004SGE i9-12900HX, GeForce RTX 3080 Ti Laptop GPU, 99 Wh | Media della classe Gaming | |
|---|---|---|---|---|---|---|---|
| Autonomia della batteria | -30% | -6% | 13% | 10% | -35% | 16% | |
| Reader / Idle (h) | 7 | 4.9 -30% | 10.1 44% | 8.71 ? 24% | |||
| H.264 (h) | 6 | 8.2 37% | 5.1 -15% | 8.64 ? 44% | |||
| WiFi v1.3 (h) | 5.8 | 5.7 -2% | 7.3 26% | 5.7 -2% | 5.6 -3% | 4.5 -22% | 7.11 ? 23% |
| Load (h) | 2.1 | 0.9 -57% | 1.8 -14% | 2.2 5% | 1.9 -10% | 0.7 -67% | 1.502 ? -28% |
| Witcher 3 ultra (h) | 0.9 | 0.9 |
Pro
Contro
Verdetto - Un notebook versatile per giocatori e streamer
Corsair ha creato un dispositivo davvero eccezionale con il Voyager a1600. La combinazione di SoC AMD e GPU AMD è buona e convince nei test. Spesso deve ammettere la sconfitta nel duello diretto con l'attuale SoC di Intel. Tuttavia, le differenze di prestazioni non sono molto evidenti. Il Voyager a1600 ha un aspetto particolarmente elevato grazie alla scelta dei materiali, che conferiscono al dispositivo un'ottima stabilità. Il dispositivo non sembra affatto goffo
La connettività risulta un po' spartana a prima vista. Tuttavia, chi si affida alla tecnologia Slipstream per collegare le periferiche difficilmente sentirà la mancanza delle porte USB Type-A.
Il Ryzen 9 6900HS di AMD si comporta bene e in modo costantemente veloce, senza perdite di prestazioni sotto carico. Lo stesso vale per la Radeon RX 6800M di AMD. Abbiamo apprezzato il display in formato 16:10. Gli unici inconvenienti sono la luminosità un po' bassa e la copertura non perfetta degli spazi colore AdobeRGB e P3, che escludono l'uso professionale per l'editing di video e foto. Come portatile da gioco, tuttavia, il Corsair Voyager a1600 può tranquillamente farne a meno.
Il Corsair Voyager a1600 è più di un notebook da gioco puro, in quanto le sue ottime caratteristiche lo rendono un dispositivo perfetto per gli streamer e i creatori di contenuti.
Tuttavia, grazie alle esclusive funzioni di streaming, il Voyager a1600 si farà ricordare. I pulsanti di avvio rapido, che possono essere assegnati a piacere, sono adatti agli streamer e si può fare a meno di un deck di streaming aggiuntivo. Detto questo, vista la destinazione d'uso, avremmo desiderato una telecamera di qualità superiore, che non fosse solo una soluzione mobile di emergenza. Il più grande svantaggio della Corsair Voyager a1600 è l'unità di raffreddamento integrata. Le temperature rimangono entro i limiti sotto carico, senza dubbio, ma il livello di rumore misurato è comunque troppo alto al massimo delle prestazioni. Chi rinuncia alla modalità Extreme sarà ricompensato con emissioni ridotte, ma allo stesso tempo rinuncerà a qualche prestazione.
Prezzo e disponibilità
Il Corsair Voyager a1600 è disponibile direttamente presso il negozio Corsair dove è necessario pagare 3.550 euro per la configurazione testata. In alternativa, Amazon vende lo stesso modello a 3.540 euro. La configurazione più economica con Ryzen 7 6800HS e 16 GB di RAM è disponibile anche su Amazon per 2.725 euro.
Corsair Voyager a1600
- 12/05/2022 v7 (old)
Sebastian Bade
Price comparison
