Recensione dell'Acer Predator Triton 300 SE PT314: Raffreddamento a metallo liquido per un portatile da 14"
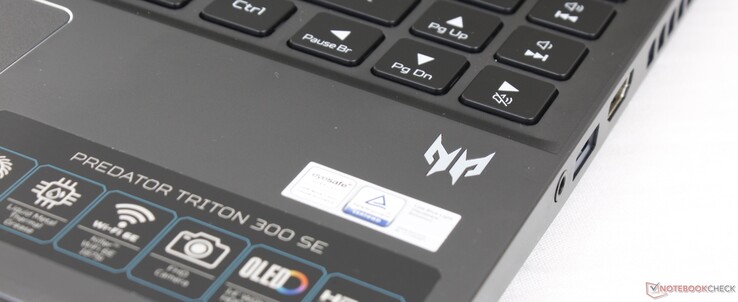
Sono passati due anni dall'ultima l'ultima recensione del Predator Triton 300. Quest'ultimo modello, chiamato Predator Triton 300 SE, utilizza le nuove CPU Core serie H di 12a generazione e le GPU Nvidia Ampere RTX con un design più piccolo da 14 pollici. In questo modo si pone in concorrenza con alcuni dei più piccoli portatili da gioco presenti sul mercato, tra cui il Razer Blade 14, Asus Zephyrus G14e l' Alienware x14.
L'unità da noi recensita è una SKU di fascia alta con CPU Core i9-12900H e display OLED a 90 Hz 1800p per circa 1950 dollari. È disponibile un'altra configurazione con CPU Core i7-12700H, display IPS 1200p a 165 Hz e metà della RAM e dello storage per centinaia di dollari in meno. Tutte le opzioni al momento sono comunque dotate della stessa GPU RTX 3060 da 95 W GeForce
È disponibile una versione più grande da 16 pollici che condivide lo stesso nome Predator Triton 300 SE ma con un numero di modello diverso (PT316 contro PT314)
Altre recensioni di Acer:
Potenziali concorrenti a confronto
Punteggio | Data | Modello | Peso | Altezza | Dimensione | Risoluzione | Prezzo |
|---|---|---|---|---|---|---|---|
| 86 % v7 (old) | 11/2022 | Acer Predator Triton 300 SE i9-12900H, GeForce RTX 3060 Laptop GPU | 1.7 kg | 19.8 mm | 14.00" | 2880x1800 | |
| 86.4 % v7 (old) | 10/2022 | Asus ROG Zephyrus G14 GA402RJ R7 6800HS, Radeon RX 6700S | 1.7 kg | 19.5 mm | 14.00" | 2560x1600 | |
| 89.4 % v7 (old) | 05/2022 | Razer Blade 14 Ryzen 9 6900HX R9 6900HX, GeForce RTX 3070 Ti Laptop GPU | 1.8 kg | 16.8 mm | 14.00" | 2560x1440 | |
| 86.7 % v7 (old) | 03/2022 | Alienware x14 i7 RTX 3060 i7-12700H, GeForce RTX 3060 Laptop GPU | 1.8 kg | 14.5 mm | 14.00" | 1920x1080 | |
| 87.2 % v7 (old) | 09/2022 | Dell Inspiron 14 Plus 7420 i7-12700H, GeForce RTX 3050 4GB Laptop GPU | 1.7 kg | 18.87 mm | 14.00" | 2240x1400 | |
| 87.7 % v7 (old) | 01/2022 | Schenker Vision 14 i7-11370H, GeForce RTX 3050 Ti Laptop GPU | 1.1 kg | 15.6 mm | 14.00" | 2880x1800 |
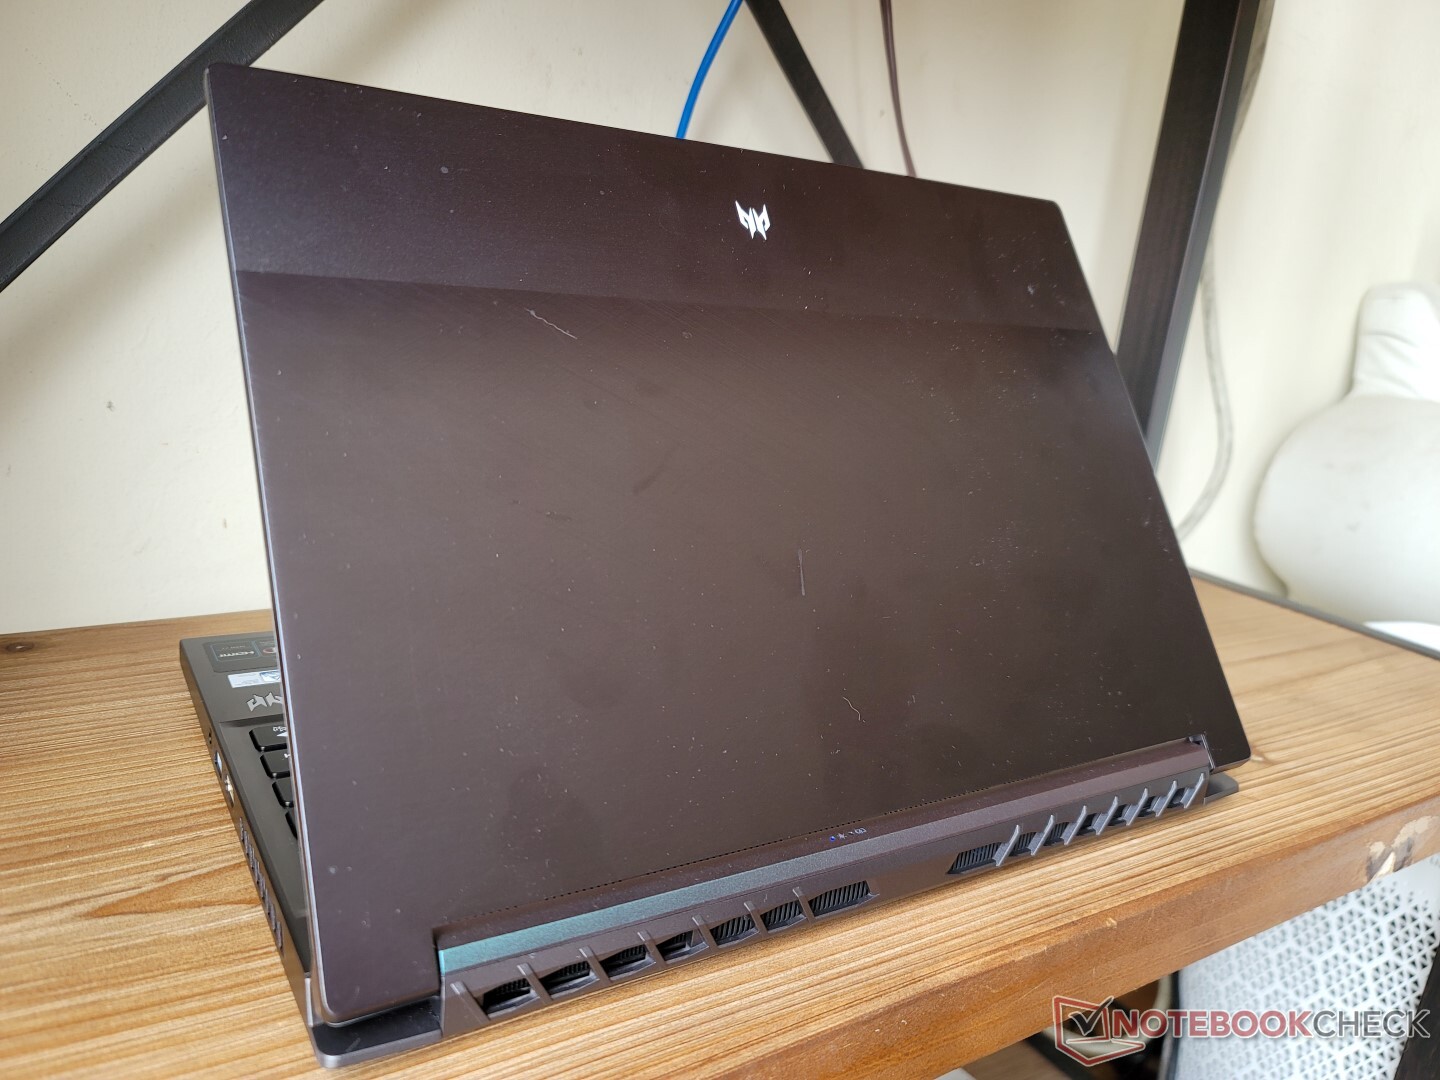
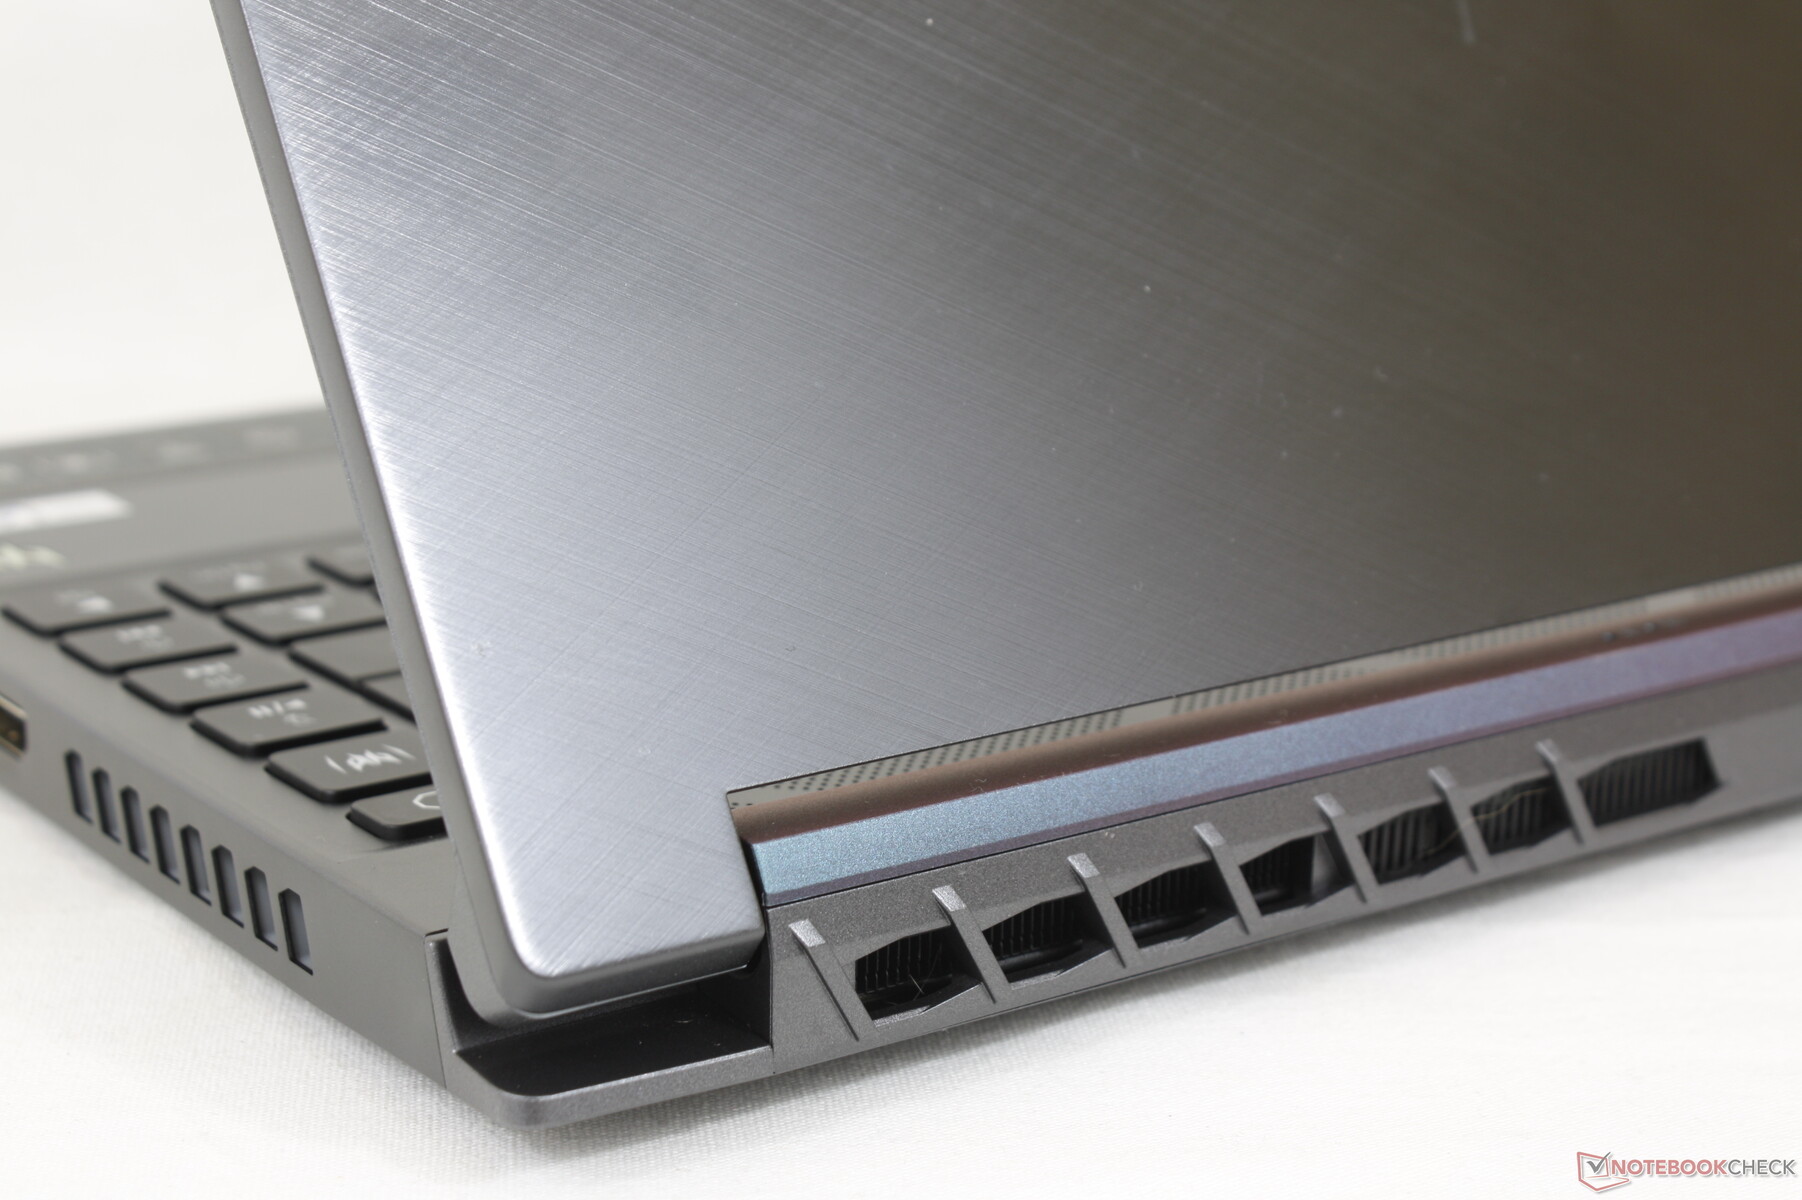
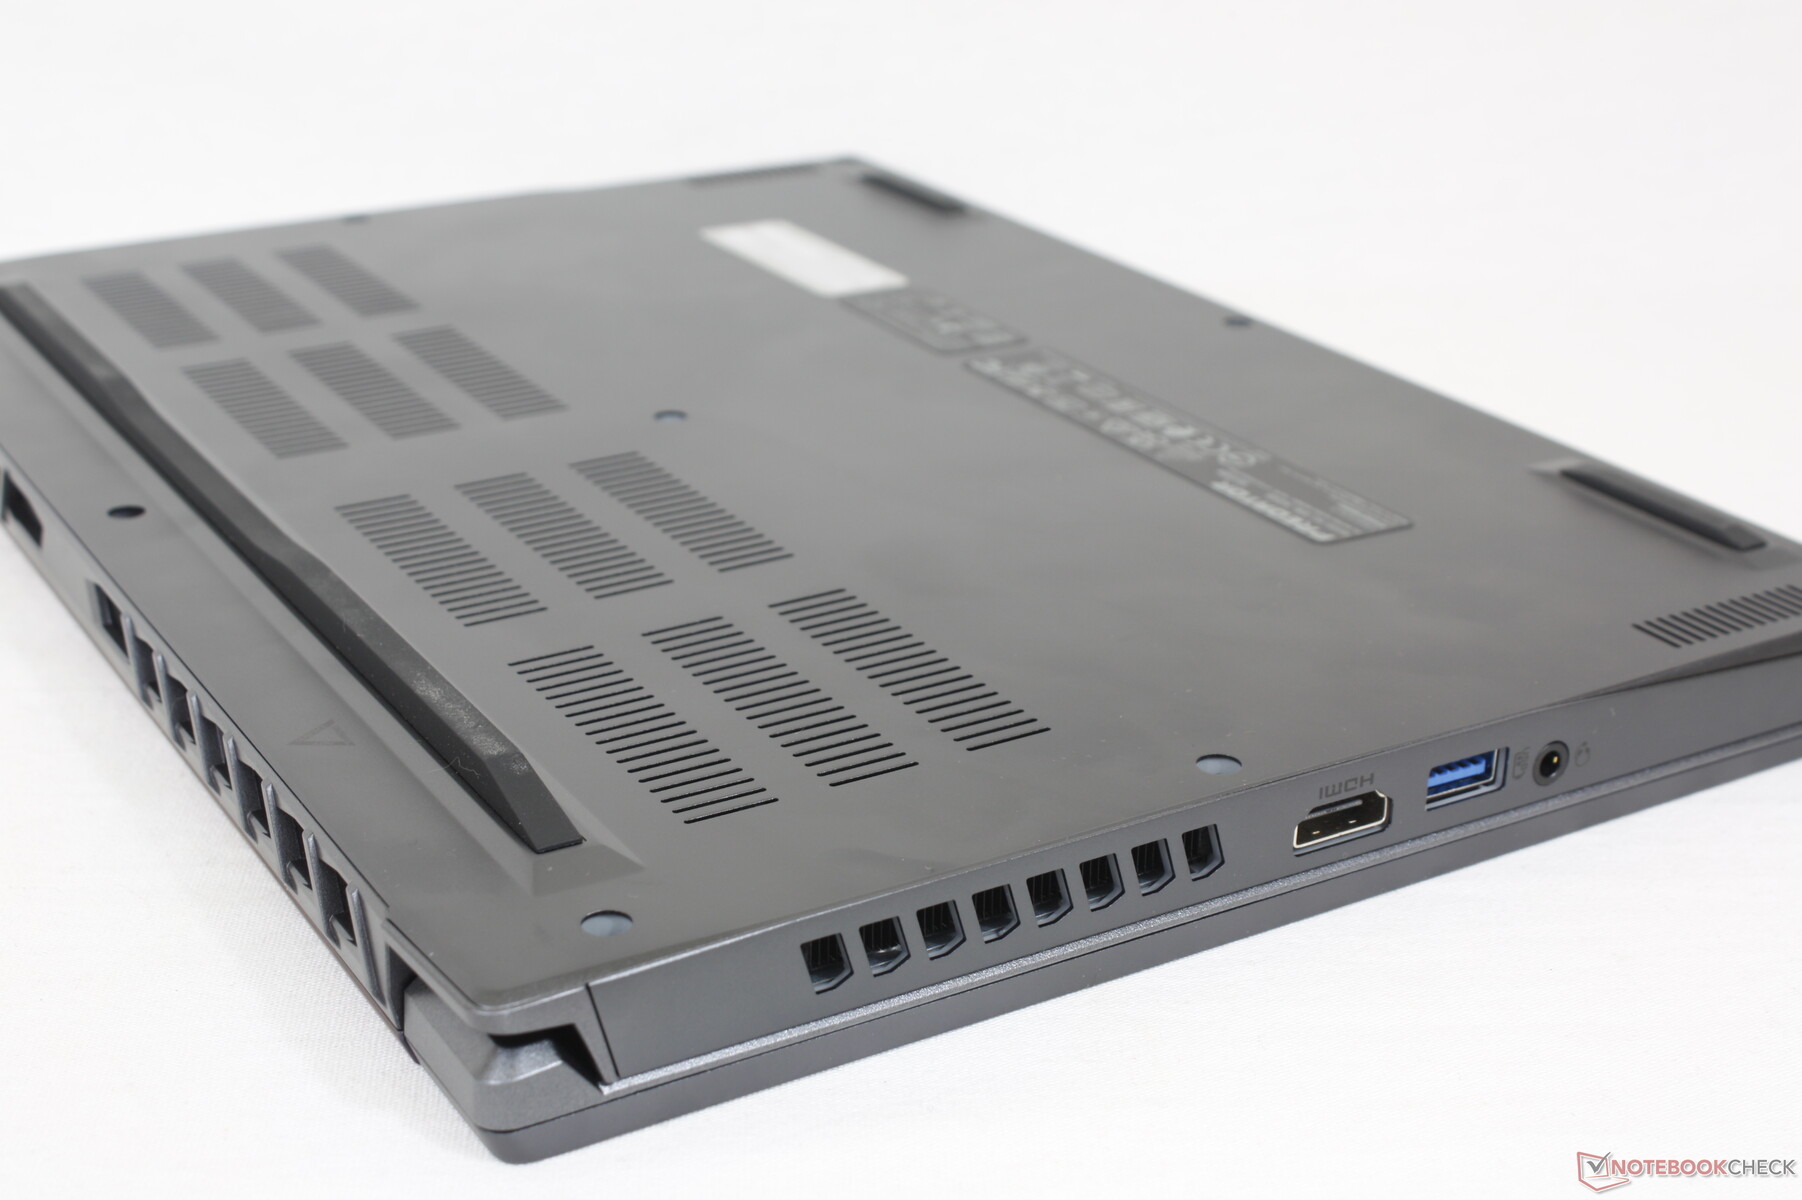
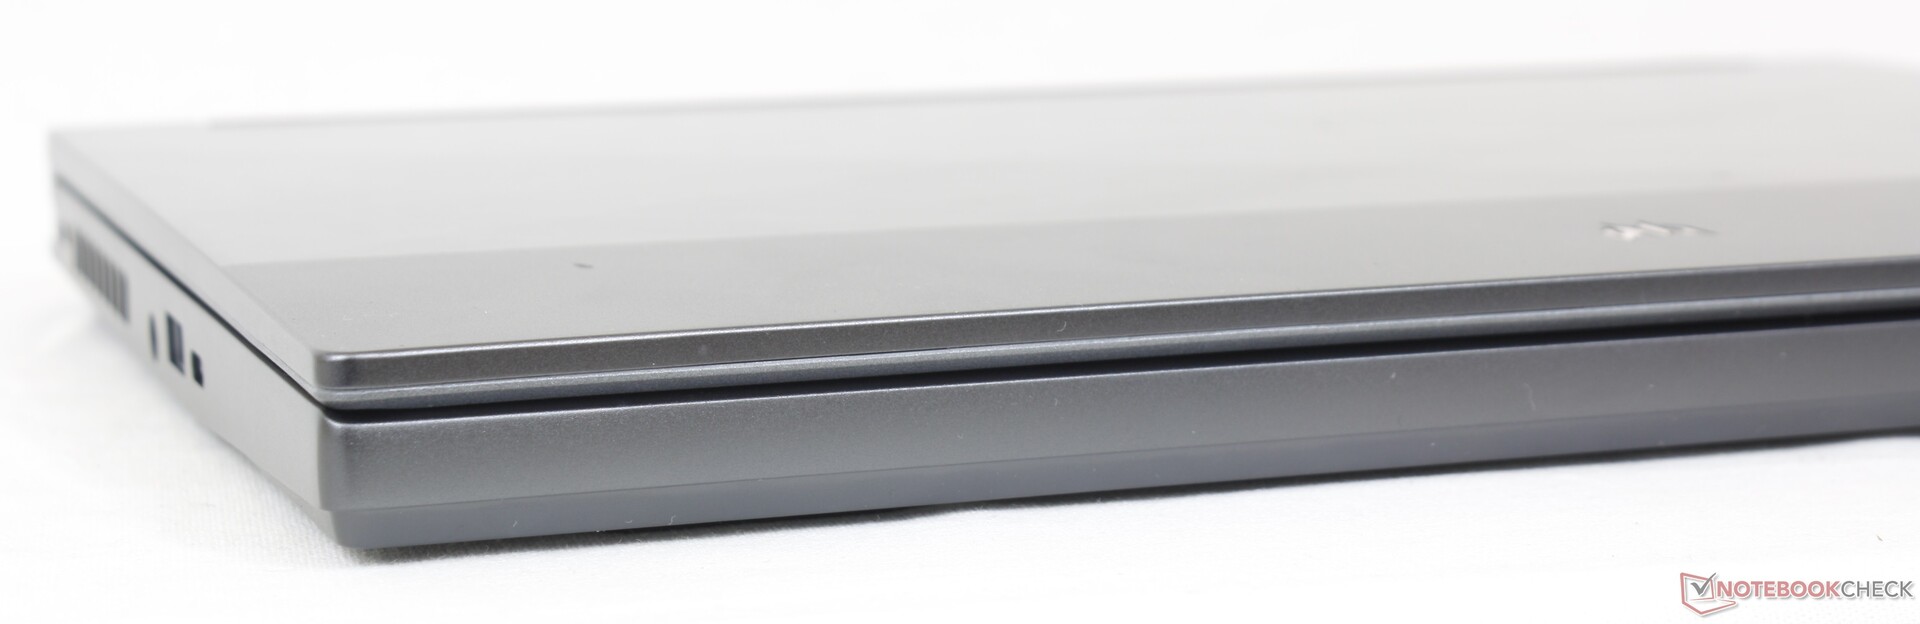
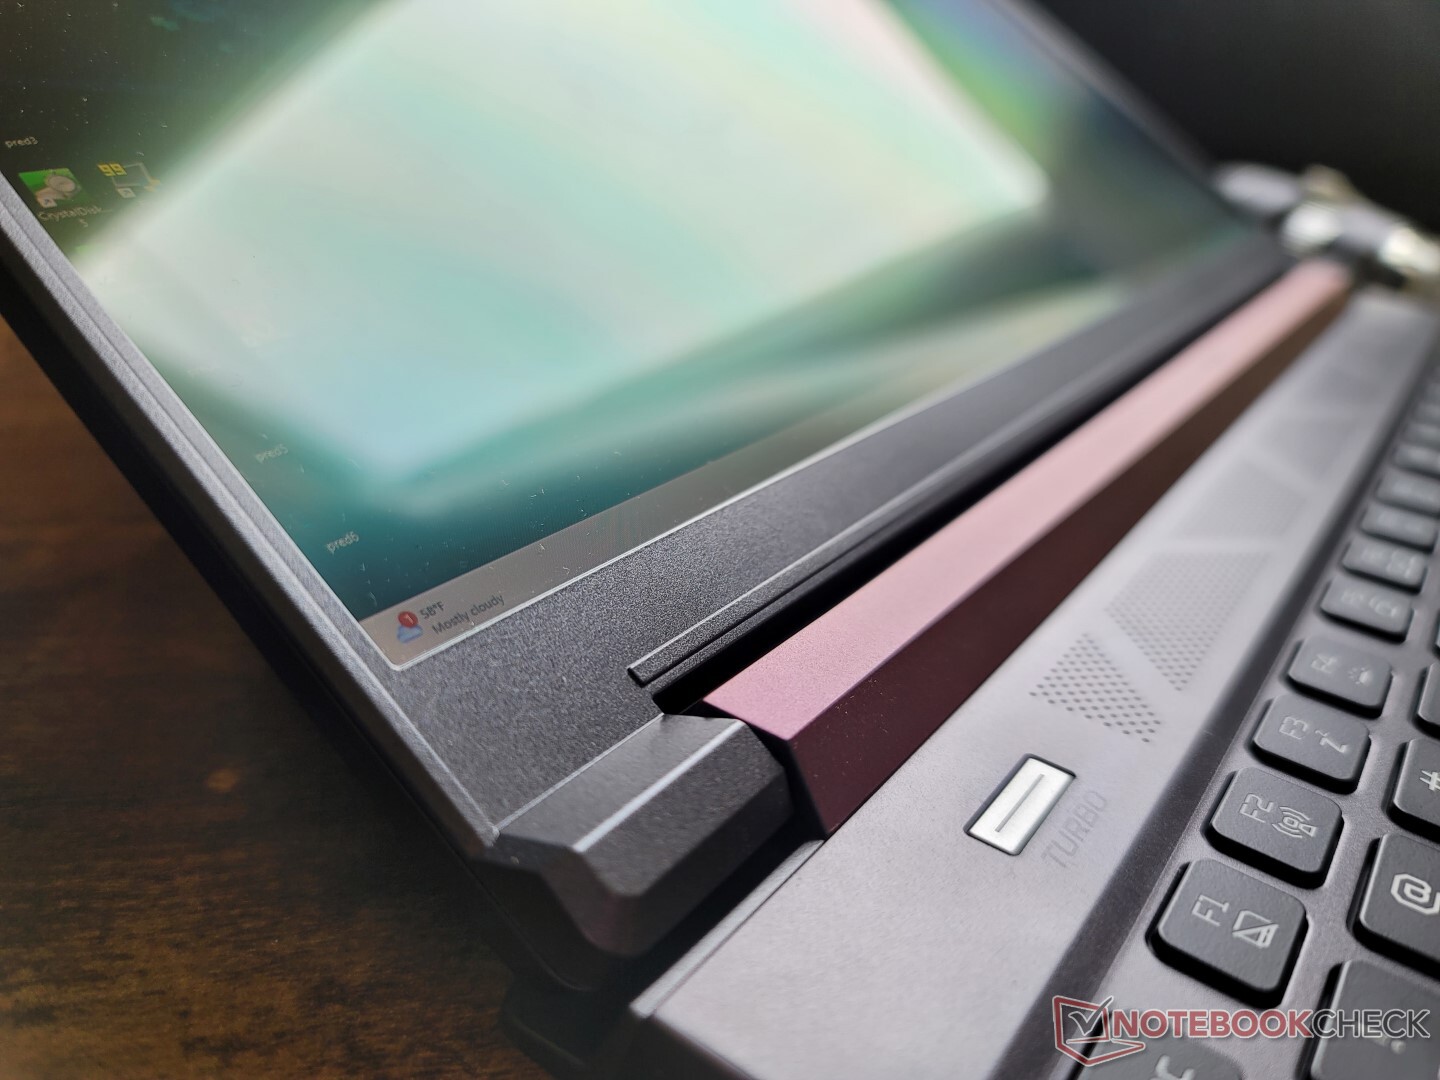
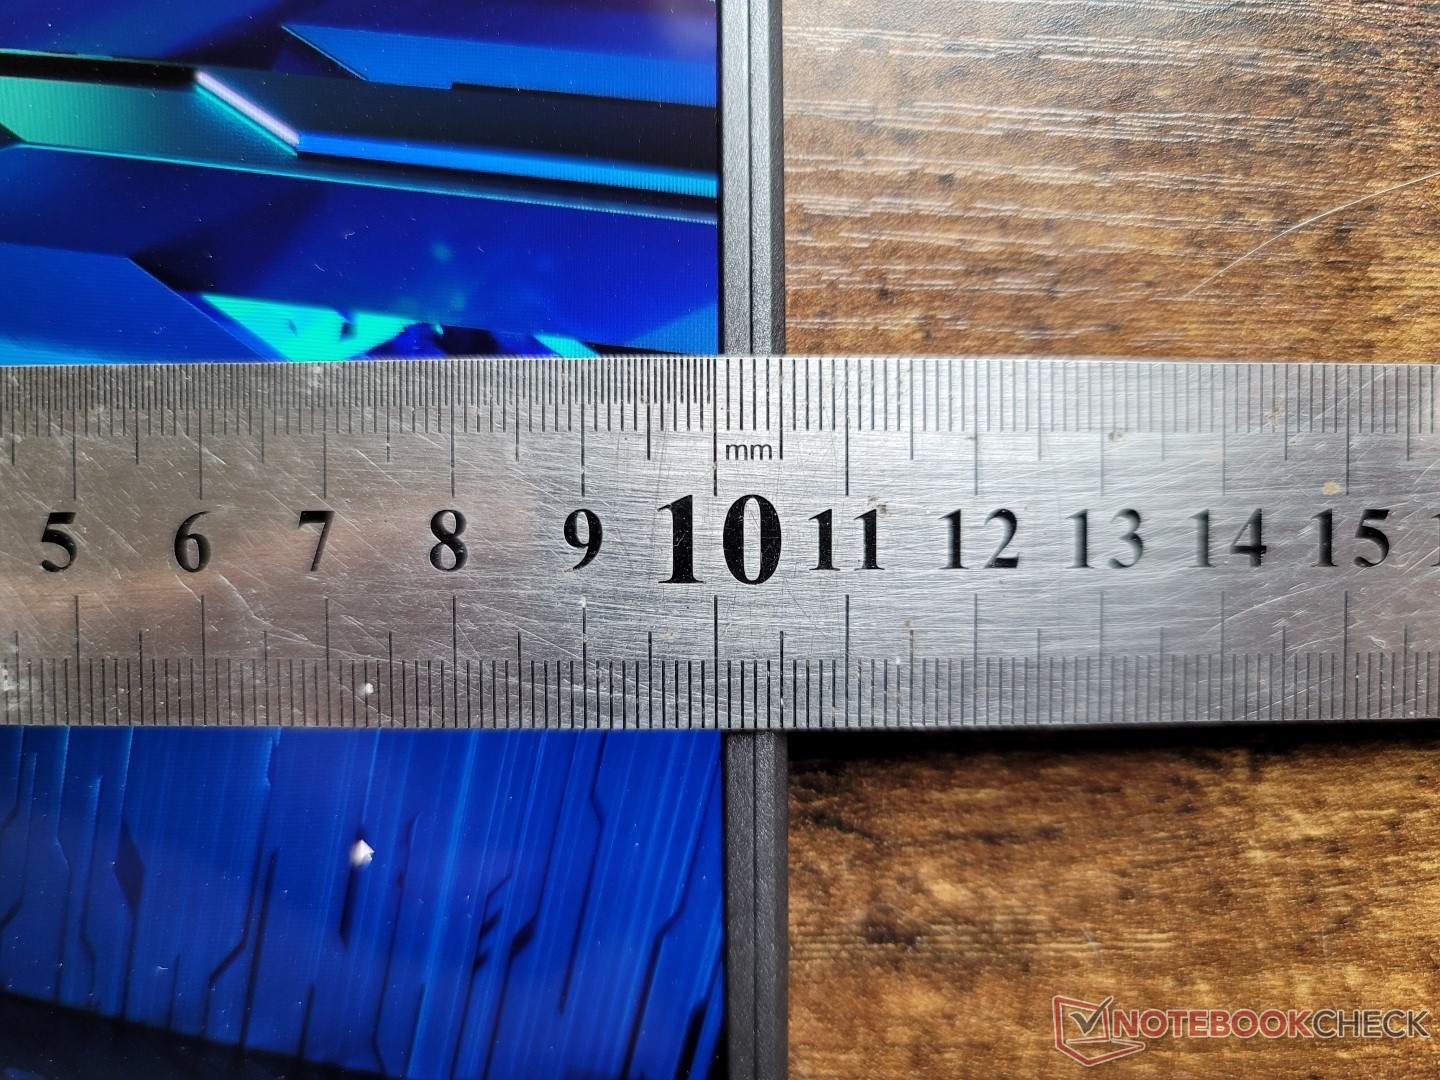
Custodia - Dimensioni simili a Zephyrus G14
La base metallica è robusta e presenta solo minimi segni di torsione o deformazione, senza scricchiolii quando si applica la pressione lungo il centro o gli angoli della tastiera. Non è rigida come quella del Razer Blade 14, ma di certo non è nemmeno economica
L'area più debole dello chassis è il display. Sebbene si tratti di un problema comune alla maggior parte dei portatili, il display dell'Acer è particolarmente sottile e notevolmente più soggetto a deformazioni rispetto ai display dello Zephyrus G14 o del Blade 14. Apprezziamo il fatto che il display possa aprirsi quasi completamente a 180 gradi, a differenza dei modelli Asus o Razer citati in precedenza, ma le cerniere dell'Acer sono più deboli e tendono a traballare maggiormente.
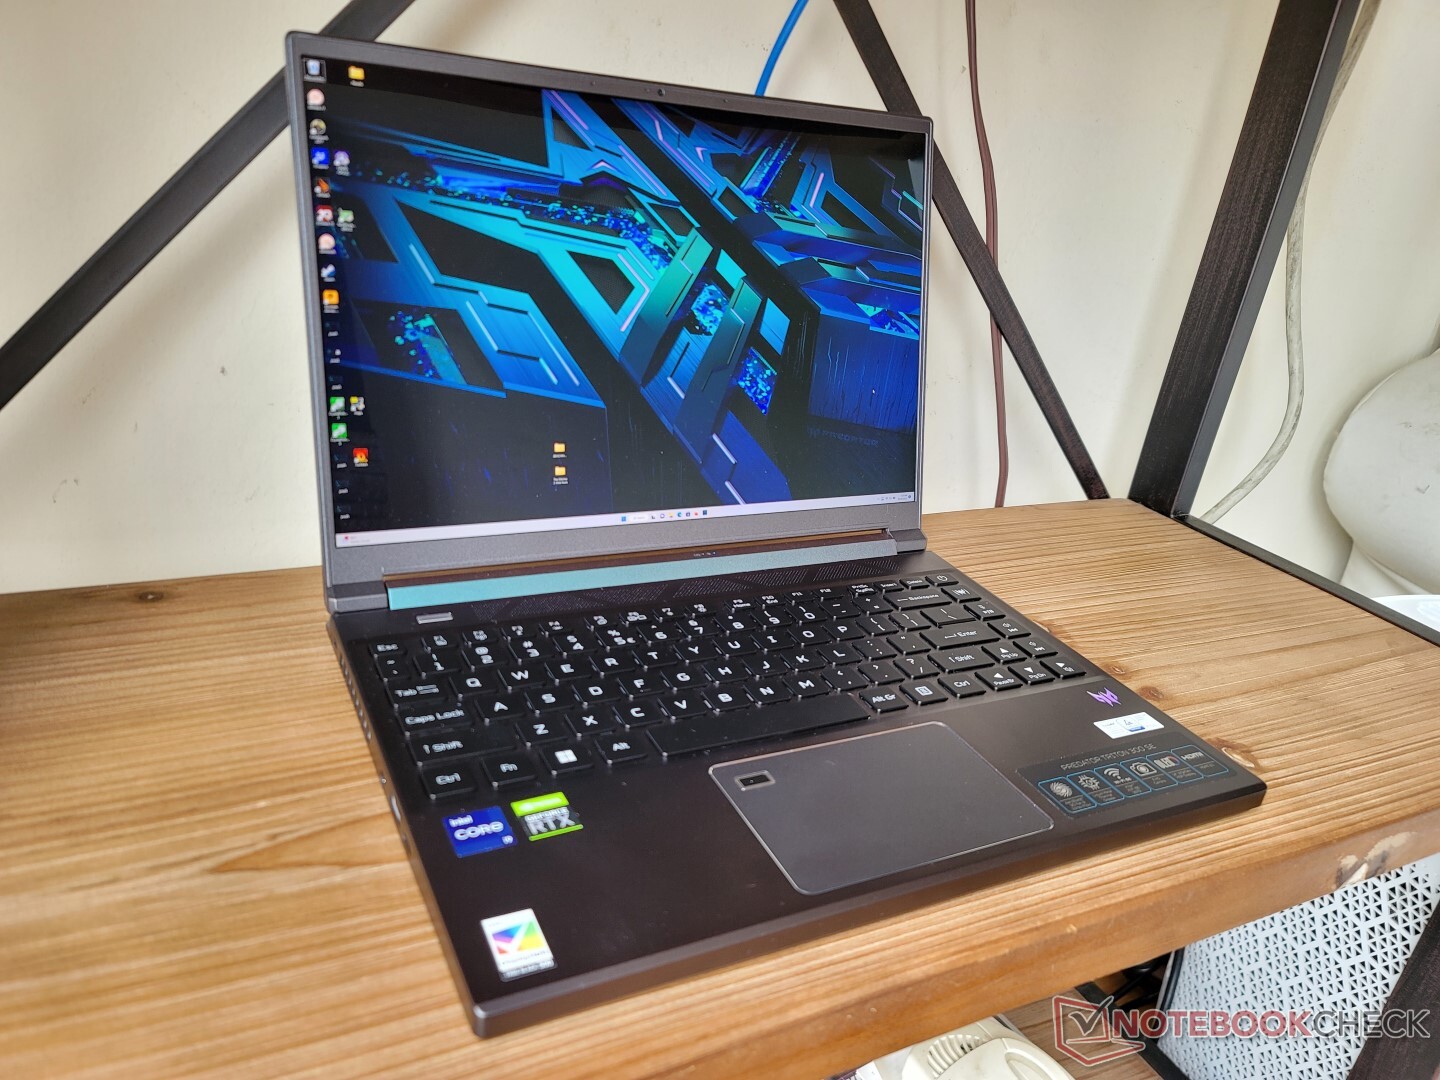
Per coincidenza, sia il peso che le dimensioni sono quasi identici a quelli dell'Asus Zephyrus G14. Il Blade 14 e l'Alienware x14 sono notevolmente più sottili, ma hanno un ingombro maggiore per compensare. La maggior parte dei normali Ultrabook da 14 pollici, come loSchenker Vision 14 possono essere significativamente più leggeri di oltre mezzo chilogrammo, ma senza i vantaggi in termini di prestazioni.
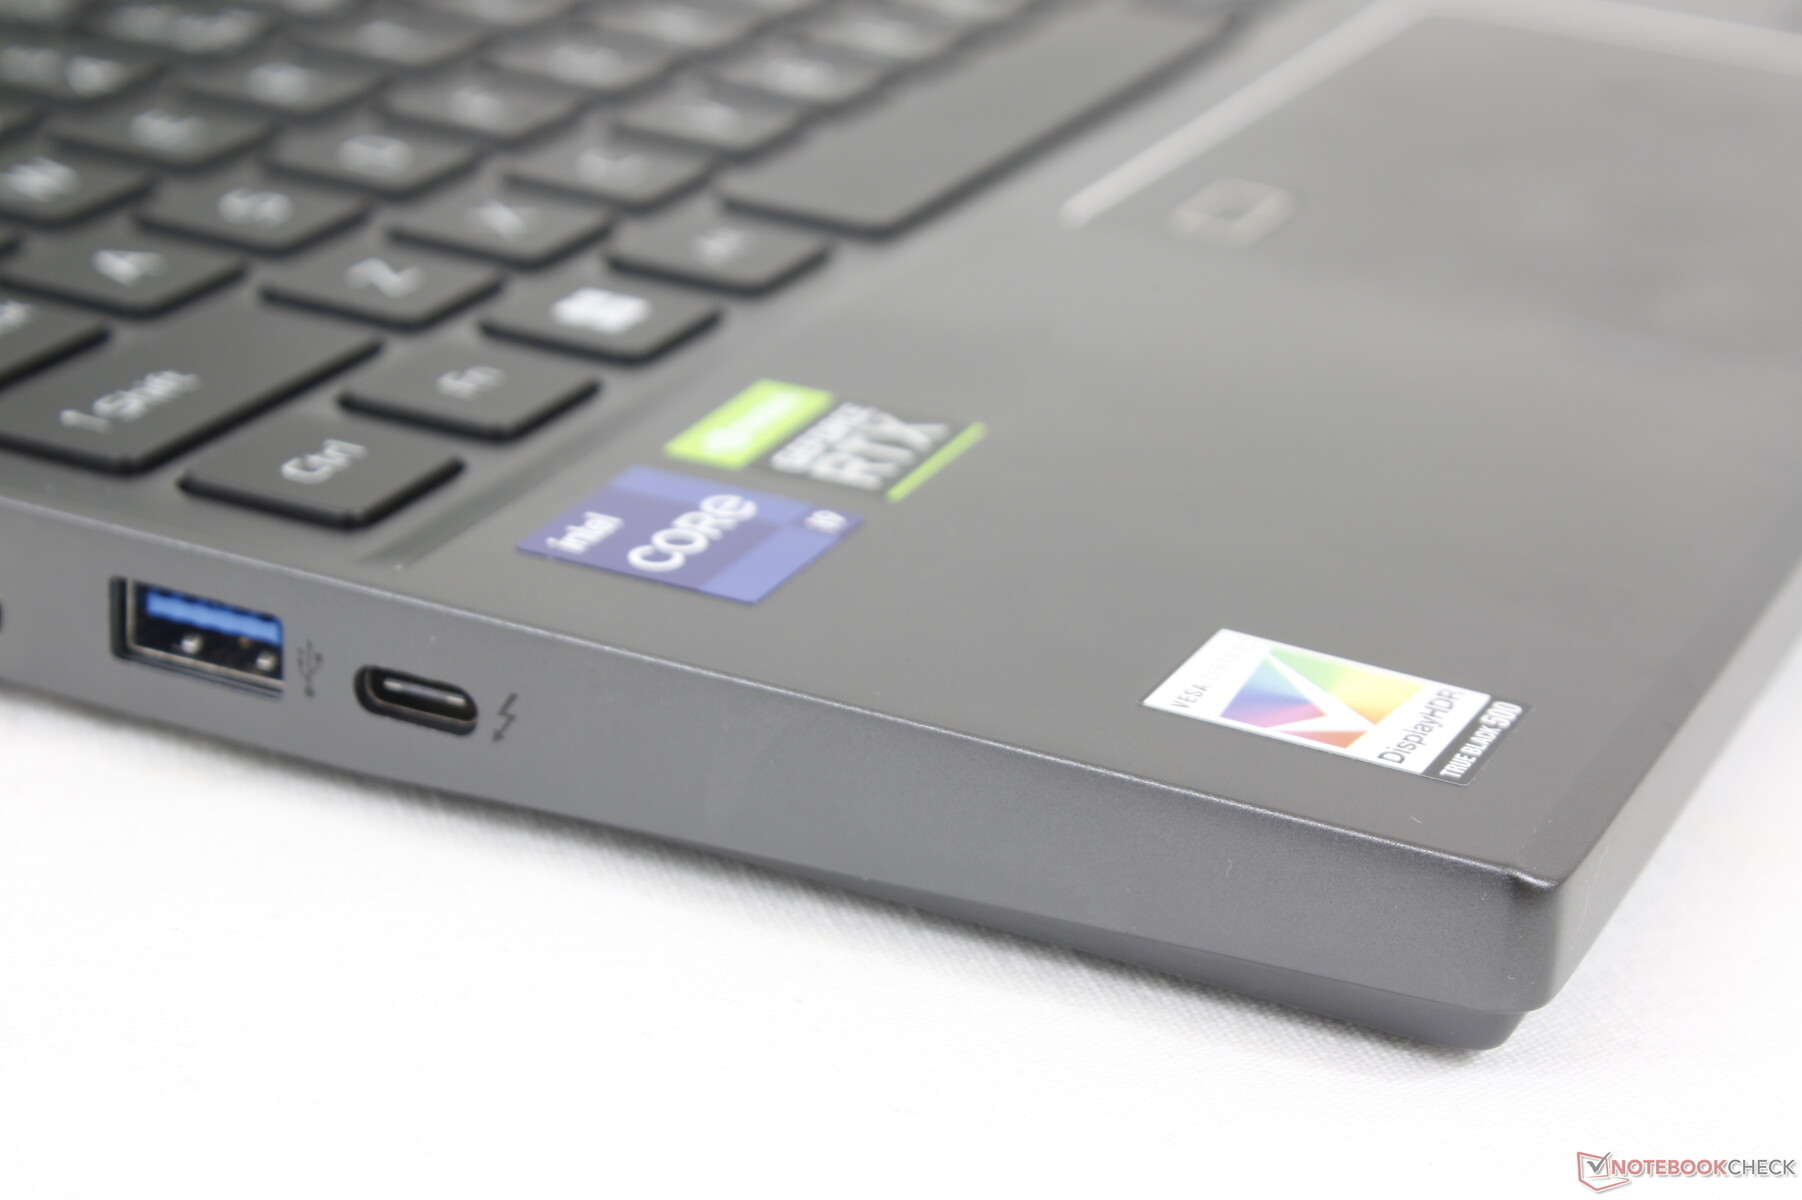
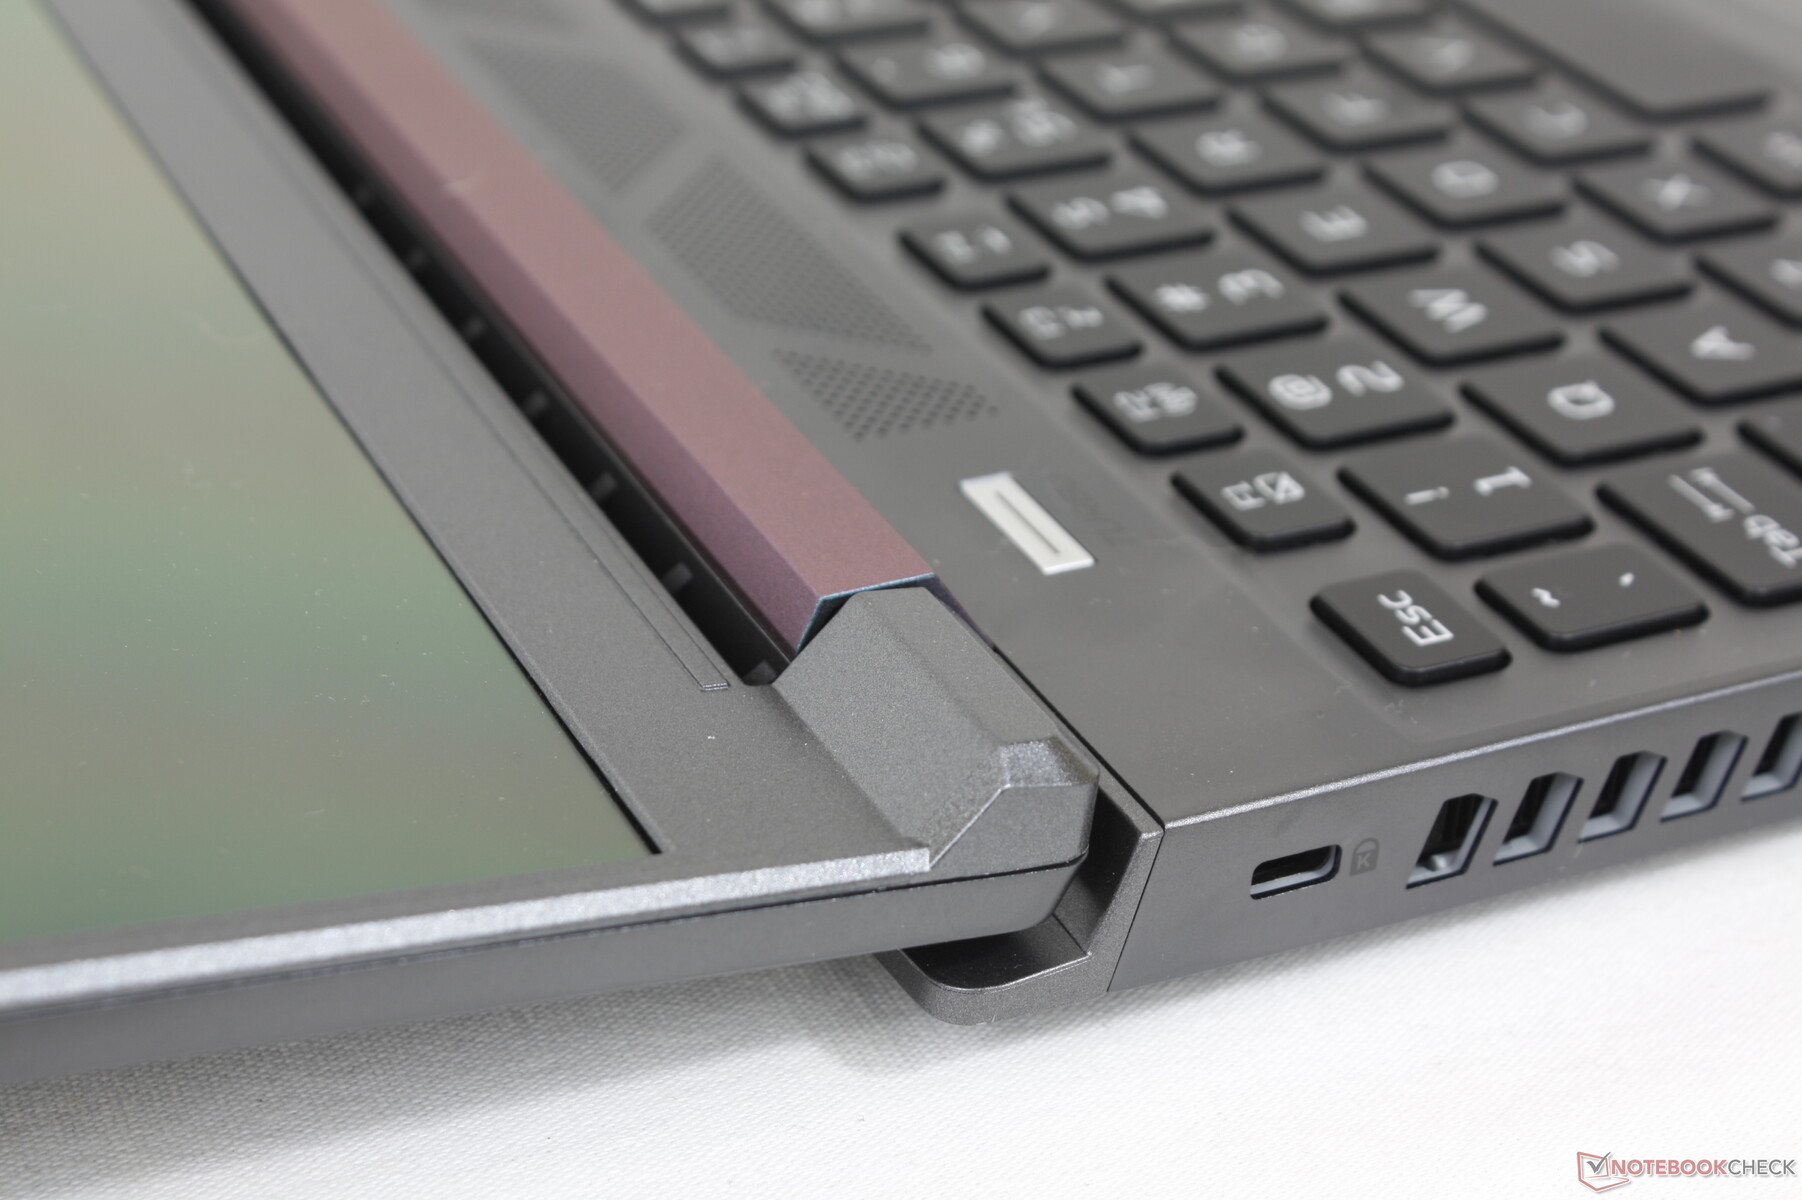
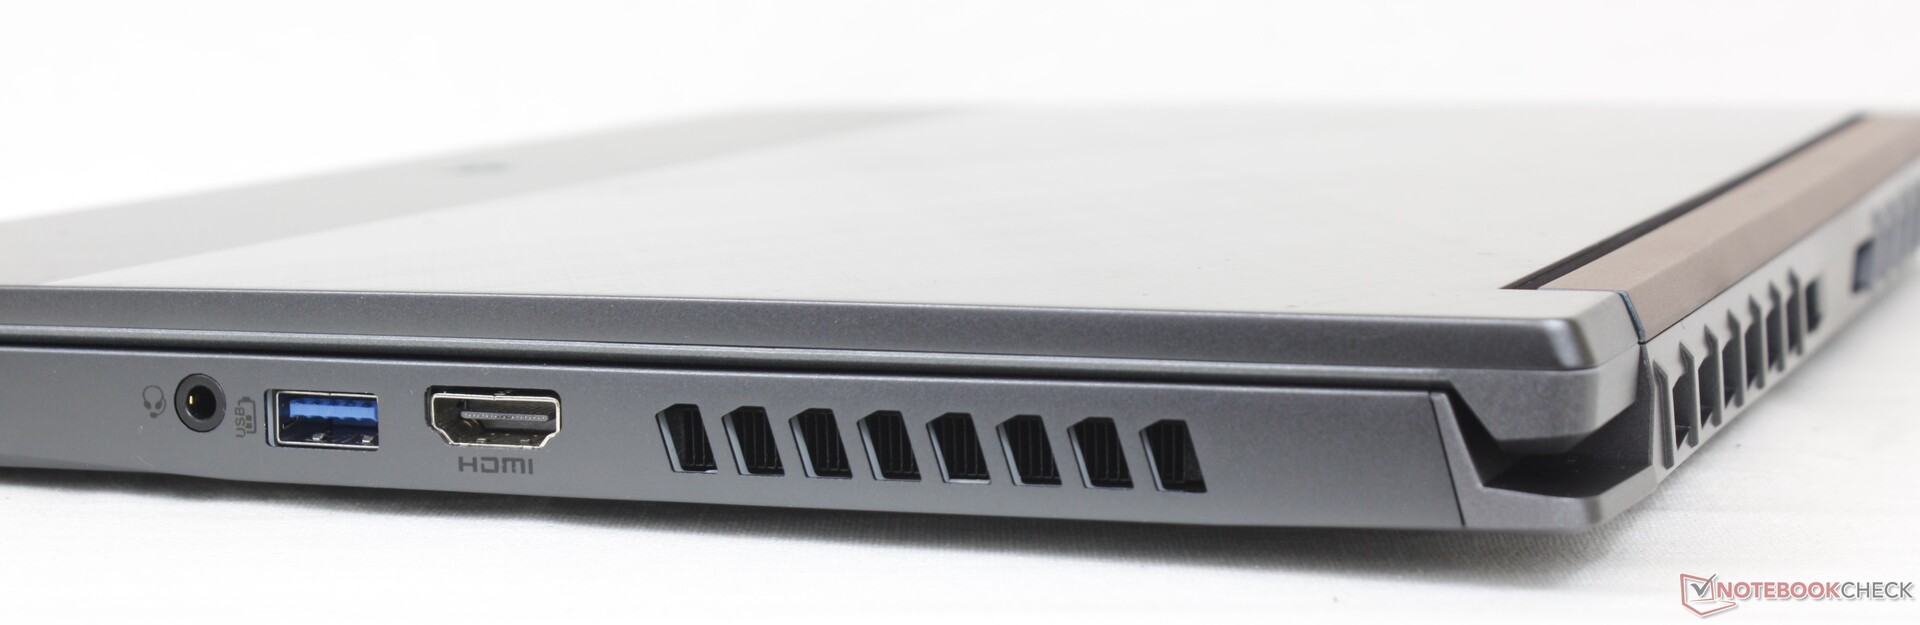
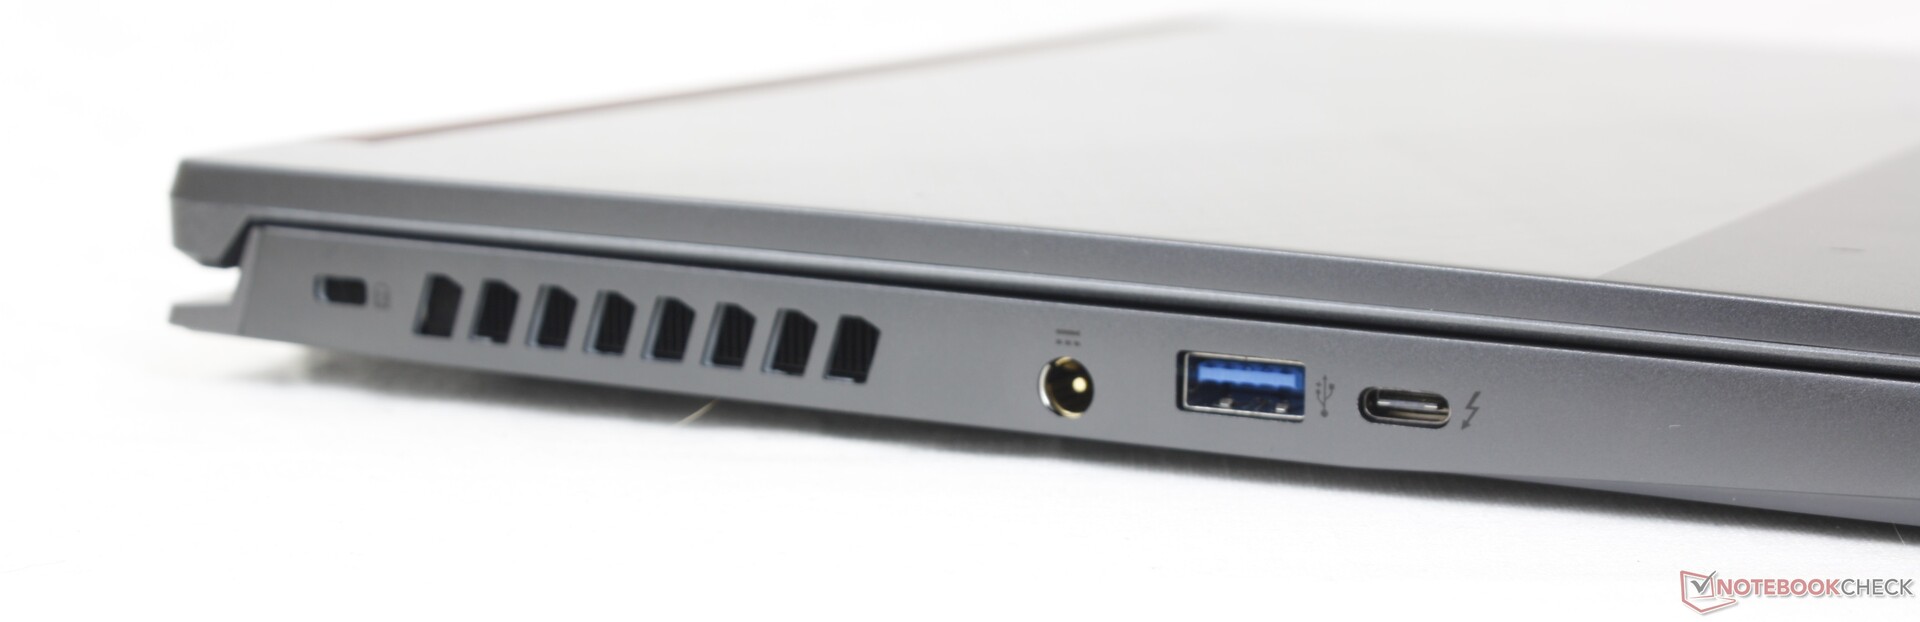
Connettività - Supporto Thunderbolt 4
Le opzioni per le porte sono più limitate rispetto all'Asus Zephyrus G14 o al Razer Blade 14, poiché ogni alternativa integra una porta USB-C in più rispetto all'Acer. Anche il posizionamento delle porte è un po' sfavorevole, perché le porte sono strette e relativamente vicine al bordo anteriore. È chiaro che le grandi griglie di ventilazione che circondano lo chassis sottraggono spazio prezioso alle porte.
Comunicazione
Un Intel AX1675i è fornito di serie per la connettività Wi-Fi 6E e Bluetooth 5.2. Abbiamo riscontrato velocità di trasferimento elevate e costanti quando siamo stati accoppiati alla nostra rete a 6 GHz.
| Networking | |
| iperf3 transmit AX12 | |
| Alienware x14 i7 RTX 3060 | |
| Schenker Vision 14 | |
| Razer Blade 14 Ryzen 9 6900HX | |
| iperf3 receive AX12 | |
| Schenker Vision 14 | |
| Razer Blade 14 Ryzen 9 6900HX | |
| Alienware x14 i7 RTX 3060 | |
| iperf3 receive AXE11000 6GHz | |
| Acer Predator Triton 300 SE | |
| Dell Inspiron 14 Plus 7420 | |
| iperf3 receive AXE11000 | |
| Asus ROG Zephyrus G14 GA402RJ | |
| iperf3 transmit AXE11000 6GHz | |
| Acer Predator Triton 300 SE | |
| Dell Inspiron 14 Plus 7420 | |
Webcam
La fotocamera da 2 MP è di serie ed è paragonabile a quella di molti Ultrabook di fascia media. Non c'è un sensore IR e nemmeno un otturatore per la privacy.


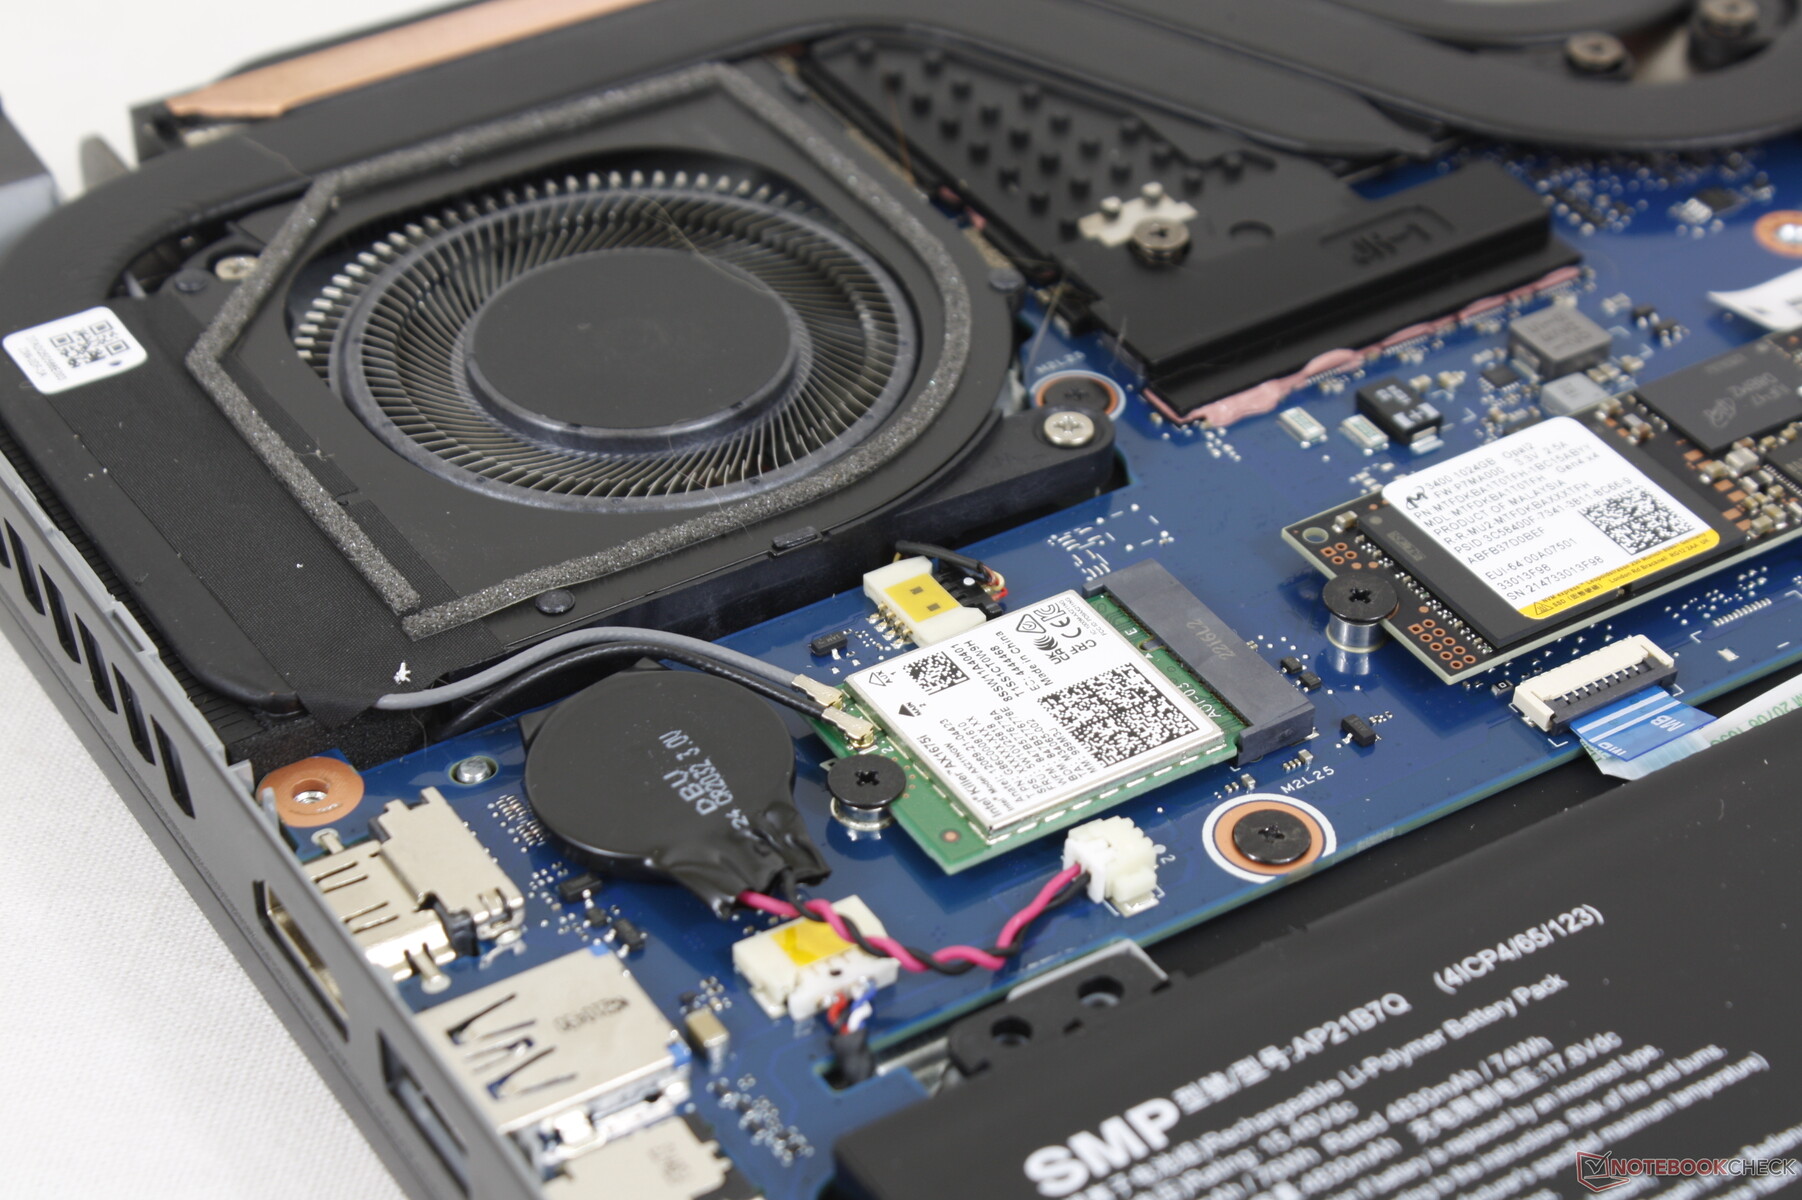
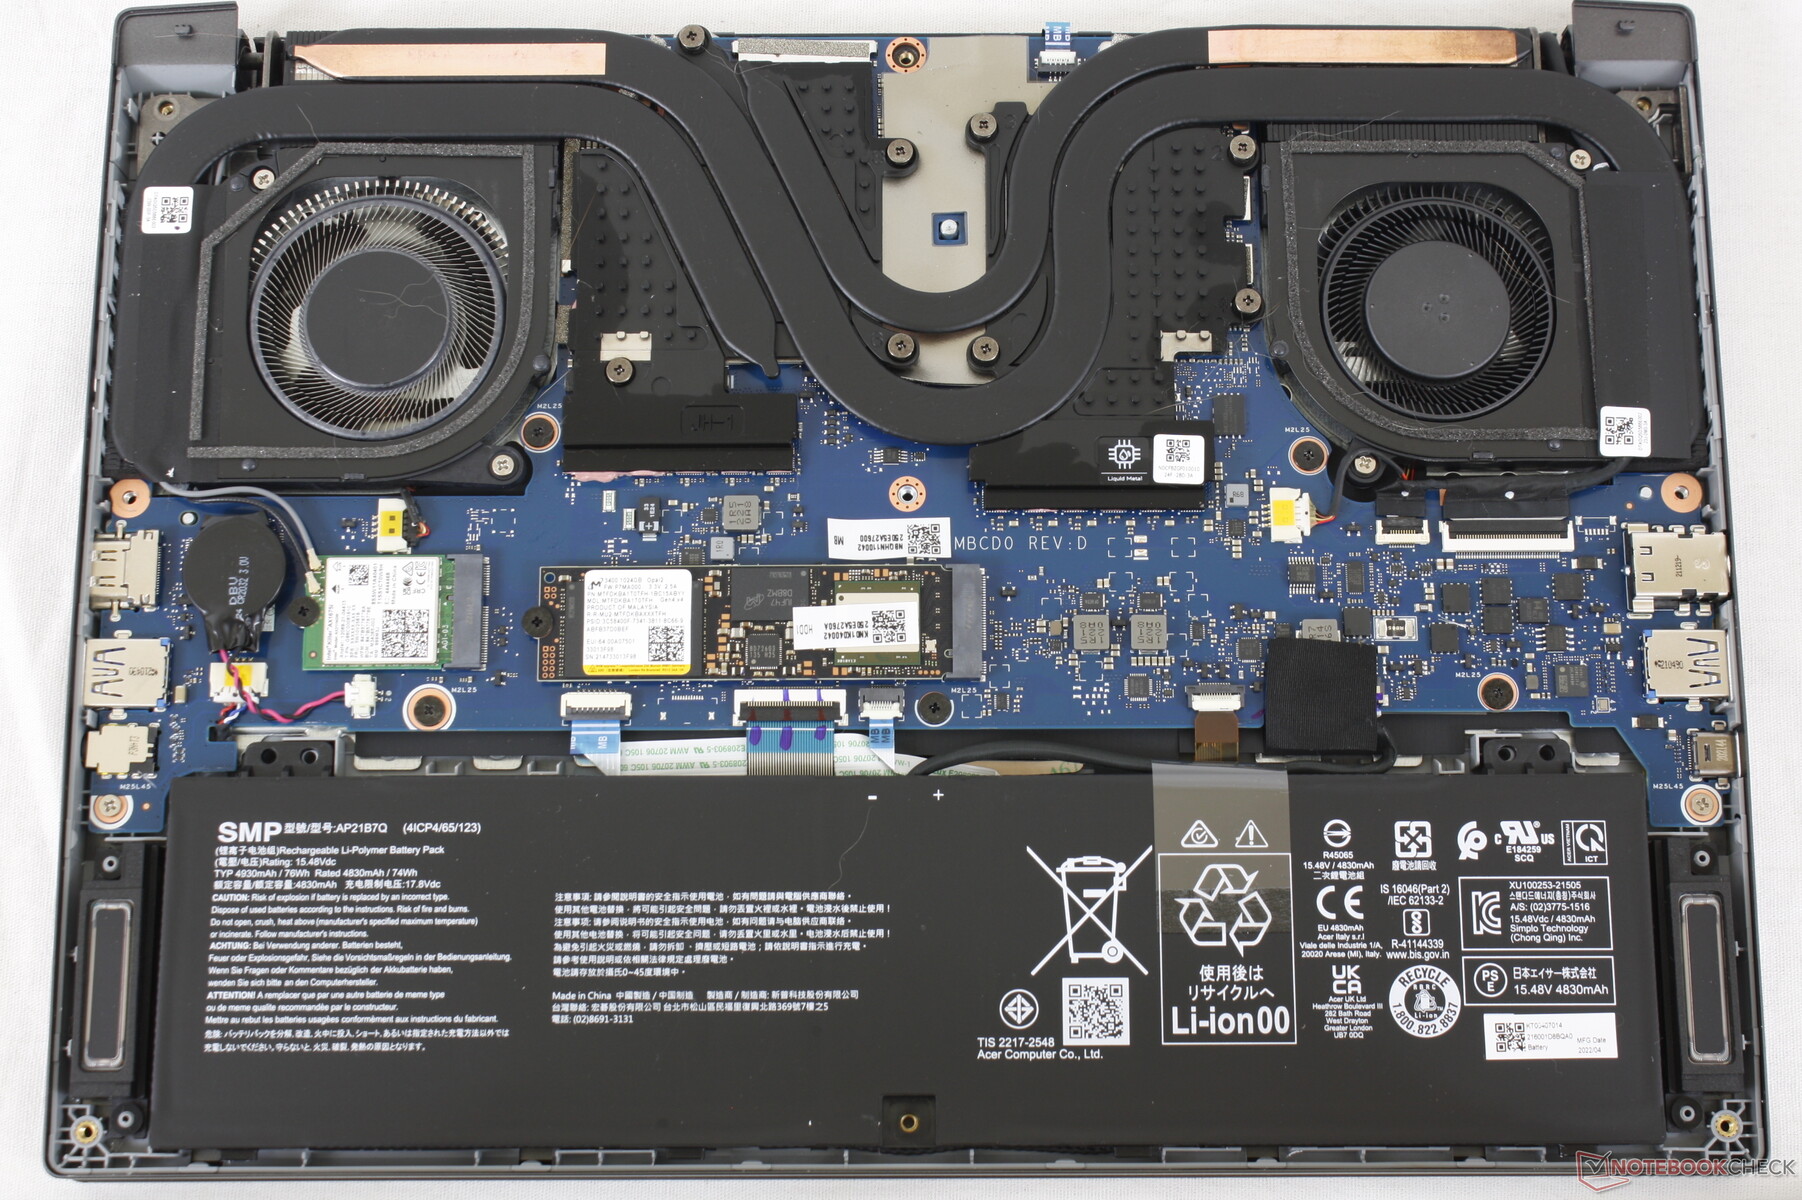
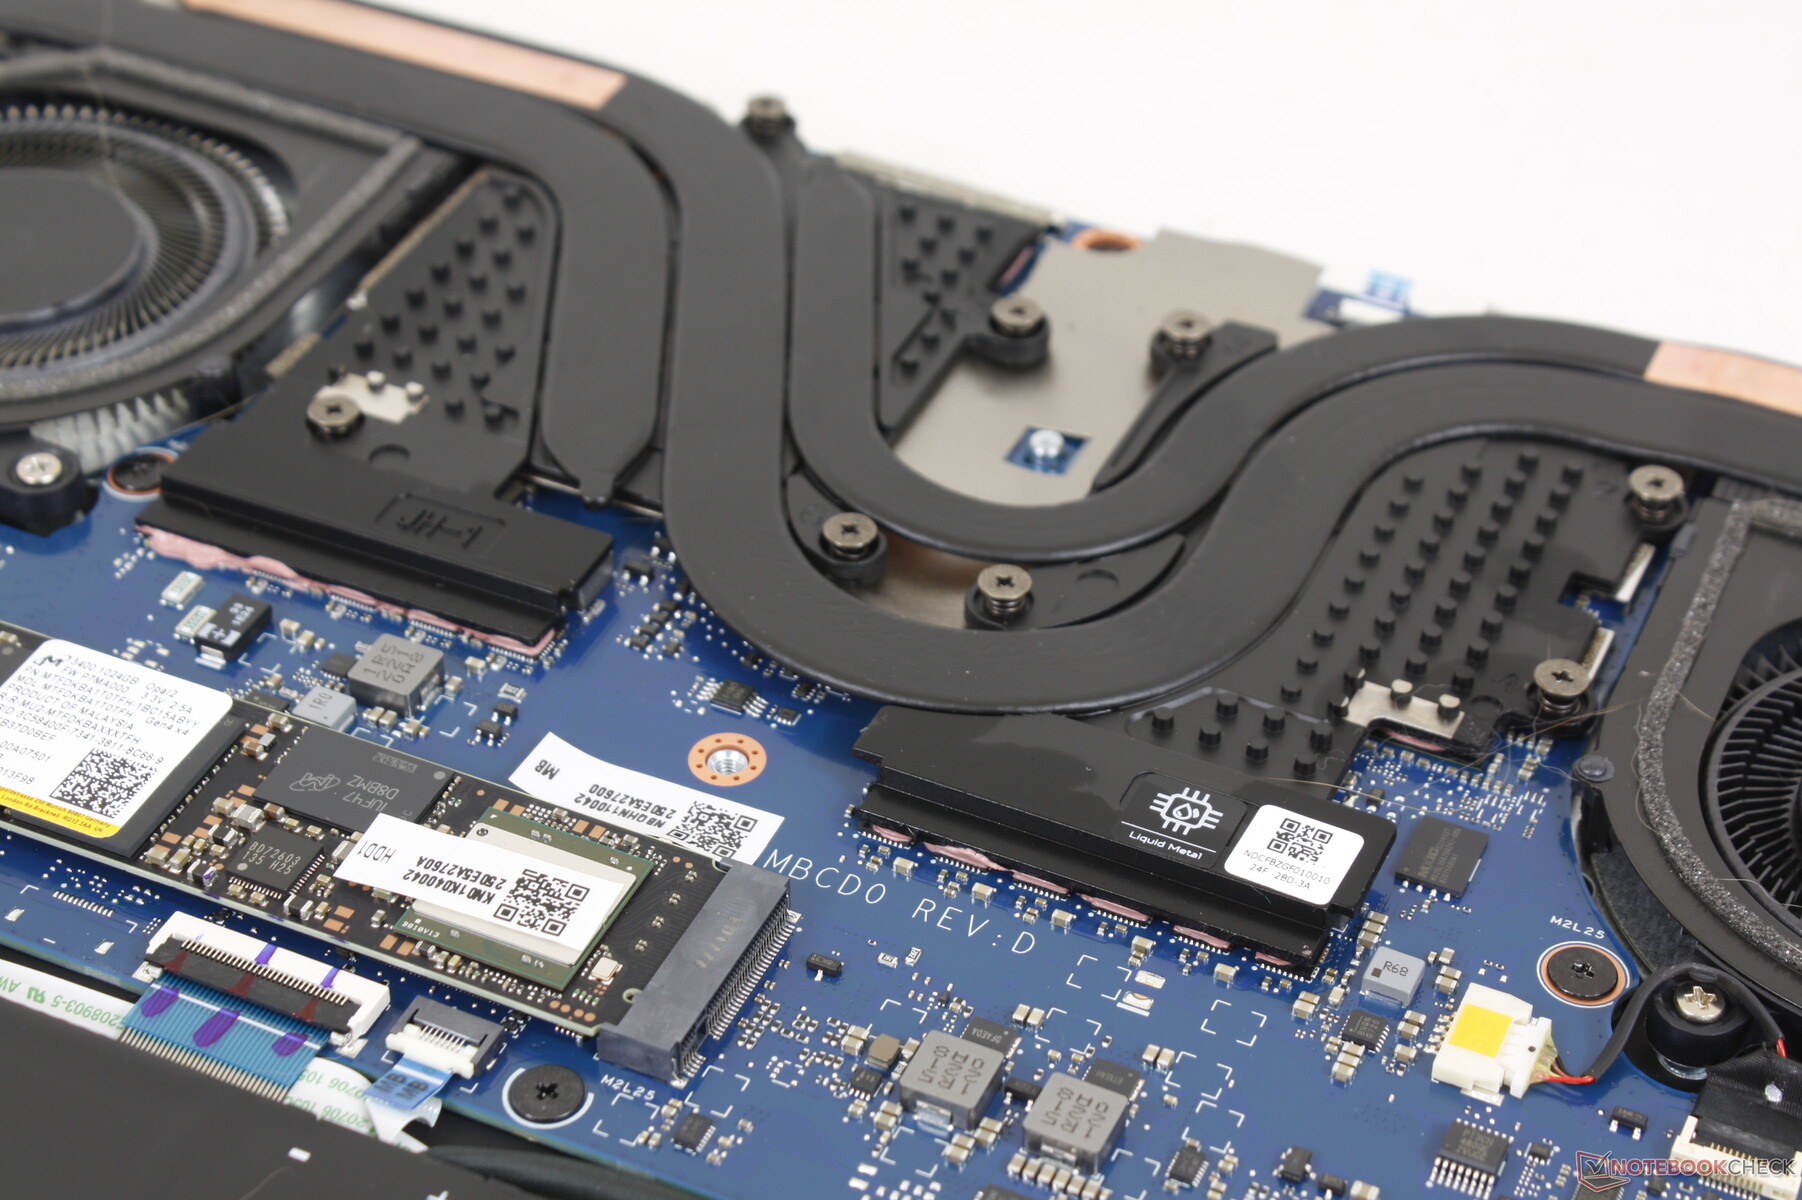
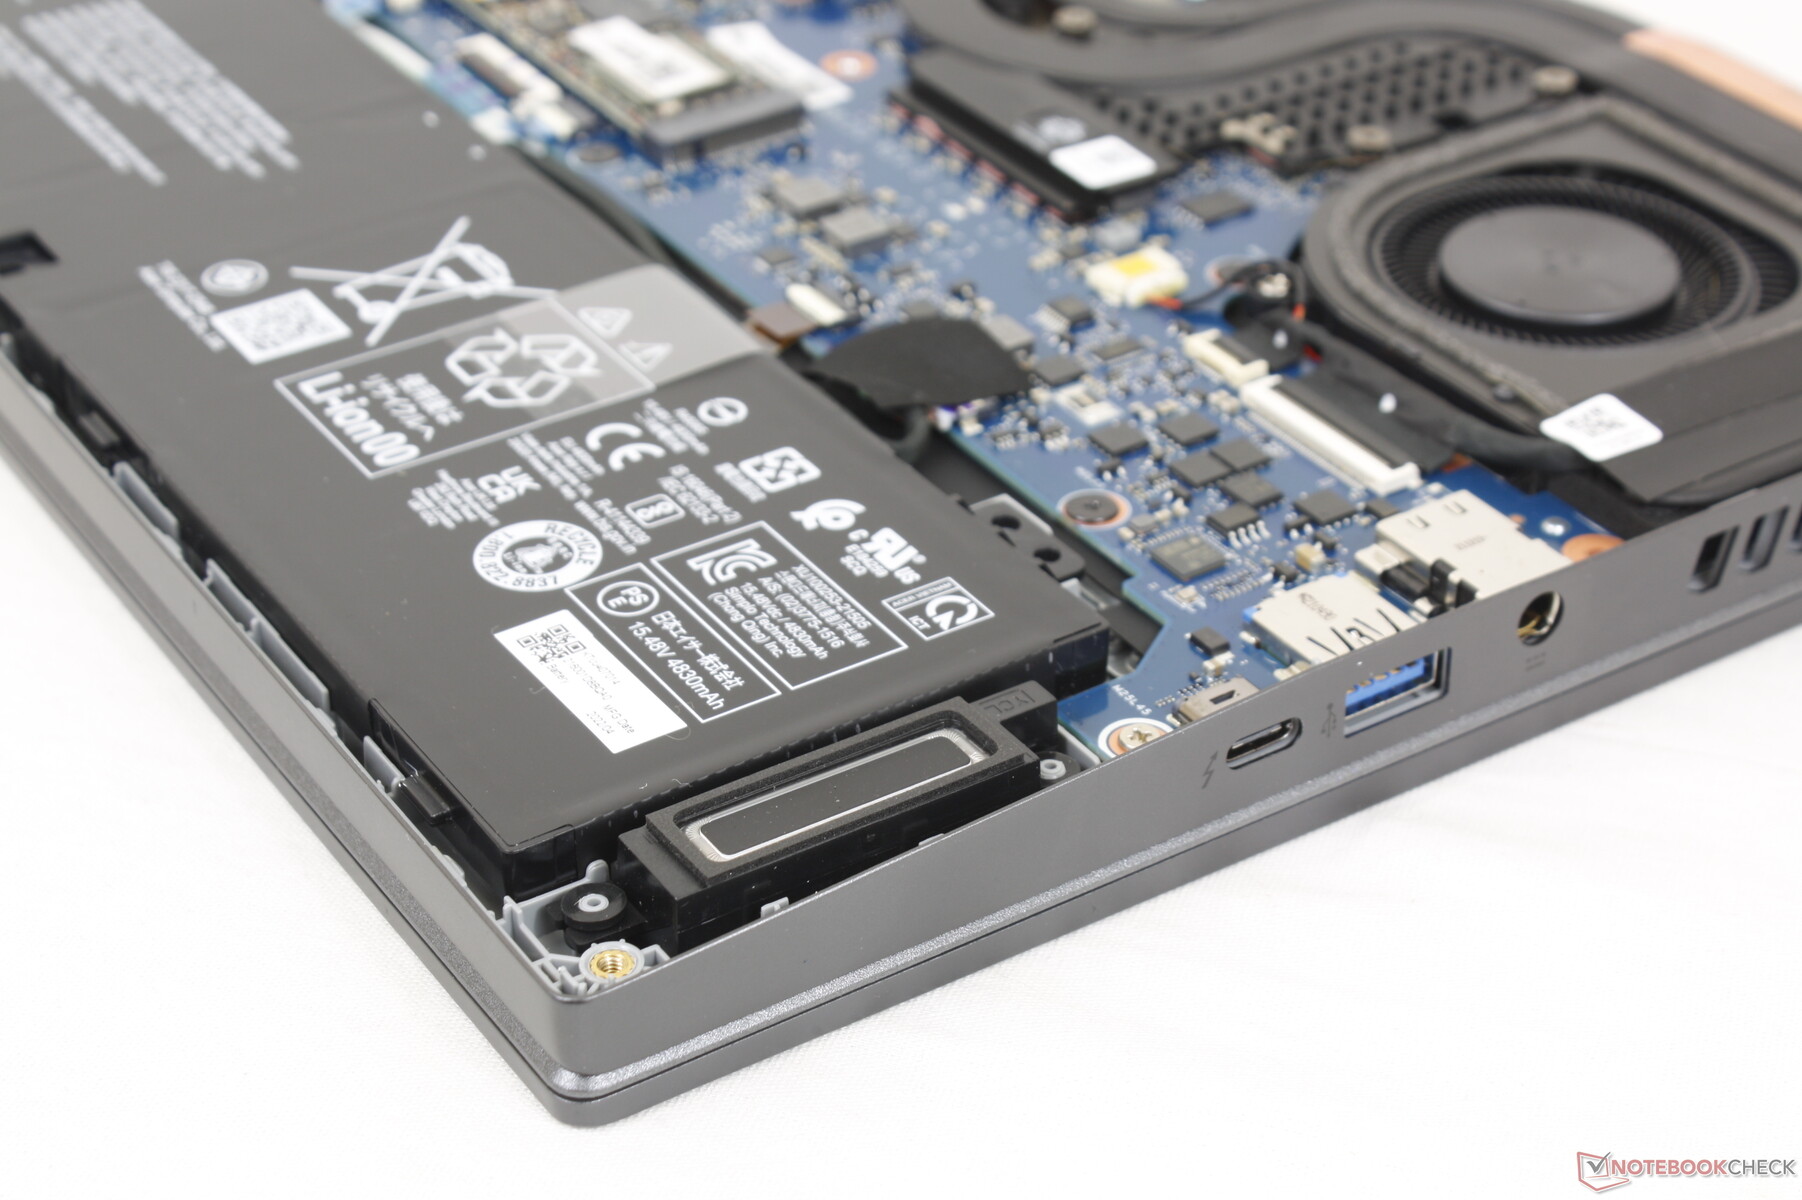
Manutenzione
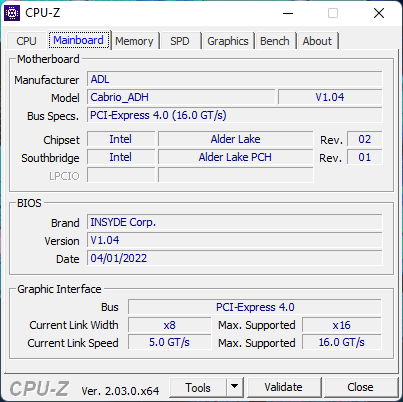
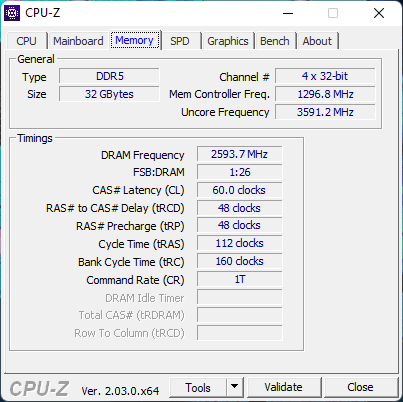
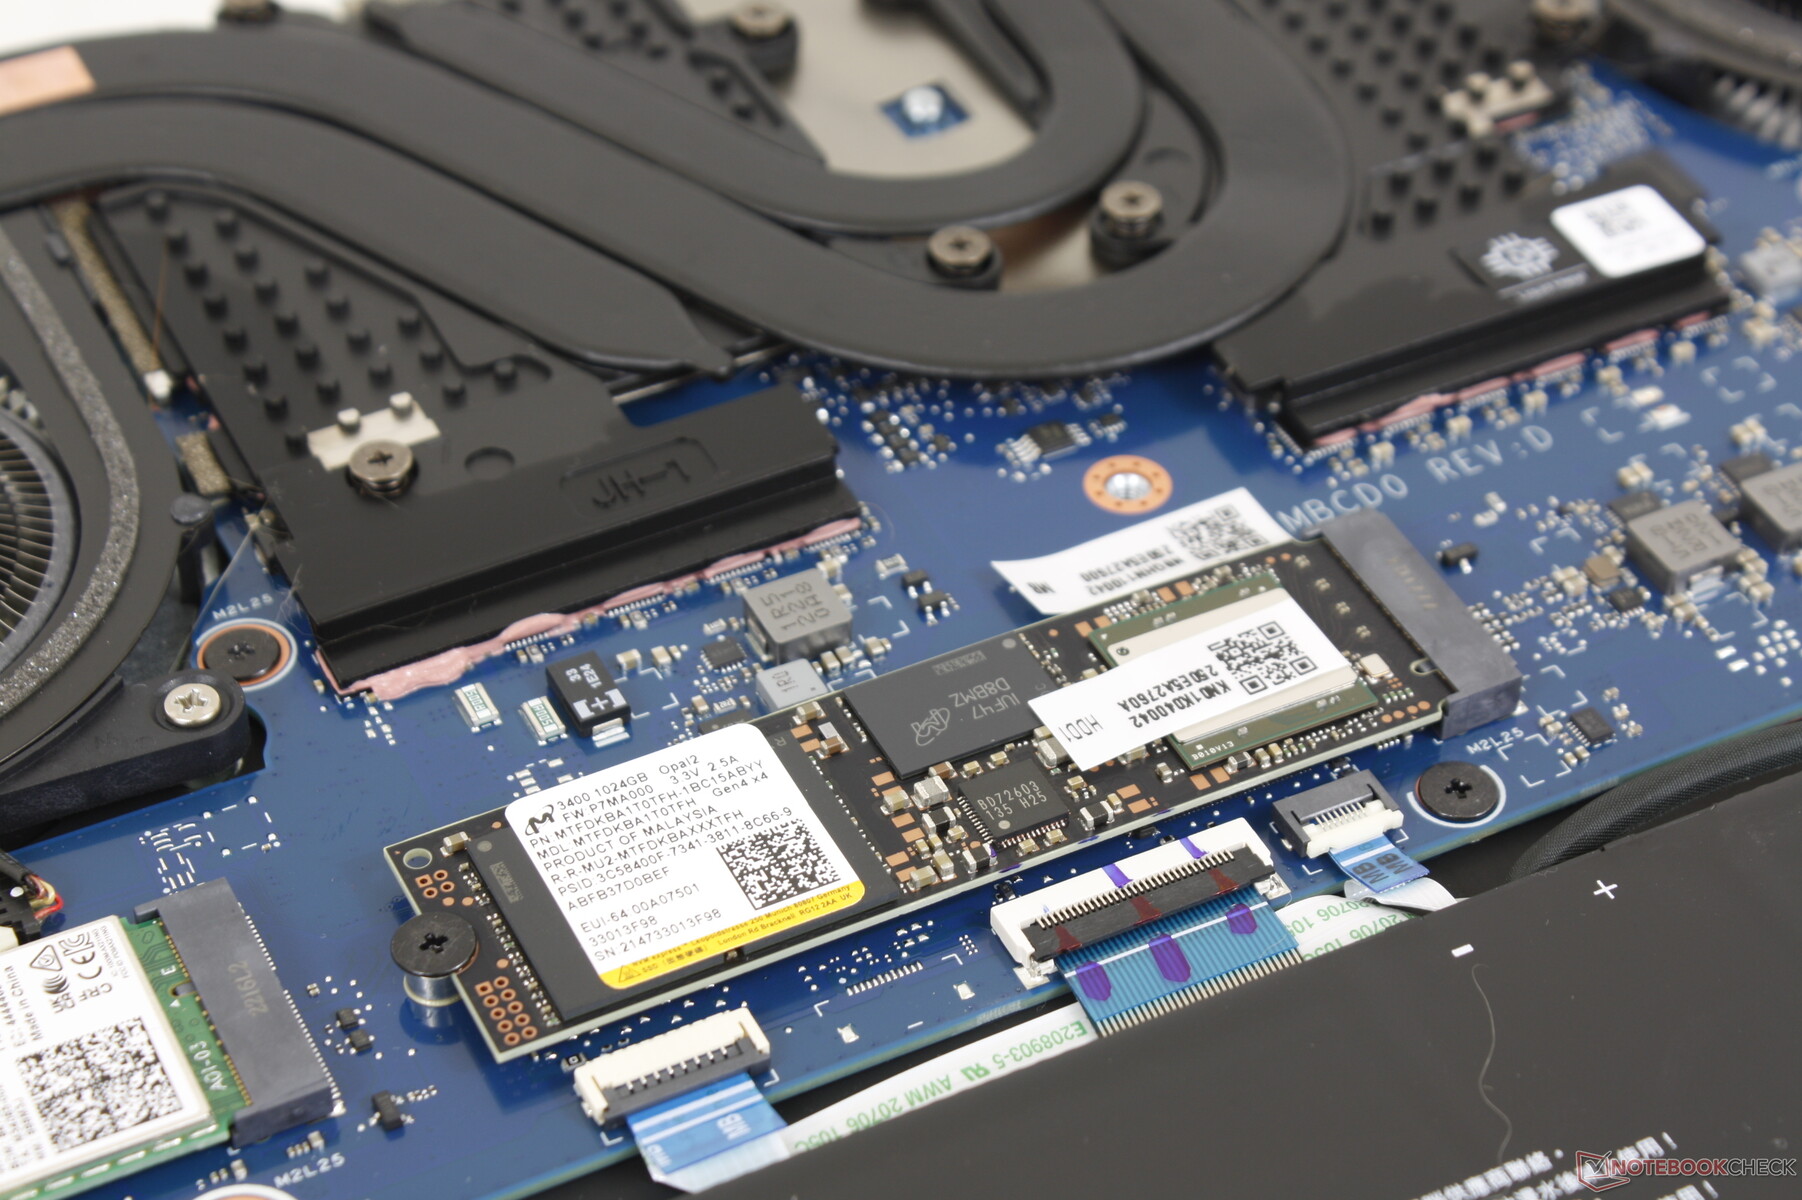
Il pannello inferiore è fissato da nove viti T6 Torx per una manutenzione relativamente semplice. Gli utenti possono aggiornare solo l'SSD, il modulo WLAN e la batteria. I moduli RAM sono saldati, a differenza del modello di precedente generazione.
Accessori e garanzia
La confezione include una pratica custodia per il trasporto, oltre all'adattatore CA e alla documentazione. Raramente altri produttori includono una custodia per il trasporto senza costi aggiuntivi. Se acquistato negli Stati Uniti, si applica la consueta garanzia limitata di un anno del produttore.
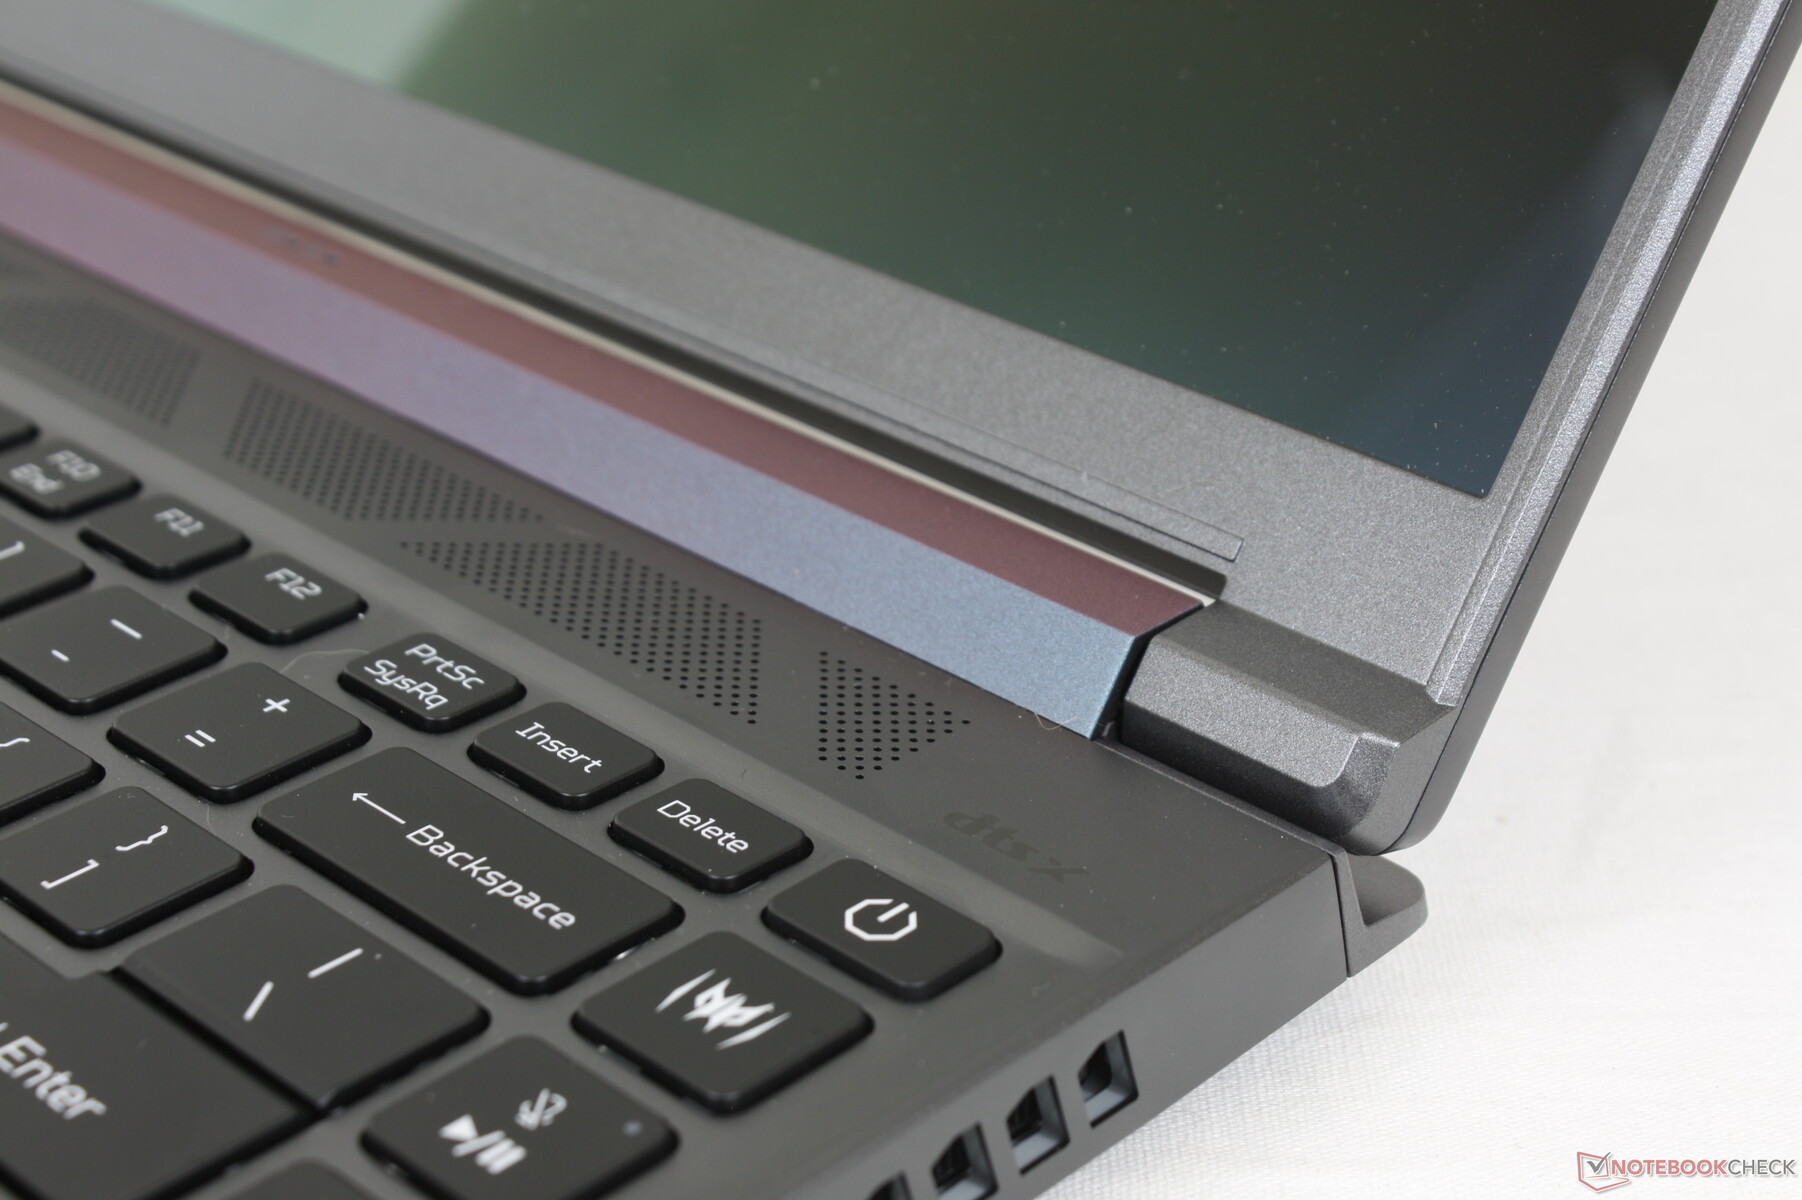
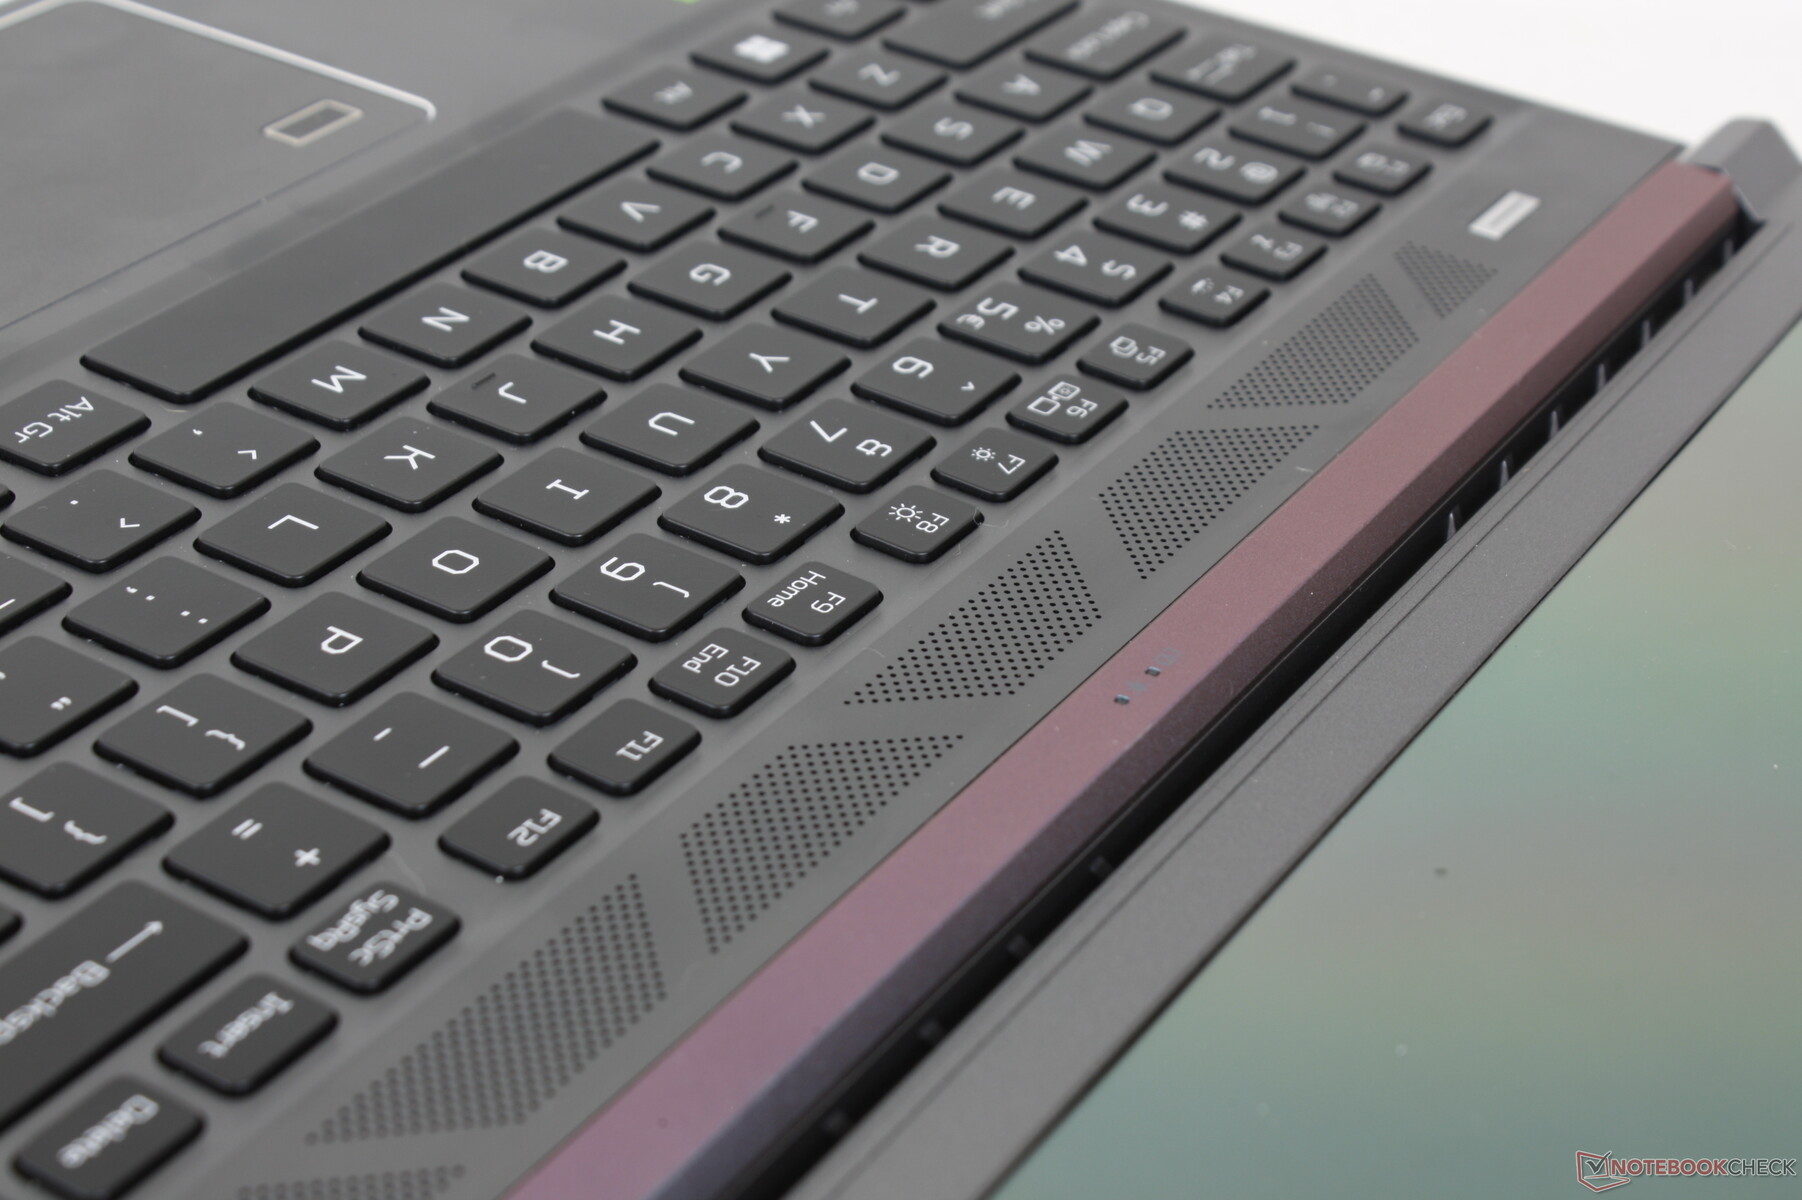
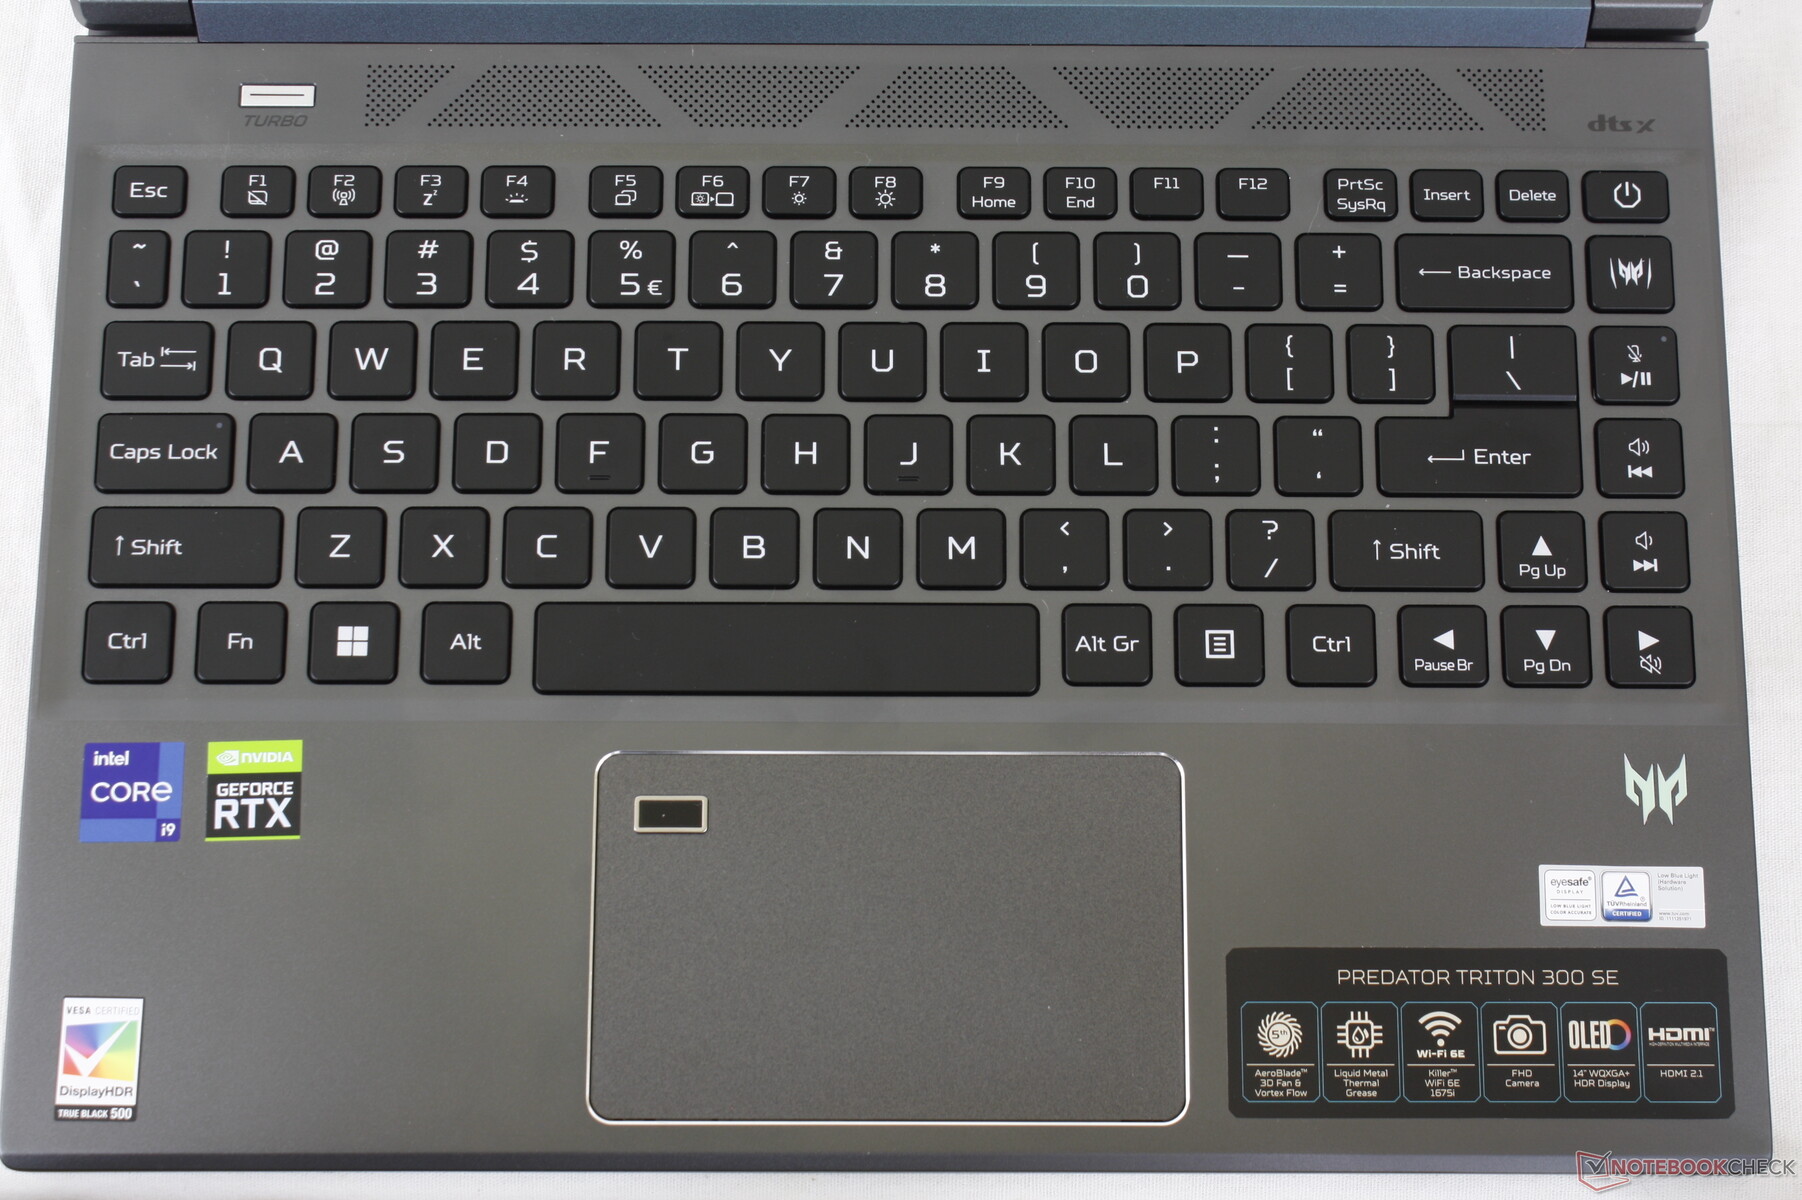
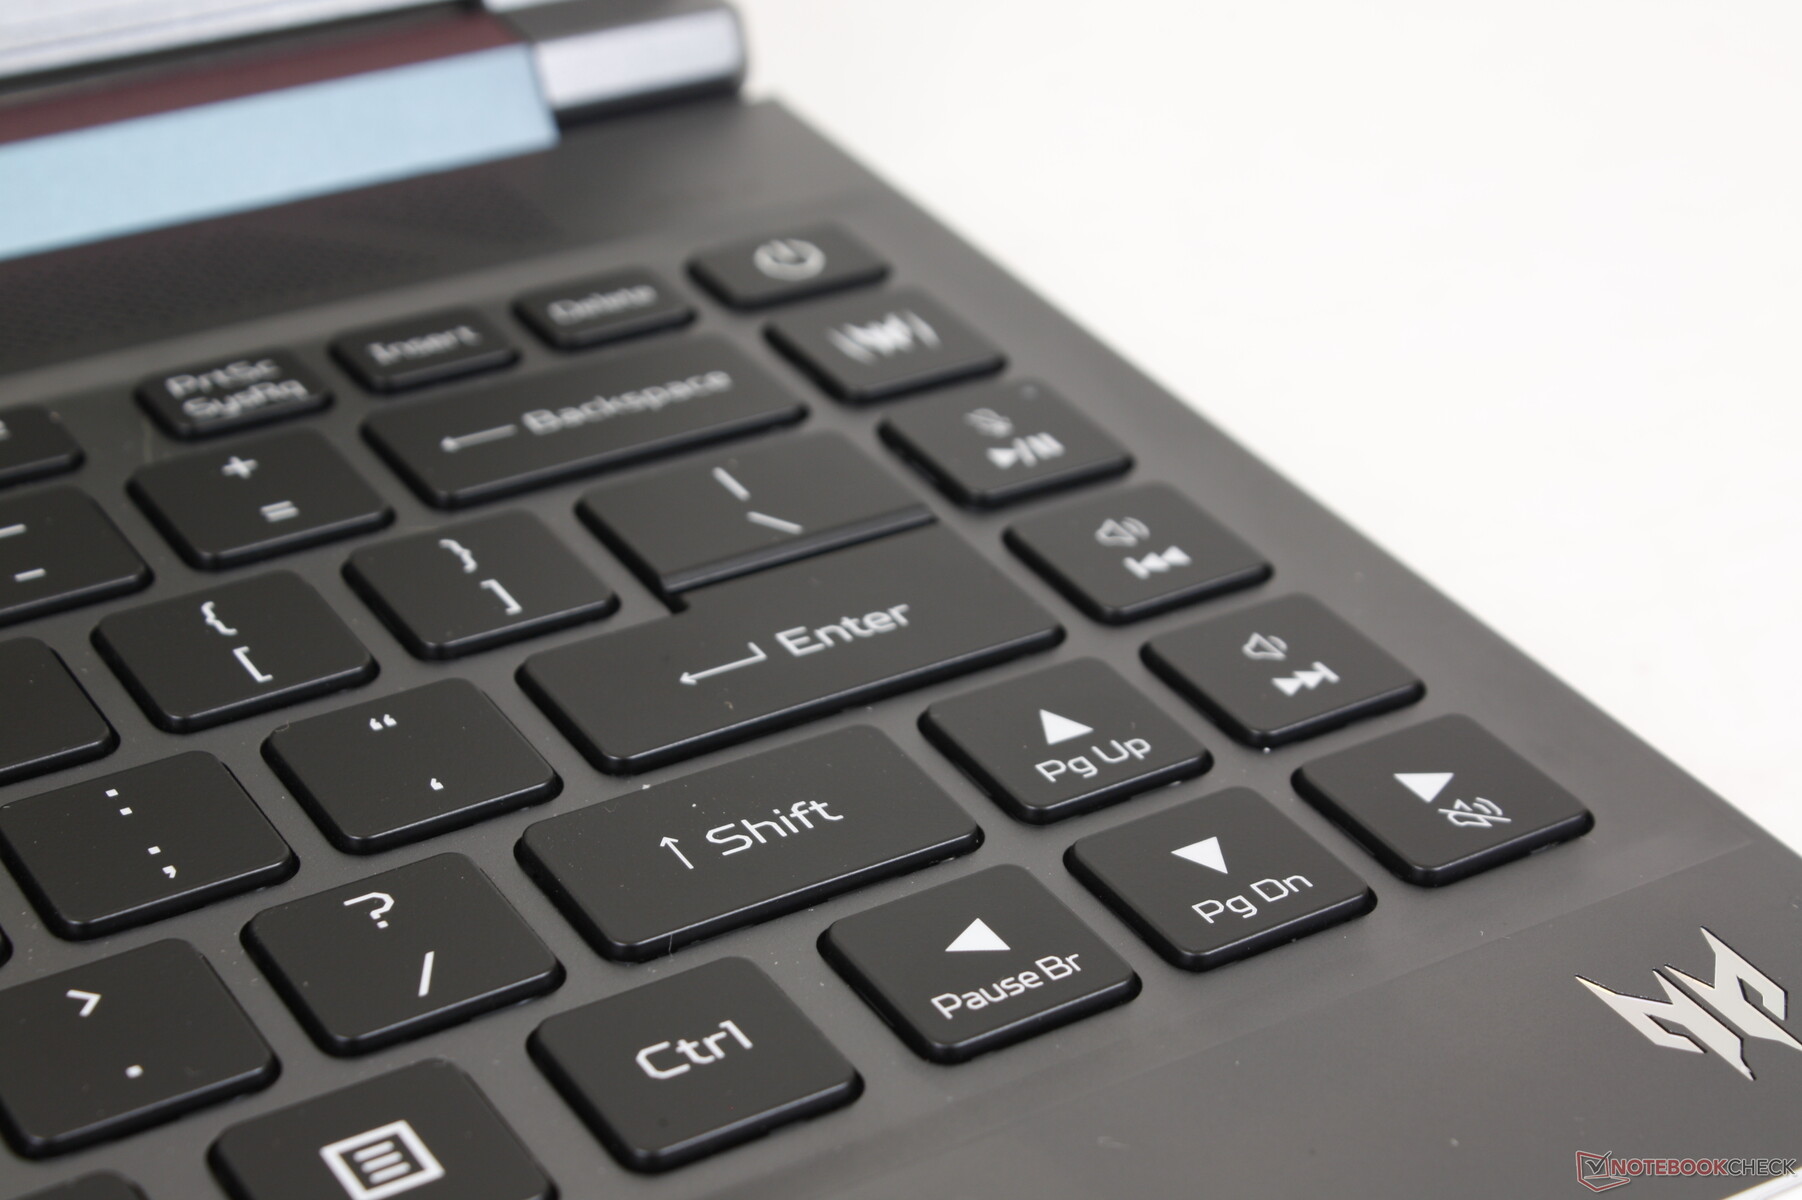
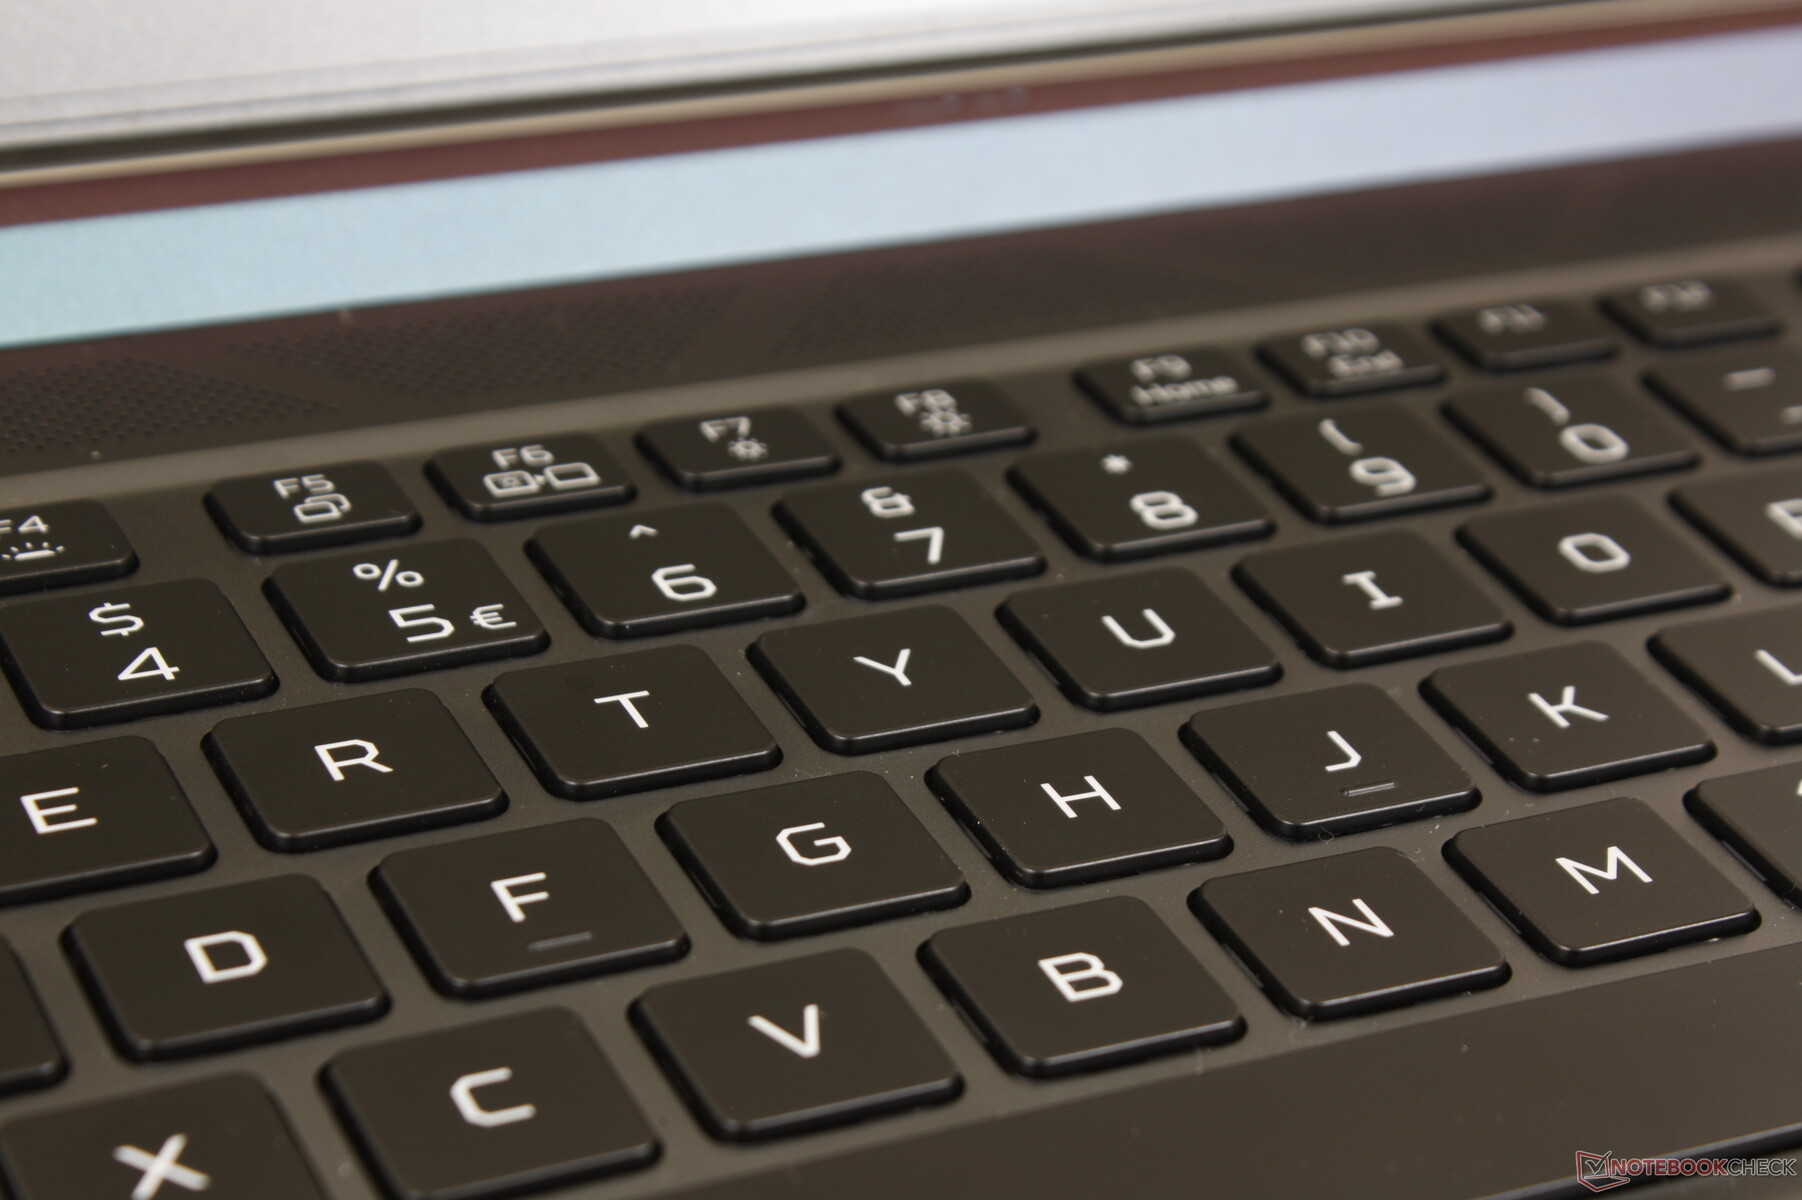
Dispositivi di input - Tasti morbidi e silenziosi
Tastiera
I tasti hanno una corsa ridotta e un feedback relativamente debole, simile a quello dei tasti del Blade 14 e di molti Utlrabook economici, come il VivoBook S14 Asus VivoBook S14. Se avete già digitato su un Ultrabook, saprete cosa aspettarvi. Il feedback può essere relativamente silenzioso, ma non è così netto e deciso come quello dei tasti di un ThinkPad o di un EliteBook di fascia business
La retroilluminazione RGB a tre zone è di serie, mentre il Blade 14 include l'illuminazione RGB per tasto. Tutti i tasti e i simboli sono retroilluminati.
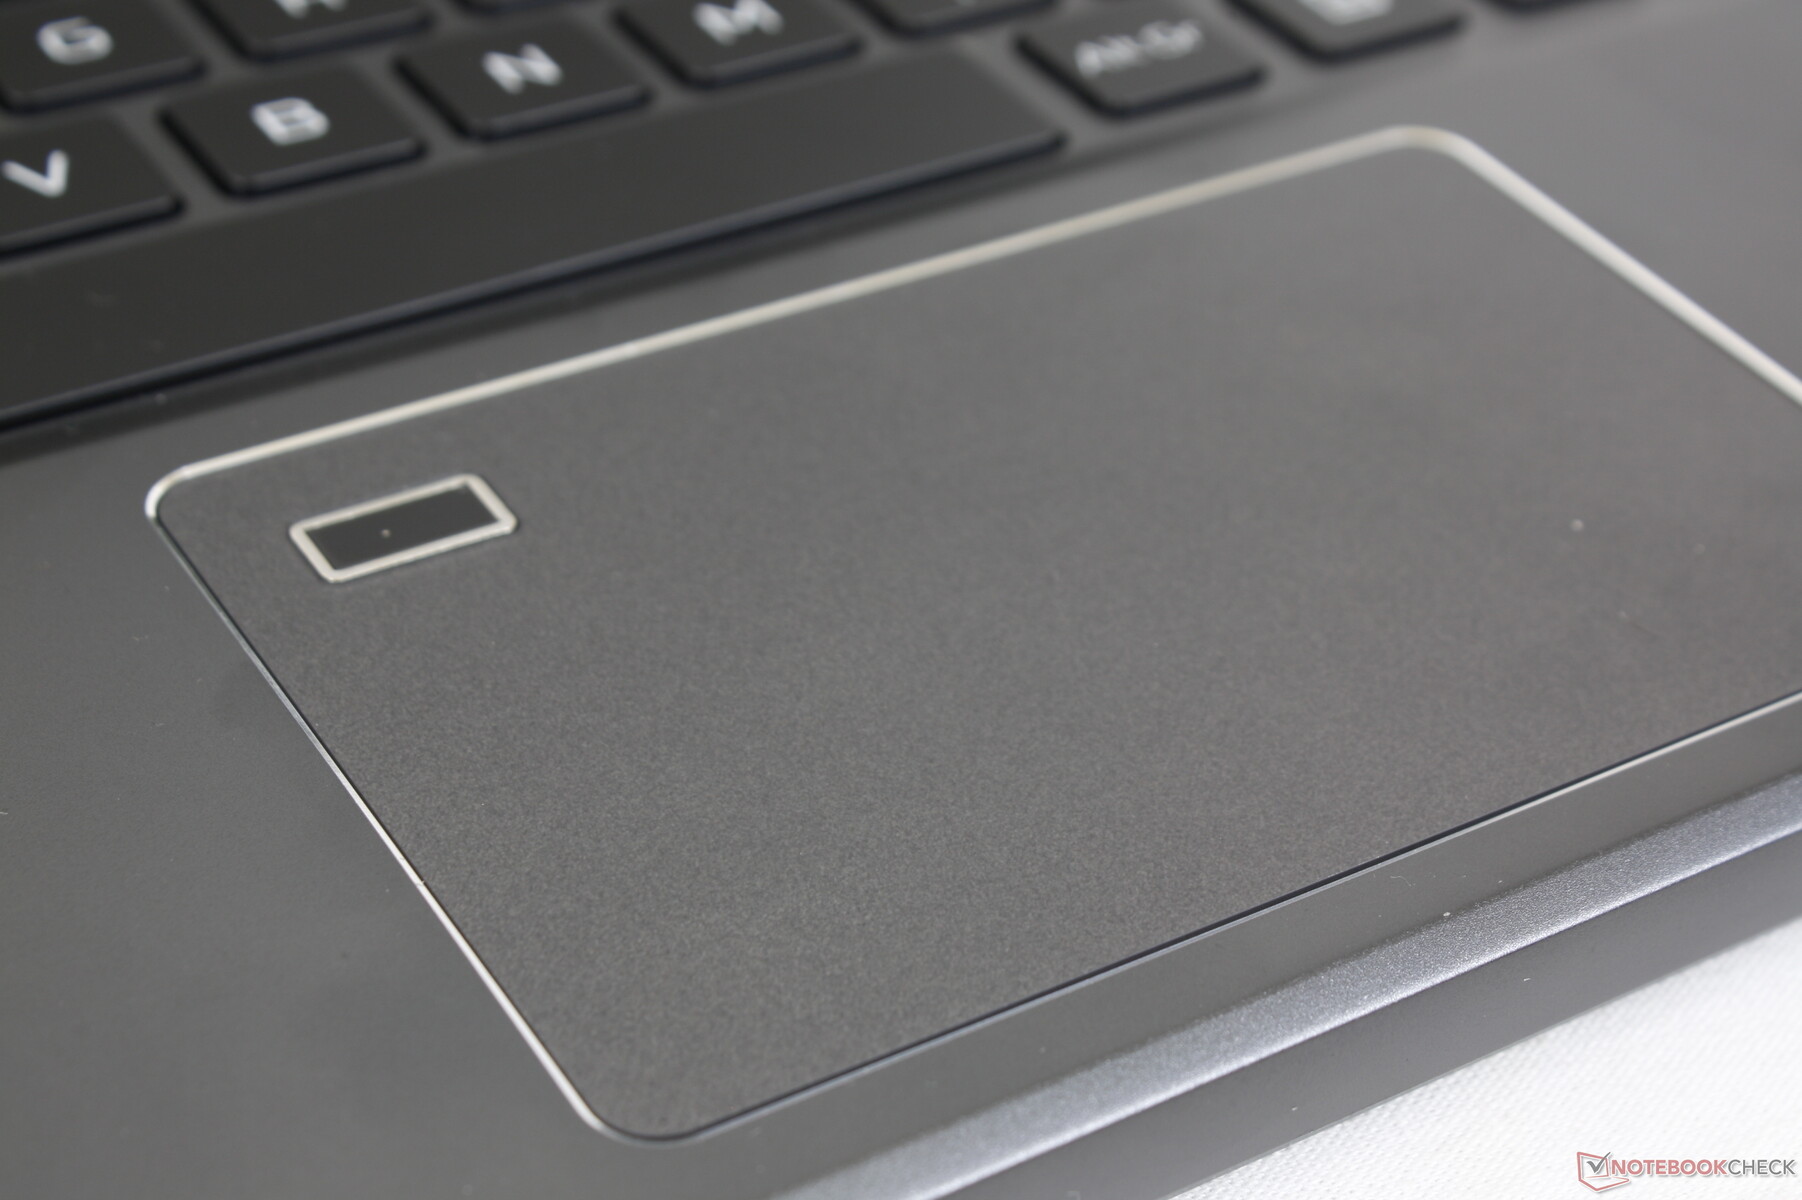
Touchpad
Il clickpad è leggermente più grande di quello dello Zephyrus G14 (10,5 x 6,5 cm contro 10,5 x 6 cm). Tuttavia, il lettore di impronte digitali all'angolo riduce lo spazio effettivo per il controllo del cursore o per gli input multi-touch e quindi il clickpad può sembrare più piccolo. La maggior parte degli altri portatili ha riposizionato il lettore di impronte digitali in aree più comode, come il pulsante di accensione o la tastiera. A questo proposito, il Predator Triton 300 SE può sembrare un telaio di vecchia concezione.
Il feedback del clickpad è morbido e poco profondo, per un'impressione di debolezza. È preferibile utilizzare un mouse USB quando possibile.
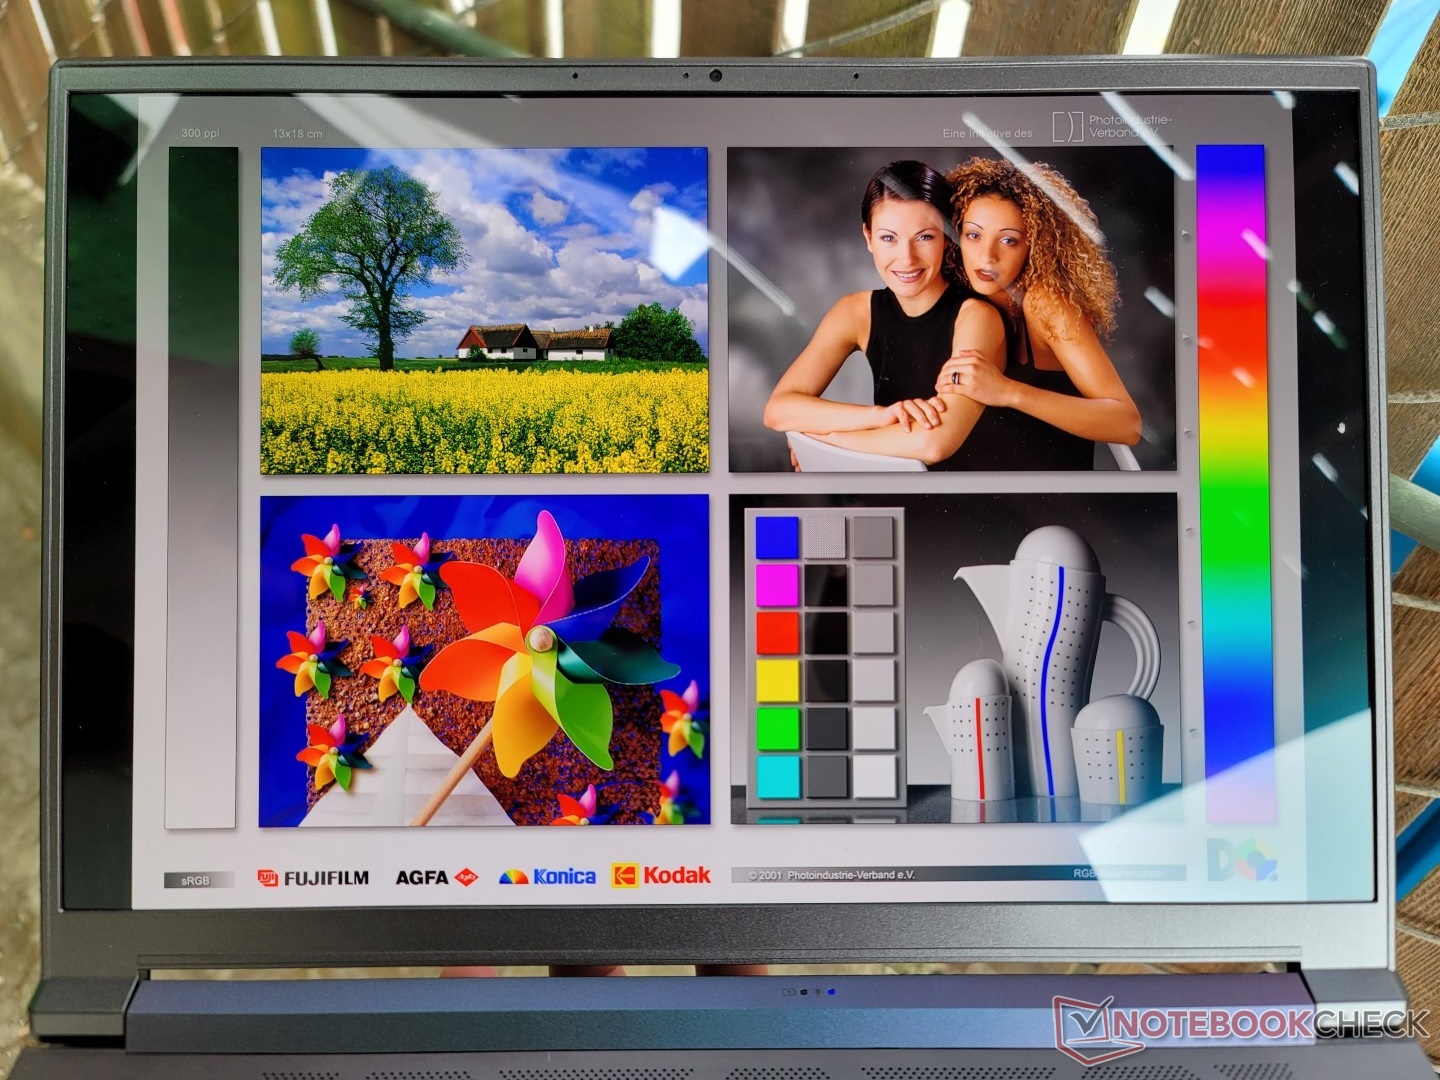
Display - Opzioni OLED e IPS
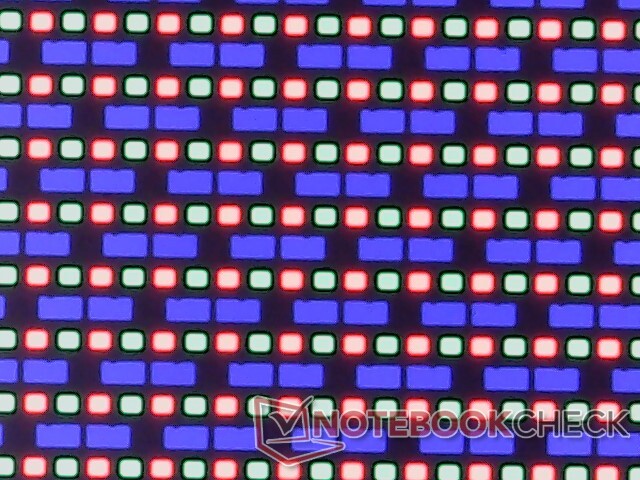
Il Predator Triton 300 SE è uno dei pochi portatili da gioco OLED a offrire sia i colori completi DCI-P3 che una frequenza di aggiornamento relativamente veloce di 90 Hz. Alcune alternative IPS possono avere una frequenza di aggiornamento ancora più veloce, come il pannello del Blade 14ma di solito promettono solo una copertura sRGB.
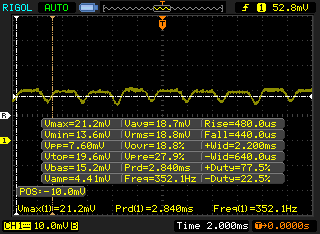
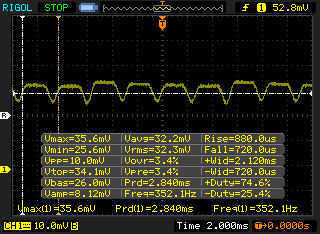
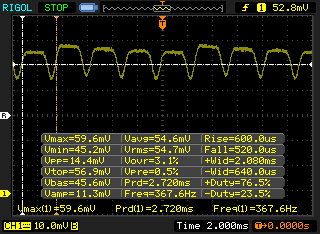
La mancanza del supporto per la sincronizzazione adattiva è uno svantaggio evidente del Predator Triton 300 SE da 14 pollici. Sebbene l'effetto ghosting sia quasi inesistente, il pannello OLED presenta una serie di svantaggi rispetto all'IPS. Una frequenza di sfarfallio di circa 352 Hz, ad esempio, rimane presente a tutti i livelli di luminosità, simile a quella che abbiamo registrato su altri portatili OLED da 14 pollici come l' Asus VivoBook 14.
Acer offre una SKU IPS da 1200p a risoluzione inferiore con supporto MUX e una frequenza di aggiornamento più veloce di 165 Hz. Se la copertura completa dei colori P3 non è importante per le vostre attività, allora l'alternativa IPS può essere presa in considerazione soprattutto per i giochi.
| |||||||||||||||||||||||||
Distribuzione della luminosità: 99 %
Al centro con la batteria: 414.3 cd/m²
Contrasto: ∞:1 (Nero: 0 cd/m²)
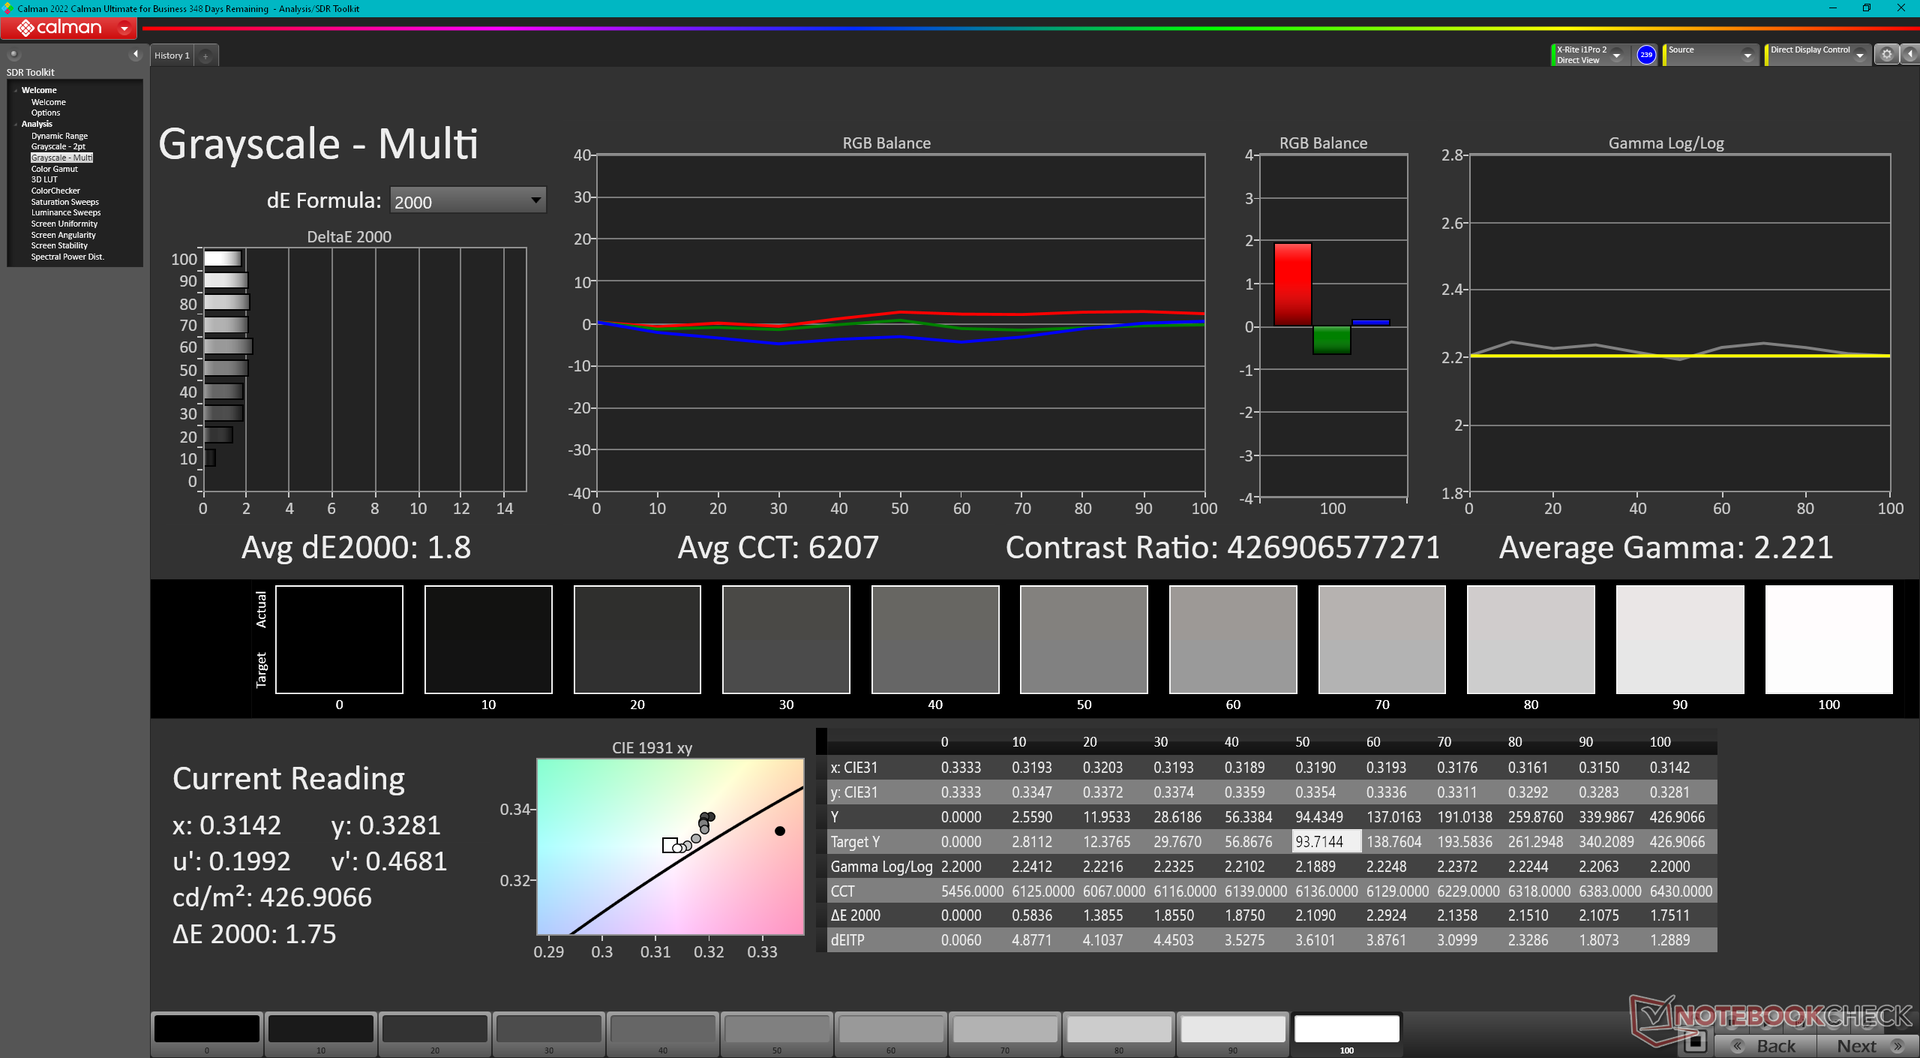
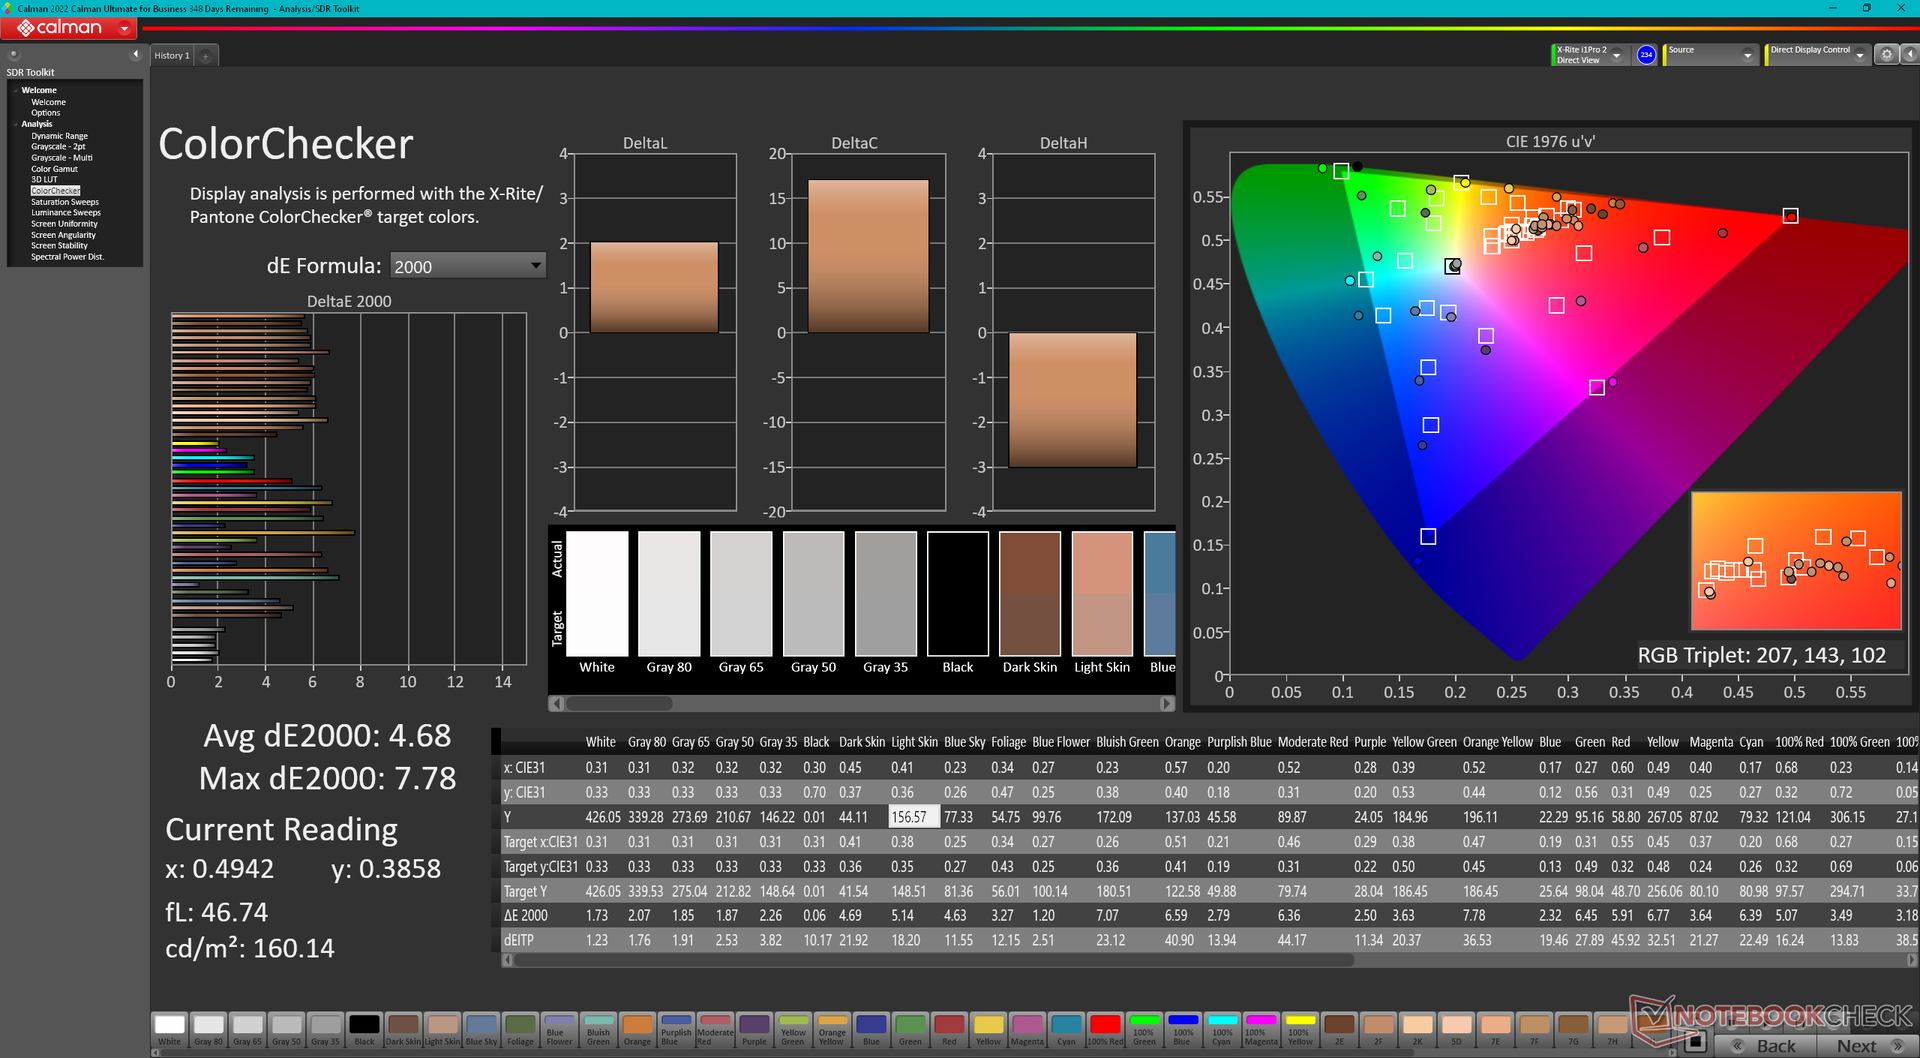
ΔE ColorChecker Calman: 4.68 | ∀{0.5-29.43 Ø4.73}
ΔE Greyscale Calman: 1.8 | ∀{0.09-98 Ø4.97}
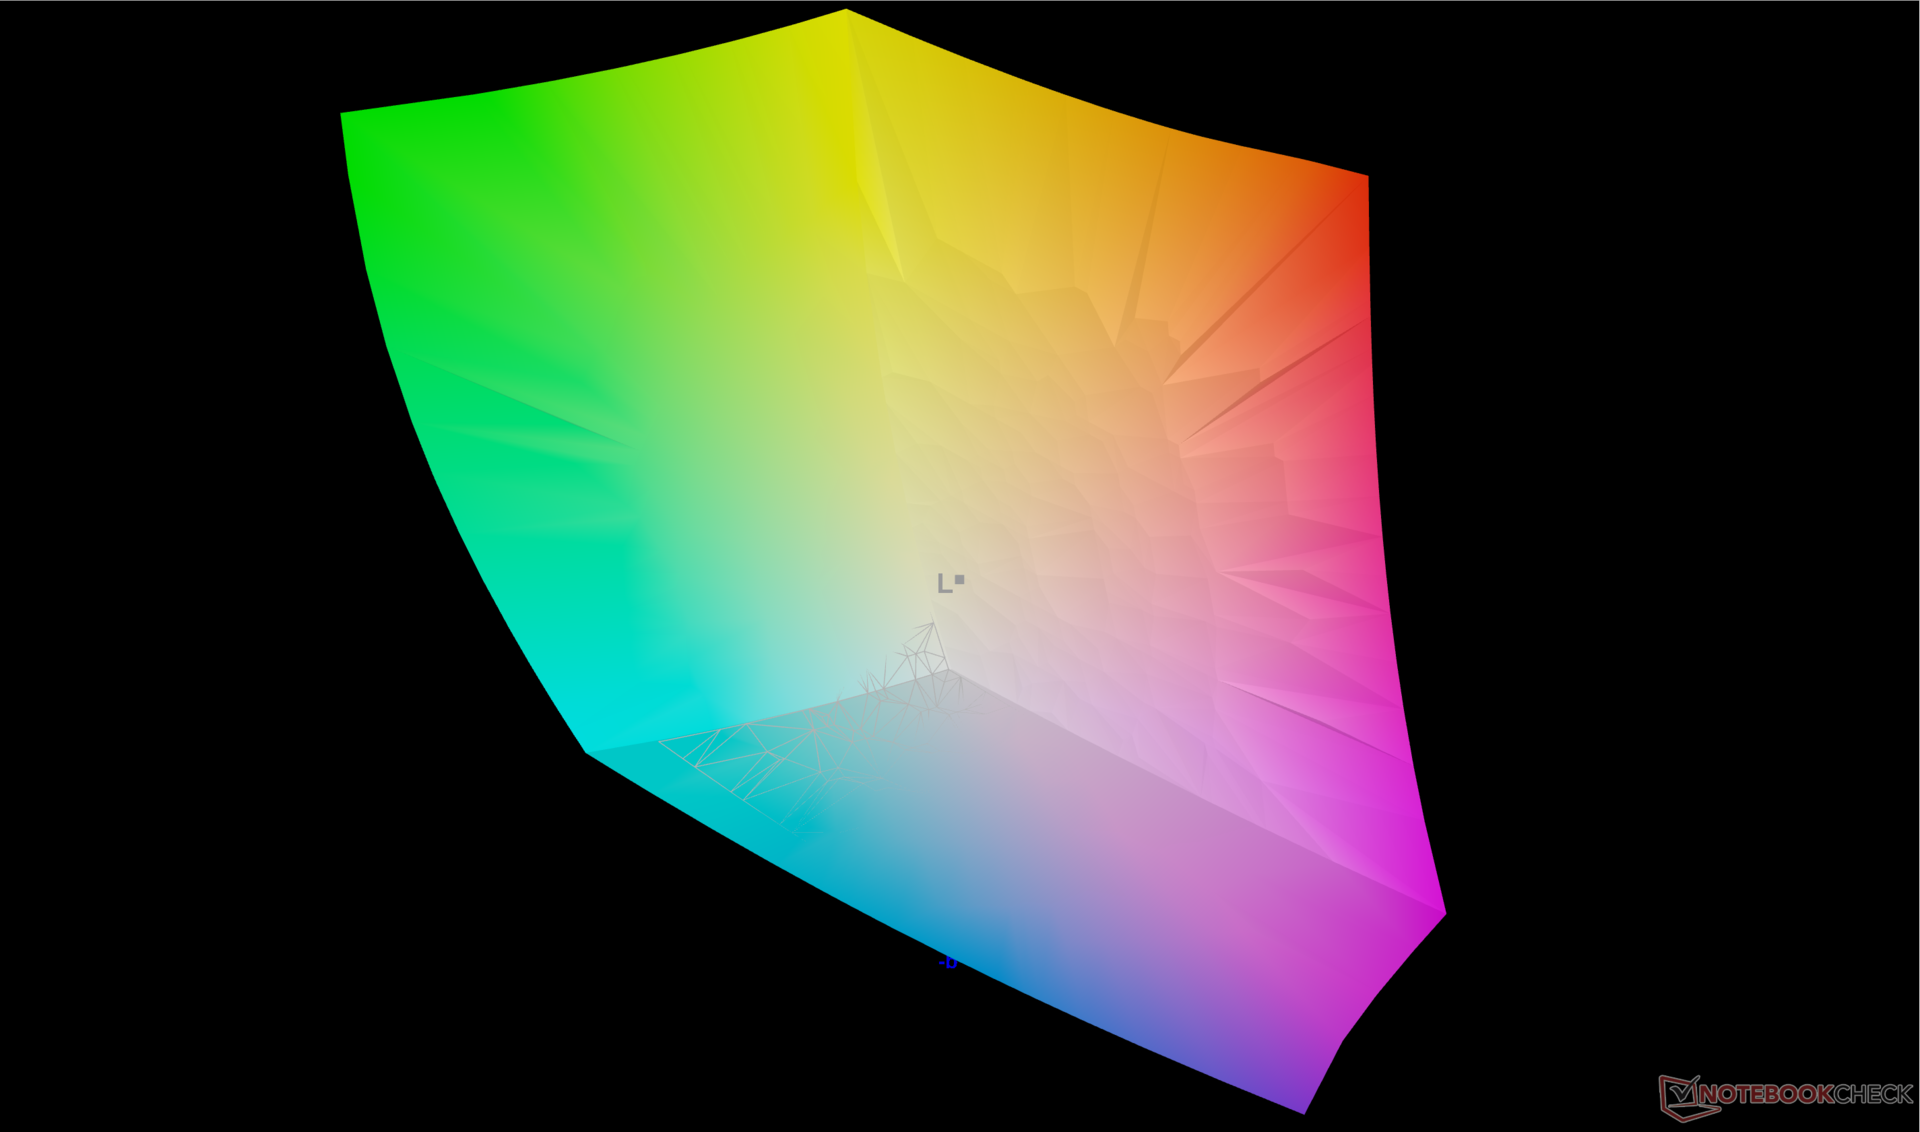
99% AdobeRGB 1998 (Argyll 3D)
100% sRGB (Argyll 3D)
99.9% Display P3 (Argyll 3D)
Gamma: 2.22
CCT: 6207 K
| Acer Predator Triton 300 SE Samsung ATNA40YK07-0, OLED, 2880x1800, 14" | Asus ROG Zephyrus G14 GA402RJ BOEhydis NE140QDM-NX1, IPS, 2560x1600, 14" | Razer Blade 14 Ryzen 9 6900HX TL140BDXP02-0, IPS, 2560x1440, 14" | Alienware x14 i7 RTX 3060 SHP154D, IPS, 1920x1080, 14" | Dell Inspiron 14 Plus 7420 InfoVision 140NWHE, IPS, 2240x1400, 14" | Schenker Vision 14 MNE007ZA1, IPS, 2880x1800, 14" | |
|---|---|---|---|---|---|---|
| Display | -5% | -5% | -4% | -21% | -17% | |
| Display P3 Coverage (%) | 99.9 | 97.6 -2% | 97.2 -3% | 99.6 0% | 68.8 -31% | 74.3 -26% |
| sRGB Coverage (%) | 100 | 99.9 0% | 99.9 0% | 100 0% | 99.3 -1% | 97.6 -2% |
| AdobeRGB 1998 Coverage (%) | 99 | 85.6 -14% | 85.7 -13% | 87.6 -12% | 69.5 -30% | 75.7 -24% |
| Response Times | -426% | -1077% | -533% | -1944% | -2062% | |
| Response Time Grey 50% / Grey 80% * (ms) | 1.36 ? | 8.3 ? -510% | 16.8 ? -1135% | 9.6 ? -606% | 32.8 ? -2312% | 40.4 ? -2871% |
| Response Time Black / White * (ms) | 1.36 ? | 6 ? -341% | 15.2 ? -1018% | 7.6 ? -459% | 22.8 ? -1576% | 18.4 ? -1253% |
| PWM Frequency (Hz) | 367.6 ? | 26191 ? | ||||
| Screen | 5% | 13% | -24% | -12% | 5% | |
| Brightness middle (cd/m²) | 414.3 | 500 21% | 354 -15% | 434 5% | 331.1 -20% | 407 -2% |
| Brightness (cd/m²) | 416 | 470 13% | 328 -21% | 411 -1% | 326 -22% | 407 -2% |
| Brightness Distribution (%) | 99 | 85 -14% | 86 -13% | 89 -10% | 85 -14% | 94 -5% |
| Black Level * (cd/m²) | 0.42 | 0.37 | 0.25 | 0.29 | 0.25 | |
| Colorchecker dE 2000 * | 4.68 | 2.45 48% | 1.66 65% | 3 36% | 2.23 52% | 2.6 44% |
| Colorchecker dE 2000 max. * | 7.78 | 5.34 31% | 3.83 51% | 7.1 9% | 5.44 30% | 4.4 43% |
| Greyscale dE 2000 * | 1.8 | 3.1 -72% | 1.6 11% | 5.1 -183% | 3.6 -100% | 2.7 -50% |
| Gamma | 2.22 99% | 2.213 99% | 2.23 99% | 2.19 100% | 2.21 100% | 2.18 101% |
| CCT | 6207 105% | 7251 90% | 6542 99% | 6204 105% | 6022 108% | 6316 103% |
| Contrast (:1) | 1190 | 957 | 1736 | 1142 | 1628 | |
| Colorchecker dE 2000 calibrated * | 1.2 | 0.7 | 0.63 | 2 | ||
| Media totale (Programma / Settaggio) | -142% /
-76% | -356% /
-190% | -187% /
-111% | -659% /
-366% | -691% /
-377% |
* ... Meglio usare valori piccoli
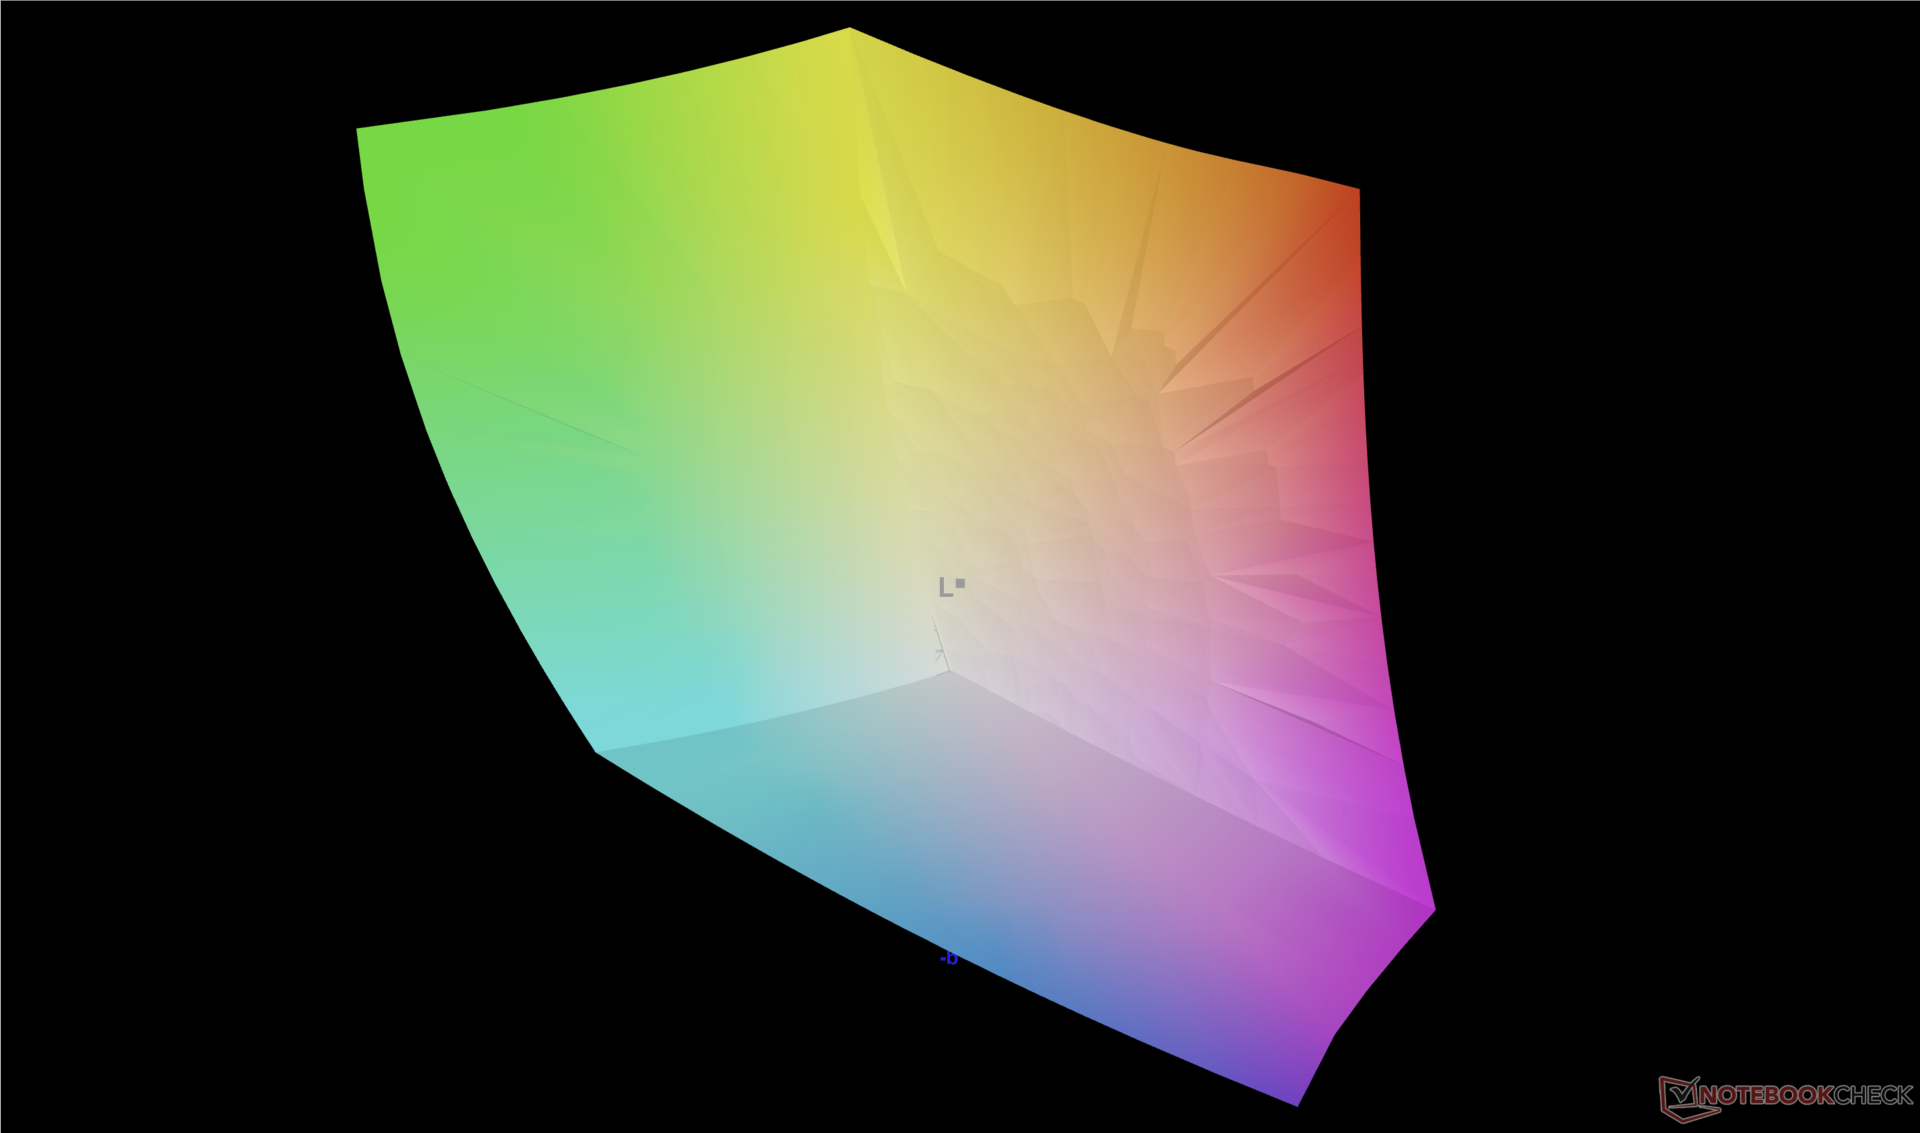
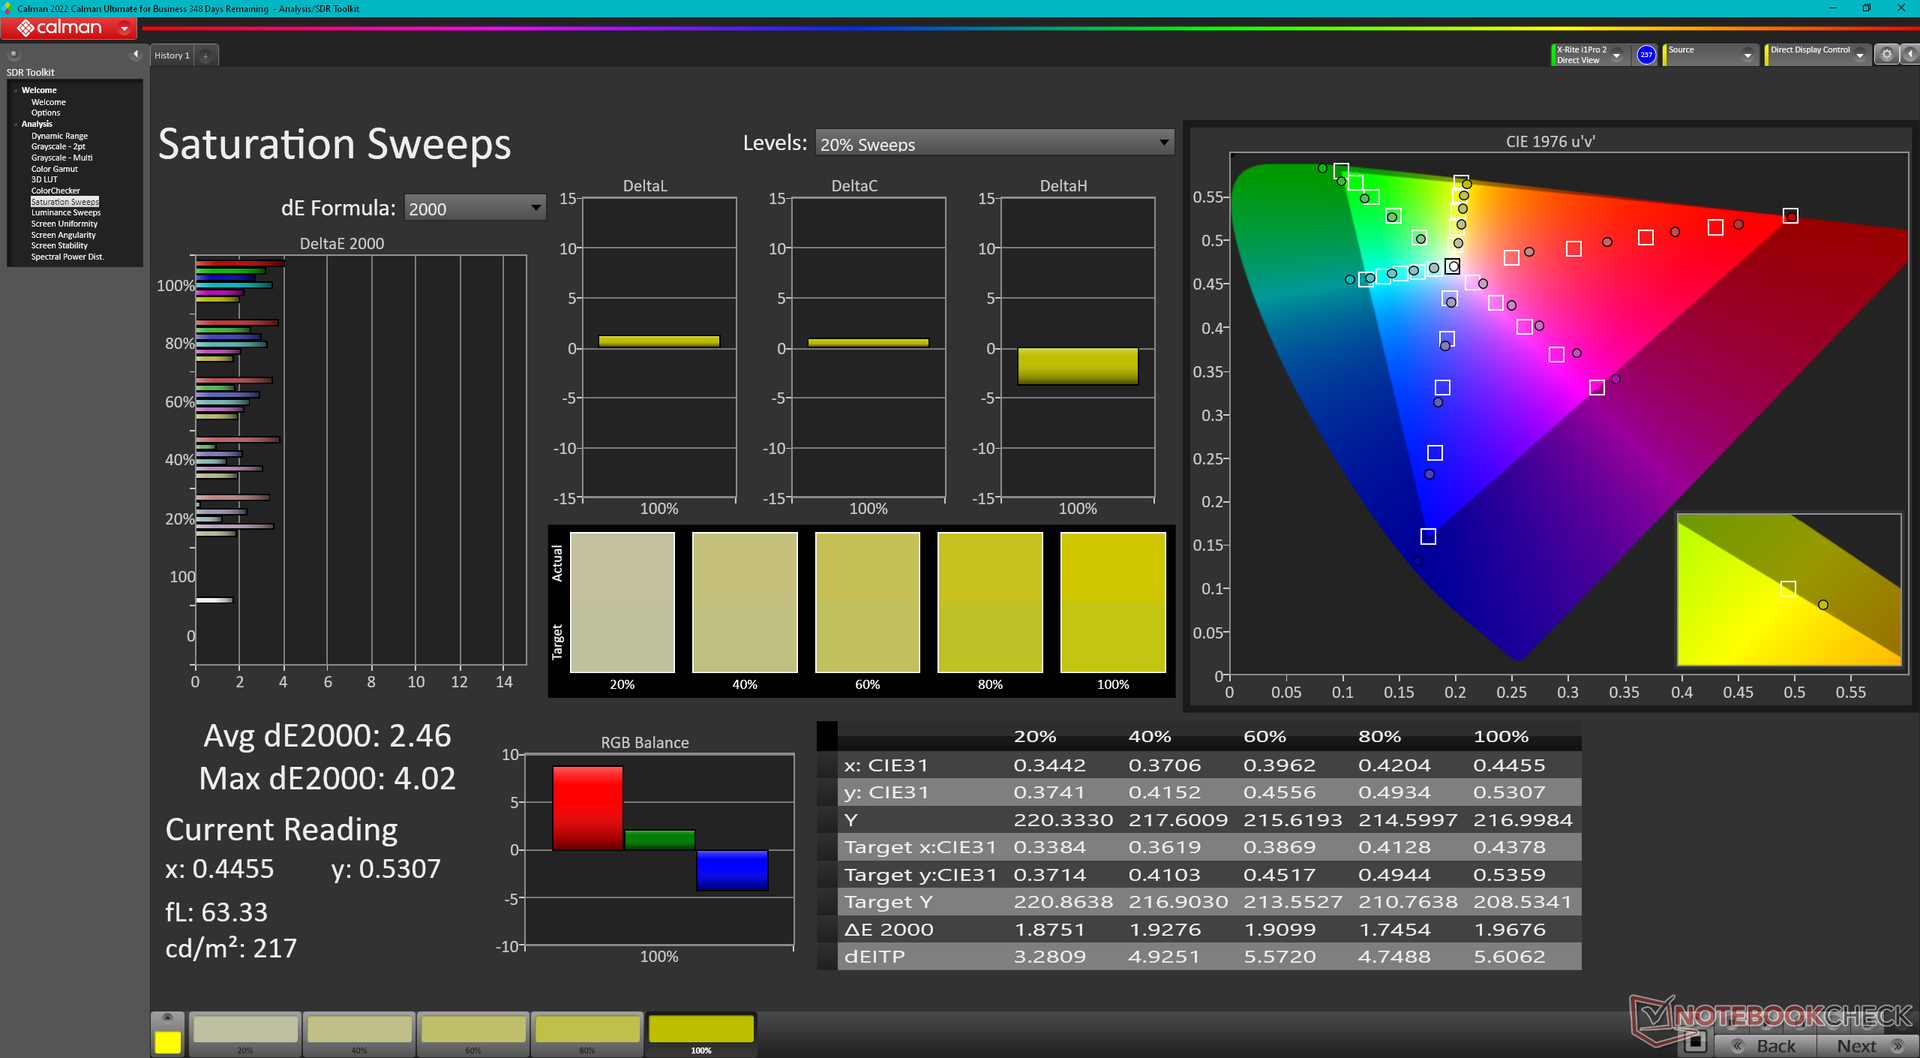
Il pannello è calibrato in modo decente rispetto allo standard P3, con valori medi di deltaE in scala di grigi e a colori di soli 1,8 e 4,68, rispettivamente.
Tempi di risposta del Display
| ↔ Tempi di risposta dal Nero al Bianco | ||
|---|---|---|
| 1.36 ms ... aumenta ↗ e diminuisce ↘ combinato | ↗ 0.52 ms Incremento | 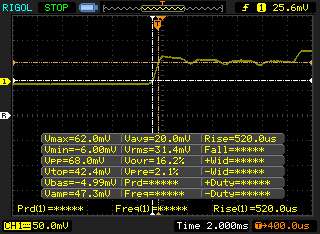 |
| ↘ 0.84 ms Calo | ||
| Lo schermo ha mostrato valori di risposta molto veloci nei nostri tests ed è molto adatto per i gaming veloce. In confronto, tutti i dispositivi di test variano da 0.1 (minimo) a 240 (massimo) ms. » 8 % di tutti i dispositivi è migliore. Questo significa che i tempi di risposta rilevati sono migliori rispettto alla media di tutti i dispositivi testati (19.9 ms). | ||
| ↔ Tempo di risposta dal 50% Grigio all'80% Grigio | ||
| 1.36 ms ... aumenta ↗ e diminuisce ↘ combinato | ↗ 0.68 ms Incremento | 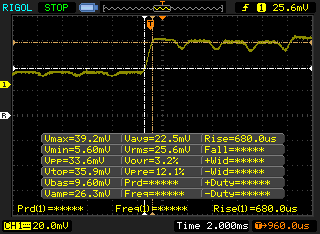 |
| ↘ 0.68 ms Calo | ||
| Lo schermo ha mostrato valori di risposta molto veloci nei nostri tests ed è molto adatto per i gaming veloce. In confronto, tutti i dispositivi di test variano da 0.165 (minimo) a 636 (massimo) ms. » 6 % di tutti i dispositivi è migliore. Questo significa che i tempi di risposta rilevati sono migliori rispettto alla media di tutti i dispositivi testati (31.1 ms). | ||
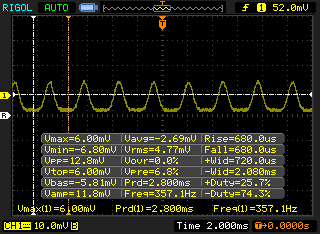
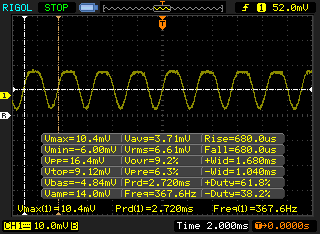
Sfarfallio dello schermo / PWM (Pulse-Width Modulation)
| flickering dello schermo / PWM rilevato | 367.6 Hz | ≤ 100 % settaggio luminosita' |  |
Il display sfarfalla a 367.6 Hz (Probabilmente a causa dell'uso di PWM) Flickering rilevato ad una luminosita' di 100 % o inferiore. Non dovrebbe verificarsi flickering o PWM sopra questo valore di luminosita'. La frequenza di 367.6 Hz è relativamente elevata, quindi la maggioranza degli utenti sensibili al PWM non dovrebbe notare alcun flickering. Tuttavia, è stato segnalato che alcuni utenti sono sensibili al PWM a 500 Hz ed oltre, quindi prestate attenzione. In confronto: 52 % di tutti i dispositivi testati non utilizza PWM per ridurre la luminosita' del display. Se è rilevato PWM, una media di 7798 (minimo: 5 - massimo: 343500) Hz è stata rilevata. | |||
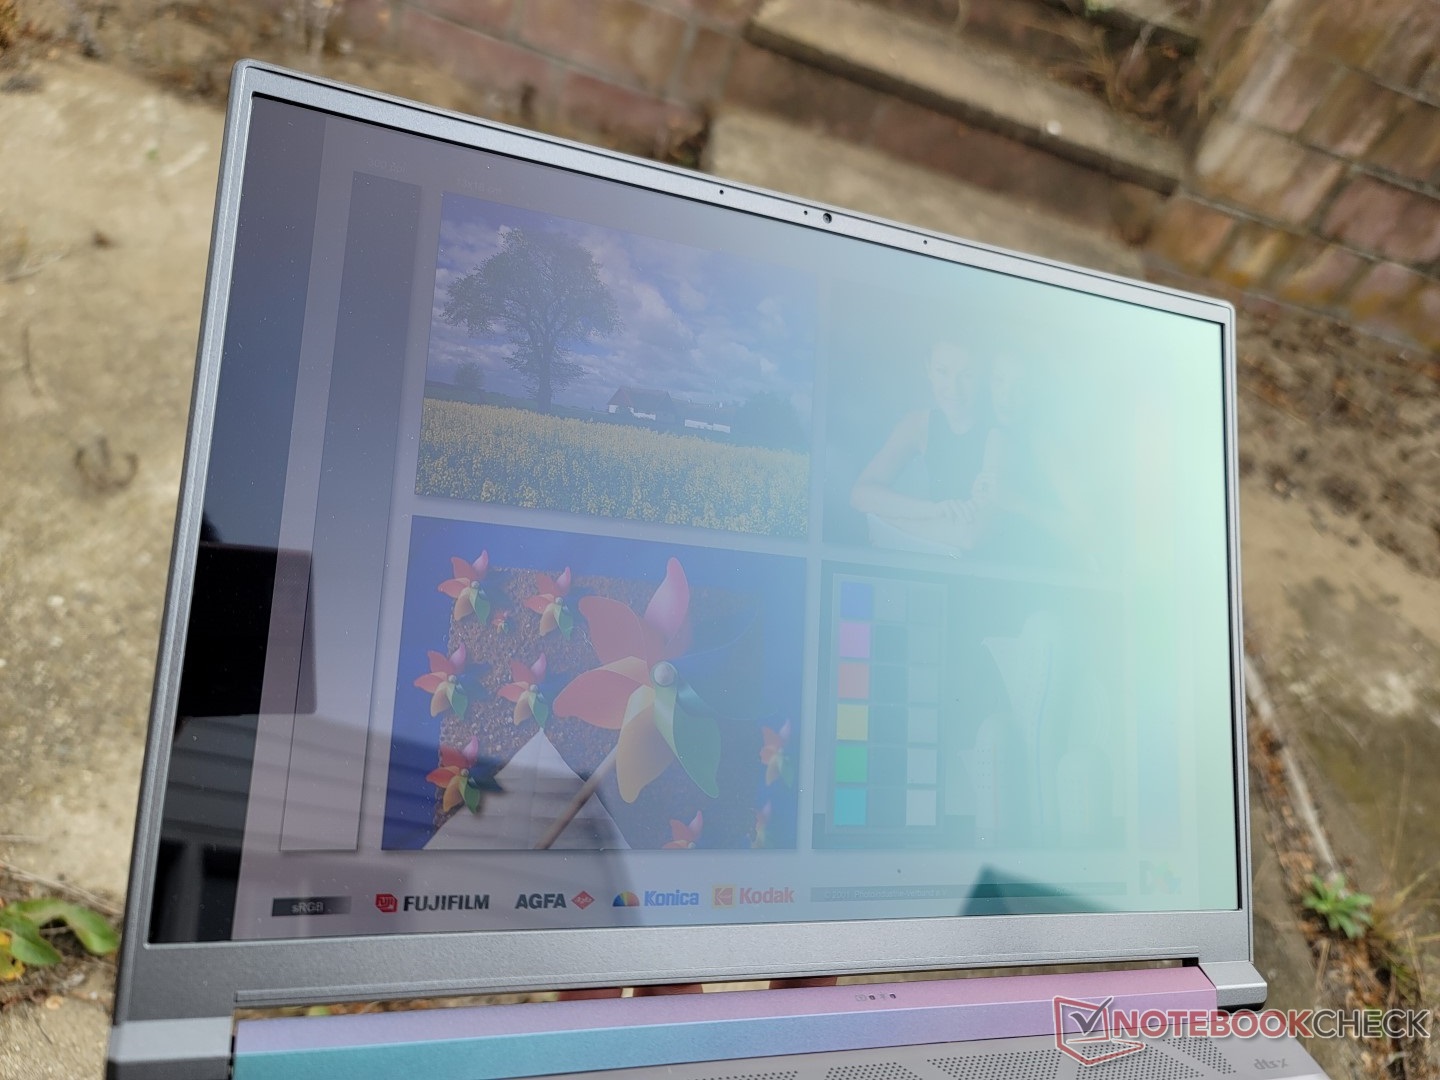
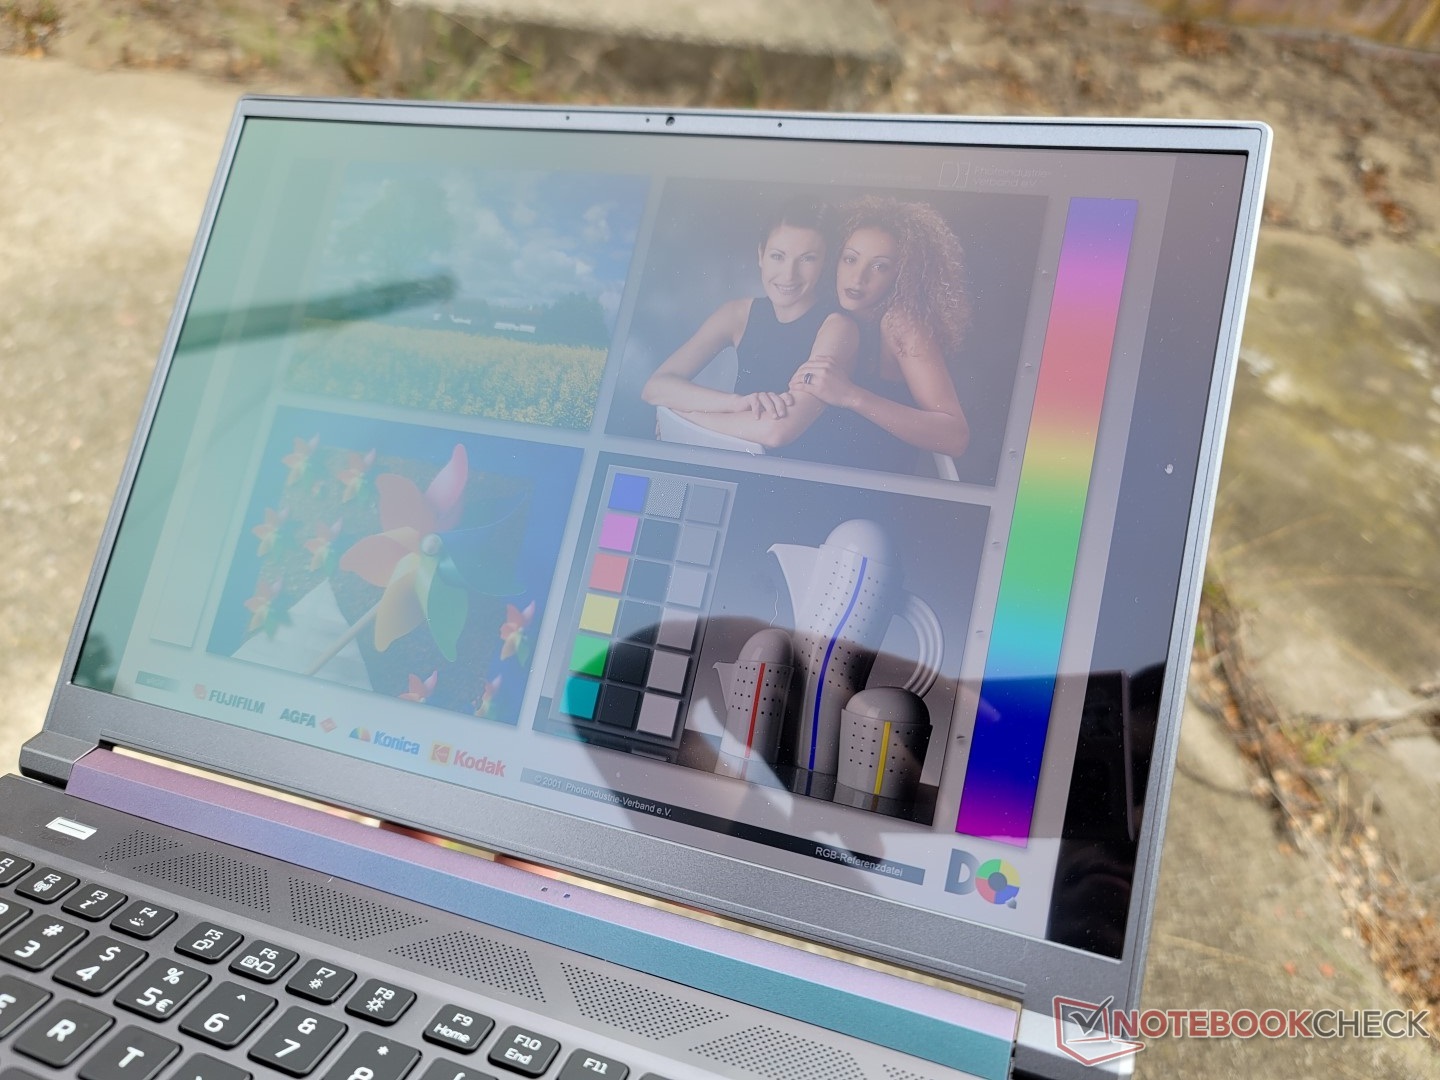
La visibilità all'aperto è discreta se all'ombra, grazie ai livelli di nero profondo e ai colori del pannello OLED lucido. Tuttavia, i riflessi sono inevitabili nella maggior parte delle condizioni. Il display opaco dello Zephyrus G14 è più luminoso di circa 100 nit per una leggibilità più agevole.
Prestazioni - Core i9 di 12a generazione
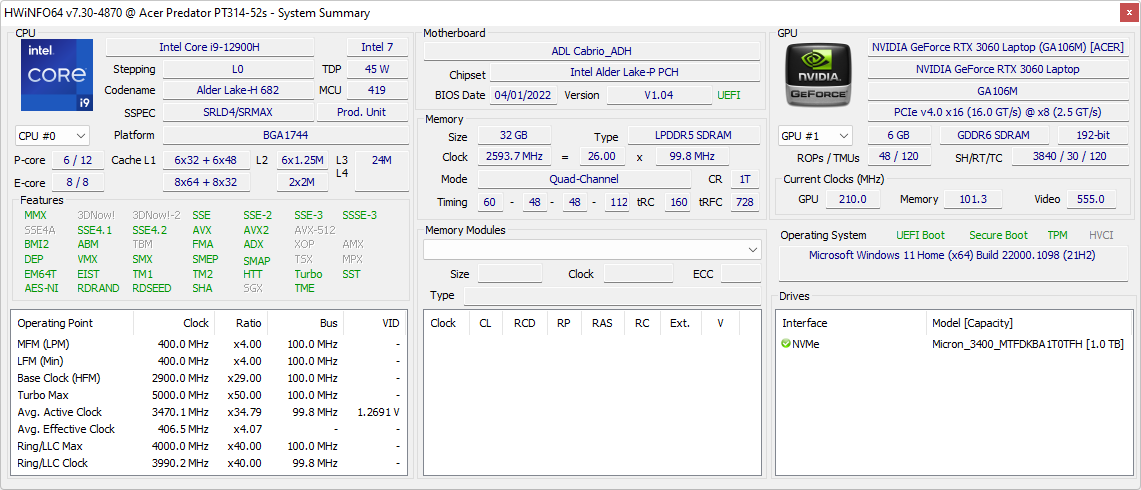
Condizioni di test
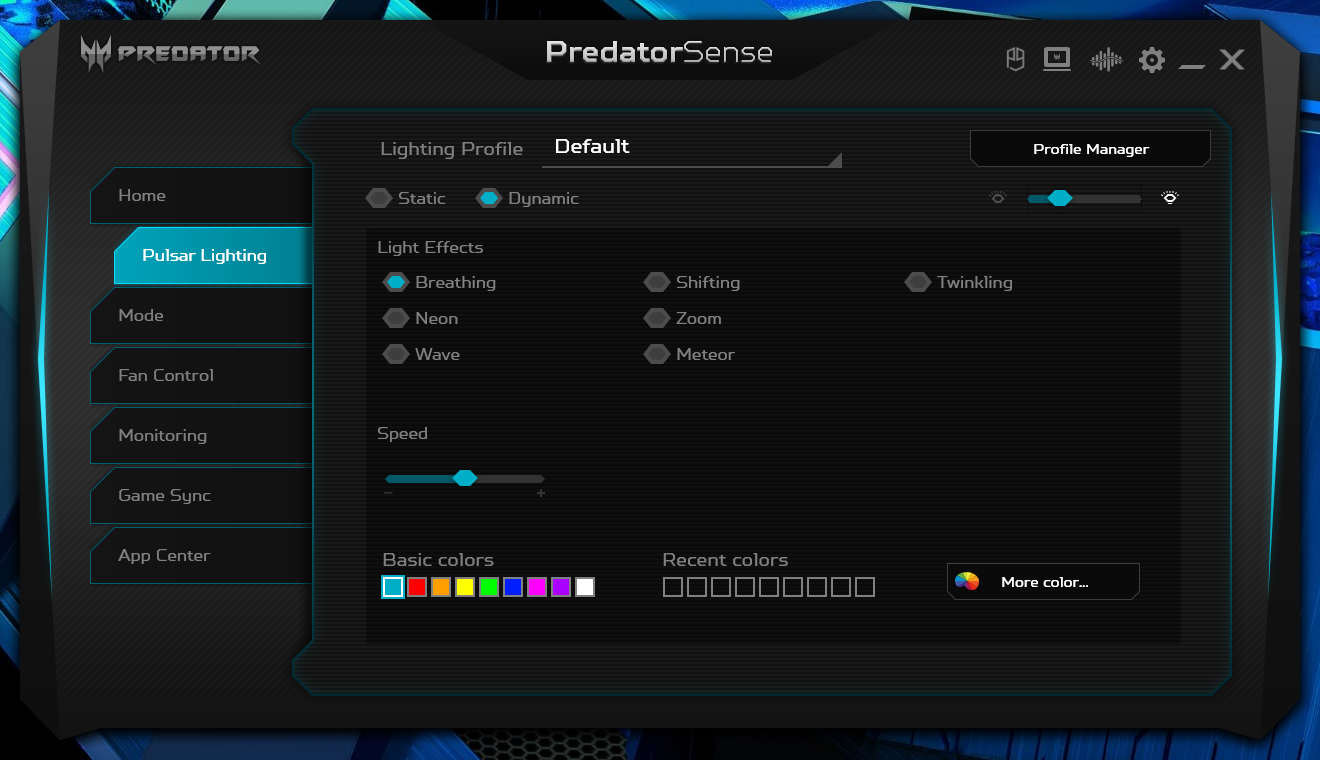
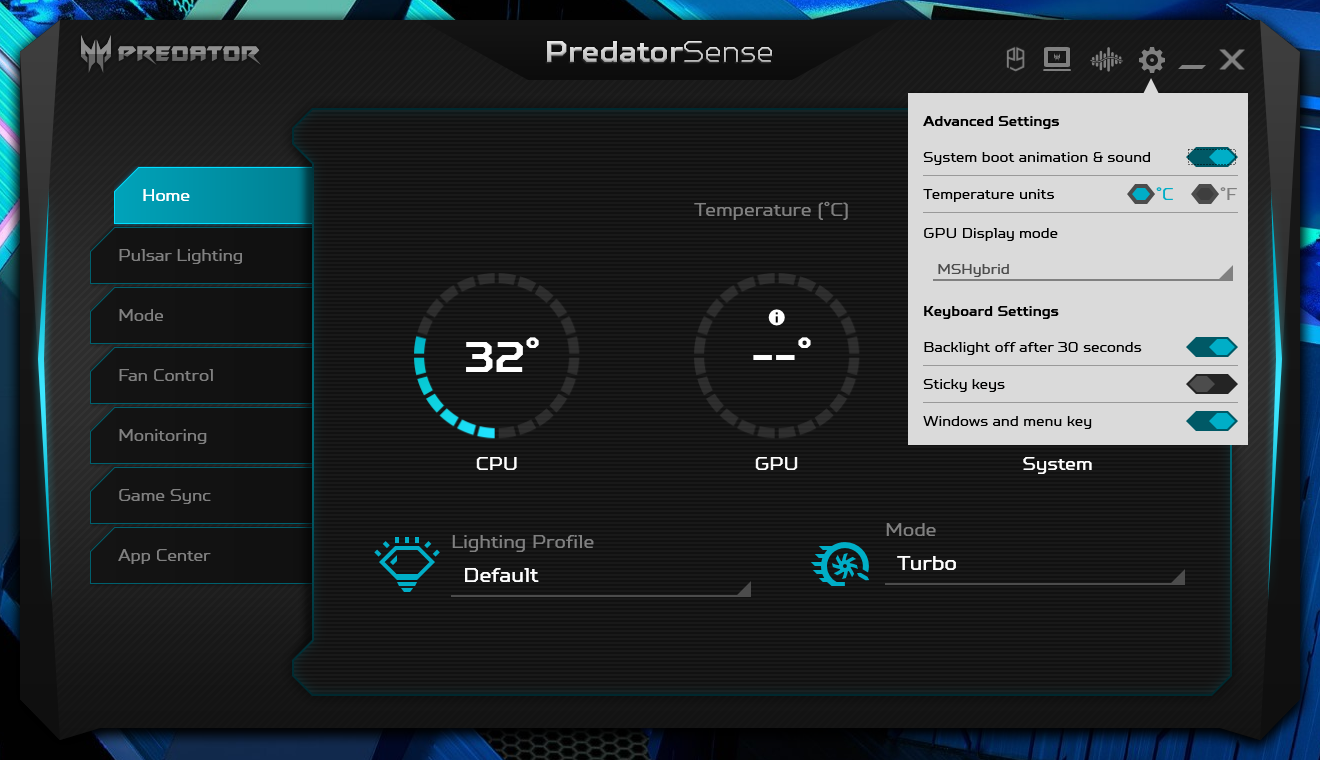
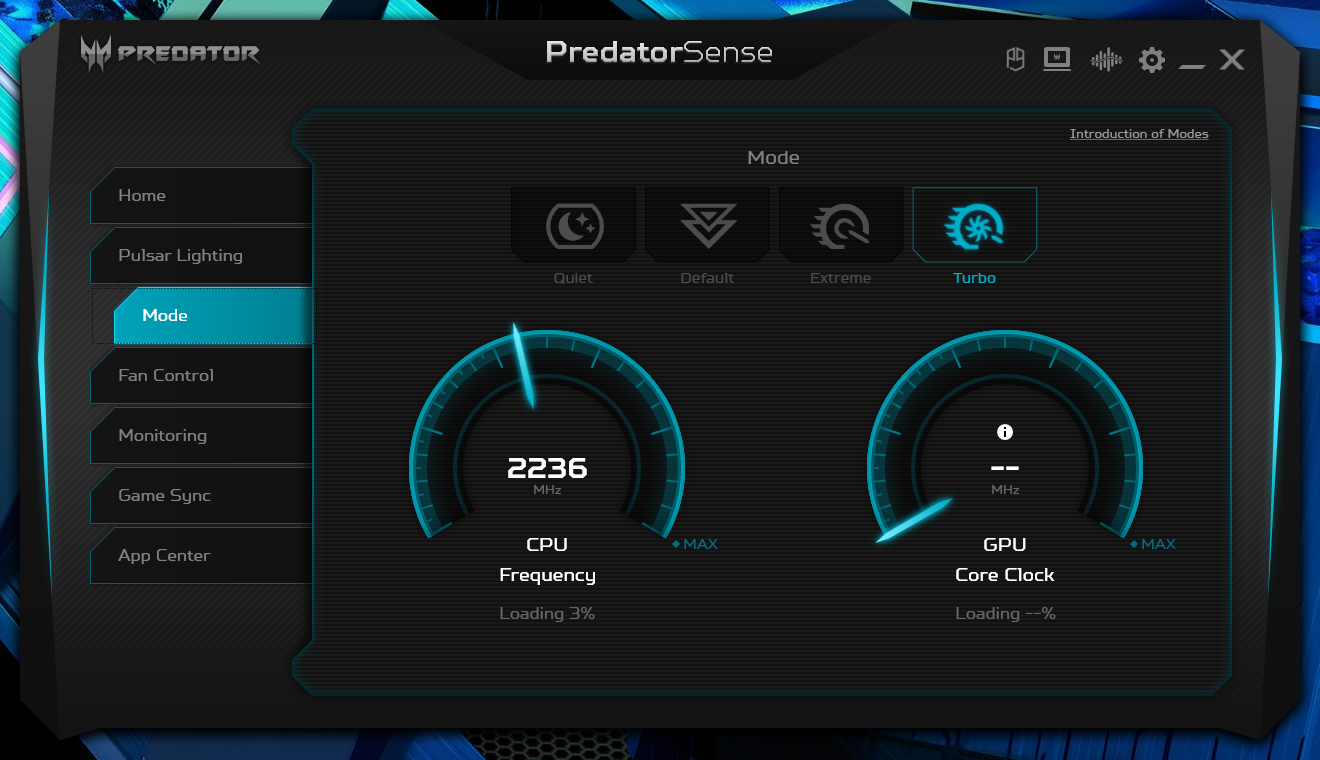
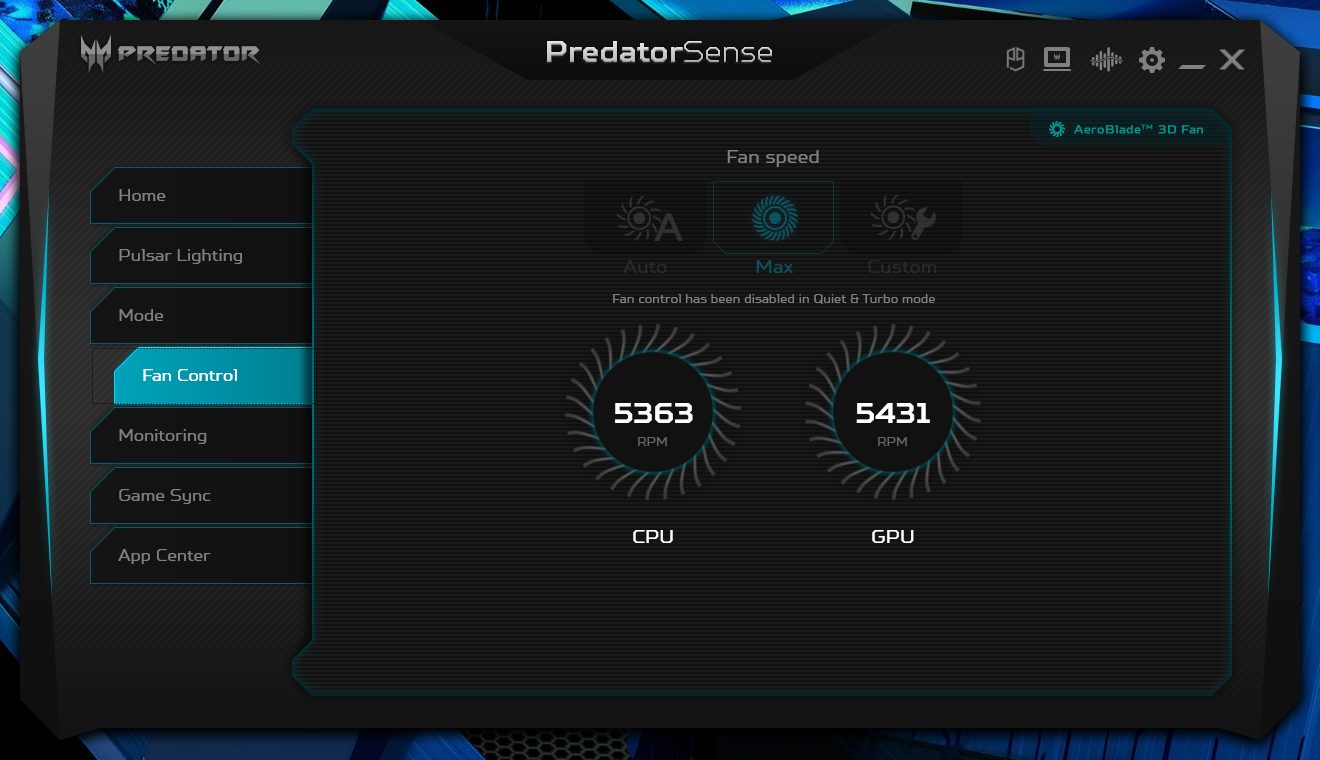
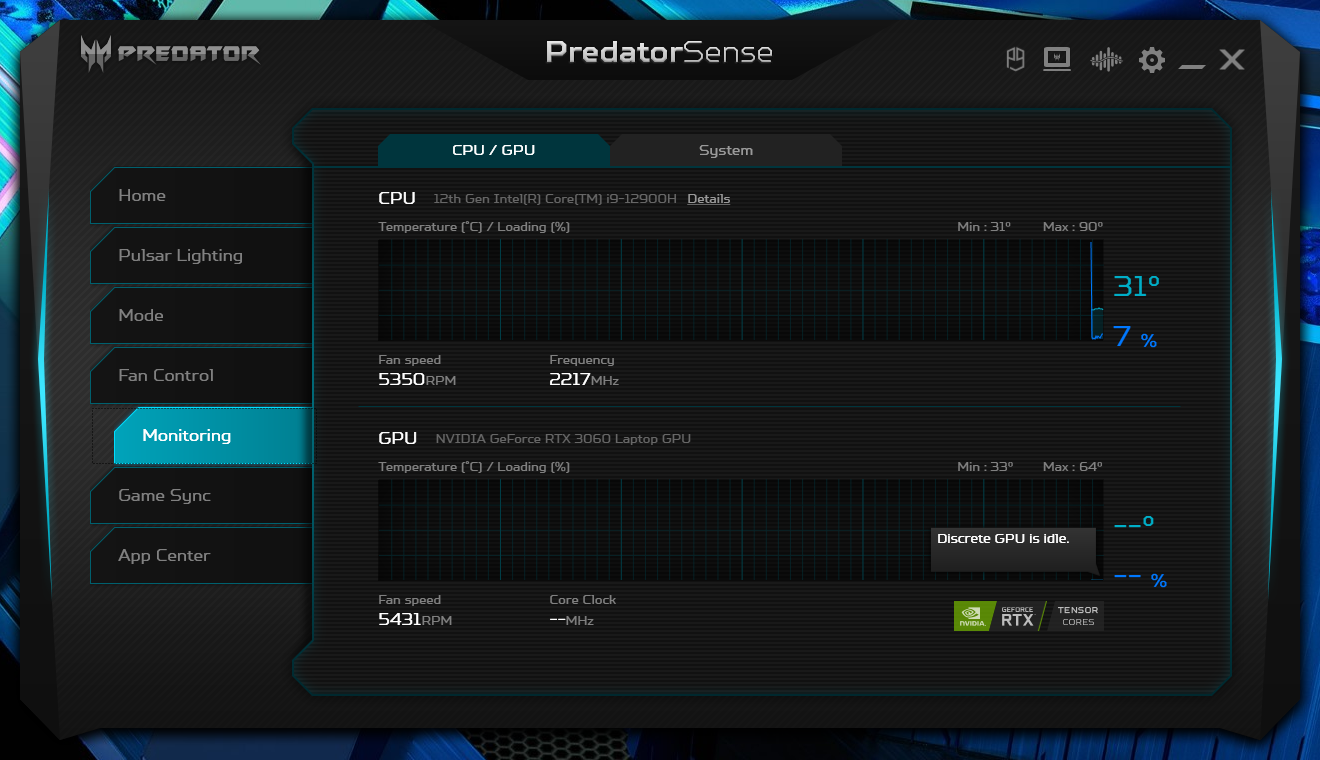
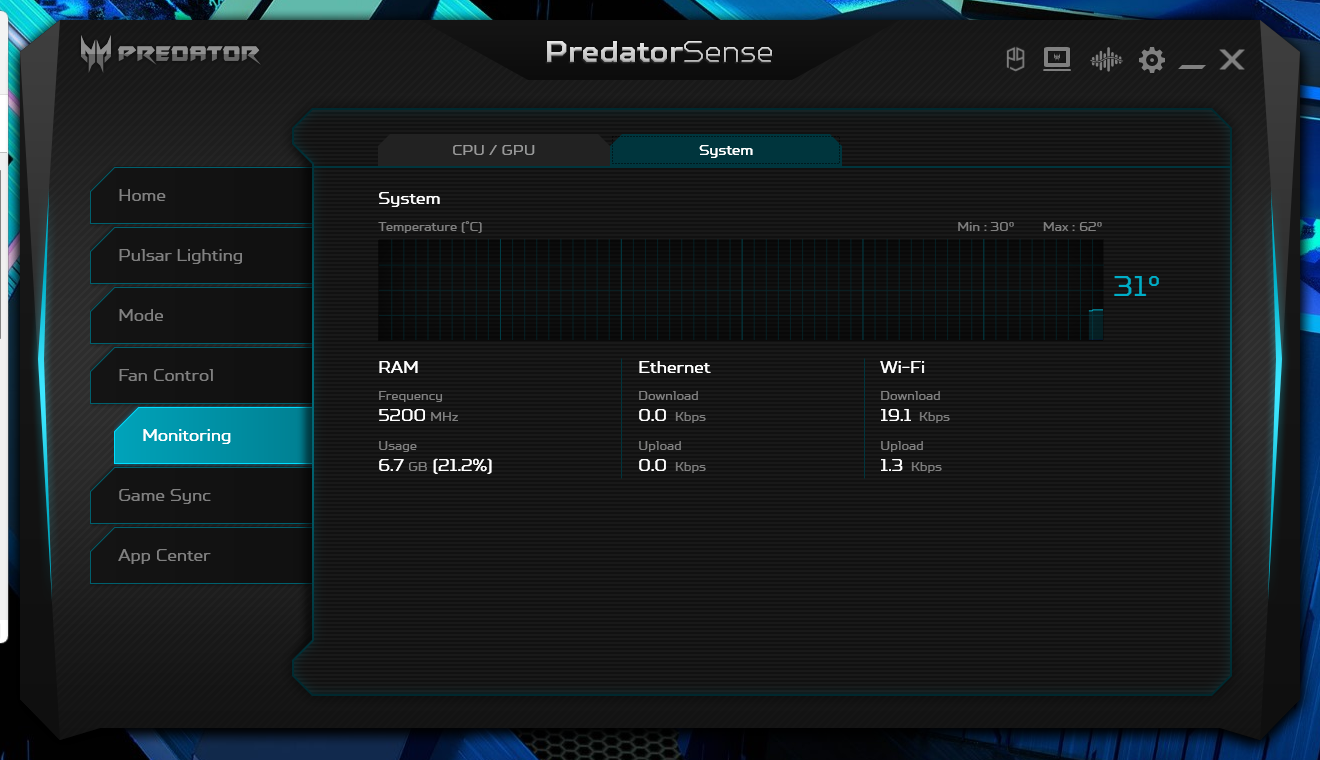
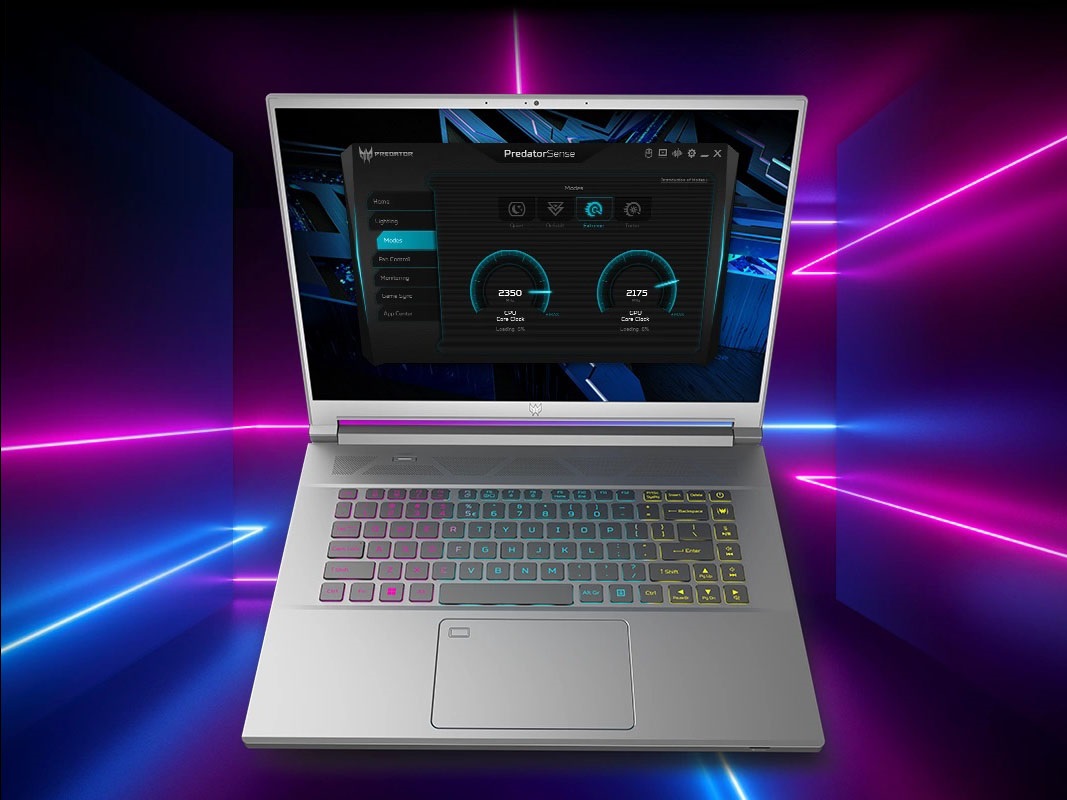
Abbiamo impostato la nostra unità in modalità "Migliori prestazioni" tramite Windows e in modalità "Turbo" tramite il software PredatorSense preinstallato prima di eseguire i benchmark qui sotto. Si raccomanda ai possessori di familiarizzare con PredatorSense, in quanto è l'hub di controllo principale per regolare la retroilluminazione della tastiera, le ventole, le impostazioni di avvio e altro ancora, come mostrano gli screenshot qui sotto
Purtroppo, il MUX è disponibile solo sulle SKU non OLED, come confermato da Acer. Se si cerca di uscire dalla modalità MSHybrid tramite PredatorSense, l'unità si blocca.
Processore
Le prestazioni della CPU sono tra le più veloci di qualsiasi portatile da gioco da 14 pollici. Per ottenere prestazioni significativamente più elevate, è necessario prendere in considerazione modelli più grandi, come l'MSI GE77 MSI GE77 con ilCore i9-12900HX. Anche in questo caso, il Core i9-12900H del nostro Acer da 14 pollici non è in grado di sostenere velocità di clock Turbo Boost molto elevate per periodi prolungati, come dimostra la sezione Stress Test che segue
Passando al Core i7-12700H Potrebbe comportare un deficit di prestazioni di appena l'1-2% in base al tempo trascorso con l'Alienware x14. I potenziali acquirenti potrebbero risparmiare qualche centinaio di dollari in questo modo e ricevere essenzialmente le stesse prestazioni del processore più costoso Core i9-12900H.
Cinebench R15 Multi Loop
Cinebench R23: Multi Core | Single Core
Cinebench R15: CPU Multi 64Bit | CPU Single 64Bit
Blender: v2.79 BMW27 CPU
7-Zip 18.03: 7z b 4 | 7z b 4 -mmt1
Geekbench 5.5: Multi-Core | Single-Core
HWBOT x265 Benchmark v2.2: 4k Preset
LibreOffice : 20 Documents To PDF
R Benchmark 2.5: Overall mean
| Cinebench R20 / CPU (Multi Core) | |
| MSI Raider GE77 HX 12UHS | |
| Acer Predator Triton 300 SE | |
| Alienware x14 i7 RTX 3060 | |
| Media Intel Core i9-12900H (2681 - 7471, n=28) | |
| Lenovo IdeaPad Gaming 3 15IAH7 | |
| Razer Blade 14 Ryzen 9 6900HX | |
| Acer Nitro 5 AN515-46-R1A1 | |
| Razer Blade 14 Ryzen 9 RTX 3070 | |
| Asus ROG Zephyrus G14 GA402RJ | |
| Asus ZenBook 14X UM5401QA-KN162 | |
| Lenovo Legion 5 Pro 16 ARH7H-82RG0047GE | |
| Schenker Vision 14 | |
| Cinebench R20 / CPU (Single Core) | |
| MSI Raider GE77 HX 12UHS | |
| Acer Predator Triton 300 SE | |
| Media Intel Core i9-12900H (624 - 738, n=28) | |
| Alienware x14 i7 RTX 3060 | |
| Lenovo IdeaPad Gaming 3 15IAH7 | |
| Acer Nitro 5 AN515-46-R1A1 | |
| Razer Blade 14 Ryzen 9 6900HX | |
| Schenker Vision 14 | |
| Lenovo Legion 5 Pro 16 ARH7H-82RG0047GE | |
| Asus ROG Zephyrus G14 GA402RJ | |
| Asus ZenBook 14X UM5401QA-KN162 | |
| Razer Blade 14 Ryzen 9 RTX 3070 | |
| Cinebench R23 / Multi Core | |
| MSI Raider GE77 HX 12UHS | |
| Acer Predator Triton 300 SE | |
| Alienware x14 i7 RTX 3060 | |
| Media Intel Core i9-12900H (7359 - 19648, n=28) | |
| Lenovo IdeaPad Gaming 3 15IAH7 | |
| Razer Blade 14 Ryzen 9 6900HX | |
| Acer Nitro 5 AN515-46-R1A1 | |
| Razer Blade 14 Ryzen 9 RTX 3070 | |
| Asus ROG Zephyrus G14 GA402RJ | |
| Asus ZenBook 14X UM5401QA-KN162 | |
| Lenovo Legion 5 Pro 16 ARH7H-82RG0047GE | |
| Schenker Vision 14 | |
| Cinebench R23 / Single Core | |
| Acer Predator Triton 300 SE | |
| MSI Raider GE77 HX 12UHS | |
| Media Intel Core i9-12900H (1634 - 1930, n=28) | |
| Alienware x14 i7 RTX 3060 | |
| Lenovo IdeaPad Gaming 3 15IAH7 | |
| Acer Nitro 5 AN515-46-R1A1 | |
| Razer Blade 14 Ryzen 9 6900HX | |
| Schenker Vision 14 | |
| Lenovo Legion 5 Pro 16 ARH7H-82RG0047GE | |
| Asus ROG Zephyrus G14 GA402RJ | |
| Asus ZenBook 14X UM5401QA-KN162 | |
| Razer Blade 14 Ryzen 9 RTX 3070 | |
| Cinebench R15 / CPU Multi 64Bit | |
| MSI Raider GE77 HX 12UHS | |
| Alienware x14 i7 RTX 3060 | |
| Media Intel Core i9-12900H (1395 - 3077, n=28) | |
| Acer Predator Triton 300 SE | |
| Razer Blade 14 Ryzen 9 6900HX | |
| Lenovo IdeaPad Gaming 3 15IAH7 | |
| Acer Nitro 5 AN515-46-R1A1 | |
| Razer Blade 14 Ryzen 9 RTX 3070 | |
| Asus ROG Zephyrus G14 GA402RJ | |
| Asus ZenBook 14X UM5401QA-KN162 | |
| Lenovo Legion 5 Pro 16 ARH7H-82RG0047GE | |
| Schenker Vision 14 | |
| Schenker Vision 14 | |
| Cinebench R15 / CPU Single 64Bit | |
| MSI Raider GE77 HX 12UHS | |
| Acer Predator Triton 300 SE | |
| Media Intel Core i9-12900H (235 - 277, n=29) | |
| Alienware x14 i7 RTX 3060 | |
| Acer Nitro 5 AN515-46-R1A1 | |
| Lenovo IdeaPad Gaming 3 15IAH7 | |
| Razer Blade 14 Ryzen 9 6900HX | |
| Lenovo Legion 5 Pro 16 ARH7H-82RG0047GE | |
| Asus ROG Zephyrus G14 GA402RJ | |
| Schenker Vision 14 | |
| Asus ZenBook 14X UM5401QA-KN162 | |
| Razer Blade 14 Ryzen 9 RTX 3070 | |
| Blender / v2.79 BMW27 CPU | |
| Schenker Vision 14 | |
| Lenovo Legion 5 Pro 16 ARH7H-82RG0047GE | |
| Asus ZenBook 14X UM5401QA-KN162 | |
| Asus ROG Zephyrus G14 GA402RJ | |
| Razer Blade 14 Ryzen 9 RTX 3070 | |
| Acer Nitro 5 AN515-46-R1A1 | |
| Media Intel Core i9-12900H (160 - 451, n=28) | |
| Alienware x14 i7 RTX 3060 | |
| Lenovo IdeaPad Gaming 3 15IAH7 | |
| Razer Blade 14 Ryzen 9 6900HX | |
| Acer Predator Triton 300 SE | |
| MSI Raider GE77 HX 12UHS | |
| 7-Zip 18.03 / 7z b 4 | |
| MSI Raider GE77 HX 12UHS | |
| Alienware x14 i7 RTX 3060 | |
| Acer Predator Triton 300 SE | |
| Razer Blade 14 Ryzen 9 6900HX | |
| Acer Nitro 5 AN515-46-R1A1 | |
| Media Intel Core i9-12900H (34684 - 76677, n=28) | |
| Asus ROG Zephyrus G14 GA402RJ | |
| Asus ZenBook 14X UM5401QA-KN162 | |
| Razer Blade 14 Ryzen 9 RTX 3070 | |
| Lenovo Legion 5 Pro 16 ARH7H-82RG0047GE | |
| Lenovo IdeaPad Gaming 3 15IAH7 | |
| Schenker Vision 14 | |
| 7-Zip 18.03 / 7z b 4 -mmt1 | |
| MSI Raider GE77 HX 12UHS | |
| Media Intel Core i9-12900H (5302 - 6289, n=28) | |
| Razer Blade 14 Ryzen 9 6900HX | |
| Acer Nitro 5 AN515-46-R1A1 | |
| Alienware x14 i7 RTX 3060 | |
| Acer Predator Triton 300 SE | |
| Lenovo Legion 5 Pro 16 ARH7H-82RG0047GE | |
| Schenker Vision 14 | |
| Asus ROG Zephyrus G14 GA402RJ | |
| Lenovo IdeaPad Gaming 3 15IAH7 | |
| Asus ZenBook 14X UM5401QA-KN162 | |
| Razer Blade 14 Ryzen 9 RTX 3070 | |
| Geekbench 5.5 / Multi-Core | |
| MSI Raider GE77 HX 12UHS | |
| Alienware x14 i7 RTX 3060 | |
| Acer Predator Triton 300 SE | |
| Media Intel Core i9-12900H (8519 - 14376, n=31) | |
| Razer Blade 14 Ryzen 9 6900HX | |
| Acer Nitro 5 AN515-46-R1A1 | |
| Asus ROG Zephyrus G14 GA402RJ | |
| Asus ZenBook 14X UM5401QA-KN162 | |
| Lenovo IdeaPad Gaming 3 15IAH7 | |
| Lenovo Legion 5 Pro 16 ARH7H-82RG0047GE | |
| Schenker Vision 14 | |
| Geekbench 5.5 / Single-Core | |
| MSI Raider GE77 HX 12UHS | |
| Acer Predator Triton 300 SE | |
| Media Intel Core i9-12900H (1631 - 1897, n=31) | |
| Alienware x14 i7 RTX 3060 | |
| Lenovo IdeaPad Gaming 3 15IAH7 | |
| Schenker Vision 14 | |
| Razer Blade 14 Ryzen 9 6900HX | |
| Acer Nitro 5 AN515-46-R1A1 | |
| Asus ROG Zephyrus G14 GA402RJ | |
| Lenovo Legion 5 Pro 16 ARH7H-82RG0047GE | |
| Asus ZenBook 14X UM5401QA-KN162 | |
| HWBOT x265 Benchmark v2.2 / 4k Preset | |
| MSI Raider GE77 HX 12UHS | |
| Acer Predator Triton 300 SE | |
| Razer Blade 14 Ryzen 9 6900HX | |
| Alienware x14 i7 RTX 3060 | |
| Media Intel Core i9-12900H (8.05 - 22.5, n=28) | |
| Acer Nitro 5 AN515-46-R1A1 | |
| Lenovo IdeaPad Gaming 3 15IAH7 | |
| Razer Blade 14 Ryzen 9 RTX 3070 | |
| Asus ROG Zephyrus G14 GA402RJ | |
| Lenovo Legion 5 Pro 16 ARH7H-82RG0047GE | |
| Asus ZenBook 14X UM5401QA-KN162 | |
| Schenker Vision 14 | |
| LibreOffice / 20 Documents To PDF | |
| Lenovo Legion 5 Pro 16 ARH7H-82RG0047GE | |
| Razer Blade 14 Ryzen 9 RTX 3070 | |
| Asus ROG Zephyrus G14 GA402RJ | |
| Asus ZenBook 14X UM5401QA-KN162 | |
| Acer Nitro 5 AN515-46-R1A1 | |
| Razer Blade 14 Ryzen 9 6900HX | |
| Lenovo IdeaPad Gaming 3 15IAH7 | |
| Schenker Vision 14 | |
| MSI Raider GE77 HX 12UHS | |
| Media Intel Core i9-12900H (36.8 - 59.8, n=28) | |
| Acer Predator Triton 300 SE | |
| Alienware x14 i7 RTX 3060 | |
| R Benchmark 2.5 / Overall mean | |
| Razer Blade 14 Ryzen 9 RTX 3070 | |
| Schenker Vision 14 | |
| Asus ZenBook 14X UM5401QA-KN162 | |
| Asus ROG Zephyrus G14 GA402RJ | |
| Lenovo IdeaPad Gaming 3 15IAH7 | |
| Lenovo Legion 5 Pro 16 ARH7H-82RG0047GE | |
| Acer Nitro 5 AN515-46-R1A1 | |
| Razer Blade 14 Ryzen 9 6900HX | |
| Alienware x14 i7 RTX 3060 | |
| Media Intel Core i9-12900H (0.4218 - 0.506, n=28) | |
| Acer Predator Triton 300 SE | |
| MSI Raider GE77 HX 12UHS | |
* ... Meglio usare valori piccoli
AIDA64: FP32 Ray-Trace | FPU Julia | CPU SHA3 | CPU Queen | FPU SinJulia | FPU Mandel | CPU AES | CPU ZLib | FP64 Ray-Trace | CPU PhotoWorxx
| Performance rating | |
| Razer Blade 14 Ryzen 9 6900HX | |
| Acer Predator Triton 300 SE | |
| Asus ROG Zephyrus G14 GA402RJ | |
| Media Intel Core i9-12900H | |
| Dell Inspiron 14 Plus 7420 | |
| Alienware x14 i7 RTX 3060 | |
| Schenker Vision 14 | |
| AIDA64 / FP32 Ray-Trace | |
| Razer Blade 14 Ryzen 9 6900HX | |
| Acer Predator Triton 300 SE | |
| Asus ROG Zephyrus G14 GA402RJ | |
| Dell Inspiron 14 Plus 7420 | |
| Media Intel Core i9-12900H (4074 - 18289, n=29) | |
| Schenker Vision 14 | |
| Alienware x14 i7 RTX 3060 | |
| AIDA64 / FPU Julia | |
| Razer Blade 14 Ryzen 9 6900HX | |
| Asus ROG Zephyrus G14 GA402RJ | |
| Acer Predator Triton 300 SE | |
| Dell Inspiron 14 Plus 7420 | |
| Media Intel Core i9-12900H (22307 - 93236, n=29) | |
| Alienware x14 i7 RTX 3060 | |
| Schenker Vision 14 | |
| AIDA64 / CPU SHA3 | |
| Acer Predator Triton 300 SE | |
| Razer Blade 14 Ryzen 9 6900HX | |
| Media Intel Core i9-12900H (1378 - 4215, n=29) | |
| Asus ROG Zephyrus G14 GA402RJ | |
| Alienware x14 i7 RTX 3060 | |
| Dell Inspiron 14 Plus 7420 | |
| Schenker Vision 14 | |
| AIDA64 / CPU Queen | |
| Acer Predator Triton 300 SE | |
| Razer Blade 14 Ryzen 9 6900HX | |
| Asus ROG Zephyrus G14 GA402RJ | |
| Media Intel Core i9-12900H (78172 - 111241, n=28) | |
| Alienware x14 i7 RTX 3060 | |
| Dell Inspiron 14 Plus 7420 | |
| Schenker Vision 14 | |
| AIDA64 / FPU SinJulia | |
| Razer Blade 14 Ryzen 9 6900HX | |
| Asus ROG Zephyrus G14 GA402RJ | |
| Acer Predator Triton 300 SE | |
| Alienware x14 i7 RTX 3060 | |
| Media Intel Core i9-12900H (5709 - 10410, n=29) | |
| Dell Inspiron 14 Plus 7420 | |
| Schenker Vision 14 | |
| AIDA64 / FPU Mandel | |
| Razer Blade 14 Ryzen 9 6900HX | |
| Asus ROG Zephyrus G14 GA402RJ | |
| Acer Predator Triton 300 SE | |
| Dell Inspiron 14 Plus 7420 | |
| Media Intel Core i9-12900H (11257 - 45581, n=29) | |
| Alienware x14 i7 RTX 3060 | |
| Schenker Vision 14 | |
| AIDA64 / CPU AES | |
| Razer Blade 14 Ryzen 9 6900HX | |
| Acer Predator Triton 300 SE | |
| Asus ROG Zephyrus G14 GA402RJ | |
| Alienware x14 i7 RTX 3060 | |
| Media Intel Core i9-12900H (31935 - 151546, n=29) | |
| Schenker Vision 14 | |
| Dell Inspiron 14 Plus 7420 | |
| AIDA64 / CPU ZLib | |
| Acer Predator Triton 300 SE | |
| Alienware x14 i7 RTX 3060 | |
| Dell Inspiron 14 Plus 7420 | |
| Media Intel Core i9-12900H (449 - 1193, n=29) | |
| Razer Blade 14 Ryzen 9 6900HX | |
| Asus ROG Zephyrus G14 GA402RJ | |
| Schenker Vision 14 | |
| AIDA64 / FP64 Ray-Trace | |
| Razer Blade 14 Ryzen 9 6900HX | |
| Acer Predator Triton 300 SE | |
| Asus ROG Zephyrus G14 GA402RJ | |
| Dell Inspiron 14 Plus 7420 | |
| Media Intel Core i9-12900H (2235 - 10511, n=29) | |
| Alienware x14 i7 RTX 3060 | |
| Schenker Vision 14 | |
| AIDA64 / CPU PhotoWorxx | |
| Acer Predator Triton 300 SE | |
| Alienware x14 i7 RTX 3060 | |
| Media Intel Core i9-12900H (20960 - 48269, n=30) | |
| Dell Inspiron 14 Plus 7420 | |
| Razer Blade 14 Ryzen 9 6900HX | |
| Schenker Vision 14 | |
| Asus ROG Zephyrus G14 GA402RJ | |
Prestazioni del sistema
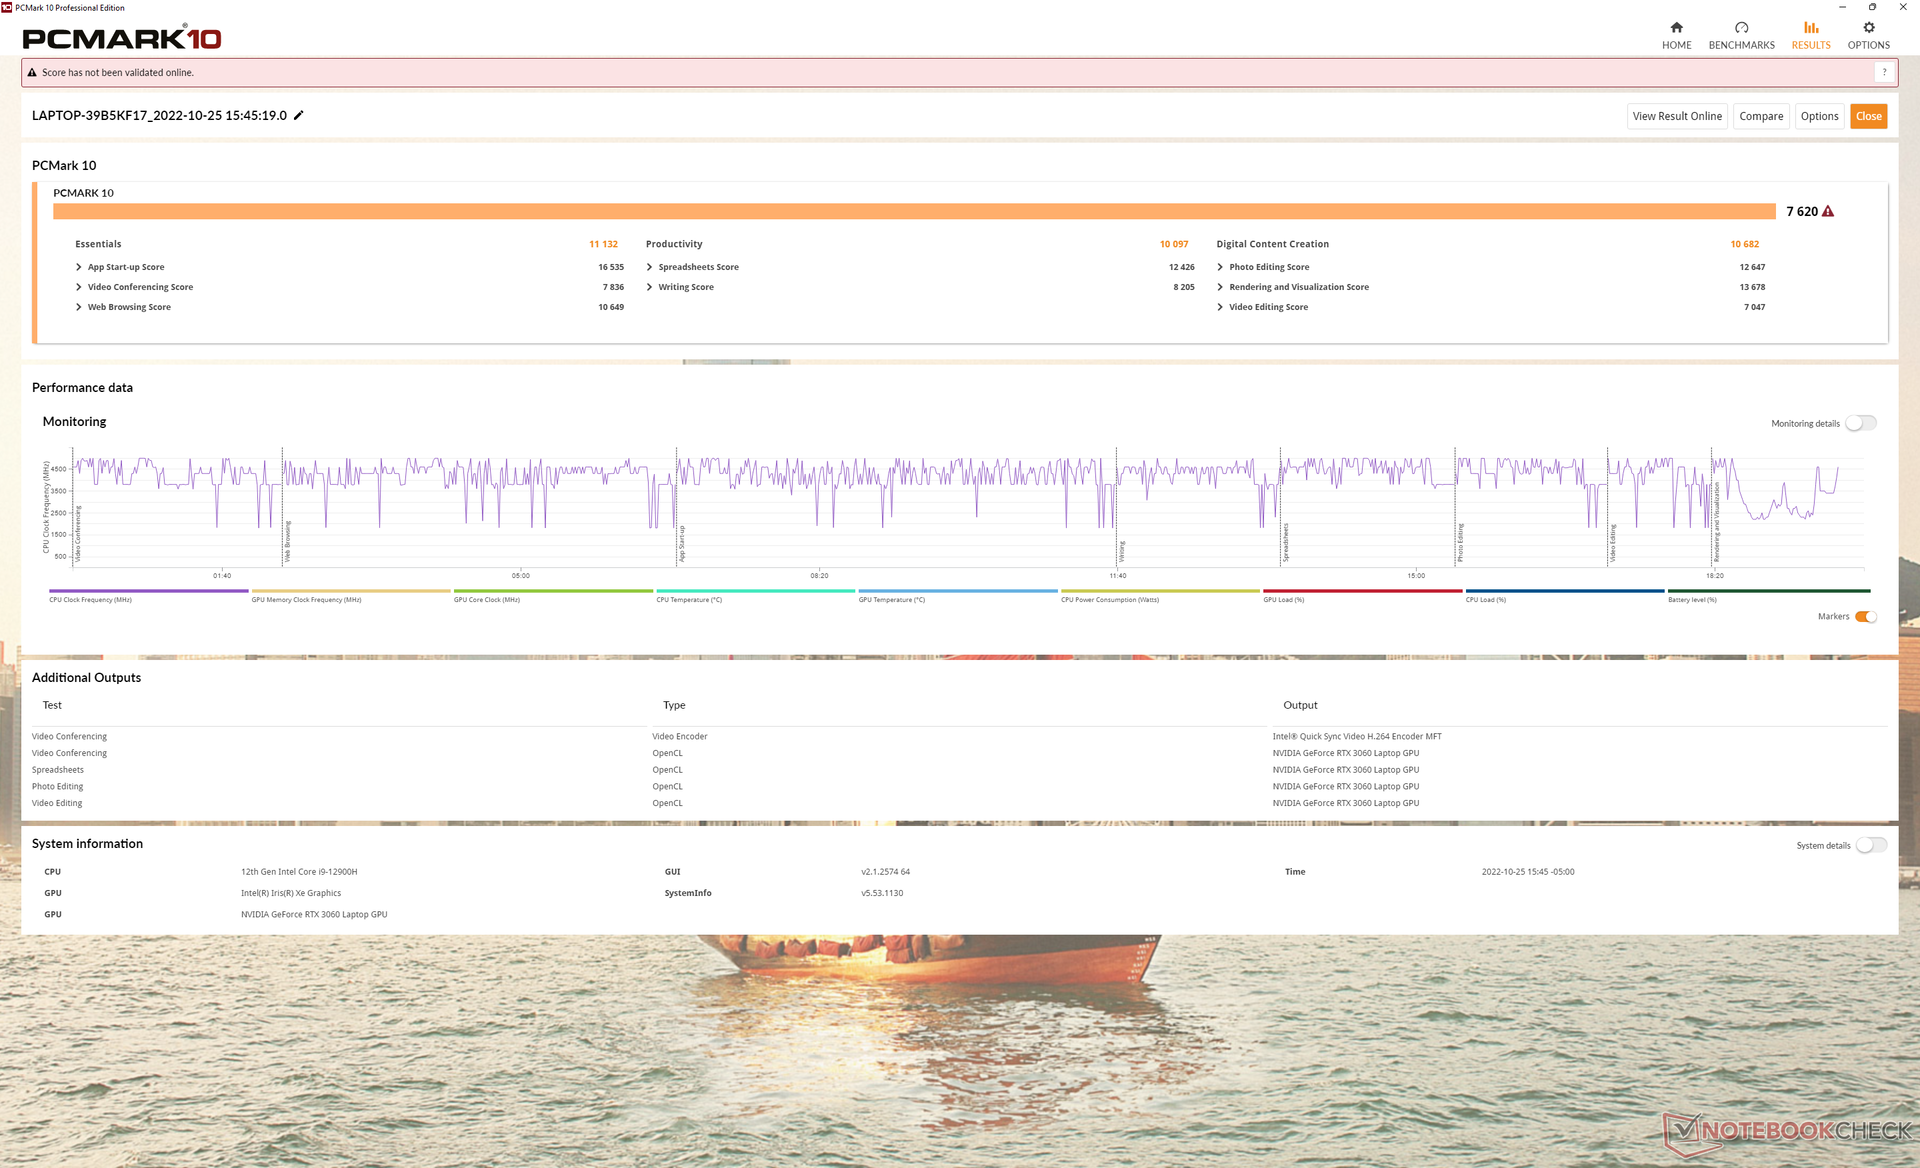
I risultati di PCMark sono quasi il 50% più veloci rispetto al Predator Triton 300 2020, dato che il modello precedente aveva un punteggio insolitamente basso nella creazione di contenuti digitali. I punteggi sono ora al punto giusto rispetto ad altri portatili da gioco con le più recenti CPU Zen 3+ o Core H di 12a generazione come ilDell G16.
CrossMark: Overall | Productivity | Creativity | Responsiveness
| CrossMark / Overall | |
| Acer Predator Triton 300 SE | |
| Alienware x14 i7 RTX 3060 | |
| Dell Inspiron 14 Plus 7420 | |
| Schenker Vision 14 | |
| CrossMark / Productivity | |
| Acer Predator Triton 300 SE | |
| Alienware x14 i7 RTX 3060 | |
| Dell Inspiron 14 Plus 7420 | |
| Schenker Vision 14 | |
| CrossMark / Creativity | |
| Acer Predator Triton 300 SE | |
| Alienware x14 i7 RTX 3060 | |
| Dell Inspiron 14 Plus 7420 | |
| Schenker Vision 14 | |
| CrossMark / Responsiveness | |
| Acer Predator Triton 300 SE | |
| Alienware x14 i7 RTX 3060 | |
| Schenker Vision 14 | |
| Dell Inspiron 14 Plus 7420 | |
| PCMark 10 Score | 7620 punti | |
Aiuto | ||
| AIDA64 / Memory Copy | |
| Alienware x14 i7 RTX 3060 | |
| Acer Predator Triton 300 SE | |
| Media Intel Core i9-12900H (34438 - 74264, n=29) | |
| Dell Inspiron 14 Plus 7420 | |
| Razer Blade 14 Ryzen 9 6900HX | |
| Asus ROG Zephyrus G14 GA402RJ | |
| Schenker Vision 14 | |
| AIDA64 / Memory Read | |
| Alienware x14 i7 RTX 3060 | |
| Acer Predator Triton 300 SE | |
| Dell Inspiron 14 Plus 7420 | |
| Media Intel Core i9-12900H (36365 - 74642, n=29) | |
| Razer Blade 14 Ryzen 9 6900HX | |
| Asus ROG Zephyrus G14 GA402RJ | |
| Schenker Vision 14 | |
| AIDA64 / Memory Write | |
| Alienware x14 i7 RTX 3060 | |
| Acer Predator Triton 300 SE | |
| Media Intel Core i9-12900H (32276 - 67858, n=29) | |
| Dell Inspiron 14 Plus 7420 | |
| Asus ROG Zephyrus G14 GA402RJ | |
| Razer Blade 14 Ryzen 9 6900HX | |
| Schenker Vision 14 | |
| AIDA64 / Memory Latency | |
| Dell Inspiron 14 Plus 7420 | |
| Alienware x14 i7 RTX 3060 | |
| Acer Predator Triton 300 SE | |
| Asus ROG Zephyrus G14 GA402RJ | |
| Media Intel Core i9-12900H (74.7 - 118.1, n=28) | |
| Razer Blade 14 Ryzen 9 6900HX | |
| Schenker Vision 14 | |
* ... Meglio usare valori piccoli
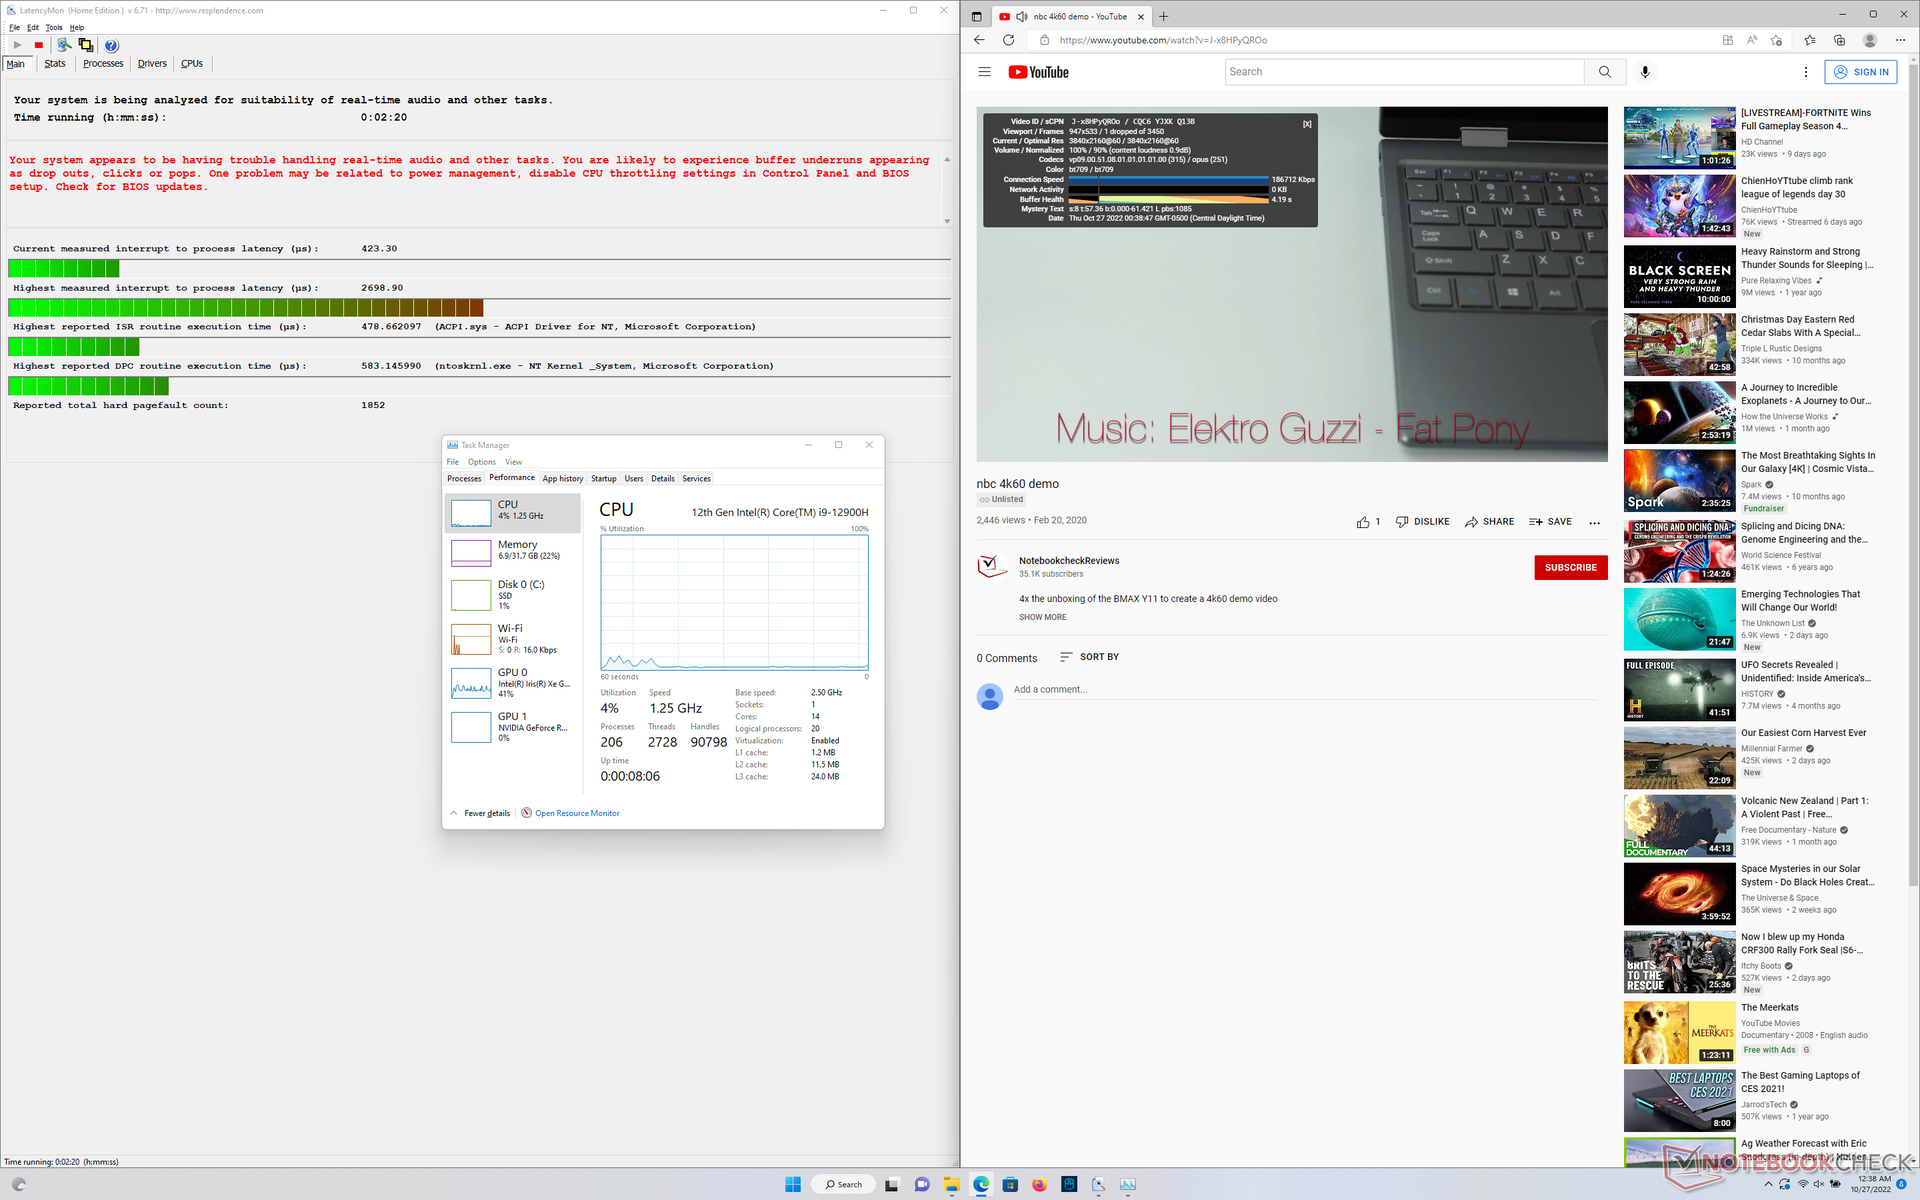
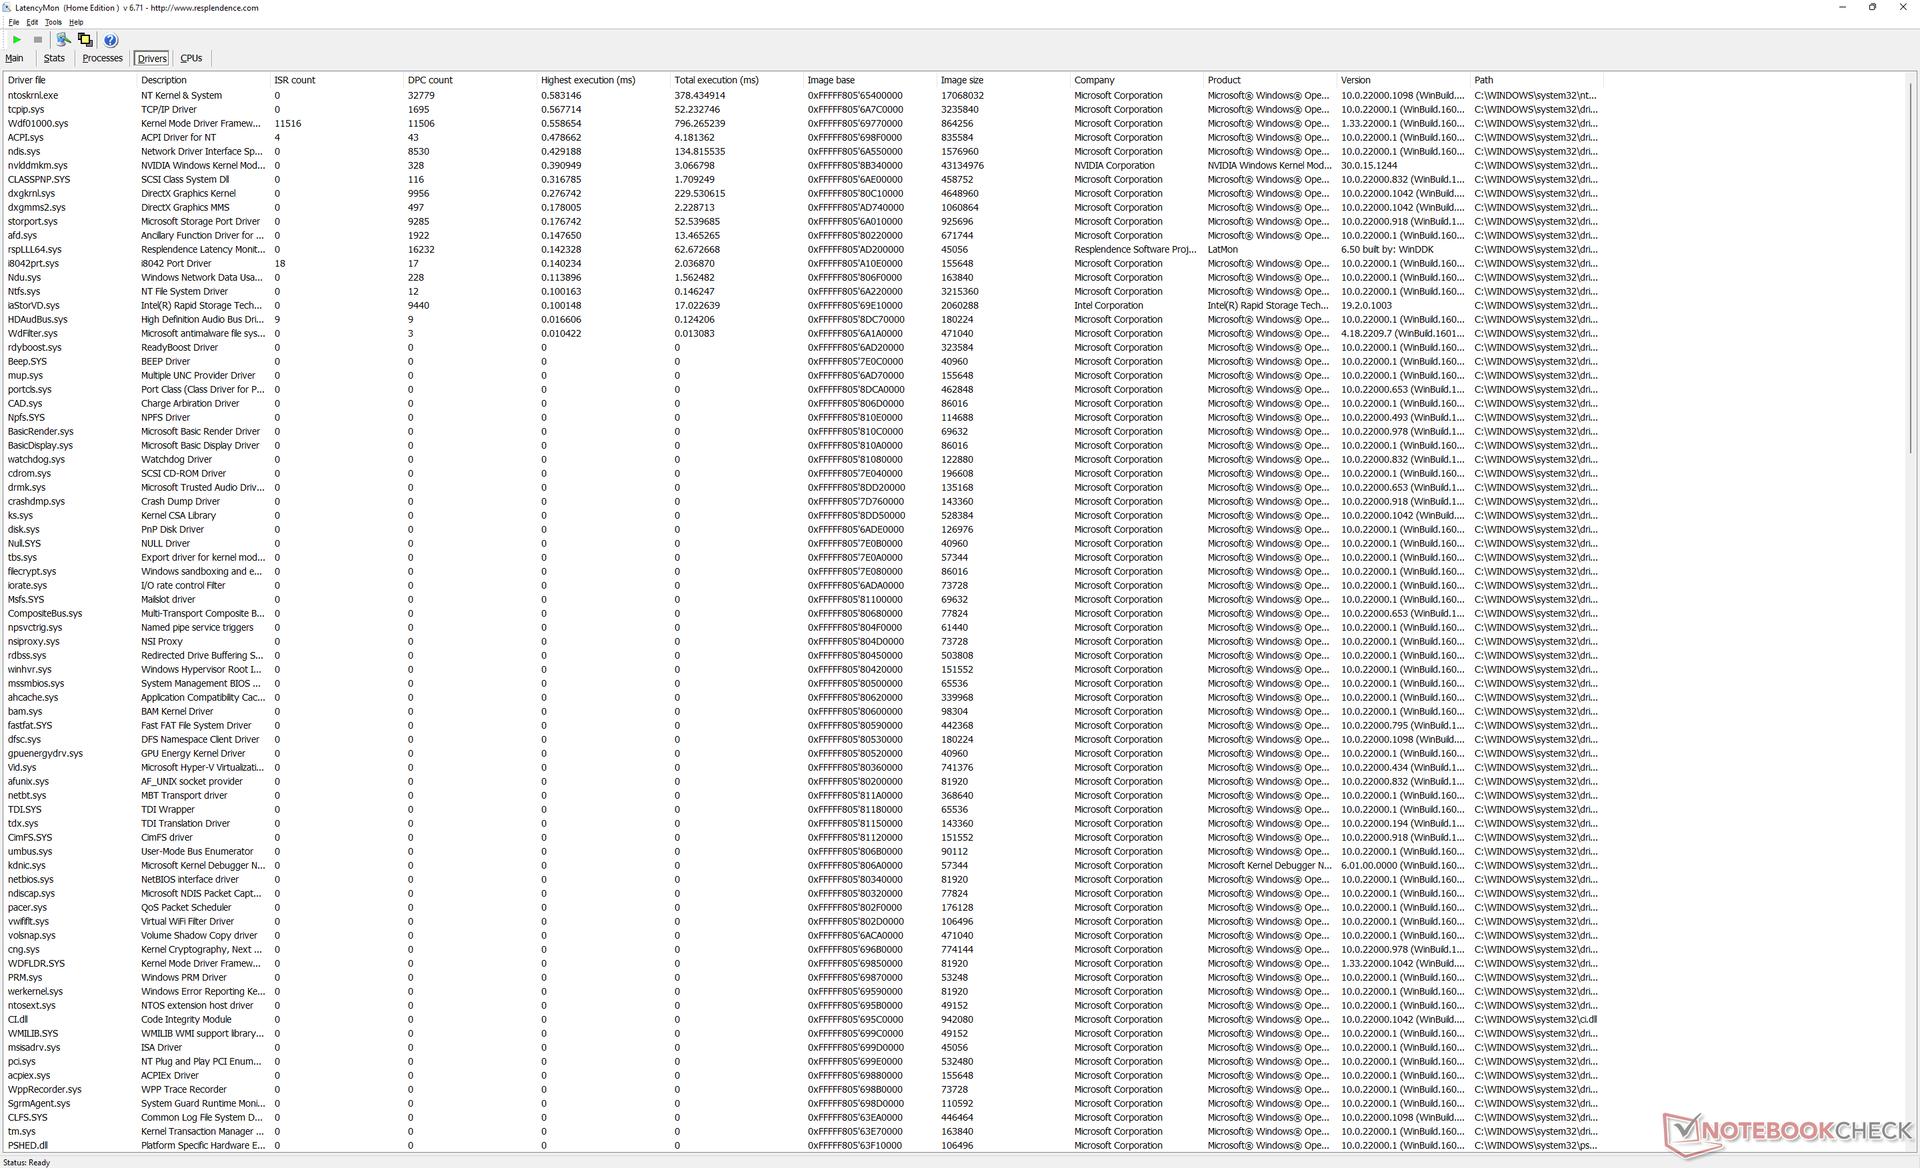
Latenza DPC
LatencyMon rivela problemi di DPC quando si aprono più schede del browser della nostra homepage. Il 2020 Predator Triton 300 soffrirebbe di problemi DPC simili e quindi è un po' deludente vedere questo problema non risolto. Al di là di questo, non si riscontrano grossi salti di fotogrammi durante la riproduzione di video 4K60.
| DPC Latencies / LatencyMon - interrupt to process latency (max), Web, Youtube, Prime95 | |
| Acer Predator Triton 300 SE | |
| Razer Blade 14 Ryzen 9 6900HX | |
| Alienware x14 i7 RTX 3060 | |
| Asus ROG Zephyrus G14 GA402RJ | |
| Schenker Vision 14 | |
| Dell Inspiron 14 Plus 7420 | |
* ... Meglio usare valori piccoli
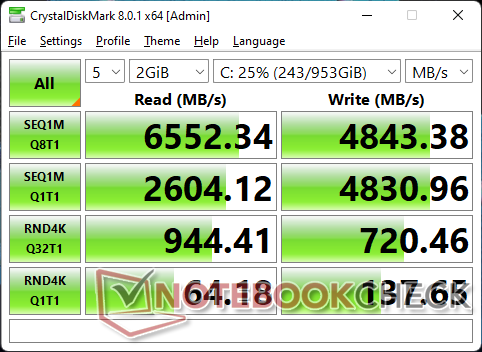
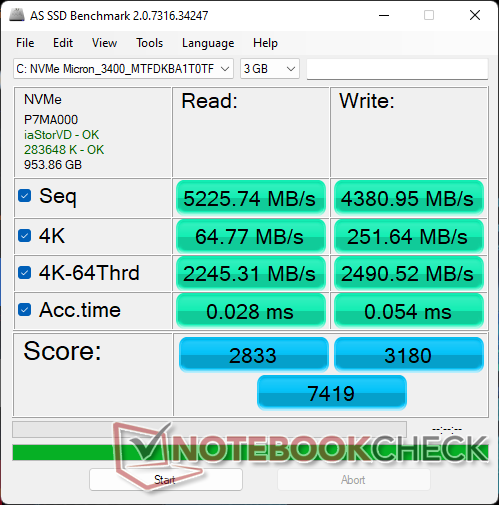
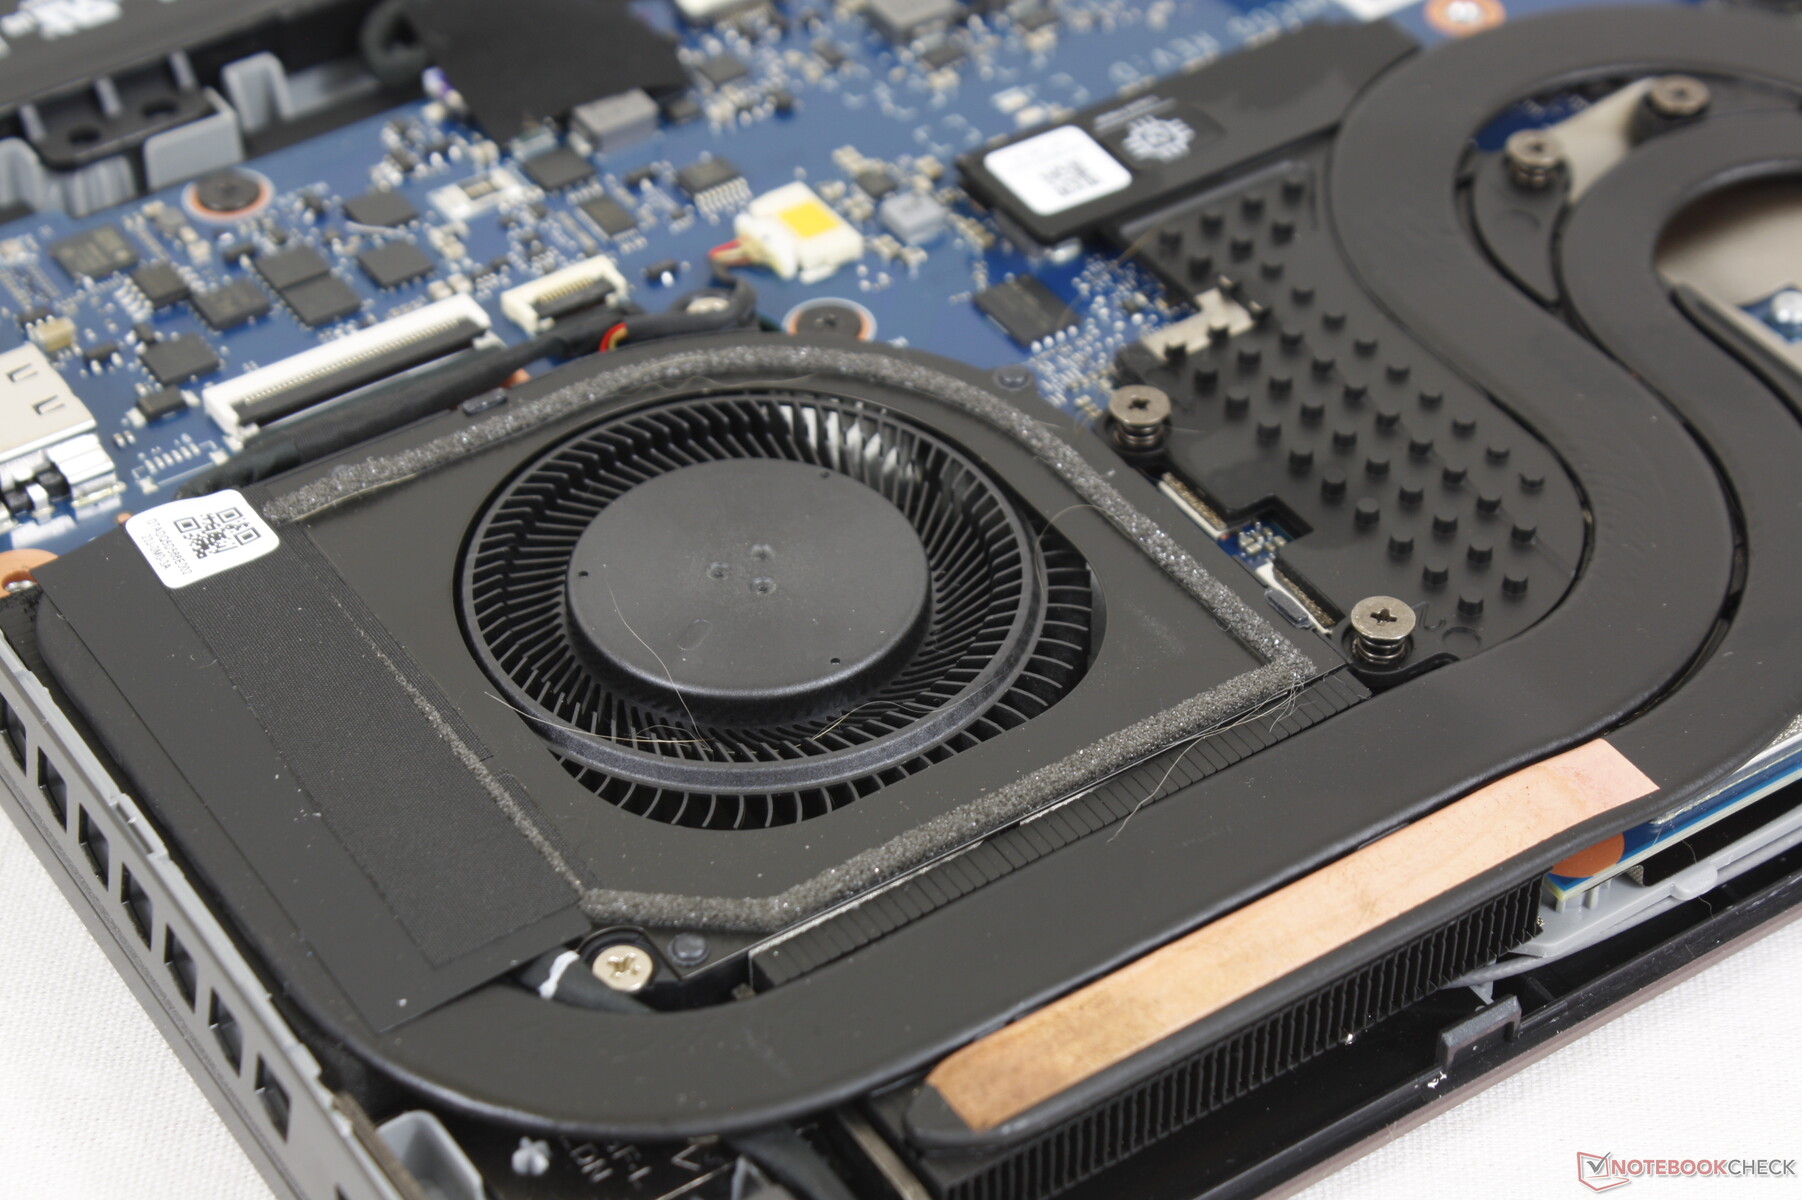
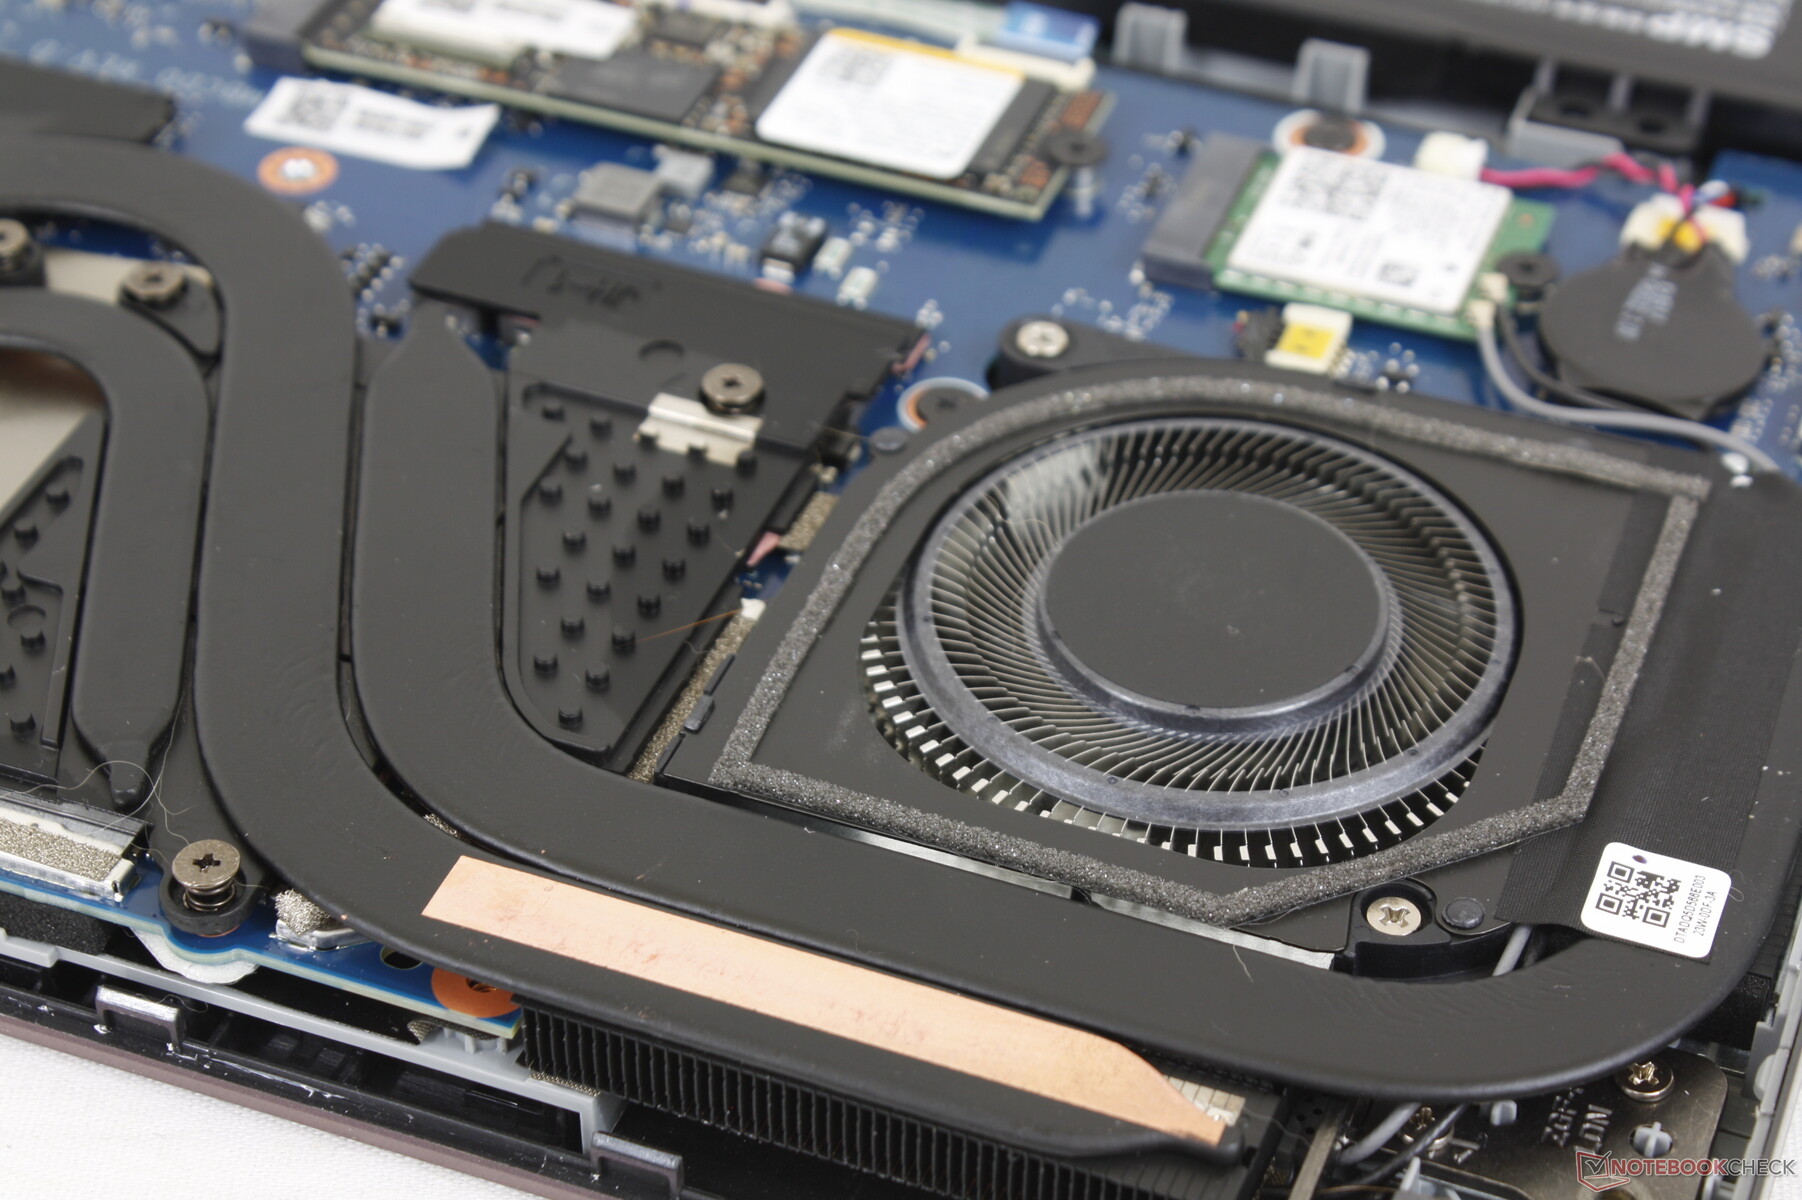
Dispositivi di stoccaggio - Non è incluso alcuno spargitore di calore
La nostra unità di prova è dotata di un 1 TB Micron 3400 PCIe4 NVMe per velocità di lettura e scrittura sequenziali fino a 6600 MB/s e 5000 MB/s, rispettivamente. Purtroppo, l'unità non è in grado di sostenere velocità così elevate per periodi prolungati, probabilmente a causa della mancanza di un diffusore di calore. I risultati del nostro ciclo DiskSpd, riportati di seguito, mostrano velocità di lettura fino a 6500 MB/s all'inizio del test, per poi scendere a soli 1700 MB/s o addirittura 400 MB/s col passare del tempo. Concorrenti come il Razer Blade 14 sono molto più bravi a sostenere velocità di trasferimento dell'SSD più elevate.

| Drive Performance rating - Percent | |
| Razer Blade 14 Ryzen 9 6900HX | |
| Schenker Vision 14 | |
| Acer Predator Triton 300 SE -11! | |
| Alienware x14 i7 RTX 3060 | |
| Asus ROG Zephyrus G14 GA402RJ | |
| Dell Inspiron 14 Plus 7420 | |
* ... Meglio usare valori piccoli
Disk Throttling: DiskSpd Read Loop, Queue Depth 8
Prestazioni della GPU - 95 W TGP
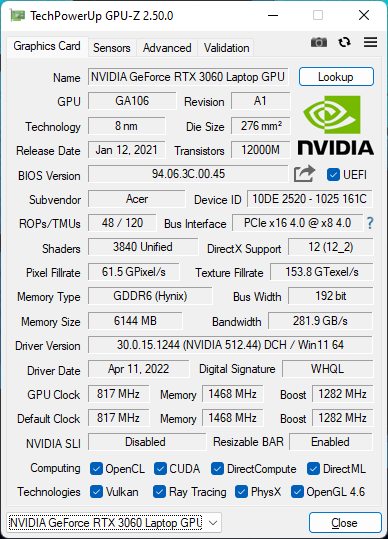
Le prestazioni grafiche sono comprese tra l'1 e il 2% della media dei laptop del nostro database dotati della stessa scheda RTX60 GeForce RTX 3060 Anche in modalità Turbo. Se la modalità Turbo è disattivata, le prestazioni diminuiscono di circa il 5-6% e risultano più lente della media. Pertanto, gli utenti devono far funzionare il Predator Triton 300 SE con l'impostazione più alta se vogliono ottenere il massimo dal portatile durante i giochi.
Le prestazioni complessive sono comunque superiori a quelle della vecchia RTX 2060 nel predator Triton 300 2020 di circa il 25-30%. La maggior parte dei giochi è stabile alle impostazioni massime di 1080p, ad eccezione dei titoli più impegnativi come Cyberpunk 2077. Le prestazioni iniziano a calare alla risoluzione nativa di 1800p e purtroppo non c'è il supporto G-Sync per alleviare il ritmo irregolare dei fotogrammi. Riteniamo che 1800p a impostazioni medie e medio-alte siano il punto di forza di questa macchina.
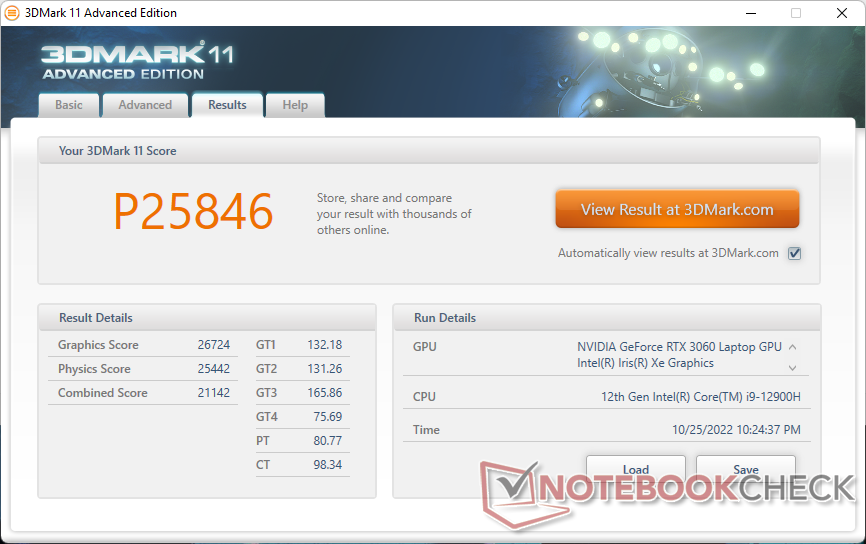

| 3DMark 11 Performance | 25846 punti | |
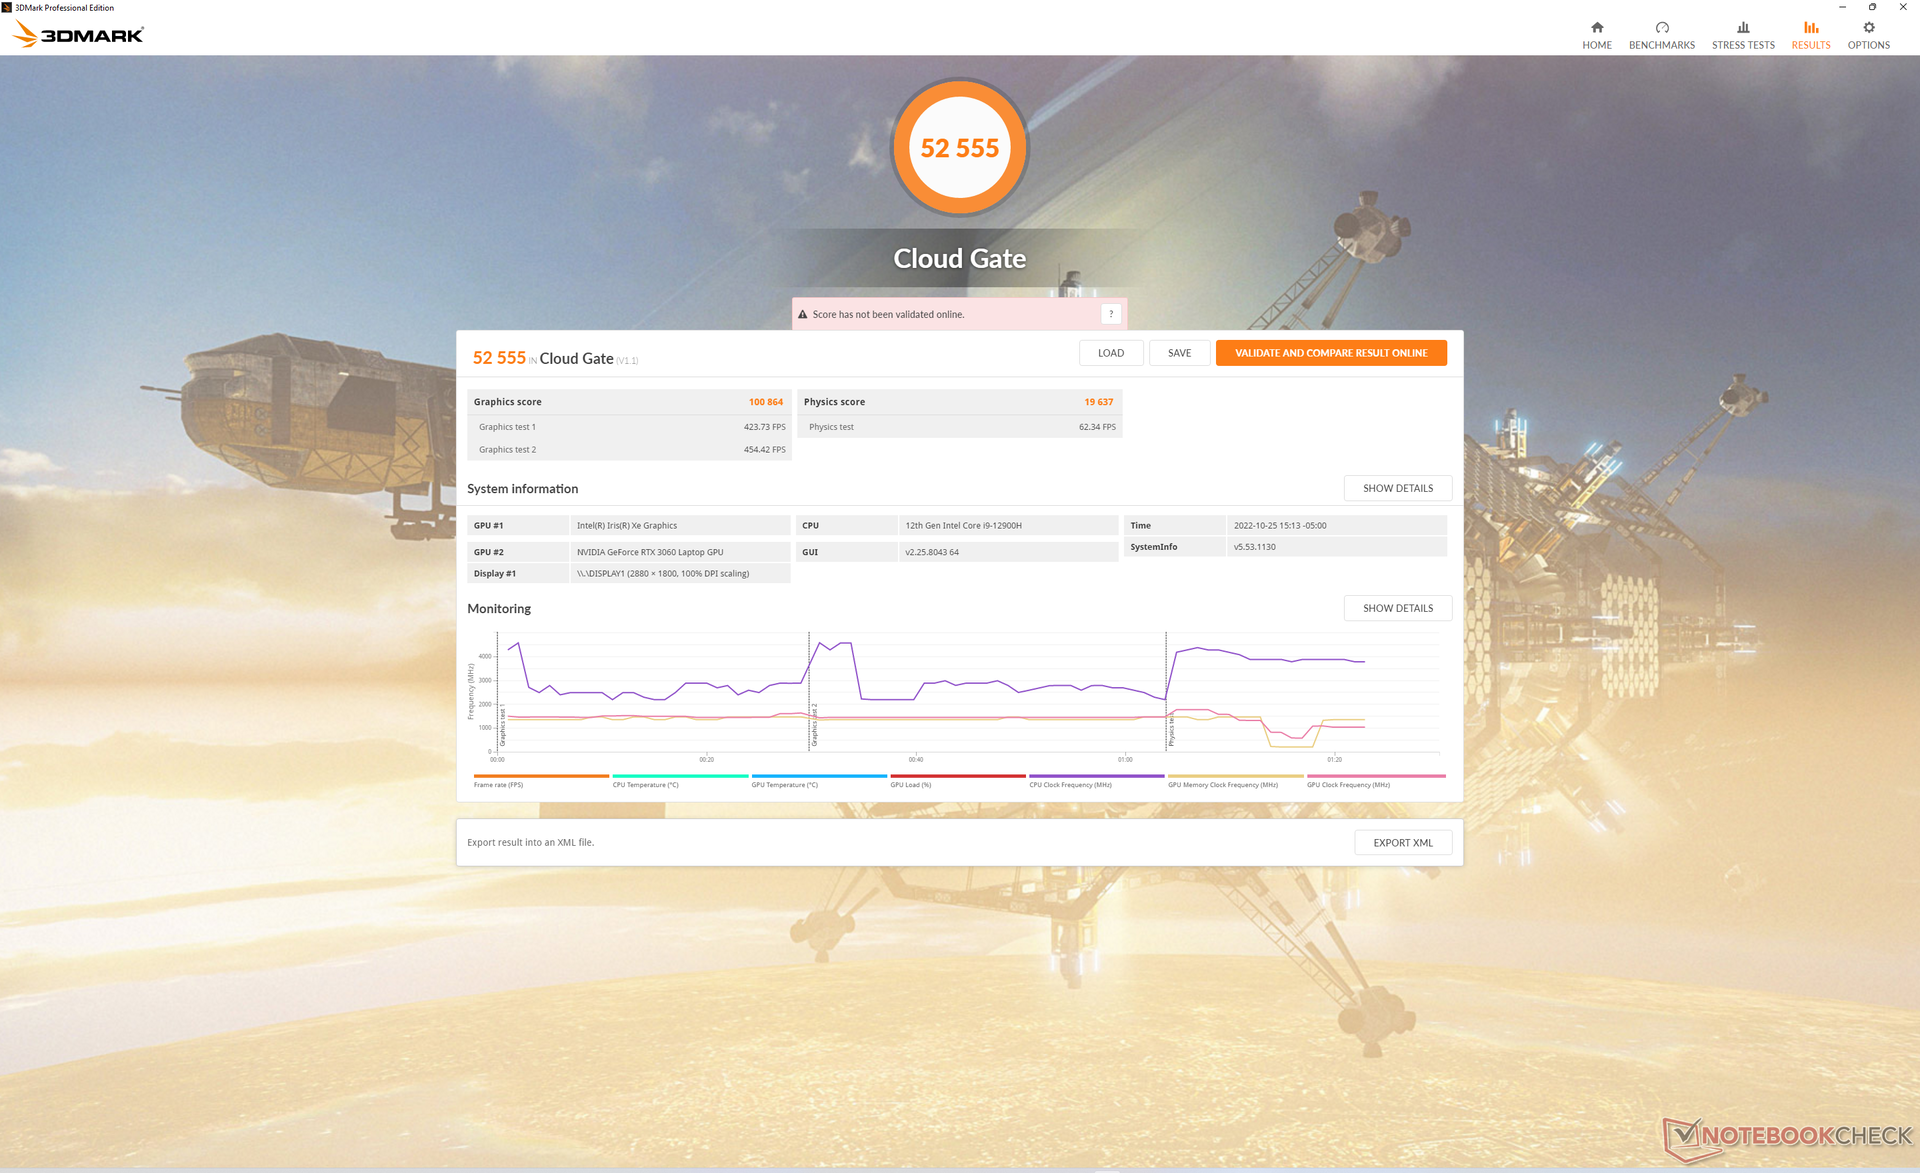
| 3DMark Cloud Gate Standard Score | 52555 punti | |
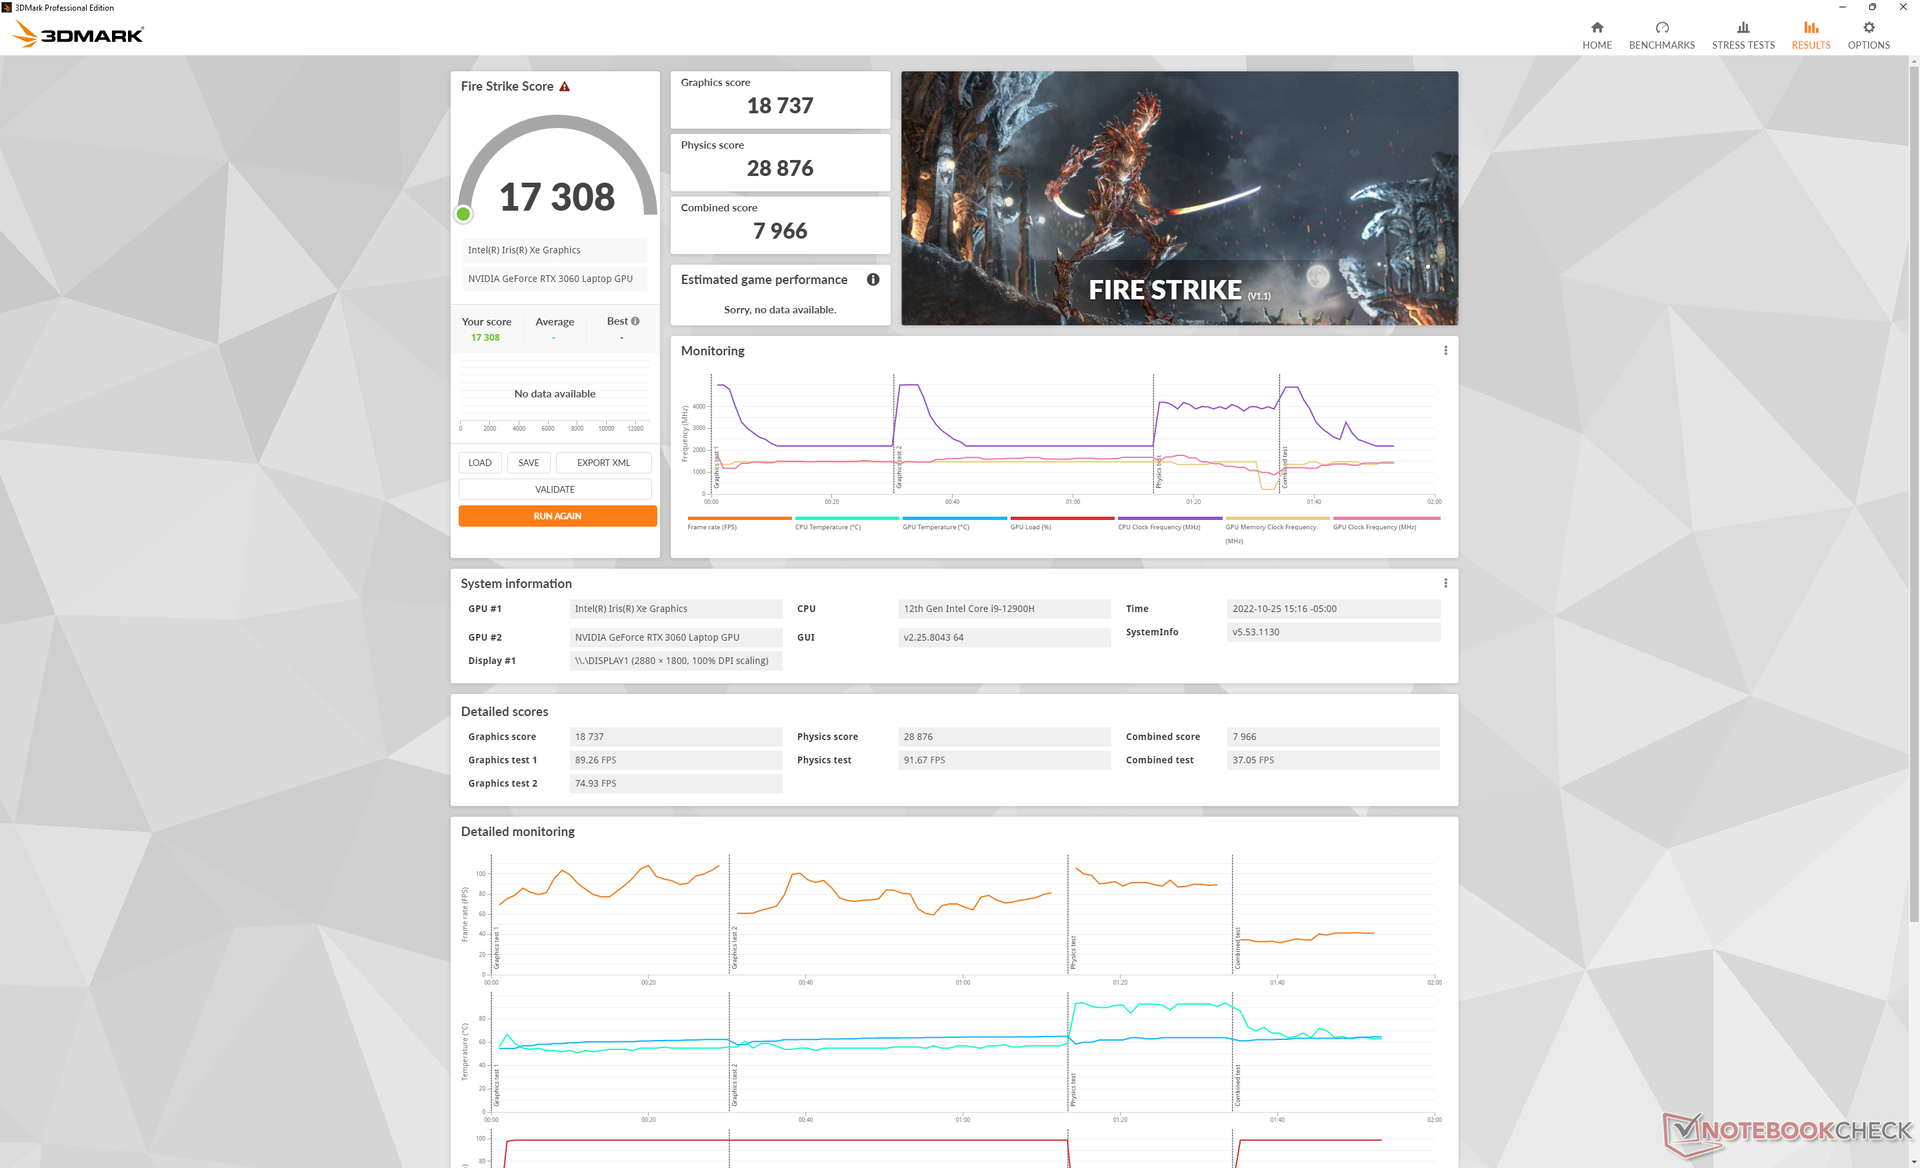
| 3DMark Fire Strike Score | 19053 punti | |
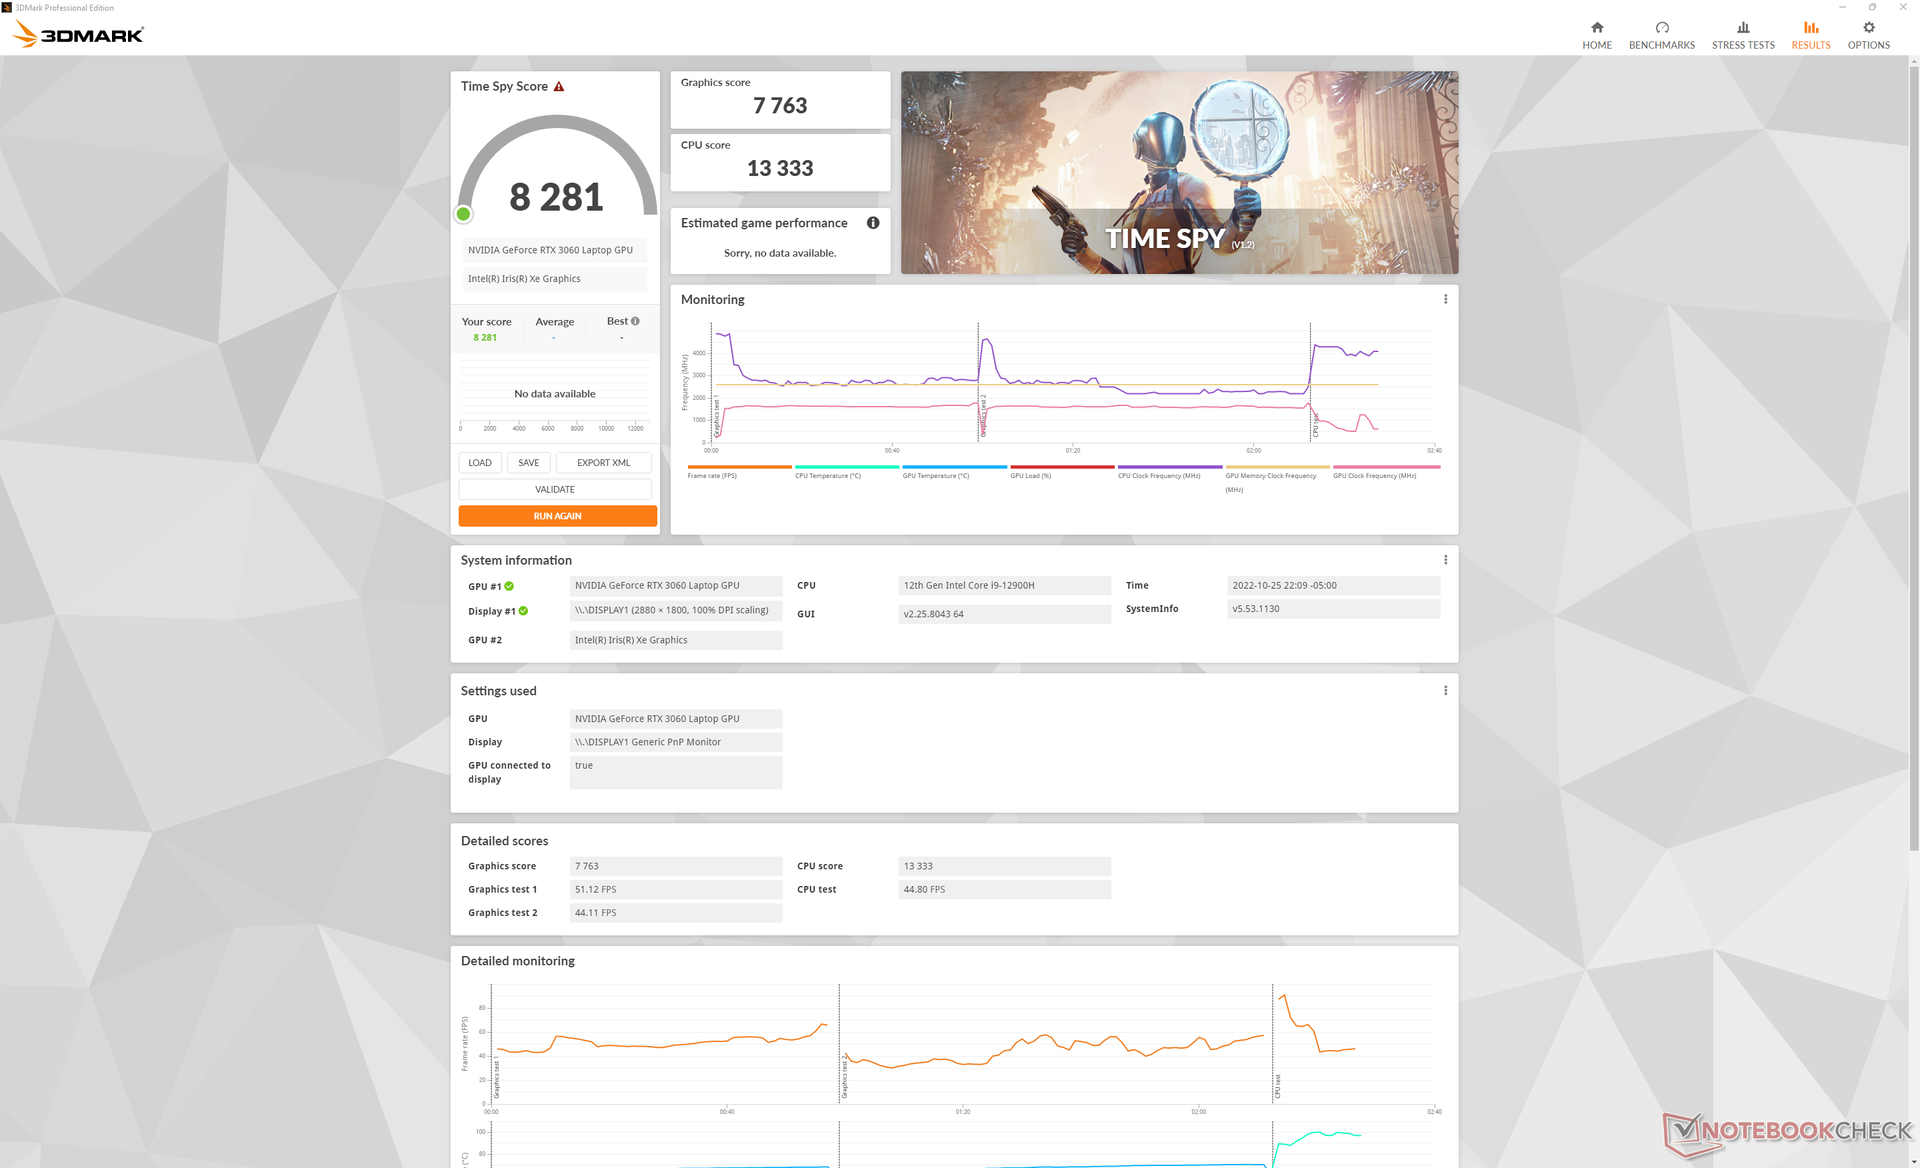
| 3DMark Time Spy Score | 8281 punti | |
Aiuto | ||
| Blender | |
| v3.3 Classroom OPTIX/RTX | |
| Dell Inspiron 14 Plus 7420 | |
| Acer Predator Triton 300 SE | |
| Media NVIDIA GeForce RTX 3060 Laptop GPU (30 - 56, n=15) | |
| v3.3 Classroom CUDA | |
| Dell Inspiron 14 Plus 7420 | |
| Acer Predator Triton 300 SE | |
| Media NVIDIA GeForce RTX 3060 Laptop GPU (51 - 89, n=15) | |
| v3.3 Classroom CPU | |
| Dell Inspiron 14 Plus 7420 | |
| Media NVIDIA GeForce RTX 3060 Laptop GPU (291 - 508, n=15) | |
| Acer Predator Triton 300 SE | |
* ... Meglio usare valori piccoli
Witcher 3 FPS Chart
| basso | medio | alto | ultra | QHD | |
|---|---|---|---|---|---|
| GTA V (2015) | 185.9 | 181.8 | 172.3 | 99.6 | 75.2 |
| The Witcher 3 (2015) | 341.1 | 230 | 145.6 | 75 | |
| Dota 2 Reborn (2015) | 185 | 169.2 | 162.1 | 153.6 | |
| Final Fantasy XV Benchmark (2018) | 176.4 | 105.1 | 79.1 | 60.5 | |
| X-Plane 11.11 (2018) | 141.8 | 126.1 | 101 | ||
| Strange Brigade (2018) | 389 | 196.7 | 157.8 | 138.6 | 100.8 |
| Cyberpunk 2077 1.6 (2022) | 109.8 | 71.9 | 70.4 | 57.7 | 36 |
Emissioni - Rumore durante il gioco
Rumore del sistema
Le modalità della ventola PredatorSense includono Quiet, Default e Turbo. Le ventole pulsano frequentemente se impostate su Default o su livelli più alti, per cui si consiglia di impostare il sistema su Quiet se si naviga sul web o si effettua lo streaming video. In caso contrario, la rumorosità della ventola può raggiungere i 34 dB(A) a fronte di uno sfondo silenzioso di 24 dB(A) quando si eseguono carichi non impegnativi.
La rumorosità della ventola varia notevolmente tra le impostazioni della modalità Default e Turbo. La rumorosità della ventola con Witcher 3 in modalità Default raggiunge i 47 dB(A) rispetto ai 60 dB(A) della modalità Turbo. 60 dB(A) sono significativamente più rumorosi rispetto alla maggior parte degli altri computer portatili, indipendentemente dalle dimensioni, come mostra la tabella sottostante. Come già detto, l'attivazione della modalità Turbo è obbligatoria per sfruttare appieno i 95 W della GPU TGP. Ciononostante, gli utenti potrebbero considerare di giocare in modalità Default per il rumore più silenzioso della ventola, anche se questo comporta un calo delle prestazioni del 5-6%.
Rumorosità
| Idle |
| 23.8 / 23.8 / 30.6 dB(A) |
| Sotto carico |
| 44.2 / 60 dB(A) |
 | ||
30 dB silenzioso 40 dB(A) udibile 50 dB(A) rumoroso |
||
min: | ||
| Acer Predator Triton 300 SE GeForce RTX 3060 Laptop GPU, i9-12900H, Micron 3400 1TB MTFDKBA1T0TFH | Asus ROG Zephyrus G14 GA402RJ Radeon RX 6700S, R7 6800HS, Micron 2450 1TB MTFDKBA1T0TFK | Razer Blade 14 Ryzen 9 6900HX GeForce RTX 3070 Ti Laptop GPU, R9 6900HX, Samsung PM9A1 MZVL21T0HCLR | Alienware x14 i7 RTX 3060 GeForce RTX 3060 Laptop GPU, i7-12700H, WDC PC SN810 1TB | Dell Inspiron 14 Plus 7420 GeForce RTX 3050 4GB Laptop GPU, i7-12700H, SK Hynix BC711 512GB HFM512GD3GX013N | Schenker Vision 14 GeForce RTX 3050 Ti Laptop GPU, i7-11370H, Samsung SSD 980 Pro 1TB MZ-V8P1T0BW | |
|---|---|---|---|---|---|---|
| Noise | 5% | 16% | 4% | 8% | 8% | |
| off /ambiente * (dB) | 23.8 | 25 -5% | 23.3 2% | 24.7 -4% | 23.2 3% | 24.3 -2% |
| Idle Minimum * (dB) | 23.8 | 25 -5% | 23.3 2% | 24.7 -4% | 23.2 3% | 24.3 -2% |
| Idle Average * (dB) | 23.8 | 26 -9% | 23.3 2% | 24.7 -4% | 23.2 3% | 24.3 -2% |
| Idle Maximum * (dB) | 30.6 | 29 5% | 23.3 24% | 30.9 -1% | 23.2 24% | 25.9 15% |
| Load Average * (dB) | 44.2 | 45 -2% | 34.7 21% | 40 10% | 47.5 -7% | 43.3 2% |
| Witcher 3 ultra * (dB) | 60.1 | 43 28% | 42.1 30% | 51.5 14% | 51.7 14% | 44.6 26% |
| Load Maximum * (dB) | 60 | 45 25% | 42.1 30% | 51.5 14% | 51.7 14% | 49.5 17% |
* ... Meglio usare valori piccoli
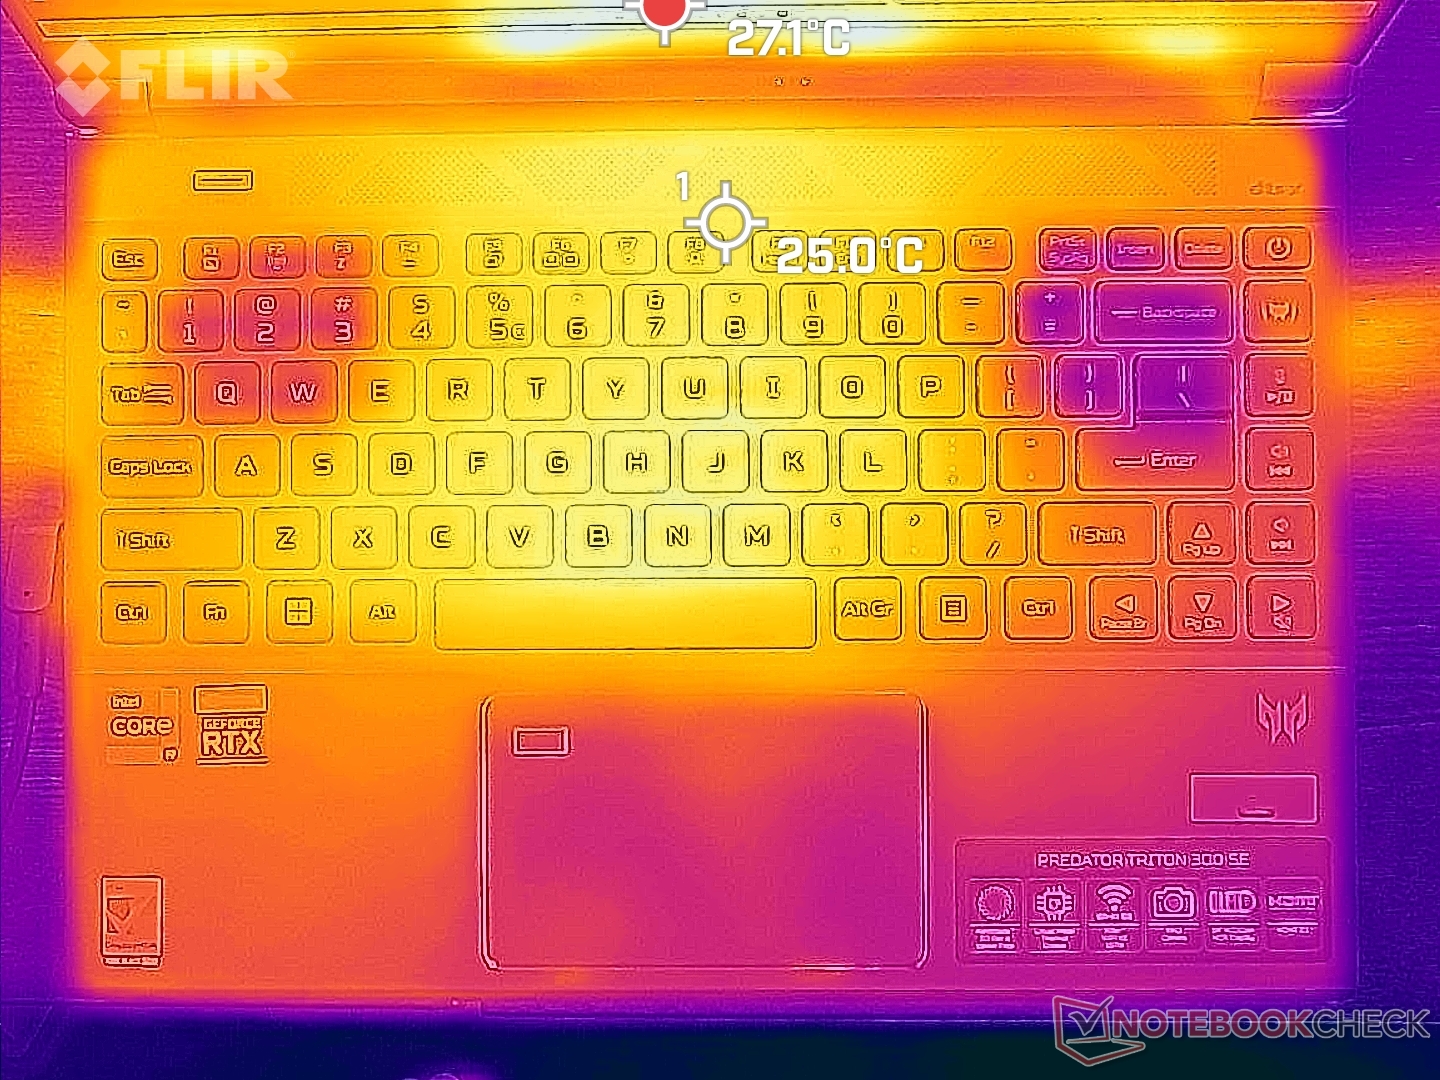
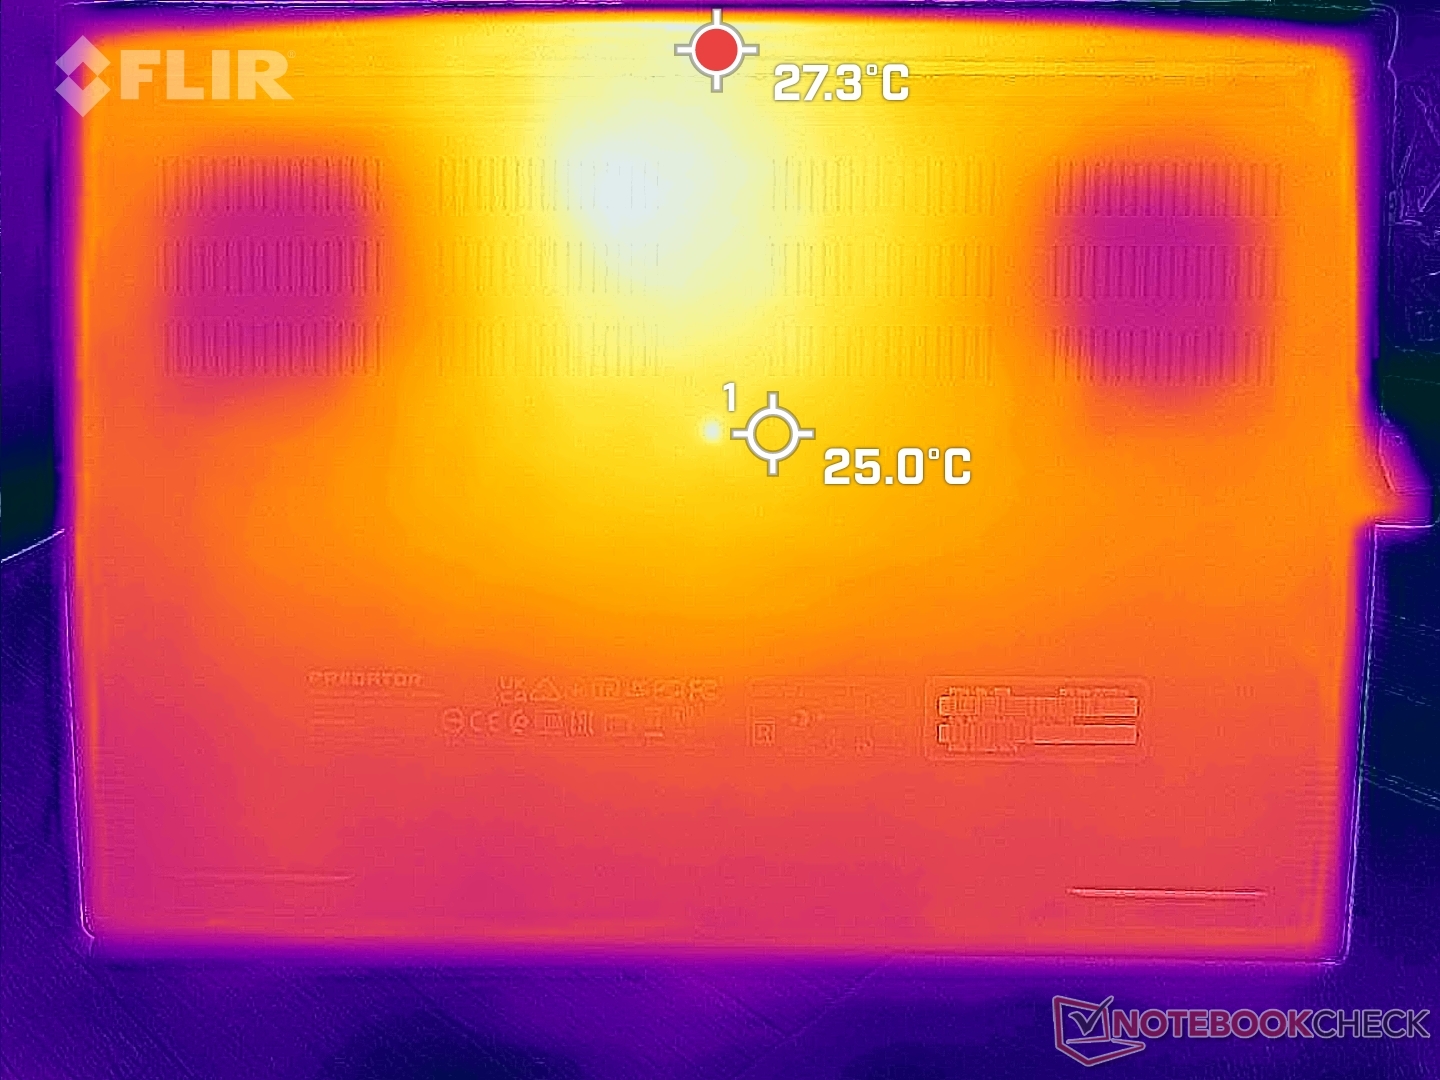
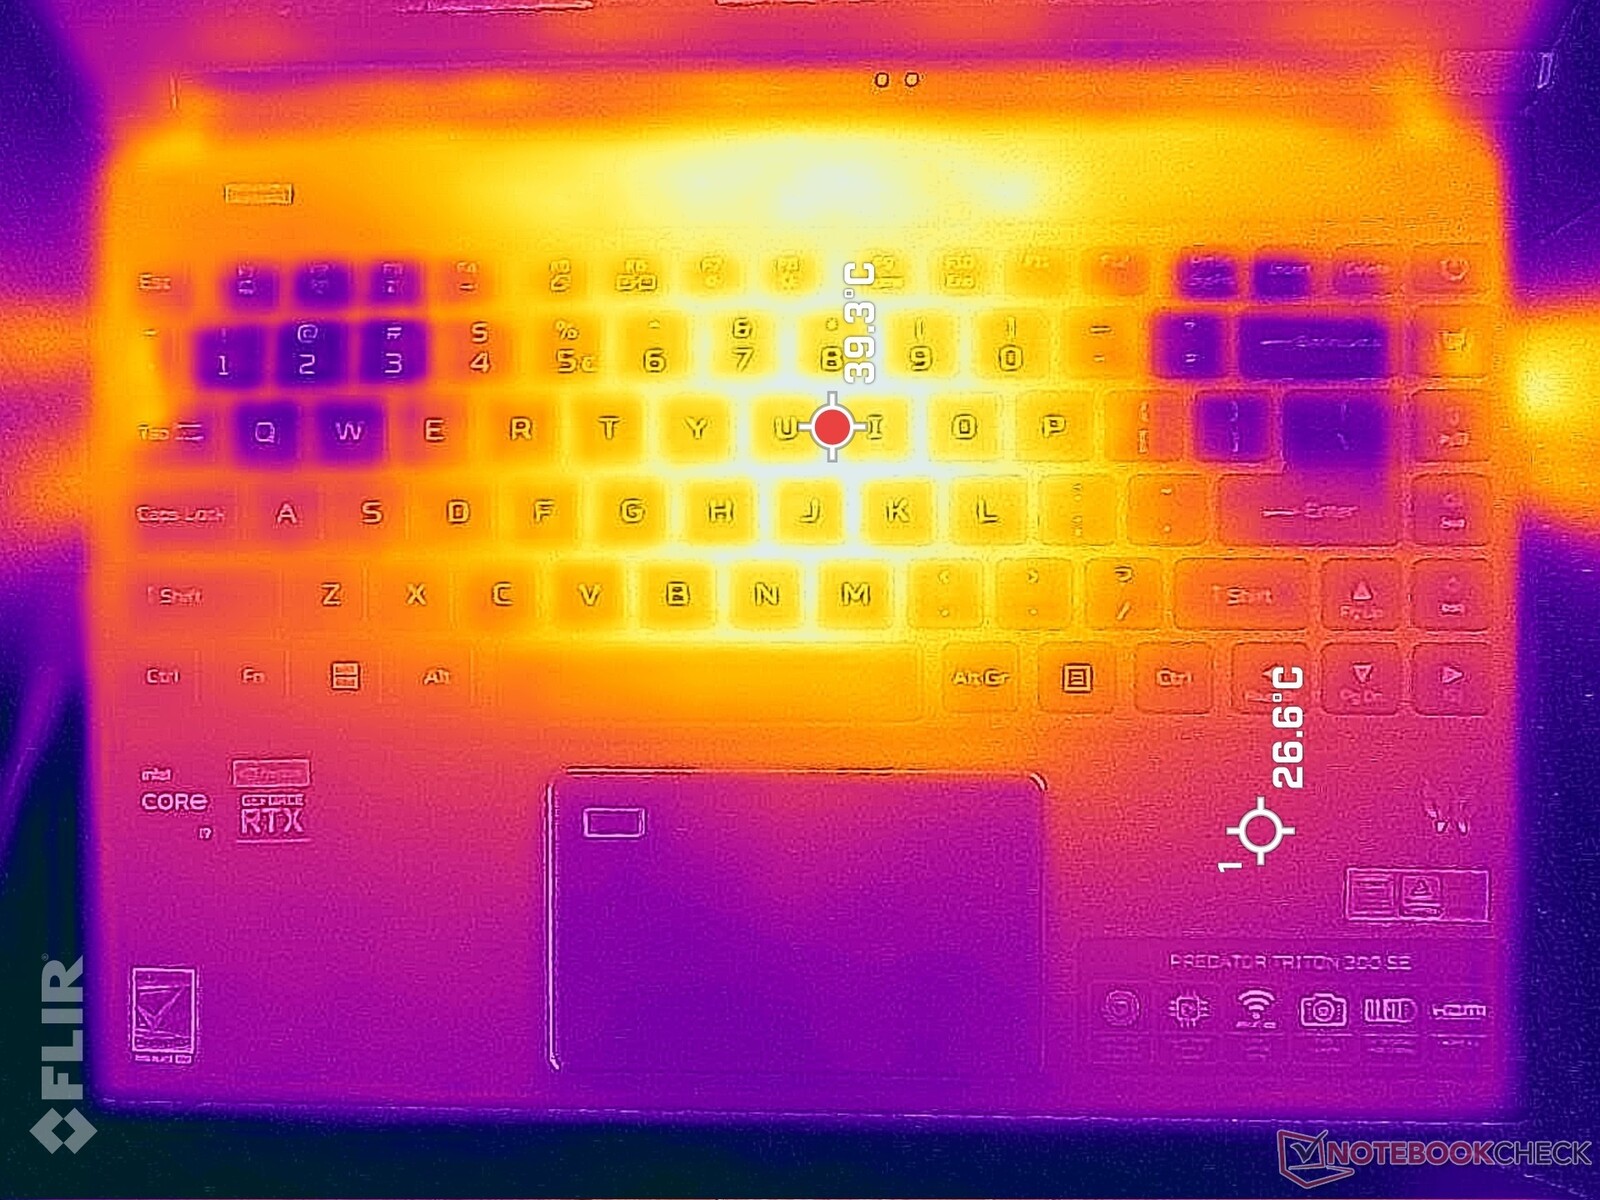
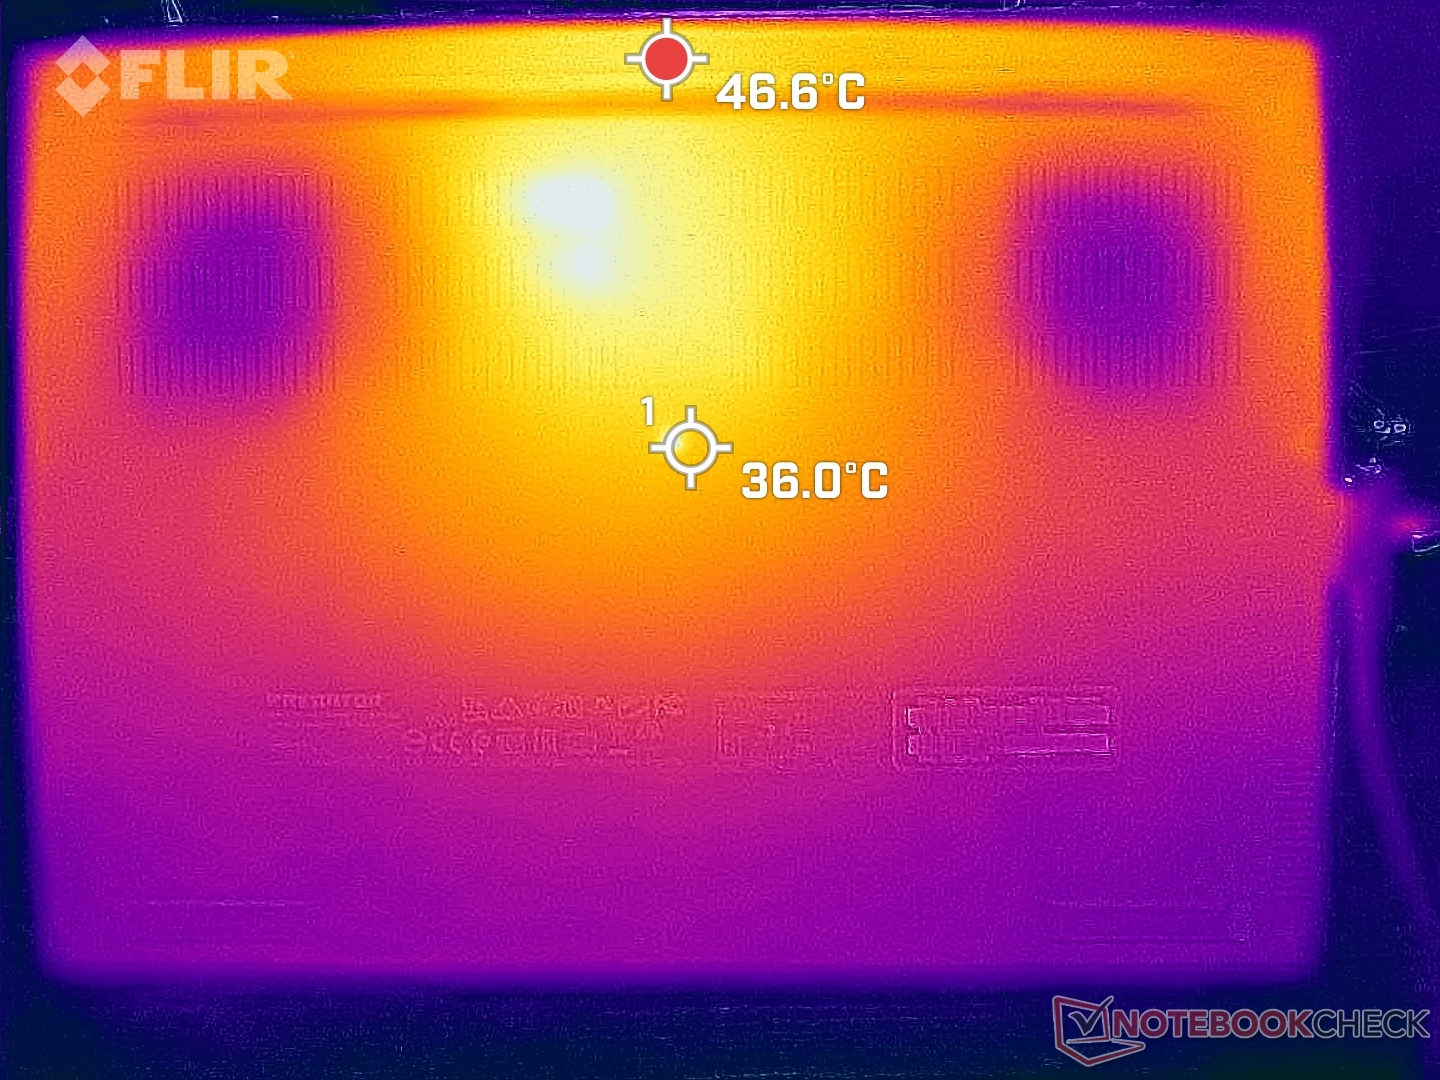
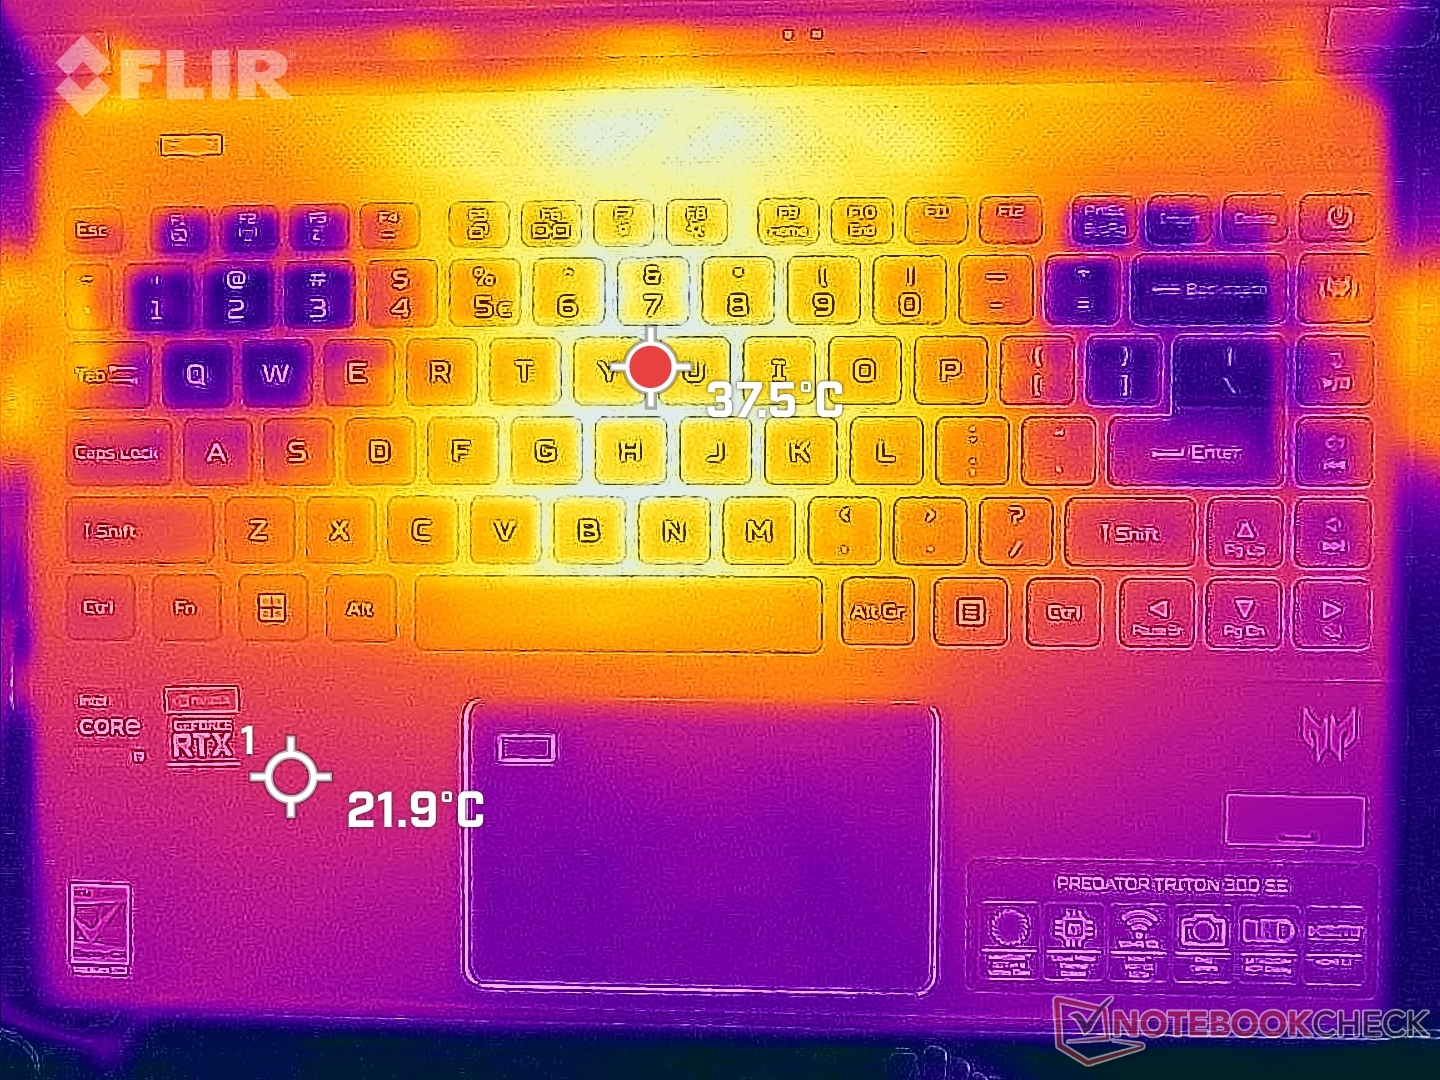
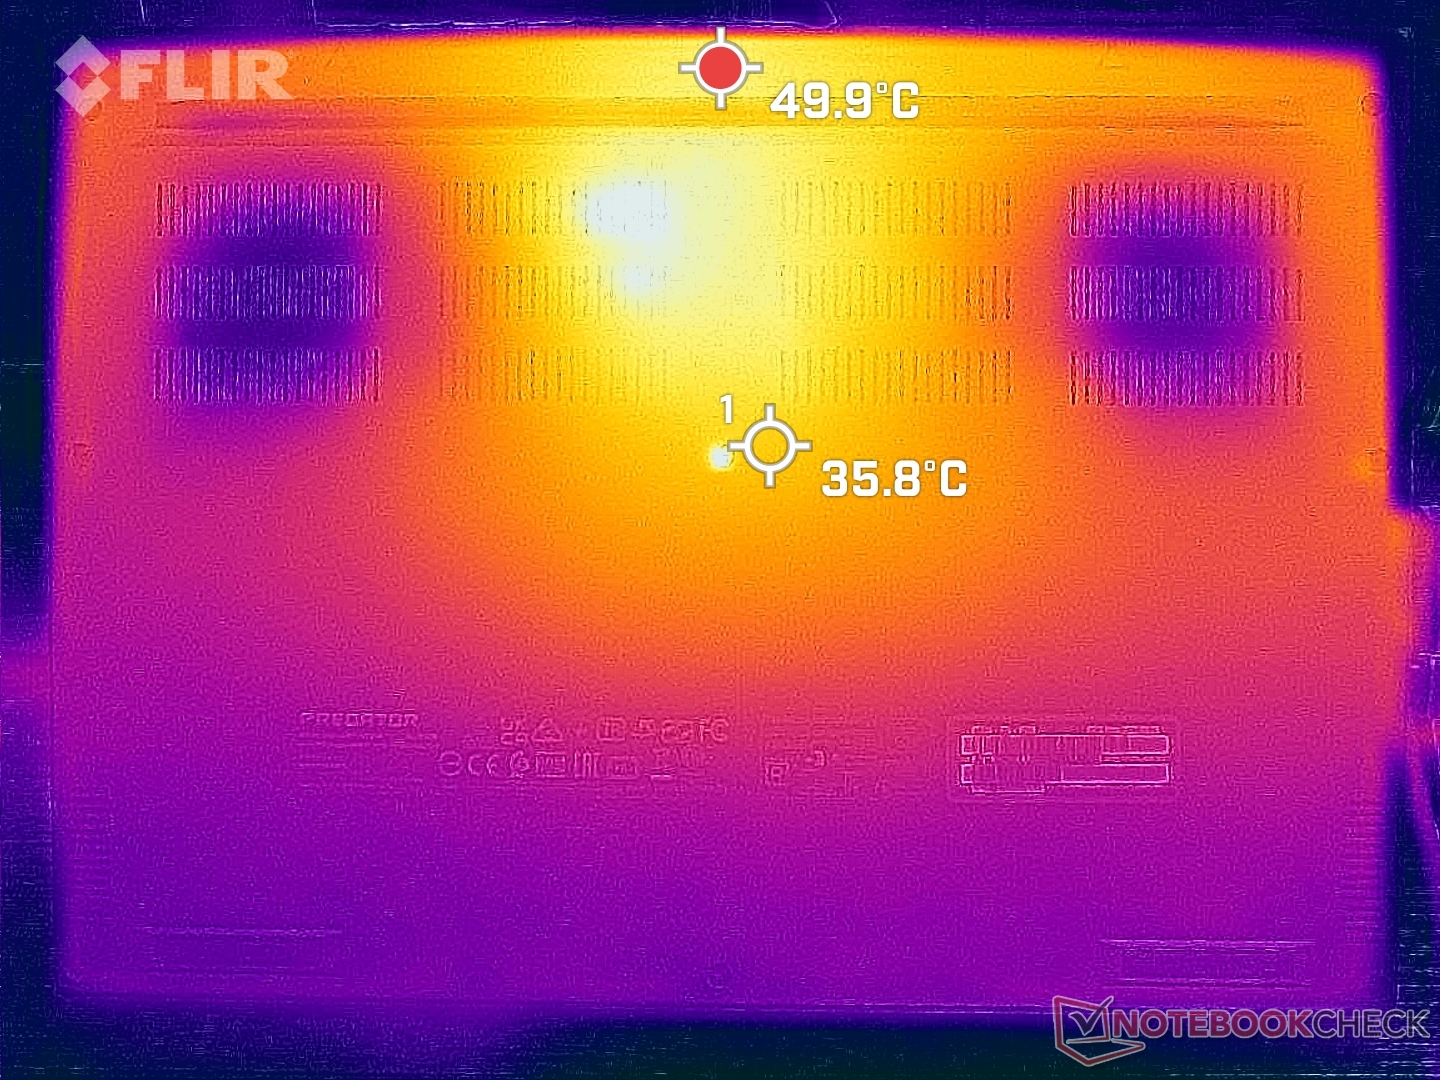
Temperatura
I punti caldi possono raggiungere i 43 C e i 46 C rispettivamente sulla parte superiore e inferiore, verso la parte posteriore dello chassis, come mostrano le mappe di calore qui sotto. Le temperature superficiali complessive sono notevolmente più basse rispetto a quelle registrate sullo Zephyrus G14 o sull' Alienware x14 dove i punti caldi possono facilmente raggiungere oltre 50 C in condizioni simili
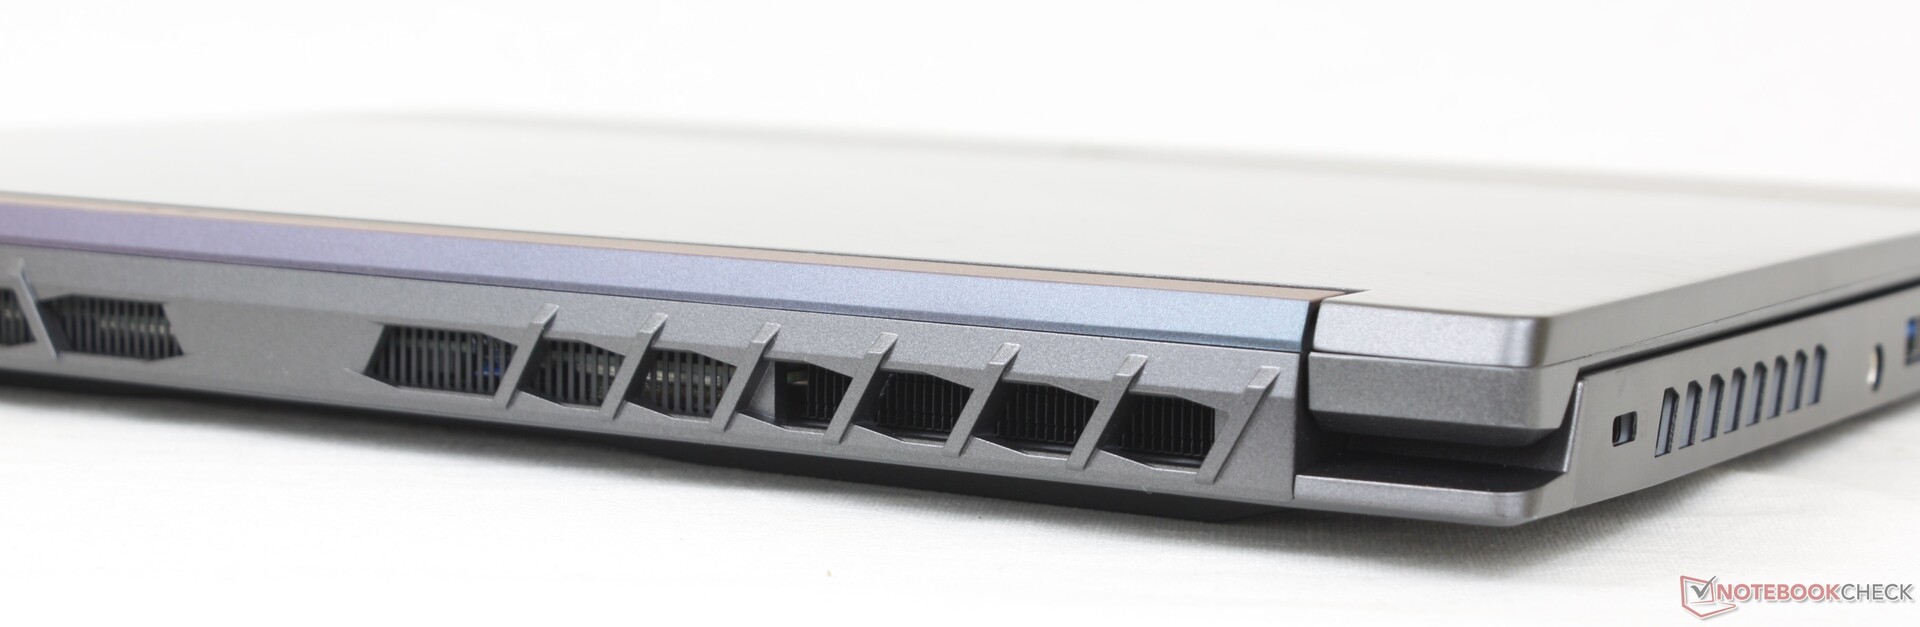
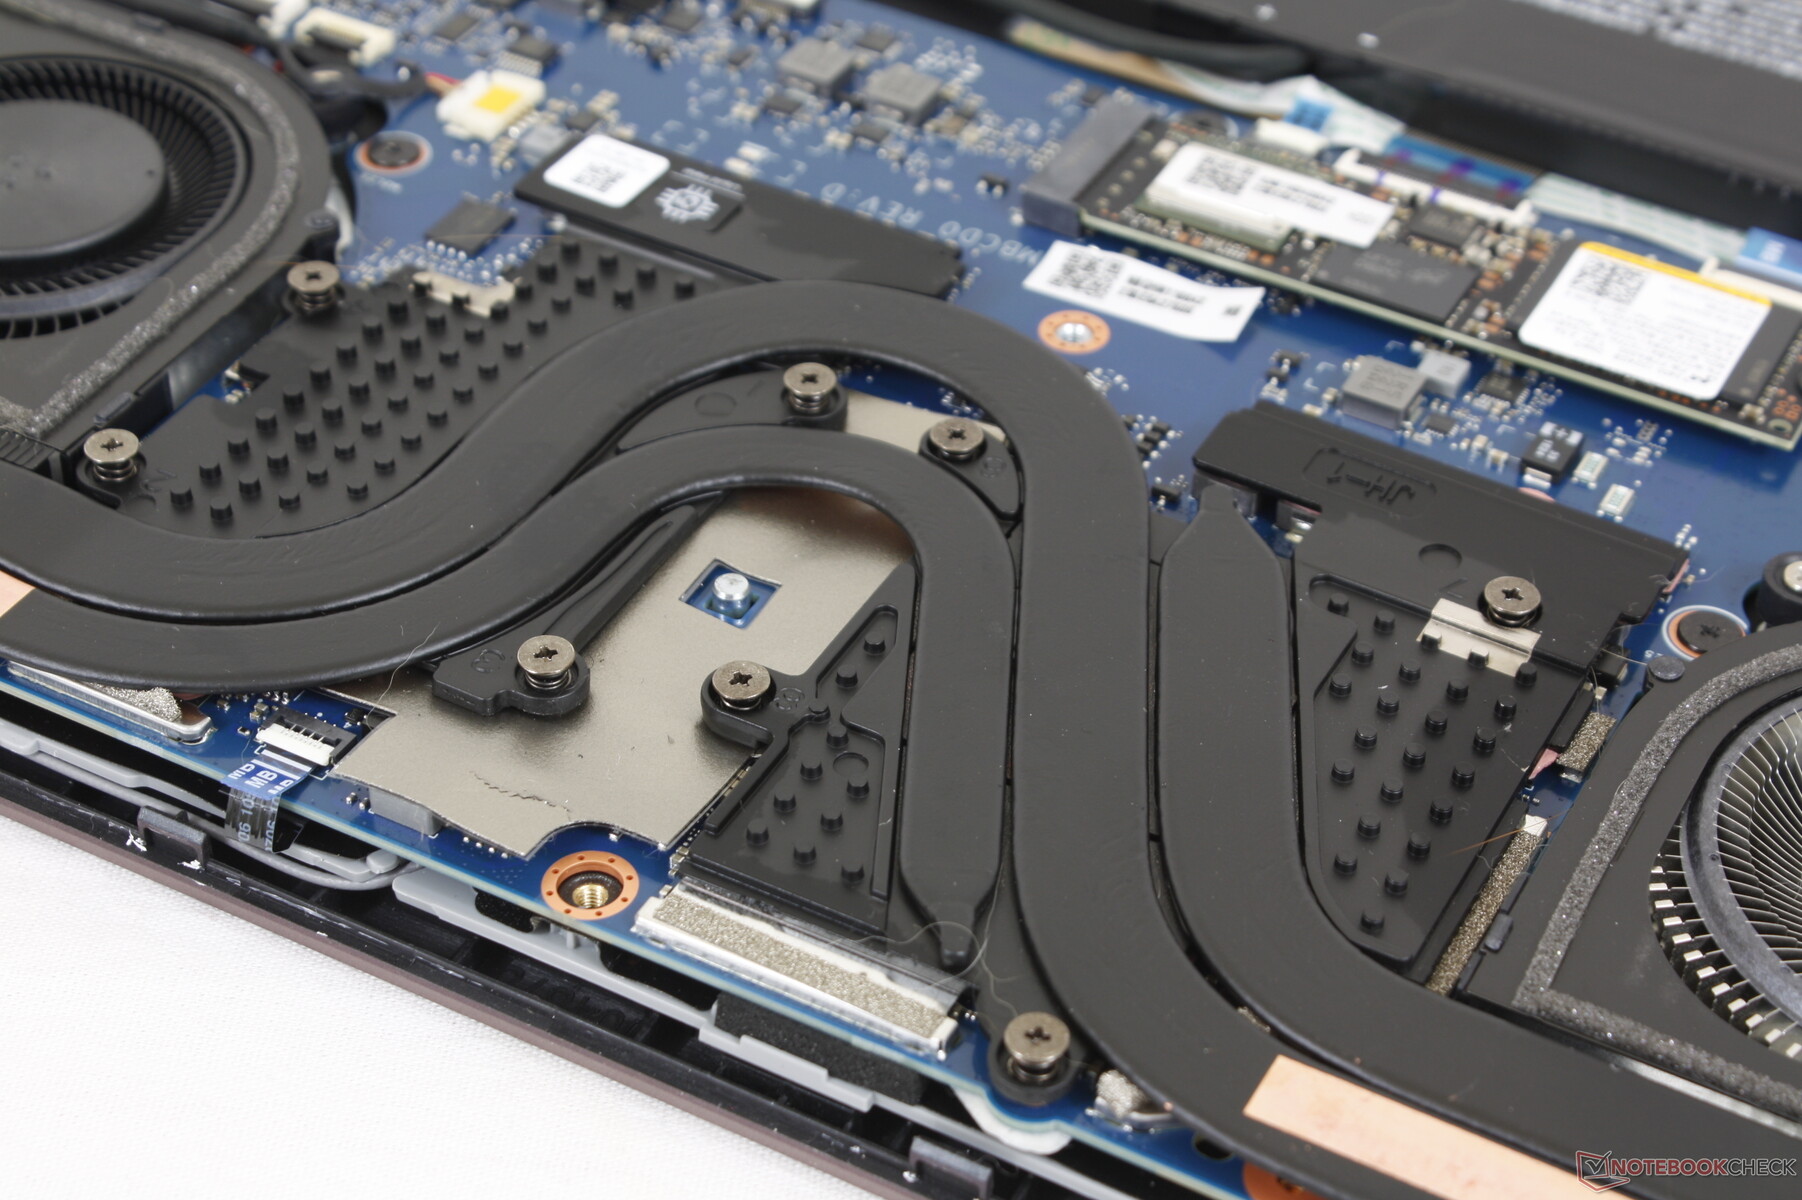
Quasi la metà dello chassis è dedicata alla ventilazione, compresi i bordi, il retro, il fondo e i lati della tastiera. Assicuratevi di non bloccare accidentalmente le griglie di ventilazione per preservare un raffreddamento ottimale.
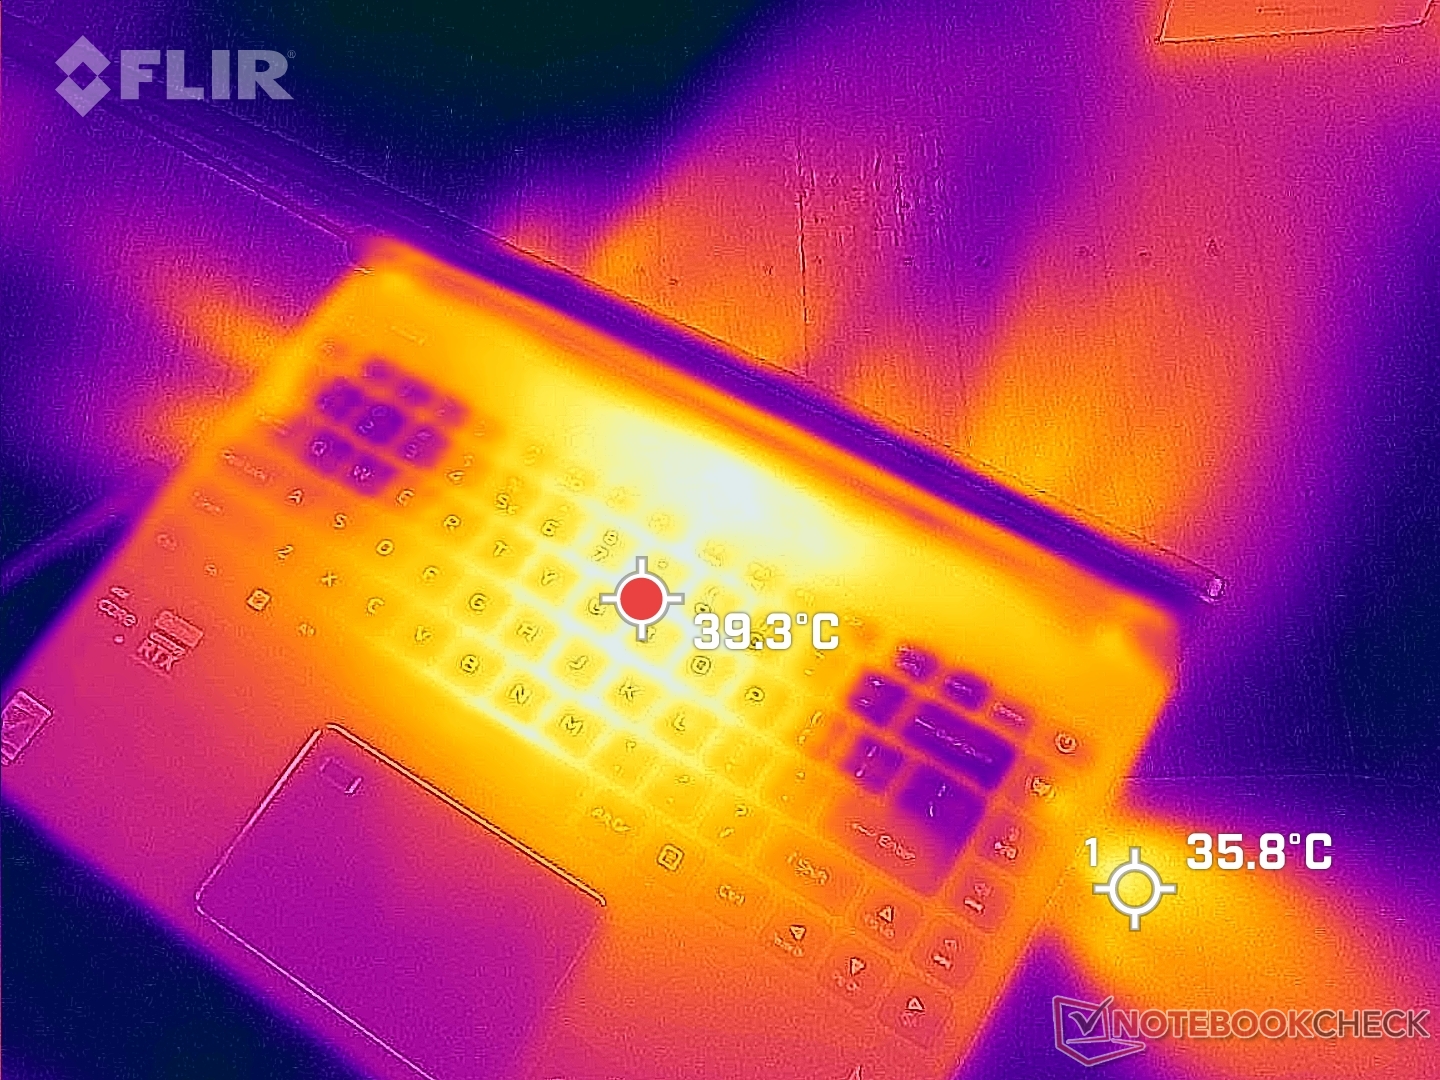
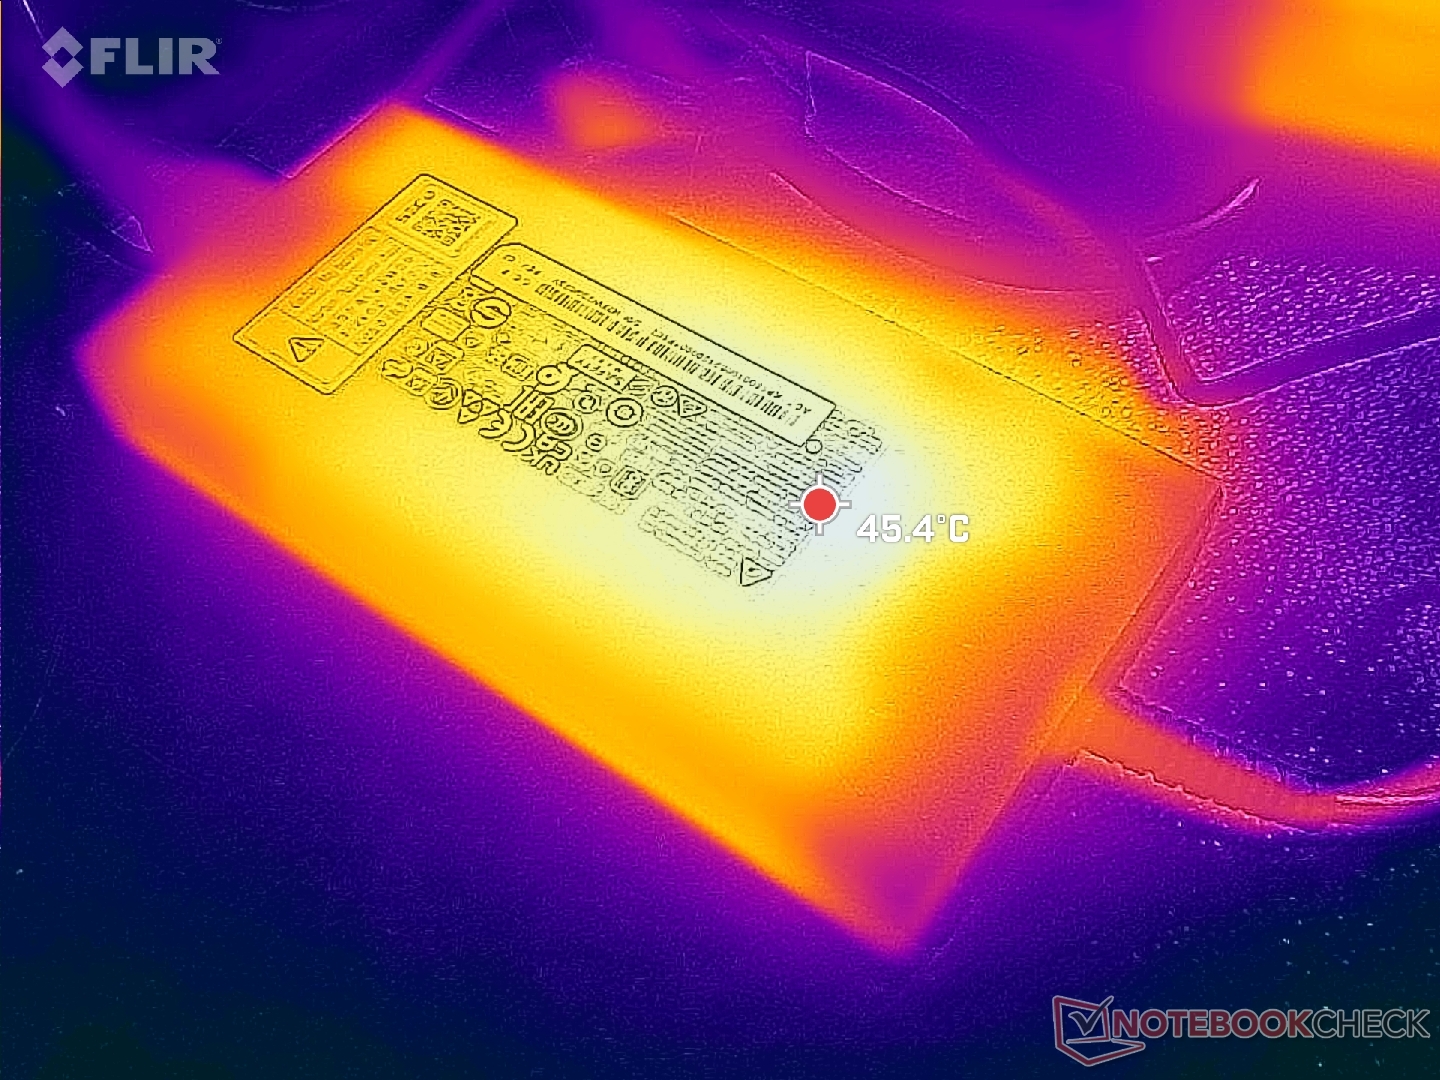
(±) La temperatura massima sul lato superiore è di 43 °C / 109 F, rispetto alla media di 40.4 °C / 105 F, che varia da 21.2 a 68.8 °C per questa classe Gaming.
(-) Il lato inferiore si riscalda fino ad un massimo di 46.4 °C / 116 F, rispetto alla media di 43.2 °C / 110 F
(+) In idle, la temperatura media del lato superiore è di 26 °C / 79 F, rispetto alla media deld ispositivo di 33.9 °C / 93 F.
(±) Riproducendo The Witcher 3, la temperatura media per il lato superiore e' di 37.1 °C / 99 F, rispetto alla media del dispositivo di 33.9 °C / 93 F.
(+) I poggiapolsi e il touchpad raggiungono la temperatura massima della pelle (32 °C / 89.6 F) e quindi non sono caldi.
(-) La temperatura media della zona del palmo della mano di dispositivi simili e'stata di 28.8 °C / 83.8 F (-3.2 °C / -5.8 F).
| Acer Predator Triton 300 SE Intel Core i9-12900H, NVIDIA GeForce RTX 3060 Laptop GPU | Asus ROG Zephyrus G14 GA402RJ AMD Ryzen 7 6800HS, AMD Radeon RX 6700S | Razer Blade 14 Ryzen 9 6900HX AMD Ryzen 9 6900HX, NVIDIA GeForce RTX 3070 Ti Laptop GPU | Alienware x14 i7 RTX 3060 Intel Core i7-12700H, NVIDIA GeForce RTX 3060 Laptop GPU | Dell Inspiron 14 Plus 7420 Intel Core i7-12700H, NVIDIA GeForce RTX 3050 4GB Laptop GPU | Schenker Vision 14 Intel Core i7-11370H, NVIDIA GeForce RTX 3050 Ti Laptop GPU | |
|---|---|---|---|---|---|---|
| Heat | -24% | -13% | -1% | 8% | -12% | |
| Maximum Upper Side * (°C) | 43 | 53 -23% | 40.6 6% | 51.3 -19% | 40 7% | 49.7 -16% |
| Maximum Bottom * (°C) | 46.4 | 54 -16% | 42.6 8% | 44.4 4% | 36.4 22% | 56 -21% |
| Idle Upper Side * (°C) | 28.2 | 34 -21% | 38 -35% | 27.2 4% | 27 4% | 28.8 -2% |
| Idle Bottom * (°C) | 28.4 | 38 -34% | 37 -30% | 26.6 6% | 29.2 -3% | 30.6 -8% |
* ... Meglio usare valori piccoli
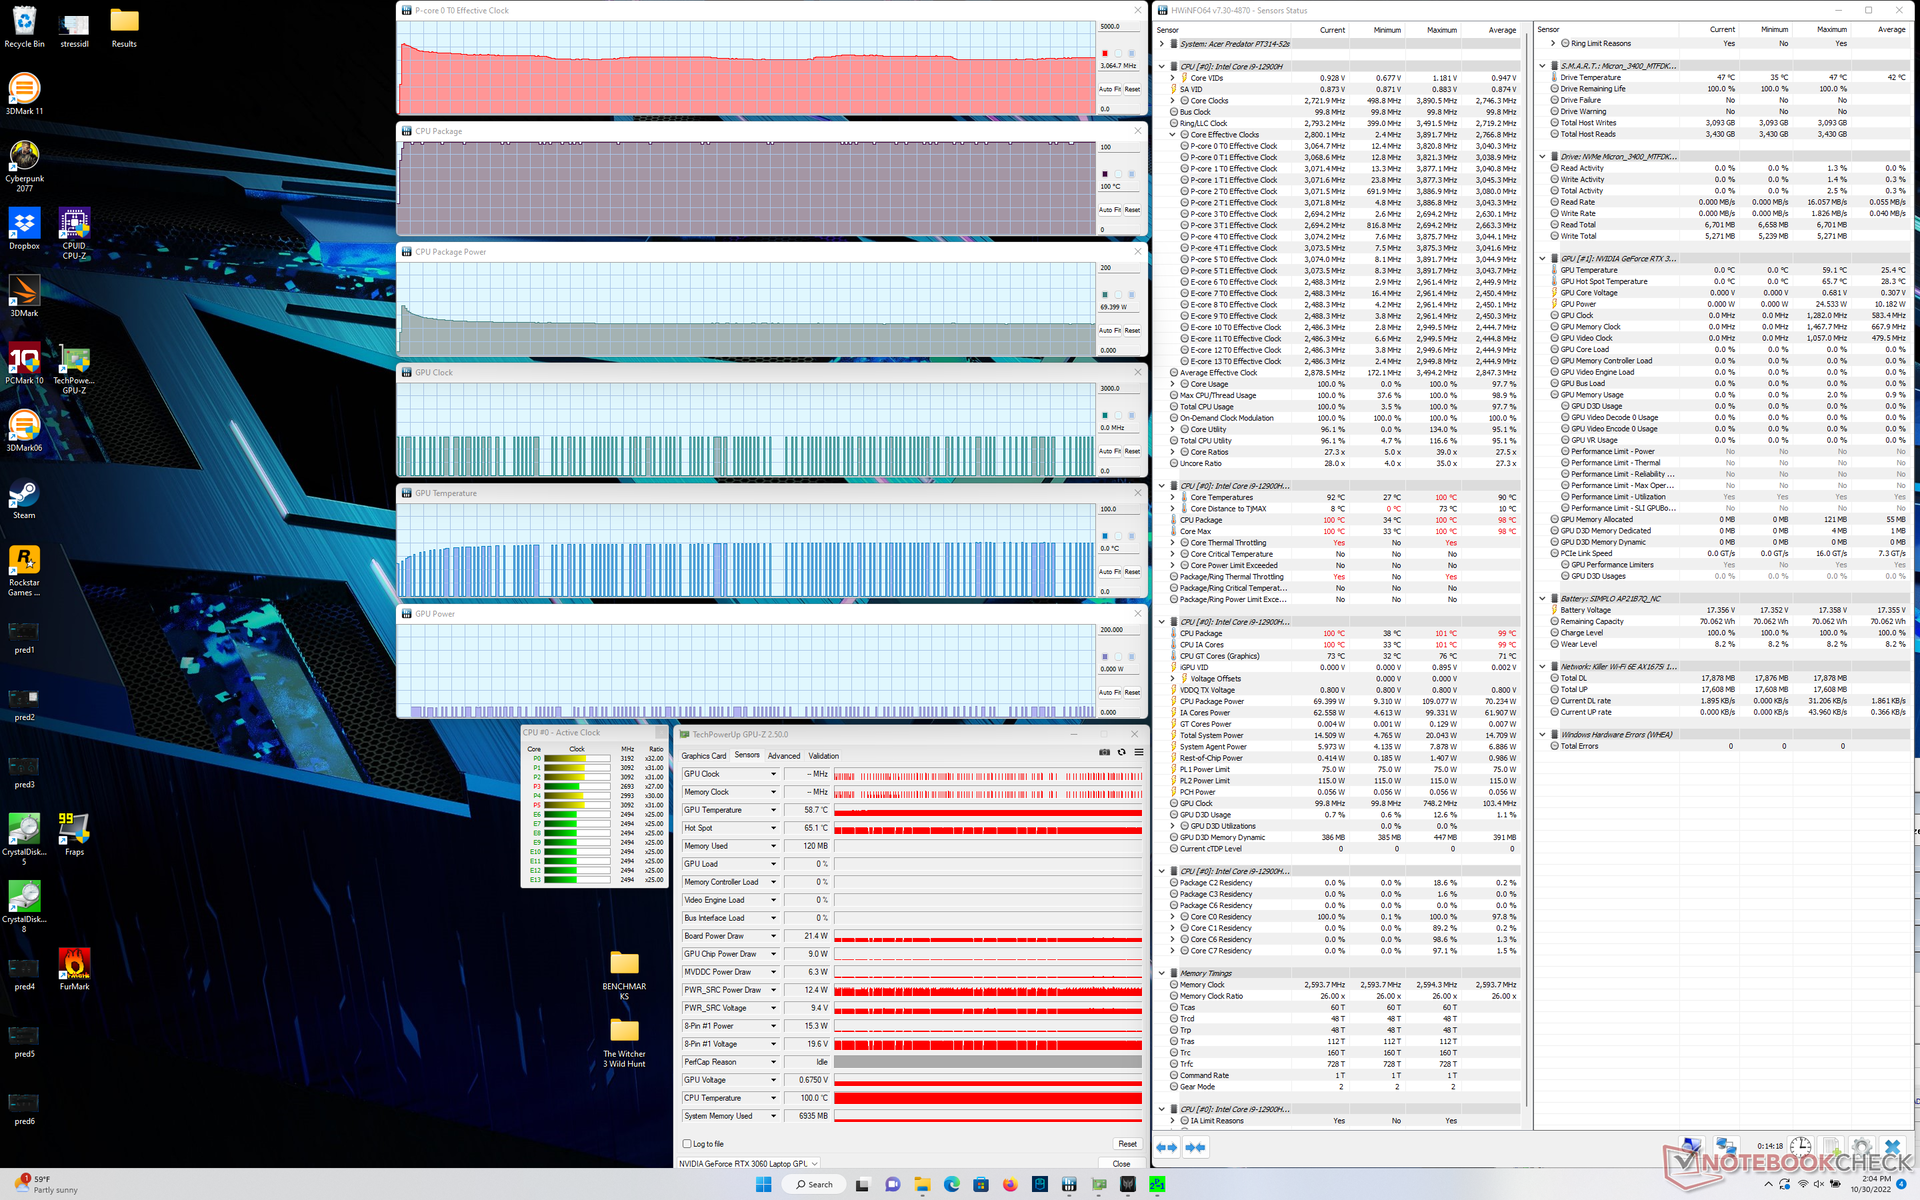
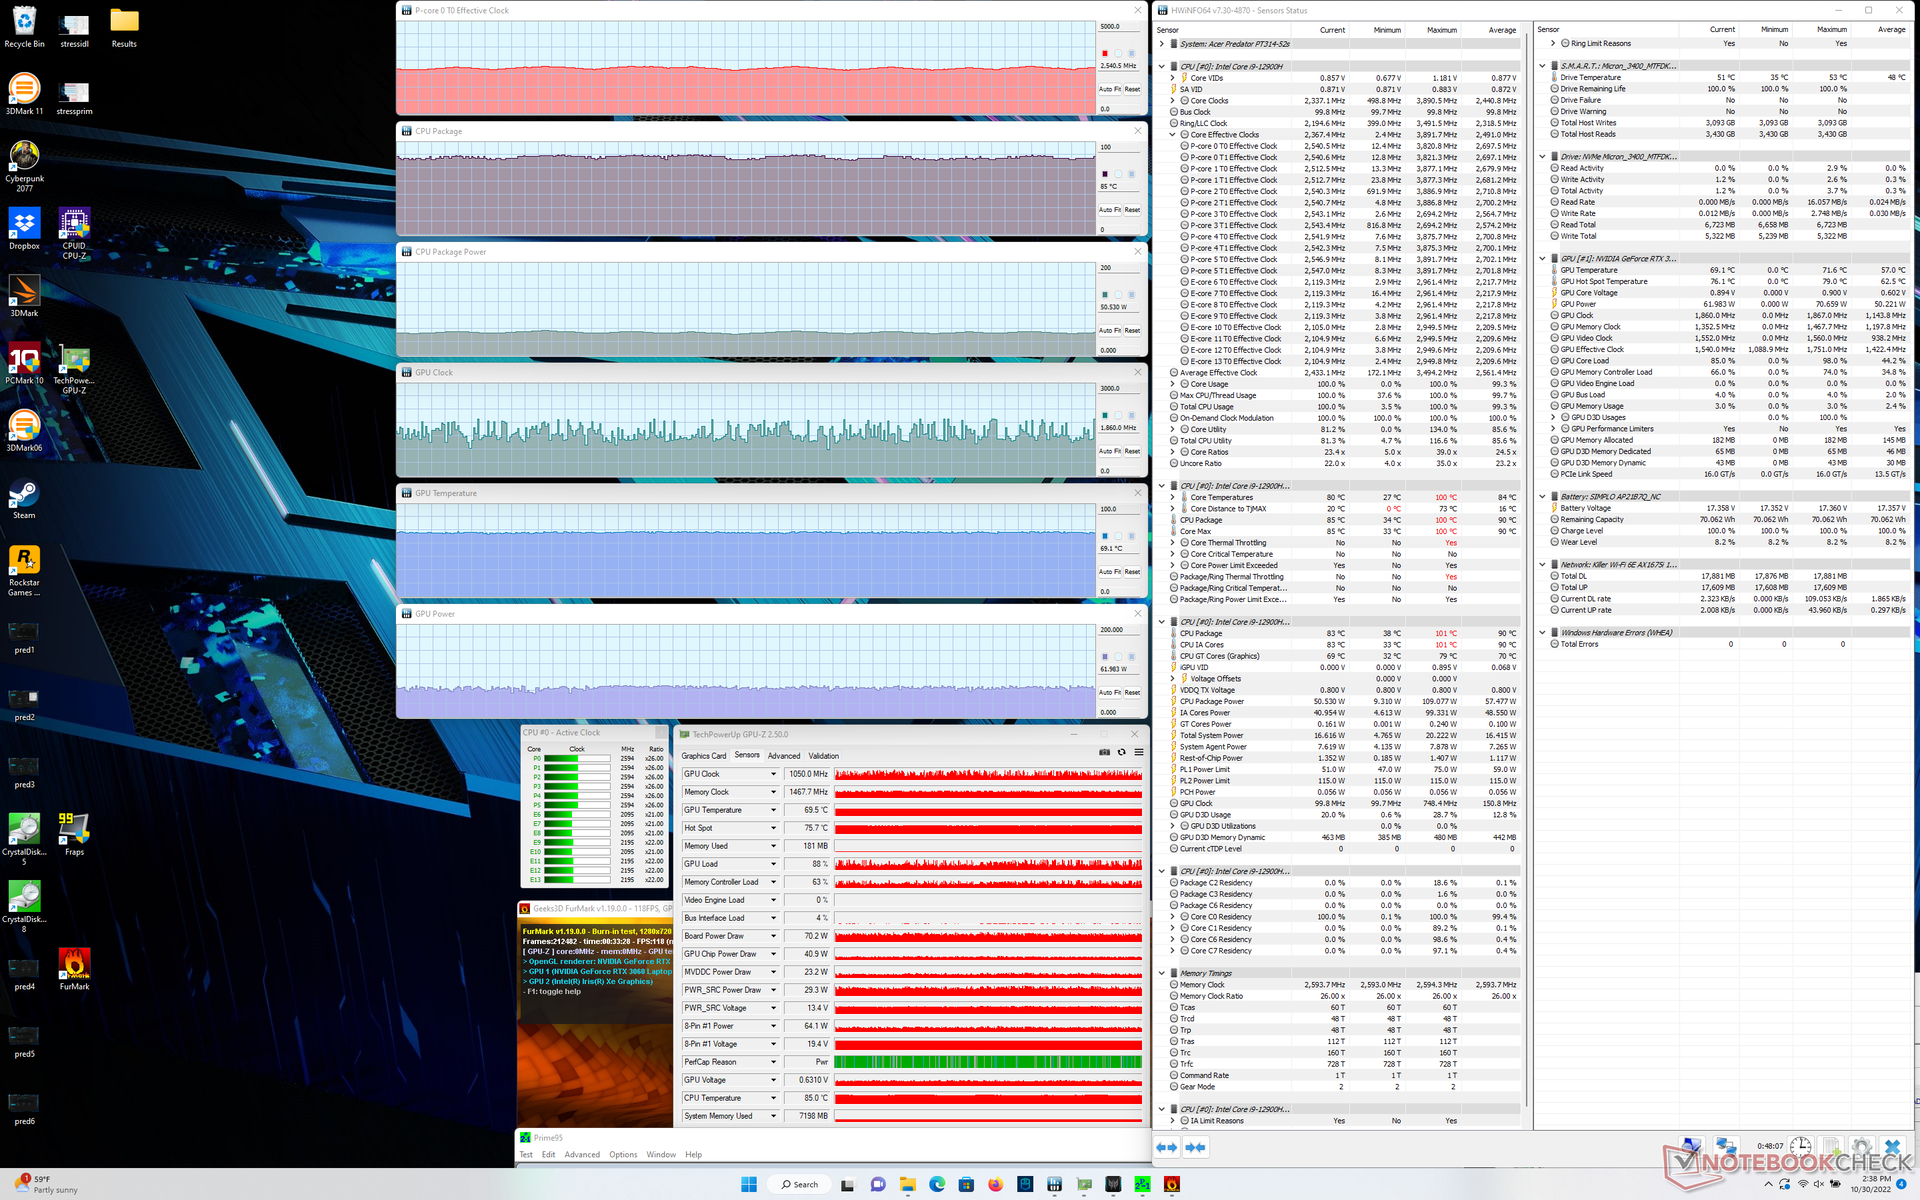
Stress test
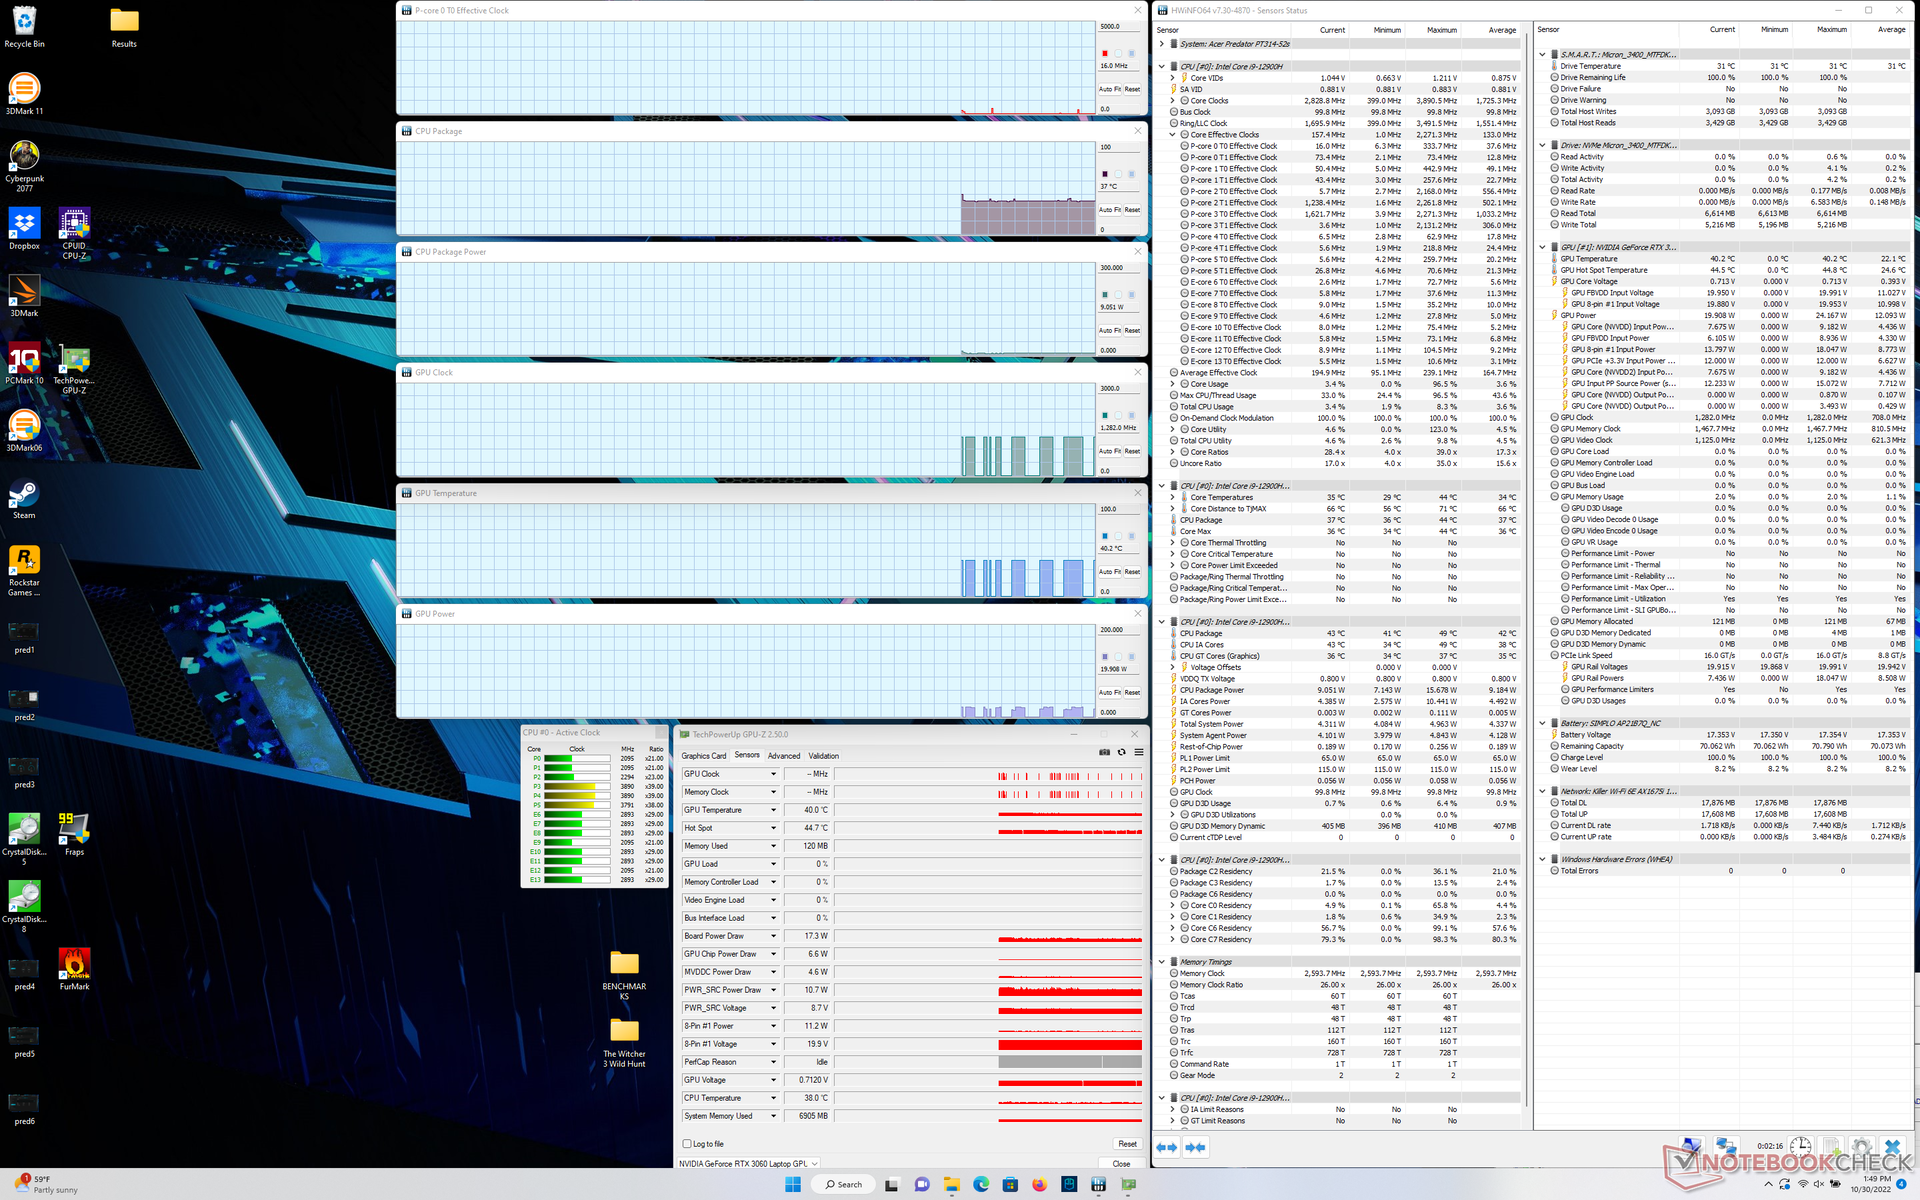
La velocità di clock della CPU, la temperatura e l'assorbimento di potenza della scheda hanno raggiunto rispettivamente i 3,7 GHz, i 100 C e i 108 W all'avvio dello stress Prime95. Dopo appena un paio di secondi, tuttavia, la frequenza di clock e l'assorbimento di potenza iniziavano a diminuire prima di stabilizzarsi a soli 3,0 GHz e 69 W, rispettivamente, mantenendo una temperatura del core di 100 C. Pochissime CPU di computer portatili si stabilizzano a temperature superiori a 90 C e quindi questo è un po' allarmante da vedere sull'Acer. Il Dell Precision 5470 con la stessa CPU Core i9-12900H, ad esempio, si stabilizza a 2,4 GHz e 80 C in condizioni simili. È chiaro che il sistema Acer spinge la CPU Core i9 fino al limite consentito dalla soluzione di raffreddamento.
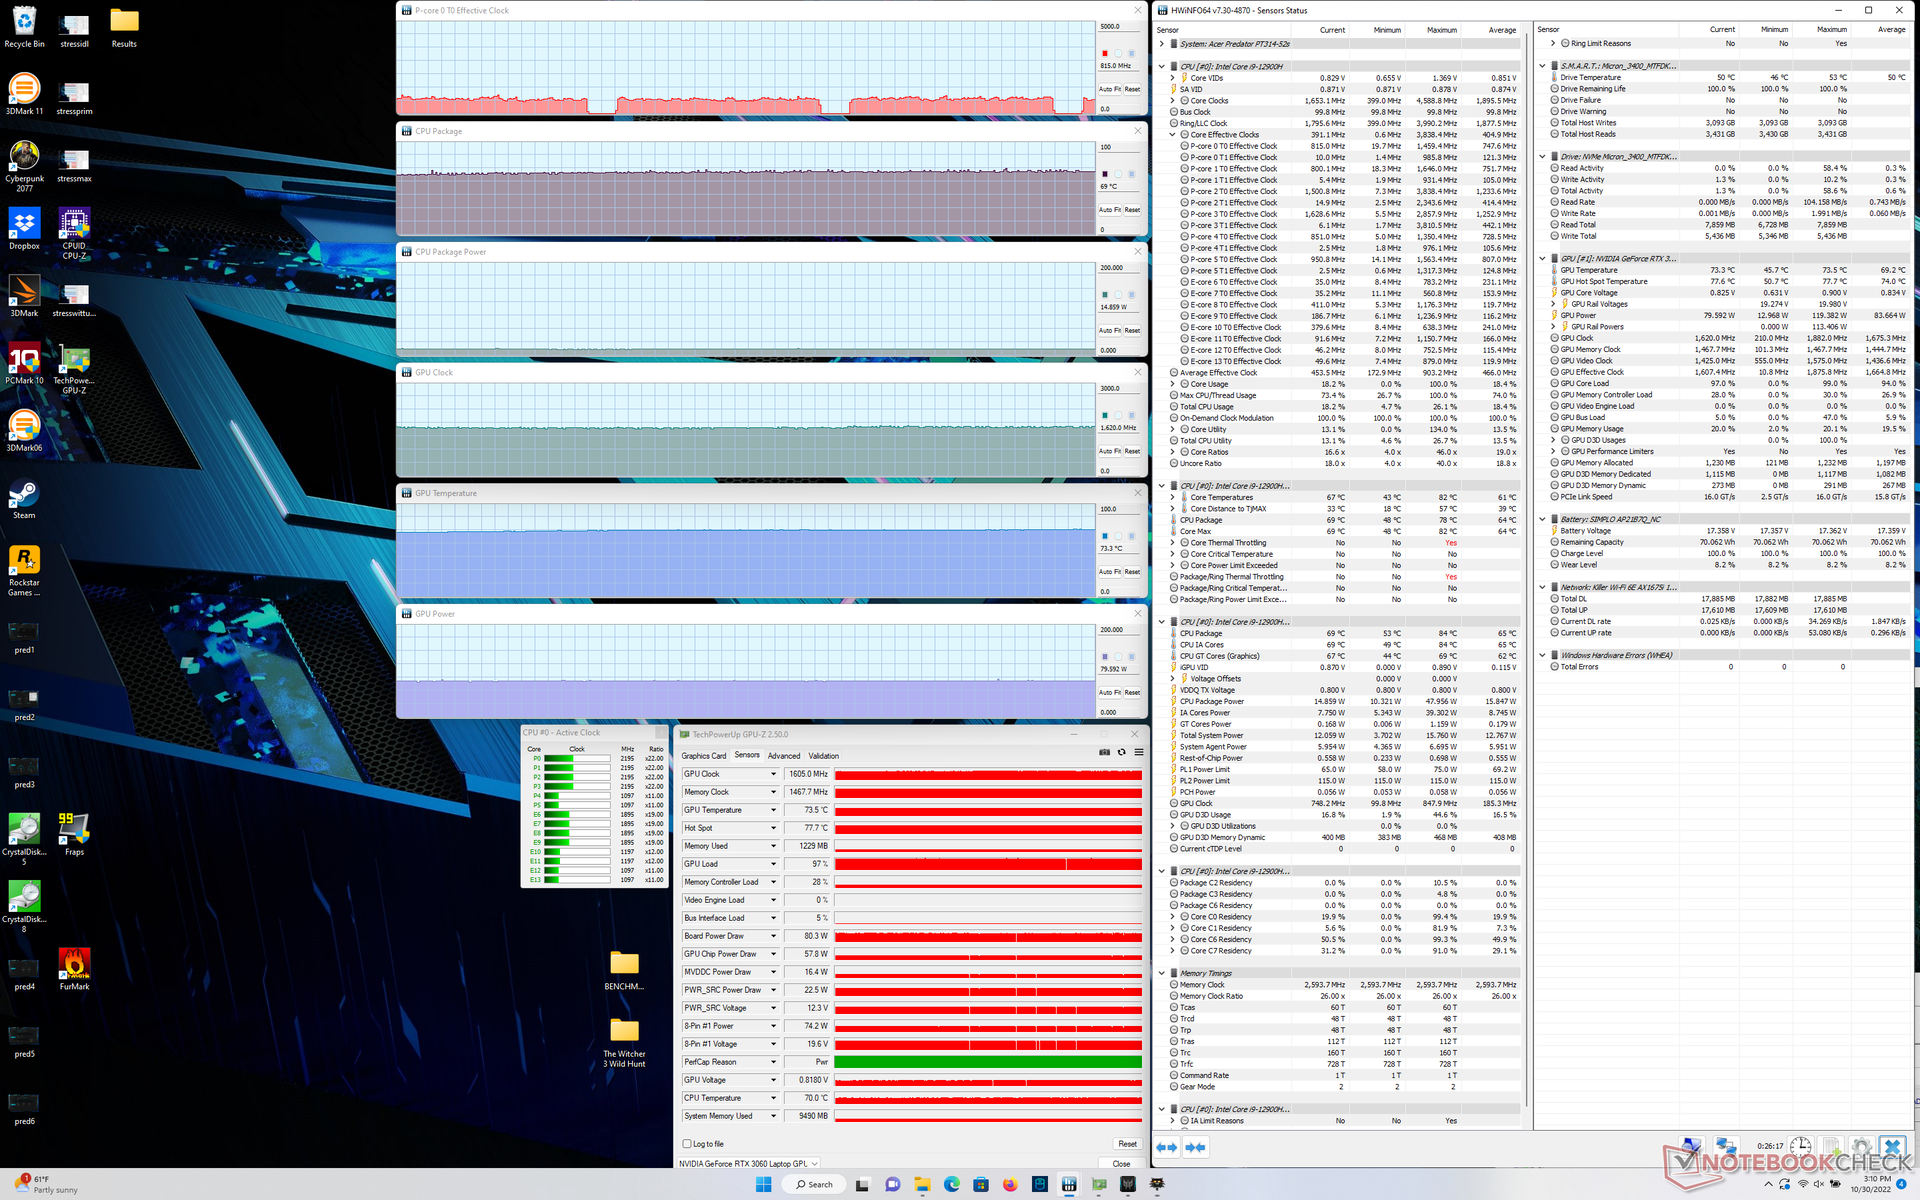
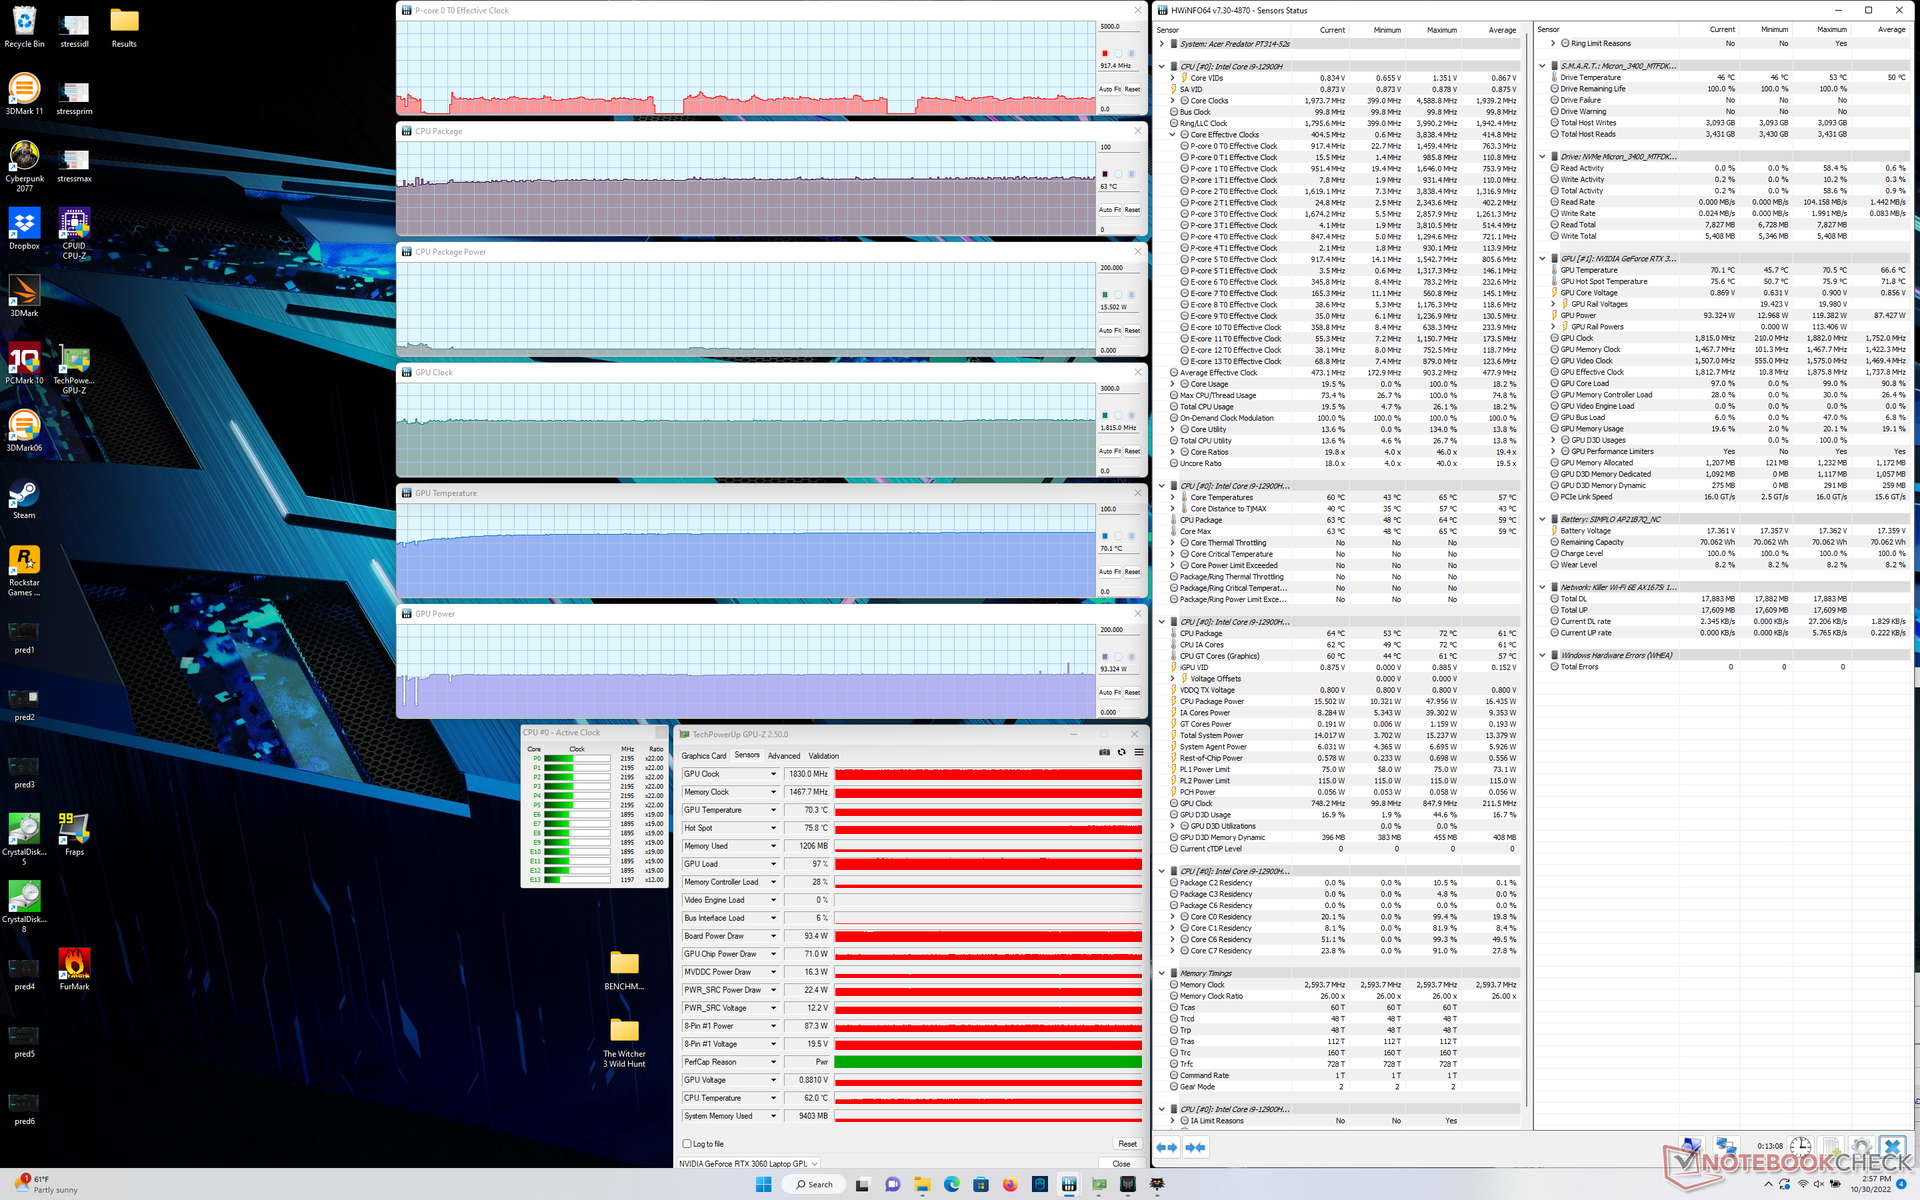
L'esecuzione Witcher 3 in modalità Turbo fa sì che la GPU Nvidia si stabilizzi a 1830 MHz, 70 C e 93 W. Se la modalità Turbo viene disattivata, le frequenze di clock e l'assorbimento di potenza della scheda scendono rispettivamente a 1605 MHz e 80 W, mentre la temperatura sale leggermente a 73 C a causa della ventola più bassa. Pertanto, gli utenti devono attivare la modalità Turbo se vogliono sfruttare appieno i 95 W della GPU TGP.
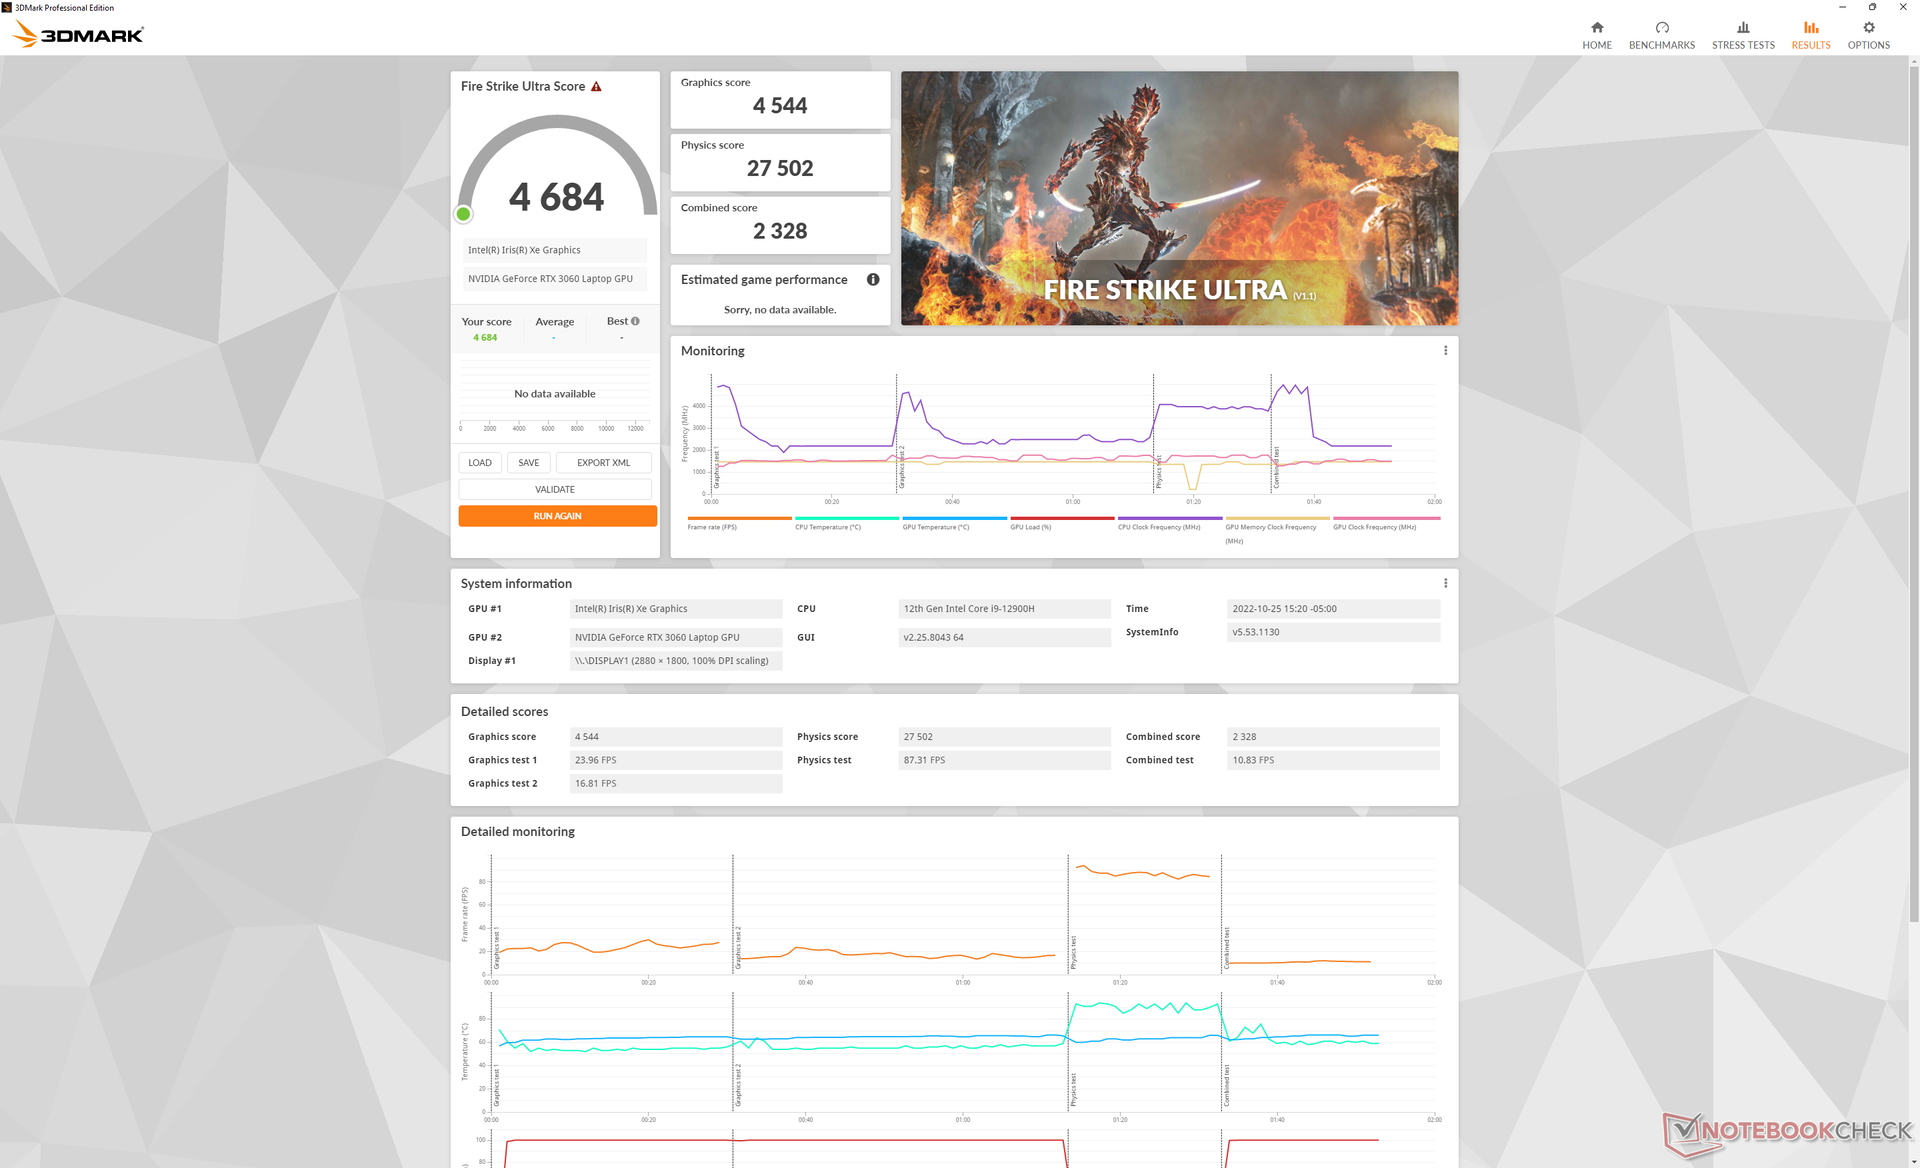
Il funzionamento a batteria limita le prestazioni, soprattutto perché la modalità Turbo richiede la rete elettrica. Un test di Fire Strike a batteria restituirebbe punteggi di Fisica e Grafica rispettivamente di 14166 e 11131 punti, rispetto a 31176 e 20405 punti con l'alimentazione di rete.
| Clock della CPU (GHz) | Clock della GPU (MHz) | Temperatura media della CPU (°C) | Temperatura media della GPU (°C) | |
| Sistema inattivo | -- | -- | 37 | 40 |
| Stress Prime95 | 3.0 - 3.1 | -- | 100 | 59 |
| StressPrime95 + FurMark | 2,5 | ~1050 | 85 | 69 |
| Witcher 3 Stress (Turbo off) | ~0,8 | 1605 | 69 | 73 |
| Witcher 3 Stress (Turbo on) | ~0,8 | 1830 | 63 | 70 |
Altoparlanti
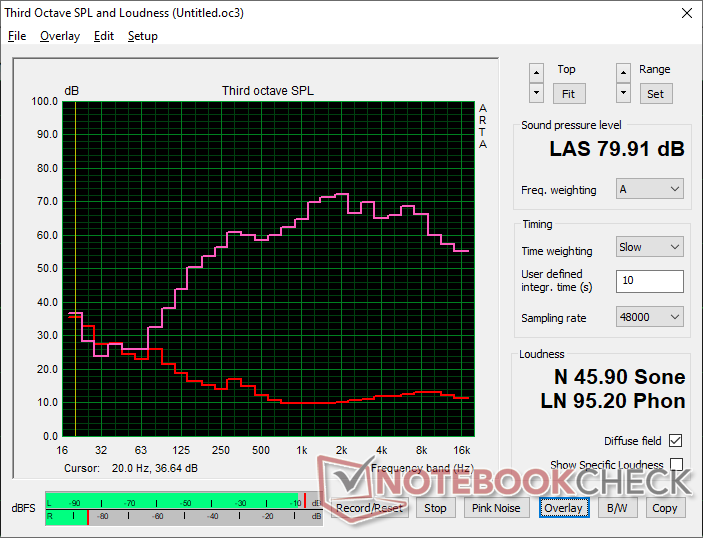
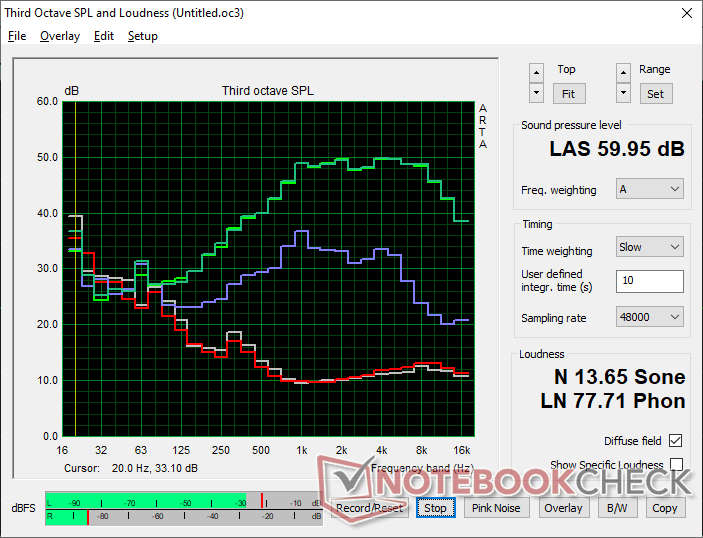
Acer Predator Triton 300 SE analisi audio
(±) | potenza degli altiparlanti media ma buona (79.9 dB)
Bassi 100 - 315 Hz
(±) | bassi ridotti - in media 10.3% inferiori alla media
(±) | la linearità dei bassi è media (9.7% delta rispetto alla precedente frequenza)
Medi 400 - 2000 Hz
(±) | medi elevati - circa 5% superiore alla media
(+) | medi lineari (4% delta rispetto alla precedente frequenza)
Alti 2 - 16 kHz
(±) | alti elevati - circa 5.5% superiori alla media
(±) | la linearità degli alti è media (7.6% delta rispetto alla precedente frequenza)
Nel complesso 100 - 16.000 Hz
(±) | la linearità complessiva del suono è media (15.1% di differenza rispetto alla media
Rispetto alla stessa classe
» 32% di tutti i dispositivi testati in questa classe è stato migliore, 6% simile, 62% peggiore
» Il migliore ha avuto un delta di 6%, medio di 18%, peggiore di 132%
Rispetto a tutti i dispositivi testati
» 21% di tutti i dispositivi testati in questa classe è stato migliore, 4% similare, 75% peggiore
» Il migliore ha avuto un delta di 4%, medio di 24%, peggiore di 134%
Apple MacBook Pro 16 2021 M1 Pro analisi audio
(+) | gli altoparlanti sono relativamente potenti (84.7 dB)
Bassi 100 - 315 Hz
(+) | bassi buoni - solo 3.8% dalla media
(+) | bassi in lineaa (5.2% delta rispetto alla precedente frequenza)
Medi 400 - 2000 Hz
(+) | medi bilanciati - solo only 1.3% rispetto alla media
(+) | medi lineari (2.1% delta rispetto alla precedente frequenza)
Alti 2 - 16 kHz
(+) | Alti bilanciati - appena 1.9% dalla media
(+) | alti lineari (2.7% delta rispetto alla precedente frequenza)
Nel complesso 100 - 16.000 Hz
(+) | suono nel complesso lineare (4.6% differenza dalla media)
Rispetto alla stessa classe
» 0% di tutti i dispositivi testati in questa classe è stato migliore, 0% simile, 100% peggiore
» Il migliore ha avuto un delta di 5%, medio di 17%, peggiore di 45%
Rispetto a tutti i dispositivi testati
» 0% di tutti i dispositivi testati in questa classe è stato migliore, 0% similare, 100% peggiore
» Il migliore ha avuto un delta di 4%, medio di 24%, peggiore di 134%
Gestione dell'energia
Consumo di energia - Più efficiente rispetto al modello di ultima generazione
Il consumo complessivo è abbastanza simile a quello dell' Alienware x14 che viene fornito con opzioni di CPU e GPU simili. Il funzionamento al minimo sul desktop in modalità risparmio energetico e con l'impostazione di luminosità più bassa consuma solo 8 W, mentre la modalità con le prestazioni più elevate e le impostazioni di luminosità consumano circa 18 W. Si noti che il consumo di energia e quindi la durata della batteria sono sensibili ai colori sullo schermo, a differenza dei pannelli IPS, come dimostrato dalle nostre misurazioni del consumo energetico OLED qui.
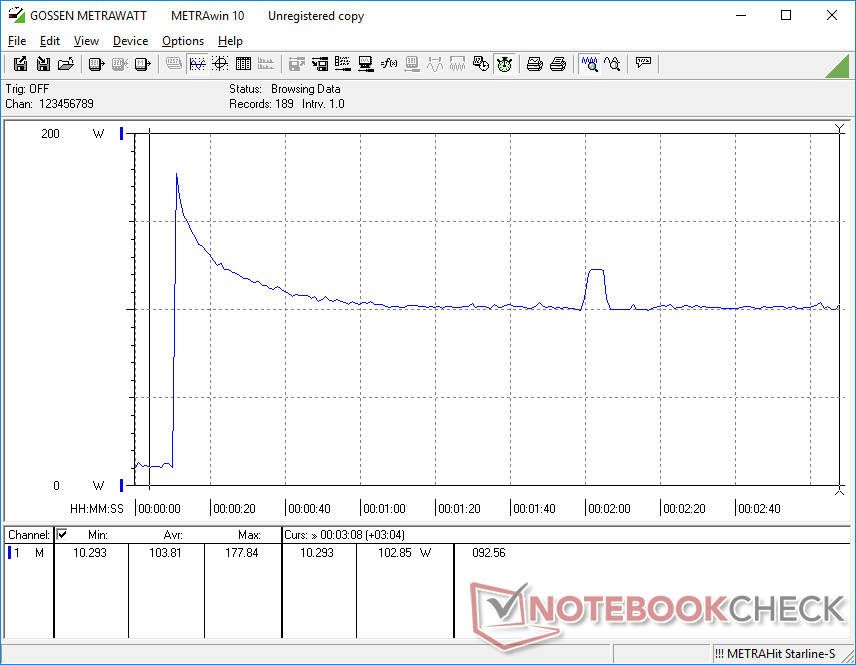
L'esecuzione Witcher 3per rappresentare il carico di gioco consuma circa il 14% in meno rispetto al Predator Triton 300 2020 2020 Predator Triton 300 e fornisce prestazioni grafiche fino al 30% più veloci, con un significativo aumento delle prestazioni per watt. La CPU di 12a generazione, tuttavia, è ora ancora più assetata di energia rispetto al passato.
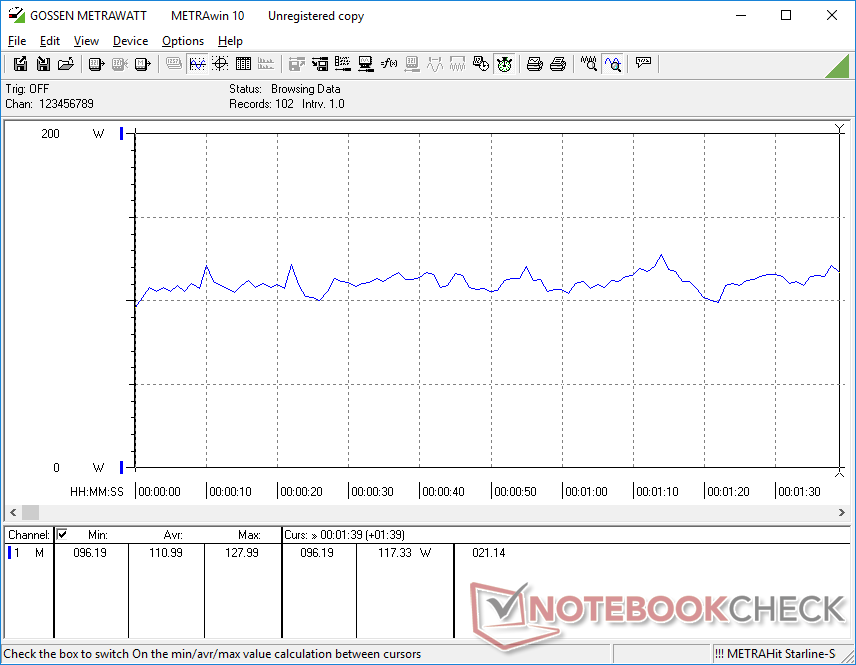
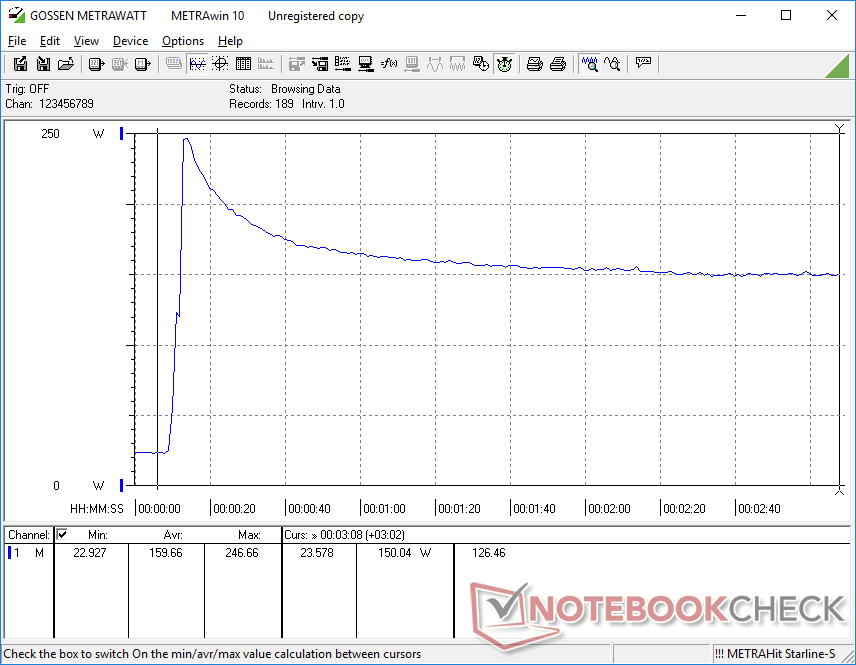
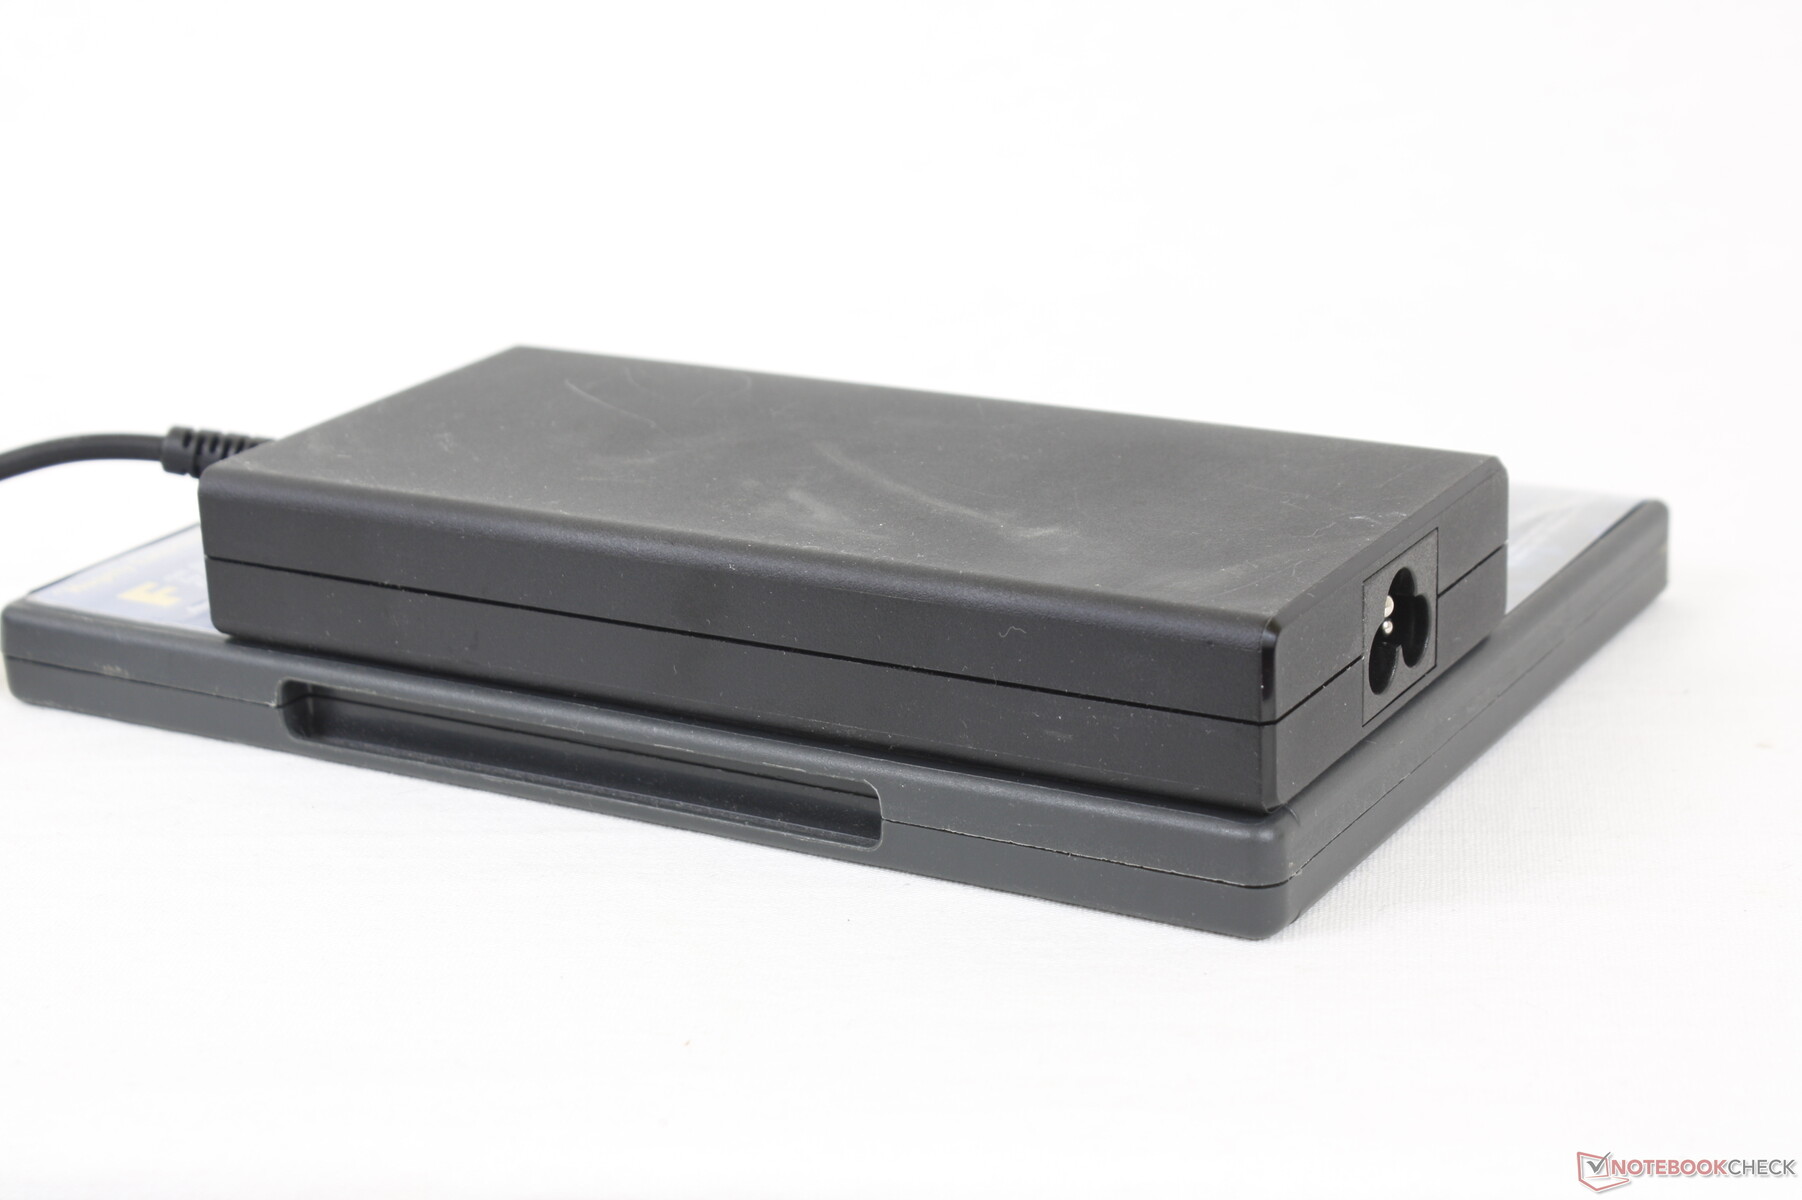
Siamo riusciti a registrare un consumo massimo temporaneo di 246 W dall'adattatore CA da 200 W di medie dimensioni (~15,1 x 7,2 x 2,3 cm) quando la CPU e la GPU sono utilizzate al 100%. Questo valore scende rapidamente e si stabilizza a un livello più sicuro di 150 W, come mostra il grafico sottostante, a causa di problemi termici. Il sistema può comunque ricaricarsi a un ritmo ragionevole durante il gioco.
| Off / Standby | |
| Idle | |
| Sotto carico |
|
Leggenda:
min: | |
| Acer Predator Triton 300 SE i9-12900H, GeForce RTX 3060 Laptop GPU, Micron 3400 1TB MTFDKBA1T0TFH, OLED, 2880x1800, 14" | Asus ROG Zephyrus G14 GA402RJ R7 6800HS, Radeon RX 6700S, Micron 2450 1TB MTFDKBA1T0TFK, IPS, 2560x1600, 14" | Razer Blade 14 Ryzen 9 6900HX R9 6900HX, GeForce RTX 3070 Ti Laptop GPU, Samsung PM9A1 MZVL21T0HCLR, IPS, 2560x1440, 14" | Alienware x14 i7 RTX 3060 i7-12700H, GeForce RTX 3060 Laptop GPU, WDC PC SN810 1TB, IPS, 1920x1080, 14" | Schenker Vision 14 i7-11370H, GeForce RTX 3050 Ti Laptop GPU, Samsung SSD 980 Pro 1TB MZ-V8P1T0BW, IPS, 2880x1800, 14" | Acer Predator Triton 300 PT315-52-79LP i7-10750H, GeForce RTX 2060 Mobile, WDC PC SN730 SDBQNTY-1T00, IPS, 1920x1080, 15.6" | |
|---|---|---|---|---|---|---|
| Power Consumption | -24% | -34% | 15% | 22% | 12% | |
| Idle Minimum * (Watt) | 7.6 | 12 -58% | 10.2 -34% | 7.9 -4% | 6.7 12% | 4 47% |
| Idle Average * (Watt) | 12.3 | 18 -46% | 26 -111% | 11.1 10% | 12.6 -2% | 10 19% |
| Idle Maximum * (Watt) | 17.6 | 26 -48% | 26.7 -52% | 11.8 33% | 15.4 12% | 19 -8% |
| Load Average * (Watt) | 111 | 88 21% | 89.3 20% | 107.4 3% | 85.7 23% | 96 14% |
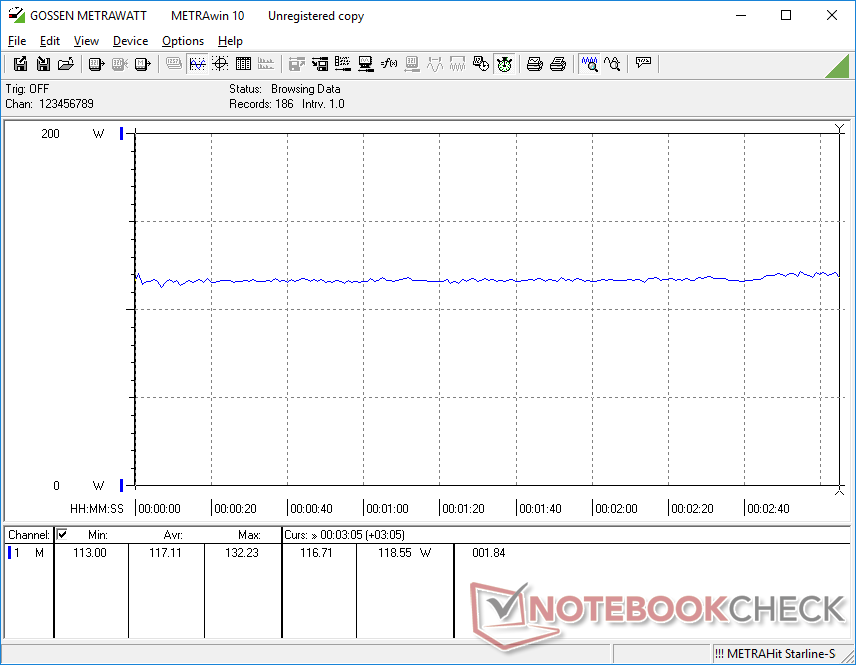
| Witcher 3 ultra * (Watt) | 117.1 | 157.7 -35% | 158.7 -36% | 111 5% | 83 29% | 136 -16% |
| Load Maximum * (Watt) | 245.8 | 194 21% | 227.5 7% | 140.4 43% | 110.9 55% | 214 13% |
* ... Meglio usare valori piccoli
Power Consumption Witcher 3 / Stresstest
Power Consumption external Monitor
Durata della batteria: non male per dimensioni e potenza
La durata media è di poco più di 6 ore di navigazione WLAN nel mondo reale con il profilo energetico Bilanciato. Tuttavia, la maggior parte degli altri portatili da 14 pollici può durare anche di più, come l'Asus ROG Zephyrus G14 o il Razer Blade 14, con diverse ore in più ciascuno. La CPU Intel più assetata di energia e il pannello OLED sono probabilmente responsabili della minore durata complessiva della batteria.
La ricarica da vuoto a pieno regime è relativamente lenta, 2 ore. Inoltre, il sistema non può essere ricaricato tramite USB-C.
| Acer Predator Triton 300 SE i9-12900H, GeForce RTX 3060 Laptop GPU, 76 Wh | Asus ROG Zephyrus G14 GA402RJ R7 6800HS, Radeon RX 6700S, 76 Wh | Razer Blade 14 Ryzen 9 6900HX R9 6900HX, GeForce RTX 3070 Ti Laptop GPU, 62 Wh | Alienware x14 i7 RTX 3060 i7-12700H, GeForce RTX 3060 Laptop GPU, 80 Wh | Dell Inspiron 14 Plus 7420 i7-12700H, GeForce RTX 3050 4GB Laptop GPU, 64 Wh | Schenker Vision 14 i7-11370H, GeForce RTX 3050 Ti Laptop GPU, 53 Wh | |
|---|---|---|---|---|---|---|
| Autonomia della batteria | 65% | 42% | 3% | 11% | -2% | |
| Reader / Idle (h) | 8.1 | 12.2 51% | 11.9 47% | |||
| WiFi v1.3 (h) | 6.2 | 10.2 65% | 9.5 53% | 8.9 44% | 7.2 16% | 5.5 -11% |
| Load (h) | 1.3 | 1.6 23% | 0.8 -38% | 0.9 -31% | 1.4 8% | |
| H.264 (h) | 9.4 | 6.8 | ||||
| Witcher 3 ultra (h) | 0.8 |
Pro
Contro
Verdetto - Buono, ma non abbastanza
Il Predator Triton 300 SE da 14 pollici deve affrontare un'agguerrita concorrenza con l'Asus Zephyrus G14, il Blade 14 o l'Alienware x14 Asus Zephyrus G14, Razer Blade 14e Alienware x14. Se confrontato con lo Zephyrus G14, il portatile Asus è spesso su vendita per centinaia di dollari in meno, pur offrendo lo stesso livello di prestazioni grafiche e un peso e dimensioni quasi identici. Rispetto al Blade 14, il portatile di Razer è probabilmente più elegante grazie al design più sottile e all'illuminazione RGB per ogni tasto. Infine, l'Alienware x14 integra tasti della tastiera più solidi e un profilo ancora più sottile. Tutte queste macchine hanno prestazioni SSD migliori rispetto all'Acer.
L'Acer Predator Triton 300 SE è un portatile da gioco particolarmente potente, indipendentemente dalle dimensioni. Tuttavia, altri portatili da gioco da 14 pollici lo battono per quanto riguarda la rumorosità della ventola e le prestazioni dell'SSD.
Il sistema Acer è anche più rumoroso delle tre alternative sopra citate quando si eseguono giochi. Ci rendiamo conto che la modalità Turbo sarà rumorosa in ogni caso, ma il fatto che sia molto più rumorosa della concorrenza mette a dura prova il sistema. La modalità Turbo deve essere attivata per sfruttare appieno la GPU dell'Acer.
Ci sono alcune qualità che lo riscattano, come il pannello OLED 16:10 a 90 Hz, la veloce CPU Core i9 e il supporto per Thunderbolt 4, tutti elementi che non sono disponibili sul Razer Blade 14 e sulla maggior parte dei modelli Asus Zephyrus G14. In effetti, il Predator Triton 300 SE è uno degli unici portatili da gioco 16:10 nella categoria dei 14 pollici al momento. Tuttavia, se queste caratteristiche uniche non sono una priorità, vale la pena considerare lo Zephyrus G14, il Blade 14 o l'Alienware x14.
Prezzo e disponibilità
Il Predator Triton 300 SE da 14 pollici è ora ampiamente disponibile presso rivenditori quali Amazon, Best Buye Newegg al prezzo di circa 2000 dollari se configurato come l'unità oggetto della nostra recensione. SKU inferioricon CPU Core i7 sono disponibili a 1600 dollari.
Acer Predator Triton 300 SE
- 11/02/2022 v7 (old)
Allen Ngo
Price comparison

