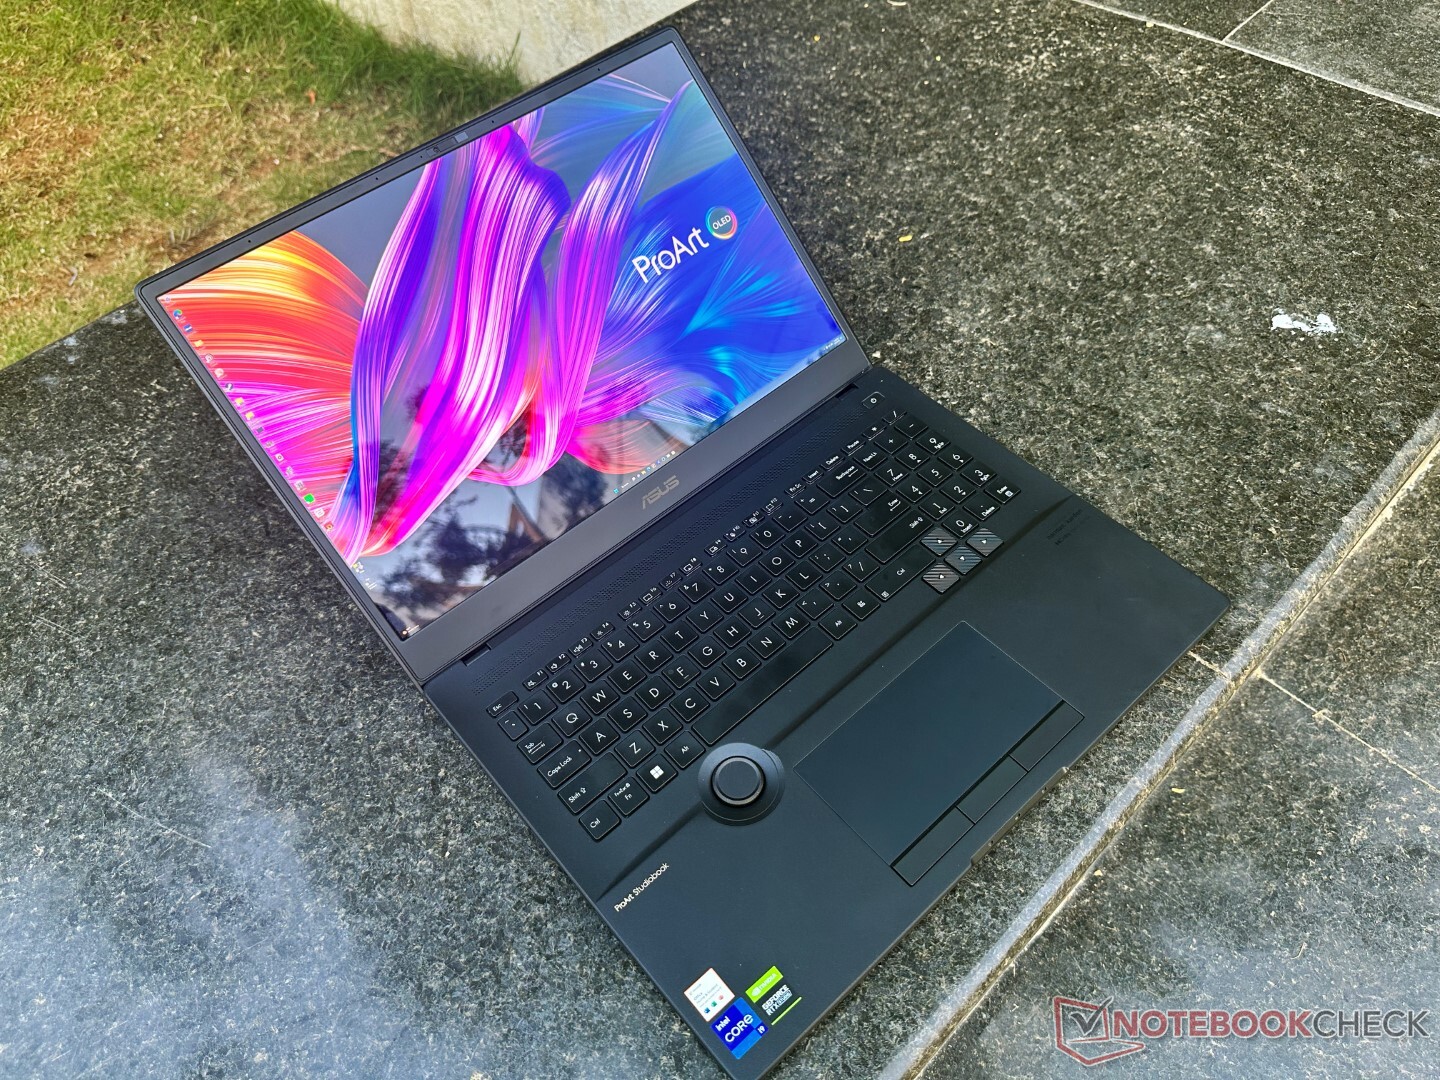
Recensione dell'Asus ProArt StudioBook 16 H7600ZW: L'alternativa definitiva al MacBook Pro per i creatori di contenuti

La linea Asus ProArt si rivolge ai professionisti creativi che necessitano di hardware di alto livello per una produttività senza ostacoli. Il ProArt StudioBook vuole essere il sostituto del MacBook Pro per i creativi sul lato Windows ed è dotato di caratteristiche uniche pensate per i creativi in movimento.
Abbiamo già recensito il ProArt StudioBook 16 Pro W7600 workstation con processore Intel Xeon W-11955 Intel Xeon W-11955M e una GPU Nvidia RTX A5000. Ora abbiamo il ProArt StudioBook 16 H7600ZW con un processore Intel Core i9-12900H Intel Core i9-12900H e una GPU per computer portatili Nvidia GeForce RTX 3070 Ti.
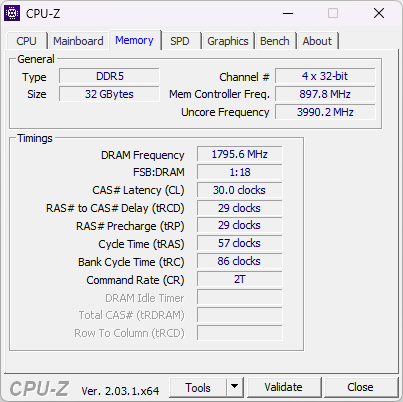
Il nostro esemplare di prova è dotato anche di 32 GB di RAM DDR5-4800, un pannello OLED 4K Samsung da 16 pollici e uno storage PCIe da 1 TB. Asus ha fissato il prezzo di questa configurazione a partire da ₹1.99.990 MRP o da US$2.699,99 negli Stati Uniti.
Sfortunatamente, Asus ha saltato del tutto le opzioni Ryzen 6000 o Ryzen 7000 per la serie ProArt. L'unica SKU basata su Ryzen attualmente disponibile è il ProArt StudioBook 16 OLED H5600 con un Ryzen 9 5900HX e GPU RTX 3070. La recensione di questa variante seguirà a breve.
Tuttavia, Asus ha presentato ilProArt StudioBook 16 3D OLEDal CES 2023 con aggiornamenti del pannello Intel 13th gen e 3D OLED, che speriamo di recensire nelle prossime settimane.
In questa recensione, abbiamo messo alla prova l'Asus ProArt StudioBook 16 H7600ZW per vedere se questo portatile ha davvero il potenziale per far fluire la vostra creatività senza ostacoli.
Potenziali concorrenti a confronto
Punteggio | Data | Modello | Peso | Altezza | Dimensione | Risoluzione | Prezzo |
|---|---|---|---|---|---|---|---|
| 89 % v7 (old) | 02/2023 | Asus ProArt StudioBook 16 H7600ZW i9-12900H, GeForce RTX 3070 Ti Laptop GPU | 2.4 kg | 19.9 mm | 16.00" | 3840x2400 | |
| 83.8 % v7 (old) | 09/2022 | MSI Creator Z17 A12UGST-054 i9-12900H, GeForce RTX 3070 Ti Laptop GPU | 2.5 kg | 19 mm | 17.00" | 2560x1600 | |
| 83.7 % v7 (old) | 06/2022 | MSI Creator Z16P B12UHST i9-12900H, GeForce RTX 3080 Ti Laptop GPU | 2.4 kg | 20.4 mm | 16.00" | 2560x1600 | |
| 86.3 % v7 (old) | 06/2022 | Asus ROG Strix Scar 15 G533ZW-LN106WS i9-12900H, GeForce RTX 3070 Ti Laptop GPU | 2.3 kg | 27.2 mm | 15.60" | 2560x1440 | |
| 88.4 % v7 (old) | 12/2022 | Asus ZenBook Pro 16X OLED UX7602ZM-ME115W i9-12900H, GeForce RTX 3060 Laptop GPU | 2.4 kg | 19.5 mm | 16.00" | 3840x2400 | |
| 84.7 % v7 (old) | 03/2022 | Gigabyte Aero 16 YE5 i9-12900HK, GeForce RTX 3080 Ti Laptop GPU | 2.3 kg | 22.4 mm | 16.00" | 3840x2400 | |
| 87.9 % v7 (old) | 10/2022 | Lenovo ThinkBook 16p G3 ARH R9 6900HX, GeForce RTX 3060 Laptop GPU | 2.1 kg | 19.5 mm | 16.00" | 2560x1600 | |
| 88.2 % v7 (old) | 05/2022 | Asus ROG Zephyrus Duo 16 GX650RX R9 6900HX, GeForce RTX 3080 Ti Laptop GPU | 2.6 kg | 20.5 mm | 16.00" | 3840x2400 | |
| 93.2 % v7 (old) | 11/2021 | Apple MacBook Pro 16 2021 M1 Pro M1 Pro, M1 Pro 16-Core GPU | 2.2 kg | 16.8 mm | 16.20" | 3456x2234 | |
| 92.1 % v7 (old) | 04/2022 | Apple MacBook Pro 14 2021 M1 Max 24-Core GPU M1 Max, M1 Max 24-Core GPU | 1.6 kg | 15.5 mm | 14.20" | 3024x1964 |
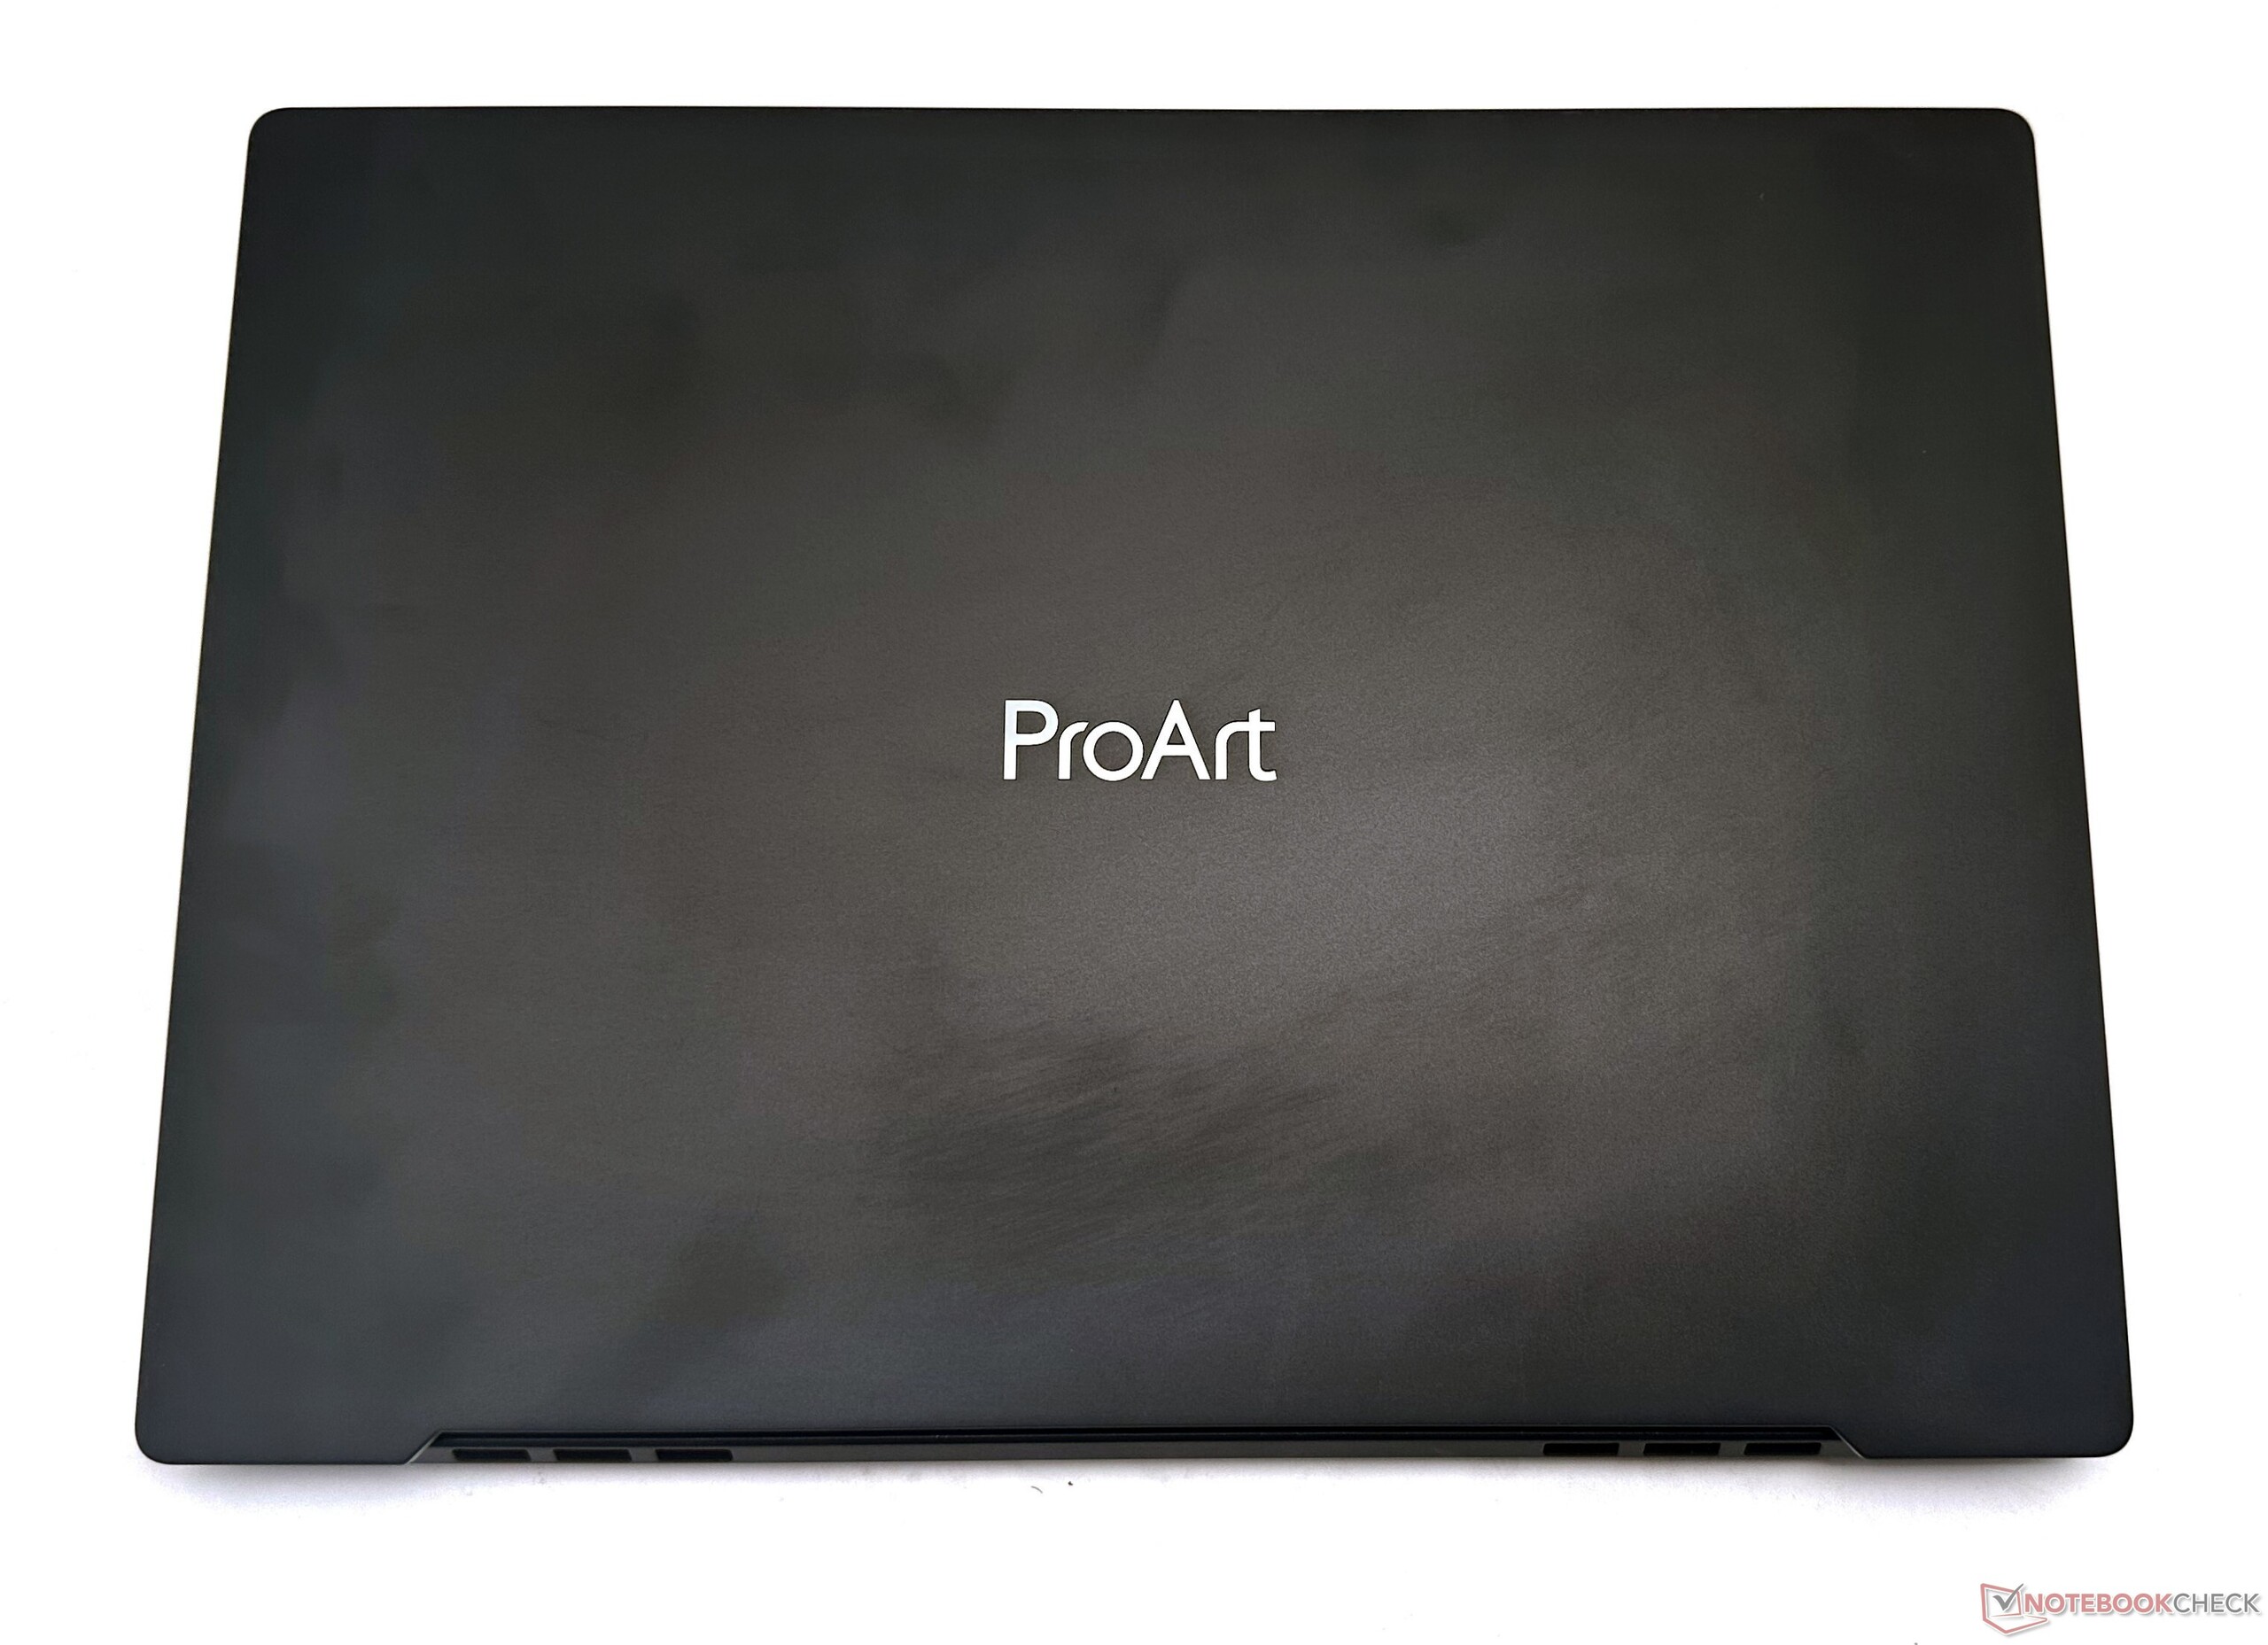
Cassa: Lega di alluminio che ispira fiducia
Lo chassis e l'aptica sono esattamente identici a quelli del ProArt StudioBook 16 Pro W7600. Il portatile è piuttosto pesante (2,4 kg), ma l'equa distribuzione del peso sullo chassis da 16 pollici sottile 0,78 pollici ispira fiducia nella gestione quotidiana.
In particolare, ci piace il design rialzato che consente una digitazione più confortevole e un flusso d'aria senza ostacoli. Non ci sono spigoli vivi e non abbiamo riscontrato alcuna oscillazione del display. Anche il coperchio è abbastanza resistente alle torsioni. Il coperchio può essere aperto con un dito fino a 150° senza problemi di stabilità.
La parte superiore del piano tastiera è dotata di prese d'aria. Il piano è ben costruito e non presenta alcuna flessione percepibile. Sul fondo sono presenti tre indicatori di stato per l'alimentazione, la batteria e l'attività dell'SSD.
Asus sostiene che il coperchio opaco con colorazione Mineral Black è dotato di un "nano-rivestimento high-tech anti-impronte". Sebbene le impronte digitali non siano visibili, il coperchio non è immune alla sporcizia e non è oleofobico.
Il ProArt StudioBook 16 soddisfa anche i criteri MIL-STD-810H per la durata e può facilmente resistere ai capricci del lavoro all'aria aperta.
Nel complesso, l'Asus ProArt StudioBook 16 non emana esattamente vibrazioni da MacBook Pro, ma la costruzione in lega di alluminio è decisamente di qualità, minimalista e ben si sposa con il prezzo richiesto.
Connettività: Velocità di trasmissione Wi-Fi 6E lenta e incoerente
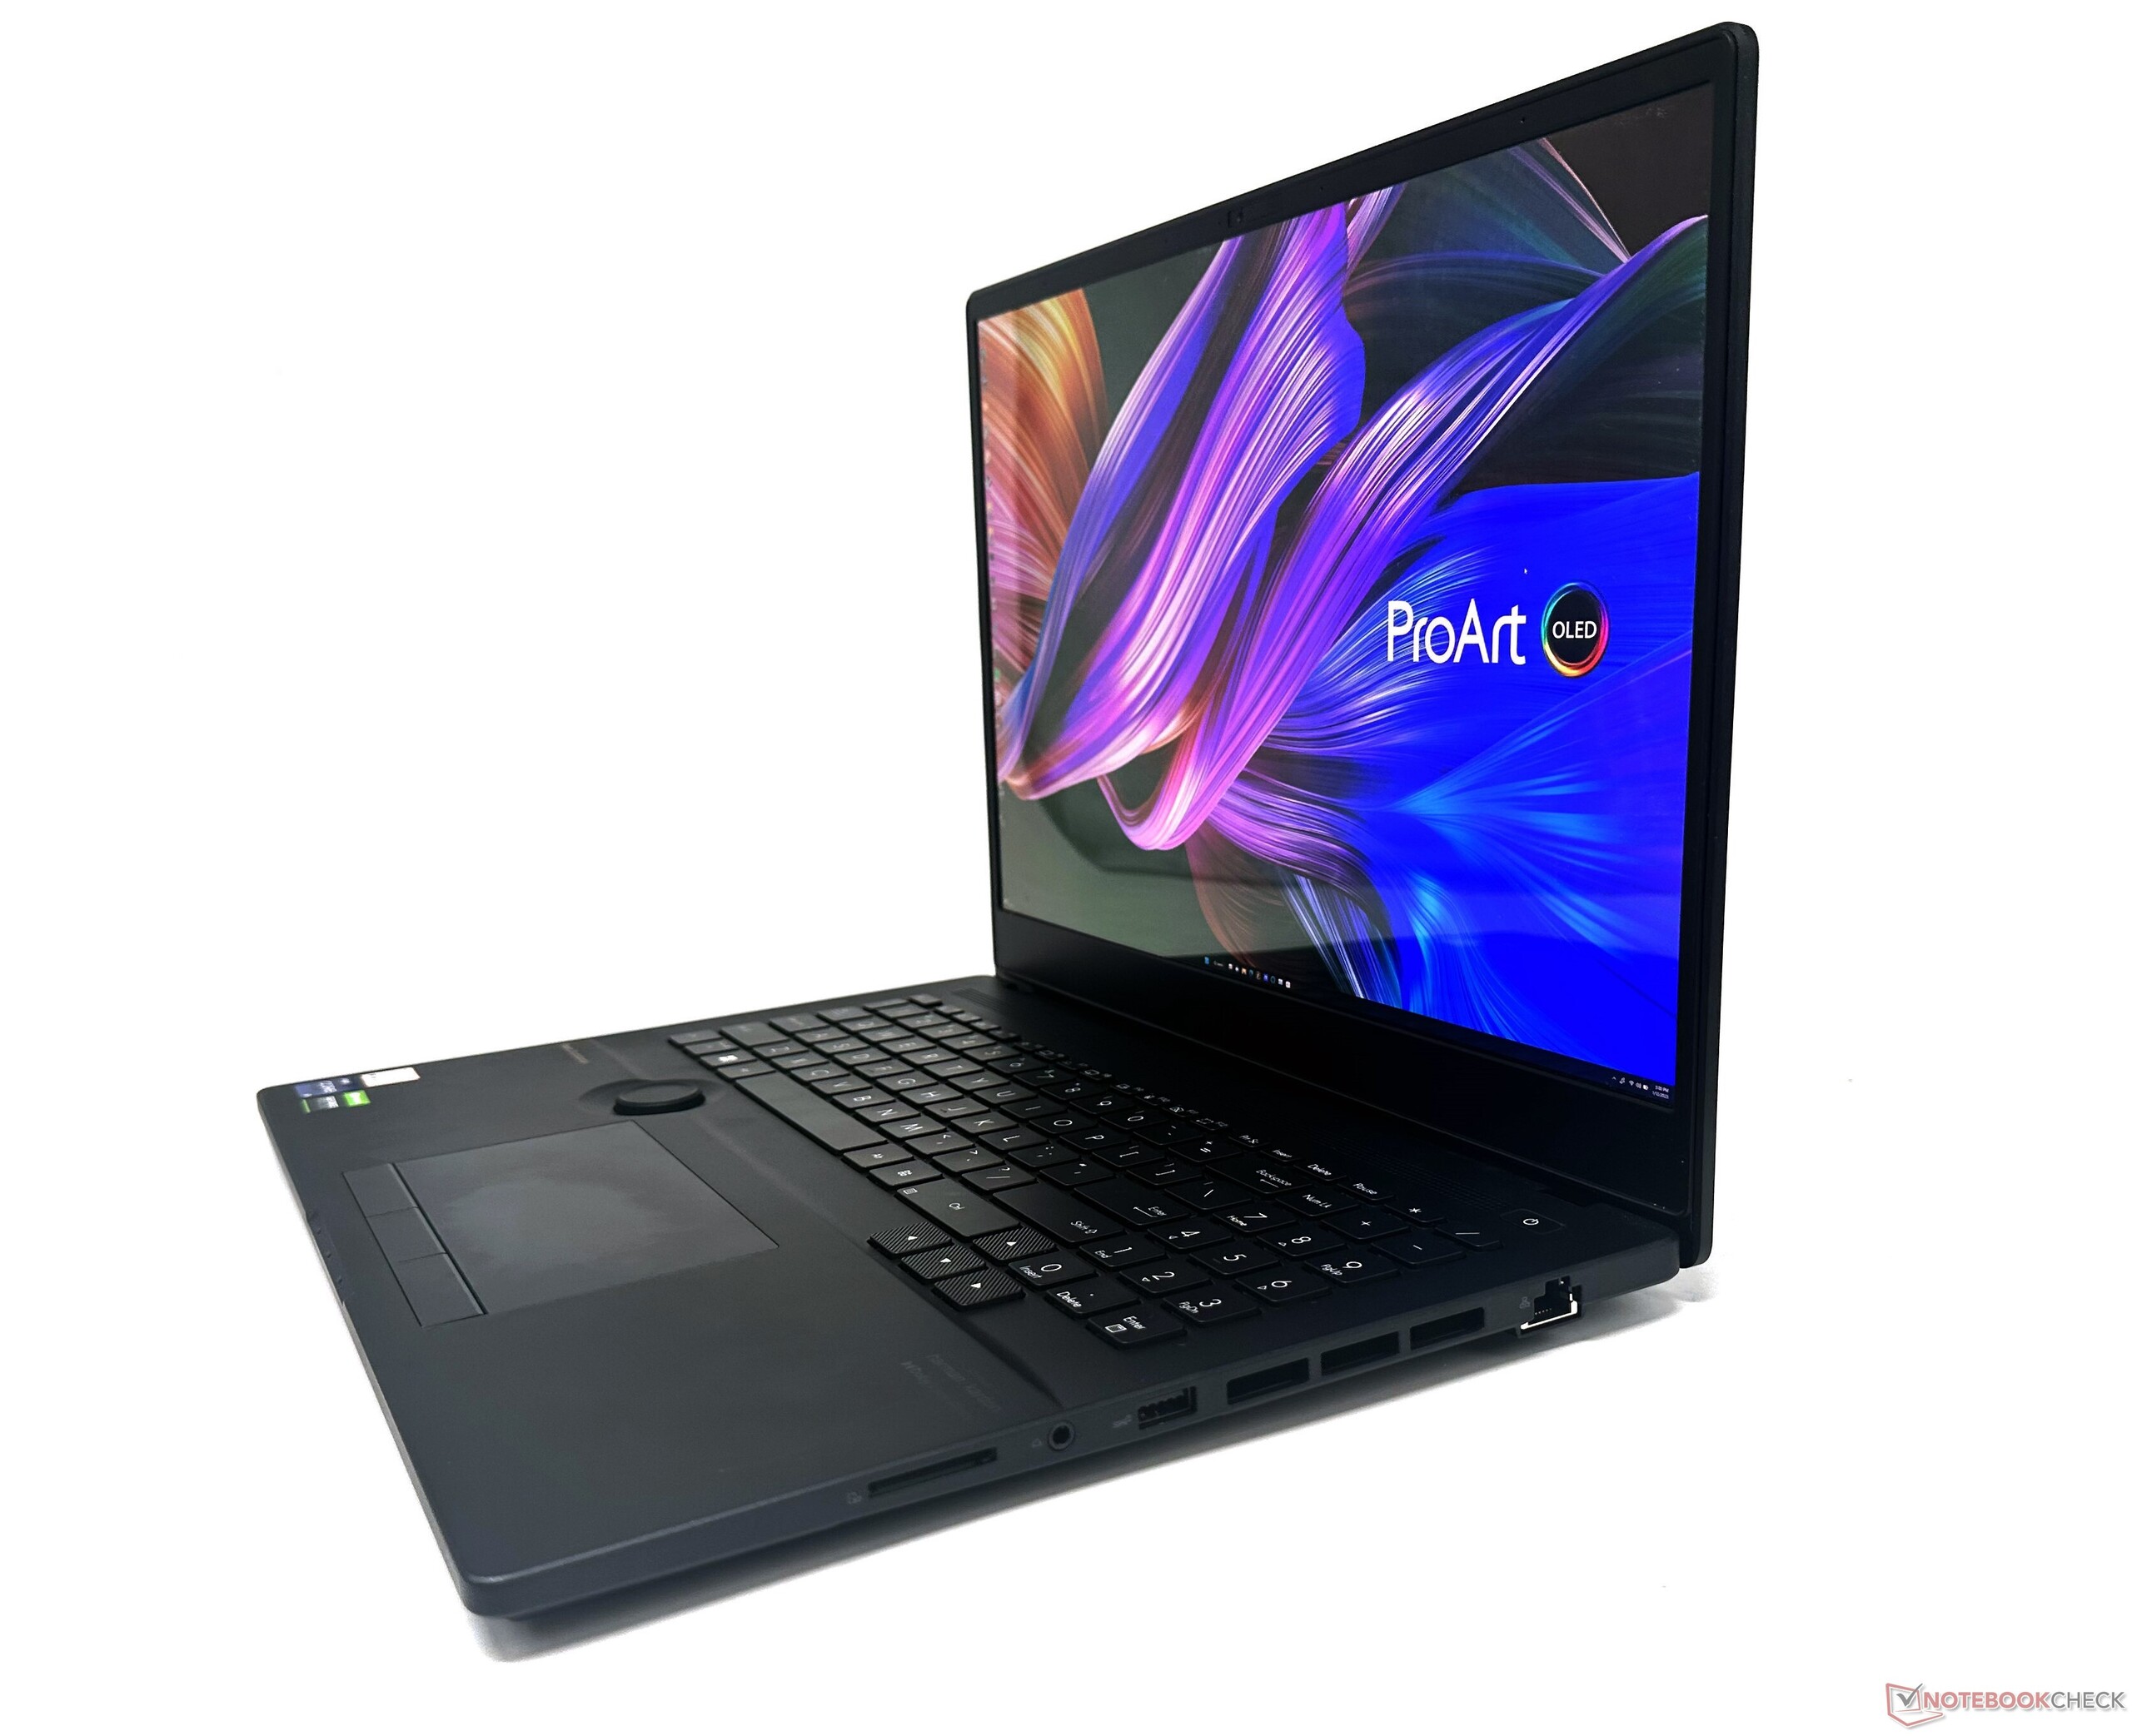
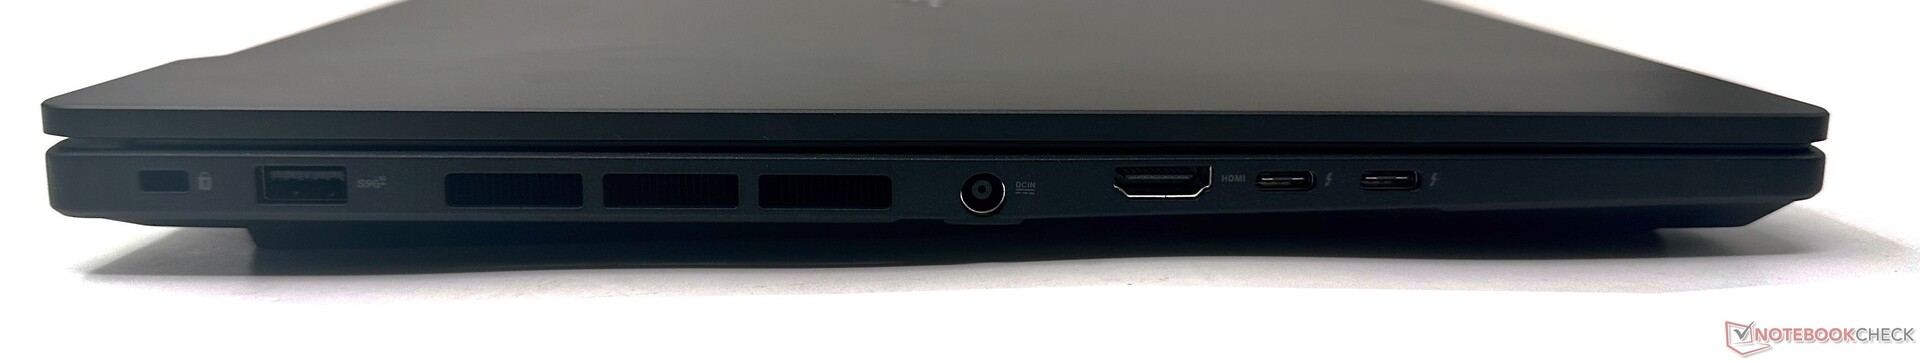
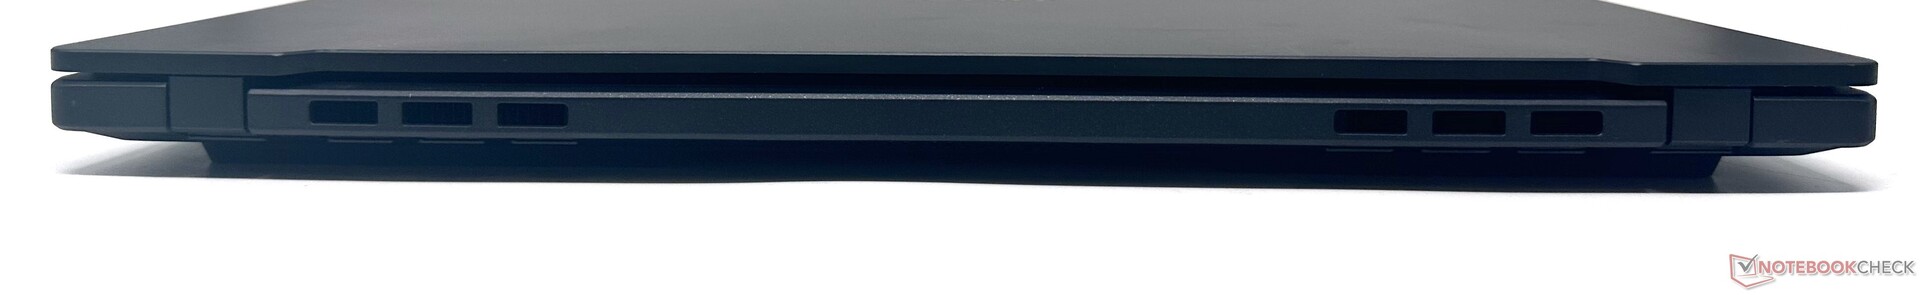
La selezione di porte dell'Asus ProArt StudioBook 16 è decente ma non molto ampia. Asus rinuncia completamente alle porte USB 2.0. Al suo posto ci sono due porte USB 3.2 Gen2 Type-A, una su entrambi i lati.
In virtù della piattaforma Intel, sono disponibili anche un paio di porte Thunderbolt 4 sulla sinistra. Sono inoltre disponibili un'uscita HDMI 2.1 e una porta LAN da 2,5 Gb.
La parte posteriore non offre alcuna connettività. Trattandosi di un portatile orientato ai creatori, sarebbe stato probabilmente più sensato collocare le porte Thunderbolt 4 sul retro invece di stiparle entrambe sul lato sinistro dello chassis. In questo modo si sarebbe evitato di ingombrare l'area di lavoro principale con dock e altri accessori.
Ciononostante, non abbiamo riscontrato particolari ostacoli durante il collegamento di più periferiche.
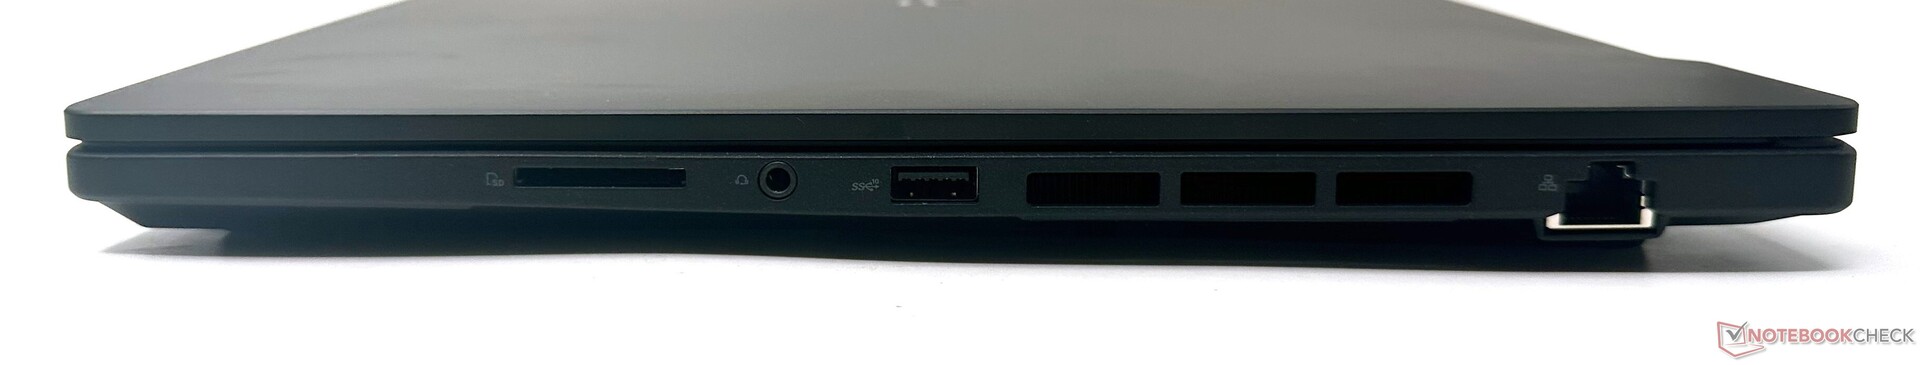
Lettore di schede SD
Asus equipaggia il ProArt StudoBook 16 con un lettore di schede SD Express 7.0. Il lettore di schede offre una velocità di trasferimento decente, vicina alla media della categoria e simile a quella dei lettori di schede Lenovo Lenovo ThinkBook 16p Gen 3 e dell' Asus ZenBook Pro 16X OLED.
Tuttavia, non si tratta delle prestazioni più veloci per le schede SD che abbiamo visto - il merito va al ROG Zephyrus Duo 16 e al 2021 Apple MacBook Pro 16.
| SD Card Reader | |
| average JPG Copy Test (av. of 3 runs) | |
| Asus ROG Zephyrus Duo 16 GX650RX (AV PRO microSD 128 GB V60) | |
| Media della classe Multimedia (23 - 531, n=40, ultimi 2 anni) | |
| Apple MacBook Pro 16 2021 M1 Pro (Angelbird AV Pro V60) | |
| MSI Creator Z17 A12UGST-054 (AV Pro SD microSD 128 GB V60) | |
| MSI Creator Z16P B12UHST (AV PRO microSD 128 GB V60) | |
| Lenovo ThinkBook 16p G3 ARH (AV PRO microSD 128 GB V60) | |
| Asus ProArt StudioBook 16 H7600ZW (AV PRO microSD 128 GB V60) | |
| Asus ZenBook Pro 16X OLED UX7602ZM-ME115W (AV Pro SD microSD 128 GB V60) | |
| maximum AS SSD Seq Read Test (1GB) | |
| Media della classe Multimedia (37.3 - 1455, n=39, ultimi 2 anni) | |
| Asus ROG Zephyrus Duo 16 GX650RX (AV PRO microSD 128 GB V60) | |
| Lenovo ThinkBook 16p G3 ARH (AV PRO microSD 128 GB V60) | |
| Asus ProArt StudioBook 16 H7600ZW (AV PRO microSD 128 GB V60) | |
| Asus ZenBook Pro 16X OLED UX7602ZM-ME115W (AV Pro SD microSD 128 GB V60) | |
| MSI Creator Z17 A12UGST-054 (AV Pro SD microSD 128 GB V60) | |
Comunicazione
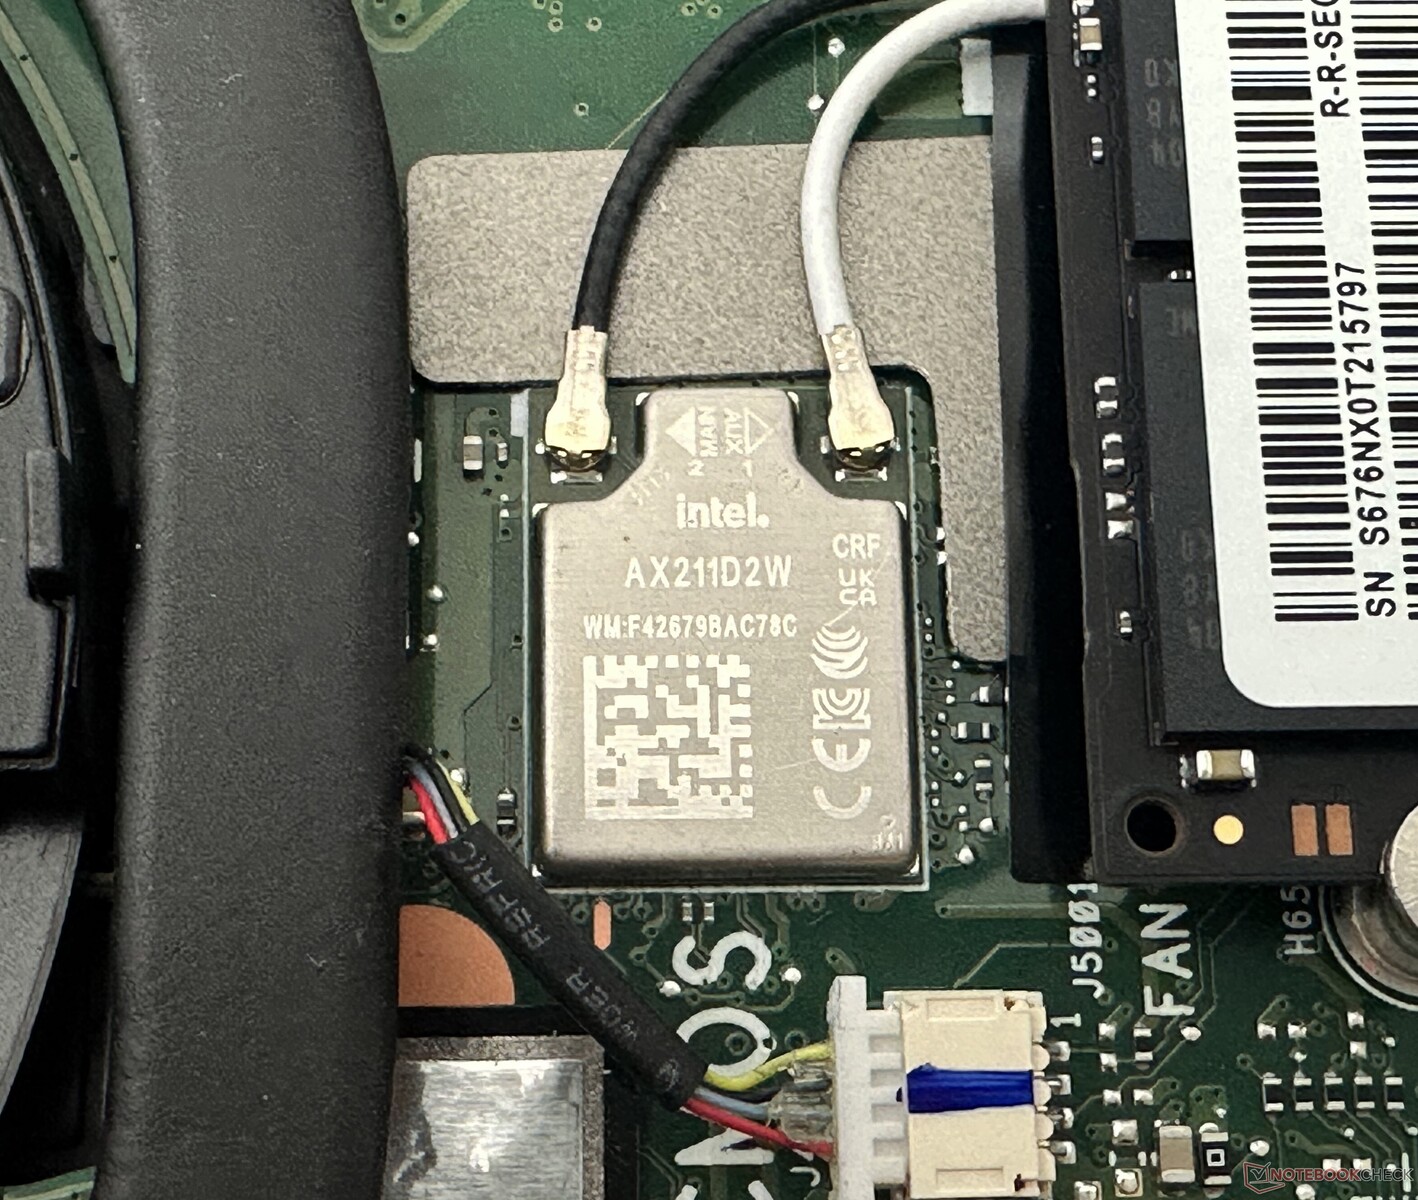
Il ProArt StudioBook 16 è dotato di una scheda WLAN Intel Wi-Fi 6E AX211, che purtroppo è saldata sulla scheda madre. Abbiamo testato le prestazioni Wi-Fi in entrambe le bande 5 GHz e 6 GHz con il nostro router di riferimento Asus ROG Rapture GT-AXE11000 a una distanza di 1 m dal portatile, senza altri dispositivi collegati o interferenze esterne.
Il portatile ha mostrato una velocità di trasferimento decente nello spettro dei 5 GHz, generalmente in linea con la concorrenza. La banda dei 6 GHz, invece, si comporta piuttosto male, in particolare nel test di trasmissione, con molta instabilità. Abbiamo riscontrato questa situazione anche dopo diverse ripetizioni.
Webcam
Il ProArt StudioBook 16 non dispone di una webcam di qualità. La qualità dell'immagine della fotocamera a 720p inclusa non è niente di eccezionale.
Le immagini mostrano grandi deviazioni di colore e mancano di nitidezza e di dettagli, anche se possono essere quasi sufficienti per una o due videochiamate in presenza di una luce ambientale adeguata. È possibile disattivare la webcam tramite una scorciatoia sul tasto F11.
Asus avrebbe potuto facilmente fornire un modulo a 1080p per il prezzo richiesto.


Sicurezza
Il ProArt StudioBook 16 è dotato di un otturatore fisico per la webcam e offre una telecamera IR per i login basati su Windows Hello. Non c'è un lettore di impronte digitali, ma sono presenti un chip TPM 2.0 e uno slot per il lucchetto Kensington.
Manutenzione
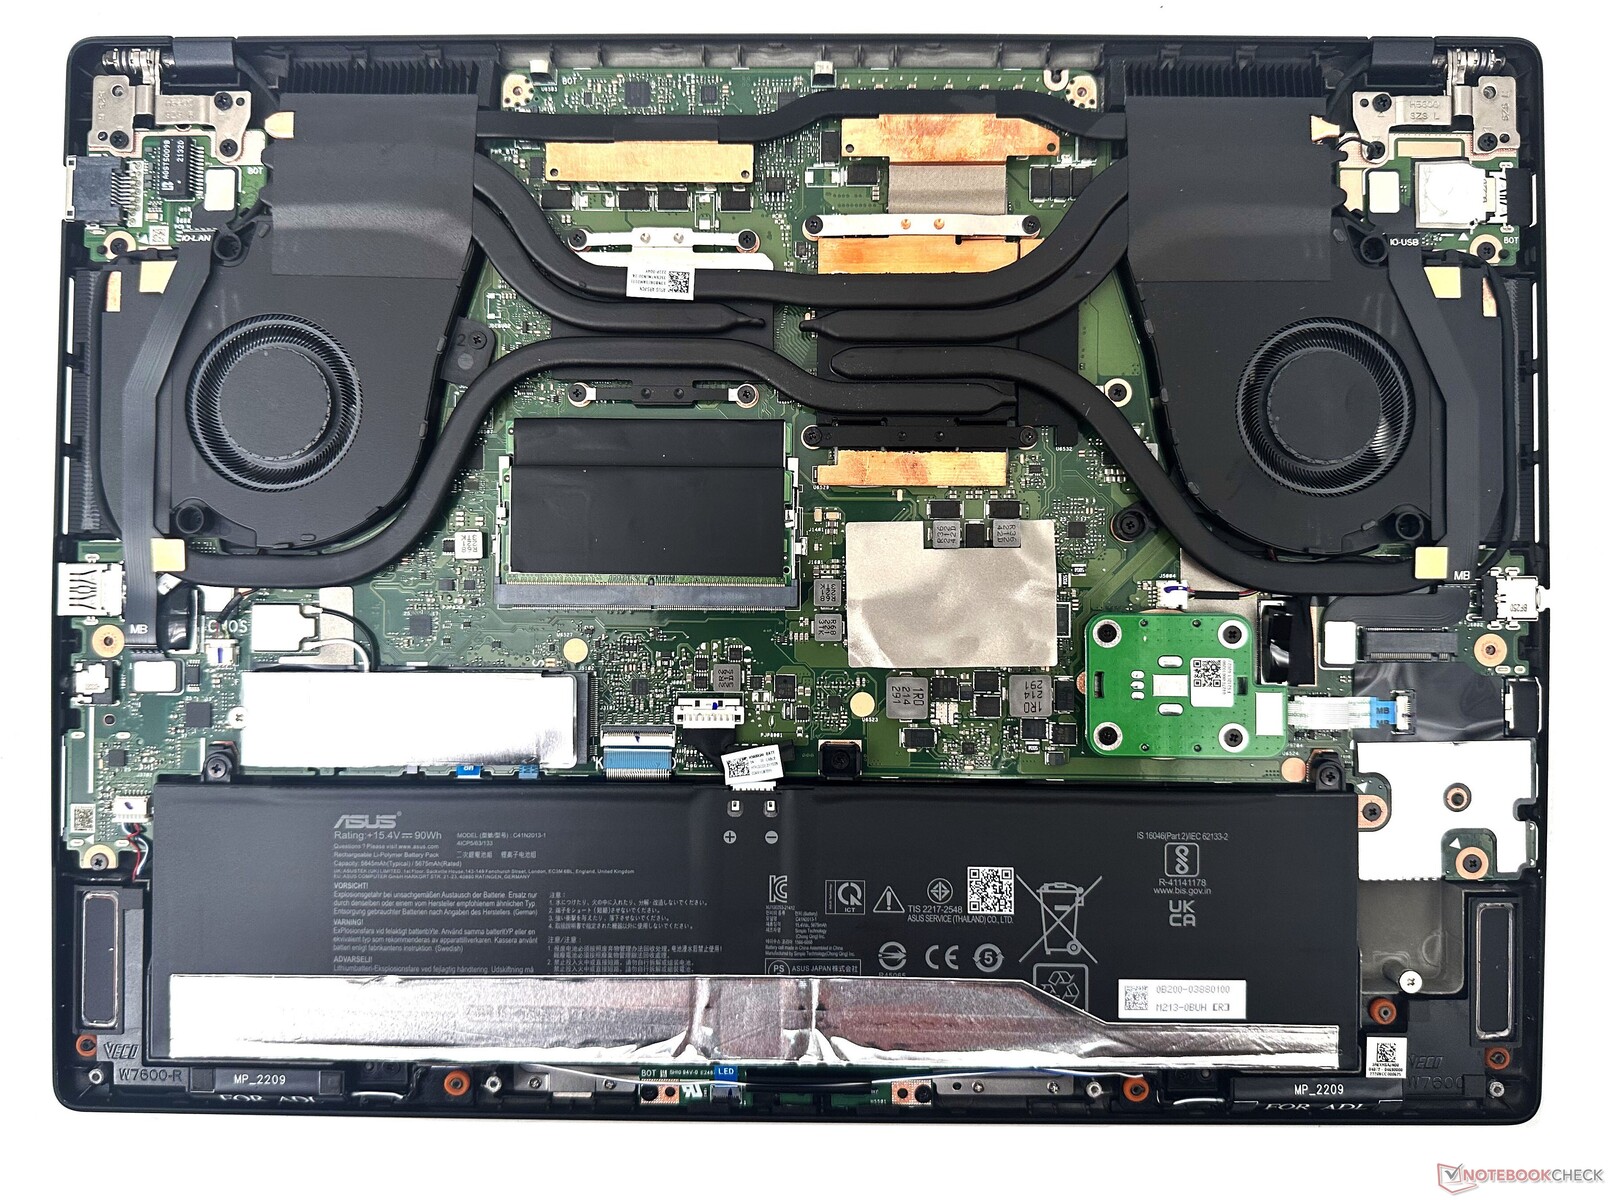
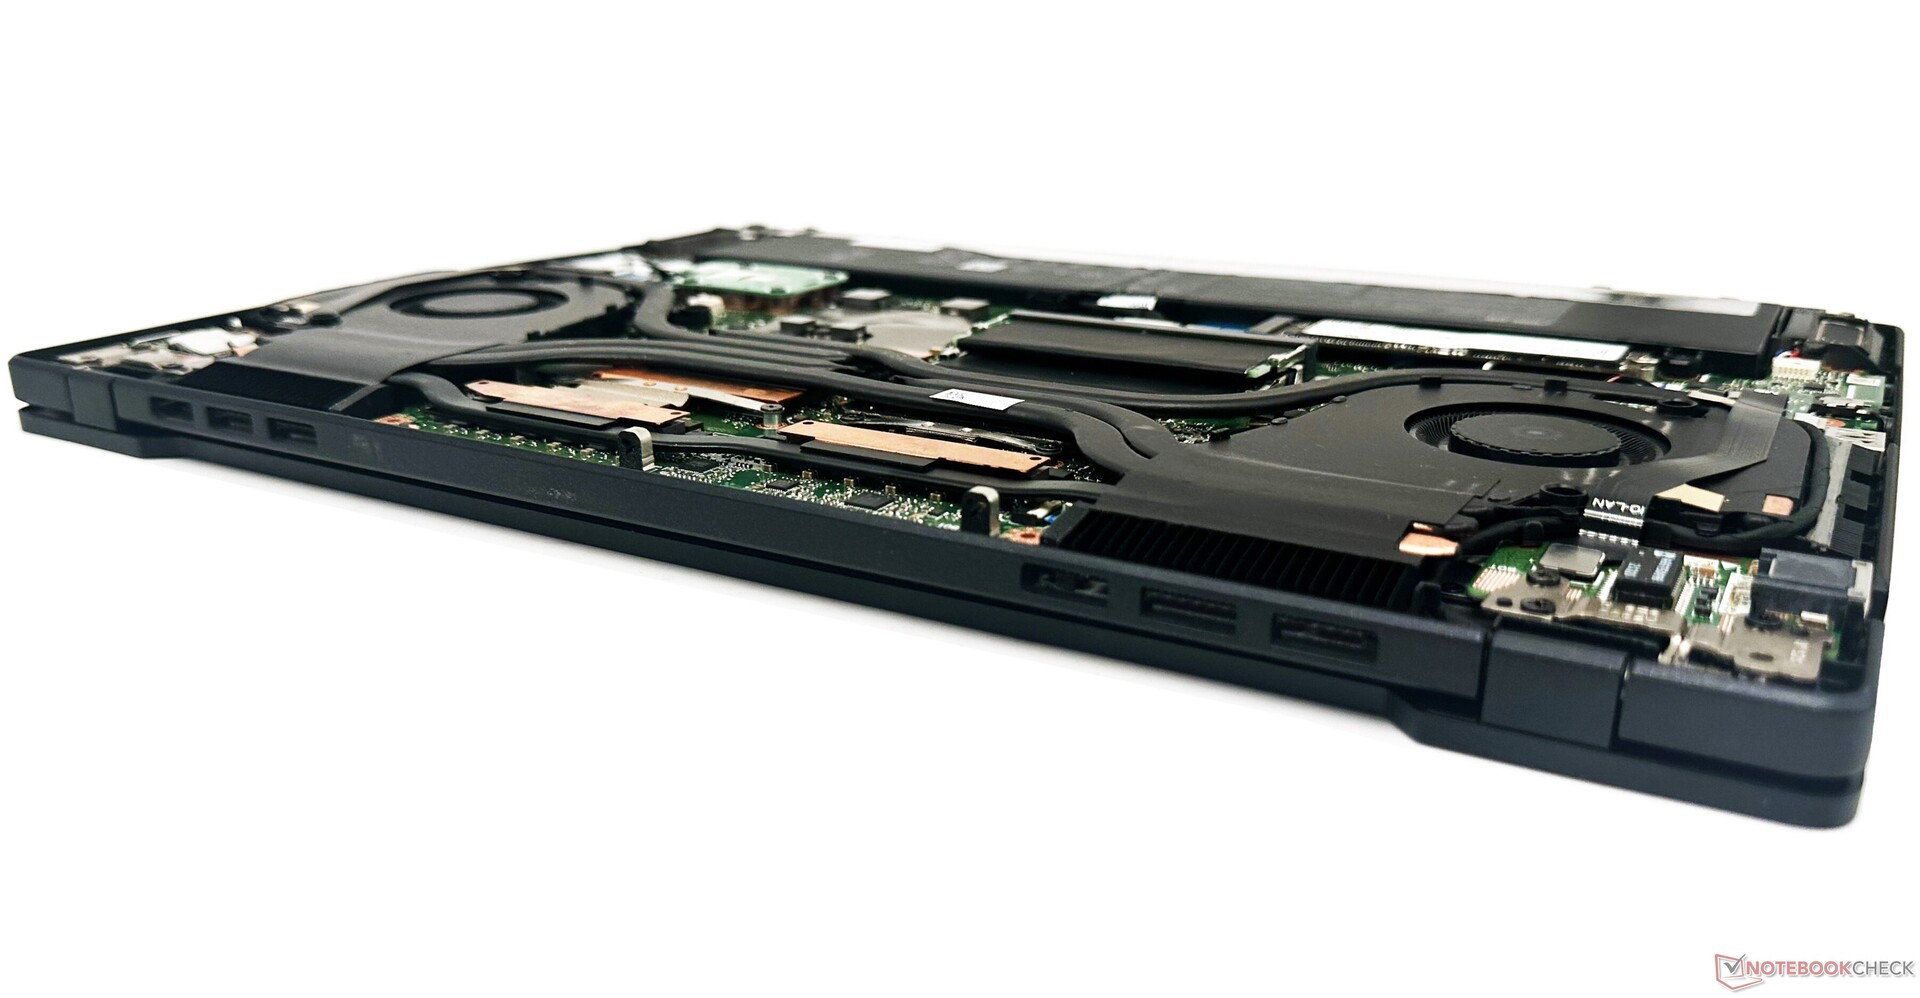
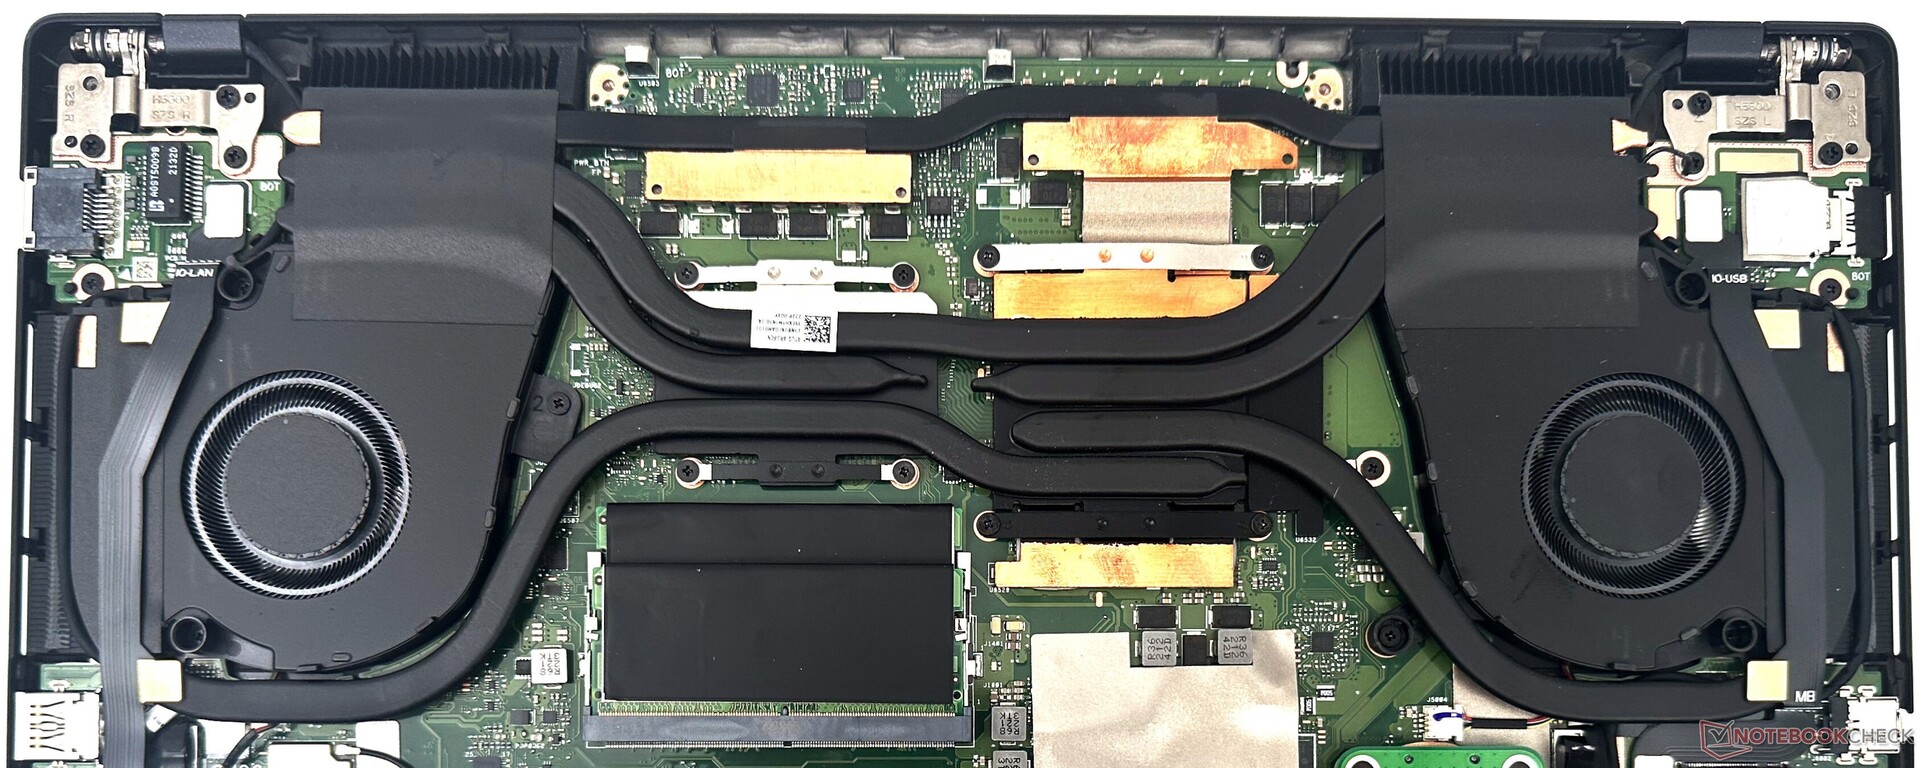
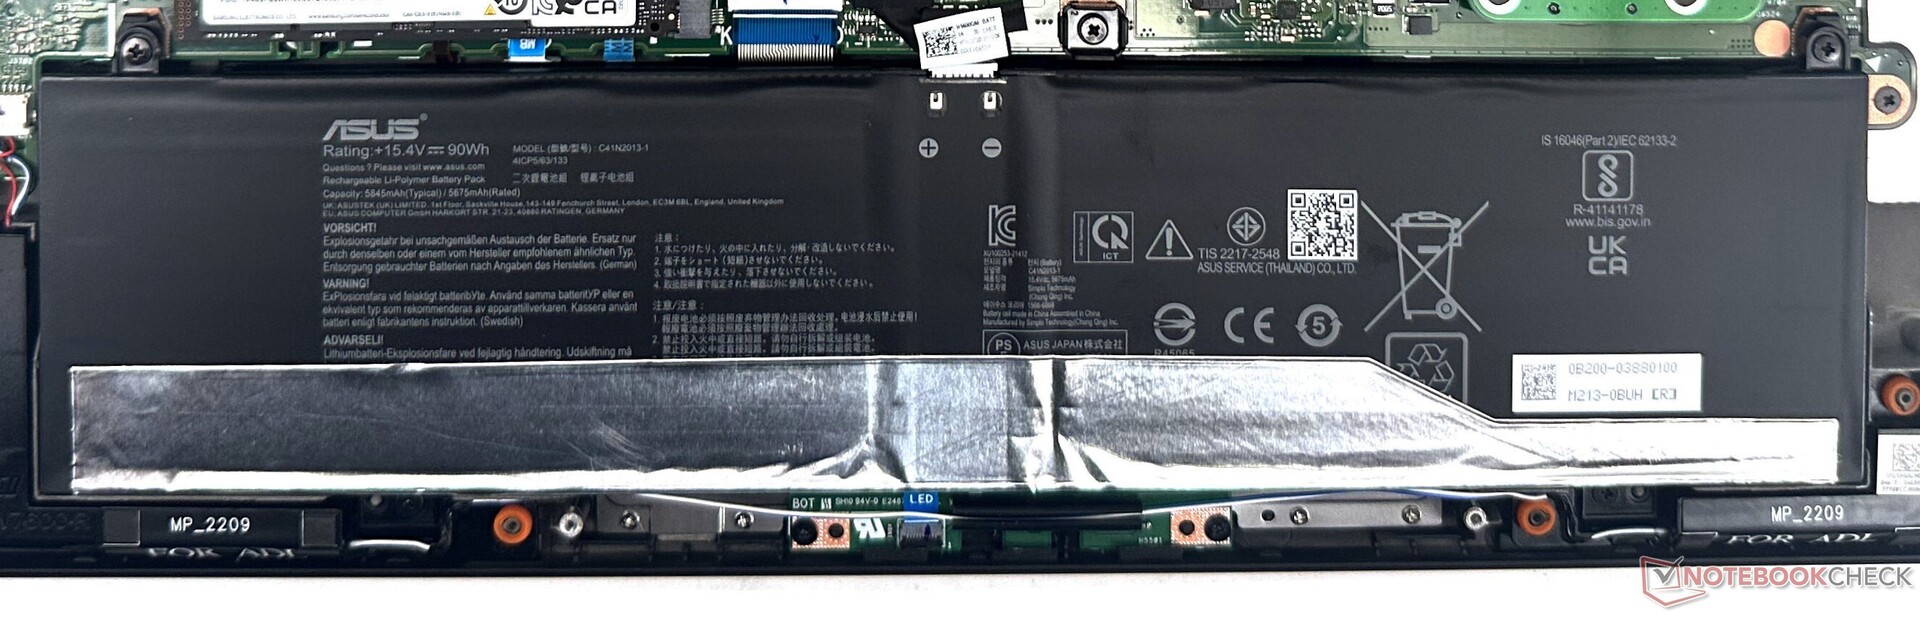
Il ProArt StudioBook 16 offre una buona possibilità di manutenzione. Per accedere ai componenti interni è necessario rimuovere le 13 strane viti Torx T5 sul pannello posteriore. Lo chassis spazioso offre una buona separazione tra i vari componenti.
La RAM e l'unità SSD NVMe possono essere sostituite o aggiornate, mentre la scheda Wi-Fi è saldata. La batteria può essere svitata se necessario. È presente anche un PCB separato per il quadrante Asus.
Accessori e garanzia
La confezione contiene l'alimentatore da 240 W e i documenti di rito. Inoltre, Asus fornisce un utile zaino progettato per i creativi in movimento.
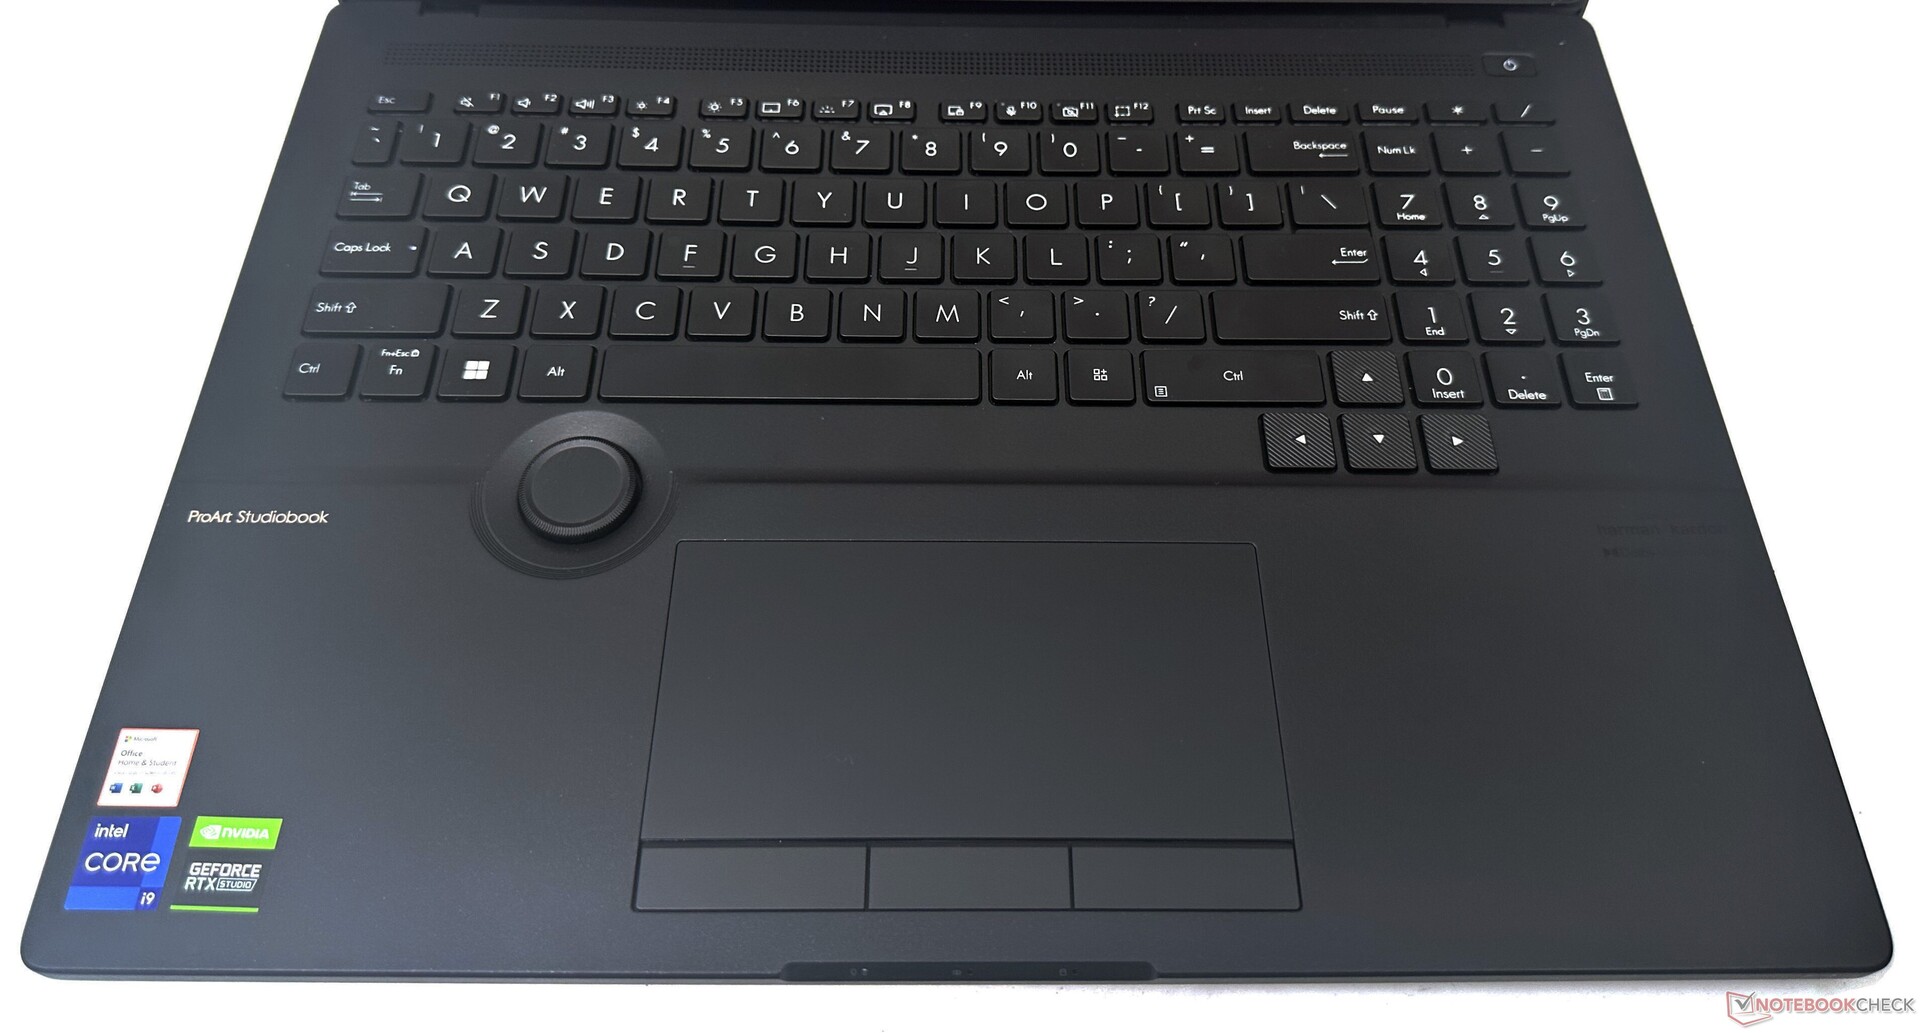
Dispositivi di input: Il touchpad ha una mente propria
Tastiera
La tastiera chiclet retroilluminata a grandezza naturale è spaziosa, con tasti freccia di dimensioni adeguate. La distanza di corsa di 1,4 mm rende la digitazione abbastanza confortevole, con un feedback tattile decente e un basso rumore. La riga superiore offre scorciatoie per le funzioni più comuni, tra cui la regolazione della retroilluminazione a tre livelli.
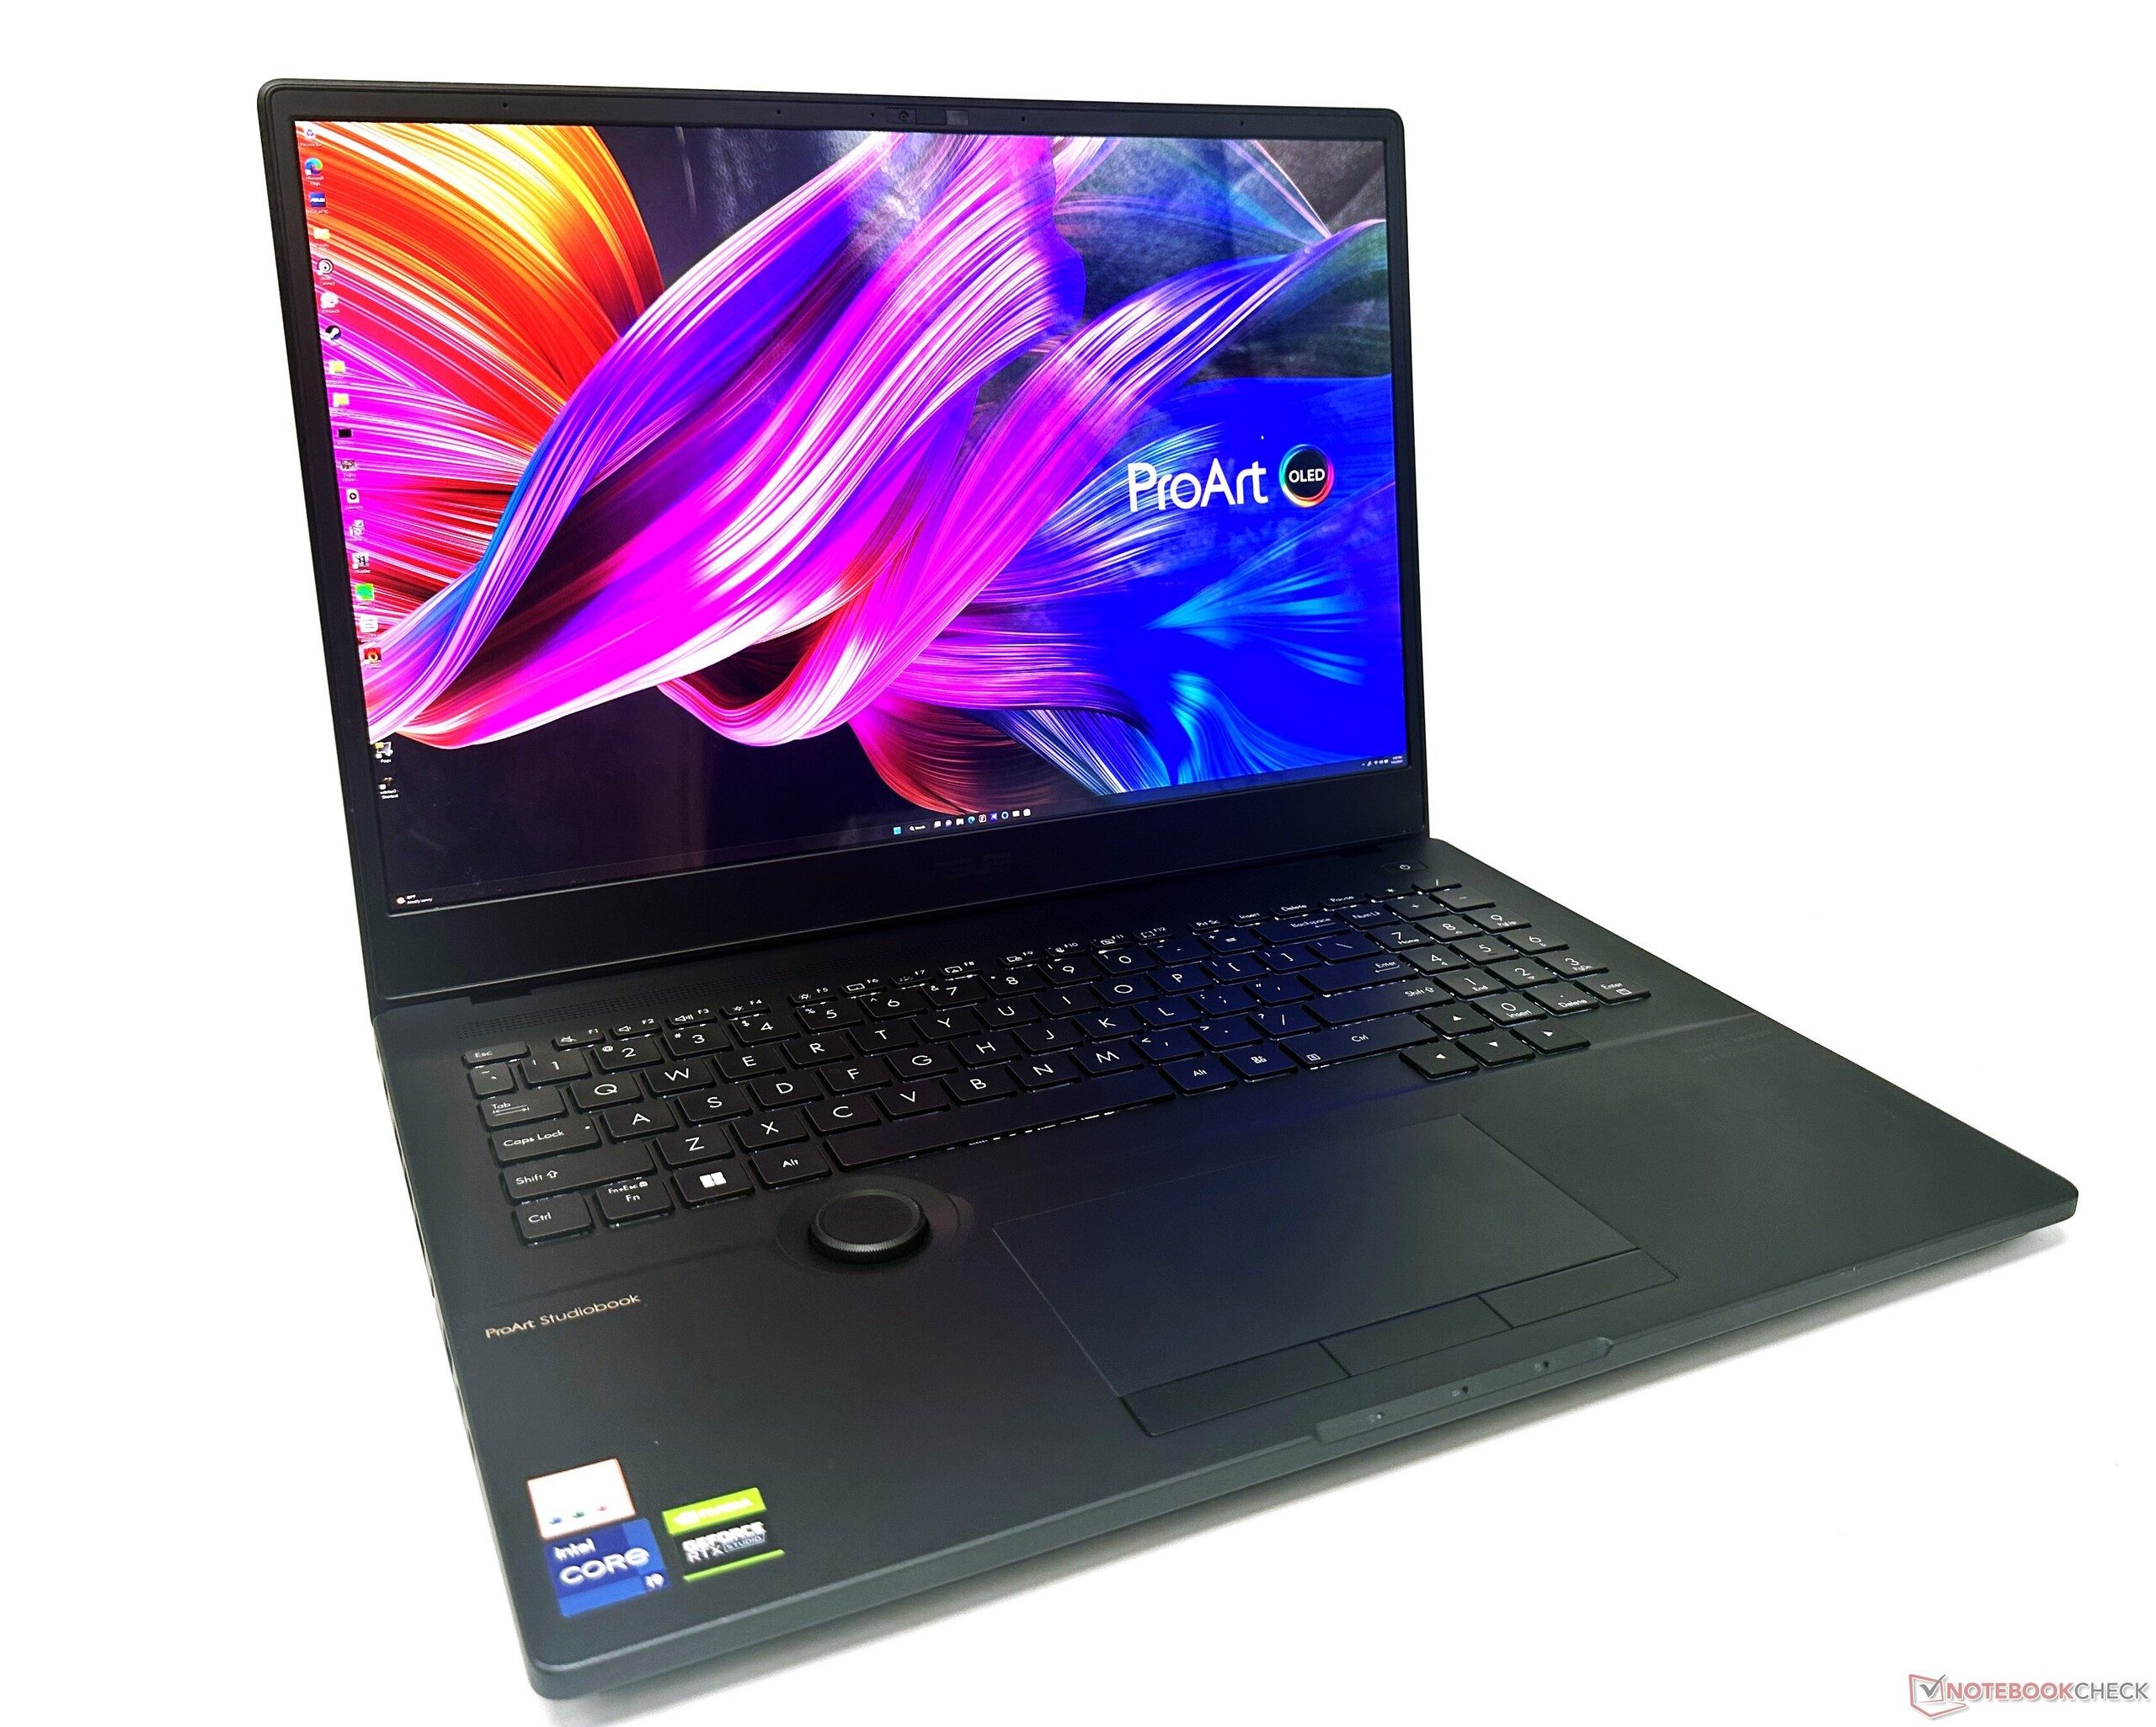
Quadrante Asus
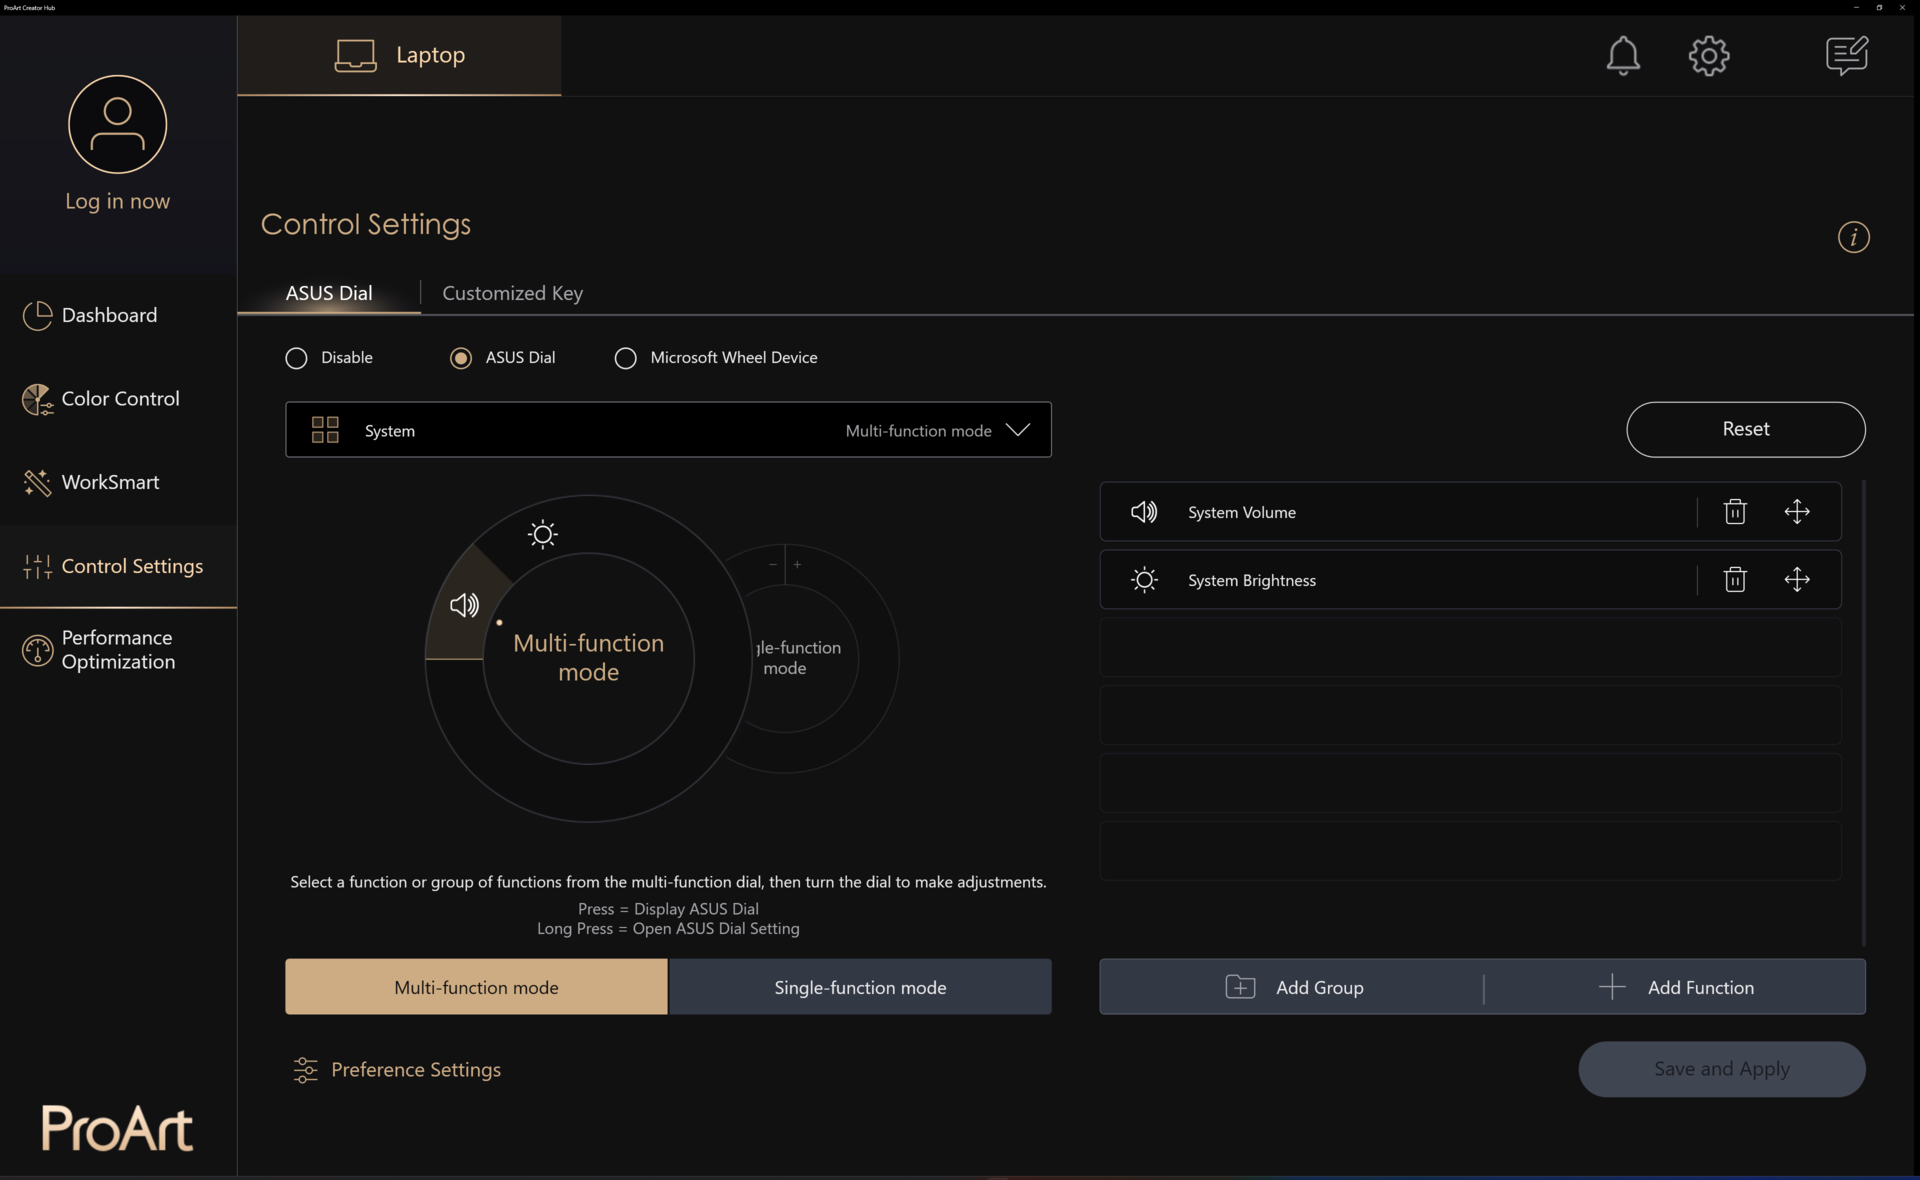
Il Dial di Asus è la caratteristica principale della serie ProArt StudioBook. Il Dial offre ai creatori una sensazione analogica di lavoro con le applicazioni.
Attualmente Asus offre la compatibilità con programmi Adobe come Photoshop, Illustrator, Lightroom Classic, Premiere Pro e After Effects, con il supporto di altre applicazioni in arrivo.
Il Dial funziona anche con le comuni funzioni di Windows, come la regolazione della luminosità e del volume. Altre funzioni del Dial possono essere aggiunte dall'Hub ProArt Creator.
In pratica, il Dial di Asus è abbastanza intuitivo, ma potrebbe richiedere un po' di tempo per abituarsi ad accedere alle funzioni con la memoria muscolare. Il Dial non ostacola la digitazione o l'uso del touchpad.
Touchpad
Il ProArt StudioBook 16 è dotato di un touchpad in vetro di qualità superiore pienamente compatibile con i gesti di Windows Precision. Asus offre tre pulsanti fisici alla base del touchpad, una rarità al giorno d'oggi, ma che può essere utile nelle applicazioni creative per eseguire panoramiche o ruotare gli oggetti nella scena.
Il touchpad stesso non fa clic, anche se i clic a sinistra vengono comunque registrati con un tocco. Tuttavia, il touchpad dell'unità in prova sembrava eccessivamente sensibile. Spesso il touchpad non riconosce un tocco come un gesto di trascinamento. Anche la modifica della sensibilità del mouse nel pannello di controllo non ha aiutato molto.
È naturale che nell'uso normale più di un dito colpisca il touchpad. Ciò innesca immediatamente un gesto di trascinamento, rendendo la navigazione dell'interfaccia utente poco intuitiva. I pulsanti fisici offrono un clic un po' molle ma soddisfacente.
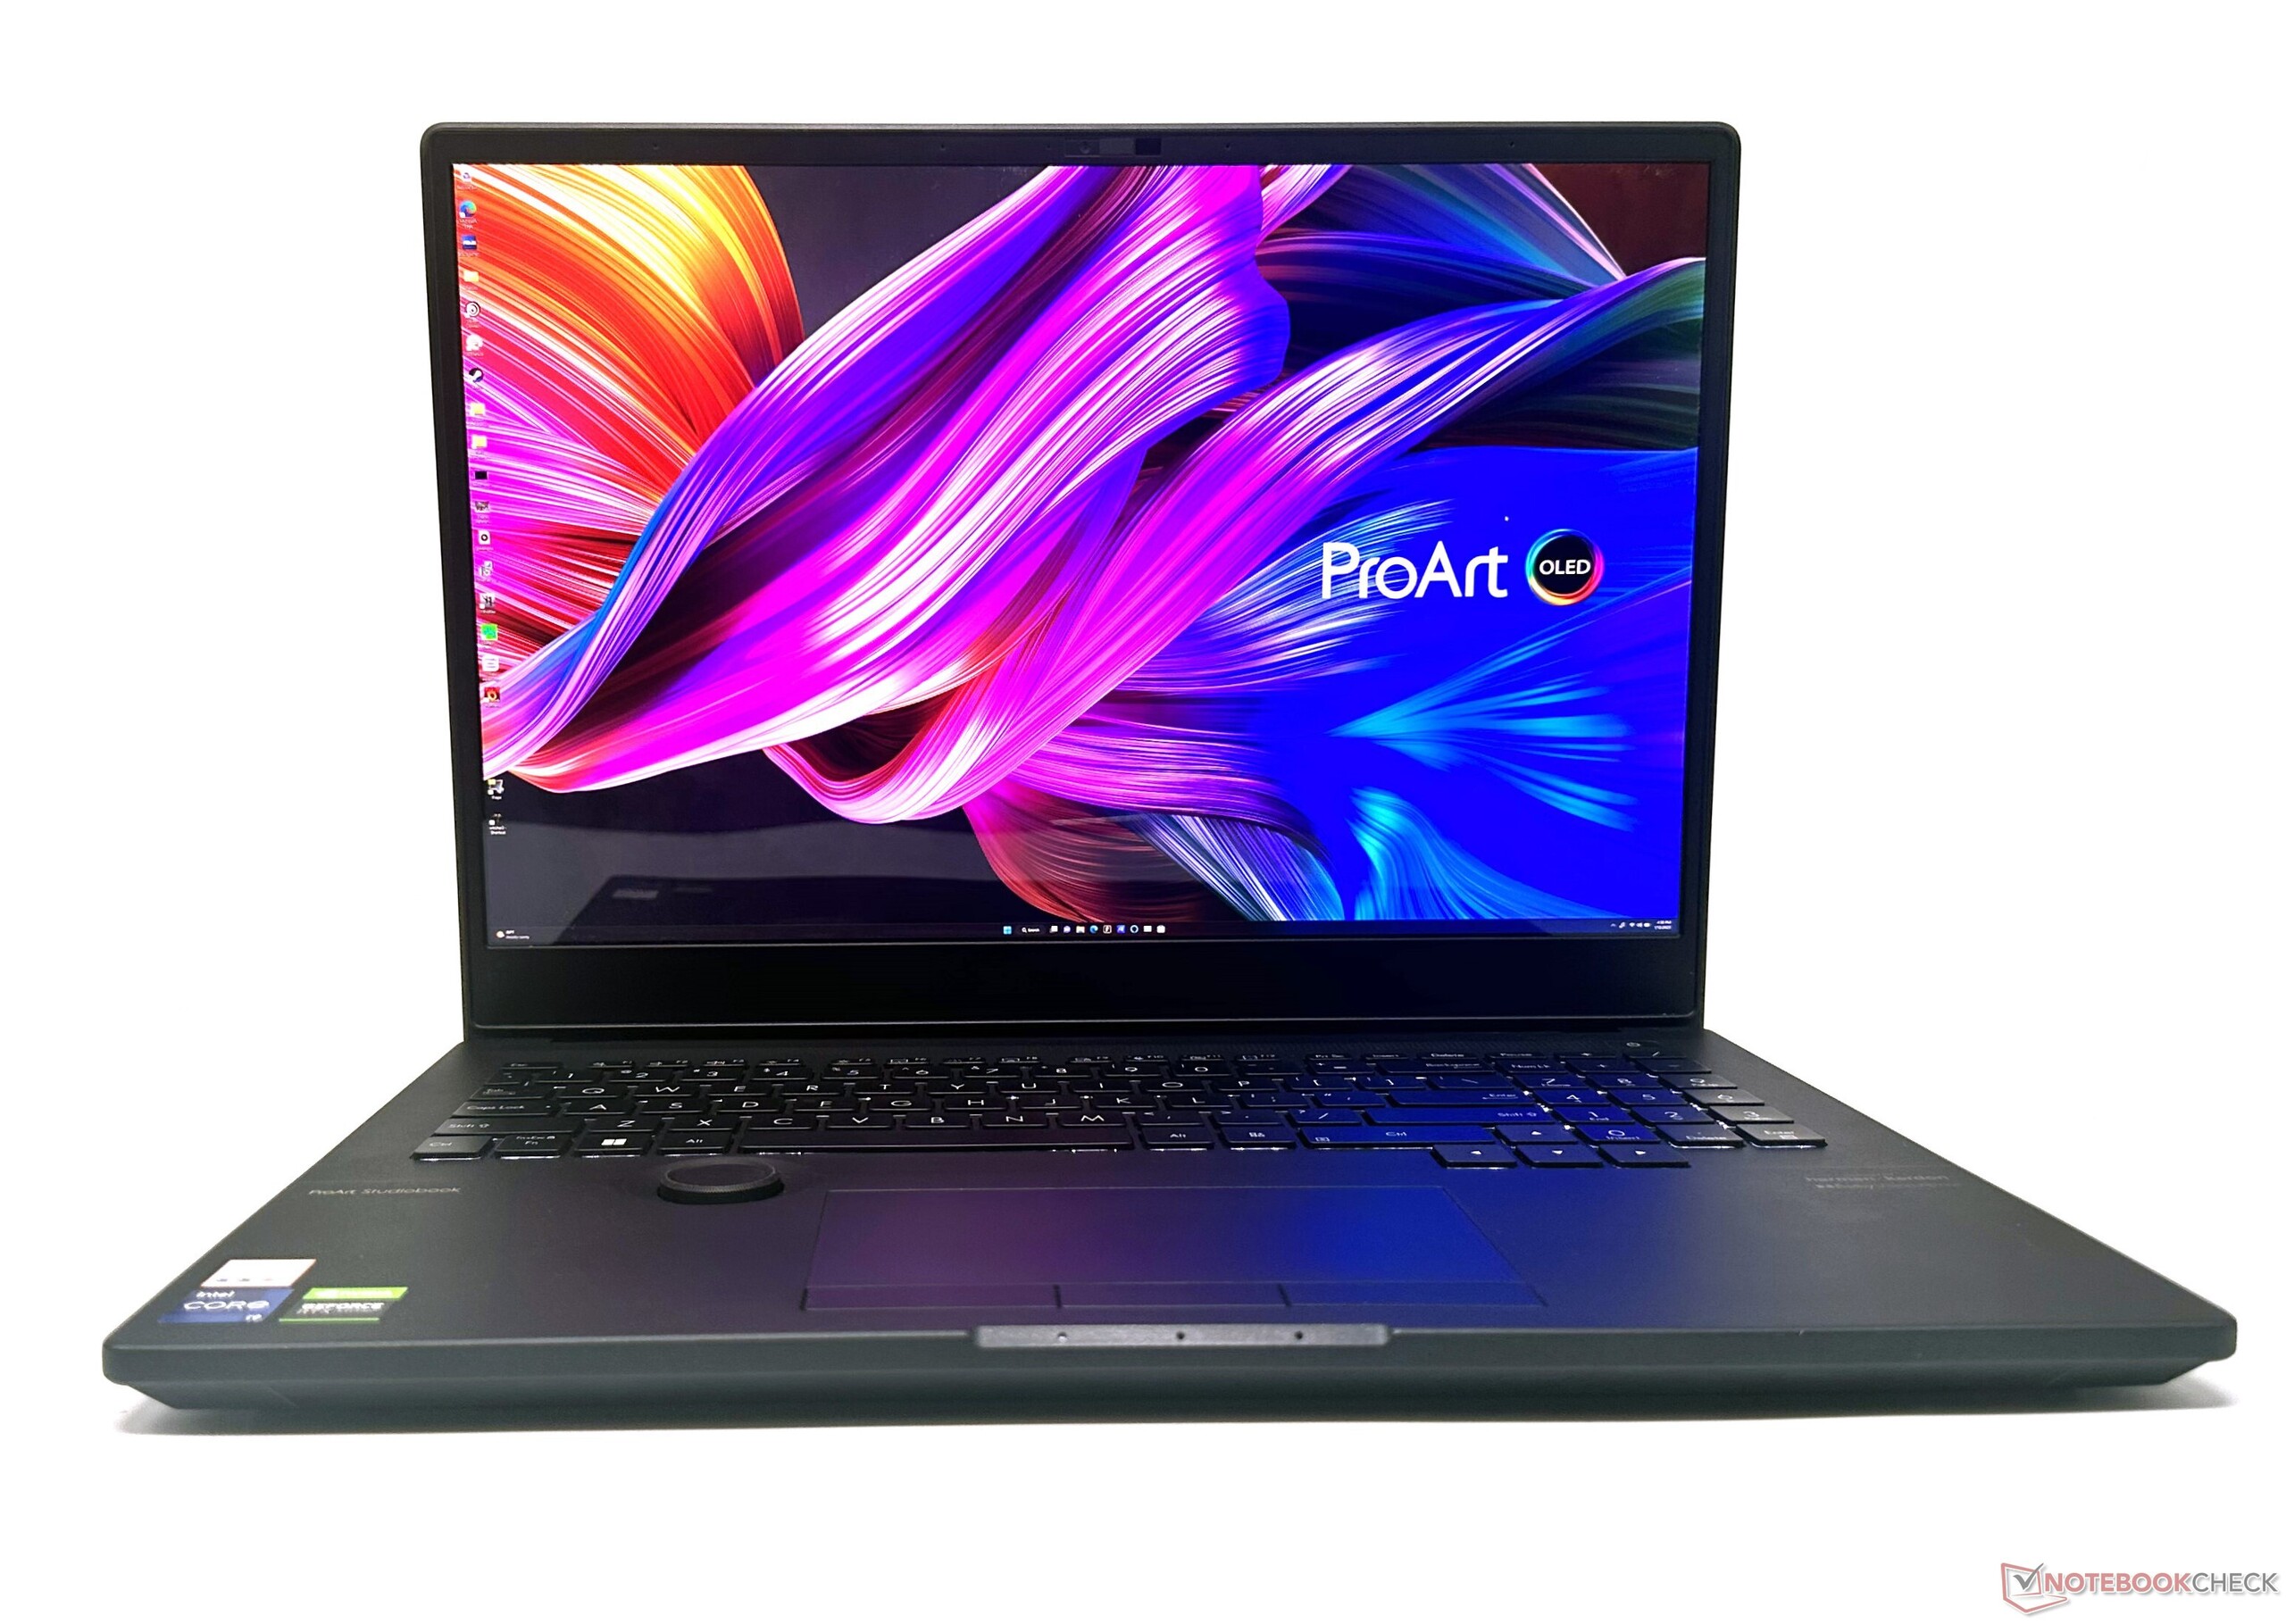
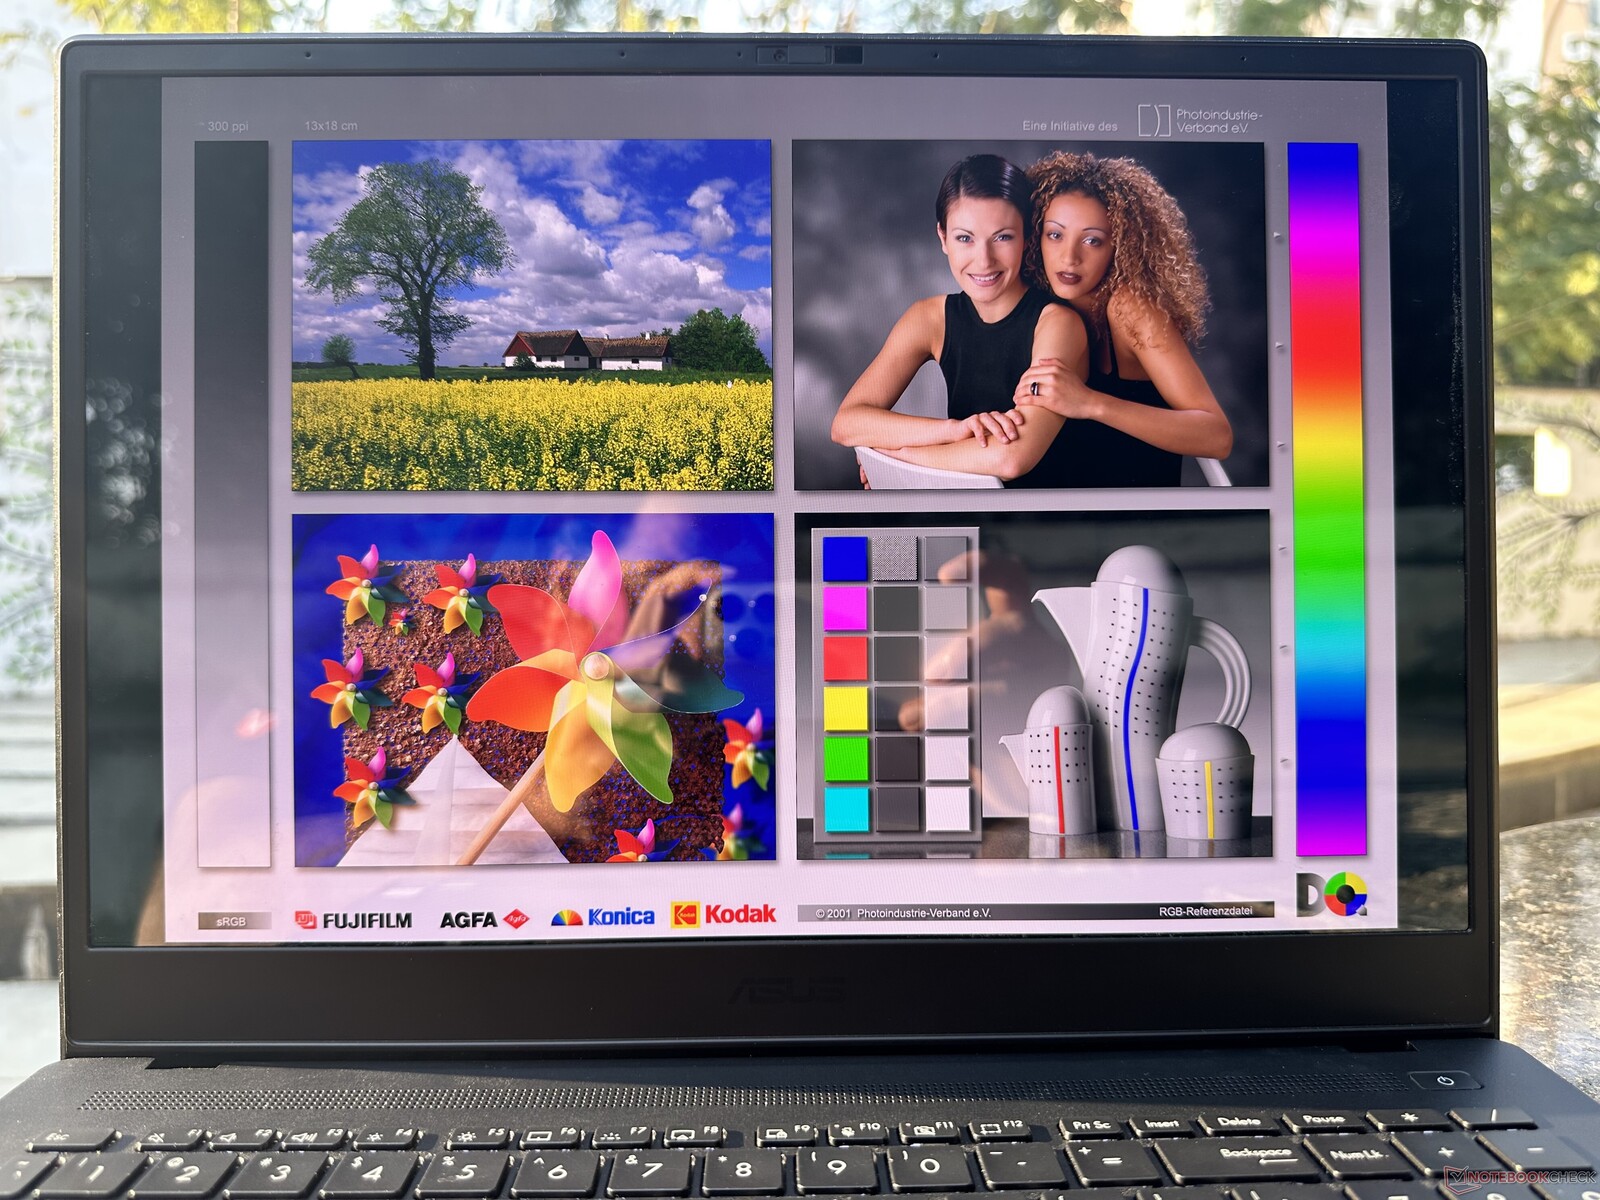
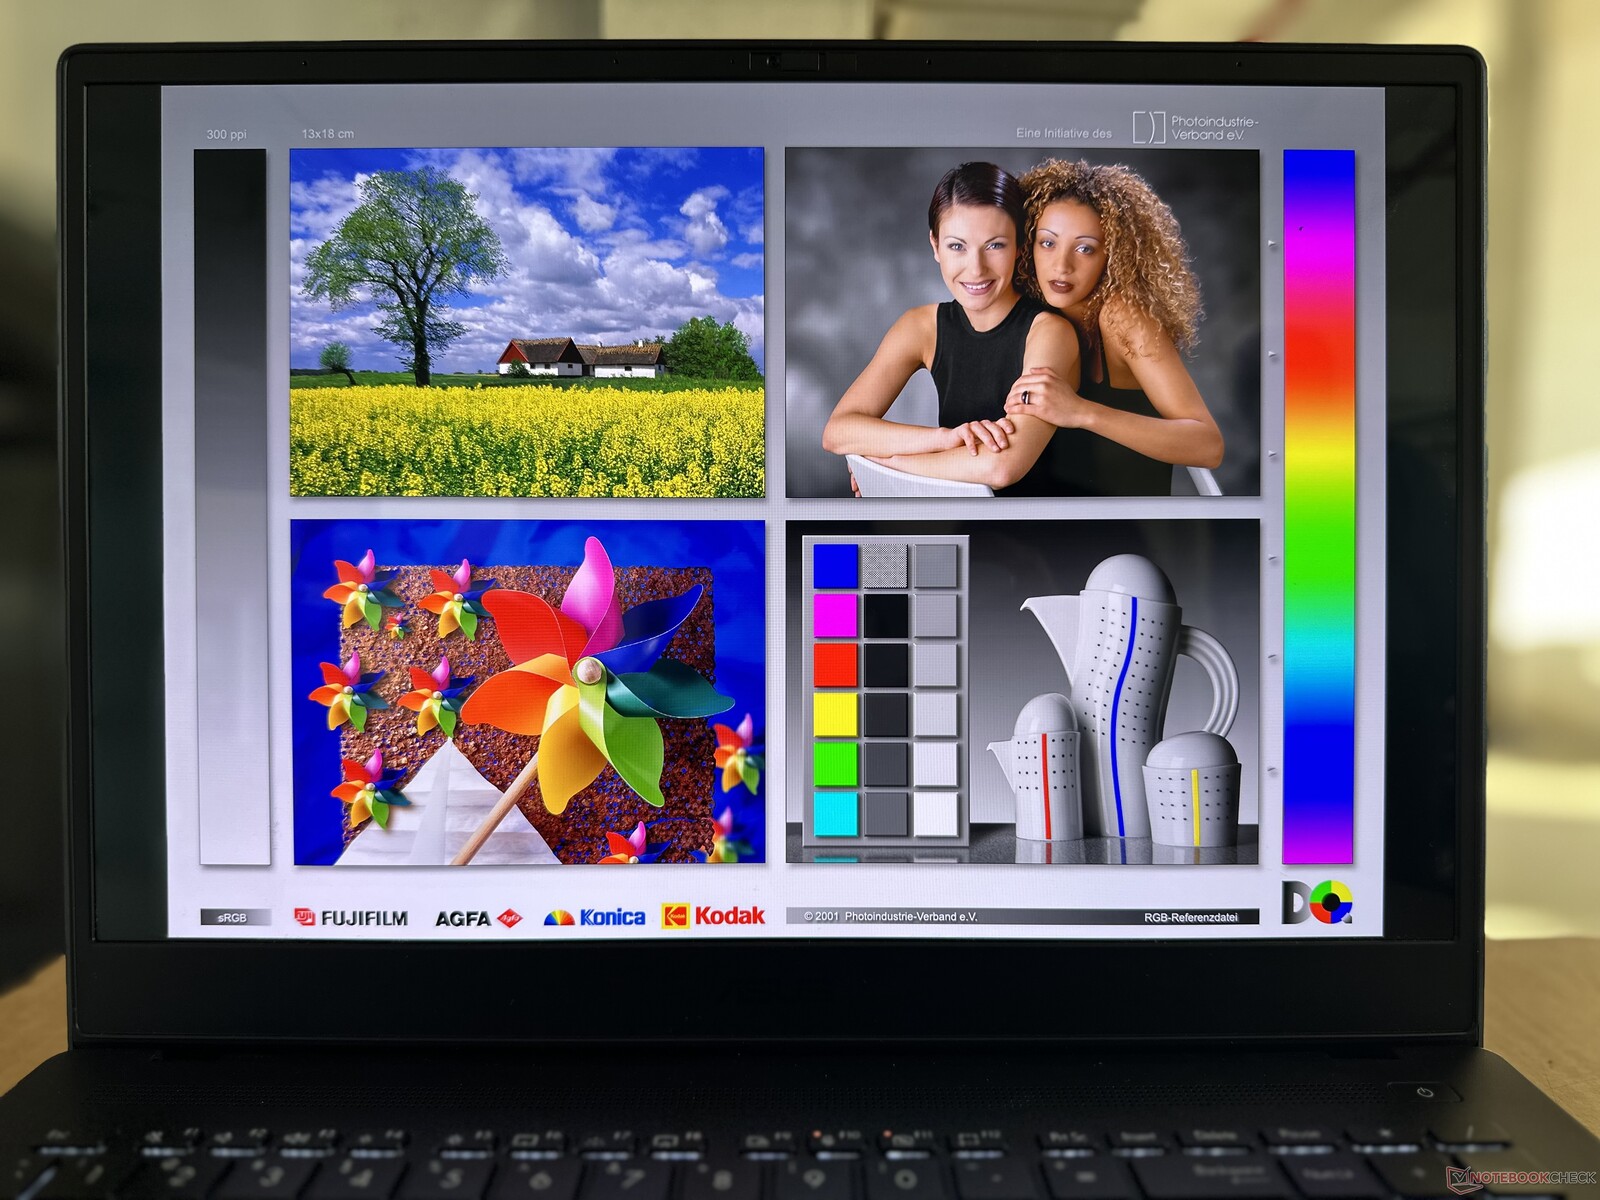
Display: pannello Dolby Vision OELD a 60 Hz con PWM
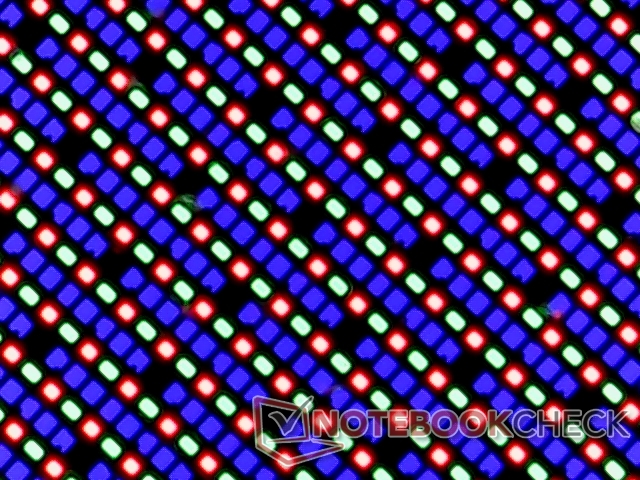
Il ProArt StudioBook 16 è dotato di un pannello OLED da 16 pollici 16:10 4K (3840 x 2400) di Samsung. Asus si accontenta di un pannello da soli 60 Hz, ma compensa in altre aree, come vedremo di seguito.
La disposizione dei sub-pixel suggerisce una matrice S-Stripe RGB con una densità complessiva di 283 PPI. Trattandosi di un pannello OLED, non si osserva alcun backlight bleed.

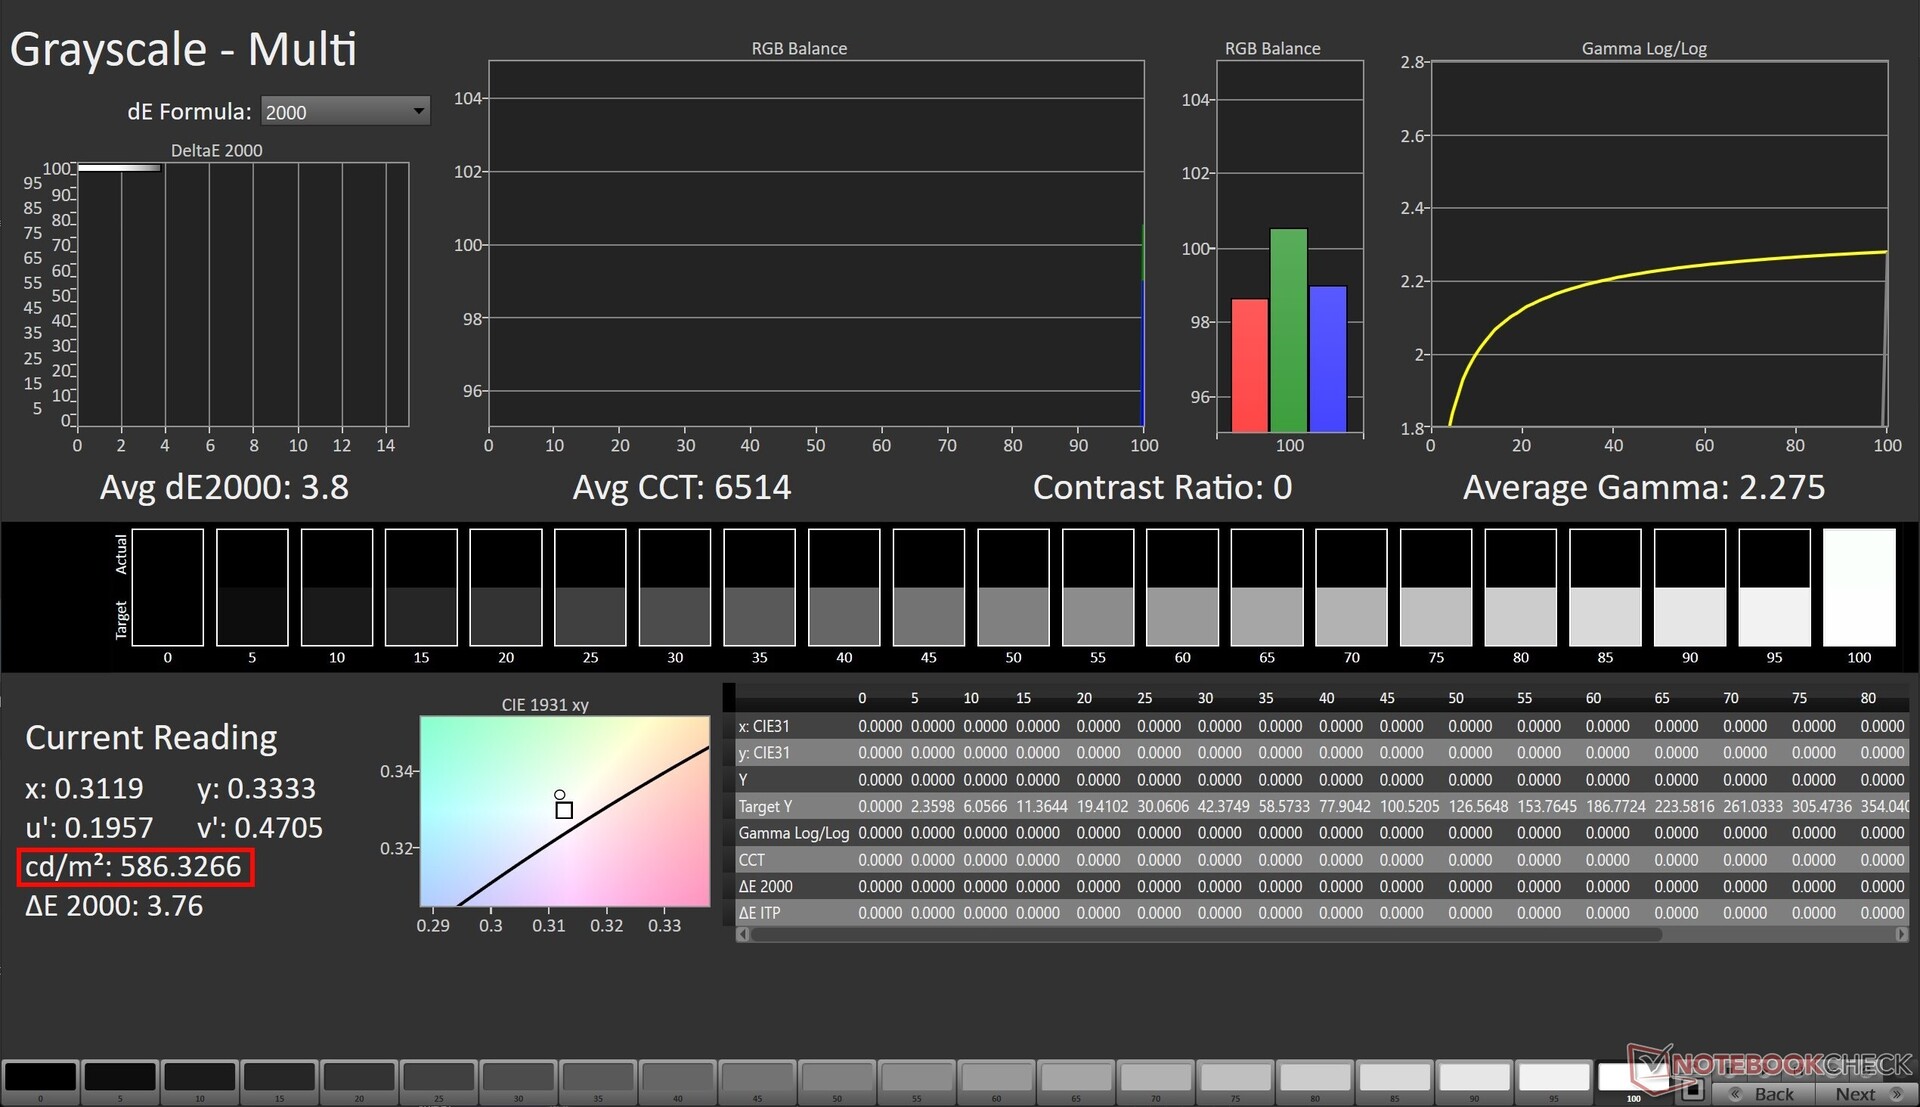
Essendo un pannello OLED, il Samsung ATNA60YV02 offre una distribuzione uniforme della luminosità del 98% e un rapporto di contrasto praticamente infinito. Abbiamo misurato un livello medio di luminosità SDR di 378 nit.
Secondo Asus, il pannello OLED del ProArt StudioBook 16 ha la certificazione VESA DisplayHDR True Black 600. È supportato il Dolby Vision HDR.
Nei nostri test, abbiamo registrato un picco di luminosità di 586 nits in modalità HDR con un'immagine bianca al 100%.
L'applicazione MyAsus offre opzioni per impostare le impostazioni di pixel refresh e pixel shift per proteggere l'OLED dal burn-in. Gli utenti possono anche regolare l'entità del DC Dimming da utilizzare.
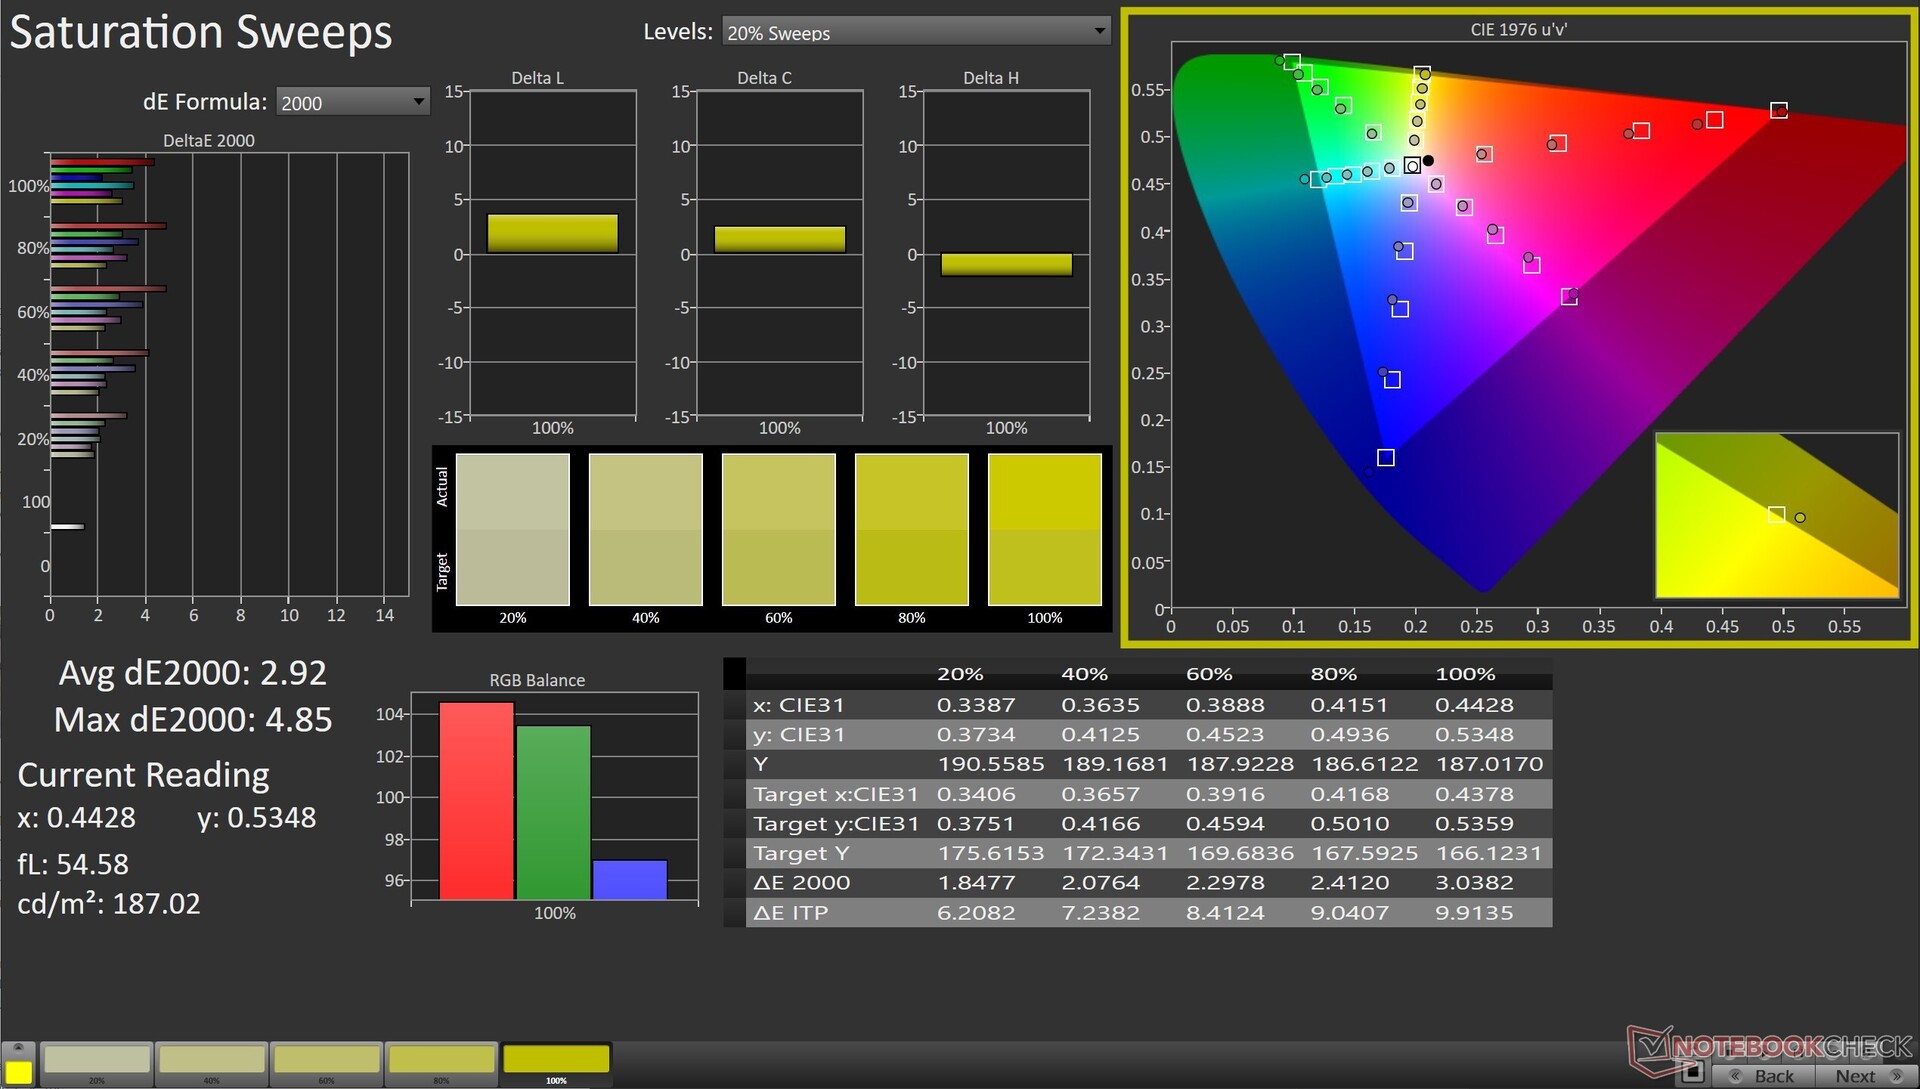
È inoltre possibile scegliere tra vari profili di colore tramite Splendid. Abbiamo eseguito la calibrazione del display con l'impostazione Normale.
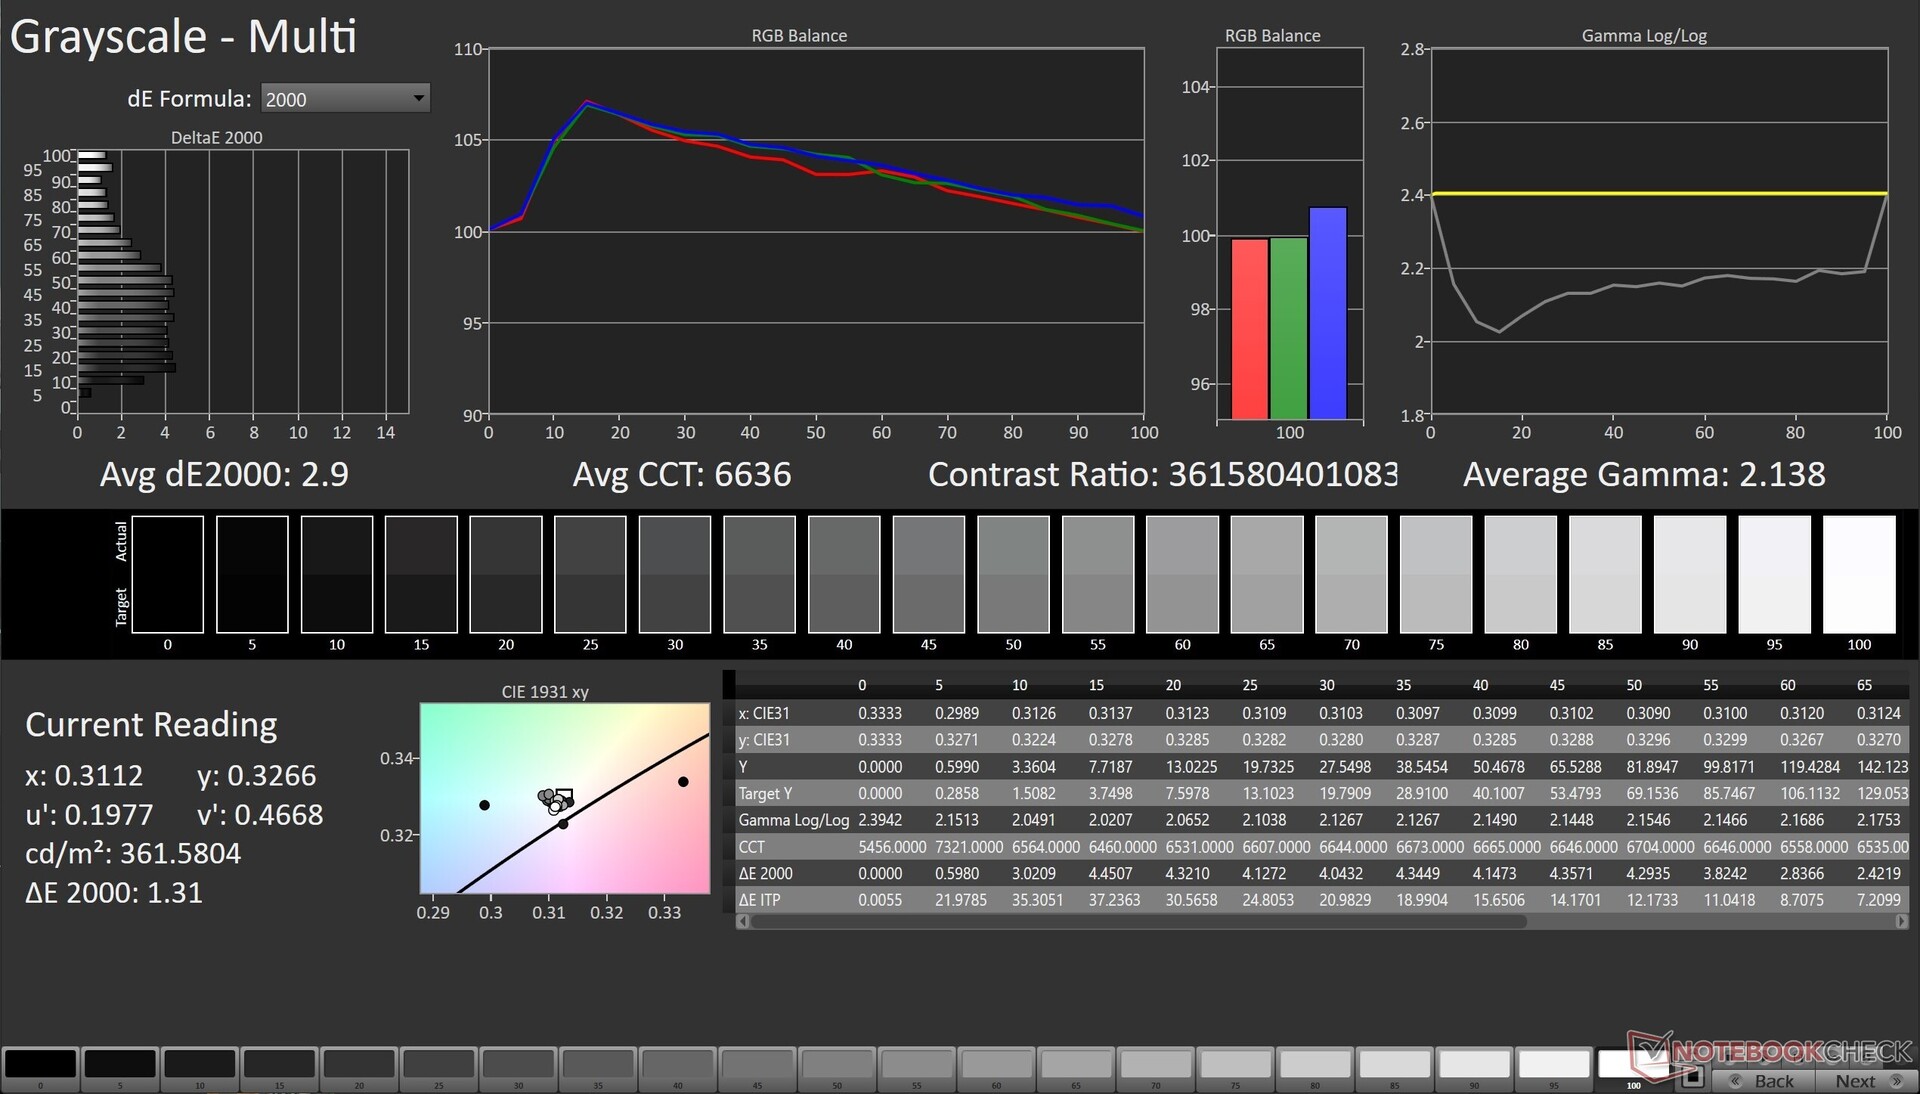
| |||||||||||||||||||||||||
Distribuzione della luminosità: 98 %
Al centro con la batteria: 369 cd/m²
Contrasto: ∞:1 (Nero: 0 cd/m²)
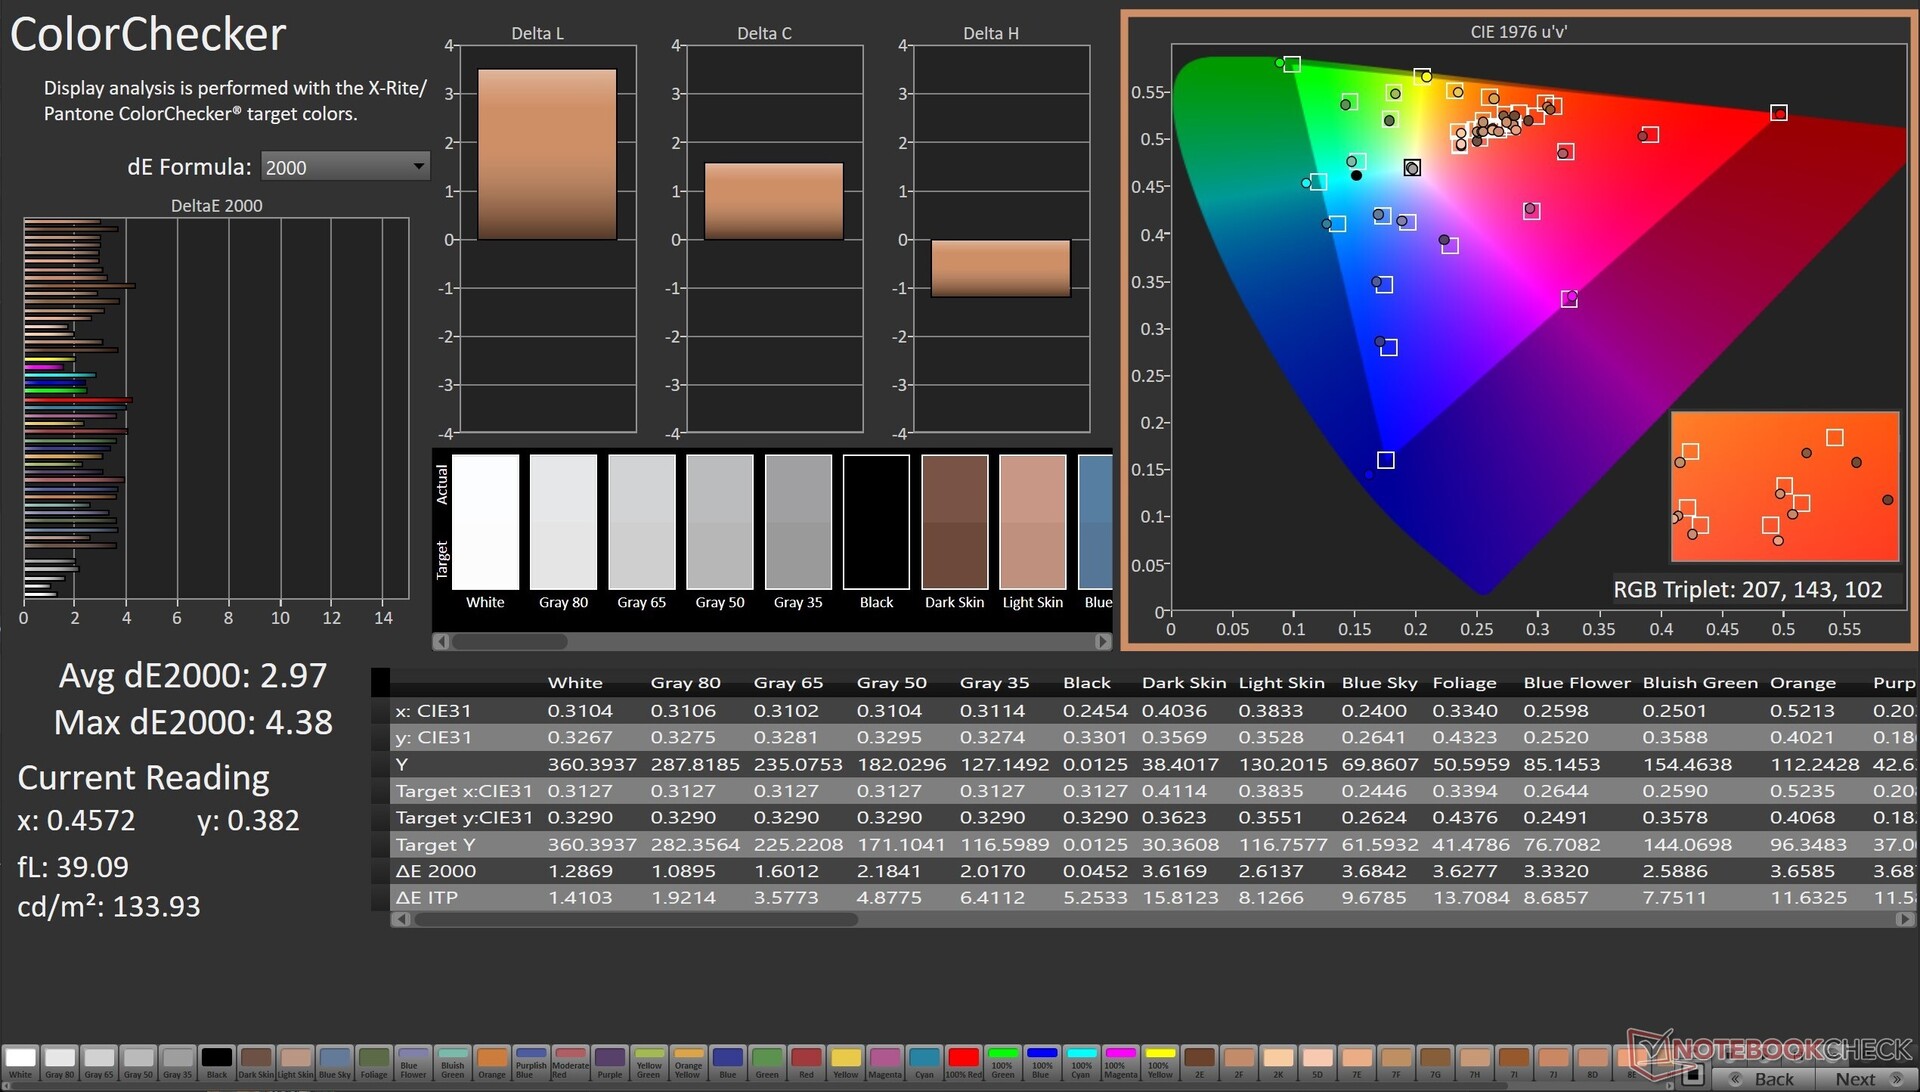
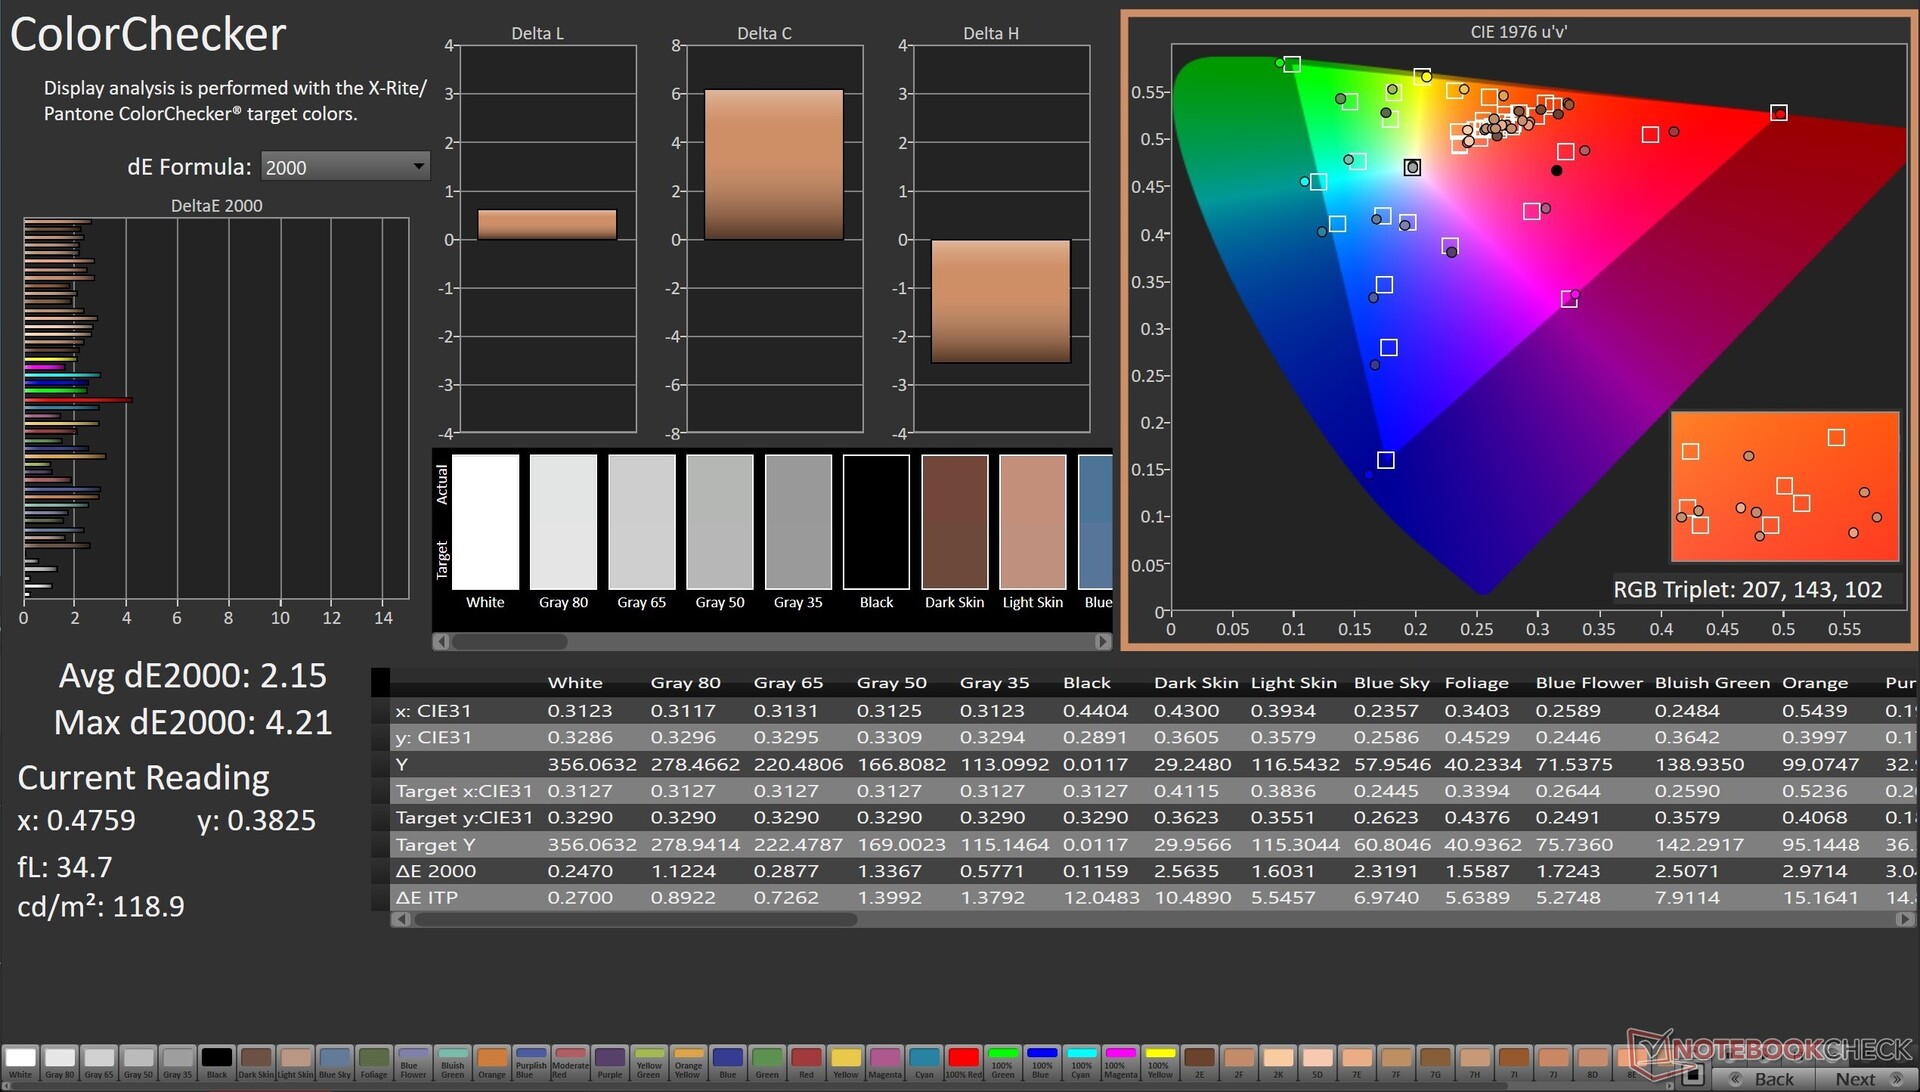
ΔE ColorChecker Calman: 2.97 | ∀{0.5-29.43 Ø4.71}
calibrated: 2.15
ΔE Greyscale Calman: 2.9 | ∀{0.09-98 Ø4.96}
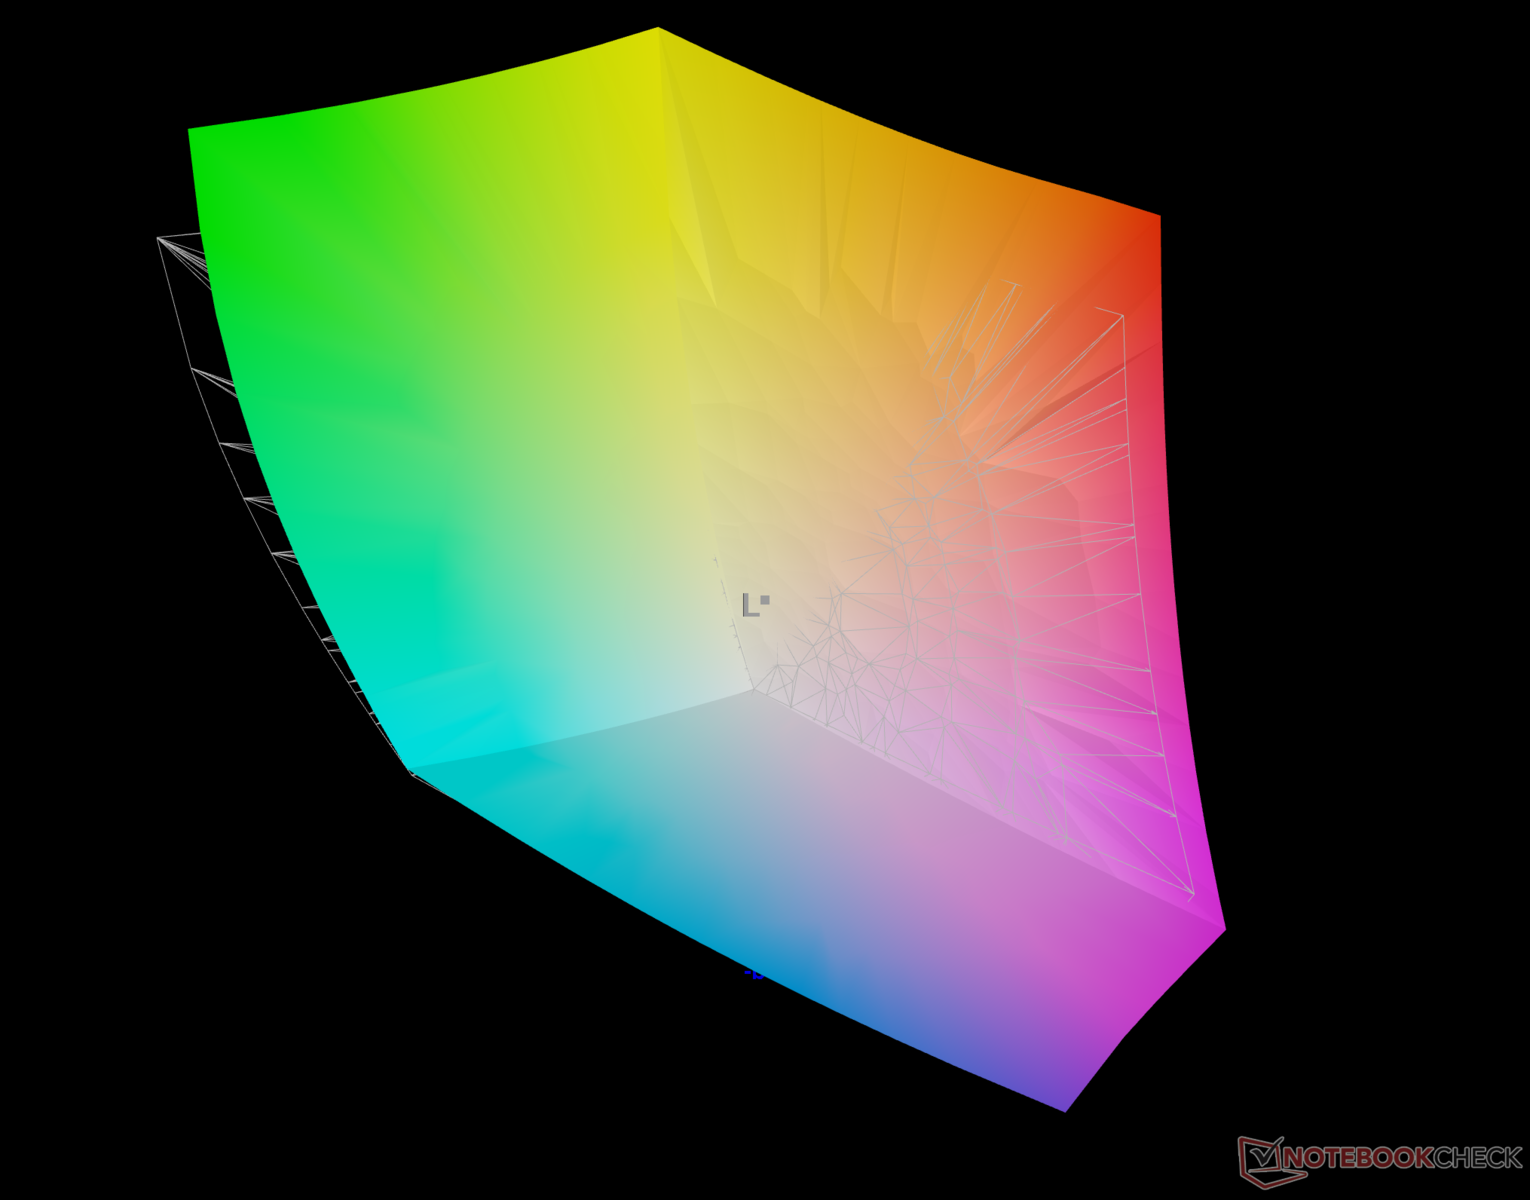
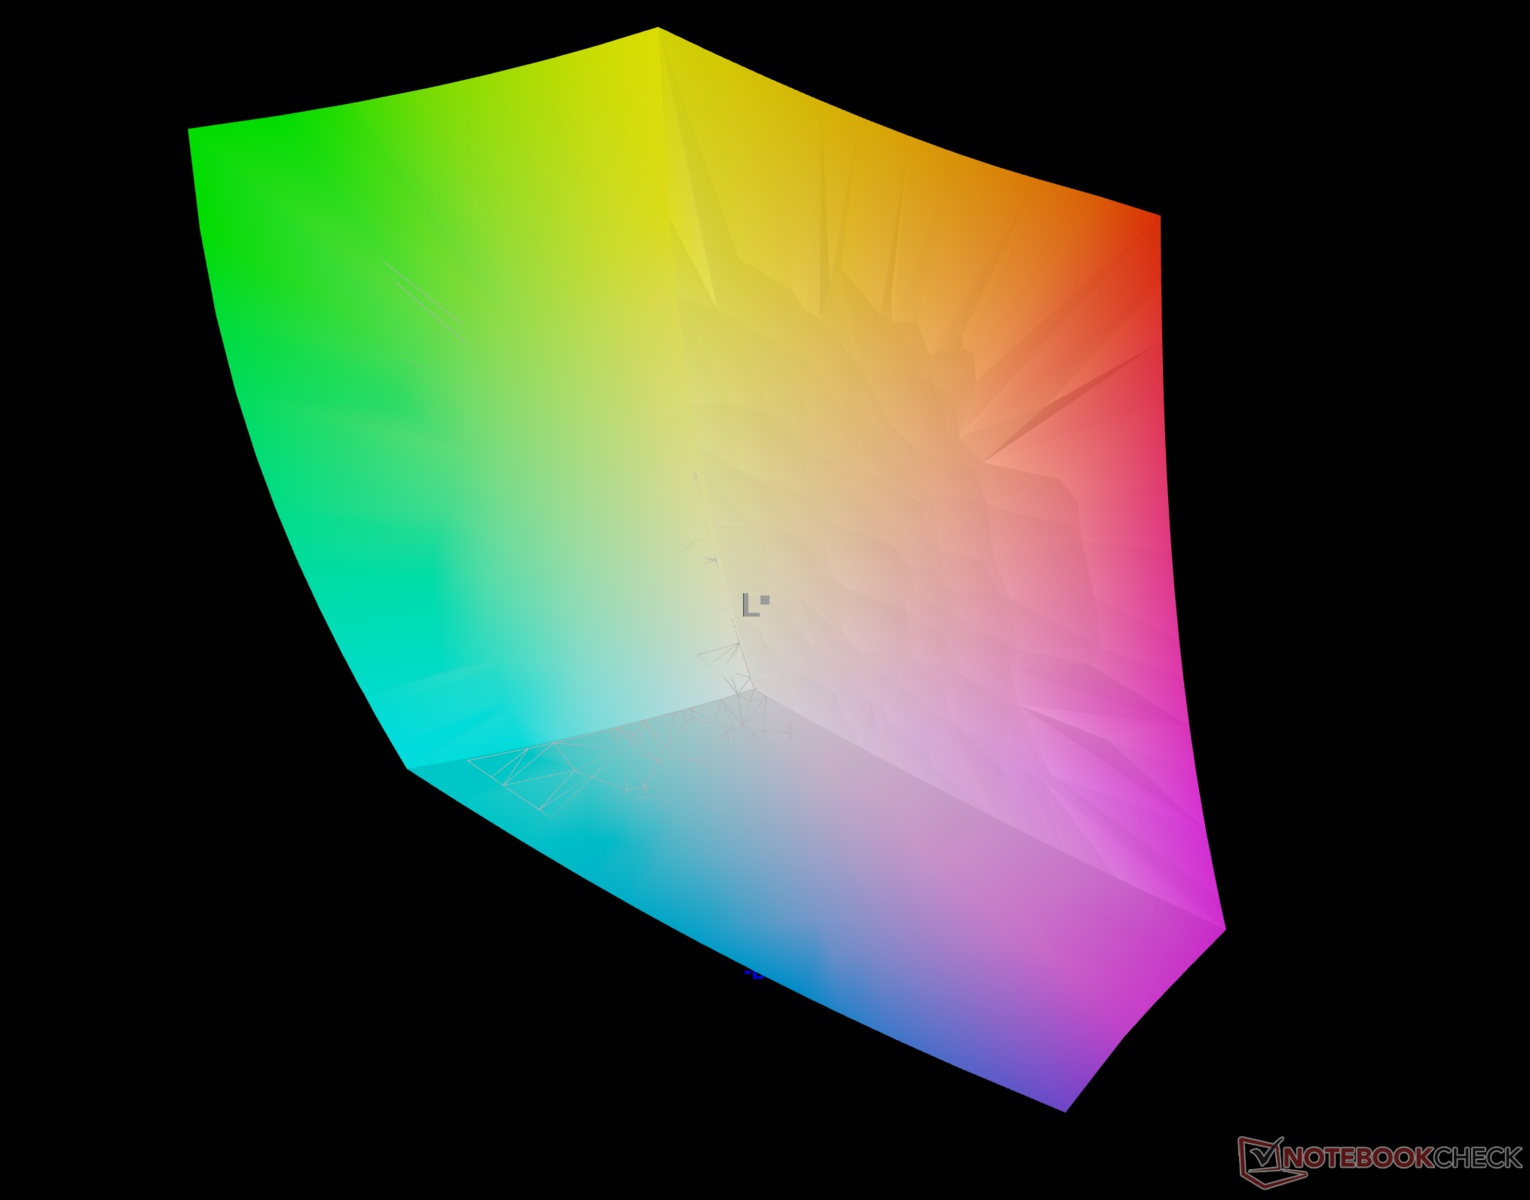
96.5% AdobeRGB 1998 (Argyll 3D)
100% sRGB (Argyll 3D)
99.6% Display P3 (Argyll 3D)
Gamma: 2.13
CCT: 6636 K
| Asus ProArt StudioBook 16 H7600ZW Samsung ATNA60YV02, OLED, 3840x2400, 16" | MSI Creator Z16P B12UHST AUOD298, IPS True Pixel (~100% DCI-P3), 2560x1600, 16" | Asus ROG Strix Scar 15 G533ZW-LN106WS BOE CQ NE156QHM-NZ2, IPS-level, 2560x1440, 15.6" | Asus ZenBook Pro 16X OLED UX7602ZM-ME115W Samsung SDC415D, OLED, 3840x2400, 16" | Asus ROG Zephyrus Duo 16 GX650RX BOE NE160QAM-NX1, IPS-Level, 3840x2400, 16" | Apple MacBook Pro 16 2021 M1 Pro Liquid Retina XDR, Mini-LED, 3456x2234, 16.2" | |
|---|---|---|---|---|---|---|
| Display | -4% | -5% | -3% | -4% | -3% | |
| Display P3 Coverage (%) | 99.6 | 97.6 -2% | 96.2 -3% | 99.84 0% | 98 -2% | 99.1 -1% |
| sRGB Coverage (%) | 100 | 99.9 0% | 99.9 0% | 99.99 0% | 99.9 0% | 100 0% |
| AdobeRGB 1998 Coverage (%) | 96.5 | 86.8 -10% | 84.5 -12% | 88.9 -8% | 86.3 -11% | 88 -9% |
| Response Times | -321% | -165% | 32% | -372% | -1488% | |
| Response Time Grey 50% / Grey 80% * (ms) | 1.6 ? | 12.9 ? -706% | 7.86 ? -391% 4.21 ? -163% | 2 ? -25% | 14.6 ? -813% | 42.8 ? -2575% |
| Response Time Black / White * (ms) | 18.32 ? | 6.4 ? 65% | 7.5 ? 59% | 2 ? 89% | 5.6 ? 69% | 91.6 ? -400% |
| PWM Frequency (Hz) | 60 ? | 59 ? | 14880 | |||
| Screen | 12% | -14% | 6% | -10% | 30% | |
| Brightness middle (cd/m²) | 370 | 428 16% | 346 -6% | 346 -6% | 459 24% | 514 39% |
| Brightness (cd/m²) | 374 | 394 5% | 329 -12% | 354 -5% | 434 16% | 497 33% |
| Brightness Distribution (%) | 98 | 86 -12% | 91 -7% | 96 -2% | 88 -10% | 95 -3% |
| Black Level * (cd/m²) | 0.42 | 0.59 | 0.44 | 0.02 | ||
| Colorchecker dE 2000 * | 2.97 | 1.67 44% | 3.06 -3% | 2.28 23% | 2.97 -0% | 1.4 53% |
| Colorchecker dE 2000 max. * | 4.38 | 5.71 -30% | 5.81 -33% | 4.94 -13% | 8.13 -86% | 2.8 36% |
| Colorchecker dE 2000 calibrated * | 2.15 | 0.71 67% | 2.57 -20% | 2.16 -0% | 1.03 52% | |
| Greyscale dE 2000 * | 2.9 | 3.1 -7% | 1.64 43% | 4.9 -69% | 2.3 21% | |
| Gamma | 2.13 103% | 2.195 100% | 2.12 104% | 2.37 93% | 2.235 98% | 2.27 97% |
| CCT | 6636 98% | 6498 100% | 7021 93% | 6384 102% | 6775 96% | 6792 96% |
| Contrast (:1) | 1019 | 586 | 1043 | 25700 | ||
| Media totale (Programma / Settaggio) | -104% /
-48% | -61% /
-49% | 12% /
8% | -129% /
-69% | -487% /
-255% |
* ... Meglio usare valori piccoli
Asus pubblicizza una copertura del 100% della gamma cromatica DCI-P3 per il pannello OLED Samsung, e le nostre misurazioni dimostrano che il pannello è effettivamente in grado di coprire completamente gli spazi colore sRGB e Display P3.
Anche la copertura Adobe RGB è molto buona (96,5%), il che rende il ProArt StudioBook 16 eccellente sia per la creazione di contenuti che per il consumo multimediale.

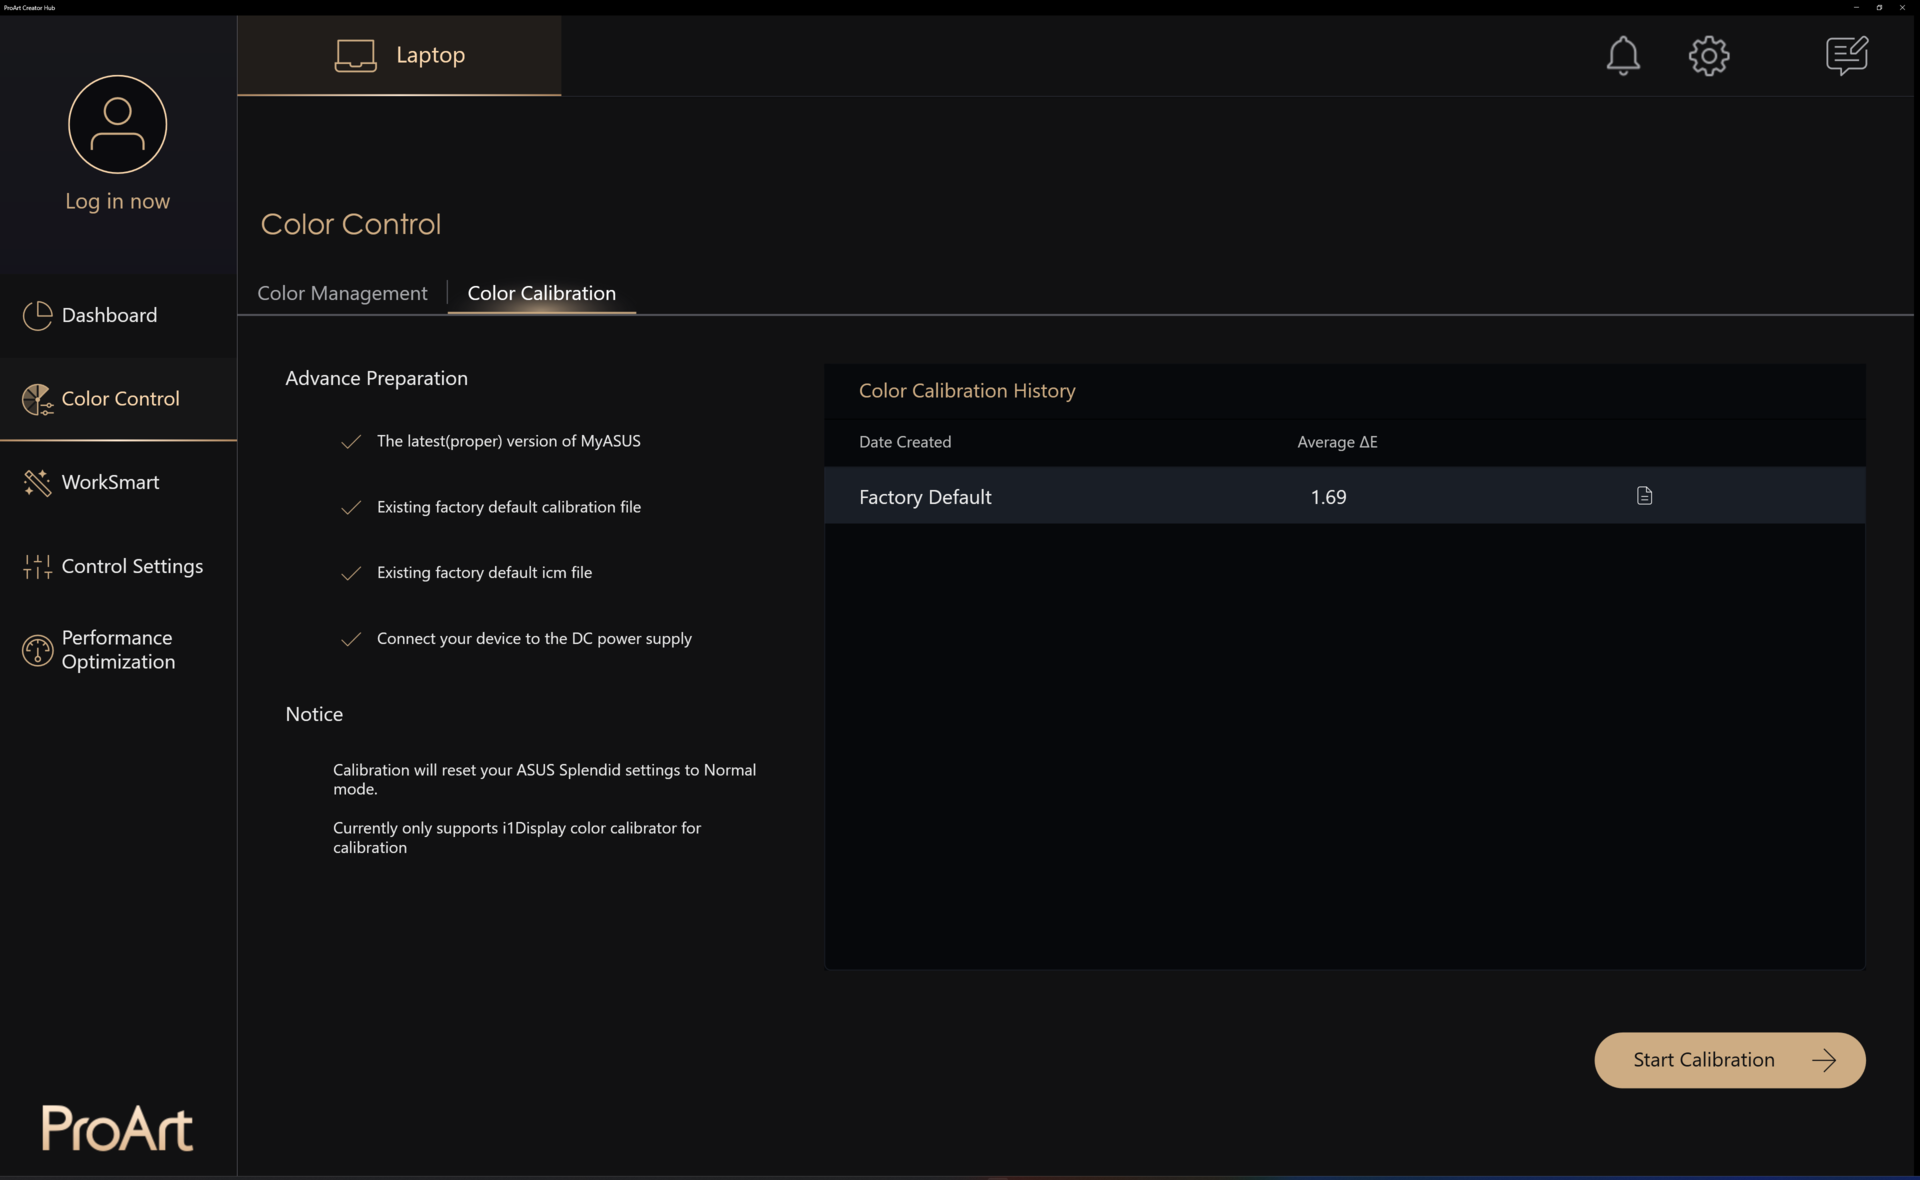
Il display convalidato da PANTONE dovrebbe offrire un Delta E medio di 1,6. Tuttavia, abbiamo misurato un Delta E di 2,9 e 2,97 in Scala di grigi e ColorChecker con il profilo colore Normale.
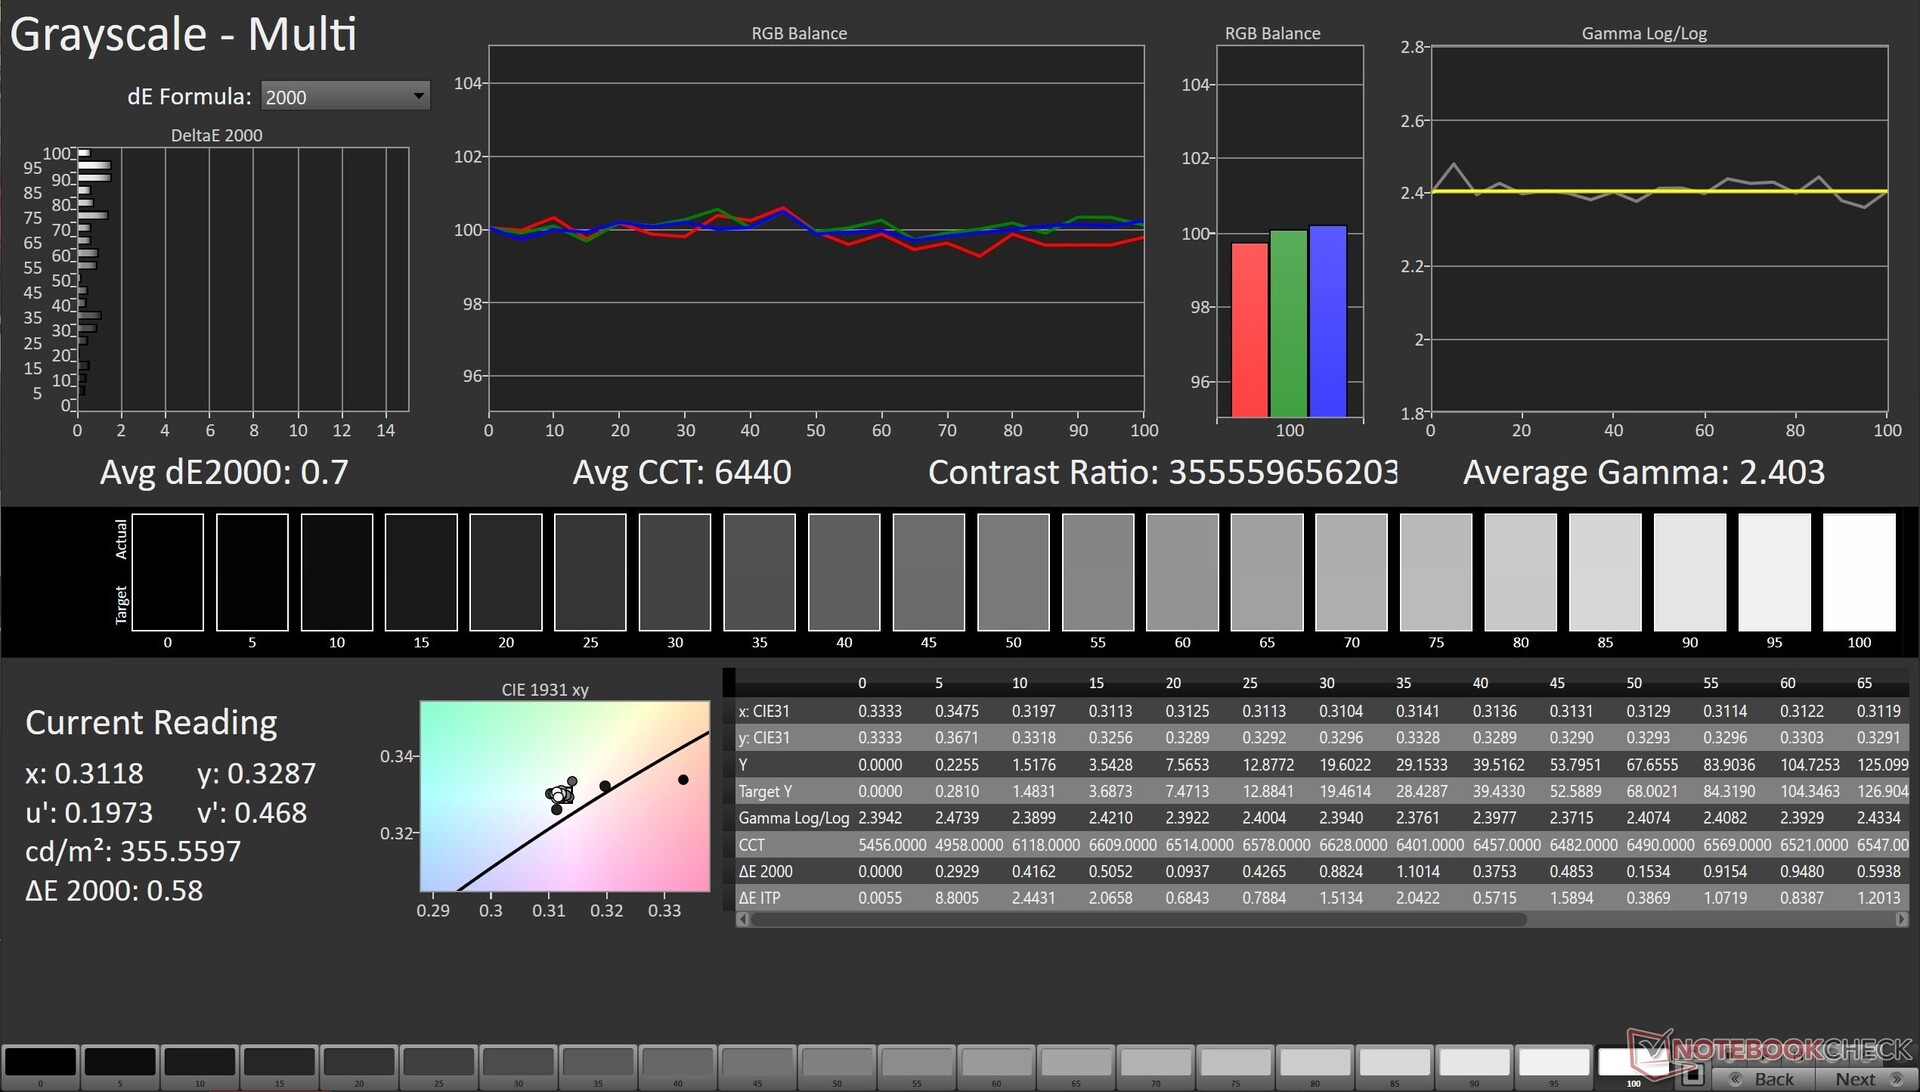
Asus offre anche la possibilità di eseguire la calibrazione del display dall'applicazione ProArt Creator Hub con uno spettrofotometro compatibile.
Un'ulteriore calibrazione del display in DCI-P3 utilizzando lo spettrofotometro X-rite i1Basic Pro 3 e il software di calibrazione del colore Calman Ultimate di Portrait Displays ha portato a un Delta E in scala di grigi significativamente migliorato, pari a soli 0,7.
Il Delta E di ColorChecker migliora leggermente dopo la calibrazione, passando a 2,15. Visivamente, la maggior parte dei colori, tranne il rosso al 100% e le tonalità di blu, mostrano miglioramenti di precisione dopo la calibrazione.
Il file ICC calibrato può essere scaricato dal link qui sopra.
Tempi di risposta del Display
| ↔ Tempi di risposta dal Nero al Bianco | ||
|---|---|---|
| 18.32 ms ... aumenta ↗ e diminuisce ↘ combinato | ↗ 17.39 ms Incremento | 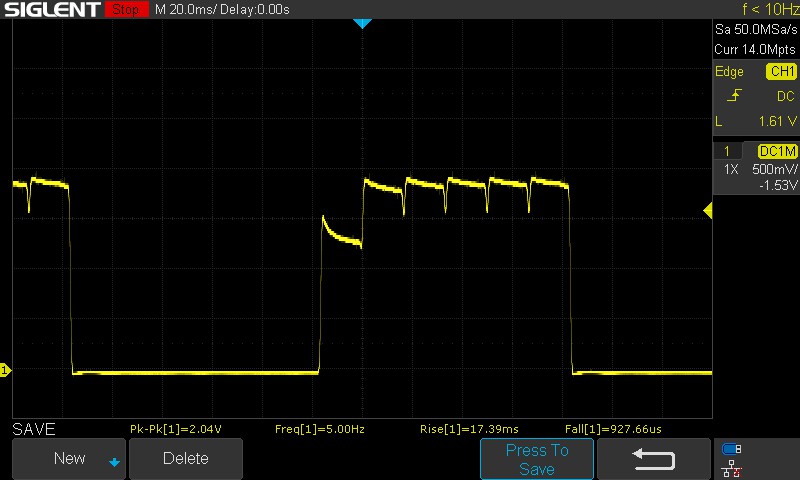 |
| ↘ 0.93 ms Calo | ||
| Lo schermo mostra buoni tempi di risposta durante i nostri tests, ma potrebbe essere troppo lento per i gamers competitivi. In confronto, tutti i dispositivi di test variano da 0.1 (minimo) a 240 (massimo) ms. » 41 % di tutti i dispositivi è migliore. Questo significa che i tempi di risposta rilevati sono simili alla media di tutti i dispositivi testati (19.8 ms). | ||
| ↔ Tempo di risposta dal 50% Grigio all'80% Grigio | ||
| 1.6 ms ... aumenta ↗ e diminuisce ↘ combinato | ↗ 0.82 ms Incremento | 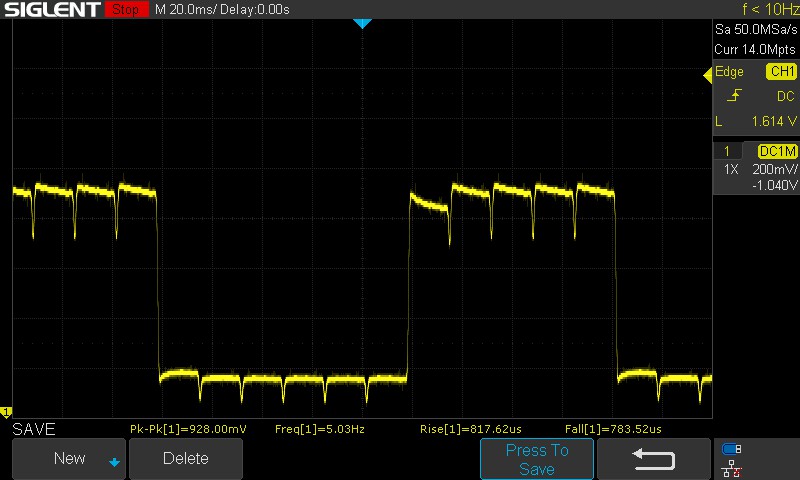 |
| ↘ 0.78 ms Calo | ||
| Lo schermo ha mostrato valori di risposta molto veloci nei nostri tests ed è molto adatto per i gaming veloce. In confronto, tutti i dispositivi di test variano da 0.165 (minimo) a 636 (massimo) ms. » 8 % di tutti i dispositivi è migliore. Questo significa che i tempi di risposta rilevati sono migliori rispettto alla media di tutti i dispositivi testati (31 ms). | ||
Il pannello OLED offre un eccellente tempo di risposta da 50% grigio a 80% grigio di 1,6 ms. La transizione dal 100% nero al 100% bianco, invece, richiede 18,32 ms. Questo tempo dovrebbe comunque essere sufficiente per i giochi e non rappresenta un problema per l'uso previsto del portatile.
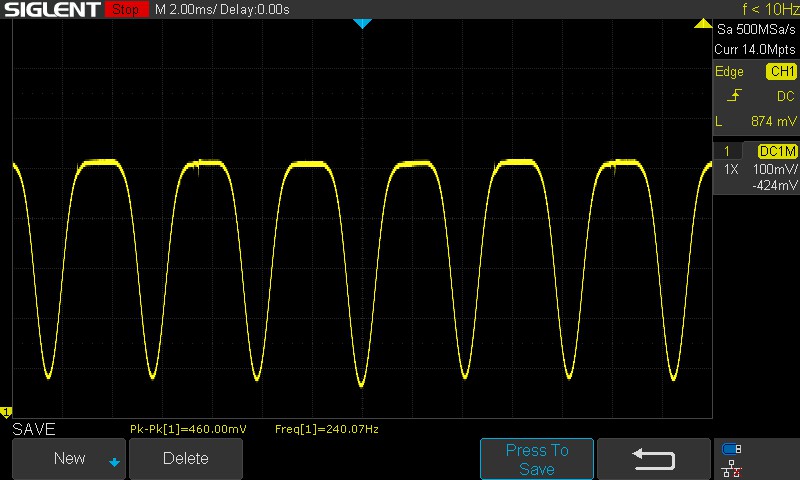
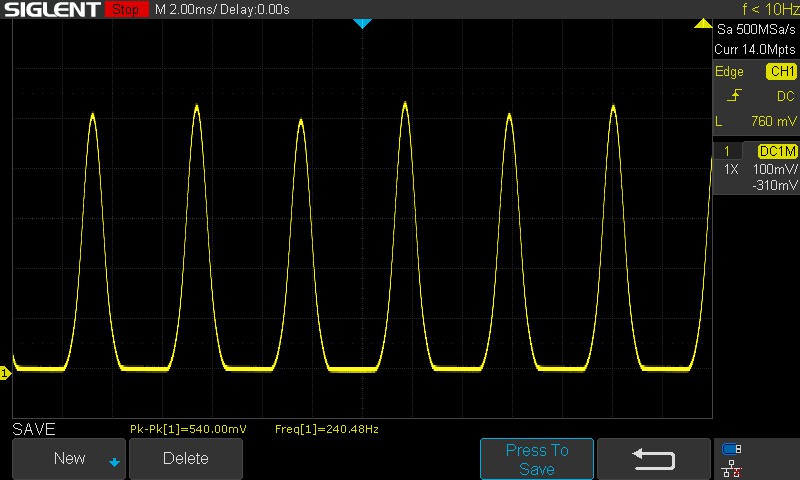
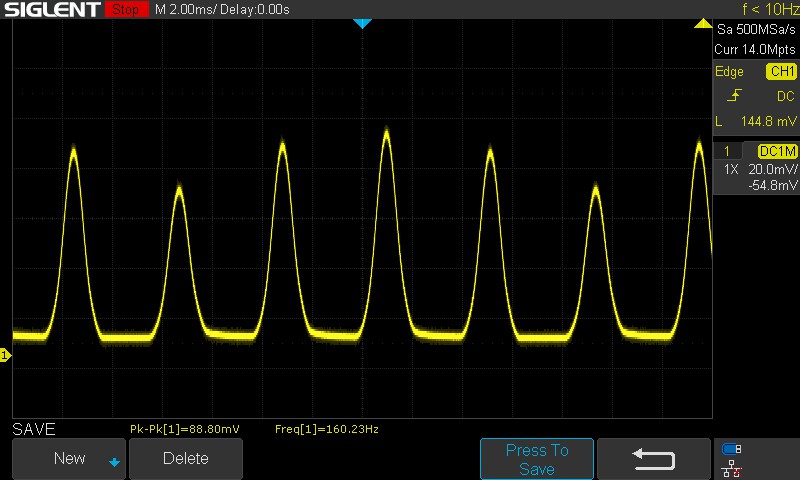
Sfarfallio dello schermo / PWM (Pulse-Width Modulation)
| flickering dello schermo / PWM rilevato | 60 Hz | ≤ 100 % settaggio luminosita' | 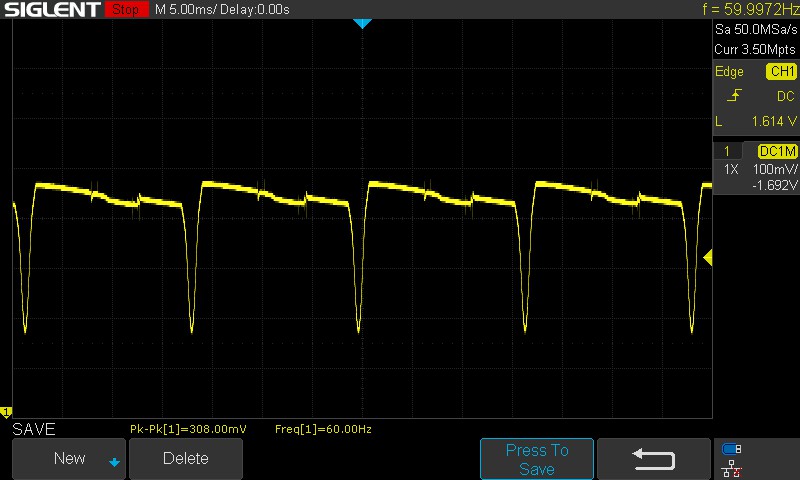 |
Il display sfarfalla a 60 Hz (Probabilmente a causa dell'uso di PWM) Flickering rilevato ad una luminosita' di 100 % o inferiore. Non dovrebbe verificarsi flickering o PWM sopra questo valore di luminosita'. La frequenza di 60 Hz è molto bassa, quindi il flickering potrebbe causare stanchezza agli occhi e mal di testa con un utilizzo prolungato. In confronto: 52 % di tutti i dispositivi testati non utilizza PWM per ridurre la luminosita' del display. Se è rilevato PWM, una media di 7747 (minimo: 5 - massimo: 343500) Hz è stata rilevata. | |||
Asus utilizza il DC Dimming per regolare l'intensità della retroilluminazione. Il DC Dimming a 60 Hz è visibile a livelli di luminosità superiori al 51% e al 100%. Al di sotto del 50%, il pannello utilizza il PWM e sfarfalla a una frequenza di 240 Hz. Questa frequenza si riduce a 160 Hz quando il cursore della luminosità di Windows è impostato sullo 0%.
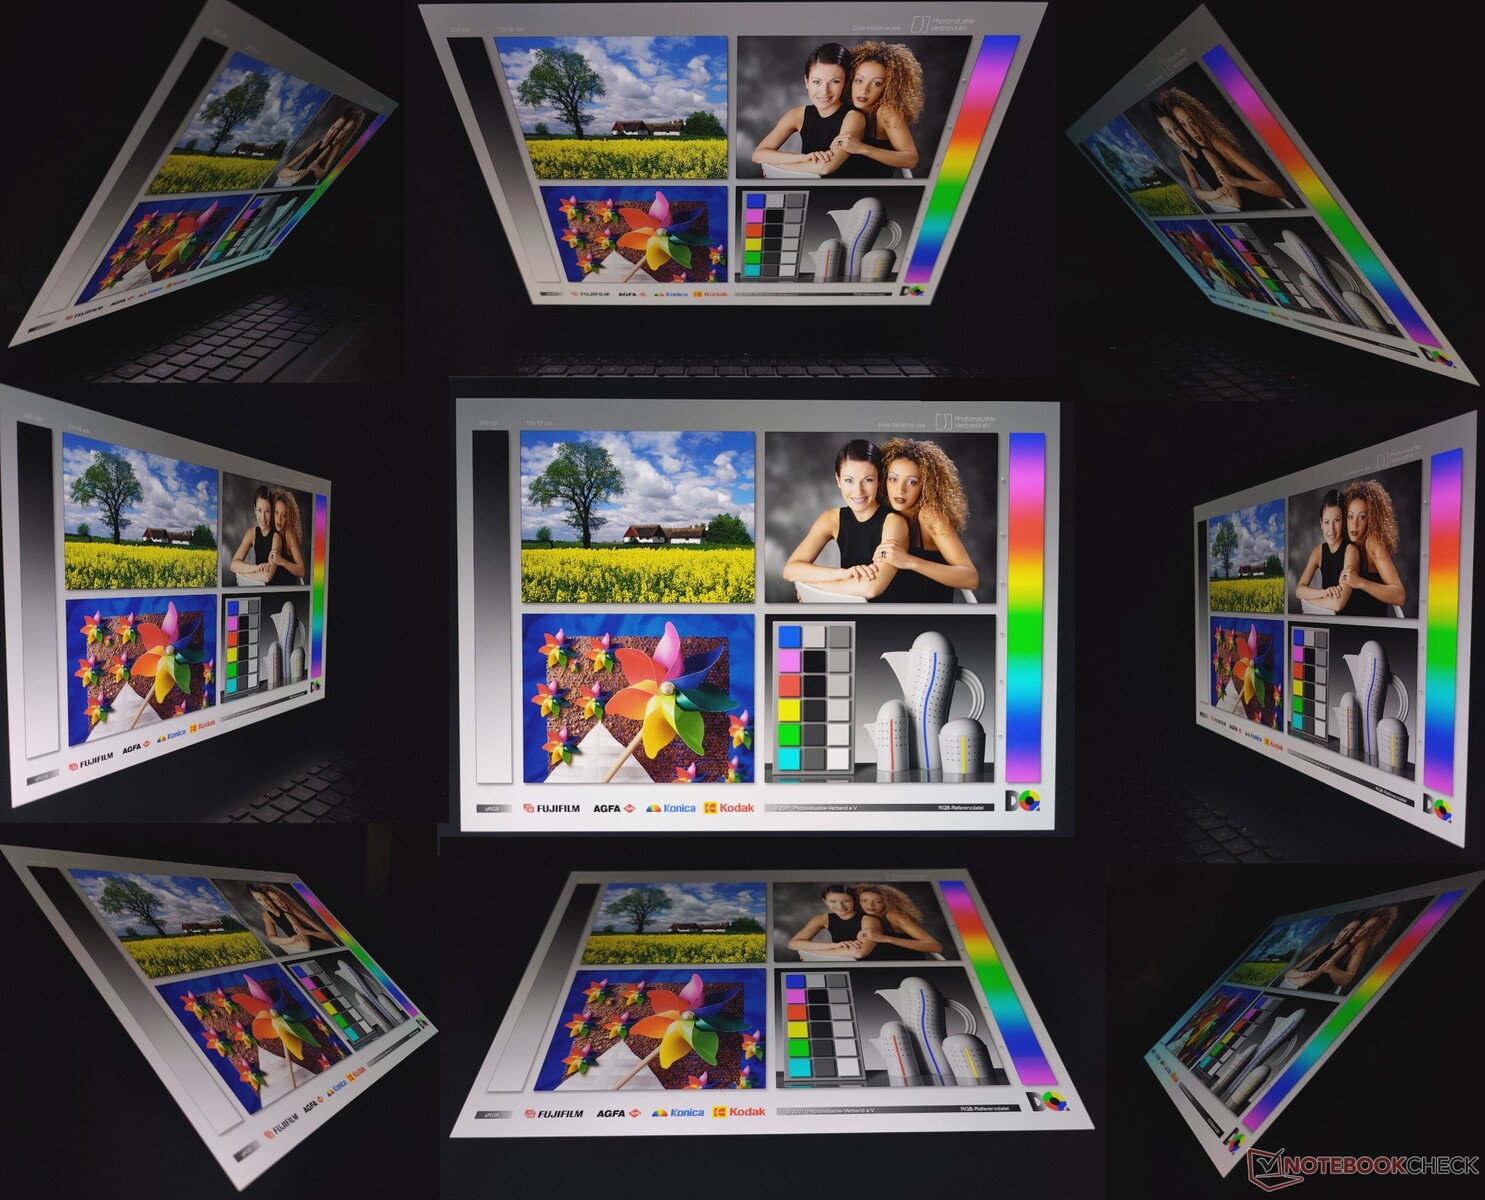
Lo schermo luminoso garantisce una buona visibilità alla luce del sole. Gli angoli di visione sono relativamente stabili, salvo una minima perdita di luminosità agli estremi.
Prestazioni: Combinazione senza esclusione di colpi di Core i9-12900H e RTX 3070 Ti
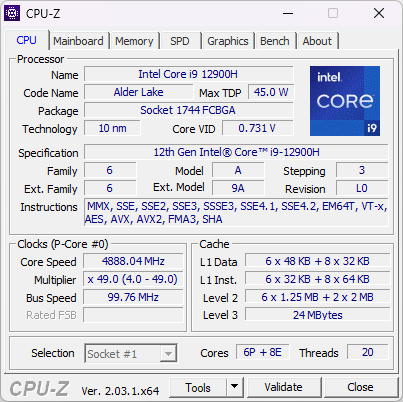
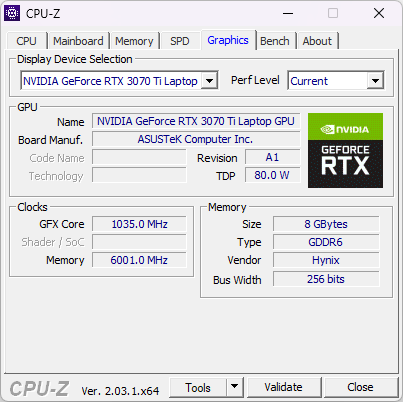
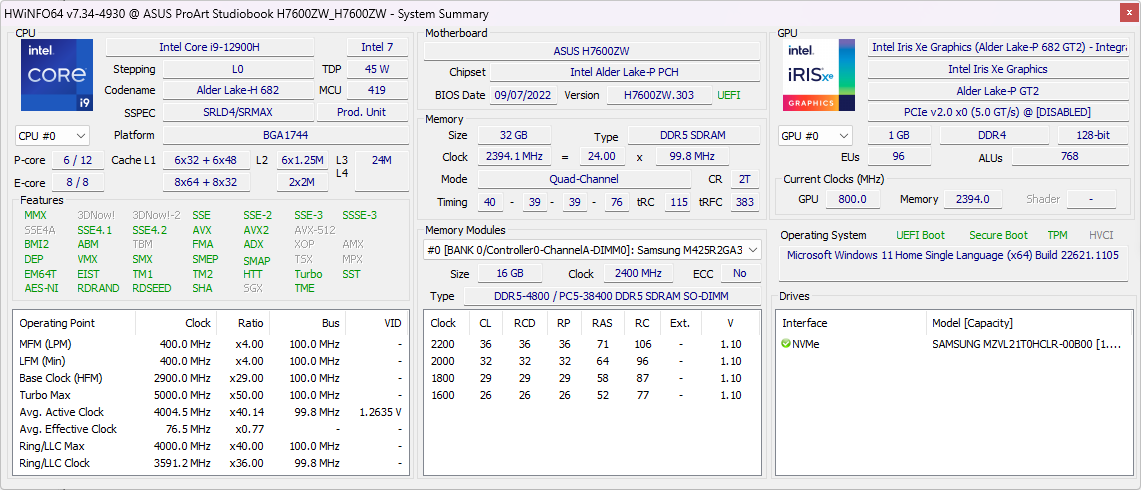
Il nostro Asus ProArt StudioBook 16 è alimentato dal processore Intel Core i9-12900H e da un processore da 115 W GPU per computer portatili Nvidia GeForce RTX 3070 Ti. Gli acquirenti hanno anche la possibilità di scegliere SKU con il processore Core i7-12700H e una GPU GeForce RTX 3060 o RTX 3080 Tiinsieme a opzioni di memoria DDR5-4800 aggiornabili fino a 64 GB.
Condizioni di test
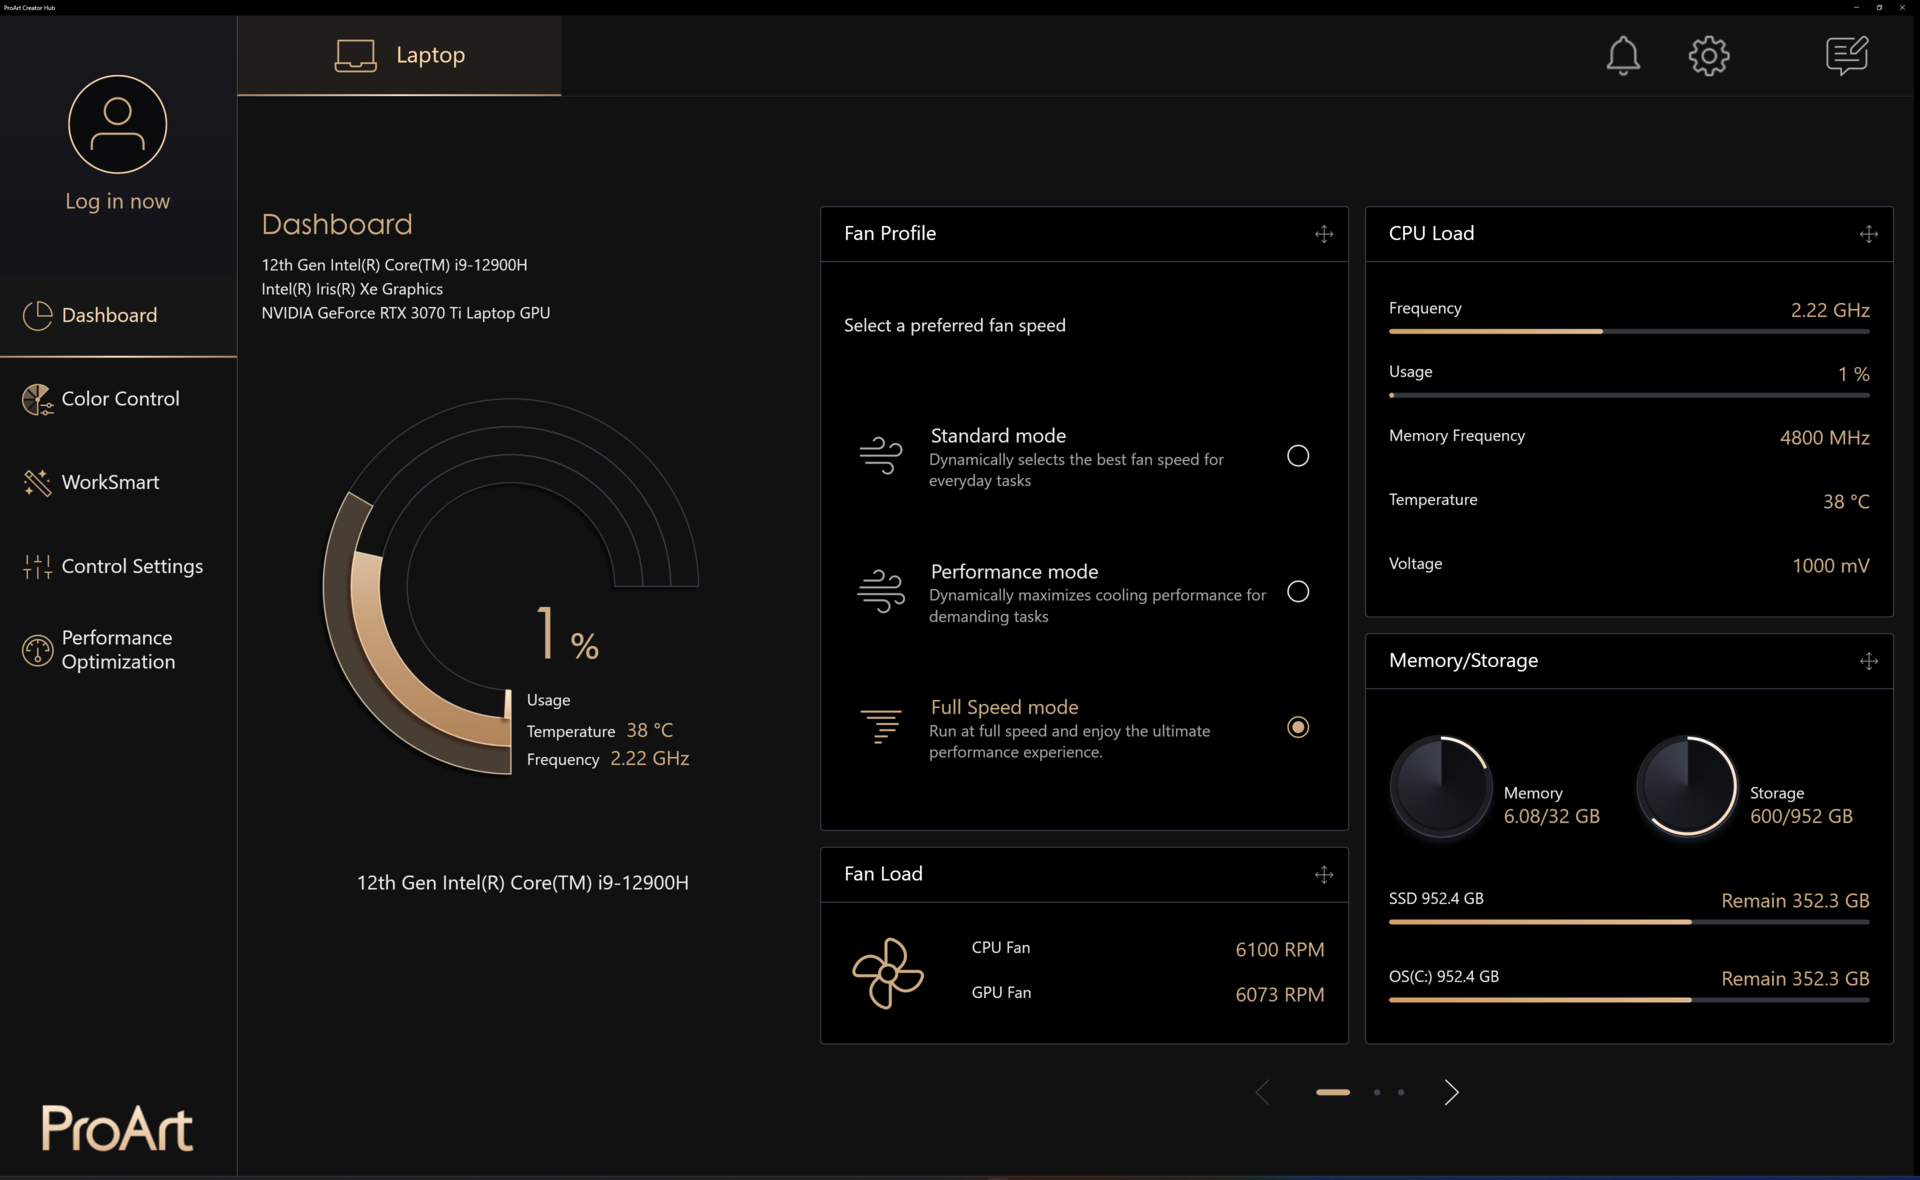
Le impostazioni del dispositivo sono distribuite tra il ProArt Creator Hub e l'applicazione MyAsus, il che può creare un po' di confusione per chi non conosce la linea ProArt.
Il ProArt Creator Hub consente di scegliere tra tre modalità di prestazioni disponibili, che influiscono sul TDP del Core i9-12900H come indicato nella tabella seguente.
Per tutti i nostri test abbiamo utilizzato la modalità di prestazione Full Speed, ad eccezione dei test di autonomia della batteria, che sono stati eseguiti in modalità Standard.
| Modalità Performance | PL1 (PBP) / Tau | PL2 (MTP) / Tau |
|---|---|---|
| Standard | 60 W / 56 s | 115 W / 2,44 ms |
| Performance | 110 W / 56 s | 115 W / 2,44 ms |
| Velocità massima | 110 W / 56 s | 115 W / 2,44 ms |
Processore

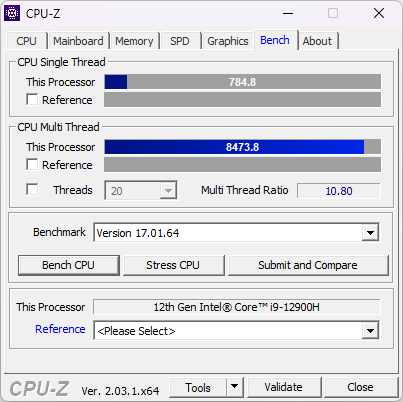
Il Core i9-12900H di Intel Alder Lake-H è dotato di 14 core e 20 thread con boost fino a 5 GHz. L'implementazione del raffreddamento di Asus sembra essere abbastanza robusta, come dimostra il nostro test Cinebench R15 multi-core in loop che non mostra alcun segno percepibile di throttling.
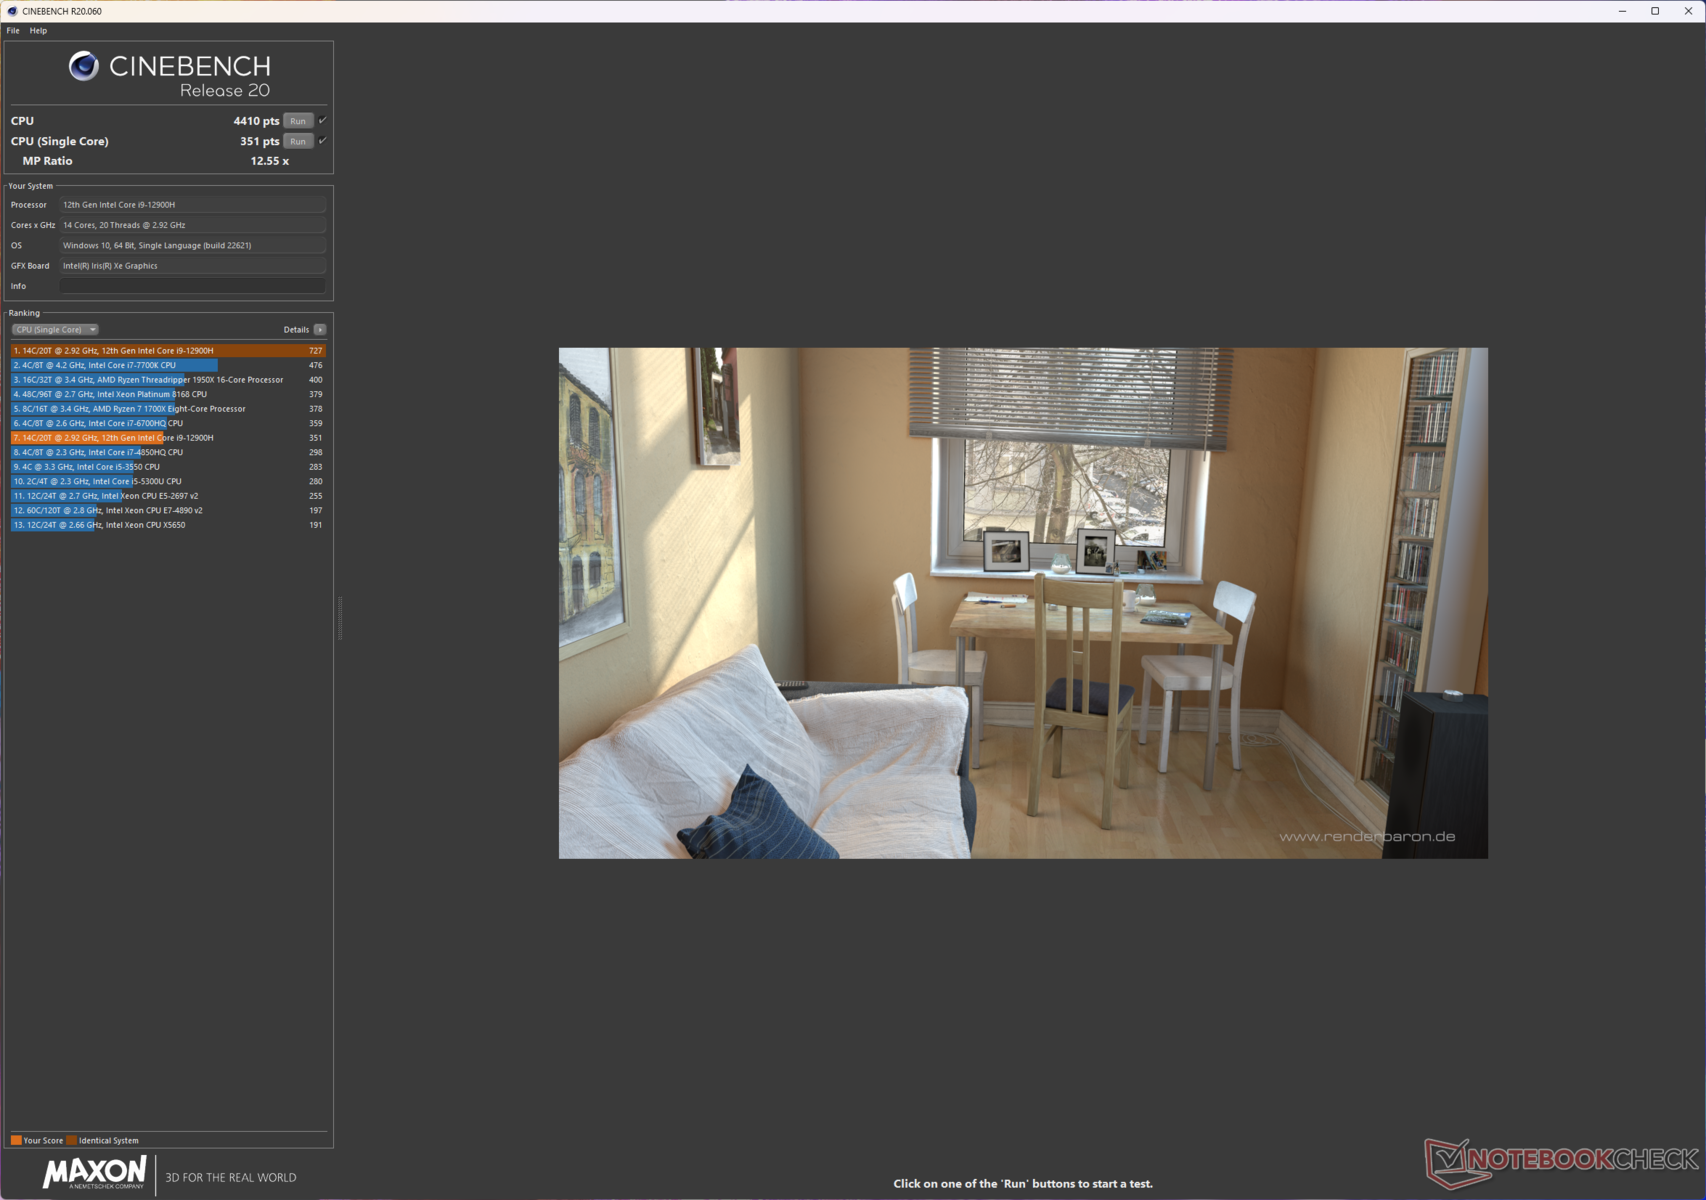
Il ProArt StudioBook 16 è in testa alla classifica delle prestazioni complessive della CPU, anche se con un vantaggio marginale rispetto ai concorrenti con lo stesso processore. Detto questo, le prestazioni single-core subiscono un minimo calo a causa dei 115 W PL2 rispetto all'MSI Creator Z16P MSI Creator Z16Pdi 160 W, Asus ROG Strix Scar 15di 135 W e di MSI Creator Z17 MSI Creator Z17di 120 W.
Rispetto al modello Apple M1 Pro e M1 Maxil Core i9-12900H del ProArt StudioBook 16 è fino al 22% più veloce in single-core e al 55% più veloce in multi-core in Cinebench R23.
Cinebench R15 Multi Loop
Cinebench R23: Multi Core | Single Core
Cinebench R20: CPU (Multi Core) | CPU (Single Core)
Cinebench R15: CPU Multi 64Bit | CPU Single 64Bit
Blender: v2.79 BMW27 CPU
7-Zip 18.03: 7z b 4 | 7z b 4 -mmt1
Geekbench 5.5: Multi-Core | Single-Core
HWBOT x265 Benchmark v2.2: 4k Preset
LibreOffice : 20 Documents To PDF
R Benchmark 2.5: Overall mean
| CPU Performance rating | |
| Asus ProArt StudioBook 16 H7600ZW | |
| Asus ROG Strix Scar 15 G533ZW-LN106WS | |
| MSI Creator Z16P B12UHST | |
| Gigabyte Aero 16 YE5 | |
| Asus ZenBook Pro 16X OLED UX7602ZM-ME115W | |
| MSI Creator Z17 A12UGST-054 | |
| Media della classe Multimedia | |
| Media Intel Core i9-12900H | |
| Asus ROG Zephyrus Duo 16 GX650RX | |
| Apple MacBook Pro 16 2021 M1 Pro -5! | |
| Apple MacBook Pro 14 2021 M1 Max 24-Core GPU -5! | |
| Lenovo ThinkBook 16p G3 ARH | |
| Cinebench R20 / CPU (Multi Core) | |
| Asus ProArt StudioBook 16 H7600ZW | |
| Asus ROG Strix Scar 15 G533ZW-LN106WS | |
| MSI Creator Z16P B12UHST | |
| Gigabyte Aero 16 YE5 | |
| Media della classe Multimedia (1887 - 12912, n=59, ultimi 2 anni) | |
| MSI Creator Z17 A12UGST-054 | |
| Asus ZenBook Pro 16X OLED UX7602ZM-ME115W | |
| Media Intel Core i9-12900H (2681 - 7471, n=28) | |
| Asus ROG Zephyrus Duo 16 GX650RX | |
| Lenovo ThinkBook 16p G3 ARH | |
| Apple MacBook Pro 14 2021 M1 Max 24-Core GPU | |
| Apple MacBook Pro 16 2021 M1 Pro | |
| Cinebench R20 / CPU (Single Core) | |
| MSI Creator Z16P B12UHST | |
| Asus ProArt StudioBook 16 H7600ZW | |
| Media della classe Multimedia (425 - 853, n=59, ultimi 2 anni) | |
| Asus ROG Strix Scar 15 G533ZW-LN106WS | |
| MSI Creator Z17 A12UGST-054 | |
| Media Intel Core i9-12900H (624 - 738, n=28) | |
| Gigabyte Aero 16 YE5 | |
| Asus ZenBook Pro 16X OLED UX7602ZM-ME115W | |
| Lenovo ThinkBook 16p G3 ARH | |
| Asus ROG Zephyrus Duo 16 GX650RX | |
| Apple MacBook Pro 14 2021 M1 Max 24-Core GPU | |
| Apple MacBook Pro 16 2021 M1 Pro | |
| Cinebench R15 / CPU Multi 64Bit | |
| Asus ROG Strix Scar 15 G533ZW-LN106WS | |
| Asus ProArt StudioBook 16 H7600ZW | |
| MSI Creator Z16P B12UHST | |
| Gigabyte Aero 16 YE5 | |
| Asus ZenBook Pro 16X OLED UX7602ZM-ME115W | |
| Media della classe Multimedia (856 - 5224, n=63, ultimi 2 anni) | |
| MSI Creator Z17 A12UGST-054 | |
| Media Intel Core i9-12900H (1395 - 3077, n=28) | |
| Asus ROG Zephyrus Duo 16 GX650RX | |
| Lenovo ThinkBook 16p G3 ARH | |
| Apple MacBook Pro 16 2021 M1 Pro | |
| Apple MacBook Pro 14 2021 M1 Max 24-Core GPU | |
| 7-Zip 18.03 / 7z b 4 | |
| Asus ProArt StudioBook 16 H7600ZW | |
| MSI Creator Z16P B12UHST | |
| Asus ZenBook Pro 16X OLED UX7602ZM-ME115W | |
| Gigabyte Aero 16 YE5 | |
| Asus ROG Strix Scar 15 G533ZW-LN106WS | |
| Asus ROG Zephyrus Duo 16 GX650RX | |
| MSI Creator Z17 A12UGST-054 | |
| Media Intel Core i9-12900H (34684 - 76677, n=28) | |
| Media della classe Multimedia (26062 - 130368, n=57, ultimi 2 anni) | |
| Lenovo ThinkBook 16p G3 ARH | |
| 7-Zip 18.03 / 7z b 4 -mmt1 | |
| Asus ProArt StudioBook 16 H7600ZW | |
| Gigabyte Aero 16 YE5 | |
| MSI Creator Z16P B12UHST | |
| Media della classe Multimedia (3666 - 7545, n=58, ultimi 2 anni) | |
| Asus ROG Strix Scar 15 G533ZW-LN106WS | |
| MSI Creator Z17 A12UGST-054 | |
| Media Intel Core i9-12900H (5302 - 6289, n=28) | |
| Asus ZenBook Pro 16X OLED UX7602ZM-ME115W | |
| Asus ROG Zephyrus Duo 16 GX650RX | |
| Lenovo ThinkBook 16p G3 ARH | |
| HWBOT x265 Benchmark v2.2 / 4k Preset | |
| Asus ProArt StudioBook 16 H7600ZW | |
| Asus ROG Strix Scar 15 G533ZW-LN106WS | |
| Asus ZenBook Pro 16X OLED UX7602ZM-ME115W | |
| MSI Creator Z16P B12UHST | |
| Media della classe Multimedia (5.26 - 36.1, n=58, ultimi 2 anni) | |
| Gigabyte Aero 16 YE5 | |
| Asus ROG Zephyrus Duo 16 GX650RX | |
| MSI Creator Z17 A12UGST-054 | |
| Media Intel Core i9-12900H (8.05 - 22.5, n=28) | |
| Lenovo ThinkBook 16p G3 ARH | |
| LibreOffice / 20 Documents To PDF | |
| Lenovo ThinkBook 16p G3 ARH | |
| Media della classe Multimedia (23.9 - 146.7, n=59, ultimi 2 anni) | |
| Asus ROG Zephyrus Duo 16 GX650RX | |
| Asus ProArt StudioBook 16 H7600ZW | |
| Media Intel Core i9-12900H (36.8 - 59.8, n=28) | |
| MSI Creator Z17 A12UGST-054 | |
| Asus ZenBook Pro 16X OLED UX7602ZM-ME115W | |
| Asus ROG Strix Scar 15 G533ZW-LN106WS | |
| Gigabyte Aero 16 YE5 | |
| MSI Creator Z16P B12UHST | |
| R Benchmark 2.5 / Overall mean | |
| Lenovo ThinkBook 16p G3 ARH | |
| Asus ROG Zephyrus Duo 16 GX650RX | |
| Media della classe Multimedia (0.3604 - 0.947, n=58, ultimi 2 anni) | |
| Media Intel Core i9-12900H (0.4218 - 0.506, n=28) | |
| MSI Creator Z17 A12UGST-054 | |
| Asus ZenBook Pro 16X OLED UX7602ZM-ME115W | |
| Asus ProArt StudioBook 16 H7600ZW | |
| MSI Creator Z16P B12UHST | |
| Asus ROG Strix Scar 15 G533ZW-LN106WS | |
| Gigabyte Aero 16 YE5 | |
* ... Meglio usare valori piccoli
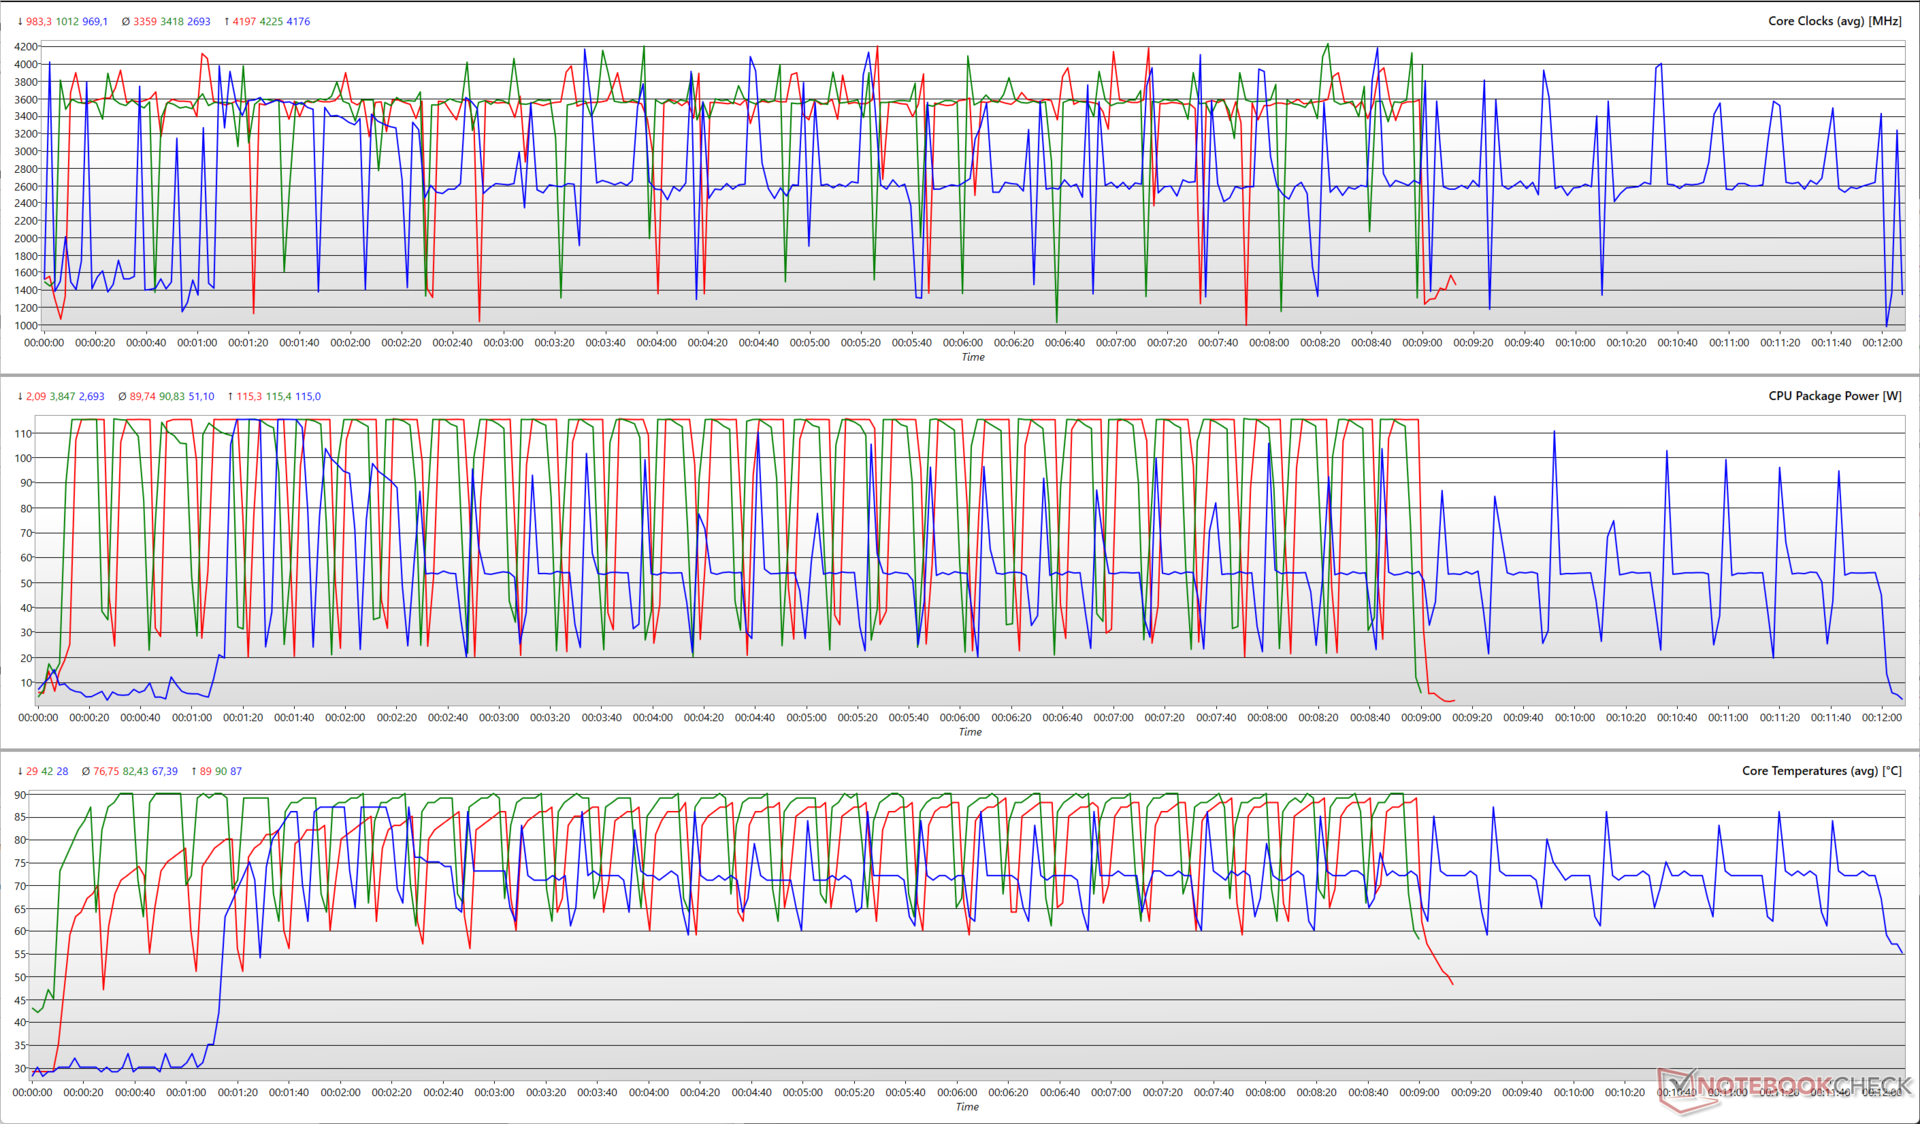
Il grafico seguente illustra come cambiano i vari parametri della CPU durante un test multi-core Cinebench R15. Vediamo che tutte e tre le modalità di prestazione sono in grado di raggiungere i limiti massimi di clock, potenza e temperatura.
Tuttavia, la modalità Standard si assesta su una potenza media inferiore di 51 W rispetto ai 90 W delle altre due modalità. Ciò si traduce in un clock medio del core più basso, pari a circa 2,7 GHz, e in temperature del core più basse, che si aggirano intorno ai 67 °C.
Le modalità Performance e Full Speed sono più o meno uguali in termini di limiti di potenza, ma quest'ultima fa girare le ventole continuamente alla massima velocità anche in idle. Pertanto, le temperature medie del core in modalità Full Speed sono inferiori di circa 6 °C rispetto alla modalità Performance.
Le prestazioni, tuttavia, subiscono un calo con l'alimentazione a batteria. I punteggi di Cinebench R20 diminuiscono del 52% in single-core e del 40% in multi-core quando si utilizza la batteria.
A differenza dei MacBook Pro con silicio Apple, che hanno prestazioni abbastanza costanti sia se collegati alla rete elettrica che a batteria, il ProArt StudioBook 16, come tutti i moderni dispositivi x86, può mostrare pienamente i suoi muscoli solo quando è collegato alla rete elettrica
.
Detto questo, le prestazioni ridotte a batteria dovrebbero comunque essere adeguate per aiutarvi a svolgere lavori creativi in movimento.
Nel complesso, il ProArt StudioBook 16 offre una potenza della CPU sufficiente per affrontare i flussi di lavoro più impegnativi senza sudare.
AIDA64: FP32 Ray-Trace | FPU Julia | CPU SHA3 | CPU Queen | FPU SinJulia | FPU Mandel | CPU AES | CPU ZLib | FP64 Ray-Trace | CPU PhotoWorxx
| Performance rating | |
| Asus ProArt StudioBook 16 H7600ZW | |
| Asus ROG Zephyrus Duo 16 GX650RX | |
| Media della classe Multimedia | |
| Lenovo ThinkBook 16p G3 ARH | |
| Asus ZenBook Pro 16X OLED UX7602ZM-ME115W | |
| Asus ROG Strix Scar 15 G533ZW-LN106WS | |
| MSI Creator Z16P B12UHST | |
| Media Intel Core i9-12900H | |
| Gigabyte Aero 16 YE5 | |
| MSI Creator Z17 A12UGST-054 | |
| AIDA64 / FP32 Ray-Trace | |
| Media della classe Multimedia (2214 - 50388, n=55, ultimi 2 anni) | |
| Asus ProArt StudioBook 16 H7600ZW | |
| Asus ROG Zephyrus Duo 16 GX650RX | |
| Lenovo ThinkBook 16p G3 ARH | |
| Asus ZenBook Pro 16X OLED UX7602ZM-ME115W | |
| Media Intel Core i9-12900H (4074 - 18289, n=29) | |
| Asus ROG Strix Scar 15 G533ZW-LN106WS | |
| MSI Creator Z16P B12UHST | |
| Gigabyte Aero 16 YE5 | |
| MSI Creator Z17 A12UGST-054 | |
| AIDA64 / FPU Julia | |
| Asus ROG Zephyrus Duo 16 GX650RX | |
| Lenovo ThinkBook 16p G3 ARH | |
| Asus ProArt StudioBook 16 H7600ZW | |
| Media della classe Multimedia (12867 - 201874, n=56, ultimi 2 anni) | |
| Asus ZenBook Pro 16X OLED UX7602ZM-ME115W | |
| Media Intel Core i9-12900H (22307 - 93236, n=29) | |
| Asus ROG Strix Scar 15 G533ZW-LN106WS | |
| MSI Creator Z16P B12UHST | |
| Gigabyte Aero 16 YE5 | |
| MSI Creator Z17 A12UGST-054 | |
| AIDA64 / CPU SHA3 | |
| Asus ProArt StudioBook 16 H7600ZW | |
| Media della classe Multimedia (626 - 8623, n=56, ultimi 2 anni) | |
| Asus ZenBook Pro 16X OLED UX7602ZM-ME115W | |
| Asus ROG Zephyrus Duo 16 GX650RX | |
| Asus ROG Strix Scar 15 G533ZW-LN106WS | |
| Lenovo ThinkBook 16p G3 ARH | |
| Media Intel Core i9-12900H (1378 - 4215, n=29) | |
| MSI Creator Z16P B12UHST | |
| Gigabyte Aero 16 YE5 | |
| MSI Creator Z17 A12UGST-054 | |
| AIDA64 / CPU Queen | |
| Asus ProArt StudioBook 16 H7600ZW | |
| Asus ZenBook Pro 16X OLED UX7602ZM-ME115W | |
| Gigabyte Aero 16 YE5 | |
| MSI Creator Z16P B12UHST | |
| MSI Creator Z17 A12UGST-054 | |
| Asus ROG Zephyrus Duo 16 GX650RX | |
| Asus ROG Strix Scar 15 G533ZW-LN106WS | |
| Lenovo ThinkBook 16p G3 ARH | |
| Media Intel Core i9-12900H (78172 - 111241, n=28) | |
| Media della classe Multimedia (13483 - 181505, n=43, ultimi 2 anni) | |
| AIDA64 / FPU SinJulia | |
| Lenovo ThinkBook 16p G3 ARH | |
| Asus ROG Zephyrus Duo 16 GX650RX | |
| Asus ProArt StudioBook 16 H7600ZW | |
| Asus ROG Strix Scar 15 G533ZW-LN106WS | |
| MSI Creator Z16P B12UHST | |
| Asus ZenBook Pro 16X OLED UX7602ZM-ME115W | |
| Gigabyte Aero 16 YE5 | |
| MSI Creator Z17 A12UGST-054 | |
| Media Intel Core i9-12900H (5709 - 10410, n=29) | |
| Media della classe Multimedia (886 - 28794, n=56, ultimi 2 anni) | |
| AIDA64 / FPU Mandel | |
| Asus ROG Zephyrus Duo 16 GX650RX | |
| Lenovo ThinkBook 16p G3 ARH | |
| Asus ProArt StudioBook 16 H7600ZW | |
| Media della classe Multimedia (6395 - 105740, n=55, ultimi 2 anni) | |
| Asus ZenBook Pro 16X OLED UX7602ZM-ME115W | |
| Media Intel Core i9-12900H (11257 - 45581, n=29) | |
| Asus ROG Strix Scar 15 G533ZW-LN106WS | |
| MSI Creator Z16P B12UHST | |
| Gigabyte Aero 16 YE5 | |
| MSI Creator Z17 A12UGST-054 | |
| AIDA64 / CPU AES | |
| Asus ProArt StudioBook 16 H7600ZW | |
| Asus ROG Zephyrus Duo 16 GX650RX | |
| Asus ROG Strix Scar 15 G533ZW-LN106WS | |
| MSI Creator Z16P B12UHST | |
| Gigabyte Aero 16 YE5 | |
| MSI Creator Z17 A12UGST-054 | |
| Media Intel Core i9-12900H (31935 - 151546, n=29) | |
| Asus ZenBook Pro 16X OLED UX7602ZM-ME115W | |
| Media della classe Multimedia (8171 - 126790, n=56, ultimi 2 anni) | |
| Lenovo ThinkBook 16p G3 ARH | |
| AIDA64 / CPU ZLib | |
| MSI Creator Z16P B12UHST | |
| Asus ROG Strix Scar 15 G533ZW-LN106WS | |
| Asus ProArt StudioBook 16 H7600ZW | |
| Asus ZenBook Pro 16X OLED UX7602ZM-ME115W | |
| Gigabyte Aero 16 YE5 | |
| Media della classe Multimedia (143.8 - 2022, n=56, ultimi 2 anni) | |
| MSI Creator Z17 A12UGST-054 | |
| Media Intel Core i9-12900H (449 - 1193, n=29) | |
| Asus ROG Zephyrus Duo 16 GX650RX | |
| Lenovo ThinkBook 16p G3 ARH | |
| AIDA64 / FP64 Ray-Trace | |
| Asus ProArt StudioBook 16 H7600ZW | |
| Media della classe Multimedia (1014 - 26875, n=56, ultimi 2 anni) | |
| Asus ROG Zephyrus Duo 16 GX650RX | |
| Lenovo ThinkBook 16p G3 ARH | |
| Asus ZenBook Pro 16X OLED UX7602ZM-ME115W | |
| Media Intel Core i9-12900H (2235 - 10511, n=29) | |
| Asus ROG Strix Scar 15 G533ZW-LN106WS | |
| MSI Creator Z16P B12UHST | |
| Gigabyte Aero 16 YE5 | |
| MSI Creator Z17 A12UGST-054 | |
| AIDA64 / CPU PhotoWorxx | |
| Media della classe Multimedia (8187 - 88154, n=56, ultimi 2 anni) | |
| Asus ZenBook Pro 16X OLED UX7602ZM-ME115W | |
| Asus ProArt StudioBook 16 H7600ZW | |
| MSI Creator Z16P B12UHST | |
| Asus ROG Strix Scar 15 G533ZW-LN106WS | |
| MSI Creator Z17 A12UGST-054 | |
| Gigabyte Aero 16 YE5 | |
| Media Intel Core i9-12900H (20960 - 48269, n=30) | |
| Asus ROG Zephyrus Duo 16 GX650RX | |
| Lenovo ThinkBook 16p G3 ARH | |
Scoprite il nostro sito dedicato Intel Core i9-12900H per ulteriori informazioni e confronti sulle prestazioni.
Prestazioni del sistema
Il ProArt StudioBook 16 non presenta alcun problema per quanto riguarda le prestazioni e la reattività del sistema di tutti i giorni. I punteggi complessivi di PCMark 10 sono in linea con le aspettative per questa configurazione.
CrossMark vede una leggera battuta d'arresto rispetto ad Asus ROG Strix Scar 15 e MSI Creator Z17, ma lo StudioBook 16 è circa il 17% più veloce di un MacBook Pro 14 M1 Max M1 Max MacBook Pro 14 e del 22% rispetto a un M1 Pro MacBook Pro 16.
Affinity Photo 2, tuttavia, vede il silicio Apple nettamente superiore al Core i9-12900H. Il ProArt StudioBook 16 è inferiore del 14% nel test combinato della CPU e fino al 55% nel test combinato della GPU rispetto al MacBook Pro 14 basato su M1 Max.
CrossMark: Overall | Productivity | Creativity | Responsiveness
Affinity Photo 2: Combined (Multi CPU) | Combined (Single / Multi GPU)
| PCMark 10 / Score | |
| MSI Creator Z16P B12UHST | |
| Asus ProArt StudioBook 16 H7600ZW | |
| Asus ROG Strix Scar 15 G533ZW-LN106WS | |
| Gigabyte Aero 16 YE5 | |
| Media della classe Multimedia (4325 - 10386, n=54, ultimi 2 anni) | |
| Media Intel Core i9-12900H, NVIDIA GeForce RTX 3070 Ti Laptop GPU (7087 - 8072, n=6) | |
| Asus ZenBook Pro 16X OLED UX7602ZM-ME115W | |
| MSI Creator Z17 A12UGST-054 | |
| Lenovo ThinkBook 16p G3 ARH | |
| Asus ROG Zephyrus Duo 16 GX650RX | |
| PCMark 10 / Essentials | |
| Asus ProArt StudioBook 16 H7600ZW | |
| MSI Creator Z16P B12UHST | |
| Asus ZenBook Pro 16X OLED UX7602ZM-ME115W | |
| Gigabyte Aero 16 YE5 | |
| Media Intel Core i9-12900H, NVIDIA GeForce RTX 3070 Ti Laptop GPU (10266 - 11663, n=6) | |
| Asus ROG Strix Scar 15 G533ZW-LN106WS | |
| Media della classe Multimedia (8025 - 11664, n=53, ultimi 2 anni) | |
| MSI Creator Z17 A12UGST-054 | |
| Lenovo ThinkBook 16p G3 ARH | |
| Asus ROG Zephyrus Duo 16 GX650RX | |
| PCMark 10 / Productivity | |
| Media della classe Multimedia (7323 - 18233, n=53, ultimi 2 anni) | |
| MSI Creator Z16P B12UHST | |
| Asus ProArt StudioBook 16 H7600ZW | |
| Asus ROG Strix Scar 15 G533ZW-LN106WS | |
| Media Intel Core i9-12900H, NVIDIA GeForce RTX 3070 Ti Laptop GPU (9402 - 10742, n=6) | |
| Asus ZenBook Pro 16X OLED UX7602ZM-ME115W | |
| Gigabyte Aero 16 YE5 | |
| MSI Creator Z17 A12UGST-054 | |
| Lenovo ThinkBook 16p G3 ARH | |
| Asus ROG Zephyrus Duo 16 GX650RX | |
| PCMark 10 / Digital Content Creation | |
| Asus ROG Strix Scar 15 G533ZW-LN106WS | |
| Gigabyte Aero 16 YE5 | |
| MSI Creator Z16P B12UHST | |
| Asus ProArt StudioBook 16 H7600ZW | |
| Media Intel Core i9-12900H, NVIDIA GeForce RTX 3070 Ti Laptop GPU (10009 - 12541, n=6) | |
| Media della classe Multimedia (3651 - 16240, n=53, ultimi 2 anni) | |
| Asus ZenBook Pro 16X OLED UX7602ZM-ME115W | |
| MSI Creator Z17 A12UGST-054 | |
| Asus ROG Zephyrus Duo 16 GX650RX | |
| Lenovo ThinkBook 16p G3 ARH | |
| CrossMark / Overall | |
| Gigabyte Aero 16 YE5 | |
| Asus ROG Strix Scar 15 G533ZW-LN106WS | |
| MSI Creator Z17 A12UGST-054 | |
| Asus ProArt StudioBook 16 H7600ZW | |
| Media della classe Multimedia (866 - 2728, n=62, ultimi 2 anni) | |
| Media Intel Core i9-12900H, NVIDIA GeForce RTX 3070 Ti Laptop GPU (1664 - 2044, n=6) | |
| Asus ZenBook Pro 16X OLED UX7602ZM-ME115W | |
| Asus ROG Zephyrus Duo 16 GX650RX | |
| Apple MacBook Pro 14 2021 M1 Max 24-Core GPU | |
| Apple MacBook Pro 16 2021 M1 Pro | |
| Lenovo ThinkBook 16p G3 ARH | |
| CrossMark / Productivity | |
| Gigabyte Aero 16 YE5 | |
| Asus ROG Strix Scar 15 G533ZW-LN106WS | |
| MSI Creator Z17 A12UGST-054 | |
| Asus ProArt StudioBook 16 H7600ZW | |
| Media Intel Core i9-12900H, NVIDIA GeForce RTX 3070 Ti Laptop GPU (1591 - 1968, n=6) | |
| Media della classe Multimedia (931 - 2489, n=62, ultimi 2 anni) | |
| Asus ROG Zephyrus Duo 16 GX650RX | |
| Asus ZenBook Pro 16X OLED UX7602ZM-ME115W | |
| Lenovo ThinkBook 16p G3 ARH | |
| Apple MacBook Pro 14 2021 M1 Max 24-Core GPU | |
| Apple MacBook Pro 16 2021 M1 Pro | |
| CrossMark / Creativity | |
| Gigabyte Aero 16 YE5 | |
| Apple MacBook Pro 14 2021 M1 Max 24-Core GPU | |
| Media della classe Multimedia (907 - 3465, n=62, ultimi 2 anni) | |
| MSI Creator Z17 A12UGST-054 | |
| Asus ROG Strix Scar 15 G533ZW-LN106WS | |
| Asus ProArt StudioBook 16 H7600ZW | |
| Apple MacBook Pro 16 2021 M1 Pro | |
| Asus ZenBook Pro 16X OLED UX7602ZM-ME115W | |
| Media Intel Core i9-12900H, NVIDIA GeForce RTX 3070 Ti Laptop GPU (1797 - 2148, n=6) | |
| Asus ROG Zephyrus Duo 16 GX650RX | |
| Lenovo ThinkBook 16p G3 ARH | |
| CrossMark / Responsiveness | |
| Gigabyte Aero 16 YE5 | |
| Asus ROG Strix Scar 15 G533ZW-LN106WS | |
| MSI Creator Z17 A12UGST-054 | |
| Media Intel Core i9-12900H, NVIDIA GeForce RTX 3070 Ti Laptop GPU (1514 - 2069, n=6) | |
| Asus ROG Zephyrus Duo 16 GX650RX | |
| Asus ProArt StudioBook 16 H7600ZW | |
| Media della classe Multimedia (605 - 2024, n=62, ultimi 2 anni) | |
| Asus ZenBook Pro 16X OLED UX7602ZM-ME115W | |
| Lenovo ThinkBook 16p G3 ARH | |
| Apple MacBook Pro 14 2021 M1 Max 24-Core GPU | |
| Apple MacBook Pro 16 2021 M1 Pro | |
| Affinity Photo 2 / Combined (Multi CPU) | |
| Apple MacBook Pro 16 2021 M1 Pro | |
| Apple MacBook Pro 14 2021 M1 Max 24-Core GPU | |
| Asus ProArt StudioBook 16 H7600ZW | |
| Media Intel Core i9-12900H, NVIDIA GeForce RTX 3070 Ti Laptop GPU (n=1) | |
| Affinity Photo 2 / Combined (Single / Multi GPU) | |
| Apple MacBook Pro 14 2021 M1 Max 24-Core GPU | |
| Apple MacBook Pro 16 2021 M1 Pro | |
| Asus ProArt StudioBook 16 H7600ZW | |
| Media Intel Core i9-12900H, NVIDIA GeForce RTX 3070 Ti Laptop GPU (n=1) | |
| PCMark 8 Home Score Accelerated v2 | 5440 punti | |
| PCMark 8 Work Score Accelerated v2 | 5380 punti | |
| PCMark 10 Score | 8072 punti | |
Aiuto | ||
| AIDA64 / Memory Copy | |
| Media della classe Multimedia (11299 - 132135, n=56, ultimi 2 anni) | |
| Asus ZenBook Pro 16X OLED UX7602ZM-ME115W | |
| MSI Creator Z16P B12UHST | |
| Gigabyte Aero 16 YE5 | |
| Asus ProArt StudioBook 16 H7600ZW | |
| MSI Creator Z17 A12UGST-054 | |
| Asus ROG Strix Scar 15 G533ZW-LN106WS | |
| Media Intel Core i9-12900H (34438 - 74264, n=29) | |
| Asus ROG Zephyrus Duo 16 GX650RX | |
| Lenovo ThinkBook 16p G3 ARH | |
| AIDA64 / Memory Read | |
| Media della classe Multimedia (11624 - 174586, n=56, ultimi 2 anni) | |
| Asus ZenBook Pro 16X OLED UX7602ZM-ME115W | |
| MSI Creator Z16P B12UHST | |
| Asus ProArt StudioBook 16 H7600ZW | |
| Gigabyte Aero 16 YE5 | |
| MSI Creator Z17 A12UGST-054 | |
| Asus ROG Strix Scar 15 G533ZW-LN106WS | |
| Media Intel Core i9-12900H (36365 - 74642, n=29) | |
| Asus ROG Zephyrus Duo 16 GX650RX | |
| Lenovo ThinkBook 16p G3 ARH | |
| AIDA64 / Memory Write | |
| Media della classe Multimedia (11755 - 134998, n=56, ultimi 2 anni) | |
| Asus ROG Strix Scar 15 G533ZW-LN106WS | |
| MSI Creator Z16P B12UHST | |
| MSI Creator Z17 A12UGST-054 | |
| Asus ProArt StudioBook 16 H7600ZW | |
| Asus ZenBook Pro 16X OLED UX7602ZM-ME115W | |
| Gigabyte Aero 16 YE5 | |
| Media Intel Core i9-12900H (32276 - 67858, n=29) | |
| Asus ROG Zephyrus Duo 16 GX650RX | |
| Lenovo ThinkBook 16p G3 ARH | |
| AIDA64 / Memory Latency | |
| Media della classe Multimedia (7 - 535, n=55, ultimi 2 anni) | |
| Lenovo ThinkBook 16p G3 ARH | |
| Asus ZenBook Pro 16X OLED UX7602ZM-ME115W | |
| Asus ROG Strix Scar 15 G533ZW-LN106WS | |
| MSI Creator Z16P B12UHST | |
| MSI Creator Z17 A12UGST-054 | |
| Asus ROG Zephyrus Duo 16 GX650RX | |
| Gigabyte Aero 16 YE5 | |
| Asus ProArt StudioBook 16 H7600ZW | |
| Media Intel Core i9-12900H (74.7 - 118.1, n=28) | |
* ... Meglio usare valori piccoli
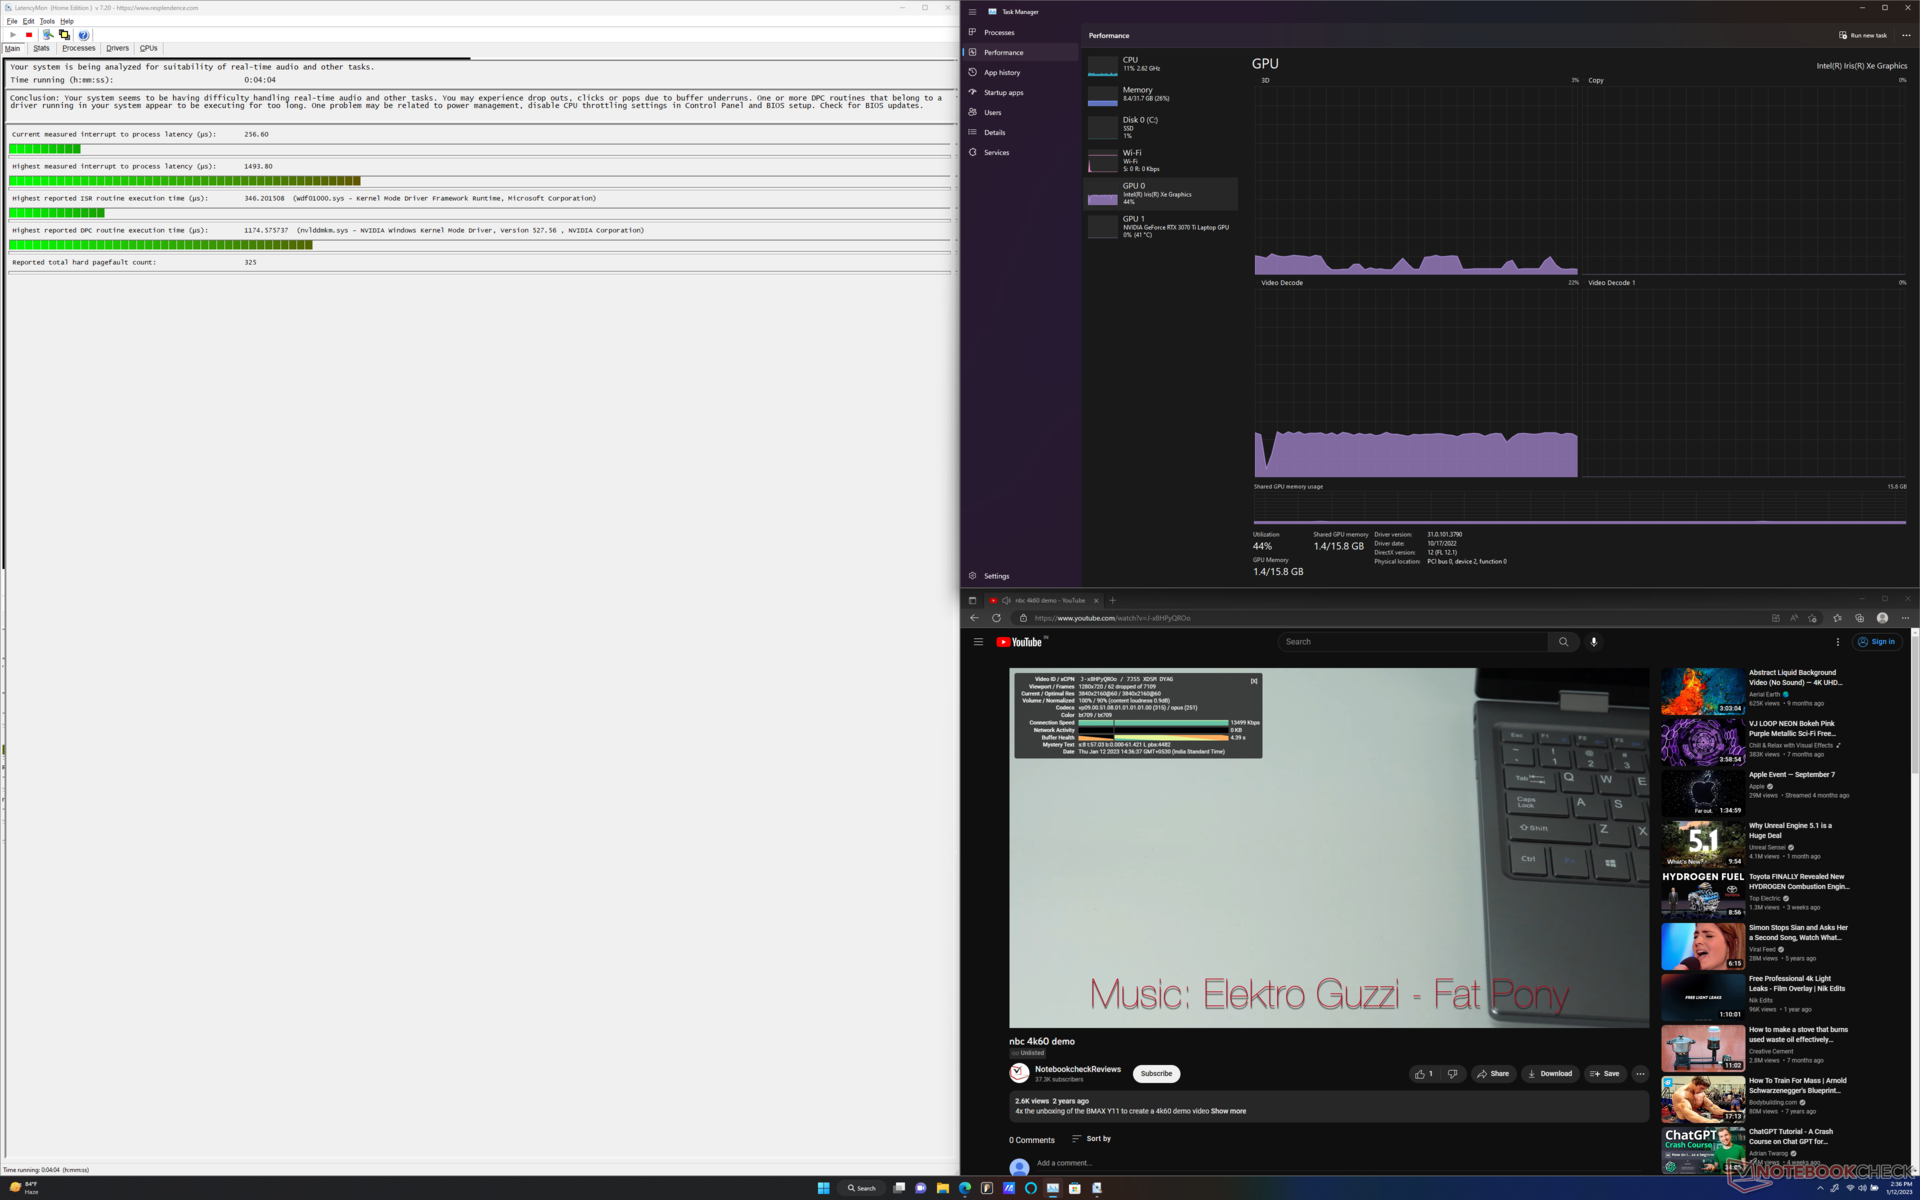
Latenza DPC
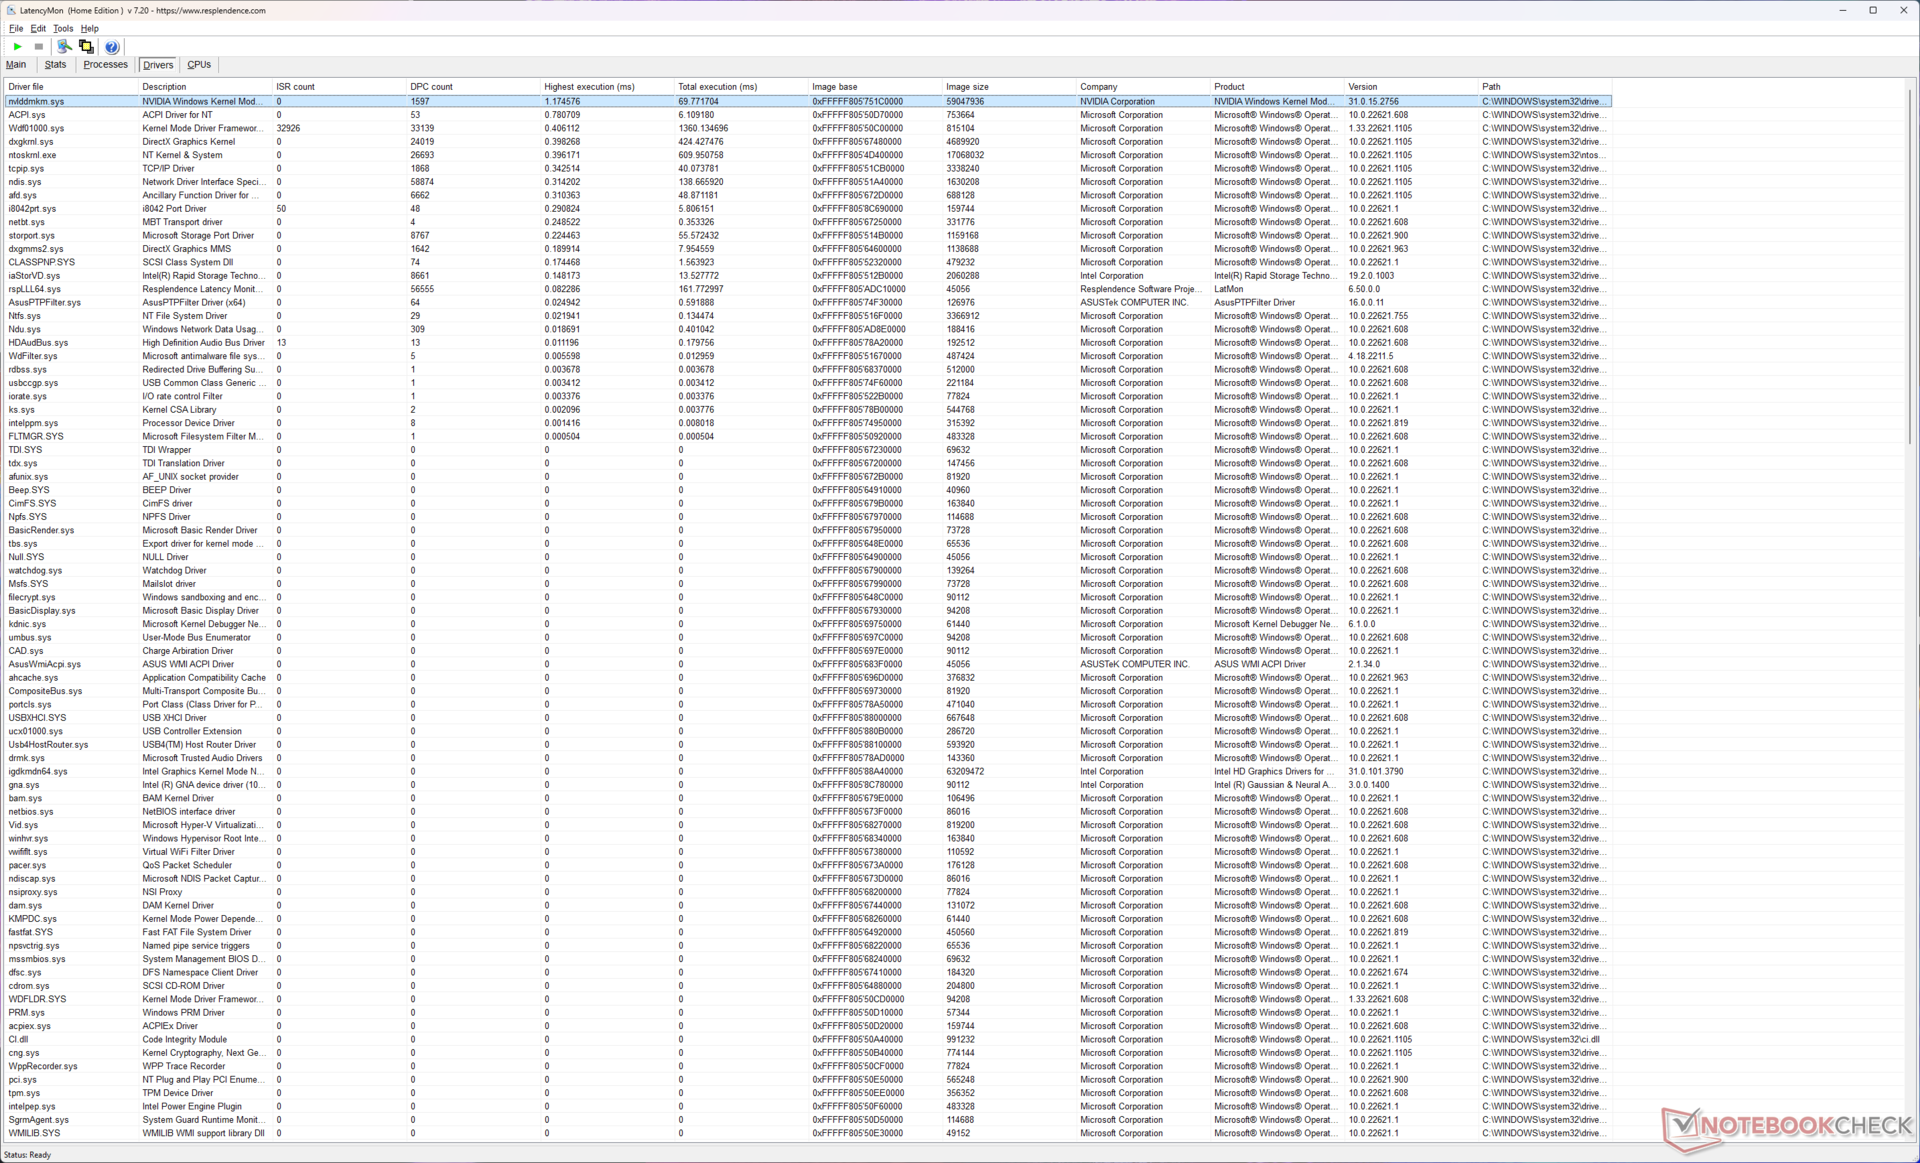
Abbiamo misurato la latenza massima da interrupt a processo a 1493,8 µs, che è un po' troppo alta per un computer portatile incentrato sulla creazione di contenuti. Il driver di sistema in modalità kernel di Nvidia sembra essere la causa dell'aumento della latenza.
| DPC Latencies / LatencyMon - interrupt to process latency (max), Web, Youtube, Prime95 | |
| Lenovo ThinkBook 16p G3 ARH | |
| MSI Creator Z17 A12UGST-054 | |
| Asus ProArt StudioBook 16 H7600ZW | |
| Asus ROG Strix Scar 15 G533ZW-LN106WS | |
| MSI Creator Z16P B12UHST | |
| Gigabyte Aero 16 YE5 | |
| Asus ROG Zephyrus Duo 16 GX650RX | |
| Asus ZenBook Pro 16X OLED UX7602ZM-ME115W | |
* ... Meglio usare valori piccoli
Il nostro Classifica della latenza DPCfornisce ulteriori confronti sulla latenza dei dispositivi recensiti.
Dispositivi di archiviazione
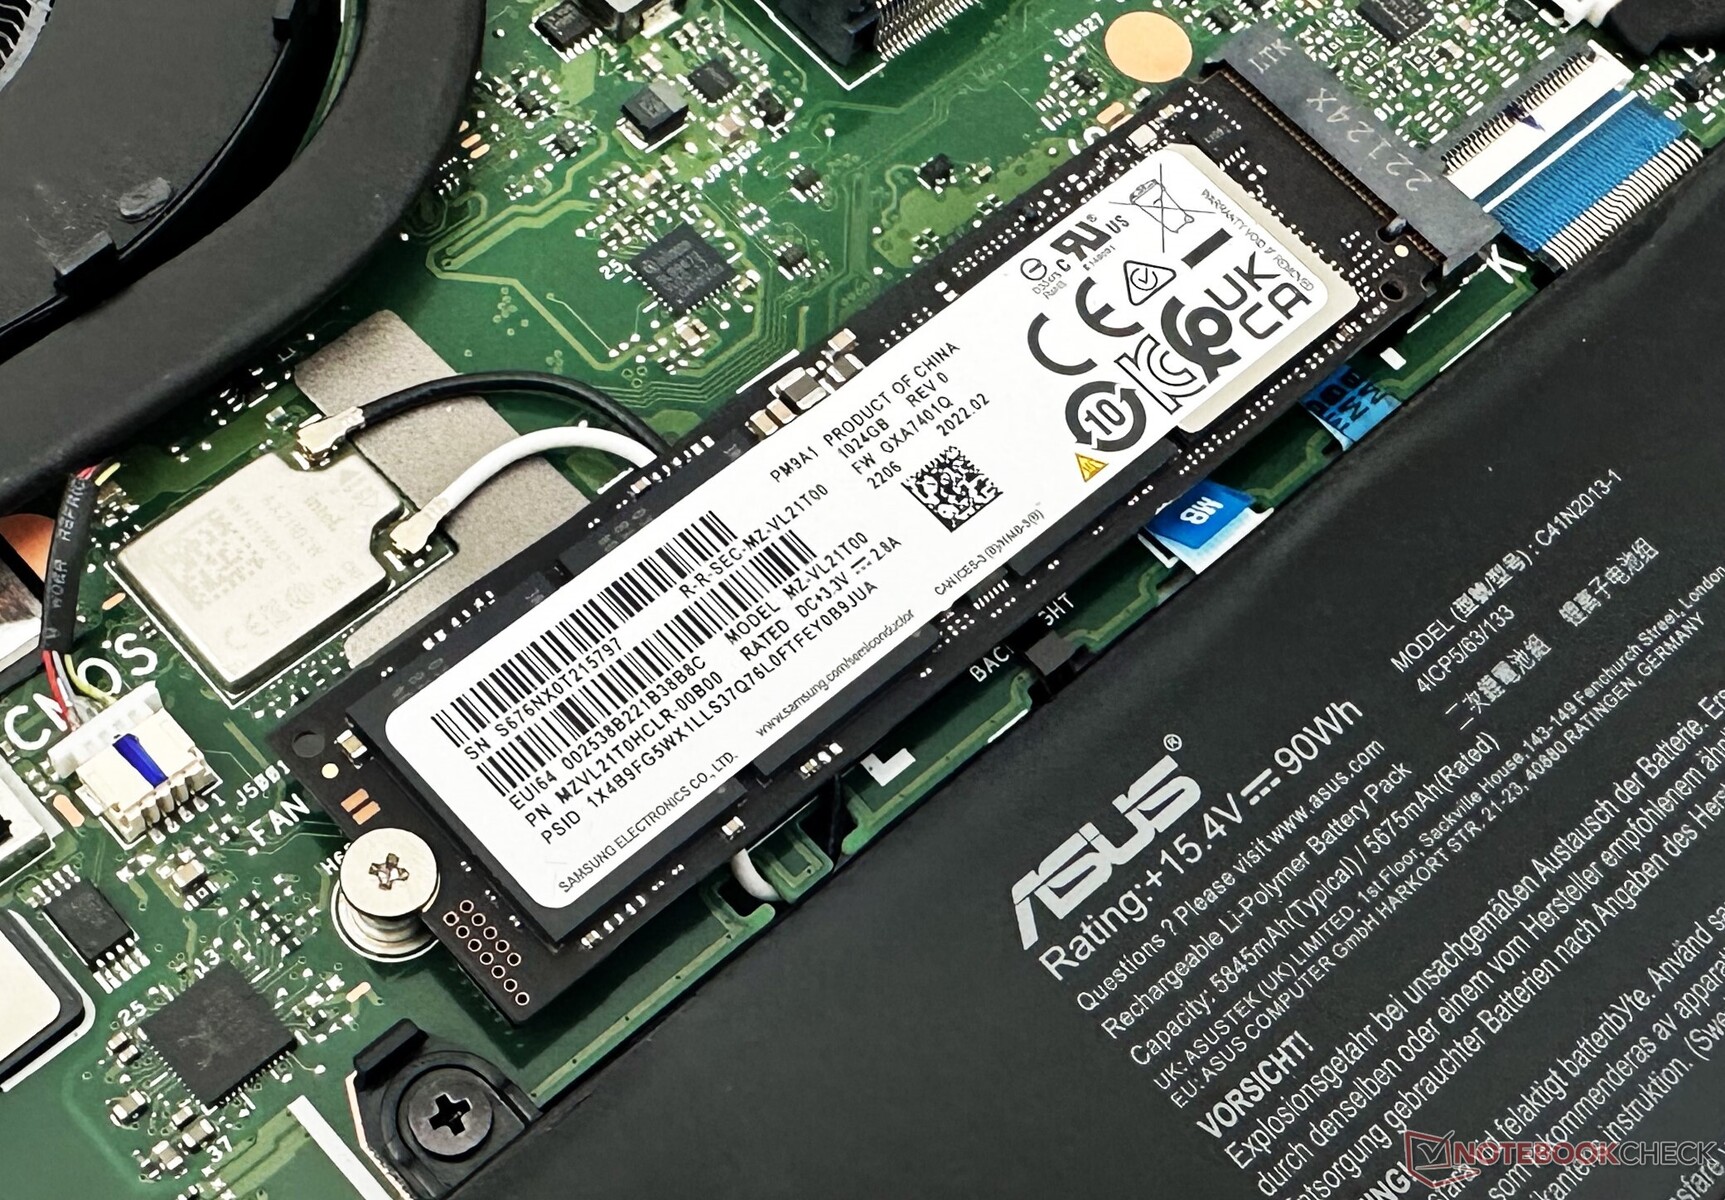
L'unità SSD Samsung PM9A1 da 1 TB NVMe inclusa si comporta decentemente nei benchmark complessivi del disco, ma è inferiore ai suoi cugini da 2 TB presenti nel ROG Strix Scar 15 e nel Creator Z16P. È comunque più veloce del 10% rispetto alla stessa unità presente nell'Asus ZenBook Pro 16X OLED.
L'unità SSD è racchiusa in un involucro di alluminio e il pannello posteriore è dotato di imbottitura termica. Tuttavia, l'unità subisce un forte rallentamento nel nostro test DiskSpd di lettura in loop con una profondità di coda pari a 8.
È disponibile uno slot M.2 2280 di riserva per aggiungere un'altra unità NVMe. Tuttavia, non è presente alcun alloggiamento per unità da 2,5 pollici.

* ... Meglio usare valori piccoli
Disk Throttling: DiskSpd Read Loop, Queue Depth 8
Consultare i nostri Parametri di riferimento per SSD e HDD per ulteriori confronti sullo storage.
Prestazioni della GPU
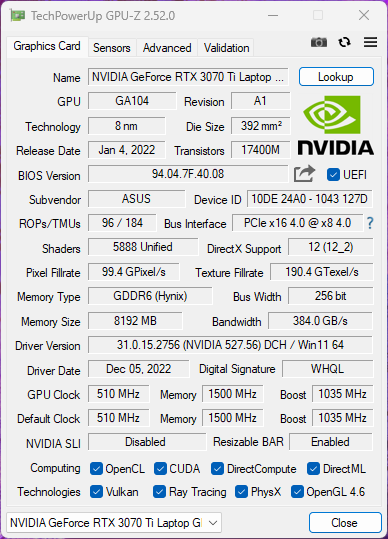
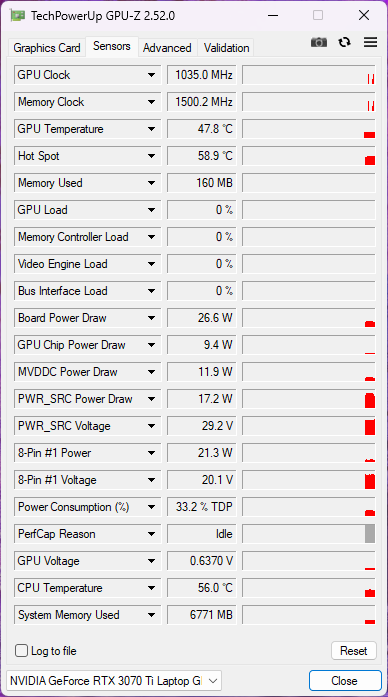
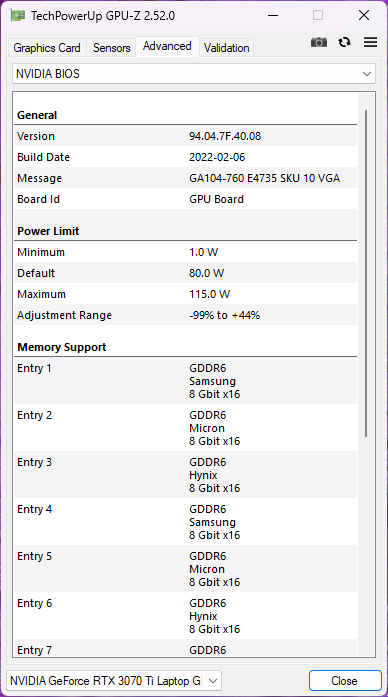
La nostra unità ProArt StudioBook 16 era dotata di una GPU Nvidia RTX 3070 Ti da 115 W GPU per computer portatili Nvidia GeForce RTX 3070 Ti con 8 GB di VRAM GDDR6. Asus non specifica i valori di Dynamic Boost per questa GPU. Il portatile utilizza i driver Nvidia Studio per impostazione predefinita.
Il TGP più basso significa che il ProArt StudioBook 16 è più lento del 15% nelle prestazioni complessive di 3DMark rispetto al ROG Strix Scar 15 che utilizza una RTX 3070 Ti da 150 W. Tuttavia, è ancora più veloce dell'8% rispetto a una GPU per laptop RTX 3080 Ti da 105 W RTX 3080 Ti nel modello Gigabyte Aero 16 YE5.
| 3DMark 11 Performance | 32806 punti | |
| 3DMark Ice Storm Standard Score | 75692 punti | |
| 3DMark Cloud Gate Standard Score | 49147 punti | |
| 3DMark Fire Strike Score | 23989 punti | |
| 3DMark Fire Strike Extreme Score | 12966 punti | |
| 3DMark Time Spy Score | 10673 punti | |
Aiuto | ||
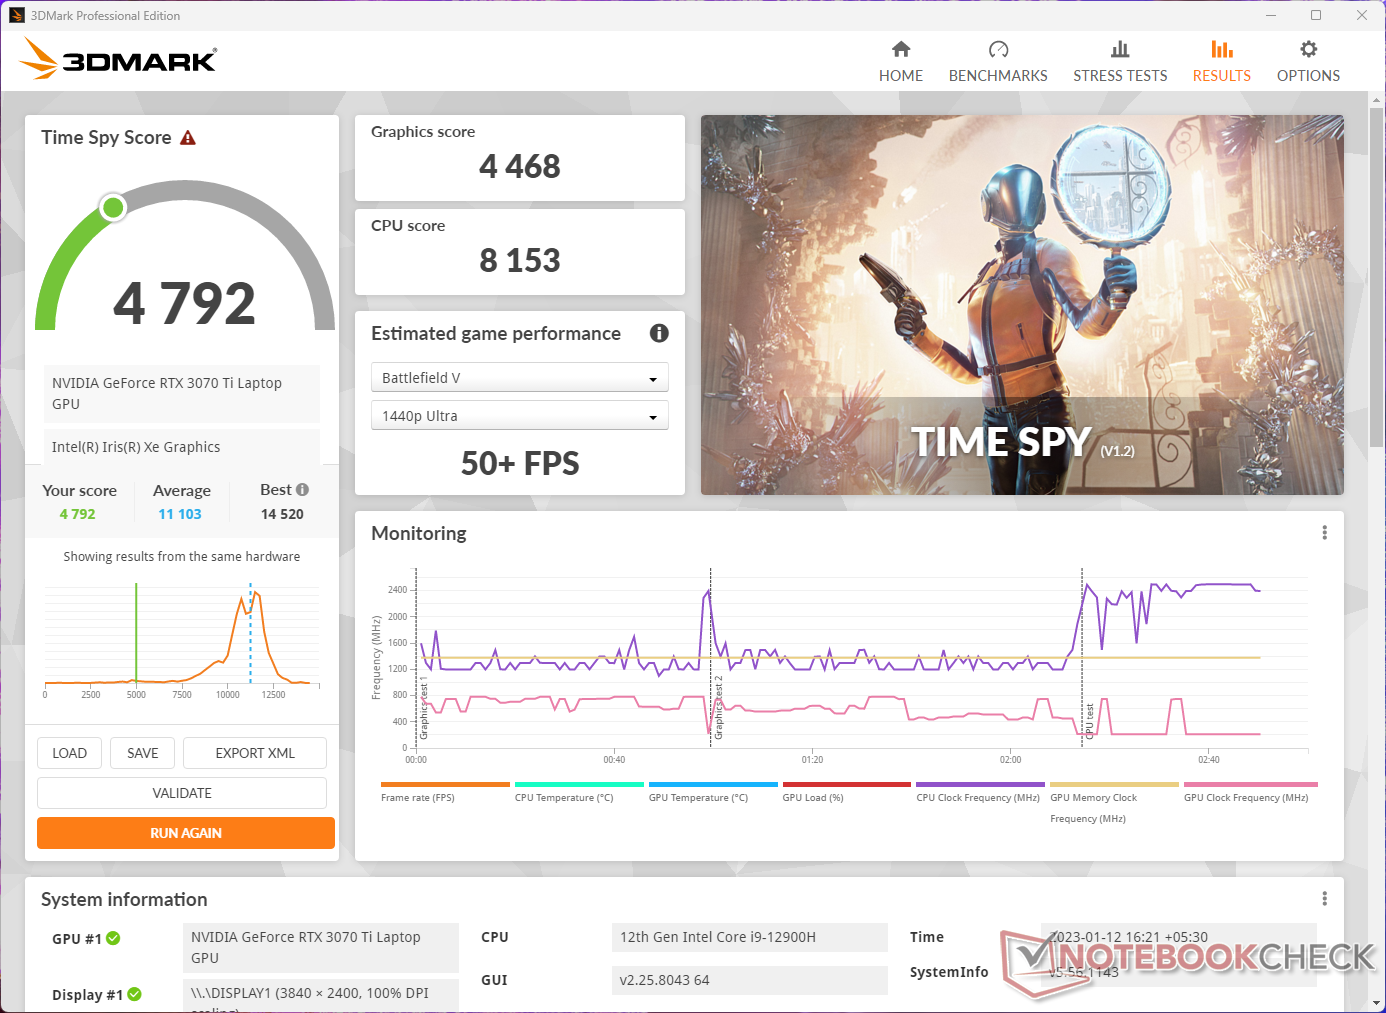
i punteggi di 3DMark Time Spy diminuiscono del 56% con la batteria. Secondo il benchmark, questo dovrebbe comunque consentire una giocabilità di oltre 50 fps a 1440p in Battlefield V.
Rispetto ai portatili basati su RTX 3060, la RTX 3070 Ti dello StudioBook 16 mostra vantaggi significativi nei test di Blender - la GPU RTX 3060 per laptop è fino al 23% e al 35% più lenta rispettivamente nei test Blender Optix e CUDA.
* ... Meglio usare valori piccoli
Prestazioni di gioco
Asus non commercializza il ProArt StudioBook 16 come un portatile da gioco, ma l'hardware fornito è certamente in grado di eseguire giochi moderni a framerate decenti. Le prestazioni di gioco cumulative sono quelle attese per un dispositivo con questa configurazione, ma sono comunque più veloci di circa il 9% rispetto all'MSI Creator Z17.
Ha persino battuto alcuni dei portatili con RTX 3080 Ti nel confronto con un margine percepibile. Tuttavia, si noti che questa deduzione è valida solo a 1080p, dove le prestazioni di gioco sono più limitate dalla CPU.
A risoluzioni più elevate e nel ray-tracing, i vantaggi della GPU RTX 3080 Ti Laptop diventano chiaramente evidenti. Tuttavia, nella maggior parte dei casi la differenza tra queste due GPU è solo del 10% quando si tratta di prestazioni raster.
| The Witcher 3 | |
| 3840x2160 High Graphics & Postprocessing (Nvidia HairWorks Off) | |
| Asus ROG Zephyrus Duo 16 GX650RX | |
| Asus ROG Strix Scar 15 G533ZW-LN106WS | |
| Media NVIDIA GeForce RTX 3070 Ti Laptop GPU (73.2 - 78, n=2) | |
| Asus ProArt StudioBook 16 H7600ZW | |
| Media della classe Multimedia (61 - 71, n=2, ultimi 2 anni) | |
| Gigabyte Aero 16 YE5 | |
| Asus ZenBook Pro 16X OLED UX7602ZM-ME115W | |
| 3840x2160 Ultra Graphics & Postprocessing (HBAO+) | |
| Asus ROG Zephyrus Duo 16 GX650RX | |
| Asus ROG Strix Scar 15 G533ZW-LN106WS | |
| Media NVIDIA GeForce RTX 3070 Ti Laptop GPU (48.4 - 52.3, n=2) | |
| Asus ProArt StudioBook 16 H7600ZW | |
| Gigabyte Aero 16 YE5 | |
Il grafico FPS di Witcher 3
Grazie all'eccellente raffreddamento di Asus, non abbiamo notato cali di frame percepibili durante lo stress con The Witcher 3 a 1080p Ultra.
| basso | medio | alto | ultra | QHD | 4K | |
|---|---|---|---|---|---|---|
| GTA V (2015) | 187.2 | 186.4 | 181.9 | 122.2 | 97.6 | 92.1 |
| The Witcher 3 (2015) | 428 | 316 | 195.9 | 105.6 | 73.2 | |
| Dota 2 Reborn (2015) | 190.6 | 174.7 | 165.6 | 159.2 | 122.6 | |
| Final Fantasy XV Benchmark (2018) | 211 | 140.1 | 106.9 | 81.1 | 46.2 | |
| X-Plane 11.11 (2018) | 155 | 136.1 | 108.4 | 91.3 | ||
| Far Cry 5 (2018) | 182 | 154 | 145 | 137 | 104 | 57 |
| Strange Brigade (2018) | 460 | 257 | 209 | 183.8 | 136.9 | 74.4 |
| F1 2021 (2021) | 371 | 252 | 208 | 119.8 | 93.5 | 53.5 |
| Cyberpunk 2077 1.6 (2022) | 124.5 | 100.3 | 87.4 | 81.3 | 51 | 28.1 |
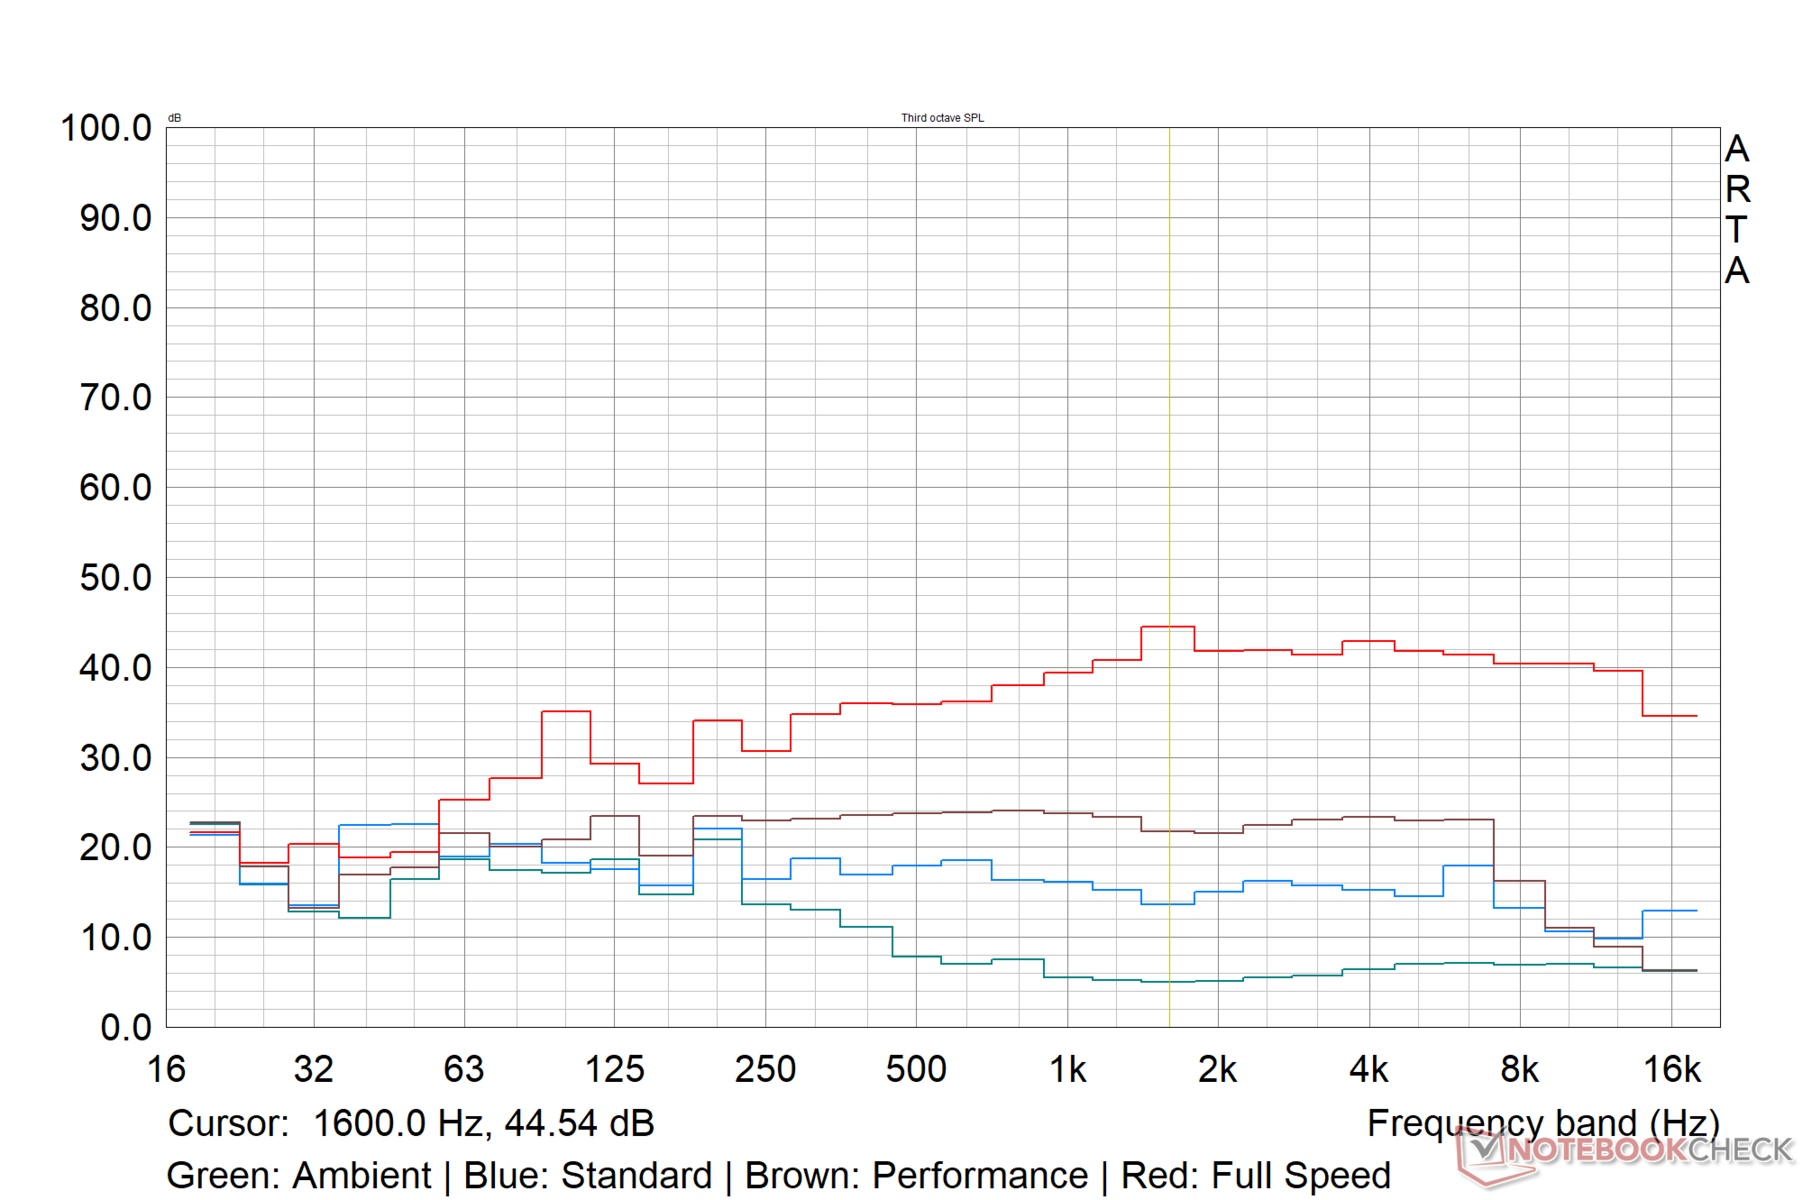
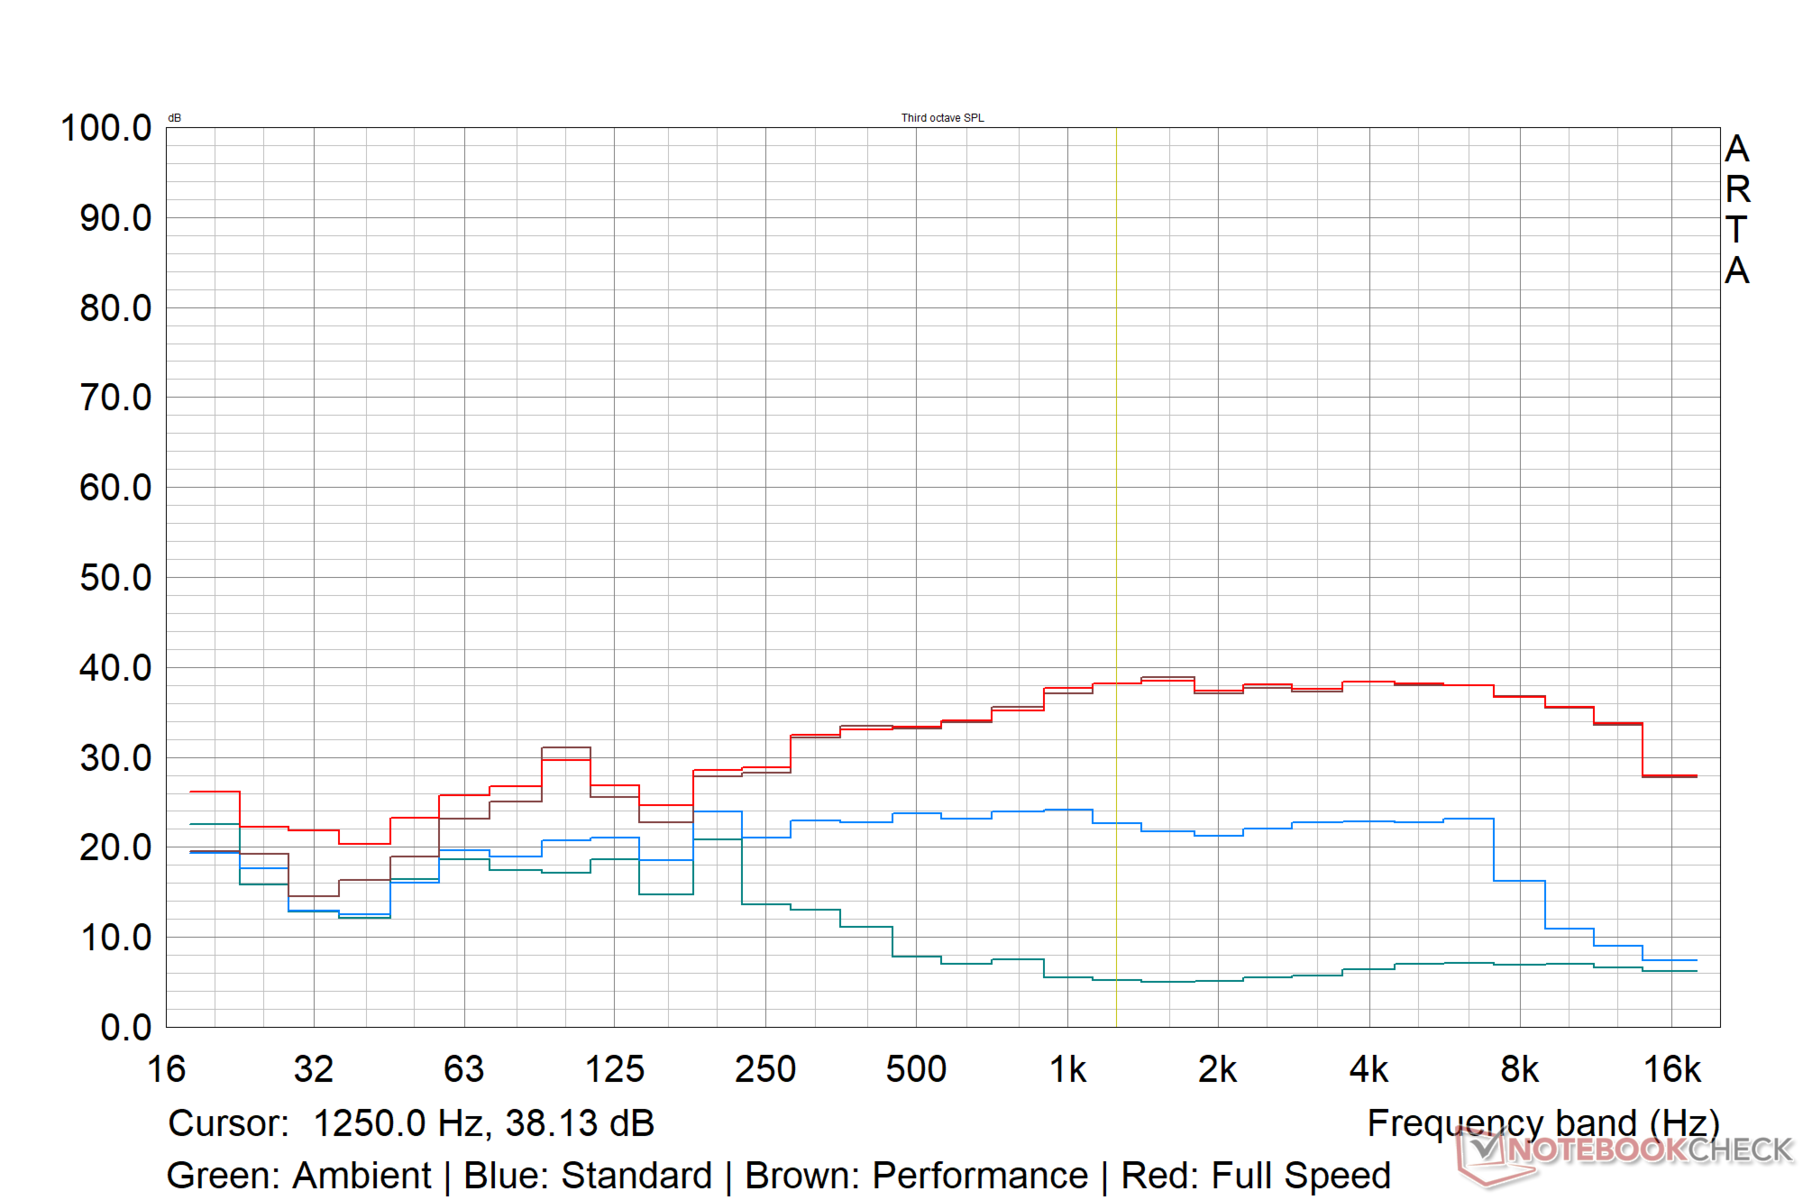
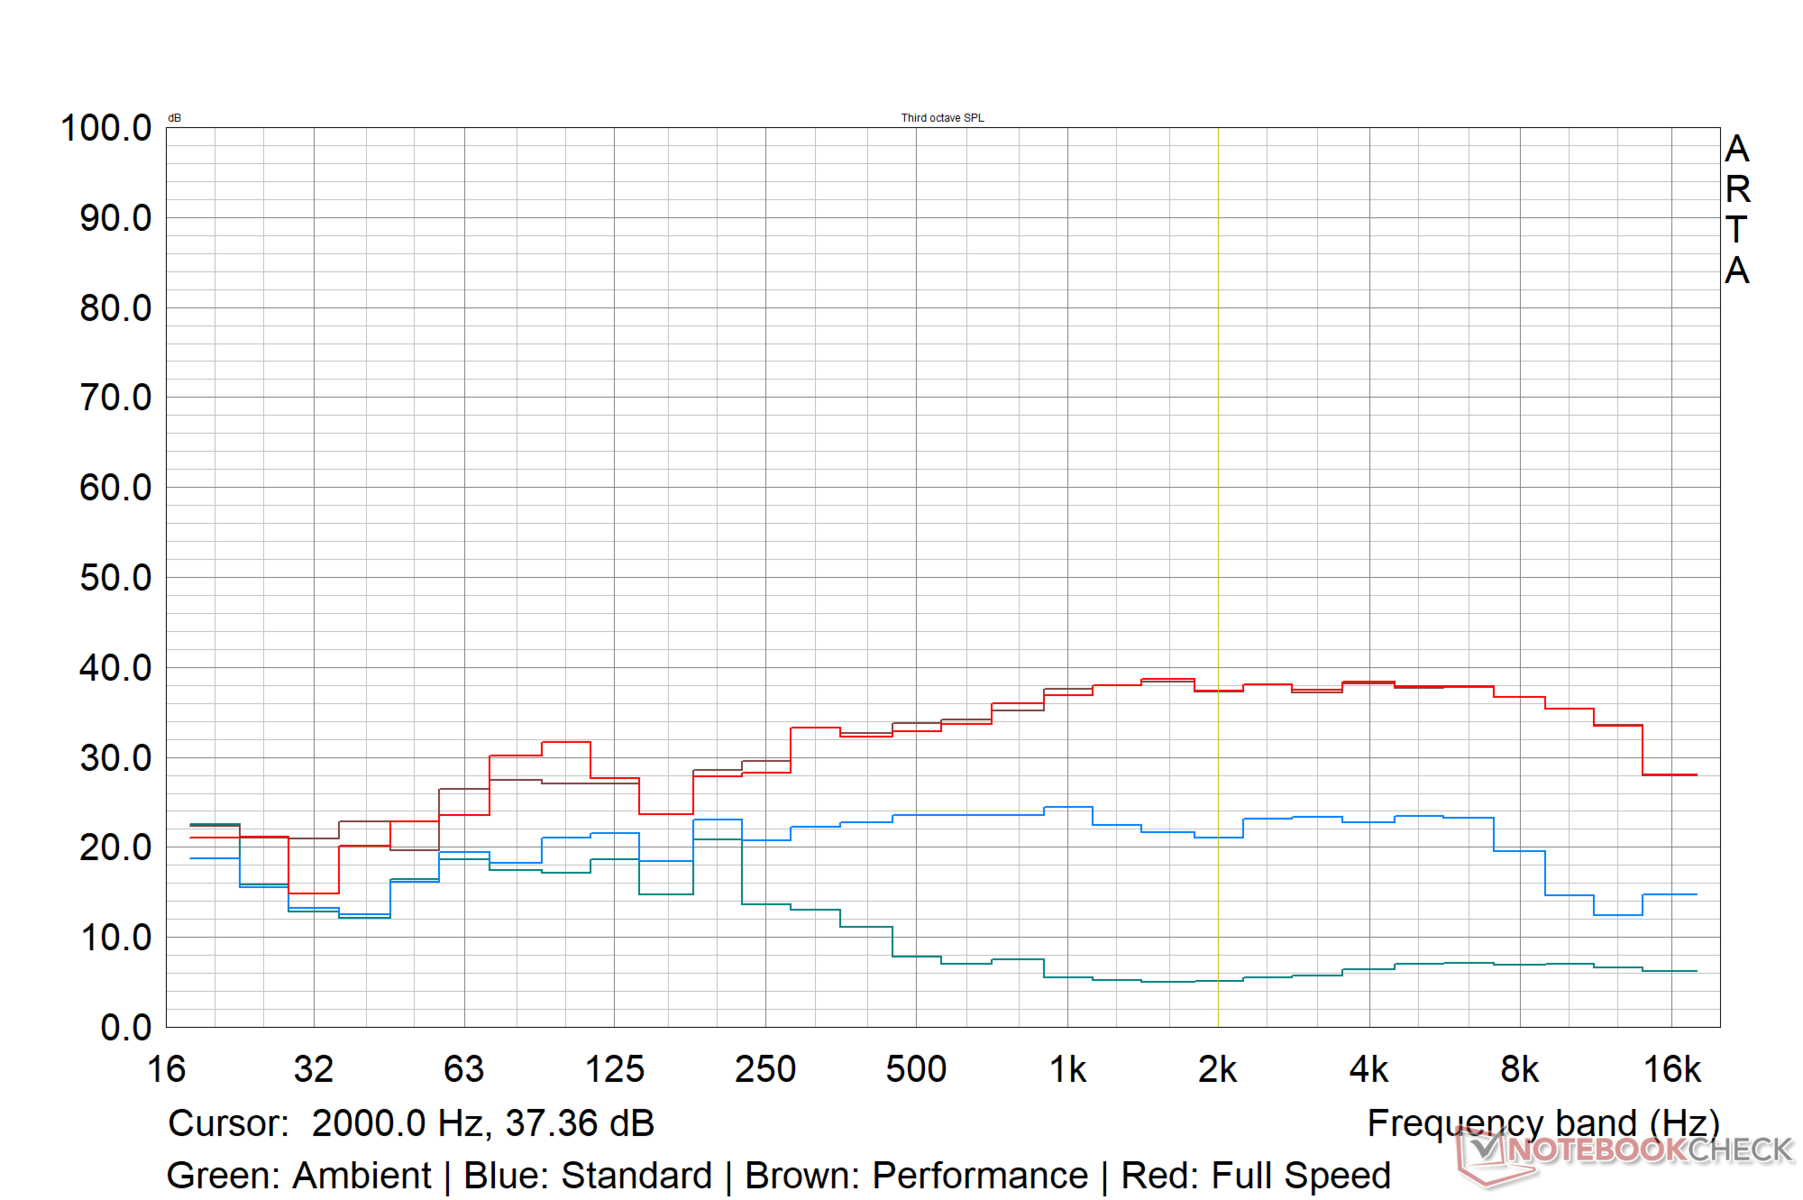
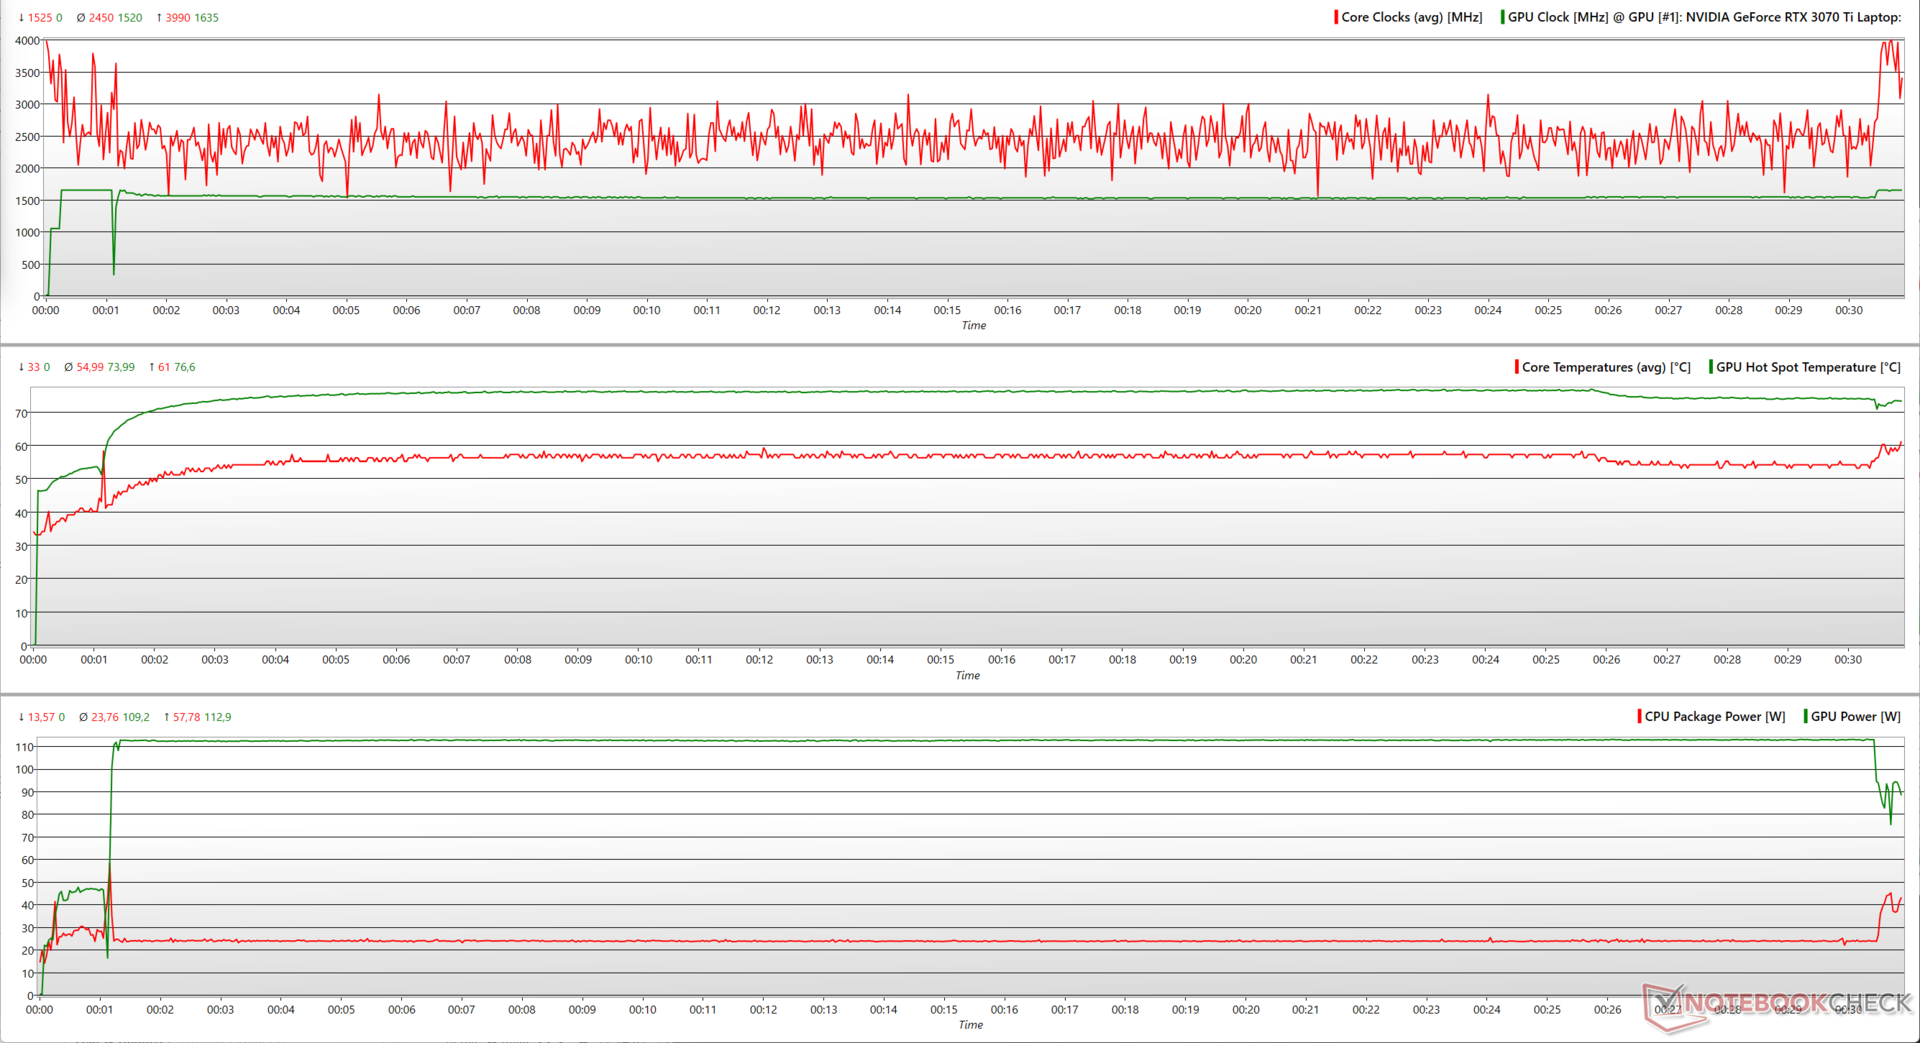
Emissioni: Rumore del ventilatore inferiore a 35 dB(A) nel profilo Standard
Rumore del sistema
Nell'impostazione Full Speed, il livello di pressione sonora (SPL) della ventola è compreso tra 50 dB(A) e 53 dB(A) anche in condizioni di inattività. Pertanto, abbiamo utilizzato la modalità Performance per una valutazione più realistica dei livelli di rumore dello StudioBook 16.
Abbiamo registrato un SPL di 49 dB(A) durante l'esecuzione di The Witcher 3 a 1080p Ultra e in uno stress combinato di Prime95 e FurMark.
Asus dichiara un livello di rumorosità inferiore a 40 dB(A) in modalità Standard, e noi lo abbiamo riscontrato. Il livello di rumore massimo rimane sotto i 35 dB(A) nel profilo Standard in tutte le condizioni di test.
Sebbene il profilo Standard sia generalmente consigliato per un uso non intensivo, non si ottengono le massime prestazioni: abbiamo osservato un calo del 24% nel punteggio multi-core di Cinebench R15 in questa modalità.
| Impostazione delle prestazioni | Inattivo dB(A) | Carico medio dB(A) | Carico massimo dB(A) | Il Witcher 3 dB(A) |
|---|---|---|---|---|
| Standard | 19,54 | 27,84 | 34,31 | 34,60 |
| Prestazioni | 20,07 | 34,53 | 49,21 | 49,14 |
| Velocità massima | 53,26 | 53,24 | 49,32 | 49,20 |
Rumorosità
| Idle |
| 20.07 / 20.07 / 20.07 dB(A) |
| Sotto carico |
| 34.53 / 49.21 dB(A) |
 | ||
30 dB silenzioso 40 dB(A) udibile 50 dB(A) rumoroso |
||
min: | ||
| Asus ProArt StudioBook 16 H7600ZW i9-12900H, GeForce RTX 3070 Ti Laptop GPU | MSI Creator Z17 A12UGST-054 i9-12900H, GeForce RTX 3070 Ti Laptop GPU | Asus ROG Strix Scar 15 G533ZW-LN106WS i9-12900H, GeForce RTX 3070 Ti Laptop GPU | Asus ROG Zephyrus Duo 16 GX650RX R9 6900HX, GeForce RTX 3080 Ti Laptop GPU | Apple MacBook Pro 14 2021 M1 Max 24-Core GPU M1 Max, M1 Max 24-Core GPU | |
|---|---|---|---|---|---|
| Noise | -41% | -58% | -23% | -9% | |
| off /ambiente * (dB) | 19.55 | 26 -33% | 26.86 -37% | 26 -33% | 24.8 -27% |
| Idle Minimum * (dB) | 20.07 | 31.8 -58% | 39.07 -95% | 26 -30% | 24.8 -24% |
| Idle Average * (dB) | 20.07 | 31.8 -58% | 39.07 -95% | 27 -35% | 24.8 -24% |
| Idle Maximum * (dB) | 20.07 | 31.8 -58% | 39.07 -95% | 29 -44% | 24.8 -24% |
| Load Average * (dB) | 34.53 | 53.9 -56% | 53.34 -54% | 41 -19% | 30.4 12% |
| Witcher 3 ultra * (dB) | 49.1 | 53.9 -10% | 56.6 -15% | 48 2% | 35.8 27% |
| Load Maximum * (dB) | 49.21 | 54.9 -12% | 56.6 -15% | 50 -2% | 49.5 -1% |
* ... Meglio usare valori piccoli
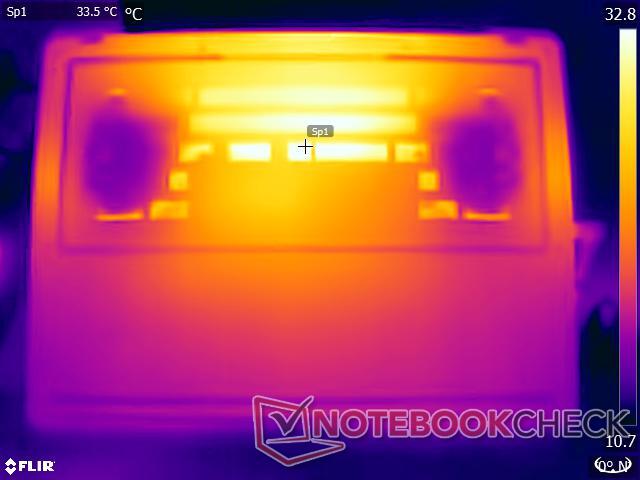
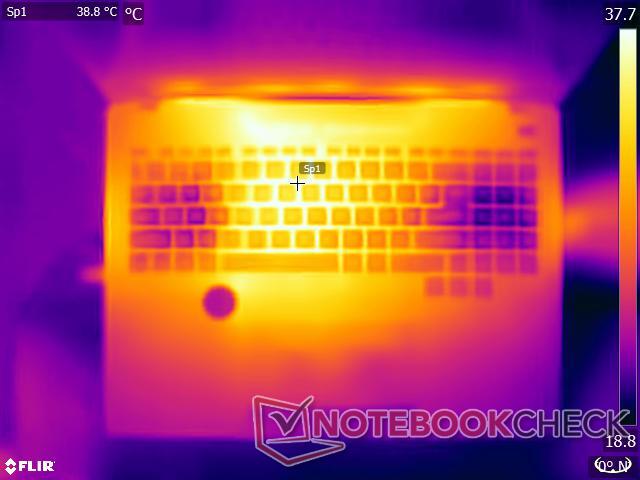
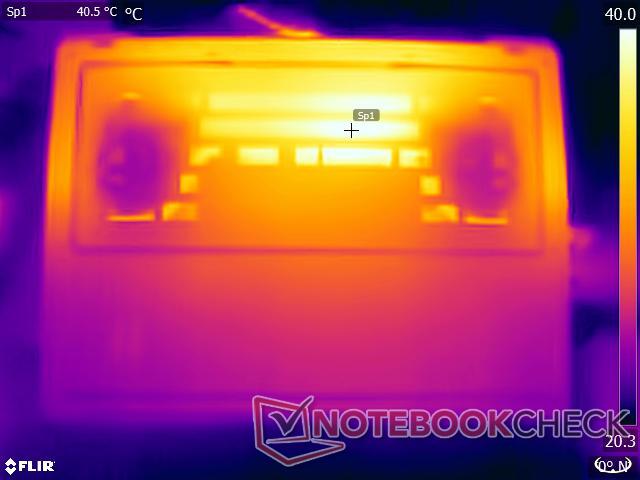
Temperatura
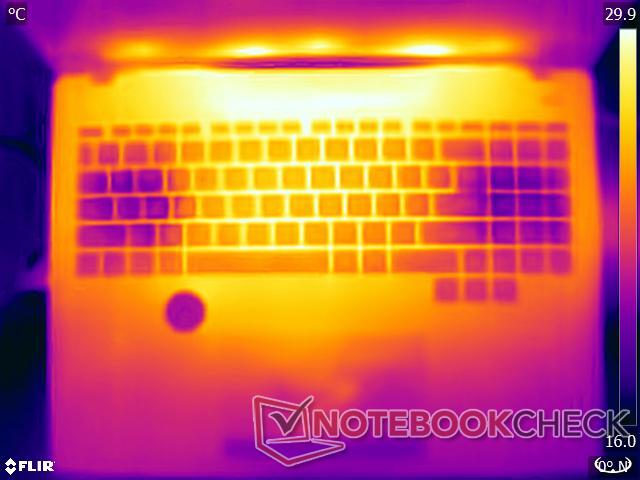
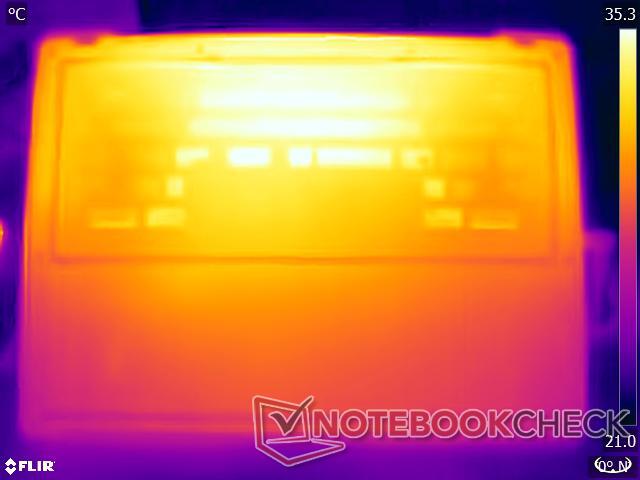
La modalità Full Speed garantisce temperature superficiali tollerabili sotto carico grazie al funzionamento continuo della ventola alla massima velocità. Le temperature superficiali più elevate sotto carico si concentrano di solito nelle zone superiore e centrale sinistra dello chassis.
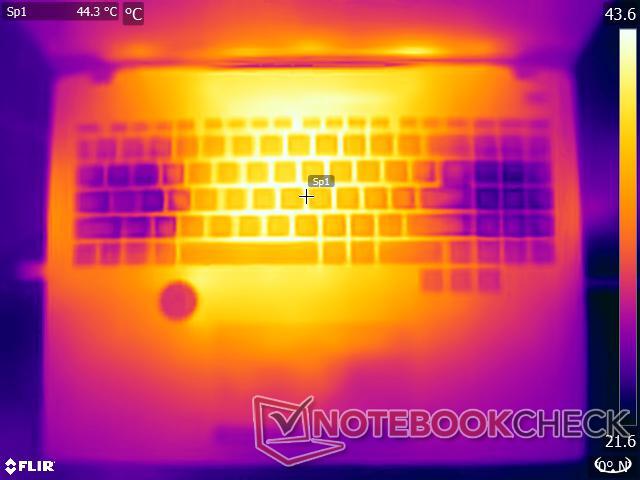
Sotto un carico combinato di Prime95 e FurMark, le temperature medie in alto e in basso sembrano essere nella regione dei 41 °C. Witcher 3 a 1080p Ultra registra temperature superficiali medie relativamente più basse, circa 34 °C.
Le aree del touchpad e del poggiapolsi si scaldano sotto carico massimo, ma per il resto rimangono relativamente fresche durante lo stress test di Witcher 3.
(±) La temperatura massima sul lato superiore è di 41.6 °C / 107 F, rispetto alla media di 36.8 °C / 98 F, che varia da 21 a 71 °C per questa classe Multimedia.
(±) Il lato inferiore si riscalda fino ad un massimo di 41.4 °C / 107 F, rispetto alla media di 39.1 °C / 102 F
(+) In idle, la temperatura media del lato superiore è di 29.5 °C / 85 F, rispetto alla media deld ispositivo di 31.3 °C / 88 F.
(±) Riproducendo The Witcher 3, la temperatura media per il lato superiore e' di 34.2 °C / 94 F, rispetto alla media del dispositivo di 31.3 °C / 88 F.
(+) I poggiapolsi e il touchpad raggiungono la temperatura massima della pelle (35.6 °C / 96.1 F) e quindi non sono caldi.
(-) La temperatura media della zona del palmo della mano di dispositivi simili e'stata di 28.7 °C / 83.7 F (-6.9 °C / -12.4 F).
Sebbene i nostri stress test rappresentino scenari estremi, per la sicurezza personale consigliamo di utilizzare il ProArt StudioBook 16 solo sulle ginocchia, eseguendo carichi di lavoro non intensivi nell'impostazione Standard.
| Asus ProArt StudioBook 16 H7600ZW Intel Core i9-12900H, NVIDIA GeForce RTX 3070 Ti Laptop GPU | MSI Creator Z17 A12UGST-054 Intel Core i9-12900H, NVIDIA GeForce RTX 3070 Ti Laptop GPU | Asus ROG Strix Scar 15 G533ZW-LN106WS Intel Core i9-12900H, NVIDIA GeForce RTX 3070 Ti Laptop GPU | Asus ROG Zephyrus Duo 16 GX650RX AMD Ryzen 9 6900HX, NVIDIA GeForce RTX 3080 Ti Laptop GPU | Apple MacBook Pro 14 2021 M1 Max 24-Core GPU Apple M1 Max, Apple M1 Max 24-Core GPU | |
|---|---|---|---|---|---|
| Heat | -28% | -19% | -12% | 5% | |
| Maximum Upper Side * (°C) | 41.6 | 63.9 -54% | 42.6 -2% | 45 -8% | 49.2 -18% |
| Maximum Bottom * (°C) | 41.4 | 68 -64% | 50.2 -21% | 50 -21% | 44.1 -7% |
| Idle Upper Side * (°C) | 31.8 | 28.3 11% | 36.2 -14% | 33 -4% | 23.5 26% |
| Idle Bottom * (°C) | 29.2 | 30.2 -3% | 40.2 -38% | 33 -13% | 23.6 19% |
* ... Meglio usare valori piccoli
Stress test
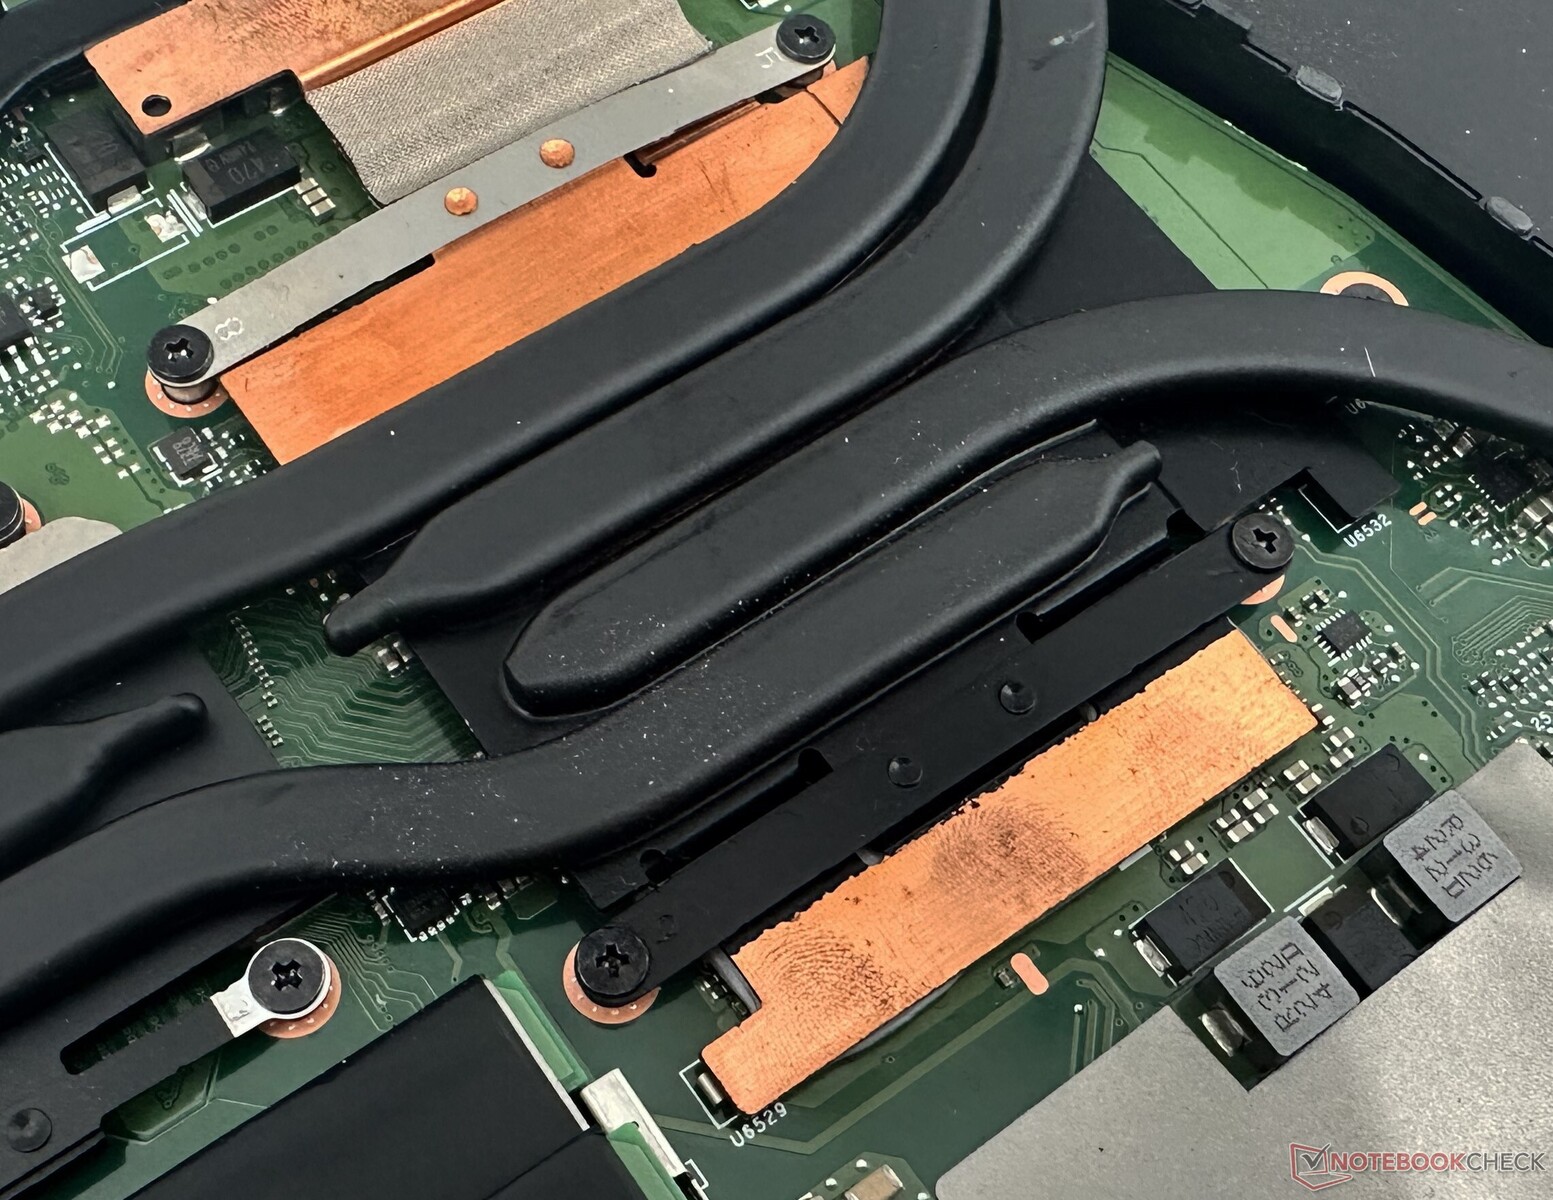
Asus utilizza un sistema di raffreddamento a doppia ventola e sei tubi di calore e un'interfaccia in metallo liquido per la CPU per mantenere il ProArt StudioBook 16 fresco.
L'esecuzione di FFT di grandi dimensioni con Prime95 vede il Core i9-12900H raggiungere i 4,2 GHz, con temperature del core che raggiungono i 91 °C e una potenza del pacchetto di 115 W.
Aggiungendo FurMark al mix, i clock medi della CPU scendono a 2,09 GHz, lasciando spazio alla GPU RTX 3070 Ti Laptop per un picco di 1.635 MHz. Sia la CPU che la GPU sono in grado di avvicinarsi ai loro obiettivi di potenza di 115 W, anche se momentaneamente. La potenza media del pacchetto Core i9-12900H si riduce a 52 W per consentire alla RTX 3070 Ti di consumare 91 W.
Il sito Witcher 3 a 1080p Ultra presenta una condizione di stress più realistica. In questo caso, i clock medi della CPU si aggirano intorno alla soglia dei 2,5 GHz, ma la GPU è in grado di funzionare costantemente con clock boost, raggiungendo un TGP massimo di 113 W per tutta la durata dell'esecuzione.
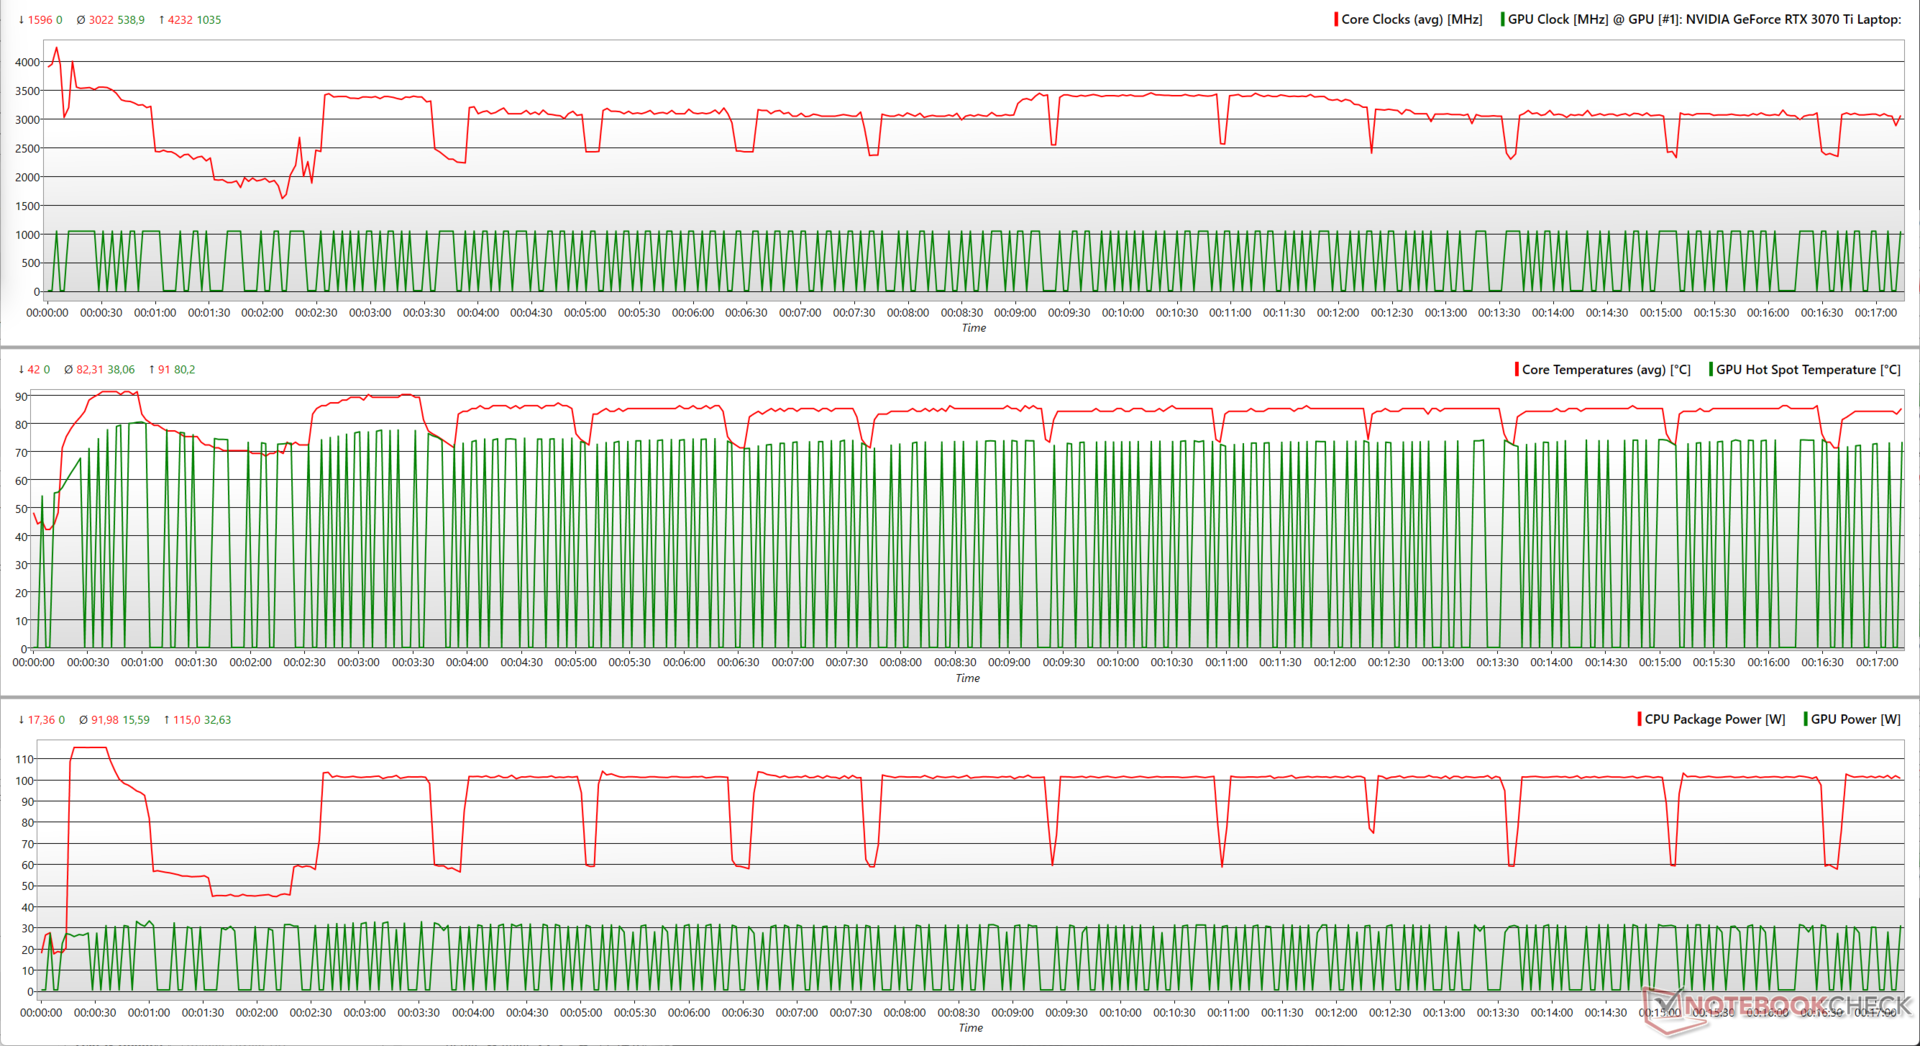
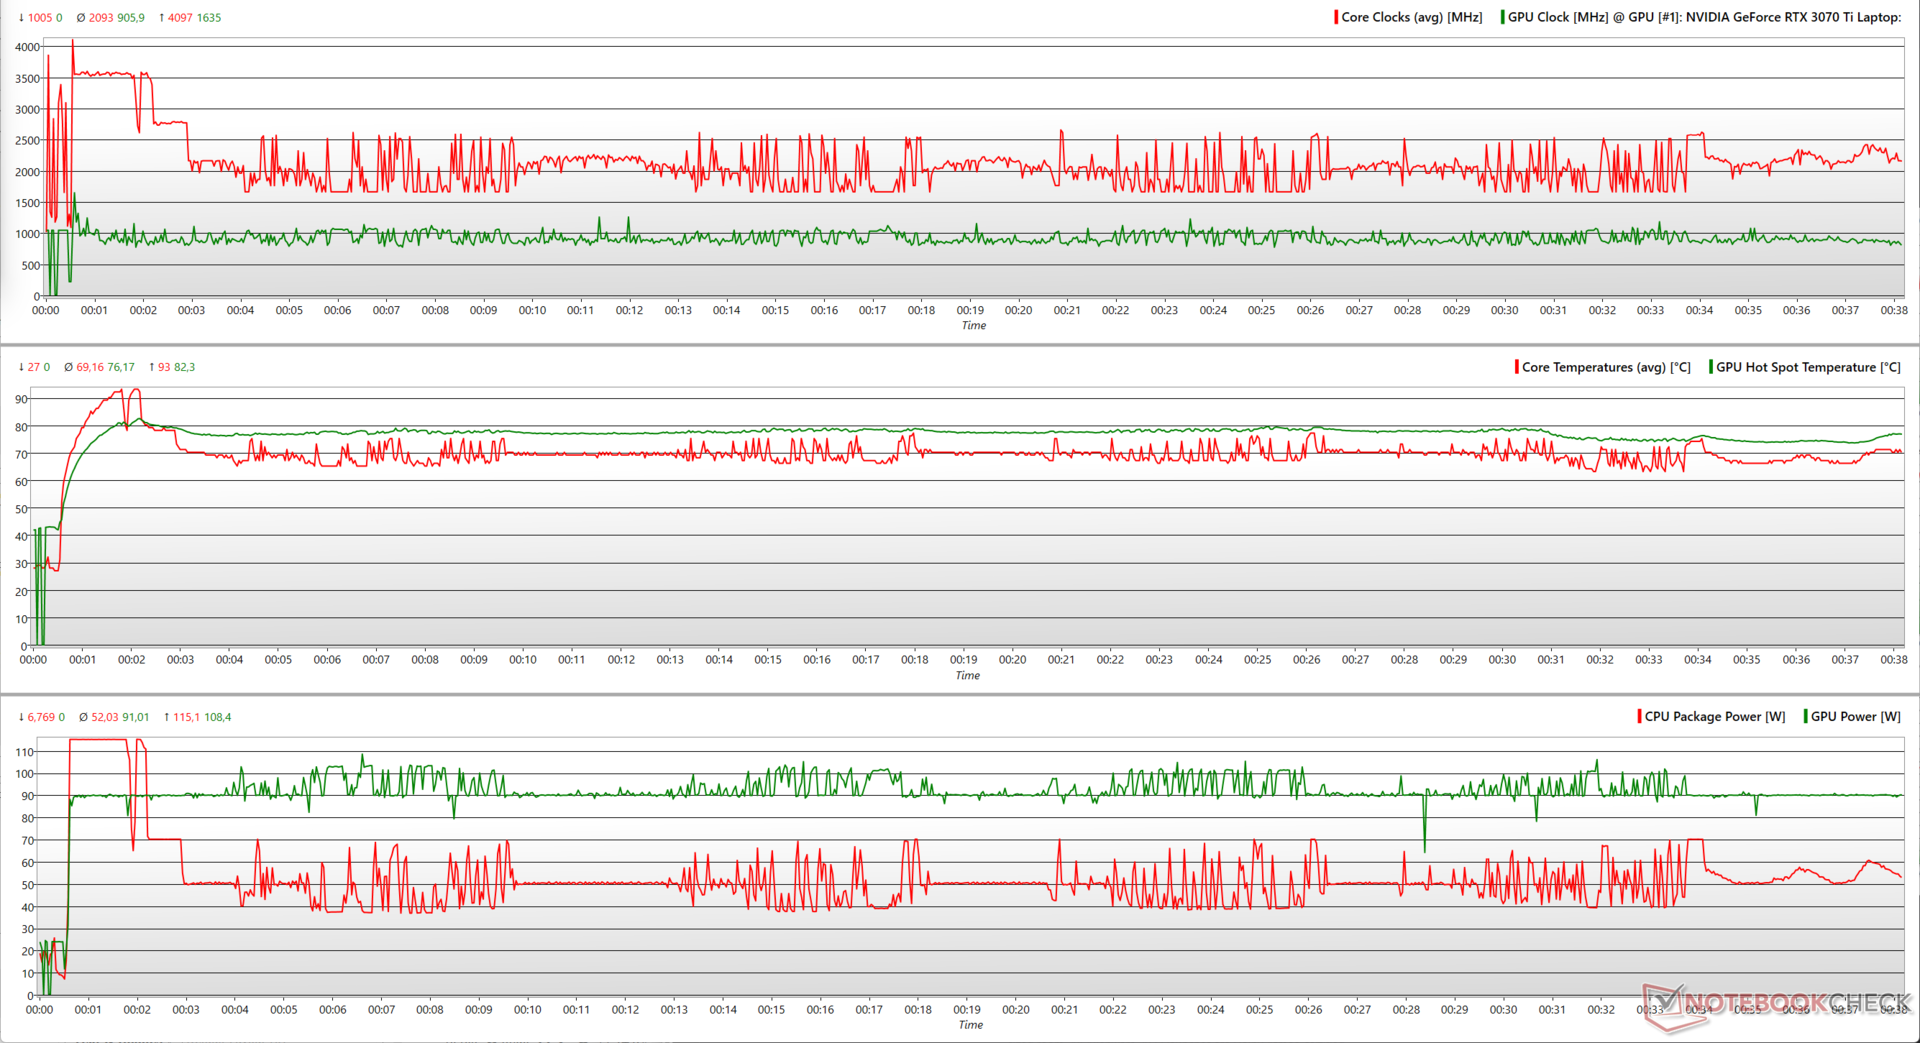
| Stress Test | Clock della CPU (GHz) | Clock della GPU (MHz) | Temperatura media della CPU (°C) | Temperatura media della GPU (°C) |
| Sistema inattivo | 2,79 | - | 54 | 28,7 |
| Prime95 | 3,03 | - | 82 | 30,9 |
| Prime95 + FurMark | 2,13 | 900 | 69 | 63,9 |
| Il Witcher 3 | 3,78 | 1.635 | 55 | 61,6 |
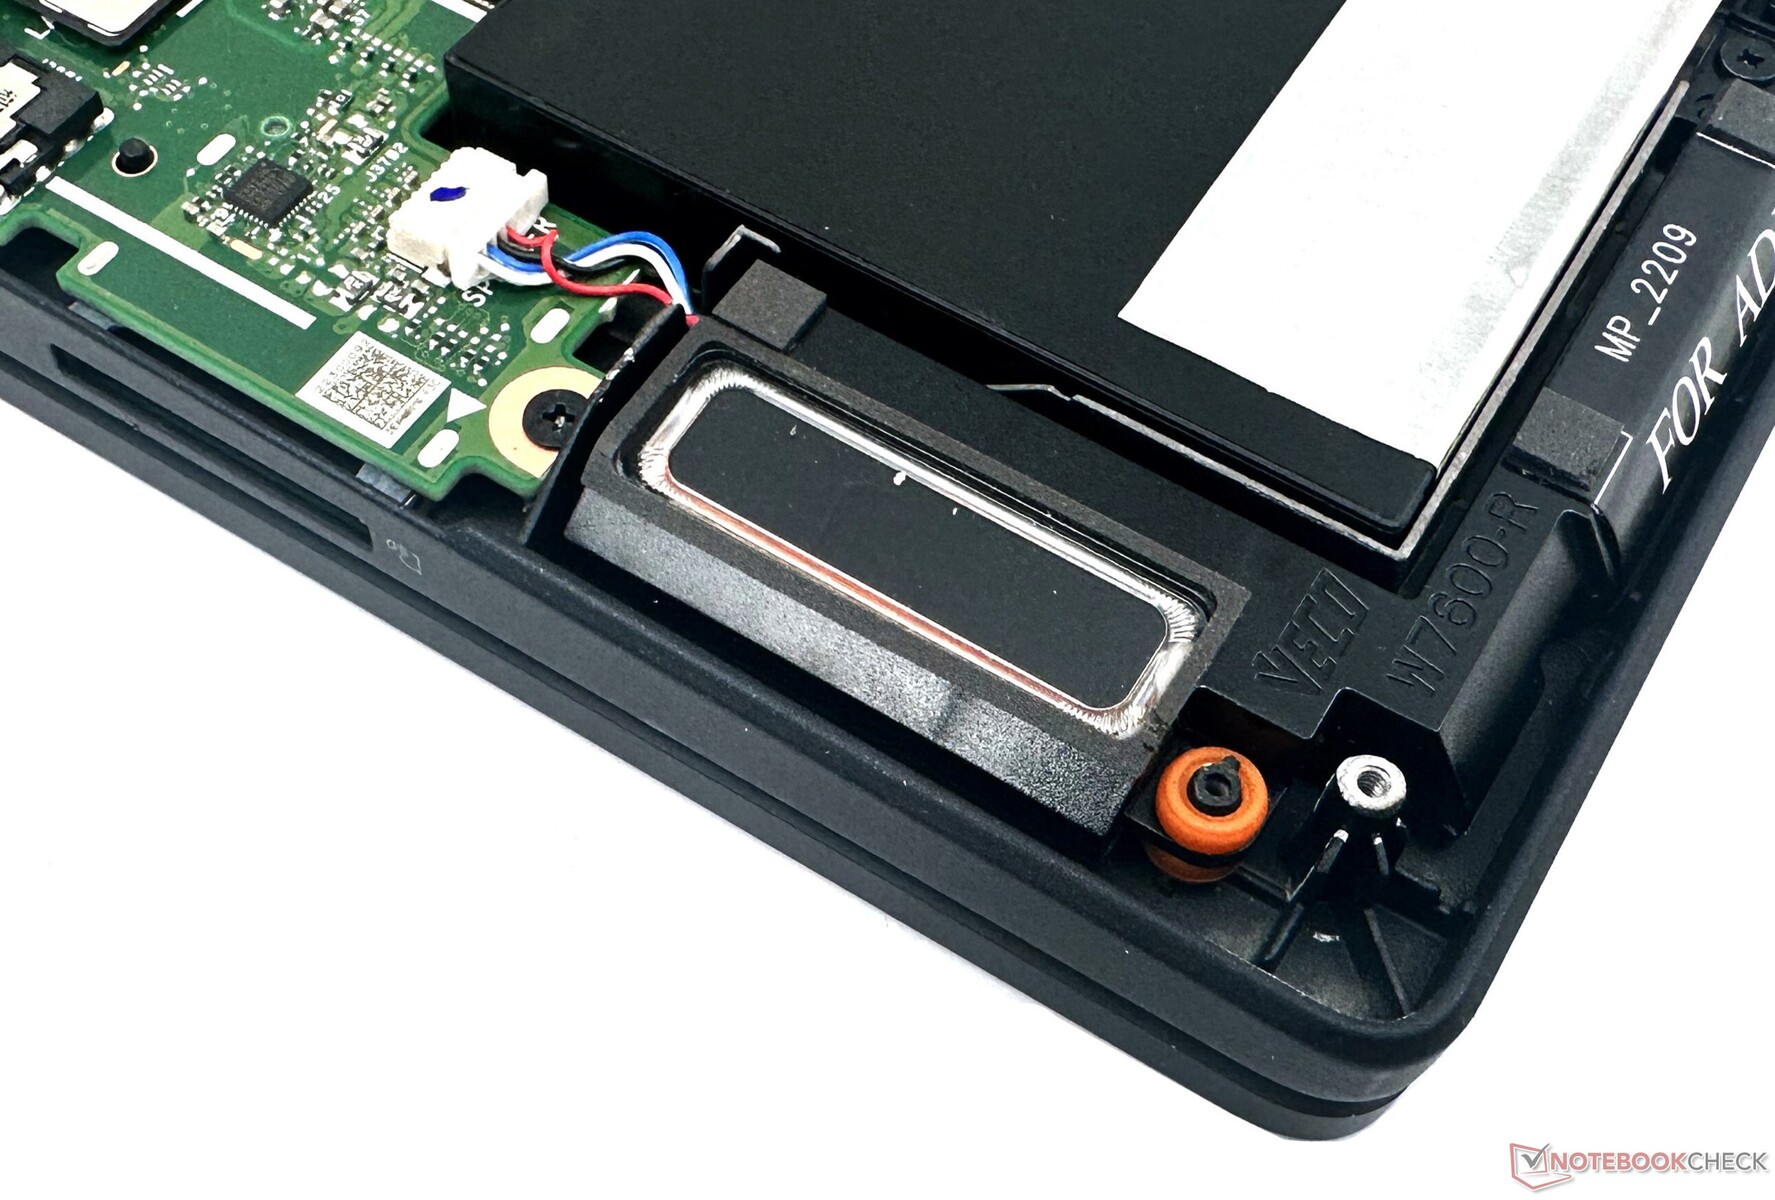
Altoparlanti
Asus ha dotato il ProArt StudioBook 16 di altoparlanti stereo integrati con Smart Amp e certificazione Harman Kardon. Il sottosistema audio supporta anche Dolby Atmos e un DAC ESS Sabre con certificazione Hi-Res Audio per il pilotaggio di cuffie ad alta impedenza.
Il volume di picco di 80,06 dB(A) è adeguato per una stanza di medie dimensioni. Osserviamo una risposta dei bassi ridotta ma comunque lineare, insieme a medi e alti di buon livello. Soggettivamente, gli altoparlanti integrati vanno bene per un ascolto casuale.
Per chi desidera una maggiore fedeltà audio, sono disponibili un jack audio da 3,5 mm e il Bluetooth 5.0.
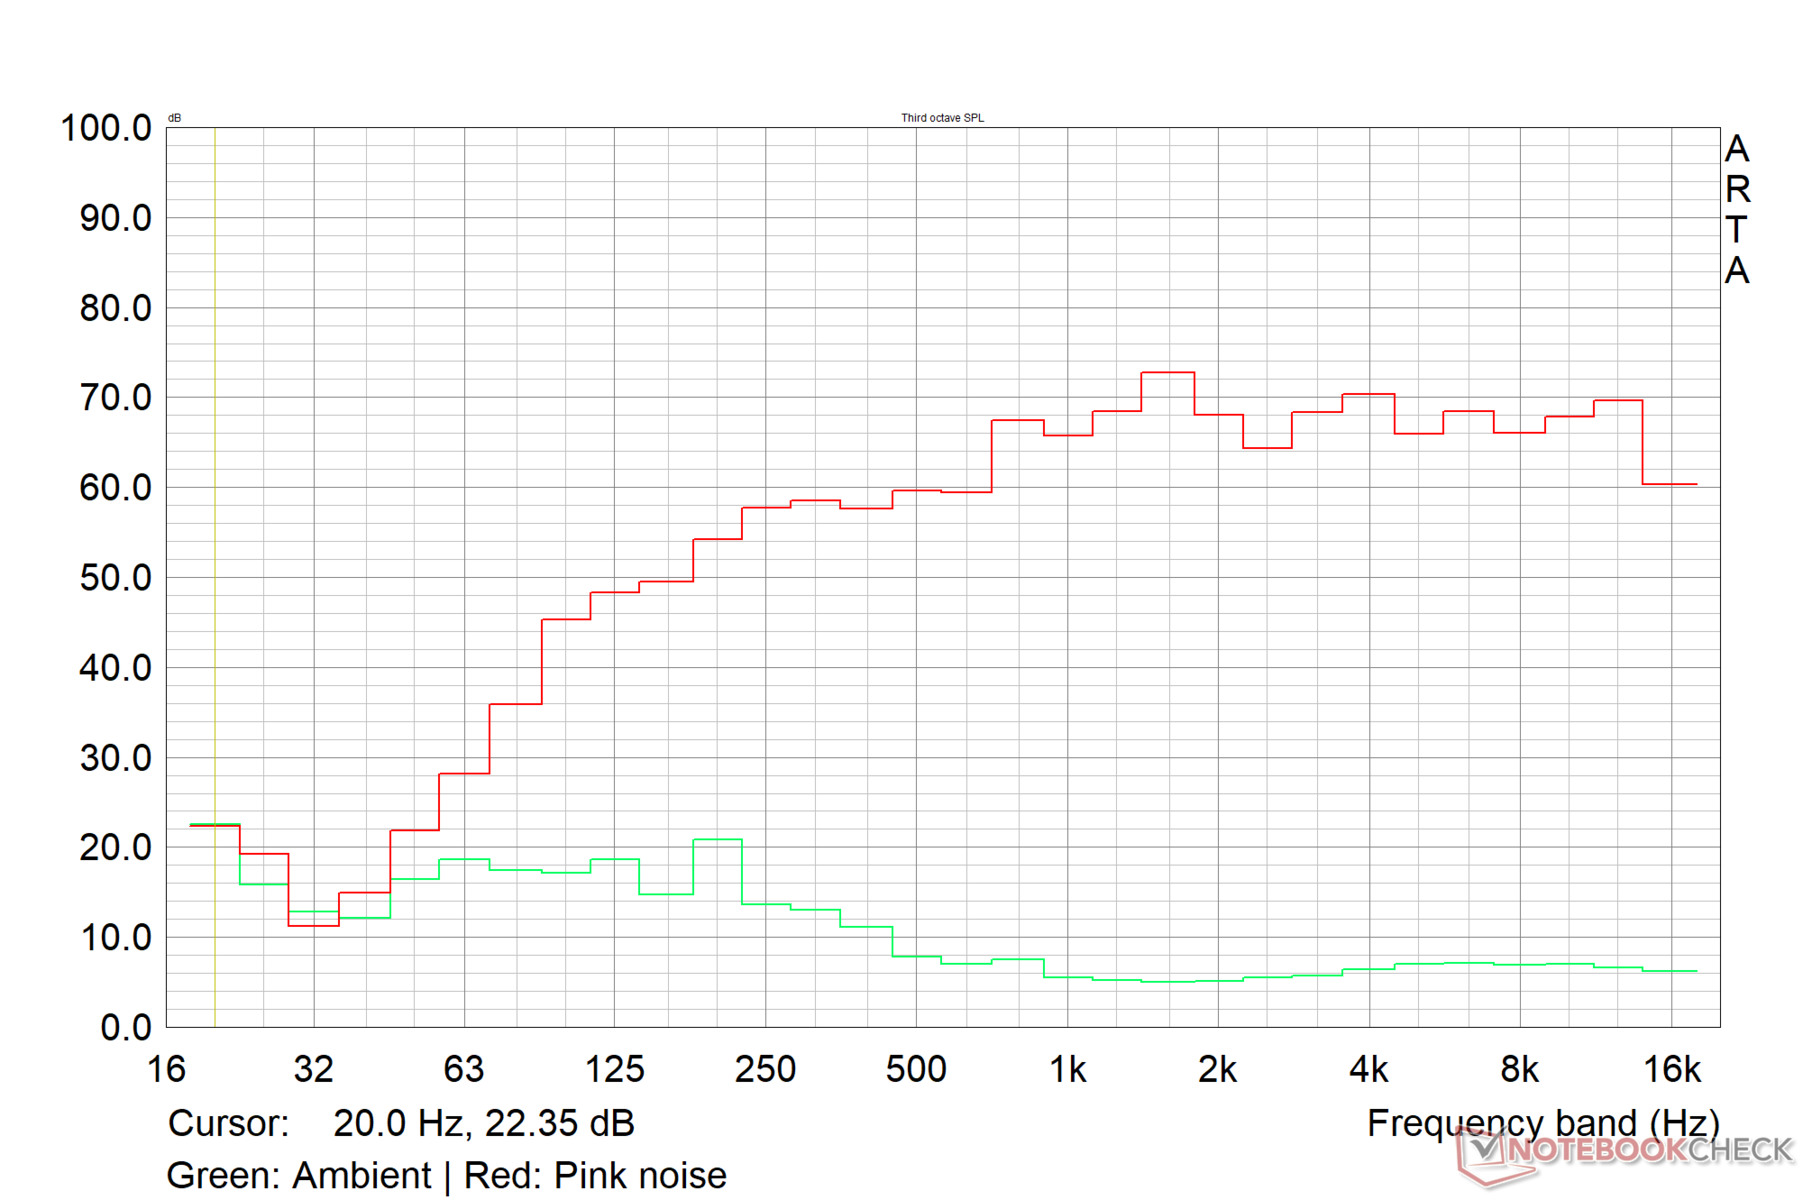
Asus ProArt StudioBook 16 H7600ZW analisi audio
(±) | potenza degli altiparlanti media ma buona (80.1 dB)
Bassi 100 - 315 Hz
(±) | bassi ridotti - in media 13.5% inferiori alla media
(+) | bassi in lineaa (6.4% delta rispetto alla precedente frequenza)
Medi 400 - 2000 Hz
(+) | medi bilanciati - solo only 4.3% rispetto alla media
(+) | medi lineari (5.2% delta rispetto alla precedente frequenza)
Alti 2 - 16 kHz
(+) | Alti bilanciati - appena 2% dalla media
(+) | alti lineari (5.1% delta rispetto alla precedente frequenza)
Nel complesso 100 - 16.000 Hz
(+) | suono nel complesso lineare (11.6% differenza dalla media)
Rispetto alla stessa classe
» 19% di tutti i dispositivi testati in questa classe è stato migliore, 4% simile, 78% peggiore
» Il migliore ha avuto un delta di 5%, medio di 17%, peggiore di 45%
Rispetto a tutti i dispositivi testati
» 8% di tutti i dispositivi testati in questa classe è stato migliore, 2% similare, 90% peggiore
» Il migliore ha avuto un delta di 4%, medio di 23%, peggiore di 134%
Apple MacBook Pro 16 2021 M1 Pro analisi audio
(+) | gli altoparlanti sono relativamente potenti (84.7 dB)
Bassi 100 - 315 Hz
(+) | bassi buoni - solo 3.8% dalla media
(+) | bassi in lineaa (5.2% delta rispetto alla precedente frequenza)
Medi 400 - 2000 Hz
(+) | medi bilanciati - solo only 1.3% rispetto alla media
(+) | medi lineari (2.1% delta rispetto alla precedente frequenza)
Alti 2 - 16 kHz
(+) | Alti bilanciati - appena 1.9% dalla media
(+) | alti lineari (2.7% delta rispetto alla precedente frequenza)
Nel complesso 100 - 16.000 Hz
(+) | suono nel complesso lineare (4.6% differenza dalla media)
Rispetto alla stessa classe
» 0% di tutti i dispositivi testati in questa classe è stato migliore, 0% simile, 100% peggiore
» Il migliore ha avuto un delta di 5%, medio di 17%, peggiore di 45%
Rispetto a tutti i dispositivi testati
» 0% di tutti i dispositivi testati in questa classe è stato migliore, 0% similare, 100% peggiore
» Il migliore ha avuto un delta di 4%, medio di 23%, peggiore di 134%
Gestione dell'energia: Alimentazione massima di 240 W sotto carico
Consumo di energia
Abbiamo registrato un consumo massimo di 241 W sotto carico, quindi l'adattatore da 240 W in dotazione dovrebbe essere appena sufficiente per alimentare il ProArt StudioBook 16 durante le attività più impegnative. Il consumo di energia dalla parete ricorda lo schema che abbiamo visto in precedenza durante gli stress test.
Tuttavia, il ProArt StudioBook 16 non soffre di un elevato consumo in idle come nel caso dell'MSI Creator Z17. Il ROG Strix Scar 15 è più parsimonioso in idle, ma il consumo sotto carico è superiore a quello dello StudioBook 16.
Non sorprende che il Apple MacBook Pro 14 con M1 Max risulta essere il più parsimonioso in questo confronto.
| Off / Standby | |
| Idle | |
| Sotto carico |
|
Leggenda:
min: | |
| Asus ProArt StudioBook 16 H7600ZW i9-12900H, GeForce RTX 3070 Ti Laptop GPU, OLED, 3840x2400, 16" | MSI Creator Z17 A12UGST-054 i9-12900H, GeForce RTX 3070 Ti Laptop GPU, IPS, 2560x1600, 17" | Asus ROG Strix Scar 15 G533ZW-LN106WS i9-12900H, GeForce RTX 3070 Ti Laptop GPU, IPS-level, 2560x1440, 15.6" | Lenovo ThinkBook 16p G3 ARH R9 6900HX, GeForce RTX 3060 Laptop GPU, IPS, 2560x1600, 16" | Apple MacBook Pro 14 2021 M1 Max 24-Core GPU M1 Max, M1 Max 24-Core GPU, Mini-LED, 3024x1964, 14.2" | Media NVIDIA GeForce RTX 3070 Ti Laptop GPU | Media della classe Multimedia | |
|---|---|---|---|---|---|---|---|
| Power Consumption | -70% | 9% | 16% | 52% | -10% | 48% | |
| Idle Minimum * (Watt) | 12.6 | 34.6 -175% | 7.56 40% | 10.3 18% | 3.2 75% | 14.2 ? -13% | 5.72 ? 55% |
| Idle Average * (Watt) | 17.41 | 43 -147% | 13.5 22% | 16 8% | 12.6 28% | 19.9 ? -14% | 10.2 ? 41% |
| Idle Maximum * (Watt) | 23.12 | 44.9 -94% | 16.87 27% | 24 -4% | 13 44% | 26.2 ? -13% | 12.4 ? 46% |
| Load Average * (Watt) | 117.5 | 145 -23% | 128.9 -10% | 85.4 27% | 57.9 51% | 125.8 ? -7% | 65.5 ? 44% |
| Witcher 3 ultra * (Watt) | 172.6 | 152.4 12% | 196.2 -14% | 132.2 23% | 76.3 56% | ||
| Load Maximum * (Watt) | 241.36 | 220 9% | 274.86 -14% | 181.9 25% | 97.7 60% | 248 ? -3% | 114 ? 53% |
* ... Meglio usare valori piccoli
Power Consumption: The Witcher 3 / Stress test
Power Consumption: External monitor
Durata della batteria
Sebbene il ProArt StudioBook 16 non possa competere con il MacBook Pro in termini di autonomia della batteria, la batteria agli ioni di litio da 90 WHr garantisce una discreta longevità prima di dover ricorrere al caricabatterie. Tutti i test della batteria sono stati eseguiti in modalità Standard.
Asus dichiara un'autonomia di 10 ore durante la riproduzione video, e noi abbiamo superato di poco le 9:45 con il nostro test di video H.264 1080p in loop a 150 nits. Il MacBook Pro 14 con M1 Max offre un'autonomia superiore del 54% nel nostro test Wi-Fi standardizzato a 150 nits di luminosità dello schermo.
È possibile svitare e sostituire la batteria se necessario.
| Asus ProArt StudioBook 16 H7600ZW i9-12900H, GeForce RTX 3070 Ti Laptop GPU, 90 Wh | MSI Creator Z17 A12UGST-054 i9-12900H, GeForce RTX 3070 Ti Laptop GPU, 90 Wh | Asus ROG Strix Scar 15 G533ZW-LN106WS i9-12900H, GeForce RTX 3070 Ti Laptop GPU, 90 Wh | Lenovo ThinkBook 16p G3 ARH R9 6900HX, GeForce RTX 3060 Laptop GPU, 71 Wh | Apple MacBook Pro 14 2021 M1 Max 24-Core GPU M1 Max, M1 Max 24-Core GPU, 69.9 Wh | Media della classe Multimedia | |
|---|---|---|---|---|---|---|
| Autonomia della batteria | 25% | -2% | -13% | 40% | 72% | |
| H.264 (h) | 9.7 | 5.5 -43% | 8.5 -12% | 12.1 25% | 16.4 ? 69% | |
| WiFi v1.3 (h) | 7.5 | 5.5 -27% | 8.4 12% | 6.5 -13% | 11.6 55% | 12.2 ? 63% |
| Witcher 3 ultra (h) | 1.3 | 1.2 -8% | ||||
| Load (h) | 0.9 | 2.2 144% | 0.9 0% | 1.668 ? 85% |
Pro
Contro
Verdetto: quasi perfetto per la creazione di contenuti mobili
L'Asus ProArt StudioBook 16 fa del suo meglio per differenziarsi dal crescente numero di computer portatili dedicati ai creatori, e ci riesce in modo abbastanza convincente.
Il design del ProArt StudioBook è minimalista ma emana classe. Lo chassis è ben costruito, il coperchio può essere aperto con un solo dito e il display ha cornici molto sottili per una maggiore immersione.
L'Asus Dial personalizzabile può essere estremamente utile nelle applicazioni supportate per chi desidera la comodità di un input di tipo analogico.
Asus utilizza un pannello OLED Samsung di alta qualità nello StudioBook 16. Non vanta un'elevata frequenza di aggiornamento, ma la precisione del colore e la copertura vicina al 100% degli spazi colore sRGB, Adobe RGB e Display P3 saranno apprezzate dai creatori. Il display soffre di PWM a bassi livelli di luminosità, ma l'uso del DC Dimming al di sopra del 50% di luminosità dovrebbe essere comunque piacevole per gli occhi.
L'Asus ProArt StudioBook 16 offre quasi tutto ciò che i creatori di contenuti si aspettano da un portatile di questo prezzo. Con un Core i9-12900H e una GPU RTX 3070 Ti Laptop dalle prestazioni eccellenti, un pannello OLED luminoso e vivido e la comodità del Dial Asus, il ProArt StudioBook 16 ha il potenziale per allontanarvi da un MacBook Pro.
Le prestazioni con la combinazione Core i9-12900H e RTX 3070 Ti Laptop GPU non riservano sorprese. Anzi, supera persino i suoi concorrenti come MSI Creator Z17 e Ryzen 9 6900HX- alimentato Asus ROG Zephyrus Duo 16 e Lenovo ThinkBook 16p G3, almeno in termini di prestazioni della CPU.
La GPU RTX 3070 Ti Laptop è ottima per i giochi in QHD e dovrebbe essere più che sufficiente per fornire una potenza sufficiente per le applicazioni di creazione di contenuti, in particolare con i driver Nvidia Studio.
Asus si rivolge chiaramente al pubblico di MacBook Pro e il ProArt StudioBook 16 è molto più avanti della concorrenza di Cupertino quando si tratta di prestazioni grezze. Detto questo, i MacBook basati sul silicio Apple hanno un vantaggio architettonico in termini di prestazioni lontano dal muro e di durata della batteria
.Inoltre, come si è visto nel benchmark Affinity Photo 2, le applicazioni ottimizzate specificamente per il silicio Apple possono mostrare prestazioni significativamente migliori rispetto alle loro versioni x86.
L'Asus ProArt StudioBook 16 non è tuttavia privo di alcuni difetti. Le prestazioni del Wi-Fi potrebbero richiedere un po' di stabilità e un maggiore throughput nella banda 6 GHz 6E. Anche le prestazioni della scheda SD possono essere molto migliorate, considerando il suo target demografico.
Il touchpad a tre pulsanti è uno dei migliori che si possano trovare su un portatile Windows, ma necessita di una messa a punto in termini di sensibilità. La batteria da 90 WHr offre un'autonomia superiore alla media, ma solo in condizioni di test.
Detto questo, l'Asus ProArt StudioBook 16 combina forma e funzionalità con prestazioni altrettanto buone, rendendolo sicuramente degno di considerazione per i creatori di contenuti se il prezzo non è un ostacolo.
Prezzi e disponibilità
La configurazione Asus ProArt StudioBook 16 H7600 con Core i9-12900H e GPU RTX 3070 Ti è disponibile al prezzo di ₹2.49.990 (~US$3.015) su Amazon India.
Negli Stati Uniti, il ProArt StudioBook 16 con Core i7-12700H, GPU RTX 3070 Ti Laptop, 16 GB di RAM e 2 TB di storage NVMe può essere acquistato a 2.549 dollari su Amazon US e a circa 2.699,99 dollari da Best Buy.
Gli acquirenti possono anche optare per una SKU di ProArt StudioBook 16 con la GPU GPU Nvidia RTX A3000 al prezzo di 2.971 dollari su Amazon US.
Asus ProArt StudioBook 16 H7600ZW
- 02/25/2023 v7 (old)
Vaidyanathan Subramaniam
Transparency
La selezione dei dispositivi da recensire viene effettuata dalla nostra redazione. Il campione di prova è stato fornito all'autore come prestito dal produttore o dal rivenditore ai fini di questa recensione. L'istituto di credito non ha avuto alcuna influenza su questa recensione, né il produttore ne ha ricevuto una copia prima della pubblicazione. Non vi era alcun obbligo di pubblicare questa recensione. In quanto società mediatica indipendente, Notebookcheck non è soggetta all'autorità di produttori, rivenditori o editori.
Ecco come Notebookcheck esegue i test
Ogni anno, Notebookcheck esamina in modo indipendente centinaia di laptop e smartphone utilizzando procedure standardizzate per garantire che tutti i risultati siano comparabili. Da circa 20 anni sviluppiamo continuamente i nostri metodi di prova e nel frattempo stabiliamo gli standard di settore. Nei nostri laboratori di prova, tecnici ed editori esperti utilizzano apparecchiature di misurazione di alta qualità. Questi test comportano un processo di validazione in più fasi. Il nostro complesso sistema di valutazione si basa su centinaia di misurazioni e parametri di riferimento ben fondati, che mantengono l'obiettività.Price comparison

