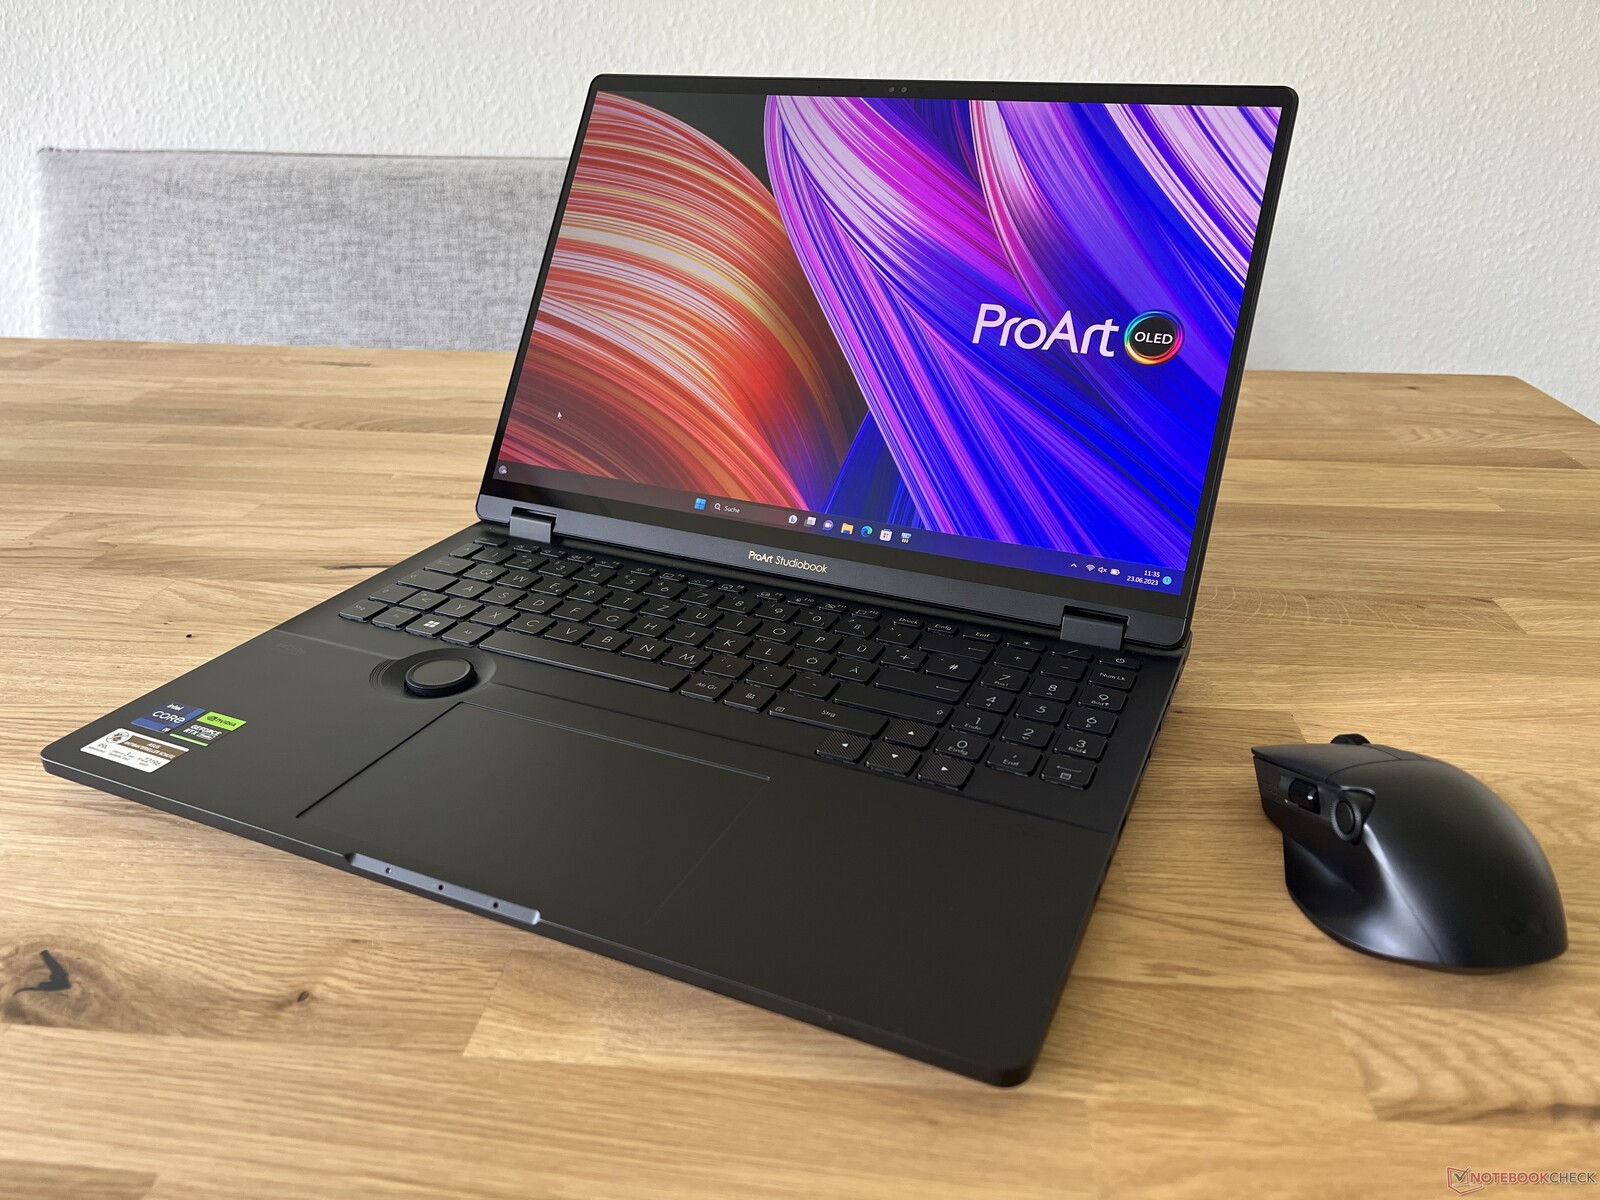
Recensione dell'Asus ProArt Studiobook 16 OLED: Laptop multimediale con prestazioni della CPU estreme
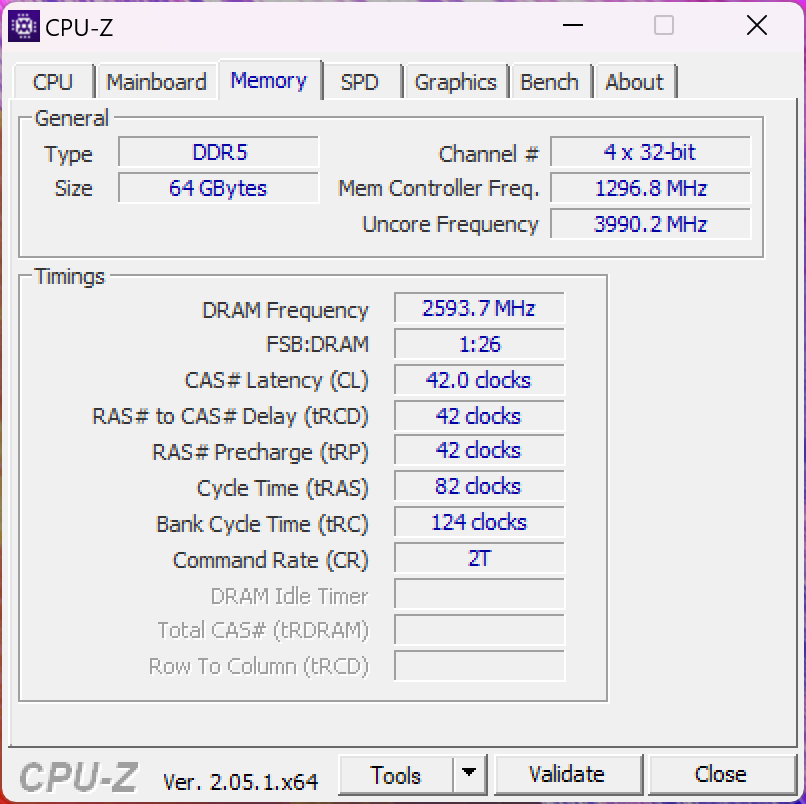
Asus si rivolge principalmente agli utenti creativi con il ProArt Studiobook 16 e offre una funzione di input aggiuntiva nel DialPad. L'attuale Studiobook 16 OLED 2023 utilizza il processore mobile più veloce di Intel, ilCore i9-13980HXin combinazione con il nuovo GeForce RTX 4070 Laptop.anche il display è cambiato: l'OLED 4K è stato sostituito da un modello touchscreen 3K con 120 Hz. Il nostro dispositivo di prova è il modello di fascia alta con 64 GB di RAM e un'unità SSD PCIe da 4 TB al prezzo di 3999 euro (4380 dollari). In alternativa, è disponibile anche una variante con RTX 4070 Laptop, 32 GB di RAM e un'unità SSD da 2 TB per 3499 euro (3800 dollari) o un RTX 4060 Laptop RTX 4060 Laptopcon 32 GB di RAM e un'unità SSD da 1 TB per 2.999 euro (3300 dollari).
Potenziali concorrenti a confronto
Punteggio | Data | Modello | Peso | Altezza | Dimensione | Risoluzione | Prezzo |
|---|---|---|---|---|---|---|---|
| 86.1 % v7 (old) | 06/2023 | Asus ProArt Studiobook 16 OLED H7604 i9-13980HX, GeForce RTX 4070 Laptop GPU | 2.4 kg | 23.9 mm | 16.00" | 3200x2000 | |
| 86.2 % v7 (old) | 03/2023 | Gigabyte AERO 16 OLED BSF i9-13900H, GeForce RTX 4070 Laptop GPU | 2.1 kg | 18 mm | 16.00" | 3840x2400 | |
| 89.4 % v7 (old) | 04/2023 | Samsung Galaxy Book3 Ultra 16 i7-13700H, GeForce RTX 4050 Laptop GPU | 1.8 kg | 16.5 mm | 16.00" | 2880x1800 | |
| 89.2 % v7 (old) | 04/2023 | MSI Stealth 17 Studio A13VH-014 i9-13900H, GeForce RTX 4080 Laptop GPU | 3 kg | 21.3 mm | 17.30" | 3840x2160 | |
| 93.7 % v7 (old) | 03/2023 | Apple MacBook Pro 16 2023 M2 Max M2 Max, M2 Max 38-Core GPU | 2.2 kg | 16.8 mm | 16.20" | 3456x2234 | |
| 88 % v7 (old) | 04/2023 | Asus Zephyrus Duo 16 GX650PY-NM006W R9 7945HX, GeForce RTX 4090 Laptop GPU | 2.7 kg | 29.7 mm | 16.00" | 2560x1600 |
Caso - ProArt è trattenuta
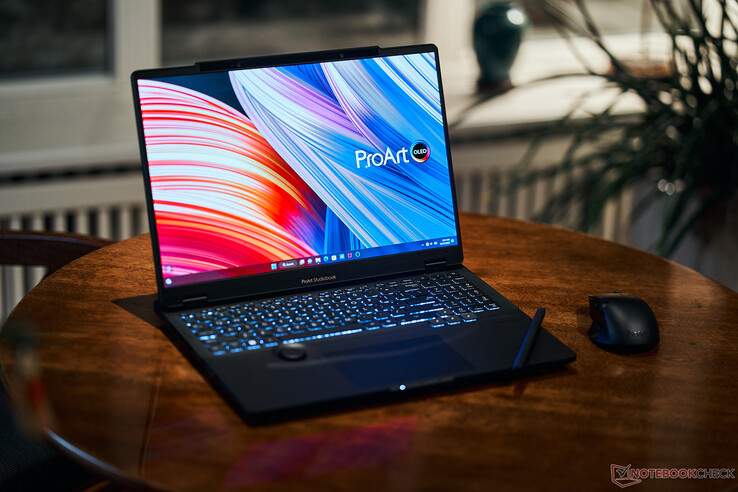
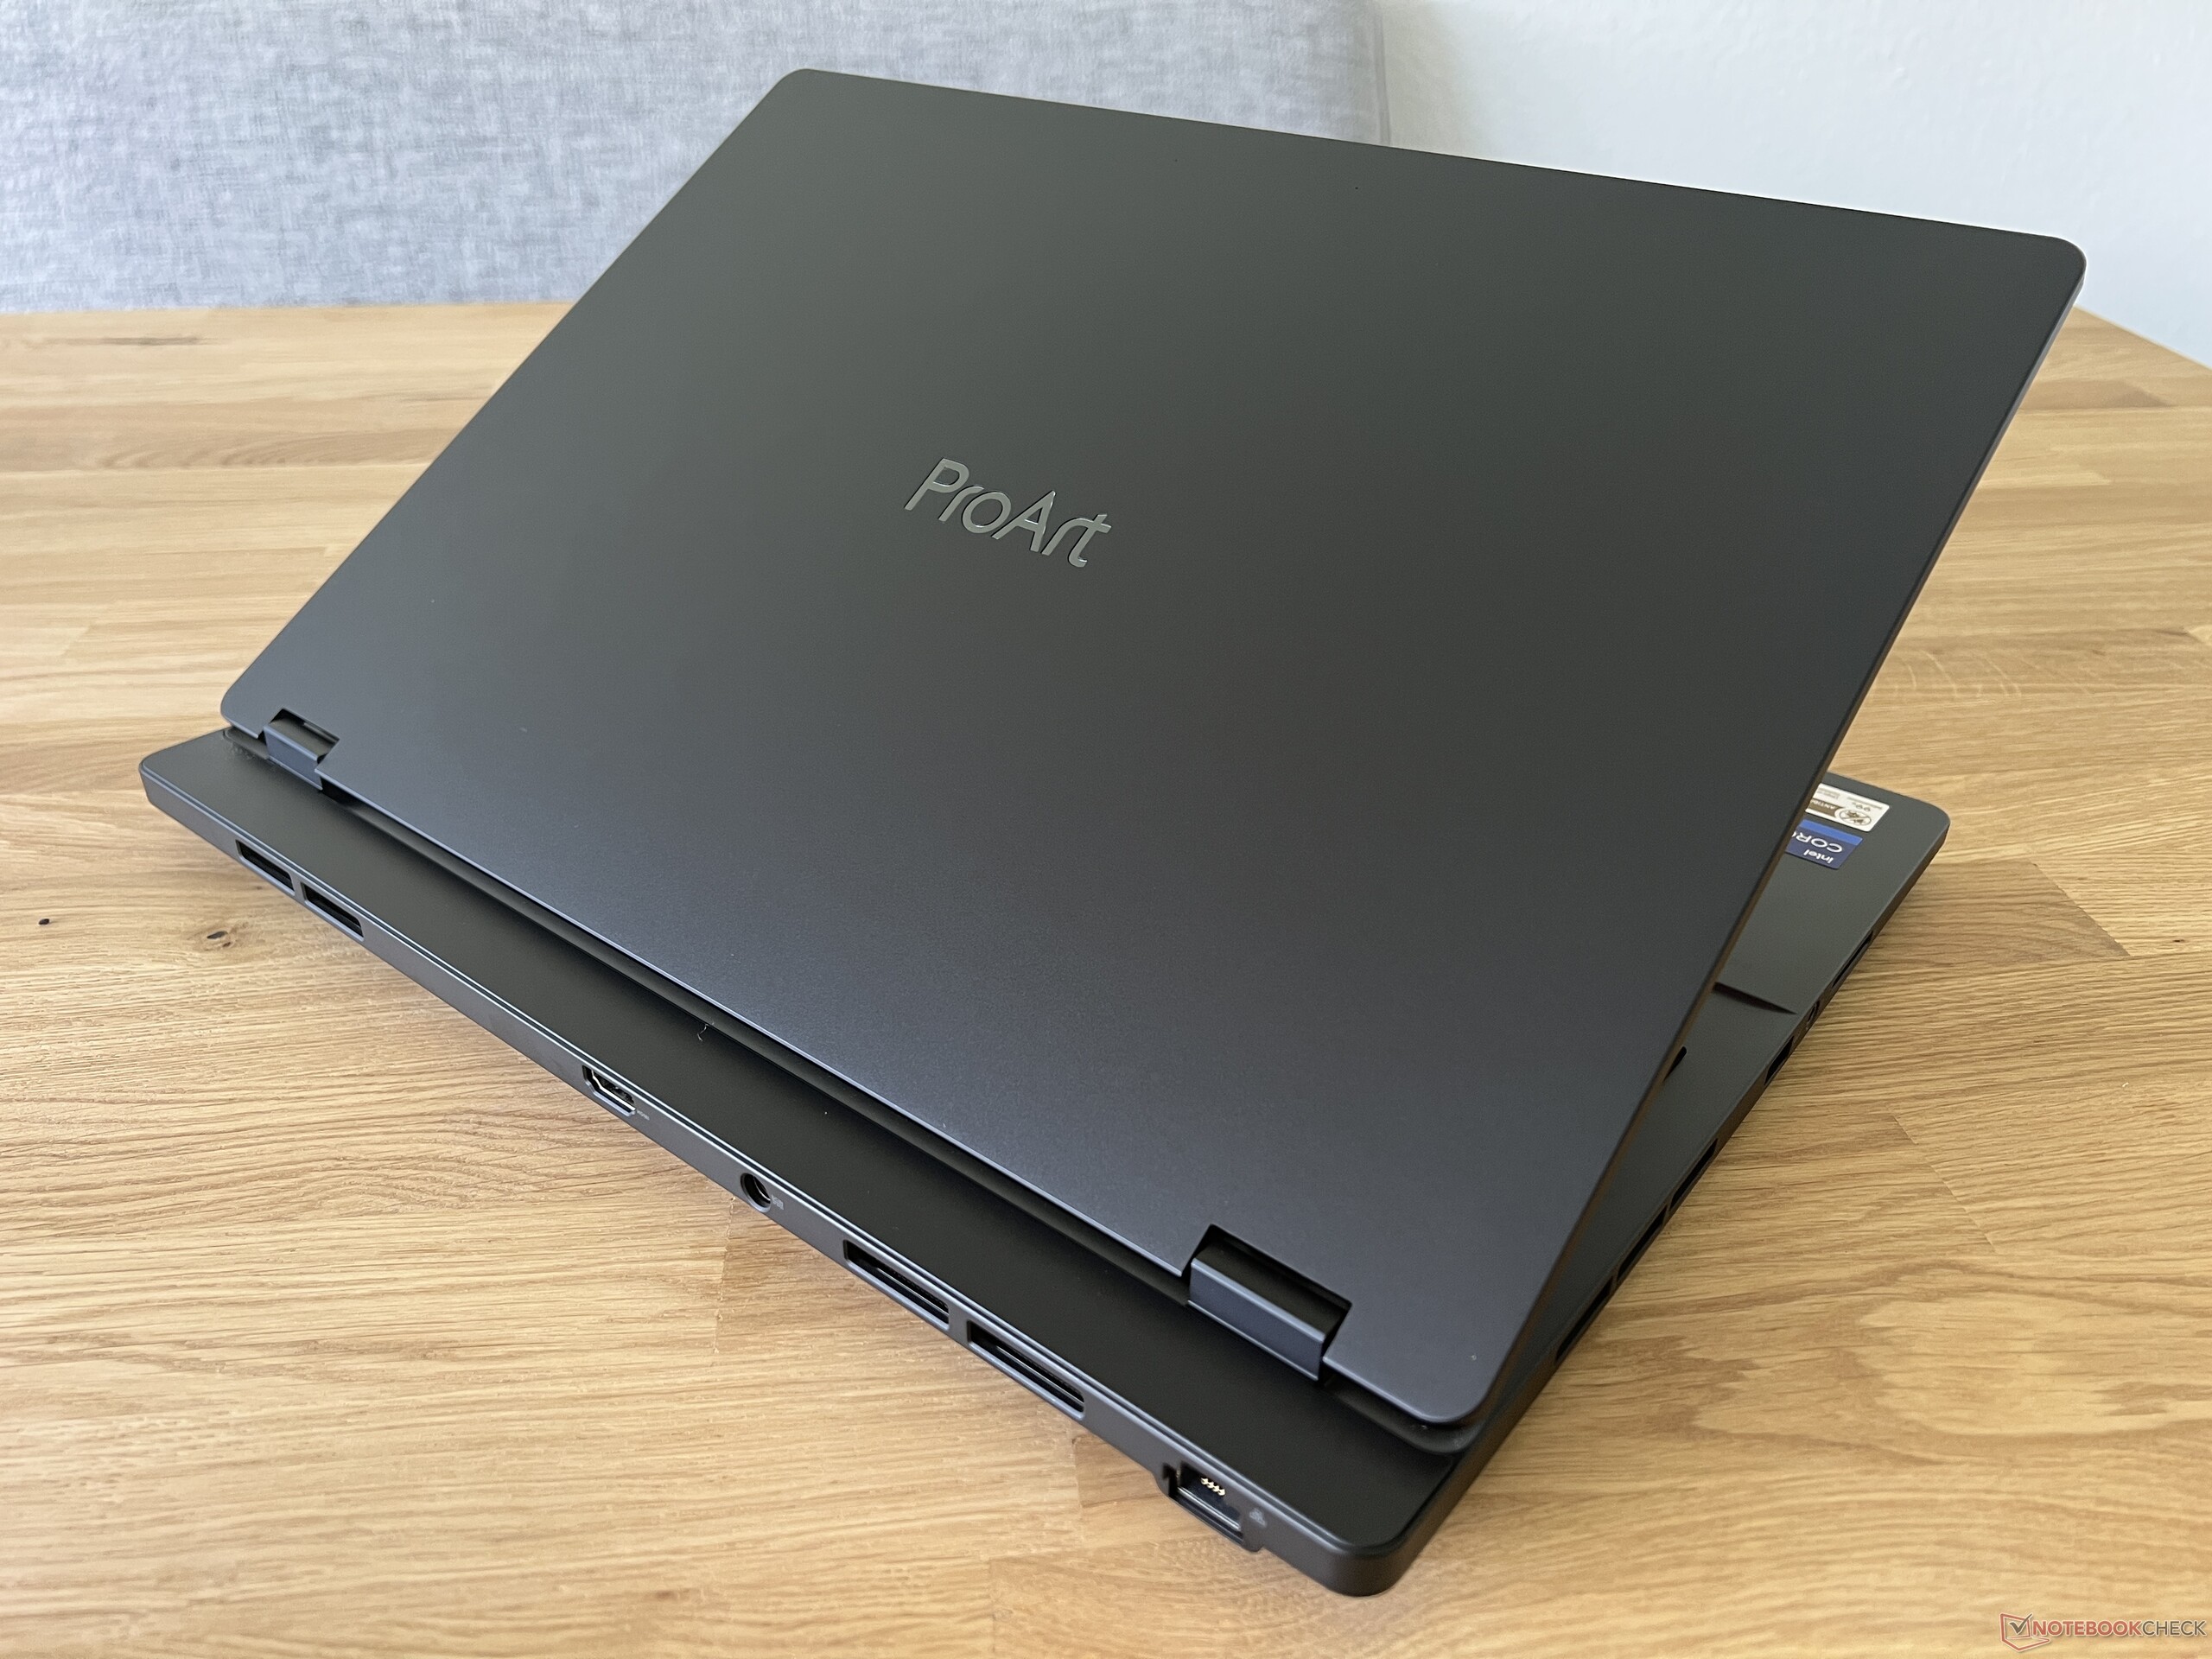
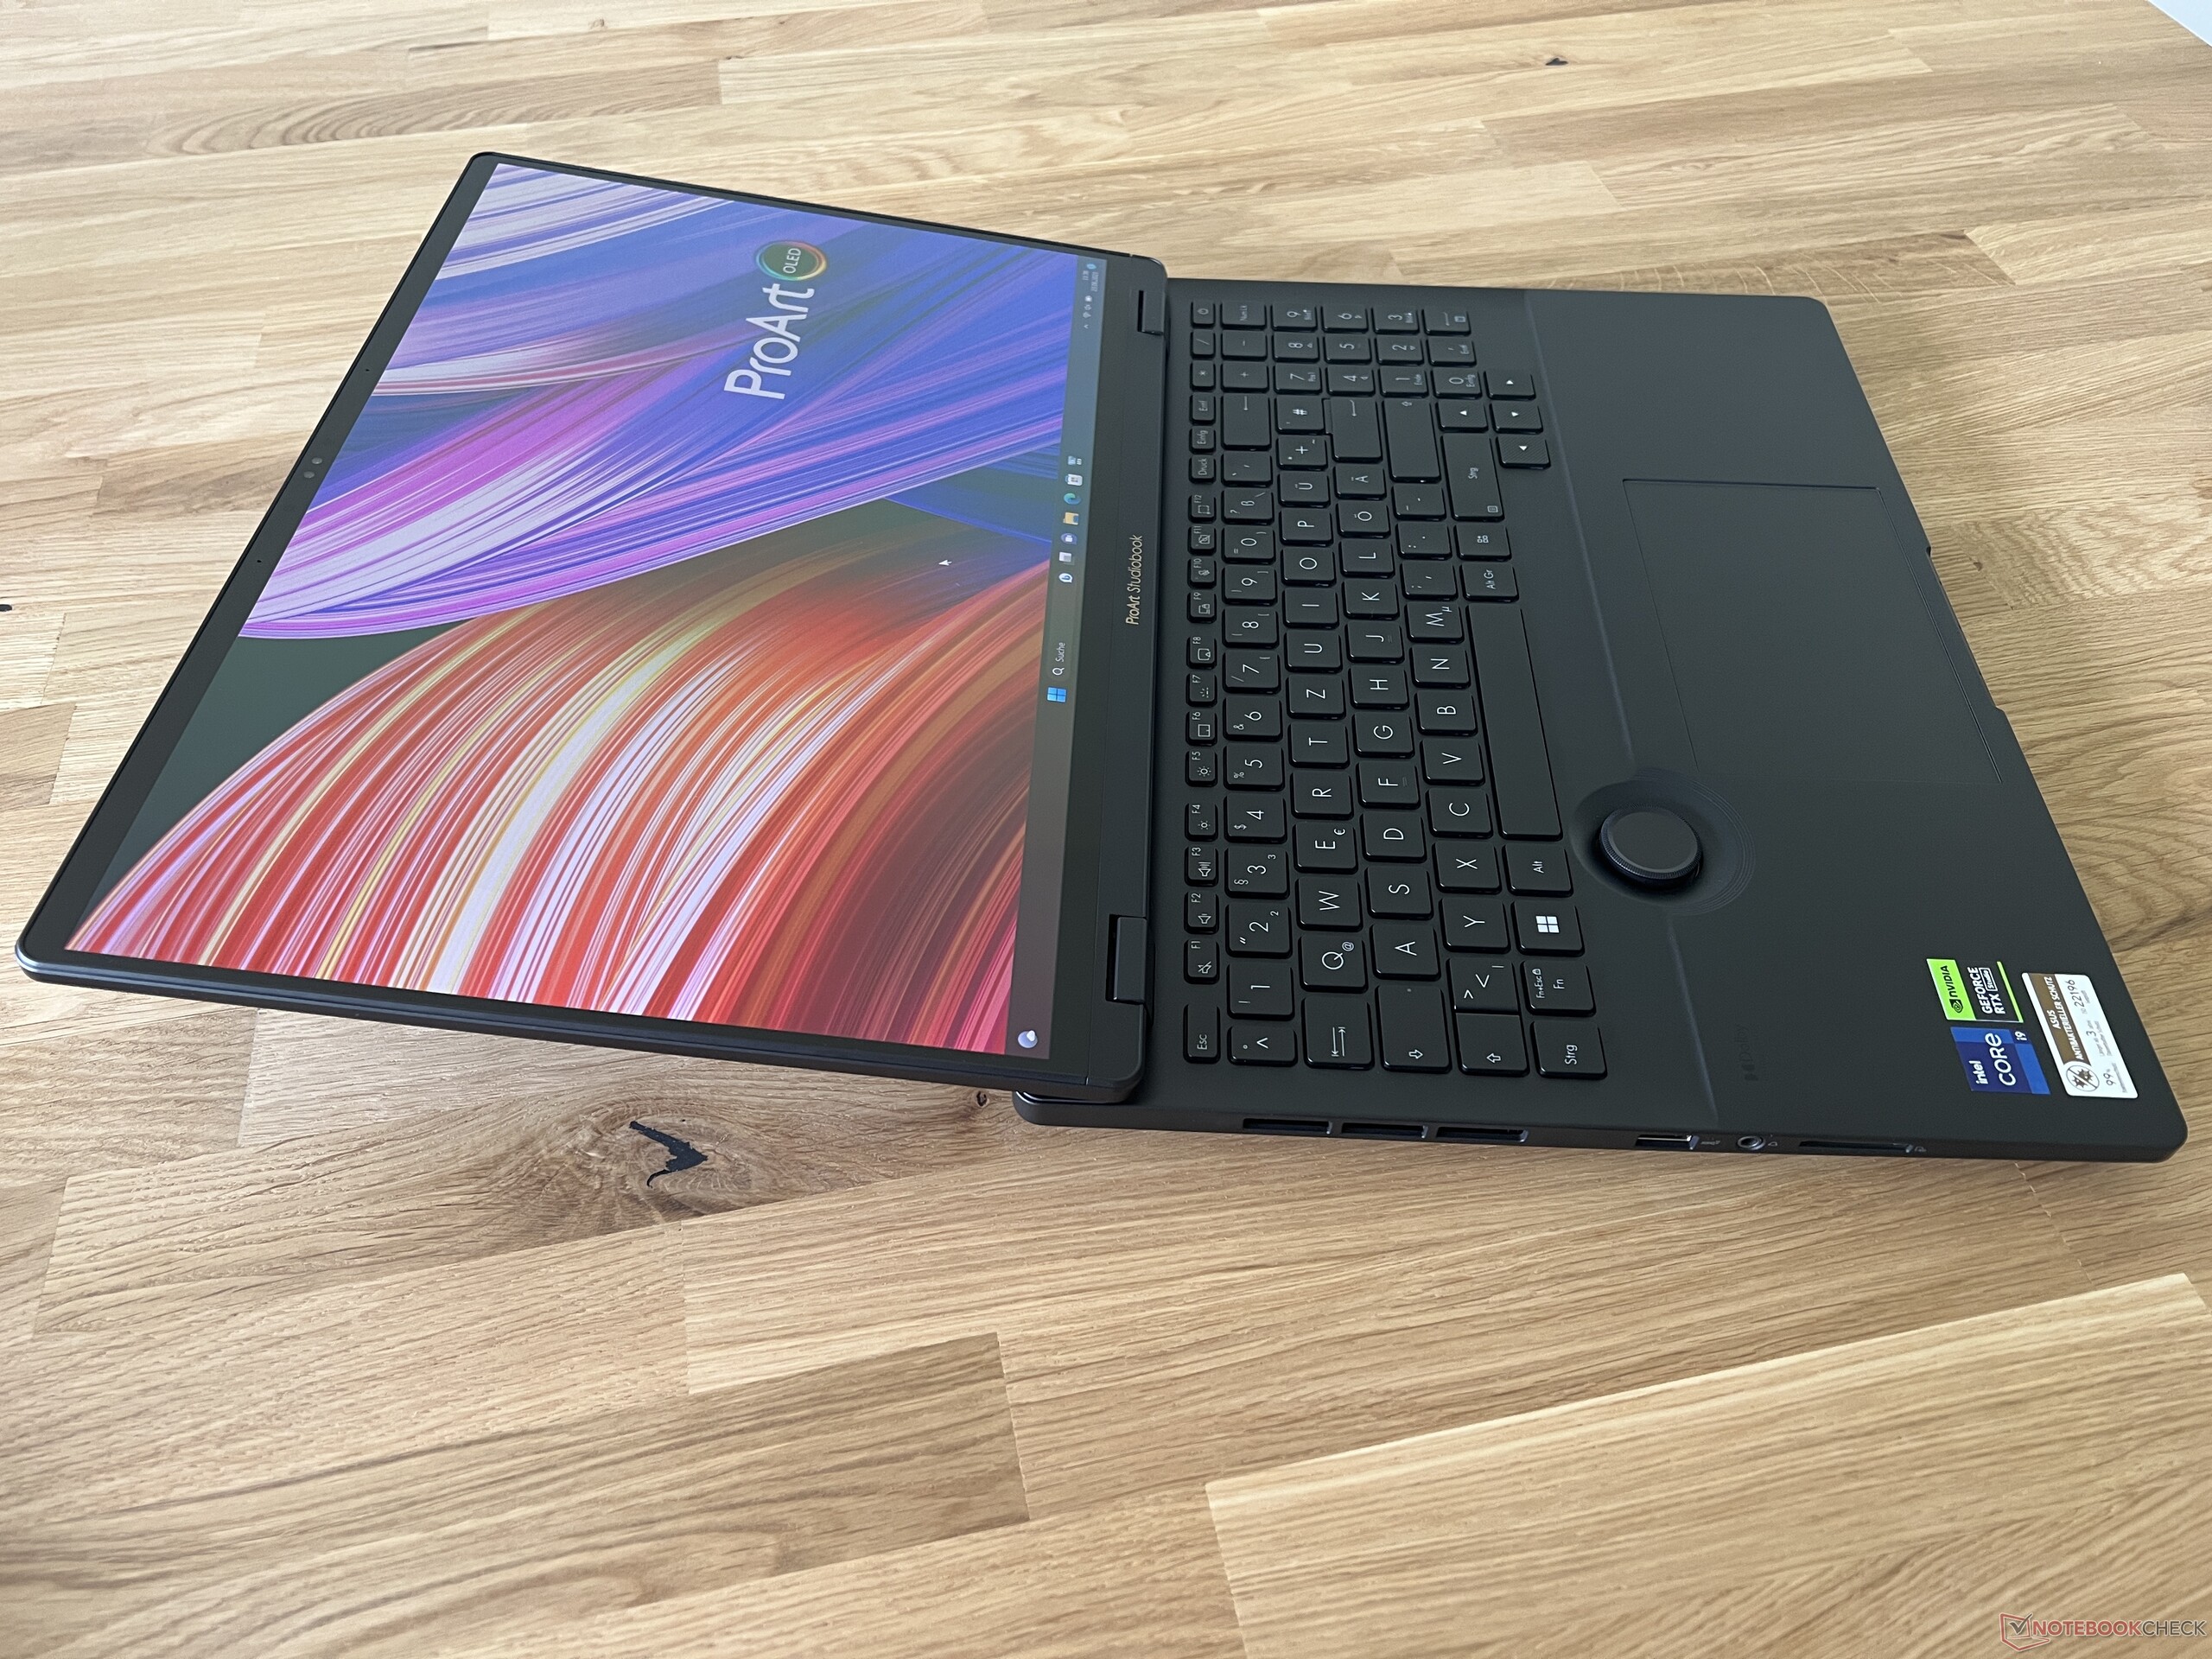
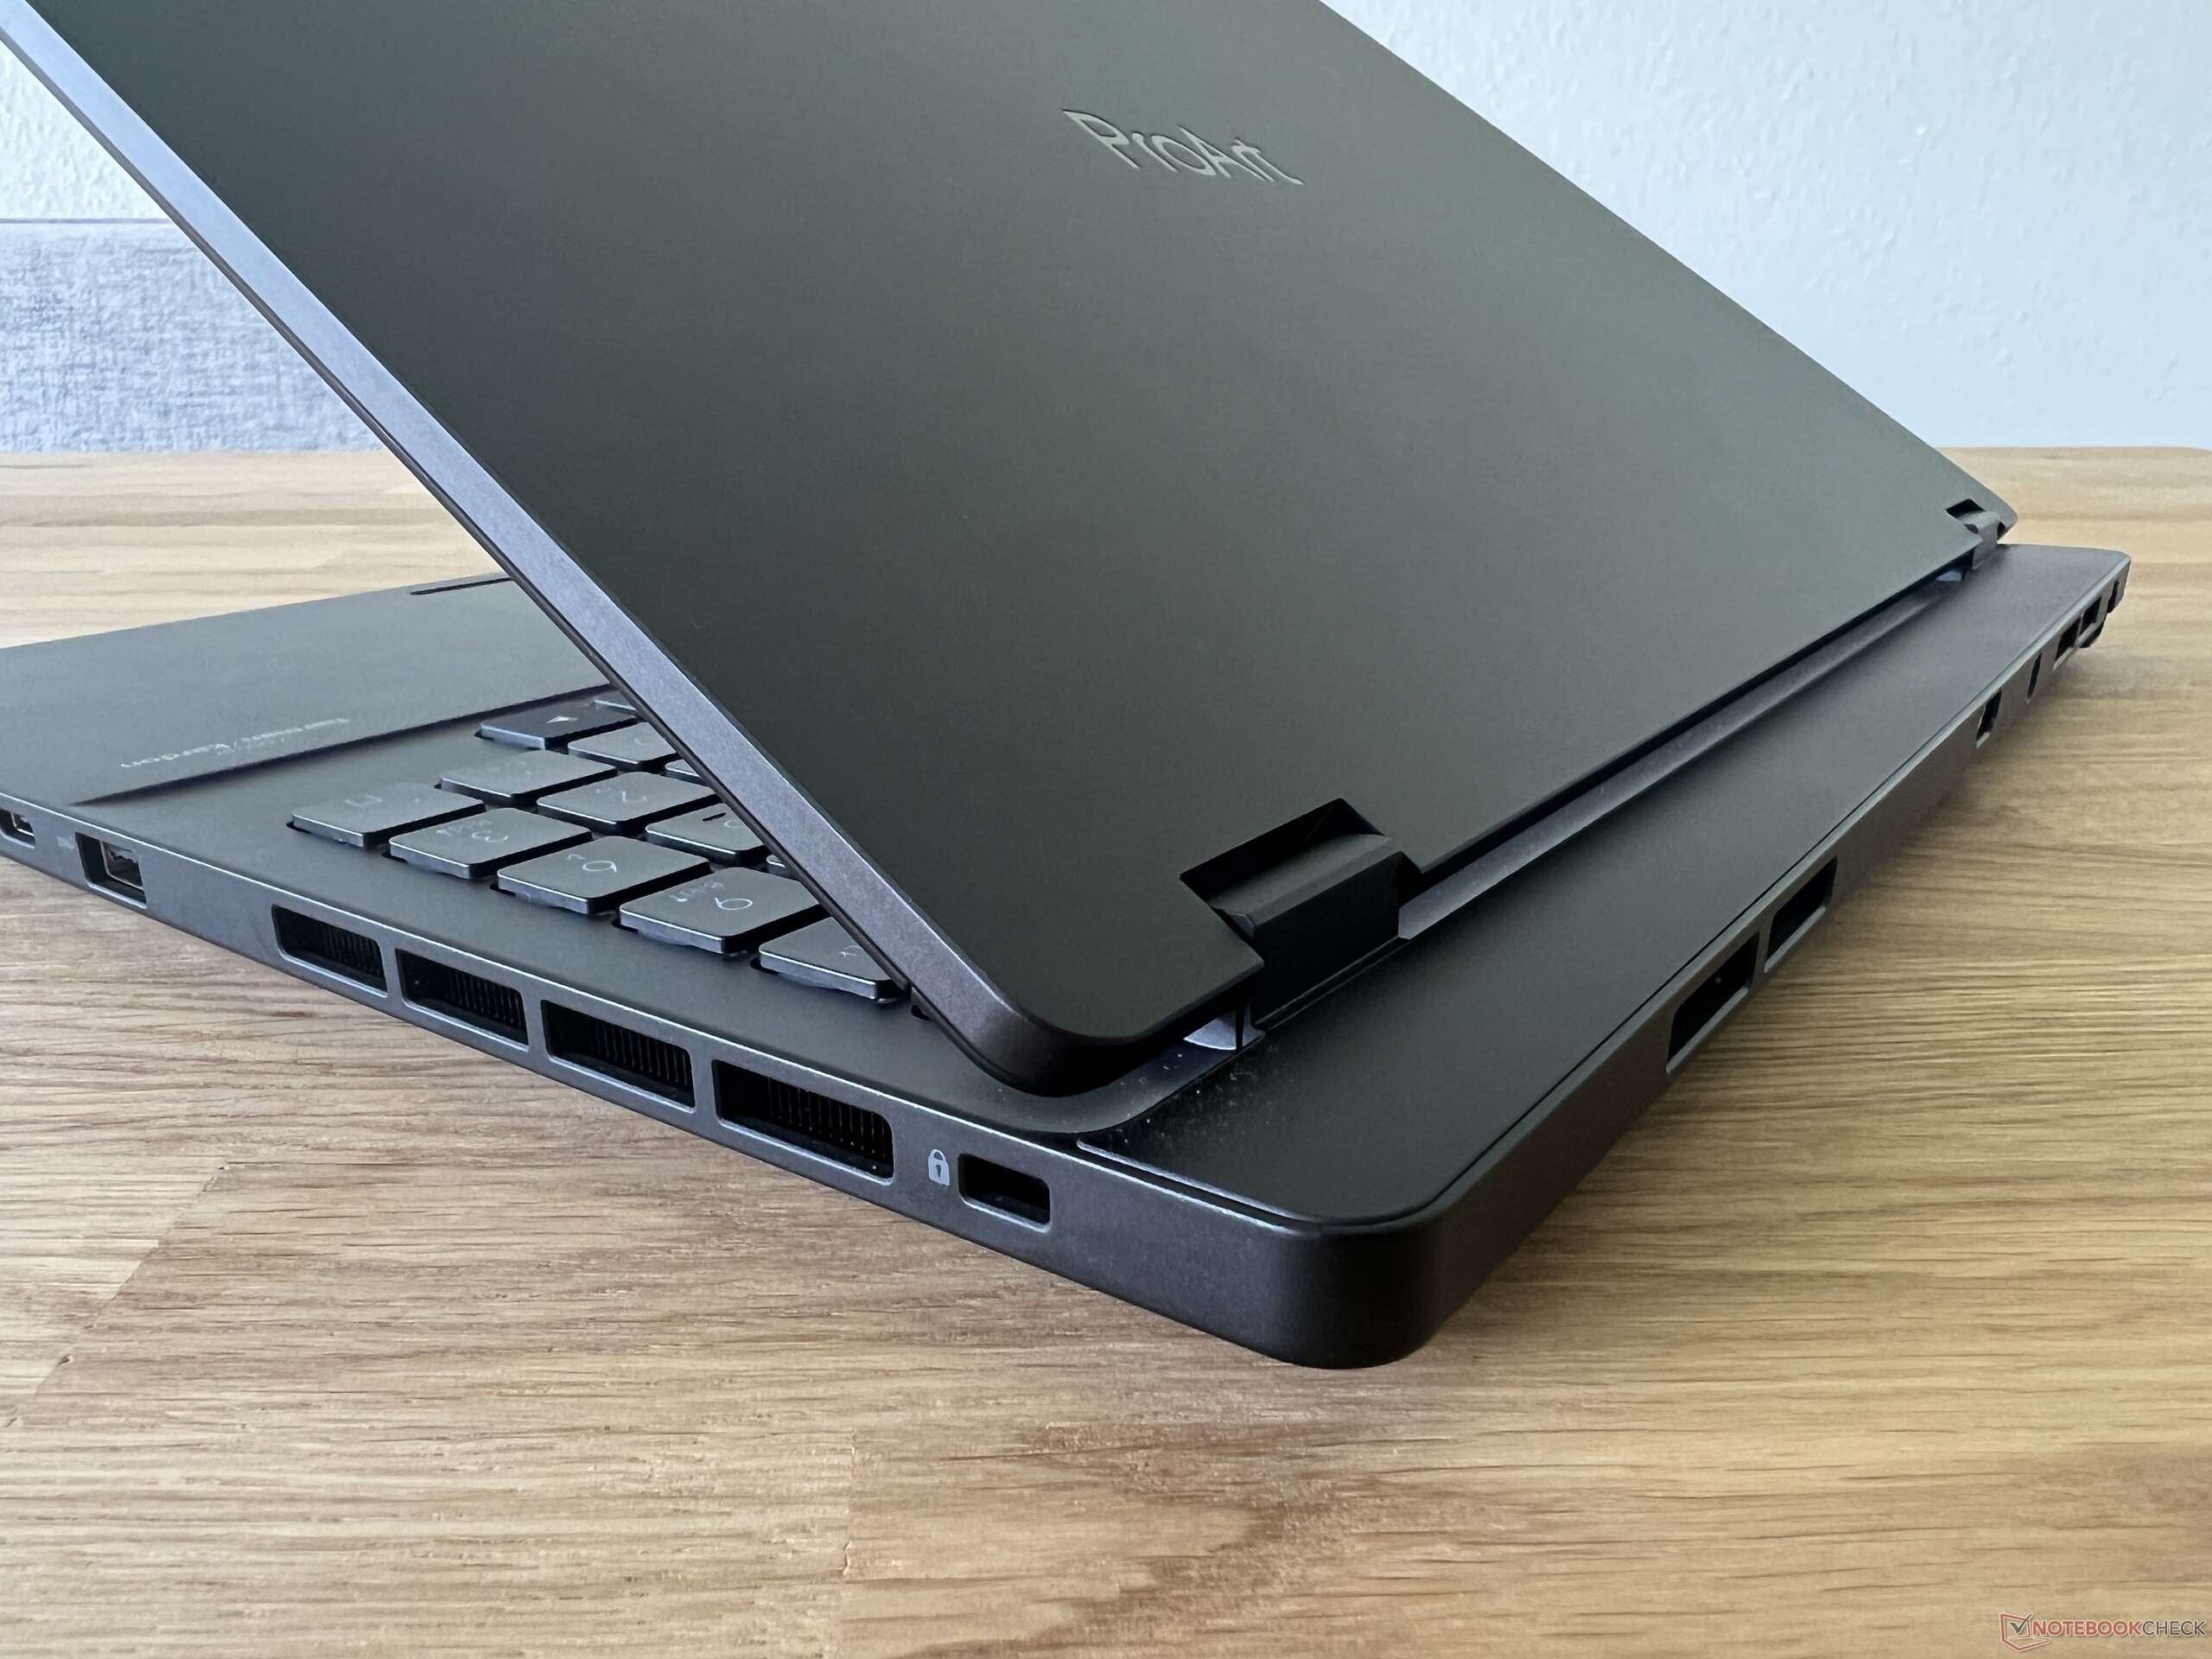
Asus utilizza la plastica nera per il ProArt Studiobook 16, che sembra di alta qualità. L'unico problema è rappresentato dalle superfici lisce, che sono molto sensibili alle impronte digitali. Nel complesso, il design è molto sobrio e, a parte il logo ProArt sul coperchio, non ci sono altri accenti visivi. Non appena si apre il coperchio, l'occhio viene immediatamente catturato dall'ampio DialPad sotto la tastiera. Il coperchio si trova leggermente davanti all'unità base, ma questo consente un angolo di apertura massimo di quasi 180 gradi
La stabilità è eccellente, sia per l'unità base che per il coperchio. Non si avvertono scricchiolii in caso di sollecitazione torsionale e non ci sono nemmeno ammaccature. Le cerniere sono ben regolate: impediscono efficacemente il traballamento e mantengono lo schermo saldamente in posizione. Solo in caso di angolazioni molto ridotte (meno di 20 gradi) il coperchio si chiude da solo a causa del peso.
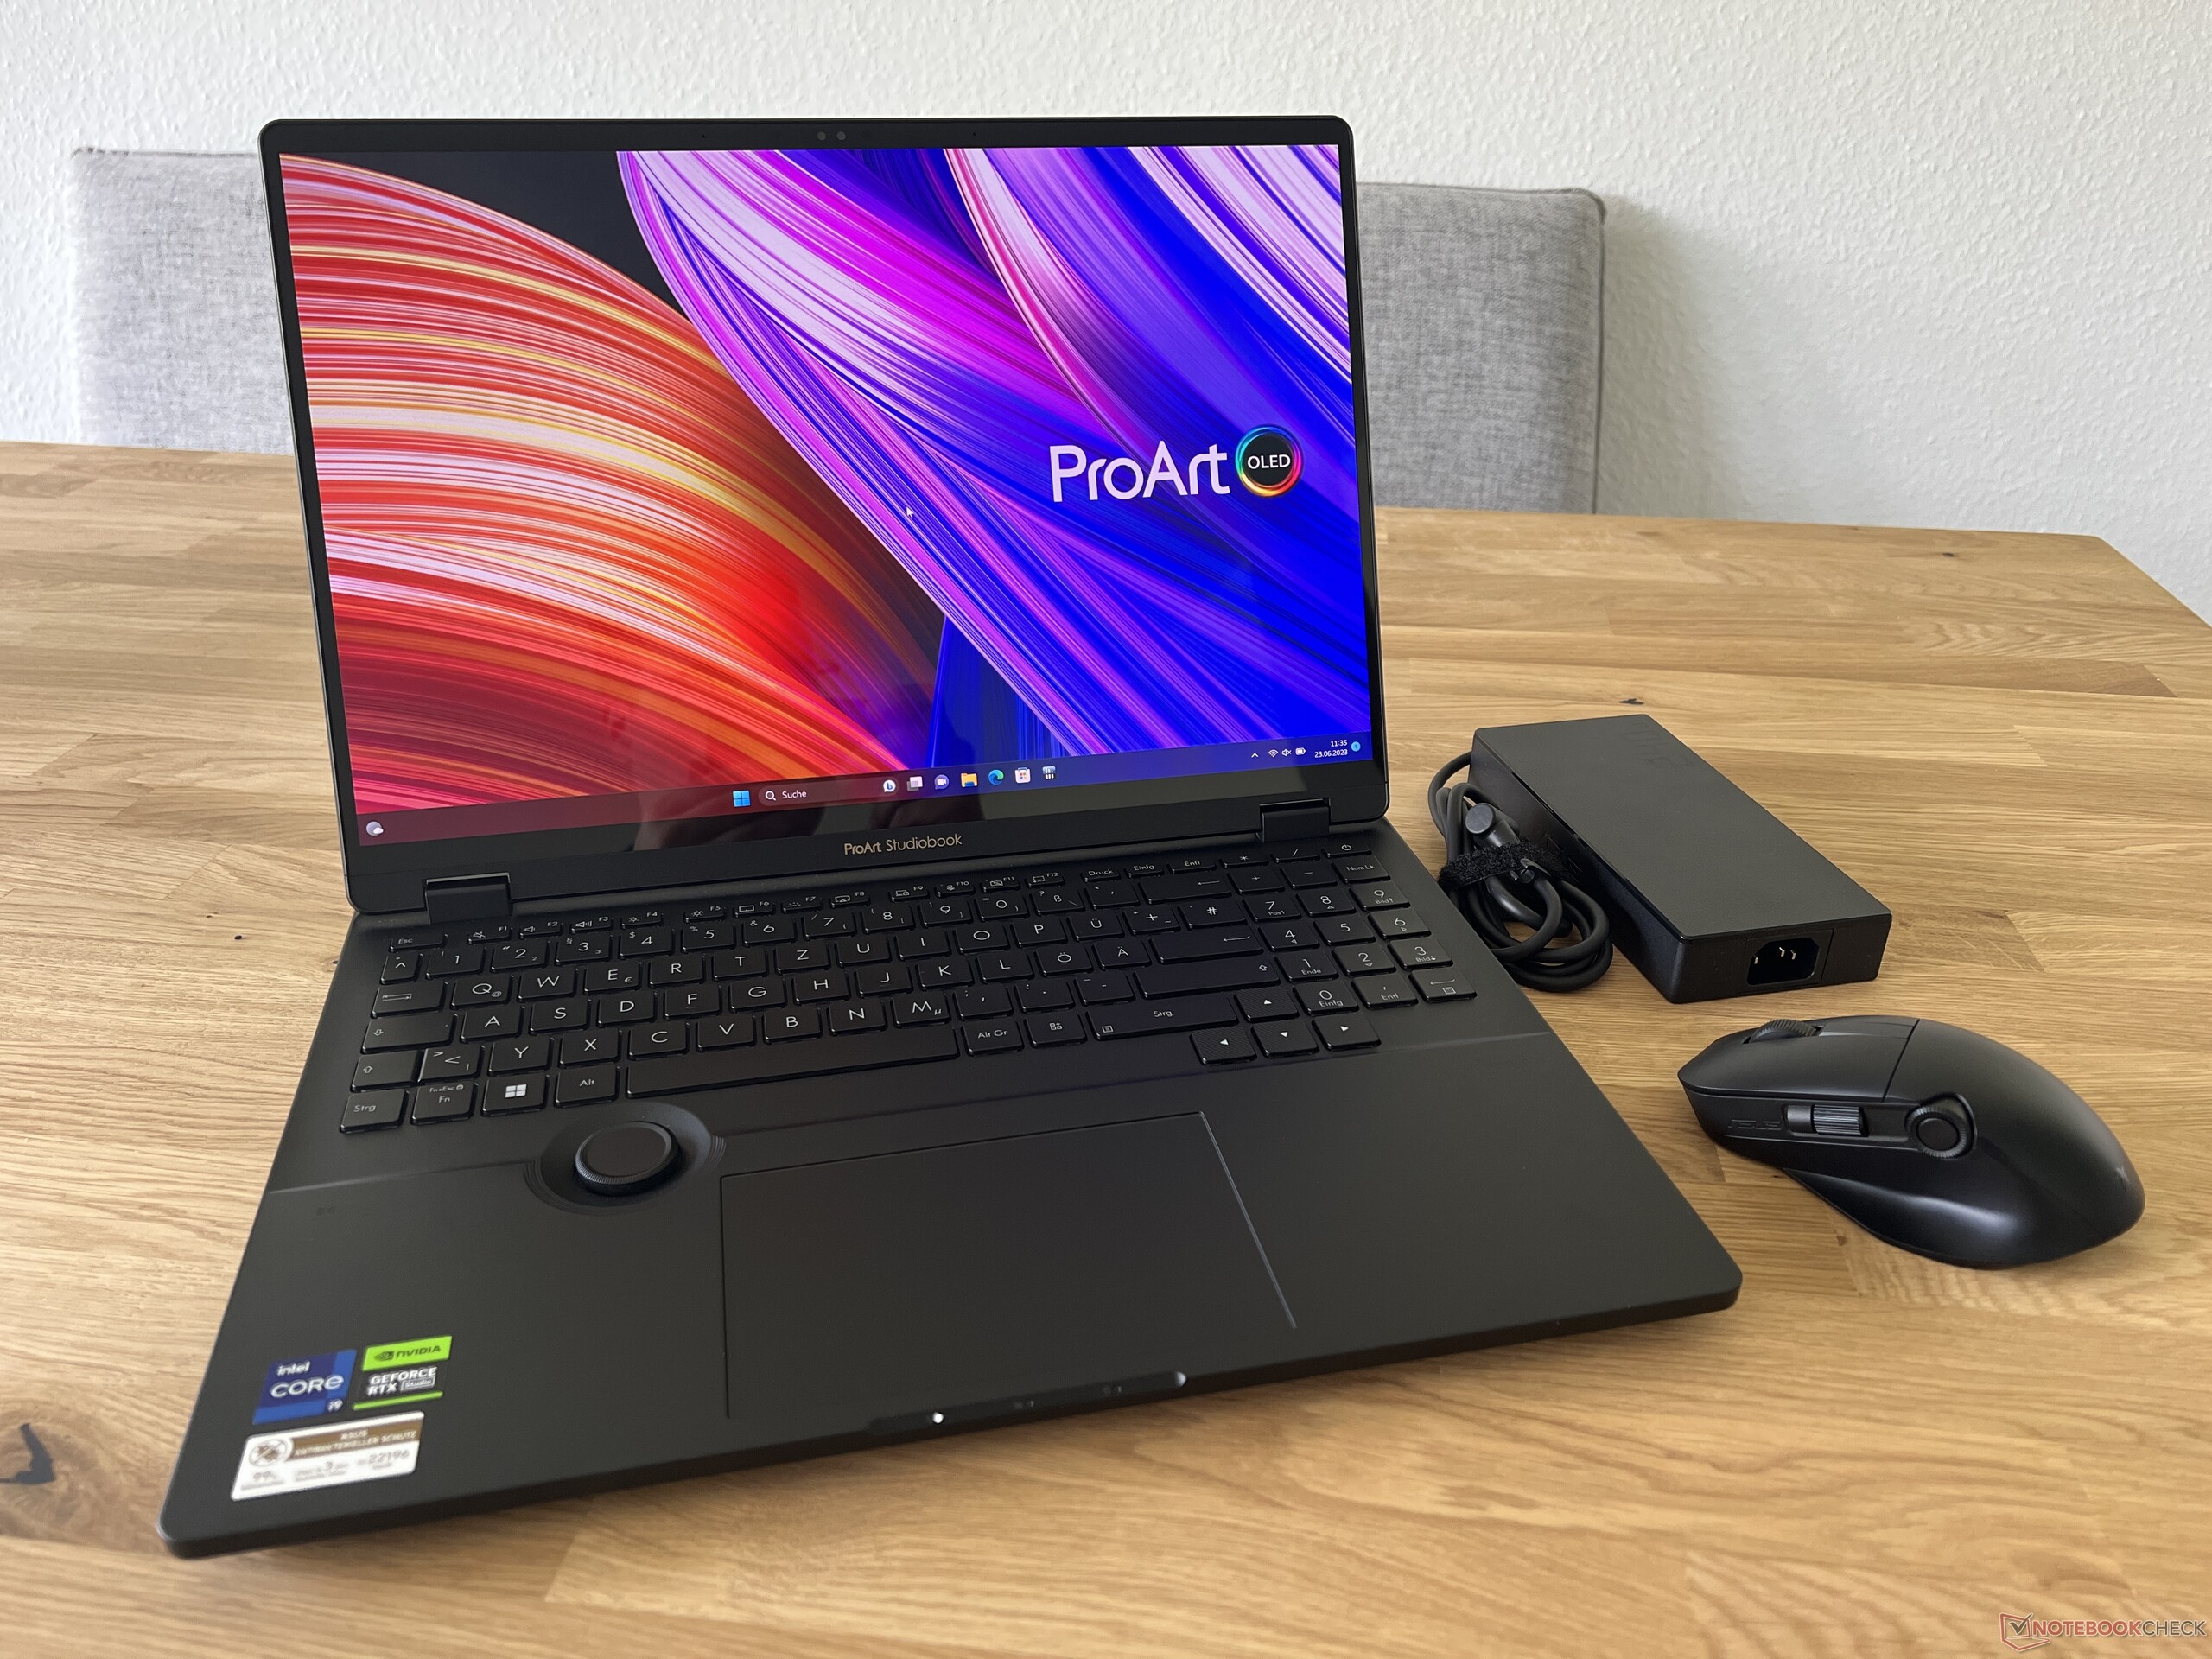
Con un peso di poco inferiore ai 2,5 kg, lo Studiobook non è leggero e, date le sue dimensioni, non è nemmeno particolarmente portatile. Il notebook si adatta comunque a zaini di grandi dimensioni, ma naturalmente occupa molto spazio in quanto 16 pollici. È anche il più grande 16 pollici del gruppo di confronto e non è nemmeno molto più piccolo dei dispositivi da 17 pollici. Il portatile è anche piuttosto spesso, circa 2,5 cm, ed è superato solo dalloZephyrus Duocon il suo secondo schermo. Per quanto riguarda l'alimentatore da 240 watt, dovrete mettere in conto 740 grammi in più per il trasporto.
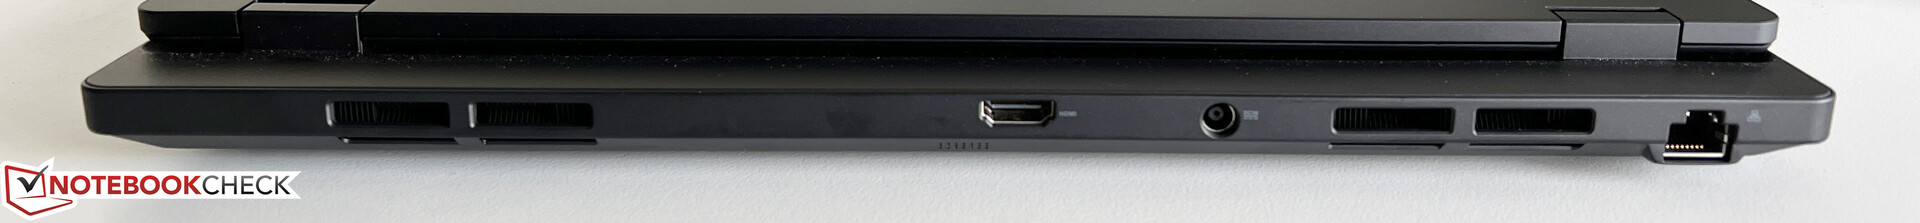
Apparecchiature - Thunderbolt 4 e HDMI 2.1
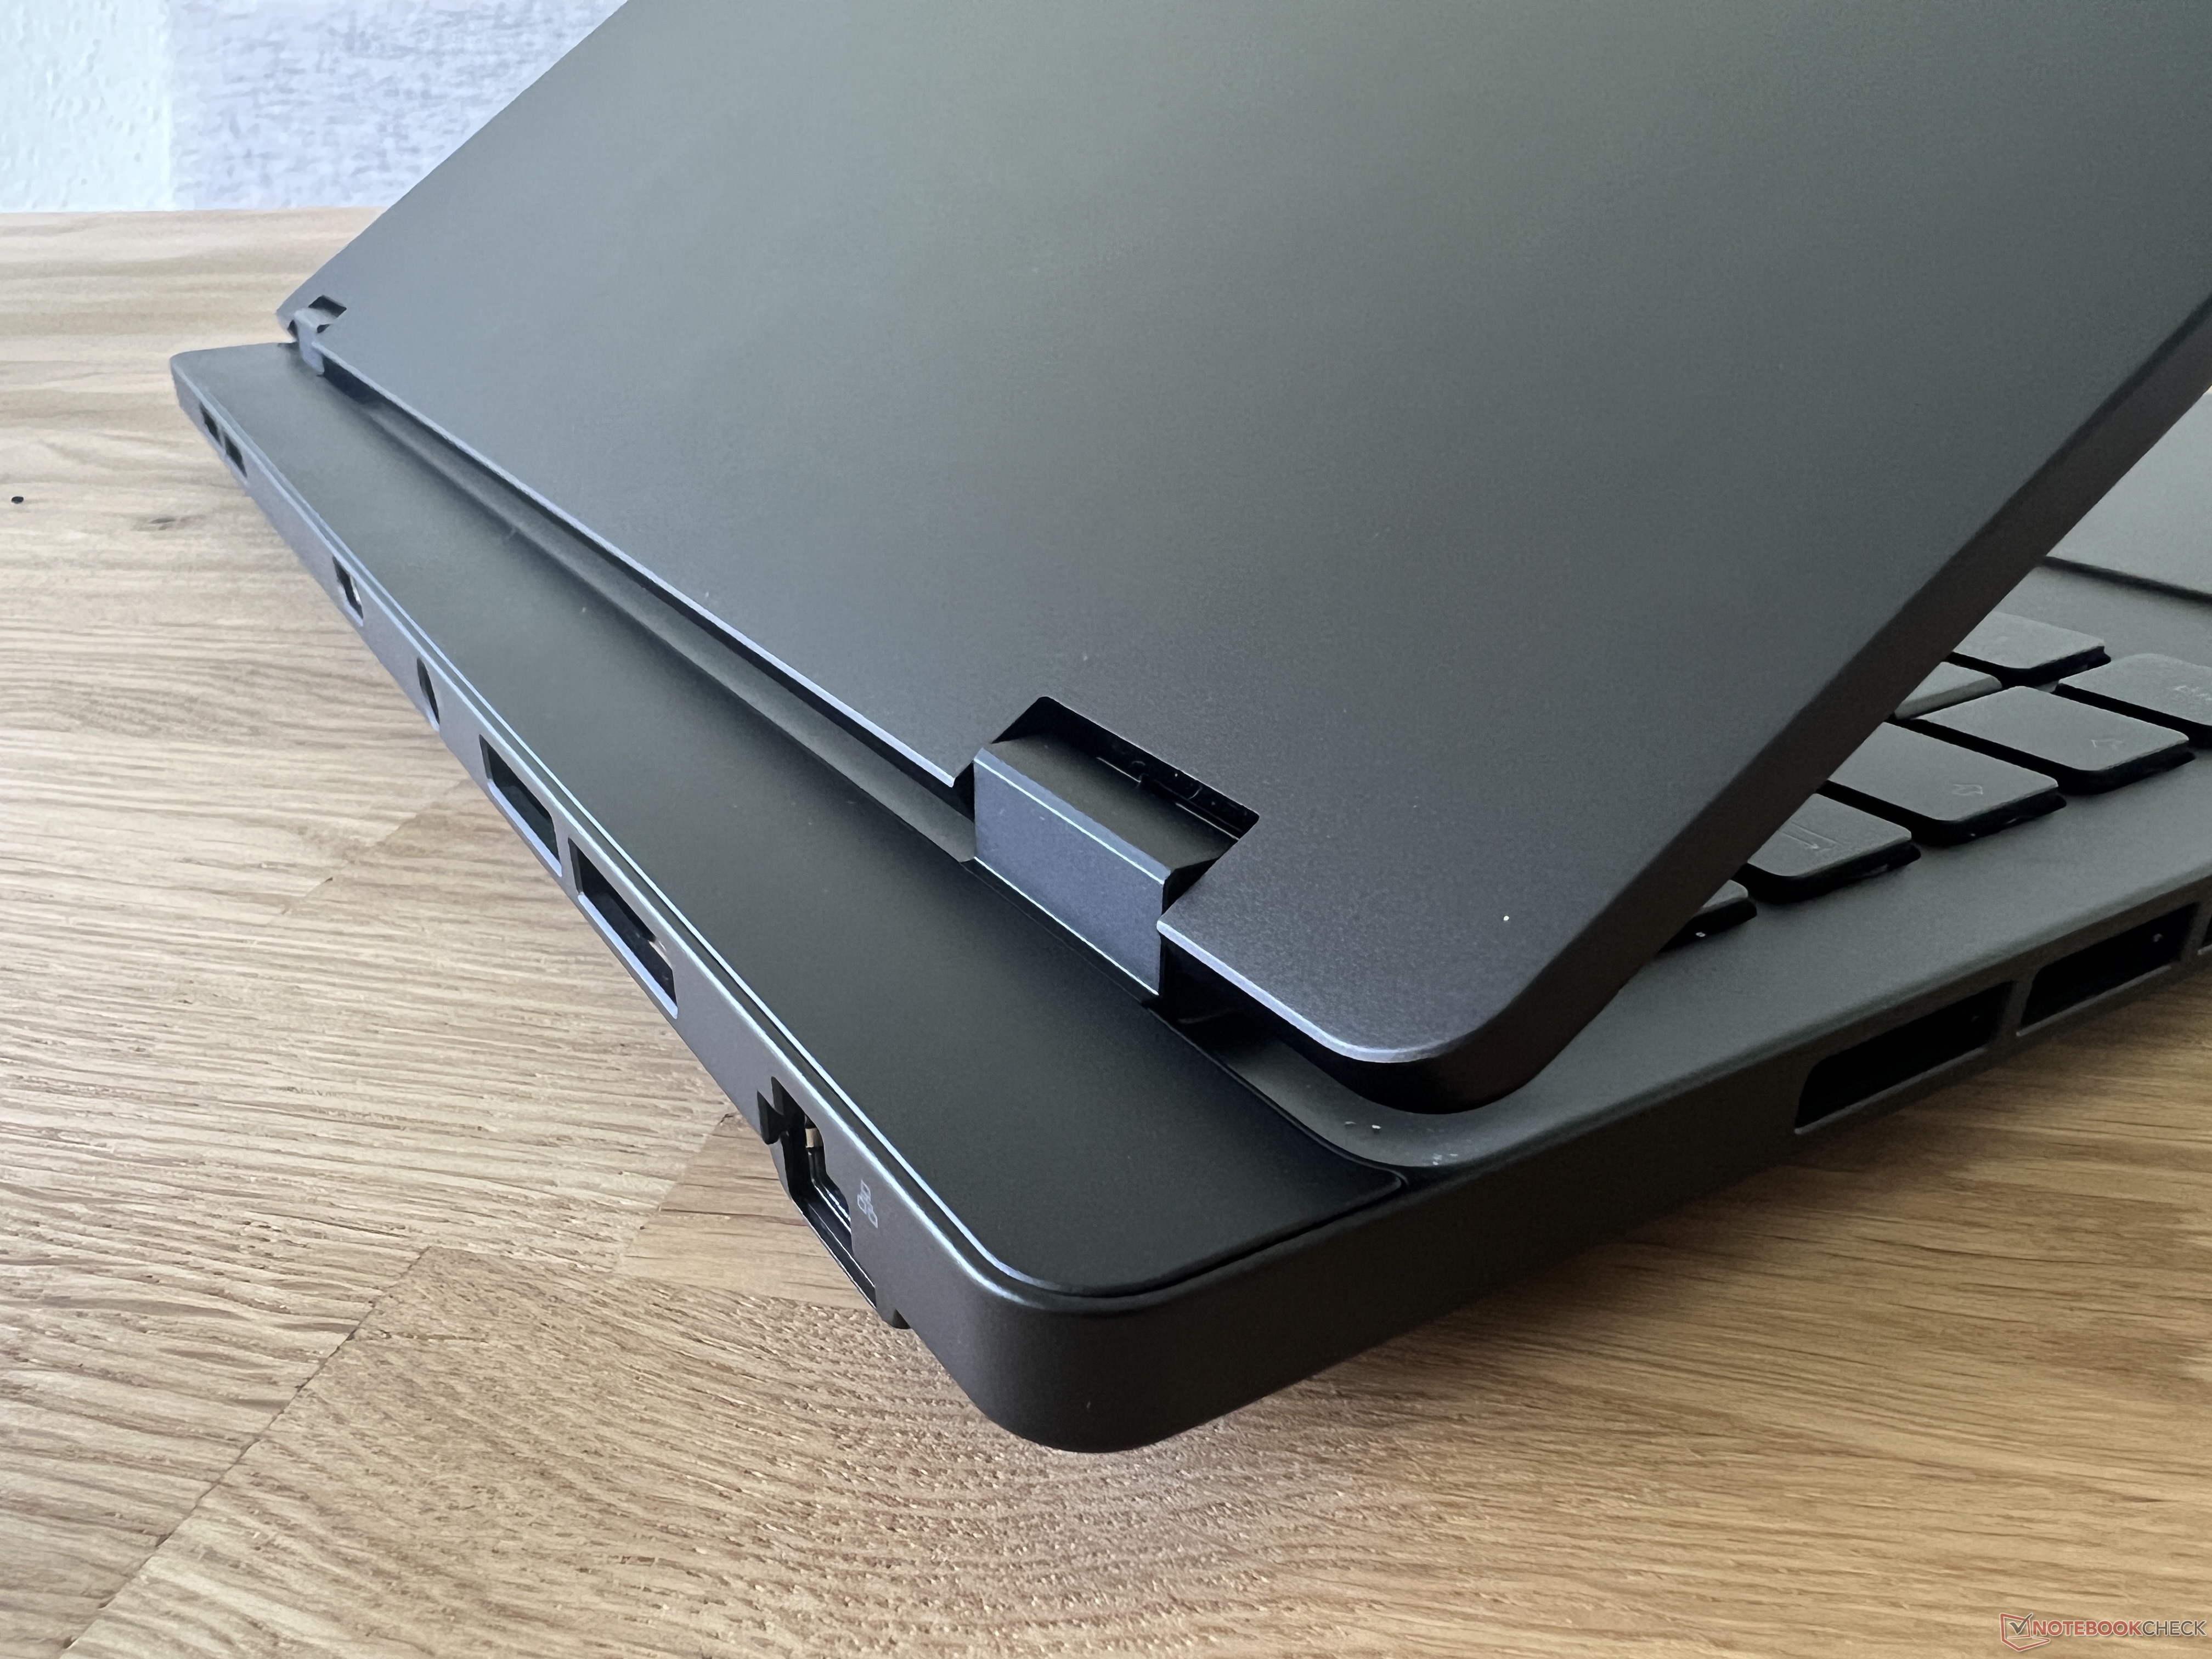
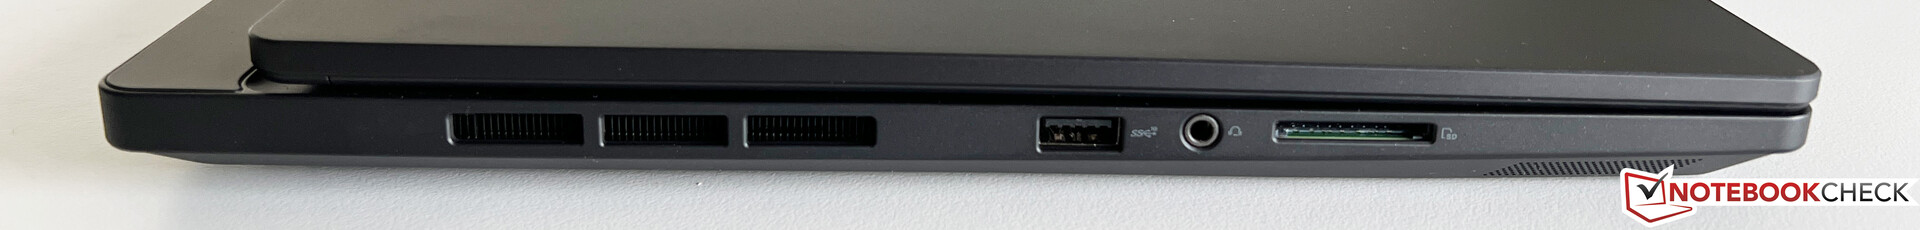
Le porte sono distribuite nelle aree anteriori di entrambi i lati e nella parte posteriore. La maggior parte delle porte USB si trova sulla parte anteriore destra, che può risultare affollata quando è completamente occupata. D'altra parte, Asus ha collocato il jack di alimentazione, la porta Ethernet e l'uscita HDMI sul retro, dove non sono d'intralcio.
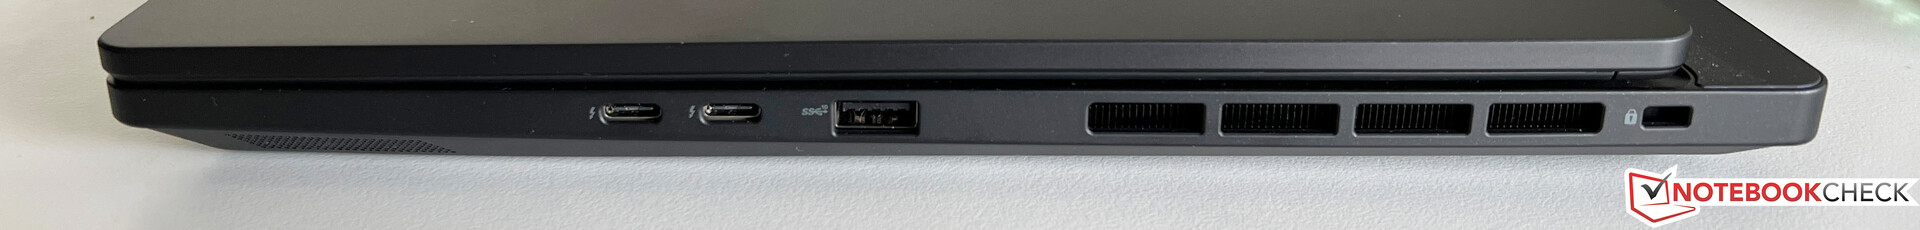
Lettore di schede SD
Sul lato sinistro si trova il lettore di schede SD completo, che raggiunge solo velocità di trasferimento medie con la nostra scheda di riferimento (Angelbird AV Pro V60). È possibile fare molto di più, come dimostra la concorrenza.
| SD Card Reader | |
| average JPG Copy Test (av. of 3 runs) | |
| Apple MacBook Pro 16 2023 M2 Max (Angelbird AV Pro V60) | |
| Asus Zephyrus Duo 16 GX650PY-NM006W (Angelbird AV Pro V60) | |
| Gigabyte AERO 16 OLED BSF | |
| Media della classe Multimedia (23 - 531, n=40, ultimi 2 anni) | |
| Samsung Galaxy Book3 Ultra 16 (AV PRO microSD 128 GB V60) | |
| Asus ProArt Studiobook 16 OLED H7604 (Angelibird AV Pro V60) | |
| MSI Stealth 17 Studio A13VH-014 | |
| maximum AS SSD Seq Read Test (1GB) | |
| Asus Zephyrus Duo 16 GX650PY-NM006W (Angelbird AV Pro V60) | |
| Apple MacBook Pro 16 2023 M2 Max (Angelbird AV Pro V60) | |
| Media della classe Multimedia (37.3 - 1455, n=39, ultimi 2 anni) | |
| Gigabyte AERO 16 OLED BSF | |
| Asus ProArt Studiobook 16 OLED H7604 (Angelibird AV Pro V60) | |
| Samsung Galaxy Book3 Ultra 16 (AV PRO microSD 128 GB V60) | |
| MSI Stealth 17 Studio A13VH-014 | |
Comunicazione
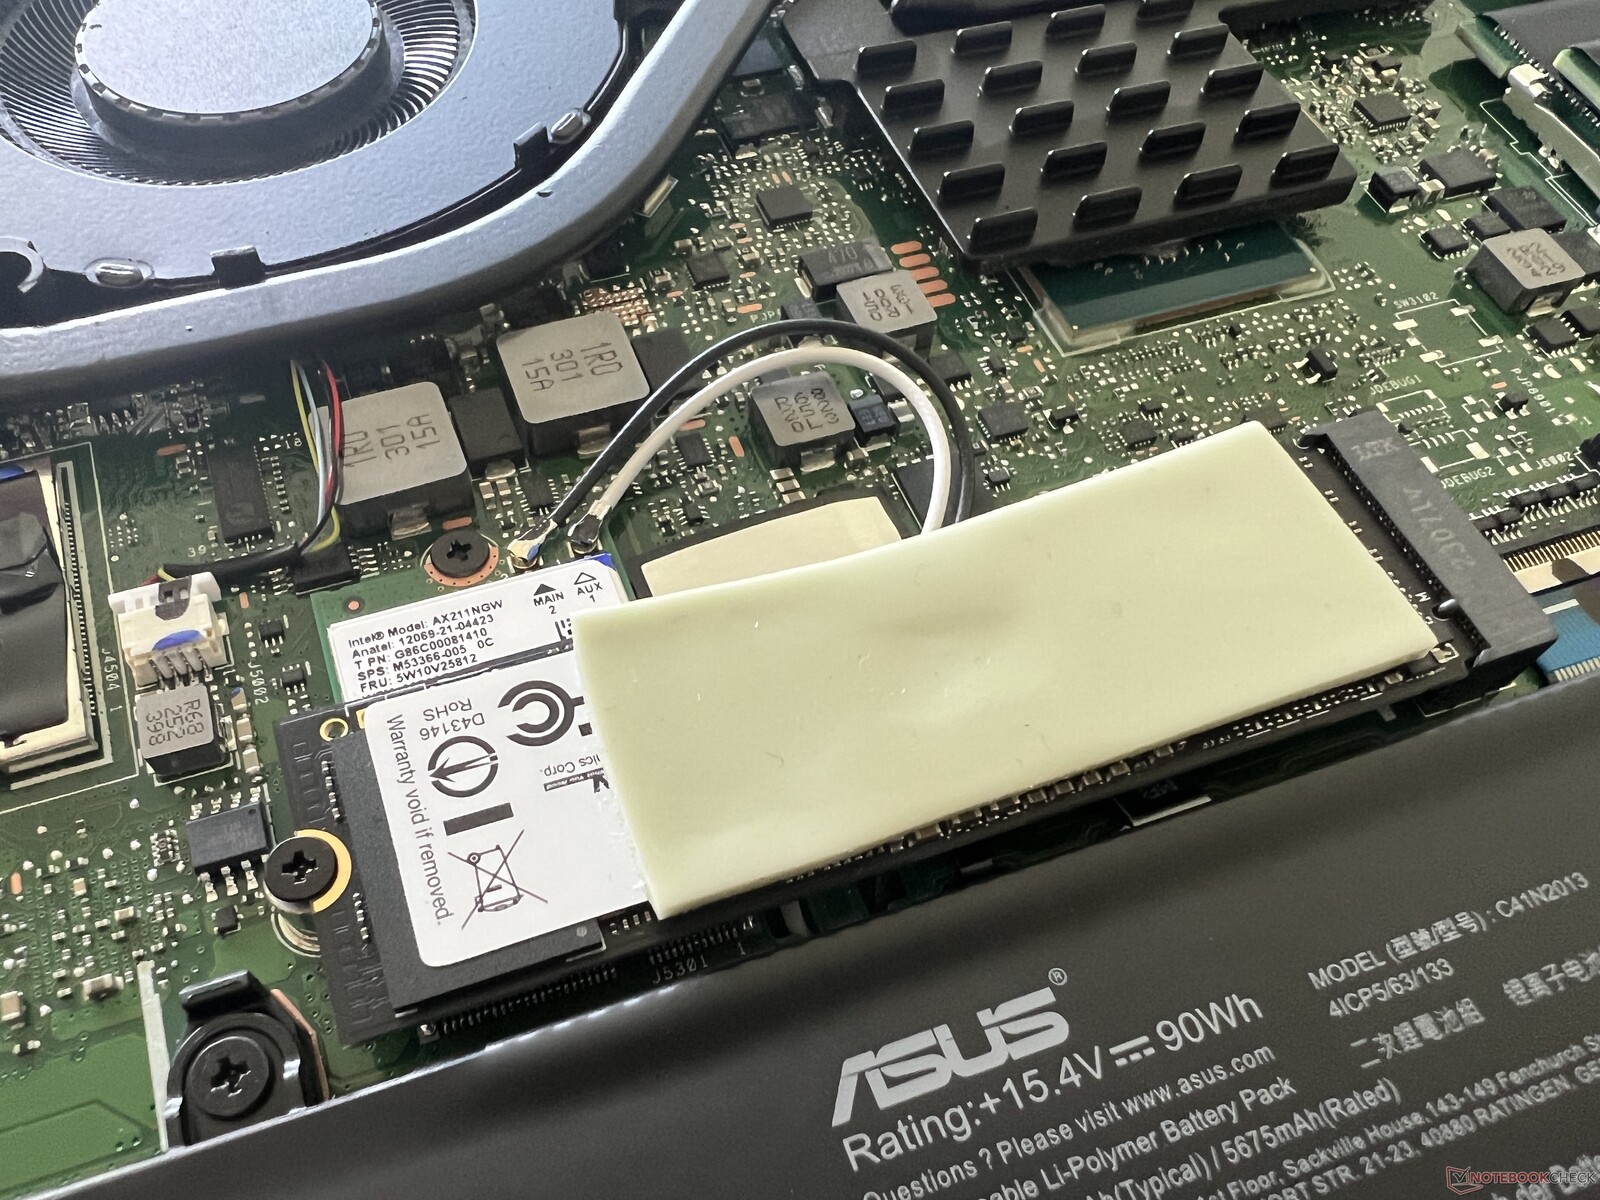
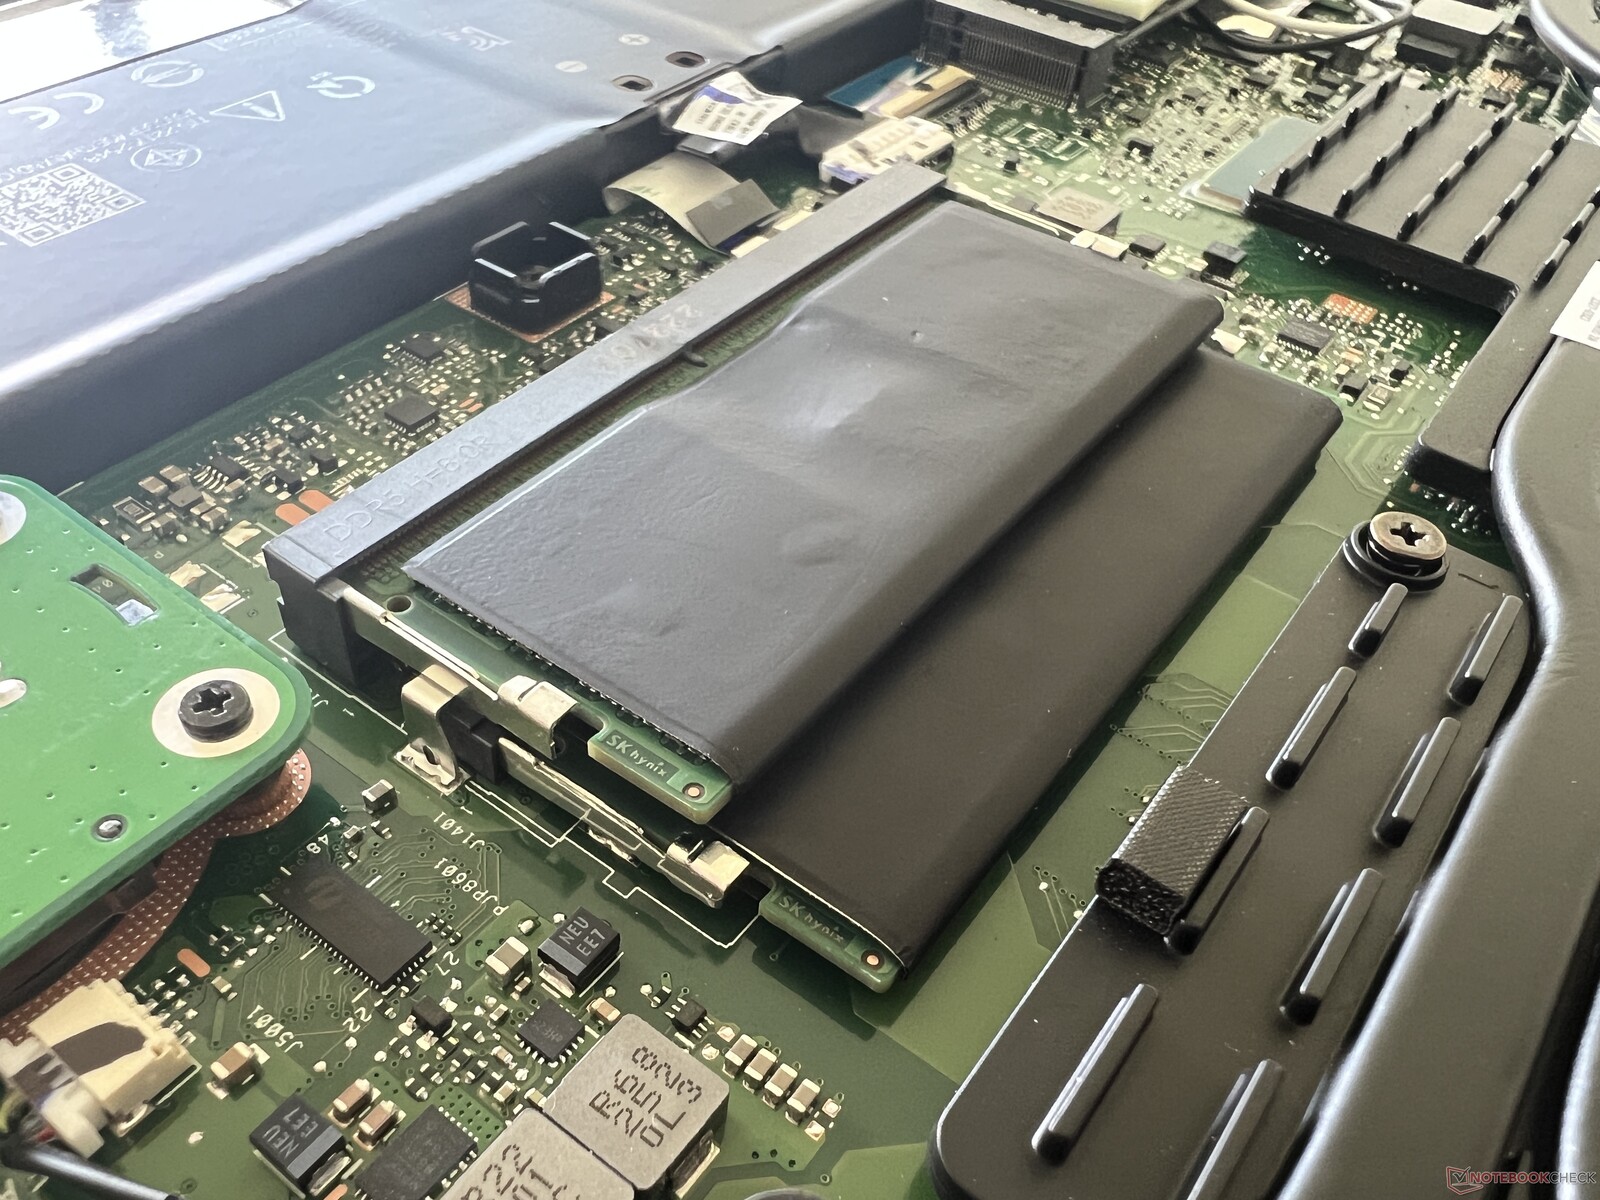
Asus installa il moderno modulo WLAN AX211 di Intel, che si trova sotto l'SSD primario e può essere sostituito. In tandem con il nostro router di riferimento di Asus, le velocità di trasferimento sono molto elevate e stabili. Non abbiamo riscontrato alcun problema di stabilità della WLAN durante la nostra recensione. Sul retro è disponibile anche una porta Ethernet da 2,5 Gbit/s per le reti cablate.
| Networking | |
| Asus ProArt Studiobook 16 OLED H7604 | |
| iperf3 transmit AXE11000 | |
| iperf3 receive AXE11000 | |
| Gigabyte AERO 16 OLED BSF | |
| iperf3 transmit AXE11000 6GHz | |
| iperf3 receive AXE11000 6GHz | |
| Samsung Galaxy Book3 Ultra 16 | |
| iperf3 transmit AXE11000 | |
| iperf3 receive AXE11000 | |
| MSI Stealth 17 Studio A13VH-014 | |
| iperf3 transmit AXE11000 | |
| iperf3 receive AXE11000 | |
| iperf3 transmit AXE11000 6GHz | |
| iperf3 receive AXE11000 6GHz | |
| Apple MacBook Pro 16 2023 M2 Max | |
| iperf3 transmit AXE11000 6GHz | |
| iperf3 receive AXE11000 6GHz | |
| Asus Zephyrus Duo 16 GX650PY-NM006W | |
| iperf3 transmit AXE11000 6GHz | |
| iperf3 receive AXE11000 6GHz | |
Webcam
La webcam a 1080p scatta immagini decenti in buone condizioni di luce, ma anche un po' distorte. È presente anche un modulo IR che supporta il riconoscimento facciale tramite Windows Hello.


Accessori
Il nostro dispositivo di prova è stato fornito con la penna Asus Pen 2.0 e con il mouse wireless ProArt MD300, il cui prezzo di listino è di 180 dollari. Come il portatile stesso, il mouse ha un piccolo DialPad installato sul lato. La possibilità di utilizzarlo in modo significativo dipende dal software in uso. È un po' fastidioso che si debba installare ArmoryCrate per regolare le impostazioni del mouse e che non sia possibile farlo nel ProArt Creator Hub. Durante i test, il mouse ha funzionato perfettamente e i clic erano molto precisi, ma anche rumorosi. I pulsanti silenziosi dei mouse Logitech, ad esempio, sono molto più silenziosi.
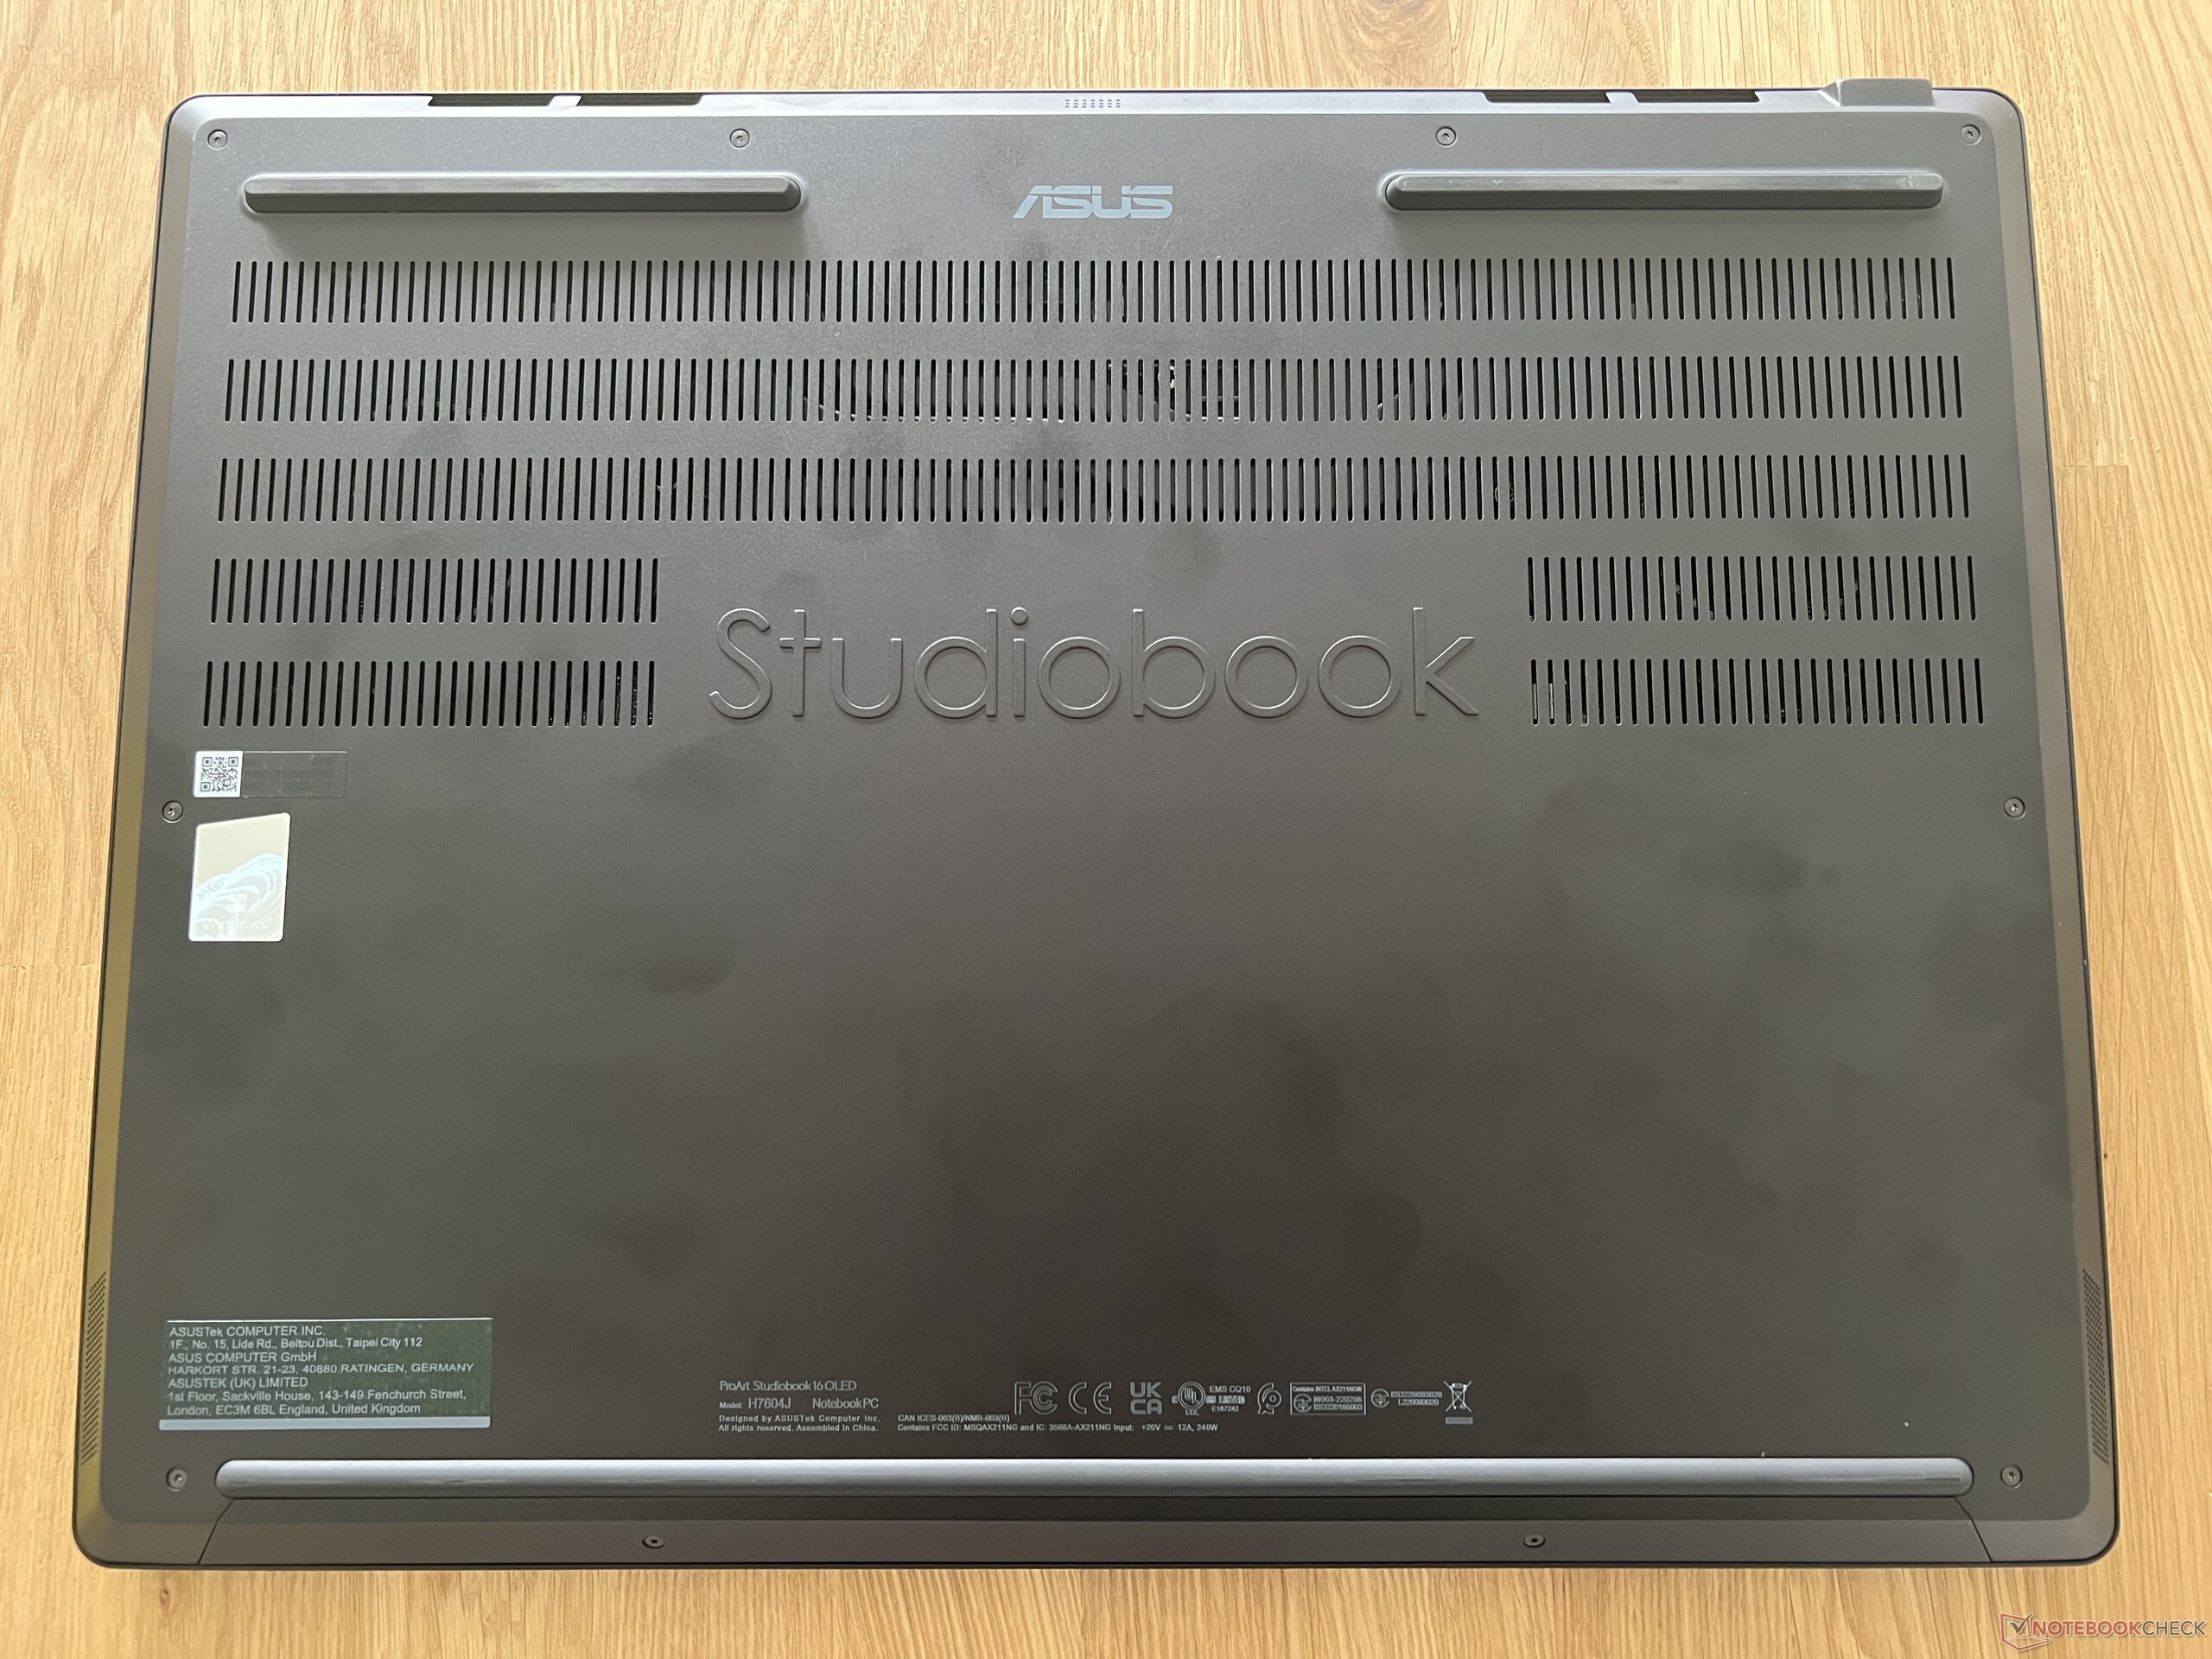
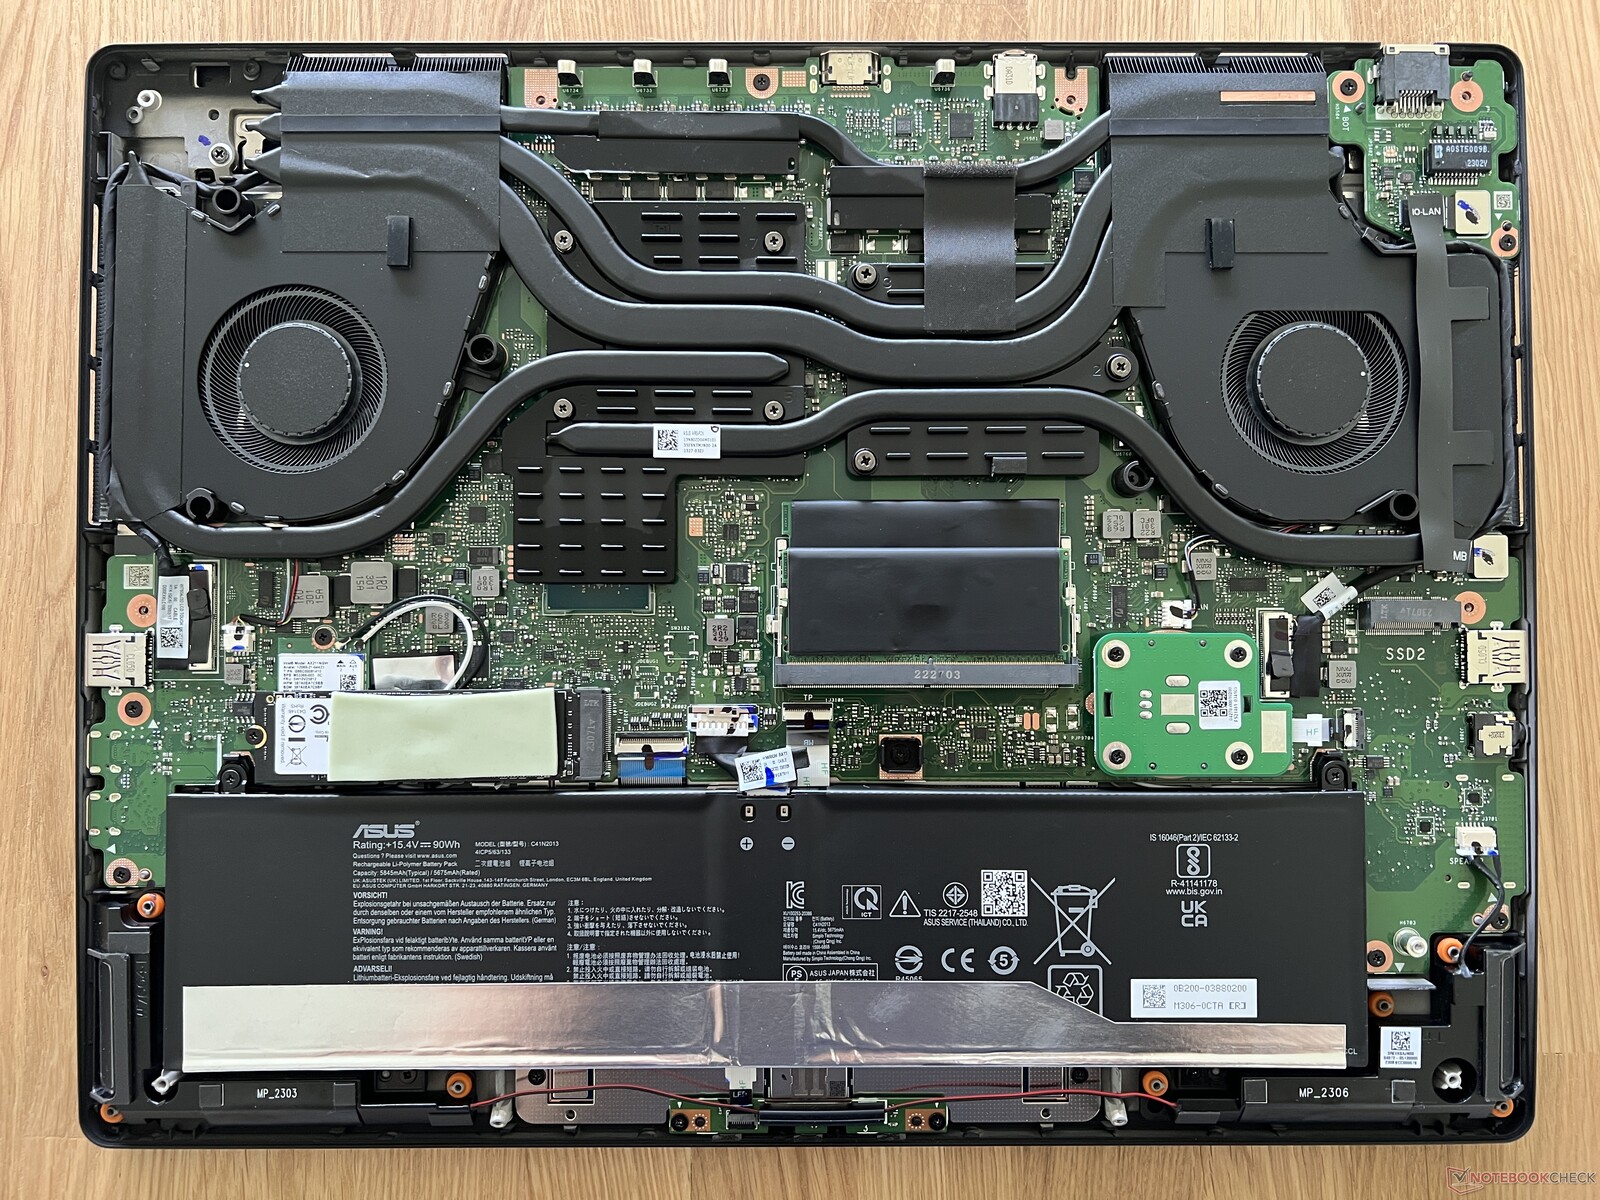
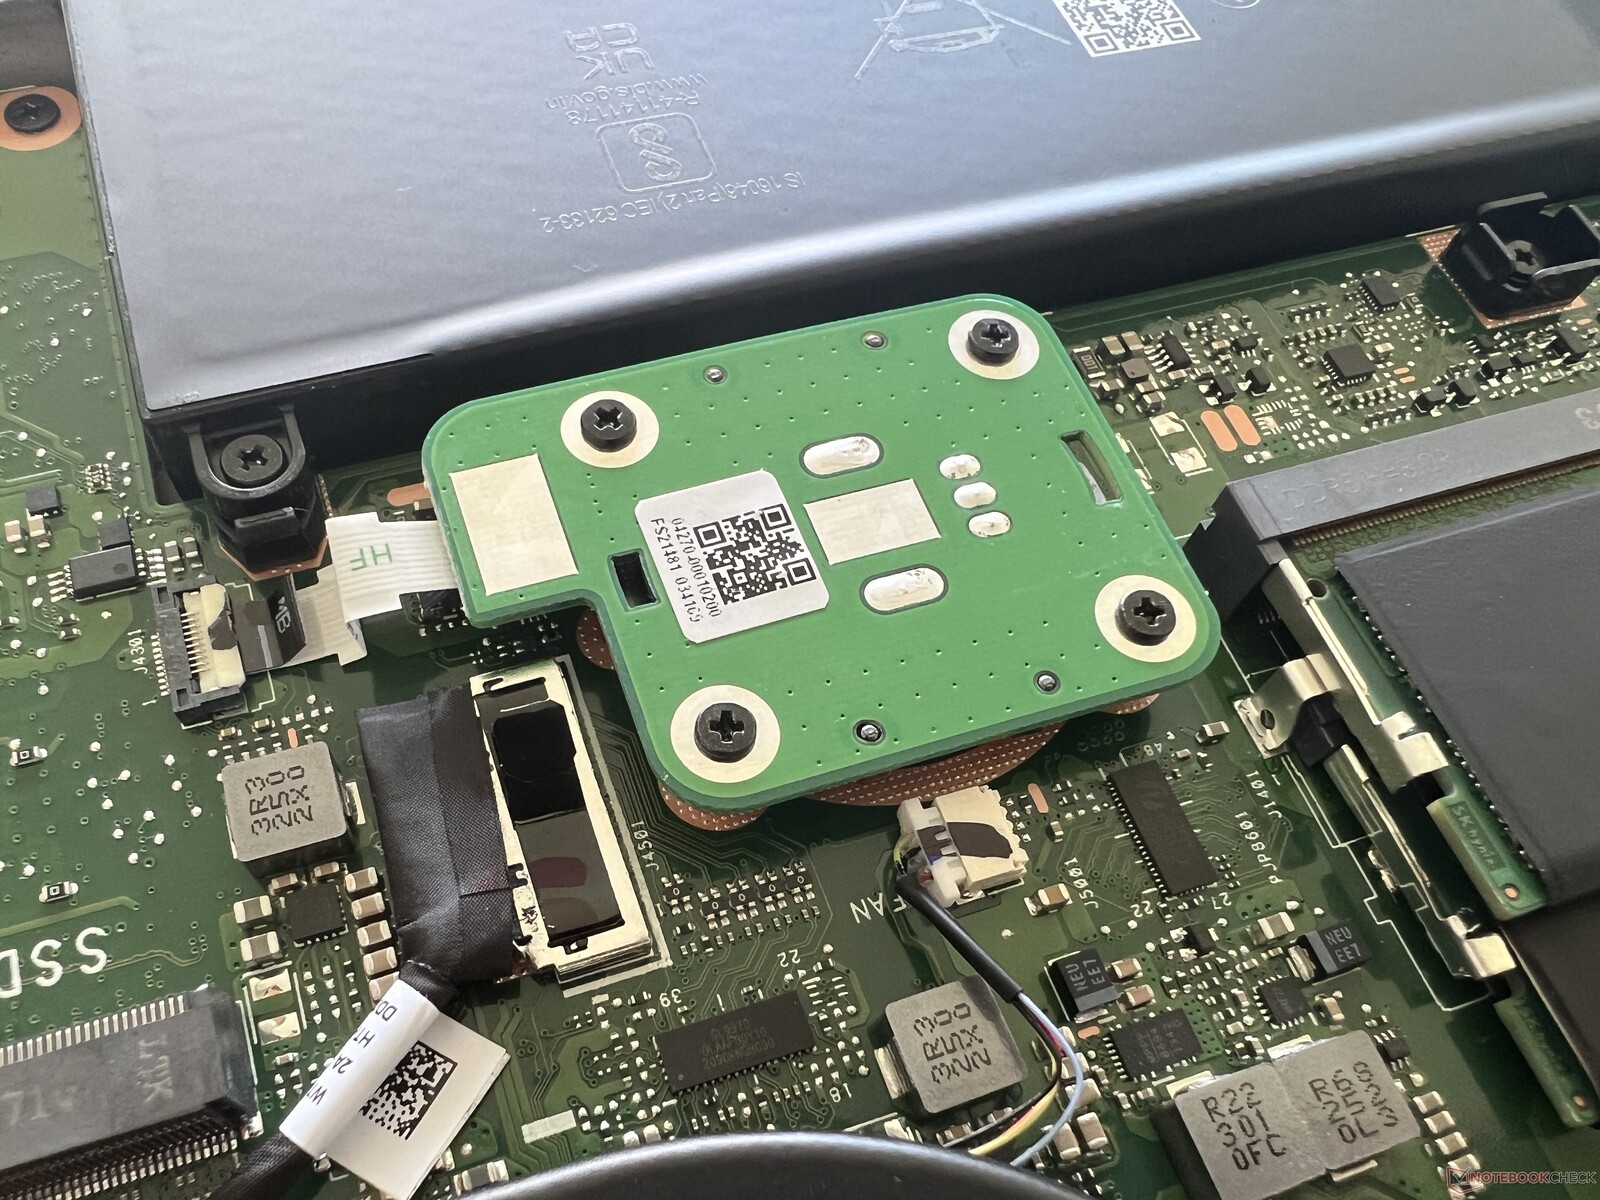
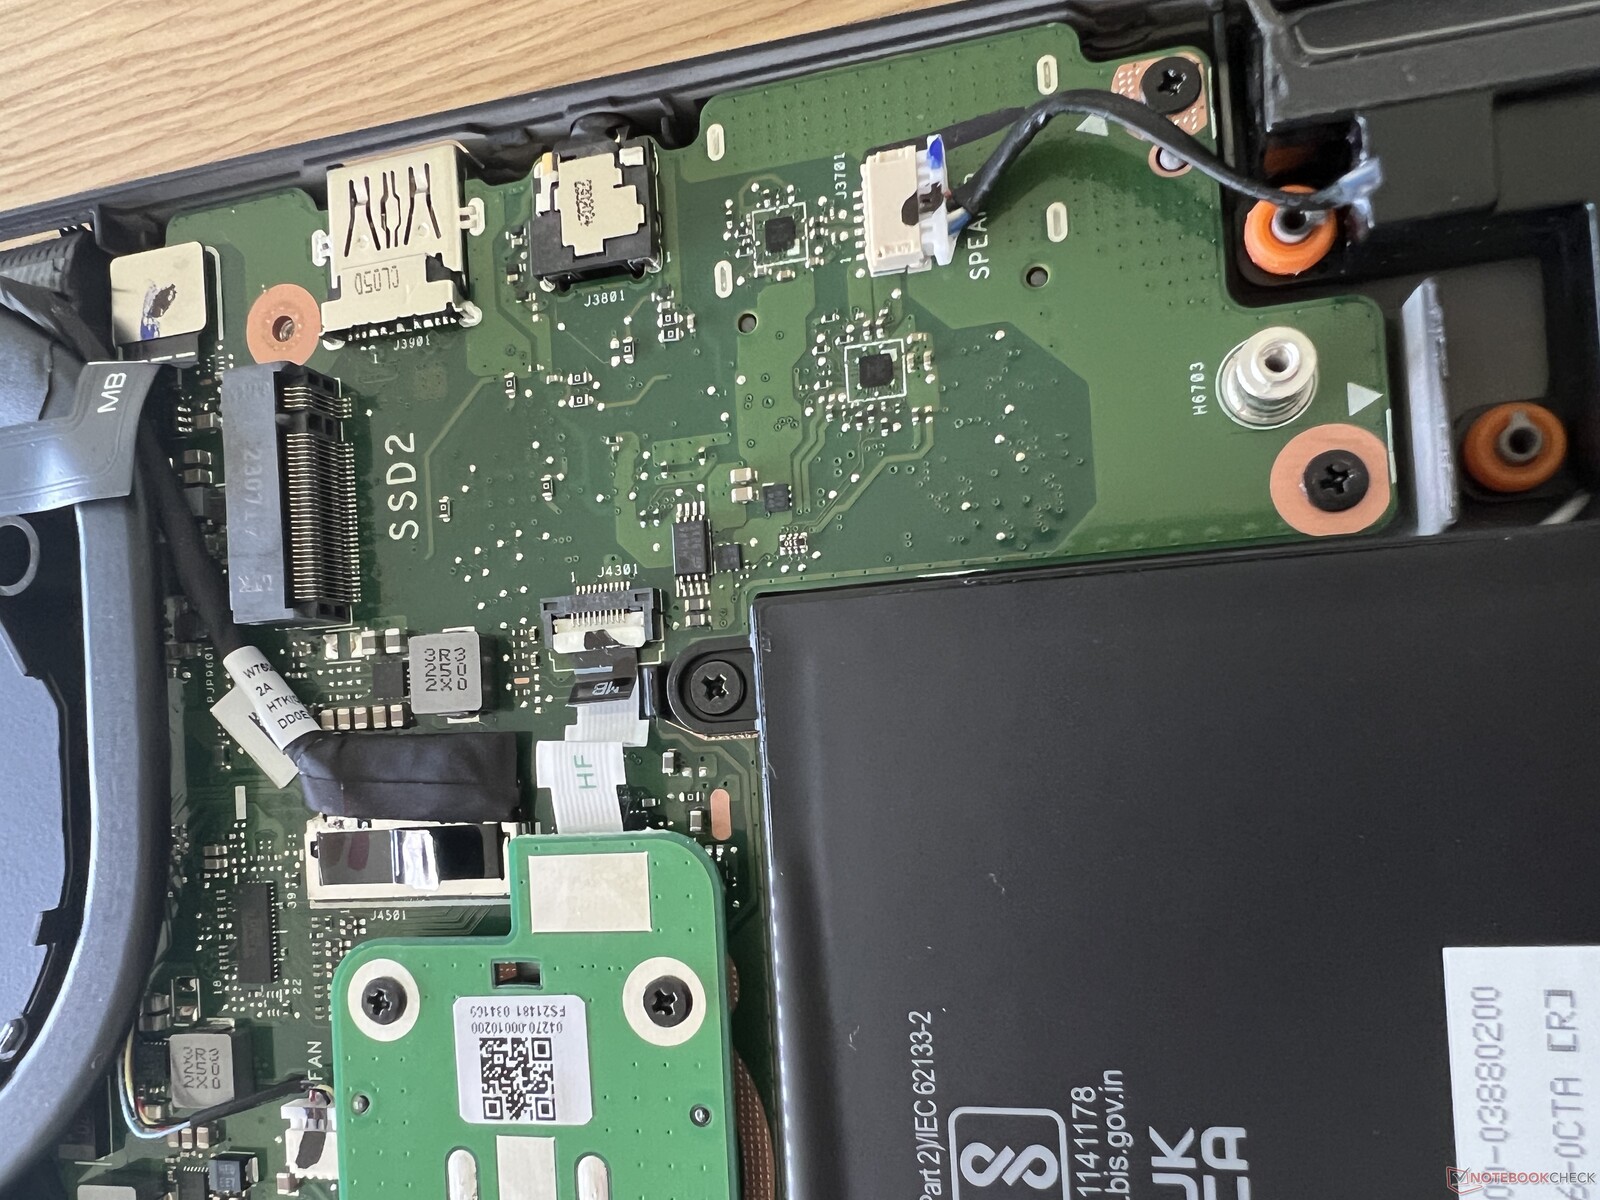
Manutenzione
Il coperchio inferiore del case è fissato con 10 viti Torx (T5) ed è ancora molto stretto dopo la rimozione delle viti. Il modo più semplice per aprire il coperchio è in corrispondenza delle uscite della ventola posteriore. All'interno domina l'ampio sistema di raffreddamento e anche le opzioni di manutenzione sono molto buone, a partire dal modulo WLAN (sotto l'SSD primario), due slot DIMM SO e due slot M.2 2280 per SSD. Ciò che colpisce è lo spazio occupato dal DialPad aggiuntivo
Dispositivi di input - DialPad e tastierino numerico
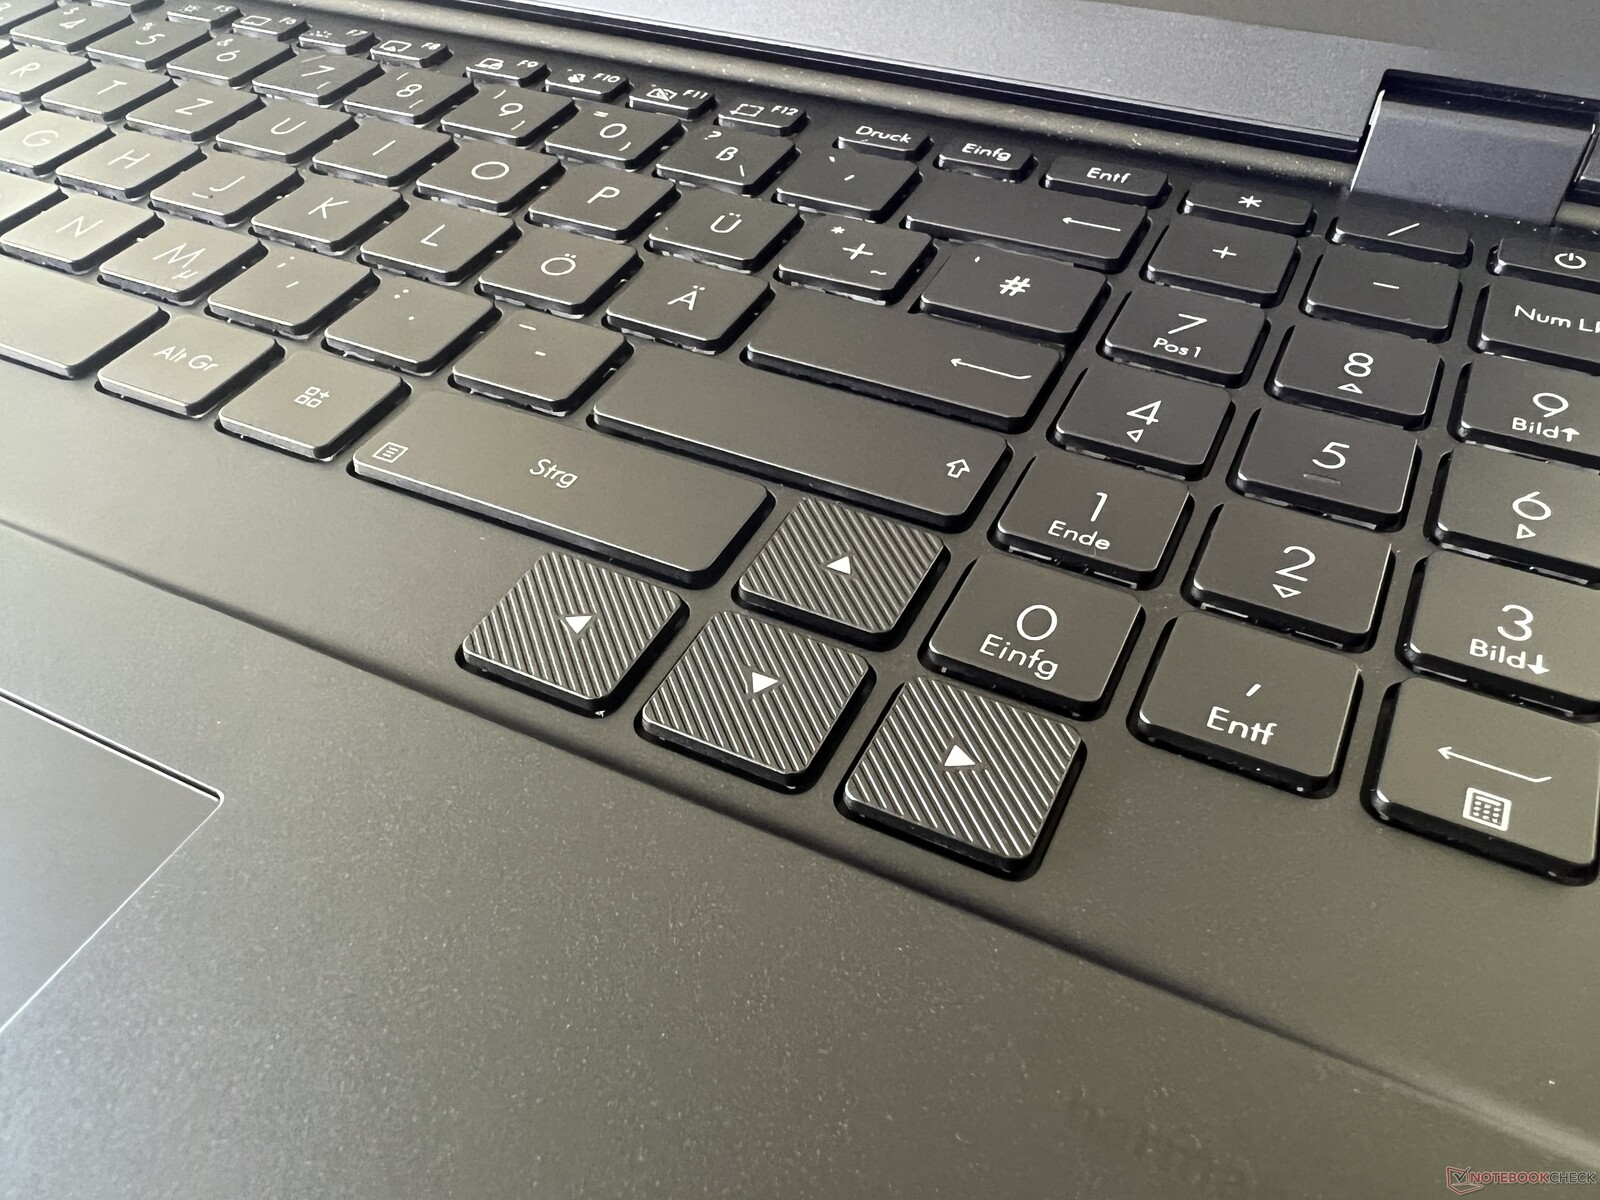
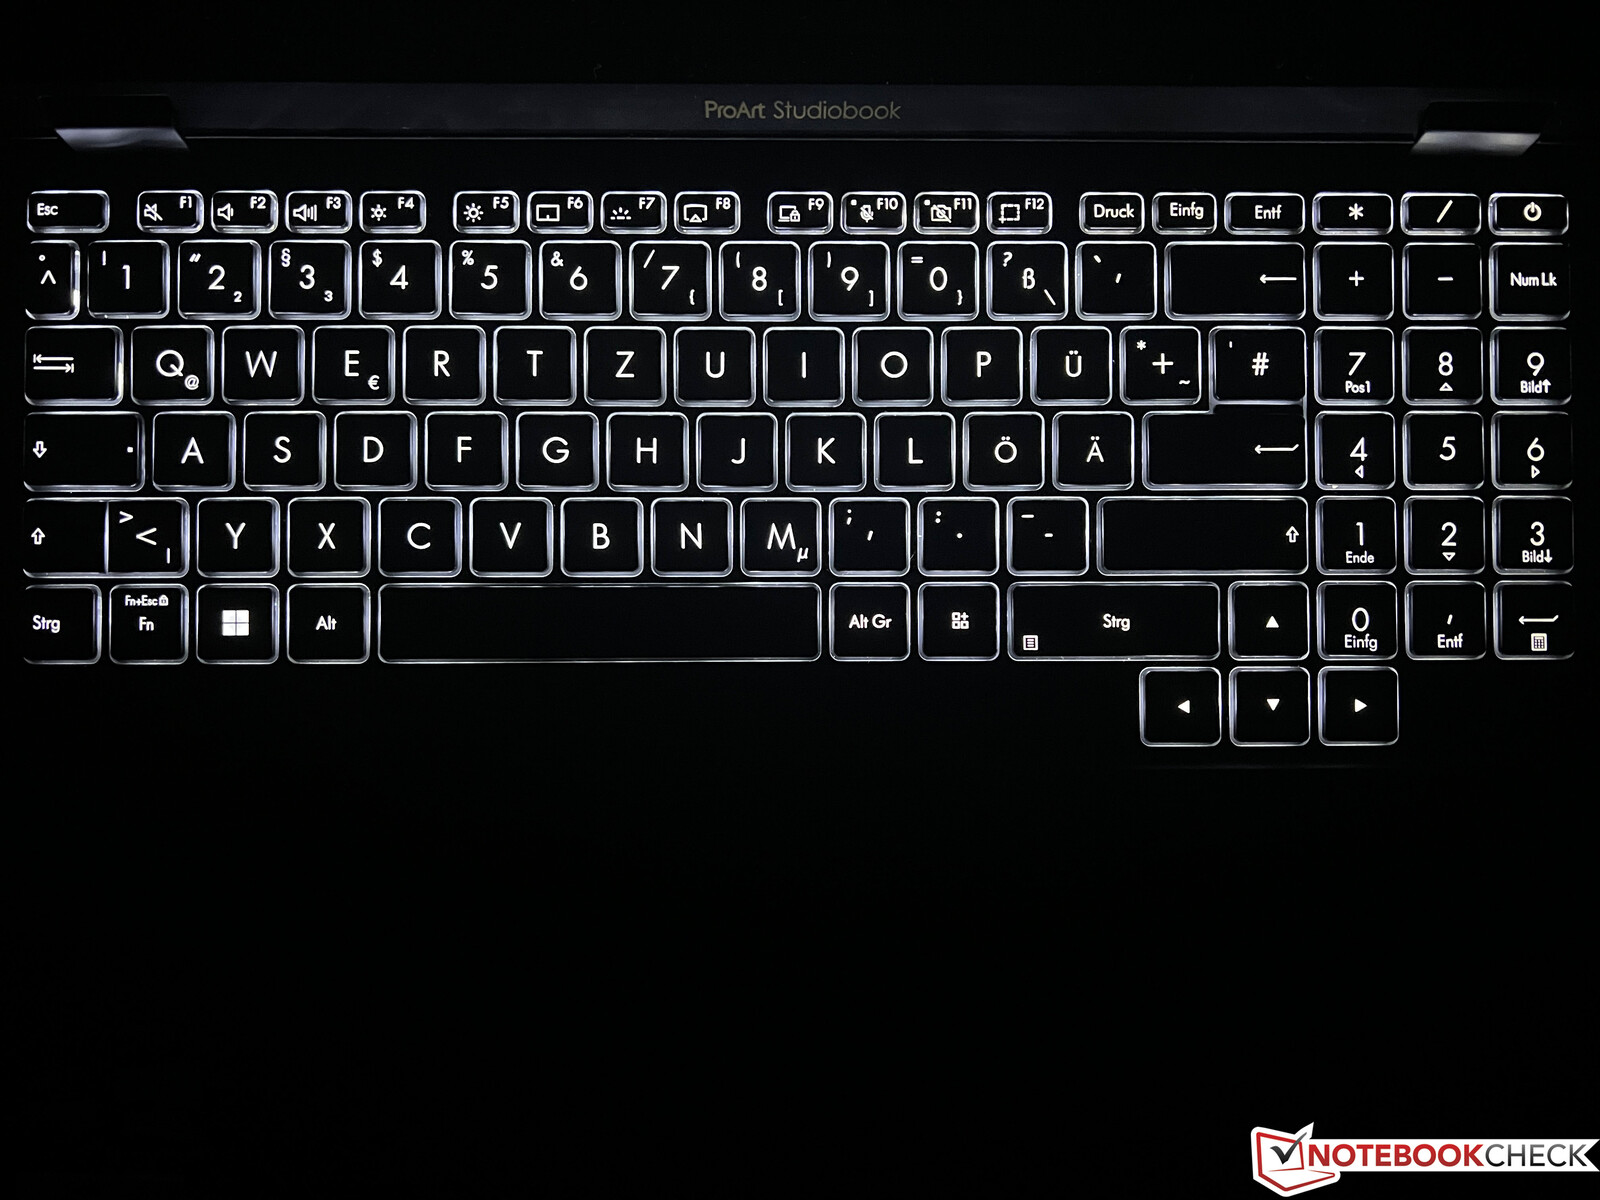
Tastiera
La tastiera ha una corsa di 1,4 mm e un tastierino numerico dedicato. La sensazione di digitazione è discreta, ma la pressione dei tasti non è delle più silenziose e la barra spaziatrice in particolare è piuttosto rumorosa. Anche il layout richiede un po' di tempo per abituarsi, perché i tasti freccia sono grandi, ma spostati verso il basso. Anche il tasto Invio su una sola riga non è perfetto. È presente un'illuminazione bianca a tre livelli, ma non si attiva automaticamente tramite sensore.
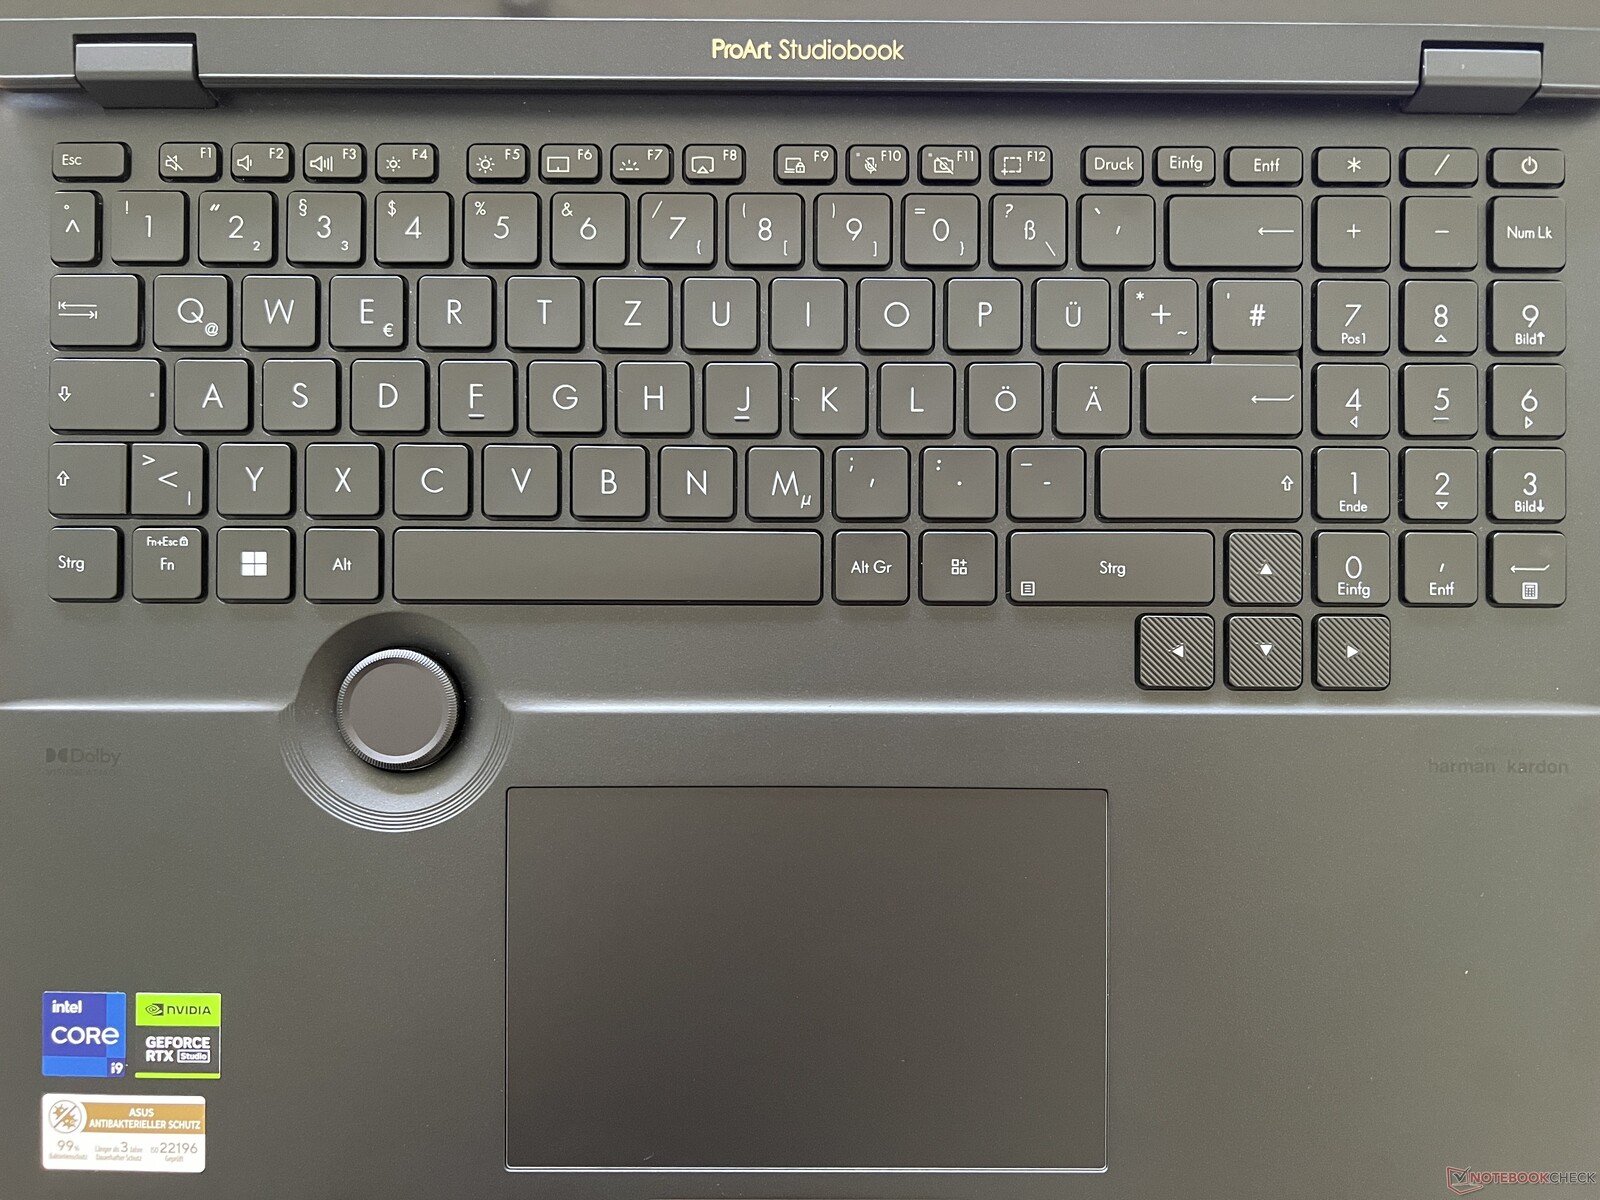
Touchpad
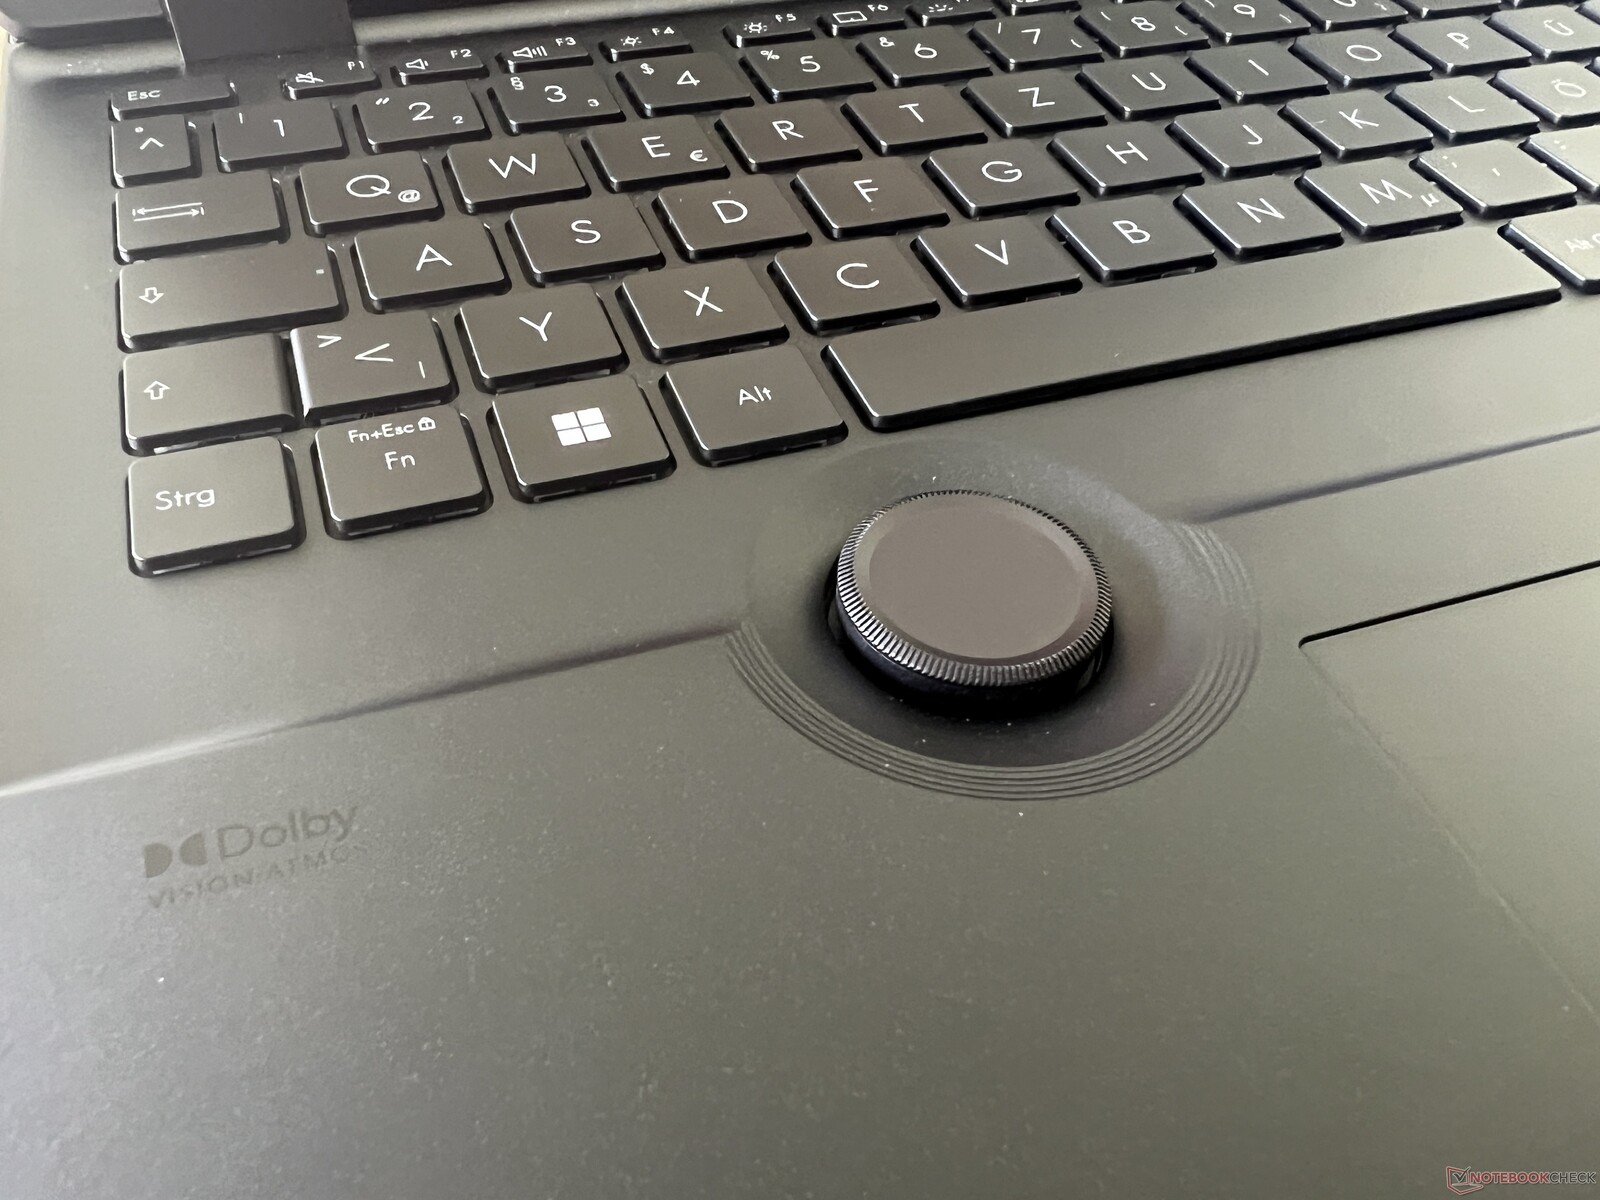
Il grande touchpad funziona in modo eccellente e può essere cliccato ovunque, caratterizzato da un rumore di clic ricco e silenzioso. La caratteristica speciale è il DialPad, un grande pulsante rotante tra il touchpad e la tastiera. L'implementazione con le applicazioni Adobe funziona bene, ma la combinazione di mouse e tasti è solitamente più veloce. Nell'uso normale del desktop, la luminosità e il volume possono essere regolati anche tramite il DialPad, ma l'operazione è molto più veloce tramite i normali tasti speciali o i tasti F.
Display - Pannello OLED a 120 Hz
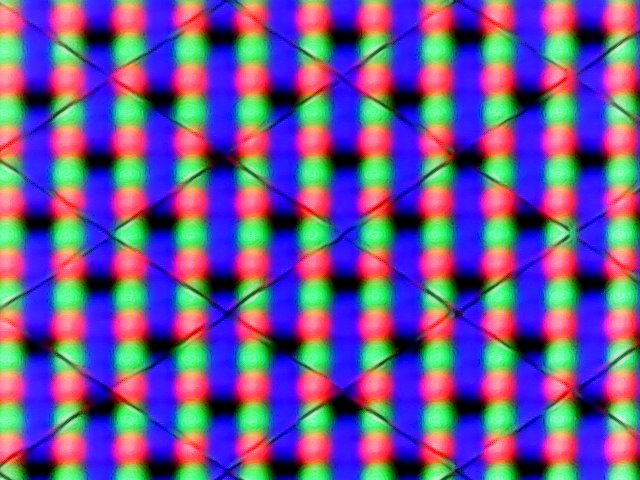
Asus è attualmente impegnata a fondo sugli schermi OLED e lo Studiobook non fa eccezione. A differenza del predecessore con display OLED 4K, qui viene utilizzato un touchscreen OLED con 3.200 x 2.000 pixel e una frequenza maggiore di 120 Hz. La qualità dell'immagine soggettiva è molto buona, ma come nello ZenBook Pro 14 recentemente recensito, le aree luminose appaiono un po' sgranate a un esame più attento, a causa dello strato touch. La luminosità non si adatta automaticamente alla luce ambientale.
Abbiamo determinato una luminosità media di 350 cd/m² in modalità SDR normale, ma grazie al valore del nero estremamente basso dei pannelli OLED, il rapporto di contrasto è molto elevato. In modalità HDR, il massimo è di quasi 580 cd/m² in una piccola sezione di immagine e di circa 480 cd/m² in un'immagine quasi completamente bianca. Tuttavia, la modalità HDR deve essere attivata manualmente nelle impostazioni di Windows, dopodiché non è più possibile utilizzare i profili colore. I pannelli OLED non presentano aloni.
| |||||||||||||||||||||||||
Distribuzione della luminosità: 95 %
Al centro con la batteria: 346 cd/m²
Contrasto: 17450:1 (Nero: 0.02 cd/m²)
ΔE ColorChecker Calman: 2.1 | ∀{0.5-29.43 Ø4.71}
calibrated: 2.1
ΔE Greyscale Calman: 1.2 | ∀{0.09-98 Ø4.96}
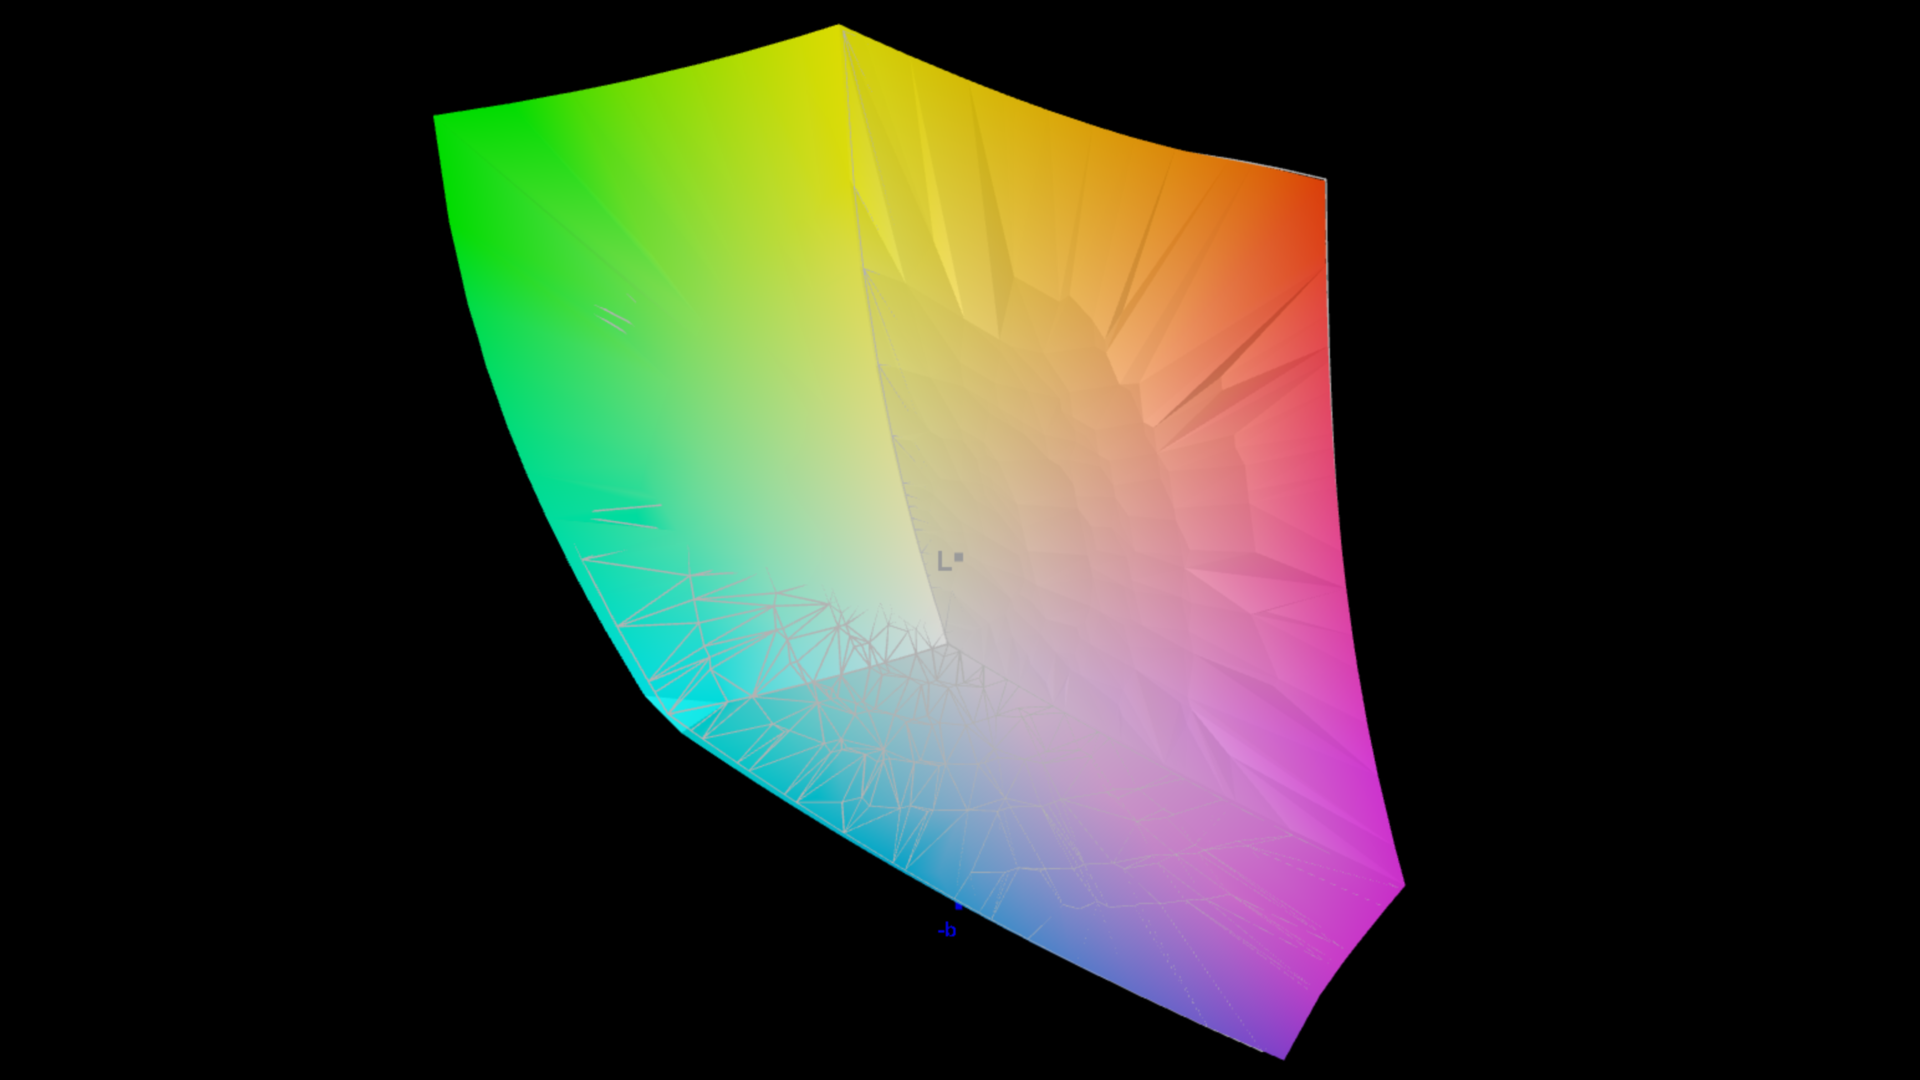
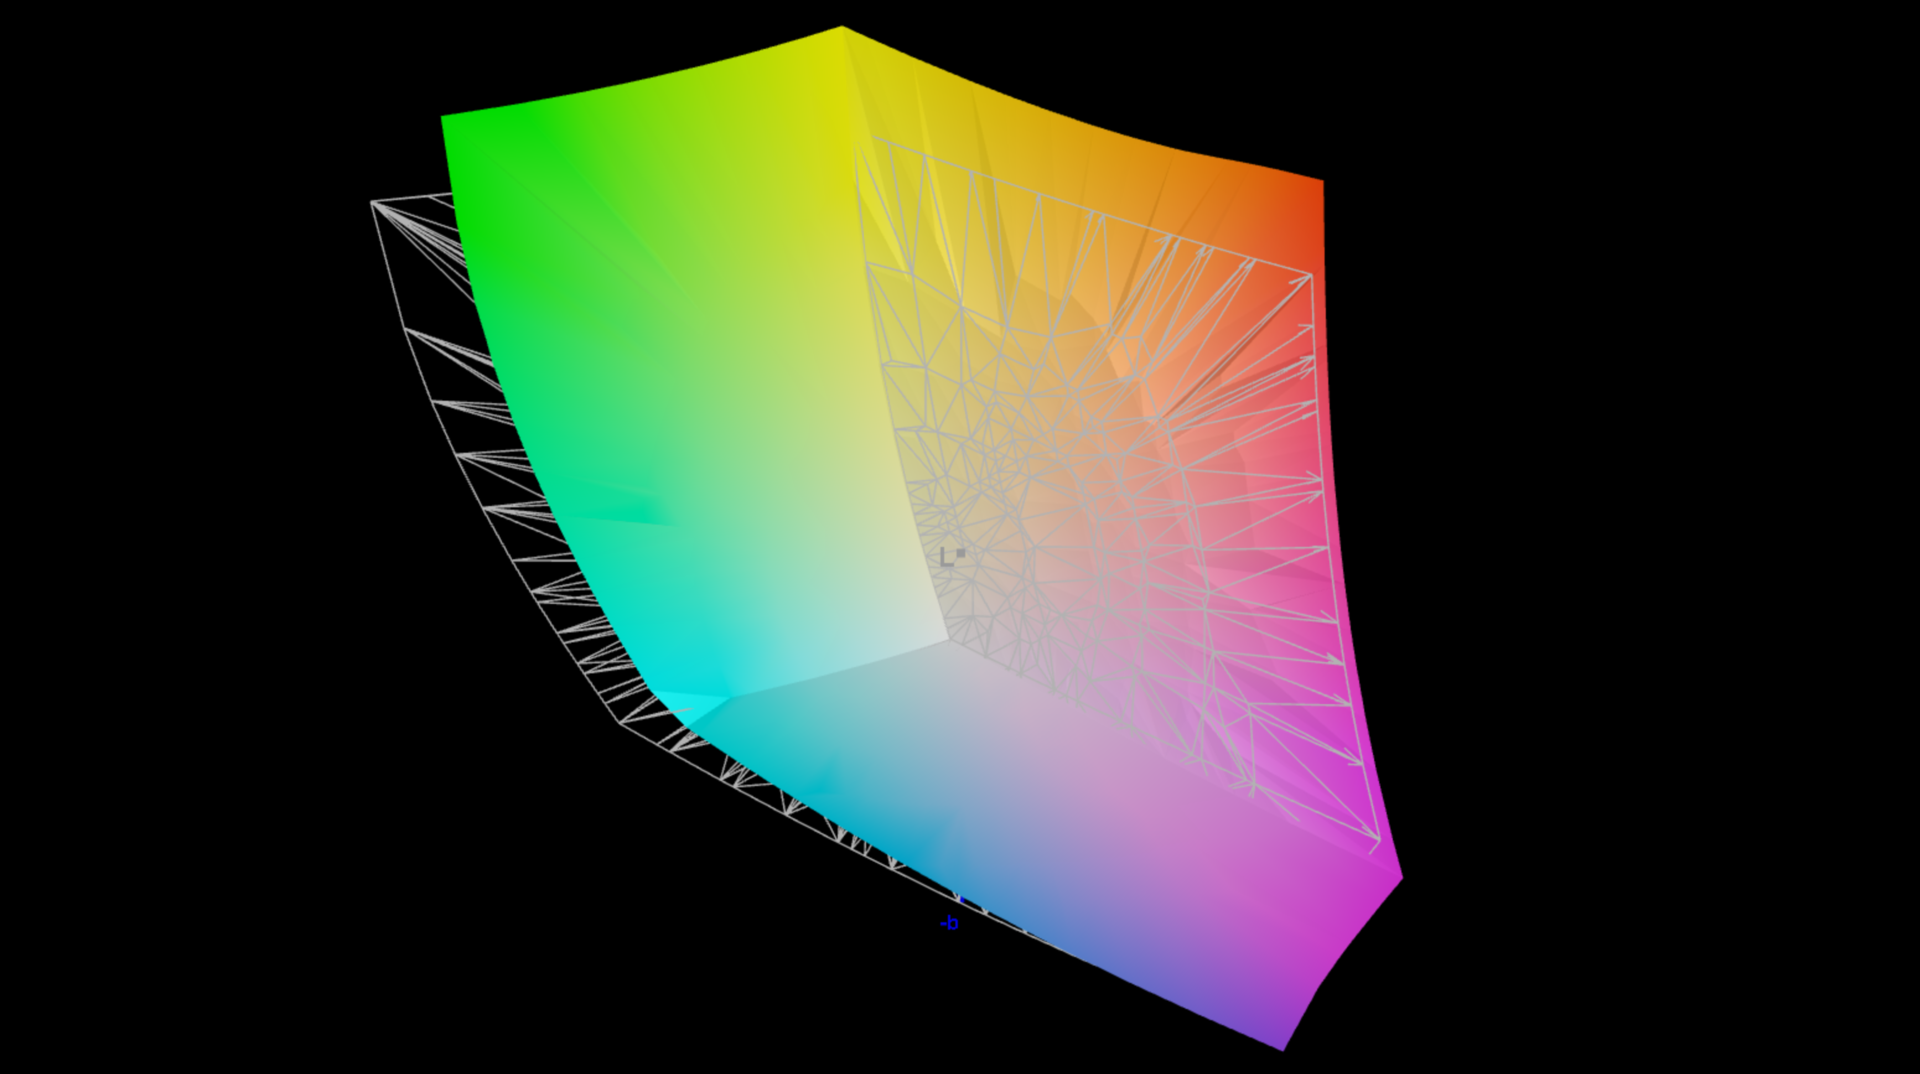
89.4% AdobeRGB 1998 (Argyll 3D)
100% sRGB (Argyll 3D)
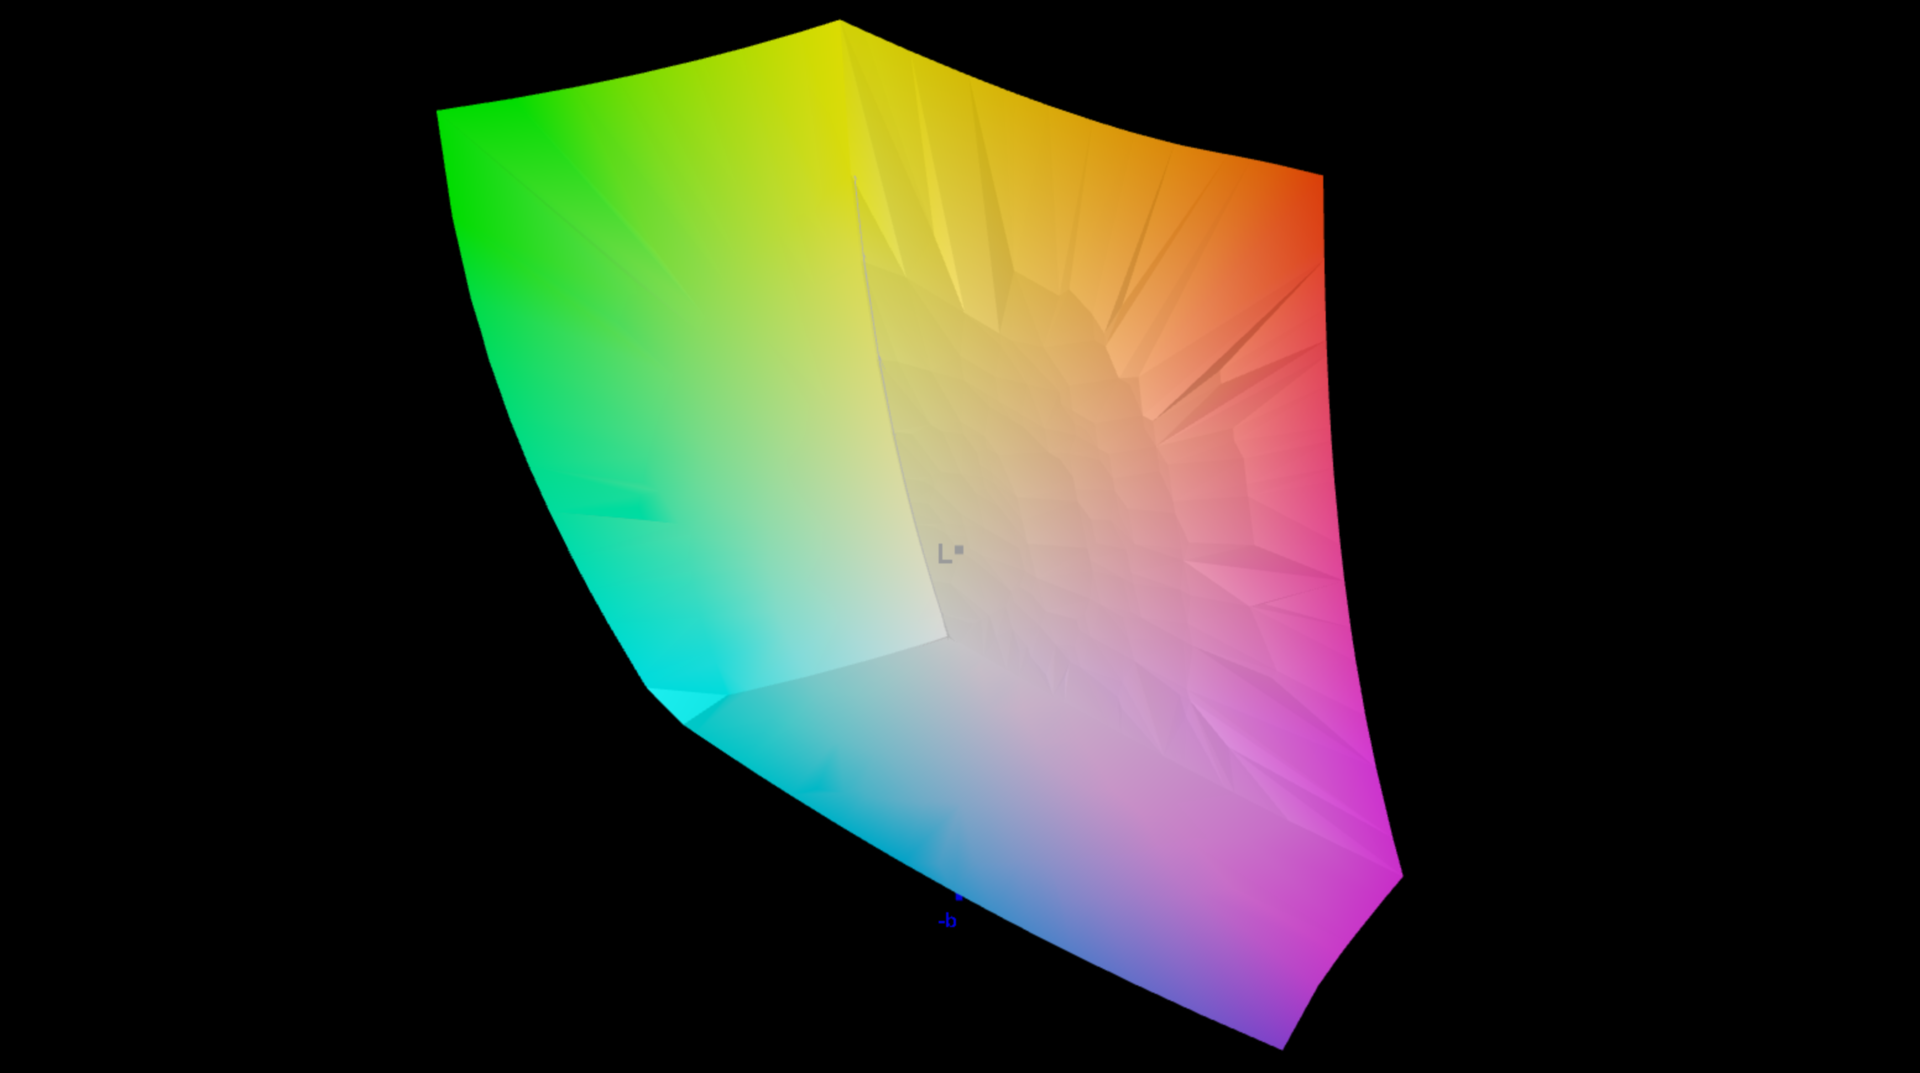
99.6% Display P3 (Argyll 3D)
Gamma: 2.19
CCT: 6545 K
| Asus ProArt Studiobook 16 OLED H7604 ATNA60BX01-1, OLED, 3200x2000, 16" | Gigabyte AERO 16 OLED BSF Samsung SDC4191 (ATNA60YV09-0, OLED, 3840x2400, 16" | Samsung Galaxy Book3 Ultra 16 Samsung ATNA60CL03-0, AMOLED, 2880x1800, 16" | MSI Stealth 17 Studio A13VH-014 AUO41A2 B173ZAN06.C, Mini LED, 3840x2160, 17.3" | Apple MacBook Pro 16 2023 M2 Max Mini-LED, 3456x2234, 16.2" | Asus Zephyrus Duo 16 GX650PY-NM006W NE160QDM-NM4, MiniLED, 2560x1600, 16" | |
|---|---|---|---|---|---|---|
| Display | 3% | 3% | -1% | -1% | 1% | |
| Display P3 Coverage (%) | 99.6 | 99.9 0% | 99.9 0% | 92 -8% | 99 -1% | 99.4 0% |
| sRGB Coverage (%) | 100 | 100 0% | 100 0% | 99.1 -1% | 100 0% | 100 0% |
| AdobeRGB 1998 Coverage (%) | 89.4 | 96.4 8% | 96.3 8% | 94.07 5% | 88.5 -1% | 90.8 2% |
| Response Times | -195% | 18% | -3871% | -9710% | -2391% | |
| Response Time Grey 50% / Grey 80% * (ms) | 0.59 ? | 2 ? -239% | 0.49 ? 17% | 46.4 ? -7764% | 80.5 ? -13544% | 15.2 ? -2476% |
| Response Time Black / White * (ms) | 0.79 ? | 1.98 ? -151% | 0.65 ? 18% | 0.62 ? 22% | 47.2 ? -5875% | 19 ? -2305% |
| PWM Frequency (Hz) | 240 ? | 60 | 240 ? | 2400 | 14880 ? | 12000 ? |
| Screen | -9% | -15% | -12% | 370% | -15% | |
| Brightness middle (cd/m²) | 349 | 389.97 12% | 400 15% | 397.29 14% | 504 44% | 712 104% |
| Brightness (cd/m²) | 350 | 395 13% | 399 14% | 392 12% | 487 39% | 703 101% |
| Brightness Distribution (%) | 95 | 97 2% | 93 -2% | 93 -2% | 94 -1% | 95 0% |
| Black Level * (cd/m²) | 0.02 | 0.03 -50% | 0.03 -50% | 0.02 -0% | 0.001 95% | 0.07 -250% |
| Contrast (:1) | 17450 | 12999 -26% | 13333 -24% | 19865 14% | 504000 2788% | 10171 -42% |
| Colorchecker dE 2000 * | 2.1 | 2 5% | 2.3 -10% | 2.52 -20% | 1.5 29% | 1.7 19% |
| Colorchecker dE 2000 max. * | 5.5 | 4.1 25% | 4.15 25% | 3.91 29% | 3.3 40% | 4 27% |
| Colorchecker dE 2000 calibrated * | 2.1 | 1.68 20% | 1.66 21% | 2.52 -20% | 1.2 43% | |
| Greyscale dE 2000 * | 1.2 | 2.23 -86% | 2.7 -125% | 2.78 -132% | 2.1 -75% | 2.8 -133% |
| Gamma | 2.19 100% | 2.41 91% | 2.266 97% | 2.63 84% | 2.25 98% | 2.21 100% |
| CCT | 6545 99% | 6323 103% | 7047 92% | 6412 101% | 6882 94% | 6978 93% |
| Media totale (Programma / Settaggio) | -67% /
-33% | 2% /
-7% | -1295% /
-561% | -3114% /
-1266% | -802% /
-351% |
* ... Meglio usare valori piccoli
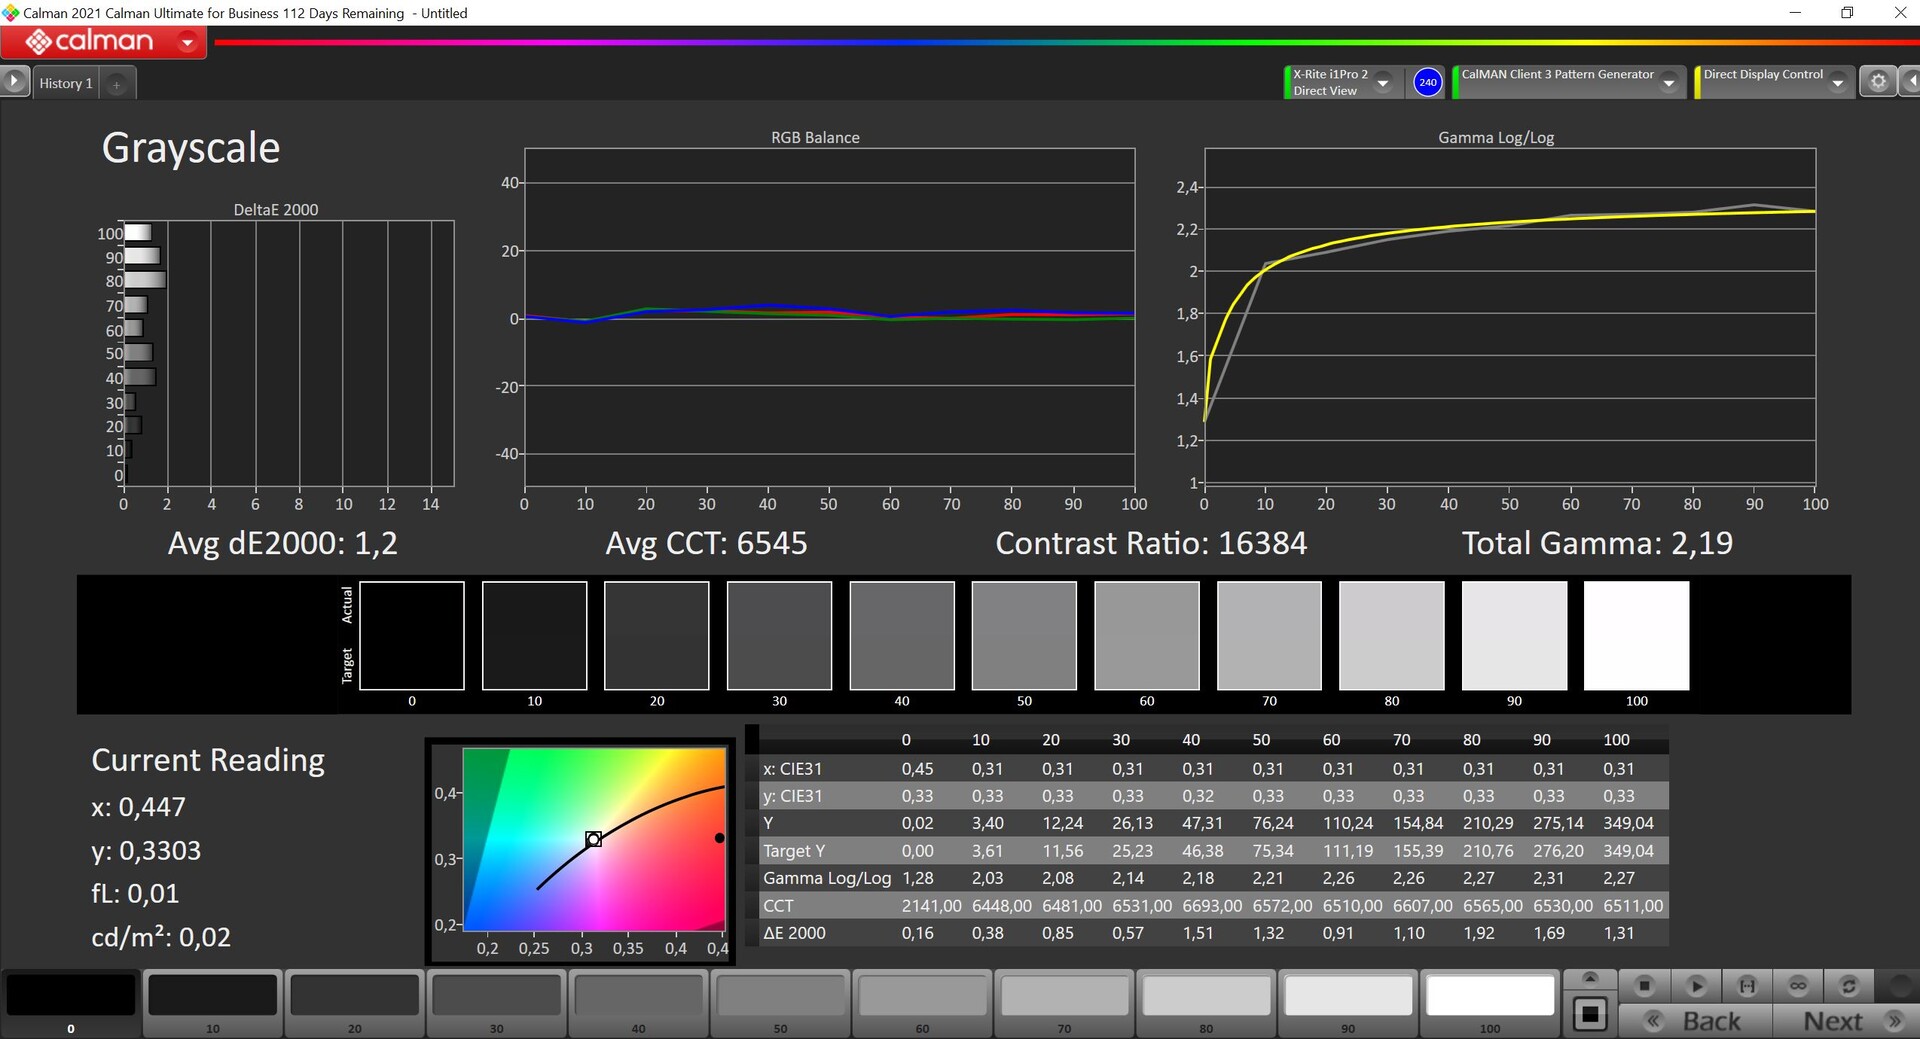
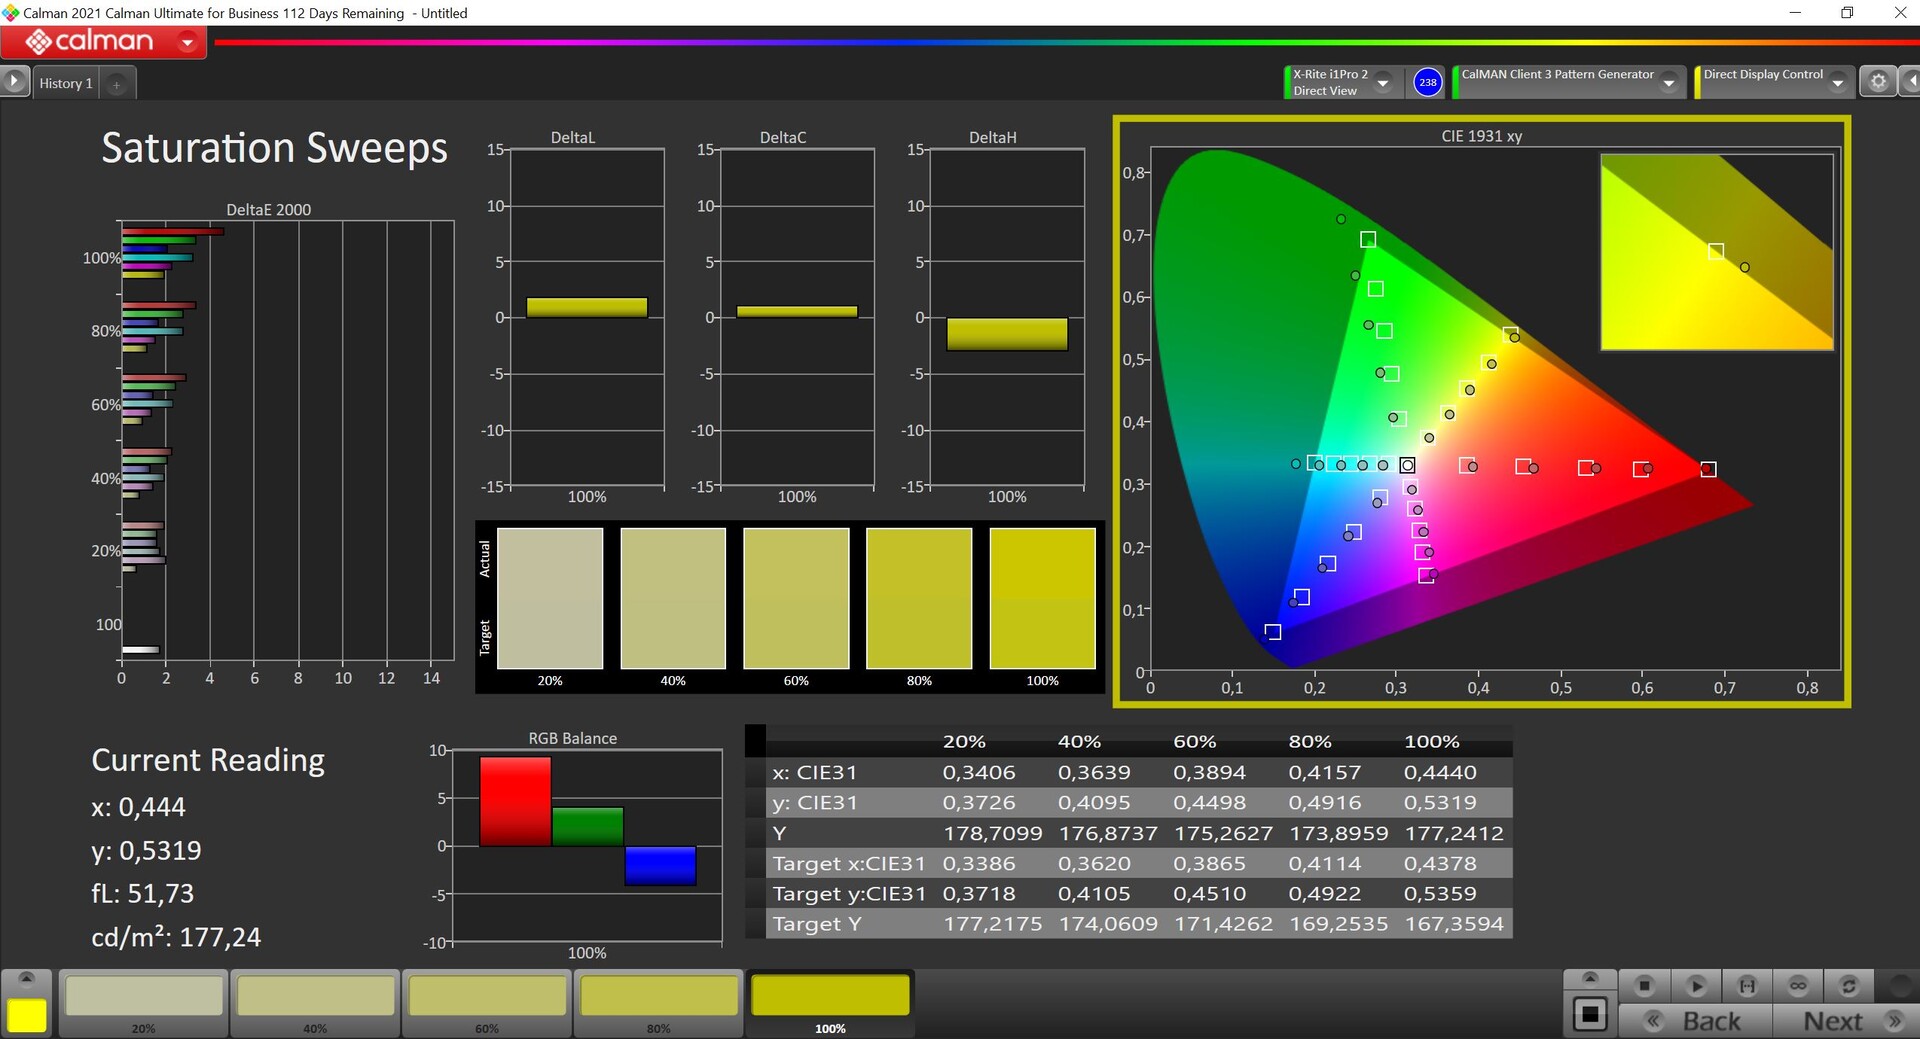
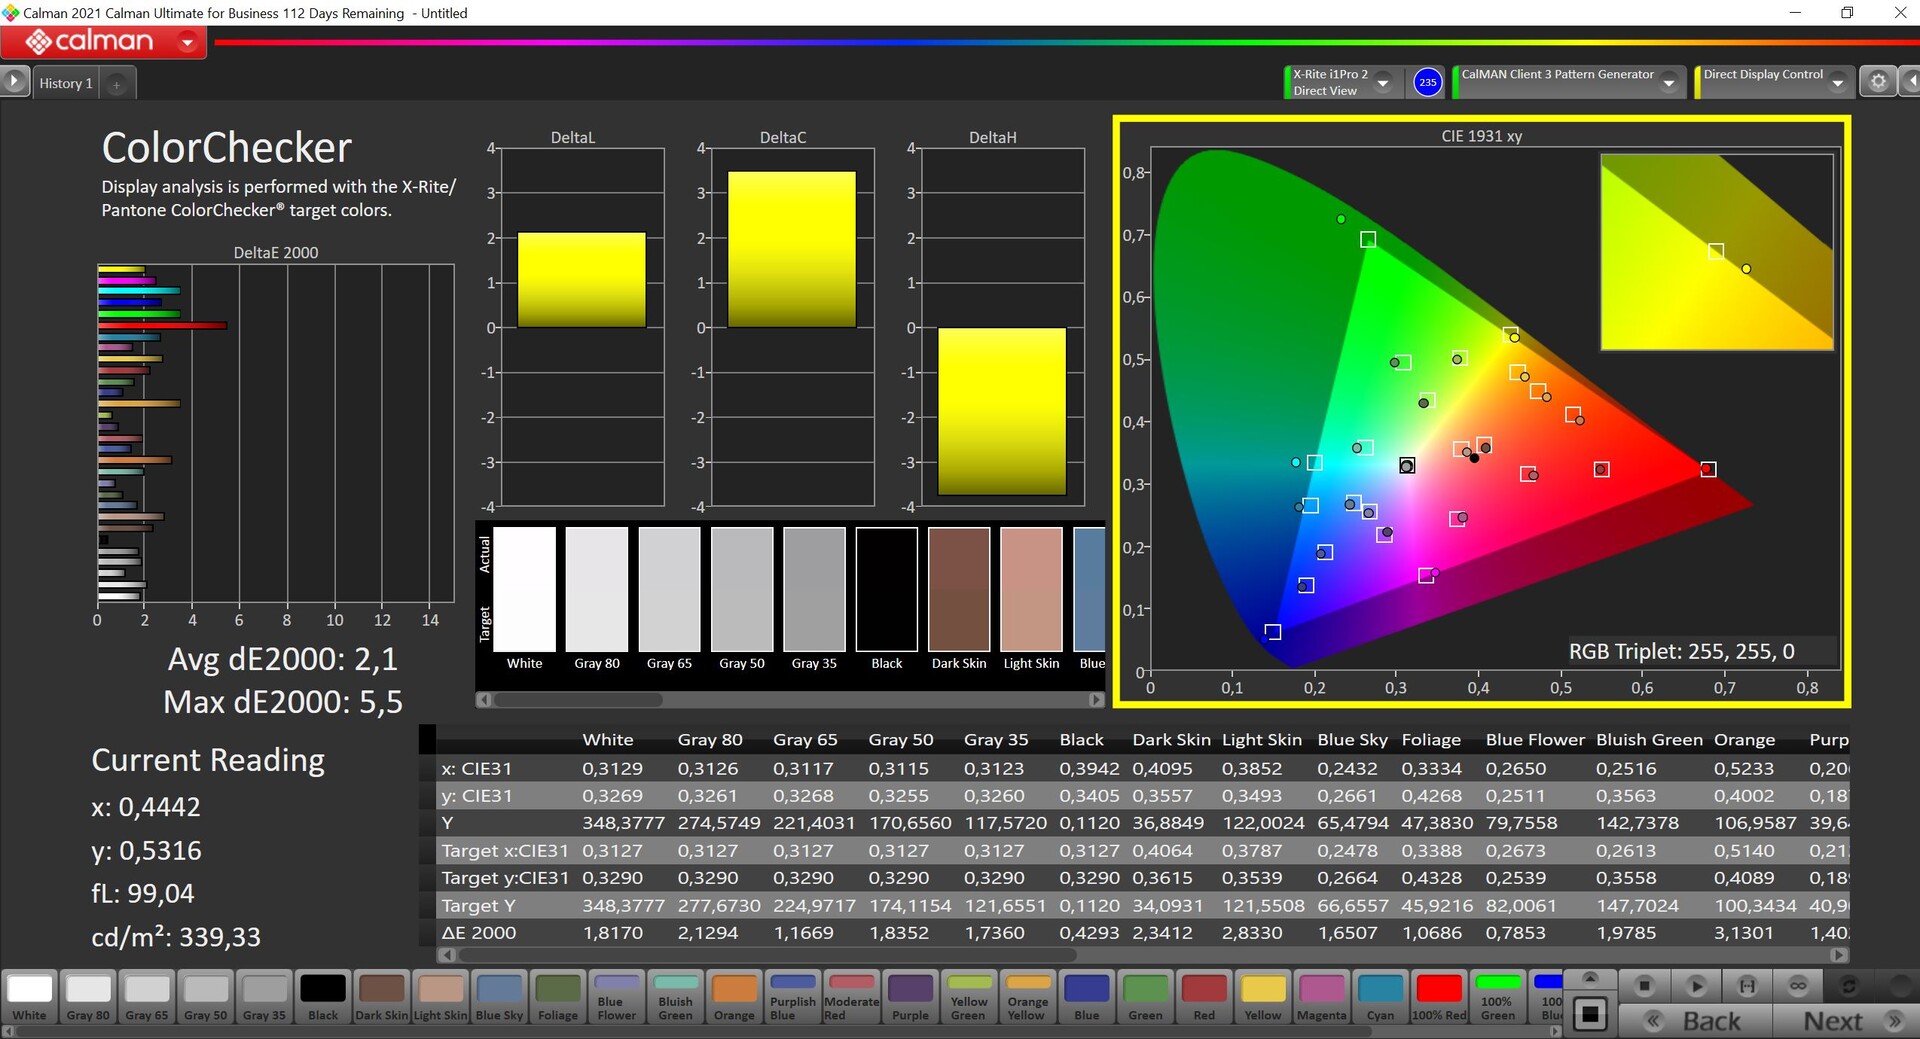
Come di consueto, nel software MyAsus sono presenti diversi profili di colore, tra cui quello "Nativo" è predefinito. In questo caso, i colori sono un po' sovrasaturi, il che dovrebbe tradursi in un'immagine un po' più potente nella pratica. Il profilo più preciso è DisplayP3, che abbiamo utilizzato anche per le nostre misurazioni con il software professionale CalMAN (X-Rite i1 Pro 2). Fondamentalmente, i risultati sono già molto buoni e non ci sono problemi in termini di color cast o temperatura del colore, anche se alcuni singoli colori sono al di sopra della deviazione importante di 3. Non siamo stati in grado di correggere questo aspetto con la nostra calibrazione, motivo per cui non forniamo un profilo da scaricare in questo caso specifico. Lo spazio colore P3 è completamente coperto.
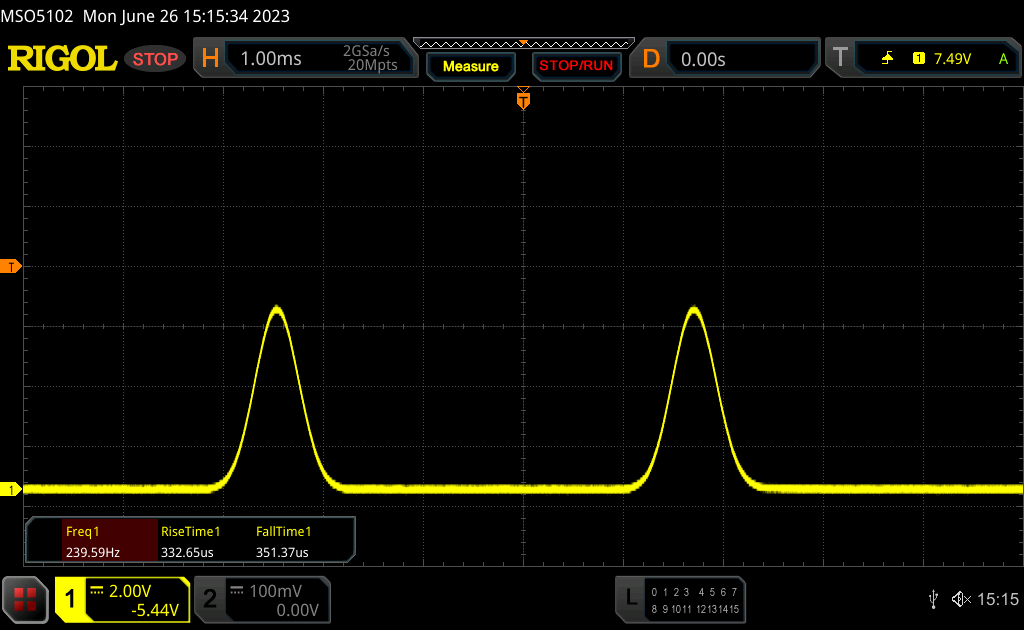
Tempi di risposta del Display
| ↔ Tempi di risposta dal Nero al Bianco | ||
|---|---|---|
| 0.79 ms ... aumenta ↗ e diminuisce ↘ combinato | ↗ 0.34 ms Incremento | 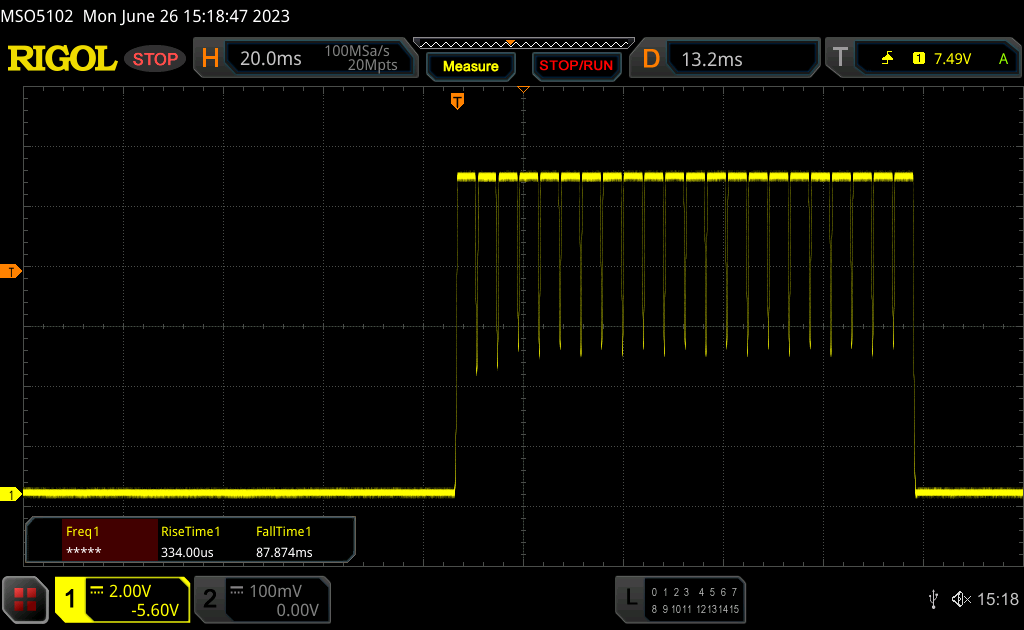 |
| ↘ 0.45 ms Calo | ||
| Lo schermo ha mostrato valori di risposta molto veloci nei nostri tests ed è molto adatto per i gaming veloce. In confronto, tutti i dispositivi di test variano da 0.1 (minimo) a 240 (massimo) ms. » 2 % di tutti i dispositivi è migliore. Questo significa che i tempi di risposta rilevati sono migliori rispettto alla media di tutti i dispositivi testati (19.8 ms). | ||
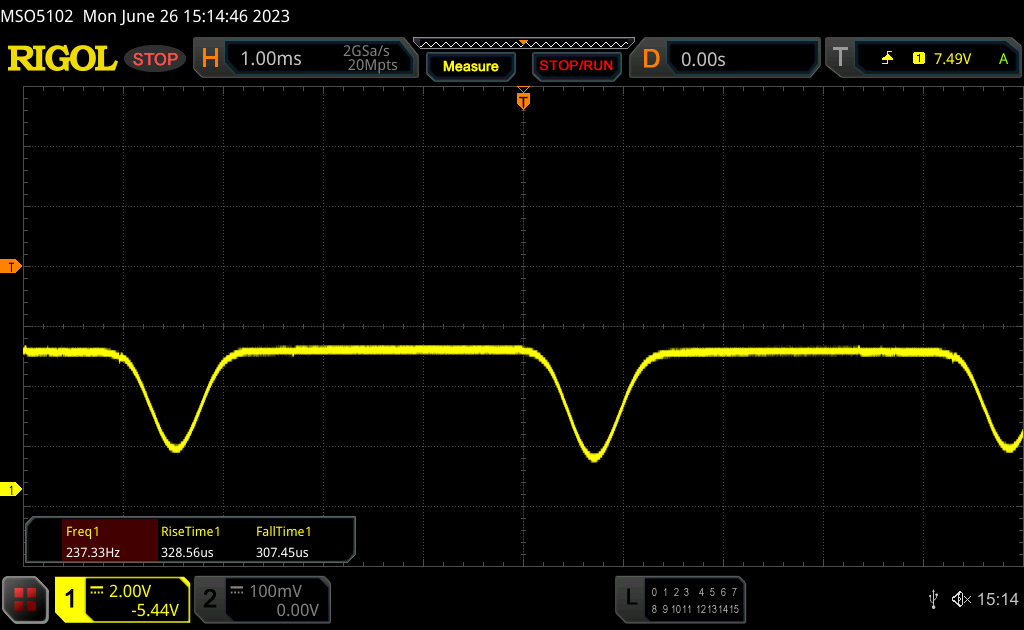
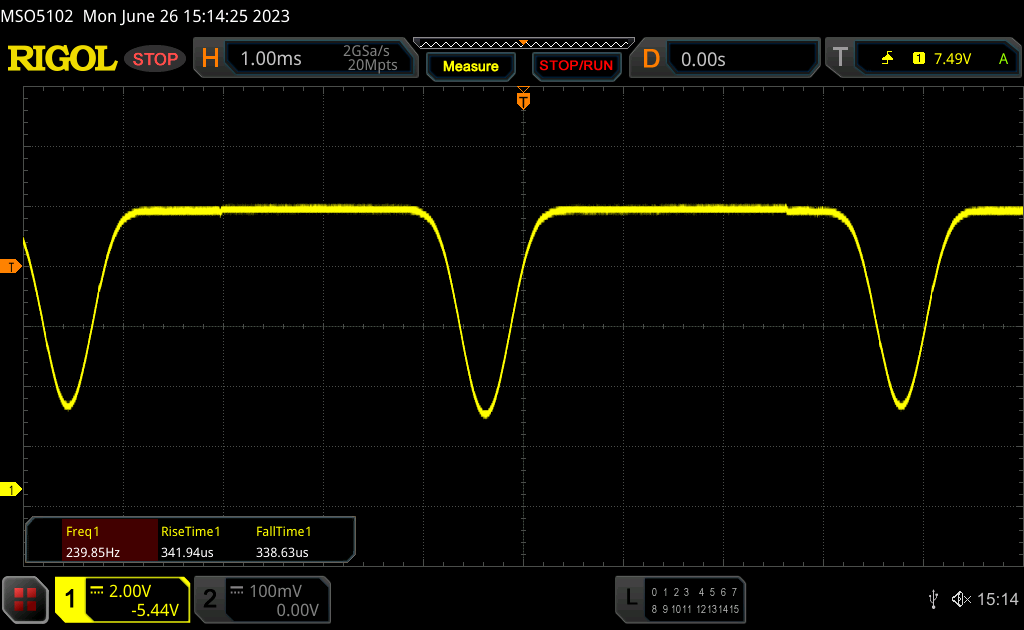
| ↔ Tempo di risposta dal 50% Grigio all'80% Grigio | ||
| 0.59 ms ... aumenta ↗ e diminuisce ↘ combinato | ↗ 0.29 ms Incremento | 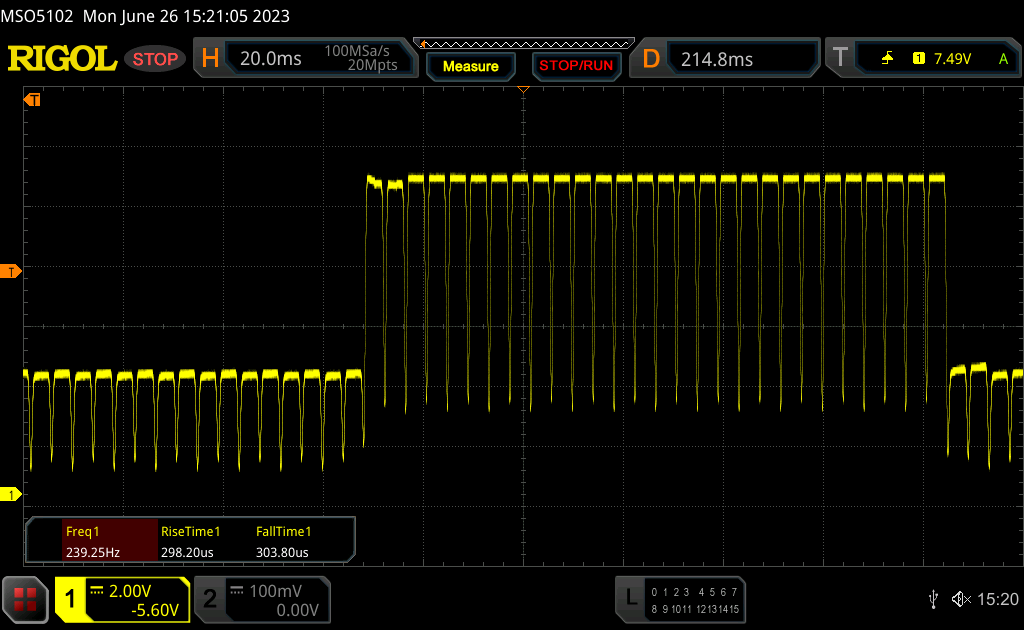 |
| ↘ 0.3 ms Calo | ||
| Lo schermo ha mostrato valori di risposta molto veloci nei nostri tests ed è molto adatto per i gaming veloce. In confronto, tutti i dispositivi di test variano da 0.165 (minimo) a 636 (massimo) ms. » 1 % di tutti i dispositivi è migliore. Questo significa che i tempi di risposta rilevati sono migliori rispettto alla media di tutti i dispositivi testati (31 ms). | ||
Sfarfallio dello schermo / PWM (Pulse-Width Modulation)
| flickering dello schermo / PWM rilevato | 240 Hz | ≤ 100 % settaggio luminosita' | 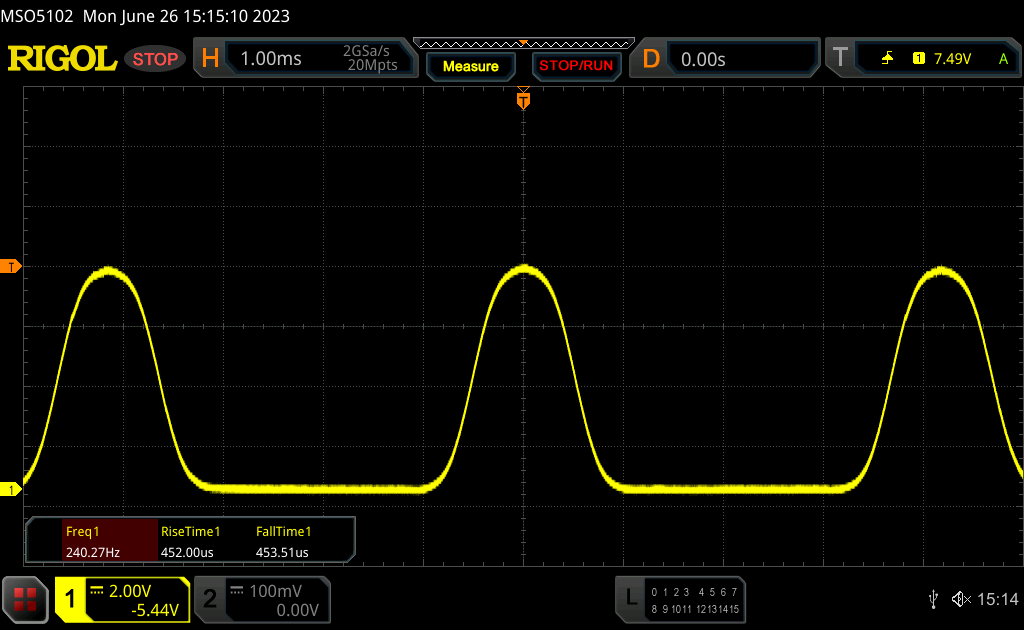 |
Il display sfarfalla a 240 Hz (Probabilmente a causa dell'uso di PWM) Flickering rilevato ad una luminosita' di 100 % o inferiore. Non dovrebbe verificarsi flickering o PWM sopra questo valore di luminosita'. La frequenza di 240 Hz è relativamente bassa, quindi gli utenti sensibili potrebbero notare il flickering ed accusare stanchezza agli occhi a questo livello di luminosità e a livelli inferiori. In confronto: 52 % di tutti i dispositivi testati non utilizza PWM per ridurre la luminosita' del display. Se è rilevato PWM, una media di 7757 (minimo: 5 - massimo: 343500) Hz è stata rilevata. | |||
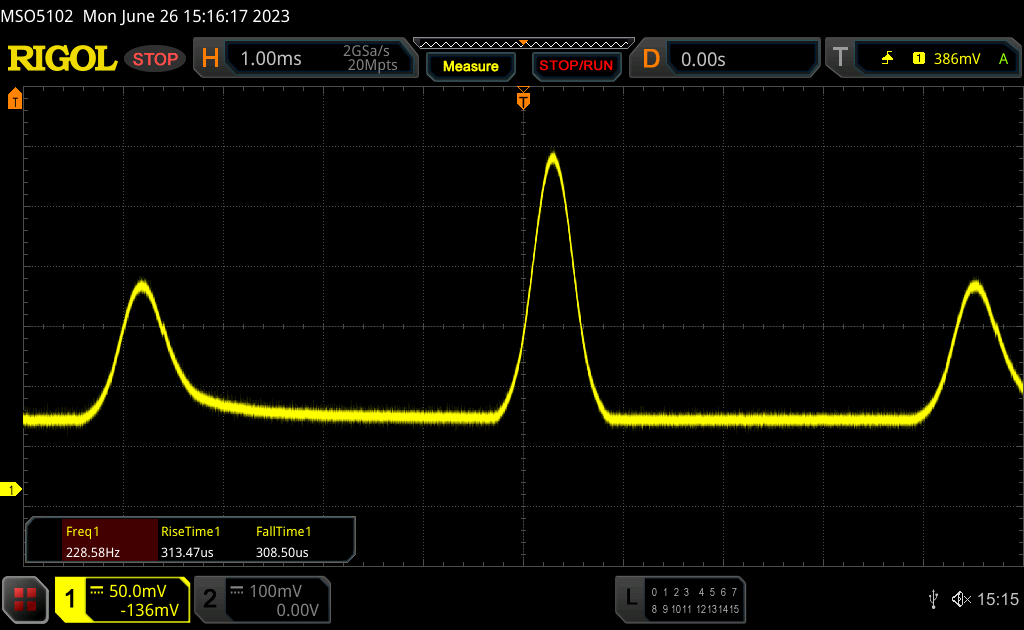
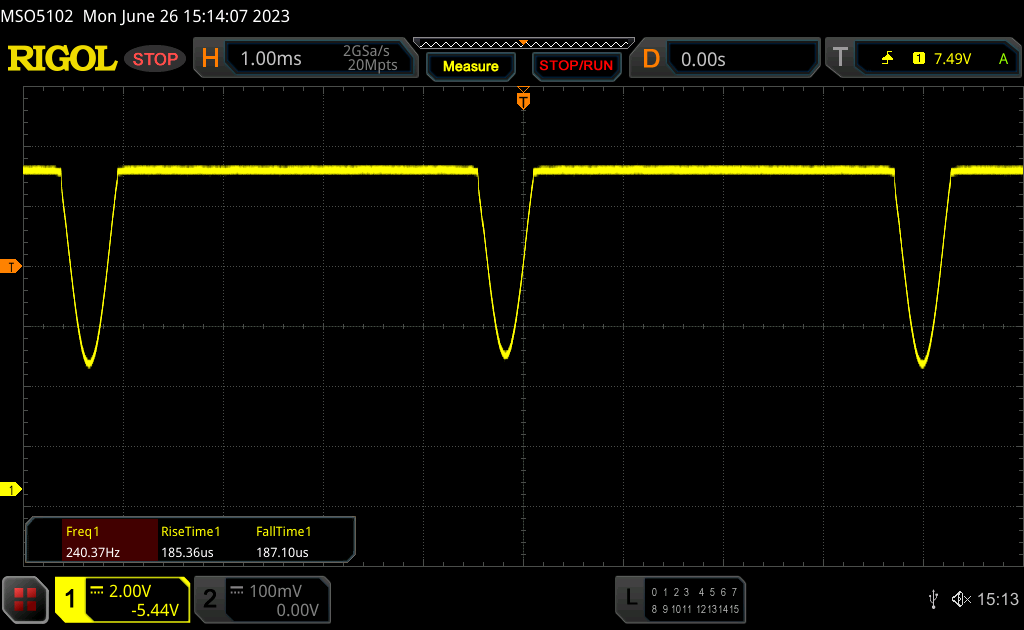
La dimmerazione CC viene utilizzata nell'intervallo di luminosità compreso tra il 100 e il 60%, mentre al di sotto di tale valore si ha un classico sfarfallio PWM a 240 Hz. Non appena la luminosità scende al di sotto del 60%, viene visualizzato un avviso che indica che la dimmerazione CC non è più disponibile. In alternativa, il cosiddetto flicker-free OLED dimming è disponibile nel software MyAsus, che abbiamo esaminato nella nostra recensione dello Zenbook S 13 OLED. In effetti, si tratta di un'aggiunta utile, ma è anche scomodo dover passare sempre dal software.
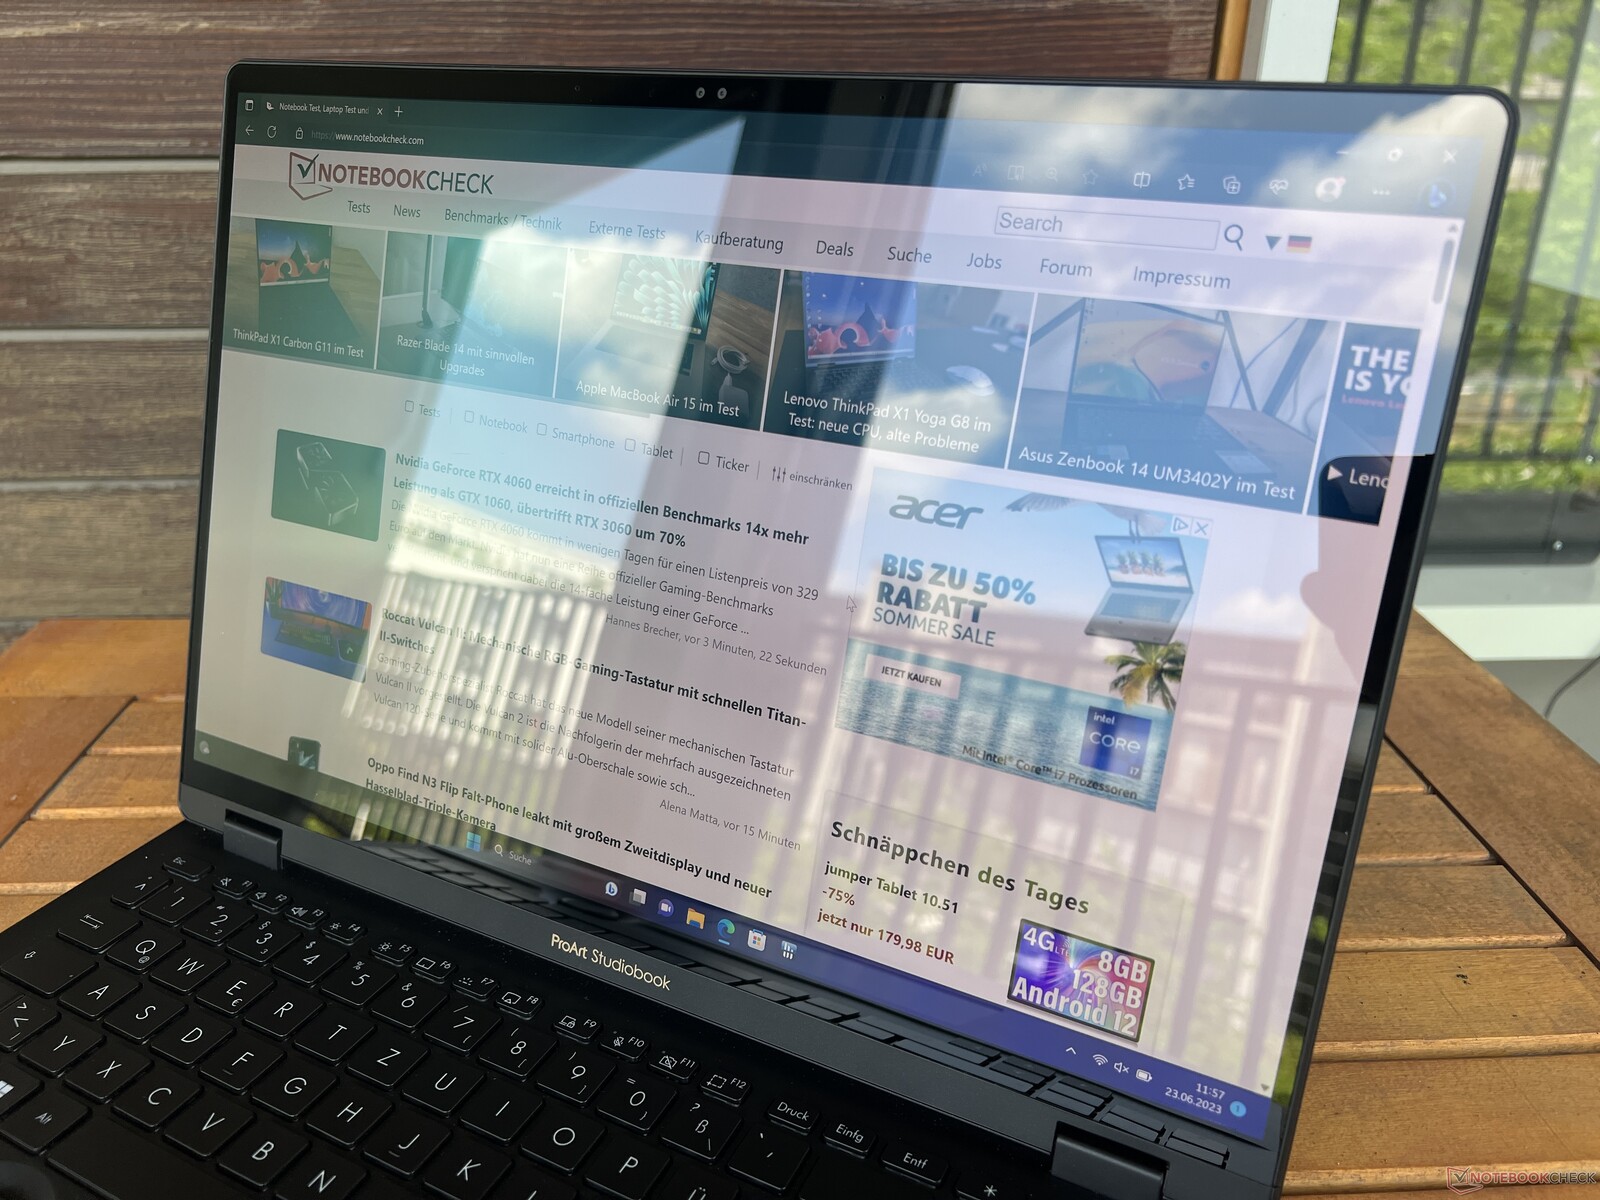
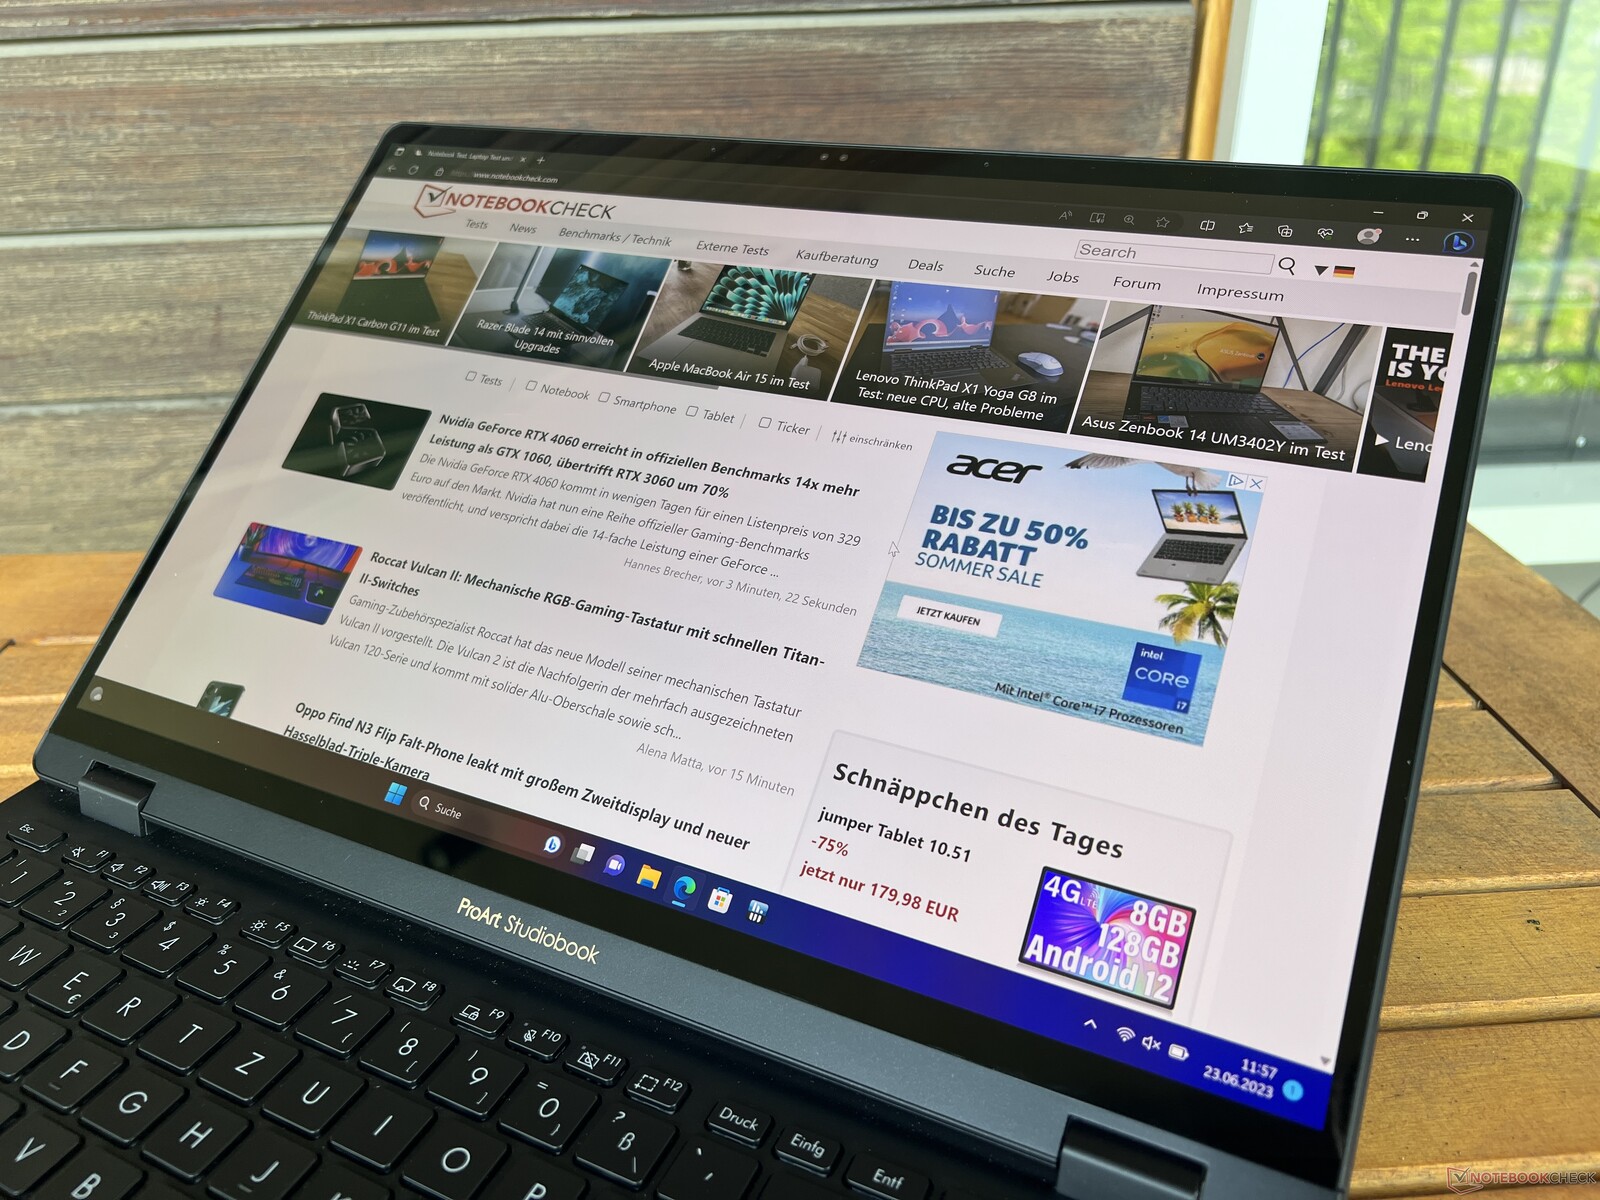
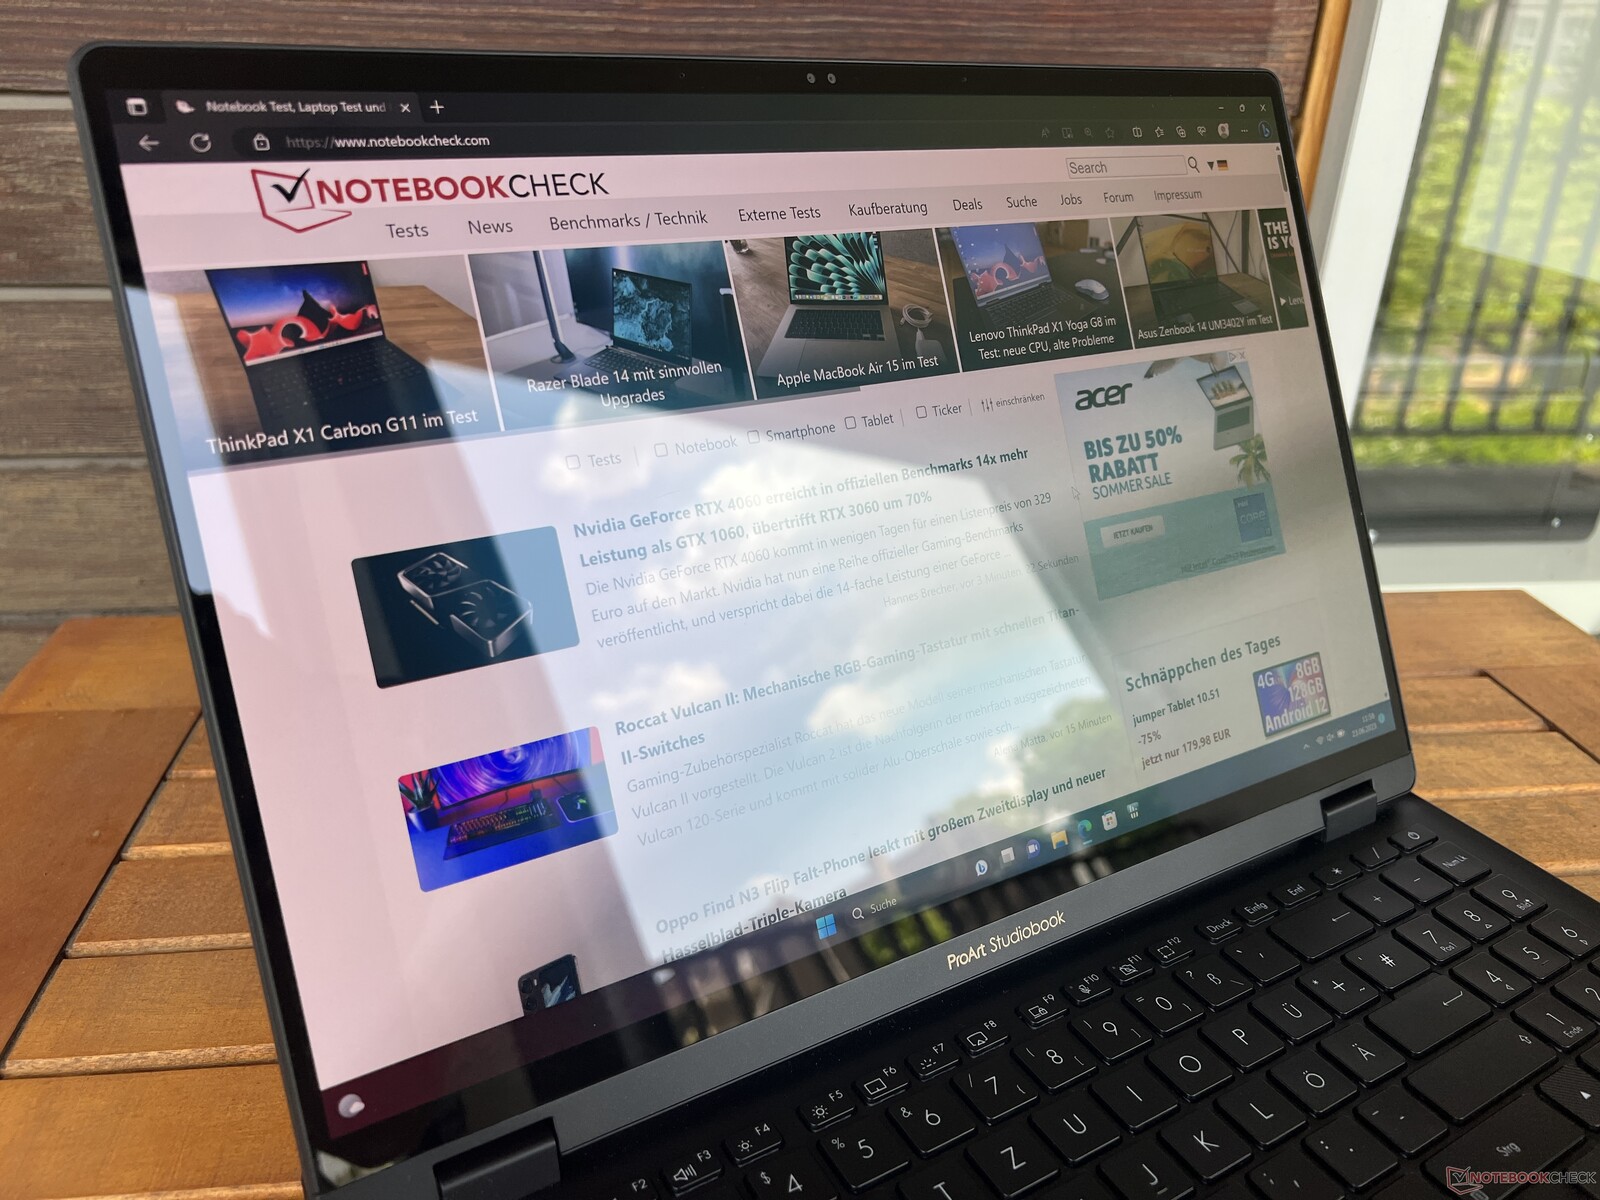
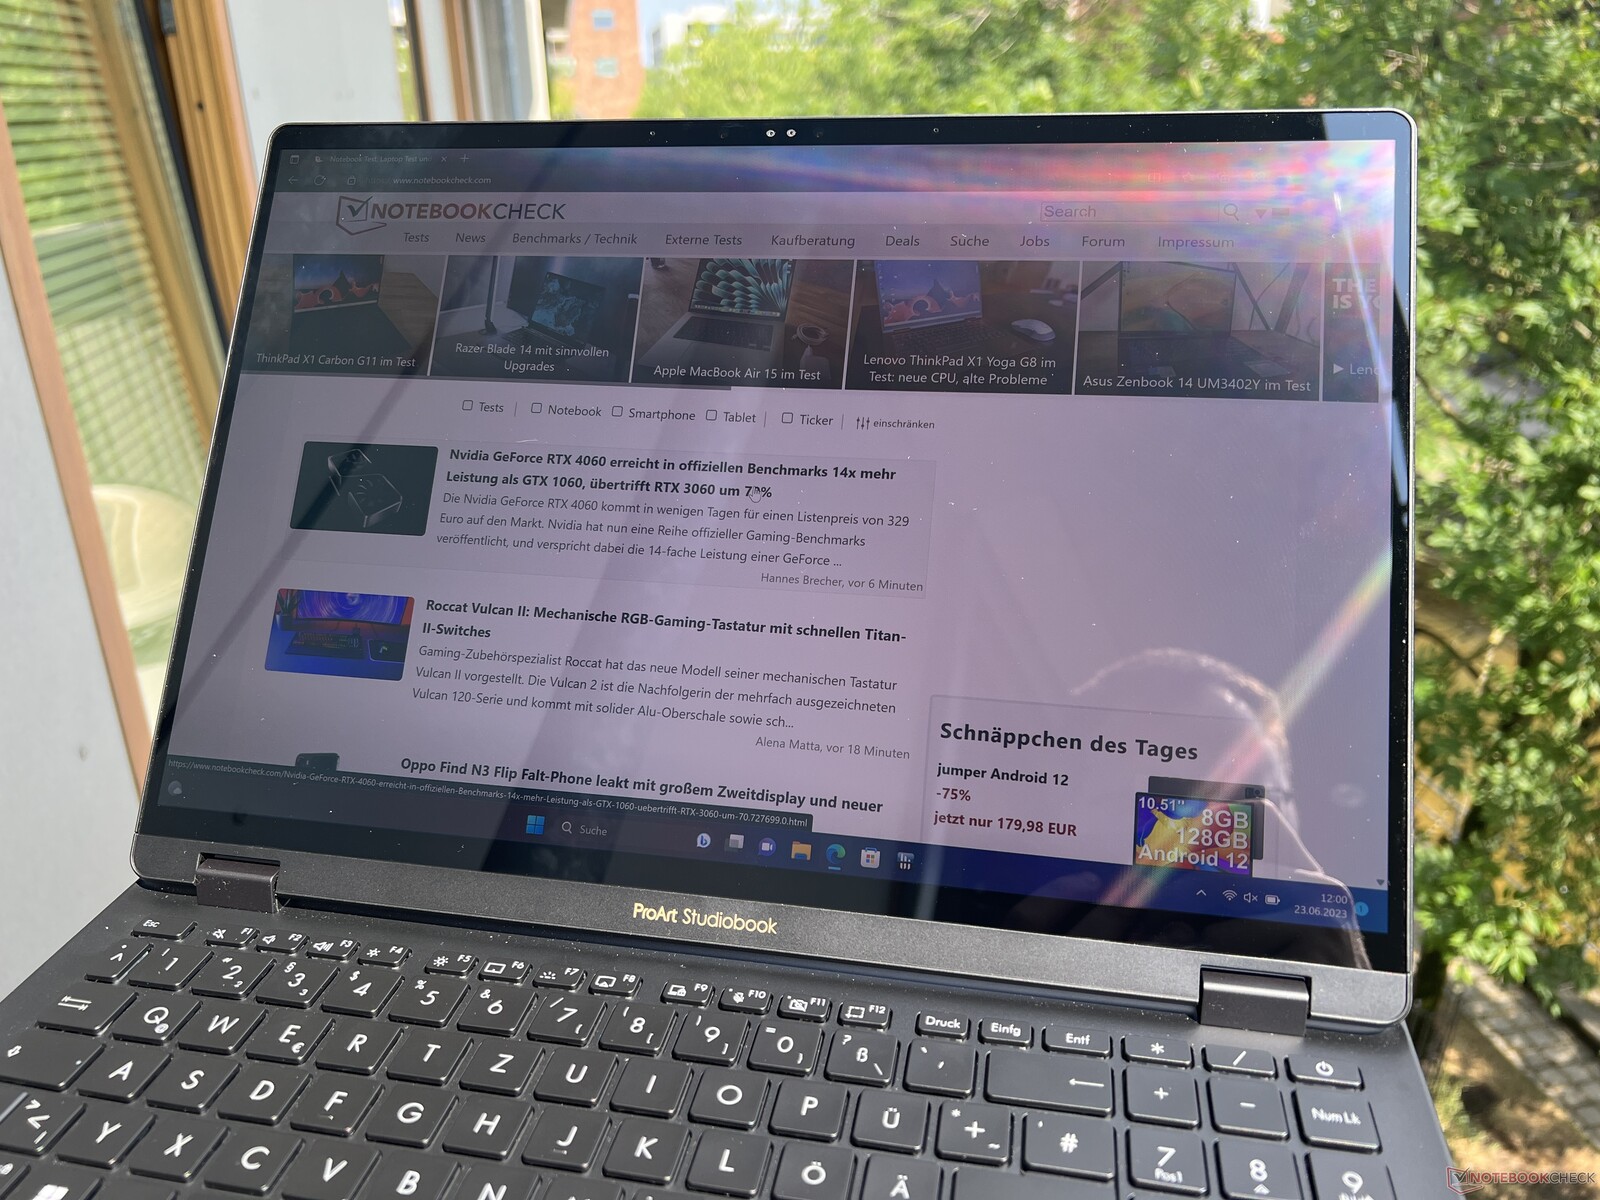
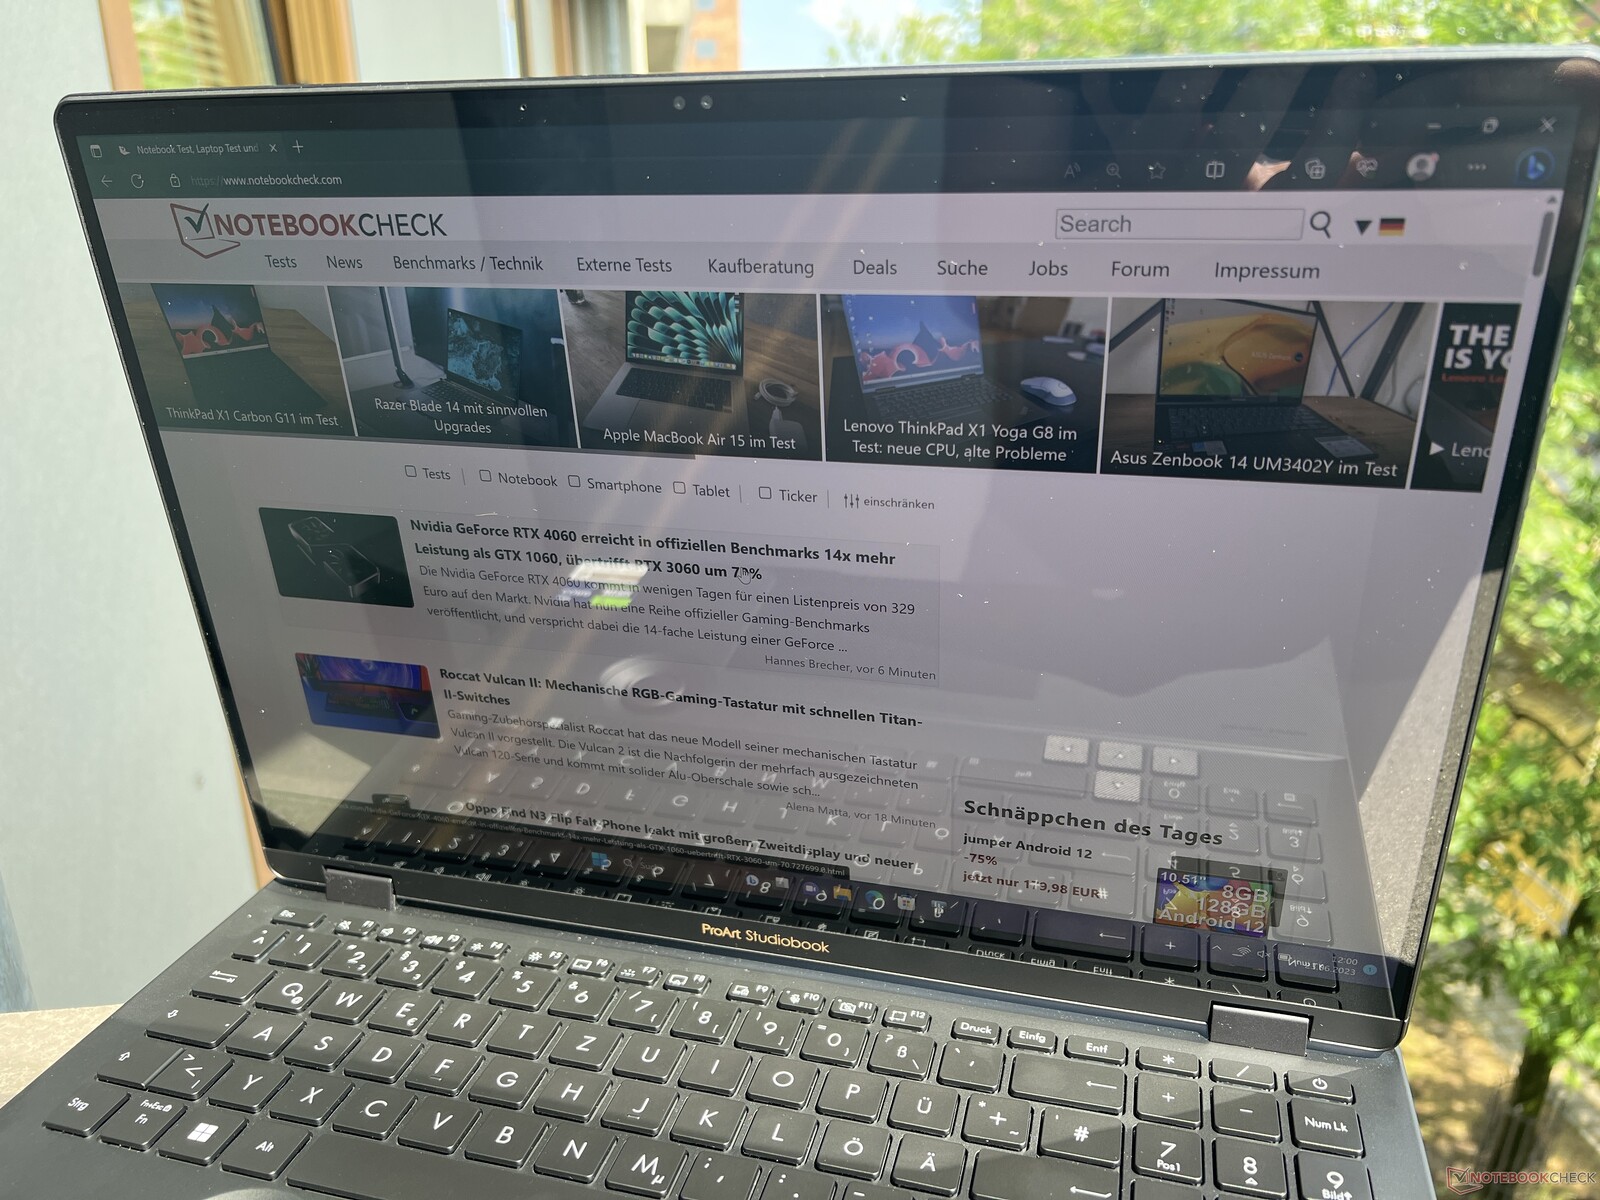
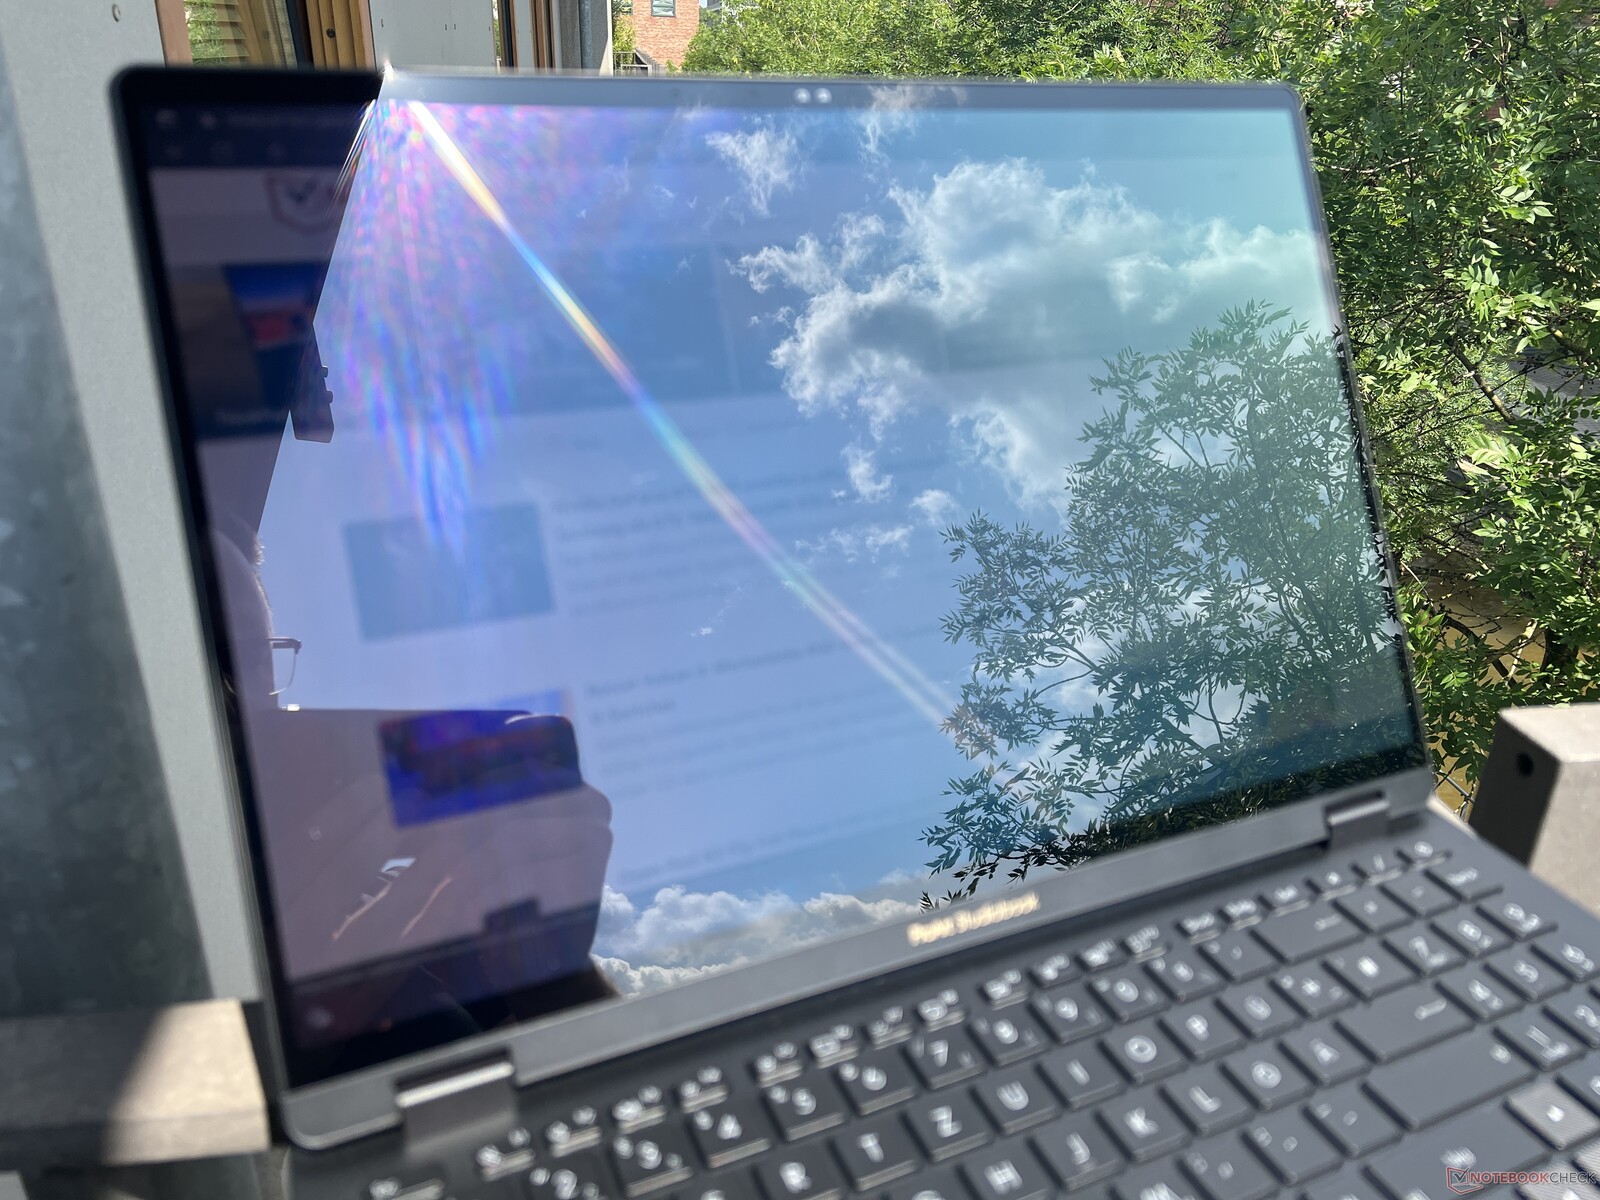
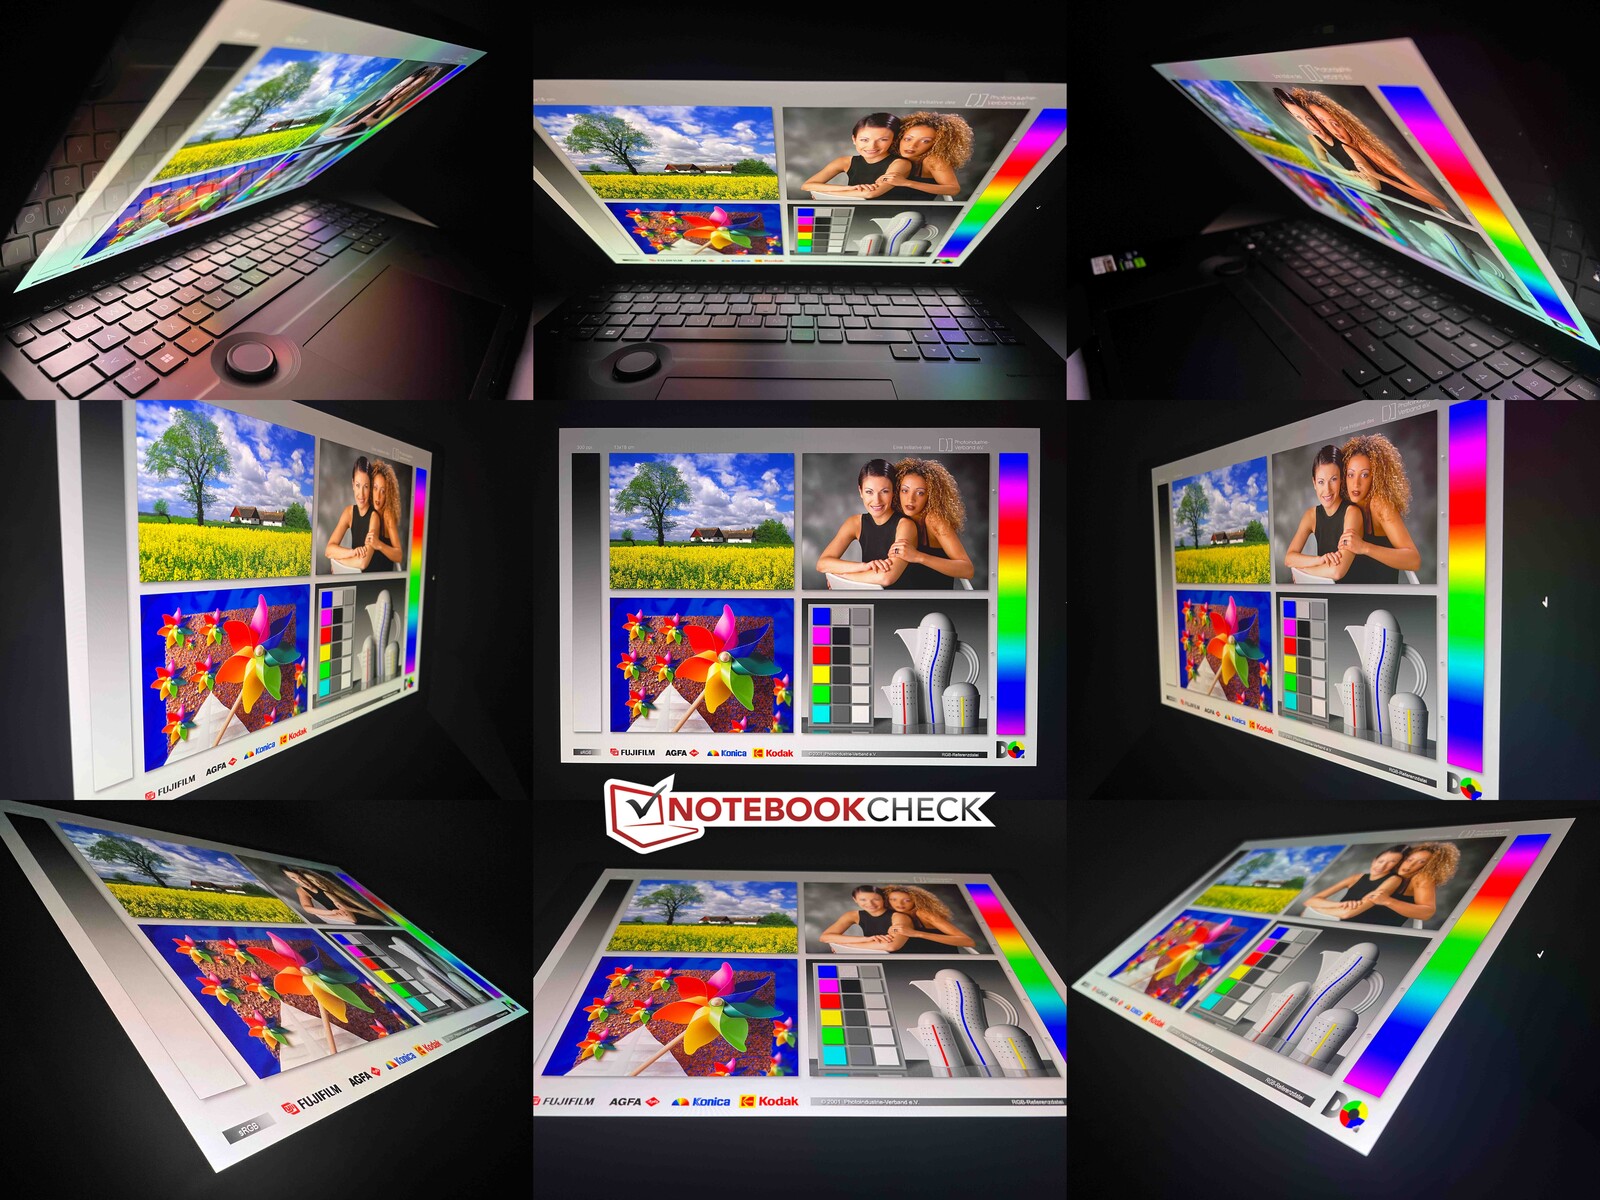
Il touchscreen è molto riflettente all'esterno, quindi è necessario evitare i riflessi delle finestre o delle fonti di luce sia all'interno che all'esterno. Non è facile, soprattutto quando c'è il sole. La stabilità dell'angolo di visione è complessivamente molto buona. Solo ad angoli molto estremi appare il tipico colore blu degli OLED.
Prestazioni - Raptor Lake-HX e Ada Lovelace
Condizioni di test
Nel ProArt Creator Hub preinstallato sono disponibili diversi profili energetici, che abbiamo elencato nella tabella seguente. Abbiamo effettuato le misurazioni e i benchmark principalmente in modalità Performance , ma in alcune sezioni esaminiamo anche gli effetti delle altre due modalità.
| Profilo energetico | Carico della CPU | Carico della GPU | Stress test | Volume massimo della ventola |
|---|---|---|---|---|
| Standard | 157/80 watt | 90 watt | CPU: 30 watt GPU: 80 watt |
47,6 dB(A) |
| Prestazioni | 170/130 watt | 130 watt | CPU: 55 watt GPU: 105 watt |
56,7 dB(A) |
| Velocità massima | 170/130 watt | 130 watt | CPU: 64 watt 95 watt |
58,9 dB(A) |
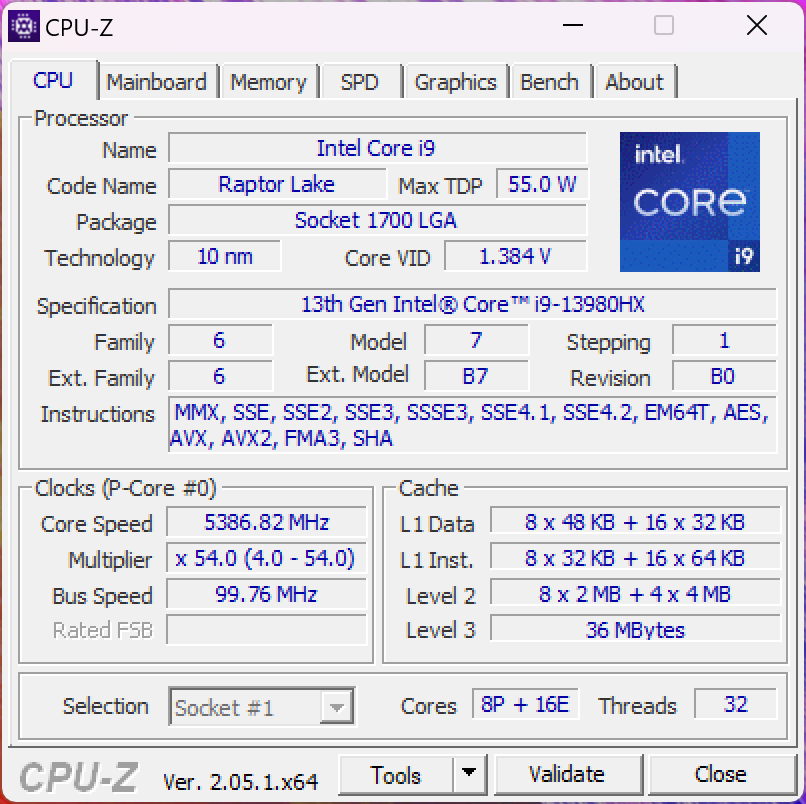
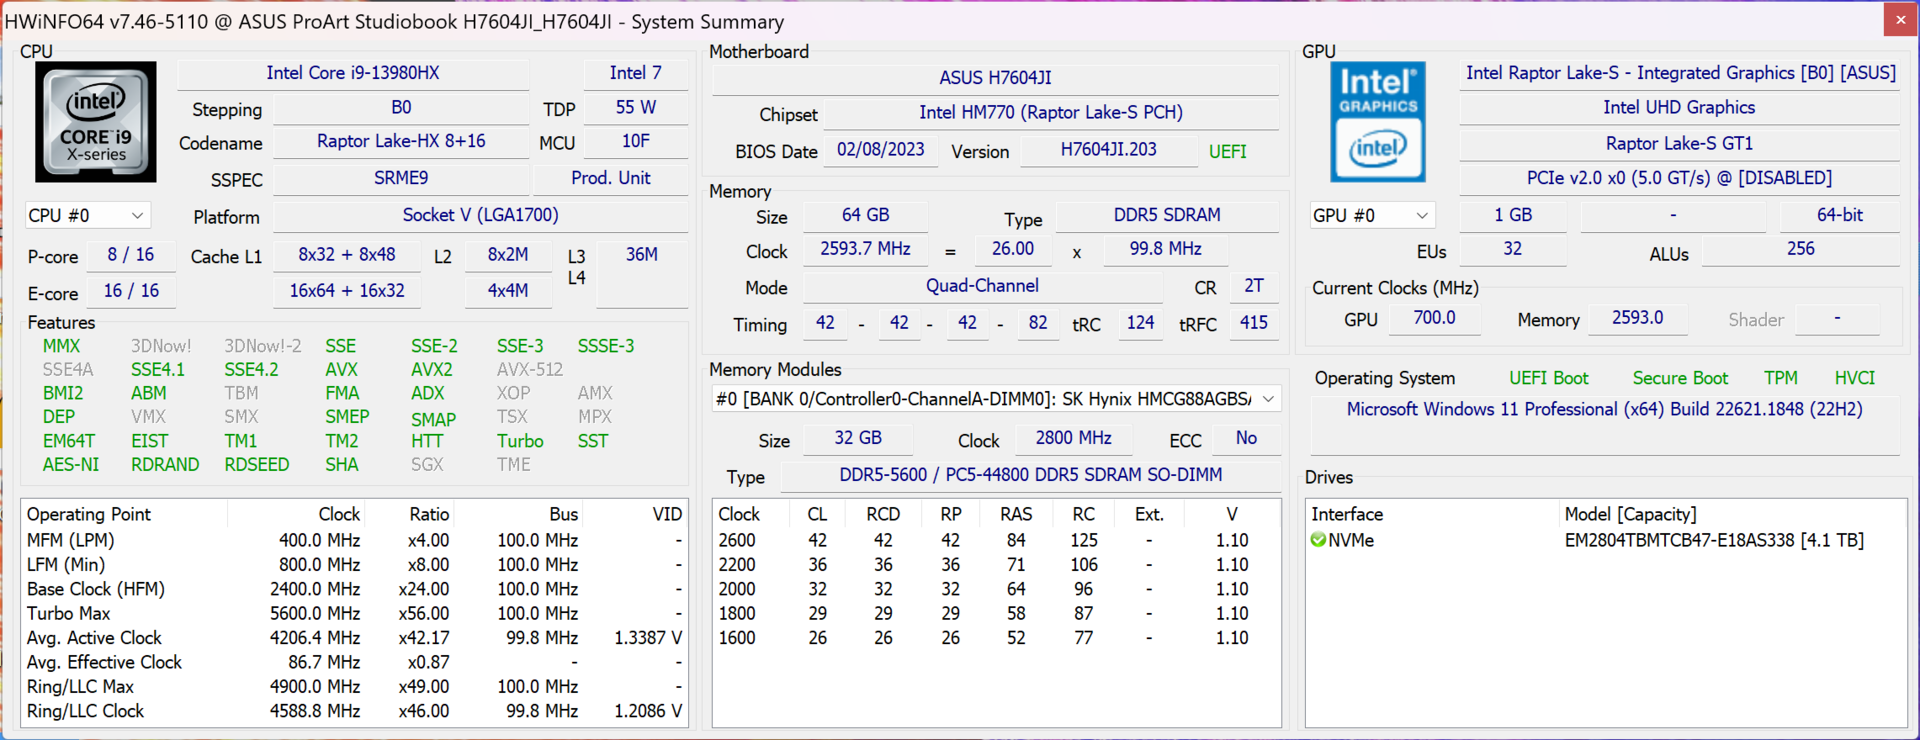
Processore - Core i9-13980HX
Come processore viene utilizzato l'attuale modello di fascia alta della serie Raptor Lake di Intel per notebook, il Core i9-13980HX
, che offre 8 core ad alte prestazioni e 16 core diefficienza. Questo processore offre 8 core per le prestazioni veloci e 16 core per l'efficienza, per cui il chip è in grado di elaborare un totale di 32 thread contemporaneamente. Nello Studiobook, il processore consuma fino a ~170 watt e scende a 130 watt dopo alcuni minuti di carico prolungato. Nei notebook da gioco di grandi dimensioni, la CPU opera un po' più velocemente, ma rispetto al gruppo di confronto con le normali CPU Intel o al Apple M2 Max, lo Studiobook ha un grande vantaggio. In termini di prestazioni single-core, il Core i9 è anche davanti al nuovo AMD Ryzen 9 7945HX, ma quest'ultimo offre ancora più prestazioni nei test multi-core e lavora in modo più efficiente.
Lontano dal socket, non rimane molto da vedere sulle capacità prestazionali del portatile, dato che la CPU può consumare solo 34/26 watt. Nel multi-test CB R23 ha ottenuto solo 11.576 punti, che corrispondono a un deficit del 63%. Lo StudioBook è quindi più lento a batteria rispetto alMacBook Pro 16 con il suo M2 Maxdove non c'è alcuna riduzione delle prestazioni con l'alimentazione a batteria. Altri benchmark della CPU sono disponibili nella la nostra sezione tecnologica.
Cinebench R15 Multi Sustained Load
Cinebench R23: Multi Core | Single Core
Cinebench R20: CPU (Multi Core) | CPU (Single Core)
Cinebench R15: CPU Multi 64Bit | CPU Single 64Bit
Blender: v2.79 BMW27 CPU
7-Zip 18.03: 7z b 4 | 7z b 4 -mmt1
Geekbench 5.5: Multi-Core | Single-Core
HWBOT x265 Benchmark v2.2: 4k Preset
LibreOffice : 20 Documents To PDF
R Benchmark 2.5: Overall mean
| CPU Performance rating | |
| Asus Zephyrus Duo 16 GX650PY-NM006W | |
| Asus ProArt Studiobook 16 OLED H7604 | |
| Media Intel Core i9-13980HX | |
| Apple MacBook Pro 16 2023 M2 Max -6! | |
| MSI Stealth 17 Studio A13VH-014 | |
| Gigabyte AERO 16 OLED BSF | |
| Media della classe Multimedia | |
| Samsung Galaxy Book3 Ultra 16 | |
| Cinebench R23 / Multi Core | |
| Asus Zephyrus Duo 16 GX650PY-NM006W | |
| Asus ProArt Studiobook 16 OLED H7604 | |
| Media Intel Core i9-13980HX (28301 - 33052, n=11) | |
| MSI Stealth 17 Studio A13VH-014 | |
| Gigabyte AERO 16 OLED BSF | |
| Media della classe Multimedia (4861 - 33362, n=76, ultimi 2 anni) | |
| Samsung Galaxy Book3 Ultra 16 | |
| Apple MacBook Pro 16 2023 M2 Max | |
| Cinebench R23 / Single Core | |
| Asus ProArt Studiobook 16 OLED H7604 | |
| Media Intel Core i9-13980HX (1825 - 2169, n=9) | |
| Media della classe Multimedia (1128 - 2459, n=68, ultimi 2 anni) | |
| Asus Zephyrus Duo 16 GX650PY-NM006W | |
| Gigabyte AERO 16 OLED BSF | |
| MSI Stealth 17 Studio A13VH-014 | |
| Samsung Galaxy Book3 Ultra 16 | |
| Apple MacBook Pro 16 2023 M2 Max | |
| Cinebench R20 / CPU (Multi Core) | |
| Asus Zephyrus Duo 16 GX650PY-NM006W | |
| Asus ProArt Studiobook 16 OLED H7604 | |
| Media Intel Core i9-13980HX (10353 - 12437, n=10) | |
| MSI Stealth 17 Studio A13VH-014 | |
| Gigabyte AERO 16 OLED BSF | |
| Media della classe Multimedia (1887 - 12912, n=59, ultimi 2 anni) | |
| Samsung Galaxy Book3 Ultra 16 | |
| Apple MacBook Pro 16 2023 M2 Max | |
| Cinebench R20 / CPU (Single Core) | |
| Asus ProArt Studiobook 16 OLED H7604 | |
| Media Intel Core i9-13980HX (717 - 825, n=10) | |
| Asus Zephyrus Duo 16 GX650PY-NM006W | |
| Media della classe Multimedia (425 - 853, n=59, ultimi 2 anni) | |
| MSI Stealth 17 Studio A13VH-014 | |
| Samsung Galaxy Book3 Ultra 16 | |
| Gigabyte AERO 16 OLED BSF | |
| Apple MacBook Pro 16 2023 M2 Max | |
| Cinebench R15 / CPU Multi 64Bit | |
| Asus Zephyrus Duo 16 GX650PY-NM006W | |
| Media Intel Core i9-13980HX (4358 - 5172, n=11) | |
| Asus ProArt Studiobook 16 OLED H7604 | |
| MSI Stealth 17 Studio A13VH-014 | |
| Gigabyte AERO 16 OLED BSF | |
| Media della classe Multimedia (856 - 5224, n=63, ultimi 2 anni) | |
| Samsung Galaxy Book3 Ultra 16 | |
| Apple MacBook Pro 16 2023 M2 Max | |
| Cinebench R15 / CPU Single 64Bit | |
| Asus ProArt Studiobook 16 OLED H7604 | |
| Asus Zephyrus Duo 16 GX650PY-NM006W | |
| Media Intel Core i9-13980HX (289 - 312, n=11) | |
| MSI Stealth 17 Studio A13VH-014 | |
| Media della classe Multimedia (184.8 - 326, n=61, ultimi 2 anni) | |
| Samsung Galaxy Book3 Ultra 16 | |
| Gigabyte AERO 16 OLED BSF | |
| Apple MacBook Pro 16 2023 M2 Max | |
| Blender / v2.79 BMW27 CPU | |
| Media della classe Multimedia (100 - 557, n=60, ultimi 2 anni) | |
| Samsung Galaxy Book3 Ultra 16 | |
| Gigabyte AERO 16 OLED BSF | |
| MSI Stealth 17 Studio A13VH-014 | |
| Media Intel Core i9-13980HX (97 - 136, n=10) | |
| Asus ProArt Studiobook 16 OLED H7604 | |
| Asus Zephyrus Duo 16 GX650PY-NM006W | |
| 7-Zip 18.03 / 7z b 4 | |
| Asus Zephyrus Duo 16 GX650PY-NM006W | |
| Asus ProArt Studiobook 16 OLED H7604 | |
| Media Intel Core i9-13980HX (104616 - 129804, n=10) | |
| MSI Stealth 17 Studio A13VH-014 | |
| Gigabyte AERO 16 OLED BSF | |
| Samsung Galaxy Book3 Ultra 16 | |
| Media della classe Multimedia (26062 - 130368, n=57, ultimi 2 anni) | |
| 7-Zip 18.03 / 7z b 4 -mmt1 | |
| Asus Zephyrus Duo 16 GX650PY-NM006W | |
| Asus ProArt Studiobook 16 OLED H7604 | |
| Media Intel Core i9-13980HX (6230 - 7163, n=10) | |
| MSI Stealth 17 Studio A13VH-014 | |
| Media della classe Multimedia (3666 - 7545, n=58, ultimi 2 anni) | |
| Gigabyte AERO 16 OLED BSF | |
| Samsung Galaxy Book3 Ultra 16 | |
| Geekbench 5.5 / Multi-Core | |
| Media Intel Core i9-13980HX (18475 - 22200, n=10) | |
| Asus ProArt Studiobook 16 OLED H7604 | |
| Asus Zephyrus Duo 16 GX650PY-NM006W | |
| Apple MacBook Pro 16 2023 M2 Max | |
| Gigabyte AERO 16 OLED BSF | |
| MSI Stealth 17 Studio A13VH-014 | |
| Media della classe Multimedia (4652 - 20422, n=58, ultimi 2 anni) | |
| Samsung Galaxy Book3 Ultra 16 | |
| Geekbench 5.5 / Single-Core | |
| Asus ProArt Studiobook 16 OLED H7604 | |
| Asus Zephyrus Duo 16 GX650PY-NM006W | |
| Media Intel Core i9-13980HX (1796 - 2139, n=10) | |
| MSI Stealth 17 Studio A13VH-014 | |
| Apple MacBook Pro 16 2023 M2 Max | |
| Media della classe Multimedia (805 - 2974, n=58, ultimi 2 anni) | |
| Gigabyte AERO 16 OLED BSF | |
| Samsung Galaxy Book3 Ultra 16 | |
| HWBOT x265 Benchmark v2.2 / 4k Preset | |
| Asus Zephyrus Duo 16 GX650PY-NM006W | |
| Media Intel Core i9-13980HX (27 - 33.4, n=9) | |
| Asus ProArt Studiobook 16 OLED H7604 | |
| MSI Stealth 17 Studio A13VH-014 | |
| Gigabyte AERO 16 OLED BSF | |
| Media della classe Multimedia (5.26 - 36.1, n=58, ultimi 2 anni) | |
| Samsung Galaxy Book3 Ultra 16 | |
| LibreOffice / 20 Documents To PDF | |
| Asus Zephyrus Duo 16 GX650PY-NM006W | |
| Gigabyte AERO 16 OLED BSF | |
| MSI Stealth 17 Studio A13VH-014 | |
| Media della classe Multimedia (23.9 - 146.7, n=59, ultimi 2 anni) | |
| Samsung Galaxy Book3 Ultra 16 | |
| Asus ProArt Studiobook 16 OLED H7604 | |
| Media Intel Core i9-13980HX (35 - 51.4, n=10) | |
| R Benchmark 2.5 / Overall mean | |
| Gigabyte AERO 16 OLED BSF | |
| Samsung Galaxy Book3 Ultra 16 | |
| Media della classe Multimedia (0.3604 - 0.947, n=58, ultimi 2 anni) | |
| MSI Stealth 17 Studio A13VH-014 | |
| Asus Zephyrus Duo 16 GX650PY-NM006W | |
| Media Intel Core i9-13980HX (0.3793 - 0.4462, n=10) | |
| Asus ProArt Studiobook 16 OLED H7604 | |
* ... Meglio usare valori piccoli
AIDA64: FP32 Ray-Trace | FPU Julia | CPU SHA3 | CPU Queen | FPU SinJulia | FPU Mandel | CPU AES | CPU ZLib | FP64 Ray-Trace | CPU PhotoWorxx
| Performance rating | |
| Asus ProArt Studiobook 16 OLED H7604 | |
| Media Intel Core i9-13980HX | |
| Gigabyte AERO 16 OLED BSF | |
| MSI Stealth 17 Studio A13VH-014 | |
| Media della classe Multimedia | |
| Samsung Galaxy Book3 Ultra 16 | |
| AIDA64 / FP32 Ray-Trace | |
| Asus ProArt Studiobook 16 OLED H7604 | |
| Media Intel Core i9-13980HX (21332 - 29553, n=9) | |
| MSI Stealth 17 Studio A13VH-014 | |
| Gigabyte AERO 16 OLED BSF | |
| Media della classe Multimedia (2214 - 50388, n=55, ultimi 2 anni) | |
| Samsung Galaxy Book3 Ultra 16 | |
| AIDA64 / FPU Julia | |
| Asus ProArt Studiobook 16 OLED H7604 | |
| Media Intel Core i9-13980HX (108001 - 148168, n=9) | |
| MSI Stealth 17 Studio A13VH-014 | |
| Gigabyte AERO 16 OLED BSF | |
| Media della classe Multimedia (12867 - 201874, n=56, ultimi 2 anni) | |
| Samsung Galaxy Book3 Ultra 16 | |
| AIDA64 / CPU SHA3 | |
| Asus ProArt Studiobook 16 OLED H7604 | |
| Media Intel Core i9-13980HX (5264 - 7142, n=9) | |
| MSI Stealth 17 Studio A13VH-014 | |
| Gigabyte AERO 16 OLED BSF | |
| Media della classe Multimedia (626 - 8623, n=56, ultimi 2 anni) | |
| Samsung Galaxy Book3 Ultra 16 | |
| AIDA64 / CPU Queen | |
| Media Intel Core i9-13980HX (126758 - 143409, n=9) | |
| Asus ProArt Studiobook 16 OLED H7604 | |
| Samsung Galaxy Book3 Ultra 16 | |
| MSI Stealth 17 Studio A13VH-014 | |
| Gigabyte AERO 16 OLED BSF | |
| Media della classe Multimedia (13483 - 181505, n=43, ultimi 2 anni) | |
| AIDA64 / FPU SinJulia | |
| Media Intel Core i9-13980HX (13785 - 17117, n=9) | |
| Asus ProArt Studiobook 16 OLED H7604 | |
| MSI Stealth 17 Studio A13VH-014 | |
| Gigabyte AERO 16 OLED BSF | |
| Samsung Galaxy Book3 Ultra 16 | |
| Media della classe Multimedia (886 - 28794, n=56, ultimi 2 anni) | |
| AIDA64 / FPU Mandel | |
| Asus ProArt Studiobook 16 OLED H7604 | |
| Media Intel Core i9-13980HX (53398 - 73758, n=9) | |
| MSI Stealth 17 Studio A13VH-014 | |
| Gigabyte AERO 16 OLED BSF | |
| Media della classe Multimedia (6395 - 105740, n=55, ultimi 2 anni) | |
| Samsung Galaxy Book3 Ultra 16 | |
| AIDA64 / CPU AES | |
| Gigabyte AERO 16 OLED BSF | |
| Asus ProArt Studiobook 16 OLED H7604 | |
| Media Intel Core i9-13980HX (105169 - 136520, n=9) | |
| MSI Stealth 17 Studio A13VH-014 | |
| Samsung Galaxy Book3 Ultra 16 | |
| Media della classe Multimedia (8171 - 126790, n=56, ultimi 2 anni) | |
| AIDA64 / CPU ZLib | |
| Asus ProArt Studiobook 16 OLED H7604 | |
| Media Intel Core i9-13980HX (1513 - 2039, n=9) | |
| MSI Stealth 17 Studio A13VH-014 | |
| Gigabyte AERO 16 OLED BSF | |
| Samsung Galaxy Book3 Ultra 16 | |
| Media della classe Multimedia (143.8 - 2022, n=56, ultimi 2 anni) | |
| AIDA64 / FP64 Ray-Trace | |
| Media Intel Core i9-13980HX (11431 - 16325, n=9) | |
| Asus ProArt Studiobook 16 OLED H7604 | |
| MSI Stealth 17 Studio A13VH-014 | |
| Gigabyte AERO 16 OLED BSF | |
| Media della classe Multimedia (1014 - 26875, n=56, ultimi 2 anni) | |
| Samsung Galaxy Book3 Ultra 16 | |
| AIDA64 / CPU PhotoWorxx | |
| MSI Stealth 17 Studio A13VH-014 | |
| Media della classe Multimedia (8187 - 88154, n=56, ultimi 2 anni) | |
| Asus ProArt Studiobook 16 OLED H7604 | |
| Samsung Galaxy Book3 Ultra 16 | |
| Media Intel Core i9-13980HX (37069 - 52949, n=9) | |
| Gigabyte AERO 16 OLED BSF | |
Prestazioni del sistema
Le prestazioni del sistema sono eccellenti, sia nei benchmark sintetici che nella pratica. Non sono stati riscontrati problemi nemmeno durante i test.
CrossMark: Overall | Productivity | Creativity | Responsiveness
| PCMark 10 / Score | |
| Asus Zephyrus Duo 16 GX650PY-NM006W | |
| Gigabyte AERO 16 OLED BSF | |
| Media della classe Multimedia (4325 - 10386, n=54, ultimi 2 anni) | |
| Asus ProArt Studiobook 16 OLED H7604 | |
| Media Intel Core i9-13980HX, NVIDIA GeForce RTX 4070 Laptop GPU (n=1) | |
| MSI Stealth 17 Studio A13VH-014 | |
| Samsung Galaxy Book3 Ultra 16 | |
| PCMark 10 / Essentials | |
| Asus Zephyrus Duo 16 GX650PY-NM006W | |
| Gigabyte AERO 16 OLED BSF | |
| Asus ProArt Studiobook 16 OLED H7604 | |
| Media Intel Core i9-13980HX, NVIDIA GeForce RTX 4070 Laptop GPU (n=1) | |
| Samsung Galaxy Book3 Ultra 16 | |
| Media della classe Multimedia (8025 - 11664, n=53, ultimi 2 anni) | |
| MSI Stealth 17 Studio A13VH-014 | |
| PCMark 10 / Productivity | |
| Asus Zephyrus Duo 16 GX650PY-NM006W | |
| Media della classe Multimedia (7323 - 18233, n=53, ultimi 2 anni) | |
| MSI Stealth 17 Studio A13VH-014 | |
| Asus ProArt Studiobook 16 OLED H7604 | |
| Media Intel Core i9-13980HX, NVIDIA GeForce RTX 4070 Laptop GPU (n=1) | |
| Gigabyte AERO 16 OLED BSF | |
| Samsung Galaxy Book3 Ultra 16 | |
| PCMark 10 / Digital Content Creation | |
| Asus Zephyrus Duo 16 GX650PY-NM006W | |
| Gigabyte AERO 16 OLED BSF | |
| MSI Stealth 17 Studio A13VH-014 | |
| Asus ProArt Studiobook 16 OLED H7604 | |
| Media Intel Core i9-13980HX, NVIDIA GeForce RTX 4070 Laptop GPU (n=1) | |
| Media della classe Multimedia (3651 - 16240, n=53, ultimi 2 anni) | |
| Samsung Galaxy Book3 Ultra 16 | |
| CrossMark / Overall | |
| Asus ProArt Studiobook 16 OLED H7604 | |
| Media Intel Core i9-13980HX, NVIDIA GeForce RTX 4070 Laptop GPU (n=1) | |
| Asus Zephyrus Duo 16 GX650PY-NM006W | |
| Apple MacBook Pro 16 2023 M2 Max | |
| Gigabyte AERO 16 OLED BSF | |
| Media della classe Multimedia (866 - 2728, n=62, ultimi 2 anni) | |
| MSI Stealth 17 Studio A13VH-014 | |
| Samsung Galaxy Book3 Ultra 16 | |
| CrossMark / Productivity | |
| Asus ProArt Studiobook 16 OLED H7604 | |
| Media Intel Core i9-13980HX, NVIDIA GeForce RTX 4070 Laptop GPU (n=1) | |
| Asus Zephyrus Duo 16 GX650PY-NM006W | |
| Gigabyte AERO 16 OLED BSF | |
| Media della classe Multimedia (931 - 2489, n=62, ultimi 2 anni) | |
| MSI Stealth 17 Studio A13VH-014 | |
| Apple MacBook Pro 16 2023 M2 Max | |
| Samsung Galaxy Book3 Ultra 16 | |
| CrossMark / Creativity | |
| Apple MacBook Pro 16 2023 M2 Max | |
| Asus ProArt Studiobook 16 OLED H7604 | |
| Media Intel Core i9-13980HX, NVIDIA GeForce RTX 4070 Laptop GPU (n=1) | |
| Asus Zephyrus Duo 16 GX650PY-NM006W | |
| Media della classe Multimedia (907 - 3465, n=62, ultimi 2 anni) | |
| Gigabyte AERO 16 OLED BSF | |
| MSI Stealth 17 Studio A13VH-014 | |
| Samsung Galaxy Book3 Ultra 16 | |
| CrossMark / Responsiveness | |
| Gigabyte AERO 16 OLED BSF | |
| Asus ProArt Studiobook 16 OLED H7604 | |
| Media Intel Core i9-13980HX, NVIDIA GeForce RTX 4070 Laptop GPU (n=1) | |
| Asus Zephyrus Duo 16 GX650PY-NM006W | |
| MSI Stealth 17 Studio A13VH-014 | |
| Media della classe Multimedia (605 - 2024, n=62, ultimi 2 anni) | |
| Samsung Galaxy Book3 Ultra 16 | |
| Apple MacBook Pro 16 2023 M2 Max | |
| PCMark 10 Score | 7491 punti | |
Aiuto | ||
| AIDA64 / Memory Copy | |
| Media della classe Multimedia (11299 - 132135, n=56, ultimi 2 anni) | |
| Asus ProArt Studiobook 16 OLED H7604 | |
| MSI Stealth 17 Studio A13VH-014 | |
| Samsung Galaxy Book3 Ultra 16 | |
| Media Intel Core i9-13980HX (62189 - 80776, n=9) | |
| Gigabyte AERO 16 OLED BSF | |
| AIDA64 / Memory Read | |
| Media della classe Multimedia (11624 - 174586, n=56, ultimi 2 anni) | |
| Asus ProArt Studiobook 16 OLED H7604 | |
| Media Intel Core i9-13980HX (62624 - 89096, n=9) | |
| MSI Stealth 17 Studio A13VH-014 | |
| Samsung Galaxy Book3 Ultra 16 | |
| Gigabyte AERO 16 OLED BSF | |
| AIDA64 / Memory Write | |
| Samsung Galaxy Book3 Ultra 16 | |
| Media della classe Multimedia (11755 - 134998, n=56, ultimi 2 anni) | |
| MSI Stealth 17 Studio A13VH-014 | |
| Asus ProArt Studiobook 16 OLED H7604 | |
| Media Intel Core i9-13980HX (59912 - 79917, n=9) | |
| Gigabyte AERO 16 OLED BSF | |
| AIDA64 / Memory Latency | |
| Media della classe Multimedia (7 - 535, n=55, ultimi 2 anni) | |
| Samsung Galaxy Book3 Ultra 16 | |
| Gigabyte AERO 16 OLED BSF | |
| MSI Stealth 17 Studio A13VH-014 | |
| Media Intel Core i9-13980HX (79.4 - 93.2, n=9) | |
| Asus ProArt Studiobook 16 OLED H7604 | |
* ... Meglio usare valori piccoli
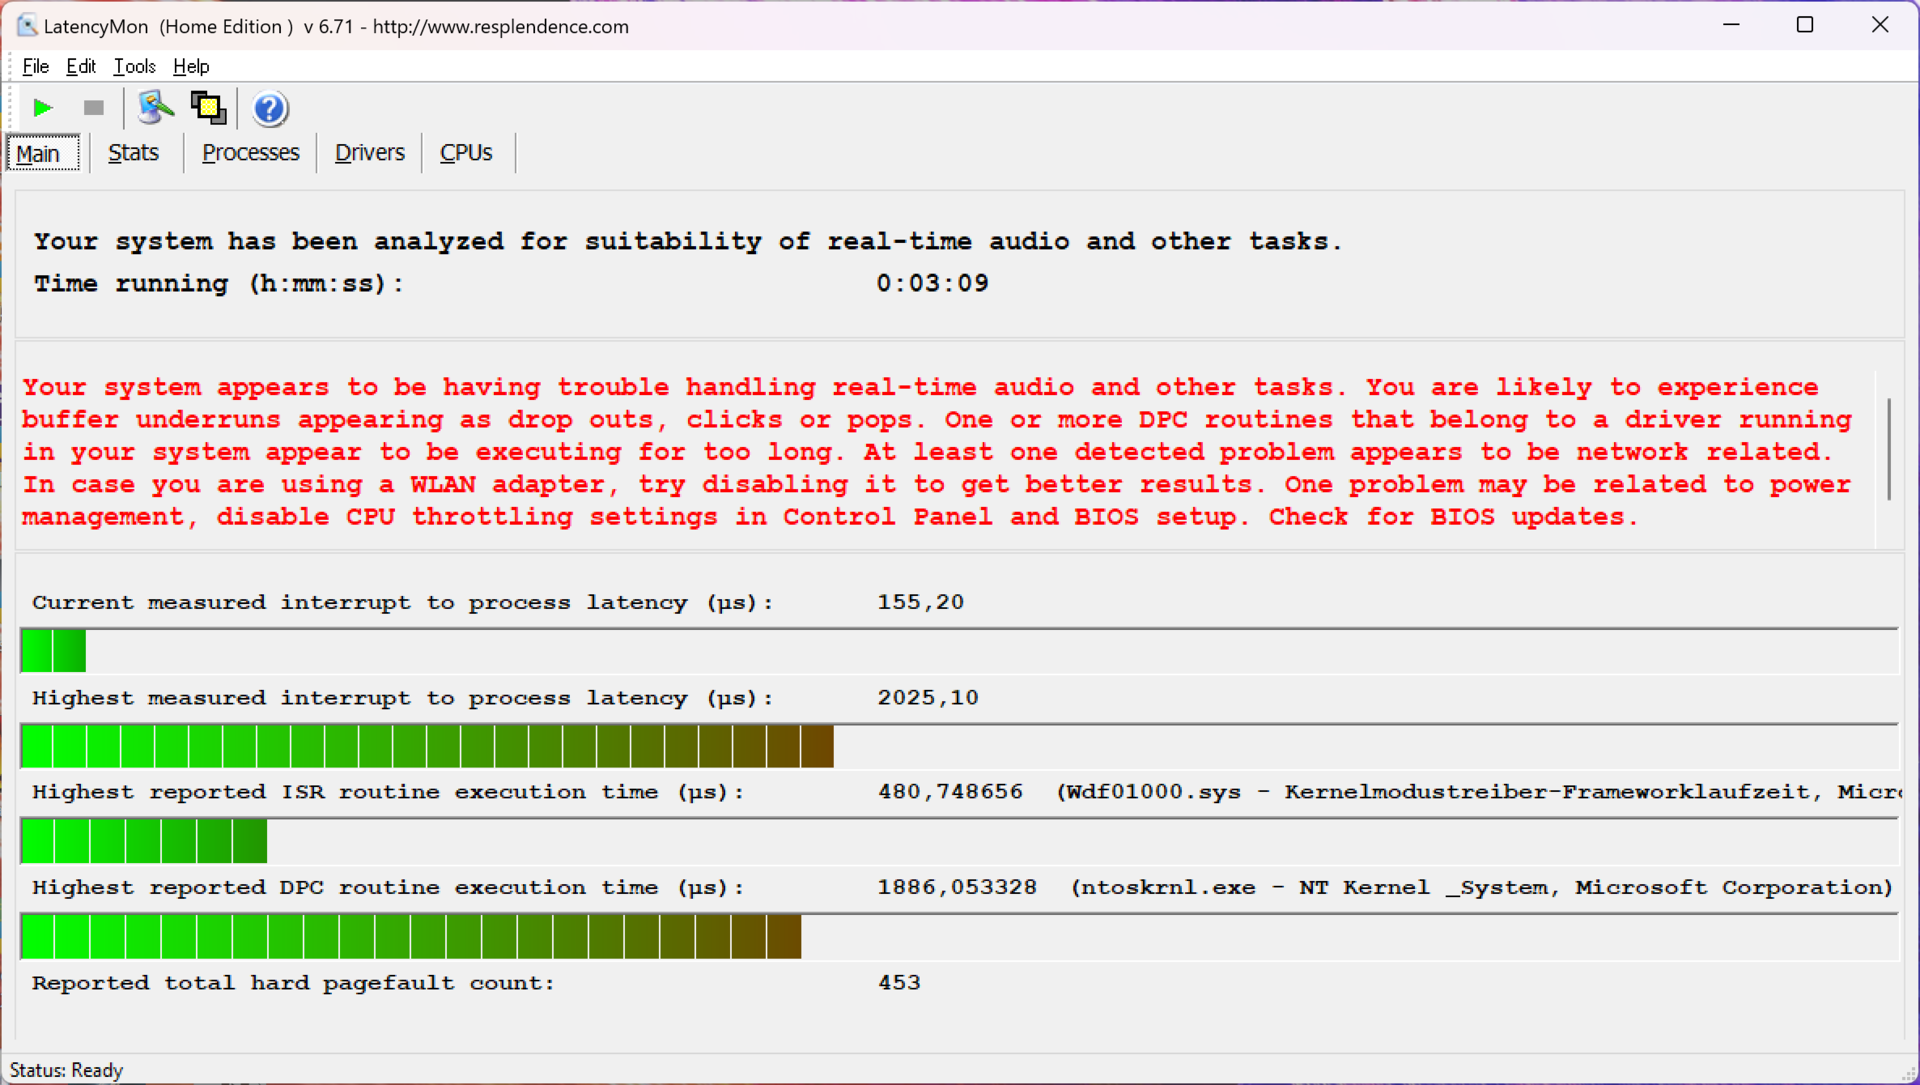
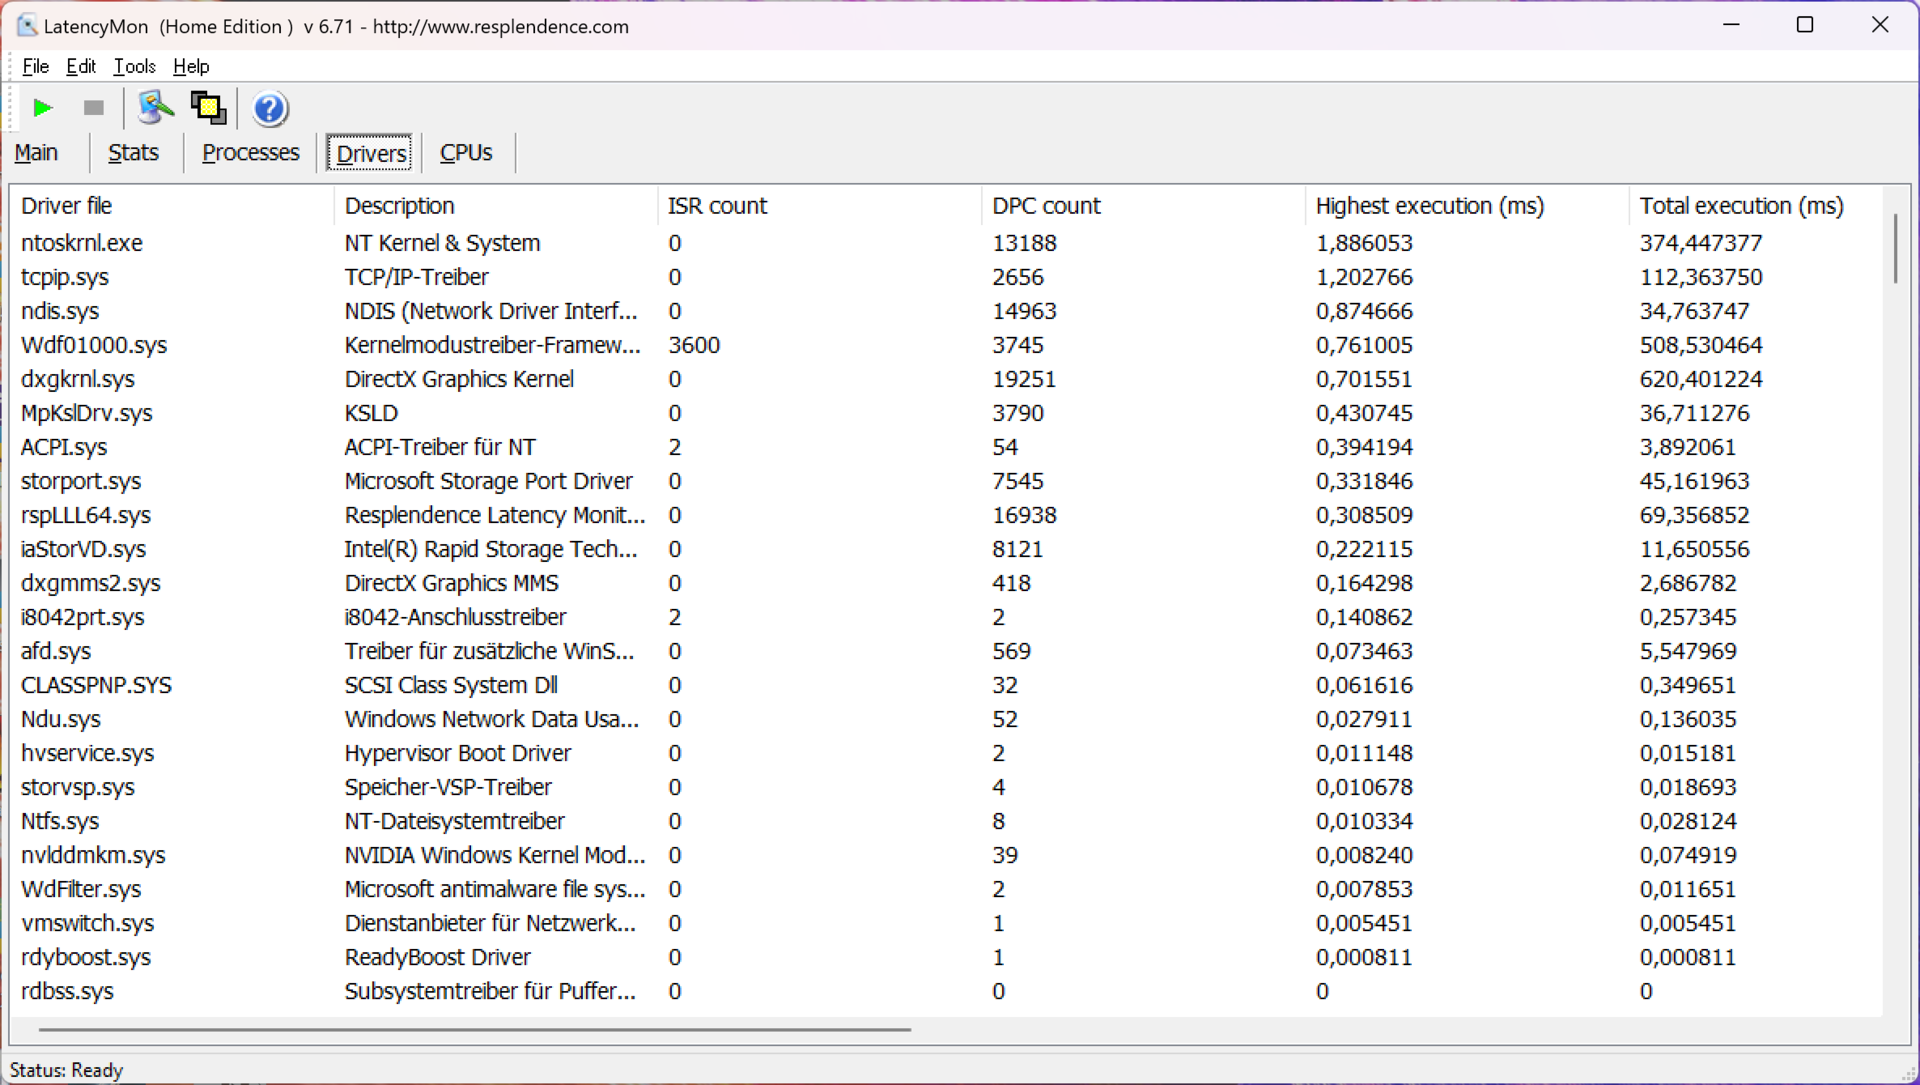
Latenza DPC
Lo Studiobook non è particolarmente adatto alle applicazioni audio in tempo reale. Nel nostro test di latenza standardizzato si sono verificate latenze elevate con l'attuale versione del BIOS.
| DPC Latencies / LatencyMon - interrupt to process latency (max), Web, Youtube, Prime95 | |
| Asus Zephyrus Duo 16 GX650PY-NM006W | |
| Samsung Galaxy Book3 Ultra 16 | |
| MSI Stealth 17 Studio A13VH-014 | |
| Asus ProArt Studiobook 16 OLED H7604 | |
| Gigabyte AERO 16 OLED BSF | |
* ... Meglio usare valori piccoli
Dispositivi di archiviazione
Nel nostro dispositivo di prova viene utilizzato un veloce SSD PCIe 4.0 di Phison, che offre un'enorme capacità di archiviazione di 4 TB. Di questi, 3,63 TB sono ancora disponibili dopo il primo avvio. L'unità è molto veloce, con velocità di trasferimento superiori a 7 GB/s e, soprattutto, le prestazioni possono essere mantenute costantemente, anche sotto carico permanente. Questo non è assolutamente uno standard. Inoltre, lo Studiobook 16 offre un altro slot M.2 2280, anch'esso collegato tramite la veloce interfaccia PCIe 4.0. Altri benchmark sulle SSD sono elencatiqui.

* ... Meglio usare valori piccoli
Sustained Read Performance: DiskSpd Read Loop, Queue Depth 8
Grafica
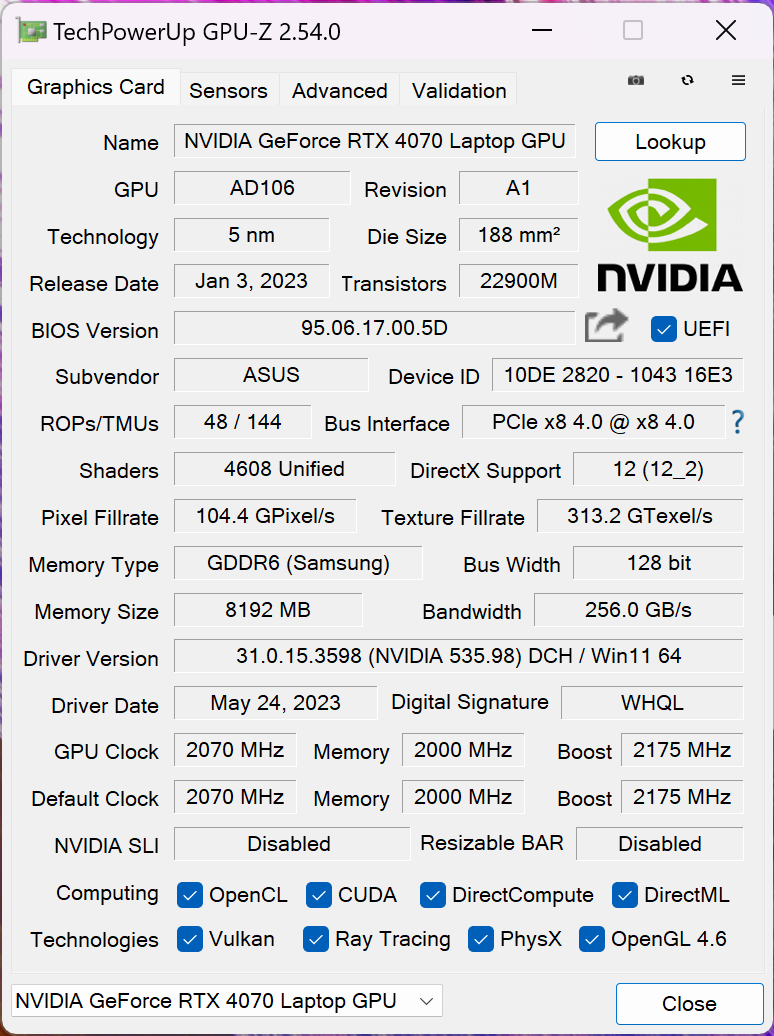
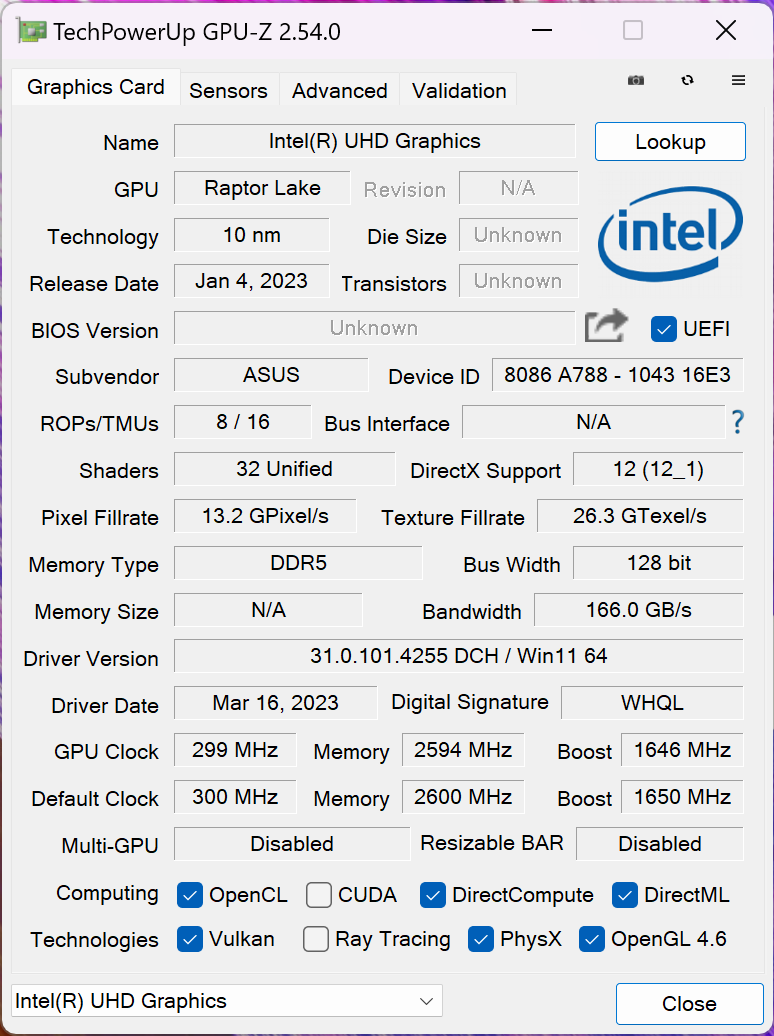
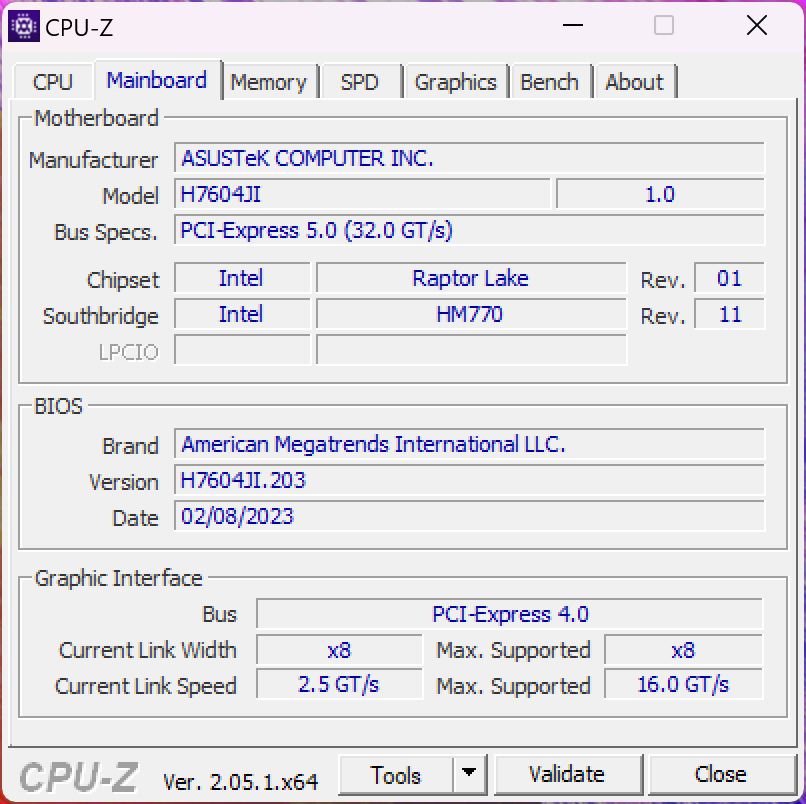
Oltre alla GPU integrata nel processore (UHD Graphics), è installata anche la veloce Nvidia GeForce RTX 4070 Laptop. La commutazione grafica avviene tramite Optimus, ma non è presente un Optimus avanzato o uno switch MUX. Con un TGP massimo di 130 watt, questo è uno dei modelli di laptop 4070 più veloci, ma questa cifra è un po' fuorviante. Come abbiamo visto nella nostra prima recensione delle nuove GPU mobili, questo valore può essere raggiunto in test sintetici come FurMark, ma il gioco è limitato a circa 105-110 watt perché la GPU raggiunge il suo clock massimo qui
Nei benchmark, la RTX 4070 è al livello previsto, dietro allaRTX 4080 Laptop e della 4090 Laptoprispetto al vecchio Studiobook 16 con la RTX 3070 Ti,il vantaggio del 7-15% non è così grande, quindi un aggiornamento non vale la pena. Le prestazioni della GPU rimangono stabili sotto carico permanente, ma le prestazioni sono inferiori di circa il 40% in modalità batteria (TGP massimo 40 watt). Altri benchmark della GPU sono disponibili qui https://www.notebookcheck.net/Mobile-Graphics-Cards-Benchmark-List.844.0.html.
| 3DMark 11 Performance | 35000 punti | |
| 3DMark Fire Strike Score | 25949 punti | |
| 3DMark Time Spy Score | 12384 punti | |
Aiuto | ||
| Blender / v3.3 Classroom OPTIX/RTX | |
| Media della classe Multimedia (12 - 105, n=23, ultimi 2 anni) | |
| Samsung Galaxy Book3 Ultra 16 | |
| Asus ProArt StudioBook 16 H7600ZW | |
| Schenker XMG Pro 15 (E23) | |
| Asus ProArt Studiobook 16 OLED H7604 | |
| Media NVIDIA GeForce RTX 4070 Laptop GPU (18 - 30, n=68) | |
| Gigabyte AERO 16 OLED BSF | |
| MSI Stealth 17 Studio A13VH-014 | |
| Asus Zephyrus Duo 16 GX650PY-NM006W | |
| Blender / v3.3 Classroom CUDA | |
| Samsung Galaxy Book3 Ultra 16 | |
| Media della classe Multimedia (20 - 186, n=23, ultimi 2 anni) | |
| Asus ProArt StudioBook 16 H7600ZW | |
| Schenker XMG Pro 15 (E23) | |
| Asus ProArt Studiobook 16 OLED H7604 | |
| Media NVIDIA GeForce RTX 4070 Laptop GPU (32 - 50, n=67) | |
| Gigabyte AERO 16 OLED BSF | |
| MSI Stealth 17 Studio A13VH-014 | |
| Asus Zephyrus Duo 16 GX650PY-NM006W | |
| Blender / v3.3 Classroom METAL | |
| Apple MacBook Pro 16 2023 M2 Max | |
| Media della classe Multimedia (17.8 - 68, n=5, ultimi 2 anni) | |
| Blender / v3.3 Classroom CPU | |
| Media della classe Multimedia (134.5 - 1042, n=63, ultimi 2 anni) | |
| Samsung Galaxy Book3 Ultra 16 | |
| Apple MacBook Pro 16 2023 M2 Max | |
| Gigabyte AERO 16 OLED BSF | |
| Media NVIDIA GeForce RTX 4070 Laptop GPU (158 - 440, n=67) | |
| Asus ProArt StudioBook 16 H7600ZW | |
| MSI Stealth 17 Studio A13VH-014 | |
| Schenker XMG Pro 15 (E23) | |
| Asus ProArt Studiobook 16 OLED H7604 | |
| Asus Zephyrus Duo 16 GX650PY-NM006W | |
* ... Meglio usare valori piccoli
Prestazioni di gioco
Le prestazioni di gioco dello Studiobook 16 sono molto buone e anche i titoli moderni possono essere riprodotti senza problemi in risoluzione QHD. Solo il ray tracing di solito richiede un upscaling per poter giocare senza problemi. Un buon esempio è Cyberpunk 2077, dove sono possibili solo 26 FPS con il preset Ray Tracing Ultra, che diventano 84 FPS con DLSS (compresa la Frame Generation). Naturalmente, l'aumento di velocità può variare a seconda del titolo e Cyberpunk è un titolo di punta per DLSS. Le prestazioni di gioco rimangono stabili durante le sessioni più lunghe, ma il vantaggio complessivo rispetto al vecchio studio book con la sua RTX 3070 Ti è minimo.
Witcher 3 FPS Chart
| basso | medio | alto | ultra | QHD | |
|---|---|---|---|---|---|
| GTA V (2015) | 183.4 | 179 | 123 | 94.5 | |
| The Witcher 3 (2015) | 249 | 107.1 | |||
| Dota 2 Reborn (2015) | 215 | 192.8 | 184.4 | 171.6 | |
| Final Fantasy XV Benchmark (2018) | 162.4 | 114.7 | 85.2 | ||
| X-Plane 11.11 (2018) | 181.6 | 164.3 | 131.1 | ||
| Far Cry 5 (2018) | 187 | 162 | 154 | 145 | 117 |
| Strange Brigade (2018) | 315 | 162.1 | 150.6 | 142.7 | 95.3 |
| Shadow of the Tomb Raider (2018) | 153 | 103 | |||
| F1 2021 (2021) | 441 | 336 | 264 | 149.8 | 110.9 |
| Cyberpunk 2077 1.6 (2022) | 129 | 113 | 96 | 87 | 54 |
| F1 22 (2022) | 138.5 | 133.8 | 111.2 | 59.4 | 42.4 |
| Call of Duty Modern Warfare 2 2022 (2022) | 102 | 72 |
Emissioni - Loud, Louder, Studiobook
Rumore
Le due ventole rimangono generalmente silenziose durante le attività quotidiane, ma diventano rapidamente rumorose non appena la CPU o la GPU sono sotto stress. Abbiamo elencato i valori nella tabella sottostante, ma in genere consigliamo di utilizzare cuffie o auricolari quando si gioca. È possibile ignorare la modalità Full Speed , poiché diventa solo più rumorosa e non offre alcun vantaggio in termini di prestazioni. Non sono stati rilevati altri rumori elettronici, come il fruscio della bobina
| Profilo energetico | 3DMark 06 | Witcher 3 | Cyberpoint 2077 | Test di stress |
|---|---|---|---|---|
| Default | 43,6dB(A) | 43,6dB(A) | 47,6dB(A) | 47,6dB(A) |
| Prestazioni | 43,6dB(A) | 43,6dB(A) | 47,6dB(A) | 47,6dB(A) |
| Velocità massima | 58,9dB(A) | 58,9dB(A) | 58,9dB(A) | 58,9dB(A) |
Rumorosità
| Idle |
| 24.5 / 24.5 / 24.5 dB(A) |
| Sotto carico |
| 47.6 / 56.7 dB(A) |
 | ||
30 dB silenzioso 40 dB(A) udibile 50 dB(A) rumoroso |
||
min: | ||
| Asus ProArt Studiobook 16 OLED H7604 GeForce RTX 4070 Laptop GPU, i9-13980HX, Phison EM2804TBMTCB47 | Gigabyte AERO 16 OLED BSF GeForce RTX 4070 Laptop GPU, i9-13900H, Gigabyte AG470S1TB-SI B10 | Samsung Galaxy Book3 Ultra 16 GeForce RTX 4050 Laptop GPU, i7-13700H, Samsung PM9A1 MZVL2512HCJQ | MSI Stealth 17 Studio A13VH-014 GeForce RTX 4080 Laptop GPU, i9-13900H, Samsung PM9A1 MZVL22T0HBLB | Apple MacBook Pro 16 2023 M2 Max M2 Max 38-Core GPU, M2 Max, Apple SSD AP2048Z | Asus Zephyrus Duo 16 GX650PY-NM006W GeForce RTX 4090 Laptop GPU, R9 7945HX, SK hynix PC801 HFS002TEJ9X101N | |
|---|---|---|---|---|---|---|
| Noise | -3% | 6% | 9% | 13% | -9% | |
| off /ambiente * (dB) | 24.5 | 23 6% | 25 -2% | 24 2% | 23.9 2% | 23.9 2% |
| Idle Minimum * (dB) | 24.5 | 23 6% | 26 -6% | 24 2% | 23.9 2% | 23.9 2% |
| Idle Average * (dB) | 24.5 | 23 6% | 27 -10% | 24 2% | 23.9 2% | 32.9 -34% |
| Idle Maximum * (dB) | 24.5 | 33.64 -37% | 28 -14% | 24 2% | 23.9 2% | 36.5 -49% |
| Load Average * (dB) | 47.6 | 51.49 -8% | 40 16% | 34.49 28% | 36.6 23% | 42.9 10% |
| Witcher 3 ultra * (dB) | 55.9 | 55.27 1% | 39 30% | 48.29 14% | 35.1 37% | 51.2 8% |
| Load Maximum * (dB) | 56.7 | 55.24 3% | 41 28% | 49.66 12% | 43.2 24% | 56 1% |
* ... Meglio usare valori piccoli
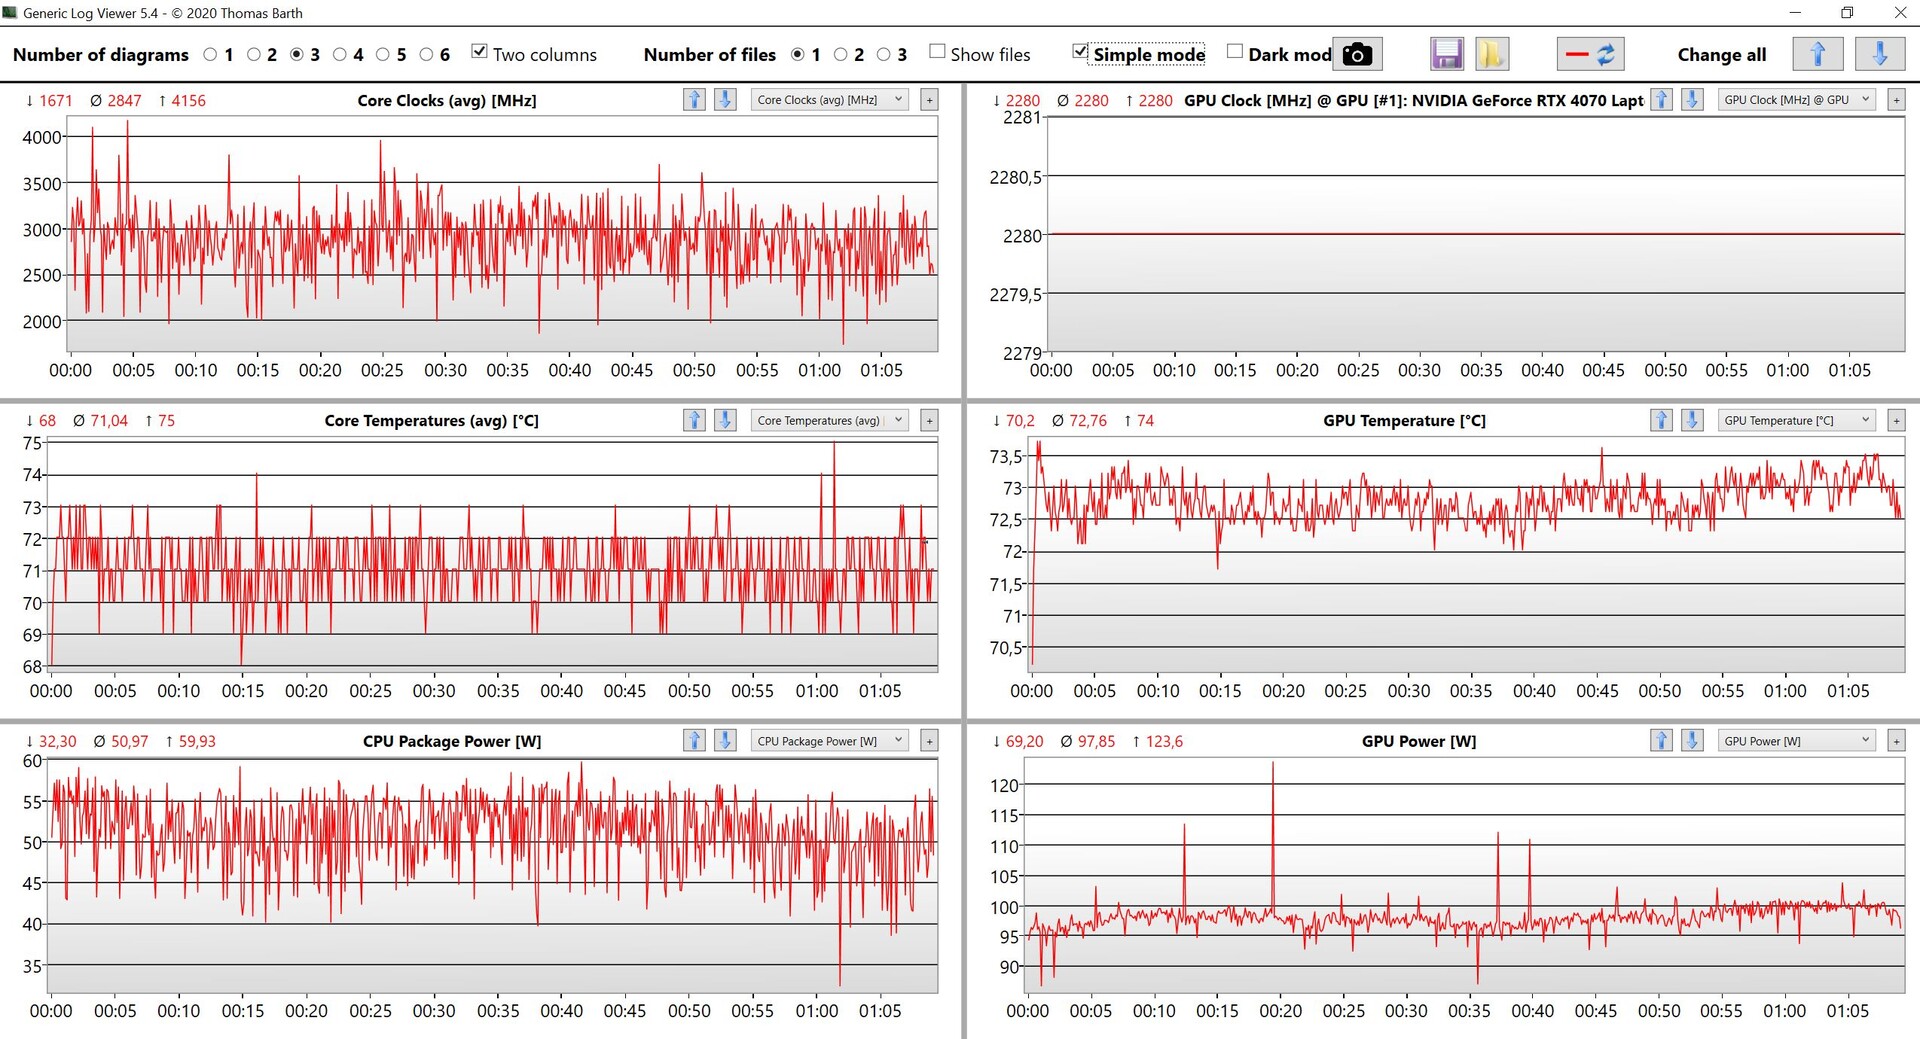
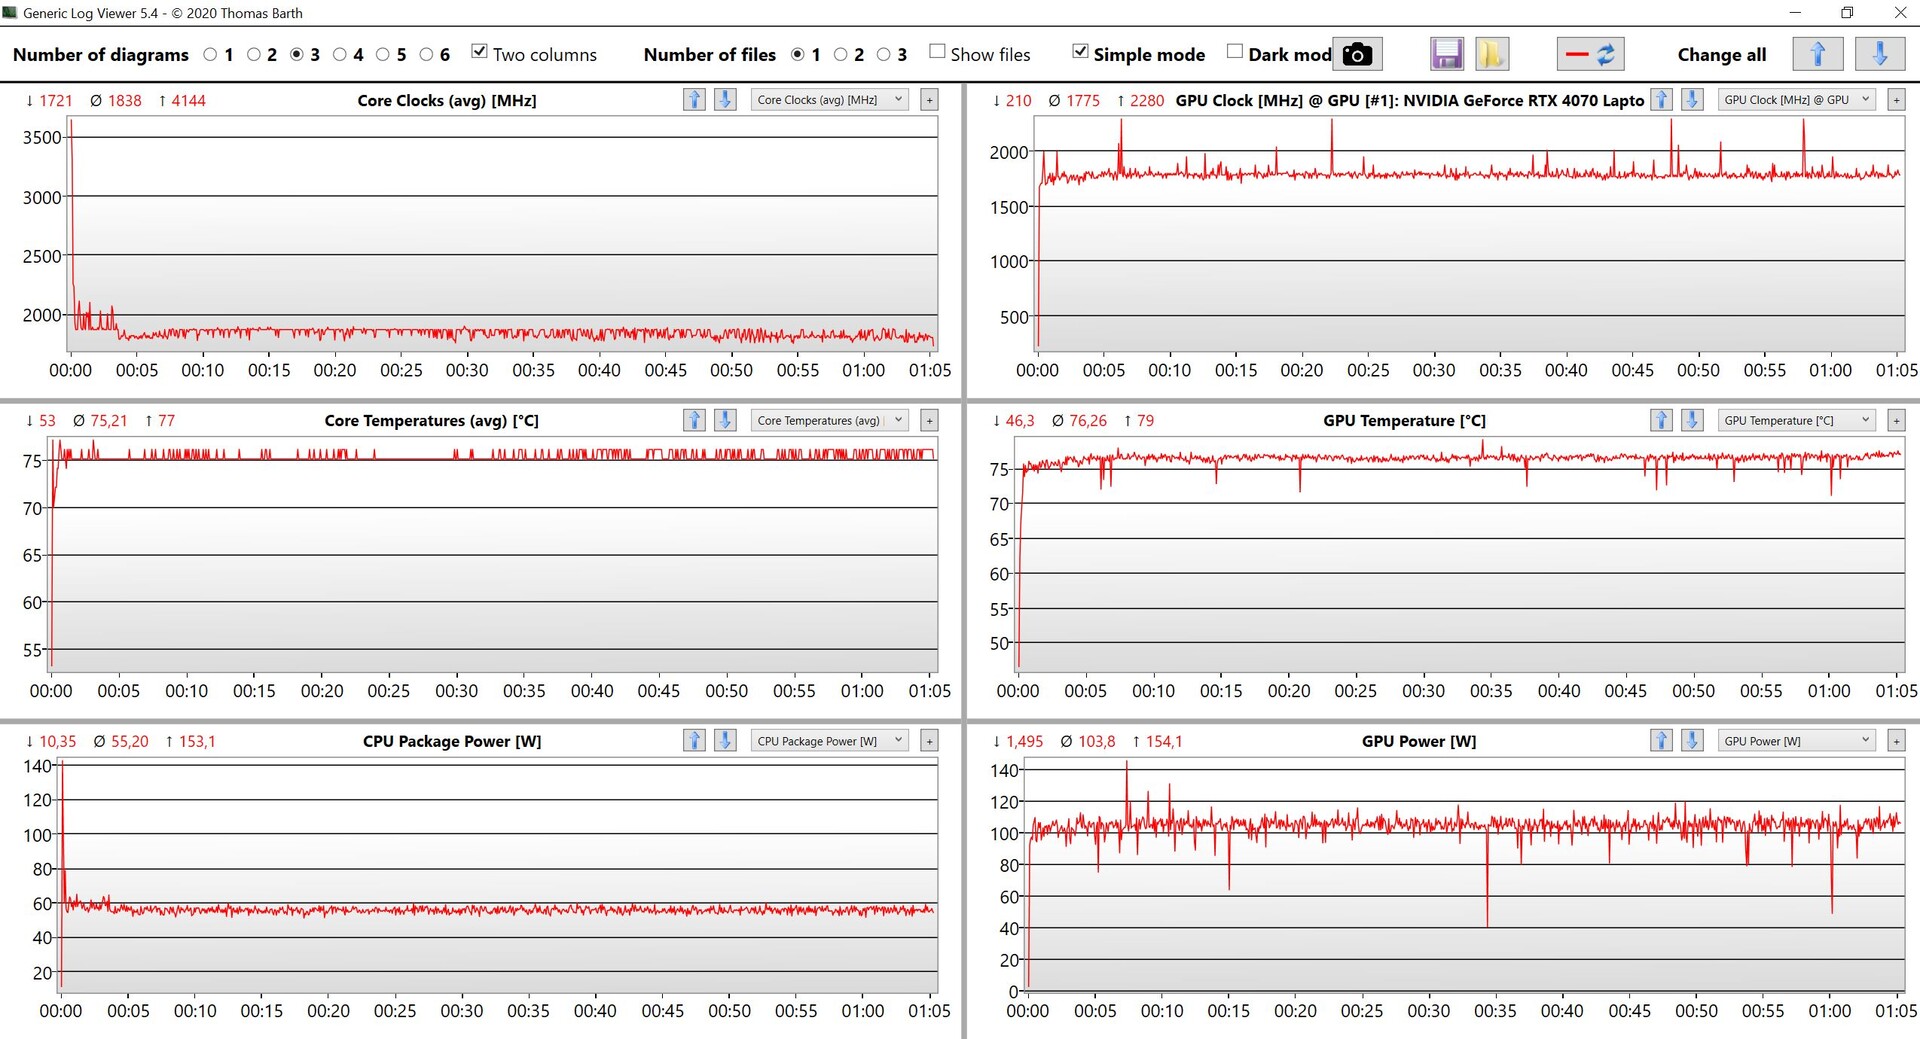
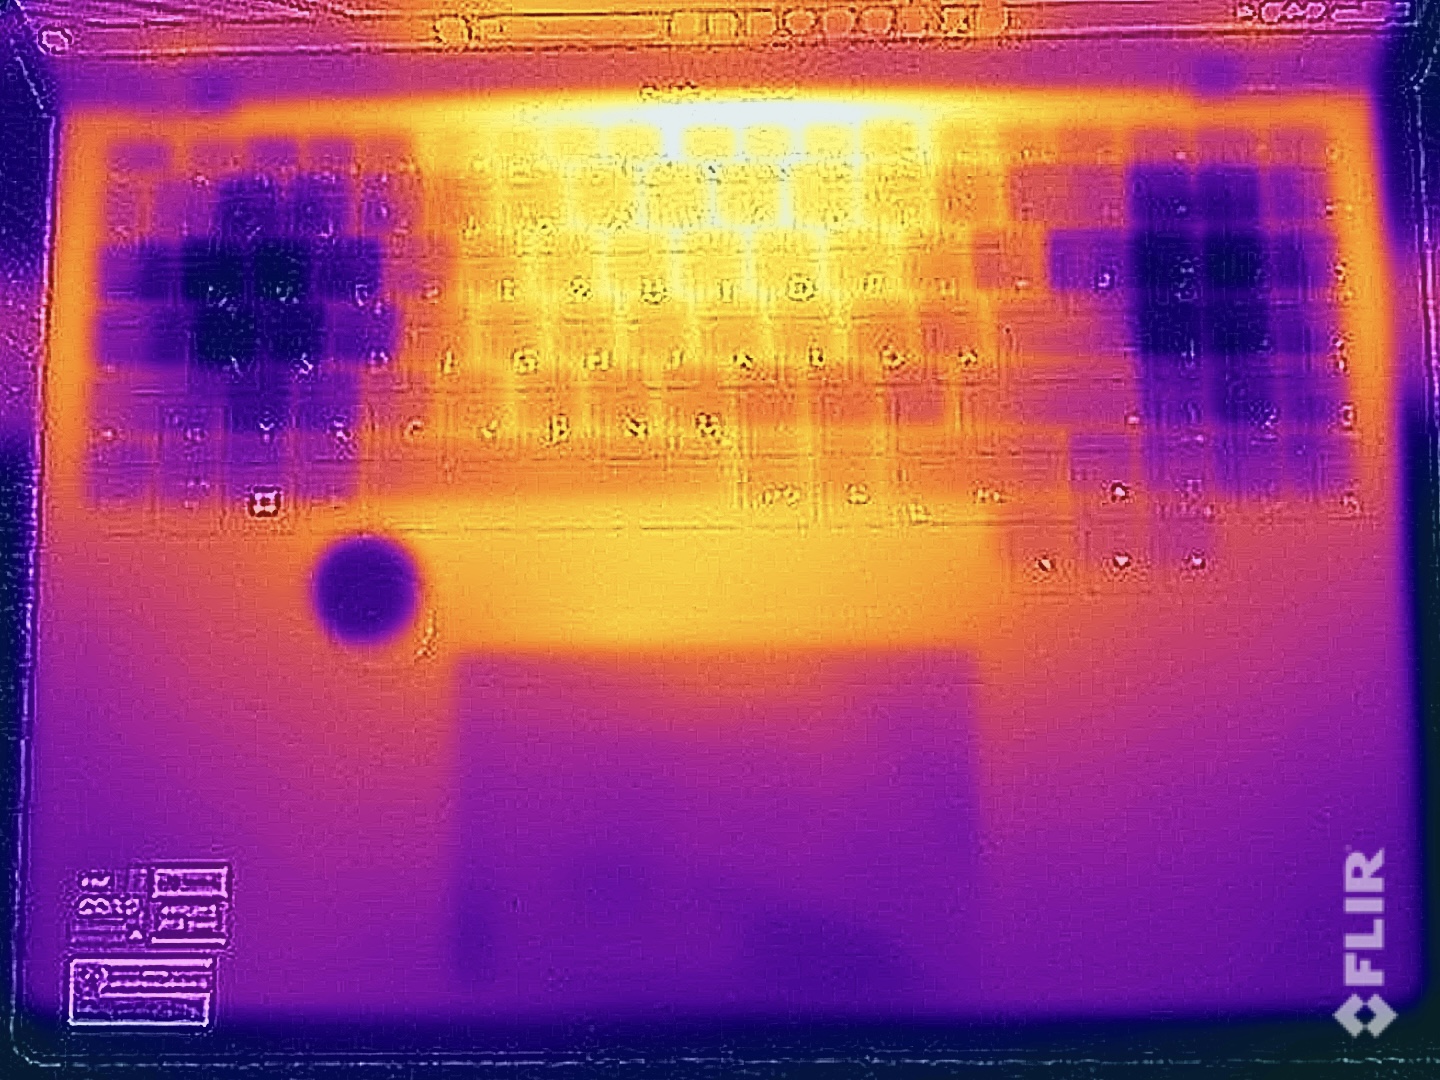
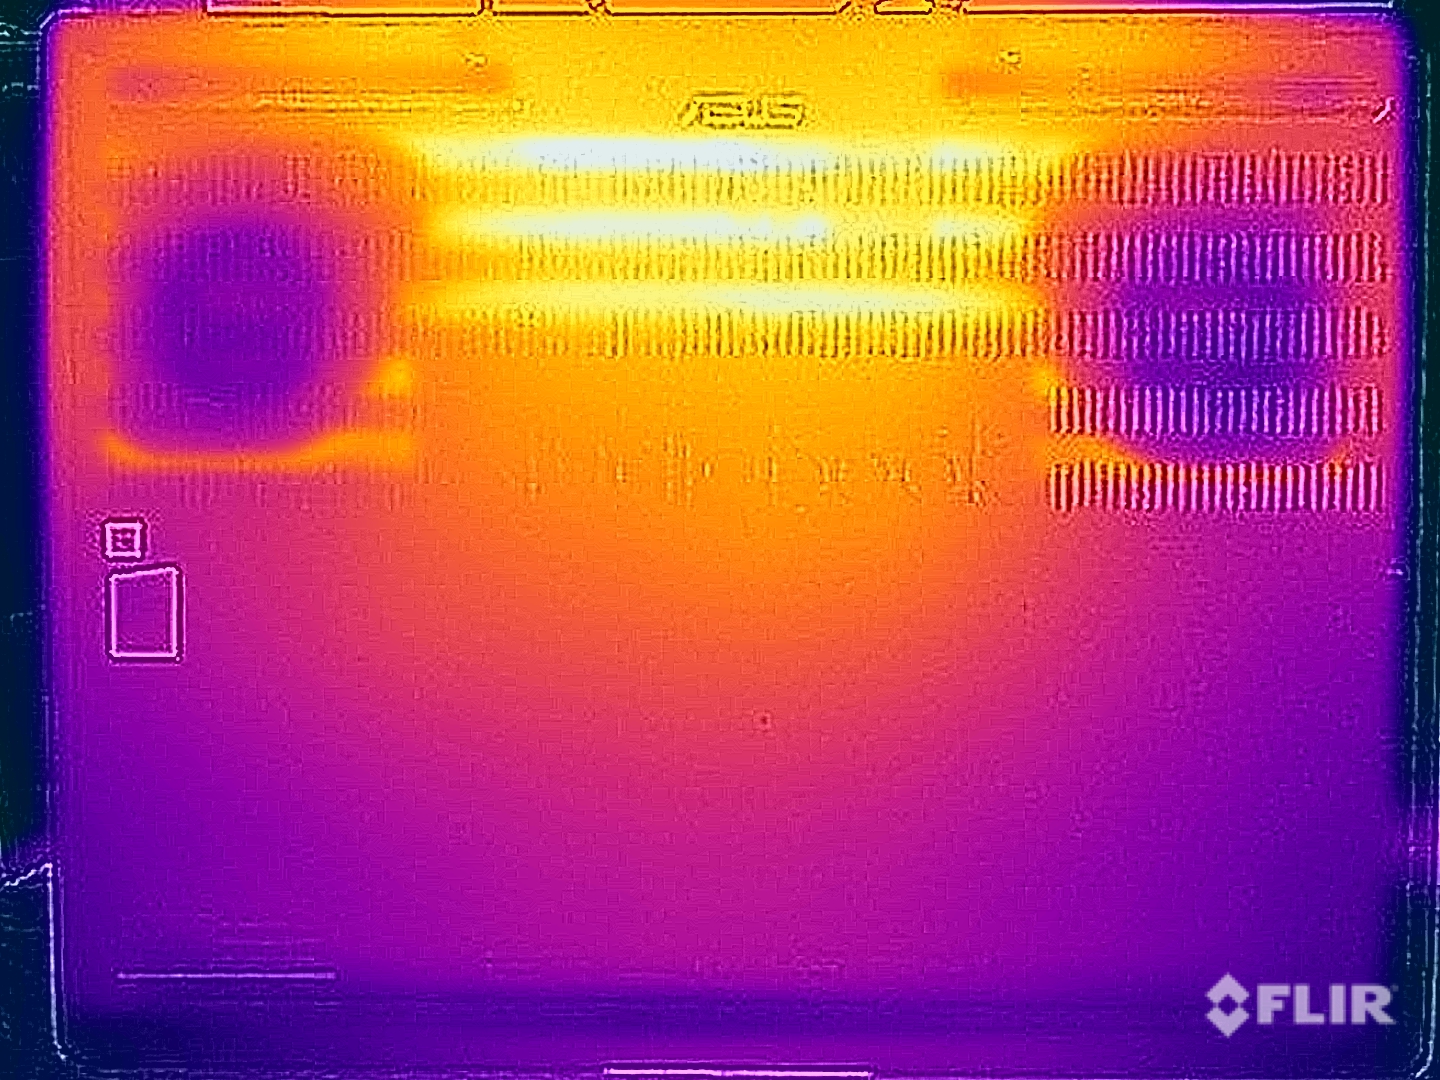
Temperatura
Le temperature di superficie sono complessivamente non problematiche, ma i forti componenti del portatile si fanno sentire rapidamente, anche in idle. Dato che le ventole non sono in funzione, abbiamo misurato più di 30 °C. Sotto carico, il lato superiore dell'unità di base rimane abbastanza confortevole con un massimo di 45 °C e non ci sono restrizioni durante la digitazione. Il lato inferiore raggiunge un massimo di poco meno di 48 °C al centro, motivo per cui è teoricamente possibile posizionare il dispositivo sulle ginocchia (ma è improbabile viste le dimensioni).
I due componenti si livellano molto rapidamente nello stress test, dove la scheda grafica è preferita dal sistema e lavora con circa 105 watt, mentre il processore è ancora a ~55 watt. Non è stata registrata alcuna riduzione delle prestazioni subito dopo lo stress test.
(±) La temperatura massima sul lato superiore è di 44.1 °C / 111 F, rispetto alla media di 36.8 °C / 98 F, che varia da 21 a 71 °C per questa classe Multimedia.
(-) Il lato inferiore si riscalda fino ad un massimo di 48 °C / 118 F, rispetto alla media di 39.1 °C / 102 F
(+) In idle, la temperatura media del lato superiore è di 31 °C / 88 F, rispetto alla media deld ispositivo di 31.3 °C / 88 F.
(±) Riproducendo The Witcher 3, la temperatura media per il lato superiore e' di 34.9 °C / 95 F, rispetto alla media del dispositivo di 31.3 °C / 88 F.
(+) I poggiapolsi e il touchpad raggiungono la temperatura massima della pelle (32.3 °C / 90.1 F) e quindi non sono caldi.
(-) La temperatura media della zona del palmo della mano di dispositivi simili e'stata di 28.7 °C / 83.7 F (-3.6 °C / -6.4 F).
| Asus ProArt Studiobook 16 OLED H7604 Intel Core i9-13980HX, NVIDIA GeForce RTX 4070 Laptop GPU | Gigabyte AERO 16 OLED BSF Intel Core i9-13900H, NVIDIA GeForce RTX 4070 Laptop GPU | Samsung Galaxy Book3 Ultra 16 Intel Core i7-13700H, NVIDIA GeForce RTX 4050 Laptop GPU | MSI Stealth 17 Studio A13VH-014 Intel Core i9-13900H, NVIDIA GeForce RTX 4080 Laptop GPU | Apple MacBook Pro 16 2023 M2 Max Apple M2 Max, Apple M2 Max 38-Core GPU | Asus Zephyrus Duo 16 GX650PY-NM006W AMD Ryzen 9 7945HX, NVIDIA GeForce RTX 4090 Laptop GPU | |
|---|---|---|---|---|---|---|
| Heat | 18% | 18% | -1% | 20% | 7% | |
| Maximum Upper Side * (°C) | 44.1 | 41 7% | 41 7% | 47 -7% | 44.2 -0% | 44.2 -0% |
| Maximum Bottom * (°C) | 48 | 47 2% | 44 8% | 54 -13% | 42.9 11% | 46.8 2% |
| Idle Upper Side * (°C) | 32.7 | 23 30% | 23 30% | 30 8% | 22.4 31% | 29.2 11% |
| Idle Bottom * (°C) | 34.9 | 23 34% | 26 26% | 32 8% | 22.3 36% | 30.2 13% |
* ... Meglio usare valori piccoli
Altoparlanti
L'impianto audio è composto da quattro altoparlanti che offrono una buona qualità sonora. Sebbene non sia sufficiente per competere con il MacBook Pro 16, poiché manca ancora un po' di pressione, è comunque complessivamente soddisfacente. Le prestazioni sono sufficienti per i video e per un po' di musica di sottofondo, e comunque non si sente molto dagli altoparlanti durante i giochi a causa delle forti ventole.
Asus ProArt Studiobook 16 OLED H7604 analisi audio
(+) | gli altoparlanti sono relativamente potenti (84 dB)
Bassi 100 - 315 Hz
(±) | bassi ridotti - in media 14.1% inferiori alla media
(±) | la linearità dei bassi è media (9.5% delta rispetto alla precedente frequenza)
Medi 400 - 2000 Hz
(+) | medi bilanciati - solo only 1.9% rispetto alla media
(+) | medi lineari (3.8% delta rispetto alla precedente frequenza)
Alti 2 - 16 kHz
(+) | Alti bilanciati - appena 4.2% dalla media
(+) | alti lineari (3.9% delta rispetto alla precedente frequenza)
Nel complesso 100 - 16.000 Hz
(+) | suono nel complesso lineare (11.2% differenza dalla media)
Rispetto alla stessa classe
» 17% di tutti i dispositivi testati in questa classe è stato migliore, 4% simile, 80% peggiore
» Il migliore ha avuto un delta di 5%, medio di 17%, peggiore di 45%
Rispetto a tutti i dispositivi testati
» 7% di tutti i dispositivi testati in questa classe è stato migliore, 2% similare, 91% peggiore
» Il migliore ha avuto un delta di 4%, medio di 23%, peggiore di 134%
Apple MacBook Pro 16 2023 M2 Max analisi audio
(+) | gli altoparlanti sono relativamente potenti (86.1 dB)
Bassi 100 - 315 Hz
(+) | bassi buoni - solo 3.9% dalla media
(+) | bassi in lineaa (5.7% delta rispetto alla precedente frequenza)
Medi 400 - 2000 Hz
(+) | medi bilanciati - solo only 1.2% rispetto alla media
(+) | medi lineari (1.5% delta rispetto alla precedente frequenza)
Alti 2 - 16 kHz
(+) | Alti bilanciati - appena 2.5% dalla media
(+) | alti lineari (1.7% delta rispetto alla precedente frequenza)
Nel complesso 100 - 16.000 Hz
(+) | suono nel complesso lineare (4.9% differenza dalla media)
Rispetto alla stessa classe
» 0% di tutti i dispositivi testati in questa classe è stato migliore, 0% simile, 99% peggiore
» Il migliore ha avuto un delta di 5%, medio di 17%, peggiore di 45%
Rispetto a tutti i dispositivi testati
» 0% di tutti i dispositivi testati in questa classe è stato migliore, 0% similare, 100% peggiore
» Il migliore ha avuto un delta di 4%, medio di 23%, peggiore di 134%
Gestione dell'alimentazione - StudioBook con breve durata della batteria
Consumo di energia
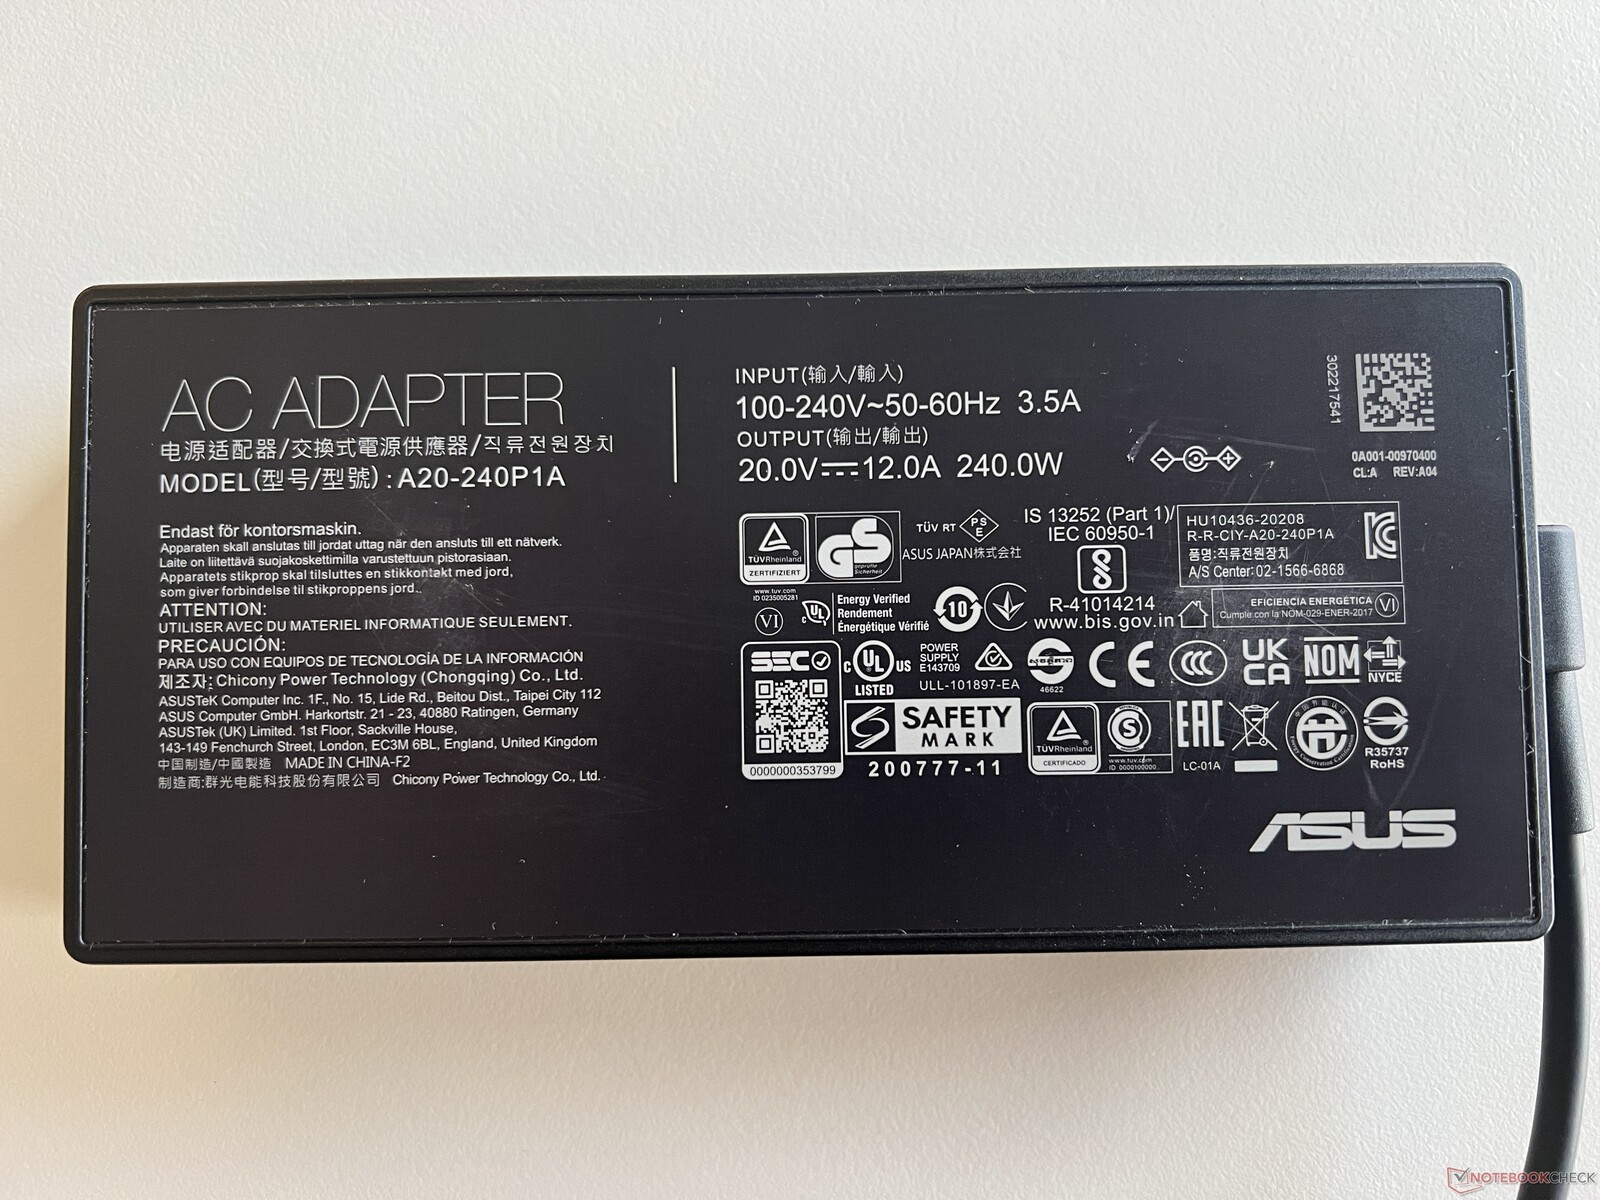
A causa del grande pannello OLED e del processore HX, l'efficienza dello Studiobook 16 non è particolarmente buona. Abbiamo misurato tra i 12 e i 21 watt in idle, a seconda della luminosità, anche se occasionalmente raggiunge i 36 watt in modalità HDR. Sotto carico, non ci sono sorprese: sale a circa 200 watt durante il gioco e si stabilizza a circa 210 watt dopo i ~247 watt iniziali nello stress test. L'alimentatore da 240 watt in dotazione è quindi sufficientemente dimensionato.
| Off / Standby | |
| Idle | |
| Sotto carico |
|
Leggenda:
min: | |
| Asus ProArt Studiobook 16 OLED H7604 i9-13980HX, GeForce RTX 4070 Laptop GPU, Phison EM2804TBMTCB47, OLED, 3200x2000, 16" | Gigabyte AERO 16 OLED BSF i9-13900H, GeForce RTX 4070 Laptop GPU, Gigabyte AG470S1TB-SI B10, OLED, 3840x2400, 16" | Samsung Galaxy Book3 Ultra 16 i7-13700H, GeForce RTX 4050 Laptop GPU, Samsung PM9A1 MZVL2512HCJQ, AMOLED, 2880x1800, 16" | MSI Stealth 17 Studio A13VH-014 i9-13900H, GeForce RTX 4080 Laptop GPU, Samsung PM9A1 MZVL22T0HBLB, Mini LED, 3840x2160, 17.3" | Apple MacBook Pro 16 2023 M2 Max M2 Max, M2 Max 38-Core GPU, Apple SSD AP2048Z, Mini-LED, 3456x2234, 16.2" | Asus Zephyrus Duo 16 GX650PY-NM006W R9 7945HX, GeForce RTX 4090 Laptop GPU, SK hynix PC801 HFS002TEJ9X101N, MiniLED, 2560x1600, 16" | Media NVIDIA GeForce RTX 4070 Laptop GPU | Media della classe Multimedia | |
|---|---|---|---|---|---|---|---|---|
| Power Consumption | 18% | 61% | 10% | 34% | -35% | 4% | 49% | |
| Idle Minimum * (Watt) | 12.8 | 11.8 8% | 3 77% | 13.9 -9% | 5.2 59% | 19.2 -50% | 13.2 ? -3% | 5.72 ? 55% |
| Idle Average * (Watt) | 19.9 | 16.1 19% | 5 75% | 20 -1% | 16.5 17% | 29.7 -49% | 18.2 ? 9% | 10.2 ? 49% |
| Idle Maximum * (Watt) | 20.3 | 17 16% | 11 46% | 20.6 -1% | 16.8 17% | 30.8 -52% | 24.6 ? -21% | 12.4 ? 39% |
| Load Average * (Watt) | 131.4 | 100.6 23% | 72 45% | 77 41% | 113 14% | 126 4% | 97 ? 26% | 65.5 ? 50% |
| Witcher 3 ultra * (Watt) | 196.5 | 158 20% | 69.7 65% | 162 18% | 92 53% | 258 -31% | ||
| Load Maximum * (Watt) | 246.8 | 192 22% | 108 56% | 216 12% | 145 41% | 330 -34% | 221 ? 10% | 114 ? 54% |
* ... Meglio usare valori piccoli
Power consumption Witcher 3 / Stress test
Power consumption with an external monitor
Durata della batteria
Visti i tassi di consumo, non sorprende che la durata della batteria non sia particolarmente buona, nonostante la batteria da 90 Wh. Per impostazione predefinita, il portatile passa alla modalità 60 Hz non appena lo si scollega. Nonostante ciò, abbiamo registrato appena 5,5 ore nel test WLAN a 150 cd/m² (120 Hz: 5 ore) e circa 4,5 ore a piena luminosità (120 Hz: ~3,5 ore). Il test video dura poco meno di 6 ore. Un video HDR alla massima luminosità scarica la batteria dopo ~2:40 ore e circa un'ora sotto carico, nonostante le prestazioni ridotte.
| Asus ProArt Studiobook 16 OLED H7604 i9-13980HX, GeForce RTX 4070 Laptop GPU, 90 Wh | Gigabyte AERO 16 OLED BSF i9-13900H, GeForce RTX 4070 Laptop GPU, 88 Wh | Samsung Galaxy Book3 Ultra 16 i7-13700H, GeForce RTX 4050 Laptop GPU, 76 Wh | MSI Stealth 17 Studio A13VH-014 i9-13900H, GeForce RTX 4080 Laptop GPU, 99 Wh | Apple MacBook Pro 16 2023 M2 Max M2 Max, M2 Max 38-Core GPU, 99.6 Wh | Asus Zephyrus Duo 16 GX650PY-NM006W R9 7945HX, GeForce RTX 4090 Laptop GPU, 90 Wh | Media della classe Multimedia | |
|---|---|---|---|---|---|---|---|
| Autonomia della batteria | 49% | 86% | 13% | 125% | -25% | 114% | |
| H.264 (h) | 6 | 7.4 23% | 13.4 123% | 5.6 -7% | 18.7 212% | 3.8 -37% | 16.4 ? 173% |
| WiFi v1.3 (h) | 5.6 | 7.5 34% | 9.6 71% | 5.6 0% | 14.8 164% | 4 -29% | 12.2 ? 118% |
| Load (h) | 1.1 | 2.1 91% | 1.8 64% | 1.6 45% | 1.1 0% | 1 -9% | 1.668 ? 52% |
| Witcher 3 ultra (h) | 2.6 |
Pro
Contro
Verdetto - Studiobook 16 con debolezze nei dettagli
Il nuovo ProArt Studiobook 16 OLED 2023 offre molte prestazioni e nel complesso è un buon portatile per gli utenti creativi, anche se presenta alcuni punti deboli nei dettagli. Prima di tutto, il Core i9-13980HX, il processore mobile più veloce di Intel, offre una grande potenza della CPU, ma è ancora inferiore al processore AMD Ryzen 9 7945HX in termini di prestazioni multi-core e di efficienza. Rispetto al Core i9-12900H del vecchio modello, invece, offre prestazioni notevolmente superiori. Tuttavia, questo non vale per la scheda grafica, perché la RTX 4070 Laptop è solo leggermente più veloce della RTX 3070 Ti, quindi in questo caso l'upgrade non vale la pena. Altri punti critici sono il raffreddamento convenzionale e il rumore della ventola in particolare, poiché il dispositivo diventa rapidamente molto rumoroso. Almeno le temperature rimangono entro i limiti.
Il display OLED è passato dal pannello 4K a 60 Hz a un touchscreen a 120 Hz con una risoluzione leggermente inferiore. La qualità dell'immagine è fondamentalmente molto buona, ma come altri touchscreen OLED di Asus, le aree luminose appaiono leggermente sgranate. Ci sono anche leggere deviazioni di colore che non siamo riusciti a correggere con la nostra calibrazione. Lo schermo OLED ha anche un impatto negativo sulla durata della batteria. La funzione software contro lo sfarfallio PWM è buona, ma le regolazioni devono essere effettuate di volta in volta tramite il software, il che è scomodo.
Tanta potenza, ma anche ventole rumorose: Il ProArt Studiobook 16 è senza dubbio un dispositivo veloce e il DialPad può aggiungere valore agli utenti creativi. Tuttavia, l'OLED a 120 Hz non convince del tutto.
Oltre al touchscreen, lo Studiobook 16 offre nuovamente il DialPad aggiuntivo, che funziona particolarmente bene con le app Adobe e può offrire un valore aggiunto anche in questo caso. Le funzionalità HDR sono ancora limitate, ma questo è dovuto a Windows. L'HDR deve essere attivato manualmente e i profili colore non sono più disponibili. Inoltre, i mini pannelli LED hanno un vantaggio quando si tratta di luminosità massima. Anche se il MacBook Pro 16 offre prestazioni della CPU nettamente inferiori (almeno nel funzionamento a rete), è comunque un'ottima scelta per gli utenti creativi e offre una durata della batteria nettamente superiore nell'uso quotidiano. Prestazioni ancora maggiori sono offerte dal ROG Zephyrus Duo 16, che è indicato come gamer, ma è interessante anche per i creatori di contenuti grazie al secondo display.
Prezzo e disponibilità
Una variante dell'Asus ProArt Studiobook 16 OLED (CPU Intel Core i9-13980HX, GPU Nvidia Geforce RTX 4070, 32GB DDR5 SO-DIMM RAM, 1TB SSD) è disponibile su Amazon USA al prezzo di 2499,99 dollari.
I prezzi sono aggiornati al 29.06.23 e sono soggetti a modifiche.
Asus ProArt Studiobook 16 OLED H7604
- 06/27/2023 v7 (old)
Andreas Osthoff
Transparency
La selezione dei dispositivi da recensire viene effettuata dalla nostra redazione. Il campione di prova è stato fornito all'autore come prestito dal produttore o dal rivenditore ai fini di questa recensione. L'istituto di credito non ha avuto alcuna influenza su questa recensione, né il produttore ne ha ricevuto una copia prima della pubblicazione. Non vi era alcun obbligo di pubblicare questa recensione. In quanto società mediatica indipendente, Notebookcheck non è soggetta all'autorità di produttori, rivenditori o editori.
Ecco come Notebookcheck esegue i test
Ogni anno, Notebookcheck esamina in modo indipendente centinaia di laptop e smartphone utilizzando procedure standardizzate per garantire che tutti i risultati siano comparabili. Da circa 20 anni sviluppiamo continuamente i nostri metodi di prova e nel frattempo stabiliamo gli standard di settore. Nei nostri laboratori di prova, tecnici ed editori esperti utilizzano apparecchiature di misurazione di alta qualità. Questi test comportano un processo di validazione in più fasi. Il nostro complesso sistema di valutazione si basa su centinaia di misurazioni e parametri di riferimento ben fondati, che mantengono l'obiettività.Price comparison

