Recensione del portatile gaming Schenker XMG Pro 15 E23 (PD50SND-G): Ecco l'equilibrio tra lavoro e gioco!
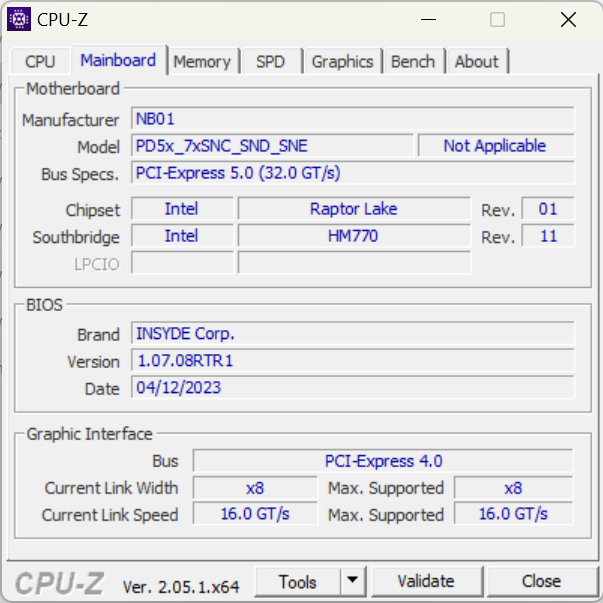
I portatili Schenker vengono aggiornati regolarmente e l'anno scorso abbiamo recensito due dei predecessori dell'XMG Pro 15. Uno di questi è stato dotato di un nuovo modello. Uno con unaTiger Lake CPUe uno con Alder Lakeed entrambi dotati di RTX 3080. Per quanto riguarda il processore, il nostro dispositivo in prova è equipaggiato con l'ultima generazione Raptor Lake e ha optato per unaNvidia GeForce RTX 4060. Ma il portatile non ha ricevuto solo modifiche interne, poiché anche il design è stato leggermente rinnovato. Il dispositivo è ora basato sul Clevo PD50SND-G barebone.
Il confronto con il predecessore è interessante perché, sebbene la scheda grafica provenga ora dall'ultima generazione Ada Lovelace di Nvidia, la sua classe di appartenenza è stata abbassata da 80 a 60. Un'altra opzione di configurazione è rappresentata dalla schedaRTX 4070. Entrambe le schede grafiche funzionano a 140-150 watt. Il Pro 15 E23 è riuscito a ottenere prestazioni impressionanti e a reggere bene il confronto con portatili da gioco come il Dell G15 5530 o ilAorus 15X ASF. Un po' più in là di questo livello è ilAsus ZenBook Pro 14 Duo. Tuttavia, il portatile multimediale vanta anche un elevato numero di fps in molti titoli attuali.
Potenziali concorrenti a confronto
Punteggio | Data | Modello | Peso | Altezza | Dimensione | Risoluzione | Prezzo |
|---|---|---|---|---|---|---|---|
| 86.2 % v7 (old) | 07/2023 | Schenker XMG Pro 15 (E23) i9-13900HX, GeForce RTX 4060 Laptop GPU | 2.4 kg | 24.9 mm | 15.60" | 2560x1440 | |
| 86.9 % v7 (old) | 07/2022 | Schenker XMG Pro 15 (i7-12700H, RTX 3080 Ti) i7-12700H, GeForce RTX 3080 Ti Laptop GPU | 2.4 kg | 25 mm | 15.60" | 2560x1440 | |
| 84.2 % v7 (old) | 06/2023 | Dell G15 5530 i7-13650HX, GeForce RTX 4060 Laptop GPU | 3 kg | 26.95 mm | 15.60" | 1920x1080 | |
| 86.3 % v7 (old) | 06/2023 | Asus TUF A15 FA507 R7 7735HS, GeForce RTX 4050 Laptop GPU | 2.2 kg | 24.9 mm | 15.60" | 1920x1080 | |
| 86.2 % v7 (old) | 04/2023 | Aorus 15X ASF i7-13700HX, GeForce RTX 4070 Laptop GPU | 2.3 kg | 19.7 mm | 15.60" | 2560x1440 | |
| 87 % v7 (old) | 06/2023 | Asus ZenBook Pro 14 Duo UX8402VV-P1021W i9-13900H, GeForce RTX 4060 Laptop GPU | 1.8 kg | 21 mm | 14.50" | 2880x1800 | |
| 82.4 % v7 (old) | 04/2023 | MSI Cyborg 15 A12VF i7-12650H, GeForce RTX 4060 Laptop GPU | 2 kg | 22.9 mm | 15.60" | 1920x1080 | |
| 88.4 % v7 (old) | 06/2023 | Alienware x16 R1 i9-13900HK, GeForce RTX 4080 Laptop GPU | 2.6 kg | 18.57 mm | 16.00" | 2560x1600 |
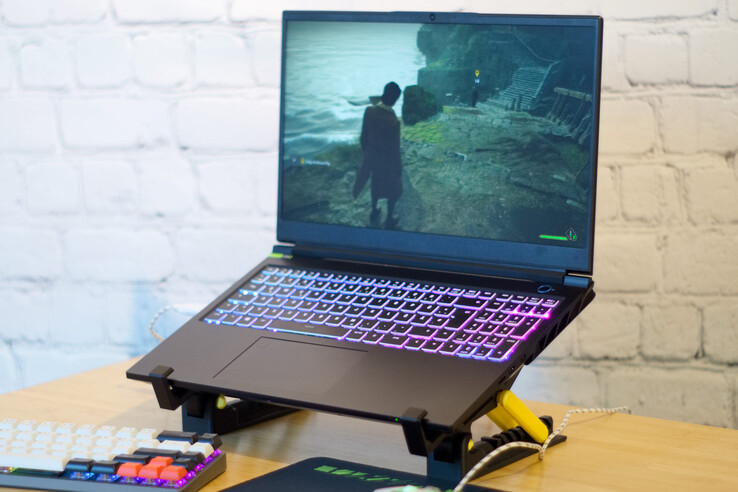
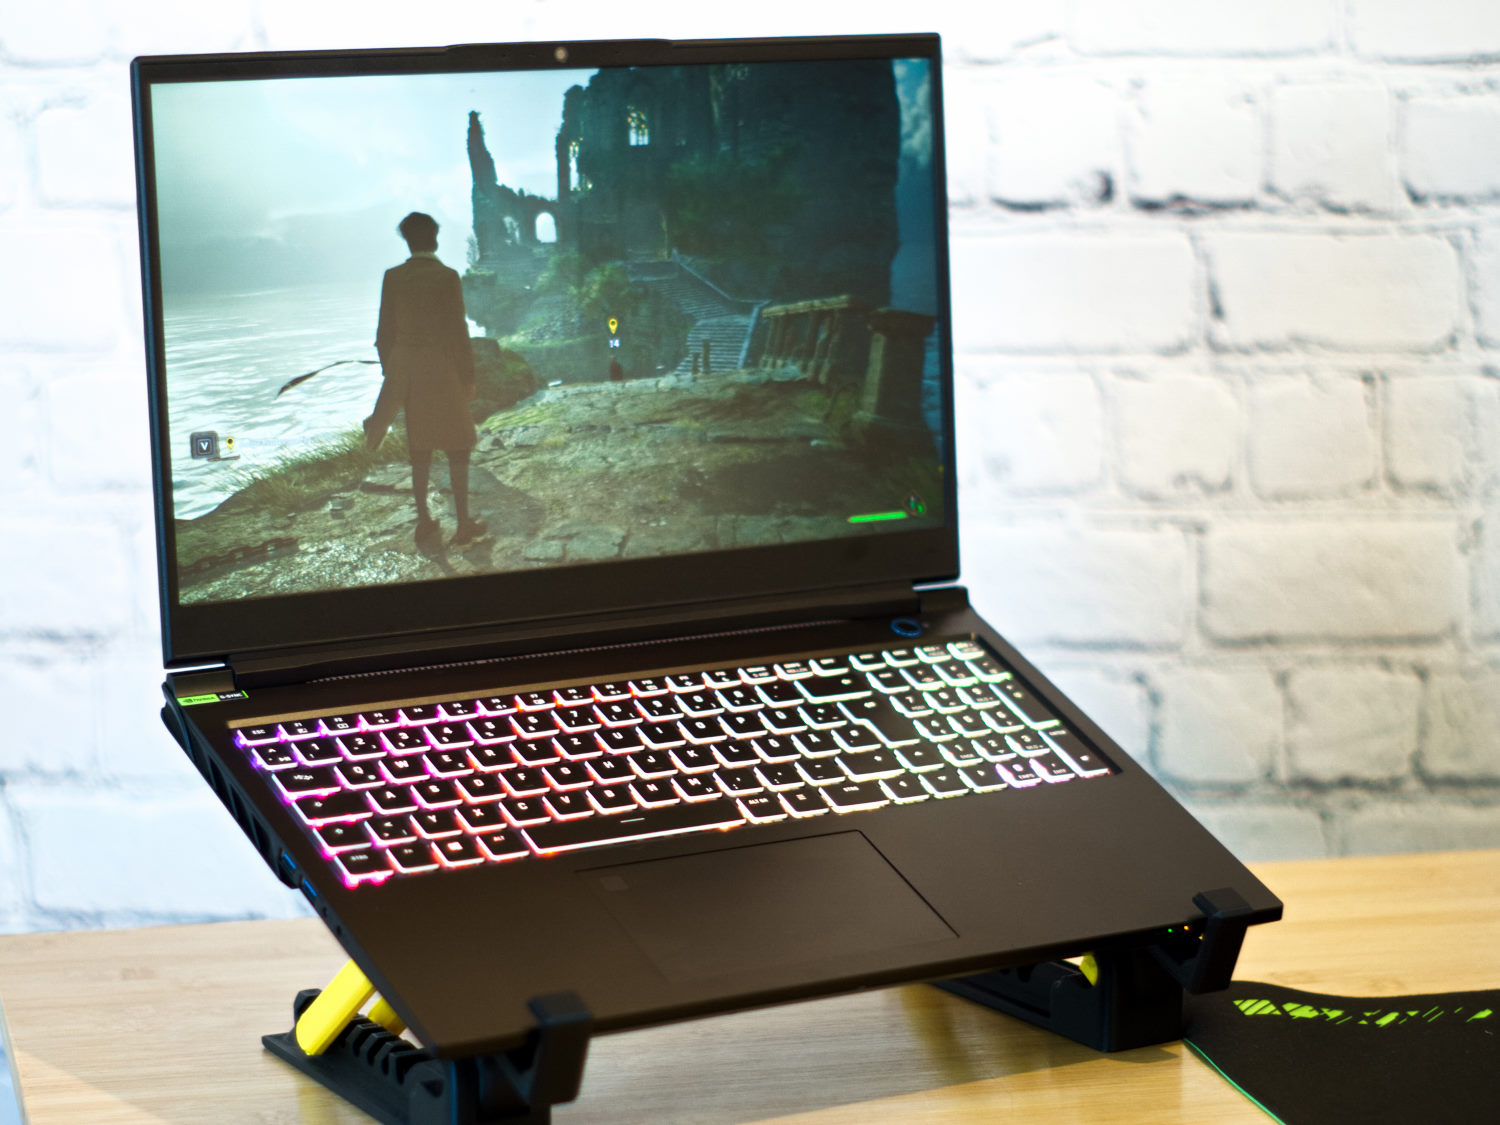
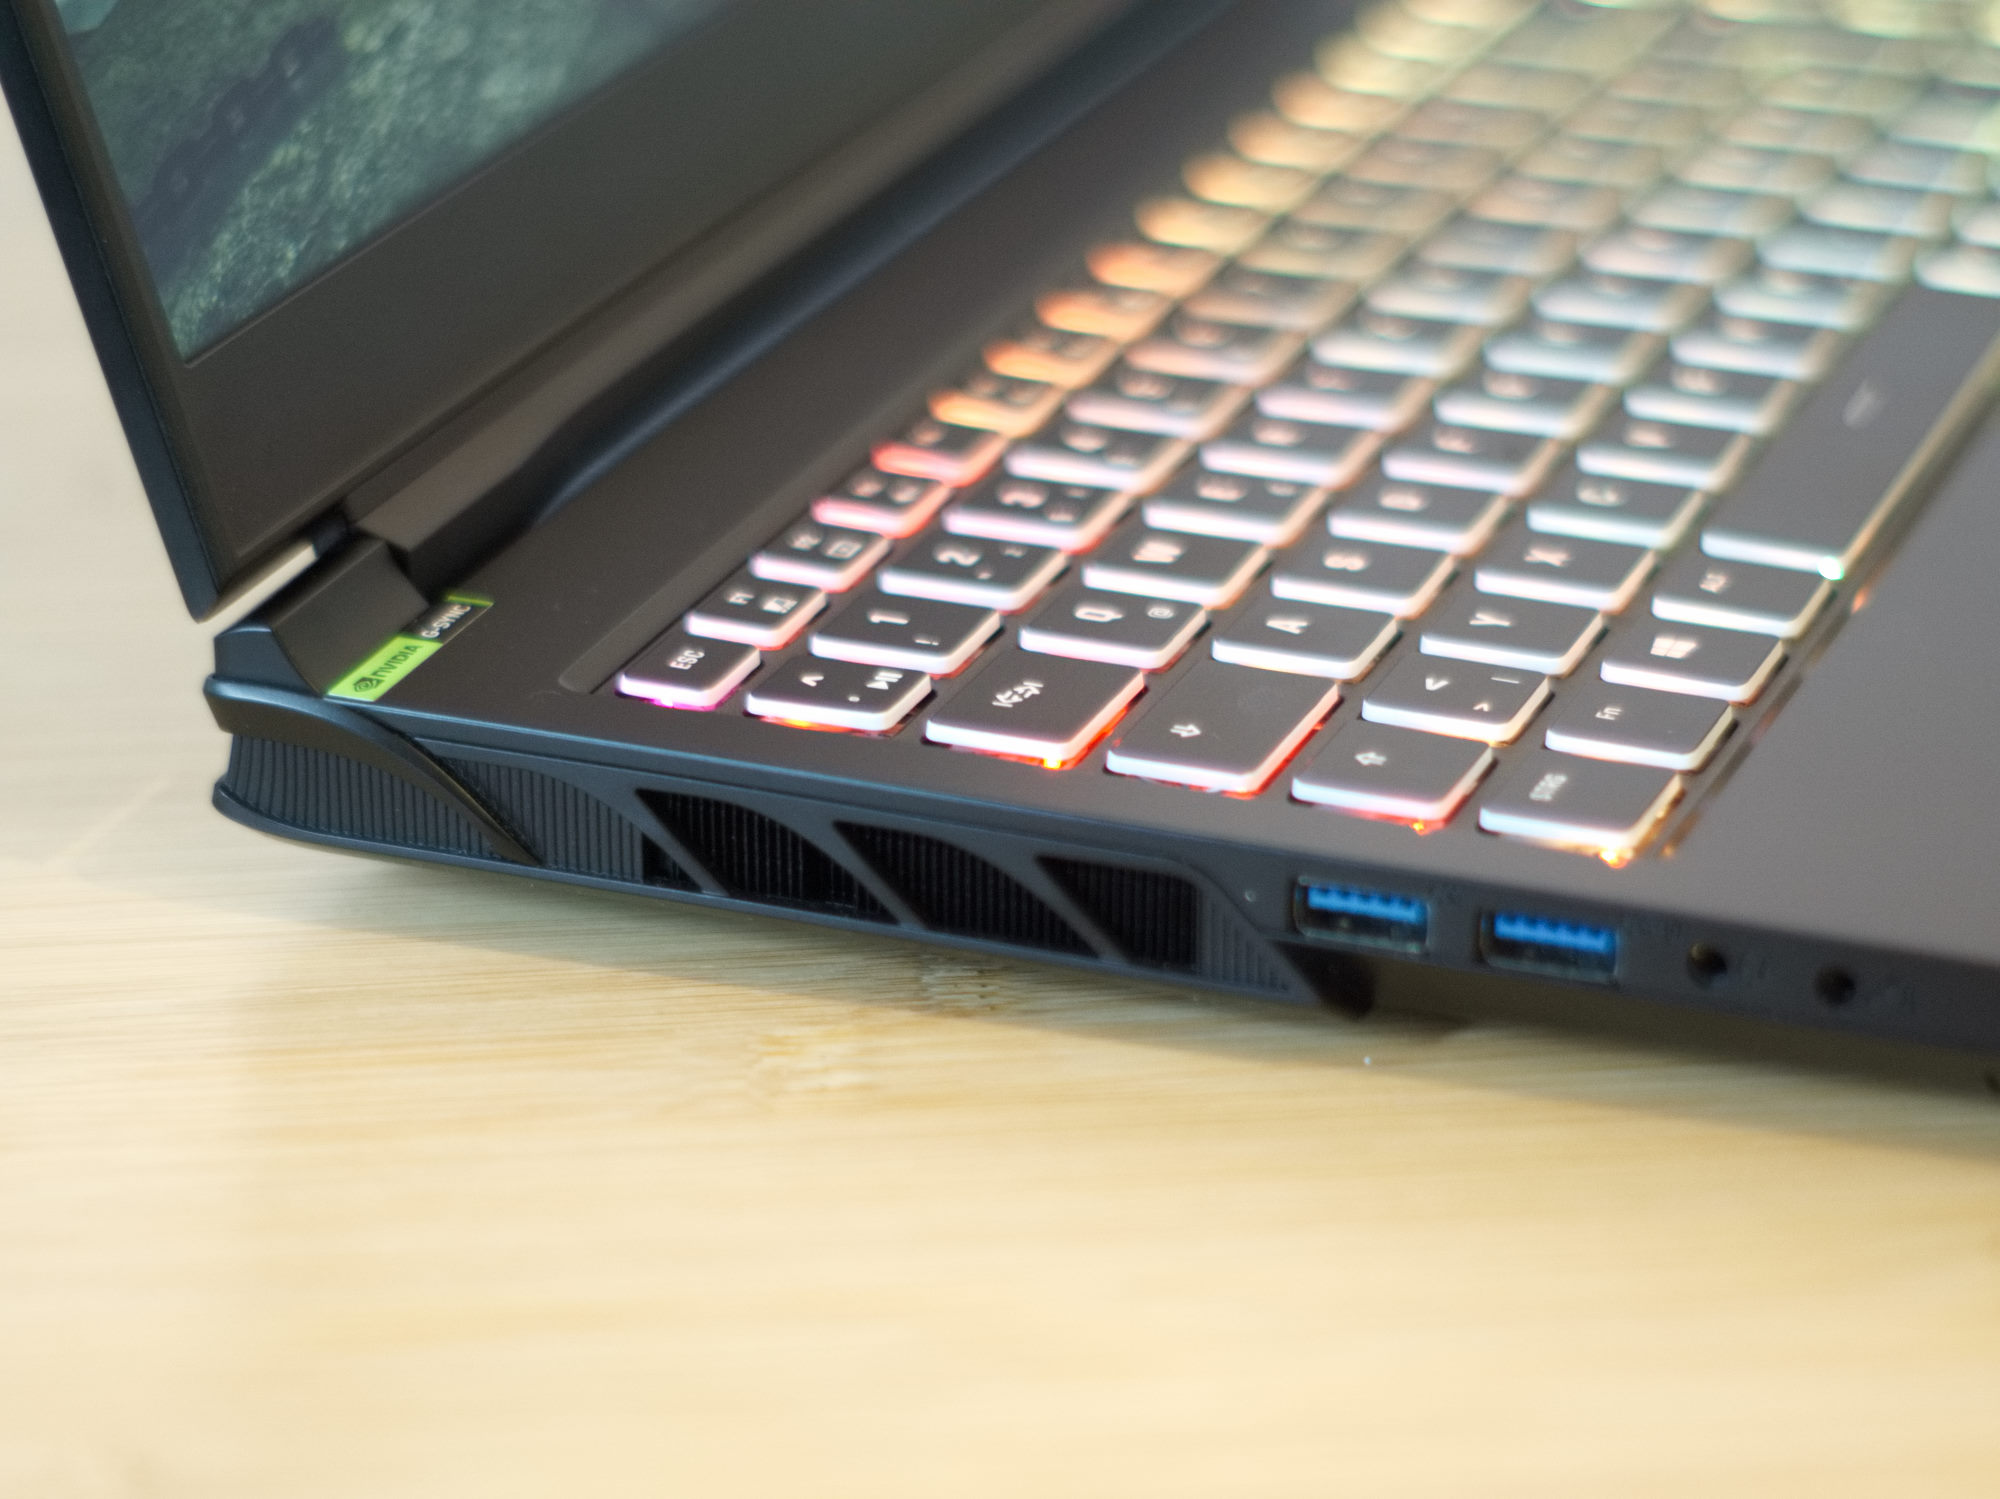
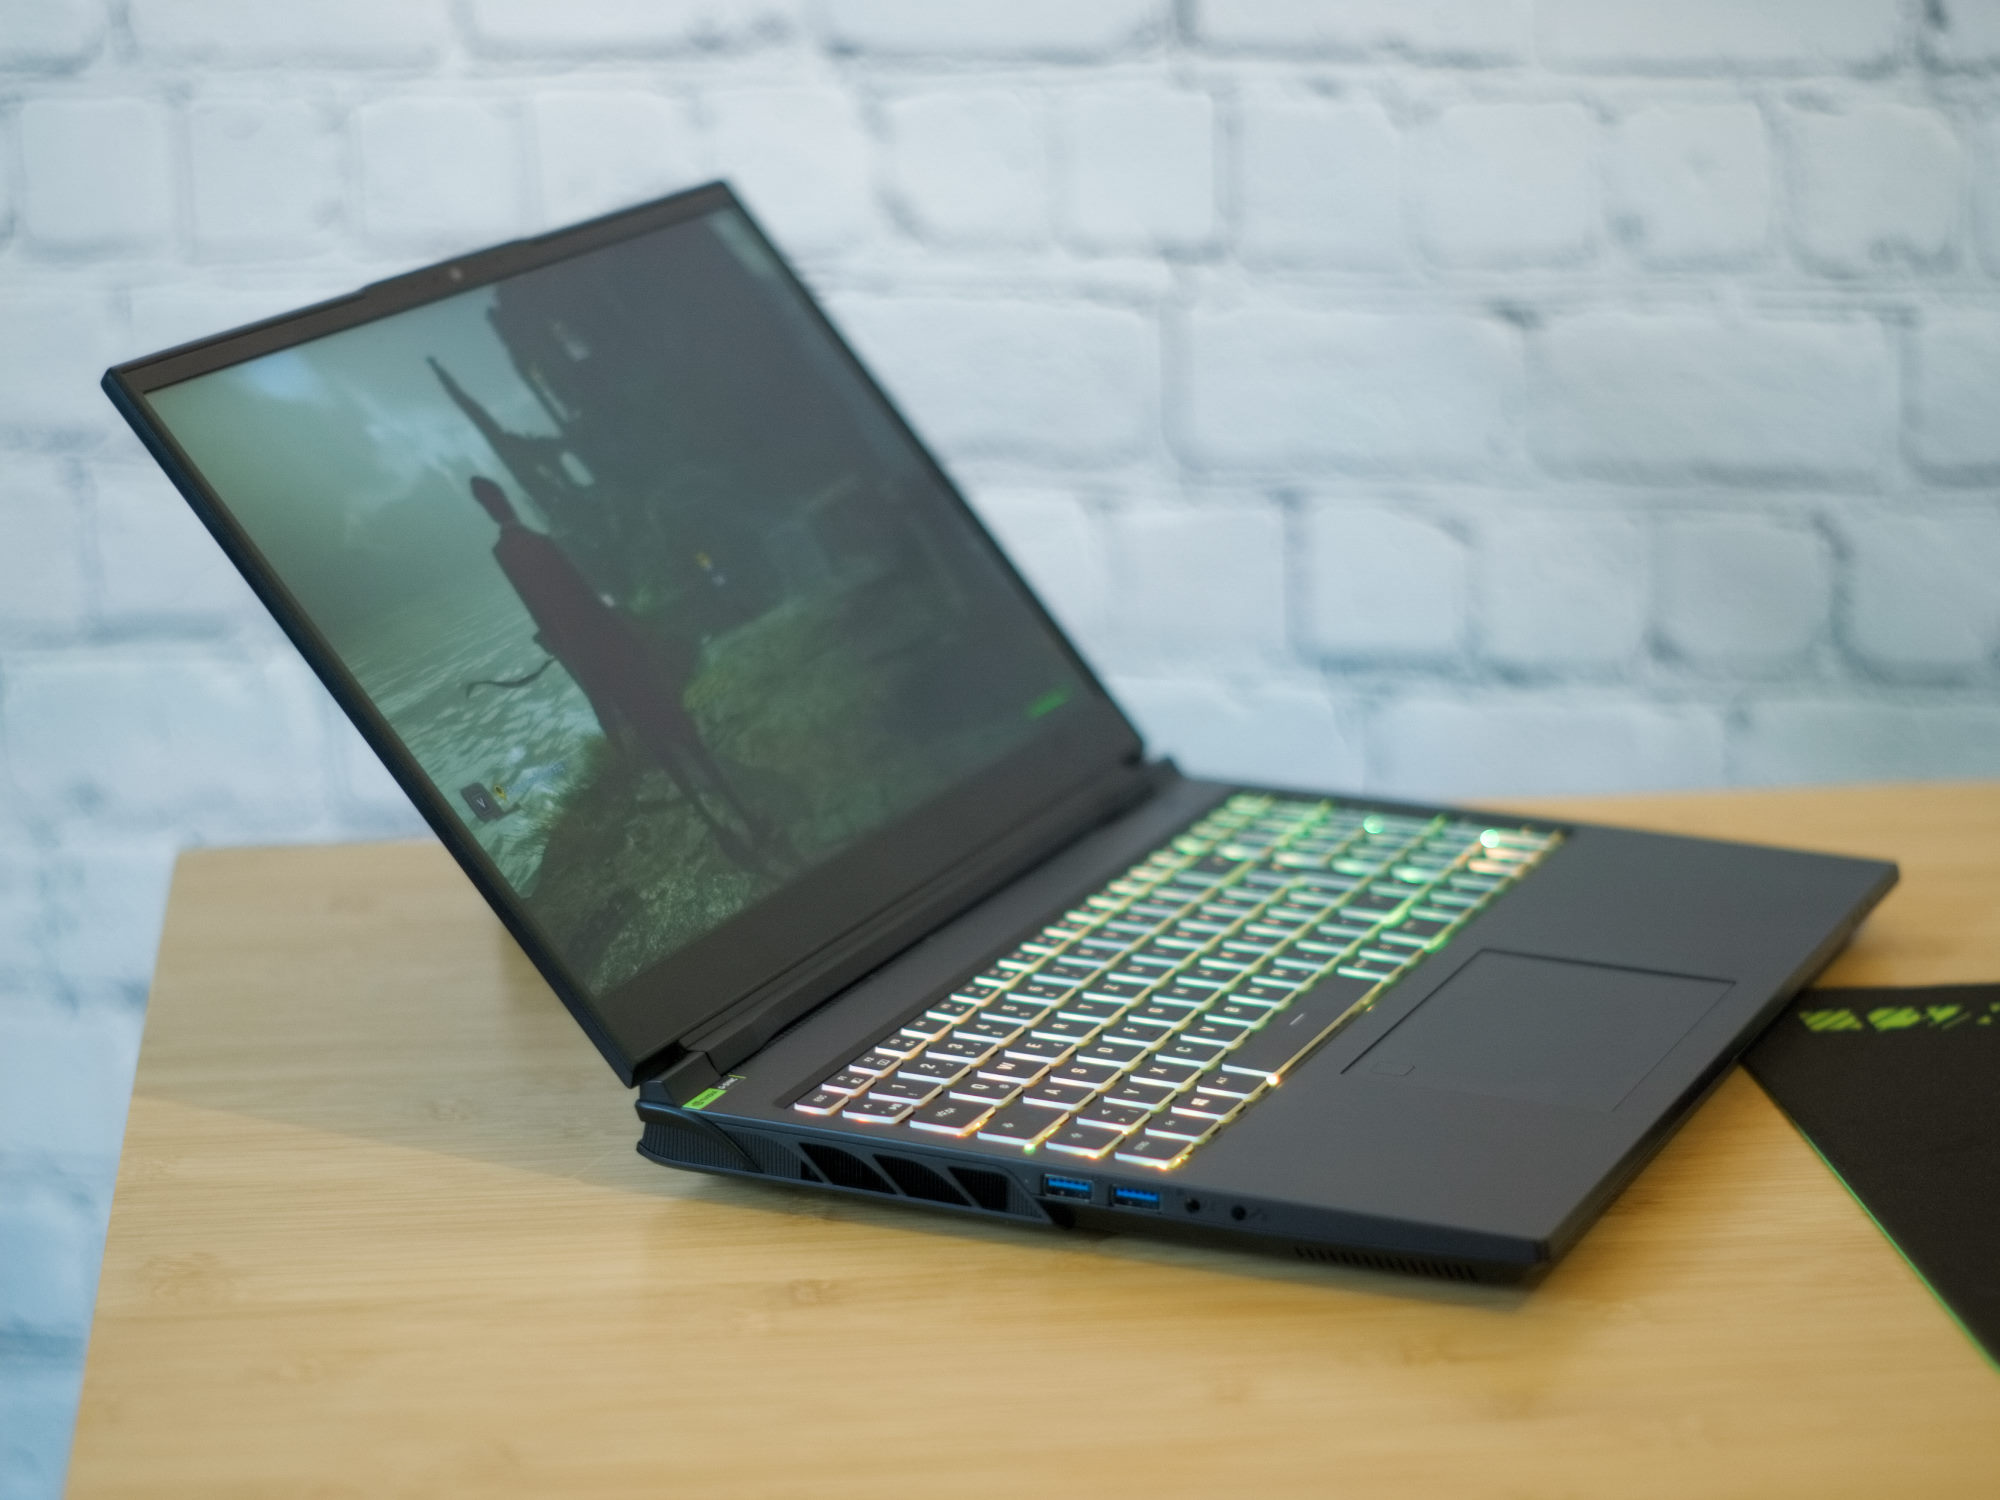
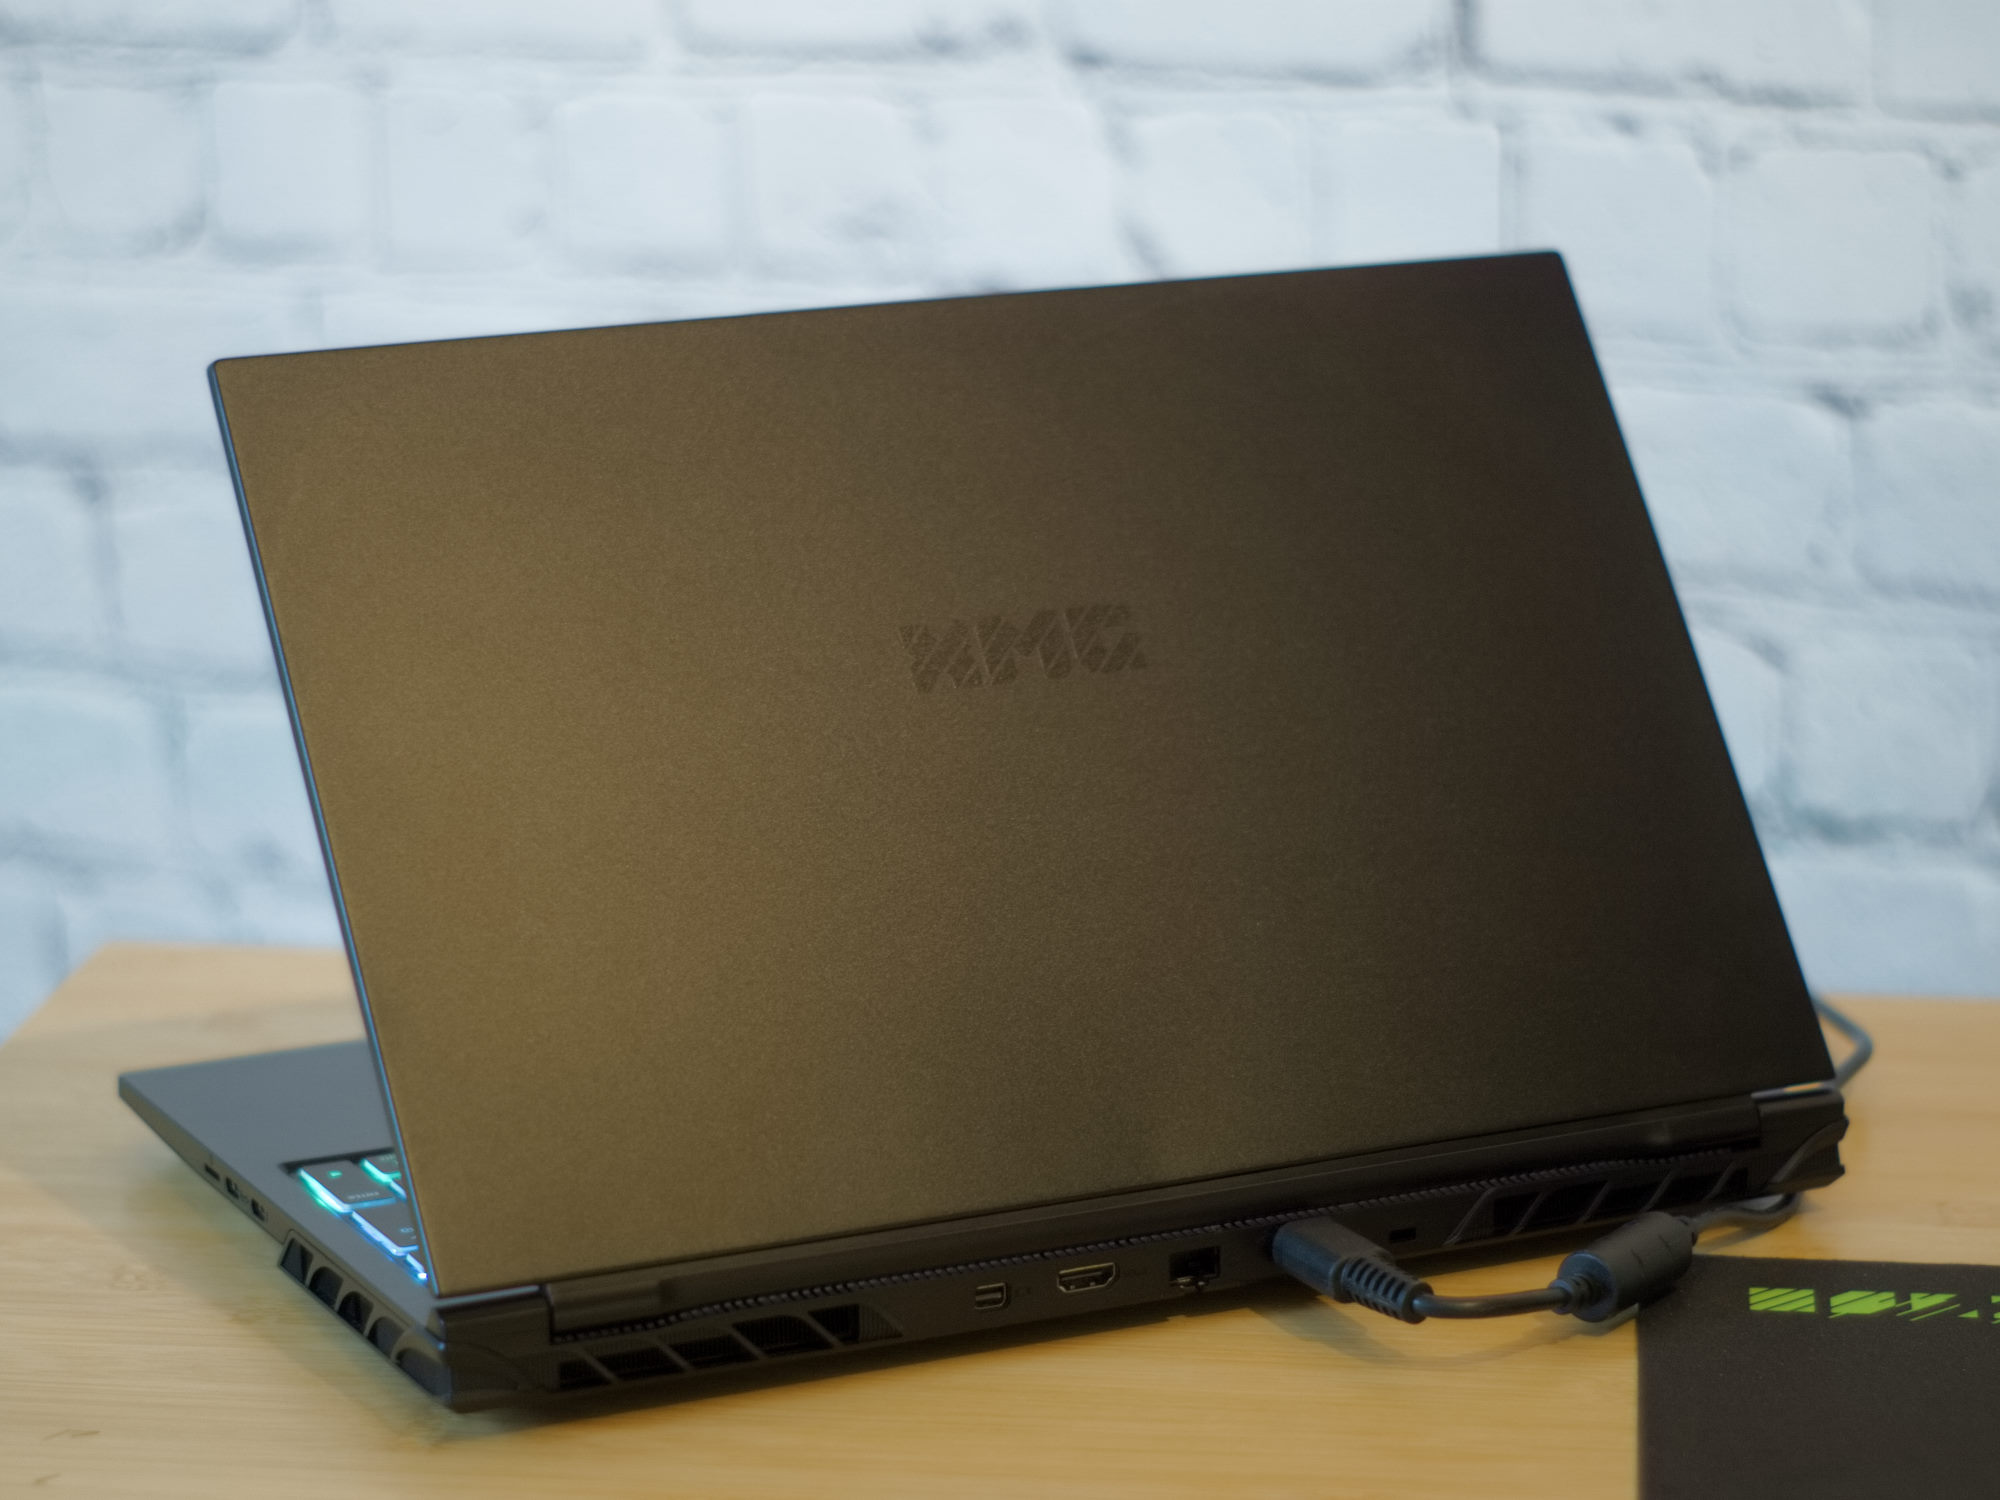
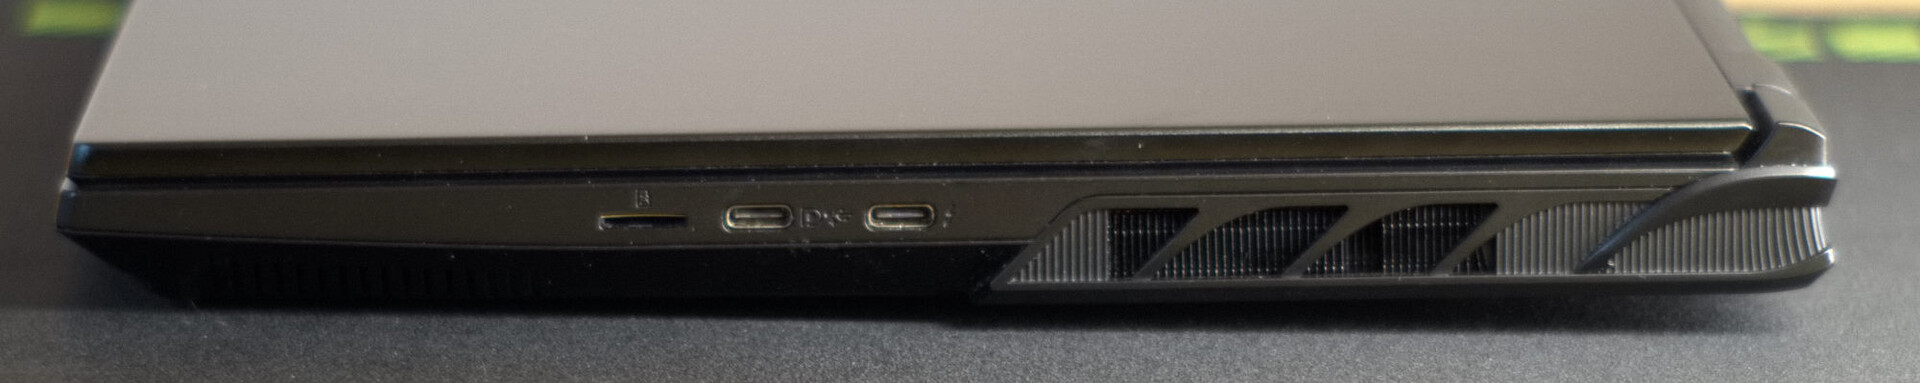
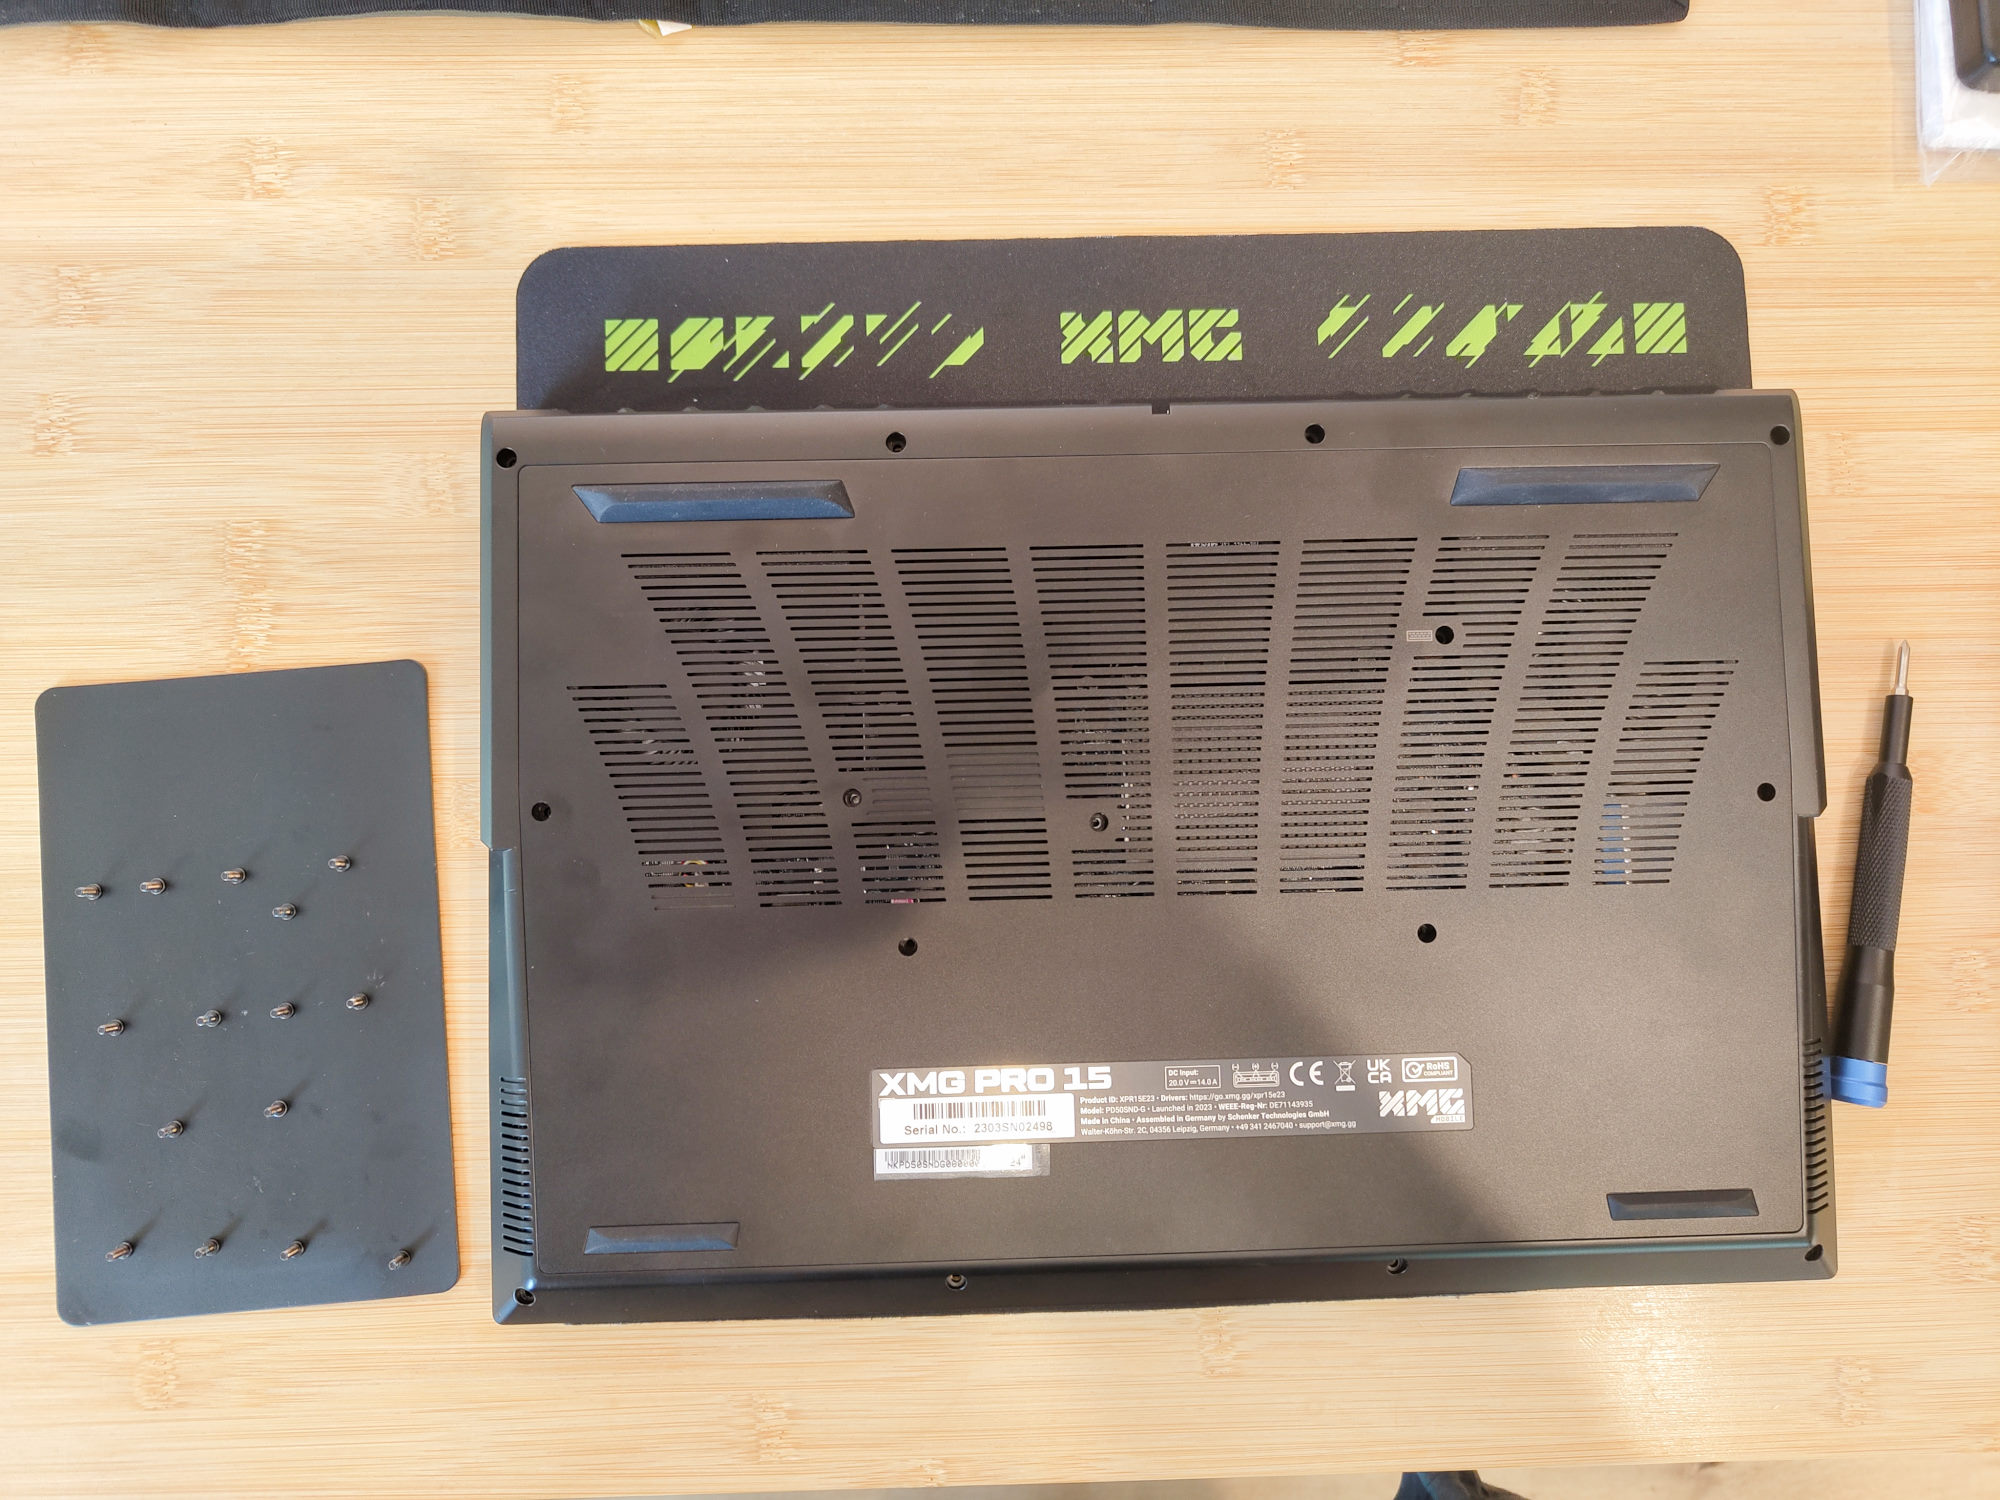
Cassa e caratteristiche - Alto contenuto di metallo
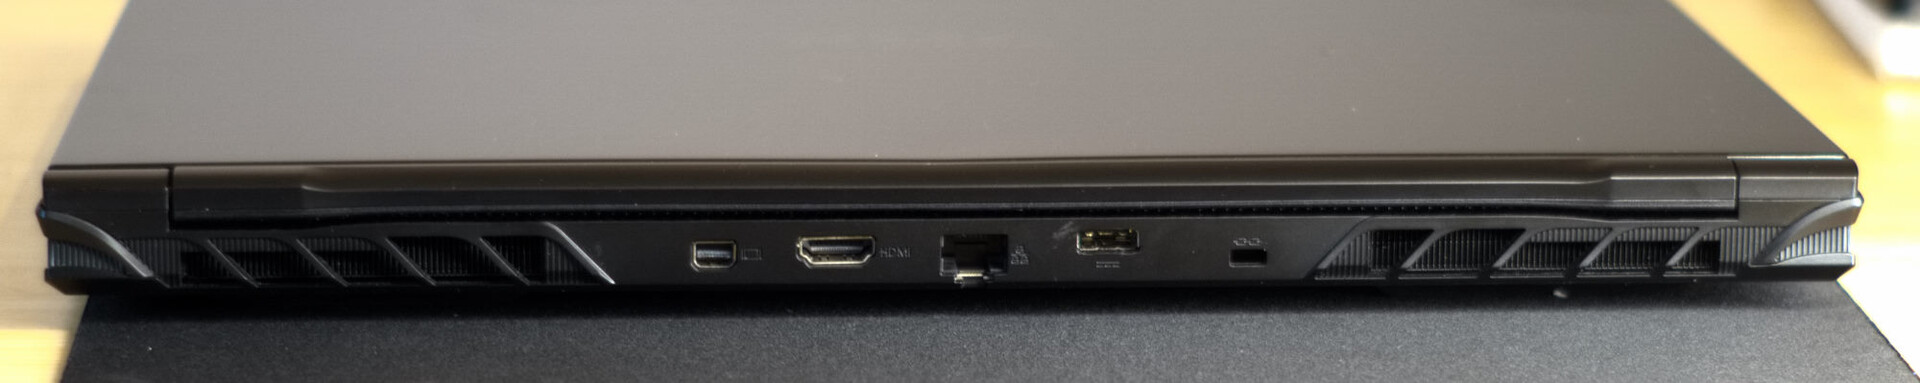
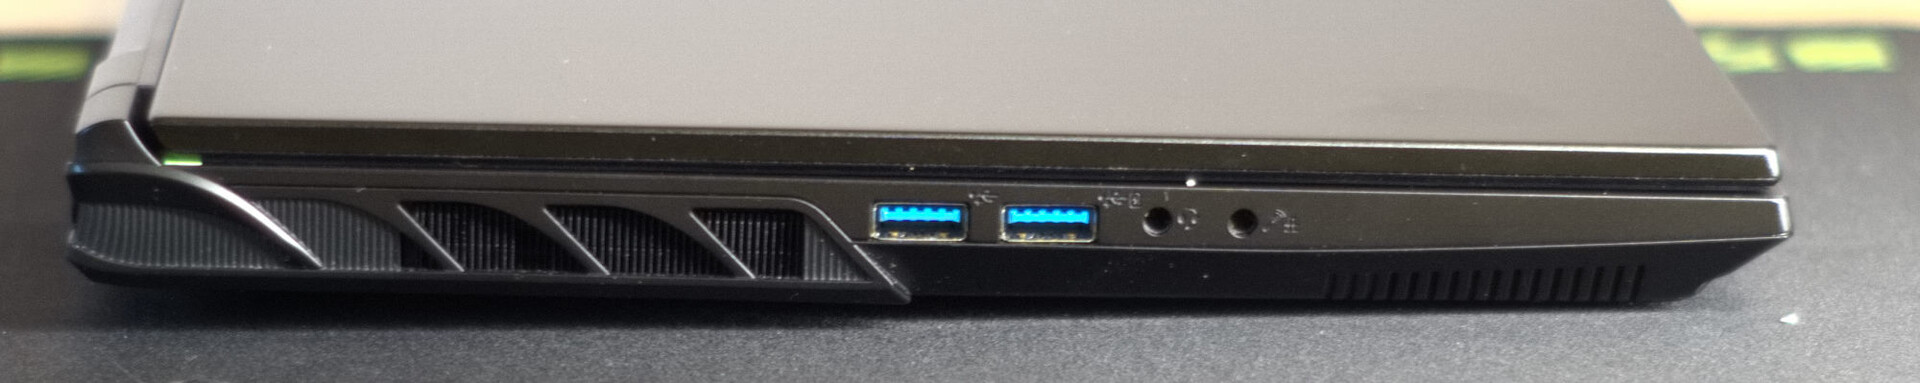
Rispetto al suo predecessore, il Pro 15 E23 ha ricevuto alcune piccole modifiche ai dettagli. Si tratta essenzialmente delle prese d'aria sui lati del portatile e dello scambio di posizione tra lo slot RJ45 e quello USB-C. Ora tutte le porte USB si trovano sui lati del dispositivo.
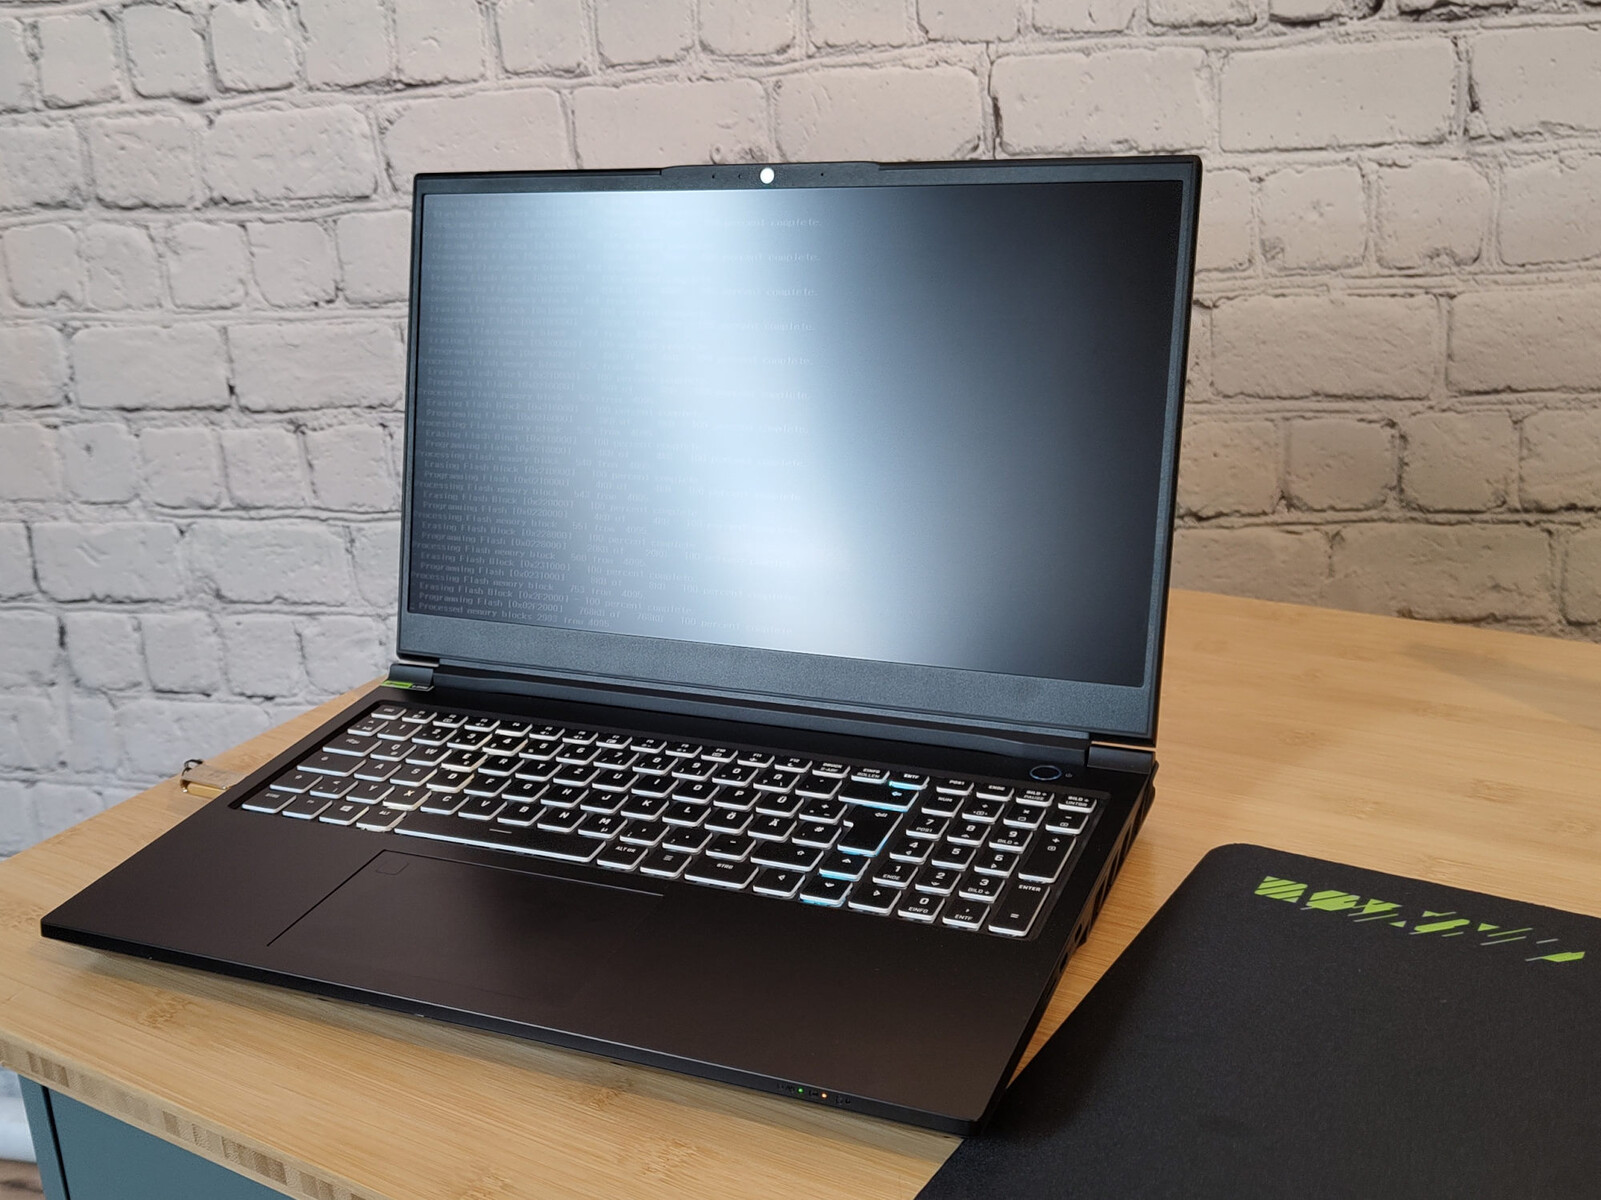
Il design rimane sobrio, nero e in gran parte privo di marchi. Le dimensioni e il peso del portatile sono quasi identici a quelli del suo predecessore. Il coperchio del display e la parte inferiore della scocca continuano a essere realizzati in alluminio, mentre la parte superiore è in plastica. Il display è incorniciato da un ampio bordo di plastica che ha uno spessore di soli 5 mm ai lati, un centimetro in alto e due centimetri in basso. È possibile ottenere un piccolo scricchiolio dallo schermo e dalla base ruotandoli. Tuttavia, per ottenere questo risultato è necessario uno sforzo considerevole, poiché tutte le parti del portatile sono molto ben costruite e solide. La tastiera e il coperchio del display si flettono leggermente solo quando si esercita una forte pressione e le cerniere mantengono saldamente il monitor in tutte le posizioni possibili tra 0° e 135°.
Lettore di schede SD, Wi-Fi e webcam
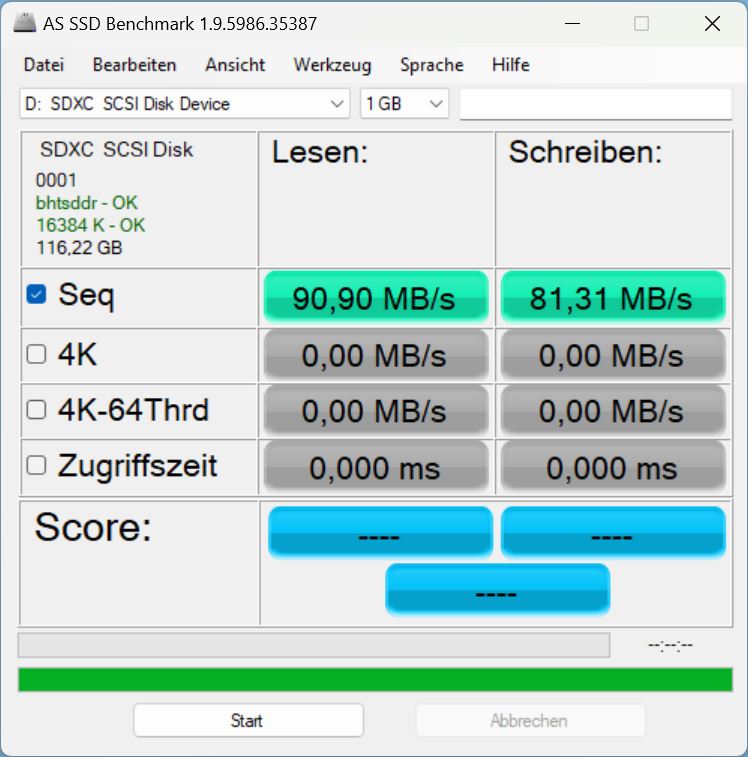
Il Das Pro 15 possiede, almeno rispetto a molti altri portatili da gioco, un lettore di schede microSD. In combinazione con la nostra microSD AV Pro (V60), abbiamo registrato buone velocità di trasferimento nell'ordine di 80-90 MB/s.
Nella rete a 6 GHz, l'Intel Wi-Fi 6E AX211 del portatile ha dimostrato velocità di trasferimento dati per lo più eccellenti, ma nella rete a 5 GHz ha restituito cifre piuttosto inferiori alla media.
Per gli streamer, la qualità della webcam Full HD integrata è probabilmente insufficiente, soprattutto in condizioni di scarsa illuminazione. Tuttavia, può essere utilizzata per videochiamate occasionali.
| SD Card Reader | |
| average JPG Copy Test (av. of 3 runs) | |
| Media della classe Gaming (20.9 - 210, n=54, ultimi 2 anni) | |
| Schenker XMG Pro 15 (E23) | |
| Schenker XMG Pro 15 (i7-12700H, RTX 3080 Ti) | |
| Asus ZenBook Pro 14 Duo UX8402VV-P1021W (AV Pro SD microSD 128 GB V60) | |
| Alienware x16 R1 (AV PRO microSD 128 GB V60) | |
| maximum AS SSD Seq Read Test (1GB) | |
| Alienware x16 R1 (AV PRO microSD 128 GB V60) | |
| Media della classe Gaming (25.5 - 261, n=51, ultimi 2 anni) | |
| Schenker XMG Pro 15 (i7-12700H, RTX 3080 Ti) | |
| Schenker XMG Pro 15 (E23) | |
| Asus ZenBook Pro 14 Duo UX8402VV-P1021W (AV Pro SD microSD 128 GB V60) | |

 GeForce RTX 4060 Laptop GPU, i9-13900HX, Crucial P5 Plus 1TB CT1000P5PSSD8")
 GeForce RTX 4060 Laptop GPU, i9-13900HX, Crucial P5 Plus 1TB CT1000P5PSSD8")
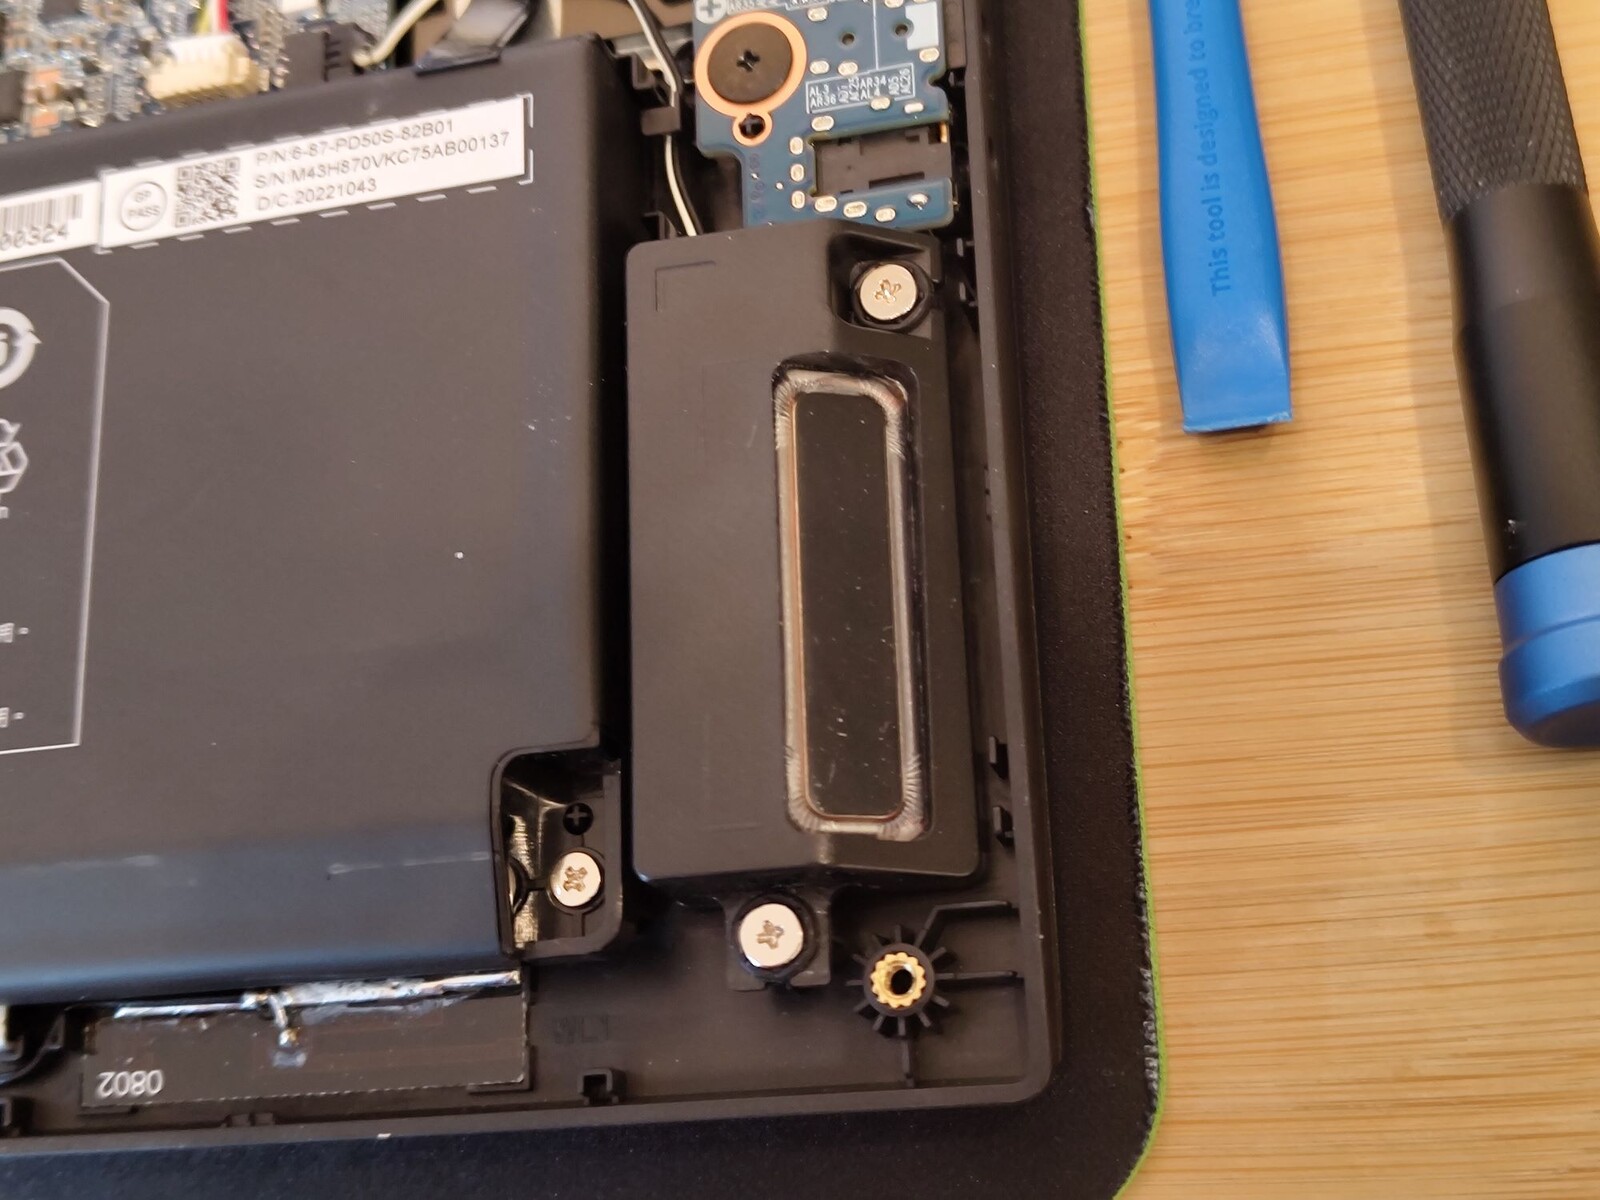
Accessori e manutenzione
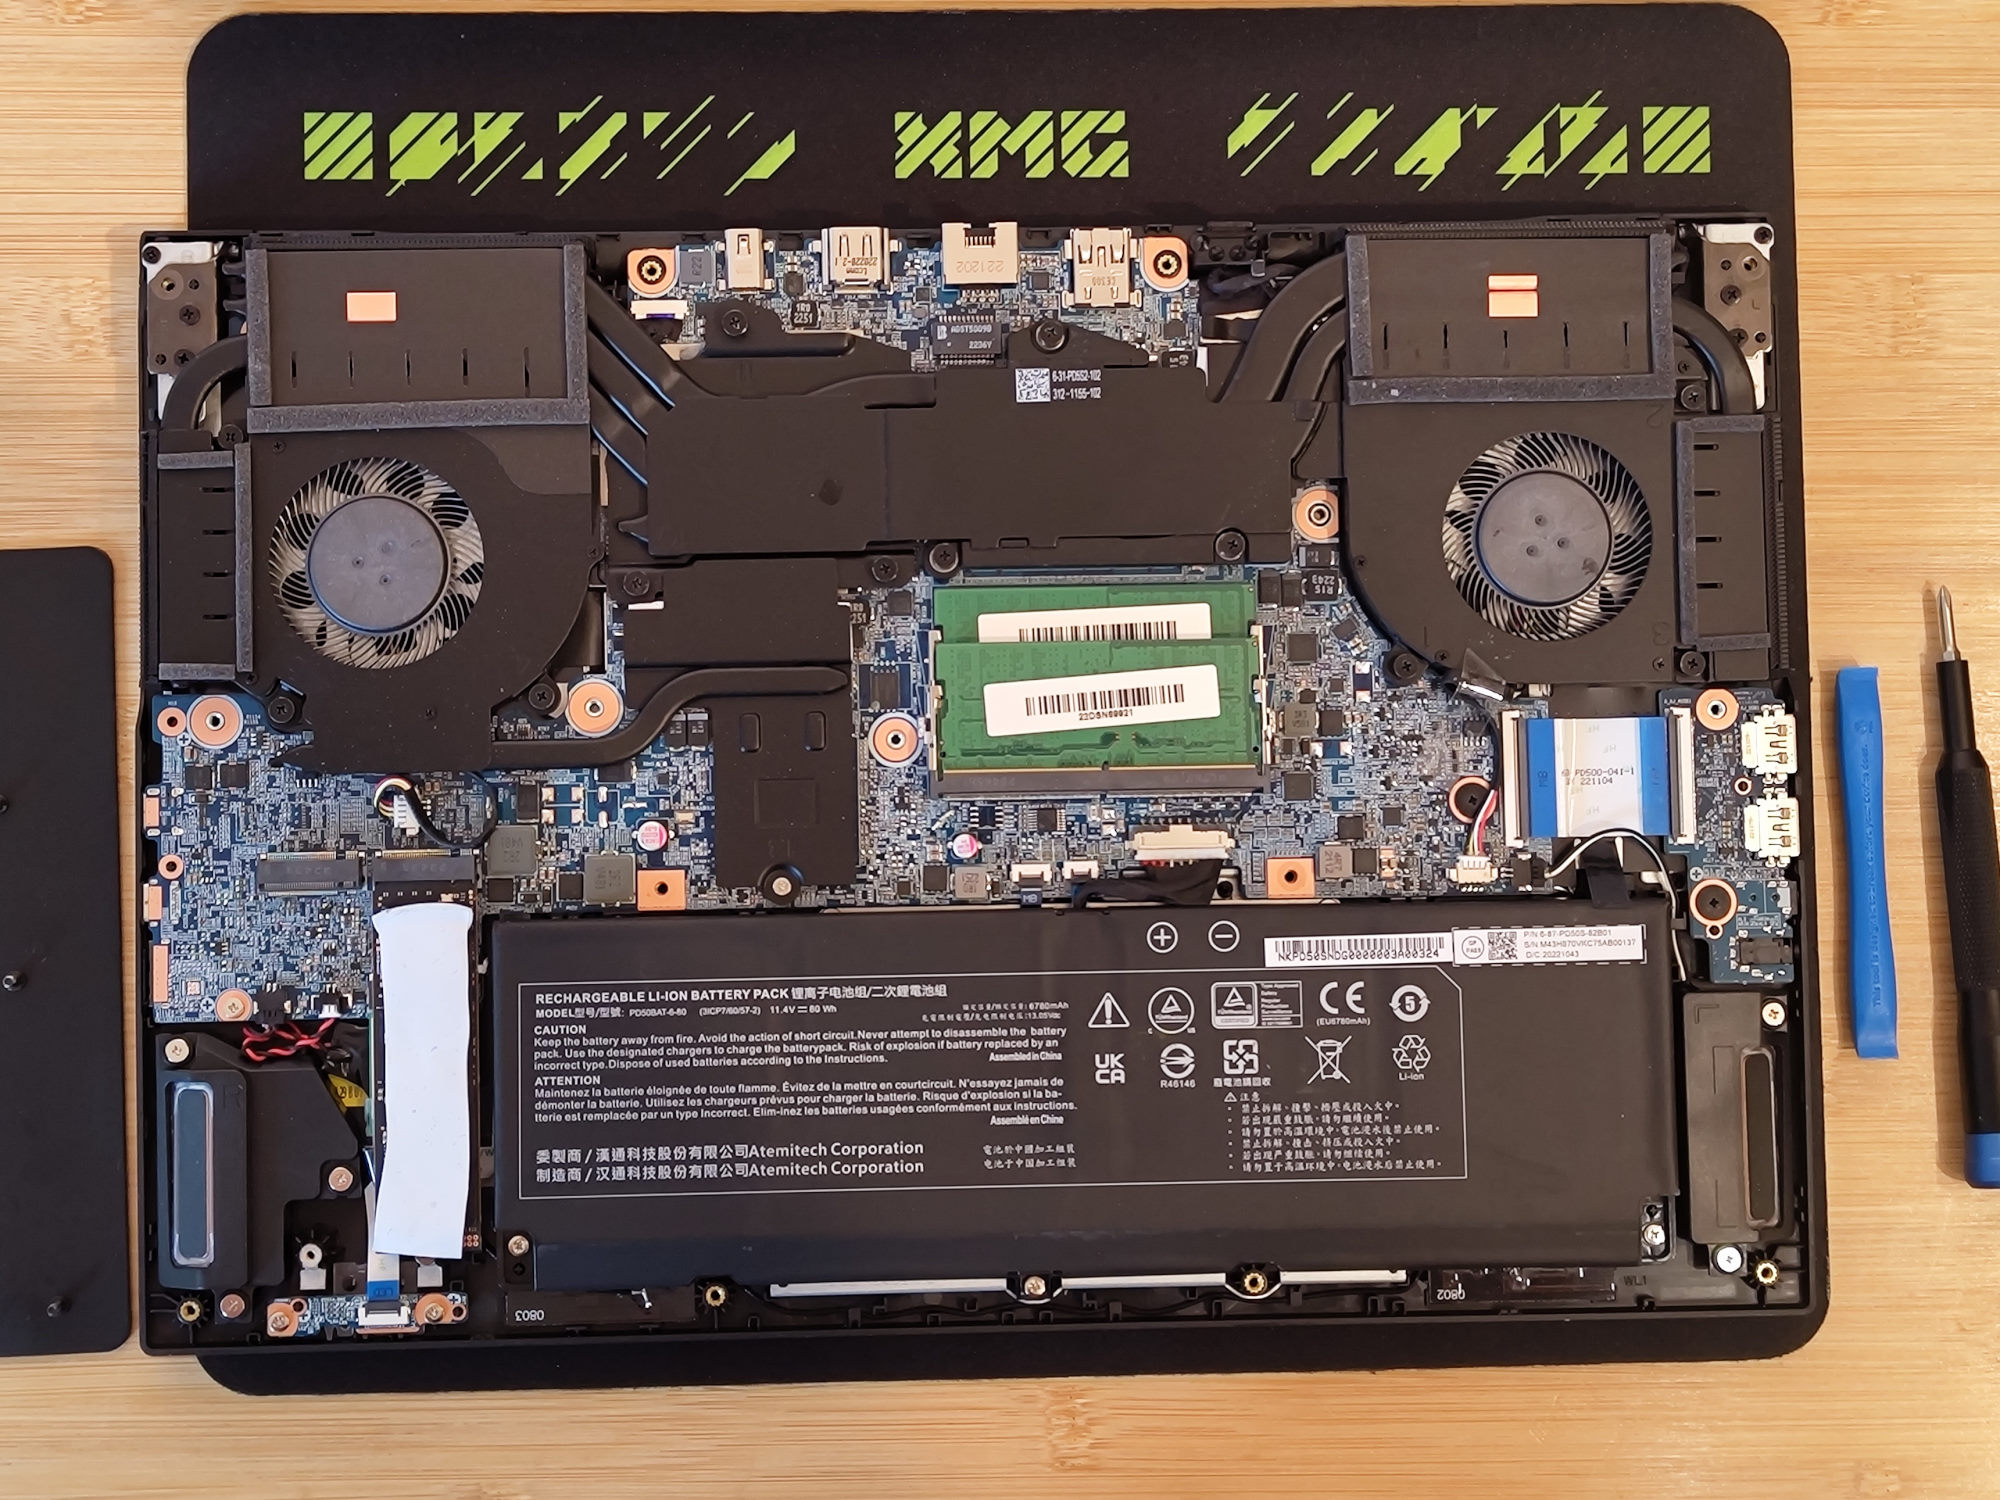
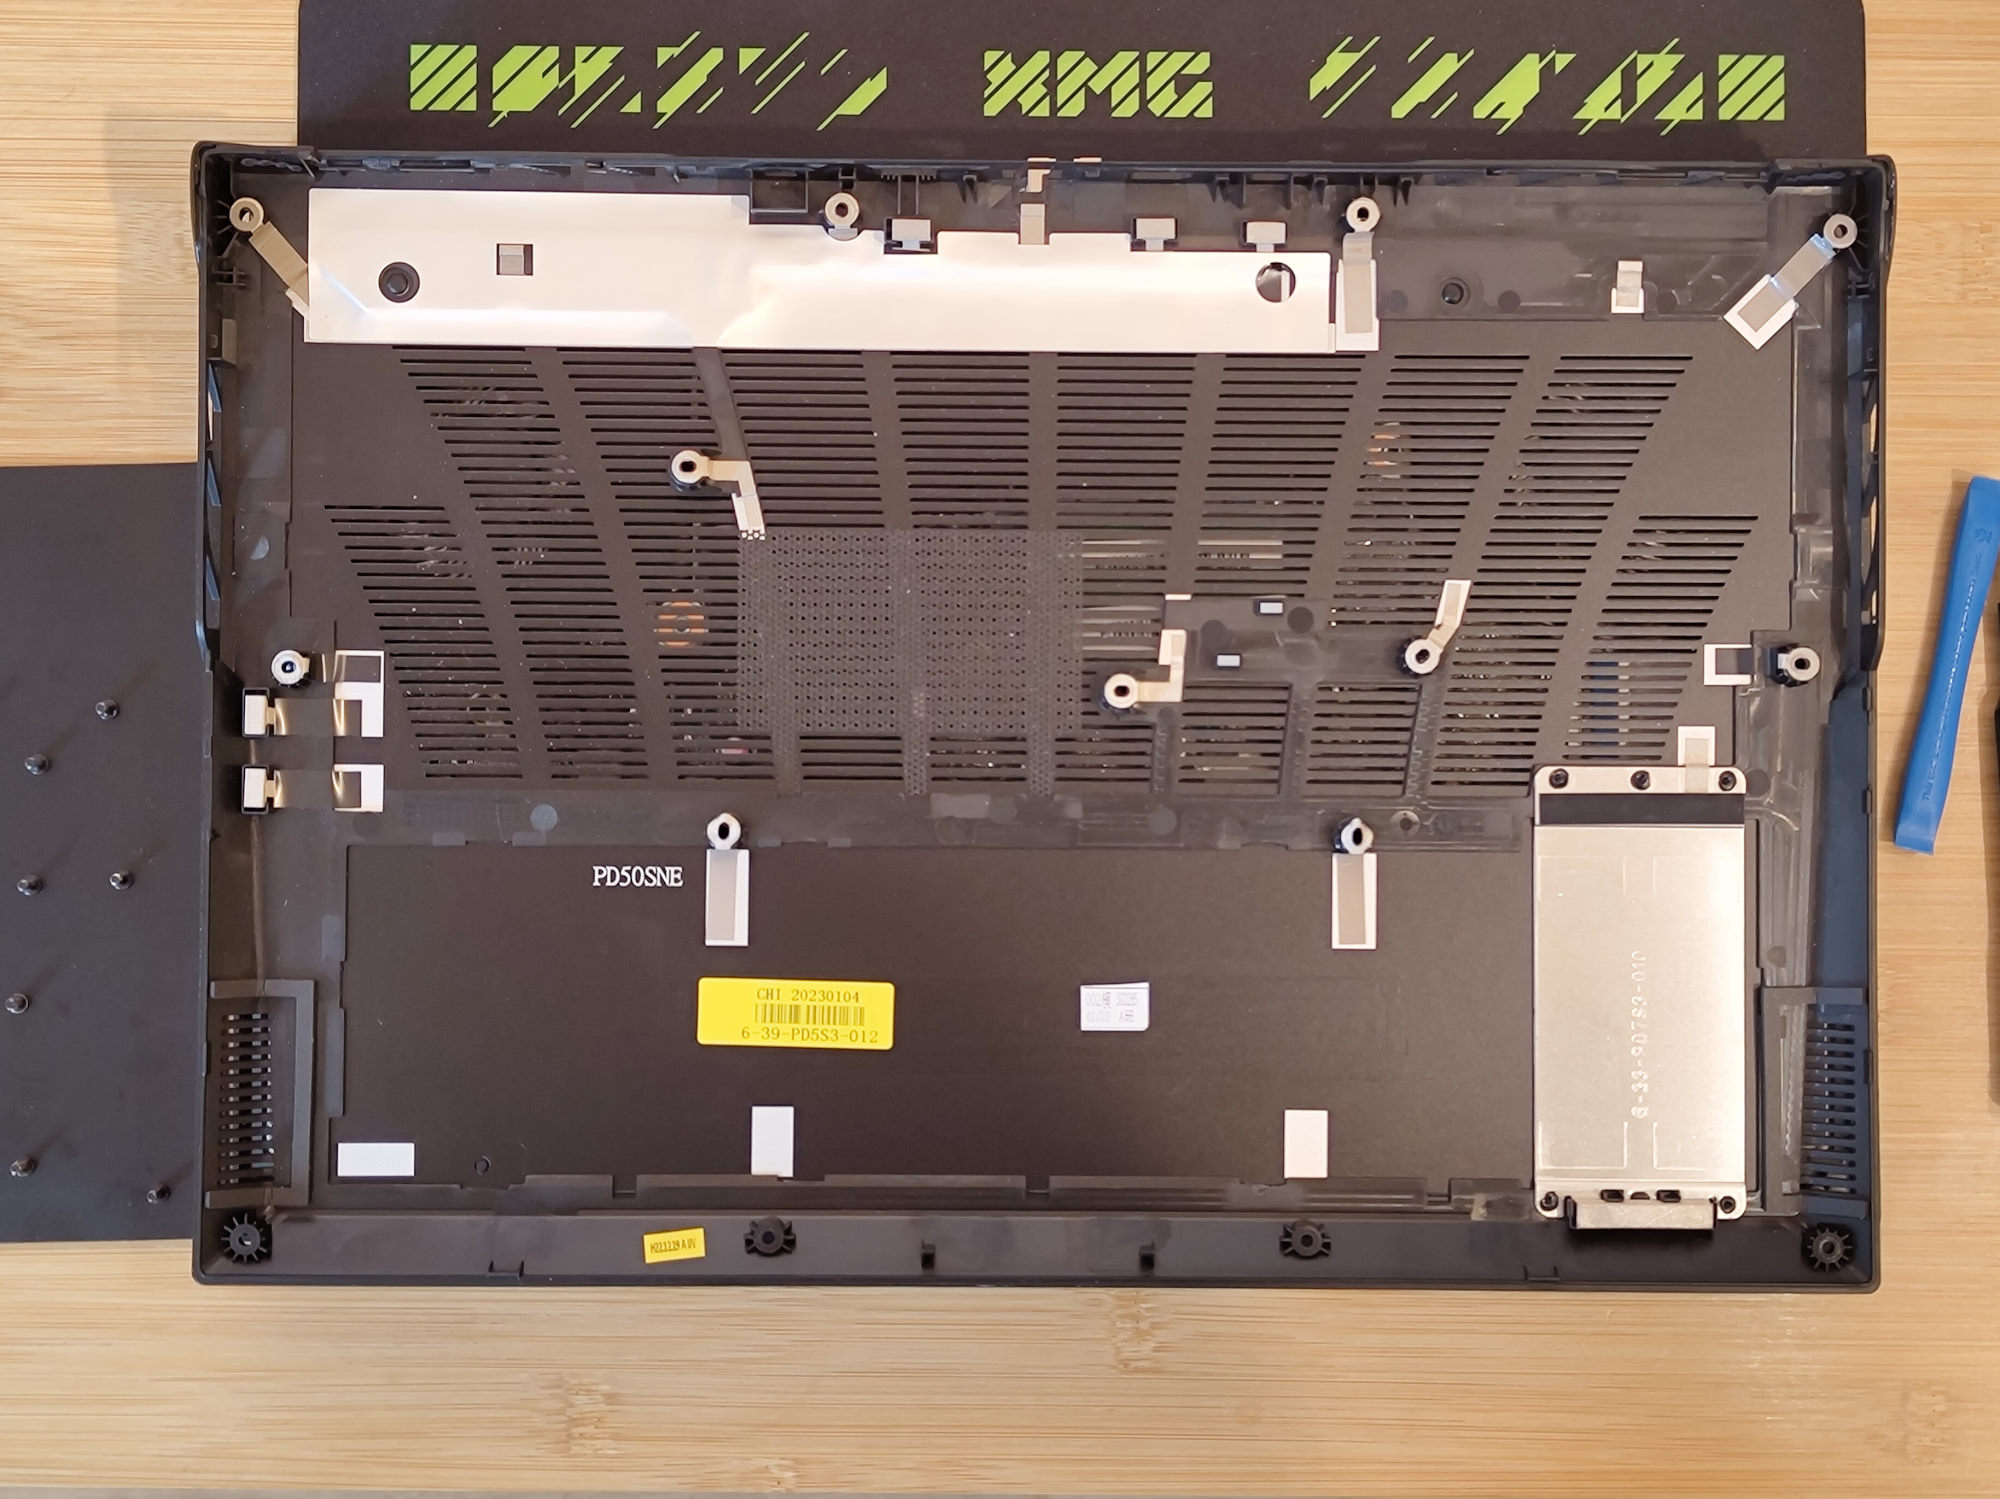
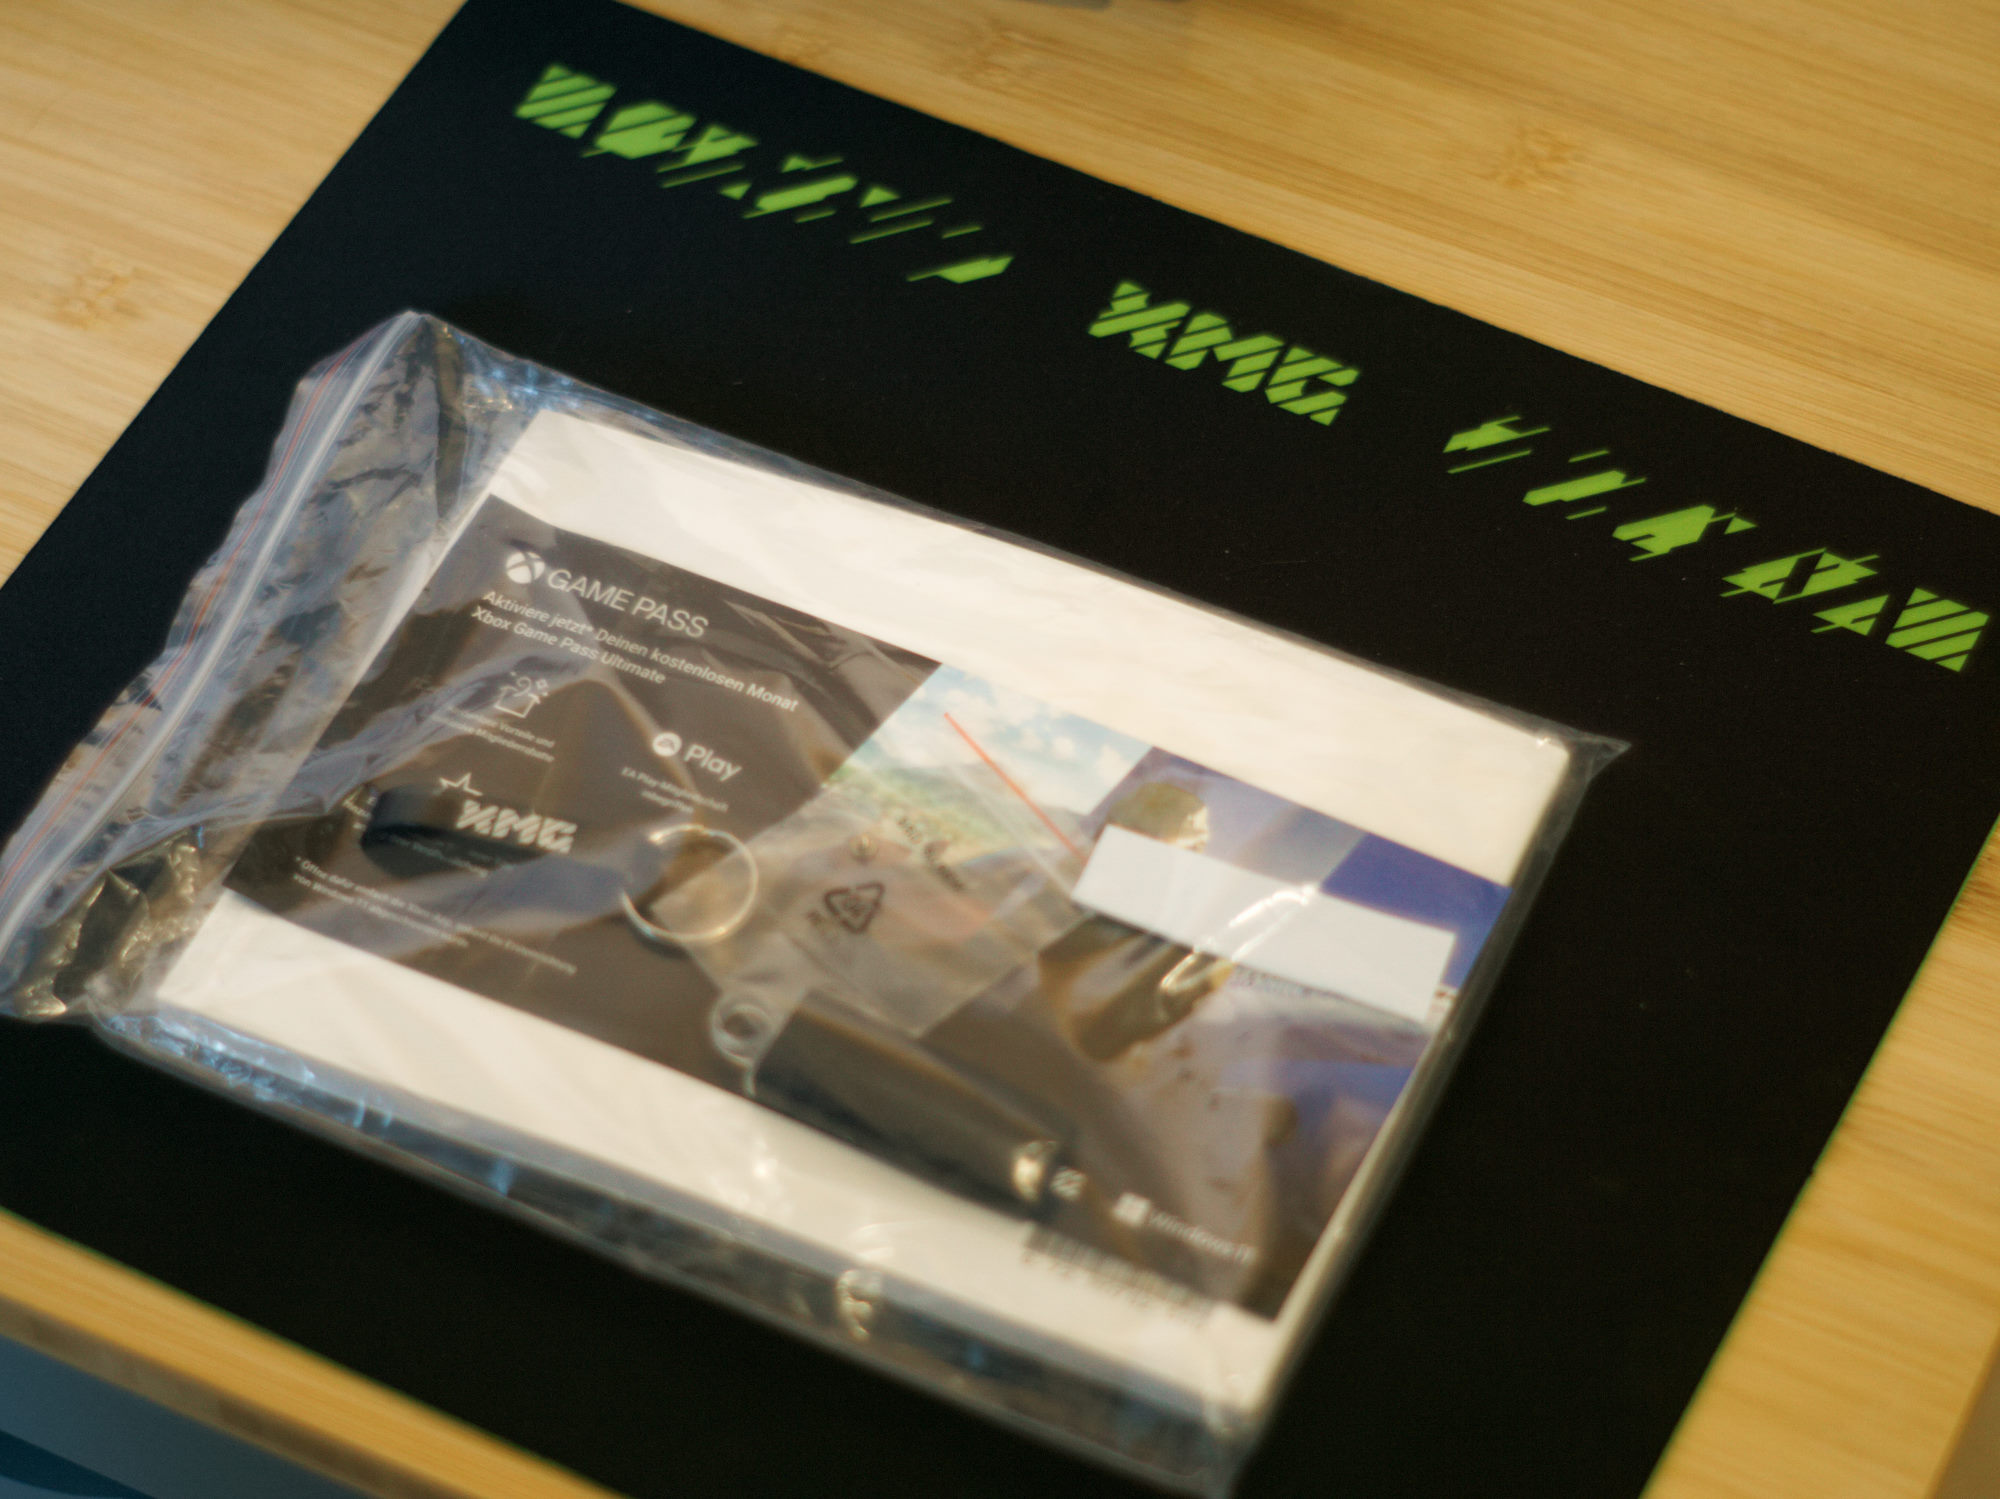
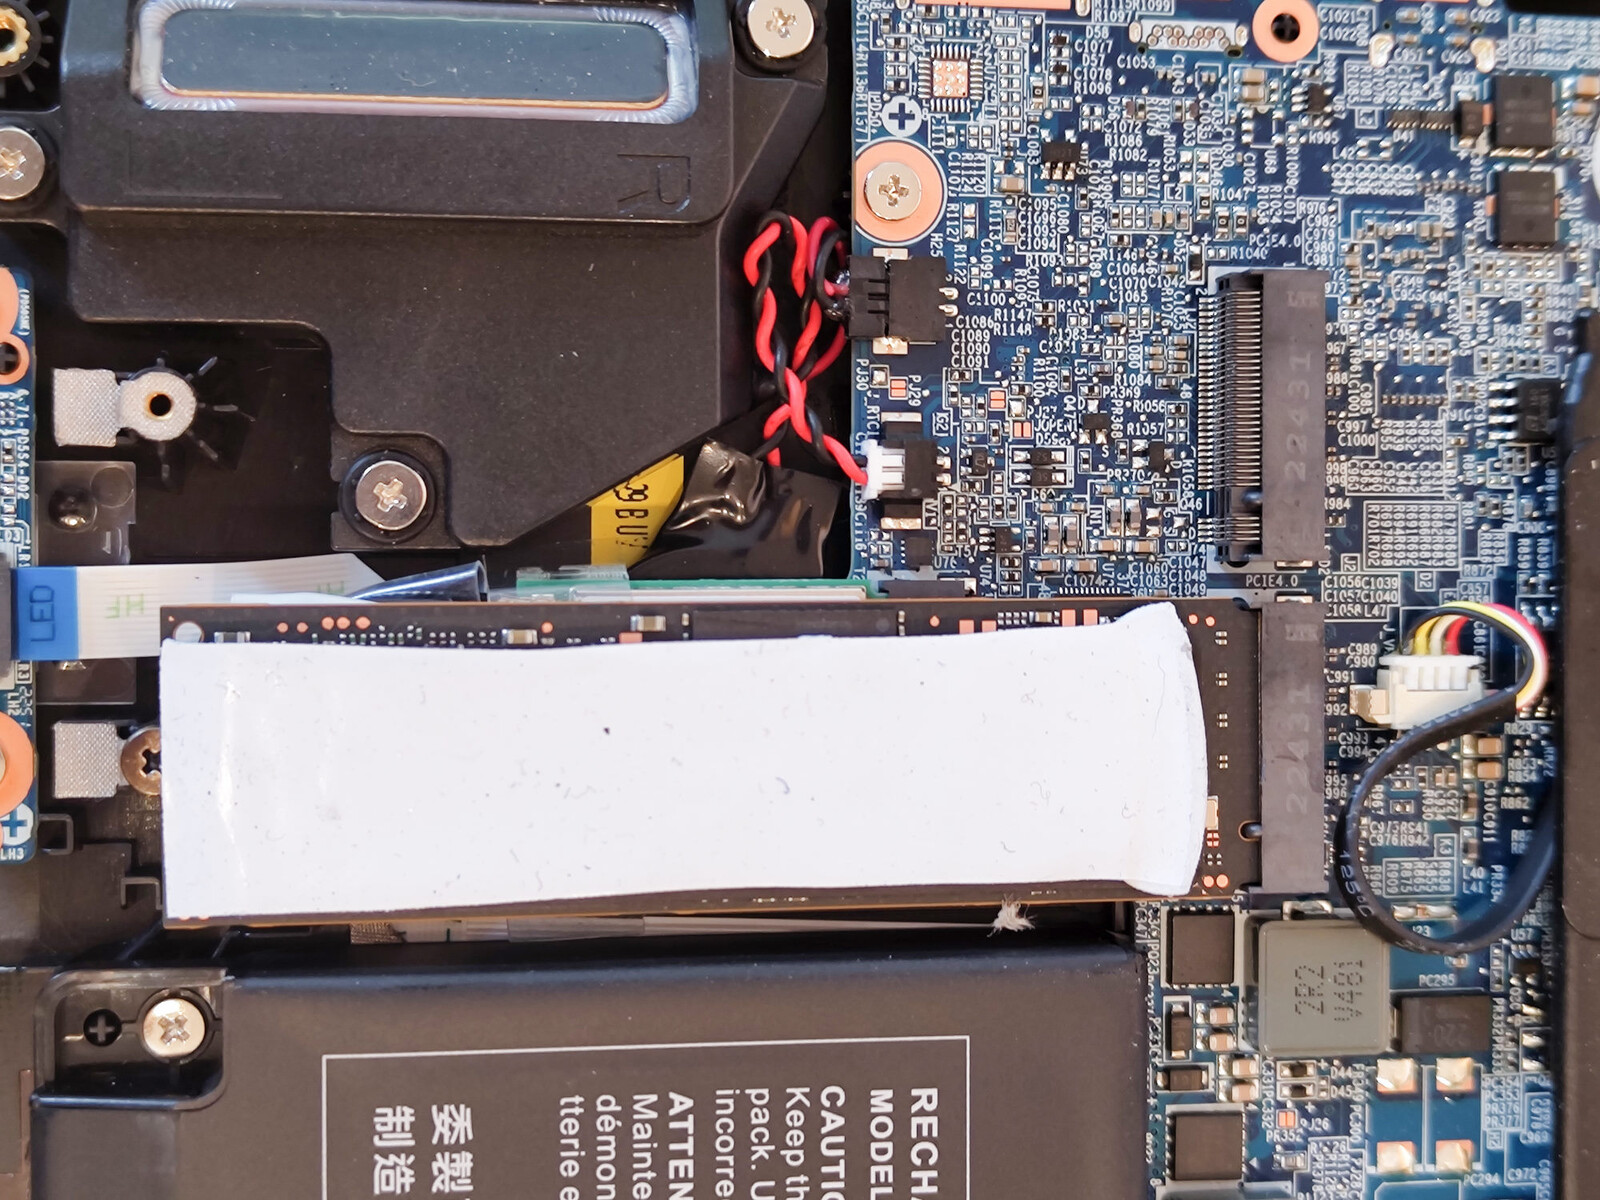
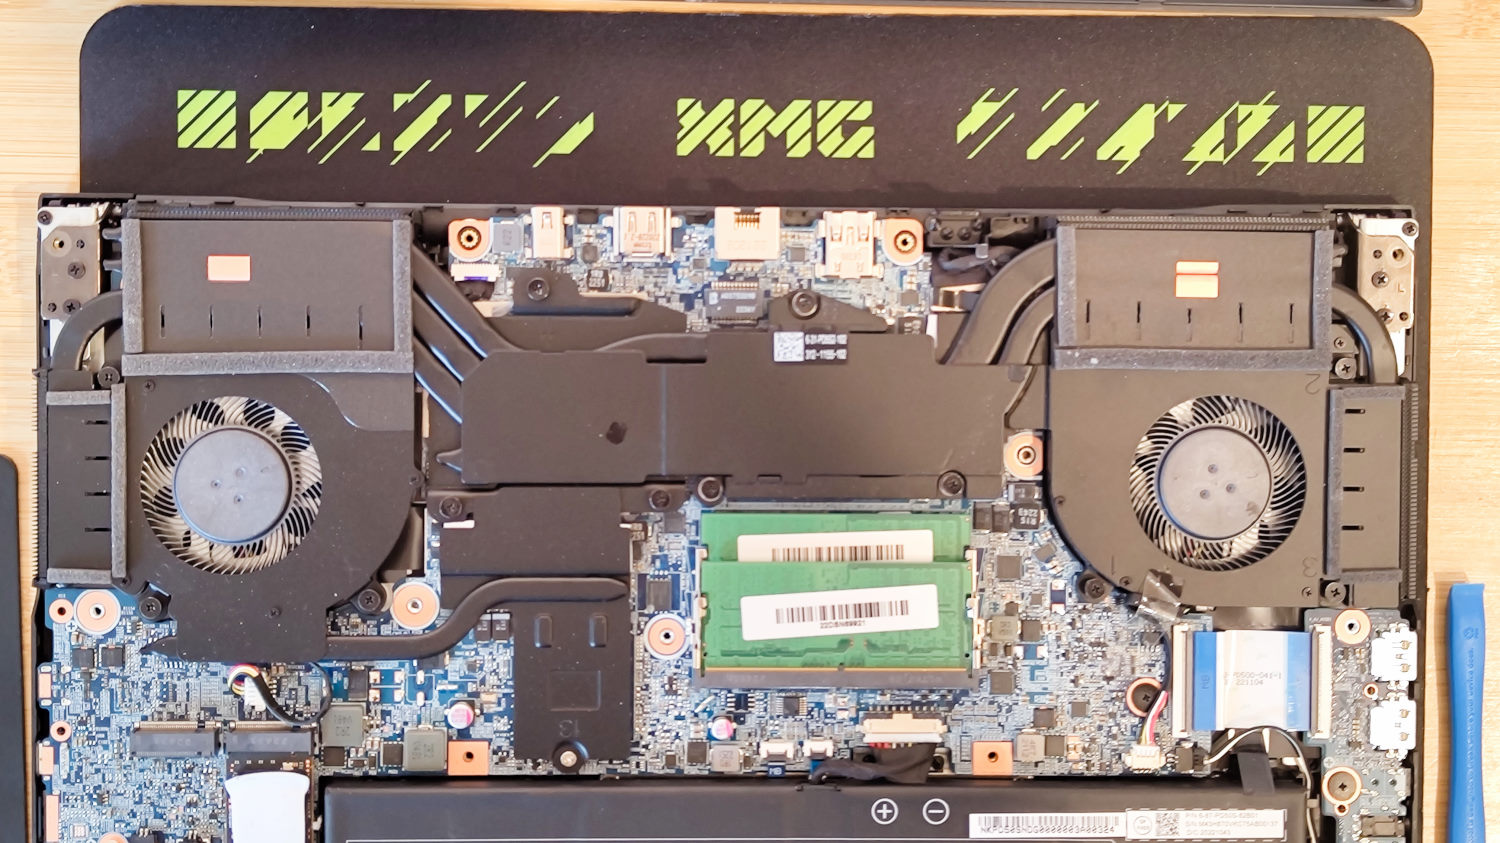
Il coperchio della base è fissato da 15 viti. Dopo averle svitate, il coperchio può essere facilmente aperto dalla parte anteriore con l'aiuto di uno strumento di apertura in plastica. Sotto di esso si trovano la RAM sostituibile e uno slot M.2 libero per un'ulteriore unità SSD. Il notebook è dotato di un apposito cuscinetto termico, di un CD con i driver, di una chiavetta USB con lo stesso contenuto, di un grande tappetino per il mouse e di un apribottiglie.
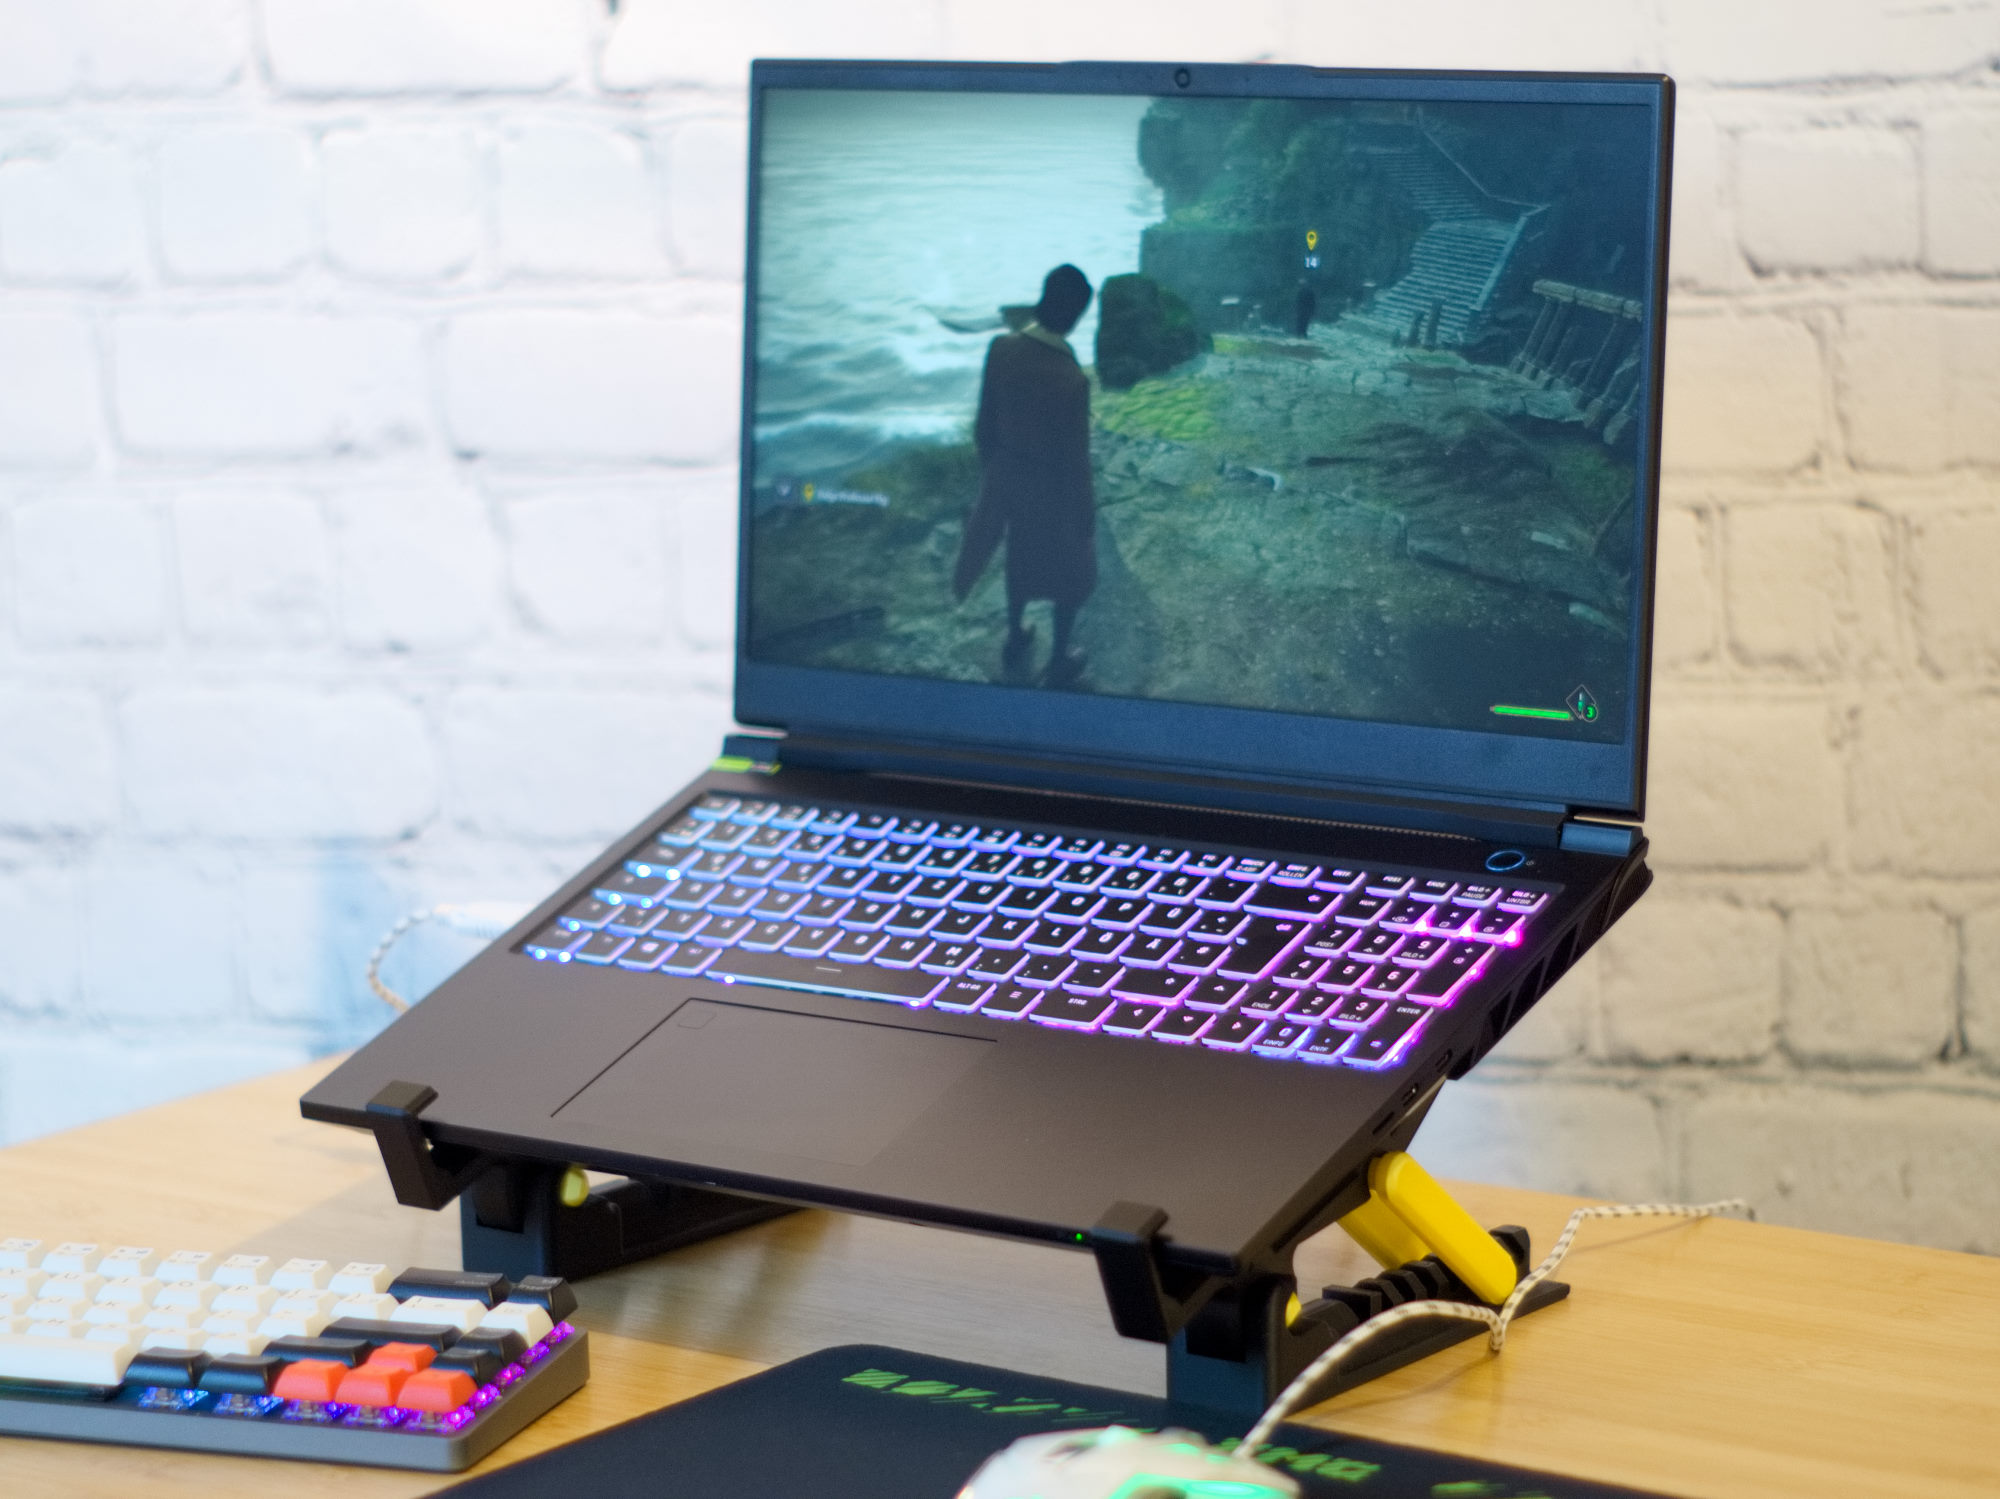
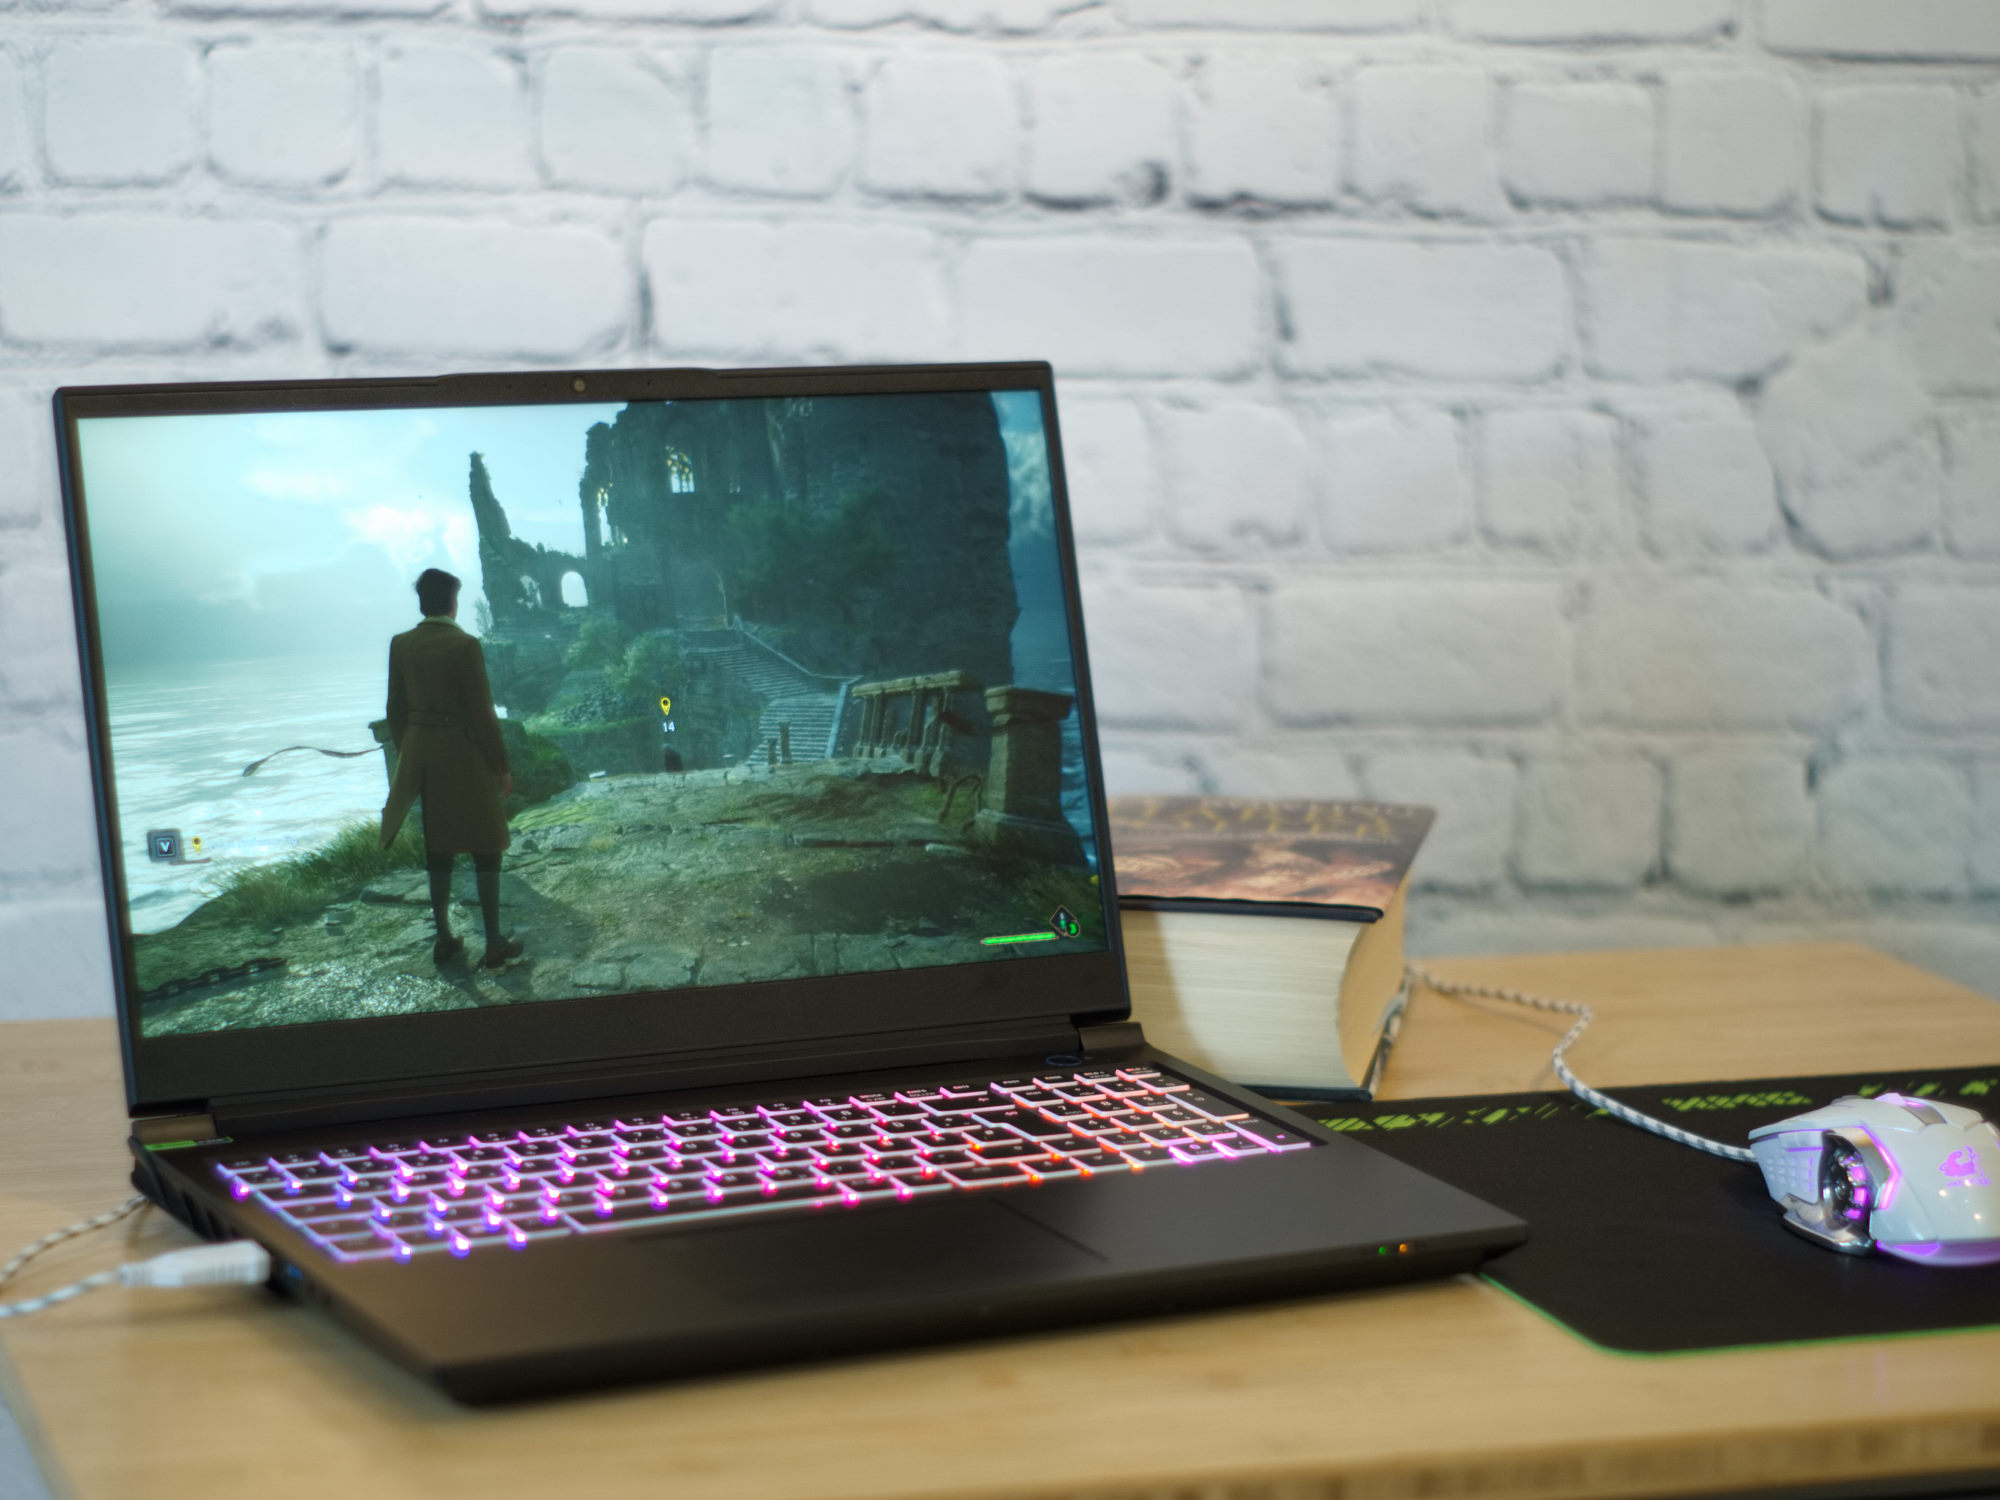
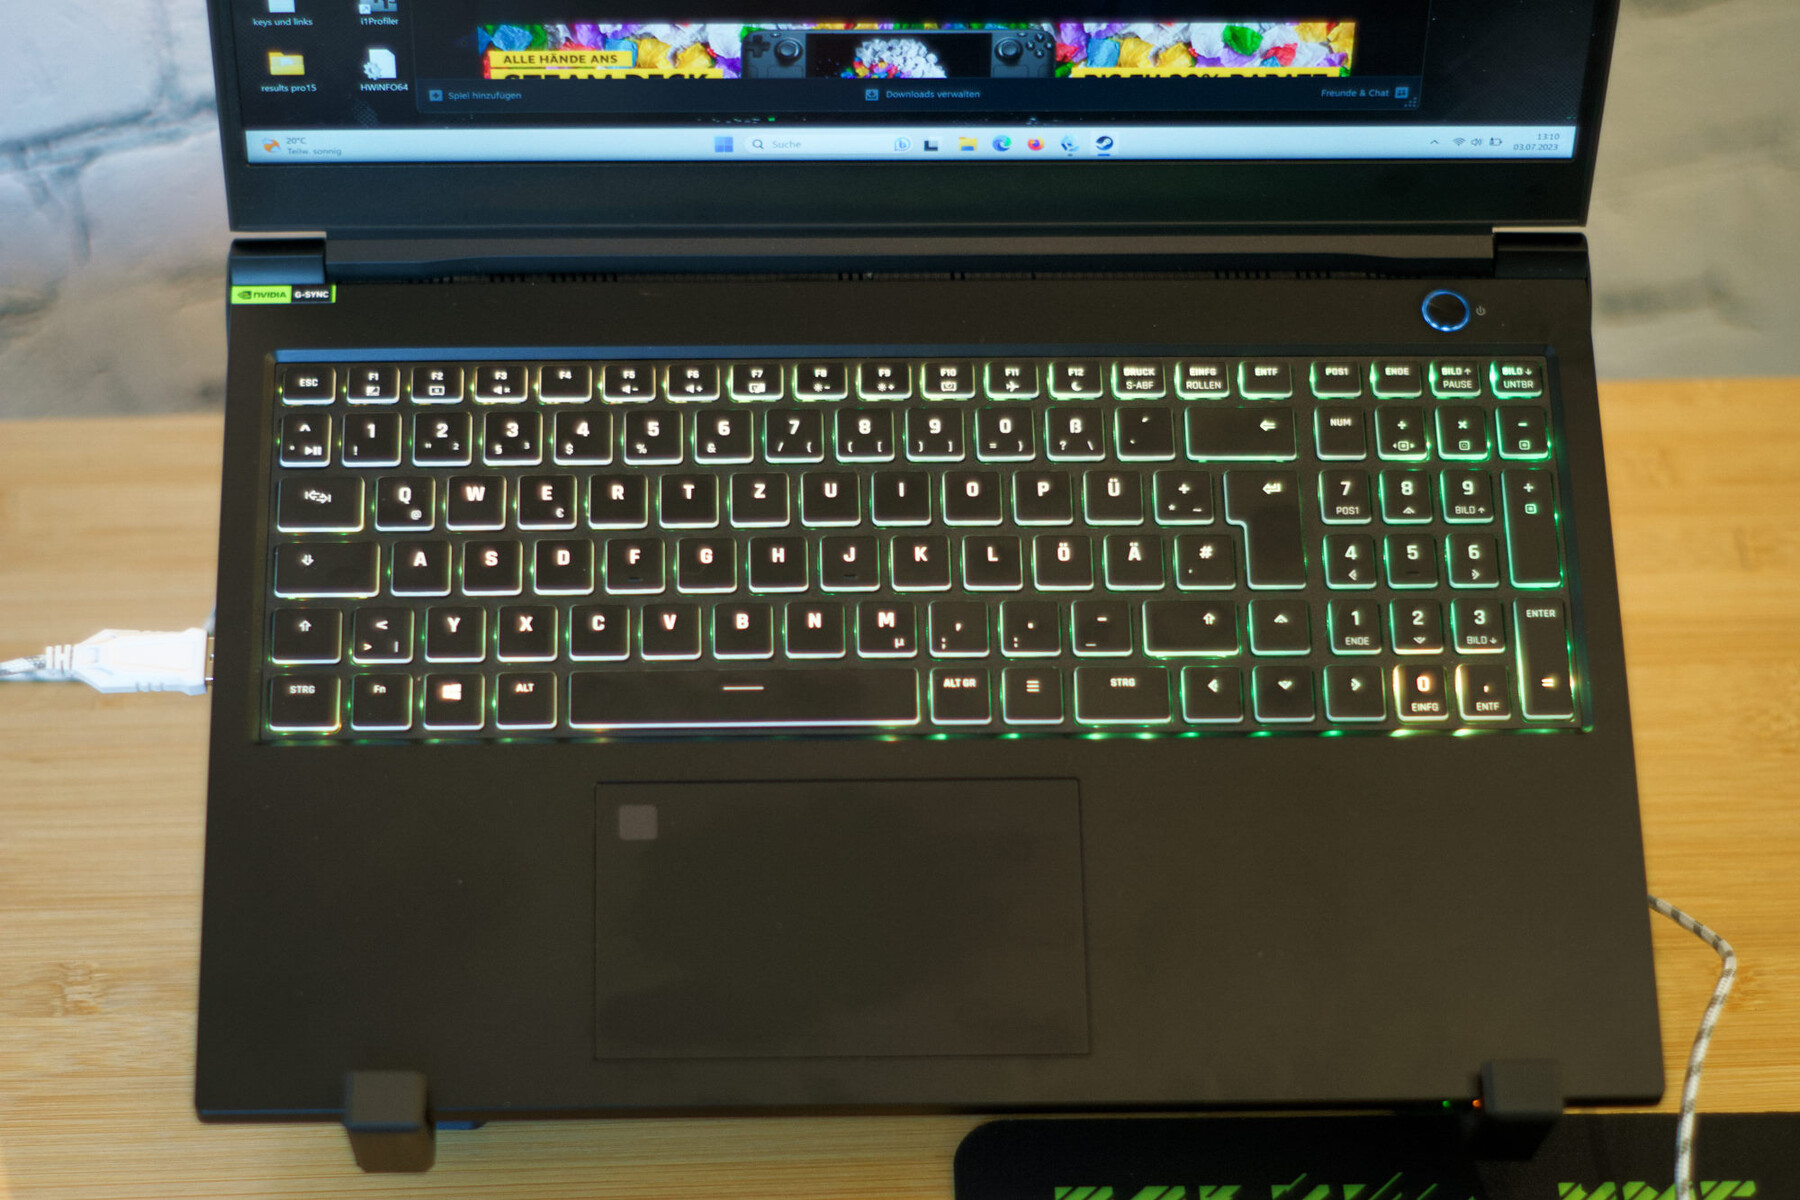
Dispositivi di input - Una tastiera RGB a grandezza naturale
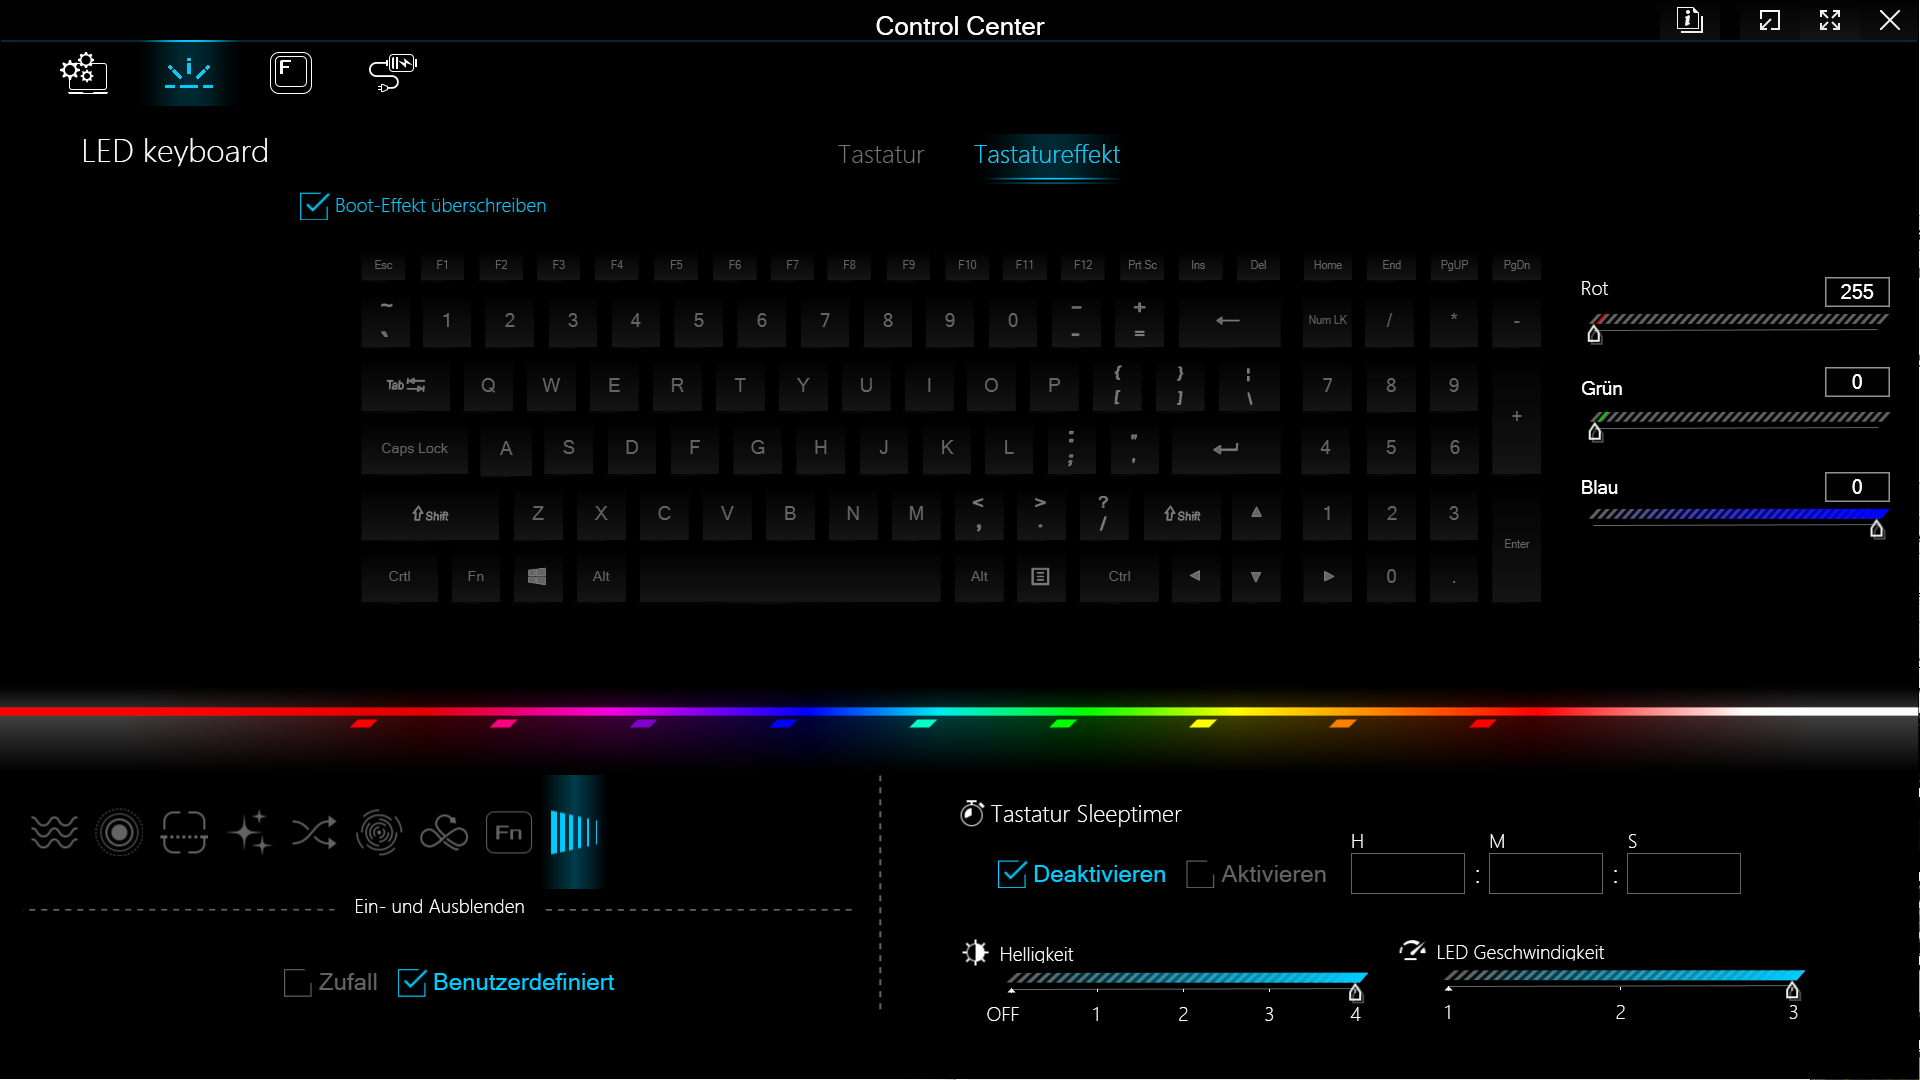
I dispositivi di input dell'XMG Pro 15 sono costituiti da un Clickpad da 12 × 7 cm con lettore di impronte digitali e da una tastiera a grandezza naturale con tastierino numerico. Entrambi hanno un'aptica piacevole e un punto di pressione tangibile. Per quanto riguarda la tastiera, la corsa dei tasti è di circa 1,5 mm. Tutti i tasti possono essere illuminati individualmente con illuminazione RGB.
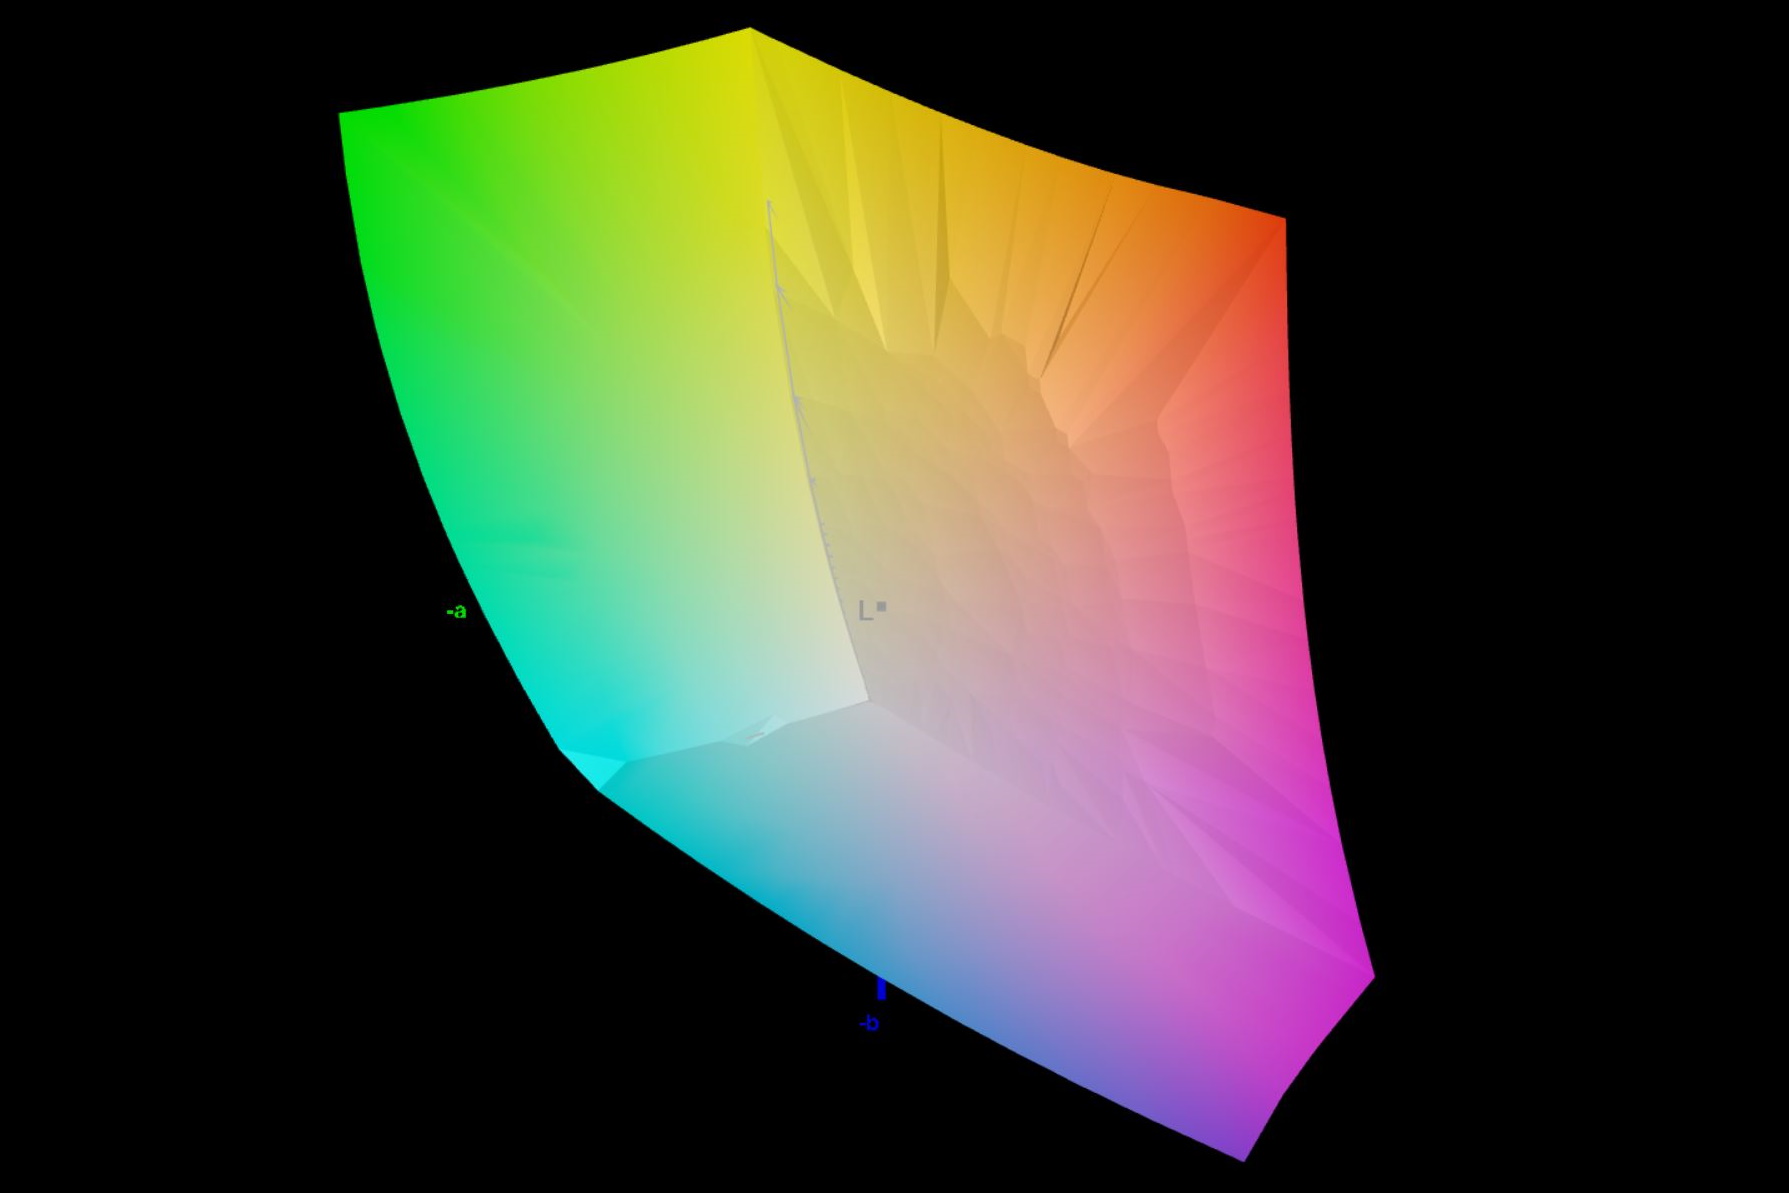
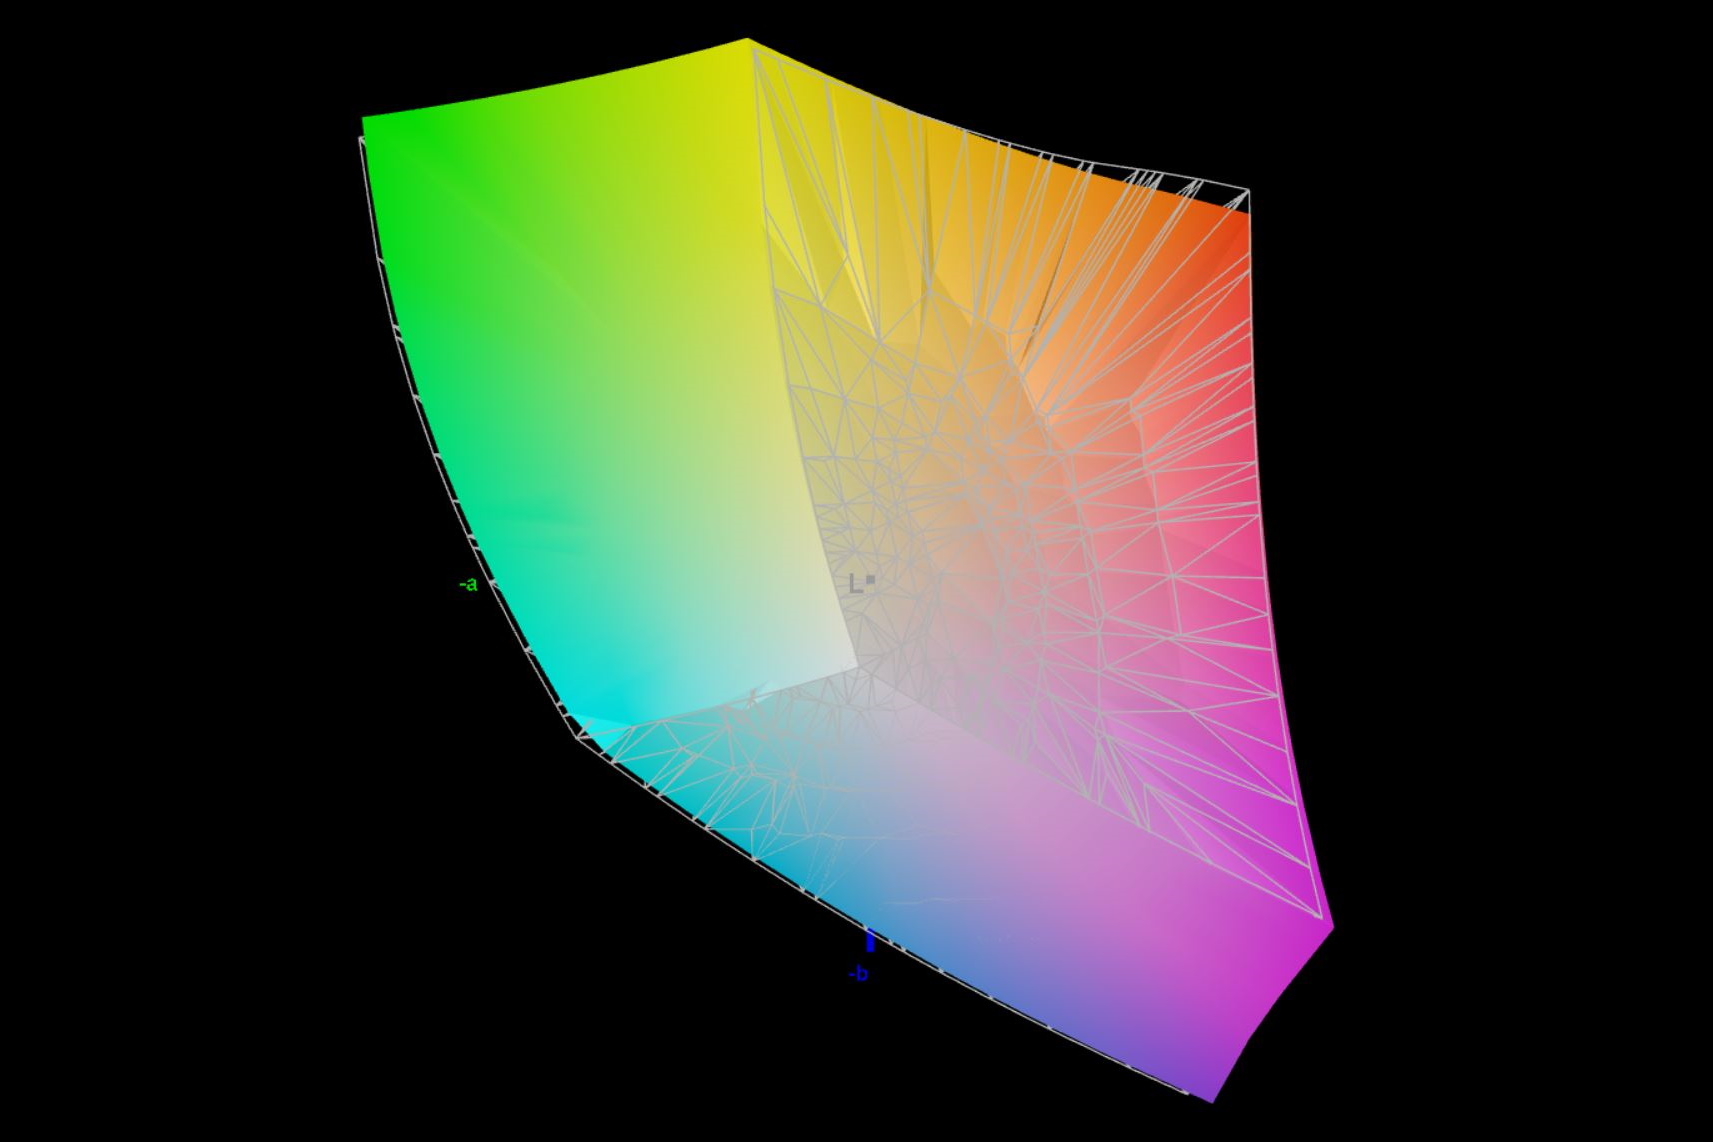
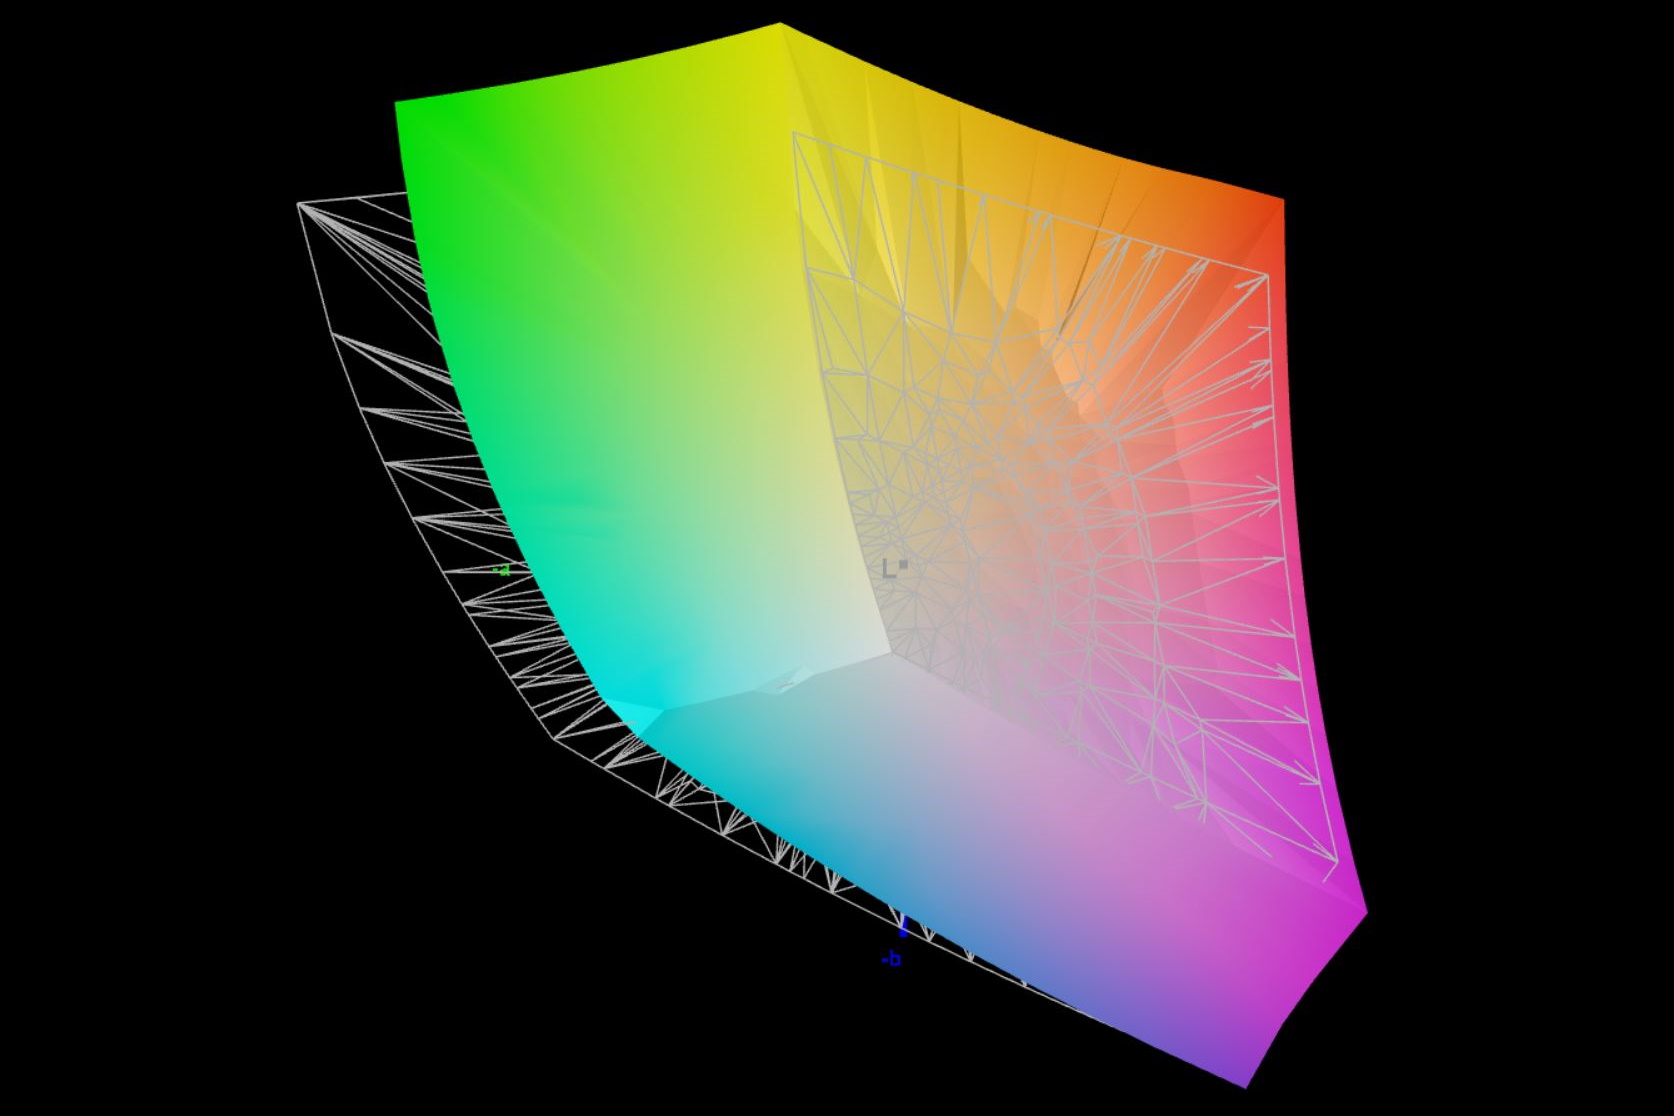
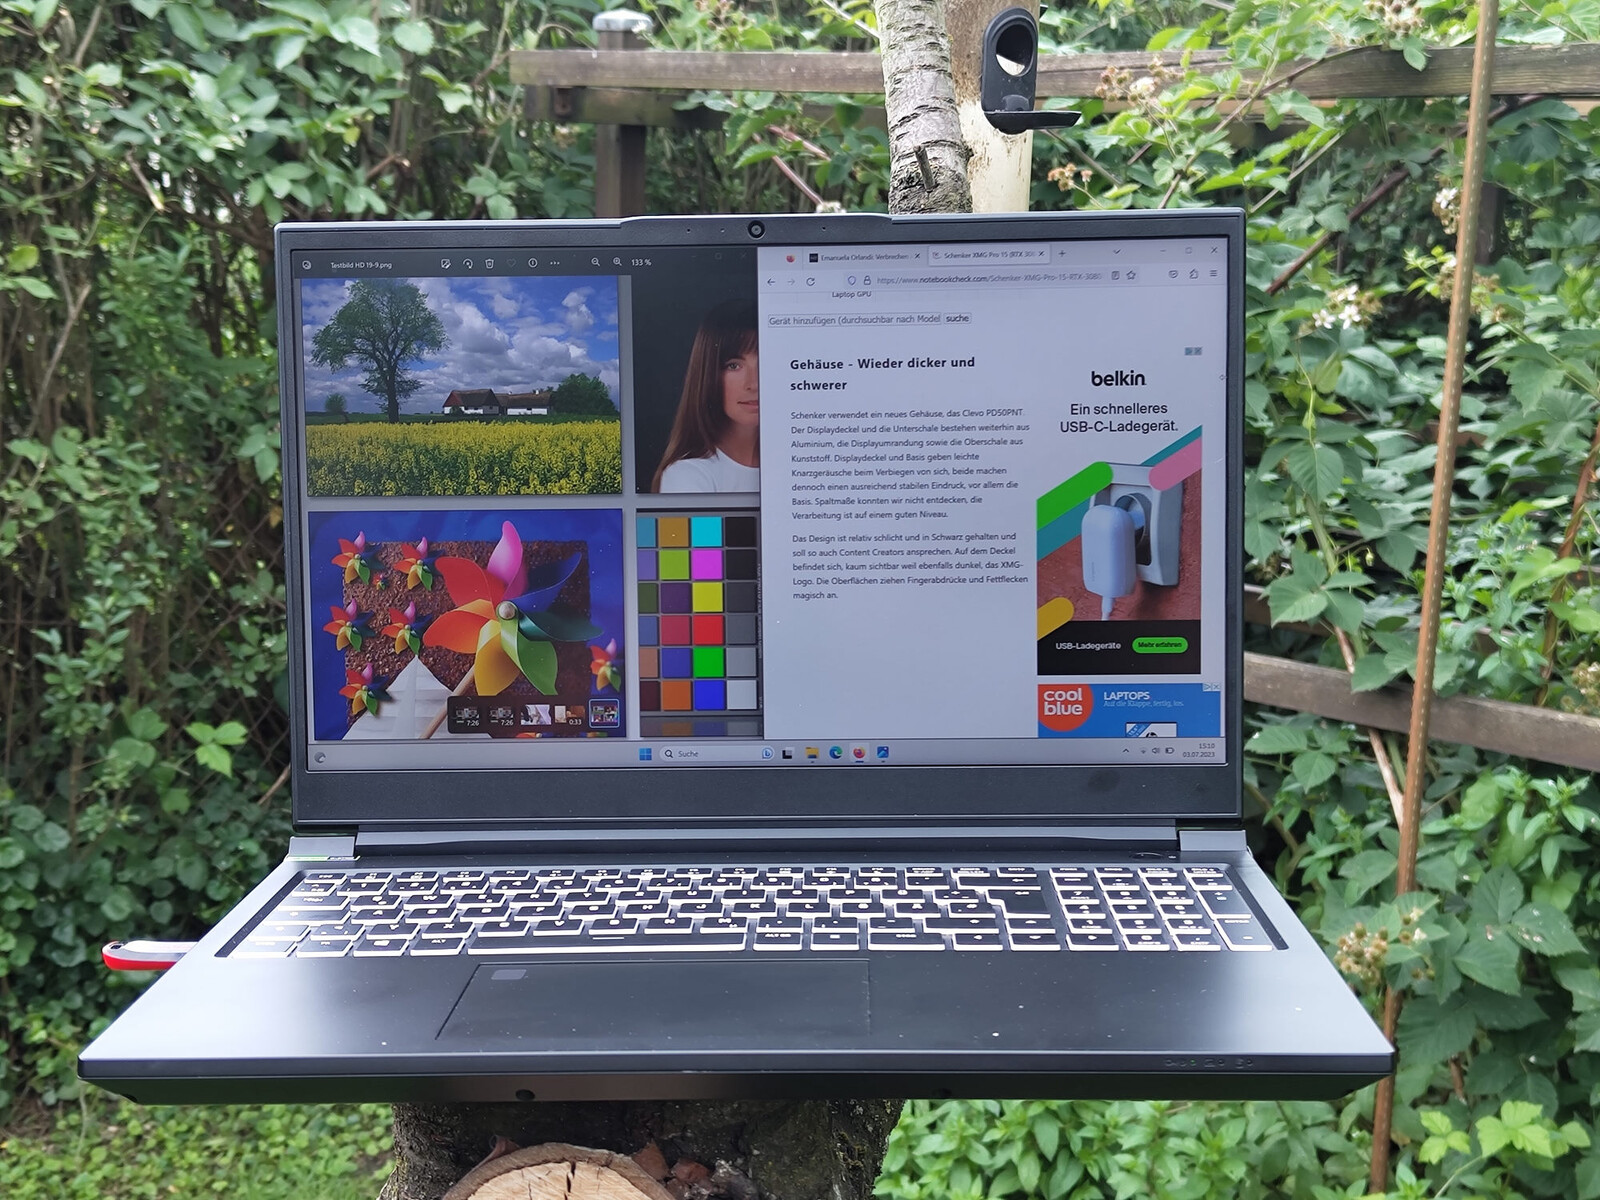
Display - Un QHD da 240 Hz e DisplayP3
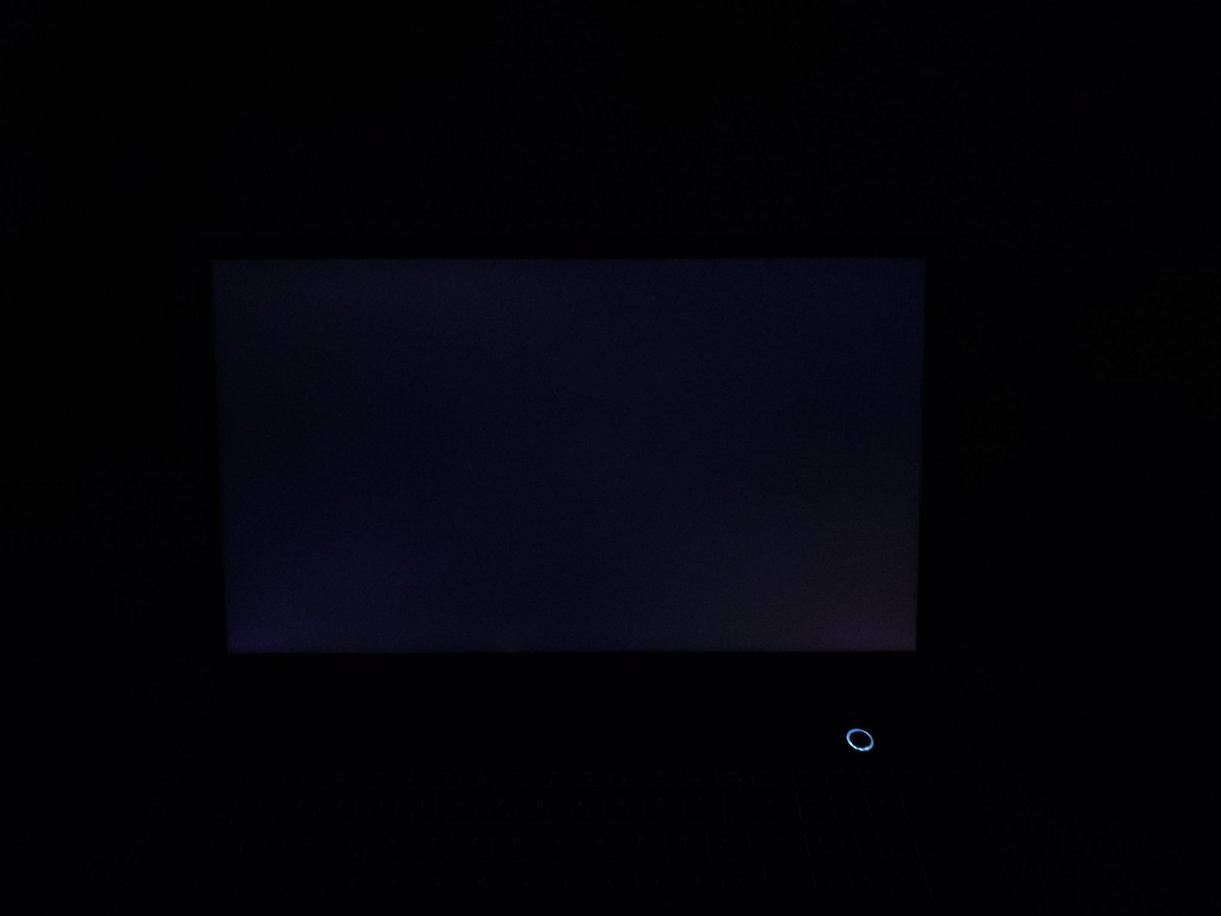
Sebbene non sia un OLED, l'XMG Pro 15 possiede un buon display IPS con G-Sync. A 240 Hz e 2.560 × 1.660 pixel, gli spazi colore sRGB e DisplayP3 sono quasi completamente coperti. Alla massima luminosità, tuttavia, si nota leggermente che il display da 300 cd/m² è illuminato in misura maggiore al centro dello schermo rispetto ai bordi. Tuttavia, a differenza del predecessore, questo non si manifesta con un'emorragia dello schermo chiaramente visibile.
Rispetto al modello di ultima generazione, i tempi di risposta del display sono rimasti sostanzialmente invariati. La frequenza dei fotogrammi è passata da 165 Hz a 240 Hz. Non abbiamo rilevato alcuno sfarfallio dello schermo.
| |||||||||||||||||||||||||
Distribuzione della luminosità: 85 %
Contrasto: 894:1 (Nero: 0.36 cd/m²)
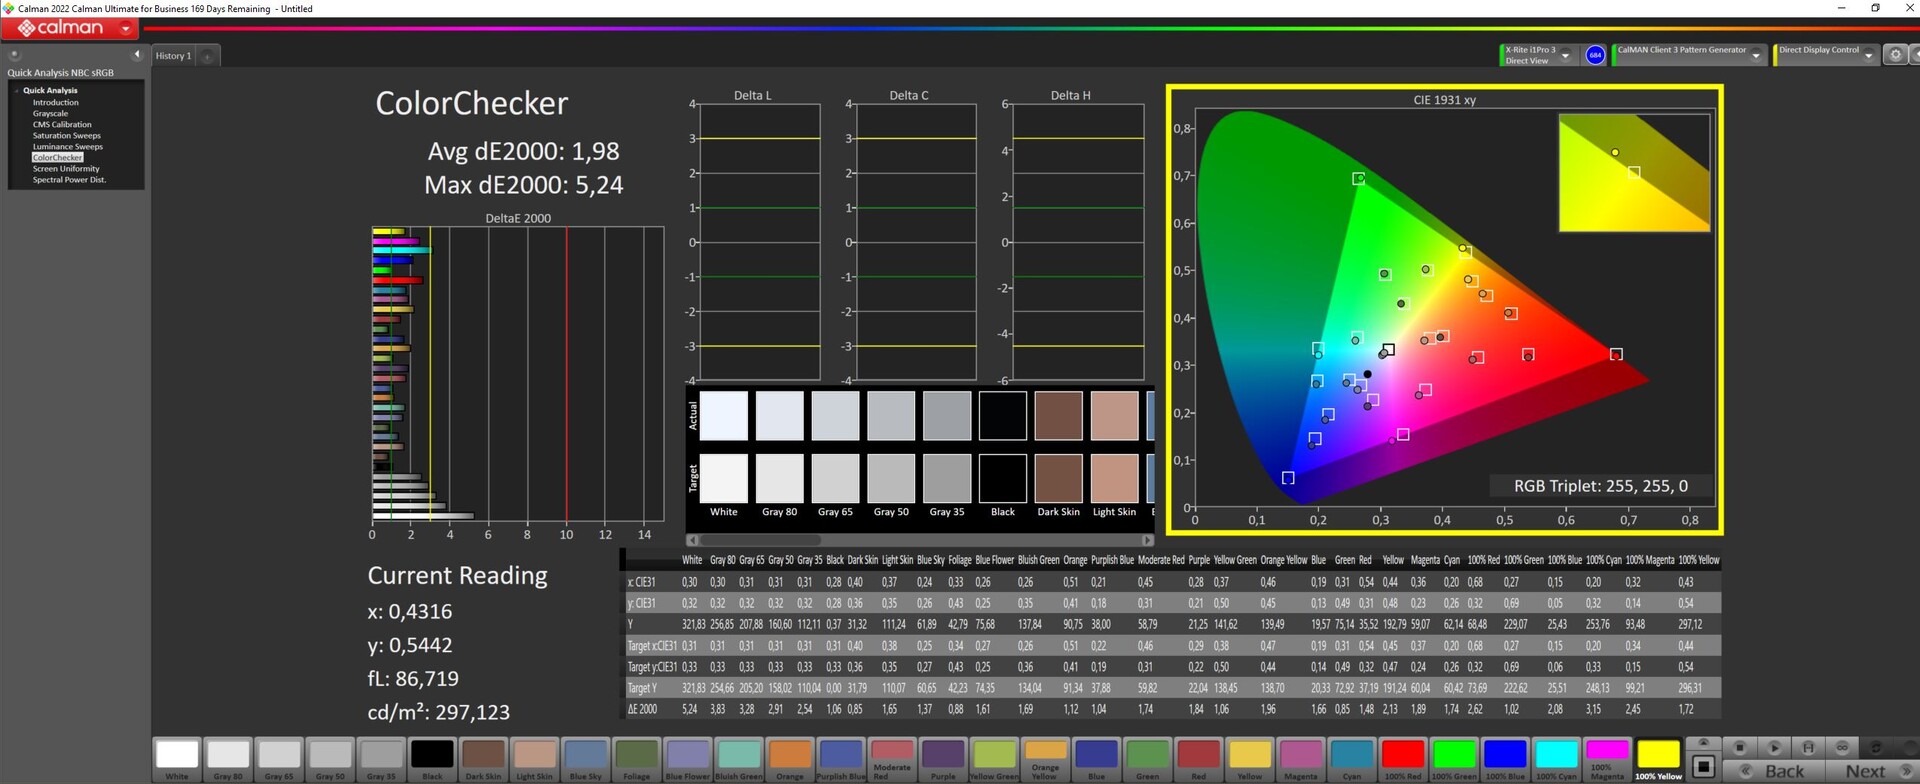
ΔE ColorChecker Calman: 1.98 | ∀{0.5-29.43 Ø4.71}
calibrated: 1.98
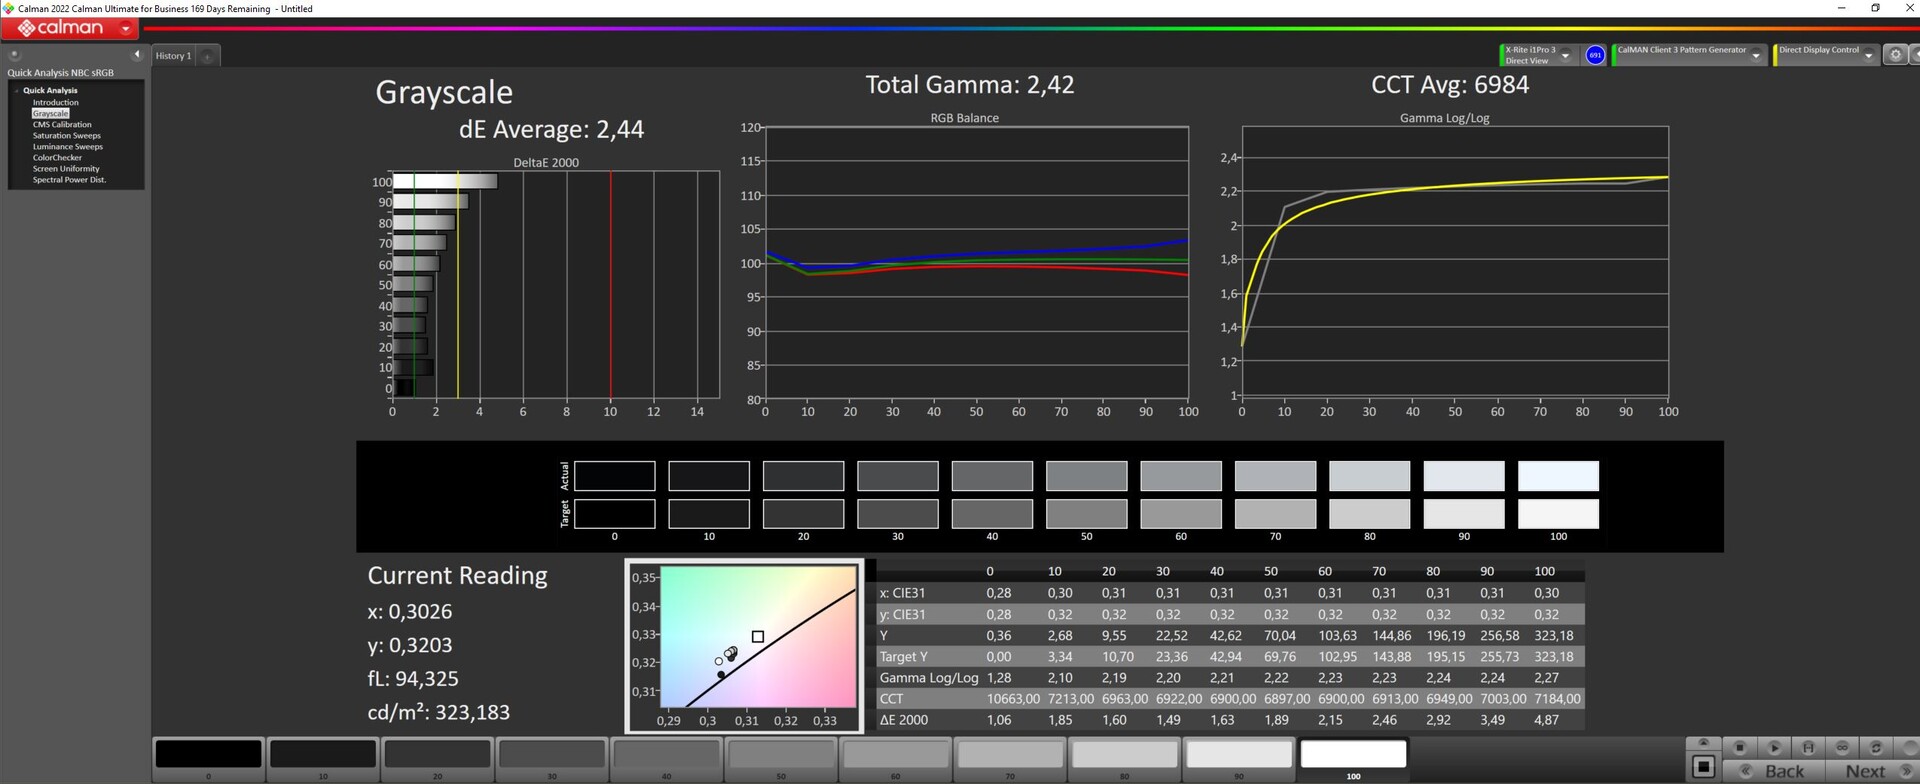
ΔE Greyscale Calman: 2.44 | ∀{0.09-98 Ø4.96}
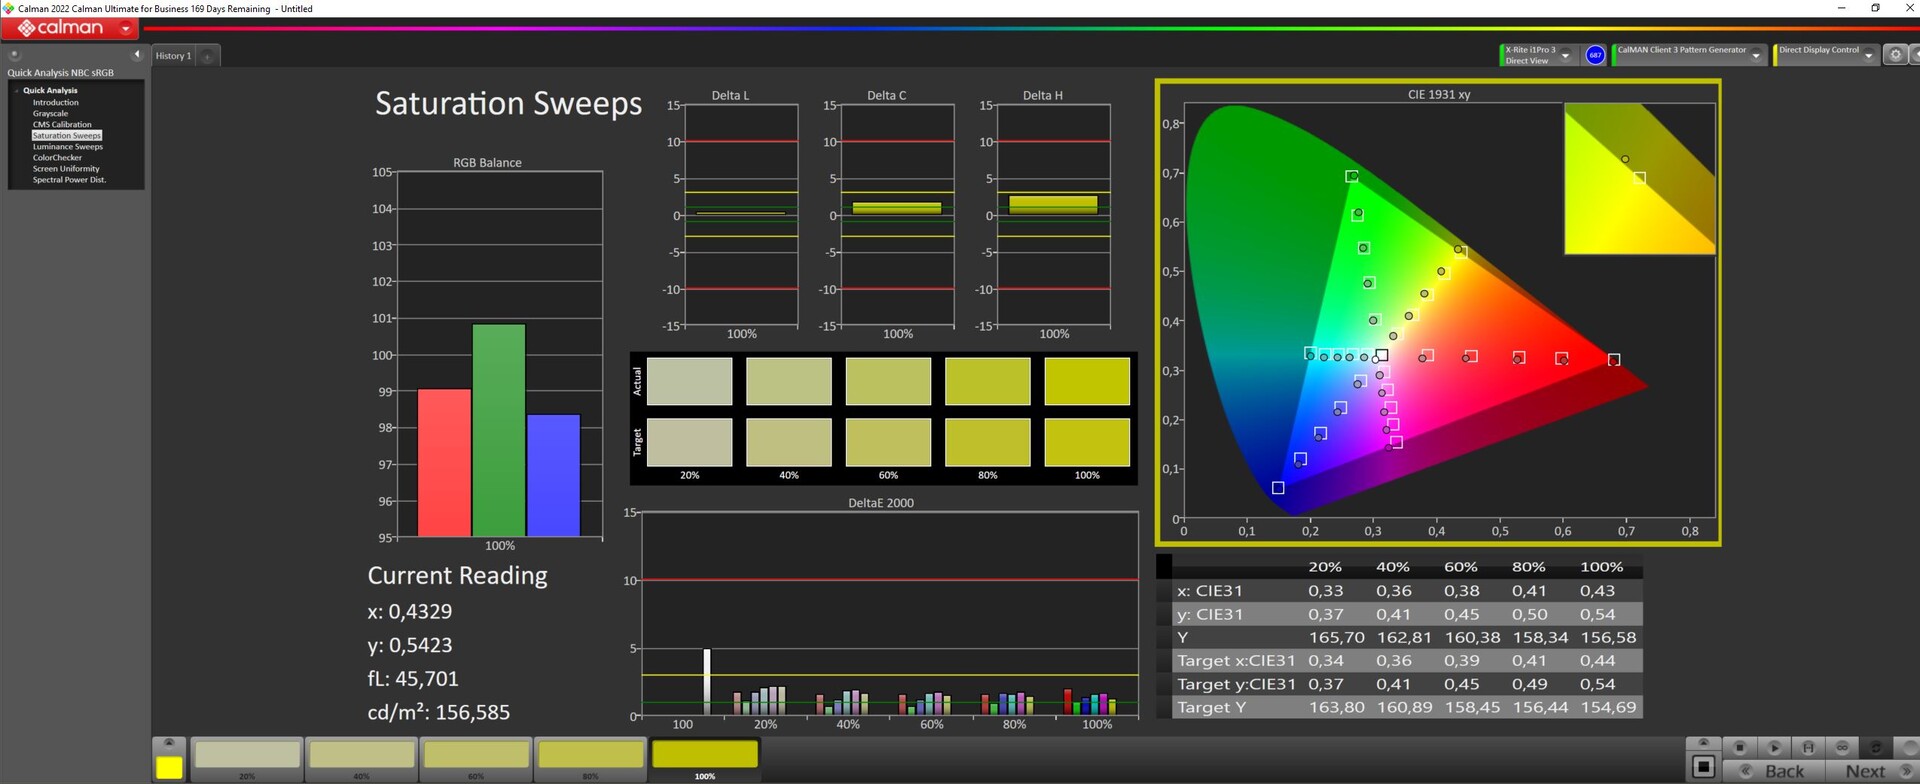
85.4% AdobeRGB 1998 (Argyll 3D)
99.9% sRGB (Argyll 3D)
97.8% Display P3 (Argyll 3D)
Gamma: 2.42
CCT: 6984 K
| Schenker XMG Pro 15 (E23) BOE0AD1, IPS, 2560x1440, 15.6" | Schenker XMG Pro 15 (i7-12700H, RTX 3080 Ti) BOE09C2 (BOE CQ NE156QHM-NY1), IPS, 2560x1440, 15.6" | Dell G15 5530 AUO B156HAN, IPS, 1920x1080, 15.6" | Aorus 15X ASF BOE CQ NE156QHM-NZ1, IPS, 2560x1440, 15.6" | MSI Cyborg 15 A12VF AU Optronics B156HAN15.1, IPS, 1920x1080, 15.6" | Alienware x16 R1 BOE NE16NZ4, IPS, 2560x1600, 16" | |
|---|---|---|---|---|---|---|
| Display | 0% | -13% | -16% | -48% | 2% | |
| Display P3 Coverage (%) | 97.8 | 97.5 0% | 73.1 -25% | 69.3 -29% | 42.3 -57% | 99.2 1% |
| sRGB Coverage (%) | 99.9 | 99.9 0% | 98.4 -2% | 98.2 -2% | 62.6 -37% | 100 0% |
| AdobeRGB 1998 Coverage (%) | 85.4 | 85.2 0% | 74.4 -13% | 70.5 -17% | 43.7 -49% | 88.6 4% |
| Response Times | 7% | 60% | 7% | -52% | 29% | |
| Response Time Grey 50% / Grey 80% * (ms) | 14 ? | 13.2 ? 6% | 3.39 ? 76% | 12.4 ? 11% | 22 ? -57% | 5.1 ? 64% |
| Response Time Black / White * (ms) | 9.6 ? | 8.8 ? 8% | 5.35 ? 44% | 9.4 ? 2% | 14 ? -46% | 10.3 ? -7% |
| PWM Frequency (Hz) | 21620 ? | |||||
| Screen | -33% | -25% | 24% | -22% | 14% | |
| Brightness middle (cd/m²) | 322 | 317 -2% | 320 -1% | 316 -2% | 247 -23% | 302.2 -6% |
| Brightness (cd/m²) | 301 | 294 -2% | 316 5% | 301 0% | 234 -22% | 285 -5% |
| Brightness Distribution (%) | 85 | 83 -2% | 94 11% | 90 6% | 89 5% | 89 5% |
| Black Level * (cd/m²) | 0.36 | 0.32 11% | 0.21 42% | 0.28 22% | 0.25 31% | 0.26 28% |
| Contrast (:1) | 894 | 991 11% | 1524 70% | 1129 26% | 988 11% | 1162 30% |
| Colorchecker dE 2000 * | 1.98 | 4.22 -113% | 4.55 -130% | 1.54 22% | 3.78 -91% | 1.63 18% |
| Colorchecker dE 2000 max. * | 5.24 | 5.97 -14% | 9.83 -88% | 2.46 53% | 6.42 -23% | 4.13 21% |
| Colorchecker dE 2000 calibrated * | 1.98 | 4.09 -107% | 1.51 24% | 1.21 39% | 3.94 -99% | 1.17 41% |
| Greyscale dE 2000 * | 2.44 | 4.41 -81% | 6.2 -154% | 1.3 47% | 2.16 11% | 2.5 -2% |
| Gamma | 2.42 91% | 2.29 96% | 2.07 106% | 2.307 95% | 2.33 94% | 2.23 99% |
| CCT | 6984 93% | 6733 97% | 6479 100% | 6456 101% | 6906 94% | 6590 99% |
| Media totale (Programma / Settaggio) | -9% /
-20% | 7% /
-10% | 5% /
13% | -41% /
-32% | 15% /
14% |
* ... Meglio usare valori piccoli
Con i colori e le scale di grigio di Calman ColorChecker, rispettivamente ΔΕ 1,98 e ΔΕ 2,44, l'XMG Pro 15 si colloca chiaramente all'interno dell'intervallo target di ΔΕ < 3. Il nostro profilo ICC (scaricabile nel box informazioni) dovrebbe essere in grado di ridurre leggermente il blu eccessivamente enfatizzato e migliorare significativamente sia le scale di grigio che la riproduzione dei colori. Insieme allo spazio colore DisplayP3, quasi completamente coperto, abbiamo a che fare con un display che sembra essere adatto all'editing video professionale.
Tempi di risposta del Display
| ↔ Tempi di risposta dal Nero al Bianco | ||
|---|---|---|
| 9.6 ms ... aumenta ↗ e diminuisce ↘ combinato | ↗ 4.2 ms Incremento | 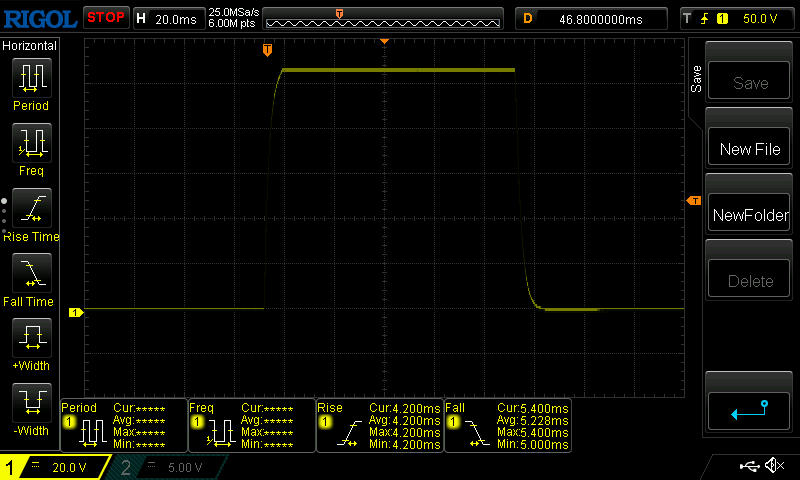 |
| ↘ 5.4 ms Calo | ||
| Lo schermo mostra veloci tempi di risposta durante i nostri tests e dovrebbe esere adatto al gaming In confronto, tutti i dispositivi di test variano da 0.1 (minimo) a 240 (massimo) ms. » 26 % di tutti i dispositivi è migliore. Questo significa che i tempi di risposta rilevati sono migliori rispettto alla media di tutti i dispositivi testati (19.8 ms). | ||
| ↔ Tempo di risposta dal 50% Grigio all'80% Grigio | ||
| 14 ms ... aumenta ↗ e diminuisce ↘ combinato | ↗ 6.6 ms Incremento | 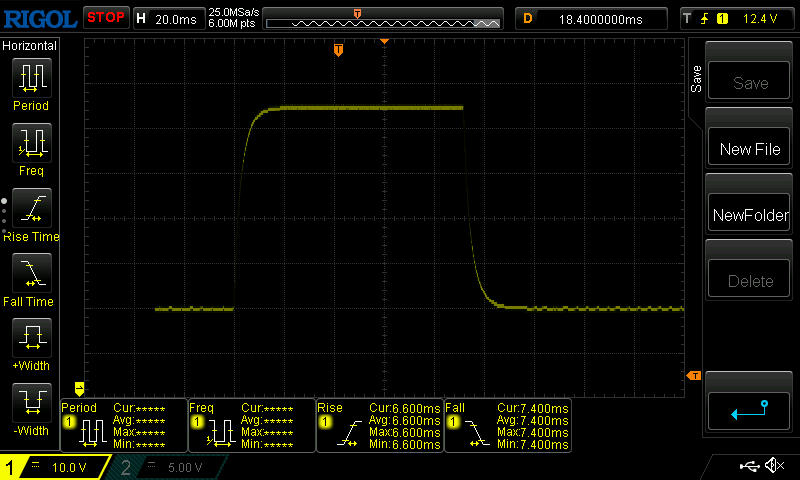 |
| ↘ 7.4 ms Calo | ||
| Lo schermo mostra buoni tempi di risposta durante i nostri tests, ma potrebbe essere troppo lento per i gamers competitivi. In confronto, tutti i dispositivi di test variano da 0.165 (minimo) a 636 (massimo) ms. » 28 % di tutti i dispositivi è migliore. Questo significa che i tempi di risposta rilevati sono migliori rispettto alla media di tutti i dispositivi testati (31 ms). | ||
Sfarfallio dello schermo / PWM (Pulse-Width Modulation)
| flickering dello schermo / PWM non rilevato | 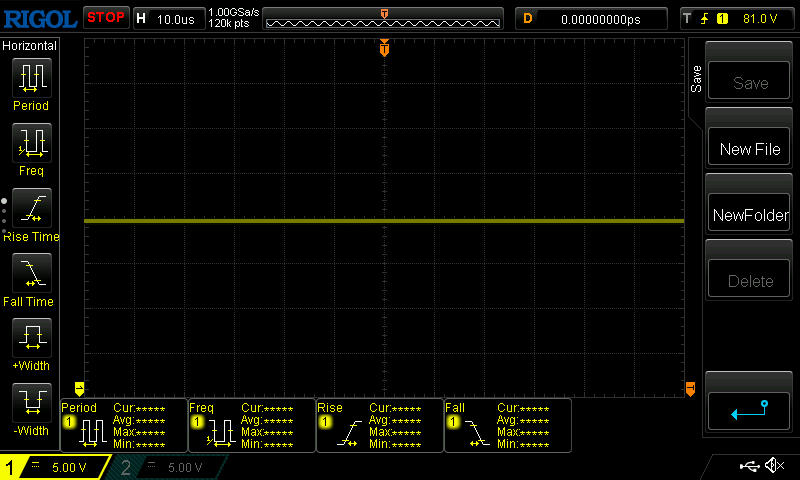 | ||
In confronto: 52 % di tutti i dispositivi testati non utilizza PWM per ridurre la luminosita' del display. Se è rilevato PWM, una media di 7757 (minimo: 5 - massimo: 343500) Hz è stata rilevata. | |||
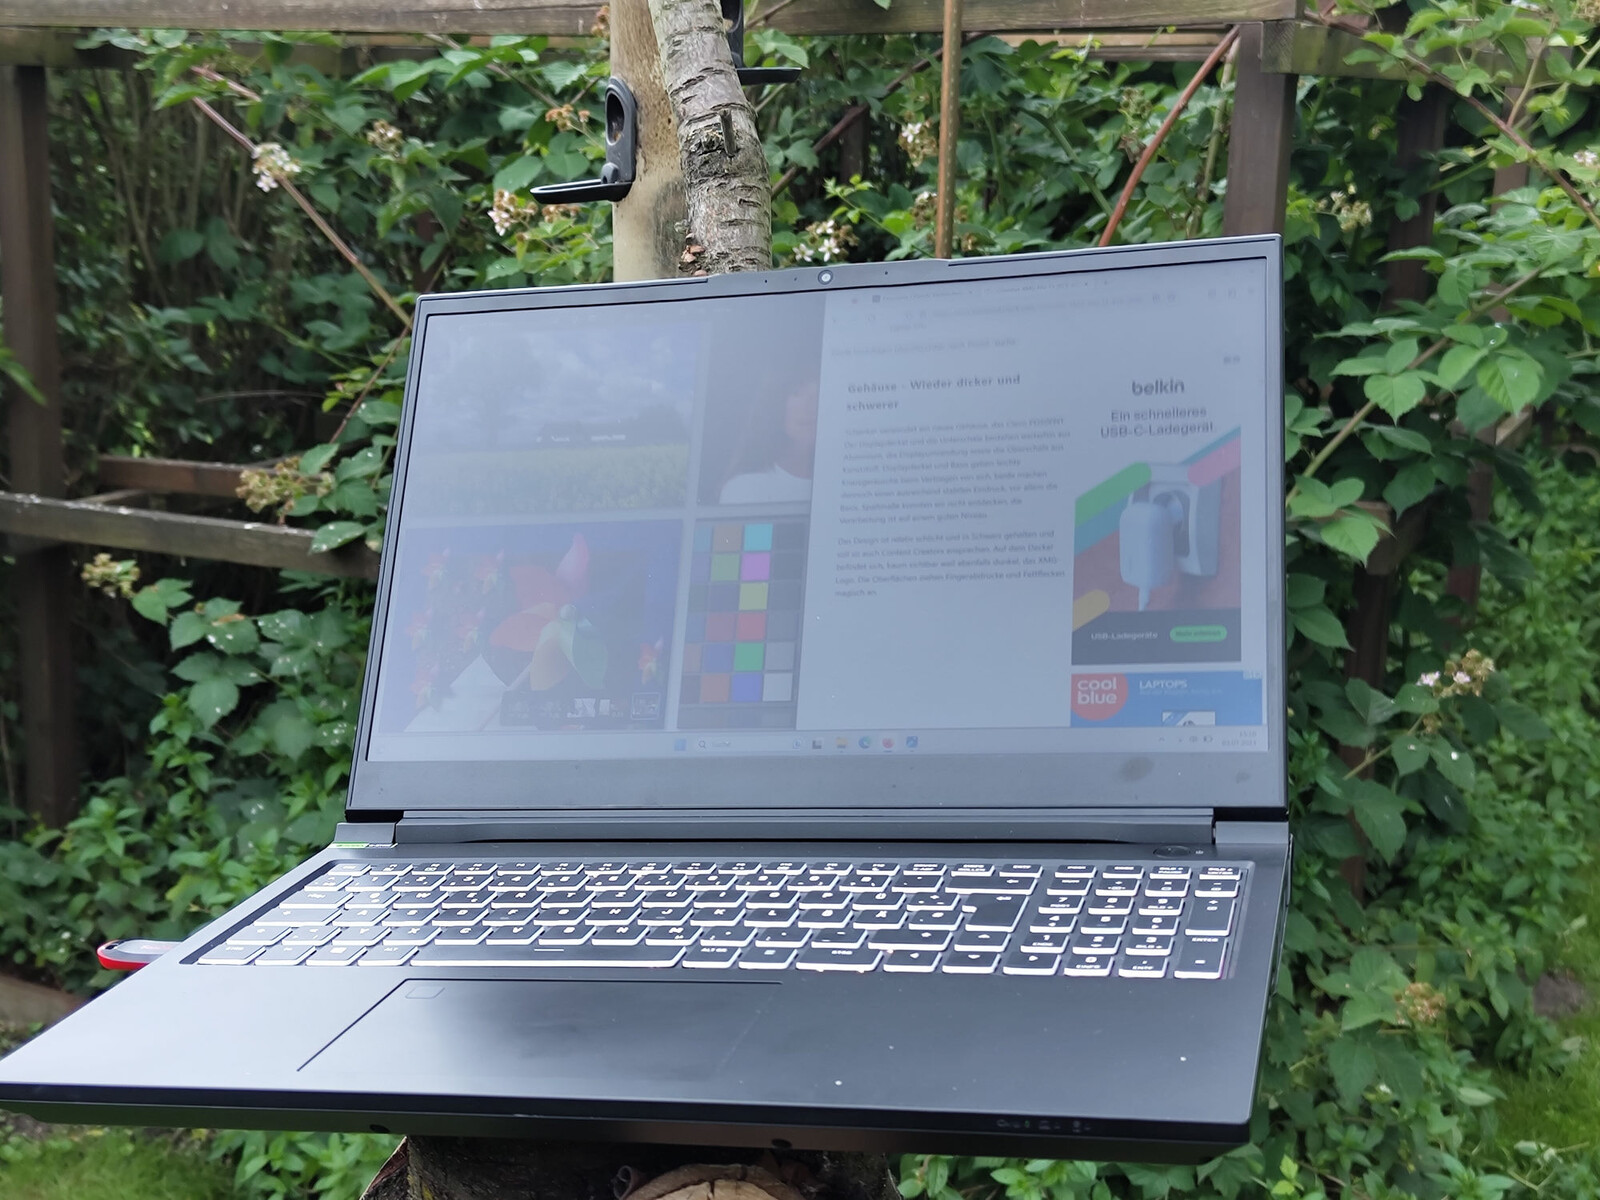
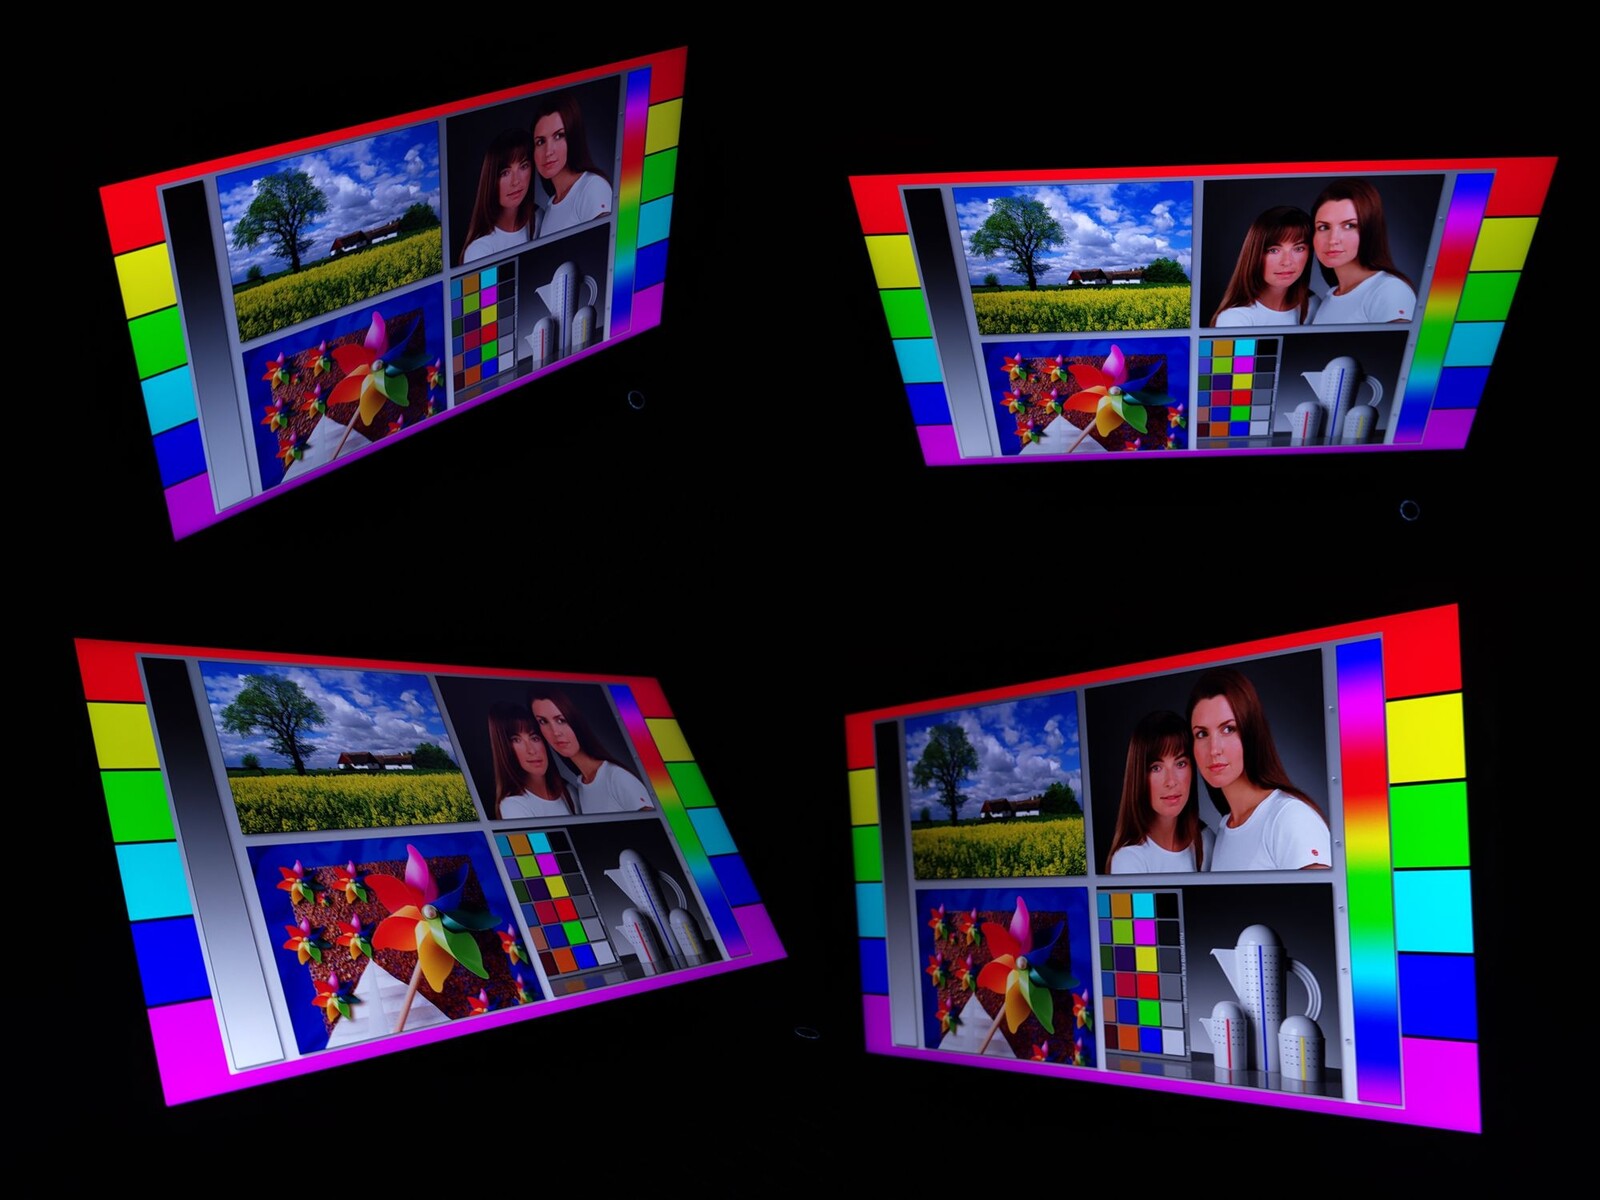
È possibile utilizzare il notebook da 15 pollici anche all'aperto, grazie al display opaco e relativamente luminoso. A seconda del luogo in cui ci si trova, è necessario scegliere l'angolo di visione appropriato per ottenere il minor numero possibile di riflessi. Fortunatamente, il pannello IPS possiede angoli di visione molto stabili.
Prestazioni - L'Intel Core i9 e l'Nvidia GeForce RTX 4060 hanno una potenza costante
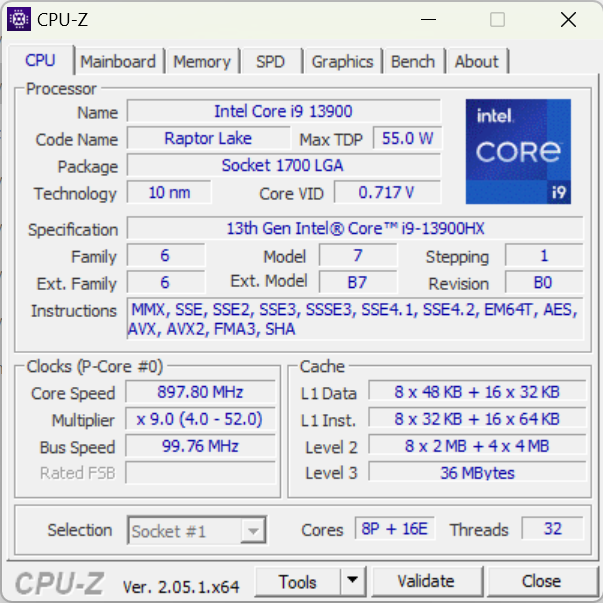
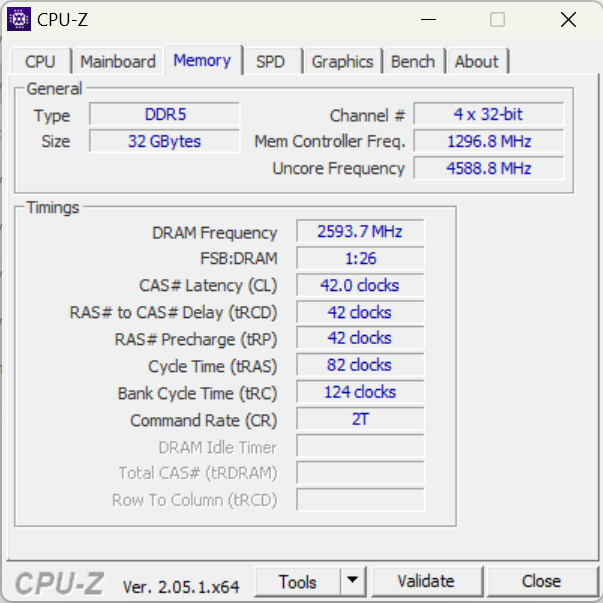
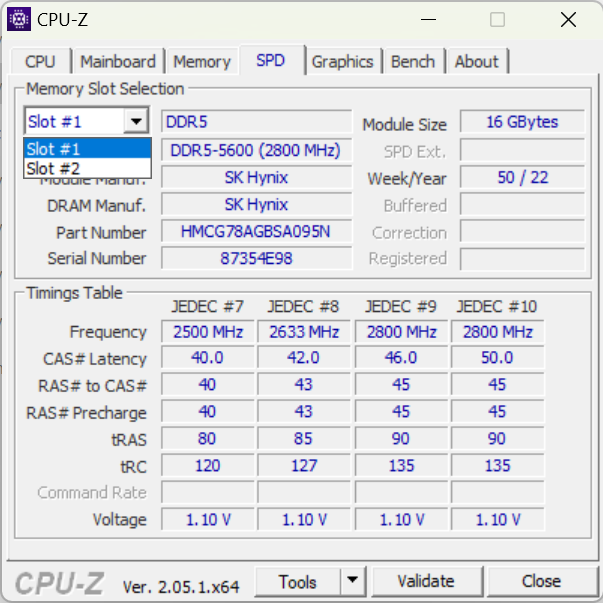
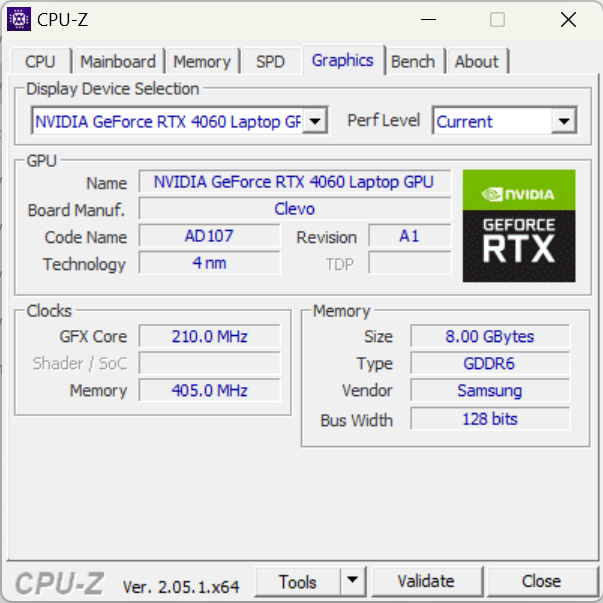
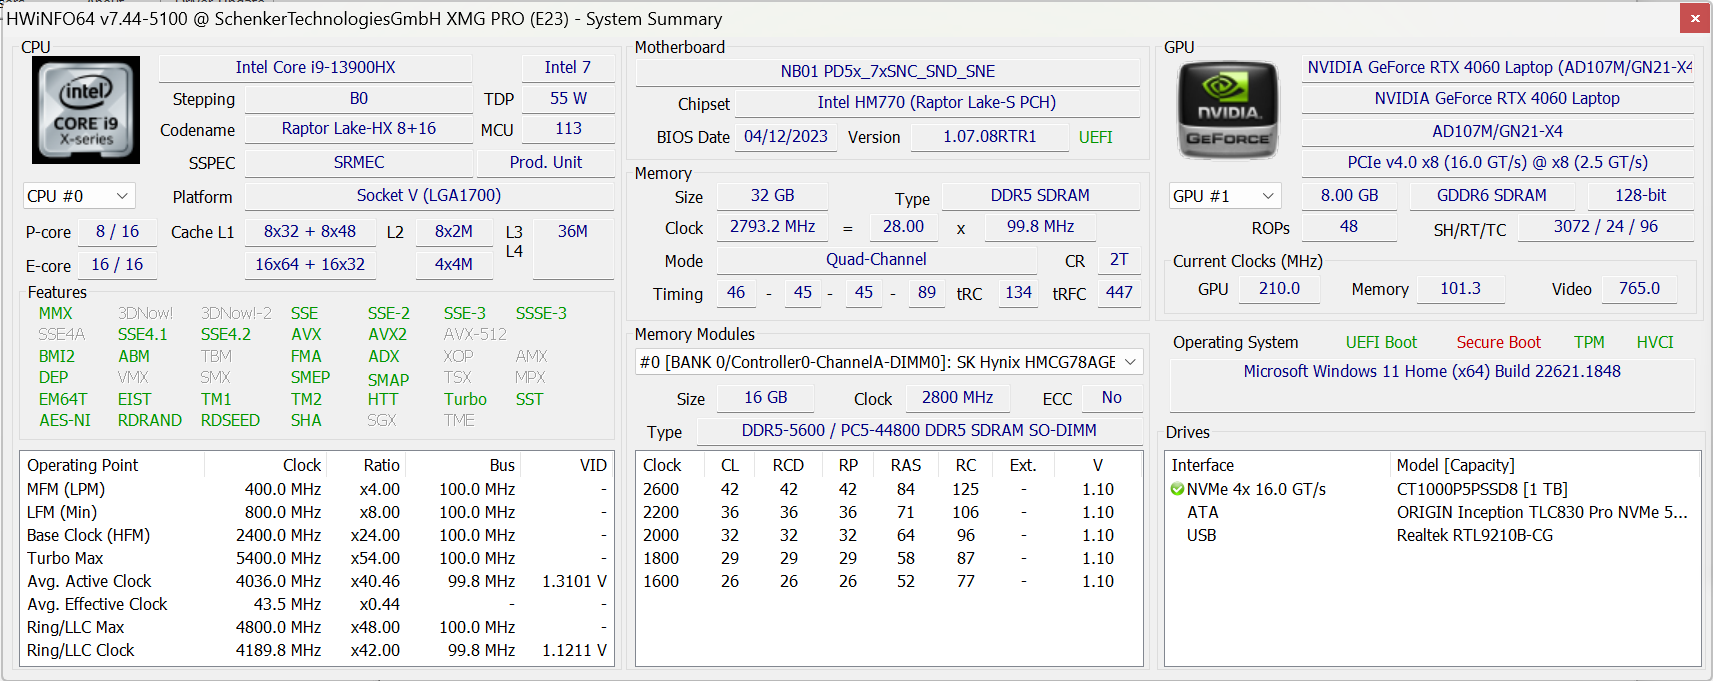
Nel nostro dispositivo di prova, un potenteIntel Core i9-13900HX e laNvidia GeForce RTX 4060 sono responsabili della potenza sufficiente per gestire i giochi e la maggior parte delle attività creative. Il portatile può essere configurato con 8 o 64 GB di RAM DDR5. Il nostro esemplare in prova è dotato di 32 GB. Come tipico di Schenker, nel processo di ordinazione di Bestware è possibile scegliere tra diverse opzioni . Oltre alla RTX 4060, è possibile configurare anche una RTX 4070. Anche per quanto riguarda le unità SSD e le opzioni WiFi è disponibile un'ampia scelta.
Condizioni di prova
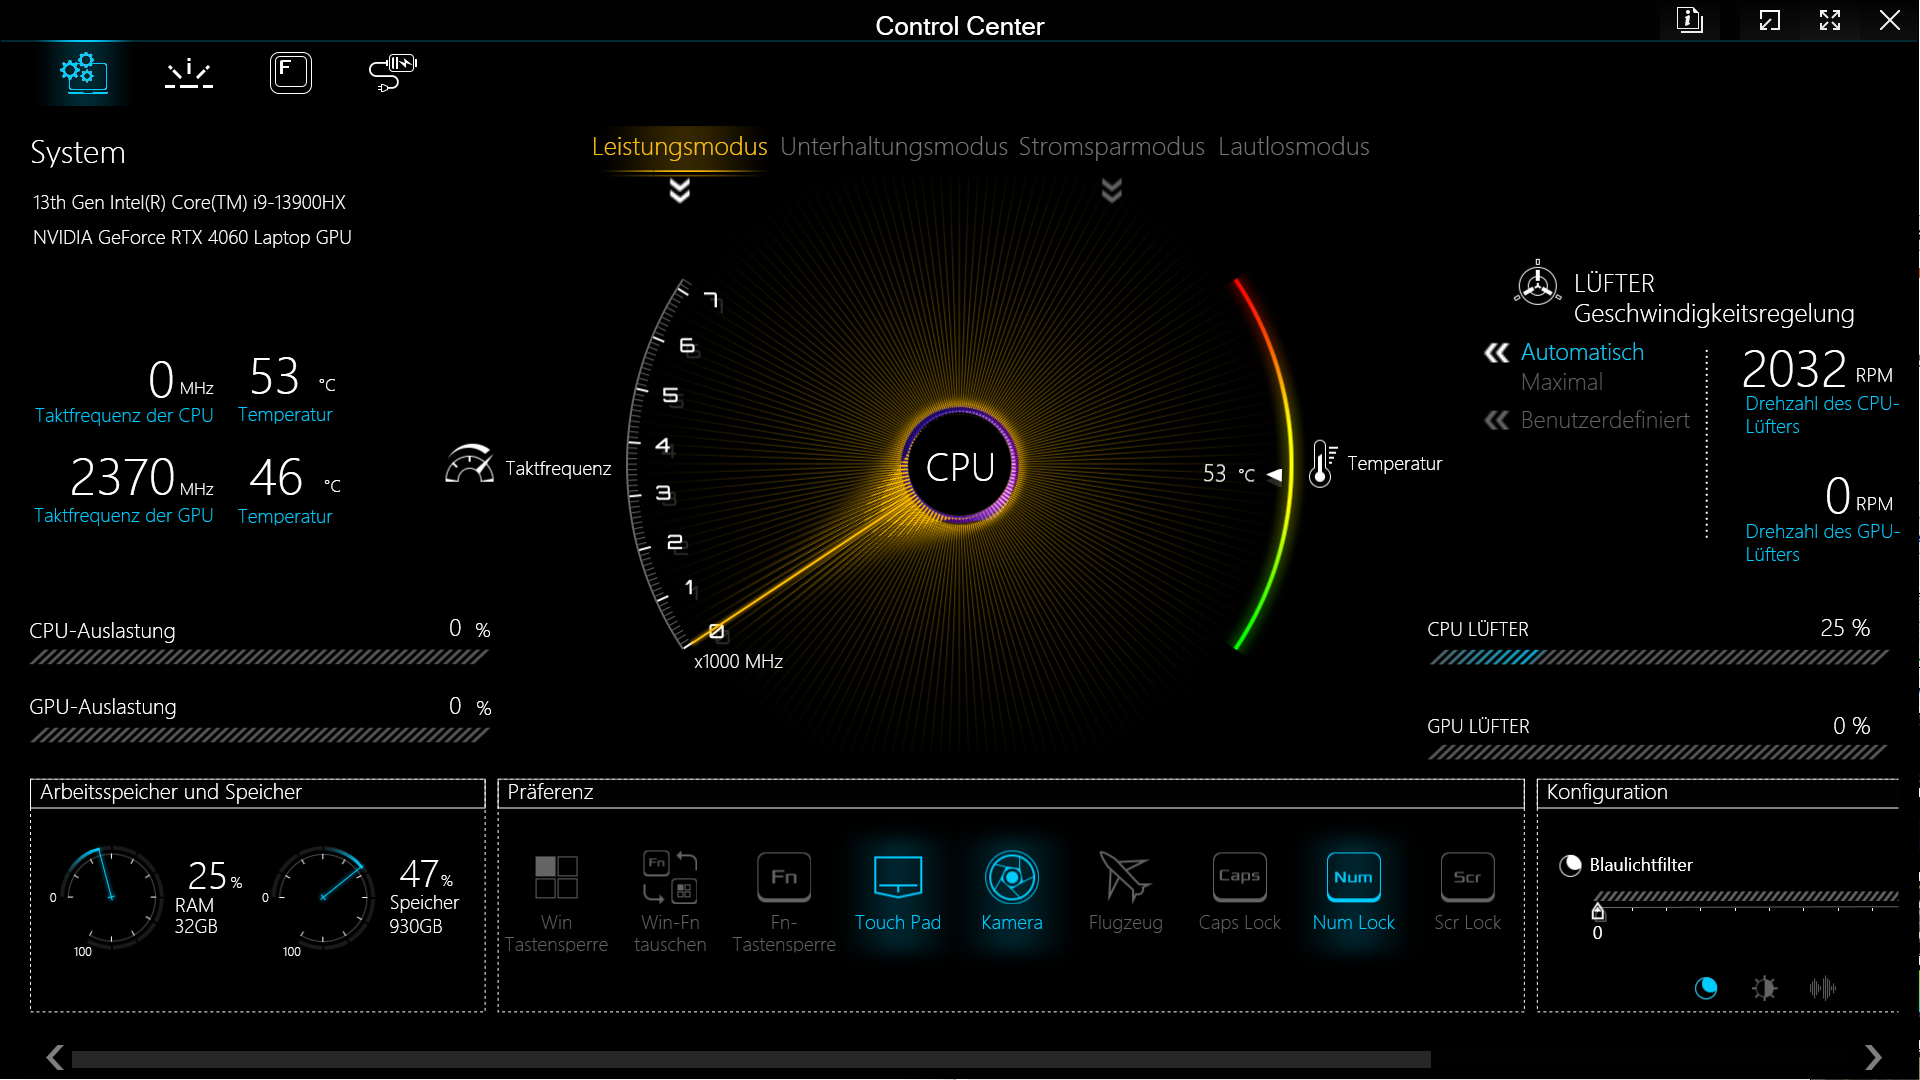
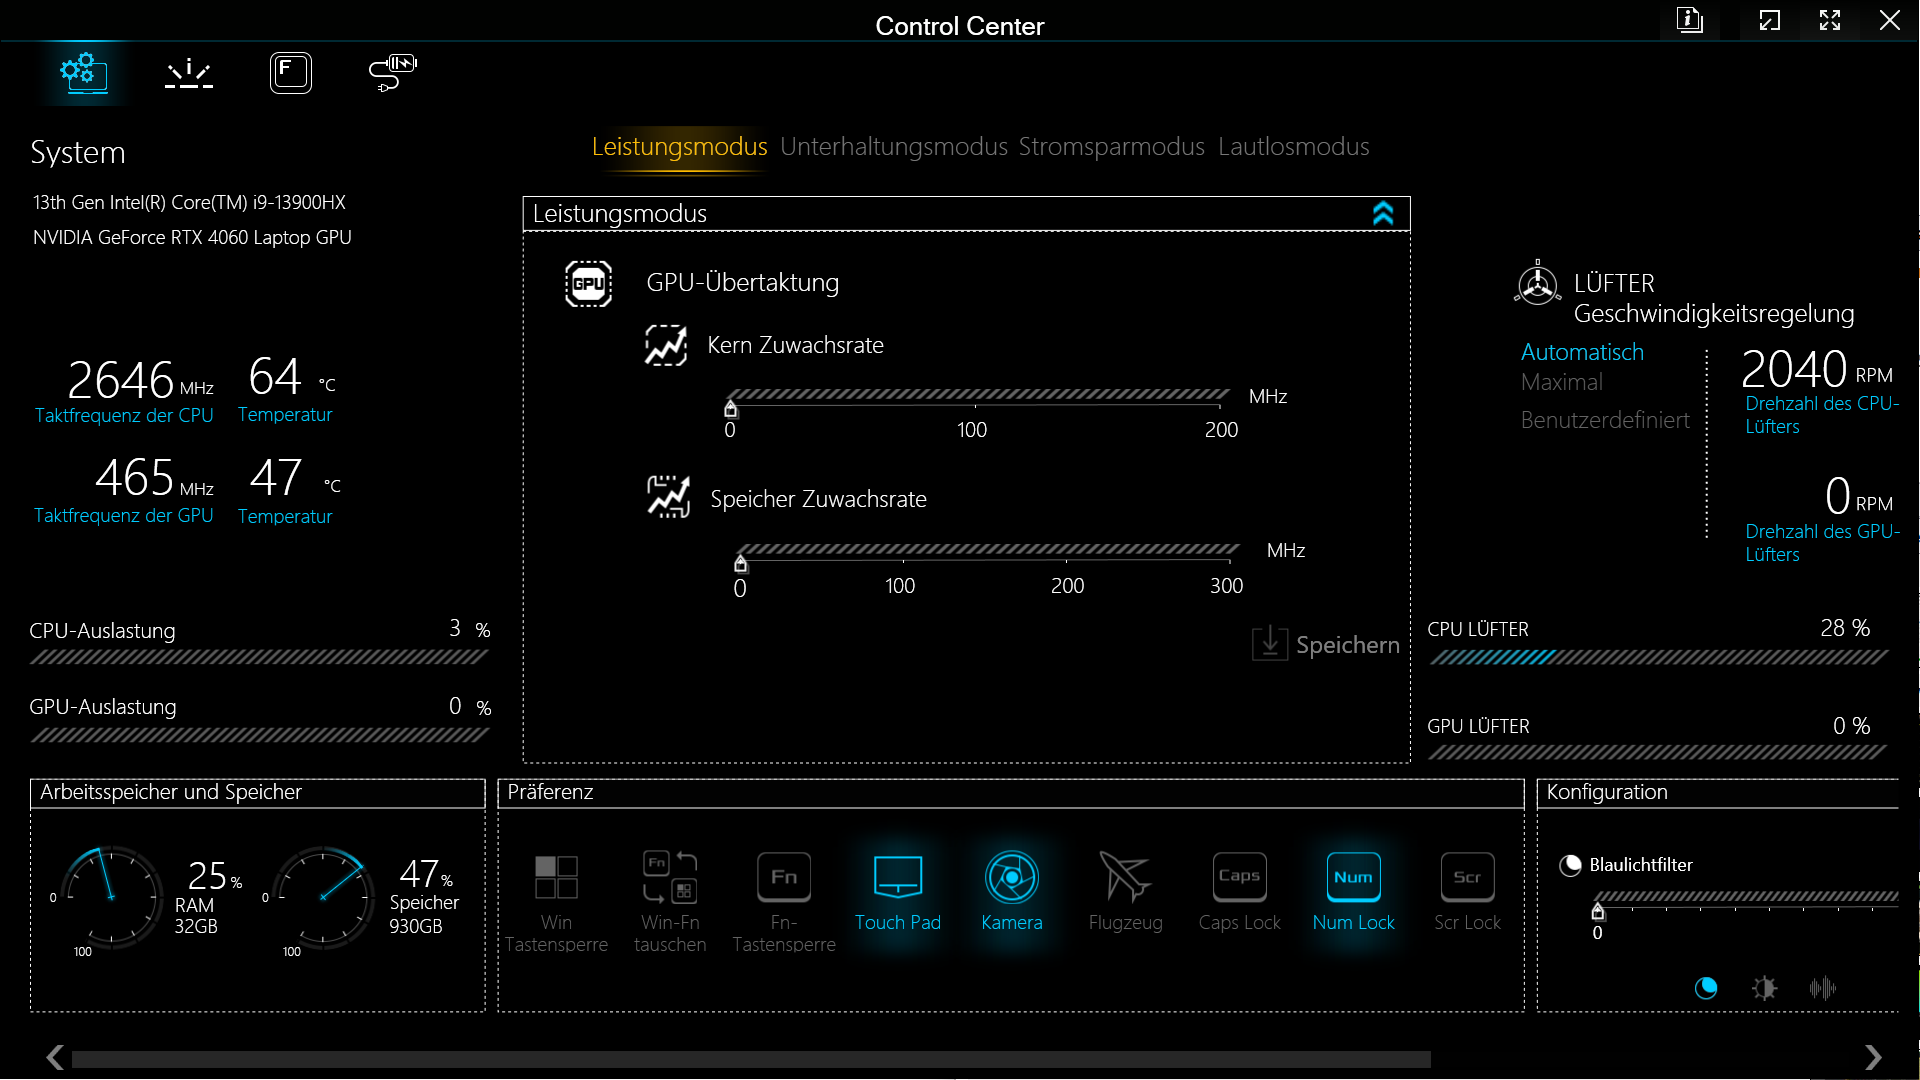
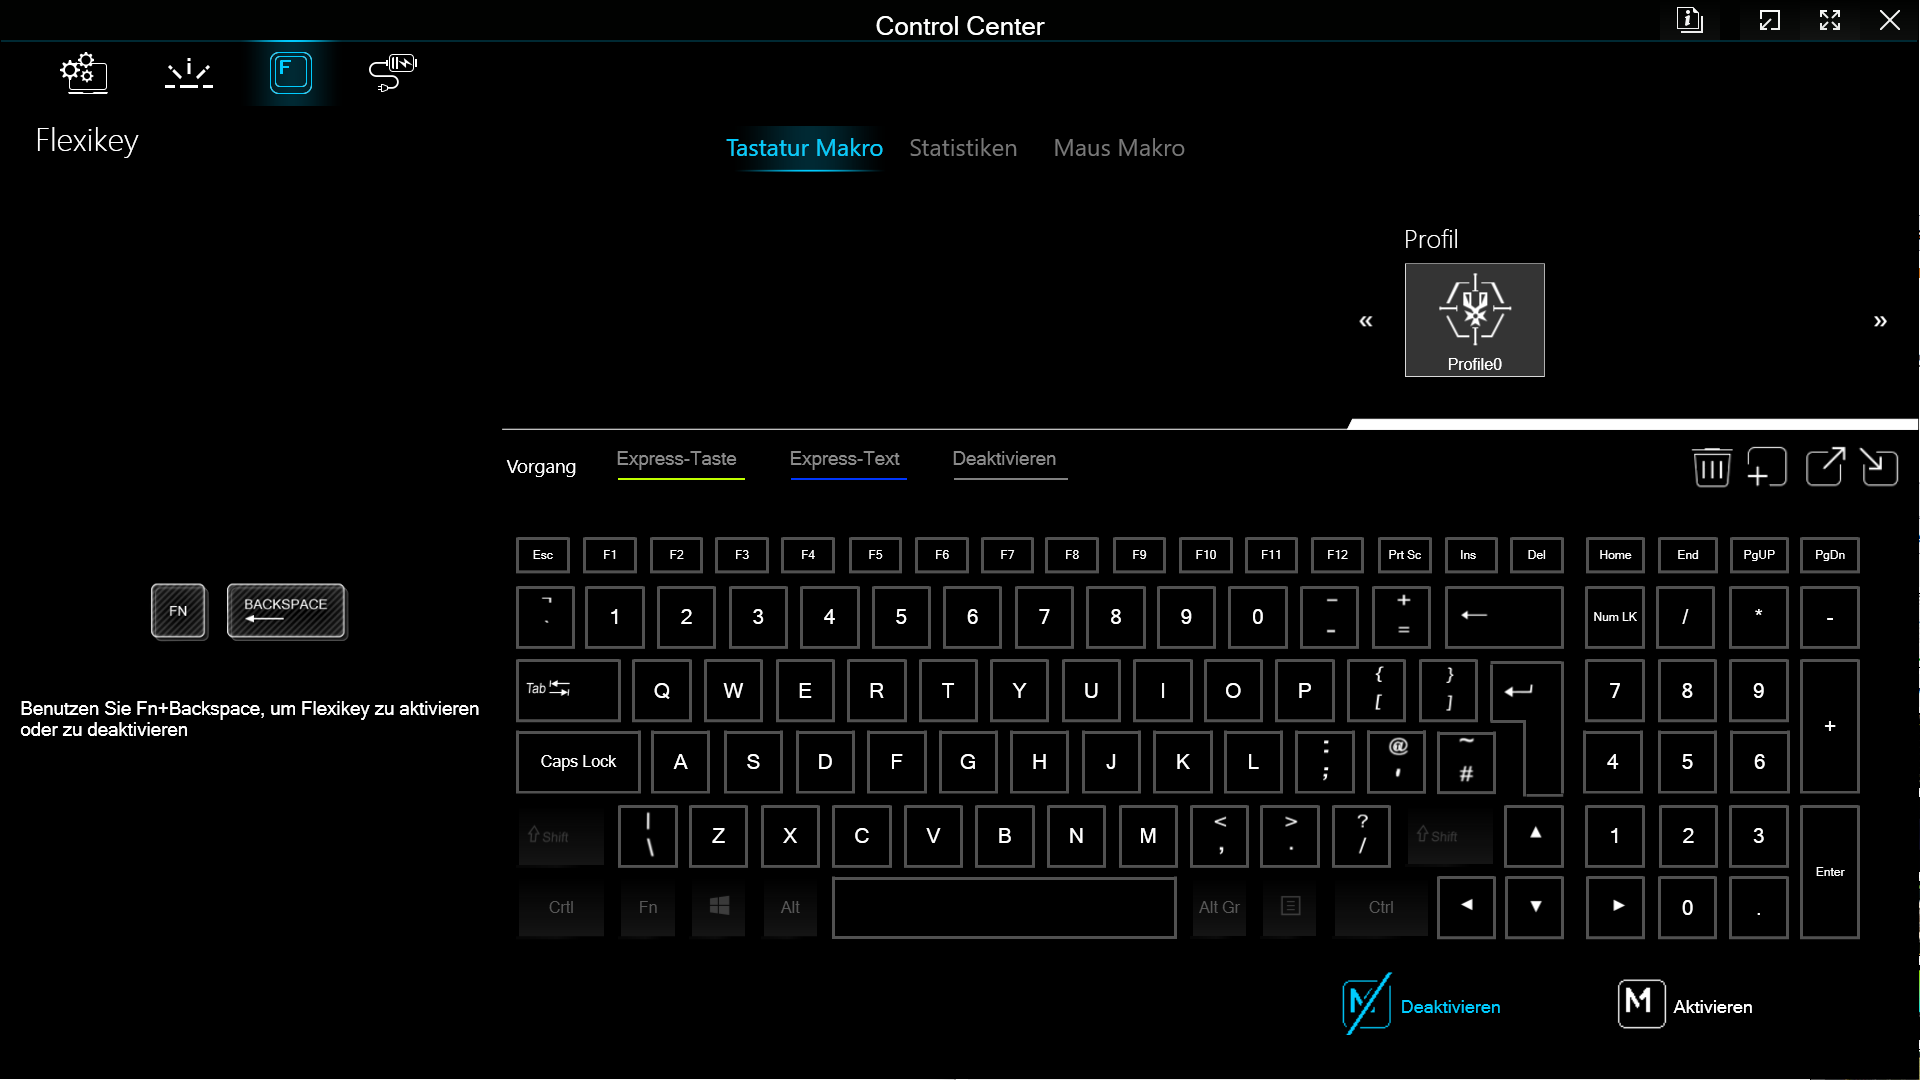
I vari livelli di prestazioni - modalità prestazioni, modalità intrattenimento, modalità risparmio energetico e modalità silenziosa - possono essere selezionati tramite il Control Center. Inoltre, in modalità prestazioni, sono disponibili opzioni per un leggero overclock della GPU e della memoria grafica. L'Intel Core i9 viene alimentato con un massimo di 135 watt e la RTX 4060 di GeForce con 140 watt, se 25 watt vengono spostati dal processore alla scheda grafica. Nelle singole modalità di risparmio energetico si applicano i seguenti valori target:
| Modus: | Modalità prestazioni | Modalità intrattenimento | Modalità risparmio energetico | Modalità silenziosa |
|---|---|---|---|---|
| CPU PL1 | 135 W | 65 W | 55 W | 45 W |
| CPU PL2 | 162 W | 115 W | 115 W | 115 W |
| Temperatura target CPU | 93 °C | 87 °C | 85 °C | 85 °C |
| GPU TGP + Dynamic Boost | 115 W + 25 W | 115 W + 0 W | 115 W + 0 W | 115 W + 0 W |
| Temperatura target GPU | 87 °C | 87 °C | 87 °C | 87 °C |
I registri che abbiamo compilato mostrano che il portatile da gioco può sopportare un aumento delle prestazioni molto elevato per un massimo di 90 secondi sia in modalità intrattenimento che in modalità prestazioni. Schenker suggerisce di svolgere le attività quotidiane in modalità intrattenimento. Tuttavia, abbiamo deciso di eseguire tutti i benchmark in modalità prestazioni.
Processore
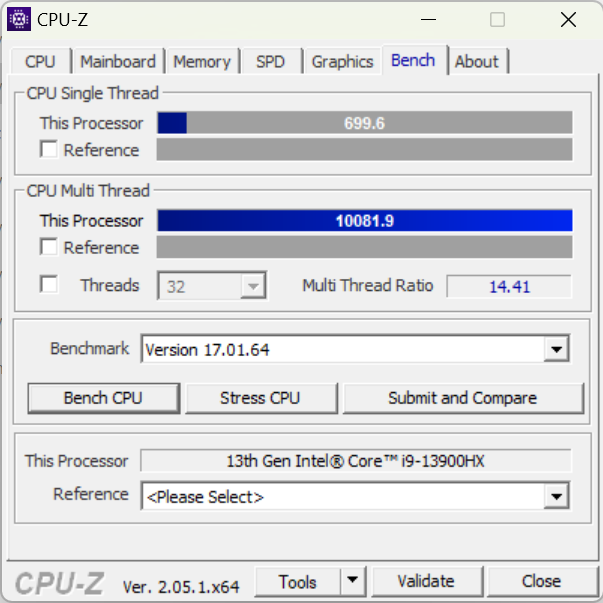
IlIntel Core i9-13900HX è il processore per laptop più potente dell'attuale generazione Raptor Lake. Questa CPU è in grado di elaborare simultaneamente 32 thread distribuiti su 8 core P e 16 core E. Grazie ai suoi elevati valori PL1 e PL2, l'i9 mostra davvero il potenziale che possiede, con l'XMG Pro 15 che supera tutti gli altri dispositivi nei benchmark dei processori.
Cinebench R15 Multi Continuous Test
Cinebench R23: Multi Core | Single Core
Cinebench R20: CPU (Multi Core) | CPU (Single Core)
Cinebench R15: CPU Multi 64Bit | CPU Single 64Bit
Blender: v2.79 BMW27 CPU
7-Zip 18.03: 7z b 4 | 7z b 4 -mmt1
Geekbench 5.5: Multi-Core | Single-Core
HWBOT x265 Benchmark v2.2: 4k Preset
LibreOffice : 20 Documents To PDF
R Benchmark 2.5: Overall mean
| CPU Performance rating | |
| Media Intel Core i9-13900HX | |
| Media della classe Gaming | |
| Schenker XMG Pro 15 (E23) | |
| Alienware x16 R1 -1! | |
| Aorus 15X ASF | |
| Dell G15 5530 | |
| Asus ZenBook Pro 14 Duo UX8402VV-P1021W | |
| Schenker XMG Pro 15 (i7-12700H, RTX 3080 Ti) | |
| MSI Cyborg 15 A12VF | |
| Asus TUF A15 FA507 | |
| Cinebench R23 / Multi Core | |
| Media Intel Core i9-13900HX (24270 - 32623, n=23) | |
| Media della classe Gaming (10488 - 42661, n=107, ultimi 2 anni) | |
| Schenker XMG Pro 15 (E23) | |
| Dell G15 5530 | |
| Aorus 15X ASF | |
| Alienware x16 R1 | |
| Asus ZenBook Pro 14 Duo UX8402VV-P1021W | |
| Schenker XMG Pro 15 (i7-12700H, RTX 3080 Ti) | |
| MSI Cyborg 15 A12VF | |
| Asus TUF A15 FA507 | |
| Cinebench R23 / Single Core | |
| Media Intel Core i9-13900HX (1867 - 2105, n=20) | |
| Media della classe Gaming (1166 - 2415, n=107, ultimi 2 anni) | |
| Asus ZenBook Pro 14 Duo UX8402VV-P1021W | |
| Alienware x16 R1 | |
| Aorus 15X ASF | |
| Schenker XMG Pro 15 (E23) | |
| Dell G15 5530 | |
| Schenker XMG Pro 15 (i7-12700H, RTX 3080 Ti) | |
| MSI Cyborg 15 A12VF | |
| Asus TUF A15 FA507 | |
| Cinebench R20 / CPU (Multi Core) | |
| Media Intel Core i9-13900HX (9152 - 12541, n=21) | |
| Media della classe Gaming (4029 - 16433, n=106, ultimi 2 anni) | |
| Schenker XMG Pro 15 (E23) | |
| Dell G15 5530 | |
| Aorus 15X ASF | |
| Alienware x16 R1 | |
| Asus ZenBook Pro 14 Duo UX8402VV-P1021W | |
| Schenker XMG Pro 15 (i7-12700H, RTX 3080 Ti) | |
| MSI Cyborg 15 A12VF | |
| Asus TUF A15 FA507 | |
| Cinebench R20 / CPU (Single Core) | |
| Media Intel Core i9-13900HX (722 - 810, n=21) | |
| Media della classe Gaming (442 - 913, n=106, ultimi 2 anni) | |
| Asus ZenBook Pro 14 Duo UX8402VV-P1021W | |
| Alienware x16 R1 | |
| Aorus 15X ASF | |
| Schenker XMG Pro 15 (E23) | |
| Dell G15 5530 | |
| Schenker XMG Pro 15 (i7-12700H, RTX 3080 Ti) | |
| MSI Cyborg 15 A12VF | |
| Asus TUF A15 FA507 | |
| Cinebench R15 / CPU Multi 64Bit | |
| Media Intel Core i9-13900HX (3913 - 4970, n=22) | |
| Media della classe Gaming (1578 - 6330, n=105, ultimi 2 anni) | |
| Schenker XMG Pro 15 (E23) | |
| Aorus 15X ASF | |
| Dell G15 5530 | |
| Alienware x16 R1 | |
| Asus ZenBook Pro 14 Duo UX8402VV-P1021W | |
| Schenker XMG Pro 15 (i7-12700H, RTX 3080 Ti) | |
| Asus TUF A15 FA507 | |
| MSI Cyborg 15 A12VF | |
| Cinebench R15 / CPU Single 64Bit | |
| Media della classe Gaming (188.8 - 350, n=106, ultimi 2 anni) | |
| Media Intel Core i9-13900HX (247 - 304, n=22) | |
| Asus ZenBook Pro 14 Duo UX8402VV-P1021W | |
| Alienware x16 R1 | |
| Aorus 15X ASF | |
| Dell G15 5530 | |
| Schenker XMG Pro 15 (i7-12700H, RTX 3080 Ti) | |
| Asus TUF A15 FA507 | |
| Schenker XMG Pro 15 (E23) | |
| MSI Cyborg 15 A12VF | |
| Blender / v2.79 BMW27 CPU | |
| MSI Cyborg 15 A12VF | |
| Asus TUF A15 FA507 | |
| Schenker XMG Pro 15 (i7-12700H, RTX 3080 Ti) | |
| Asus ZenBook Pro 14 Duo UX8402VV-P1021W | |
| Aorus 15X ASF | |
| Dell G15 5530 | |
| Media della classe Gaming (79 - 330, n=104, ultimi 2 anni) | |
| Schenker XMG Pro 15 (E23) | |
| Media Intel Core i9-13900HX (101 - 153, n=22) | |
| 7-Zip 18.03 / 7z b 4 | |
| Media Intel Core i9-13900HX (90675 - 127283, n=21) | |
| Schenker XMG Pro 15 (E23) | |
| Media della classe Gaming (33491 - 148086, n=105, ultimi 2 anni) | |
| Dell G15 5530 | |
| Alienware x16 R1 | |
| Aorus 15X ASF | |
| Asus ZenBook Pro 14 Duo UX8402VV-P1021W | |
| Schenker XMG Pro 15 (i7-12700H, RTX 3080 Ti) | |
| Asus TUF A15 FA507 | |
| MSI Cyborg 15 A12VF | |
| 7-Zip 18.03 / 7z b 4 -mmt1 | |
| Media Intel Core i9-13900HX (6340 - 7177, n=21) | |
| Media della classe Gaming (4199 - 7436, n=105, ultimi 2 anni) | |
| Aorus 15X ASF | |
| Schenker XMG Pro 15 (E23) | |
| Asus ZenBook Pro 14 Duo UX8402VV-P1021W | |
| Alienware x16 R1 | |
| Dell G15 5530 | |
| Asus TUF A15 FA507 | |
| Schenker XMG Pro 15 (i7-12700H, RTX 3080 Ti) | |
| MSI Cyborg 15 A12VF | |
| Geekbench 5.5 / Multi-Core | |
| Media Intel Core i9-13900HX (17614 - 21075, n=22) | |
| Schenker XMG Pro 15 (E23) | |
| Media della classe Gaming (6460 - 28263, n=105, ultimi 2 anni) | |
| Aorus 15X ASF | |
| Alienware x16 R1 | |
| Dell G15 5530 | |
| Asus ZenBook Pro 14 Duo UX8402VV-P1021W | |
| Schenker XMG Pro 15 (i7-12700H, RTX 3080 Ti) | |
| MSI Cyborg 15 A12VF | |
| Asus TUF A15 FA507 | |
| Geekbench 5.5 / Single-Core | |
| Media della classe Gaming (986 - 2474, n=105, ultimi 2 anni) | |
| Media Intel Core i9-13900HX (1345 - 2093, n=22) | |
| Alienware x16 R1 | |
| Asus ZenBook Pro 14 Duo UX8402VV-P1021W | |
| Aorus 15X ASF | |
| Dell G15 5530 | |
| Schenker XMG Pro 15 (E23) | |
| MSI Cyborg 15 A12VF | |
| Schenker XMG Pro 15 (i7-12700H, RTX 3080 Ti) | |
| Asus TUF A15 FA507 | |
| HWBOT x265 Benchmark v2.2 / 4k Preset | |
| Media Intel Core i9-13900HX (23.5 - 34.4, n=22) | |
| Media della classe Gaming (11.5 - 44.4, n=105, ultimi 2 anni) | |
| Schenker XMG Pro 15 (E23) | |
| Dell G15 5530 | |
| Alienware x16 R1 | |
| Aorus 15X ASF | |
| Schenker XMG Pro 15 (i7-12700H, RTX 3080 Ti) | |
| Asus ZenBook Pro 14 Duo UX8402VV-P1021W | |
| Asus TUF A15 FA507 | |
| MSI Cyborg 15 A12VF | |
| MSI Cyborg 15 A12VF | |
| LibreOffice / 20 Documents To PDF | |
| Schenker XMG Pro 15 (E23) | |
| Asus TUF A15 FA507 | |
| Media della classe Gaming (33.2 - 88.8, n=105, ultimi 2 anni) | |
| Schenker XMG Pro 15 (i7-12700H, RTX 3080 Ti) | |
| Dell G15 5530 | |
| Alienware x16 R1 | |
| Aorus 15X ASF | |
| Media Intel Core i9-13900HX (32.8 - 51.1, n=21) | |
| Asus ZenBook Pro 14 Duo UX8402VV-P1021W | |
| MSI Cyborg 15 A12VF | |
| R Benchmark 2.5 / Overall mean | |
| Asus TUF A15 FA507 | |
| MSI Cyborg 15 A12VF | |
| Schenker XMG Pro 15 (E23) | |
| Schenker XMG Pro 15 (i7-12700H, RTX 3080 Ti) | |
| Aorus 15X ASF | |
| Asus ZenBook Pro 14 Duo UX8402VV-P1021W | |
| Media della classe Gaming (0.3439 - 0.759, n=106, ultimi 2 anni) | |
| Alienware x16 R1 | |
| Dell G15 5530 | |
| Media Intel Core i9-13900HX (0.375 - 0.4564, n=22) | |
* ... Meglio usare valori piccoli
AIDA64: FP32 Ray-Trace | FPU Julia | CPU SHA3 | CPU Queen | FPU SinJulia | FPU Mandel | CPU AES | CPU ZLib | FP64 Ray-Trace | CPU PhotoWorxx
| Performance rating | |
| Media della classe Gaming | |
| Media Intel Core i9-13900HX | |
| Schenker XMG Pro 15 (E23) | |
| Alienware x16 R1 | |
| Aorus 15X ASF | |
| Dell G15 5530 | |
| Asus TUF A15 FA507 | |
| Asus ZenBook Pro 14 Duo UX8402VV-P1021W | |
| MSI Cyborg 15 A12VF | |
| Schenker XMG Pro 15 (i7-12700H, RTX 3080 Ti) | |
| AIDA64 / FP32 Ray-Trace | |
| Media della classe Gaming (10227 - 85542, n=105, ultimi 2 anni) | |
| Media Intel Core i9-13900HX (17589 - 27615, n=22) | |
| Alienware x16 R1 | |
| Dell G15 5530 | |
| Schenker XMG Pro 15 (E23) | |
| Aorus 15X ASF | |
| Asus TUF A15 FA507 | |
| Asus ZenBook Pro 14 Duo UX8402VV-P1021W | |
| MSI Cyborg 15 A12VF | |
| Schenker XMG Pro 15 (i7-12700H, RTX 3080 Ti) | |
| AIDA64 / FPU Julia | |
| Media della classe Gaming (51376 - 238426, n=105, ultimi 2 anni) | |
| Media Intel Core i9-13900HX (88686 - 137015, n=22) | |
| Asus TUF A15 FA507 | |
| Schenker XMG Pro 15 (E23) | |
| Alienware x16 R1 | |
| Dell G15 5530 | |
| Aorus 15X ASF | |
| Asus ZenBook Pro 14 Duo UX8402VV-P1021W | |
| MSI Cyborg 15 A12VF | |
| Schenker XMG Pro 15 (i7-12700H, RTX 3080 Ti) | |
| AIDA64 / CPU SHA3 | |
| Media della classe Gaming (2180 - 10115, n=105, ultimi 2 anni) | |
| Media Intel Core i9-13900HX (4362 - 7029, n=22) | |
| Schenker XMG Pro 15 (E23) | |
| Dell G15 5530 | |
| Alienware x16 R1 | |
| Aorus 15X ASF | |
| Asus TUF A15 FA507 | |
| Asus ZenBook Pro 14 Duo UX8402VV-P1021W | |
| MSI Cyborg 15 A12VF | |
| Schenker XMG Pro 15 (i7-12700H, RTX 3080 Ti) | |
| AIDA64 / CPU Queen | |
| Media Intel Core i9-13900HX (125644 - 141385, n=22) | |
| Schenker XMG Pro 15 (E23) | |
| Alienware x16 R1 | |
| Media della classe Gaming (49785 - 173351, n=90, ultimi 2 anni) | |
| Aorus 15X ASF | |
| Asus ZenBook Pro 14 Duo UX8402VV-P1021W | |
| Dell G15 5530 | |
| Asus TUF A15 FA507 | |
| Schenker XMG Pro 15 (i7-12700H, RTX 3080 Ti) | |
| MSI Cyborg 15 A12VF | |
| AIDA64 / FPU SinJulia | |
| Media Intel Core i9-13900HX (12334 - 17179, n=22) | |
| Media della classe Gaming (4424 - 33636, n=105, ultimi 2 anni) | |
| Asus TUF A15 FA507 | |
| Schenker XMG Pro 15 (E23) | |
| Aorus 15X ASF | |
| Alienware x16 R1 | |
| Dell G15 5530 | |
| Schenker XMG Pro 15 (i7-12700H, RTX 3080 Ti) | |
| Asus ZenBook Pro 14 Duo UX8402VV-P1021W | |
| MSI Cyborg 15 A12VF | |
| AIDA64 / FPU Mandel | |
| Media della classe Gaming (25115 - 128721, n=105, ultimi 2 anni) | |
| Media Intel Core i9-13900HX (43850 - 69202, n=22) | |
| Asus TUF A15 FA507 | |
| Alienware x16 R1 | |
| Schenker XMG Pro 15 (E23) | |
| Dell G15 5530 | |
| Aorus 15X ASF | |
| Asus ZenBook Pro 14 Duo UX8402VV-P1021W | |
| MSI Cyborg 15 A12VF | |
| Schenker XMG Pro 15 (i7-12700H, RTX 3080 Ti) | |
| AIDA64 / CPU AES | |
| Aorus 15X ASF | |
| Media Intel Core i9-13900HX (89413 - 237881, n=22) | |
| Media della classe Gaming (39258 - 247074, n=105, ultimi 2 anni) | |
| Schenker XMG Pro 15 (E23) | |
| Dell G15 5530 | |
| Alienware x16 R1 | |
| Asus TUF A15 FA507 | |
| MSI Cyborg 15 A12VF | |
| Asus ZenBook Pro 14 Duo UX8402VV-P1021W | |
| Schenker XMG Pro 15 (i7-12700H, RTX 3080 Ti) | |
| AIDA64 / CPU ZLib | |
| Media Intel Core i9-13900HX (1284 - 1958, n=22) | |
| Media della classe Gaming (574 - 2531, n=105, ultimi 2 anni) | |
| Schenker XMG Pro 15 (E23) | |
| Dell G15 5530 | |
| Alienware x16 R1 | |
| Aorus 15X ASF | |
| Schenker XMG Pro 15 (i7-12700H, RTX 3080 Ti) | |
| MSI Cyborg 15 A12VF | |
| Asus ZenBook Pro 14 Duo UX8402VV-P1021W | |
| Asus TUF A15 FA507 | |
| AIDA64 / FP64 Ray-Trace | |
| Media della classe Gaming (5509 - 45446, n=105, ultimi 2 anni) | |
| Media Intel Core i9-13900HX (9481 - 15279, n=22) | |
| Alienware x16 R1 | |
| Dell G15 5530 | |
| Schenker XMG Pro 15 (E23) | |
| Aorus 15X ASF | |
| Asus TUF A15 FA507 | |
| Asus ZenBook Pro 14 Duo UX8402VV-P1021W | |
| MSI Cyborg 15 A12VF | |
| Schenker XMG Pro 15 (i7-12700H, RTX 3080 Ti) | |
| AIDA64 / CPU PhotoWorxx | |
| Schenker XMG Pro 15 (E23) | |
| Alienware x16 R1 | |
| Media Intel Core i9-13900HX (42994 - 51994, n=22) | |
| Media della classe Gaming (12271 - 89891, n=105, ultimi 2 anni) | |
| Asus ZenBook Pro 14 Duo UX8402VV-P1021W | |
| Dell G15 5530 | |
| MSI Cyborg 15 A12VF | |
| Aorus 15X ASF | |
| Schenker XMG Pro 15 (i7-12700H, RTX 3080 Ti) | |
| Asus TUF A15 FA507 | |
Prestazioni del sistema
Anche per quanto riguarda le prestazioni di sistema, il dispositivo recensito ha fatto registrare ottimi numeri e ha persino superato le prestazioni dell'Aorus 15X ASF Aorus 15X ASFnonostante condivida valori simili di TDP e TGP. In PCMark 10, l'XMG Pro 15 si colloca solo pochi punti dietro il sottile Asus ZenBook Pro 14 Duo il che dimostra che un portatile da gioco potente non deve sempre essere un portatile da gioco pesante.
CrossMark: Overall | Productivity | Creativity | Responsiveness
| PCMark 10 / Score | |
| Media della classe Gaming (5828 - 12414, n=93, ultimi 2 anni) | |
| Alienware x16 R1 | |
| Asus ZenBook Pro 14 Duo UX8402VV-P1021W | |
| Schenker XMG Pro 15 (E23) | |
| Media Intel Core i9-13900HX, NVIDIA GeForce RTX 4060 Laptop GPU (n=1) | |
| Asus TUF A15 FA507 | |
| Aorus 15X ASF | |
| MSI Cyborg 15 A12VF | |
| Dell G15 5530 | |
| Schenker XMG Pro 15 (i7-12700H, RTX 3080 Ti) | |
| PCMark 10 / Essentials | |
| Schenker XMG Pro 15 (E23) | |
| Media Intel Core i9-13900HX, NVIDIA GeForce RTX 4060 Laptop GPU (n=1) | |
| Asus ZenBook Pro 14 Duo UX8402VV-P1021W | |
| Alienware x16 R1 | |
| Dell G15 5530 | |
| Schenker XMG Pro 15 (i7-12700H, RTX 3080 Ti) | |
| Aorus 15X ASF | |
| MSI Cyborg 15 A12VF | |
| Media della classe Gaming (8810 - 11935, n=97, ultimi 2 anni) | |
| Asus TUF A15 FA507 | |
| PCMark 10 / Productivity | |
| Media della classe Gaming (6845 - 25323, n=95, ultimi 2 anni) | |
| Schenker XMG Pro 15 (E23) | |
| Media Intel Core i9-13900HX, NVIDIA GeForce RTX 4060 Laptop GPU (n=1) | |
| Dell G15 5530 | |
| MSI Cyborg 15 A12VF | |
| Alienware x16 R1 | |
| Asus ZenBook Pro 14 Duo UX8402VV-P1021W | |
| Aorus 15X ASF | |
| Asus TUF A15 FA507 | |
| Schenker XMG Pro 15 (i7-12700H, RTX 3080 Ti) | |
| PCMark 10 / Digital Content Creation | |
| Alienware x16 R1 | |
| Media della classe Gaming (7602 - 19954, n=95, ultimi 2 anni) | |
| Asus ZenBook Pro 14 Duo UX8402VV-P1021W | |
| Asus TUF A15 FA507 | |
| Aorus 15X ASF | |
| Schenker XMG Pro 15 (E23) | |
| Media Intel Core i9-13900HX, NVIDIA GeForce RTX 4060 Laptop GPU (n=1) | |
| MSI Cyborg 15 A12VF | |
| Schenker XMG Pro 15 (i7-12700H, RTX 3080 Ti) | |
| Dell G15 5530 | |
| CrossMark / Overall | |
| Aorus 15X ASF | |
| Media della classe Gaming (1366 - 2409, n=94, ultimi 2 anni) | |
| Schenker XMG Pro 15 (E23) | |
| Media Intel Core i9-13900HX, NVIDIA GeForce RTX 4060 Laptop GPU (n=1) | |
| Alienware x16 R1 | |
| Asus ZenBook Pro 14 Duo UX8402VV-P1021W | |
| Dell G15 5530 | |
| MSI Cyborg 15 A12VF | |
| Asus TUF A15 FA507 | |
| CrossMark / Productivity | |
| Aorus 15X ASF | |
| Media della classe Gaming (1386 - 2254, n=94, ultimi 2 anni) | |
| Alienware x16 R1 | |
| Schenker XMG Pro 15 (E23) | |
| Media Intel Core i9-13900HX, NVIDIA GeForce RTX 4060 Laptop GPU (n=1) | |
| Asus ZenBook Pro 14 Duo UX8402VV-P1021W | |
| Dell G15 5530 | |
| MSI Cyborg 15 A12VF | |
| Asus TUF A15 FA507 | |
| CrossMark / Creativity | |
| Media della classe Gaming (1343 - 2786, n=94, ultimi 2 anni) | |
| Schenker XMG Pro 15 (E23) | |
| Media Intel Core i9-13900HX, NVIDIA GeForce RTX 4060 Laptop GPU (n=1) | |
| Aorus 15X ASF | |
| Asus ZenBook Pro 14 Duo UX8402VV-P1021W | |
| Dell G15 5530 | |
| Alienware x16 R1 | |
| MSI Cyborg 15 A12VF | |
| Asus TUF A15 FA507 | |
| CrossMark / Responsiveness | |
| Aorus 15X ASF | |
| Alienware x16 R1 | |
| Schenker XMG Pro 15 (E23) | |
| Media Intel Core i9-13900HX, NVIDIA GeForce RTX 4060 Laptop GPU (n=1) | |
| Media della classe Gaming (1226 - 2334, n=94, ultimi 2 anni) | |
| MSI Cyborg 15 A12VF | |
| Asus ZenBook Pro 14 Duo UX8402VV-P1021W | |
| Dell G15 5530 | |
| Asus TUF A15 FA507 | |
| PCMark 10 Score | 7521 punti | |
Aiuto | ||
| AIDA64 / Memory Copy | |
| Schenker XMG Pro 15 (E23) | |
| Media Intel Core i9-13900HX (67716 - 79193, n=22) | |
| Alienware x16 R1 | |
| Media della classe Gaming (21750 - 129946, n=105, ultimi 2 anni) | |
| Asus ZenBook Pro 14 Duo UX8402VV-P1021W | |
| Dell G15 5530 | |
| Aorus 15X ASF | |
| MSI Cyborg 15 A12VF | |
| Asus TUF A15 FA507 | |
| Schenker XMG Pro 15 (i7-12700H, RTX 3080 Ti) | |
| AIDA64 / Memory Read | |
| Schenker XMG Pro 15 (E23) | |
| Media Intel Core i9-13900HX (73998 - 88462, n=22) | |
| Media della classe Gaming (22956 - 118858, n=105, ultimi 2 anni) | |
| Dell G15 5530 | |
| Alienware x16 R1 | |
| Aorus 15X ASF | |
| MSI Cyborg 15 A12VF | |
| Asus ZenBook Pro 14 Duo UX8402VV-P1021W | |
| Asus TUF A15 FA507 | |
| Schenker XMG Pro 15 (i7-12700H, RTX 3080 Ti) | |
| AIDA64 / Memory Write | |
| Alienware x16 R1 | |
| Media della classe Gaming (22297 - 135096, n=105, ultimi 2 anni) | |
| Schenker XMG Pro 15 (E23) | |
| Media Intel Core i9-13900HX (65472 - 77045, n=22) | |
| Asus ZenBook Pro 14 Duo UX8402VV-P1021W | |
| Dell G15 5530 | |
| MSI Cyborg 15 A12VF | |
| Aorus 15X ASF | |
| Asus TUF A15 FA507 | |
| Schenker XMG Pro 15 (i7-12700H, RTX 3080 Ti) | |
| AIDA64 / Memory Latency | |
| Media della classe Gaming (75.3 - 259, n=105, ultimi 2 anni) | |
| Alienware x16 R1 | |
| Asus ZenBook Pro 14 Duo UX8402VV-P1021W | |
| MSI Cyborg 15 A12VF | |
| Dell G15 5530 | |
| Aorus 15X ASF | |
| Media Intel Core i9-13900HX (75.3 - 91.1, n=22) | |
| Schenker XMG Pro 15 (E23) | |
| Asus TUF A15 FA507 | |
* ... Meglio usare valori piccoli
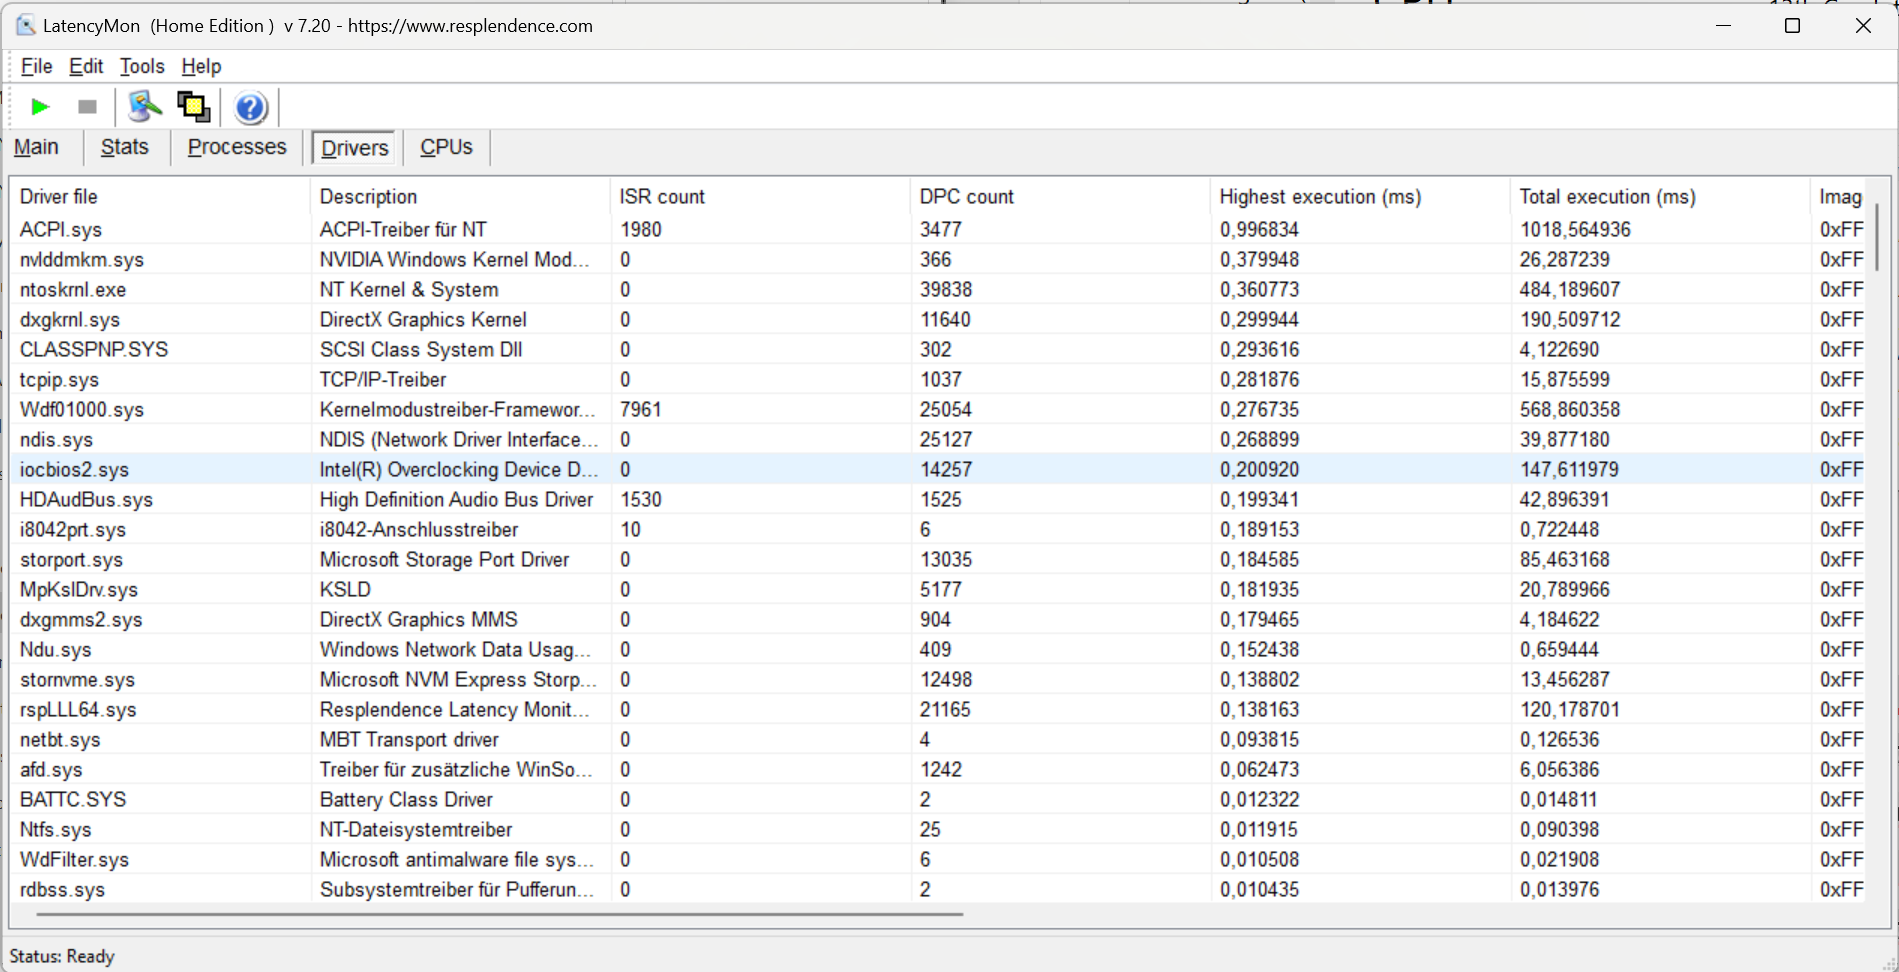
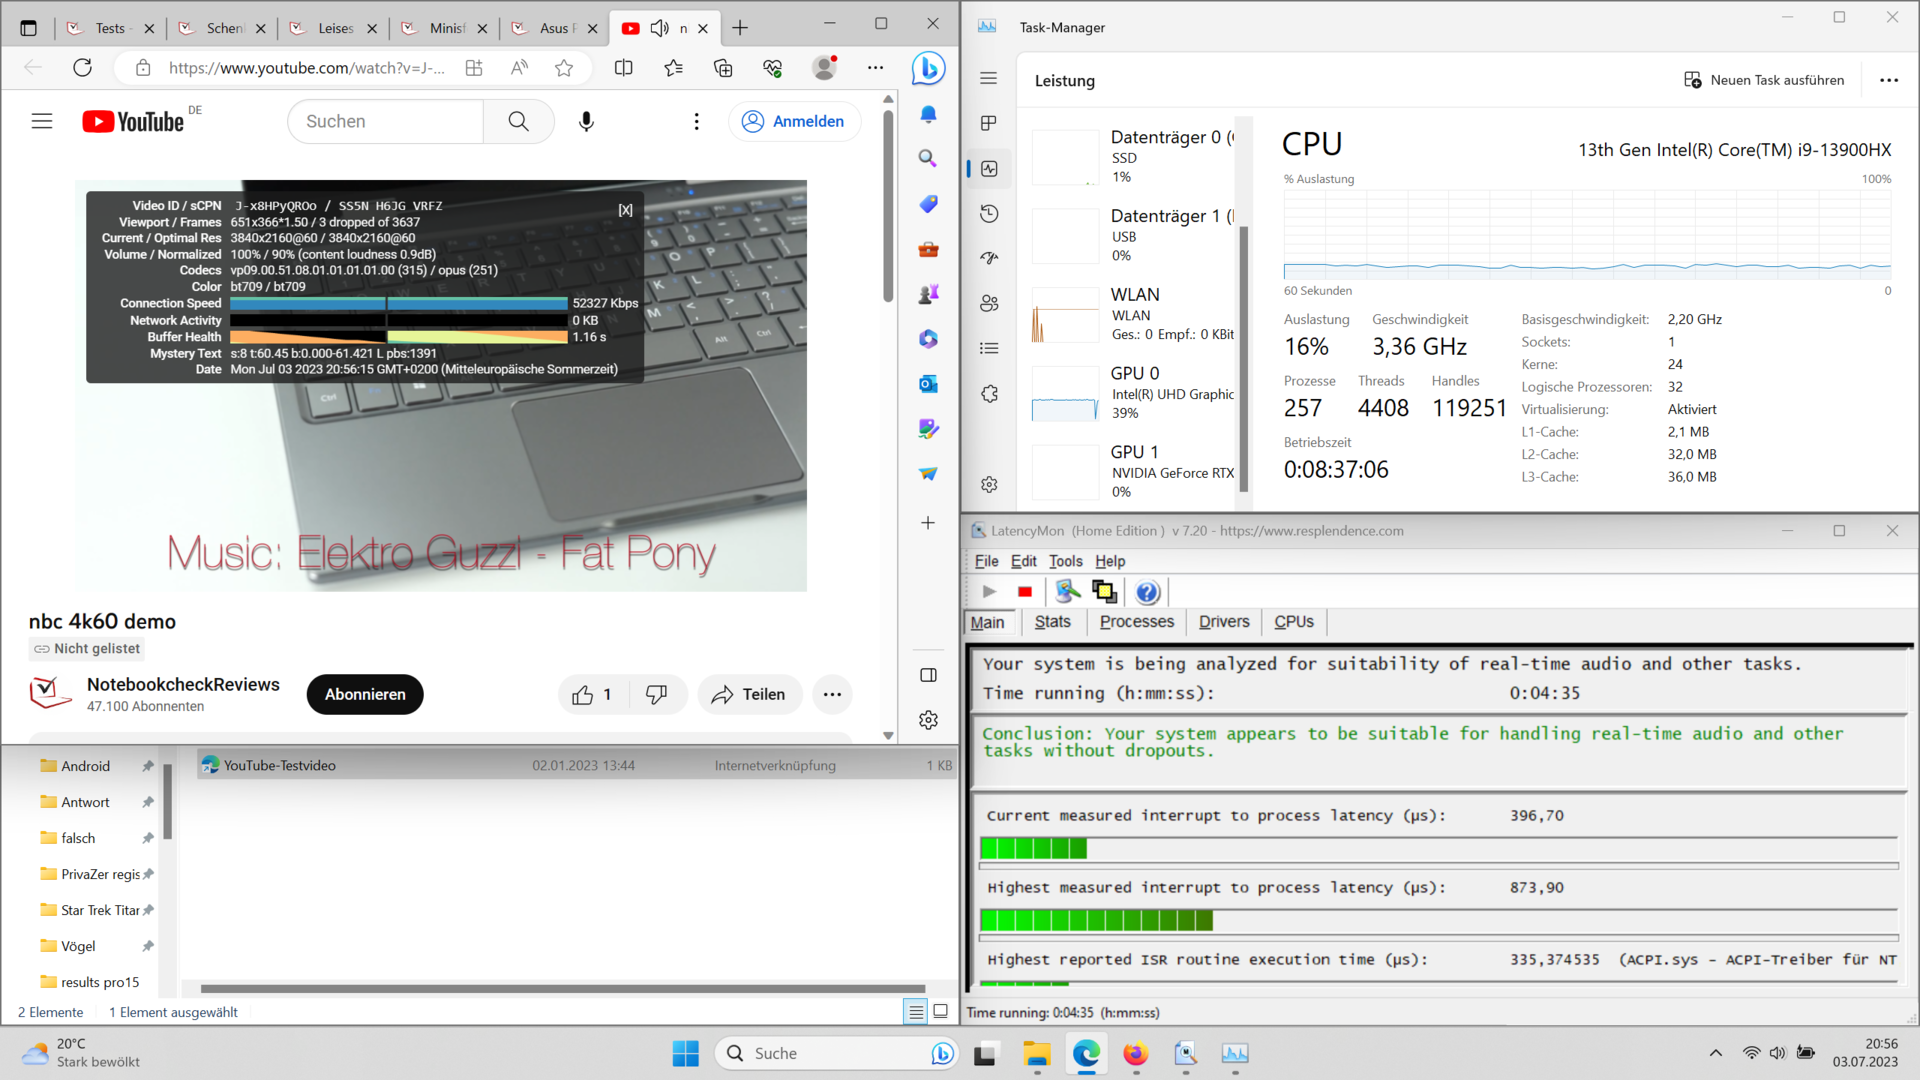
Latenze DPC
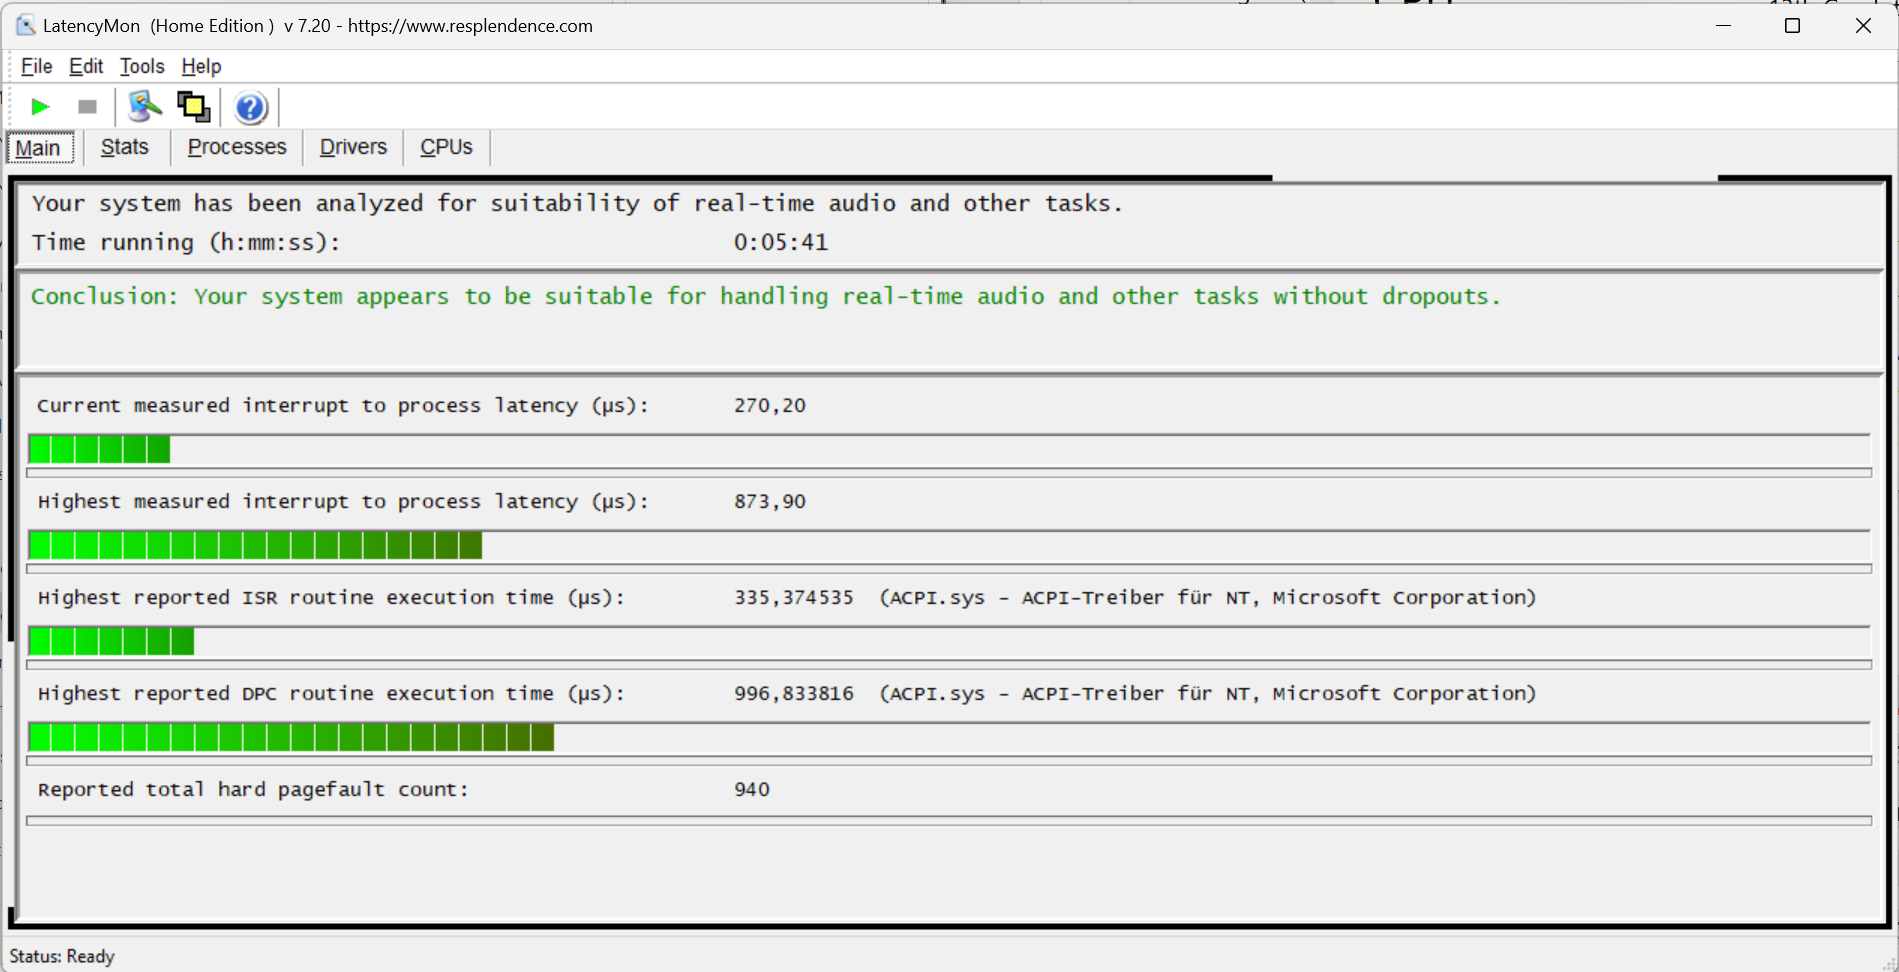
In quest'area, si nota che i problemi di interazione tra i driver Nvidia e gli altri driver sono stati nel frattempo superati. In questo portatile, al momento del test, le latenze DPC sono a un livello basso con i driver e il firmware attuali.
| DPC Latencies / LatencyMon - interrupt to process latency (max), Web, Youtube, Prime95 | |
| Dell G15 5530 | |
| Aorus 15X ASF | |
| Schenker XMG Pro 15 (i7-12700H, RTX 3080 Ti) | |
| Alienware x16 R1 | |
| MSI Cyborg 15 A12VF | |
| Asus ZenBook Pro 14 Duo UX8402VV-P1021W | |
| Schenker XMG Pro 15 (E23) | |
* ... Meglio usare valori piccoli
Memoria di massa
Tra le unità SSD NVMe offerte da Schenker per l'XMG Pro 15, il Crucial P5 Plus non è probabilmente l'opzione più veloce. Tuttavia, nei test ha fornito buoni valori che ha mantenuto per lunghi periodi di tempo. Nel ciclo DiskSpd, abbiamo osservato un throttling minimo solo dopo un bel po' di esecuzioni.

* ... Meglio usare valori piccoli
Continuous Performance Read: DiskSpd Read Loop, Queue Depth 8
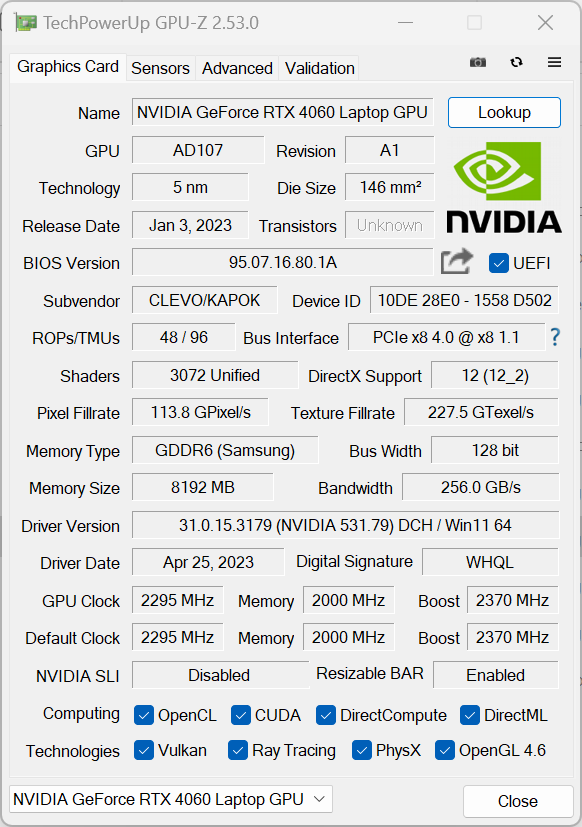
Scheda grafica
Veniamo ora alla domanda centrale della nostra recensione. Può laNvidia GeForce RTX 4060 del nostro dispositivo in prova è in grado di tenere il passo con il predecessoreRTX 3080 Ti? La risposta onesta a questa domanda è un chiaro sì e no. A seconda del benchmark, dovrete fare i conti con prestazioni inferiori del 10-20%. Quando si gioca, la differenza di prestazioni tra l'attuale XMG Pro 15 e il predecessore dipende piuttosto dal gioco: mentre qualcosa come The Witcher 3 trae vantaggio dalla maggiore velocità di clock della 4060 e raggiunge frame rate più elevati, in GTA V, il Pro 15 E23 rimane un po' indietro rispetto al suo predecessore. Tuttavia, l'XMG Pro 15 può essere configurato anche con unaRTX 4070. IlAorus 15X ASFmostra che la differenza di prestazioni tra una RTX 3080 Ti e una RTX 4070 è molto bassa, in ogni situazione. Poiché l'Aorus e l'XMG Pro 15 operano con valori TDP e TGP quasi identici, questo indica le possibili prestazioni che ci si può aspettare dall'XMG Pro 15 con una RTX 4070.
| 3DMark 11 Performance | 29518 punti | |
| 3DMark Ice Storm Standard Score | 146918 punti | |
| 3DMark Cloud Gate Standard Score | 54429 punti | |
| 3DMark Fire Strike Score | 23131 punti | |
| 3DMark Time Spy Score | 10776 punti | |
Aiuto | ||
* ... Meglio usare valori piccoli
| The Witcher 3 - 1920x1080 Ultra Graphics & Postprocessing (HBAO+) | |
| Media della classe Gaming (104.7 - 240, n=7, ultimi 2 anni) | |
| Alienware x16 R1 | |
| Schenker XMG Pro 15 (E23) | |
| Asus ZenBook Pro 14 Duo UX8402VV-P1021W | |
| Schenker XMG Pro 15 (i7-12700H, RTX 3080 Ti) | |
| Aorus 15X ASF | |
| Dell G15 5530 | |
| Asus TUF A15 FA507 | |
| MSI Cyborg 15 A12VF | |
| Final Fantasy XV Benchmark - 1920x1080 High Quality | |
| Alienware x16 R1 | |
| Media della classe Gaming (41 - 215, n=95, ultimi 2 anni) | |
| Aorus 15X ASF | |
| Schenker XMG Pro 15 (i7-12700H, RTX 3080 Ti) | |
| Dell G15 5530 | |
| Asus ZenBook Pro 14 Duo UX8402VV-P1021W | |
| Asus TUF A15 FA507 | |
| MSI Cyborg 15 A12VF | |
| Hogwarts Legacy | |
| 2560x1440 Ultra Preset AA:High T | |
| Media della classe Gaming (n=1ultimi 2 anni) | |
| Schenker XMG Pro 15 (E23) | |
| Media NVIDIA GeForce RTX 4060 Laptop GPU (42.8 - 45, n=4) | |
| 1920x1080 Ultra Preset AA:High T | |
| Media della classe Gaming (n=1ultimi 2 anni) | |
| Media NVIDIA GeForce RTX 4060 Laptop GPU (61.9 - 91.9, n=6) | |
| Schenker XMG Pro 15 (E23) | |
| MSI Cyborg 15 A12VF | |
| Asus TUF A15 FA507 | |
| 1920x1080 High Preset AA:High T | |
| Asus TUF A15 FA507 | |
| Media NVIDIA GeForce RTX 4060 Laptop GPU (70.8 - 107.7, n=6) | |
| MSI Cyborg 15 A12VF | |
| Schenker XMG Pro 15 (E23) | |
| basso | medio | alto | ultra | QHD | 4K | |
|---|---|---|---|---|---|---|
| GTA V (2015) | 184.5 | 178.9 | 170.6 | 107.2 | 87 | |
| The Witcher 3 (2015) | 112 | 159.7 | ||||
| Dota 2 Reborn (2015) | 210 | 182.9 | 176.1 | 154.3 | 126.4 | |
| X-Plane 11.11 (2018) | 154.9 | 135.9 | 111 | 102 | ||
| Strange Brigade (2018) | 377 | 267 | 213 | 183.3 | 127.5 | |
| Shadow of the Tomb Raider (2018) | 142 | 94 | ||||
| Cyberpunk 2077 1.6 (2022) | 80.6 | 48.56 | ||||
| Tiny Tina's Wonderlands (2022) | 89.29 | 60.01 | ||||
| F1 22 (2022) | 245 | 235 | 179.8 | 66.4 | 43 | |
| Call of Duty Modern Warfare 2 2022 (2022) | 91 | 66 | ||||
| Hogwarts Legacy (2023) | 90.4 | 70.8 | 64 | 44.4 |
Emissioni ed energia: altoparlanti silenziosi e ventilatori rumorosi
Emissioni acustiche
Purtroppo, nei test, l'XMG Pro 15 si è dimostrato molto rumoroso. Utilizzando la modalità performance attivata a pieno carico e a una distanza di 15 centimetri, abbiamo misurato ben 53 dB(A) in Prime95 e Furmark. Le ventole hanno però altri assi nella manica. La nostra esperienza dimostra che la modalità di intrattenimento offre prestazioni sufficienti per molti giochi. Questo riduce significativamente il livello di rumore emesso dal portatile. Nell'uso normale, senza applicazioni 3D, è possibile aspettarsi un funzionamento molto silenzioso. Questo, almeno, lo aiuta ad avere il naso un po' più avanti rispetto al predecessore.
Rumorosità
| Idle |
| 24 / 24 / 24 dB(A) |
| Sotto carico |
| 53.65 / 53.65 dB(A) |
 | ||
30 dB silenzioso 40 dB(A) udibile 50 dB(A) rumoroso |
||
min: | ||
| Schenker XMG Pro 15 (E23) GeForce RTX 4060 Laptop GPU, i9-13900HX, Crucial P5 Plus 1TB CT1000P5PSSD8 | Schenker XMG Pro 15 (i7-12700H, RTX 3080 Ti) GeForce RTX 3080 Ti Laptop GPU, i7-12700H, Samsung SSD 980 Pro 1TB MZ-V8P1T0BW | Dell G15 5530 GeForce RTX 4060 Laptop GPU, i7-13650HX, SSTC CL4-3D512-Q11 | Asus TUF A15 FA507 GeForce RTX 4050 Laptop GPU, R7 7735HS, Micron 2400 MTFDKBA512QFM | Aorus 15X ASF GeForce RTX 4070 Laptop GPU, i7-13700HX, Gigabyte AG470S1TB-SI B10 | Asus ZenBook Pro 14 Duo UX8402VV-P1021W GeForce RTX 4060 Laptop GPU, i9-13900H, Samsung PM9A1 MZVL22T0HBLB | MSI Cyborg 15 A12VF GeForce RTX 4060 Laptop GPU, i7-12650H, Samsung PM9B1 1024GB MZVL41T0HBLB | Alienware x16 R1 GeForce RTX 4080 Laptop GPU, i9-13900HK, SK hynix PC801 HFS001TEJ9X101N | |
|---|---|---|---|---|---|---|---|---|
| Noise | -11% | 7% | 14% | -13% | -13% | -25% | 4% | |
| off /ambiente * (dB) | 24 | 23 4% | 20.41 15% | 23.3 3% | 25 -4% | 25.2 -5% | 27 -13% | 22.7 5% |
| Idle Minimum * (dB) | 24 | 23 4% | 26.85 -12% | 23.3 3% | 28 -17% | 25.2 -5% | 27 -13% | 23.1 4% |
| Idle Average * (dB) | 24 | 31.22 -30% | 26.85 -12% | 23.3 3% | 29 -21% | 25.2 -5% | 37.5 -56% | 25.8 -8% |
| Idle Maximum * (dB) | 24 | 33.09 -38% | 26.85 -12% | 23.3 3% | 36 -50% | 32.5 -35% | 38 -58% | 25.8 -8% |
| Load Average * (dB) | 53.65 | 56.35 -5% | 27.65 48% | 29.6 45% | 50 7% | 59.7 -11% | 56.3 -5% | 39.3 27% |
| Witcher 3 ultra * (dB) | 53.53 | 56.89 -6% | 47.9 11% | 43 20% | 54 -1% | 49.9 7% | ||
| Load Maximum * (dB) | 53.65 | 56.89 -6% | 47.86 11% | 43 20% | 58 -8% | 60.9 -14% | 56.3 -5% | 54.8 -2% |
* ... Meglio usare valori piccoli
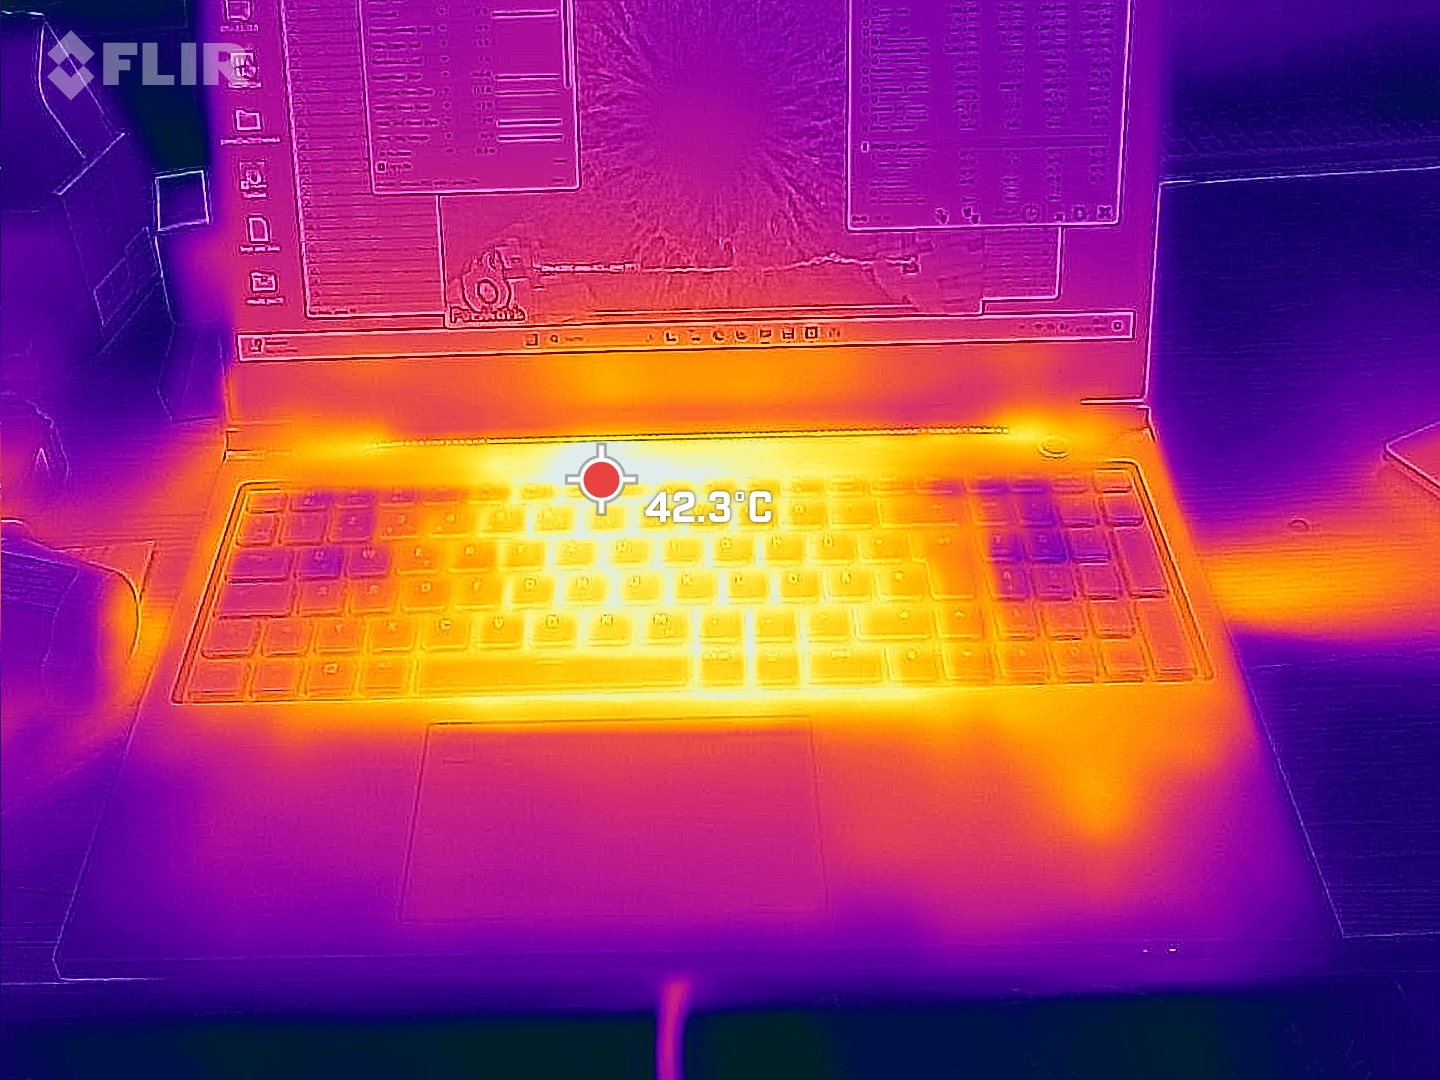
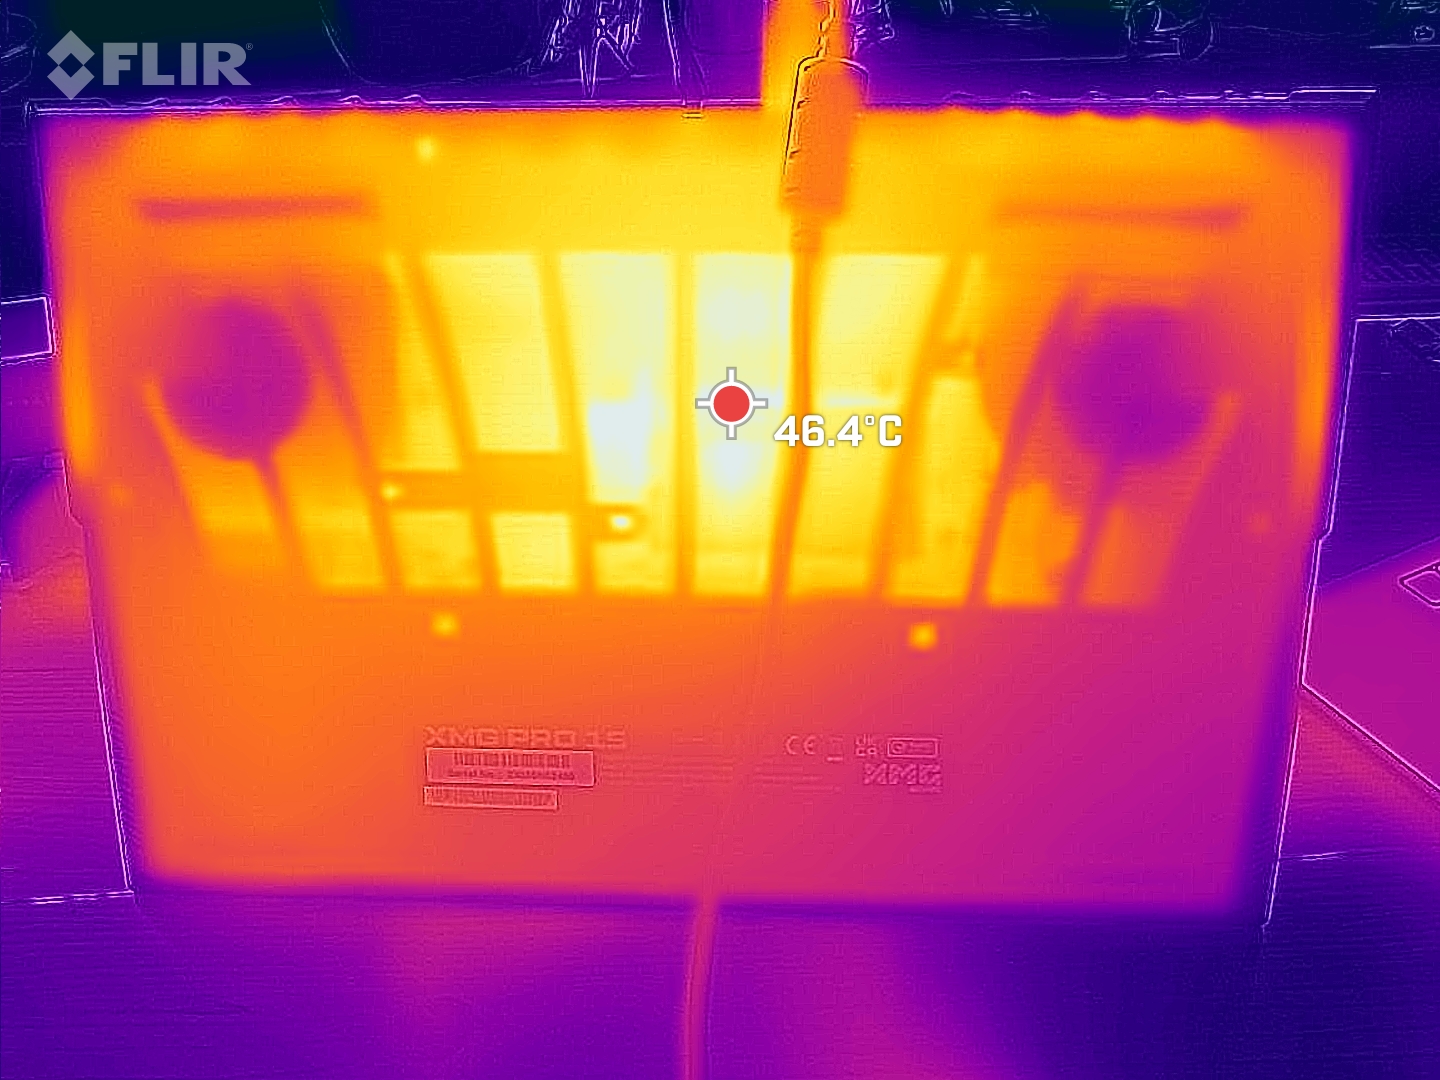
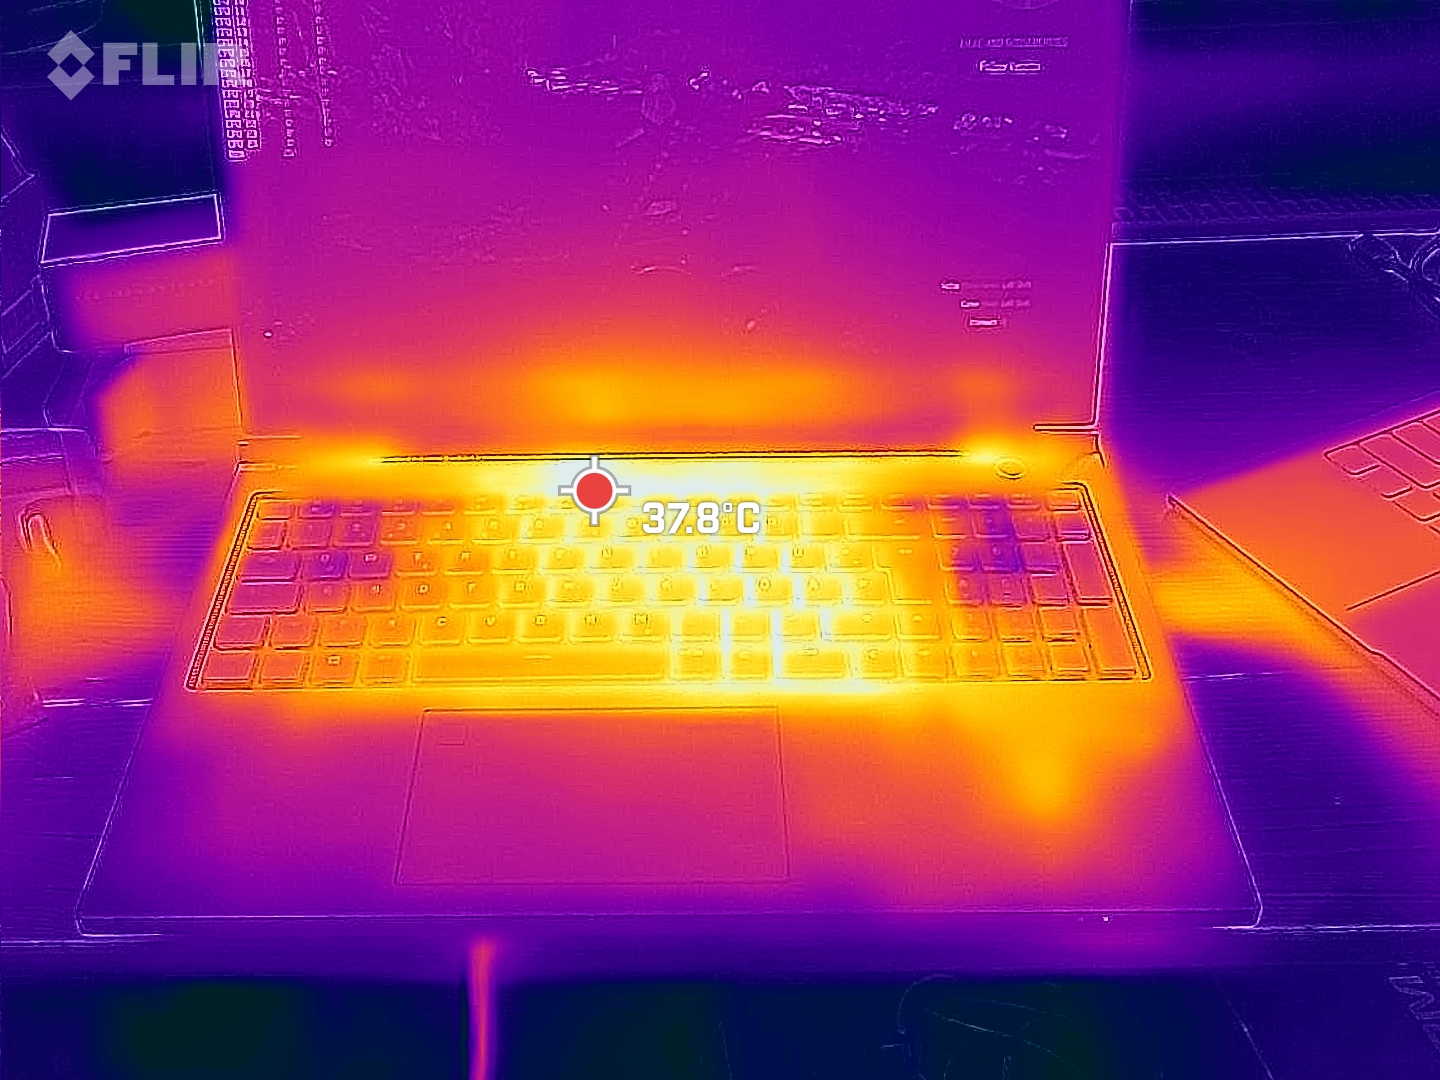
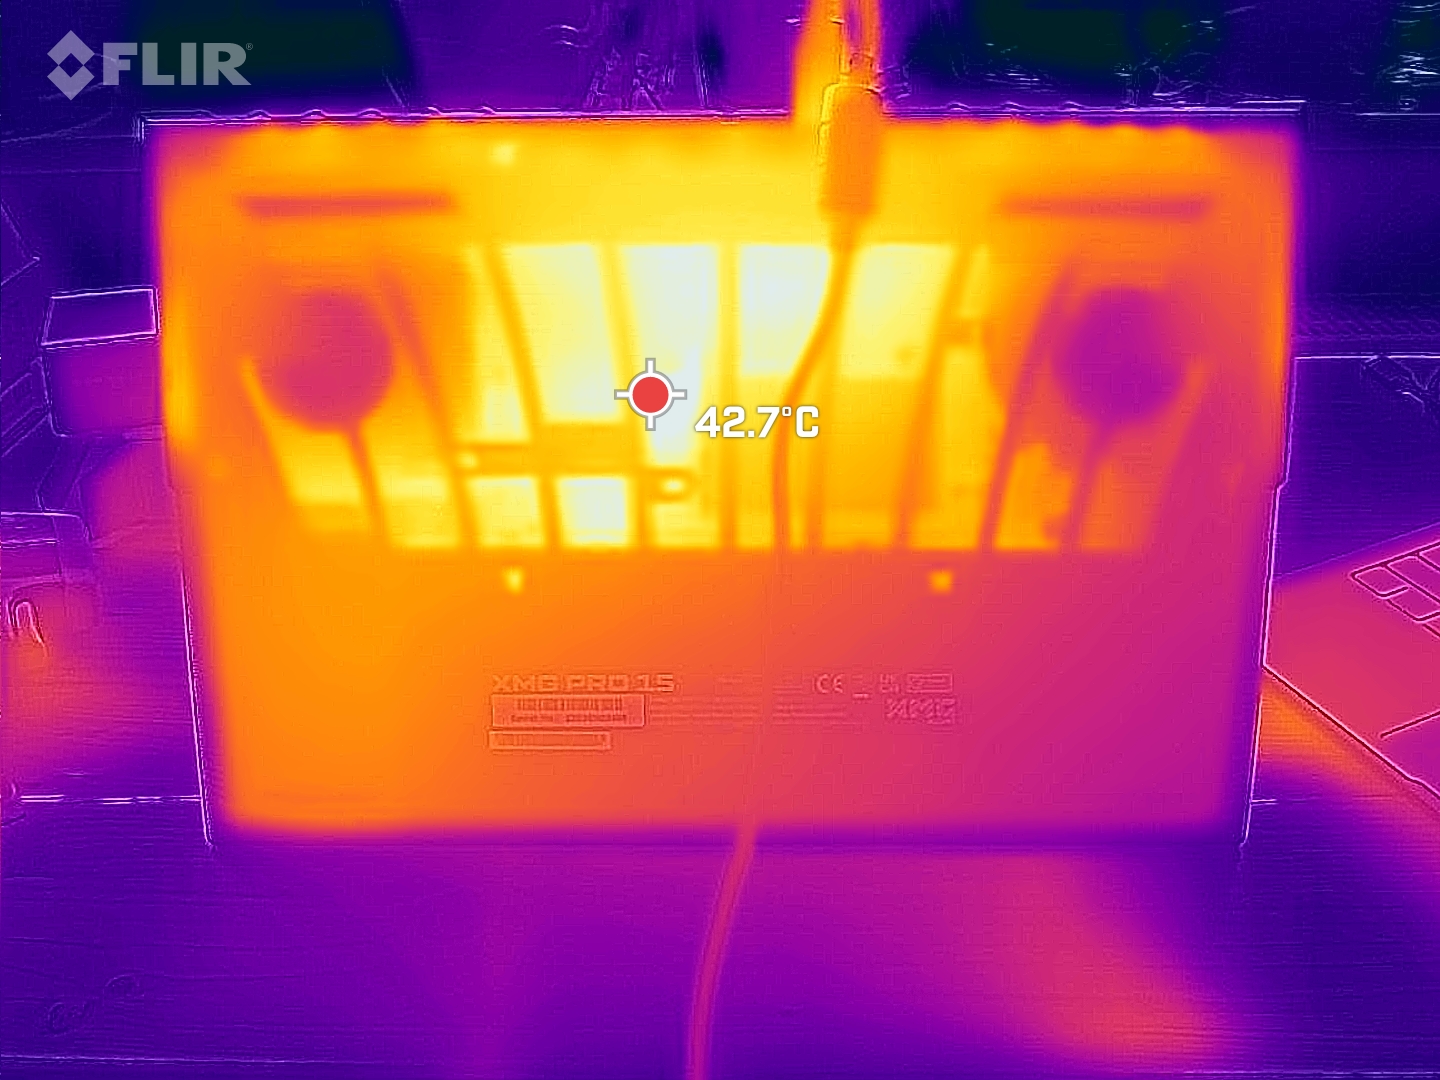
Temperatura
Con temperature superficiali fino a 50 °C nello stress test, l'XMG Pro 15 è notevolmente più caldo di molti dei suoi concorrenti. Tuttavia, da un lato, stiamo parlando solo di punti caldi relativamente piccoli e, dall'altro, la superficie dell'unità base è in plastica. Al contatto, questo fa sì che le alte temperature appaiano significativamente più basse. Quando si gioca sarebbe sbagliato descrivere la tastiera come fredda, ma non è comunque spiacevolmente calda. Anche le prestazioni del portatile non subiscono rallentamenti nel tempo.
(-) La temperatura massima sul lato superiore è di 50 °C / 122 F, rispetto alla media di 40.4 °C / 105 F, che varia da 21.2 a 68.8 °C per questa classe Gaming.
(-) Il lato inferiore si riscalda fino ad un massimo di 50 °C / 122 F, rispetto alla media di 43.2 °C / 110 F
(+) In idle, la temperatura media del lato superiore è di 28.7 °C / 84 F, rispetto alla media deld ispositivo di 33.9 °C / 93 F.
(±) Riproducendo The Witcher 3, la temperatura media per il lato superiore e' di 35.6 °C / 96 F, rispetto alla media del dispositivo di 33.9 °C / 93 F.
(+) I poggiapolsi e il touchpad raggiungono la temperatura massima della pelle (34 °C / 93.2 F) e quindi non sono caldi.
(-) La temperatura media della zona del palmo della mano di dispositivi simili e'stata di 28.8 °C / 83.8 F (-5.2 °C / -9.4 F).
| Schenker XMG Pro 15 (E23) Intel Core i9-13900HX, NVIDIA GeForce RTX 4060 Laptop GPU | Schenker XMG Pro 15 (i7-12700H, RTX 3080 Ti) Intel Core i7-12700H, NVIDIA GeForce RTX 3080 Ti Laptop GPU | Dell G15 5530 Intel Core i7-13650HX, NVIDIA GeForce RTX 4060 Laptop GPU | Asus TUF A15 FA507 AMD Ryzen 7 7735HS, NVIDIA GeForce RTX 4050 Laptop GPU | Aorus 15X ASF Intel Core i7-13700HX, NVIDIA GeForce RTX 4070 Laptop GPU | Asus ZenBook Pro 14 Duo UX8402VV-P1021W Intel Core i9-13900H, NVIDIA GeForce RTX 4060 Laptop GPU | MSI Cyborg 15 A12VF Intel Core i7-12650H, NVIDIA GeForce RTX 4060 Laptop GPU | Alienware x16 R1 Intel Core i9-13900HK, NVIDIA GeForce RTX 4080 Laptop GPU | |
|---|---|---|---|---|---|---|---|---|
| Heat | -5% | -9% | 11% | 13% | 9% | 15% | -4% | |
| Maximum Upper Side * (°C) | 50 | 57 -14% | 54 -8% | 48.9 2% | 42 16% | 37.1 26% | 47.5 5% | 47.2 6% |
| Maximum Bottom * (°C) | 50 | 52 -4% | 62.2 -24% | 44.6 11% | 51 -2% | 49.4 1% | 35.5 29% | 47.8 4% |
| Idle Upper Side * (°C) | 33 | 32 3% | 33.4 -1% | 27.1 18% | 27 18% | 30 9% | 27.7 16% | 36.8 -12% |
| Idle Bottom * (°C) | 32 | 34 -6% | 33.4 -4% | 27.5 14% | 26 19% | 32.4 -1% | 29.5 8% | 35.8 -12% |
* ... Meglio usare valori piccoli
Altoparlanti
Il volume medio percepito dai due diffusori dell'XMG Pro 15 è di soli 72,5 dB(A). Molte gamme di frequenza sono significativamente inferiori al volume della ventola sotto carico. Di conseguenza, quando si gioca, è necessario utilizzare cuffie o altoparlanti esterni. Questi possono essere collegati tramite il jack per cuffie da 3,5 mm, Bluetooth o S/PDIF ottico tramite il connettore da 3,5 mm. Con questo metodo è anche possibile collegare un sistema audio surround direttamente al computer.
Schenker XMG Pro 15 (E23) analisi audio
(±) | potenza degli altiparlanti media ma buona (72.52 dB)
Bassi 100 - 315 Hz
(±) | bassi ridotti - in media 12.9% inferiori alla media
(±) | la linearità dei bassi è media (7.2% delta rispetto alla precedente frequenza)
Medi 400 - 2000 Hz
(±) | medi elevati - circa 6.2% superiore alla media
(±) | linearità dei medi adeguata (7.8% delta rispetto alla precedente frequenza)
Alti 2 - 16 kHz
(+) | Alti bilanciati - appena 2.5% dalla media
(+) | alti lineari (4.6% delta rispetto alla precedente frequenza)
Nel complesso 100 - 16.000 Hz
(±) | la linearità complessiva del suono è media (18% di differenza rispetto alla media
Rispetto alla stessa classe
» 56% di tutti i dispositivi testati in questa classe è stato migliore, 9% simile, 36% peggiore
» Il migliore ha avuto un delta di 6%, medio di 18%, peggiore di 132%
Rispetto a tutti i dispositivi testati
» 38% di tutti i dispositivi testati in questa classe è stato migliore, 8% similare, 54% peggiore
» Il migliore ha avuto un delta di 4%, medio di 23%, peggiore di 134%
Asus ZenBook Pro 14 Duo UX8402VV-P1021W analisi audio
(+) | gli altoparlanti sono relativamente potenti (83.7 dB)
Bassi 100 - 315 Hz
(-) | quasi nessun basso - in media 19.9% inferiori alla media
(±) | la linearità dei bassi è media (11.9% delta rispetto alla precedente frequenza)
Medi 400 - 2000 Hz
(+) | medi bilanciati - solo only 1.2% rispetto alla media
(+) | medi lineari (4.7% delta rispetto alla precedente frequenza)
Alti 2 - 16 kHz
(±) | alti elevati - circa 5.5% superiori alla media
(+) | alti lineari (5.9% delta rispetto alla precedente frequenza)
Nel complesso 100 - 16.000 Hz
(±) | la linearità complessiva del suono è media (16.1% di differenza rispetto alla media
Rispetto alla stessa classe
» 41% di tutti i dispositivi testati in questa classe è stato migliore, 6% simile, 53% peggiore
» Il migliore ha avuto un delta di 5%, medio di 17%, peggiore di 45%
Rispetto a tutti i dispositivi testati
» 26% di tutti i dispositivi testati in questa classe è stato migliore, 5% similare, 69% peggiore
» Il migliore ha avuto un delta di 4%, medio di 23%, peggiore di 134%
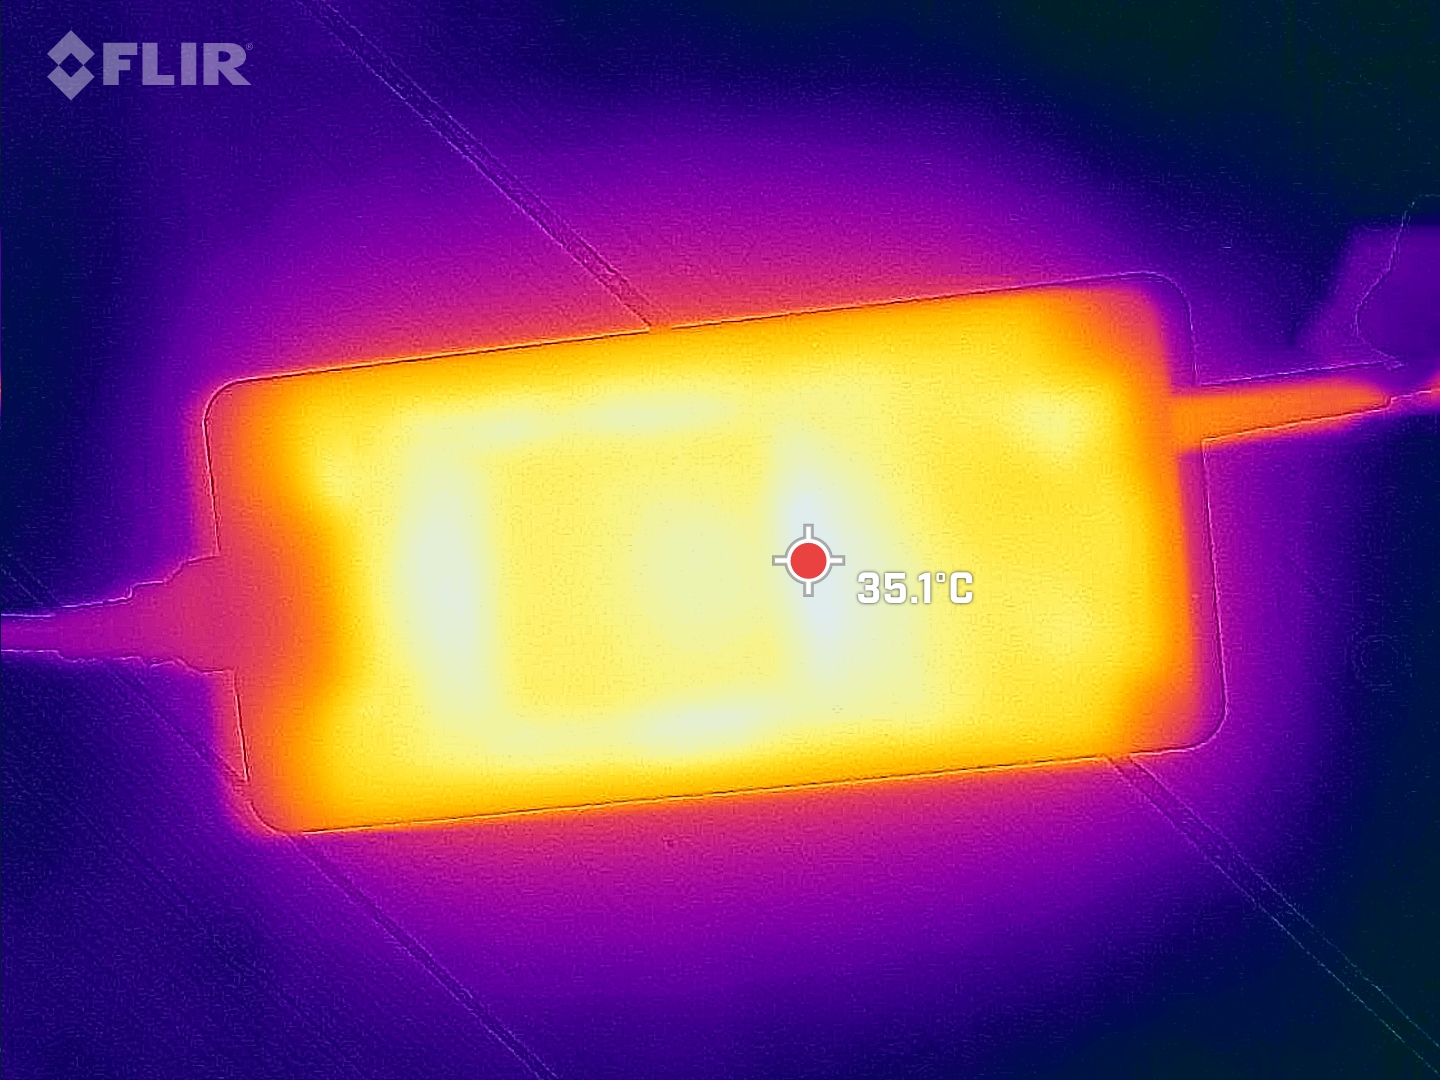
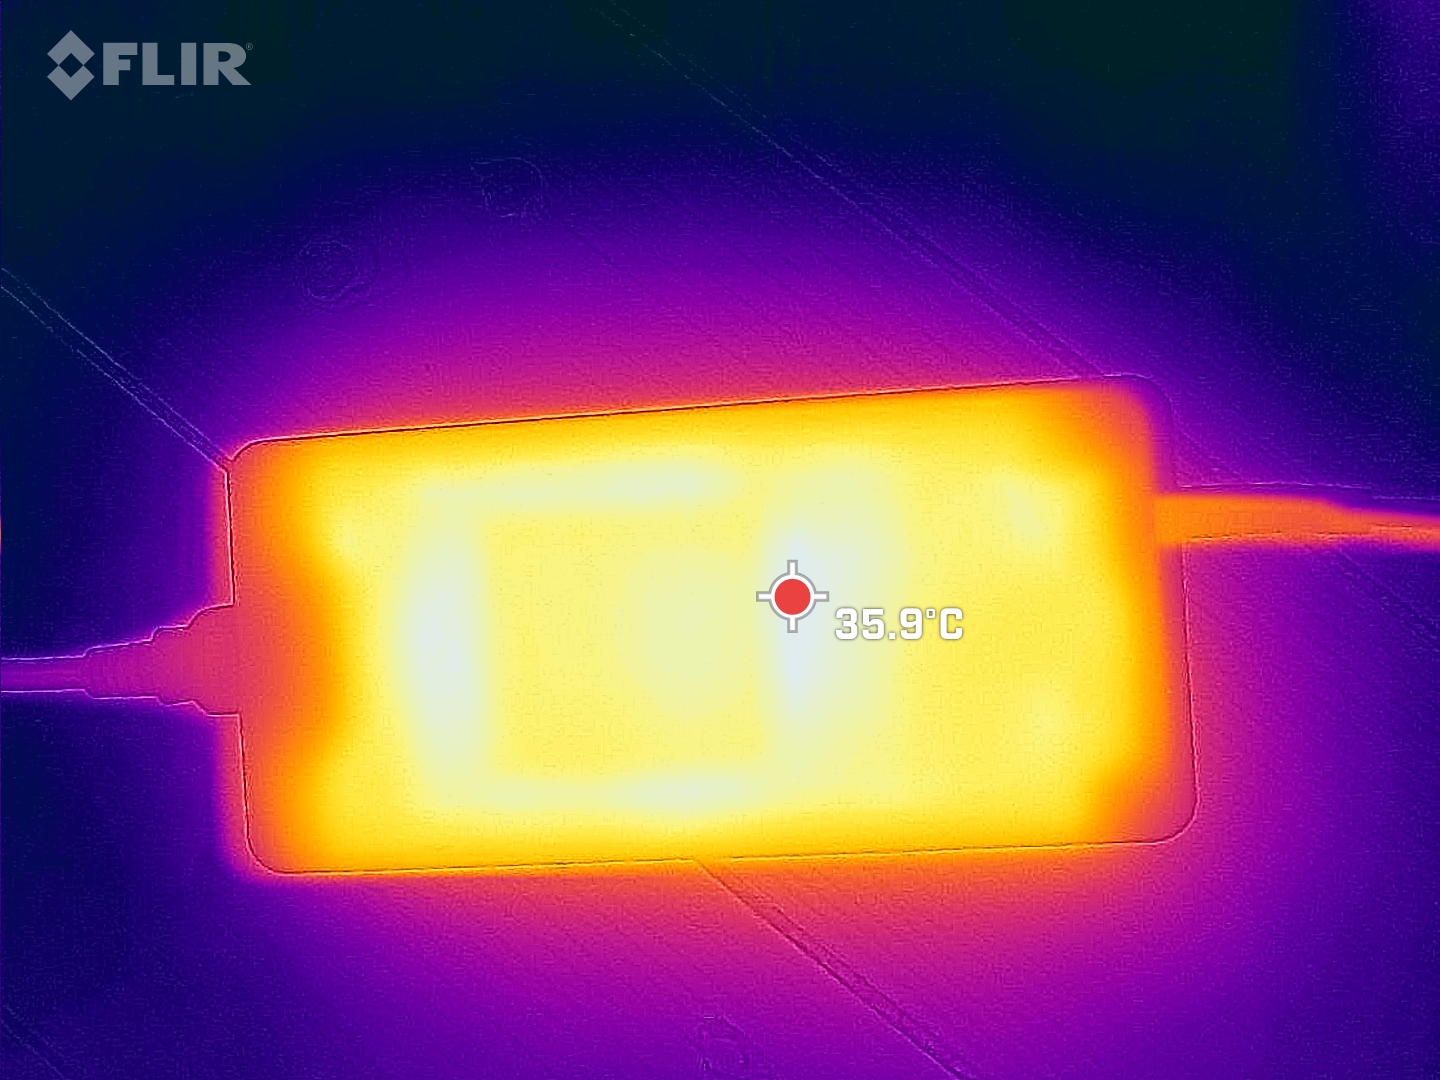
Consumo di energia
In linea con la sua categoria, lo Schenker XMG Pro 15 non è un miracolo di risparmio energetico. È inclusa una grande PSU che può fornire fino a 280 watt. Se utilizzato con il portatile da gioco, ciò significa che ha ancora un po' di riserva. Nello stress test Prime95 e Furmark ha assorbito un massimo di 269 watt, ma in media si è attestato sui 215 watt.
| Off / Standby | |
| Idle | |
| Sotto carico |
|
Leggenda:
min: | |
Power consumption Witcher 3 / stress test
Power consumption with an external monitor
Durata della batteria
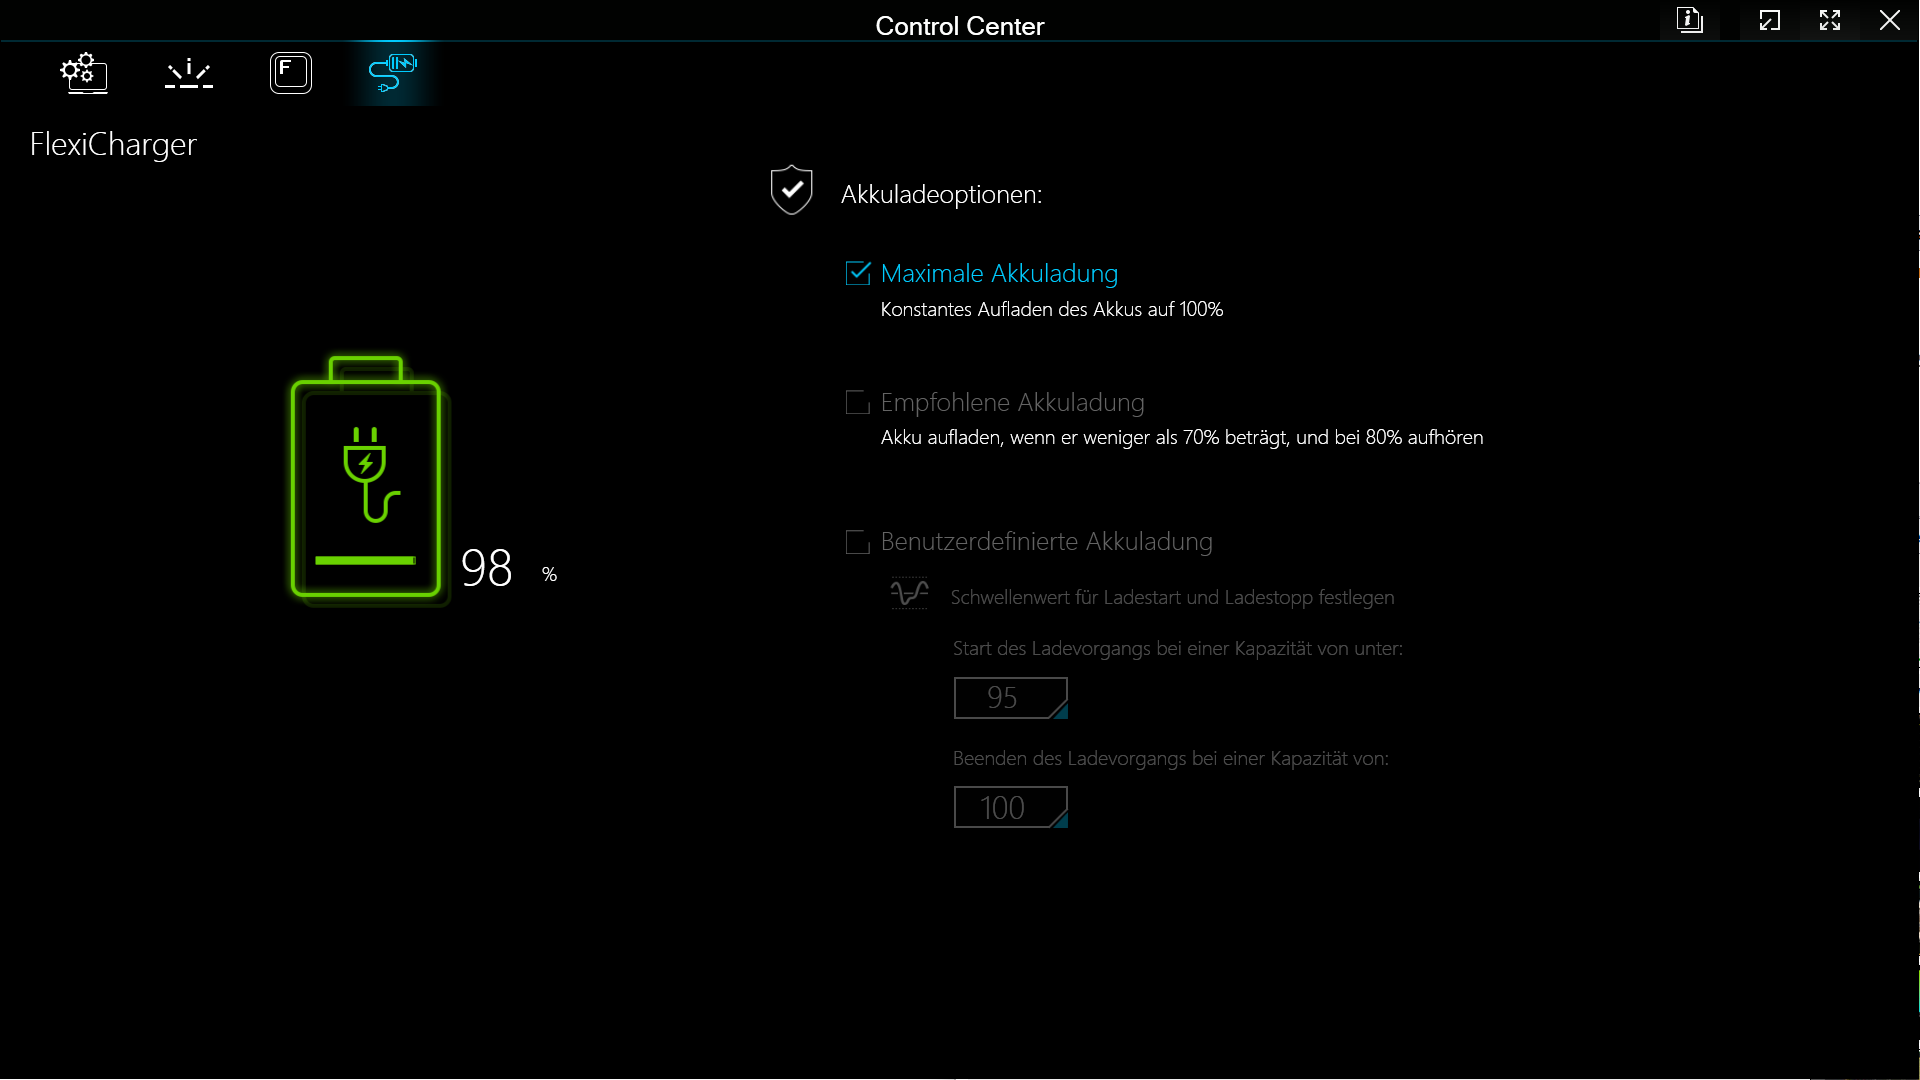
Nel nostro test di navigazione internet Wi-Fi, l'XMG Pro 15 E23 non è riuscito a superare le sei ore. Tuttavia, non ci si può aspettare molto altro da una batteria da 80 Wh. Detto questo, il dispositivo in prova ha un piccolo problema quando si tratta della modalità di sospensione della dGPU: non si attiva sempre in modo affidabile, ma Schenker è consapevole del problema e sta lavorando a una soluzione.
| Schenker XMG Pro 15 (E23) i9-13900HX, GeForce RTX 4060 Laptop GPU, 80 Wh | Schenker XMG Pro 15 (i7-12700H, RTX 3080 Ti) i7-12700H, GeForce RTX 3080 Ti Laptop GPU, 80 Wh | Dell G15 5530 i7-13650HX, GeForce RTX 4060 Laptop GPU, 86 Wh | Asus TUF A15 FA507 R7 7735HS, GeForce RTX 4050 Laptop GPU, 90 Wh | Aorus 15X ASF i7-13700HX, GeForce RTX 4070 Laptop GPU, 99 Wh | Asus ZenBook Pro 14 Duo UX8402VV-P1021W i9-13900H, GeForce RTX 4060 Laptop GPU, 76 Wh | MSI Cyborg 15 A12VF i7-12650H, GeForce RTX 4060 Laptop GPU, 53.5 Wh | Alienware x16 R1 i9-13900HK, GeForce RTX 4080 Laptop GPU, 90 Wh | Media della classe Gaming | |
|---|---|---|---|---|---|---|---|---|---|
| Autonomia della batteria | -2% | -22% | 29% | 25% | 71% | 27% | -60% | 2% | |
| WiFi v1.3 (h) | 5.7 | 5.8 2% | 6.5 14% | 11.7 105% | 8.2 44% | 9 58% | 7.5 32% | 2.5 -56% | 7.11 ? 25% |
| Load (h) | 1.9 | 1.8 -5% | 0.8 -58% | 1 -47% | 2 5% | 3.5 84% | 2.3 21% | 0.7 -63% | 1.502 ? -21% |
| H.264 (h) | 5.3 | 6.8 | 12.5 | 7.9 | 8 | 8.32 ? | |||
| Witcher 3 ultra (h) | 0.8 | ||||||||
| Reader / Idle (h) | 11.3 | 13.6 | 7.3 | 8.27 ? |
Pro
Contro
Verdetto: perfetto per l'equilibrio tra lavoro e gioco

L'XMG Pro 15 E23 è pubblicizzato come una workstation da gioco. Nella nostra recensione, soddisfa tutti i requisiti di un buon portatile da gioco di fascia media, ma anche molti aspetti che lo rendono un portatile decente per il lavoro video e cinematografico. Il design senza pretese non riflette in alcun modo le prestazioni da 15,6 pollici del dispositivo. Schenker ha perfezionato un barebone solido, dotato di buoni dispositivi di input e di un'ampia selezione di porte, oltre che di componenti di qualità superiore.
Alcuni degli svantaggi del predecessore sono stati significativamente ridotti o completamente eliminati. Ora l'SSD funziona stabilmente ad alta velocità, il display è più luminoso e il volume è stato leggermente regolato. Il portatile da gioco potrebbe ancora non essere silenzioso, ma ora conosce i momenti giusti per comportarsi correttamente.
Alcuni dei bordi frastagliati dell'XMG Pro 15 E23 sono stati smussati, il che significa che il portatile da gioco presenta ora solo alcuni piccoli inconvenienti.
Non ci sono punti negativi evidenti che spiccano. L'assenza di una porta USB posteriore è piuttosto spiacevole, il che significa che solo una configurazione di mouse e tastiera wireless consentirà di ottenere un desktop senza cavi. Chi non vuole spingere il portatile ai suoi limiti prestazionali si divertirà a utilizzare la modalità di intrattenimento silenziosa. Anche la maggior parte dei giochi funziona bene. Solo i tempi di risposta lenti del display QHD a 240 Hz ci preoccupano. Nel frattempo, la differenza rispetto a concorrenti comeAorus 15X ASF o MSI Cyborg 15 si trova solo nei dettagli. Chi desidera un portatile da gioco più interessante farebbe meglio a dare un'occhiata all'Alienware x16 R1.Alienware x16 R1 o l'Asus ROG Strix G16- ma non sarà ricompensato con tanta potenza in più.
Prezzo e disponibilità
L'XMG Pro 15 può essere configurato presso Bestware: senza Windows, un SSD e la quantità minima di RAM, il portatile parte da 1.893 euro. Il nostro dispositivo di prova senza Windows 11 costa 2.150 euro. Per un Windows 11 Home attivato, Bestware chiede 100 euro in più. Schenker non sta chiaramente seguendo la spirale dei prezzi al rialzo. L'anno scorso, il Pro 15 E22con RTX 3070 Ti, 32 GB di RAM e un SSD da 1 TB costava 2.510 euro. Per il modello E23 con RTX 4070 Ti, 32 GB di RAM e 1 TB di SSD, Bestware propone un prezzo di 2.400 euro.
Schenker XMG Pro 15 (E23)
- 07/04/2023 v7 (old)
Marc Herter
Transparency
La selezione dei dispositivi da recensire viene effettuata dalla nostra redazione. Il campione di prova è stato fornito all'autore come prestito dal produttore o dal rivenditore ai fini di questa recensione. L'istituto di credito non ha avuto alcuna influenza su questa recensione, né il produttore ne ha ricevuto una copia prima della pubblicazione. Non vi era alcun obbligo di pubblicare questa recensione. In quanto società mediatica indipendente, Notebookcheck non è soggetta all'autorità di produttori, rivenditori o editori.
Ecco come Notebookcheck esegue i test
Ogni anno, Notebookcheck esamina in modo indipendente centinaia di laptop e smartphone utilizzando procedure standardizzate per garantire che tutti i risultati siano comparabili. Da circa 20 anni sviluppiamo continuamente i nostri metodi di prova e nel frattempo stabiliamo gli standard di settore. Nei nostri laboratori di prova, tecnici ed editori esperti utilizzano apparecchiature di misurazione di alta qualità. Questi test comportano un processo di validazione in più fasi. Il nostro complesso sistema di valutazione si basa su centinaia di misurazioni e parametri di riferimento ben fondati, che mantengono l'obiettività.Price comparison

