Recensione del portatile Alienware x16 R1: Debutto delle prestazioni dell'Intel Core i9-13900HK

Presentato al CES 2023l'Alienware x16 R1 è il secondo modello da 16 pollici della famiglia, dopo l'Alienware m16, più spesso e potente, che dobbiamo ancora recensire. I due modelli integrano l'attuale 14 pollici, 15 pollici, 17 pollici e 18 pollici Le opzioni Alienware già presenti sul mercato.
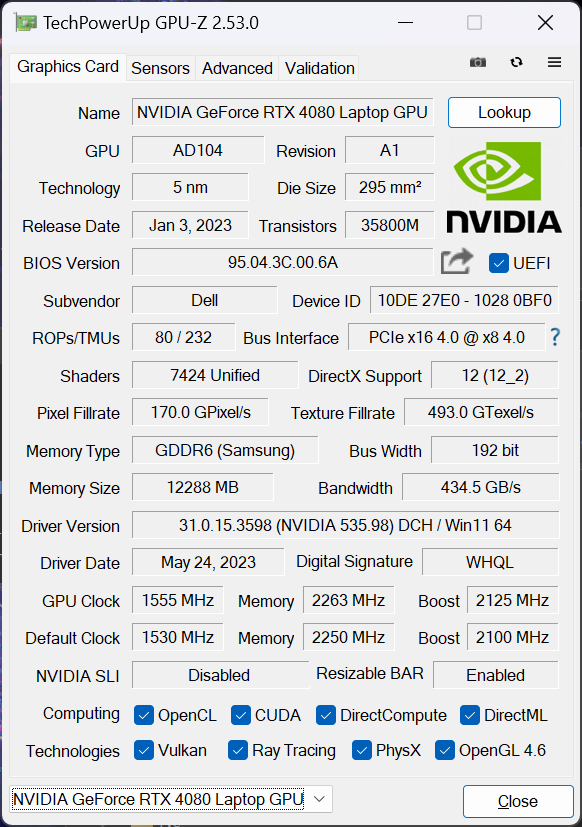
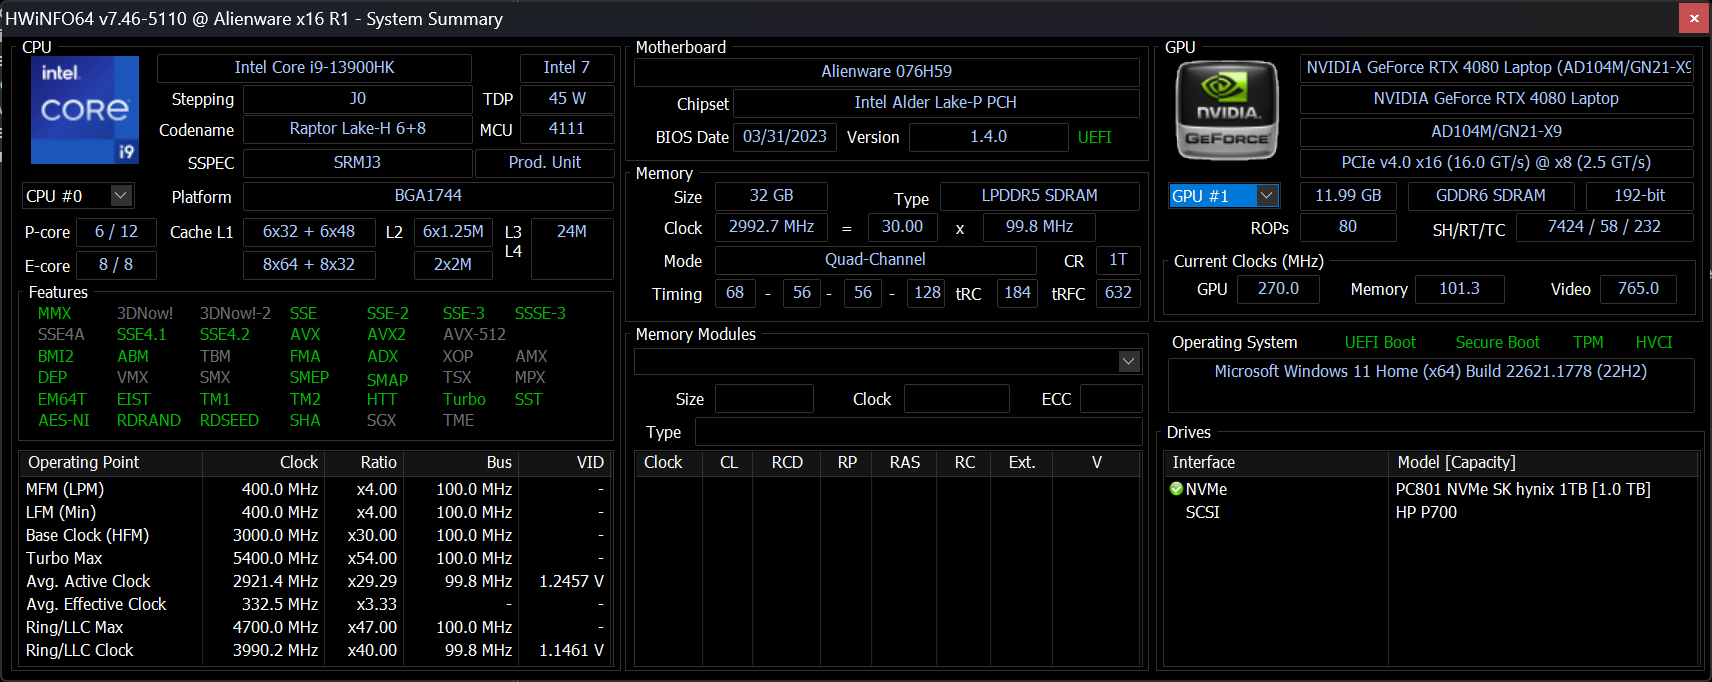
La nostra unità di prova è una configurazione di fascia alta con CPU Raptor Lake Core i9-13900HK di 13a generazione, GPU RTX 4080 di GeForce e display IPS da 16,0 pollici 2560 x 1600 240 Hz per circa 3350 dollari. Sono disponibili configurazioni più economiche o più costose che vanno dal Core i7-13620H, display a 1200p e GPU RTX 4050 fino alla RTX 4090 per un prezzo compreso tra 2.200 e oltre 4.000 dollari.
Le alternative all'Alienware x16 R1 includono altri portatili da gioco da 16 pollici come Lenovo Legion Pro 7, Asus ROG Zephyrus M16, Razer Blade 16, o HP Omen 16. Questa particolare categoria di dimensioni è cresciuta in popolarità negli ultimi due anni.
Altre recensioni Dell:
Potenziali concorrenti a confronto
Punteggio | Data | Modello | Peso | Altezza | Dimensione | Risoluzione | Prezzo |
|---|---|---|---|---|---|---|---|
| 88.4 % v7 (old) | 06/2023 | Alienware x16 R1 i9-13900HK, GeForce RTX 4080 Laptop GPU | 2.6 kg | 18.57 mm | 16.00" | 2560x1600 | |
| 88.8 % v7 (old) | 06/2023 | Lenovo Legion Pro 7 RTX4090 i9-13900HX, GeForce RTX 4090 Laptop GPU | 2.7 kg | 26 mm | 16.00" | 2560x1600 | |
| 89.4 % v7 (old) | 03/2023 | Asus ROG Zephyrus M16 GU604VY-NM042X i9-13900H, GeForce RTX 4090 Laptop GPU | 2.3 kg | 22.9 mm | 16.00" | 2560x1600 | |
| 91.2 % v7 (old) | 02/2023 | Razer Blade 16 Early 2023 i9-13950HX, GeForce RTX 4080 Laptop GPU | 2.4 kg | 21.99 mm | 16.00" | 2560x1600 | |
| 86.1 % v7 (old) | 10/2022 | Dell G16 7620 i7-12700H, GeForce RTX 3060 Laptop GPU | 2.6 kg | 26.9 mm | 16.00" | 2560x1600 | |
| 86.1 % v7 (old) | 01/2023 | Alienware m17 R5 (R9 6900HX, RX 6850M XT) R9 6900HX, Radeon RX 6850M XT | 3.4 kg | 26.7 mm | 17.00" | 3840x2160 |
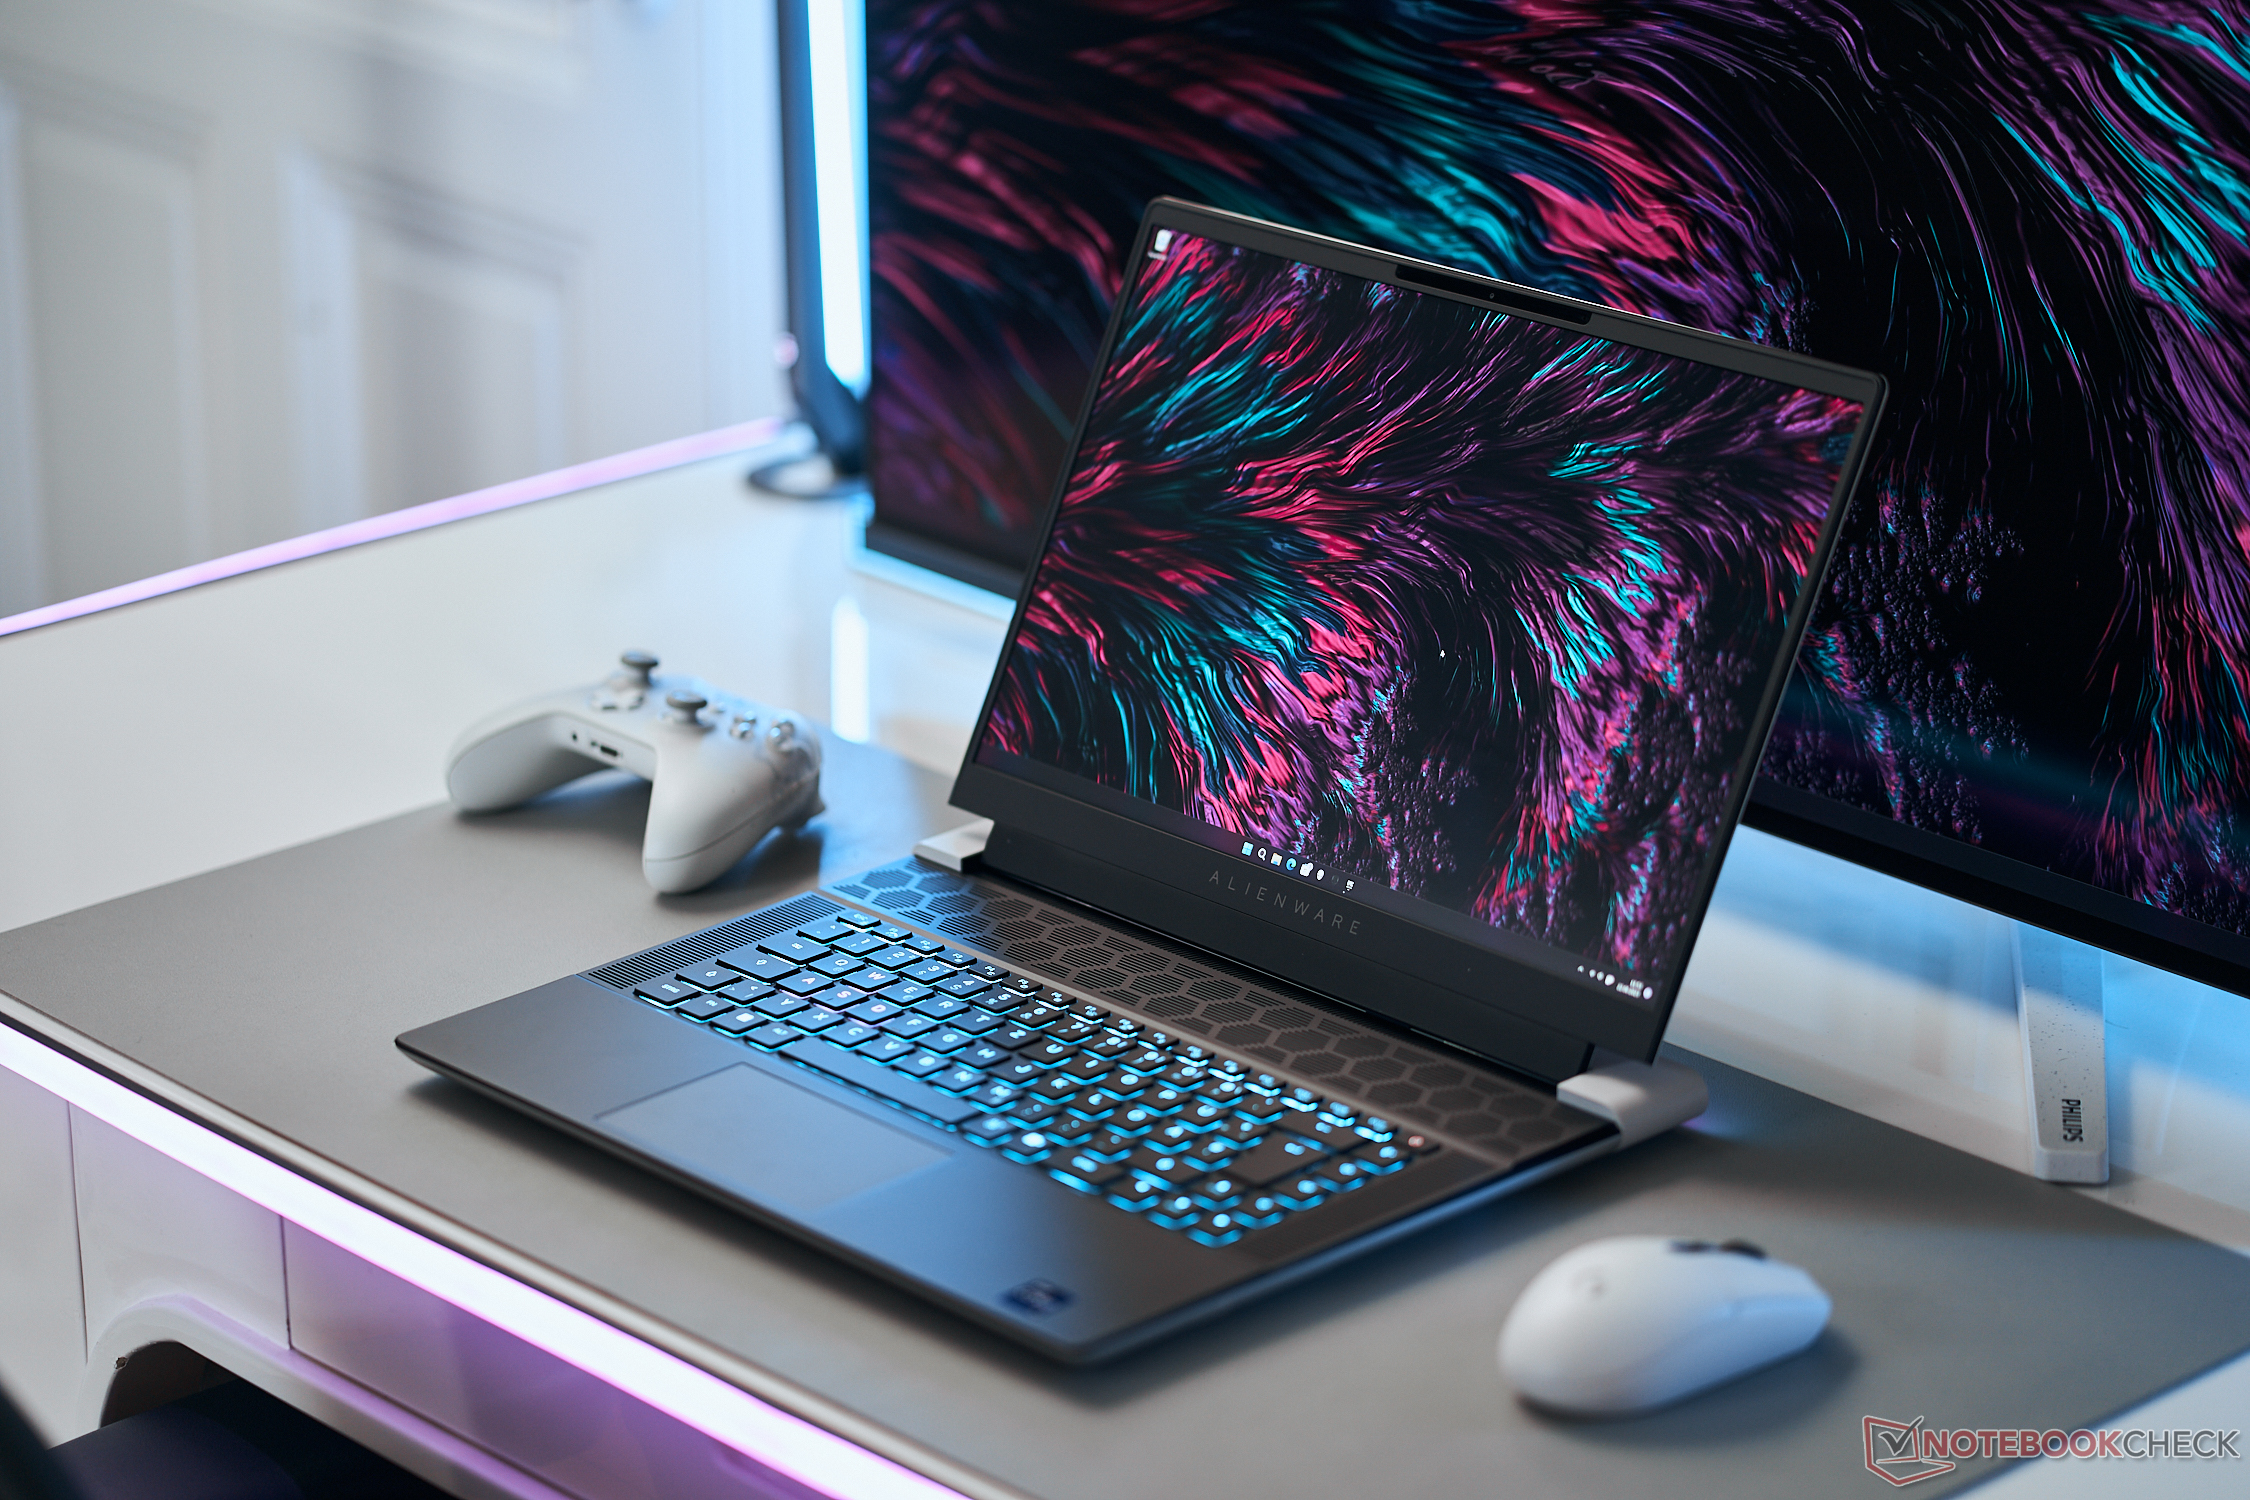
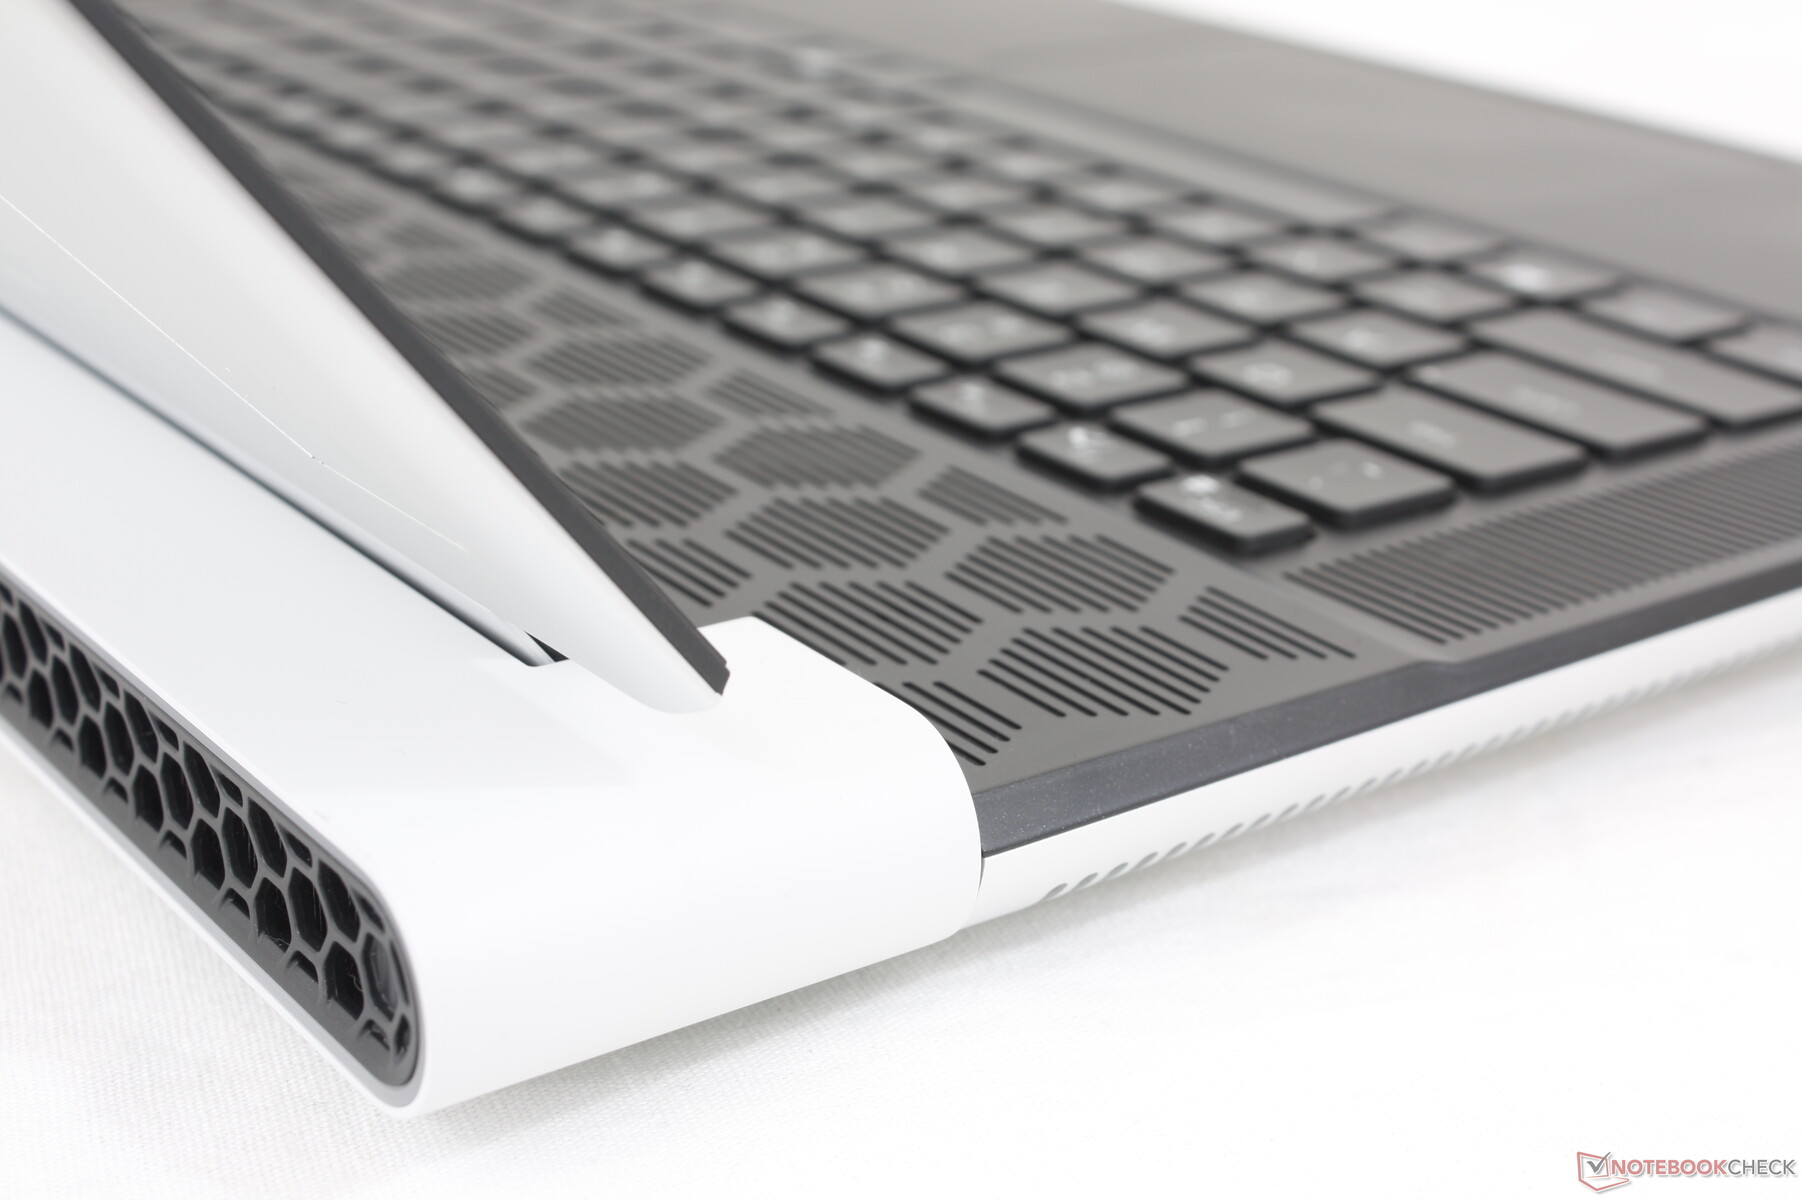
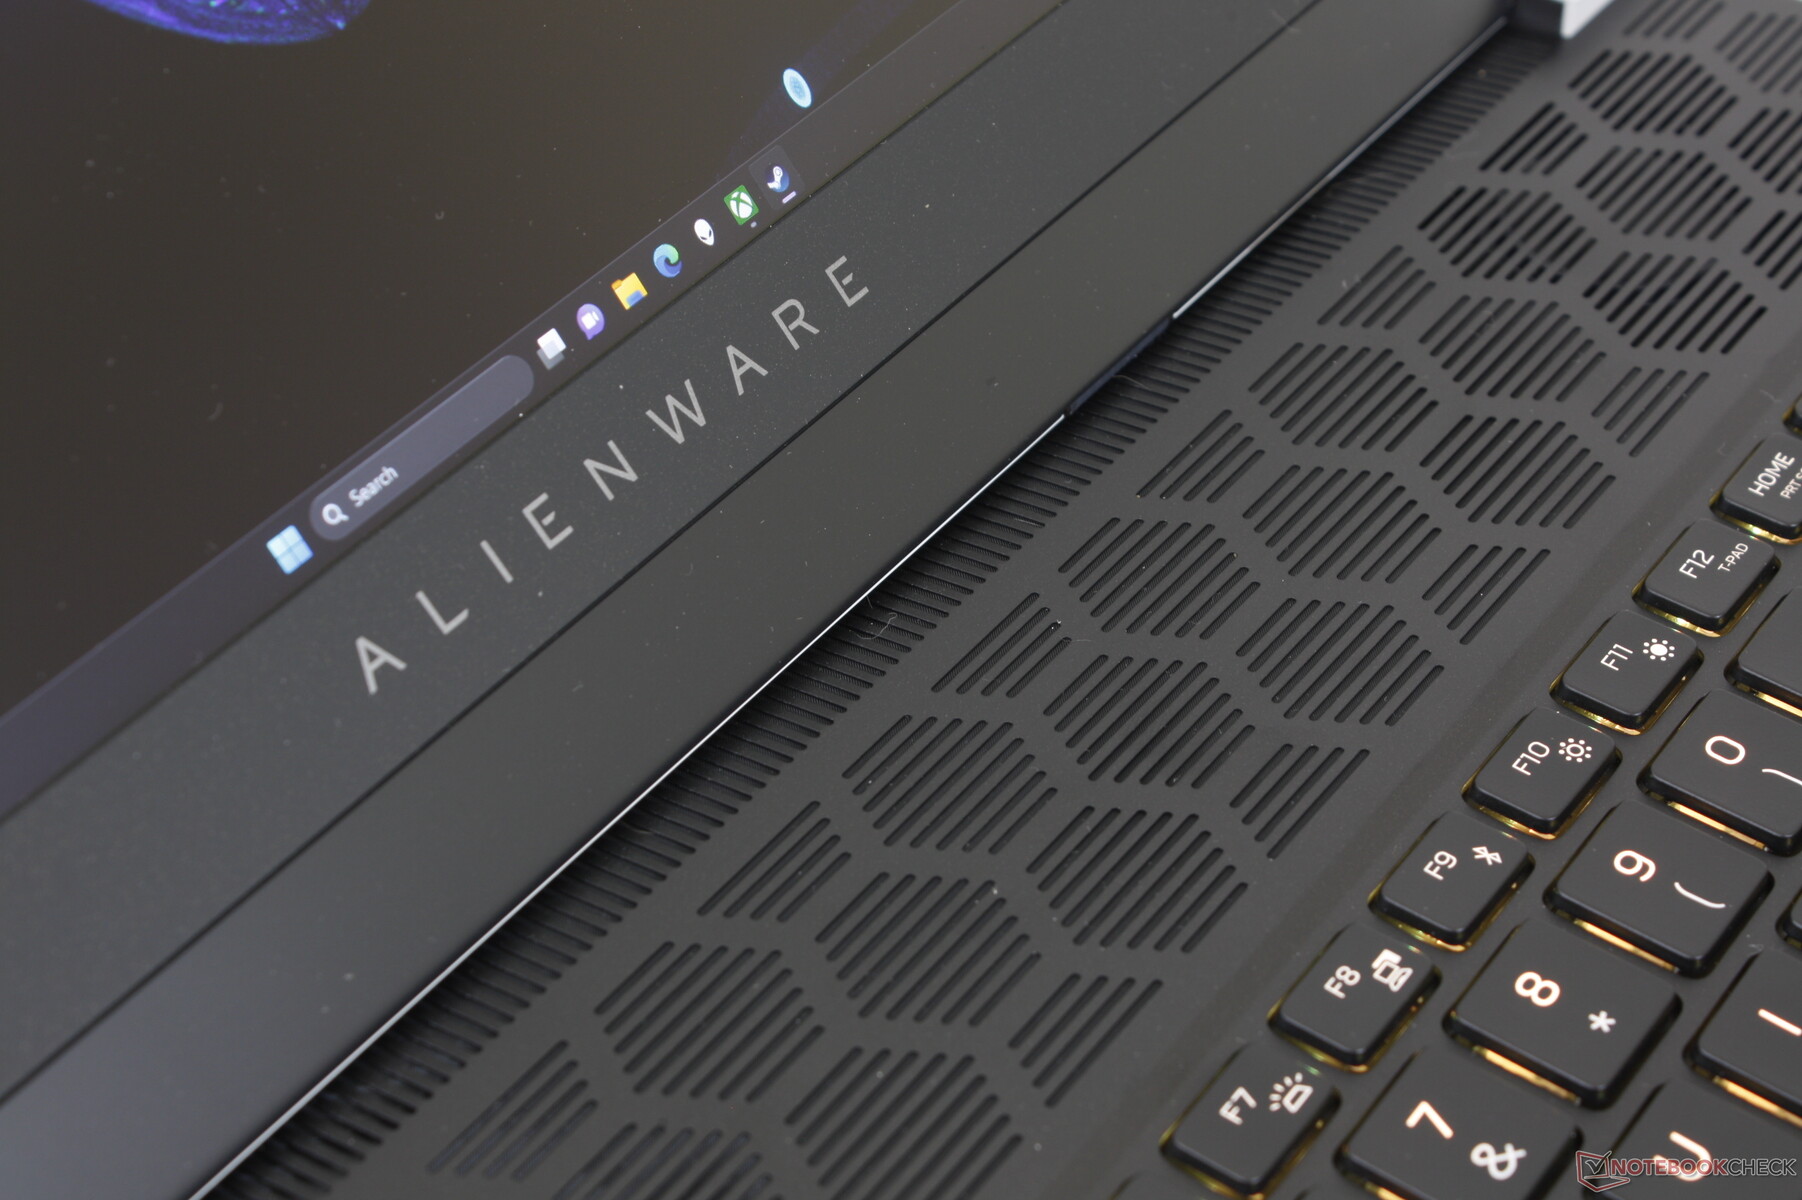
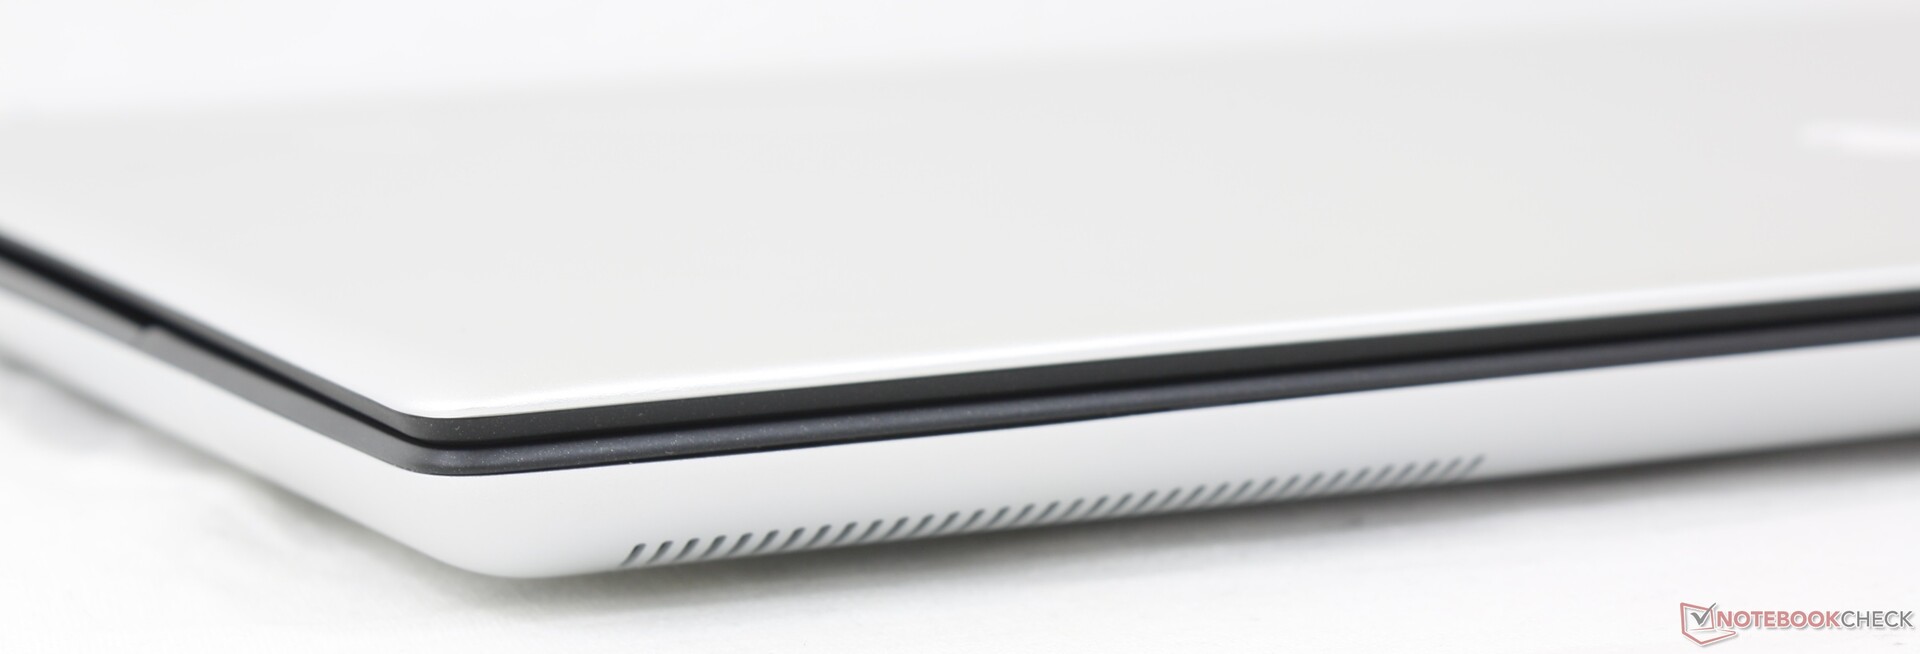
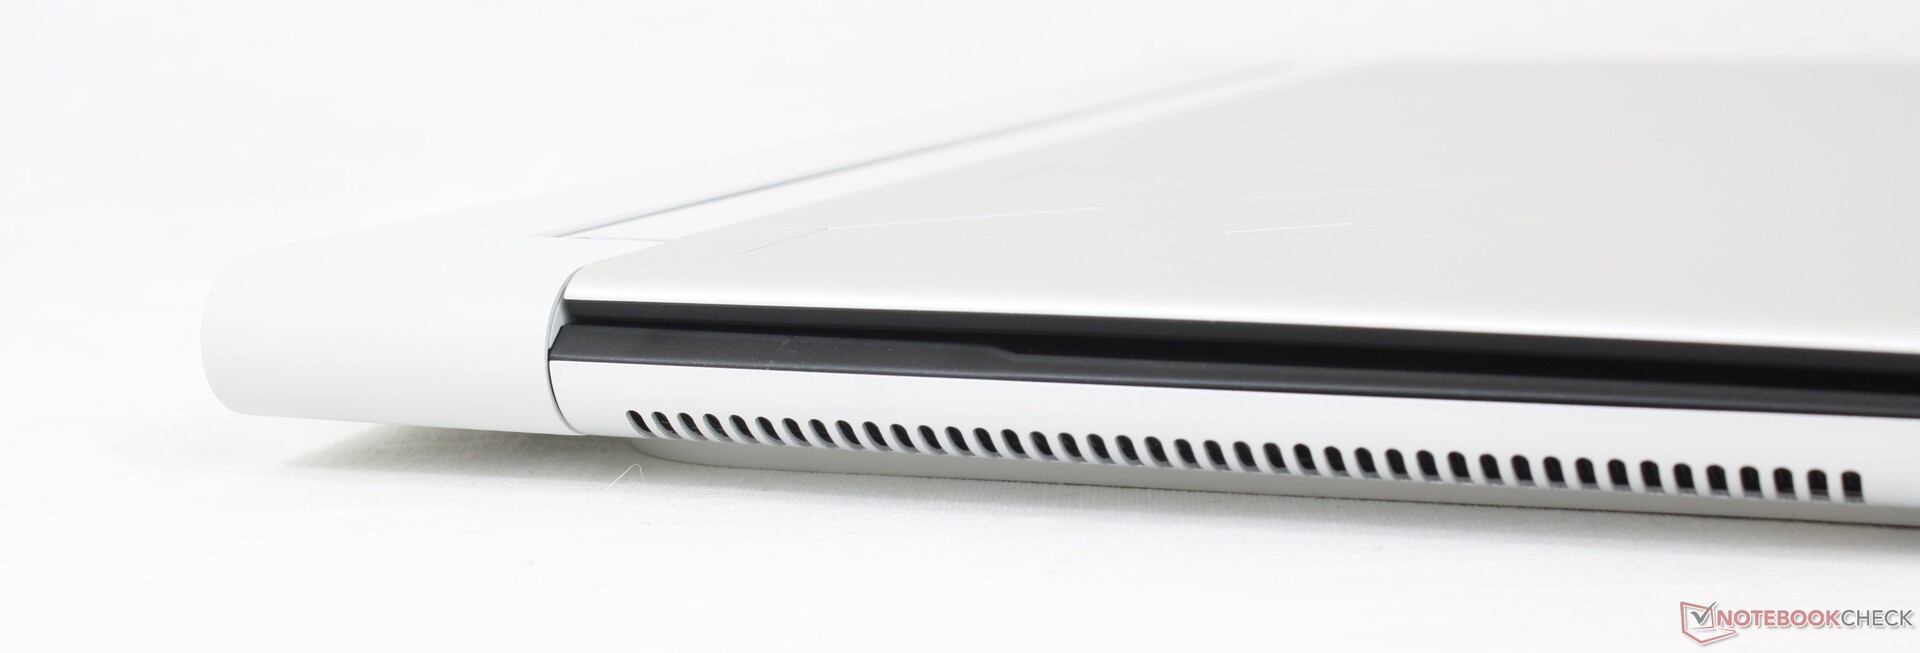
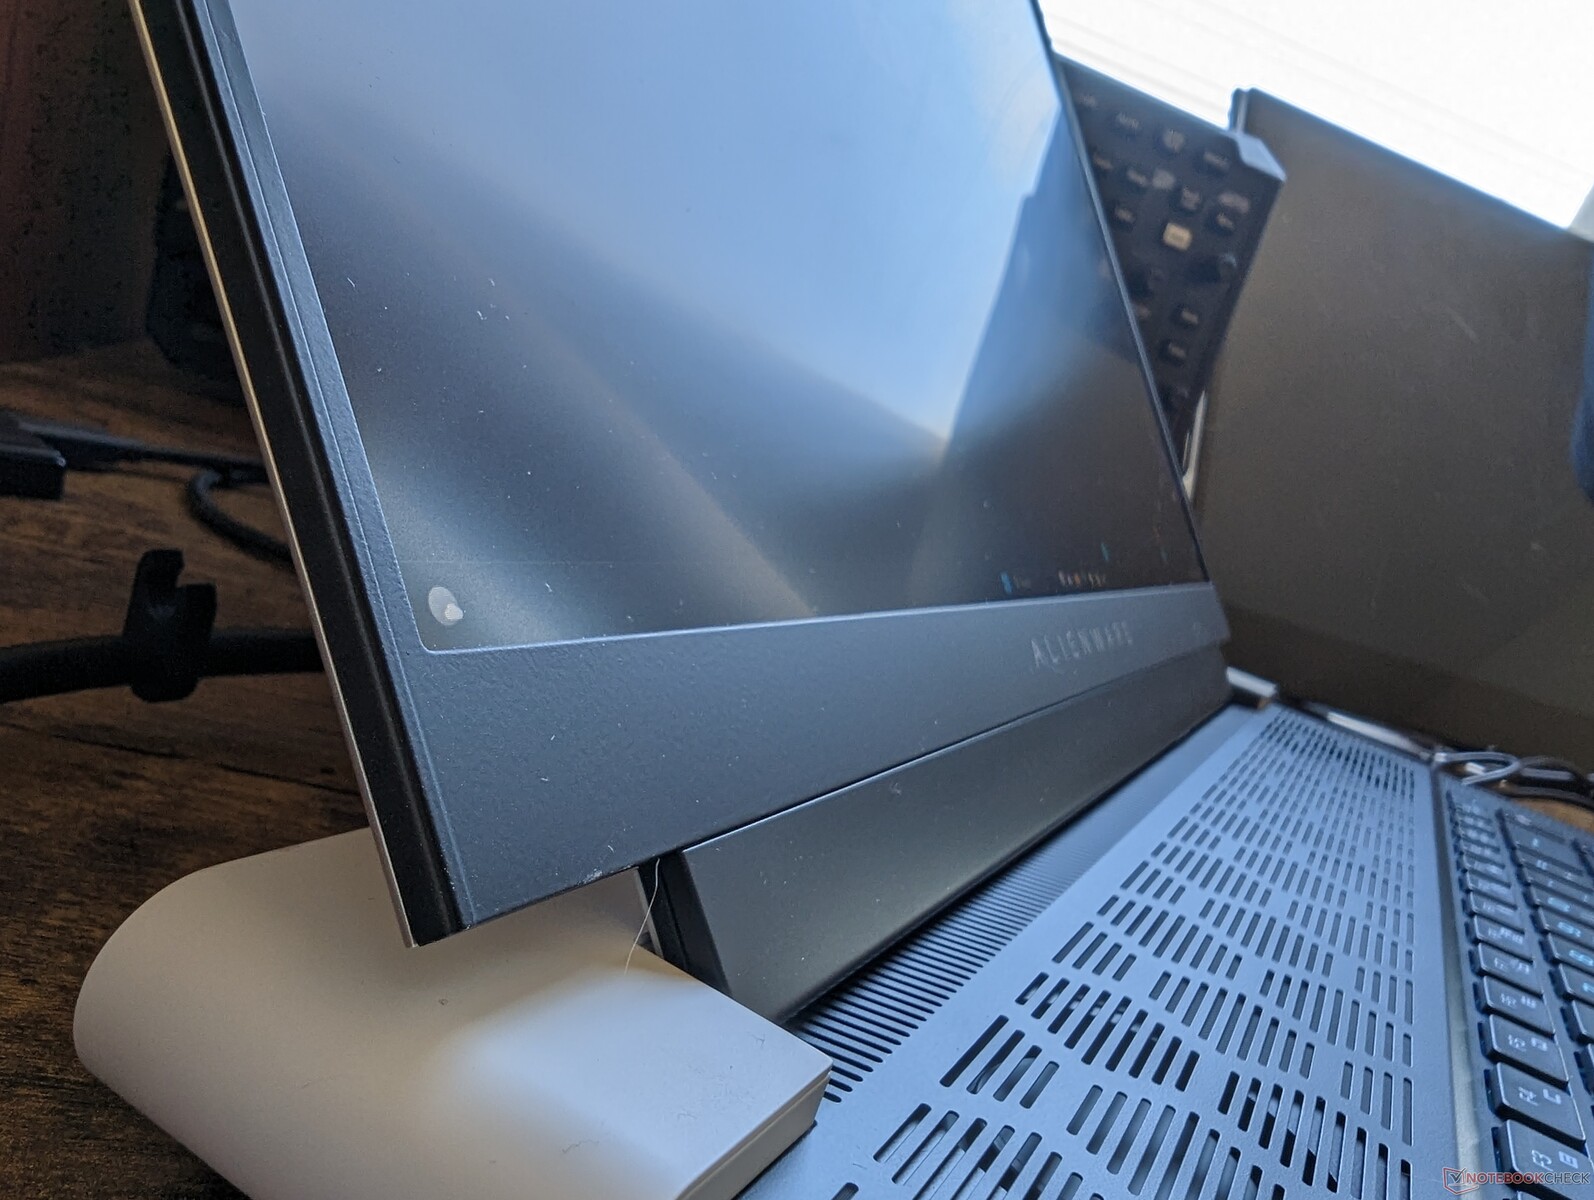
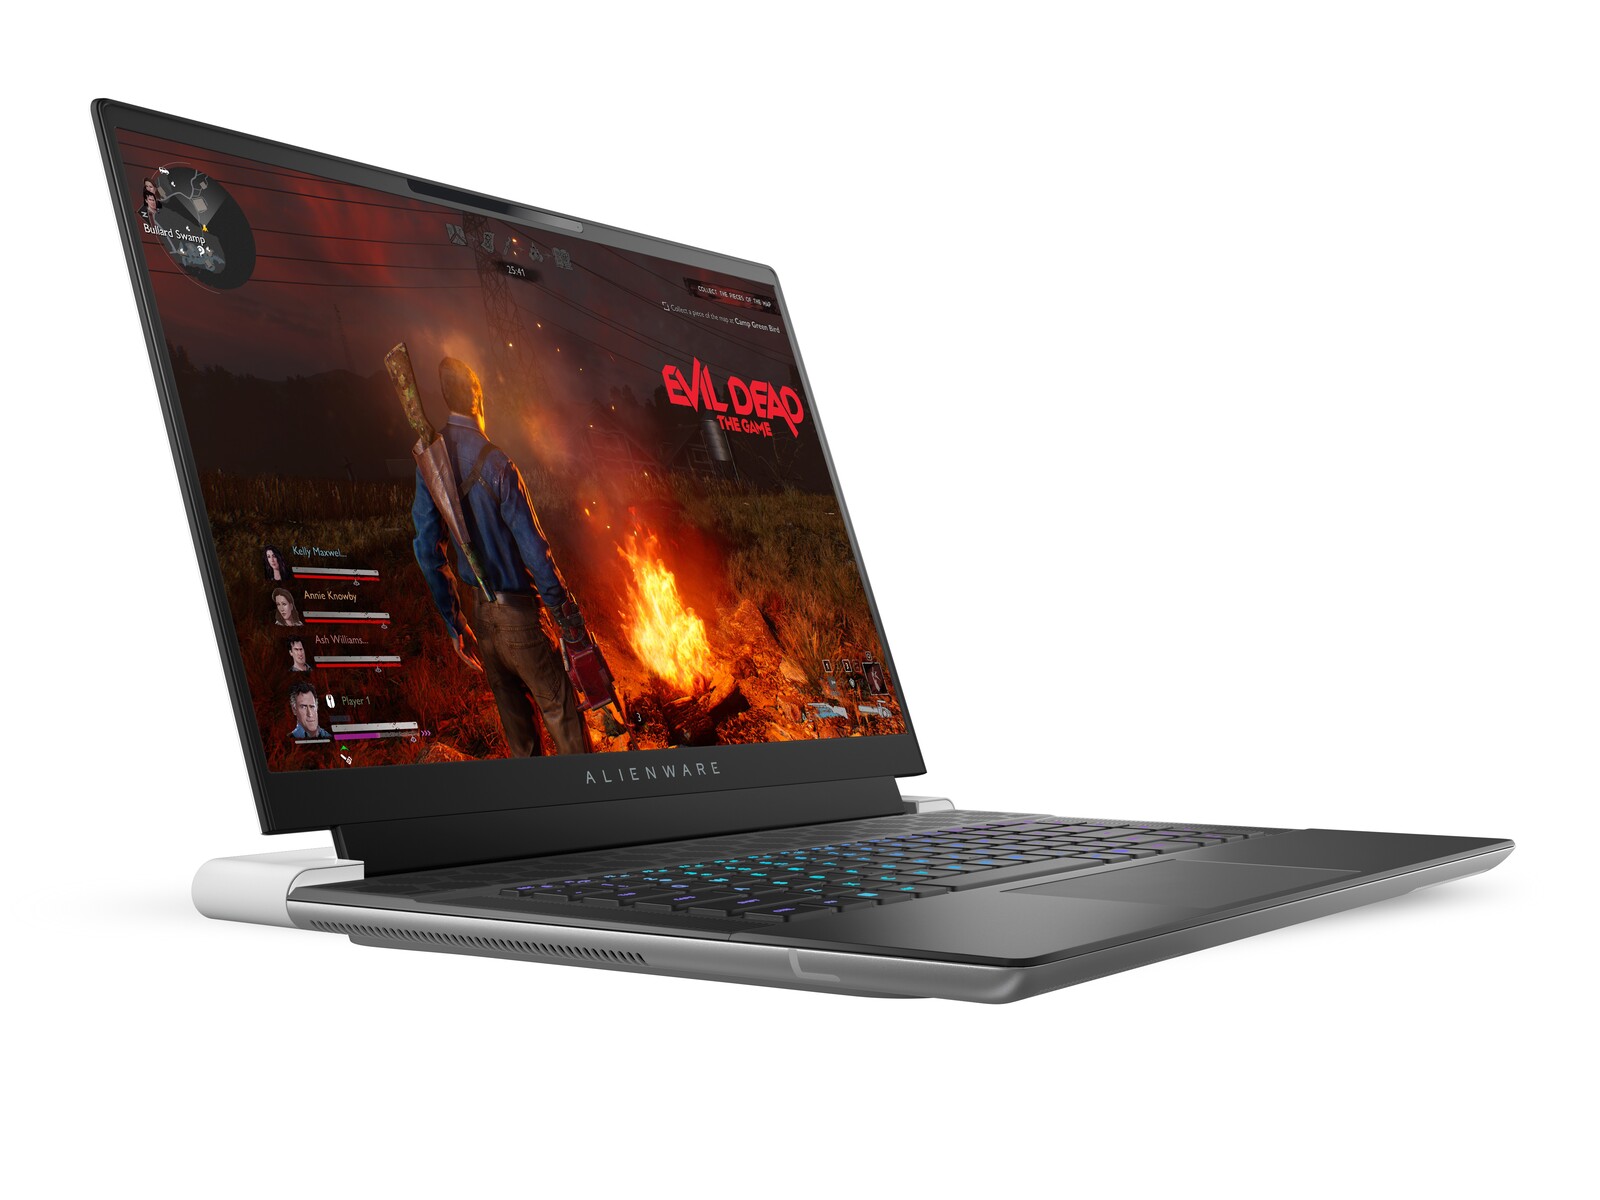
Case - Distintamente Alienware
Il telaio ha molto in comune con il modello Alienware x15 R2 e X17 R2, in quanto tutti condividono il linguaggio di design Legend 3. Le due tonalità di bianco e nero, l'alluminio anodizzato e la lega di magnesio e l'anello RGB lungo la parte posteriore contribuiscono a distinguere visivamente la serie Alienware dall'oceano di altri portatili da gioco. Se sia più attraente o desiderabile rispetto ai modelli concorrenti dipende dalle preferenze dell'utente.
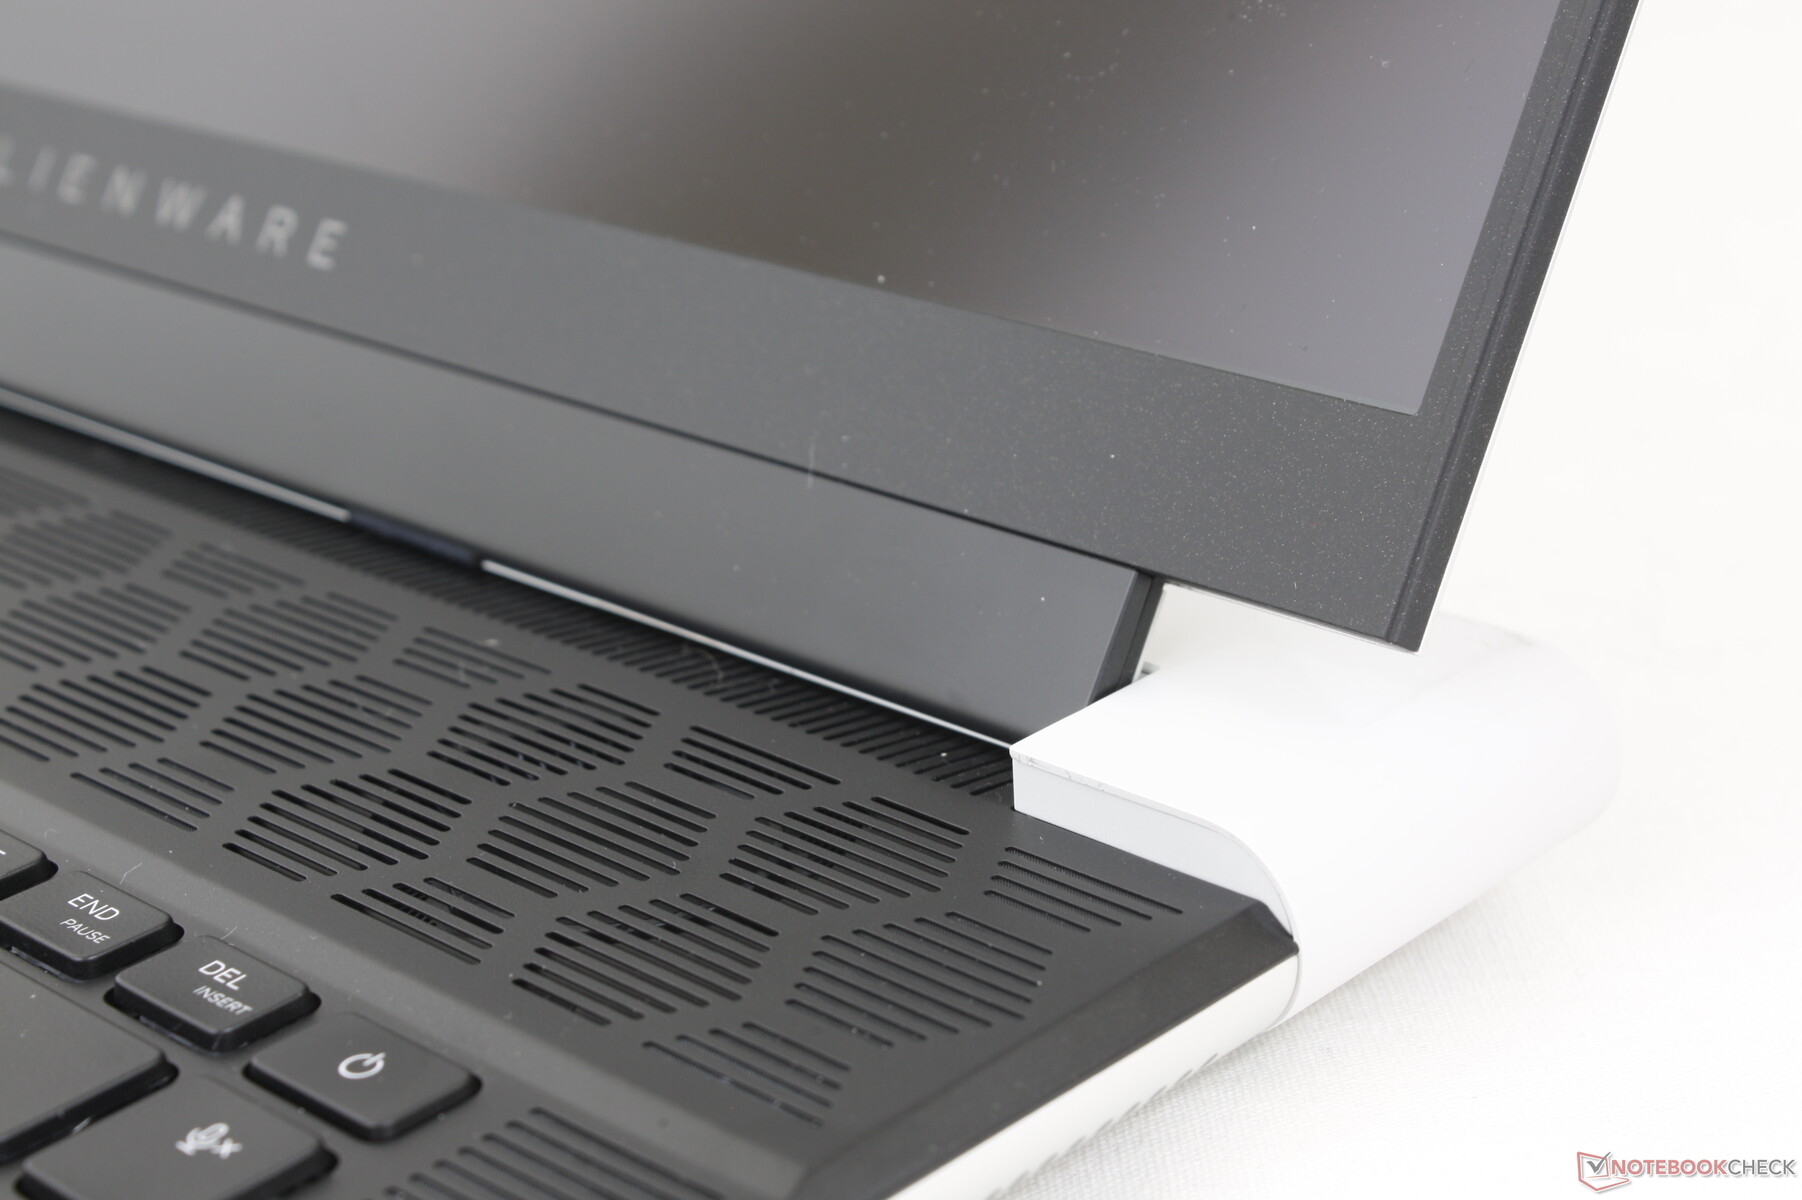
La rigidità del telaio è eccellente, soprattutto alla base, dove le torsioni e le deformazioni sono minime. Il coperchio e le cerniere, tuttavia, non sono così rigidi come vorremmo se confrontati con i display più rigidi della serie Asus Strix Scar Asus Strix Scar o del Blade 16.
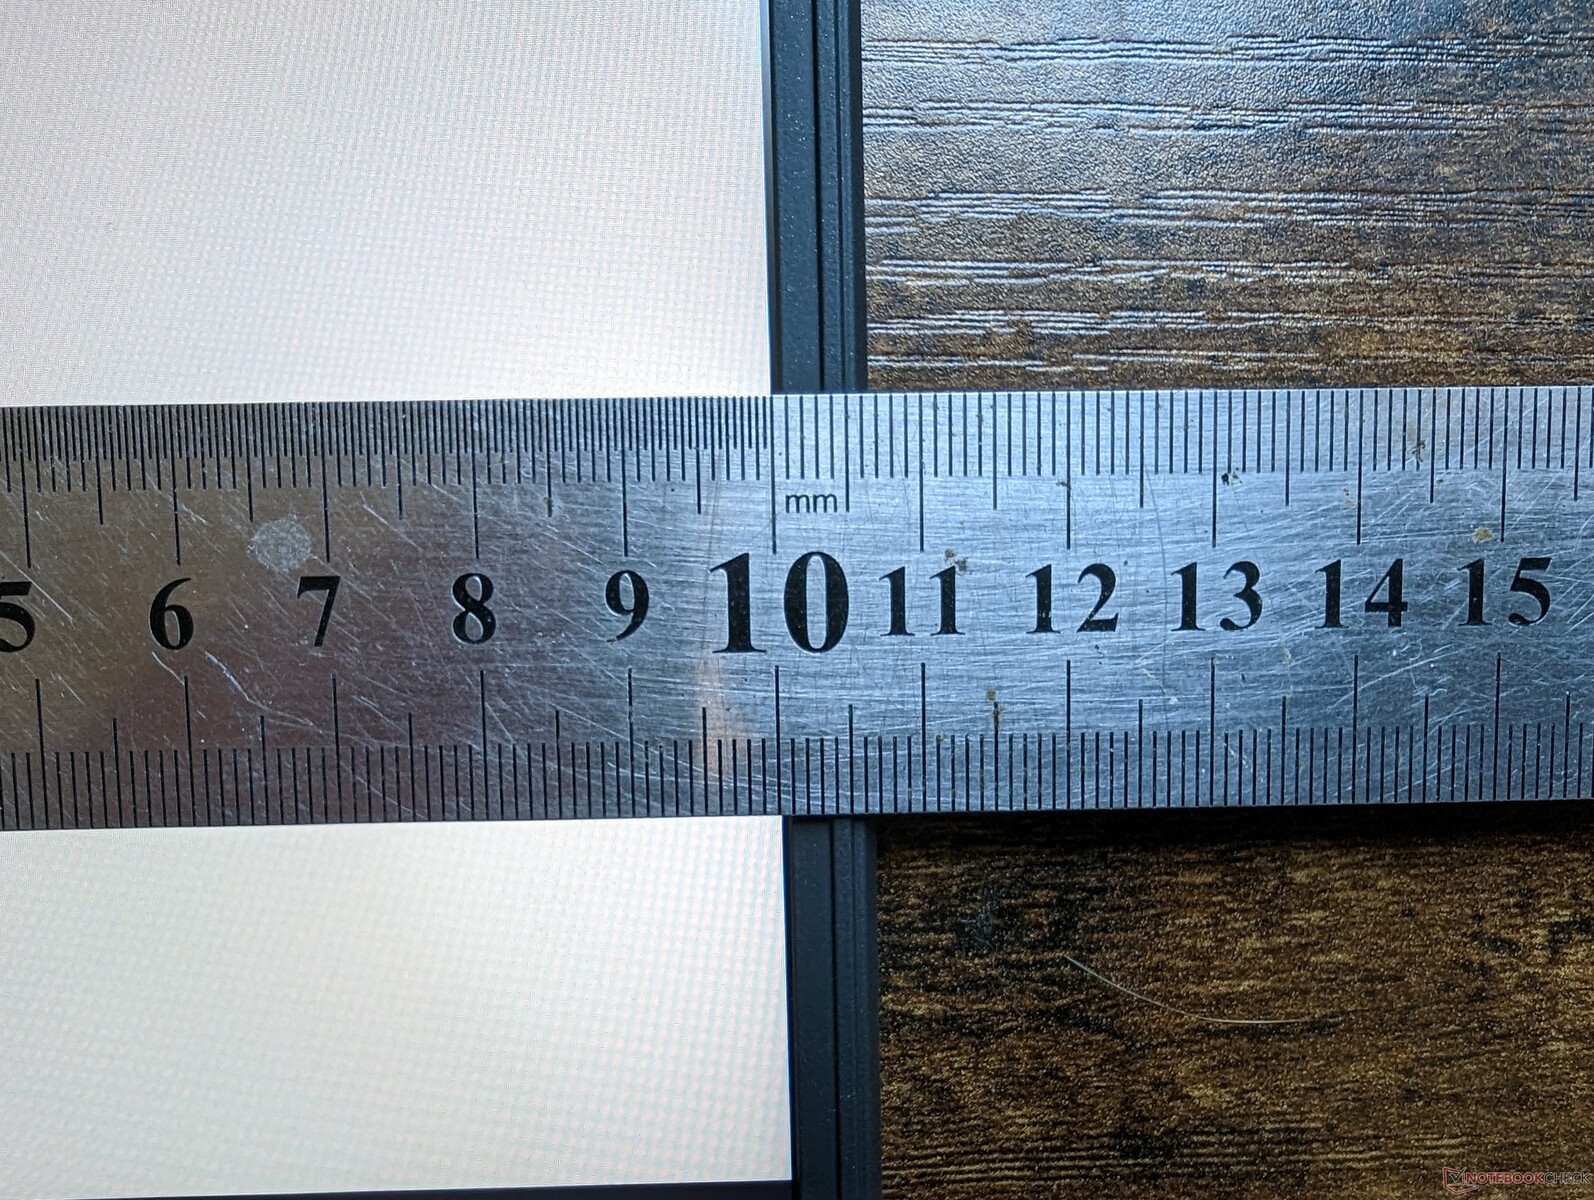
Con un'altezza inferiore a 19 mm, l'Alienware x16 è uno dei portatili da gioco da 16 pollici più sottili sul mercato, più sottile persino del Razer Blade 16. Sfortunatamente, il sistema è più largo e più lungo per un ingombro molto maggiore e quindi il suo volume complessivo non è inferiore a quello di molti concorrenti. Ad esempio, l'Alienware è quasi 4 mm più sottile del Blade 16, ma è più lungo di oltre 40 mm e di conseguenza più pesante di circa 200 grammi.

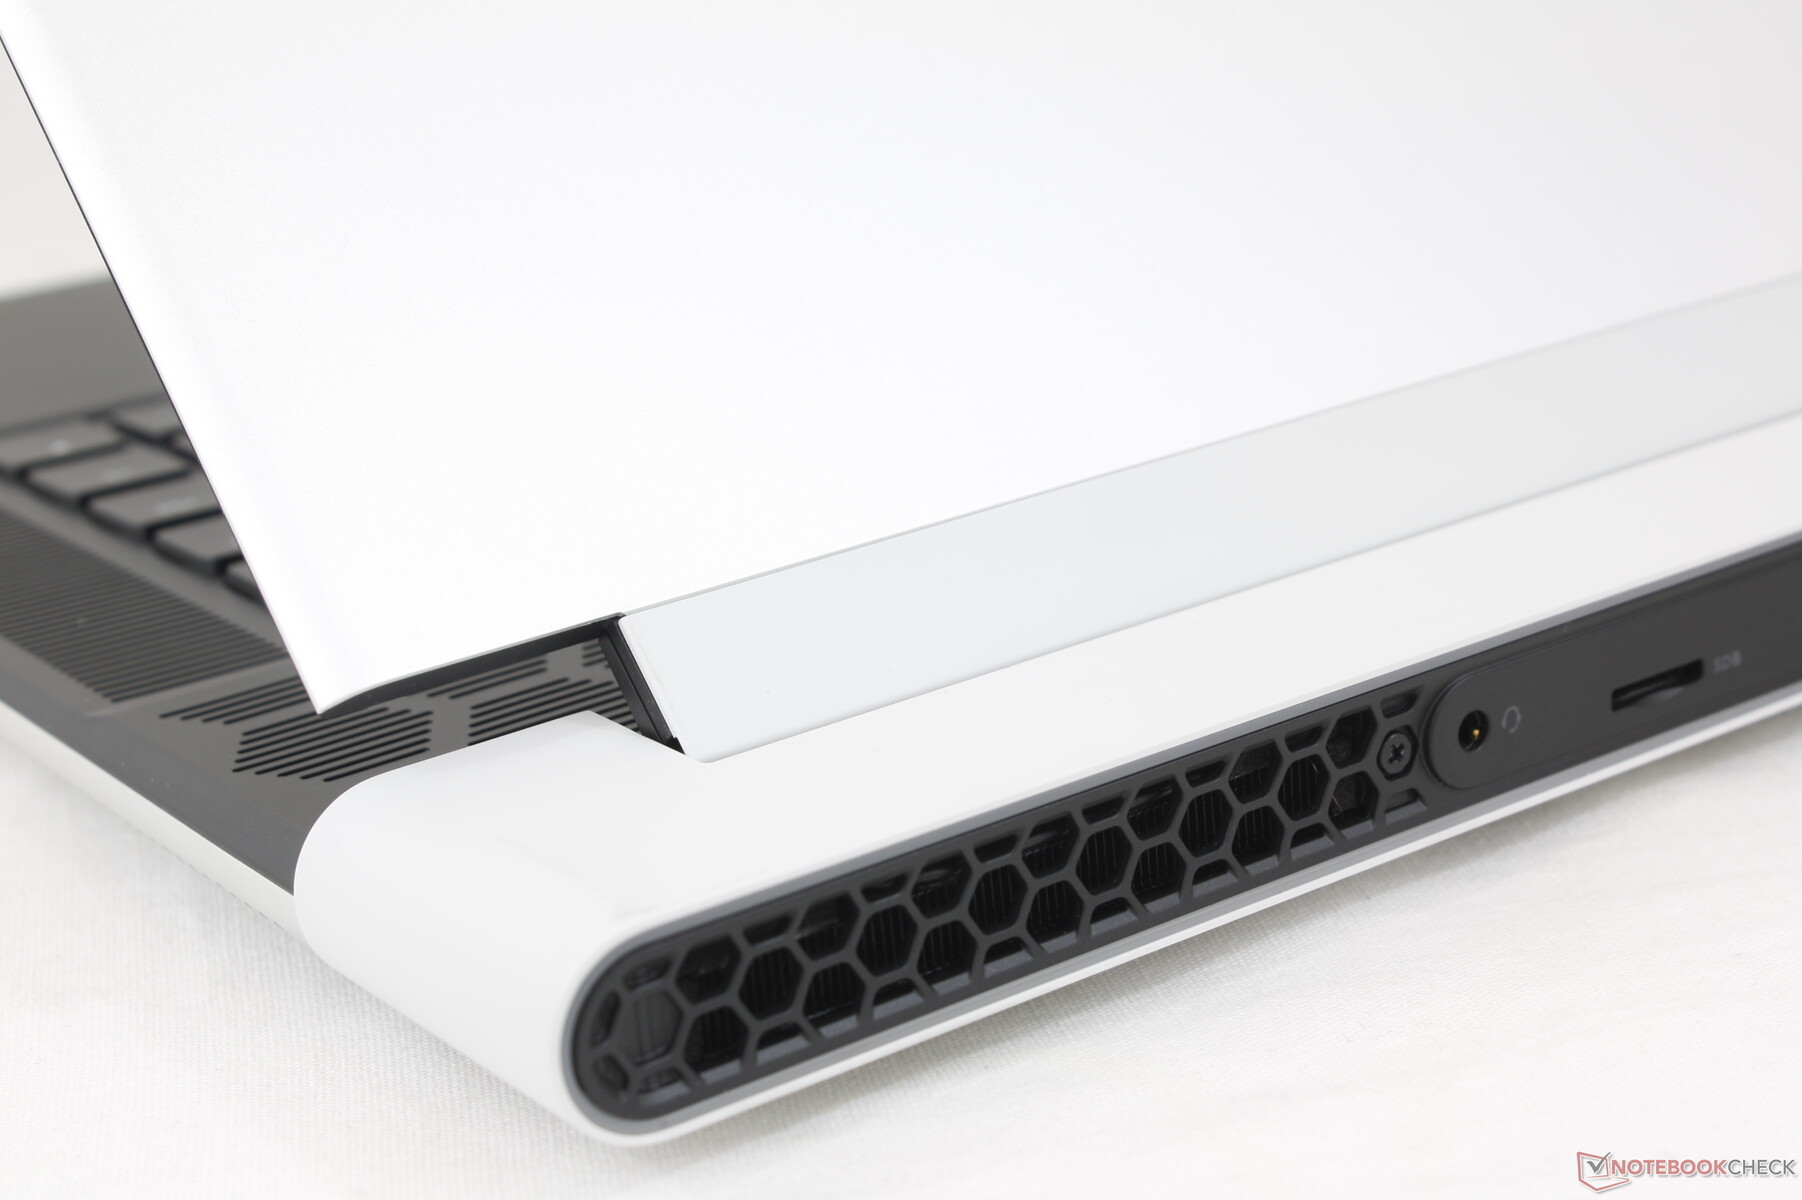
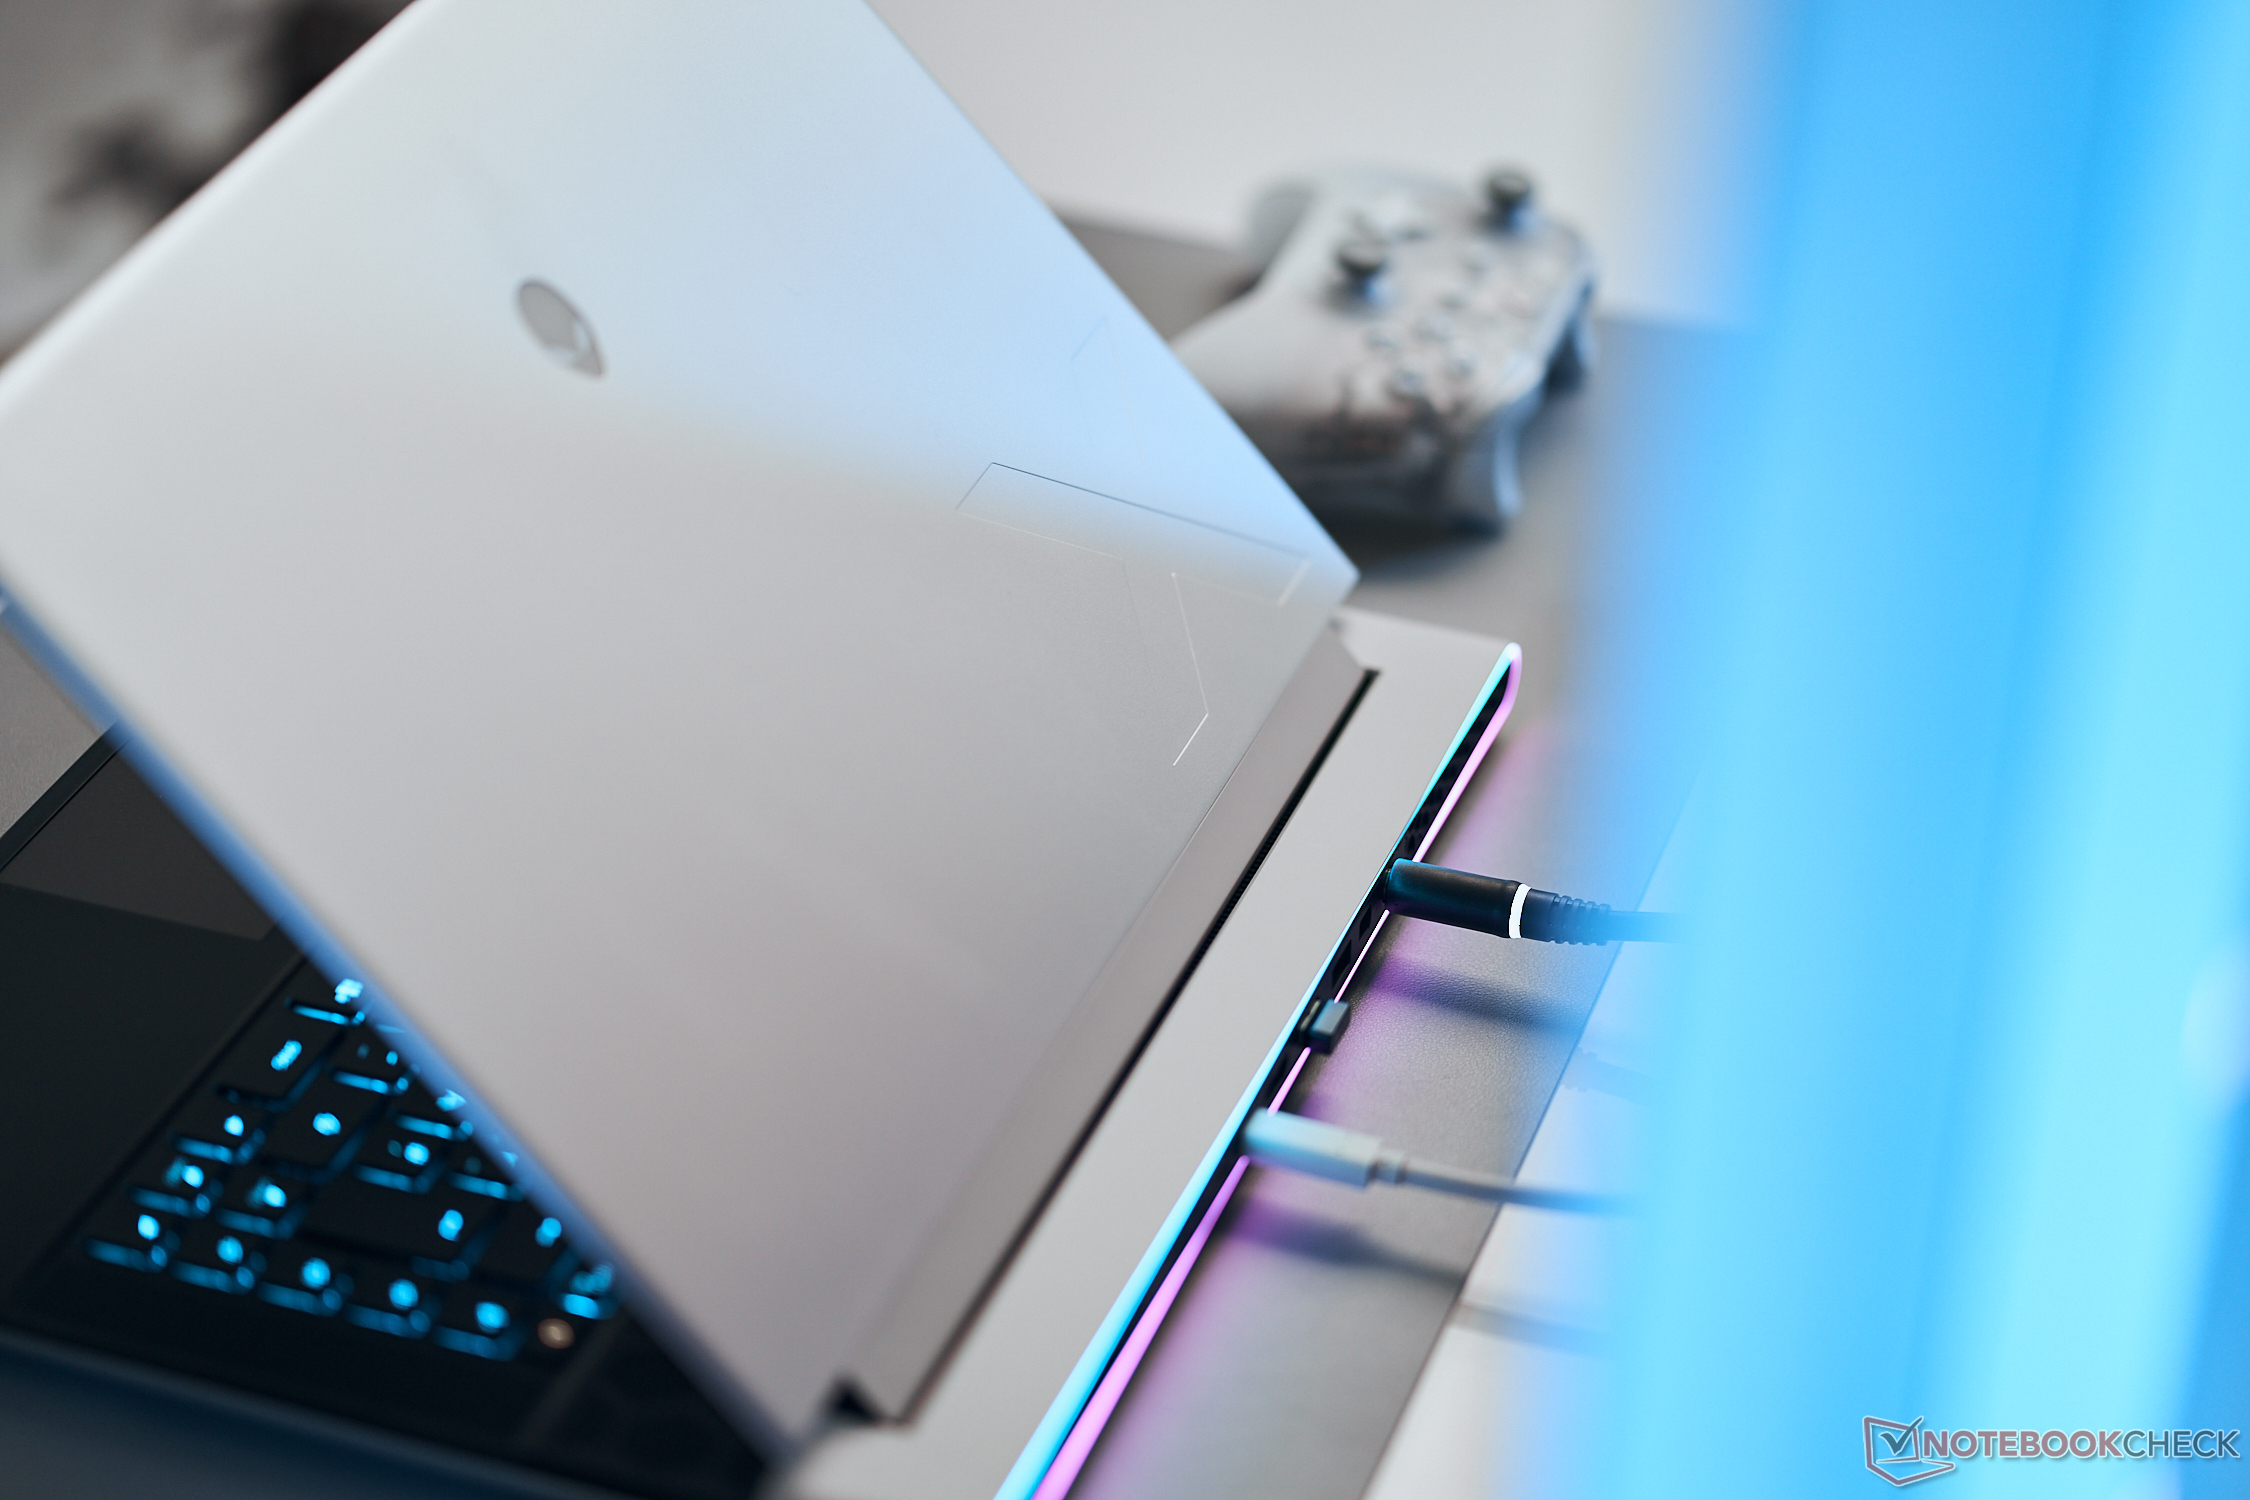
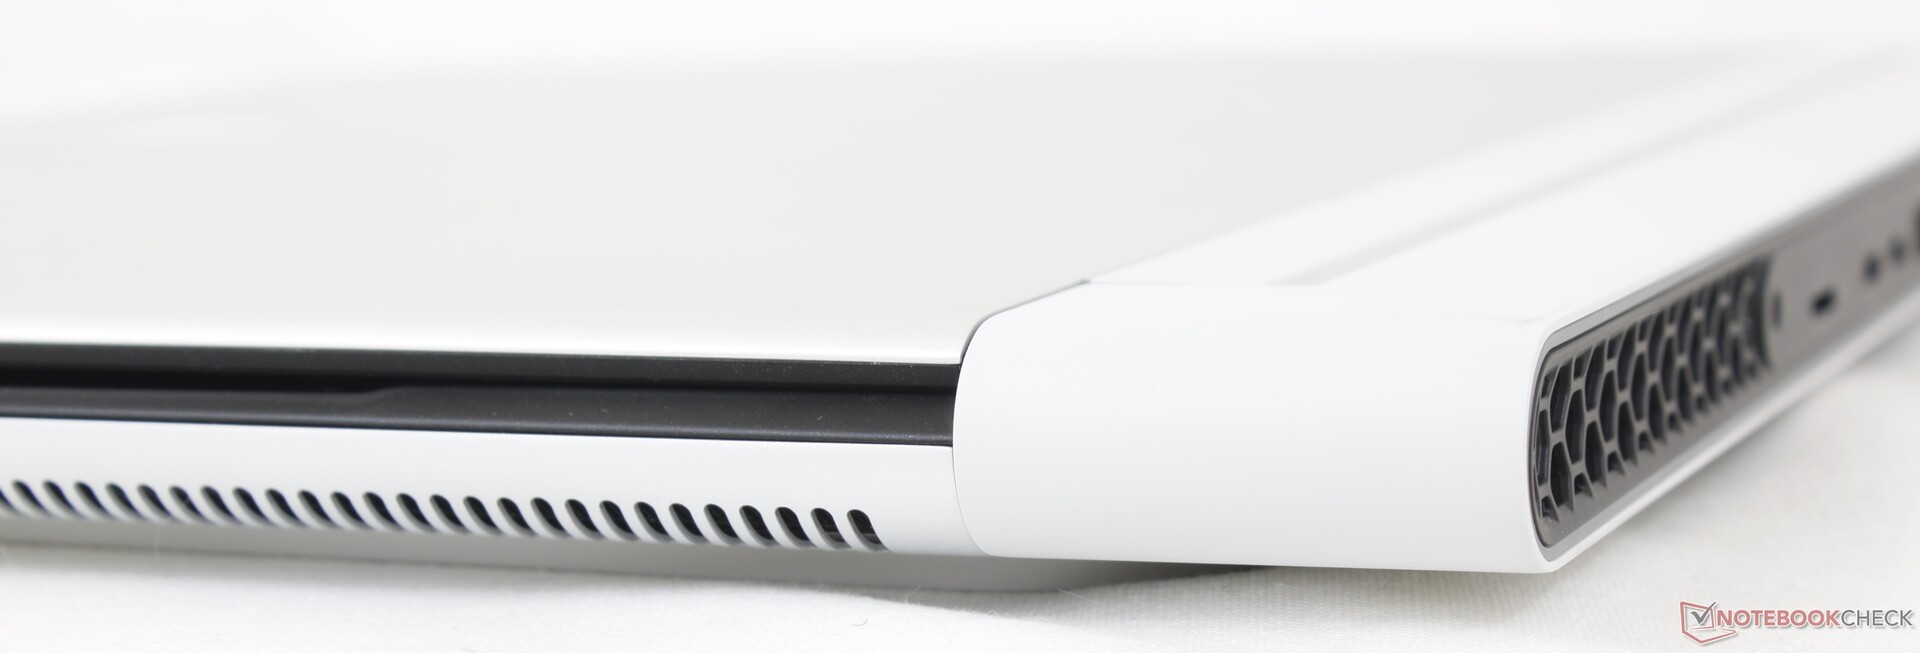
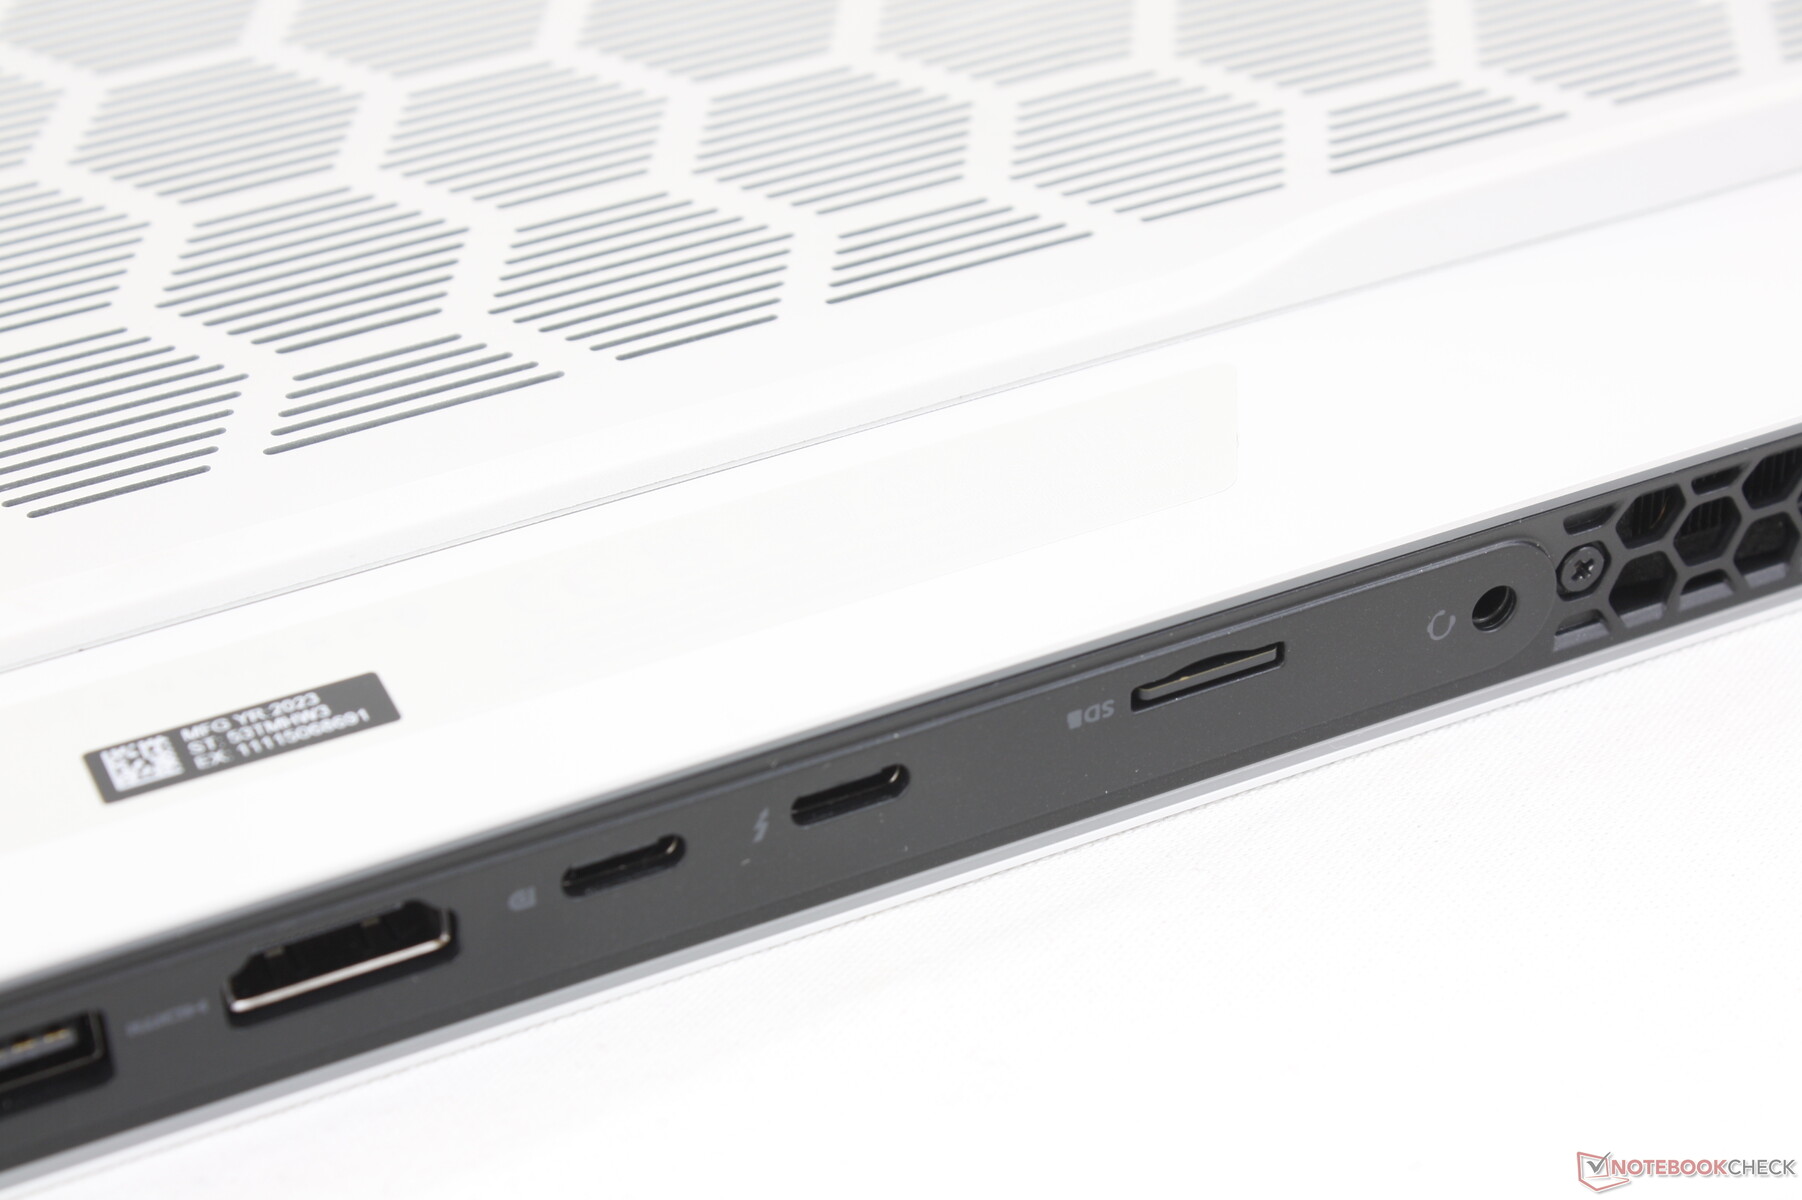
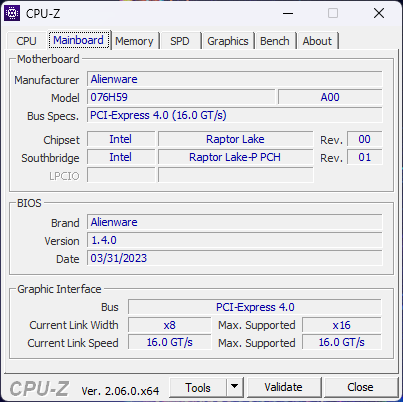
Connettività - Niente ai lati
Tutte le porte si trovano sul retro, il che può essere sia una fortuna che una seccatura. Da un lato, l'assenza di porte laterali elimina i cavi antiestetici e fastidiosi. D'altro canto, il posizionamento delle porte non è ideale, soprattutto per le porte USB di uso comune.
Si tenga presente che Thunderbolt 4 è supportato solo da una delle due porte USB-C.
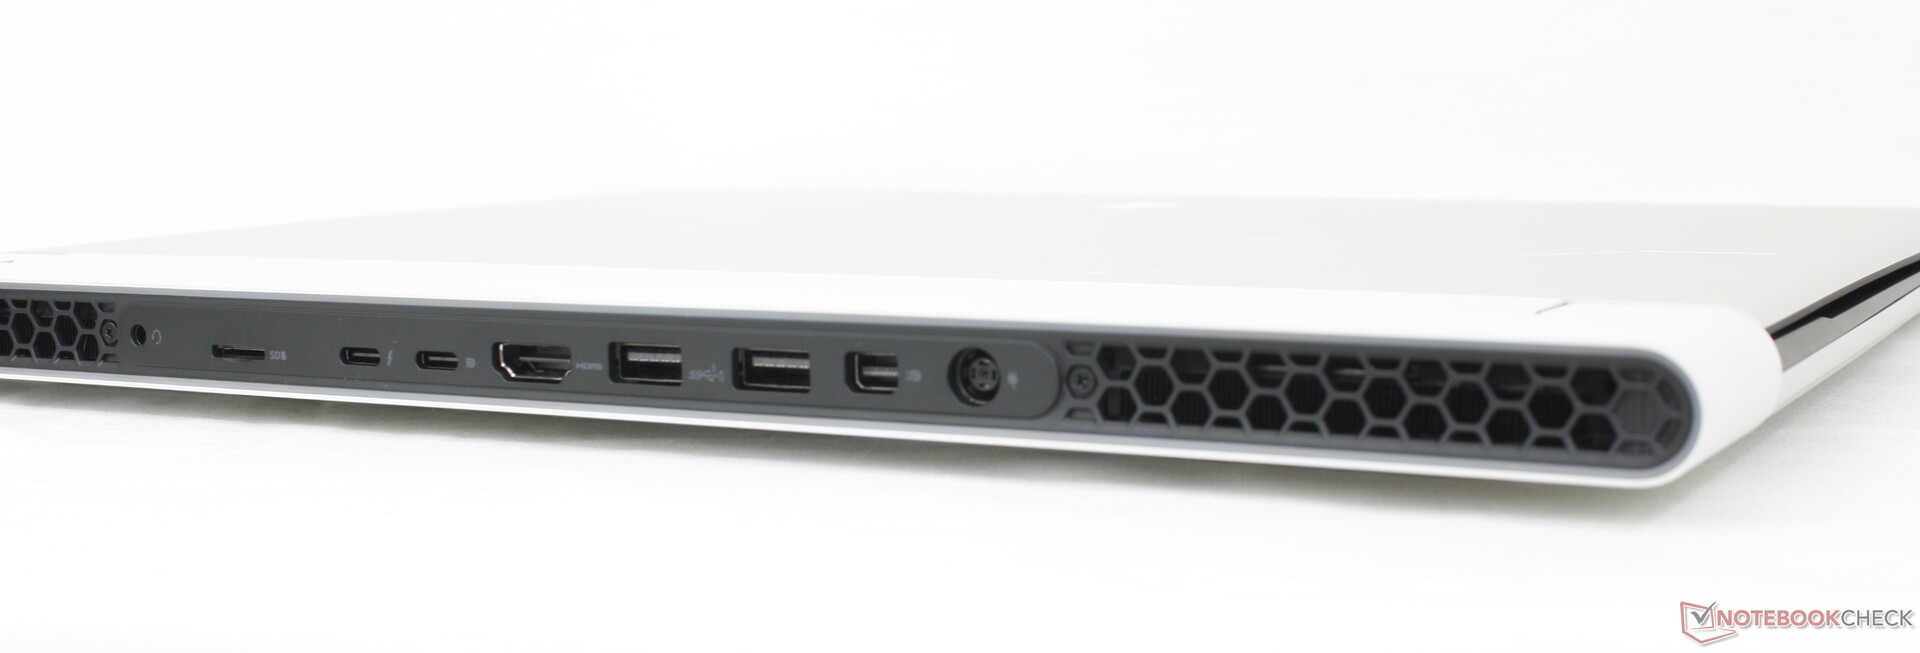
Lettore di schede SD
L'unità SSD riporta una velocità di lettura sequenziale di 256,1 MB/s, mentre in un test reale il trasferimento di 1 GB di foto sarebbe molto più lento, con soli 57 MB/s con la nostra scheda MicroSD UHS-II, anche dopo vari tentativi.
A differenza della maggior parte degli altri portatili, il lettore MicroSD si trova sul retro dello chassis anziché sui lati.
| SD Card Reader | |
| average JPG Copy Test (av. of 3 runs) | |
| Asus ROG Zephyrus M16 GU604VY-NM042X | |
| Razer Blade 16 Early 2023 (AV PRO microSD 128 GB V60) | |
| Alienware x16 R1 (AV PRO microSD 128 GB V60) | |
| maximum AS SSD Seq Read Test (1GB) | |
| Alienware x16 R1 (AV PRO microSD 128 GB V60) | |
| Razer Blade 16 Early 2023 (AV PRO microSD 128 GB V60) | |
| Asus ROG Zephyrus M16 GU604VY-NM042X | |
Comunicazione
| Networking | |
| iperf3 transmit AXE11000 | |
| Lenovo Legion Pro 7 16IRX8H | |
| Razer Blade 16 Early 2023 | |
| Alienware x16 R1 | |
| Alienware m17 R5 (R9 6900HX, RX 6850M XT) | |
| Dell G16 7620 | |
| iperf3 receive AXE11000 | |
| Lenovo Legion Pro 7 16IRX8H | |
| Razer Blade 16 Early 2023 | |
| Alienware x16 R1 | |
| Dell G16 7620 | |
| Alienware m17 R5 (R9 6900HX, RX 6850M XT) | |
| iperf3 transmit AXE11000 6GHz | |
| Asus ROG Zephyrus M16 GU604VY-NM042X | |
| Razer Blade 16 Early 2023 | |
| Alienware x16 R1 | |
| iperf3 receive AXE11000 6GHz | |
| Asus ROG Zephyrus M16 GU604VY-NM042X | |
| Razer Blade 16 Early 2023 | |
| Alienware x16 R1 | |
Webcam
Una webcam da 2MP è di serie insieme al supporto IR for Hello. Tuttavia, non c'è nessun otturatore per la privacy.


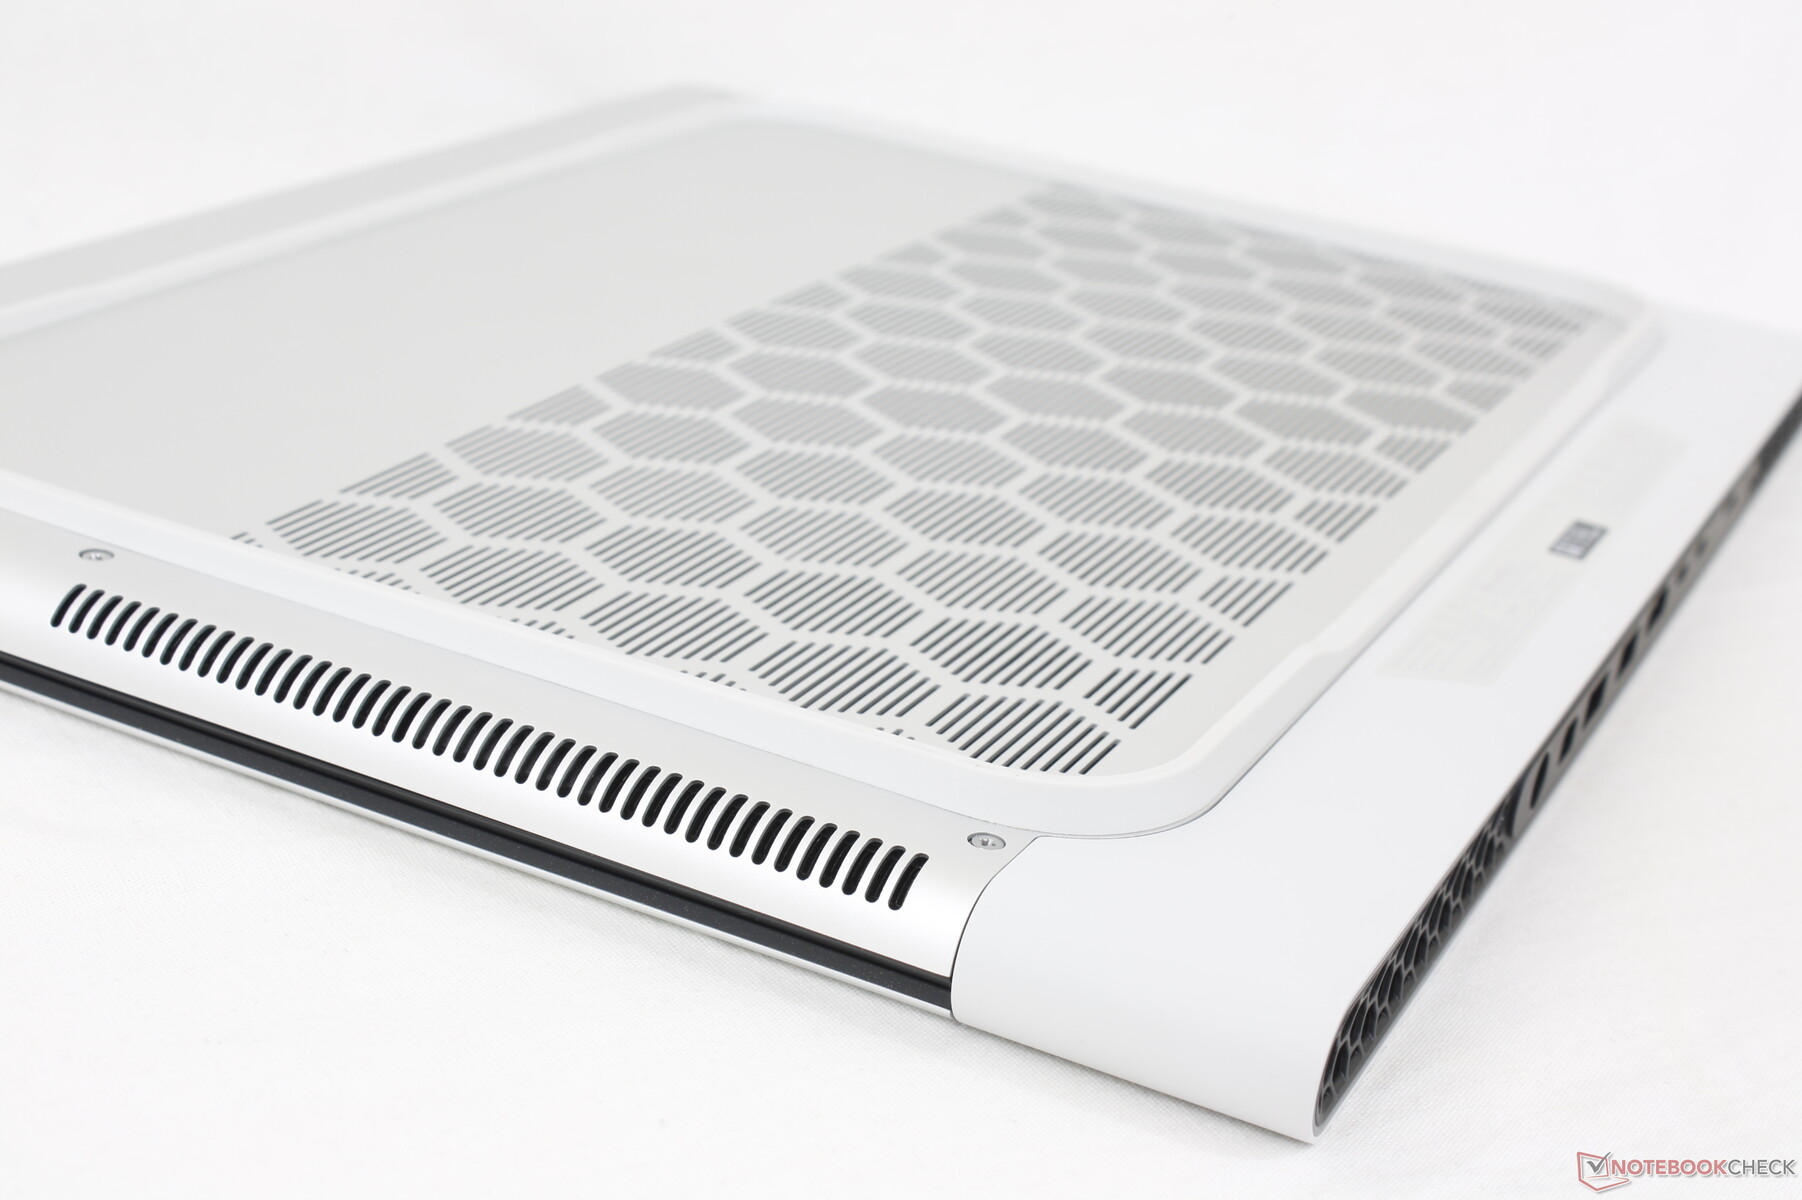
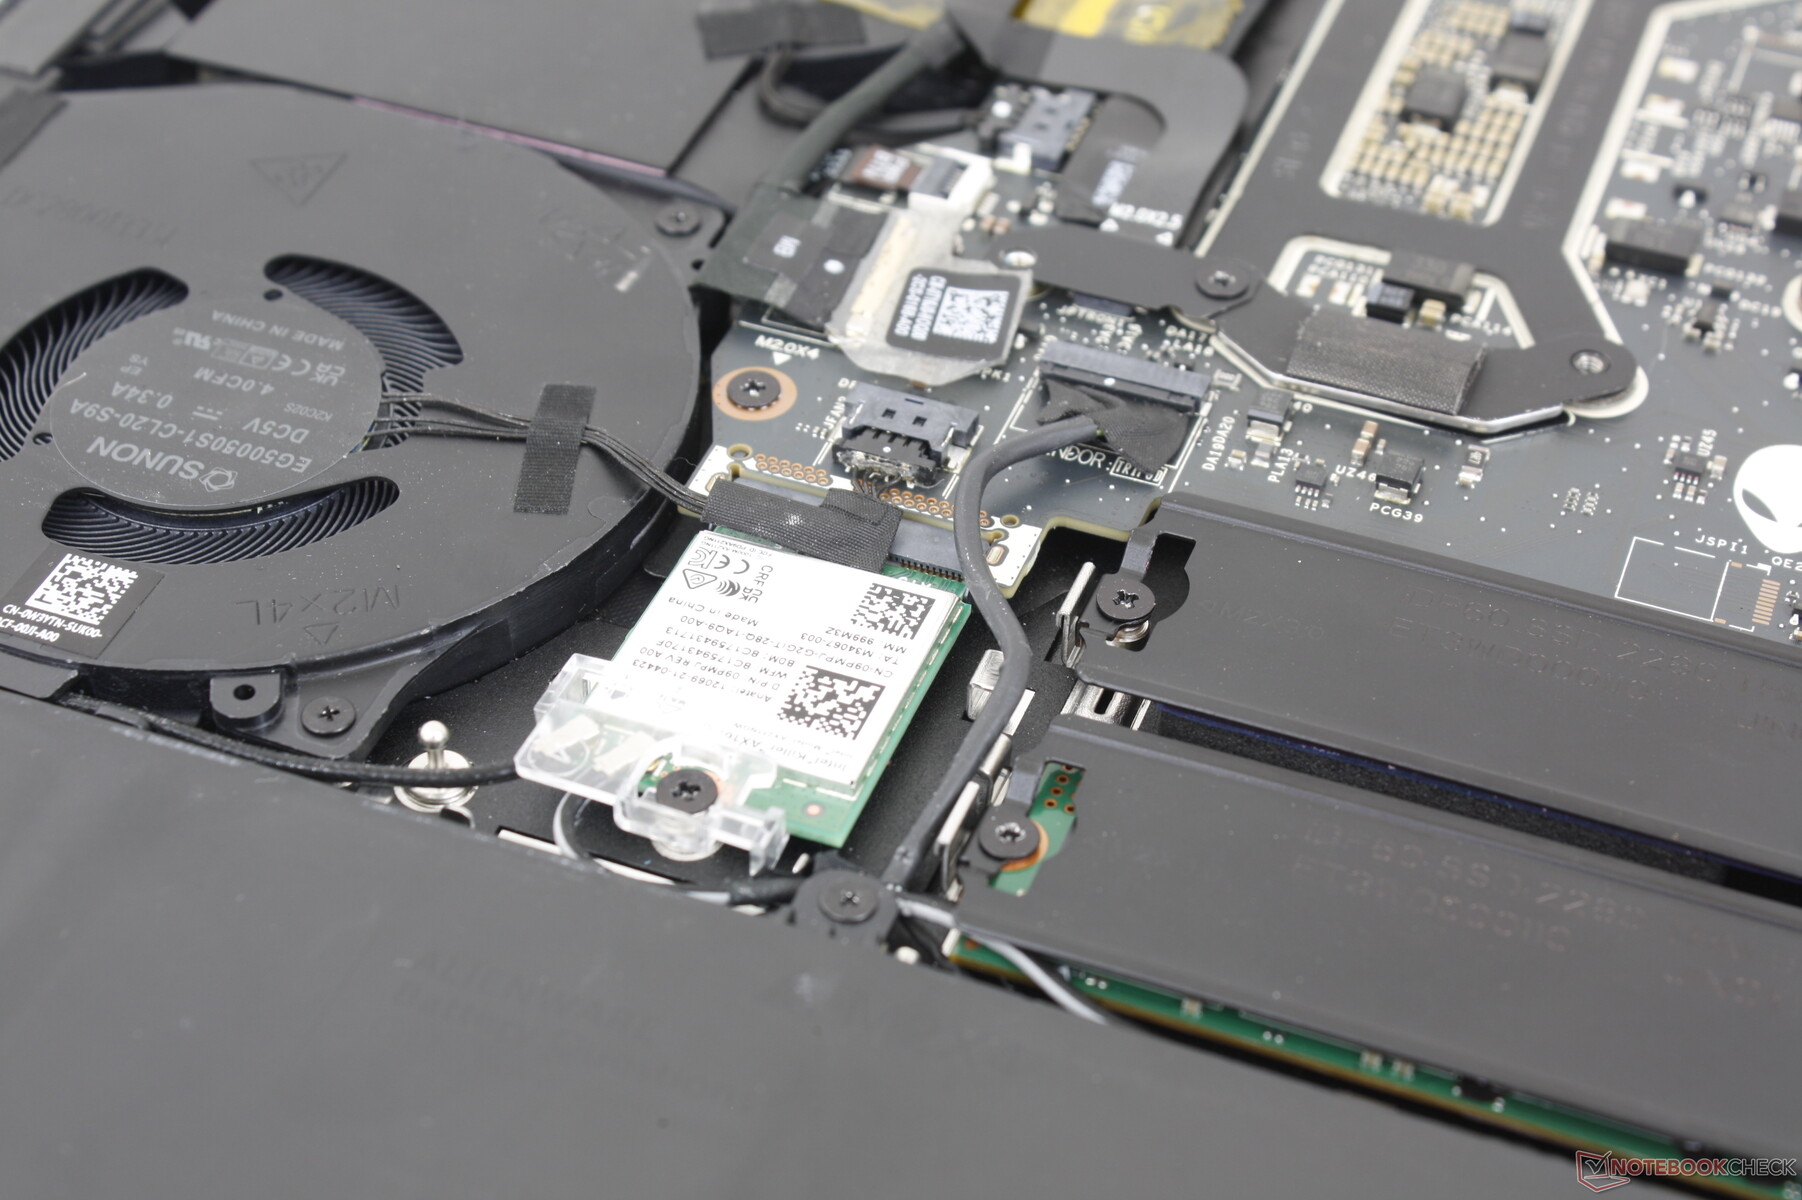
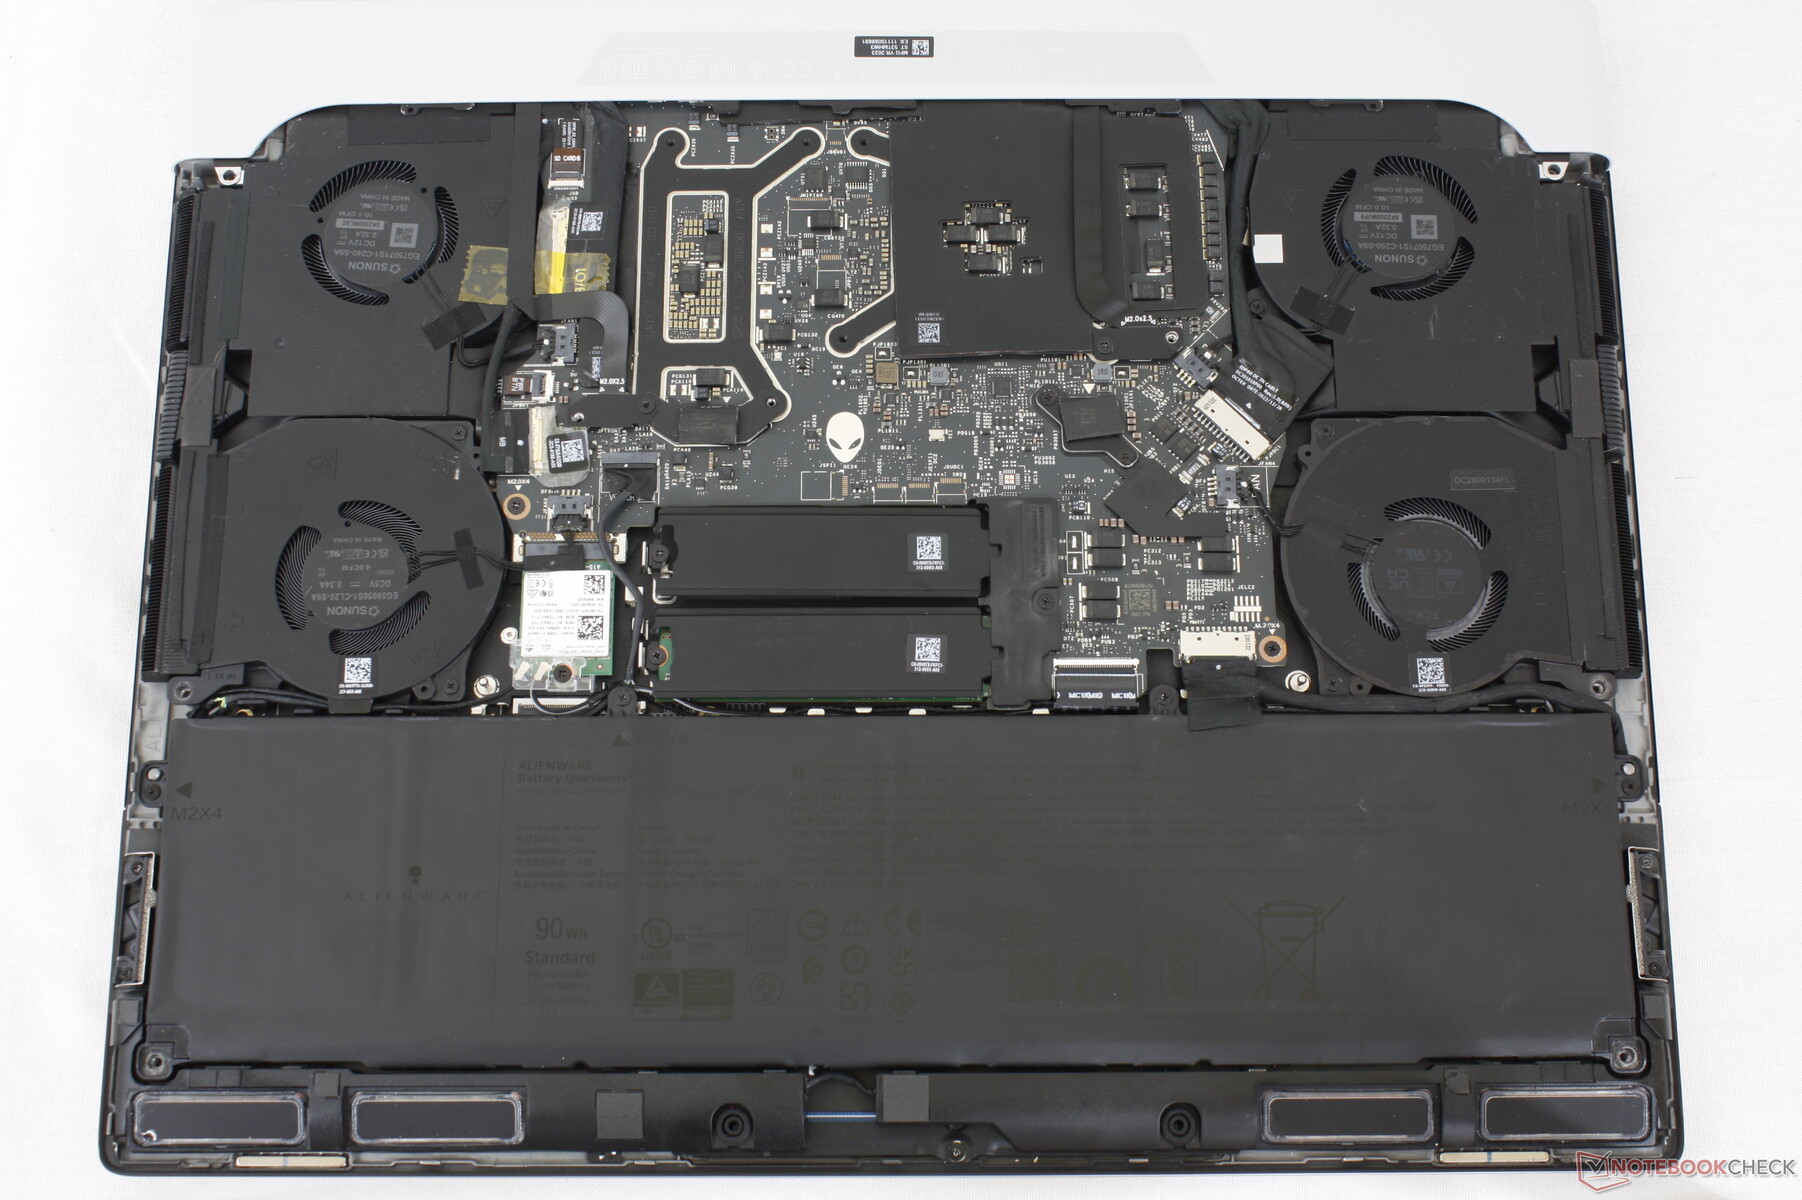
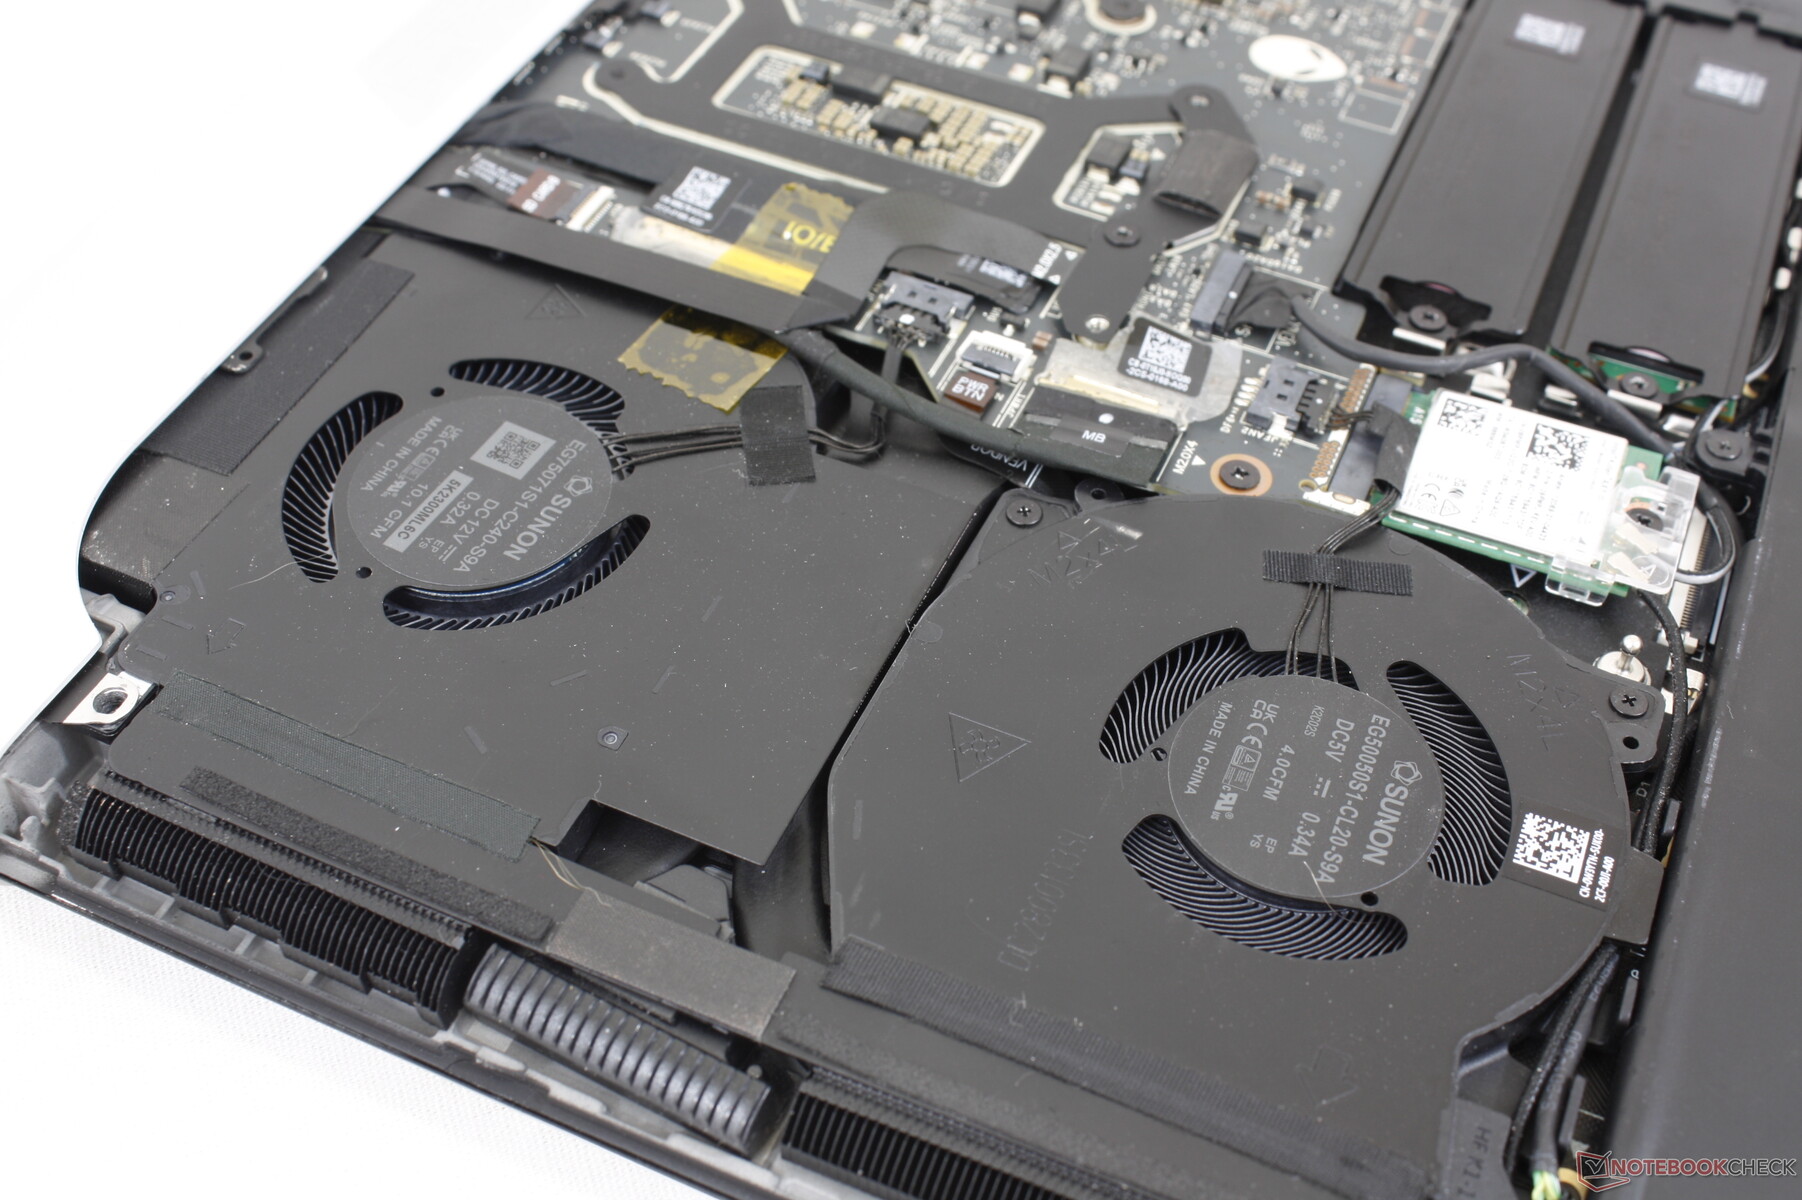
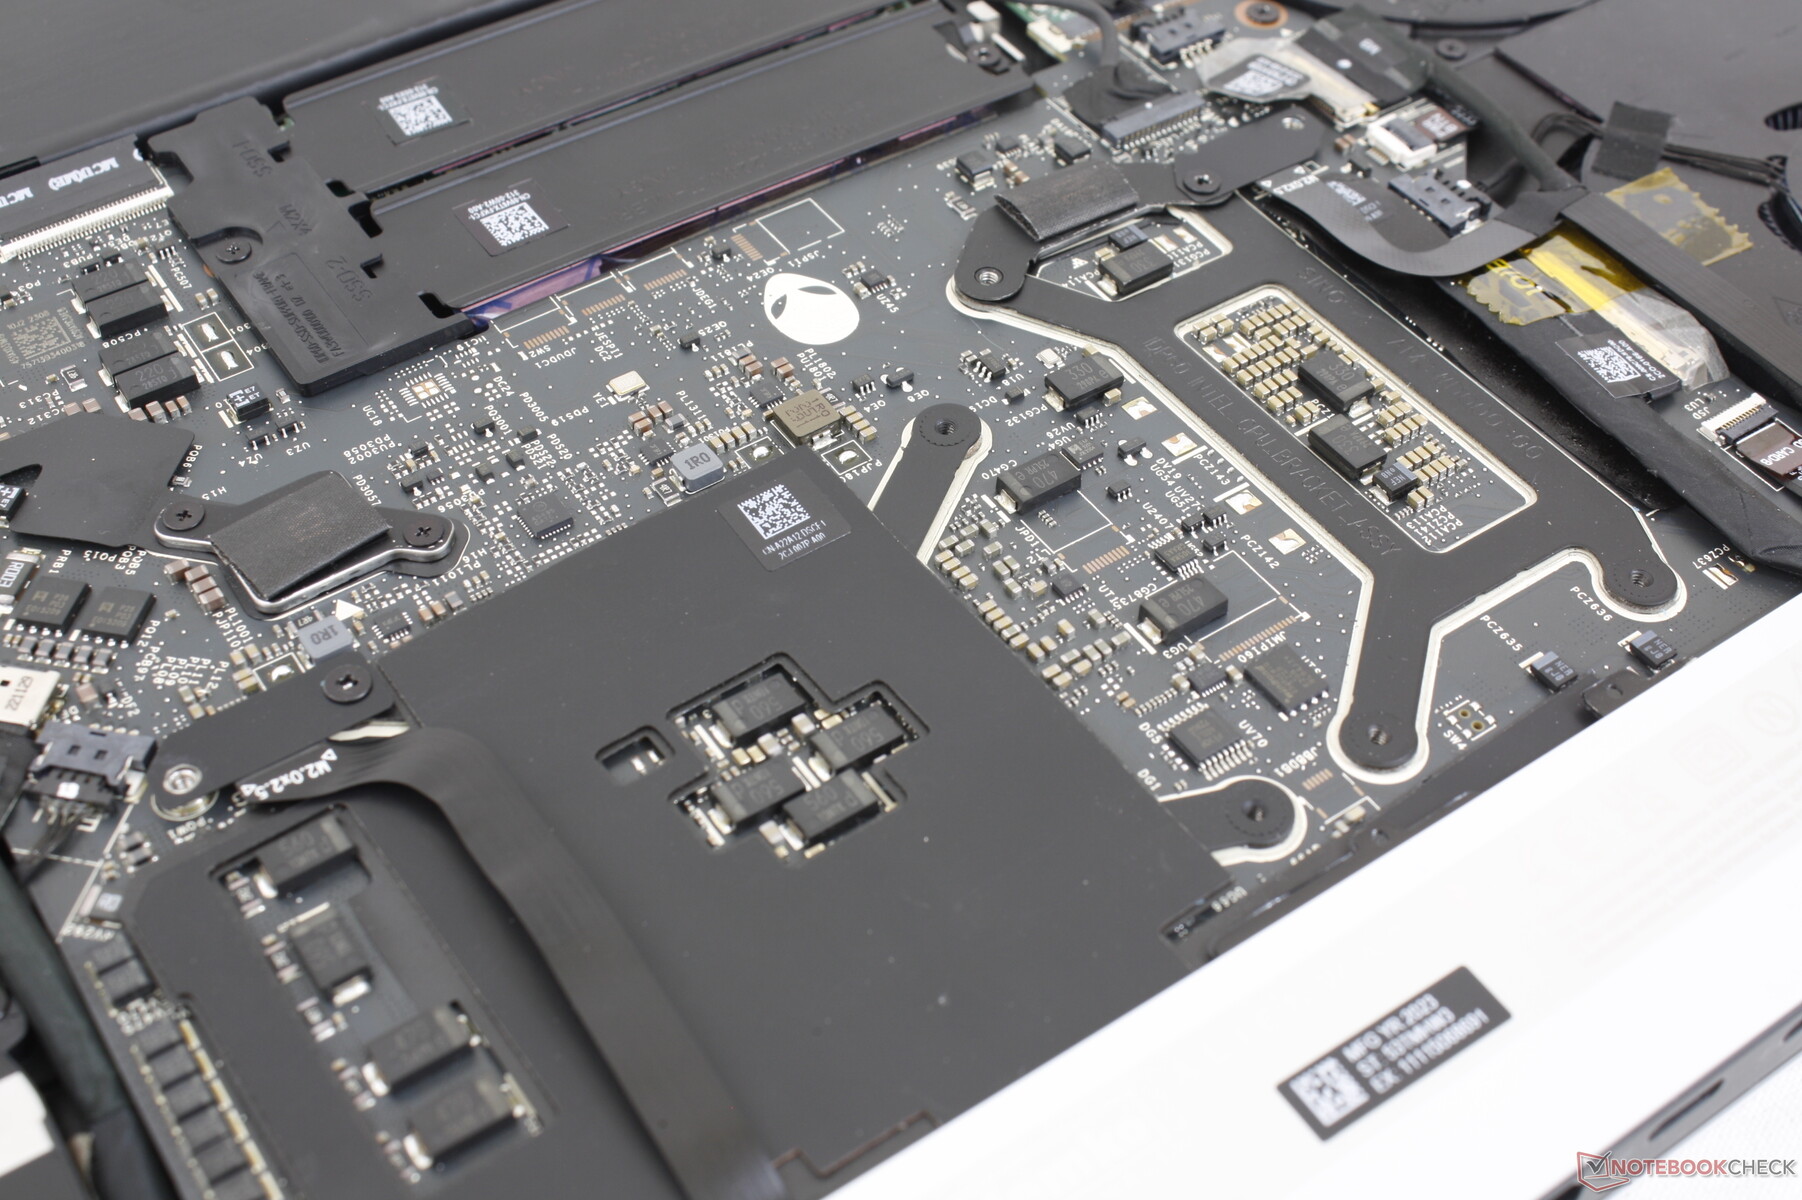
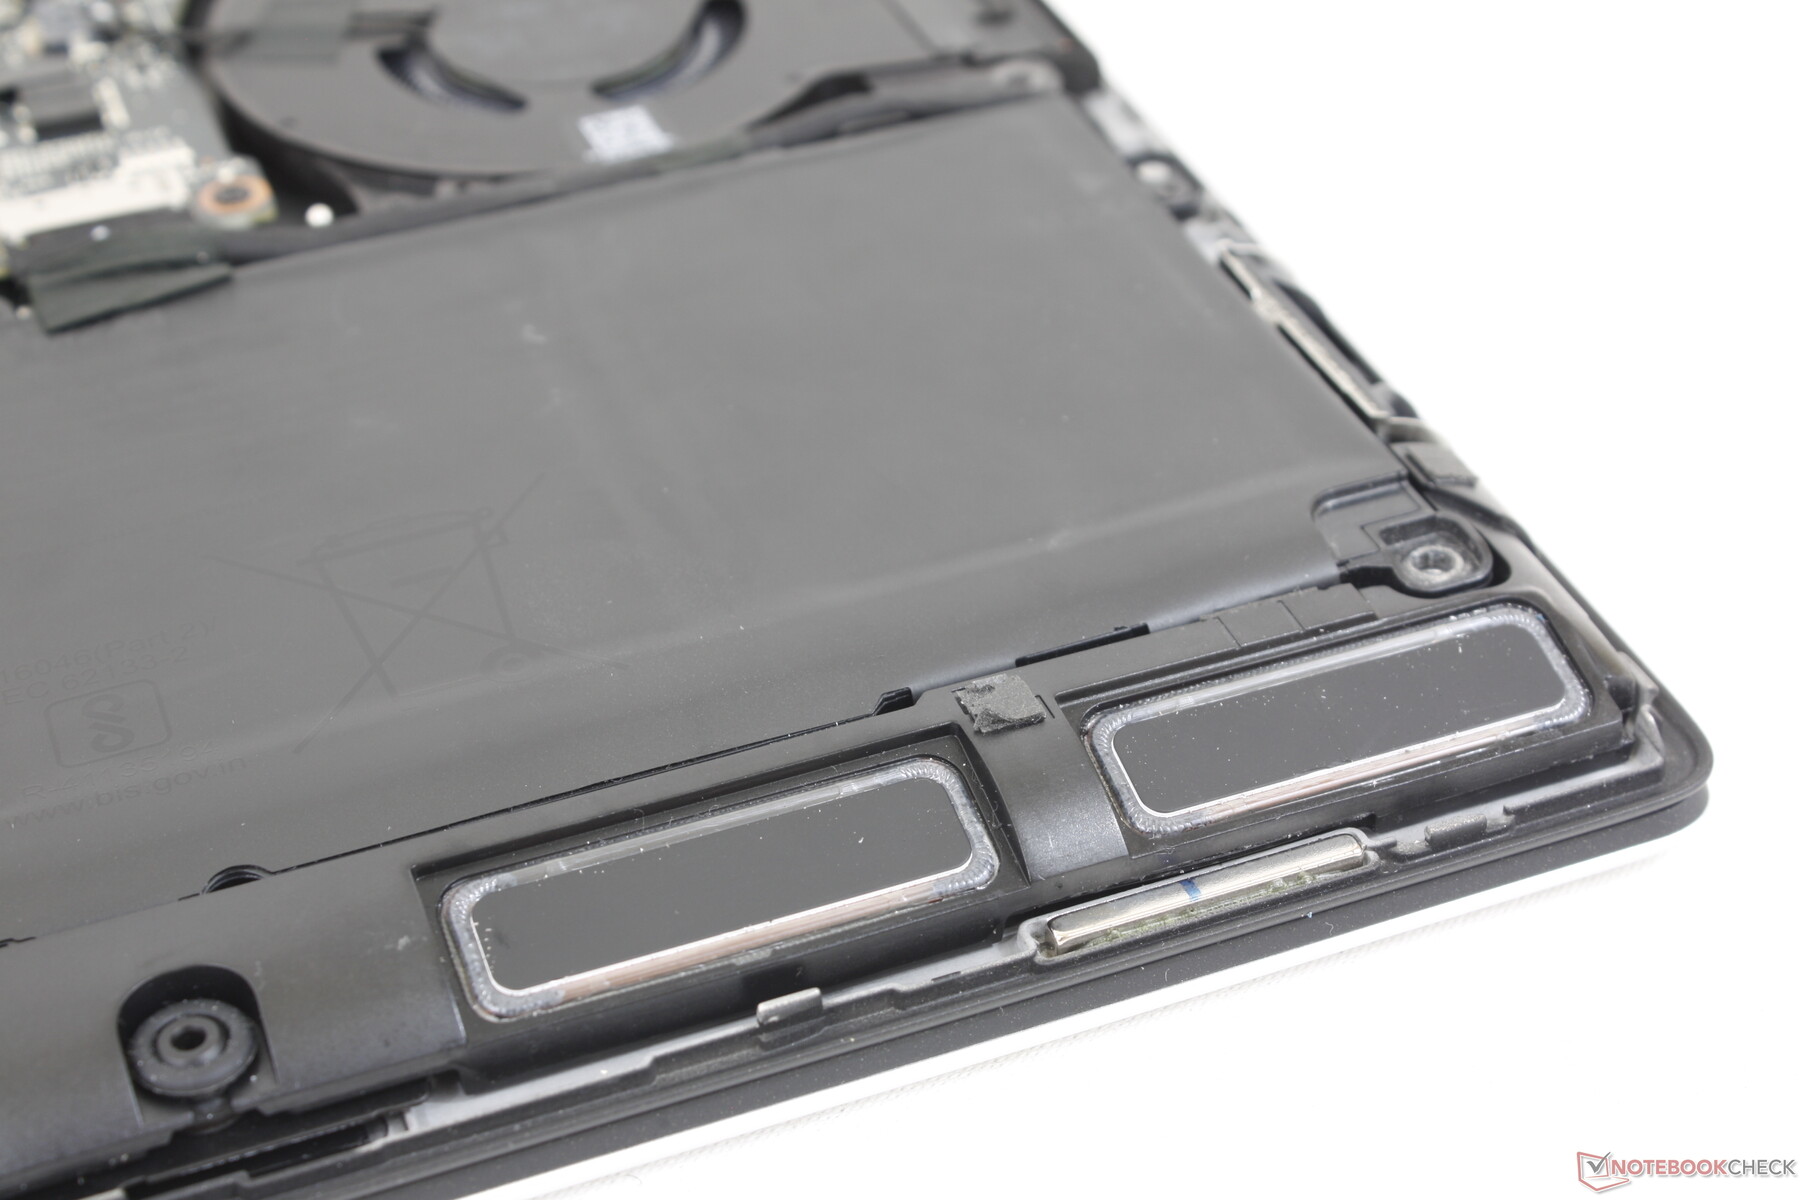
Manutenzione
Il pannello inferiore è fissato da sole sei viti Phillips per una facile rimozione. I proprietari hanno accesso diretto ai due slot per SSD M.2 2280, alla batteria e al modulo WLAN rimovibile.
Accessori e garanzia
La confezione non contiene altri extra oltre all'adattatore CA e alla documentazione. Se acquistato negli Stati Uniti, si applica la consueta garanzia limitata di un anno del produttore.
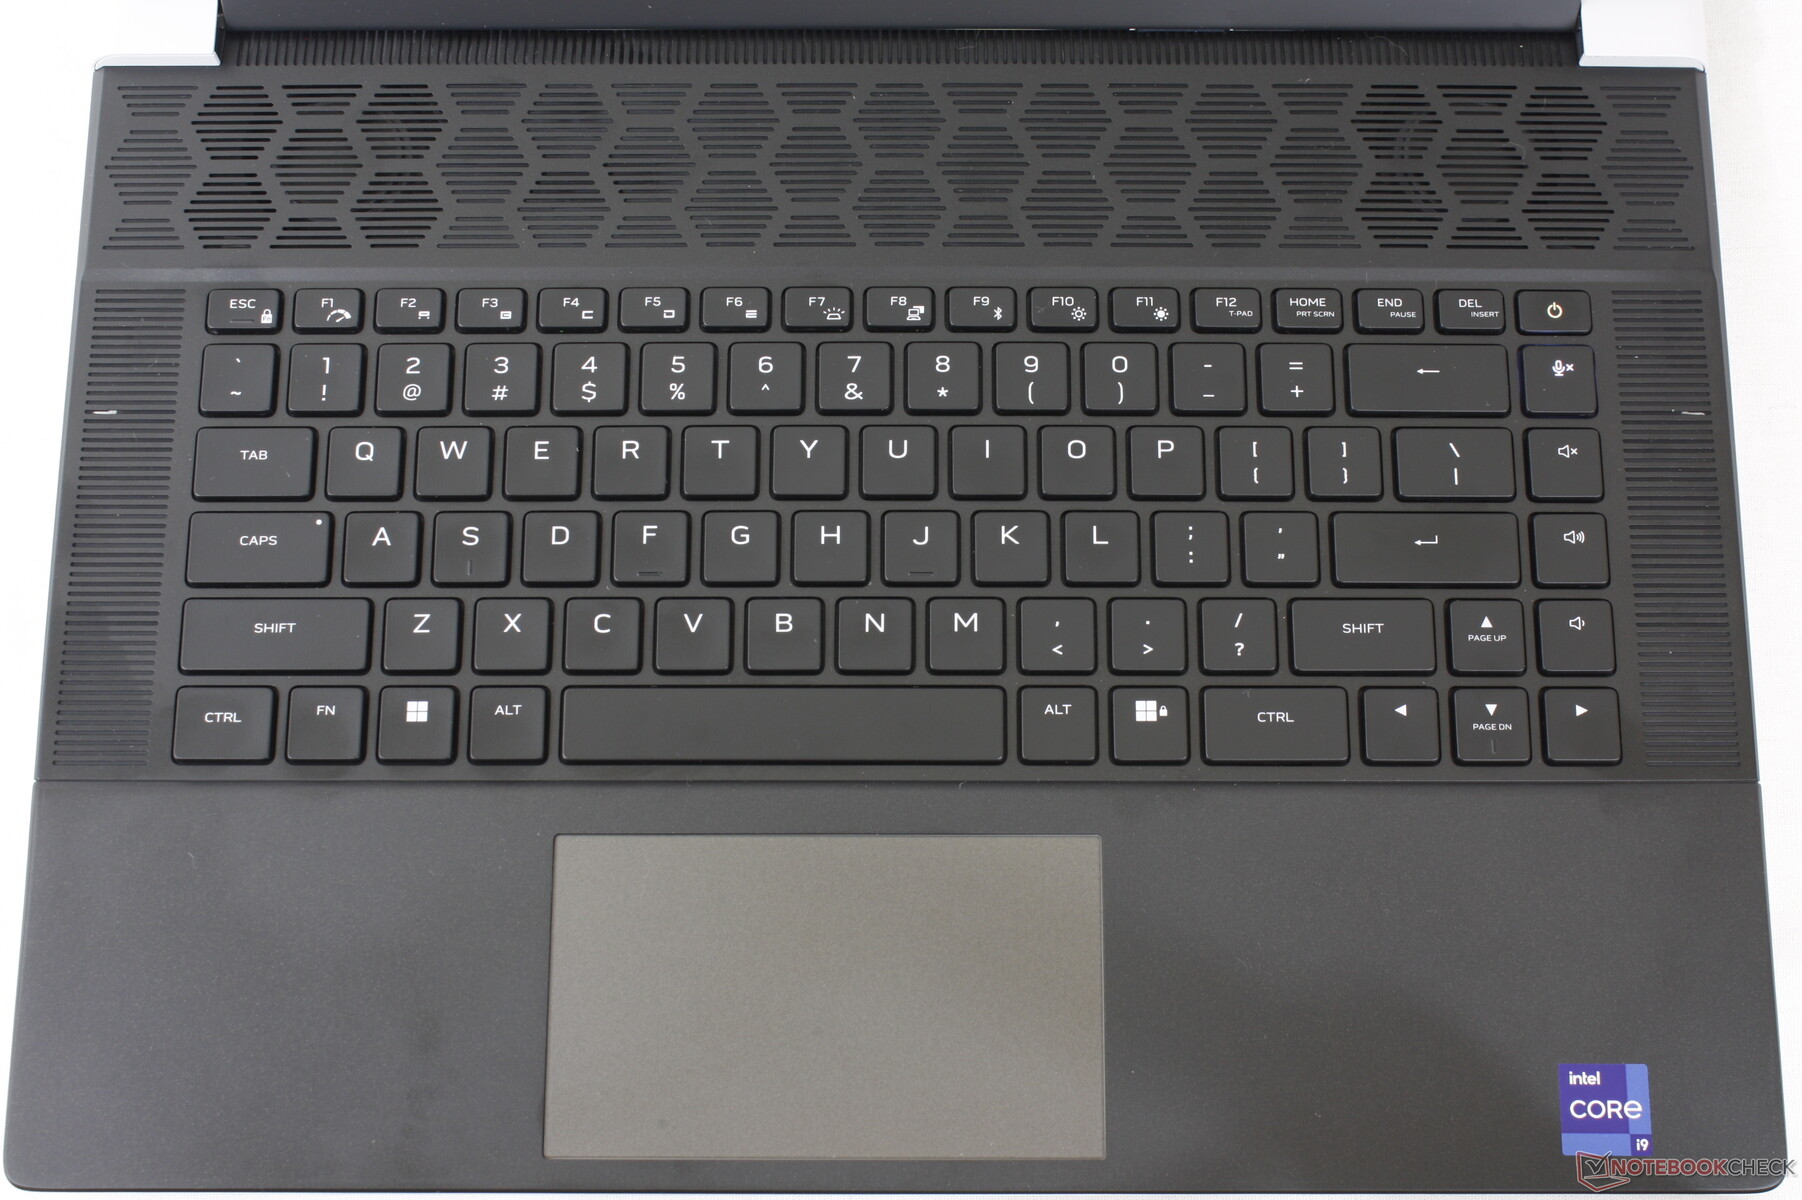
Dispositivi di input: i tasti meccanici sono forti e orgogliosi
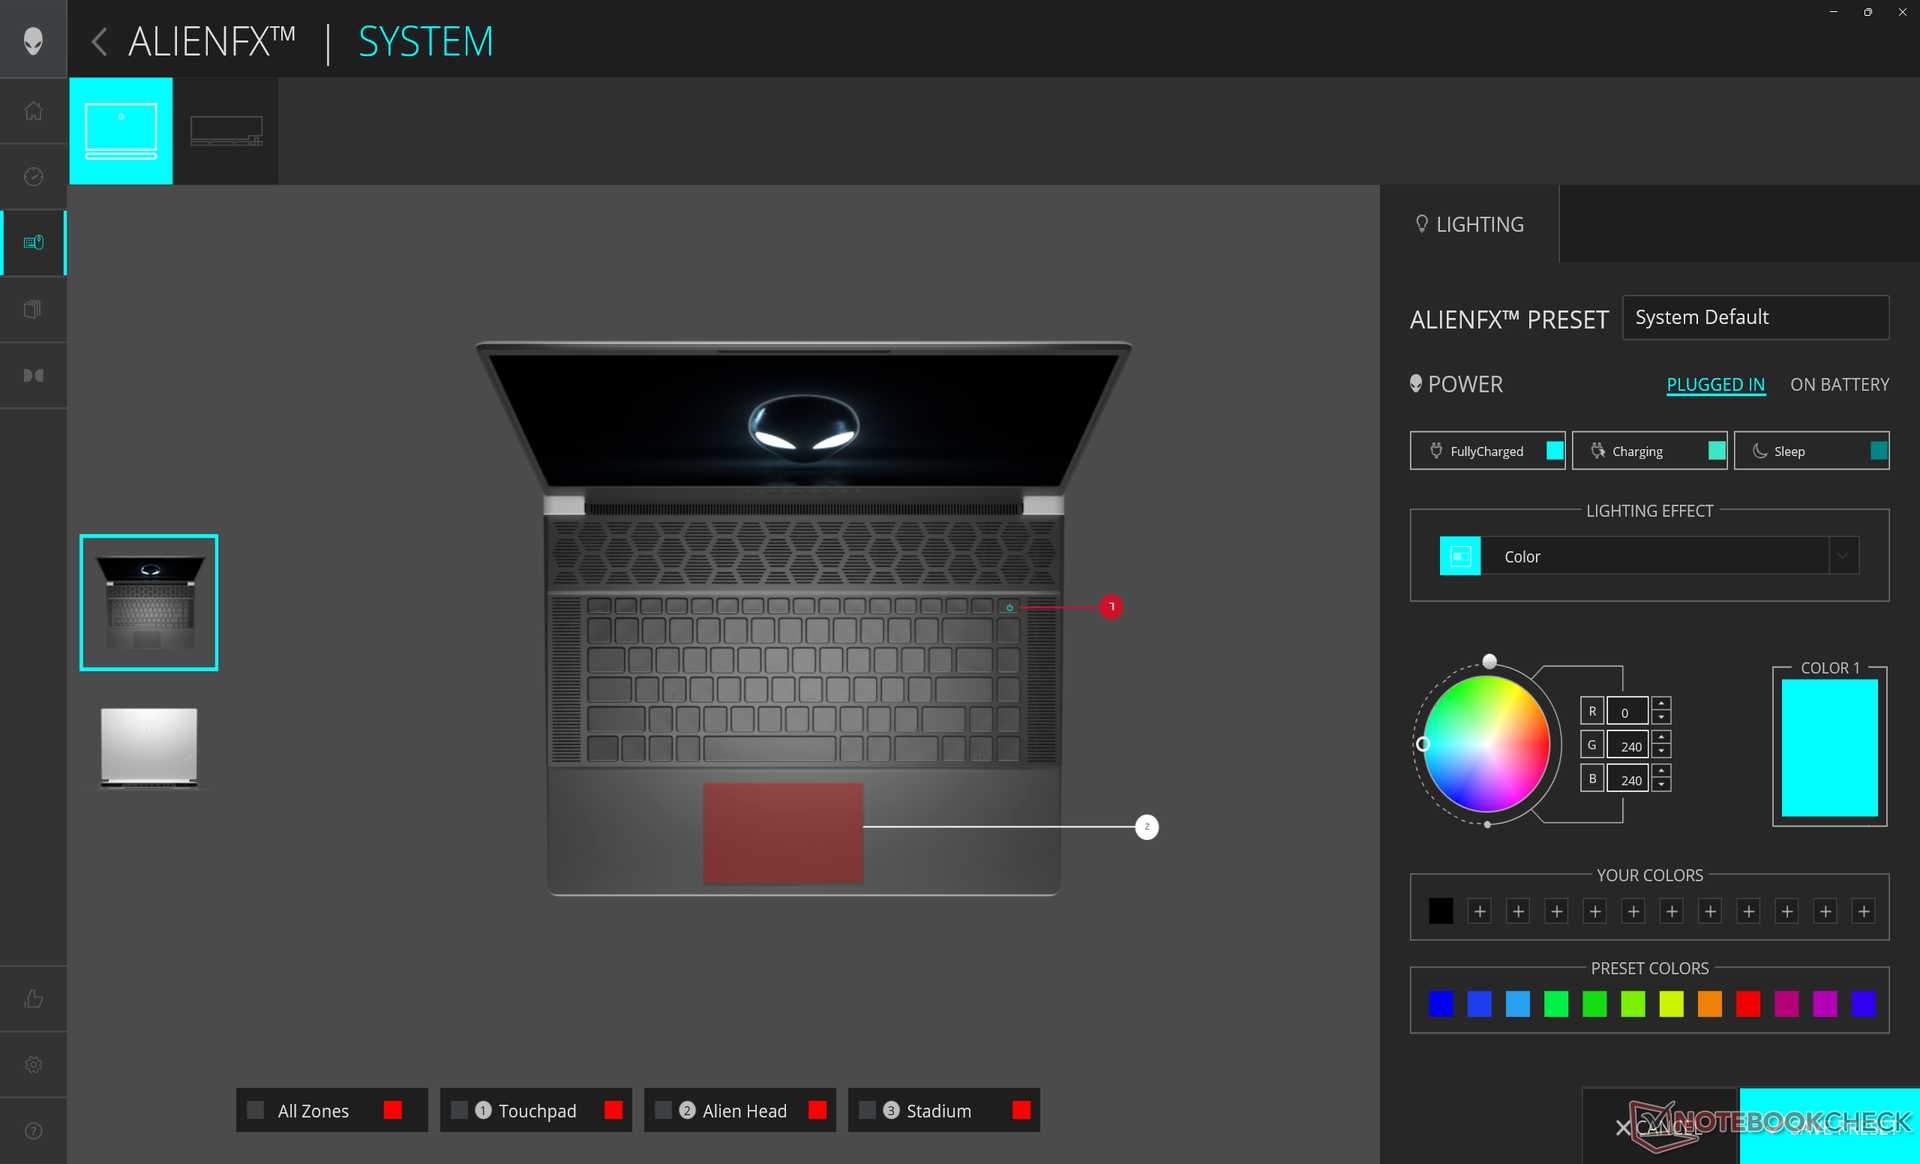
Tastiera
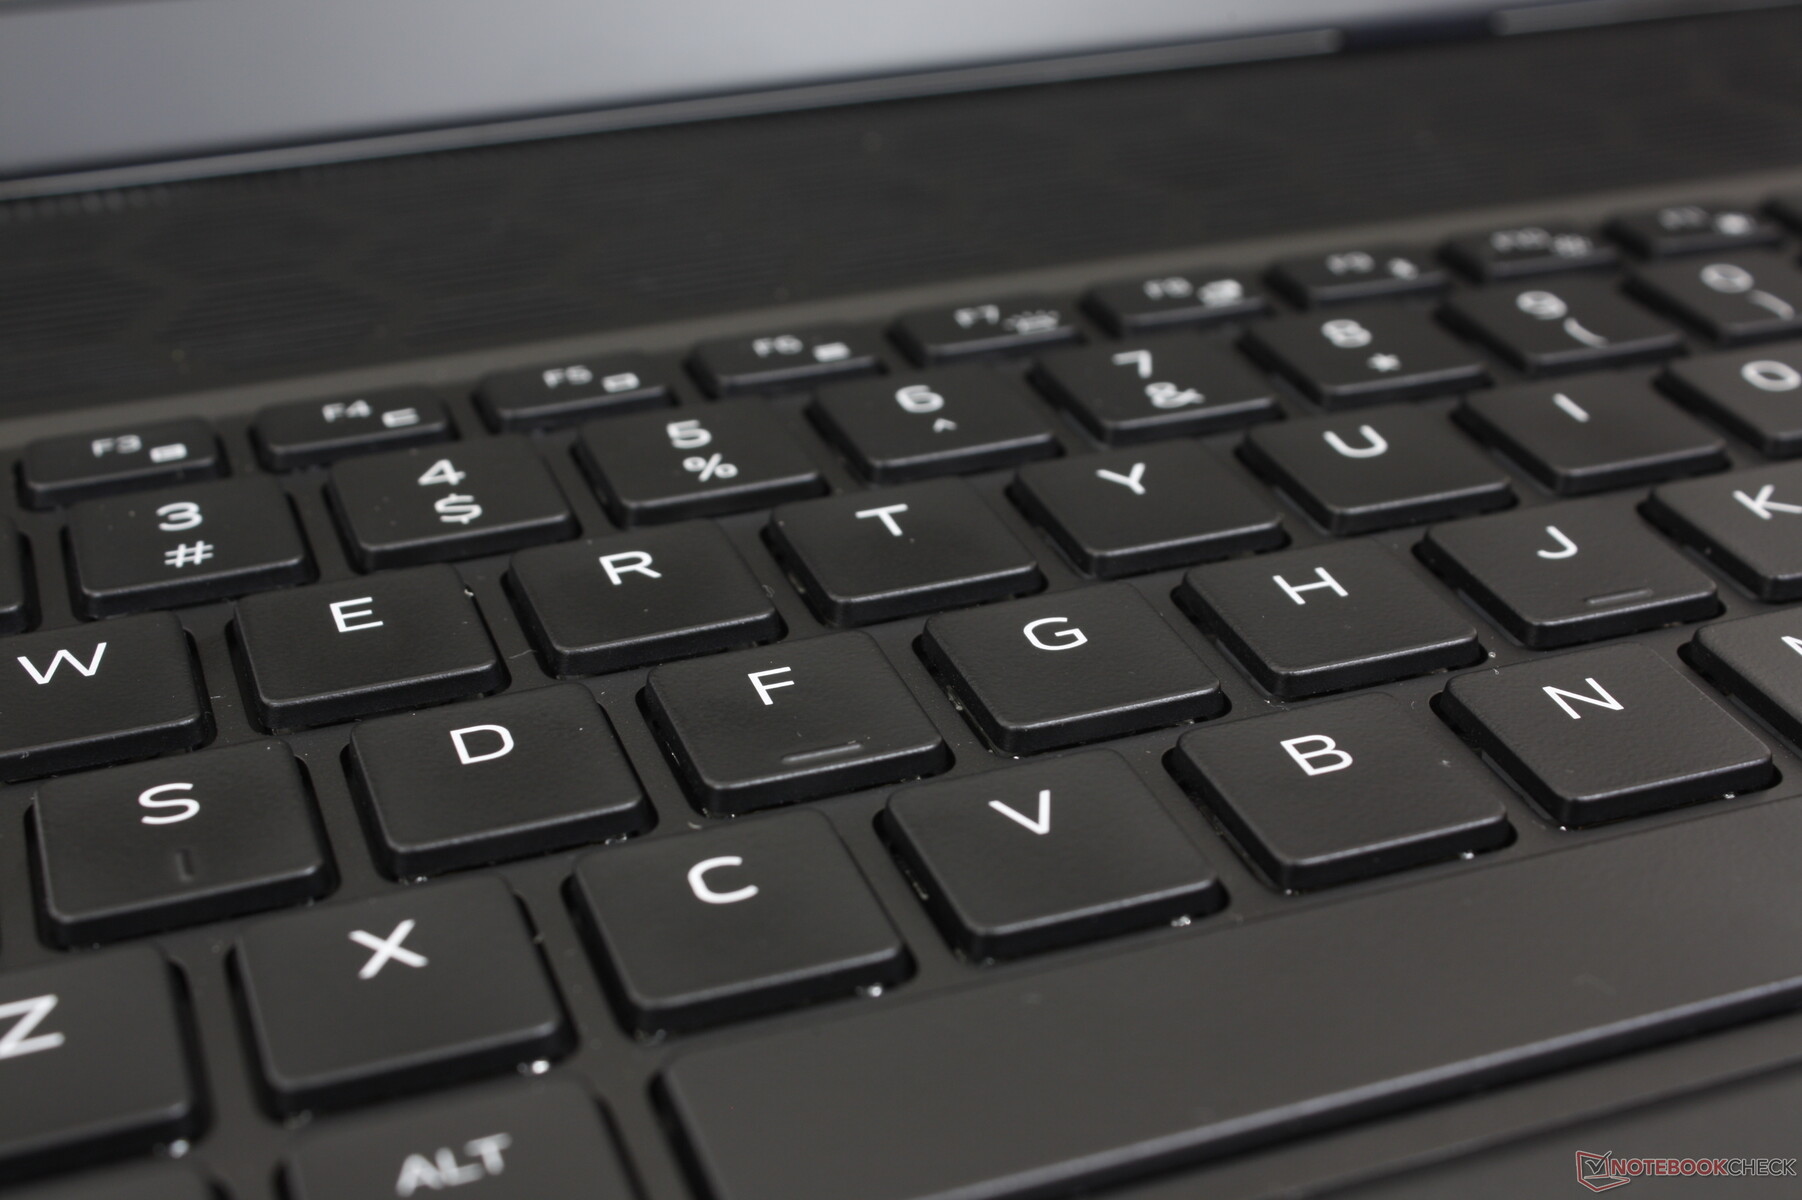
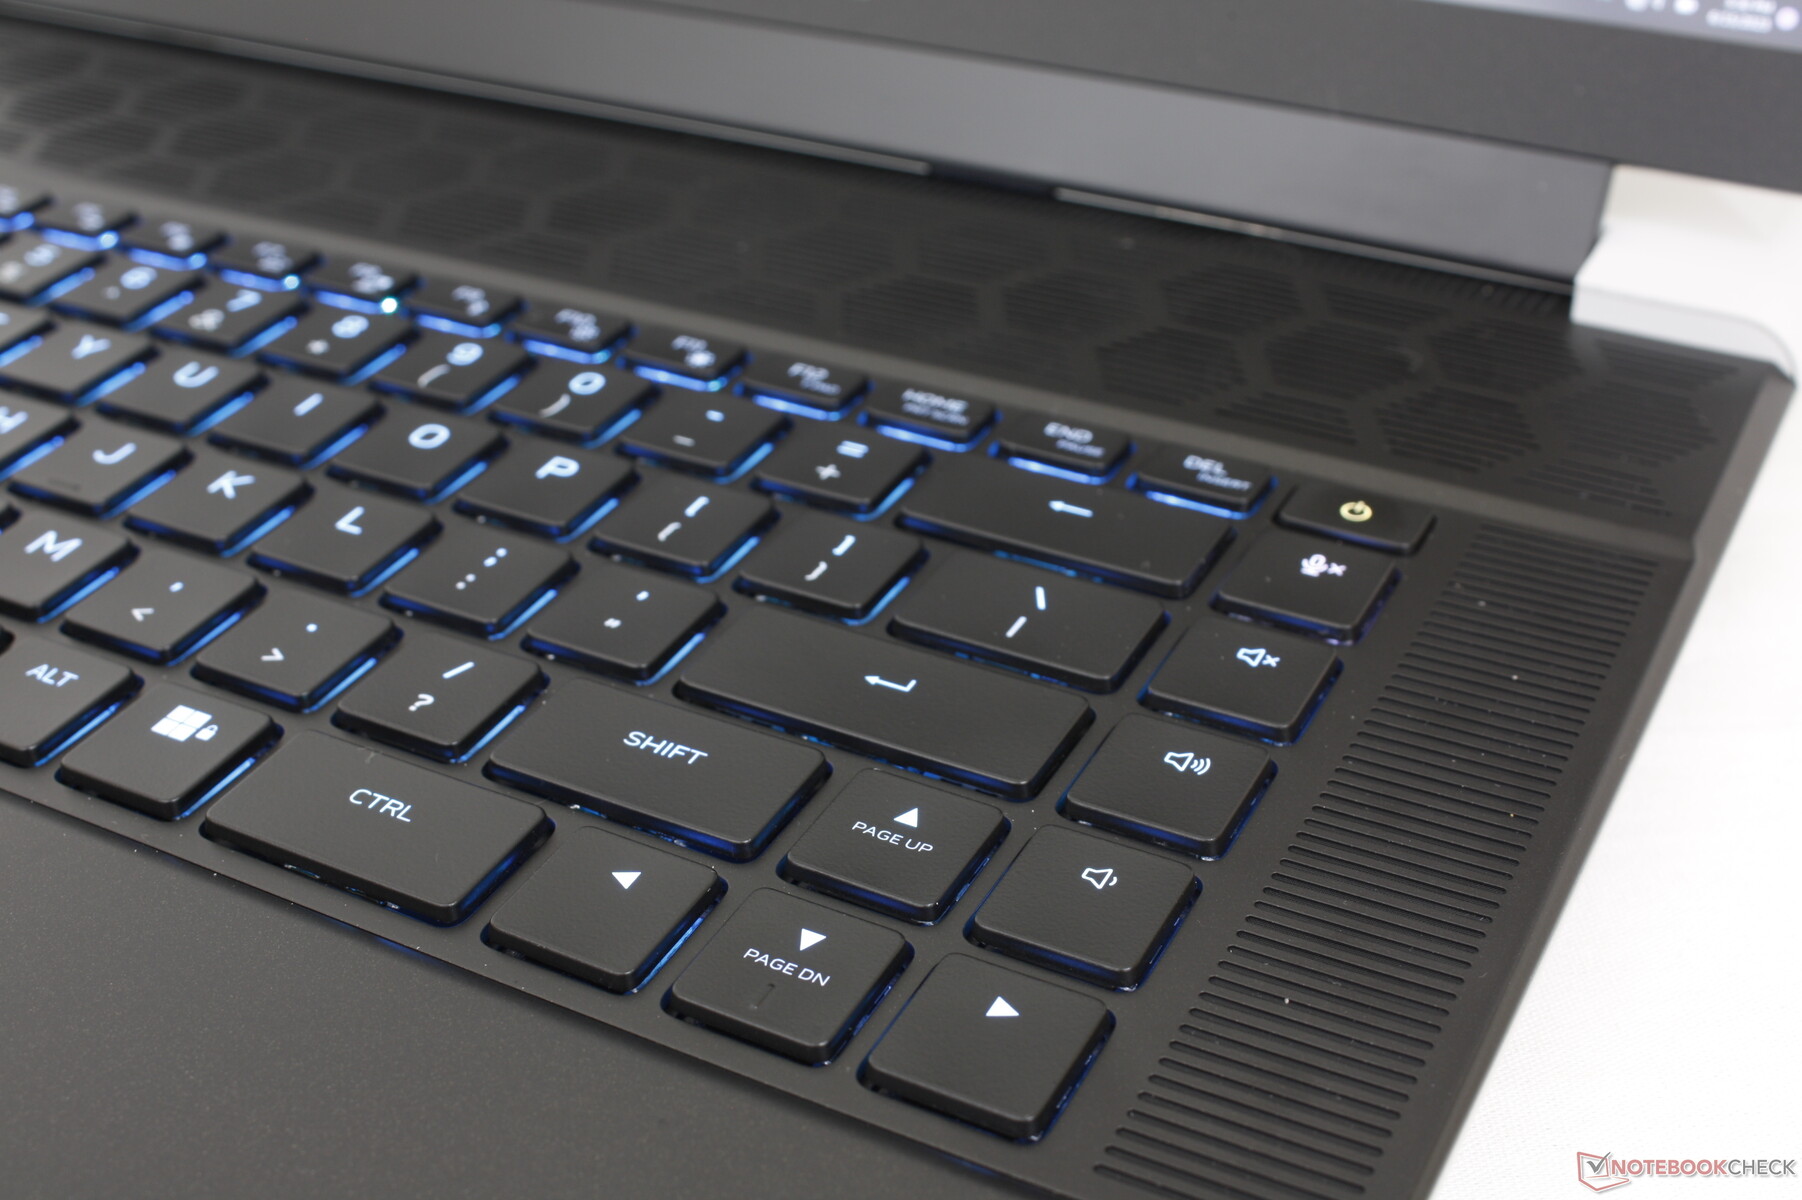
Dell offre due opzioni di tastiera: tasti standard a membrana e tasti CherryMX a profilo ultra basso, ciascuno con illuminazione RGB per tasto. La nostra unità di prova è dotata di questi ultimi e l'esperienza di digitazione è notte e giorno se confrontata con i tasti a membrana della maggior parte dei portatili da gioco. La corsa dei tasti di 1,8 mm è più profonda rispetto a quella tipica di 1,5 mm e il feedback è molto più solido e più preciso, per una sensazione più soddisfacente. È difficile tornare a digitare su un computer come il Razer Blade 16 dopo essersi abituati ai tasti CherryMX dell'Alienware x16.
Lo svantaggio principale, ovviamente, è il rumore significativamente più forte dei tasti meccanici. Pertanto, si consiglia di prendere in considerazione l'opzione standard non meccanica se si intende utilizzare il portatile in ambienti sensibili al rumore, come aule scolastiche o dormitori angusti.
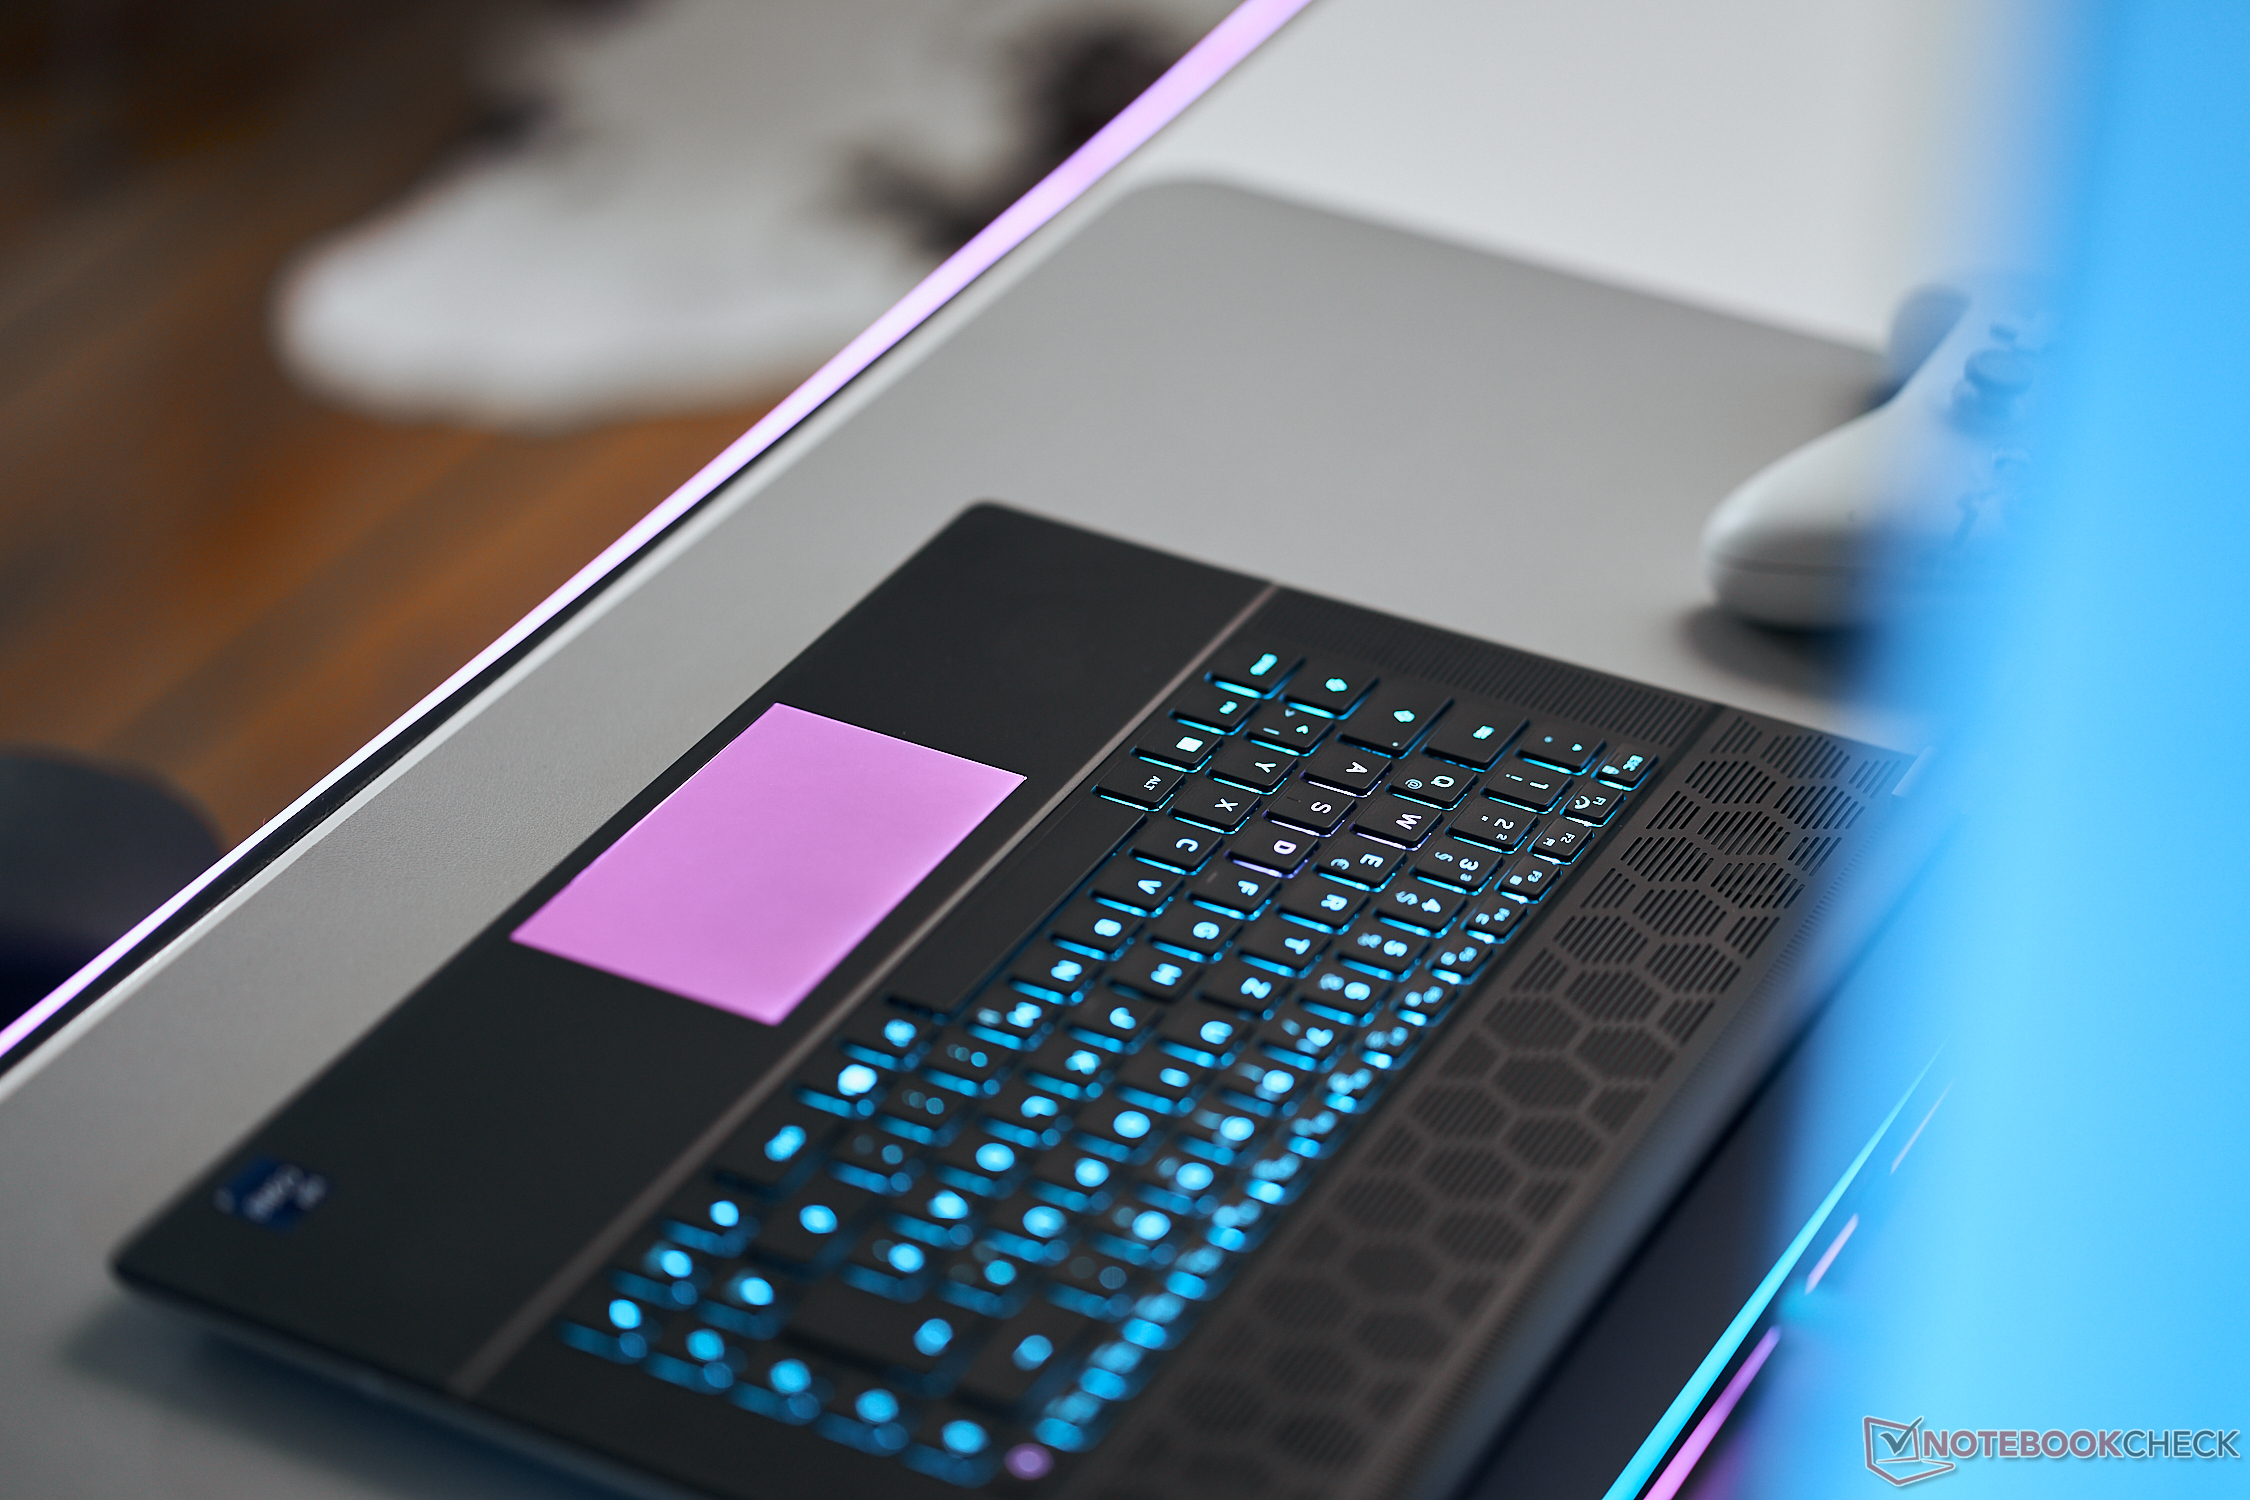
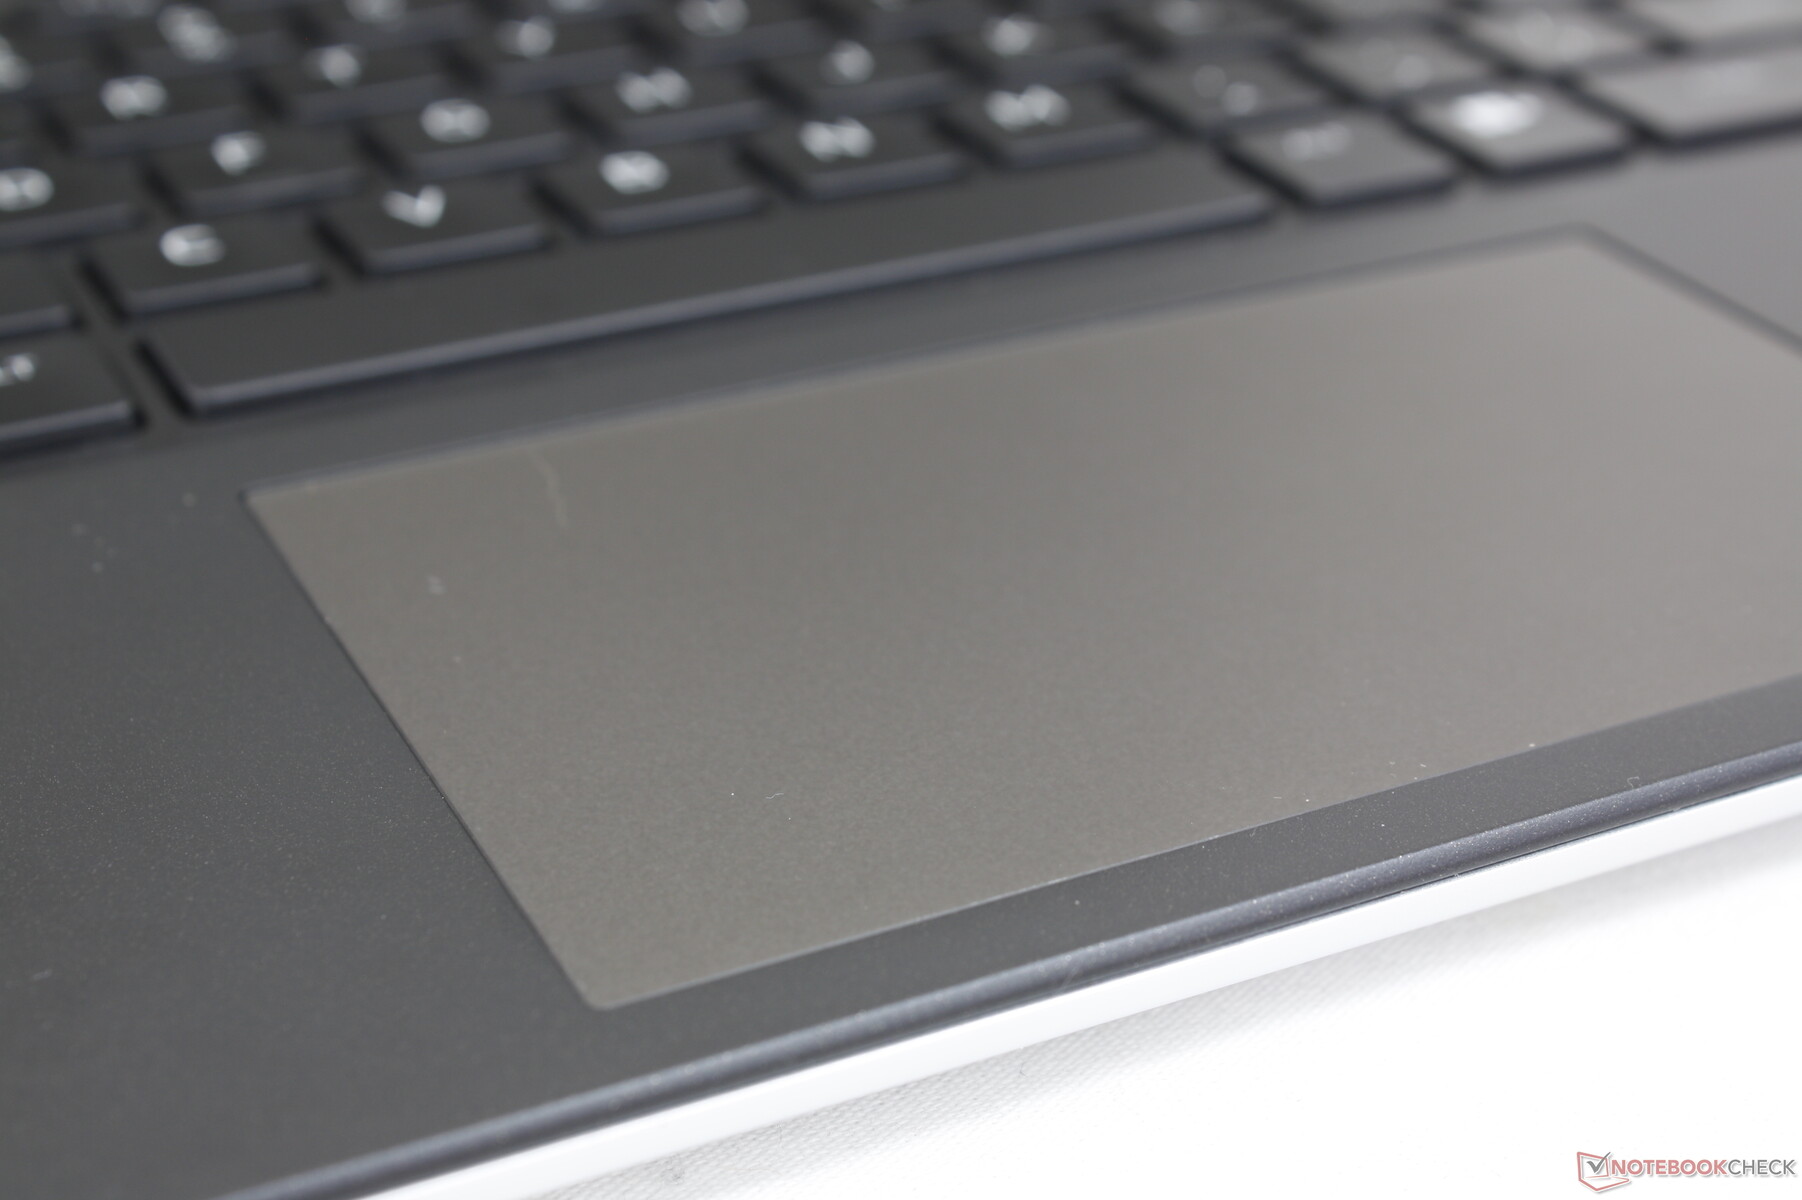
Touchpad
Il clickpad è uno dei più piccoli per un portatile da gioco da 16 pollici, con soli 11,2 x 6,5 cm rispetto ai 17 x 9,7 cm e ai 12 x 7,5 cm del Blade 16 e del Legion Pro 5 1616, rispettivamente. Le dimensioni ridotte sono dovute all'ampia soluzione di raffreddamento e alle griglie di ventilazione che occupano più spazio lungo la metà posteriore del sistema. Lo scorrimento è fluido, con solo un leggero impuntamento quando ci si muove a velocità ridotta per ottenere clic più precisi.
Il feedback quando si fa clic è leggero e molto superficiale, con una sensazione insoddisfacente. In base a questo e alla superficie ridotta, è chiaro che Dell si aspetta che la maggior parte degli utenti abbia un mouse USB pronto all'uso.
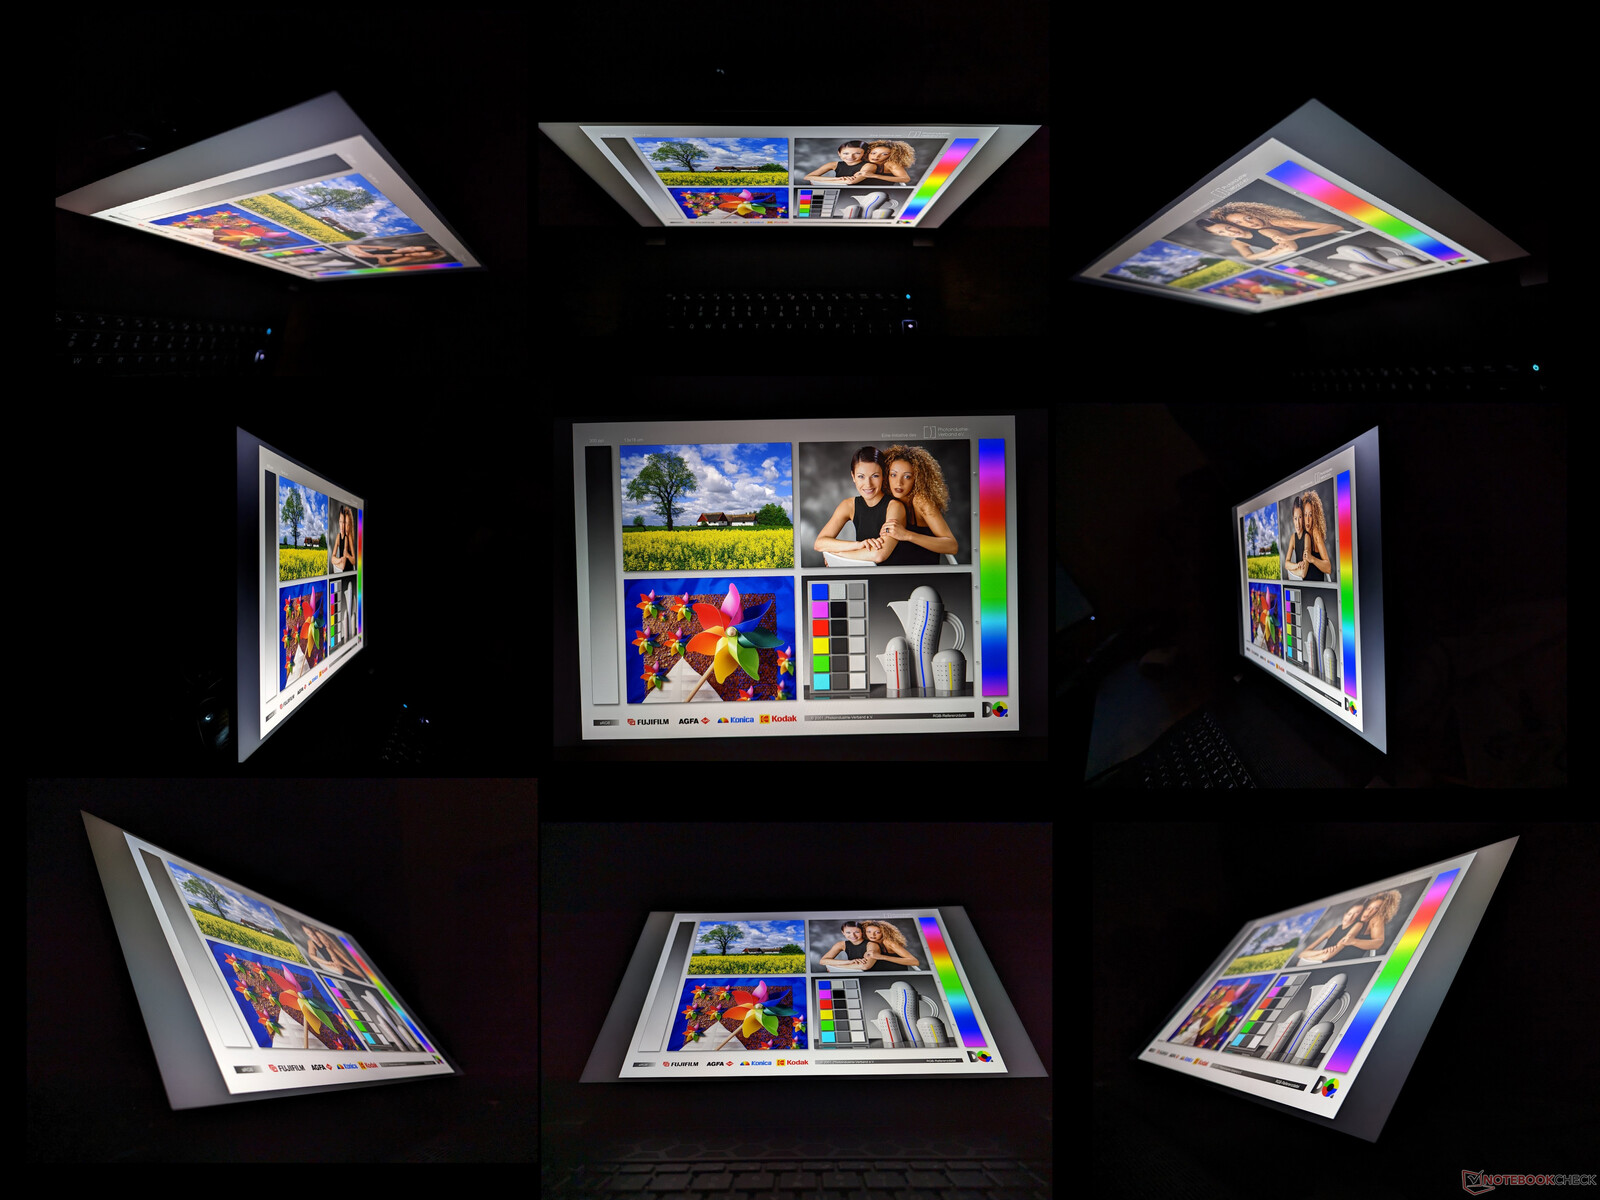
Display - Nessuna cattiva opzione
Sono disponibili tre opzioni di visualizzazione e le nostre misure riflettono solo l'opzione in grassetto:
- 2560 x 1600, 165 Hz, 3 ms, 100% sRGB, G-Sync
- 1920 x 1200, 480 Hz, 3 ms, 100% DCI-P3, G-Sync
- 2560 x 1600, 240 Hz, 3 ms, 100% DCI-P3, G-Sync
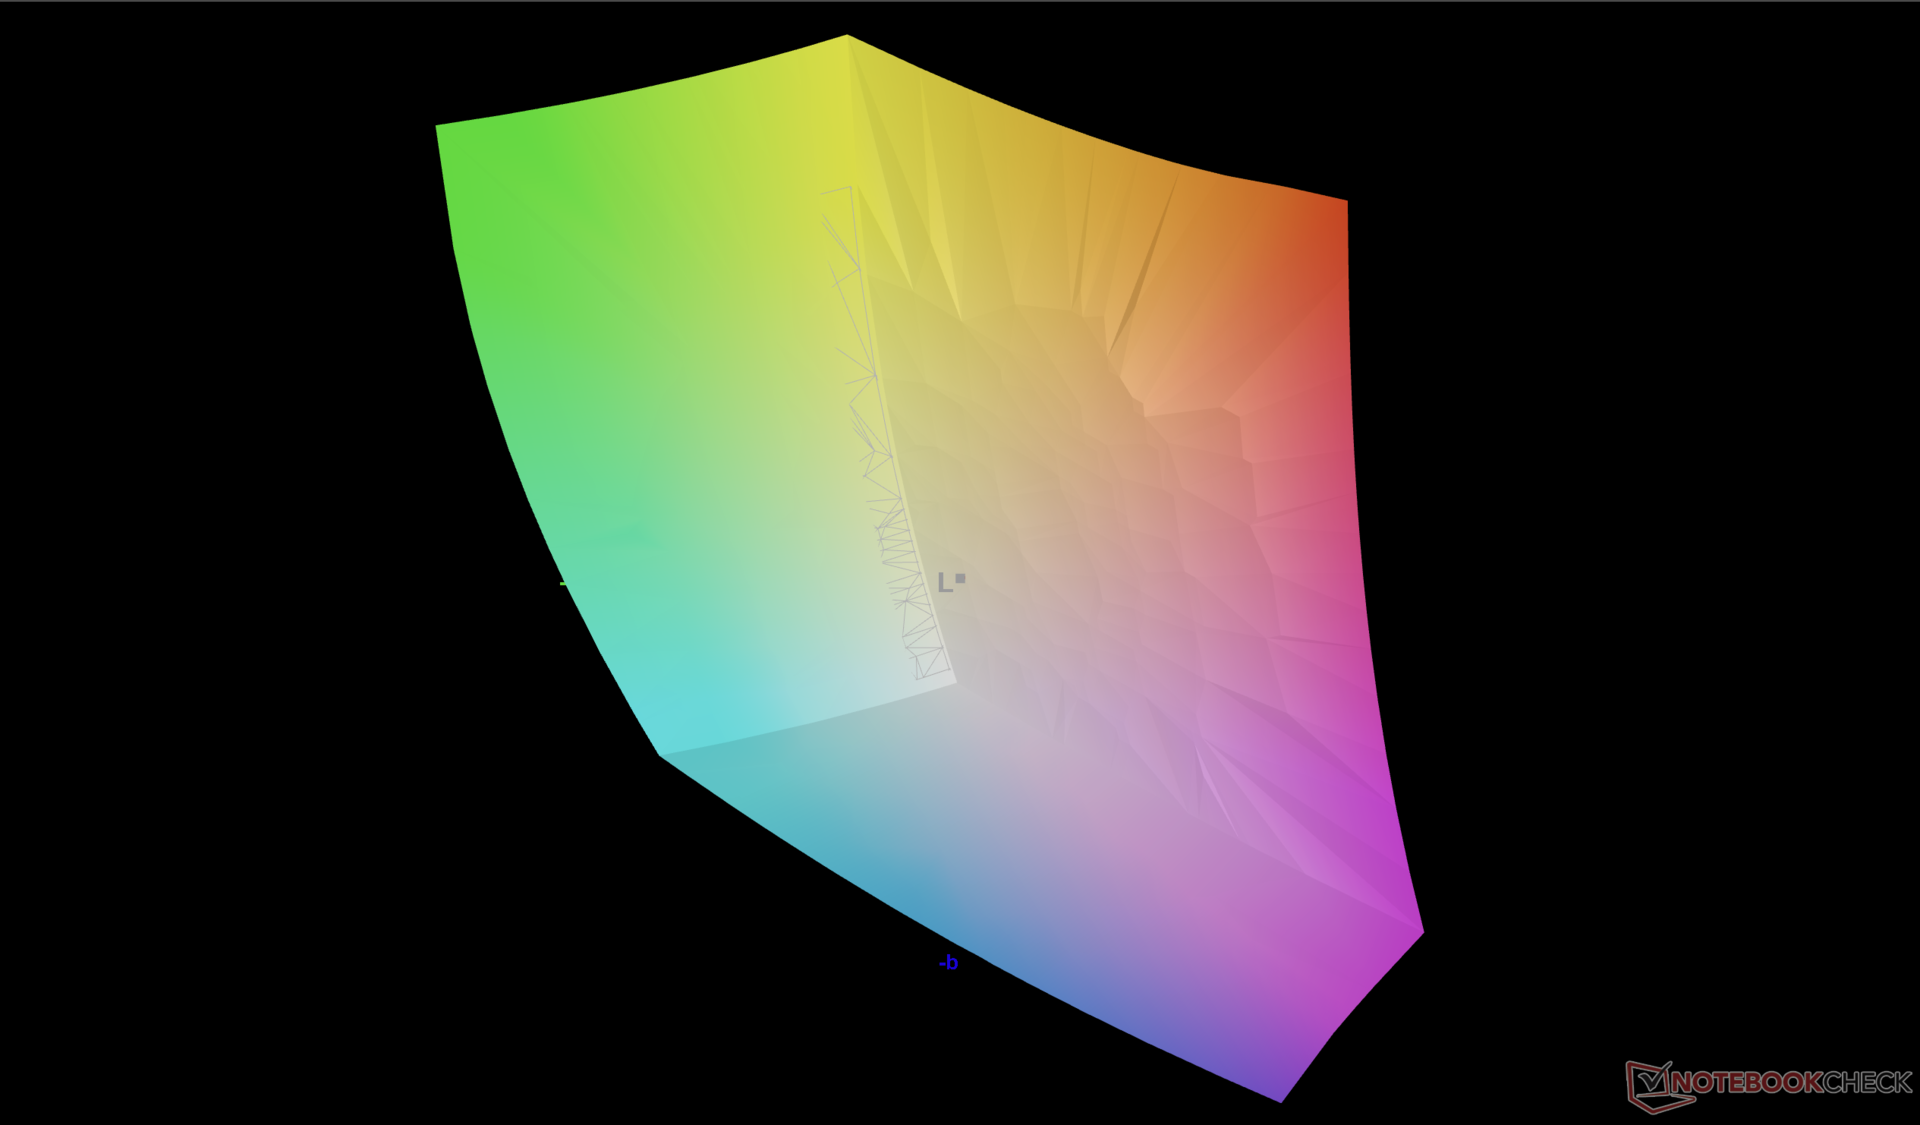
Non c'è un pannello sbagliato, poiché tutti i pannelli sono adatti ai giochi grazie alle loro velocità di aggiornamento e ai tempi di risposta rapidi. Detto questo, il pannello 1600p240 da noi configurato è il punto di forza per la maggior parte degli utenti, poiché l'opzione 1200p480 sacrifica la risoluzione e l'opzione 1600p165 ha colori meno intensi. L'esperienza visiva è paragonabile a quella del Blade 16, mentre è migliore rispetto a Dell G16 e Lenovo Legion Pro 7 16 in termini di gamma cromatica.
| |||||||||||||||||||||||||
Distribuzione della luminosità: 89 %
Al centro con la batteria: 302.2 cd/m²
Contrasto: 1162:1 (Nero: 0.26 cd/m²)
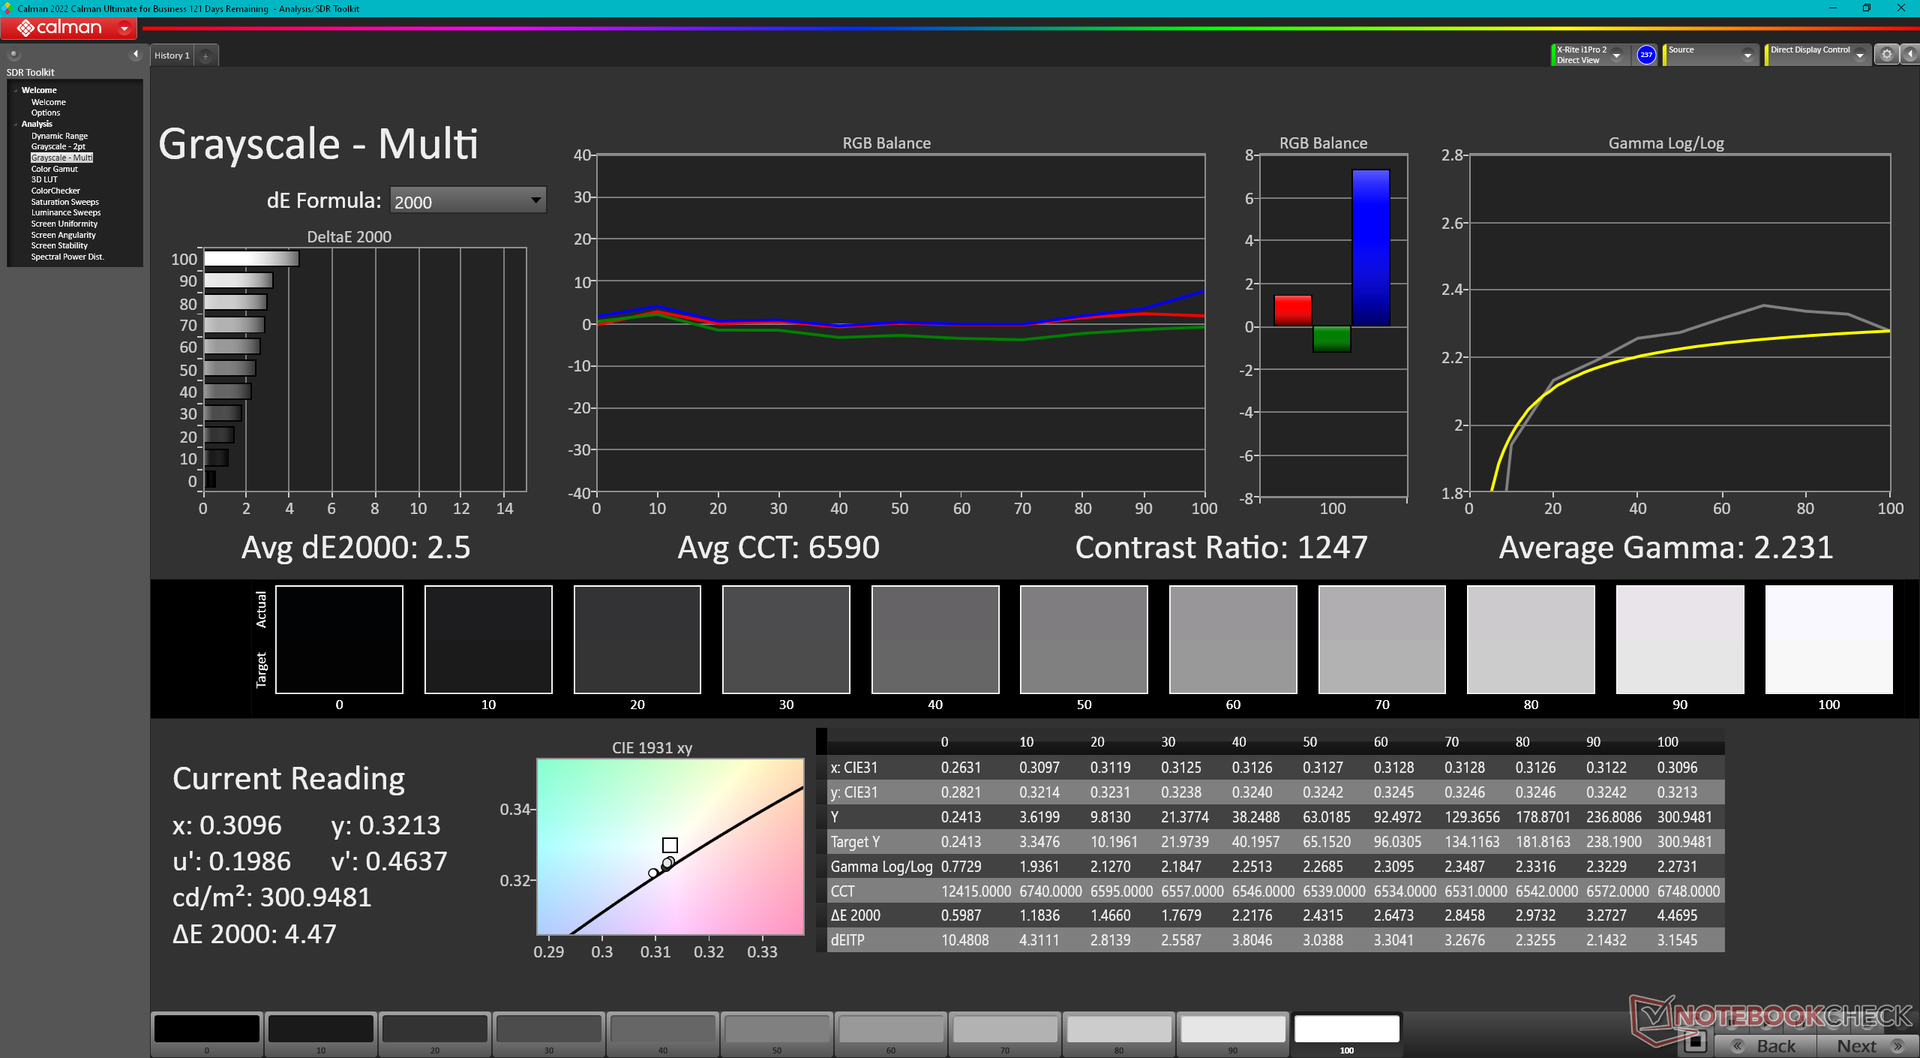
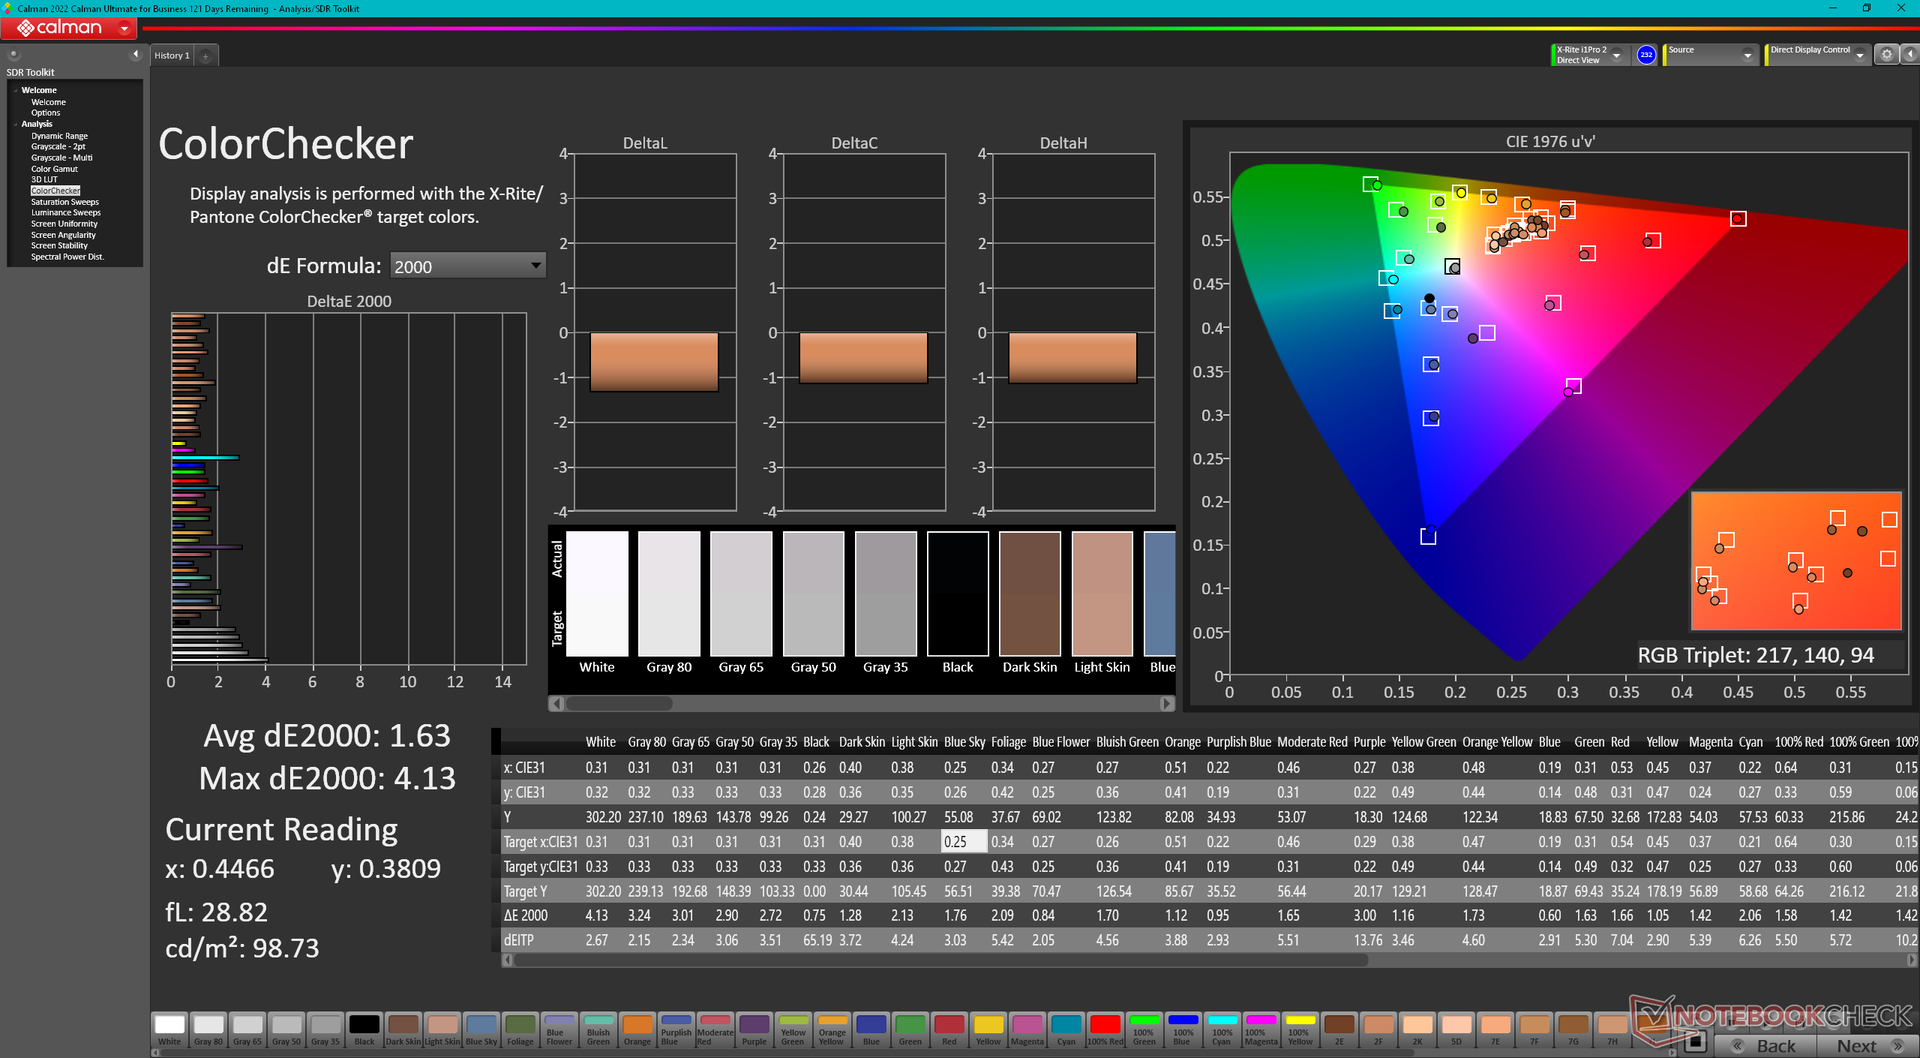
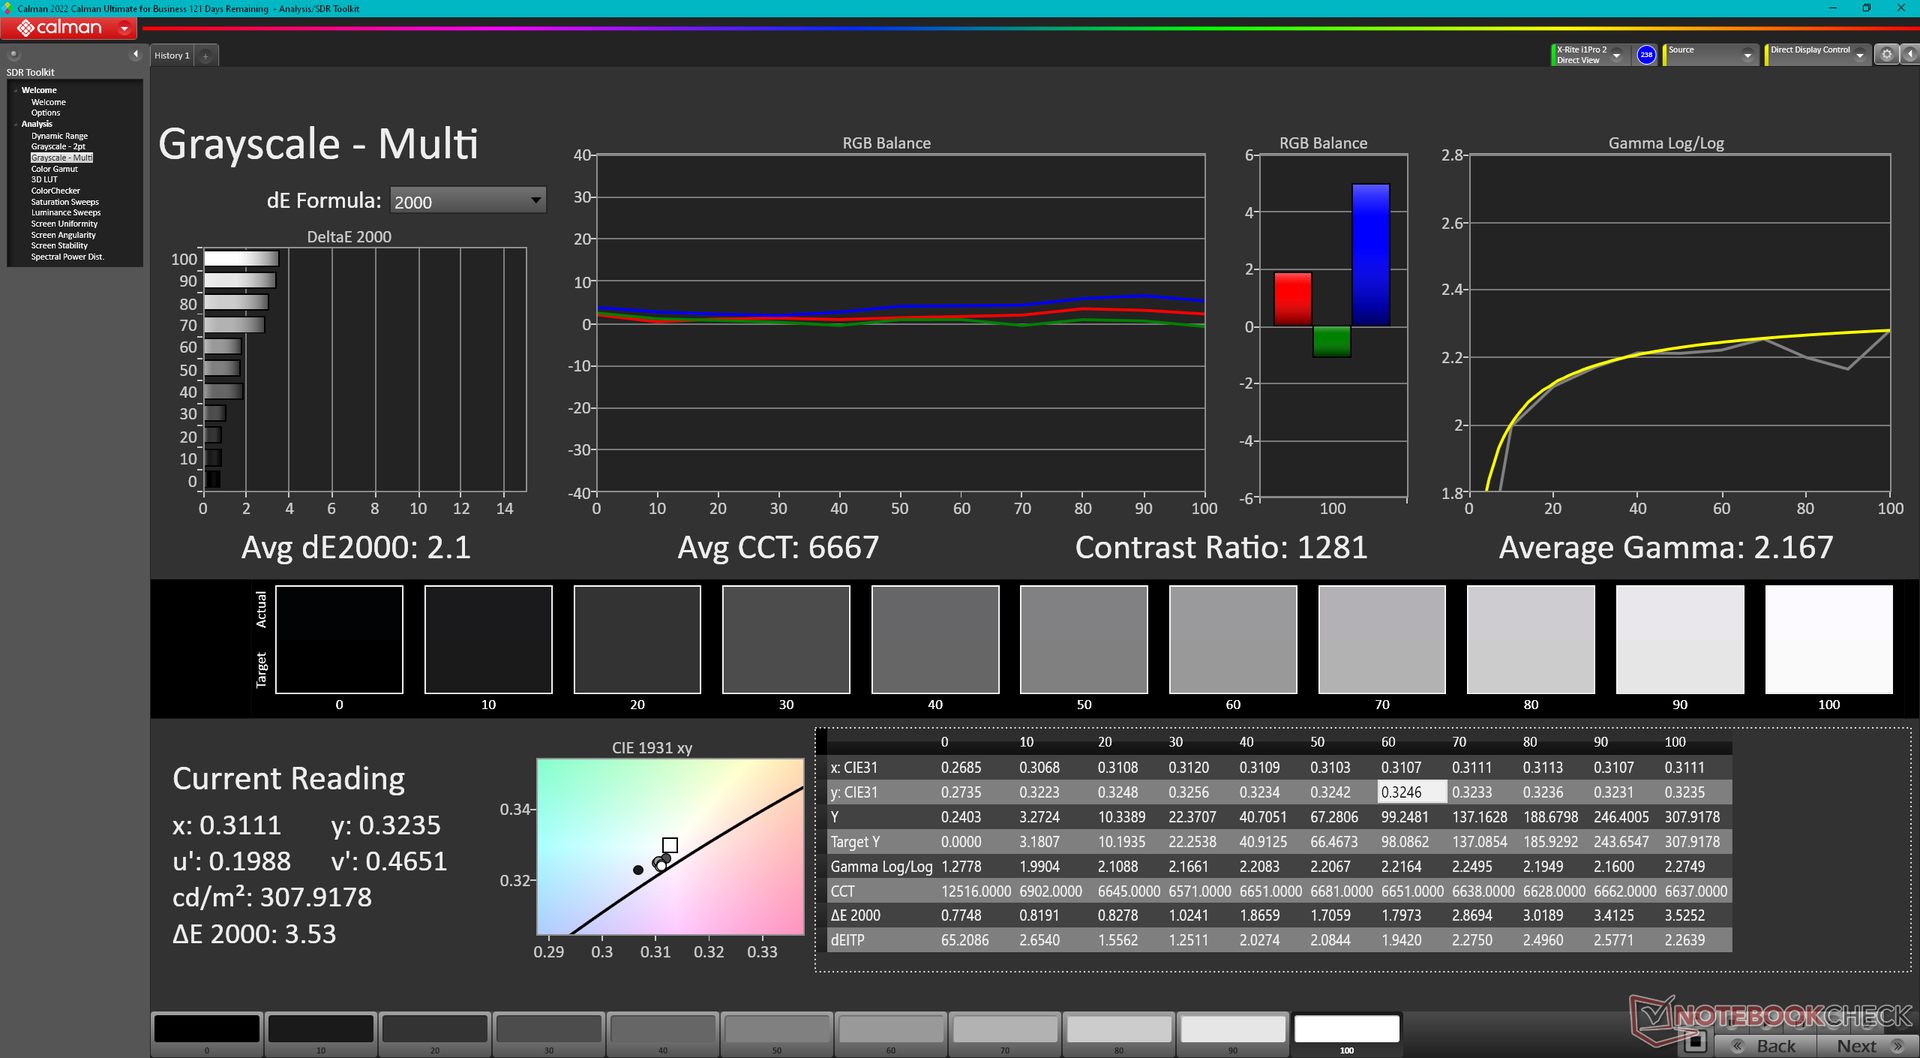
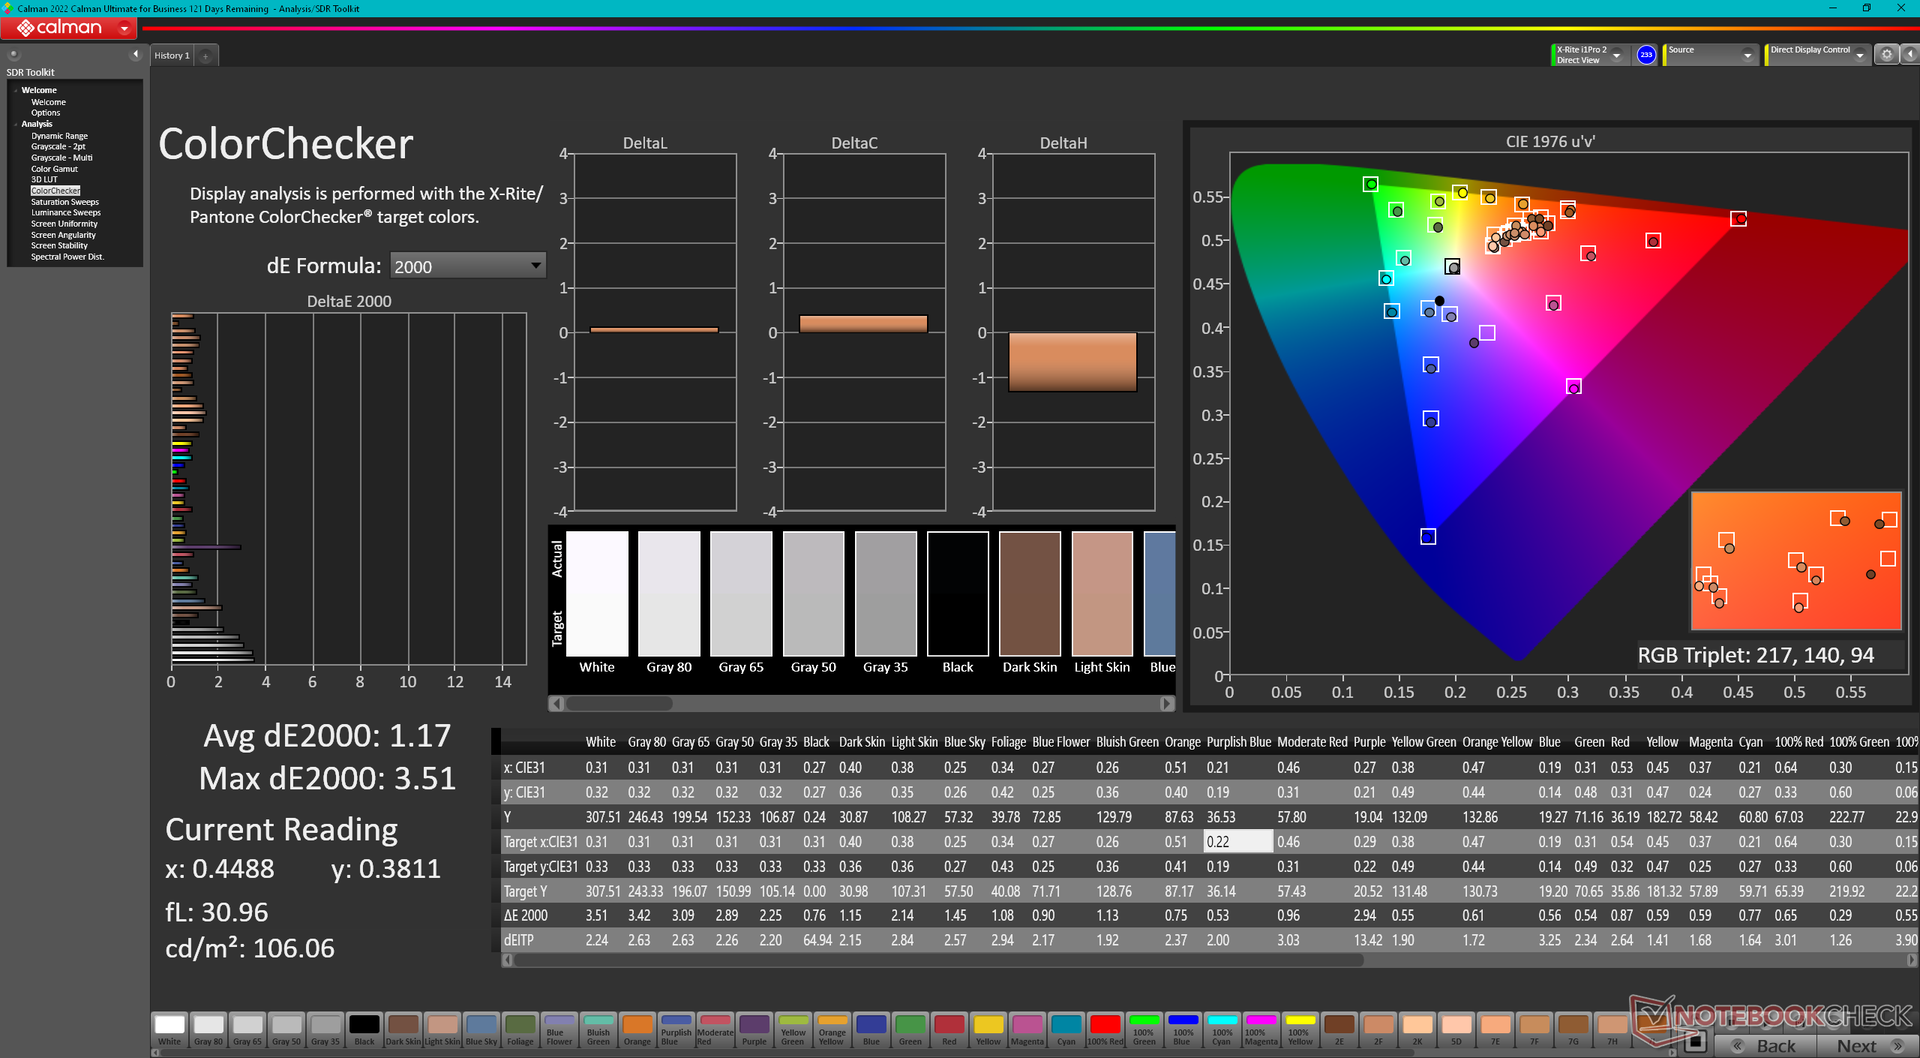
ΔE ColorChecker Calman: 1.63 | ∀{0.5-29.43 Ø4.71}
calibrated: 1.17
ΔE Greyscale Calman: 2.5 | ∀{0.09-98 Ø4.96}
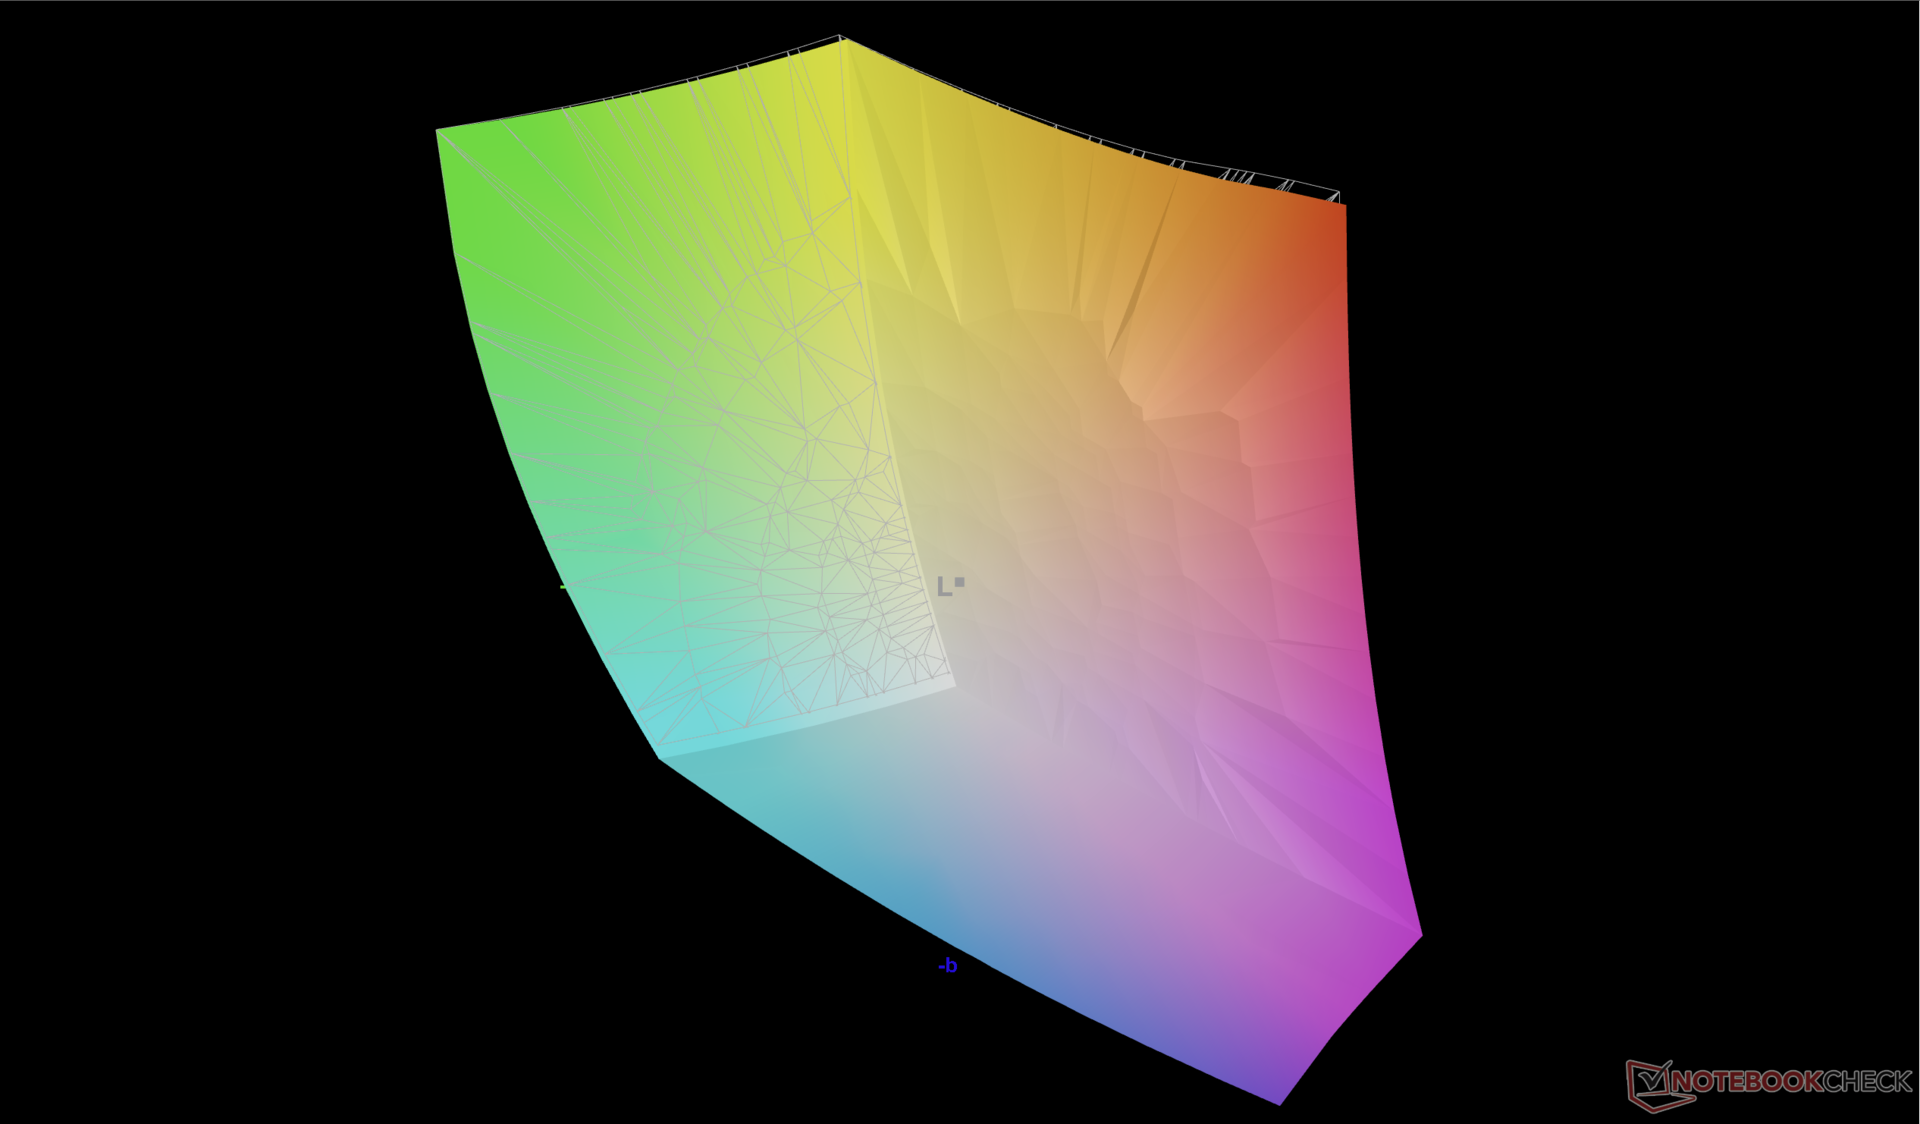
88.6% AdobeRGB 1998 (Argyll 3D)
100% sRGB (Argyll 3D)
99.2% Display P3 (Argyll 3D)
Gamma: 2.23
CCT: 6590 K
| Alienware x16 R1 BOE NE16NZ4, IPS, 2560x1600, 16" | Asus ROG Zephyrus M16 GU604VY-NM042X BOE0B74 (NE160QDM-NM4, IPS, 2560x1600, 16" | Razer Blade 16 Early 2023 CSOT T3 MNG007DA4-1, IPS, 2560x1600, 16" | Dell G16 7620 BOE NE16QDM, IPS, 2560x1600, 16" | Alienware m17 R5 (R9 6900HX, RX 6850M XT) AU Optronics AUODBA3, IPS, 3840x2160, 17" | Lenovo Legion Pro 7 16IRX8H MNG007DA2-3 (CSO1628), IPS, 2560x1600, 16" | |
|---|---|---|---|---|---|---|
| Display | 1% | 0% | -18% | -1% | -17% | |
| Display P3 Coverage (%) | 99.2 | 99.33 0% | 98.5 -1% | 68.3 -31% | 97.2 -2% | 69.1 -30% |
| sRGB Coverage (%) | 100 | 99.9 0% | 100 0% | 98 -2% | 99.6 0% | 99.7 0% |
| AdobeRGB 1998 Coverage (%) | 88.6 | 90.01 2% | 89.7 1% | 70.5 -20% | 88.4 0% | 71.2 -20% |
| Response Times | -542% | -23% | -35% | -118% | -49% | |
| Response Time Grey 50% / Grey 80% * (ms) | 5.1 ? | 50.8 ? -896% | 6.6 ? -29% | 8.6 ? -69% | 16.4 ? -222% | 12.3 ? -141% |
| Response Time Black / White * (ms) | 10.3 ? | 29.6 ? -187% | 12 ? -17% | 10.4 ? -1% | 11.6 ? -13% | 5.9 ? 43% |
| PWM Frequency (Hz) | 12000 | |||||
| Screen | 247% | -8% | -4% | -80% | 31% | |
| Brightness middle (cd/m²) | 302.2 | 634 110% | 456.8 51% | 369.4 22% | 484 60% | 511 69% |
| Brightness (cd/m²) | 285 | 627 120% | 437 53% | 348 22% | 449 58% | 469 65% |
| Brightness Distribution (%) | 89 | 92 3% | 83 -7% | 83 -7% | 87 -2% | 86 -3% |
| Black Level * (cd/m²) | 0.26 | 0.03 88% | 0.35 -35% | 0.32 -23% | 0.55 -112% | 0.4 -54% |
| Contrast (:1) | 1162 | 21133 1719% | 1305 12% | 1154 -1% | 880 -24% | 1278 10% |
| Colorchecker dE 2000 * | 1.63 | 0.89 45% | 3.7 -127% | 1.78 -9% | 4.8 -194% | 0.95 42% |
| Colorchecker dE 2000 max. * | 4.13 | 1.79 57% | 6.42 -55% | 4.41 -7% | 7.48 -81% | 2.07 50% |
| Colorchecker dE 2000 calibrated * | 1.17 | 0.91 22% | 0.66 44% | 1.22 -4% | 4.74 -305% | 0.91 22% |
| Greyscale dE 2000 * | 2.5 | 1.13 55% | 2.6 -4% | 3.2 -28% | 5.5 -120% | 0.6 76% |
| Gamma | 2.23 99% | 2.47 89% | 2.3 96% | 2.2 100% | 2.42 91% | 2.176 101% |
| CCT | 6590 99% | 6497 100% | 6108 106% | 6750 96% | 6148 106% | 6545 99% |
| Media totale (Programma / Settaggio) | -98% /
81% | -10% /
-8% | -19% /
-11% | -66% /
-68% | -12% /
9% |
* ... Meglio usare valori piccoli
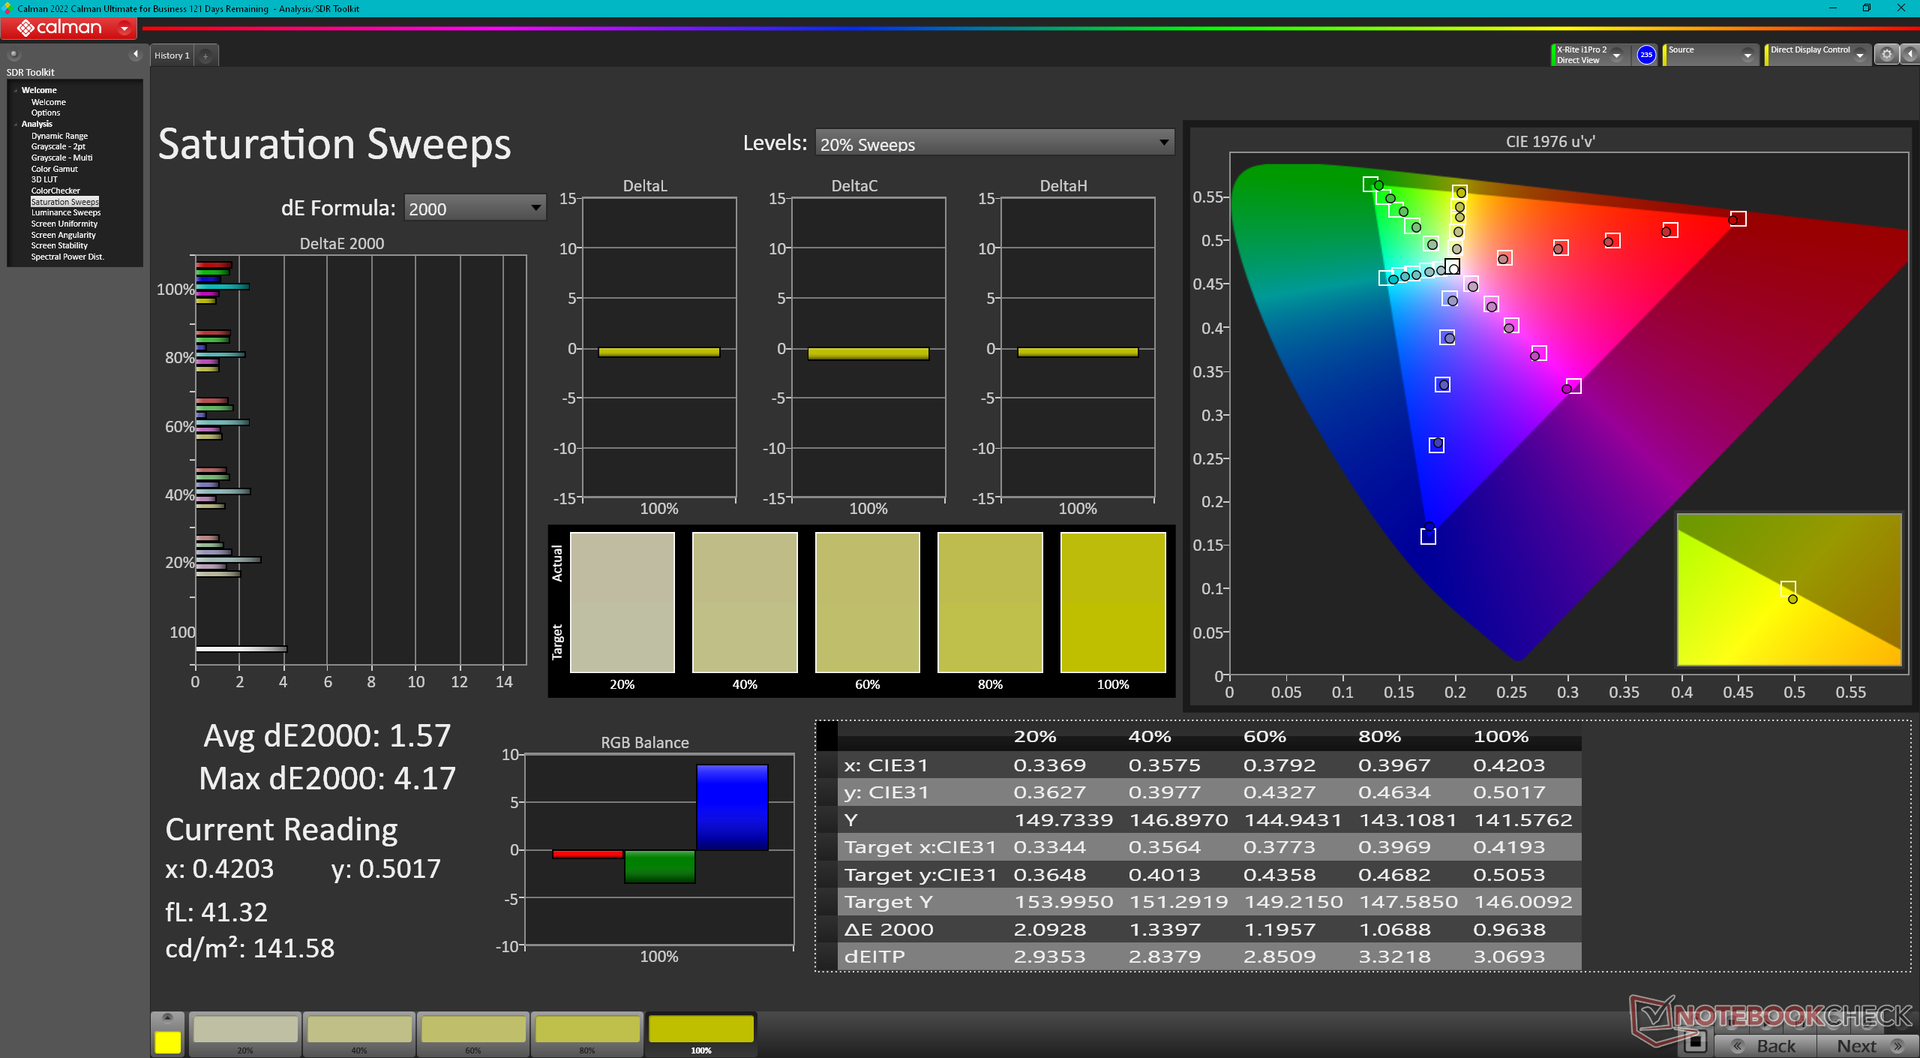
Il display è ben calibrato, con valori medi di deltaE della scala di grigi e del colore di appena 2,5 e 1,63, rispettivamente. Il tentativo di calibrare ulteriormente il display con il nostro colorimetro X-Rite produrrebbe solo piccoli miglioramenti e quindi non è necessaria una calibrazione da parte dell'utente finale.

Tempi di risposta del Display
| ↔ Tempi di risposta dal Nero al Bianco | ||
|---|---|---|
| 10.3 ms ... aumenta ↗ e diminuisce ↘ combinato | ↗ 5.4 ms Incremento | 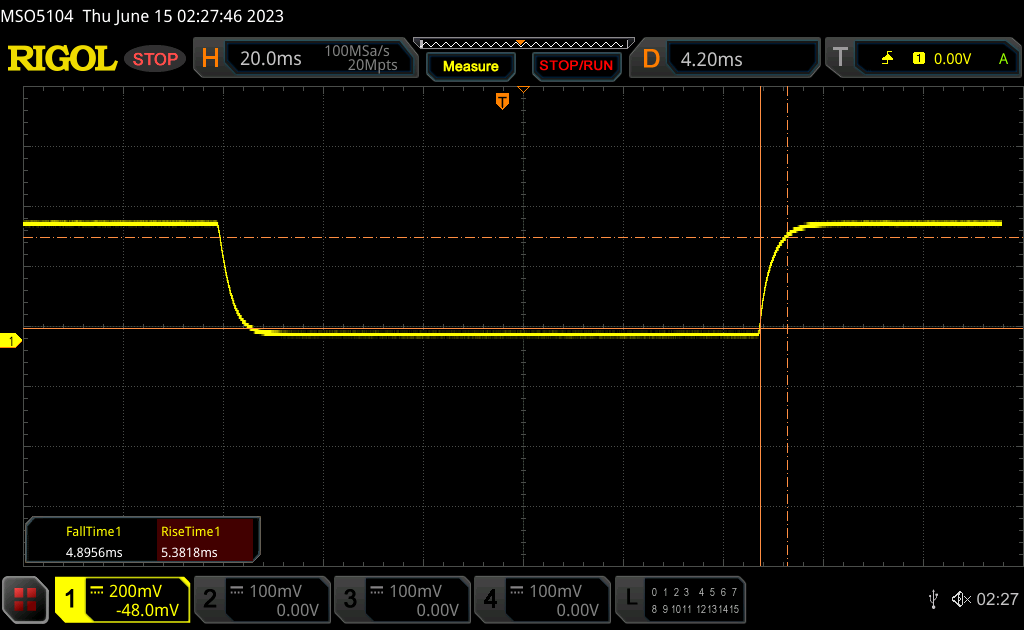 |
| ↘ 4.9 ms Calo | ||
| Lo schermo mostra buoni tempi di risposta durante i nostri tests, ma potrebbe essere troppo lento per i gamers competitivi. In confronto, tutti i dispositivi di test variano da 0.1 (minimo) a 240 (massimo) ms. » 28 % di tutti i dispositivi è migliore. Questo significa che i tempi di risposta rilevati sono migliori rispettto alla media di tutti i dispositivi testati (19.8 ms). | ||
| ↔ Tempo di risposta dal 50% Grigio all'80% Grigio | ||
| 5.1 ms ... aumenta ↗ e diminuisce ↘ combinato | ↗ 2.4 ms Incremento | 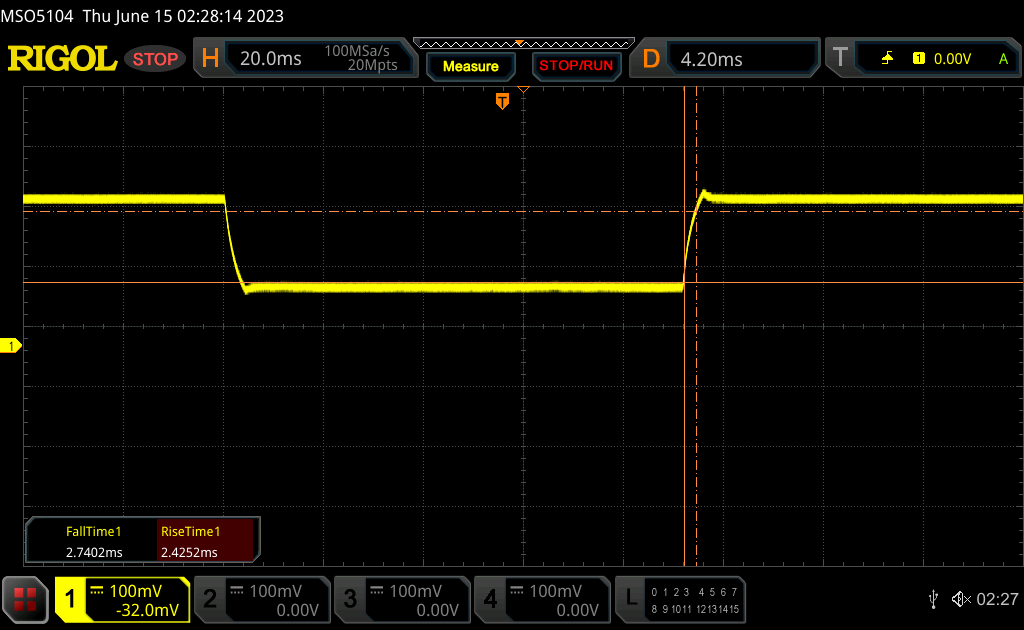 |
| ↘ 2.7 ms Calo | ||
| Lo schermo ha mostrato valori di risposta molto veloci nei nostri tests ed è molto adatto per i gaming veloce. In confronto, tutti i dispositivi di test variano da 0.165 (minimo) a 636 (massimo) ms. » 17 % di tutti i dispositivi è migliore. Questo significa che i tempi di risposta rilevati sono migliori rispettto alla media di tutti i dispositivi testati (30.9 ms). | ||
Sfarfallio dello schermo / PWM (Pulse-Width Modulation)
| flickering dello schermo / PWM non rilevato |  | ||
In confronto: 52 % di tutti i dispositivi testati non utilizza PWM per ridurre la luminosita' del display. Se è rilevato PWM, una media di 7741 (minimo: 5 - massimo: 343500) Hz è stata rilevata. | |||
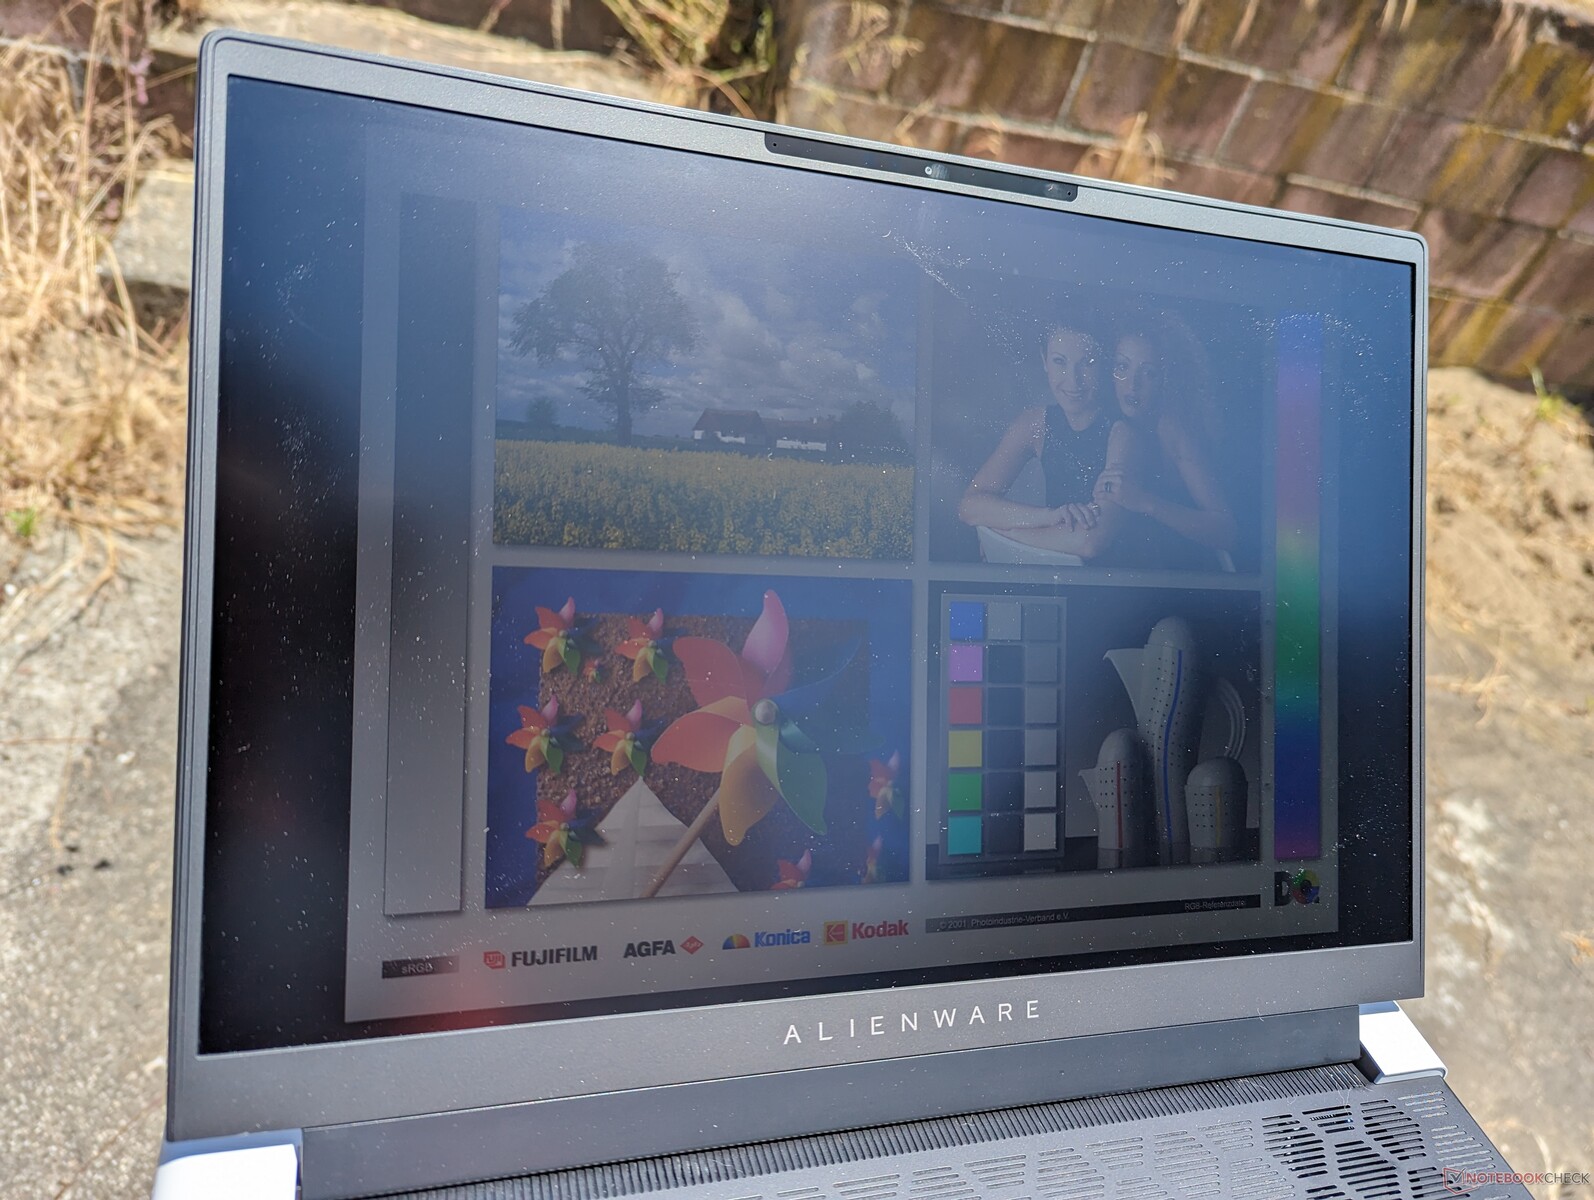
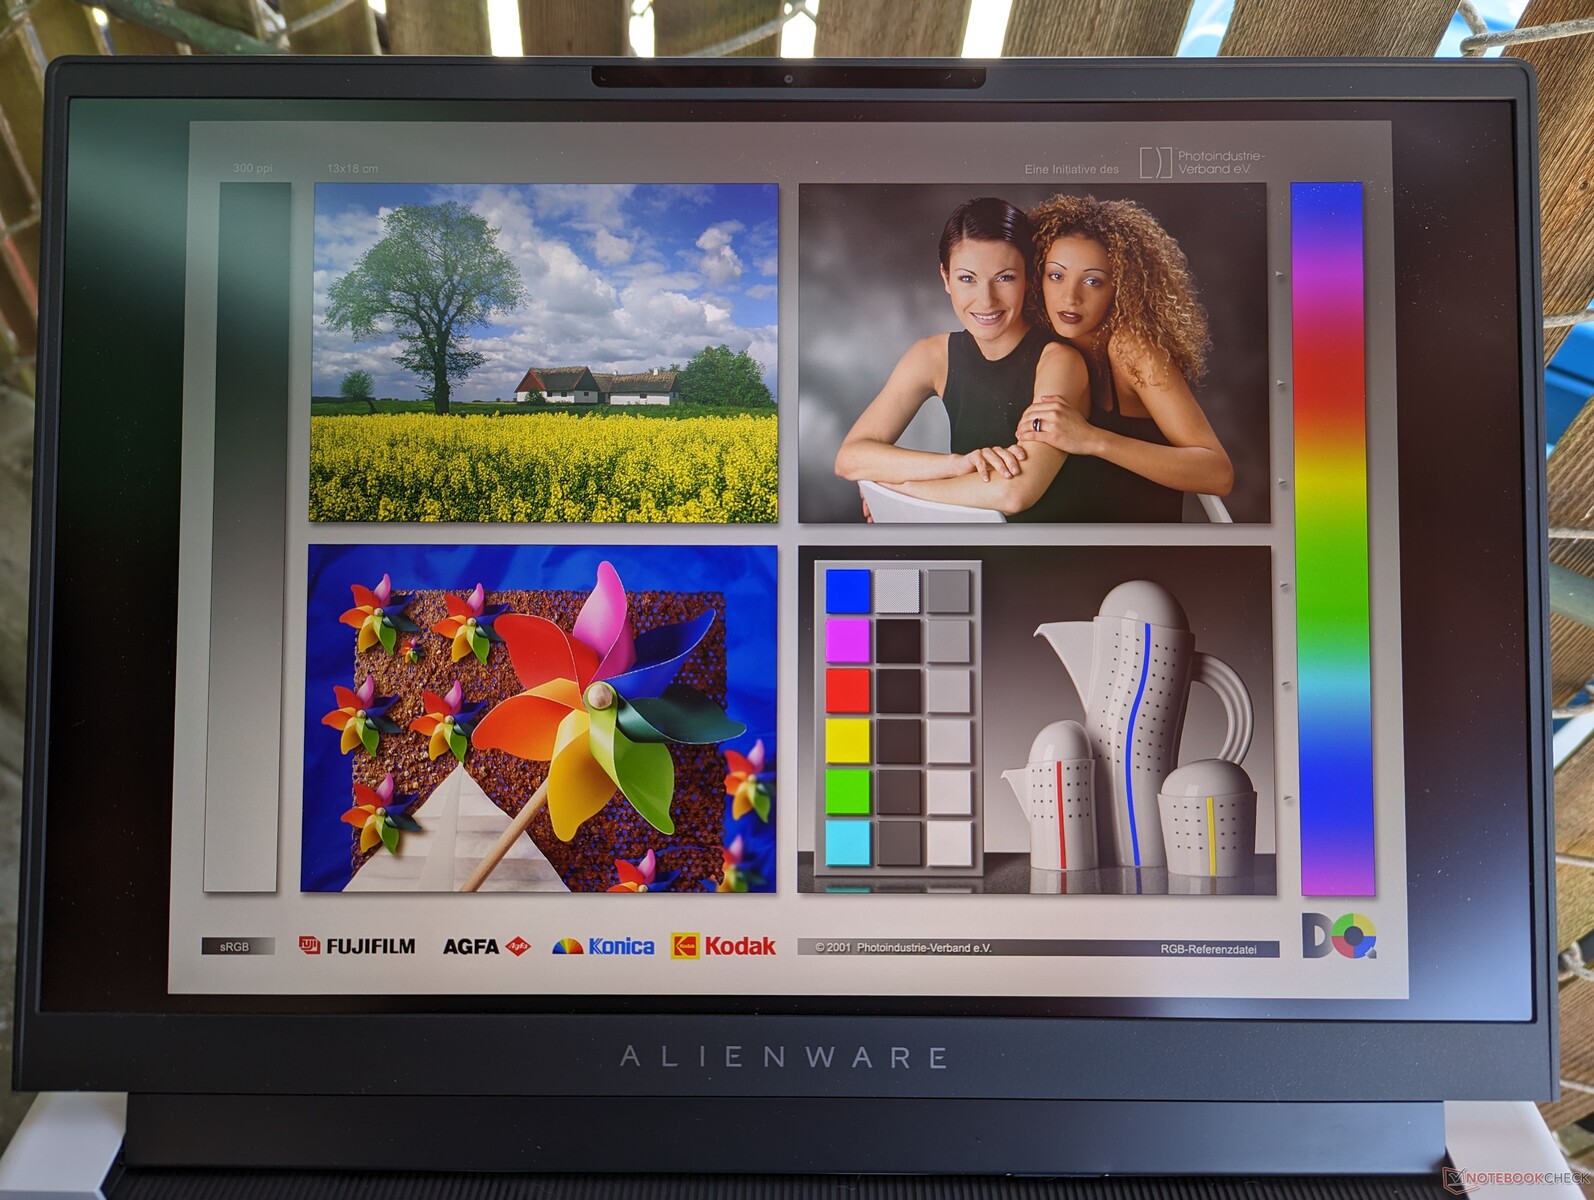
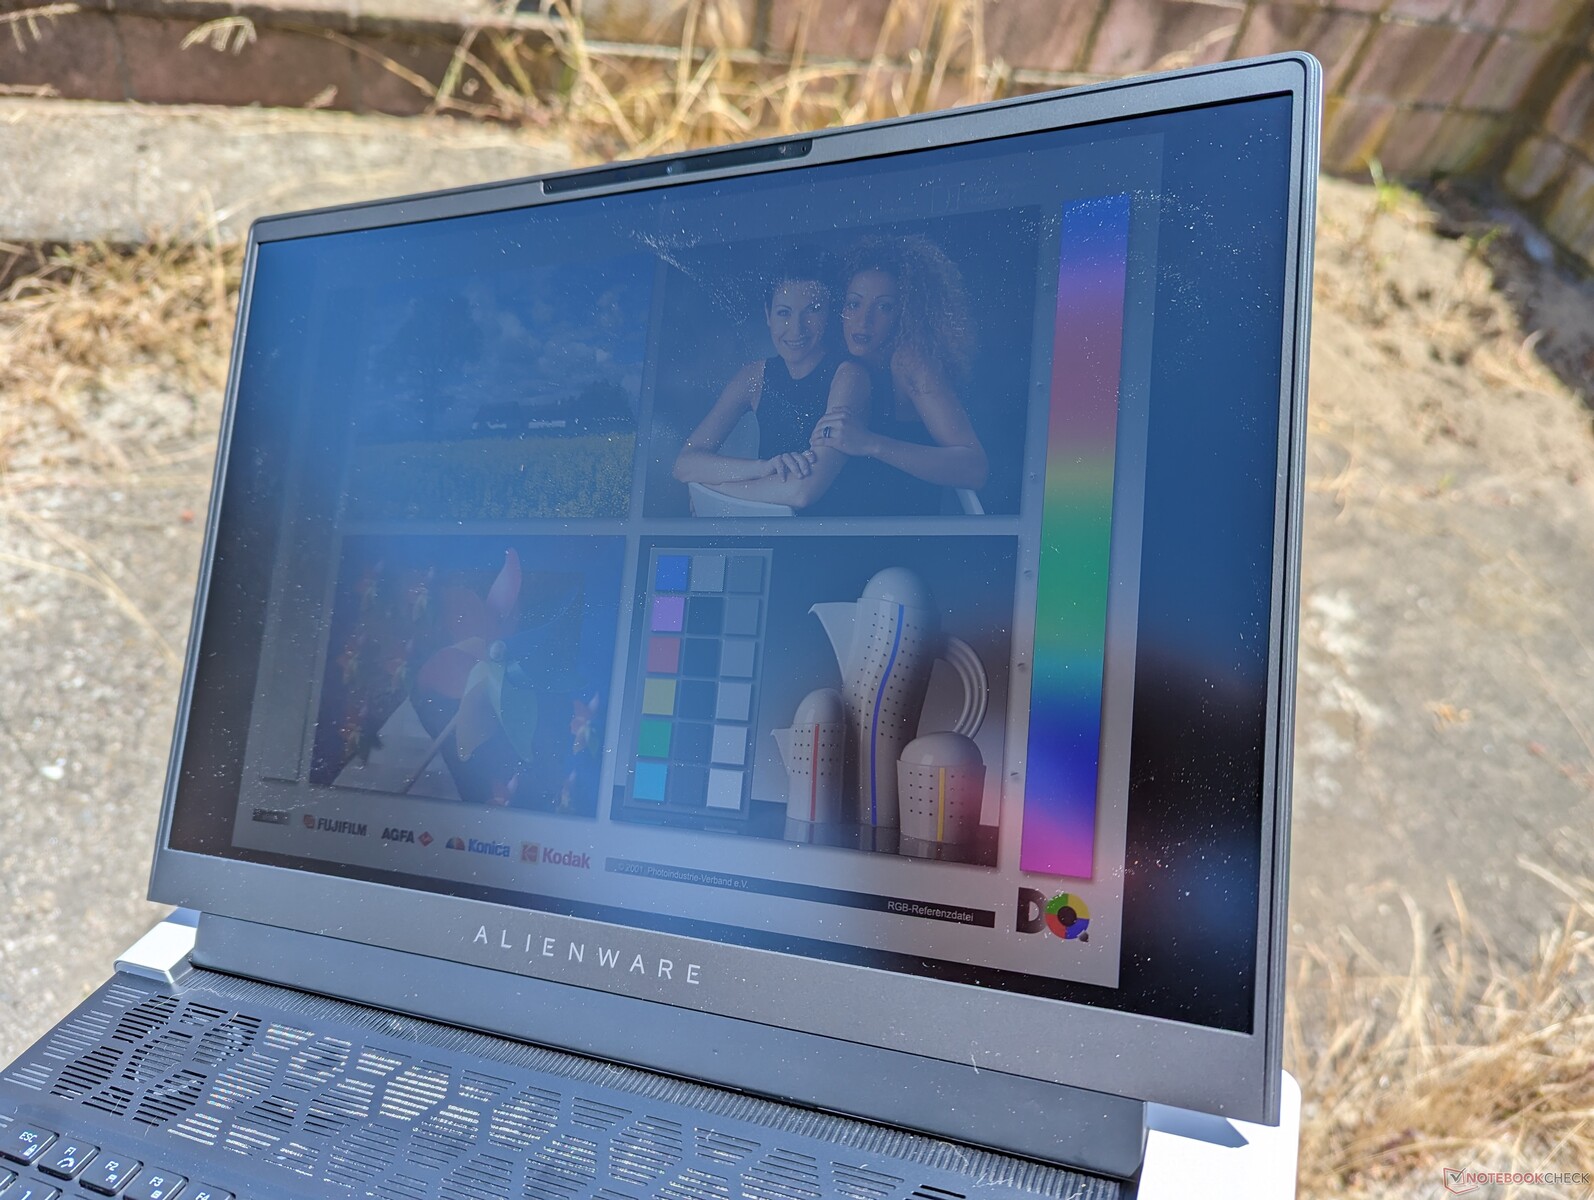
La visibilità all'aperto non è così elevata come su altri portatili da gioco da 16 pollici come loZephyrus M16blade 16 o Legion Pro 7 16, poiché il display dell'Alienware è notevolmente più debole. Se a questo si aggiunge l'ingombro relativamente elevato, l'Alienware x16 R1 non è sicuramente un portatile adatto agli ambienti esterni, nonostante il design sottile dello chassis.
Prestazioni - CPU da urlo, GPU impressionante
Condizioni di test
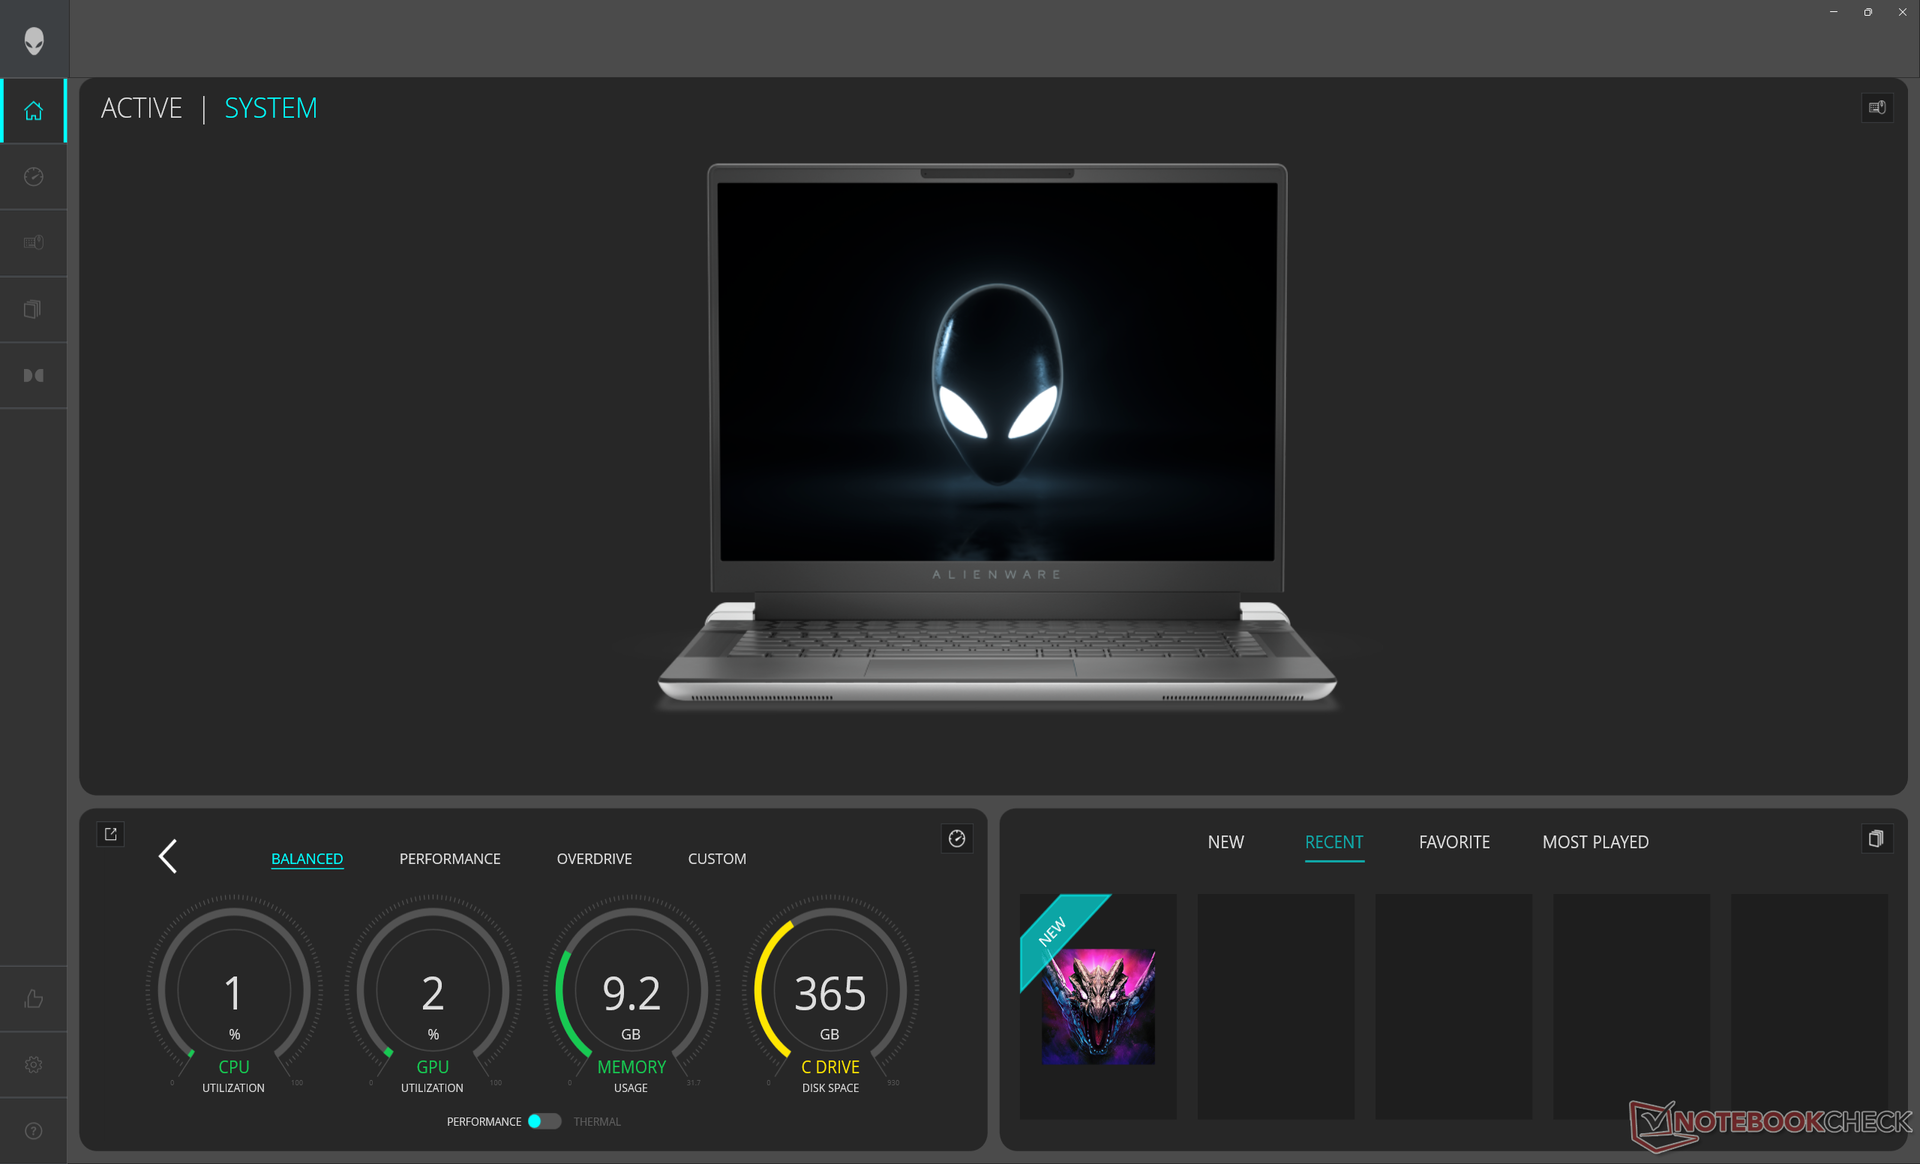
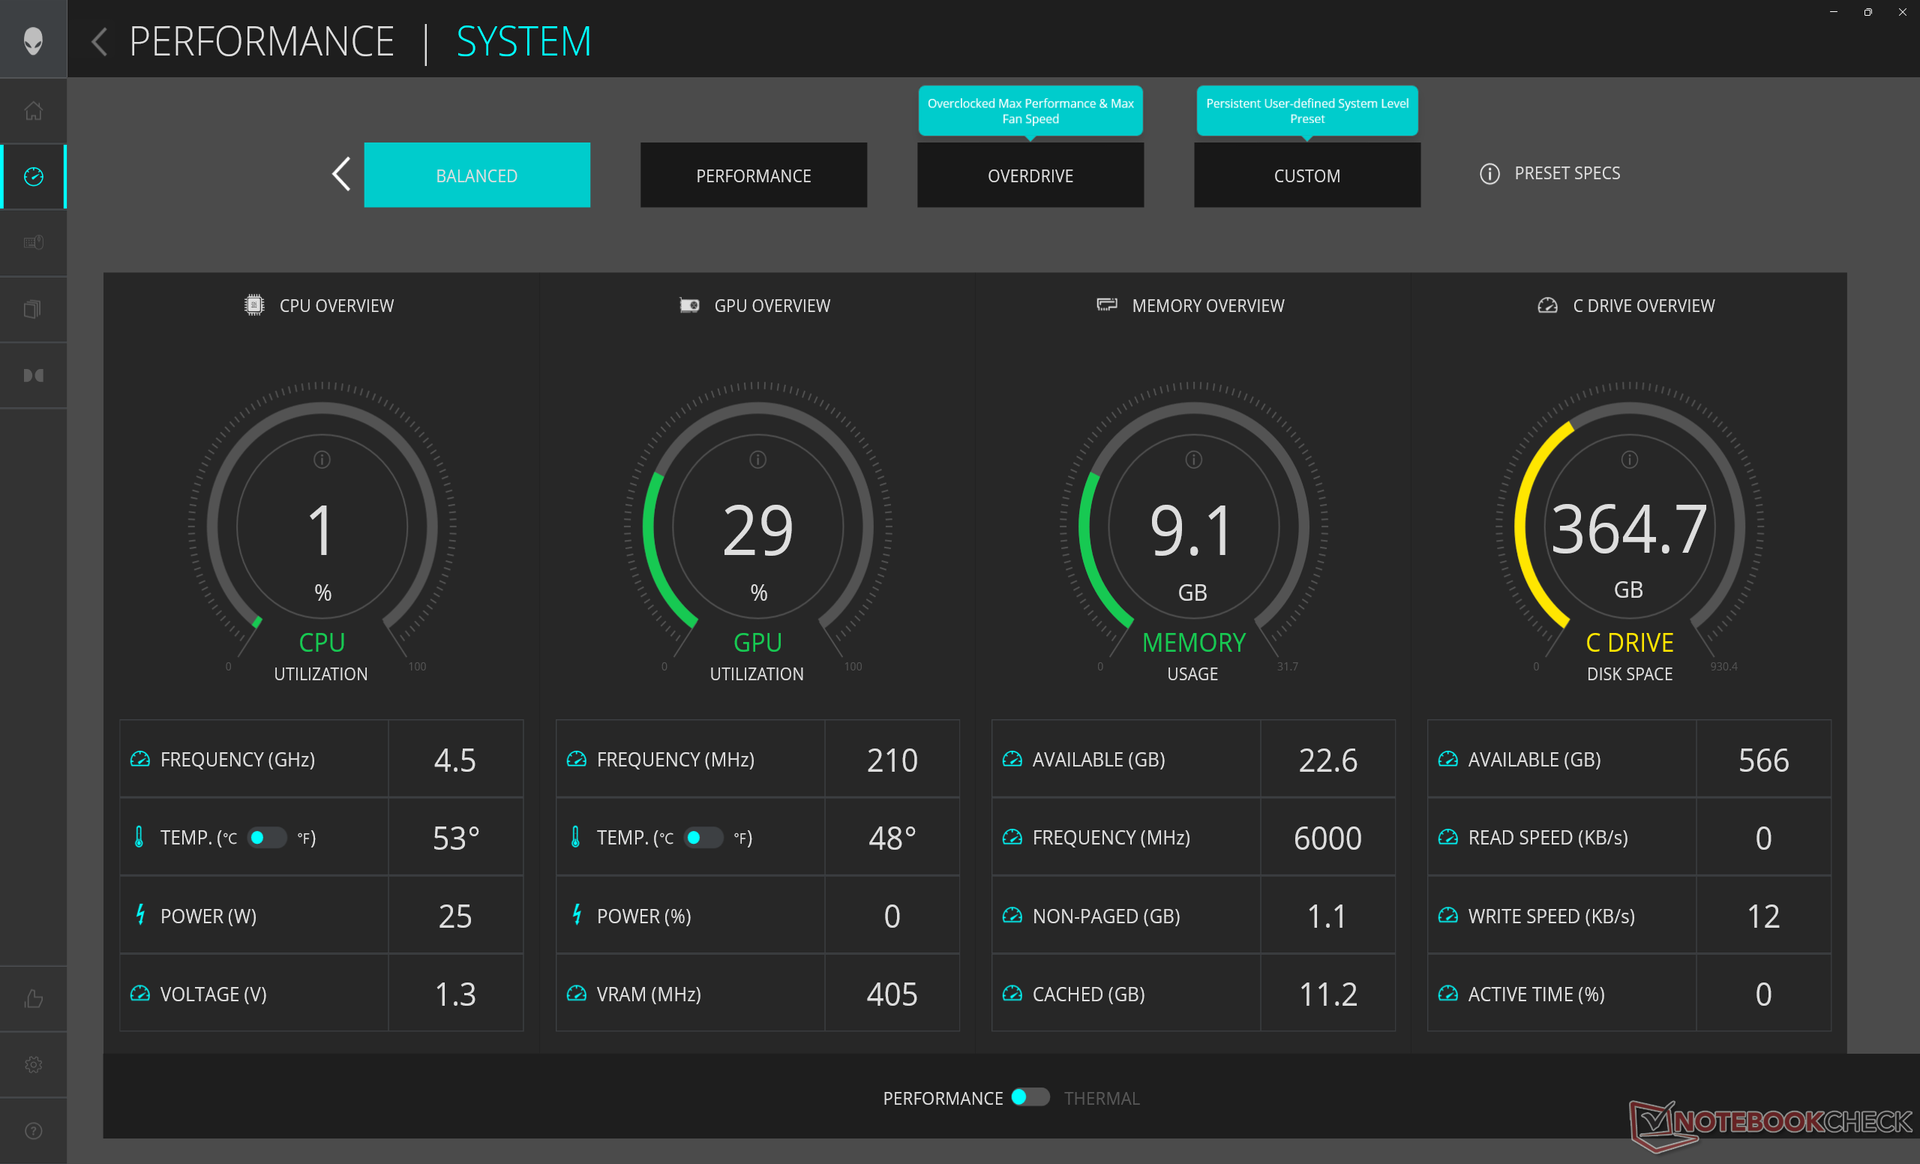
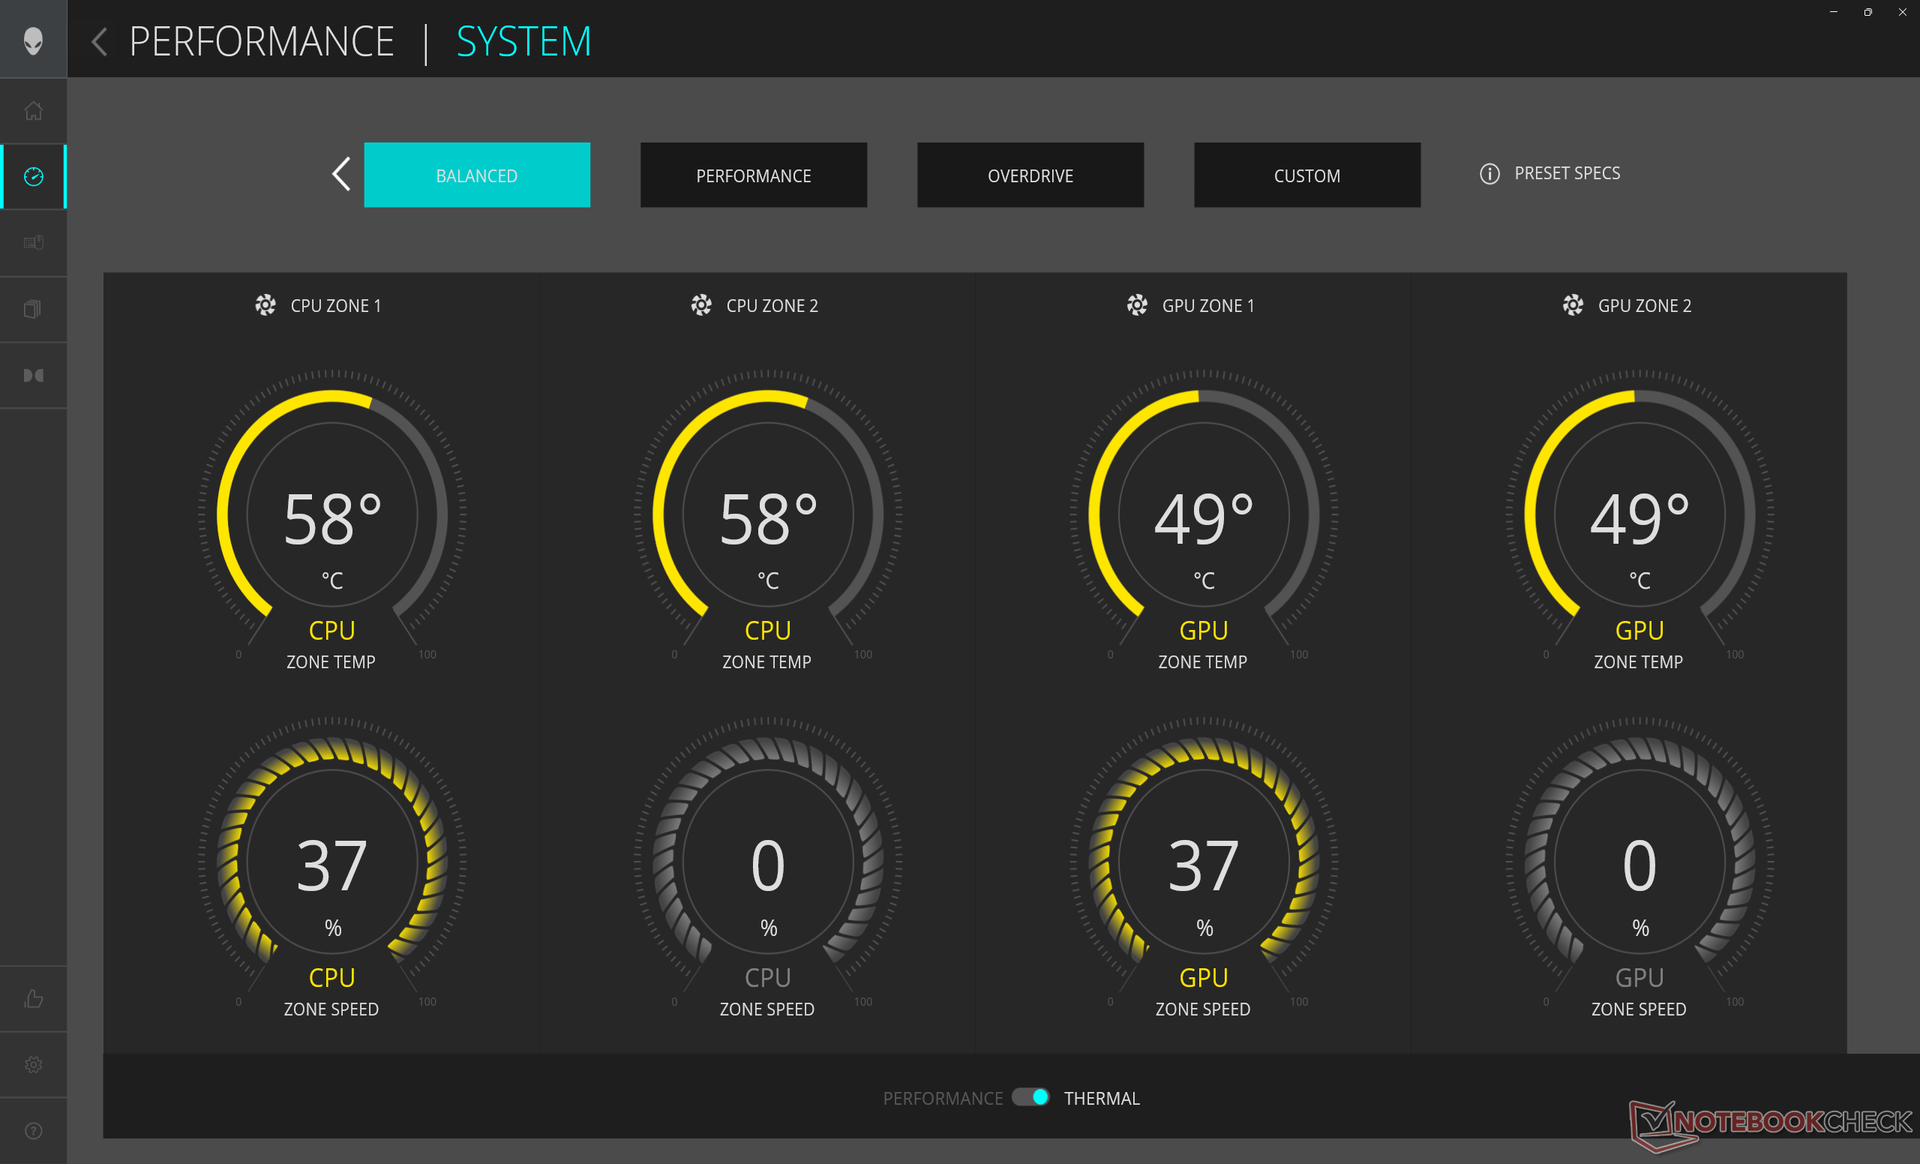
Abbiamo impostato la nostra unità in modalità Overdrive tramite l'Alienware Command Center (ACC) e in modalità High Performance tramite Windows prima di eseguire i benchmark qui sotto. Ci siamo anche assicurati di impostare la grafica solo in modalità dGPU e non Optimus tramite il pannello di controllo Nvidia. Purtroppo, i profili energetici dell'ACC non sono sincronizzati con Windows e quindi è possibile avere profili attivi in conflitto (ad esempio, uno impostato su Risparmio energetico e l'altro su Prestazioni).
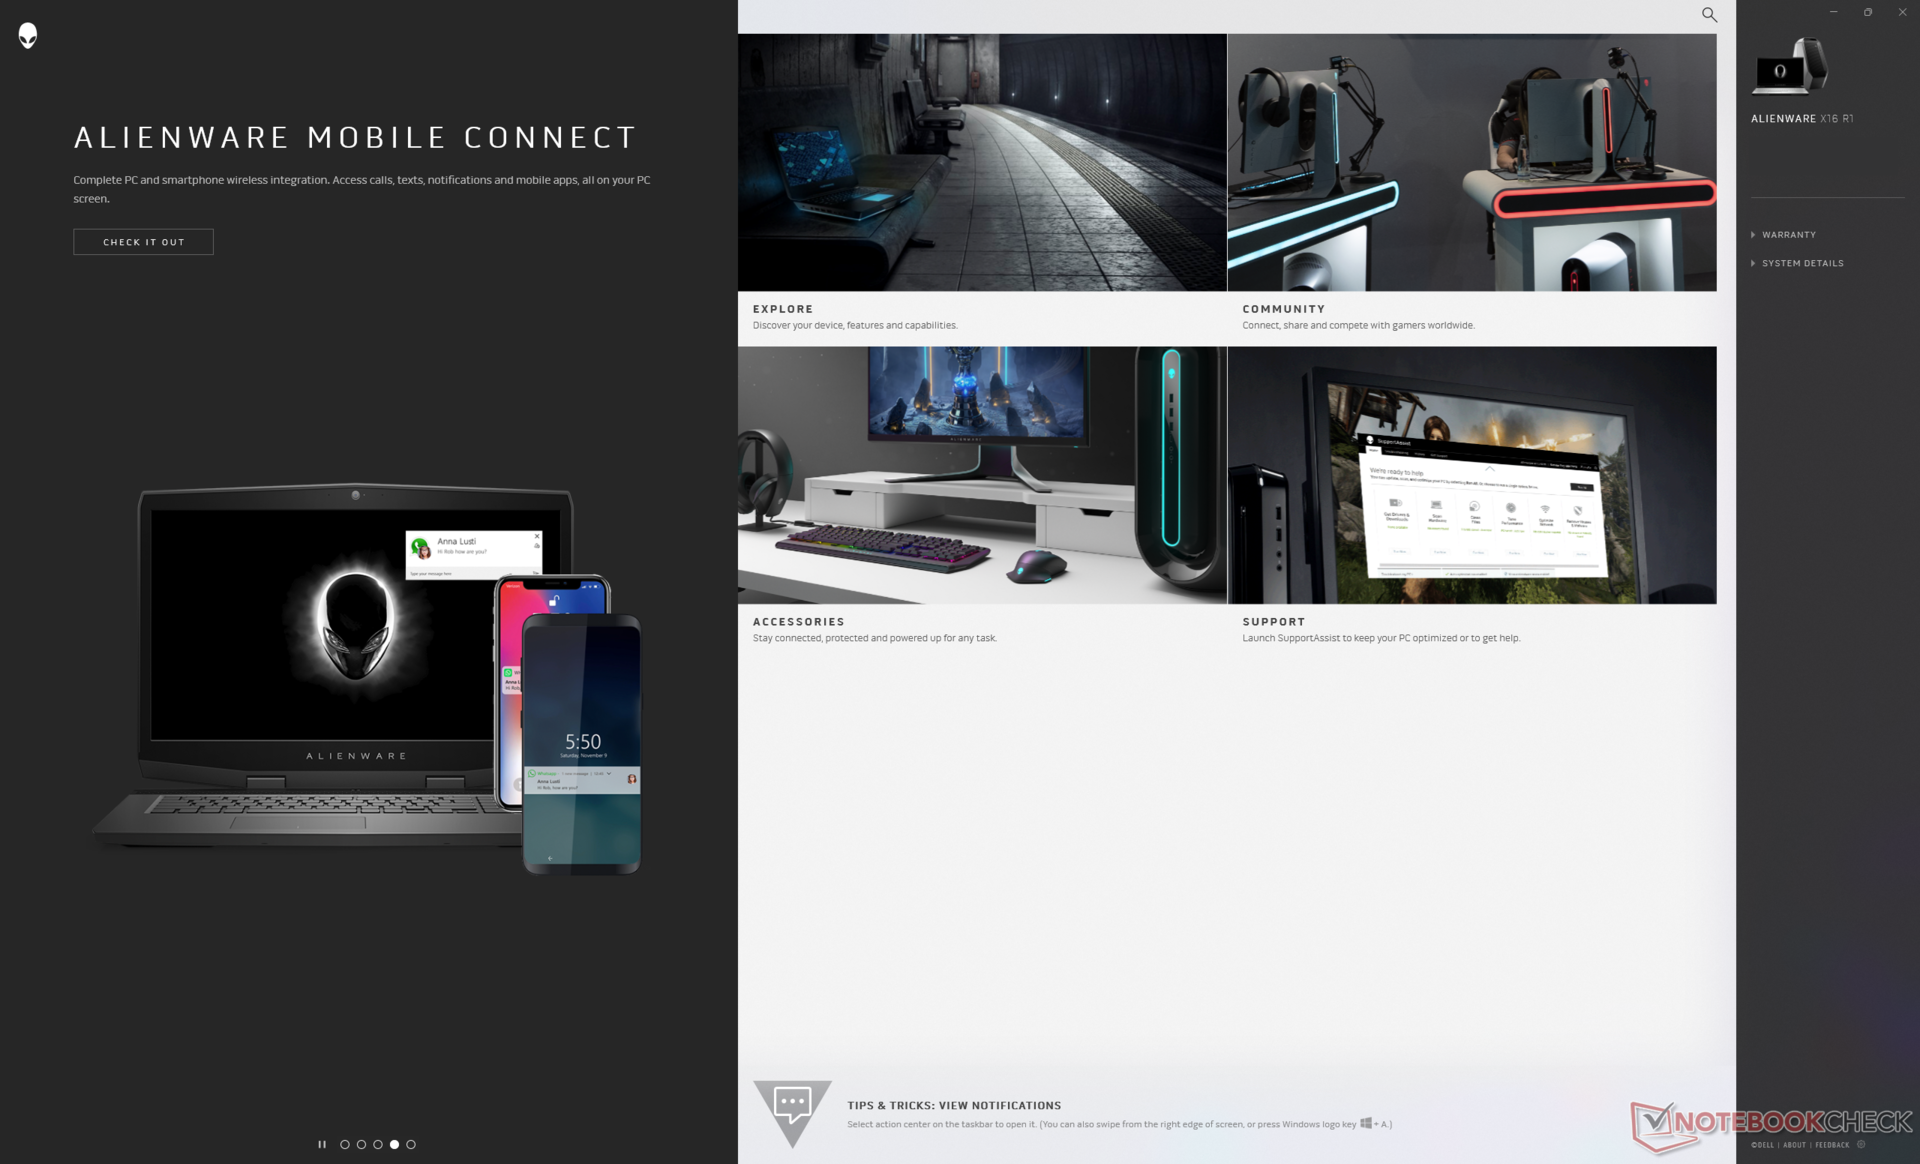
ACC non deve essere confuso con My Alienware. Il primo è un hub di controllo per i dati vitali del sistema, le impostazioni RGB, i profili di alimentazione e le impostazioni di gioco, mentre il secondo è un nodo per l'assistenza Dell, la connessione mobile e gli accessori opzionali.
L'Advanced Optimus o MUX è supportato su tutte le SKU. Tenere presente che G-Sync è attivo per il monitor interno se impostato solo in modalità dGPU.
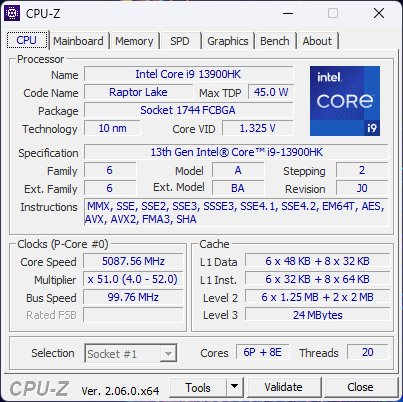
Processore
È importante notare che il modello raggiunge il limite massimo di potenza del Core i9-13900HK e non al Core i9-13900HX quest'ultimo in grado di offrire prestazioni multi-thread superiori del 50-60%. Le prestazioni complessive del nostro Core i7-13900HK sono quindi quasi identiche a quelle del meno costoso Core i9-13900H e paragonabili a quelle del concorrente Ryzen 7 7745HX. Per ottenere prestazioni più elevate, i giocatori potrebbero prendere in considerazione il più spesso Alienware m16 o il Lenovo Legion Pro 7, che possono essere configurati con il Core i7-13900HX.
Il downgrade al meno costoso i7-13620H o i7-13700H si prevede un impatto sulle prestazioni del processore di circa il 15-20%, in base al tempo trascorso con l'MSI Katana 17 e il Dell XPS 17 9730.
Cinebench R15 Multi Loop
Cinebench R20: CPU (Multi Core) | CPU (Single Core)
Cinebench R23: Multi Core | Single Core
Cinebench R15: CPU Multi 64Bit | CPU Single 64Bit
Blender: v2.79 BMW27 CPU
7-Zip 18.03: 7z b 4 | 7z b 4 -mmt1
Geekbench 5.5: Multi-Core | Single-Core
HWBOT x265 Benchmark v2.2: 4k Preset
LibreOffice : 20 Documents To PDF
R Benchmark 2.5: Overall mean
* ... Meglio usare valori piccoli
AIDA64: FP32 Ray-Trace | FPU Julia | CPU SHA3 | CPU Queen | FPU SinJulia | FPU Mandel | CPU AES | CPU ZLib | FP64 Ray-Trace | CPU PhotoWorxx
| Performance rating | |
| Lenovo Legion Pro 7 RTX4090 | |
| Razer Blade 16 Early 2023 | |
| Asus ROG Zephyrus M16 GU604VY-NM042X | |
| Alienware x16 R1 | |
| Alienware m17 R5 (R9 6900HX, RX 6850M XT) | |
| Dell G16 7620 | |
| Media Intel Core i9-13900HK | |
Prestazioni del sistema
CrossMark: Overall | Productivity | Creativity | Responsiveness
| PCMark 10 / Score | |
| Alienware x16 R1 | |
| Media Intel Core i9-13900HK, NVIDIA GeForce RTX 4080 Laptop GPU (n=1) | |
| Asus ROG Zephyrus M16 GU604VY-NM042X | |
| Lenovo Legion Pro 7 RTX4090 | |
| Razer Blade 16 Early 2023 | |
| Alienware m17 R5 (R9 6900HX, RX 6850M XT) | |
| Dell G16 7620 | |
| PCMark 10 / Essentials | |
| Asus ROG Zephyrus M16 GU604VY-NM042X | |
| Alienware x16 R1 | |
| Media Intel Core i9-13900HK, NVIDIA GeForce RTX 4080 Laptop GPU (n=1) | |
| Lenovo Legion Pro 7 RTX4090 | |
| Razer Blade 16 Early 2023 | |
| Dell G16 7620 | |
| Alienware m17 R5 (R9 6900HX, RX 6850M XT) | |
| PCMark 10 / Productivity | |
| Asus ROG Zephyrus M16 GU604VY-NM042X | |
| Alienware x16 R1 | |
| Media Intel Core i9-13900HK, NVIDIA GeForce RTX 4080 Laptop GPU (n=1) | |
| Alienware m17 R5 (R9 6900HX, RX 6850M XT) | |
| Lenovo Legion Pro 7 RTX4090 | |
| Dell G16 7620 | |
| Razer Blade 16 Early 2023 | |
| PCMark 10 / Digital Content Creation | |
| Lenovo Legion Pro 7 RTX4090 | |
| Razer Blade 16 Early 2023 | |
| Alienware x16 R1 | |
| Media Intel Core i9-13900HK, NVIDIA GeForce RTX 4080 Laptop GPU (n=1) | |
| Asus ROG Zephyrus M16 GU604VY-NM042X | |
| Alienware m17 R5 (R9 6900HX, RX 6850M XT) | |
| Dell G16 7620 | |
| CrossMark / Overall | |
| Asus ROG Zephyrus M16 GU604VY-NM042X | |
| Alienware x16 R1 | |
| Media Intel Core i9-13900HK, NVIDIA GeForce RTX 4080 Laptop GPU (n=1) | |
| Dell G16 7620 | |
| Alienware m17 R5 (R9 6900HX, RX 6850M XT) | |
| Razer Blade 16 Early 2023 | |
| CrossMark / Productivity | |
| Asus ROG Zephyrus M16 GU604VY-NM042X | |
| Alienware x16 R1 | |
| Media Intel Core i9-13900HK, NVIDIA GeForce RTX 4080 Laptop GPU (n=1) | |
| Dell G16 7620 | |
| Alienware m17 R5 (R9 6900HX, RX 6850M XT) | |
| Razer Blade 16 Early 2023 | |
| CrossMark / Creativity | |
| Asus ROG Zephyrus M16 GU604VY-NM042X | |
| Alienware x16 R1 | |
| Media Intel Core i9-13900HK, NVIDIA GeForce RTX 4080 Laptop GPU (n=1) | |
| Dell G16 7620 | |
| Razer Blade 16 Early 2023 | |
| Alienware m17 R5 (R9 6900HX, RX 6850M XT) | |
| CrossMark / Responsiveness | |
| Alienware x16 R1 | |
| Media Intel Core i9-13900HK, NVIDIA GeForce RTX 4080 Laptop GPU (n=1) | |
| Asus ROG Zephyrus M16 GU604VY-NM042X | |
| Dell G16 7620 | |
| Razer Blade 16 Early 2023 | |
| Alienware m17 R5 (R9 6900HX, RX 6850M XT) | |
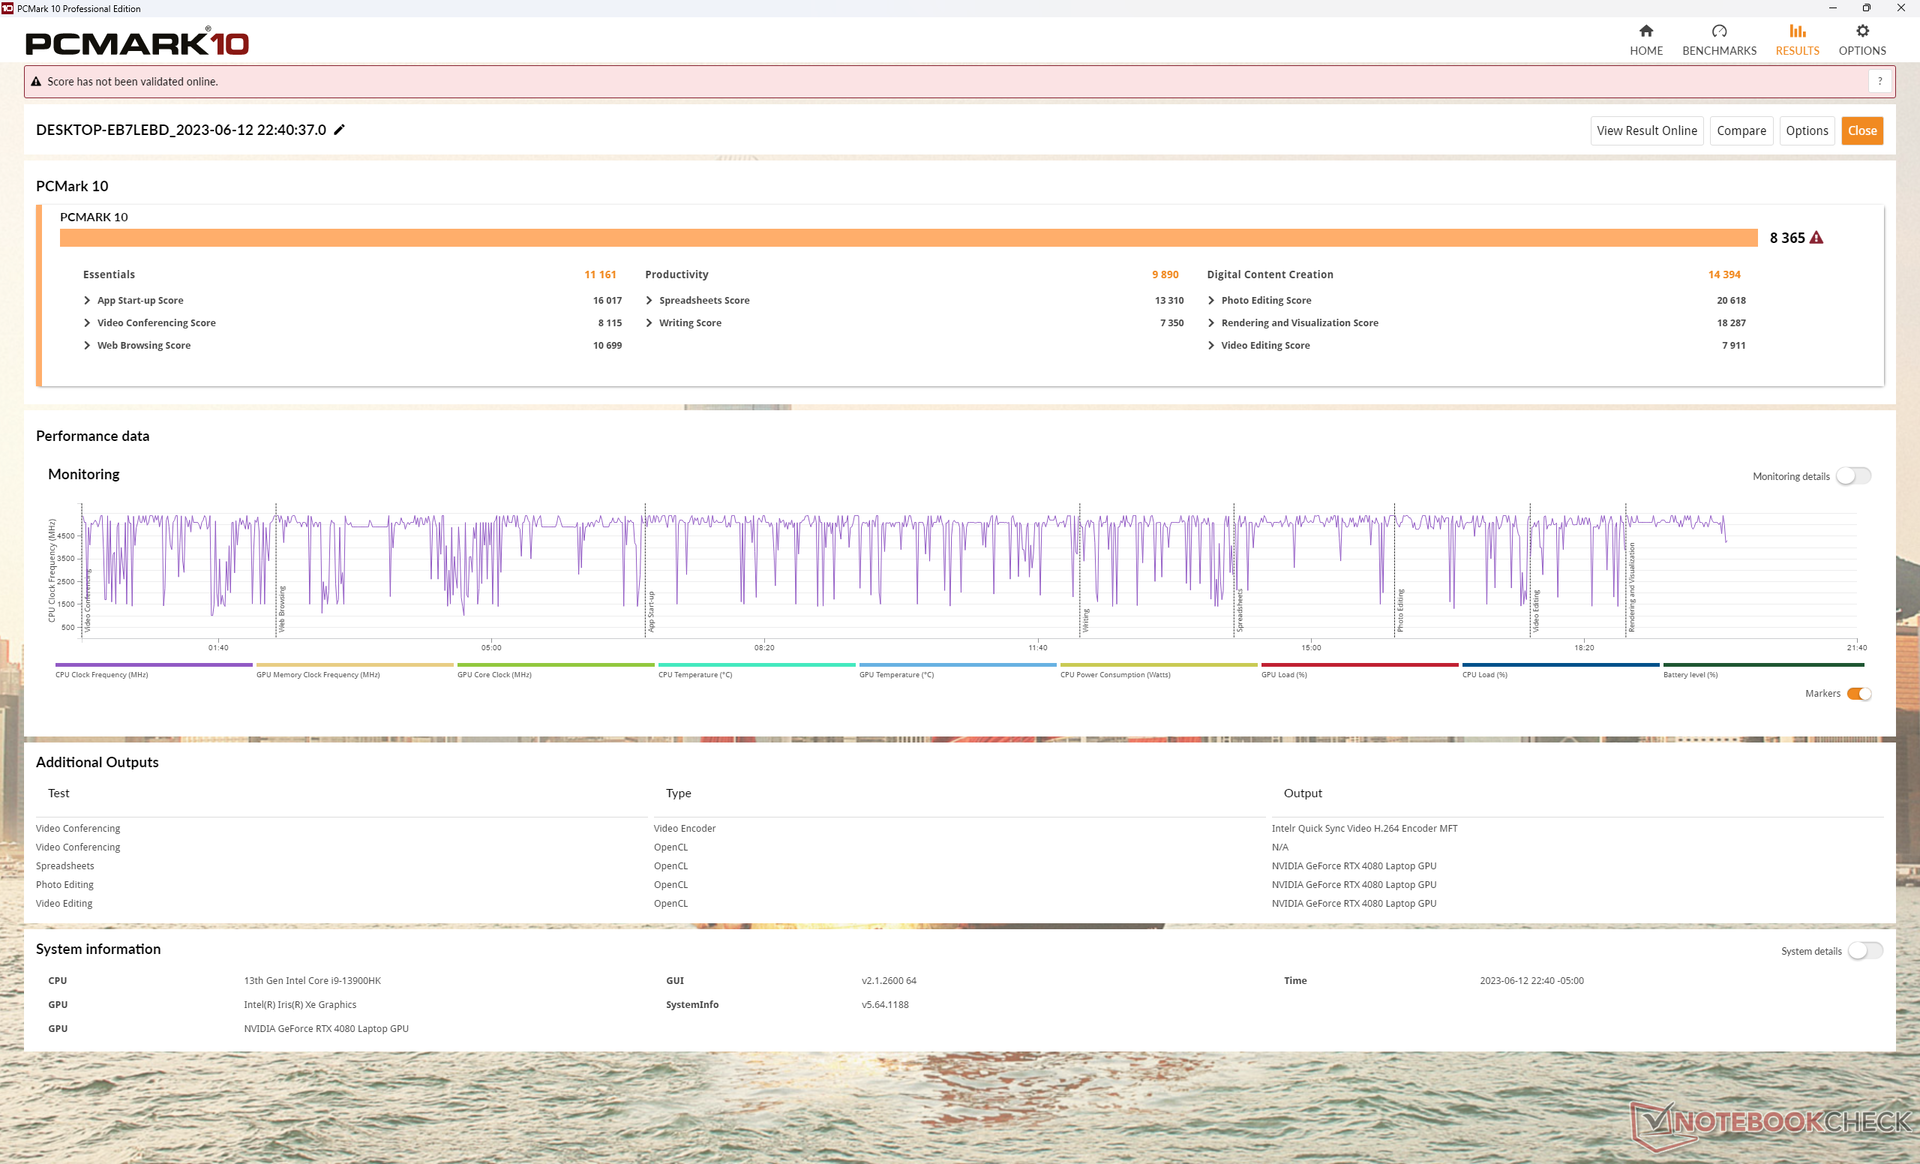
| PCMark 10 Score | 8365 punti | |
Aiuto | ||
* ... Meglio usare valori piccoli
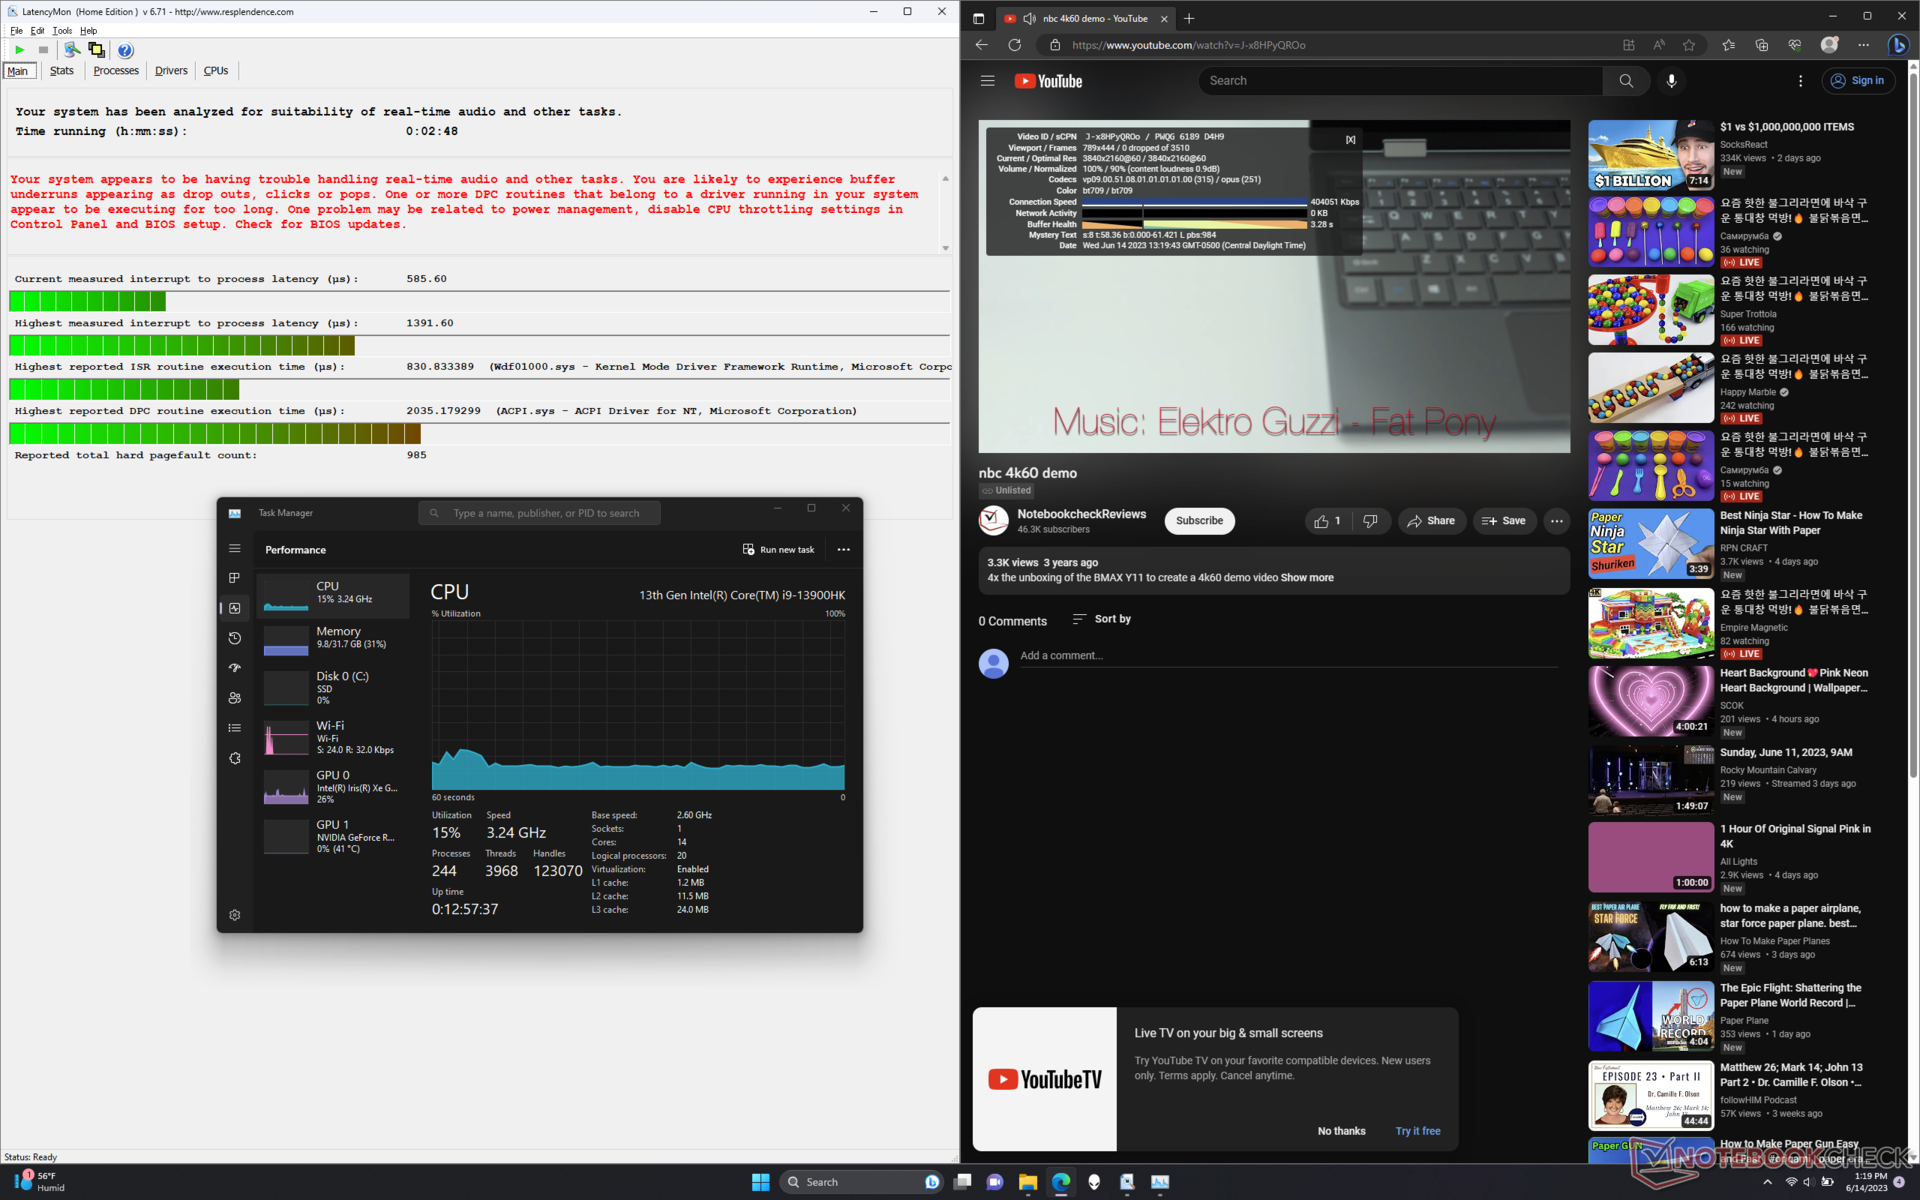
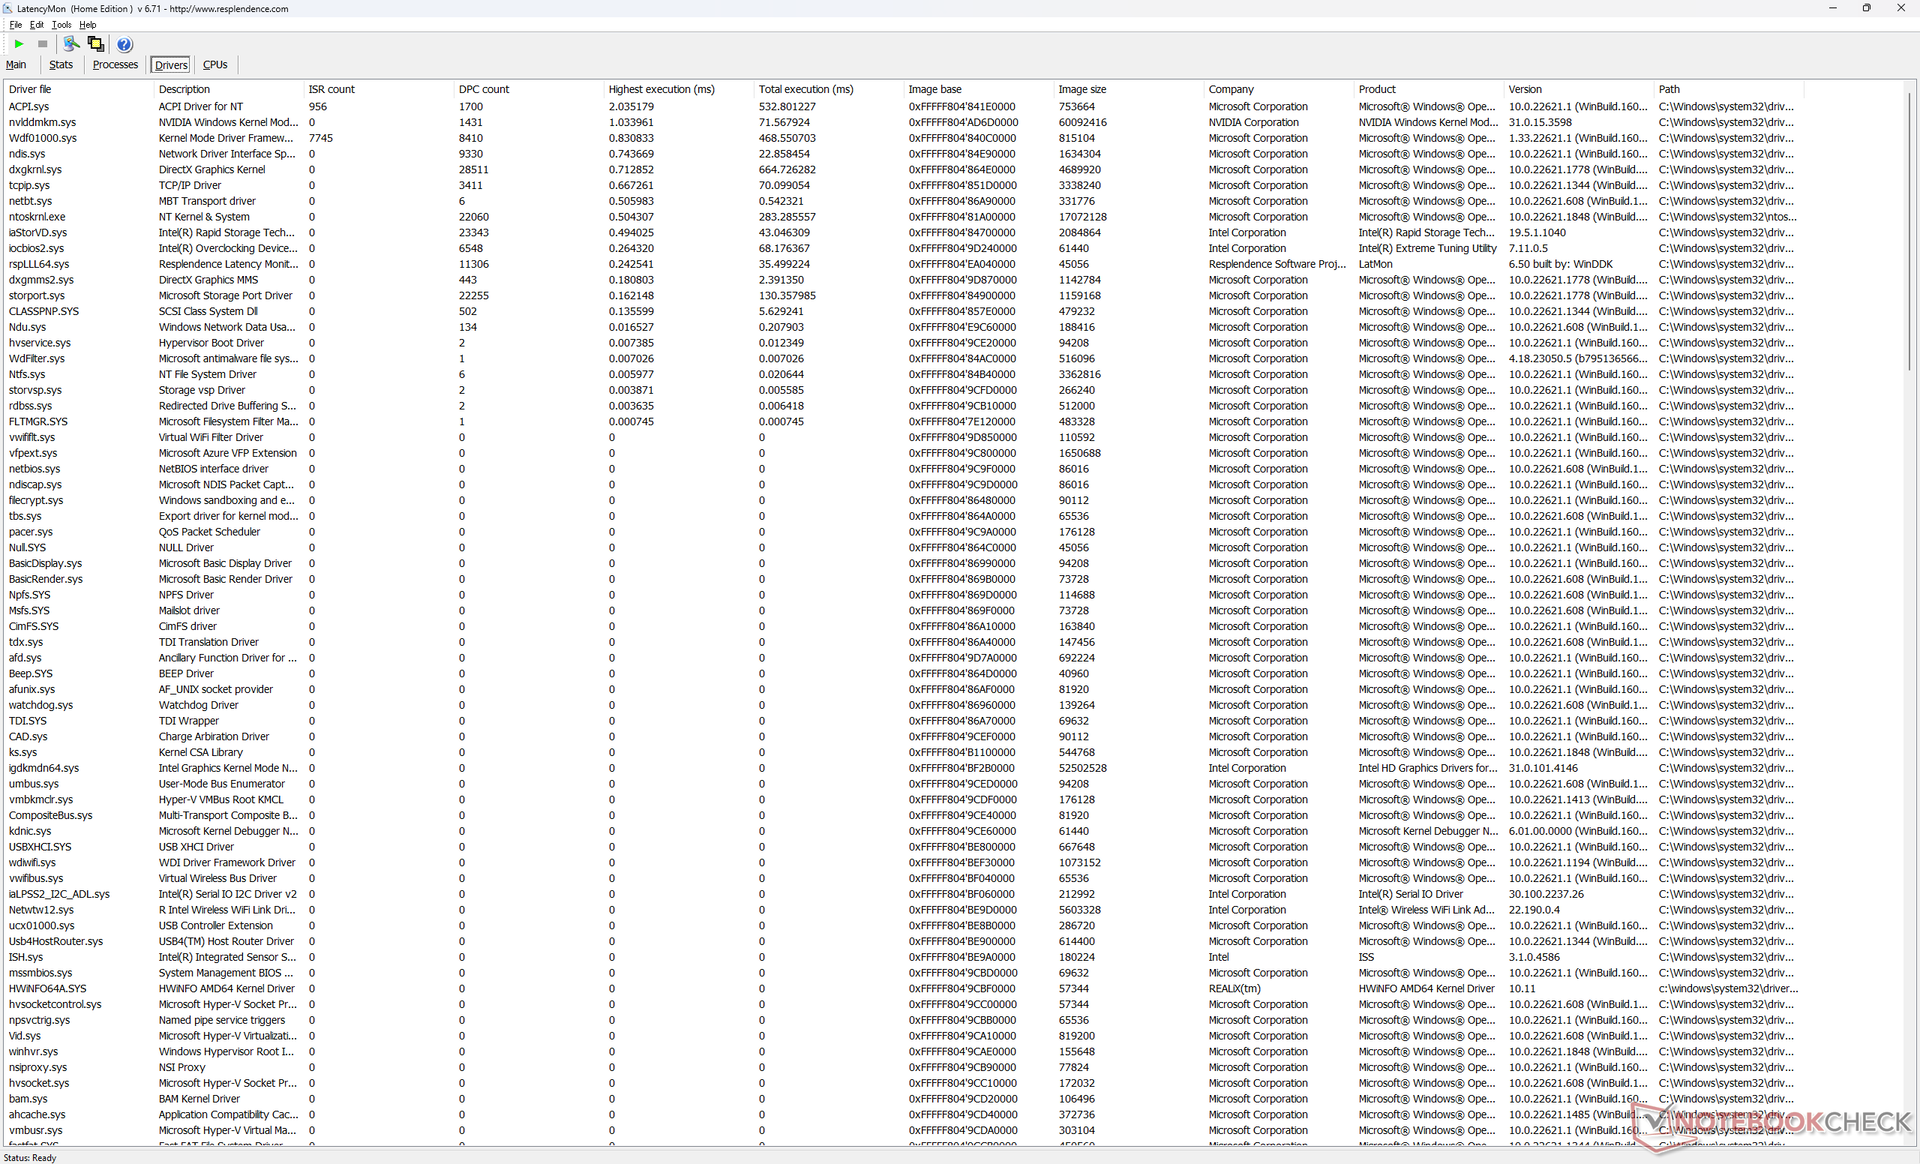
Latenza DPC
LatencyMon rivela problemi di DPC quando si aprono più schede del browser della nostra homepage. la riproduzione di video 4K a 60 FPS è invece perfetta, senza cadute di fotogrammi.
| DPC Latencies / LatencyMon - interrupt to process latency (max), Web, Youtube, Prime95 | |
| Lenovo Legion Pro 7 RTX4090 | |
| Asus ROG Zephyrus M16 GU604VY-NM042X | |
| Razer Blade 16 Early 2023 | |
| Alienware x16 R1 | |
| Alienware m17 R5 (R9 6900HX, RX 6850M XT) | |
| Dell G16 7620 | |
* ... Meglio usare valori piccoli
Dispositivi di archiviazione
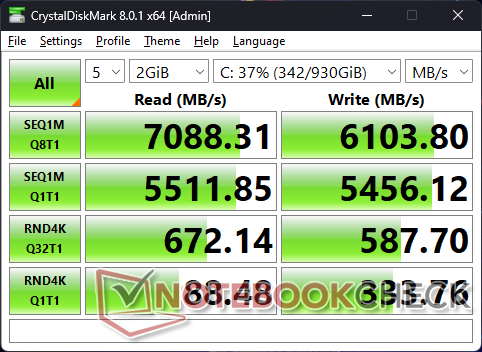
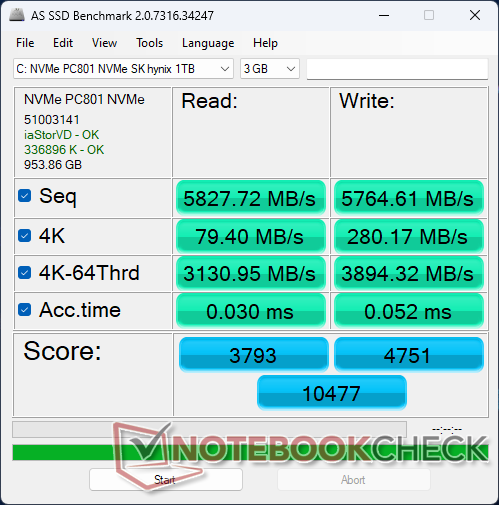
Il PCIe4 x4 SK Hynix PC801 nella nostra unità può raggiungere velocità di lettura fino a 7100 MB/s, paragonabili a quelle del popolare Samsung PM9A1. Purtroppo, l'unità ha problemi a mantenere la velocità di trasferimento massima per periodi prolungati, probabilmente a causa di un raffreddamento insufficiente. Quando si esegue DiskSpd in loop, ad esempio, le velocità di lettura scendono fino a 3400 MB/s dopo pochi minuti di stress test, come mostra il grafico seguente. I risultati non miglioravano dopo aver ripetuto il test.


| Drive Performance rating - Percent | |
| Alienware x16 R1 | |
| Lenovo Legion Pro 7 RTX4090 | |
| Dell G16 7620 | |
| Asus ROG Zephyrus M16 GU604VY-NM042X | |
| Razer Blade 16 Early 2023 | |
| Alienware m17 R5 (R9 6900HX, RX 6850M XT) | |
* ... Meglio usare valori piccoli
Disk Throttling: DiskSpd Read Loop, Queue Depth 8
Prestazioni della GPU - 175 W GeForce RTX 4080
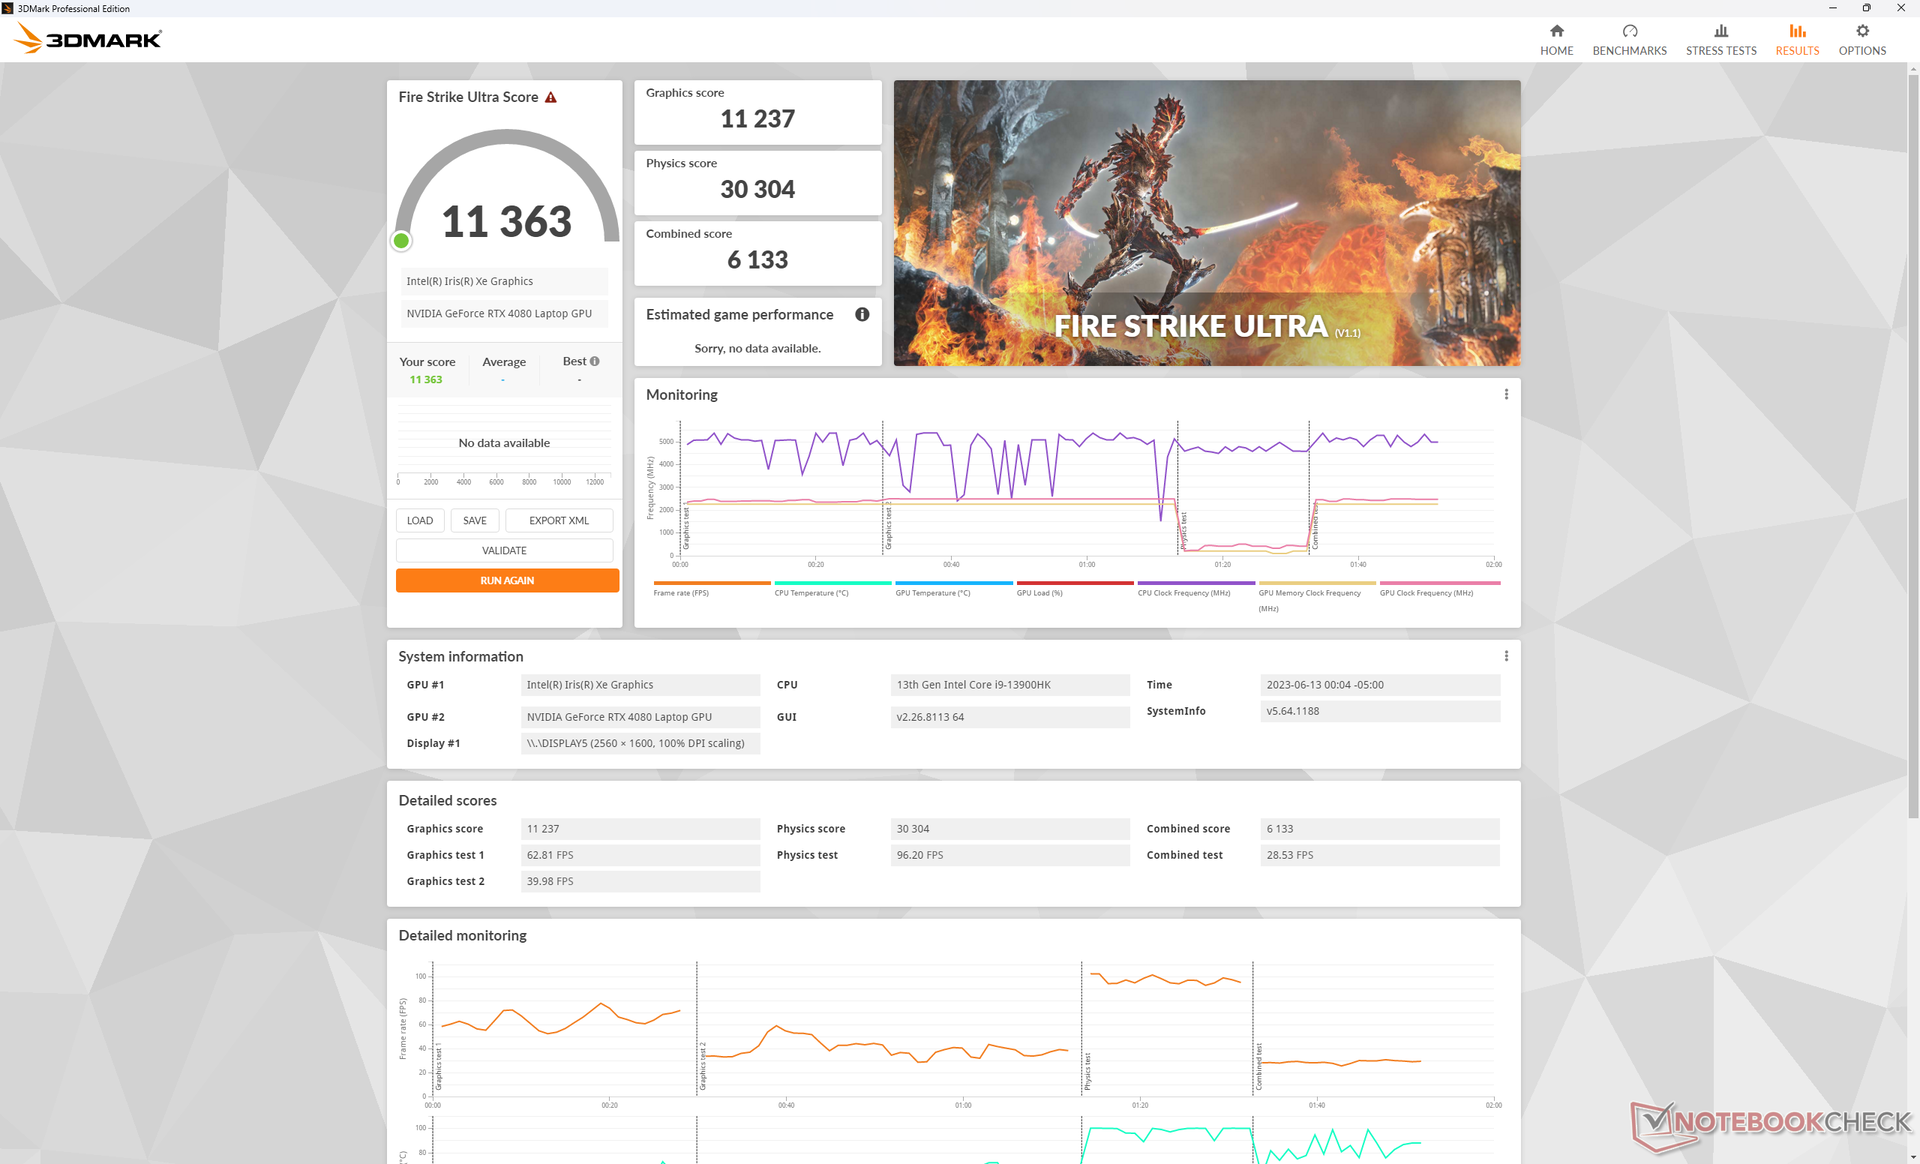
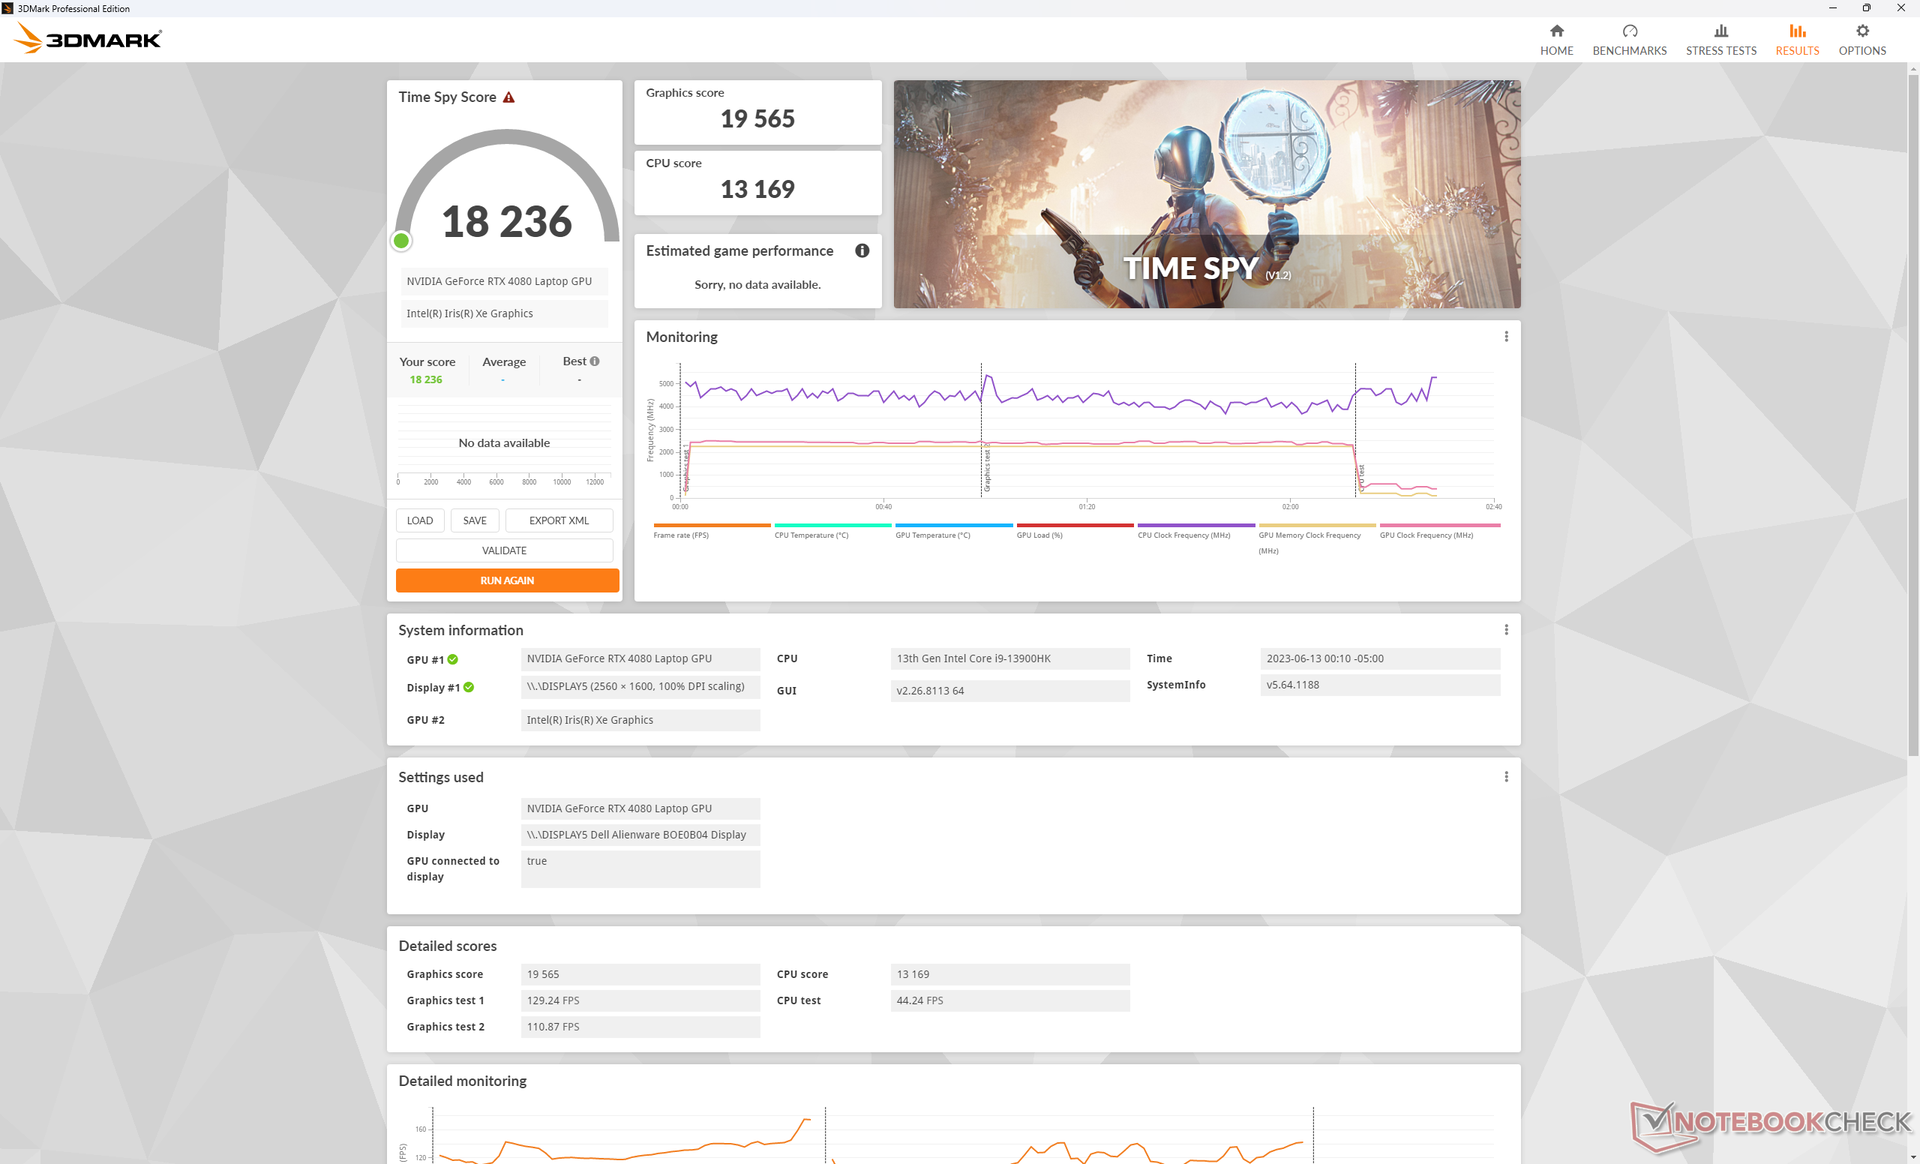
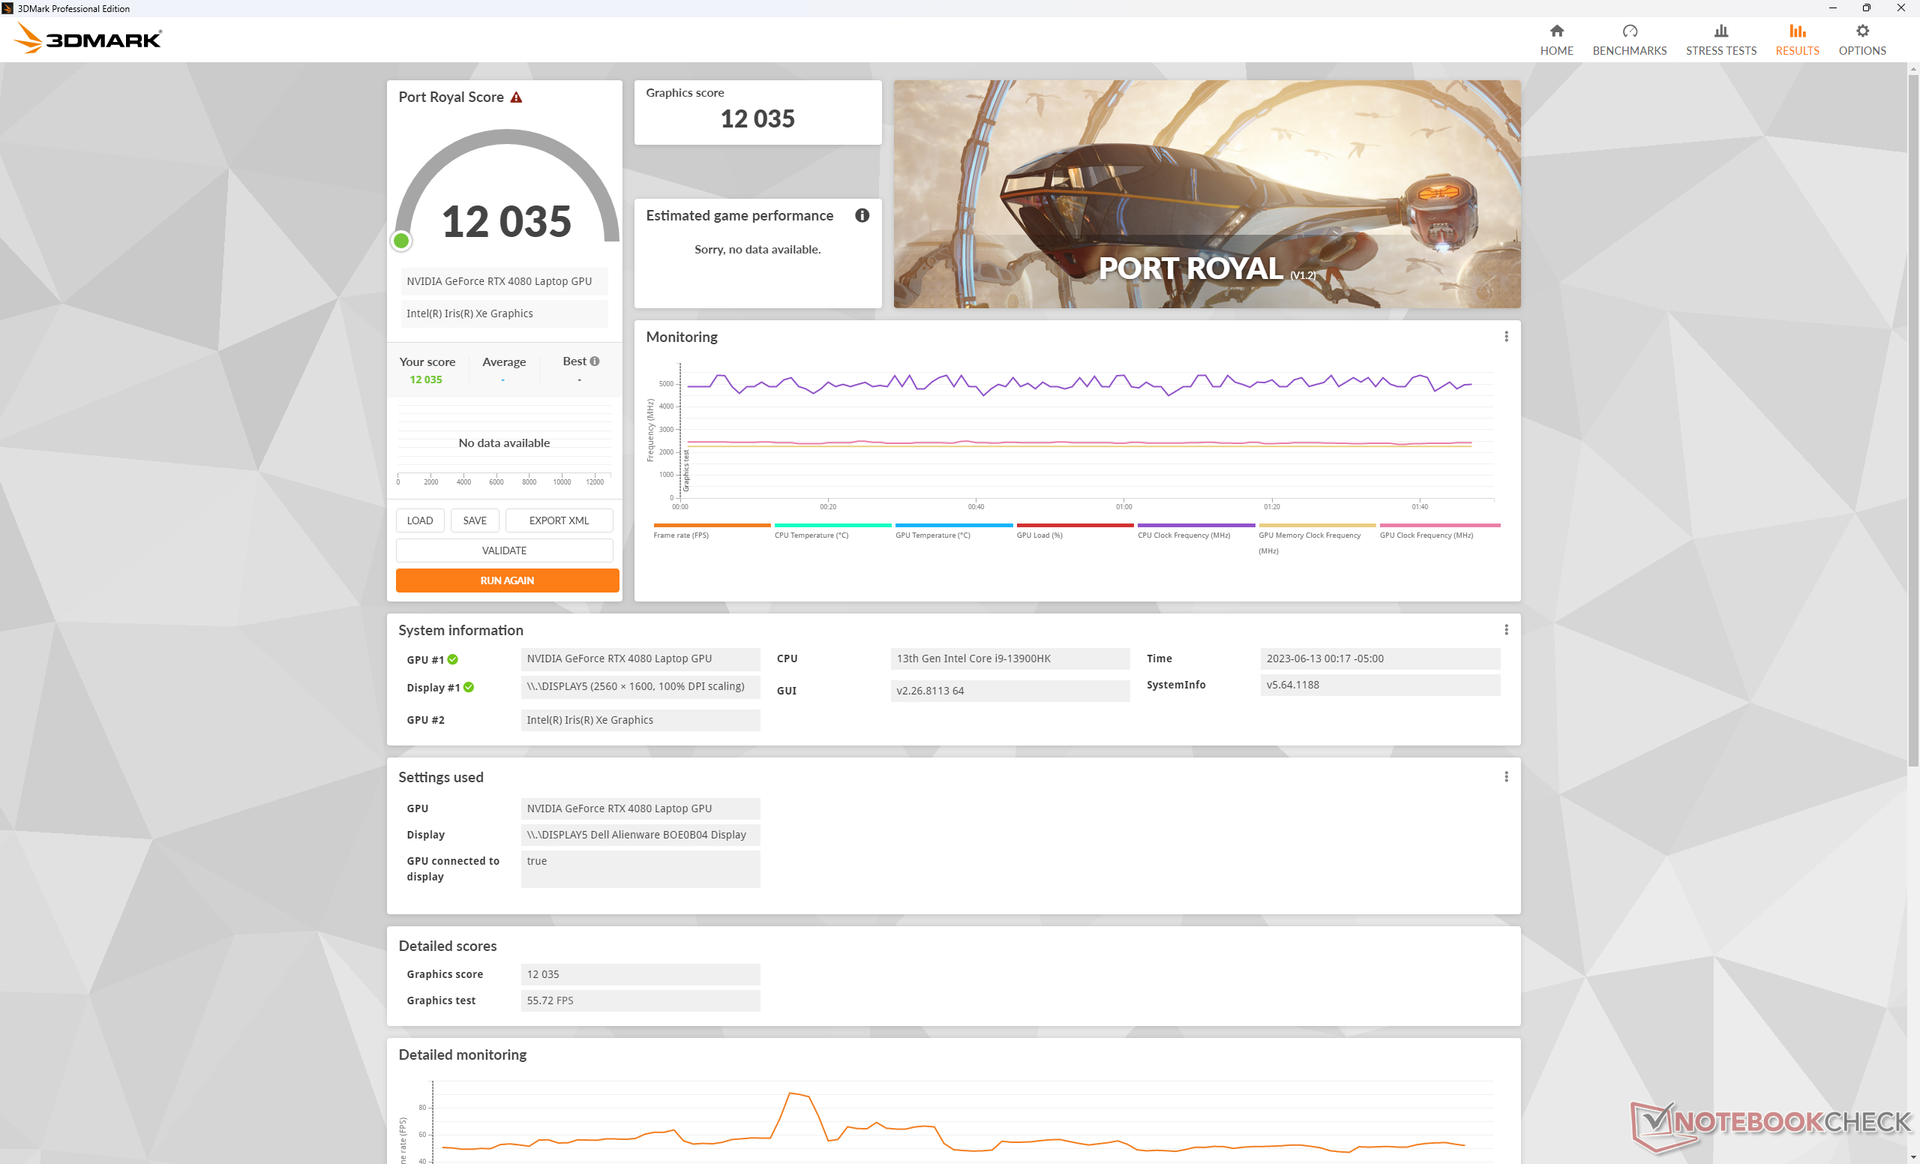
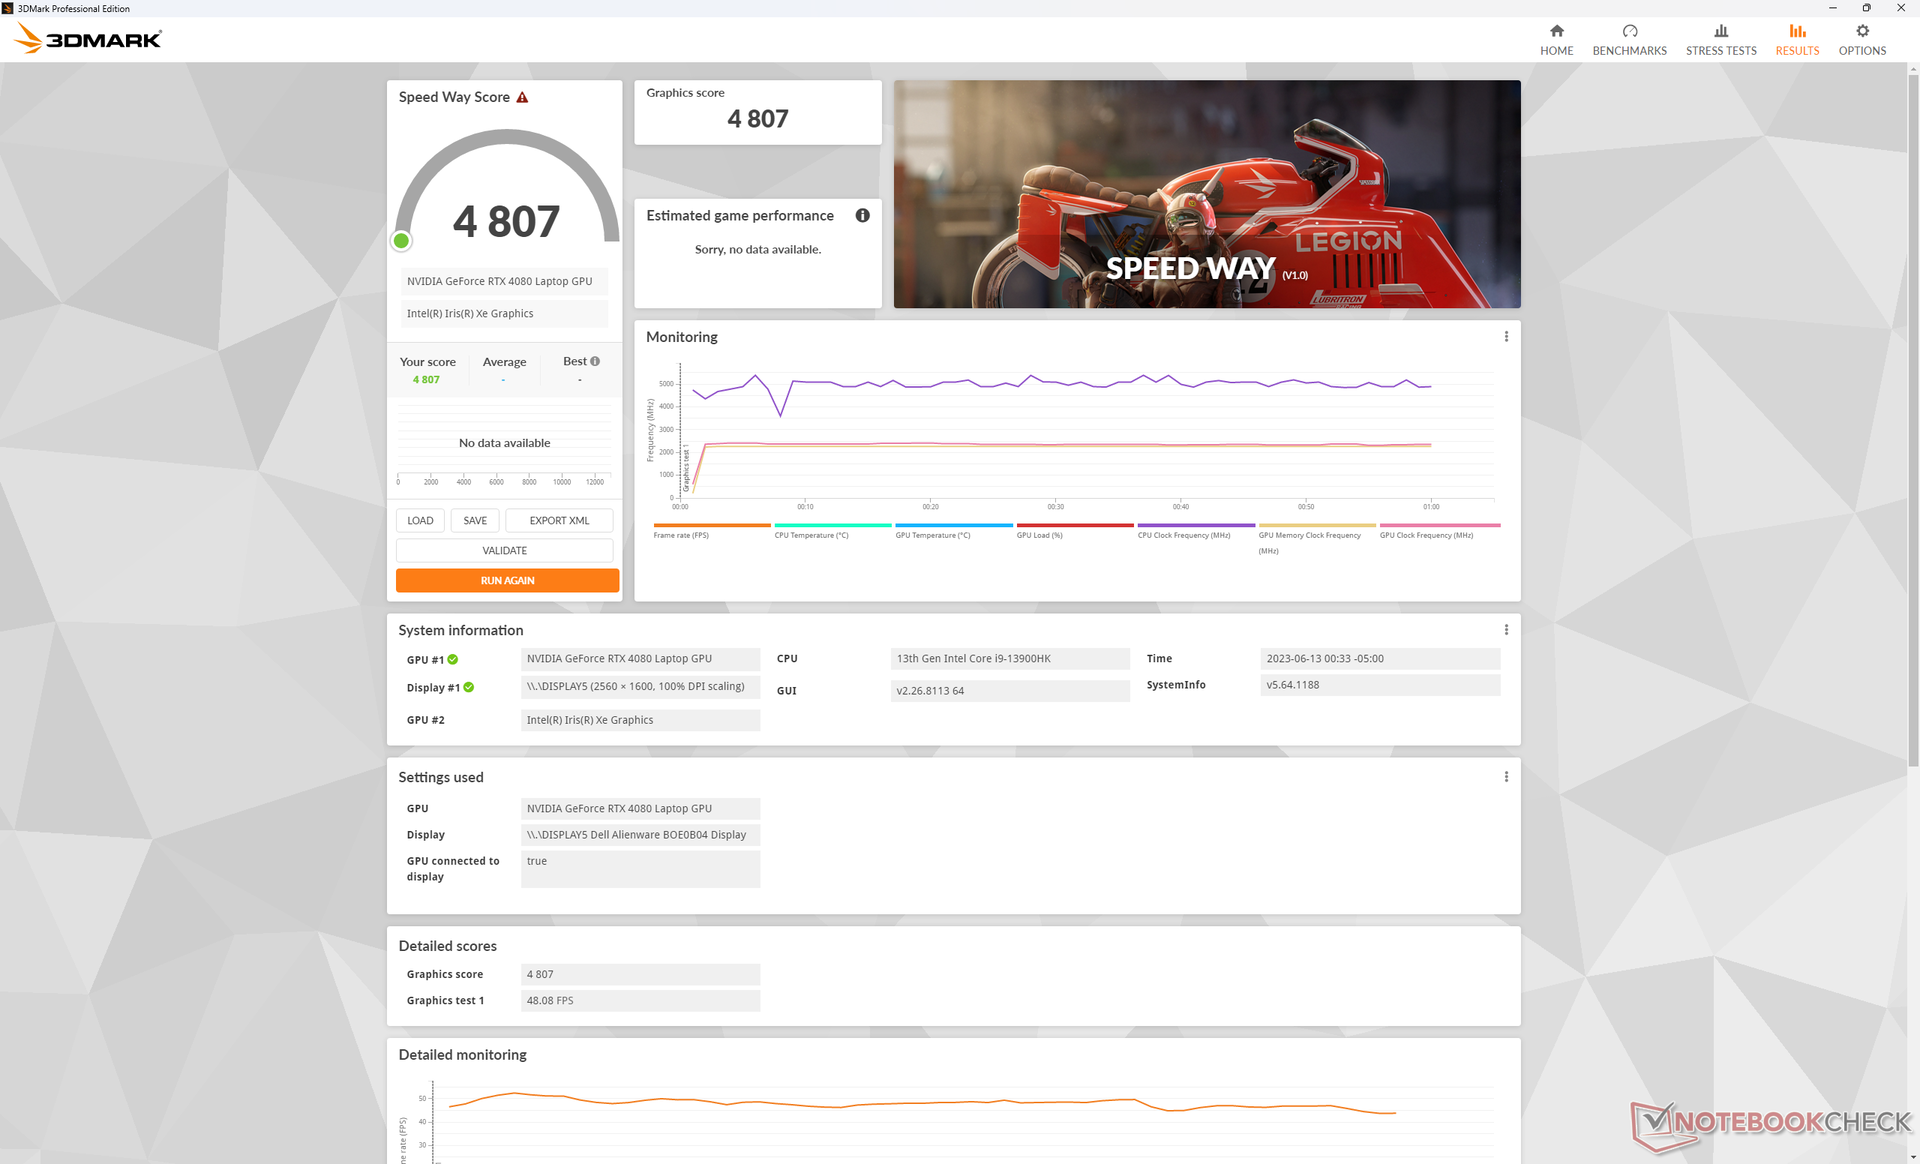
La GeForce RTX 4080 nel nostro Alienware x16 è più veloce di circa il 5-10% rispetto alla media dei portatili del nostro database dotati della stessa GPU RTX 4080. Il vantaggio potrebbe non sembrare molto, ma è sufficiente per rendere il sistema uno dei portatili da gioco con RTX 4080 più veloci che si possano acquistare. i risultati di 3DMark sono solo del 10% rispetto a quelli di RTX 4090 dell'asus Zephyrus Duo 16per esempio.
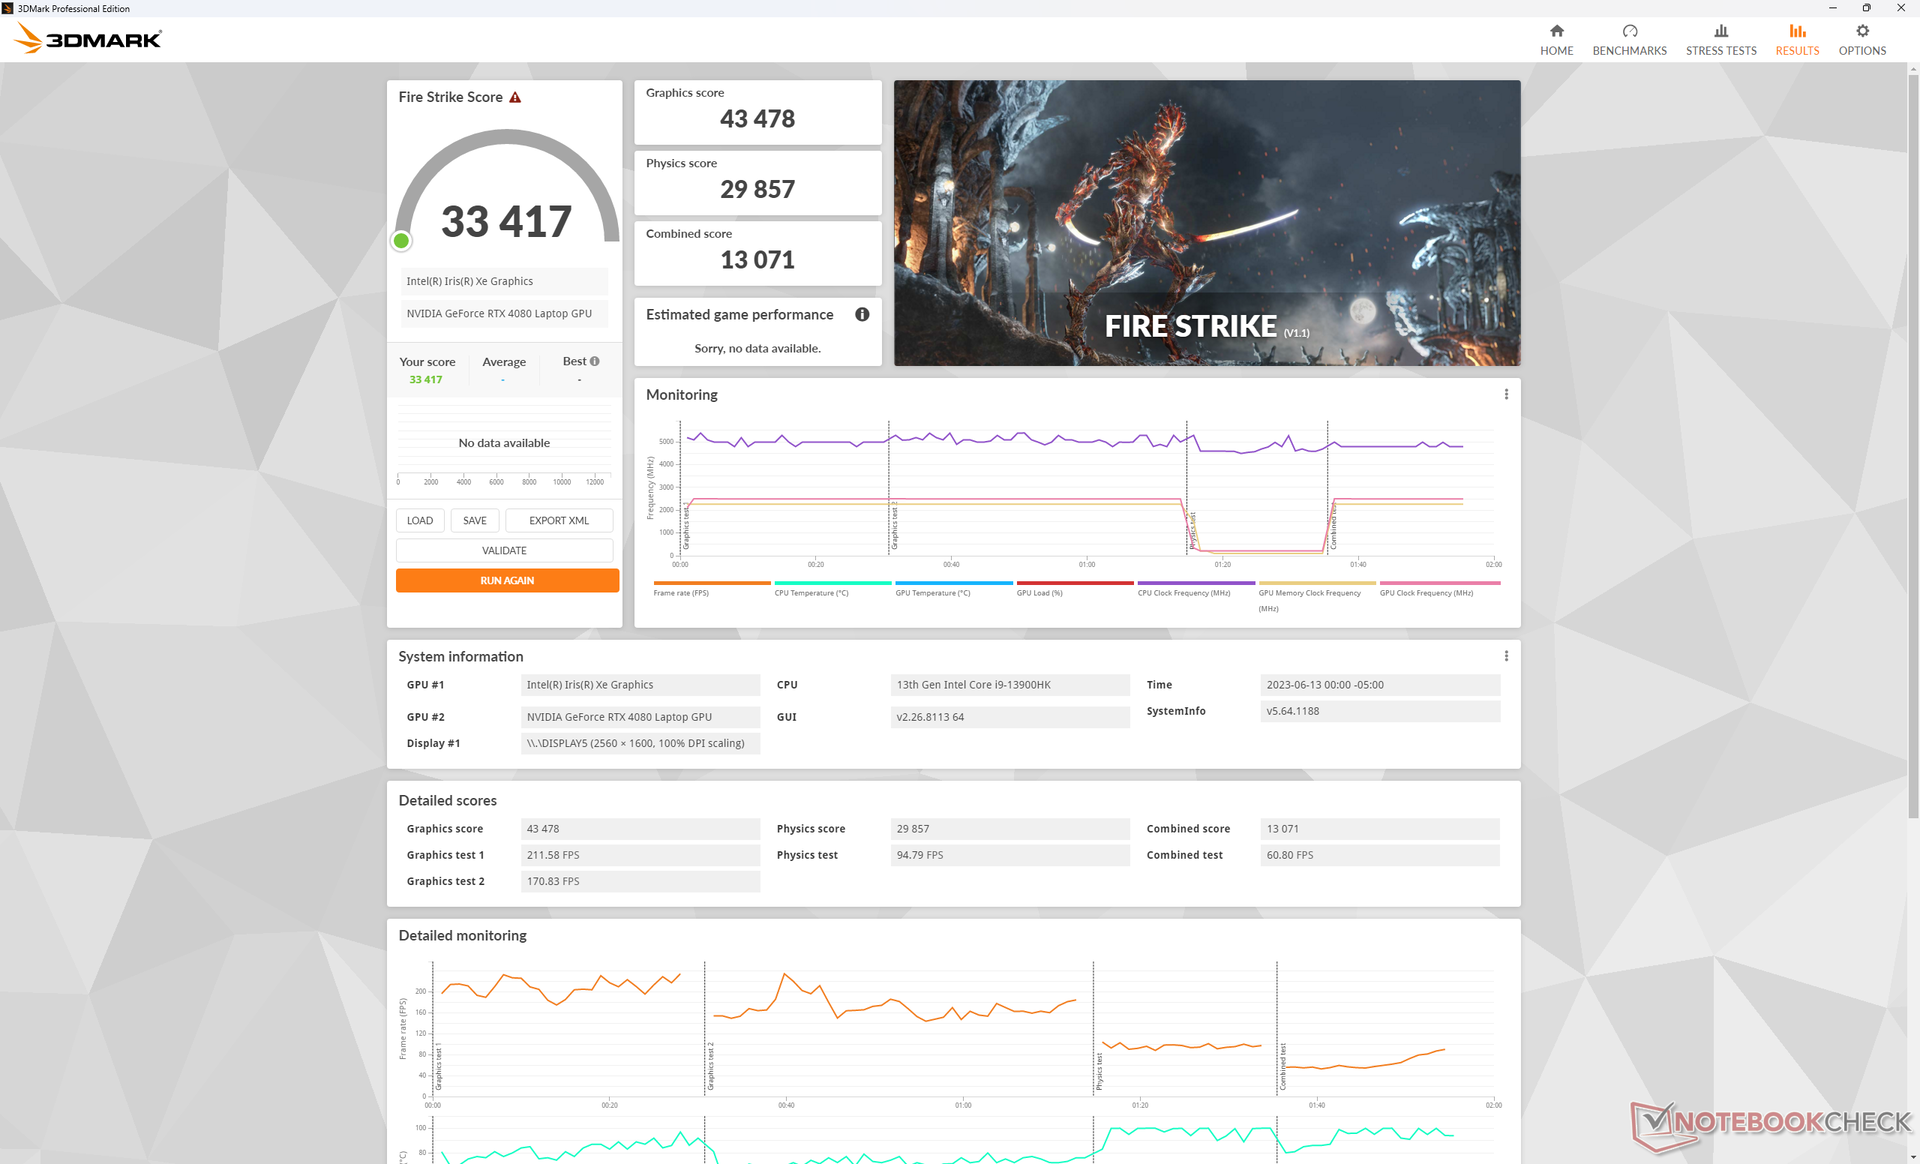
È interessante notare che i punteggi di 3DMark si riducono di pochi punti percentuali quando si utilizzano le modalità Performance e Balanced, più silenziose, anziché la modalità Overdrive, più elevata, come mostra la tabella sottostante. Questo dato è importante da tenere presente nelle sezioni Stress Test e Rumore di sistema che seguono.
Passaggio alla RTX 4070 dovrebbe avere un impatto sulle prestazioni del 30-35%, mentre l'aggiornamento alla RTX 4090 dovrebbe aumentare le prestazioni di circa il 10%.
| Impostazione del profilo energetico | Fire Strike Punteggio fisico | Fire Strike Punteggio GPU | Fire Strike Punteggio combinato |
| Overdrive | 29857 | 43478 | 13071 |
| Prestazioni | 27890 (-7%) | 43605 (-0%) | 12961 (-1%) |
| Equilibrato | 28704 (-4%) | 41909 (-4%) | 12476 (-5%) |
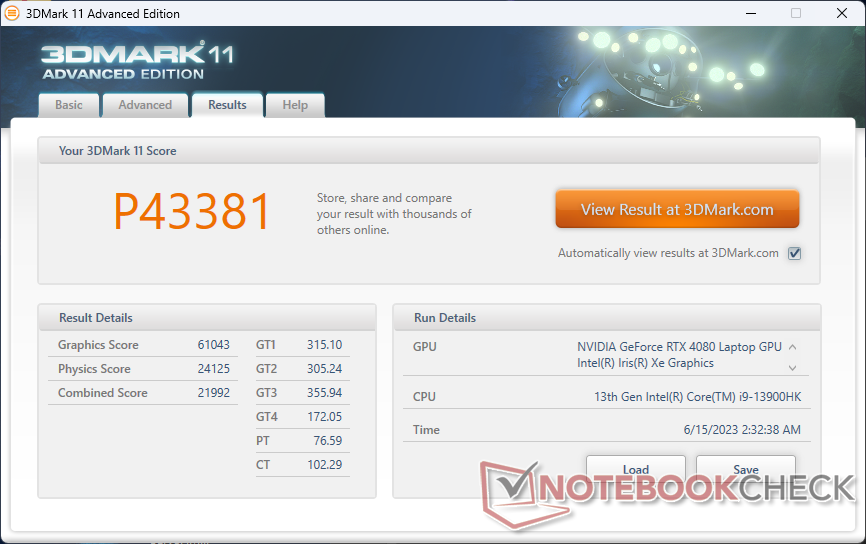
| 3DMark 11 Performance | 43381 punti | |
| 3DMark Fire Strike Score | 33417 punti | |
| 3DMark Time Spy Score | 18236 punti | |
Aiuto | ||
* ... Meglio usare valori piccoli
Prestazioni di gioco
Tutti i giochi sono giocabili alla risoluzione nativa QHD+ con frame rate stabili a 60 FPS o superiori. Anche i giochi in 4K sono possibili su un monitor esterno con la maggior parte delle impostazioni su valori alti o massimi, compresi Returnal e F122. Per ottenere frame rate a tre cifre, tuttavia, è necessario attivare DLSS 2 o DLSS 3, se disponibili, per sfruttare meglio l'elevata frequenza di aggiornamento del monitor.
Witcher 3 FPS Chart
| basso | medio | alto | ultra | QHD | 4K | |
|---|---|---|---|---|---|---|
| GTA V (2015) | 185.8 | 180.4 | 176.4 | 120.3 | 115.4 | 142.9 |
| The Witcher 3 (2015) | 425.6 | 352.7 | 306.5 | 160.2 | 115 | |
| Dota 2 Reborn (2015) | 178.8 | 164 | 159.7 | 146.8 | 129.4 | |
| Final Fantasy XV Benchmark (2018) | 211 | 195.5 | 164.2 | 132.4 | 76.2 | |
| X-Plane 11.11 (2018) | 145.3 | 134.5 | 104.2 | 90.5 | ||
| Strange Brigade (2018) | 469 | 373 | 350 | 325 | 237 | 120.5 |
| Shadow of the Tomb Raider (2018) | 165 | 143 | 84 | |||
| Far Cry 6 (2021) | 121 | 112 | 73 | |||
| Cyberpunk 2077 1.6 (2022) | 158 | 150.9 | 141.2 | 133.6 | 84.4 | 38.5 |
| Tiny Tina's Wonderlands (2022) | 256.6 | 217.3 | 183.3 | 156.4 | 111.1 | 58.6 |
| F1 22 (2022) | 265 | 259 | 244 | 110 | 79 | 39 |
| Call of Duty Modern Warfare 2 2022 (2022) | 139 | 110 | 67 | |||
| Returnal (2023) | 116 | 117 | 114 | 109 | 79 | 43 |
Emissioni
Rumore di sistema - Molte opzioni di profilo di potenza
Il rumore della ventola è direttamente legato alle impostazioni del profilo energetico ACC. Se non si gioca, si consiglia di impostare l'ACC in modalità Bilanciata o Tranquilla, poiché le ventole tendono a pulsare molto più frequentemente quando sono in modalità Performance o Overdrive.
Funzionamento Witcher 3 in modalità Performance e Overdrive si ottiene un rumore della ventola rispettivamente di 50 dB(A) e 55 dB(A). Poiché la perdita di frame rate è minima tra le modalità Performance e Overdrive, come indicato nella precedente sezione sulle prestazioni della GPU, è possibile avere un'esperienza di gioco sensibilmente più silenziosa quando si imposta la modalità Performance. Il rumore della ventola sarebbe ancora più silenzioso in modalità Balanced, senza impattare in modo significativo sul frame rate. 50+ dB(A) è ancora molto forte, naturalmente, ma è comunque un valore comune a modelli concorrenti come il Lenovo Legion Pro 7 o il Razer Blade 16.
Rumorosità
| Idle |
| 23.1 / 25.8 / 25.8 dB(A) |
| Sotto carico |
| 39.3 / 54.8 dB(A) |
 | ||
30 dB silenzioso 40 dB(A) udibile 50 dB(A) rumoroso |
||
min: | ||
| Alienware x16 R1 GeForce RTX 4080 Laptop GPU, i9-13900HK, SK hynix PC801 HFS001TEJ9X101N | Lenovo Legion Pro 7 RTX4090 GeForce RTX 4090 Laptop GPU, i9-13900HX, Samsung PM9A1 MZVL21T0HCLR | Asus ROG Zephyrus M16 GU604VY-NM042X GeForce RTX 4090 Laptop GPU, i9-13900H, Samsung PM9A1 MZVL22T0HBLB | Razer Blade 16 Early 2023 GeForce RTX 4080 Laptop GPU, i9-13950HX, SSSTC CA6-8D1024 | Dell G16 7620 GeForce RTX 3060 Laptop GPU, i7-12700H, WDC PC SN810 512GB | Alienware m17 R5 (R9 6900HX, RX 6850M XT) Radeon RX 6850M XT, R9 6900HX, SSSTC CA6-8D1024 | |
|---|---|---|---|---|---|---|
| Noise | -17% | -10% | 3% | -2% | 2% | |
| off /ambiente * (dB) | 22.7 | 25 -10% | 24 -6% | 23 -1% | 23.2 -2% | 23 -1% |
| Idle Minimum * (dB) | 23.1 | 28 -21% | 24 -4% | 23 -0% | 28.3 -23% | 23 -0% |
| Idle Average * (dB) | 25.8 | 30 -16% | 29.96 -16% | 23 11% | 28.8 -12% | 28.11 -9% |
| Idle Maximum * (dB) | 25.8 | 38 -47% | 34.27 -33% | 23.6 9% | 28.9 -12% | 28.11 -9% |
| Load Average * (dB) | 39.3 | 48 -22% | 35.89 9% | 39 1% | 32.4 18% | 30.62 22% |
| Witcher 3 ultra * (dB) | 49.9 | 53 -6% | 57.5 -15% | 51.6 -3% | 48.3 3% | 49.75 -0% |
| Load Maximum * (dB) | 54.8 | 55 -0% | 57.54 -5% | 51.3 6% | 48.1 12% | 50.17 8% |
* ... Meglio usare valori piccoli
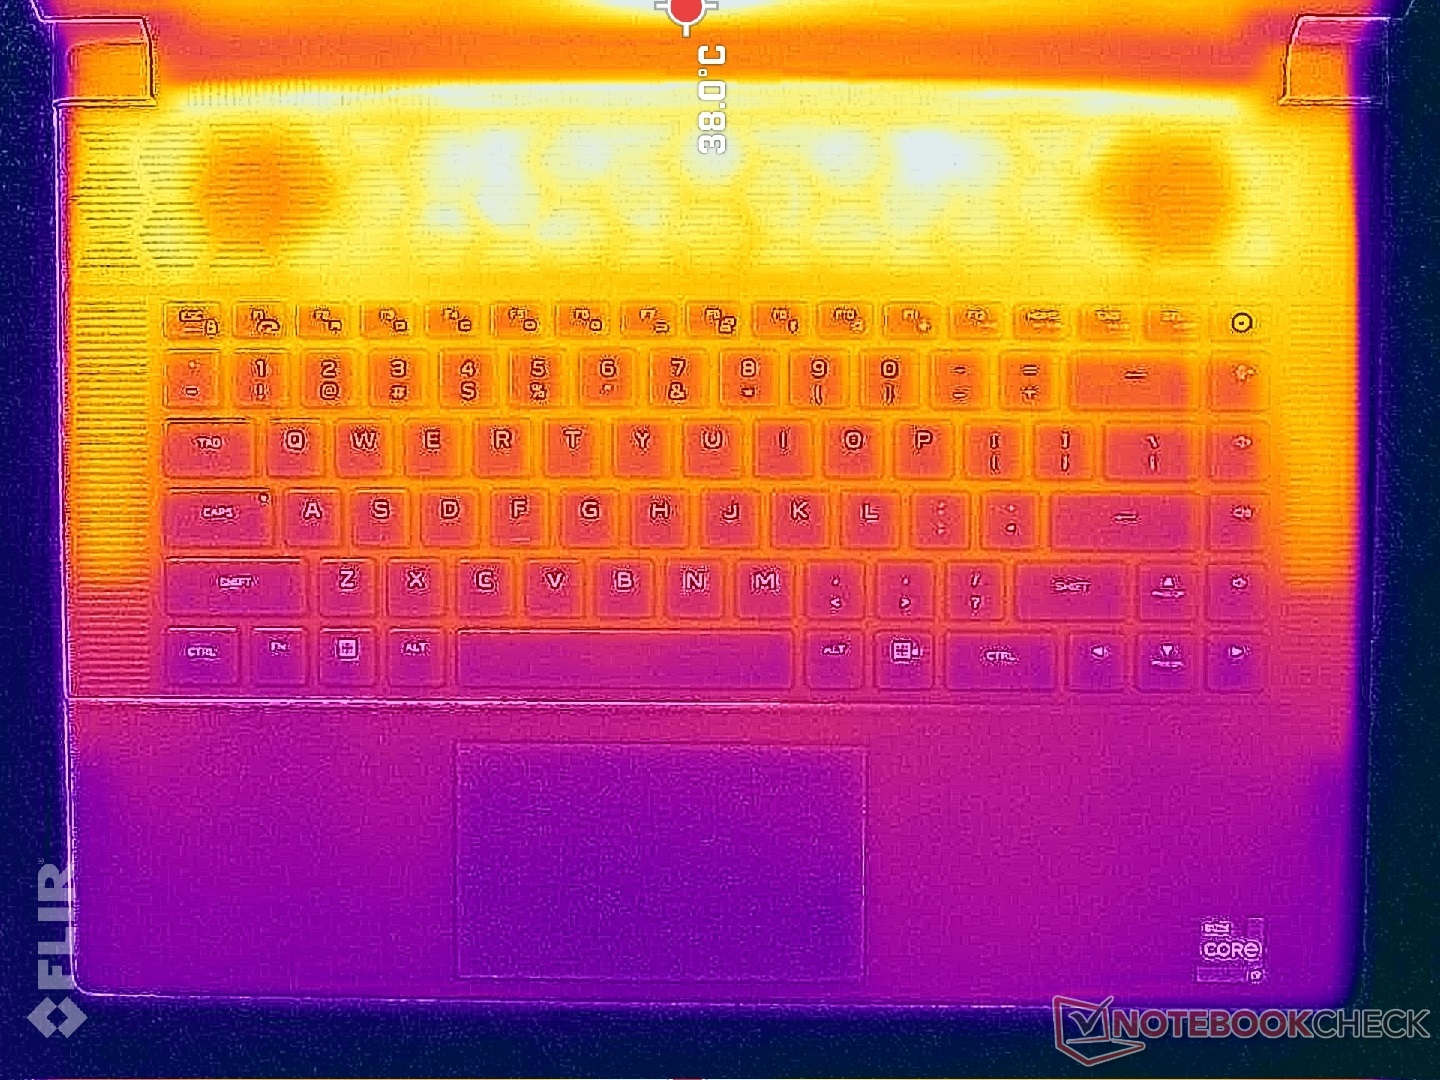
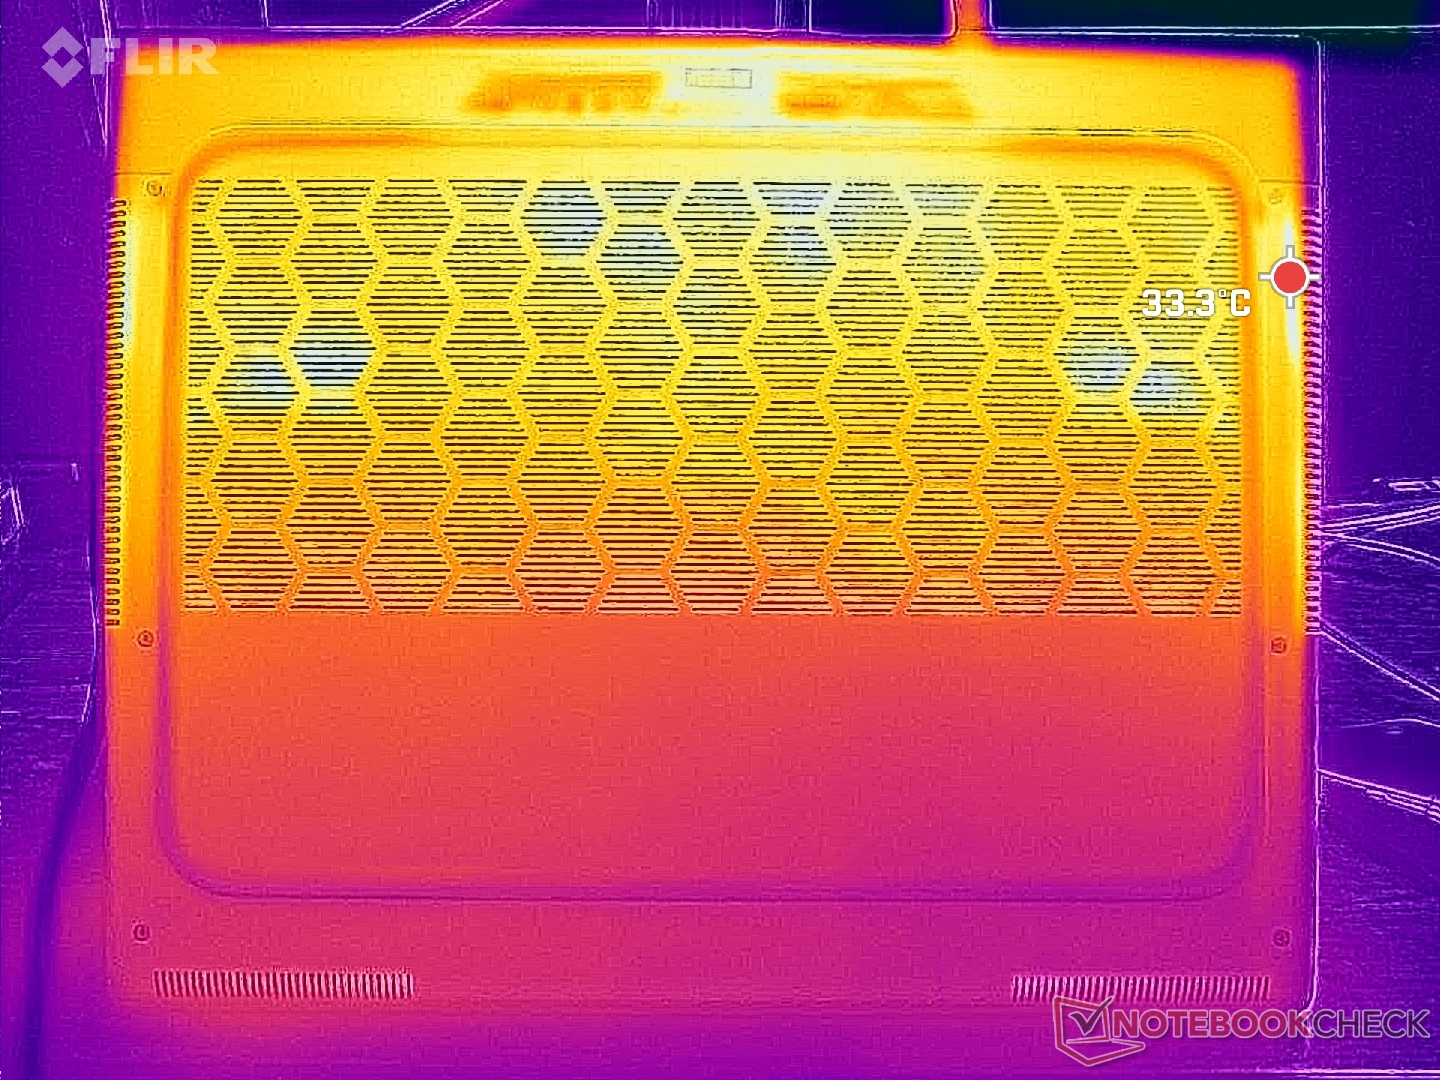
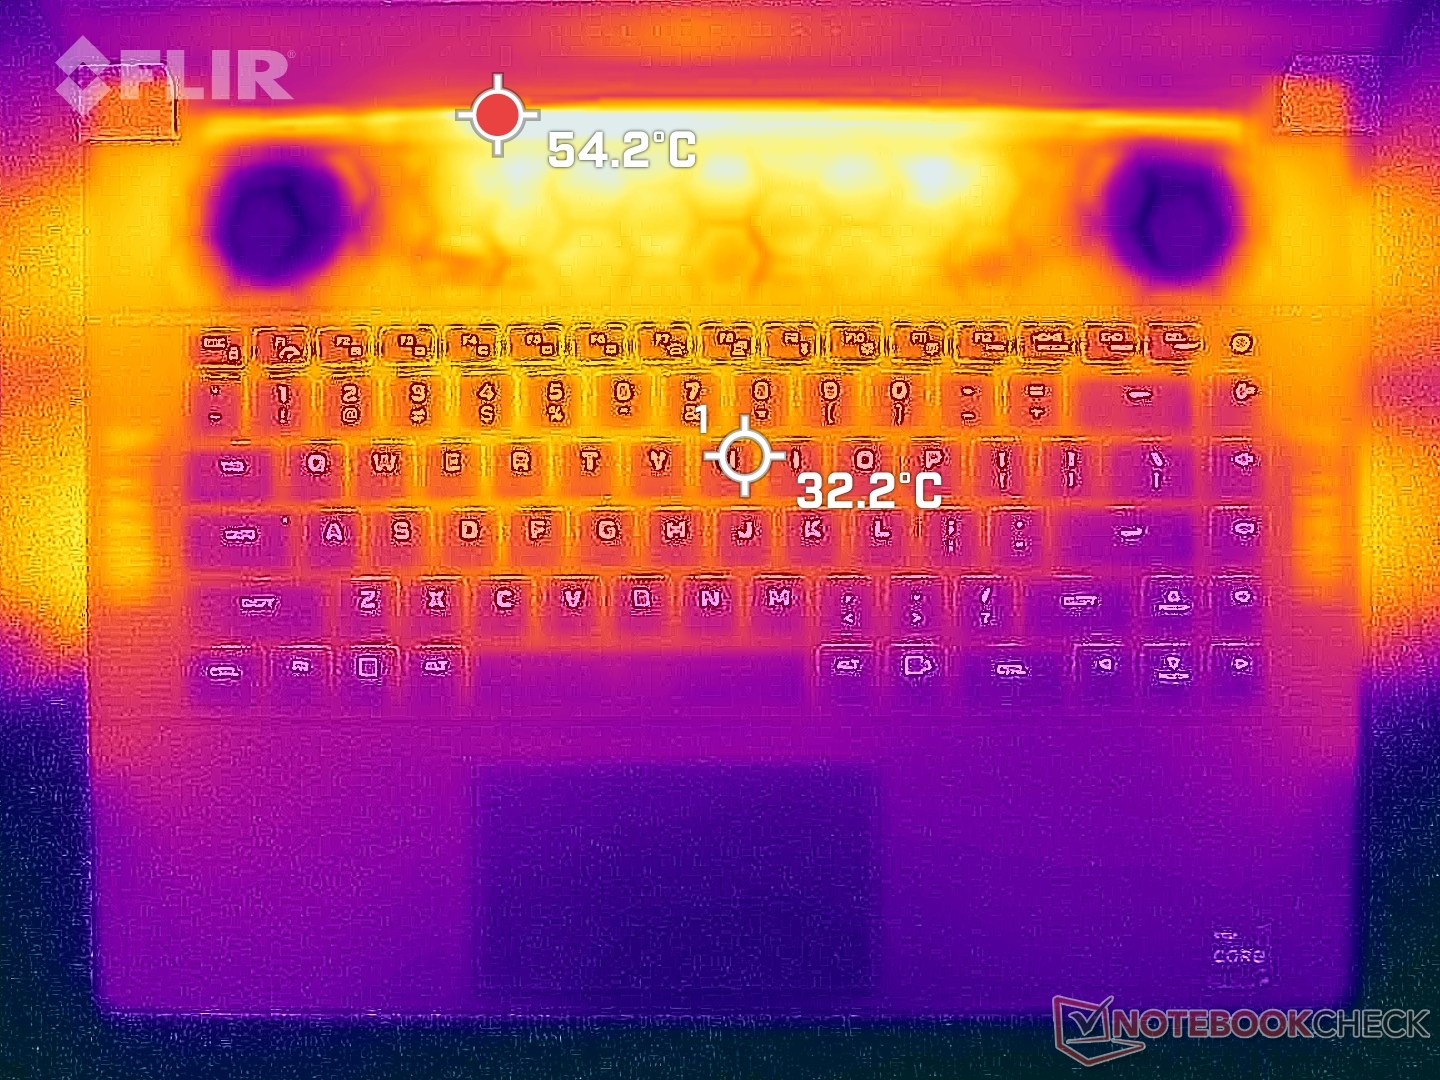
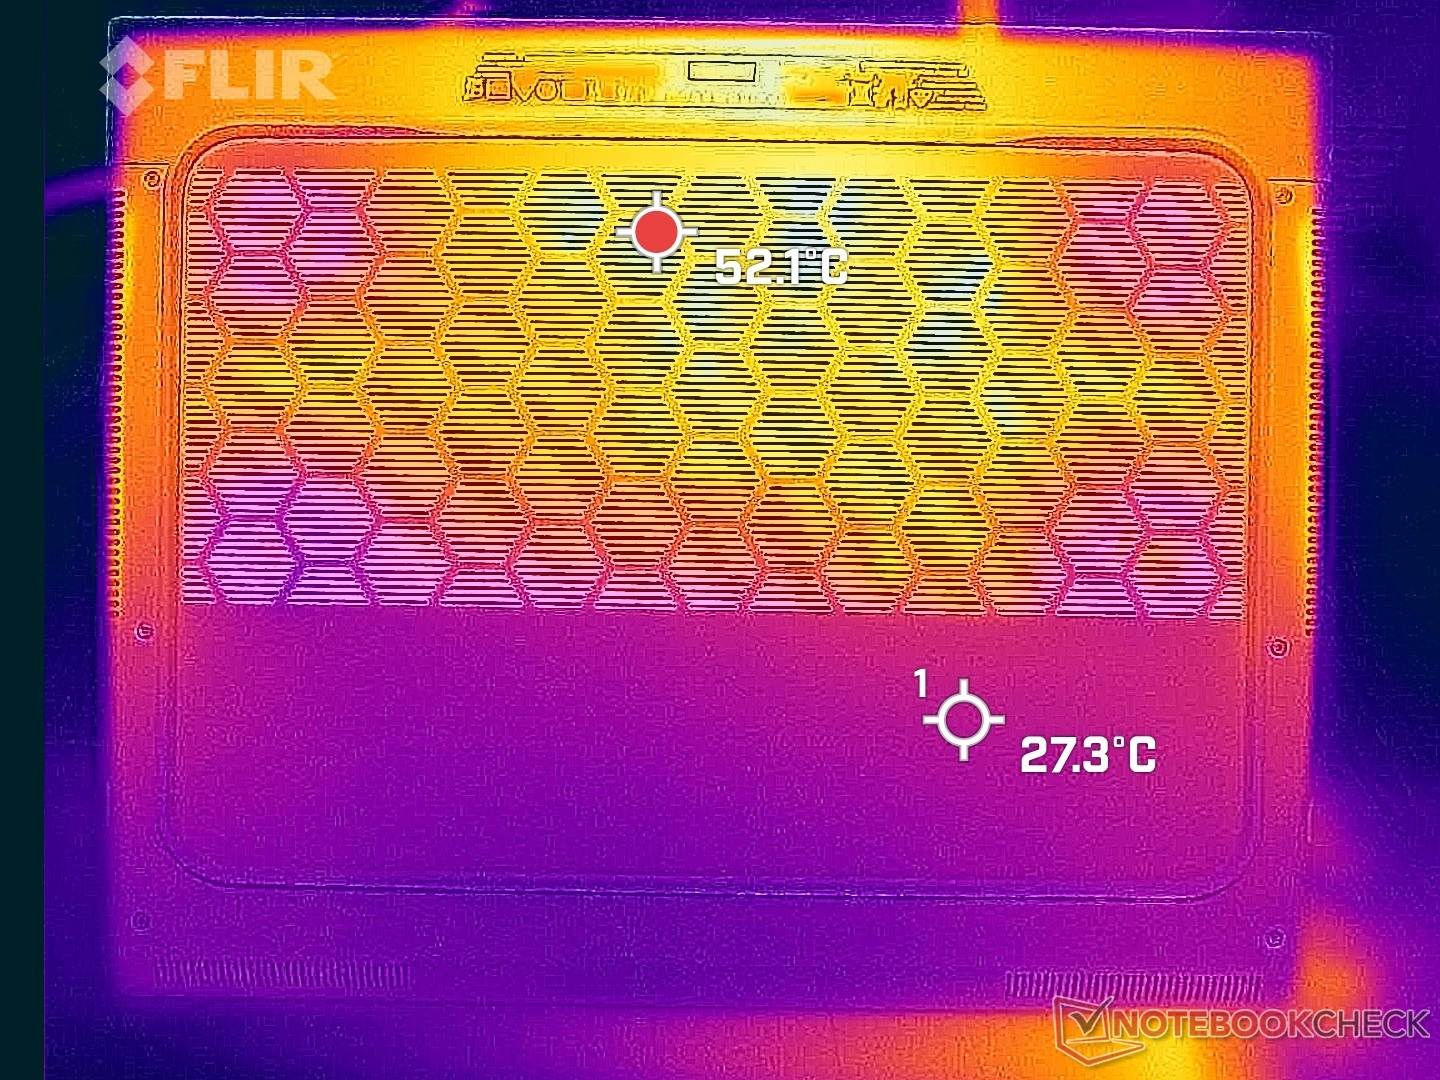
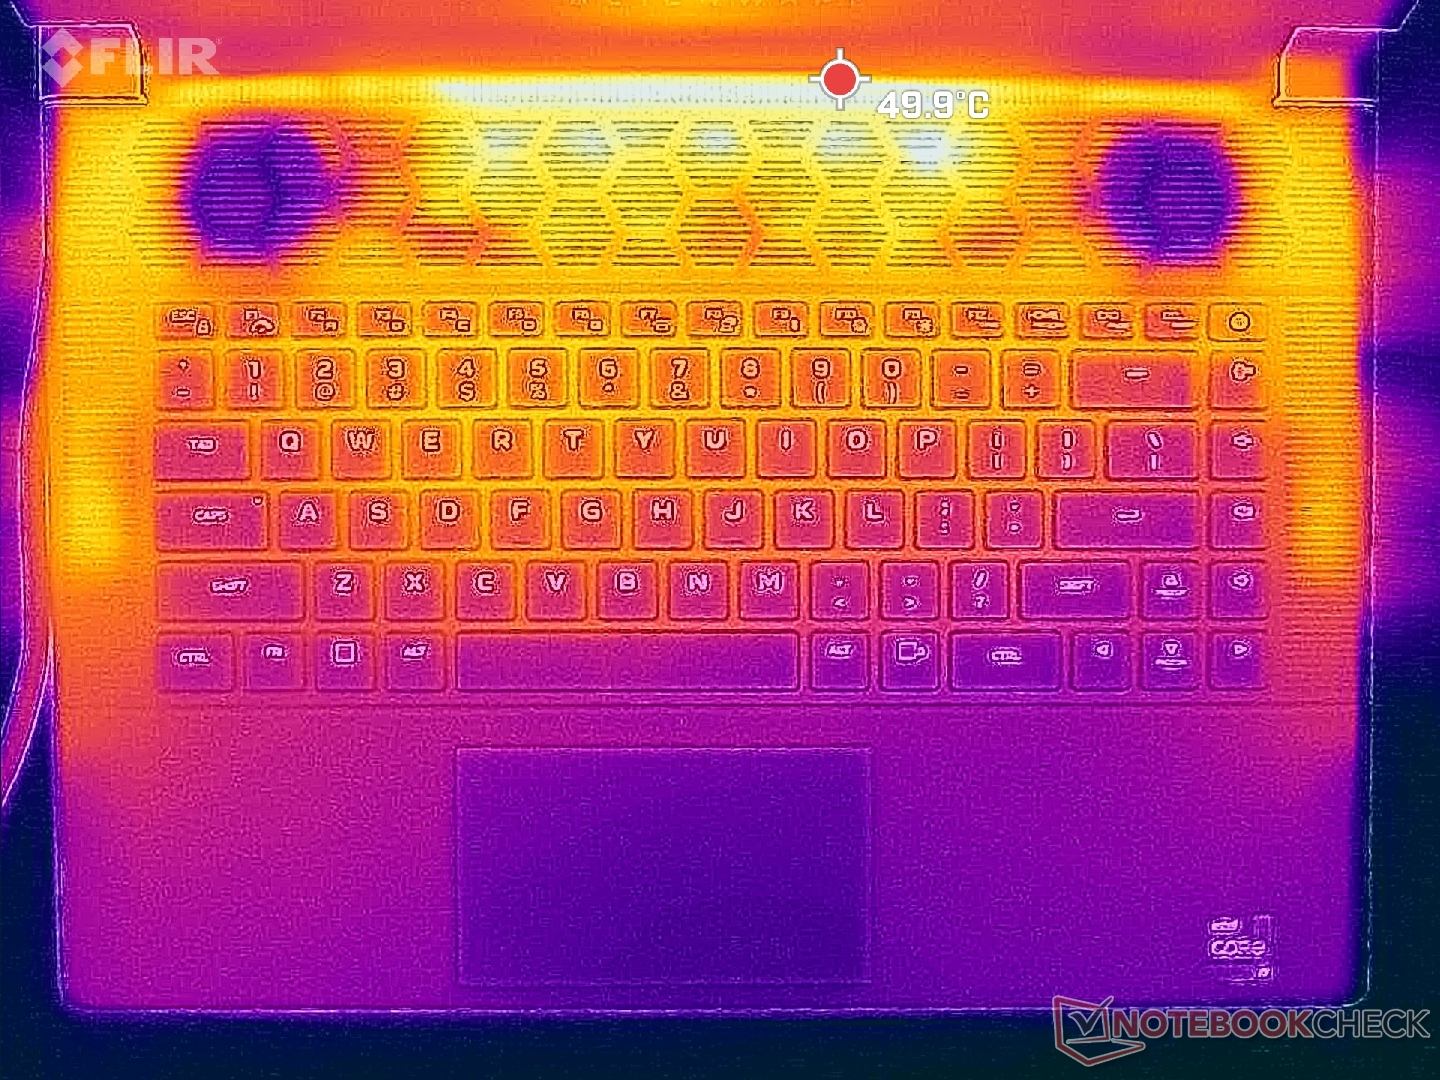
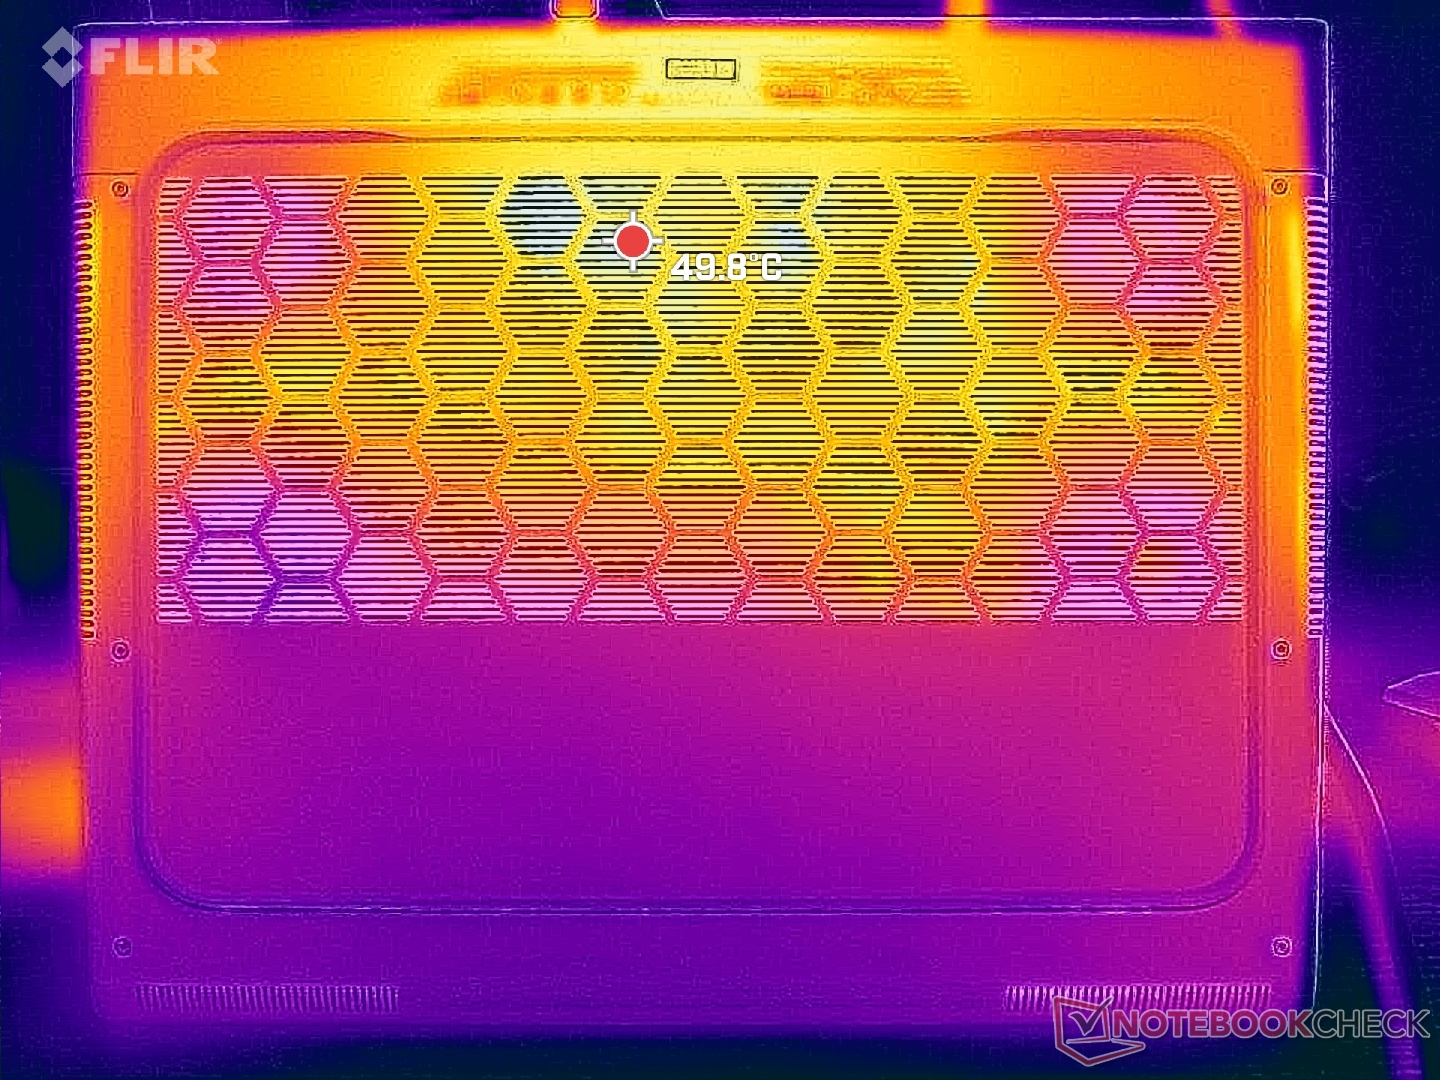
Temperatura
Le temperature di superficie possono essere molto calde a causa del design sottile del profilo. I punti caldi possono raggiungere circa 50 C sulla parte superiore e inferiore, rispetto ai 40 C del Blade 16. Per fortuna, questi punti caldi si trovano verso la parte posteriore e lontano dai poggiapolsi. Fortunatamente, questi punti caldi si trovano verso la parte posteriore e lontano dai poggiapolsi.
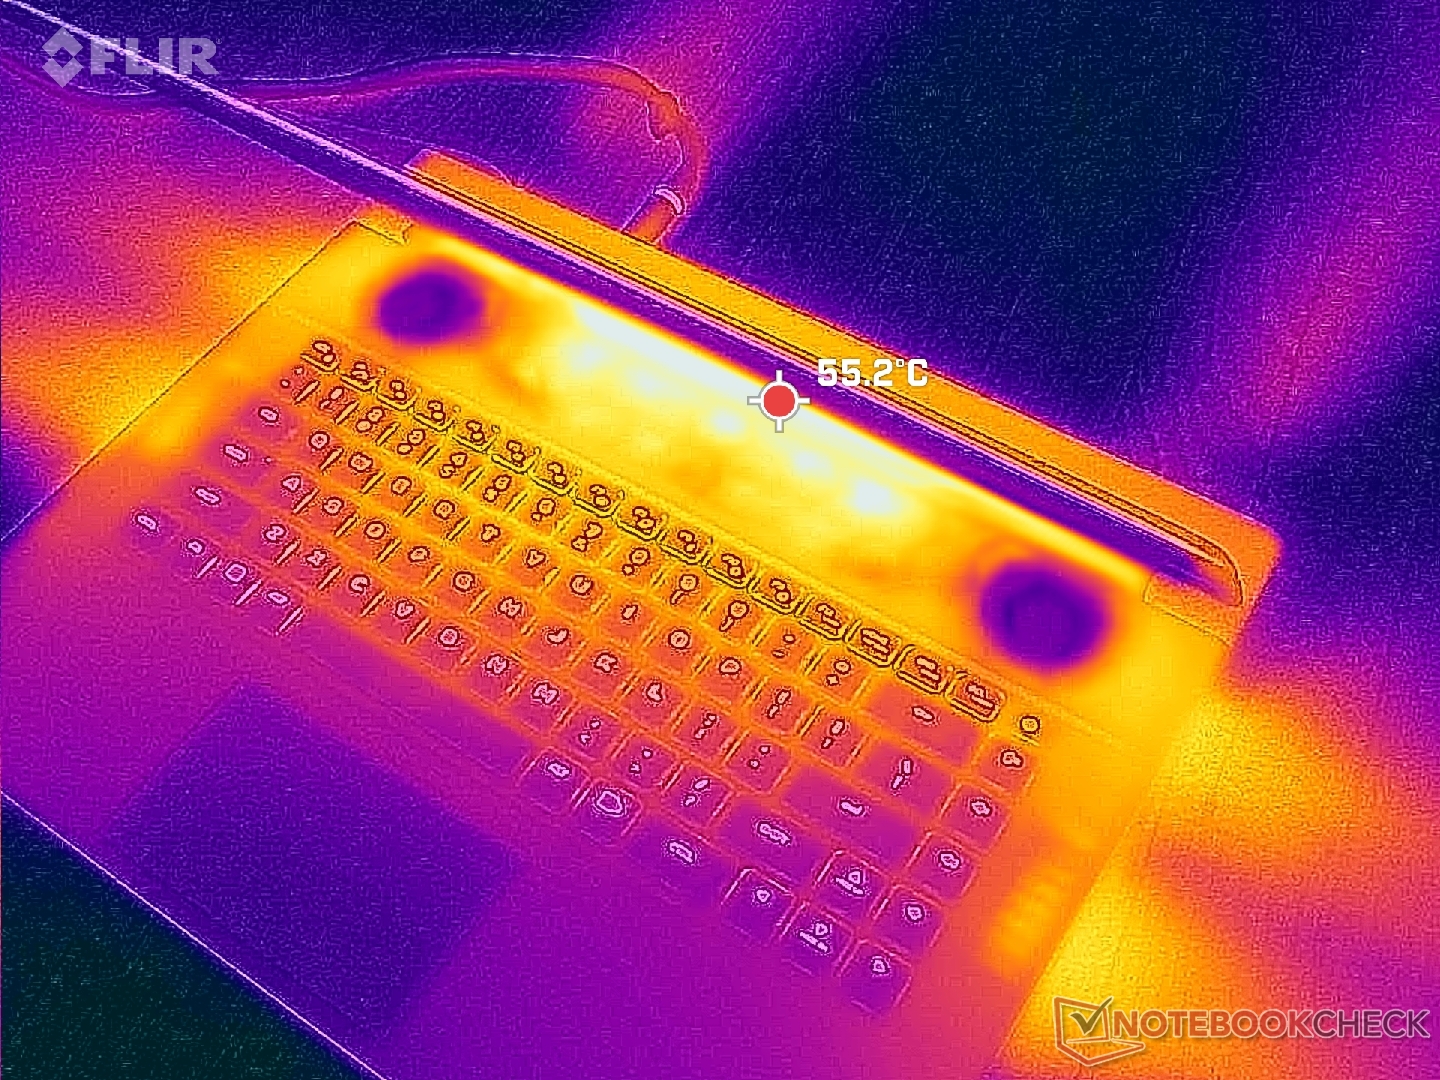
(-) La temperatura massima sul lato superiore è di 47.2 °C / 117 F, rispetto alla media di 40.4 °C / 105 F, che varia da 21.2 a 68.8 °C per questa classe Gaming.
(-) Il lato inferiore si riscalda fino ad un massimo di 47.8 °C / 118 F, rispetto alla media di 43.2 °C / 110 F
(+) In idle, la temperatura media del lato superiore è di 30.8 °C / 87 F, rispetto alla media deld ispositivo di 33.9 °C / 93 F.
(±) Riproducendo The Witcher 3, la temperatura media per il lato superiore e' di 38 °C / 100 F, rispetto alla media del dispositivo di 33.9 °C / 93 F.
(+) I poggiapolsi e il touchpad sono piu' freddi della temperatura della pelle con un massimo di 30.6 °C / 87.1 F e sono quindi freddi al tatto.
(±) La temperatura media della zona del palmo della mano di dispositivi simili e'stata di 28.8 °C / 83.8 F (-1.8 °C / -3.3 F).
| Alienware x16 R1 Intel Core i9-13900HK, NVIDIA GeForce RTX 4080 Laptop GPU | Lenovo Legion Pro 7 RTX4090 Intel Core i9-13900HX, NVIDIA GeForce RTX 4090 Laptop GPU | Asus ROG Zephyrus M16 GU604VY-NM042X Intel Core i9-13900H, NVIDIA GeForce RTX 4090 Laptop GPU | Razer Blade 16 Early 2023 Intel Core i9-13950HX, NVIDIA GeForce RTX 4080 Laptop GPU | Dell G16 7620 Intel Core i7-12700H, NVIDIA GeForce RTX 3060 Laptop GPU | Alienware m17 R5 (R9 6900HX, RX 6850M XT) AMD Ryzen 9 6900HX, AMD Radeon RX 6850M XT | |
|---|---|---|---|---|---|---|
| Heat | -4% | 6% | 15% | 14% | 2% | |
| Maximum Upper Side * (°C) | 47.2 | 53 -12% | 50 -6% | 40 15% | 47.6 -1% | 53 -12% |
| Maximum Bottom * (°C) | 47.8 | 59 -23% | 58 -21% | 37.6 21% | 54 -13% | 56 -17% |
| Idle Upper Side * (°C) | 36.8 | 34 8% | 26 29% | 32.4 12% | 23 37% | 30 18% |
| Idle Bottom * (°C) | 35.8 | 32 11% | 28 22% | 31.4 12% | 24.6 31% | 29 19% |
* ... Meglio usare valori piccoli
Stress test
La frequenza di clock della CPU, l'assorbimento di potenza della scheda e la temperatura del core raggiungevano rispettivamente 4,5 GHz, 178 W e 99 C quando si avviava lo stress Prime95. La CPU si stabilizzava a 3,8 GHz, 123 W e 99 C dopo un paio di minuti. Con temperature così elevate, è chiaro che il processore sta spingendo la soluzione di raffreddamento ai suoi limiti per sostenere le più alte velocità di clock Turbo Boost possibili. Ripetendo lo stesso test sul Blade 16, ad esempio, si otterrebbe una temperatura stabile del core di 82 C.
Quando si esegue Witcher 3 in modalità Overdrive, per rappresentare i carichi di gioco tipici, la GPU si stabilizza a circa 166 W contro un obiettivo di 175 W. È interessante notare che l'assorbimento di potenza della scheda scende a malapena a 161 W quando si utilizza la modalità Balanced, come mostrano gli screenshot qui sotto, che rappresentano un deficit di prestazioni molto marginale rispetto al rumore della ventola significativamente più silenzioso rispetto alla modalità Overdrive. I possessori possono quindi considerare di giocare in modalità Balanced invece che nelle più rumorose modalità Performance o Overdrive.
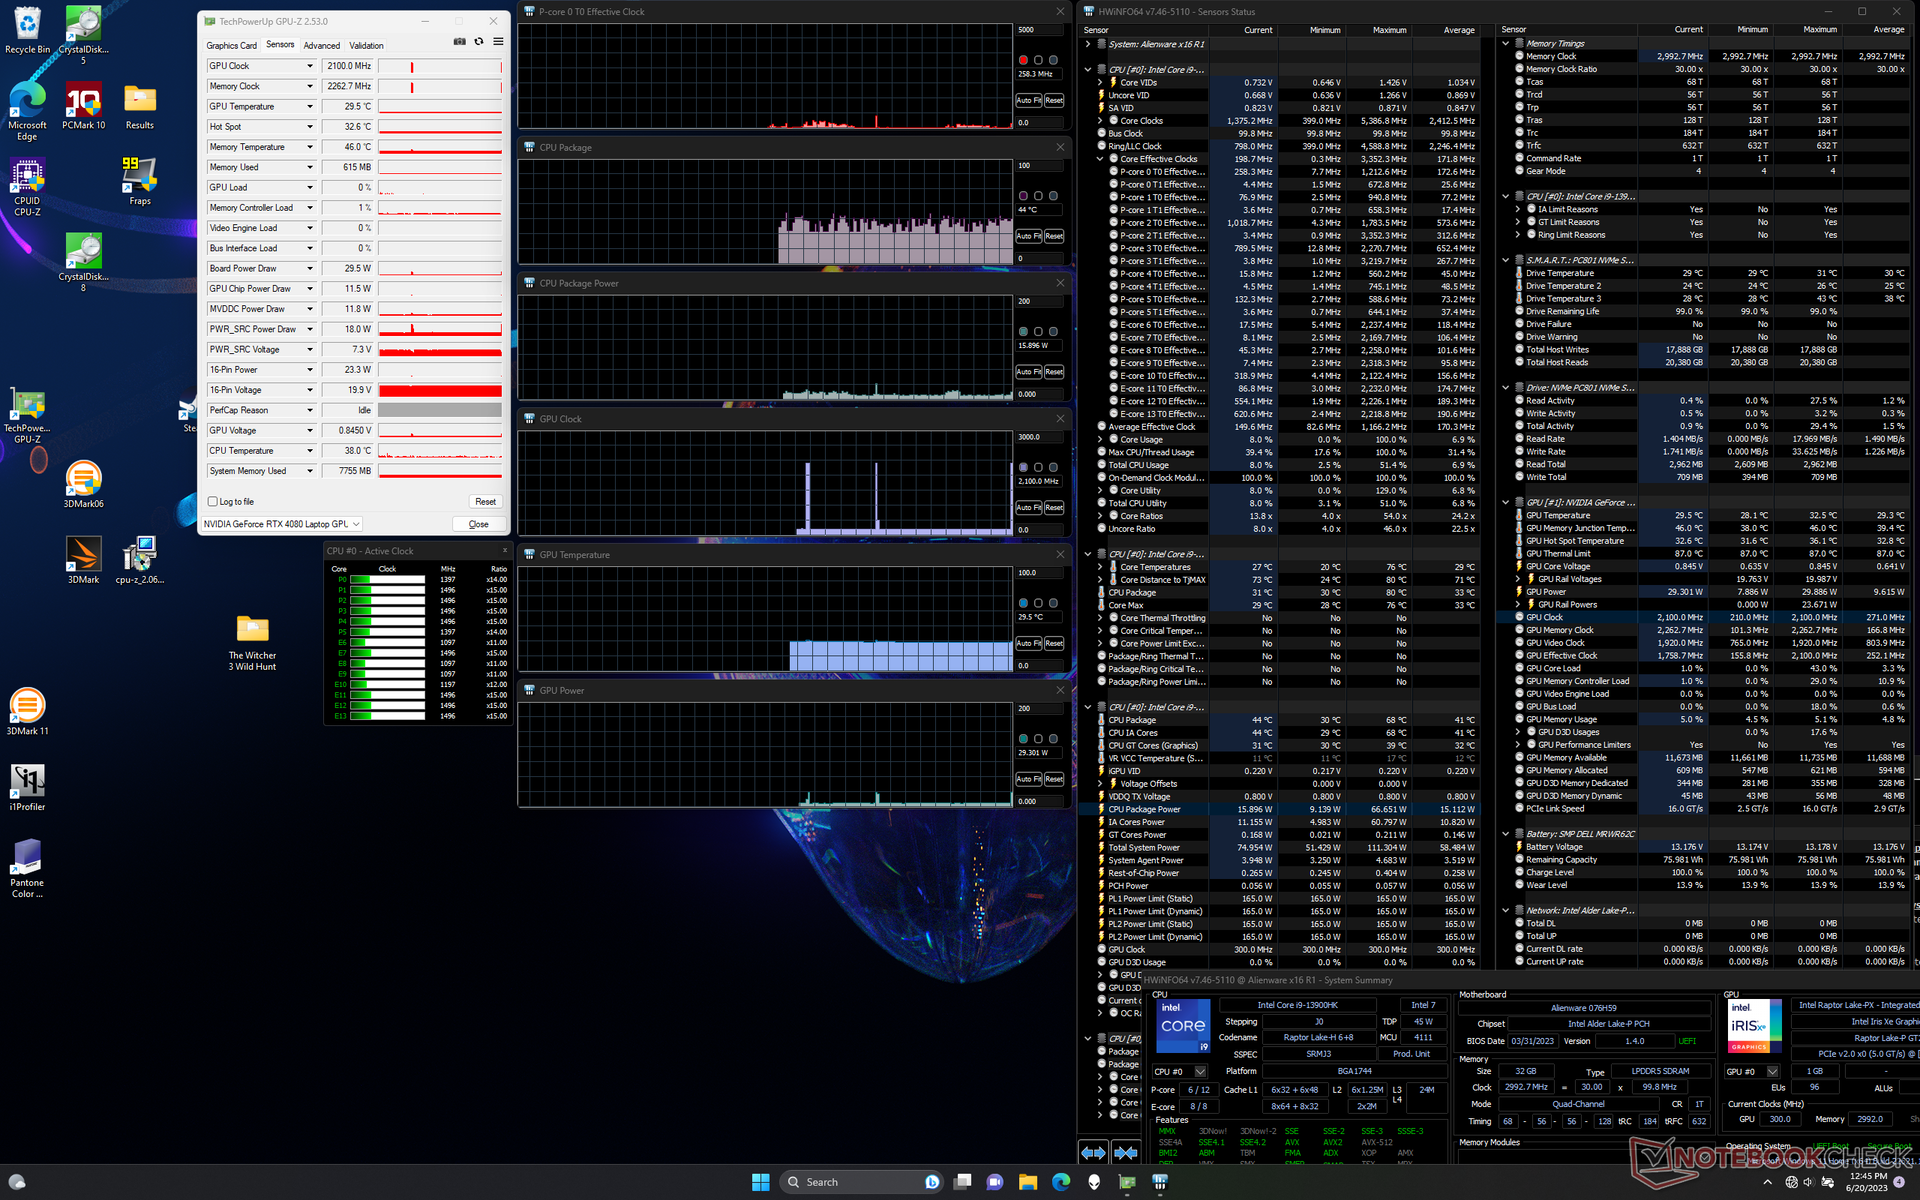
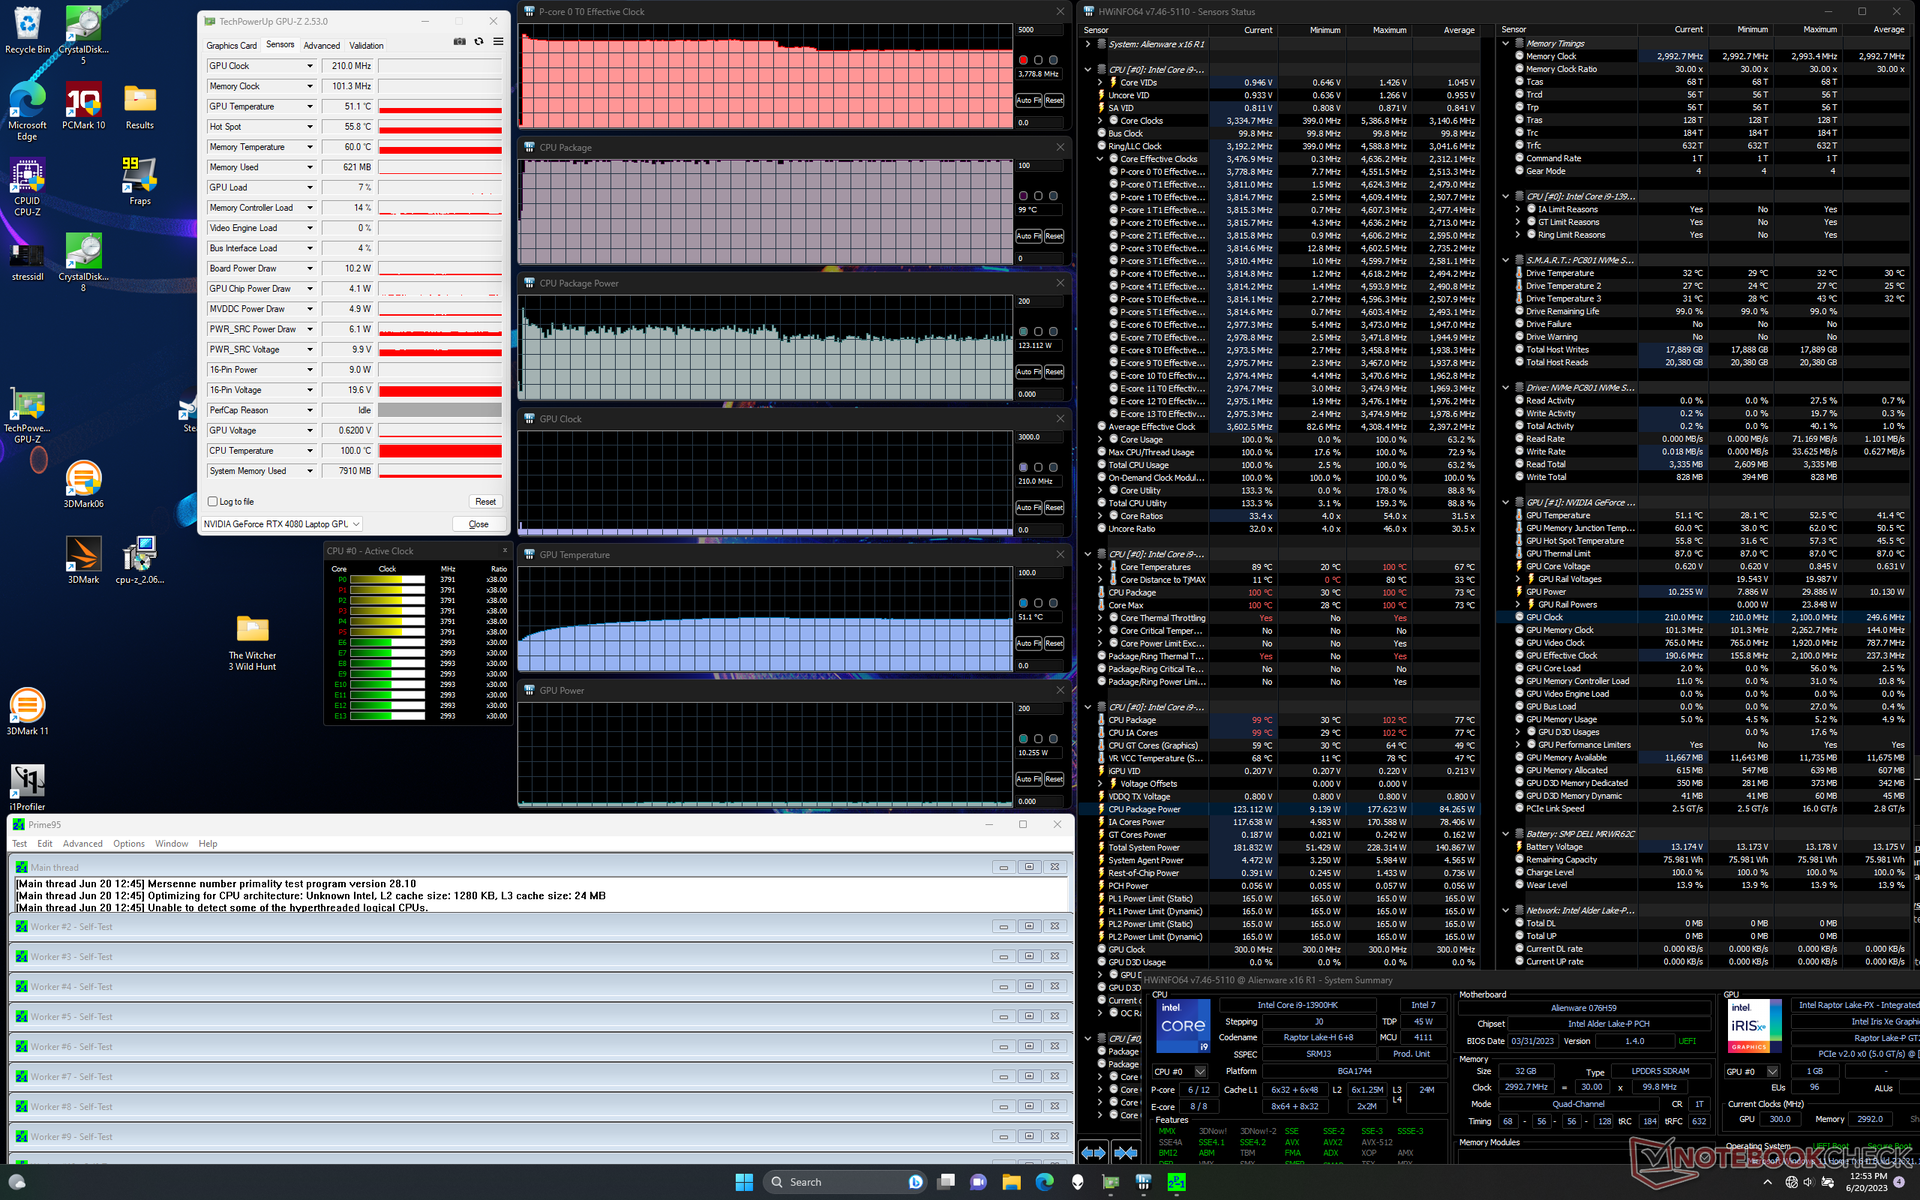
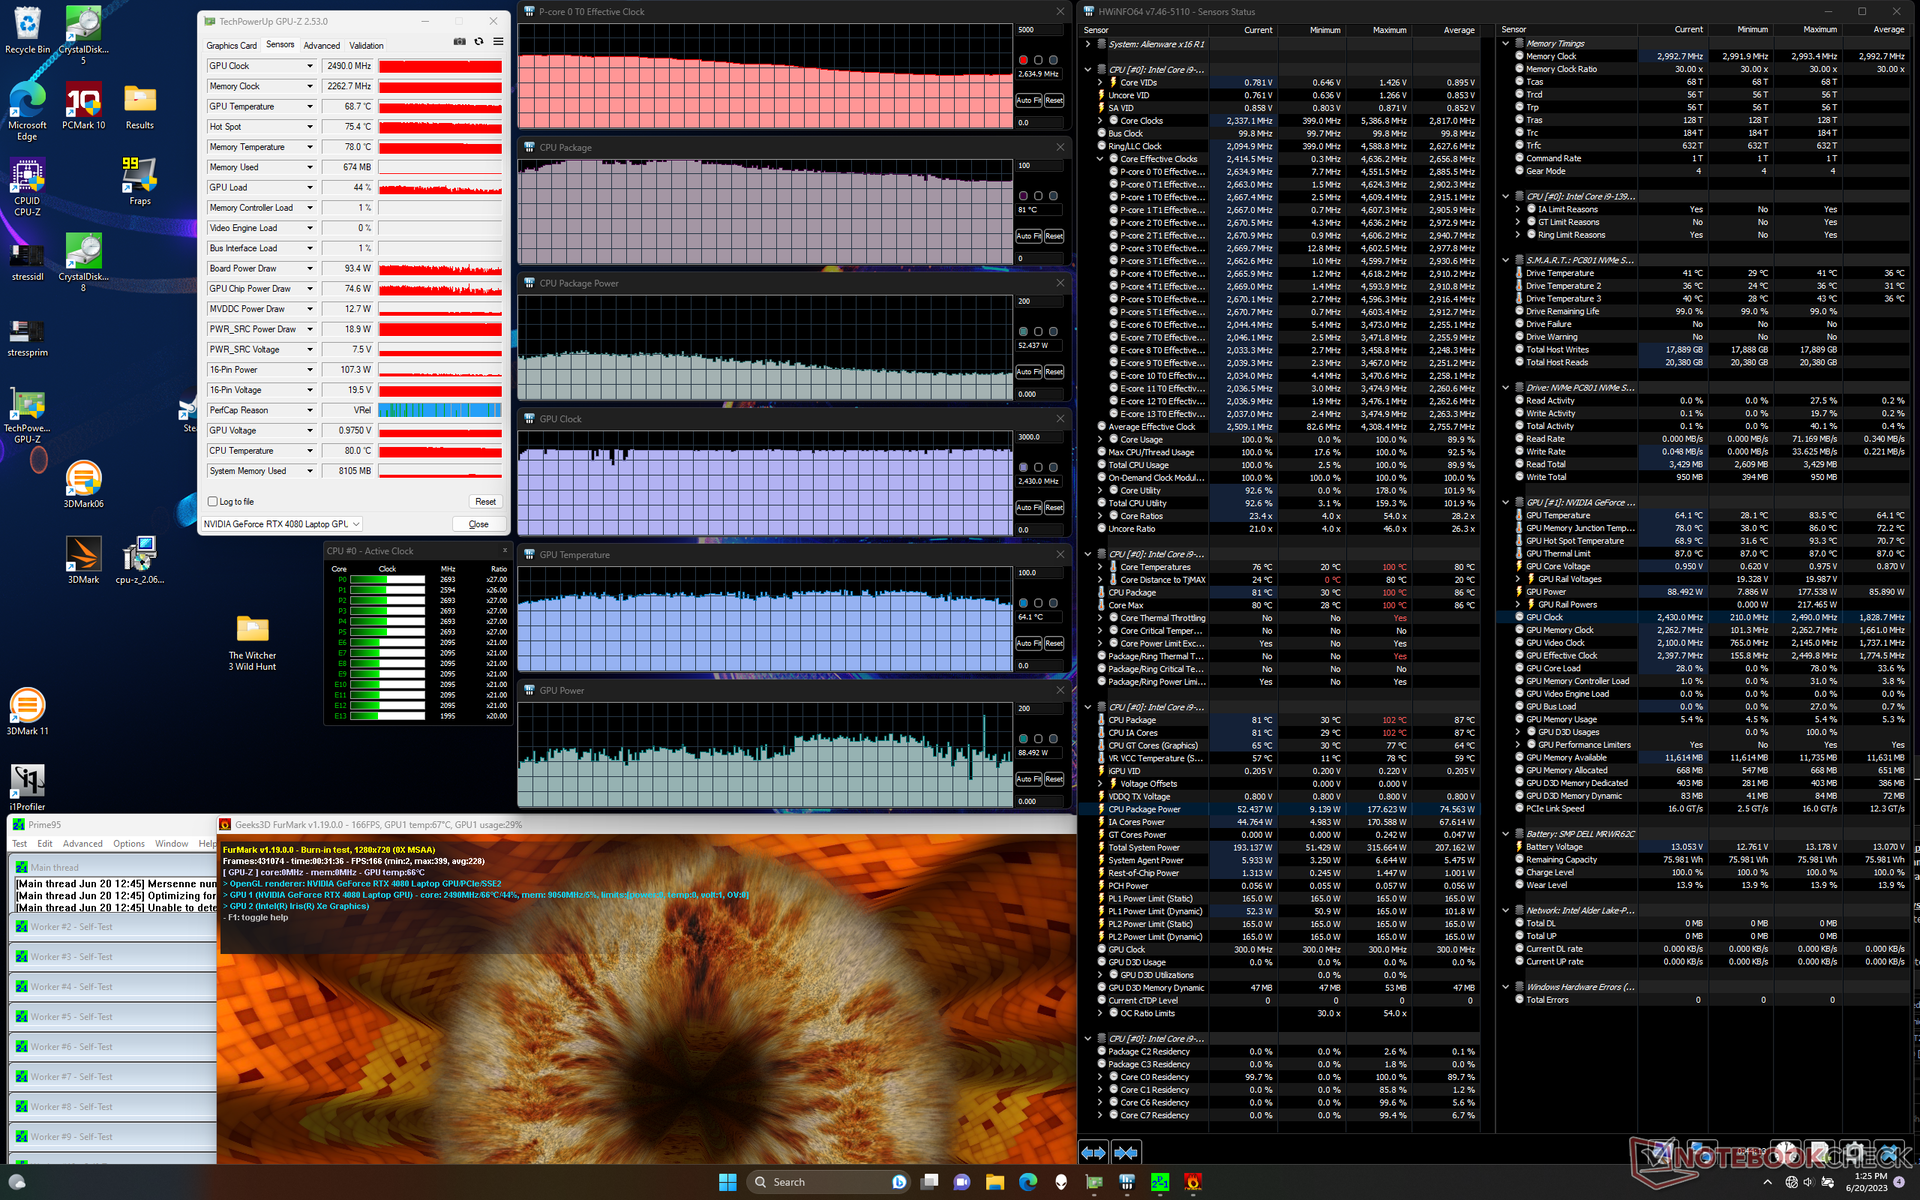
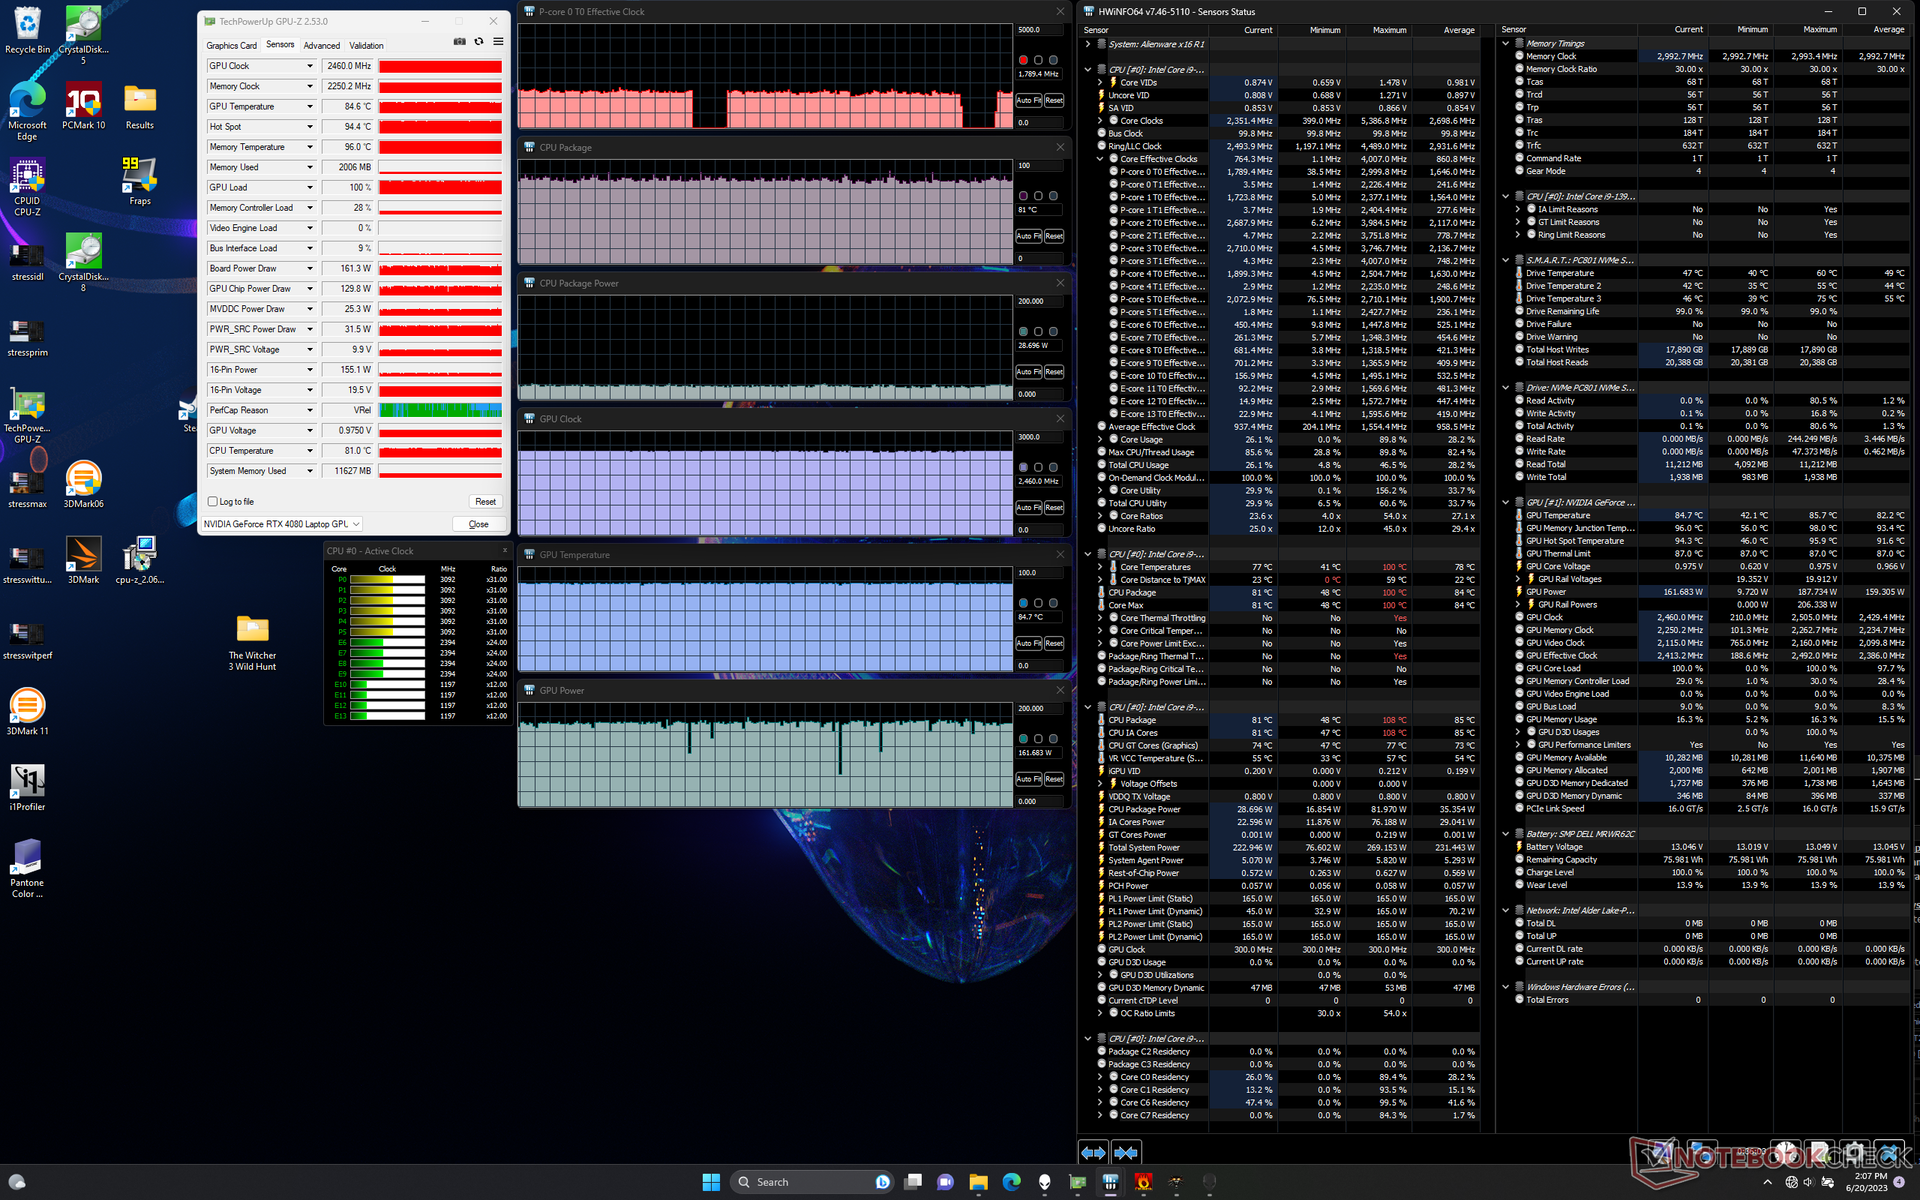

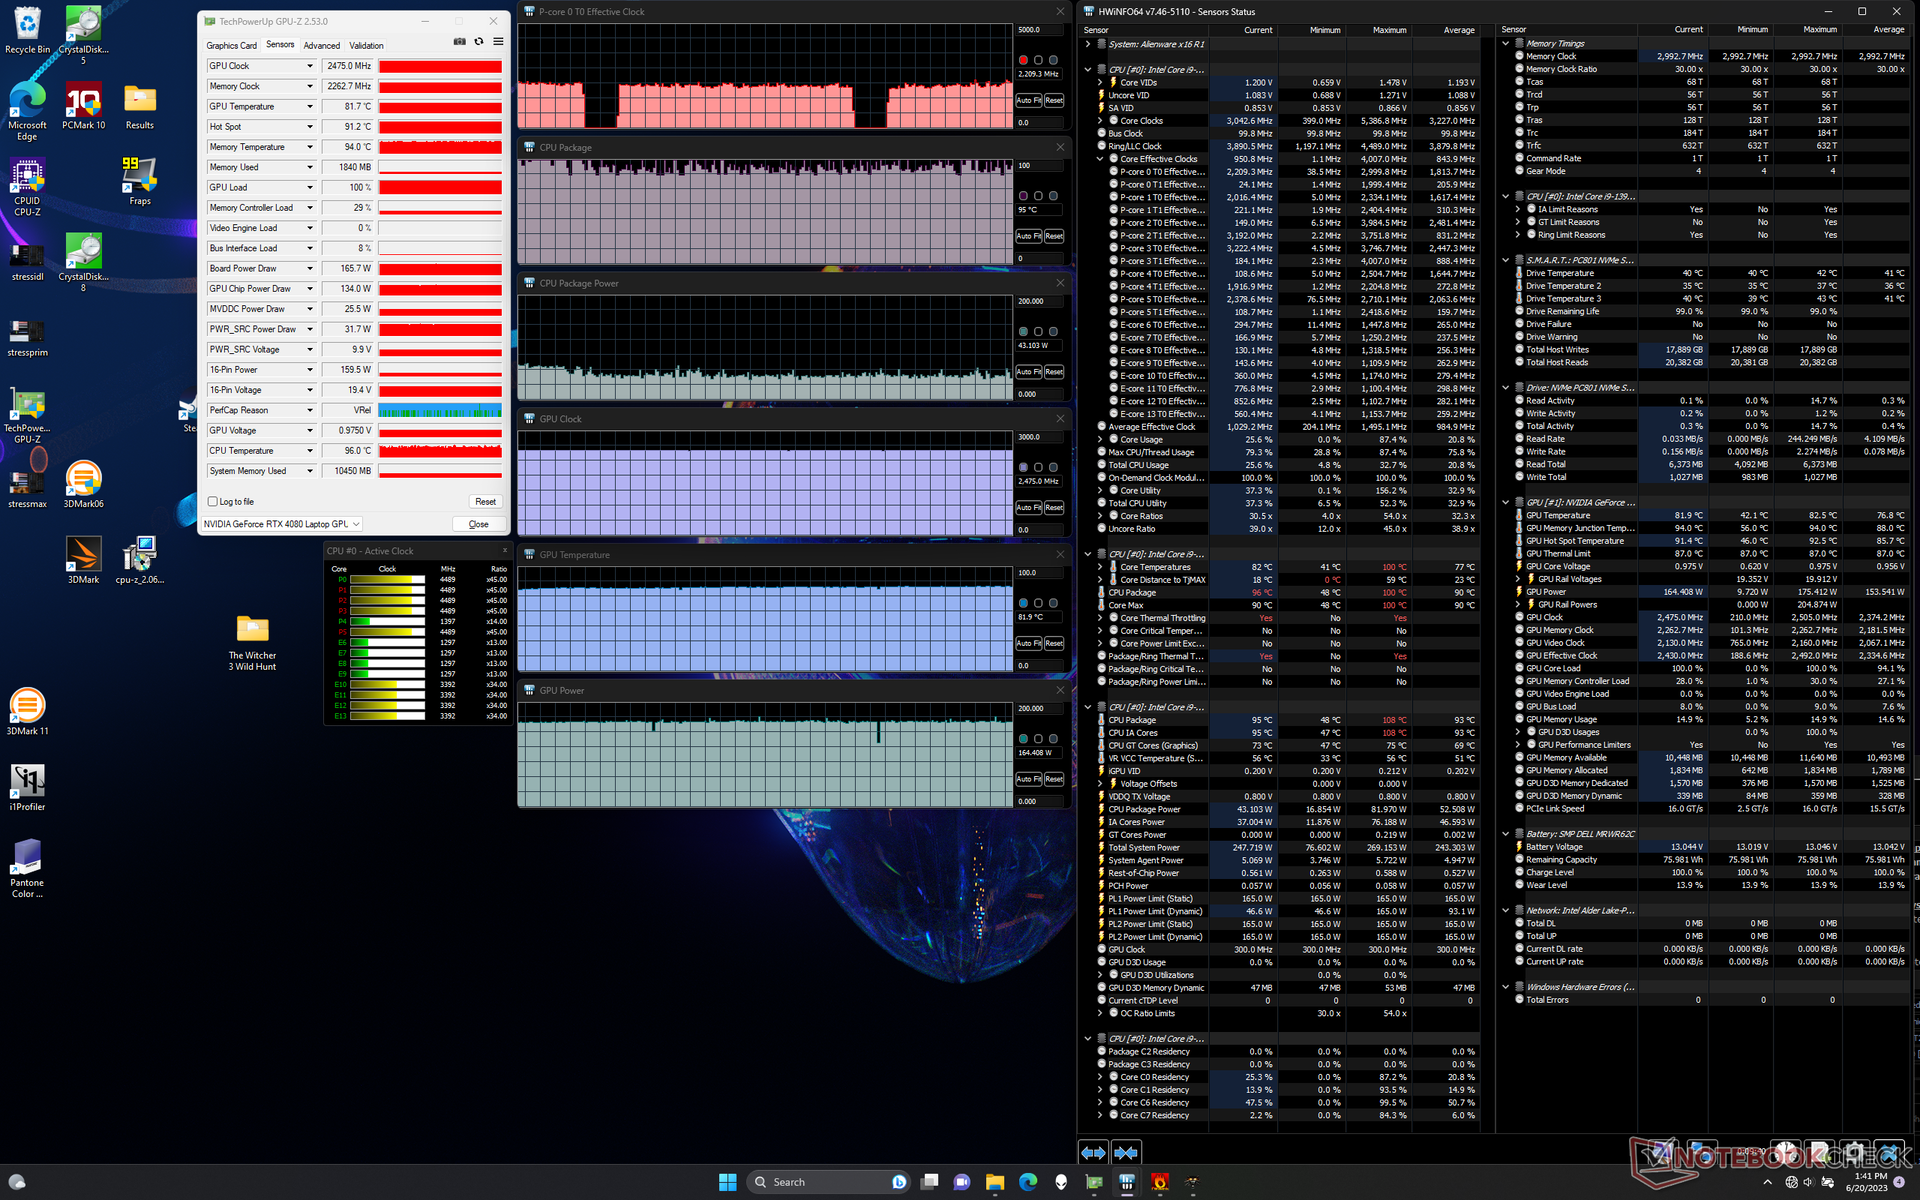
| Clock della CPU (GHz) | Clock della GPU (MHz) | Temperatura media della CPU (°C) | Temperatura media della GPU (°C) | |
| Sistema inattivo | -- | -- | 44 | 30 |
| Stress Prime95 | 3,8 | -- | 99 | 51 |
| StressPrime95 + FurMark | 2,5 - 3,6 | 2475 | 82 - 100 | 72 - 77 |
| Witcher 3 Stress (modalità bilanciata) | ~1,8 | 2460 | 81 | 85 |
| Witcher 3 Stress (modalità Performance) | ~1,8 | 2460 | 80 | 82 |
| Witcher 3 Stress (modalità Overdrive) | ~2,2 | 2475 | 95 | 82 |
Altoparlanti
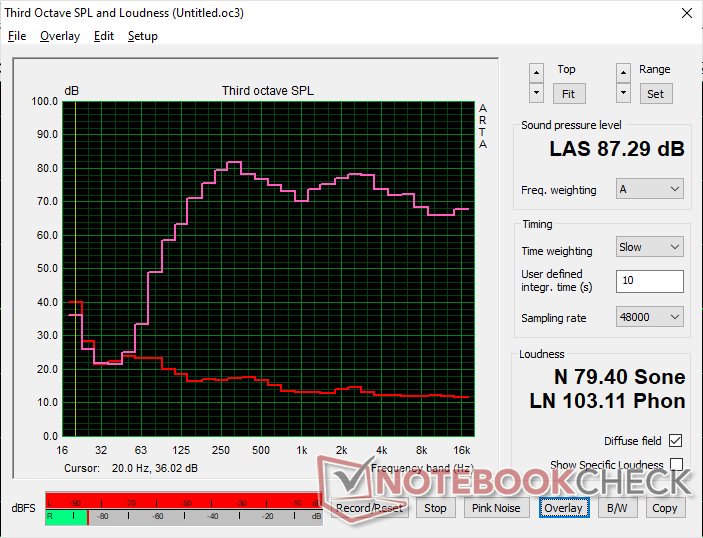
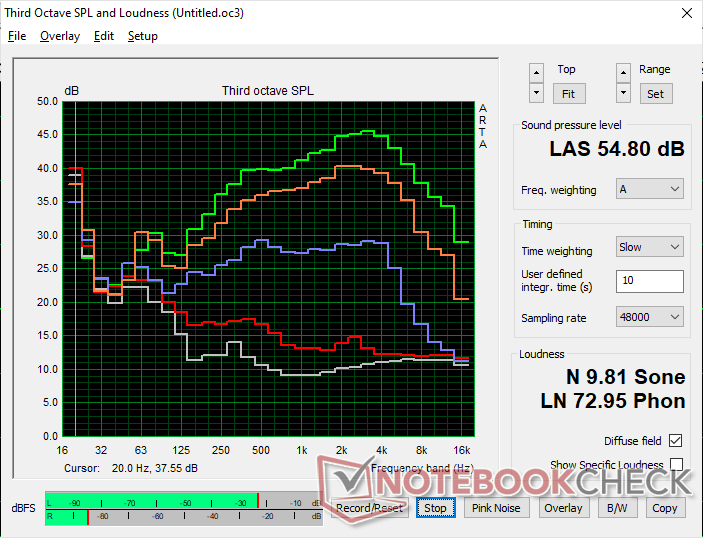
Alienware x16 R1 analisi audio
(+) | gli altoparlanti sono relativamente potenti (87.3 dB)
Bassi 100 - 315 Hz
(±) | bassi ridotti - in media 7.3% inferiori alla media
(±) | la linearità dei bassi è media (9.1% delta rispetto alla precedente frequenza)
Medi 400 - 2000 Hz
(+) | medi bilanciati - solo only 2.2% rispetto alla media
(+) | medi lineari (3.8% delta rispetto alla precedente frequenza)
Alti 2 - 16 kHz
(+) | Alti bilanciati - appena 3.6% dalla media
(+) | alti lineari (3.3% delta rispetto alla precedente frequenza)
Nel complesso 100 - 16.000 Hz
(+) | suono nel complesso lineare (7.9% differenza dalla media)
Rispetto alla stessa classe
» 1% di tutti i dispositivi testati in questa classe è stato migliore, 1% simile, 98% peggiore
» Il migliore ha avuto un delta di 6%, medio di 18%, peggiore di 132%
Rispetto a tutti i dispositivi testati
» 2% di tutti i dispositivi testati in questa classe è stato migliore, 1% similare, 98% peggiore
» Il migliore ha avuto un delta di 4%, medio di 23%, peggiore di 134%
Apple MacBook Pro 16 2021 M1 Pro analisi audio
(+) | gli altoparlanti sono relativamente potenti (84.7 dB)
Bassi 100 - 315 Hz
(+) | bassi buoni - solo 3.8% dalla media
(+) | bassi in lineaa (5.2% delta rispetto alla precedente frequenza)
Medi 400 - 2000 Hz
(+) | medi bilanciati - solo only 1.3% rispetto alla media
(+) | medi lineari (2.1% delta rispetto alla precedente frequenza)
Alti 2 - 16 kHz
(+) | Alti bilanciati - appena 1.9% dalla media
(+) | alti lineari (2.7% delta rispetto alla precedente frequenza)
Nel complesso 100 - 16.000 Hz
(+) | suono nel complesso lineare (4.6% differenza dalla media)
Rispetto alla stessa classe
» 0% di tutti i dispositivi testati in questa classe è stato migliore, 0% simile, 100% peggiore
» Il migliore ha avuto un delta di 5%, medio di 17%, peggiore di 45%
Rispetto a tutti i dispositivi testati
» 0% di tutti i dispositivi testati in questa classe è stato migliore, 0% similare, 100% peggiore
» Il migliore ha avuto un delta di 4%, medio di 23%, peggiore di 134%
Gestione dell'energia
Consumo di energia: elevato come previsto
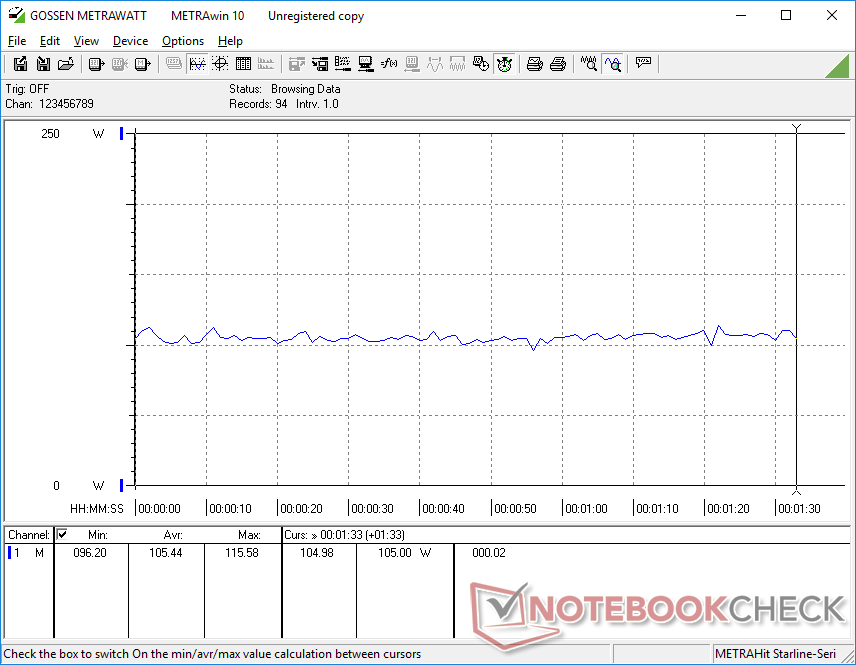
Il consumo energetico varia tra i 25 W e i 50 W quando è al minimo sul desktop, a seconda del profilo di alimentazione, della GPU e delle impostazioni di luminosità. Questo intervallo è alto anche per la categoria, dato che altri modelli da 16 pollici come il Razer Blade 16 o l' Alienware m17 possono raggiungere i 15 W con impostazioni di alimentazione minime simili.
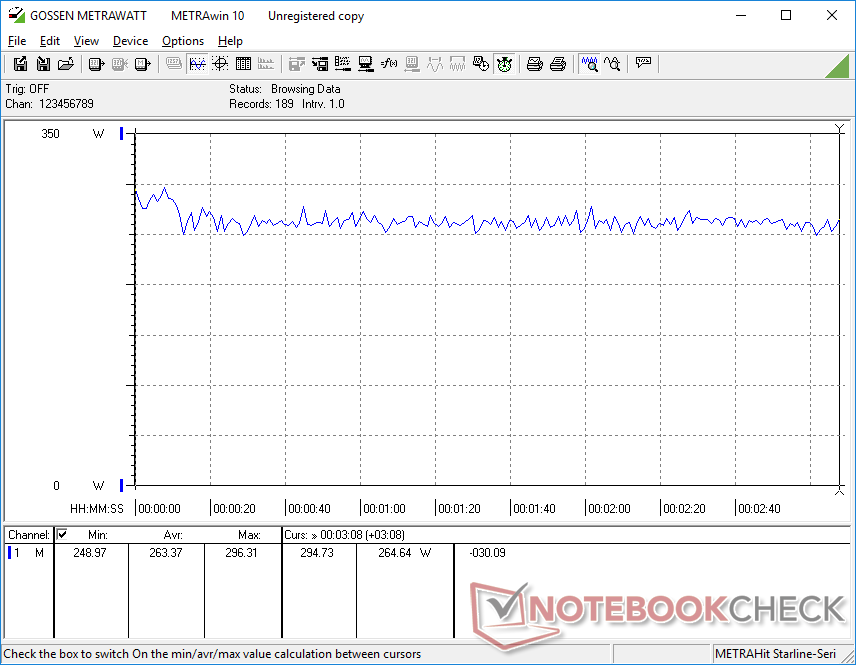
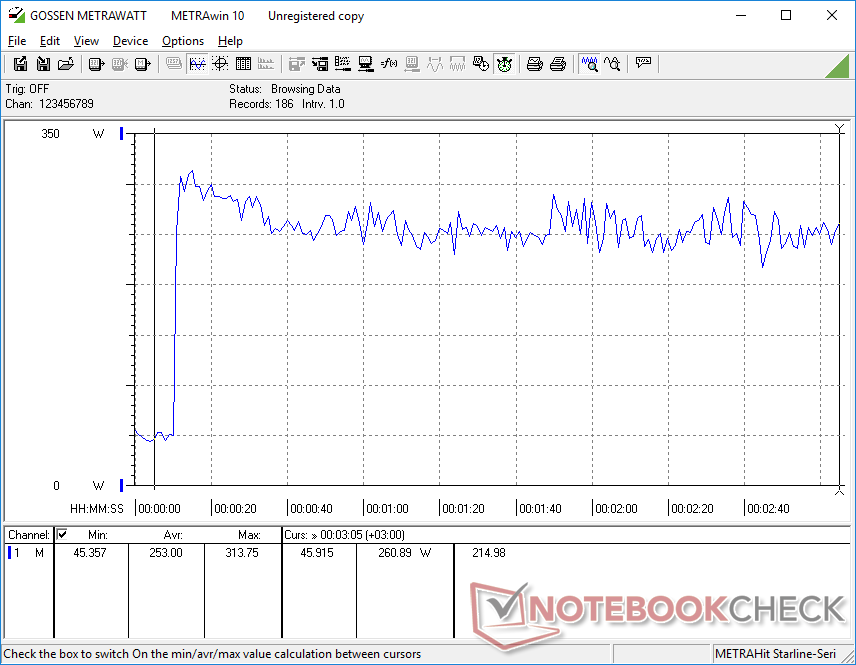
Il gioco richiede circa 263 W, che si collocano tra l'Asus ROG Strix G16 e l'MSI GE78 HX MSI GE78 HX ciascuno con la stessa GPU RTX 4080. Forse più importante, il modello con RTX 4090 Asus ROG Zephyrus M16 consuma il 20% di energia in meno pur fornendo all'incirca le stesse prestazioni grafiche del nostro Alienware con RTX 4080.
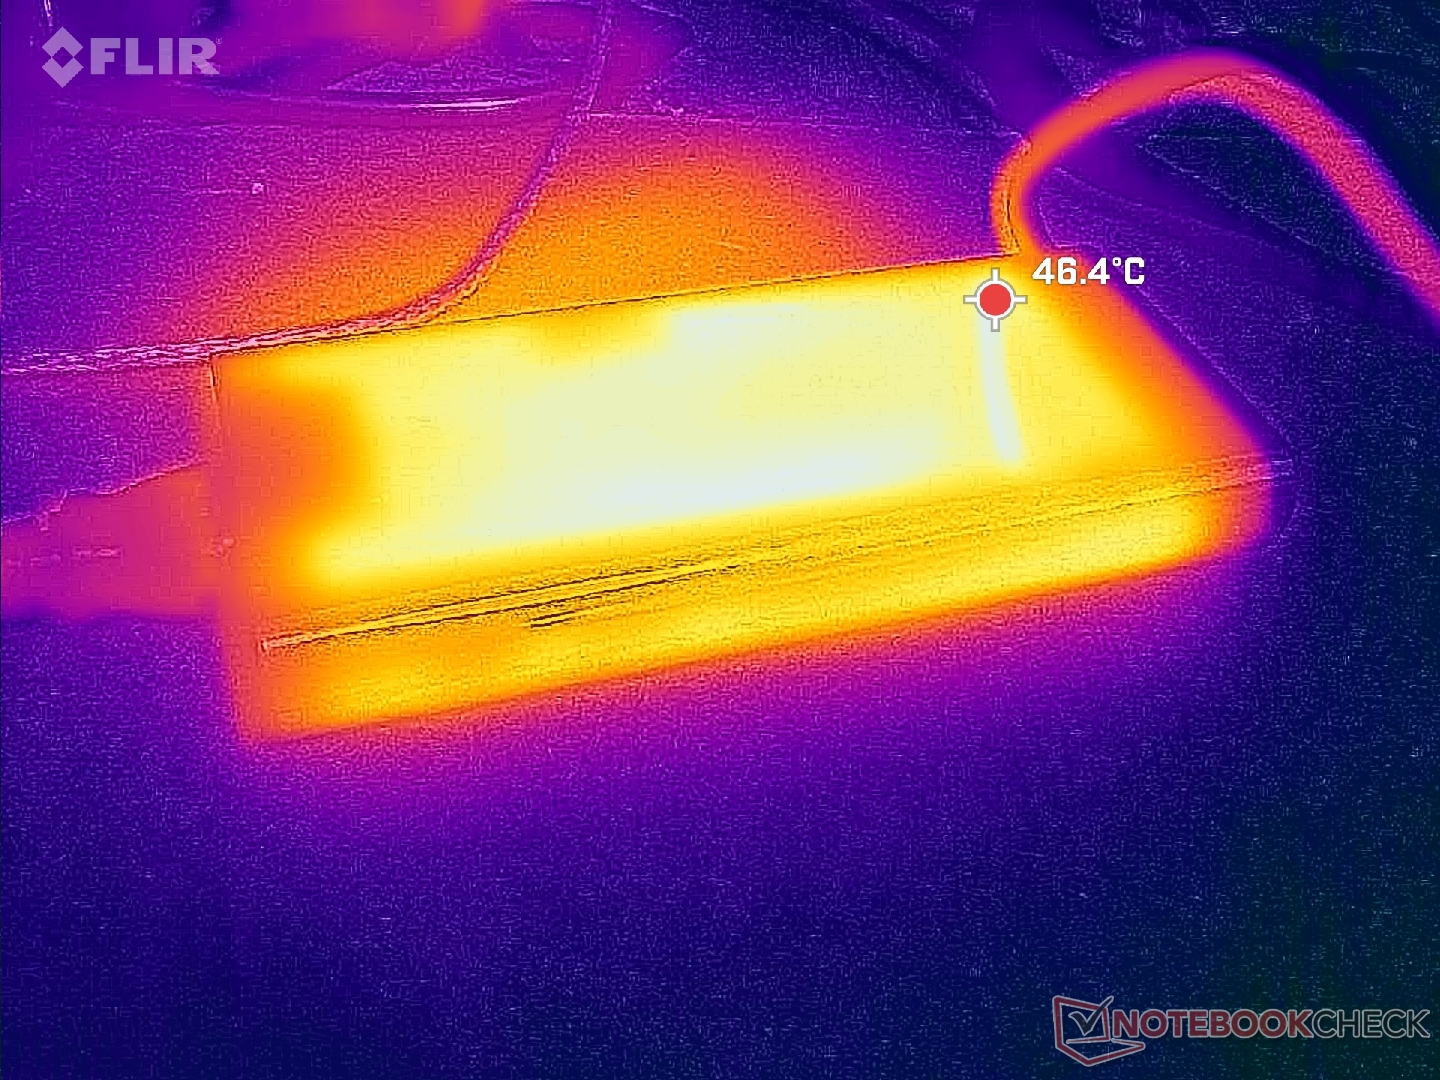
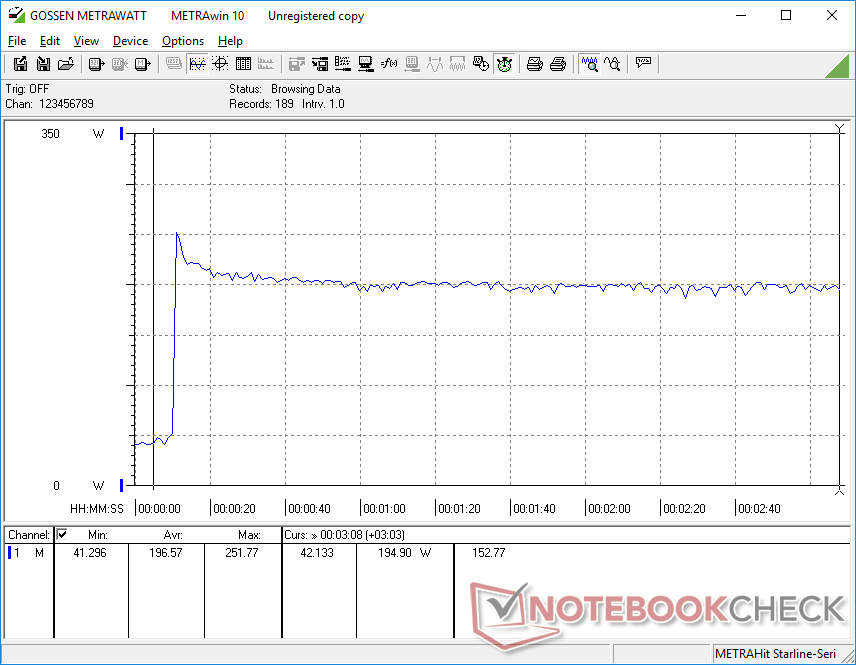
Siamo riusciti a misurare un consumo massimo temporaneo di 313 W dall'adattatore CA medio-grande (~18,3 x 8,6 x 2,6 cm) da 330 W quando sia la CPU che la GPU sono al 100% di utilizzo. La velocità di ricarica rallenta quando si eseguono carichi così impegnativi.
| Off / Standby | |
| Idle | |
| Sotto carico |
|
Leggenda:
min: | |
| Alienware x16 R1 i9-13900HK, GeForce RTX 4080 Laptop GPU, SK hynix PC801 HFS001TEJ9X101N, IPS, 2560x1600, 16" | Lenovo Legion Pro 7 RTX4090 i9-13900HX, GeForce RTX 4090 Laptop GPU, Samsung PM9A1 MZVL21T0HCLR, IPS, 2560x1600, 16" | Asus ROG Zephyrus M16 GU604VY-NM042X i9-13900H, GeForce RTX 4090 Laptop GPU, Samsung PM9A1 MZVL22T0HBLB, IPS, 2560x1600, 16" | Razer Blade 16 Early 2023 i9-13950HX, GeForce RTX 4080 Laptop GPU, SSSTC CA6-8D1024, IPS, 2560x1600, 16" | Dell G16 7620 i7-12700H, GeForce RTX 3060 Laptop GPU, WDC PC SN810 512GB, IPS, 2560x1600, 16" | Alienware m17 R5 (R9 6900HX, RX 6850M XT) R9 6900HX, Radeon RX 6850M XT, SSSTC CA6-8D1024, IPS, 3840x2160, 17" | |
|---|---|---|---|---|---|---|
| Power Consumption | 5% | 21% | 12% | 30% | 33% | |
| Idle Minimum * (Watt) | 25.2 | 20 21% | 20 21% | 15.2 40% | 14.4 43% | 13 48% |
| Idle Average * (Watt) | 29.9 | 25 16% | 24 20% | 22.8 24% | 17.8 40% | 16.5 45% |
| Idle Maximum * (Watt) | 49.8 | 35 30% | 25 50% | 49.8 -0% | 31.5 37% | 17 66% |
| Load Average * (Watt) | 105.4 | 136 -29% | 107 -2% | 121.2 -15% | 101.2 4% | 93 12% |
| Witcher 3 ultra * (Watt) | 263 | 282 -7% | 208 21% | 242 8% | 176.9 33% | 239 9% |
| Load Maximum * (Watt) | 313.8 | 320 -2% | 267 15% | 273.7 13% | 242.9 23% | 251 20% |
* ... Meglio usare valori piccoli
Power Consumption Witcher 3 / Stresstest
Power Consumption external Monitor
Durata della batteria
Siamo riusciti a registrare solo 2,5 ore di autonomia durante il nostro test di navigazione WLAN, anche con l'ACC impostato sulla modalità batteria e il sistema in modalità iGPU Optimus. Ripetendo il test si otterrebbero numeri simili. Non ci aspettiamo tempi di esecuzione lunghi dai portatili da gioco, ma questo è comunque molto più breve rispetto alle piattaforme concorrenti. Dell dichiara un'autonomia di navigazione di oltre 7 ore, che riusciamo a ottenere solo quando è al minimo sul desktop con l'impostazione di luminosità più bassa. I risultati sono insoliti, dato che il nostroAlienware x17 durava il doppio del nostro Alienware x16 durante lo stesso test WLAN.
La ricarica da vuoto a pieno richiede circa due ore con l'adattatore CA in dotazione. Il sistema può essere ricaricato anche tramite adattatori USB-C, compresi quelli da 130 W forniti con i modelli XPS.
| Alienware x16 R1 i9-13900HK, GeForce RTX 4080 Laptop GPU, 90 Wh | Asus ROG Zephyrus M16 GU604VY-NM042X i9-13900H, GeForce RTX 4090 Laptop GPU, 90 Wh | Razer Blade 16 Early 2023 i9-13950HX, GeForce RTX 4080 Laptop GPU, 95.2 Wh | Dell G16 7620 i7-12700H, GeForce RTX 3060 Laptop GPU, 84 Wh | Alienware m17 R5 (R9 6900HX, RX 6850M XT) R9 6900HX, Radeon RX 6850M XT, 97 Wh | Lenovo Legion Pro 7 16IRX8H i9-13900HX, GeForce RTX 4080 Laptop GPU, 99.9 Wh | |
|---|---|---|---|---|---|---|
| Autonomia della batteria | 193% | 89% | 32% | 125% | 97% | |
| Reader / Idle (h) | 7.3 | 8.9 22% | 7.1 -3% | 6.4 -12% | ||
| WiFi v1.3 (h) | 2.5 | 4.3 72% | 6.1 144% | 5 100% | 4.8 92% | 5.1 104% |
| Load (h) | 0.7 | 2.9 314% | 1.4 100% | 0.7 0% | 1.8 157% | 2.1 200% |
| H.264 (h) | 4.8 | 4.9 |
Pro
Contro
Verdetto - Riesce a inseguire sia la sottigliezza sia la grafica
È opinione comune che le prestazioni di un computer portatile siano inversamente proporzionali alla sottigliezza. L'Alienware x16 sfida questo concetto essendo uno dei più sottili nella sua categoria di dimensioni, pur superando i principali concorrenti come il Razer Blade 16, Asus ROG Strix G16o HP Omen 17 in termini di prestazioni grafiche. È impressionante che il modello sia in grado di inserire una GPU RTX GeForce da 175 W, dato il profilo ultrasottile.
Se state cercando di massimizzare le prestazioni della GPU riducendo al minimo la sottigliezza, allora l'Alienware x16 dovrebbe essere in cima alla vostra lista.
Ci sono tuttavia diversi svantaggi, alcuni dei quali sono esclusivi dell'Alienware x16. In primo luogo, il fatto che sia super sottile non significa che sia super piccolo o leggero, in quanto il sistema è molto grande in termini di lunghezza e larghezza per compensare l'altezza Z più sottile. In secondo luogo, la mancanza di porte lungo i lati può rendere ogni volta un po' complicato il collegamento di monitor o accessori. Infine, il Core i9-13900HK offre solo miglioramenti marginali rispetto alla generazione precedenteCore i9-12900H poiché non è neanche lontanamente paragonabile alla potenza delCore i9-13900HX che è disponibile sul più spesso Alienware m16 e non sull'Alienware x16. Per massimizzare la potenza della GPU sono state probabilmente necessarie delle concessioni in termini di ingombro, posizionamento delle porte e prestazioni della CPU.
Prezzo e disponibilità
Dell distribuisce ora l'Alienware x16 ai consumatori a partire da 2.200 dollari per la configurazione base fino a 3.350 dollari per la configurazione da noi recensita.
Alienware x16 R1
- 06/22/2023 v7 (old)
Allen Ngo
Transparency
La selezione dei dispositivi da recensire viene effettuata dalla nostra redazione. Il campione di prova è stato fornito all'autore come prestito dal produttore o dal rivenditore ai fini di questa recensione. L'istituto di credito non ha avuto alcuna influenza su questa recensione, né il produttore ne ha ricevuto una copia prima della pubblicazione. Non vi era alcun obbligo di pubblicare questa recensione. In quanto società mediatica indipendente, Notebookcheck non è soggetta all'autorità di produttori, rivenditori o editori.
Ecco come Notebookcheck esegue i test
Ogni anno, Notebookcheck esamina in modo indipendente centinaia di laptop e smartphone utilizzando procedure standardizzate per garantire che tutti i risultati siano comparabili. Da circa 20 anni sviluppiamo continuamente i nostri metodi di prova e nel frattempo stabiliamo gli standard di settore. Nei nostri laboratori di prova, tecnici ed editori esperti utilizzano apparecchiature di misurazione di alta qualità. Questi test comportano un processo di validazione in più fasi. Il nostro complesso sistema di valutazione si basa su centinaia di misurazioni e parametri di riferimento ben fondati, che mantengono l'obiettività.Price comparison

