Recensione del portatile MSI Raider GE78 HX 13VH: core i9-13950HX di 13a generazione e aggiornamenti GeForce RTX 4080
Presentato al CES 2023il Raider GE78 da 16:10 e 17,0 pollici succede al Raider GE77 da 16:9 e 17,3 pollici del 2022 con interni aggiornati e un nuovo design dello chassis. È dotato di alcune delle più potenti CPU Raptor Lake-H di Intel e di GPU mobile GeForce 40 attualmente disponibili su qualsiasi modello di laptop. La serie GE di MSI si colloca appena sotto la serie GT77 Titan, ancora più costosa e più grande, in termini di classificazione.
Le SKU vanno dalla CPU Core i9-13950HX di 13a generazione, GPU RTX 4070 da 140 W GeForce e display IPS 1920 x 1200 165 Hz fino al Core i9-13980HX, RTX 4090 da 175 W e display IPS 2560 x 1600 240 Hz per circa 4200 dollari. La nostra specifica unità di recensione è una configurazione di fascia media superiore con Core i9-13950HX, RTX 4080 da 175 W e display a 1600p per circa 3700 dollari.
I concorrenti del GE78 includono altri portatili da gioco da 17 pollici di fascia alta come il Razer Blade 17, Asus ROG Strix Scar 17,Alienware m17 R5, o ilEluktronics Mech-17 GP2. È disponibile anche una versione da 16,0 pollici chiamata Raider GE68.
Altre recensioni di MSI:
Potenziali concorrenti a confronto
Punteggio | Data | Modello | Peso | Altezza | Dimensione | Risoluzione | Prezzo |
|---|---|---|---|---|---|---|---|
| 88.3 % v7 (old) | 03/2023 | MSI GE78HX 13VH-070US i9-13950HX, GeForce RTX 4080 Laptop GPU | 3 kg | 23 mm | 17.00" | 2560x1600 | |
| 89.9 % v7 (old) | 03/2023 | Eluktronics Mech-17 GP2 i9-13900HX, GeForce RTX 4090 Laptop GPU | 2.9 kg | 27 mm | 17.00" | 2560x1600 | |
| 88.4 % v7 (old) | 04/2023 | Asus ROG Strix G17 G713PI R9 7945HX, GeForce RTX 4070 Laptop GPU | 2.8 kg | 30.7 mm | 17.30" | 2560x1440 | |
| 89 % v7 (old) | 02/2023 | MSI Titan GT77 HX 13VI i9-13950HX, GeForce RTX 4090 Laptop GPU | 3.5 kg | 23 mm | 17.30" | 3840x2160 | |
| 86.8 % v7 (old) | 07/2022 | MSI Raider GE77 HX 12UHS i9-12900HX, GeForce RTX 3080 Ti Laptop GPU | 3.1 kg | 25.9 mm | 17.30" | 3840x2160 | |
| 89.9 % v7 (old) | 07/2022 | Razer Blade 17 Early 2022 i9-12900H, GeForce RTX 3080 Ti Laptop GPU | 2.8 kg | 19.9 mm | 17.30" | 3840x2160 |
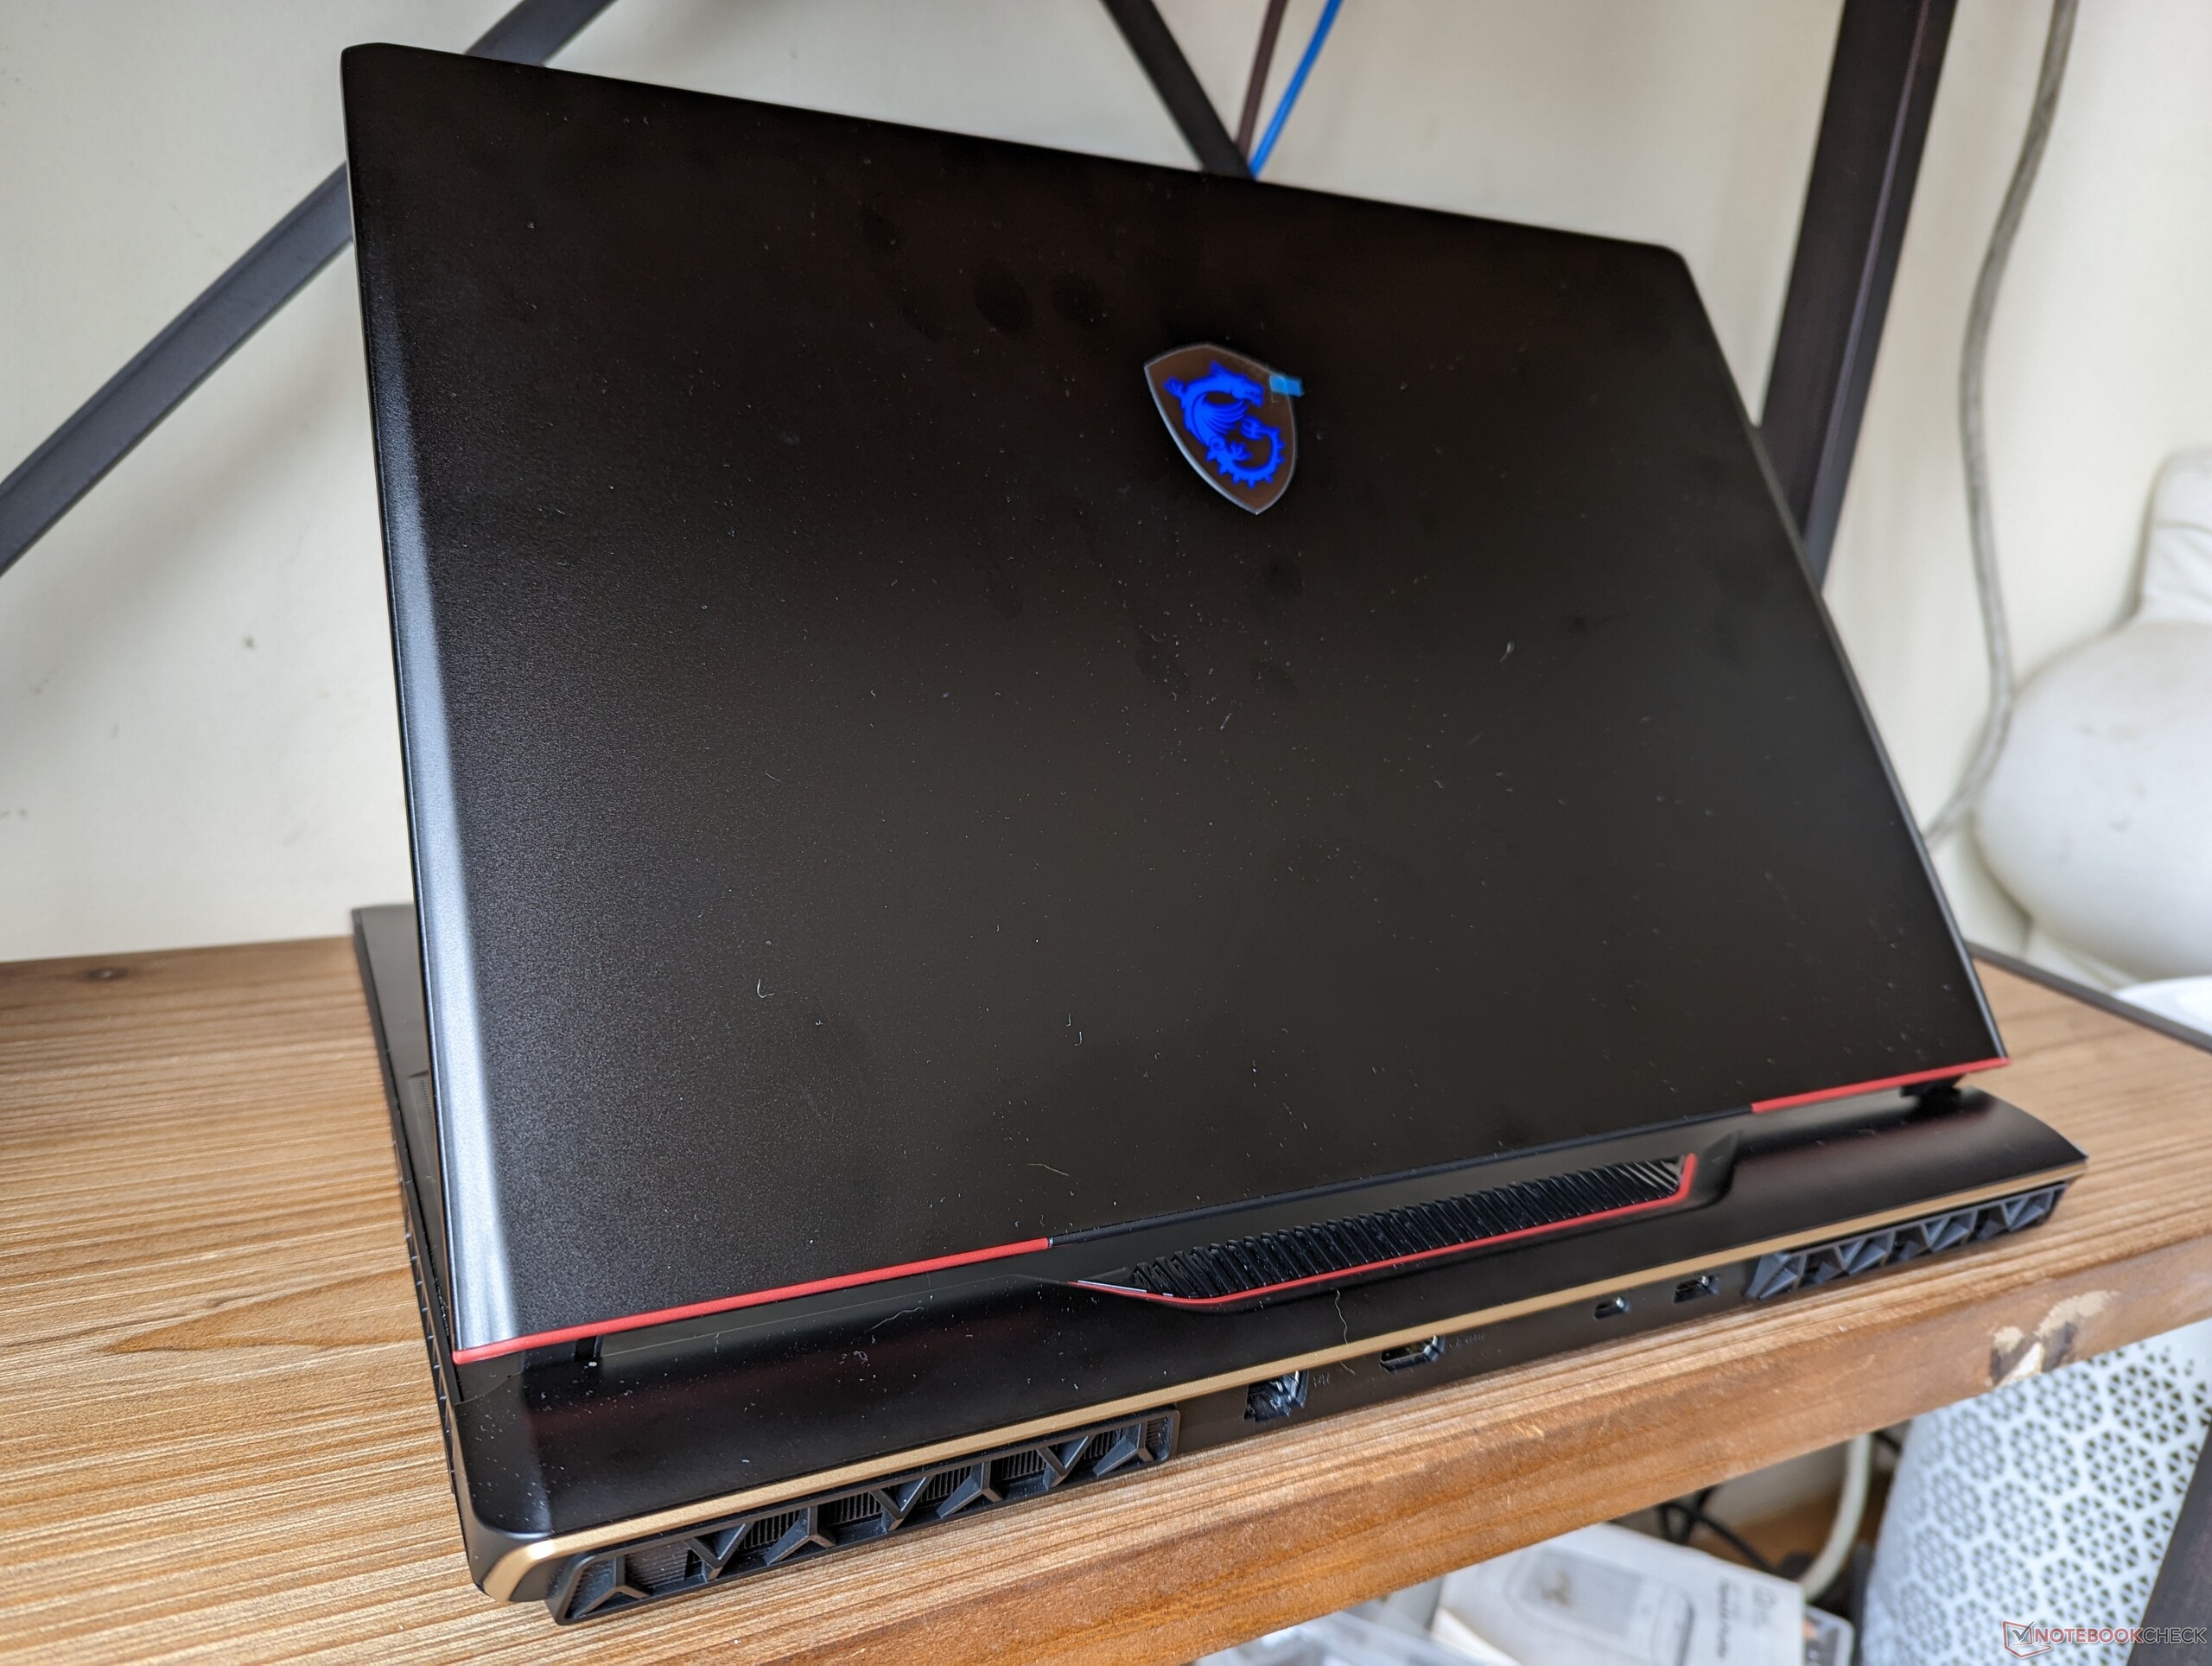
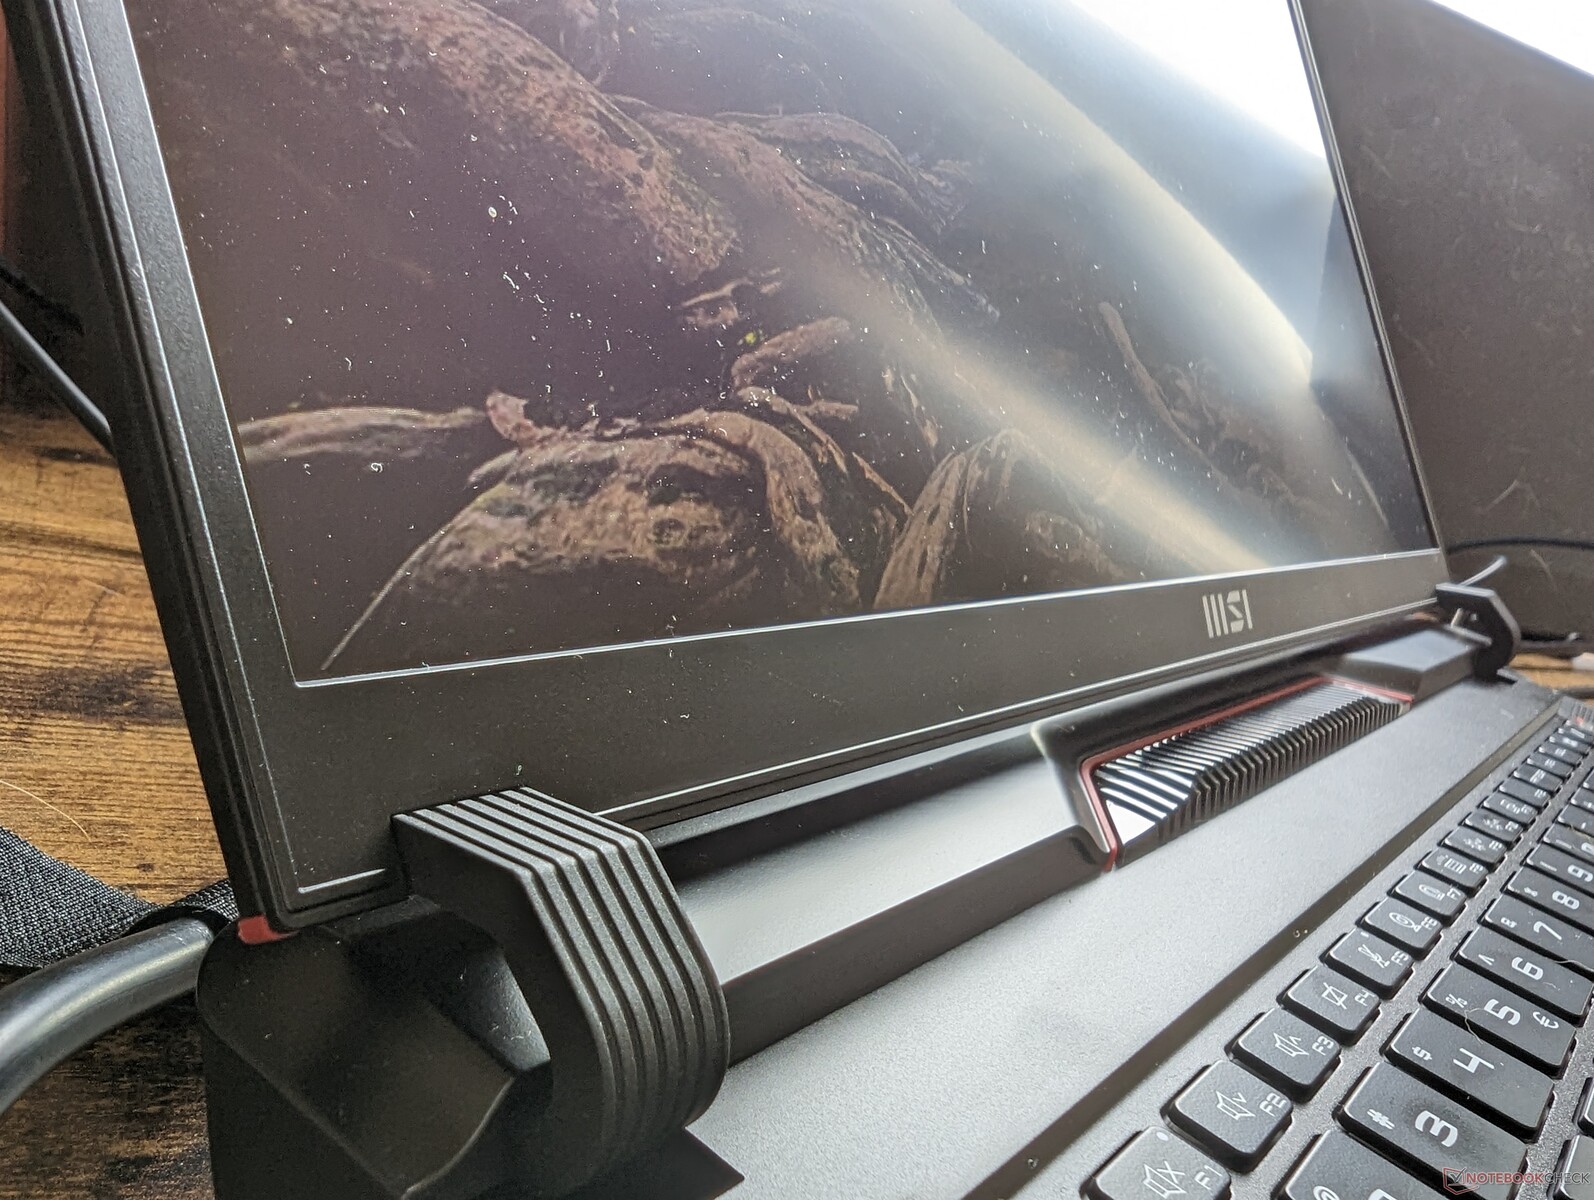
Custodia - Retro-futuristica
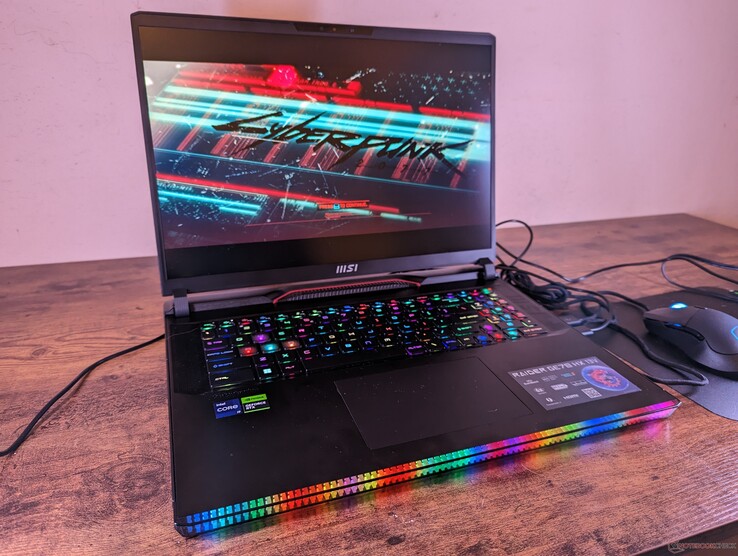
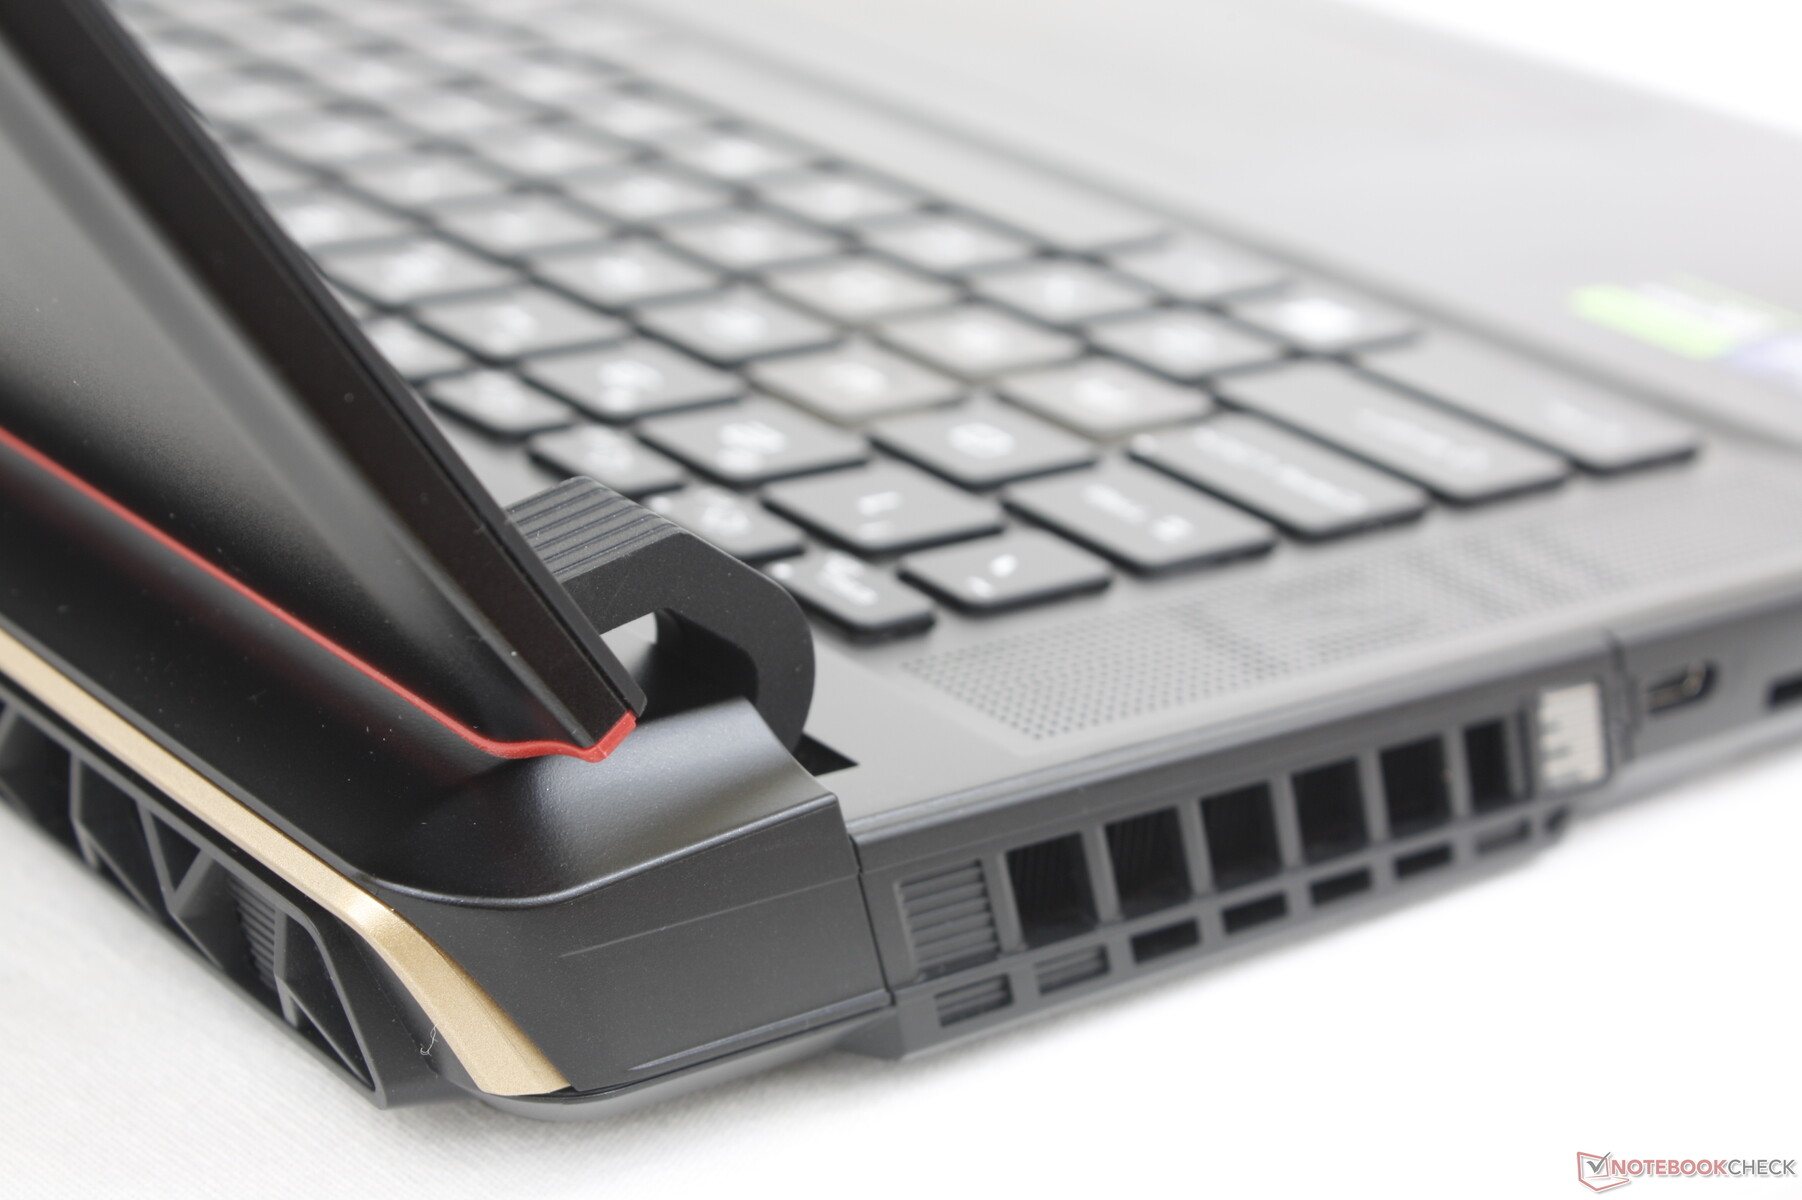
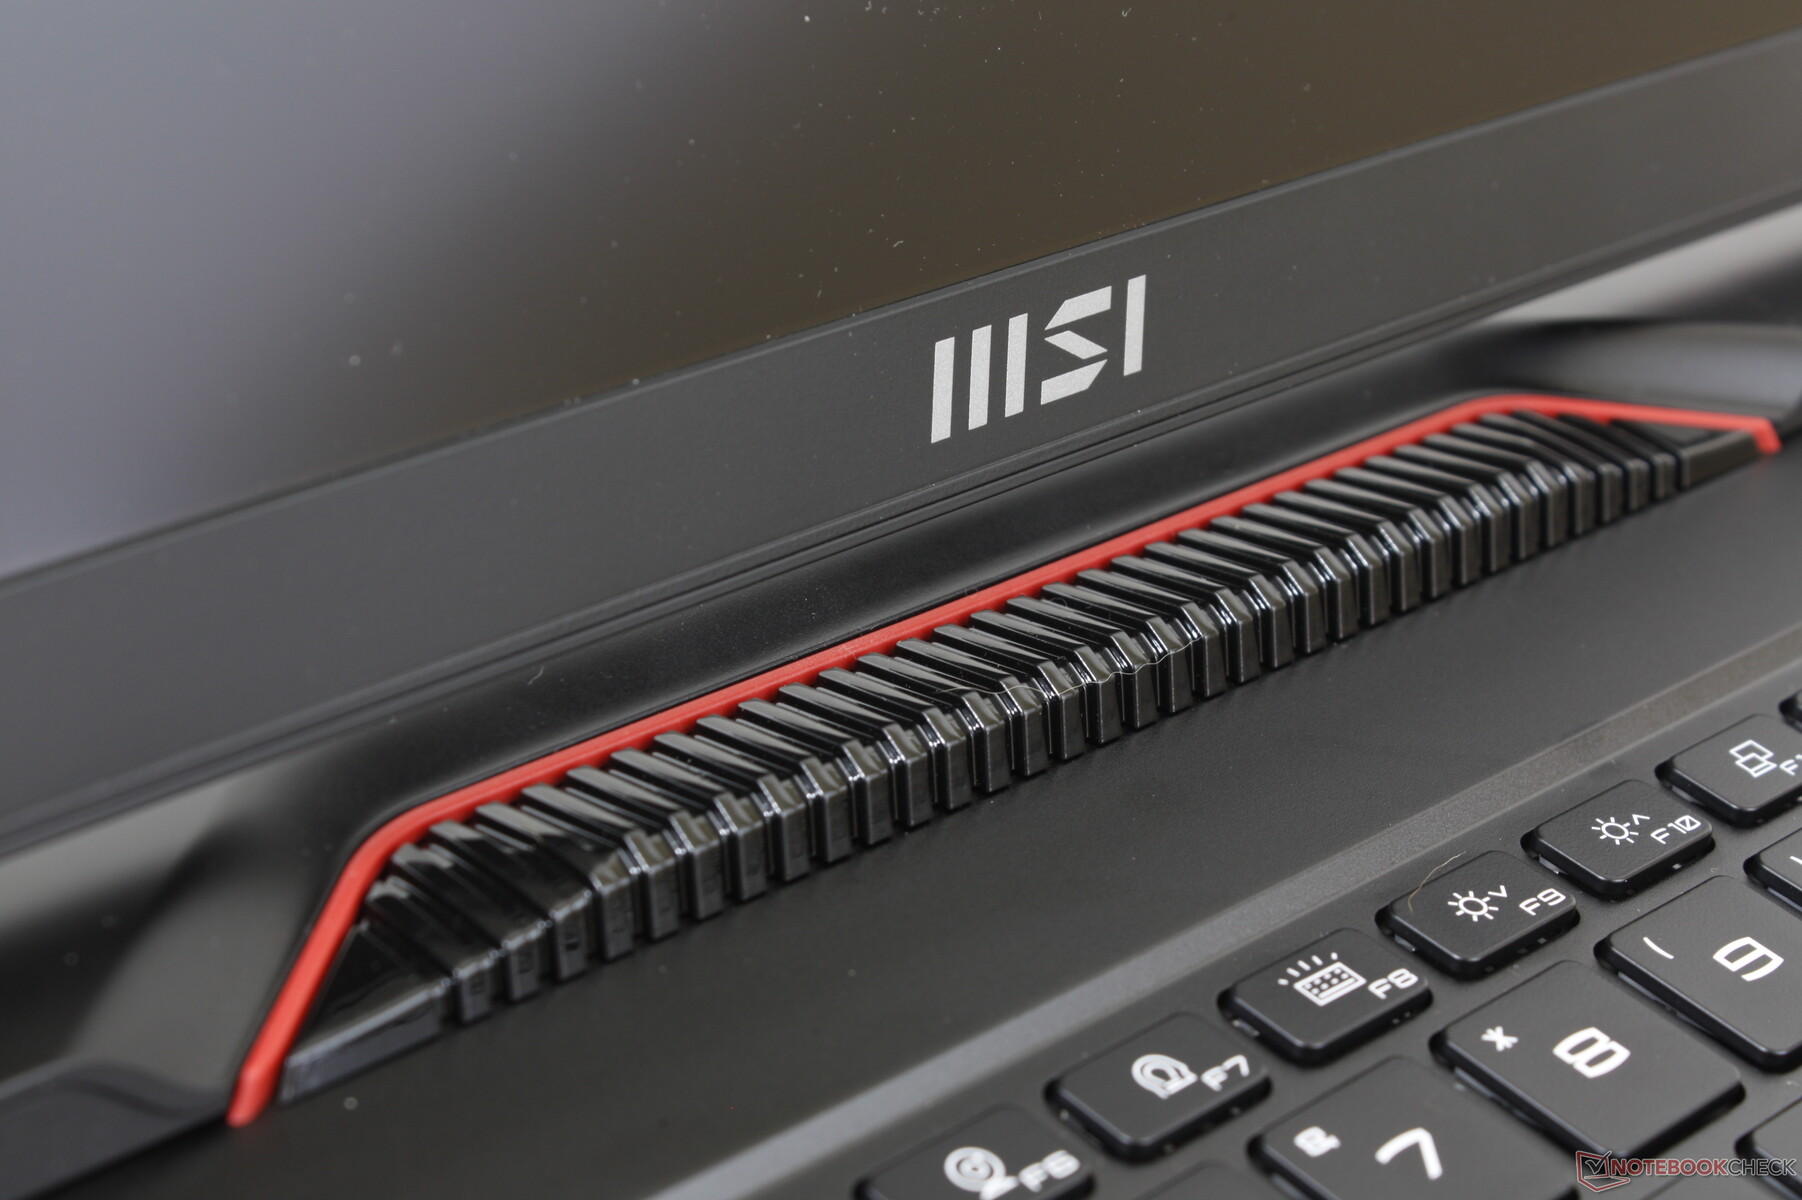
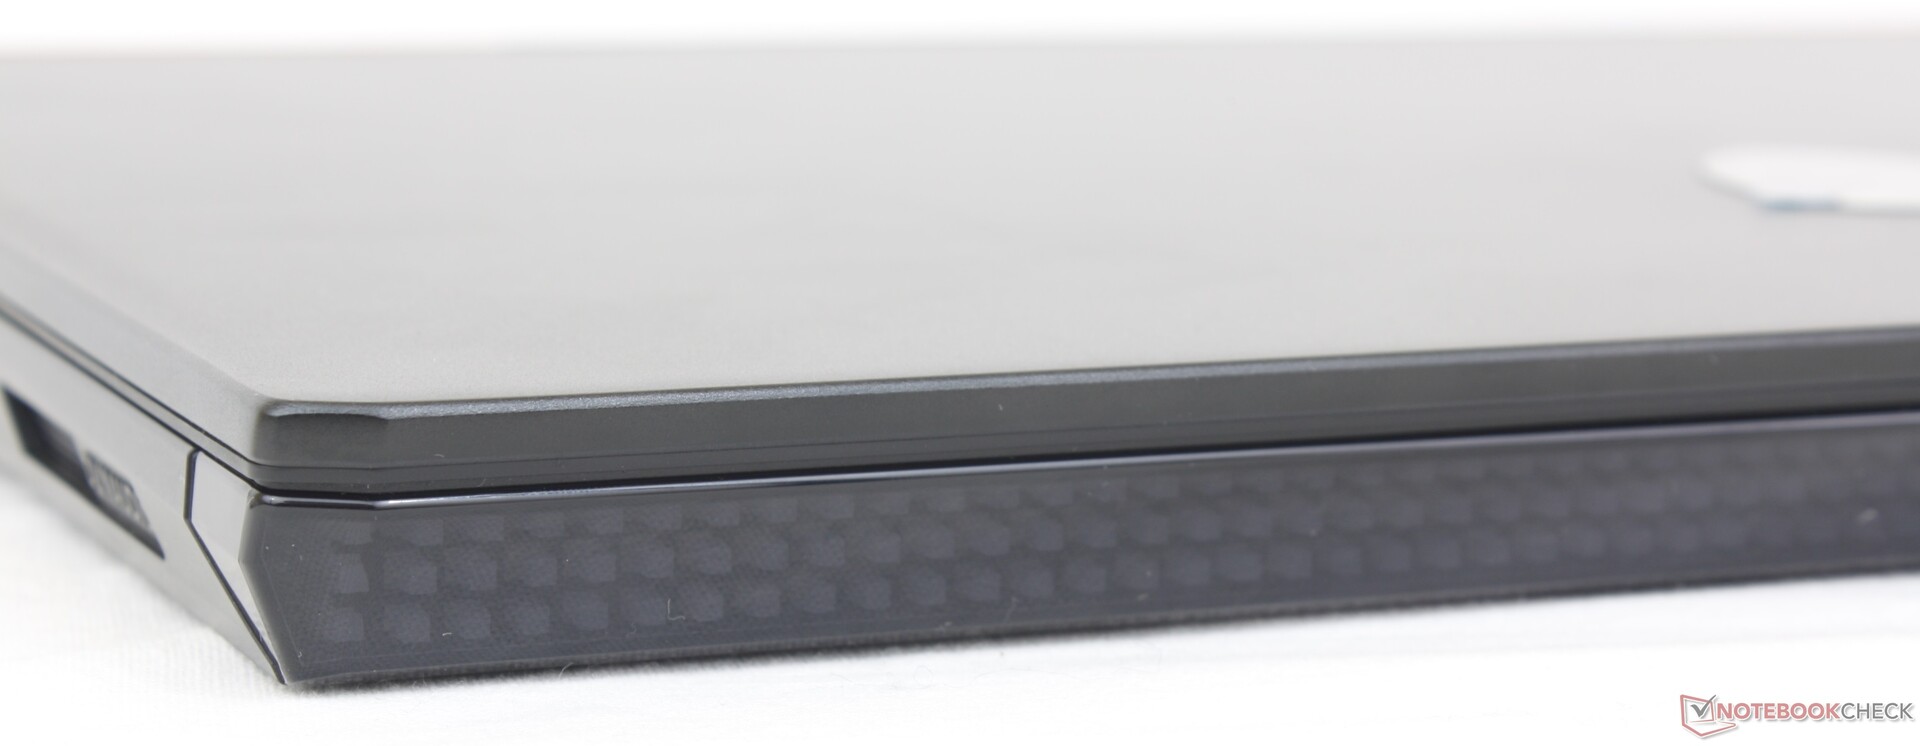
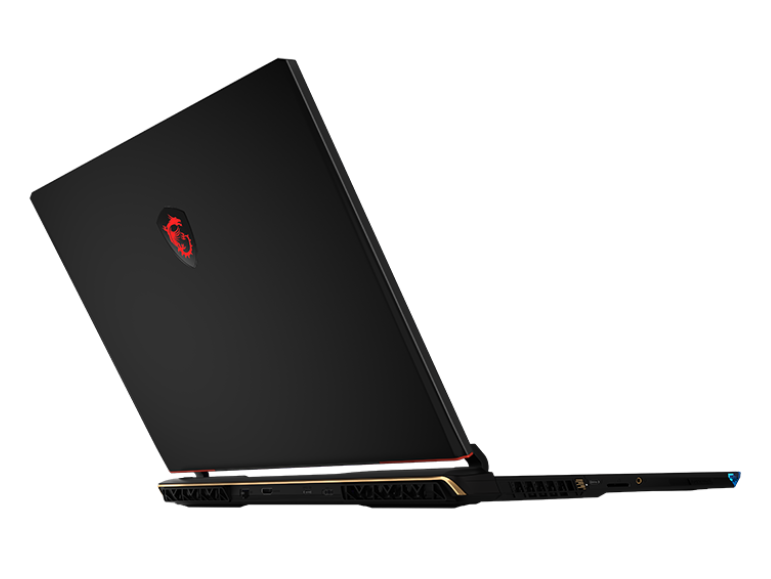
Secondo MSI, il design dell'ultimo modello GE privilegiava il minimalismo con superfici lisce e piatte. Nel tentativo di riportare un po' di stile nella serie, il design del GE78 si è ispirato ai giochi a 8 bit e all'estetica degli anni '80. Per questo motivo, l'ultimo modello incorpora più curve lungo la parte posteriore e una nuova barra luminosa lungo il bordo anteriore, composta da singoli "pixel" LED RGB. Le luci pixelate sono simili nello stile alla Hyundai Ioniq 6, anch'essa ispirata all'estetica retrò. Il risultato finale è un look unico che aiuta a distinguere visivamente il GE78 dal mare di altri portatili da gioco presenti sul mercato. Se il nuovo GE78 sia migliore o meno del vecchio GE77, tuttavia, è solo una questione di gusti.
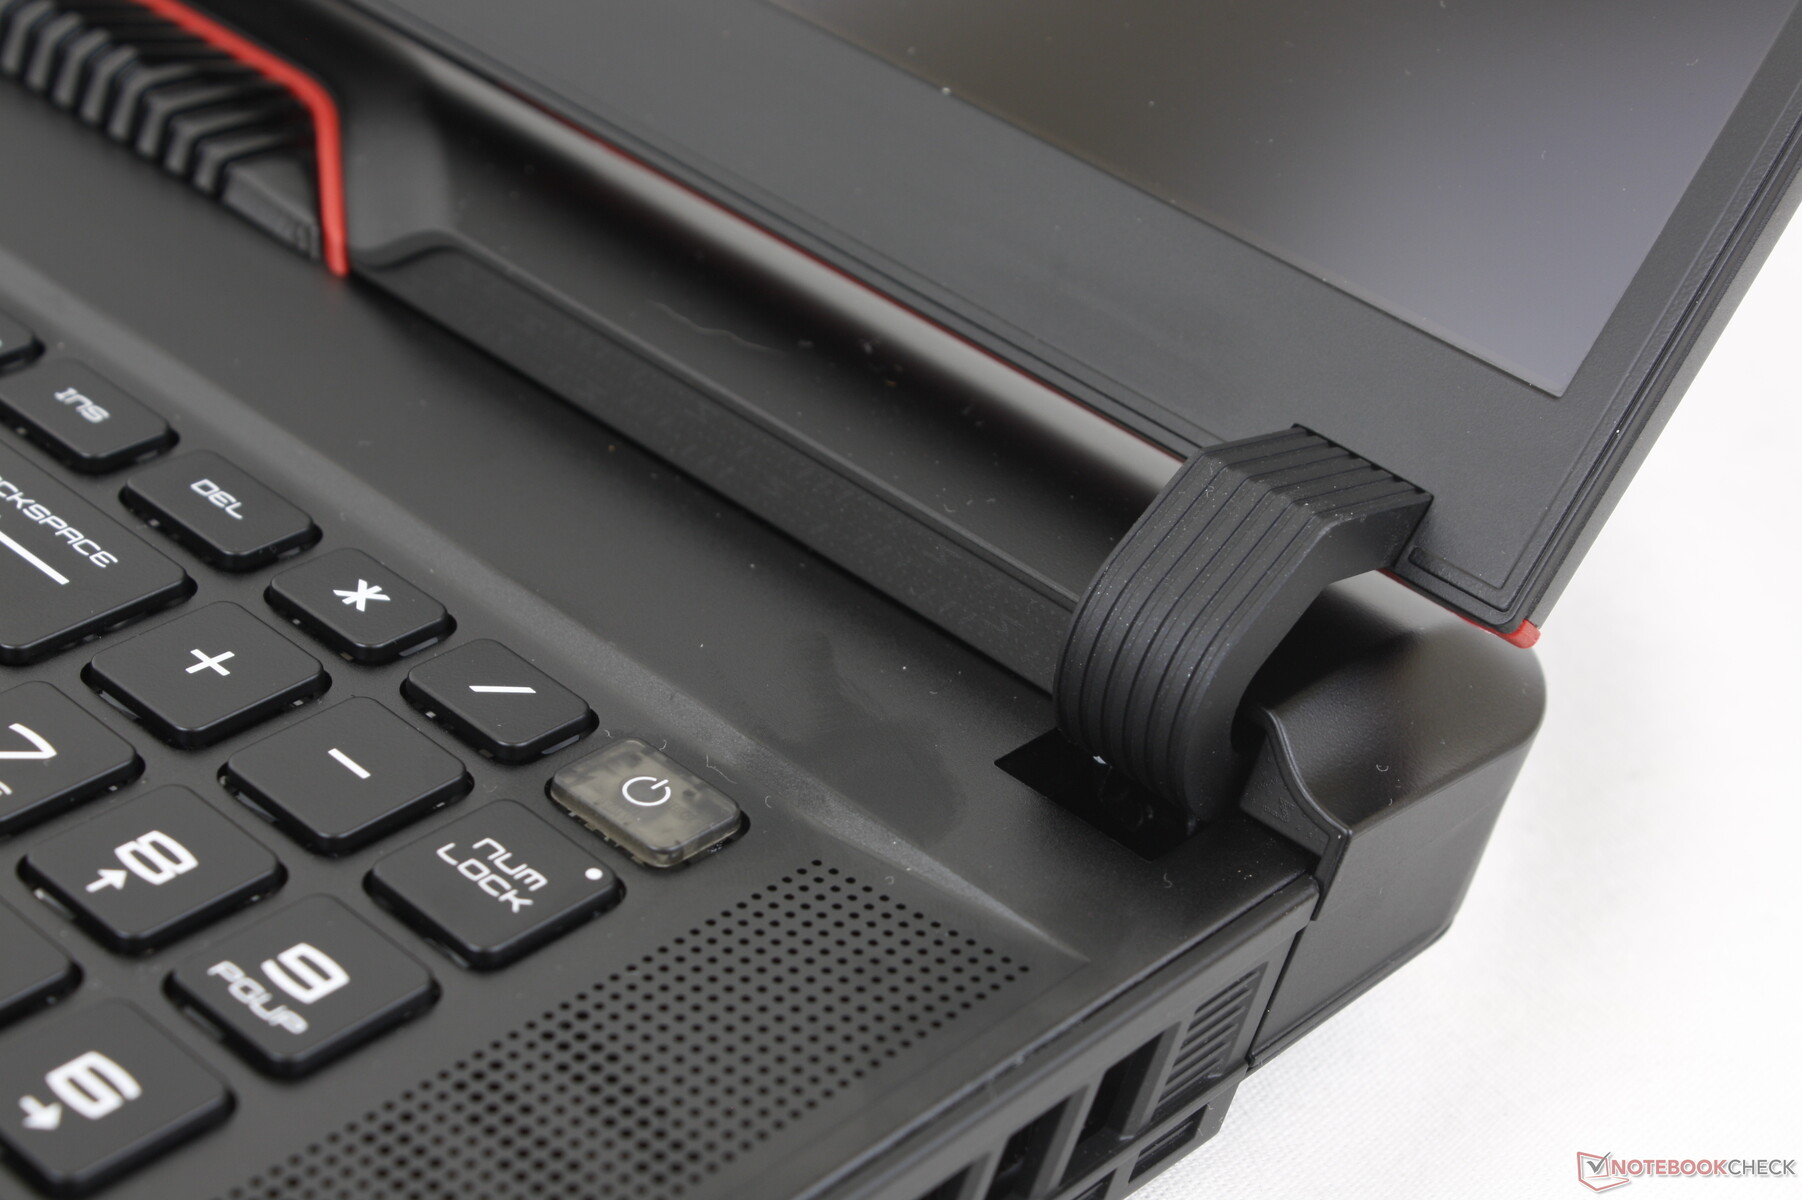
La qualità costruttiva non passa in secondo piano rispetto ai cambiamenti estetici. Le nuove cerniere, ad esempio, sono ora più grandi e più solide di quelle del GE77 e quindi è probabile che durino di più. In effetti, assomigliano molto alle cerniere della serie Asus Strix Scar. Per il resto, la rigidità del telaio è simile a quella del GE77, con scricchiolii minimi e solo un po' di deformazione quando si applica la pressione sul coperchio esterno.
C'è una maggiore possibilità di spazi vuoti tra i materiali, poiché lo scheletro del GE78 è composto da più parti singole rispetto a un tipico design unibody come quello del Razer Blade. Questo è particolarmente vero per la parte posteriore e i bordi, dove possiamo notare uno spazio leggermente più ampio su un lato rispetto all'altro della nostra unità di prova. Non è preoccupante, ma vale comunque la pena di verificarlo.
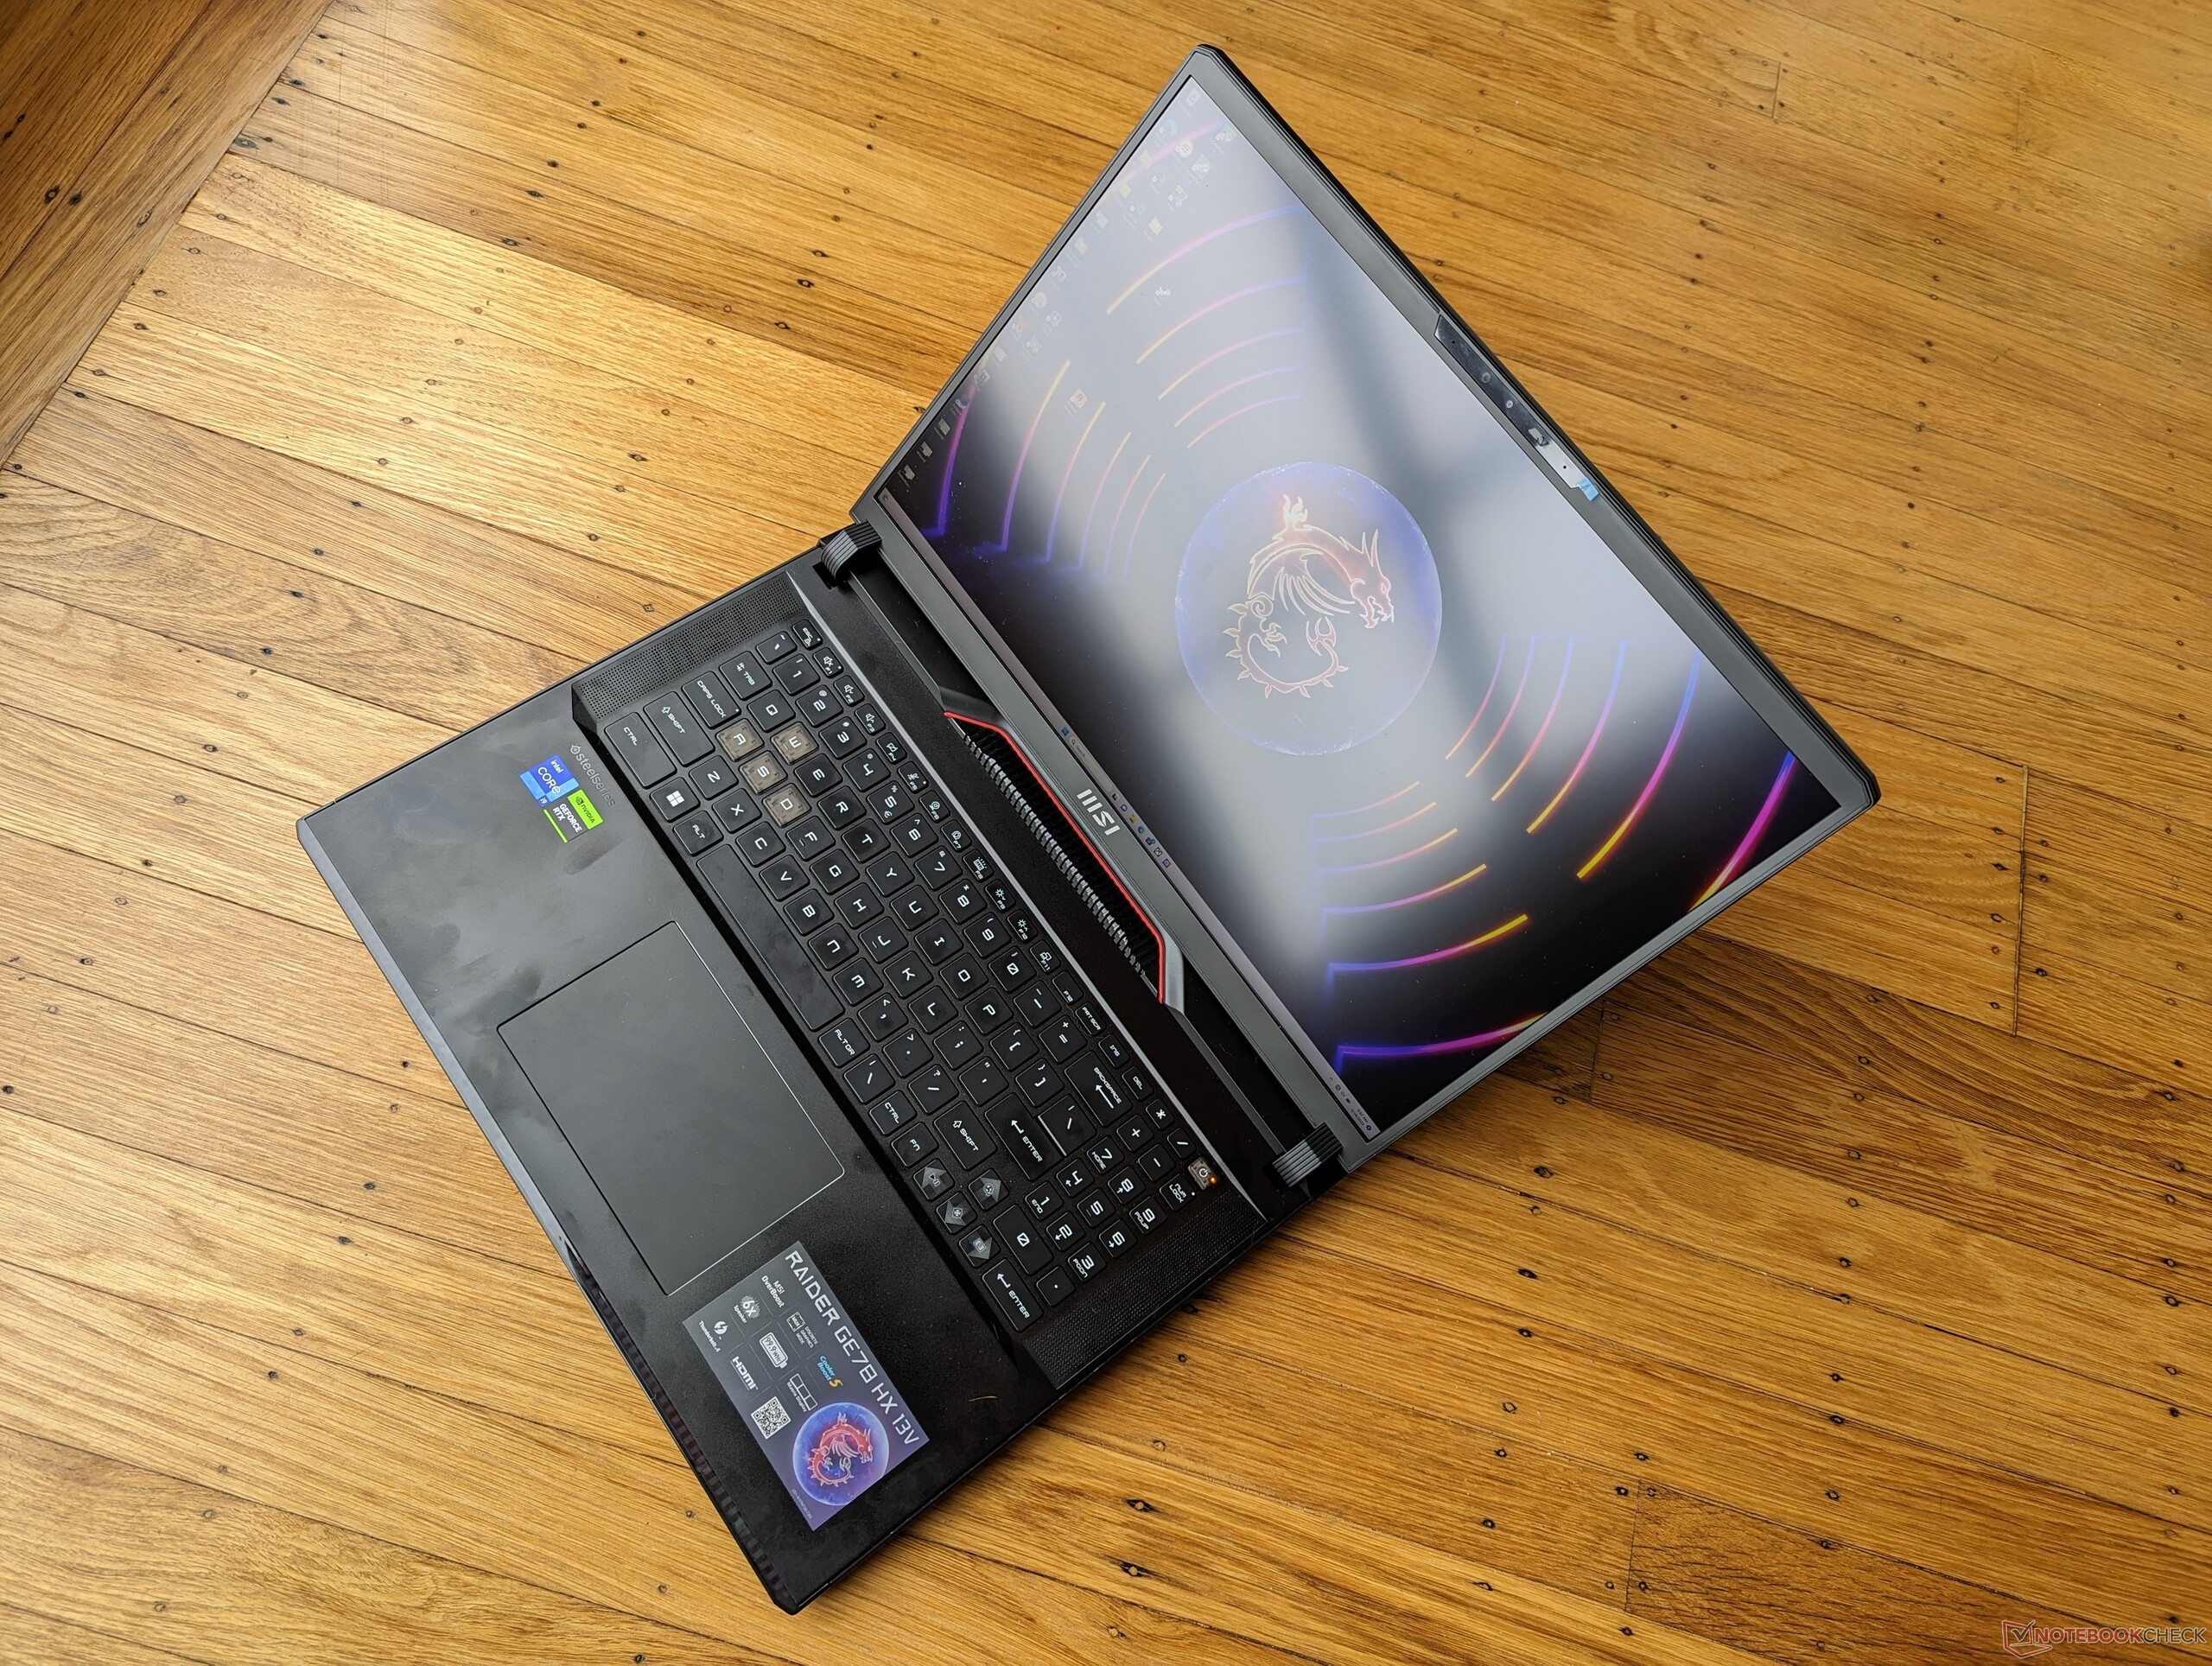
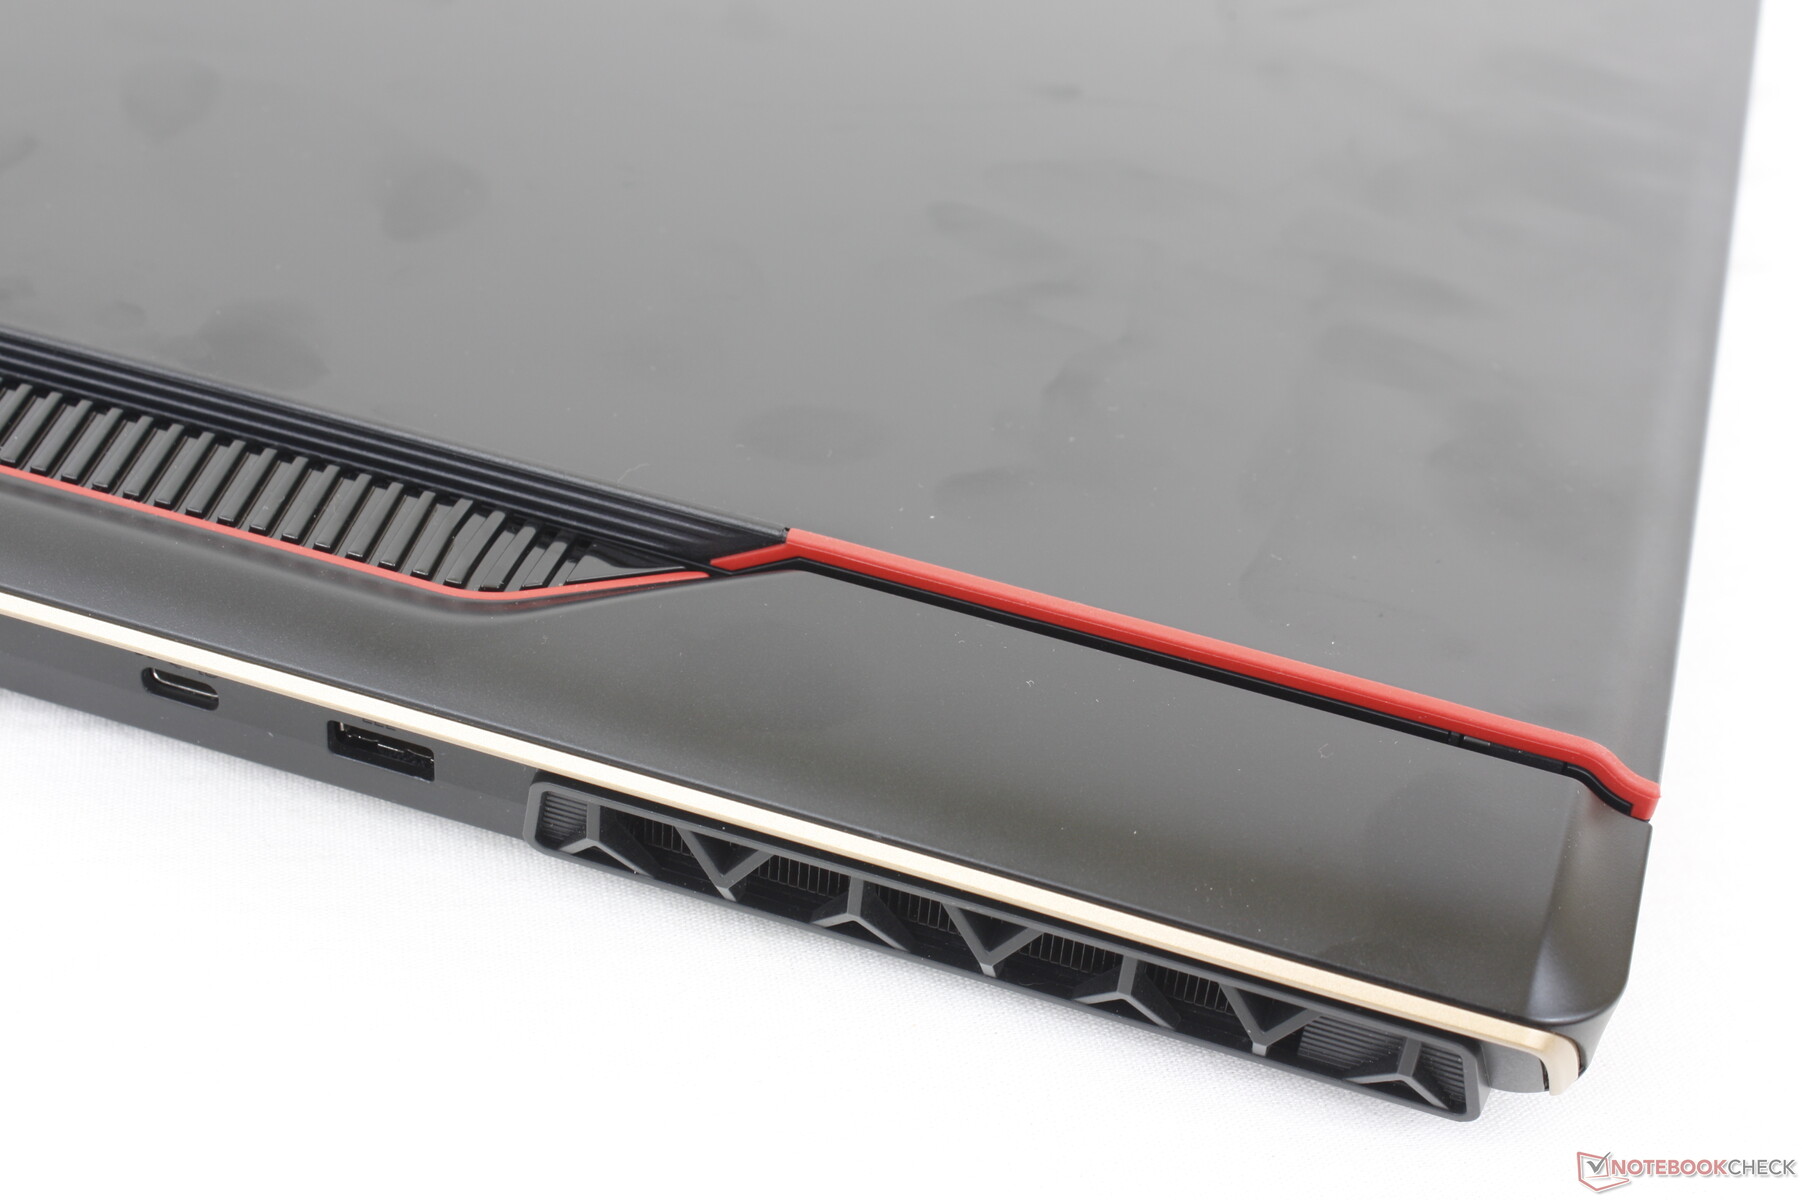
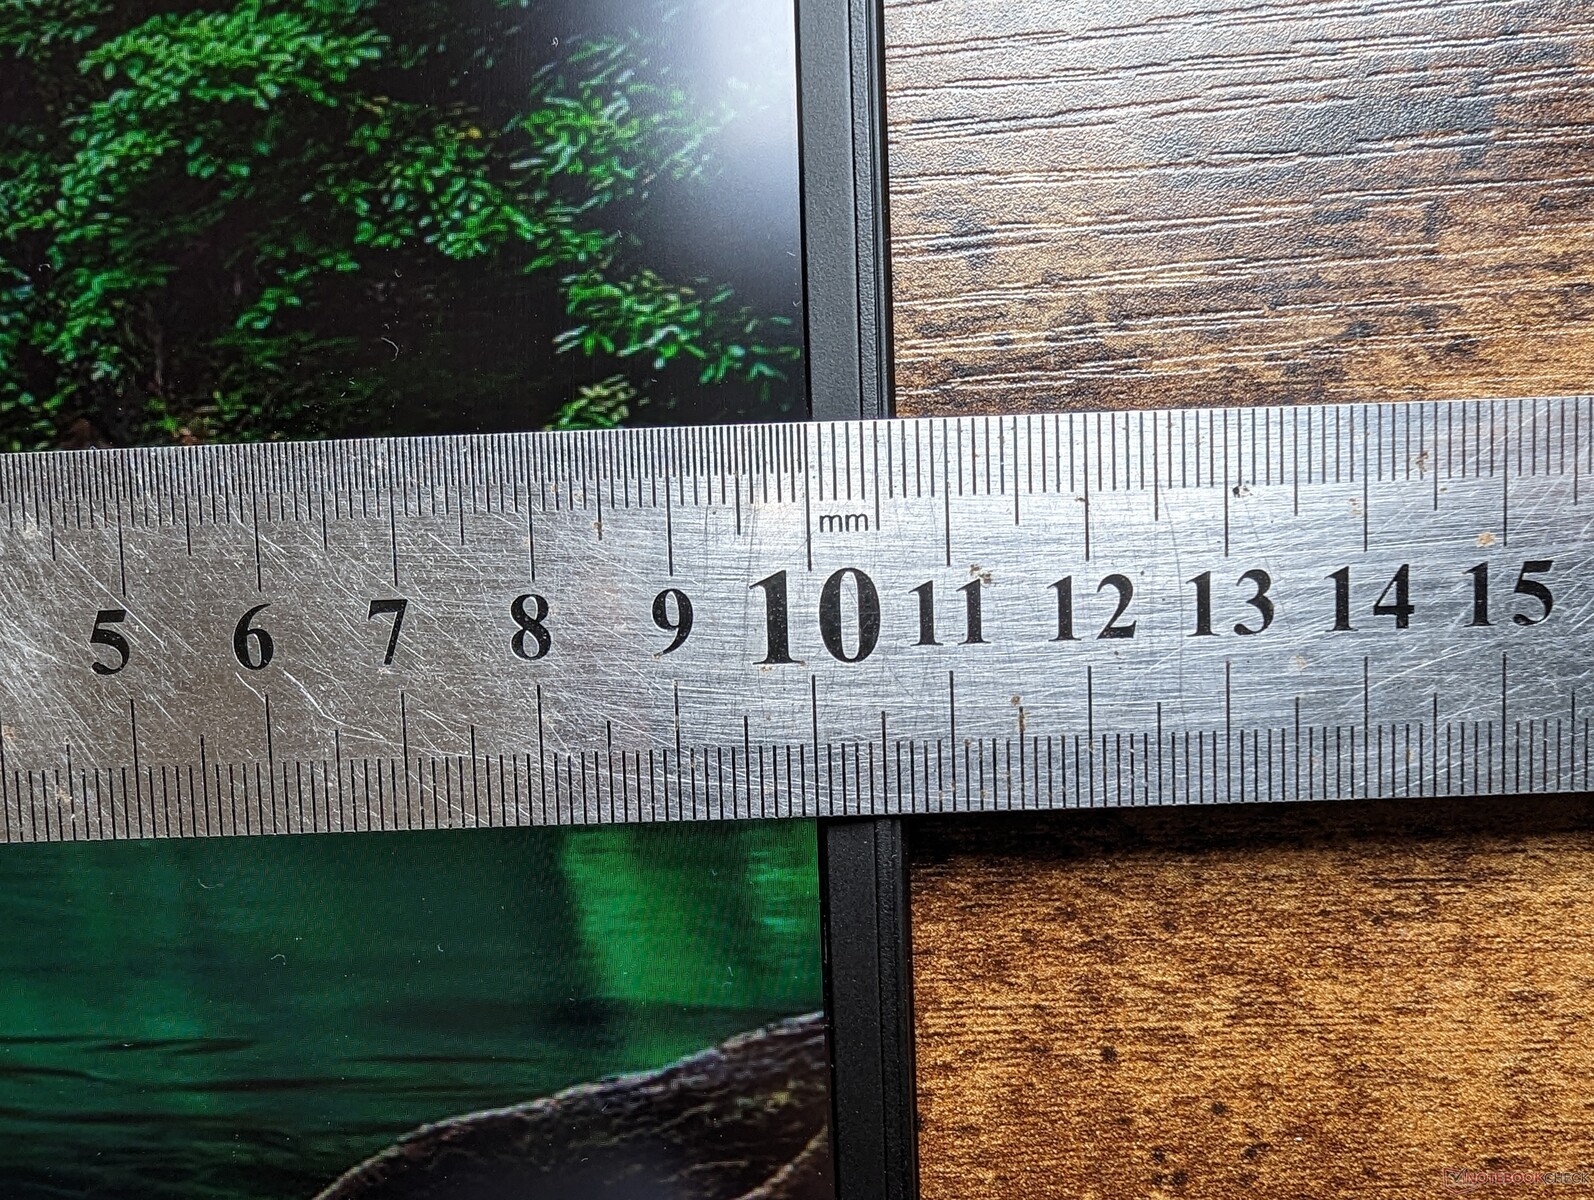
A causa del cambio di rapporto d'aspetto da 16:9 a 16:10, il GE78 è più corto in lunghezza ma più largo in larghezza per un ingombro più quadrato rispetto al suo predecessore. Tuttavia, è ancora più sottile di un paio di millimetri, quindi non bisogna pensare che il GE78 sia più spesso solo per la sua estetica di ispirazione retrò. Il peso complessivo è di circa 200 grammi superiore a quello del Razer Blade 17.
Connettività - USB-C in ogni direzione
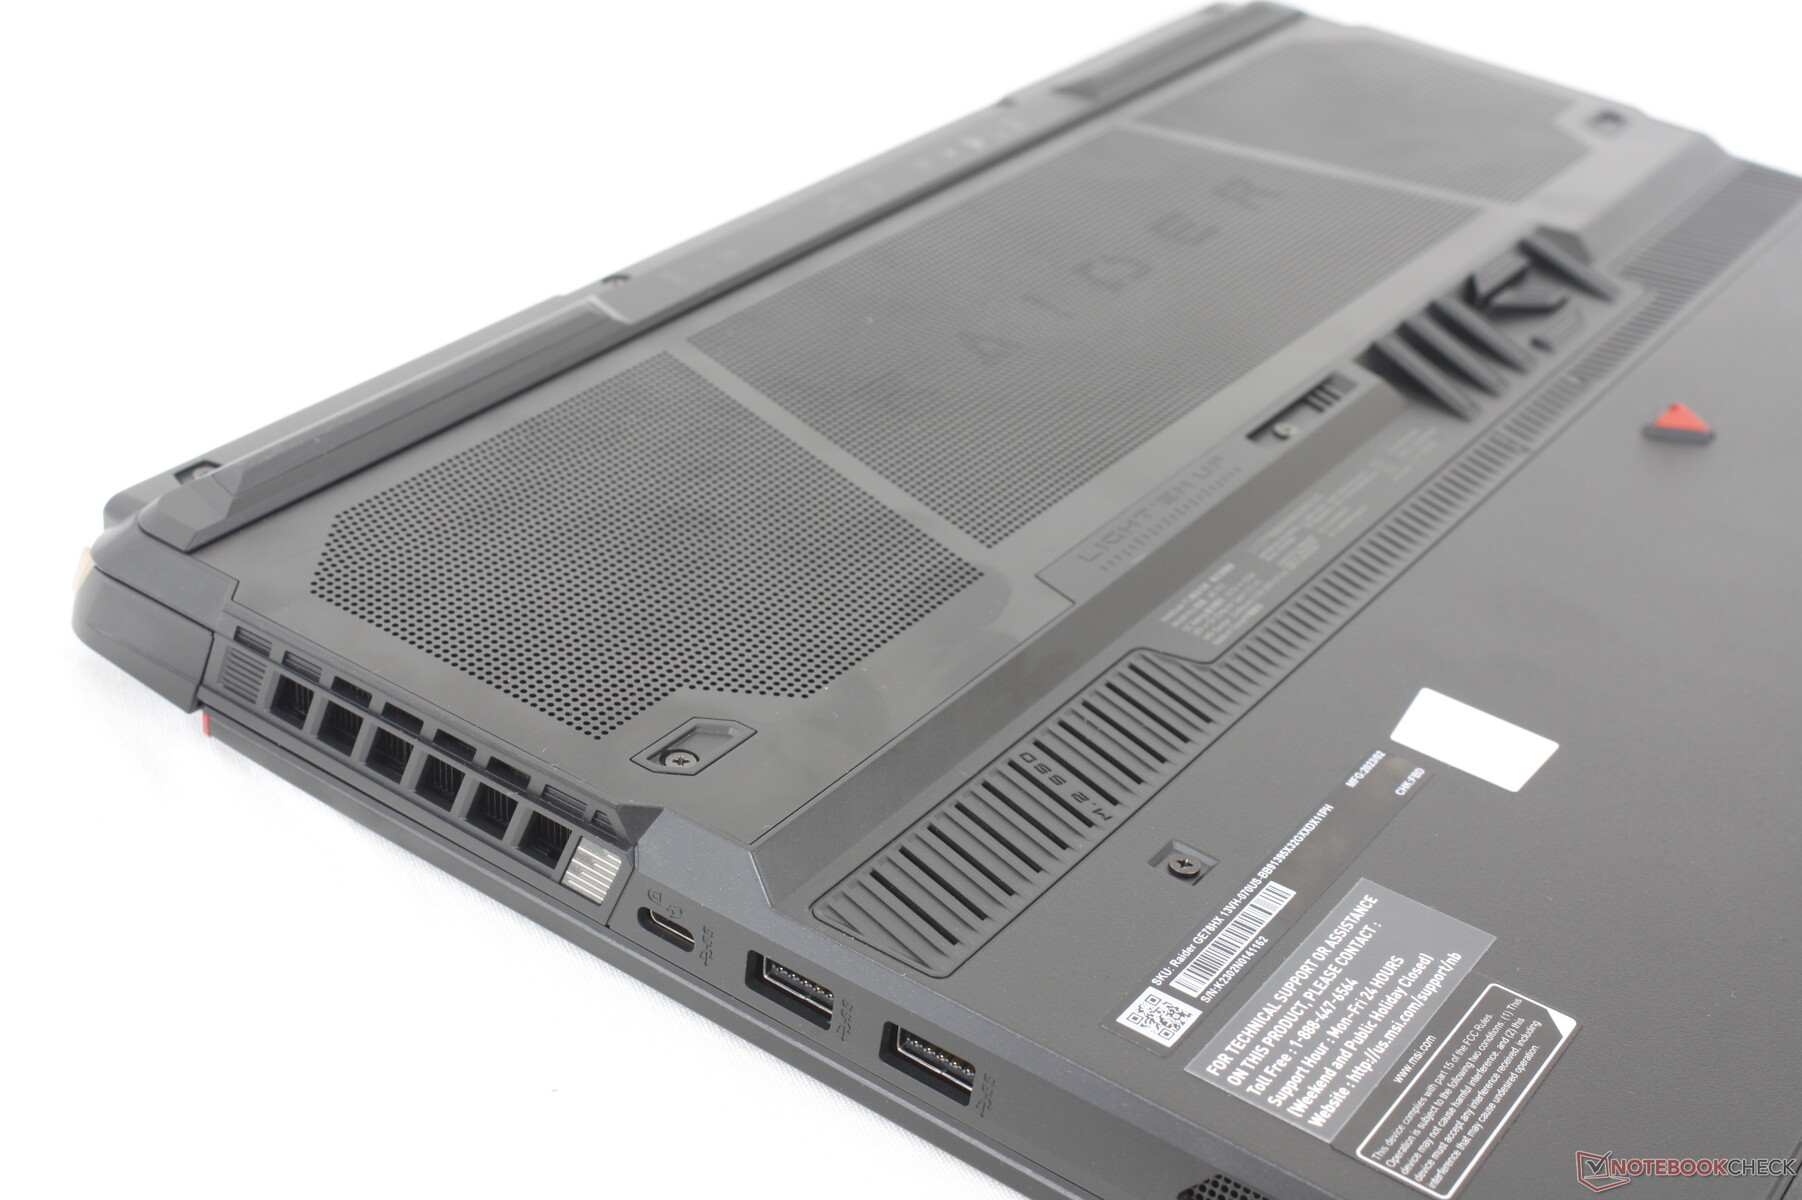
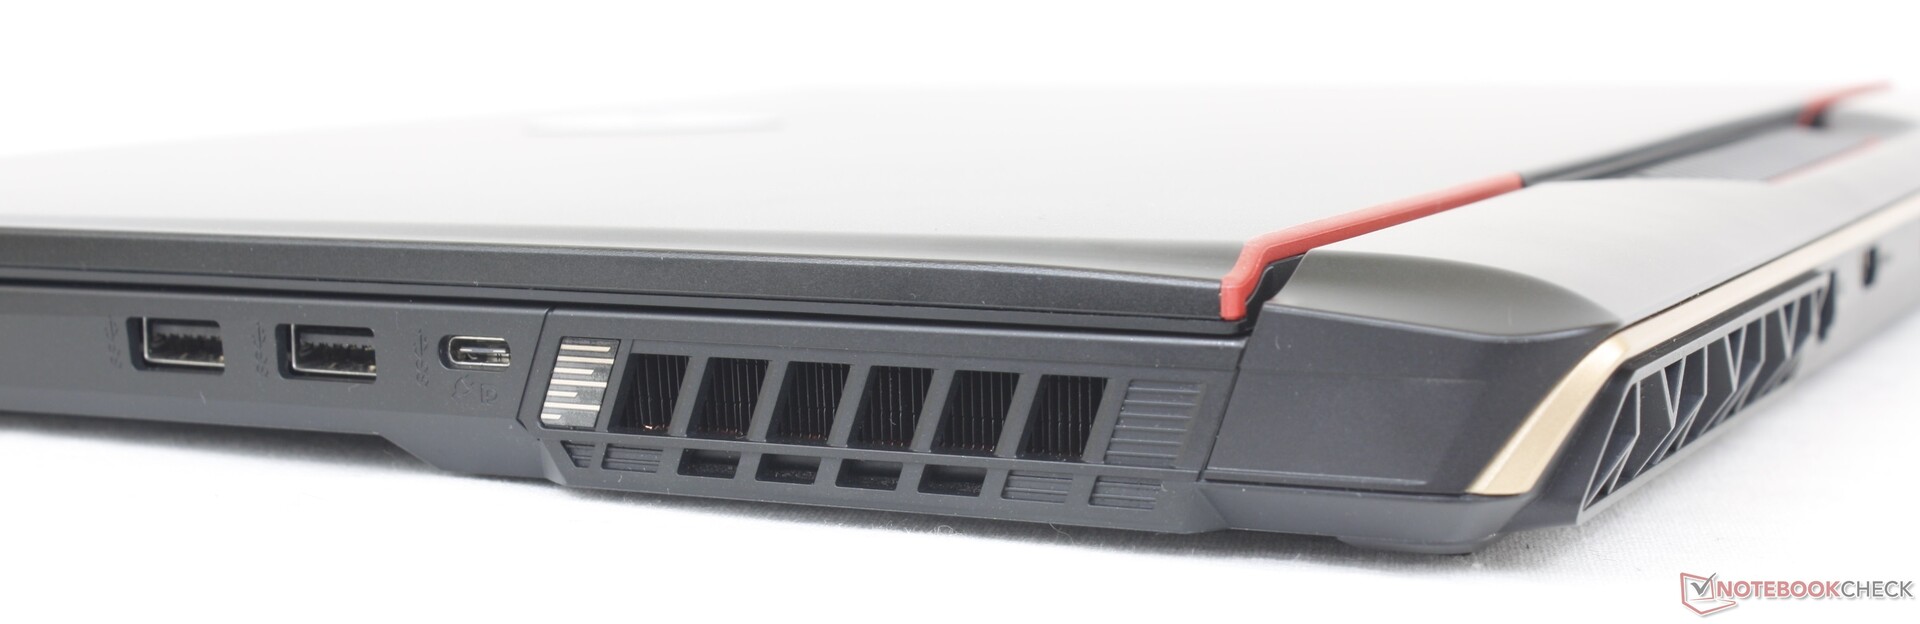
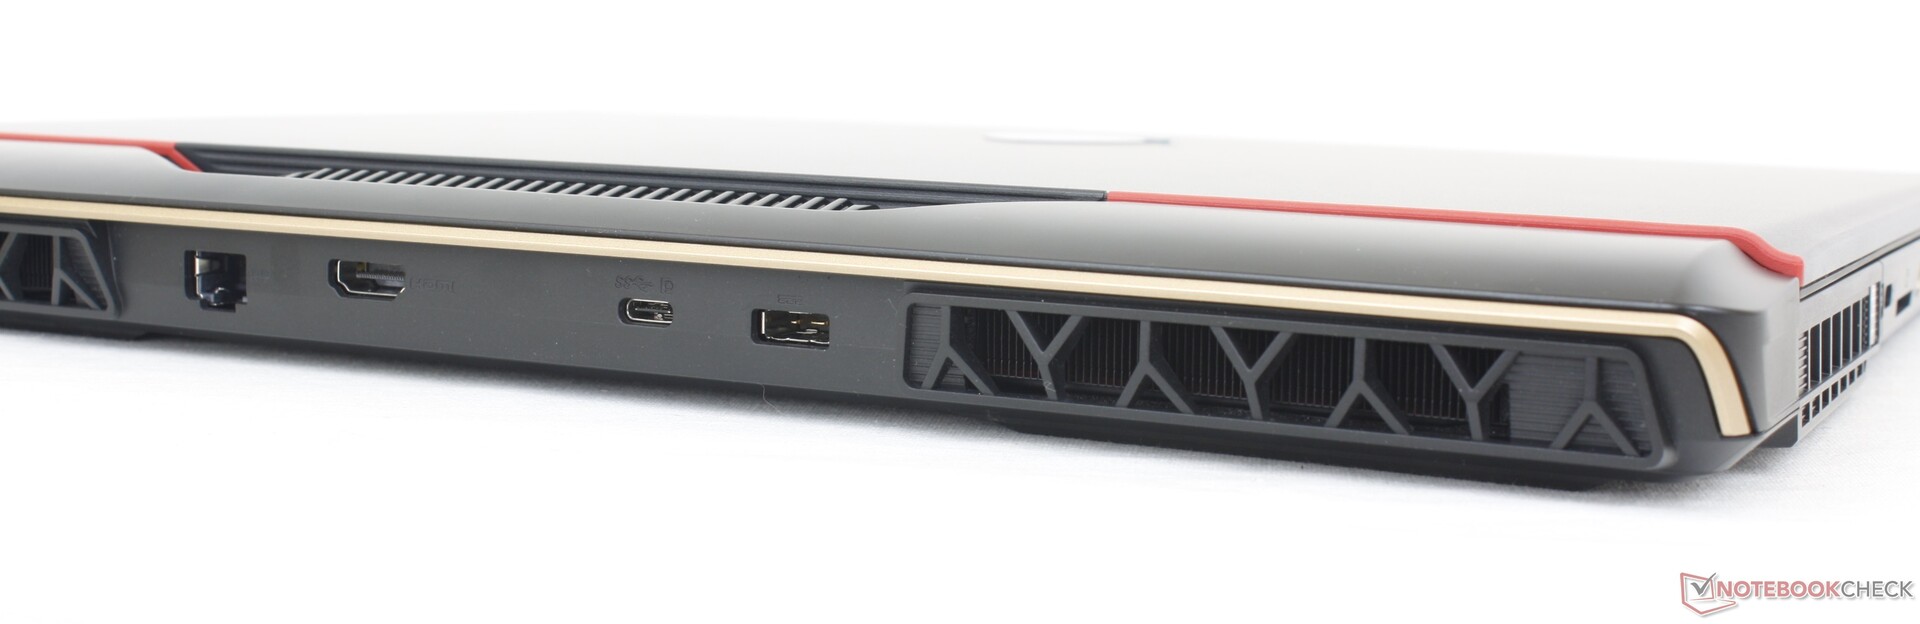
Le opzioni e il posizionamento delle porte sono cambiati rispetto al GE77. In particolare, il GE78 sostituisce una porta USB-A con una terza porta USB-C e quindi ora è presente una porta USB-C su ciascun lato dello chassis.
Purtroppo, le tre porte USB-C non sono tutte uguali. In primo luogo, i dispositivi Thunderbolt sono supportati solo dalla porta USB-C sinistra. In secondo luogo, le loro funzionalità DisplayPort sono legate all'impostazione MUX. Quando la dGPU è attiva, ad esempio, il nostro monitor esterno DP funzionerebbe solo sulla porta USB-C lungo il bordo destro, mentre non funzionerebbe sulla porta USB-C sinistra o posteriore. Se la modalità iGPU o GPU ibrida è attiva, il monitor esterno DP funziona solo sulla porta USB-C del bordo sinistro, mentre non funziona sulle porte USB-C del bordo posteriore o destro. Non siamo riusciti a far funzionare il DP sulla porta USB-C posteriore.
In terzo luogo, MSI pubblicizza Power Delivery, ma non siamo riusciti a farlo funzionare. La nostra unità non si è ricaricata tramite USB-C, indipendentemente dalla porta o dal numero di adattatori USB-C testati.
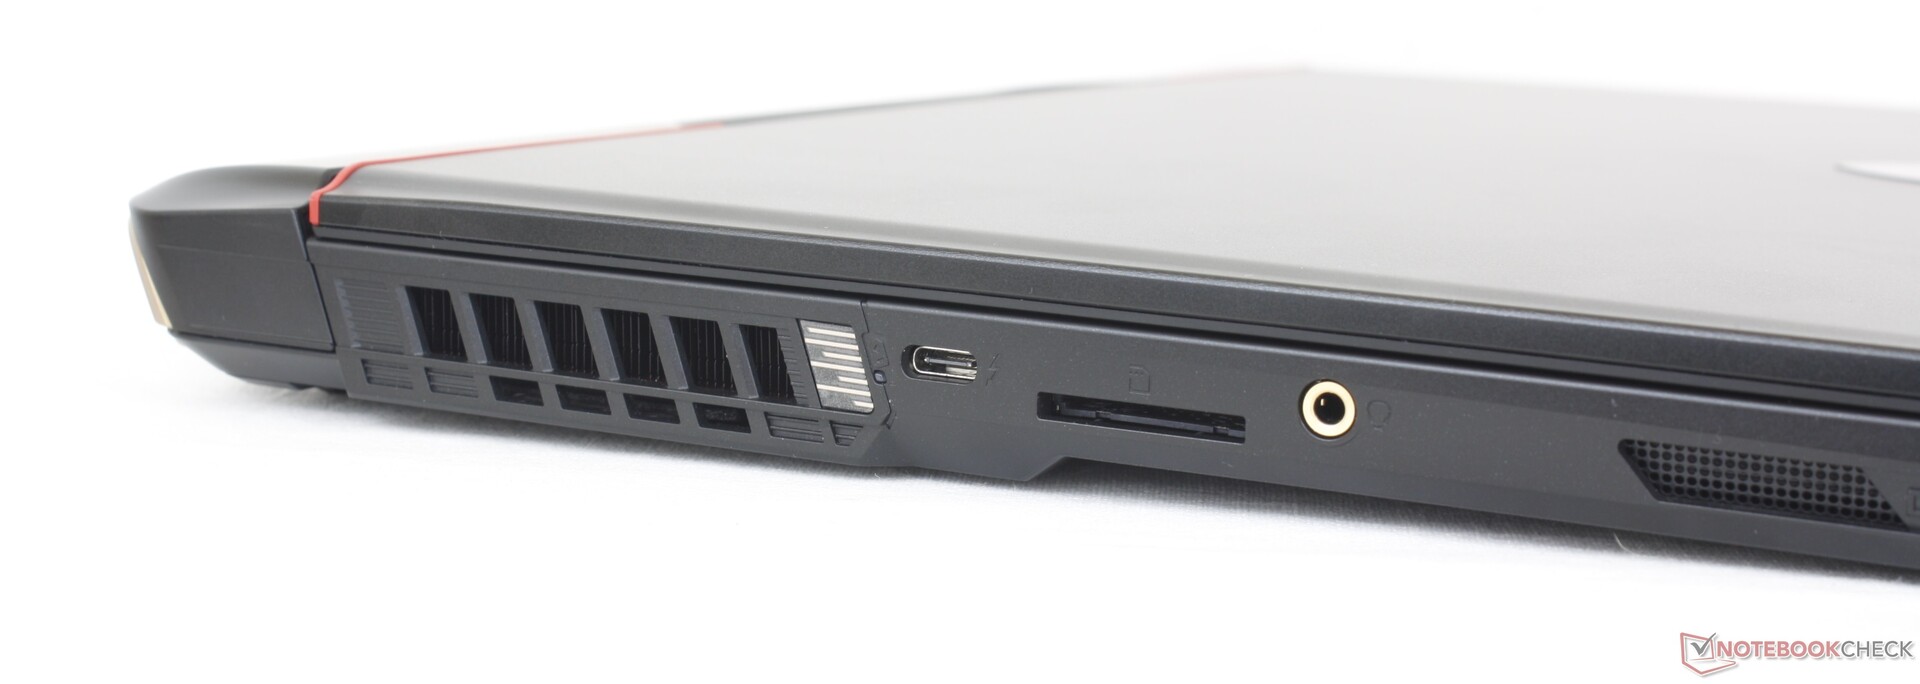
Lettore di schede SD
Le velocità di trasferimento tramite il lettore SD integrato sono deludenti se si considera il prezzo elevato del GE78. Per trasferire 1 GB di immagini dalla nostra scheda di prova UHS-II al desktop ci vogliono circa 16 secondi, contro la metà del Razer Blade 17 Razer Blade 17.
| SD Card Reader | |
| average JPG Copy Test (av. of 3 runs) | |
| Razer Blade 17 Early 2022 (AV PRO microSD 128 GB V60) | |
| MSI Titan GT77 HX 13VI (Angelibird AV Pro V60) | |
| Eluktronics Mech-17 GP2 (Angelibird AV Pro V60) | |
| MSI GE78HX 13VH-070US (Angelibird AV Pro V60) | |
| MSI Raider GE77 HX 12UHS (AV PRO microSD 128 GB V60) | |
| maximum AS SSD Seq Read Test (1GB) | |
| Eluktronics Mech-17 GP2 (Angelibird AV Pro V60) | |
| MSI GE78HX 13VH-070US (Angelibird AV Pro V60) | |
| MSI Titan GT77 HX 13VI (Angelibird AV Pro V60) | |
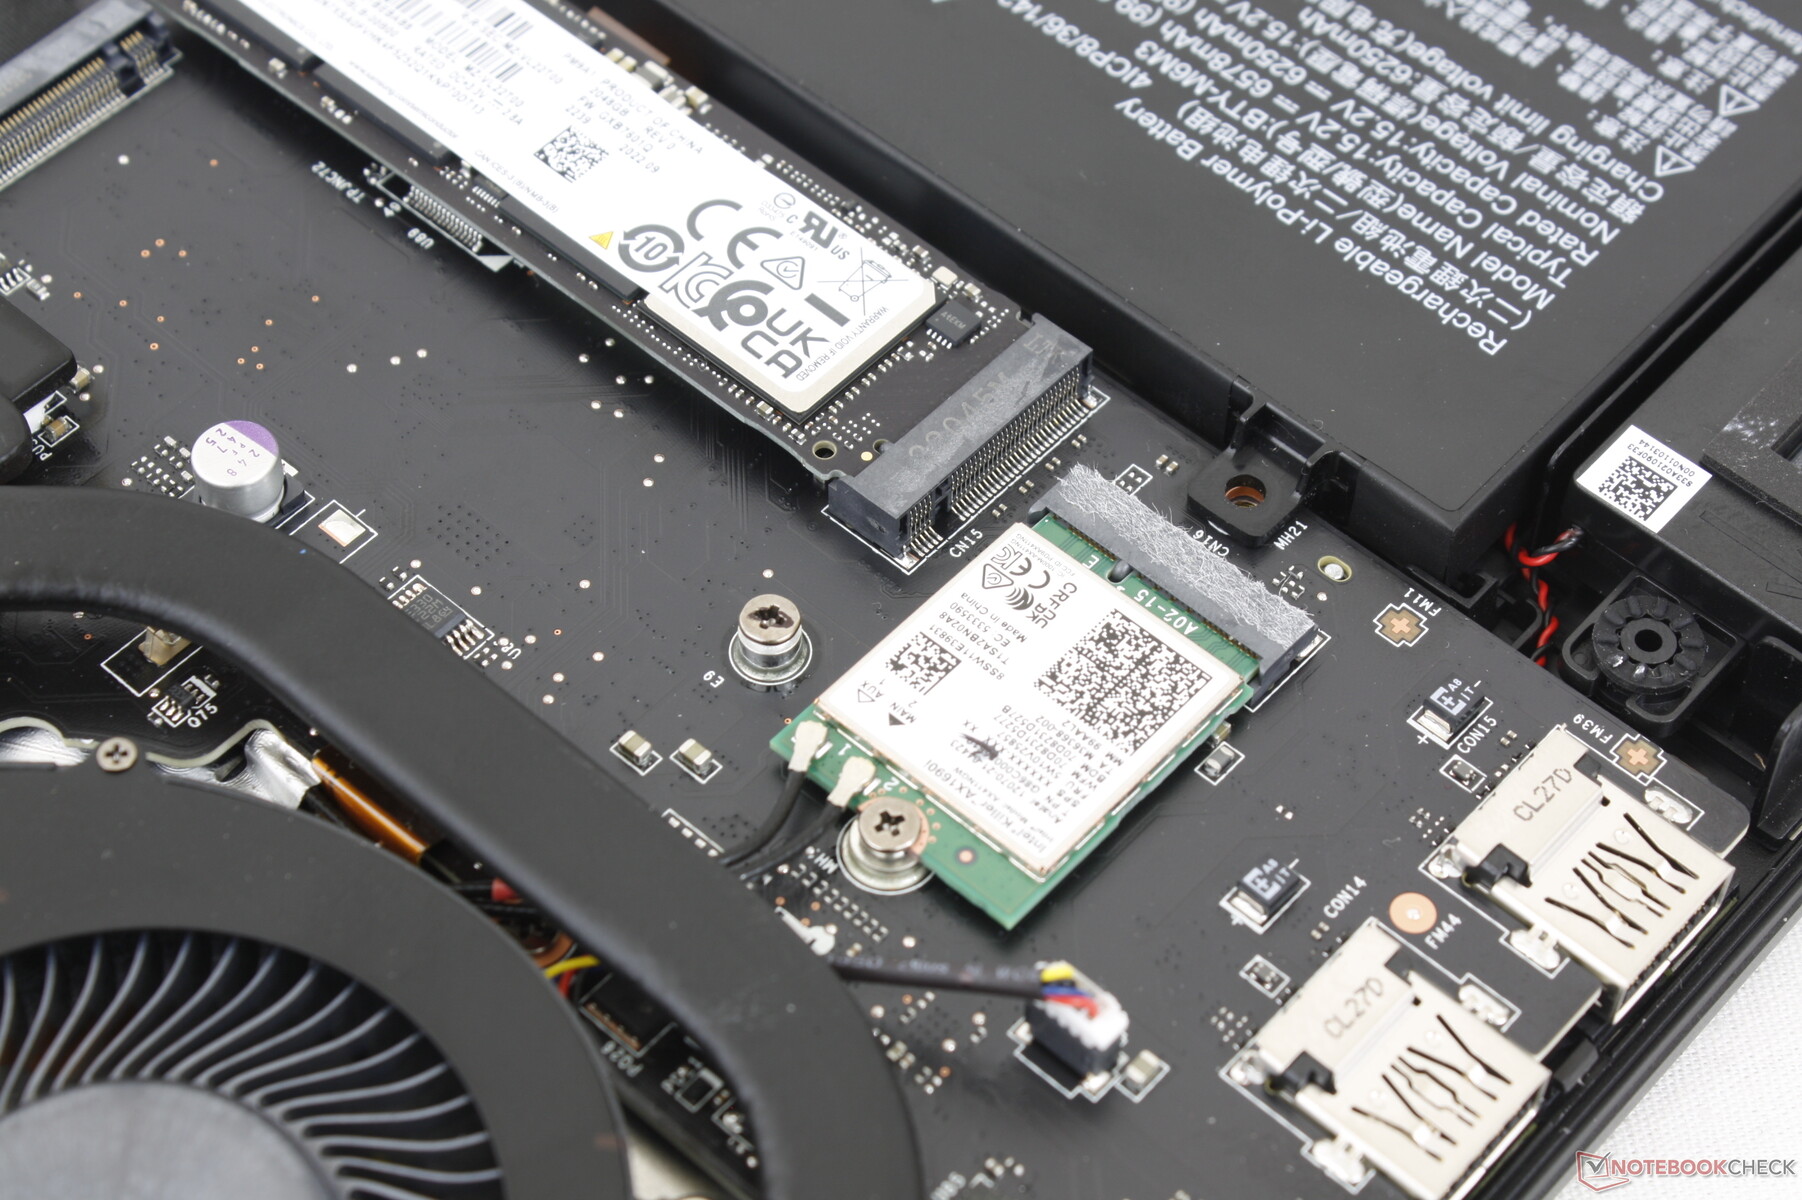
Comunicazione
Un modulo Killer AX1690i è fornito di serie per la connettività Wi-Fi 6E e Bluetooth 5.3. Il modulo Killer è essenzialmente un Intel AX210/211 rimarchiato e ottimizzato per i portatili da gioco. Non abbiamo riscontrato alcun problema quando è stato accoppiato al nostro router di prova Asus AXE11000 a 6 GHz.
| Networking | |
| iperf3 transmit AXE11000 | |
| Asus ROG Strix G17 G713PI | |
| MSI Titan GT77 HX 13VI | |
| Eluktronics Mech-17 GP2 | |
| MSI GE78HX 13VH-070US | |
| iperf3 receive AXE11000 | |
| Asus ROG Strix G17 G713PI | |
| Razer Blade 17 Early 2022 | |
| MSI Titan GT77 HX 13VI | |
| Eluktronics Mech-17 GP2 | |
| MSI GE78HX 13VH-070US | |
| iperf3 transmit AXE11000 6GHz | |
| MSI GE78HX 13VH-070US | |
| iperf3 receive AXE11000 6GHz | |
| MSI Raider GE77 HX 12UHS | |
| MSI GE78HX 13VH-070US | |
Webcam
La webcam integrata da 2 MP del GE78 rimane uno standard nella maggior parte dei portatili da gioco. Alcuni altri produttori, come Razer, hanno alzato la posta a 5 MP per un'immagine più nitida.
L'IR e l'otturatore fisico della webcam sono di serie, rispettivamente per il supporto di Hello e per una maggiore privacy.


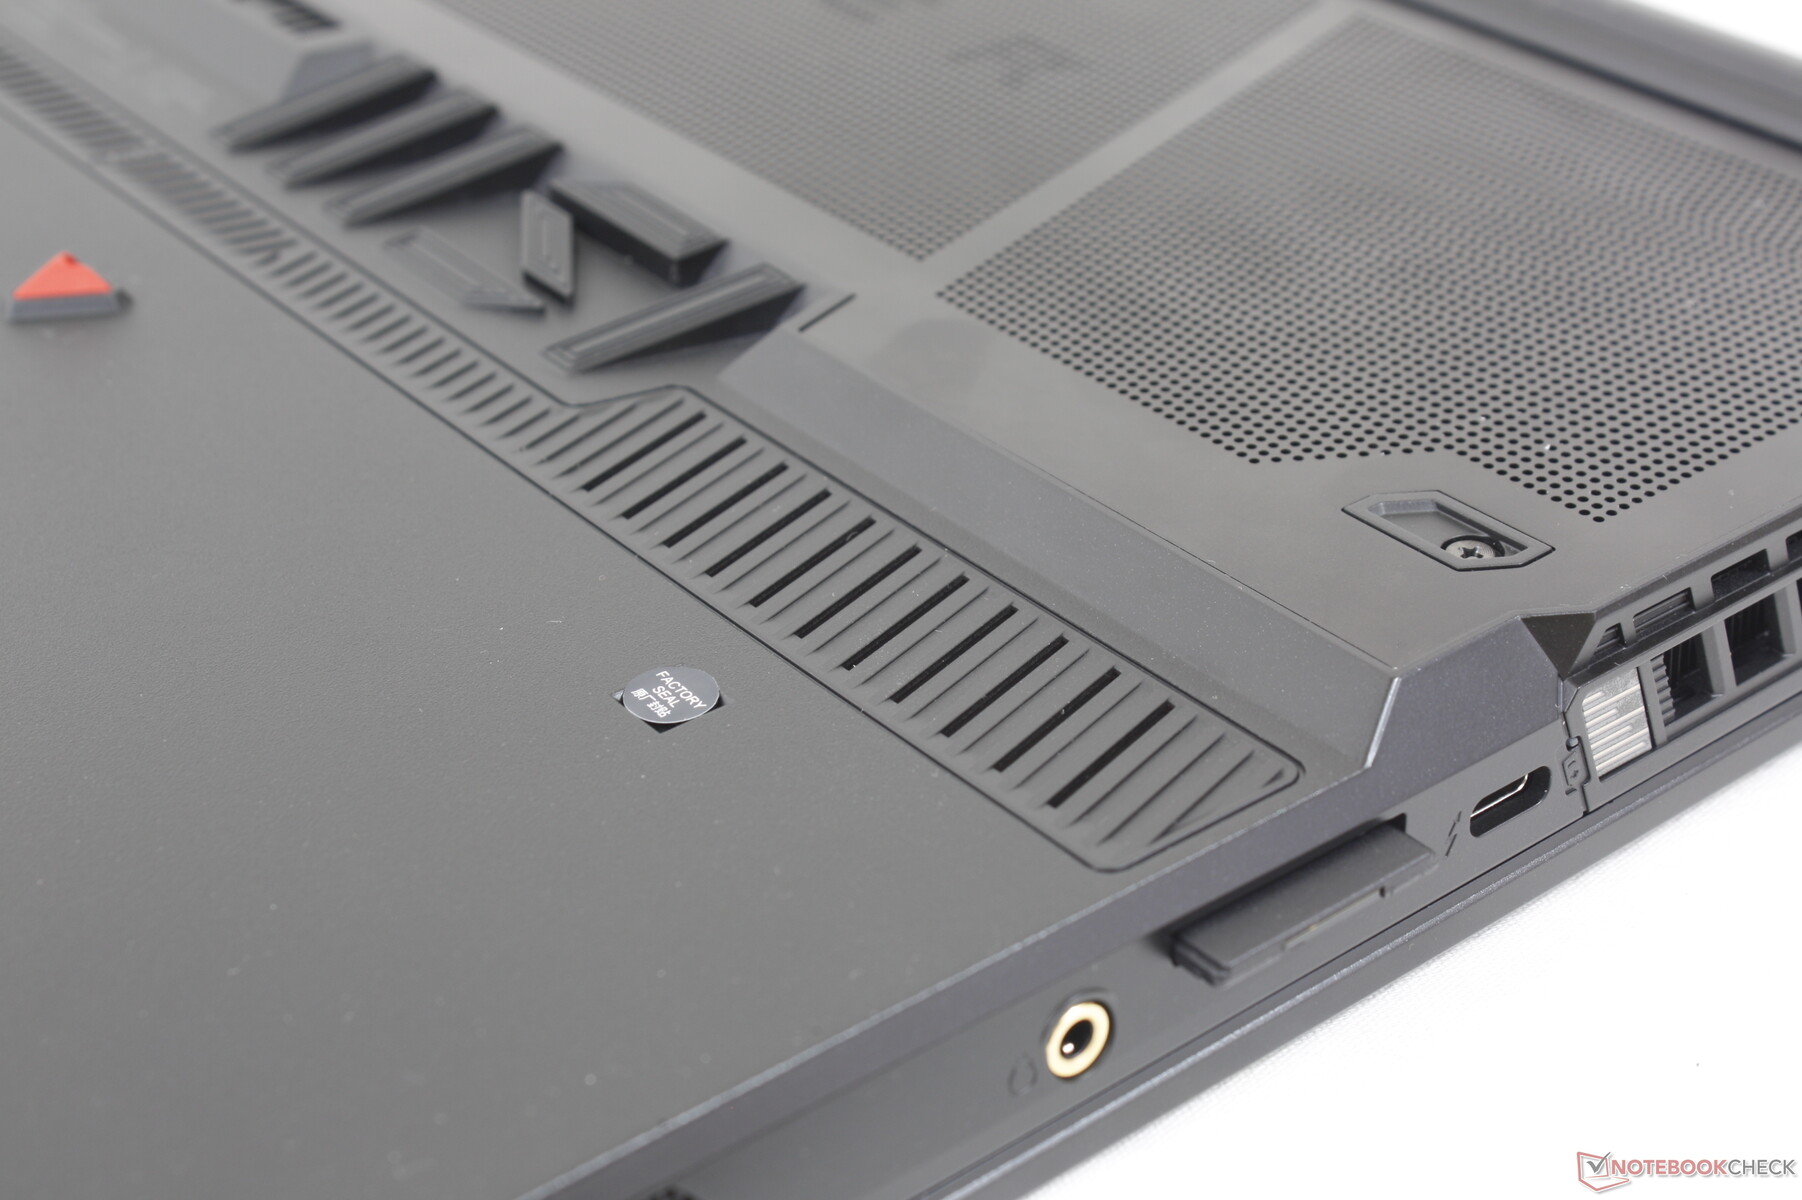
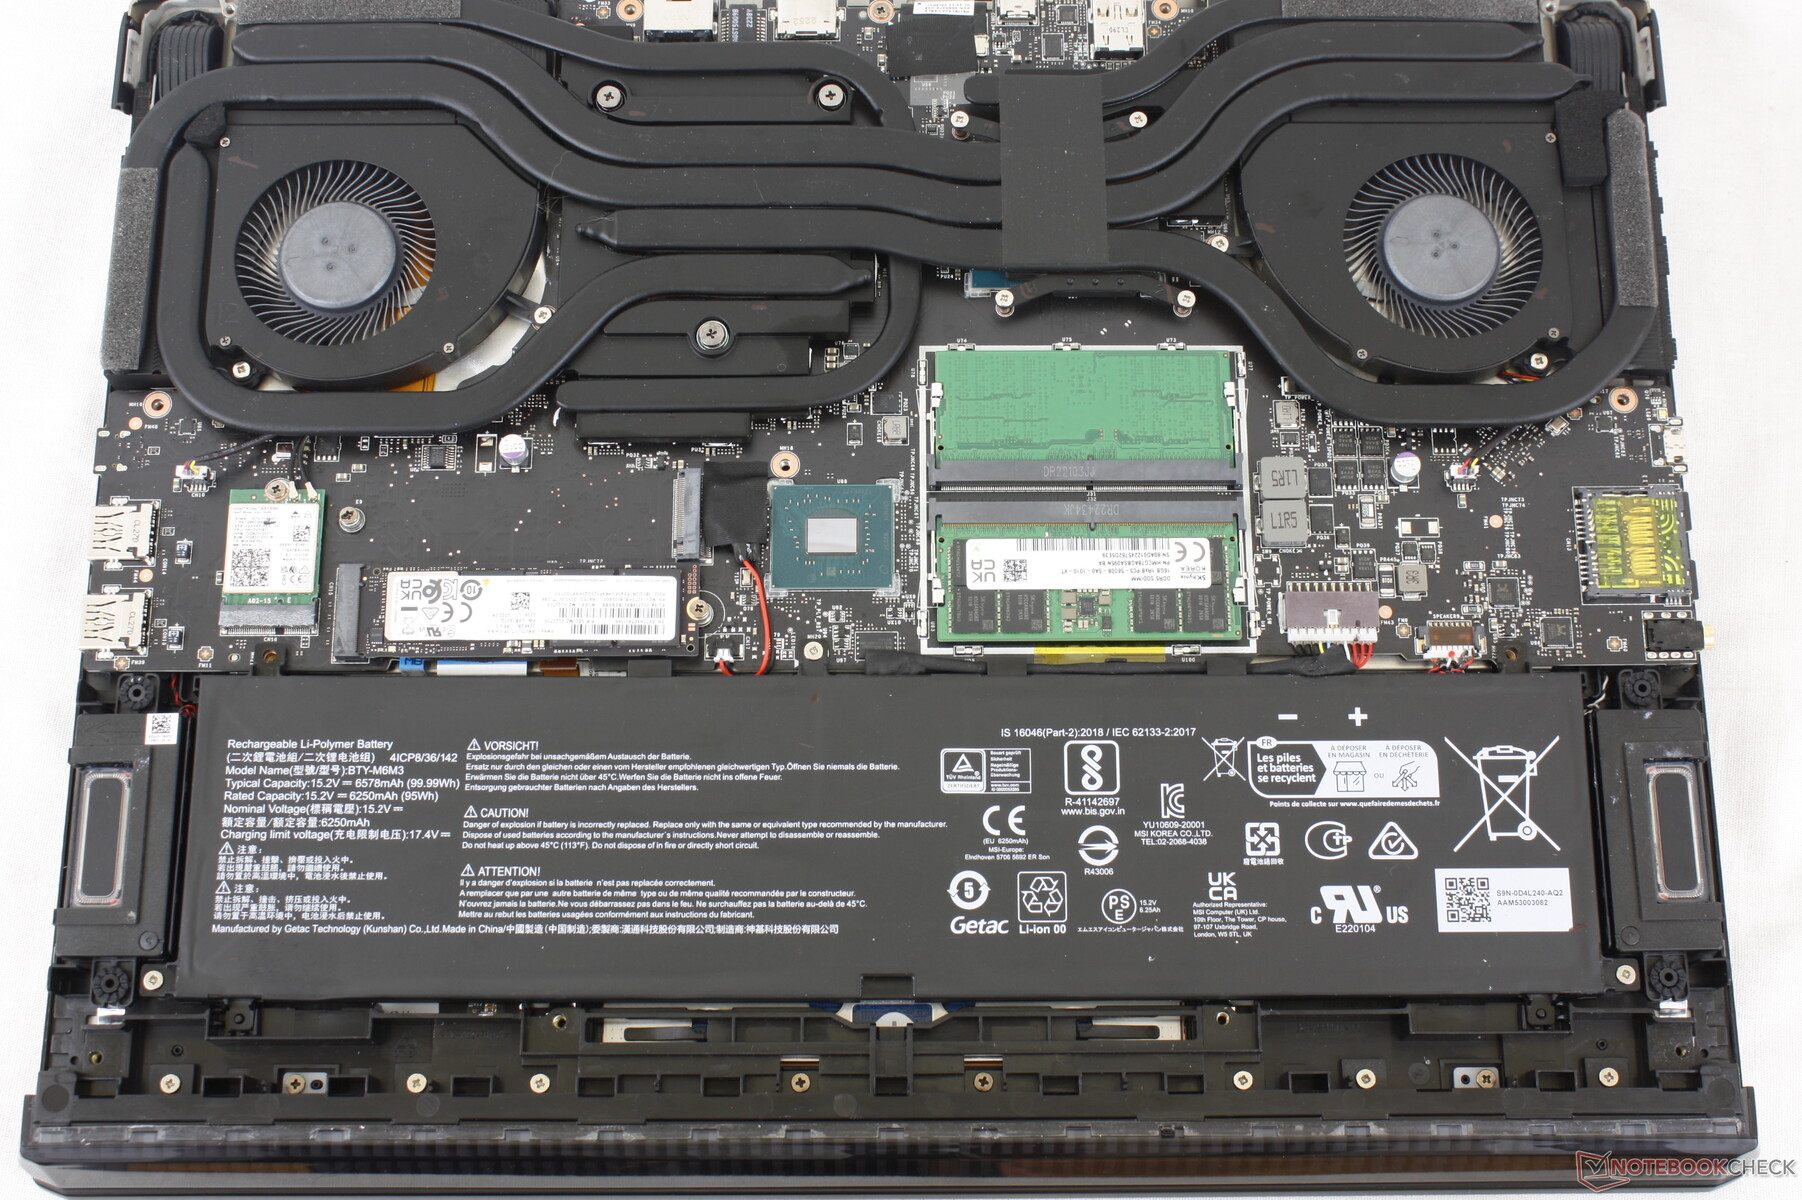
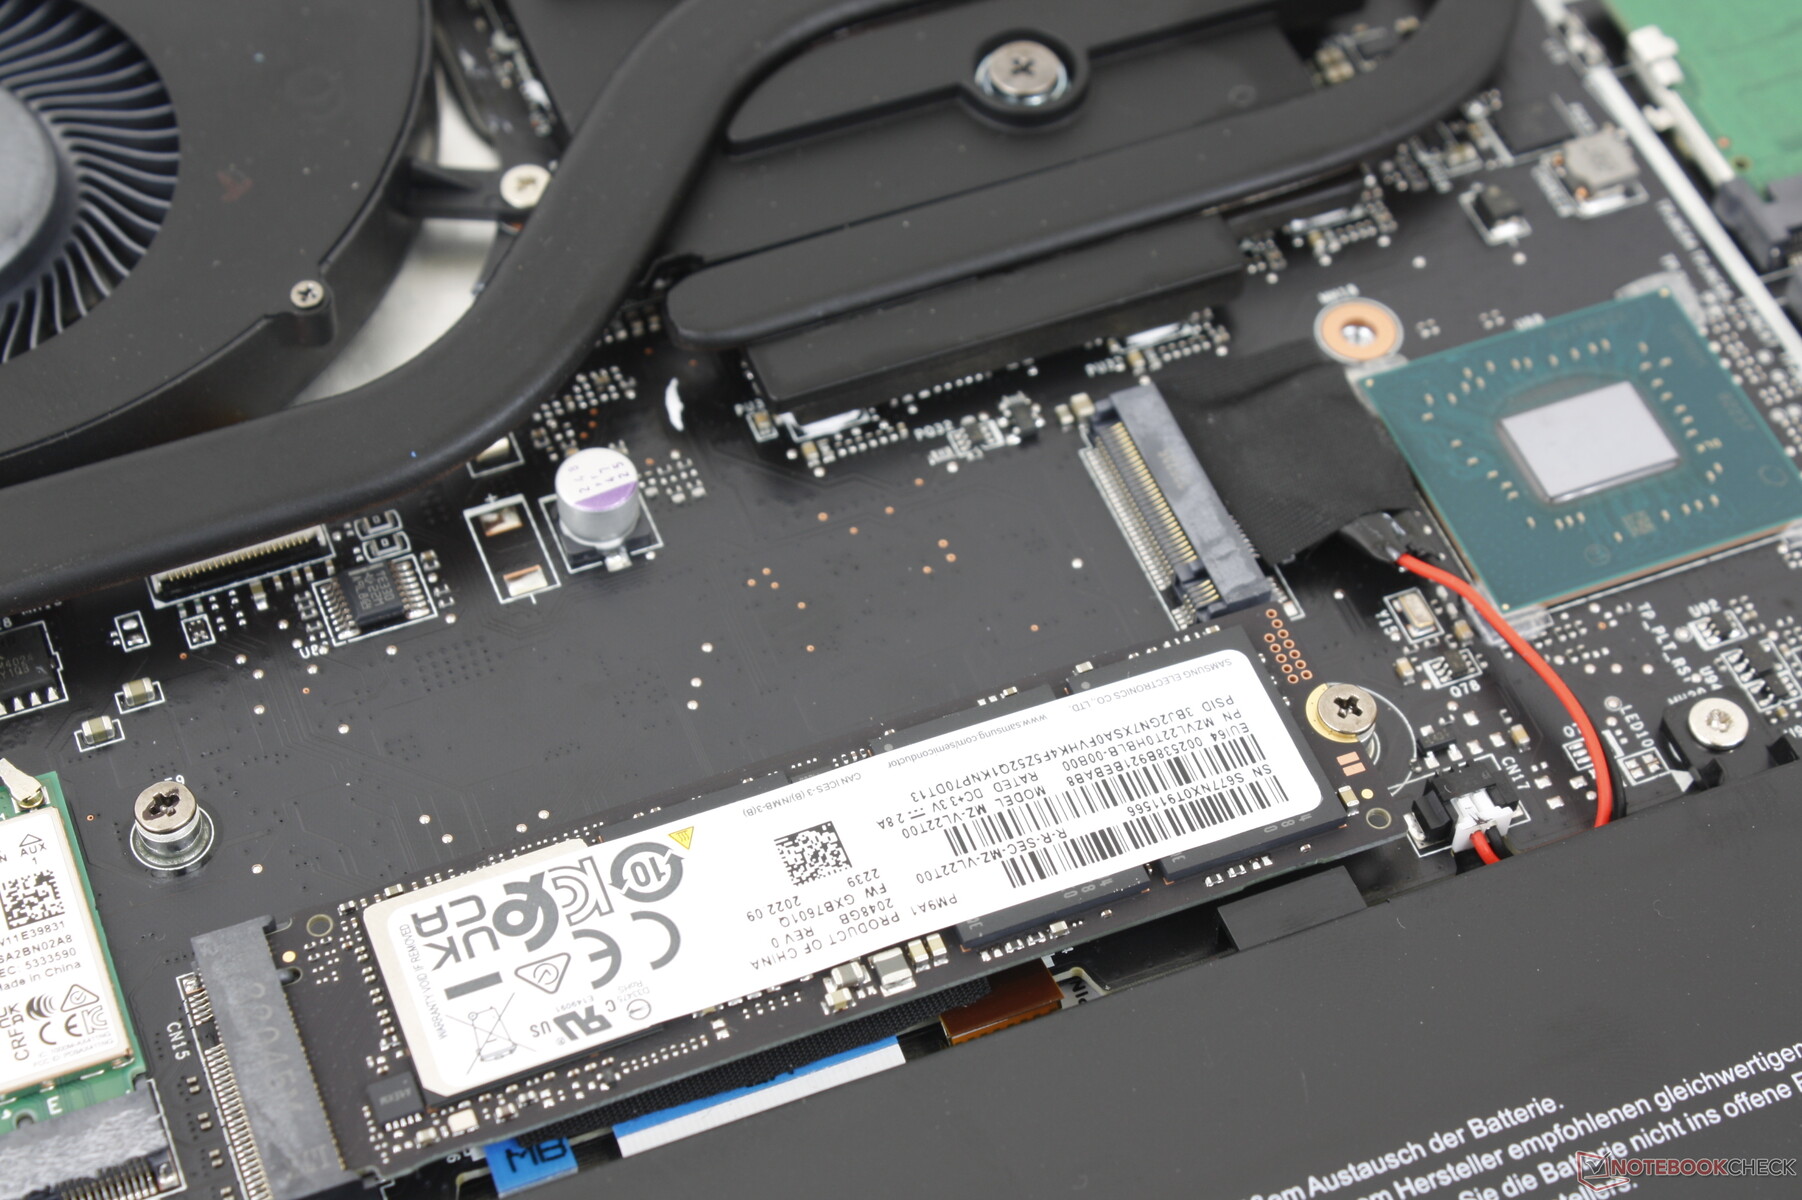
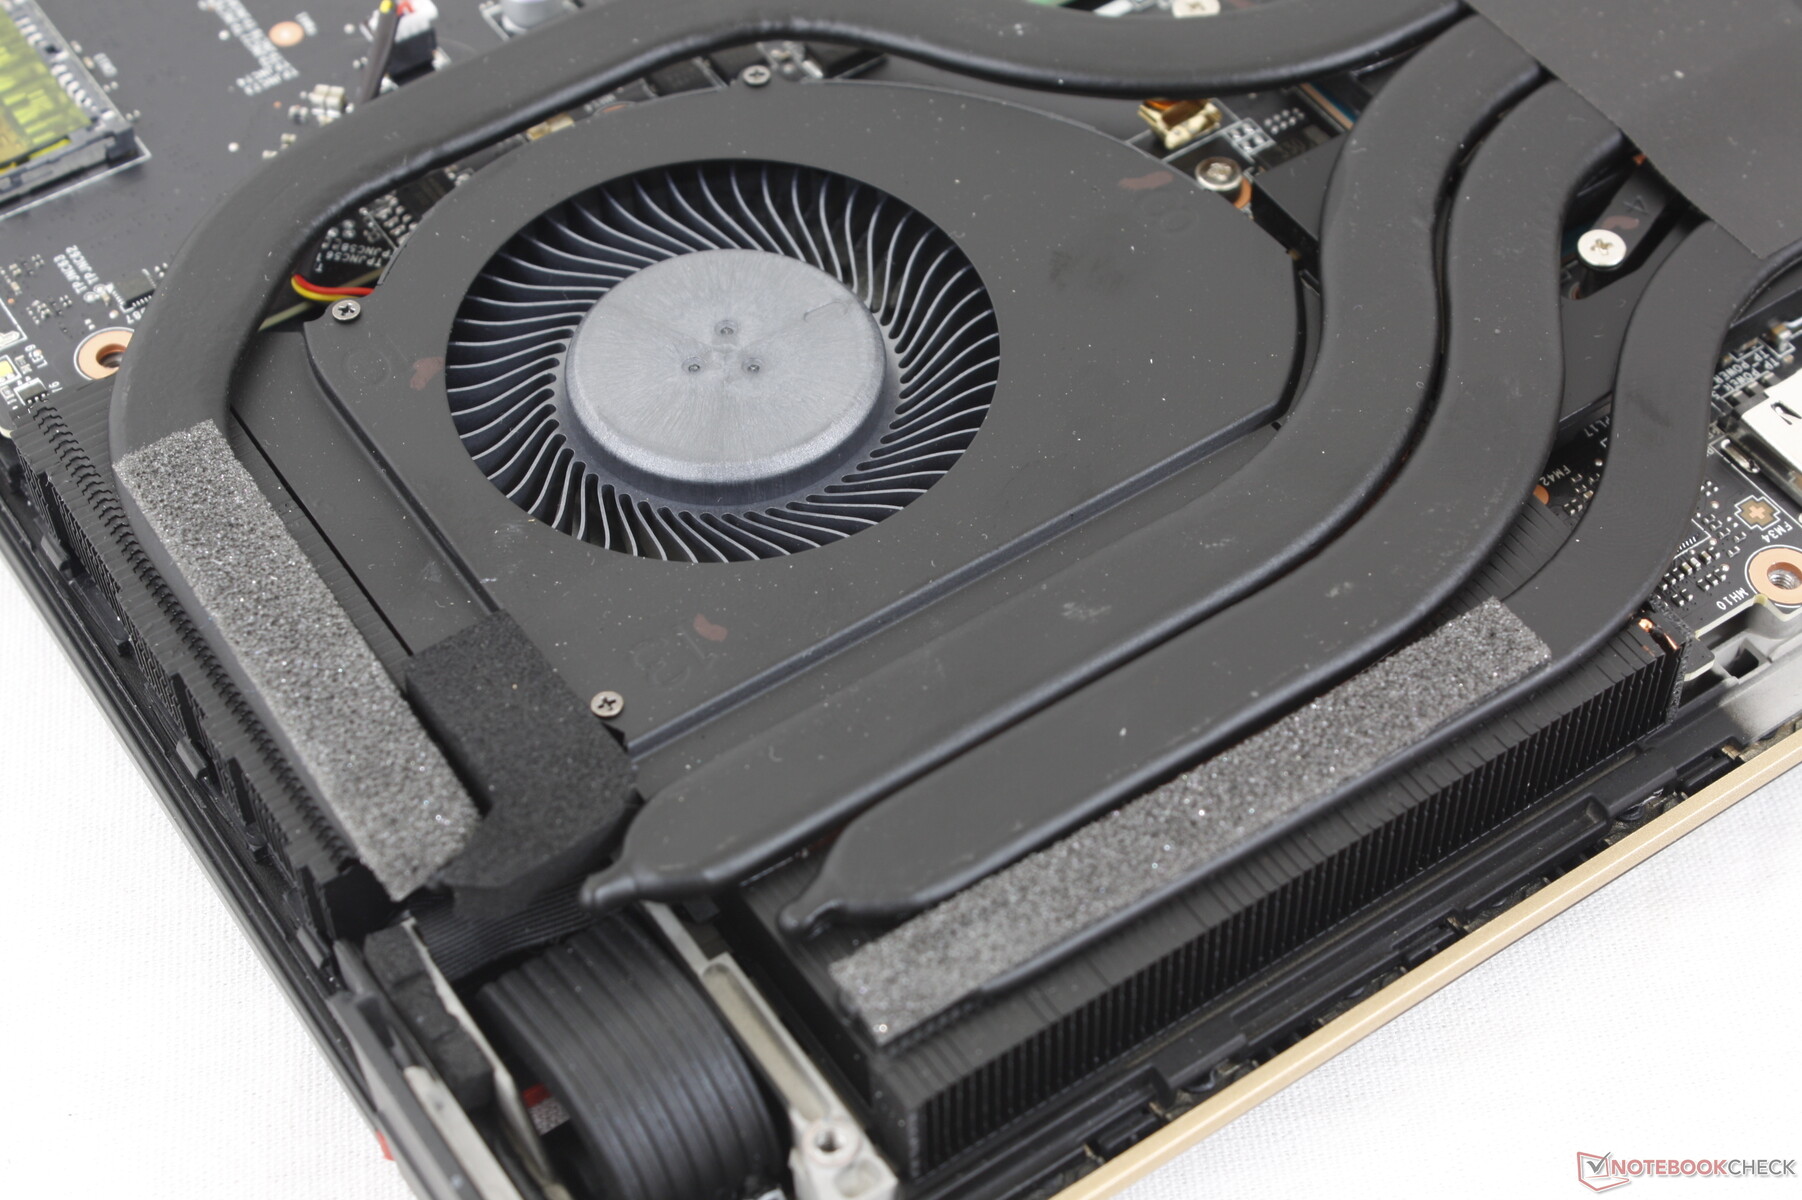
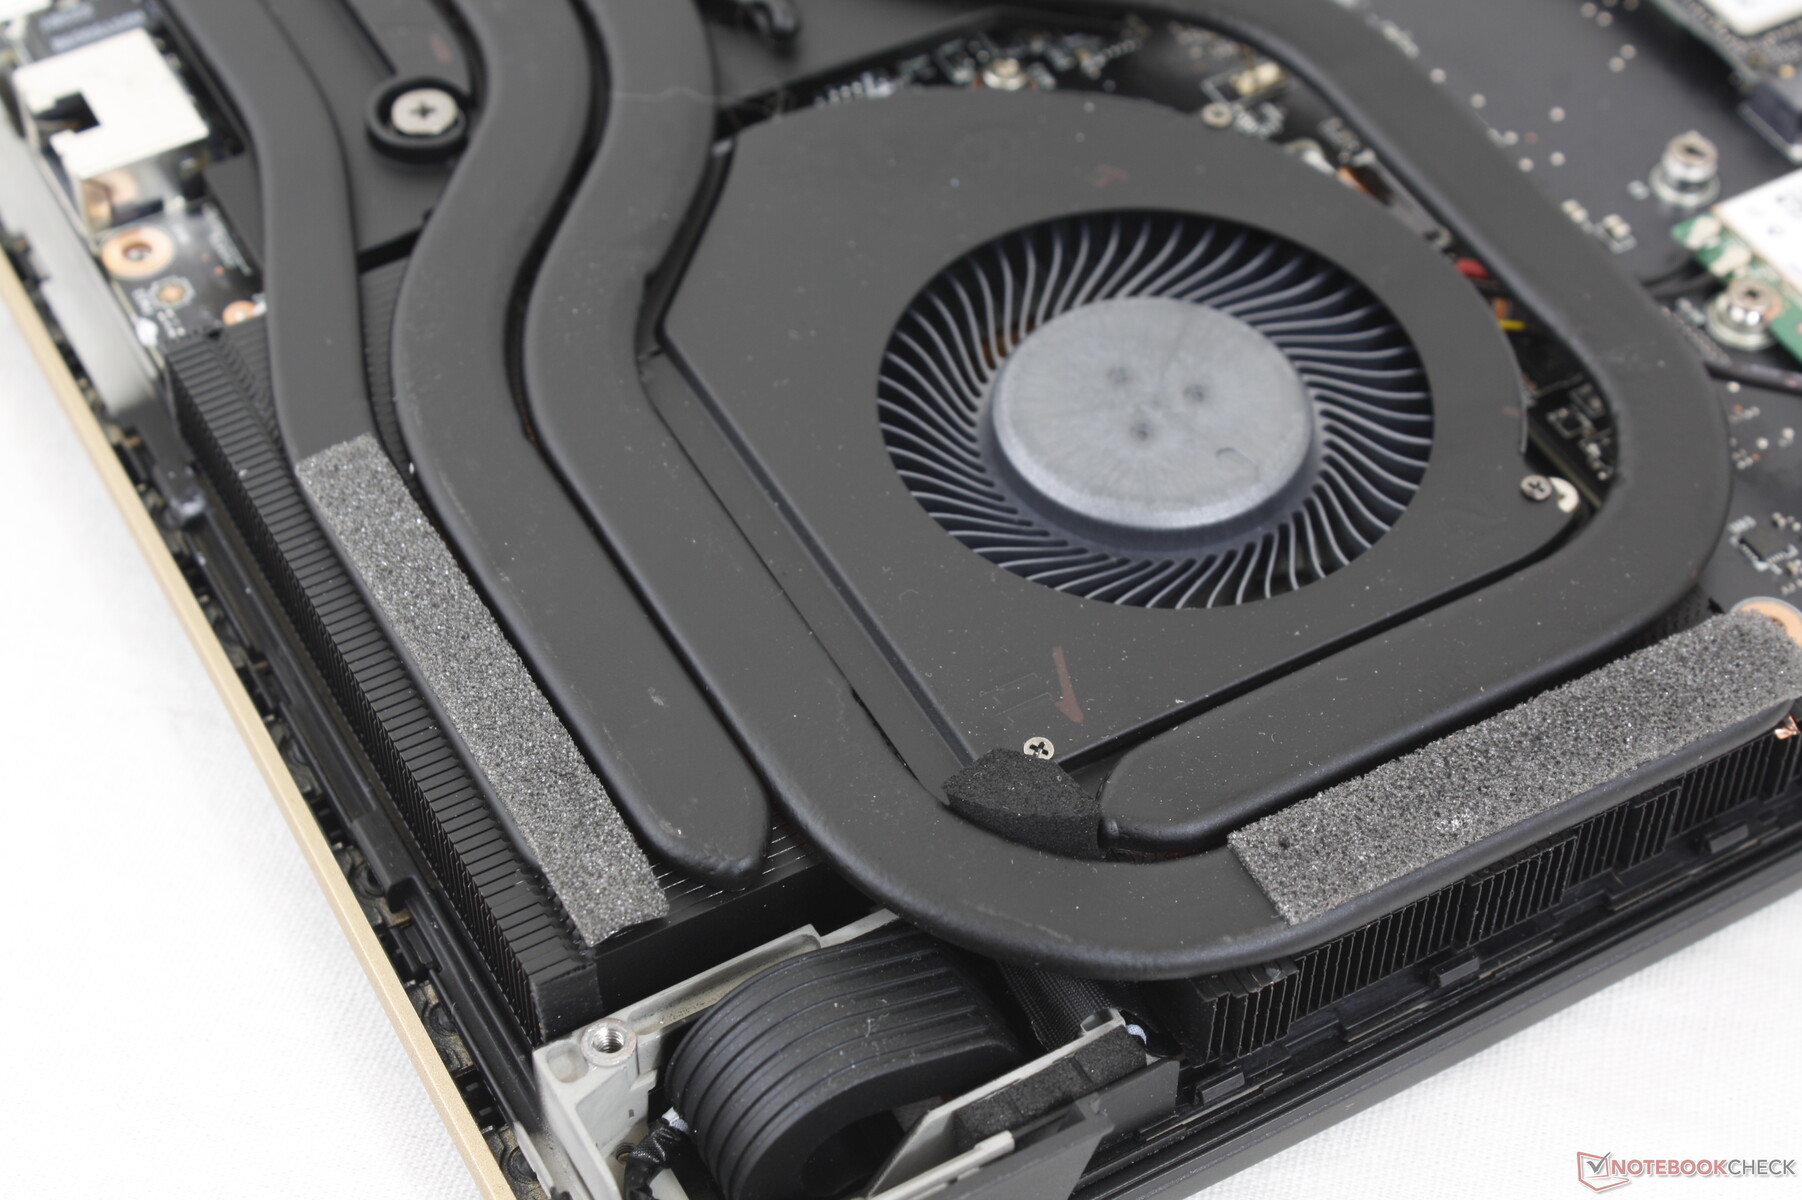
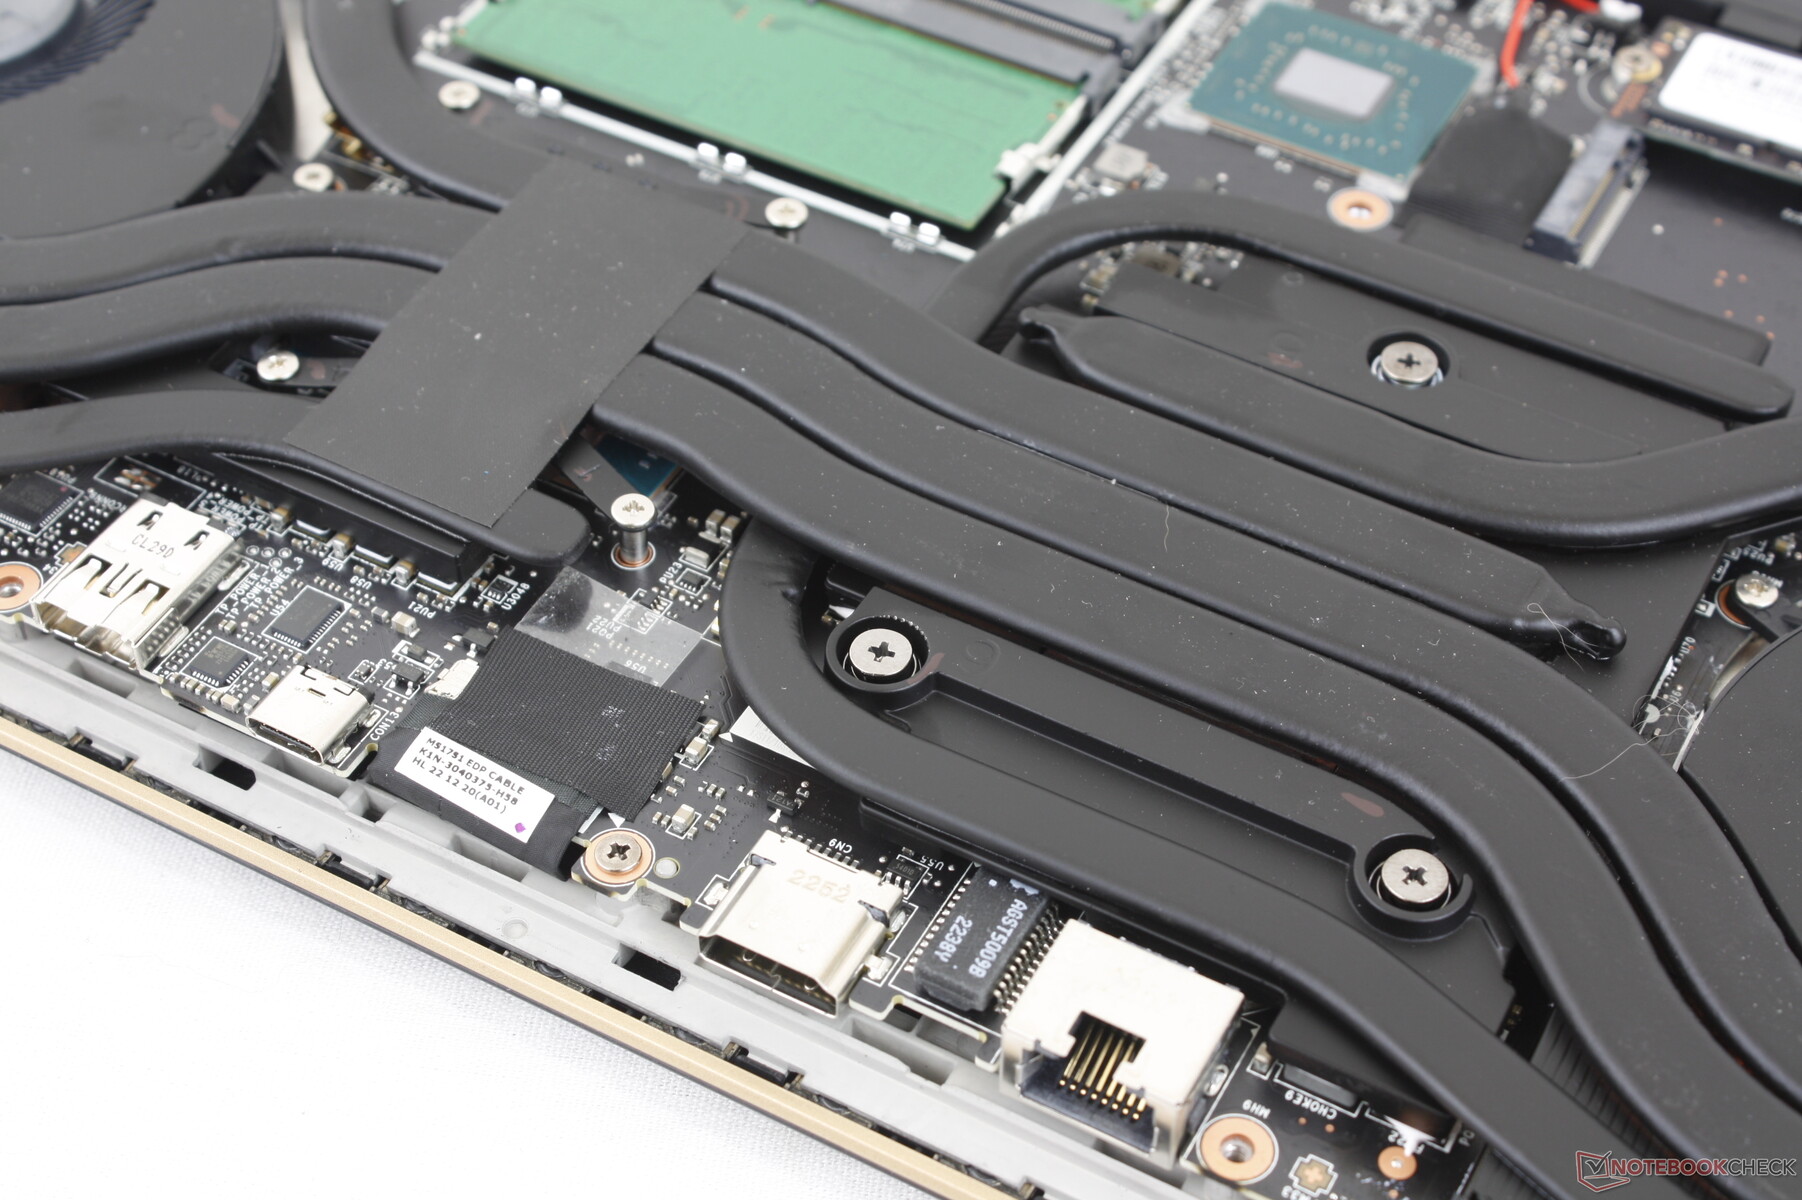
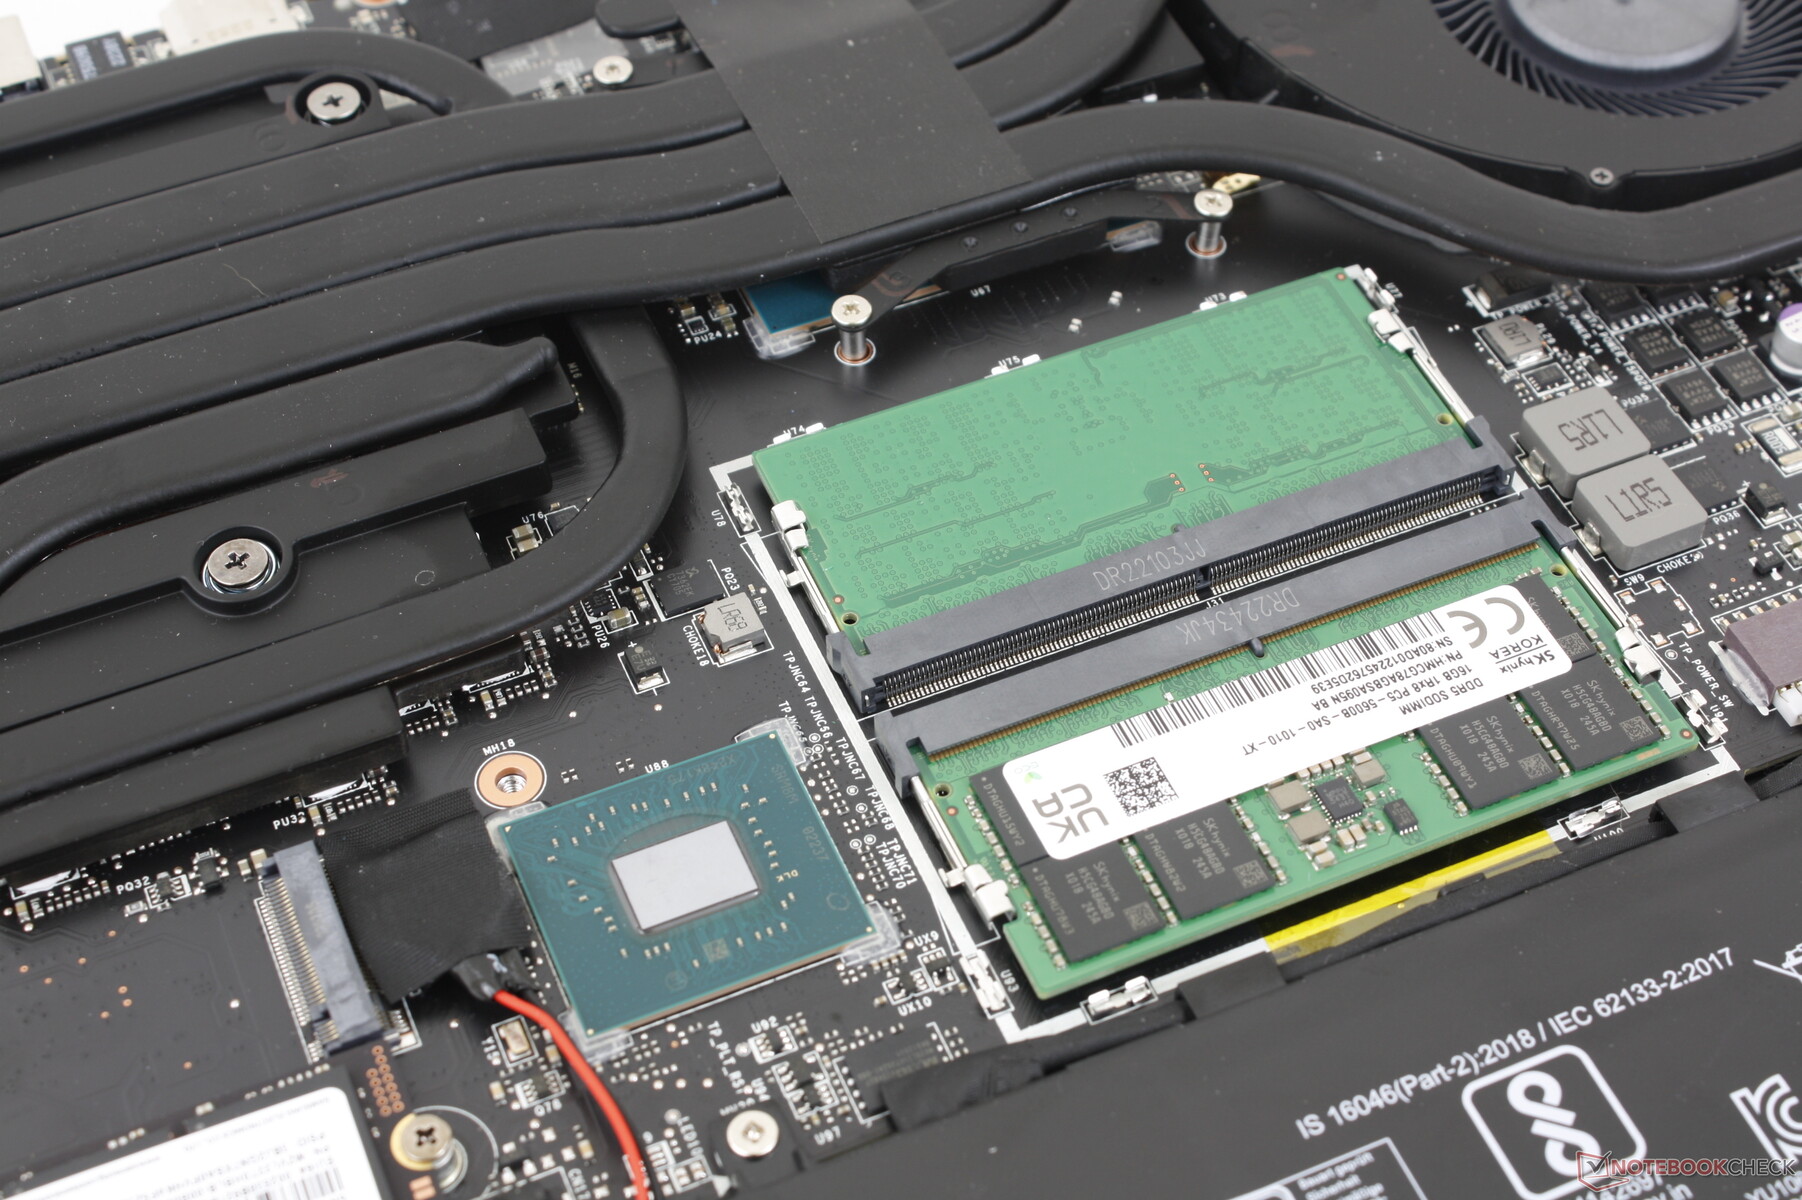
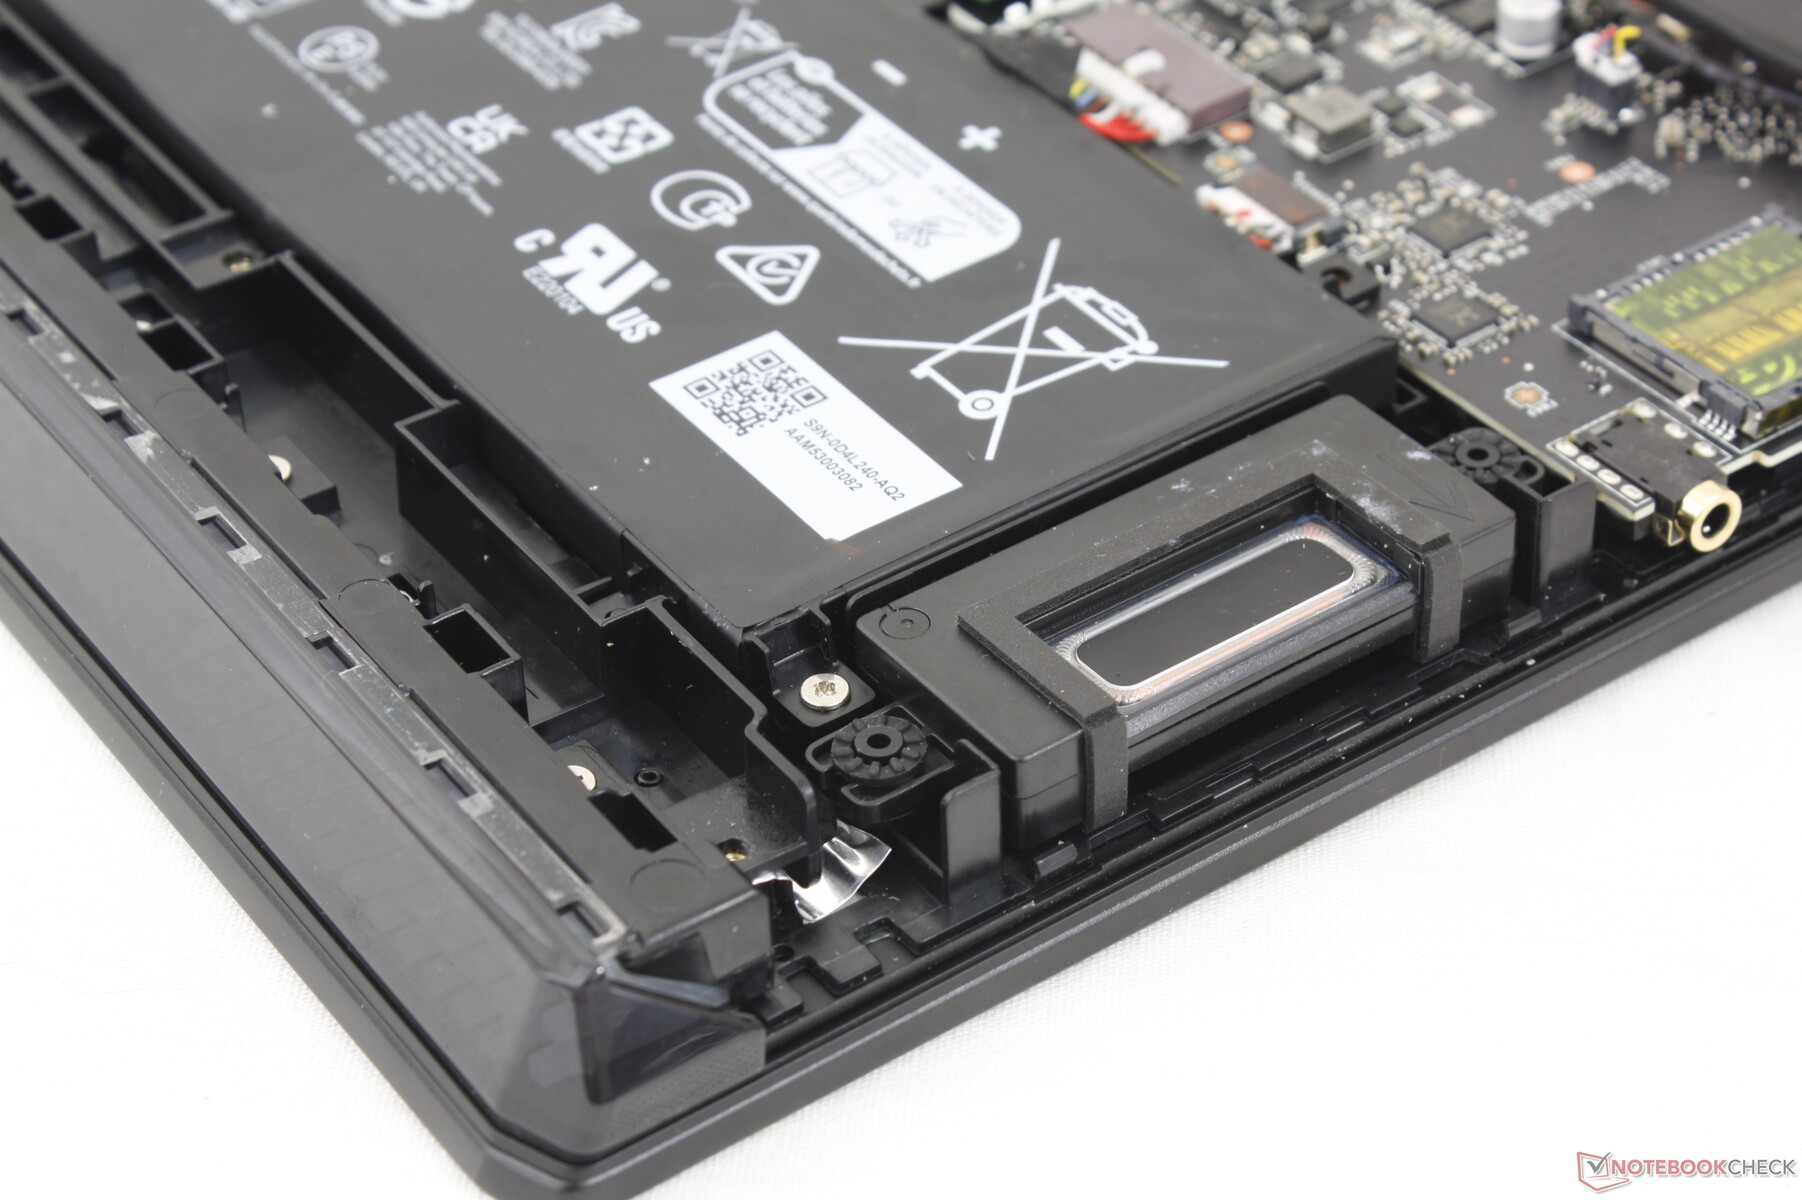
Manutenzione: un po' più difficile di prima
Il pannello inferiore è fissato da 12 viti Philips. Come di consueto per MSI, se si vuole rimuovere il pannello inferiore per effettuare interventi di manutenzione è necessario rompere l'adesivo "factory seal".
Si raccomanda di utilizzare un bordo di plastica affilato quando si rimuove il pannello inferiore, poiché le chiusure intorno ai bordi possono essere piuttosto strette. Una volta rimosso, gli utenti avranno accesso diretto a 2 slot SODIMM, 2 slot SSD M.2, modulo WLAN e batteria.
Accessori e garanzia
La confezione non contiene altri extra oltre all'adattatore CA e alla documentazione. La garanzia standard limitata di un anno è valida se acquistata negli Stati Uniti.
Dispositivi di input: più grandi e più raffinati
Tastiera
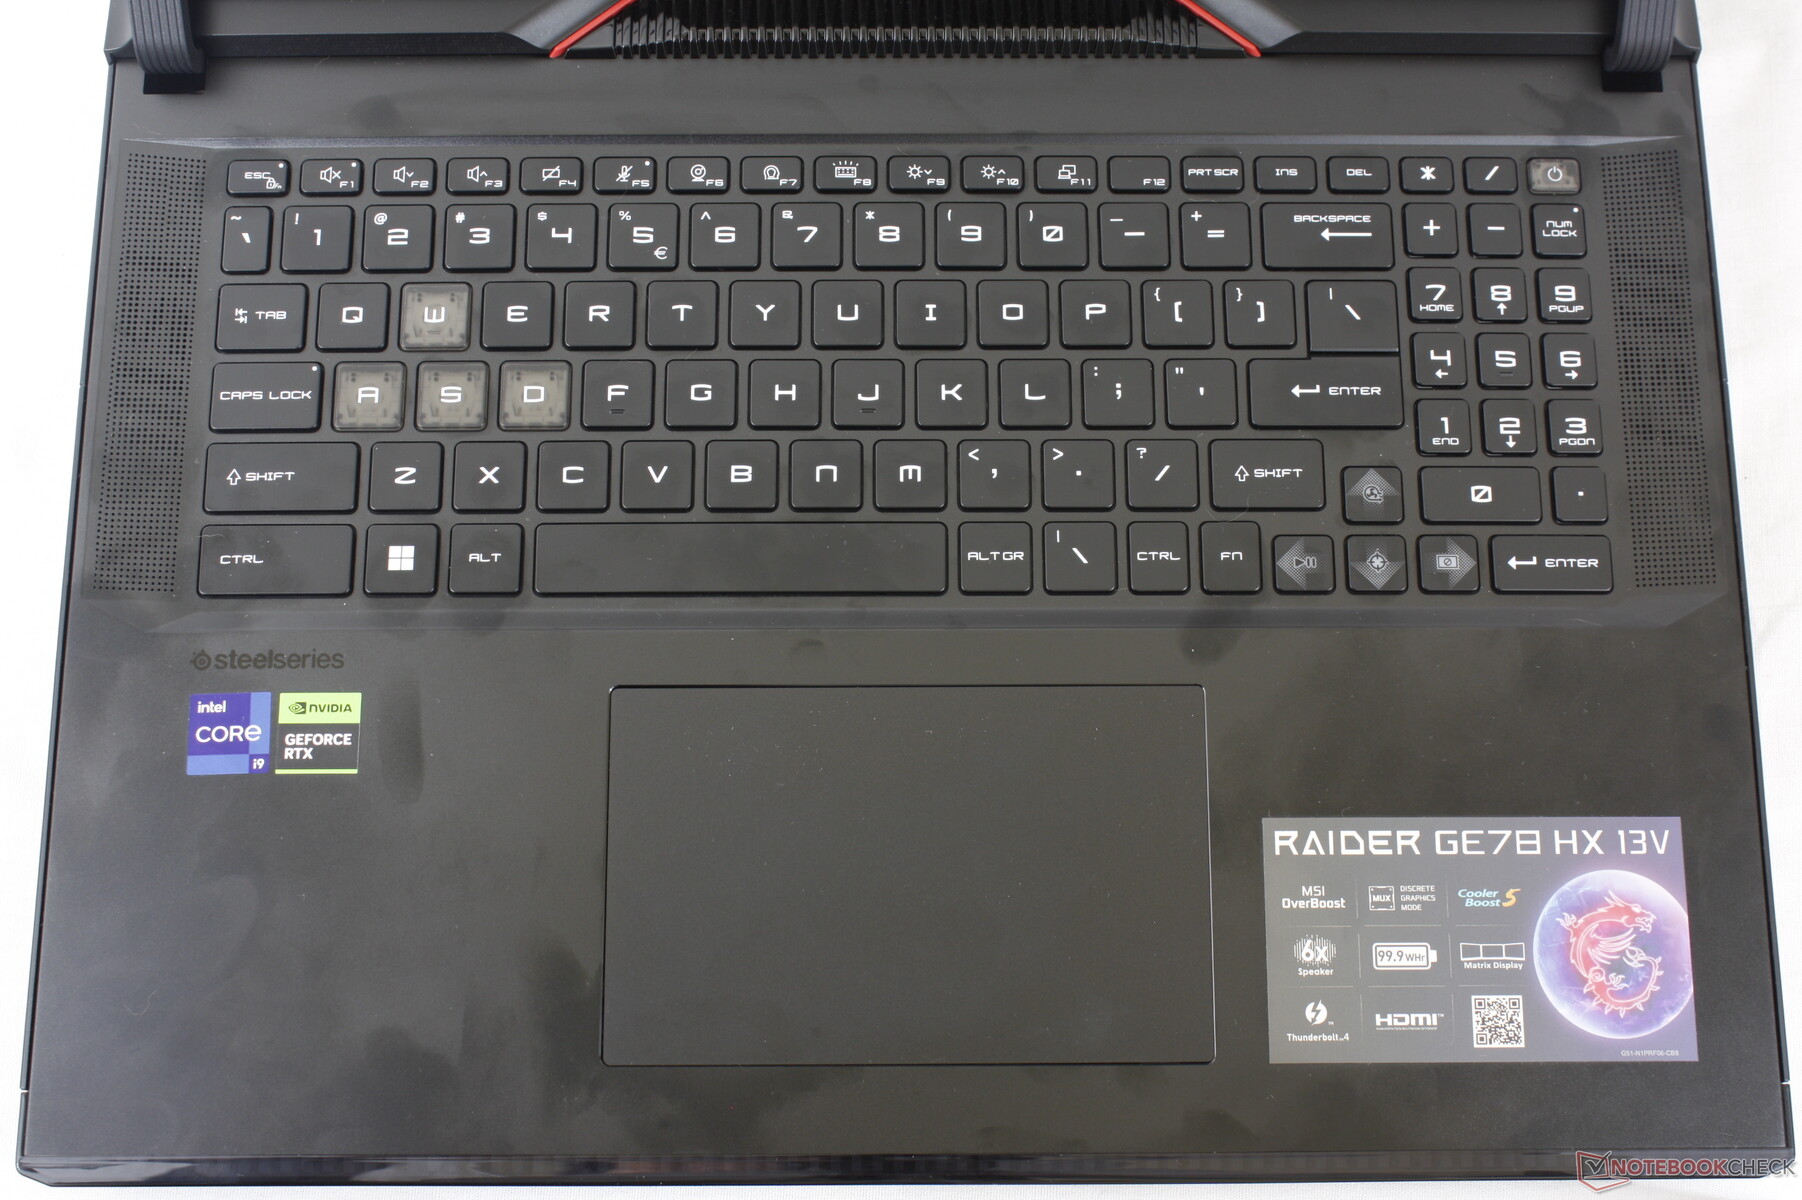
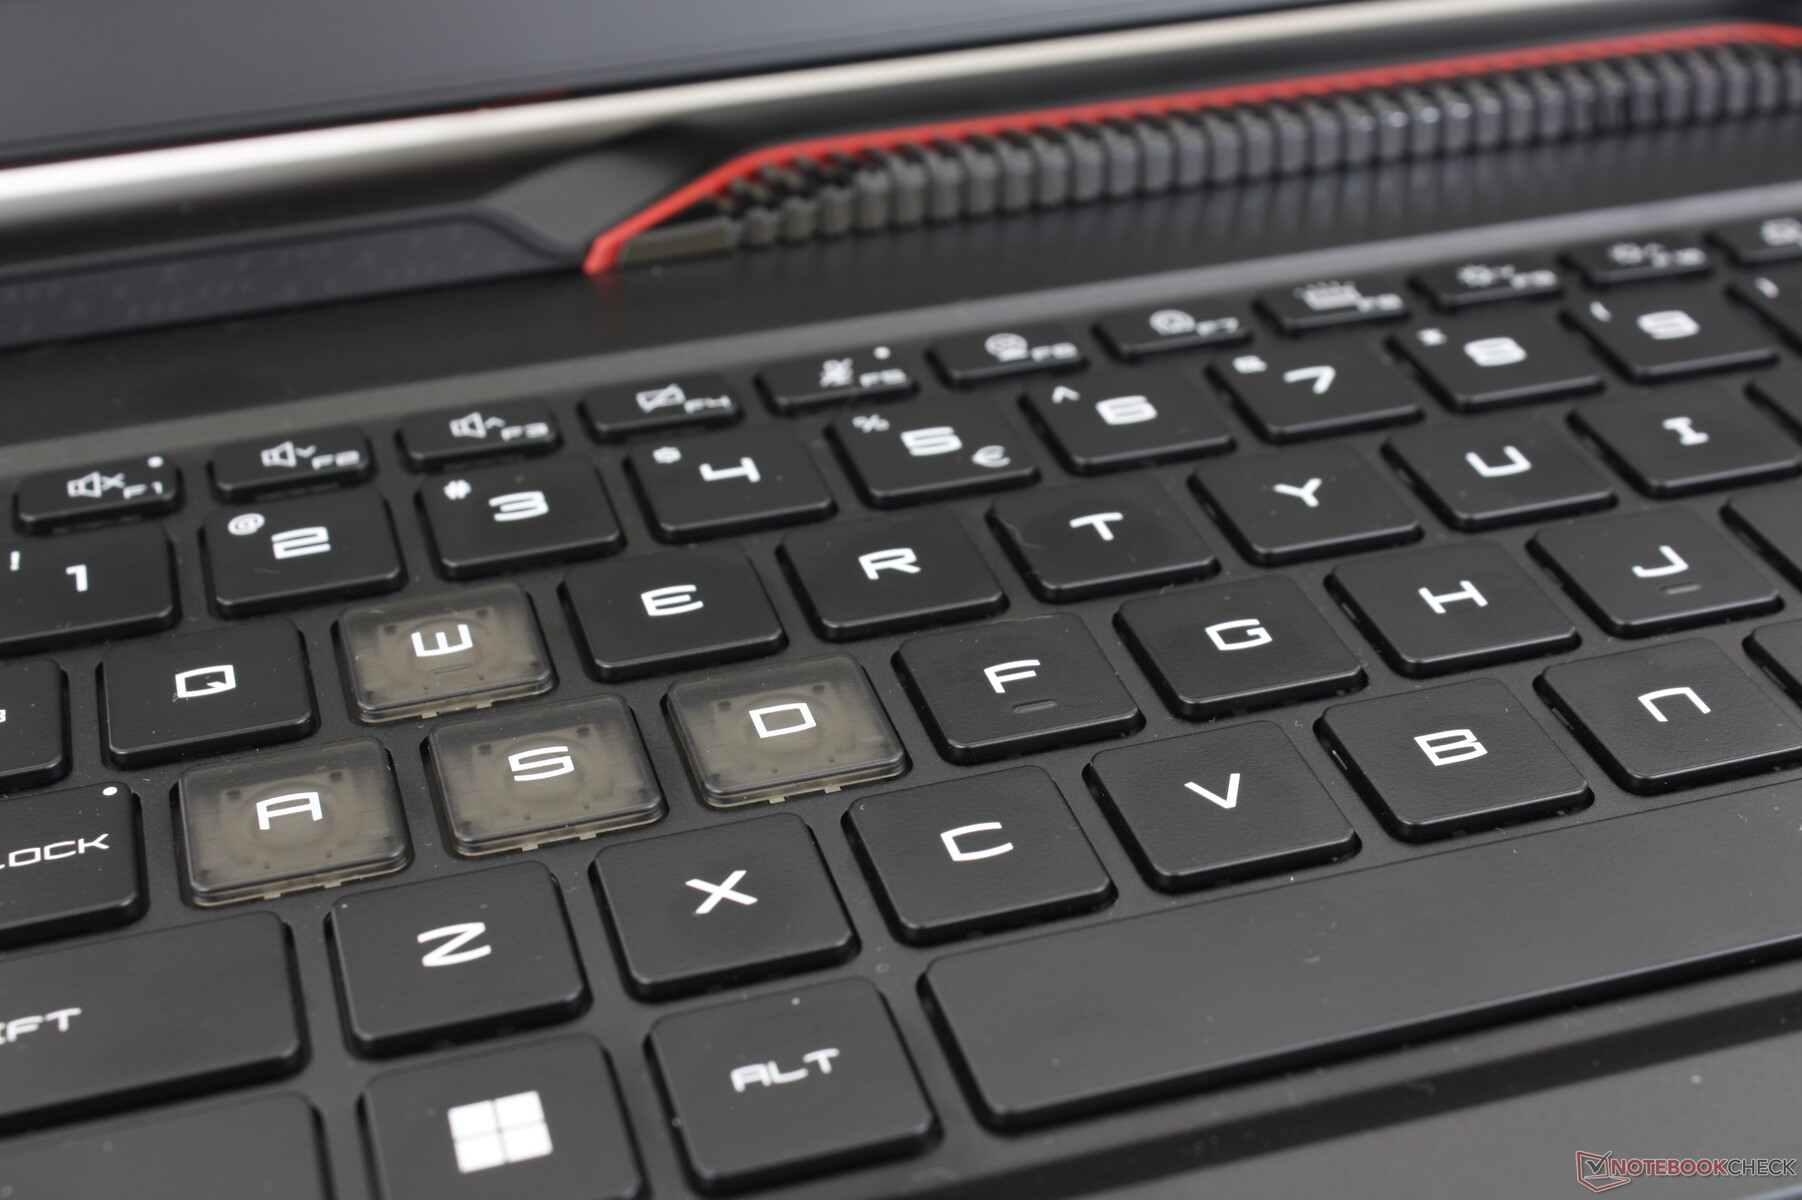
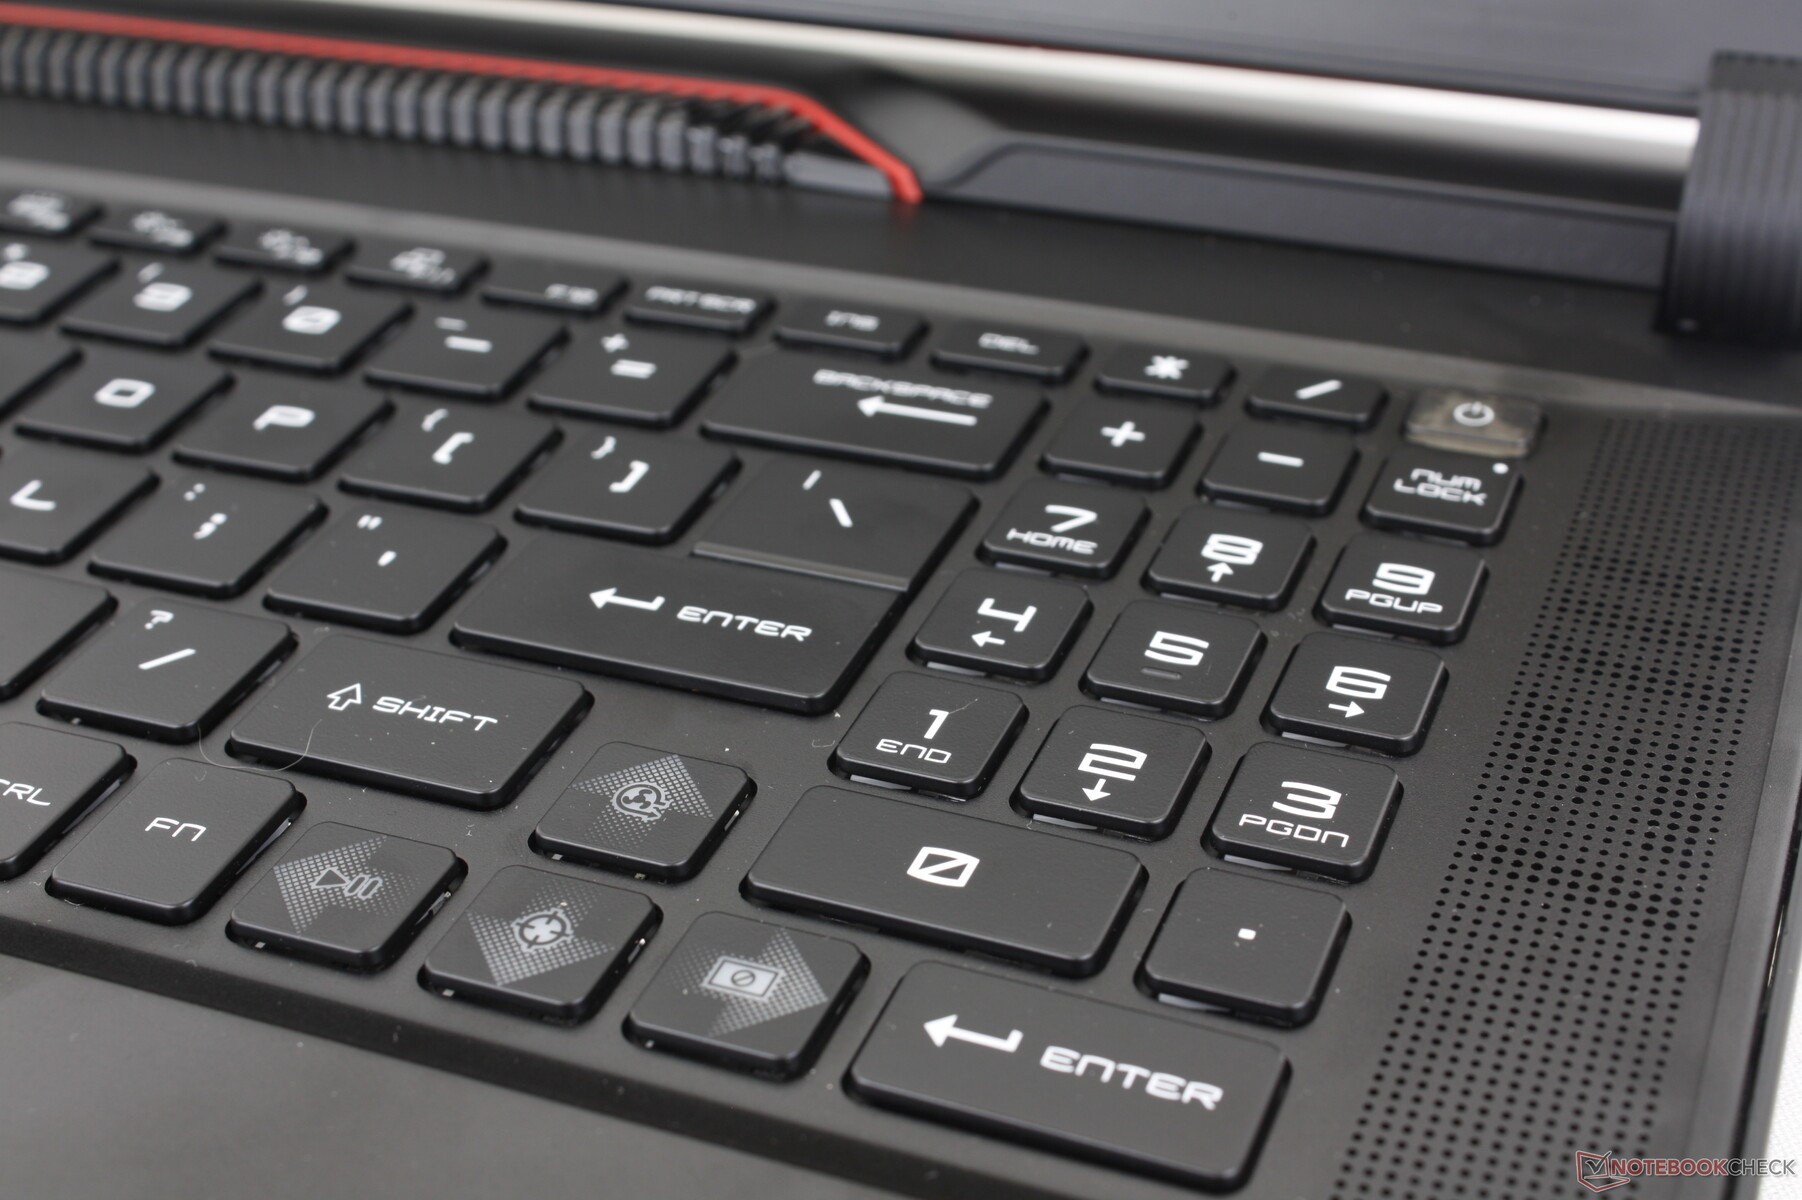
MSI ha rinnovato i keycaps e l'etichettatura sui tasti rispetto al modello GE77. Il feedback dei tasti è ancora molto buono, se non migliore di prima; i tasti Spazio e Invio, in particolare, sono più rumorosi e più cliccabili questa volta per un'esperienza di digitazione più soddisfacente.
I tasti freccia e il tastierino numerico avrebbero bisogno di un po' di lavoro. Nonostante il grande formato da 17 pollici, questi tasti specifici sono piccoli e angusti. In confronto, i tasti freccia e il tastierino numerico della serie Lenovo Legion sono più grandi e spaziosi. I giochi che utilizzano spesso i tasti freccia, come i titoli di corse, possono essere più difficili da giocare sul sistema MSI.
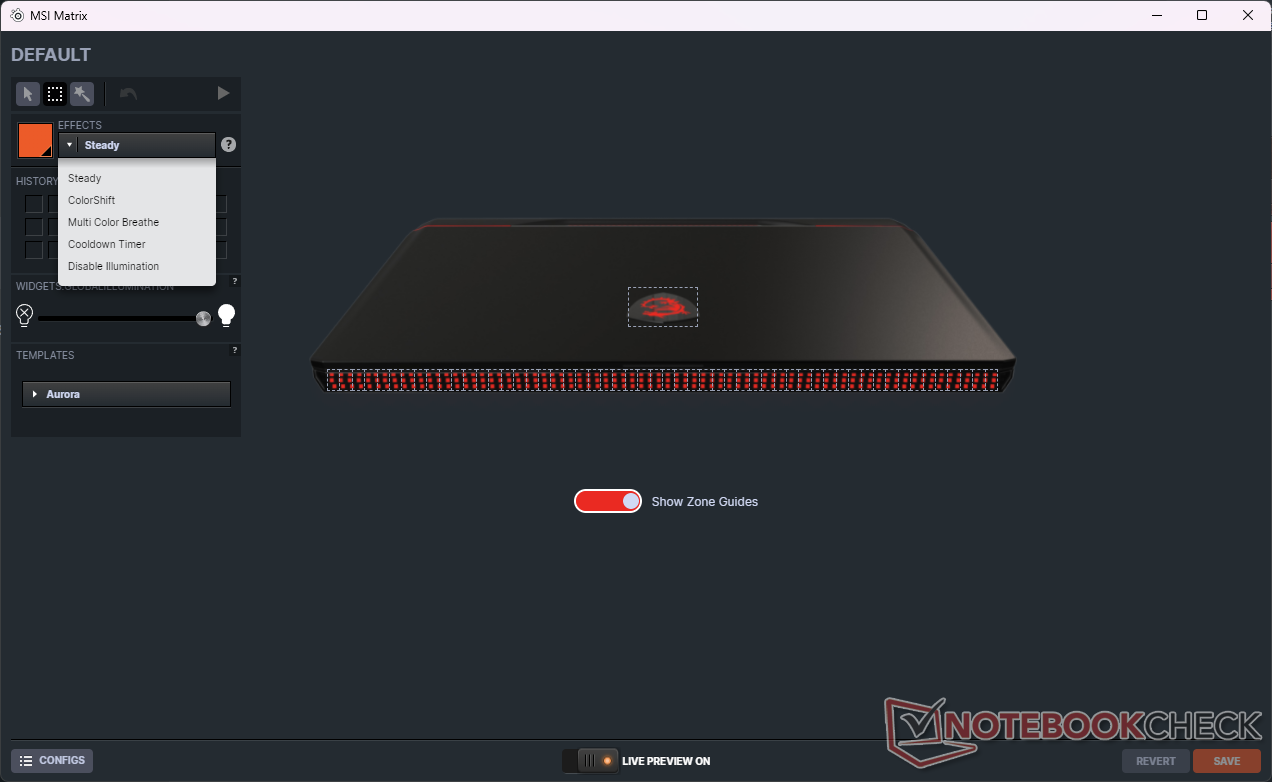
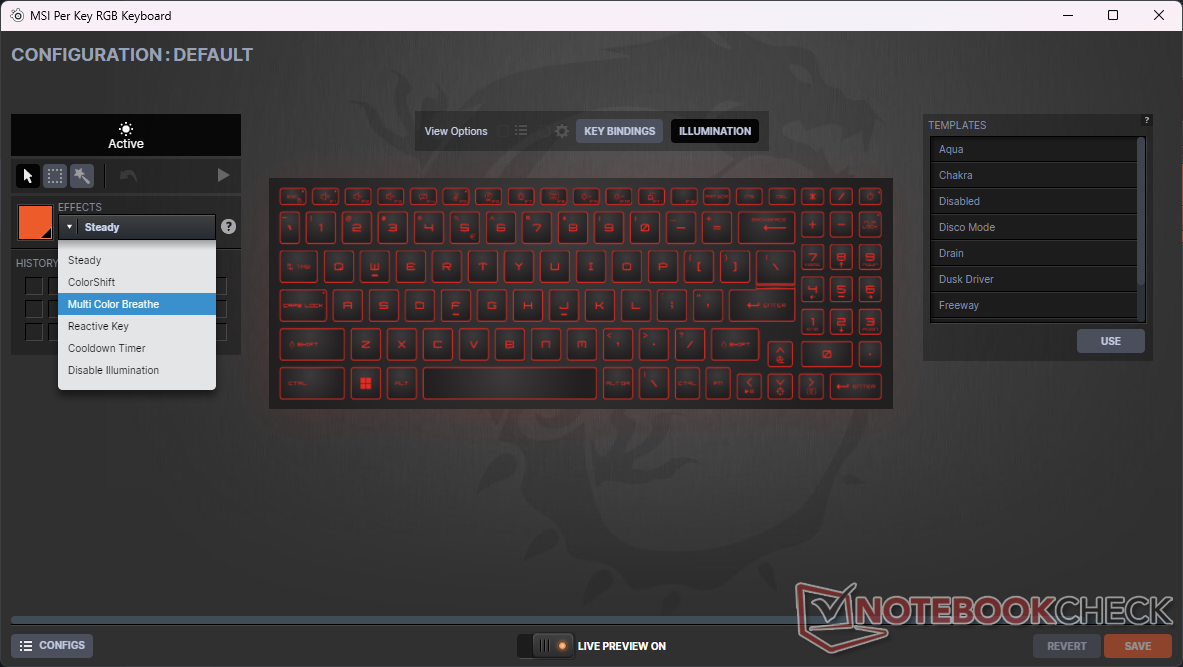
Gli effetti di illuminazione RGB per ogni tasto sono controllati dal software SteelSeries GG preinstallato, come mostrano gli screenshot qui sotto. L'applicazione controlla anche la barra luminosa a "matrice" di pixel lungo il bordo anteriore dello chassis.
Touchpad
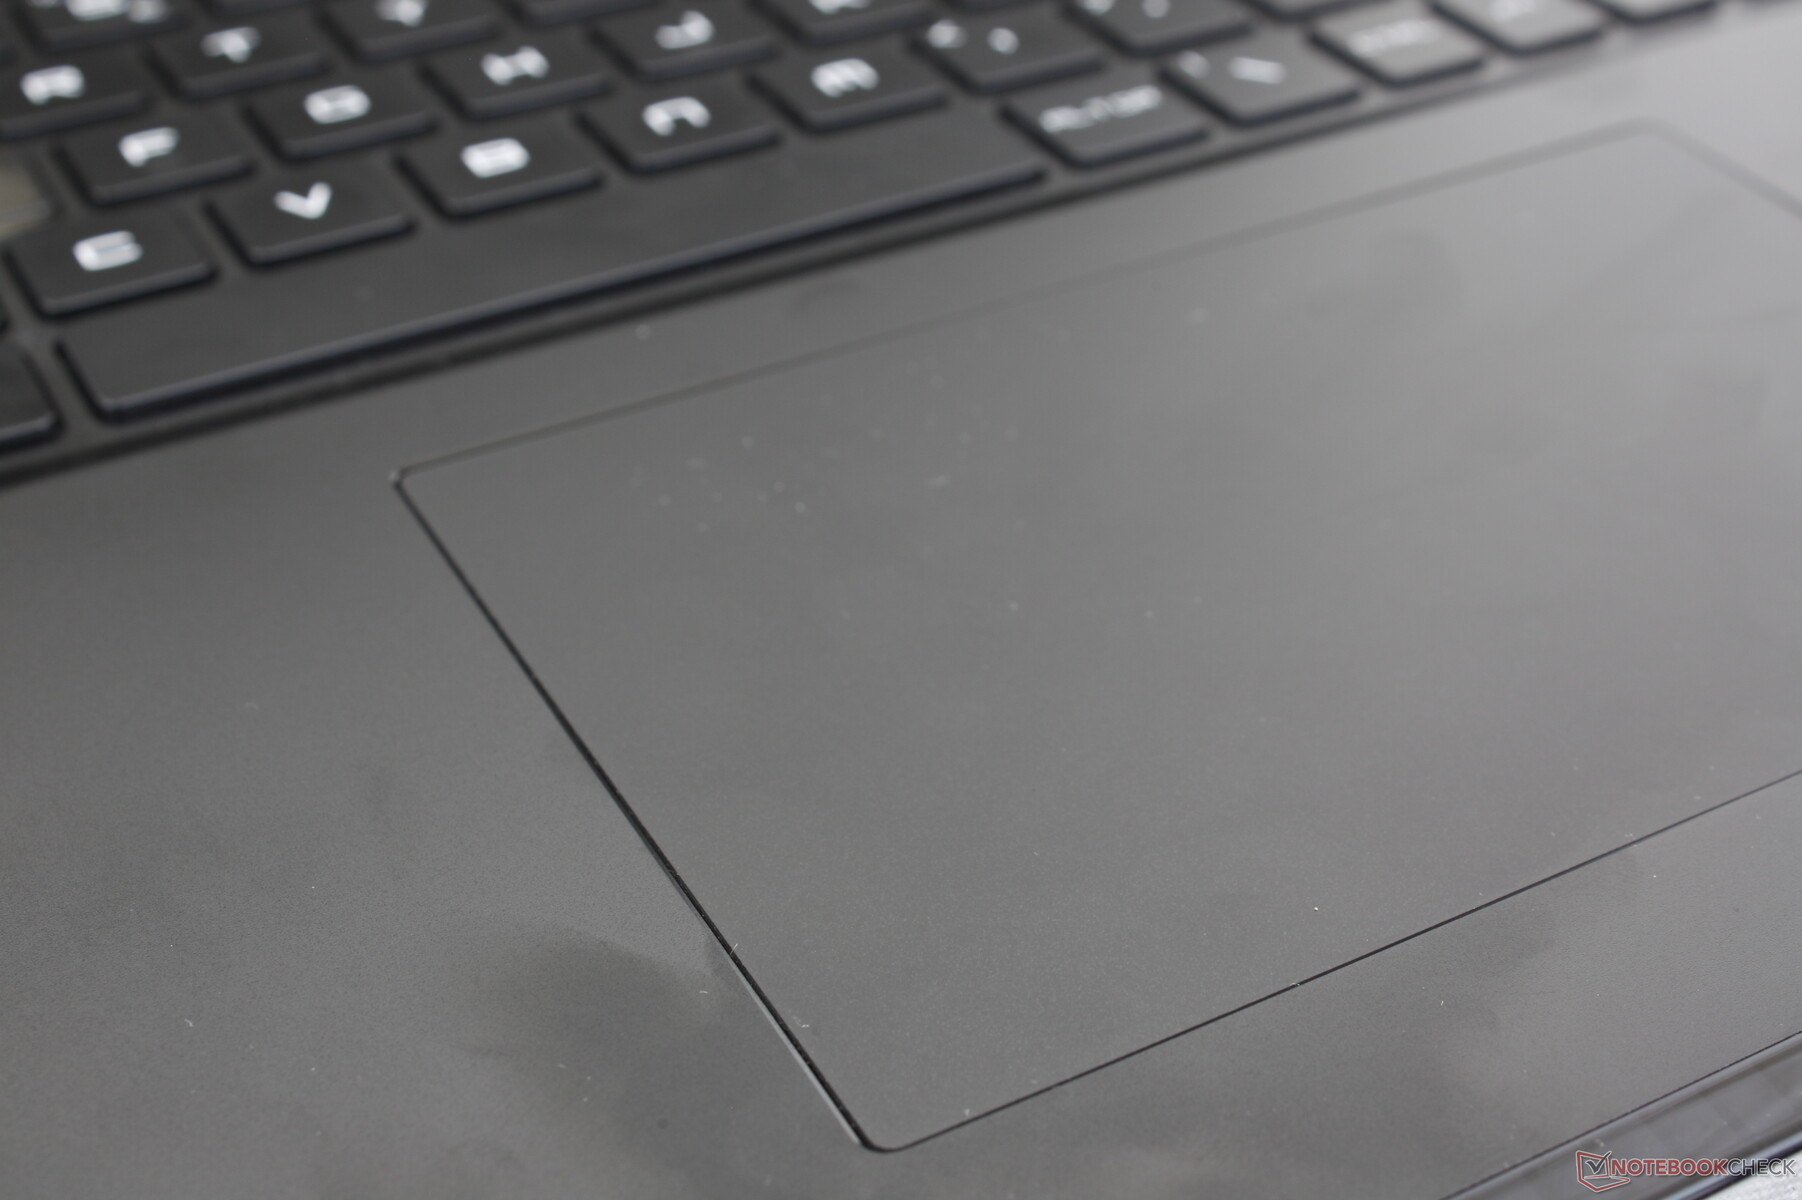
Le dimensioni del clickpad sono cresciute, passando dalla minuscola superficie di 10,5 x 6,5 cm del GE77 a quella molto più spaziosa di 13 x 8,2 cm del GE78. Tuttavia, lo scorrimento sulla superficie in plastica è più appiccicoso di quanto ci si aspettasse, per cui si avverte una resistenza leggermente maggiore quando si scivola a velocità più elevate. Il feedback quando si preme è silenzioso, ma troppo superficiale e debole per una sensazione complessivamente insoddisfacente.
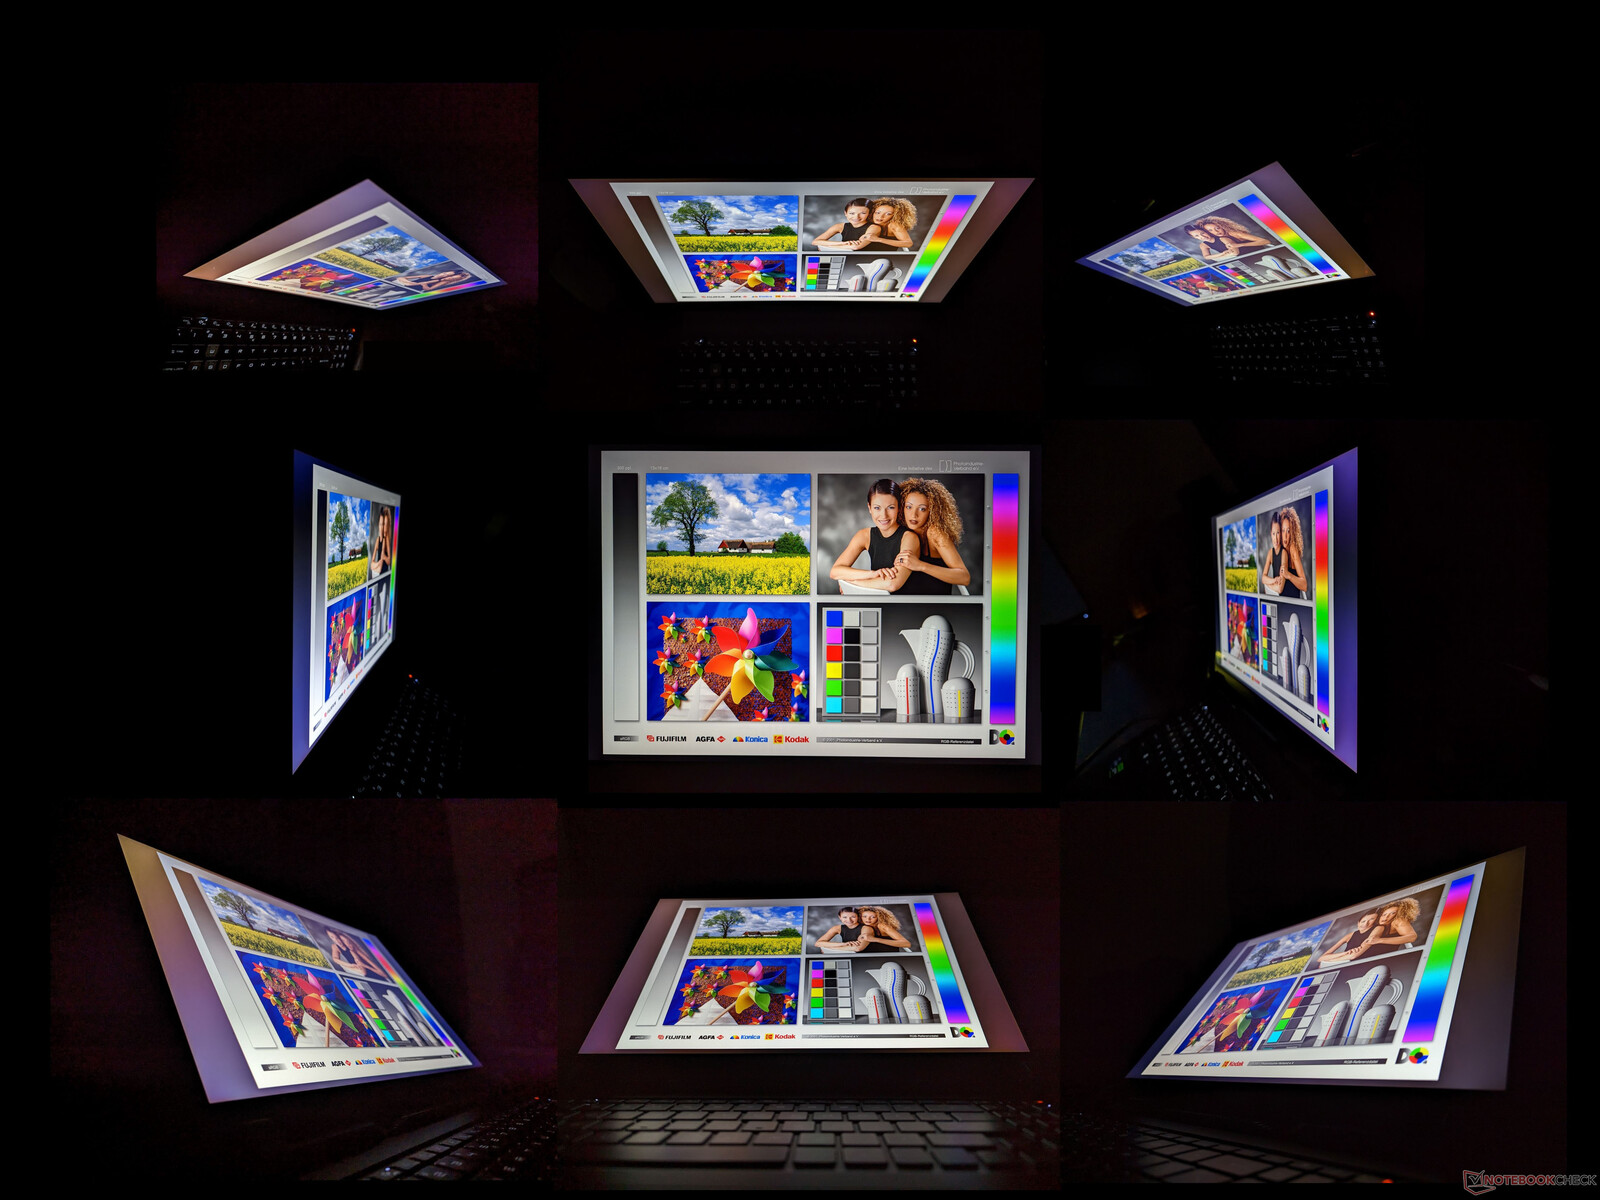
Display - Dov'è il supporto G-Sync?
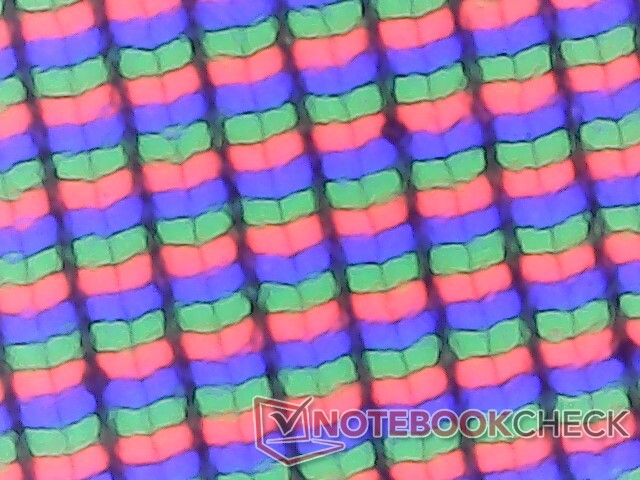
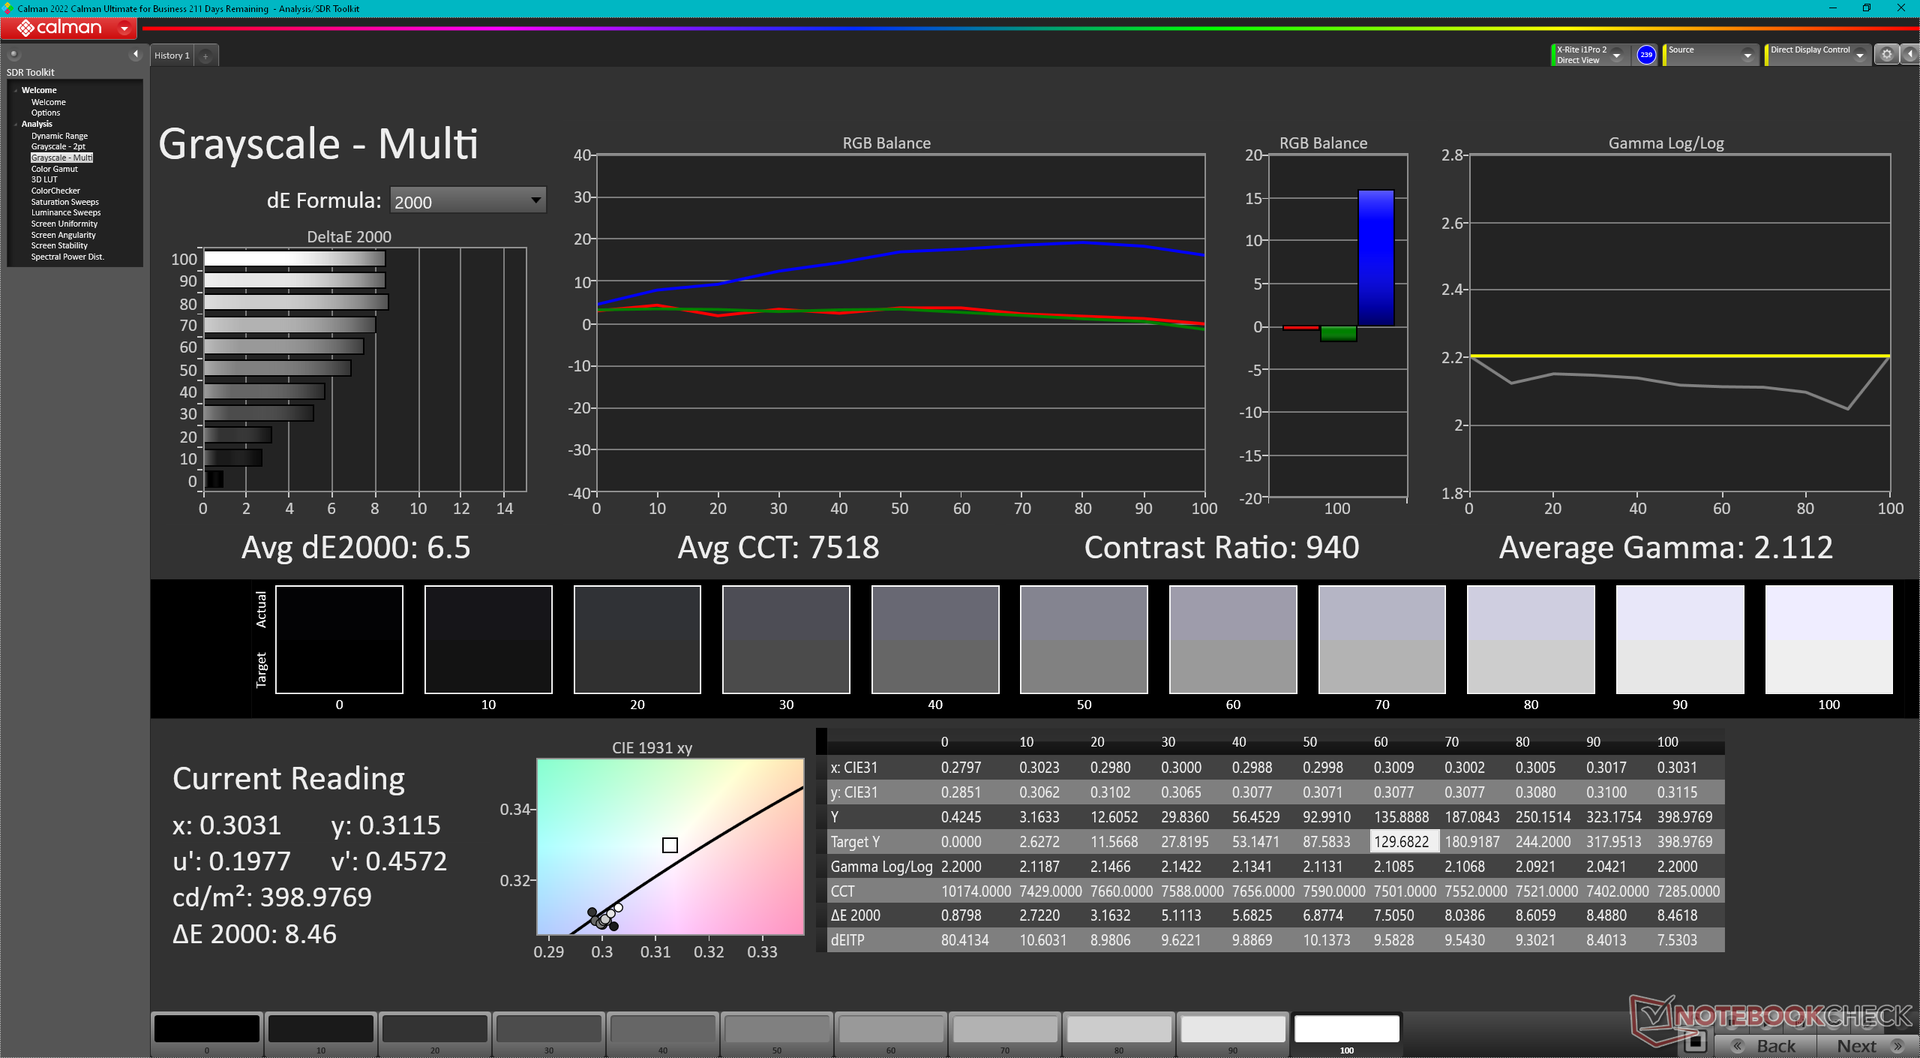
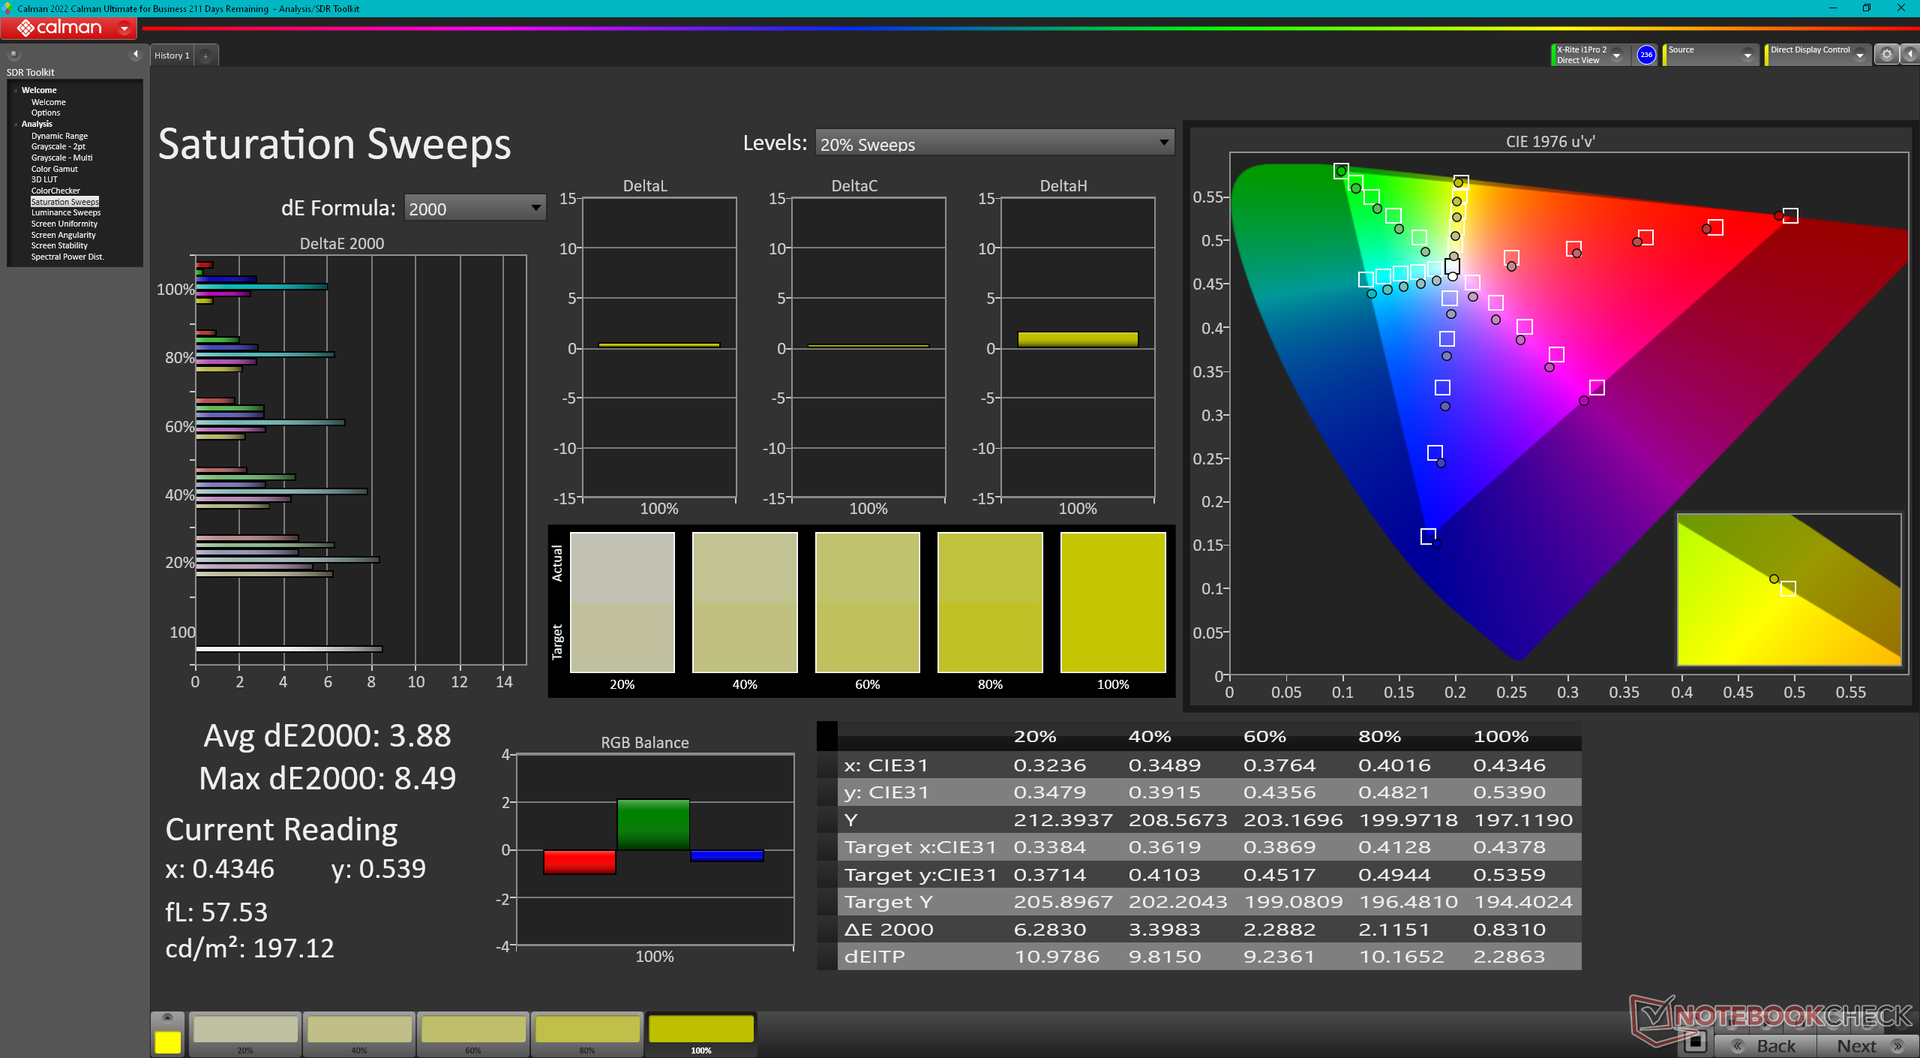
Il GE78 è il primo portatile nel nostro database a montare il pannello IPS AU Optronics B170QAN01.2. Tuttavia, tutte le nostre misurazioni interne mostrano che è essenzialmente identico al pannello AU Optronics B173ZAN06.1 del GE77 dello scorso anno, tranne che per le dimensioni (17,0 pollici contro 17,3 pollici), il rapporto di aspetto (16:10 contro 16:9) e la frequenza di aggiornamento (240 Hz contro 120 Hz). Gli attributi principali, come gli ampi colori P3, i tempi di risposta rapidi, la luminosità di 400 nit e il discreto rapporto di contrasto, rimangono più o meno gli stessi per un'esperienza visiva simile.
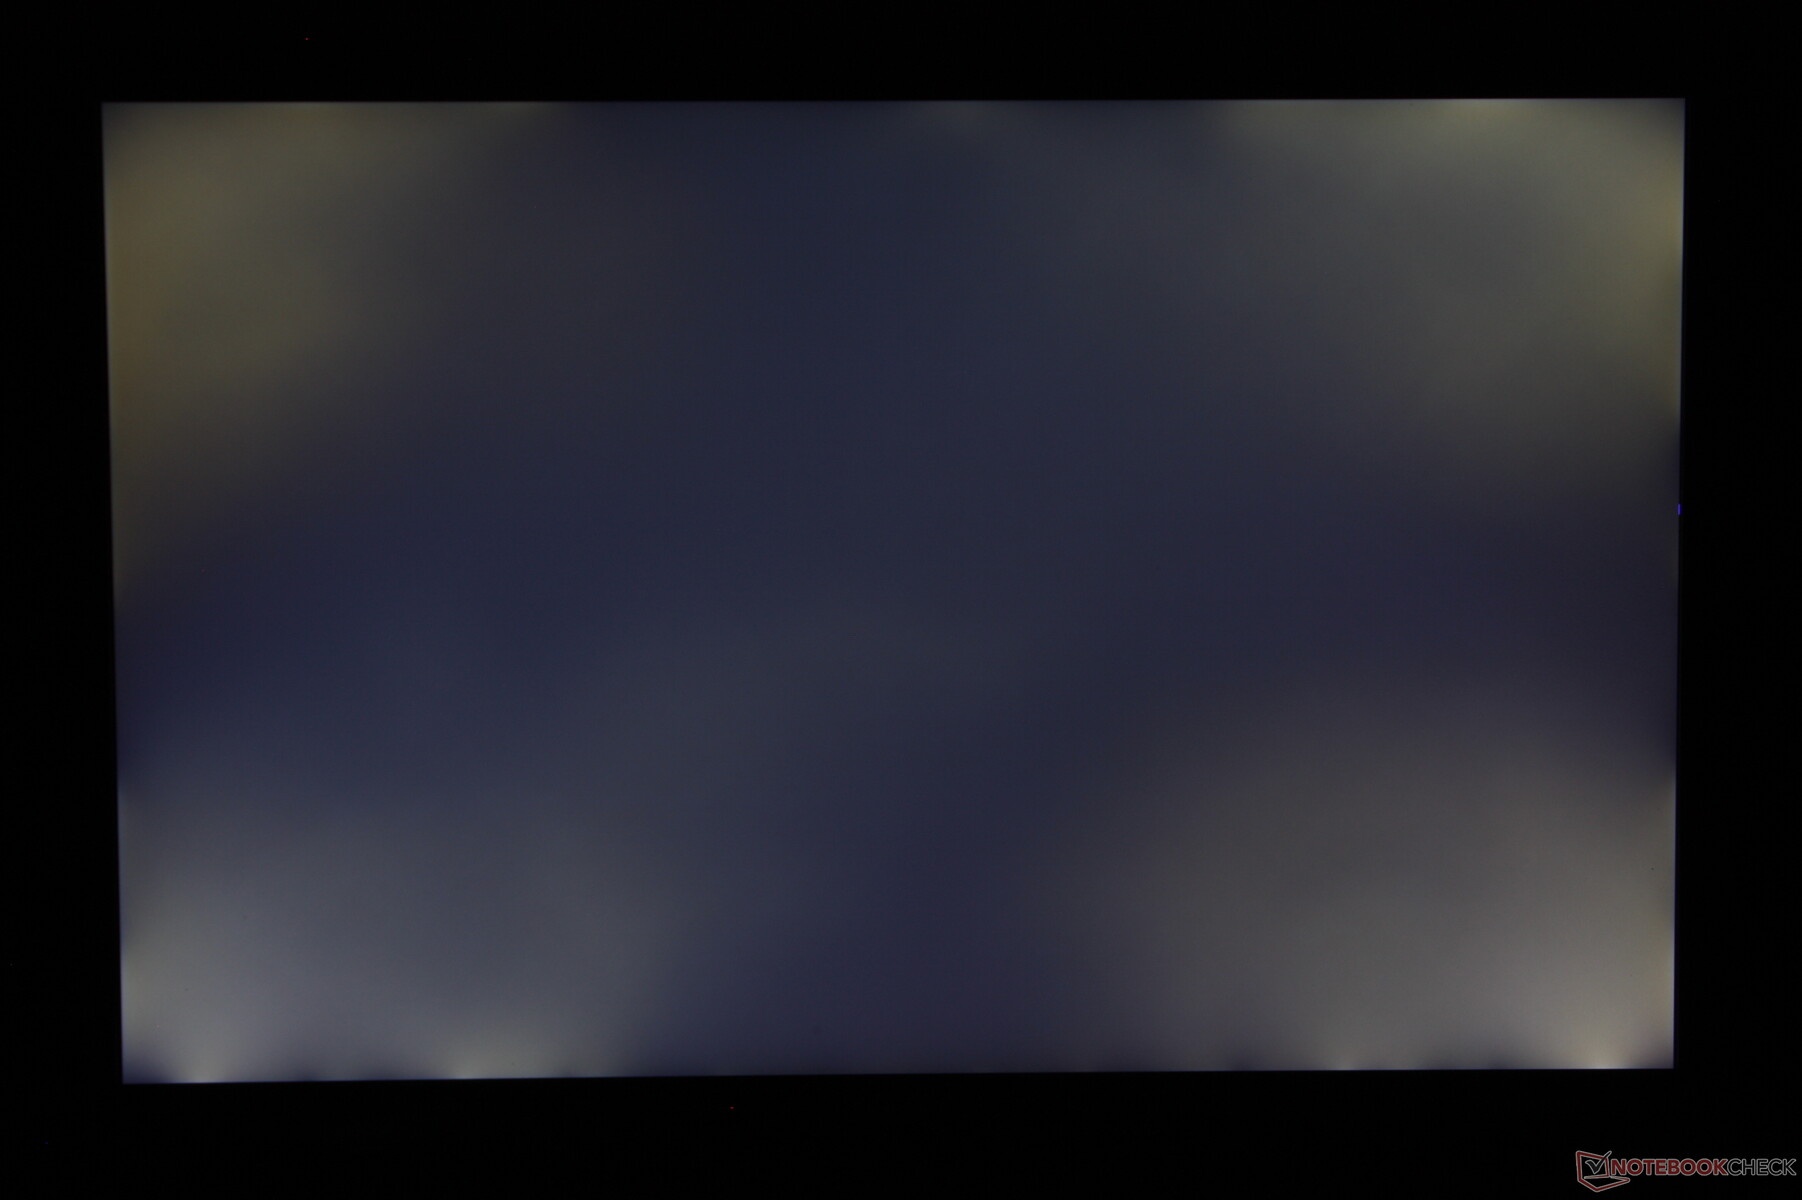
Forse l'aspetto più grave del display è il terribile controllo del backlight bleeding sulla nostra unità di test specifica. Come mostra lo screenshot qui sotto, l'emorragia di luce si nota soprattutto durante la riproduzione di filmati con bordi neri o durante l'esecuzione di alcuni giochi. Un certo livello di backlight bleeding è prevedibile per la maggior parte dei pannelli IPS, ma è decisamente troppo consistente su un portatile di fascia alta come il nostro GE78.
| |||||||||||||||||||||||||
Distribuzione della luminosità: 89 %
Al centro con la batteria: 398.6 cd/m²
Contrasto: 867:1 (Nero: 0.46 cd/m²)
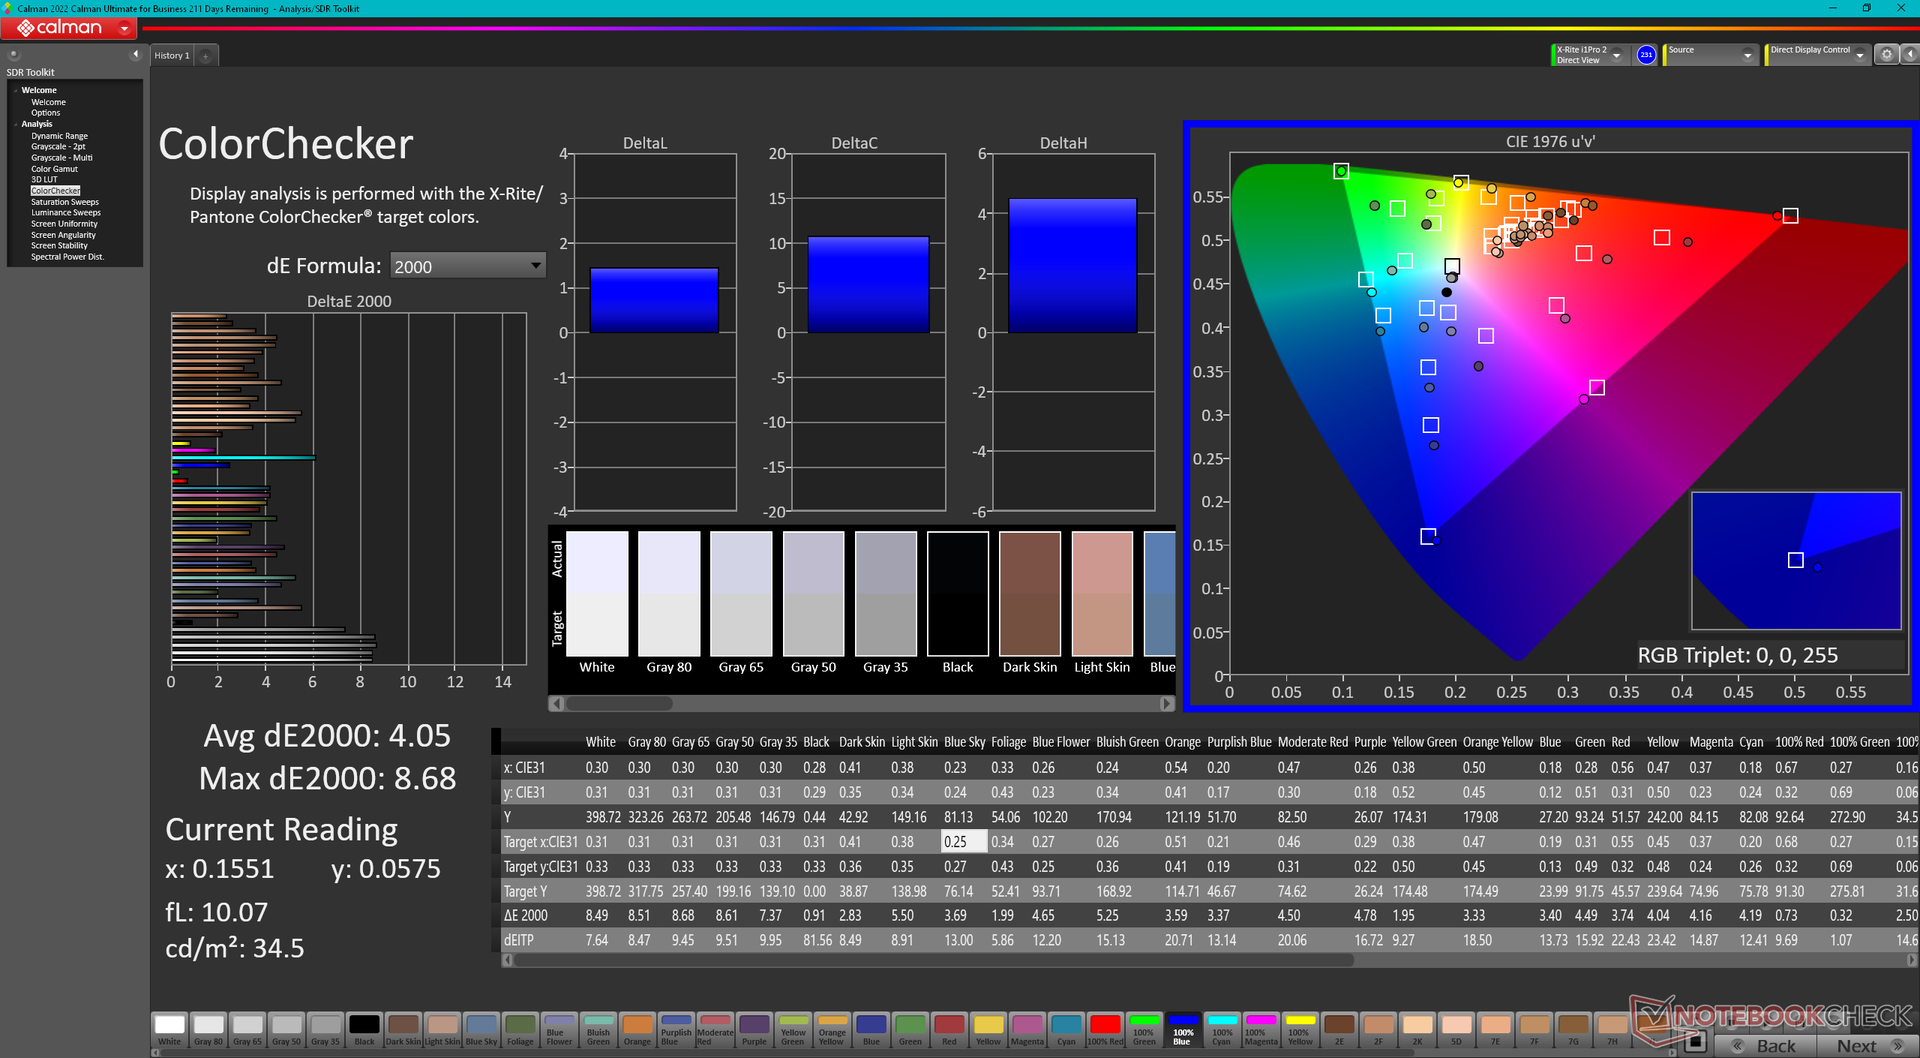
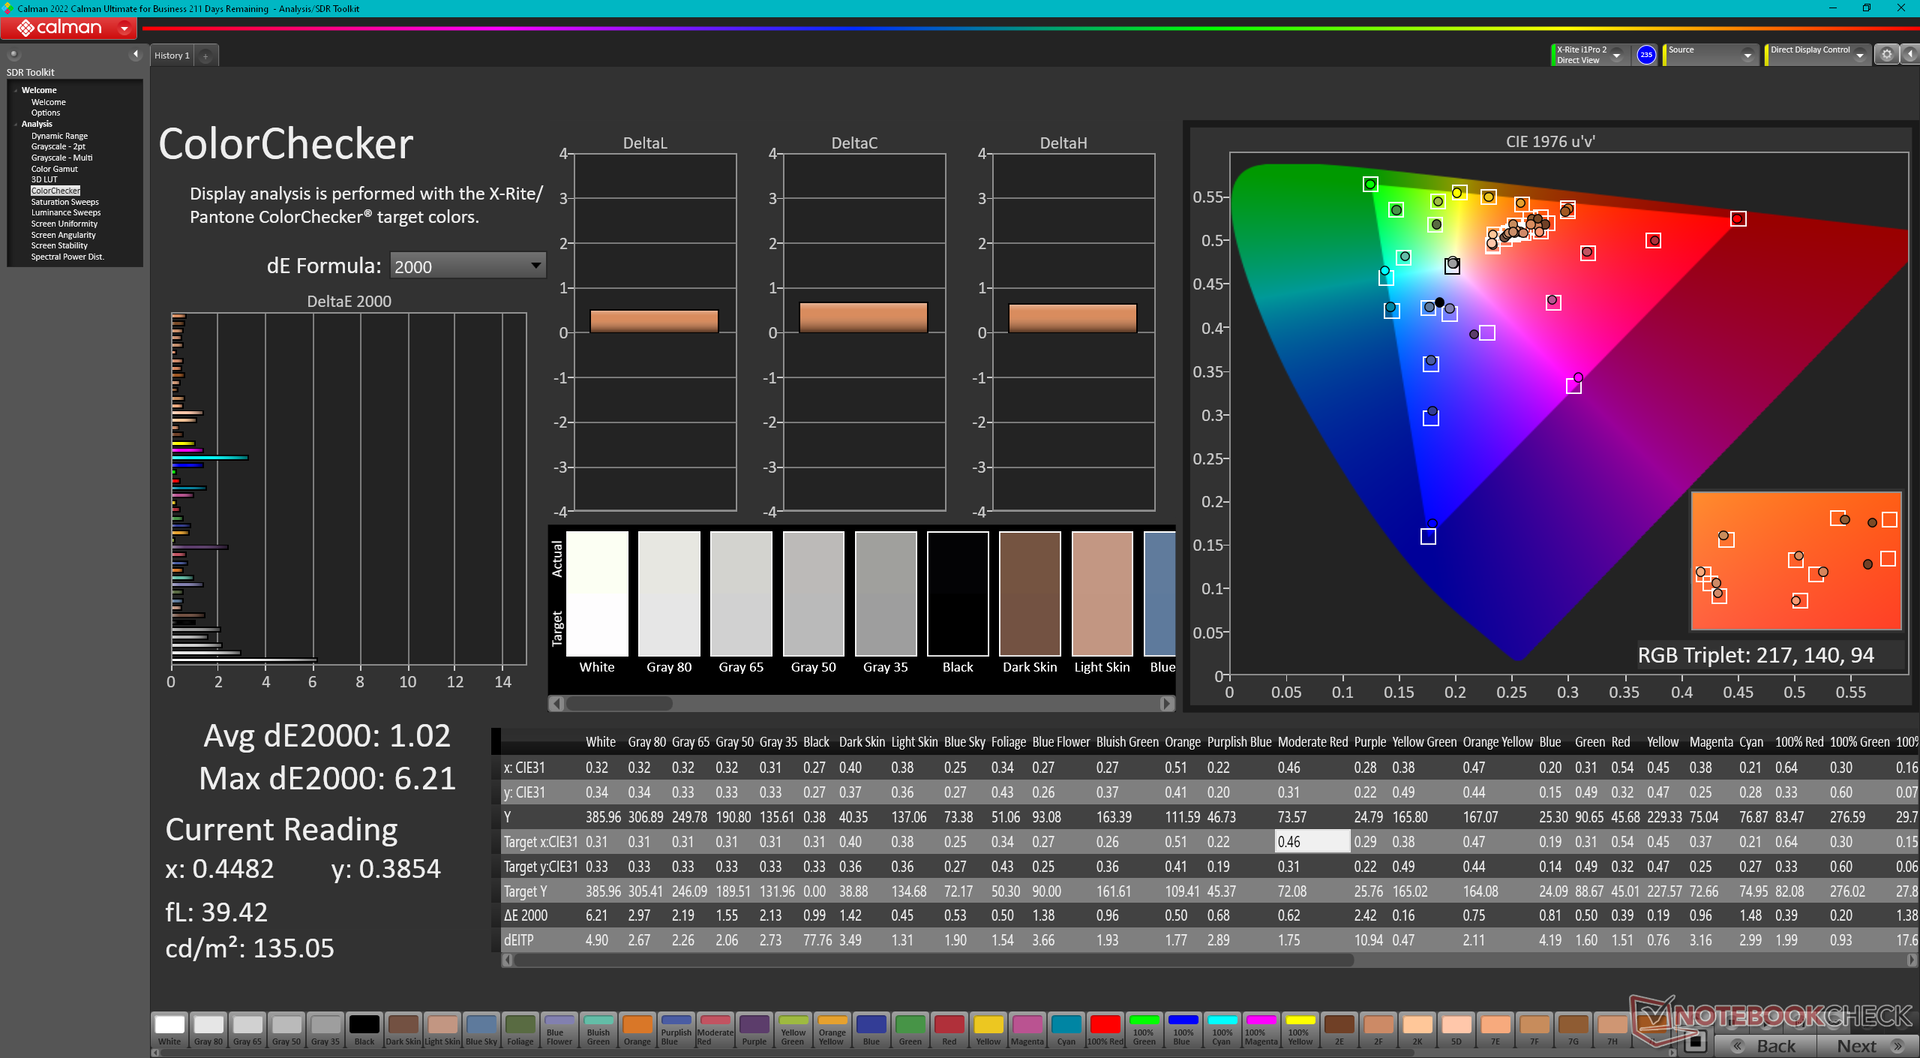
ΔE ColorChecker Calman: 4.05 | ∀{0.5-29.43 Ø4.72}
calibrated: 1.02
ΔE Greyscale Calman: 6.5 | ∀{0.09-98 Ø4.97}
86.5% AdobeRGB 1998 (Argyll 3D)
99.9% sRGB (Argyll 3D)
97.6% Display P3 (Argyll 3D)
Gamma: 2.11
CCT: 7518 K
| MSI GE78HX 13VH-070US AU Optronics B170QAN01.2, IPS, 2560x1600, 17" | Eluktronics Mech-17 GP2 BOE NE170QDM-NZ1, IPS, 2560x1600, 17" | Asus ROG Strix G17 G713PI BOE0B69, IPS, 2560x1440, 17.3" | MSI Titan GT77 HX 13VI B173ZAN06.C, Mini-LED, 3840x2160, 17.3" | MSI Raider GE77 HX 12UHS AU Optronics B173ZAN06.1, IPS, 3840x2160, 17.3" | Razer Blade 17 Early 2022 AU Optronics B173ZAN06.9, IPS, 3840x2160, 17.3" | |
|---|---|---|---|---|---|---|
| Display | -16% | 0% | 1% | -1% | 1% | |
| Display P3 Coverage (%) | 97.6 | 69.1 -29% | 98.3 1% | 94.9 -3% | 96.6 -1% | 99.4 2% |
| sRGB Coverage (%) | 99.9 | 99.7 0% | 100 0% | 99.9 0% | 99.8 0% | 100 0% |
| AdobeRGB 1998 Coverage (%) | 86.5 | 69.8 -19% | 85.9 -1% | 92.4 7% | 85.8 -1% | 87.3 1% |
| Response Times | -117% | -30% | -565% | -13% | -33% | |
| Response Time Grey 50% / Grey 80% * (ms) | 4.2 ? | 12 ? -186% | 5.3 ? -26% | 38.4 ? -814% | 5.8 ? -38% | 7.5 ? -79% |
| Response Time Black / White * (ms) | 6.4 ? | 9.4 ? -47% | 8.6 ? -34% | 26.6 ? -316% | 5.6 ? 13% | 5.6 ? 13% |
| PWM Frequency (Hz) | 2380 ? | |||||
| Screen | 27% | 27% | 77665% | -32% | 36% | |
| Brightness middle (cd/m²) | 398.6 | 417.3 5% | 327 -18% | 606 52% | 381 -4% | 503 26% |
| Brightness (cd/m²) | 384 | 387 1% | 320 -17% | 602 57% | 371 -3% | 486 27% |
| Brightness Distribution (%) | 89 | 87 -2% | 89 0% | 93 4% | 84 -6% | 84 -6% |
| Black Level * (cd/m²) | 0.46 | 0.42 9% | 0.38 17% | 0.0001 100% | 0.52 -13% | 0.44 4% |
| Contrast (:1) | 867 | 994 15% | 861 -1% | 6060000 698862% | 733 -15% | 1143 32% |
| Colorchecker dE 2000 * | 4.05 | 2.14 47% | 1.01 75% | 4.8 -19% | 1.08 73% | |
| Colorchecker dE 2000 max. * | 8.68 | 4.09 53% | 4.01 54% | 8.2 6% | 4.54 48% | |
| Colorchecker dE 2000 calibrated * | 1.02 | 0.42 59% | 0.41 60% | 1.8 -76% | 2.53 -148% | 0.6 41% |
| Greyscale dE 2000 * | 6.5 | 3.1 52% | 1.6 75% | 6.5 -0% | 1.3 80% | |
| Gamma | 2.11 104% | 2.19 100% | 2.168 101% | 2.63 84% | 2.151 102% | |
| CCT | 7518 86% | 6040 108% | 6659 98% | 6596 99% | 6541 99% | |
| Media totale (Programma / Settaggio) | -35% /
-3% | -1% /
13% | 25700% /
49847% | -15% /
-20% | 1% /
19% |
* ... Meglio usare valori piccoli
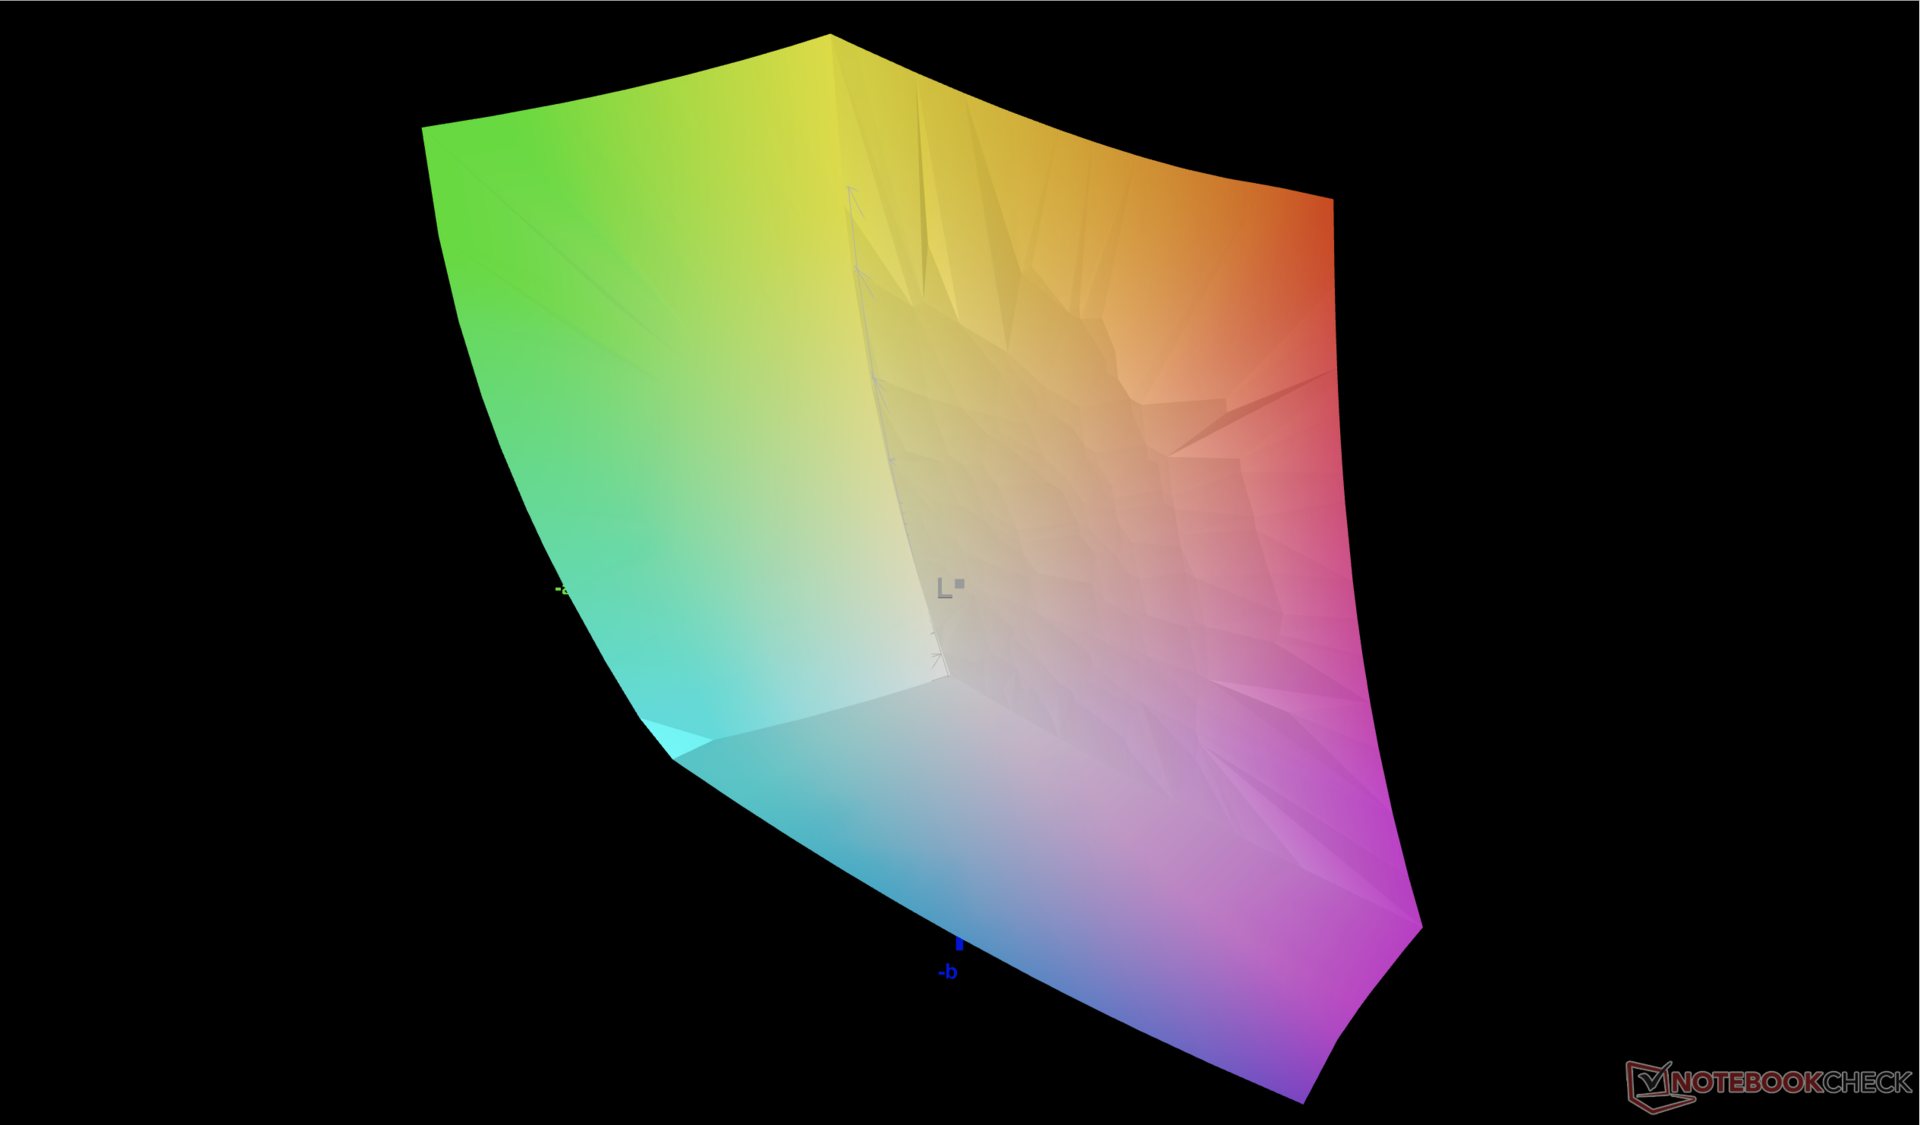
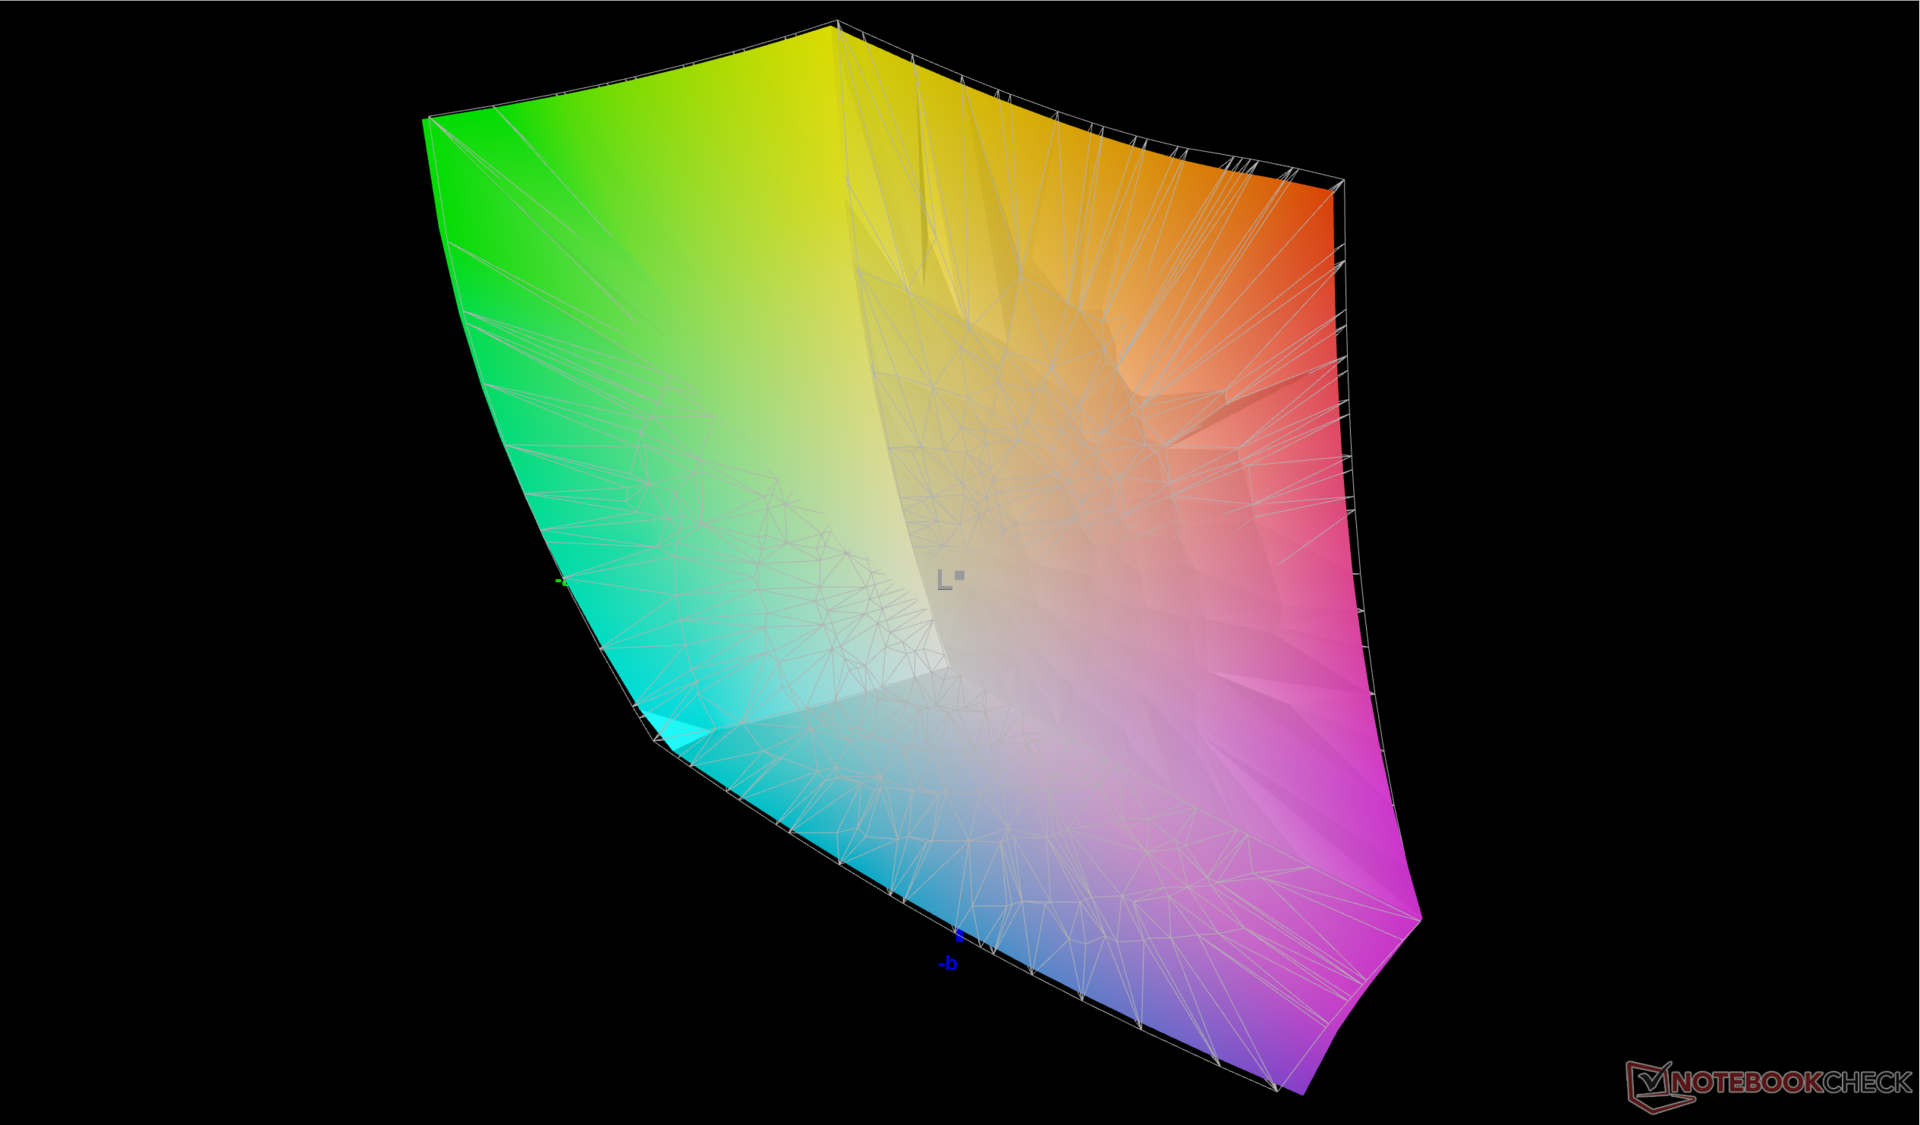
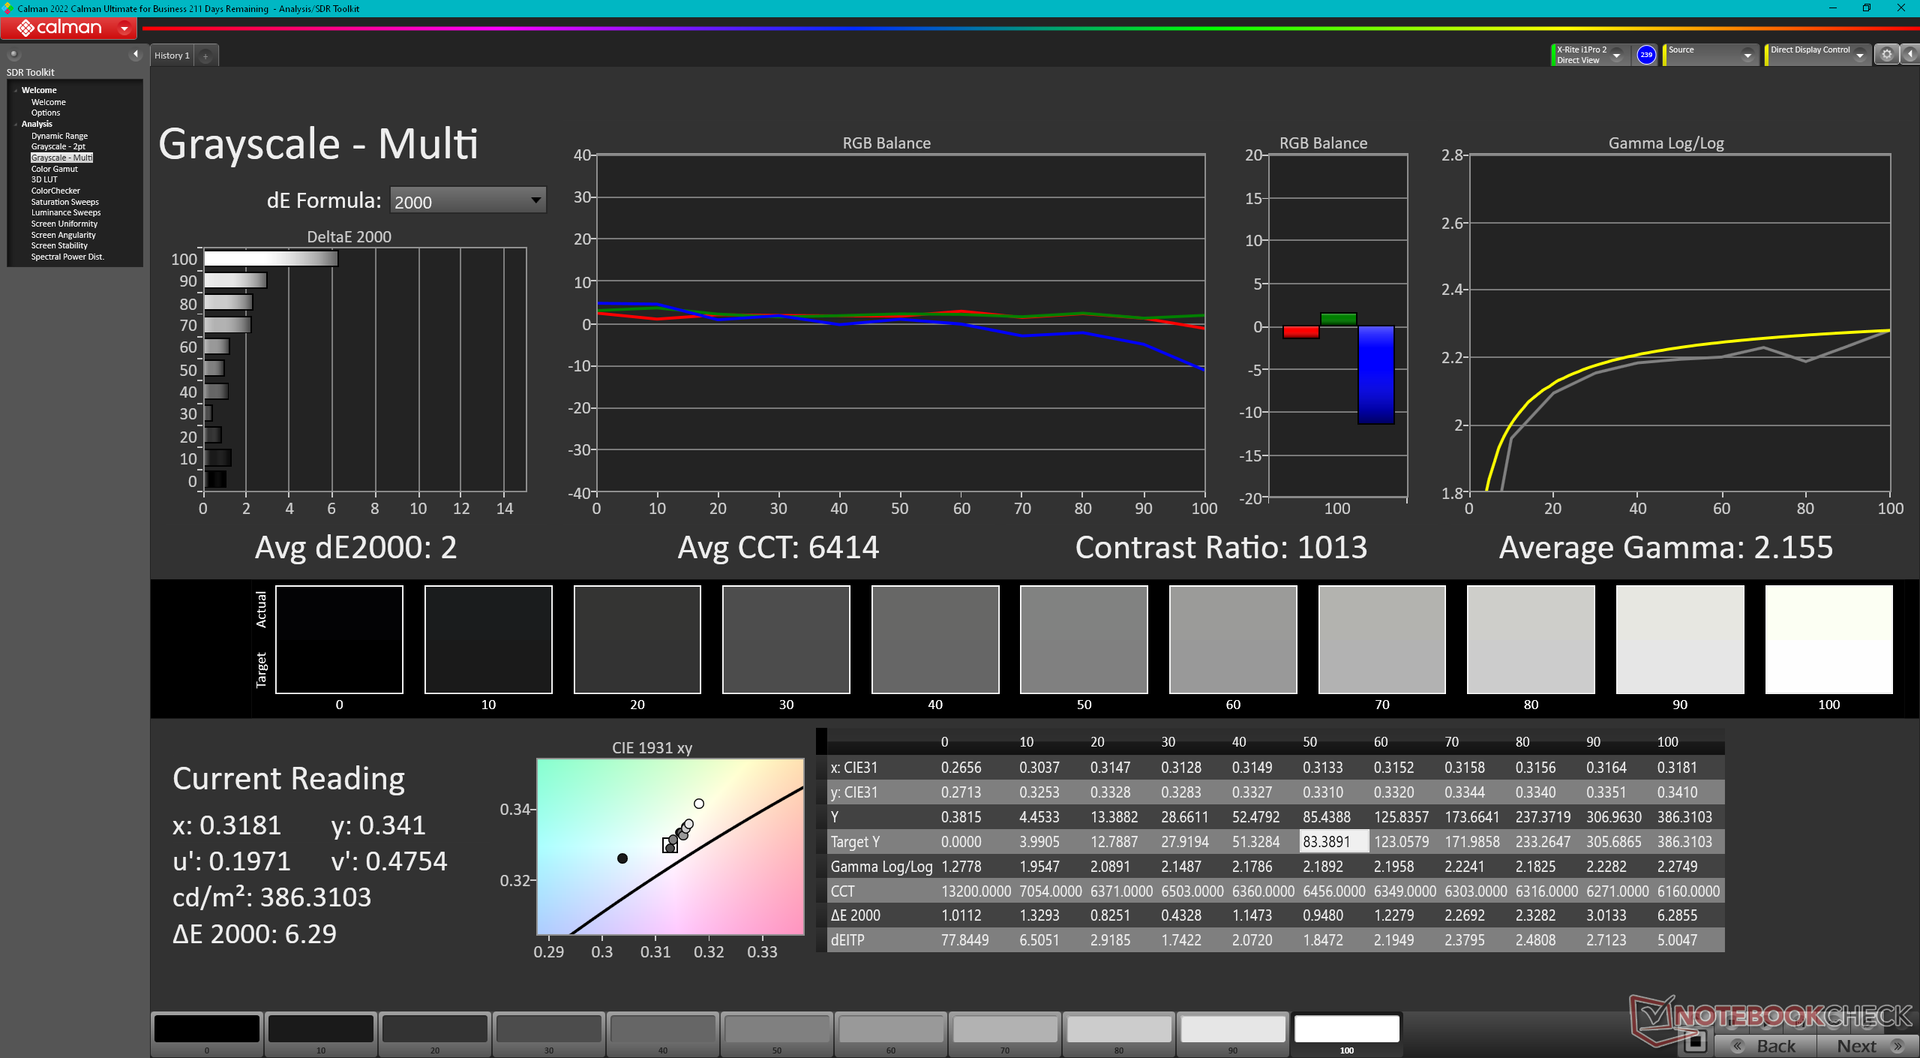
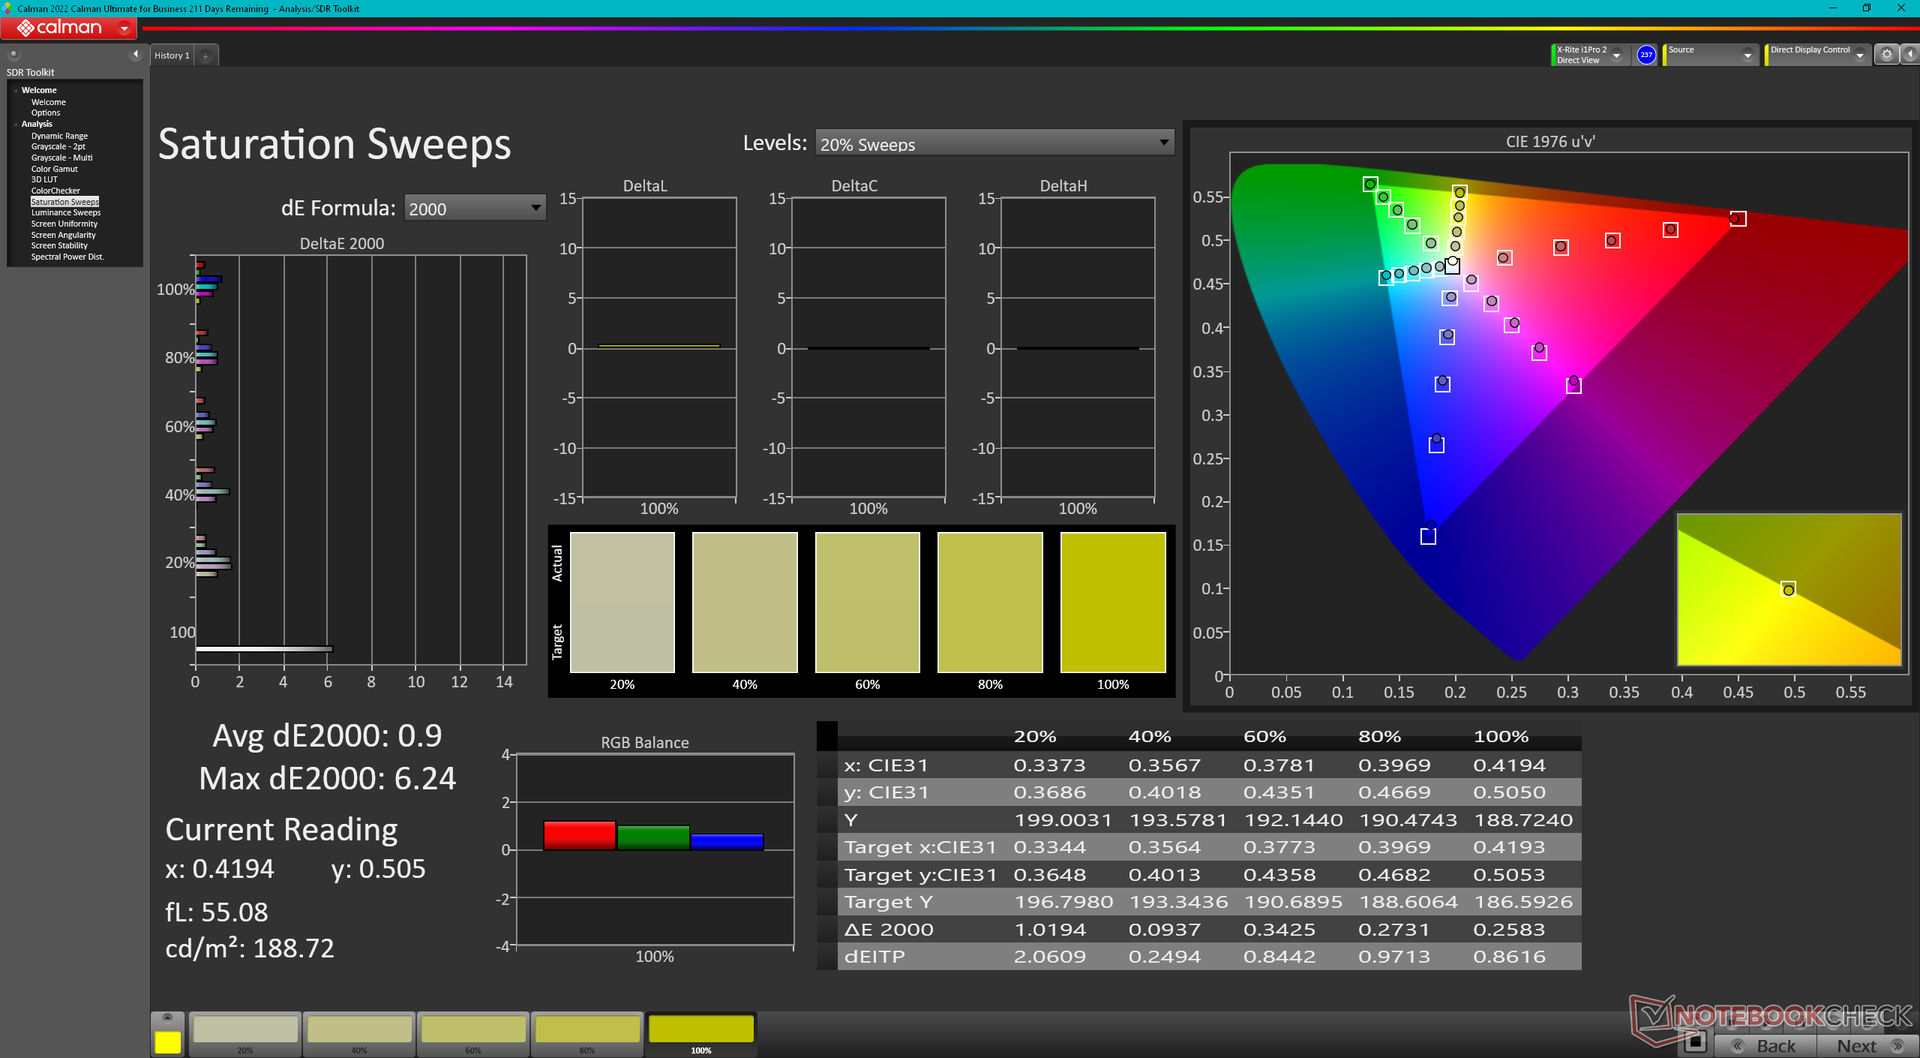
Il display è impostato di default sui colori P3. Sebbene l'accuratezza dei colori non sia male, il modello non è calibrato in fabbrica, a differenza della serie MSI Creator Serie MSI Creator. Consigliamo di applicare il nostro profilo ICM calibrato sopra per ottenere colori più accurati dal pannello, soprattutto perché copre interamente sRGB e P3. Con il nostro colorimetro X-Rite siamo riusciti a ridurre i valori medi del DeltaE della scala di grigi e dei colori rispettivamente a 2 e 1,02.
Tempi di risposta del Display
| ↔ Tempi di risposta dal Nero al Bianco | ||
|---|---|---|
| 6.4 ms ... aumenta ↗ e diminuisce ↘ combinato | ↗ 2.8 ms Incremento | 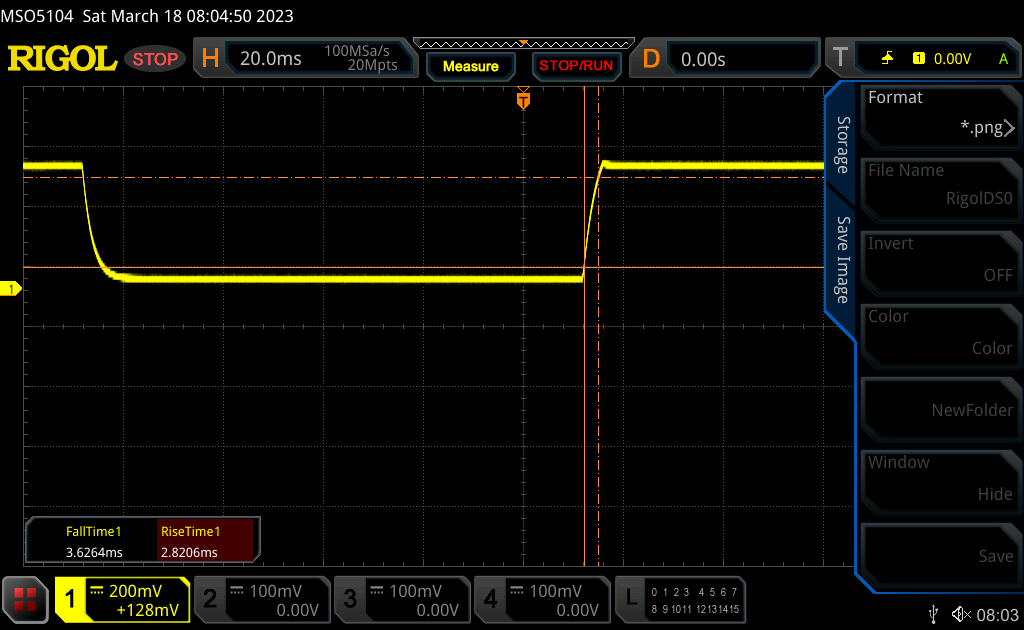 |
| ↘ 3.6 ms Calo | ||
| Lo schermo ha mostrato valori di risposta molto veloci nei nostri tests ed è molto adatto per i gaming veloce. In confronto, tutti i dispositivi di test variano da 0.1 (minimo) a 240 (massimo) ms. » 20 % di tutti i dispositivi è migliore. Questo significa che i tempi di risposta rilevati sono migliori rispettto alla media di tutti i dispositivi testati (19.9 ms). | ||
| ↔ Tempo di risposta dal 50% Grigio all'80% Grigio | ||
| 4.2 ms ... aumenta ↗ e diminuisce ↘ combinato | ↗ 1.9 ms Incremento | 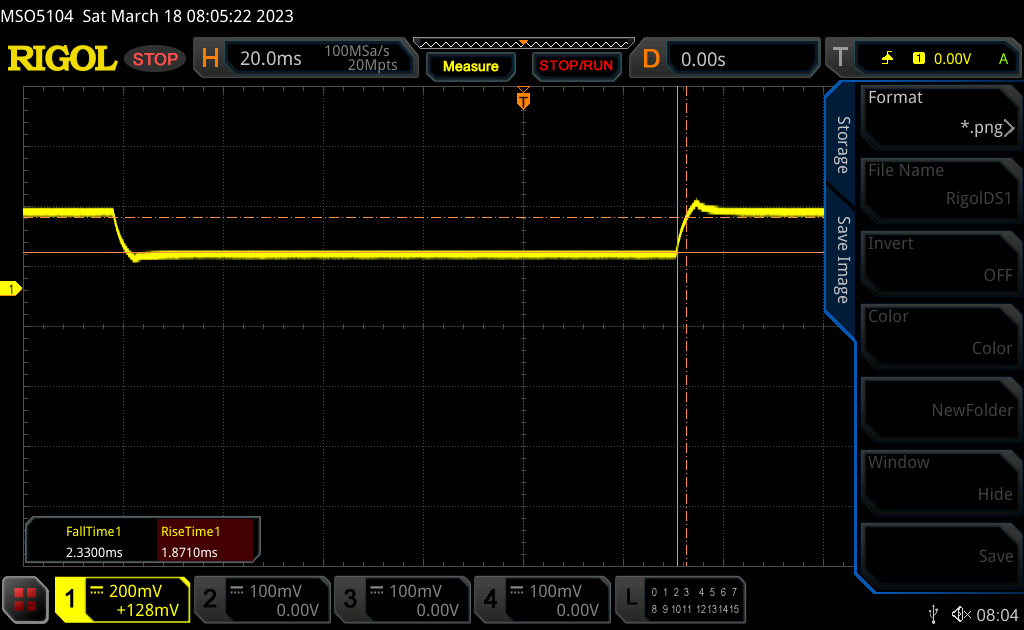 |
| ↘ 2.3 ms Calo | ||
| Lo schermo ha mostrato valori di risposta molto veloci nei nostri tests ed è molto adatto per i gaming veloce. In confronto, tutti i dispositivi di test variano da 0.165 (minimo) a 636 (massimo) ms. » 16 % di tutti i dispositivi è migliore. Questo significa che i tempi di risposta rilevati sono migliori rispettto alla media di tutti i dispositivi testati (31.1 ms). | ||
Sfarfallio dello schermo / PWM (Pulse-Width Modulation)
| flickering dello schermo / PWM non rilevato |  | ||
In confronto: 52 % di tutti i dispositivi testati non utilizza PWM per ridurre la luminosita' del display. Se è rilevato PWM, una media di 7784 (minimo: 5 - massimo: 343500) Hz è stata rilevata. | |||
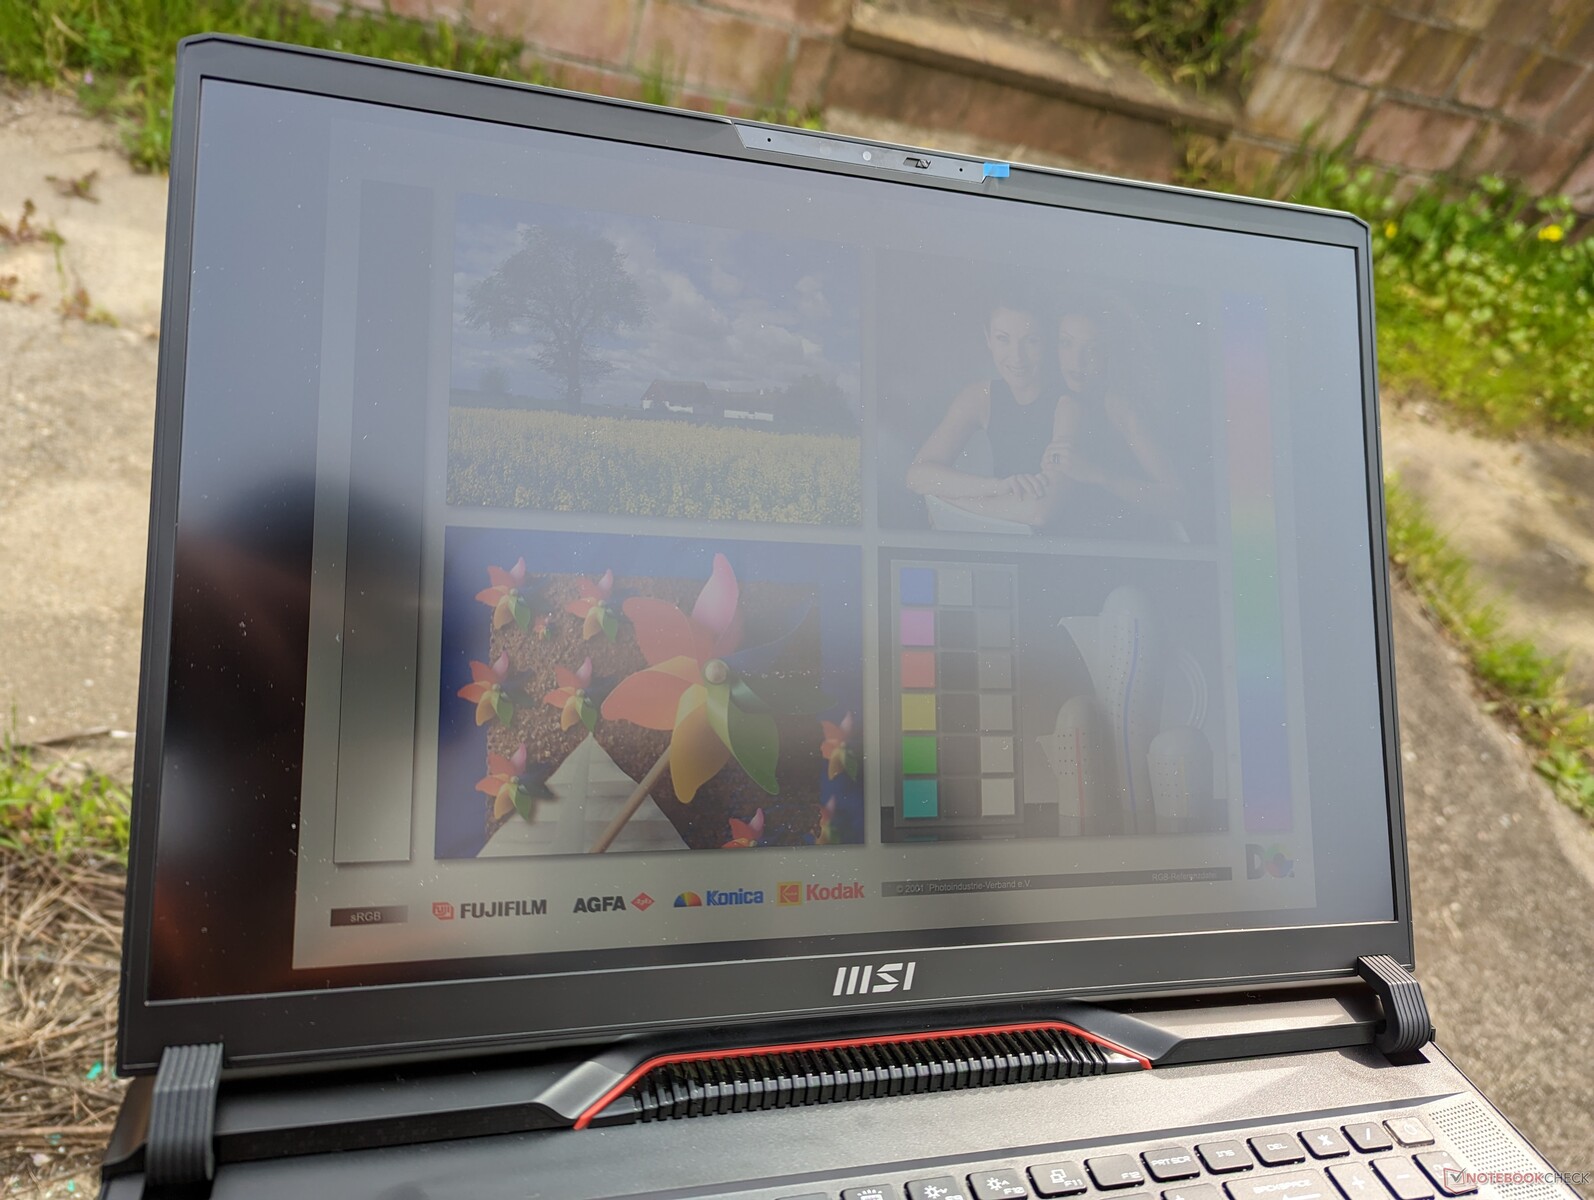
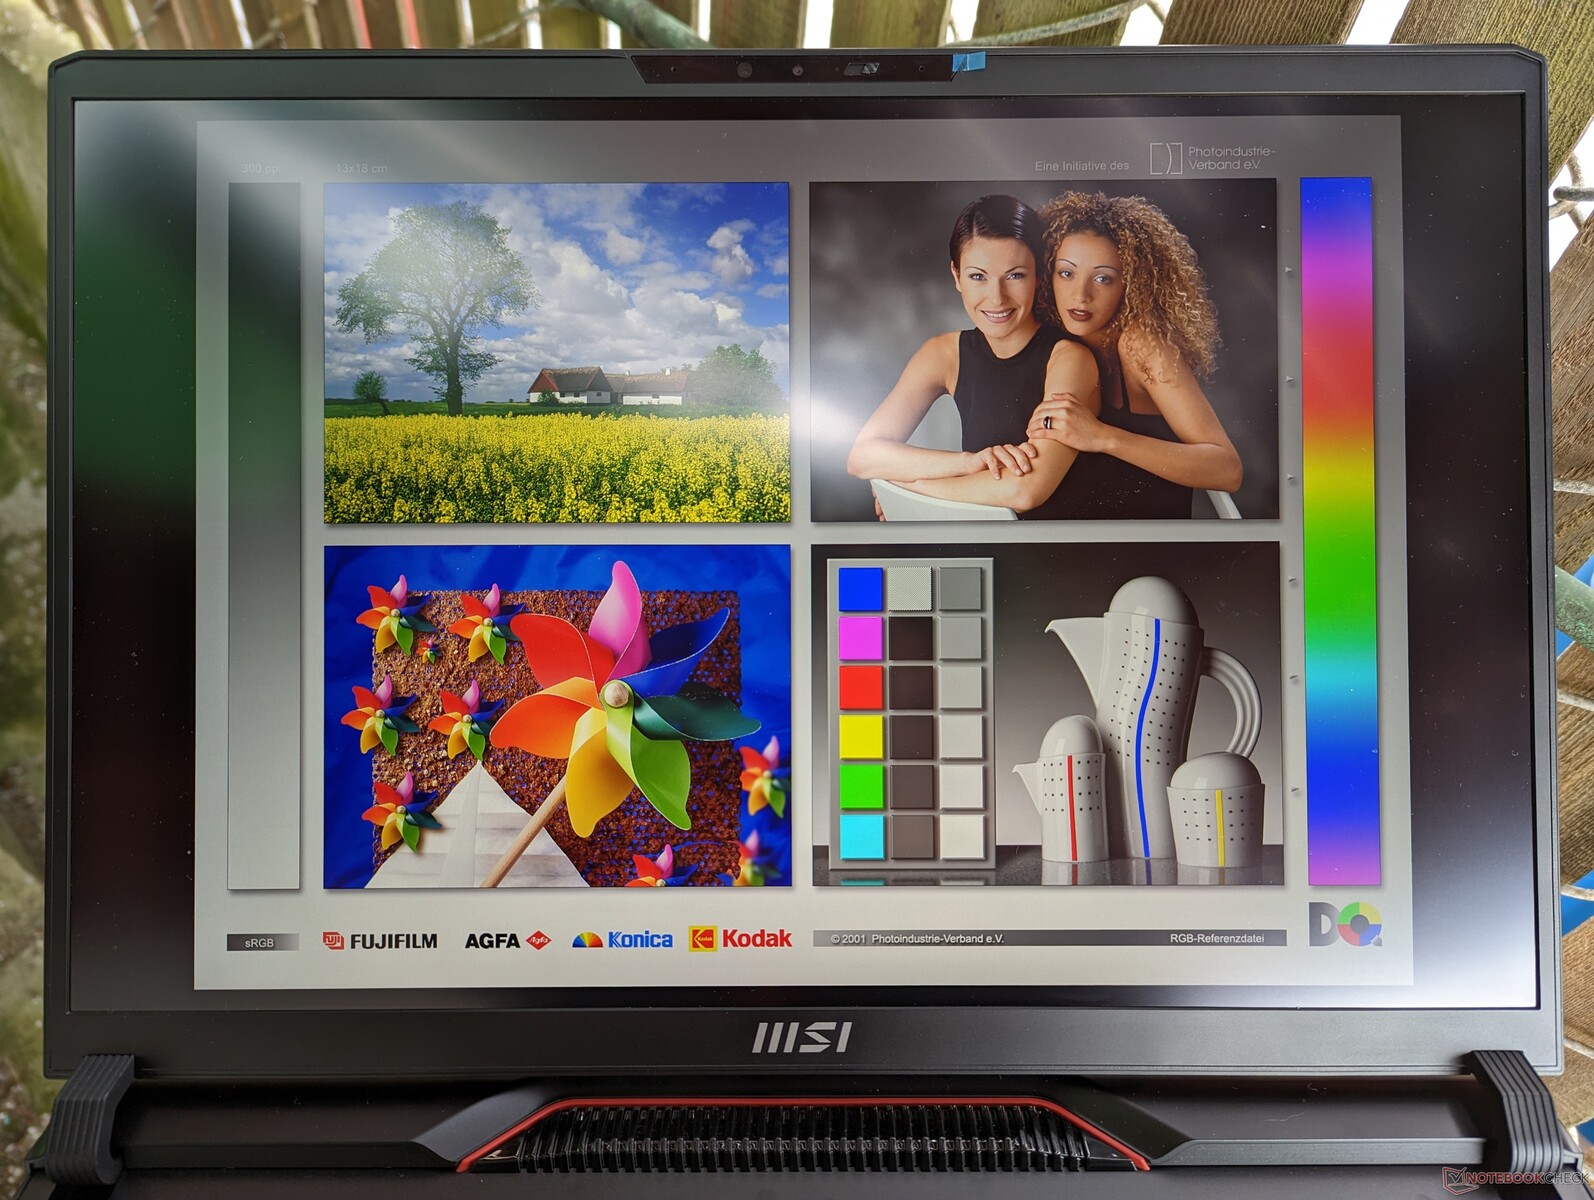
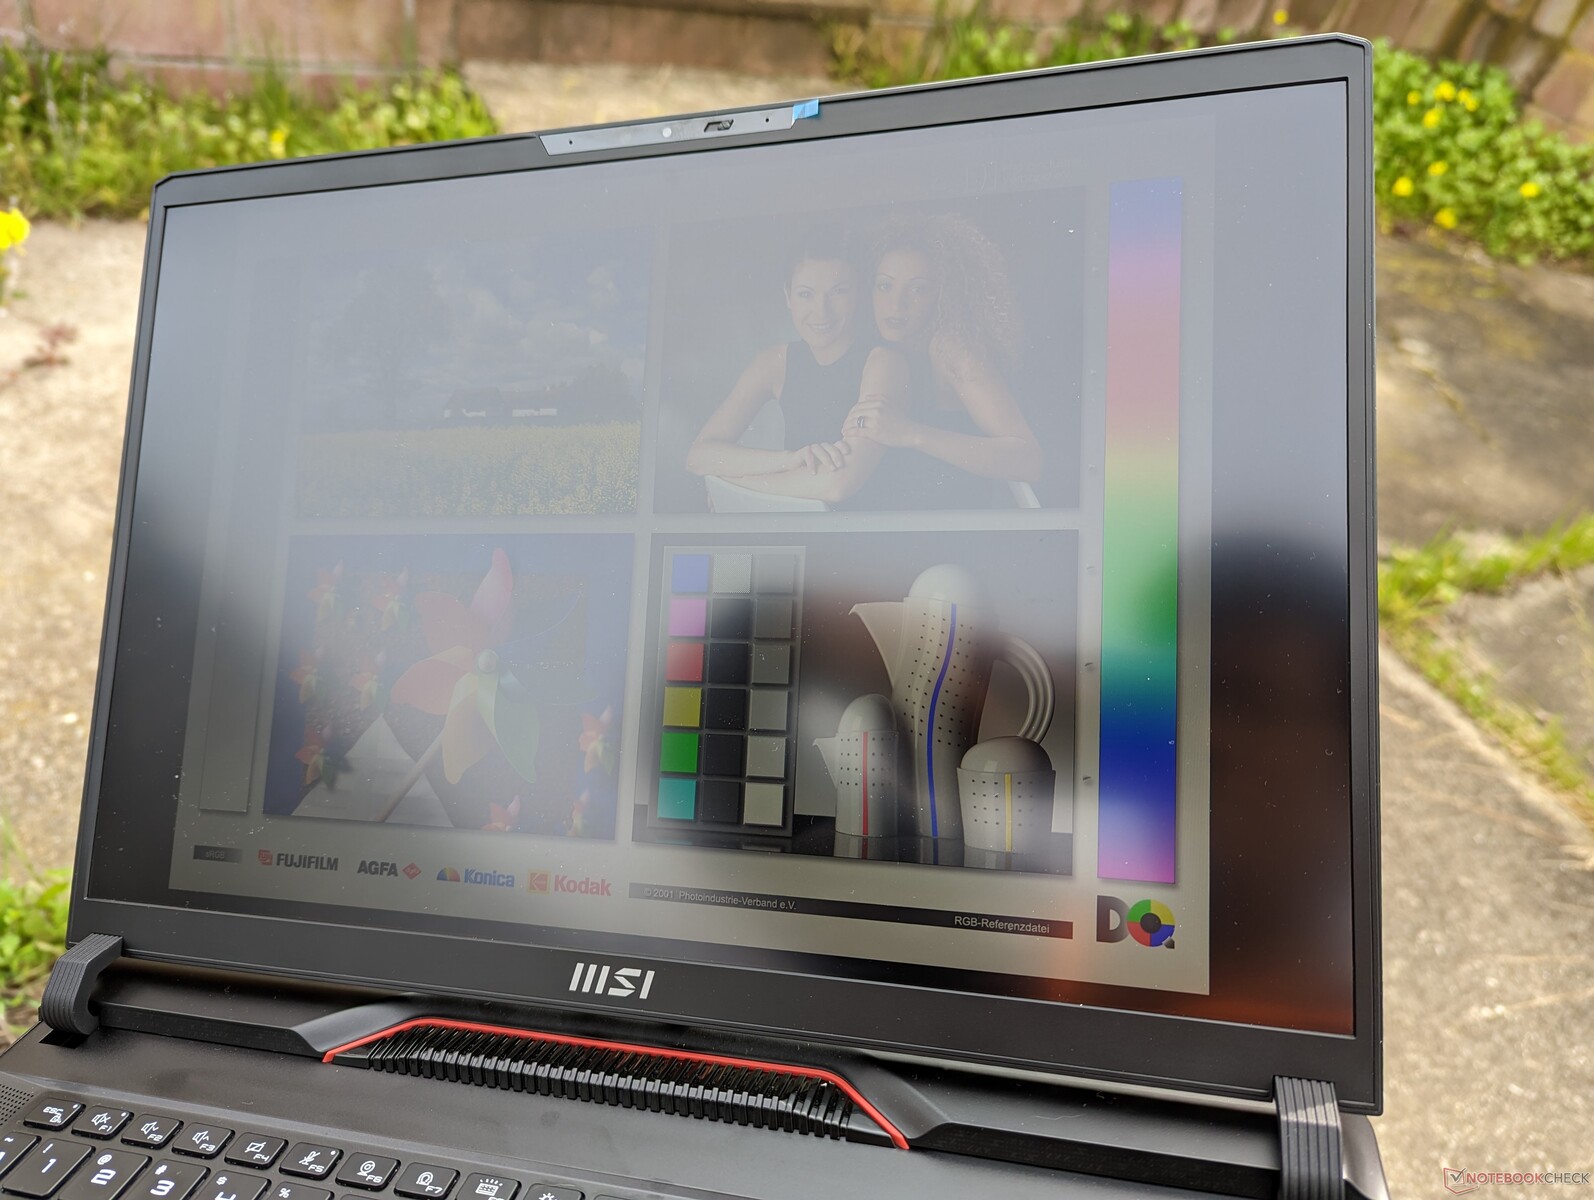
La visibilità all'aperto rimane più o meno la stessa del GE77. Il pannello mini-LED delTitan GT77 è ancora più luminoso di 1,5 volte per una migliore visibilità all'aperto, ma il modello stesso è molto più grande del nostro GE78.
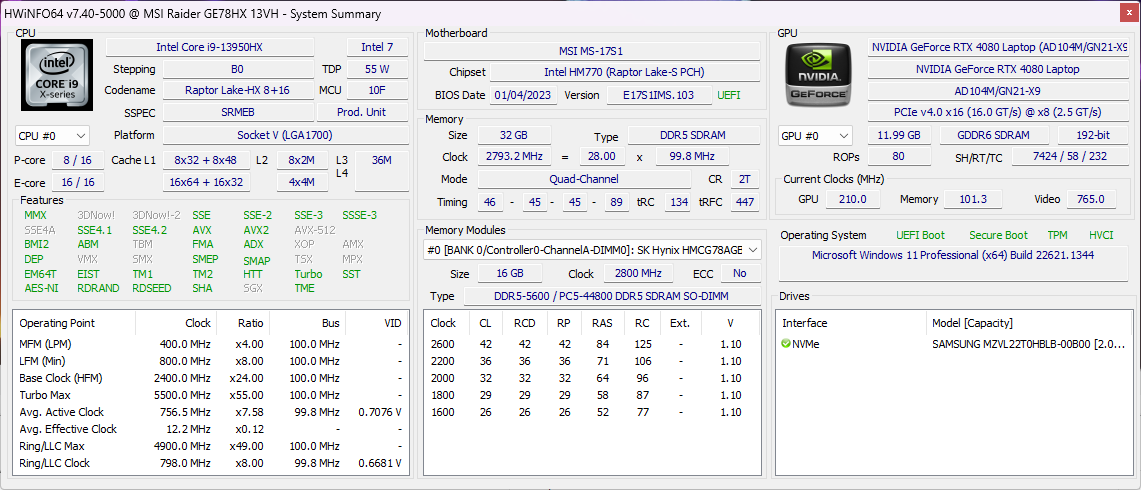
Prestazioni - Intel 13th Gen + Mobile GeForce RTX 40
Condizioni di test
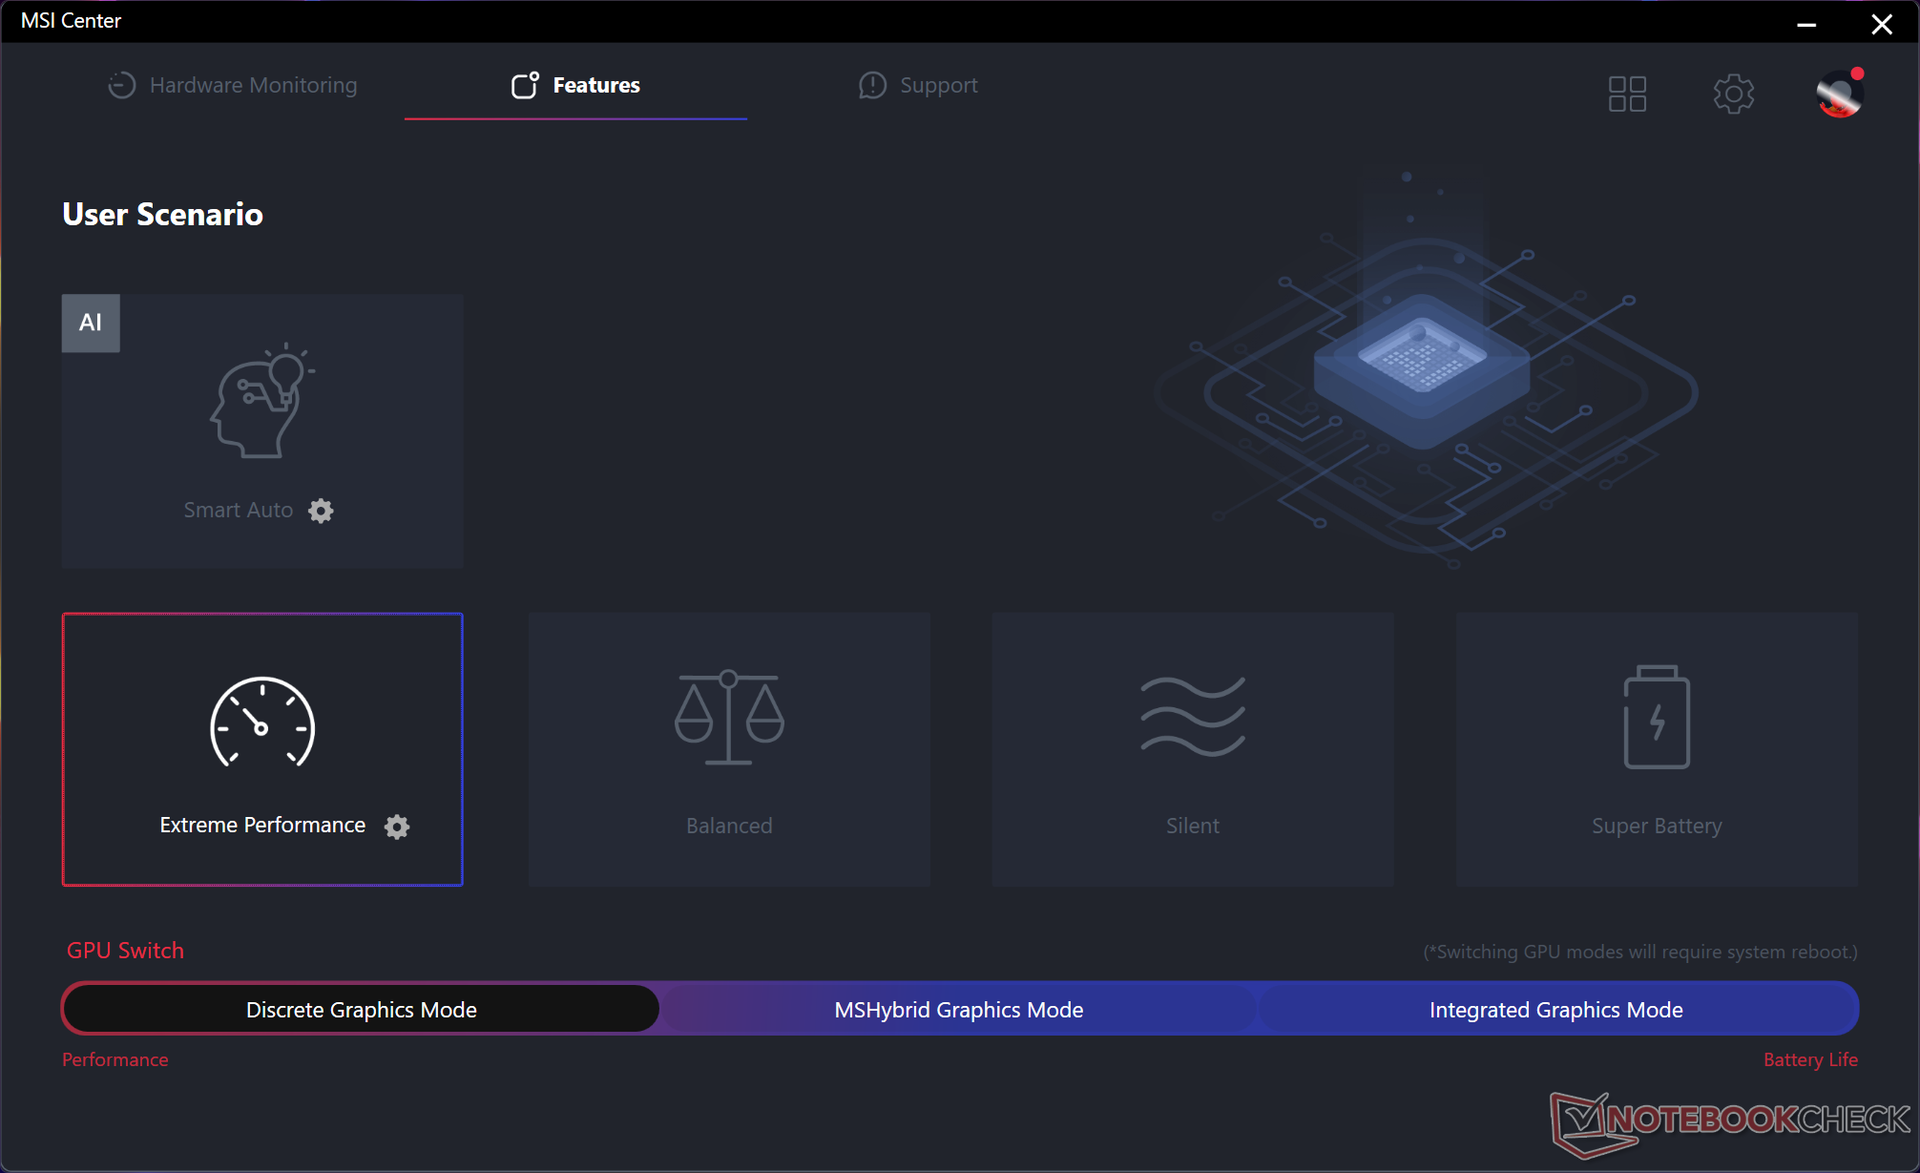
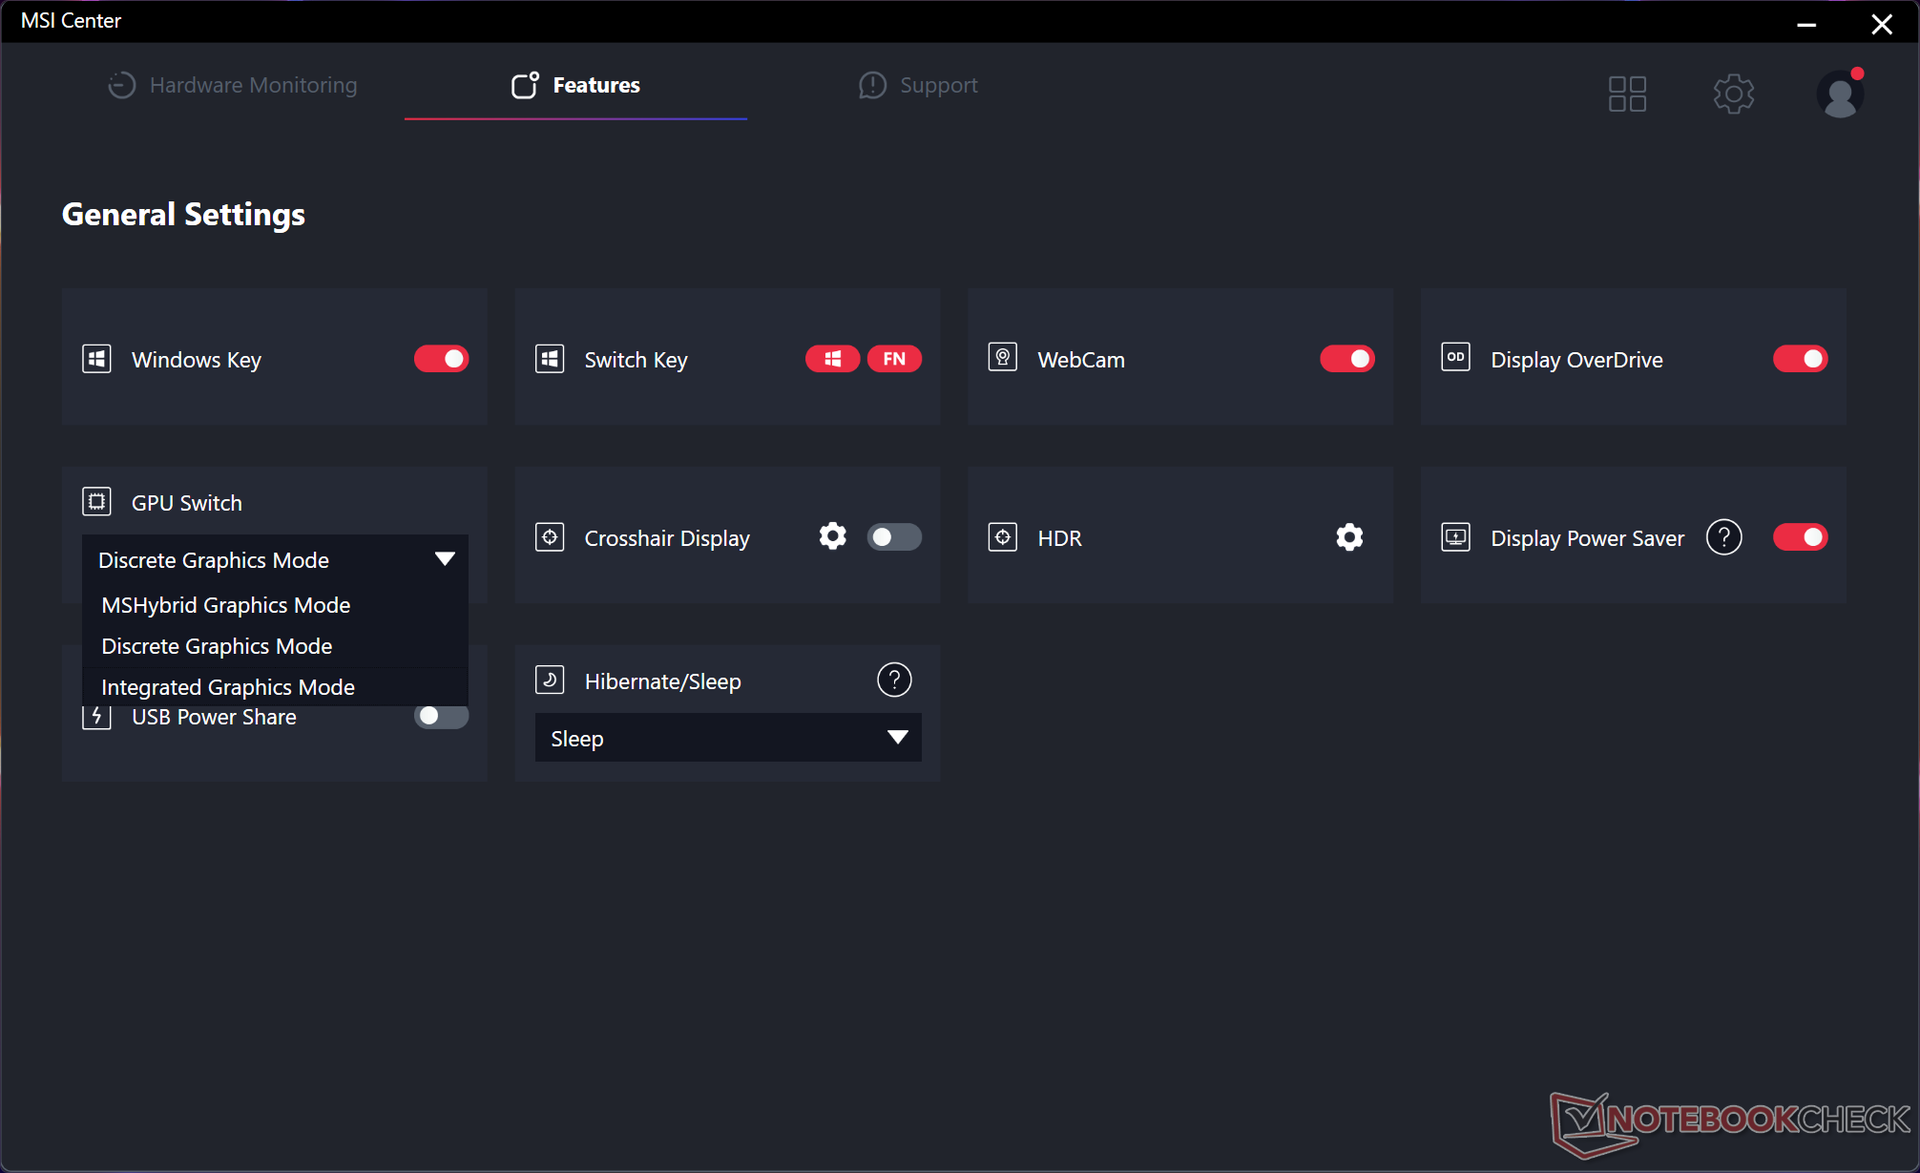
Abbiamo impostato la nostra unità in modalità Extreme Performance, Auto fan mode, Discrete Graphics mode e Windows Best Performance mode prima di eseguire i benchmark qui sotto. Purtroppo, le modalità di alimentazione di MSI non si sincronizzano con Windows e quindi è possibile che MSI Center sia impostato sulla modalità Prestazioni estreme e Windows sulla modalità Risparmio energetico contemporaneamente.
È disponibile un'altra modalità per le ventole, chiamata Cooler Boost, che porta le ventole al massimo numero di giri indipendentemente dall'attività sullo schermo. Tuttavia, questo non migliora necessariamente le prestazioni, come dimostra la sezione Stress Test che segue.
Si noti che MSI Center si imposta automaticamente sulla modalità Extreme Performance quando si utilizza la modalità Discrete Graphics, anche quando si dice al software di utilizzare la modalità Balanced. Per evitare confusione, sarebbe meglio eliminare tutte le opzioni della modalità prestazioni se sono incompatibili con la selezione della GPU corrente.
Advanced Optimus non è supportato e quindi è necessario un riavvio quando si passa dalla GPU discreta (MUX) alla modalità ibrida MS. G-Sync non è supportato sul display interno.
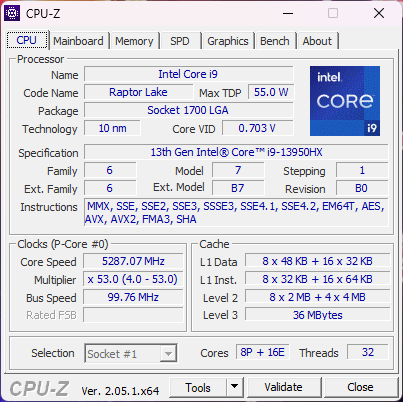
Processore
Le prestazioni della CPU grezza sono tra le più veloci di qualsiasi portatile, indipendentemente dalle dimensioni o dal produttore. Il Core i9-13950HX di 13a generazione Core i9-13950HX del nostro MSI supererebbe le prestazioni dell'ultimo Zen 4 Ryzen 9 7945HX del concorrente Asus ROG Strix G17 G713PI rispettivamente del 5% e del 15% nei test multi-thread e single-thread. I guadagni anno su anno rispetto al precedente Core i9-12900HX di 12a gen Core i9-12900HX nel GE77 dell'anno scorso è anch'esso significativo, pari al 45%.
Per quanto il Core i9-13950HX possa essere impressionante, i potenziali acquirenti potrebbero comunque prendere in considerazione il minore Core i9-13900HX perché le differenze di prestazioni tra i due processori sono di appena il 5%.
Cinebench R15 Multi Loop
Cinebench R23: Multi Core | Single Core
Cinebench R20: CPU (Multi Core) | CPU (Single Core)
Cinebench R15: CPU Multi 64Bit | CPU Single 64Bit
Blender: v2.79 BMW27 CPU
7-Zip 18.03: 7z b 4 | 7z b 4 -mmt1
Geekbench 5.5: Multi-Core | Single-Core
HWBOT x265 Benchmark v2.2: 4k Preset
LibreOffice : 20 Documents To PDF
R Benchmark 2.5: Overall mean
* ... Meglio usare valori piccoli
AIDA64: FP32 Ray-Trace | FPU Julia | CPU SHA3 | CPU Queen | FPU SinJulia | FPU Mandel | CPU AES | CPU ZLib | FP64 Ray-Trace | CPU PhotoWorxx
| Performance rating | |
| Asus ROG Strix G17 G713PI | |
| Eluktronics Mech-17 GP2 | |
| MSI GE78HX 13VH-070US | |
| MSI Titan GT77 HX 13VI | |
| Media Intel Core i9-13950HX | |
| MSI Raider GE77 HX 12UHS | |
| Razer Blade 17 Early 2022 | |
| AIDA64 / FP32 Ray-Trace | |
| Asus ROG Strix G17 G713PI | |
| MSI Titan GT77 HX 13VI | |
| MSI GE78HX 13VH-070US | |
| Eluktronics Mech-17 GP2 | |
| Media Intel Core i9-13950HX (17993 - 28957, n=9) | |
| MSI Raider GE77 HX 12UHS | |
| Razer Blade 17 Early 2022 | |
| AIDA64 / FPU Julia | |
| Asus ROG Strix G17 G713PI | |
| MSI Titan GT77 HX 13VI | |
| MSI GE78HX 13VH-070US | |
| Eluktronics Mech-17 GP2 | |
| Media Intel Core i9-13950HX (89362 - 144303, n=9) | |
| MSI Raider GE77 HX 12UHS | |
| Razer Blade 17 Early 2022 | |
| AIDA64 / CPU SHA3 | |
| Asus ROG Strix G17 G713PI | |
| MSI Titan GT77 HX 13VI | |
| Eluktronics Mech-17 GP2 | |
| MSI GE78HX 13VH-070US | |
| Media Intel Core i9-13950HX (4518 - 7093, n=9) | |
| MSI Raider GE77 HX 12UHS | |
| Razer Blade 17 Early 2022 | |
| AIDA64 / CPU Queen | |
| Asus ROG Strix G17 G713PI | |
| Eluktronics Mech-17 GP2 | |
| MSI GE78HX 13VH-070US | |
| MSI Titan GT77 HX 13VI | |
| Media Intel Core i9-13950HX (131931 - 140103, n=8) | |
| MSI Raider GE77 HX 12UHS | |
| Razer Blade 17 Early 2022 | |
| AIDA64 / FPU SinJulia | |
| Asus ROG Strix G17 G713PI | |
| Eluktronics Mech-17 GP2 | |
| MSI Titan GT77 HX 13VI | |
| MSI GE78HX 13VH-070US | |
| Media Intel Core i9-13950HX (12318 - 17057, n=9) | |
| MSI Raider GE77 HX 12UHS | |
| Razer Blade 17 Early 2022 | |
| AIDA64 / FPU Mandel | |
| Asus ROG Strix G17 G713PI | |
| MSI Titan GT77 HX 13VI | |
| MSI GE78HX 13VH-070US | |
| Eluktronics Mech-17 GP2 | |
| Media Intel Core i9-13950HX (44372 - 71038, n=9) | |
| MSI Raider GE77 HX 12UHS | |
| Razer Blade 17 Early 2022 | |
| AIDA64 / CPU AES | |
| Eluktronics Mech-17 GP2 | |
| MSI Raider GE77 HX 12UHS | |
| Asus ROG Strix G17 G713PI | |
| Media Intel Core i9-13950HX (99981 - 204491, n=9) | |
| MSI Titan GT77 HX 13VI | |
| MSI GE78HX 13VH-070US | |
| Razer Blade 17 Early 2022 | |
| AIDA64 / CPU ZLib | |
| Asus ROG Strix G17 G713PI | |
| MSI GE78HX 13VH-070US | |
| MSI Titan GT77 HX 13VI | |
| Eluktronics Mech-17 GP2 | |
| Media Intel Core i9-13950HX (1263 - 2069, n=9) | |
| MSI Raider GE77 HX 12UHS | |
| Razer Blade 17 Early 2022 | |
| AIDA64 / FP64 Ray-Trace | |
| Asus ROG Strix G17 G713PI | |
| MSI Titan GT77 HX 13VI | |
| MSI GE78HX 13VH-070US | |
| Eluktronics Mech-17 GP2 | |
| Media Intel Core i9-13950HX (9649 - 15573, n=9) | |
| MSI Raider GE77 HX 12UHS | |
| Razer Blade 17 Early 2022 | |
| AIDA64 / CPU PhotoWorxx | |
| MSI GE78HX 13VH-070US | |
| Media Intel Core i9-13950HX (40233 - 50864, n=9) | |
| MSI Raider GE77 HX 12UHS | |
| Eluktronics Mech-17 GP2 | |
| MSI Titan GT77 HX 13VI | |
| Razer Blade 17 Early 2022 | |
| Asus ROG Strix G17 G713PI | |
Prestazioni del sistema
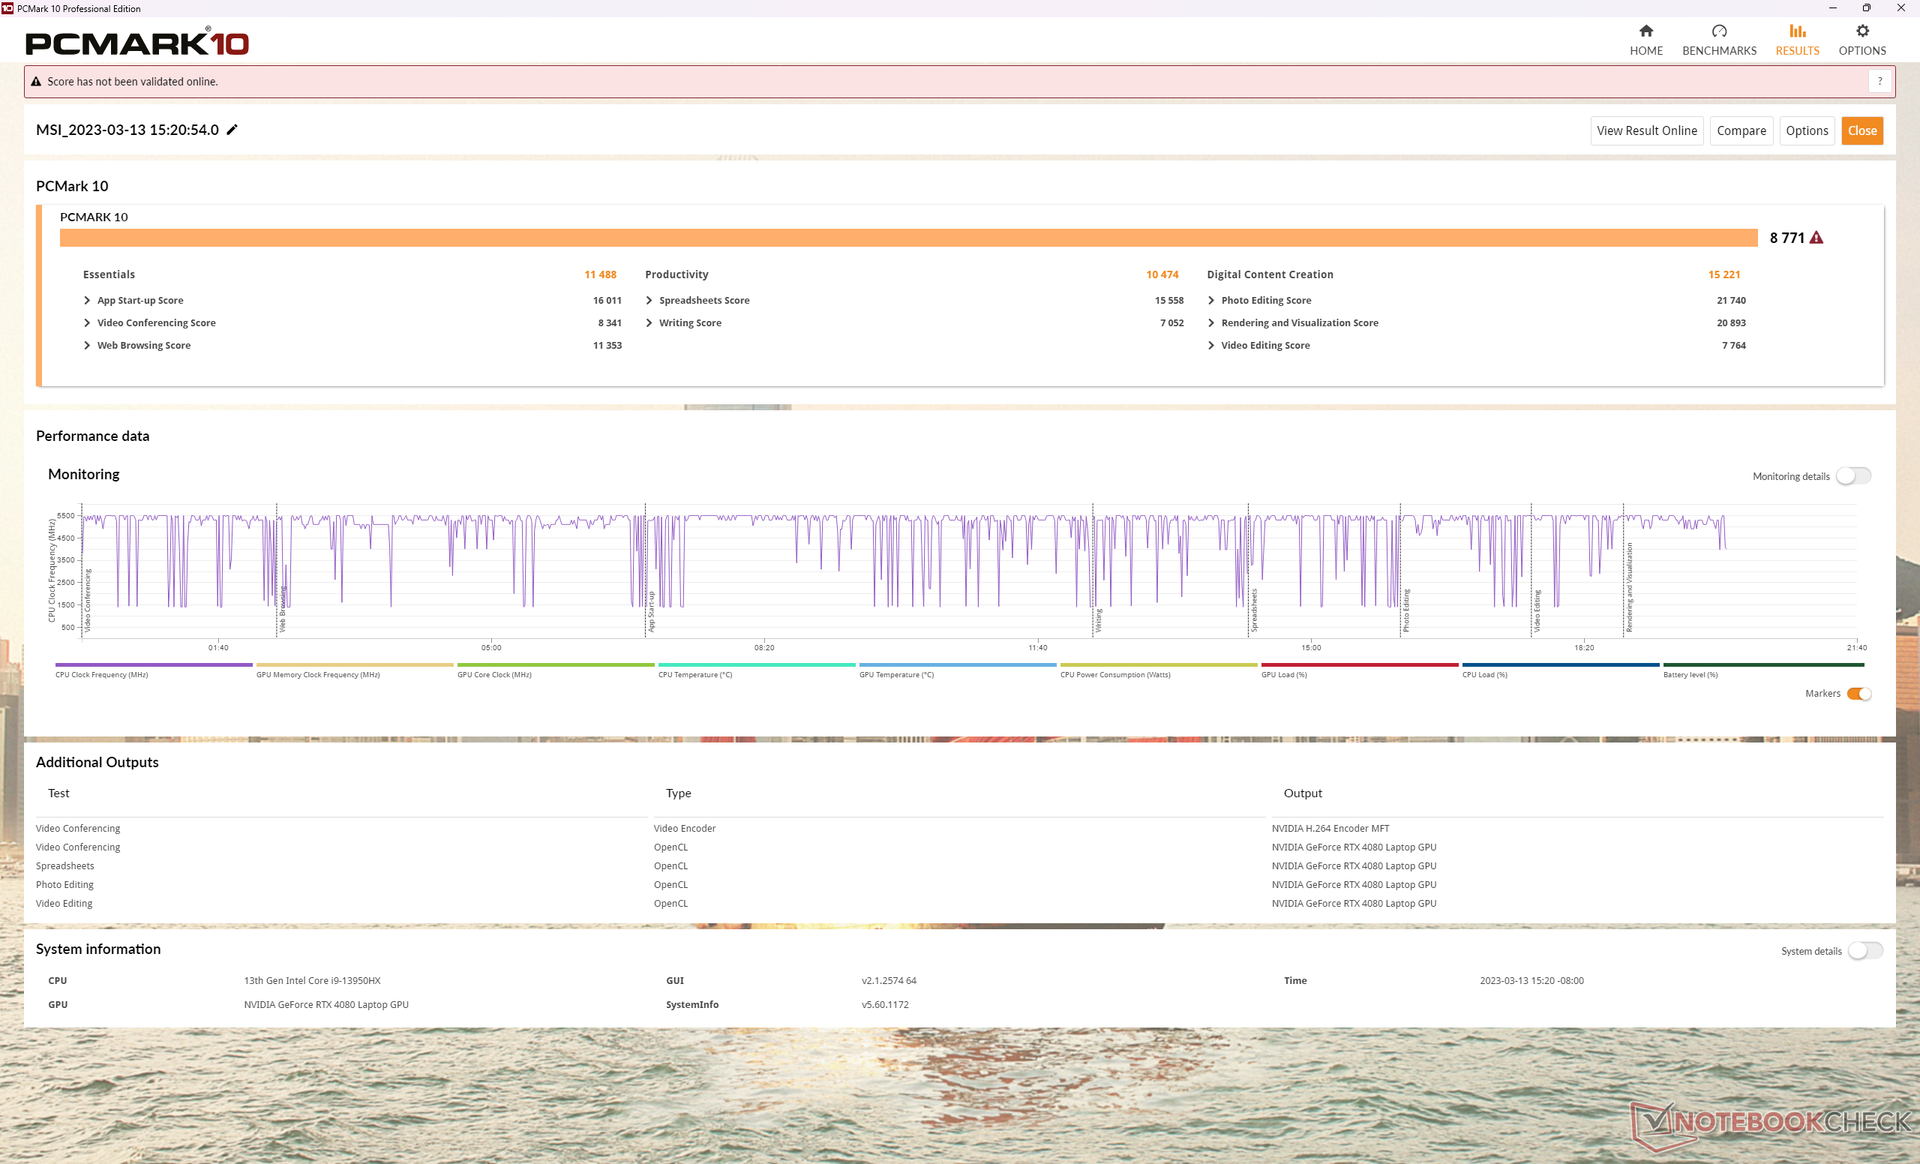
I risultati di PCMark 10 sono costantemente superiori a quelli del GE77 con hardware di ultima generazione, soprattutto nel sottotest Digital Content, dove le prestazioni della GPU sono favorite.
Abbiamo riscontrato un problema sulla nostra unità: a volte non si risvegliava dalla sospensione, richiedendo ogni volta un riavvio. Il problema sembra verificarsi più spesso in modalità dGPU piuttosto che in modalità MS Hybrid.
CrossMark: Overall | Productivity | Creativity | Responsiveness
| PCMark 10 / Score | |
| Eluktronics Mech-17 GP2 | |
| MSI Titan GT77 HX 13VI | |
| MSI GE78HX 13VH-070US | |
| Media Intel Core i9-13950HX, NVIDIA GeForce RTX 4080 Laptop GPU (7888 - 8771, n=2) | |
| Asus ROG Strix G17 G713PI | |
| Razer Blade 17 Early 2022 | |
| MSI Raider GE77 HX 12UHS | |
| PCMark 10 / Essentials | |
| Eluktronics Mech-17 GP2 | |
| MSI Titan GT77 HX 13VI | |
| MSI GE78HX 13VH-070US | |
| Media Intel Core i9-13950HX, NVIDIA GeForce RTX 4080 Laptop GPU (11078 - 11488, n=2) | |
| Asus ROG Strix G17 G713PI | |
| Razer Blade 17 Early 2022 | |
| MSI Raider GE77 HX 12UHS | |
| PCMark 10 / Productivity | |
| Asus ROG Strix G17 G713PI | |
| Eluktronics Mech-17 GP2 | |
| MSI GE78HX 13VH-070US | |
| MSI Titan GT77 HX 13VI | |
| MSI Raider GE77 HX 12UHS | |
| Media Intel Core i9-13950HX, NVIDIA GeForce RTX 4080 Laptop GPU (8271 - 10474, n=2) | |
| Razer Blade 17 Early 2022 | |
| PCMark 10 / Digital Content Creation | |
| MSI Titan GT77 HX 13VI | |
| Eluktronics Mech-17 GP2 | |
| MSI GE78HX 13VH-070US | |
| Media Intel Core i9-13950HX, NVIDIA GeForce RTX 4080 Laptop GPU (14535 - 15221, n=2) | |
| Razer Blade 17 Early 2022 | |
| MSI Raider GE77 HX 12UHS | |
| Asus ROG Strix G17 G713PI | |
| CrossMark / Overall | |
| Eluktronics Mech-17 GP2 | |
| MSI Raider GE77 HX 12UHS | |
| MSI Titan GT77 HX 13VI | |
| Asus ROG Strix G17 G713PI | |
| MSI GE78HX 13VH-070US | |
| Razer Blade 17 Early 2022 | |
| Media Intel Core i9-13950HX, NVIDIA GeForce RTX 4080 Laptop GPU (1592 - 1899, n=2) | |
| CrossMark / Productivity | |
| MSI Raider GE77 HX 12UHS | |
| Eluktronics Mech-17 GP2 | |
| MSI Titan GT77 HX 13VI | |
| Asus ROG Strix G17 G713PI | |
| MSI GE78HX 13VH-070US | |
| Razer Blade 17 Early 2022 | |
| Media Intel Core i9-13950HX, NVIDIA GeForce RTX 4080 Laptop GPU (1509 - 1846, n=2) | |
| CrossMark / Creativity | |
| Eluktronics Mech-17 GP2 | |
| MSI Titan GT77 HX 13VI | |
| MSI Raider GE77 HX 12UHS | |
| Asus ROG Strix G17 G713PI | |
| MSI GE78HX 13VH-070US | |
| Media Intel Core i9-13950HX, NVIDIA GeForce RTX 4080 Laptop GPU (1780 - 2035, n=2) | |
| Razer Blade 17 Early 2022 | |
| CrossMark / Responsiveness | |
| MSI Raider GE77 HX 12UHS | |
| MSI Titan GT77 HX 13VI | |
| Eluktronics Mech-17 GP2 | |
| MSI GE78HX 13VH-070US | |
| Asus ROG Strix G17 G713PI | |
| Razer Blade 17 Early 2022 | |
| Media Intel Core i9-13950HX, NVIDIA GeForce RTX 4080 Laptop GPU (1342 - 1681, n=2) | |
| PCMark 10 Score | 8771 punti | |
Aiuto | ||
| AIDA64 / Memory Copy | |
| MSI GE78HX 13VH-070US | |
| Media Intel Core i9-13950HX (61938 - 78813, n=9) | |
| MSI Raider GE77 HX 12UHS | |
| Eluktronics Mech-17 GP2 | |
| MSI Titan GT77 HX 13VI | |
| Razer Blade 17 Early 2022 | |
| Asus ROG Strix G17 G713PI | |
| AIDA64 / Memory Read | |
| MSI GE78HX 13VH-070US | |
| Media Intel Core i9-13950HX (62368 - 86831, n=9) | |
| Eluktronics Mech-17 GP2 | |
| MSI Raider GE77 HX 12UHS | |
| MSI Titan GT77 HX 13VI | |
| Razer Blade 17 Early 2022 | |
| Asus ROG Strix G17 G713PI | |
| AIDA64 / Memory Write | |
| MSI GE78HX 13VH-070US | |
| Media Intel Core i9-13950HX (59501 - 80441, n=9) | |
| Eluktronics Mech-17 GP2 | |
| MSI Raider GE77 HX 12UHS | |
| MSI Titan GT77 HX 13VI | |
| Asus ROG Strix G17 G713PI | |
| Razer Blade 17 Early 2022 | |
| AIDA64 / Memory Latency | |
| MSI Titan GT77 HX 13VI | |
| Media Intel Core i9-13950HX (84.4 - 99.5, n=9) | |
| Eluktronics Mech-17 GP2 | |
| Asus ROG Strix G17 G713PI | |
| MSI GE78HX 13VH-070US | |
| MSI Raider GE77 HX 12UHS | |
* ... Meglio usare valori piccoli
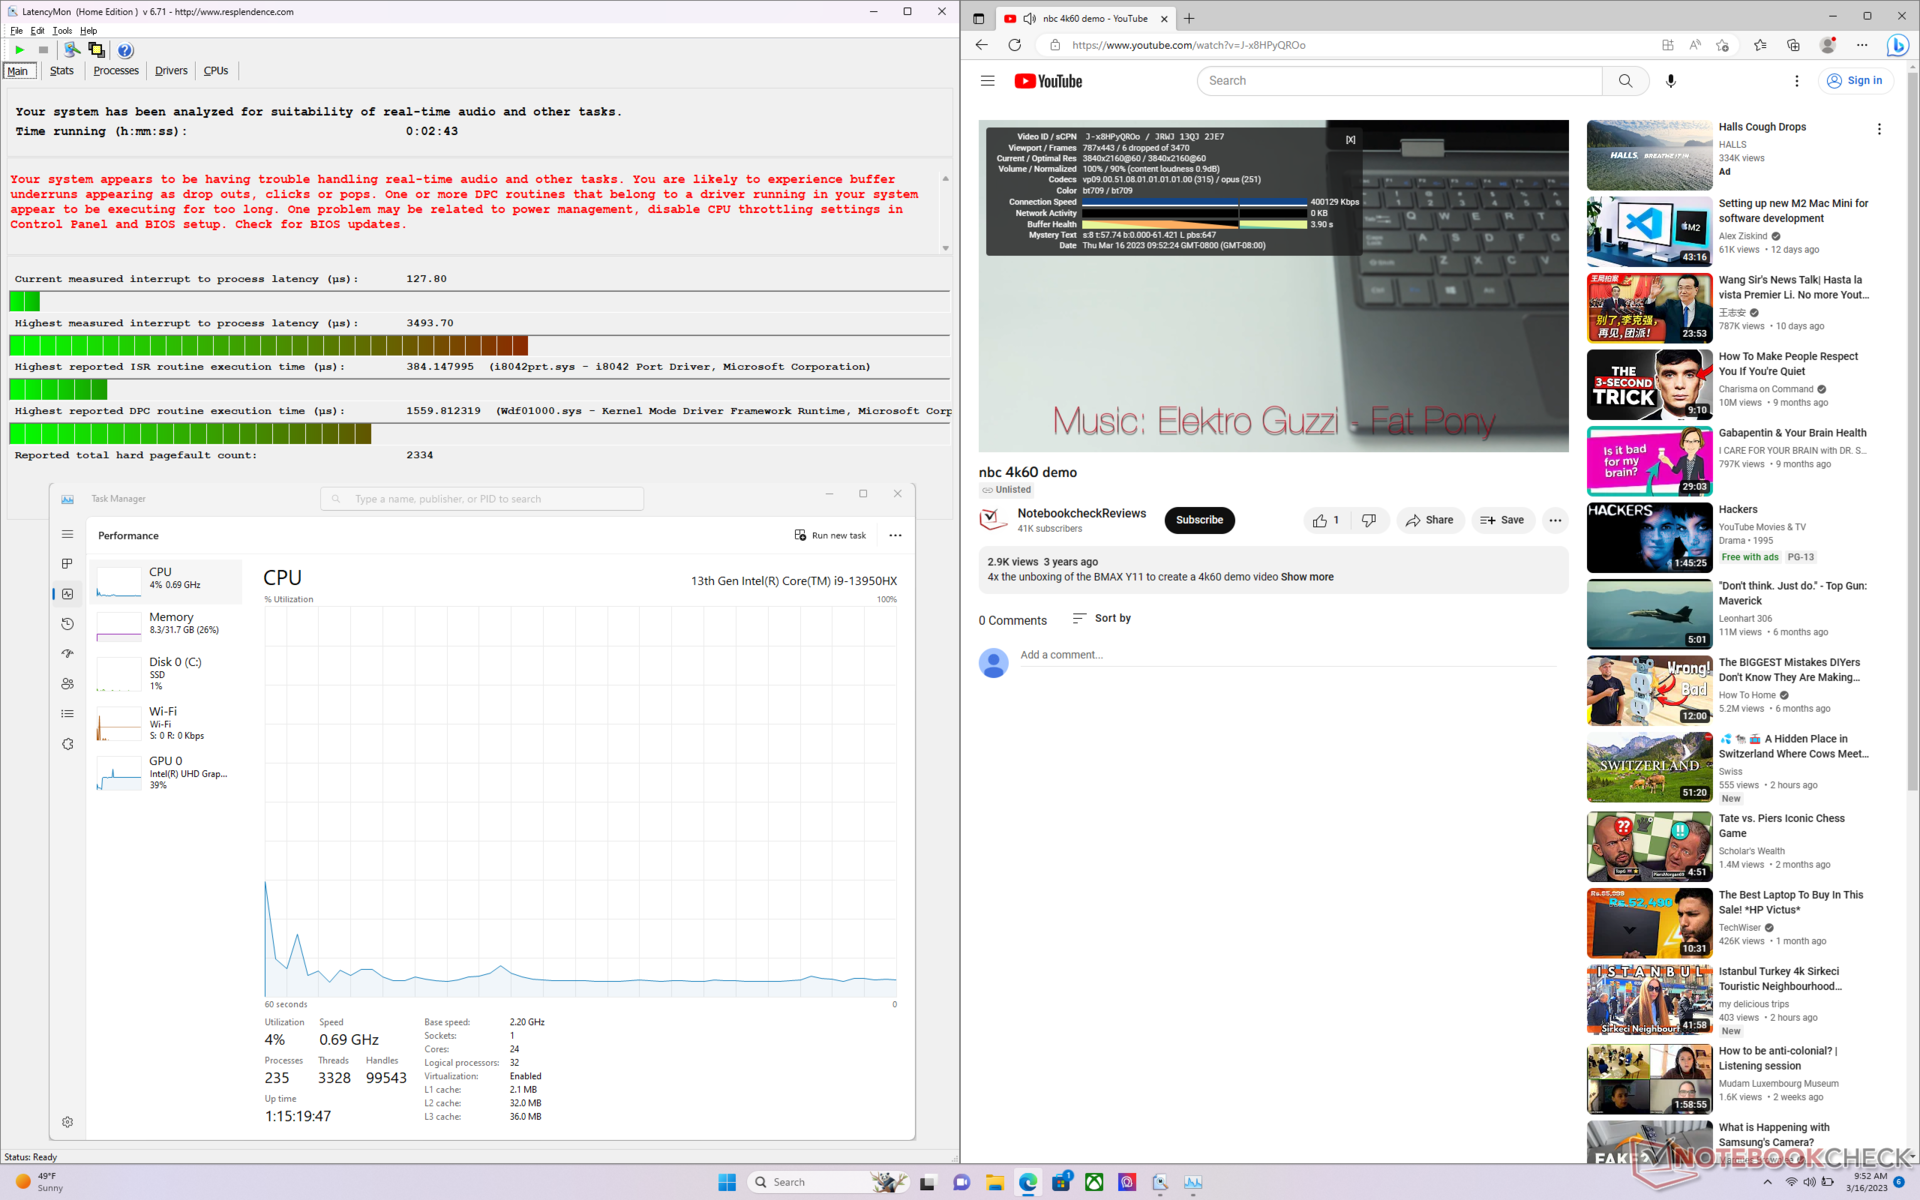
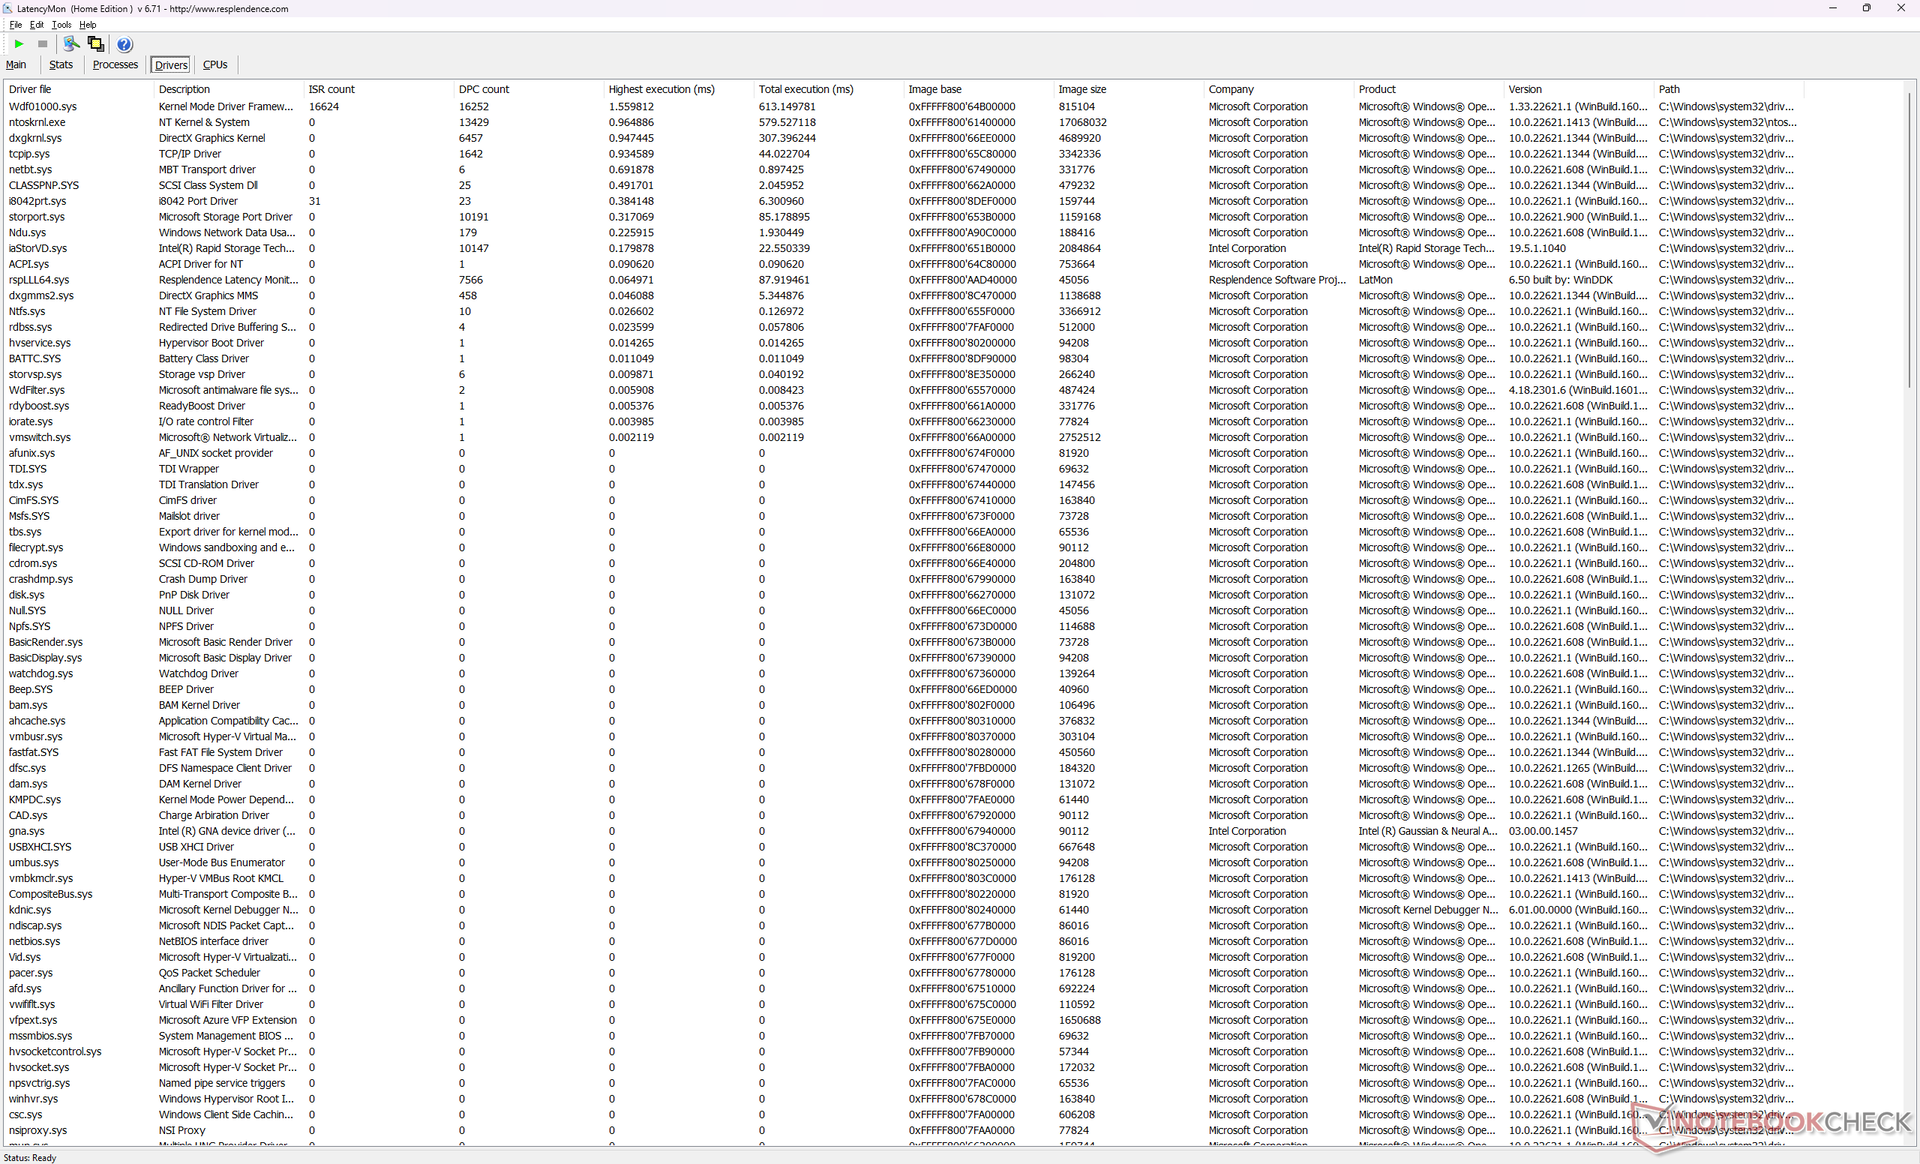
Latenza DPC
LatencyMon rivela problemi di DPC quando si aprono più schede del browser della nostra homepage anche quando è impostata solo l'iGPU. Nvidia ha riconosciuto un bug con i suoi ultimi driver grafici che provoca anche elevate latenze DPC.
la riproduzione di video in 4K a 60 FPS è imperfetta, con 6 fotogrammi caduti durante il nostro video di prova della durata di un minuto. Ripetere il test non avrebbe migliorato i risultati.
| DPC Latencies / LatencyMon - interrupt to process latency (max), Web, Youtube, Prime95 | |
| MSI Titan GT77 HX 13VI | |
| MSI GE78HX 13VH-070US | |
| MSI Raider GE77 HX 12UHS | |
| Asus ROG Strix G17 G713PI | |
| Eluktronics Mech-17 GP2 | |
| Razer Blade 17 Early 2022 | |
* ... Meglio usare valori piccoli
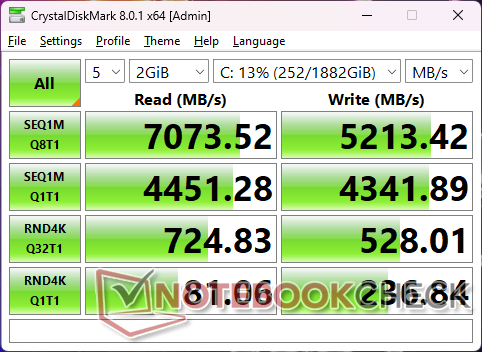
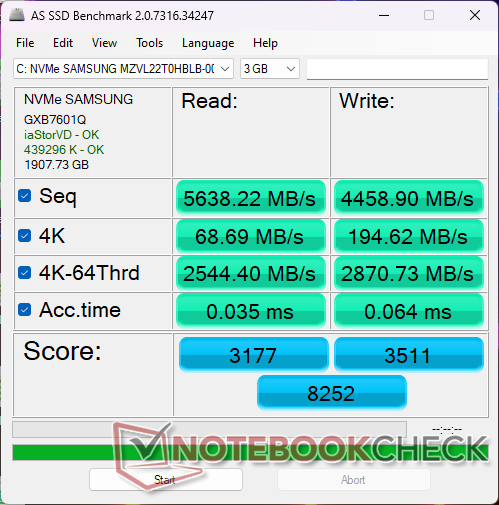
Dispositivi di storage - Pronti per le unità SSD PCIe5
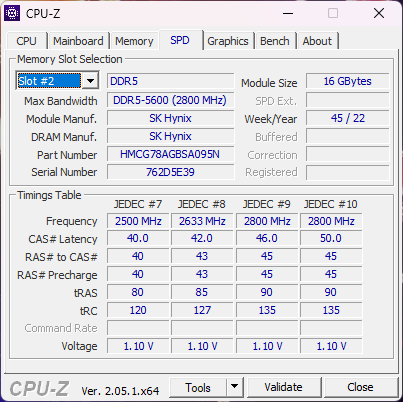
La nostra unità di prova viene fornita con un 2 TB Samsung PM9A1 che è una delle più veloci unità SSD PCIe4 x4 NVMe disponibili. L'unità non ha avuto problemi a mantenere velocità di trasferimento superiori a 7000 MB/s anche quando è stata sottoposta a stress, come mostrano i risultati del nostro ciclo DiskSpd qui sotto. Questo è prevedibile dal momento che il GE78 può supportare unità SSD PCIe5 ancora più veloci quando saranno ampiamente disponibili.

| Drive Performance rating - Percent | |
| MSI Raider GE77 HX 12UHS | |
| Razer Blade 17 Early 2022 | |
| MSI GE78HX 13VH-070US | |
| MSI Titan GT77 HX 13VI | |
| Eluktronics Mech-17 GP2 | |
| Asus ROG Strix G17 G713PI | |
* ... Meglio usare valori piccoli
Disk Throttling: DiskSpd Read Loop, Queue Depth 8
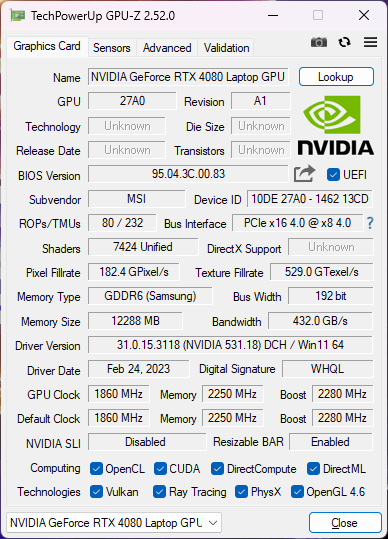
Prestazioni della GPU - Grafica a 175 W
Il modello offre attualmente tre opzioni di GPU mobile: la GeForce RTX 4070, 4080o 4090. Il passaggio dal modello mobile 4070 al modello mobile 4080 aumenterà le prestazioni del 40-60%, mentre il passaggio dal modello mobile 4080 al modello mobile 4090 aumenterà le prestazioni solo del 10% circa. Conoscere il confronto tra queste tre GPU mobili dovrebbe aiutare a decidere quale configurazione GE78 acquistare.
La nostra configurazione RTX 4080 offre prestazioni grezze dal 30 al 50% superiori a quelle della RTX 3080 Ti rTX 3080 Ti della GE77 dello scorso anno. Se il titolo supporta DLSS 3, come Cyberpunk 2077, le prestazioni possono essere fino a 2 o 3 volte superiori. Vi consigliamo di consultare la nostra pagina di recensione dedicata alla RTX 4080 mobile per ulteriori benchmark e confronti relativi alla serie GeForce 40 mobile.
La RTX 4080 mobile non dovrebbe essere confrontata direttamente con la rTX 4080 per desktop che è significativamente più assetata di energia e più veloce di circa 1,5 volte.
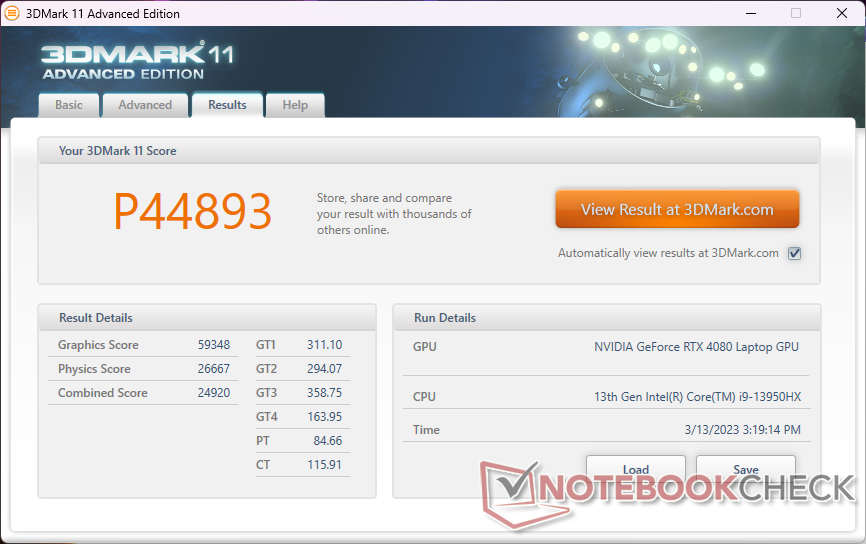
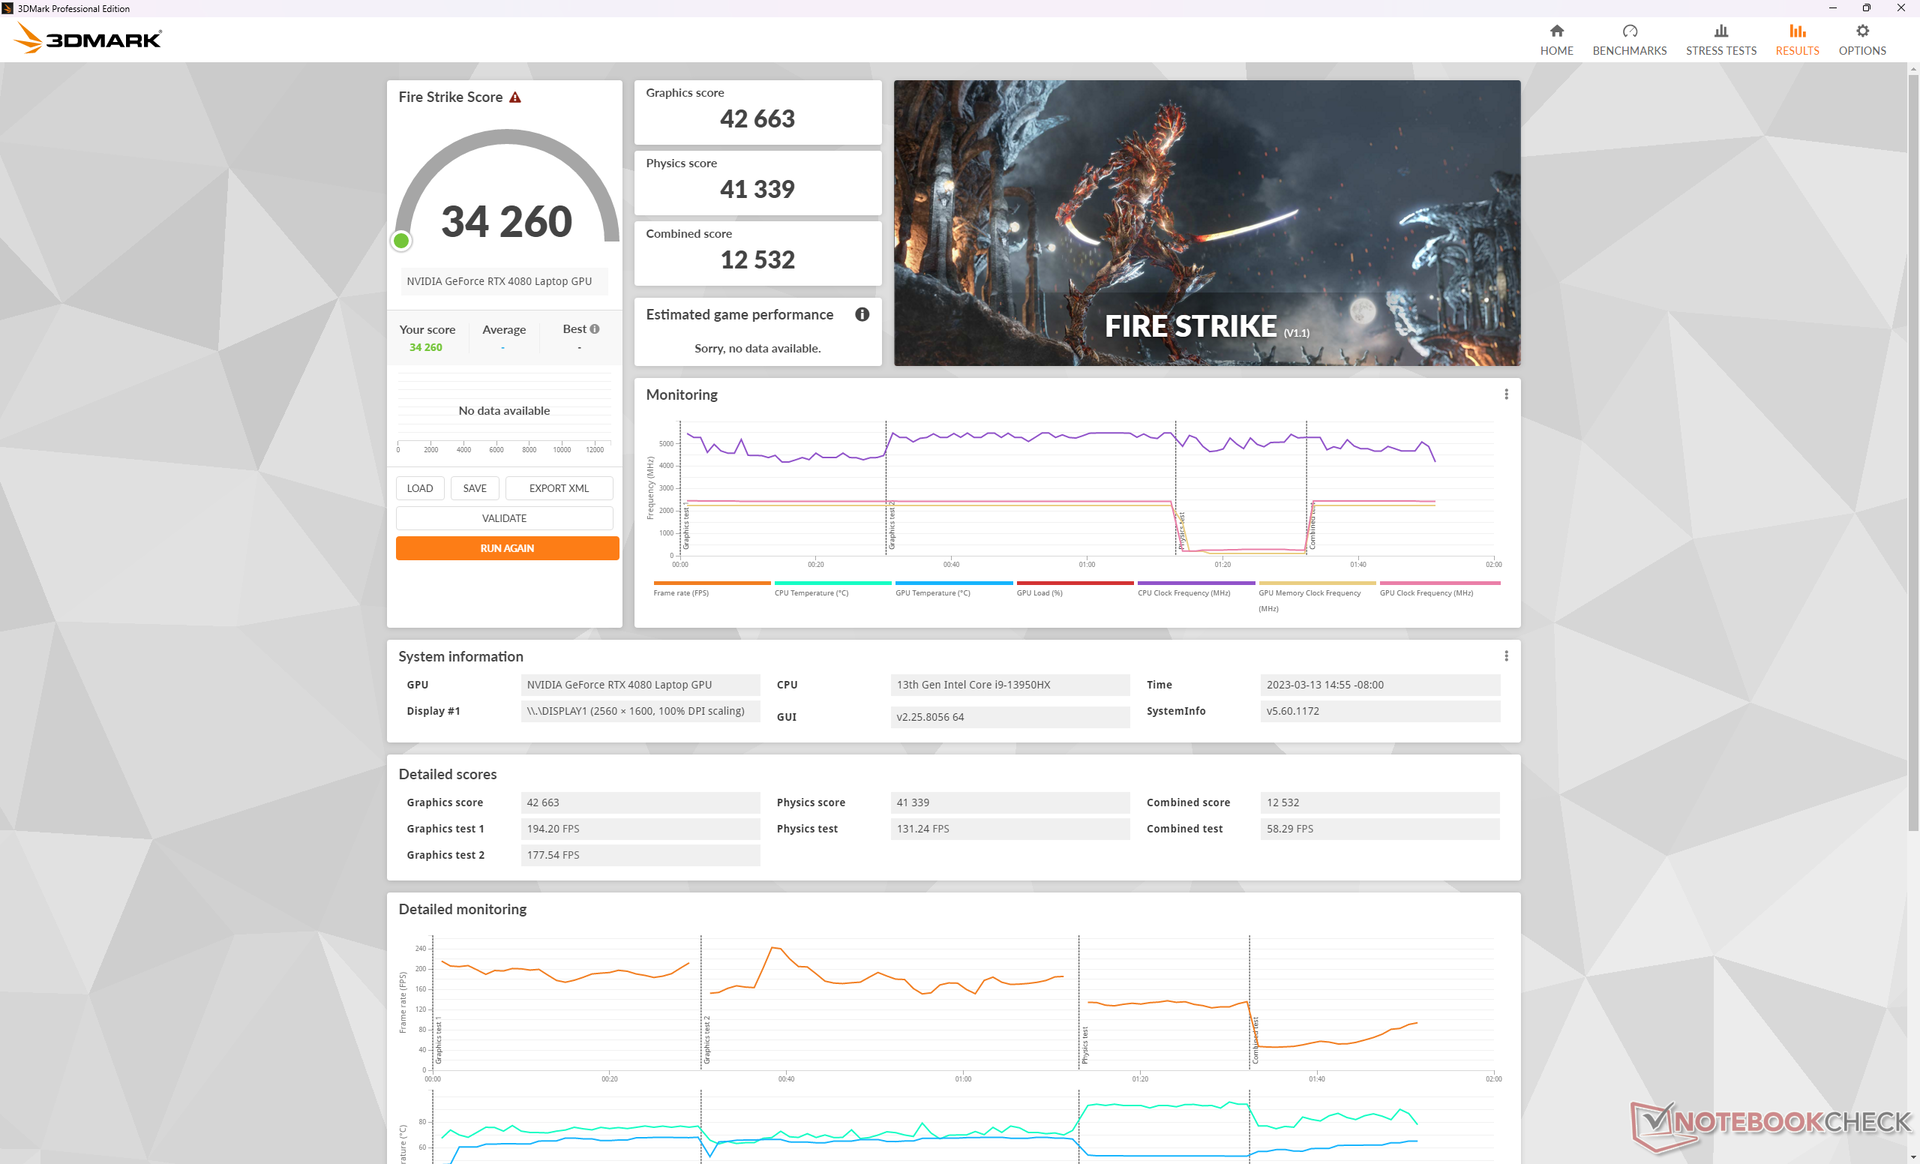
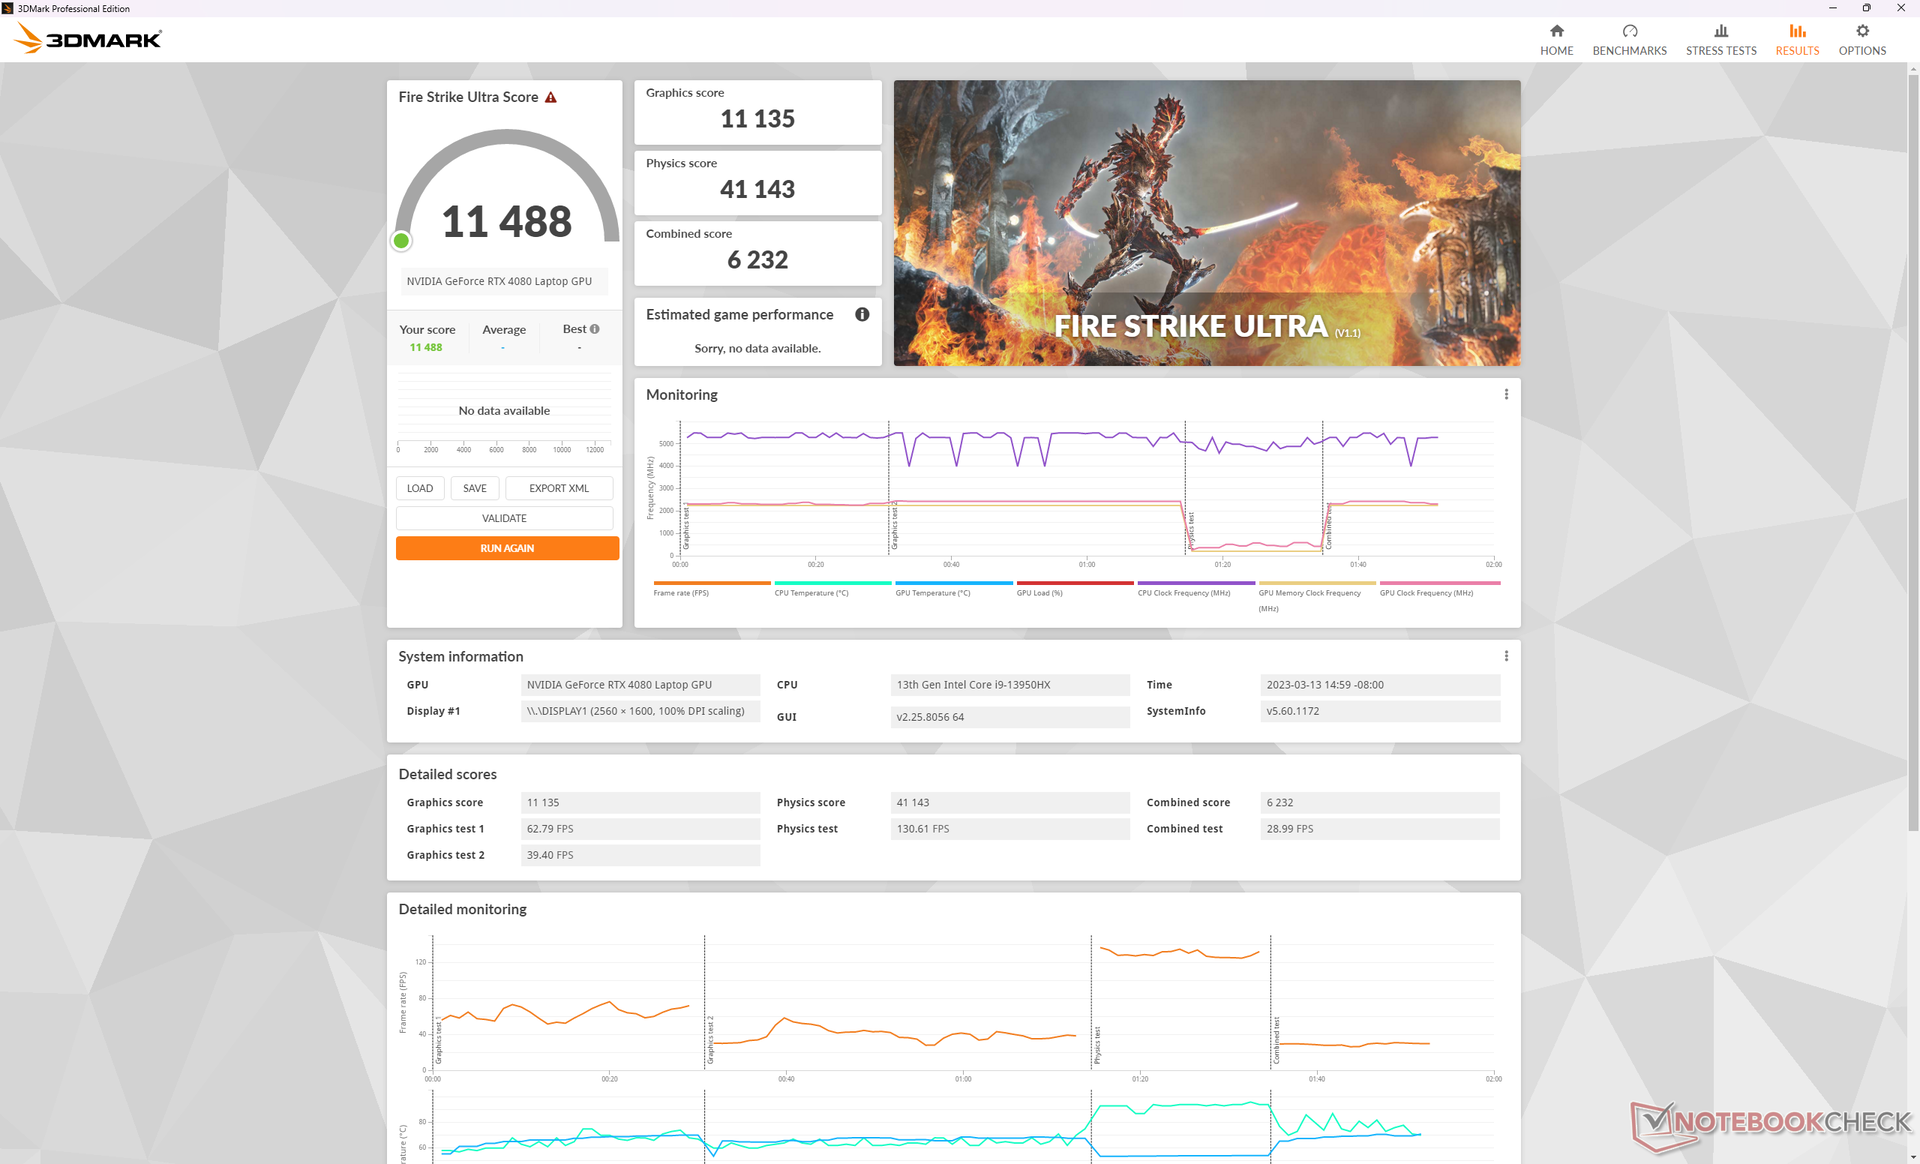
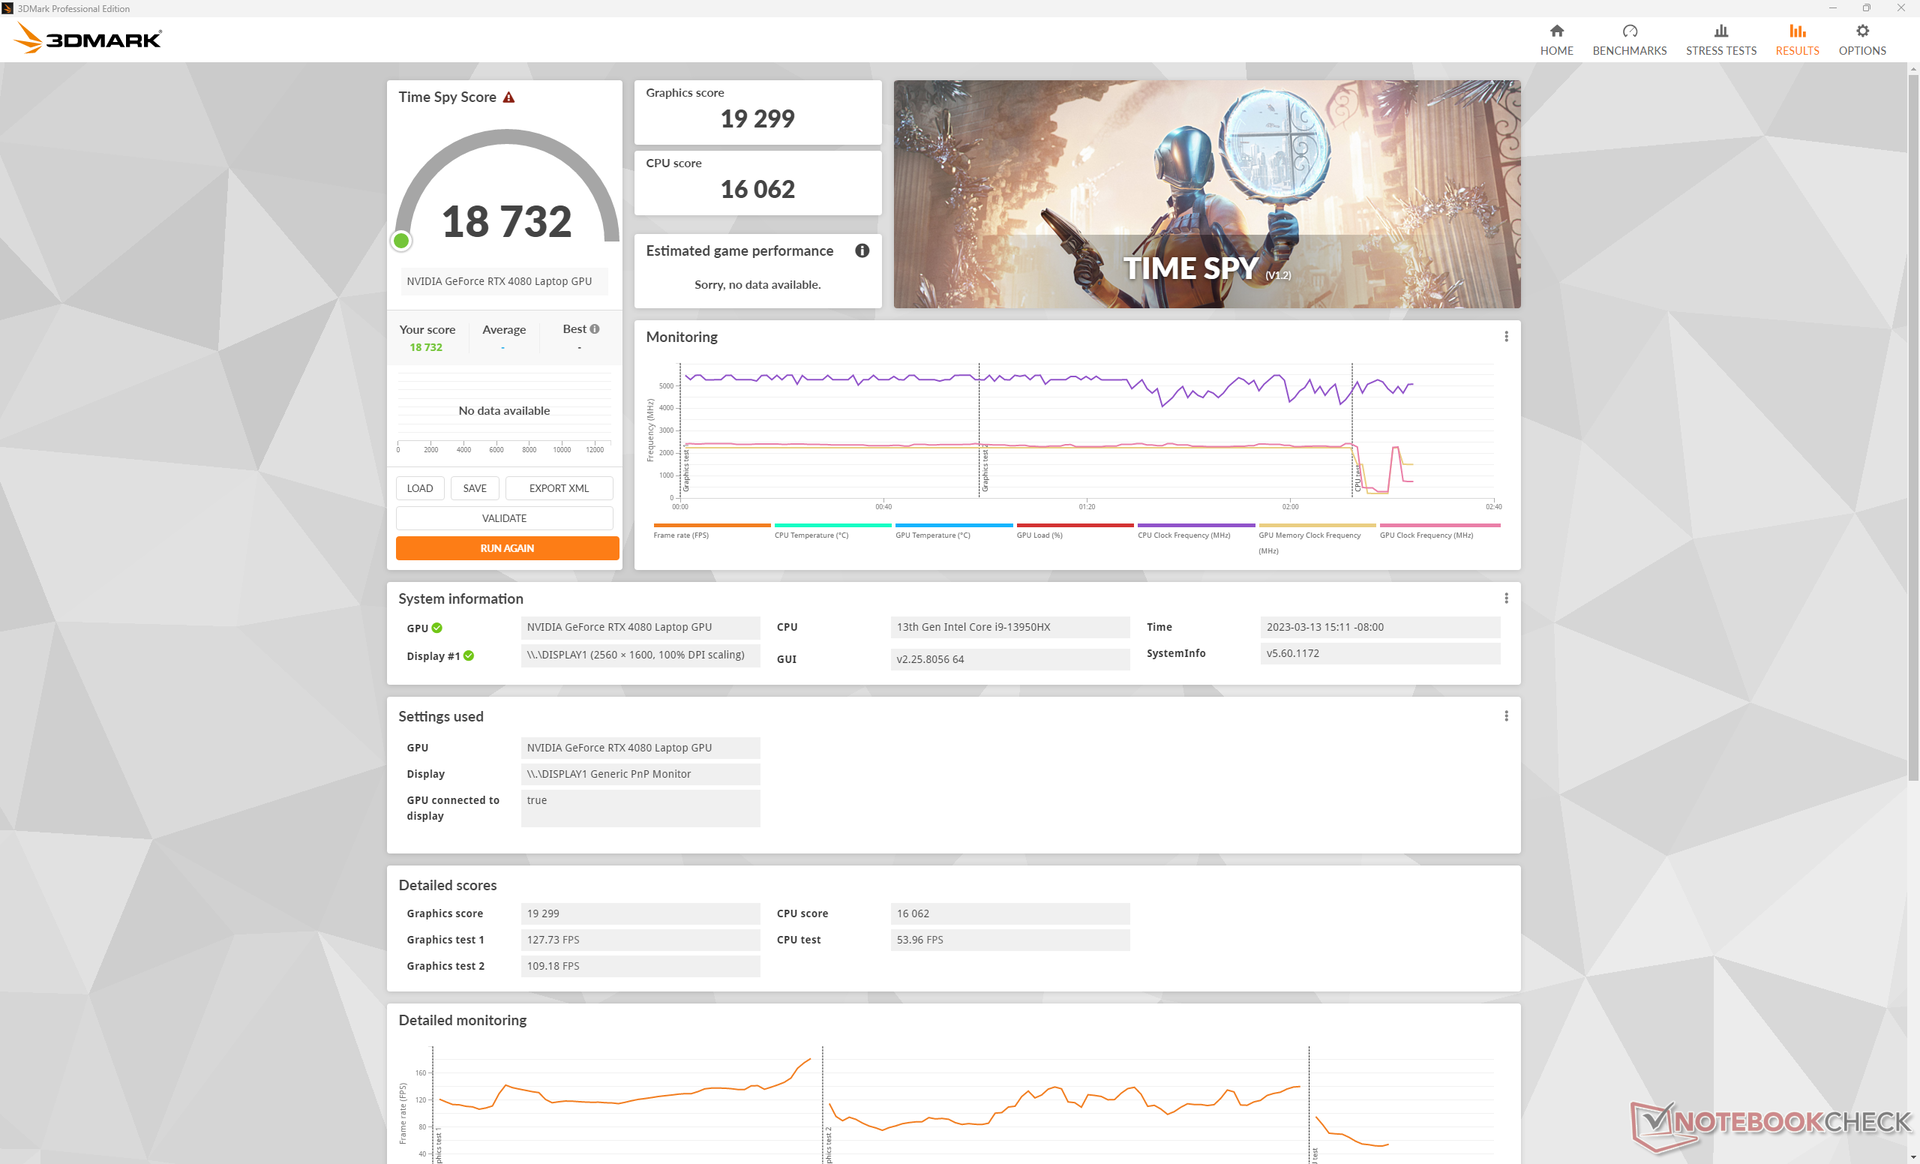
| 3DMark 11 Performance | 44893 punti | |
| 3DMark Fire Strike Score | 34260 punti | |
| 3DMark Time Spy Score | 18732 punti | |
Aiuto | ||
* ... Meglio usare valori piccoli
| The Witcher 3 - 1920x1080 Ultra Graphics & Postprocessing (HBAO+) | |
| KFA2 GeForce RTX 4080 SG | |
| Eluktronics Mech-17 GP2 | |
| MSI GE78HX 13VH-070US | |
| MSI Raider GE77 HX 12UHS | |
| Alienware m17 R5 (R9 6900HX, RX 6850M XT) | |
| Asus ROG Strix G17 G713PI | |
| Corsair Voyager a1600 | |
| MSI Katana 17 B13VFK | |
| Schenker Compact 17 | |
| Schenker XMG Core 15 (M22) | |
| HP Omen 15-en0375ng | |
Witcher 3 FPS Chart
| basso | medio | alto | ultra | QHD | 4K | |
|---|---|---|---|---|---|---|
| GTA V (2015) | 172.9 | 170 | 164.7 | 102.9 | 103.7 | 144.6 |
| The Witcher 3 (2015) | 605.7 | 539.8 | 382.9 | 175.9 | 129.4 | |
| Dota 2 Reborn (2015) | 180.4 | 161.7 | 154.8 | 145.6 | 142.6 | |
| Final Fantasy XV Benchmark (2018) | 180.4 | 166.9 | 148.5 | 131.6 | 76.2 | |
| X-Plane 11.11 (2018) | 174.1 | 157.4 | 126.8 | 110 | ||
| Strange Brigade (2018) | 324 | 272 | 267 | 258 | 237 | 121.5 |
| Cyberpunk 2077 1.6 (2022) | 149.2 | 142.6 | 136.8 | 135.8 | 88.6 | 40.2 |
| F1 22 (2022) | 237 | 235 | 228 | 115.4 | 77.4 | 39 |
Emissioni - Un giocatore rumoroso
Rumore del sistema
Le ventole interne sono quasi sempre attive, indipendentemente dal carico sullo schermo. Siamo riusciti a registrare un ronzio silenzioso di 24,2 dB(A) contro uno sfondo silenzioso di 23,4 dB(A) quando il dispositivo è semplicemente al minimo in modalità Risparmio energetico. Se si naviga sul web o si trasmettono video in streaming, il rumore della ventola si aggira in genere tra i 25 e i 31 dB(A). Non è abbastanza forte da distrarre, ma è comunque percepibile. Macchine concorrenti come ilEluktronics Mech-17 o Asus ROG Strix G17 G713PI si comportano in modo simile.
Giocando in modalità Performance (o Estrema) il rumore della ventola supera di poco i 56 dB(A), un valore che si colloca nella fascia più alta dello spettro dei portatili da gioco. I già citati portatili Eluktronics e Asus, ad esempio, funzionano in modo sensibilmente più silenzioso, rispettivamente a 51 e 46 dB(A), con carichi di gioco simili.
Abilitando la modalità Cooler Boost, i giri della ventola aumenteranno al limite assoluto, indipendentemente dal carico sullo schermo, per un livello di rumore che si avvicina ai 60 dB(A). Le prestazioni di gioco, tuttavia, non sono necessariamente più veloci e quindi la modalità Cooler Boost riguarda più il controllo della temperatura che quello delle prestazioni. Abbiamo avuto osservazioni simili su altri portatili MSI con la stessa funzione Cooler Boost.
Rumorosità
| Idle |
| 24.2 / 25.6 / 31 dB(A) |
| Sotto carico |
| 43.3 / 59.1 dB(A) |
 | ||
30 dB silenzioso 40 dB(A) udibile 50 dB(A) rumoroso |
||
min: | ||
| MSI GE78HX 13VH-070US GeForce RTX 4080 Laptop GPU, i9-13950HX, Samsung PM9A1 MZVL22T0HBLB | Eluktronics Mech-17 GP2 GeForce RTX 4090 Laptop GPU, i9-13900HX, Samsung PM9A1 MZVL21T0HCLR | Asus ROG Strix G17 G713PI GeForce RTX 4070 Laptop GPU, R9 7945HX, WD PC SN560 SDDPNQE-1T00 | MSI Titan GT77 HX 13VI GeForce RTX 4090 Laptop GPU, i9-13950HX, Samsung PM9A1 MZVL22T0HBLB | MSI Raider GE77 HX 12UHS GeForce RTX 3080 Ti Laptop GPU, i9-12900HX, Samsung PM9A1 MZVL22T0HBLB | Razer Blade 17 Early 2022 GeForce RTX 3080 Ti Laptop GPU, i9-12900H, Samsung PM9A1 MZVL21T0HCLR | |
|---|---|---|---|---|---|---|
| Noise | -1% | 1% | -7% | -15% | -3% | |
| off /ambiente * (dB) | 23.4 | 25.2 -8% | 25 -7% | 24.6 -5% | 26 -11% | 26 -11% |
| Idle Minimum * (dB) | 24.2 | 28 -16% | 26 -7% | 29.2 -21% | 26 -7% | 26 -7% |
| Idle Average * (dB) | 25.6 | 28 -9% | 29 -13% | 29.2 -14% | 34 -33% | 27 -5% |
| Idle Maximum * (dB) | 31 | 30.4 2% | 30 3% | 29.2 6% | 46 -48% | 32 -3% |
| Load Average * (dB) | 43.3 | 41 5% | 46 -6% | 50.7 -17% | 50 -15% | 50 -15% |
| Witcher 3 ultra * (dB) | 56.3 | 50.7 10% | 46 18% | 53.3 5% | 55 2% | 51 9% |
| Load Maximum * (dB) | 59.1 | 52.6 11% | 47 20% | 61 -3% | 57 4% | 51 14% |
* ... Meglio usare valori piccoli
Temperatura
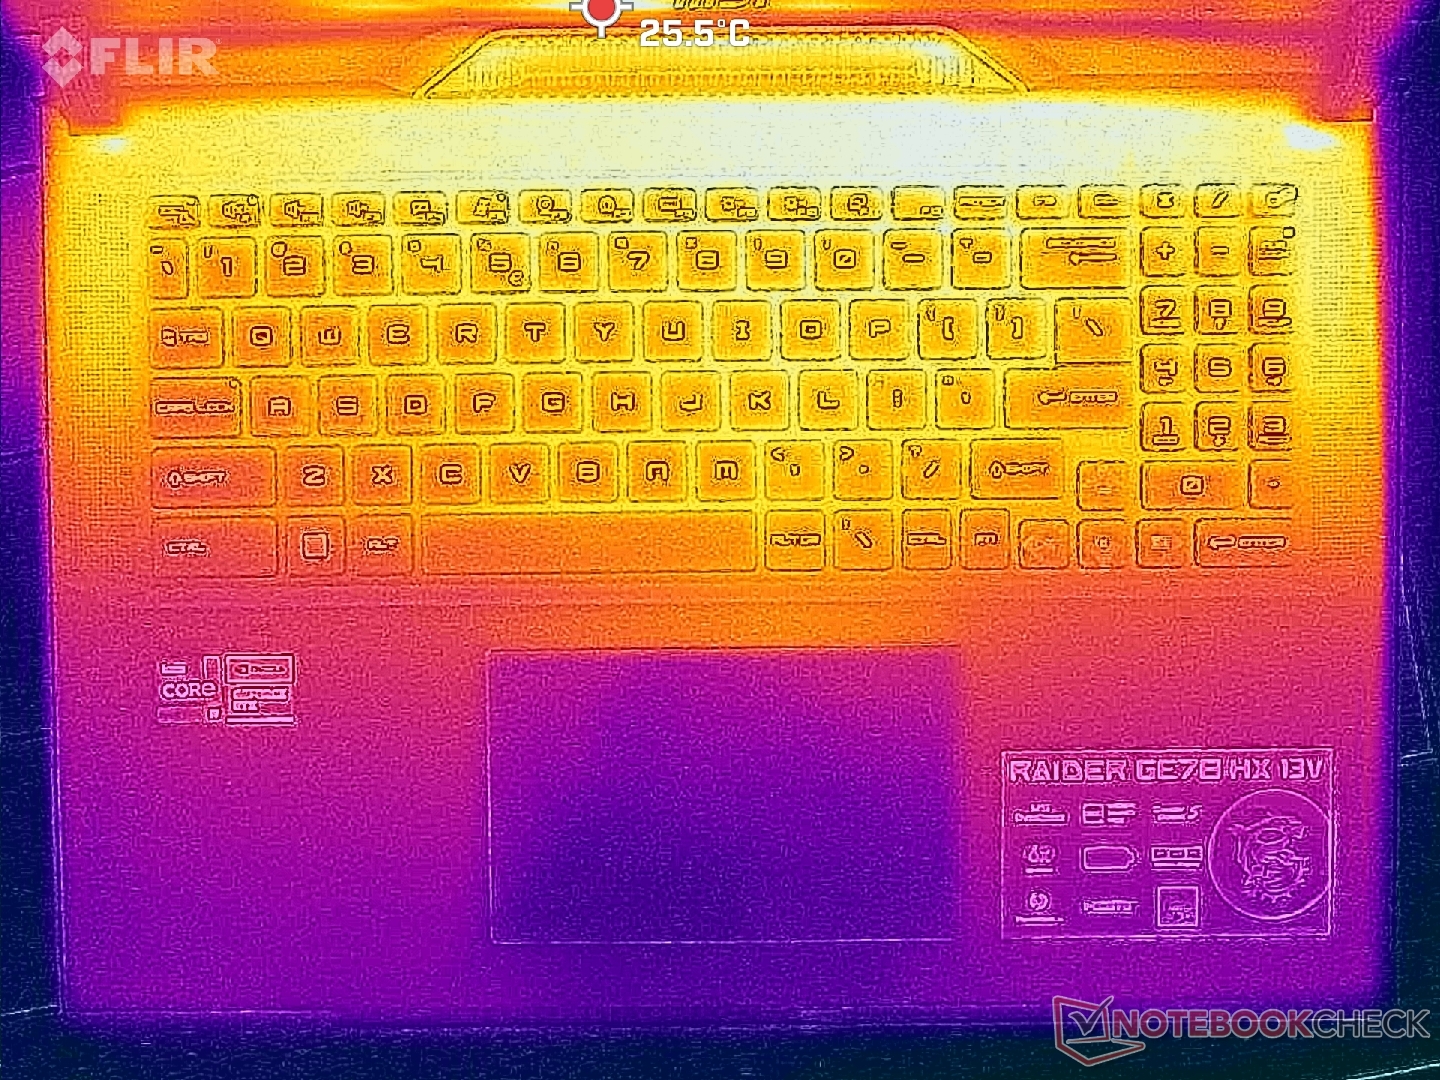
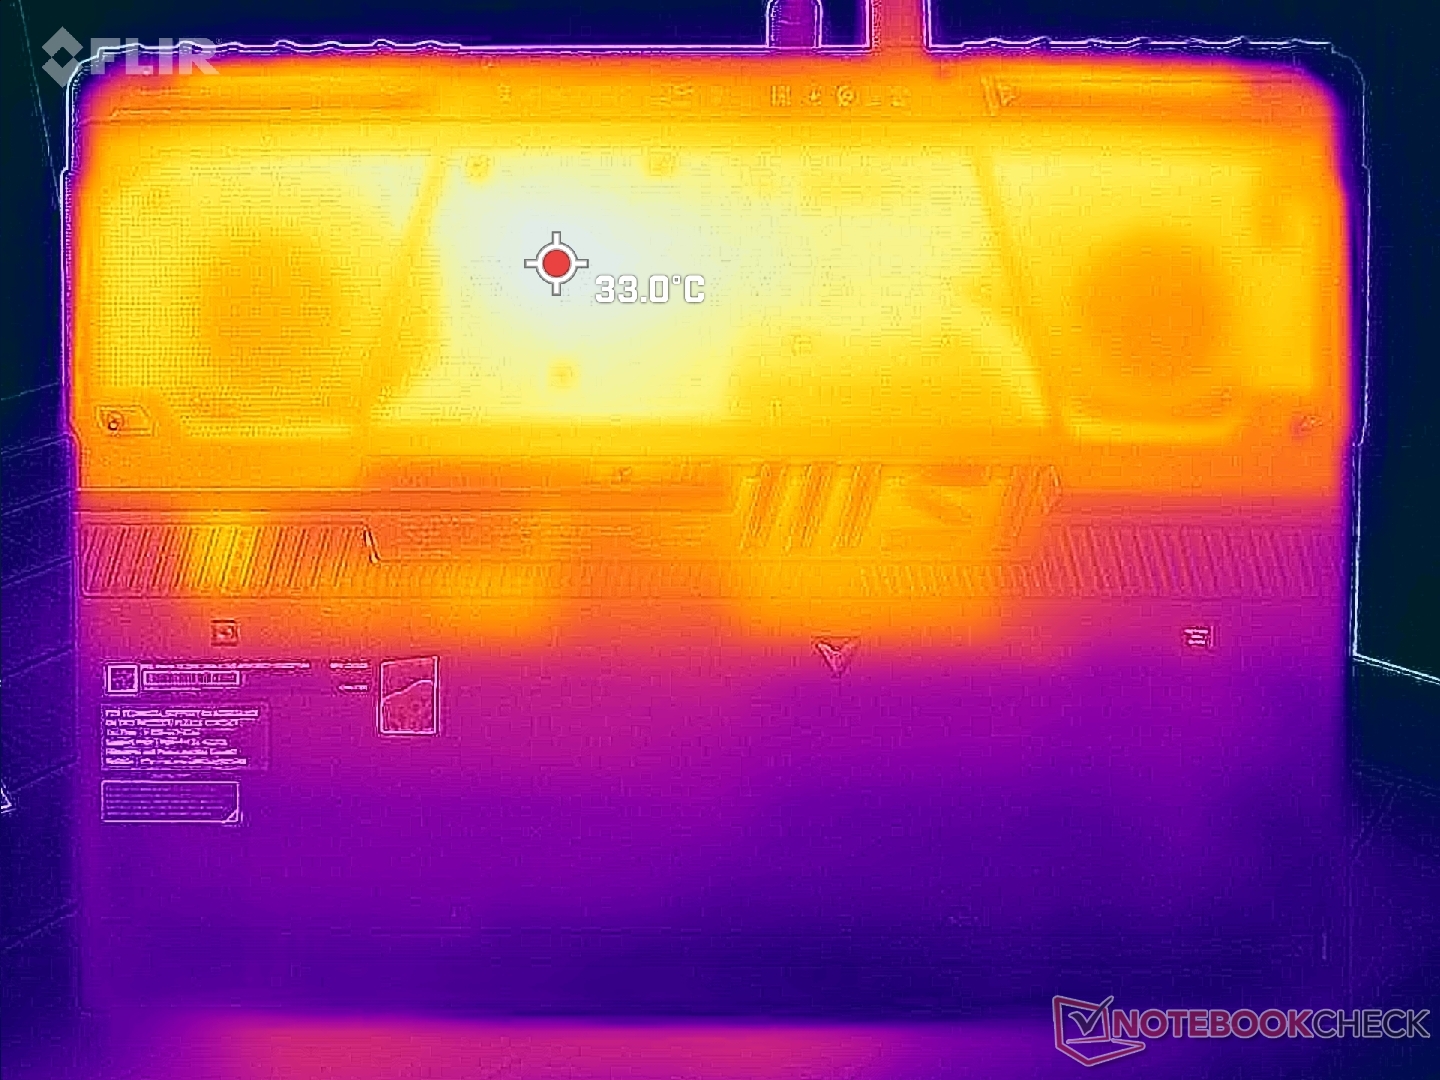
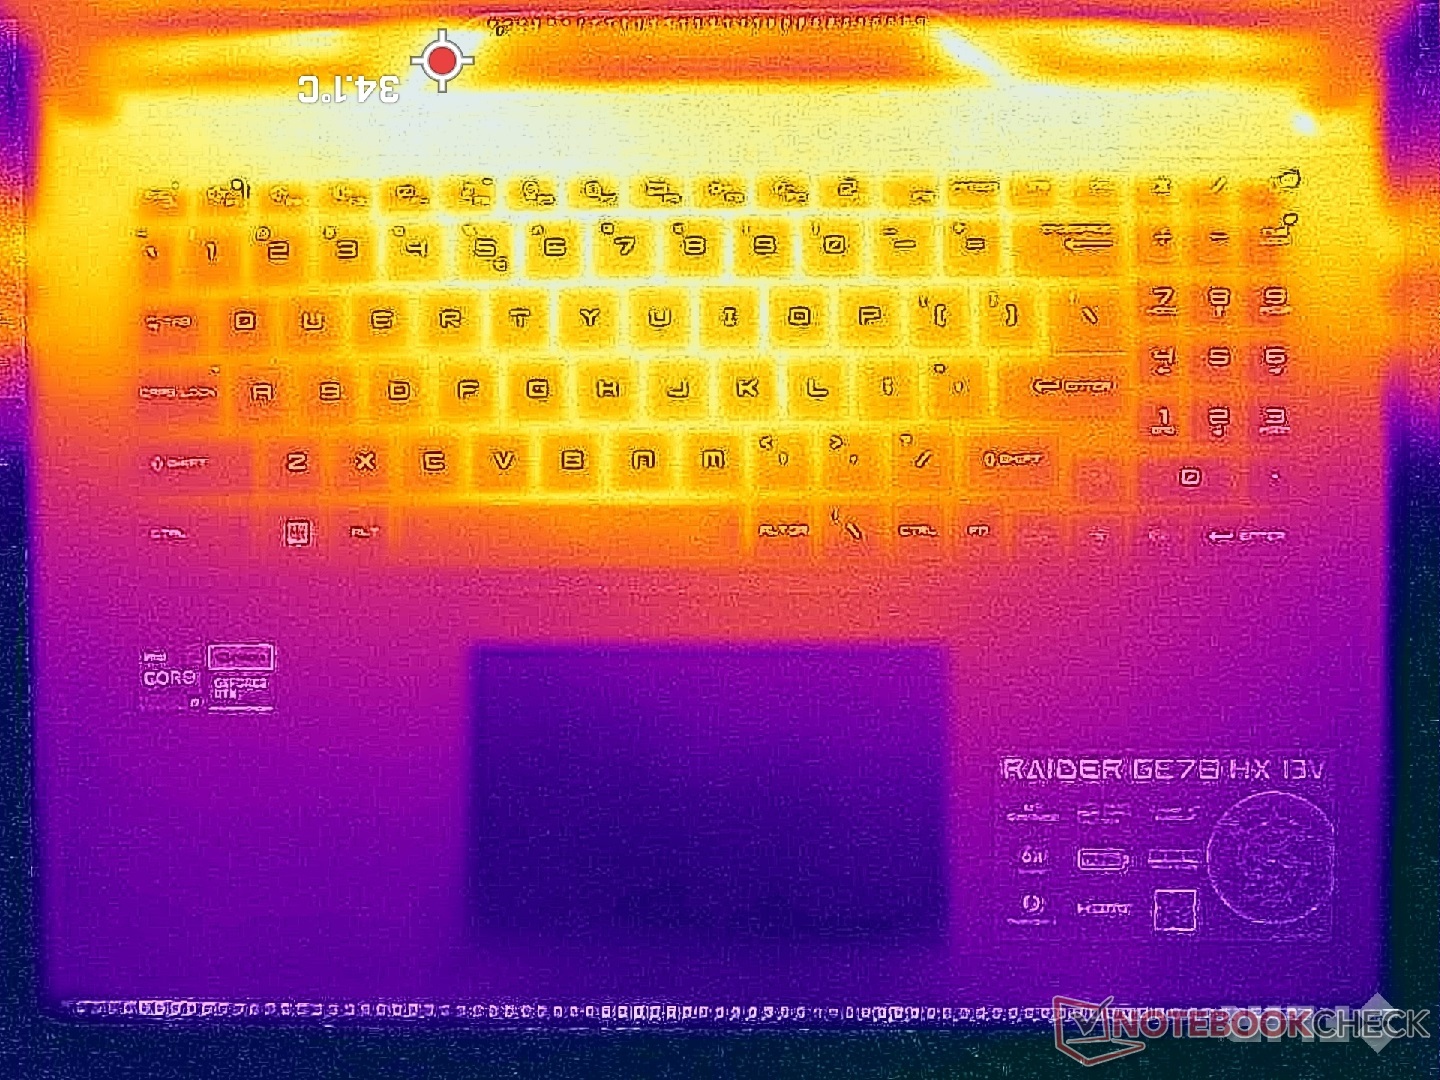
Le temperature superficiali non sono un problema per i modelli MSI GE e GT, poiché sono in gran parte in plastica e con un design più spesso. La temperatura media della superficie quando si gioca con il GE78, ad esempio, è di circa 32 C sia sulla parte superiore che su quella inferiore, rispetto ai 43 C-44 C del Razer Blade 17 Razer Blade 17.
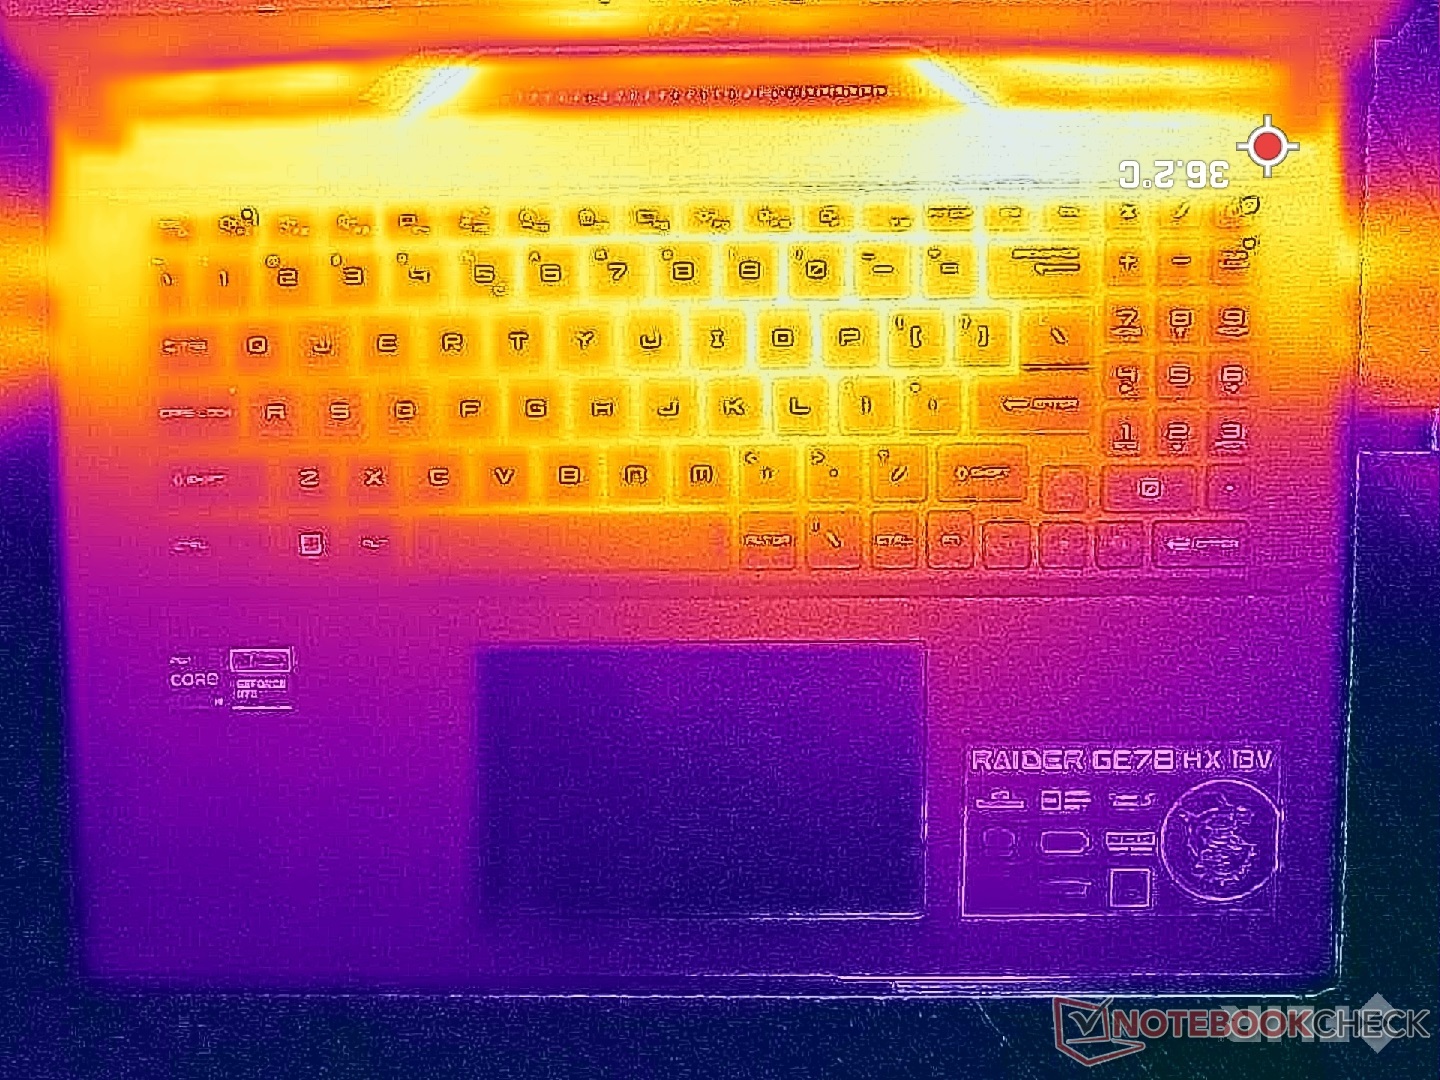
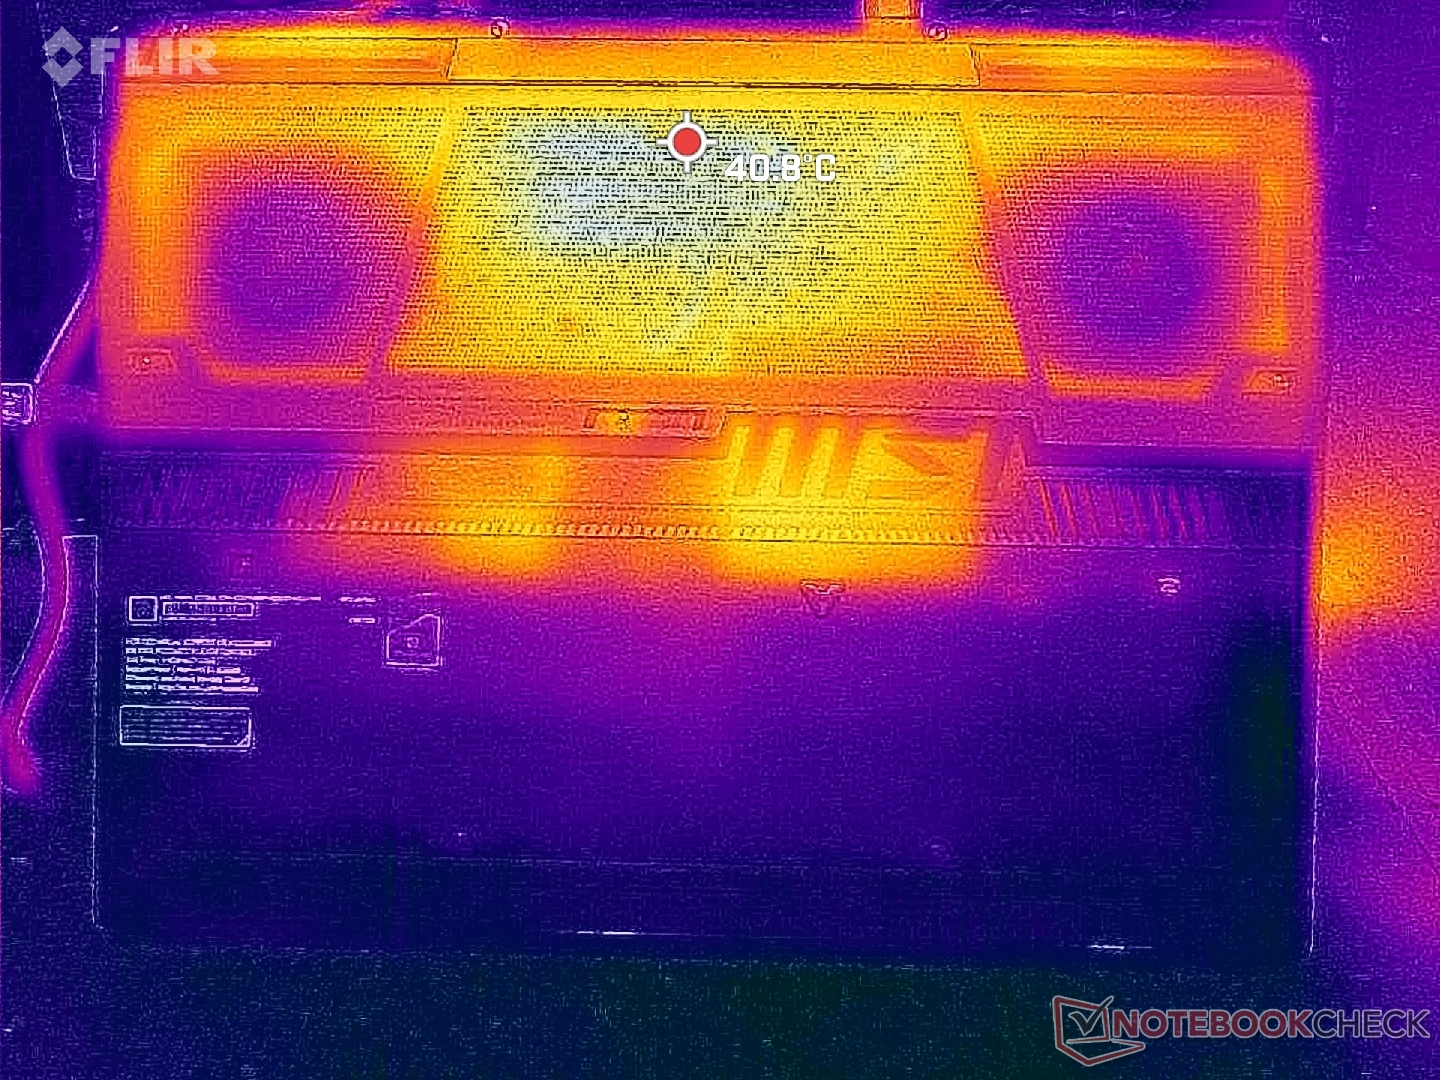
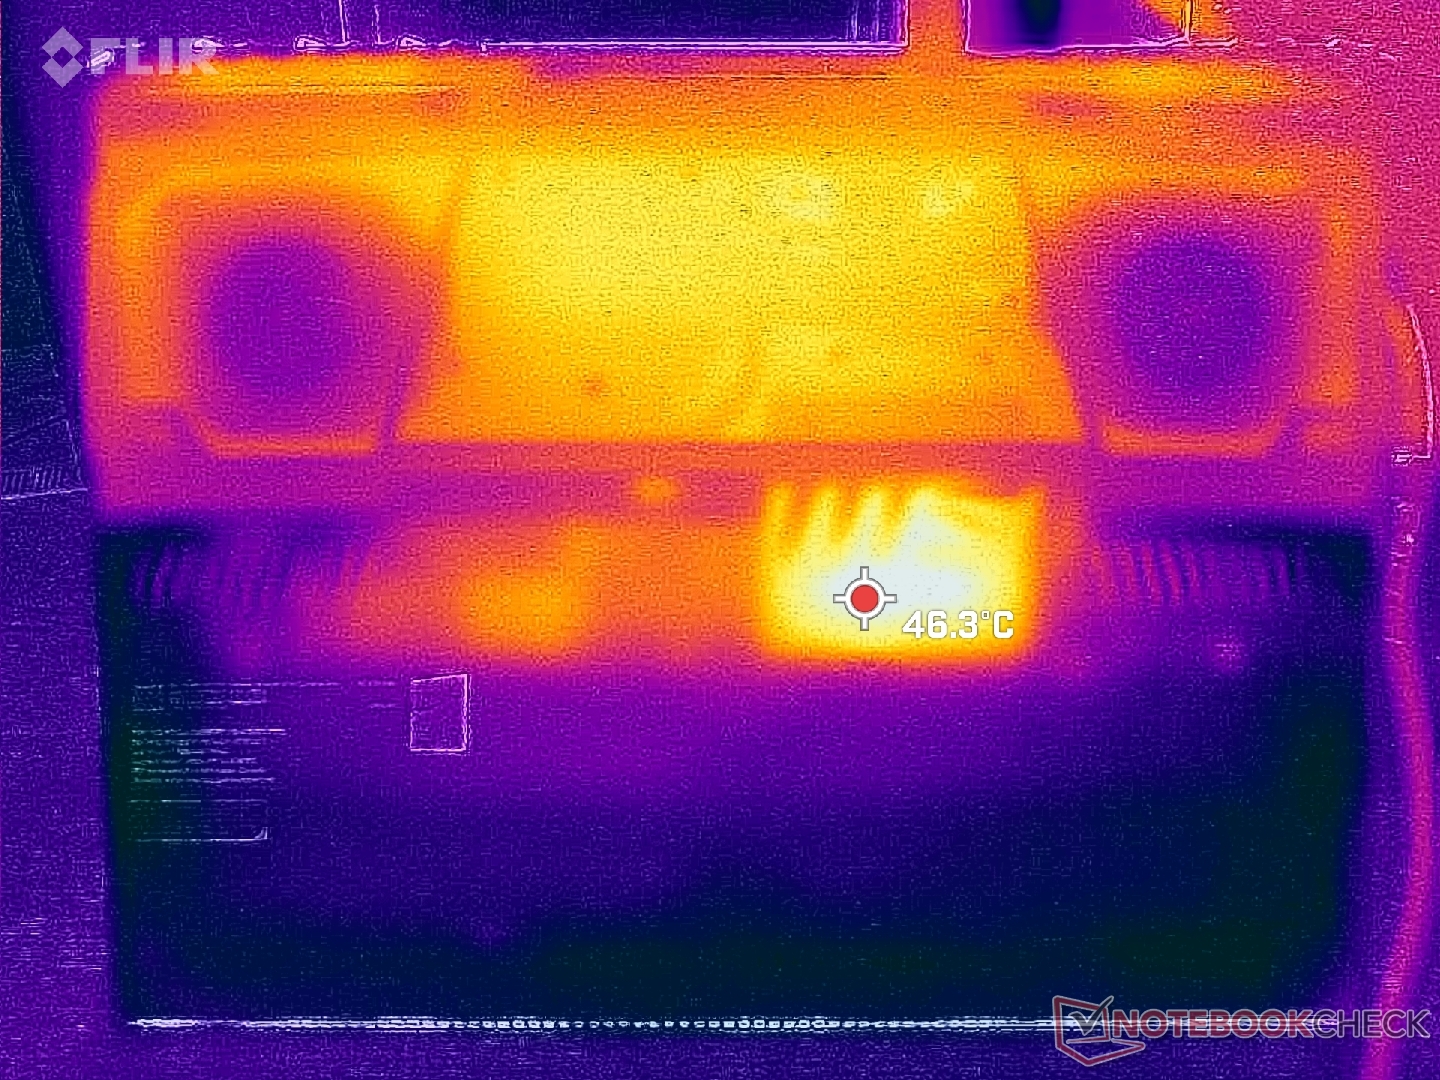
I punti caldi del sistema si trovano verso la parte posteriore dello chassis e lontano dalla parte anteriore, come mostrano le mappe di temperatura qui sotto. I palmi delle mani o le dita non dovrebbero quindi sentire un calore fastidioso durante la digitazione o il gioco.
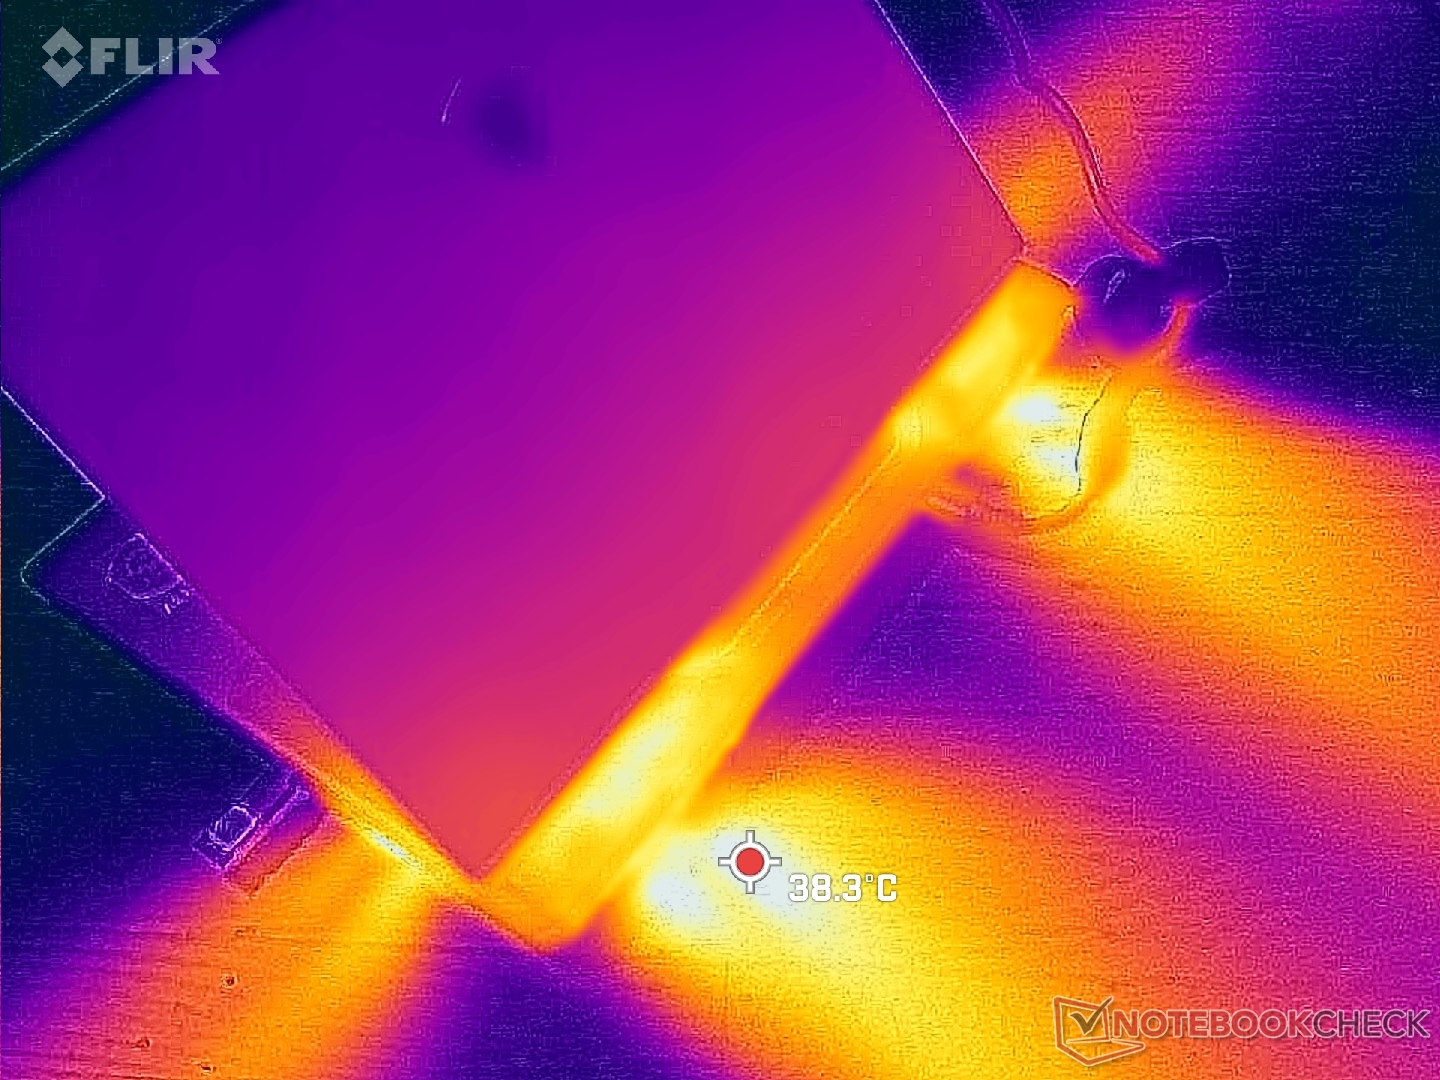
(+) La temperatura massima sul lato superiore è di 37.4 °C / 99 F, rispetto alla media di 40.4 °C / 105 F, che varia da 21.2 a 68.8 °C per questa classe Gaming.
(±) Il lato inferiore si riscalda fino ad un massimo di 45 °C / 113 F, rispetto alla media di 43.2 °C / 110 F
(+) In idle, la temperatura media del lato superiore è di 25.7 °C / 78 F, rispetto alla media deld ispositivo di 33.9 °C / 93 F.
(+) Riproducendo The Witcher 3, la temperatura media per il lato superiore e' di 30.5 °C / 87 F, rispetto alla media del dispositivo di 33.9 °C / 93 F.
(+) I poggiapolsi e il touchpad sono piu' freddi della temperatura della pelle con un massimo di 24.6 °C / 76.3 F e sono quindi freddi al tatto.
(+) La temperatura media della zona del palmo della mano di dispositivi simili e'stata di 28.8 °C / 83.8 F (+4.2 °C / 7.5 F).
| MSI GE78HX 13VH-070US Intel Core i9-13950HX, NVIDIA GeForce RTX 4080 Laptop GPU | Eluktronics Mech-17 GP2 Intel Core i9-13900HX, NVIDIA GeForce RTX 4090 Laptop GPU | Asus ROG Strix G17 G713PI AMD Ryzen 9 7945HX, NVIDIA GeForce RTX 4070 Laptop GPU | MSI Titan GT77 HX 13VI Intel Core i9-13950HX, NVIDIA GeForce RTX 4090 Laptop GPU | MSI Raider GE77 HX 12UHS Intel Core i9-12900HX, NVIDIA GeForce RTX 3080 Ti Laptop GPU | Razer Blade 17 Early 2022 Intel Core i9-12900H, NVIDIA GeForce RTX 3080 Ti Laptop GPU | |
|---|---|---|---|---|---|---|
| Heat | 1% | -5% | 5% | -33% | -24% | |
| Maximum Upper Side * (°C) | 37.4 | 39 -4% | 42 -12% | 40.6 -9% | 53 -42% | 50 -34% |
| Maximum Bottom * (°C) | 45 | 44 2% | 41 9% | 41.1 9% | 58 -29% | 56 -24% |
| Idle Upper Side * (°C) | 29.8 | 31 -4% | 33 -11% | 26.2 12% | 38 -28% | 36 -21% |
| Idle Bottom * (°C) | 32.4 | 29.8 8% | 34 -5% | 30.3 6% | 43 -33% | 38 -17% |
* ... Meglio usare valori piccoli
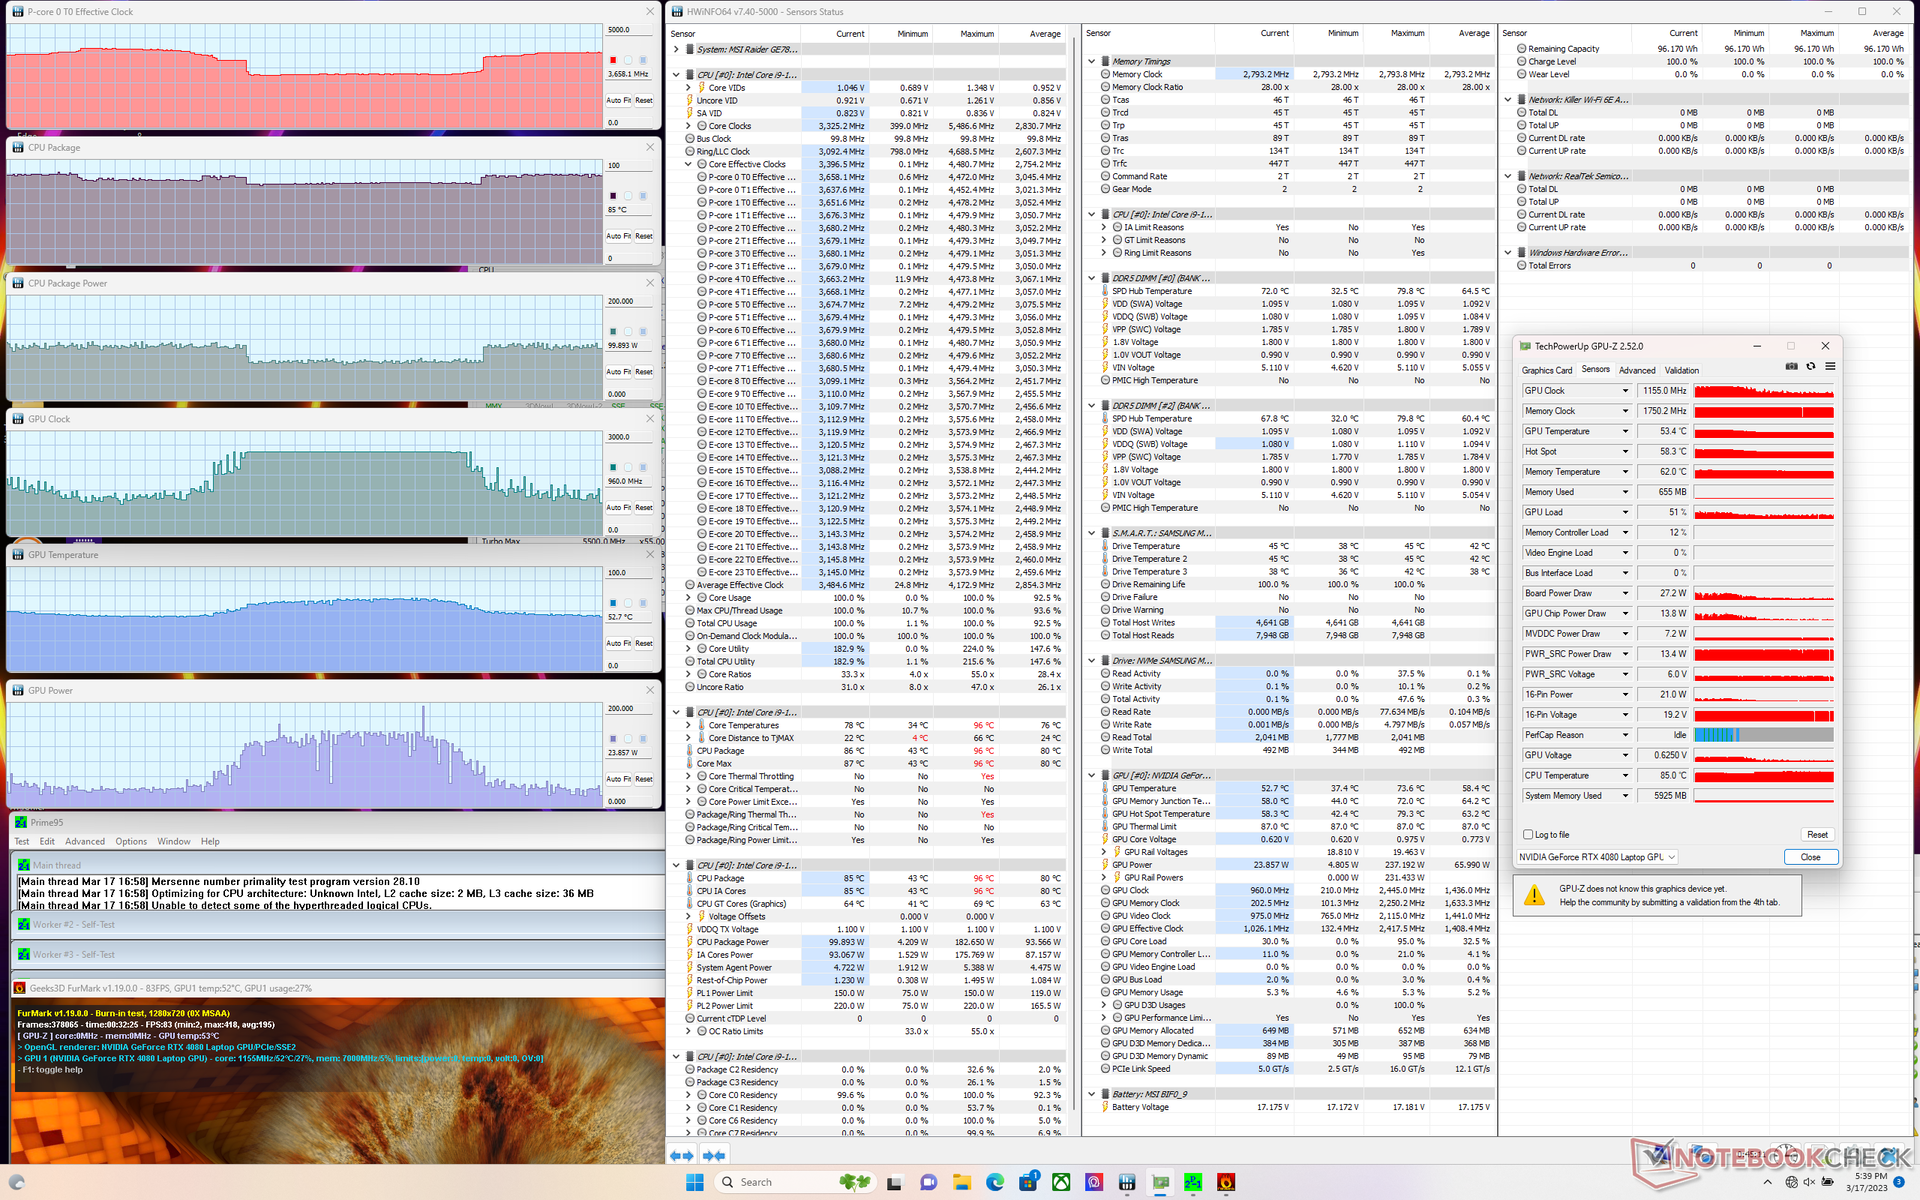
Stress test
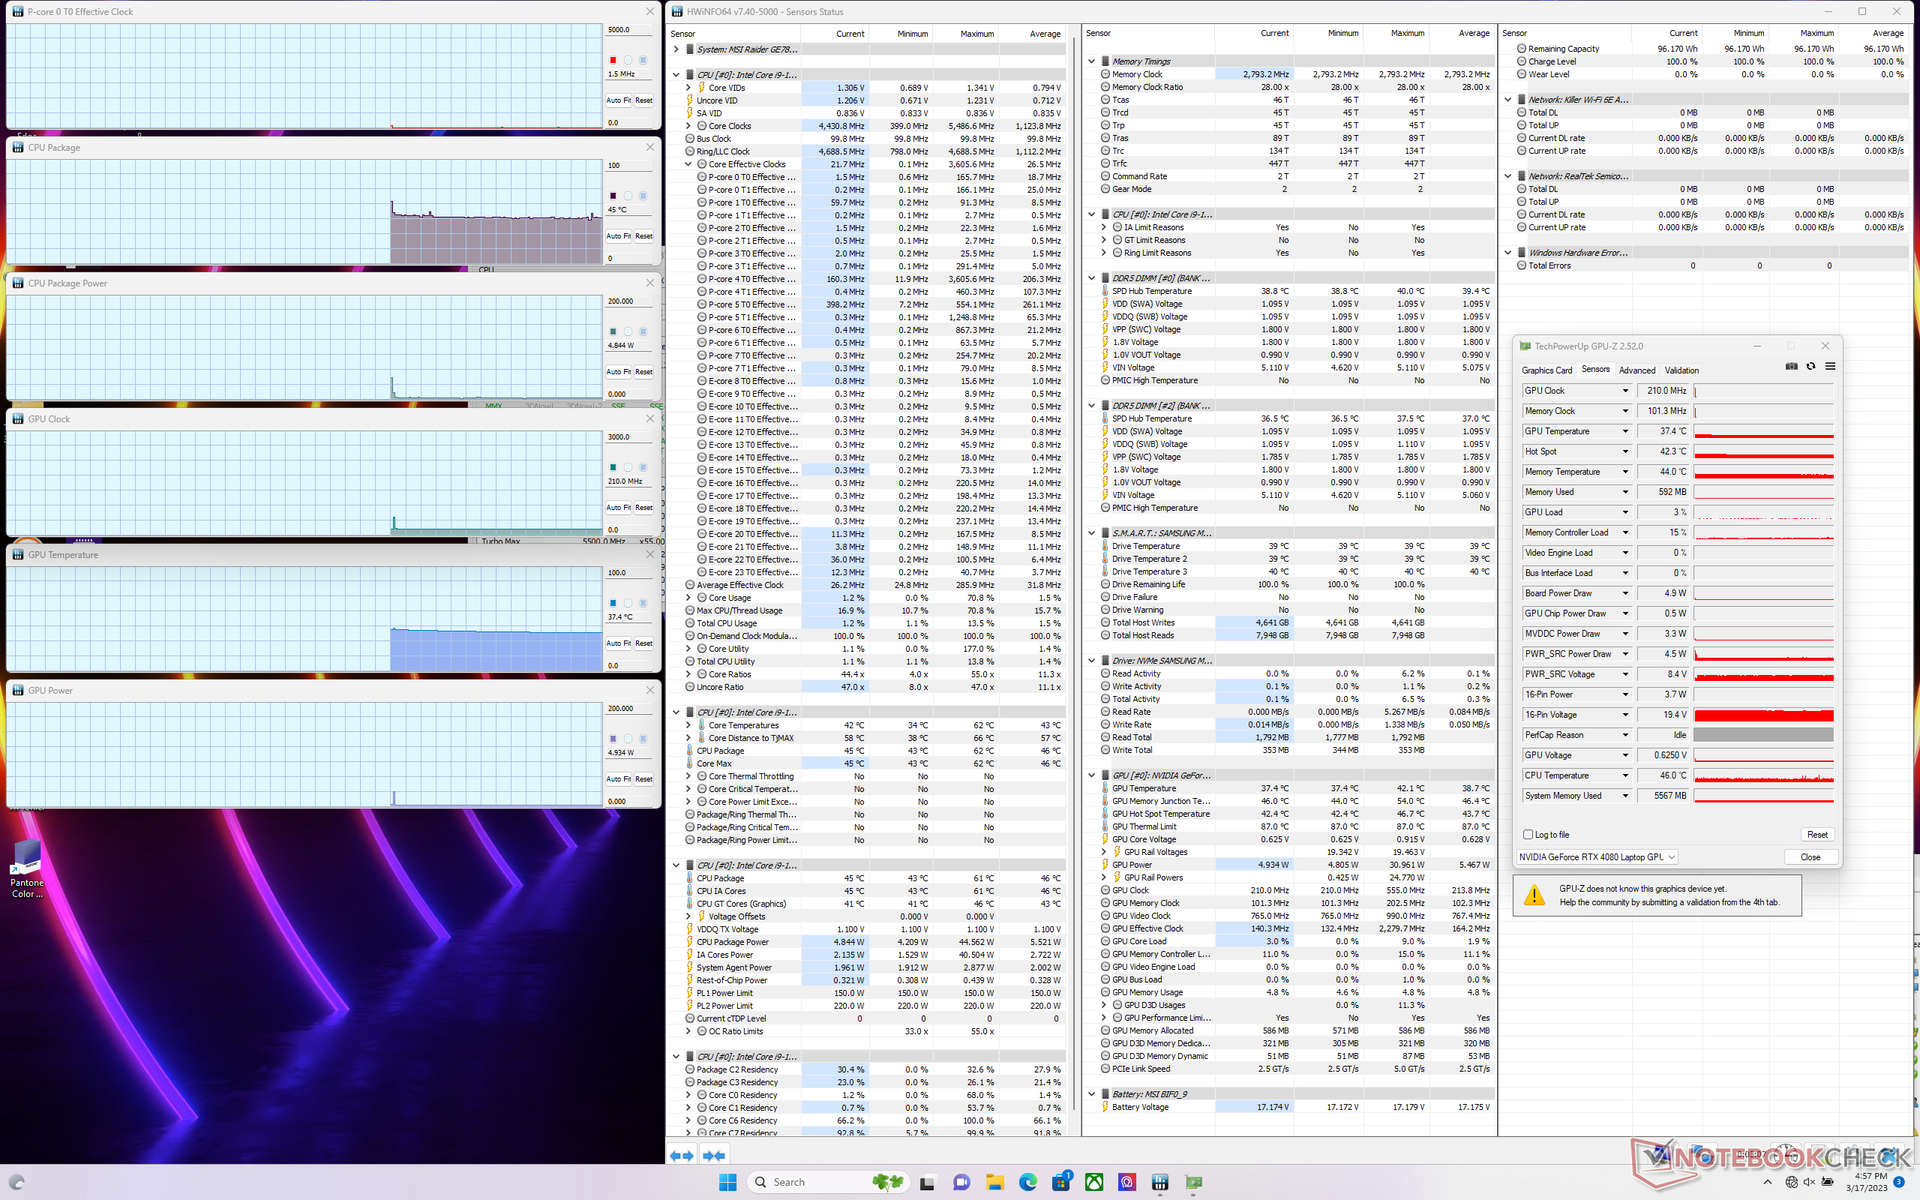
Quando si esegue Prime95 per stressare la CPU, le frequenze di clock e l'assorbimento di potenza della scheda aumentano rispettivamente a 4,5 GHz e 173 W, durando solo pochi secondi o fino a raggiungere una temperatura del nucleo di 95 C. Successivamente, le frequenze di clock e l'assorbimento di potenza della scheda diminuiscono costantemente fino a stabilizzarsi a circa 3,7 GHz e 144 W, rispettivamente. La temperatura del nucleo rimane molto alta, a 91 C, il che significa che c'è poco spazio per ulteriori prestazioni del processore. Ripetendo lo stesso test sulRazer Blade 16 con una CPU Core i9 simile, si otterrebbe una velocità di clock media più bassa e una temperatura del core più bassa, rispettivamente di ~3,2 GHz e 82 C. La serie Core i9 di Intel di 13a generazione può essere veloce, ma le temperature del core sono elevate su tutta la linea.
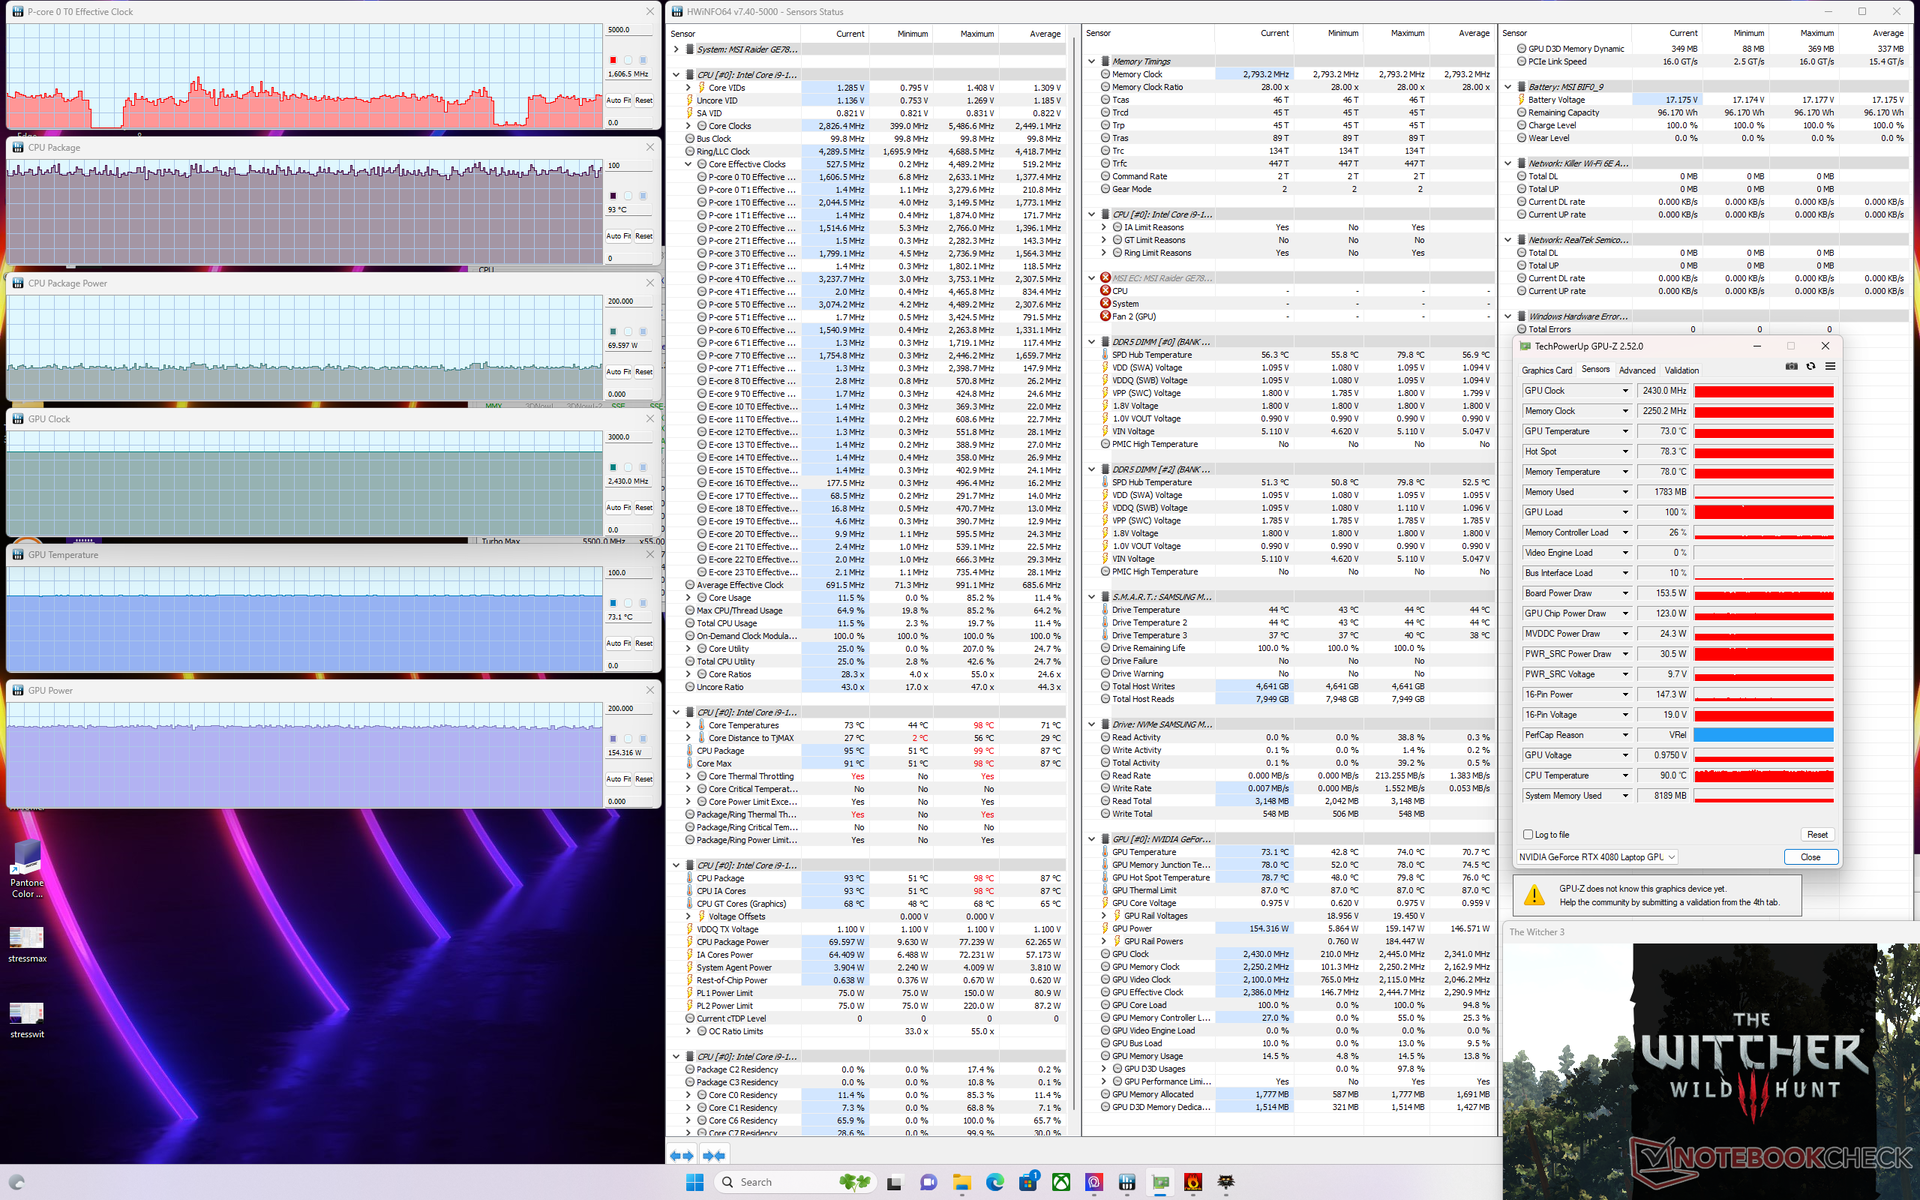
Eseguendo Witcher 3 per rappresentare i carichi di gioco tipici, si otterrebbe una frequenza di clock della GPU, una temperatura della GPU e un assorbimento di potenza della scheda stabili, rispettivamente, a 2430 MHz, 73 C e 156 W. I risultati rimarrebbero identici se Cooler Boost fosse abilitato. Ci aspettiamo che l'assorbimento di potenza della scheda sia più vicino a 175 W se configurata con la più veloce GPU RTX 4090.
Il funzionamento a batteria limita le prestazioni, come prevedibile. Fire Strike a batteria restituirebbe punteggi di Fisica e Grafica di soli 18881 e 22232 punti, rispettivamente, rispetto ai 41339 e 42663 punti della rete elettrica.
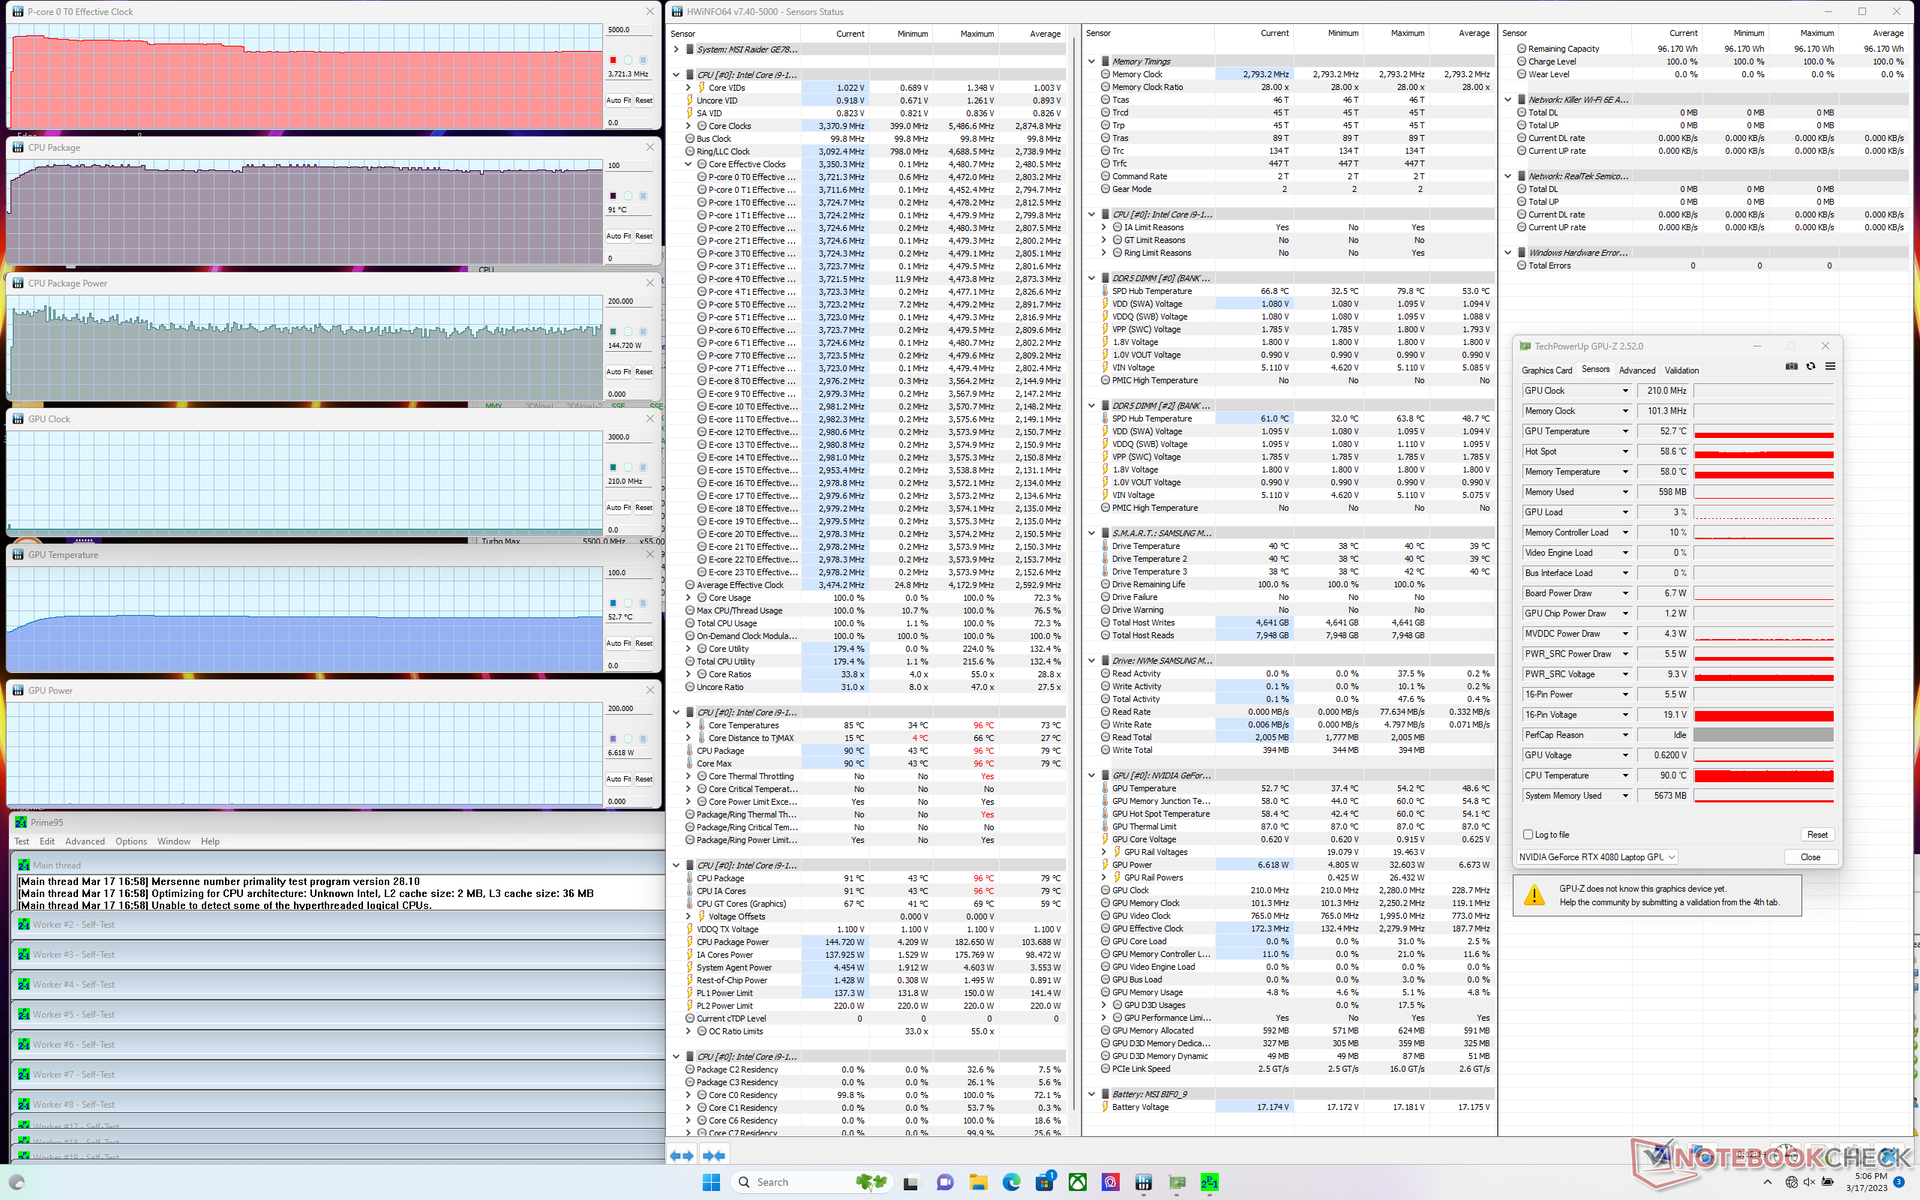
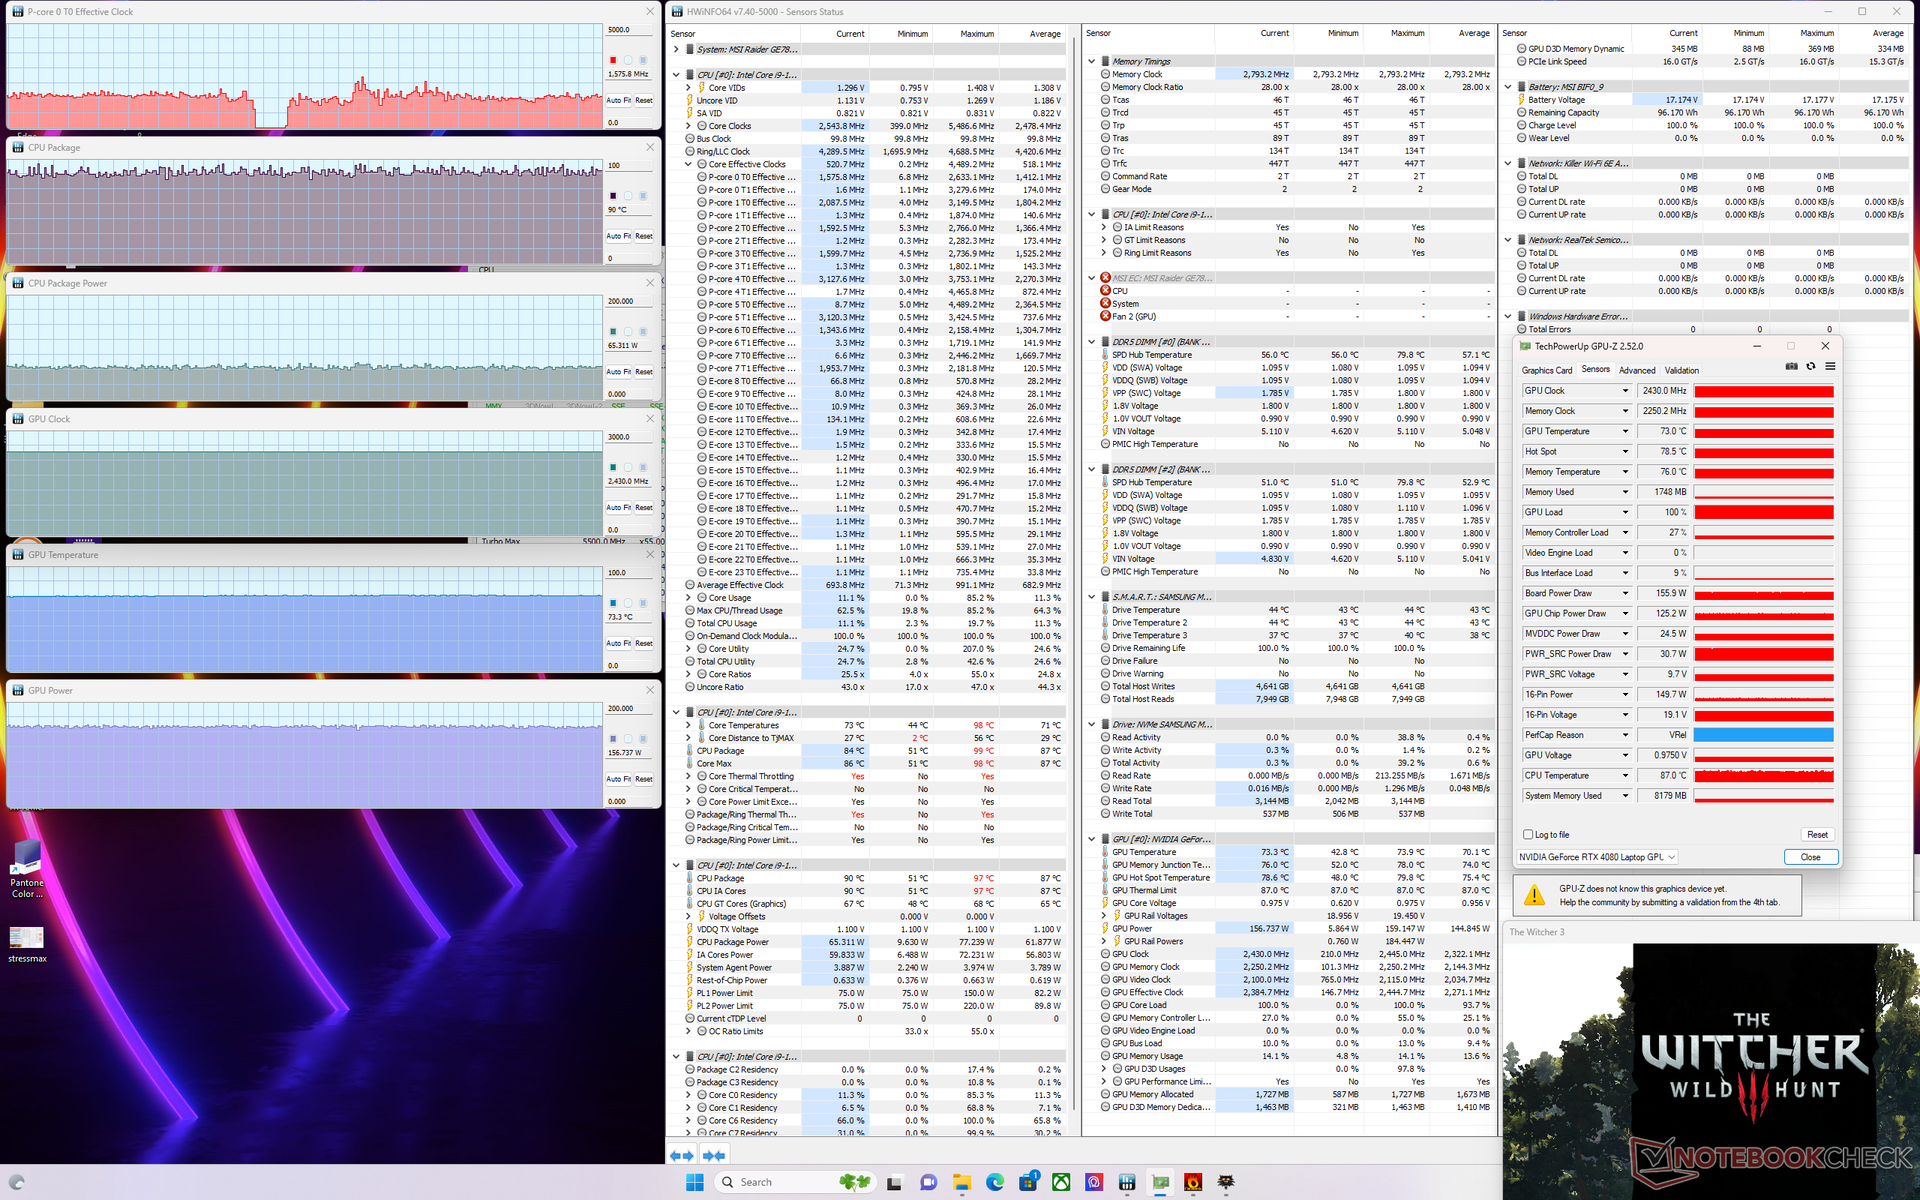
| Clock della CPU (GHz) | Clock della GPU (MHz) | Temperatura media della CPU (°C) | Temperatura media della GPU (°C) | |
| Sistema inattivo | -- | -- | 45 | 37 |
| Stress Prime95 | 3,7 | -- | 91 | 53 |
| Prime95 + FurMark Stress | 2,4 - 3,7 | 960 - 2360 | 82 - 85 | 53 - 60 |
| Witcher 3 Stress | ~1.6 | 2430 | 93 | 73 |
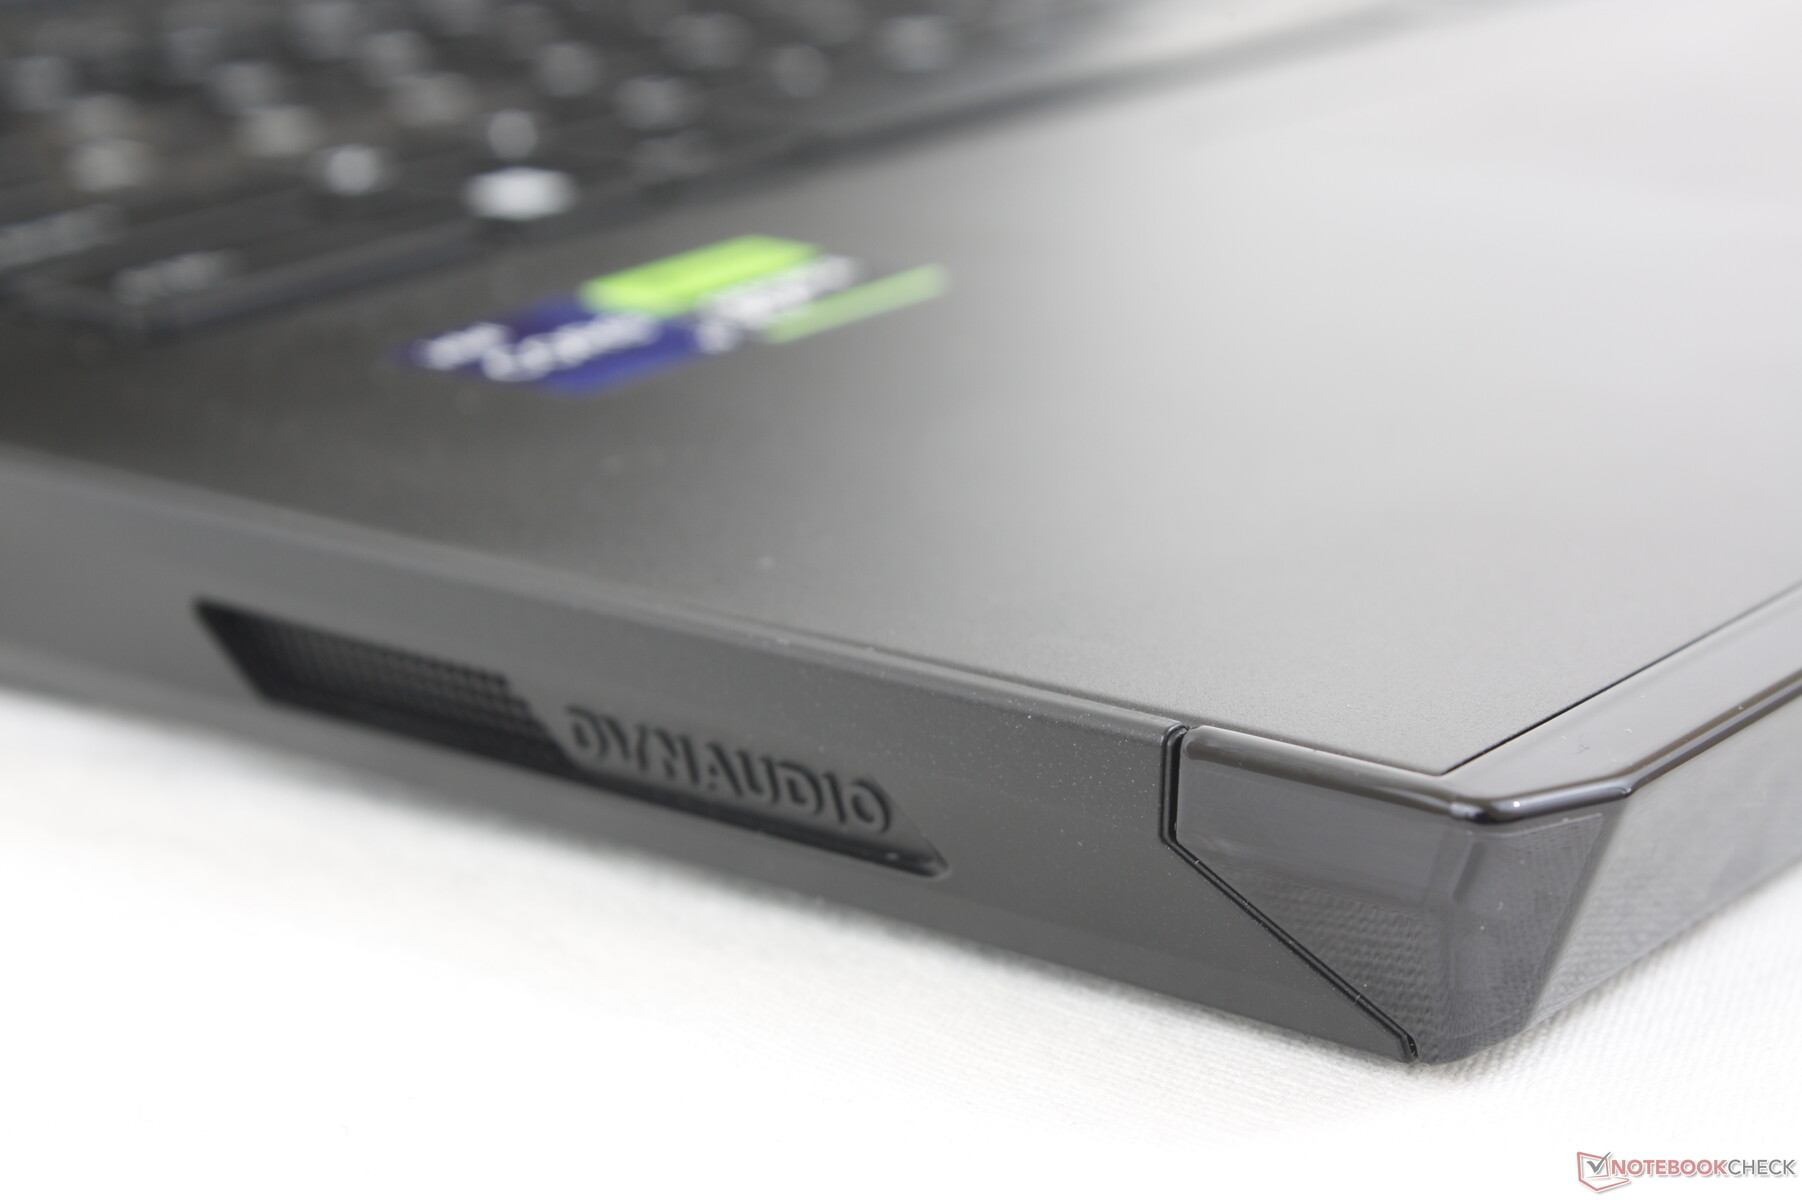
Altoparlanti
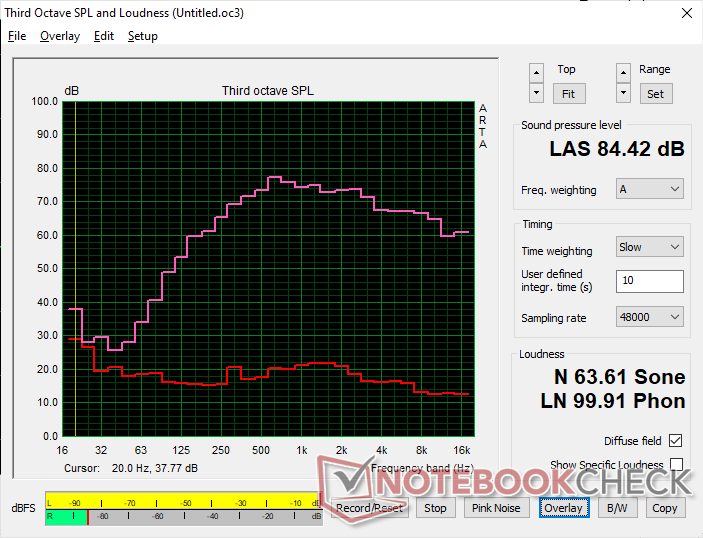
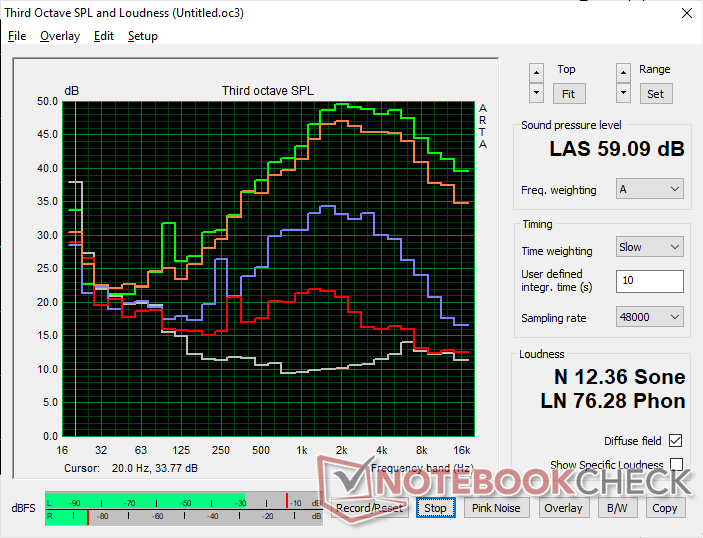
MSI GE78HX 13VH-070US analisi audio
(+) | gli altoparlanti sono relativamente potenti (84.4 dB)
Bassi 100 - 315 Hz
(±) | bassi ridotti - in media 8.3% inferiori alla media
(±) | la linearità dei bassi è media (9.3% delta rispetto alla precedente frequenza)
Medi 400 - 2000 Hz
(±) | medi elevati - circa 6.8% superiore alla media
(+) | medi lineari (3.4% delta rispetto alla precedente frequenza)
Alti 2 - 16 kHz
(+) | Alti bilanciati - appena 2% dalla media
(+) | alti lineari (2.6% delta rispetto alla precedente frequenza)
Nel complesso 100 - 16.000 Hz
(+) | suono nel complesso lineare (12% differenza dalla media)
Rispetto alla stessa classe
» 12% di tutti i dispositivi testati in questa classe è stato migliore, 4% simile, 84% peggiore
» Il migliore ha avuto un delta di 6%, medio di 18%, peggiore di 132%
Rispetto a tutti i dispositivi testati
» 9% di tutti i dispositivi testati in questa classe è stato migliore, 2% similare, 88% peggiore
» Il migliore ha avuto un delta di 4%, medio di 24%, peggiore di 134%
Apple MacBook Pro 16 2021 M1 Pro analisi audio
(+) | gli altoparlanti sono relativamente potenti (84.7 dB)
Bassi 100 - 315 Hz
(+) | bassi buoni - solo 3.8% dalla media
(+) | bassi in lineaa (5.2% delta rispetto alla precedente frequenza)
Medi 400 - 2000 Hz
(+) | medi bilanciati - solo only 1.3% rispetto alla media
(+) | medi lineari (2.1% delta rispetto alla precedente frequenza)
Alti 2 - 16 kHz
(+) | Alti bilanciati - appena 1.9% dalla media
(+) | alti lineari (2.7% delta rispetto alla precedente frequenza)
Nel complesso 100 - 16.000 Hz
(+) | suono nel complesso lineare (4.6% differenza dalla media)
Rispetto alla stessa classe
» 0% di tutti i dispositivi testati in questa classe è stato migliore, 0% simile, 100% peggiore
» Il migliore ha avuto un delta di 5%, medio di 17%, peggiore di 45%
Rispetto a tutti i dispositivi testati
» 0% di tutti i dispositivi testati in questa classe è stato migliore, 0% similare, 100% peggiore
» Il migliore ha avuto un delta di 4%, medio di 24%, peggiore di 134%
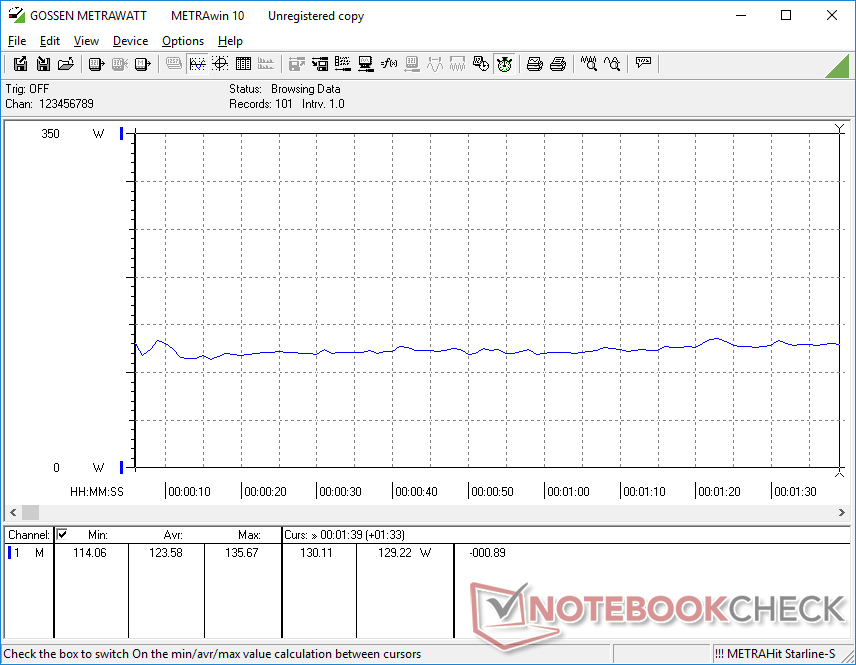
Gestione dell'energia - Mattone di potenza grassa ad alto consumo
Consumo di energia
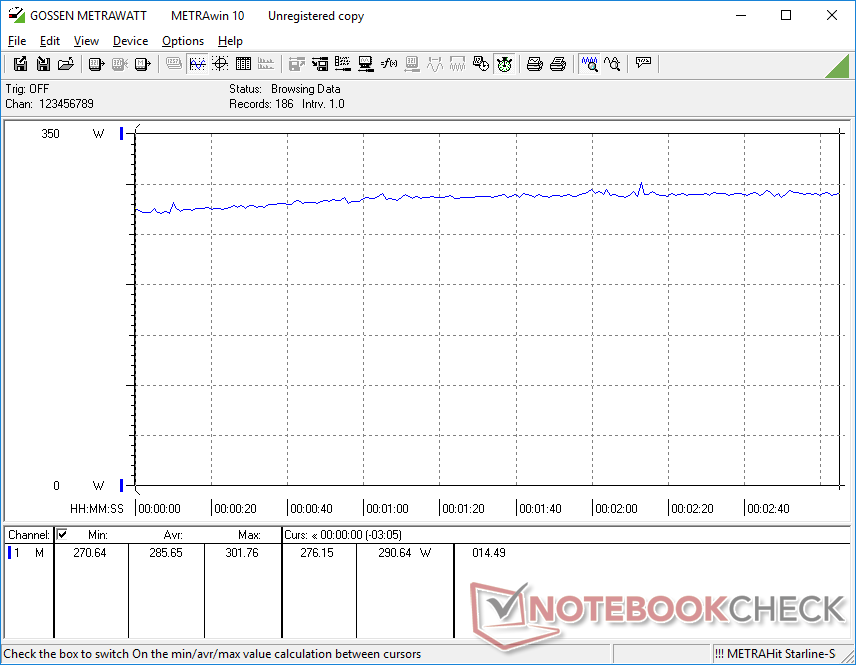
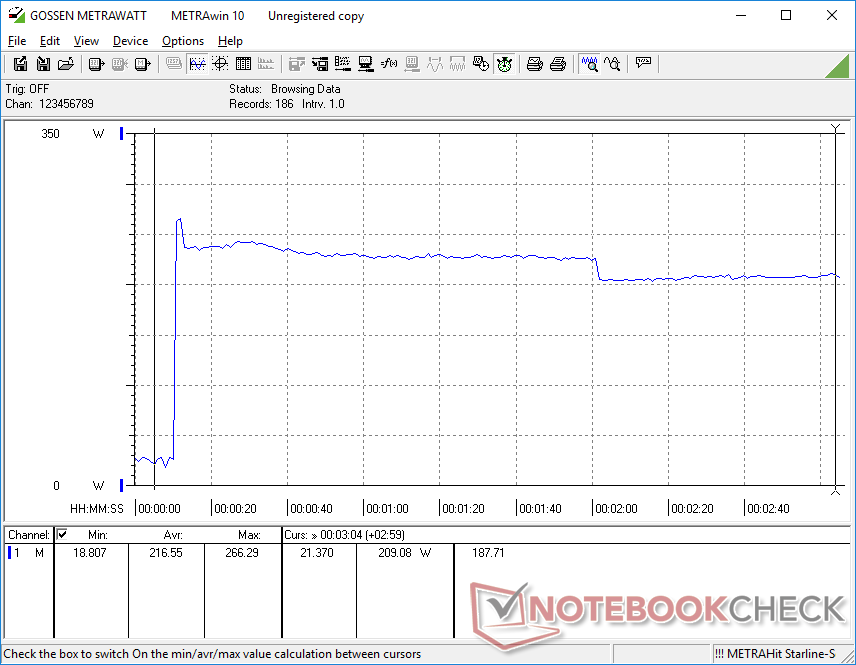
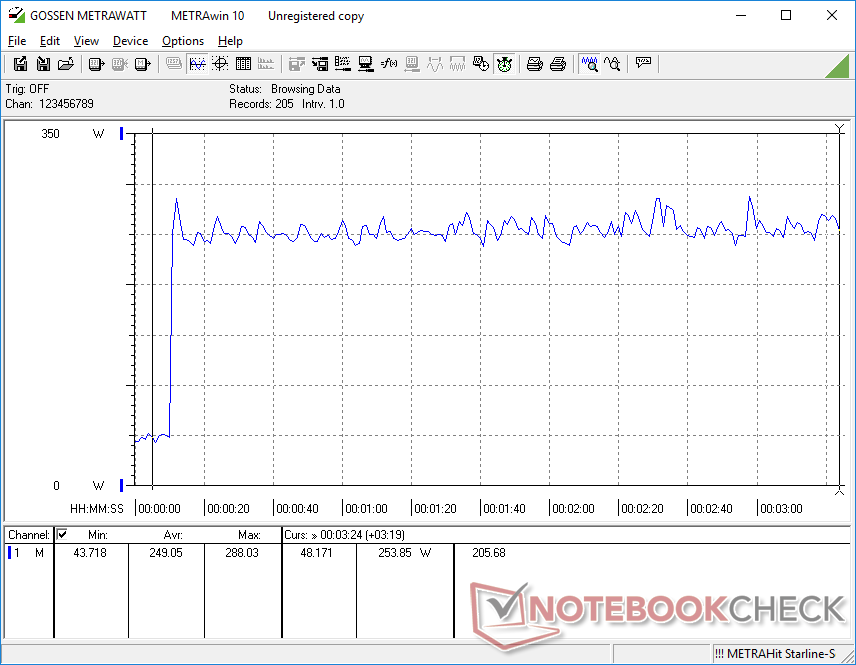
Il consumo energetico è ora ancora più elevato rispetto a quello dei laptop con CPU Intel di 12a generazione e GPU GeForce 30 di precedente generazione, che era già piuttosto elevato in partenza. Ad esempio, i giochi consumano 286 W rispetto ai 247 W del GE77. Le prestazioni della GPU per watt sono comunque migliori sulla serie GeForce 40, quindi almeno l'aumento del consumo è relativamente minore, tutto sommato.
L'esecuzione di Prime95 su un monitor esterno consumerebbe il 32% di energia in più rispetto al GE77 con carichi simili, per un aumento del 40-45% delle prestazioni grezze del processore. Le prestazioni della CPU per watt sono quindi appena superiori quando si passa dalla serie Core-H di 12a generazione a quella di 13a.
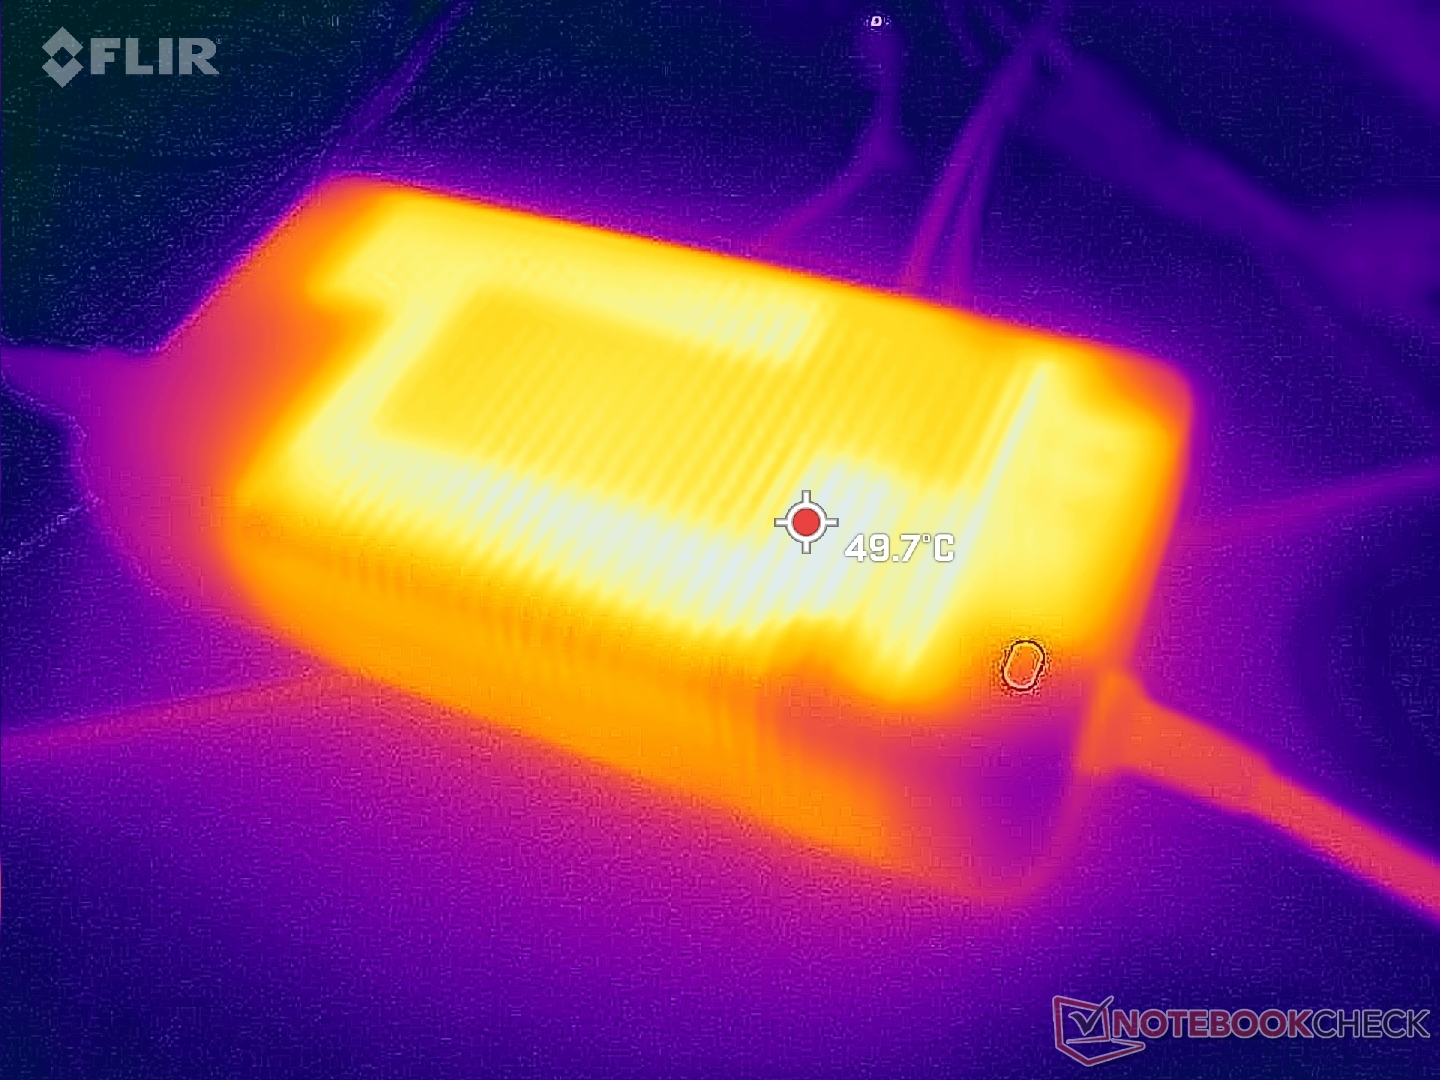
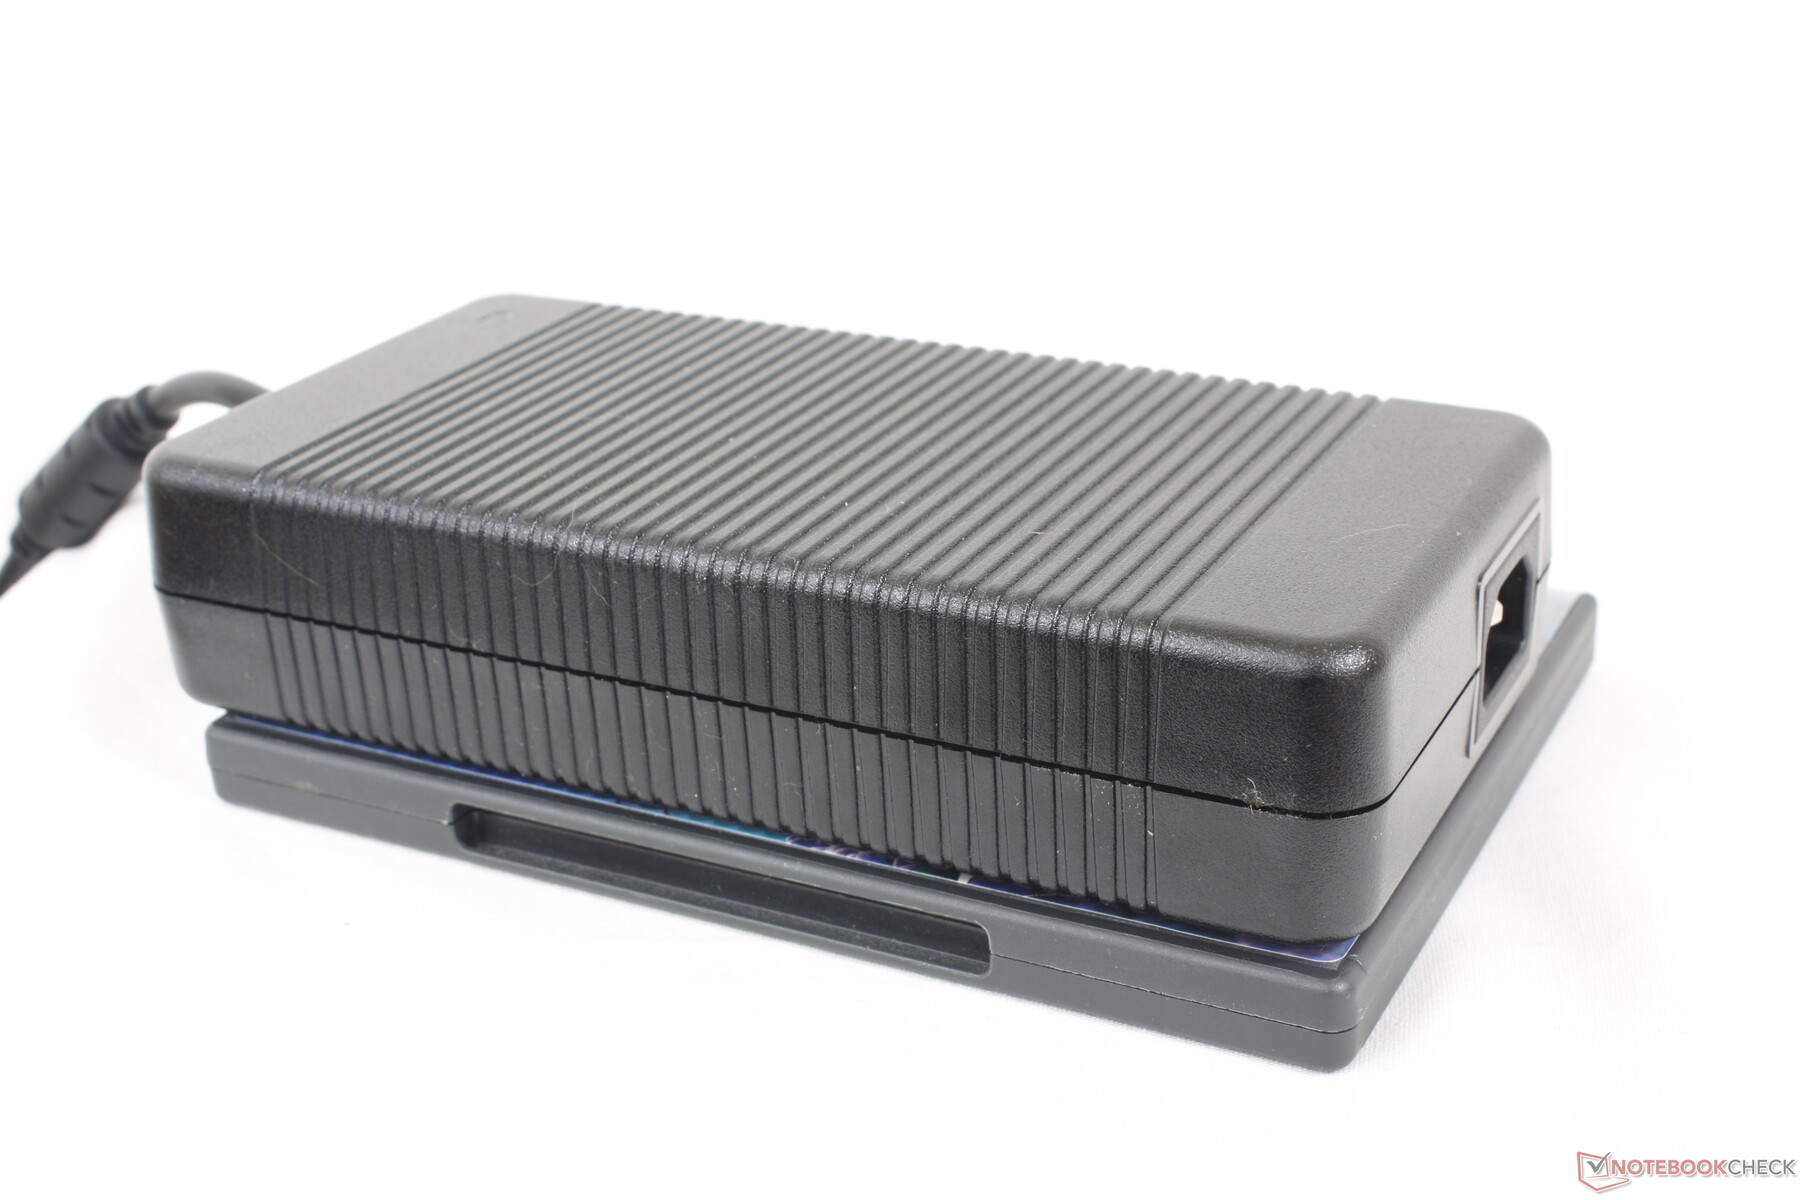
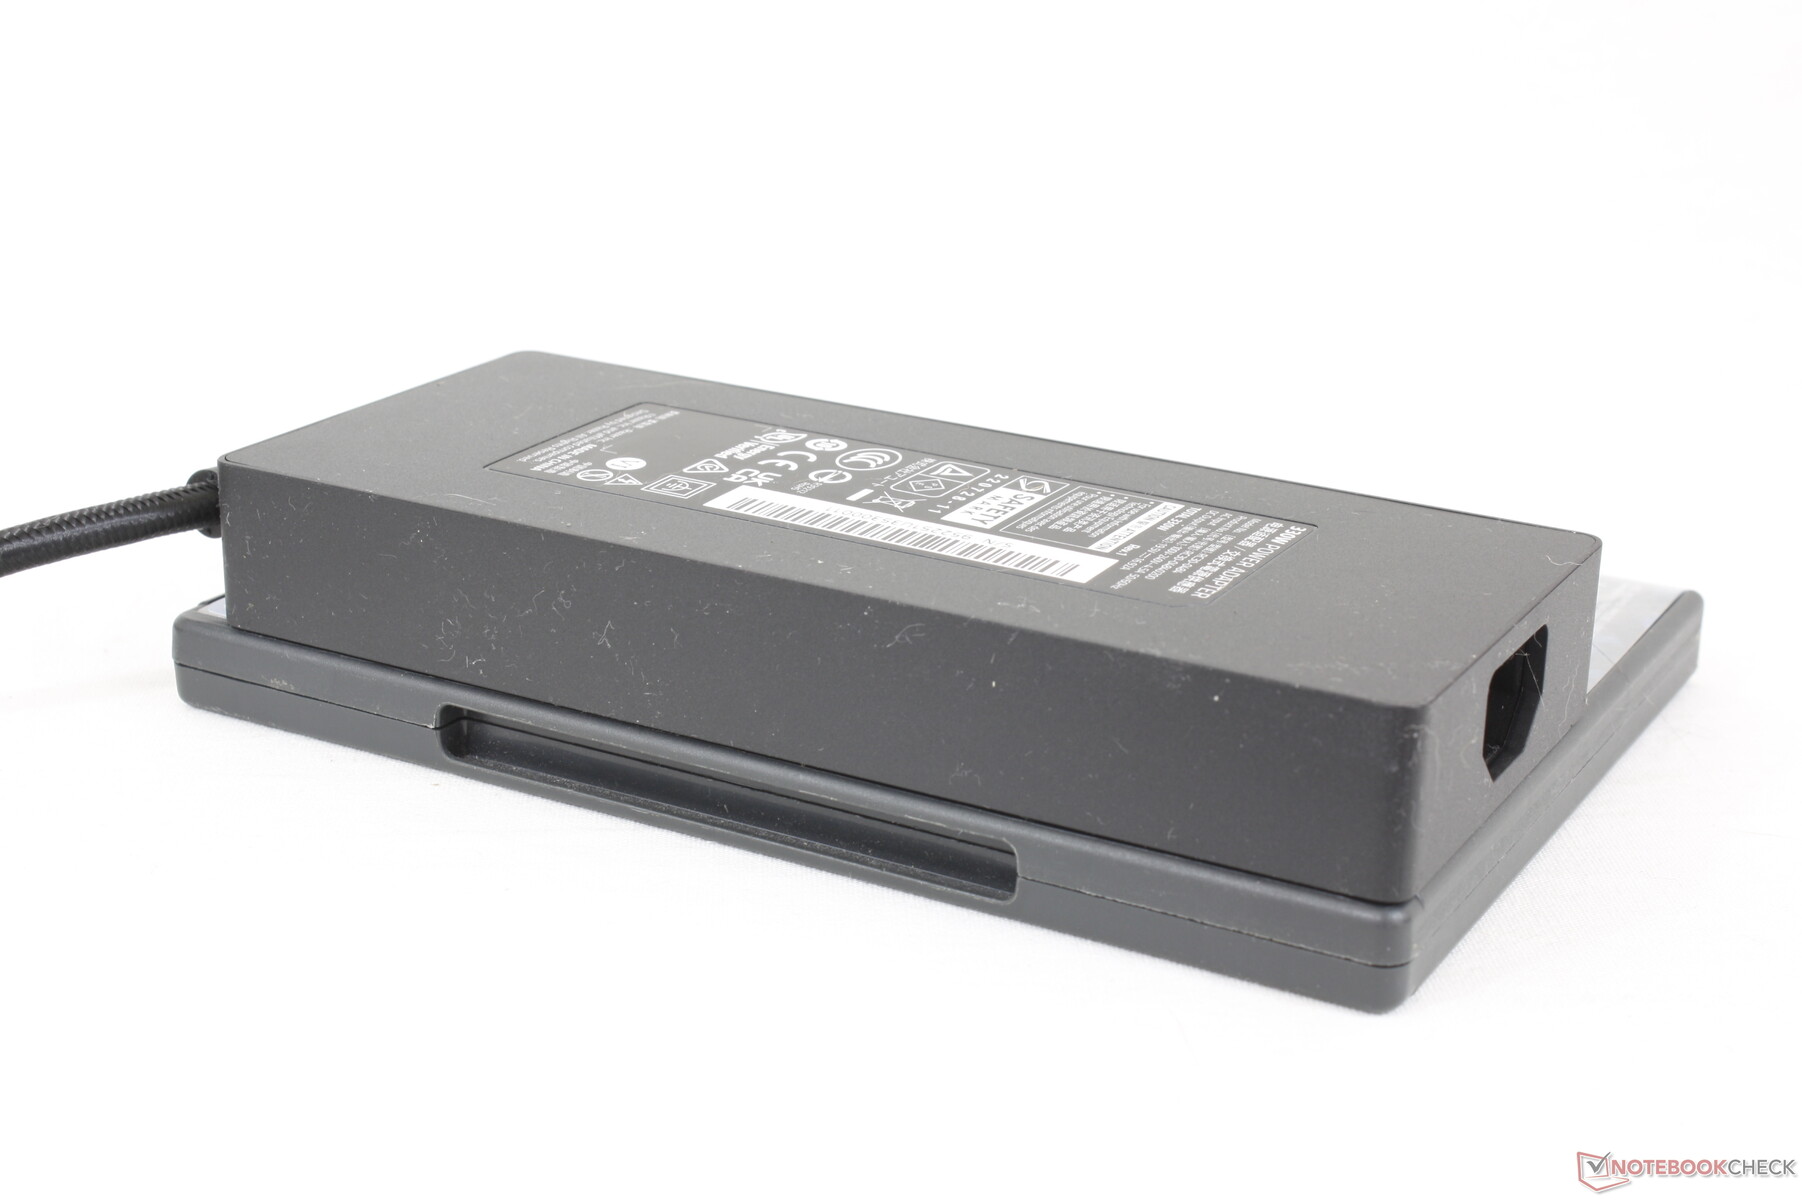
Siamo riusciti a registrare un consumo massimo temporaneo di 288 W dall'ingombrante (~19,9 x 9,8 x 4,2 cm) adattatore CA da 330 W quando la CPU e la GPU sono sottoposte a Prime95 e FurMark contemporaneamente. A differenza di Razer, MSI non è ancora passata alla ricarica GaN e quindi il suo alimentatore da 330 W è notevolmente più grande e più pesante della soluzione di Razer da 330 W.
| Off / Standby | |
| Idle | |
| Sotto carico |
|
Leggenda:
min: | |
| MSI GE78HX 13VH-070US i9-13950HX, GeForce RTX 4080 Laptop GPU, Samsung PM9A1 MZVL22T0HBLB, IPS, 2560x1600, 17" | Eluktronics Mech-17 GP2 i9-13900HX, GeForce RTX 4090 Laptop GPU, Samsung PM9A1 MZVL21T0HCLR, IPS, 2560x1600, 17" | Asus ROG Strix G17 G713PI R9 7945HX, GeForce RTX 4070 Laptop GPU, WD PC SN560 SDDPNQE-1T00, IPS, 2560x1440, 17.3" | MSI Titan GT77 HX 13VI i9-13950HX, GeForce RTX 4090 Laptop GPU, Samsung PM9A1 MZVL22T0HBLB, Mini-LED, 3840x2160, 17.3" | MSI Raider GE77 HX 12UHS i9-12900HX, GeForce RTX 3080 Ti Laptop GPU, Samsung PM9A1 MZVL22T0HBLB, IPS, 3840x2160, 17.3" | Razer Blade 17 Early 2022 i9-12900H, GeForce RTX 3080 Ti Laptop GPU, Samsung PM9A1 MZVL21T0HCLR, IPS, 3840x2160, 17.3" | |
|---|---|---|---|---|---|---|
| Power Consumption | 1% | 15% | 2% | 5% | 6% | |
| Idle Minimum * (Watt) | 16.1 | 14 13% | 15 7% | 14 13% | 13 19% | 17 -6% |
| Idle Average * (Watt) | 24 | 19.3 20% | 20 17% | 21.6 10% | 19 21% | 23 4% |
| Idle Maximum * (Watt) | 34 | 36.8 -8% | 29 15% | 24.8 27% | 29 15% | 34 -0% |
| Load Average * (Watt) | 123.6 | 117.2 5% | 121 2% | 122.5 1% | 143 -16% | 120 3% |
| Witcher 3 ultra * (Watt) | 286 | 304 -6% | 179.8 37% | 265 7% | 247 14% | 229 20% |
| Load Maximum * (Watt) | 285.7 | 342.5 -20% | 246 14% | 418 -46% | 352 -23% | 243 15% |
* ... Meglio usare valori piccoli
Power Consumption Witcher 3 / Stresstest
Power Consumption external Monitor
Durata della batteria
I tempi di esecuzione sono piuttosto buoni, considerando l'hardware esigente al suo interno. Siamo riusciti a registrare poco più di 6 ore di navigazione WLAN nel mondo reale con il profilo energetico Bilanciato e la iGPU attiva. Concorrenti come ilEluktronics Mech-17 GP2 o Asus ROG Strix G17 G713PI durano rispettivamente da una a due ore in meno in condizioni simili.
La ricarica da vuoto a pieno regime richiede circa 2,5 ore, un'ora in più rispetto alla maggior parte degli Ultrabook. Sebbene MSI dichiari che la ricarica PD è supportata, non siamo riusciti a caricare la nostra unità di prova tramite nessuna delle tre porte USB-C.
| MSI GE78HX 13VH-070US i9-13950HX, GeForce RTX 4080 Laptop GPU, 99 Wh | Eluktronics Mech-17 GP2 i9-13900HX, GeForce RTX 4090 Laptop GPU, 99 Wh | Asus ROG Strix G17 G713PI R9 7945HX, GeForce RTX 4070 Laptop GPU, 90 Wh | MSI Titan GT77 HX 13VI i9-13950HX, GeForce RTX 4090 Laptop GPU, 99.9 Wh | MSI Raider GE77 HX 12UHS i9-12900HX, GeForce RTX 3080 Ti Laptop GPU, 99.99 Wh | Razer Blade 17 Early 2022 i9-12900H, GeForce RTX 3080 Ti Laptop GPU, 82 Wh | |
|---|---|---|---|---|---|---|
| Autonomia della batteria | -16% | -32% | -10% | 19% | -9% | |
| Reader / Idle (h) | 7.3 | 9.8 34% | 7.1 -3% | |||
| WiFi v1.3 (h) | 6.1 | 5.1 -16% | 4.3 -30% | 5.3 -13% | 5.4 -11% | 3.8 -38% |
| Load (h) | 1.5 | 1 -33% | 1.4 -7% | 2 33% | 1.7 13% | |
| H.264 (h) | 2.8 | 6 | 6.5 | 4.8 | ||
| Witcher 3 ultra (h) | 1.1 |
Pro
Contro
Verdetto - Eccellente incremento delle prestazioni anno su anno
Dal punto di vista delle prestazioni, il GE78 offre un notevole incremento rispetto al GE77 a fronte di un consumo energetico leggermente superiore. Tuttavia, per poter usufruire dei vantaggi in termini di prestazioni, è necessario acquistare le configurazioni RTX 4080 o 4090, in quanto la RTX 4070 è più vicina in termini di prestazioni alla vecchia RTX 3080 Ti.
In termini di design, alcuni utenti potrebbero preferire il look minimalista 16:9 del vecchio GE77 rispetto al GE78 di ispirazione retrò 16:10 e viceversa. Non diremmo che uno sia migliore dell'altro in termini di estetica, ma daremo il vantaggio al GE78 per le sue cerniere più robuste e per i tasti e il clickpad più grandi.
L'MSI GE78 è un grande passo avanti rispetto al GE77 in termini di prestazioni. Alcune delle sue caratteristiche, tuttavia, sono carenti rispetto alla concorrenza, soprattutto se si considera la fascia di prezzo superiore ai 3000 dollari.
Speriamo che i problemi riscontrati sulla nostra unità non siano diffusi sulle unità di vendita al dettaglio. Il blocco al risveglio dal sonno, la forte perdita di luce e i problemi di latenza DPC sono problemi che non dovrebbero essere presenti su un modello costoso come il GE78. La mancanza di G-Sync, di Advanced Optimus e di una ricarica GaN più sottile è un altro aspetto negativo, se si considerano alternative come la serie Razer Blade Razer Blade razer Blade le offrono di default.
Prezzo e disponibilità
MSI GE78HX 13VH-070US
- 03/21/2023 v7 (old)
Allen Ngo
Transparency
La selezione dei dispositivi da recensire viene effettuata dalla nostra redazione. Il campione di prova è stato fornito all'autore come prestito dal produttore o dal rivenditore ai fini di questa recensione. L'istituto di credito non ha avuto alcuna influenza su questa recensione, né il produttore ne ha ricevuto una copia prima della pubblicazione. Non vi era alcun obbligo di pubblicare questa recensione. In quanto società mediatica indipendente, Notebookcheck non è soggetta all'autorità di produttori, rivenditori o editori.
Ecco come Notebookcheck esegue i test
Ogni anno, Notebookcheck esamina in modo indipendente centinaia di laptop e smartphone utilizzando procedure standardizzate per garantire che tutti i risultati siano comparabili. Da circa 20 anni sviluppiamo continuamente i nostri metodi di prova e nel frattempo stabiliamo gli standard di settore. Nei nostri laboratori di prova, tecnici ed editori esperti utilizzano apparecchiature di misurazione di alta qualità. Questi test comportano un processo di validazione in più fasi. Il nostro complesso sistema di valutazione si basa su centinaia di misurazioni e parametri di riferimento ben fondati, che mantengono l'obiettività.Price comparison

