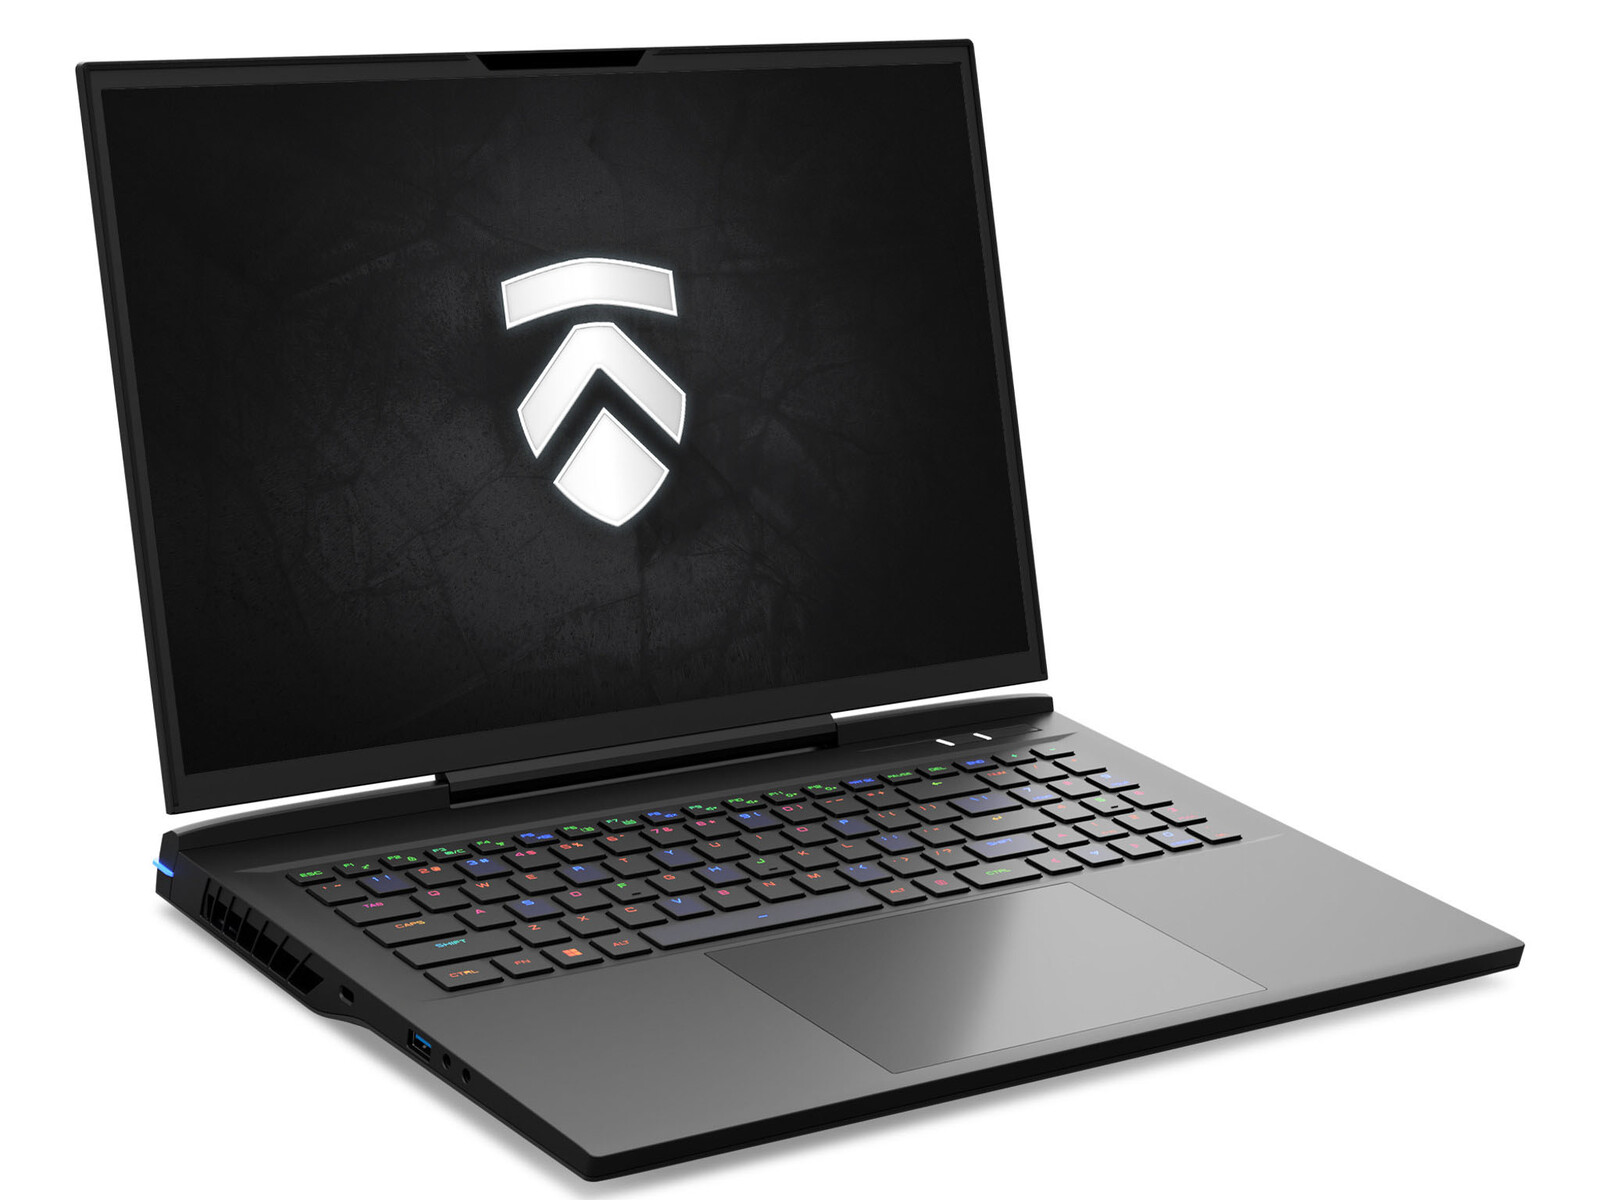
Recensione del portatile Mech-17 GP2 di Eluktronics: MSI GT77 Titan: prestazioni senza dimensioni
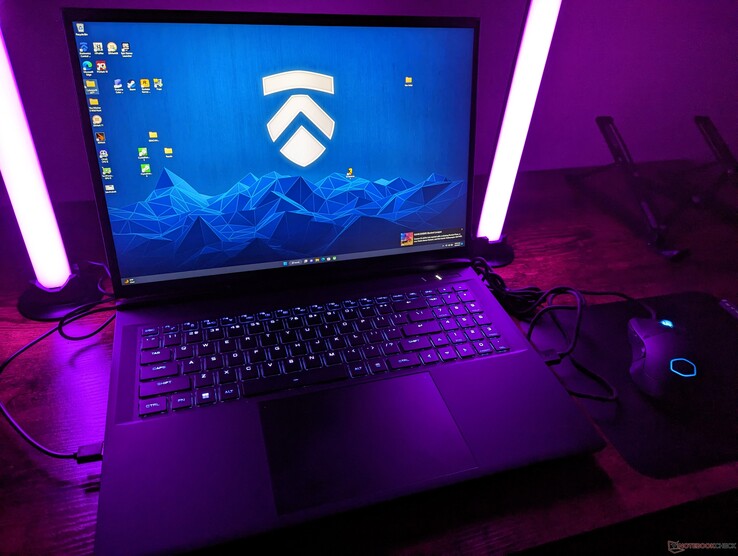
Il Mech-17 GP2 di Eluktronics sostituisce il Mech-17 GP dello scorso anno, sostituendo le opzioni Intel 12th gen e Nvidia Ampere rispettivamente con Intel 13th gen e Nvidia Ada Lovelace. Si distingue per l'offerta di CPU Core serie HX e di grafica GeForce RTX 4090 da 175 W, nonostante l'ingombro ridotto rispetto ad altri portatili da gioco da 17 pollici.
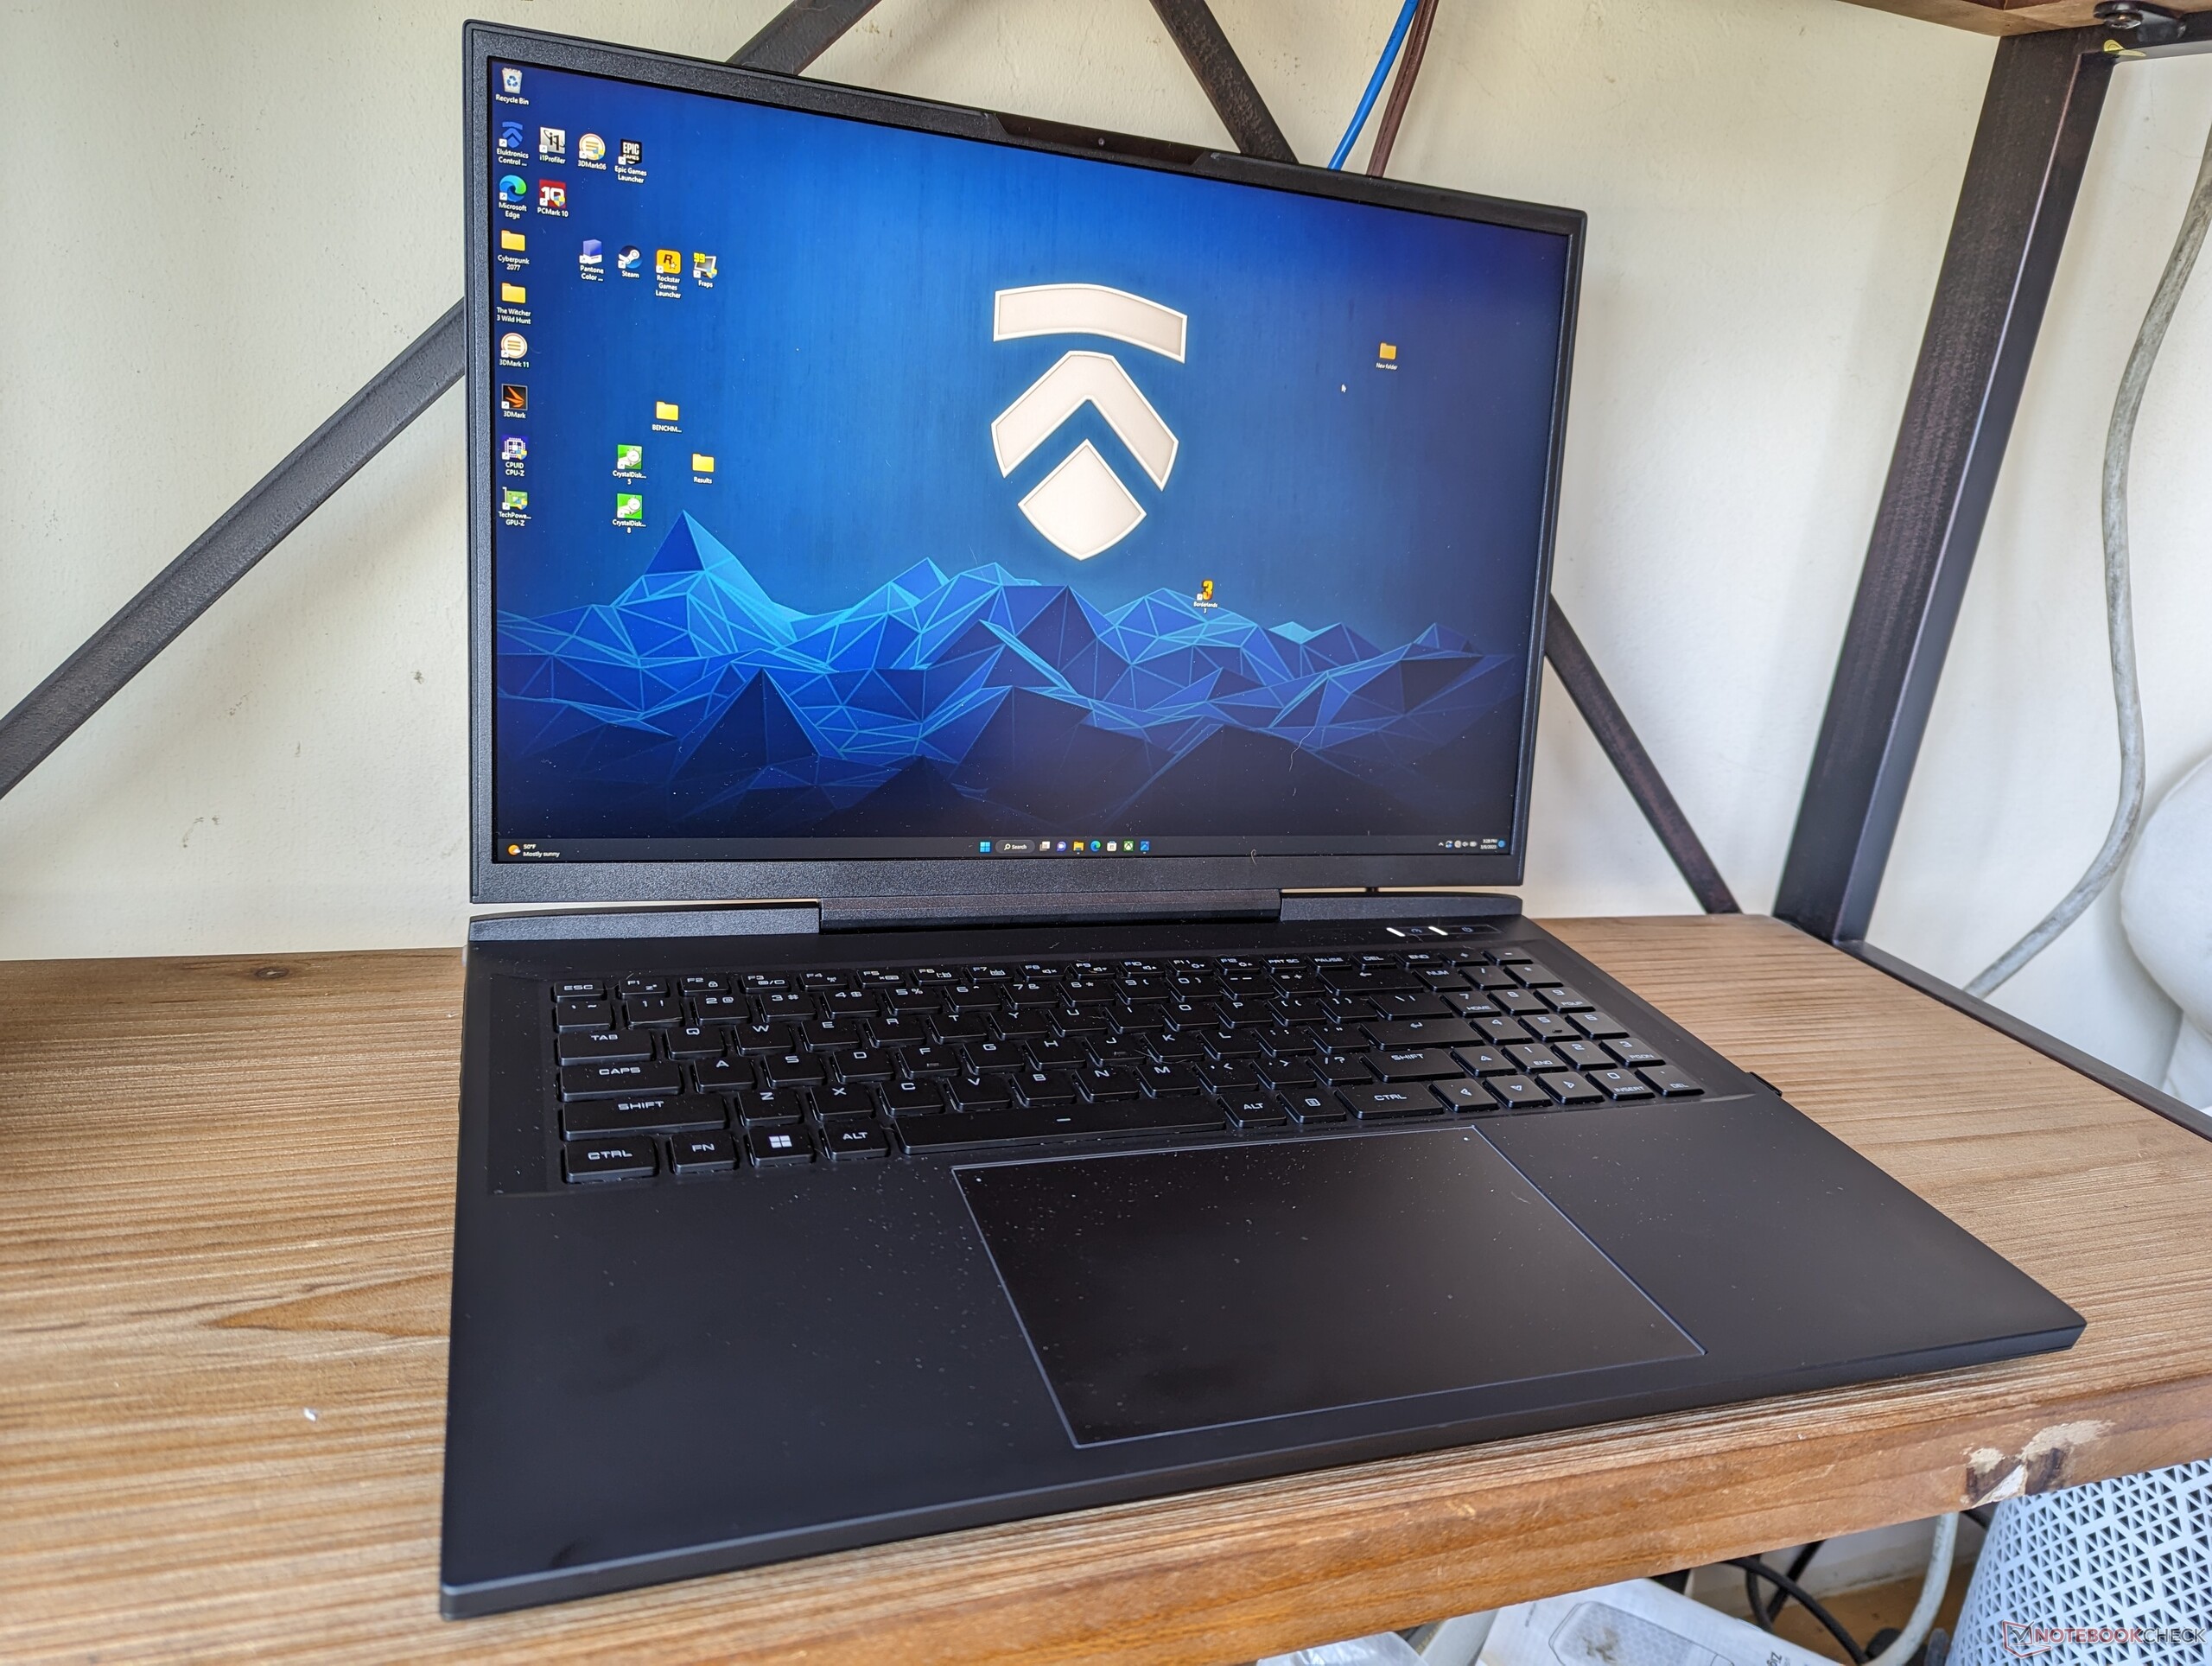
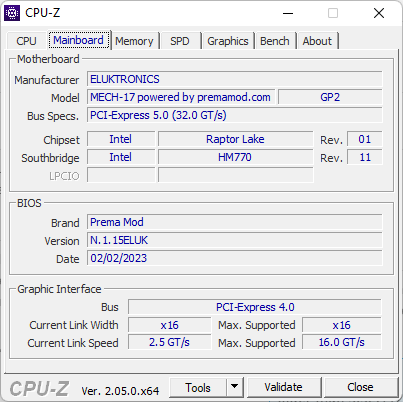
Il Mech-17 GP2 è basato su una versione aggiornata dello Schenker Neo 17 M22 progettato da Uniwill lo scorso anno. Si tratta essenzialmente del Neo 17 E23, ma con il marchio Eluktronics. Quest'anno sono state apportate diverse modifiche importanti alla scheda madre, che illustreremo in dettaglio nelle nostre analisi qui di seguito. Per il resto, il design esterno rimane identico e quindi vi consigliamo di consultare la nostra recensione di Schenker Neo 17 M22 per saperne di più sulle caratteristiche fisiche del Mech-17 GP2.
La nostra configurazione è stata completamente configurata con Core i9-13900HX e RTX 4090 per circa 3400 dollari. Sono disponibili SKU inferiori fino alla RTX 4070, ma tutte le opzioni hanno la stessa CPU e lo stesso display IPS da 240 Hz 2560 x 1600.
Le alternative al Mech-17 GP2 includono altri portatili da gioco di fascia alta da 17 pollici come Razer Blade 17, Alienware m17 R5, Asus Zephyrus S17, o MSI Titan GT77.
Altre recensioni di Eluktronics:
Potenziali concorrenti a confronto
Punteggio | Data | Modello | Peso | Altezza | Dimensione | Risoluzione | Prezzo |
|---|---|---|---|---|---|---|---|
| 89.9 % v7 (old) | 03/2023 | Eluktronics Mech-17 GP2 i9-13900HX, GeForce RTX 4090 Laptop GPU | 2.9 kg | 27 mm | 17.00" | 2560x1600 | |
| 87.6 % v7 (old) | 09/2022 | Schenker XMG Neo 17 M22 R9 6900HX, GeForce RTX 3080 Ti Laptop GPU | 2.8 kg | 27 mm | 17.00" | 2560x1600 | |
| 82.1 % v7 (old) | 02/2023 | MSI Katana 17 B13VFK i7-13620H, GeForce RTX 4060 Laptop GPU | 2.8 kg | 25.2 mm | 17.30" | 1920x1080 | |
| 89 % v7 (old) | 02/2023 | MSI Titan GT77 HX 13VI i9-13950HX, GeForce RTX 4090 Laptop GPU | 3.5 kg | 23 mm | 17.30" | 3840x2160 | |
| 86.1 % v7 (old) | 01/2023 | Alienware m17 R5 (R9 6900HX, RX 6850M XT) R9 6900HX, Radeon RX 6850M XT | 3.4 kg | 26.7 mm | 17.00" | 3840x2160 | |
| 91.4 % v7 (old) | 02/2023 | Razer Blade 18 RTX 4070 i9-13950HX, GeForce RTX 4070 Laptop GPU | 3 kg | 21.9 mm | 18.00" | 2560x1600 |
Caso
Lettore di schede SD
Il lettore di schede SD è lento rispetto al prezzo elevato del modello. Il Razer Blade 18 e la Dell XPS hanno lettori di schede da 2 a 3 volte più veloci.
| SD Card Reader | |
| average JPG Copy Test (av. of 3 runs) | |
| Razer Blade 18 RTX 4070 (Angelibird AV Pro V60) | |
| MSI Titan GT77 HX 13VI (Angelibird AV Pro V60) | |
| Eluktronics Mech-17 GP2 (Angelibird AV Pro V60) | |
| Schenker XMG Neo 17 M22 (AV PRO microSD 128 GB V60) | |
| maximum AS SSD Seq Read Test (1GB) | |
| Razer Blade 18 RTX 4070 (Angelibird AV Pro V60) | |
| Eluktronics Mech-17 GP2 (Angelibird AV Pro V60) | |
| MSI Titan GT77 HX 13VI (Angelibird AV Pro V60) | |
Comunicazione
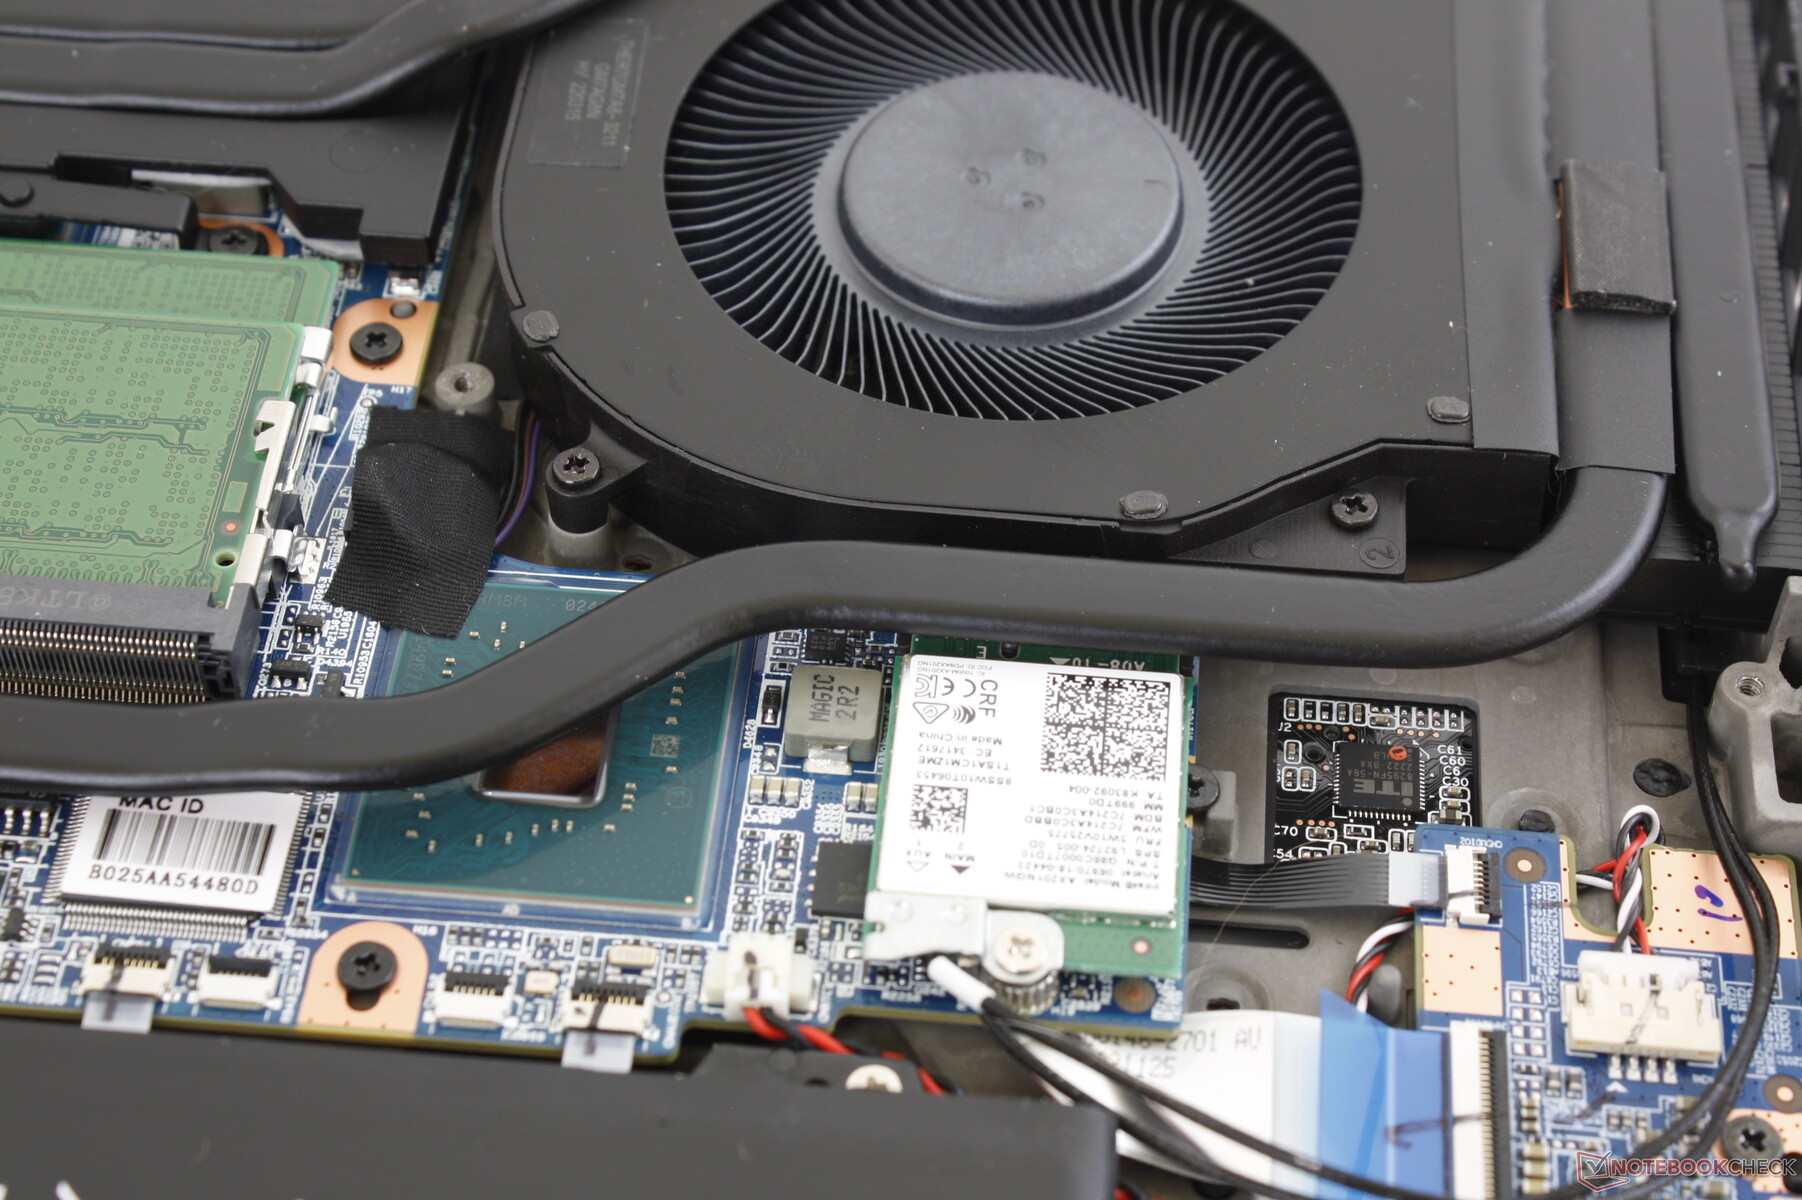
Un Intel AX201 è fornito di serie per la connettività Wi-Fi 6 e Bluetooth 5.2. Tuttavia, ci aspettavamo un AX210/211 per una maggiore velocità del Wi-Fi 6E, considerando il prezzo del sistema.
| Networking | |
| iperf3 transmit AXE11000 | |
| MSI Titan GT77 HX 13VI | |
| MSI Katana 17 B13VFK | |
| Eluktronics Mech-17 GP2 | |
| Razer Blade 18 RTX 4070 | |
| Alienware m17 R5 (R9 6900HX, RX 6850M XT) | |
| Schenker XMG Neo 17 M22 | |
| iperf3 receive AXE11000 | |
| MSI Katana 17 B13VFK | |
| MSI Titan GT77 HX 13VI | |
| Razer Blade 18 RTX 4070 | |
| Eluktronics Mech-17 GP2 | |
| Alienware m17 R5 (R9 6900HX, RX 6850M XT) | |
| Schenker XMG Neo 17 M22 | |
| iperf3 transmit AXE11000 6GHz | |
| Razer Blade 18 RTX 4070 | |
| iperf3 receive AXE11000 6GHz | |
| Razer Blade 18 RTX 4070 | |
Webcam
La webcam FHD da 2 MP e l'IR sono di serie per il supporto di Hello. Tuttavia, non c'è un interruttore per la privacy o un'opzione per l'otturatore.


Manutenzione
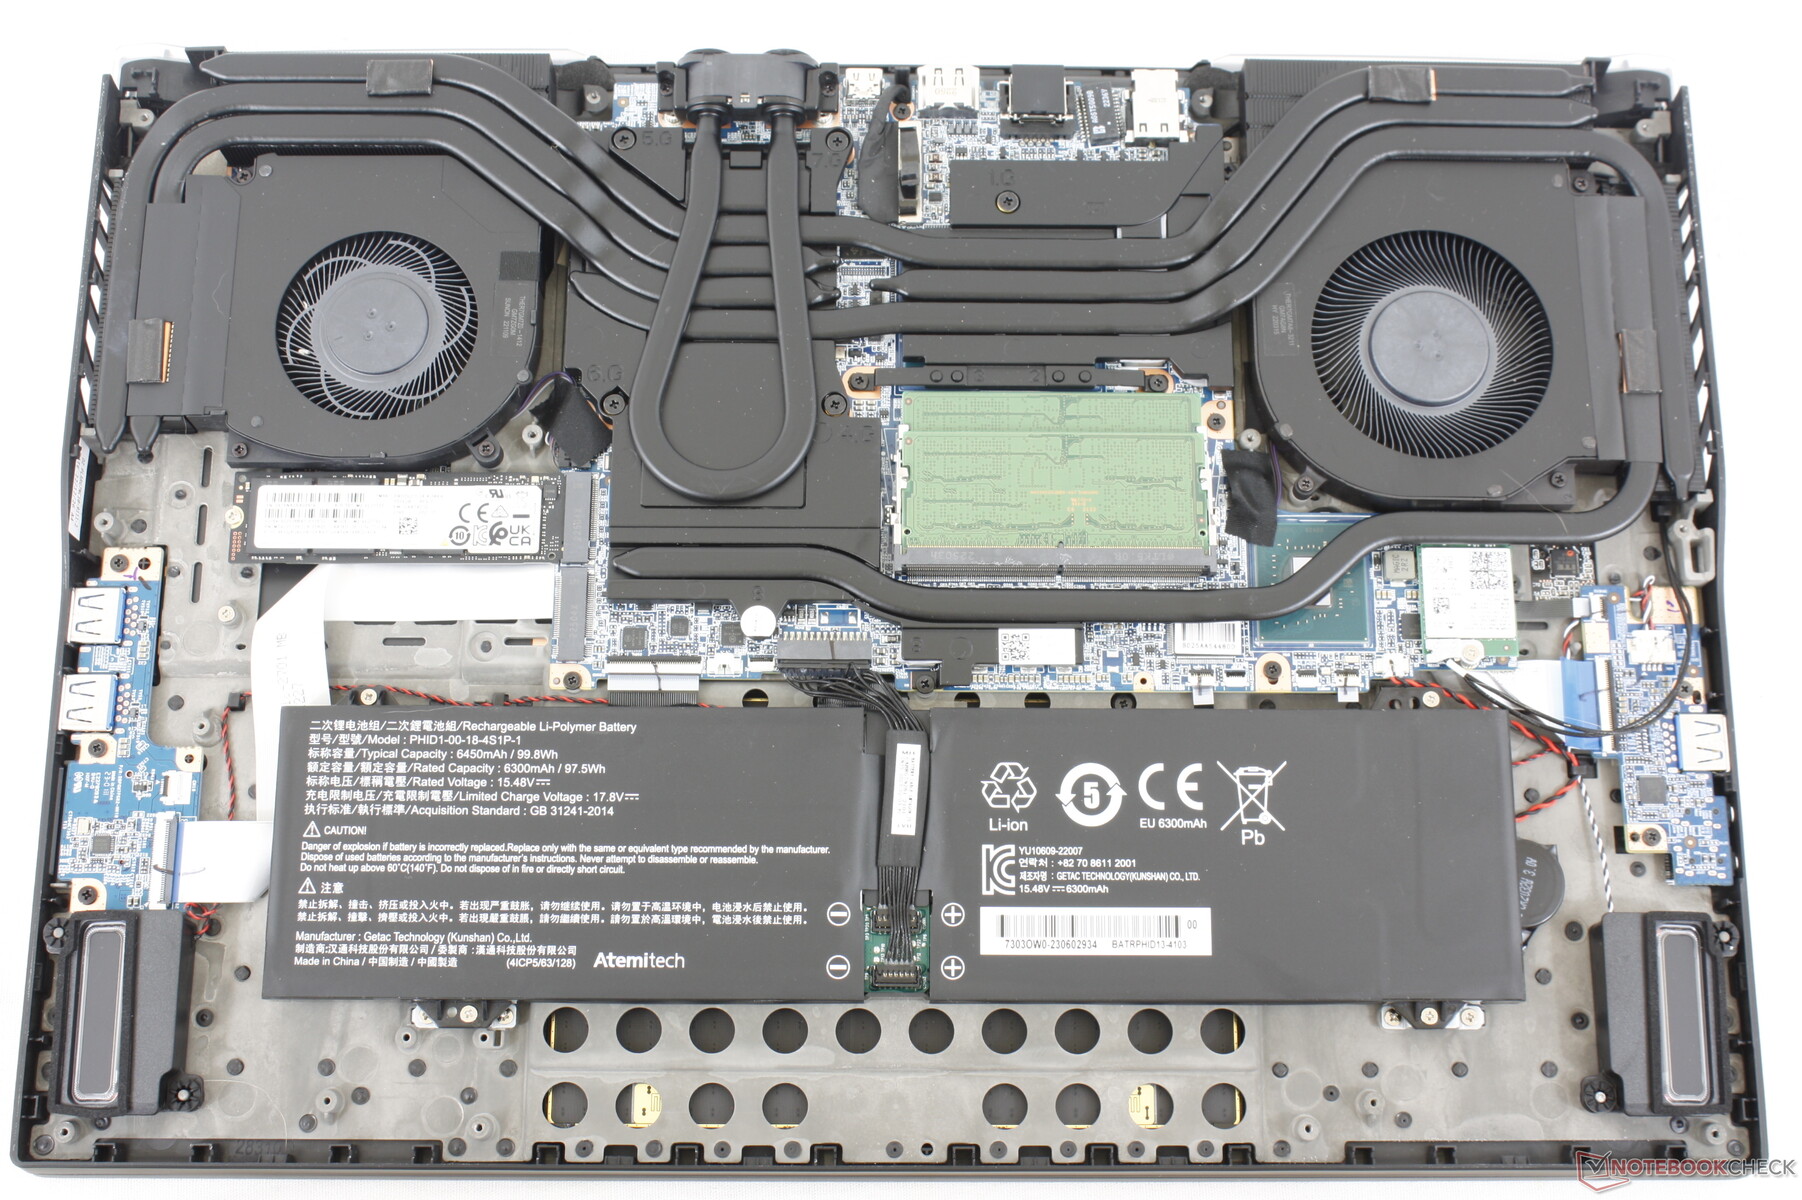
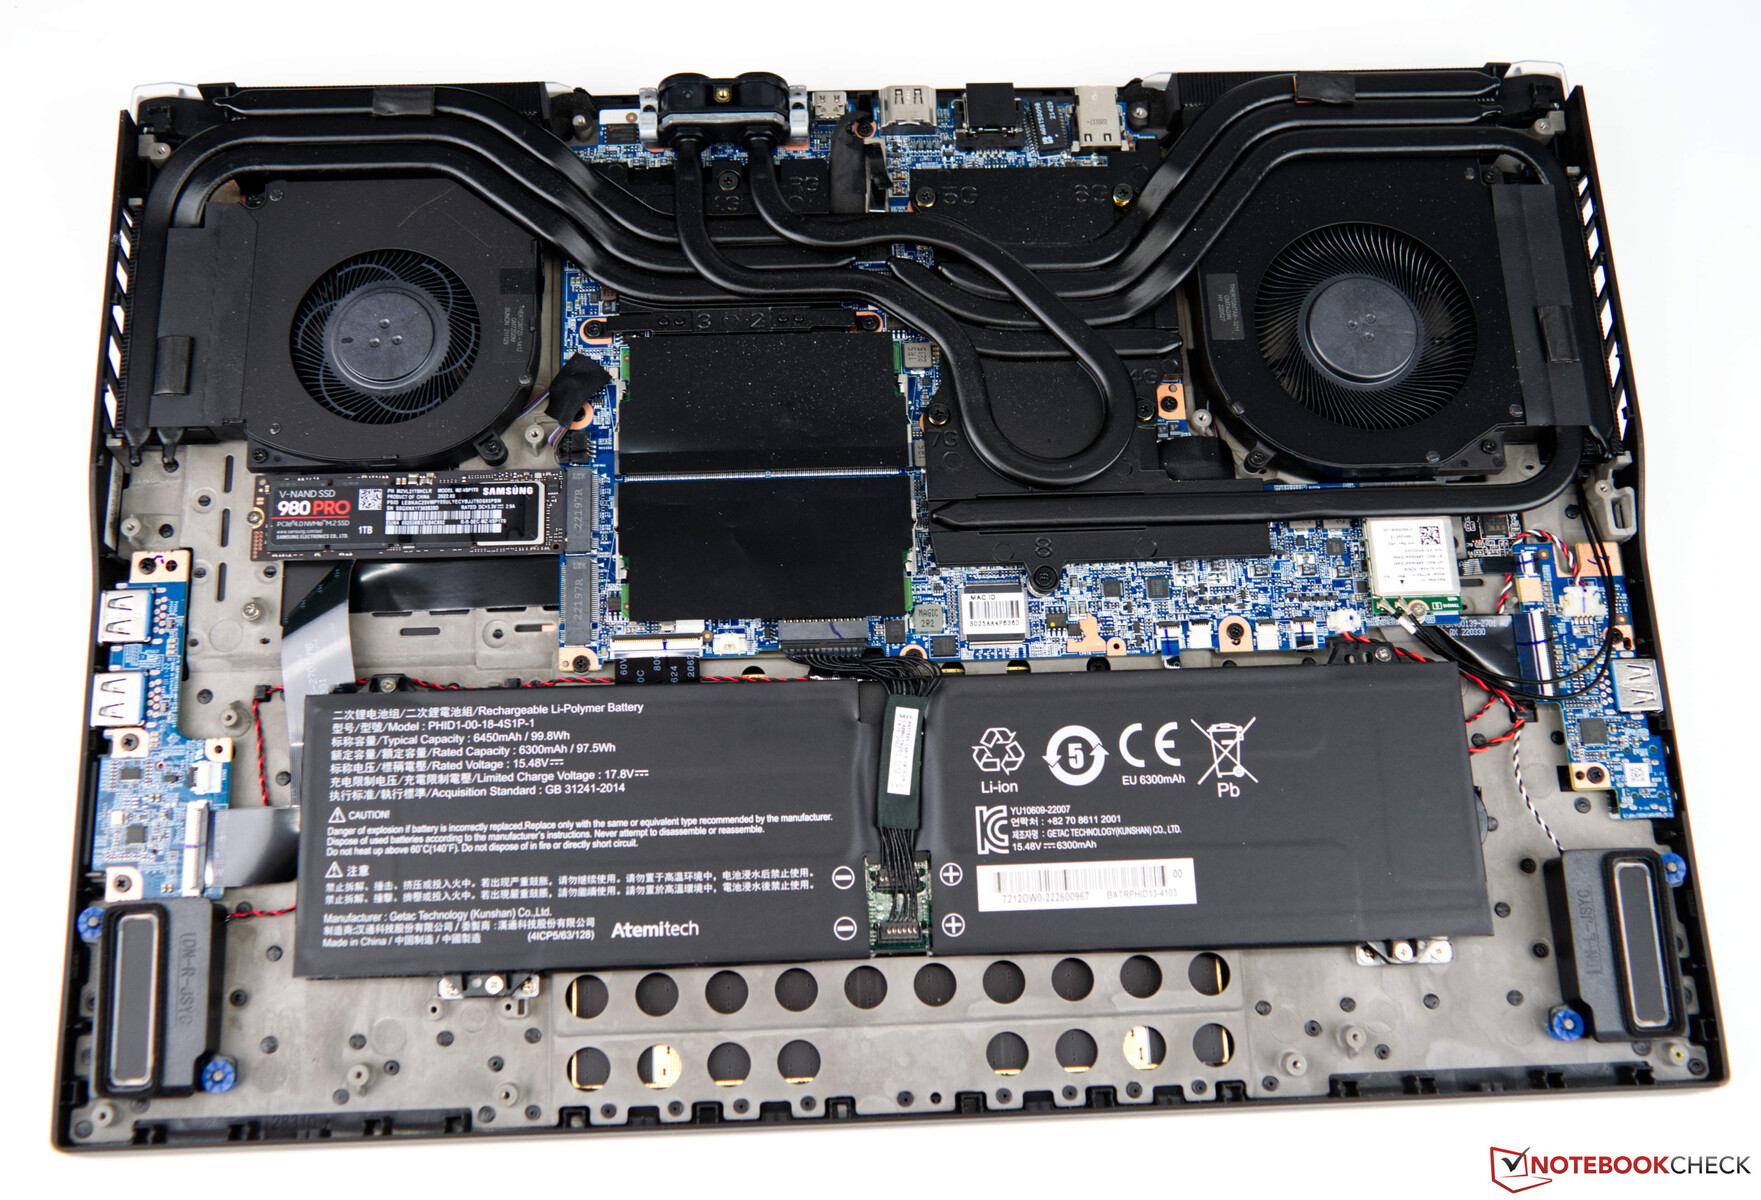
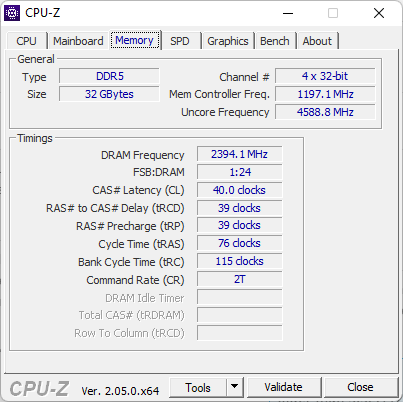
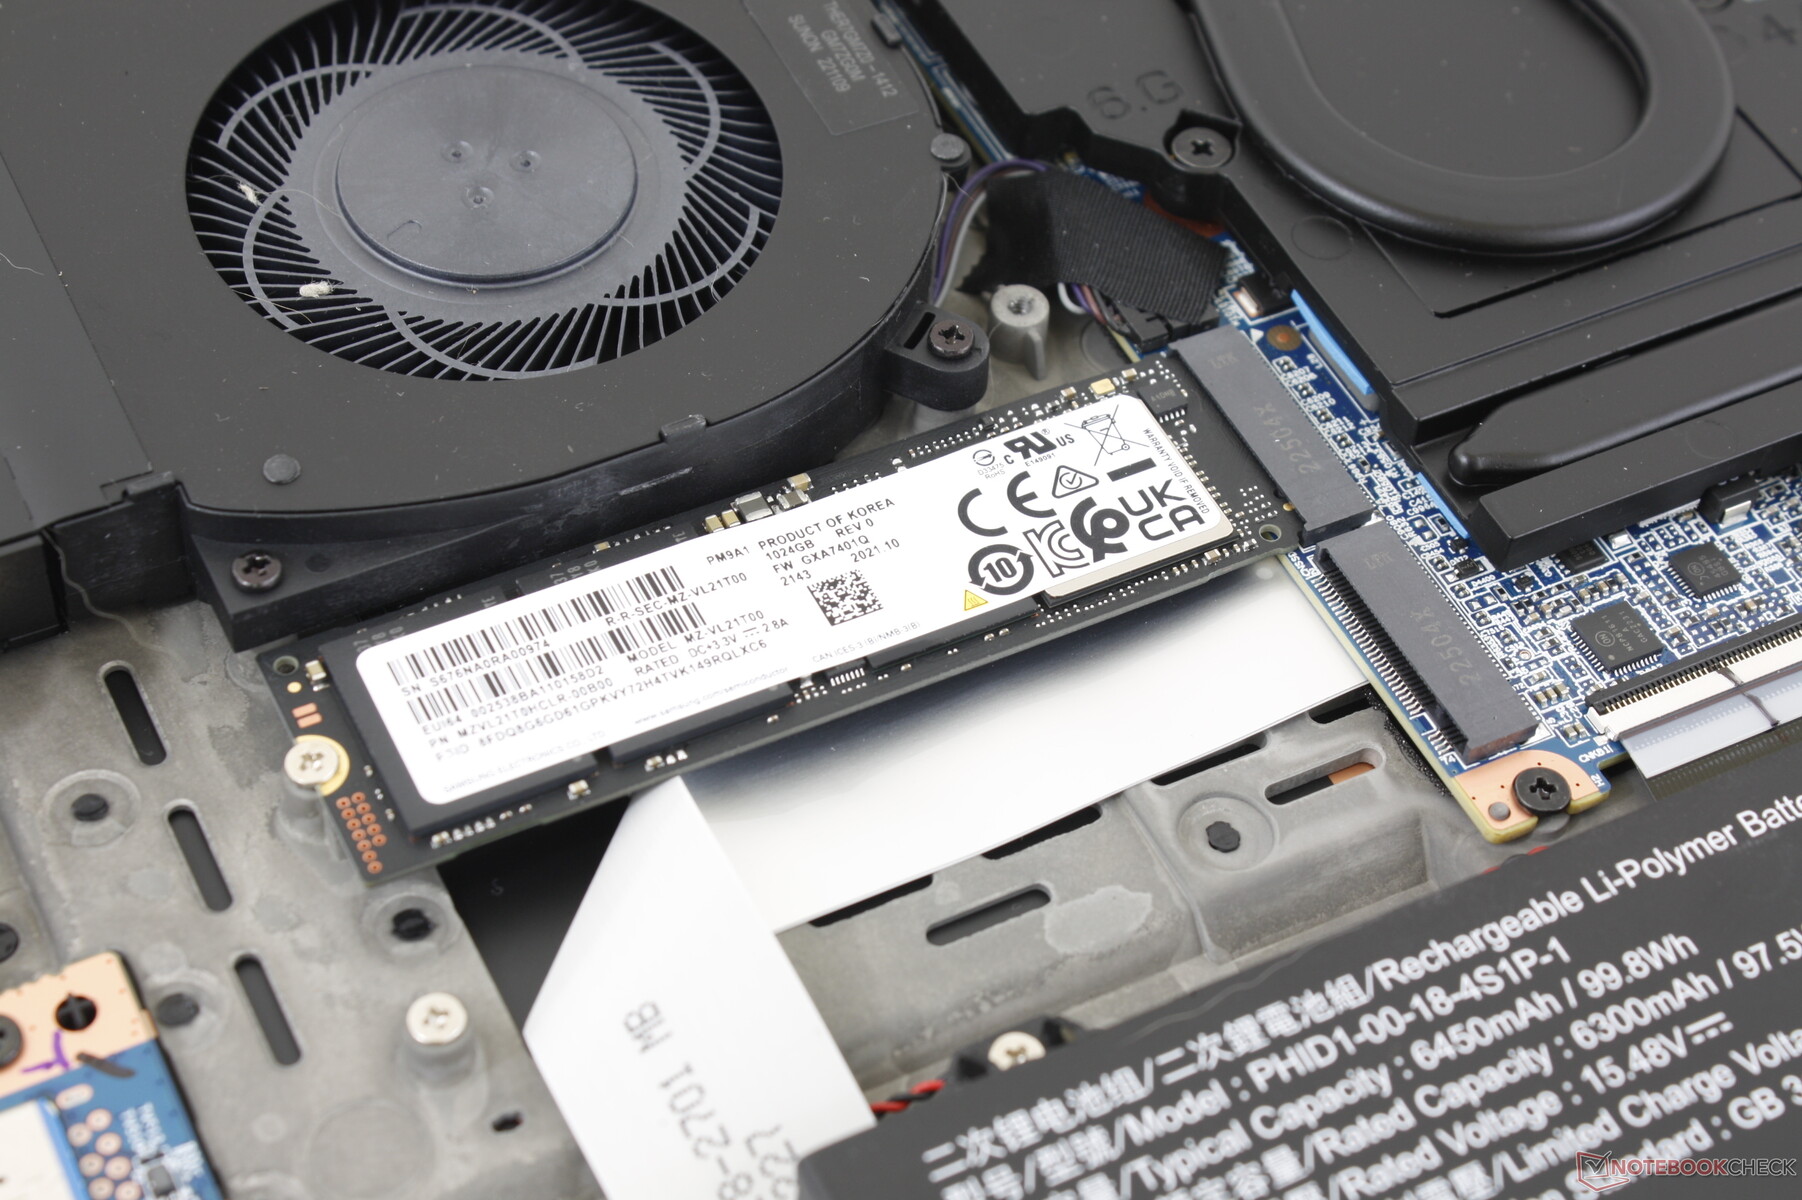
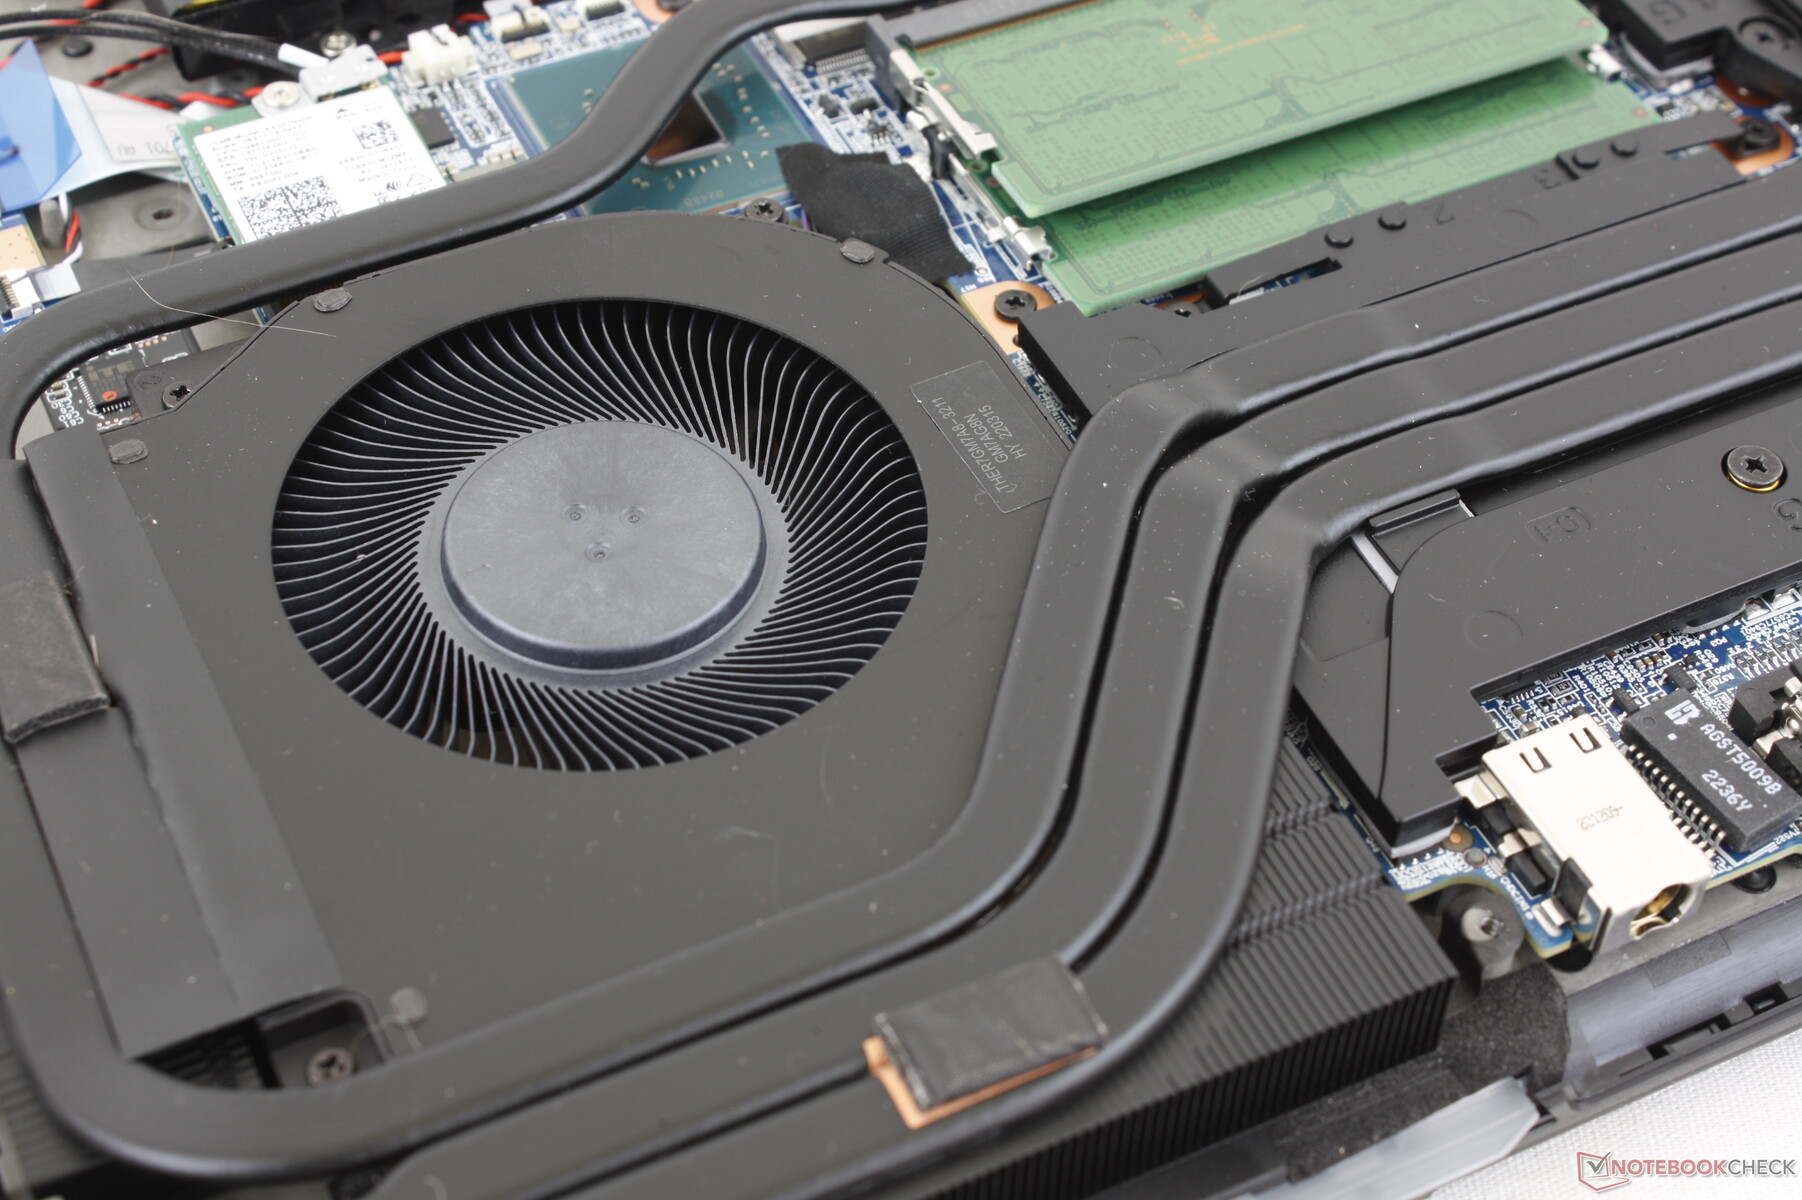
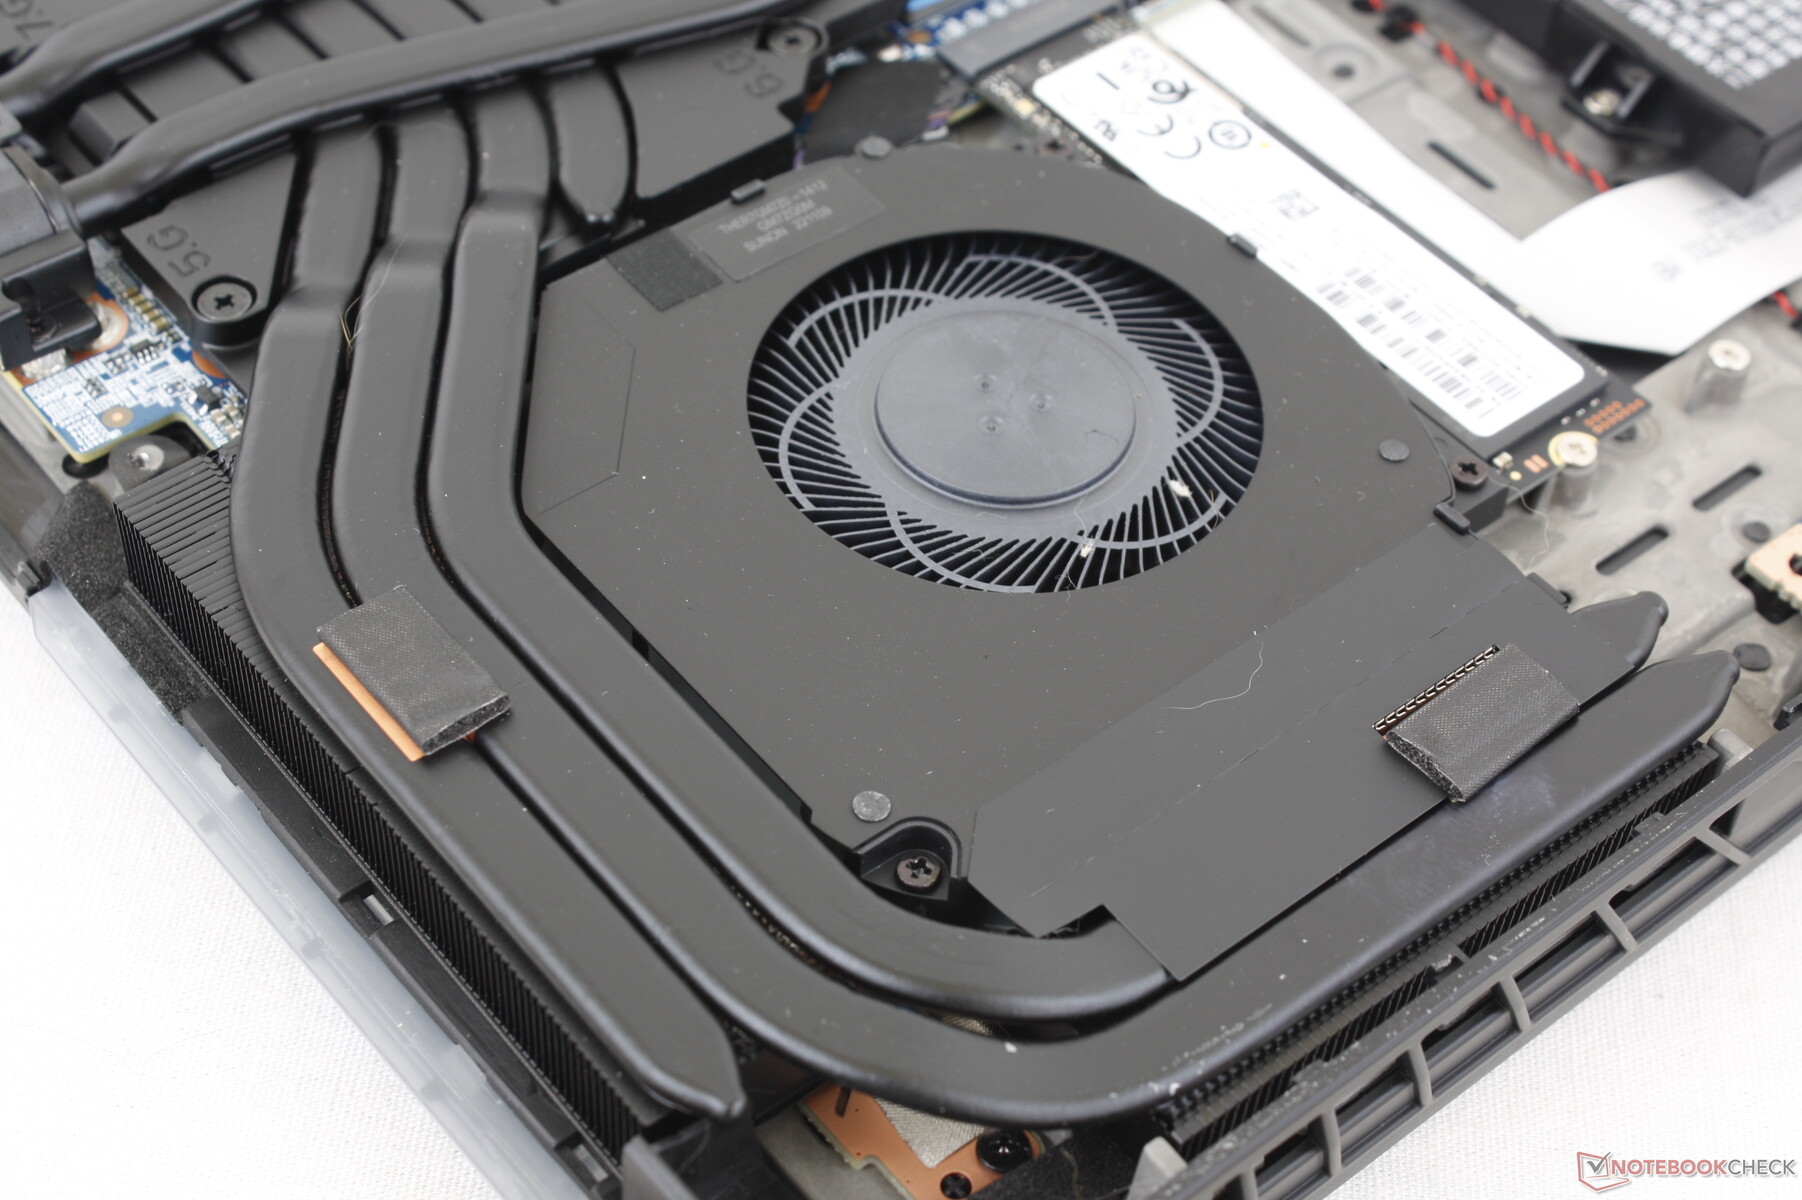
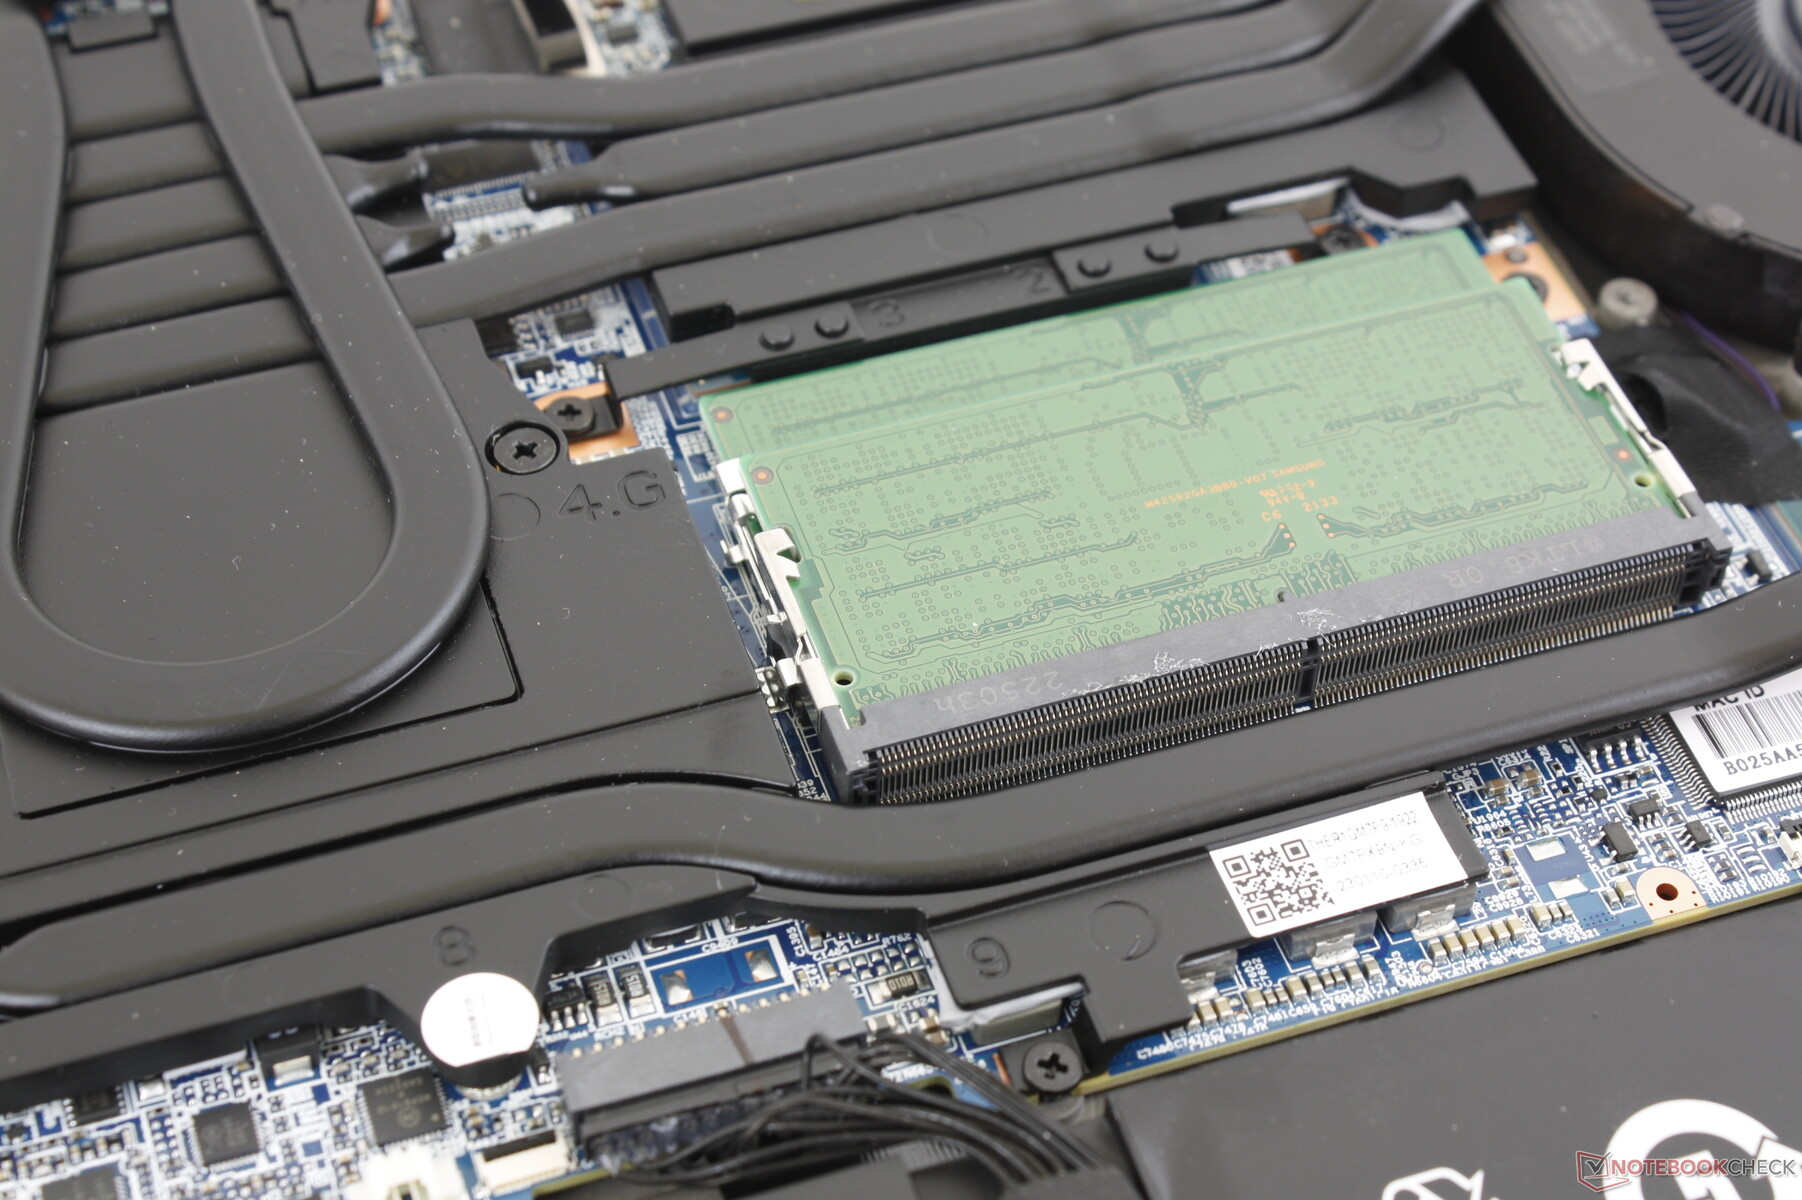
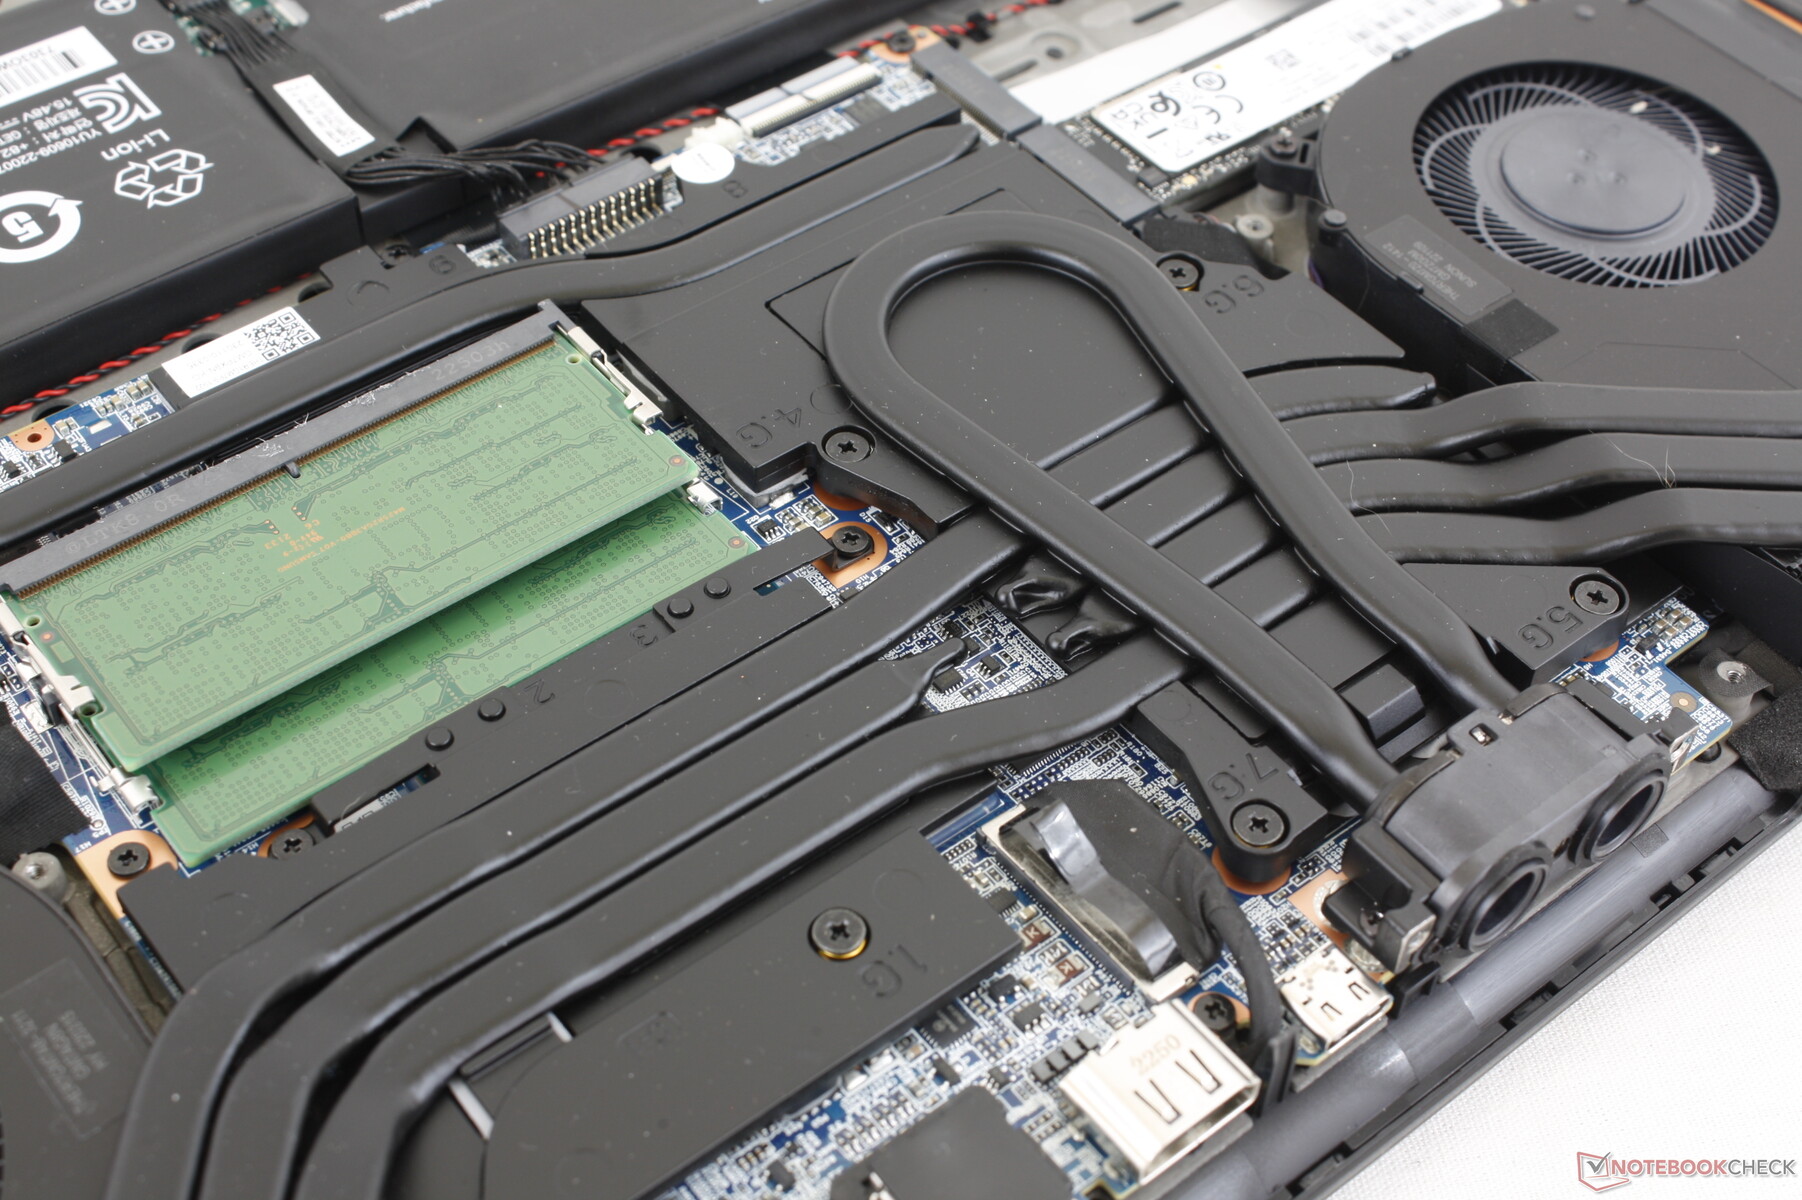
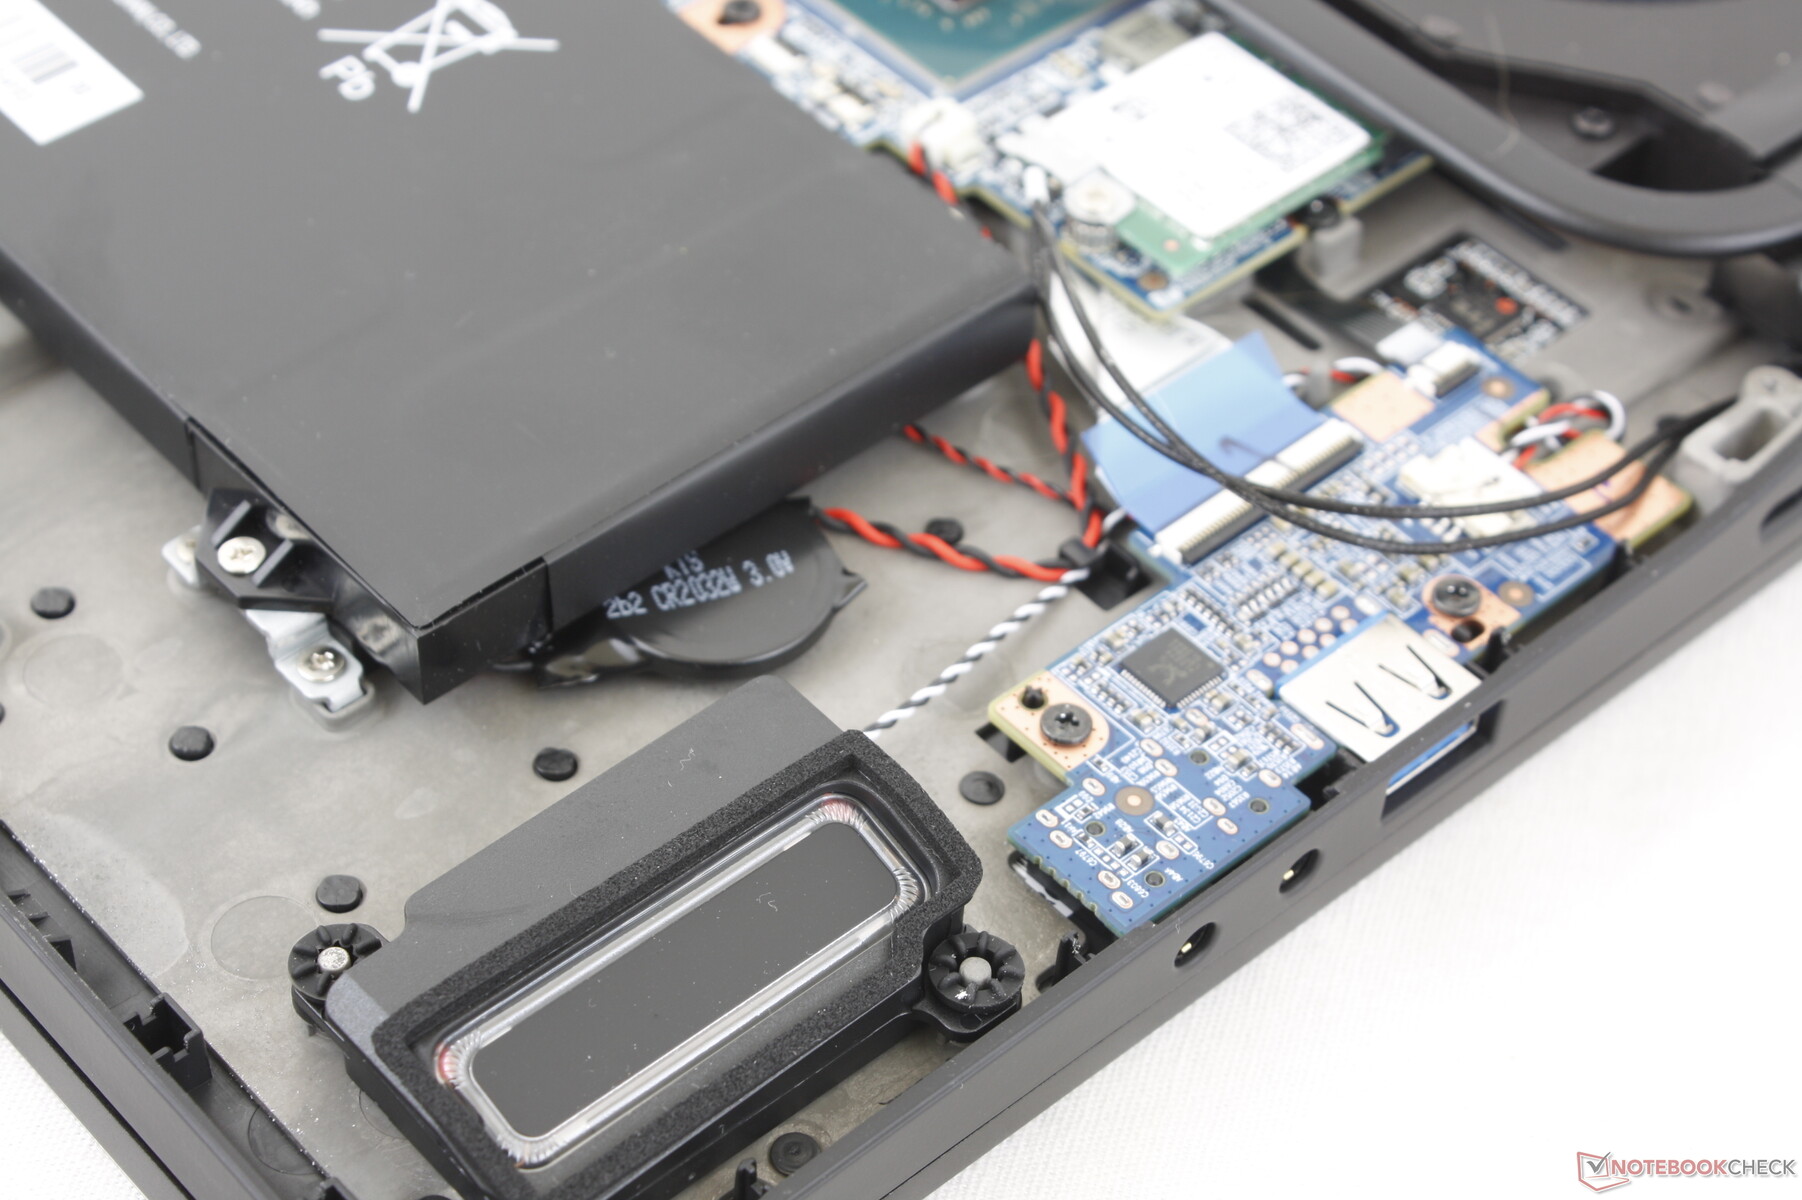
Il pannello inferiore è fissato da 14 viti Philips per facilitare la manutenzione. Il produttore ha rivisto i componenti interni rispetto al modello dello scorso anno, come mostrato di seguito, anche se il design esterno rimane identico. I due moduli RAM sono ora impilati per risparmiare spazio sulla scheda madre, mentre la CPU e la GPU hanno cambiato posizione.
Accessori e garanzia
La confezione non contiene altri extra oltre all'adattatore CA e alla documentazione cartacea. Il modello è compatibile con il radiatore esterno opzionale Liquid Propulsion Package (LPP G2) di seconda generazione.
La garanzia limitata standard del produttore è di un anno. L'upgrade a tre anni è disponibile con un sovrapprezzo di 250 dollari.
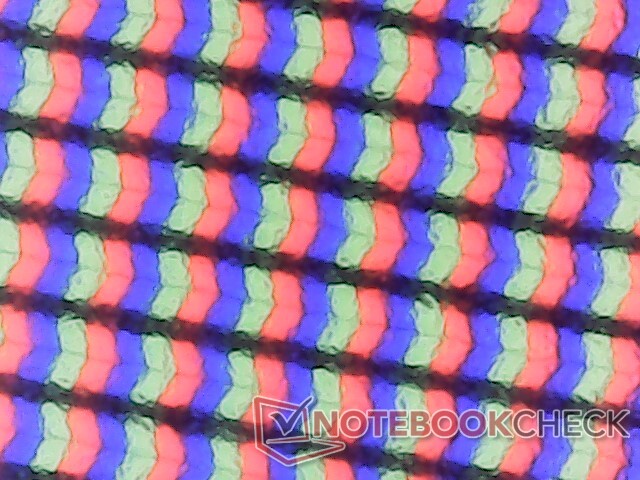
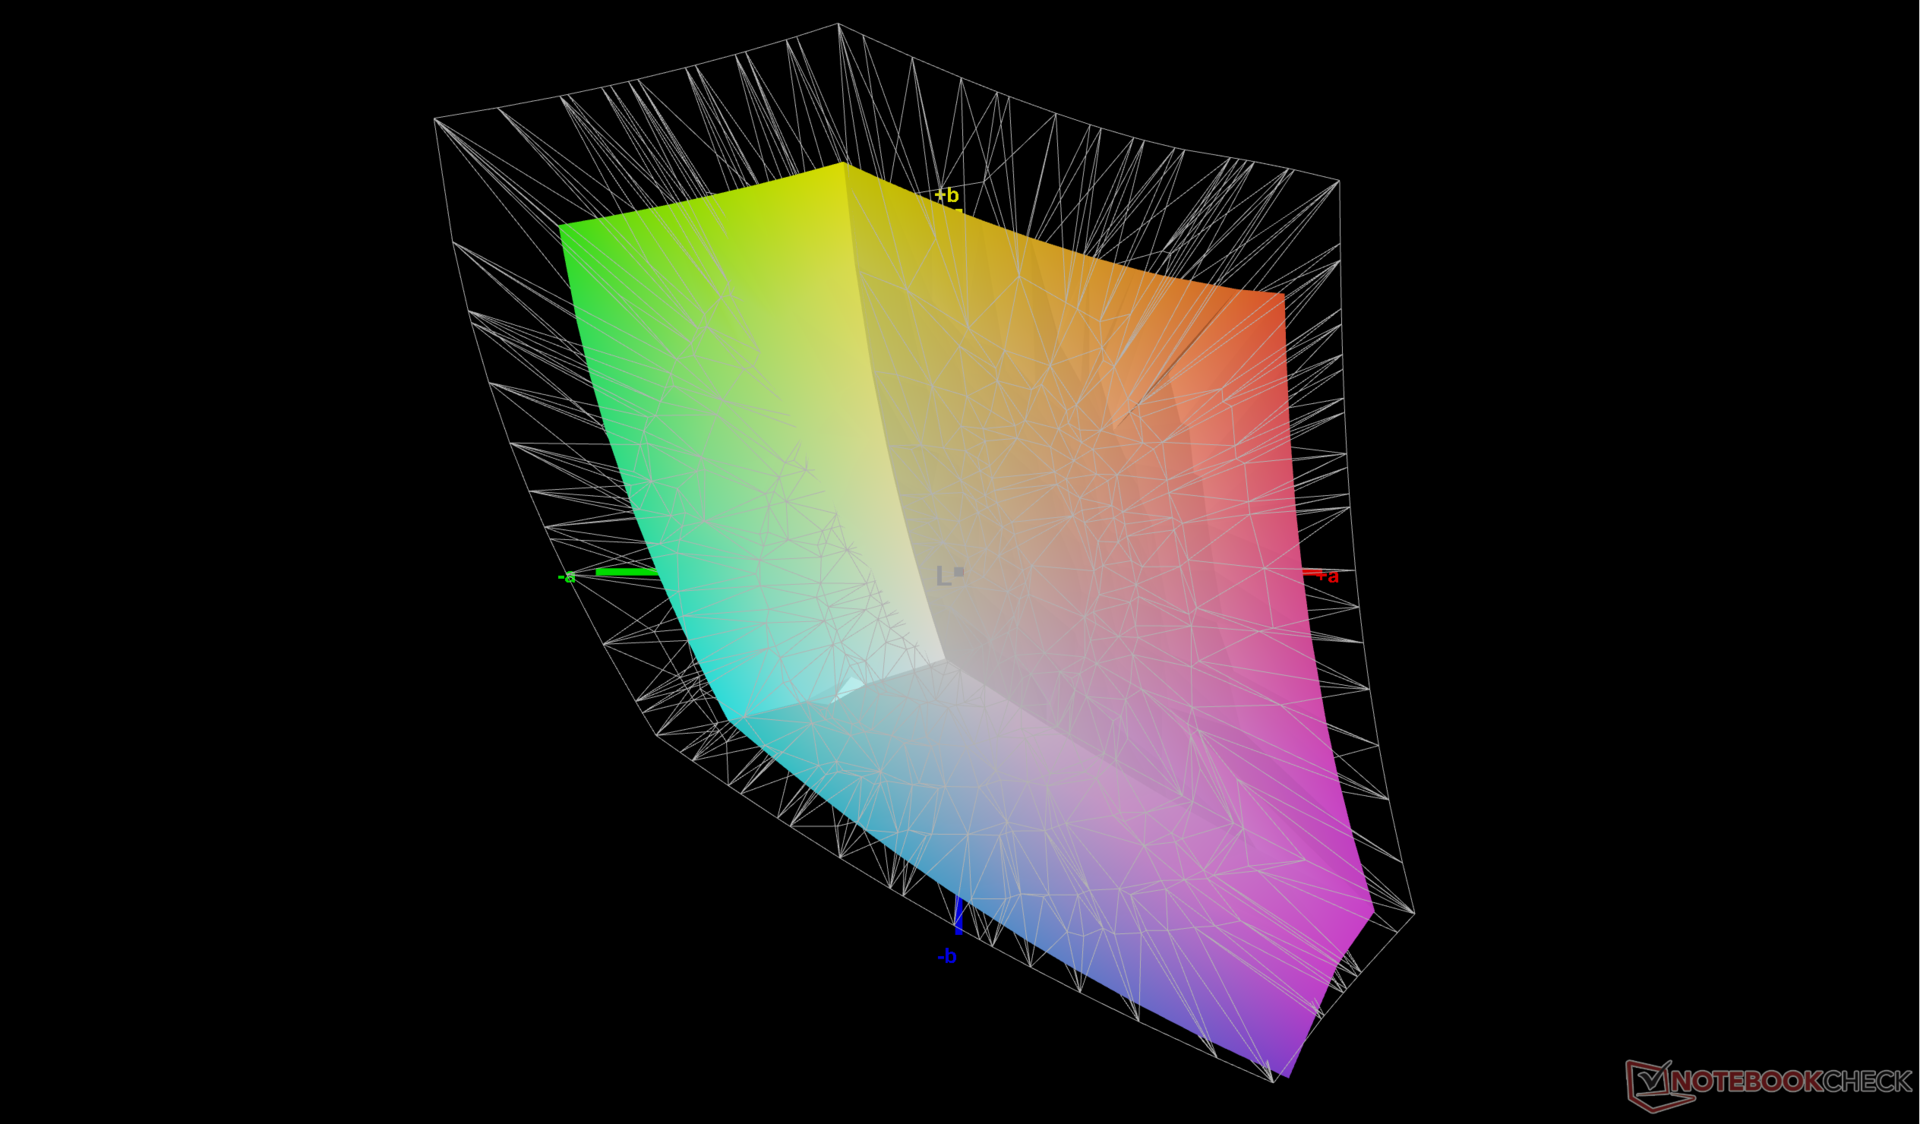
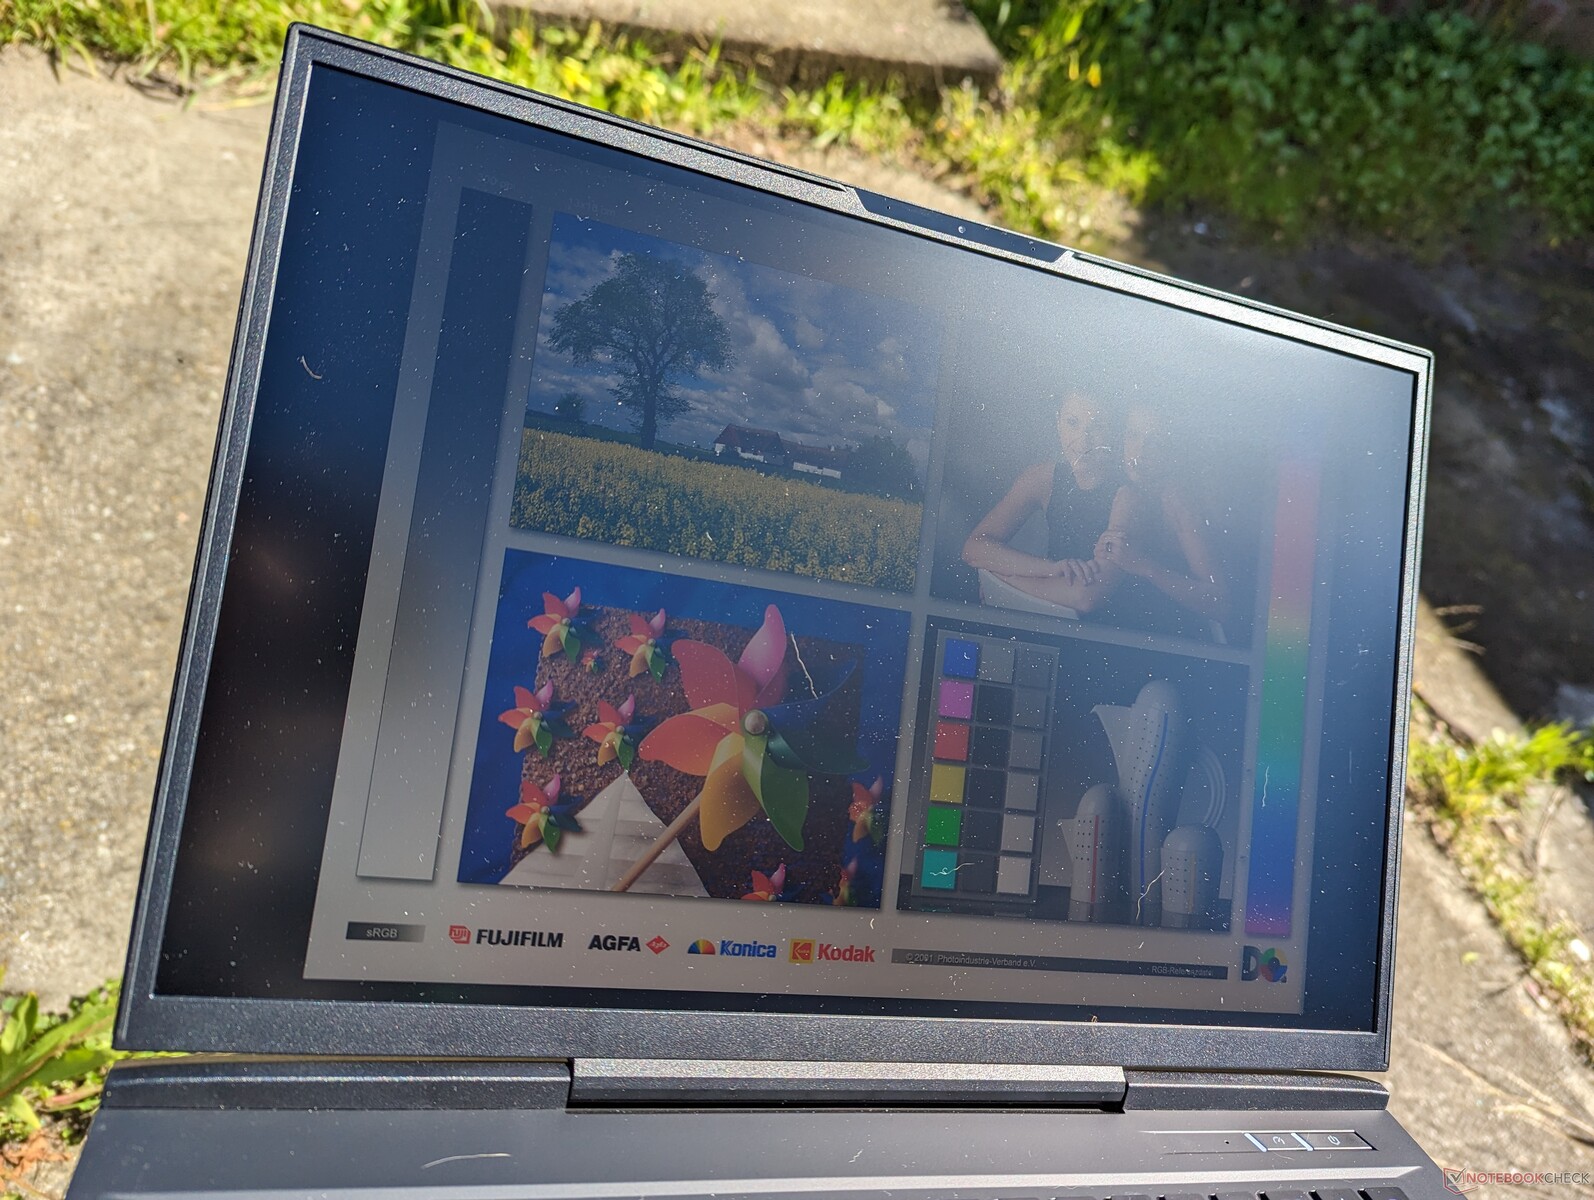
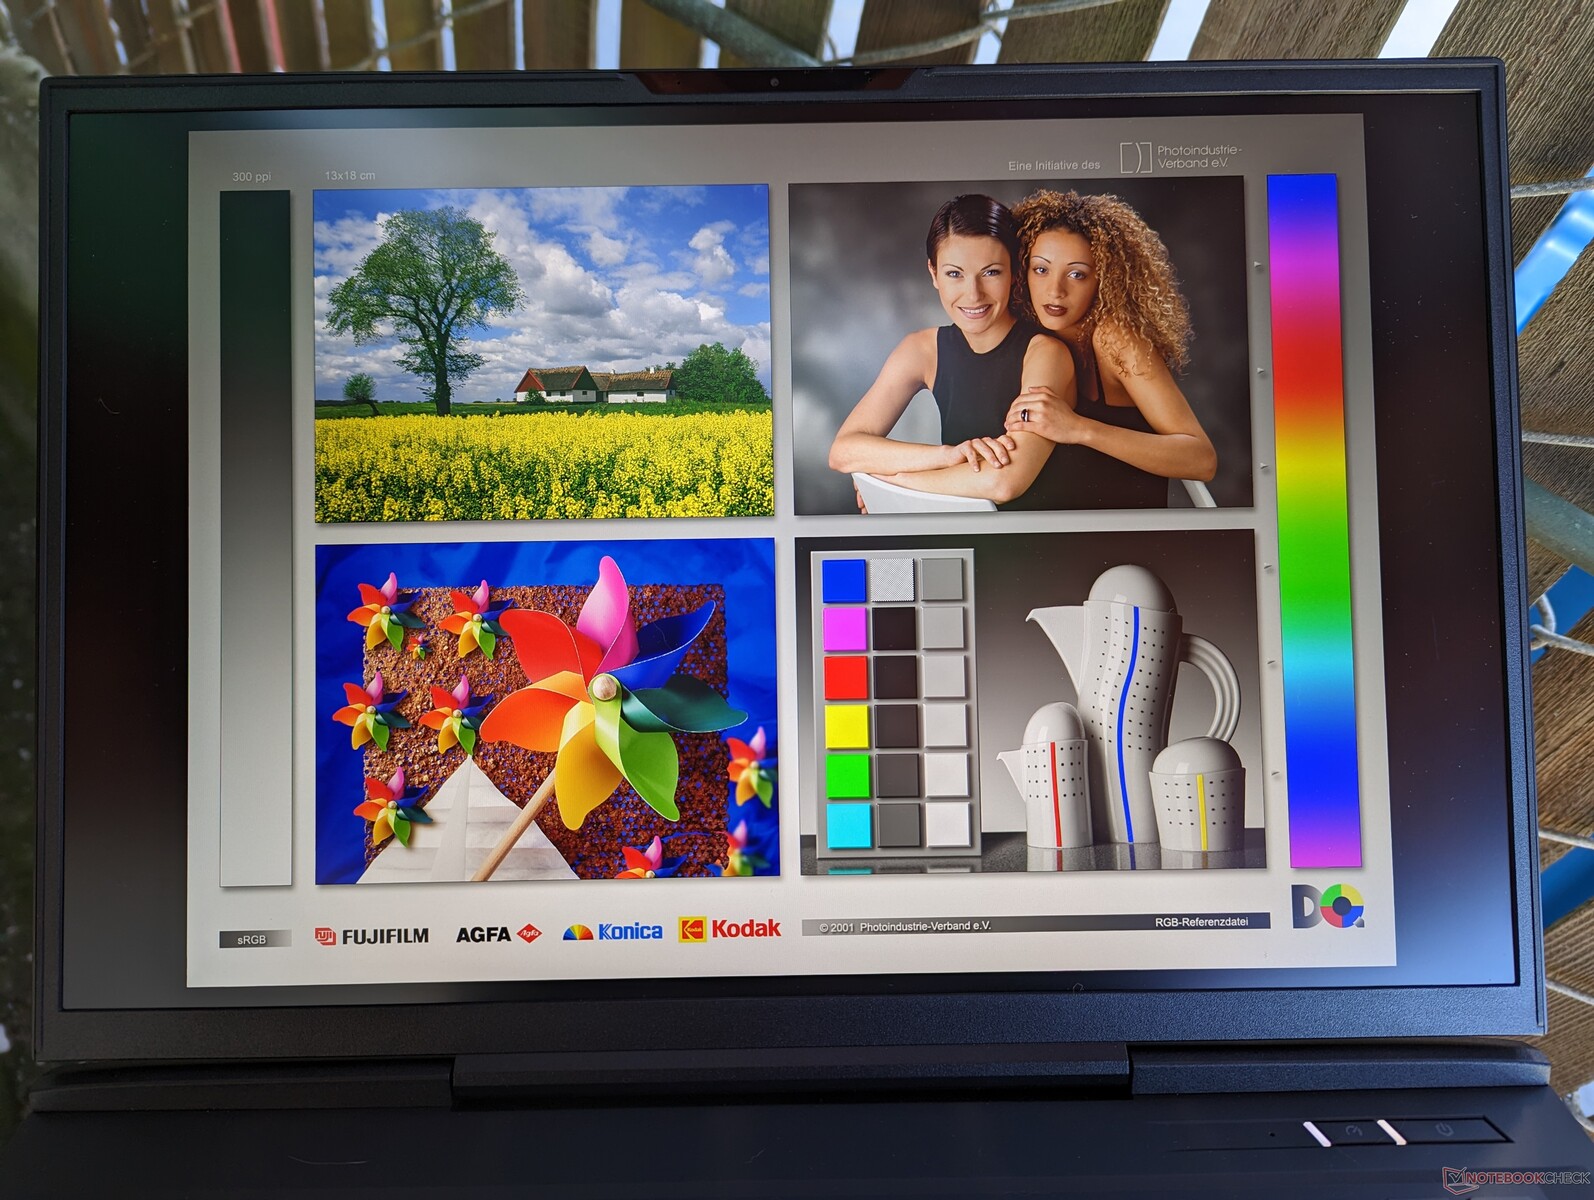
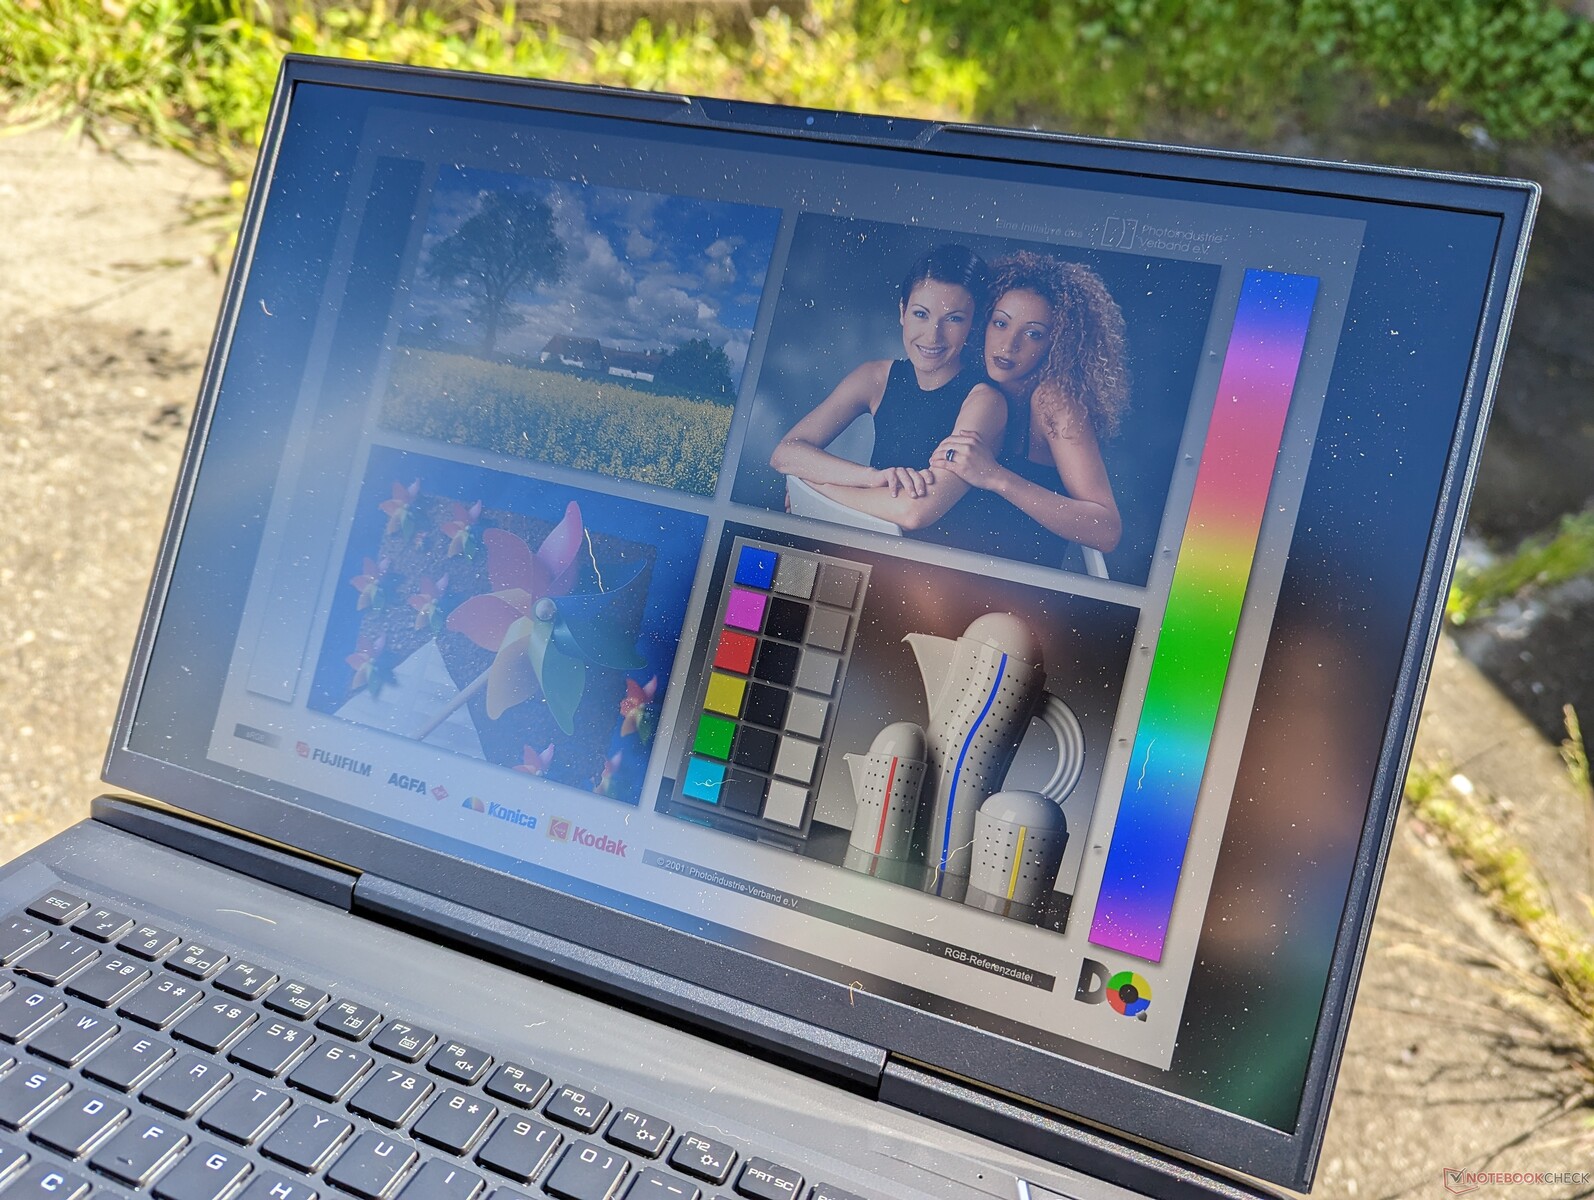
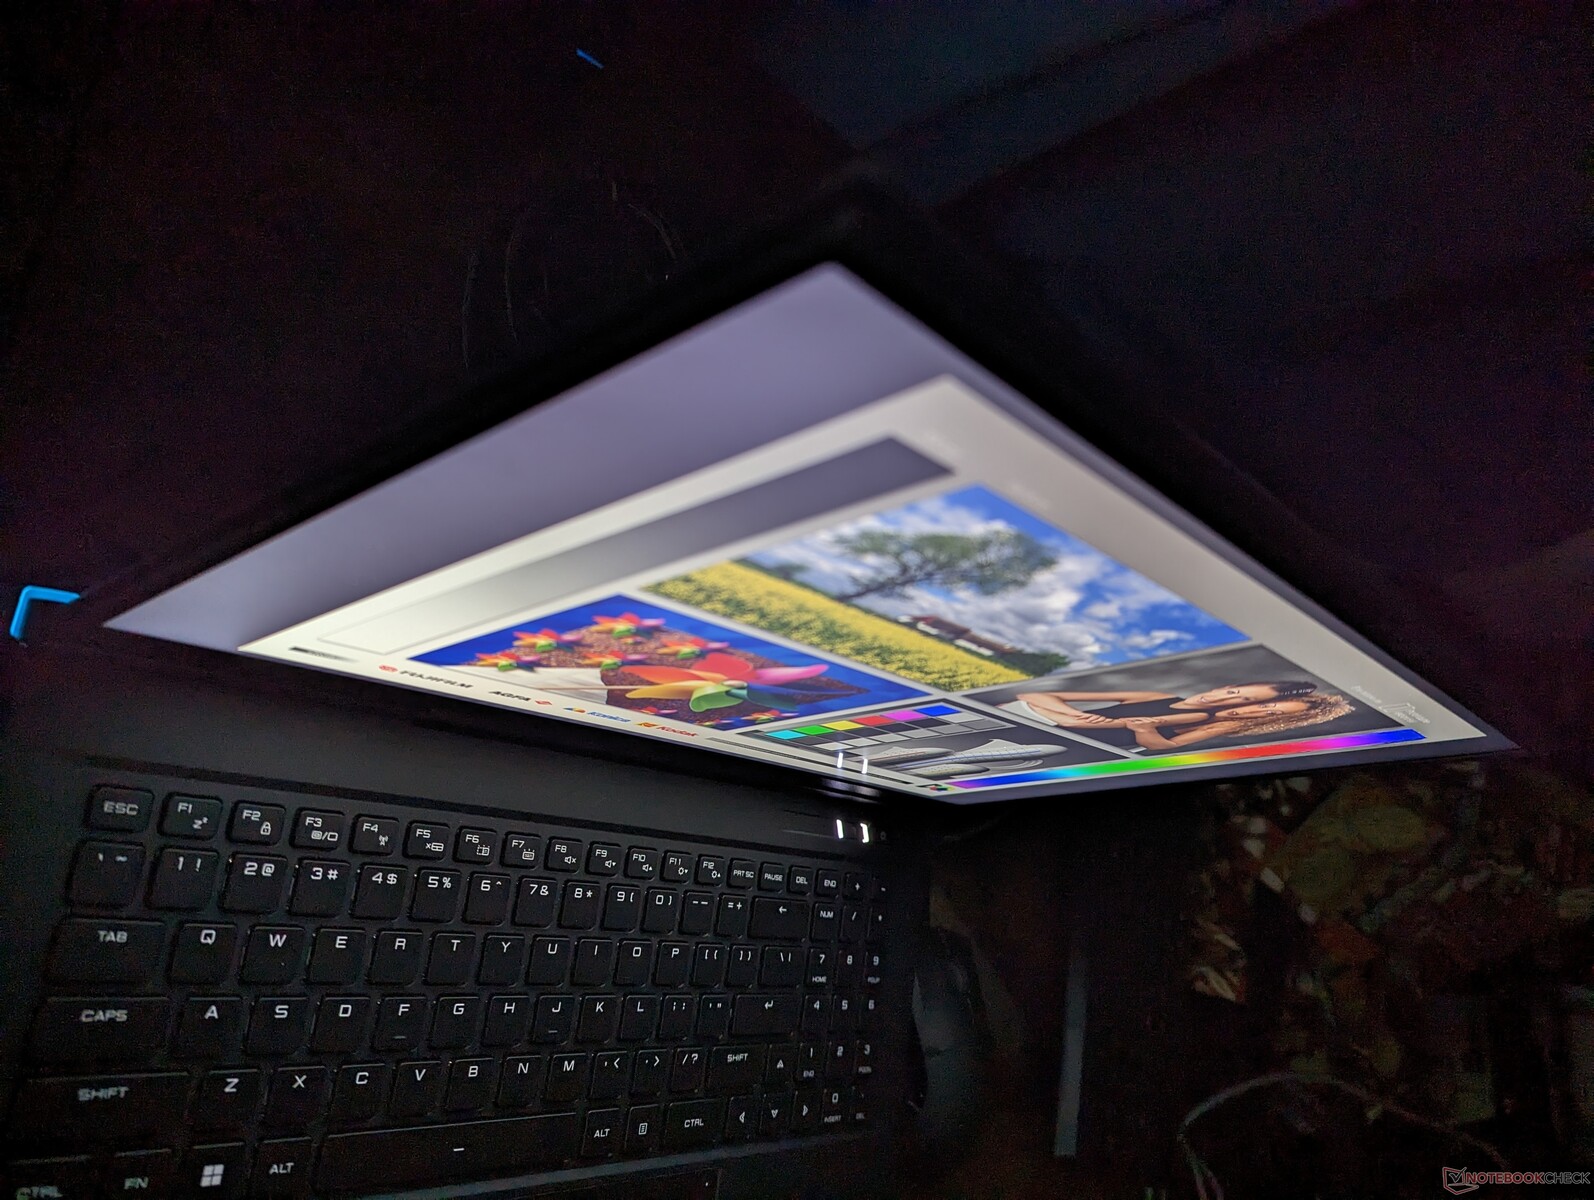
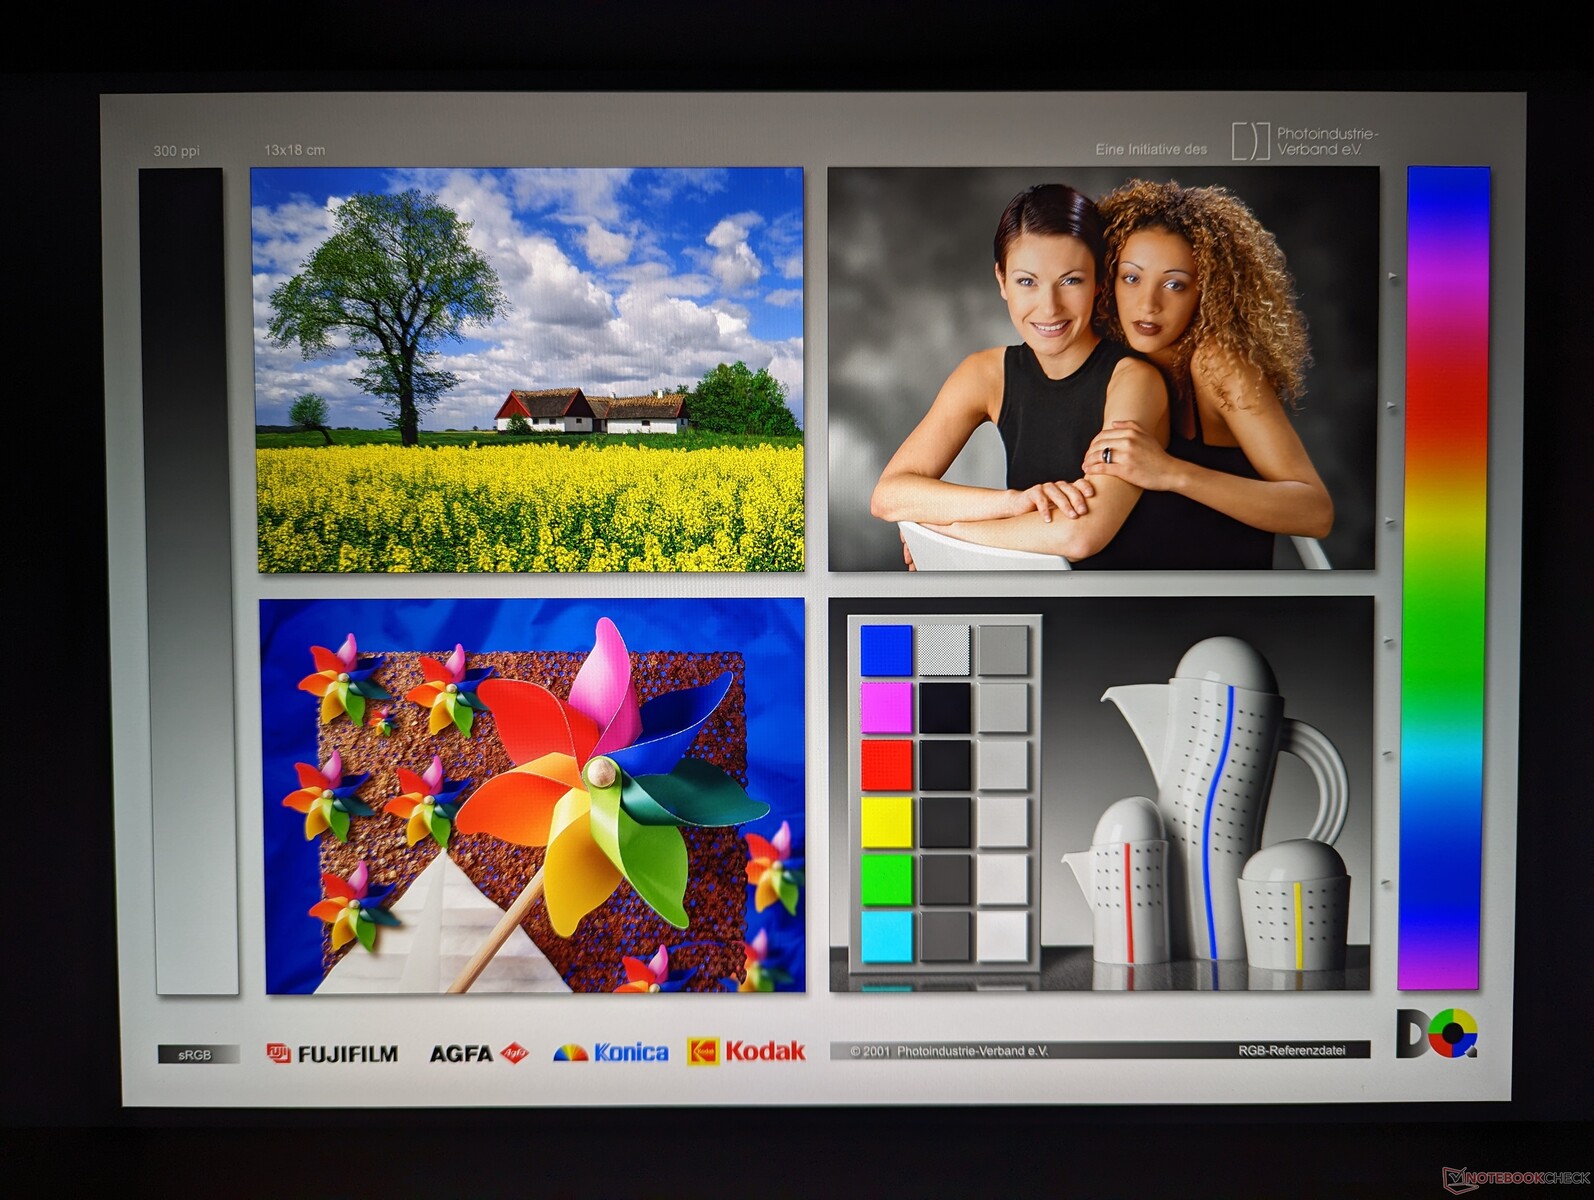
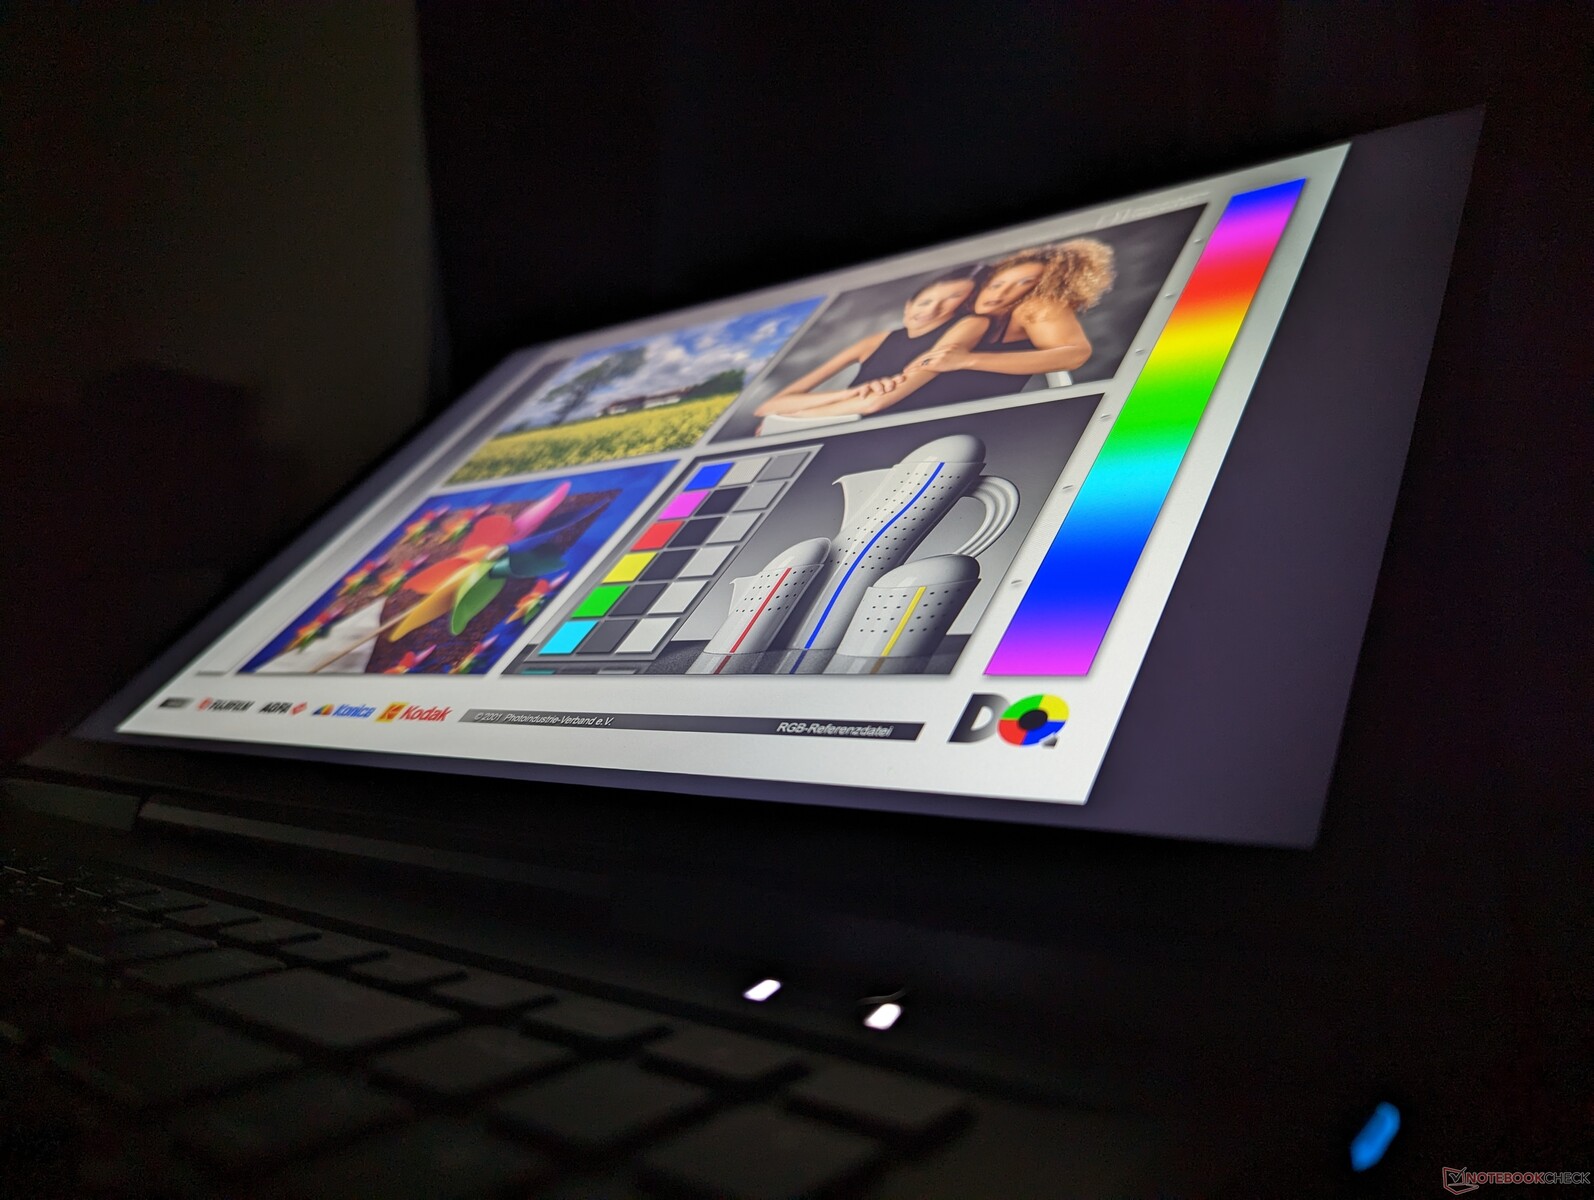
Display
Il nostro modello 2023 utilizza lo stesso pannello BOE NE170QDM-NZ1 e lo stesso controller BOE0A99 del modello 2022, il che significa che l'esperienza visiva non cambia di anno in anno. Di conseguenza, le nostre misurazioni sono quasi identiche tra i modelli 2022 e 2023. Non si tratta di una lamentela, tuttavia, perché il pannello offre quasi tutto ciò che ci aspettiamo da un portatile da gioco di fascia alta, tra cui velocità di aggiornamento, tempi di risposta rapidi, copertura completa sRGB e supporto G-Sync. Per risoluzioni più elevate e colori P3 ancora più profondi, tuttavia, dovrete cercare altrove, come l'MSI GT77 o il Razer Blade 18.
| |||||||||||||||||||||||||
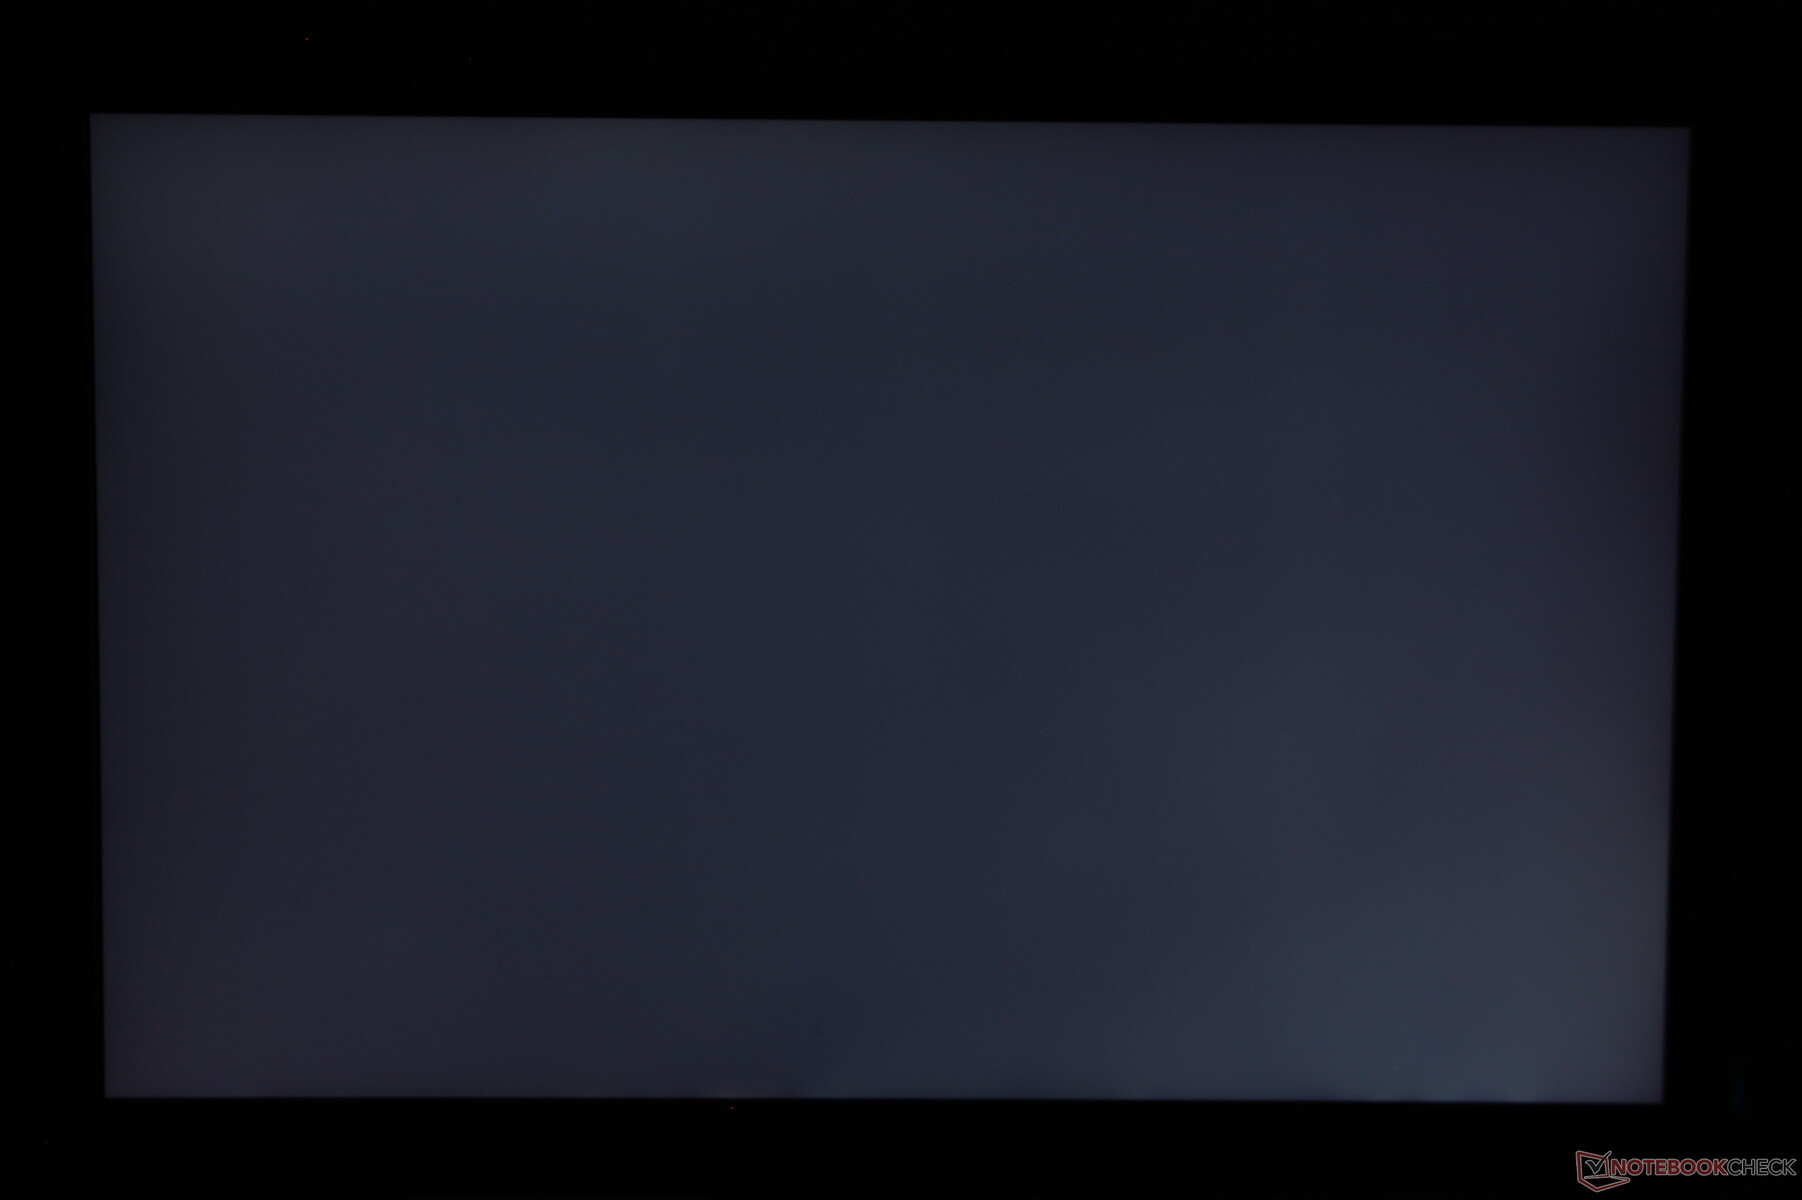
Distribuzione della luminosità: 87 %
Al centro con la batteria: 417.3 cd/m²
Contrasto: 994:1 (Nero: 0.42 cd/m²)
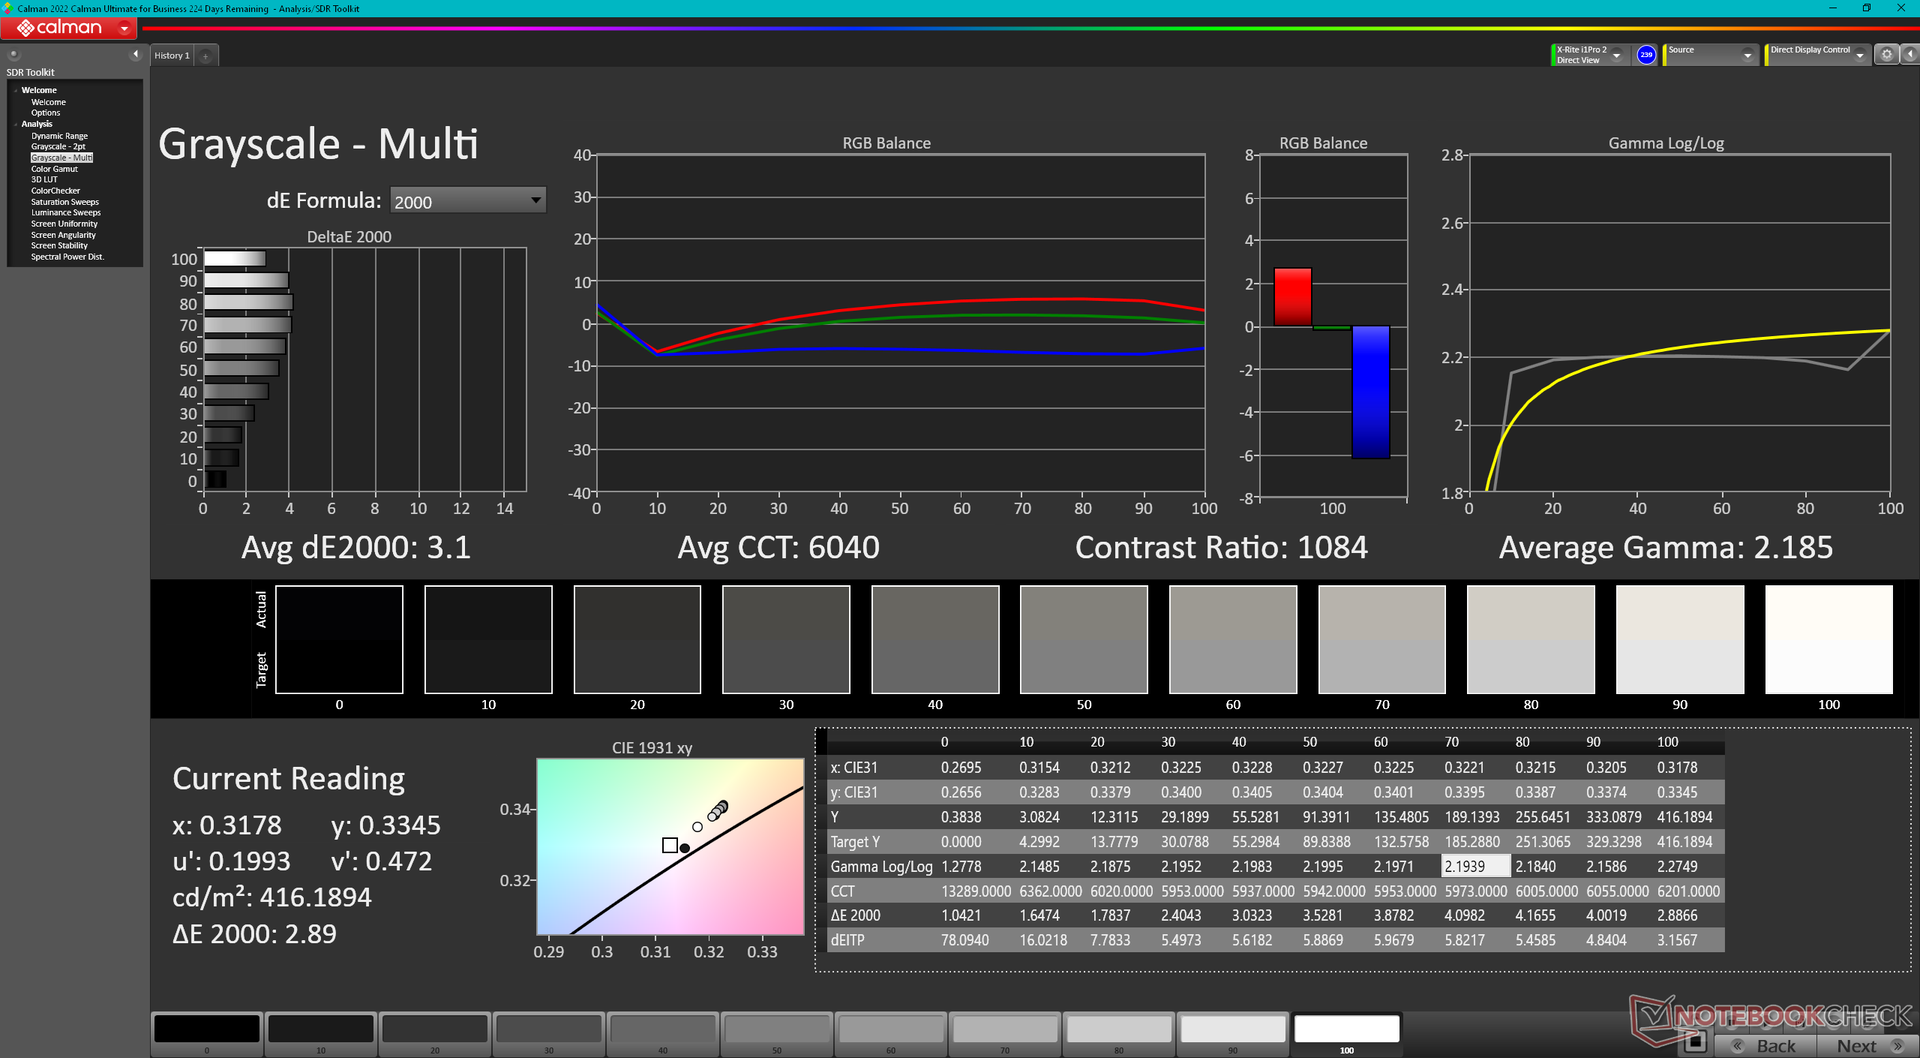
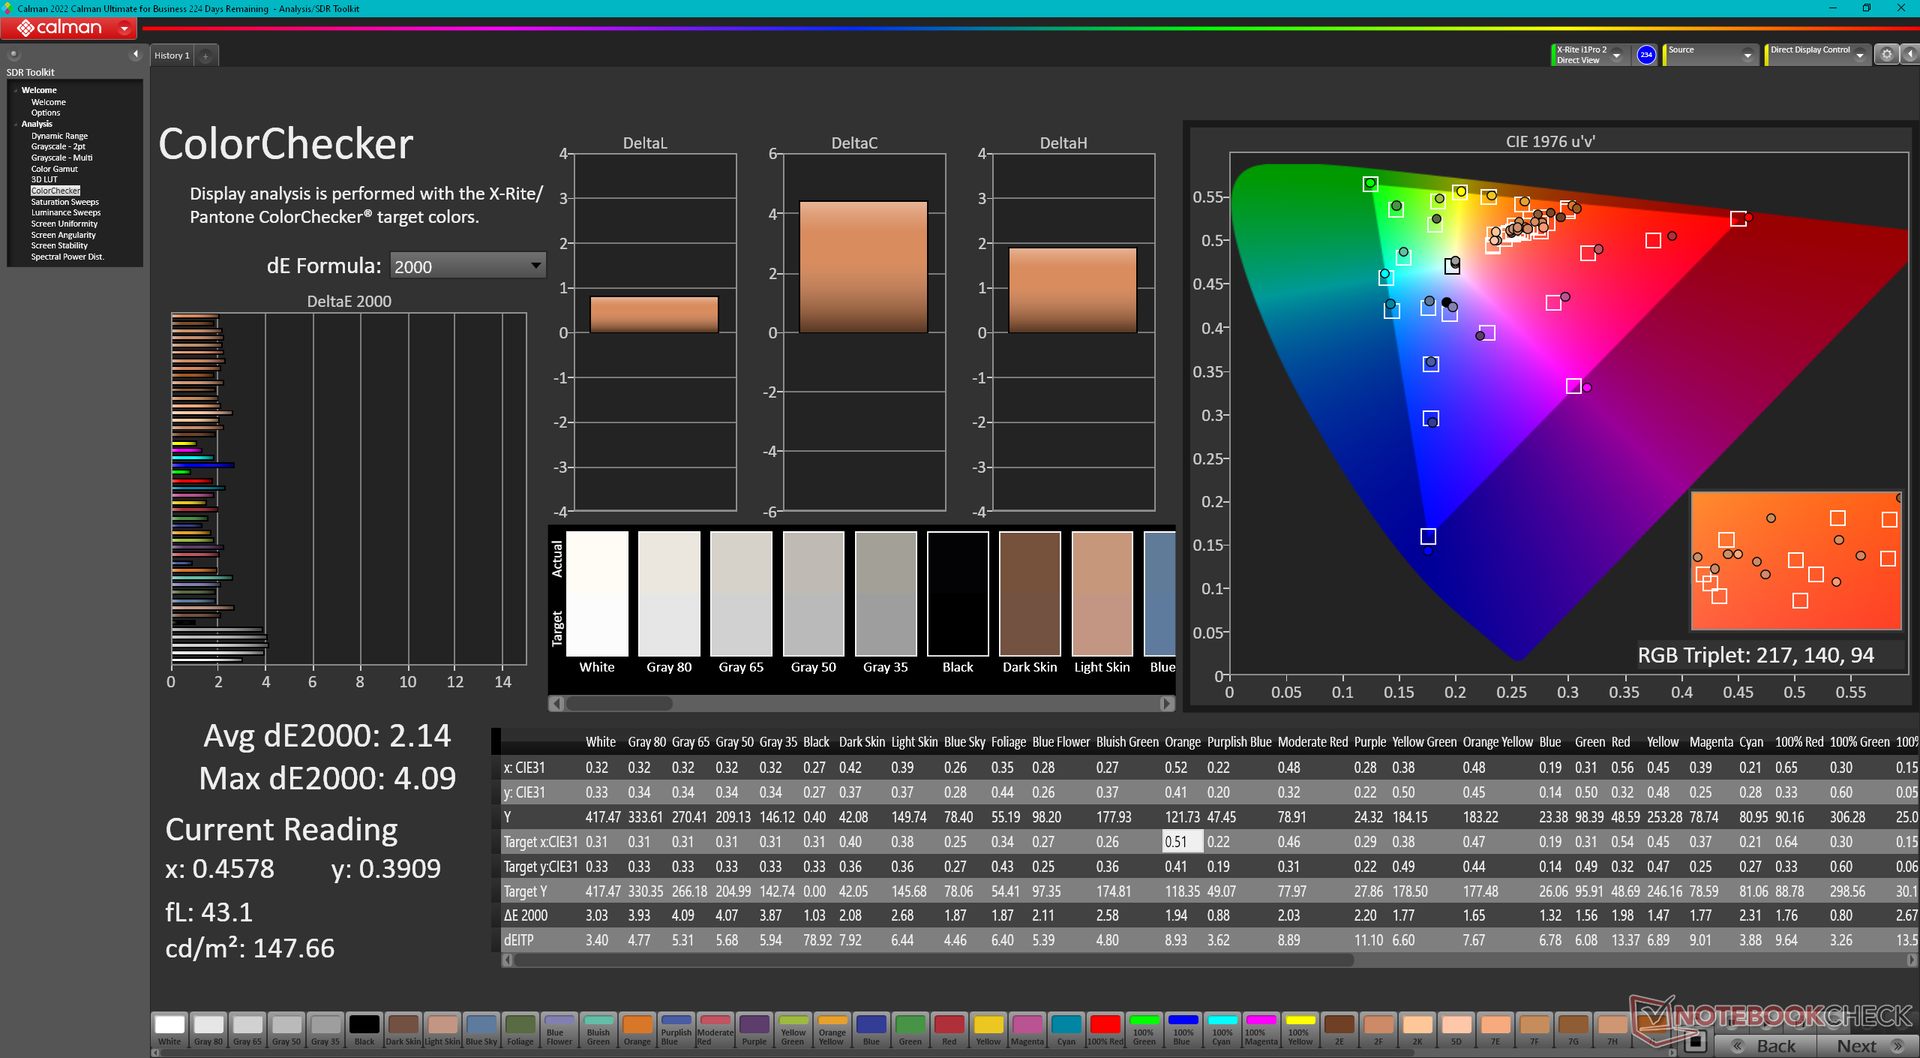
ΔE ColorChecker Calman: 2.14 | ∀{0.5-29.43 Ø4.72}
calibrated: 0.42
ΔE Greyscale Calman: 3.1 | ∀{0.09-98 Ø4.97}
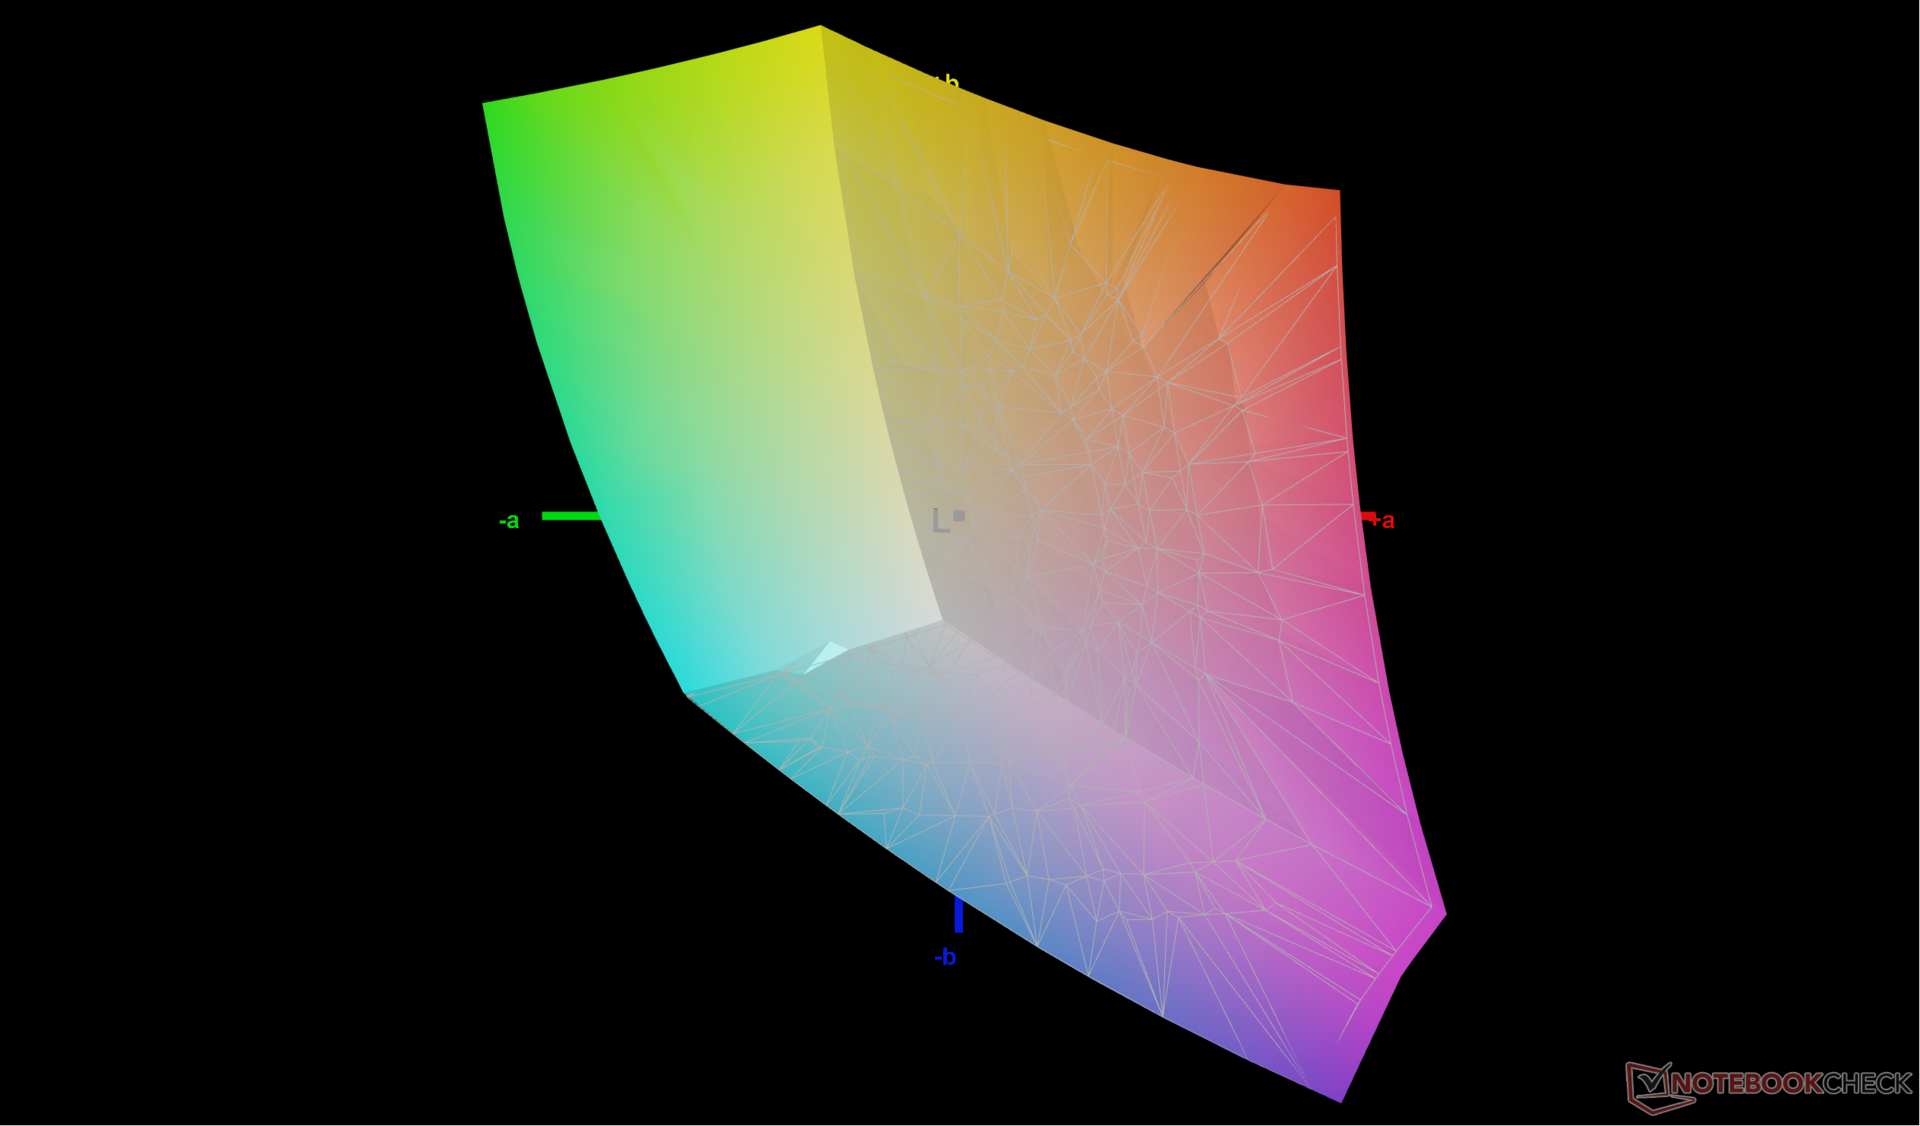
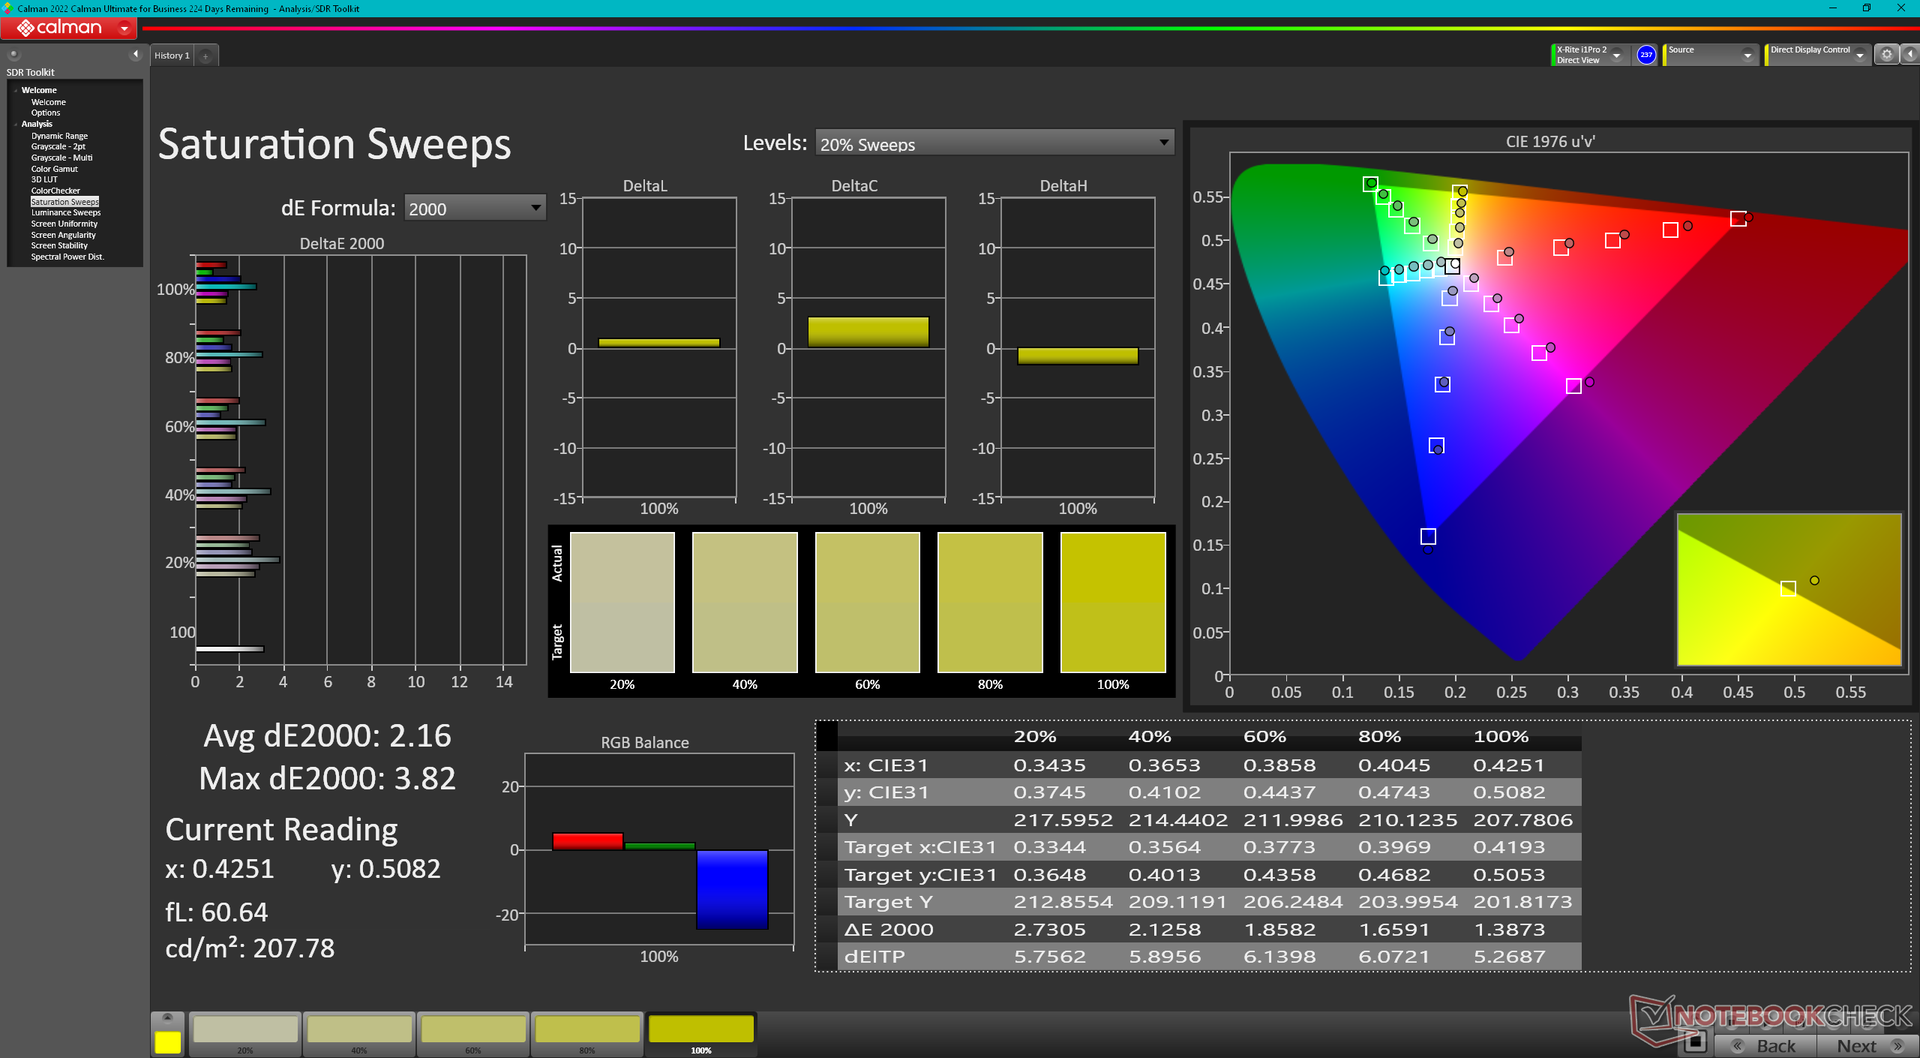
69.8% AdobeRGB 1998 (Argyll 3D)
99.7% sRGB (Argyll 3D)
69.1% Display P3 (Argyll 3D)
Gamma: 2.19
CCT: 6040 K
| Eluktronics Mech-17 GP2 BOE NE170QDM-NZ1, IPS, 2560x1600, 17" | Schenker XMG Neo 17 M22 BOE0A99, IPS, 2560x1600, 17" | MSI Katana 17 B13VFK B173HAN04.9, IPS LED, 1920x1080, 17.3" | MSI Titan GT77 HX 13VI B173ZAN06.C, Mini-LED, 3840x2160, 17.3" | Alienware m17 R5 (R9 6900HX, RX 6850M XT) AU Optronics AUODBA3, IPS, 3840x2160, 17" | Razer Blade 18 RTX 4070 AU Optronics B180QAN01.0, IPS, 2560x1600, 18" | |
|---|---|---|---|---|---|---|
| Display | 0% | -40% | 23% | 23% | 21% | |
| Display P3 Coverage (%) | 69.1 | 69 0% | 40.8 -41% | 94.9 37% | 97.2 41% | 96.9 40% |
| sRGB Coverage (%) | 99.7 | 99.8 0% | 61 -39% | 99.9 0% | 99.6 0% | 99.8 0% |
| AdobeRGB 1998 Coverage (%) | 69.8 | 69.6 0% | 42.2 -40% | 92.4 32% | 88.4 27% | 85.3 22% |
| Response Times | 23% | -176% | -202% | -30% | 40% | |
| Response Time Grey 50% / Grey 80% * (ms) | 12 ? | 10.8 ? 10% | 33 ? -175% | 38.4 ? -220% | 16.4 ? -37% | 4.2 ? 65% |
| Response Time Black / White * (ms) | 9.4 ? | 6.1 ? 35% | 26 ? -177% | 26.6 ? -183% | 11.6 ? -23% | 8 ? 15% |
| PWM Frequency (Hz) | 2380 ? | |||||
| Screen | 1% | -158% | 67678% | -147% | -64% | |
| Brightness middle (cd/m²) | 417.3 | 415 -1% | 267 -36% | 606 45% | 484 16% | 549.6 32% |
| Brightness (cd/m²) | 387 | 399 3% | 256 -34% | 602 56% | 449 16% | 524 35% |
| Brightness Distribution (%) | 87 | 90 3% | 93 7% | 93 7% | 87 0% | 89 2% |
| Black Level * (cd/m²) | 0.42 | 0.43 -2% | 0.21 50% | 0.0001 100% | 0.55 -31% | 0.53 -26% |
| Contrast (:1) | 994 | 965 -3% | 1271 28% | 6060000 609558% | 880 -11% | 1037 4% |
| Colorchecker dE 2000 * | 2.14 | 1.44 33% | 4.7 -120% | 4.8 -124% | 4.8 -124% | 3.32 -55% |
| Colorchecker dE 2000 max. * | 4.09 | 2.33 43% | 20.4 -399% | 8.2 -100% | 7.48 -83% | 6.63 -62% |
| Colorchecker dE 2000 calibrated * | 0.42 | 0.89 -112% | 4.5 -971% | 1.8 -329% | 4.74 -1029% | 2.7 -543% |
| Greyscale dE 2000 * | 3.1 | 1.8 42% | 1.5 52% | 6.5 -110% | 5.5 -77% | 2 35% |
| Gamma | 2.19 100% | 2.132 103% | 2.12 104% | 2.63 84% | 2.42 91% | 2.29 96% |
| CCT | 6040 108% | 6327 103% | 6552 99% | 6596 99% | 6148 106% | 6319 103% |
| Media totale (Programma / Settaggio) | 8% /
4% | -125% /
-135% | 22500% /
43484% | -51% /
-94% | -1% /
-31% |
* ... Meglio usare valori piccoli
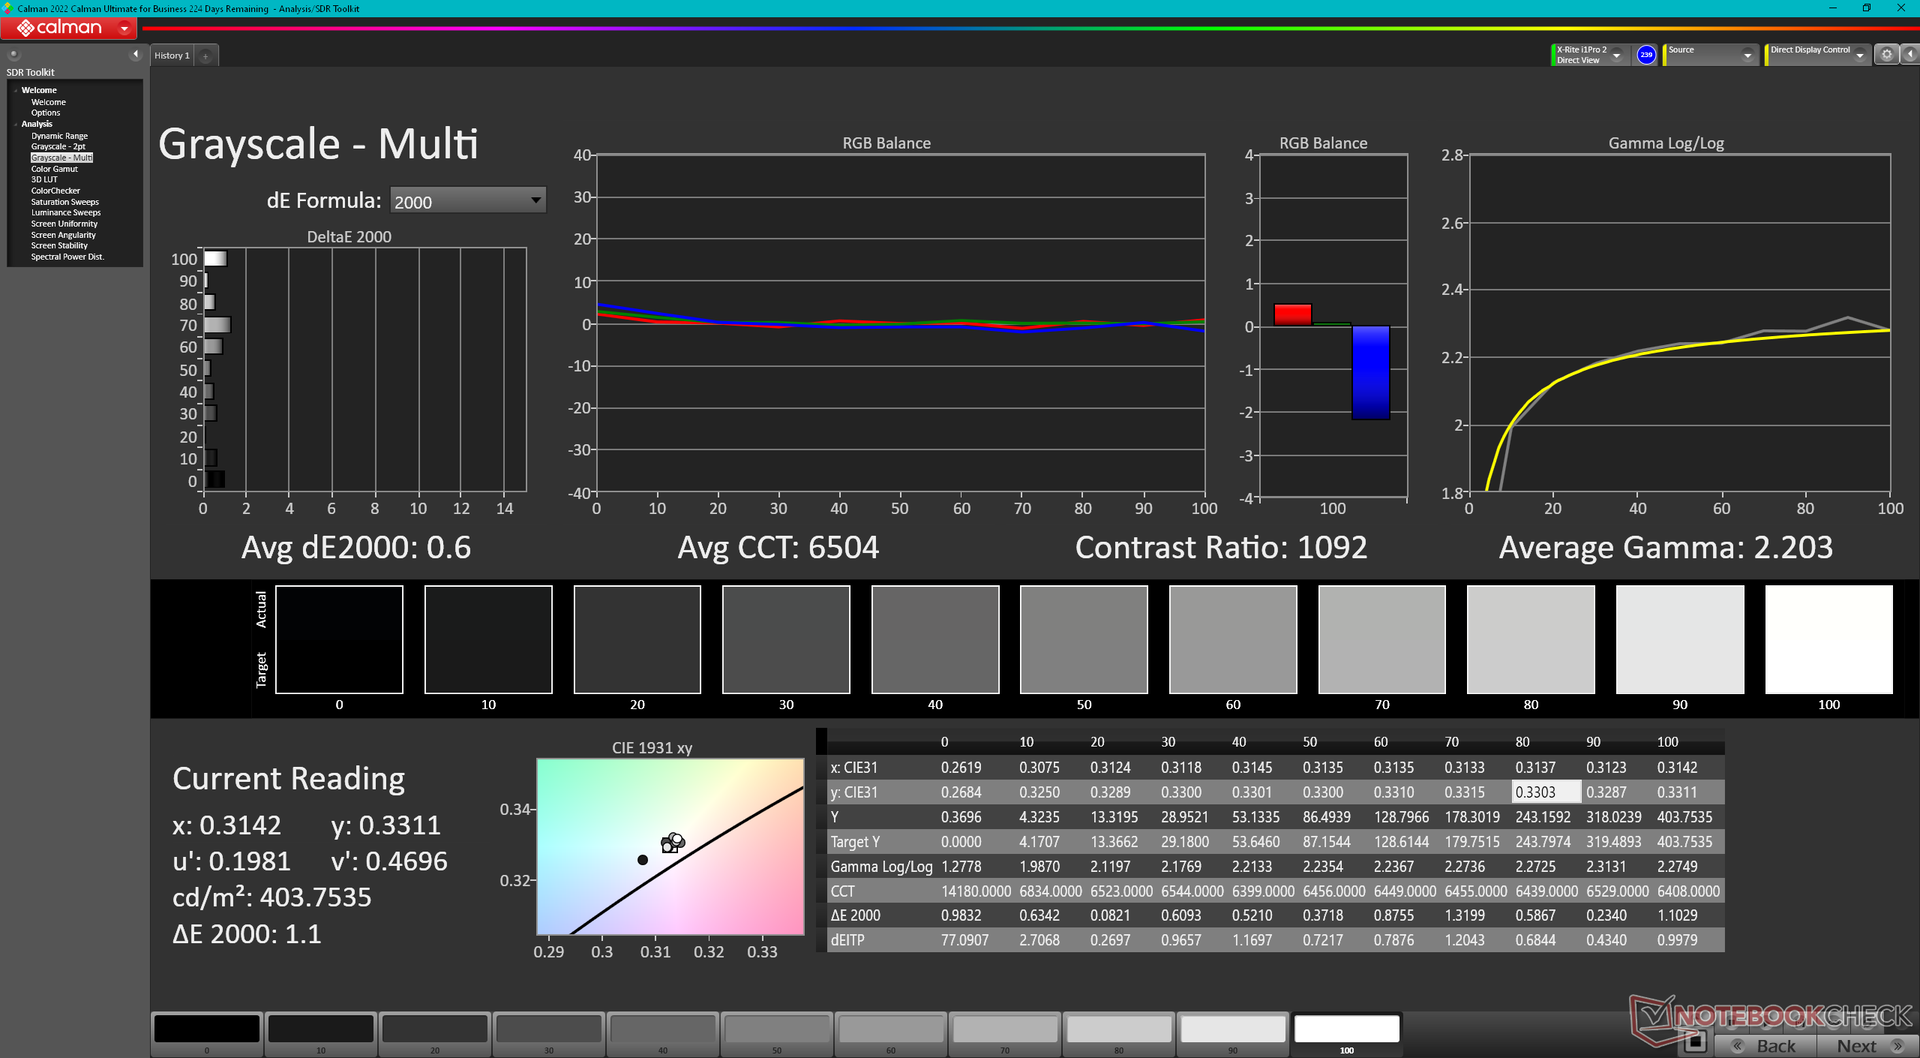
Il display è ben calibrato, con valori medi di deltaE della scala di grigi e del colore di soli 3,1 e 2,14, rispettivamente. La calibrazione da parte nostra migliorerebbe ulteriormente le medie deltaE, portandole a soli 0,6 e 0,42 rispetto allo standard sRGB. Il nostro profilo ICM calibrato è disponibile per il download gratuito.
Tempi di risposta del Display
| ↔ Tempi di risposta dal Nero al Bianco | ||
|---|---|---|
| 9.4 ms ... aumenta ↗ e diminuisce ↘ combinato | ↗ 4.9 ms Incremento | 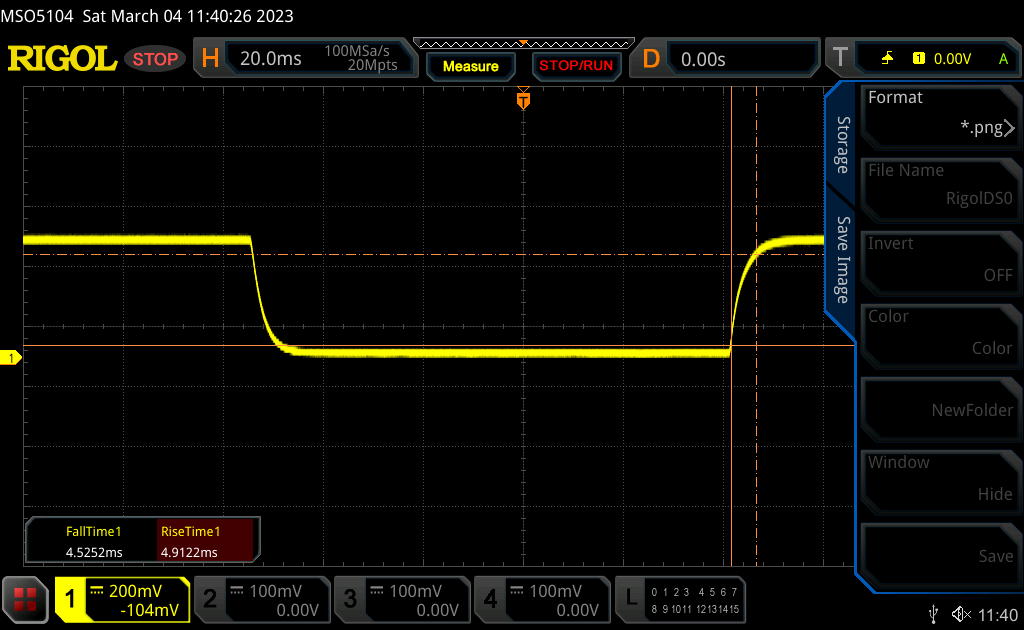 |
| ↘ 4.5 ms Calo | ||
| Lo schermo mostra veloci tempi di risposta durante i nostri tests e dovrebbe esere adatto al gaming In confronto, tutti i dispositivi di test variano da 0.1 (minimo) a 240 (massimo) ms. » 26 % di tutti i dispositivi è migliore. Questo significa che i tempi di risposta rilevati sono migliori rispettto alla media di tutti i dispositivi testati (19.8 ms). | ||
| ↔ Tempo di risposta dal 50% Grigio all'80% Grigio | ||
| 12 ms ... aumenta ↗ e diminuisce ↘ combinato | ↗ 5.4 ms Incremento | 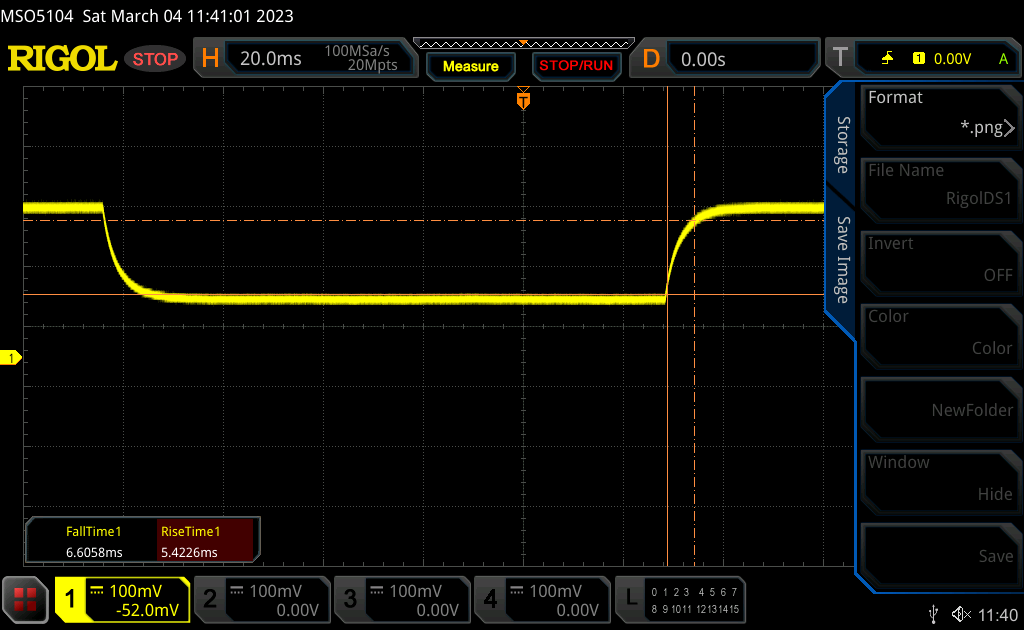 |
| ↘ 6.6 ms Calo | ||
| Lo schermo mostra buoni tempi di risposta durante i nostri tests, ma potrebbe essere troppo lento per i gamers competitivi. In confronto, tutti i dispositivi di test variano da 0.165 (minimo) a 636 (massimo) ms. » 25 % di tutti i dispositivi è migliore. Questo significa che i tempi di risposta rilevati sono migliori rispettto alla media di tutti i dispositivi testati (31 ms). | ||
Sfarfallio dello schermo / PWM (Pulse-Width Modulation)
| flickering dello schermo / PWM non rilevato | 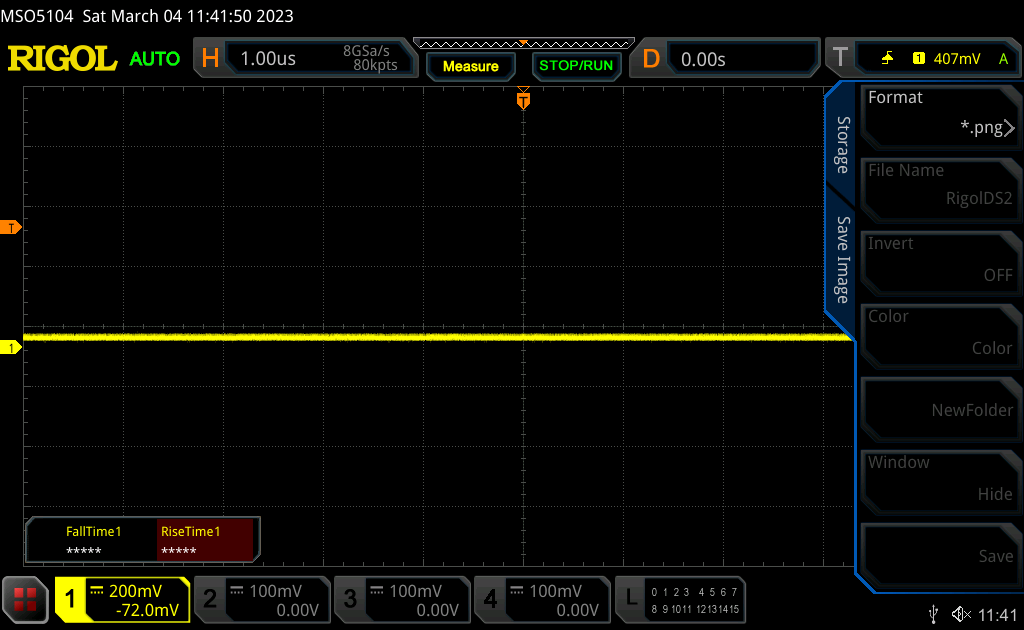 | ||
In confronto: 52 % di tutti i dispositivi testati non utilizza PWM per ridurre la luminosita' del display. Se è rilevato PWM, una media di 7772 (minimo: 5 - massimo: 343500) Hz è stata rilevata. | |||
Prestazioni
Condizioni di test
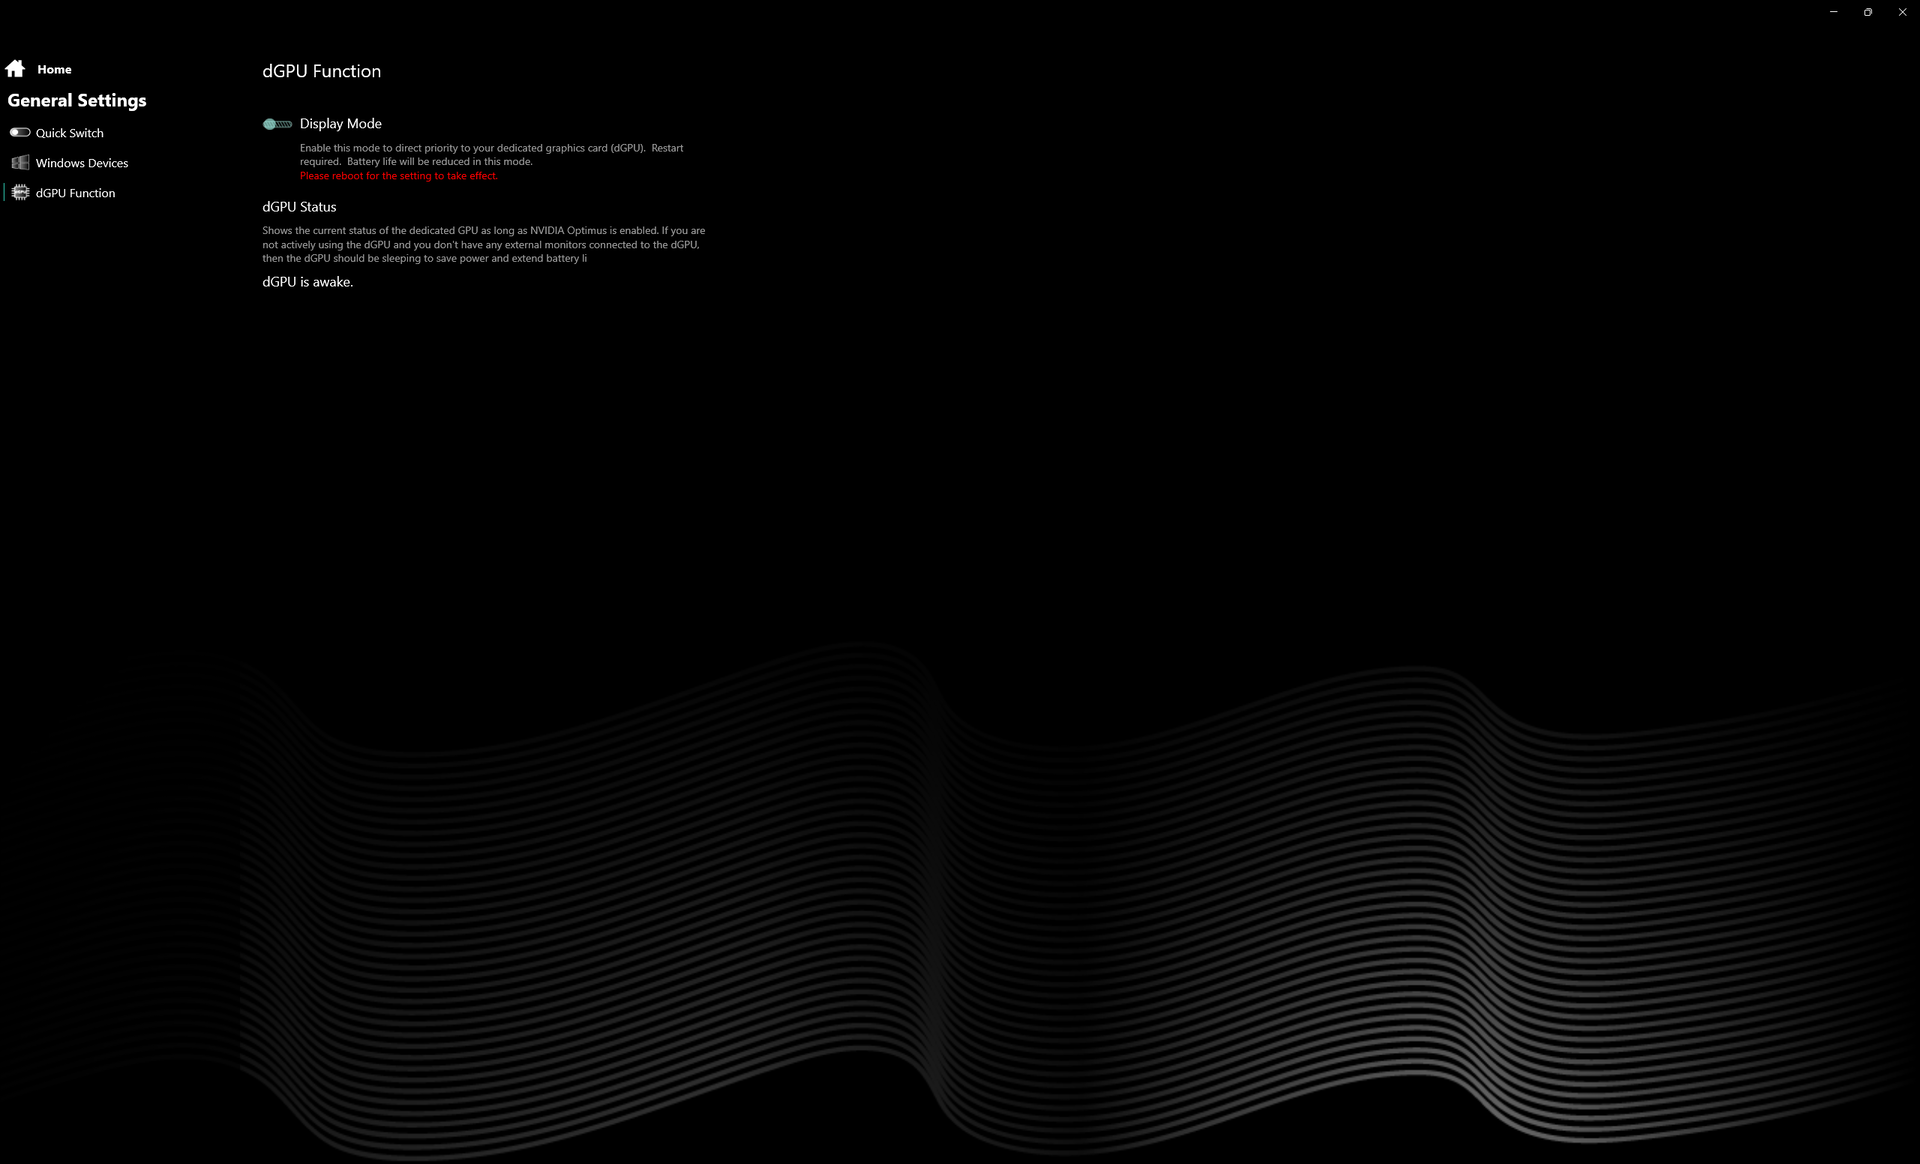
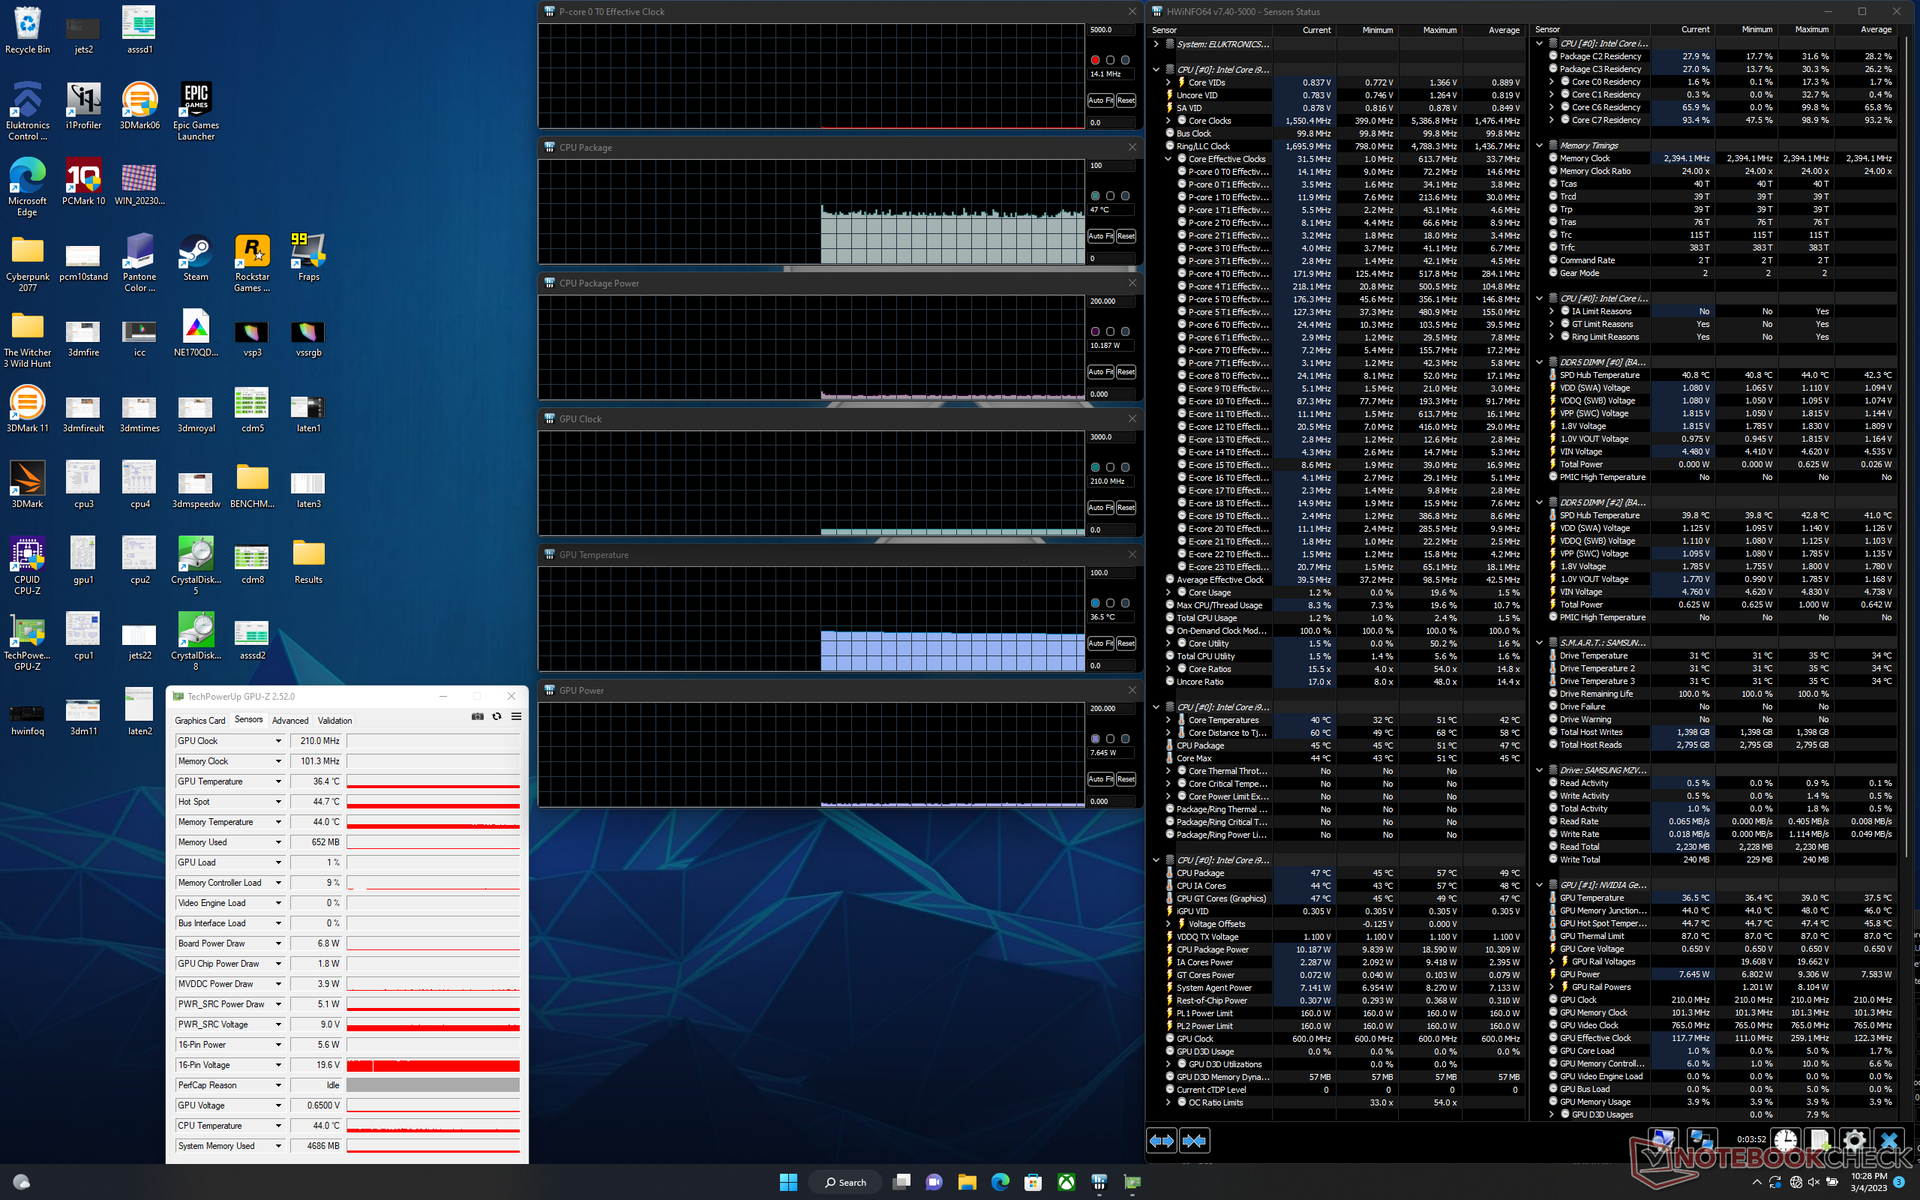
Abbiamo impostato la nostra unità in modalità Performance tramite Windows e "Beast Mode" tramite il software Eluktronics Control Center preinstallato prima di eseguire i benchmark qui sotto. Abbiamo anche impostato il sistema in modalità dGPU tramite il pannello di controllo Nvidia. I possessori dovrebbero familiarizzare con il Control Center, in quanto è l'hub per l'attivazione di funzioni specifiche del modello come RGB, modalità di carica della batteria, modalità di prestazioni, modalità di raffreddamento a liquido e altro ancora. È supportato l'Optimus avanzato (MUX).
Abbiamo riscontrato una serie di problemi sulla nostra unità di prova, tra cui schermate di avvio vuote, almeno un blocco del sistema durante il gioco e riavvii automatici quando la CPU e la GPU sono al massimo dell'utilizzo per periodi prolungati. Abbiamo risolto il primo problema disabilitando l'avvio rapido nel menu del BIOS, ma questi problemi non dovrebbero essere presenti in primo luogo.

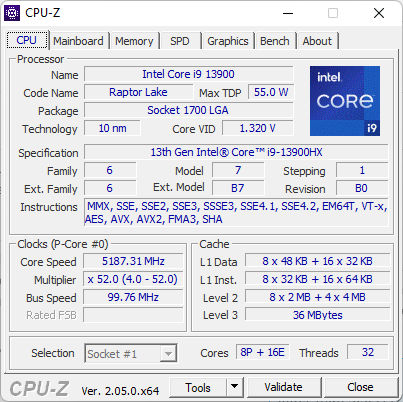
Processore
Le prestazioni grezze della CPU sono inferiori dell'1-2% rispetto al Core i9-13950X di 13a generazione Core i9-13950HX nella MSI Titan GT77 e quindi possono benissimo essere equivalenti nella maggior parte degli scenari. Passando dal Ryzen 9 6900HX al nostro Core i9-13900HX aumenta le prestazioni multi-thread di uno straordinario 2-2,5 volte. Il Core i7-12700HX di 12a generazione Core i7-12700Hche è ancora comune in molti portatili da gioco di fascia media, è circa il 50% più lento.
La sostenibilità delle prestazioni è eccellente, senza grossi cali di prestazioni o comportamenti ciclici nel tempo.
Cinebench R15 Multi Loop
Cinebench R23: Multi Core | Single Core
Cinebench R20: CPU (Multi Core) | CPU (Single Core)
Cinebench R15: CPU Multi 64Bit | CPU Single 64Bit
Blender: v2.79 BMW27 CPU
7-Zip 18.03: 7z b 4 | 7z b 4 -mmt1
Geekbench 5.5: Multi-Core | Single-Core
HWBOT x265 Benchmark v2.2: 4k Preset
LibreOffice : 20 Documents To PDF
R Benchmark 2.5: Overall mean
| Cinebench R20 / CPU (Single Core) | |
| MSI Titan GT77 HX 13VI | |
| Eluktronics Mech-17 GP2 | |
| Razer Blade 18 RTX 4070 | |
| Media Intel Core i9-13900HX (722 - 810, n=21) | |
| Corsair One i300 | |
| MSI Titan GT77 12UHS | |
| MSI Katana 17 B13VFK | |
| MSI Pulse GL76 12UGK | |
| MSI GS76 Stealth 11UH | |
| Schenker XMG Neo 17 M22 | |
| HP Omen 16-n0033dx | |
| Schenker XMG Core 17 (Early 2021) | |
| HWBOT x265 Benchmark v2.2 / 4k Preset | |
| Eluktronics Mech-17 GP2 | |
| MSI Titan GT77 HX 13VI | |
| Razer Blade 18 RTX 4070 | |
| Media Intel Core i9-13900HX (23.5 - 34.4, n=22) | |
| Corsair One i300 | |
| MSI Titan GT77 12UHS | |
| MSI Pulse GL76 12UGK | |
| Schenker XMG Neo 17 M22 | |
| MSI Katana 17 B13VFK | |
| HP Omen 16-n0033dx | |
| MSI GS76 Stealth 11UH | |
| Schenker XMG Core 17 (Early 2021) | |
| LibreOffice / 20 Documents To PDF | |
| HP Omen 16-n0033dx | |
| MSI Katana 17 B13VFK | |
| Schenker XMG Core 17 (Early 2021) | |
| Schenker XMG Neo 17 M22 | |
| MSI GS76 Stealth 11UH | |
| MSI Titan GT77 HX 13VI | |
| MSI Pulse GL76 12UGK | |
| Razer Blade 18 RTX 4070 | |
| Media Intel Core i9-13900HX (32.8 - 51.1, n=21) | |
| MSI Titan GT77 12UHS | |
| Corsair One i300 | |
| Eluktronics Mech-17 GP2 | |
* ... Meglio usare valori piccoli
AIDA64: FP32 Ray-Trace | FPU Julia | CPU SHA3 | CPU Queen | FPU SinJulia | FPU Mandel | CPU AES | CPU ZLib | FP64 Ray-Trace | CPU PhotoWorxx
| Performance rating | |
| Eluktronics Mech-17 GP2 | |
| MSI Titan GT77 HX 13VI | |
| Razer Blade 18 RTX 4070 | |
| Media Intel Core i9-13900HX | |
| Schenker XMG Neo 17 M22 | |
| Alienware m17 R5 (R9 6900HX, RX 6850M XT) | |
| MSI Katana 17 B13VFK | |
| AIDA64 / FP32 Ray-Trace | |
| MSI Titan GT77 HX 13VI | |
| Eluktronics Mech-17 GP2 | |
| Razer Blade 18 RTX 4070 | |
| Media Intel Core i9-13900HX (17589 - 27615, n=22) | |
| Alienware m17 R5 (R9 6900HX, RX 6850M XT) | |
| Schenker XMG Neo 17 M22 | |
| MSI Katana 17 B13VFK | |
| AIDA64 / FPU Julia | |
| MSI Titan GT77 HX 13VI | |
| Eluktronics Mech-17 GP2 | |
| Razer Blade 18 RTX 4070 | |
| Media Intel Core i9-13900HX (88686 - 137015, n=22) | |
| Alienware m17 R5 (R9 6900HX, RX 6850M XT) | |
| Schenker XMG Neo 17 M22 | |
| MSI Katana 17 B13VFK | |
| AIDA64 / CPU SHA3 | |
| MSI Titan GT77 HX 13VI | |
| Eluktronics Mech-17 GP2 | |
| Razer Blade 18 RTX 4070 | |
| Media Intel Core i9-13900HX (4362 - 7029, n=22) | |
| Alienware m17 R5 (R9 6900HX, RX 6850M XT) | |
| Schenker XMG Neo 17 M22 | |
| MSI Katana 17 B13VFK | |
| AIDA64 / CPU Queen | |
| Eluktronics Mech-17 GP2 | |
| MSI Titan GT77 HX 13VI | |
| Razer Blade 18 RTX 4070 | |
| Media Intel Core i9-13900HX (125644 - 141385, n=22) | |
| Alienware m17 R5 (R9 6900HX, RX 6850M XT) | |
| Schenker XMG Neo 17 M22 | |
| MSI Katana 17 B13VFK | |
| AIDA64 / FPU SinJulia | |
| Eluktronics Mech-17 GP2 | |
| MSI Titan GT77 HX 13VI | |
| Razer Blade 18 RTX 4070 | |
| Media Intel Core i9-13900HX (12334 - 17179, n=22) | |
| Alienware m17 R5 (R9 6900HX, RX 6850M XT) | |
| Schenker XMG Neo 17 M22 | |
| MSI Katana 17 B13VFK | |
| AIDA64 / FPU Mandel | |
| MSI Titan GT77 HX 13VI | |
| Eluktronics Mech-17 GP2 | |
| Razer Blade 18 RTX 4070 | |
| Media Intel Core i9-13900HX (43850 - 69202, n=22) | |
| Alienware m17 R5 (R9 6900HX, RX 6850M XT) | |
| Schenker XMG Neo 17 M22 | |
| MSI Katana 17 B13VFK | |
| AIDA64 / CPU AES | |
| Eluktronics Mech-17 GP2 | |
| Media Intel Core i9-13900HX (89413 - 237881, n=22) | |
| MSI Titan GT77 HX 13VI | |
| Schenker XMG Neo 17 M22 | |
| Razer Blade 18 RTX 4070 | |
| MSI Katana 17 B13VFK | |
| Alienware m17 R5 (R9 6900HX, RX 6850M XT) | |
| AIDA64 / CPU ZLib | |
| MSI Titan GT77 HX 13VI | |
| Eluktronics Mech-17 GP2 | |
| Razer Blade 18 RTX 4070 | |
| Media Intel Core i9-13900HX (1284 - 1958, n=22) | |
| Alienware m17 R5 (R9 6900HX, RX 6850M XT) | |
| Schenker XMG Neo 17 M22 | |
| MSI Katana 17 B13VFK | |
| AIDA64 / FP64 Ray-Trace | |
| MSI Titan GT77 HX 13VI | |
| Eluktronics Mech-17 GP2 | |
| Razer Blade 18 RTX 4070 | |
| Media Intel Core i9-13900HX (9481 - 15279, n=22) | |
| Alienware m17 R5 (R9 6900HX, RX 6850M XT) | |
| Schenker XMG Neo 17 M22 | |
| MSI Katana 17 B13VFK | |
| AIDA64 / CPU PhotoWorxx | |
| Razer Blade 18 RTX 4070 | |
| Media Intel Core i9-13900HX (42994 - 51994, n=22) | |
| Eluktronics Mech-17 GP2 | |
| MSI Titan GT77 HX 13VI | |
| MSI Katana 17 B13VFK | |
| Alienware m17 R5 (R9 6900HX, RX 6850M XT) | |
| Schenker XMG Neo 17 M22 | |
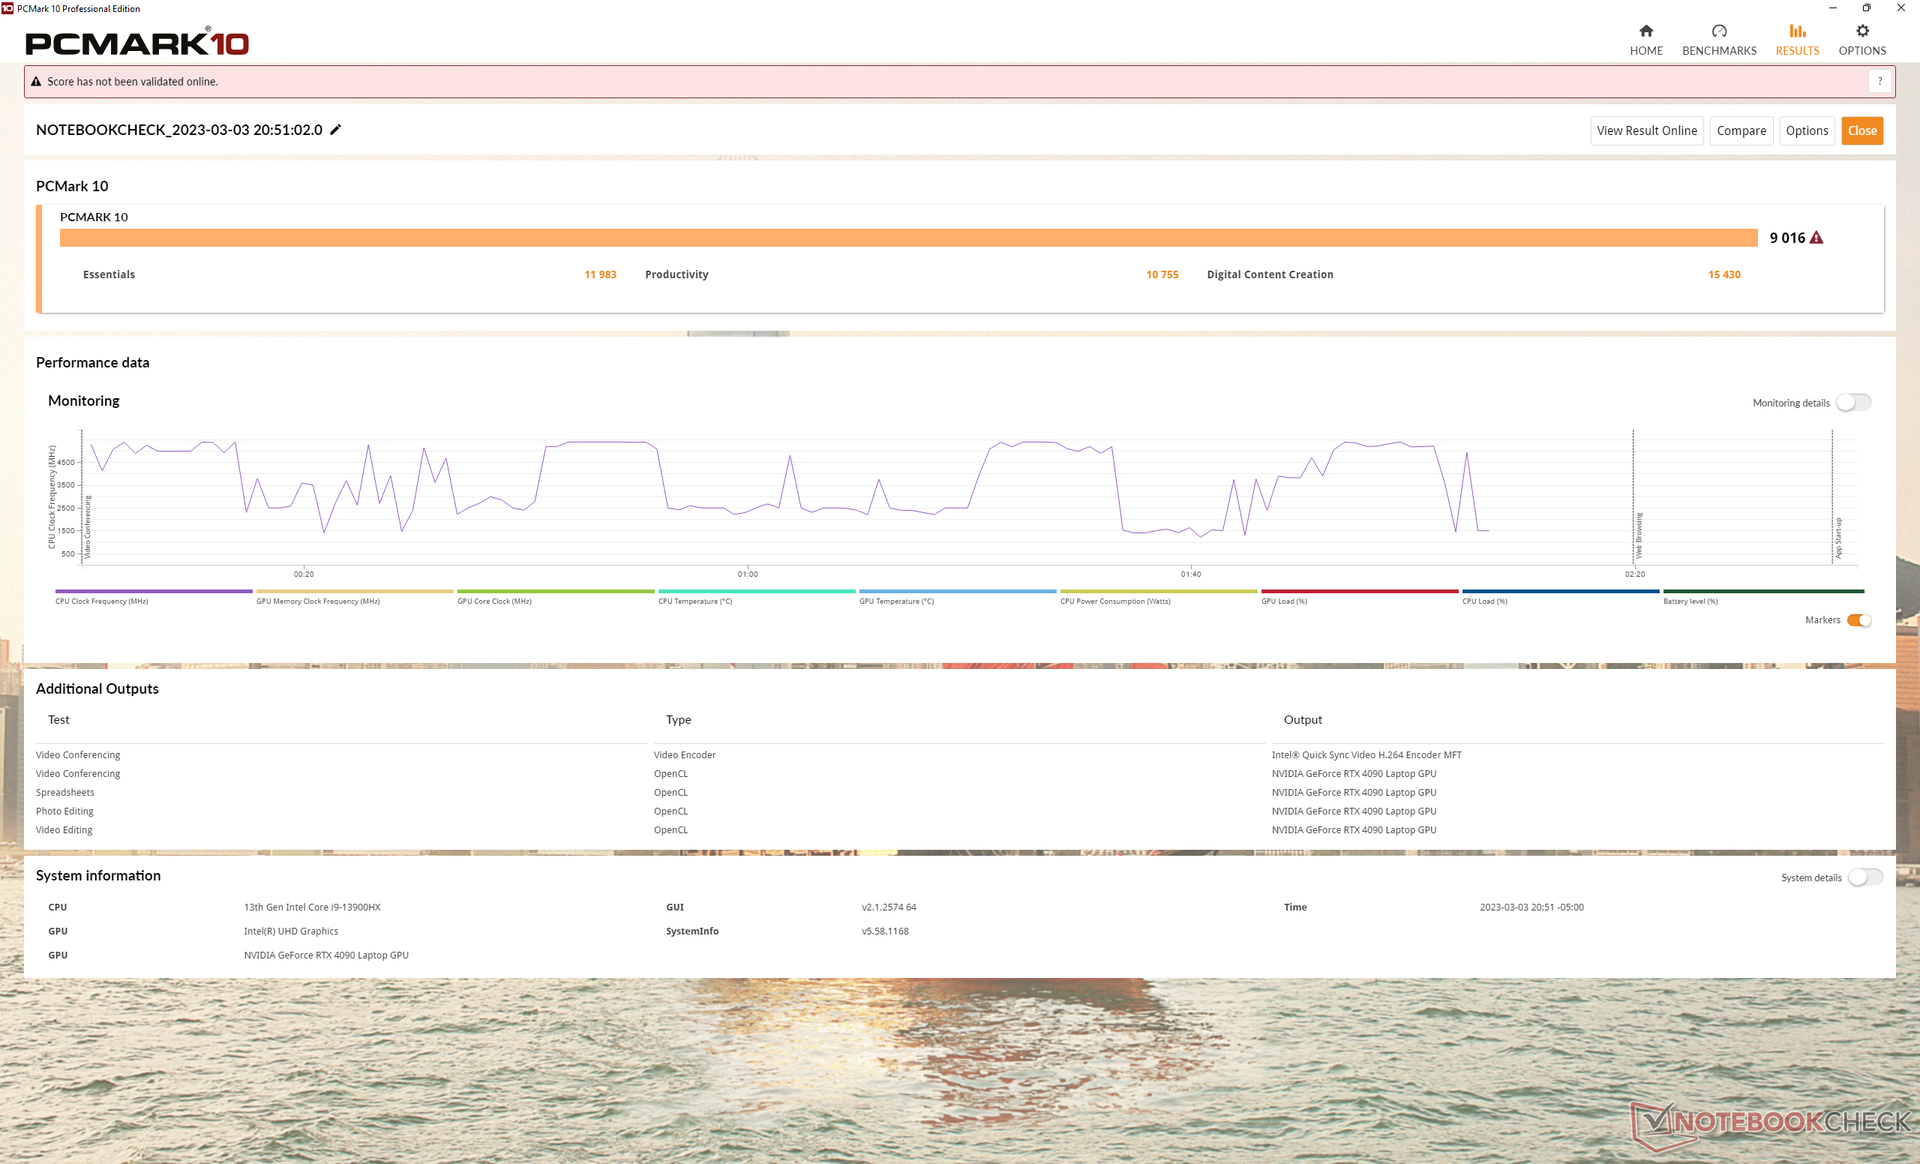
Prestazioni del sistema
I punteggi di PCMark sono tra i più alti del nostro database e rivaleggiano con la MSI Titan GT77. Il punteggio di Digital Content Creation, in particolare, è superiore di quasi il 70% rispetto al modello RTX 3080 Ti dello scorso anno, grazie all'aumento delle prestazioni grafiche.
CrossMark: Overall | Productivity | Creativity | Responsiveness
| PCMark 10 / Score | |
| Eluktronics Mech-17 GP2 | |
| MSI Titan GT77 HX 13VI | |
| Media Intel Core i9-13900HX, NVIDIA GeForce RTX 4090 Laptop GPU (7690 - 9331, n=8) | |
| Razer Blade 18 RTX 4070 | |
| Alienware m17 R5 (R9 6900HX, RX 6850M XT) | |
| MSI Katana 17 B13VFK | |
| Schenker XMG Neo 17 M22 | |
| PCMark 10 / Essentials | |
| Eluktronics Mech-17 GP2 | |
| MSI Titan GT77 HX 13VI | |
| Razer Blade 18 RTX 4070 | |
| Media Intel Core i9-13900HX, NVIDIA GeForce RTX 4090 Laptop GPU (10972 - 11983, n=8) | |
| MSI Katana 17 B13VFK | |
| Alienware m17 R5 (R9 6900HX, RX 6850M XT) | |
| Schenker XMG Neo 17 M22 | |
| PCMark 10 / Productivity | |
| Eluktronics Mech-17 GP2 | |
| Media Intel Core i9-13900HX, NVIDIA GeForce RTX 4090 Laptop GPU (9038 - 11680, n=8) | |
| MSI Titan GT77 HX 13VI | |
| Razer Blade 18 RTX 4070 | |
| Schenker XMG Neo 17 M22 | |
| MSI Katana 17 B13VFK | |
| Alienware m17 R5 (R9 6900HX, RX 6850M XT) | |
| PCMark 10 / Digital Content Creation | |
| MSI Titan GT77 HX 13VI | |
| Eluktronics Mech-17 GP2 | |
| Media Intel Core i9-13900HX, NVIDIA GeForce RTX 4090 Laptop GPU (10605 - 16395, n=8) | |
| Alienware m17 R5 (R9 6900HX, RX 6850M XT) | |
| Razer Blade 18 RTX 4070 | |
| MSI Katana 17 B13VFK | |
| Schenker XMG Neo 17 M22 | |
| CrossMark / Overall | |
| Eluktronics Mech-17 GP2 | |
| MSI Titan GT77 HX 13VI | |
| Razer Blade 18 RTX 4070 | |
| Media Intel Core i9-13900HX, NVIDIA GeForce RTX 4090 Laptop GPU (1825 - 2295, n=8) | |
| MSI Katana 17 B13VFK | |
| Schenker XMG Neo 17 M22 | |
| Alienware m17 R5 (R9 6900HX, RX 6850M XT) | |
| CrossMark / Productivity | |
| Eluktronics Mech-17 GP2 | |
| MSI Titan GT77 HX 13VI | |
| Razer Blade 18 RTX 4070 | |
| Media Intel Core i9-13900HX, NVIDIA GeForce RTX 4090 Laptop GPU (1666 - 2166, n=8) | |
| MSI Katana 17 B13VFK | |
| Schenker XMG Neo 17 M22 | |
| Alienware m17 R5 (R9 6900HX, RX 6850M XT) | |
| CrossMark / Creativity | |
| Eluktronics Mech-17 GP2 | |
| MSI Titan GT77 HX 13VI | |
| Razer Blade 18 RTX 4070 | |
| Media Intel Core i9-13900HX, NVIDIA GeForce RTX 4090 Laptop GPU (2162 - 2514, n=8) | |
| MSI Katana 17 B13VFK | |
| Schenker XMG Neo 17 M22 | |
| Alienware m17 R5 (R9 6900HX, RX 6850M XT) | |
| CrossMark / Responsiveness | |
| Razer Blade 18 RTX 4070 | |
| MSI Titan GT77 HX 13VI | |
| Eluktronics Mech-17 GP2 | |
| Media Intel Core i9-13900HX, NVIDIA GeForce RTX 4090 Laptop GPU (1441 - 2275, n=8) | |
| MSI Katana 17 B13VFK | |
| Schenker XMG Neo 17 M22 | |
| Alienware m17 R5 (R9 6900HX, RX 6850M XT) | |
| PCMark 10 Score | 9016 punti | |
Aiuto | ||
| AIDA64 / Memory Copy | |
| Razer Blade 18 RTX 4070 | |
| Media Intel Core i9-13900HX (67716 - 79193, n=22) | |
| Eluktronics Mech-17 GP2 | |
| MSI Titan GT77 HX 13VI | |
| MSI Katana 17 B13VFK | |
| Alienware m17 R5 (R9 6900HX, RX 6850M XT) | |
| Schenker XMG Neo 17 M22 | |
| AIDA64 / Memory Read | |
| Razer Blade 18 RTX 4070 | |
| Media Intel Core i9-13900HX (73998 - 88462, n=22) | |
| Eluktronics Mech-17 GP2 | |
| MSI Titan GT77 HX 13VI | |
| MSI Katana 17 B13VFK | |
| Schenker XMG Neo 17 M22 | |
| Alienware m17 R5 (R9 6900HX, RX 6850M XT) | |
| AIDA64 / Memory Write | |
| Razer Blade 18 RTX 4070 | |
| Media Intel Core i9-13900HX (65472 - 77045, n=22) | |
| Eluktronics Mech-17 GP2 | |
| MSI Titan GT77 HX 13VI | |
| Schenker XMG Neo 17 M22 | |
| Alienware m17 R5 (R9 6900HX, RX 6850M XT) | |
| MSI Katana 17 B13VFK | |
| AIDA64 / Memory Latency | |
| MSI Katana 17 B13VFK | |
| Alienware m17 R5 (R9 6900HX, RX 6850M XT) | |
| MSI Titan GT77 HX 13VI | |
| Schenker XMG Neo 17 M22 | |
| Eluktronics Mech-17 GP2 | |
| Media Intel Core i9-13900HX (75.3 - 91.1, n=22) | |
| Razer Blade 18 RTX 4070 | |
* ... Meglio usare valori piccoli
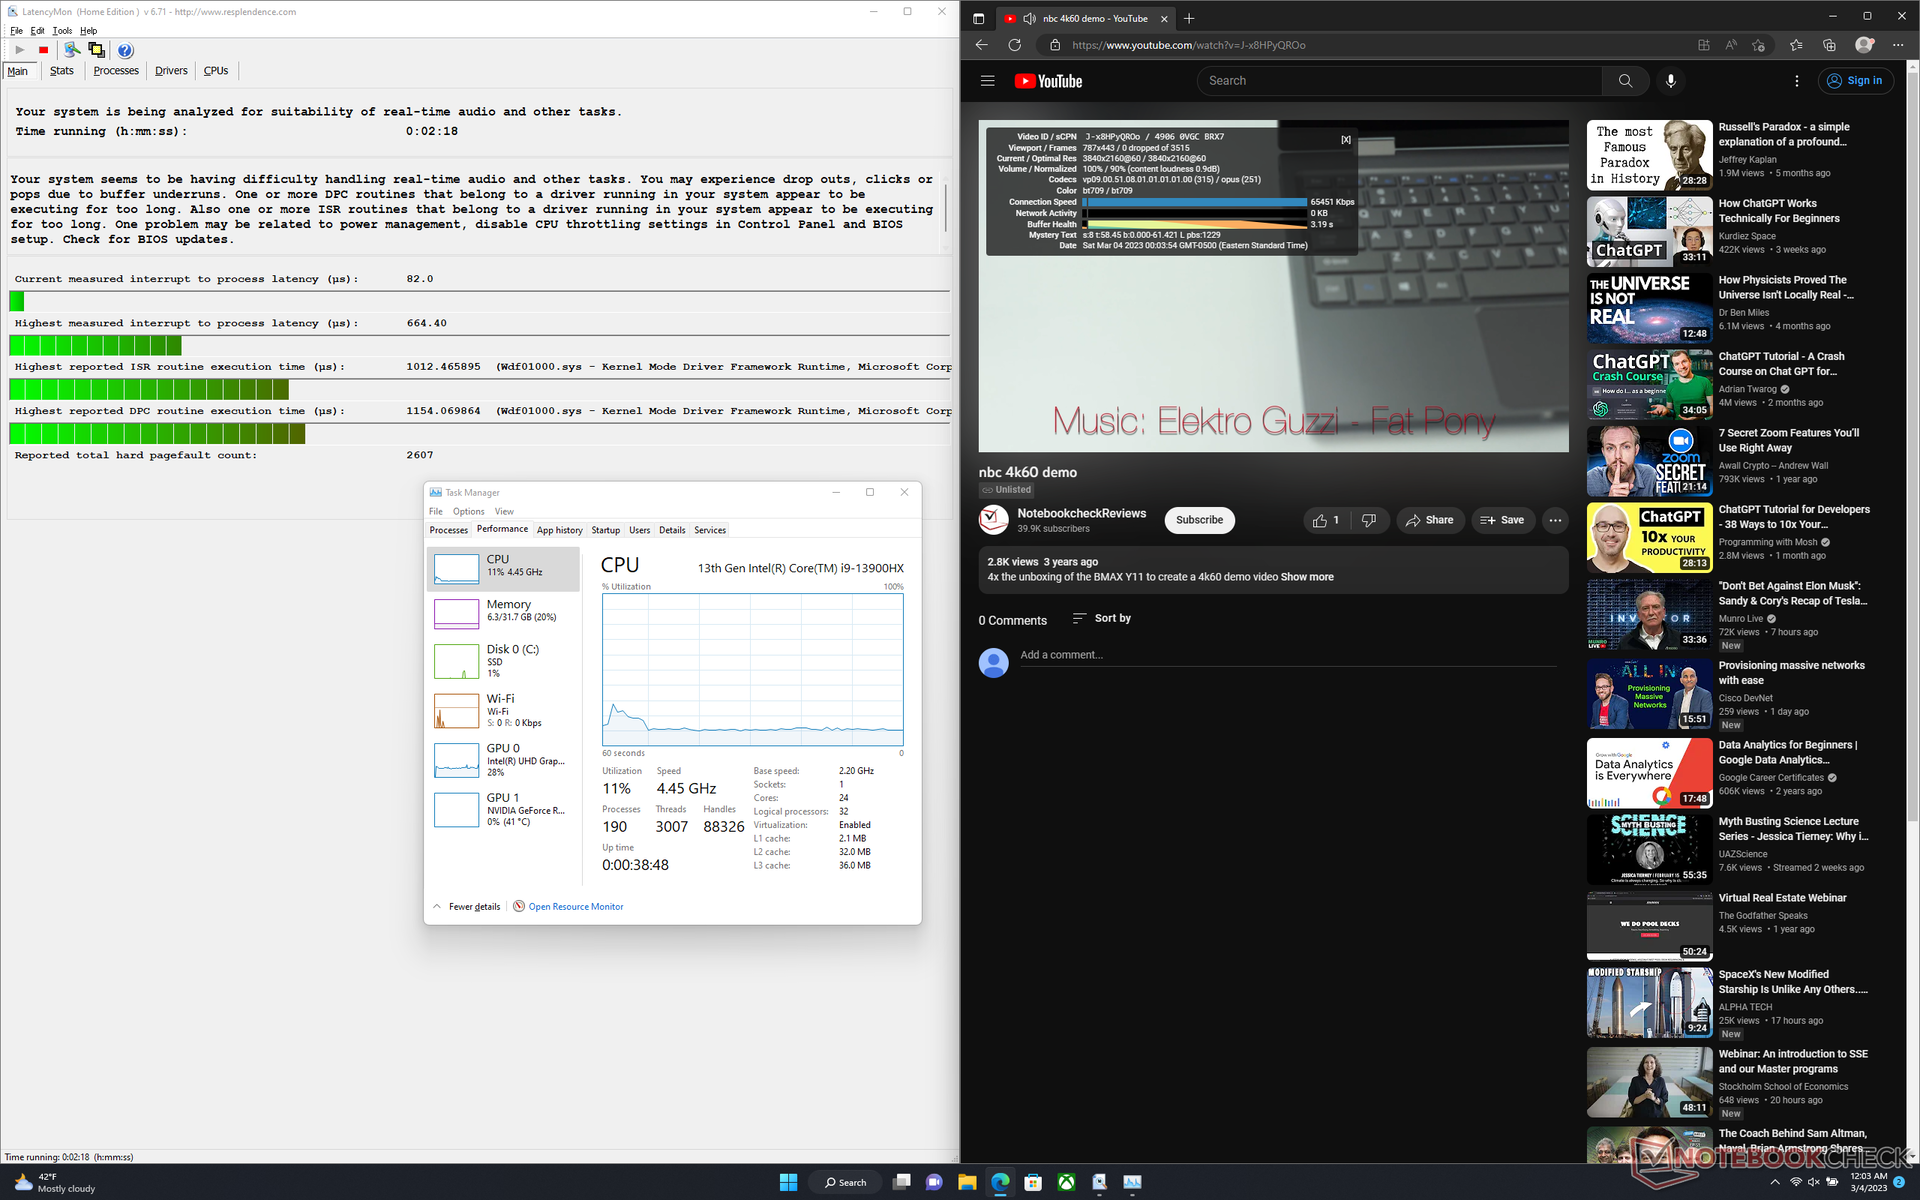
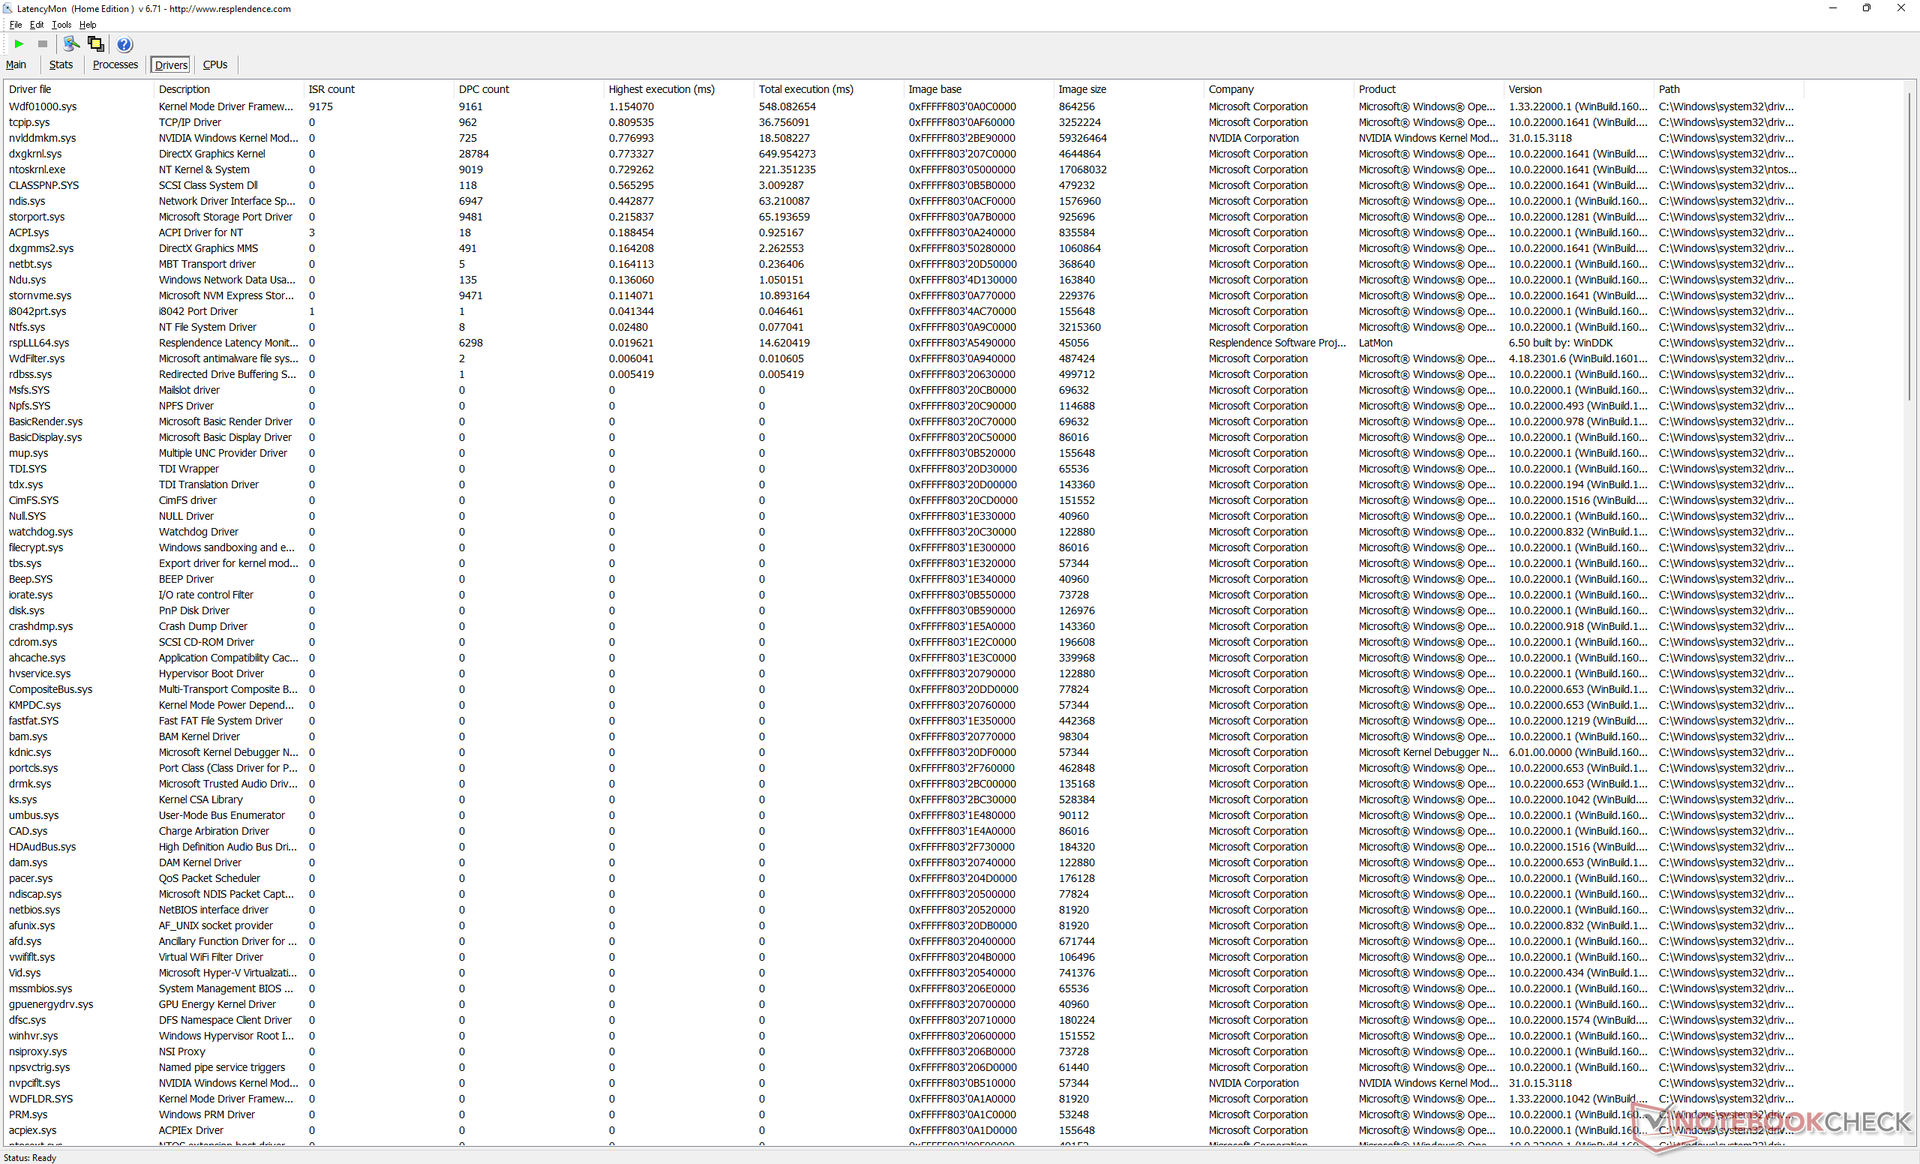
Latenza DPC
LatencyMon rivela lievi problemi di DPC quando si aprono più schede del browser della nostra homepage. la riproduzione di video 4K a 60 FPS è invece perfetta, senza cadute di fotogrammi.
| DPC Latencies / LatencyMon - interrupt to process latency (max), Web, Youtube, Prime95 | |
| MSI Titan GT77 HX 13VI | |
| Schenker XMG Neo 17 M22 | |
| MSI Katana 17 B13VFK | |
| Alienware m17 R5 (R9 6900HX, RX 6850M XT) | |
| Razer Blade 18 RTX 4070 | |
| Eluktronics Mech-17 GP2 | |
* ... Meglio usare valori piccoli
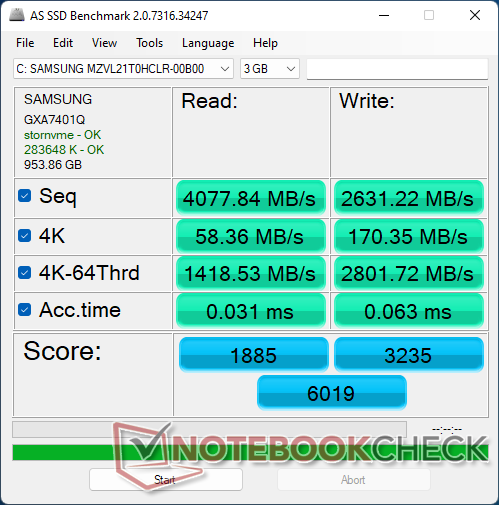
Dispositivi di archiviazione
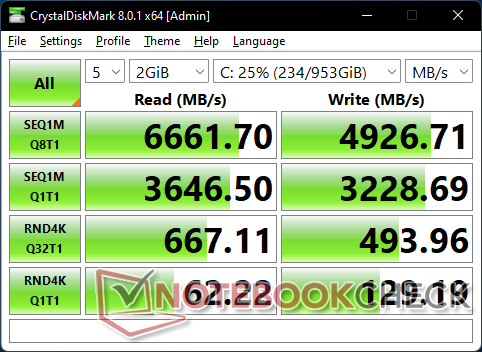
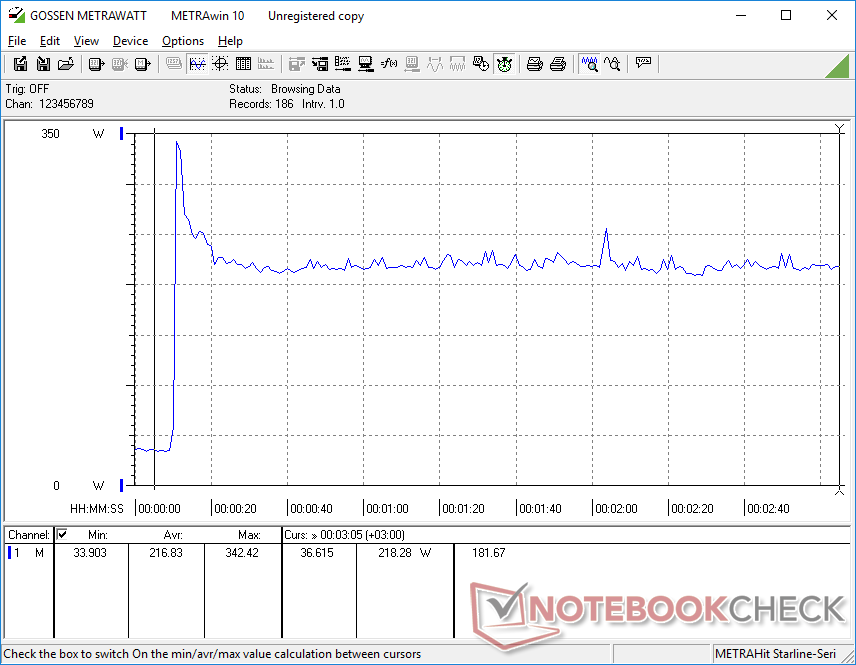
La nostra unità viene fornita con un disco da 1 TB Samsung PM9A1 MZVL21T0HCLR che è una delle più veloci unità SSD PCIe4 x4 NVMe per il mercato consumer attualmente disponibili. Sfortunatamente, l'unità nella nostra unità ha problemi a mantenere la massima velocità di trasferimento per periodi prolungati, come mostra il grafico del nostro stress test qui sotto. In confronto, il Razer Blade 15 con la stessa unità Samsung è in grado di sostenere velocità di trasferimento di 6700 MB/s senza alcun problema.

| Drive Performance rating - Percent | |
| Schenker XMG Neo 17 M22 | |
| MSI Titan GT77 HX 13VI | |
| Razer Blade 18 RTX 4070 | |
| MSI Katana 17 B13VFK | |
| Eluktronics Mech-17 GP2 | |
| Alienware m17 R5 (R9 6900HX, RX 6850M XT) | |
* ... Meglio usare valori piccoli
Disk Throttling: DiskSpd Read Loop, Queue Depth 8
Prestazioni della GPU
Le prestazioni complessive sono più veloci di circa il 40-60% rispetto alla rTX 3080 Ti mobile per essere all'incirca alla pari con la rTX 3080 Ti per desktop. L'abilitazione del DLSS 3 sui titoli supportati aumenta ulteriormente le prestazioni di 2 o 3 volte, anche se con potenziali artefatti grafici.
La maggior parte dei giochi può essere eseguita a 4K nativi e 60 FPS se gli effetti RT non sono supportati o sono disabilitati. Fanno eccezione i titoli molto impegnativi come Cyberpunk 2077 o F1 22, dove i frame rate si aggirano invece tra i 40 e i 50 FPS. In questo caso, G-Sync e DLSS possono essere utili per ridurre il tearing e aumentare le prestazioni, rispettivamente.
La scelta della configurazione RTX 4080 o RTX 4070 al posto della RTX 4090 riduce le prestazioni grafiche rispettivamente del 10-15% e del 40-45%. Pertanto, la differenza di prestazioni tra la 4090 e la 4080 è molto inferiore a quella tra la 4080 e la 4070, anche se la differenza di prezzo è di 500 dollari tra i due modelli.
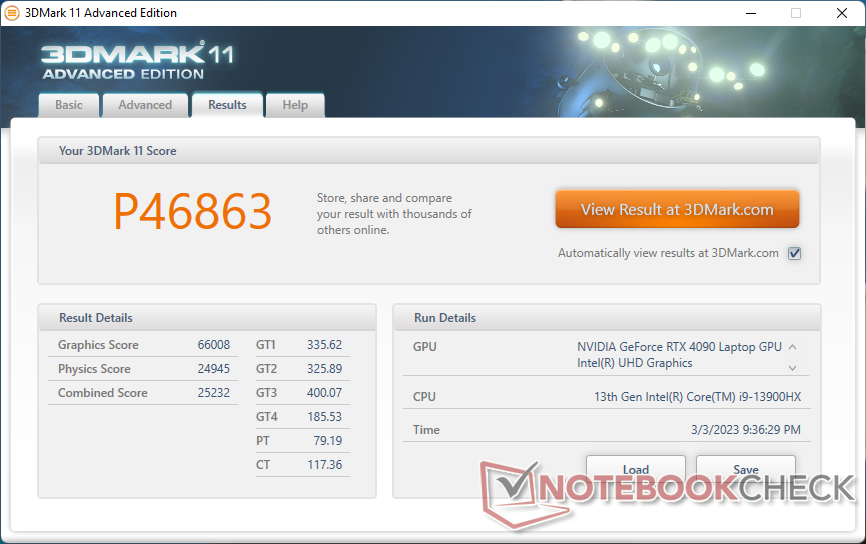
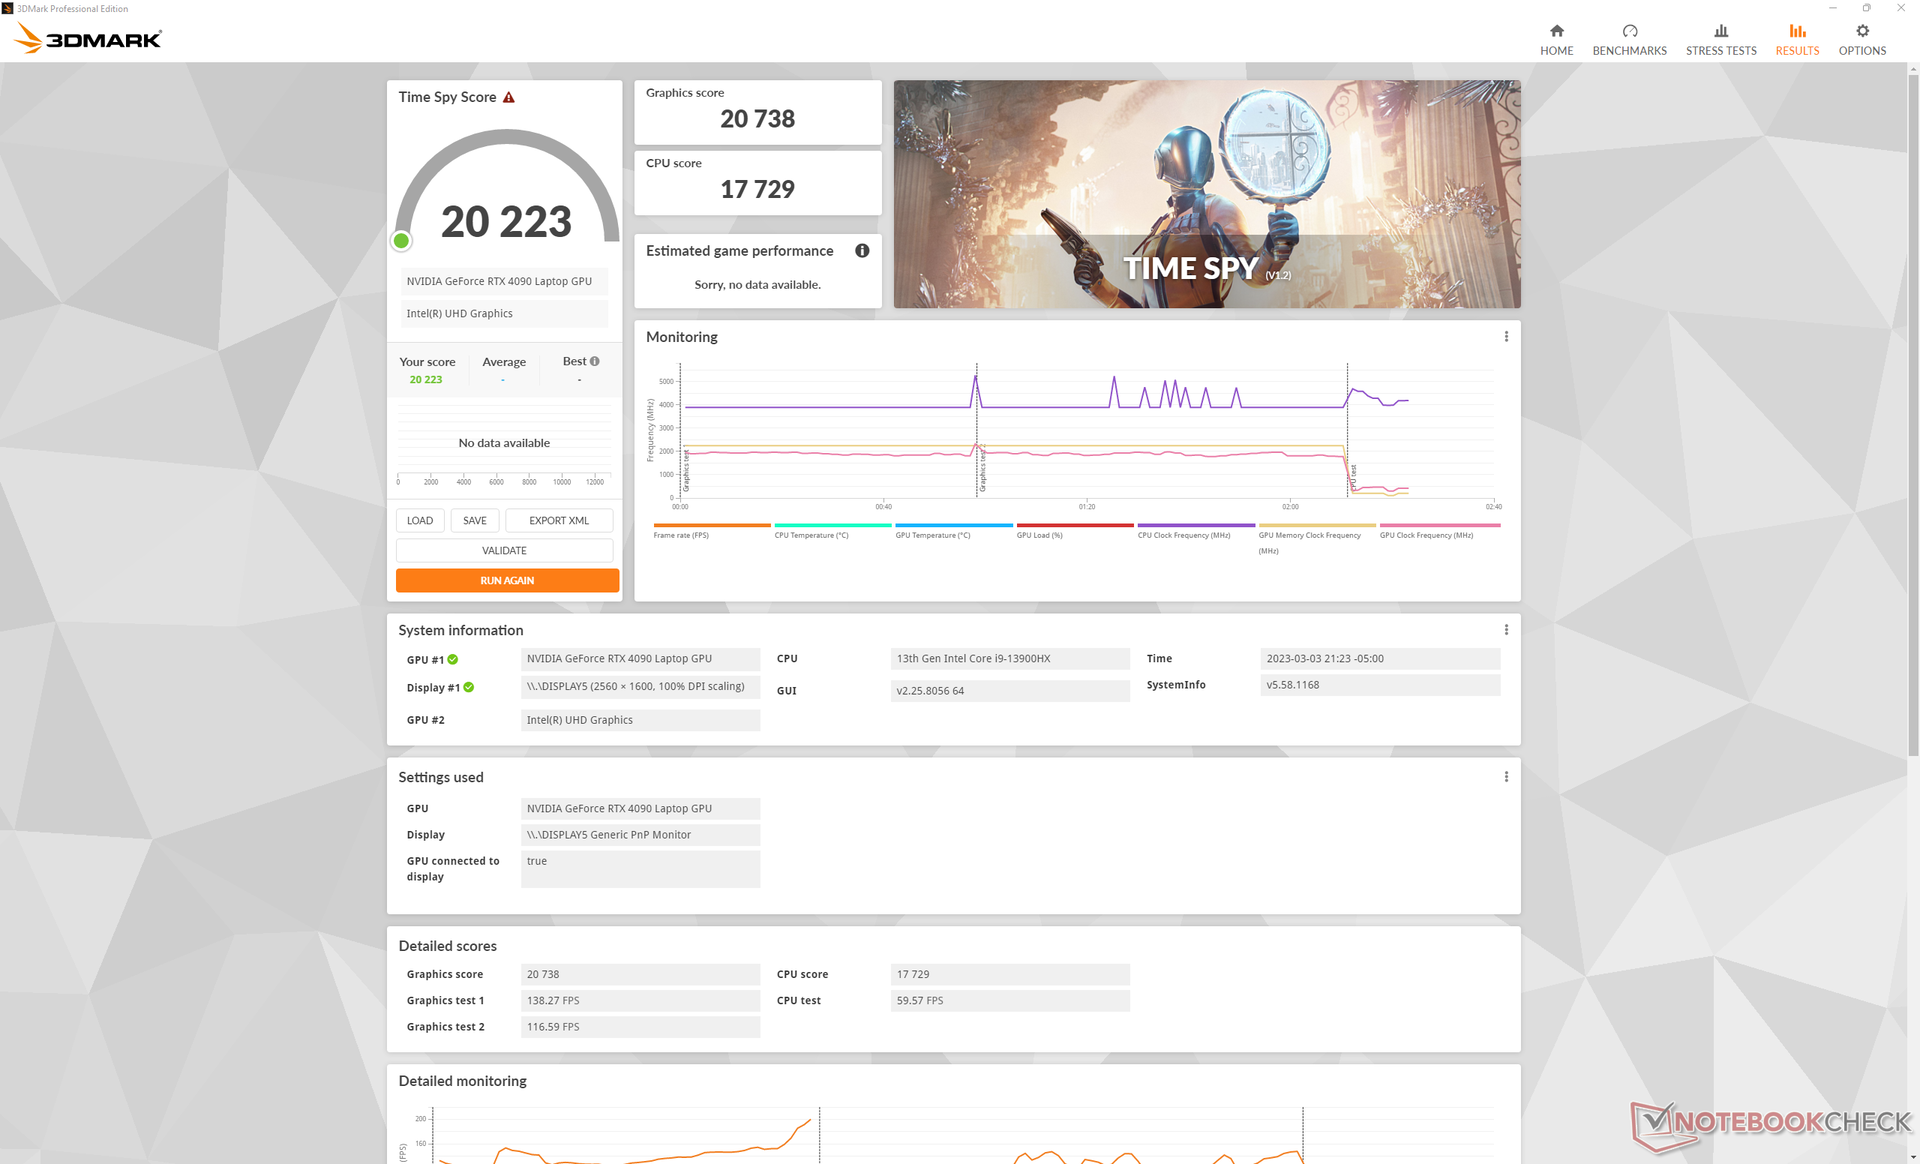
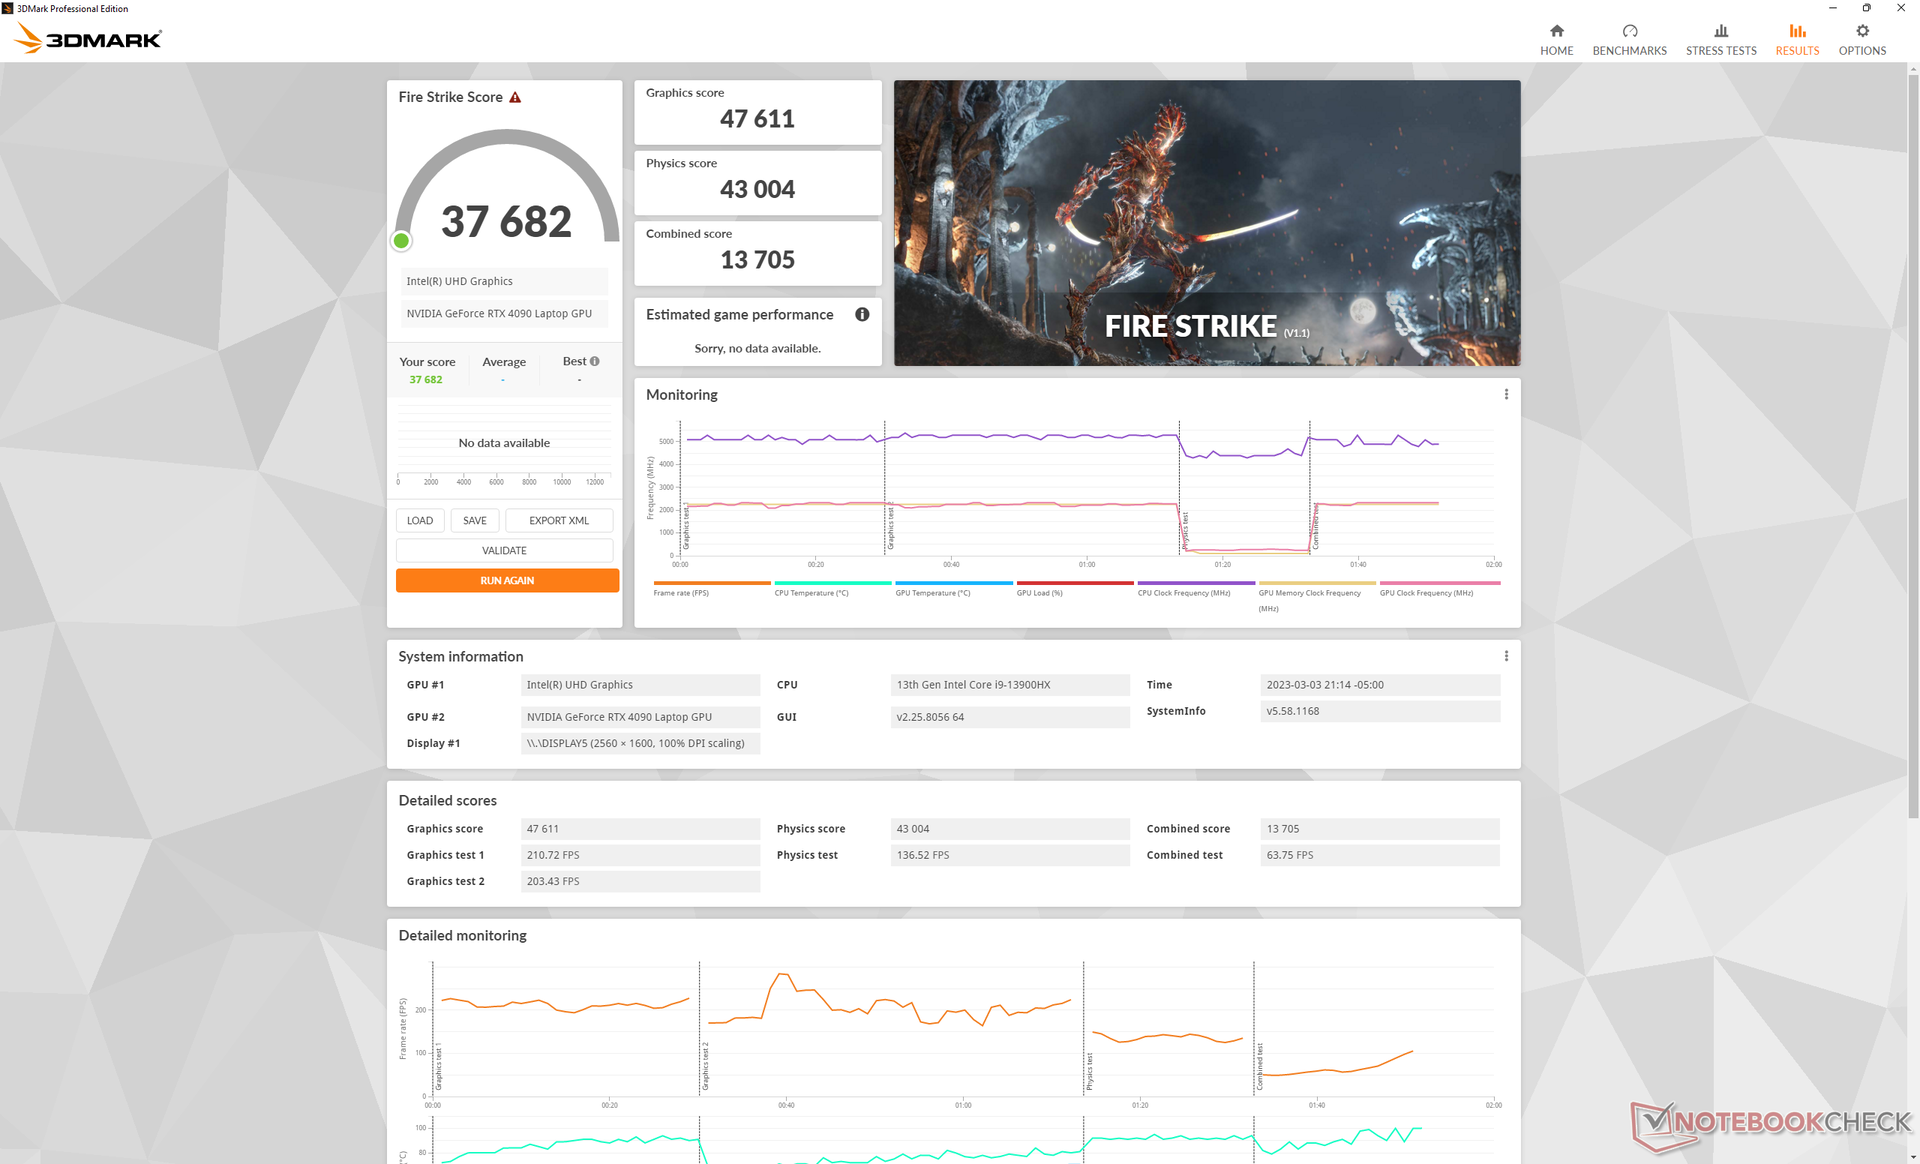
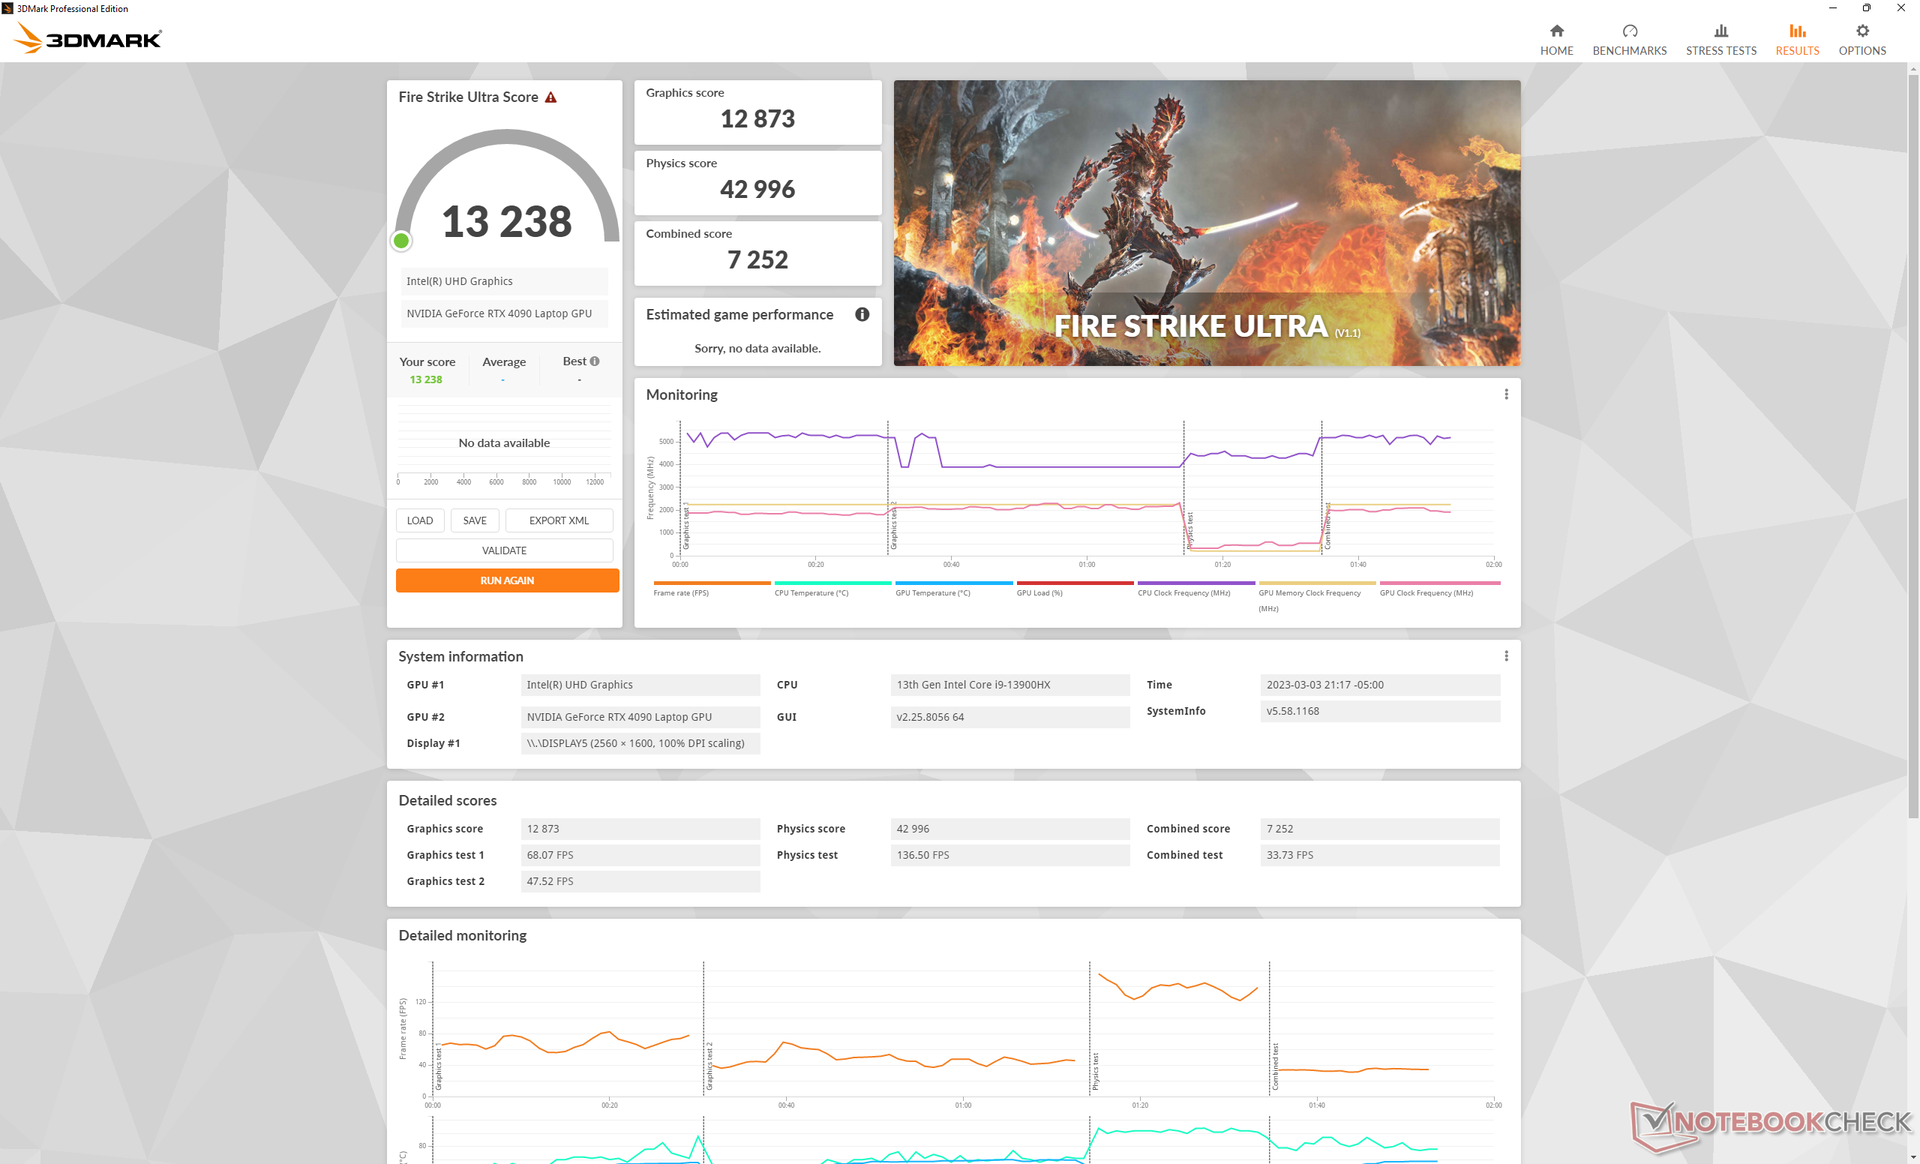
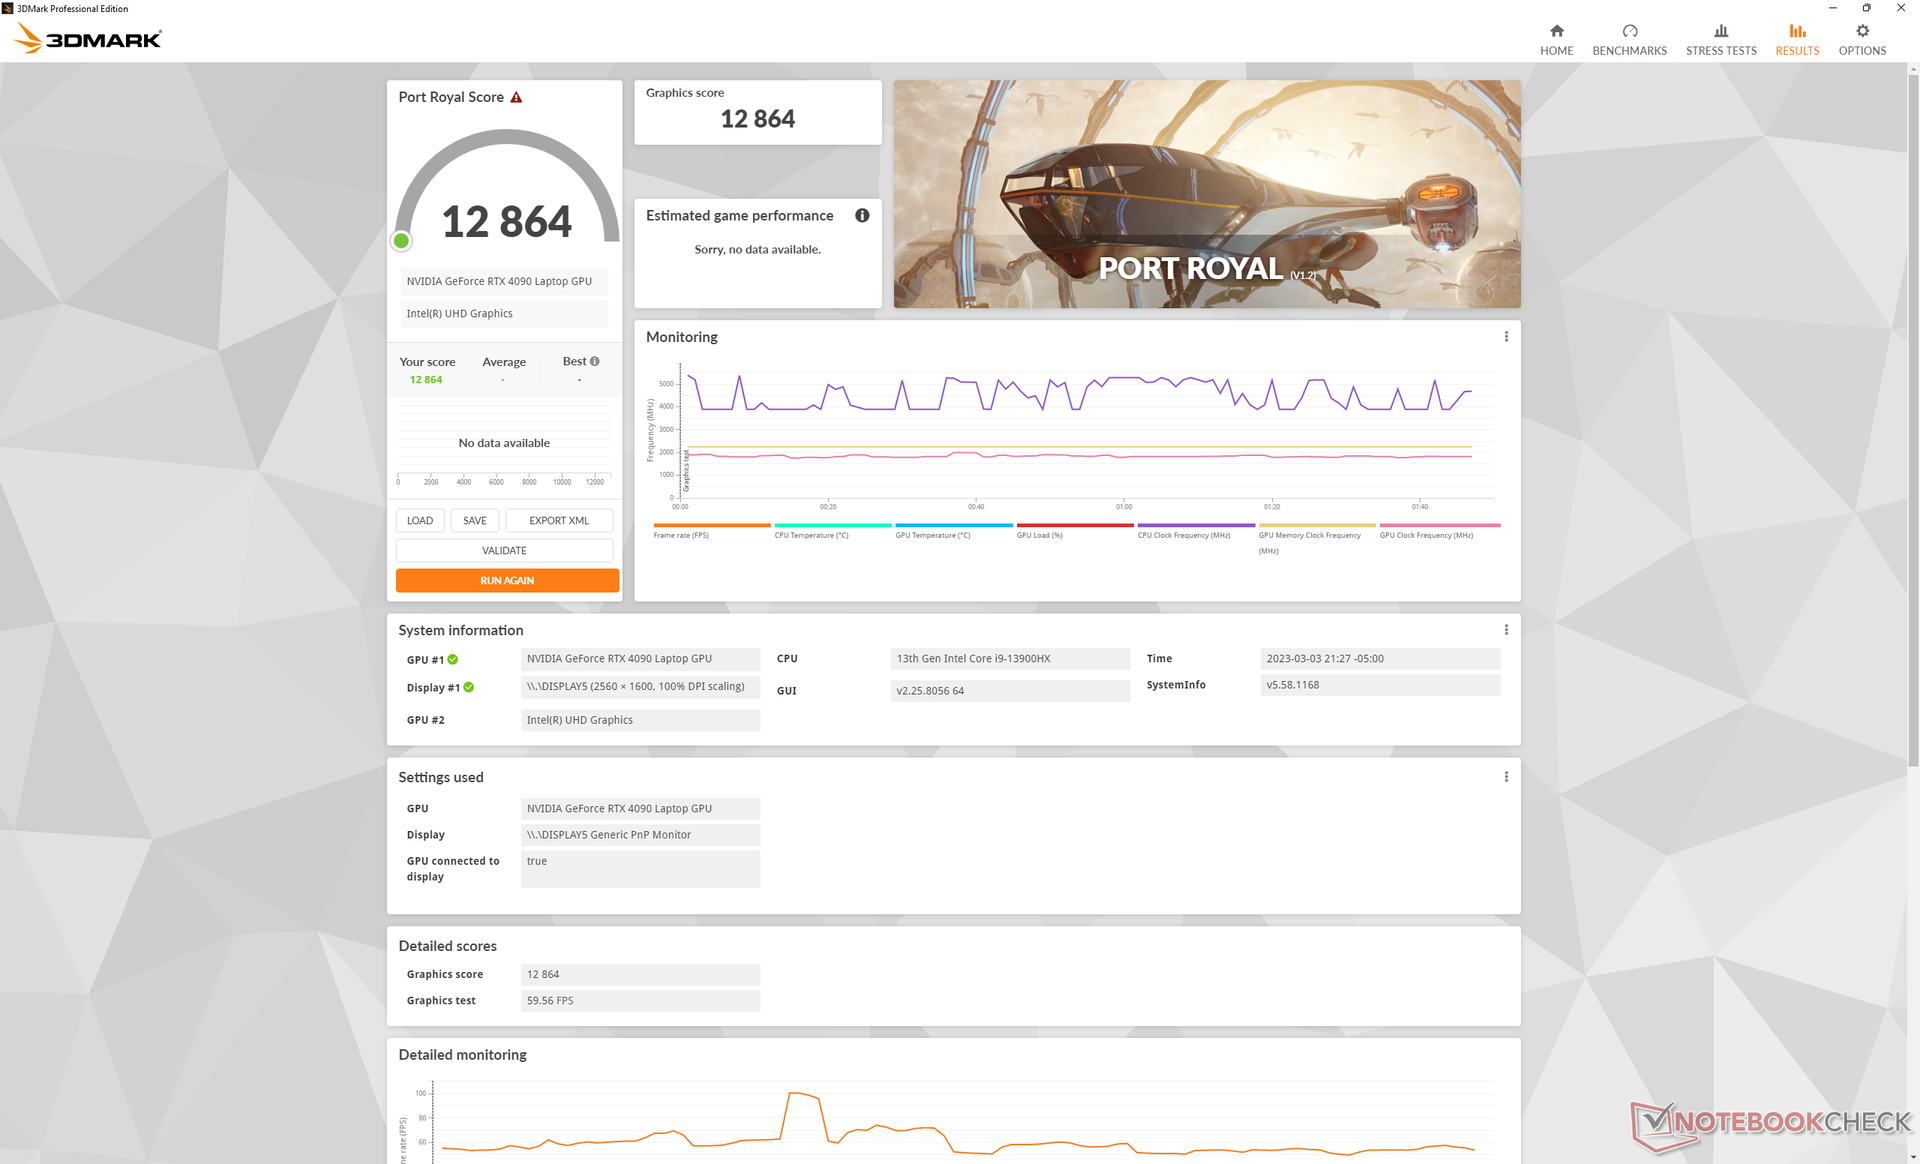
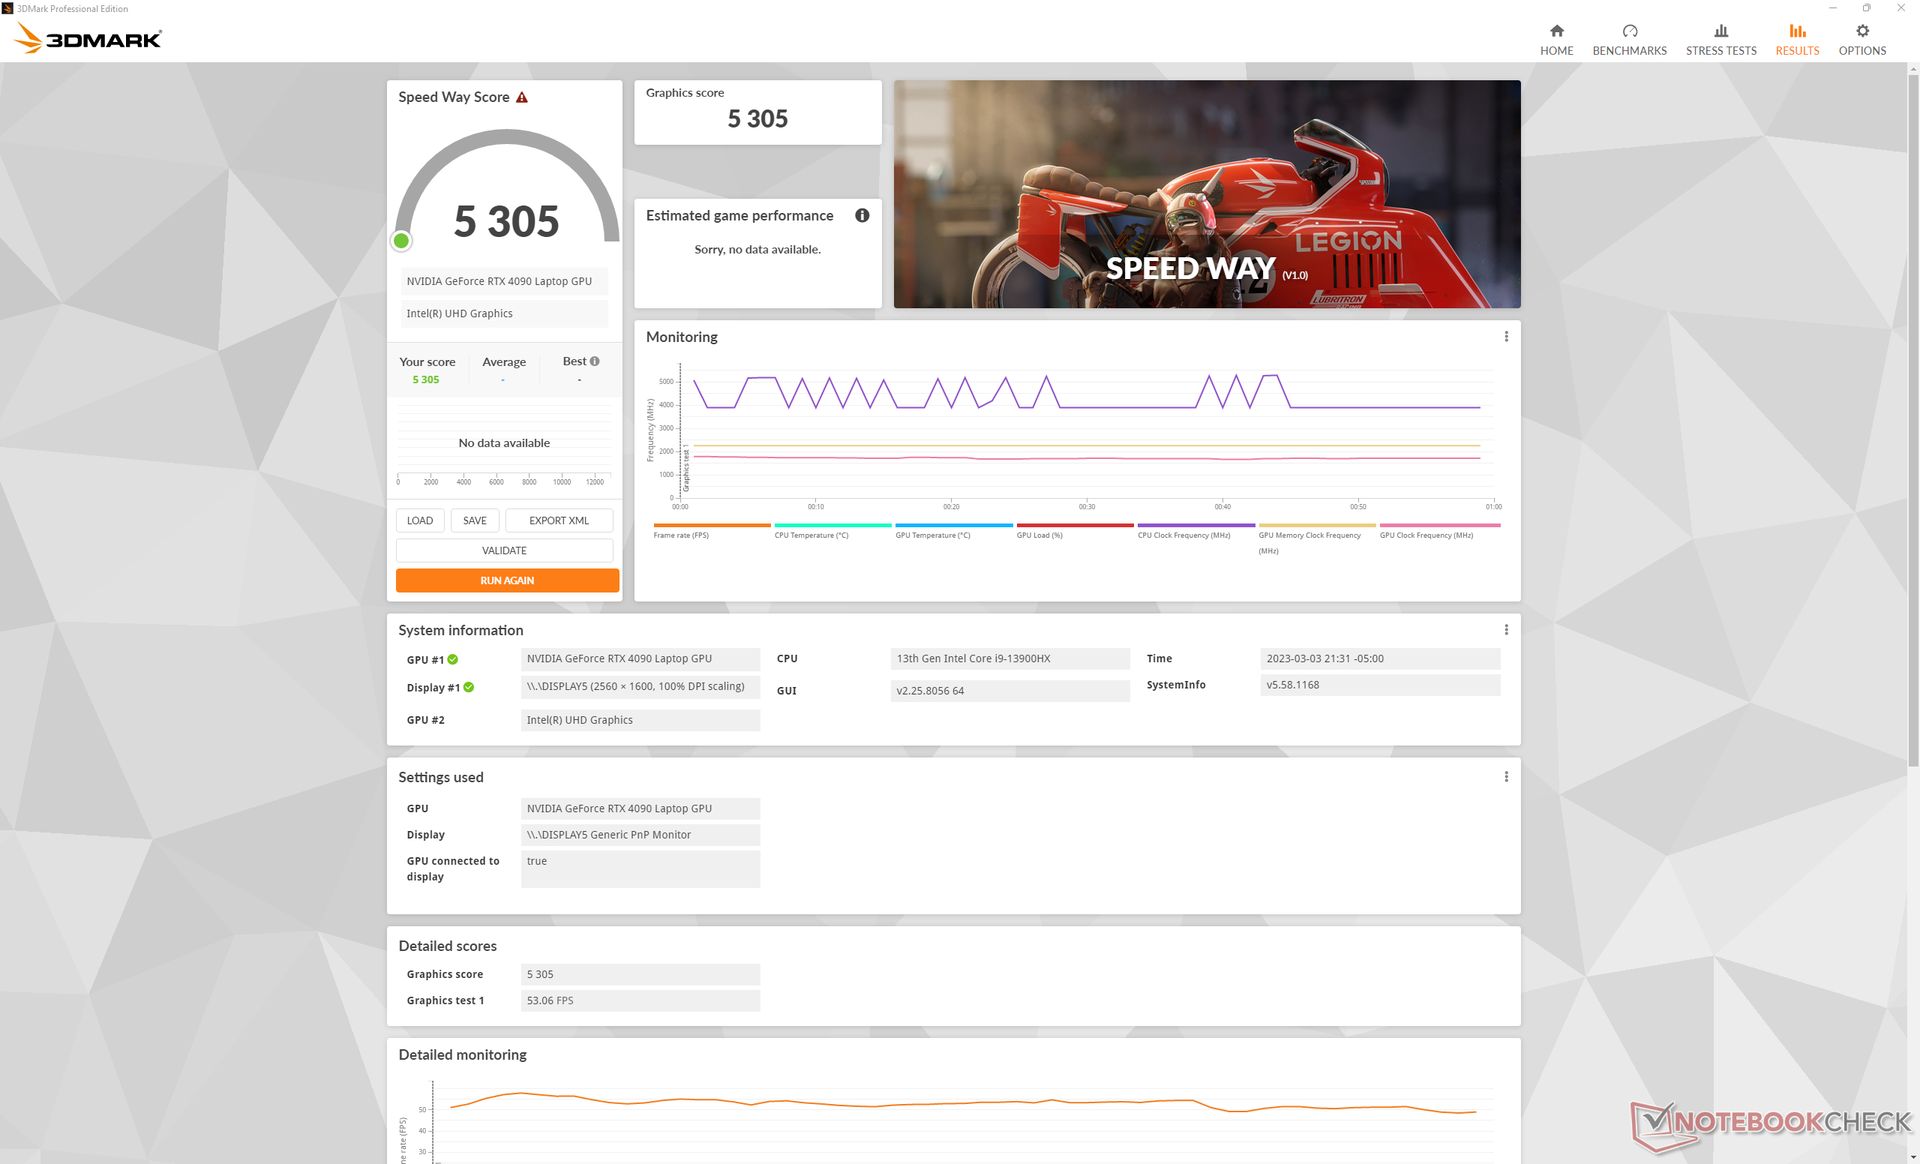
| 3DMark 11 Performance | 46863 punti | |
| 3DMark Fire Strike Score | 37682 punti | |
| 3DMark Time Spy Score | 20223 punti | |
Aiuto | ||
* ... Meglio usare valori piccoli
| The Witcher 3 - 1920x1080 Ultra Graphics & Postprocessing (HBAO+) | |
| Schenker XMG SECTOR, i9 13900K, RTX 4090 | |
| Eluktronics Mech-17 GP2 | |
| Corsair One i300 | |
| MSI Titan GT77 12UHS | |
| Schenker XMG Neo 17 M22 | |
| Razer Blade 18 RTX 4070 | |
| MSI Katana 17 B13VFK | |
| MSI GS76 Stealth 11UH | |
| MSI Pulse GL76 12UGK | |
| HP Omen 16-n0033dx | |
| Schenker XMG Core 17 (Early 2021) | |
| Cyberpunk 2077 1.6 - 1920x1080 Ultra Preset | |
| Schenker XMG SECTOR, i9 13900K, RTX 4090 | |
| Eluktronics Mech-17 GP2 | |
| MSI Titan GT77 12UHS | |
| Razer Blade 18 RTX 4070 | |
| MSI Katana 17 B13VFK | |
| MSI Pulse GL76 12UGK | |
| HP Omen 16-n0033dx | |
Witcher 3 FPS Chart
| basso | medio | alto | ultra | QHD | 4K | |
|---|---|---|---|---|---|---|
| GTA V (2015) | 187.5 | 187.2 | 186.5 | 149.8 | 146.3 | 180.2 |
| The Witcher 3 (2015) | 717.7 | 617.3 | 449 | 216.3 | 167.6 | |
| Dota 2 Reborn (2015) | 243 | 216 | 205 | 192.5 | 186.7 | |
| Final Fantasy XV Benchmark (2018) | 233 | 230 | 194.9 | 157.1 | 90.8 | |
| X-Plane 11.11 (2018) | 212 | 188.8 | 146.4 | 124.7 | ||
| Strange Brigade (2018) | 656 | 508 | 465 | 421 | 315 | 163.4 |
| Metro Exodus (2019) | 240.1 | 207.1 | 173.8 | 146.5 | 127.7 | 82.1 |
| Borderlands 3 (2019) | 284.2 | 269.7 | 238.5 | 179.7 | 129.4 | 72.2 |
| Cyberpunk 2077 1.6 (2022) | 191.1 | 178.6 | 166.9 | 159.7 | 101.3 | 47.8 |
| F1 22 (2022) | 375 | 358 | 322 | 140.6 | 91.8 | 45.3 |
Emissioni
Rumore del sistema
Sebbene siano state apportate modifiche alla soluzione di raffreddamento rispetto al modello dello scorso anno, la rumorosità complessiva delle ventole rimane pressoché invariata. Le ventole interne sono sempre attive, indipendentemente dall'impostazione o dal carico sullo schermo. Raccomandiamo la modalità Office o Balanced se non si eseguono applicazioni intensive, in quanto le ventole diventano sensibilmente più silenziose e apatiche.
Quando si gioca in modalità Performance o "Beast", la rumorosità delle ventole si assesta tra i 50 e i 52 dB(A), simile a quella dell'Alienware m17 R5 o del Razer Blade 18 in condizioni simili. Le cuffie sono quasi indispensabili se il rumore della ventola supera i 50 dB(A) quando si gioca.
Il metallo liquido Thermal Grizzly è di serie su tutte le configurazioni.
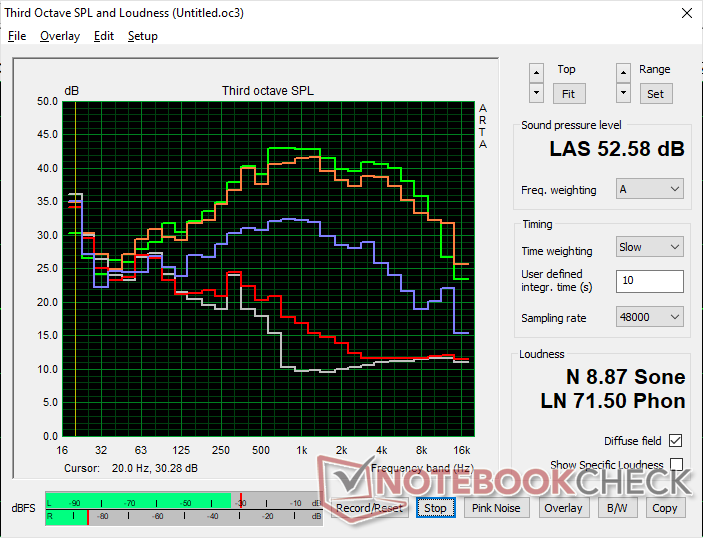
Rumorosità
| Idle |
| 28 / 28 / 30.4 dB(A) |
| Sotto carico |
| 41 / 52.6 dB(A) |
 | ||
30 dB silenzioso 40 dB(A) udibile 50 dB(A) rumoroso |
||
min: | ||
| Eluktronics Mech-17 GP2 GeForce RTX 4090 Laptop GPU, i9-13900HX, Samsung PM9A1 MZVL21T0HCLR | Schenker XMG Neo 17 M22 GeForce RTX 3080 Ti Laptop GPU, R9 6900HX, Samsung SSD 980 Pro 1TB MZ-V8P1T0BW | MSI Katana 17 B13VFK GeForce RTX 4060 Laptop GPU, i7-13620H, Micron 2400 MTFDKBA1T0QFM | MSI Titan GT77 HX 13VI GeForce RTX 4090 Laptop GPU, i9-13950HX, Samsung PM9A1 MZVL22T0HBLB | Alienware m17 R5 (R9 6900HX, RX 6850M XT) Radeon RX 6850M XT, R9 6900HX, SSSTC CA6-8D1024 | Razer Blade 18 RTX 4070 GeForce RTX 4070 Laptop GPU, i9-13950HX, SSSTC CA6-8D1024 | |
|---|---|---|---|---|---|---|
| Noise | -8% | -6% | -7% | 10% | 9% | |
| off /ambiente * (dB) | 25.2 | 26 -3% | 24.5 3% | 24.6 2% | 23 9% | 23.5 7% |
| Idle Minimum * (dB) | 28 | 26 7% | 24.5 12% | 29.2 -4% | 23 18% | 23.8 15% |
| Idle Average * (dB) | 28 | 29 -4% | 24.5 12% | 29.2 -4% | 28.11 -0% | 23.8 15% |
| Idle Maximum * (dB) | 30.4 | 40 -32% | 40 -32% | 29.2 4% | 28.11 8% | 26.8 12% |
| Load Average * (dB) | 41 | 47 -15% | 48.3 -18% | 50.7 -24% | 30.62 25% | 37.3 9% |
| Witcher 3 ultra * (dB) | 50.7 | 52 -3% | 56 -10% | 53.3 -5% | 49.75 2% | 48 5% |
| Load Maximum * (dB) | 52.6 | 54 -3% | 59.1 -12% | 61 -16% | 50.17 5% | 53.5 -2% |
* ... Meglio usare valori piccoli
Temperatura
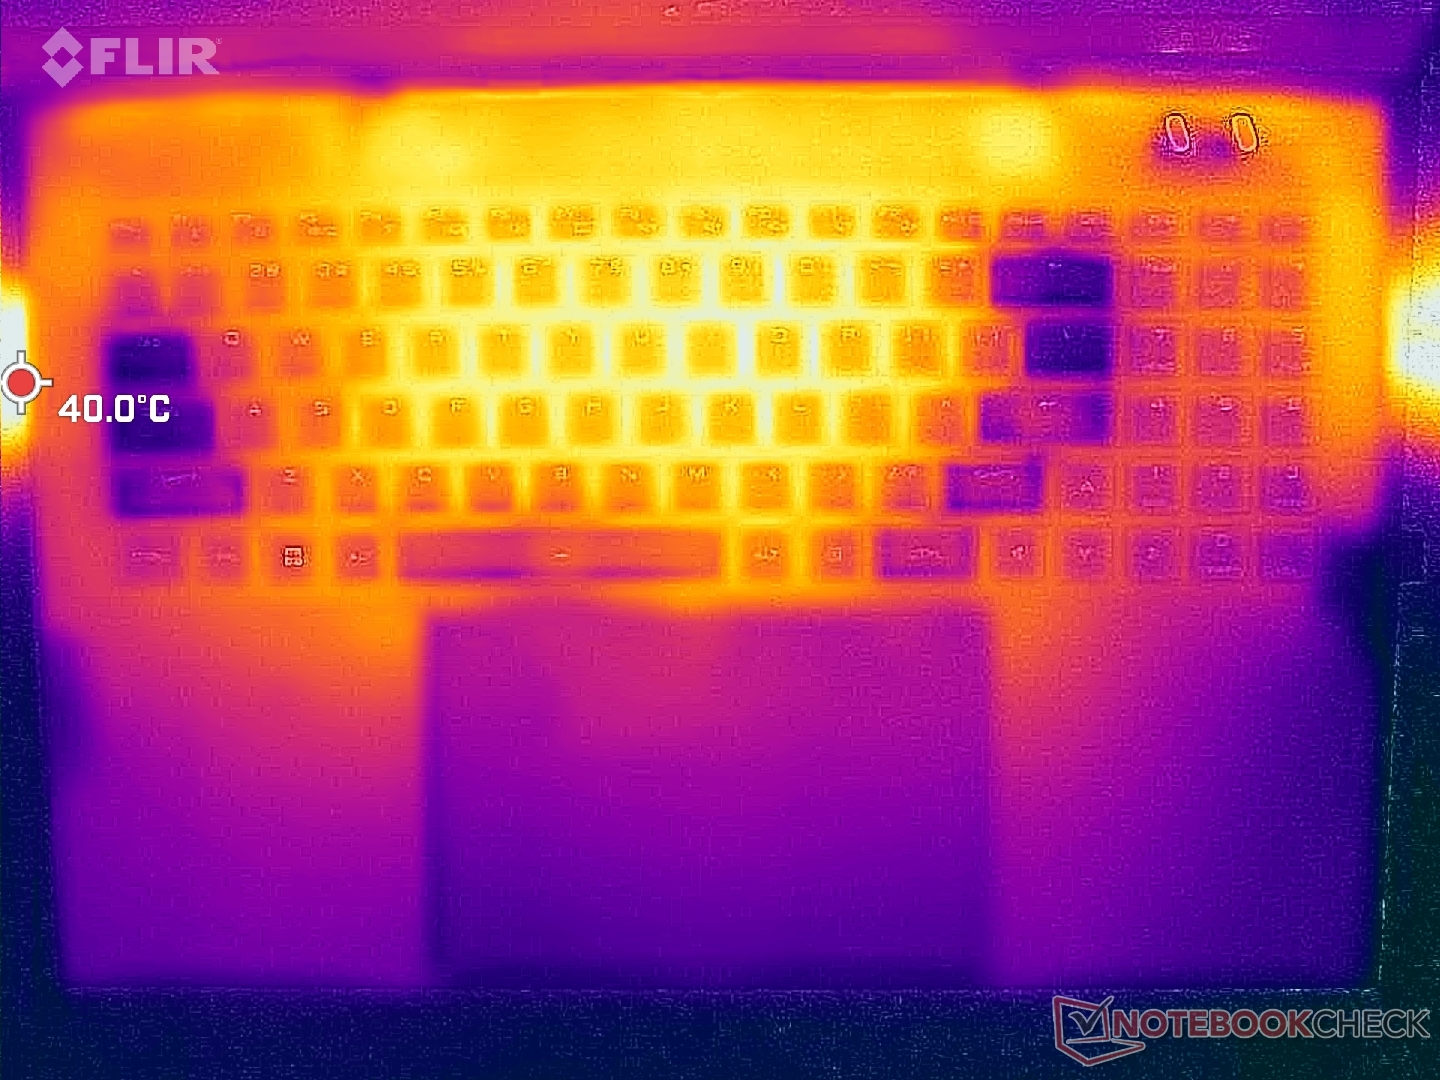
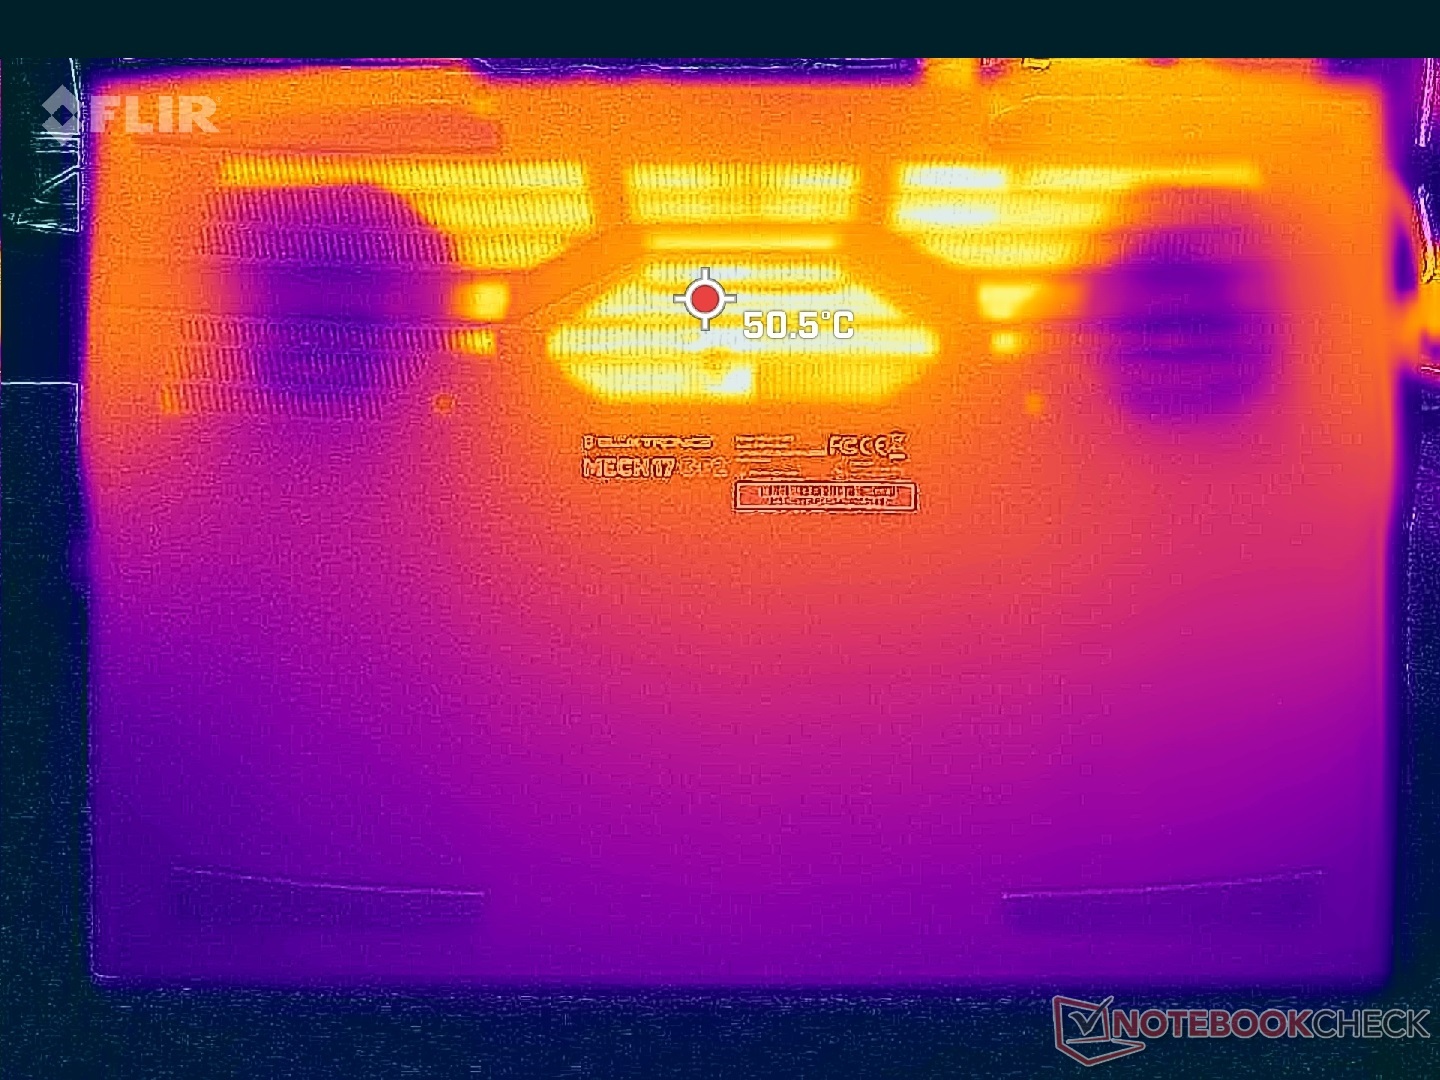
Le temperature della superficie sono più calde verso il centro e più fresche lungo i lati della tastiera e i poggiapolsi. L'aria fresca entra attraverso i tasti WASD per mantenere le dita fresche durante il gioco. I punti caldi da 39 C a 44 C sono più freddi di quelli che abbiamo registrato sull'Alienware m17 R5 Alienware m17 R5 dove i punti caldi possono raggiungere i 50 C - 57 C in condizioni di gioco simili.
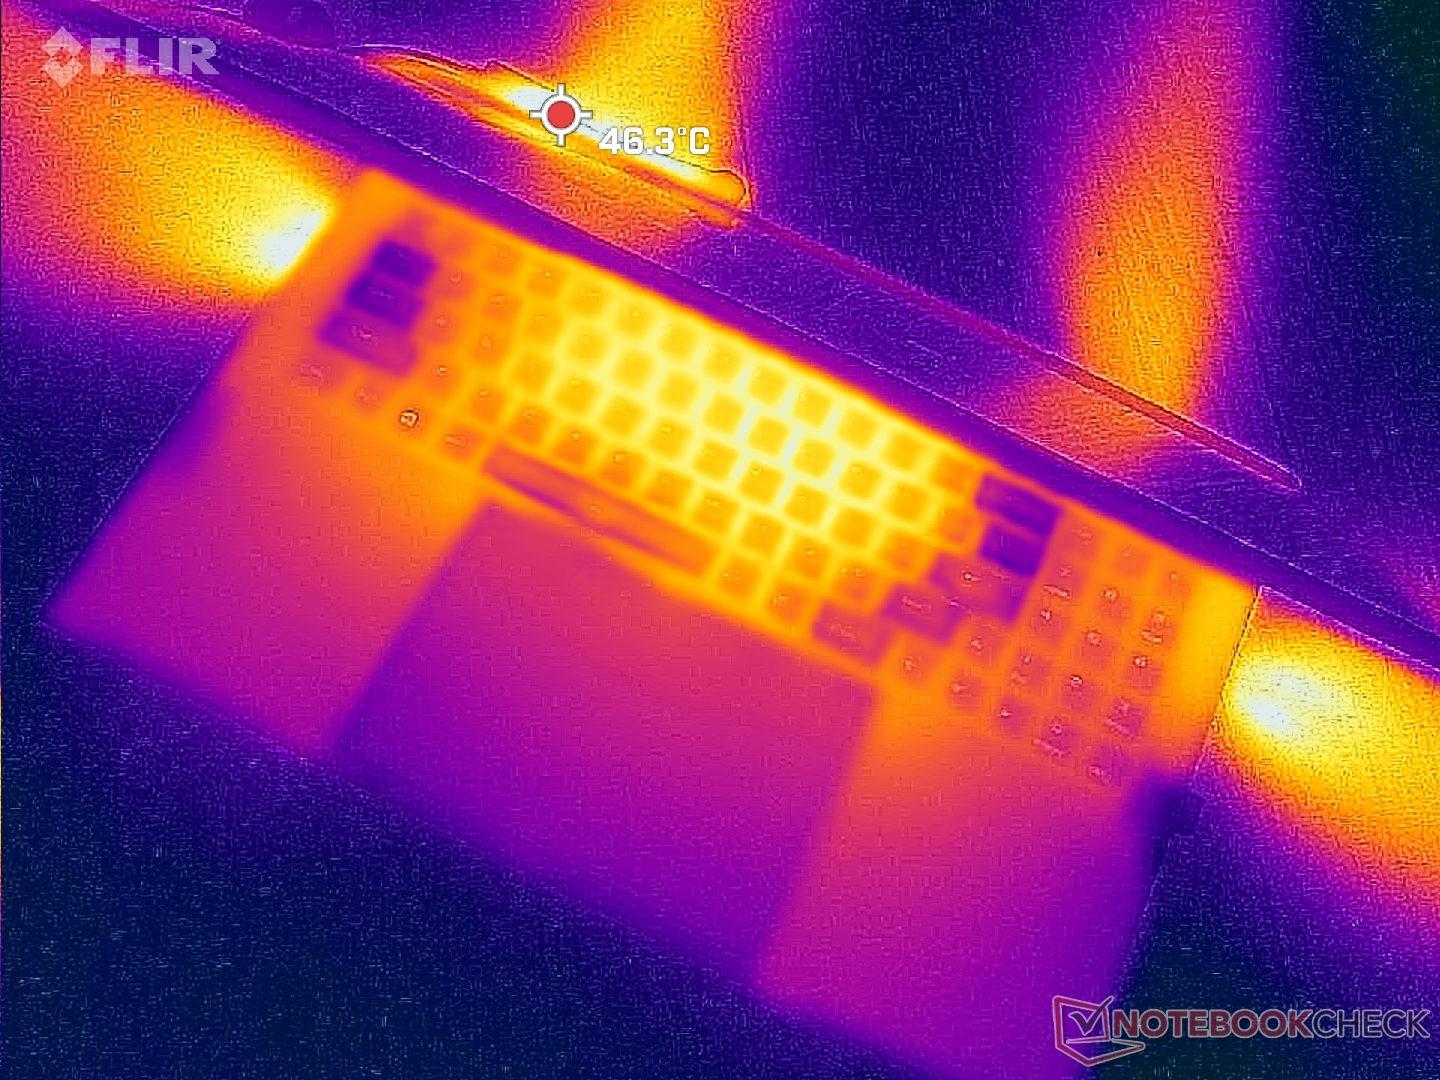
(+) La temperatura massima sul lato superiore è di 39 °C / 102 F, rispetto alla media di 40.4 °C / 105 F, che varia da 21.2 a 68.8 °C per questa classe Gaming.
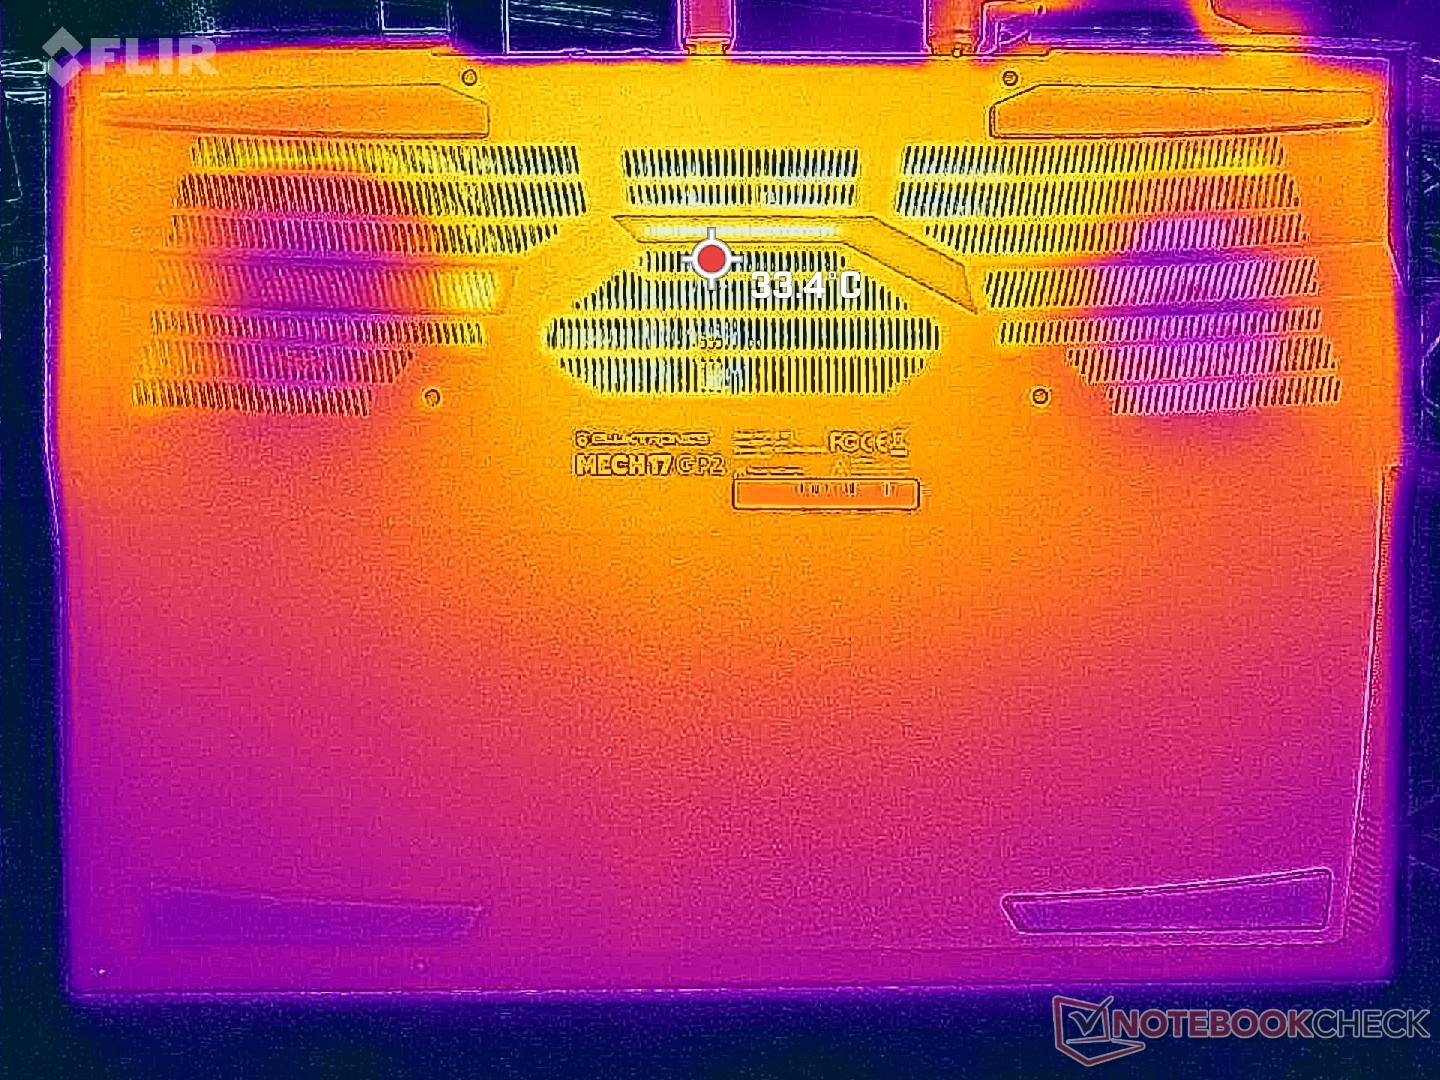
(±) Il lato inferiore si riscalda fino ad un massimo di 44 °C / 111 F, rispetto alla media di 43.2 °C / 110 F
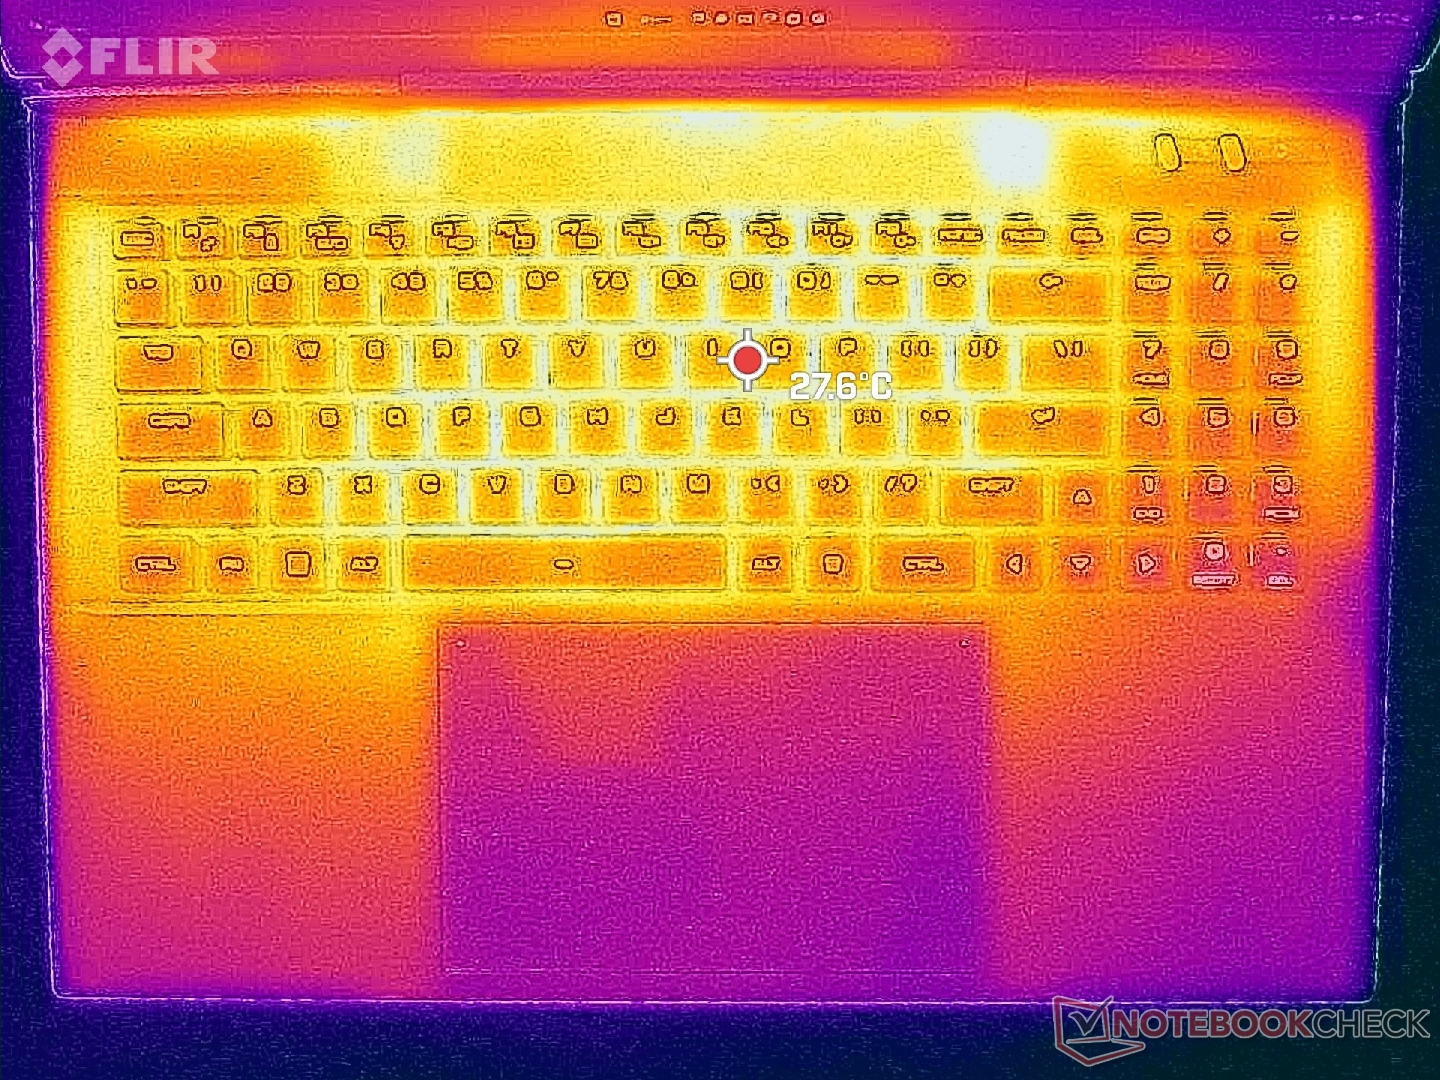
(+) In idle, la temperatura media del lato superiore è di 27.5 °C / 82 F, rispetto alla media deld ispositivo di 33.9 °C / 93 F.
(+) I poggiapolsi e il touchpad sono piu' freddi della temperatura della pelle con un massimo di 25 °C / 77 F e sono quindi freddi al tatto.
(+) La temperatura media della zona del palmo della mano di dispositivi simili e'stata di 28.8 °C / 83.8 F (+3.8 °C / 6.8 F).
| Eluktronics Mech-17 GP2 Intel Core i9-13900HX, NVIDIA GeForce RTX 4090 Laptop GPU | Schenker XMG Neo 17 M22 AMD Ryzen 9 6900HX, NVIDIA GeForce RTX 3080 Ti Laptop GPU | MSI Katana 17 B13VFK Intel Core i7-13620H, NVIDIA GeForce RTX 4060 Laptop GPU | MSI Titan GT77 HX 13VI Intel Core i9-13950HX, NVIDIA GeForce RTX 4090 Laptop GPU | Alienware m17 R5 (R9 6900HX, RX 6850M XT) AMD Ryzen 9 6900HX, AMD Radeon RX 6850M XT | Razer Blade 18 RTX 4070 Intel Core i9-13950HX, NVIDIA GeForce RTX 4070 Laptop GPU | |
|---|---|---|---|---|---|---|
| Heat | -13% | -7% | 4% | -14% | 1% | |
| Maximum Upper Side * (°C) | 39 | 49 -26% | 41.6 -7% | 40.6 -4% | 53 -36% | 39.2 -1% |
| Maximum Bottom * (°C) | 44 | 52 -18% | 43.1 2% | 41.1 7% | 56 -27% | 35.6 19% |
| Idle Upper Side * (°C) | 31 | 30 3% | 32 -3% | 26.2 15% | 30 3% | 31.8 -3% |
| Idle Bottom * (°C) | 29.8 | 33 -11% | 35.8 -20% | 30.3 -2% | 29 3% | 33.2 -11% |
* ... Meglio usare valori piccoli
Stress test
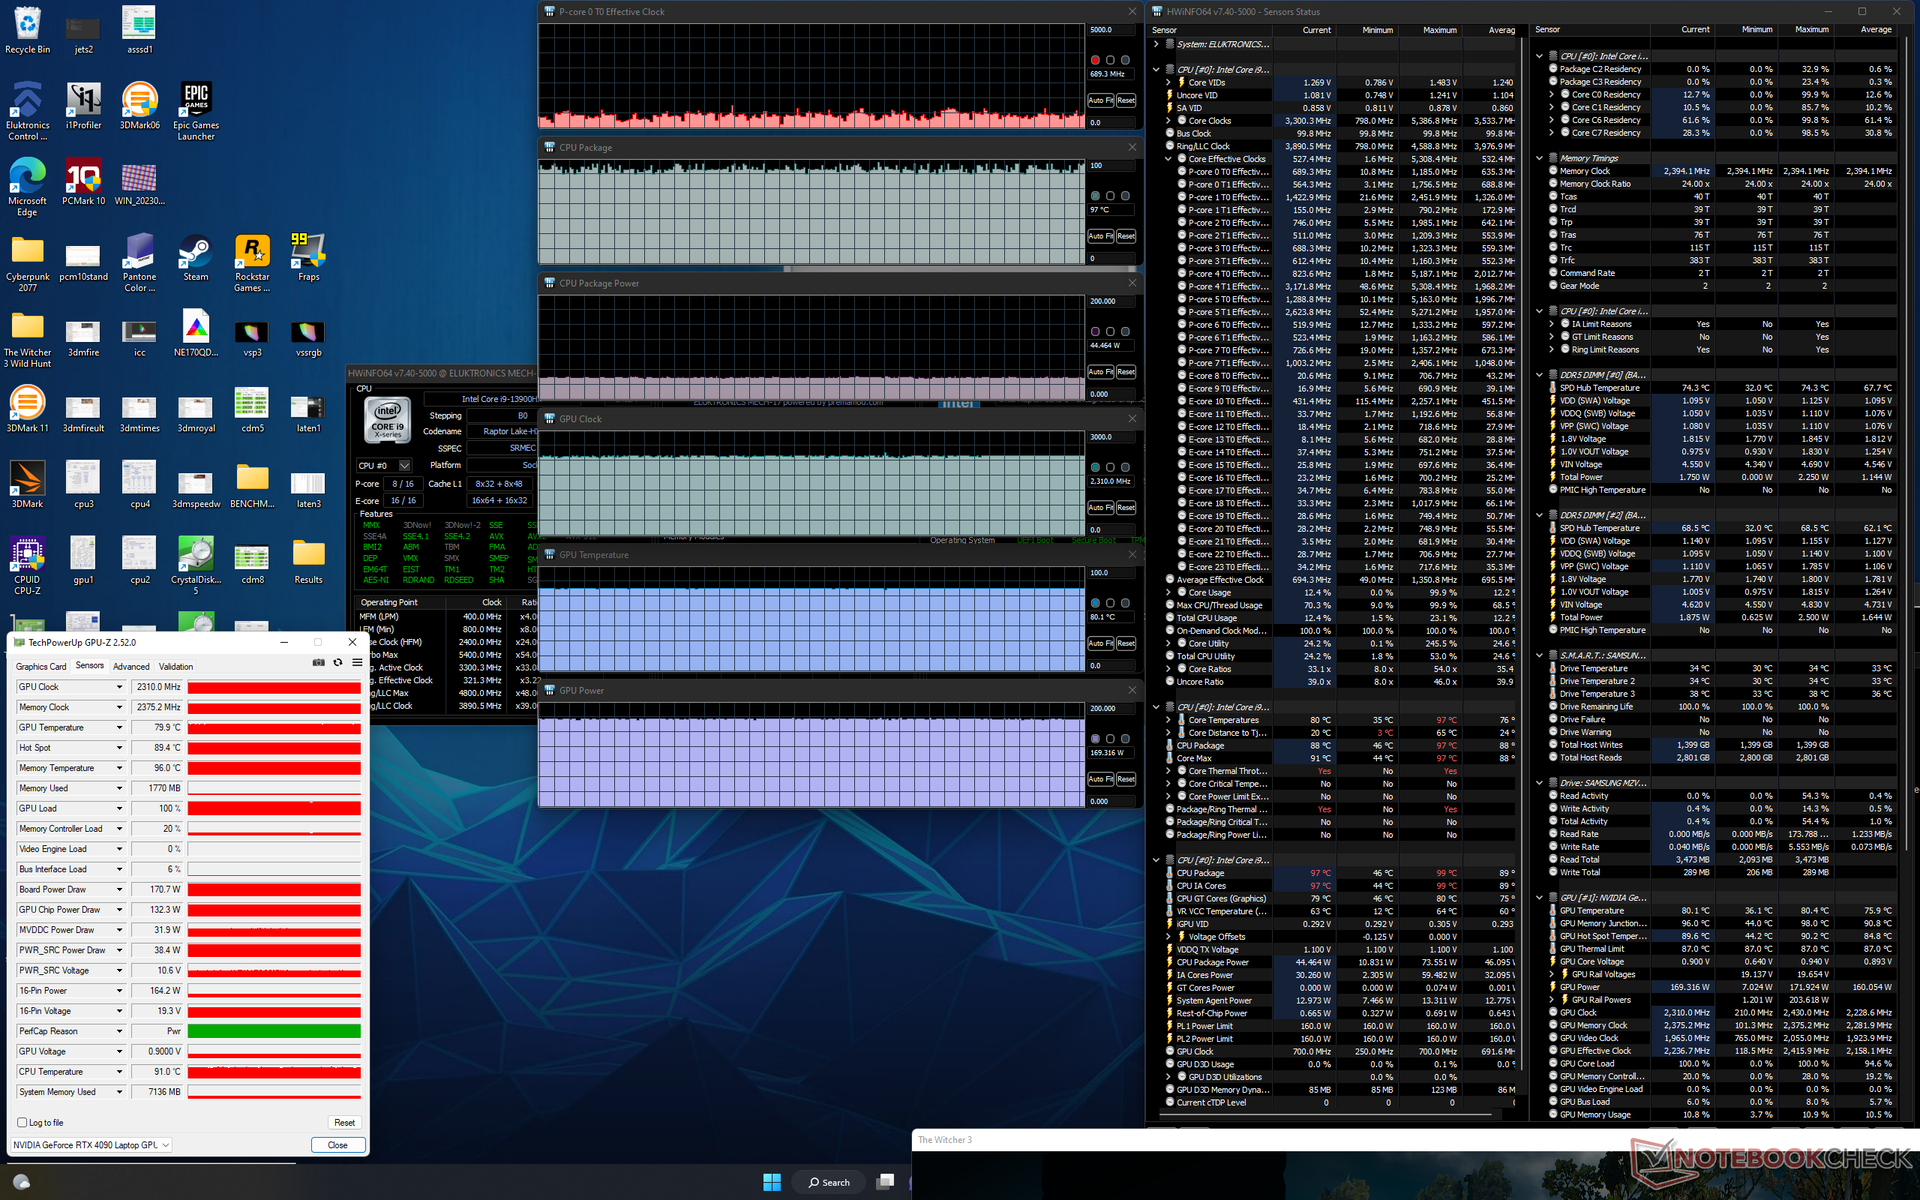
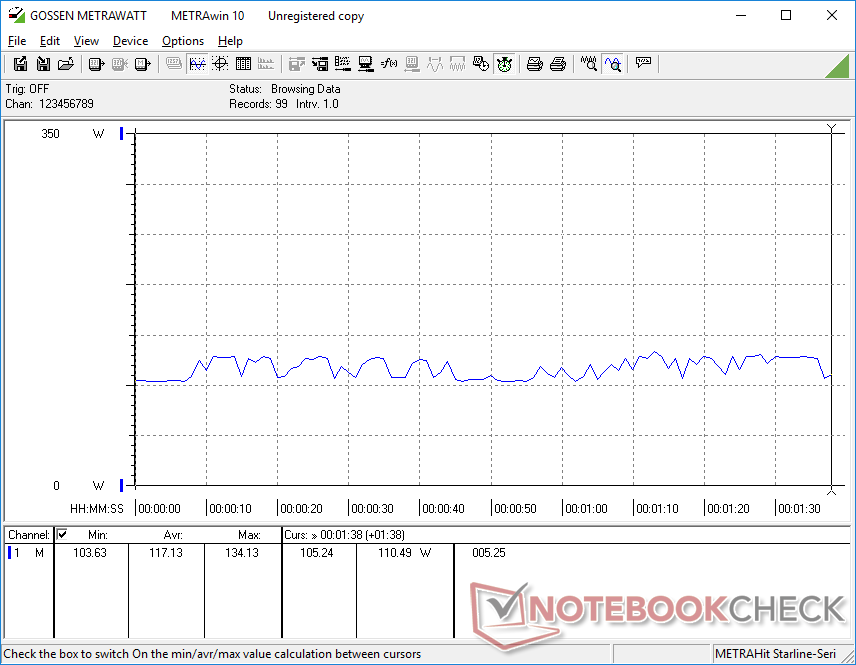
Quando è stata sottoposta a Prime95, la CPU è salita a 4,7 GHz, 160 W e 96 C solo per un paio di secondi prima di scendere immediatamente a 4,1 GHz e 107 W. La temperatura del core, tuttavia, è rimasta molto alta a 96 C. Dopo qualche altro minuto, le frequenze di clock sono scese ulteriormente a 3,4 GHz con variazioni minime della temperatura e dell'assorbimento di potenza della scheda.
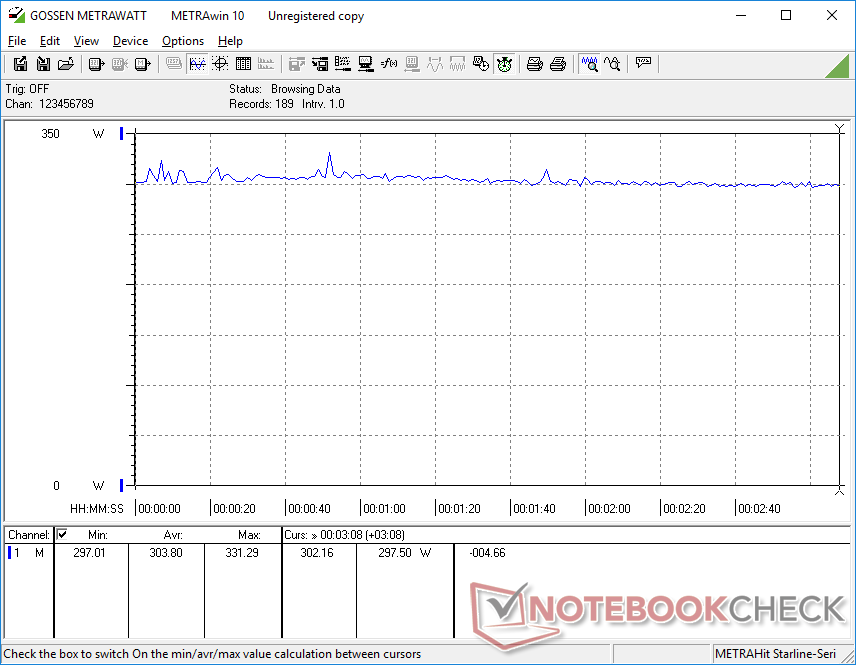
La velocità di clock della GPU, la temperatura e l'assorbimento di potenza si stabilizzavano rispettivamente a 2310 MHz, 80 C e 169 W, quando si eseguiva Witcher 3. La GPU è valutata per un TGP di 175 W e quindi l'assorbimento reale di 169 W si avvicina molto. La temperatura della CPU rimarrebbe purtroppo elevata a 96 C rispetto agli 85 C o ai 66 C del Razer Blade 18(RTX 4070) o MSI GT77rispettivamente.
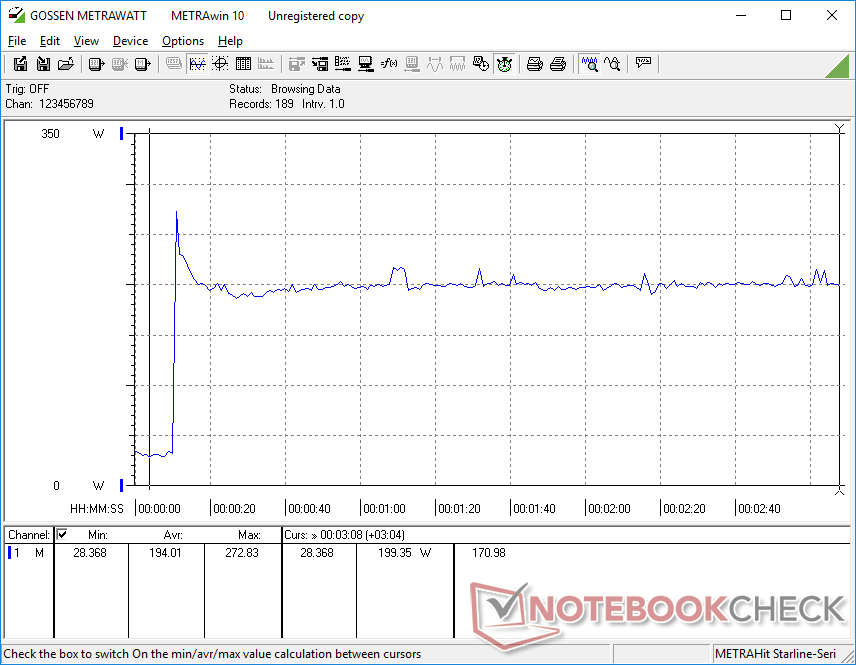
L'esecuzione simultanea di Prime95 e FurMark per più di qualche minuto ha mandato in crash la nostra unità ogni volta. Sospettiamo che le alte temperature del core siano responsabili dello spegnimento e del riavvio automatico. La maggior parte degli altri computer portatili ridurrebbe le prestazioni in presenza di carichi così elevati per evitare il crash.
Il funzionamento a batteria limita notevolmente le prestazioni. Un test di Fire Strike a batteria restituirebbe punteggi di Fisica e Grafica rispettivamente di 11430 e 11496 punti, rispetto a 43004 e 47611 punti con l'alimentazione a rete.
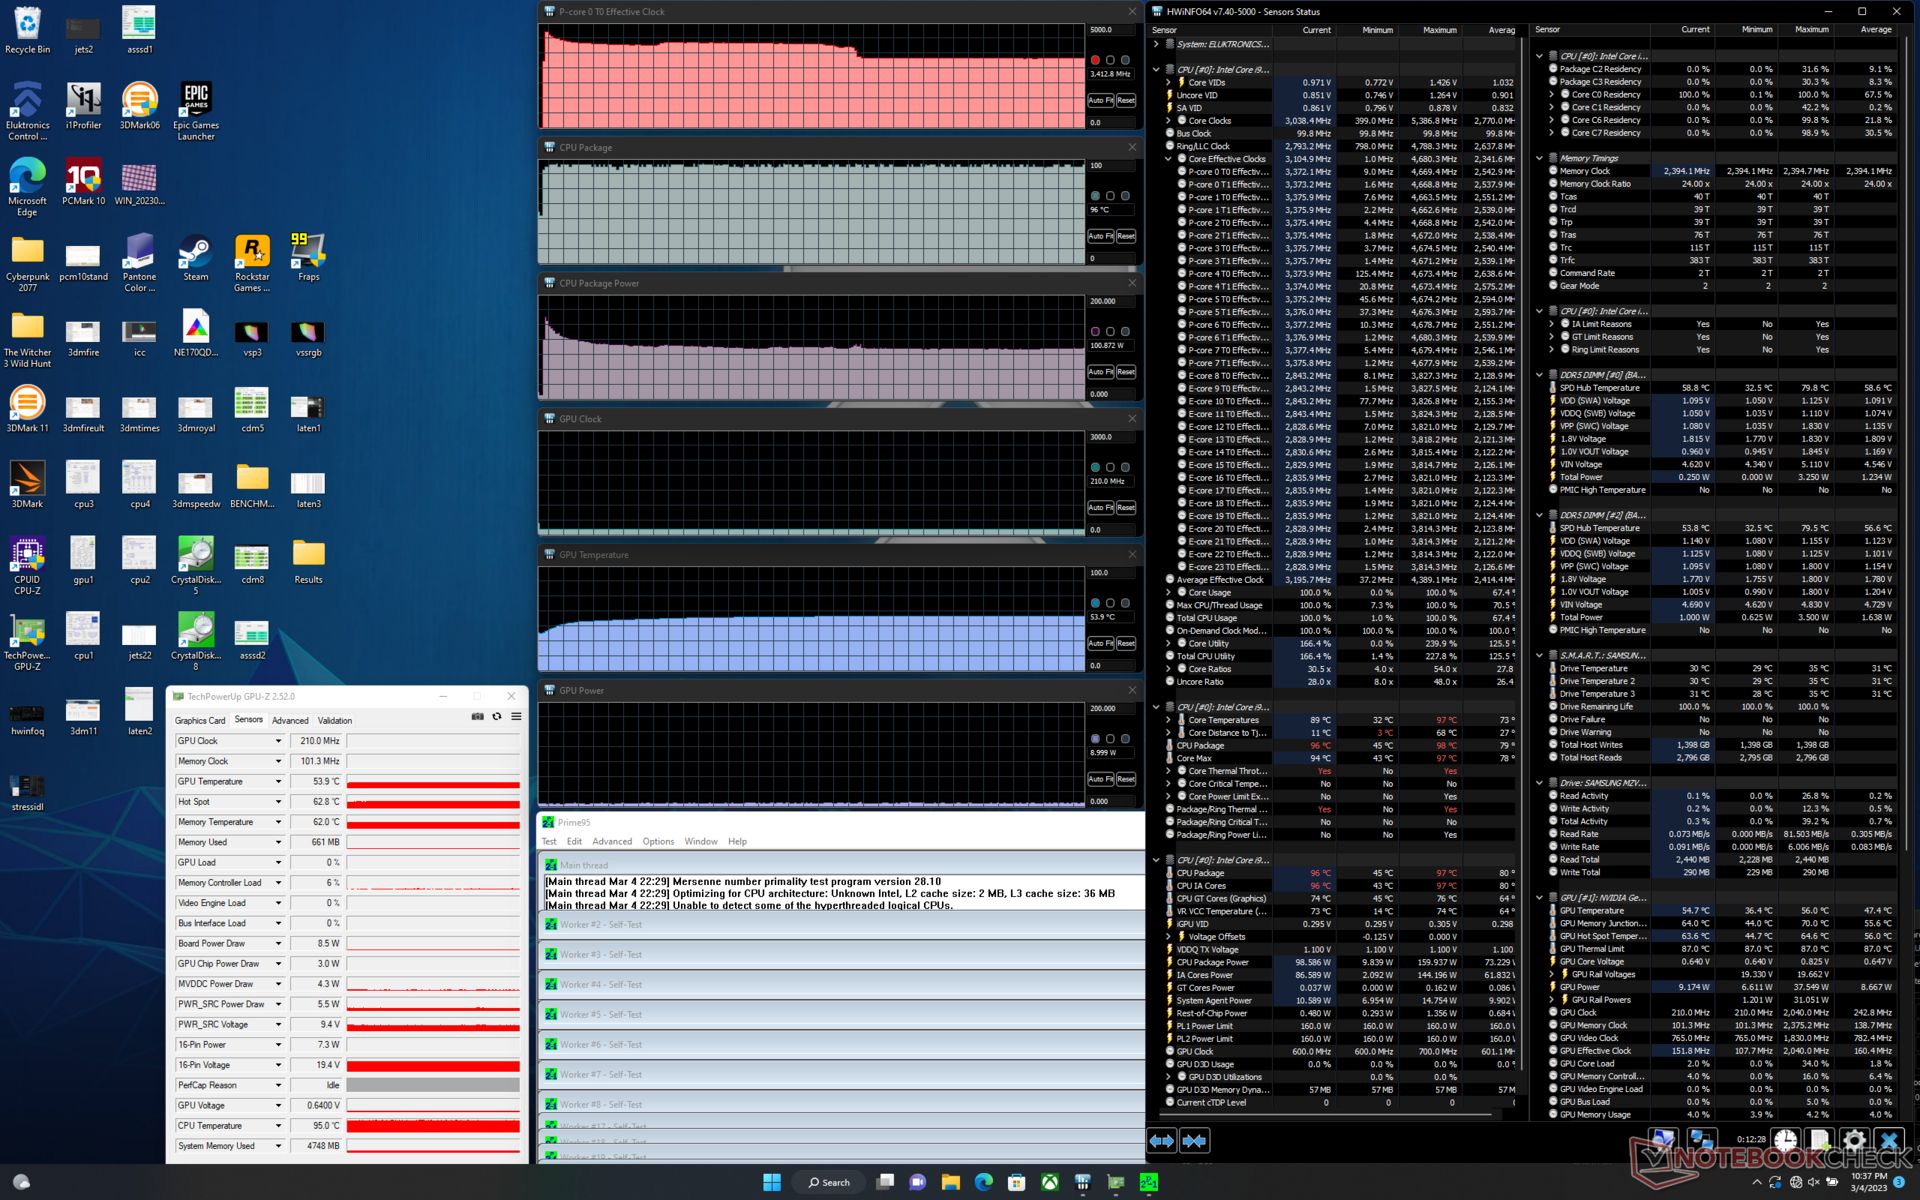
| Clock della CPU (GHz) | Clock della GPU (MHz) | Temperatura media della CPU (°C) | Temperatura media della GPU (°C) | |
| Sistema inattivo | -- | -- | 47 | 37 |
| Stress Prime95 | 3,4 | -- | 96 | 54 |
| Witcher 3 Stress | ~0,7 | 2310 | 97 | 80 |
Altoparlanti
Eluktronics Mech-17 GP2 analisi audio
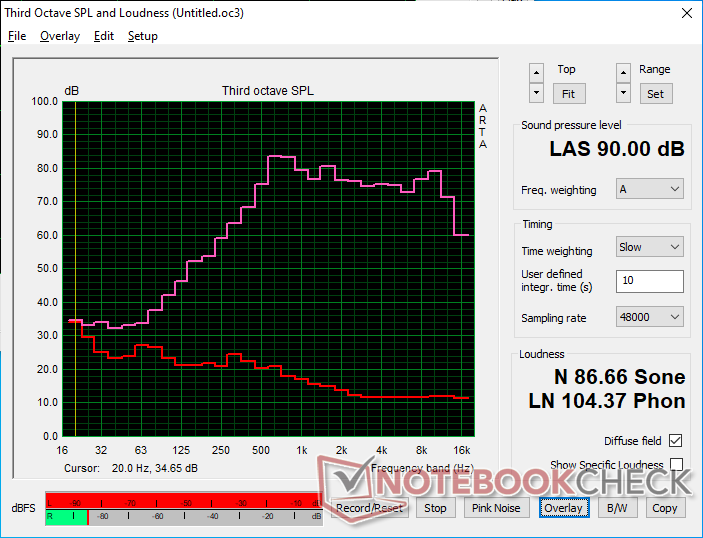
(+) | gli altoparlanti sono relativamente potenti (90 dB)
Bassi 100 - 315 Hz
(-) | quasi nessun basso - in media 22.5% inferiori alla media
(±) | la linearità dei bassi è media (7.3% delta rispetto alla precedente frequenza)
Medi 400 - 2000 Hz
(+) | medi bilanciati - solo only 4.4% rispetto alla media
(±) | linearità dei medi adeguata (7.4% delta rispetto alla precedente frequenza)
Alti 2 - 16 kHz
(+) | Alti bilanciati - appena 1.3% dalla media
(+) | alti lineari (2.7% delta rispetto alla precedente frequenza)
Nel complesso 100 - 16.000 Hz
(±) | la linearità complessiva del suono è media (15% di differenza rispetto alla media
Rispetto alla stessa classe
» 32% di tutti i dispositivi testati in questa classe è stato migliore, 6% simile, 62% peggiore
» Il migliore ha avuto un delta di 6%, medio di 18%, peggiore di 132%
Rispetto a tutti i dispositivi testati
» 20% di tutti i dispositivi testati in questa classe è stato migliore, 4% similare, 75% peggiore
» Il migliore ha avuto un delta di 4%, medio di 24%, peggiore di 134%
Apple MacBook Pro 16 2021 M1 Pro analisi audio
(+) | gli altoparlanti sono relativamente potenti (84.7 dB)
Bassi 100 - 315 Hz
(+) | bassi buoni - solo 3.8% dalla media
(+) | bassi in lineaa (5.2% delta rispetto alla precedente frequenza)
Medi 400 - 2000 Hz
(+) | medi bilanciati - solo only 1.3% rispetto alla media
(+) | medi lineari (2.1% delta rispetto alla precedente frequenza)
Alti 2 - 16 kHz
(+) | Alti bilanciati - appena 1.9% dalla media
(+) | alti lineari (2.7% delta rispetto alla precedente frequenza)
Nel complesso 100 - 16.000 Hz
(+) | suono nel complesso lineare (4.6% differenza dalla media)
Rispetto alla stessa classe
» 0% di tutti i dispositivi testati in questa classe è stato migliore, 0% simile, 100% peggiore
» Il migliore ha avuto un delta di 5%, medio di 17%, peggiore di 45%
Rispetto a tutti i dispositivi testati
» 0% di tutti i dispositivi testati in questa classe è stato migliore, 0% similare, 100% peggiore
» Il migliore ha avuto un delta di 4%, medio di 24%, peggiore di 134%
Gestione dell'energia
Consumo di energia
Il consumo energetico complessivo è nettamente superiore a quello registrato sul modello AMD-Ampere 2022. Ad esempio, il semplice funzionamento al minimo su desktop consuma tra i 14 e i 37 W, rispetto ai soli 7-17 W della versione 2022. Il gioco richiede il 37% di energia in più sulla nostra unità 2023, ma le prestazioni per watt sono ancora molto buone, poiché gli utenti ottengono prestazioni grafiche superiori del 40-60% rispetto alla RTX 3080 Ti mobile.
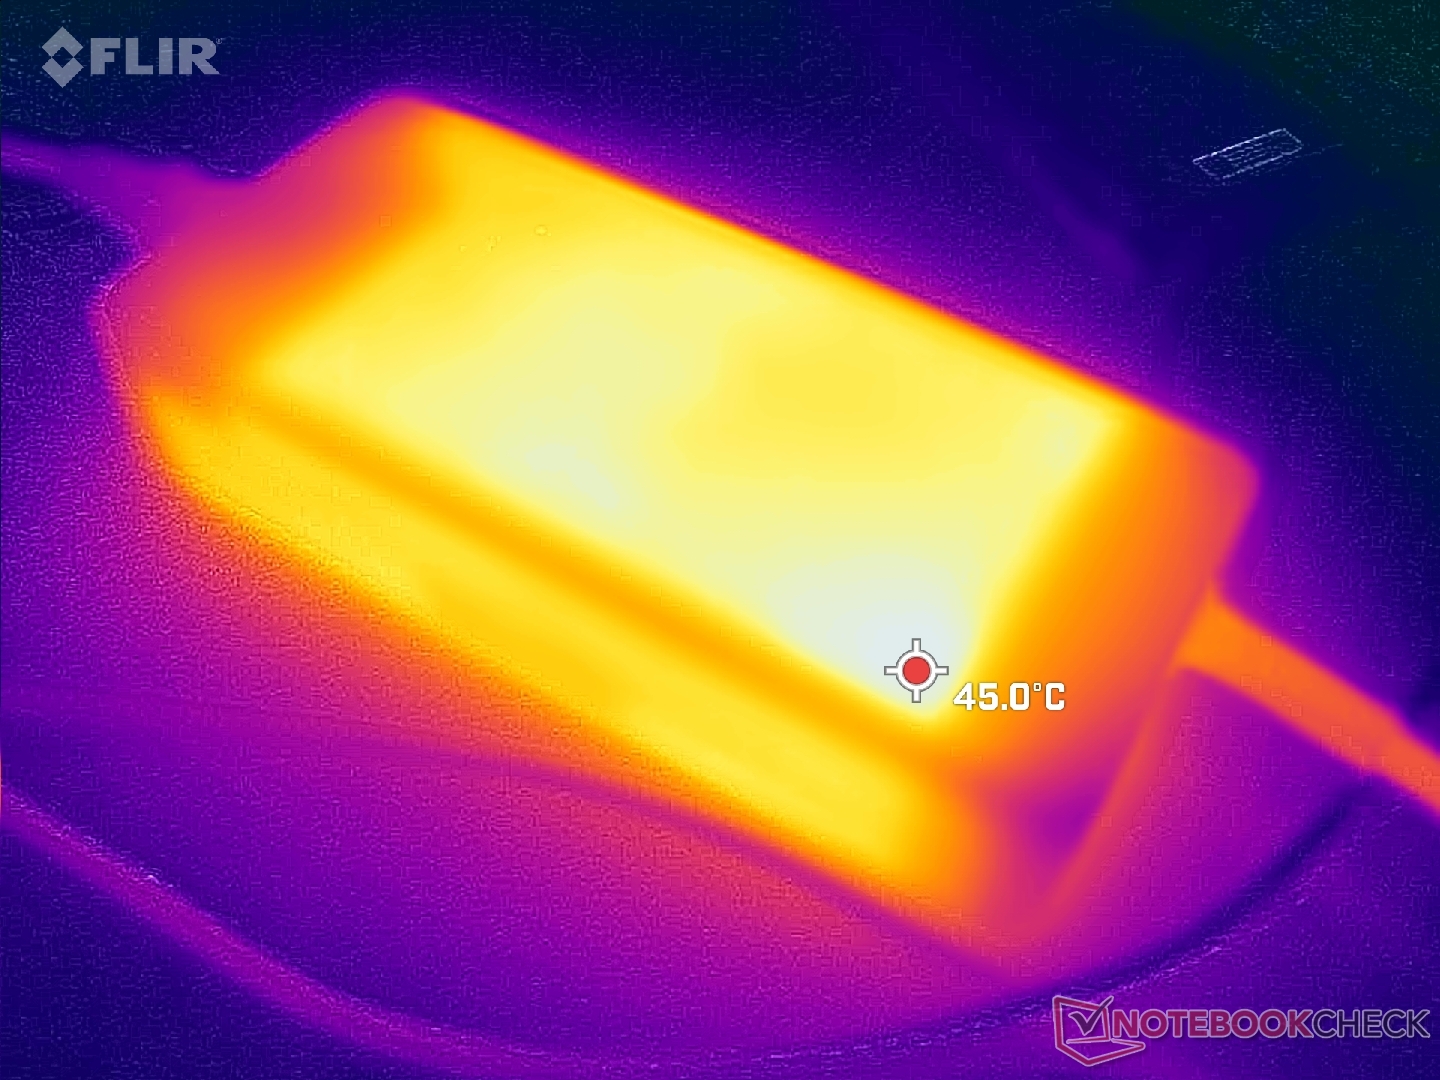
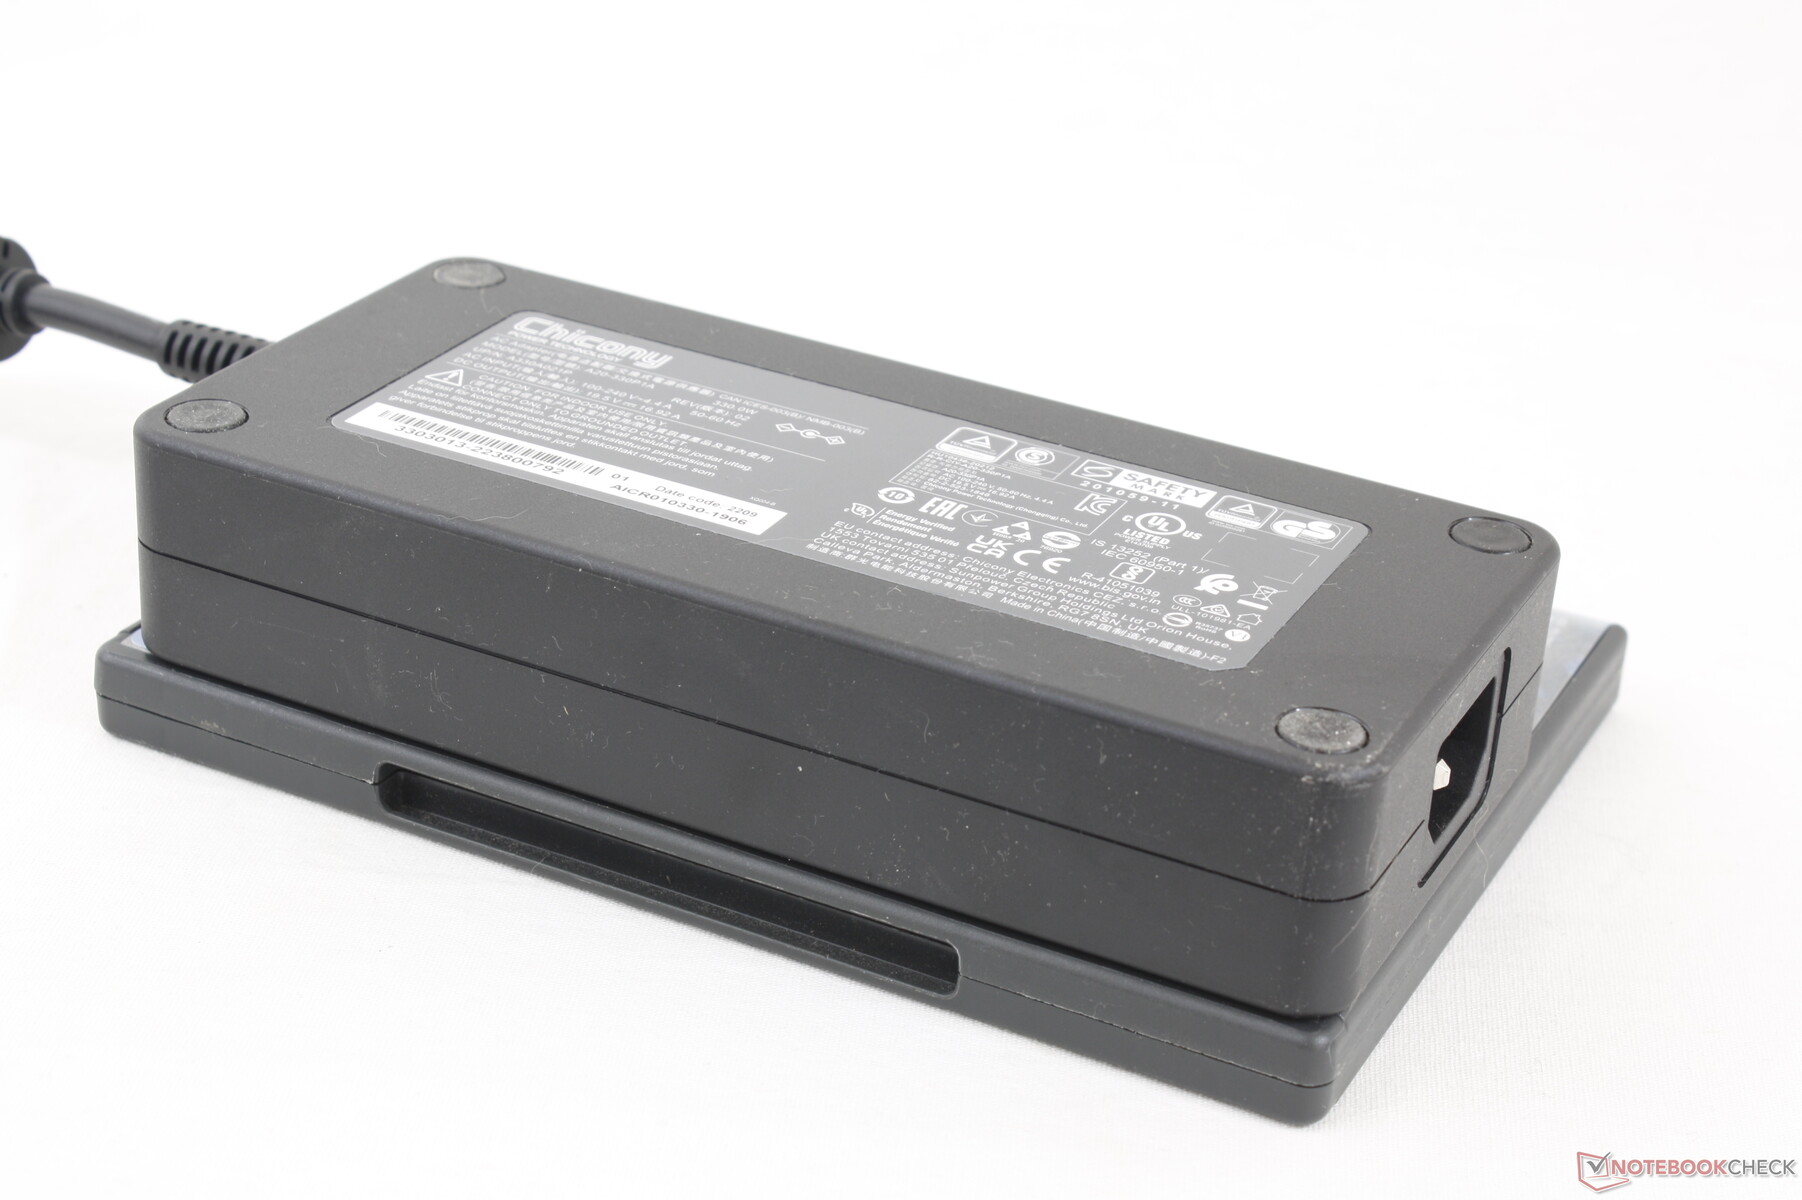
L'adattatore CA da 330 W è più grande dell'adattatore CA da 330 W del nuovo Razer Blade nuovo Razer Blade (~18,5 x 8,5 x 3,6 cm contro ~18 x 7,5 x 2,5 cm) poiché Eluktronics e Uniwill non sono ancora passati alla ricarica GaN. Siamo riusciti a registrare un consumo massimo temporaneo di 343 W quando la CPU e la GPU sono utilizzate al 100%.
| Off / Standby | |
| Idle | |
| Sotto carico |
|
Leggenda:
min: | |
| Eluktronics Mech-17 GP2 i9-13900HX, GeForce RTX 4090 Laptop GPU, Samsung PM9A1 MZVL21T0HCLR, IPS, 2560x1600, 17" | Schenker XMG Neo 17 M22 R9 6900HX, GeForce RTX 3080 Ti Laptop GPU, Samsung SSD 980 Pro 1TB MZ-V8P1T0BW, IPS, 2560x1600, 17" | MSI Katana 17 B13VFK i7-13620H, GeForce RTX 4060 Laptop GPU, Micron 2400 MTFDKBA1T0QFM, IPS LED, 1920x1080, 17.3" | MSI Titan GT77 HX 13VI i9-13950HX, GeForce RTX 4090 Laptop GPU, Samsung PM9A1 MZVL22T0HBLB, Mini-LED, 3840x2160, 17.3" | Alienware m17 R5 (R9 6900HX, RX 6850M XT) R9 6900HX, Radeon RX 6850M XT, SSSTC CA6-8D1024, IPS, 3840x2160, 17" | Razer Blade 18 RTX 4070 i9-13950HX, GeForce RTX 4070 Laptop GPU, SSSTC CA6-8D1024, IPS, 2560x1600, 18" | |
|---|---|---|---|---|---|---|
| Power Consumption | 35% | 35% | 1% | 24% | -24% | |
| Idle Minimum * (Watt) | 14 | 7 50% | 12.2 13% | 14 -0% | 13 7% | 24.5 -75% |
| Idle Average * (Watt) | 19.3 | 11 43% | 14.9 23% | 21.6 -12% | 16.5 15% | 34.1 -77% |
| Idle Maximum * (Watt) | 36.8 | 17 54% | 15.8 57% | 24.8 33% | 17 54% | 47.7 -30% |
| Load Average * (Watt) | 117.2 | 92 22% | 85.22 27% | 122.5 -5% | 93 21% | 140 -19% |
| Witcher 3 ultra * (Watt) | 304 | 221 27% | 151.1 50% | 265 13% | 239 21% | 202 34% |
| Load Maximum * (Watt) | 342.5 | 306 11% | 212.8 38% | 418 -22% | 251 27% | 261 24% |
* ... Meglio usare valori piccoli
Power Consumption Witcher 3 / Stresstest
Power Consumption external Monitor
Durata della batteria
Il tempo di funzionamento della WLAN è più breve rispetto al Neo 17 M22 alimentato da AMD dello scorso anno di diverse ore, per un totale di poco più di 5 ore. Entrambe le unità di test sono state impostate sul profilo energetico Balanced con Optimus attivo sulla iGPU.
La ricarica da vuoto a pieno regime richiede tra le 2 e le 2,5 ore. Il sistema non può essere ricaricato tramite USB-C.
| Eluktronics Mech-17 GP2 i9-13900HX, GeForce RTX 4090 Laptop GPU, 99 Wh | Schenker XMG Neo 17 M22 R9 6900HX, GeForce RTX 3080 Ti Laptop GPU, 99 Wh | MSI Katana 17 B13VFK i7-13620H, GeForce RTX 4060 Laptop GPU, 53.5 Wh | MSI Titan GT77 HX 13VI i9-13950HX, GeForce RTX 4090 Laptop GPU, 99.9 Wh | Alienware m17 R5 (R9 6900HX, RX 6850M XT) R9 6900HX, Radeon RX 6850M XT, 97 Wh | Razer Blade 18 RTX 4070 i9-13950HX, GeForce RTX 4070 Laptop GPU, 91.7 Wh | |
|---|---|---|---|---|---|---|
| Autonomia della batteria | 76% | -43% | 4% | -6% | -22% | |
| WiFi v1.3 (h) | 5.1 | 9 76% | 2.9 -43% | 5.3 4% | 4.8 -6% | 4 -22% |
| Reader / Idle (h) | 12 | 7 | ||||
| H.264 (h) | 6.6 | 6 | 4.9 | |||
| Load (h) | 1.8 | 1 | 1.4 | 1.8 | 1.3 |
Pro
Contro
Verdetto - Un po' troppo letterale l'aumento del calore
Il Mech-17 GP2 è più piccolo del 7 per cento e più leggero del 17 per cento rispetto alla MSI GT77 HX Titan pur offrendo quasi le stesse prestazioni. Di conseguenza è molto compatto, ma forse un po' troppo. Le temperature della CPU sono estremamente elevate anche per un portatile da gioco durante l'esecuzione dei giochi. Sebbene l'intervallo di ~97 C sia tecnicamente "sicuro" per il processore Intel, è comunque più caldo rispetto al modello dell'anno scorso e non è esattamente confortante per l'utente finale. L'elevata temperatura del core può forse essere attenuata utilizzando la docking station esterna per il raffreddamento ad acqua, ma un portatile non dovrebbe dipendere da un accessorio opzionale per un raffreddamento ottimale.
Prestazioni elevate al costo di alte temperature del nucleo.
Oltre alle elevate prestazioni per volume, anche il prezzo è un fattore distintivo del modello. Il Mech-17 GP2 è uno dei pochi portatili GeForce 40 a essere fornito con un'opzione barebone, il che significa che è possibile risparmiare diverse centinaia di dollari se si possono fornire la propria RAM, l'SSD e il sistema operativo. 299 dollari per uno dei portatili da gioco più veloci del mercato non è poi così male; basta tenere d'occhio le temperature dei core.
Prezzo e disponibilità
Amazon sta spedendo il Mech-17 GP2 con RTX 4090 al prezzo di 4400 dollari USA, completo di RAM e memoria. In alternativa, gli utenti possono acquistare direttamente da Eluktronics per avere più opzioni configurabili.
Eluktronics Mech-17 GP2
- 03/08/2023 v7 (old)
Allen Ngo
Transparency
La selezione dei dispositivi da recensire viene effettuata dalla nostra redazione. Il campione di prova è stato fornito all'autore come prestito dal produttore o dal rivenditore ai fini di questa recensione. L'istituto di credito non ha avuto alcuna influenza su questa recensione, né il produttore ne ha ricevuto una copia prima della pubblicazione. Non vi era alcun obbligo di pubblicare questa recensione. In quanto società mediatica indipendente, Notebookcheck non è soggetta all'autorità di produttori, rivenditori o editori.
Ecco come Notebookcheck esegue i test
Ogni anno, Notebookcheck esamina in modo indipendente centinaia di laptop e smartphone utilizzando procedure standardizzate per garantire che tutti i risultati siano comparabili. Da circa 20 anni sviluppiamo continuamente i nostri metodi di prova e nel frattempo stabiliamo gli standard di settore. Nei nostri laboratori di prova, tecnici ed editori esperti utilizzano apparecchiature di misurazione di alta qualità. Questi test comportano un processo di validazione in più fasi. Il nostro complesso sistema di valutazione si basa su centinaia di misurazioni e parametri di riferimento ben fondati, che mantengono l'obiettività.Price comparison

