Notebookcheck Logo

Recensione del PC desktop di fascia alta XMG SECTOR con Intel Core i9-13900K e Nvidia GeForce RTX 4090
Gioco senza compromessi!

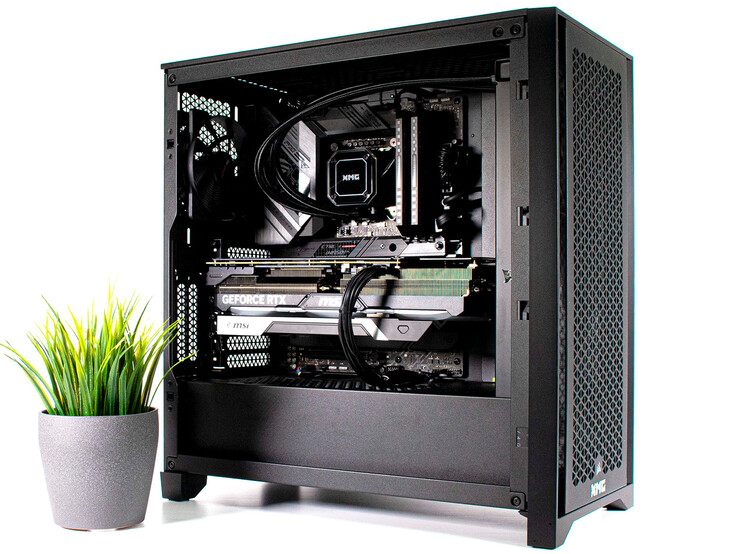
XMG SECTOR è il nome dato a questo computer da gioco all'avanguardia. In questa recensione, esamineremo da vicino le prestazioni di una configurazione di fascia alta con un Intel Core i9-13900K e una Nvidia GeForce RTX 4090.
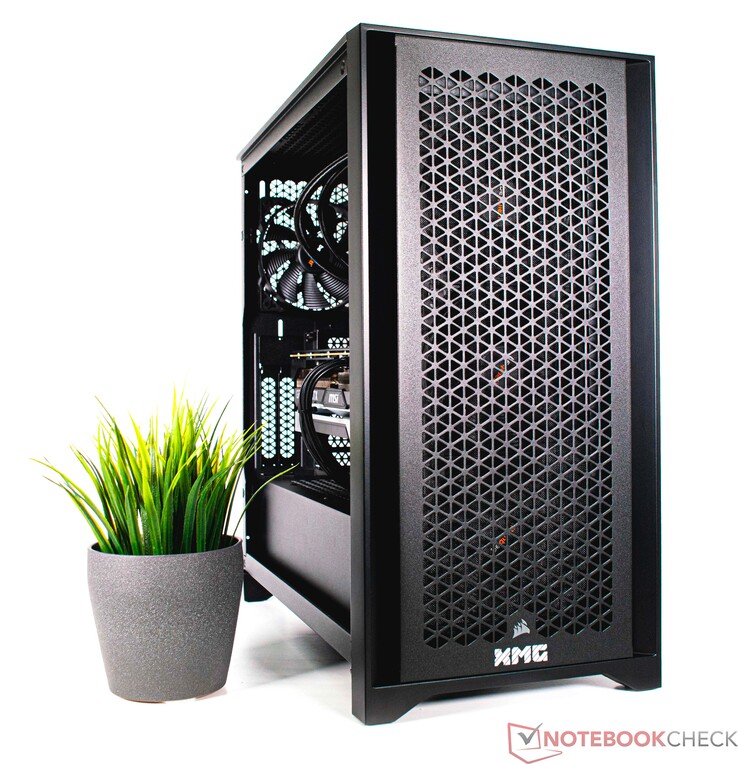
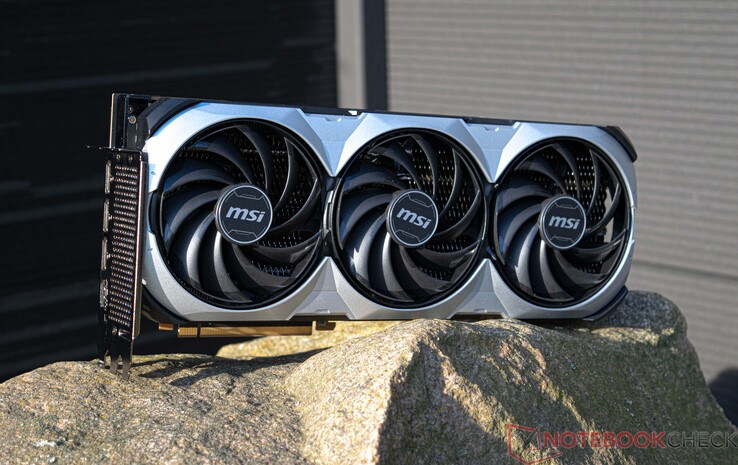
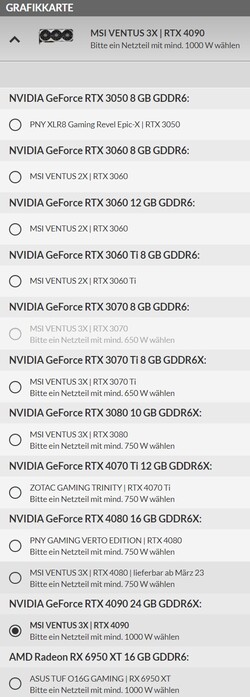
XMG SECTOR Intel con un Core i9-13900K e un MSI GeForce RTX 4090 VENTUS 3X

Molti associano Schenker a potenti computer portatili. L'aggiunta del marchio "XMG" indica dispositivi di gioco di fascia alta, che nel frattempo includono anche PC desktop. In questa recensione ci concentreremo sul modello XMG SECTOR basato su Intel. La configurazione di base ha un prezzo di 1.239 euro (1.306 dollari) e viene fornita con un Intel Core i5-12400F, 16 GB di RAM e una scheda di memoria Nvidia RTX 30 Nvidia GeForce RTX 3060. La nostra unità in prova è un modello di fascia alta con un Core i9-13900K e una GeForce RTX 4090ma ha anche un prezzo molto elevato di circa 4.700 euro (4.956 dollari). Tuttavia, grazie alle numerose opzioni offerte dallo shop XMGè possibile dotare il PC di vari componenti hardware e assemblare un sistema su misura per le proprie esigenze.

XMG SECTOR, i9 13900K, RTX 4090
Processore
Intel Core i9-13900K 24 x 3 - 5.8 GHz, 253 W PL2 / Short Burst, 125 W PL1 / Sustained, Raptor Lake
Scheda grafica
NVIDIA GeForce RTX 4090 - 24 GB VRAM, Core: 2550 MHz, Memoria: 1313 MHz, 450 W TDP, GDDR6X, Nvidia 528.49
Memoria
32 GB 
, DDR5-5600, 2 of 4 slots occupied, max 128 GB
Scheda madre
Intel Z690 (Alder Lake-S PCH)
Harddisk
Samsung SSD 980 Pro 2TB MZ-V8P2T0, 2048 GB 
, 1750 GB libera
Scheda audio
Intel Alder Lake-S PCH - cAVS (Audio, Voice, Speech)
Porte di connessione
2 USB 2.0, 10 USB 3.2 Gen 2x2 20Gbps, 2 HDMI, 4 DisplayPort, Connessioni Audio: ALC4080 ROG SupremeFX 7.1 Surround Sound High Definition Audio CODEC ALC4080
Rete
Intel Ethernet Controller I225-V (10/100/1000/2500MBit/s), Intel Wi-Fi 6E AX211 (a/b/g/h/n = Wi-Fi 4/ac = Wi-Fi 5/ax = Wi-Fi 6/ Wi-Fi 6E 6 GHz), Bluetooth 5.2
Dimensioni
altezza x larghezza x profondità (in mm): 466 x 230 x 453
Sistema Operativo
Microsoft Windows 11 Pro
Altre caratteristiche
Asus Amoury Crate, Corsair iCUE, 36 Mesi Garanzia
Prezzo
4620 EUR
Nota: il produttore potrebbe usare componenti di fornitori diversi pannelli dei diplay, drive o banchi di memoria con specifiche simili.


XMG Settore Intel
XMG Settore Intel
XMG Settore Intel
XMG Settore Intel
XMG Settore Intel
XMG Settore Intel
XMG Settore Intel
XMG Settore Intel
XMG Settore Intel
XMG Settore Intel
XMG Settore Intel
XMG Settore Intel
XMG Settore Intel
XMG Settore Intel
XMG Settore Intel
XMG SECTOR Intel (gestione dei cavi)

Case - Corsair 4000D Airflow

Schenker ha installato l'hardware di XMG SECTOR Intel in un Corsair 4000D Airflow nero. Il case è dotato di una finestra in vetro scuro per mostrare i componenti all'interno con effetti di luce. Tuttavia, il dissipatore AIO incluso e i moduli di memoria Corsair Dominator RGB sono le uniche fonti di illuminazione nella nostra configurazione di recensione.

Il Corsair 4000D Airflow è fondamentalmente un case di qualità superiore con spazio sufficiente per ospitare numerosi componenti. Anche la massiccia MSI GeForce RTX 4090 VENTUS 3X può essere inserita nel case senza problemi.

Specifiche tecniche

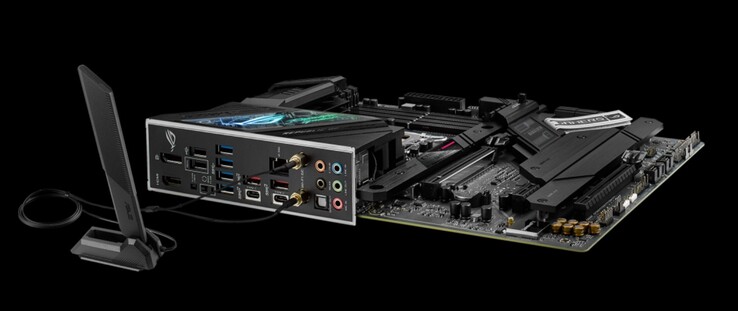
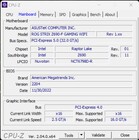
Non è stato fatto praticamente alcun compromesso in termini di porte di I/O. Ad esempio, la scheda madre inclusa (Asus ROG Strix Z690-F Gaming) offre una miriade di interfacce USB e moderne porte per il networking. Inoltre, può ospitare fino a quattro unità SSD M.2 e 128 GB di RAM DDR5 ed è dotata di 6 connettori SATA 6Gb/s. Gli utenti hanno accesso diretto a una porta USB-A e una USB-C sul pannello frontale del Corsair 4000D Airflow. Le uscite di visualizzazione disponibili dipendono dalla scheda grafica del sistema. La nostra unità in prova dispone di tre DisplayPort e un'uscita HDMI. Se il sistema non è dotato di una CPU non-F, è possibile utilizzare la GPU integrata del processore per l'uscita video in alternativa alla scheda grafica dedicata. Esistono anche vari modi per pilotare i display dalla scheda madre.

Asus ROG Strix Z690-F Gaming (fonte: Asus)

Connettività

Sull'Asus ROG Strix Z690-F Gaming è installato un modulo wireless Intel Wi-Fi 6E AX211. Le prestazioni del modulo non ci hanno convinto del tutto quando lo abbiamo testato con il nostro router di riferimento, l'Asus ROG Rapture GT-AXE11000. Le velocità di trasferimento registrate erano inferiori alle nostre aspettative quando il sistema era connesso alla rete 5G. Dopo il passaggio a una connessione 6G, le velocità di trasferimento sono migliorate sostanzialmente. In alternativa, la scheda madre della nostra unità di recensione dispone anche di un'interfaccia RJ45 che supporta velocità fino a 2,5 Gbit/s.

Networking
iperf3 receive AXE11000
Media Intel Wi-Fi 6E AX211
  (582 - 1890, n=239)
1379 MBit/s +63%
Minisforum Neptune Series NAD9
Intel Wi-Fi 6E AX210
1318 (663min - 1363max) MBit/s +56%
Media della classe Desktop
  (801 - 1478, n=4, ultimi 2 anni)
1011 MBit/s +20%
Intel NUC13 Raptor Canyon
Killer Wi-Fi 6E AX1690i 160MHz
917 (844min - 932max) MBit/s +8%
Minipc Union Ace Magician AMR5
MediaTek RZ608
903 MBit/s +7%
SCHENKER XMG SECTOR, i9 13900K, RTX 4090
Intel Wi-Fi 6E AX211
846 (428min - 891max) MBit/s
Minisforum EliteMini B550
MediaTek RZ608
430 MBit/s -49%
iperf3 transmit AXE11000
Intel NUC13 Raptor Canyon
Killer Wi-Fi 6E AX1690i 160MHz
1618 (1563min - 1670max) MBit/s +157%
Minisforum Neptune Series NAD9
Intel Wi-Fi 6E AX210
1320 (1165min - 1353max) MBit/s +110%
Media Intel Wi-Fi 6E AX211
  (464 - 1921, n=239)
1234 MBit/s +96%
Media della classe Desktop
  (629 - 1618, n=3, ultimi 2 anni)
1027 MBit/s +63%
Minipc Union Ace Magician AMR5
MediaTek RZ608
967 MBit/s +54%
SCHENKER XMG SECTOR, i9 13900K, RTX 4090
Intel Wi-Fi 6E AX211
629 (537min - 692max) MBit/s
Minisforum EliteMini B550
MediaTek RZ608
572 MBit/s -9%
iperf3 transmit AXE11000 6GHz
Media della classe Desktop
  (1513 - 1734, n=3, ultimi 2 anni)
1616 MBit/s +7%
SCHENKER XMG SECTOR, i9 13900K, RTX 4090
Intel Wi-Fi 6E AX211
1513 (773min - 1554max) MBit/s
Media Intel Wi-Fi 6E AX211
  (632 - 1851, n=211)
1372 MBit/s -9%
Minipc Union Ace Magician AMR5
MediaTek RZ608
967 (486min - 993max) MBit/s -36%
Minisforum EliteMini B550
MediaTek RZ608
572 (532min - 680max) MBit/s -62%
iperf3 receive AXE11000 6GHz
SCHENKER XMG SECTOR, i9 13900K, RTX 4090
Intel Wi-Fi 6E AX211
1751 (882min - 1765max) MBit/s
Media della classe Desktop
  (1751 - 1751, n=2, ultimi 2 anni)
1751 MBit/s 0%
Media Intel Wi-Fi 6E AX211
  (700 - 1857, n=210)
1493 MBit/s -15%
Minipc Union Ace Magician AMR5
MediaTek RZ608
903 (450min - 913max) MBit/s -48%
Minisforum EliteMini B550
MediaTek RZ608
430 (379min - 451max) MBit/s -75%
0501001502002503003504004505005506006507007508008509009501000105011001150120012501300135014001450150015501600165017001750Tooltip
SCHENKER XMG SECTOR, i9 13900K, RTX 4090; iperf3 transmit AXE11000 6GHz; iperf 3.1.3: Ø1487 (773-1554)
SCHENKER XMG SECTOR, i9 13900K, RTX 4090; iperf3 receive AXE11000 6GHz; iperf 3.1.3: Ø1721 (882-1765)
SCHENKER XMG SECTOR, i9 13900K, RTX 4090; iperf3 receive AXE11000; iperf 3.1.3: Ø832 (428-891)
SCHENKER XMG SECTOR, i9 13900K, RTX 4090; iperf3 transmit AXE11000; iperf 3.1.3: Ø629 (537-692)

Accessori

Nella confezione, oltre al computer stesso, troverete vari accessori per la scheda madre, come cavi e antenne Wi-Fi, oltre a cavi inutilizzati appartenenti all'alimentatore, che è completamente modulare.

Manutenzione

La manutenzione di XMG SECTOR Intel è un gioco da ragazzi. I pannelli laterali del Corsair 4000D Airflow possono essere facilmente rimossi, consentendo di eliminare la polvere dalle ventole in modo rapido e pratico. Il Corsair iCUE H150i Elite Capellix incluso è una soluzione di raffreddamento AIO ad alte prestazioni che non richiede una grande manutenzione.

Garanzia

Schenker offre una garanzia di base di 36 mesi con servizio di ritiro e restituzione su ogni XMG SECTOR Intel. Tuttavia, non è possibile estendere il periodo di garanzia durante il processo di ordinazione.

Prestazioni: la seconda CPU Intel più veloce incontra la GPU più veloce

L'XMG SECTOR Intel oggetto di questa recensione è equipaggiato con la seconda CPU da gioco Intel più veloce - il Core i9-13900K. Il processore è affiancato da 32 GB di memoria e da un'unità SSD con una capacità di ben 2 TB, il che significa che il sistema dispone di spazio di archiviazione sufficiente per ospitare giochi per PC di grandi dimensioni. La scheda grafica inclusa è una MSI GeForce RTX 4090 VENTUS 3X, che è la GPU più veloce del mercato consumer in questo momento.

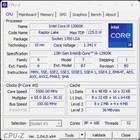
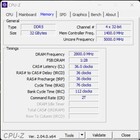
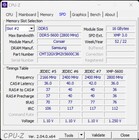
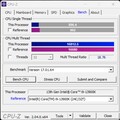
CPU-Z
CPU-Z
CPU-Z
CPU-Z
CPU-Z
CPU-Z
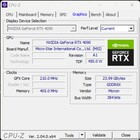
GPU-Z
GPU-Z
GPU-Z
HWiNFO

Condizioni di prova

Tutti i test relativi alle prestazioni sono stati eseguiti con il profilo energetico impostato su "Prestazioni elevate", in modo da ottenere i migliori risultati possibili. Inoltre, il produttore ha già disabilitato tutte le restrizioni sull'utilizzo della CPU nel BIOS. Di conseguenza, il Core i9-13900K non era limitato a un consumo massimo di 253 watt (PL2 della CPU). Siamo passati a un piano energetico diverso solo quando abbiamo misurato il consumo energetico e i livelli di rumore. Fare riferimento a questa pagina per saperne di più sui nostri criteri di test.

Processore

Il nostro XMG SECTOR Intel è alimentato da un Core i9-13900Kche è la seconda CPU da gioco più veloce di Intel al momento. I risultati prodotti dall'unità in prova sono buoni come ci si poteva aspettare. È un testa a testa con gli altri dispositivi del nostro confronto. Per quanto riguarda le prestazioni, la differenza tra XMG SECTOR e il sistema di test con specifiche simili è estremamente ridotta, appena il 2%, e può essere quasi attribuita alle tolleranze di misurazione.

Il processore non è vincolato da alcun limite di potenza perché tutte le restrizioni sono state eliminate. Di conseguenza, le prestazioni della CPU sono limitate dalla temperatura, che va di pari passo con il raffreddatore AIO installato.

Potete trovare altri benchmark dei processori su questa pagina.

Cinebench R15
Cinebench R15
Cinebench R20
Cinebench R20
Cinebench R23
Cinebench R23
Performance Rating - Percent
Intel Core i9-13900K, Intel Core i9-13900K
i9-13900K, 3000 MHz
77.5 pt
SCHENKER XMG SECTOR, i9 13900K, RTX 4090, Intel Core i9-13900K
i9-13900K, 3000 MHz
76.3 pt
NVIDIA GeForce RTX 3090 Founders Edition, AMD Ryzen 9 7950X
R9 7950X, 4500 MHz
75.5 pt
Intel NUC13 Raptor Canyon, Intel Core i9-13900K
i9-13900K, 3000 MHz
72.5 pt
AMD Ryzen 9 7900X, AMD Ryzen 9 7900X
R9 7900X, 4700 MHz
68.7 pt
Corsair One i300, Intel Core i9-12900K
i9-12900K, 3200 MHz
65 pt
Intel Core i9-12900K, Intel Core i9-12900K
i9-12900K, 3200 MHz
64.9 pt
Intel Core i5-13600K, Intel Core i5-13600K
i5-13600K, 3500 MHz
63.4 pt
Intel Dragon Canyon NUC - RTX 3060, Intel Core i9-12900
i9-12900, 2400 MHz
56 pt
Minisforum Neptune Series NAD9, Intel Core i9-12900H
i9-12900H, 1800 MHz
49.7 pt
Cinebench R15
CPU Single 64Bit
NVIDIA GeForce RTX 3090 Founders Edition, AMD Ryzen 9 7950X
R9 7950X, 4500 MHz
328 Points +3%
Intel Core i9-13900K, Intel Core i9-13900K
i9-13900K, 3000 MHz
327 Points +3%
AMD Ryzen 9 7900X, AMD Ryzen 9 7900X
R9 7900X, 4700 MHz
324 Points +2%
Intel NUC13 Raptor Canyon, Intel Core i9-13900K
i9-13900K, 3000 MHz
319 Points +1%
SCHENKER XMG SECTOR, i9 13900K, RTX 4090, Intel Core i9-13900K
i9-13900K, 3000 MHz
317 Points
Corsair One i300, Intel Core i9-12900K
i9-12900K, 3200 MHz
292 Points -8%
Intel Core i5-13600K, Intel Core i5-13600K
i5-13600K, 3500 MHz
289 Points -9%
Intel Core i9-12900K, Intel Core i9-12900K
i9-12900K, 3200 MHz
286 Points -10%
Intel Dragon Canyon NUC - RTX 3060, Intel Core i9-12900
i9-12900, 2400 MHz
262 Points -17%
Minisforum Neptune Series NAD9, Intel Core i9-12900H
i9-12900H, 1800 MHz
247 Points -22%
CPU Multi 64Bit
NVIDIA GeForce RTX 3090 Founders Edition, AMD Ryzen 9 7950X
R9 7950X, 4500 MHz
6209 Points +4%
Intel Core i9-13900K, Intel Core i9-13900K
i9-13900K, 3000 MHz
6191 Points +4%
SCHENKER XMG SECTOR, i9 13900K, RTX 4090, Intel Core i9-13900K
i9-13900K, 3000 MHz
5975 Points
Intel NUC13 Raptor Canyon, Intel Core i9-13900K
i9-13900K, 3000 MHz
5321 Points -11%
AMD Ryzen 9 7900X, AMD Ryzen 9 7900X
R9 7900X, 4700 MHz
4856 Points -19%
Intel Core i9-12900K, Intel Core i9-12900K
i9-12900K, 3200 MHz
4057 Points -32%
Intel Core i5-13600K, Intel Core i5-13600K
i5-13600K, 3500 MHz
3643 Points -39%
Corsair One i300, Intel Core i9-12900K
i9-12900K, 3200 MHz
3473 Points -42%
Intel Dragon Canyon NUC - RTX 3060, Intel Core i9-12900
i9-12900, 2400 MHz
3299 Points -45%
Minisforum Neptune Series NAD9, Intel Core i9-12900H
i9-12900H, 1800 MHz
2067 Points -65%
Cinebench R20
CPU (Single Core)
Intel NUC13 Raptor Canyon, Intel Core i9-13900K
i9-13900K, 3000 MHz
853 Points +1%
SCHENKER XMG SECTOR, i9 13900K, RTX 4090, Intel Core i9-13900K
i9-13900K, 3000 MHz
846 Points
Intel Core i9-13900K, Intel Core i9-13900K
i9-13900K, 3000 MHz
828 Points -2%
NVIDIA GeForce RTX 3090 Founders Edition, AMD Ryzen 9 7950X
R9 7950X, 4500 MHz
795 Points -6%
AMD Ryzen 9 7900X, AMD Ryzen 9 7900X
R9 7900X, 4700 MHz
786 Points -7%
Corsair One i300, Intel Core i9-12900K
i9-12900K, 3200 MHz
777 Points -8%
Intel Core i5-13600K, Intel Core i5-13600K
i5-13600K, 3500 MHz
775 Points -8%
Intel Core i9-12900K, Intel Core i9-12900K
i9-12900K, 3200 MHz
766 Points -9%
Intel Dragon Canyon NUC - RTX 3060, Intel Core i9-12900
i9-12900, 2400 MHz
703 Points -17%
Minisforum Neptune Series NAD9, Intel Core i9-12900H
i9-12900H, 1800 MHz
682 Points -19%
CPU (Multi Core)
Intel Core i9-13900K, Intel Core i9-13900K
i9-13900K, 3000 MHz
15181 Points +3%
NVIDIA GeForce RTX 3090 Founders Edition, AMD Ryzen 9 7950X
R9 7950X, 4500 MHz
14786 Points 0%
SCHENKER XMG SECTOR, i9 13900K, RTX 4090, Intel Core i9-13900K
i9-13900K, 3000 MHz
14739 Points
Intel NUC13 Raptor Canyon, Intel Core i9-13900K
i9-13900K, 3000 MHz
13415 Points -9%
AMD Ryzen 9 7900X, AMD Ryzen 9 7900X
R9 7900X, 4700 MHz
11563 Points -22%
Intel Core i9-12900K, Intel Core i9-12900K
i9-12900K, 3200 MHz
10240 Points -31%
Corsair One i300, Intel Core i9-12900K
i9-12900K, 3200 MHz
9630 Points -35%
Intel Core i5-13600K, Intel Core i5-13600K
i5-13600K, 3500 MHz
9265 Points -37%
Intel Dragon Canyon NUC - RTX 3060, Intel Core i9-12900
i9-12900, 2400 MHz
7179 Points -51%
Minisforum Neptune Series NAD9, Intel Core i9-12900H
i9-12900H, 1800 MHz
4941 Points -66%
Cinebench R23
Single Core
Intel Core i9-13900K, Intel Core i9-13900K
i9-13900K, 3000 MHz
2267 Points +3%
SCHENKER XMG SECTOR, i9 13900K, RTX 4090, Intel Core i9-13900K
i9-13900K, 3000 MHz
2210 Points
Intel NUC13 Raptor Canyon, Intel Core i9-13900K
i9-13900K, 3000 MHz
2203 Points 0%
NVIDIA GeForce RTX 3090 Founders Edition, AMD Ryzen 9 7950X
R9 7950X, 4500 MHz
2045 Points -7%
AMD Ryzen 9 7900X, AMD Ryzen 9 7900X
R9 7900X, 4700 MHz
2039 Points -8%
Corsair One i300, Intel Core i9-12900K
i9-12900K, 3200 MHz
2011 Points -9%
Intel Core i5-13600K, Intel Core i5-13600K
i5-13600K, 3500 MHz
2010 Points -9%
Intel Core i9-12900K, Intel Core i9-12900K
i9-12900K, 3200 MHz
1998 Points -10%
Intel Dragon Canyon NUC - RTX 3060, Intel Core i9-12900
i9-12900, 2400 MHz
1825 Points -17%
Minisforum Neptune Series NAD9, Intel Core i9-12900H
i9-12900H, 1800 MHz
1743 Points -21%
Multi Core
Intel Core i9-13900K, Intel Core i9-13900K
i9-13900K, 3000 MHz
40103 Points +5%
SCHENKER XMG SECTOR, i9 13900K, RTX 4090, Intel Core i9-13900K
i9-13900K, 3000 MHz
38314 Points
NVIDIA GeForce RTX 3090 Founders Edition, AMD Ryzen 9 7950X
R9 7950X, 4500 MHz
37792 Points -1%
Intel NUC13 Raptor Canyon, Intel Core i9-13900K
i9-13900K, 3000 MHz
32592 Points -15%
AMD Ryzen 9 7900X, AMD Ryzen 9 7900X
R9 7900X, 4700 MHz
29480 Points -23%
Intel Core i9-12900K, Intel Core i9-12900K
i9-12900K, 3200 MHz
27005 Points -30%
Corsair One i300, Intel Core i9-12900K
i9-12900K, 3200 MHz
25245 Points -34%
Intel Core i5-13600K, Intel Core i5-13600K
i5-13600K, 3500 MHz
24268 Points -37%
Intel Dragon Canyon NUC - RTX 3060, Intel Core i9-12900
i9-12900, 2400 MHz
18628 Points -51%
Minisforum Neptune Series NAD9, Intel Core i9-12900H
i9-12900H, 1800 MHz
13320 Points -65%
Cinebench R11.5
CPU Single 64Bit
Intel Core i9-13900K, Intel Core i9-13900K
i9-13900K, 3000 MHz
3.92 Points +3%
NVIDIA GeForce RTX 3090 Founders Edition, AMD Ryzen 9 7950X
R9 7950X, 4500 MHz
3.86 Points +1%
AMD Ryzen 9 7900X, AMD Ryzen 9 7900X
R9 7900X, 4700 MHz
3.83 Points +1%
SCHENKER XMG SECTOR, i9 13900K, RTX 4090, Intel Core i9-13900K
i9-13900K, 3000 MHz
3.81 Points
Intel NUC13 Raptor Canyon, Intel Core i9-13900K
i9-13900K, 3000 MHz
3.8 Points 0%
Corsair One i300, Intel Core i9-12900K
i9-12900K, 3200 MHz
3.5 Points -8%
Intel Core i9-12900K, Intel Core i9-12900K
i9-12900K, 3200 MHz
3.49 Points -8%
Intel Core i5-13600K, Intel Core i5-13600K
i5-13600K, 3500 MHz
3.48 Points -9%
Intel Dragon Canyon NUC - RTX 3060, Intel Core i9-12900
i9-12900, 2400 MHz
3.16 Points -17%
Minisforum Neptune Series NAD9, Intel Core i9-12900H
i9-12900H, 1800 MHz
2.86 Points -25%
CPU Multi 64Bit
Intel Core i9-13900K, Intel Core i9-13900K
i9-13900K, 3000 MHz
70.78 Points +5%
NVIDIA GeForce RTX 3090 Founders Edition, AMD Ryzen 9 7950X
R9 7950X, 4500 MHz
68.61 Points +2%
SCHENKER XMG SECTOR, i9 13900K, RTX 4090, Intel Core i9-13900K
i9-13900K, 3000 MHz
67.42 Points
Intel NUC13 Raptor Canyon, Intel Core i9-13900K
i9-13900K, 3000 MHz
62.2 Points -8%
AMD Ryzen 9 7900X, AMD Ryzen 9 7900X
R9 7900X, 4700 MHz
54.51 Points -19%
Intel Core i9-12900K, Intel Core i9-12900K
i9-12900K, 3200 MHz
47.06 Points -30%
Corsair One i300, Intel Core i9-12900K
i9-12900K, 3200 MHz
44.18 Points -34%
Intel Core i5-13600K, Intel Core i5-13600K
i5-13600K, 3500 MHz
42.38 Points -37%
Intel Dragon Canyon NUC - RTX 3060, Intel Core i9-12900
i9-12900, 2400 MHz
38.96 Points -42%
Minisforum Neptune Series NAD9, Intel Core i9-12900H
i9-12900H, 1800 MHz
25.96 Points -61%
Cinebench R10
Rendering Single CPUs 64Bit
Intel Core i9-13900K, Intel Core i9-13900K
i9-13900K, 3000 MHz
18236 Points +5%
Intel NUC13 Raptor Canyon, Intel Core i9-13900K
i9-13900K, 3000 MHz
17761 Points +2%
SCHENKER XMG SECTOR, i9 13900K, RTX 4090, Intel Core i9-13900K
i9-13900K, 3000 MHz
17418 Points
Corsair One i300, Intel Core i9-12900K
i9-12900K, 3200 MHz
16397 Points -6%
AMD Ryzen 9 7900X, AMD Ryzen 9 7900X
R9 7900X, 4700 MHz
16338 Points -6%
NVIDIA GeForce RTX 3090 Founders Edition, AMD Ryzen 9 7950X
R9 7950X, 4500 MHz
16260 Points -7%
Intel Core i5-13600K, Intel Core i5-13600K
i5-13600K, 3500 MHz
16235 Points -7%
Intel Core i9-12900K, Intel Core i9-12900K
i9-12900K, 3200 MHz
16144 Points -7%
Intel Dragon Canyon NUC - RTX 3060, Intel Core i9-12900
i9-12900, 2400 MHz
14610 Points -16%
Minisforum Neptune Series NAD9, Intel Core i9-12900H
i9-12900H, 1800 MHz
12846 Points -26%
Rendering Multiple CPUs 64Bit
Intel NUC13 Raptor Canyon, Intel Core i9-13900K
i9-13900K, 3000 MHz
138969 Points +3%
SCHENKER XMG SECTOR, i9 13900K, RTX 4090, Intel Core i9-13900K
i9-13900K, 3000 MHz
134838 Points
Intel Core i9-13900K, Intel Core i9-13900K
i9-13900K, 3000 MHz
132000 Points -2%
NVIDIA GeForce RTX 3090 Founders Edition, AMD Ryzen 9 7950X
R9 7950X, 4500 MHz
130289 Points -3%
AMD Ryzen 9 7900X, AMD Ryzen 9 7900X
R9 7900X, 4700 MHz
121250 Points -10%
Corsair One i300, Intel Core i9-12900K
i9-12900K, 3200 MHz
112893 Points -16%
Intel Core i9-12900K, Intel Core i9-12900K
i9-12900K, 3200 MHz
112749 Points -16%
Intel Core i5-13600K, Intel Core i5-13600K
i5-13600K, 3500 MHz
110412 Points -18%
Intel Dragon Canyon NUC - RTX 3060, Intel Core i9-12900
i9-12900, 2400 MHz
107565 Points -20%
Minisforum Neptune Series NAD9, Intel Core i9-12900H
i9-12900H, 1800 MHz
77409 Points -43%
Blender - v2.79 BMW27 CPU
Minisforum Neptune Series NAD9, Intel Core i9-12900H
i9-12900H, 1800 MHz
273 Seconds * -225%
Intel Dragon Canyon NUC - RTX 3060, Intel Core i9-12900
i9-12900, 2400 MHz
262.7 Seconds * -213%
Intel Core i5-13600K, Intel Core i5-13600K
i5-13600K, 3500 MHz
135 Seconds * -61%
Corsair One i300, Intel Core i9-12900K
i9-12900K, 3200 MHz
128.3 Seconds * -53%
Intel Core i9-12900K, Intel Core i9-12900K
i9-12900K, 3200 MHz
121.1 Seconds * -44%
AMD Ryzen 9 7900X, AMD Ryzen 9 7900X
R9 7900X, 4700 MHz
106 Seconds * -26%
Intel NUC13 Raptor Canyon, Intel Core i9-13900K
i9-13900K, 3000 MHz
101 Seconds * -20%
NVIDIA GeForce RTX 3090 Founders Edition, AMD Ryzen 9 7950X
R9 7950X, 4500 MHz
85 Seconds * -1%
SCHENKER XMG SECTOR, i9 13900K, RTX 4090, Intel Core i9-13900K
i9-13900K, 3000 MHz
84 Seconds *
Intel Core i9-13900K, Intel Core i9-13900K
i9-13900K, 3000 MHz
80 Seconds * +5%
wPrime 2.10
32m
Intel Core i9-12900K, Intel Core i9-12900K
i9-12900K, 3200 MHz
4.924 s * -114%
Minisforum Neptune Series NAD9, Intel Core i9-12900H
i9-12900H, 1800 MHz
3.421 s * -48%
Intel Dragon Canyon NUC - RTX 3060, Intel Core i9-12900
i9-12900, 2400 MHz
2.67 s * -16%
Intel Core i5-13600K, Intel Core i5-13600K
i5-13600K, 3500 MHz
2.527 s * -10%
Corsair One i300, Intel Core i9-12900K
i9-12900K, 3200 MHz
2.398 s * -4%
SCHENKER XMG SECTOR, i9 13900K, RTX 4090, Intel Core i9-13900K
i9-13900K, 3000 MHz
2.305 s *
Intel NUC13 Raptor Canyon, Intel Core i9-13900K
i9-13900K, 3000 MHz
1.97 s * +15%
Intel Core i9-13900K, Intel Core i9-13900K
i9-13900K, 3000 MHz
1.818 s * +21%
AMD Ryzen 9 7900X, AMD Ryzen 9 7900X
R9 7900X, 4700 MHz
1.781 s * +23%
NVIDIA GeForce RTX 3090 Founders Edition, AMD Ryzen 9 7950X
R9 7950X, 4500 MHz
1.669 s * +28%
1024m
Intel Dragon Canyon NUC - RTX 3060, Intel Core i9-12900
i9-12900, 2400 MHz
211.8 s * -143%
Corsair One i300, Intel Core i9-12900K
i9-12900K, 3200 MHz
195 s * -124%
Intel Core i9-12900K, Intel Core i9-12900K
i9-12900K, 3200 MHz
190.6 s * -119%
Minisforum Neptune Series NAD9, Intel Core i9-12900H
i9-12900H, 1800 MHz
189.07 s * -117%
Intel Core i5-13600K, Intel Core i5-13600K
i5-13600K, 3500 MHz
177.592 s * -104%
Intel NUC13 Raptor Canyon, Intel Core i9-13900K
i9-13900K, 3000 MHz
90.13 s * -3%
SCHENKER XMG SECTOR, i9 13900K, RTX 4090, Intel Core i9-13900K
i9-13900K, 3000 MHz
87.11 s *
Intel Core i9-13900K, Intel Core i9-13900K
i9-13900K, 3000 MHz
79.738 s * +8%
AMD Ryzen 9 7900X, AMD Ryzen 9 7900X
R9 7900X, 4700 MHz
39.954 s * +54%
NVIDIA GeForce RTX 3090 Founders Edition, AMD Ryzen 9 7950X
R9 7950X, 4500 MHz
30.811 s * +65%
X264 HD Benchmark 4.0
Pass 1
SCHENKER XMG SECTOR, i9 13900K, RTX 4090, Intel Core i9-13900K
i9-13900K, 3000 MHz
422 (420min - 424max) fps
Intel NUC13 Raptor Canyon, Intel Core i9-13900K
i9-13900K, 3000 MHz
416.5 (414min - 417max) fps -1%
Intel Core i9-13900K, Intel Core i9-13900K
i9-13900K, 3000 MHz
412 (410min - 417max) fps -2%
Intel Core i5-13600K, Intel Core i5-13600K
i5-13600K, 3500 MHz
388 (386min - 388max) fps -8%
NVIDIA GeForce RTX 3090 Founders Edition, AMD Ryzen 9 7950X
R9 7950X, 4500 MHz
379.5 (378min - 385max) fps -10%
AMD Ryzen 9 7900X, AMD Ryzen 9 7900X
R9 7900X, 4700 MHz
376 (369min - 378max) fps -11%
Intel Core i9-12900K, Intel Core i9-12900K
i9-12900K, 3200 MHz
368.5 (366min - 369max) fps -13%
Corsair One i300, Intel Core i9-12900K
i9-12900K, 3200 MHz
365 (342min - 367max) fps -14%
Intel Dragon Canyon NUC - RTX 3060, Intel Core i9-12900
i9-12900, 2400 MHz
310 (303min - 324max) fps -27%
Minisforum Neptune Series NAD9, Intel Core i9-12900H
i9-12900H, 1800 MHz
245 (239min - 261max) fps -42%
Pass 2
SCHENKER XMG SECTOR, i9 13900K, RTX 4090, Intel Core i9-13900K
i9-13900K, 3000 MHz
269 (268min - 270max) fps
Intel Core i9-13900K, Intel Core i9-13900K
i9-13900K, 3000 MHz
267 (266min - 271max) fps -1%
NVIDIA GeForce RTX 3090 Founders Edition, AMD Ryzen 9 7950X
R9 7950X, 4500 MHz
266.5 (263min - 267max) fps -1%
Intel NUC13 Raptor Canyon, Intel Core i9-13900K
i9-13900K, 3000 MHz
247.5 (238min - 251max) fps -8%
AMD Ryzen 9 7900X, AMD Ryzen 9 7900X
R9 7900X, 4700 MHz
241 (240min - 242max) fps -10%
Intel Core i9-12900K, Intel Core i9-12900K
i9-12900K, 3200 MHz
206 (206min - 206max) fps -23%
Intel Core i5-13600K, Intel Core i5-13600K
i5-13600K, 3500 MHz
199 (198.5min - 199.4max) fps -26%
Corsair One i300, Intel Core i9-12900K
i9-12900K, 3200 MHz
196 (194min - 197max) fps -27%
Intel Dragon Canyon NUC - RTX 3060, Intel Core i9-12900
i9-12900, 2400 MHz
147.5 (134min - 173max) fps -45%
Minisforum Neptune Series NAD9, Intel Core i9-12900H
i9-12900H, 1800 MHz
125.25 (105.2min - 130max) fps -53%
WinRAR - Result
AMD Ryzen 9 7900X, AMD Ryzen 9 7900X
R9 7900X, 4700 MHz
17225 KB/s +26%
NVIDIA GeForce RTX 3090 Founders Edition, AMD Ryzen 9 7950X
R9 7950X, 4500 MHz
16351 KB/s +19%
Intel Core i9-13900K, Intel Core i9-13900K
i9-13900K, 3000 MHz
14836 KB/s +8%
SCHENKER XMG SECTOR, i9 13900K, RTX 4090, Intel Core i9-13900K
i9-13900K, 3000 MHz
13706 KB/s
Intel NUC13 Raptor Canyon, Intel Core i9-13900K
i9-13900K, 3000 MHz
13210 KB/s -4%
Corsair One i300, Intel Core i9-12900K
i9-12900K, 3200 MHz
12876 KB/s -6%
Intel Core i5-13600K, Intel Core i5-13600K
i5-13600K, 3500 MHz
10937 KB/s -20%
Intel Core i9-12900K, Intel Core i9-12900K
i9-12900K, 3200 MHz
10792 KB/s -21%
Intel Dragon Canyon NUC - RTX 3060, Intel Core i9-12900
i9-12900, 2400 MHz
10739 KB/s -22%
Minisforum Neptune Series NAD9, Intel Core i9-12900H
i9-12900H, 1800 MHz
7937 KB/s -42%
TrueCrypt
AES Mean 100MB
NVIDIA GeForce RTX 3090 Founders Edition, AMD Ryzen 9 7950X
R9 7950X, 4500 MHz
30.7 GB/s +25%
Intel Core i9-13900K, Intel Core i9-13900K
i9-13900K, 3000 MHz
27 GB/s +10%
SCHENKER XMG SECTOR, i9 13900K, RTX 4090, Intel Core i9-13900K
i9-13900K, 3000 MHz
24.6 GB/s
Intel NUC13 Raptor Canyon, Intel Core i9-13900K
i9-13900K, 3000 MHz
20.5 GB/s -17%
Corsair One i300, Intel Core i9-12900K
i9-12900K, 3200 MHz
20 GB/s -19%
Intel Core i5-13600K, Intel Core i5-13600K
i5-13600K, 3500 MHz
18.8 GB/s -24%
Intel Core i9-12900K, Intel Core i9-12900K
i9-12900K, 3200 MHz
18.5 GB/s -25%
Intel Dragon Canyon NUC - RTX 3060, Intel Core i9-12900
i9-12900, 2400 MHz
17.2 GB/s -30%
AMD Ryzen 9 7900X, AMD Ryzen 9 7900X
R9 7900X, 4700 MHz
14.8 GB/s -40%
Minisforum Neptune Series NAD9, Intel Core i9-12900H
i9-12900H, 1800 MHz
8.6 GB/s -65%
Twofish Mean 100MB
Intel Core i9-13900K, Intel Core i9-13900K
i9-13900K, 3000 MHz
5.4 GB/s 0%
SCHENKER XMG SECTOR, i9 13900K, RTX 4090, Intel Core i9-13900K
i9-13900K, 3000 MHz
5.4 GB/s
Intel NUC13 Raptor Canyon, Intel Core i9-13900K
i9-13900K, 3000 MHz
5.2 GB/s -4%
NVIDIA GeForce RTX 3090 Founders Edition, AMD Ryzen 9 7950X
R9 7950X, 4500 MHz
4.5 GB/s -17%
Intel Core i9-12900K, Intel Core i9-12900K
i9-12900K, 3200 MHz
3.7 GB/s -31%
Corsair One i300, Intel Core i9-12900K
i9-12900K, 3200 MHz
3.5 GB/s -35%
Intel Dragon Canyon NUC - RTX 3060, Intel Core i9-12900
i9-12900, 2400 MHz
3.4 GB/s -37%
Intel Core i5-13600K, Intel Core i5-13600K
i5-13600K, 3500 MHz
3.1 GB/s -43%
AMD Ryzen 9 7900X, AMD Ryzen 9 7900X
R9 7900X, 4700 MHz
2.8 GB/s -48%
Minisforum Neptune Series NAD9, Intel Core i9-12900H
i9-12900H, 1800 MHz
2 GB/s -63%
Serpent Mean 100MB
Intel Core i9-13900K, Intel Core i9-13900K
i9-13900K, 3000 MHz
3 GB/s +3%
SCHENKER XMG SECTOR, i9 13900K, RTX 4090, Intel Core i9-13900K
i9-13900K, 3000 MHz
2.9 GB/s
NVIDIA GeForce RTX 3090 Founders Edition, AMD Ryzen 9 7950X
R9 7950X, 4500 MHz
2.8 GB/s -3%
Intel NUC13 Raptor Canyon, Intel Core i9-13900K
i9-13900K, 3000 MHz
2.6 GB/s -10%
Corsair One i300, Intel Core i9-12900K
i9-12900K, 3200 MHz
2 GB/s -31%
Intel Core i9-12900K, Intel Core i9-12900K
i9-12900K, 3200 MHz
1.9 GB/s -34%
Intel Dragon Canyon NUC - RTX 3060, Intel Core i9-12900
i9-12900, 2400 MHz
1.9 GB/s -34%
Intel Core i5-13600K, Intel Core i5-13600K
i5-13600K, 3500 MHz
1.7 GB/s -41%
AMD Ryzen 9 7900X, AMD Ryzen 9 7900X
R9 7900X, 4700 MHz
1.5 GB/s -48%
Minisforum Neptune Series NAD9, Intel Core i9-12900H
i9-12900H, 1800 MHz
0.974 GB/s -66%
Geekbench 5.5
Multi-Core
NVIDIA GeForce RTX 3090 Founders Edition, AMD Ryzen 9 7950X
R9 7950X, 4500 MHz
24625 Points +2%
Intel Core i9-13900K, Intel Core i9-13900K
i9-13900K, 3000 MHz
24157 Points +1%
SCHENKER XMG SECTOR, i9 13900K, RTX 4090, Intel Core i9-13900K
i9-13900K, 3000 MHz
24033 Points
Intel NUC13 Raptor Canyon, Intel Core i9-13900K
i9-13900K, 3000 MHz
22448 Points -7%
AMD Ryzen 9 7900X, AMD Ryzen 9 7900X
R9 7900X, 4700 MHz
19987 Points -17%
Intel Core i9-12900K, Intel Core i9-12900K
i9-12900K, 3200 MHz
17854 Points -26%
Corsair One i300, Intel Core i9-12900K
i9-12900K, 3200 MHz
17698 Points -26%
Intel Core i5-13600K, Intel Core i5-13600K
i5-13600K, 3500 MHz
16651 Points -31%
Minisforum Neptune Series NAD9, Intel Core i9-12900H
i9-12900H, 1800 MHz
9695 Points -60%
Intel Dragon Canyon NUC - RTX 3060, Intel Core i9-12900
i9-12900, 2400 MHz
8924 Points -63%
Single-Core
NVIDIA GeForce RTX 3090 Founders Edition, AMD Ryzen 9 7950X
R9 7950X, 4500 MHz
2311 Points +4%
Intel Core i9-13900K, Intel Core i9-13900K
i9-13900K, 3000 MHz
2290 Points +3%
AMD Ryzen 9 7900X, AMD Ryzen 9 7900X
R9 7900X, 4700 MHz
2274 Points +3%
SCHENKER XMG SECTOR, i9 13900K, RTX 4090, Intel Core i9-13900K
i9-13900K, 3000 MHz
2218 Points
Intel NUC13 Raptor Canyon, Intel Core i9-13900K
i9-13900K, 3000 MHz
2106 Points -5%
Intel Core i9-12900K, Intel Core i9-12900K
i9-12900K, 3200 MHz
2042 Points -8%
Corsair One i300, Intel Core i9-12900K
i9-12900K, 3200 MHz
1969 Points -11%
Intel Core i5-13600K, Intel Core i5-13600K
i5-13600K, 3500 MHz
1967 Points -11%
Minisforum Neptune Series NAD9, Intel Core i9-12900H
i9-12900H, 1800 MHz
1861 Points -16%
Intel Dragon Canyon NUC - RTX 3060, Intel Core i9-12900
i9-12900, 2400 MHz
1656 Points -25%
Geekbench 5.0
5.0 Multi-Core
NVIDIA GeForce RTX 3090 Founders Edition, AMD Ryzen 9 7950X
R9 7950X, 4500 MHz
24479 Points +3%
Intel Core i9-13900K, Intel Core i9-13900K
i9-13900K, 3000 MHz
24021 Points +2%
SCHENKER XMG SECTOR, i9 13900K, RTX 4090, Intel Core i9-13900K
i9-13900K, 3000 MHz
23664 Points
Intel NUC13 Raptor Canyon, Intel Core i9-13900K
i9-13900K, 3000 MHz
22024 Points -7%
AMD Ryzen 9 7900X, AMD Ryzen 9 7900X
R9 7900X, 4700 MHz
19975 Points -16%
Intel Core i9-12900K, Intel Core i9-12900K
i9-12900K, 3200 MHz
17959 Points -24%
Corsair One i300, Intel Core i9-12900K
i9-12900K, 3200 MHz
17697 Points -25%
Intel Core i5-13600K, Intel Core i5-13600K
i5-13600K, 3500 MHz
16635 Points -30%
Minisforum Neptune Series NAD9, Intel Core i9-12900H
i9-12900H, 1800 MHz
9663 Points -59%
Intel Dragon Canyon NUC - RTX 3060, Intel Core i9-12900
i9-12900, 2400 MHz
8845 Points -63%
5.0 Single-Core
NVIDIA GeForce RTX 3090 Founders Edition, AMD Ryzen 9 7950X
R9 7950X, 4500 MHz
2222 Points +3%
Intel Core i9-13900K, Intel Core i9-13900K
i9-13900K, 3000 MHz
2214 Points +3%
AMD Ryzen 9 7900X, AMD Ryzen 9 7900X
R9 7900X, 4700 MHz
2194 Points +2%
SCHENKER XMG SECTOR, i9 13900K, RTX 4090, Intel Core i9-13900K
i9-13900K, 3000 MHz
2151 Points
Intel NUC13 Raptor Canyon, Intel Core i9-13900K
i9-13900K, 3000 MHz
2148 Points 0%
Intel Core i9-12900K, Intel Core i9-12900K
i9-12900K, 3200 MHz
1968 Points -9%
Intel Core i5-13600K, Intel Core i5-13600K
i5-13600K, 3500 MHz
1931 Points -10%
Corsair One i300, Intel Core i9-12900K
i9-12900K, 3200 MHz
1927 Points -10%
Minisforum Neptune Series NAD9, Intel Core i9-12900H
i9-12900H, 1800 MHz
1838 Points -15%
Intel Dragon Canyon NUC - RTX 3060, Intel Core i9-12900
i9-12900, 2400 MHz
1638 Points -24%
Geekbench 4.4
64 Bit Single-Core Score
Intel Core i9-13900K, Intel Core i9-13900K
i9-13900K, 3000 MHz
9598 Points 0%
SCHENKER XMG SECTOR, i9 13900K, RTX 4090, Intel Core i9-13900K
i9-13900K, 3000 MHz
9583 Points
NVIDIA GeForce RTX 3090 Founders Edition, AMD Ryzen 9 7950X
R9 7950X, 4500 MHz
9322 Points -3%
Intel NUC13 Raptor Canyon, Intel Core i9-13900K
i9-13900K, 3000 MHz
9218 Points -4%
AMD Ryzen 9 7900X, AMD Ryzen 9 7900X
R9 7900X, 4700 MHz
9193 Points -4%
Intel Core i9-12900K, Intel Core i9-12900K
i9-12900K, 3200 MHz
8665 Points -10%
Intel Core i5-13600K, Intel Core i5-13600K
i5-13600K, 3500 MHz
8618 Points -10%
Corsair One i300, Intel Core i9-12900K
i9-12900K, 3200 MHz
8593 Points -10%
Minisforum Neptune Series NAD9, Intel Core i9-12900H
i9-12900H, 1800 MHz
8015 Points -16%
Intel Dragon Canyon NUC - RTX 3060, Intel Core i9-12900
i9-12900, 2400 MHz
6991 Points -27%
64 Bit Multi-Core Score
NVIDIA GeForce RTX 3090 Founders Edition, AMD Ryzen 9 7950X
R9 7950X, 4500 MHz
89678 Points +6%
Intel Core i9-13900K, Intel Core i9-13900K
i9-13900K, 3000 MHz
86695 Points +2%
SCHENKER XMG SECTOR, i9 13900K, RTX 4090, Intel Core i9-13900K
i9-13900K, 3000 MHz
84916 Points
Intel NUC13 Raptor Canyon, Intel Core i9-13900K
i9-13900K, 3000 MHz
77347 Points -9%
AMD Ryzen 9 7900X, AMD Ryzen 9 7900X
R9 7900X, 4700 MHz
74731 Points -12%
Corsair One i300, Intel Core i9-12900K
i9-12900K, 3200 MHz
64238 Points -24%
Intel Core i9-12900K, Intel Core i9-12900K
i9-12900K, 3200 MHz
63583 Points -25%
Intel Core i5-13600K, Intel Core i5-13600K
i5-13600K, 3500 MHz
60407 Points -29%
Minisforum Neptune Series NAD9, Intel Core i9-12900H
i9-12900H, 1800 MHz
36692 Points -57%
Intel Dragon Canyon NUC - RTX 3060, Intel Core i9-12900
i9-12900, 2400 MHz
36310 Points -57%
3DMark 11 - 1280x720 Performance Physics
Intel Core i9-13900K, Intel Core i9-13900K
i9-13900K, 3000 MHz
32273 Points +5%
SCHENKER XMG SECTOR, i9 13900K, RTX 4090, Intel Core i9-13900K
i9-13900K, 3000 MHz
30809 Points
Intel Core i5-13600K, Intel Core i5-13600K
i5-13600K, 3500 MHz
30480 Points -1%
Intel NUC13 Raptor Canyon, Intel Core i9-13900K
i9-13900K, 3000 MHz
29023 Points -6%
Corsair One i300, Intel Core i9-12900K
i9-12900K, 3200 MHz
28789 Points -7%
AMD Ryzen 9 7900X, AMD Ryzen 9 7900X
R9 7900X, 4700 MHz
28618 Points -7%
NVIDIA GeForce RTX 3090 Founders Edition, AMD Ryzen 9 7950X
R9 7950X, 4500 MHz
28618 Points -7%
Intel Core i9-12900K, Intel Core i9-12900K
i9-12900K, 3200 MHz
28211 Points -8%
Intel Dragon Canyon NUC - RTX 3060, Intel Core i9-12900
i9-12900, 2400 MHz
24314 Points -21%
Minisforum Neptune Series NAD9, Intel Core i9-12900H
i9-12900H, 1800 MHz
18382 Points -40%
7-Zip 18.03
7z b 4
NVIDIA GeForce RTX 3090 Founders Edition, AMD Ryzen 9 7950X
R9 7950X, 4500 MHz
161724 MIPS +9%
SCHENKER XMG SECTOR, i9 13900K, RTX 4090, Intel Core i9-13900K
i9-13900K, 3000 MHz
148053 MIPS
Intel Core i9-13900K, Intel Core i9-13900K
i9-13900K, 3000 MHz
147068 MIPS -1%
Intel NUC13 Raptor Canyon, Intel Core i9-13900K
i9-13900K, 3000 MHz
127201 MIPS -14%
AMD Ryzen 9 7900X, AMD Ryzen 9 7900X
R9 7900X, 4700 MHz
124975 MIPS -16%
Intel Core i9-12900K, Intel Core i9-12900K
i9-12900K, 3200 MHz
97671 MIPS -34%
Corsair One i300, Intel Core i9-12900K
i9-12900K, 3200 MHz
96960 MIPS -35%
Intel Core i5-13600K, Intel Core i5-13600K
i5-13600K, 3500 MHz
89647 MIPS -39%
Minisforum Neptune Series NAD9, Intel Core i9-12900H
i9-12900H, 1800 MHz
51151 MIPS -65%
Intel Dragon Canyon NUC - RTX 3060, Intel Core i9-12900
i9-12900, 2400 MHz
50152 MIPS -66%
7z b 4 -mmt1
NVIDIA GeForce RTX 3090 Founders Edition, AMD Ryzen 9 7950X
R9 7950X, 4500 MHz
8365 MIPS +17%
AMD Ryzen 9 7900X, AMD Ryzen 9 7900X
R9 7900X, 4700 MHz
8282 MIPS +15%
Intel Core i9-13900K, Intel Core i9-13900K
i9-13900K, 3000 MHz
7272 MIPS +1%
Intel NUC13 Raptor Canyon, Intel Core i9-13900K
i9-13900K, 3000 MHz
7255 MIPS +1%
SCHENKER XMG SECTOR, i9 13900K, RTX 4090, Intel Core i9-13900K
i9-13900K, 3000 MHz
7176 MIPS
Corsair One i300, Intel Core i9-12900K
i9-12900K, 3200 MHz
6580 MIPS -8%
Intel Core i9-12900K, Intel Core i9-12900K
i9-12900K, 3200 MHz
6571 MIPS -8%
Intel Core i5-13600K, Intel Core i5-13600K
i5-13600K, 3500 MHz
6502 MIPS -9%
Minisforum Neptune Series NAD9, Intel Core i9-12900H
i9-12900H, 1800 MHz
6019 MIPS -16%
Intel Dragon Canyon NUC - RTX 3060, Intel Core i9-12900
i9-12900, 2400 MHz
5979 MIPS -17%
HWBOT x265 Benchmark v2.2 - 4k Preset
NVIDIA GeForce RTX 3090 Founders Edition, AMD Ryzen 9 7950X
R9 7950X, 4500 MHz
44.4 fps +9%
Intel Core i9-13900K, Intel Core i9-13900K
i9-13900K, 3000 MHz
42.6 fps +5%
SCHENKER XMG SECTOR, i9 13900K, RTX 4090, Intel Core i9-13900K
i9-13900K, 3000 MHz
40.7 fps
AMD Ryzen 9 7900X, AMD Ryzen 9 7900X
R9 7900X, 4700 MHz
36.2 fps -11%
Intel NUC13 Raptor Canyon, Intel Core i9-13900K
i9-13900K, 3000 MHz
34.5 fps -15%
Intel Core i9-12900K, Intel Core i9-12900K
i9-12900K, 3200 MHz
30 fps -26%
Corsair One i300, Intel Core i9-12900K
i9-12900K, 3200 MHz
29 fps -29%
Intel Core i5-13600K, Intel Core i5-13600K
i5-13600K, 3500 MHz
27.6 fps -32%
Intel Dragon Canyon NUC - RTX 3060, Intel Core i9-12900
i9-12900, 2400 MHz
14.4 fps -65%
Minisforum Neptune Series NAD9, Intel Core i9-12900H
i9-12900H, 1800 MHz
14.1 fps -65%
R Benchmark 2.5 - Overall mean
Intel Dragon Canyon NUC - RTX 3060, Intel Core i9-12900
i9-12900, 2400 MHz
0.535 sec * -50%
Minisforum Neptune Series NAD9, Intel Core i9-12900H
i9-12900H, 1800 MHz
0.4641 sec * -30%
Intel Core i9-12900K, Intel Core i9-12900K
i9-12900K, 3200 MHz
0.4216 sec * -18%
Intel Core i5-13600K, Intel Core i5-13600K
i5-13600K, 3500 MHz
0.405 sec * -14%
Corsair One i300, Intel Core i9-12900K
i9-12900K, 3200 MHz
0.3946 sec * -11%
Intel NUC13 Raptor Canyon, Intel Core i9-13900K
i9-13900K, 3000 MHz
0.3911 sec * -10%
AMD Ryzen 9 7900X, AMD Ryzen 9 7900X
R9 7900X, 4700 MHz
0.3736 sec * -5%
NVIDIA GeForce RTX 3090 Founders Edition, AMD Ryzen 9 7950X
R9 7950X, 4500 MHz
0.3682 sec * -3%
SCHENKER XMG SECTOR, i9 13900K, RTX 4090, Intel Core i9-13900K
i9-13900K, 3000 MHz
0.356 sec *
Intel Core i9-13900K, Intel Core i9-13900K
i9-13900K, 3000 MHz
0.3539 sec * +1%
LibreOffice - 20 Documents To PDF
Intel Dragon Canyon NUC - RTX 3060, Intel Core i9-12900
i9-12900, 2400 MHz
44.9 s * -22%
Intel NUC13 Raptor Canyon, Intel Core i9-13900K
i9-13900K, 3000 MHz
41.6 s * -13%
Intel Core i9-12900K, Intel Core i9-12900K
i9-12900K, 3200 MHz
40.6 s * -11%
Corsair One i300, Intel Core i9-12900K
i9-12900K, 3200 MHz
38.1 s * -4%
Minisforum Neptune Series NAD9, Intel Core i9-12900H
i9-12900H, 1800 MHz
38 s * -4%
SCHENKER XMG SECTOR, i9 13900K, RTX 4090, Intel Core i9-13900K
i9-13900K, 3000 MHz
36.7 s *
Intel Core i9-13900K, Intel Core i9-13900K
i9-13900K, 3000 MHz
36.6 s * -0%
NVIDIA GeForce RTX 3090 Founders Edition, AMD Ryzen 9 7950X
R9 7950X, 4500 MHz
35.5 s * +3%
Intel Core i5-13600K, Intel Core i5-13600K
i5-13600K, 3500 MHz
35 s * +5%
AMD Ryzen 9 7900X, AMD Ryzen 9 7900X
R9 7900X, 4700 MHz
34.9 s * +5%
WebXPRT 3 - Overall
SCHENKER XMG SECTOR, i9 13900K, RTX 4090, Intel Core i9-13900K
i9-13900K, 3000 MHz
382 Points
AMD Ryzen 9 7900X, AMD Ryzen 9 7900X
R9 7900X, 4700 MHz
371 Points -3%
NVIDIA GeForce RTX 3090 Founders Edition, AMD Ryzen 9 7950X
R9 7950X, 4500 MHz
366 Points -4%
Intel Core i9-13900K, Intel Core i9-13900K
i9-13900K, 3000 MHz
361 Points -5%
Intel NUC13 Raptor Canyon, Intel Core i9-13900K
i9-13900K, 3000 MHz
338 Points -12%
Intel Core i5-13600K, Intel Core i5-13600K
i5-13600K, 3500 MHz
333 Points -13%
Corsair One i300, Intel Core i9-12900K
i9-12900K, 3200 MHz
330 Points -14%
Intel Core i9-12900K, Intel Core i9-12900K
i9-12900K, 3200 MHz
320 Points -16%
Minisforum Neptune Series NAD9, Intel Core i9-12900H
i9-12900H, 1800 MHz
311 Points -19%
Intel Dragon Canyon NUC - RTX 3060, Intel Core i9-12900
i9-12900, 2400 MHz
269 Points -30%
Mozilla Kraken 1.1 - Total
Intel Dragon Canyon NUC - RTX 3060, Intel Core i9-12900
i9-12900, 2400 MHz
602 ms * -42%
Minisforum Neptune Series NAD9, Intel Core i9-12900H
i9-12900H, 1800 MHz
577 ms * -36%
Intel Core i9-12900K, Intel Core i9-12900K
i9-12900K, 3200 MHz
481 ms * -14%
Corsair One i300, Intel Core i9-12900K
i9-12900K, 3200 MHz
475 ms * -12%
Intel Core i5-13600K, Intel Core i5-13600K
i5-13600K, 3500 MHz
469 ms * -11%
Intel NUC13 Raptor Canyon, Intel Core i9-13900K
i9-13900K, 3000 MHz
438 ms * -4%
NVIDIA GeForce RTX 3090 Founders Edition, AMD Ryzen 9 7950X
R9 7950X, 4500 MHz
433 ms * -2%
Intel Core i9-13900K, Intel Core i9-13900K
i9-13900K, 3000 MHz
432 ms * -2%
AMD Ryzen 9 7900X, AMD Ryzen 9 7900X
R9 7900X, 4700 MHz
431 ms * -2%
SCHENKER XMG SECTOR, i9 13900K, RTX 4090, Intel Core i9-13900K
i9-13900K, 3000 MHz
423 ms *
3DMark
3840x2160 Fire Strike Ultra Physics
Intel Core i9-13900K, Intel Core i9-13900K
i9-13900K, 3000 MHz
54036 Points +9%
SCHENKER XMG SECTOR, i9 13900K, RTX 4090, Intel Core i9-13900K
i9-13900K, 3000 MHz
49729 Points
Intel NUC13 Raptor Canyon, Intel Core i9-13900K
i9-13900K, 3000 MHz
46030 Points -7%
AMD Ryzen 9 7900X, AMD Ryzen 9 7900X
R9 7900X, 4700 MHz
42399 Points -15%
NVIDIA GeForce RTX 3090 Founders Edition, AMD Ryzen 9 7950X
R9 7950X, 4500 MHz
42399 Points -15%
Corsair One i300, Intel Core i9-12900K
i9-12900K, 3200 MHz
41303 Points -17%
Intel Core i9-12900K, Intel Core i9-12900K
i9-12900K, 3200 MHz
39462 Points -21%
Intel Dragon Canyon NUC - RTX 3060, Intel Core i9-12900
i9-12900, 2400 MHz
37967 Points -24%
Intel Core i5-13600K, Intel Core i5-13600K
i5-13600K, 3500 MHz
36774 Points -26%
Minisforum Neptune Series NAD9, Intel Core i9-12900H
i9-12900H, 1800 MHz
21422 Points -57%
1920x1080 Fire Strike Physics
Intel Core i9-13900K, Intel Core i9-13900K
i9-13900K, 3000 MHz
53853 Points +8%
SCHENKER XMG SECTOR, i9 13900K, RTX 4090, Intel Core i9-13900K
i9-13900K, 3000 MHz
50014 Points
Intel NUC13 Raptor Canyon, Intel Core i9-13900K
i9-13900K, 3000 MHz
46013 Points -8%
AMD Ryzen 9 7900X, AMD Ryzen 9 7900X
R9 7900X, 4700 MHz
42682 Points -15%
NVIDIA GeForce RTX 3090 Founders Edition, AMD Ryzen 9 7950X
R9 7950X, 4500 MHz
42682 Points -15%
Corsair One i300, Intel Core i9-12900K
i9-12900K, 3200 MHz
40694 Points -19%
Intel Core i9-12900K, Intel Core i9-12900K
i9-12900K, 3200 MHz
39112 Points -22%
Intel Core i5-13600K, Intel Core i5-13600K
i5-13600K, 3500 MHz
35386 Points -29%
Intel Dragon Canyon NUC - RTX 3060, Intel Core i9-12900
i9-12900, 2400 MHz
35153 Points -30%
Minisforum Neptune Series NAD9, Intel Core i9-12900H
i9-12900H, 1800 MHz
22244 Points -56%
2560x1440 Time Spy CPU
SCHENKER XMG SECTOR, i9 13900K, RTX 4090, Intel Core i9-13900K
i9-13900K, 3000 MHz
19799 Points
Intel Core i9-13900K, Intel Core i9-13900K
i9-13900K, 3000 MHz
19392 Points -2%
Corsair One i300, Intel Core i9-12900K
i9-12900K, 3200 MHz
18680 Points -6%
Intel Core i9-12900K, Intel Core i9-12900K
i9-12900K, 3200 MHz
18431 Points -7%
Intel Core i5-13600K, Intel Core i5-13600K
i5-13600K, 3500 MHz
17124 Points -14%
AMD Ryzen 9 7900X, AMD Ryzen 9 7900X
R9 7900X, 4700 MHz
16616 Points -16%
NVIDIA GeForce RTX 3090 Founders Edition, AMD Ryzen 9 7950X
R9 7950X, 4500 MHz
16616 Points -16%
Intel NUC13 Raptor Canyon, Intel Core i9-13900K
i9-13900K, 3000 MHz
16236 Points -18%
Intel Dragon Canyon NUC - RTX 3060, Intel Core i9-12900
i9-12900, 2400 MHz
15095 Points -24%
Minisforum Neptune Series NAD9, Intel Core i9-12900H
i9-12900H, 1800 MHz
10539 Points -47%

* ... Meglio usare valori piccoli

XMG SECTOR Intel in Cinebench R15 Multi loop

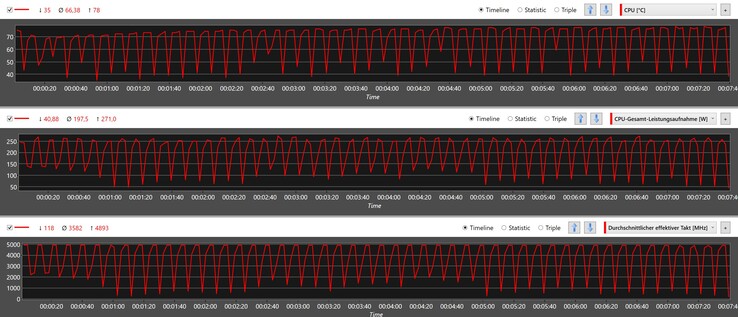
L'esecuzione di Cinebench R15 in loop ci ha dato un primo sguardo all'efficienza della soluzione di raffreddamento del PC. Non c'è stato alcun calo notevole delle prestazioni dopo i primi cicli. L'XMG SECTOR Intel si è comportato molto bene, ricevendo un punteggio medio di 5.917.

Metriche della CPU durante il ciclo di Cinebench R15
03156309451260157518902205252028353150346537804095441047255040535556705985Tooltip
SCHENKER XMG SECTOR, i9 13900K, RTX 4090 Intel Core i9-13900K, Intel Core i9-13900K: Ø5917 (5893.62-5963.03)
Intel Core i9-12900K Intel Core i9-12900K, Intel Core i9-12900K: Ø3987 (3920.42-4037.55)
AMD Ryzen 9 7900X AMD Ryzen 9 7900X, AMD Ryzen 9 7900X: Ø4785 (4739.9-4829.17)
NVIDIA GeForce RTX 3090 Founders Edition AMD Ryzen 9 7950X, AMD Ryzen 9 7950X: Ø6154 (6136.85-6189.08)
Intel Core i9-13900K Intel Core i9-13900K, Intel Core i9-13900K: Ø6182 (6045.95-6213.11)
Minisforum Neptune Series NAD9 Intel Core i9-12900H, Intel Core i9-12900H: Ø1703 (1657.14-2261.04)
Corsair One i300 Intel Core i9-12900K, Intel Core i9-12900K: Ø3491 (3392.13-3530.45)
Intel NUC13 Raptor Canyon Intel Core i9-13900K, Intel Core i9-13900K: Ø4779 (4708.1-5265.93)
Intel Dragon Canyon NUC - RTX 3060 Intel Core i9-12900, Intel Core i9-12900: Ø2592 (2433.39-3346.44)

Prestazioni del sistema

L'XMG SECTOR Intel si è dimostrato estremamente scattante nei benchmark sintetici, ponendosi così alla pari con i concorrenti. Inoltre, la nostra unità di recensione ha fornito prestazioni eccezionali nei test di memoria AIDA64 ed è riuscita ad assicurarsi il primo posto grazie alla memoria veloce (DDR5-5600) e alle basse latenze. Durante il tempo trascorso con l'XMG SECTOR Intel, ha funzionato costantemente molto velocemente senza alcuna latenza significativa.

Performance Rating - Percent
AMD Ryzen 9 7900X
AMD Ryzen 9 7900X, NVIDIA GeForce RTX 3090,
99 pt
NVIDIA GeForce RTX 3090 Founders Edition
AMD Ryzen 9 7950X, NVIDIA GeForce RTX 3090, Corsair MP600
99 pt
Intel Core i9-13900K
Intel Core i9-13900K, NVIDIA GeForce RTX 3090, Corsair MP600
97.8 pt
SCHENKER XMG SECTOR, i9 13900K, RTX 4090
Intel Core i9-13900K, NVIDIA GeForce RTX 4090, Samsung SSD 980 Pro 2TB MZ-V8P2T0
96.6 pt
Intel Core i5-13600K
Intel Core i5-13600K, NVIDIA GeForce RTX 3090, Corsair MP600
95.7 pt
Intel NUC13 Raptor Canyon
Intel Core i9-13900K, NVIDIA GeForce RTX 3080 Ti, Kingston Fury Renegade SFYRS1000G
91.2 pt
Corsair One i300
Intel Core i9-12900K, NVIDIA GeForce RTX 3080 Ti, Samsung PM9A1 MZVL22T0HBLB
89.2 pt
Intel Core i9-12900K
Intel Core i9-12900K, NVIDIA Titan RTX, Intel Optane 905P 480GB 2.5
87.4 pt
Intel Dragon Canyon NUC - RTX 3060
Intel Core i9-12900, NVIDIA GeForce RTX 3060, Transcend M.2 SSD 2200S TS512GMTE220S
84.5 pt
Minisforum Neptune Series NAD9
Intel Core i9-12900H, Intel Iris Xe Graphics G7 96EUs, Kingston OM8PGP4512Q-A0
71.2 pt
PCMark 10
Score
SCHENKER XMG SECTOR, i9 13900K, RTX 4090
Intel Core i9-13900K, NVIDIA GeForce RTX 4090, Samsung SSD 980 Pro 2TB MZ-V8P2T0
10043 Points
AMD Ryzen 9 7900X
AMD Ryzen 9 7900X, NVIDIA GeForce RTX 3090,
9911 Points -1%
NVIDIA GeForce RTX 3090 Founders Edition
AMD Ryzen 9 7950X, NVIDIA GeForce RTX 3090, Corsair MP600
9911 Points -1%
Intel Core i9-13900K
Intel Core i9-13900K, NVIDIA GeForce RTX 3090, Corsair MP600
9788 Points -3%
Intel Core i5-13600K
Intel Core i5-13600K, NVIDIA GeForce RTX 3090, Corsair MP600
9362 Points -7%
Intel NUC13 Raptor Canyon
Intel Core i9-13900K, NVIDIA GeForce RTX 3080 Ti, Kingston Fury Renegade SFYRS1000G
9118 Points -9%
Corsair One i300
Intel Core i9-12900K, NVIDIA GeForce RTX 3080 Ti, Samsung PM9A1 MZVL22T0HBLB
8897 Points -11%
Intel Core i9-12900K
Intel Core i9-12900K, NVIDIA Titan RTX, Intel Optane 905P 480GB 2.5
8604 Points -14%
Intel Dragon Canyon NUC - RTX 3060
Intel Core i9-12900, NVIDIA GeForce RTX 3060, Transcend M.2 SSD 2200S TS512GMTE220S
8083 Points -20%
Minisforum Neptune Series NAD9
Intel Core i9-12900H, Intel Iris Xe Graphics G7 96EUs, Kingston OM8PGP4512Q-A0
6187 Points -38%
Essentials
Intel Core i9-13900K
Intel Core i9-13900K, NVIDIA GeForce RTX 3090, Corsair MP600
12868 Points +6%
AMD Ryzen 9 7900X
AMD Ryzen 9 7900X, NVIDIA GeForce RTX 3090,
12651 Points +4%
NVIDIA GeForce RTX 3090 Founders Edition
AMD Ryzen 9 7950X, NVIDIA GeForce RTX 3090, Corsair MP600
12651 Points +4%
Intel Core i5-13600K
Intel Core i5-13600K, NVIDIA GeForce RTX 3090, Corsair MP600
12306 Points +1%
SCHENKER XMG SECTOR, i9 13900K, RTX 4090
Intel Core i9-13900K, NVIDIA GeForce RTX 4090, Samsung SSD 980 Pro 2TB MZ-V8P2T0
12194 Points
Corsair One i300
Intel Core i9-12900K, NVIDIA GeForce RTX 3080 Ti, Samsung PM9A1 MZVL22T0HBLB
11660 Points -4%
Intel NUC13 Raptor Canyon
Intel Core i9-13900K, NVIDIA GeForce RTX 3080 Ti, Kingston Fury Renegade SFYRS1000G
11598 Points -5%
Minisforum Neptune Series NAD9
Intel Core i9-12900H, Intel Iris Xe Graphics G7 96EUs, Kingston OM8PGP4512Q-A0
11217 Points -8%
Intel Dragon Canyon NUC - RTX 3060
Intel Core i9-12900, NVIDIA GeForce RTX 3060, Transcend M.2 SSD 2200S TS512GMTE220S
11171 Points -8%
Intel Core i9-12900K
Intel Core i9-12900K, NVIDIA Titan RTX, Intel Optane 905P 480GB 2.5
11086 Points -9%
Productivity
AMD Ryzen 9 7900X
AMD Ryzen 9 7900X, NVIDIA GeForce RTX 3090,
11853 Points +5%
NVIDIA GeForce RTX 3090 Founders Edition
AMD Ryzen 9 7950X, NVIDIA GeForce RTX 3090, Corsair MP600
11853 Points +5%
Intel Core i5-13600K
Intel Core i5-13600K, NVIDIA GeForce RTX 3090, Corsair MP600
11630 Points +3%
Intel Core i9-13900K
Intel Core i9-13900K, NVIDIA GeForce RTX 3090, Corsair MP600
11370 Points +1%
SCHENKER XMG SECTOR, i9 13900K, RTX 4090
Intel Core i9-13900K, NVIDIA GeForce RTX 4090, Samsung SSD 980 Pro 2TB MZ-V8P2T0
11268 Points
Intel NUC13 Raptor Canyon
Intel Core i9-13900K, NVIDIA GeForce RTX 3080 Ti, Kingston Fury Renegade SFYRS1000G
10988 Points -2%
Intel Core i9-12900K
Intel Core i9-12900K, NVIDIA Titan RTX, Intel Optane 905P 480GB 2.5
10699 Points -5%
Corsair One i300
Intel Core i9-12900K, NVIDIA GeForce RTX 3080 Ti, Samsung PM9A1 MZVL22T0HBLB
10470 Points -7%
Intel Dragon Canyon NUC - RTX 3060
Intel Core i9-12900, NVIDIA GeForce RTX 3060, Transcend M.2 SSD 2200S TS512GMTE220S
10205 Points -9%
Minisforum Neptune Series NAD9
Intel Core i9-12900H, Intel Iris Xe Graphics G7 96EUs, Kingston OM8PGP4512Q-A0
7673 Points -32%
CrossMark / Overall
Intel Core i9-13900K, Intel Core i9-13900K
NVIDIA GeForce RTX 3090, Corsair MP600
2589 Points +5%
NVIDIA GeForce RTX 3090 Founders Edition, AMD Ryzen 9 7950X
NVIDIA GeForce RTX 3090, Corsair MP600
2512 Points +2%
SCHENKER XMG SECTOR, i9 13900K, RTX 4090, Intel Core i9-13900K
NVIDIA GeForce RTX 4090, Samsung SSD 980 Pro 2TB MZ-V8P2T0
2464 Points
AMD Ryzen 9 7900X, AMD Ryzen 9 7900X
NVIDIA GeForce RTX 3090,
2405 Points -2%
Corsair One i300, Intel Core i9-12900K
NVIDIA GeForce RTX 3080 Ti, Samsung PM9A1 MZVL22T0HBLB
2308 Points -6%
Intel Core i5-13600K, Intel Core i5-13600K
NVIDIA GeForce RTX 3090, Corsair MP600
2271 Points -8%
Intel NUC13 Raptor Canyon, Intel Core i9-13900K
NVIDIA GeForce RTX 3080 Ti, Kingston Fury Renegade SFYRS1000G
2263 Points -8%
Minisforum Neptune Series NAD9, Intel Core i9-12900H
Intel Iris Xe Graphics G7 96EUs, Kingston OM8PGP4512Q-A0
1894 Points -23%
Intel Dragon Canyon NUC - RTX 3060, Intel Core i9-12900
NVIDIA GeForce RTX 3060, Transcend M.2 SSD 2200S TS512GMTE220S
1785 Points -28%
CrossMark / Productivity
Intel Core i9-13900K, Intel Core i9-13900K
NVIDIA GeForce RTX 3090, Corsair MP600
2388 Points +6%
NVIDIA GeForce RTX 3090 Founders Edition, AMD Ryzen 9 7950X
NVIDIA GeForce RTX 3090, Corsair MP600
2336 Points +3%
SCHENKER XMG SECTOR, i9 13900K, RTX 4090, Intel Core i9-13900K
NVIDIA GeForce RTX 4090, Samsung SSD 980 Pro 2TB MZ-V8P2T0
2263 Points
AMD Ryzen 9 7900X, AMD Ryzen 9 7900X
NVIDIA GeForce RTX 3090,
2211 Points -2%
Corsair One i300, Intel Core i9-12900K
NVIDIA GeForce RTX 3080 Ti, Samsung PM9A1 MZVL22T0HBLB
2169 Points -4%
Intel Core i5-13600K, Intel Core i5-13600K
NVIDIA GeForce RTX 3090, Corsair MP600
2115 Points -7%
Intel NUC13 Raptor Canyon, Intel Core i9-13900K
NVIDIA GeForce RTX 3080 Ti, Kingston Fury Renegade SFYRS1000G
2059 Points -9%
Minisforum Neptune Series NAD9, Intel Core i9-12900H
Intel Iris Xe Graphics G7 96EUs, Kingston OM8PGP4512Q-A0
1921 Points -15%
Intel Dragon Canyon NUC - RTX 3060, Intel Core i9-12900
NVIDIA GeForce RTX 3060, Transcend M.2 SSD 2200S TS512GMTE220S
1816 Points -20%
CrossMark / Creativity
NVIDIA GeForce RTX 3090 Founders Edition, AMD Ryzen 9 7950X
NVIDIA GeForce RTX 3090, Corsair MP600
2786 Points +1%
Intel Core i9-13900K, Intel Core i9-13900K
NVIDIA GeForce RTX 3090, Corsair MP600
2784 Points +1%
SCHENKER XMG SECTOR, i9 13900K, RTX 4090, Intel Core i9-13900K
NVIDIA GeForce RTX 4090, Samsung SSD 980 Pro 2TB MZ-V8P2T0
2765 Points
AMD Ryzen 9 7900X, AMD Ryzen 9 7900X
NVIDIA GeForce RTX 3090,
2673 Points -3%
Intel NUC13 Raptor Canyon, Intel Core i9-13900K
NVIDIA GeForce RTX 3080 Ti, Kingston Fury Renegade SFYRS1000G
2625 Points -5%
Corsair One i300, Intel Core i9-12900K
NVIDIA GeForce RTX 3080 Ti, Samsung PM9A1 MZVL22T0HBLB
2495 Points -10%
Intel Core i5-13600K, Intel Core i5-13600K
NVIDIA GeForce RTX 3090, Corsair MP600
2412 Points -13%
Minisforum Neptune Series NAD9, Intel Core i9-12900H
Intel Iris Xe Graphics G7 96EUs, Kingston OM8PGP4512Q-A0
1800 Points -35%
Intel Dragon Canyon NUC - RTX 3060, Intel Core i9-12900
NVIDIA GeForce RTX 3060, Transcend M.2 SSD 2200S TS512GMTE220S
1724 Points -38%
CrossMark / Responsiveness
Intel Core i9-13900K, Intel Core i9-13900K
NVIDIA GeForce RTX 3090, Corsair MP600
2653 Points +18%
Intel Core i5-13600K, Intel Core i5-13600K
NVIDIA GeForce RTX 3090, Corsair MP600
2350 Points +4%
NVIDIA GeForce RTX 3090 Founders Edition, AMD Ryzen 9 7950X
NVIDIA GeForce RTX 3090, Corsair MP600
2288 Points +2%
AMD Ryzen 9 7900X, AMD Ryzen 9 7900X
NVIDIA GeForce RTX 3090,
2251 Points 0%
SCHENKER XMG SECTOR, i9 13900K, RTX 4090, Intel Core i9-13900K
NVIDIA GeForce RTX 4090, Samsung SSD 980 Pro 2TB MZ-V8P2T0
2251 Points
Corsair One i300, Intel Core i9-12900K
NVIDIA GeForce RTX 3080 Ti, Samsung PM9A1 MZVL22T0HBLB
2203 Points -2%
Minisforum Neptune Series NAD9, Intel Core i9-12900H
Intel Iris Xe Graphics G7 96EUs, Kingston OM8PGP4512Q-A0
2116 Points -6%
Intel NUC13 Raptor Canyon, Intel Core i9-13900K
NVIDIA GeForce RTX 3080 Ti, Kingston Fury Renegade SFYRS1000G
1929 Points -14%
Intel Dragon Canyon NUC - RTX 3060, Intel Core i9-12900
NVIDIA GeForce RTX 3060, Transcend M.2 SSD 2200S TS512GMTE220S
1885 Points -16%
AIDA64 / Memory Copy
SCHENKER XMG SECTOR, i9 13900K, RTX 4090
Intel Core i9-13900K, NVIDIA GeForce RTX 4090
80203 MB/s
Intel Core i9-13900K
Intel Core i9-13900K, NVIDIA GeForce RTX 3090
74937 MB/s -7%
Media Intel Core i9-13900K
  (68722 - 80203, n=4)
74763 MB/s -7%
Corsair One i300
Intel Core i9-12900K, NVIDIA GeForce RTX 3080 Ti
73501 MB/s -8%
Intel Core i9-12900K
Intel Core i9-12900K, NVIDIA Titan RTX
73146 MB/s -9%
NVIDIA GeForce RTX 3090 Founders Edition
AMD Ryzen 9 7950X, NVIDIA GeForce RTX 3090
73104 MB/s -9%
Intel Core i5-13600K
Intel Core i5-13600K, NVIDIA GeForce RTX 3090
71725 MB/s -11%
AMD Ryzen 9 7900X
AMD Ryzen 9 7900X, NVIDIA GeForce RTX 3090
69140 MB/s -14%
Intel NUC13 Raptor Canyon
Intel Core i9-13900K, NVIDIA GeForce RTX 3080 Ti
68722 MB/s -14%
Media della classe Desktop
  (43747 - 88386, n=13, ultimi 2 anni)
66686 MB/s -17%
Minisforum Neptune Series NAD9
Intel Core i9-12900H, Iris Xe G7 96EUs
45941 MB/s -43%
Intel Dragon Canyon NUC - RTX 3060
Intel Core i9-12900, NVIDIA GeForce RTX 3060
44474 MB/s -45%
AIDA64 / Memory Read
SCHENKER XMG SECTOR, i9 13900K, RTX 4090
Intel Core i9-13900K, NVIDIA GeForce RTX 4090
88780 MB/s
Intel Core i9-13900K
Intel Core i9-13900K, NVIDIA GeForce RTX 3090
83883 MB/s -6%
Media Intel Core i9-13900K
  (73392 - 88780, n=4)
82310 MB/s -7%
Intel Core i9-12900K
Intel Core i9-12900K, NVIDIA Titan RTX
81059 MB/s -9%
NVIDIA GeForce RTX 3090 Founders Edition
AMD Ryzen 9 7950X, NVIDIA GeForce RTX 3090
78282 MB/s -12%
Intel Core i5-13600K
Intel Core i5-13600K, NVIDIA GeForce RTX 3090
75757 MB/s -15%
AMD Ryzen 9 7900X
AMD Ryzen 9 7900X, NVIDIA GeForce RTX 3090
75338 MB/s -15%
Corsair One i300
Intel Core i9-12900K, NVIDIA GeForce RTX 3080 Ti
74809 MB/s -16%
Intel NUC13 Raptor Canyon
Intel Core i9-13900K, NVIDIA GeForce RTX 3080 Ti
73392 MB/s -17%
Media della classe Desktop
  (47347 - 94830, n=13, ultimi 2 anni)
71825 MB/s -19%
Intel Dragon Canyon NUC - RTX 3060
Intel Core i9-12900, NVIDIA GeForce RTX 3060
49616 MB/s -44%
Minisforum Neptune Series NAD9
Intel Core i9-12900H, Iris Xe G7 96EUs
49559 MB/s -44%
AIDA64 / Memory Write
NVIDIA GeForce RTX 3090 Founders Edition
AMD Ryzen 9 7950X, NVIDIA GeForce RTX 3090
79843 MB/s +1%
SCHENKER XMG SECTOR, i9 13900K, RTX 4090
Intel Core i9-13900K, NVIDIA GeForce RTX 4090
78678 MB/s
AMD Ryzen 9 7900X
AMD Ryzen 9 7900X, NVIDIA GeForce RTX 3090
76967 MB/s -2%
Media della classe Desktop
  (46768 - 84869, n=13, ultimi 2 anni)
75621 MB/s -4%
Intel Core i9-13900K
Intel Core i9-13900K, NVIDIA GeForce RTX 3090
74140 MB/s -6%
Media Intel Core i9-13900K
  (68948 - 78678, n=4)
73938 MB/s -6%
Intel Core i9-12900K
Intel Core i9-12900K, NVIDIA Titan RTX
73707 MB/s -6%
Intel Core i5-13600K
Intel Core i5-13600K, NVIDIA GeForce RTX 3090
73484 MB/s -7%
Corsair One i300
Intel Core i9-12900K, NVIDIA GeForce RTX 3080 Ti
72243 MB/s -8%
Intel NUC13 Raptor Canyon
Intel Core i9-13900K, NVIDIA GeForce RTX 3080 Ti
68948 MB/s -12%
Minisforum Neptune Series NAD9
Intel Core i9-12900H, Iris Xe G7 96EUs
46815 MB/s -40%
Intel Dragon Canyon NUC - RTX 3060
Intel Core i9-12900, NVIDIA GeForce RTX 3060
45577 MB/s -42%
AIDA64 / Memory Latency
Minisforum Neptune Series NAD9
Intel Core i9-12900H, Iris Xe G7 96EUs
100 ns * -38%
Intel NUC13 Raptor Canyon
Intel Core i9-13900K, NVIDIA GeForce RTX 3080 Ti
93.4 ns * -29%
Intel Dragon Canyon NUC - RTX 3060
Intel Core i9-12900, NVIDIA GeForce RTX 3060
87.4 ns * -20%
Corsair One i300
Intel Core i9-12900K, NVIDIA GeForce RTX 3080 Ti
82.9 ns * -14%
Intel Core i5-13600K
Intel Core i5-13600K, NVIDIA GeForce RTX 3090
81.1 ns * -12%
Media Intel Core i9-13900K
  (72.6 - 93.4, n=4)
79.9 ns * -10%
Intel Core i9-13900K
Intel Core i9-13900K, NVIDIA GeForce RTX 3090
76.5 ns * -5%
Media della classe Desktop
  (64.3 - 93.4, n=13, ultimi 2 anni)
75.6 ns * -4%
SCHENKER XMG SECTOR, i9 13900K, RTX 4090
Intel Core i9-13900K, NVIDIA GeForce RTX 4090
72.6 ns *
AMD Ryzen 9 7900X
AMD Ryzen 9 7900X, NVIDIA GeForce RTX 3090
63.3 ns * +13%
NVIDIA GeForce RTX 3090 Founders Edition
AMD Ryzen 9 7950X, NVIDIA GeForce RTX 3090
61.7 ns * +15%

* ... Meglio usare valori piccoli

Memoria di massa

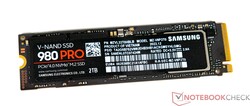
Samsung 980 Pro con capacità di 2 TB

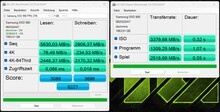
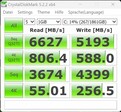
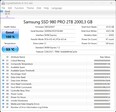
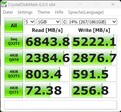
La nostra unità di recensione è dotata di un'unità SSD NVMe Samsung superveloce. La Samsung 980 Pro è una delle più veloci unità SSD di fascia consumer. Lo si vede anche nei benchmark: l'unità ha quasi sempre superato le soluzioni di archiviazione dei dispositivi concorrenti. Solo il Kingston Fury Renegade nel Intel NUC13 Raptor Canyon è riuscito a superare le prestazioni del Samsung 980 Pro nel benchmark AS-SSD. Detto questo, questo è sufficiente per far sì che l'unità SSD Samsung si classifichi al primo posto nella valutazione complessiva. Anche durante lo stress test, l'unità è riuscita a mantenere un'elevata velocità di lettura per un periodo prolungato, indicando che il raffreddamento dell'SSD è molto efficace.

È possibile installare fino a tre ulteriori unità SSD M.2 sull'Asus ROG Strix Z690-F Gaming. È inoltre possibile collegare altre unità di archiviazione tramite SATA.

Consultare la nostra tabella di confronto dei dispositivi di archiviazione https://www.notebookcheck.net/Laptop-harddisks-HDD-SSD-benchmarks.22089.0.html per ulteriori informazioni e benchmark.

AS SSD
AS SSD
CDM 3
CDM 3
CDM 5
CDM 5
CDM 6
CDM 6
CDI
CDI
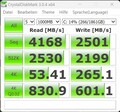
Samsung SSD 980 Pro 2TB MZ-V8P2T0
Sequential Read: 4168 MB/s
Sequential Write: 2501 MB/s
512K Read: 2530 MB/s
512K Write: 2199 MB/s
4K Read: 53.41 MB/s
4K Write: 265.1 MB/s
4K QD32 Read: 830.9 MB/s
4K QD32 Write: 601.1 MB/s
Drive Performance Rating - Percent
SCHENKER XMG SECTOR, i9 13900K, RTX 4090
Samsung SSD 980 Pro 2TB MZ-V8P2T0
76.7 pt
Corsair One i300
Samsung PM9A1 MZVL22T0HBLB
71.4 pt
NVIDIA GeForce RTX 3090 Founders Edition
Corsair MP600
68.6 pt
Media della classe Desktop
 
67.1 pt
Intel NUC13 Raptor Canyon
Kingston Fury Renegade SFYRS1000G
66.1 pt
Intel Core i5-13600K
Corsair MP600
64.6 pt
Minisforum Neptune Series NAD9
Kingston OM8PGP4512Q-A0
63.3 pt
Intel Core i9-13900K
Corsair MP600
62.8 pt
Intel Core i9-12900K -11!
Intel Optane 905P 480GB 2.5
48.8 pt
Intel Dragon Canyon NUC - RTX 3060 -11!
Transcend M.2 SSD 2200S TS512GMTE220S
41.7 pt
DiskSpd
seq read
SCHENKER XMG SECTOR, i9 13900K, RTX 4090
Samsung SSD 980 Pro 2TB MZ-V8P2T0
4240 (4214.4min - 4240.14max) MB/s
Intel NUC13 Raptor Canyon
Kingston Fury Renegade SFYRS1000G
3912 (3515.15min - 3912.09max) MB/s -8%
Corsair One i300
Samsung PM9A1 MZVL22T0HBLB
3903 (3884.75min - 3902.54max) MB/s -8%
Media della classe Desktop
  (938 - 4547, n=8, ultimi 2 anni)
3292 MB/s -22%
NVIDIA GeForce RTX 3090 Founders Edition
Corsair MP600
2844 (2808.51min - 2843.5max) MB/s -33%
Minisforum Neptune Series NAD9
Kingston OM8PGP4512Q-A0
2815 (2802.79min - 2814.97max) MB/s -34%
Intel Core i9-13900K
Corsair MP600
2559 (2552.58min - 2558.53max) MB/s -40%
Intel Core i5-13600K
Corsair MP600
2540 (2489.74min - 2539.65max) MB/s -40%
Intel Core i9-12900K
Intel Optane 905P 480GB 2.5
2399 (2391.55min - 2399.35max) MB/s -43%
Intel Dragon Canyon NUC - RTX 3060
Transcend M.2 SSD 2200S TS512GMTE220S
1936 (1755.26min - 1936.41max) MB/s -54%
seq write
SCHENKER XMG SECTOR, i9 13900K, RTX 4090
Samsung SSD 980 Pro 2TB MZ-V8P2T0
4415 (4407.16min - 4415.11max) MB/s
Intel NUC13 Raptor Canyon
Kingston Fury Renegade SFYRS1000G
4256 (3822.69min - 4255.75max) MB/s -4%
NVIDIA GeForce RTX 3090 Founders Edition
Corsair MP600
4249 (4220.68min - 4248.83max) MB/s -4%
Media della classe Desktop
  (1128 - 6288, n=8, ultimi 2 anni)
4026 MB/s -9%
Corsair One i300
Samsung PM9A1 MZVL22T0HBLB
3926 (3865.92min - 3925.78max) MB/s -11%
Minisforum Neptune Series NAD9
Kingston OM8PGP4512Q-A0
3402 (3372.67min - 3402.21max) MB/s -23%
Intel Core i9-13900K
Corsair MP600
2312 (2306.66min - 2312.32max) MB/s -48%
Intel Core i5-13600K
Corsair MP600
2298 (2289.29min - 2297.64max) MB/s -48%
Intel Core i9-12900K
Intel Optane 905P 480GB 2.5
2031 (2015.57min - 2031.3max) MB/s -54%
Intel Dragon Canyon NUC - RTX 3060
Transcend M.2 SSD 2200S TS512GMTE220S
1744 (525.75min - 1743.78max) MB/s -60%
seq q8 t1 read
Intel NUC13 Raptor Canyon
Kingston Fury Renegade SFYRS1000G
7116 (6584.47min - 7116.06max) MB/s +3%
SCHENKER XMG SECTOR, i9 13900K, RTX 4090
Samsung SSD 980 Pro 2TB MZ-V8P2T0
6887 (5840.78min - 6886.7max) MB/s
Corsair One i300
Samsung PM9A1 MZVL22T0HBLB
6756 (5986.3min - 6756.18max) MB/s -2%
Media della classe Desktop
  (3170 - 7378, n=8, ultimi 2 anni)
6153 MB/s -11%
Intel Dragon Canyon NUC - RTX 3060
Transcend M.2 SSD 2200S TS512GMTE220S
4996 (4330.97min - 4996.25max) MB/s -27%
NVIDIA GeForce RTX 3090 Founders Edition
Corsair MP600
4957 (2740.32min - 4956.62max) MB/s -28%
Minisforum Neptune Series NAD9
Kingston OM8PGP4512Q-A0
4801 (4506.78min - 4800.59max) MB/s -30%
Intel Core i5-13600K
Corsair MP600
2763 (2551.6min - 2763max) MB/s -60%
Intel Core i9-13900K
Corsair MP600
2754 (2536.92min - 2754.19max) MB/s -60%
Intel Core i9-12900K
Intel Optane 905P 480GB 2.5
2609 (2459.44min - 2609.28max) MB/s -62%
seq q8 t1 write
Intel NUC13 Raptor Canyon
Kingston Fury Renegade SFYRS1000G
6135 (6096.84min - 6134.8max) MB/s +22%
Media della classe Desktop
  (1482 - 6920, n=8, ultimi 2 anni)
5293 MB/s +6%
SCHENKER XMG SECTOR, i9 13900K, RTX 4090
Samsung SSD 980 Pro 2TB MZ-V8P2T0
5013 (5000.1min - 5013.07max) MB/s
Corsair One i300
Samsung PM9A1 MZVL22T0HBLB
4979 (4960.54min - 4978.96max) MB/s -1%
NVIDIA GeForce RTX 3090 Founders Edition
Corsair MP600
4245 (4146.91min - 4245.26max) MB/s -15%
Minisforum Neptune Series NAD9
Kingston OM8PGP4512Q-A0
3402 (3374.28min - 3401.67max) MB/s -32%
Intel Dragon Canyon NUC - RTX 3060
Transcend M.2 SSD 2200S TS512GMTE220S
2524 (535.17min - 2524.36max) MB/s -50%
Intel Core i5-13600K
Corsair MP600
2460 (2453.46min - 2459.54max) MB/s -51%
Intel Core i9-13900K
Corsair MP600
2456 (2454.84min - 2455.97max) MB/s -51%
Intel Core i9-12900K
Intel Optane 905P 480GB 2.5
2196 (2180.83min - 2195.51max) MB/s -56%
4k q1 t1 read
Intel Core i9-13900K
Corsair MP600
345 (343.41min - 344.76max) MB/s +275%
Intel Core i5-13600K
Corsair MP600
325 (323.73min - 325.16max) MB/s +254%
Intel Core i9-12900K
Intel Optane 905P 480GB 2.5
285 (284min - 285.36max) MB/s +210%
SCHENKER XMG SECTOR, i9 13900K, RTX 4090
Samsung SSD 980 Pro 2TB MZ-V8P2T0
91.9 (91.15min - 91.85max) MB/s
Corsair One i300
Samsung PM9A1 MZVL22T0HBLB
87.2 (87.01min - 87.2max) MB/s -5%
Intel NUC13 Raptor Canyon
Kingston Fury Renegade SFYRS1000G
86.5 (82.21min - 86.46max) MB/s -6%
Minisforum Neptune Series NAD9
Kingston OM8PGP4512Q-A0
82.1 (81.4min - 82.09max) MB/s -11%
Media della classe Desktop
  (38.7 - 91.9, n=8, ultimi 2 anni)
70.5 MB/s -23%
NVIDIA GeForce RTX 3090 Founders Edition
Corsair MP600
62.3 (58.37min - 62.31max) MB/s -32%
Intel Dragon Canyon NUC - RTX 3060
Transcend M.2 SSD 2200S TS512GMTE220S
45.7 (45.38min - 45.71max) MB/s -50%
4k q1 t1 write
Minisforum Neptune Series NAD9
Kingston OM8PGP4512Q-A0
425 (415.92min - 425.01max) MB/s +57%
NVIDIA GeForce RTX 3090 Founders Edition
Corsair MP600
351 (297.15min - 350.84max) MB/s +30%
Intel Dragon Canyon NUC - RTX 3060
Transcend M.2 SSD 2200S TS512GMTE220S
320 (298.75min - 319.53max) MB/s +18%
Intel Core i9-13900K
Corsair MP600
310 (308.09min - 309.59max) MB/s +14%
Corsair One i300
Samsung PM9A1 MZVL22T0HBLB
295 (288.34min - 294.77max) MB/s +9%
Intel Core i5-13600K
Corsair MP600
294 (291.43min - 294.03max) MB/s +8%
SCHENKER XMG SECTOR, i9 13900K, RTX 4090
Samsung SSD 980 Pro 2TB MZ-V8P2T0
271 (264.25min - 270.78max) MB/s
Media della classe Desktop
  (160.7 - 364, n=8, ultimi 2 anni)
258 MB/s -5%
Intel Core i9-12900K
Intel Optane 905P 480GB 2.5
246 (244.38min - 245.84max) MB/s -9%
Intel NUC13 Raptor Canyon
Kingston Fury Renegade SFYRS1000G
192 (183.56min - 191.99max) MB/s -29%
4k q32 t16 read
SCHENKER XMG SECTOR, i9 13900K, RTX 4090
Samsung SSD 980 Pro 2TB MZ-V8P2T0
4319 (4295.11min - 4319max) MB/s
Corsair One i300
Samsung PM9A1 MZVL22T0HBLB
4073 (4068.14min - 4073.28max) MB/s -6%
NVIDIA GeForce RTX 3090 Founders Edition
Corsair MP600
3104 (3072.88min - 3104.25max) MB/s -28%
Media della classe Desktop
  (569 - 4319, n=8, ultimi 2 anni)
2563 MB/s -41%
Intel Core i5-13600K
Corsair MP600
2431 (2427.76min - 2431.49max) MB/s -44%
Intel Core i9-13900K
Corsair MP600
2430 (2426.93min - 2430.36max) MB/s -44%
Intel Core i9-12900K
Intel Optane 905P 480GB 2.5
2297 (2286.24min - 2297max) MB/s -47%
Minisforum Neptune Series NAD9
Kingston OM8PGP4512Q-A0
1944 (1936.89min - 1943.53max) MB/s -55%
Intel NUC13 Raptor Canyon
Kingston Fury Renegade SFYRS1000G
1176 (1157.2min - 1176.4max) MB/s -73%
Intel Dragon Canyon NUC - RTX 3060
Transcend M.2 SSD 2200S TS512GMTE220S
970 (966.45min - 970.29max) MB/s -78%
4k q32 t16 write
SCHENKER XMG SECTOR, i9 13900K, RTX 4090
Samsung SSD 980 Pro 2TB MZ-V8P2T0
4245 (4217.75min - 4244.71max) MB/s
NVIDIA GeForce RTX 3090 Founders Edition
Corsair MP600
3746 (3719.98min - 3746.14max) MB/s -12%
Corsair One i300
Samsung PM9A1 MZVL22T0HBLB
3528 (3508.87min - 3527.71max) MB/s -17%
Intel Core i5-13600K
Corsair MP600
2471 (2463.07min - 2471.47max) MB/s -42%
Intel Core i9-13900K
Corsair MP600
2464 (2459.08min - 2464.27max) MB/s -42%
Media della classe Desktop
  (446 - 5015, n=8, ultimi 2 anni)
2430 MB/s -43%
Minisforum Neptune Series NAD9
Kingston OM8PGP4512Q-A0
2396 (2376.28min - 2396.46max) MB/s -44%
Intel Dragon Canyon NUC - RTX 3060
Transcend M.2 SSD 2200S TS512GMTE220S
1119 (483.18min - 1119.3max) MB/s -74%
Intel Core i9-12900K
Intel Optane 905P 480GB 2.5
919 (908.14min - 919.3max) MB/s -78%
Intel NUC13 Raptor Canyon
Kingston Fury Renegade SFYRS1000G
538 (527.91min - 538.21max) MB/s -87%
AS SSD
Score Total
Intel NUC13 Raptor Canyon
Kingston Fury Renegade SFYRS1000G
8263 Points 0%
SCHENKER XMG SECTOR, i9 13900K, RTX 4090
Samsung SSD 980 Pro 2TB MZ-V8P2T0
8227 Points
Media della classe Desktop
  (3592 - 11756, n=5, ultimi 2 anni)
8037 Points -2%
NVIDIA GeForce RTX 3090 Founders Edition
Corsair MP600
8017 Points -3%
Minisforum Neptune Series NAD9
Kingston OM8PGP4512Q-A0
7134 Points -13%
Intel Core i5-13600K
Corsair MP600
6769 Points -18%
Corsair One i300
Samsung PM9A1 MZVL22T0HBLB
6693 Points -19%
Intel Core i9-13900K
Corsair MP600
509.99 Points -94%
Score Read
SCHENKER XMG SECTOR, i9 13900K, RTX 4090
Samsung SSD 980 Pro 2TB MZ-V8P2T0
3086 Points
Intel Core i9-13900K
Corsair MP600
2877 Points -7%
Corsair One i300
Samsung PM9A1 MZVL22T0HBLB
2777 Points -10%
Intel Core i5-13600K
Corsair MP600
2748 Points -11%
Media della classe Desktop
  (1233 - 3960, n=5, ultimi 2 anni)
2665 Points -14%
NVIDIA GeForce RTX 3090 Founders Edition
Corsair MP600
2590 Points -16%
Minisforum Neptune Series NAD9
Kingston OM8PGP4512Q-A0
2391 Points -23%
Intel NUC13 Raptor Canyon
Kingston Fury Renegade SFYRS1000G
1792 Points -42%
Score Write
Intel NUC13 Raptor Canyon
Kingston Fury Renegade SFYRS1000G
5665 Points +53%
NVIDIA GeForce RTX 3090 Founders Edition
Corsair MP600
4109 Points +11%
Media della classe Desktop
  (1784 - 5774, n=5, ultimi 2 anni)
4079 Points +10%
SCHENKER XMG SECTOR, i9 13900K, RTX 4090
Samsung SSD 980 Pro 2TB MZ-V8P2T0
3696 Points
Minisforum Neptune Series NAD9
Kingston OM8PGP4512Q-A0
3538 Points -4%
Intel Core i9-13900K
Corsair MP600
2700 Points -27%
Corsair One i300
Samsung PM9A1 MZVL22T0HBLB
2556 Points -31%
Intel Core i5-13600K
Corsair MP600
2515 Points -32%
Seq Read
Intel NUC13 Raptor Canyon
Kingston Fury Renegade SFYRS1000G
5664 MB/s +1%
SCHENKER XMG SECTOR, i9 13900K, RTX 4090
Samsung SSD 980 Pro 2TB MZ-V8P2T0
5630 MB/s
Corsair One i300
Samsung PM9A1 MZVL22T0HBLB
5397 MB/s -4%
Media della classe Desktop
  (2903 - 6331, n=5, ultimi 2 anni)
5356 MB/s -5%
NVIDIA GeForce RTX 3090 Founders Edition
Corsair MP600
4220.6 MB/s -25%
Minisforum Neptune Series NAD9
Kingston OM8PGP4512Q-A0
4147 MB/s -26%
Intel Core i9-13900K
Corsair MP600
2533 MB/s -55%
Intel Core i5-13600K
Corsair MP600
2402 MB/s -57%
Seq Write
Corsair One i300
Samsung PM9A1 MZVL22T0HBLB
4006 MB/s +38%
NVIDIA GeForce RTX 3090 Founders Edition
Corsair MP600
4005.1 MB/s +38%
Media della classe Desktop
  (1487 - 6117, n=5, ultimi 2 anni)
3784 MB/s +30%
Minisforum Neptune Series NAD9
Kingston OM8PGP4512Q-A0
3292 MB/s +13%
Intel NUC13 Raptor Canyon
Kingston Fury Renegade SFYRS1000G
3081 MB/s +6%
SCHENKER XMG SECTOR, i9 13900K, RTX 4090
Samsung SSD 980 Pro 2TB MZ-V8P2T0
2908 MB/s
Intel Core i9-13900K
Corsair MP600
2169 MB/s -25%
Intel Core i5-13600K
Corsair MP600
2070 MB/s -29%
4K Read
Intel Core i9-13900K
Corsair MP600
314.36 MB/s +311%
Intel Core i5-13600K
Corsair MP600
295.51 MB/s +286%
Minisforum Neptune Series NAD9
Kingston OM8PGP4512Q-A0
103.66 MB/s +36%
Corsair One i300
Samsung PM9A1 MZVL22T0HBLB
83 MB/s +8%
Media della classe Desktop
  (59.7 - 98.1, n=5, ultimi 2 anni)
79.1 MB/s +3%
Intel NUC13 Raptor Canyon
Kingston Fury Renegade SFYRS1000G
77.71 MB/s +2%
SCHENKER XMG SECTOR, i9 13900K, RTX 4090
Samsung SSD 980 Pro 2TB MZ-V8P2T0
76.5 MB/s
NVIDIA GeForce RTX 3090 Founders Edition
Corsair MP600
68.86 MB/s -10%
4K Write
Minisforum Neptune Series NAD9
Kingston OM8PGP4512Q-A0
365.87 MB/s +56%
Intel Core i9-13900K
Corsair MP600
277.34 MB/s +18%
Intel NUC13 Raptor Canyon
Kingston Fury Renegade SFYRS1000G
272.11 MB/s +16%
Intel Core i5-13600K
Corsair MP600
262.68 MB/s +12%
Media della classe Desktop
  (216 - 272, n=5, ultimi 2 anni)
242 MB/s +3%
Corsair One i300
Samsung PM9A1 MZVL22T0HBLB
236.7 MB/s +1%
SCHENKER XMG SECTOR, i9 13900K, RTX 4090
Samsung SSD 980 Pro 2TB MZ-V8P2T0
235 MB/s
NVIDIA GeForce RTX 3090 Founders Edition
Corsair MP600
233.83 MB/s 0%
4K-64 Read
SCHENKER XMG SECTOR, i9 13900K, RTX 4090
Samsung SSD 980 Pro 2TB MZ-V8P2T0
2446 MB/s
Intel Core i9-13900K
Corsair MP600
2308.94 MB/s -6%
Intel Core i5-13600K
Corsair MP600
2212.67 MB/s -10%
Corsair One i300
Samsung PM9A1 MZVL22T0HBLB
2154 MB/s -12%
NVIDIA GeForce RTX 3090 Founders Edition
Corsair MP600
2098.67 MB/s -14%
Media della classe Desktop
  (883 - 3236, n=5, ultimi 2 anni)
2050 MB/s -16%
Minisforum Neptune Series NAD9
Kingston OM8PGP4512Q-A0
1872.82 MB/s -23%
Intel NUC13 Raptor Canyon
Kingston Fury Renegade SFYRS1000G
1148.16 MB/s -53%
4K-64 Write
Intel NUC13 Raptor Canyon
Kingston Fury Renegade SFYRS1000G
5085.1 MB/s +60%
NVIDIA GeForce RTX 3090 Founders Edition
Corsair MP600
3474.92 MB/s +10%
Media della classe Desktop
  (1418 - 5085, n=5, ultimi 2 anni)
3458 MB/s +9%
SCHENKER XMG SECTOR, i9 13900K, RTX 4090
Samsung SSD 980 Pro 2TB MZ-V8P2T0
3170 MB/s
Minisforum Neptune Series NAD9
Kingston OM8PGP4512Q-A0
2842.9 MB/s -10%
Intel Core i9-13900K
Corsair MP600
2205.84 MB/s -30%
Intel Core i5-13600K
Corsair MP600
2045.48 MB/s -35%
Corsair One i300
Samsung PM9A1 MZVL22T0HBLB
1918 MB/s -39%
Access Time Read
NVIDIA GeForce RTX 3090 Founders Edition
Corsair MP600
0.108 ms * -64%
Intel NUC13 Raptor Canyon
Kingston Fury Renegade SFYRS1000G
0.104 ms * -58%
Minisforum Neptune Series NAD9
Kingston OM8PGP4512Q-A0