Notebookcheck Logo

Recensione della GPU desktop KFA2 GeForce RTX 4080 SG: Grandi prestazioni e prezzi discutibili

FPS e illuminazione RGB a volontà! Oltre alla GeForce RTX 4090, Nvidia ha rilasciato la GeForce RTX 4080, un modello leggermente meno costoso basato sull'ultima architettura Ada Lovelace dell'azienda. Ciononostante, i produttori chiedono più di 1.000 euro (1.070 dollari) per la seconda scheda grafica più veloce del team verde. Ora abbiamo dato un'occhiata più da vicino a un modello RTX 4080 prodotto da KFA2. In questa recensione scoprirete la posizione di questa scheda in termini di prestazioni.
KFA2 GeForce RTX 4080 Gioco serio
Connettori esterni sul KFA2 GeForce RTX 4080 SG

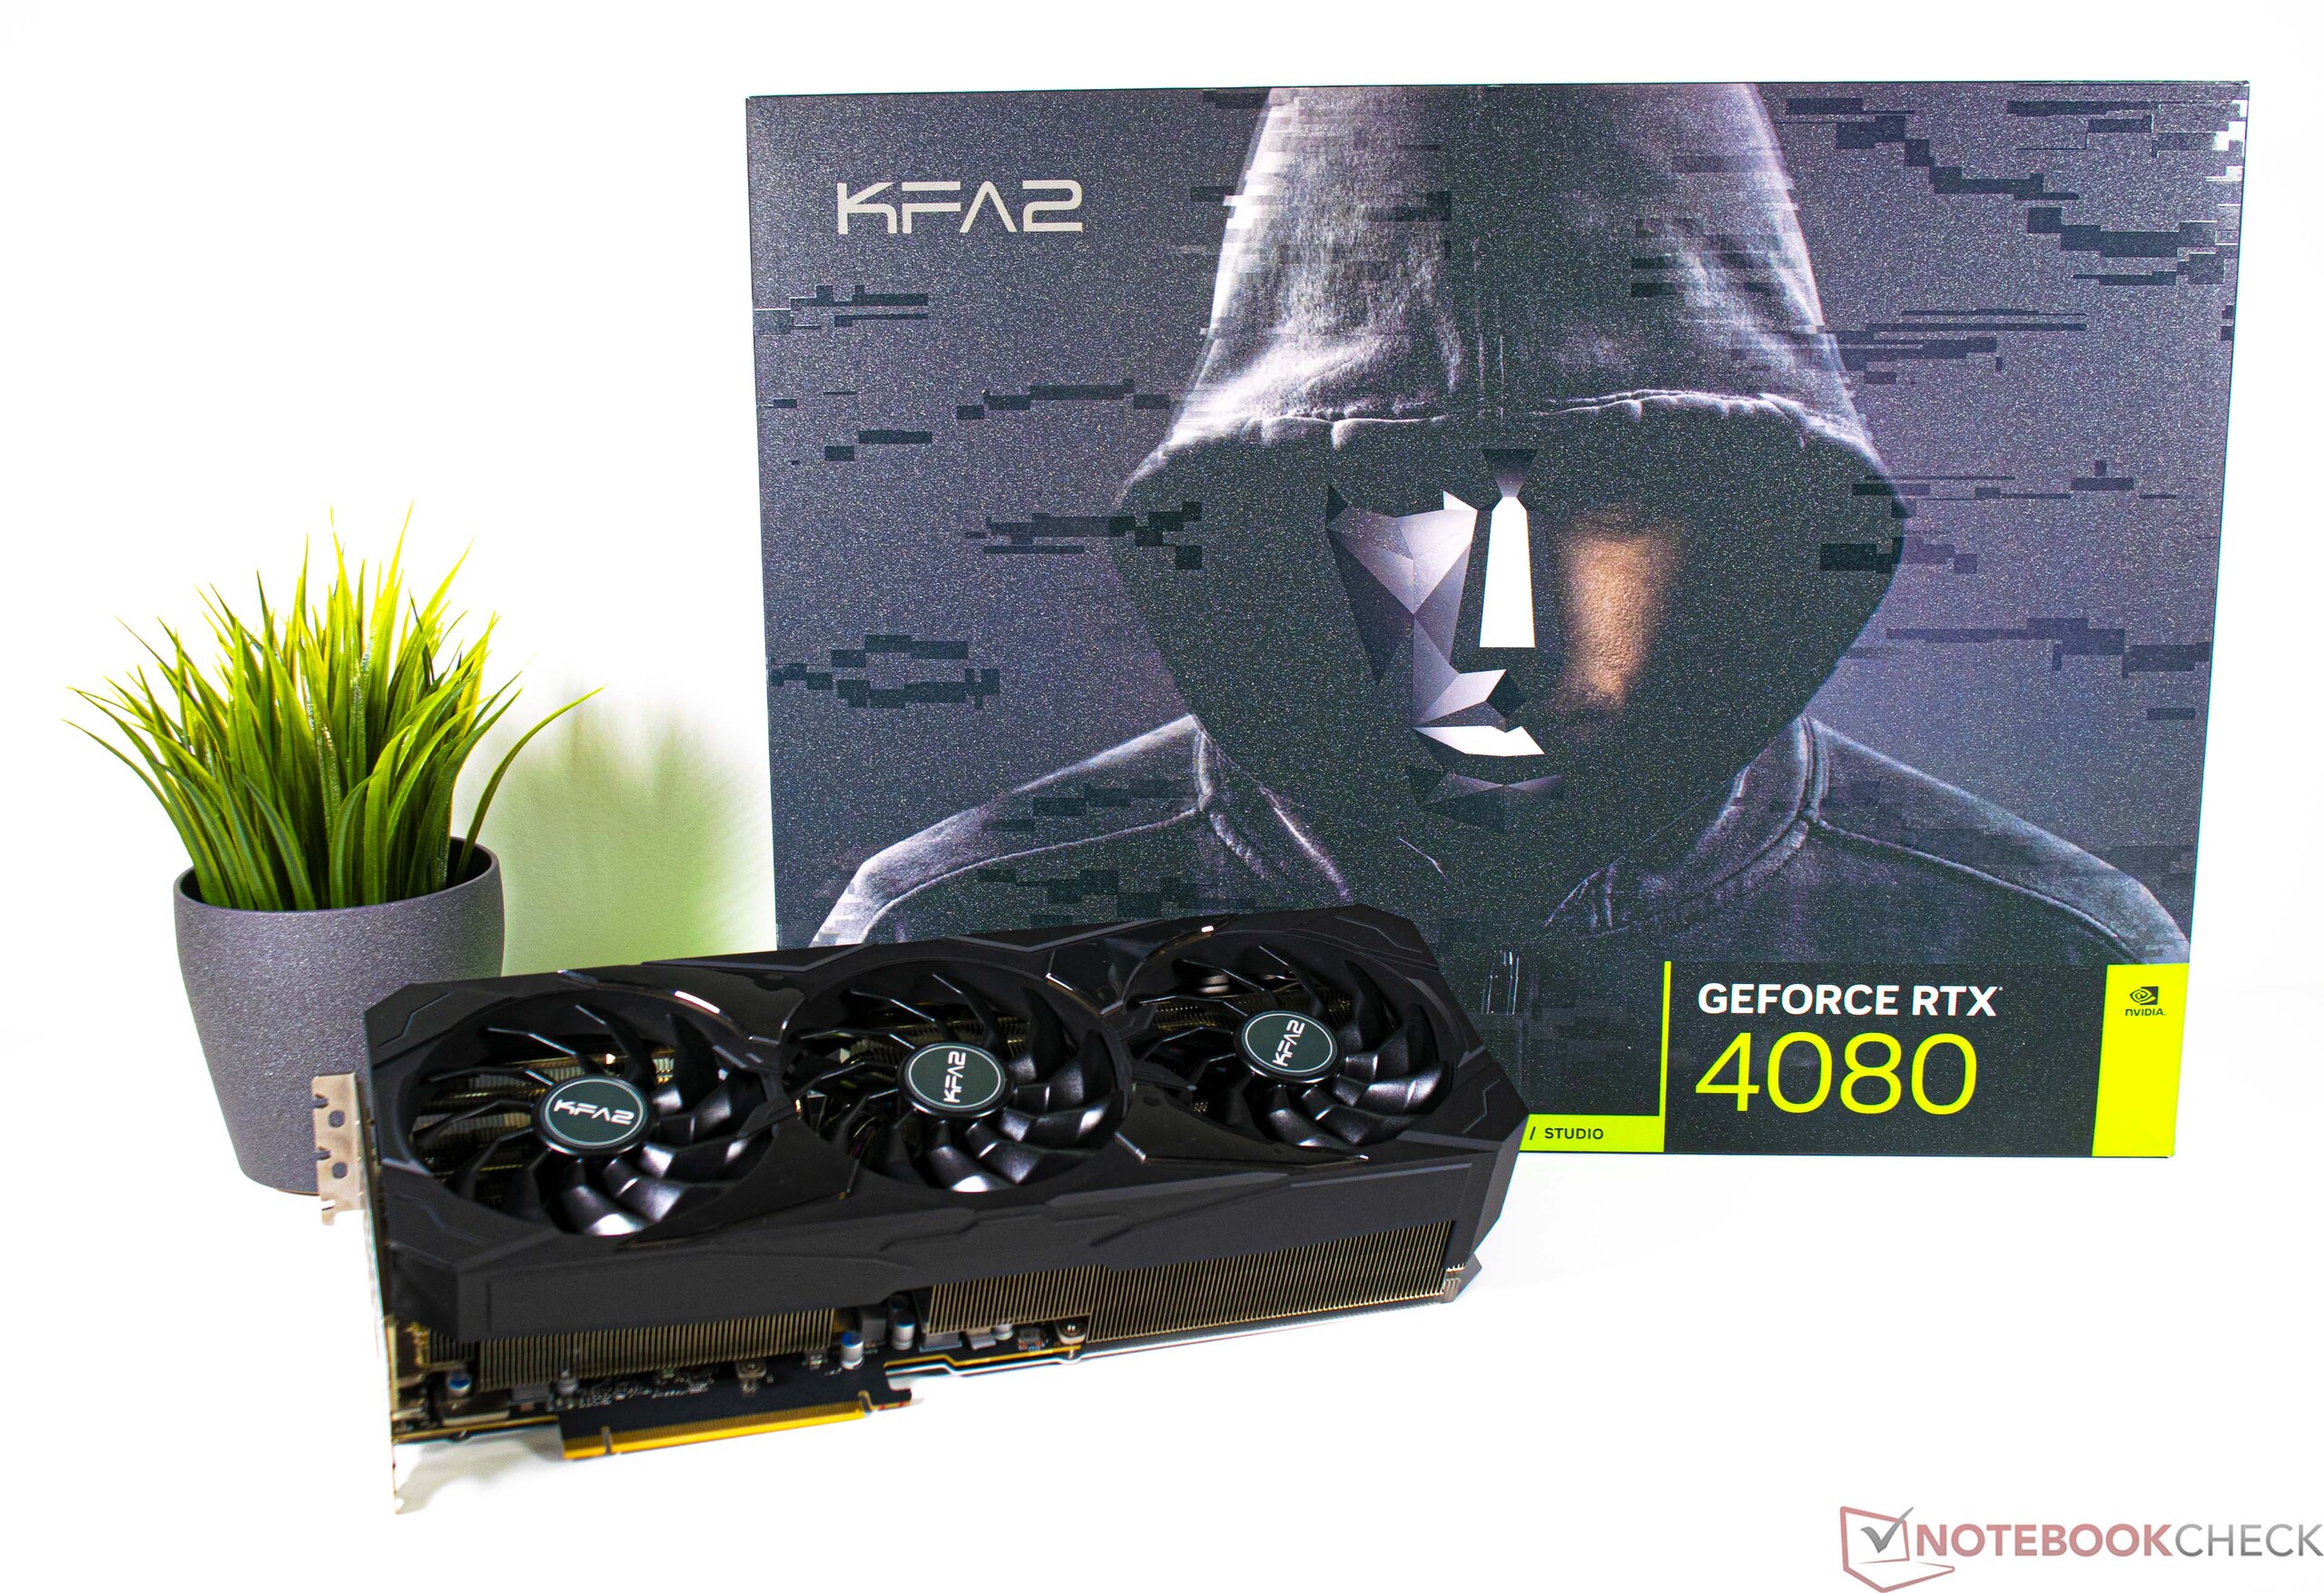
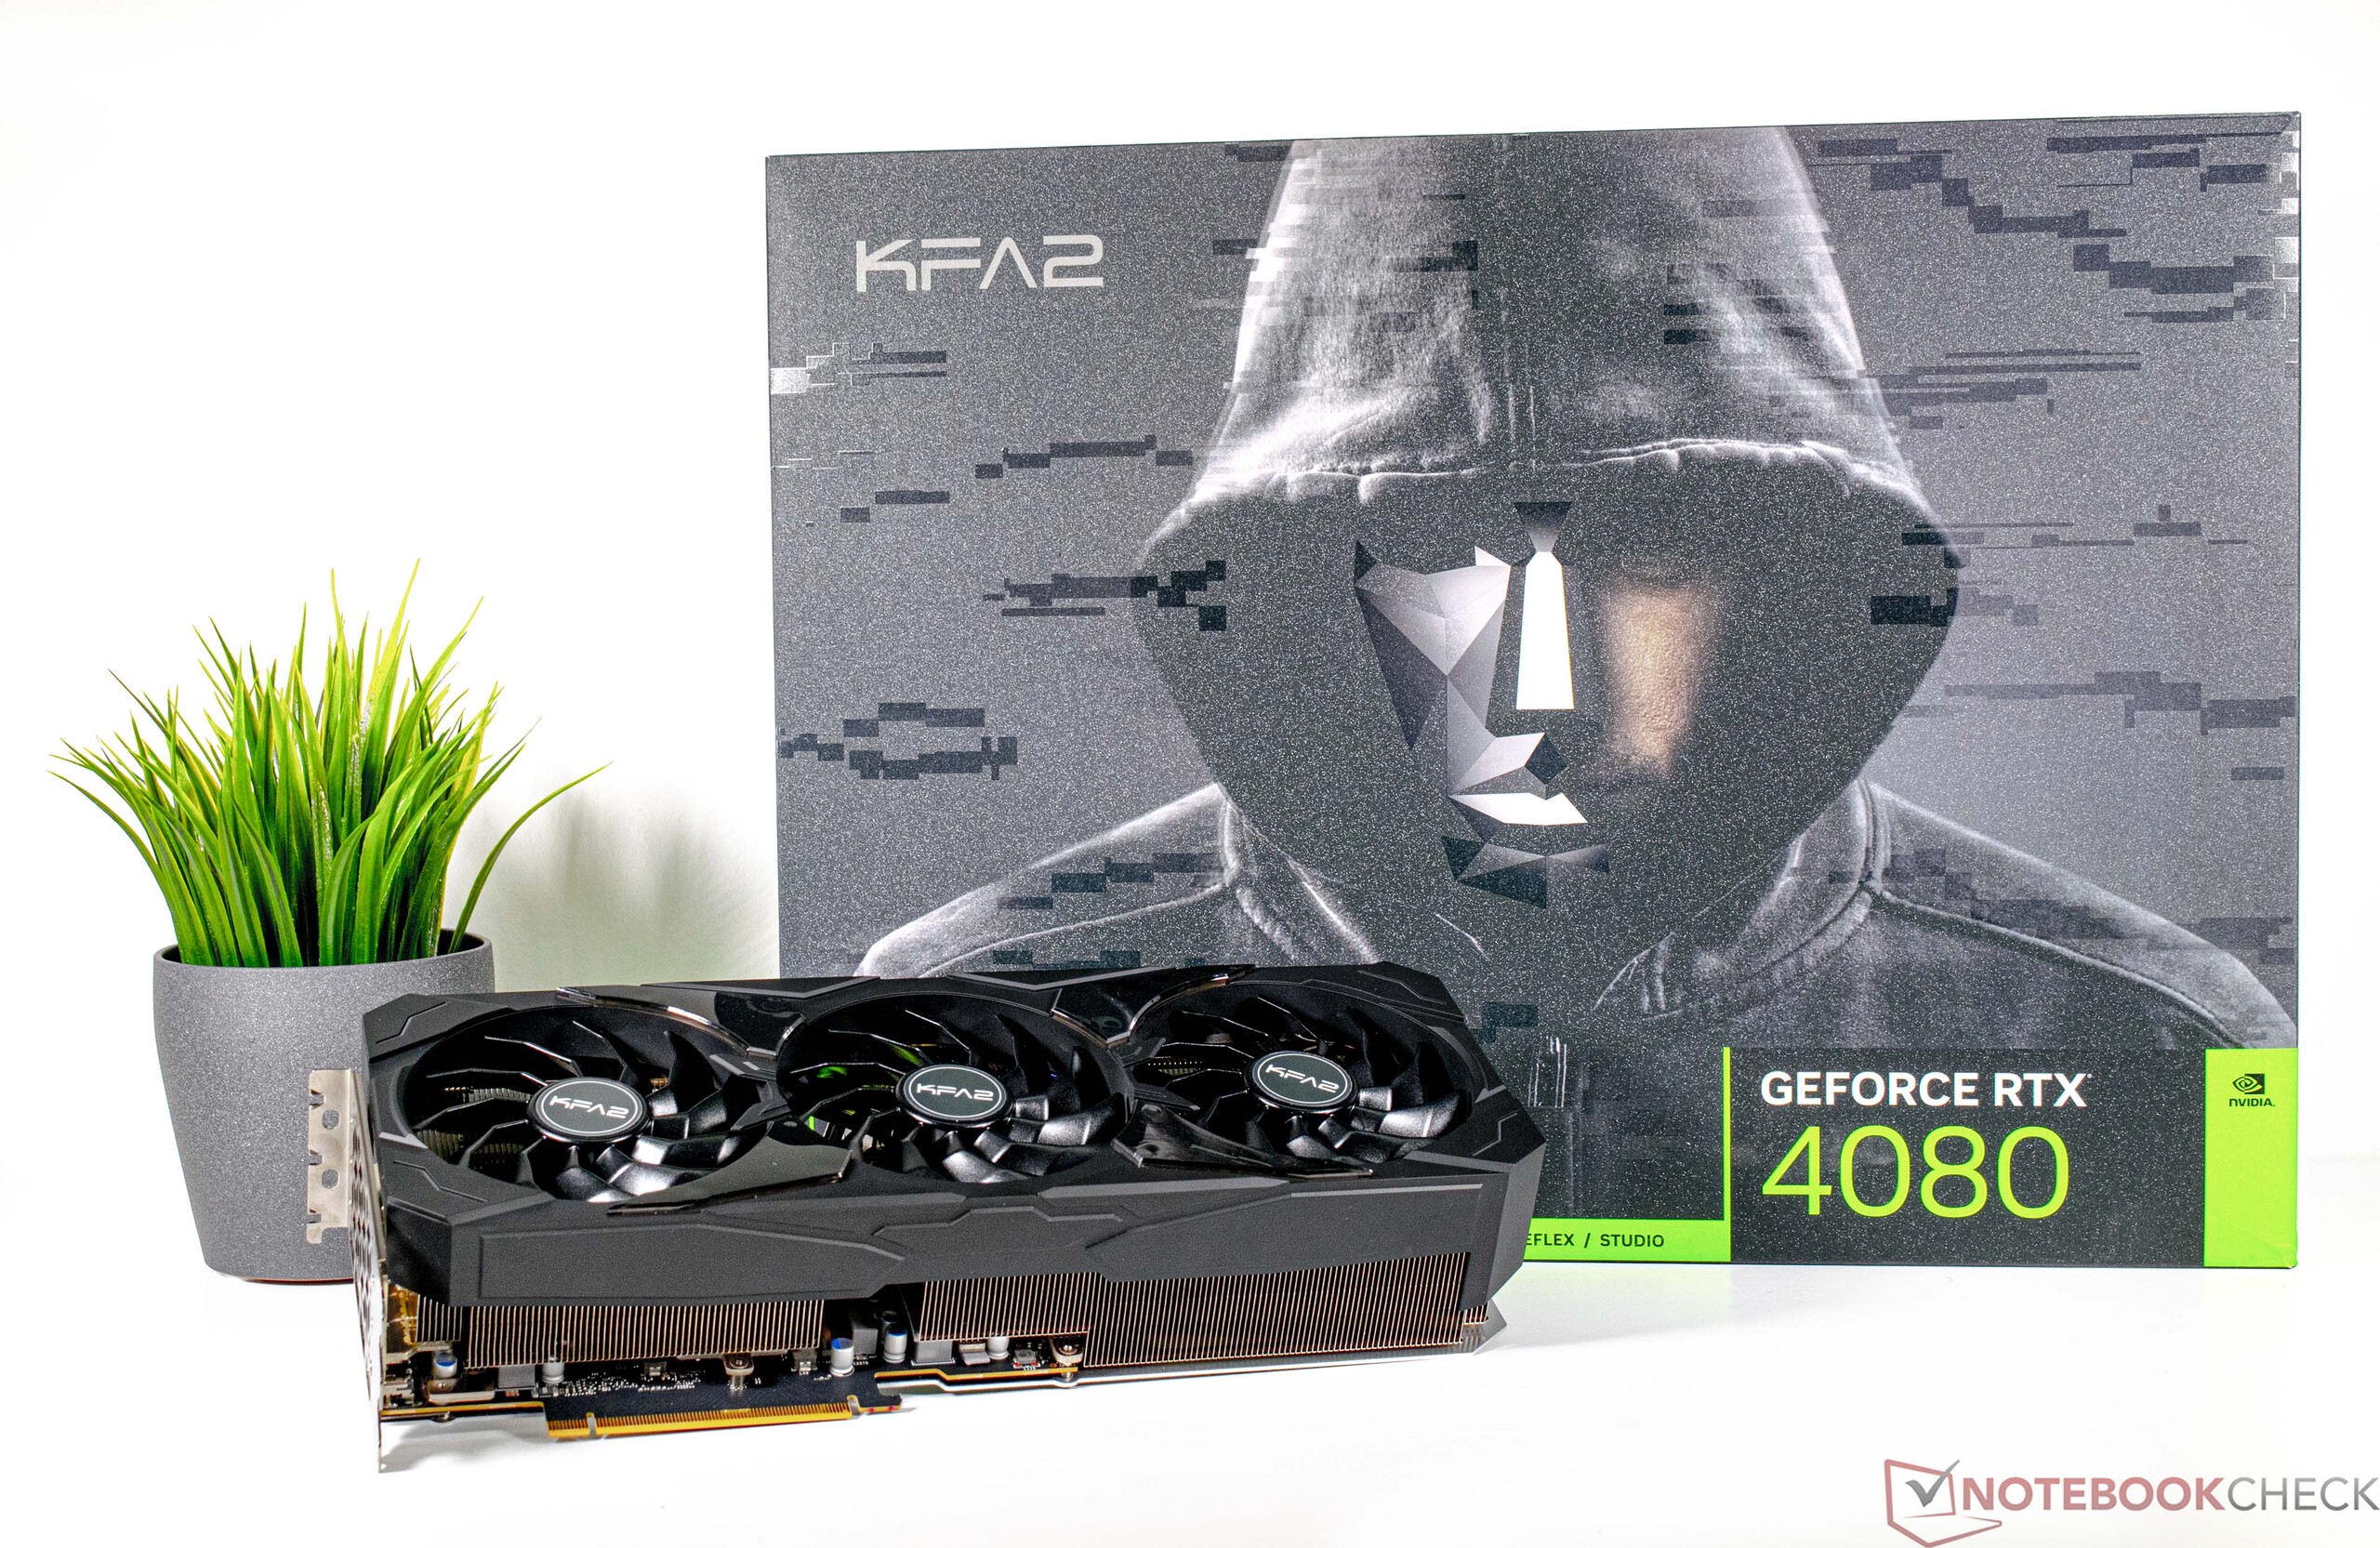
Dopo la recente recensione della KFA2 GeForce RTX 4090 SGè ora la volta del più piccolo KFA2 GeForce RTX 4080 SG per mostrare cosa ha sotto il cofano. A proposito di cofano, a differenza della linea Ampere, il secondo modello più veloce dell'attuale generazione si basa su un chip grafico diverso da quello del modello di fascia alta. Utilizza la GPU AD103, che è sostanzialmente più piccola e quindi più economica da produrre rispetto alla AD102. Tuttavia, il minor costo di produzione non si riflette completamente nel prezzo attuale. Si tratta di un problema ampiamente discusso e anche noi riteniamo che i prezzi debbano essere ridotti in modo significativo per evitare che le schede grafiche più recenti finiscano per scaldare gli scaffali. L'RRP della GeForce RTX 4080 è più che raddoppiato rispetto al suo predecessore (GeForce RTX 3080). Per il momento lasciamo qui la nostra critica ai prezzi. Da questo momento in poi, vogliamo invece concentrarci sulle prestazioni e sulle caratteristiche della KFA2 GeForce RTX 4080 SG e discutere di quanto questo modello sia all'altezza, in particolare rispetto a GPU RDNA3 di AMD.

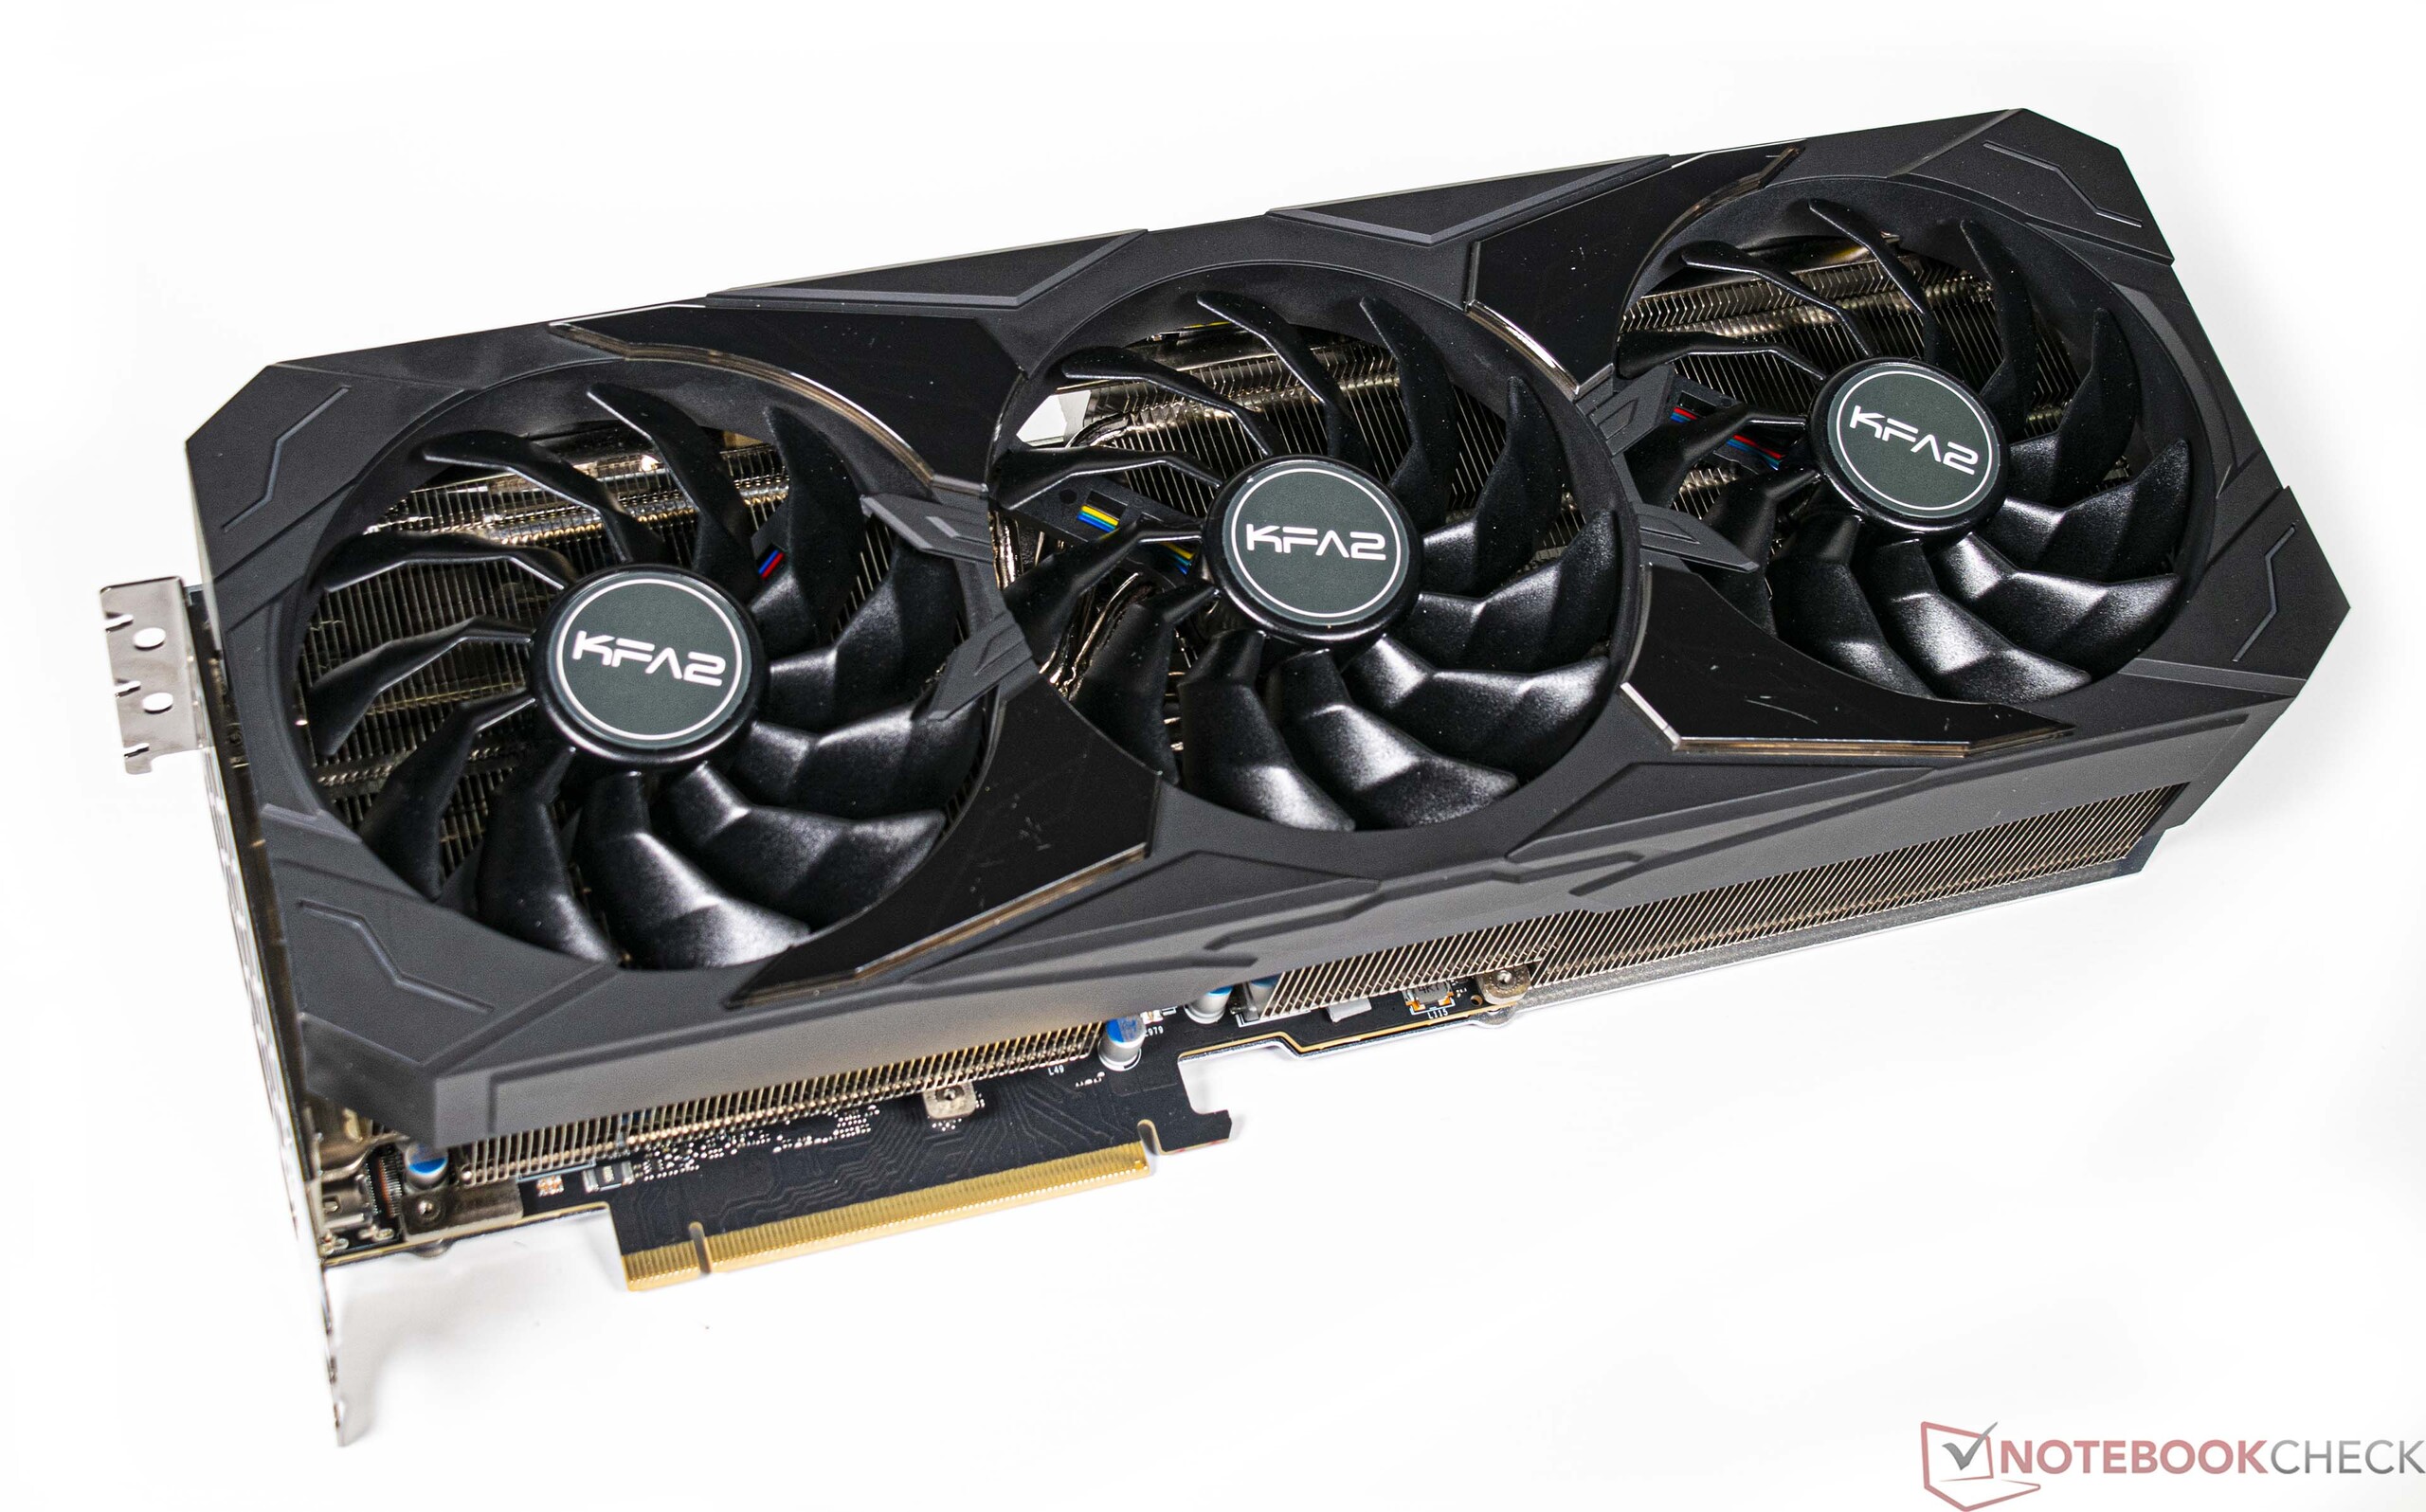
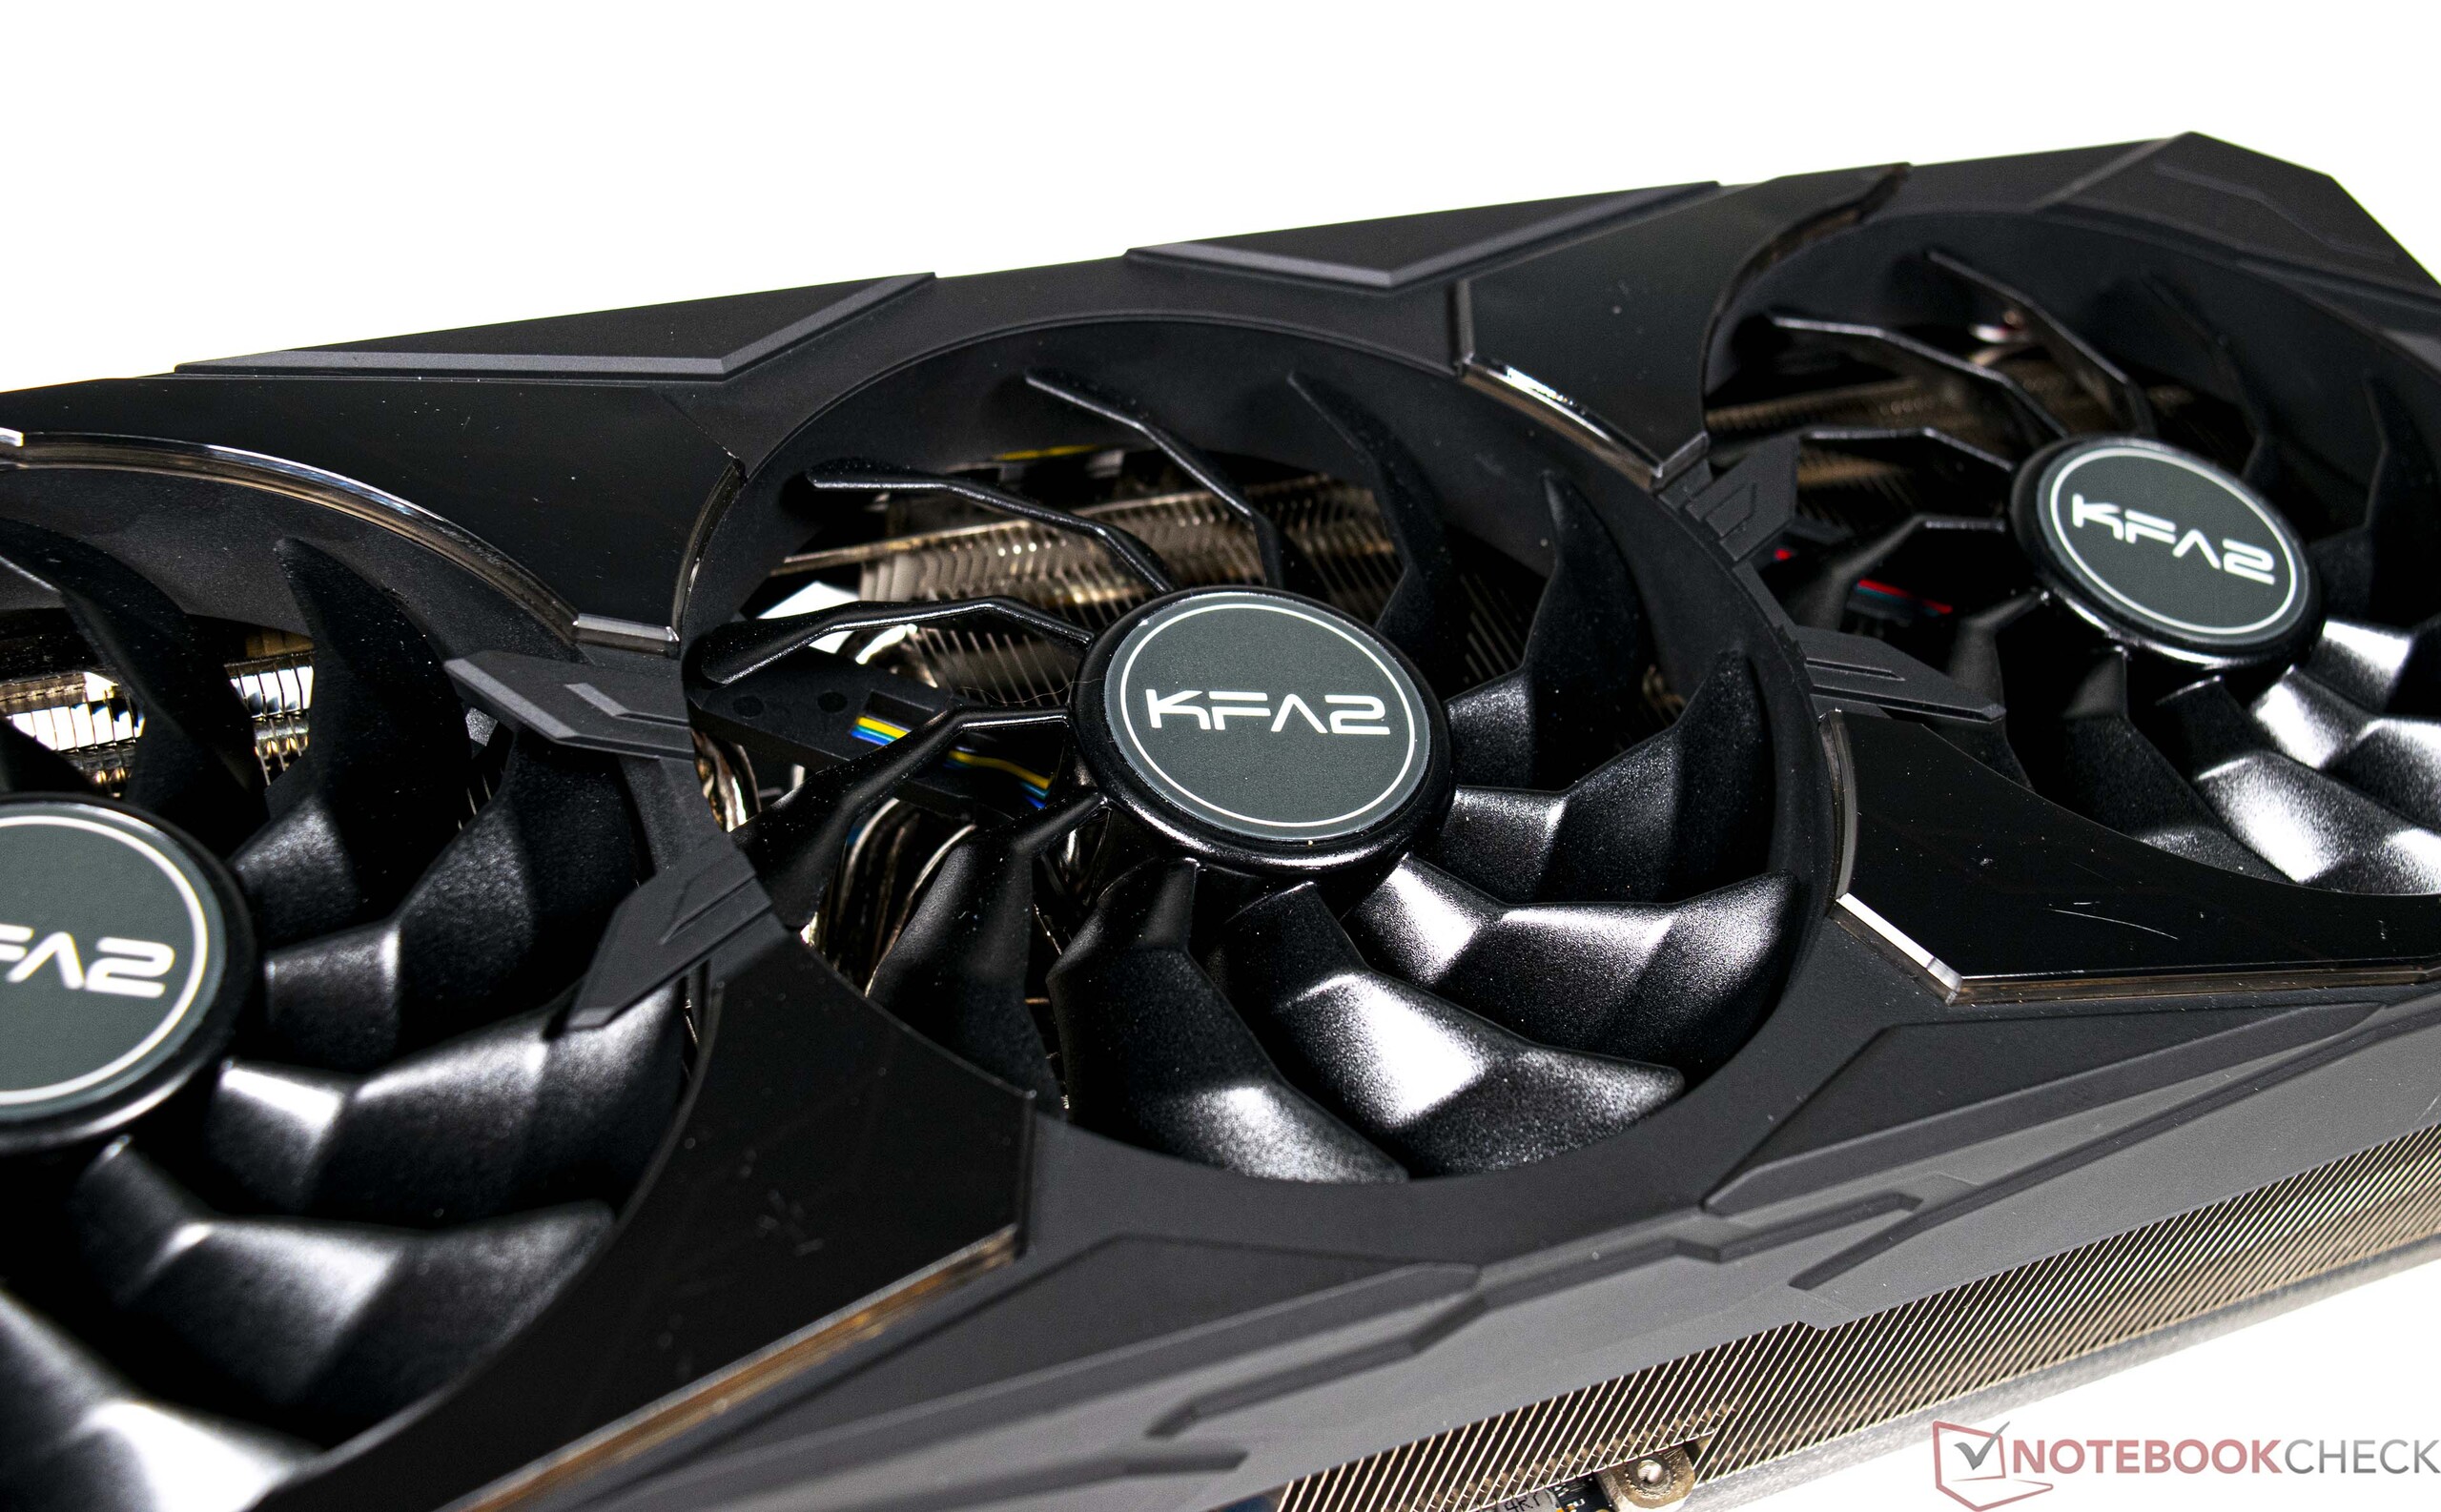
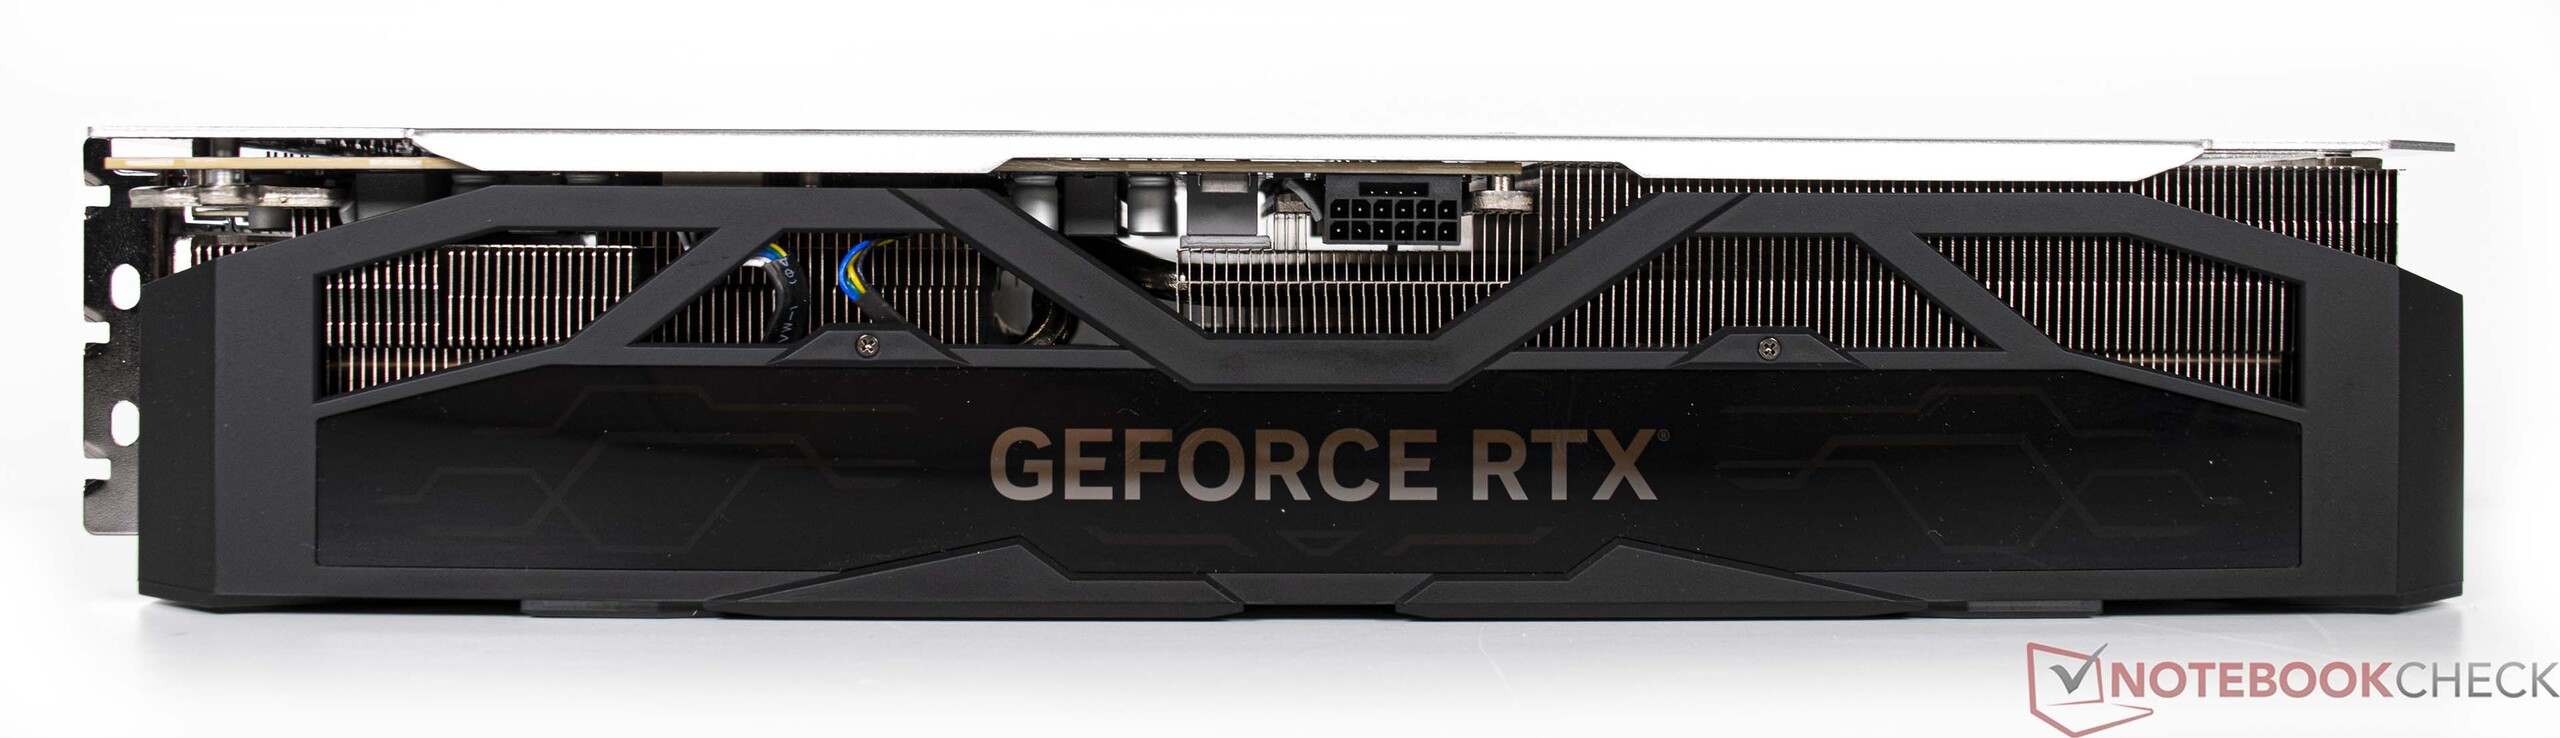
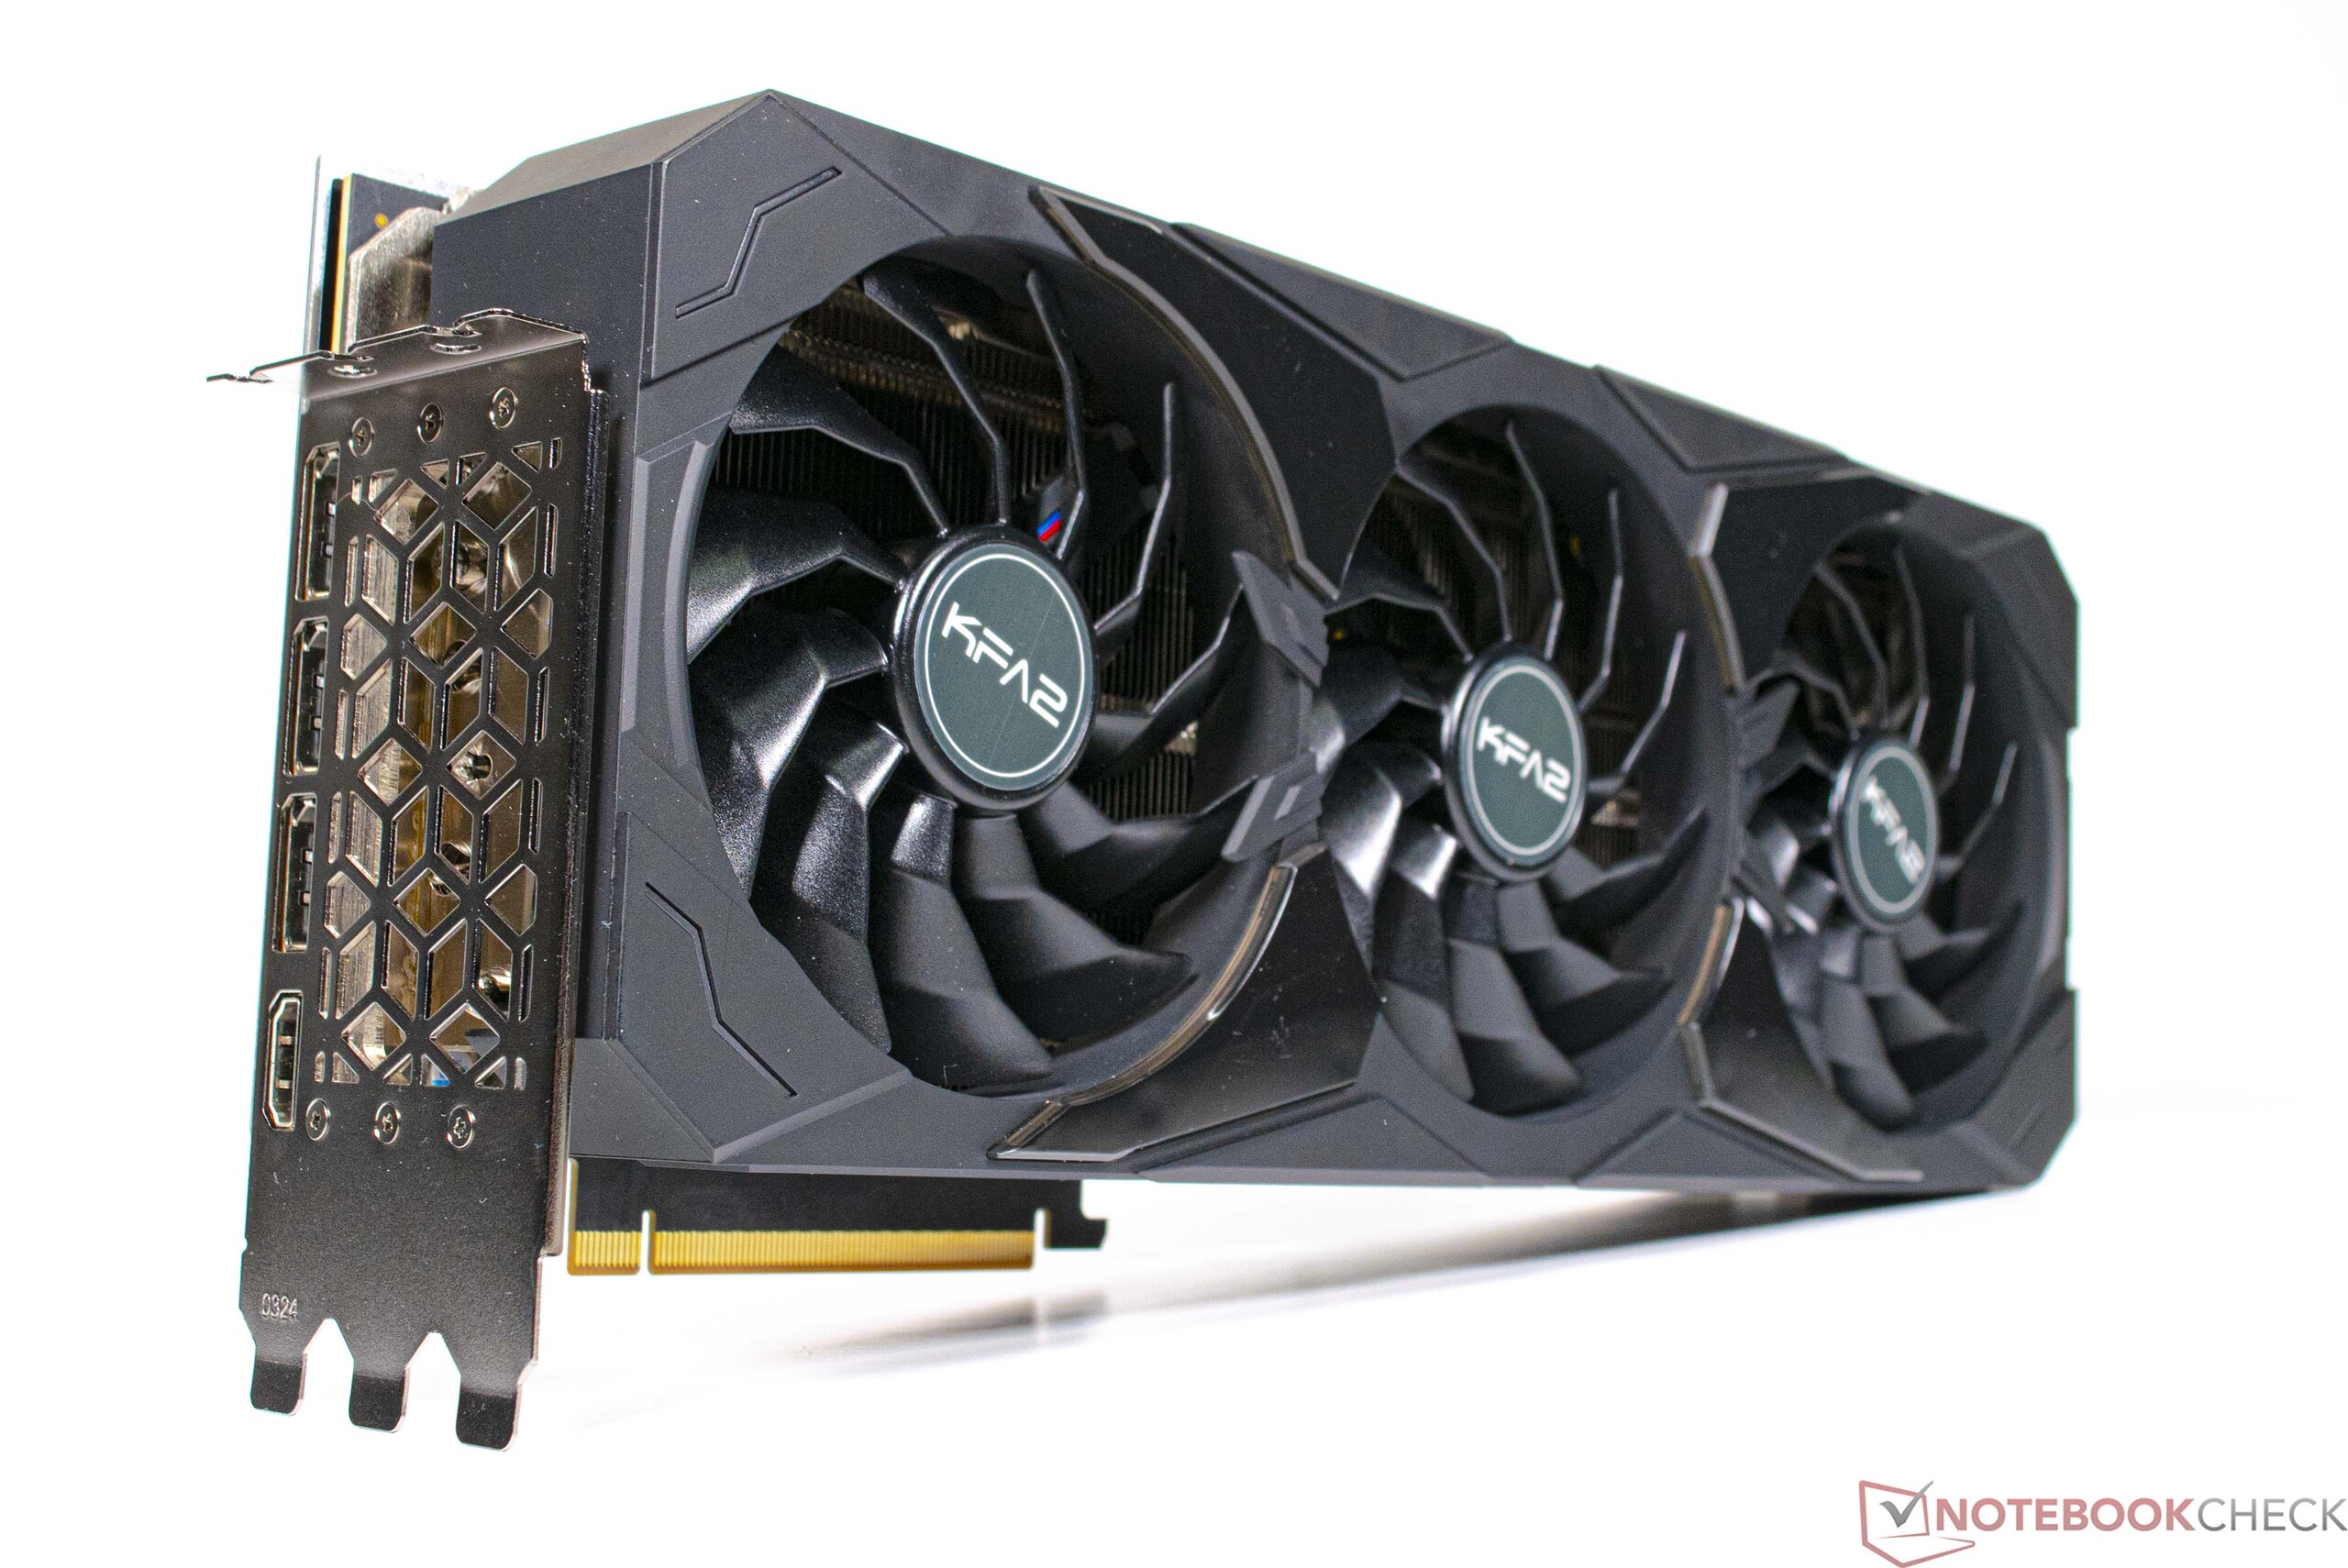
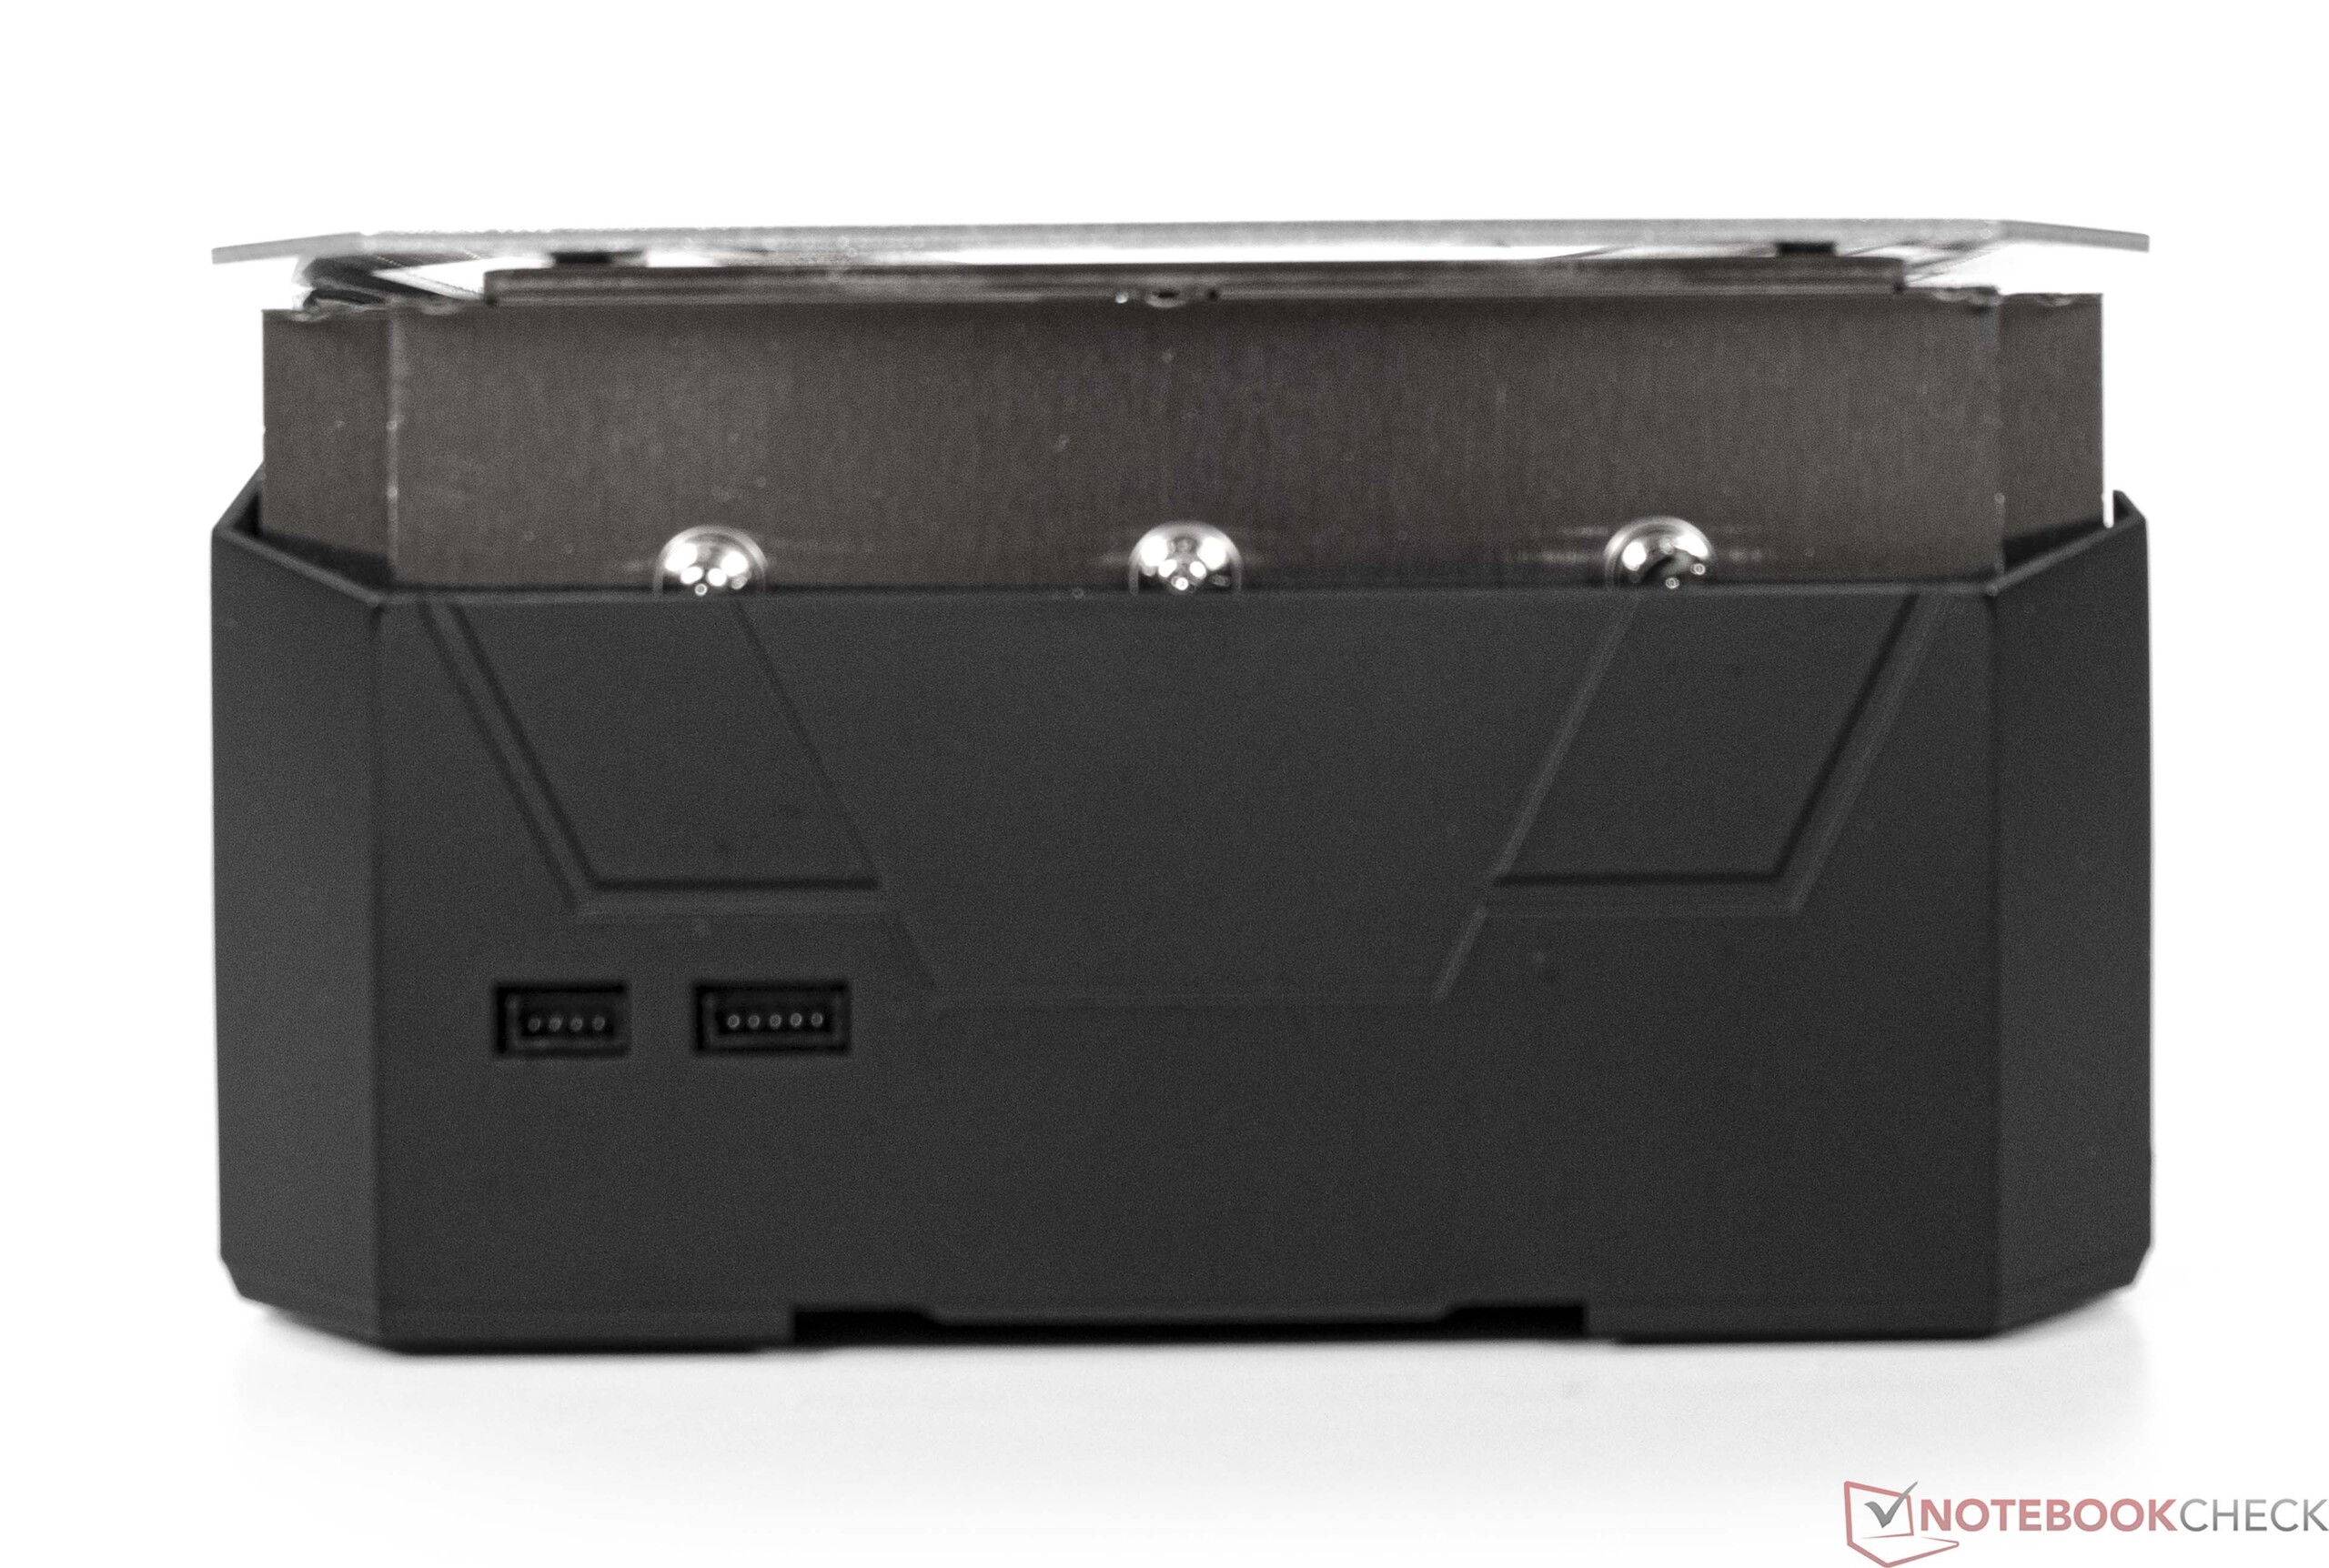
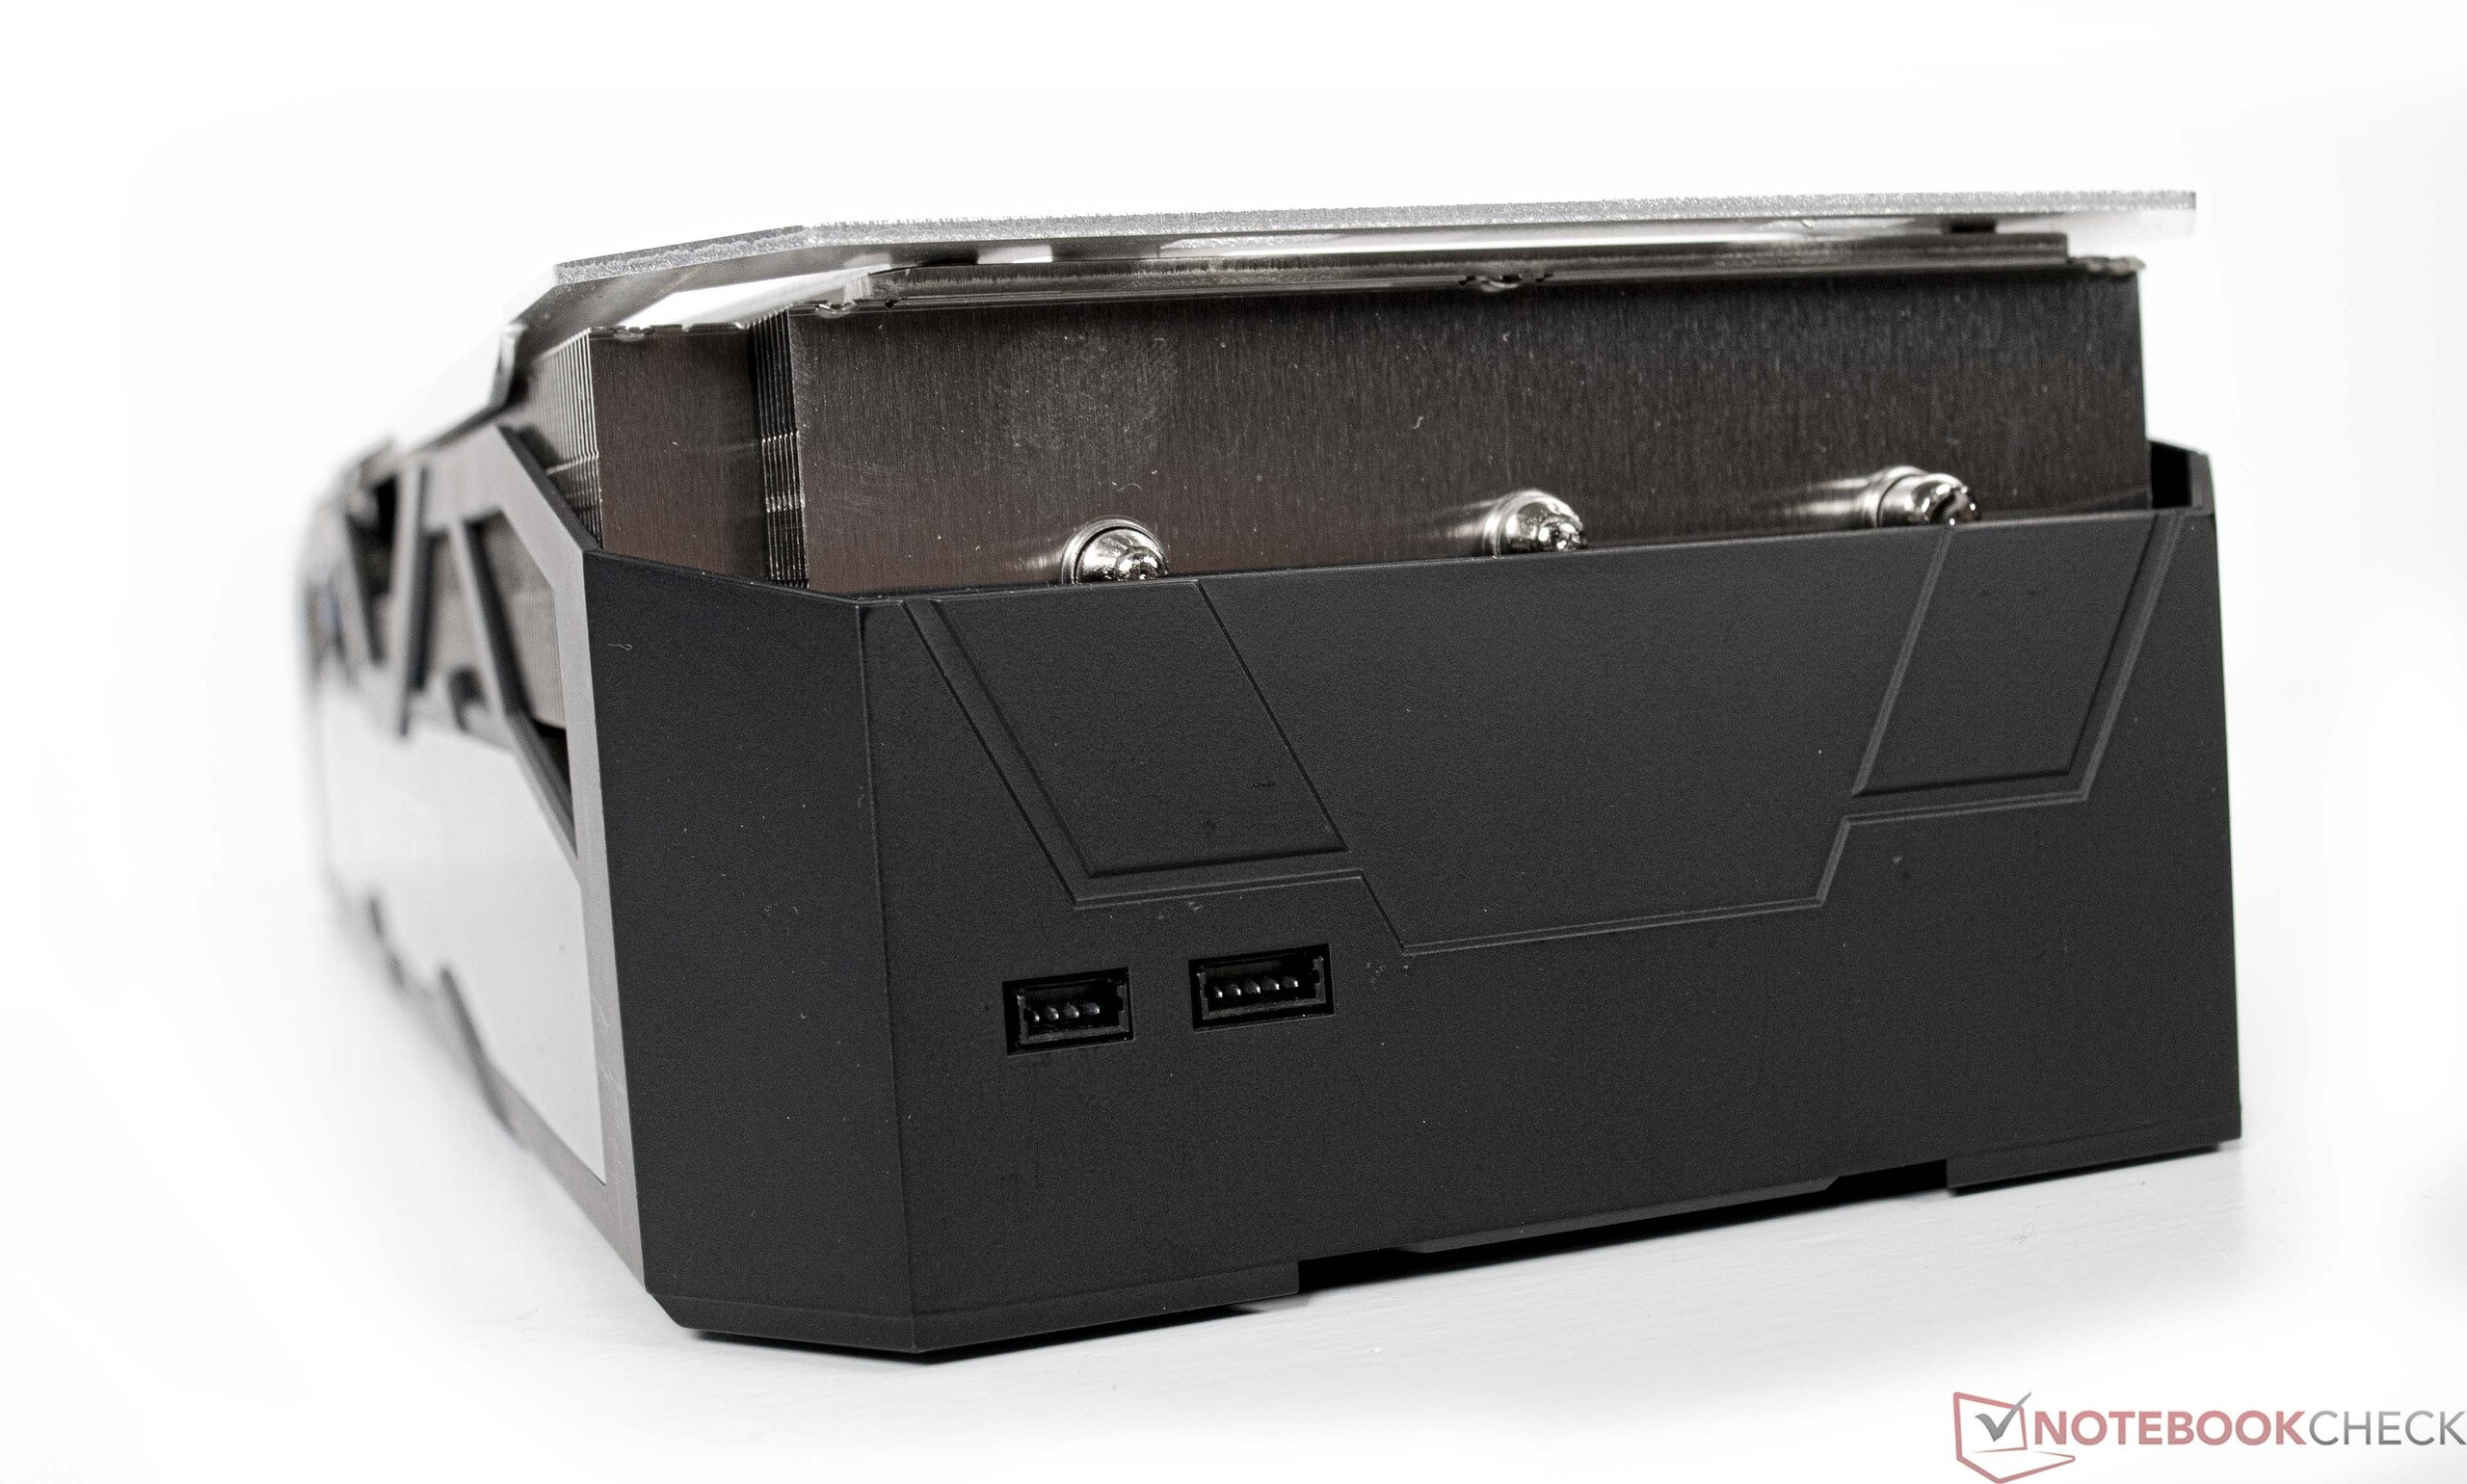
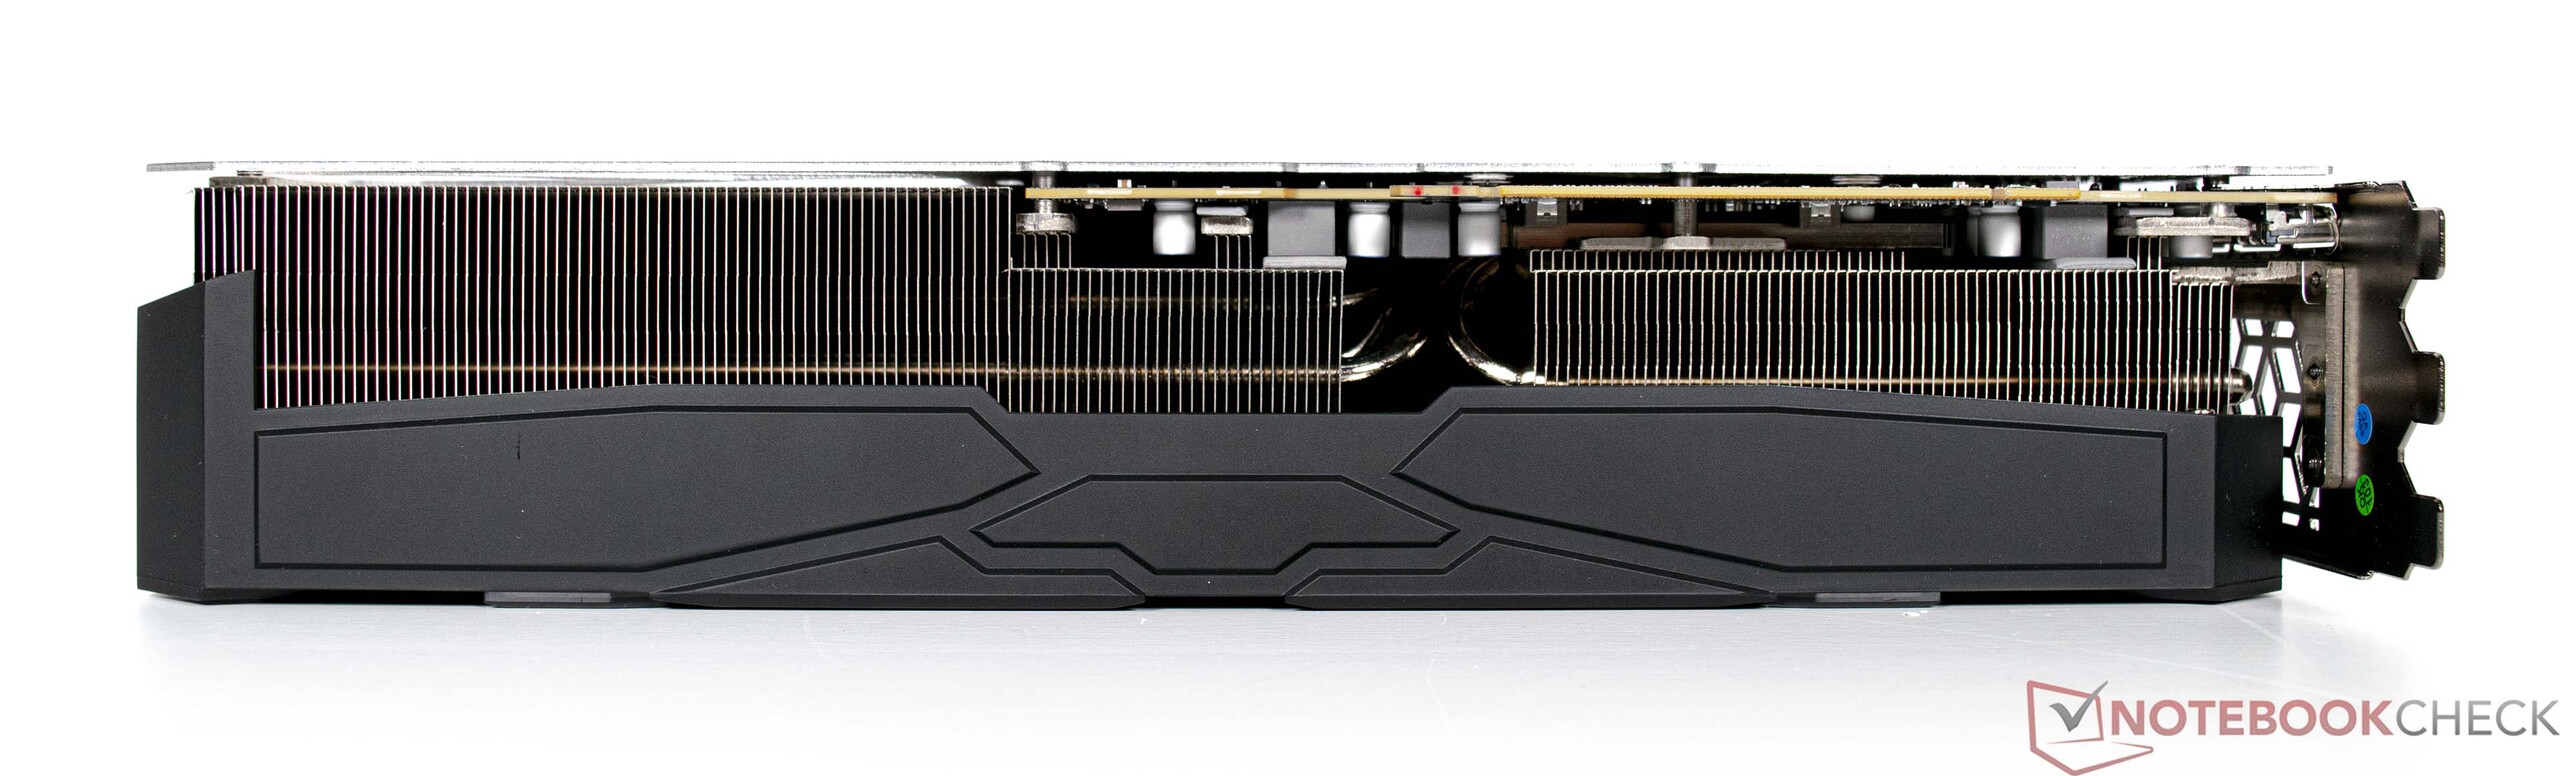
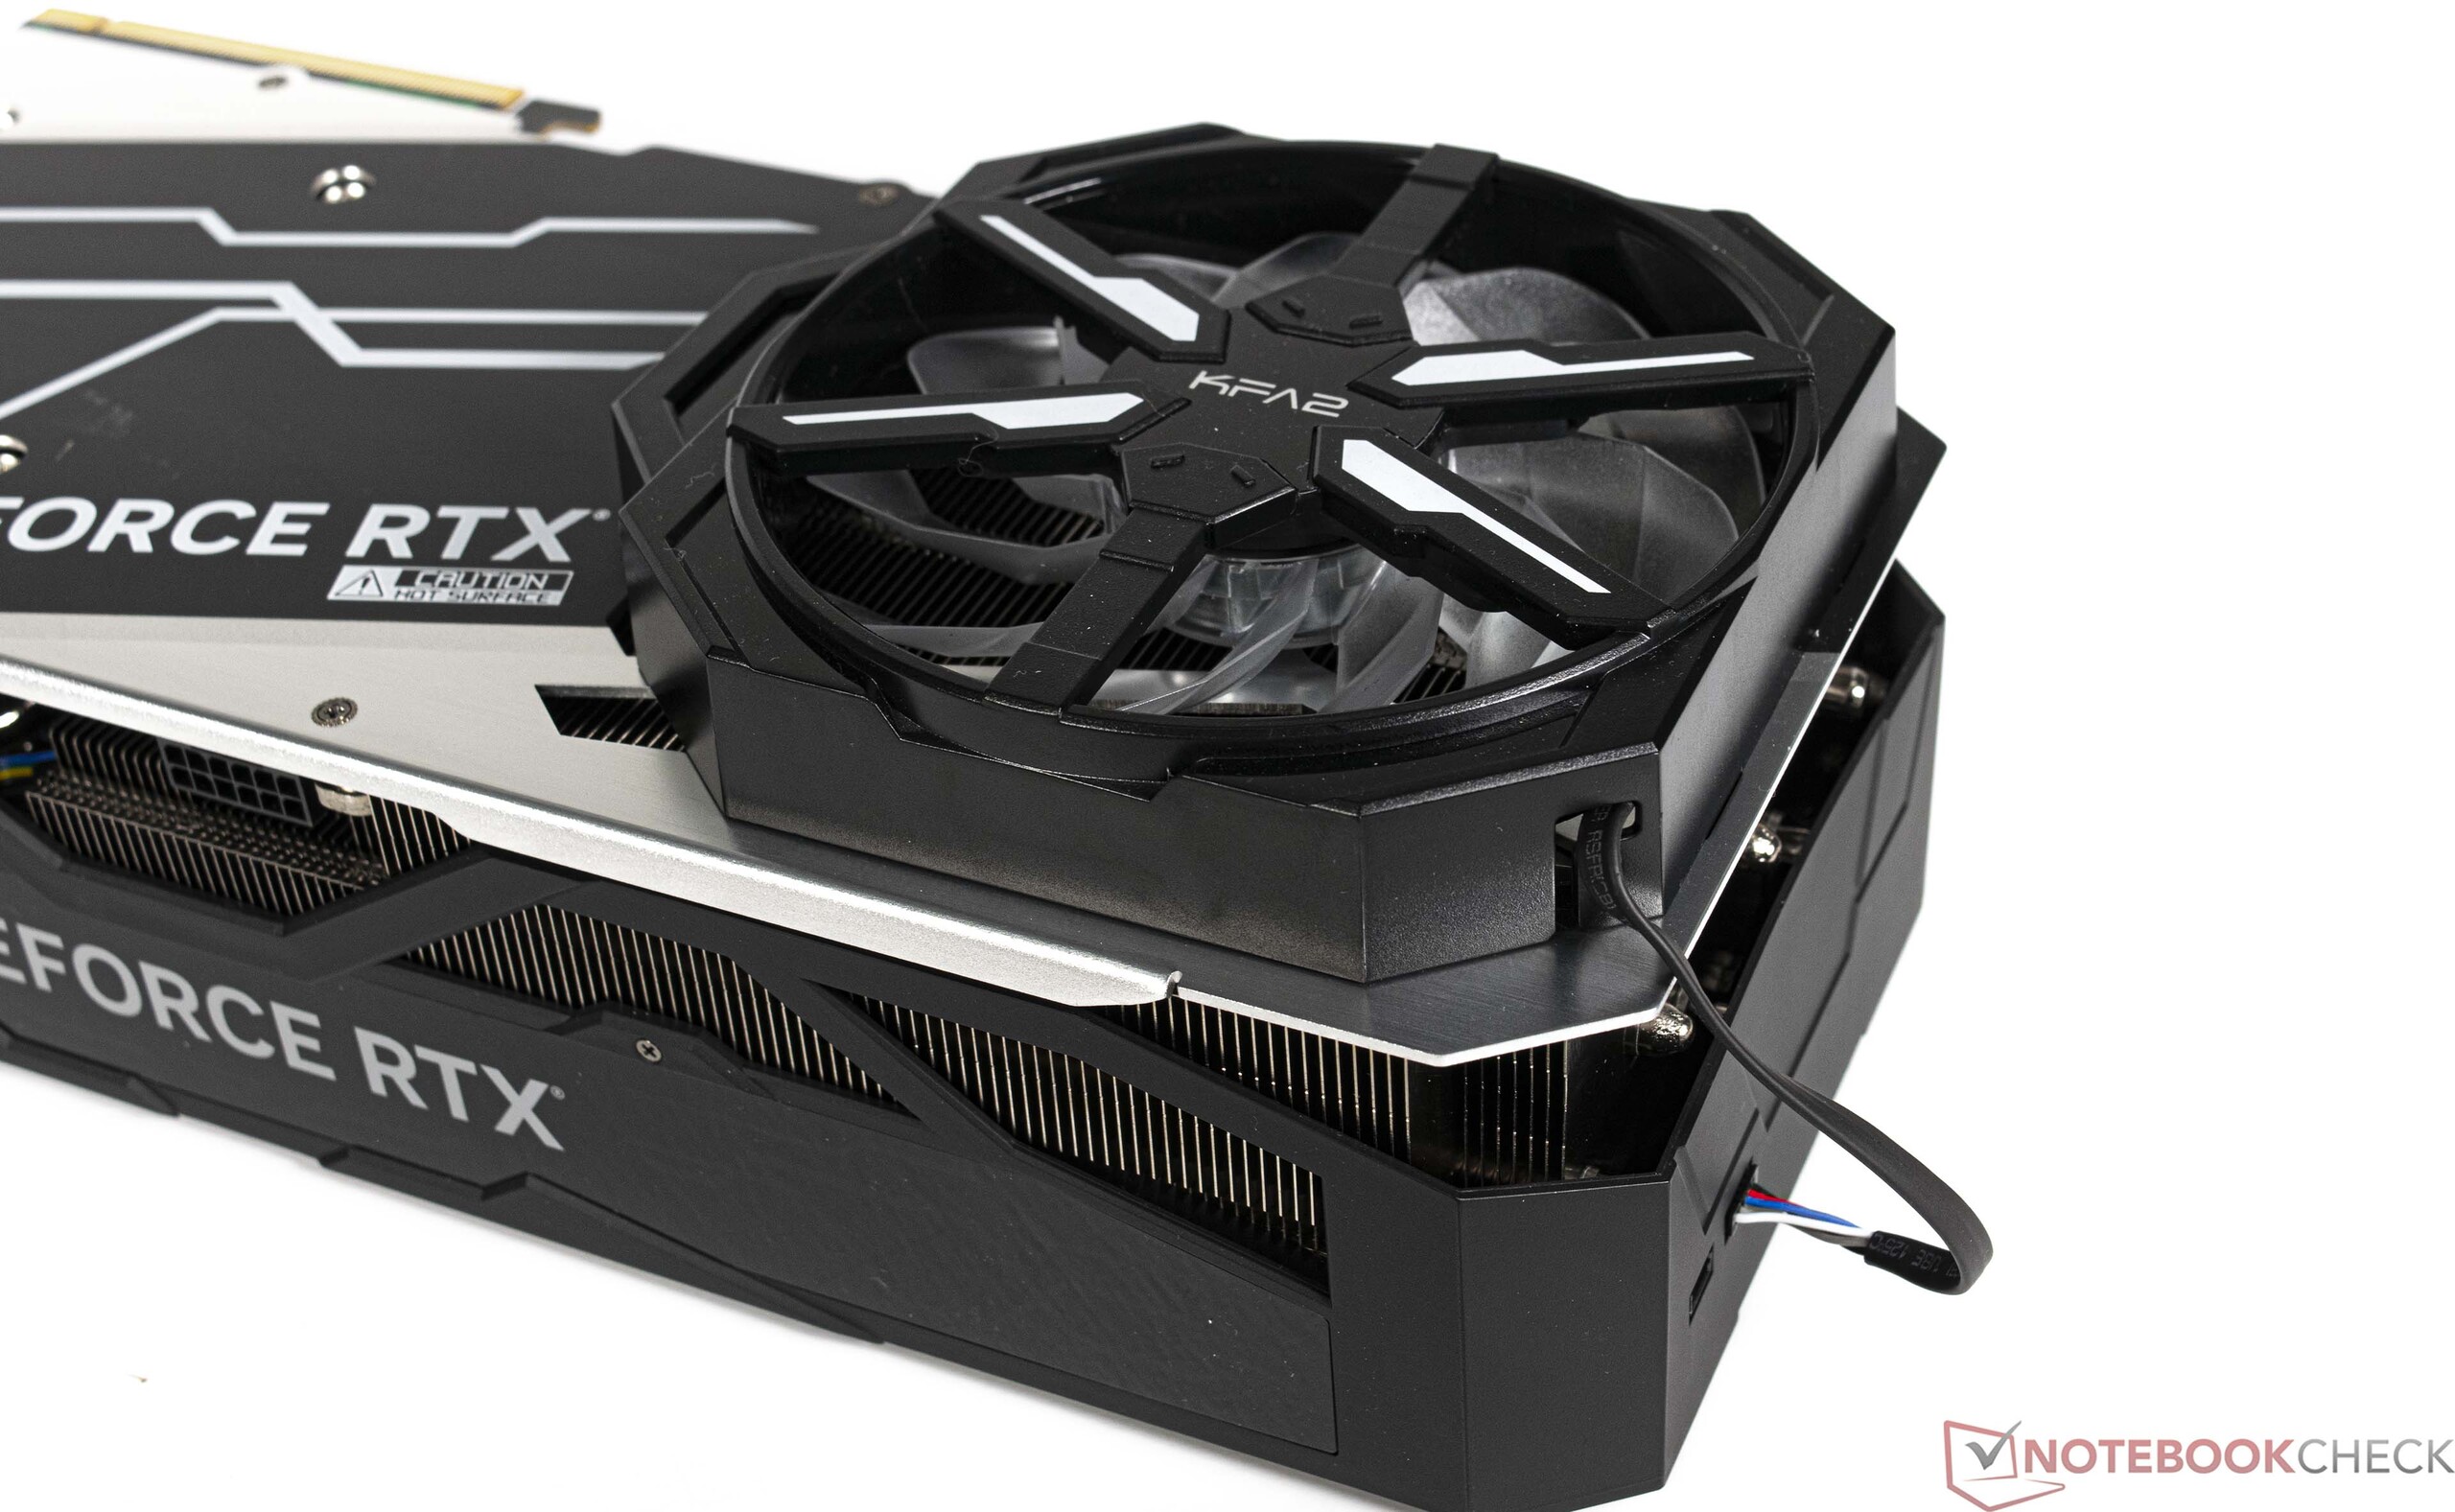
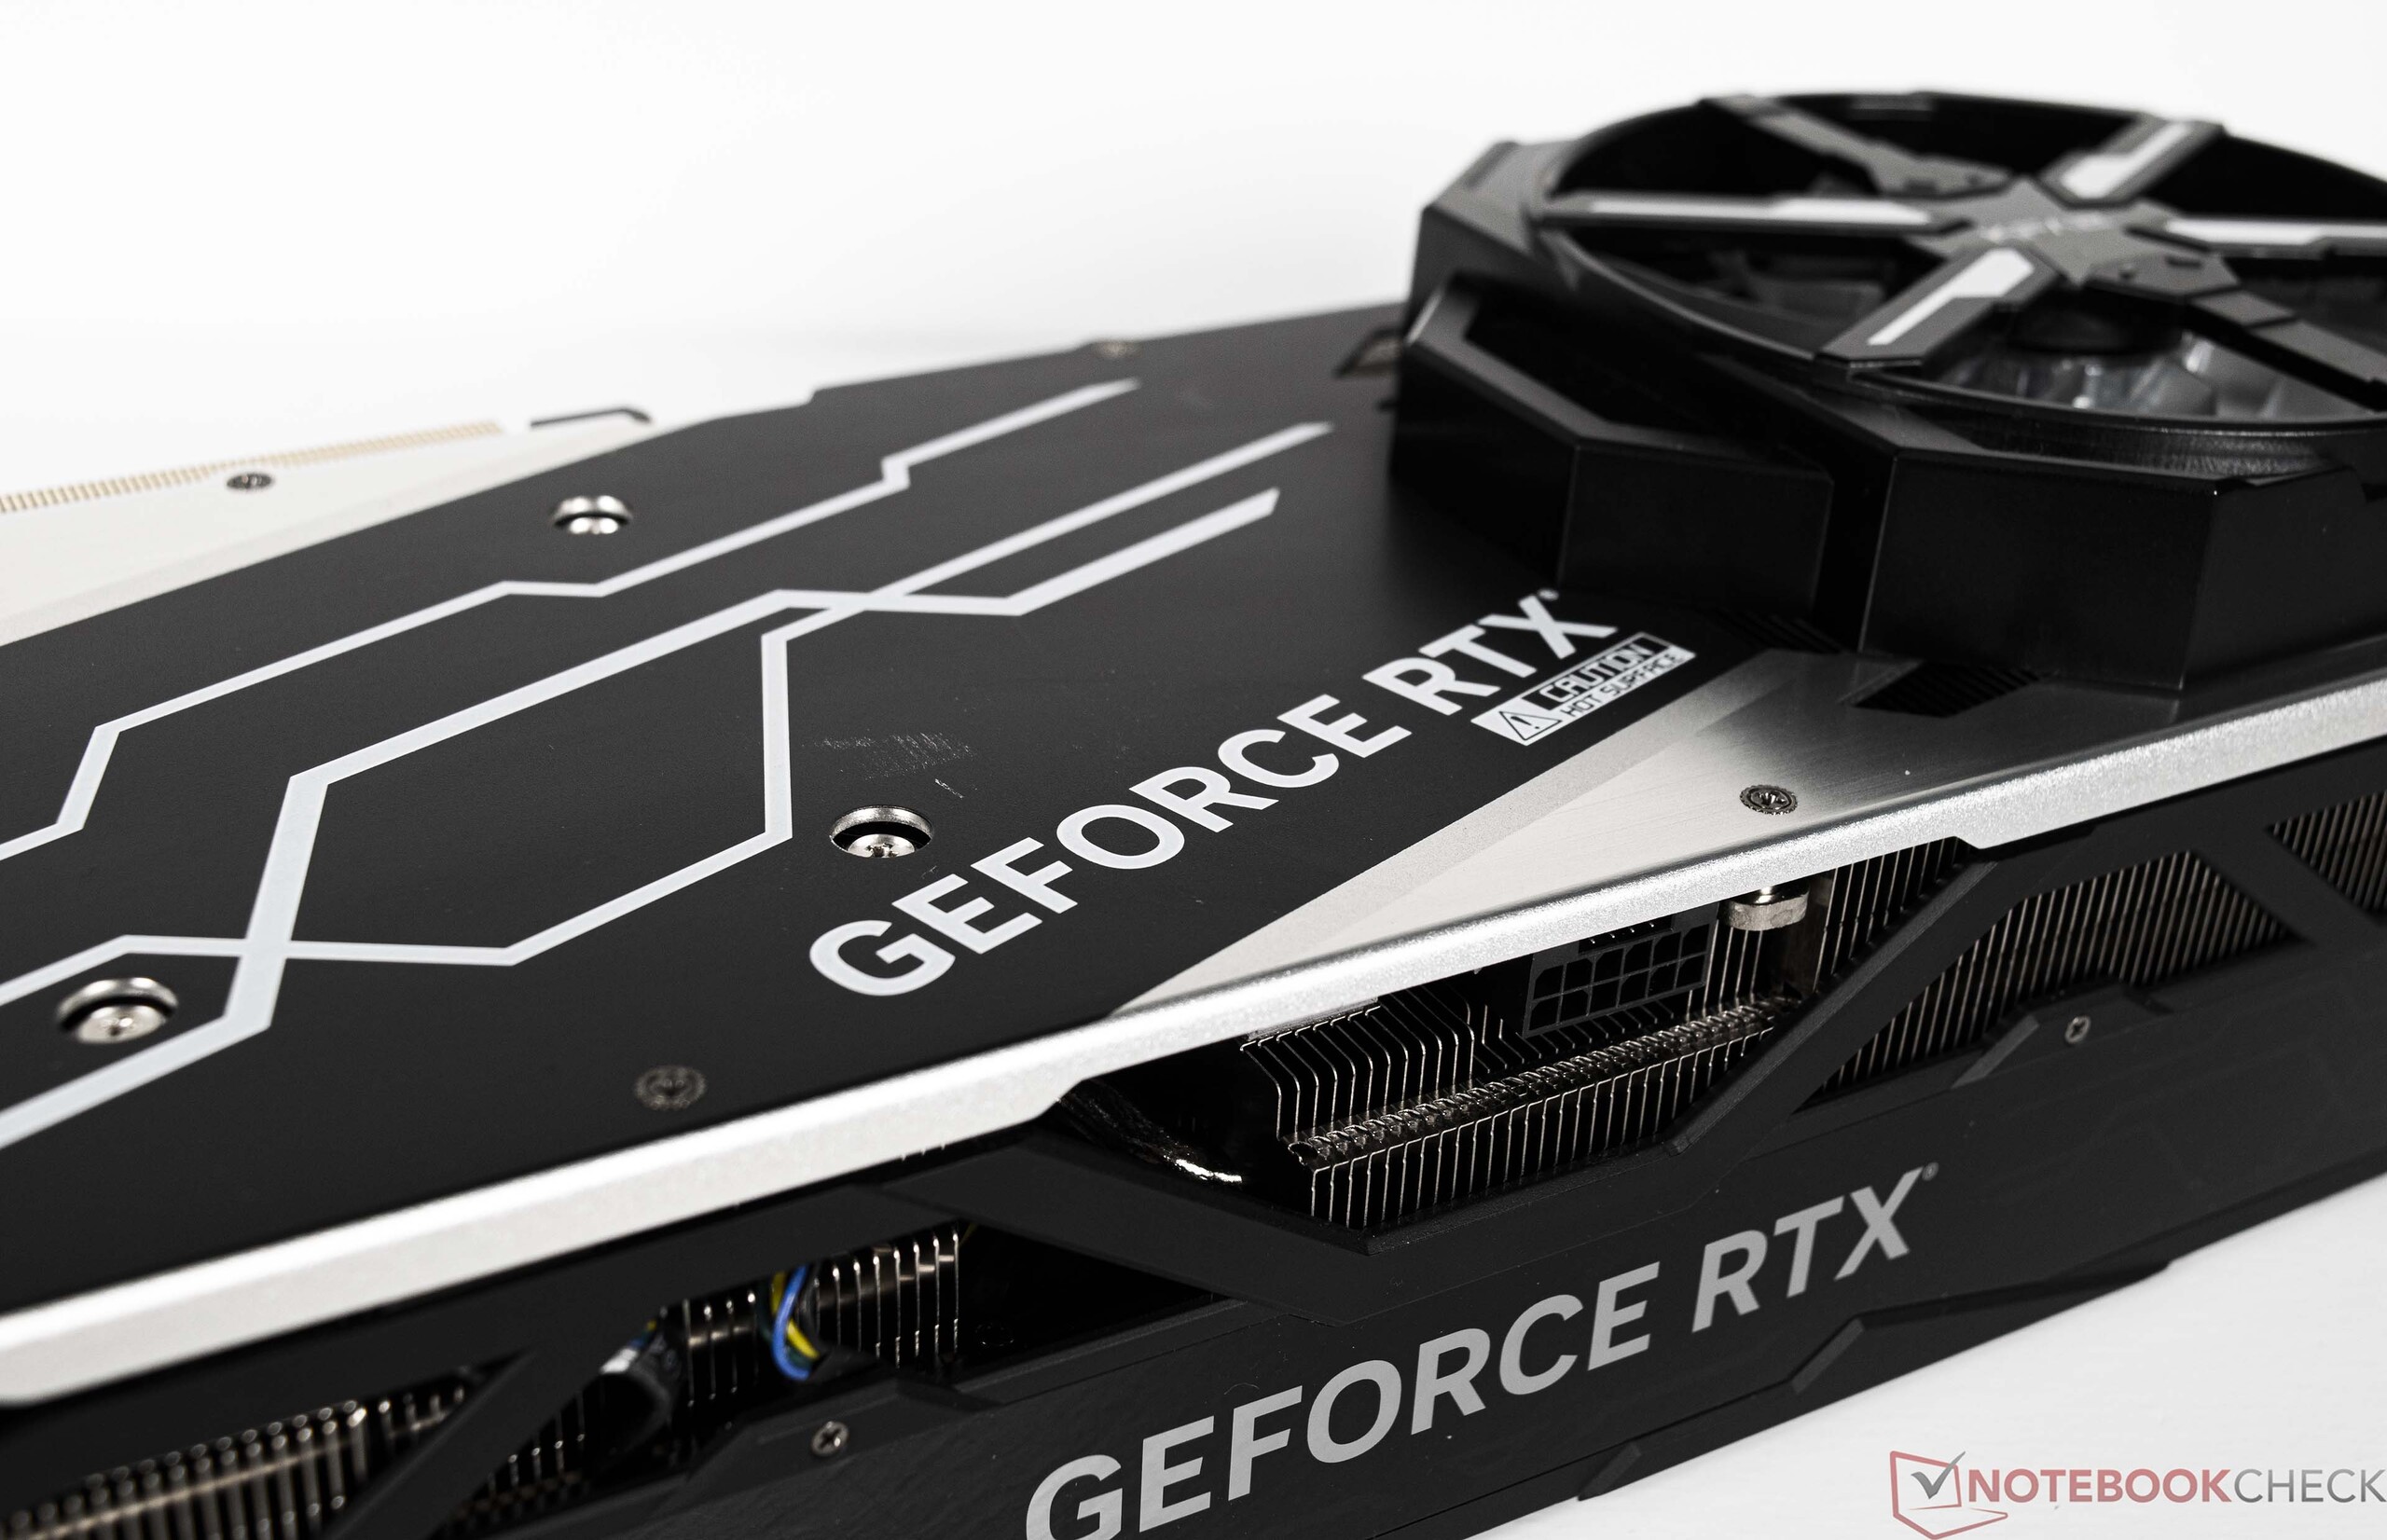
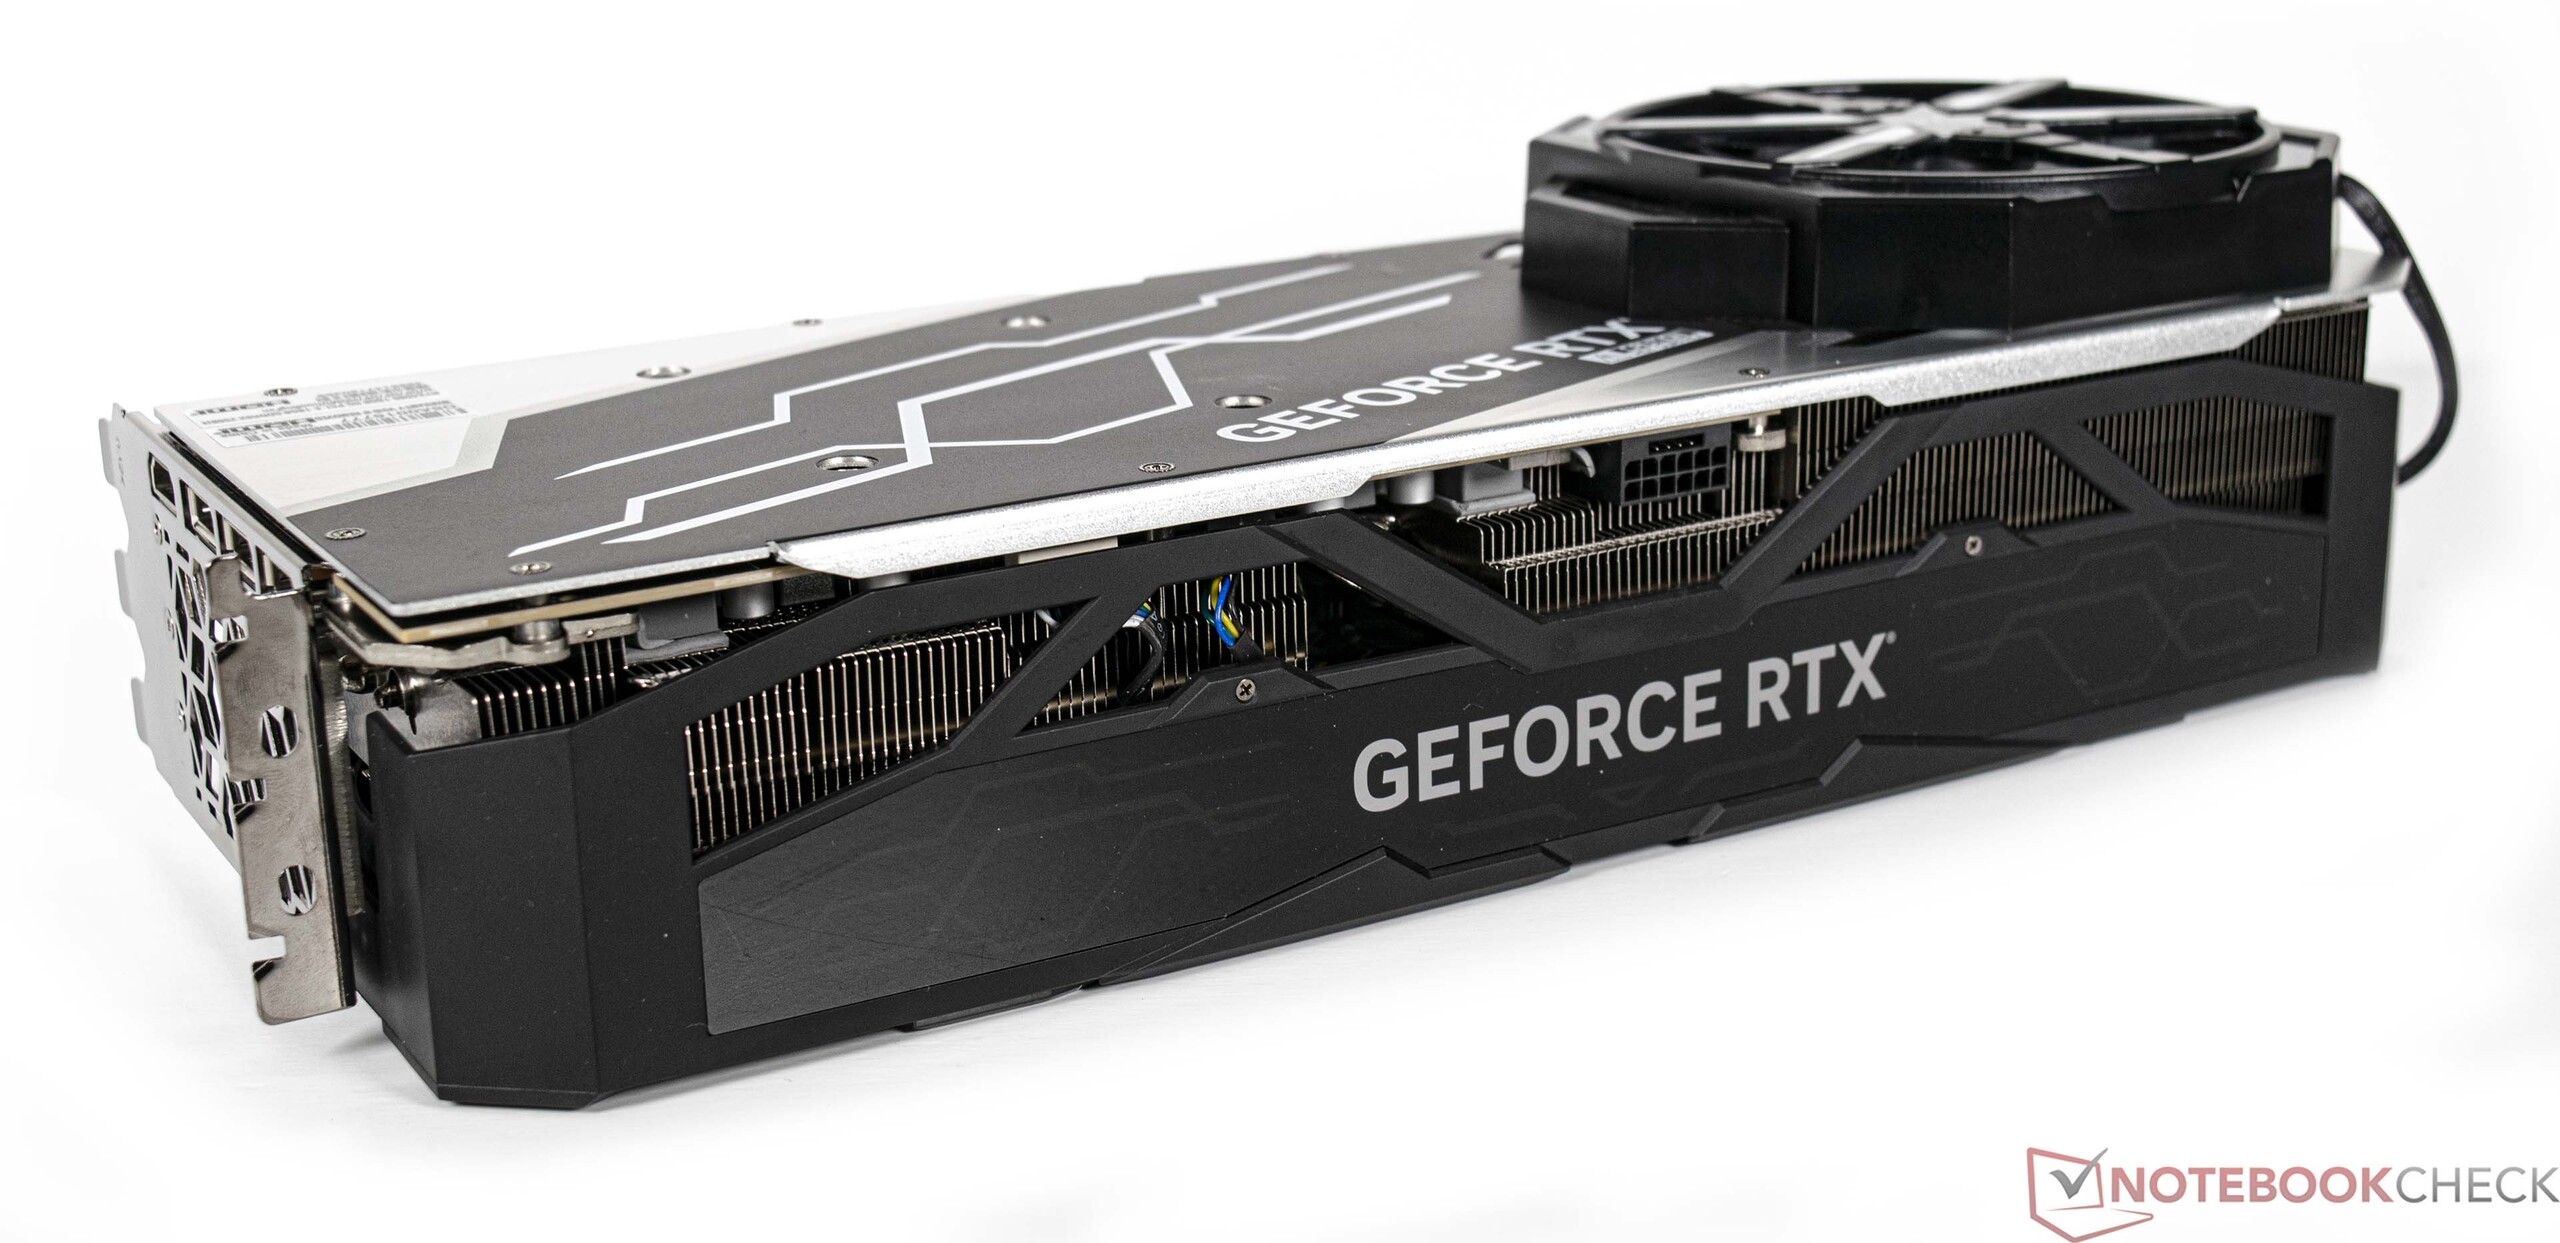
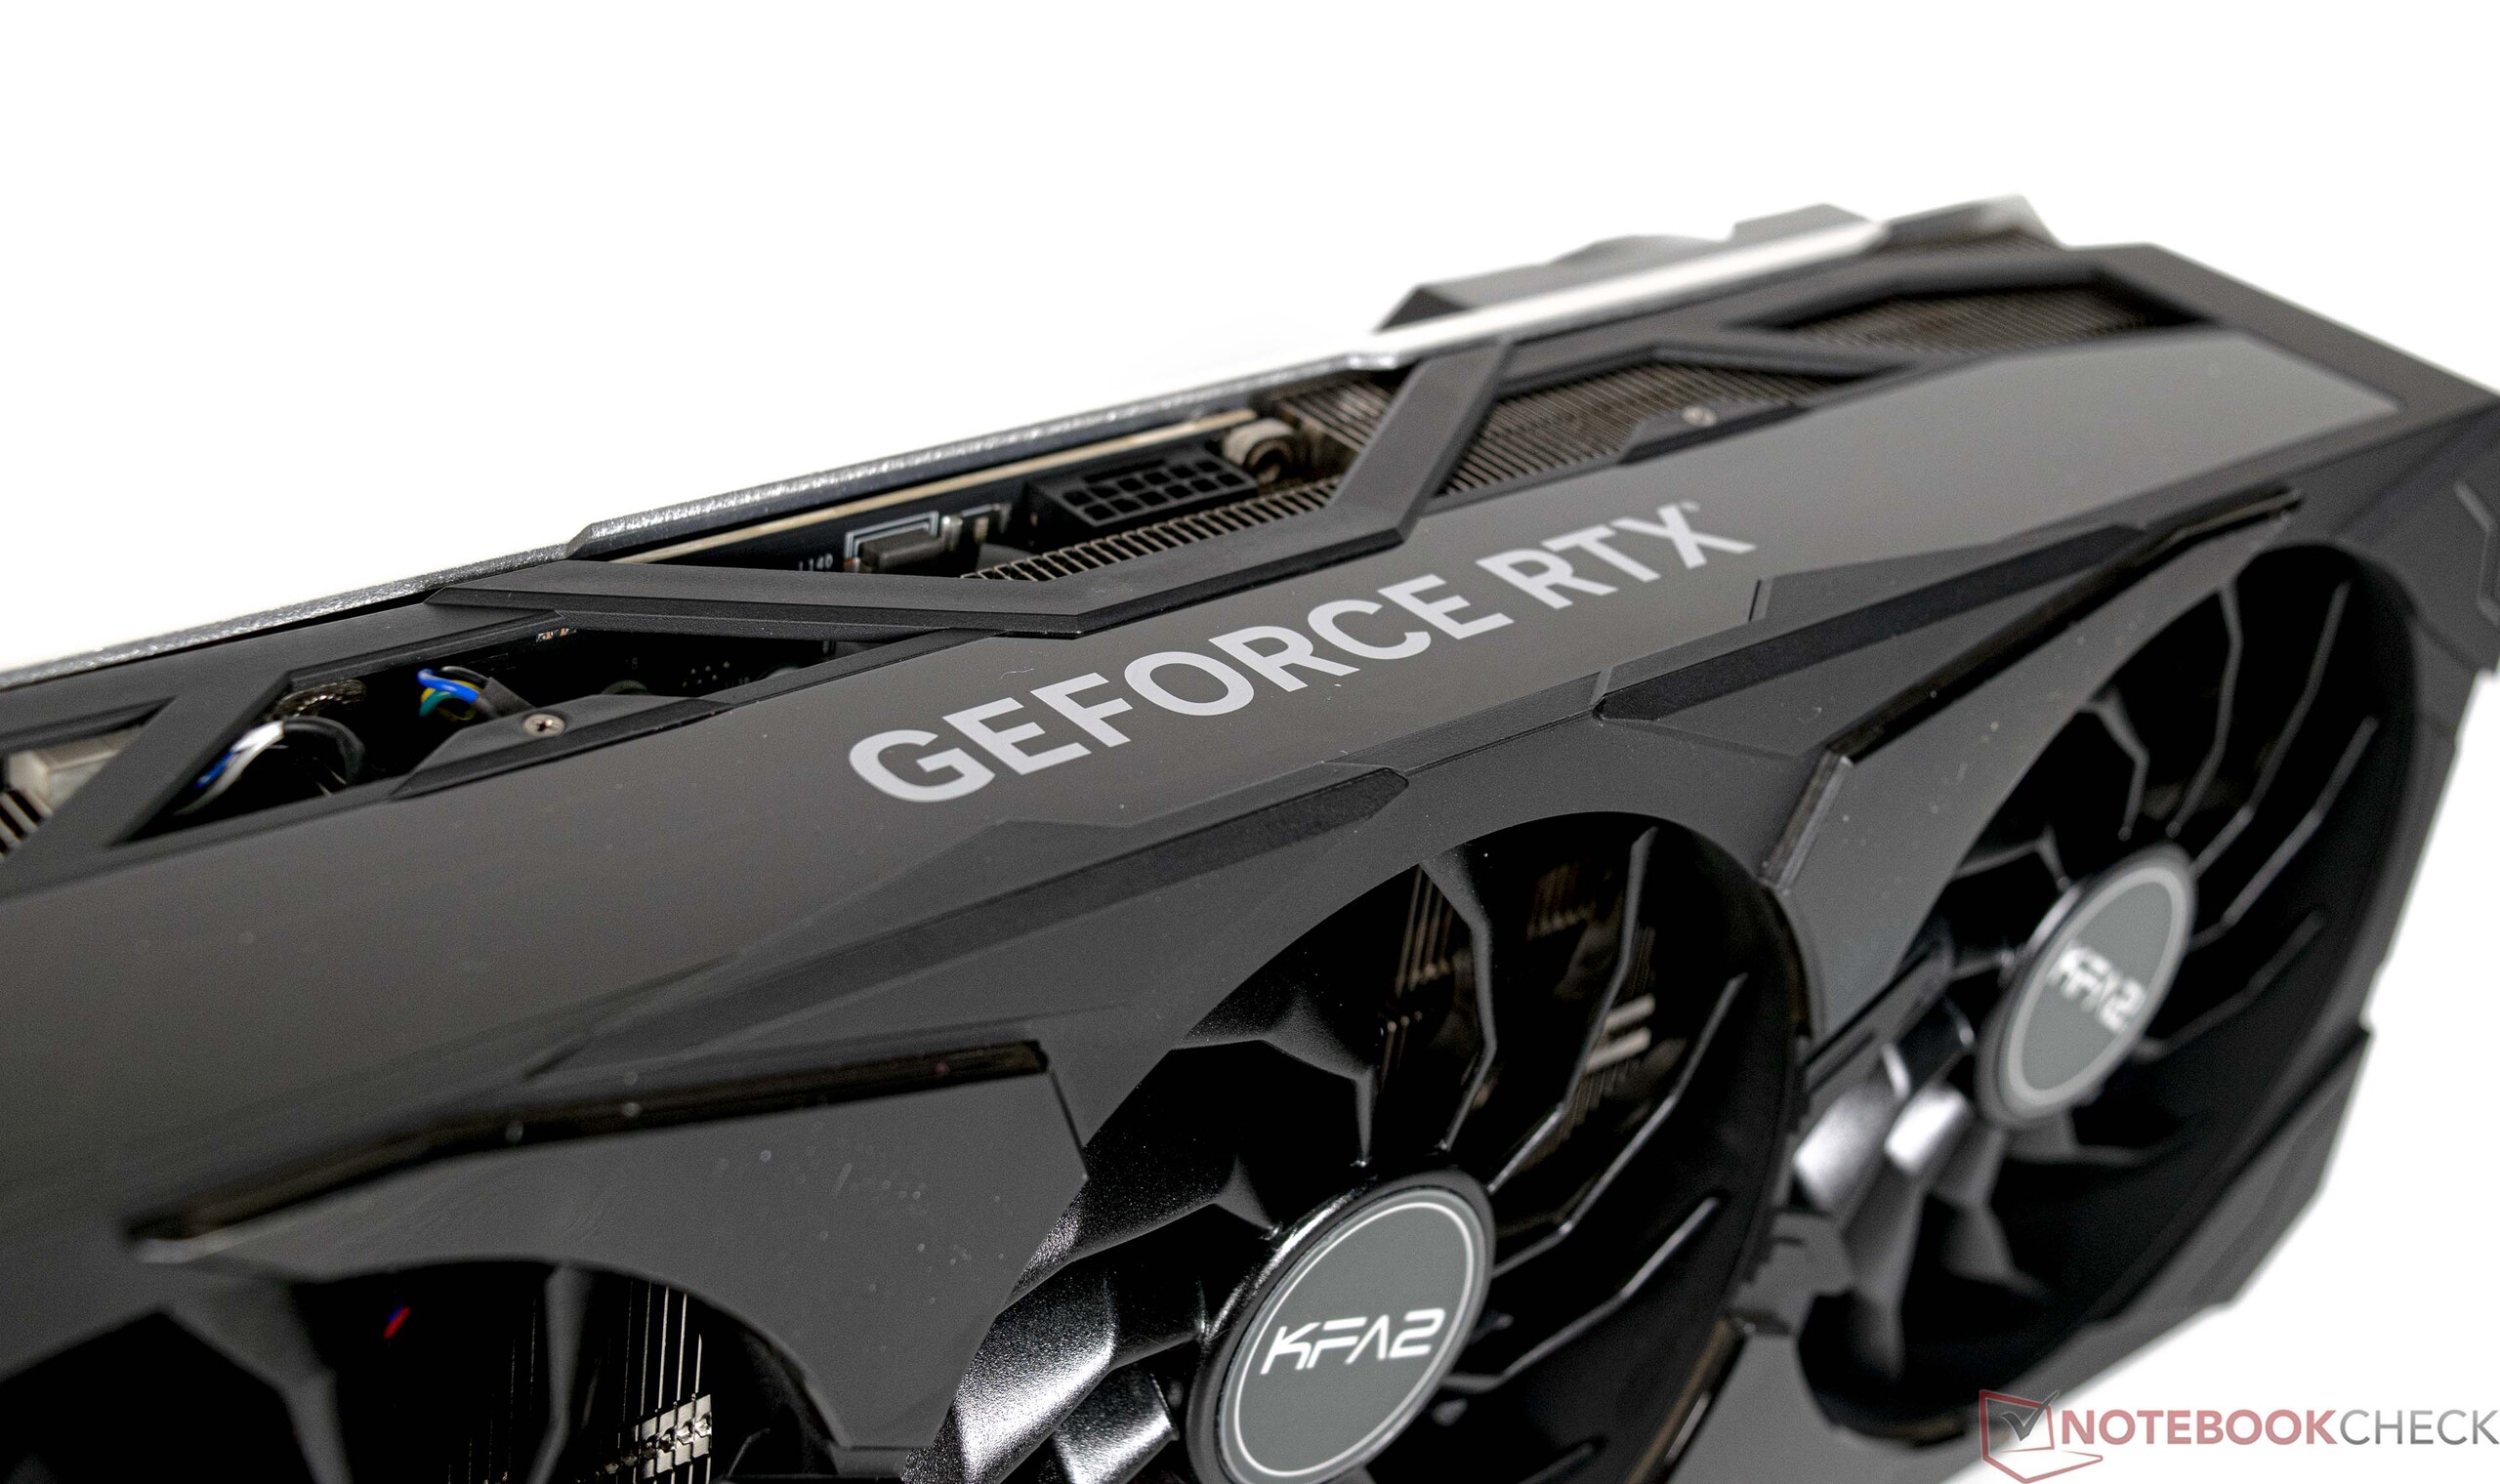
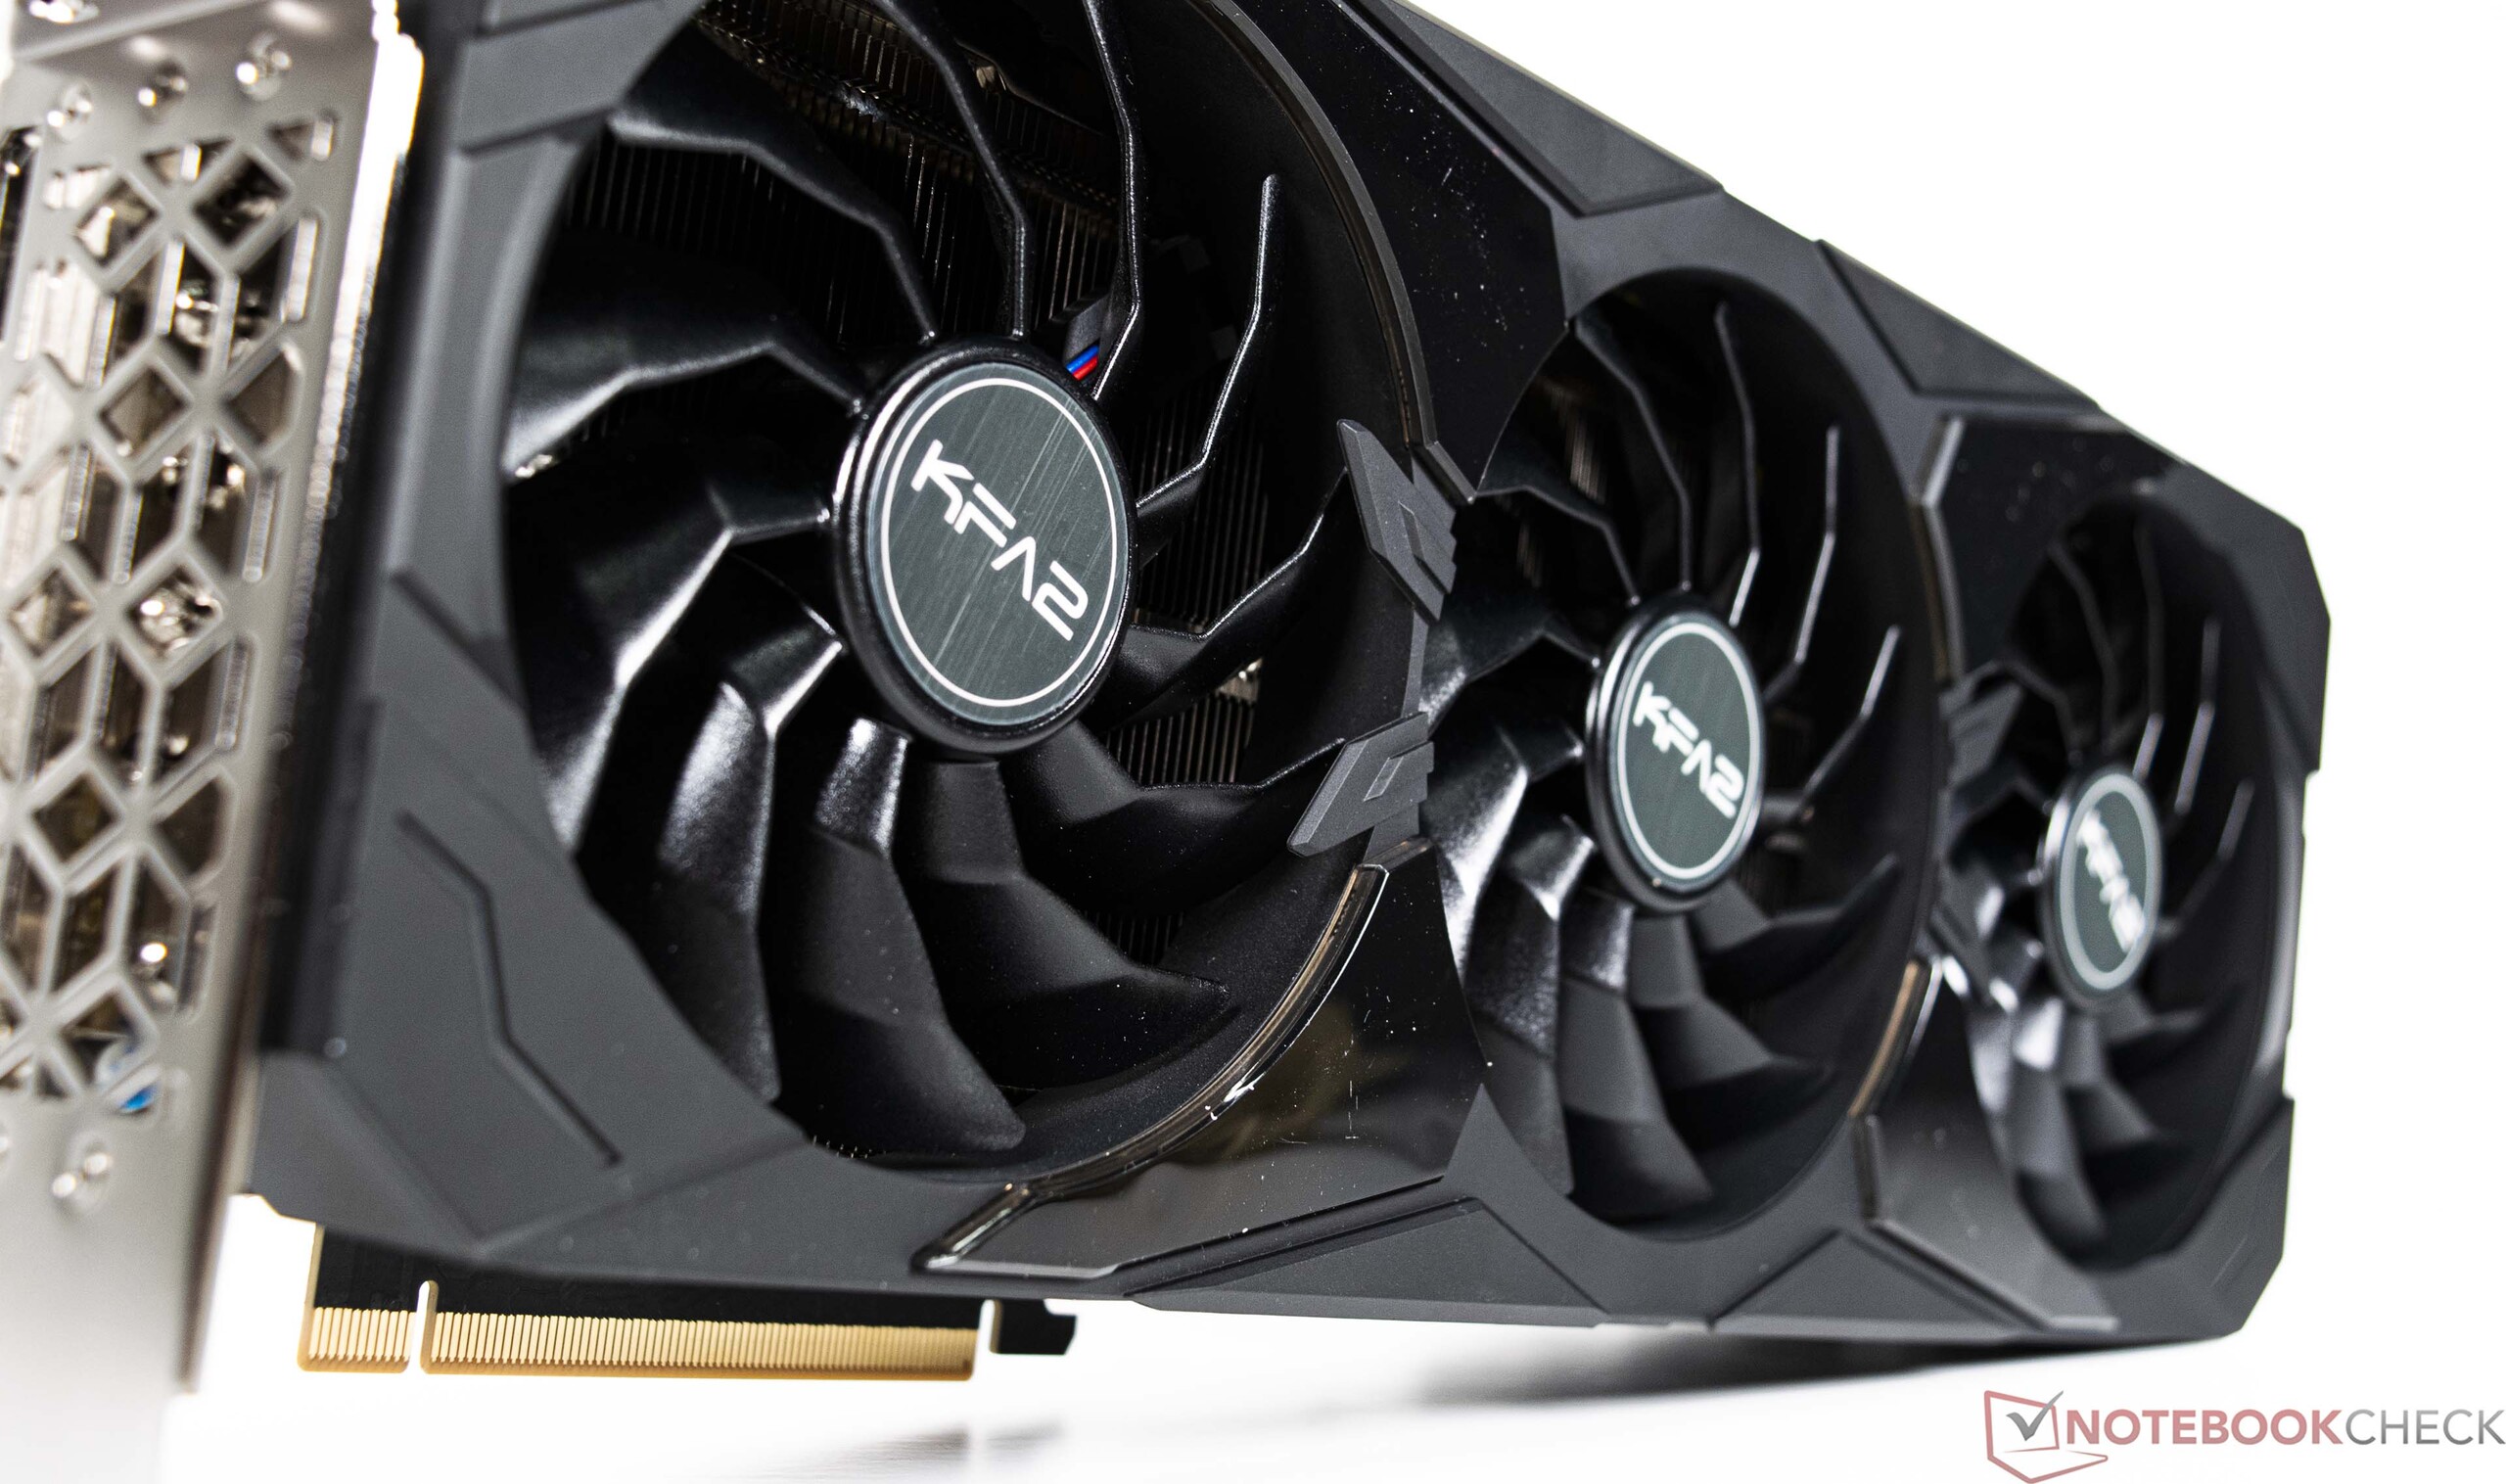
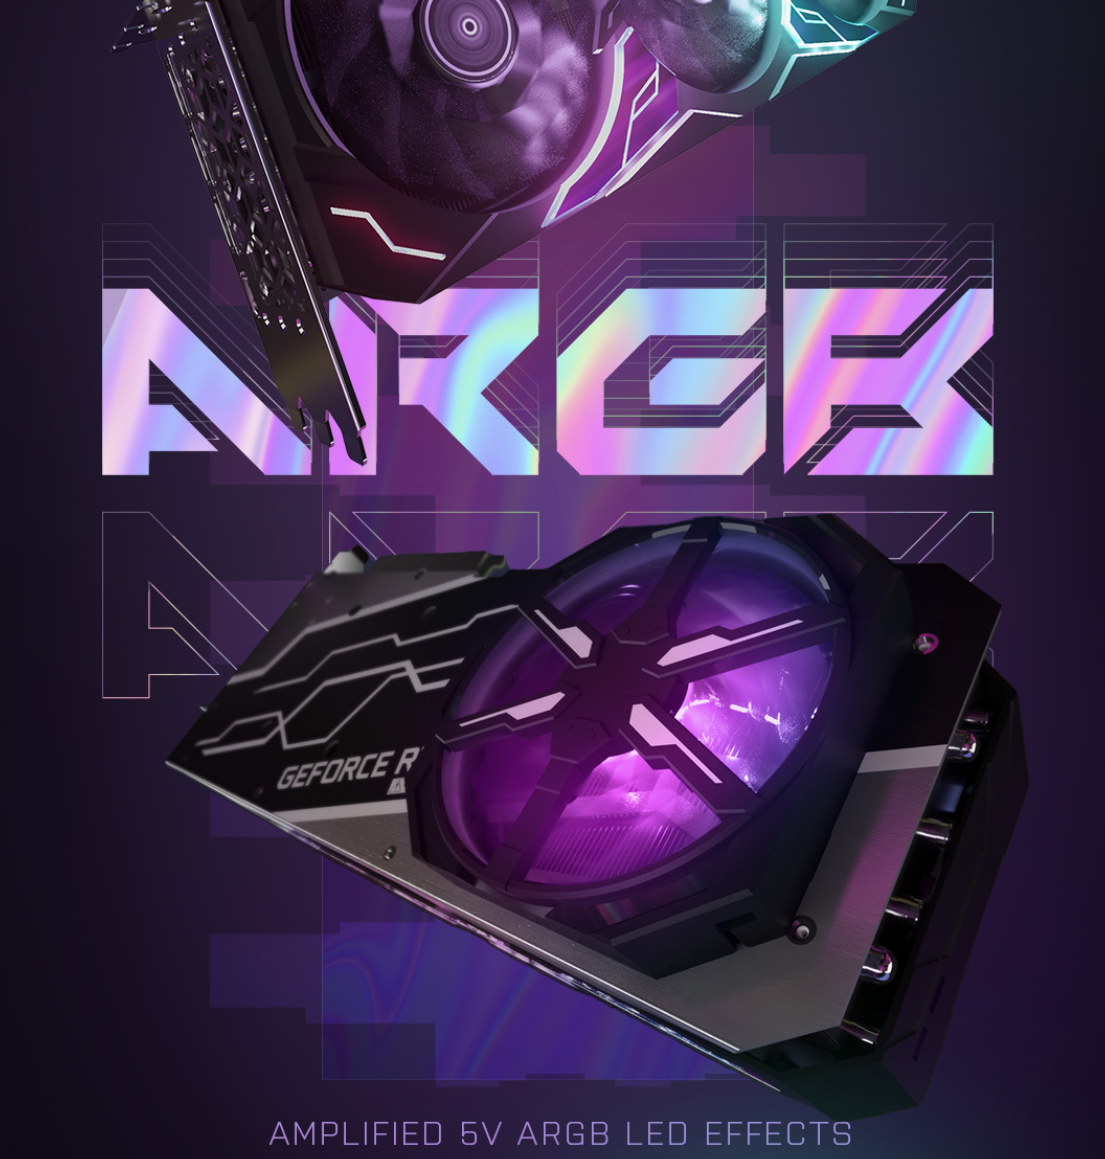
Sebbene KFA2 sia spesso uno dei produttori con i prezzi più bassi, l'azienda si considera un concorrente di altri produttori che offrono schede più costose, come Asus con la sua serie Strix e MSI con i suoi modelli Suprim-X. Purtroppo non siamo stati in grado di confrontare le diverse schede testa a testa perché non abbiamo ancora messo le mani su nessun modello Asus o MSI. Tuttavia, possiamo dire che la KFA2 GeForce RTX 4080 SG ha lo stesso livello di lavorazione della KFA2 GeForce RTX 4090 SG. Nonostante l'utilizzo di potenza nominale molto inferiore rispetto al modello superiore, KFA2 GeForce RTX 4080 SG è dotato di un enorme radiatore quad-slot. Inoltre, la scheda è dotata di un'illuminazione RGB che attira l'attenzione. Come tutti gli attuali modelli della serie RTX 40, la RTX 4080 è alimentata tramite il nuovo connettore 12VHPWR. KFA2 non ha fatto nulla di diverso e ha incluso un adattatore appropriato da 3x6+2 pin PCIe a 12VHPWR.

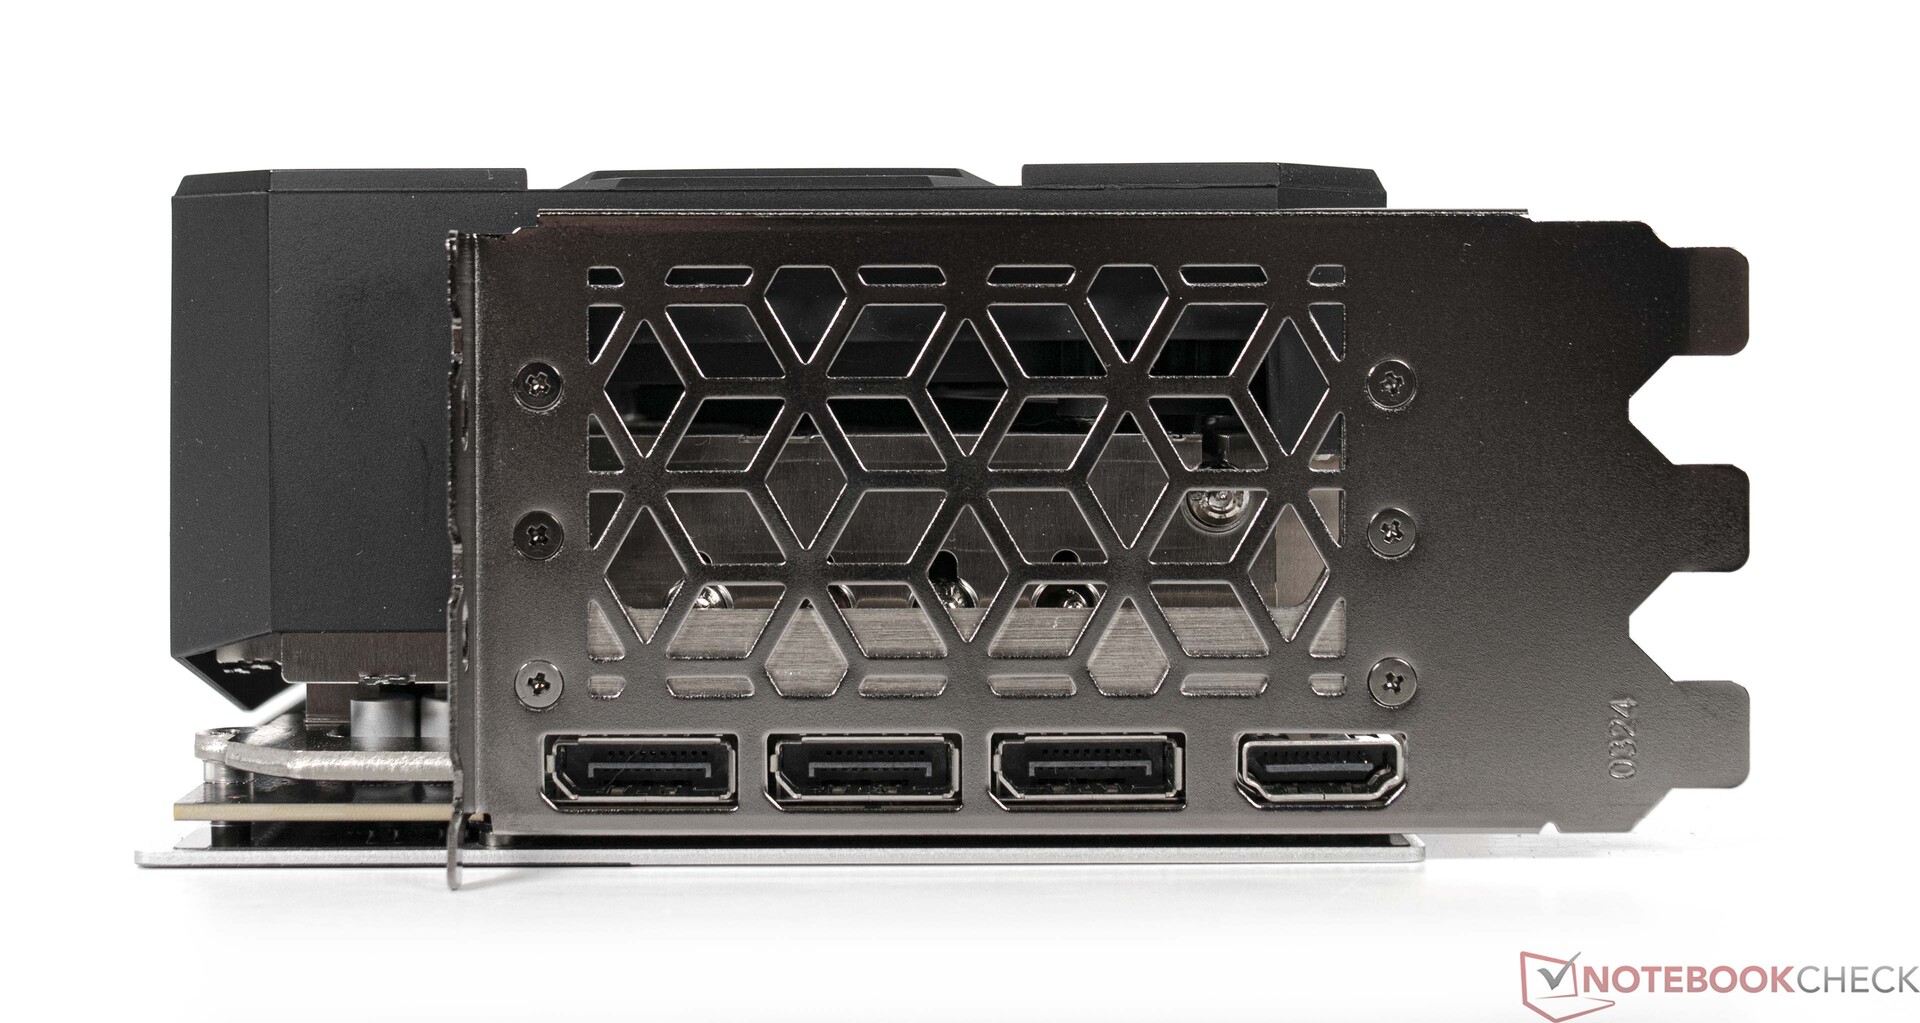
All'esterno, KFA2 GeForce RTX 4080 SG presenta 1 porta HDMI 2.1a e 3 porte DisplayPort 1.4a.

Confronto delle specifiche della GPU

Specifiche RTX 4090 (FE) RTX 4080 KFA2 RTX 4080 RTX 3090 Ti RTX 3090 (FE) RTX 3080 Ti (FE) RTX 3080 (FE) Titan RTX
Chip AD102 AD103 AD103 GA102 GA102 GA102 GA102 TU102
Processo FinFET 4 nm 4 nm 4 nm 8 nm 8 nm 8 nm 8 nm 12 nm
Core CUDA 16.384 9.728 9.728 10.752 10.496 10.240 8.704 4.608
Unità di texture 512 304 304 336 328 320 272 288
Core tensoriali 512 4. Gen. 304 4. Gen. Gen. 304 4. Gen. 336 3. Gen. 328 3. Gen. 320 3. Gen. Gen. 320 3. Gen. Gen. 272 3. Gen. Gen. 576 2. Gen.
Core RT 128 76 76 84 82 80 68 72
Clock di base della GPU 2.235 MHz 2.205 MHz 2.205 MHz 1.560 MHz 1.395 MHz 1.365 MHz 1.440 MHz 1.350 MHz
GPU boost clock 2.520 MHz 2.505 MHz 2.565 MHz 1.860 MHz 1.695 MHz 1.665 MHz 1.710 MHz 1.770 MHz
Bus di memoria 384 bit 256 bit 256 bit 384 bit 384 bit 384 bit 320 bit 384 bit
Larghezza di banda della memoria 1.008 GB/s 716,8 GB/s 716,8 GB/s 1.008 GB/s 936 GB/s 912,4 GB/s 760 GB/s 672 GB/s
Memoria video 24 GB GDDR6X 16 GB GDDR6X 16 GB GDDR6X 24 GB GDDR6X 24 GB GDDR6X 12 GB GDDR6X 10 GB GDDR6X 24 GB GDDR6
Consumo energetico 450 W 320 W 320 W 450 W 350 W 350 W 320 W 280 W

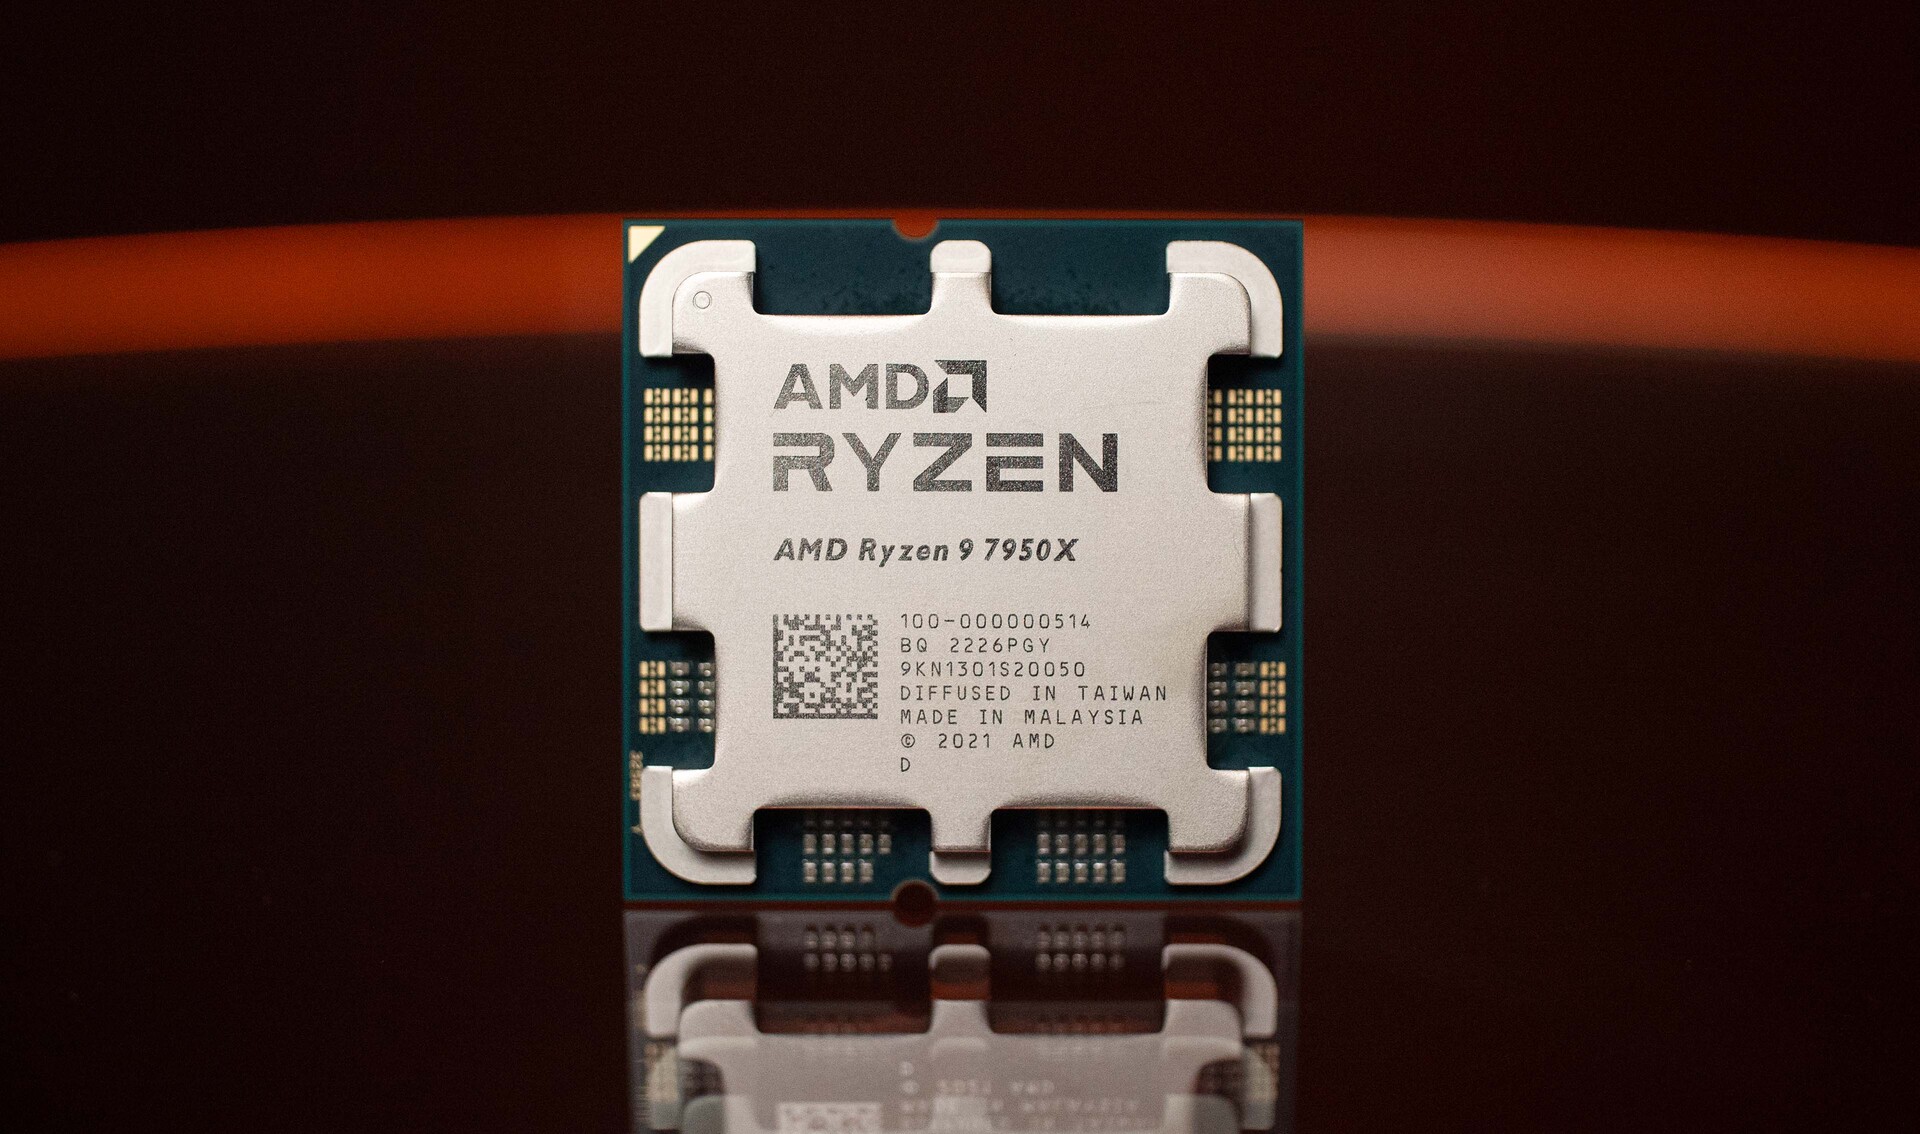
Il nostro sistema di test è basato su AMD Ryzen 9 7950X

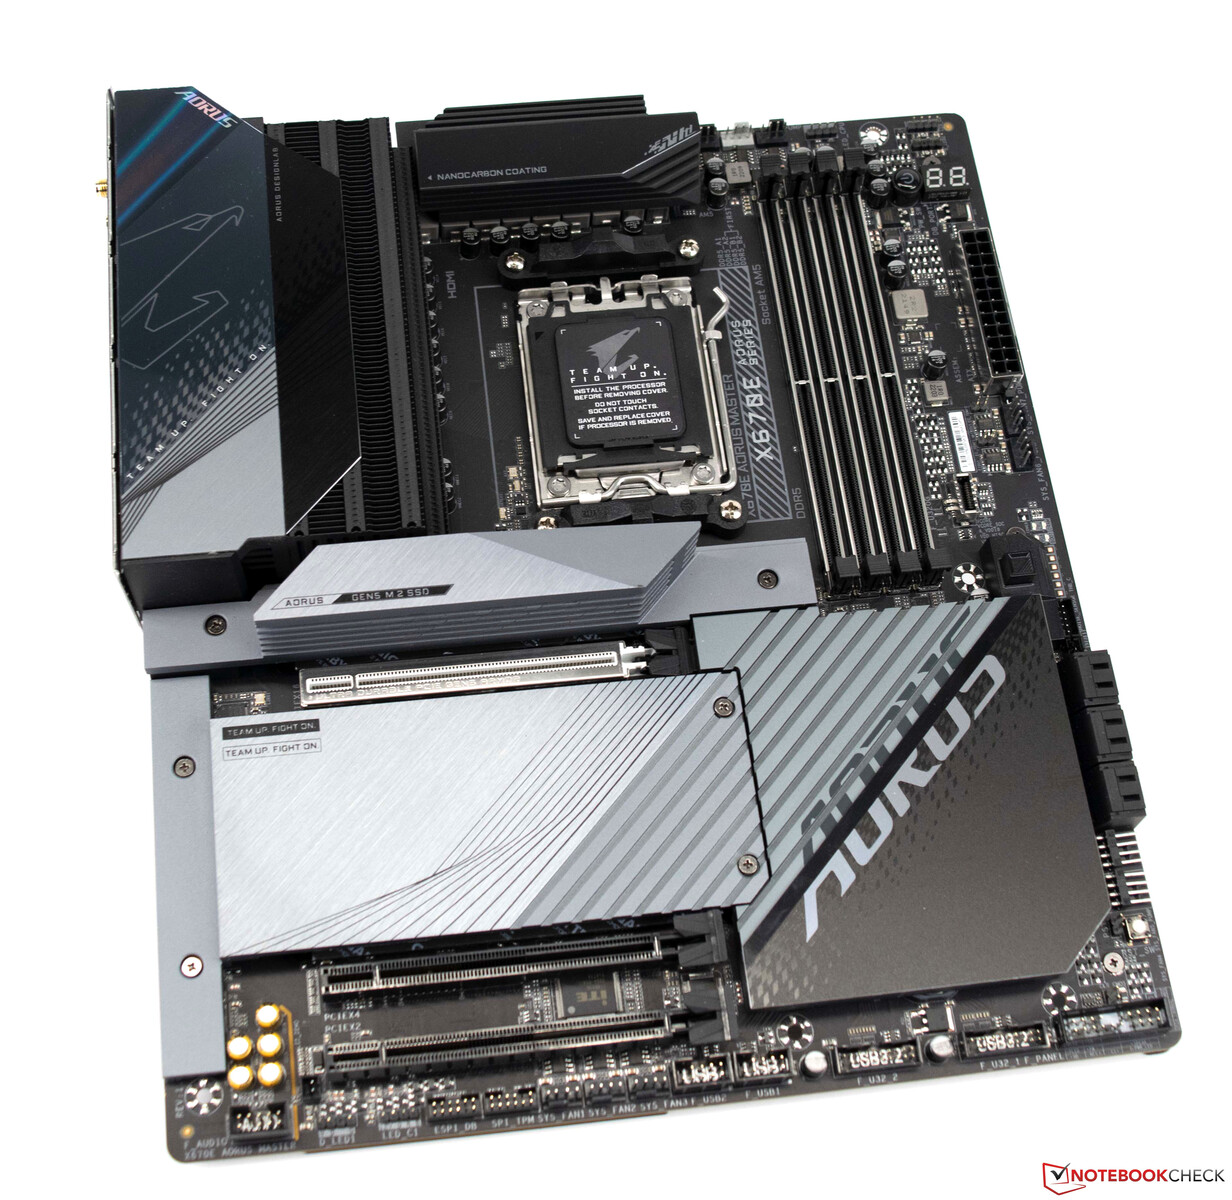
Il nostro sistema di prova è dotato di una scheda madre Gigabyte X670E Aorus Master abbinata a una CPU AMD ad alte prestazioni (Ryzen 9 7950X), raffreddata da una soluzione AIO di Alphacool (Alphacool Eisbaer Aurora 360 mm). Il sistema dispone di 32 GB di memoria G.Skill con un profilo EXPO appropriato ed è collegato a un monitor Gigabyte M32U.

Gigabyte X670E Aorus Master
AMD Ryzen 9 7950X
AMD Ryzen 9 7950X
G.Skill Trident Z5 Neo

Specifiche dettagliate del sistema di test

Per i benchmark e i test di questa recensione abbiamo utilizzato il seguente sistema:

  • Lian-Li O11 Dynamic
  • AMD Ryzen 9 7950X
  • Gigabyte X670E Aorus Master, BIOS: F8a
  • Alphacool Eisbear 360 AIO
  • Alimentatore Corsair RM 1000x
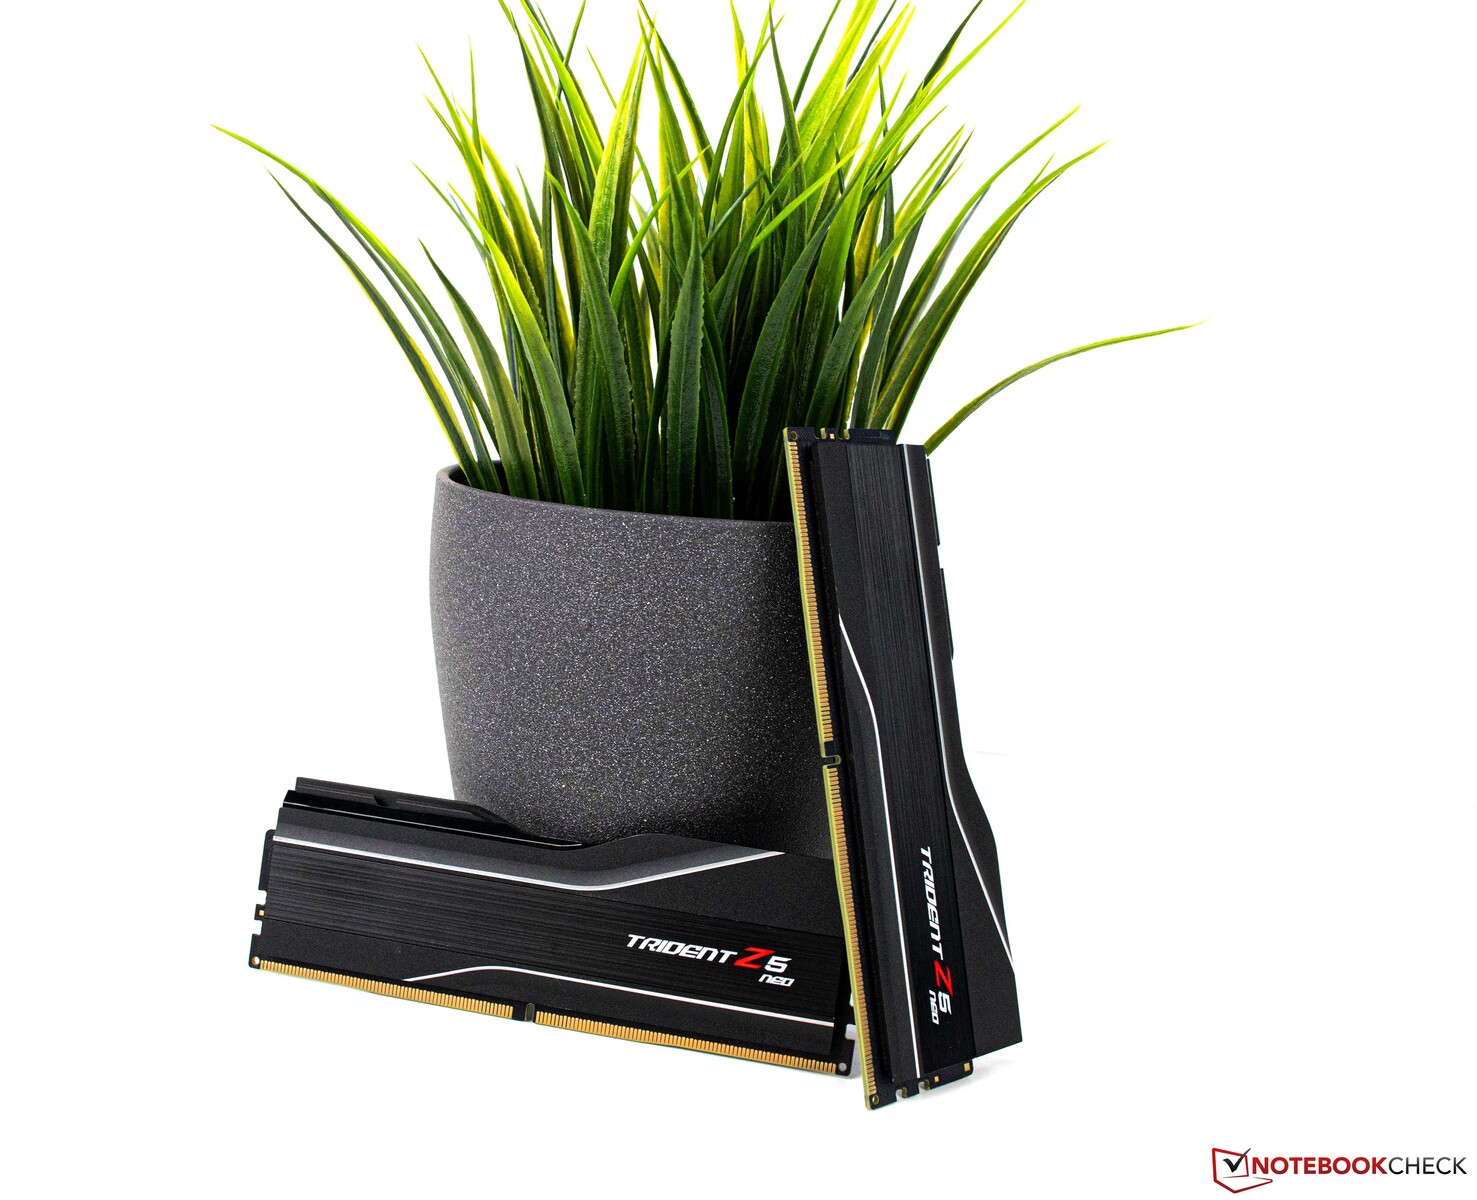
  • G.Skill Trident Z5 Neo DDR5-6000 2x 16 GB, EXPO (DDR5-6000 CL30-38-38-96)
  • Corsair MP600 2 TB
  • Crucial MX500 2 TB
  • Microsoft Windows 11 Professional 64-Bit (versione 22H2)

Dettagli su KFA2 GeForce RTX 4080 SG

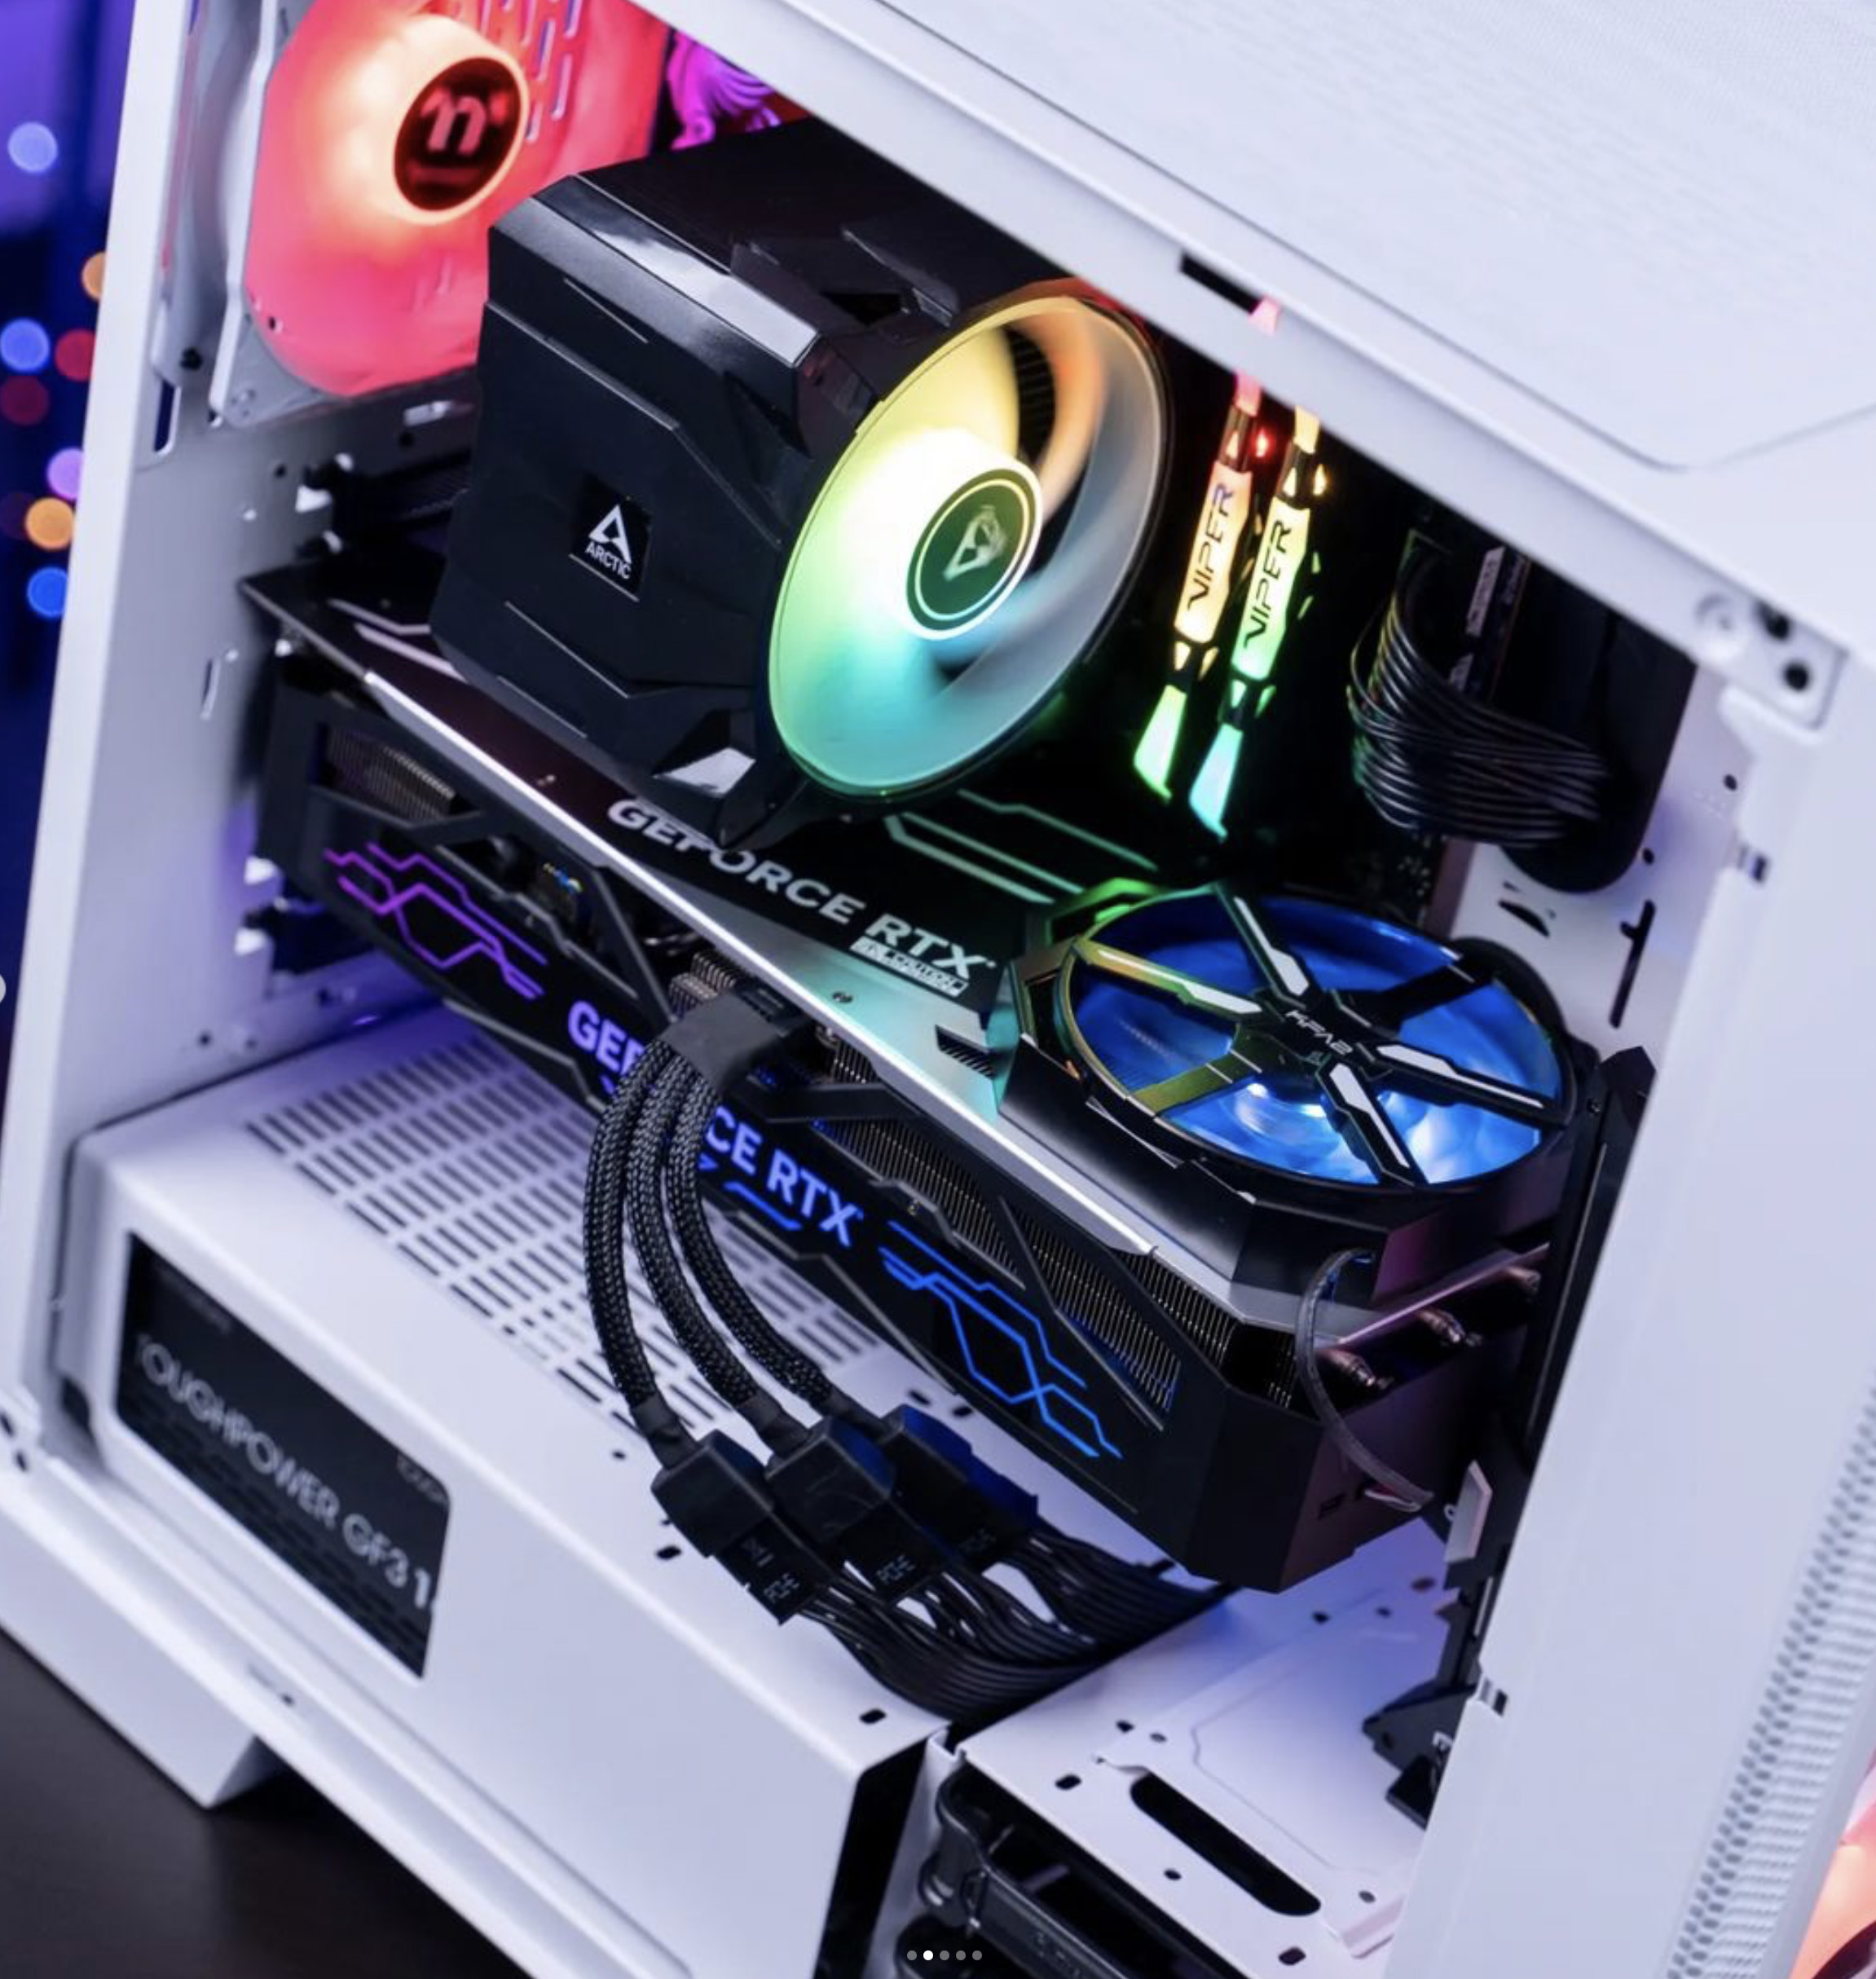
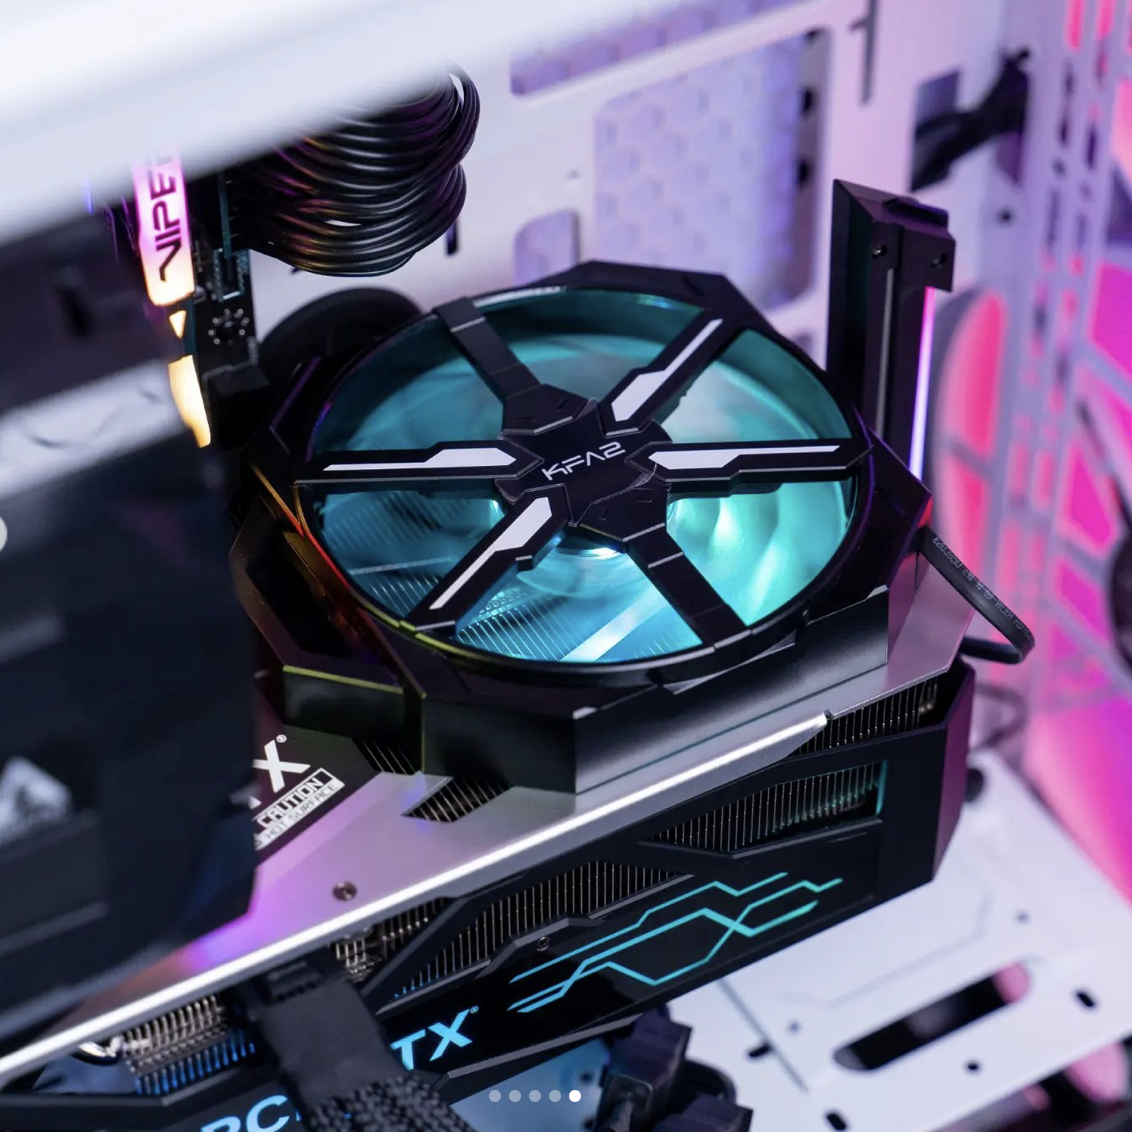
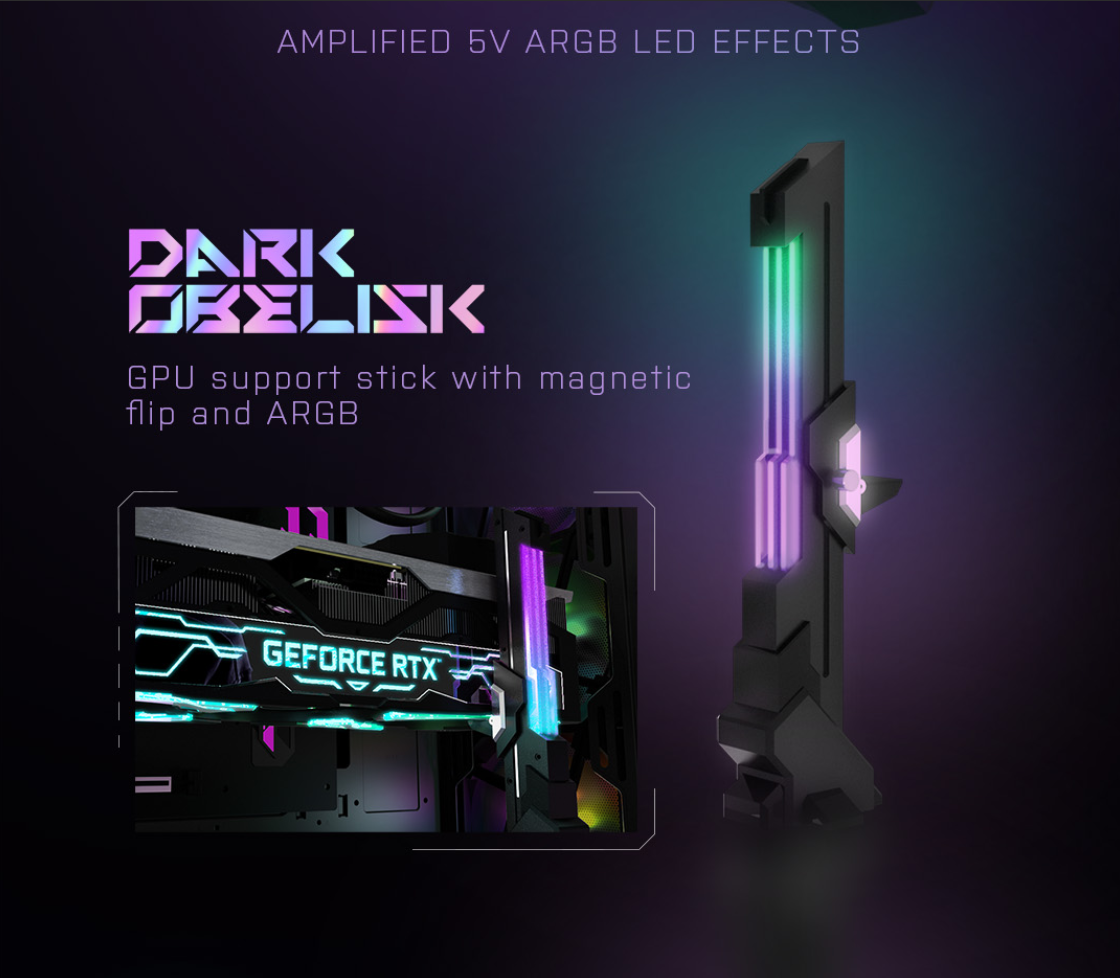
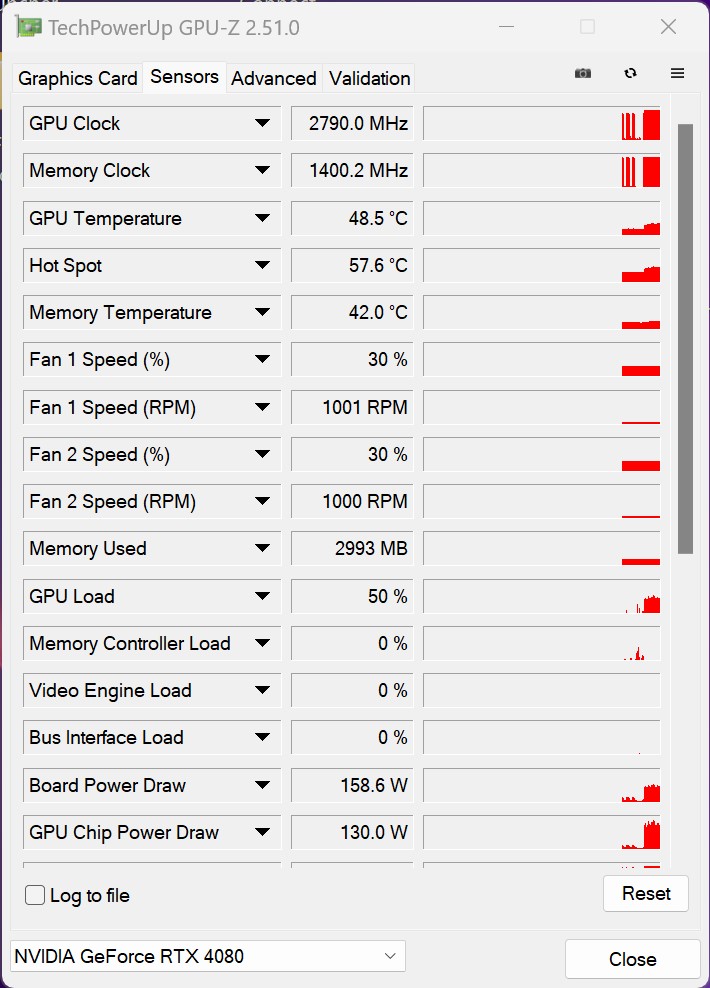
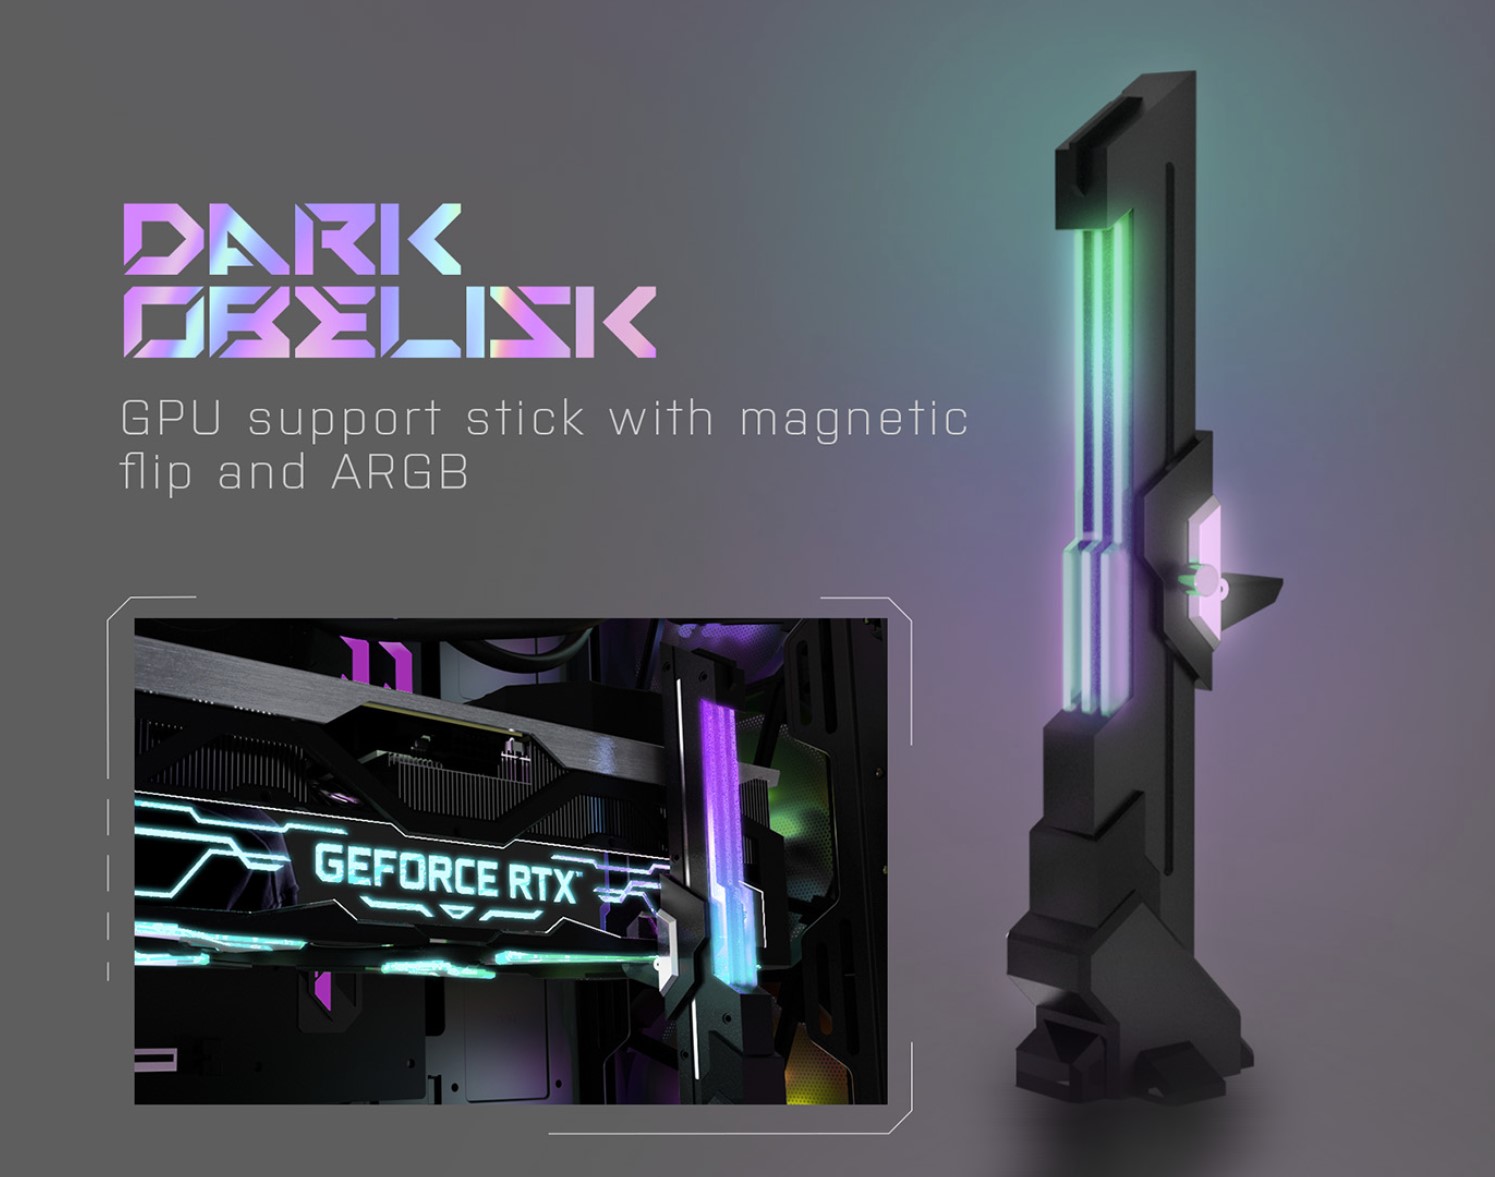
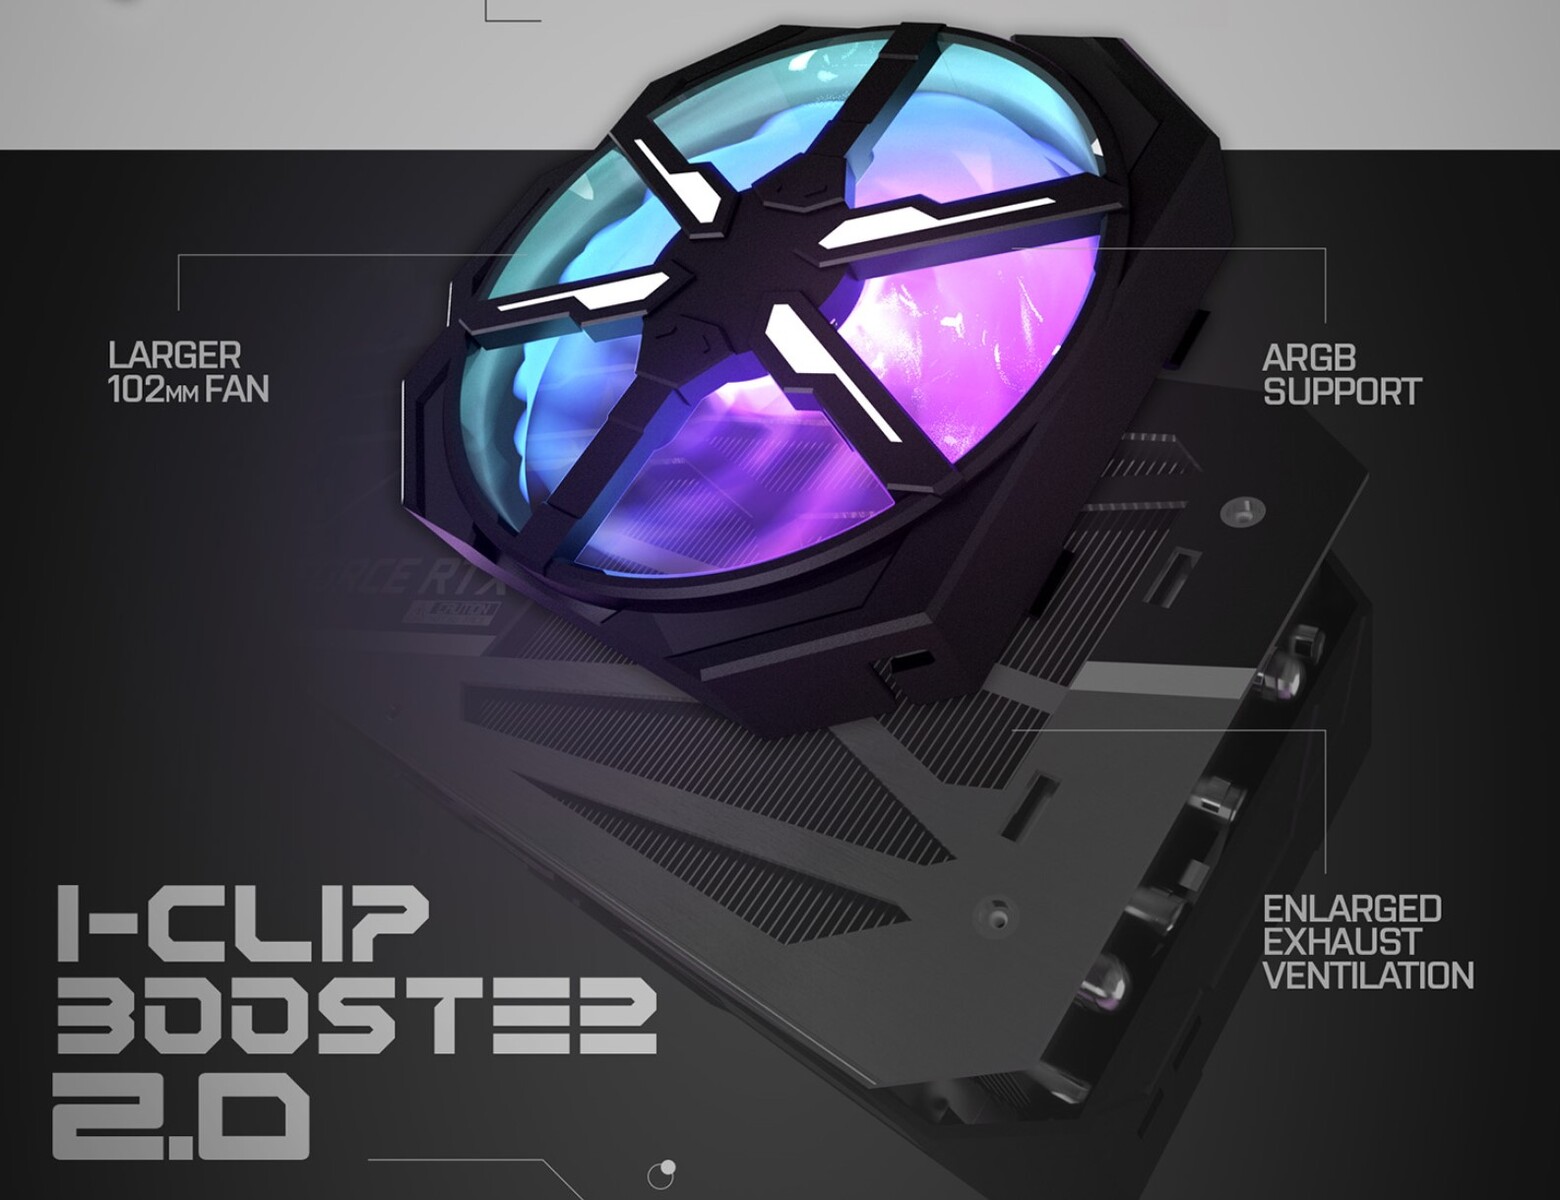
KFA2 ha dato alla GeForce RTX 4080 SG una velocità di clock leggermente superiore a quella specificata da Nvidia - il clock massimo di boost è stato aumentato di 60 MHz per essere precisi. Ma questo è irrilevante nella pratica, perché durante i nostri test siamo riusciti a raggiungere velocità più elevate. In media, abbiamo registrato velocità di clock della GPU di circa 2,8 GHz durante il gioco. Il leggero strumento Xtreme Tuner consente agli utenti di controllare le ventole e l'illuminazione della scheda grafica. Per i nostri test, tuttavia, non abbiamo apportato alcuna modifica alle impostazioni predefinite. La funzione 1-Click OC, spesso presente nei modelli KFA2, è più che altro una funzione di facciata. Nelle applicazioni reali, aumentare la velocità della GPU di soli 15 MHz non fa praticamente alcuna differenza. Ci auguriamo che in futuro questa funzione apporti qualcosa di più. Oltre alla scheda grafica stessa, nella confezione troverete anche una ventola opzionale progettata per essere montata sul retro della scheda. Peccato che la ventola sia incompatibile con la nostra scheda madre, impedendoci così di utilizzarla nella nostra recensione. L'azienda ha incluso anche una staffa per GPU (ARGB Dark Obelisk). Questo oggetto è dotato di illuminazione RGB integrata e quindi si sposa bene con il design complessivo della KFA2 GeForce RTX 4080 SG.

GPU-Z
GPU-Z
GPU-Z
GPU-Z
GPU-Z
GPU-Z
Obelisco scuro ARGB - Supporto GPU (fonte: KFA2)
ventola ARGB opzionale per il retro (fonte: KFA2)

Parametri di riferimento sintetici

Nei test sintetici, la KFA2 GeForce RTX 4080 SG ha fornito esattamente lo stesso livello di prestazioni della Founders Edition di Nvidia. La scheda KFA2 è stata in grado di superare una AMD Radeon RX 7900 XT dell'undici per cento. La GPU di punta di AMD, la Radeon RX 7900 XTX, si colloca nella stessa fascia di prestazioni ed è solo trascurabilmente più veloce della nostra unità di recensione. Dopo aver visto un enorme salto di prestazioni dalla GeForce RTX 3090 alla RTX 4090, abbiamo osservato un guadagno di prestazioni simile quando abbiamo confrontato la RTX 4080 con la RTX 3080 Ti. Nel complesso, l'architettura Ada Lovelace di Nvidia offre ben il 26% di prestazioni in più rispetto ad Ampere.

In termini di prestazioni di calcolo, Nvidia ha chiaramente la meglio in alcuni casi, mentre AMD è decisamente migliore in altri. Per questo motivo, coloro che sono alla ricerca di prestazioni di calcolo elevate devono considerare attentamente quali programmi software intendono utilizzare e quale scheda grafica è in vantaggio in quelle particolari applicazioni. Per questo motivo, non possiamo raccomandare in modo definitivo un prodotto in particolare.

Performance Rating - Percent
Palit GeForce RTX 4090 GameRock OC
99.4 pt
KFA2 GeForce RTX 4090 SG
98.3 pt
AMD Radeon RX 7900 XTX
80.9 pt
NVIDIA GeForce RTX 4080 Founders Edition
80.2 pt
KFA2 GeForce RTX 4080 SG
79.5 pt
AMD Radeon RX 7900 XT
71.9 pt
MSI Radeon RX 6950 XT Gaming X Trio
65.2 pt
ASUS TUF Gaming GeForce RTX 3080 Ti OC
62.9 pt
NVIDIA GeForce RTX 3090 Founders Edition
62.4 pt
Sapphire AMD Radeon RX 6950 XT Nitro+ Pure
61.5 pt
KFA2 GeForce RTX 3080 SG
55.4 pt
Nvidia Titan RTX
50.3 pt
3DMark
2560x1440 Time Spy Graphics
Palit GeForce RTX 4090 GameRock OC
36836 Points +33%
KFA2 GeForce RTX 4090 SG
36252 Points +30%
AMD Radeon RX 7900 XTX
29699 Points +7%
NVIDIA GeForce RTX 4080 Founders Edition
28133 Points +1%
KFA2 GeForce RTX 4080 SG
27791 Points
AMD Radeon RX 7900 XT
25874 Points -7%
MSI Radeon RX 6950 XT Gaming X Trio
22289 Points -20%
Sapphire AMD Radeon RX 6950 XT Nitro+ Pure
21719 Points -22%
NVIDIA GeForce RTX 3090 Founders Edition
19467 Points -30%
ASUS TUF Gaming GeForce RTX 3080 Ti OC
19460 Points -30%
KFA2 GeForce RTX 3080 SG
17956 Points -35%
Nvidia Titan RTX
15106 Points -46%
Fire Strike Extreme Graphics
Palit GeForce RTX 4090 GameRock OC
46270 Points +36%
KFA2 GeForce RTX 4090 SG
45470 Points +34%
AMD Radeon RX 7900 XTX
39570 Points +17%
KFA2 GeForce RTX 4080 SG
33912 Points
AMD Radeon RX 7900 XT
33747 Points 0%
NVIDIA GeForce RTX 4080 Founders Edition
33475 Points -1%
MSI Radeon RX 6950 XT Gaming X Trio
30406 Points -10%
Sapphire AMD Radeon RX 6950 XT Nitro+ Pure
29704 Points -12%
NVIDIA GeForce RTX 3090 Founders Edition
24730 Points -27%
ASUS TUF Gaming GeForce RTX 3080 Ti OC
24250 Points -28%
KFA2 GeForce RTX 3080 SG
22078 Points -35%
Nvidia Titan RTX
17759 Points -48%
3840x2160 Fire Strike Ultra Graphics
Palit GeForce RTX 4090 GameRock OC
25018 Points +46%
KFA2 GeForce RTX 4090 SG
24633 Points +44%
AMD Radeon RX 7900 XTX
20214 Points +18%
NVIDIA GeForce RTX 4080 Founders Edition
17122 Points 0%
KFA2 GeForce RTX 4080 SG
17120 Points
AMD Radeon RX 7900 XT
17078 Points 0%
MSI Radeon RX 6950 XT Gaming X Trio
15188 Points -11%
Sapphire AMD Radeon RX 6950 XT Nitro+ Pure
14978 Points -13%
NVIDIA GeForce RTX 3090 Founders Edition
12587 Points -26%
ASUS TUF Gaming GeForce RTX 3080 Ti OC
12341 Points -28%
KFA2 GeForce RTX 3080 SG
11340 Points -34%
Nvidia Titan RTX
8755 Points -49%
1920x1080 Fire Strike Graphics
Palit GeForce RTX 4090 GameRock OC
72678 Points +11%
KFA2 GeForce RTX 4090 SG
72165 Points +11%
AMD Radeon RX 7900 XTX
66967 Points +3%
KFA2 GeForce RTX 4080 SG
65190 Points
AMD Radeon RX 7900 XT
63712 Points -2%
Sapphire AMD Radeon RX 6950 XT Nitro+ Pure
60092 Points -8%
MSI Radeon RX 6950 XT Gaming X Trio
59672 Points -8%
NVIDIA GeForce RTX 4080 Founders Edition
58893 Points -10%
NVIDIA GeForce RTX 3090 Founders Edition
48831 Points -25%
ASUS TUF Gaming GeForce RTX 3080 Ti OC
48709 Points -25%
KFA2 GeForce RTX 3080 SG
44533 Points -32%
Nvidia Titan RTX
37257 Points -43%
Unigine Superposition
7680x4320 8k Optimized
Palit GeForce RTX 4090 GameRock OC
13082 Points +52%
KFA2 GeForce RTX 4090 SG
12979 Points +51%
AMD Radeon RX 7900 XTX
8751 Points +2%
KFA2 GeForce RTX 4080 SG
8604 Points
NVIDIA GeForce RTX 4080 Founders Edition
8556 Points -1%
ASUS TUF Gaming GeForce RTX 3080 Ti OC
7161 Points -17%
NVIDIA GeForce RTX 3090 Founders Edition
7051 Points -18%
AMD Radeon RX 7900 XT
7034 Points -18%
Sapphire AMD Radeon RX 6950 XT Nitro+ Pure
6645 Points -23%
KFA2 GeForce RTX 3080 SG
6548 Points -24%
MSI Radeon RX 6950 XT Gaming X Trio
6464 Points -25%
Nvidia Titan RTX
5402 Points -37%
3840x2160 4k Optimized
Palit GeForce RTX 4090 GameRock OC
33943 Points +51%
KFA2 GeForce RTX 4090 SG
33581 Points +49%
AMD Radeon RX 7900 XTX
23174 Points +3%
KFA2 GeForce RTX 4080 SG
22482 Points
NVIDIA GeForce RTX 4080 Founders Edition
22343 Points -1%
AMD Radeon RX 7900 XT
18806 Points -16%
Sapphire AMD Radeon RX 6950 XT Nitro+ Pure
17725 Points -21%
MSI Radeon RX 6950 XT Gaming X Trio
16993 Points -24%
ASUS TUF Gaming GeForce RTX 3080 Ti OC
16412 Points -27%
NVIDIA GeForce RTX 3090 Founders Edition
16188 Points -28%
KFA2 GeForce RTX 3080 SG
14986 Points -33%
Nvidia Titan RTX
12050 Points -46%
1920x1080 1080p Extreme
Palit GeForce RTX 4090 GameRock OC
21824 Points +31%
KFA2 GeForce RTX 4090 SG
21288 Points +28%
AMD Radeon RX 7900 XTX
17264 Points +4%
KFA2 GeForce RTX 4080 SG
16635 Points
NVIDIA GeForce RTX 4080 Founders Edition
16623 Points 0%
AMD Radeon RX 7900 XT
14181 Points -15%
ASUS TUF Gaming GeForce RTX 3080 Ti OC
12347 Points -26%
Sapphire AMD Radeon RX 6950 XT Nitro+ Pure
12079 Points -27%
NVIDIA GeForce RTX 3090 Founders Edition
12059 Points -28%
MSI Radeon RX 6950 XT Gaming X Trio
12048 Points -28%
KFA2 GeForce RTX 3080 SG
11424 Points -31%
Nvidia Titan RTX
9014 Points -46%
1920x1080 1080p High
Palit GeForce RTX 4090 GameRock OC
46814 Points +27%
KFA2 GeForce RTX 4090 SG
45619 Points +24%
NVIDIA GeForce RTX 4080 Founders Edition
37399 Points +2%
KFA2 GeForce RTX 4080 SG
36824 Points
AMD Radeon RX 7900 XTX
36536 Points -1%
AMD Radeon RX 7900 XT
31426 Points -15%
MSI Radeon RX 6950 XT Gaming X Trio
28797 Points -22%
Sapphire AMD Radeon RX 6950 XT Nitro+ Pure
28478 Points -23%
ASUS TUF Gaming GeForce RTX 3080 Ti OC
26711 Points -27%
NVIDIA GeForce RTX 3090 Founders Edition
26320 Points -29%
KFA2 GeForce RTX 3080 SG
24051 Points -35%
Nvidia Titan RTX
20335 Points -45%
1280x720 720p Low
NVIDIA GeForce RTX 4080 Founders Edition
55670 Points +12%
Palit GeForce RTX 4090 GameRock OC
51741 Points +4%
Nvidia Titan RTX
50876 Points +2%
KFA2 GeForce RTX 4090 SG
50650 Points +2%
NVIDIA GeForce RTX 3090 Founders Edition
50487 Points +2%
ASUS TUF Gaming GeForce RTX 3080 Ti OC
49754 Points 0%
KFA2 GeForce RTX 4080 SG
49734 Points
AMD Radeon RX 7900 XTX
47274 Points -5%
AMD Radeon RX 7900 XT
45904 Points -8%
MSI Radeon RX 6950 XT Gaming X Trio
42809 Points -14%
KFA2 GeForce RTX 3080 SG
38209 Points -23%
Sapphire AMD Radeon RX 6950 XT Nitro+ Pure
33955 Points -32%
Unigine Heaven 4.0
Extreme Preset DX11
Palit GeForce RTX 4090 GameRock OC
491.5 fps +23%
KFA2 GeForce RTX 4090 SG
486.9 fps +22%
KFA2 GeForce RTX 4080 SG
399.9 fps
NVIDIA GeForce RTX 4080 Founders Edition
389.4 (11.3min - 813.1max) fps -3%
AMD Radeon RX 7900 XTX
357.6 fps -11%
AMD Radeon RX 7900 XT
319.7 fps -20%
MSI Radeon RX 6950 XT Gaming X Trio
317.8 fps -21%
ASUS TUF Gaming GeForce RTX 3080 Ti OC
311.6 fps -22%
NVIDIA GeForce RTX 3090 Founders Edition
309.7 fps -23%
Sapphire AMD Radeon RX 6950 XT Nitro+ Pure
293.8 fps -27%
KFA2 GeForce RTX 3080 SG
274.3 fps -31%
Nvidia Titan RTX
248.1 fps -38%
Extreme Preset OpenGL
Palit GeForce RTX 4090 GameRock OC
450.4 fps +21%
KFA2 GeForce RTX 4090 SG
447.1 fps +20%
KFA2 GeForce RTX 4080 SG
371.1 fps
AMD Radeon RX 7900 XTX
370.2 fps 0%
NVIDIA GeForce RTX 4080 Founders Edition
364.2 (15min - 770.5max) fps -2%
AMD Radeon RX 7900 XT
330.2 fps -11%
ASUS TUF Gaming GeForce RTX 3080 Ti OC
282.1 fps -24%
NVIDIA GeForce RTX 3090 Founders Edition
274.7 fps -26%
MSI Radeon RX 6950 XT Gaming X Trio
251.9 fps -32%
KFA2 GeForce RTX 3080 SG
251.4 fps -32%
Sapphire AMD Radeon RX 6950 XT Nitro+ Pure
222.7 fps -40%
Nvidia Titan RTX
218 fps -41%
Unigine Valley 1.0
1920x1080 Extreme HD DirectX AA:x8
NVIDIA GeForce RTX 4080 Founders Edition
277.5 (71.7min - 487.9max) fps +8%
KFA2 GeForce RTX 4090 SG
276 fps +7%
Palit GeForce RTX 4090 GameRock OC
270.7 fps +5%
AMD Radeon RX 7900 XTX
264.5 fps +3%
KFA2 GeForce RTX 4080 SG
257 fps
AMD Radeon RX 7900 XT
243.3 fps -5%
MSI Radeon RX 6950 XT Gaming X Trio
239.4 fps -7%
ASUS TUF Gaming GeForce RTX 3080 Ti OC
237.3 fps -8%
NVIDIA GeForce RTX 3090 Founders Edition
235.4 fps -8%
Sapphire AMD Radeon RX 6950 XT Nitro+ Pure
209.2 fps -19%
KFA2 GeForce RTX 3080 SG
203.8 fps -21%
Nvidia Titan RTX
191.4 fps -26%
1920x1080 Extreme HD Preset OpenGL AA:x8
Palit GeForce RTX 4090 GameRock OC
288 fps +24%
KFA2 GeForce RTX 4090 SG
288 fps +24%
NVIDIA GeForce RTX 4080 Founders Edition
257 (79.3min - 462.8max) fps +11%
AMD Radeon RX 7900 XTX
254.2 fps +10%
KFA2 GeForce RTX 4080 SG
231.8 fps
AMD Radeon RX 7900 XT
225.9 fps -3%
ASUS TUF Gaming GeForce RTX 3080 Ti OC
208.8 fps -10%
NVIDIA GeForce RTX 3090 Founders Edition
205.8 fps -11%
MSI Radeon RX 6950 XT Gaming X Trio
186.5 fps -20%
KFA2 GeForce RTX 3080 SG
186.1 fps -20%
Sapphire AMD Radeon RX 6950 XT Nitro+ Pure
176.9 fps -24%
Nvidia Titan RTX
160.8 fps -31%
3DMark 11
1280x720 Performance GPU
Palit GeForce RTX 4090 GameRock OC
107723 Points +22%
KFA2 GeForce RTX 4090 SG
106709 Points +21%
KFA2 GeForce RTX 4080 SG
88359 Points
NVIDIA GeForce RTX 4080 Founders Edition
86838 Points -2%
AMD Radeon RX 7900 XTX
83322 Points -6%
AMD Radeon RX 7900 XT
77784 Points -12%
MSI Radeon RX 6950 XT Gaming X Trio
73975 Points -16%
Sapphire AMD Radeon RX 6950 XT Nitro+ Pure
70480 Points -20%
NVIDIA GeForce RTX 3090 Founders Edition
62735 Points -29%
ASUS TUF Gaming GeForce RTX 3080 Ti OC
62189 Points -30%
KFA2 GeForce RTX 3080 SG
56634 Points -36%
Nvidia Titan RTX
50900 Points -42%
1280x720 Performance
Palit GeForce RTX 4090 GameRock OC
69323 Points +10%
KFA2 GeForce RTX 4090 SG
69012 Points +10%
KFA2 GeForce RTX 4080 SG
62760 Points
NVIDIA GeForce RTX 4080 Founders Edition
60209 Points -4%
AMD Radeon RX 7900 XTX
56526 Points -10%
AMD Radeon RX 7900 XT
54796 Points -13%
MSI Radeon RX 6950 XT Gaming X Trio
52806 Points -16%
ASUS TUF Gaming GeForce RTX 3080 Ti OC
51094 Points -19%
NVIDIA GeForce RTX 3090 Founders Edition
48185 Points -23%
Nvidia Titan RTX
44979 Points -28%
Sapphire AMD Radeon RX 6950 XT Nitro+ Pure
44827 Points -29%
KFA2 GeForce RTX 3080 SG
41410 Points -34%

Compute benchmarks and professional applications

LuxMark v2.0 64Bit
Sala GPUs-only
AMD Radeon RX 6950 XT
31954 Samples/s +34%
NVIDIA GeForce RTX 4090
27201 Samples/s +14%
NVIDIA GeForce RTX 4090
26576 Samples/s +12%
NVIDIA GeForce RTX 4080
24835 Samples/s +4%
KFA2 GeForce RTX 4080 SG
23809 Samples/s
NVIDIA GeForce RTX 3080 Ti
15115 Samples/s -37%
AMD Radeon RX 7900 XTX
15019 Samples/s -37%
NVIDIA GeForce RTX 3090
14990 Samples/s -37%
NVIDIA GeForce RTX 3080 12 GB
14204 Samples/s -40%
AMD Radeon RX 7900 XT
13489 Samples/s -43%
AMD Radeon RX 6950 XT
12057 Samples/s -49%
NVIDIA Titan RTX
10996 Samples/s -54%
Room GPUs-only
NVIDIA GeForce RTX 4090
12316 Samples/s +26%
NVIDIA GeForce RTX 4090
12190 Samples/s +25%
NVIDIA GeForce RTX 4080
10491 Samples/s +8%
KFA2 GeForce RTX 4080 SG
9757 Samples/s
NVIDIA GeForce RTX 3090
5948 Samples/s -39%
NVIDIA GeForce RTX 3080 Ti
5857 Samples/s -40%
NVIDIA GeForce RTX 3080 12 GB
5768 Samples/s -41%
AMD Radeon RX 7900 XTX
5161 Samples/s -47%
AMD Radeon RX 6950 XT
5097 Samples/s -48%
NVIDIA Titan RTX
4703 Samples/s -52%
AMD Radeon RX 7900 XT
4451 Samples/s -54%
AMD Radeon RX 6950 XT
4173 Samples/s -57%
ComputeMark v2.1
1024x600 Normal, QJuliaRayTrace
NVIDIA GeForce RTX 4090
34332 Points +39%
NVIDIA GeForce RTX 4090
33298 Points +35%
KFA2 GeForce RTX 4080 SG
24631 Points
NVIDIA GeForce RTX 4080
24307 Points -1%
AMD Radeon RX 7900 XTX
17915 Points -27%
NVIDIA GeForce RTX 3080 Ti
17749 Points -28%
NVIDIA GeForce RTX 3090
17713 Points -28%
AMD Radeon RX 7900 XT
16990 Points -31%
NVIDIA GeForce RTX 3080 12 GB
15594 Points -37%
AMD Radeon RX 6950 XT
13672 Points -44%
AMD Radeon RX 6950 XT
13580 Points -45%
NVIDIA Titan RTX
10129 Points -59%
1024x600 Normal, Mandel Scalar
NVIDIA GeForce RTX 4090
22889 Points +55%
NVIDIA GeForce RTX 4090
22402 Points +51%
AMD Radeon RX 7900 XTX
15458 Points +4%
KFA2 GeForce RTX 4080 SG
14810 Points
NVIDIA GeForce RTX 4080
14733 Points -1%
AMD Radeon RX 7900 XT
13989 Points -6%
AMD Radeon RX 6950 XT
12020 Points -19%
AMD Radeon RX 6950 XT
11854 Points -20%
NVIDIA GeForce RTX 3080 Ti
11318 Points -24%
NVIDIA GeForce RTX 3090
11270 Points -24%
NVIDIA GeForce RTX 3080 12 GB
9698 Points -35%
NVIDIA Titan RTX
6406 Points -57%
1024x600 Normal, Mandel Vector
NVIDIA GeForce RTX 4090
17336 Points +55%
NVIDIA GeForce RTX 4090
16935 Points +51%
AMD Radeon RX 7900 XTX
13737 Points +22%
AMD Radeon RX 7900 XT
13022 Points +16%
NVIDIA GeForce RTX 4080
11772 Points +5%
KFA2 GeForce RTX 4080 SG
11220 Points
AMD Radeon RX 6950 XT
9933 Points -11%
NVIDIA GeForce RTX 3090
9861 Points -12%
NVIDIA GeForce RTX 3080 Ti
9860 Points -12%
AMD Radeon RX 6950 XT
9555 Points -15%
NVIDIA GeForce RTX 3080 12 GB
8326 Points -26%
NVIDIA Titan RTX
5440 Points -52%
1024x600 Normal, Fluid 2DTexArr
AMD Radeon RX 7900 XTX
7315 Points +31%
NVIDIA GeForce RTX 4090
6891 Points +23%
NVIDIA GeForce RTX 4090
6792 Points +21%
AMD Radeon RX 7900 XT
6460 Points +15%
KFA2 GeForce RTX 4080 SG
5605 Points
NVIDIA GeForce RTX 4080
5523 Points -1%
NVIDIA GeForce RTX 3080 Ti
4546 Points -19%
NVIDIA GeForce RTX 3090
4517 Points -19%
AMD Radeon RX 6950 XT
4455 Points -21%
AMD Radeon RX 6950 XT
4349 Points -22%
NVIDIA GeForce RTX 3080 12 GB
4175 Points -26%
NVIDIA Titan RTX
3828 Points -32%
1024x600 Normal, Fluid 3DTex
NVIDIA GeForce RTX 4090
10724 Points +65%
NVIDIA GeForce RTX 4090
10589 Points +63%
AMD Radeon RX 7900 XTX
8537 Points +32%
AMD Radeon RX 7900 XT
7109 Points +10%
KFA2 GeForce RTX 4080 SG
6484 Points
NVIDIA GeForce RTX 4080
6385 Points -2%
AMD Radeon RX 6950 XT
5577 Points -14%
AMD Radeon RX 6950 XT
5515 Points -15%
NVIDIA GeForce RTX 3090
5501 Points -15%
NVIDIA GeForce RTX 3080 Ti
5418 Points -16%
NVIDIA GeForce RTX 3080 12 GB
4900 Points -24%
NVIDIA Titan RTX
4027 Points -38%
1024x600 Normal, Score
NVIDIA GeForce RTX 4090
92171 Points +47%
NVIDIA GeForce RTX 4090
90016 Points +43%
AMD Radeon RX 7900 XTX
62963 Points 0%
KFA2 GeForce RTX 4080 SG
62753 Points
NVIDIA GeForce RTX 4080
62720 Points 0%
AMD Radeon RX 7900 XT
57570 Points -8%
NVIDIA GeForce RTX 3080 Ti
48892 Points -22%
NVIDIA GeForce RTX 3090
48862 Points -22%
AMD Radeon RX 6950 XT
45552 Points -27%
AMD Radeon RX 6950 XT
44959 Points -28%
NVIDIA GeForce RTX 3080 12 GB
42692 Points -32%
NVIDIA Titan RTX
29830 Points -52%
Blender - v3.3 Classroom CUDA
NVIDIA Titan RTX
31 Seconds *
NVIDIA GeForce RTX 3080 Ti
21 Seconds *
Geekbench 5.5
OpenCL Score
NVIDIA GeForce RTX 4090
354266 Points +32%
NVIDIA GeForce RTX 4090
351918 Points +31%
KFA2 GeForce RTX 4080 SG
267859 Points
NVIDIA GeForce RTX 4080
267804 Points 0%
NVIDIA GeForce RTX 3090
214334 Points -20%
NVIDIA GeForce RTX 3080 12 GB
201306 Points -25%
AMD Radeon RX 6950 XT
190428 Points -29%
NVIDIA Titan RTX
145407 Points -46%
Vulkan Score
NVIDIA GeForce RTX 4090
139130 Points
NVIDIA GeForce RTX 4090
112022 Points
NVIDIA Titan RTX
94363 Points
NVIDIA GeForce RTX 3090
91596 Points
AMD Radeon RX 6950 XT
87497 Points
NVIDIA GeForce RTX 3080 12 GB
62742 Points
V-Ray 5 Benchmark
GPU CUDA
NVIDIA GeForce RTX 4090
4393 mpaths +42%
NVIDIA GeForce RTX 4090
4332 mpaths +40%
KFA2 GeForce RTX 4080 SG
3089 mpaths
NVIDIA GeForce RTX 4080
3067 mpaths -1%
NVIDIA GeForce RTX 3090
2102 mpaths -32%
NVIDIA GeForce RTX 3080 Ti
2070 mpaths -33%
NVIDIA GeForce RTX 3080 12 GB
383 mpaths -88%
AMD Radeon RX 6950 XT
383 mpaths -88%
GPU RTX
NVIDIA GeForce RTX 4090
6053 mpaths +44%
NVIDIA GeForce RTX 4090
6010 mpaths +43%
KFA2 GeForce RTX 4080 SG
4209 mpaths
NVIDIA GeForce RTX 4080
4193 mpaths 0%
NVIDIA GeForce RTX 3090
2979 mpaths -29%
NVIDIA GeForce RTX 3080 Ti
2883 mpaths -32%
Premiere Pro PugetBench
Overall Score 0.9
NVIDIA GeForce RTX 4090
1018 Points +6%
KFA2 GeForce RTX 4080 SG
962 Points
NVIDIA Titan RTX
954 Points -1%
AMD Radeon RX 7900 XTX
928 Points -4%
NVIDIA GeForce RTX 3080 Ti
927 Points -4%
AMD Radeon RX 6950 XT
920 Points -4%
AMD Radeon RX 7900 XT
903 Points -6%
NVIDIA GeForce RTX 3080 12 GB
796 Points -17%
AMD Radeon RX 6950 XT
717 Points -25%
GPU 0.9
NVIDIA GeForce RTX 4090
100.2 Points +18%
KFA2 GeForce RTX 4080 SG
85.1 Points
NVIDIA GeForce RTX 3080 Ti
81.3 Points -4%
NVIDIA GeForce RTX 3080 12 GB
81.2 Points -5%
AMD Radeon RX 7900 XTX
71.1 Points -16%
NVIDIA Titan RTX
69.7 Points -18%
AMD Radeon RX 7900 XT
67 Points -21%
AMD Radeon RX 6950 XT
66.1 Points -22%
AMD Radeon RX 6950 XT
65.3 Points -23%
Photoshop PugetBench
Overall Score
AMD Radeon RX 7900 XT
1619 Points +4%
AMD Radeon RX 7900 XTX
1594 Points +2%
KFA2 GeForce RTX 4080 SG
1563 Points
AMD Radeon RX 6950 XT
1560 Points 0%
NVIDIA GeForce RTX 4090
1559 Points 0%
NVIDIA GeForce RTX 3080 Ti
1555 Points -1%
NVIDIA Titan RTX
1346 Points -14%
AMD Radeon RX 6950 XT
1128 Points -28%
NVIDIA GeForce RTX 3080 12 GB
1005 Points -36%
GPU Score
AMD Radeon RX 7900 XT
169.5 Points +7%
AMD Radeon RX 7900 XTX
169.3 Points +7%
AMD Radeon RX 6950 XT
169 Points +7%
KFA2 GeForce RTX 4080 SG
158.4 Points
NVIDIA GeForce RTX 4090
155.7 Points -2%
NVIDIA GeForce RTX 3080 Ti
155.2 Points -2%
NVIDIA Titan RTX
132.1 Points -17%
AMD Radeon RX 6950 XT
131.5 Points -17%
NVIDIA GeForce RTX 3080 12 GB
109.4 Points -31%
Affinity Photo 2 - Combined (Single / Multi GPU)
NVIDIA GeForce RTX 4090
8448 Points +4%
KFA2 GeForce RTX 4080 SG
8144 Points
NVIDIA GeForce RTX 3080 Ti
8130 Points 0%
NVIDIA Titan RTX
6714 Points -18%
AMD Radeon RX 6950 XT
2759 Points -66%
AMD Radeon RX 7900 XTX
2656 Points -67%
AMD Radeon RX 7900 XT
2627 Points -68%
SPECviewperf 12
1900x1060 Solidworks (sw-03)
AMD Radeon RX 7900 XTX
360 fps +219%
AMD Radeon RX 7900 XT
342 fps +203%
AMD Radeon RX 6950 XT
218 fps +93%
NVIDIA Titan RTX
207 fps +83%
AMD Radeon RX 6950 XT
157 fps +39%
NVIDIA GeForce RTX 4080
127 fps +12%
NVIDIA GeForce RTX 4090
127 fps +12%
NVIDIA GeForce RTX 4090
126 fps +12%
KFA2 GeForce RTX 4080 SG
113 fps
NVIDIA GeForce RTX 3080 Ti
106 fps -6%
NVIDIA GeForce RTX 3090
105 fps -7%
NVIDIA GeForce RTX 3080 12 GB
73.8 fps -35%
1900x1060 Siemens NX (snx-02)
AMD Radeon RX 7900 XTX
400 fps +1752%
AMD Radeon RX 7900 XT
373 fps +1627%
NVIDIA Titan RTX
283 fps +1210%
AMD Radeon RX 6950 XT
56.4 fps +161%
AMD Radeon RX 6950 XT
49.4 fps +129%
NVIDIA GeForce RTX 4090
27.1 fps +25%
NVIDIA GeForce RTX 4090
26.4 fps +22%
NVIDIA GeForce RTX 4080
23.4 fps +8%
KFA2 GeForce RTX 4080 SG
21.6 fps
NVIDIA GeForce RTX 3080 Ti
16.6 fps -23%
NVIDIA GeForce RTX 3090
16.4 fps -24%
NVIDIA GeForce RTX 3080 12 GB
12 fps -44%
1900x1060 Showcase (showcase-01)
NVIDIA GeForce RTX 4090
457 fps +37%
NVIDIA GeForce RTX 4090
448 fps +35%
KFA2 GeForce RTX 4080 SG
333 fps
AMD Radeon RX 7900 XTX
322 fps -3%
AMD Radeon RX 6950 XT
308 fps -8%
NVIDIA GeForce RTX 4080
304 fps -9%
AMD Radeon RX 7900 XT
278 fps -17%
AMD Radeon RX 6950 XT
264 fps -21%
NVIDIA GeForce RTX 3090
262 fps -21%
NVIDIA GeForce RTX 3080 Ti
252 fps -24%
NVIDIA GeForce RTX 3080 12 GB
226 fps -32%
NVIDIA Titan RTX
197 fps -41%
1900x1060 Medical (medical-01)
AMD Radeon RX 7900 XTX
347 fps +103%
AMD Radeon RX 7900 XT
288 fps +68%
NVIDIA GeForce RTX 4080
227 fps +33%
KFA2 GeForce RTX 4080 SG
171 fps
NVIDIA GeForce RTX 3080 Ti
142 fps -17%
NVIDIA GeForce RTX 4090
119 fps -30%
NVIDIA GeForce RTX 4090
118 fps -31%
NVIDIA Titan RTX
101 fps -41%
AMD Radeon RX 6950 XT
95.2 fps -44%
NVIDIA GeForce RTX 3090
85.8 fps -50%
AMD Radeon RX 6950 XT
58.3 fps -66%
NVIDIA GeForce RTX 3080 12 GB
40.3 fps -76%
1900x1060 Maya (maya-04)
AMD Radeon RX 7900 XTX
367 fps +19%
AMD Radeon RX 7900 XT
347 fps +12%
NVIDIA GeForce RTX 4090
317 fps +3%
NVIDIA GeForce RTX 4090
316 fps +2%
NVIDIA GeForce RTX 4080
310 fps 0%
KFA2 GeForce RTX 4080 SG
309 fps
NVIDIA GeForce RTX 3090
302 fps -2%
NVIDIA GeForce RTX 3080 Ti
302 fps -2%
NVIDIA Titan RTX
260 fps -16%
AMD Radeon RX 6950 XT
195 fps -37%
NVIDIA GeForce RTX 3080 12 GB
139 fps -55%
AMD Radeon RX 6950 XT
90.7 fps -71%
1900x1060 Energy (energy-01)
AMD Radeon RX 7900 XTX
85.2 fps +45%
AMD Radeon RX 7900 XT
72.4 fps +23%
KFA2 GeForce RTX 4080 SG
58.8 fps
NVIDIA GeForce RTX 4080
57.5 fps -2%
NVIDIA GeForce RTX 4090
54.7 fps -7%
NVIDIA GeForce RTX 4090
54.2 fps -8%
AMD Radeon RX 6950 XT
34.3 fps -42%
NVIDIA Titan RTX
28.8 fps -51%
NVIDIA GeForce RTX 3080 Ti
27.6 fps -53%
NVIDIA GeForce RTX 3090
25.6 fps -56%
AMD Radeon RX 6950 XT
23 fps -61%
NVIDIA GeForce RTX 3080 12 GB
17.2 fps -71%
1900x1060 Creo (creo-01)
NVIDIA Titan RTX
197 fps +79%
AMD Radeon RX 7900 XTX
187 fps +70%
AMD Radeon RX 7900 XT
176 fps +60%
AMD Radeon RX 6950 XT
163 fps +48%
NVIDIA GeForce RTX 4080
118 fps +7%
AMD Radeon RX 6950 XT
115 fps +5%
NVIDIA GeForce RTX 4090
115 fps +5%
NVIDIA GeForce RTX 4090
114 fps +4%
KFA2 GeForce RTX 4080 SG
110 fps
NVIDIA GeForce RTX 3080 Ti
94.7 fps -14%
NVIDIA GeForce RTX 3090
93.7 fps -15%
NVIDIA GeForce RTX 3080 12 GB
74.4 fps -32%
1900x1060 Catia (catia-04)
AMD Radeon RX 7900 XTX
536 fps +143%
AMD Radeon RX 7900 XT
481 fps +118%
AMD Radeon RX 6950 XT
368 fps +67%
NVIDIA Titan RTX
332 fps +50%
NVIDIA GeForce RTX 4090
257 fps +16%
NVIDIA GeForce RTX 4090
254 fps +15%
NVIDIA GeForce RTX 4080
229 fps +4%
KFA2 GeForce RTX 4080 SG
221 fps
AMD Radeon RX 6950 XT
199 fps -10%
NVIDIA GeForce RTX 3080 Ti
171 fps -23%
NVIDIA GeForce RTX 3090
167 fps -24%
NVIDIA GeForce RTX 3080 12 GB
79.1 fps -64%
1900x1060 3ds Max (3dsmax-05)
NVIDIA GeForce RTX 4090
571 fps +14%
NVIDIA GeForce RTX 4090
561 fps +12%
AMD Radeon RX 7900 XTX
553 fps +10%
KFA2 GeForce RTX 4080 SG
502 fps
AMD Radeon RX 7900 XT
502 fps 0%
AMD Radeon RX 6950 XT
484 fps -4%
NVIDIA GeForce RTX 4080
477 fps -5%
AMD Radeon RX 6950 XT
418 fps -17%
NVIDIA GeForce RTX 3090
389 fps -23%
NVIDIA GeForce RTX 3080 Ti
385 fps -23%
NVIDIA GeForce RTX 3080 12 GB
334 fps -33%
NVIDIA Titan RTX
315 fps -37%
SPECviewperf 13
Solidworks (sw-04)
AMD Radeon RX 7900 XTX
323 fps +80%
AMD Radeon RX 7900 XT
307 fps +72%
AMD Radeon RX 6950 XT
254 fps +42%
NVIDIA Titan RTX
218 fps +22%
AMD Radeon RX 6950 XT
210 fps +17%
NVIDIA GeForce RTX 4090
186 fps +4%
NVIDIA GeForce RTX 4080
183 fps +2%
NVIDIA GeForce RTX 4090
182 fps +2%
KFA2 GeForce RTX 4080 SG
179 fps
NVIDIA GeForce RTX 3080 Ti
153 fps -15%
NVIDIA GeForce RTX 3090
151 fps -16%
NVIDIA GeForce RTX 3080 12 GB
108 fps -40%
Siemens NX (snx-03)
AMD Radeon RX 7900 XTX
725 fps +1759%
AMD Radeon RX 7900 XT
675 fps +1631%
NVIDIA Titan RTX
512 fps +1213%
AMD Radeon RX 6950 XT
101 fps +159%
AMD Radeon RX 6950 XT
89.7 fps +130%
NVIDIA GeForce RTX 4090
49.1 fps +26%
NVIDIA GeForce RTX 4090
47.9 fps +23%
NVIDIA GeForce RTX 4080
42.1 fps +8%
KFA2 GeForce RTX 4080 SG
39 fps
NVIDIA GeForce RTX 3080 Ti
29.9 fps -23%
NVIDIA GeForce RTX 3090
29.7 fps -24%
NVIDIA GeForce RTX 3080 12 GB
26.3 fps -33%
Showcase (showcase-02)
NVIDIA GeForce RTX 4090
455 fps +36%
NVIDIA GeForce RTX 4090
448 fps +34%
KFA2 GeForce RTX 4080 SG
334 fps
AMD Radeon RX 7900 XTX
323 fps -3%
AMD Radeon RX 6950 XT
312 fps -7%
NVIDIA GeForce RTX 4080
305 fps -9%
AMD Radeon RX 7900 XT
279 fps -16%
AMD Radeon RX 6950 XT
264 fps -21%
NVIDIA GeForce RTX 3090
262 fps -22%
NVIDIA GeForce RTX 3080 Ti
252 fps -25%
NVIDIA GeForce RTX 3080 12 GB
228 fps -32%
NVIDIA Titan RTX
198 fps -41%
Medical (medical-02)
AMD Radeon RX 7900 XTX
263 fps +75%
AMD Radeon RX 7900 XT
237 fps +58%
NVIDIA GeForce RTX 4090
186 fps +24%
NVIDIA GeForce RTX 4090
182 fps +21%
AMD Radeon RX 6950 XT
157 fps +5%
KFA2 GeForce RTX 4080 SG
150 fps
NVIDIA GeForce RTX 4080
148 fps -1%
NVIDIA GeForce RTX 3080 Ti
107 fps -29%
NVIDIA GeForce RTX 3090
106 fps -29%
NVIDIA GeForce RTX 3080 12 GB
102 fps -32%
NVIDIA Titan RTX
92 fps -39%
Maya (maya-05)
AMD Radeon RX 7900 XTX
735 fps +8%
NVIDIA GeForce RTX 4080
726 fps +7%
NVIDIA GeForce RTX 4090
715 fps +5%
NVIDIA GeForce RTX 4090
715 fps +5%
KFA2 GeForce RTX 4080 SG
678 fps
AMD Radeon RX 7900 XT
670 fps -1%
NVIDIA GeForce RTX 3080 Ti
569 fps -16%
NVIDIA GeForce RTX 3090
556 fps -18%
NVIDIA Titan RTX
499 fps -26%
NVIDIA GeForce RTX 3080 12 GB
460 fps -32%
AMD Radeon RX 6950 XT
460 fps -32%
AMD Radeon RX 6950 XT
372 fps -45%
Energy (energy-02)
AMD Radeon RX 7900 XTX
187 fps +102%
AMD Radeon RX 7900 XT
147 fps +59%
NVIDIA GeForce RTX 4090
126 fps +36%
NVIDIA GeForce RTX 4090
123 fps +33%
KFA2 GeForce RTX 4080 SG
92.6 fps
NVIDIA GeForce RTX 4080
91.7 fps -1%
AMD Radeon RX 6950 XT
60.8 fps -34%
AMD Radeon RX 6950 XT
60.3 fps -35%
NVIDIA Titan RTX
51.8 fps -44%
NVIDIA GeForce RTX 3080 Ti
44.1 fps -52%
NVIDIA GeForce RTX 3090
43.8 fps -53%
NVIDIA GeForce RTX 3080 12 GB
37.6 fps -59%
Creo (creo-02)
AMD Radeon RX 7900 XTX
613 fps +16%
AMD Radeon RX 7900 XT
567 fps +7%
NVIDIA GeForce RTX 4090
552 fps +4%
NVIDIA GeForce RTX 4080
544 fps +3%
NVIDIA GeForce RTX 4090
544 fps +3%
KFA2 GeForce RTX 4080 SG
529 fps
NVIDIA GeForce RTX 3080 Ti
402 fps -24%
NVIDIA GeForce RTX 3090
392 fps -26%
NVIDIA Titan RTX
386 fps -27%
AMD Radeon RX 6950 XT
374 fps -29%
NVIDIA GeForce RTX 3080 12 GB
324 fps -39%
AMD Radeon RX 6950 XT
323 fps -39%
Catia (catia-05)
AMD Radeon RX 7900 XTX
825 fps +143%
AMD Radeon RX 7900 XT
728 fps +114%
AMD Radeon RX 6950 XT
588 fps +73%
NVIDIA Titan RTX
534 fps +57%
AMD Radeon RX 6950 XT
450 fps +32%
NVIDIA GeForce RTX 4090
402 fps +18%
NVIDIA GeForce RTX 4090
396 fps +16%
KFA2 GeForce RTX 4080 SG
340 fps
NVIDIA GeForce RTX 4080
333 fps -2%
NVIDIA GeForce RTX 3080 Ti
258 fps -24%
NVIDIA GeForce RTX 3090
252 fps -26%
NVIDIA GeForce RTX 3080 12 GB
206 fps -39%
3ds Max (3dsmax-06)
AMD Radeon RX 7900 XTX
564 fps +13%
NVIDIA GeForce RTX 4090
563 fps +13%
NVIDIA GeForce RTX 4090
558 fps +12%
AMD Radeon RX 7900 XT
506 fps +2%
KFA2 GeForce RTX 4080 SG
497 fps
AMD Radeon RX 6950 XT
483 fps -3%
NVIDIA GeForce RTX 4080
478 fps -4%
AMD Radeon RX 6950 XT
416 fps -16%
NVIDIA GeForce RTX 3090
387 fps -22%
NVIDIA GeForce RTX 3080 Ti
382 fps -23%
NVIDIA GeForce RTX 3080 12 GB
334 fps -33%
NVIDIA Titan RTX
321 fps -35%
SPECviewperf 2020
3840x2160 CATIA (catia-06)
AMD Radeon RX 7900 XTX
127 fps +68%
AMD Radeon RX 7900 XT
113 fps +50%
NVIDIA GeForce RTX 4090
95.3 fps +26%
NVIDIA GeForce RTX 4090
94.7 fps +25%
NVIDIA Titan RTX
90.9 fps +20%
NVIDIA GeForce RTX 4080
76.5 fps +1%
KFA2 GeForce RTX 4080 SG
75.5 fps
NVIDIA GeForce RTX 3080 Ti
59.9 fps -21%
AMD Radeon RX 6950 XT
59.7 fps -21%
NVIDIA GeForce RTX 3090
58.5 fps -23%
NVIDIA GeForce RTX 3080 12 GB
53.7 fps -29%
AMD Radeon RX 6950 XT
53 fps -30%
3840x2160 Creo (creo-03)
AMD Radeon RX 7900 XTX
187 fps +46%
AMD Radeon RX 7900 XT
173 fps +35%
NVIDIA GeForce RTX 4080
136 fps +6%
NVIDIA Titan RTX
135 fps +5%
NVIDIA GeForce RTX 4090
133 fps +4%
NVIDIA GeForce RTX 4090
133 fps +4%
KFA2 GeForce RTX 4080 SG
128 fps
NVIDIA GeForce RTX 3090
115 fps -10%
NVIDIA GeForce RTX 3080 Ti
114 fps -11%
AMD Radeon RX 6950 XT
92.4 fps -28%
NVIDIA GeForce RTX 3080 12 GB
90 fps -30%
AMD Radeon RX 6950 XT
73.1 fps -43%
3840x2160 Energy (energy-03)
NVIDIA GeForce RTX 4090
141 fps +56%
NVIDIA GeForce RTX 4090
137 fps +52%
AMD Radeon RX 7900 XTX
129 fps +43%
AMD Radeon RX 7900 XT
99.6 fps +10%
NVIDIA GeForce RTX 3090
96.6 fps +7%
NVIDIA Titan RTX
93.9 fps +4%
KFA2 GeForce RTX 4080 SG
90.4 fps
AMD Radeon RX 6950 XT
69.3 fps -23%
NVIDIA GeForce RTX 3080 Ti
57.5 fps -36%
AMD Radeon RX 6950 XT
47.6 fps -47%
NVIDIA GeForce RTX 4080
45.6 fps -50%
NVIDIA GeForce RTX 3080 12 GB
37.2 fps -59%
3840x2160 Maya (maya-06)
NVIDIA GeForce RTX 4090
525 fps +17%
NVIDIA GeForce RTX 4090
498 fps +11%
AMD Radeon RX 7900 XTX
481 fps +8%
KFA2 GeForce RTX 4080 SG
447 fps
NVIDIA GeForce RTX 4080
426 fps -5%
AMD Radeon RX 7900 XT
401 fps -10%
NVIDIA GeForce RTX 3080 Ti
366 fps -18%
NVIDIA GeForce RTX 3090
356 fps -20%
AMD Radeon RX 6950 XT
315 fps -30%
NVIDIA GeForce RTX 3080 12 GB
314 fps -30%
AMD Radeon RX 6950 XT
296 fps -34%
NVIDIA Titan RTX
274 fps -39%
3840x2160 Medical (medical-03)
AMD Radeon RX 7900 XTX
62.3 fps +93%
AMD Radeon RX 7900 XT
53.9 fps +67%
NVIDIA GeForce RTX 4090
45.9 fps +43%
NVIDIA GeForce RTX 4090
44.8 fps +39%
AMD Radeon RX 6950 XT
35 fps +9%
AMD Radeon RX 6950 XT
34.4 fps +7%
KFA2 GeForce RTX 4080 SG
32.2 fps
NVIDIA GeForce RTX 4080
28.3 fps -12%
NVIDIA GeForce RTX 3080 Ti
22.9 fps -29%
NVIDIA GeForce RTX 3090
20 fps -38%
NVIDIA GeForce RTX 3080 12 GB
18.8 fps -42%
NVIDIA Titan RTX
16.5 fps -49%
3840x2160 Siemens NX (snx-04)
AMD Radeon RX 7900 XTX
514 fps +1511%
AMD Radeon RX 7900 XT
476 fps +1392%
NVIDIA Titan RTX
375 fps +1076%
AMD Radeon RX 6950 XT
98.4 fps +208%
AMD Radeon RX 6950 XT
88.6 fps +178%
NVIDIA GeForce RTX 4090
41.3 fps +29%
NVIDIA GeForce RTX 4090
41.1 fps +29%
NVIDIA GeForce RTX 4080
34.1 fps +7%
KFA2 GeForce RTX 4080 SG
31.9 fps
NVIDIA GeForce RTX 3080 Ti
24.9 fps -22%
NVIDIA GeForce RTX 3090
24.7 fps -23%
NVIDIA GeForce RTX 3080 12 GB
21.8 fps -32%

* ... Meglio usare valori piccoli

Parametri di gioco

Come il KFA2 GeForce RTX 4090 SGkFA2 GeForce RTX 4080 SG offre prestazioni di gioco immensamente elevate che mostrano i loro muscoli solo a 2160p. Inutile dire che il modello è in grado di gestire comodamente i 1440p e che la CPU è un fattore meno limitante rispetto alla più veloce RTX 4090. I concorrenti di AMD non si battono più di tanto contro la KFA2 GeForce RTX 4080 SG, nonostante il fatto che alcuni giochi funzionino meglio con le schede grafiche AMD. D'altra parte, ci sono anche giochi che funzionano molto meglio sulle GPU Nvidia. Una volta attivate le funzioni di ray tracing, le schede Nvidia sono ancora più avanti rispetto alle nuove schede grafiche RDNA3. Senza DLSS, tuttavia, anche le GPU Nvidia più veloci hanno difficoltà a gestire il ray-tracing a risoluzioni più elevate. Come dimostrato da Cyberpunk 2077, dovrete accontentarvi di 1080p quando il DLSS è disabilitato

In ogni caso, va notato che DLSS 3.0 è disponibile esclusivamente sulle nuove GPU GeForce RTX 40 Series. AMD ha già pronta una funzione simile sotto forma di FSR, uno standard aperto che può essere utilizzato anche con le GPU Nvidia. In definitiva, spetta agli sviluppatori di giochi integrare queste funzionalità nei loro giochi. È possibile fare clic su qui per trovare un elenco di giochi che supportano DLSS 3.0 al momento o che lo faranno in futuro.

GTA V - 3840x2160 High/On (Advanced Graphics Off) AA:FX AF:8x
Palit GeForce RTX 4090 GameRock OC
187.5 (2.97min, 200P1 - 593max) fps +2%
NVIDIA GeForce RTX 4080 Founders Edition
186.1 (3.61min, 142.9P1 - 612max) fps +1%
AMD Radeon RX 7900 XTX
184.8 (5.75min, 142.9P1 - 559max) fps 0%
KFA2 GeForce RTX 4080 SG
183.9 (5.11min, 142.9P1 - 570max) fps
ASUS TUF Gaming GeForce RTX 3080 Ti OC
182.6 (2.49min, 125P1 - 569max) fps -1%
NVIDIA GeForce RTX 3090 Founders Edition
182.5 (2.85min, 142.9P1 - 284max) fps -1%
MSI Radeon RX 6950 XT Gaming X Trio
175.5 (4.99min, 125P1 - 618max) fps -5%
AMD Radeon RX 7900 XT
175.1 (5.09min, 125P1 - 687max) fps -5%
Sapphire AMD Radeon RX 6950 XT Nitro+ Pure
173.1 (2.93min, 100P1 - 384max) fps -6%
KFA2 GeForce RTX 3080 SG
169.6 (14.8min, 125P1 - 411max) fps -8%
Nvidia Titan RTX
140.8 (6.17min, 100P1 - 320max) fps -23%
The Witcher 3 - 3840x2160 High Graphics & Postprocessing (Nvidia HairWorks Off)
Palit GeForce RTX 4090 GameRock OC
284 (88.3min, 166.6P0.1, 240P1 - 831max) fps +41%
NVIDIA GeForce RTX 4080 Founders Edition
204 (183min, 183.55P1 - 227max) fps +1%
KFA2 GeForce RTX 4080 SG
202 (77.2min, 112.7P0.1, 171.7P1 - 783max) fps
AMD Radeon RX 7900 XTX
163.8 (49.6min, 112P0.1, 134.1P1 - 463max) fps -19%
AMD Radeon RX 7900 XT
158.5 (83.2min, 111.2P0.1, 122.8P1 - 408max) fps -22%
NVIDIA GeForce RTX 3090 Founders Edition
155.5 (28min, 94.5P0.1, 133.8P1 - 704max) fps -23%
ASUS TUF Gaming GeForce RTX 3080 Ti OC
154.9 (54.5min, 91.3P0.1, 134.4P1 - 636max) fps -23%
MSI Radeon RX 6950 XT Gaming X Trio
148.3 (41.6min, 103P0.1, 117.2P1 - 530max) fps -27%
Sapphire AMD Radeon RX 6950 XT Nitro+ Pure
139.7 (10.4min, 105.6P0.1, 118.6P1 - 388max) fps -31%
KFA2 GeForce RTX 3080 SG
131.8 (48.2min, 72.3P0.1, 107.3P1 - 454max) fps -35%
AMD Radeon RX 6900 XT
122 (105min, 105P1 - 134max) fps -40%
Nvidia Titan RTX
107.1 (11min, 80.3P0.1, 94.1P1 - 583max) fps -47%
Final Fantasy XV Benchmark - 3840x2160 High Quality
Palit GeForce RTX 4090 GameRock OC
161.1 fps +38%
KFA2 GeForce RTX 4080 SG
116.9 fps
NVIDIA GeForce RTX 4080 Founders Edition
115.4 fps -1%
AMD Radeon RX 7900 XTX
101.6 fps -13%
NVIDIA GeForce RTX 3090 Founders Edition
87.1 fps -25%
ASUS TUF Gaming GeForce RTX 3080 Ti OC
86.4 fps -26%
Sapphire AMD Radeon RX 6950 XT Nitro+ Pure
86 fps -26%
MSI Radeon RX 6950 XT Gaming X Trio
85.6 fps -27%
AMD Radeon RX 7900 XT
84.9 fps -27%
KFA2 GeForce RTX 3080 SG
76.7 fps -34%
Nvidia Titan RTX
65.2 fps -44%
Strange Brigade - 3840x2160 ultra AA:ultra AF:16
Palit GeForce RTX 4090 GameRock OC
281 (31.7min, 239P1 - 482max) fps +44%
KFA2 GeForce RTX 4080 SG
195.1 (12.1min, 170.6P1 - 503max) fps
MSI Radeon RX 6950 XT Gaming X Trio
175 (140min, 143.3P1 - 264max) fps -10%
AMD Radeon RX 7900 XT
172.6 (138.4min, 143.7P1 - 320max) fps -12%
AMD Radeon RX 7900 XTX
172.6 (138.4min, 143.7P1 - 320max) fps -12%
Sapphire AMD Radeon RX 6950 XT Nitro+ Pure
168.6 (37.6min, 139.6P1 - 268max) fps -14%
NVIDIA GeForce RTX 3090 Founders Edition
163.2 (60.1min, 136.1P1 - 584max) fps -16%
ASUS TUF Gaming GeForce RTX 3080 Ti OC
161.8 (38.7min, 135.9P1 - 423max) fps -17%
KFA2 GeForce RTX 3080 SG
141.5 (44.1min, 113.4P1 - 188.6max) fps -27%
Nvidia Titan RTX
115 (67.4min, 100P1 - 517max) fps -41%
Far Cry 5 - 3840x2160 Ultra Preset AA:T
Palit GeForce RTX 4090 GameRock OC
175 (140min - 212max) fps +26%
AMD Radeon RX 7900 XTX
155 (134min - 180max) fps +12%
NVIDIA GeForce RTX 4080 Founders Edition
140 (126min - 159max) fps +1%
KFA2 GeForce RTX 4080 SG
139 (125min - 163max) fps
AMD Radeon RX 7900 XT
132 (116min - 162max) fps -5%
MSI Radeon RX 6950 XT Gaming X Trio
126 (109min - 157max) fps -9%
Sapphire AMD Radeon RX 6950 XT Nitro+ Pure
121 (106min - 147max) fps -13%
ASUS TUF Gaming GeForce RTX 3080 Ti OC
109 (98min - 128max) fps -22%
NVIDIA GeForce RTX 3090 Founders Edition
107 (96min - 128max) fps -23%
KFA2 GeForce RTX 3080 SG
102 (93min - 121max) fps -27%
Nvidia Titan RTX
82 (73min - 99max) fps -41%
Far Cry New Dawn - 3840x2160 Ultra Preset
Palit GeForce RTX 4090 GameRock OC
145 (104min - 215max) fps +12%
AMD Radeon RX 7900 XTX
138 (98min - 216max) fps +6%
KFA2 GeForce RTX 4080 SG
130 (102min - 169max) fps
AMD Radeon RX 7900 XT
129 (97min - 184max) fps -1%
MSI Radeon RX 6950 XT Gaming X Trio
125 (96min - 174max) fps -4%
Sapphire AMD Radeon RX 6950 XT Nitro+ Pure
111 (75min - 167max) fps -15%
ASUS TUF Gaming GeForce RTX 3080 Ti OC
110 (85min - 131max) fps -15%
NVIDIA GeForce RTX 3090 Founders Edition
108 (93min - 129max) fps -17%
AMD Radeon RX 6900 XT
101 (79min - 135max) fps -22%
KFA2 GeForce RTX 3080 SG
98 (79min - 122max) fps -25%
Nvidia Titan RTX
83 (70min - 100max) fps -36%
Far Cry 6 - 3840x2160 Ultra Graphics Quality + HD Textures AA:T
Palit GeForce RTX 4090 GameRock OC
136.9 (122min - 148max) fps +28%
AMD Radeon RX 7900 XTX
124 (113min - 136max) fps +16%
NVIDIA GeForce RTX 4080 Founders Edition
109 (97min - 117max) fps +2%
KFA2 GeForce RTX 4080 SG
107 (98min - 116max) fps
AMD Radeon RX 7900 XT
104.1 (95min - 114max) fps -3%
MSI Radeon RX 6950 XT Gaming X Trio
94.7 (87min - 103max) fps -11%
Sapphire AMD Radeon RX 6950 XT Nitro+ Pure
86.5 (78min - 100max) fps -19%
ASUS TUF Gaming GeForce RTX 3080 Ti OC
86.2 (79min - 93max) fps -19%
NVIDIA GeForce RTX 3090 Founders Edition
84.9 (78min - 92max) fps -21%
Nvidia Titan RTX
63.6 (56min - 69max) fps -41%
KFA2 GeForce RTX 3080 SG
57.2 (28min - 69max) fps -47%
Metro Exodus - 3840x2160 Ultra Quality AF:16x
Palit GeForce RTX 4090 GameRock OC
139.7 (76.95min - 229.15max) fps +34%
NVIDIA GeForce RTX 4080 Founders Edition
105.7 (67.17min - 159.57max) fps +2%
KFA2 GeForce RTX 4080 SG
103.9 (62.73min - 167.39max) fps
AMD Radeon RX 7900 XTX
103.5 (66.43min - 144.4max) fps 0%
AMD Radeon RX 7900 XT
86.9 (56.86min - 117.84max) fps -16%
MSI Radeon RX 6950 XT Gaming X Trio
79.3 (52.59min - 103.86max) fps -24%
ASUS TUF Gaming GeForce RTX 3080 Ti OC
77.1 (48.66min - 128.68max) fps -26%
NVIDIA GeForce RTX 3090 Founders Edition
75.9 (48.64min - 130.4max) fps -27%
Sapphire AMD Radeon RX 6950 XT Nitro+ Pure
75 (50.07min - 98.87max) fps -28%
AMD Radeon RX 6900 XT
66.7 (42.71min - 92.25max) fps -36%
KFA2 GeForce RTX 3080 SG
65.2 (41.36min - 117.12max) fps -37%
Nvidia Titan RTX
56.8 (35.78min - 93.88max) fps -45%
F1 2020 - 3840x2160 Ultra High Preset AA:T AF:16x
Palit GeForce RTX 4090 GameRock OC
286 (245min - 335max) fps +42%
KFA2 GeForce RTX 4080 SG
201 (172min - 235max) fps
AMD Radeon RX 7900 XTX
199.6 (160min - 242max) fps -1%
AMD Radeon RX 7900 XT
165.5 (136min - 199max) fps -18%
MSI Radeon RX 6950 XT Gaming X Trio
158.1 (126min - 189max) fps -21%
Sapphire AMD Radeon RX 6950 XT Nitro+ Pure
150.1 (119min - 178max) fps -25%
ASUS TUF Gaming GeForce RTX 3080 Ti OC
145.9 (124min - 173max) fps -27%
NVIDIA GeForce RTX 3090 Founders Edition
143.6 (121min - 170max) fps -29%
AMD Radeon RX 6900 XT
137 (109min - 165max) fps -32%
AMD Radeon RX 6900 XT
136 (110min - 161max) fps -32%
KFA2 GeForce RTX 3080 SG
124.6 (107min - 145max) fps -38%
Nvidia Titan RTX
103.4 (89min - 121max) fps -49%
F1 2021 - 3840x2160 Ultra High Preset + Raytracing AA:T AF:16x
Palit GeForce RTX 4090 GameRock OC
199.1 (168min, 166P1 - 223max) fps +38%
KFA2 GeForce RTX 4080 SG
144.3 (123min, 122P1 - 162max) fps
NVIDIA GeForce RTX 4080 Founders Edition
143.5 (123min, 115P1 - 160max) fps -1%
AMD Radeon RX 7900 XTX
133.6 (114min, 113P1 - 154max) fps -7%
AMD Radeon RX 7900 XT
112.3 (95min, 95P1 - 129max) fps -22%
ASUS TUF Gaming GeForce RTX 3080 Ti OC
105.6 (91min, 91P1 - 117max) fps -27%
NVIDIA GeForce RTX 3090 Founders Edition
102.7 (90min, 89P1 - 116max) fps -29%
MSI Radeon RX 6950 XT Gaming X Trio
102.1 (86min, 86P1 - 116max) fps -29%
Sapphire AMD Radeon RX 6950 XT Nitro+ Pure
99.7 (85min, 85P1 - 113max) fps -31%
KFA2 GeForce RTX 3080 SG
93.5 (82min, 82P1 - 105max) fps -35%
Nvidia Titan RTX
73.2 (64min, 64P1 - 84max) fps -49%
F1 22 - 3840x2160 Ultra High Preset AA:T AF:16x
Palit GeForce RTX 4090 GameRock OC
82.5 (72min, 71P1 - 96max) fps +42%
NVIDIA GeForce RTX 4080 Founders Edition
58.9 (50min, 49P1 - 68max) fps +2%
KFA2 GeForce RTX 4080 SG
57.9 (50min, 49P1 - 67max) fps
AMD Radeon RX 7900 XTX
52.4 (37min, 38P1 - 64max) fps -9%
AMD Radeon RX 7900 XT
44.9 (32min, 32P1 - 57max) fps -22%
ASUS TUF Gaming GeForce RTX 3080 Ti OC
43.4 (36min, 36P1 - 51max) fps -25%
NVIDIA GeForce RTX 3090 Founders Edition
42.6 (36min, 28P1 - 49max) fps -26%
MSI Radeon RX 6950 XT Gaming X Trio
36.5 (27min, 27P1 - 47max) fps -37%
Sapphire AMD Radeon RX 6950 XT Nitro+ Pure
35.8 (24min, 25P1 - 47max) fps -38%
Nvidia Titan RTX
29.3 (25min, 24P1 - 34max) fps -49%
Borderlands 3 - 3840x2160 Badass Overall Quality (DX11)
Palit GeForce RTX 4090 GameRock OC
135 fps +42%
NVIDIA GeForce RTX 4080 Founders Edition
95.7 fps +1%
KFA2 GeForce RTX 4080 SG
95.2 fps
AMD Radeon RX 7900 XTX
88.4 fps -7%
AMD Radeon RX 7900 XT
74.6 fps -22%
ASUS TUF Gaming GeForce RTX 3080 Ti OC
73.8 fps -22%
NVIDIA GeForce RTX 3090 Founders Edition
72.8 fps -24%
MSI Radeon RX 6950 XT Gaming X Trio
70.9 fps -26%
KFA2 GeForce RTX 3080 SG
59.9 fps -37%
Sapphire AMD Radeon RX 6950 XT Nitro+ Pure
59.9 fps -37%
AMD Radeon RX 6900 XT
59.8 fps -37%
AMD Radeon RX 6900 XT
57.1 fps -40%
Nvidia Titan RTX
49.7 fps -48%
Cyberpunk 2077 1.6 - 3840x2160 Ultra Preset
Palit GeForce RTX 4090 GameRock OC
78 (48.3min - 106.8max) fps +23%
AMD Radeon RX 7900 XTX
71.4 (59.4min - 93.7max) fps +13%
NVIDIA GeForce RTX 4080 Founders Edition
63.5 (42.2min - 84.6max) fps 0%
KFA2 GeForce RTX 4080 SG
63.4 (54min - 82.1max) fps
AMD Radeon RX 7900 XT
60 (44.6min - 79.3max) fps -5%
ASUS TUF Gaming GeForce RTX 3080 Ti OC
49.7 (41.5min - 63.7max) fps -22%
MSI Radeon RX 6950 XT Gaming X Trio
48.5 (39.1min - 63.9max) fps -24%
Sapphire AMD Radeon RX 6950 XT Nitro+ Pure
43.2 fps -32%
Metro Exodus - 1920x1080 Ultra Quality DXR AF:16x
NVIDIA GeForce RTX 4090
AMD Ryzen 9 7950X, NVIDIA GeForce RTX 4090
157.3 (96.47min - 223.46max) fps +6%
NVIDIA GeForce RTX 4080
AMD Ryzen 9 7950X, NVIDIA GeForce RTX 4080
148.6 (73.78min - 213.36max) fps
AMD Radeon RX 7900 XTX
AMD Ryzen 9 7950X, AMD Radeon RX 7900 XTX
141.2 (89.03min - 194.63max) fps -5%
NVIDIA GeForce RTX 4080
Intel Core i9-13900K, NVIDIA GeForce RTX 4080
137.2 (68.42min - 213.17max) fps -8%
AMD Radeon RX 7900 XT
AMD Ryzen 9 7950X, AMD Radeon RX 7900 XT
124.3 (78.88min - 166max) fps -16%
NVIDIA GeForce RTX 3080 Ti
AMD Ryzen 9 7950X, NVIDIA GeForce RTX 3080 Ti
121.2 (66.05min - 193.46max) fps -18%
NVIDIA GeForce RTX 3090
AMD Ryzen 9 7950X, NVIDIA GeForce RTX 3090
115.4 (65.7min - 181.59max) fps -22%
AMD Radeon RX 6950 XT
AMD Ryzen 9 7950X, AMD Radeon RX 6950 XT
110.2 (69.77min - 143.88max) fps -26%
Far Cry 6 - 1920x1080 Ultra Graphics Quality + HD Textures + DXR AA:T
NVIDIA GeForce RTX 4080
Intel Core i9-13900K, NVIDIA GeForce RTX 4080
154 (125min - 209max) fps +22%
AMD Radeon RX 7900 XTX
AMD Ryzen 9 7950X, AMD Radeon RX 7900 XTX
152.1 (75min - 229max) fps +20%
AMD Radeon RX 7900 XT
AMD Ryzen 9 7950X, AMD Radeon RX 7900 XT
143.6 (46min - 227max) fps +13%
NVIDIA GeForce RTX 4090
AMD Ryzen 9 7950X, NVIDIA GeForce RTX 4090
133.4 (108min - 196max) fps +5%
AMD Radeon RX 6950 XT
AMD Ryzen 9 7950X, AMD Radeon RX 6950 XT
132.8 (51min - 198max) fps +5%
NVIDIA GeForce RTX 3080 Ti
AMD Ryzen 9 7950X, NVIDIA GeForce RTX 3080 Ti
128.6 (109min - 170max) fps +1%
NVIDIA GeForce RTX 4080
AMD Ryzen 9 7950X, NVIDIA GeForce RTX 4080
126.7 (103min - 189max) fps
NVIDIA GeForce RTX 3090
AMD Ryzen 9 7950X, NVIDIA GeForce RTX 3090
123 (106min - 155max) fps -3%
AMD Radeon RX 6800
AMD Ryzen 9 7950X, AMD Radeon RX 6800
112.6 (63min - 152max) fps -11%
AMD Radeon RX 6950 XT
AMD Ryzen 9 5900X, AMD Radeon RX 6950 XT
101.6 (24min - 161max) fps -20%
Cyberpunk 2077 1.6
3840x2160 Ray Tracing Ultra Preset (DLSS off)
NVIDIA GeForce RTX 4090
AMD Ryzen 9 7950X, NVIDIA GeForce RTX 4090 (1.6)
42.5 (31.9min - 56.3max) fps +43%
NVIDIA GeForce RTX 4080
Intel Core i9-13900K, NVIDIA GeForce RTX 4080 (1.6)
30.7 (23.5min - 40.6max) fps +3%
NVIDIA GeForce RTX 4080
AMD Ryzen 9 7950X, NVIDIA GeForce RTX 4080 (1.61)
29.8 (22.7min - 39.4max) fps
NVIDIA GeForce RTX 3090
AMD Ryzen 9 7950X, NVIDIA GeForce RTX 3090 (1.6)
20.8 (14.2min - 28.9max) fps -30%
AMD Radeon RX 7900 XTX
AMD Ryzen 9 7950X, AMD Radeon RX 7900 XTX (1.61)
20.7 (14.4min - 28.9max) fps -31%
NVIDIA GeForce RTX 3080 Ti
AMD Ryzen 9 7950X, NVIDIA GeForce RTX 3080 Ti (1.61)
18.6 (9.13min - 27.1max) fps -38%
AMD Radeon RX 7900 XT
AMD Ryzen 9 7950X, AMD Radeon RX 7900 XT (1.61)
17.6 (12min - 25max) fps -41%
AMD Radeon RX 6950 XT
AMD Ryzen 9 7950X, AMD Radeon RX 6950 XT (1.61)
13.7 (9.28min - 20.6max) fps -54%
AMD Radeon RX 6800
AMD Ryzen 9 7950X, AMD Radeon RX 6800 (1.61)
9.47 (6.59min - 14.7max) fps -68%
1920x1080 Ray Tracing Ultra Preset (DLSS off)
NVIDIA GeForce RTX 4090
AMD Ryzen 9 7950X, NVIDIA GeForce RTX 4090 (1.6)
118.6 (69.3min - 161.9max) fps +23%
NVIDIA GeForce RTX 4080
Intel Core i9-13900K, NVIDIA GeForce RTX 4080 (1.6)
100.1 (77.6min - 133.3max) fps +4%
NVIDIA GeForce RTX 4080
AMD Ryzen 9 7950X, NVIDIA GeForce RTX 4080 (1.61)
96.1 (60.6min - 138.8max) fps
NVIDIA GeForce RTX 3080 Ti
AMD Ryzen 9 7950X, NVIDIA GeForce RTX 3080 Ti (1.61)
69.1 (53.3min - 89.8max) fps -28%
NVIDIA GeForce RTX 3090
AMD Ryzen 9 7950X, NVIDIA GeForce RTX 3090 (1.6)
65.7 (51min - 85.4max) fps -32%
AMD Radeon RX 7900 XTX
AMD Ryzen 9 7950X, AMD Radeon RX 7900 XTX (1.61)
64.6 (49.1min - 85.9max) fps -33%
AMD Radeon RX 7900 XT
AMD Ryzen 9 7950X, AMD Radeon RX 7900 XT (1.61)
57.1 (41.7min - 77.1max) fps -41%
AMD Radeon RX 6950 XT
AMD Ryzen 9 7950X, AMD Radeon RX 6950 XT (1.61)
47.7 (32.5min - 66.9max) fps -50%
AMD Radeon RX 6800
AMD Ryzen 9 7950X, AMD Radeon RX 6800 (1.61)
33.7 (23.1min - 47.4max) fps -65%
Control - 1920x1080 High Quality Preset & High Ray Tracing Preset (DX12)
NVIDIA GeForce RTX 4090
AMD Ryzen 9 7950X, NVIDIA GeForce RTX 4090
189.9 (19.4min, 126.6P0.1, 139.6P1 - 292max) fps +19%
NVIDIA GeForce RTX 4080
Intel Core i9-13900K, NVIDIA GeForce RTX 4080
162.8 (28.9min, 60.8P0.1, 129.4P1 - 273max) fps +2%
NVIDIA GeForce RTX 4080
AMD Ryzen 9 7950X, NVIDIA GeForce RTX 4080
159.4 (18.2min, 92.7P0.1, 125.9P1 - 262max) fps
AMD Radeon RX 7900 XTX
AMD Ryzen 9 7950X, AMD Radeon RX 7900 XTX
133.7 (23.2min, 92.6P0.1, 104.6P1 - 239max) fps -16%
NVIDIA GeForce RTX 3080 Ti
AMD Ryzen 9 7950X, NVIDIA GeForce RTX 3080 Ti
120.6 (6.57min, 82.4P0.1, 100.1P1 - 224max) fps -24%
AMD Radeon RX 7900 XT
AMD Ryzen 9 7950X, AMD Radeon RX 7900 XT
116.1 (8.47min, 62.1P0.1, 91.4P1 - 219max) fps -27%
AMD Radeon RX 6950 XT
AMD Ryzen 9 7950X, AMD Radeon RX 6950 XT
102.9 (20.6min, 66.5P0.1, 80.5P1 - 242max) fps -35%
AMD Radeon RX 6950 XT
AMD Ryzen 9 5900X, AMD Radeon RX 6950 XT
97.7 (7.66min, 62.8P0.1, 73.5P1 - 198.6max) fps -39%
Ghostwire Tokyo - 1920x1080 Highest Settings + Maximum Ray Tracing
NVIDIA GeForce RTX 4090
AMD Ryzen 9 7950X, NVIDIA GeForce RTX 4090
183.2 (43min, 94.2P0.1, 137.8P1 - 221max) fps +15%
NVIDIA GeForce RTX 4080
Intel Core i9-13900K, NVIDIA GeForce RTX 4080
166.2 (30.4min, 60P0.1, 115.2P1 - 248max) fps +4%
NVIDIA GeForce RTX 4080
AMD Ryzen 9 7950X, NVIDIA GeForce RTX 4080
159.6 (39.5min, 86.7P0.1, 114.5P1 - 226max) fps
AMD Radeon RX 7900 XTX
AMD Ryzen 9 7950X, AMD Radeon RX 7900 XTX
136.3 (39.1min, 76.4P0.1, 95.8P1 - 243max) fps -15%
NVIDIA GeForce RTX 3080 Ti
AMD Ryzen 9 7950X, NVIDIA GeForce RTX 3080 Ti
119.9 (39.2min, 61.9P0.1, 80.9P1 - 230max) fps -25%
AMD Radeon RX 7900 XT
AMD Ryzen 9 7950X, AMD Radeon RX 7900 XT
116.5 (30.3min, 71.6P0.1, 78.1P1 - 246max) fps -27%
AMD Radeon RX 6950 XT
AMD Ryzen 9 7950X, AMD Radeon RX 6950 XT
99 (35.8min, 58.6P0.1, 66P1 - 237max) fps -38%
The Callisto Protocol - 1920x1080 Ultra Preset (without FSR Upscaling) + Full Ray-Tracing
AMD Radeon RX 7900 XTX
AMD Ryzen 9 7950X, AMD Radeon RX 7900 XTX
98 fps +13%
NVIDIA GeForce RTX 4090
AMD Ryzen 9 7950X, NVIDIA GeForce RTX 4090
92 fps +6%
AMD Radeon RX 7900 XT
AMD Ryzen 9 7950X, AMD Radeon RX 7900 XT
89 fps +2%
NVIDIA GeForce RTX 4080
AMD Ryzen 9 7950X, NVIDIA GeForce RTX 4080
87 fps
AMD Radeon RX 6950 XT
AMD Ryzen 9 7950X, AMD Radeon RX 6950 XT
84 fps -3%
NVIDIA GeForce RTX 3080 Ti
AMD Ryzen 9 7950X, NVIDIA GeForce RTX 3080 Ti
76 fps -13%
AMD Radeon RX 6800
AMD Ryzen 9 7950X, AMD Radeon RX 6800
66 fps -24%
Spider-Man Miles Morales - 1920x0180 Very High Preset + Ray-Tracing AA:T
NVIDIA GeForce RTX 4090
AMD Ryzen 9 7950X, NVIDIA GeForce RTX 4090
122.2 (60.2min, 67.7P0.1, 89P1 - 221max) fps +7%
NVIDIA GeForce RTX 4080
AMD Ryzen 9 7950X, NVIDIA GeForce RTX 4080
114.7 (49.8min, 65.7P0.1, 93.2P1 - 157.5max) fps
AMD Radeon RX 7900 XTX
AMD Ryzen 9 7950X, AMD Radeon RX 7900 XTX
98.6 (68.4min, 71.9P0.1, 82.3P1 - 147.1max) fps -14%
NVIDIA GeForce RTX 3080 Ti
AMD Ryzen 9 7950X, NVIDIA GeForce RTX 3080 Ti
93.9 (66.7min, 73.8P0.1, 79.2P1 - 160.1max) fps -18%
AMD Radeon RX 7900 XT
AMD Ryzen 9 7950X, AMD Radeon RX 7900 XT
88.5 (67.1min, 70.7P0.1, 74.7P1 - 196.4max) fps -23%
AMD Radeon RX 6950 XT
AMD Ryzen 9 7950X, AMD Radeon RX 6950 XT
80.9 (60.3min, 63.4P0.1, 67.7P1 - 165.3max) fps -29%
AMD Radeon RX 6800
AMD Ryzen 9 7950X, AMD Radeon RX 6800
65 (48.7min, 50.9P0.1, 52.4P1 - 129.3max) fps -43%
basso medio alto ultraQHD4K DLSS4K
GTA V (2015) 188.1 188 187.7 164.3 159.2 183.9
The Witcher 3 (2015) 811 719 549 268 202
Dota 2 Reborn (2015) 287.8 256.8 247.1 228.6 221.7
Final Fantasy XV Benchmark (2018) 236 235 225 195.7 116.9
X-Plane 11.11 (2018) 219 193.6 149.4 124.9
Far Cry 5 (2018) 239 209 203 188 185 139
Strange Brigade (2018) 681 548 531 482 390 195.1
Shadow of the Tomb Raider (2018) 334 299 304 288 241 132.2
Far Cry New Dawn (2019) 196 173 166 150 149 130
Metro Exodus (2019) 300 256 212 177.7 153.7 103.9
Control (2019) 240 240 235 162 82.4
Borderlands 3 (2019) 239 203 189.9 187.2 163.2 95.2
F1 2020 (2020) 552 478 463 396 332 201
F1 2021 (2021) 656 606 514 256 240 144.3
Far Cry 6 (2021) 205 177.3 161.6 155 150.6 107
Forza Horizon 5 (2021) 302 242 238 177 164 124
God of War (2022) 274 271 229 164.9 136.3 95.3
GRID Legends (2022) 318 287 254 237 233 163.3
Cyberpunk 2077 1.6 (2022) 216 213 201 190.1 129.1 63.4
Ghostwire Tokyo (2022) 294 283 252 124.6
Tiny Tina's Wonderlands (2022) 385 320 269 226 165.8 89
F1 22 (2022) 423 411 384 172.8 113.8 57.9
The Quarry (2022) 376 291 249 207 149 79.2
FIFA 23 (2022) 278 274 274 274 272 218
A Plague Tale Requiem (2022) 174.1 172.5 153.9 127 95.4 54.4
Uncharted Legacy of Thieves Collection (2022) 145.5 144.7 142.1 140.4 125.6 77.7
Call of Duty Modern Warfare 2 2022 (2022) 317 286 230 219 170 158 112
Spider-Man Miles Morales (2022) 198.6 180.3 178.2 157.3 202 103.9
The Callisto Protocol (2022) 231 213 172 171 138 85
Need for Speed Unbound (2022) 177.8 171.4 160.4 140.3 137.8 104.5

Emissioni del KFA2 GeForce RTX 4080 SG

Design rivisto della ventola con maggiore flusso d'aria (fonte: KFA2)
connettore 12VHPWR su KFA2 GeForce RTX 4080 SG (fonte: KFA2)

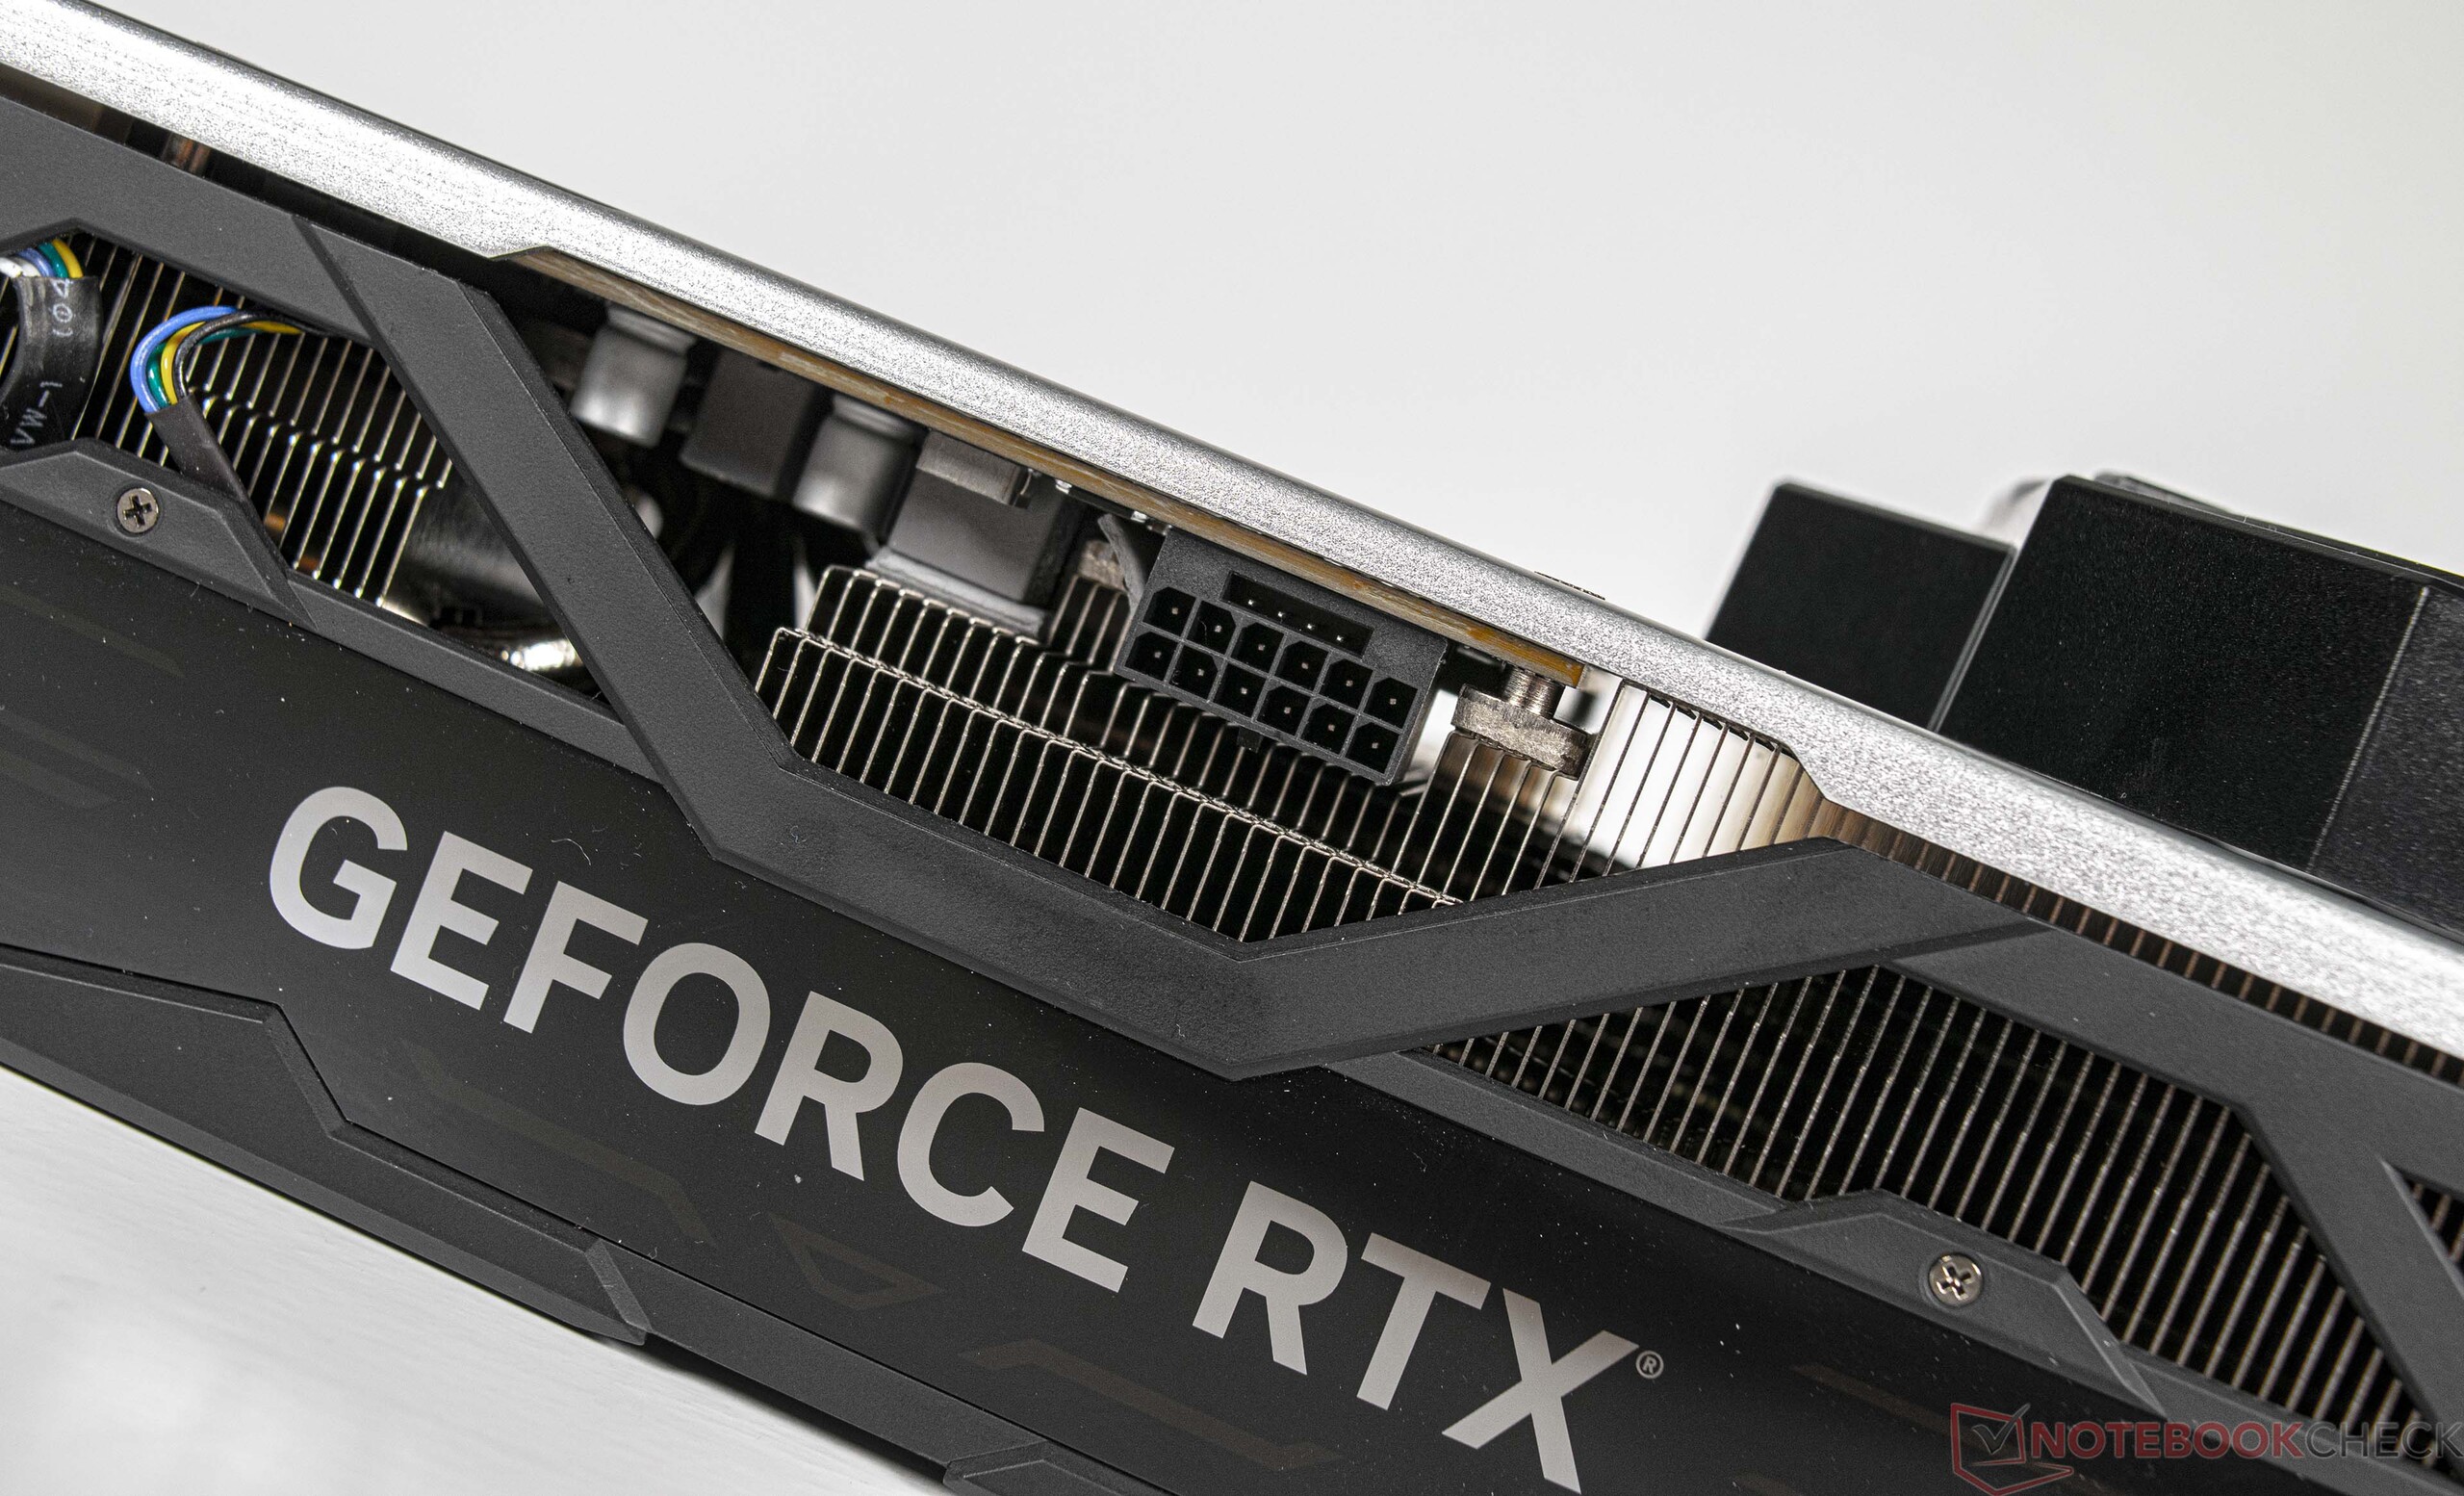
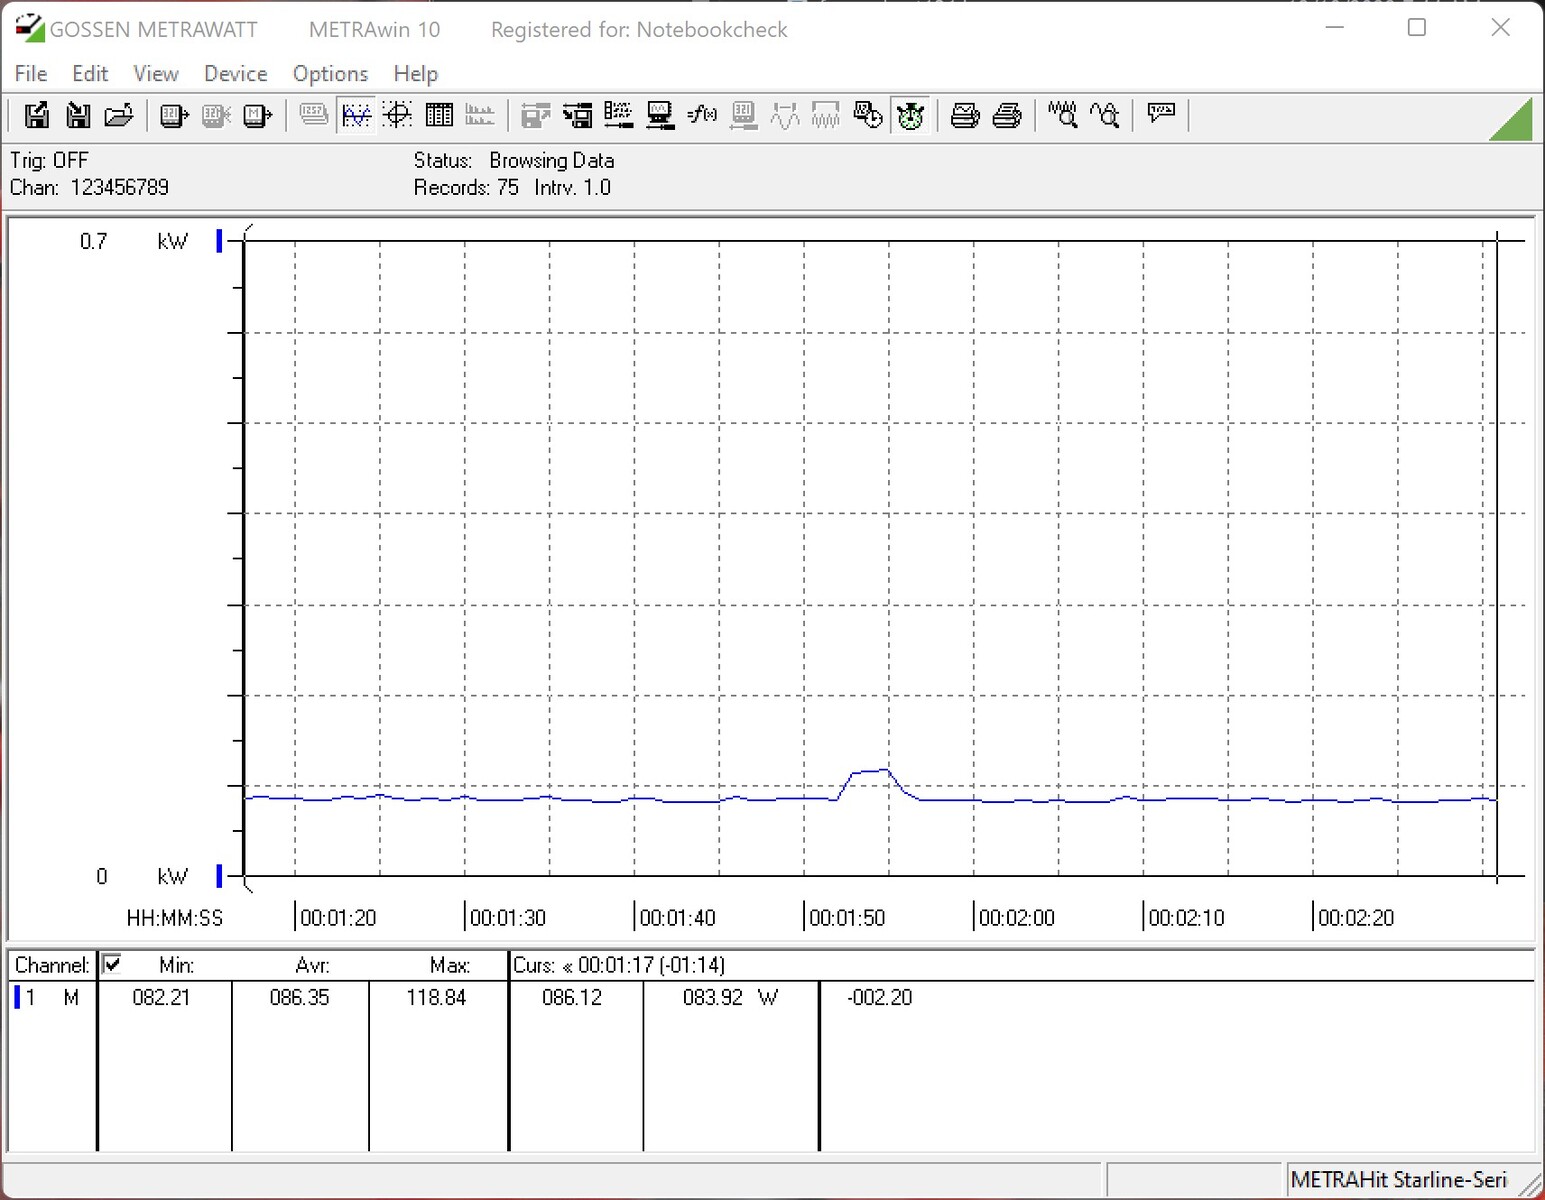
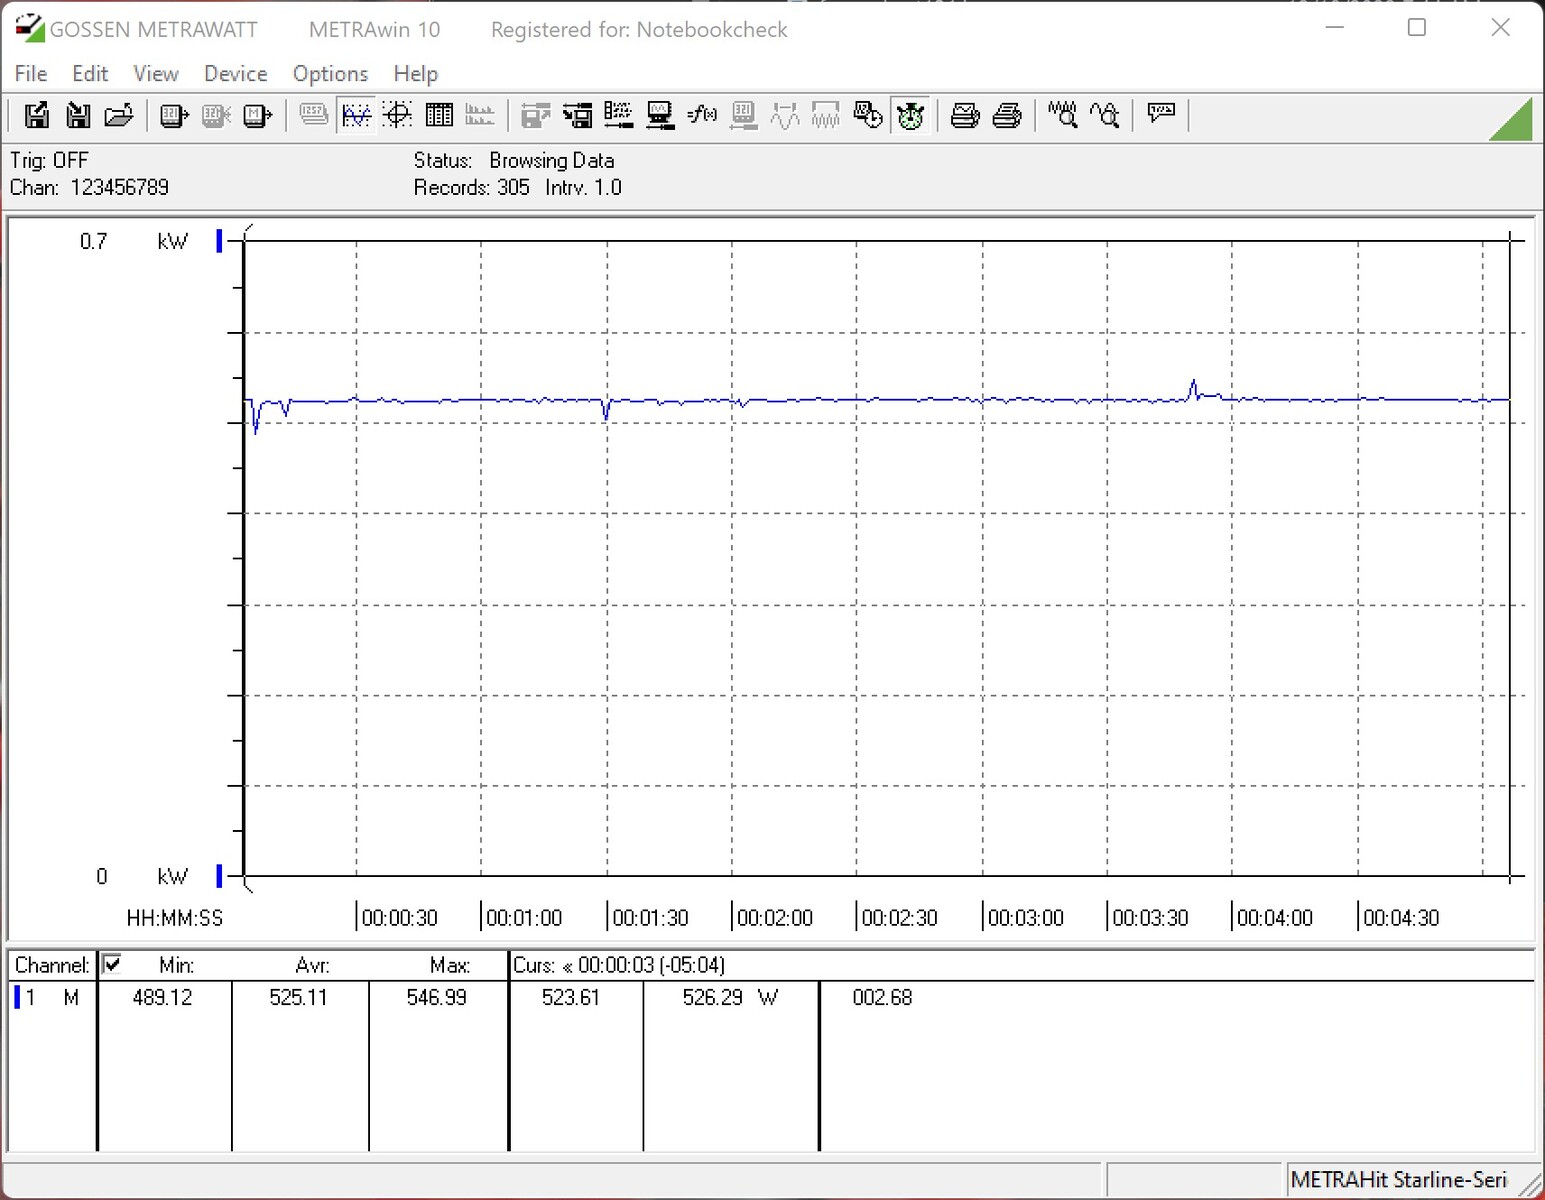
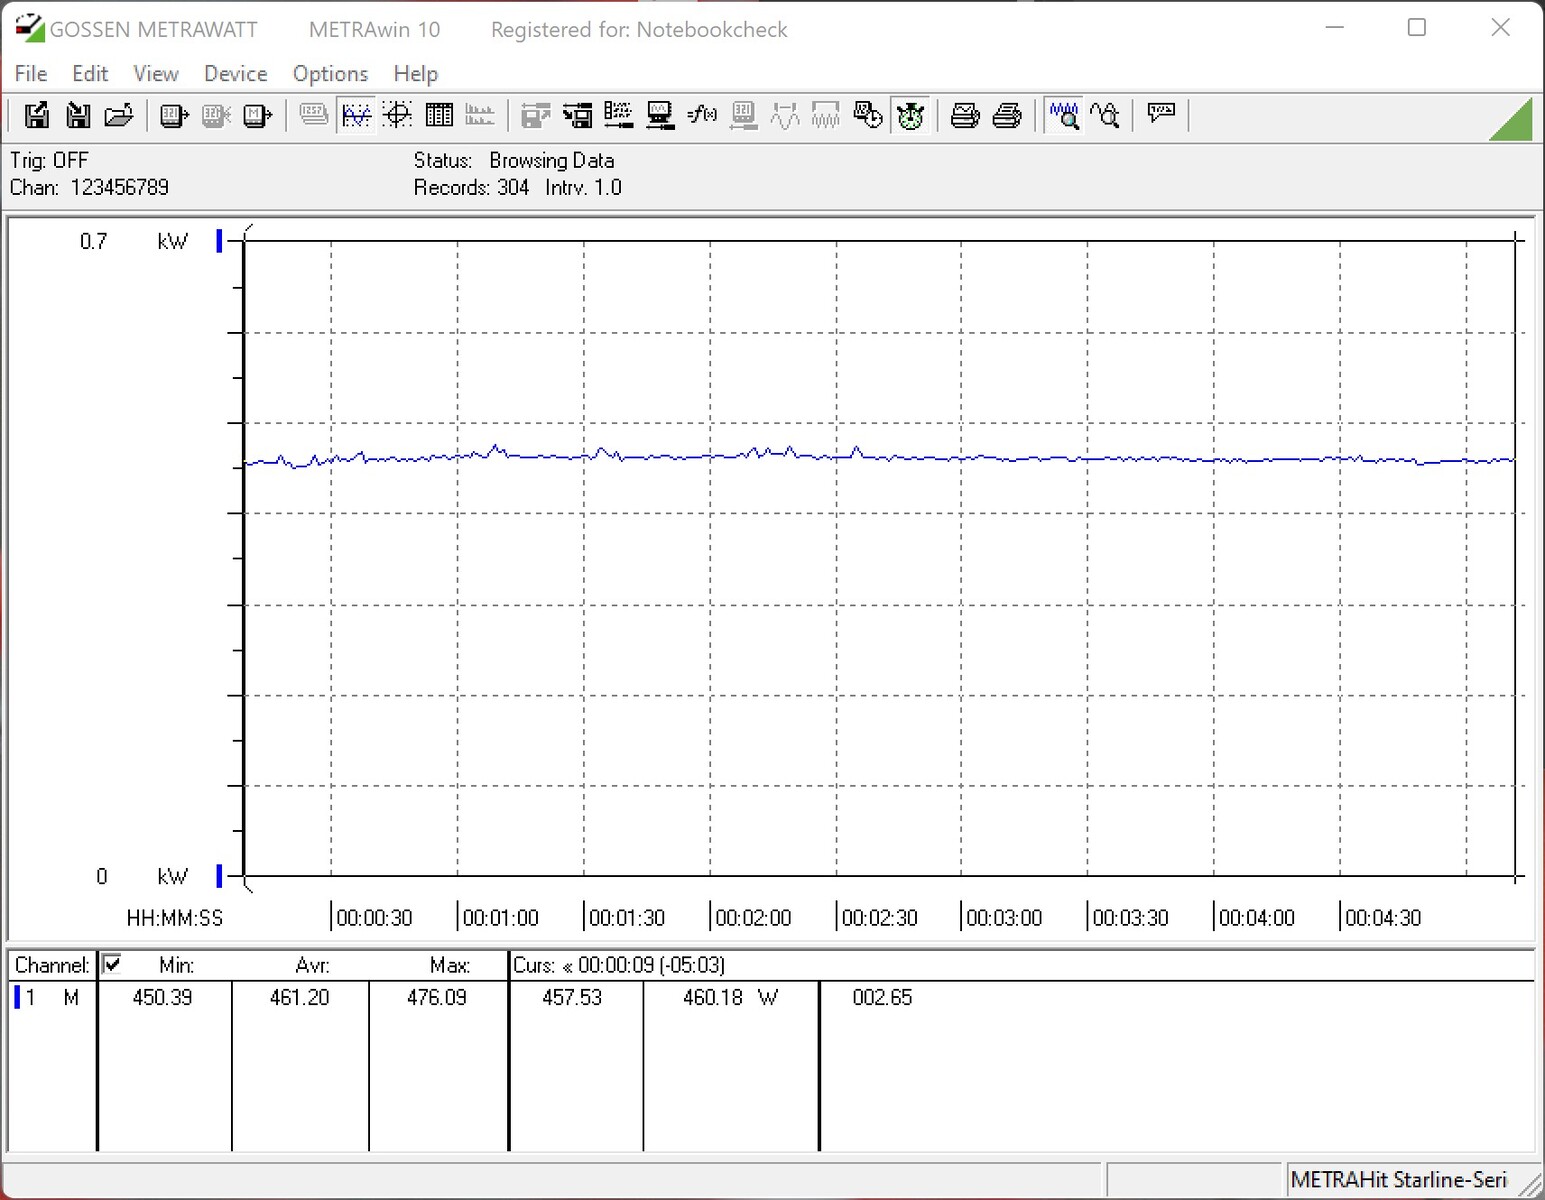
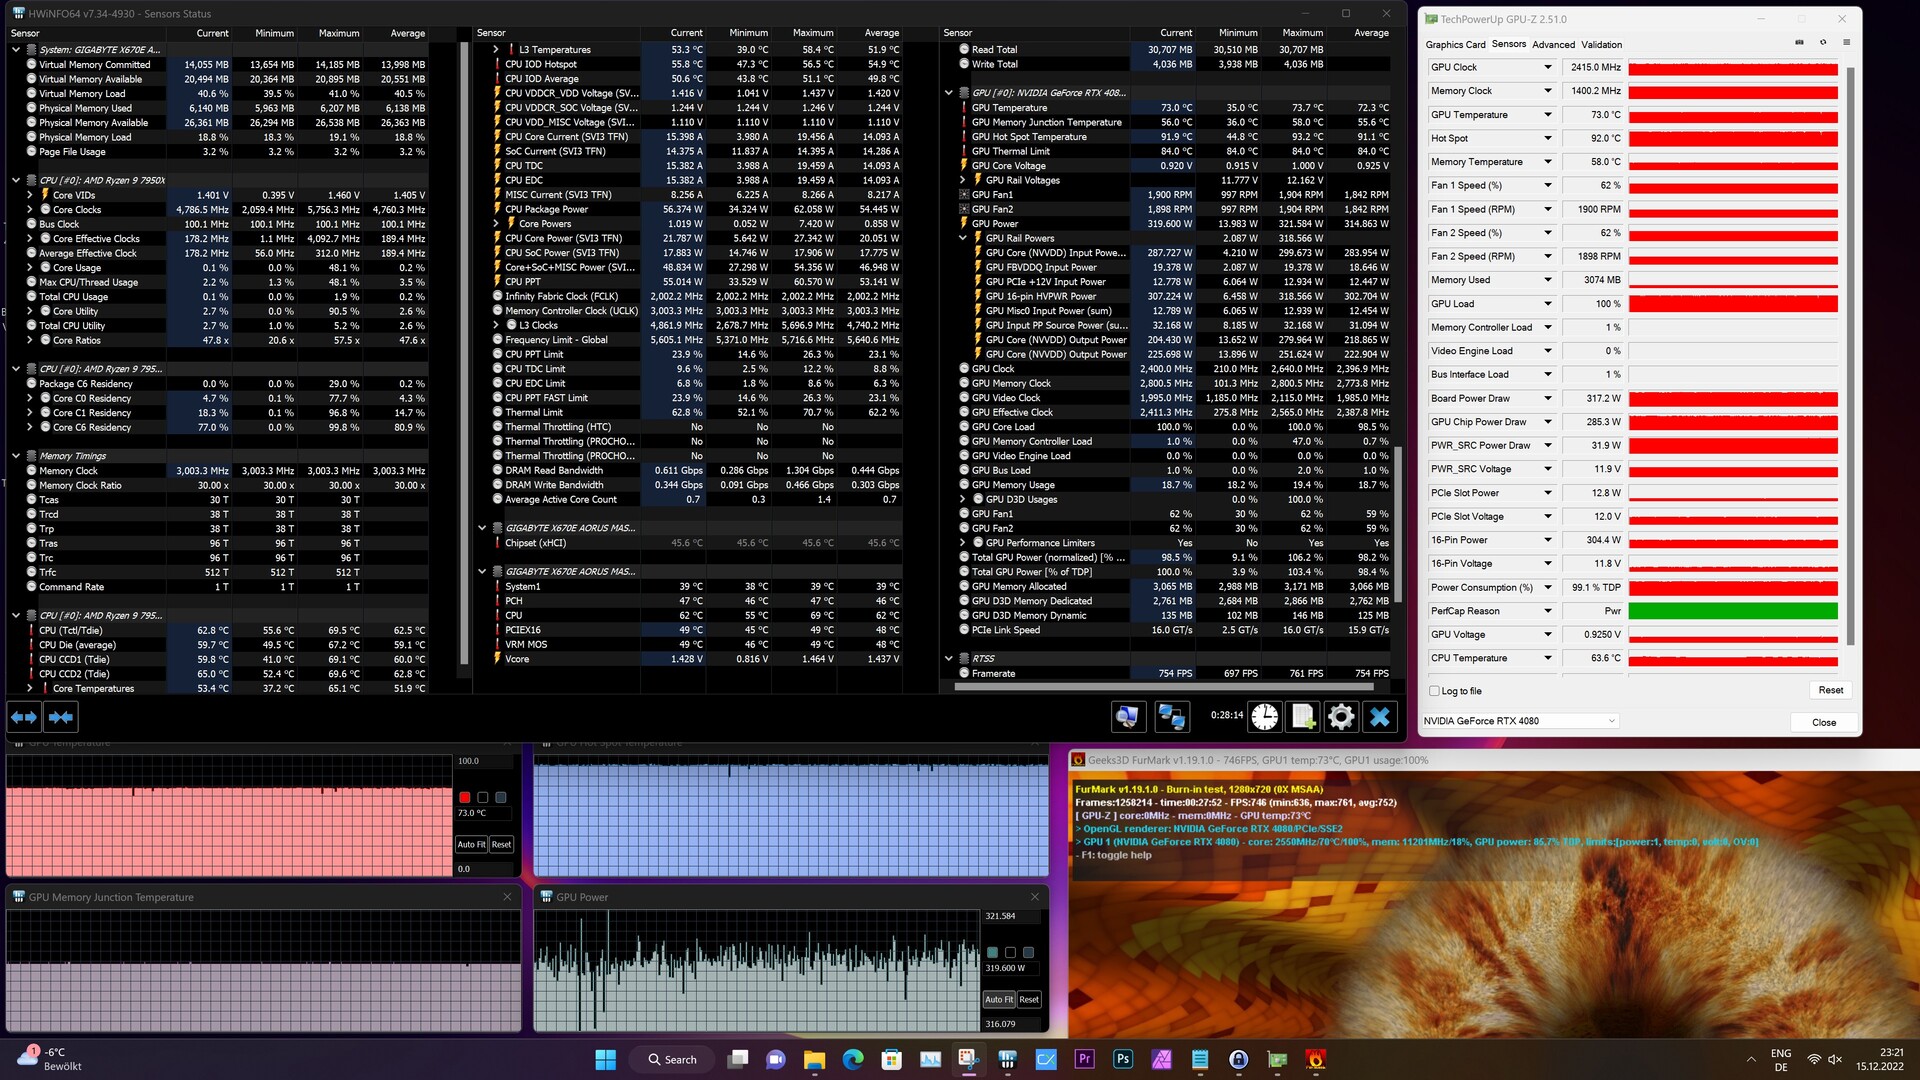
La KFA2 GeForce RTX 4080 SG ha un consumo energetico di 320 watt, pari a quello di una scheda Founders Edition di Nvidia. Anche se il consumo di energia è rimasto invariato rispetto a una scheda GeForce RTX 3080la RTX 4080 ha superato notevolmente il suo predecessore nei nostri test. L'efficienza energetica è stata migliorata con un margine impressionante grazie ad Ada Lovelace e al nodo a 4 nm. Il target di potenza della KFA2 GeForce RTX 4080 SG può essere aumentato fino al 31%, consentendo alla sola scheda grafica di consumare fino a 420 watt di potenza. Utilizzando il connettore 12VHPWR (incluso nella confezione come adattatore con 3x6+2 pin PCIe), l'assorbimento di potenza della GPU è ancora entro i limiti consentiti. Per evitare problemi di alimentazione, si consiglia di utilizzare tre cavi separati per collegare la scheda all'alimentatore

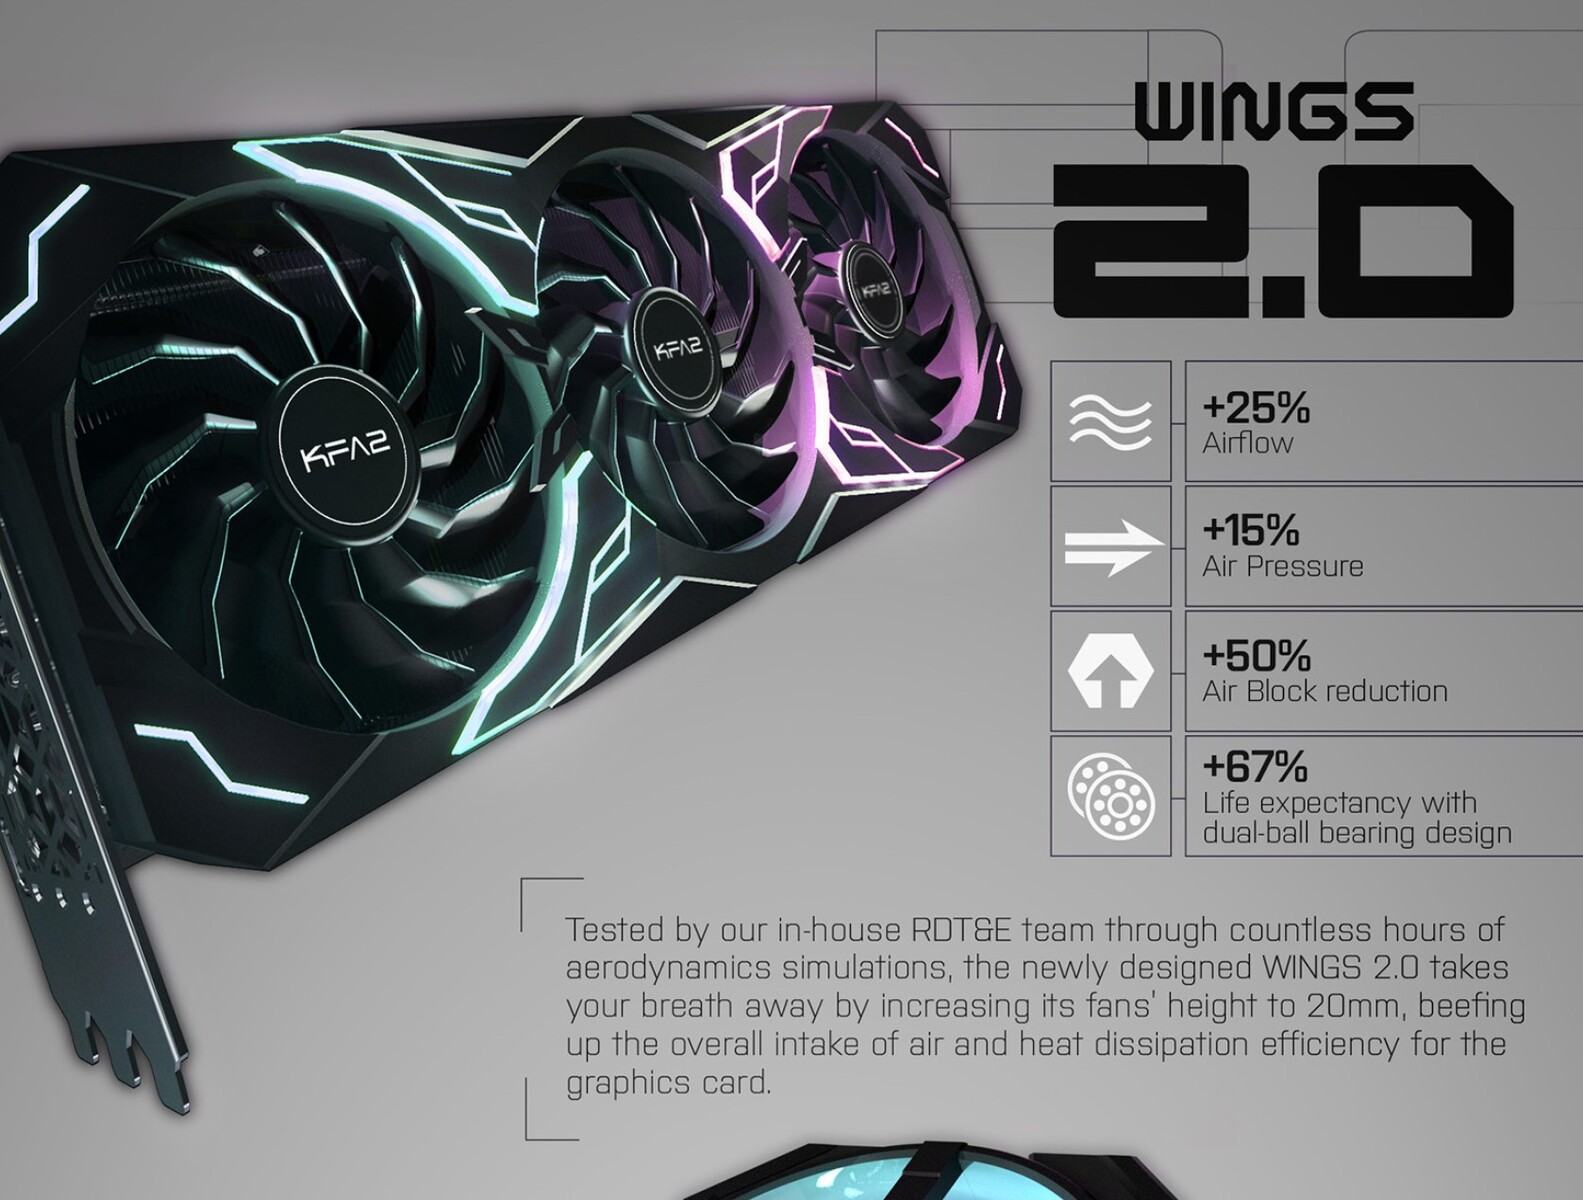
Durante lo stress test, la KFA2 GeForce RTX 4080 SG ha raggiunto senza problemi i 320 watt e abbiamo registrato una temperatura della GPU di circa 74°C (165°F). Tuttavia, la temperatura dell'hotspot della GPU ha raggiunto i 93°C (199°F) sotto carico. La VRAM è rimasta incredibilmente fresca, a 58°C (136°F). La scheda KFA2 si affida a un enorme dissipatore con tre ventole assiali da 102 mm per dissipare il calore. Opzionalmente, è possibile installare un'altra ventola da 102 mm sul retro della scheda. Sfortunatamente, non abbiamo potuto testarle a causa dell'incompatibilità con la nostra scheda madre. Le ventole hanno generato un silenzioso fruscio che poteva essere udito anche con il case del computer chiuso (42 dB(A) di rumore in base alla nostra misurazione). Quando abbiamo aumentato il limite di potenza, i livelli di rumore della GPU sono saliti a 43 dB(A). Durante il gioco (The Witcher 3, 1080p, preset Ultra), la nostra configurazione ha prodotto un piacevole rumore di 36 dB(A). Inoltre, non abbiamo notato alcun fastidioso fruscio della bobina

In termini di consumo energetico, la KFA2 GeForce RTX 4080 SG lascia una buona impressione ed è a pari merito con la AMD Radeon RX 7900 XT, una scheda che offre prestazioni nettamente inferiori. La KFA GeForce RTX 3080 SG, che abbiamo recensito in precedenza, richiedeva più energia sotto carico. Rispetto alla KFA2 GeForce RTX 4090 SG, la più piccola scheda grafica Ada Lovelace consuma il 30% di energia in meno sotto carico. Tuttavia, è bene ricordare che la RTX 4090 ha una potenza nominale di 450 watt e offre prestazioni sostanzialmente superiori

Il produttore consiglia di utilizzare un'unità di alimentazione da 750 watt. Questa raccomandazione si basa su un sistema con un AMD Ryzen 9 5900X. Tuttavia, se il sistema è dotato di un processore Ryzen 9 7000 Series o di un processore Intel Raptor Lake, è necessario tenere in considerazione il maggiore consumo energetico di queste CPU sotto carico. Pertanto, si consiglia di abbinare la scheda grafica a un'unità di alimentazione da 850 watt.

Rumorosità

Idle
30.9 / 30.9 / 30.9 dB(A)
Sotto carico
31 / 42.1 dB(A)
  red to green bar
 
 
30 dB
silenzioso
40 dB(A)
udibile
50 dB(A)
rumoroso
 
min: dark, med: mid, max: light   Earthworks M23R, Arta (15 cm di distanza)   Rumorosità ambientale: 30.4 dB(A)
dB(A) 0102030405060708090Deep BassMiddle BassHigh BassLower RangeMidsHigher MidsLower HighsMid HighsUpper HighsSuper Highs2033.331.232.53233.931.533.32532.433.631.130.729.631.732.4313131.731.329.63030.6314029.329.429.328.530.730.329.35028.934.234.233.533.432.928.96328.327.727.827.927.927.728.38028.326.126.428.829.126.928.310027.72625.625.324.526.827.712525.425.224.924.523.724.425.416025.125.123.823.323.62425.120025.724.222.822.822.522.425.725025.524.521.422.821.121.225.531524.822.620.221.320.821.324.840024.721.519.82020.520.124.750023.620.619.219.719.21923.663023.820.318.618.919.118.923.880025.52118.418.31818.225.5100026.422.117.917.317.817.226.4125028.920.817.416.917.216.928.91600312116.816.817.316.931200032.623.816.616.517.316.532.6250031.520.516.816.616.916.331.5315030.221.116.316.51816.130.240002919.716.416.417.416.629500028.517.316.716.717.116.528.563002417.116.716.81716.624800019.917.116.916.917.116.819.91000018.217.417.217.217.117.118.21250017.817.717.517.617.417.417.81600018.118.3181817.917.918.1SPL40.832.729.629.629.929.540.8N3.31.81.31.31.31.33.3median 25.5median 21median 17.9median 17.6median 17.9median 17.4median 25.5Delta3.52.82.32.31.82.33.5hearing rangehide median Fan NoiseKFA2 GeForce RTX 4080 SG
Consumo di energia del sistema di test (inattivo)
Consumo di energia del sistema di test (FurMark PT 100 per cento)
Consumo di energia del sistema di test (FurMark PT 131 per cento)
Consumo di energia del sistema di test (gioco - The Witcher 3, Ultra preset)
Stress test FurMark (PT 100 per cento)
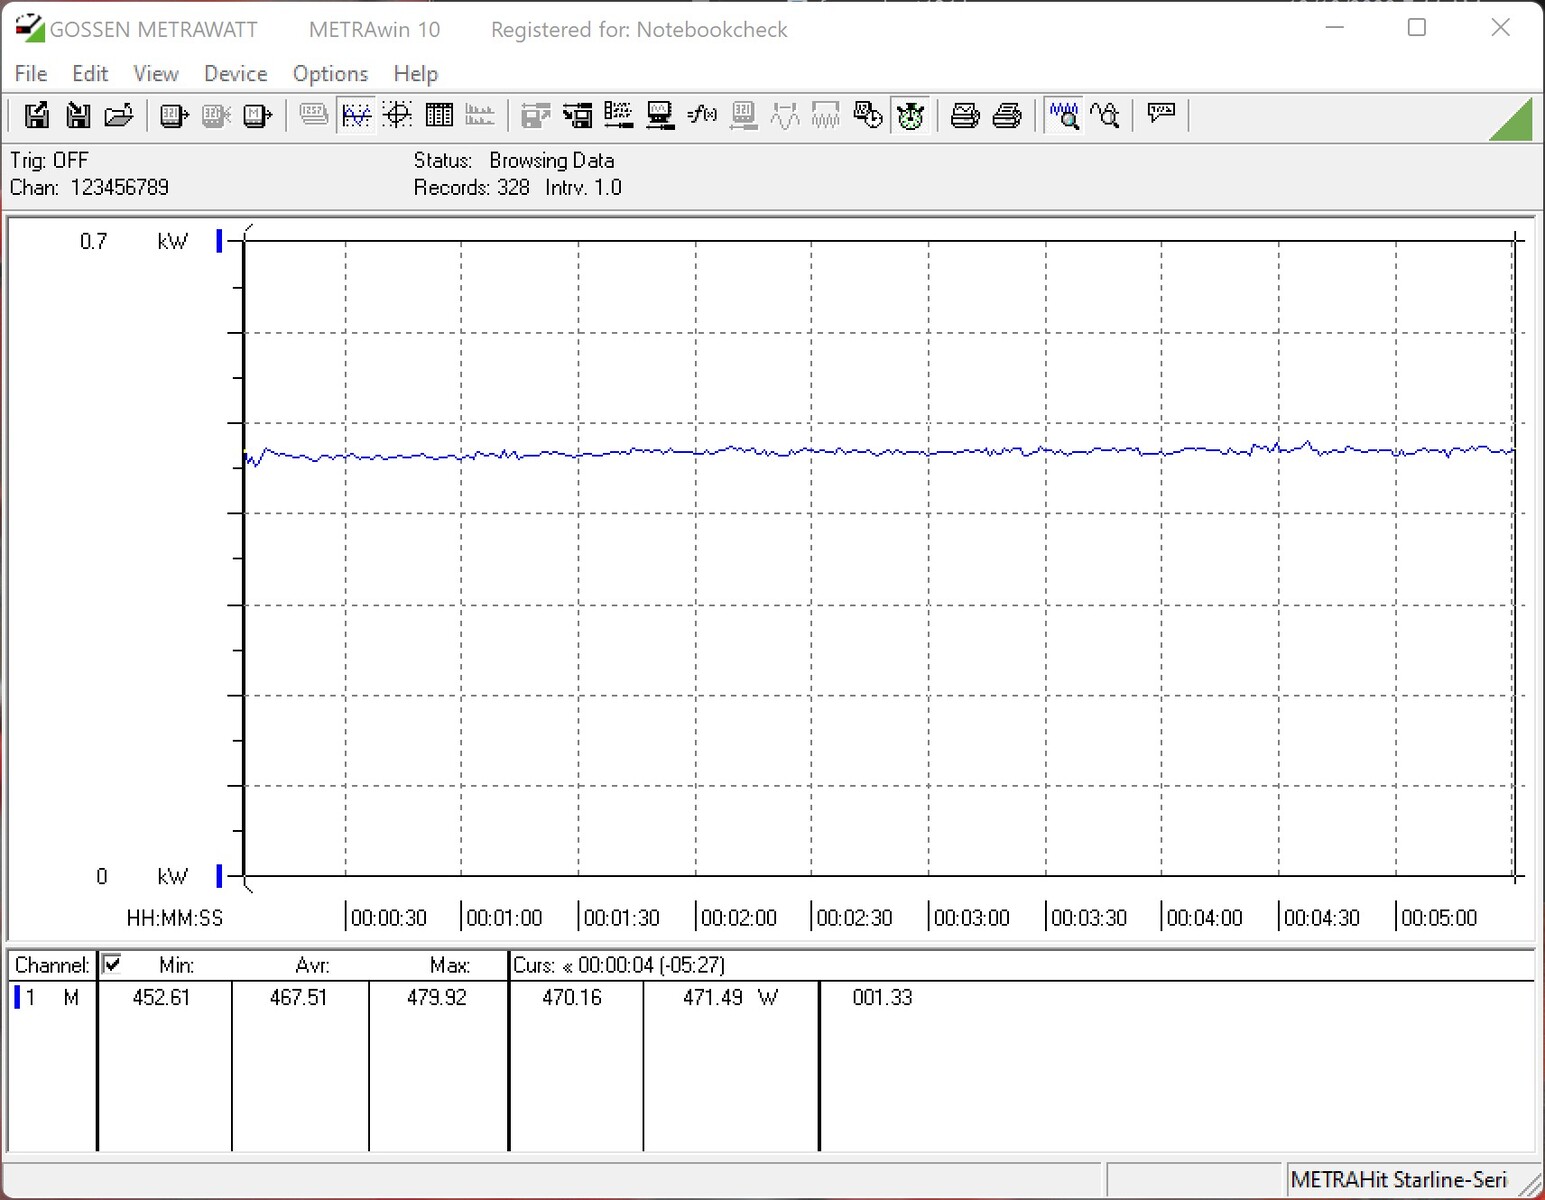
Power Consumption / The Witcher 3 ultra (external Monitor)
MSI Radeon RX 6950 XT Gaming X Trio
MSI Radeon RX 6950 XT Gaming X Trio, AMD Ryzen 9 7950X (Idle: 79.6 W)
610 (607min, 608P1 - 618max) Watt * -32%
Sapphire AMD Radeon RX 6950 XT Nitro+ Pure
Sapphire AMD Radeon RX 6950 XT Nitro+ Pure, AMD Ryzen 9 5900X
589 (583min, 584P1 - 598max) Watt * -28%
AMD Ryzen 7 5800X3D
AMD Ryzen 7 5800X3D, AMD Ryzen 7 5800X3D (Idle: 102 W)
561 (533min, 542P1 - 582max) Watt * -22%
KFA2 GeForce RTX 4090 SG
KFA2 GeForce RTX 4090 SG, AMD Ryzen 9 7950X
546 (526min, 532P1 - 564max) Watt * -18%
AMD Radeon RX 7900 XTX
AMD Radeon RX 7900 XTX, AMD Ryzen 9 7950X (Idle: 86.5 W)
540 (527min, 530P1 - 564max) Watt * -17%
NVIDIA GeForce RTX 3090 Founders Edition
NVIDIA GeForce RTX 3090 Founders Edition, AMD Ryzen 9 7950X
538 (532min, 532P1 - 570max) Watt * -17%
ASUS TUF Gaming GeForce RTX 3080 Ti OC
ASUS TUF Gaming GeForce RTX 3080 Ti OC, AMD Ryzen 9 7950X (Idle: 78.2 W)
528 (511min, 523P1 - 549max) Watt * -15%
KFA2 GeForce RTX 3080 SG
KFA2 GeForce RTX 3080 SG, AMD Ryzen 9 5900X
518 (509min, 510P1 - 539max) Watt * -12%
AMD Radeon RX 6900 XT
AMD Radeon RX 6900 XT, AMD Ryzen 9 5950X (Idle: 99.15 W)
488.3 (459.99min - 512.79max) Watt * -6%
KFA2 GeForce RTX 4080 SG
KFA2 GeForce RTX 4080 SG, AMD Ryzen 9 7950X (Idle: 86.4 W)
461 (450min, 453P1 - 476max) Watt *
AMD Radeon RX 7900 XT
AMD Radeon RX 7900 XT, AMD Ryzen 9 7950X (Idle: 84.6 W)
459 (451min, 453P1 - 488max) Watt * -0%
Power Consumption / FurMark 1.19 GPU Stress Test (external Monitor)
KFA2 GeForce RTX 4090 SG
KFA2 GeForce RTX 4090 SG, AMD Ryzen 9 7950X
618 (593min, 605P1 - 652max) Watt * -32%
MSI Radeon RX 6950 XT Gaming X Trio
MSI Radeon RX 6950 XT Gaming X Trio, AMD Ryzen 9 7950X (Idle: 79.6 W)
604 (579min, 587P1 - 627max) Watt * -29%
Sapphire AMD Radeon RX 6950 XT Nitro+ Pure
Sapphire AMD Radeon RX 6950 XT Nitro+ Pure, AMD Ryzen 9 5900X
564 (525min, 551P1 - 601max) Watt * -21%
AMD Radeon RX 7900 XTX
AMD Radeon RX 7900 XTX, AMD Ryzen 9 7950X (Idle: 86.5 W)
518 (501min, 502P1 - 525max) Watt * -11%
NVIDIA GeForce RTX 3090 Founders Edition
NVIDIA GeForce RTX 3090 Founders Edition, AMD Ryzen 9 7950X
516 (512min, 514P1 - 541max) Watt * -10%
ASUS TUF Gaming GeForce RTX 3080 Ti OC
ASUS TUF Gaming GeForce RTX 3080 Ti OC, AMD Ryzen 9 7950X (Idle: 78.2 W)
513 (500min, 506P1 - 527max) Watt * -10%
AMD Radeon RX 7900 XT
AMD Radeon RX 7900 XT, AMD Ryzen 9 7950X (Idle: 84.6 W)
513 (500min, 506P1 - 527max) Watt * -10%
KFA2 GeForce RTX 3080 SG
KFA2 GeForce RTX 3080 SG, AMD Ryzen 9 5900X
487 (475min, 477P1 - 501max) Watt * -4%
KFA2 GeForce RTX 4080 SG
KFA2 GeForce RTX 4080 SG, AMD Ryzen 9 7950X (Idle: 86.4 W)
468 (453min, 459P1 - 480max) Watt *
AMD Radeon RX 6900 XT
AMD Radeon RX 6900 XT, AMD Ryzen 9 5950X (Idle: 99.15 W)
456.8 (378.13min - 484.67max) Watt * +2%

* ... Meglio usare valori piccoli

Power consumption with external monitor

0255075100125150175200225250275300325350375400425450475Tooltip
KFA2 GeForce RTX 4080 SG; 1280x720 FurMark 1.19 GPU Stress Test (external Monitor): Ø468 (453-480)
KFA2 GeForce RTX 4080 SG; 1920x1080 The Witcher 3 ultra (external Monitor): Ø461 (450-476)
KFA2 GeForce RTX 4080 SG; Idle 1min (external Monitor): Ø86.3 (82.2-118.8)

Pro

+ elevate prestazioni 3D
+ un notevole salto di prestazioni rispetto alla generazione precedente a parità di TDP
+ moderna architettura a 4 nm
+ 16 GB di VRAM DLSS 3.0 con generazione di frame
+ modalità di arresto della ventola
+ grande design
+ aspetto accattivante
+ quarta ventola opzionale
+ robusta staffa per GPU con illuminazione RGB

Contro

- connettore di alimentazione posizionato in modo scomodo
- molto grande (verificare la compatibilità con il case)
- nessuna DisplayPort 2.1
- troppo costoso

Verdetto - Ottime prestazioni e un sacco di RGB

KFA2 GeForce RTX 4080 SG recensione: prodotto gentilmente fornito da KFA2 Germany

KFA2 GeForce RTX 4080 SG è in tutto e per tutto una scheda grafica estremamente veloce ed è adatta per eseguire giochi impegnativi senza compromessi. Rispetto alla GeForce RTX 3080la scheda è in grado di offrire prestazioni nettamente superiori a parità di consumo energetico. I vantaggi della nuova generazione di GPU sono particolarmente evidenti quando si attiva il ray tracing. Insieme al DLSS 3.0 (compresa la Frame Generation), anche i nuovi giochi possono essere eseguiti senza problemi a 2160p con gli effetti di ray tracing attivati. Purtroppo, però, per raggiungere questo livello di prestazioni è necessario disporre di una RTX 4080 o RTX 4090 GeForce. Gli utenti delle vecchie GPU Nvidia sono esclusi dall'azione

Il modello KFA2 oggetto di questa recensione è caratterizzato da un design appositamente sviluppato e da un massiccio dispositivo di raffreddamento che si è comportato in modo stupefacente durante la nostra recensione. È persino in grado di raffreddare la scheda in modo silenzioso nelle applicazioni 2D grazie alla modalità di arresto della ventola. La GPU richiede molta energia, con una potenza nominale di 320 watt, ma il consumo energetico rientra comunque in una fascia ragionevole. A nostro avviso, l'aumento costante del consumo energetico non è la strada giusta da seguire

KFA2 GeForce RTX 4080 SG è un'ottima scheda grafica e ci ha impressionato per le sue elevate prestazioni di gioco. L'ampia gamma di luci RGB attira l'attenzione sul massiccio radiatore.

La scheda grafica è alimentata tramite un connettore da 12VHPWR. Le opinioni su questo connettore possono essere discordanti, ma non abbiamo ancora riscontrato alcun problema. L'unico problema è che pensiamo che il connettore 12VHPWR sia posizionato in un punto non ottimale. A causa di quanto la scheda grafica sporge sopra lo slot PCIe, è necessario allocare spazio sufficiente per il grande cavo dell'adattatore in modo che non si attorcigli proprio accanto alla GPU. Questo potrebbe causare problemi di spazio in molti computer

KFA2 GeForce RTX 4080 SG è in competizione con

Please share our article, every link counts!
> Recensioni e prove di notebook, tablets e smartphones > Recensioni e prove > Recensioni e prove > Recensione della GPU desktop KFA2 GeForce RTX 4080 SG: Grandi prestazioni e prezzi discutibili
Sebastian Bade, 2023-01- 4 (Update: 2023-01- 4)