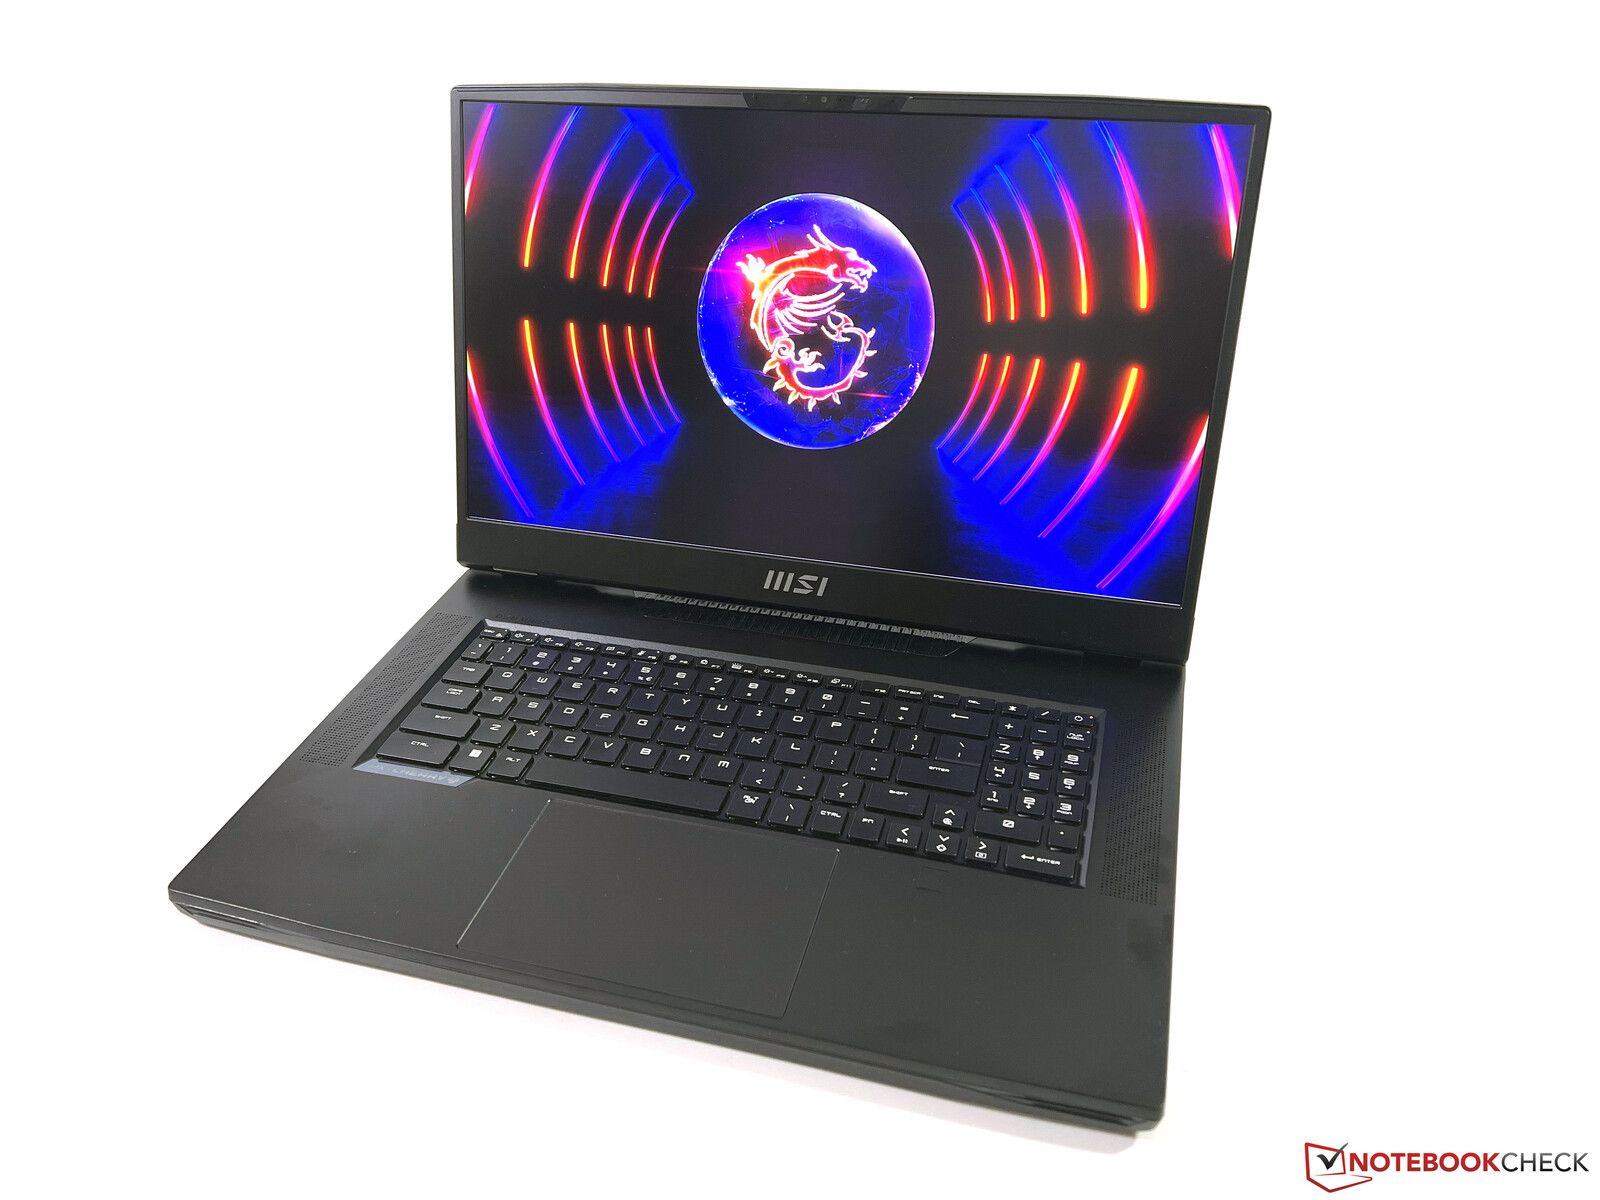
Recensione dell'MSI Titan GT77 HX 13V - Laptop gaming con RTX 4090 e Core i9-13950HX
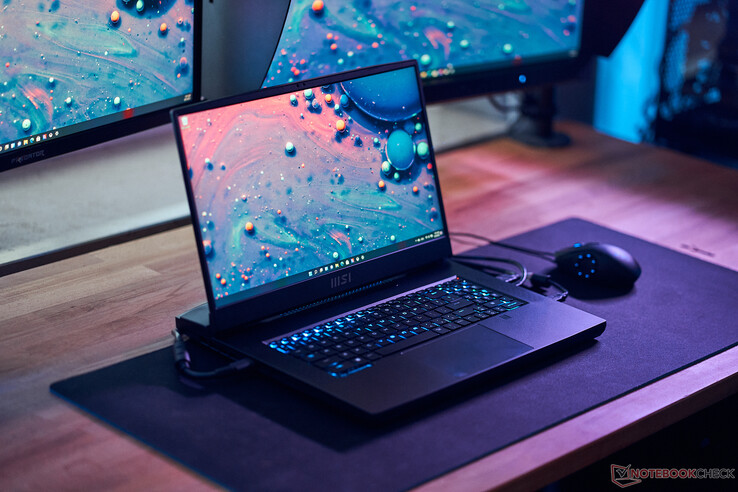
La serie Titan GT77 di MSI offre computer portatili da gioco di punta progettati per ottenere le massime prestazioni. Il nuovo modello 2023 GT77 HX 13VI prosegue questo concetto e utilizza alcuni dei migliori componenti mobili disponibili. Oltre alle ultime CPU Raptor Lake-HX di Intel, è possibile usufruire delle nuovissime GPU per laptop di Nvidia: GeForce RTX 4080o GeForce RTX 4090. MSI ha inoltre dotato il nuovo GT77 di uno schermo Mini-LED 4K con una frequenza di aggiornamento di 144 Hz.
La nostra unità di recensione è un'unità di pre-produzione con ilCore i9-13950HXGeForce RTX 4090, 64 GB di RAM, 4 TB di memoria SSD e schermo Mini-LED 4K. Le configurazioni di vendita al dettaglio (GT77 HX 13VI) con le stesse specifiche saranno fornite con il modelloCore i9-13980HX(clock leggermente superiore, ma senza supporto vPro) per un prezzo di 6599 euro in Germania (5299 dollari); la SKU con RTX 4080 e 2 TB di memoria SSD viene venduta a 5499 euro (GT77 HX 13VH, 4299 dollari).
Potenziali concorrenti a confronto
Punteggio | Data | Modello | Peso | Altezza | Dimensione | Risoluzione | Prezzo |
|---|---|---|---|---|---|---|---|
| 89 % v7 (old) | 02/2023 | MSI Titan GT77 HX 13VI i9-13950HX, GeForce RTX 4090 Laptop GPU | 3.5 kg | 23 mm | 17.30" | 3840x2160 | |
| 91.2 % v7 (old) | 02/2023 | Razer Blade 16 Early 2023 i9-13950HX, GeForce RTX 4080 Laptop GPU | 2.4 kg | 21.99 mm | 16.00" | 2560x1600 | |
| 86.9 % v7 (old) | 11/2022 | Asus ROG Strix Scar 17 SE G733CX-LL014W i9-12950HX, GeForce RTX 3080 Ti Laptop GPU | 2.9 kg | 28.3 mm | 17.30" | 2560x1440 | |
| 88.3 % v7 (old) | 08/2022 | MSI Titan GT77 12UHS i9-12900HX, GeForce RTX 3080 Ti Laptop GPU | 3.3 kg | 23 mm | 17.30" | 1920x1080 | |
| 89.2 % v7 (old) | 05/2022 | Alienware x17 R2 P48E i9-12900HK, GeForce RTX 3080 Ti Laptop GPU | 3.1 kg | 20.9 mm | 17.30" | 1920x1080 | |
| 87.6 % v7 (old) | 09/2022 | Schenker XMG Neo 17 M22 R9 6900HX, GeForce RTX 3080 Ti Laptop GPU | 2.8 kg | 27 mm | 17.00" | 2560x1600 |
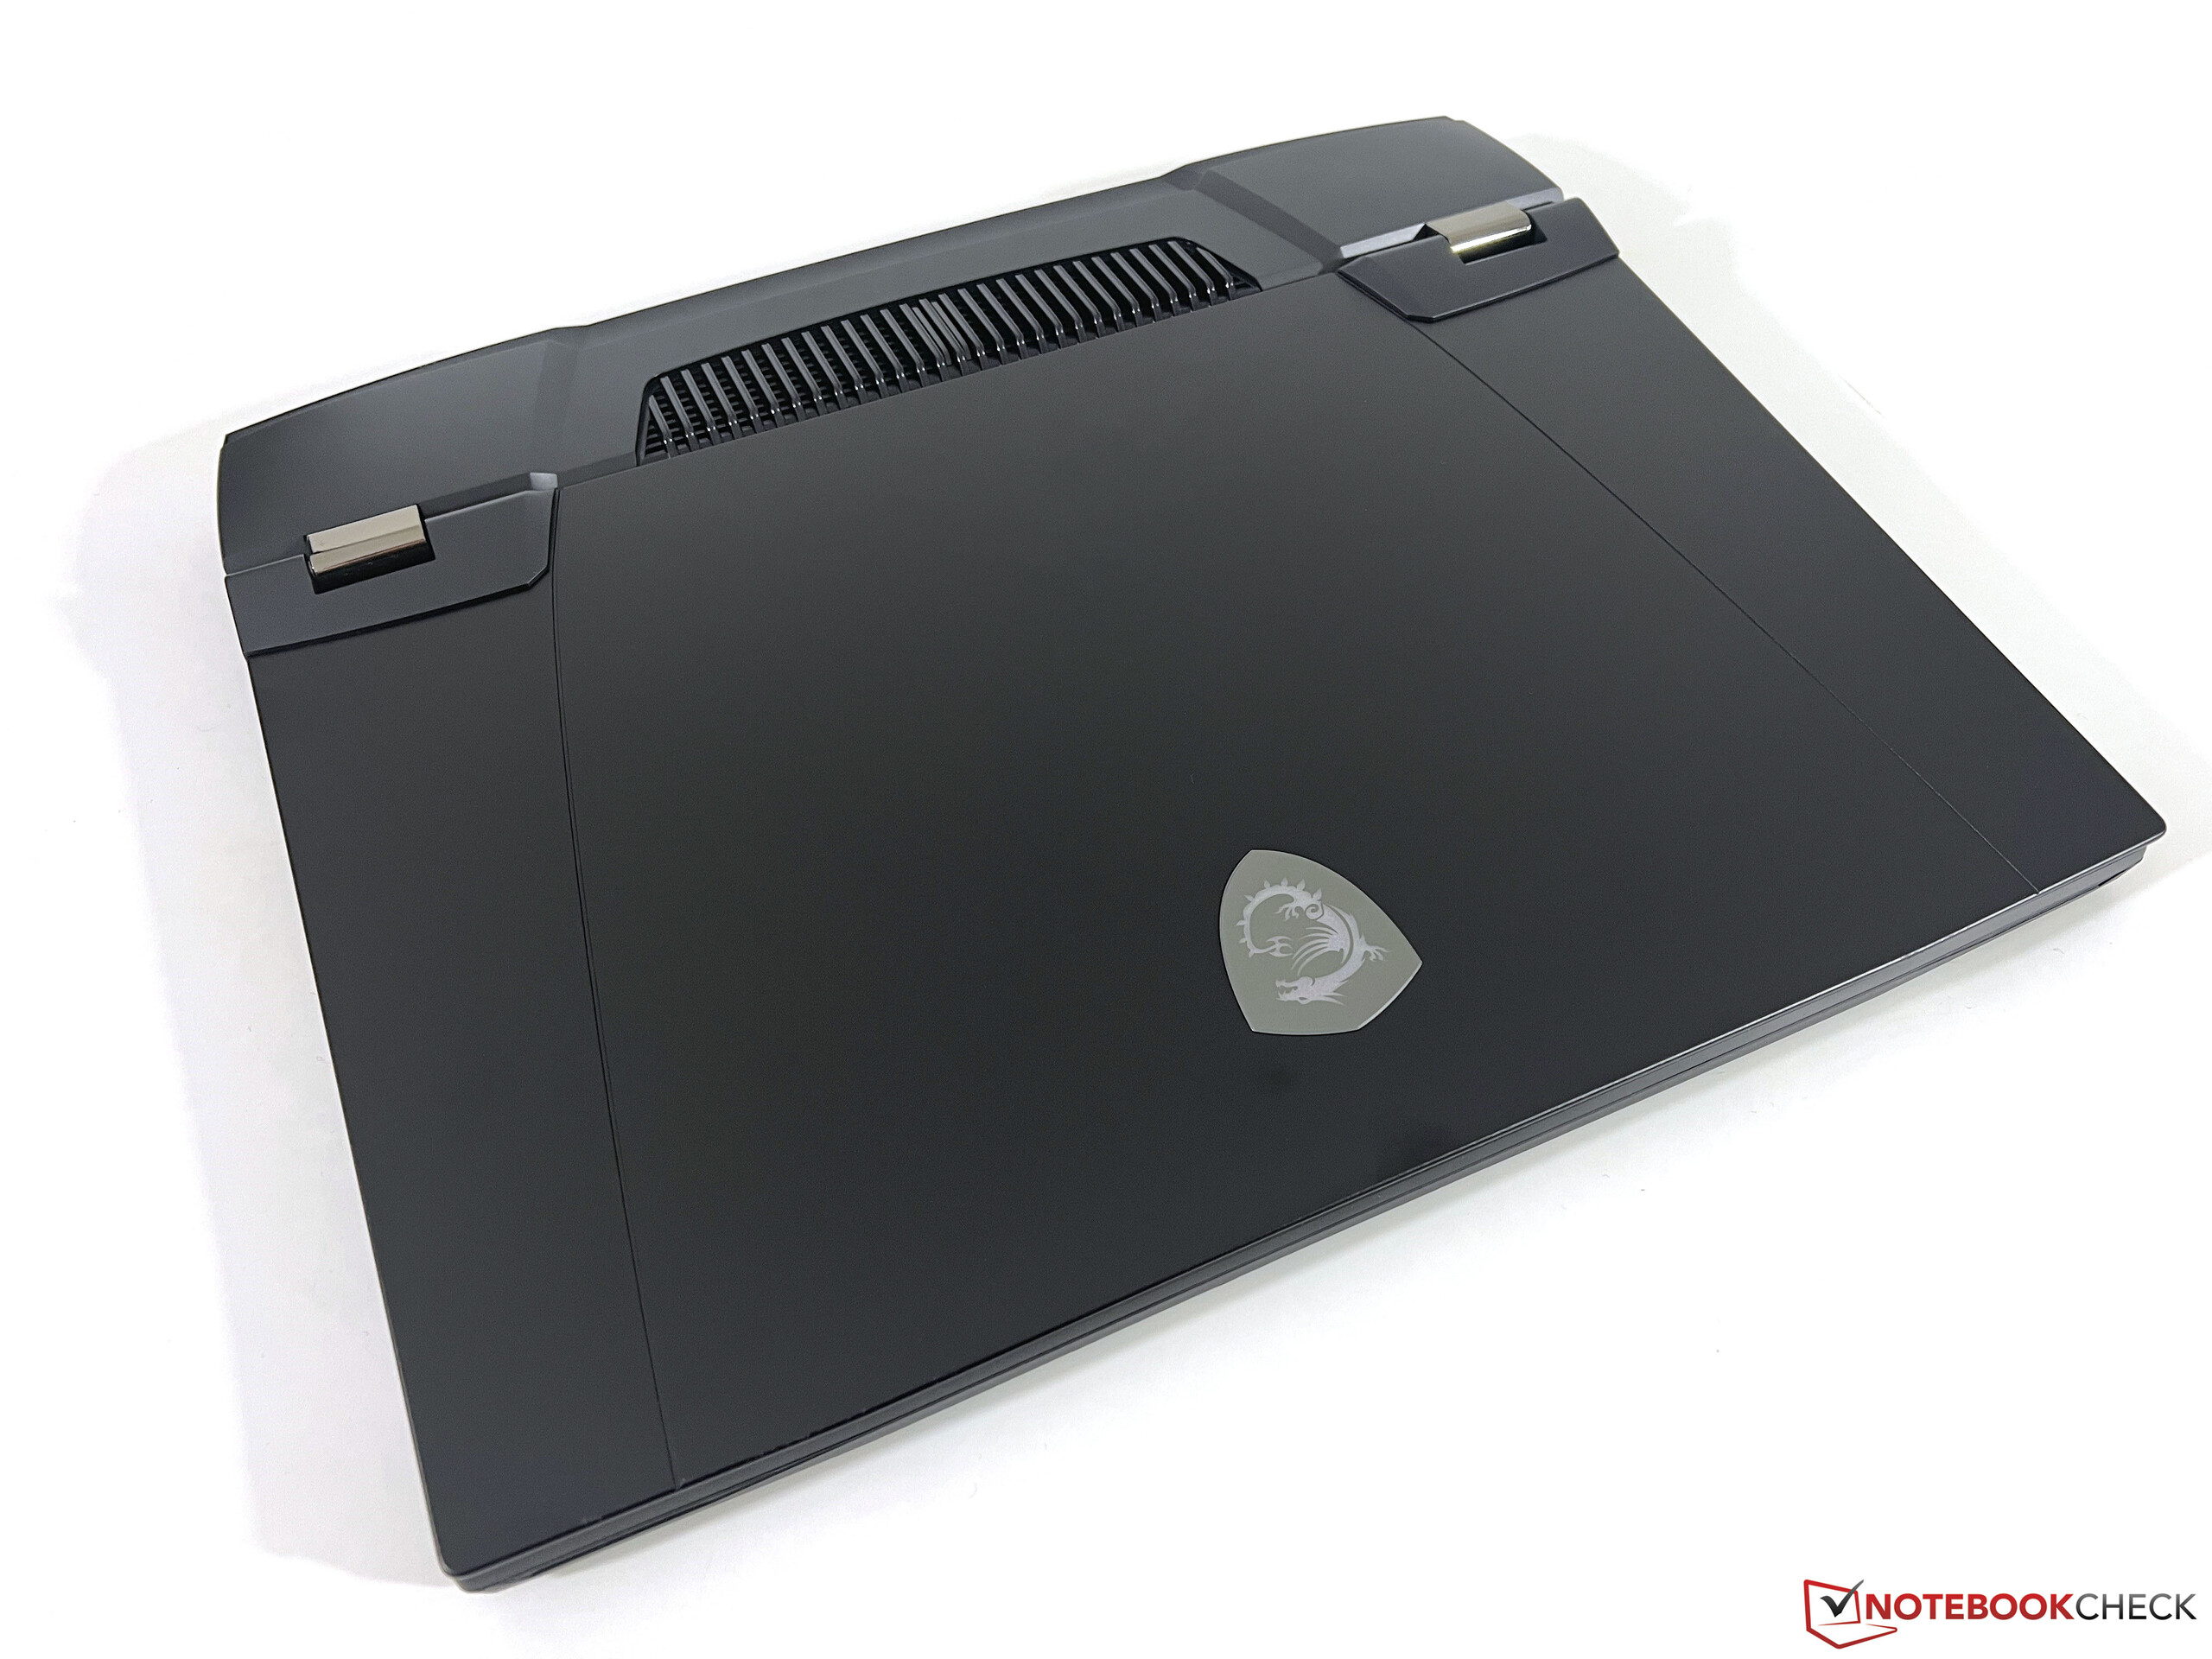
Caso - Titano con illuminazione limitata
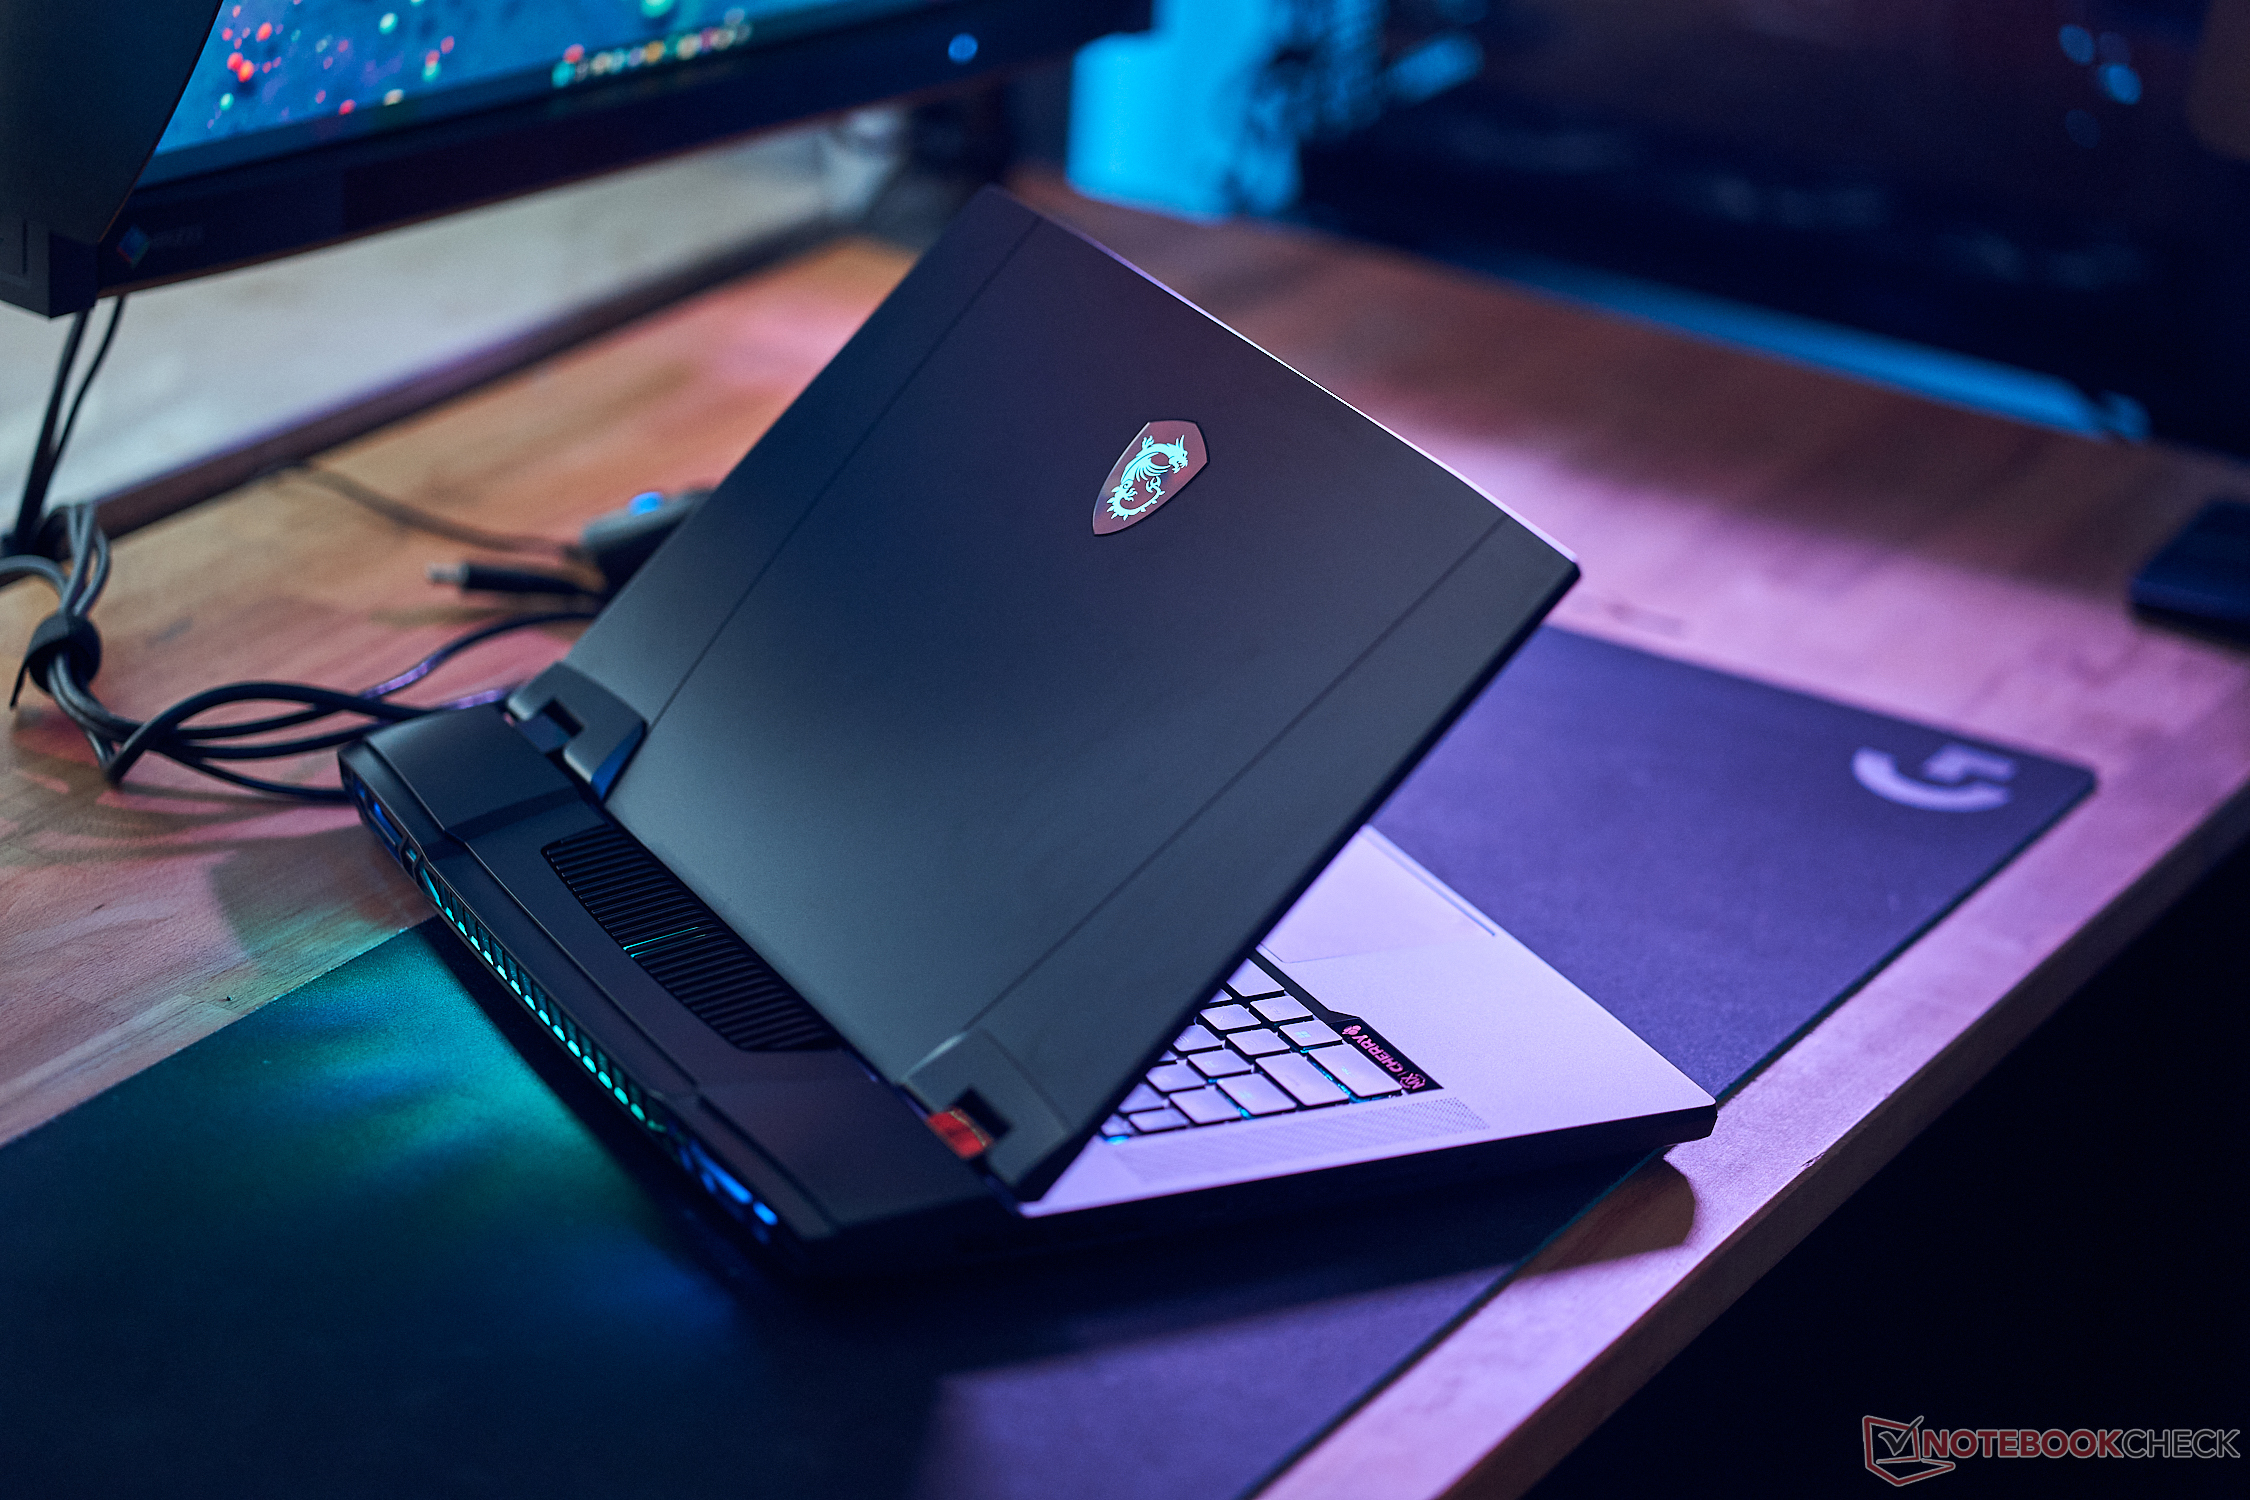
MSI ha introdotto un nuovo design del telaio per laTitan GT77quindi non ci sono cambiamenti visivi per il nuovo modello. Lo chassis nero è molto sobrio per un videogiocatore di fascia alta e anche l'illuminazione RGB è limitata al logo sul coperchio e agli scarichi della ventola sul retro. Si tratta di preferenze personali, ma è possibile utilizzare il portatile anche in ambienti professionali se si disattiva l'illuminazione. Sulle superfici lisce si notano rapidamente le impronte digitali, che devono essere pulite regolarmente. MSI utilizza ancora uno schermo in formato 16:9 per il modello 2023.
La qualità dello chassis è discreta, anche se è quasi interamente in plastica. Soprattutto il materiale ruvido nella parte inferiore non soddisfa le aspettative del prezzo elevato e potrebbe essere utilizzato anche su un portatile da 500 euro. La qualità costruttiva complessiva è comunque decente; l'unità di base è molto robusta e si avvertono solo lievi scricchiolii. Il coperchio invece è più flessibile, ma non siamo riusciti a provocare distorsioni dell'immagine. Avremmo preferito cerniere del display leggermente più rigide e il coperchio traballa un po' quando si regola l'angolo di apertura (fino a ~135 gradi).
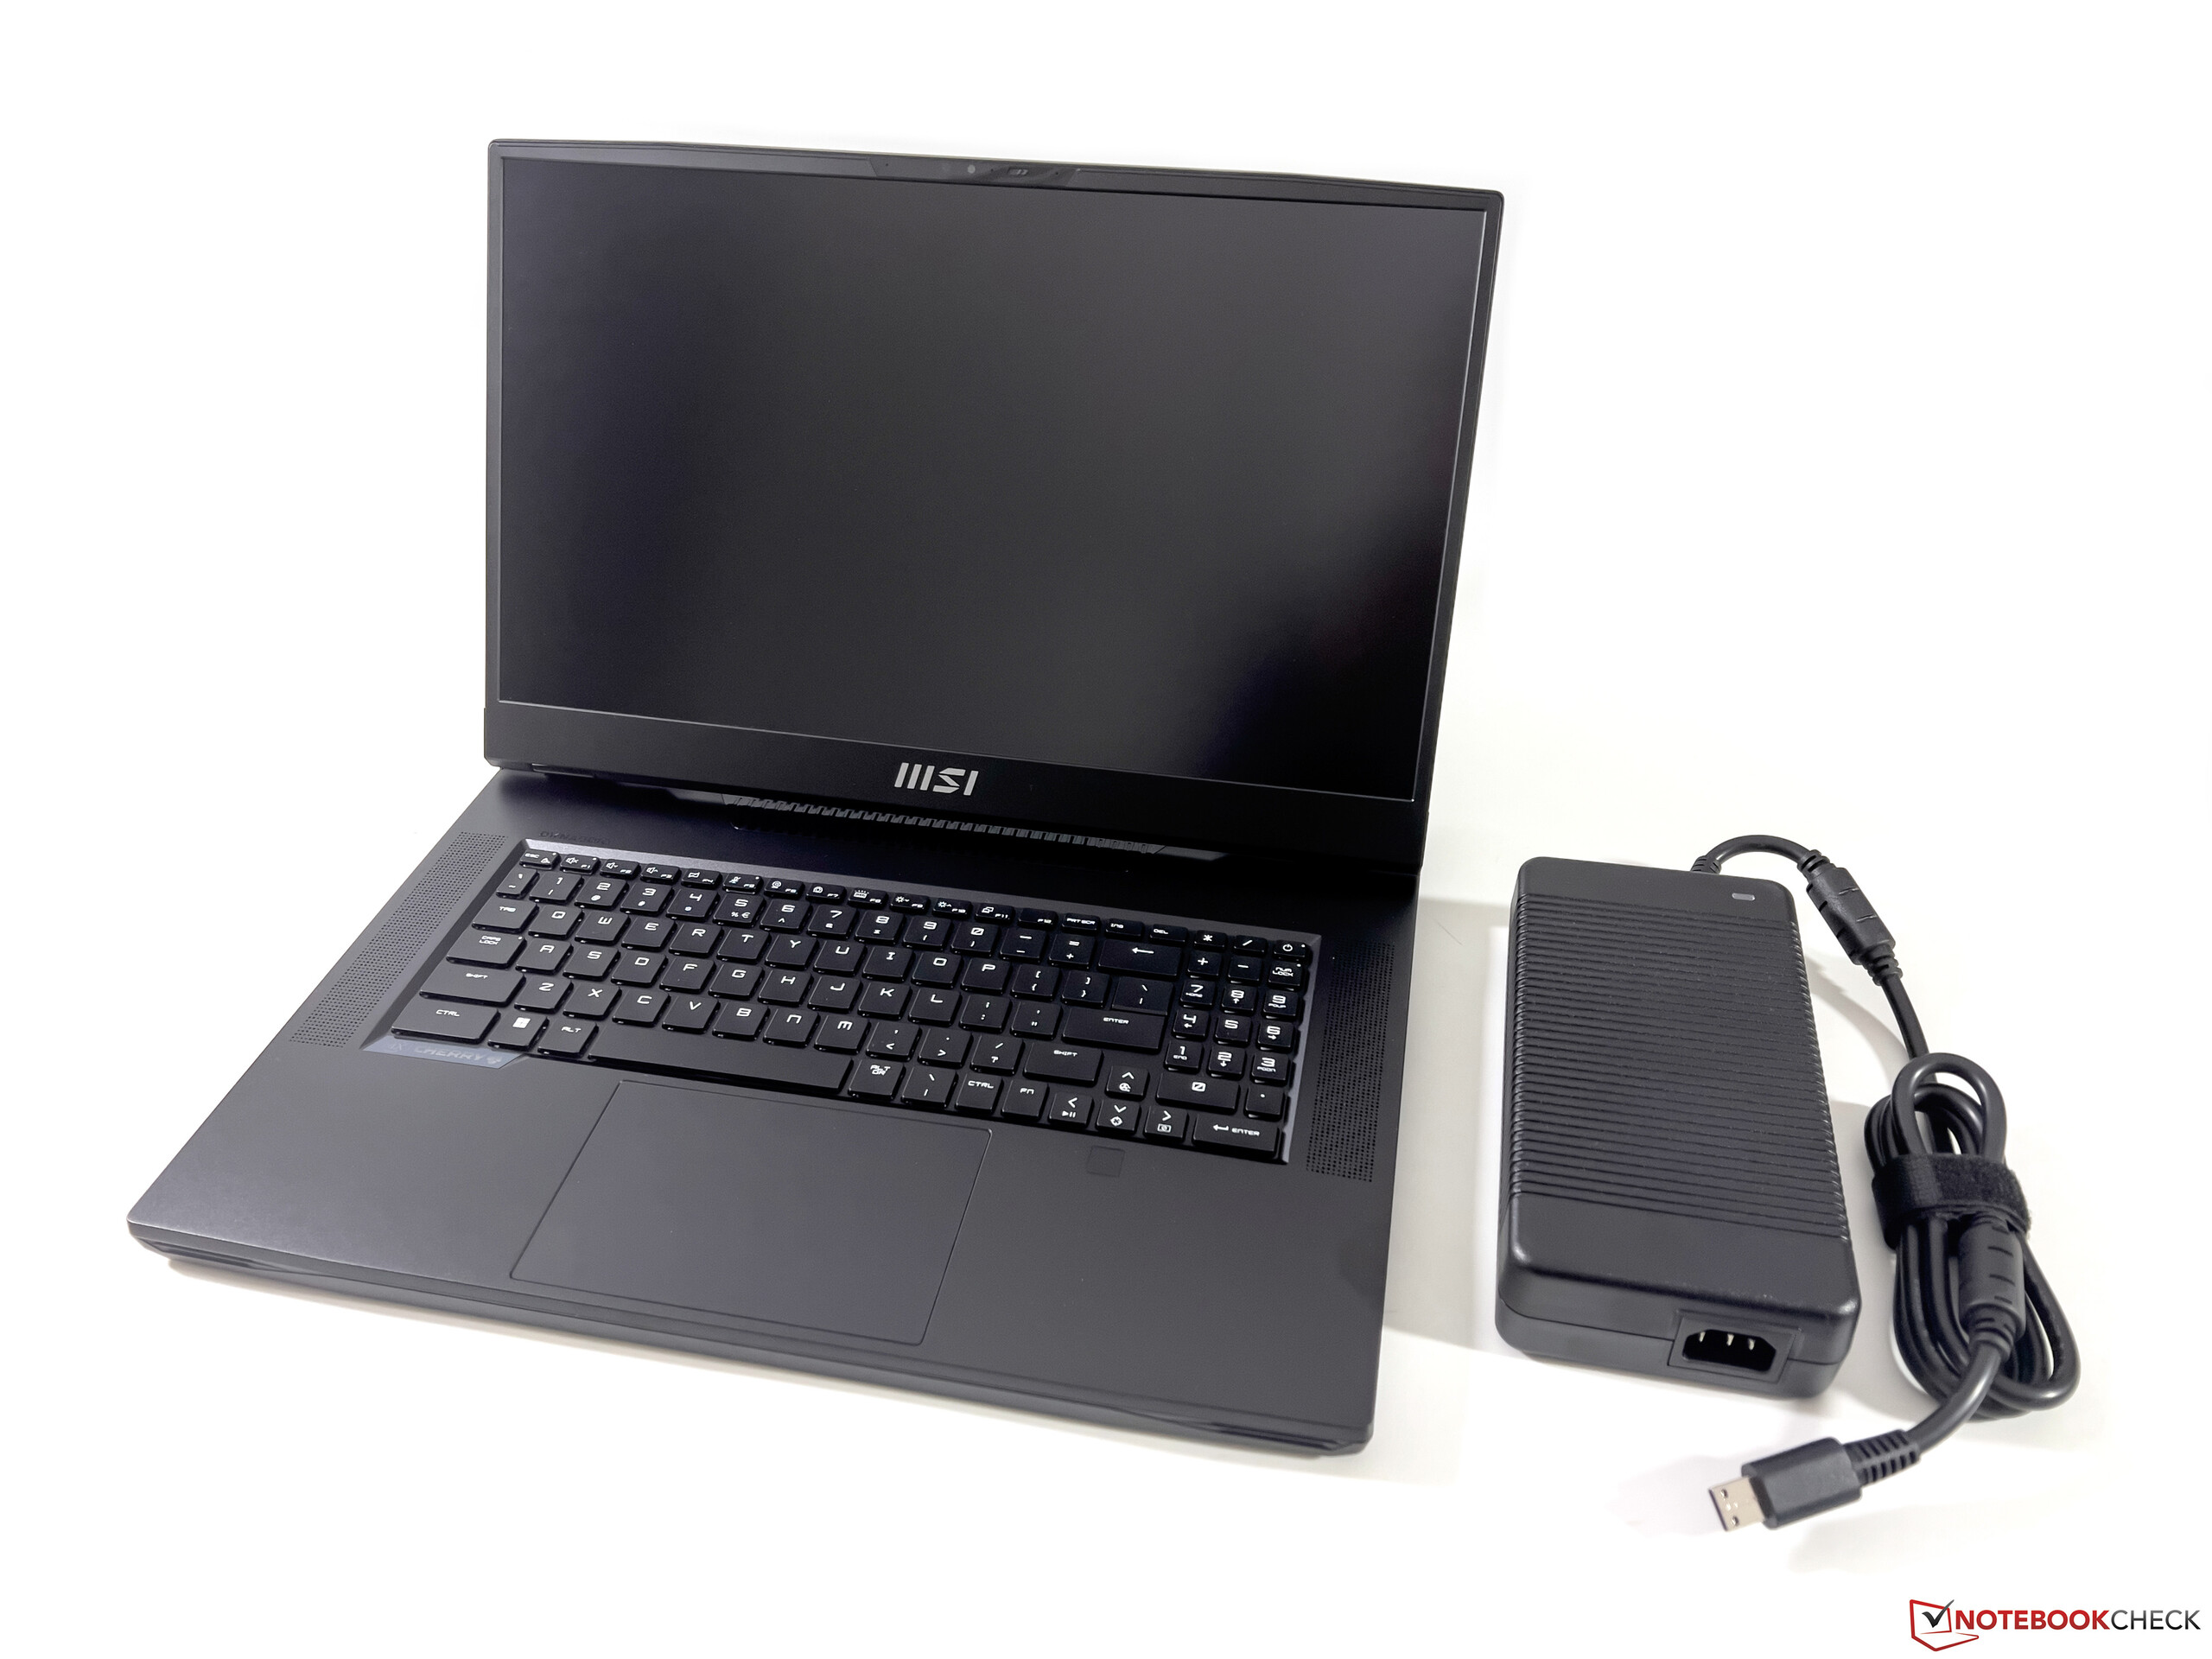
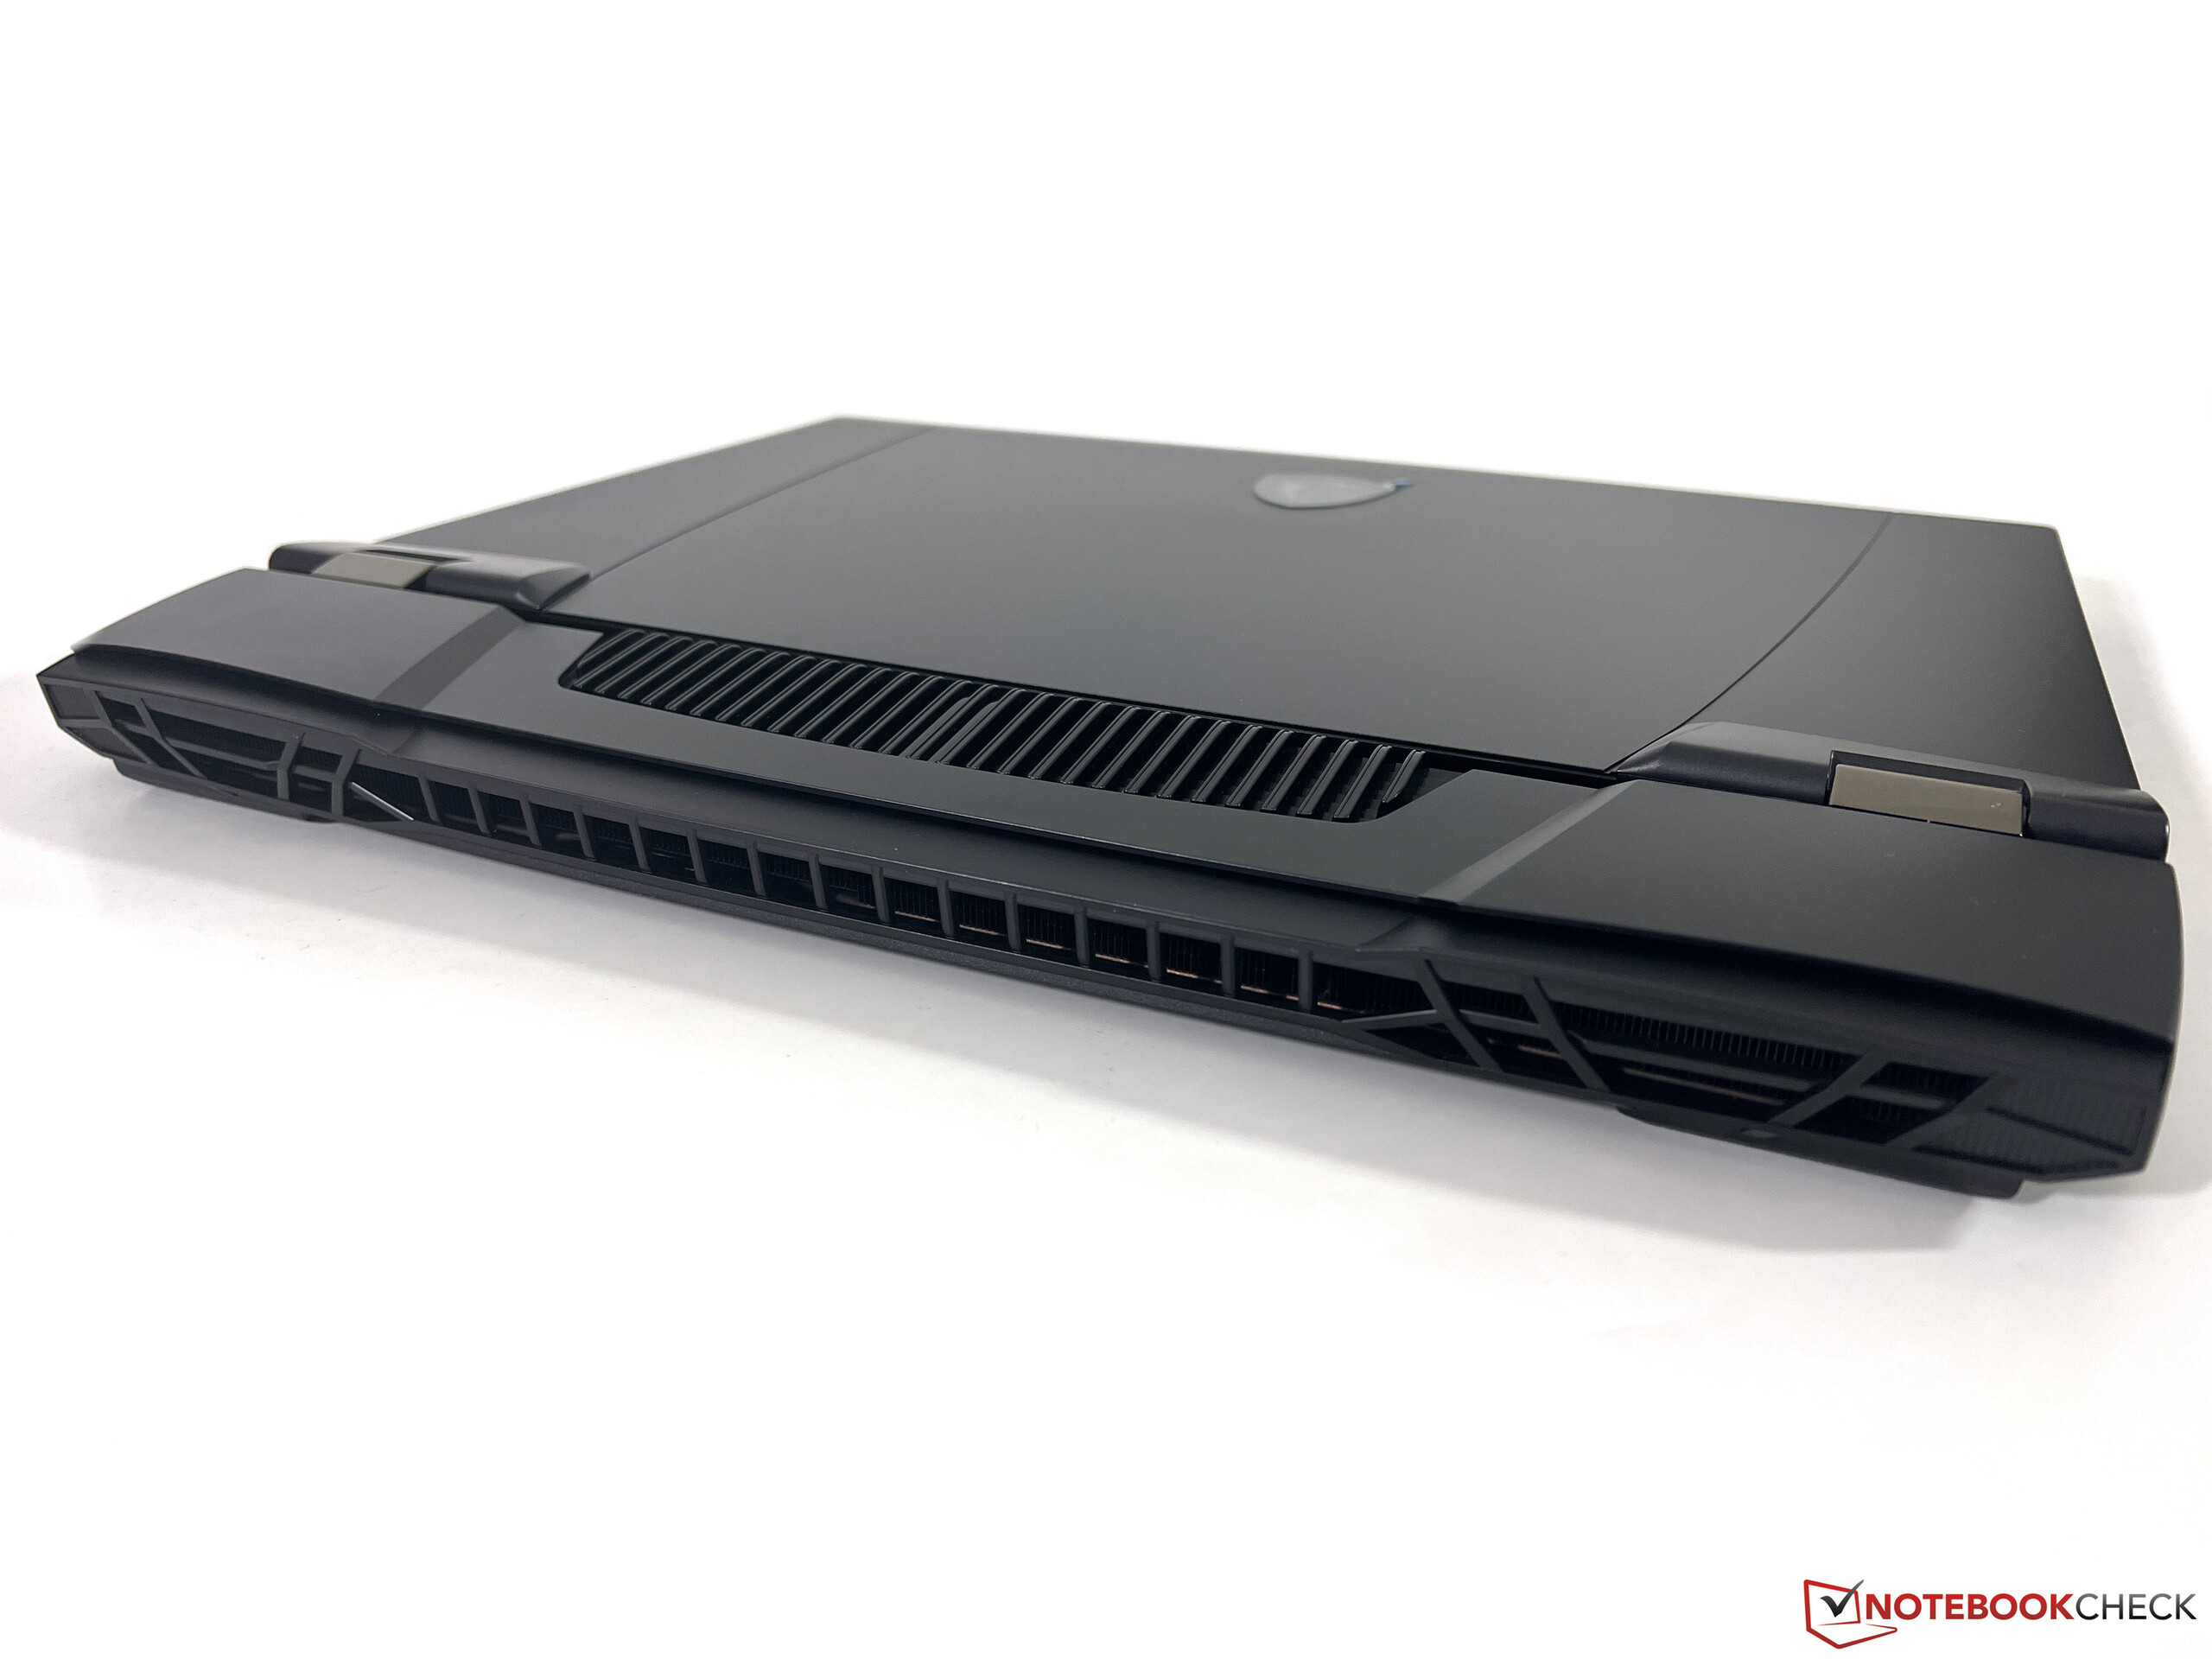
Con i suoi 2,3 cm, il GT77 è ancora un computer relativamente sottile, soprattutto se si considera il potente hardware. Tuttavia, a causa della grande unità di raffreddamento sul retro, il notebook è molto profondo e ha un ingombro molto maggiore rispetto ai suoi rivali. È anche molto pesante, quasi 3,5 kg, e bisogna aggiungere altri 1,4 kg per l'ingombrante adattatore di alimentazione da 330W.
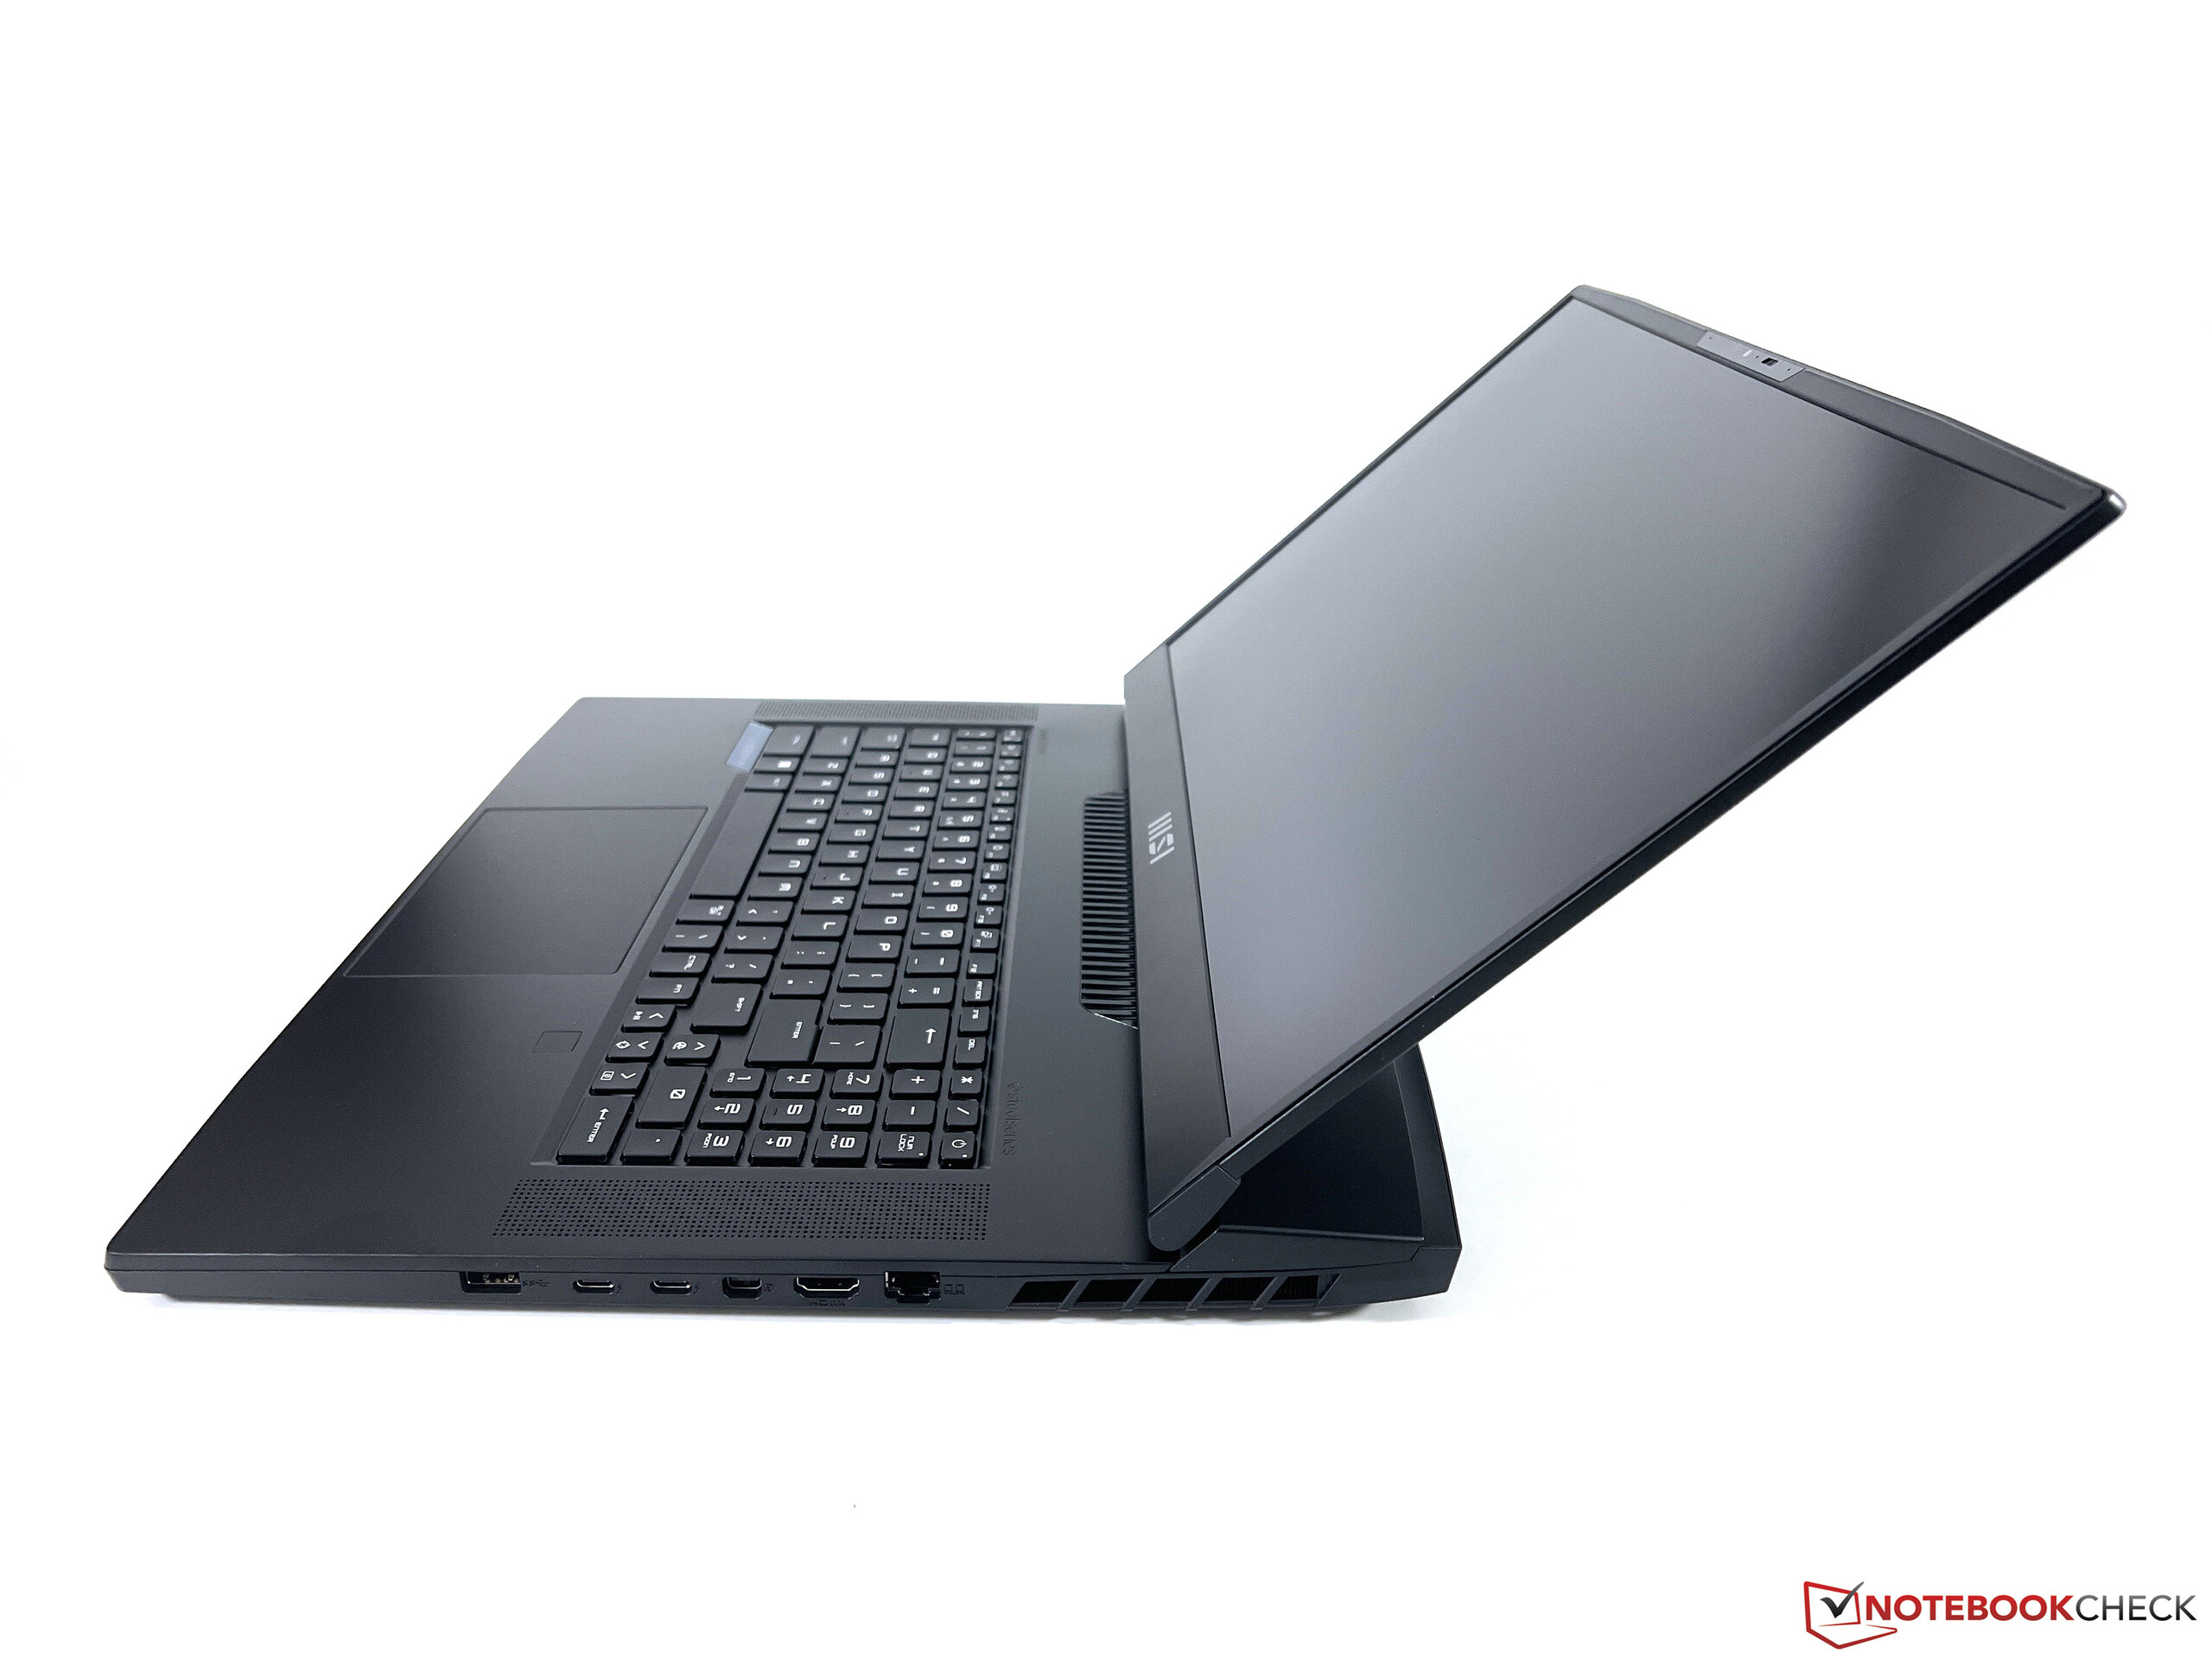
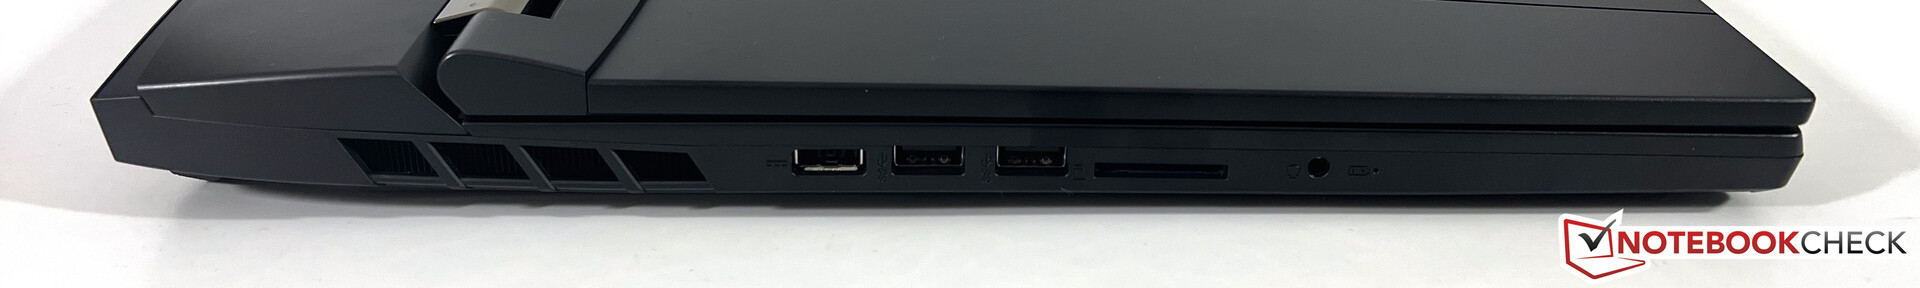
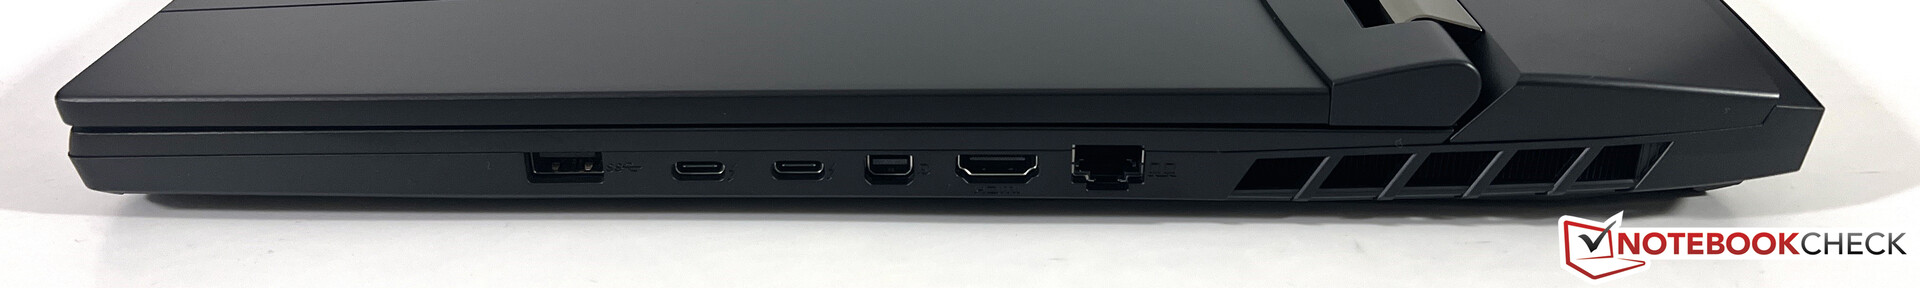
Connettività - Thunderbolt e lettore di schede
Non è cambiato nulla in termini di porte e sono ancora presenti tutti gli standard più importanti. Tutte le porte sono posizionate sui due lati, poiché l'area posteriore è utilizzata esclusivamente per il raffreddamento. È anche possibile caricare la batteria dalla porta USB-C posteriore, ma è necessario un alimentatore da 100W (i moduli da 65W non funzionano).
Lettore di schede SD
Il lettore di schede SD può ospitare schede di memoria full-size e gestisce velocità di trasferimento medie superiori a 80 MB/s con la nostra scheda di riferimento (AV Pro V60).
| SD Card Reader | |
| average JPG Copy Test (av. of 3 runs) | |
| Alienware x17 R2 P48E (AV Pro V60) | |
| Media della classe Gaming (20.9 - 210, n=54, ultimi 2 anni) | |
| Razer Blade 16 Early 2023 (AV PRO microSD 128 GB V60) | |
| MSI Titan GT77 HX 13VI (Angelibird AV Pro V60) | |
| MSI Titan GT77 12UHS (AV PRO microSD 128 GB V60) | |
| Schenker XMG Neo 17 M22 (AV PRO microSD 128 GB V60) | |
| maximum AS SSD Seq Read Test (1GB) | |
| Alienware x17 R2 P48E (AV Pro V60) | |
| Razer Blade 16 Early 2023 (AV PRO microSD 128 GB V60) | |
| Media della classe Gaming (25.5 - 261, n=51, ultimi 2 anni) | |
| MSI Titan GT77 12UHS (AV PRO microSD 128 GB V60) | |
| MSI Titan GT77 HX 13VI (Angelibird AV Pro V60) | |
Comunicazione
MSI equipaggia la nuova Titan GT77 con il modulo Wi-Fi Killer AX1690i, che supporta l'attuale standard Wi-Fi 6E e il Bluetooth 5.3. Il nostro esemplare statunitense non si è collegato ai 6 GHz del router di riferimento di Asus, ma la qualità del segnale è stata molto buona anche quando abbiamo utilizzato la rete a 5 GHz (Wi-Fi 6). È inoltre possibile utilizzare la porta Ethernet da 2,5 Gbps.
Webcam
La webcam è dotata di un otturatore meccanico, ma questi sono praticamente tutti gli aspetti positivi. MSI utilizza ancora la pessima webcam da 720p, che non scatta buone foto nemmeno in condizioni di buona illuminazione. Ci si può aspettare di più nel 2023, soprattutto considerando il prezzo.


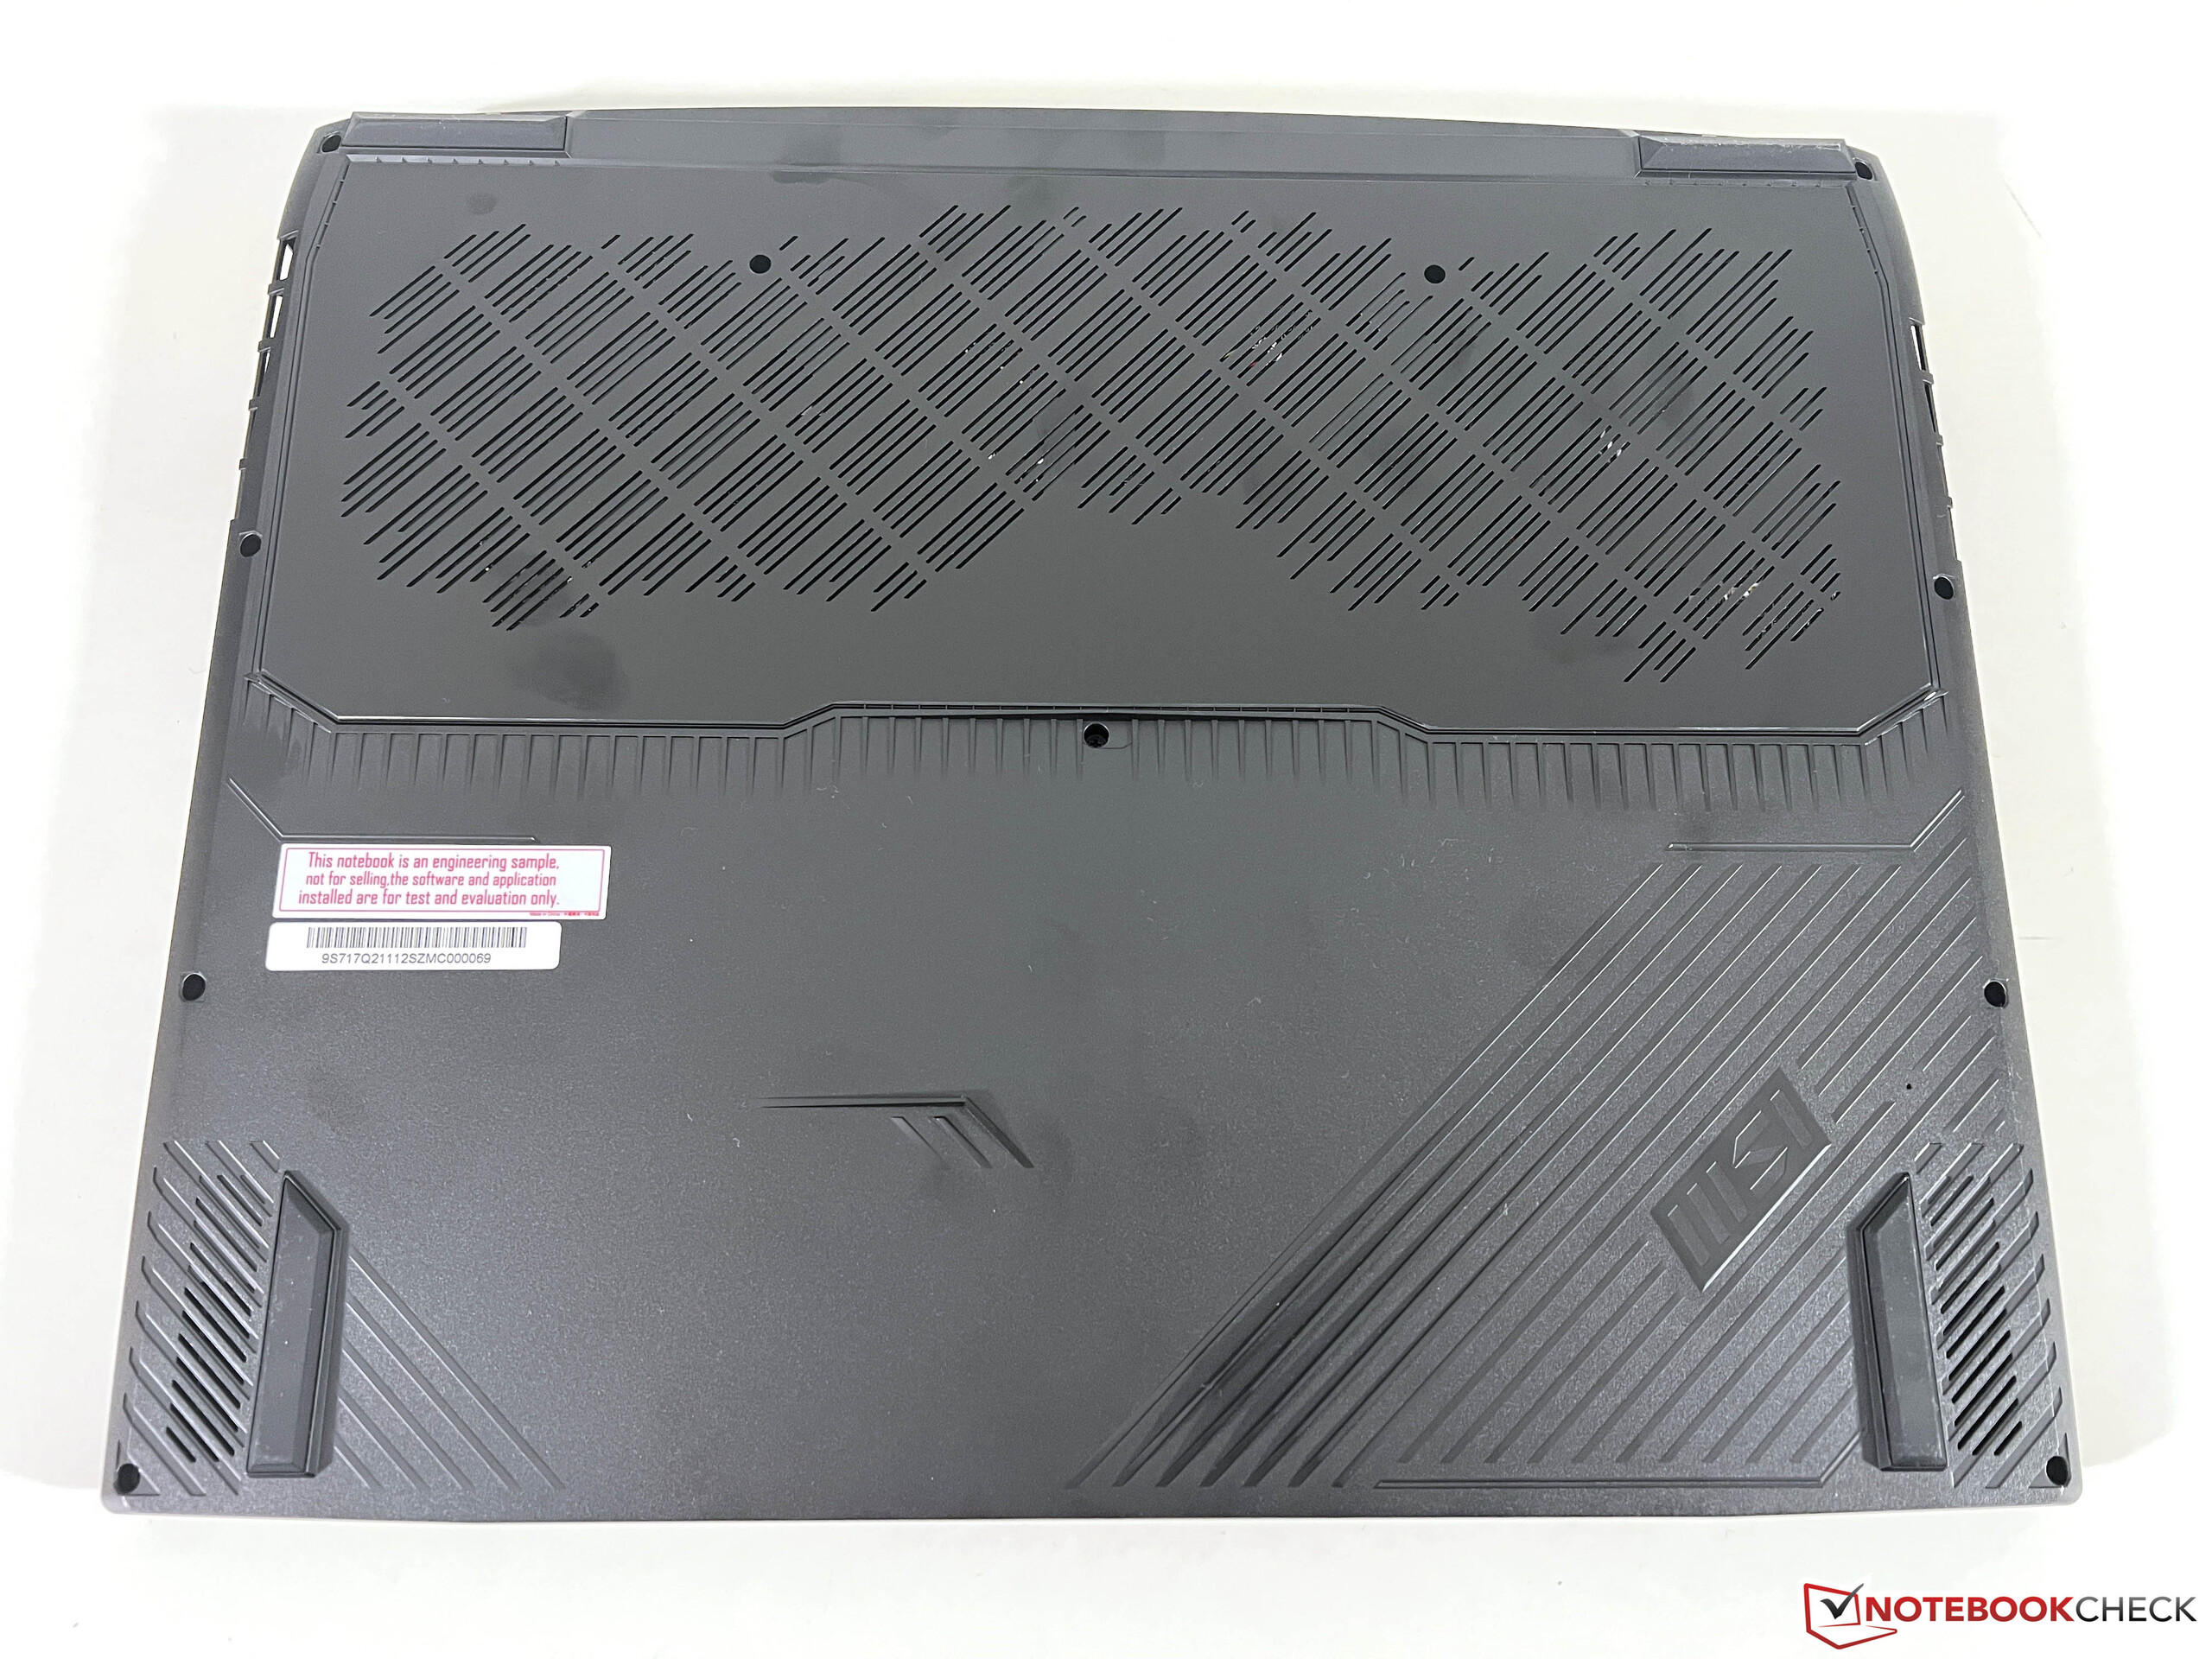
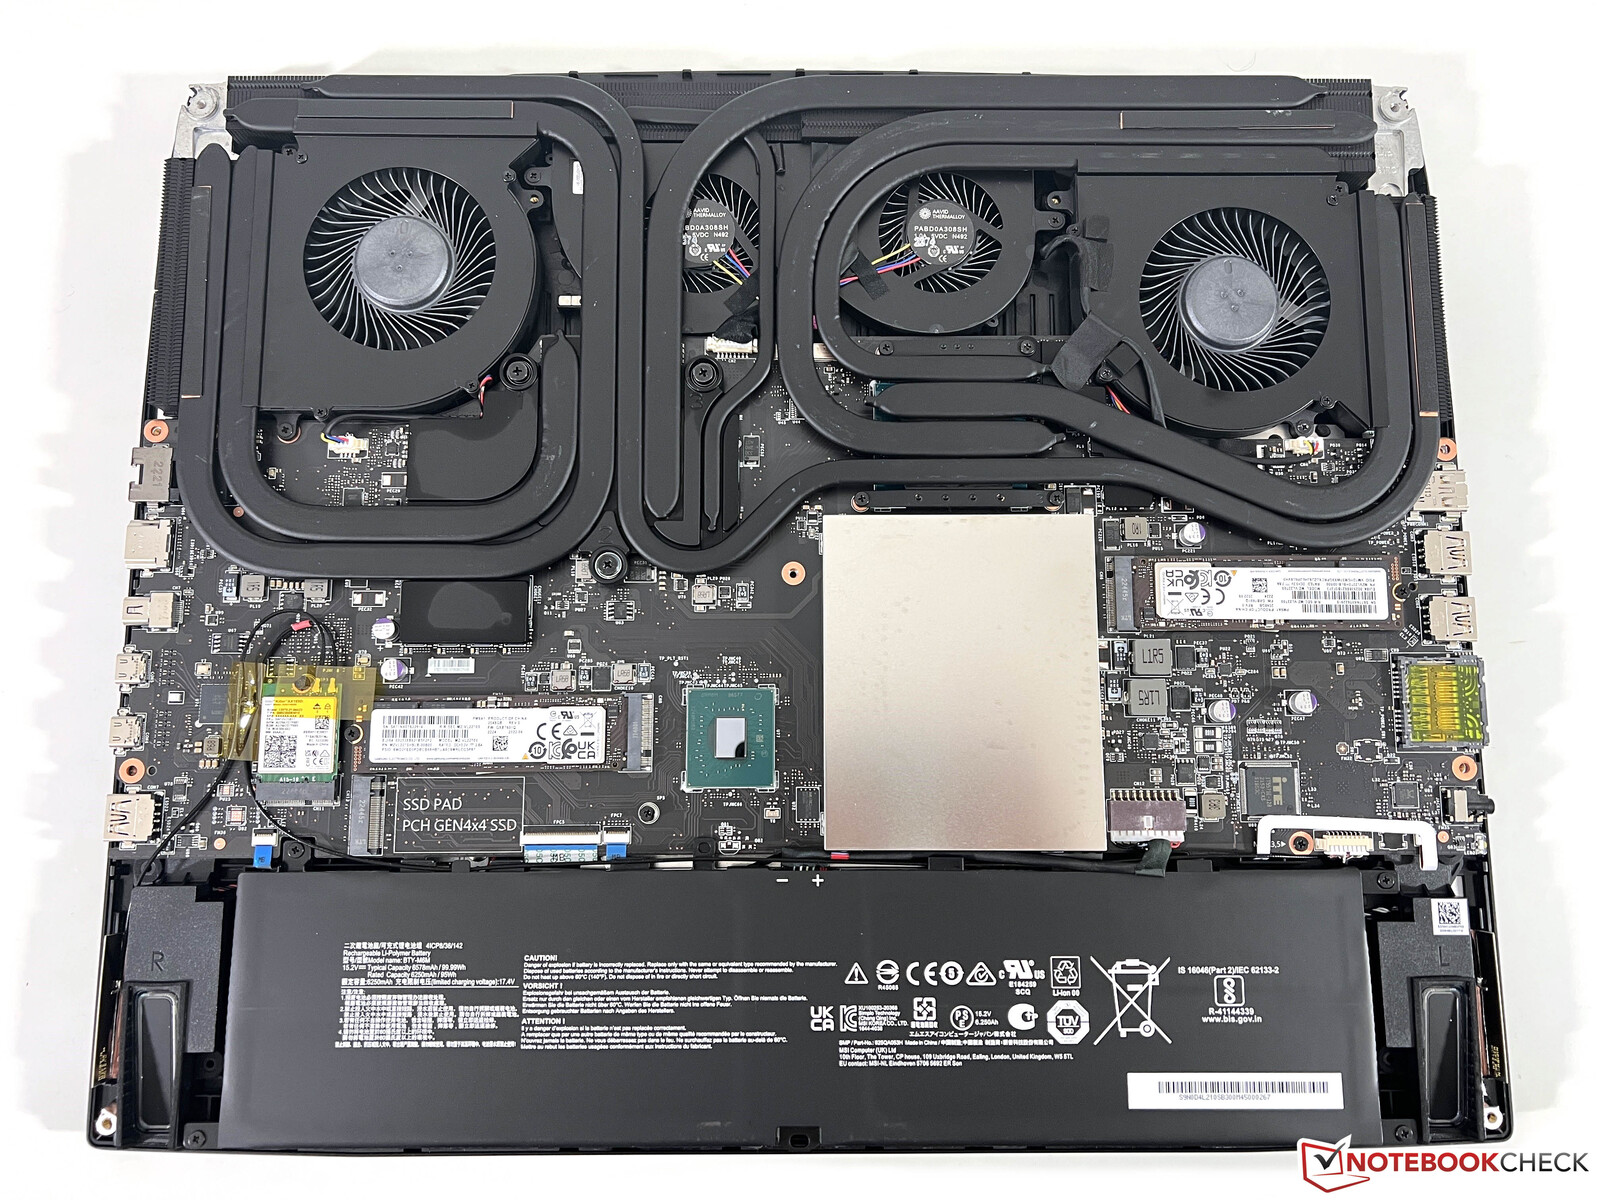
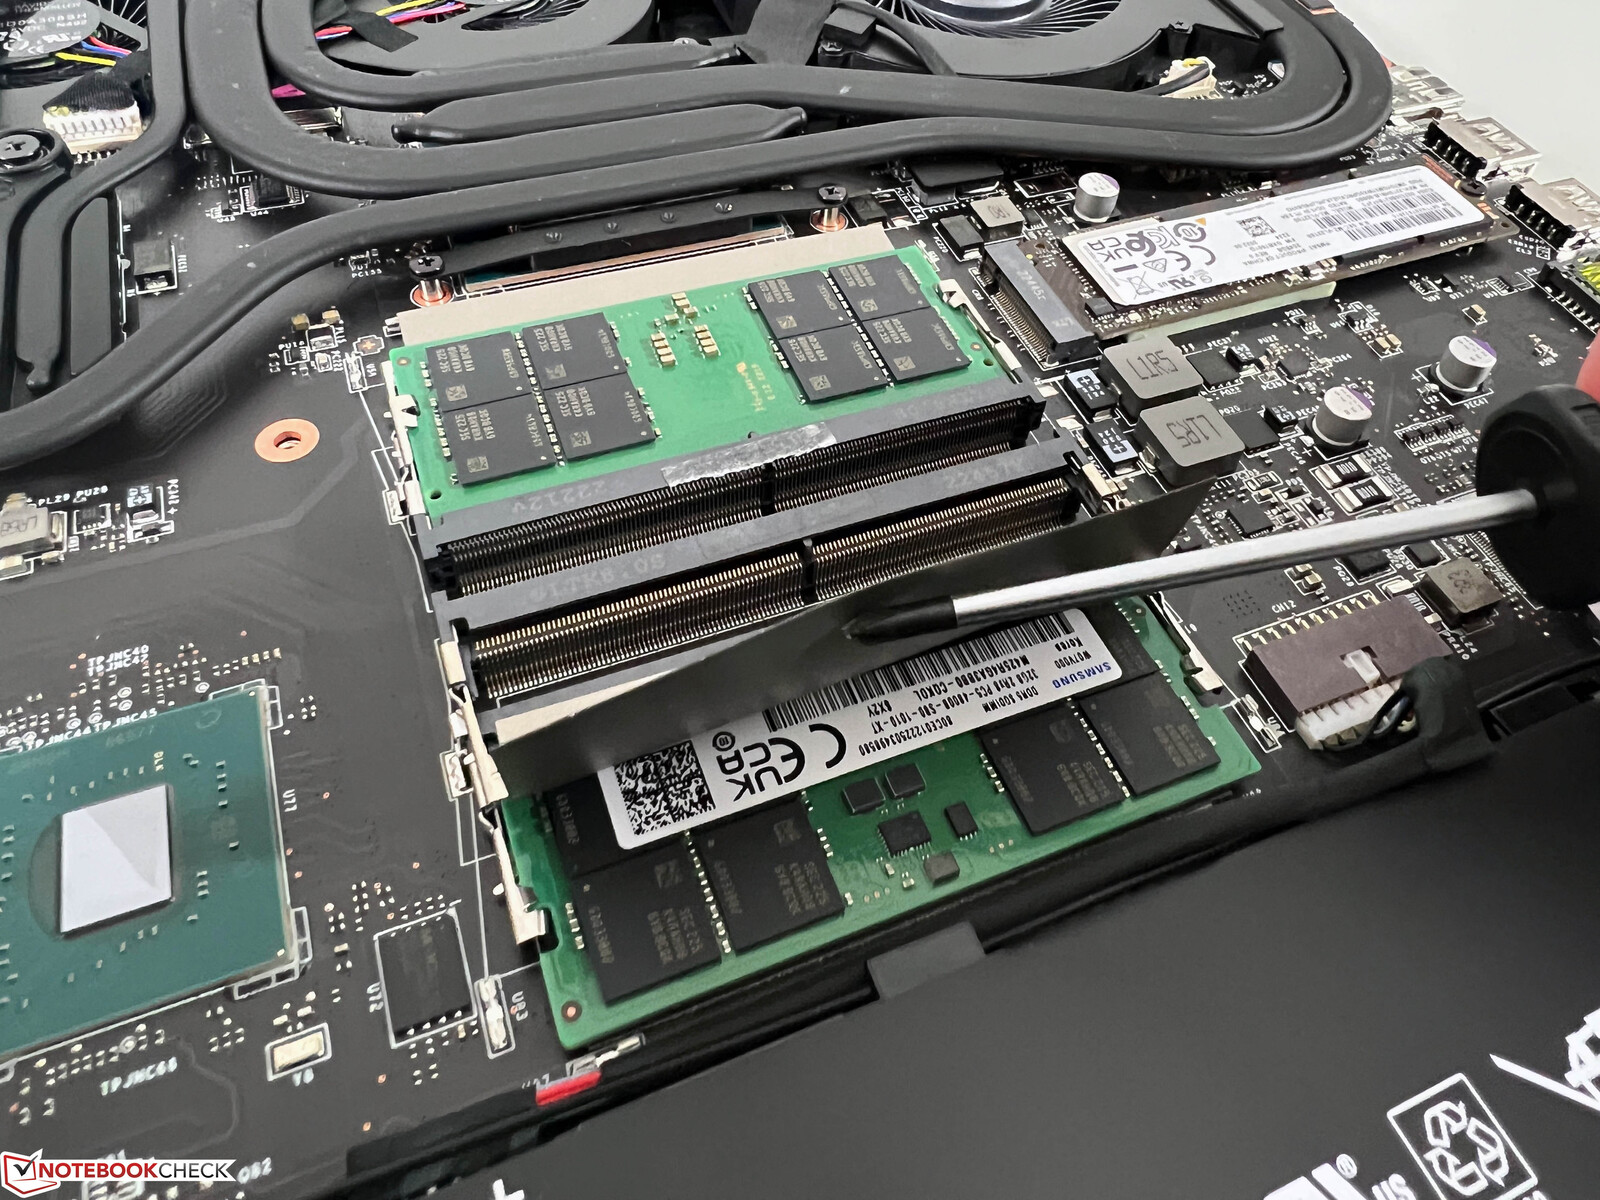
Manutenzione
L'intero coperchio inferiore è fissato da viti Philips standard e può essere rimosso, ma il coperchio è molto stretto e il processo non è semplice. Oltre ai quattro slot SO-DIMM è possibile utilizzare anche tre slot M.2 per gli aggiornamenti. È anche possibile sostituire il modulo Wi-Fi e pulire le ventole. MSI ha modificato il layout di raffreddamento e utilizza un maggior numero di heat pipe rispetto al modello precedente modello precedentee ciò significa che il quarto slot M.2 è stato rimosso.
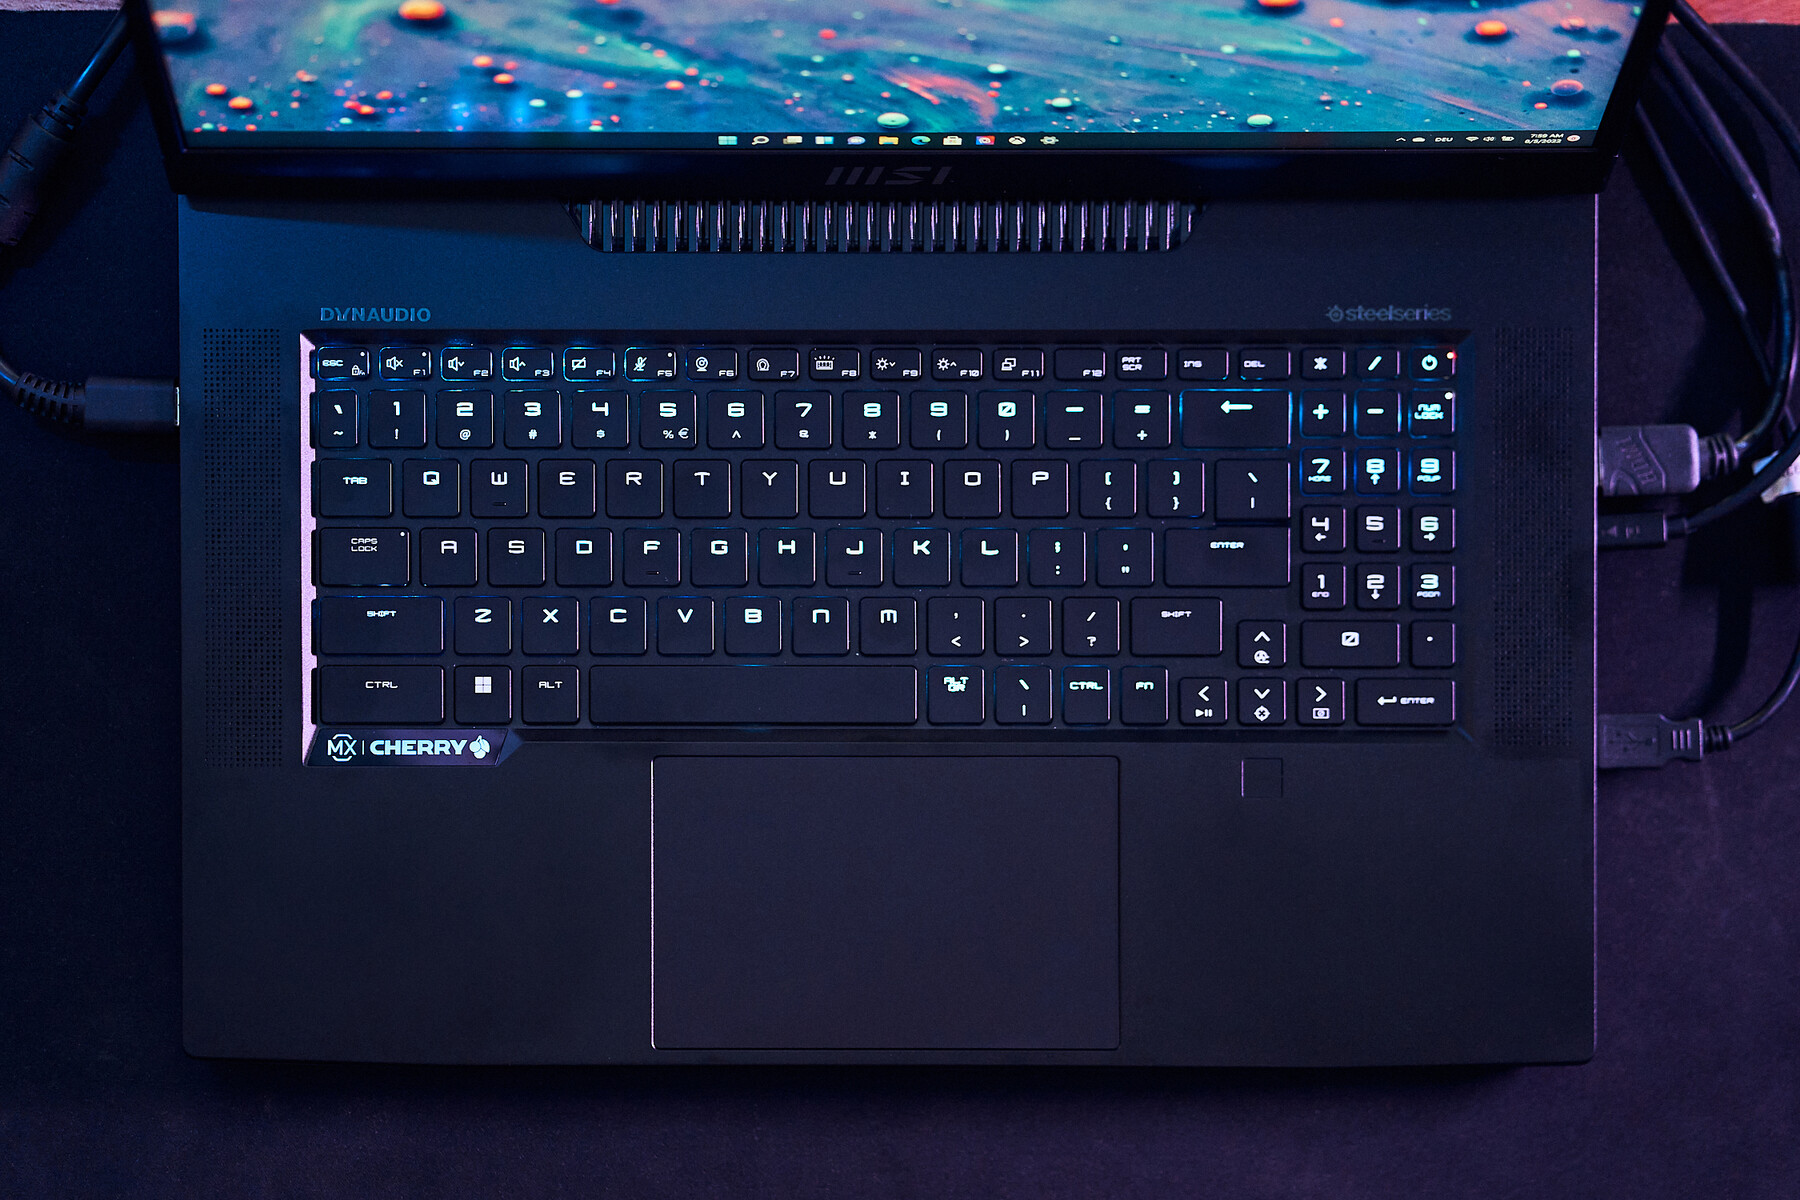
Dispositivi di input - MSI con un'ottima tastiera meccanica
Abbiamo già apprezzato la tastiera meccanica del modello precedente e la situazione non è cambiata. Il rumore di battitura è un po' più alto rispetto alle tradizionali tastiere con cupola in gomma, ma l'unità Cherry è sensibilmente più silenziosa della tastiera meccanica che si può ottenere con il modelloXMG Neo 17ad esempio. I tasti freccia e il tastierino numerico dedicato (che è un po' più stretto) utilizzano interruttori convenzionali. È possibile regolare l'illuminazione di ogni singolo tasto, ma è anche possibile scegliere un colore poco appariscente per tutti i tasti. Il lettore di impronte digitali è integrato nel palm rest proprio sotto i tasti freccia.
Il grande clickpad ha funzionato bene durante la nostra recensione e le operazioni standard del cursore non sono un problema, ma il rumore del clic è un po' forte. Tuttavia, la maggior parte dei giocatori utilizzerà comunque un mouse o un gamepad esterno.
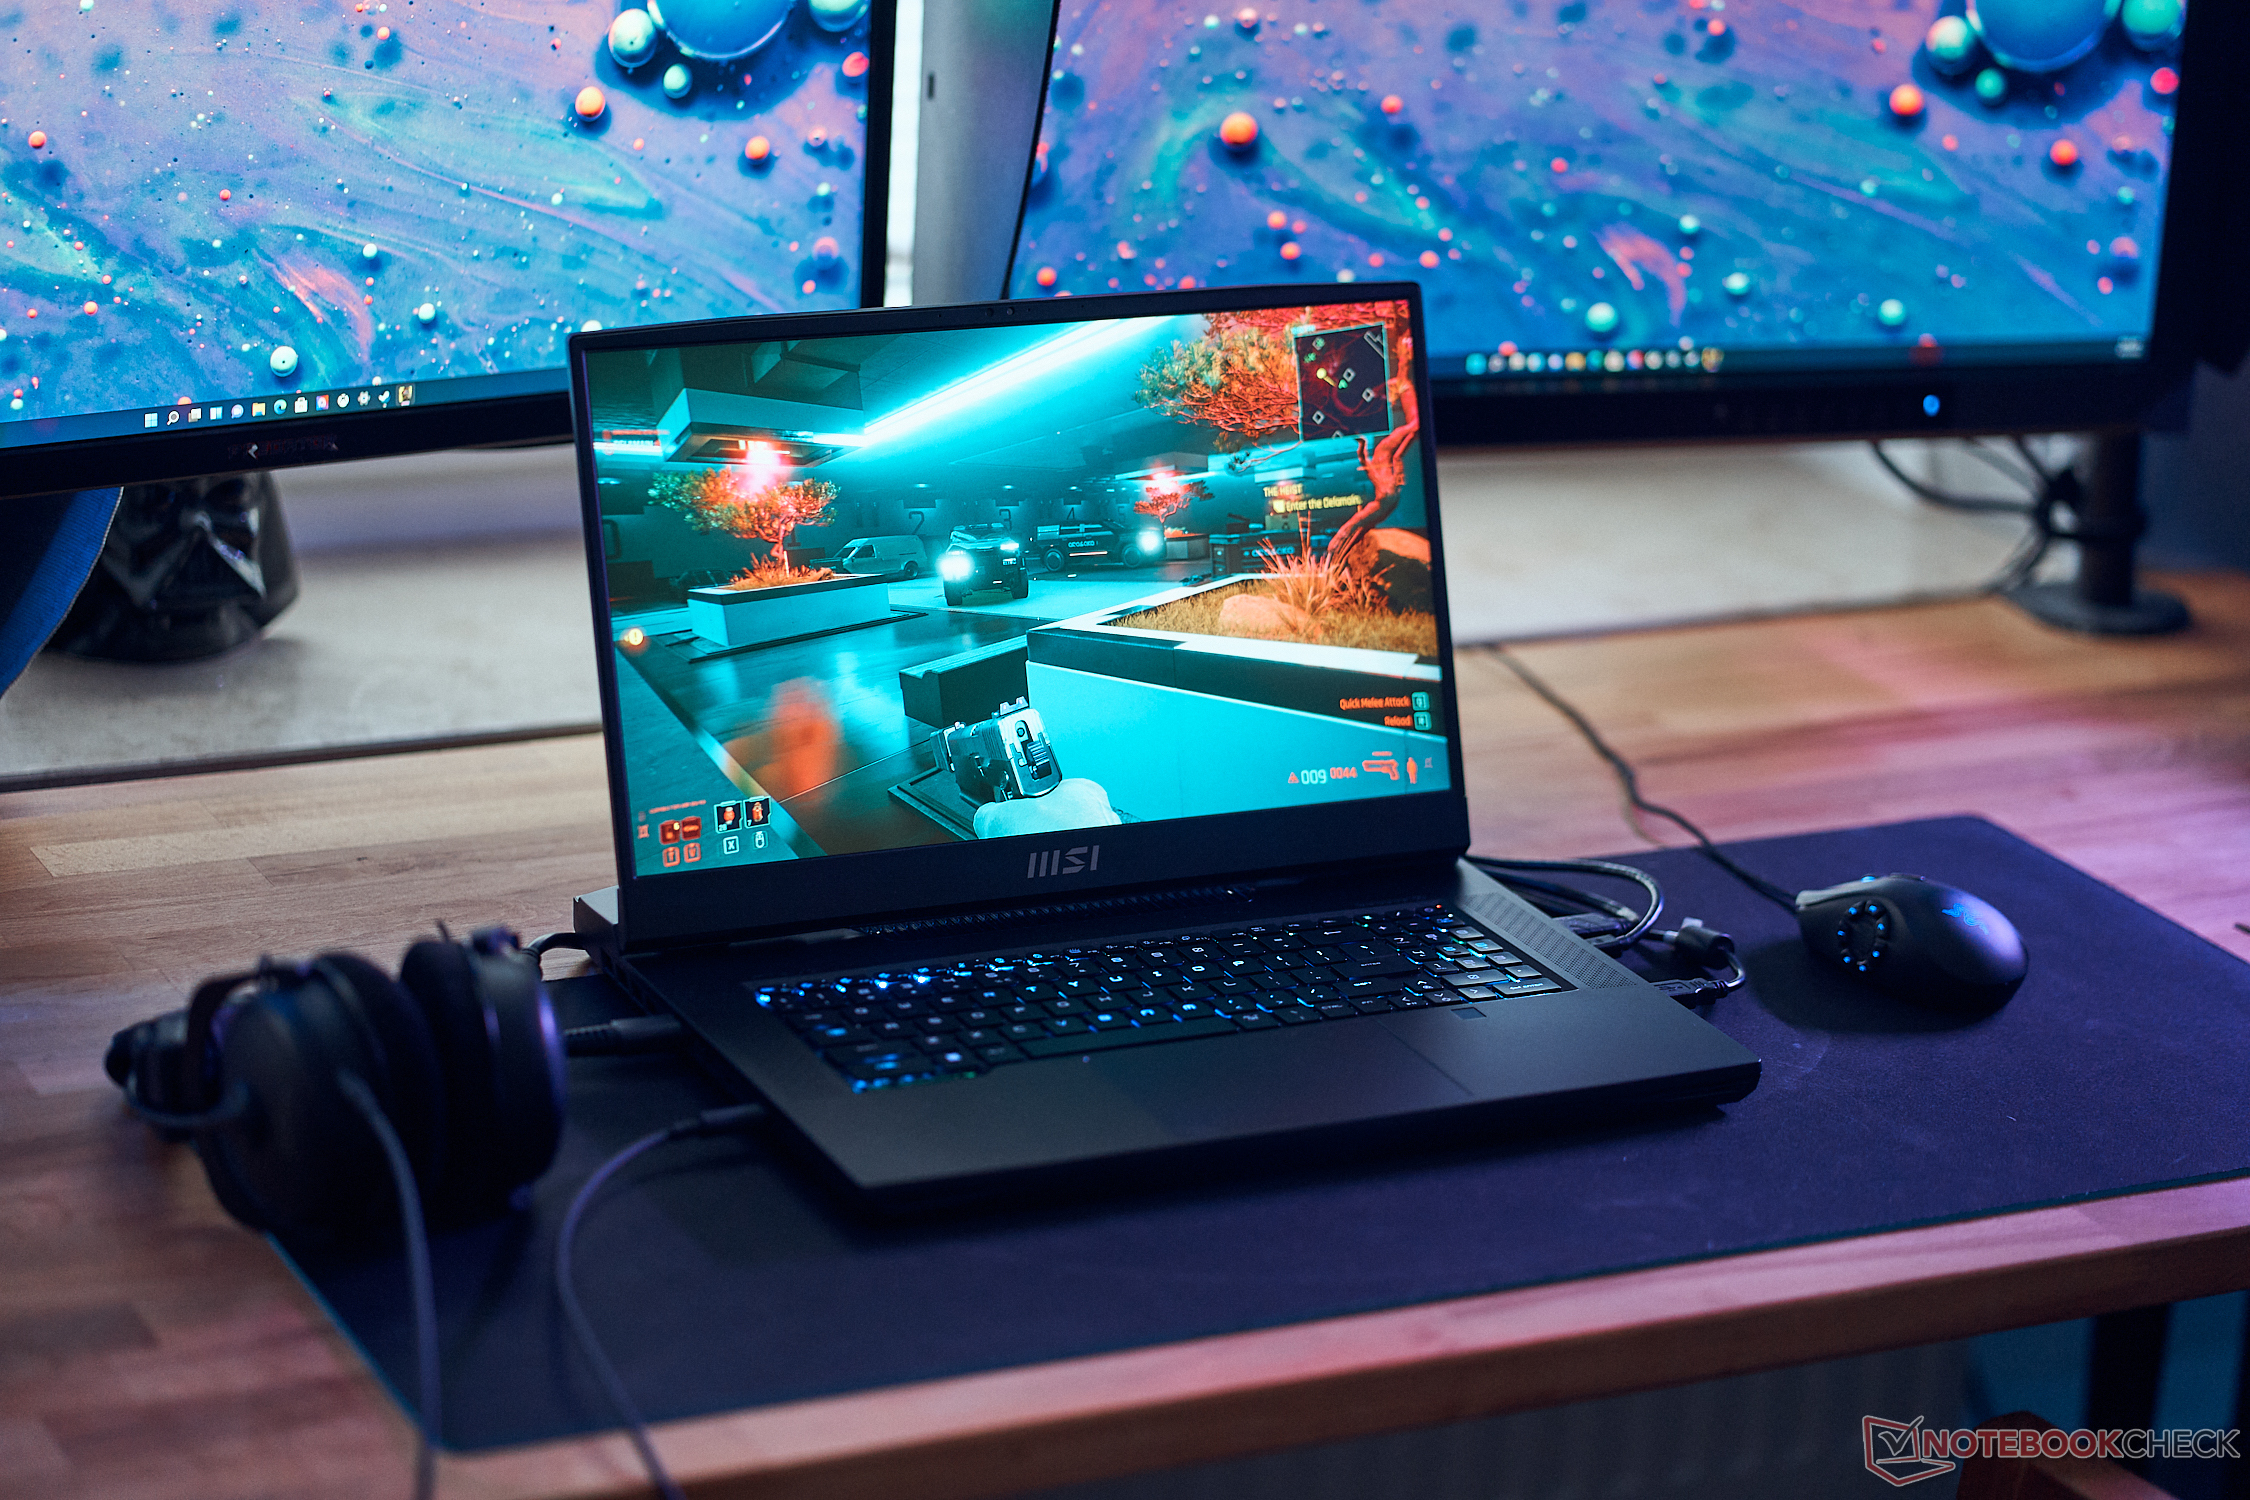
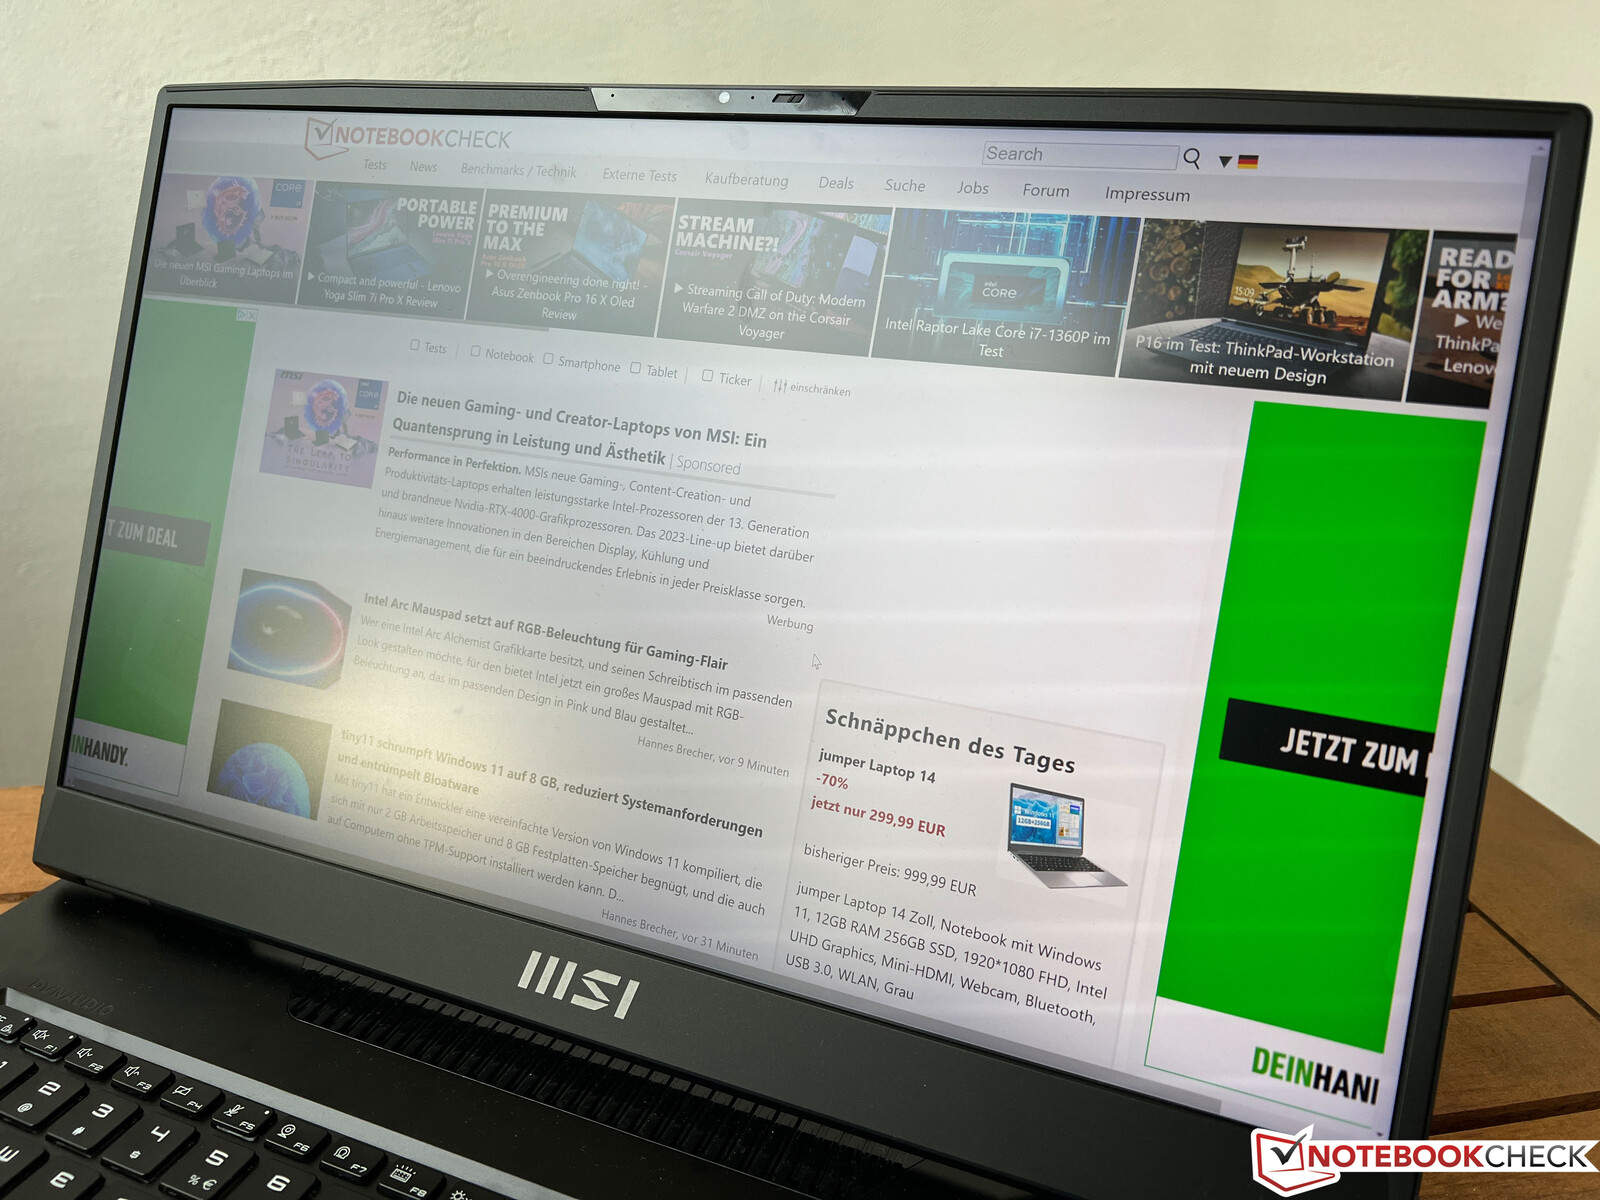
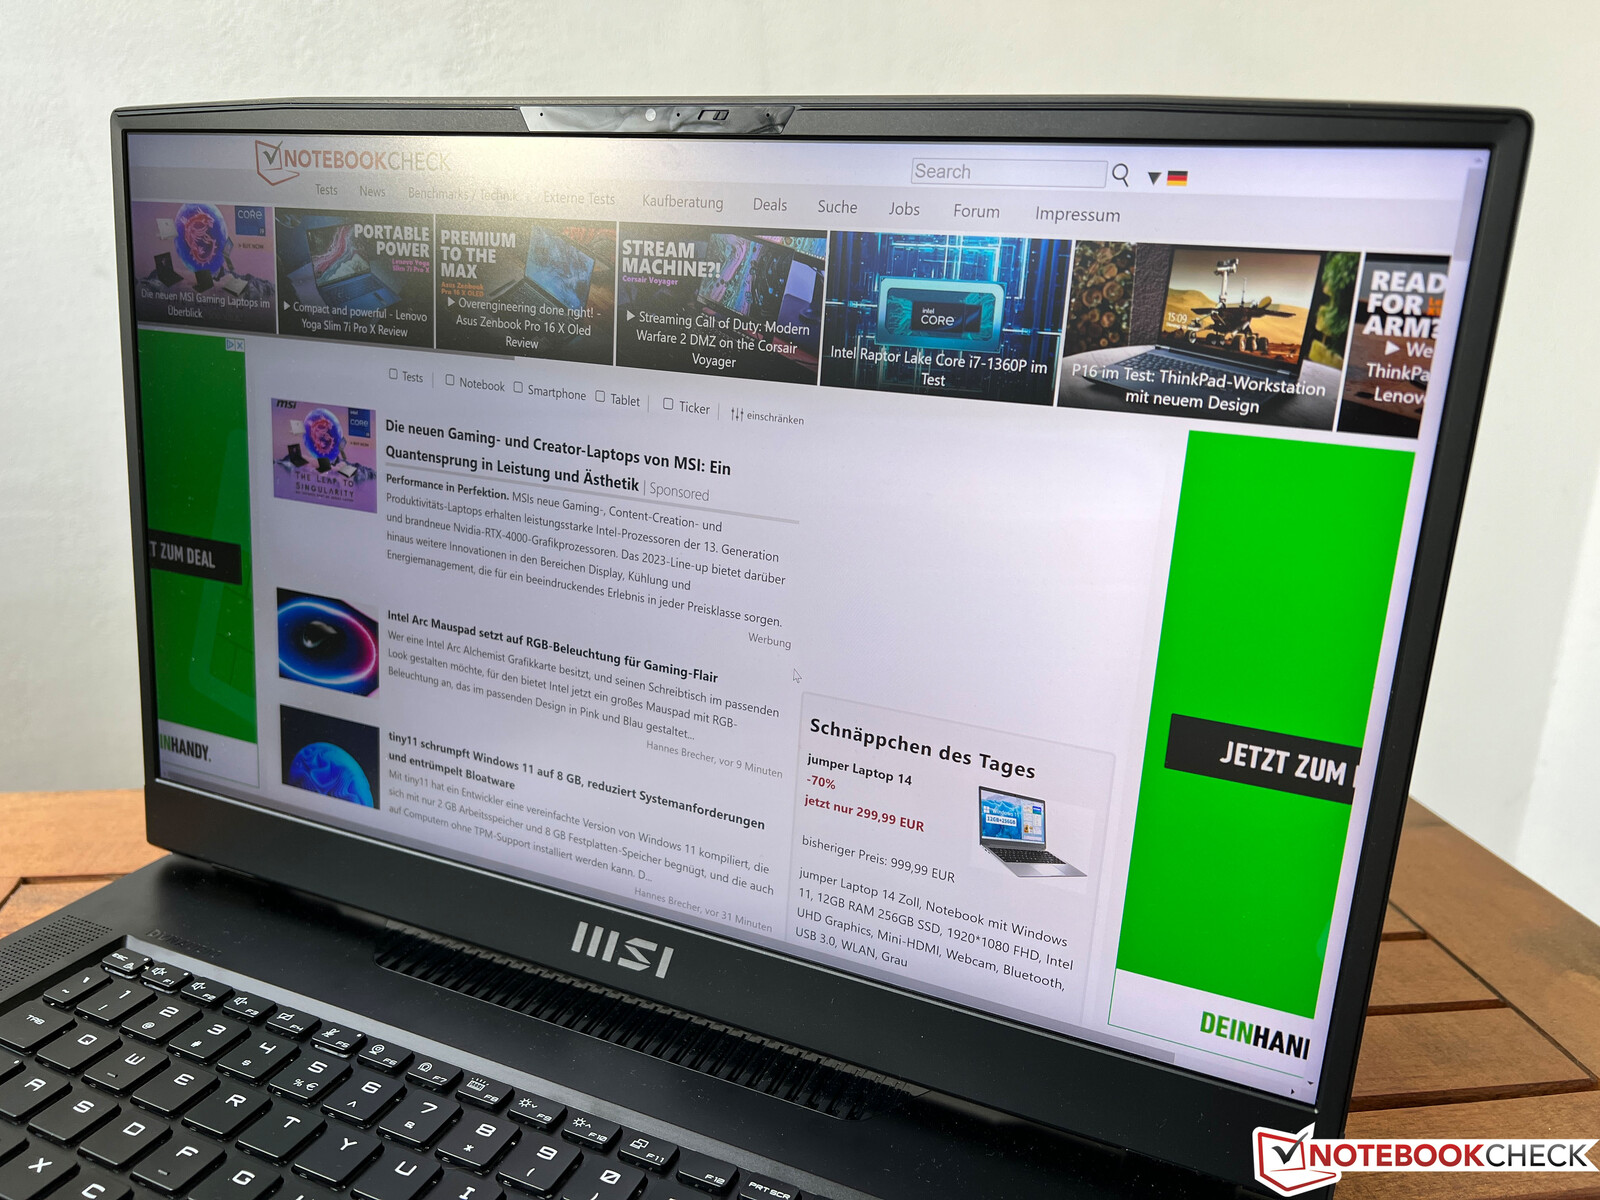
Display - Mini-LED 4K a 144 Hz

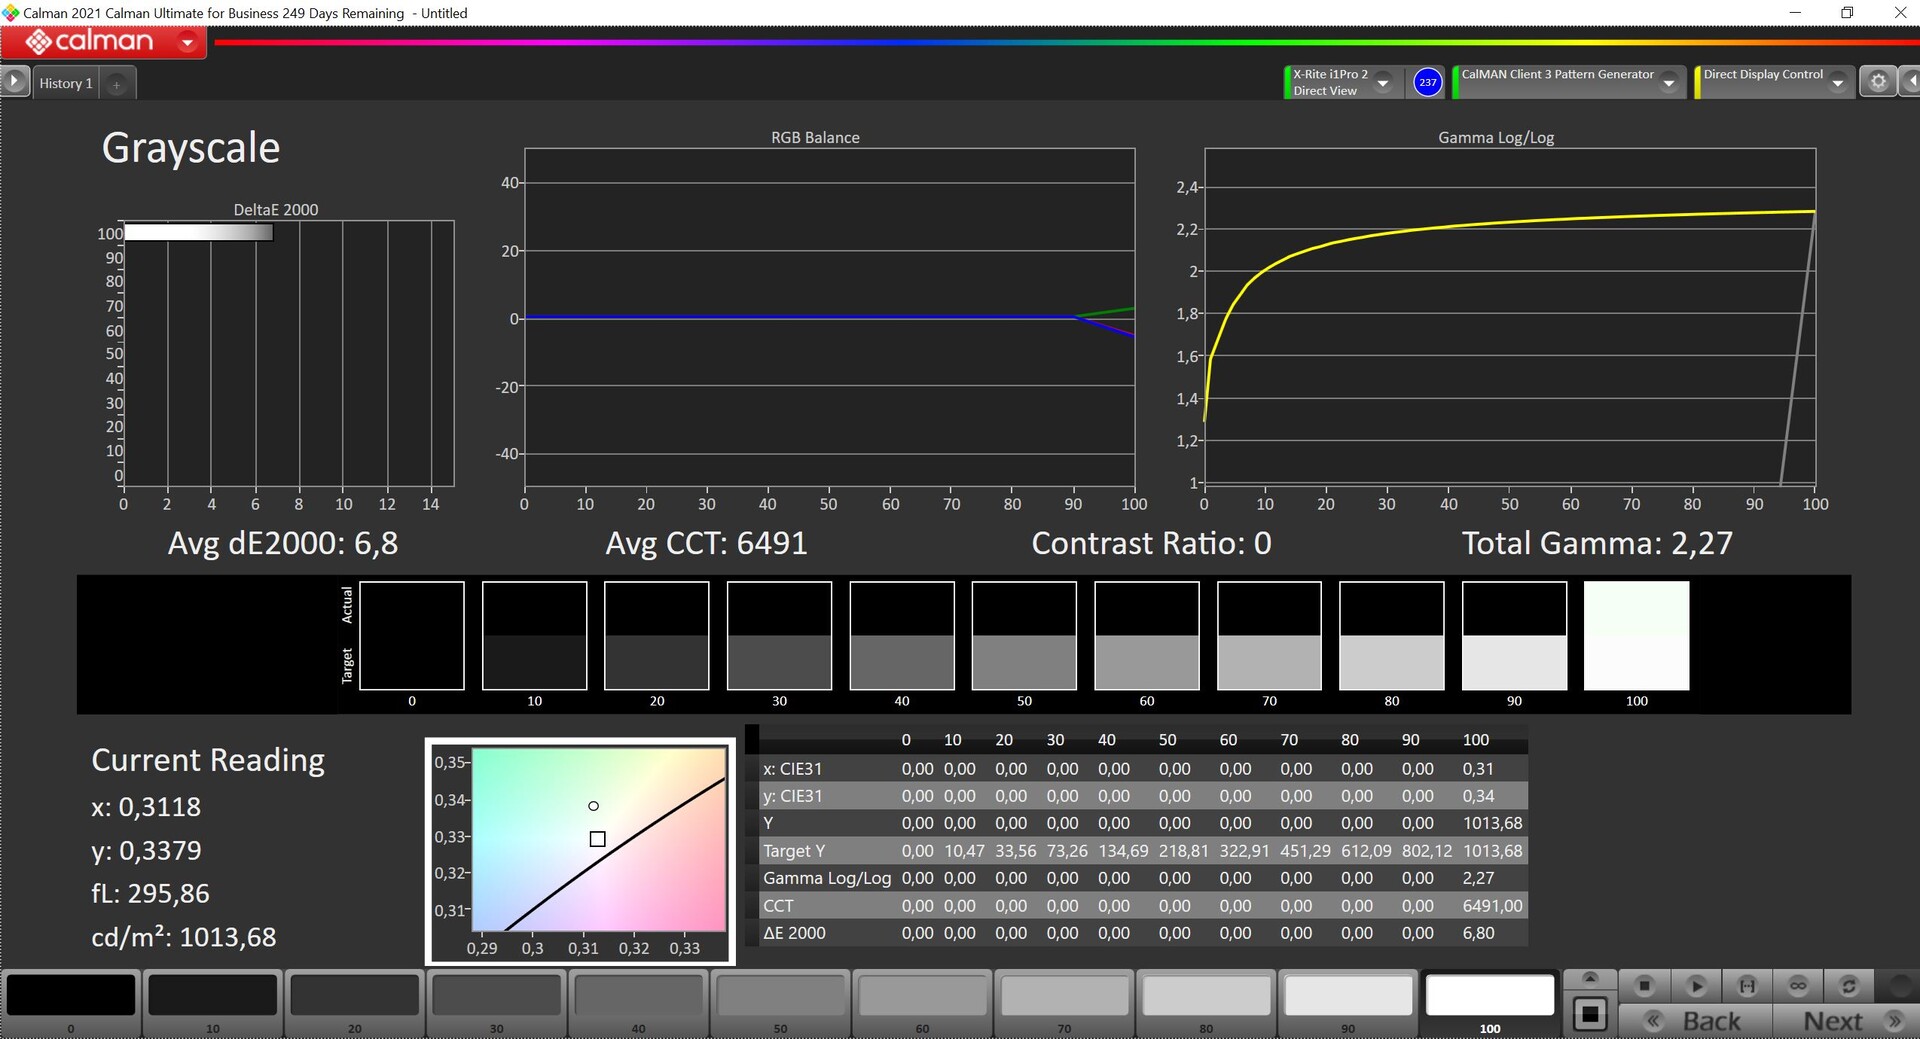
MSI non solo utilizza gli ultimi modelli di CPU e GPU, ma offre anche un nuovissimo pannello Mini-LED con risoluzione 4K (16:9, 3840 x 2160 pixel) e una frequenza di aggiornamento di 144 Hz. È anche possibile ottenere uno schermo IPS QHD con 240 Hz. La qualità dell'immagine soggettiva del pannello Mini-LED opaco di AU Optronics (B173ZAN06.C) è impressionante, con contenuti nitidissimi e colori ricchi. Le immagini nere sono effettivamente nere e gli schermi Mini-LED non presentano alcuna perdita di luminosità. MSI pubblicizza più di 1000 zone di oscuramento, ma è comunque possibile notare il blooming. Gli oggetti luminosi su sfondi scuri creano nuvole luminose poiché l'intera zona di oscuramento è illuminata. Tuttavia, si nota solo quando appaiono i loghi, ma non l'abbiamo notato durante i giochi o le attività quotidiane. Abbiamo rilevato una luminosità media di 600 nit e un rapporto di contrasto molto elevato grazie al basso valore del nero.
Il pannello supporta HDR 1000 e possiamo confermare una luminosità massima di oltre 1000 nits su un'immagine completamente bianca, ma il pannello non raggiunge valori superiori mentre il pannello Mini-LED delApple MacBook Pro 16può raggiungere fino a 1600 nits per piccole parti del display. L'implementazione dell'HDR in Windows è ancora una catastrofe rispetto a macOS. L'HDR deve essere attivato manualmente, non è più possibile utilizzare alcun profilo colore e non è possibile utilizzare l'HDR a batteria. Non ci sorprenderebbe se molti utenti non utilizzassero affatto l'HDR, visti questi problemi, ed è un peccato. La qualità dei video HDR è paragonabile a quella del MacBook Pro 16, nonostante la superficie opaca, e l'abbiamo testato fianco a fianco.
| |||||||||||||||||||||||||
Distribuzione della luminosità: 93 %
Al centro con la batteria: 402 cd/m²
Contrasto: 6060000:1 (Nero: 0.0001 cd/m²)
ΔE ColorChecker Calman: 4.8 | ∀{0.5-29.43 Ø4.72}
calibrated: 1.8
ΔE Greyscale Calman: 6.5 | ∀{0.09-98 Ø4.97}
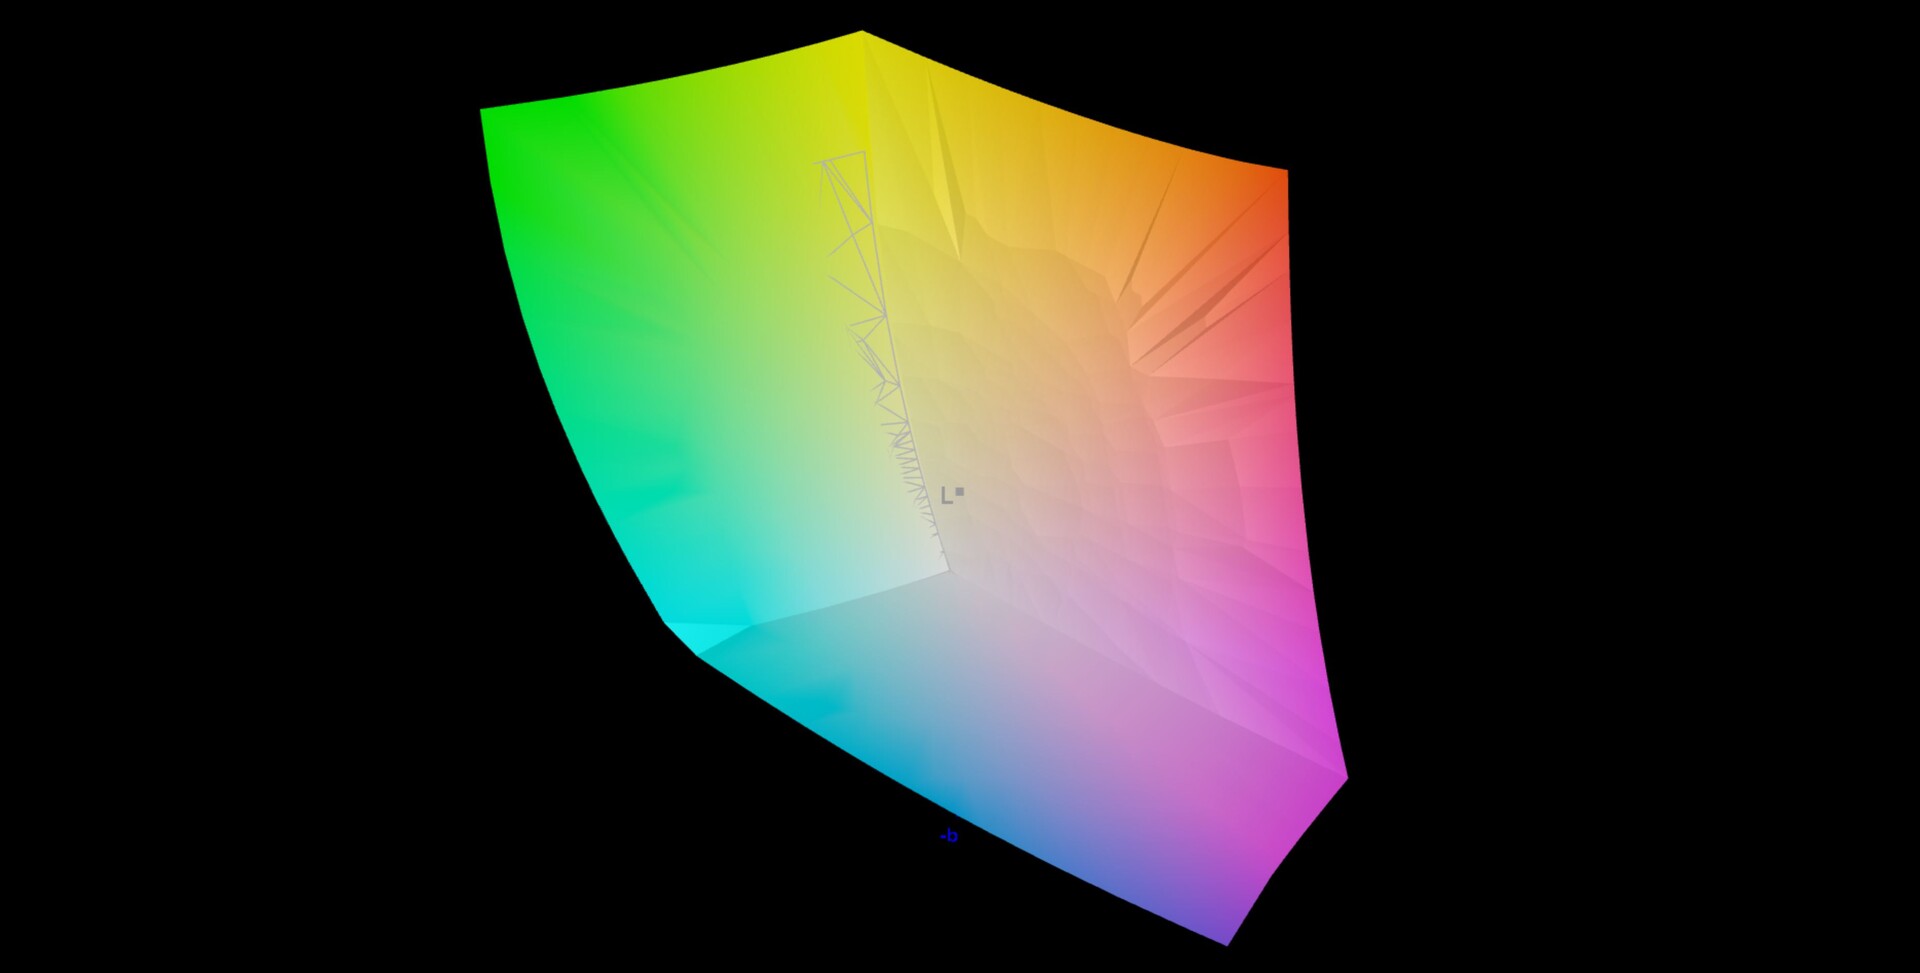
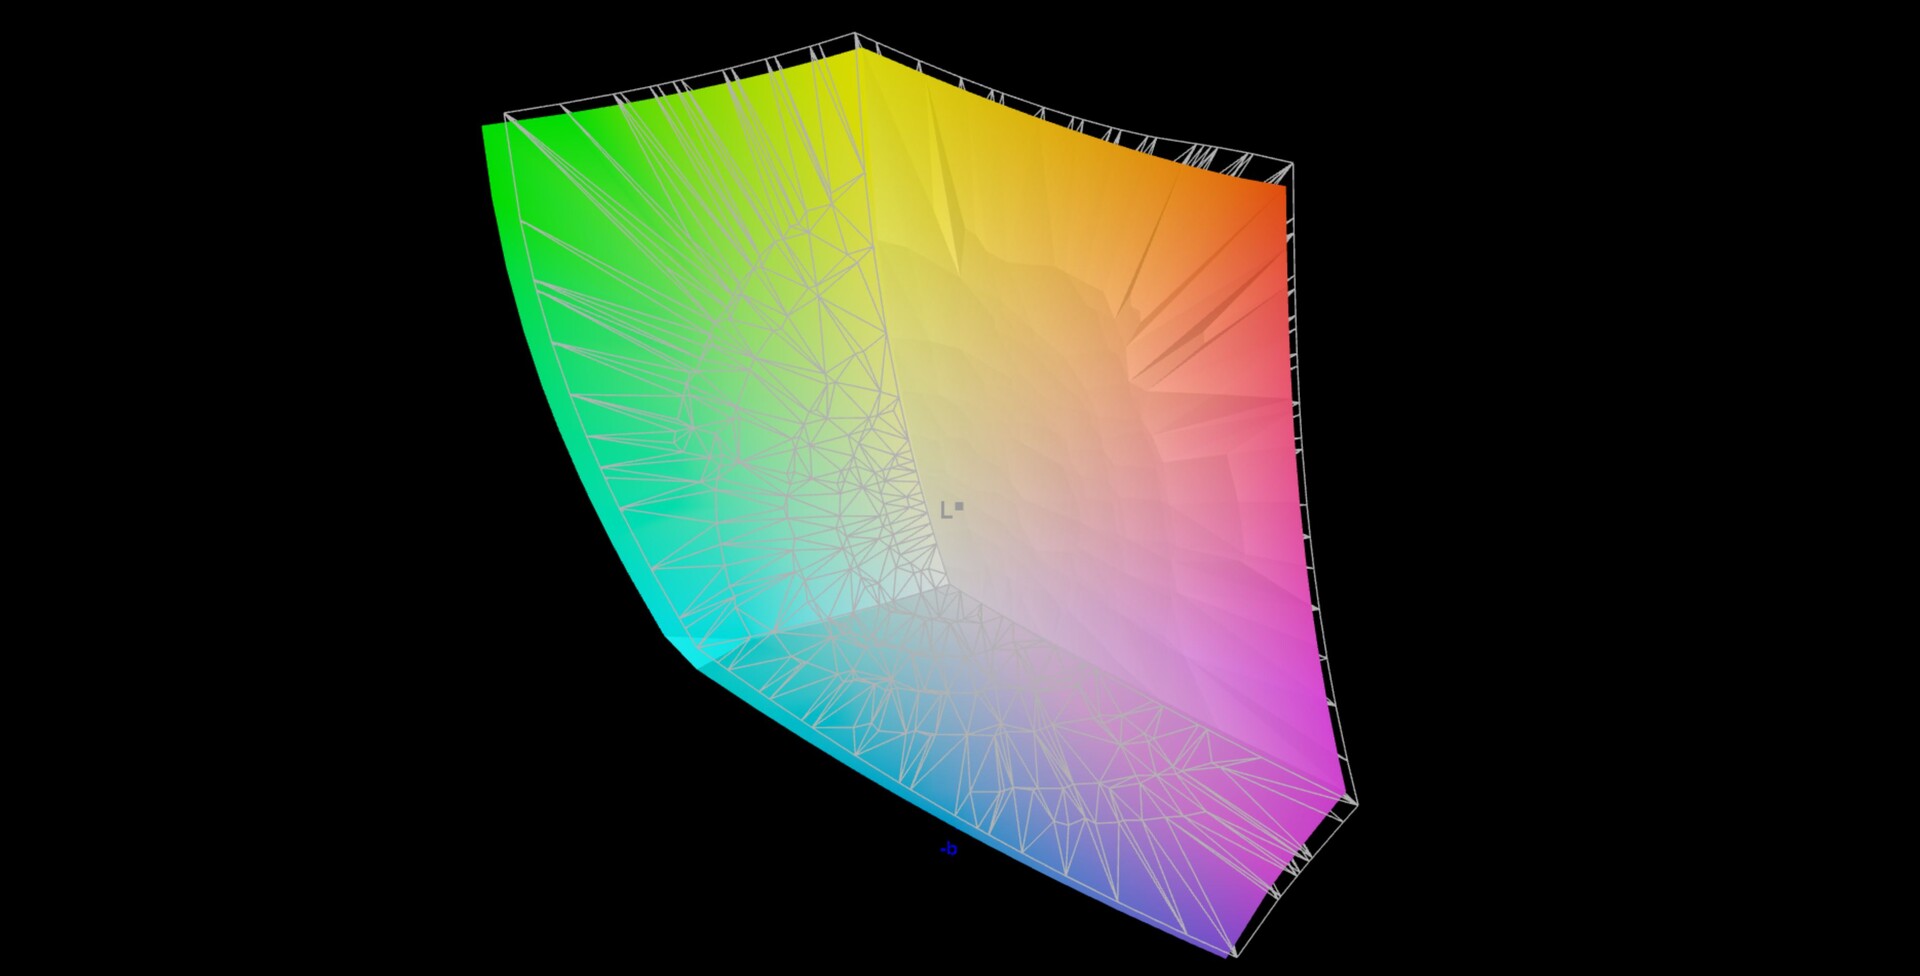
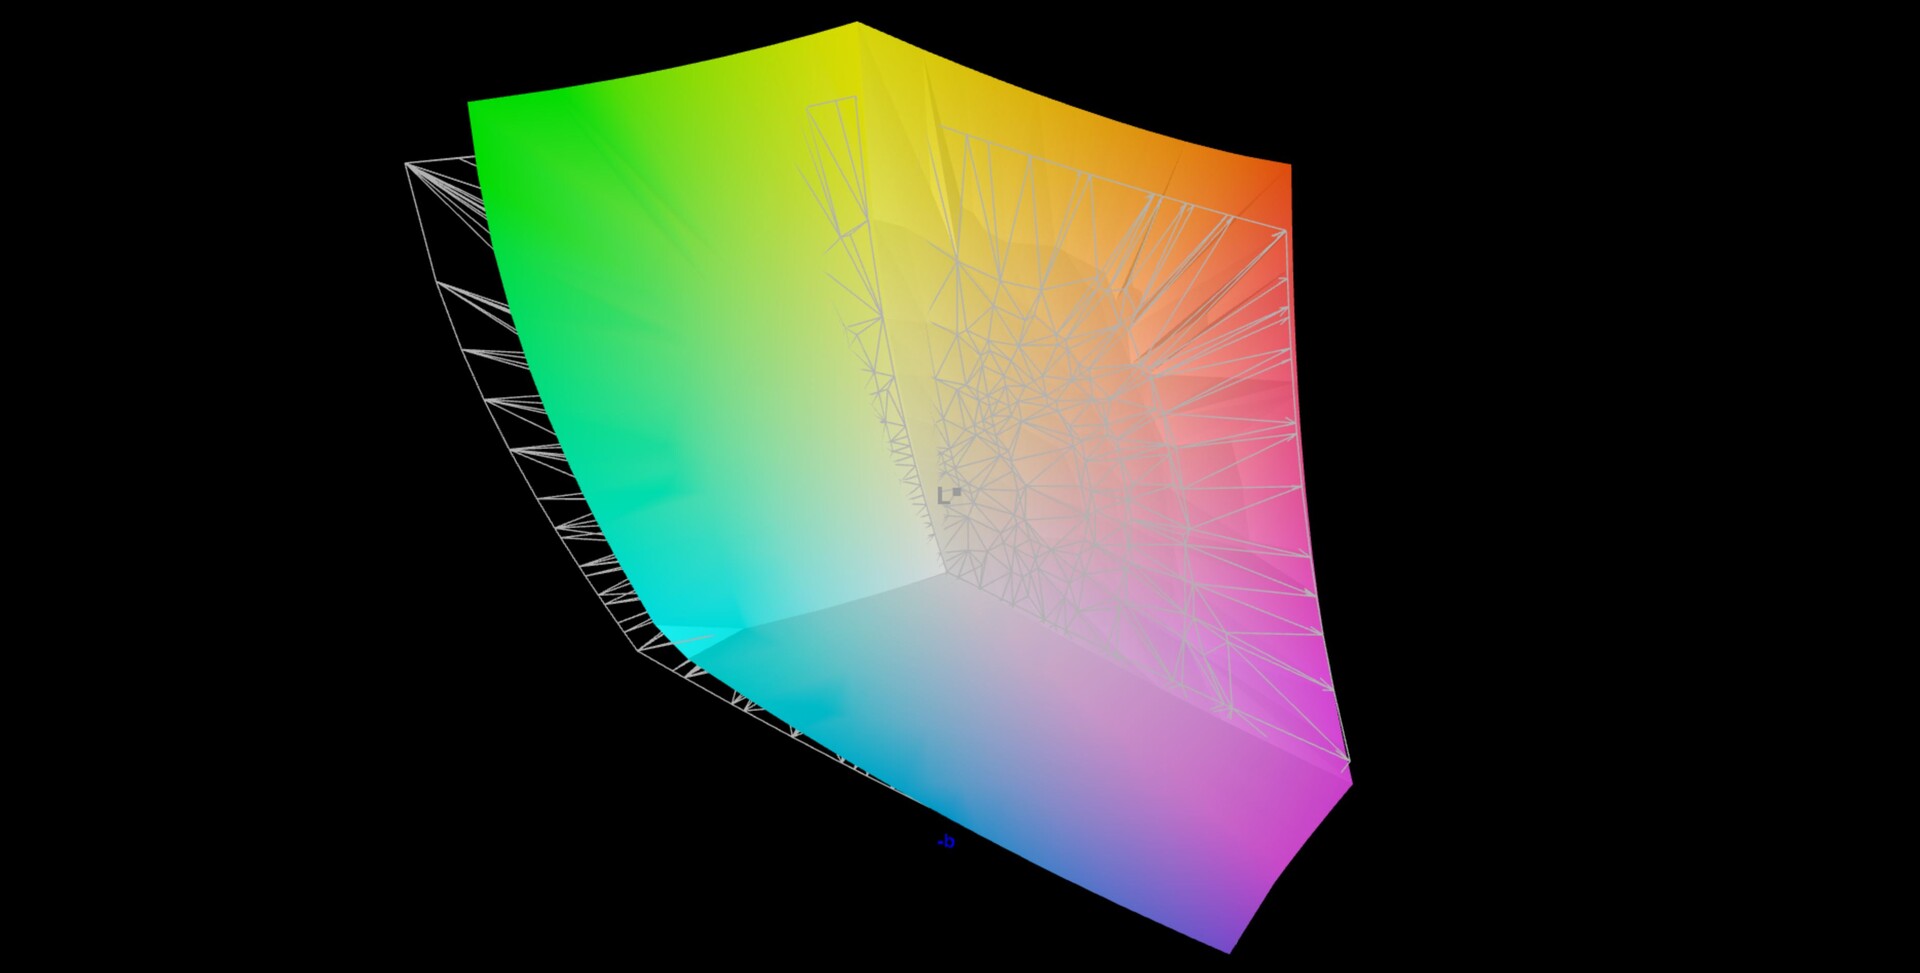
92.4% AdobeRGB 1998 (Argyll 3D)
99.9% sRGB (Argyll 3D)
94.9% Display P3 (Argyll 3D)
Gamma: 2.63
CCT: 6596 K
| MSI Titan GT77 HX 13VI B173ZAN06.C, Mini-LED, 3840x2160, 17.3" | Razer Blade 16 Early 2023 CSOT T3 MNG007DA4-1, IPS, 2560x1600, 16" | Asus ROG Strix Scar 17 SE G733CX-LL014W NE173QHM-NZ2, IPS, 2560x1440, 17.3" | MSI Titan GT77 12UHS Sharp SHP1544 LQ173M1JW08, IPS-Level, 1920x1080, 17.3" | Alienware x17 R2 P48E AU Optronics B173HAN, IPS, 1920x1080, 17.3" | Schenker XMG Neo 17 M22 BOE0A99, IPS, 2560x1600, 17" | |
|---|---|---|---|---|---|---|
| Display | 0% | -2% | -16% | -10% | -17% | |
| Display P3 Coverage (%) | 94.9 | 98.5 4% | 97.1 2% | 70.8 -25% | 79.2 -17% | 69 -27% |
| sRGB Coverage (%) | 99.9 | 100 0% | 99.9 0% | 98.9 -1% | 99.8 0% | 99.8 0% |
| AdobeRGB 1998 Coverage (%) | 92.4 | 89.7 -3% | 84.8 -8% | 73 -21% | 79.6 -14% | 69.6 -25% |
| Response Times | 69% | 74% | 86% | 67% | 75% | |
| Response Time Grey 50% / Grey 80% * (ms) | 38.4 ? | 6.6 ? 83% | 5.7 ? 85% | 3.03 ? 92% | 12.4 ? 68% | 10.8 ? 72% |
| Response Time Black / White * (ms) | 26.6 ? | 12 ? 55% | 10.1 ? 62% | 5.28 ? 80% | 9.2 ? 65% | 6.1 ? 77% |
| PWM Frequency (Hz) | 2380 ? | |||||
| Screen | -38877% | -37485% | -44442% | -32218% | -47756% | |
| Brightness middle (cd/m²) | 606 | 456.8 -25% | 320 -47% | 280 -54% | 365.4 -40% | 415 -32% |
| Brightness (cd/m²) | 602 | 437 -27% | 303 -50% | 275 -54% | 344 -43% | 399 -34% |
| Brightness Distribution (%) | 93 | 83 -11% | 87 -6% | 79 -15% | 85 -9% | 90 -3% |
| Black Level * (cd/m²) | 0.0001 | 0.35 -349900% | 0.3 -299900% | 0.4 -399900% | 0.29 -289900% | 0.43 -429900% |
| Contrast (:1) | 6060000 | 1305 -100% | 1067 -100% | 700 -100% | 1260 -100% | 965 -100% |
| Colorchecker dE 2000 * | 4.8 | 3.7 23% | 1.1 77% | 2.1 56% | 3.17 34% | 1.44 70% |
| Colorchecker dE 2000 max. * | 8.2 | 6.42 22% | 2.7 67% | 5.83 29% | 7.69 6% | 2.33 72% |
| Colorchecker dE 2000 calibrated * | 1.8 | 0.66 63% | 1.58 12% | 0.51 72% | 0.89 51% | |
| Greyscale dE 2000 * | 6.5 | 2.6 60% | 1.1 83% | 3.3 49% | 5.3 18% | 1.8 72% |
| Gamma | 2.63 84% | 2.3 96% | 2.13 103% | 2.13 103% | 2.18 101% | 2.132 103% |
| CCT | 6596 99% | 6108 106% | 6599 98% | 7060 92% | 5879 111% | 6327 103% |
| Media totale (Programma / Settaggio) | -12936% /
-24983% | -12471% /
-23057% | -14791% /
-28561% | -10720% /
-20704% | -15899% /
-30693% |
* ... Meglio usare valori piccoli
MSI fornisce la Titan GT77 con il software True Color, che offre diverse preimpostazioni per gli spazi colore e gli scenari (come Gamer, Office, Movie) ed è anche possibile utilizzare il software per calibrare lo schermo. Abbiamo utilizzato il software professionale CalMAN in combinazione con lo spettrofotometro X-Rite i1 Pro 2 e il profilo Display P3, poiché il pannello dovrebbe coprire l'intero gamut P3.
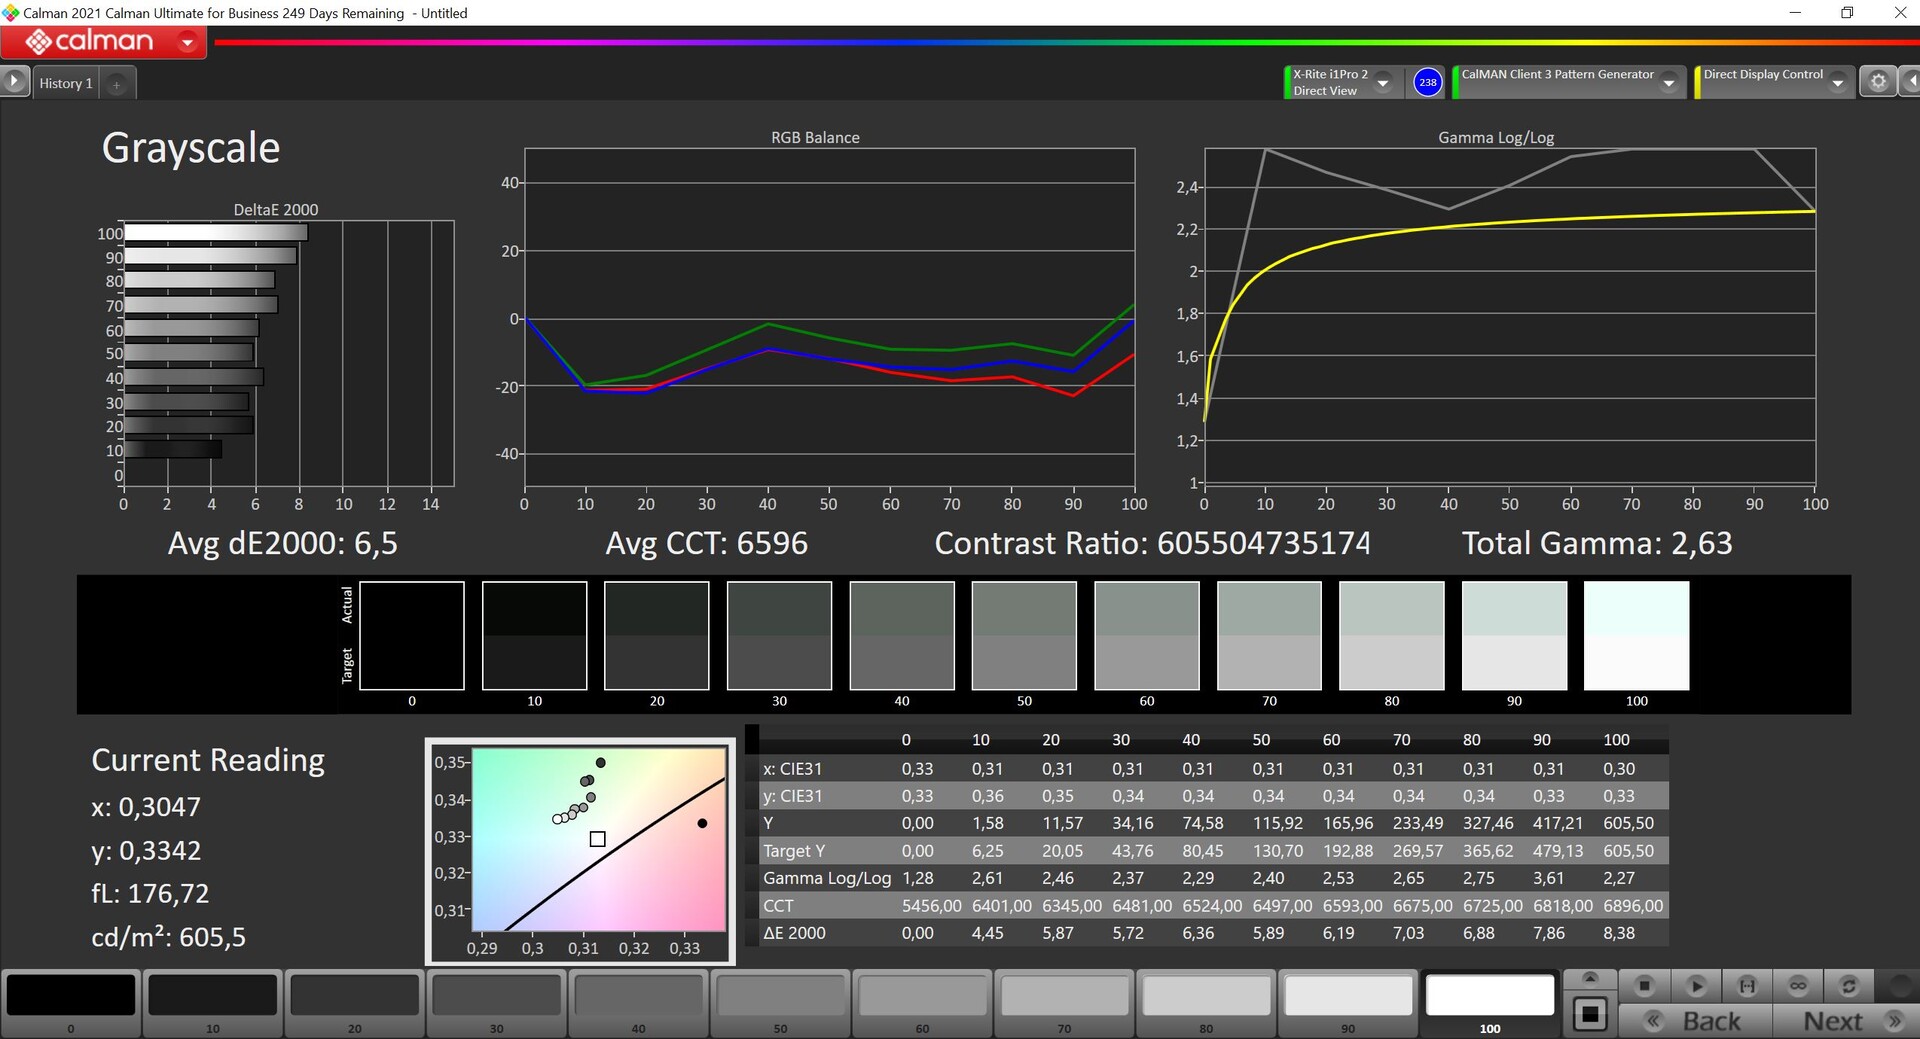
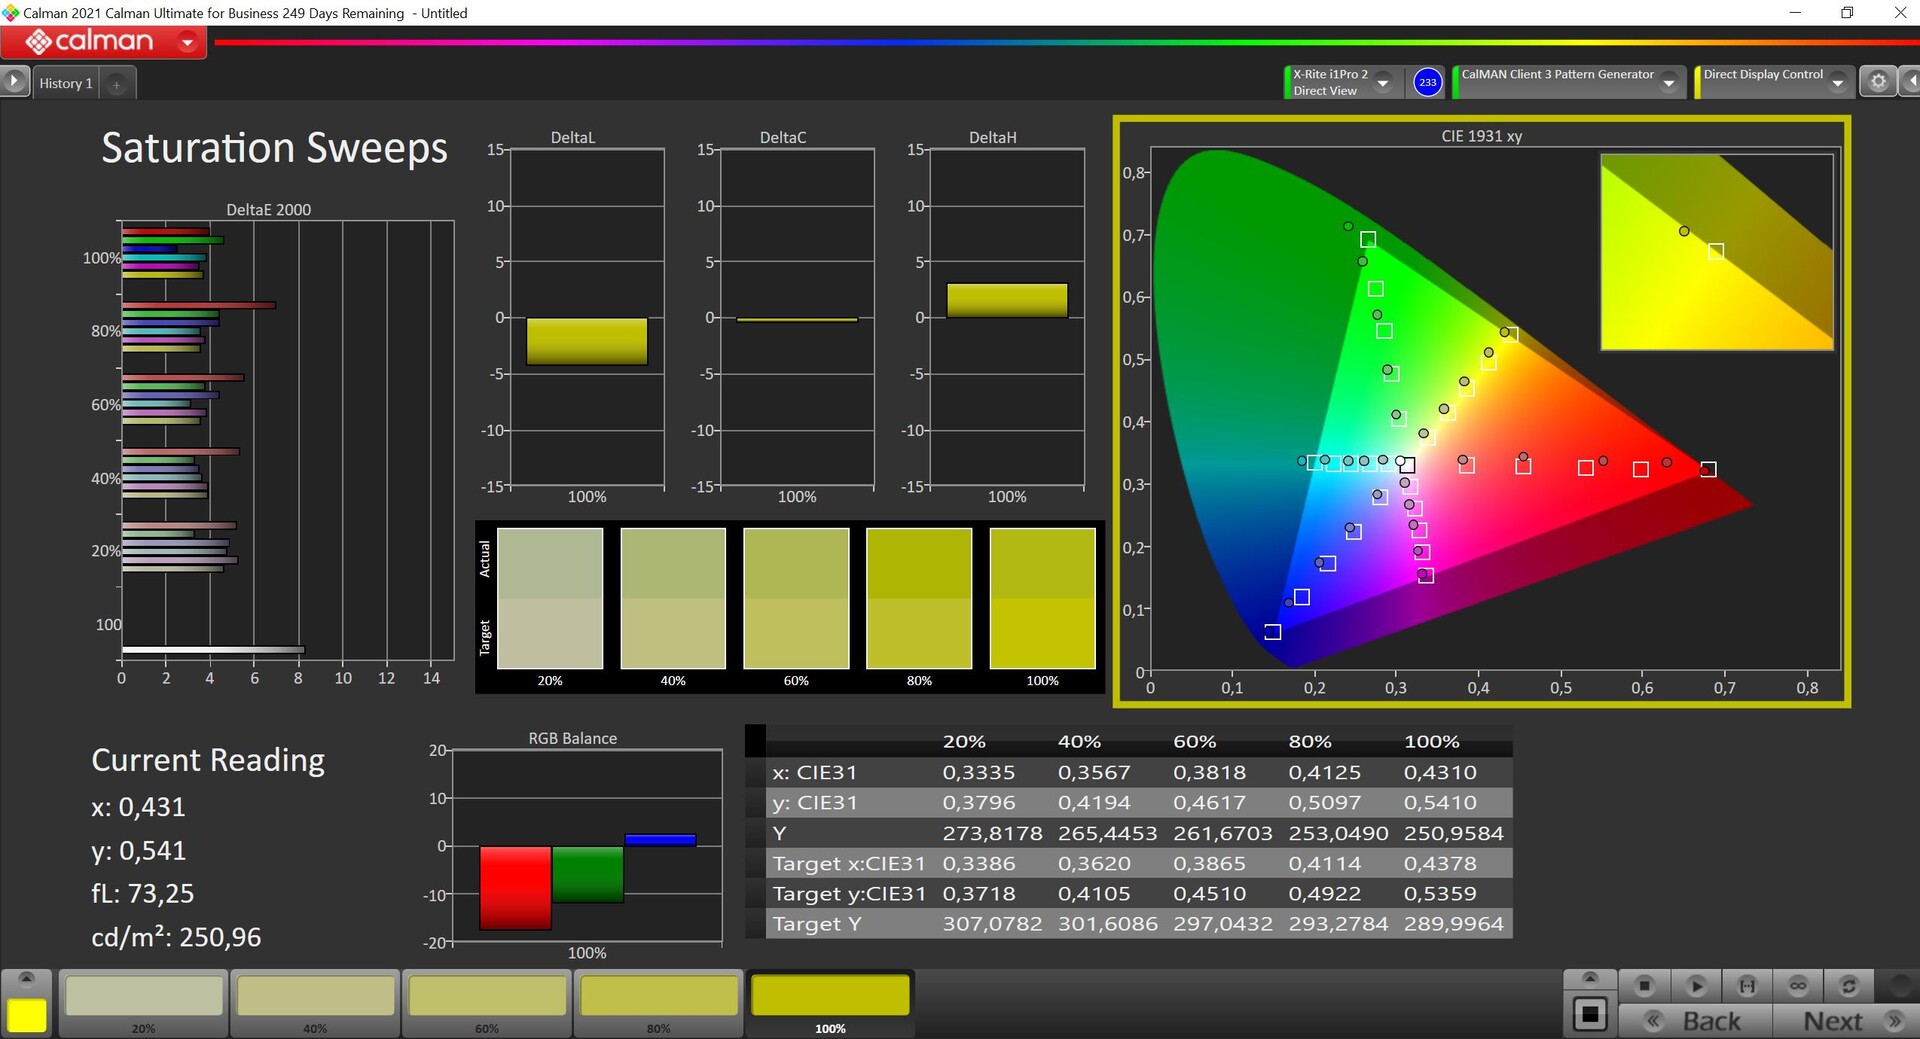
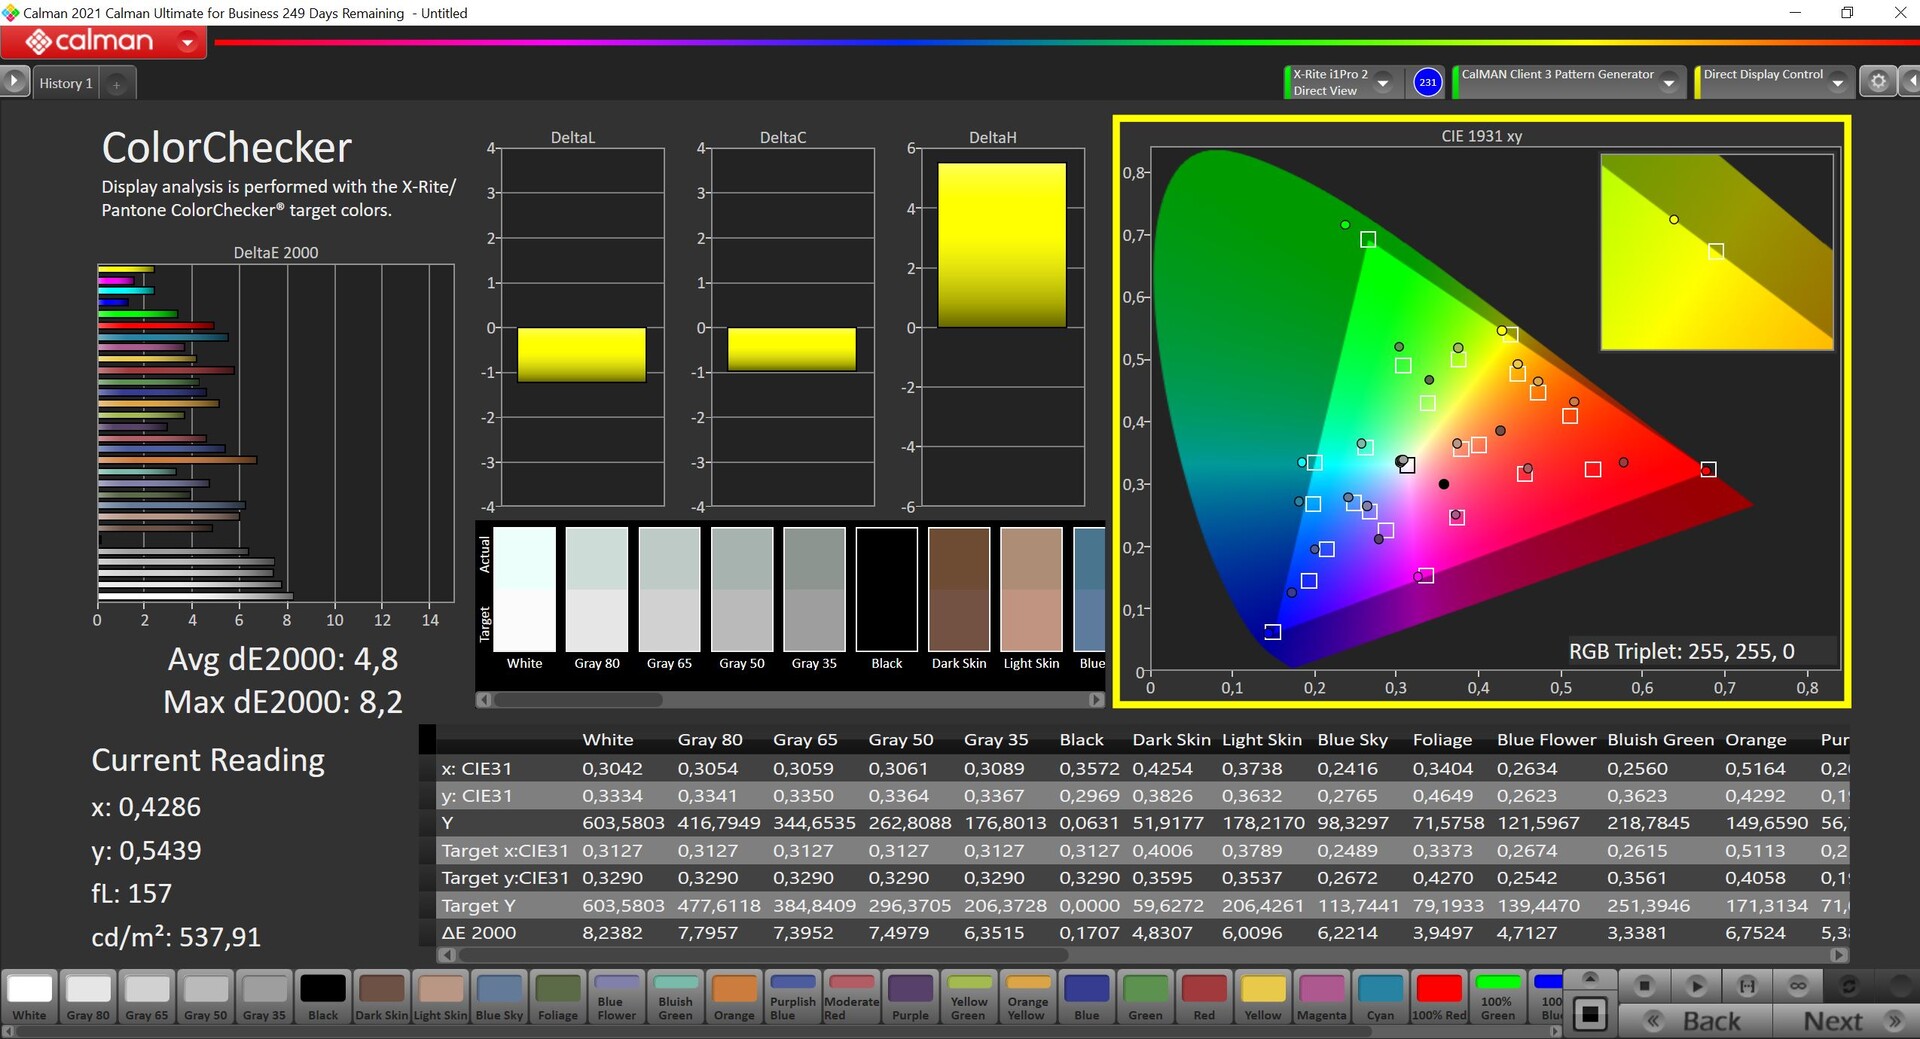
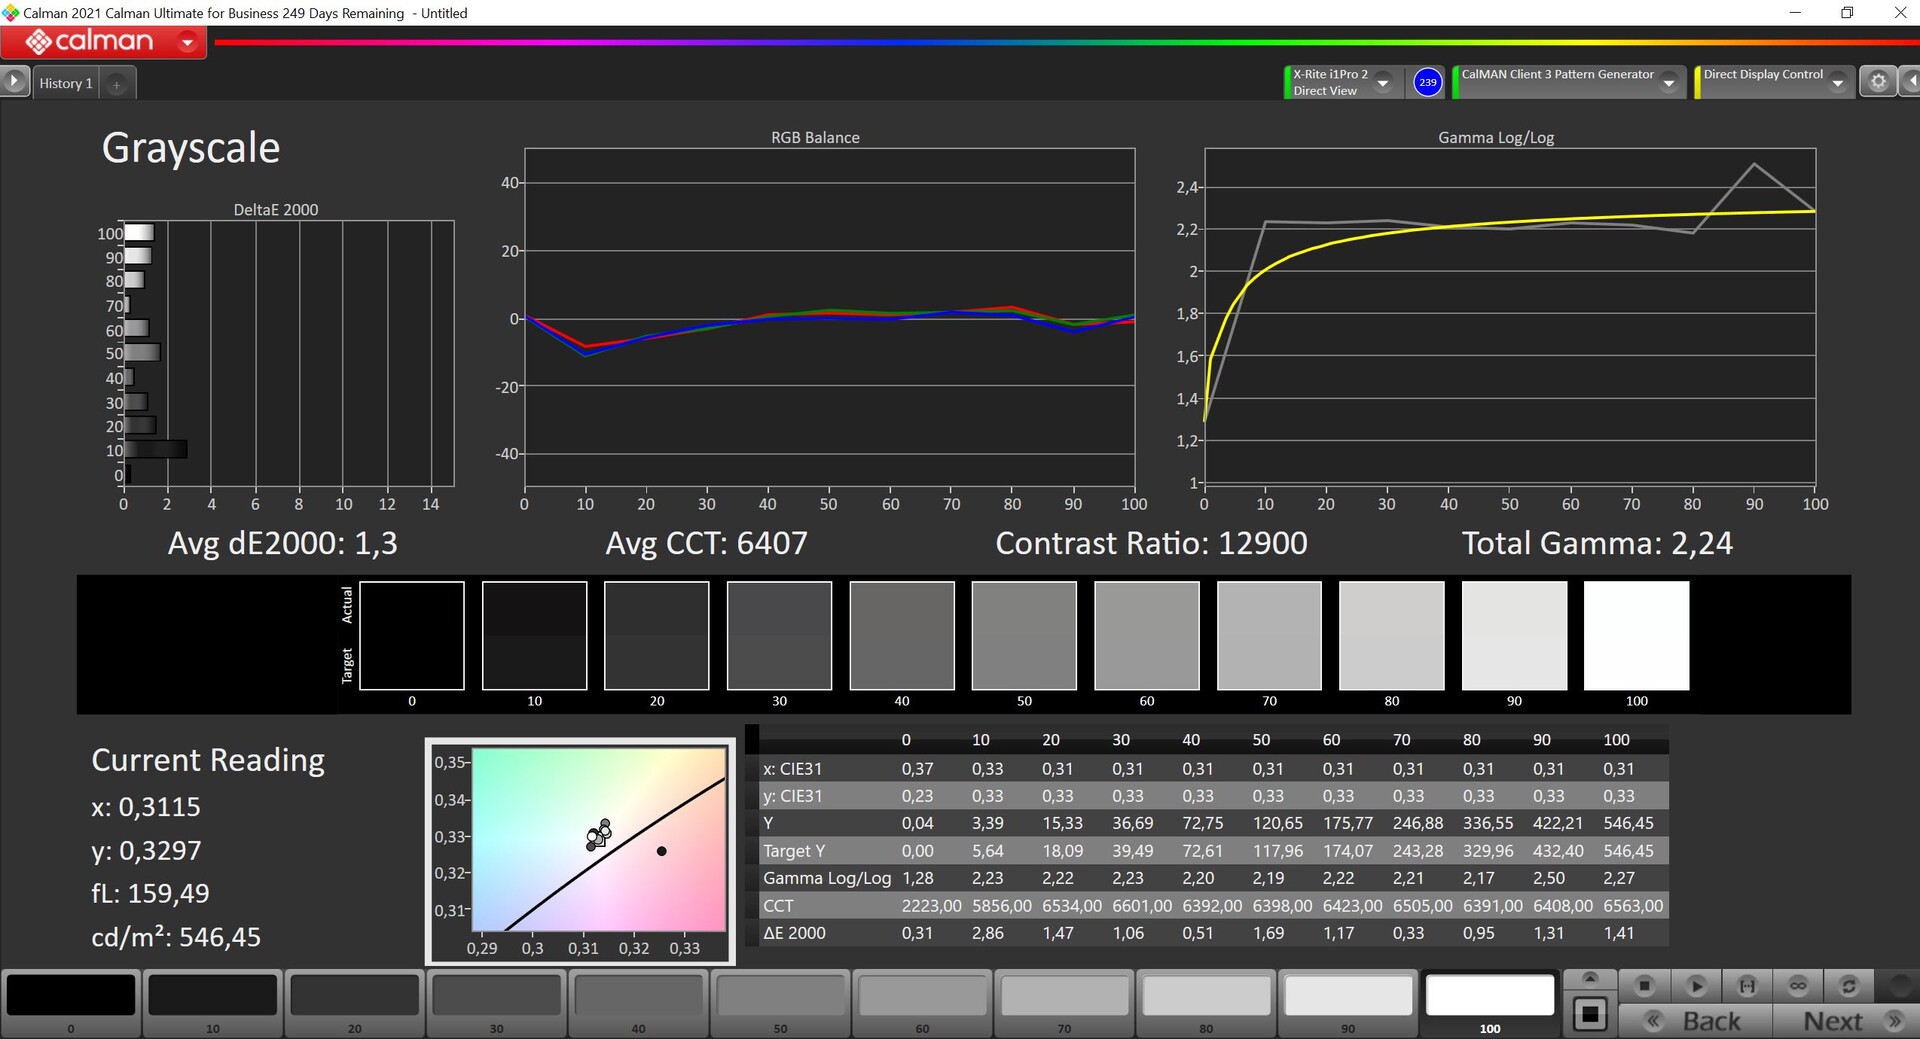
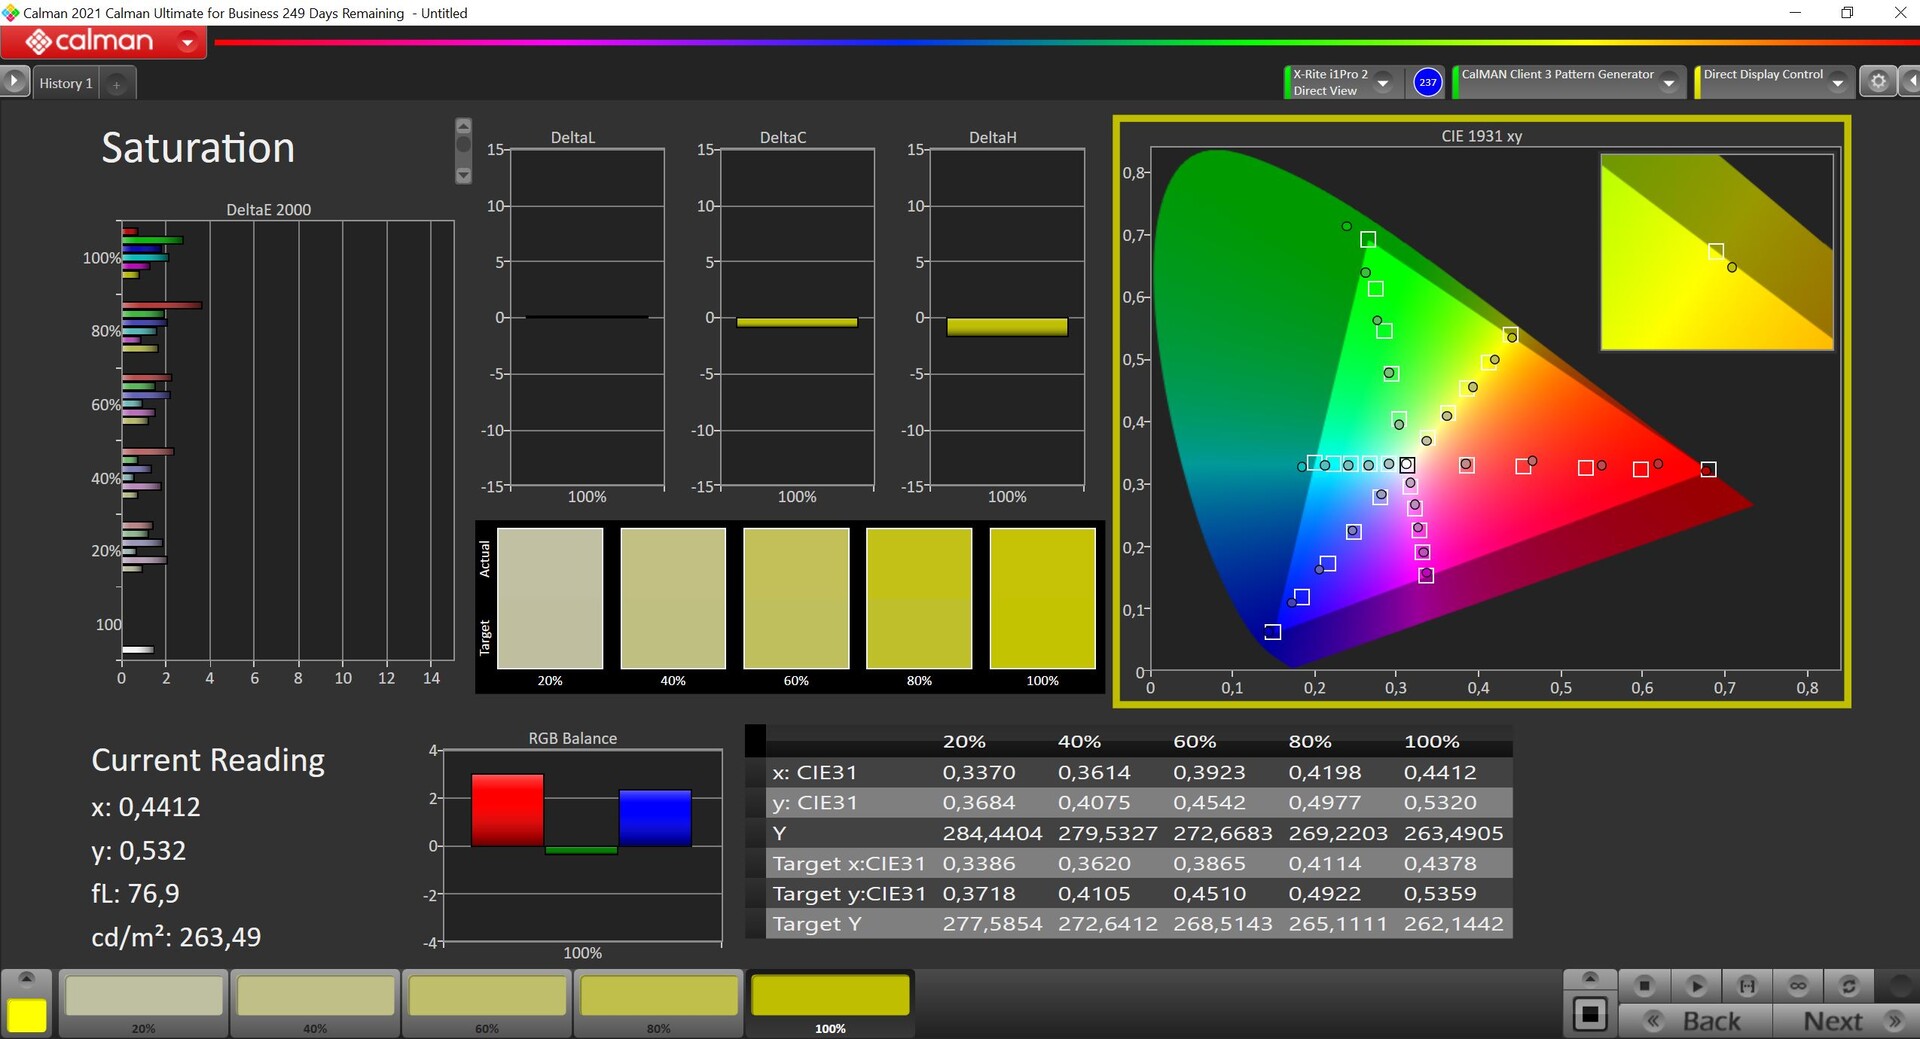
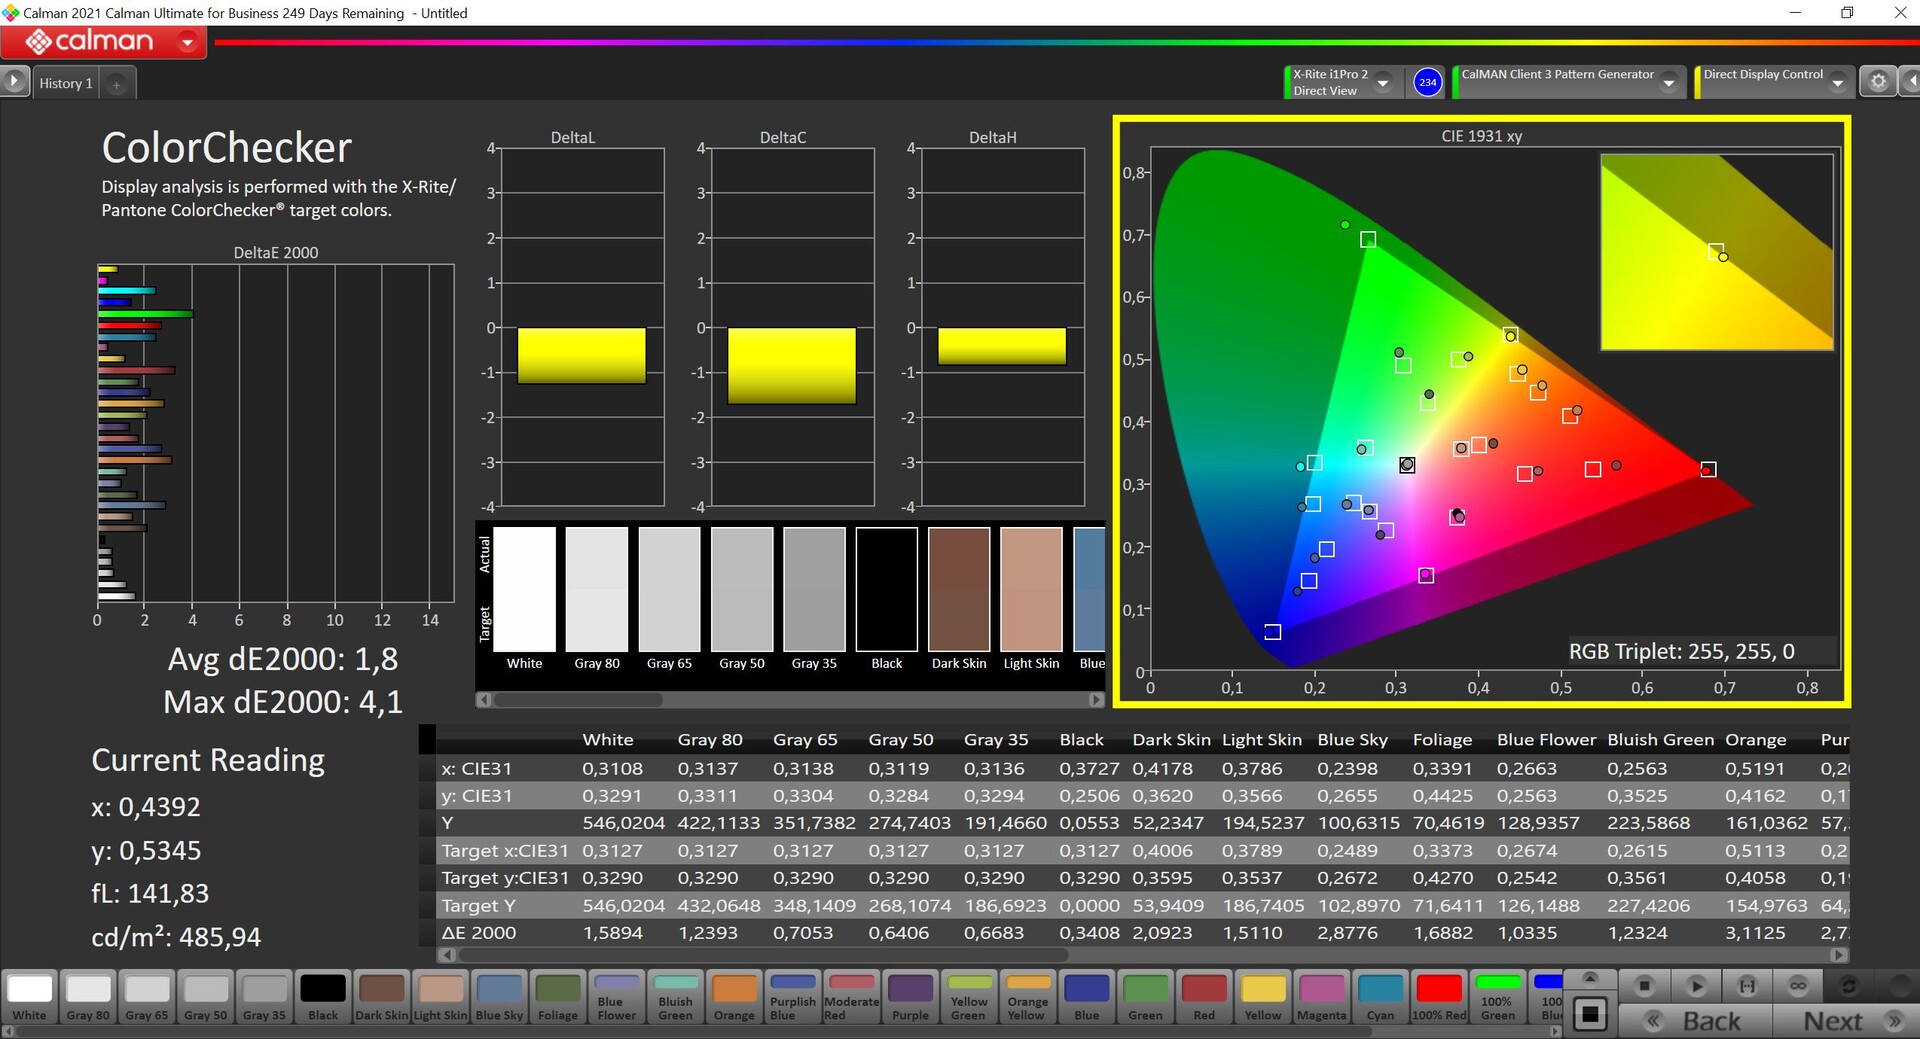
Le deviazioni rispetto al gamut di riferimento P3 sono molto elevate, sia per la scala di grigi che per i colori. La nostra calibrazione (il profilo corrispondente è disponibile gratuitamente nel riquadro del display) migliora notevolmente le prestazioni cromatiche, ma abbassa anche la luminosità massima di circa 50 nits. Raccomandiamo comunque il profilo calibrato ed è possibile modificare immagini/video, anche se le nostre misurazioni mostrano che lo spazio colore P3 è coperto solo al 95%.
Tempi di risposta del Display
| ↔ Tempi di risposta dal Nero al Bianco | ||
|---|---|---|
| 26.6 ms ... aumenta ↗ e diminuisce ↘ combinato | ↗ 9.2 ms Incremento | 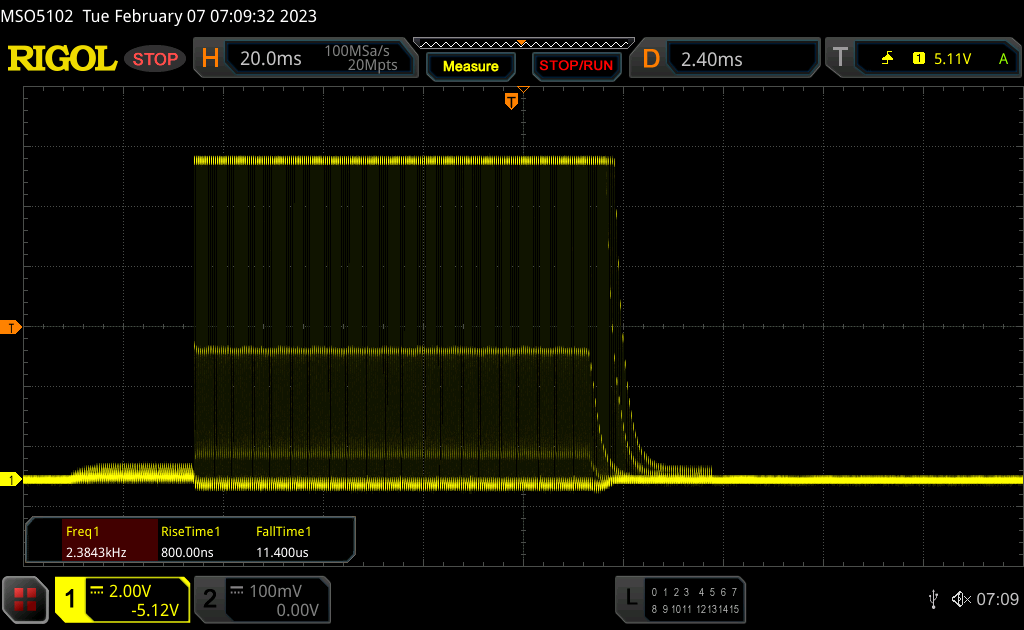 |
| ↘ 17.4 ms Calo | ||
| Lo schermo mostra tempi di risposta relativamente lenti nei nostri tests e potrebbe essere troppo lento per i gamers. In confronto, tutti i dispositivi di test variano da 0.1 (minimo) a 240 (massimo) ms. » 67 % di tutti i dispositivi è migliore. Questo significa che i tempi di risposta rilevati sono peggiori rispetto alla media di tutti i dispositivi testati (19.8 ms). | ||
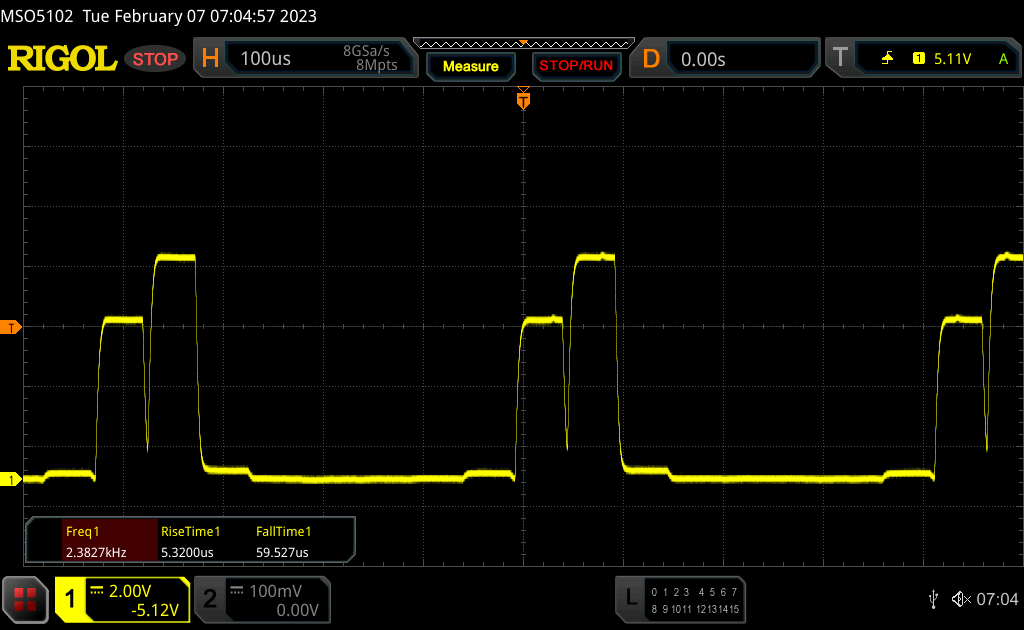
| ↔ Tempo di risposta dal 50% Grigio all'80% Grigio | ||
| 38.4 ms ... aumenta ↗ e diminuisce ↘ combinato | ↗ 13.6 ms Incremento | 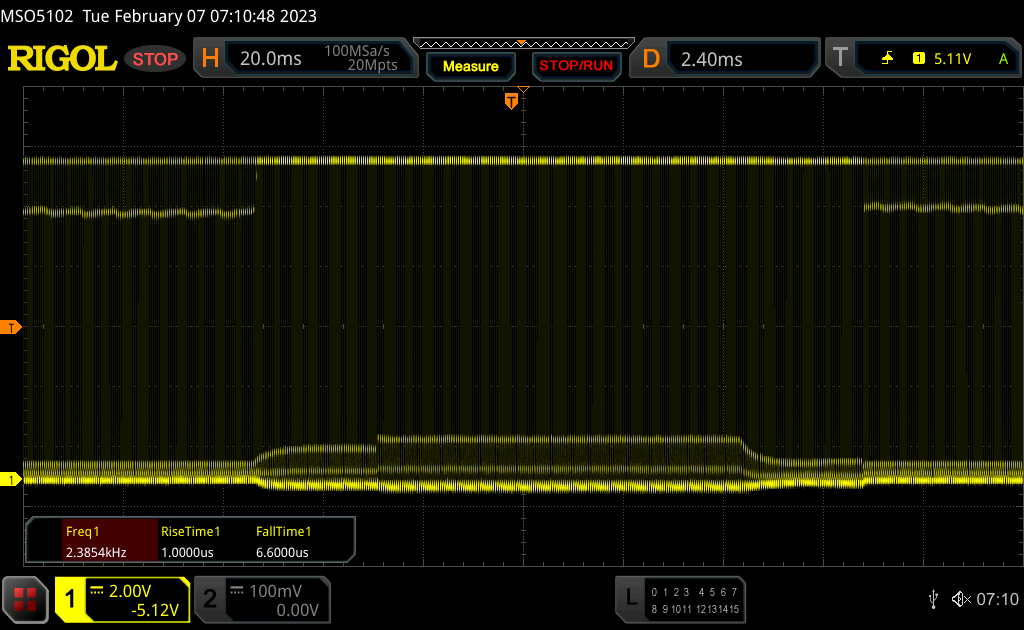 |
| ↘ 24.8 ms Calo | ||
| Lo schermo mostra tempi di risposta lenti nei nostri tests e sarà insoddisfacente per i gamers. In confronto, tutti i dispositivi di test variano da 0.165 (minimo) a 636 (massimo) ms. » 57 % di tutti i dispositivi è migliore. Questo significa che i tempi di risposta rilevati sono peggiori rispetto alla media di tutti i dispositivi testati (31 ms). | ||
Sfarfallio dello schermo / PWM (Pulse-Width Modulation)
| flickering dello schermo / PWM rilevato | 2380 Hz | ≤ 100 % settaggio luminosita' | 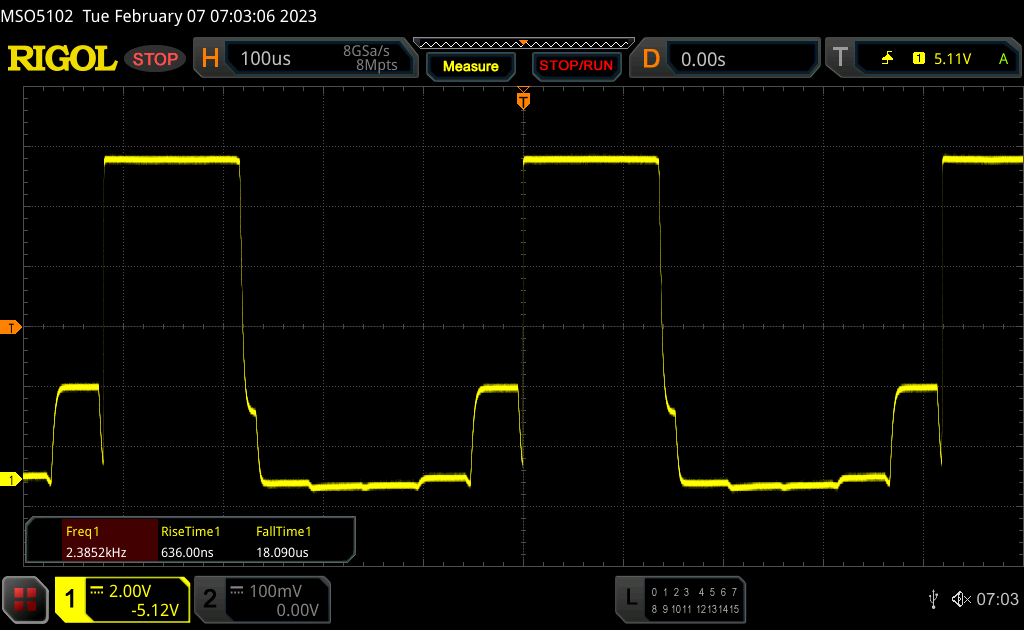 |
Il display sfarfalla a 2380 Hz (Probabilmente a causa dell'uso di PWM) Flickering rilevato ad una luminosita' di 100 % o inferiore. Non dovrebbe verificarsi flickering o PWM sopra questo valore di luminosita'. La frequenza di 2380 Hz è abbastanza alta, quindi la maggioranza degli utenti sensibili al PWM non dovrebbero notare alcun flickering. In confronto: 52 % di tutti i dispositivi testati non utilizza PWM per ridurre la luminosita' del display. Se è rilevato PWM, una media di 7769 (minimo: 5 - massimo: 343500) Hz è stata rilevata. | |||


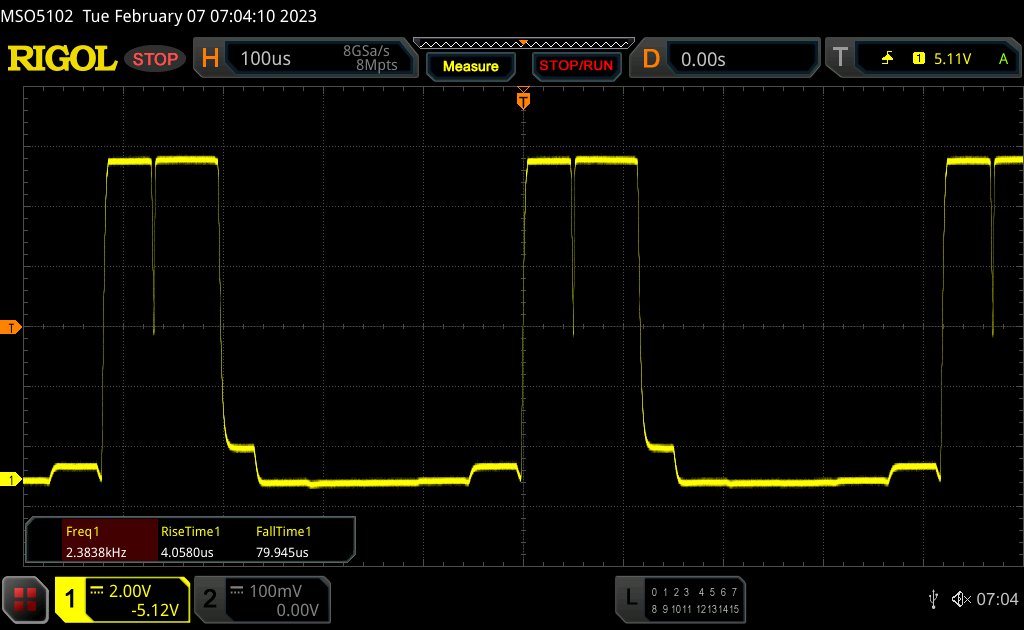
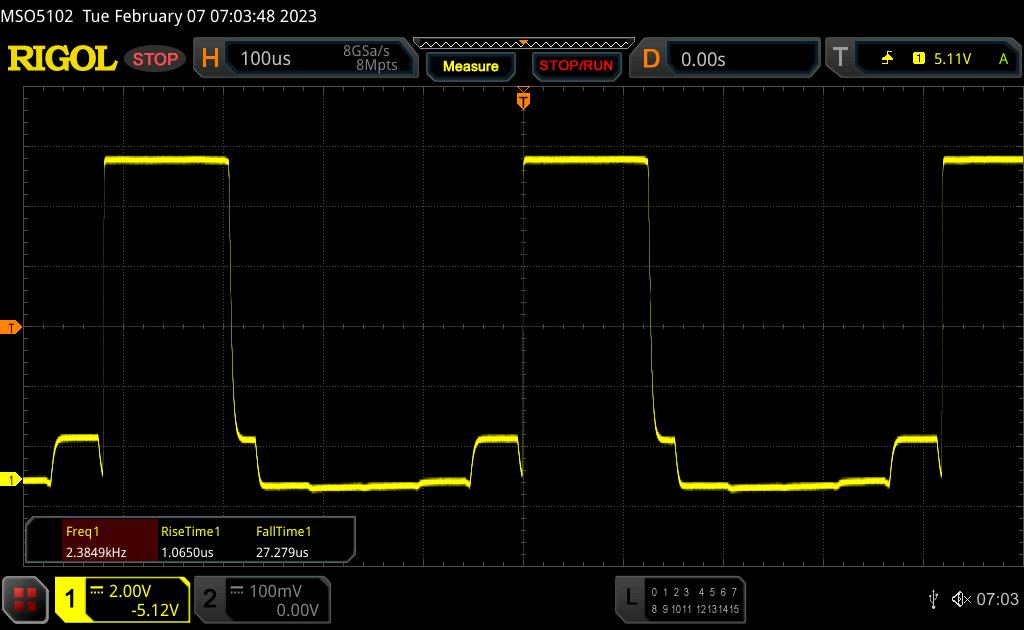
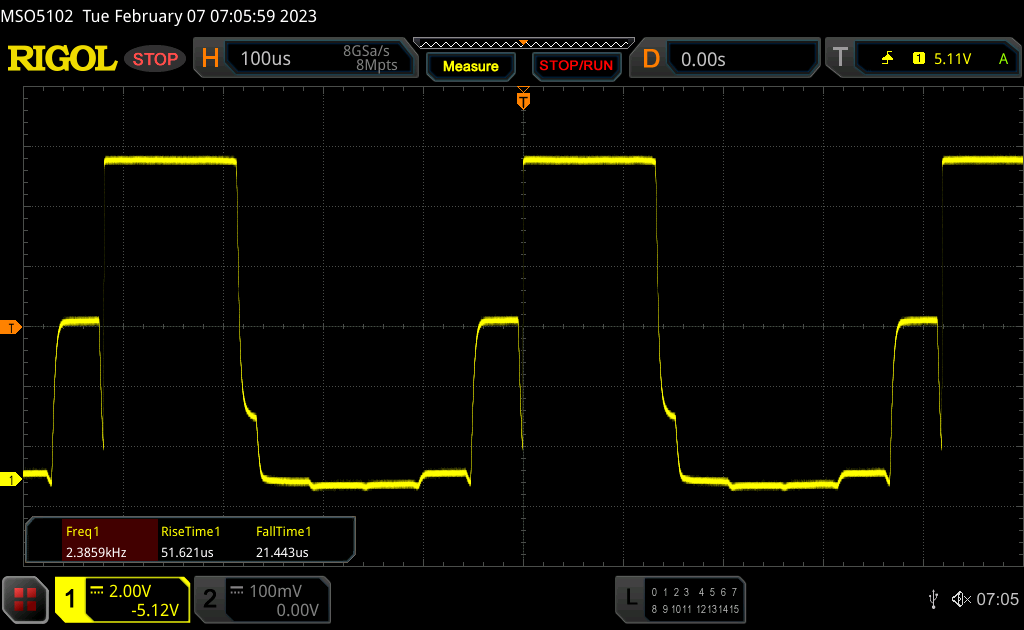
Rileviamo la PWM a tutti i livelli di luminosità (anche a quello massimo dell'HDR) con una frequenza di 2,38 kHz, il che rende davvero difficile determinare i tempi di risposta. Aggiungeremo i risultati corrispondenti in seguito.
Il pannello opaco e l'elevata luminosità dovrebbero essere ideali per gli ambienti esterni, ma MSI limita le capacità esterne del GT77. L'HDR non è possibile con l'alimentazione a batteria e anche la luminosità massima SDR si riduce da ~600 a ~400 nits non appena si stacca l'alimentatore. Non ci sono limitazioni in termini di stabilità dell'angolo di visione.

Prestazioni - Core i9 HX e RTX 4090
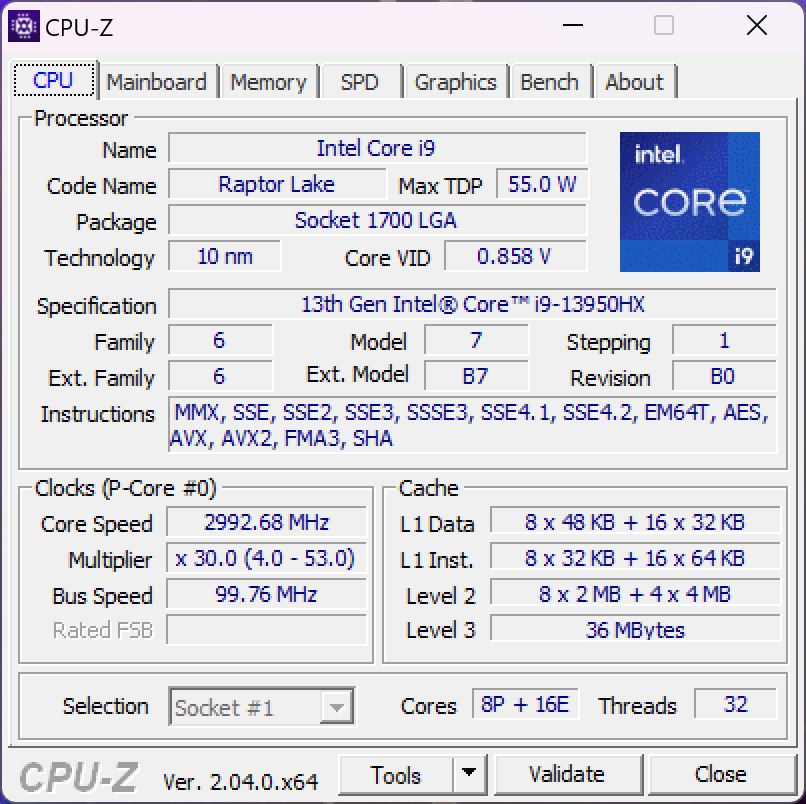
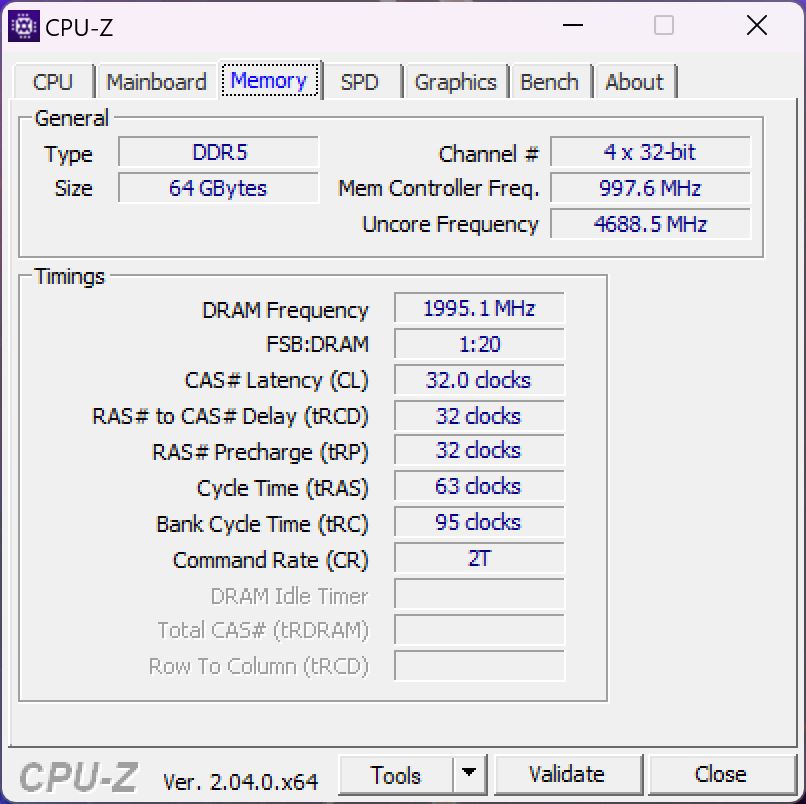
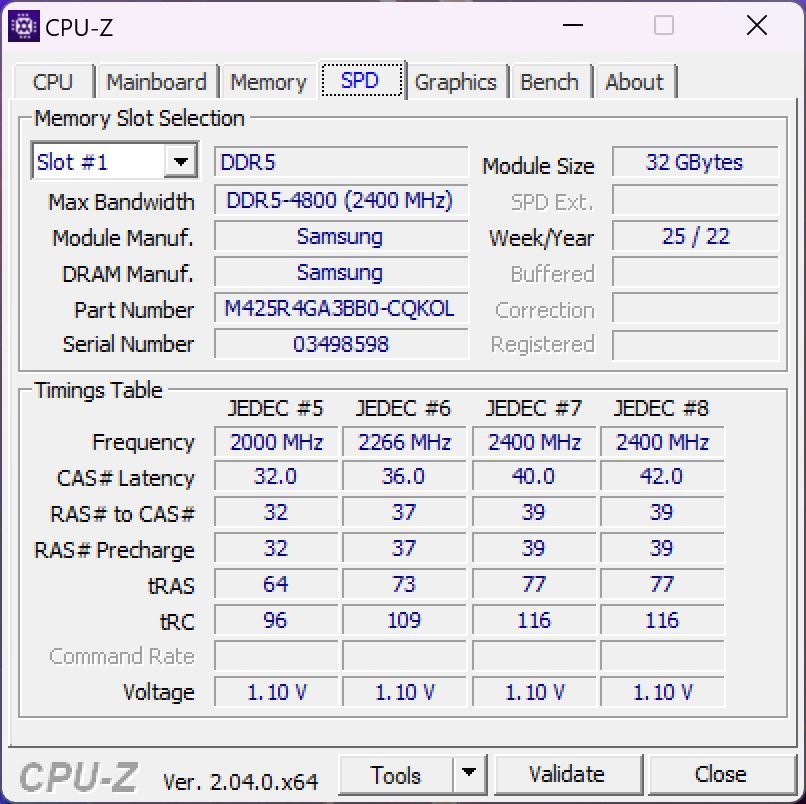
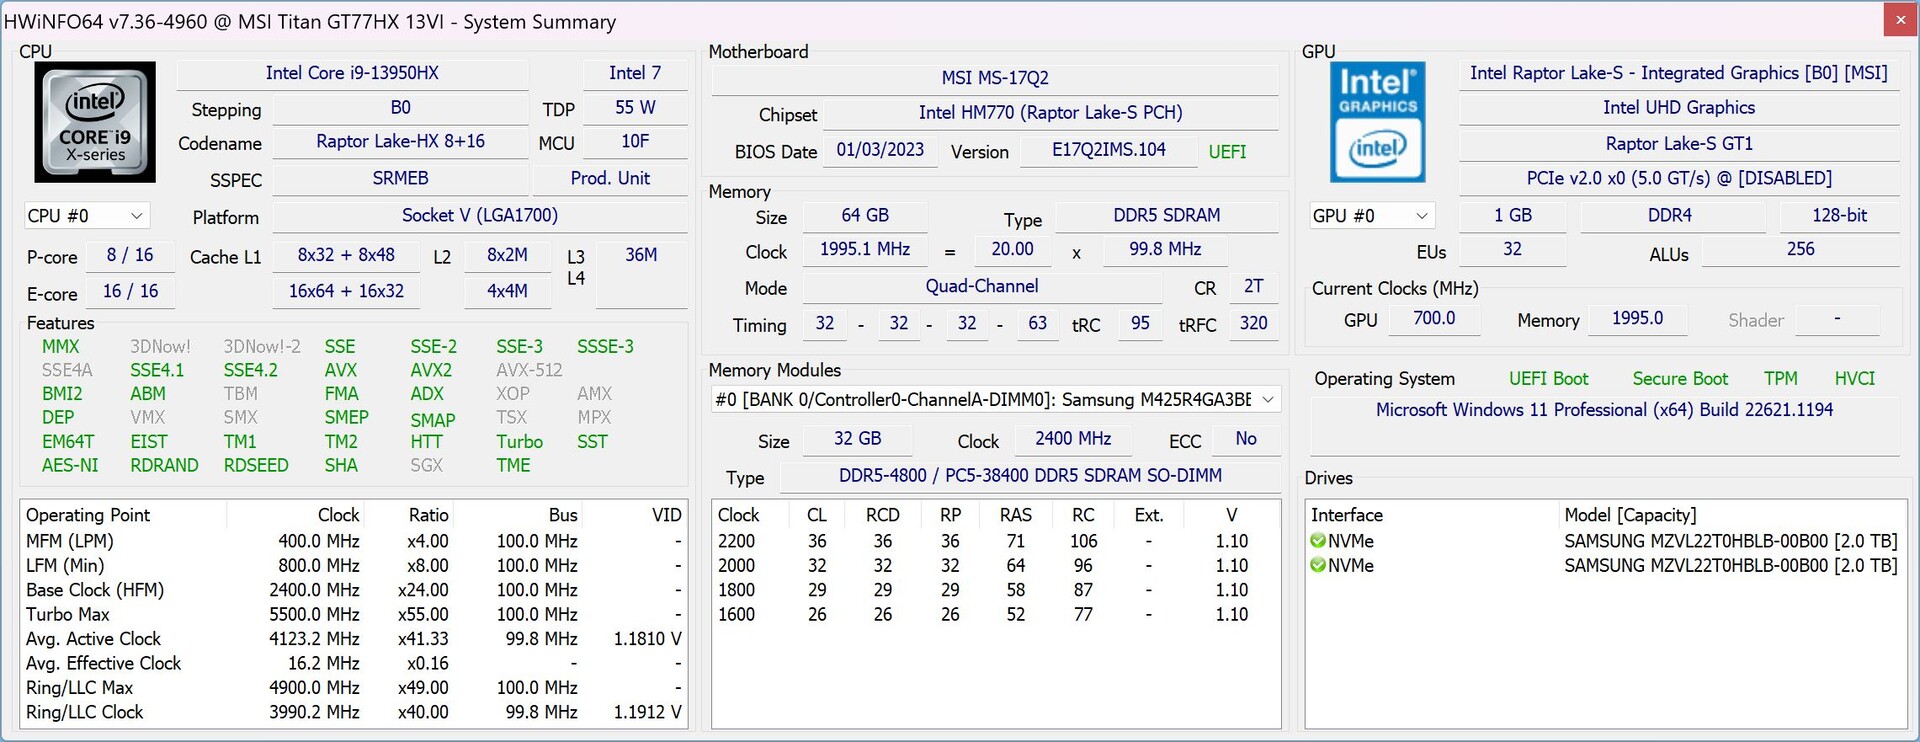
La nostra unità di prova è equipaggiata con ilCore i9-13950HXuna delle CPU mobili più veloci di Intel. La versione retail sarà equipaggiata con ilCore i9-13980HXma offre solo un clock massimo superiore di 100 MHz per i core P a favore del supporto vPro. Quest'ultimo non è importante quando si gioca, ma potrebbe essere interessante quando si intende utilizzare il Titan come workstation mobile. MSI utilizza ancora le DDR5-4800 al posto delle più veloci DDR5-5600 e si può scegliere la nuovaGeForce RTX 4080o laRTX 4090per i portatili.
Recensione Impostazioni
Il software MSI Center precaricato offre diverse impostazioni delle prestazioni con una modalità AI e quattro preset aggiuntivi (Extreme Performance, Balanced, Silent, Super Battery). È anche possibile selezionare la modalità grafica (ibrida, solo dGPU, solo iGPU) grazie a un MUX, ma non c'è il supporto per Advanced Optimus, il che significa che le modifiche richiedono un riavvio.
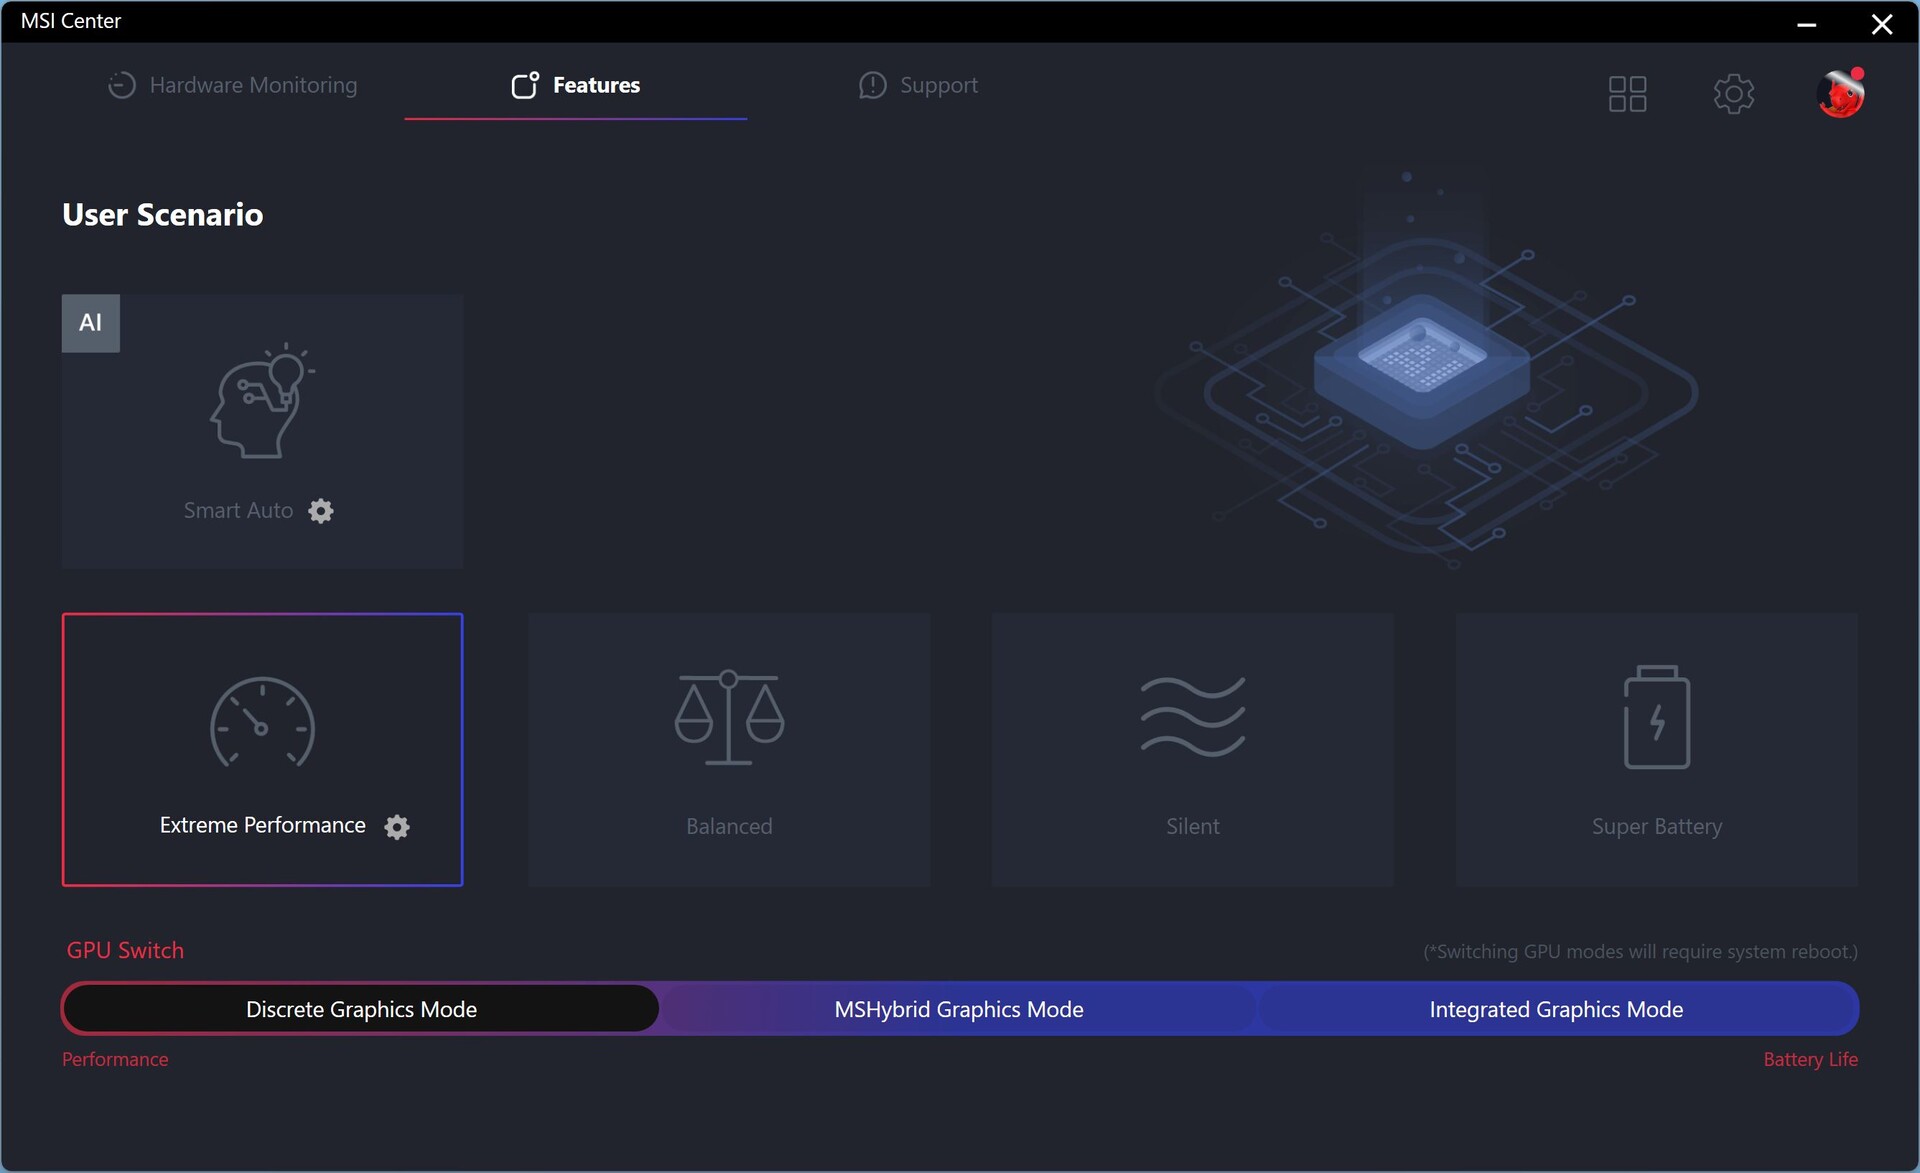
Per i nostri benchmark abbiamo utilizzato il preset Extreme Performance con la modalità GPU discreta (iGPU disattivata), ma abbiamo utilizzato l'iGPU per i test della batteria. Non abbiamo riscontrato alcun problema serio con il software MSI, ma c'era un bug con la modalità grafica discreta che non ci permetteva di abbassare la luminosità del display. Ci aspettiamo che questo problema venga risolto nelle unità di vendita al dettaglio.
Processore - Core i9-13950HX
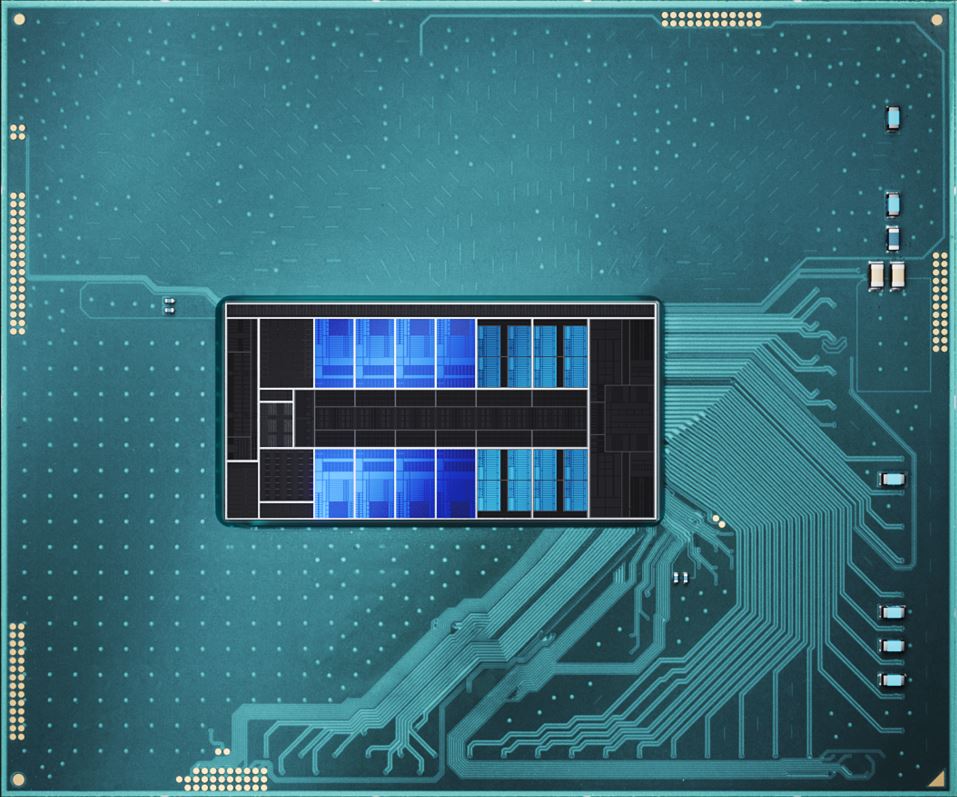
Contrariamente ai più lenti processori mobili Raptor Lakeintel ha modificato la configurazione dei core per i chip di fascia alta della serie HX rispetto alle vecchie CPU Alder Lake. I clock sono più alti, ma ora c'è anche il doppio del numero di core di efficienza (da 8 a 16), il che significa che la CPU può eseguire fino a 32 thread contemporaneamente (16 core E + 8 core P con hyper threading).
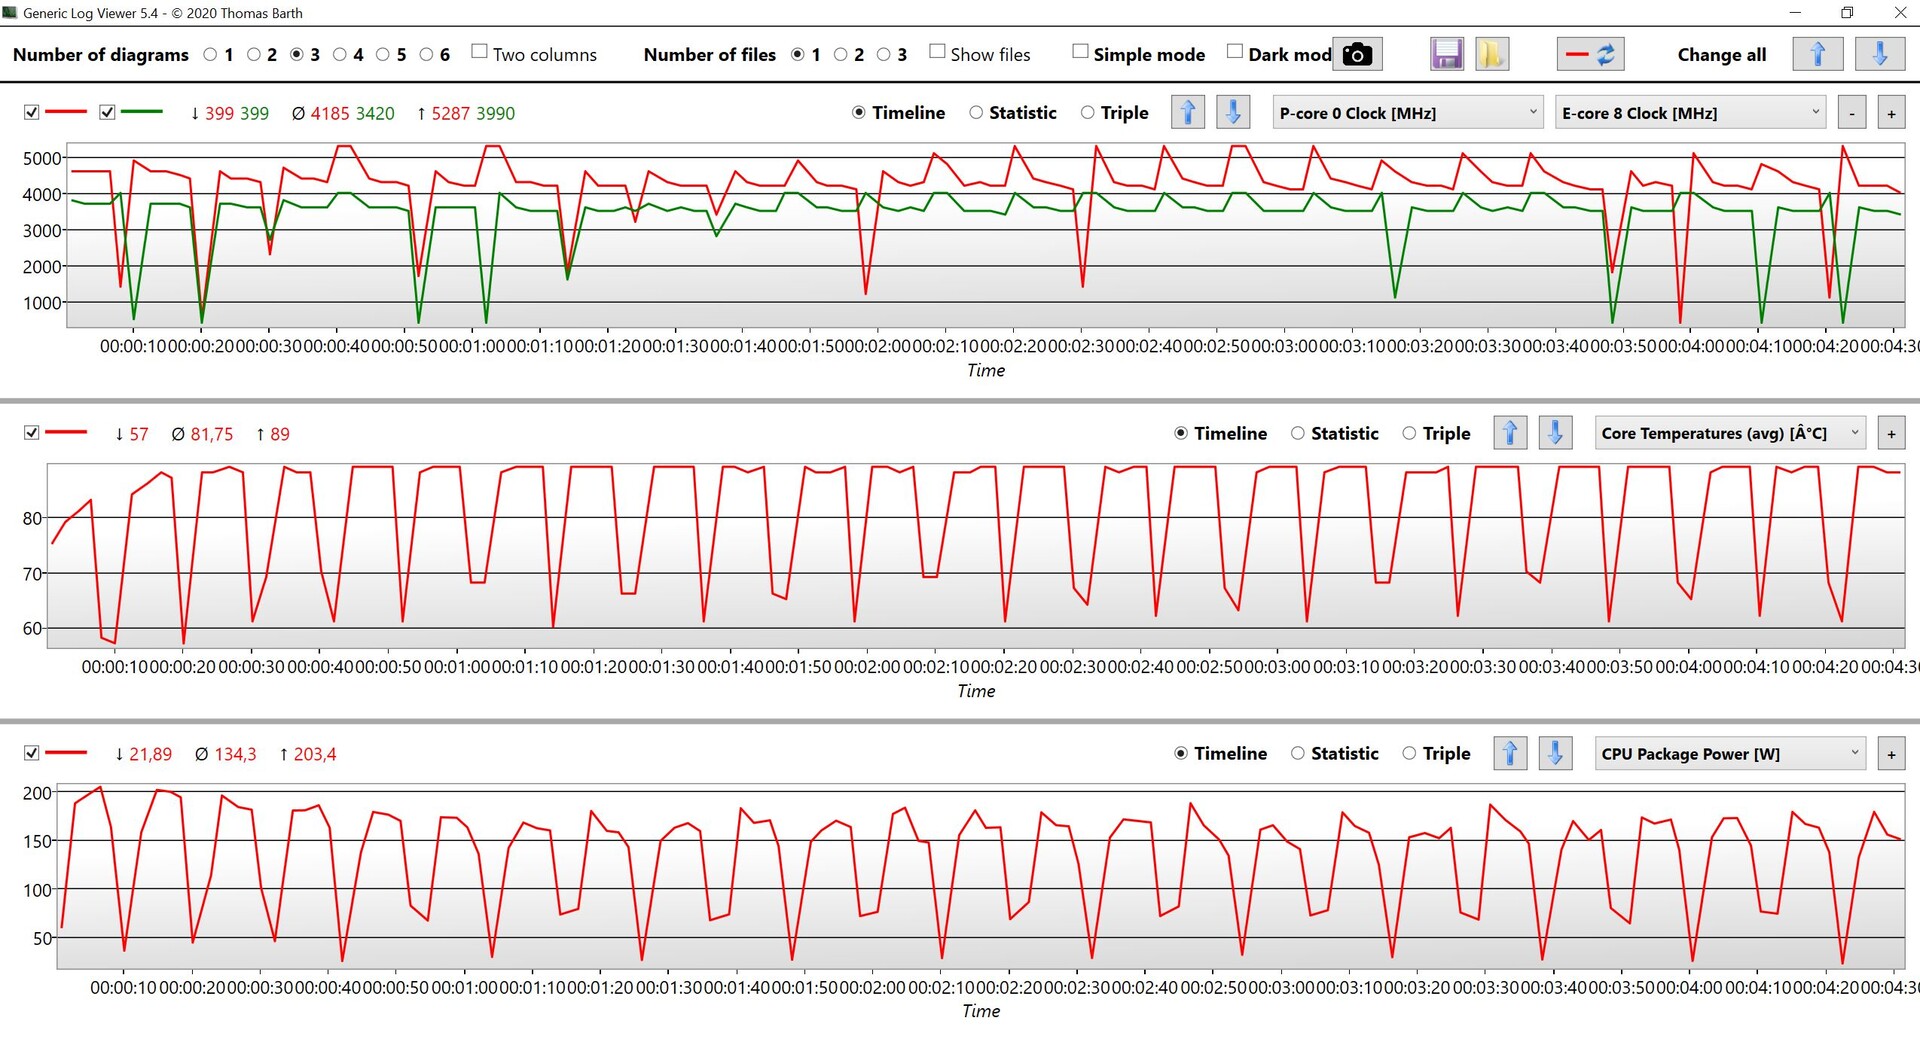
Le prestazioni del nuovoCore i9-13950HXnella MSI Titan GT77 sono eccellenti grazie ai generosi limiti di potenza. Le prestazioni oscillano un po', ma possiamo osservare un consumo di oltre 200W all'inizio dei benchmark prima che il chip si stabilizzi intorno ai 150W. Il salto di prestazioni rispetto alla vecchiaTitan GT77con ilCore i9-12900HXè del 22% in tutti i benchmark della CPU e il Core i9-13950HX nel nuovoRazer Blade 16è stato battuto del 14%.
Come previsto, i miglioramenti maggiori si registrano nei test multi-core, dove si nota solo il maggior numero di core. Ad esempio: Il nuovo GT77 è più veloce del 45% rispetto al vecchio GT77 con Core i9-12900HX in Cinebench R23 Multi. Il vantaggio rispetto agli altri processori Raptor Lake HX dimostra che si tratta di un'implementazione molto veloce. Il nuovo modello è più veloce anche nei test single-core, ma il vantaggio è molto più basso, pari al 6-10%.
Le prestazioni della CPU sono bloccate a 25W con l'alimentazione a batteria, anche nella modalità più veloce, il che comporta un deficit di prestazioni di oltre il 70% negli scenari multi-core. Ulteriori benchmark della CPU sono elencati nella la nostra sezione tecnica.
Cinebench R15 Multi Dauertest
Cinebench R23: Multi Core | Single Core
Cinebench R20: CPU (Multi Core) | CPU (Single Core)
Cinebench R15: CPU Multi 64Bit | CPU Single 64Bit
Blender: v2.79 BMW27 CPU
7-Zip 18.03: 7z b 4 | 7z b 4 -mmt1
Geekbench 5.5: Multi-Core | Single-Core
HWBOT x265 Benchmark v2.2: 4k Preset
LibreOffice : 20 Documents To PDF
R Benchmark 2.5: Overall mean
| CPU Performance rating | |
| MSI Titan GT77 HX 13VI | |
| Schenker XMG Neo 16 Raptor Lake | |
| Media Intel Core i9-13950HX | |
| Razer Blade 16 Early 2023 | |
| Media della classe Gaming | |
| MSI Titan GT77 12UHS | |
| Asus ROG Strix Scar 17 SE G733CX-LL014W | |
| Alienware x17 R2 P48E | |
| Schenker XMG Neo 17 M22 | |
| Cinebench R23 / Multi Core | |
| MSI Titan GT77 HX 13VI | |
| Media Intel Core i9-13950HX (24560 - 33277, n=7) | |
| Schenker XMG Neo 16 Raptor Lake | |
| Schenker XMG Neo 16 Raptor Lake | |
| Schenker XMG Neo 16 Raptor Lake | |
| Razer Blade 16 Early 2023 | |
| Media della classe Gaming (10488 - 40970, n=110, ultimi 2 anni) | |
| MSI Titan GT77 12UHS | |
| Asus ROG Strix Scar 17 SE G733CX-LL014W | |
| Alienware x17 R2 P48E | |
| Schenker XMG Neo 17 M22 | |
| Cinebench R23 / Single Core | |
| MSI Titan GT77 HX 13VI | |
| Media Intel Core i9-13950HX (1952 - 2113, n=7) | |
| Schenker XMG Neo 16 Raptor Lake | |
| Razer Blade 16 Early 2023 | |
| Media della classe Gaming (1166 - 2356, n=110, ultimi 2 anni) | |
| MSI Titan GT77 12UHS | |
| Alienware x17 R2 P48E | |
| Asus ROG Strix Scar 17 SE G733CX-LL014W | |
| Schenker XMG Neo 17 M22 | |
| Cinebench R20 / CPU (Multi Core) | |
| MSI Titan GT77 HX 13VI | |
| Schenker XMG Neo 16 Raptor Lake | |
| Media Intel Core i9-13950HX (8697 - 12648, n=7) | |
| Media della classe Gaming (4029 - 16108, n=109, ultimi 2 anni) | |
| Razer Blade 16 Early 2023 | |
| MSI Titan GT77 12UHS | |
| Asus ROG Strix Scar 17 SE G733CX-LL014W | |
| Alienware x17 R2 P48E | |
| Schenker XMG Neo 17 M22 | |
| Cinebench R20 / CPU (Single Core) | |
| MSI Titan GT77 HX 13VI | |
| Media Intel Core i9-13950HX (742 - 816, n=7) | |
| Media della classe Gaming (442 - 895, n=109, ultimi 2 anni) | |
| Schenker XMG Neo 16 Raptor Lake | |
| Razer Blade 16 Early 2023 | |
| Asus ROG Strix Scar 17 SE G733CX-LL014W | |
| MSI Titan GT77 12UHS | |
| Alienware x17 R2 P48E | |
| Schenker XMG Neo 17 M22 | |
| Cinebench R15 / CPU Multi 64Bit | |
| MSI Titan GT77 HX 13VI | |
| Schenker XMG Neo 16 Raptor Lake | |
| Schenker XMG Neo 16 Raptor Lake | |
| Media Intel Core i9-13950HX (3625 - 5227, n=7) | |
| Razer Blade 16 Early 2023 | |
| Media della classe Gaming (1578 - 6271, n=108, ultimi 2 anni) | |
| MSI Titan GT77 12UHS | |
| Asus ROG Strix Scar 17 SE G733CX-LL014W | |
| Alienware x17 R2 P48E | |
| Schenker XMG Neo 17 M22 | |
| Cinebench R15 / CPU Single 64Bit | |
| MSI Titan GT77 HX 13VI | |
| Schenker XMG Neo 16 Raptor Lake | |
| Schenker XMG Neo 16 Raptor Lake | |
| Media della classe Gaming (188.8 - 343, n=109, ultimi 2 anni) | |
| Media Intel Core i9-13950HX (274 - 303, n=7) | |
| MSI Titan GT77 12UHS | |
| Asus ROG Strix Scar 17 SE G733CX-LL014W | |
| Razer Blade 16 Early 2023 | |
| Alienware x17 R2 P48E | |
| Schenker XMG Neo 17 M22 | |
| Blender / v2.79 BMW27 CPU | |
| Schenker XMG Neo 17 M22 | |
| Asus ROG Strix Scar 17 SE G733CX-LL014W | |
| Alienware x17 R2 P48E | |
| Media della classe Gaming (80 - 330, n=107, ultimi 2 anni) | |
| MSI Titan GT77 12UHS | |
| Razer Blade 16 Early 2023 | |
| Media Intel Core i9-13950HX (100 - 137, n=7) | |
| Schenker XMG Neo 16 Raptor Lake | |
| MSI Titan GT77 HX 13VI | |
| 7-Zip 18.03 / 7z b 4 | |
| MSI Titan GT77 HX 13VI | |
| Schenker XMG Neo 16 Raptor Lake | |
| Media Intel Core i9-13950HX (99351 - 127295, n=7) | |
| Razer Blade 16 Early 2023 | |
| Media della classe Gaming (33491 - 148086, n=108, ultimi 2 anni) | |
| MSI Titan GT77 12UHS | |
| Asus ROG Strix Scar 17 SE G733CX-LL014W | |
| Alienware x17 R2 P48E | |
| Schenker XMG Neo 17 M22 | |
| 7-Zip 18.03 / 7z b 4 -mmt1 | |
| MSI Titan GT77 HX 13VI | |
| Schenker XMG Neo 16 Raptor Lake | |
| Media Intel Core i9-13950HX (6445 - 7064, n=7) | |
| Razer Blade 16 Early 2023 | |
| Media della classe Gaming (4199 - 7436, n=108, ultimi 2 anni) | |
| MSI Titan GT77 12UHS | |
| Asus ROG Strix Scar 17 SE G733CX-LL014W | |
| Schenker XMG Neo 17 M22 | |
| Alienware x17 R2 P48E | |
| Geekbench 5.5 / Multi-Core | |
| Schenker XMG Neo 16 Raptor Lake | |
| MSI Titan GT77 HX 13VI | |
| Media Intel Core i9-13950HX (16776 - 21853, n=7) | |
| Razer Blade 16 Early 2023 | |
| Media della classe Gaming (6460 - 27010, n=108, ultimi 2 anni) | |
| MSI Titan GT77 12UHS | |
| Asus ROG Strix Scar 17 SE G733CX-LL014W | |
| Alienware x17 R2 P48E | |
| Schenker XMG Neo 17 M22 | |
| Geekbench 5.5 / Single-Core | |
| Media della classe Gaming (986 - 2474, n=108, ultimi 2 anni) | |
| MSI Titan GT77 HX 13VI | |
| Schenker XMG Neo 16 Raptor Lake | |
| Media Intel Core i9-13950HX (1805 - 2097, n=7) | |
| MSI Titan GT77 12UHS | |
| Alienware x17 R2 P48E | |
| Asus ROG Strix Scar 17 SE G733CX-LL014W | |
| Razer Blade 16 Early 2023 | |
| Schenker XMG Neo 17 M22 | |
| HWBOT x265 Benchmark v2.2 / 4k Preset | |
| MSI Titan GT77 HX 13VI | |
| Schenker XMG Neo 16 Raptor Lake | |
| Media Intel Core i9-13950HX (26 - 34.5, n=7) | |
| Razer Blade 16 Early 2023 | |
| Media della classe Gaming (11.5 - 44.3, n=108, ultimi 2 anni) | |
| MSI Titan GT77 12UHS | |
| Asus ROG Strix Scar 17 SE G733CX-LL014W | |
| Alienware x17 R2 P48E | |
| Schenker XMG Neo 17 M22 | |
| LibreOffice / 20 Documents To PDF | |
| Schenker XMG Neo 17 M22 | |
| Media della classe Gaming (19 - 88.8, n=108, ultimi 2 anni) | |
| Razer Blade 16 Early 2023 | |
| MSI Titan GT77 HX 13VI | |
| Schenker XMG Neo 16 Raptor Lake | |
| Media Intel Core i9-13950HX (32.8 - 52.1, n=7) | |
| Alienware x17 R2 P48E | |
| MSI Titan GT77 12UHS | |
| Asus ROG Strix Scar 17 SE G733CX-LL014W | |
| R Benchmark 2.5 / Overall mean | |
| Schenker XMG Neo 17 M22 | |
| Alienware x17 R2 P48E | |
| Media della classe Gaming (0.3439 - 0.759, n=109, ultimi 2 anni) | |
| Asus ROG Strix Scar 17 SE G733CX-LL014W | |
| MSI Titan GT77 12UHS | |
| Razer Blade 16 Early 2023 | |
| MSI Titan GT77 HX 13VI | |
| Media Intel Core i9-13950HX (0.3823 - 0.4121, n=7) | |
| Schenker XMG Neo 16 Raptor Lake | |
* ... Meglio usare valori piccoli
AIDA64: FP32 Ray-Trace | FPU Julia | CPU SHA3 | CPU Queen | FPU SinJulia | FPU Mandel | CPU AES | CPU ZLib | FP64 Ray-Trace | CPU PhotoWorxx
| Performance rating | |
| MSI Titan GT77 HX 13VI | |
| Schenker XMG Neo 16 Raptor Lake | |
| Media della classe Gaming | |
| Media Intel Core i9-13950HX | |
| Razer Blade 16 Early 2023 | |
| MSI Titan GT77 12UHS | |
| Asus ROG Strix Scar 17 SE G733CX-LL014W | |
| Schenker XMG Neo 17 M22 | |
| Alienware x17 R2 P48E | |
| AIDA64 / FP32 Ray-Trace | |
| Media della classe Gaming (10227 - 85542, n=107, ultimi 2 anni) | |
| MSI Titan GT77 HX 13VI | |
| Schenker XMG Neo 16 Raptor Lake | |
| Razer Blade 16 Early 2023 | |
| Razer Blade 16 Early 2023 | |
| Razer Blade 16 Early 2023 | |
| Media Intel Core i9-13950HX (17993 - 28957, n=9) | |
| MSI Titan GT77 12UHS | |
| Asus ROG Strix Scar 17 SE G733CX-LL014W | |
| Schenker XMG Neo 17 M22 | |
| Alienware x17 R2 P48E | |
| AIDA64 / FPU Julia | |
| MSI Titan GT77 HX 13VI | |
| Media della classe Gaming (51376 - 238426, n=107, ultimi 2 anni) | |
| Schenker XMG Neo 16 Raptor Lake | |
| Razer Blade 16 Early 2023 | |
| Razer Blade 16 Early 2023 | |
| Razer Blade 16 Early 2023 | |
| Media Intel Core i9-13950HX (89362 - 144303, n=9) | |
| MSI Titan GT77 12UHS | |
| Schenker XMG Neo 17 M22 | |
| Asus ROG Strix Scar 17 SE G733CX-LL014W | |
| Alienware x17 R2 P48E | |
| AIDA64 / CPU SHA3 | |
| MSI Titan GT77 HX 13VI | |
| Schenker XMG Neo 16 Raptor Lake | |
| Razer Blade 16 Early 2023 | |
| Razer Blade 16 Early 2023 | |
| Razer Blade 16 Early 2023 | |
| Media della classe Gaming (2180 - 9817, n=107, ultimi 2 anni) | |
| Media Intel Core i9-13950HX (4518 - 7093, n=9) | |
| MSI Titan GT77 12UHS | |
| Asus ROG Strix Scar 17 SE G733CX-LL014W | |
| Alienware x17 R2 P48E | |
| Schenker XMG Neo 17 M22 | |
| AIDA64 / CPU Queen | |
| MSI Titan GT77 HX 13VI | |
| Schenker XMG Neo 16 Raptor Lake | |
| Media Intel Core i9-13950HX (131931 - 140103, n=8) | |
| Razer Blade 16 Early 2023 | |
| Razer Blade 16 Early 2023 | |
| Media della classe Gaming (49785 - 173351, n=95, ultimi 2 anni) | |
| Alienware x17 R2 P48E | |
| Asus ROG Strix Scar 17 SE G733CX-LL014W | |
| MSI Titan GT77 12UHS | |
| Schenker XMG Neo 17 M22 | |
| AIDA64 / FPU SinJulia | |
| MSI Titan GT77 HX 13VI | |
| Schenker XMG Neo 16 Raptor Lake | |
| Razer Blade 16 Early 2023 | |
| Razer Blade 16 Early 2023 | |
| Razer Blade 16 Early 2023 | |
| Media Intel Core i9-13950HX (12318 - 17057, n=9) | |
| Media della classe Gaming (4424 - 33636, n=107, ultimi 2 anni) | |
| MSI Titan GT77 12UHS | |
| Schenker XMG Neo 17 M22 | |
| Asus ROG Strix Scar 17 SE G733CX-LL014W | |
| Alienware x17 R2 P48E | |
| AIDA64 / FPU Mandel | |
| Media della classe Gaming (25115 - 128721, n=107, ultimi 2 anni) | |
| MSI Titan GT77 HX 13VI | |
| Schenker XMG Neo 16 Raptor Lake | |
| Razer Blade 16 Early 2023 | |
| Razer Blade 16 Early 2023 | |
| Razer Blade 16 Early 2023 | |
| Media Intel Core i9-13950HX (44372 - 71038, n=9) | |
| Schenker XMG Neo 17 M22 | |
| MSI Titan GT77 12UHS | |
| Asus ROG Strix Scar 17 SE G733CX-LL014W | |
| Alienware x17 R2 P48E | |
| AIDA64 / CPU AES | |
| MSI Titan GT77 12UHS | |
| Asus ROG Strix Scar 17 SE G733CX-LL014W | |
| Razer Blade 16 Early 2023 | |
| Razer Blade 16 Early 2023 | |
| Razer Blade 16 Early 2023 | |
| Media Intel Core i9-13950HX (99981 - 204491, n=9) | |
| MSI Titan GT77 HX 13VI | |
| Schenker XMG Neo 17 M22 | |
| Schenker XMG Neo 16 Raptor Lake | |
| Alienware x17 R2 P48E | |
| Media della classe Gaming (39258 - 247074, n=107, ultimi 2 anni) | |
| AIDA64 / CPU ZLib | |
| MSI Titan GT77 HX 13VI | |
| Schenker XMG Neo 16 Raptor Lake | |
| Razer Blade 16 Early 2023 | |
| Razer Blade 16 Early 2023 | |
| Razer Blade 16 Early 2023 | |
| Media Intel Core i9-13950HX (1263 - 2069, n=9) | |
| Media della classe Gaming (574 - 2531, n=107, ultimi 2 anni) | |
| MSI Titan GT77 12UHS | |
| Asus ROG Strix Scar 17 SE G733CX-LL014W | |
| Alienware x17 R2 P48E | |
| Schenker XMG Neo 17 M22 | |
| AIDA64 / FP64 Ray-Trace | |
| Media della classe Gaming (5509 - 45446, n=107, ultimi 2 anni) | |
| MSI Titan GT77 HX 13VI | |
| Schenker XMG Neo 16 Raptor Lake | |
| Razer Blade 16 Early 2023 | |
| Razer Blade 16 Early 2023 | |
| Razer Blade 16 Early 2023 | |
| Media Intel Core i9-13950HX (9649 - 15573, n=9) | |
| MSI Titan GT77 12UHS | |
| Asus ROG Strix Scar 17 SE G733CX-LL014W | |
| Schenker XMG Neo 17 M22 | |
| Alienware x17 R2 P48E | |
| AIDA64 / CPU PhotoWorxx | |
| Razer Blade 16 Early 2023 | |
| Razer Blade 16 Early 2023 | |
| Razer Blade 16 Early 2023 | |
| Media Intel Core i9-13950HX (40233 - 50864, n=9) | |
| Schenker XMG Neo 16 Raptor Lake | |
| Media della classe Gaming (12271 - 89891, n=107, ultimi 2 anni) | |
| Asus ROG Strix Scar 17 SE G733CX-LL014W | |
| MSI Titan GT77 12UHS | |
| MSI Titan GT77 HX 13VI | |
| Alienware x17 R2 P48E | |
| Schenker XMG Neo 17 M22 | |
Prestazioni del sistema
Le prestazioni soggettive del GT77 sono eccellenti e anche i risultati dei benchmark sintetici sono molto buoni, ma non c'è da sorprendersi considerando il potente hardware. Anche i rivali sono molto veloci e si nota una grande differenza tra i sistemi.
CrossMark: Overall | Productivity | Creativity | Responsiveness
| PCMark 10 / Score | |
| MSI Titan GT77 HX 13VI | |
| Media della classe Gaming (5828 - 11574, n=95, ultimi 2 anni) | |
| Media Intel Core i9-13950HX, NVIDIA GeForce RTX 4090 Laptop GPU (7597 - 8884, n=2) | |
| MSI Titan GT77 12UHS | |
| Alienware x17 R2 P48E | |
| Razer Blade 16 Early 2023 | |
| Asus ROG Strix Scar 17 SE G733CX-LL014W | |
| Schenker XMG Neo 17 M22 | |
| PCMark 10 / Essentials | |
| MSI Titan GT77 HX 13VI | |
| Media Intel Core i9-13950HX, NVIDIA GeForce RTX 4090 Laptop GPU (10903 - 11761, n=2) | |
| Alienware x17 R2 P48E | |
| MSI Titan GT77 12UHS | |
| Razer Blade 16 Early 2023 | |
| Media della classe Gaming (8810 - 12600, n=99, ultimi 2 anni) | |
| Asus ROG Strix Scar 17 SE G733CX-LL014W | |
| Schenker XMG Neo 17 M22 | |
| PCMark 10 / Productivity | |
| Media della classe Gaming (6845 - 21327, n=97, ultimi 2 anni) | |
| MSI Titan GT77 12UHS | |
| Alienware x17 R2 P48E | |
| Asus ROG Strix Scar 17 SE G733CX-LL014W | |
| MSI Titan GT77 HX 13VI | |
| Schenker XMG Neo 17 M22 | |
| Media Intel Core i9-13950HX, NVIDIA GeForce RTX 4090 Laptop GPU (8330 - 9851, n=2) | |
| Razer Blade 16 Early 2023 | |
| PCMark 10 / Digital Content Creation | |
| MSI Titan GT77 HX 13VI | |
| Media Intel Core i9-13950HX, NVIDIA GeForce RTX 4090 Laptop GPU (13099 - 16424, n=2) | |
| Razer Blade 16 Early 2023 | |
| Media della classe Gaming (7602 - 19657, n=97, ultimi 2 anni) | |
| MSI Titan GT77 12UHS | |
| Alienware x17 R2 P48E | |
| Asus ROG Strix Scar 17 SE G733CX-LL014W | |
| Schenker XMG Neo 17 M22 | |
| CrossMark / Overall | |
| MSI Titan GT77 HX 13VI | |
| Asus ROG Strix Scar 17 SE G733CX-LL014W | |
| MSI Titan GT77 12UHS | |
| Media Intel Core i9-13950HX, NVIDIA GeForce RTX 4090 Laptop GPU (2019 - 2139, n=2) | |
| Schenker XMG Neo 16 Raptor Lake | |
| Media della classe Gaming (1366 - 2409, n=95, ultimi 2 anni) | |
| Alienware x17 R2 P48E | |
| Schenker XMG Neo 17 M22 | |
| Razer Blade 16 Early 2023 | |
| CrossMark / Productivity | |
| MSI Titan GT77 12UHS | |
| MSI Titan GT77 HX 13VI | |
| Asus ROG Strix Scar 17 SE G733CX-LL014W | |
| Media Intel Core i9-13950HX, NVIDIA GeForce RTX 4090 Laptop GPU (1909 - 1977, n=2) | |
| Media della classe Gaming (1386 - 2254, n=95, ultimi 2 anni) | |
| Schenker XMG Neo 16 Raptor Lake | |
| Alienware x17 R2 P48E | |
| Schenker XMG Neo 17 M22 | |
| Razer Blade 16 Early 2023 | |
| CrossMark / Creativity | |
| MSI Titan GT77 HX 13VI | |
| Schenker XMG Neo 16 Raptor Lake | |
| Asus ROG Strix Scar 17 SE G733CX-LL014W | |
| Media Intel Core i9-13950HX, NVIDIA GeForce RTX 4090 Laptop GPU (2222 - 2423, n=2) | |
| MSI Titan GT77 12UHS | |
| Media della classe Gaming (1343 - 2729, n=95, ultimi 2 anni) | |
| Alienware x17 R2 P48E | |
| Schenker XMG Neo 17 M22 | |
| Razer Blade 16 Early 2023 | |
| CrossMark / Responsiveness | |
| MSI Titan GT77 12UHS | |
| Asus ROG Strix Scar 17 SE G733CX-LL014W | |
| MSI Titan GT77 HX 13VI | |
| Media Intel Core i9-13950HX, NVIDIA GeForce RTX 4090 Laptop GPU (1792 - 1861, n=2) | |
| Media della classe Gaming (1226 - 2334, n=95, ultimi 2 anni) | |
| Alienware x17 R2 P48E | |
| Schenker XMG Neo 16 Raptor Lake | |
| Schenker XMG Neo 17 M22 | |
| Razer Blade 16 Early 2023 | |
| PCMark 10 Score | 8884 punti | |
Aiuto | ||
| AIDA64 / Memory Copy | |
| Razer Blade 16 Early 2023 | |
| Razer Blade 16 Early 2023 | |
| Razer Blade 16 Early 2023 | |
| Media Intel Core i9-13950HX (61938 - 78813, n=9) | |
| Media della classe Gaming (21750 - 129946, n=107, ultimi 2 anni) | |
| Schenker XMG Neo 16 Raptor Lake | |
| MSI Titan GT77 12UHS | |
| MSI Titan GT77 HX 13VI | |
| Asus ROG Strix Scar 17 SE G733CX-LL014W | |
| Alienware x17 R2 P48E | |
| Schenker XMG Neo 17 M22 | |
| AIDA64 / Memory Read | |
| Razer Blade 16 Early 2023 | |
| Razer Blade 16 Early 2023 | |
| Razer Blade 16 Early 2023 | |
| Media Intel Core i9-13950HX (62368 - 86831, n=9) | |
| Schenker XMG Neo 16 Raptor Lake | |
| Media della classe Gaming (22956 - 118858, n=107, ultimi 2 anni) | |
| Asus ROG Strix Scar 17 SE G733CX-LL014W | |
| MSI Titan GT77 HX 13VI | |
| MSI Titan GT77 12UHS | |
| Alienware x17 R2 P48E | |
| Schenker XMG Neo 17 M22 | |
| AIDA64 / Memory Write | |
| Razer Blade 16 Early 2023 | |
| Razer Blade 16 Early 2023 | |
| Razer Blade 16 Early 2023 | |
| Media della classe Gaming (22297 - 135096, n=107, ultimi 2 anni) | |
| Media Intel Core i9-13950HX (59501 - 80441, n=9) | |
| Schenker XMG Neo 16 Raptor Lake | |
| Asus ROG Strix Scar 17 SE G733CX-LL014W | |
| MSI Titan GT77 HX 13VI | |
| MSI Titan GT77 12UHS | |
| Schenker XMG Neo 17 M22 | |
| Alienware x17 R2 P48E | |
| AIDA64 / Memory Latency | |
| Media della classe Gaming (75.3 - 259, n=107, ultimi 2 anni) | |
| Razer Blade 16 Early 2023 | |
| Razer Blade 16 Early 2023 | |
| Razer Blade 16 Early 2023 | |
| Alienware x17 R2 P48E | |
| MSI Titan GT77 HX 13VI | |
| Schenker XMG Neo 17 M22 | |
| Schenker XMG Neo 16 Raptor Lake | |
| Media Intel Core i9-13950HX (84.4 - 99.5, n=9) | |
| MSI Titan GT77 12UHS | |
| Asus ROG Strix Scar 17 SE G733CX-LL014W | |
* ... Meglio usare valori piccoli
Latenza DPC
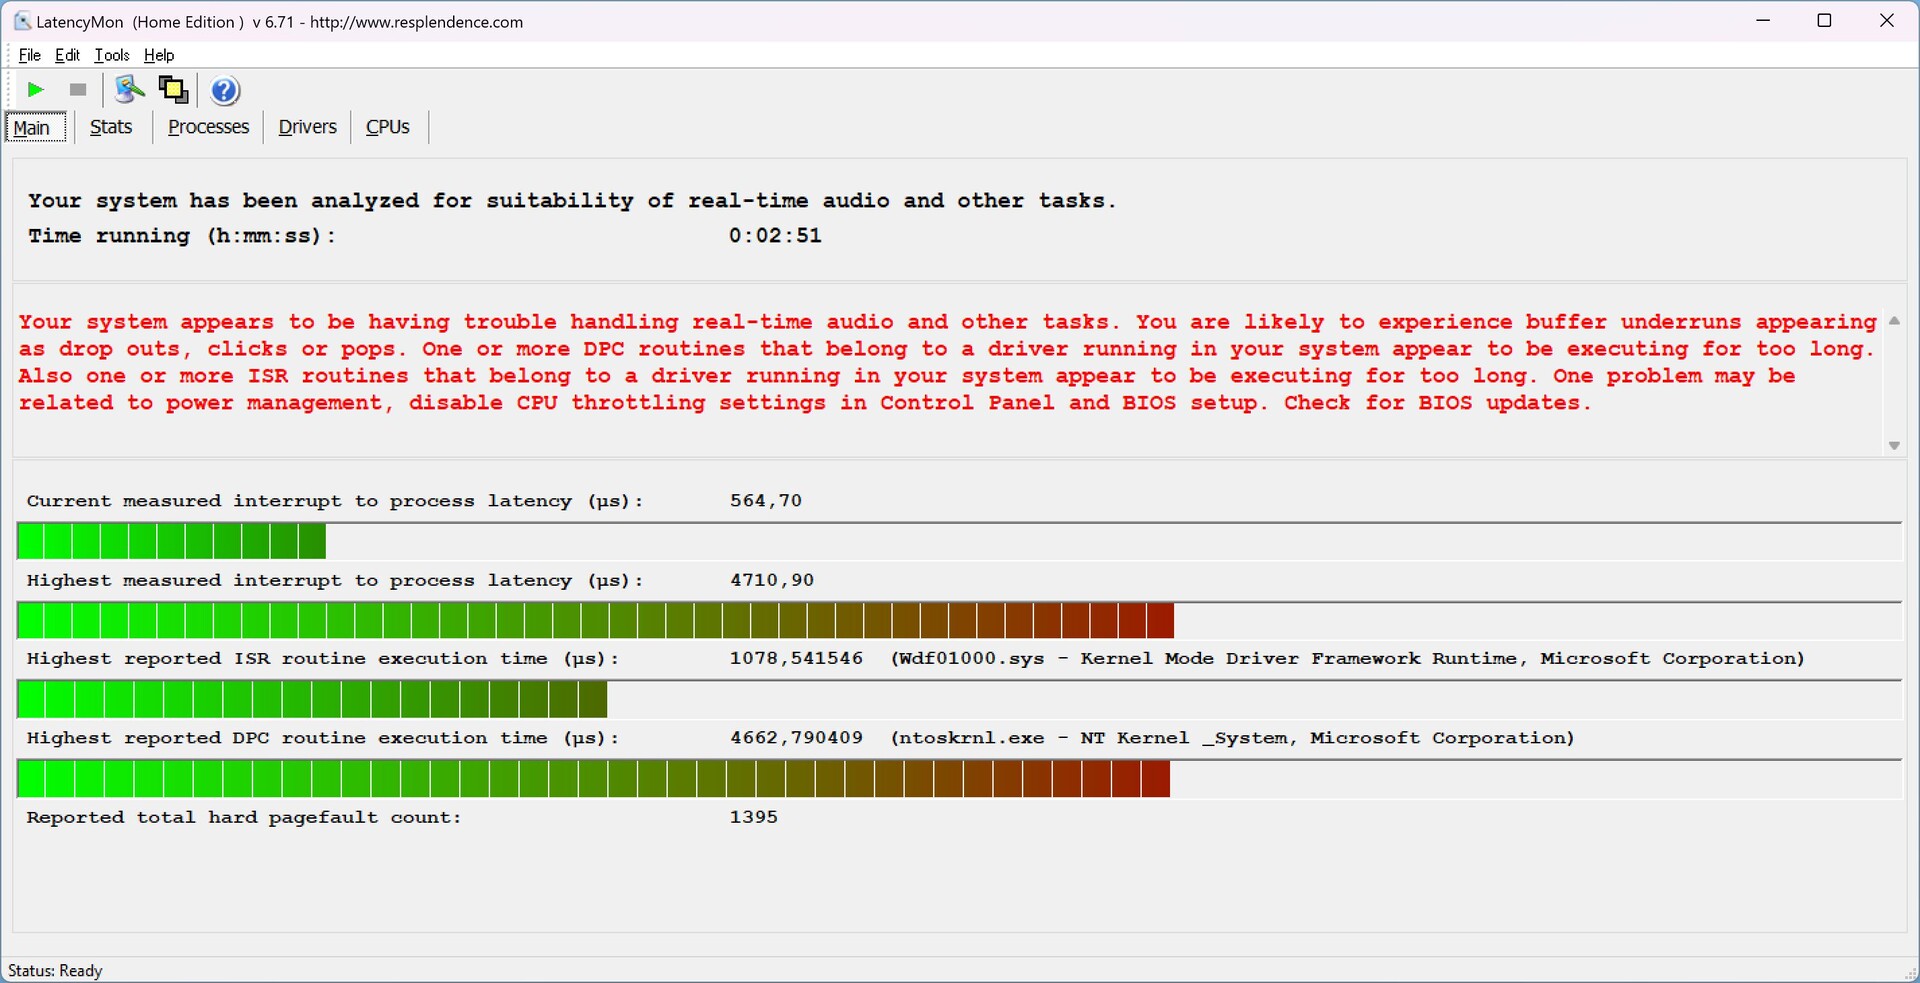
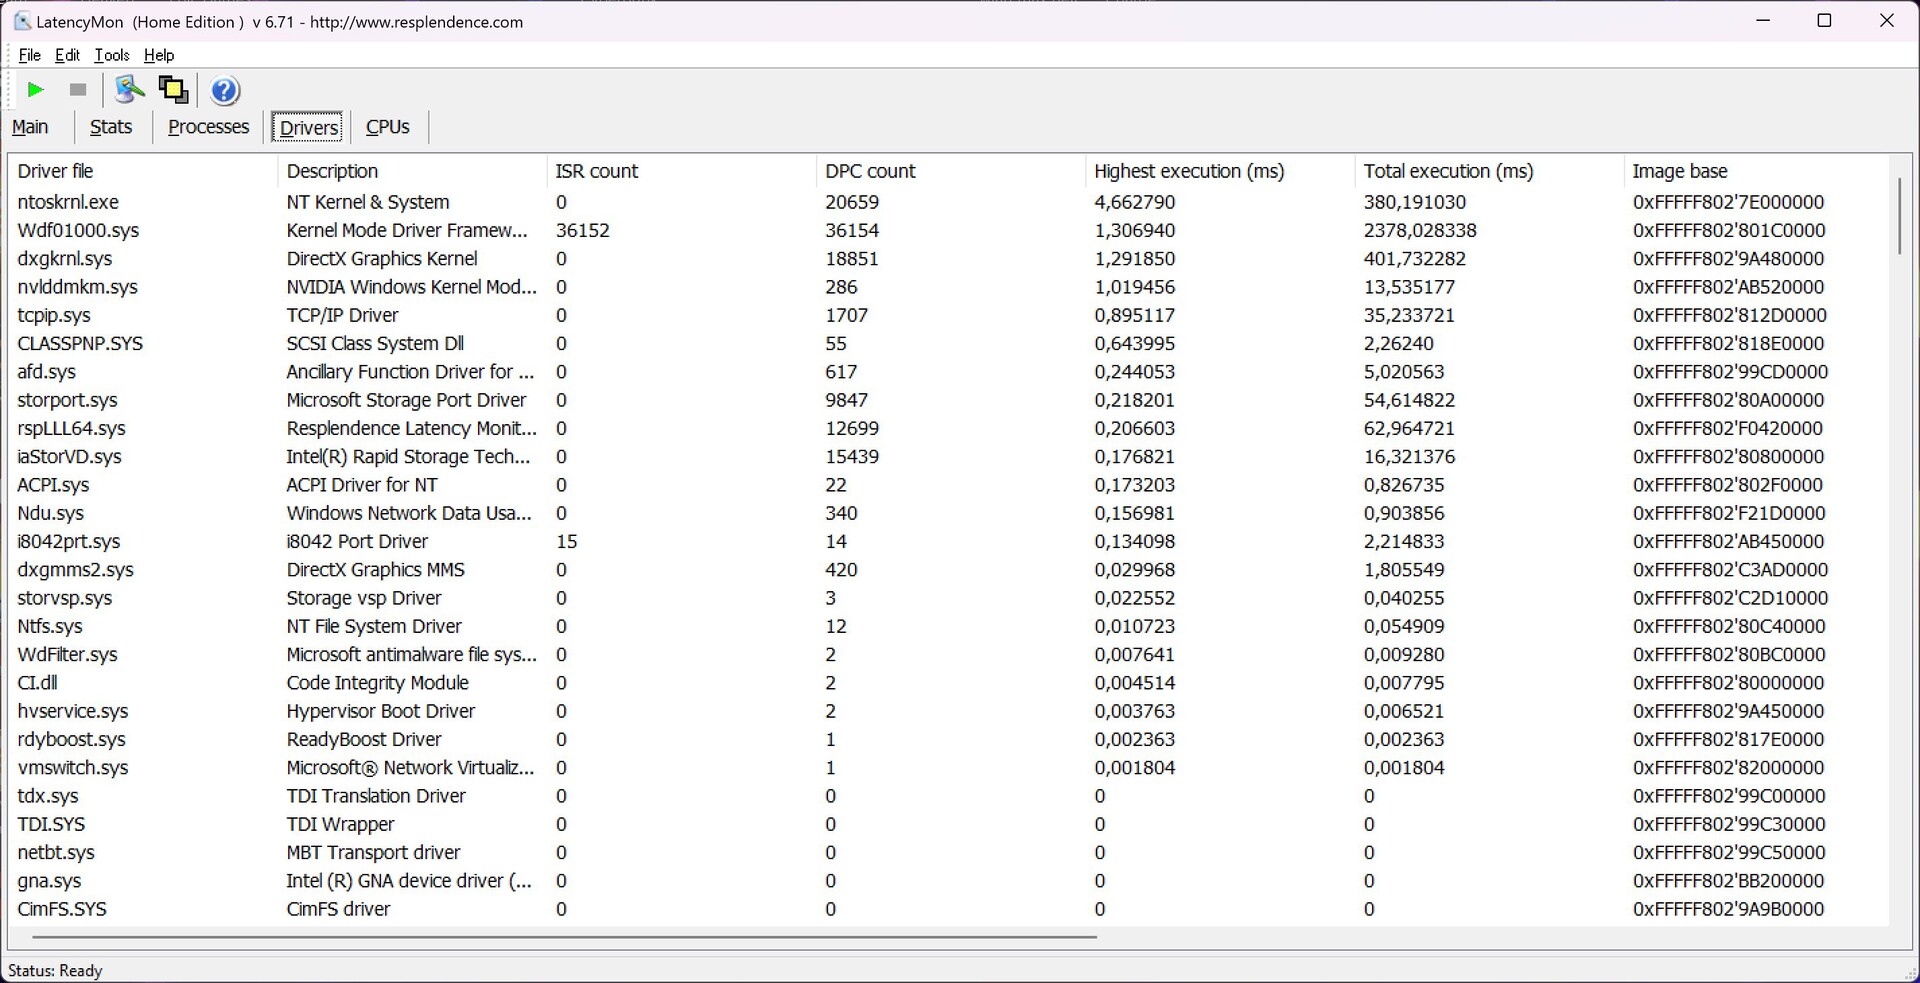
Il nostro test di latenza standardizzato (navigazione web, riproduzione di YouTube in 4K, carico della CPU) mostra limitazioni importanti per le applicazioni audio in tempo reale con l'attuale versione del BIOS (1.04).
| DPC Latencies / LatencyMon - interrupt to process latency (max), Web, Youtube, Prime95 | |
| MSI Titan GT77 HX 13VI | |
| Schenker XMG Neo 17 M22 | |
| Asus ROG Strix Scar 17 SE G733CX-LL014W | |
| Razer Blade 16 Early 2023 | |
| MSI Titan GT77 12UHS | |
| MSI Titan GT77 12UHS | |
| Alienware x17 R2 P48E | |
* ... Meglio usare valori piccoli
Dispositivi di archiviazione
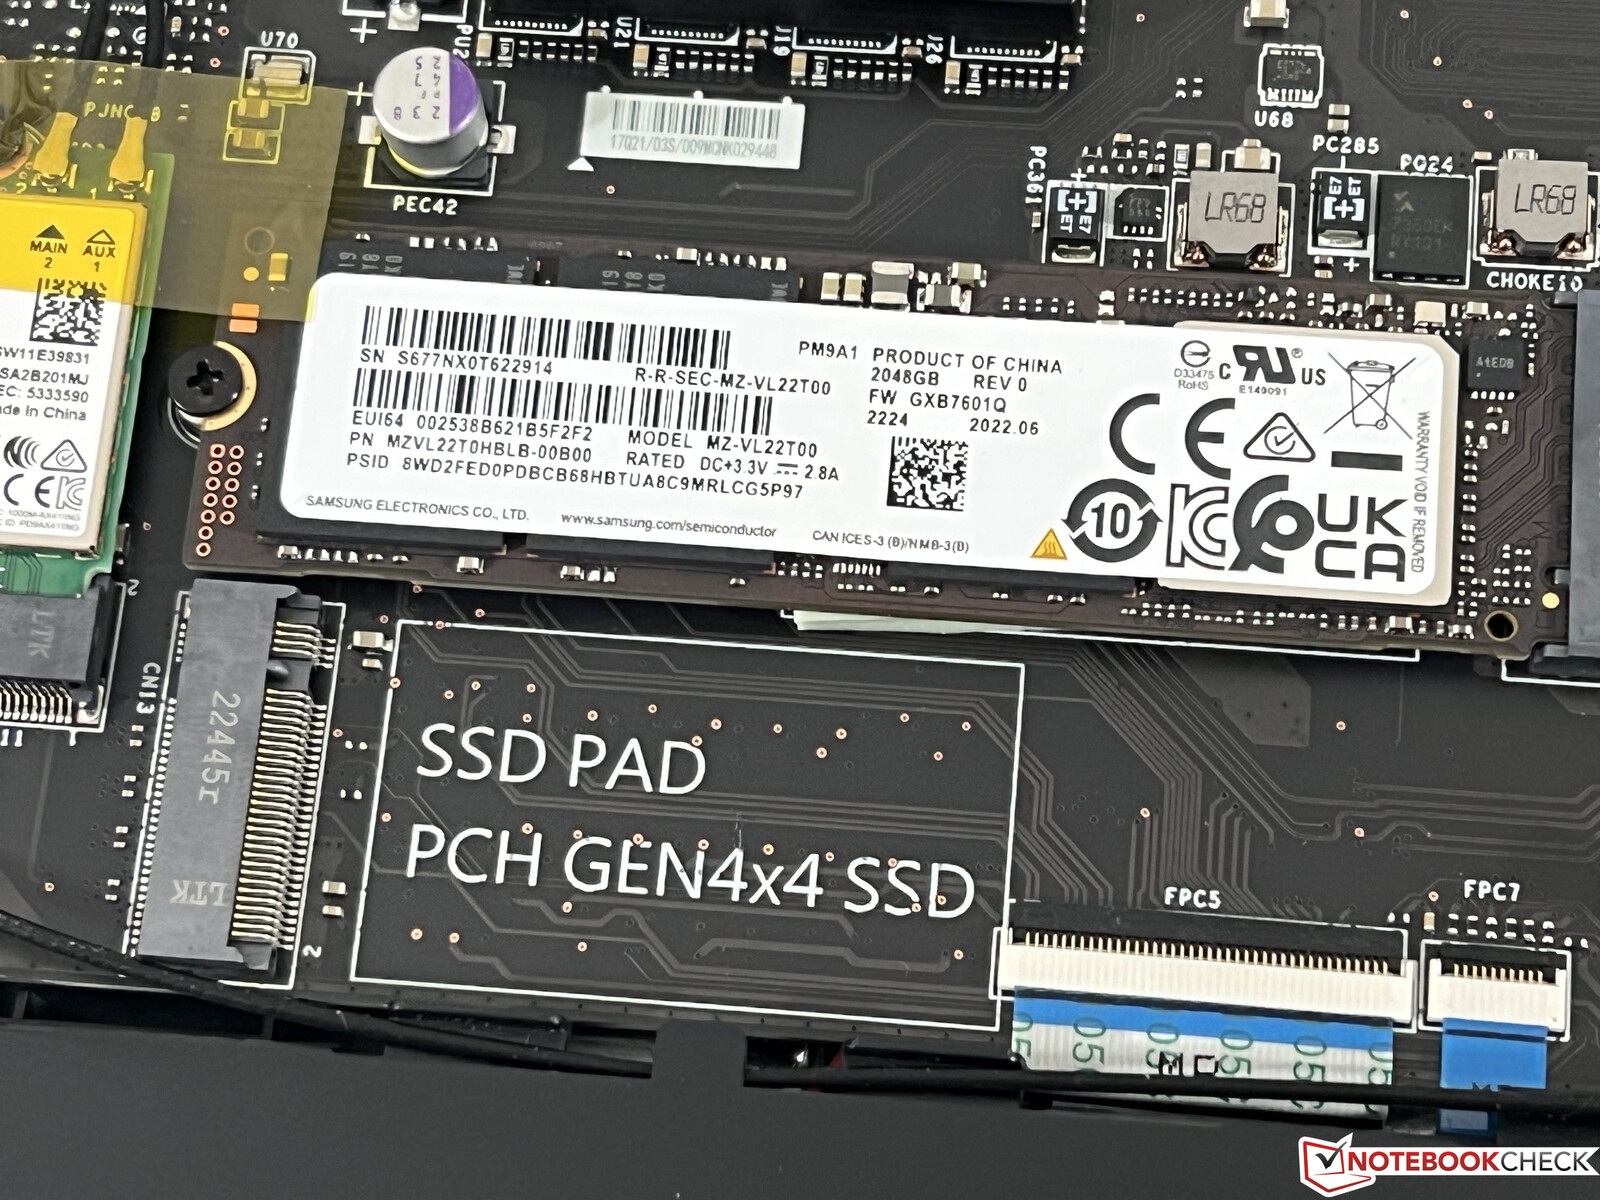
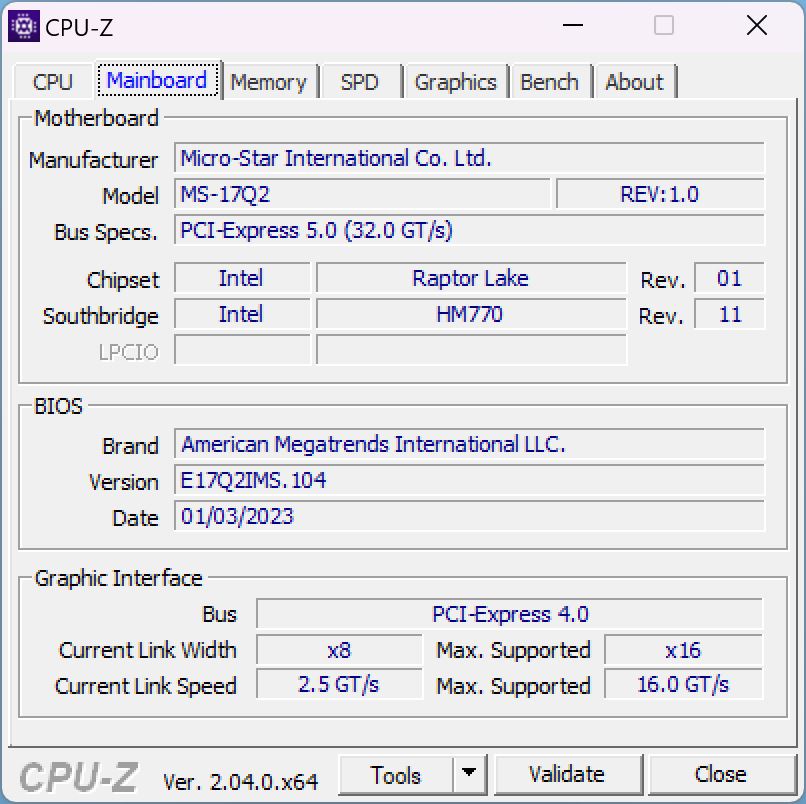
Il Titan 2023 è uno dei primi portatili con un'interfaccia PCIe 5.0 veloce, ma non ci sono ancora SSD adatti sul mercato. Gli altri due slot supportano PCIe 4.0 e la nostra unità di recensione è equipaggiata con due SSD da 2 TB di Samsung (PM9A1, versione OEM del 980 Pro) in una configurazione RAID 0. Oltre alla pura capacità di 4 TB (3,97 liberi per l'utente), possiamo anche registrare velocità di trasferimento superiori a 11 GB/s. Tuttavia, queste prestazioni non possono essere mantenute a lungo e si riducono notevolmente dopo pochi minuti, quindi il raffreddamento dell'SSD potrebbe essere una buona idea. Altri benchmark sull'SSD sono disponibili qui.

* ... Meglio usare valori piccoli
Disk Throttling: DiskSpd Read Loop, Queue Depth 8
Prestazioni della GPU - Laptop RTX 4090
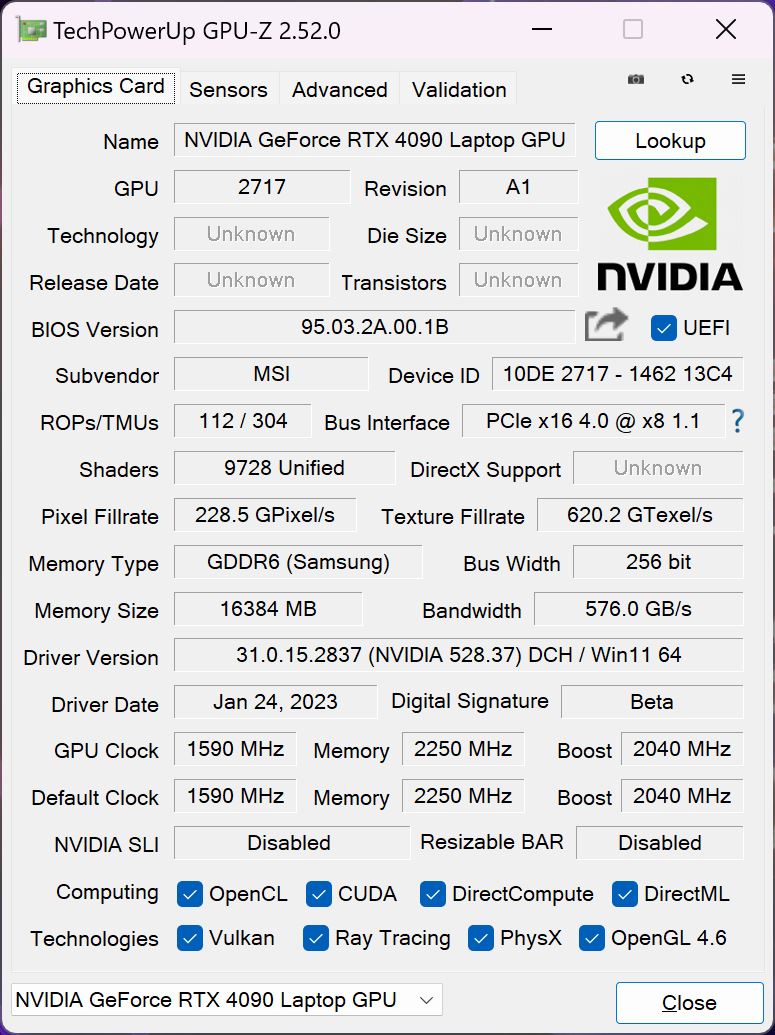
LaGeForce RTX 4090è la nuova GPU mobile di fascia alta di Nvidia e la GT77 utilizza la versione più veloce con un consumo massimo di 175W (150W TGP + 25W Dynamic Boost dalla CPU), 16 GB di VRAM e un clock massimo del core di 2340 MHz.
Le prestazioni grafiche sono eccellenti e la nuova RTX 4090 si colloca tra i modelli desktopRTX 3090/RTX 3090 Tie i modelli desktopRTX 4070 TieRTX 4080nei benchmark sintetici. Il vantaggio rispetto alla vecchiaRTX 3080 Tinella precedenteGT77è del 40-60% (a seconda del benchmark) nonostante lo stesso TGP. LarTX 4080 mobilenelRazer Blade 16è più lenta del 17-19% a seconda del benchmark.
La nuova Titan è in grado di mantenere le prestazioni grafiche e lo stress test 3dMark Time Spy è facilmente superato al 99%. Il consumo energetico è però limitato a 27 W a batteria, il che comporta un deficit di prestazioni di quasi l'80%.
Geekbench 5.5: OpenCL Score
GFXBench: 3840x2160 4K Aztec Ruins High Tier Offscreen | 2560x1440 Aztec Ruins High Tier Offscreen
| 3DMark / Wild Life Extreme Unlimited | |
| NVIDIA GeForce RTX 3090 Ti | |
| NVIDIA GeForce RTX 4090 Laptop GPU | |
| Media NVIDIA GeForce RTX 4090 Laptop GPU (34246 - 44948, n=7) | |
| Media della classe Gaming (22281 - 47946, n=17, ultimi 2 anni) | |
| NVIDIA GeForce RTX 3080 Ti Laptop GPU | |
| NVIDIA GeForce RTX 3080 Ti Laptop GPU | |
| NVIDIA GeForce RTX 3080 Ti Laptop GPU | |
| Apple M2 Max 38-Core GPU | |
| NVIDIA GeForce RTX 3080 Ti Laptop GPU | |
| 3DMark / Speed Way Score | |
| NVIDIA GeForce RTX 4080 | |
| NVIDIA GeForce RTX 4090 Laptop GPU | |
| NVIDIA GeForce RTX 4090 Laptop GPU | |
| Media NVIDIA GeForce RTX 4090 Laptop GPU (4401 - 5940, n=27) | |
| NVIDIA GeForce RTX 4070 Ti | |
| NVIDIA GeForce RTX 3080 Ti | |
| NVIDIA GeForce RTX 3090 | |
| Media della classe Gaming (1577 - 6643, n=45, ultimi 2 anni) | |
| NVIDIA GeForce RTX 4080 Laptop GPU | |
| NVIDIA GeForce RTX 3080 Ti Laptop GPU | |
| GFXBench / 4K Aztec Ruins High Tier Offscreen | |
| Media NVIDIA GeForce RTX 4090 Laptop GPU (239 - 246, n=3) | |
| NVIDIA GeForce RTX 4090 Laptop GPU | |
| NVIDIA GeForce RTX 4080 Laptop GPU | |
| Apple M2 Max 38-Core GPU | |
| Media della classe Gaming (100.4 - 243, n=6, ultimi 2 anni) | |
| GFXBench / Aztec Ruins High Tier Offscreen | |
| Media NVIDIA GeForce RTX 4090 Laptop GPU (518 - 550, n=3) | |
| NVIDIA GeForce RTX 4090 Laptop GPU | |
| NVIDIA GeForce RTX 4080 Laptop GPU | |
| Apple M2 Max 38-Core GPU | |
| Media della classe Gaming (232 - 507, n=6, ultimi 2 anni) | |
| 3DMark 06 Standard Score | 67927 punti | |
| 3DMark Vantage P Result | 113387 punti | |
| 3DMark 11 Performance | 49253 punti | |
| 3DMark Fire Strike Score | 37594 punti | |
| 3DMark Fire Strike Extreme Score | 25475 punti | |
| 3DMark Time Spy Score | 20862 punti | |
Aiuto | ||
Photoshop PugetBench: Filter Score | General Score | GPU Score | Overall Score
Premiere Pro PugetBench: GPU 0.9 | Live Playback 0.9 | Export 0.9 | Overall Score 0.9
| Blender / v3.3 Classroom OPTIX/RTX | |
| Alienware x15 R2 P111F | |
| Asus ROG Strix Scar 17 SE G733CX-LL014W | |
| MSI Titan GT77 12UHS | |
| Media della classe Gaming (9 - 32, n=109, ultimi 2 anni) | |
| Razer Blade 16 Early 2023 | |
| ASUS TUF Gaming GeForce RTX 3080 Ti OC | |
| Intel Core i5-13400F | |
| Media NVIDIA GeForce RTX 4090 Laptop GPU (9 - 19, n=39) | |
| KFA2 GeForce RTX 4070 Ti SG | |
| MSI Titan GT77 HX 13VI | |
| Schenker XMG Neo 16 Raptor Lake | |
| KFA2 GeForce RTX 4080 SG | |
| Blender / v3.3 Classroom CUDA | |
| Alienware x15 R2 P111F | |
| Media della classe Gaming (15 - 233, n=110, ultimi 2 anni) | |
| Asus ROG Strix Scar 17 SE G733CX-LL014W | |
| MSI Titan GT77 12UHS | |
| Razer Blade 16 Early 2023 | |
| ASUS TUF Gaming GeForce RTX 3080 Ti OC | |
| Intel Core i5-13400F | |
| Media NVIDIA GeForce RTX 4090 Laptop GPU (16 - 24, n=39) | |
| Schenker XMG Neo 16 Raptor Lake | |
| MSI Titan GT77 HX 13VI | |
| Blender / v3.3 Classroom CPU | |
| Alienware x15 R2 P111F | |
| Intel Core i5-13400F | |
| Apple MacBook Pro 16 2023 M2 Max | |
| Asus ROG Strix Scar 17 SE G733CX-LL014W | |
| MSI Titan GT77 12UHS | |
| Media della classe Gaming (122 - 565, n=105, ultimi 2 anni) | |
| Razer Blade 16 Early 2023 | |
| Schenker XMG Neo 16 Raptor Lake | |
| Media NVIDIA GeForce RTX 4090 Laptop GPU (144 - 305, n=39) | |
| MSI Titan GT77 HX 13VI | |
| ASUS TUF Gaming GeForce RTX 3080 Ti OC | |
| Blender / v3.3 Classroom METAL | |
| Apple MacBook Pro 16 2023 M2 Max | |
| Photoshop PugetBench / Filter Score | |
| KFA2 GeForce RTX 4080 SG | |
| ASUS TUF Gaming GeForce RTX 3080 Ti OC | |
| KFA2 GeForce RTX 4070 Ti SG | |
| Intel Core i5-13400F | |
| Apple MacBook Pro 16 2023 M2 Max | |
| MSI Titan GT77 HX 13VI | |
| Media NVIDIA GeForce RTX 4090 Laptop GPU (91.9 - 104.6, n=5) | |
| Photoshop PugetBench / General Score | |
| MSI Titan GT77 HX 13VI | |
| Media NVIDIA GeForce RTX 4090 Laptop GPU (151.8 - 168.2, n=5) | |
| Apple MacBook Pro 16 2023 M2 Max | |
| KFA2 GeForce RTX 4080 SG | |
| ASUS TUF Gaming GeForce RTX 3080 Ti OC | |
| KFA2 GeForce RTX 4070 Ti SG | |
| Intel Core i5-13400F | |
| Photoshop PugetBench / GPU Score | |
| KFA2 GeForce RTX 4080 SG | |
| ASUS TUF Gaming GeForce RTX 3080 Ti OC | |
| KFA2 GeForce RTX 4070 Ti SG | |
| Apple MacBook Pro 16 2023 M2 Max | |
| Media NVIDIA GeForce RTX 4090 Laptop GPU (109.1 - 119.4, n=5) | |
| MSI Titan GT77 HX 13VI | |
| Intel Core i5-13400F | |
| Photoshop PugetBench / Overall Score | |
| KFA2 GeForce RTX 4080 SG | |
| ASUS TUF Gaming GeForce RTX 3080 Ti OC | |
| KFA2 GeForce RTX 4070 Ti SG | |
| MSI Titan GT77 HX 13VI | |
| Media NVIDIA GeForce RTX 4090 Laptop GPU (1225 - 1356, n=5) | |
| Apple MacBook Pro 16 2023 M2 Max | |
| Intel Core i5-13400F | |
| Premiere Pro PugetBench / GPU 0.9 | |
| MSI Titan GT77 HX 13VI | |
| Media NVIDIA GeForce RTX 4090 Laptop GPU (75.8 - 109.2, n=3) | |
| KFA2 GeForce RTX 4080 SG | |
| Intel Core i5-13400F | |
| ASUS TUF Gaming GeForce RTX 3080 Ti OC | |
| KFA2 GeForce RTX 4070 Ti SG | |
| Apple MacBook Pro 16 2023 M2 Max | |
| Premiere Pro PugetBench / Live Playback 0.9 | |
| MSI Titan GT77 HX 13VI | |
| Media NVIDIA GeForce RTX 4090 Laptop GPU (91.7 - 118, n=3) | |
| KFA2 GeForce RTX 4080 SG | |
| KFA2 GeForce RTX 4070 Ti SG | |
| ASUS TUF Gaming GeForce RTX 3080 Ti OC | |
| Intel Core i5-13400F | |
| Apple MacBook Pro 16 2023 M2 Max | |
| Premiere Pro PugetBench / Export 0.9 | |
| MSI Titan GT77 HX 13VI | |
| KFA2 GeForce RTX 4070 Ti SG | |
| KFA2 GeForce RTX 4080 SG | |
| ASUS TUF Gaming GeForce RTX 3080 Ti OC | |
| Media NVIDIA GeForce RTX 4090 Laptop GPU (78.4 - 113.4, n=3) | |
| Apple MacBook Pro 16 2023 M2 Max | |
| Intel Core i5-13400F | |
| Premiere Pro PugetBench / Overall Score 0.9 | |
| Apple MacBook Pro 16 2023 M2 Max | |
| MSI Titan GT77 HX 13VI | |
| Media NVIDIA GeForce RTX 4090 Laptop GPU (821 - 1105, n=3) | |
| KFA2 GeForce RTX 4070 Ti SG | |
| KFA2 GeForce RTX 4080 SG | |
| ASUS TUF Gaming GeForce RTX 3080 Ti OC | |
| Intel Core i5-13400F | |
Photoshop PugetBench: Filter Score | General Score | GPU Score | Overall Score
Premiere Pro PugetBench: GPU 0.9 | Live Playback 0.9 | Export 0.9 | Overall Score 0.9
* ... Meglio usare valori piccoli
La RTX 4090 non dispone di driver speciali come le GPU per workstation, ma le prestazioni sono comunque impressionanti e la nuova GPU GeForce è in grado di battere anche le GPU professionali.RTX A5500in alcuni test SPECviewperf (come Maya, SiemensNX). Tuttavia, la GPU consumer a volte è anche in fondo, quindi dipende dal carico di lavoro, ma le GPU professionali non sono sempre necessarie.
Prestazioni di gioco
Le prestazioni di gioco sono semplicemente sorprendenti e la combinazione di Core i9-13950HX e RTX 4090 gestisce tutti i giochi testati senza problemi anche in 4K con le impostazioni massime. L'unica eccezione è rappresentata da casi estremi come Cyberpunk 2077 con il preset RT Ultra in 4K, dove si può intervenire con l'upscaling (per saperne di più). I giochi predefiniti che testiamo con ogni portatile mostrano un vantaggio medio del 26% rispetto alla vecchiaRTX 3080 Tima il vantaggio è maggiore nei titoli più recenti e a risoluzioni più elevate.
| The Witcher 3 - 1920x1080 Ultra Graphics & Postprocessing (HBAO+) | |
| Schenker XMG Neo 16 Raptor Lake | |
| MSI Titan GT77 HX 13VI | |
| Razer Blade 16 Early 2023 | |
| Media della classe Gaming (95 - 240, n=8, ultimi 2 anni) | |
| MSI Titan GT77 12UHS | |
| Alienware x17 R2 P48E | |
| Schenker XMG Neo 17 M22 | |
| Asus ROG Strix Scar 17 SE G733CX-LL014W | |
Anche le prestazioni di Raytracing sono molto buone e la nuova RTX 4090 è all'incirca alla pari con la RTX 4070 Ti per desktop.rTX 4070 Ti per desktop.
| The Witcher 3 v4 - 1920x1080 RT Ultra Preset / On AA:FX | |
| KFA2 GeForce RTX 4070 Ti SG | |
| MSI Titan GT77 HX 13VI | |
| Schenker XMG Neo 16 Raptor Lake | |
| Media NVIDIA GeForce RTX 4090 Laptop GPU (53.1 - 68, n=5) | |
| The Callisto Protocol - 1920x1080 Ultra Preset (without FSR Upscaling) + Full Ray-Tracing | |
| KFA2 GeForce RTX 4080 SG | |
| KFA2 GeForce RTX 4070 Ti SG | |
| ASUS TUF Gaming GeForce RTX 3080 Ti OC | |
| MSI Titan GT77 HX 13VI | |
| Media NVIDIA GeForce RTX 4090 Laptop GPU (32 - 79.6, n=5) | |
| Schenker XMG Neo 16 Raptor Lake | |
| Spider-Man Miles Morales - 1920x0180 Very High Preset + Ray-Tracing AA:T | |
| KFA2 GeForce RTX 4080 SG | |
| KFA2 GeForce RTX 4070 Ti SG | |
| Schenker XMG Neo 16 Raptor Lake | |
| ASUS TUF Gaming GeForce RTX 3080 Ti OC | |
| MSI Titan GT77 HX 13VI | |
| Media NVIDIA GeForce RTX 4090 Laptop GPU (79.6 - 96.2, n=4) | |
| Watch Dogs Legion - 1920x1080 Ultra Preset + Ultra Ray Tracing (DX12) | |
| Schenker XMG Neo 16 Raptor Lake | |
| Zotac Gaming GeForce RTX 3090 Ti AMP Extreme Holo | |
| Media NVIDIA GeForce RTX 4090 Laptop GPU (84 - 90, n=2) | |
| MSI Titan GT77 HX 13VI | |
| Razer Blade 16 Early 2023 | |
| MSI Titan GT77 12UHS | |
| Alienware x15 R2 P111F | |
| Gioco | Impostazione | DLSS off | DLSS on (Balanced) | Differenza |
|---|---|---|---|---|
| Spider-Man Miles Morales | 4K Ultra | 83 FPS | 132 FPS | +59 % |
| Witcher 3 4.00 | 4K RT Ultra | 27 FPS | 50 FPS | +85 % |
| Cyberpunk 2077 1.5 | RT 4K | 22 FPS | 95 FPS | +331 % |
| God of War | 4K Ultra | 80 FPS | 111 FPS | +38 % |
Di solito eseguiamo i nostri benchmark di gioco senza tecnologie di upscaling come Nvidia DLSS o AMD FSR. Tuttavia, le prestazioni possono trarre grande beneficio quando il titolo lo supporta e abbiamo notato alcuni miglioramenti importanti con DLSS 3.0 attivato senza alcun deficit visivo. Considerando questi risultati, le prossime varianti più piccoleRTX 4060eRTX 4070dovrebbero essere in grado di gestire giochi in 4K quando il DLSS è attivo.
Le prestazioni di gioco sono completamente stabili, come dimostra anche il nostro ciclo Witcher 3. Tuttavia, le prestazioni si riducono ancora una volta in modo massiccio con la batteria.
Witcher 3 FPS-Diagramm
Abbiamo anche verificato l'efficienza della nuova GPU con il nostro test Witcher 3. L'influenza della CPU non è molto grande e utilizziamo i valori collegati a uno schermo esterno, in modo da poter eliminare i diversi tipi di display e confrontare i risultati con le GPU desktop. Il risultato della nuova RTX 4090 è impressionante, perché la GPU è circa il 40% più efficiente della RTX 3080 Ti Mobile (140W) nell'Alienware x15.Alienware x15e dellarTX 4080 desktop. La nuova GT77 è anche più efficiente del 53% rispetto al modello precedente modello precedente con laRTX 3080 Tia parità di TGP.
| basso | medio | alto | ultra | QHD | 4K DLSS | 4K | |
|---|---|---|---|---|---|---|---|
| GTA V (2015) | 184.1 | 182.6 | 140.9 | 138.5 | 175.7 | ||
| The Witcher 3 (2015) | 619 | 546 | 422 | 198.9 | 160 | ||
| Dota 2 Reborn (2015) | 225 | 206 | 194.1 | 185.9 | 178.9 | ||
| Final Fantasy XV Benchmark (2018) | 230 | 221 | 187.4 | 162.9 | 94.7 | ||
| X-Plane 11.11 (2018) | 203 | 177.5 | 134.1 | 114.3 | |||
| Far Cry 5 (2018) | 186 | 173 | 160 | 159 | 113 | ||
| Strange Brigade (2018) | 490 | 396 | 391 | 373 | 309 | 159.3 | |
| Shadow of the Tomb Raider (2018) | 245 | 227 | 219 | 214 | 187 | 103 | |
| Metro Exodus (2019) | 204 | 183 | 153 | 132 | 116 | 81 | |
| Control (2019) | 240 | 232 | 187 | 122 | 63 | ||
| Borderlands 3 (2019) | 201 | 176 | 162 | 151 | 130 | 76 | |
| Horizon Zero Dawn (2020) | 209 | 189 | 174 | 163 | 154 | 131 | 95 |
| Mafia Definitive Edition (2020) | 219 | 189 | 179 | 161 | 93 | ||
| Watch Dogs Legion (2020) | 152 | 144 | 131 | 120 | 109 | 69 | |
| F1 2021 (2021) | 501 | 449 | 417 | 209 | 192.4 | 114.4 | |
| Far Cry 6 (2021) | 167 | 147 | 144 | 135 | 89 | ||
| Forza Horizon 5 (2021) | 220 | 181 | 174 | 124 | 113 | 95 | |
| God of War (2022) | 201 | 200 | 180 | 133 | 115 | 80 | |
| Rainbow Six Extraction (2022) | 378 | 347 | 346 | 314 | 219 | 112 | |
| Dying Light 2 (2022) | 240 | 206 | 174 | 121 | 62 | ||
| GRID Legends (2022) | 254 | 230 | 210 | 199 | 190 | 132 | |
| Cyberpunk 2077 1.6 (2022) | 156 | 144 | 138 | 135 | 98 | 56 | |
| Ghostwire Tokyo (2022) | 237 | 236 | 234 | 231 | 206 | 100 | |
| Tiny Tina's Wonderlands (2022) | 339 | 289 | 224 | 182 | 131 | 70 | |
| F1 22 (2022) | 316 | 294 | 283 | 138.2 | 90.1 | 44.9 | |
| Call of Duty Modern Warfare 2 2022 (2022) | 230 | 215 | 183 | 176 | 135 | 126 | 85 |
| Spider-Man Miles Morales (2022) | 134 | 131 | 118 | 116 | 113 | 83 | |
| The Callisto Protocol (2022) | 195 | 181 | 145 | 144 | 114 | 68 | |
| The Witcher 3 v4 (2023) | 240 | 189 | 173 | 150 | 104 | 50 | |
| Dead Space Remake (2023) | 147 | 141 | 130 | 129 | 100 | 53 |
Emissioni - GT77 con più tubi termici
Rumore del sistema
La Titan GT77 utilizza quattro ventole e numerose heat pipe per dissipare tutto il calore. Una delle ventole (la ventola 1, secondo MSI Control) gira sempre a ~1500 giri al minuto indipendentemente dalle impostazioni di potenza, il che si traduce in un mormorio di 29,2 dB(A). Non è quindi mai un sistema silenzioso e a volte si possono sentire anche rumori elettronici a 29 dB(A). L'attività costante della ventola significa che le ventole non girano durante carichi di lavoro leggeri come la navigazione web. Tuttavia, se si inizia a stressare la CPU o la GPU, il sistema diventa molto rumoroso molto rapidamente. È interessante notare che le ventole più rumorose sono state 61 dB(A) durante il carico della CPU, mentre lo stress test ha prodotto "solo" 53,3 dB(A). Il motivo è il comportamento della ventola, che si può vedere anche nelle immagini qui sotto.
Abbiamo misurato tra i 53 e i 56 dB(A) a seconda del titolo, che è ovviamente molto rumoroso. Ci sono due approcci diversi: si possono usare le cuffie (preferibilmente con cancellazione del rumore) o la modalità Silent, che limita il rumore della ventola a 39,6 dB(A). Anche le prestazioni subiranno un calo, ma la maggior parte dei giochi funzionerà comunque senza problemi grazie alle enormi riserve di prestazioni. È possibile attivare manualmente la funzione Cooler Boost, che porterà a 62,8 dB(A), ma non abbiamo mai raggiunto questo livello durante i test.
| Prestazioni estreme | Bilanciato | Silenzioso | |
|---|---|---|---|
| Witcher 3 4.00 Ultra 4K | 55,7 dB(A) | 55,7 dB(A) | 39,6 dB(A) |
| Witcher 3 Ultra | 53,3 dB(A) | 53,3 dB(A) | 39,6 dB(A) |
| Dead Space Remake Ultra 4K | 55,7 dB(A) | 53,3 dB(A) | 39,6 dB(A) |
| CB R23 Multi | 61 dB(A) | 55,7 dB(A) | 36,8 dB(A) |
| Furmark | 56,1 dB(A) | 53,3 dB(A) | 39,6 dB(A) |
Rumorosità
| Idle |
| 29.2 / 29.2 / 29.2 dB(A) |
| Sotto carico |
| 50.7 / 61 dB(A) |
 | ||
30 dB silenzioso 40 dB(A) udibile 50 dB(A) rumoroso |
||
min: | ||
| MSI Titan GT77 HX 13VI GeForce RTX 4090 Laptop GPU, i9-13950HX, Samsung PM9A1 MZVL22T0HBLB | Razer Blade 16 Early 2023 GeForce RTX 4080 Laptop GPU, i9-13950HX, SSSTC CA6-8D1024 | Asus ROG Strix Scar 17 SE G733CX-LL014W GeForce RTX 3080 Ti Laptop GPU, i9-12950HX, Samsung PM9A1 MZVL22T0HBLB | MSI Titan GT77 12UHS GeForce RTX 3080 Ti Laptop GPU, i9-12900HX, Samsung PM9A1 MZVL21T0HCLR | Alienware x17 R2 P48E GeForce RTX 3080 Ti Laptop GPU, i9-12900HK, 2x Samsung PM9A1 1TB (RAID 0) | Schenker XMG Neo 17 M22 GeForce RTX 3080 Ti Laptop GPU, R9 6900HX, Samsung SSD 980 Pro 1TB MZ-V8P1T0BW | |
|---|---|---|---|---|---|---|
| Noise | 16% | 19% | 10% | 18% | -2% | |
| off /ambiente * (dB) | 24.6 | 23 7% | 23.9 3% | 21.9 11% | 22.7 8% | 26 -6% |
| Idle Minimum * (dB) | 29.2 | 23 21% | 23.9 18% | 24.53 16% | 23.1 21% | 26 11% |
| Idle Average * (dB) | 29.2 | 23 21% | 23.9 18% | 24.53 16% | 23.1 21% | 29 1% |
| Idle Maximum * (dB) | 29.2 | 23.6 19% | 23.9 18% | 24.53 16% | 23.1 21% | 40 -37% |
| Load Average * (dB) | 50.7 | 39 23% | 34.3 32% | 46.25 9% | 31.9 37% | 47 7% |
| Witcher 3 ultra * (dB) | 53.3 | 51.6 3% | 56.86 -7% | 52.5 2% | 52 2% | |
| Load Maximum * (dB) | 61 | 51.3 16% | 45.9 25% | 54.25 11% | 52.5 14% | 54 11% |
* ... Meglio usare valori piccoli
Temperatura
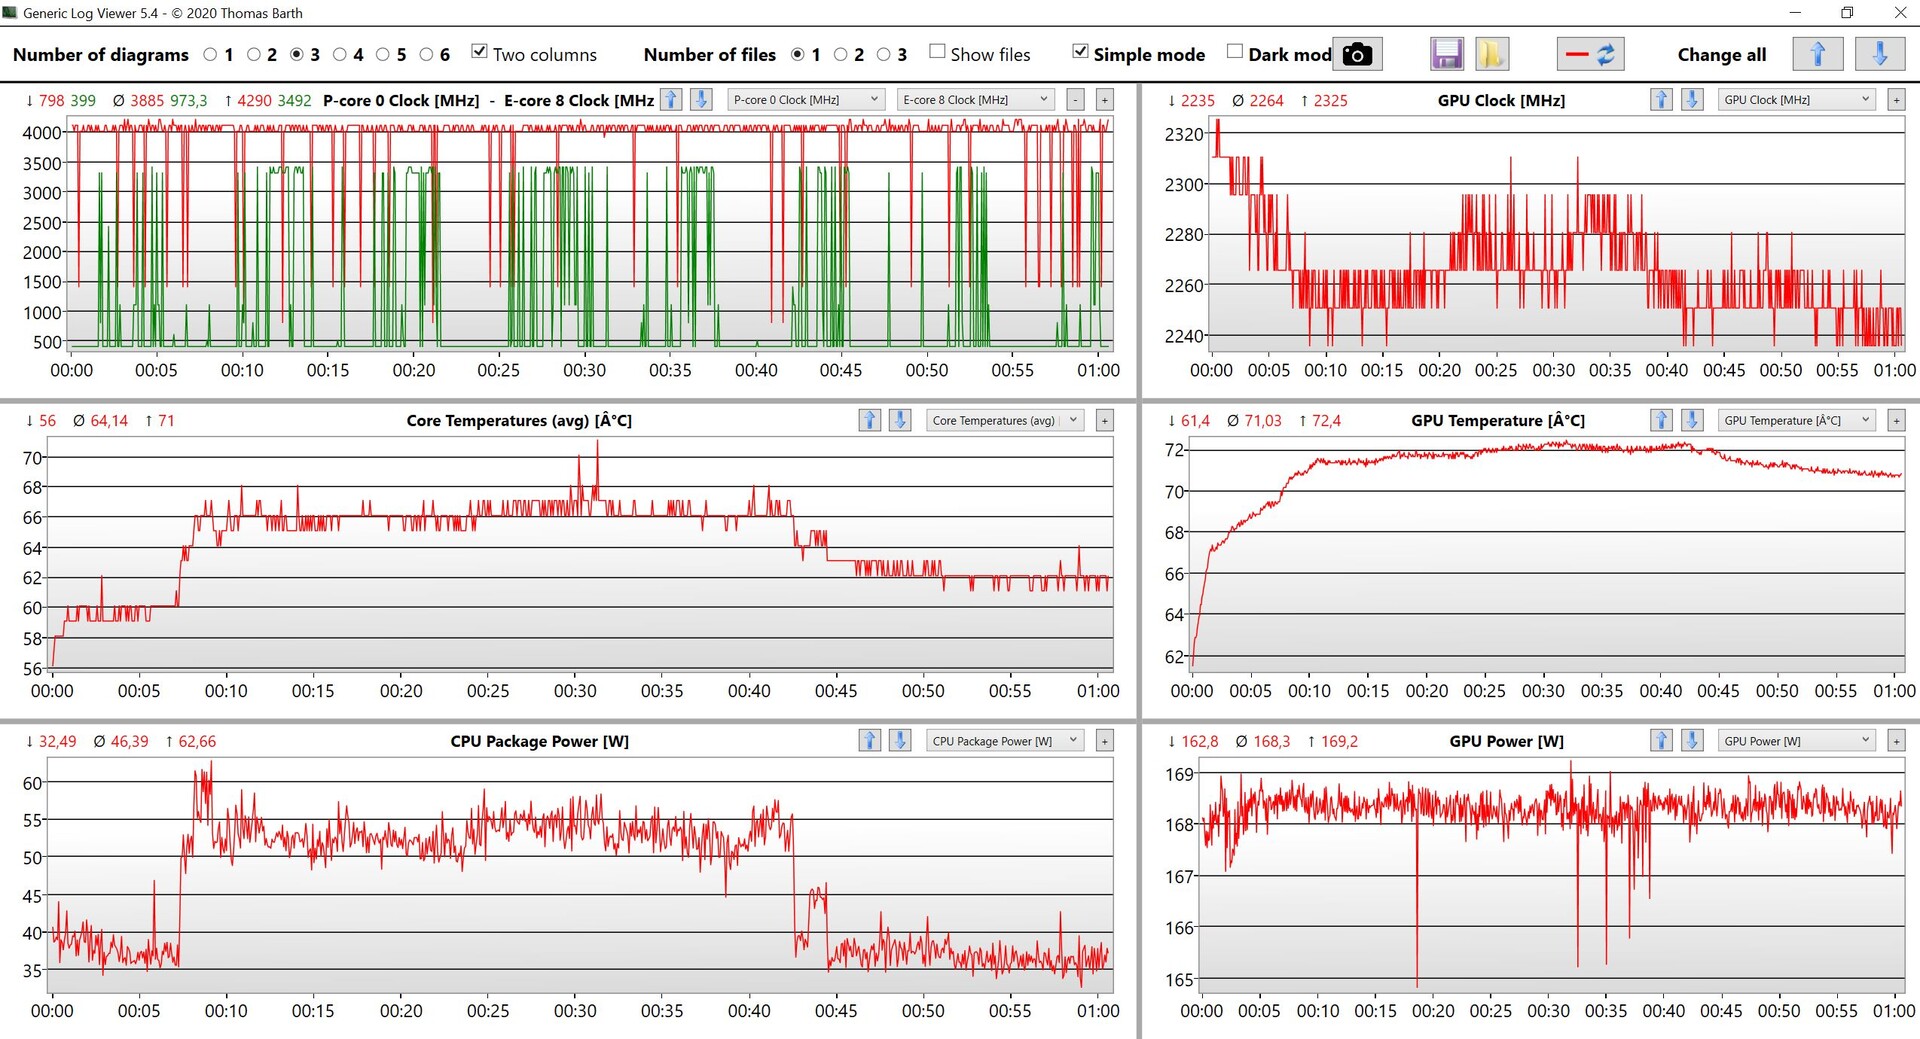
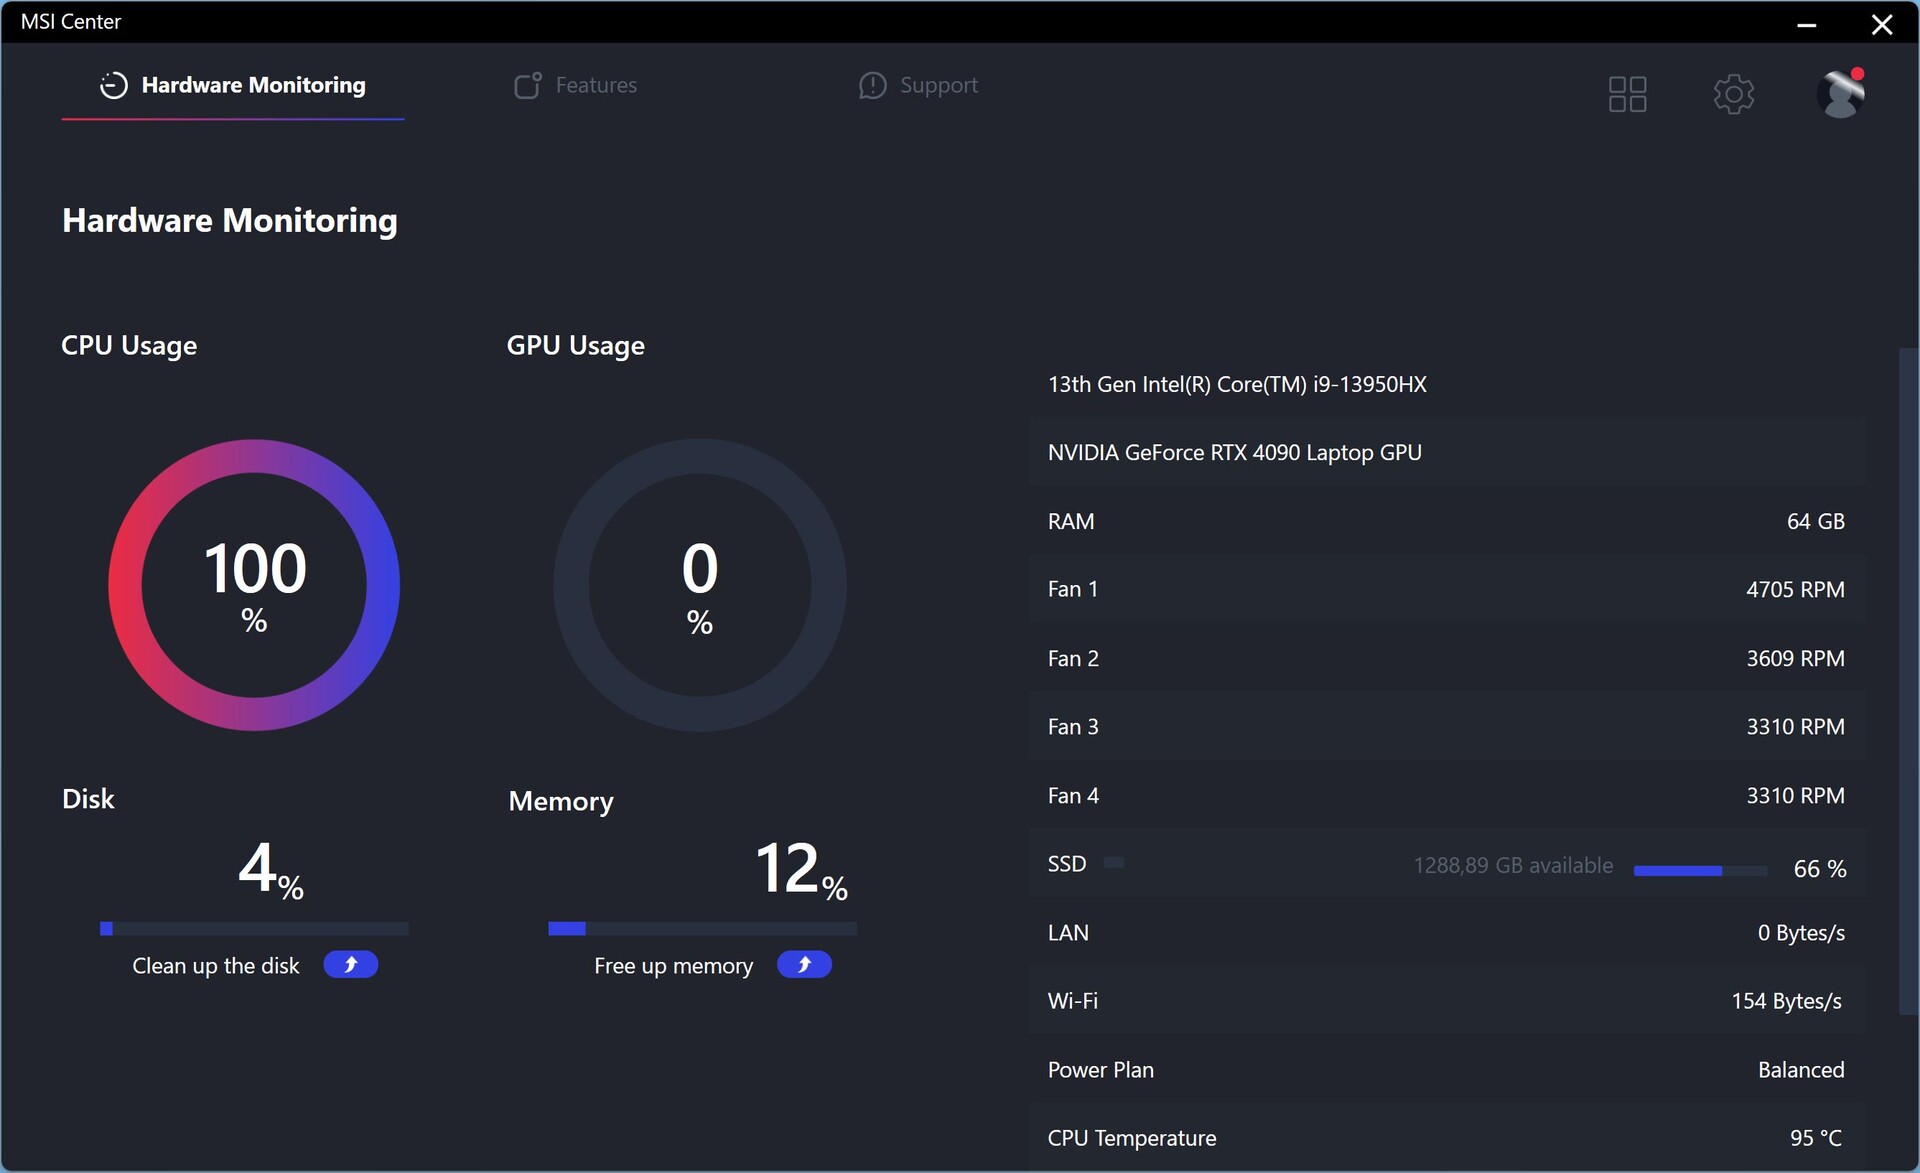
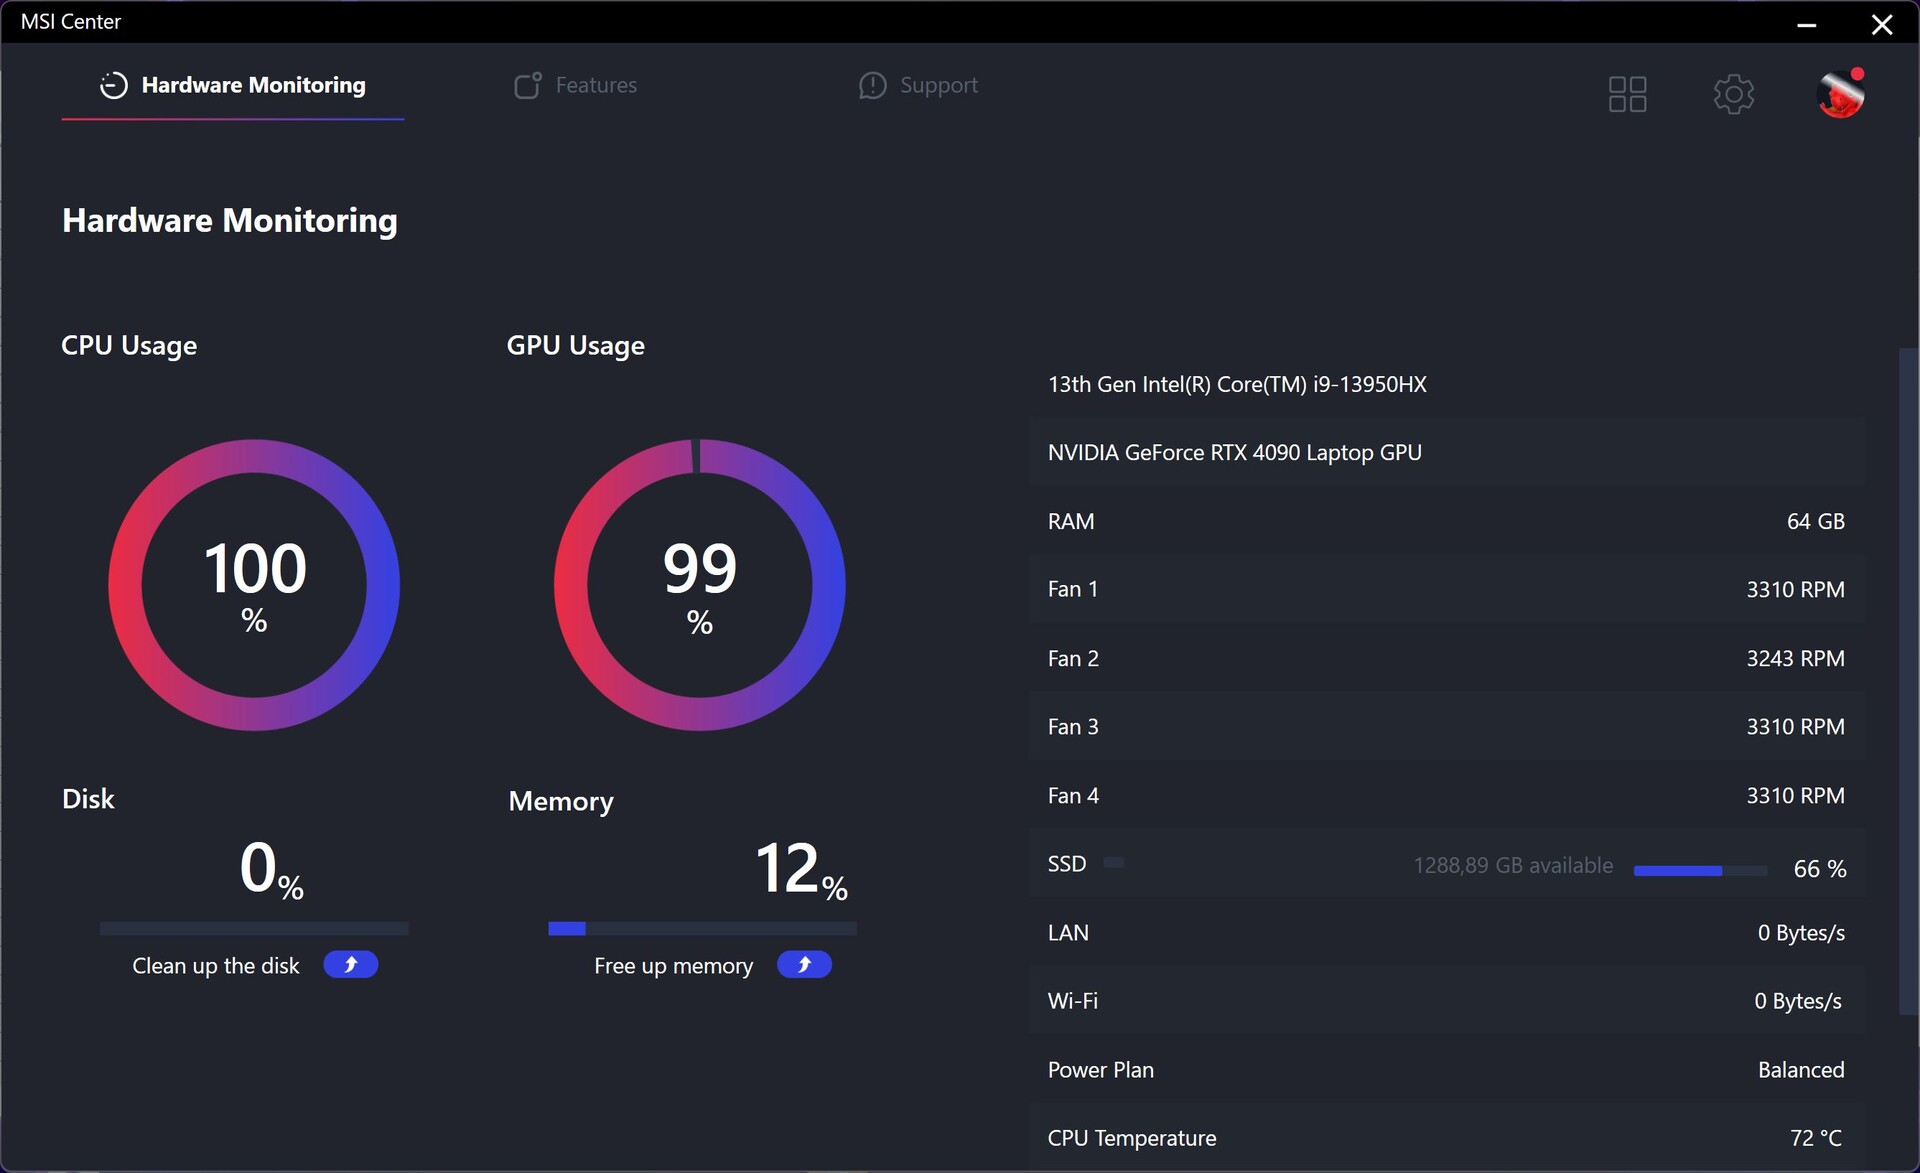
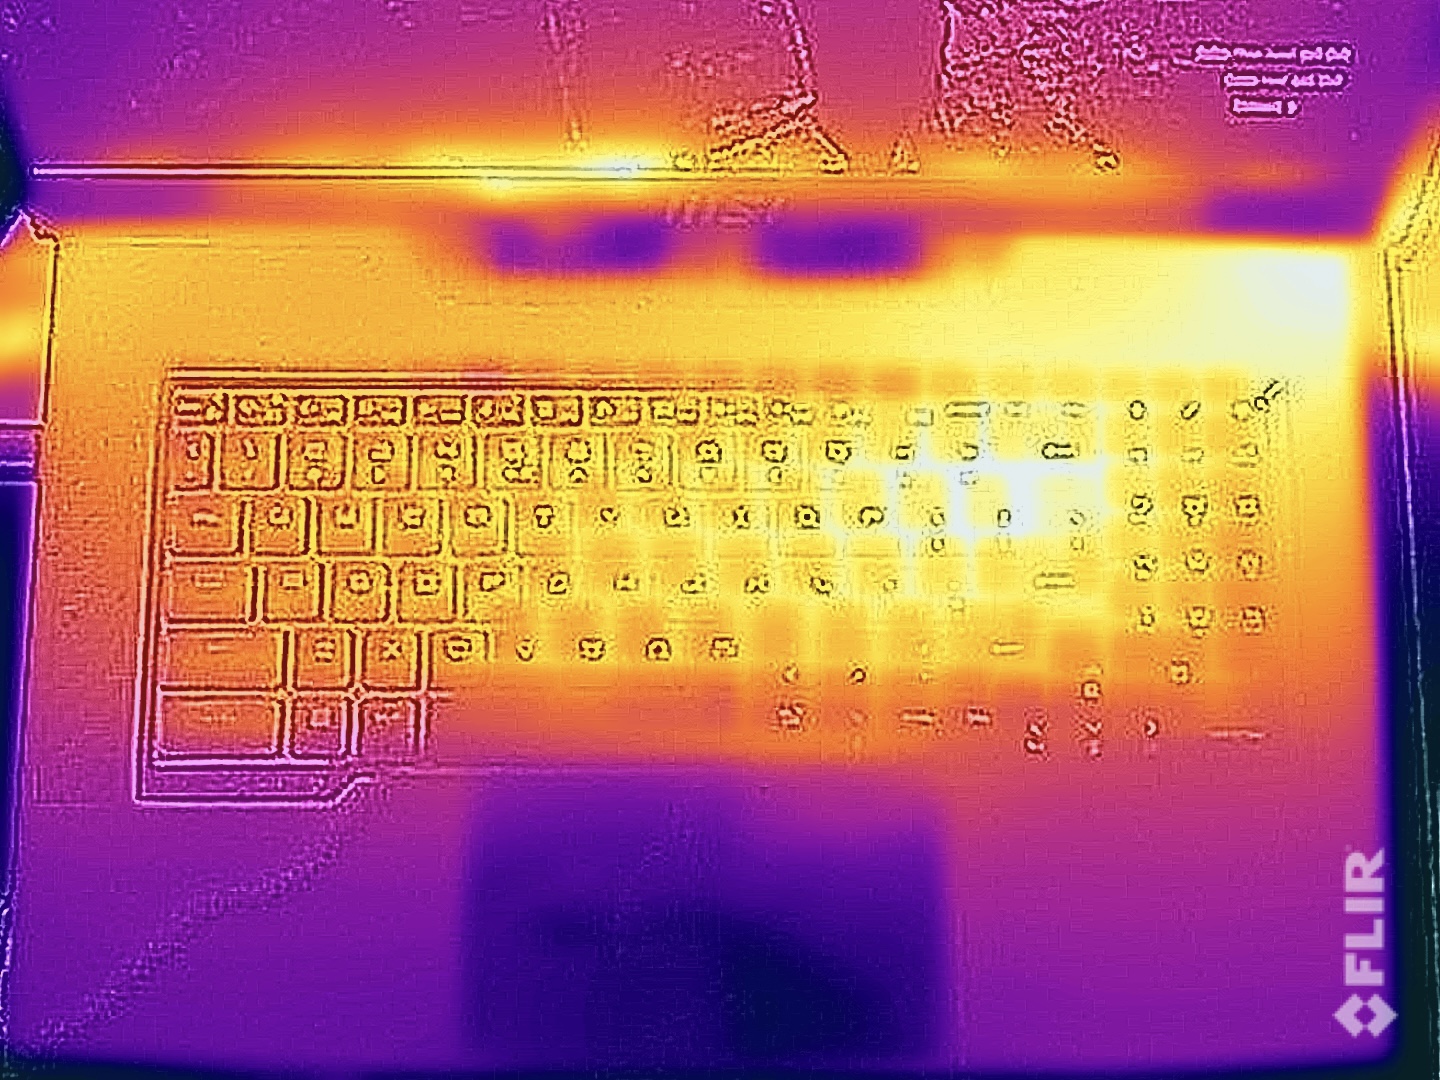
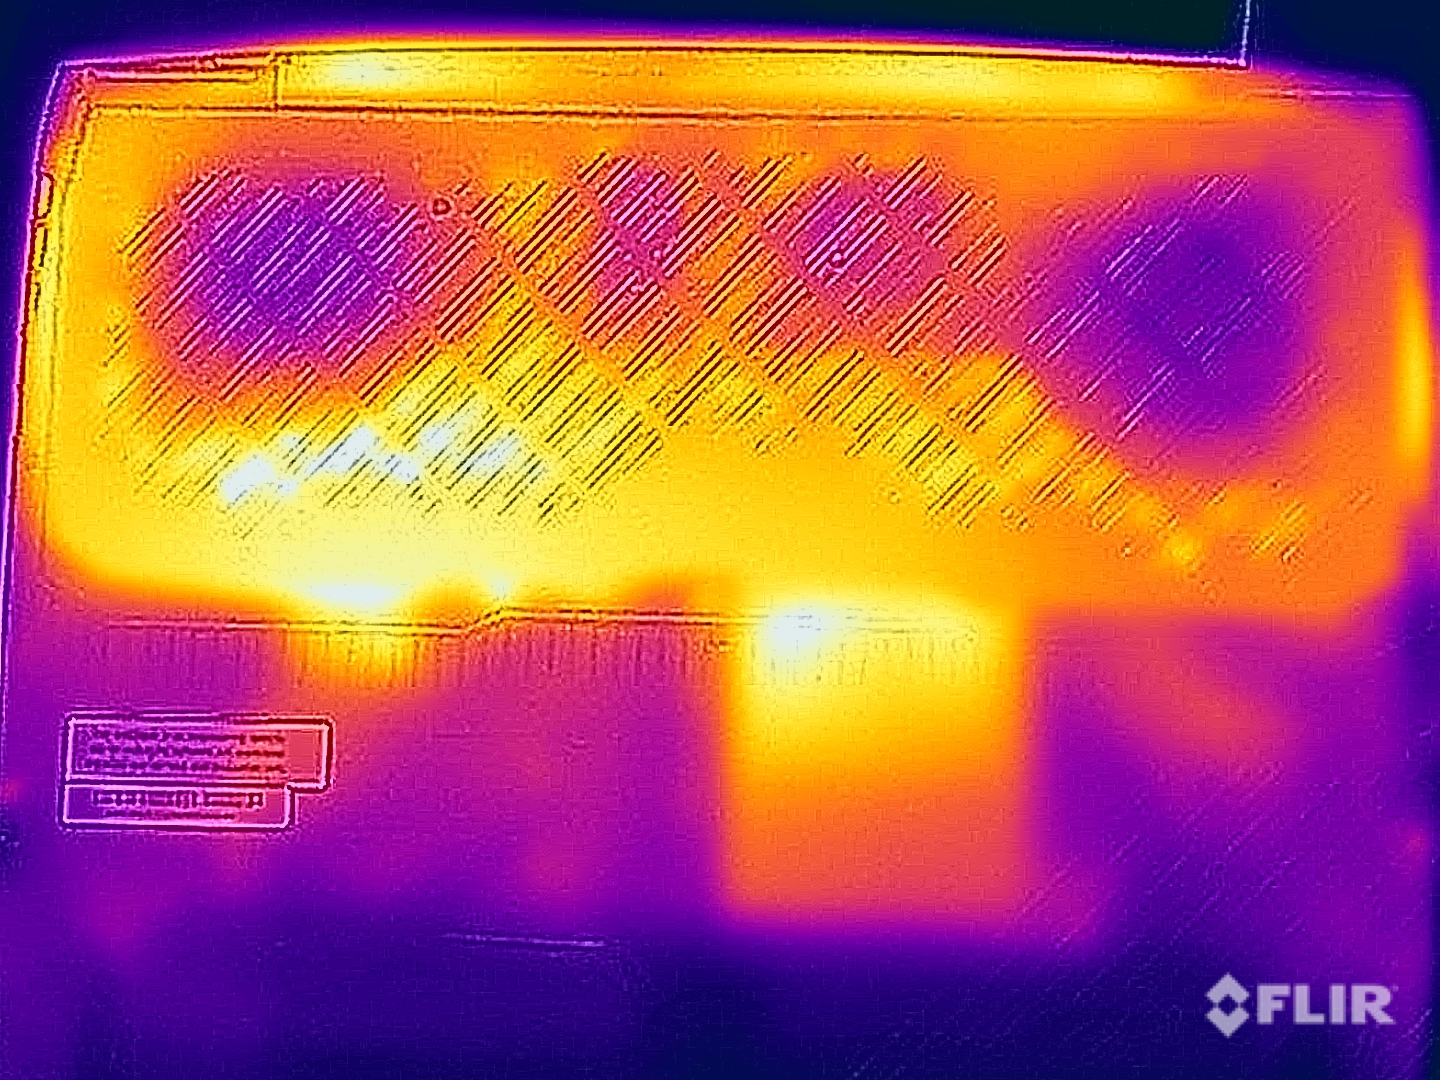
Le ventole rumorose hanno un grande vantaggio, perché le temperature superficiali sono sorprendentemente basse e si può ancora utilizzare la tastiera senza limitazioni durante le sessioni di gioco più lunghe. Abbiamo controllato i risultati più volte, ma i numeri erano gli stessi. Difficilmente riusciamo a misurare più di 40 °C sotto carico, il che è un ottimo risultato considerando le prestazioni.
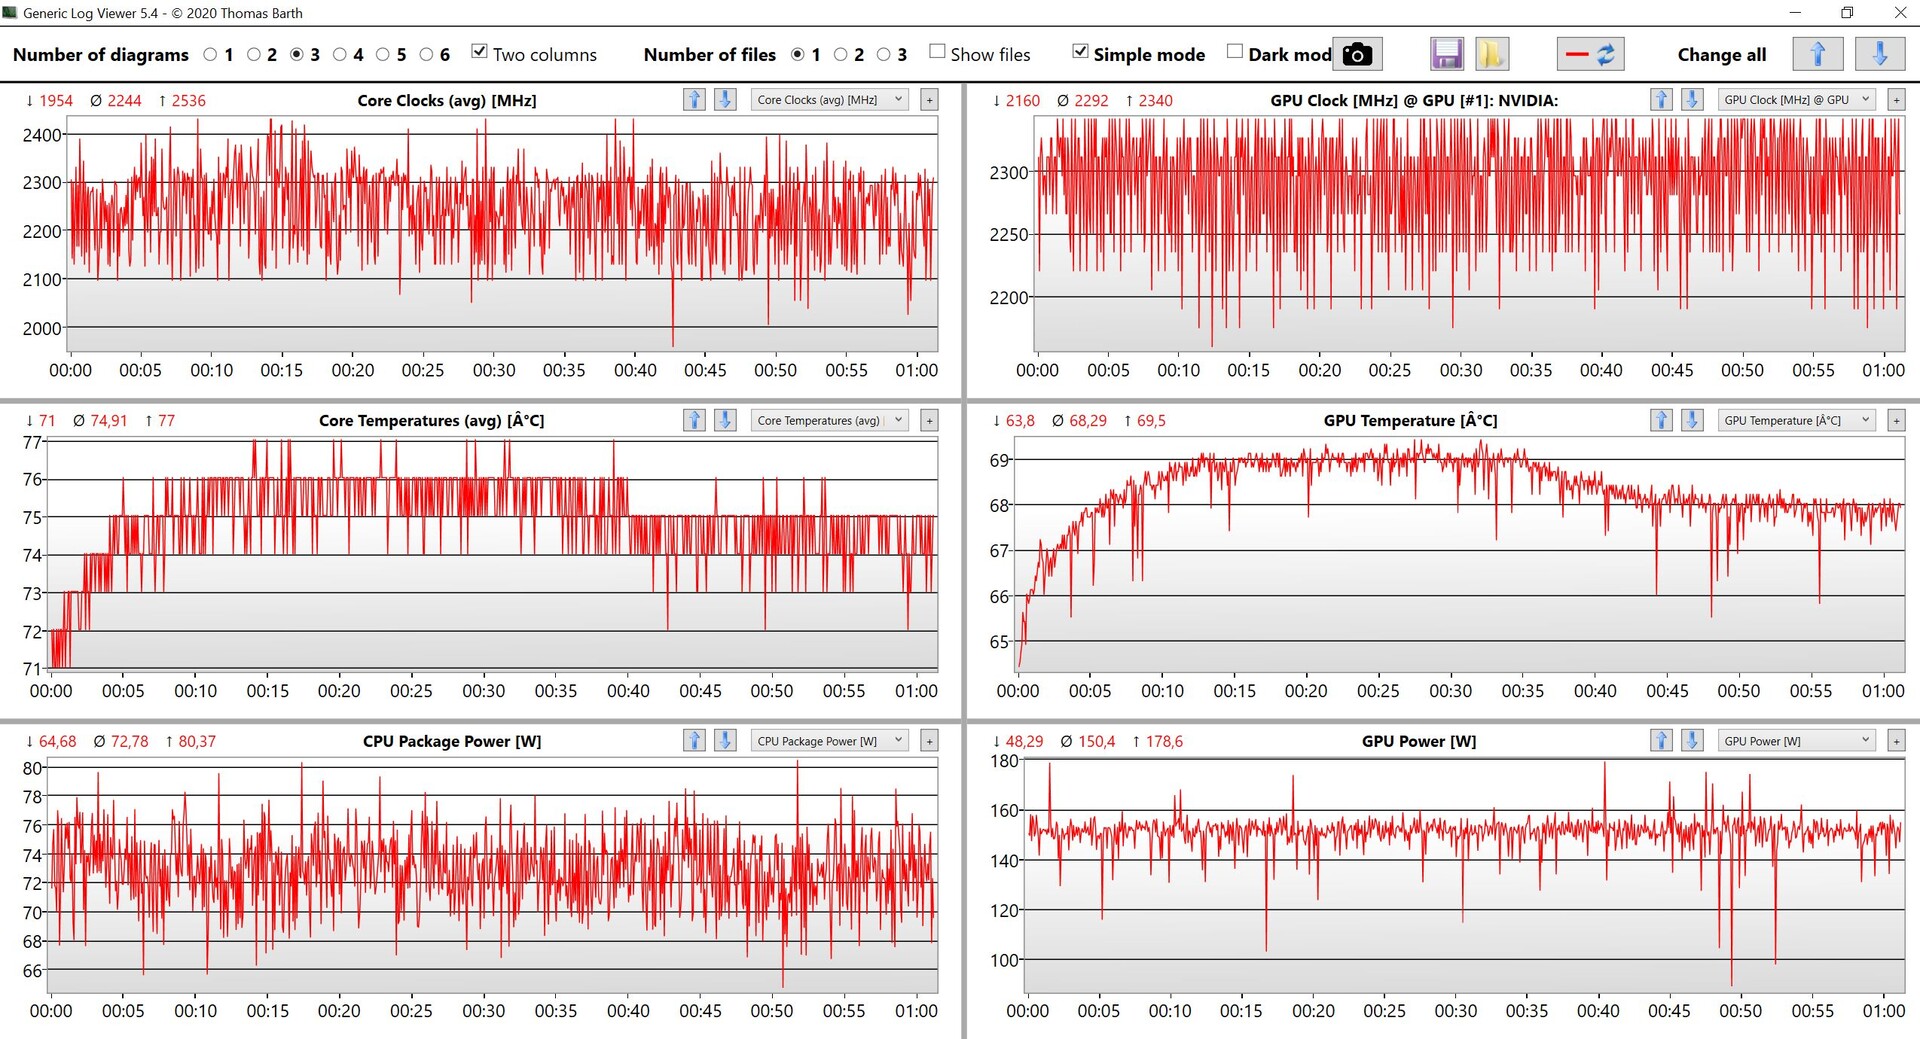
La CPU e la GPU si stabilizzano rapidamente a 75W e 150W, rispettivamente, durante lo stress test e le prestazioni sono costanti. Il sistema raffredda un totale di 225W, ma MSI annuncia addirittura un massimo di 250W per i sistemi con il Core i9-13980HX.Core i9-13980HXquindi le temperature potrebbero essere un po' più alte (non ci aspettiamo ventole più rumorose).
(±) La temperatura massima sul lato superiore è di 40.6 °C / 105 F, rispetto alla media di 40.4 °C / 105 F, che varia da 21.2 a 68.8 °C per questa classe Gaming.
(±) Il lato inferiore si riscalda fino ad un massimo di 41.1 °C / 106 F, rispetto alla media di 43.2 °C / 110 F
(+) In idle, la temperatura media del lato superiore è di 25.2 °C / 77 F, rispetto alla media deld ispositivo di 33.9 °C / 93 F.
(±) Riproducendo The Witcher 3, la temperatura media per il lato superiore e' di 36.2 °C / 97 F, rispetto alla media del dispositivo di 33.9 °C / 93 F.
(+) I poggiapolsi e il touchpad sono piu' freddi della temperatura della pelle con un massimo di 29.6 °C / 85.3 F e sono quindi freddi al tatto.
(±) La temperatura media della zona del palmo della mano di dispositivi simili e'stata di 28.8 °C / 83.8 F (-0.8 °C / -1.5 F).
| MSI Titan GT77 HX 13VI Intel Core i9-13950HX, NVIDIA GeForce RTX 4090 Laptop GPU | Razer Blade 16 Early 2023 Intel Core i9-13950HX, NVIDIA GeForce RTX 4080 Laptop GPU | Asus ROG Strix Scar 17 SE G733CX-LL014W Intel Core i9-12950HX, NVIDIA GeForce RTX 3080 Ti Laptop GPU | MSI Titan GT77 12UHS Intel Core i9-12900HX, NVIDIA GeForce RTX 3080 Ti Laptop GPU | Alienware x17 R2 P48E Intel Core i9-12900HK, NVIDIA GeForce RTX 3080 Ti Laptop GPU | Schenker XMG Neo 17 M22 AMD Ryzen 9 6900HX, NVIDIA GeForce RTX 3080 Ti Laptop GPU | |
|---|---|---|---|---|---|---|
| Heat | -5% | -19% | -22% | -11% | -18% | |
| Maximum Upper Side * (°C) | 40.6 | 40 1% | 48.8 -20% | 40.8 -0% | 49.6 -22% | 49 -21% |
| Maximum Bottom * (°C) | 41.1 | 37.6 9% | 52.4 -27% | 52.4 -27% | 42.4 -3% | 52 -27% |
| Idle Upper Side * (°C) | 26.2 | 32.4 -24% | 30.4 -16% | 34.6 -32% | 29.2 -11% | 30 -15% |
| Idle Bottom * (°C) | 30.3 | 31.4 -4% | 34.1 -13% | 38.4 -27% | 32 -6% | 33 -9% |
* ... Meglio usare valori piccoli
Altoparlanti
Il GT77 offre comunque due buoni altoparlanti stereo in combinazione con due woofer, che producono un suono decente. Tuttavia, non è possibile divertirsi durante il gioco, poiché le ventole sono troppo rumorose, ma il sistema audio è sicuramente sufficiente per la riproduzione occasionale di musica e video.
MSI Titan GT77 HX 13VI analisi audio
(+) | gli altoparlanti sono relativamente potenti (90.1 dB)
Bassi 100 - 315 Hz
(±) | bassi ridotti - in media 14.3% inferiori alla media
(±) | la linearità dei bassi è media (7.5% delta rispetto alla precedente frequenza)
Medi 400 - 2000 Hz
(+) | medi bilanciati - solo only 3.5% rispetto alla media
(+) | medi lineari (3.2% delta rispetto alla precedente frequenza)
Alti 2 - 16 kHz
(+) | Alti bilanciati - appena 1.9% dalla media
(+) | alti lineari (3.8% delta rispetto alla precedente frequenza)
Nel complesso 100 - 16.000 Hz
(+) | suono nel complesso lineare (11.1% differenza dalla media)
Rispetto alla stessa classe
» 8% di tutti i dispositivi testati in questa classe è stato migliore, 3% simile, 89% peggiore
» Il migliore ha avuto un delta di 6%, medio di 18%, peggiore di 132%
Rispetto a tutti i dispositivi testati
» 7% di tutti i dispositivi testati in questa classe è stato migliore, 2% similare, 92% peggiore
» Il migliore ha avuto un delta di 4%, medio di 24%, peggiore di 134%
Alienware x17 R2 P48E analisi audio
(+) | gli altoparlanti sono relativamente potenti (84.3 dB)
Bassi 100 - 315 Hz
(±) | bassi ridotti - in media 9.7% inferiori alla media
(+) | bassi in lineaa (5.5% delta rispetto alla precedente frequenza)
Medi 400 - 2000 Hz
(+) | medi bilanciati - solo only 1.6% rispetto alla media
(+) | medi lineari (3% delta rispetto alla precedente frequenza)
Alti 2 - 16 kHz
(±) | alti elevati - circa 5% superiori alla media
(±) | la linearità degli alti è media (7.6% delta rispetto alla precedente frequenza)
Nel complesso 100 - 16.000 Hz
(+) | suono nel complesso lineare (9.3% differenza dalla media)
Rispetto alla stessa classe
» 3% di tutti i dispositivi testati in questa classe è stato migliore, 2% simile, 95% peggiore
» Il migliore ha avuto un delta di 6%, medio di 18%, peggiore di 132%
Rispetto a tutti i dispositivi testati
» 3% di tutti i dispositivi testati in questa classe è stato migliore, 1% similare, 96% peggiore
» Il migliore ha avuto un delta di 4%, medio di 24%, peggiore di 134%
Gestione dell'energia - Titan con batteria da 99,9 Wh
Consumo di energia
Il consumo energetico della nuova GT77 al minimo con l'iGPU non è male e non ci sono grandi differenze rispetto ai modelli precedenti nemmeno sotto carico, il che è impressionante considerando l'aumento delle prestazioni. Possiamo osservare un consumo massimo di 420W quando iniziamo lo stress test, ma scenderà rapidamente a ~290W una volta che i componenti si saranno assestati. Ciò significa che l'alimentatore da 330W è sufficiente.
| Off / Standby | |
| Idle | |
| Sotto carico |
|
Leggenda:
min: | |
| MSI Titan GT77 HX 13VI i9-13950HX, GeForce RTX 4090 Laptop GPU, Samsung PM9A1 MZVL22T0HBLB, Mini-LED, 3840x2160, 17.3" | Razer Blade 16 Early 2023 i9-13950HX, GeForce RTX 4080 Laptop GPU, SSSTC CA6-8D1024, IPS, 2560x1600, 16" | Asus ROG Strix Scar 17 SE G733CX-LL014W i9-12950HX, GeForce RTX 3080 Ti Laptop GPU, Samsung PM9A1 MZVL22T0HBLB, IPS, 2560x1440, 17.3" | MSI Titan GT77 12UHS i9-12900HX, GeForce RTX 3080 Ti Laptop GPU, Samsung PM9A1 MZVL21T0HCLR, IPS-Level, 1920x1080, 17.3" | Alienware x17 R2 P48E i9-12900HK, GeForce RTX 3080 Ti Laptop GPU, 2x Samsung PM9A1 1TB (RAID 0), IPS, 1920x1080, 17.3" | Schenker XMG Neo 17 M22 R9 6900HX, GeForce RTX 3080 Ti Laptop GPU, Samsung SSD 980 Pro 1TB MZ-V8P1T0BW, IPS, 2560x1600, 17" | Media NVIDIA GeForce RTX 4090 Laptop GPU | Media della classe Gaming | |
|---|---|---|---|---|---|---|---|---|
| Power Consumption | -12% | -7% | -30% | -37% | 33% | -9% | 14% | |
| Idle Minimum * (Watt) | 14 | 15.2 -9% | 19.3 -38% | 30.21 -116% | 24.1 -72% | 7 50% | 16.2 ? -16% | 13.2 ? 6% |
| Idle Average * (Watt) | 21.6 | 22.8 -6% | 26.5 -23% | 32.42 -50% | 28.5 -32% | 11 49% | 23.1 ? -7% | 18.9 ? 13% |
| Idle Maximum * (Watt) | 24.8 | 49.8 -101% | 27.1 -9% | 33.7 -36% | 60 -142% | 17 31% | 34.2 ? -38% | 24.5 ? 1% |
| Load Average * (Watt) | 122.5 | 121.2 1% | 141 -15% | 125.09 -2% | 128.7 -5% | 92 25% | 130.5 ? -7% | 108.8 ? 11% |
| Witcher 3 ultra * (Watt) | 265 | 242 9% | 225 15% | 256 3% | 254 4% | 221 17% | ||
| Load Maximum * (Watt) | 418 | 273.7 35% | 307.9 26% | 321.88 23% | 323 23% | 306 27% | 324 ? 22% | 254 ? 39% |
* ... Meglio usare valori piccoli
Power consumption Witcher 3 / Stress test
Power consumption external screen
Durata della batteria
MSI ha già implementato la batteria più grande possibile con 99,9 Wh, ma l'autonomia è ancora limitata a causa degli elevati consumi. Abbiamo già detto che la luminosità del display è ridotta a batteria e che non è possibile utilizzare l'HDR, ma è comunque possibile aspettarsi circa 5-6 ore a una luminosità di 150 nits (il 69% della luminosità massima della nostra unità di recensione) in scenari pratici. L'autonomia minima è di 1,5 ore, ma abbiamo già detto che le prestazioni si riducono notevolmente. Una carica completa richiede 158 minuti all'accensione del dispositivo; l'80% della capacità è disponibile dopo poco più di 1,5 ore.
| MSI Titan GT77 HX 13VI i9-13950HX, GeForce RTX 4090 Laptop GPU, 99.9 Wh | Razer Blade 16 Early 2023 i9-13950HX, GeForce RTX 4080 Laptop GPU, 95.2 Wh | Asus ROG Strix Scar 17 SE G733CX-LL014W i9-12950HX, GeForce RTX 3080 Ti Laptop GPU, 90 Wh | MSI Titan GT77 12UHS i9-12900HX, GeForce RTX 3080 Ti Laptop GPU, 99.9 Wh | Alienware x17 R2 P48E i9-12900HK, GeForce RTX 3080 Ti Laptop GPU, 87 Wh | Schenker XMG Neo 17 M22 R9 6900HX, GeForce RTX 3080 Ti Laptop GPU, 99 Wh | Media della classe Gaming | |
|---|---|---|---|---|---|---|---|
| Autonomia della batteria | 8% | -21% | 17% | -53% | 36% | 25% | |
| H.264 (h) | 6 | 7.2 20% | 6.6 10% | 8.28 ? 38% | |||
| WiFi v1.3 (h) | 5.3 | 6.1 15% | 4.2 -21% | 6.9 30% | 2 -62% | 9 70% | 6.96 ? 31% |
| Load (h) | 1.4 | 1.4 0% | 1.4 0% | 0.8 -43% | 1.8 29% | 1.47 ? 5% | |
| Witcher 3 ultra (h) | 1.5 |
Pro
Contro
Verdetto - GT77 con prestazioni di gioco estreme e un ottimo display
La nuova MSI Titan GT77 molto probabilmente raggiungerà solo un gruppo molto ristretto di utenti a causa del prezzo elevato, ma è comunque una vetrina impressionante di ciò che è possibile fare. Il gamer di fascia alta combina i migliori componenti attualmente disponibili sotto quasi tutti i punti di vista e rappresenta un ottimo pacchetto complessivo, che non deve nascondersi dietro a sistemi desktop completi.
Lo chassis è già noto dal predecessore e lascia una buona impressione, ma le opzioni di illuminazione sono piuttosto limitate (il che può essere positivo o negativo a seconda delle preferenze) e le superfici lisce sono molto inclini alle impronte digitali. La tastiera meccanica è ancora eccellente e le porte sono sufficienti. Il nuovo Processore HX dell'attuale generazione Raptor Lake di Intel è mediamente più veloce di circa il 22% rispetto al suo predecessore, ma la nuovaGeForce RTX 4090è ancora più impressionante. Nonostante un TGP simile a 175W, è circa il 40-60% più veloce della vecchiaRTX 3080 Tie può competere con le versioni desktop della RTX 3090/RTX 3090 Ti. Rispetto alle attuali GPU RTX-40xx per desktop, la nuova RTX 4090 Laptop si colloca proprio tra la RTX 4070 Ti e la RTX 4080.
Nessun portatile da gioco offre maggiori prestazioni in questo momento: MSI GT77 con il Core i9-13950HX e la RTX 4090 di GeForce utilizza l'hardware più veloce che si possa avere per un portatile. I giochi hanno un aspetto incredibile sul nuovo pannello Mini-LED 4K.
La combinazione hardware non ha problemi con la risoluzione 4K nativa del nuovo schermo Mini-LED (144 Hz). La qualità dell'immagine soggettiva è eccellente e i giochi sono davvero belli. È anche possibile utilizzare il pannello per l'editing delle immagini dopo una calibrazione, possibile con il software True Color precaricato. Il display supporta anche l'HDR con una luminosità di oltre 1000 nits, ma l'implementazione dell'HDR in Windows è ancora terribile rispetto a macOS, dove funziona perfettamente.
Considerando l'hardware potente, il design poco appariscente dello chassis, il buon display e l'eccellente tastiera, la Titan GT77 funziona molto bene anche come workstation mobile e persino la RTX A5500 rimane indietro in alcune applicazioni professionali.
Il raffreddamento funziona molto bene grazie alle quattro ventole e alle numerose heat pipe, e difficilmente riusciamo a misurare temperature superficiali superiori a 40 °C anche sotto carico, ma in compenso le ventole sono estremamente rumorose. Dovreste aspettarvi tra i 54-57 dB(A) durante il gioco e addirittura più di 60 dB(A) quando si stressa solo la CPU. Il rumore delle ventole è molto costante, ma consigliamo comunque di utilizzare delle cuffie (preferibilmente con cancellazione attiva del rumore). È anche possibile utilizzare la modalità silenziosa e ridurre il rumore della ventola a 40 dB(A). Le prestazioni subiranno un calo, ma saranno comunque più che sufficienti nella maggior parte dei titoli.
La MSI Titan GT77 presenta anche alcuni svantaggi, soprattutto se si considera il prezzo elevato. Tra questi, l'uso di plastica a basso costo (in particolare il coperchio inferiore), la lentezza della Ram DDR5-4800 e la pessima webcam a 720p. Le prestazioni delle due unità SSD da 2 TB in configurazione RAID 0 sono molto elevate, ma non stabili. Il GT77 è il primo portatile da gioco da 17 pollici con il nuovo hardware nella nostra recensione e siamo già ansiosi di testare la concorrenza nelle prossime due settimane.
Prezzo e disponibilità
Il nuovo MSI Titan GT77 HX 13 VI è disponibile presso il negozio MSI al prezzo di 5299 dollari.
MSI Titan GT77 HX 13VI
- 02/07/2023 v7 (old)
Andreas Osthoff
Transparency
La selezione dei dispositivi da recensire viene effettuata dalla nostra redazione. Il campione di prova è stato fornito all'autore come prestito dal produttore o dal rivenditore ai fini di questa recensione. L'istituto di credito non ha avuto alcuna influenza su questa recensione, né il produttore ne ha ricevuto una copia prima della pubblicazione. Non vi era alcun obbligo di pubblicare questa recensione. In quanto società mediatica indipendente, Notebookcheck non è soggetta all'autorità di produttori, rivenditori o editori.
Ecco come Notebookcheck esegue i test
Ogni anno, Notebookcheck esamina in modo indipendente centinaia di laptop e smartphone utilizzando procedure standardizzate per garantire che tutti i risultati siano comparabili. Da circa 20 anni sviluppiamo continuamente i nostri metodi di prova e nel frattempo stabiliamo gli standard di settore. Nei nostri laboratori di prova, tecnici ed editori esperti utilizzano apparecchiature di misurazione di alta qualità. Questi test comportano un processo di validazione in più fasi. Il nostro complesso sistema di valutazione si basa su centinaia di misurazioni e parametri di riferimento ben fondati, che mantengono l'obiettività.Price comparison

