Recensione dell'Asus ROG Strix Scar 17 SE - Laptop per il gaming dotato di RTX 3080 Ti
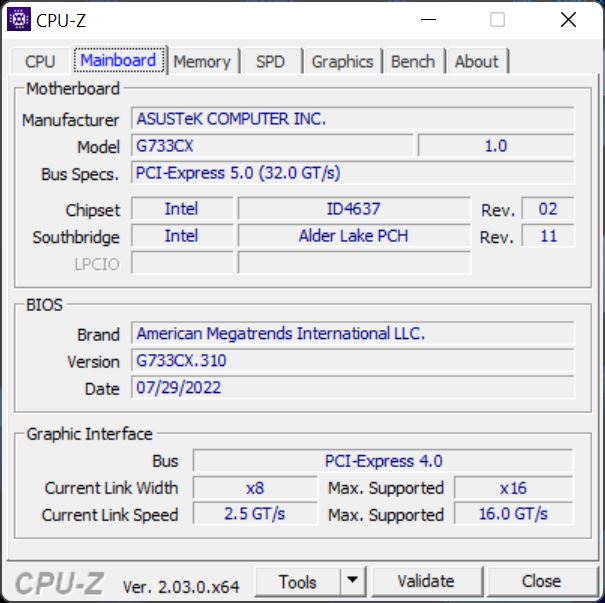
Il ROG Strix Scar SE è l'ammiraglia da gioco di Asus e anche nel 2022 è equipaggiato con i componenti più veloci attualmente disponibili sul mercato. Abbiamo testato il modello di punta G733CX con l'Intel Core i9-12950HX, la Nvidia GeForce RTX 3080 Ti, due SSD da 2 TB di Samsung e un veloce pannello QHD con frequenza di aggiornamento di 240 Hz. Anche il prezzo è di fascia alta, dato che l'MSRP della nostra unità di prova è di 3.999 euro (~$4.129).
Potenziali concorrenti a confronto
Punteggio | Data | Modello | Peso | Altezza | Dimensione | Risoluzione | Prezzo |
|---|---|---|---|---|---|---|---|
| 86.9 % v7 (old) | 11/2022 | Asus ROG Strix Scar 17 SE G733CX-LL014W i9-12950HX, GeForce RTX 3080 Ti Laptop GPU | 2.9 kg | 28.3 mm | 17.30" | 2560x1440 | |
| 88.9 % v7 (old) | 09/2022 | Lenovo Legion 7 16IAX7-82TD004SGE i9-12900HX, GeForce RTX 3080 Ti Laptop GPU | 2.6 kg | 20 mm | 16.00" | 2560x1600 | |
| 88.3 % v7 (old) | 08/2022 | MSI Titan GT77 12UHS i9-12900HX, GeForce RTX 3080 Ti Laptop GPU | 3.3 kg | 23 mm | 17.30" | 1920x1080 | |
| 87.6 % v7 (old) | 09/2022 | Schenker XMG Neo 17 M22 R9 6900HX, GeForce RTX 3080 Ti Laptop GPU | 2.8 kg | 27 mm | 17.00" | 2560x1600 | |
| 89.2 % v7 (old) | 05/2022 | Alienware x17 R2 P48E i9-12900HK, GeForce RTX 3080 Ti Laptop GPU | 3.1 kg | 20.9 mm | 17.30" | 1920x1080 |
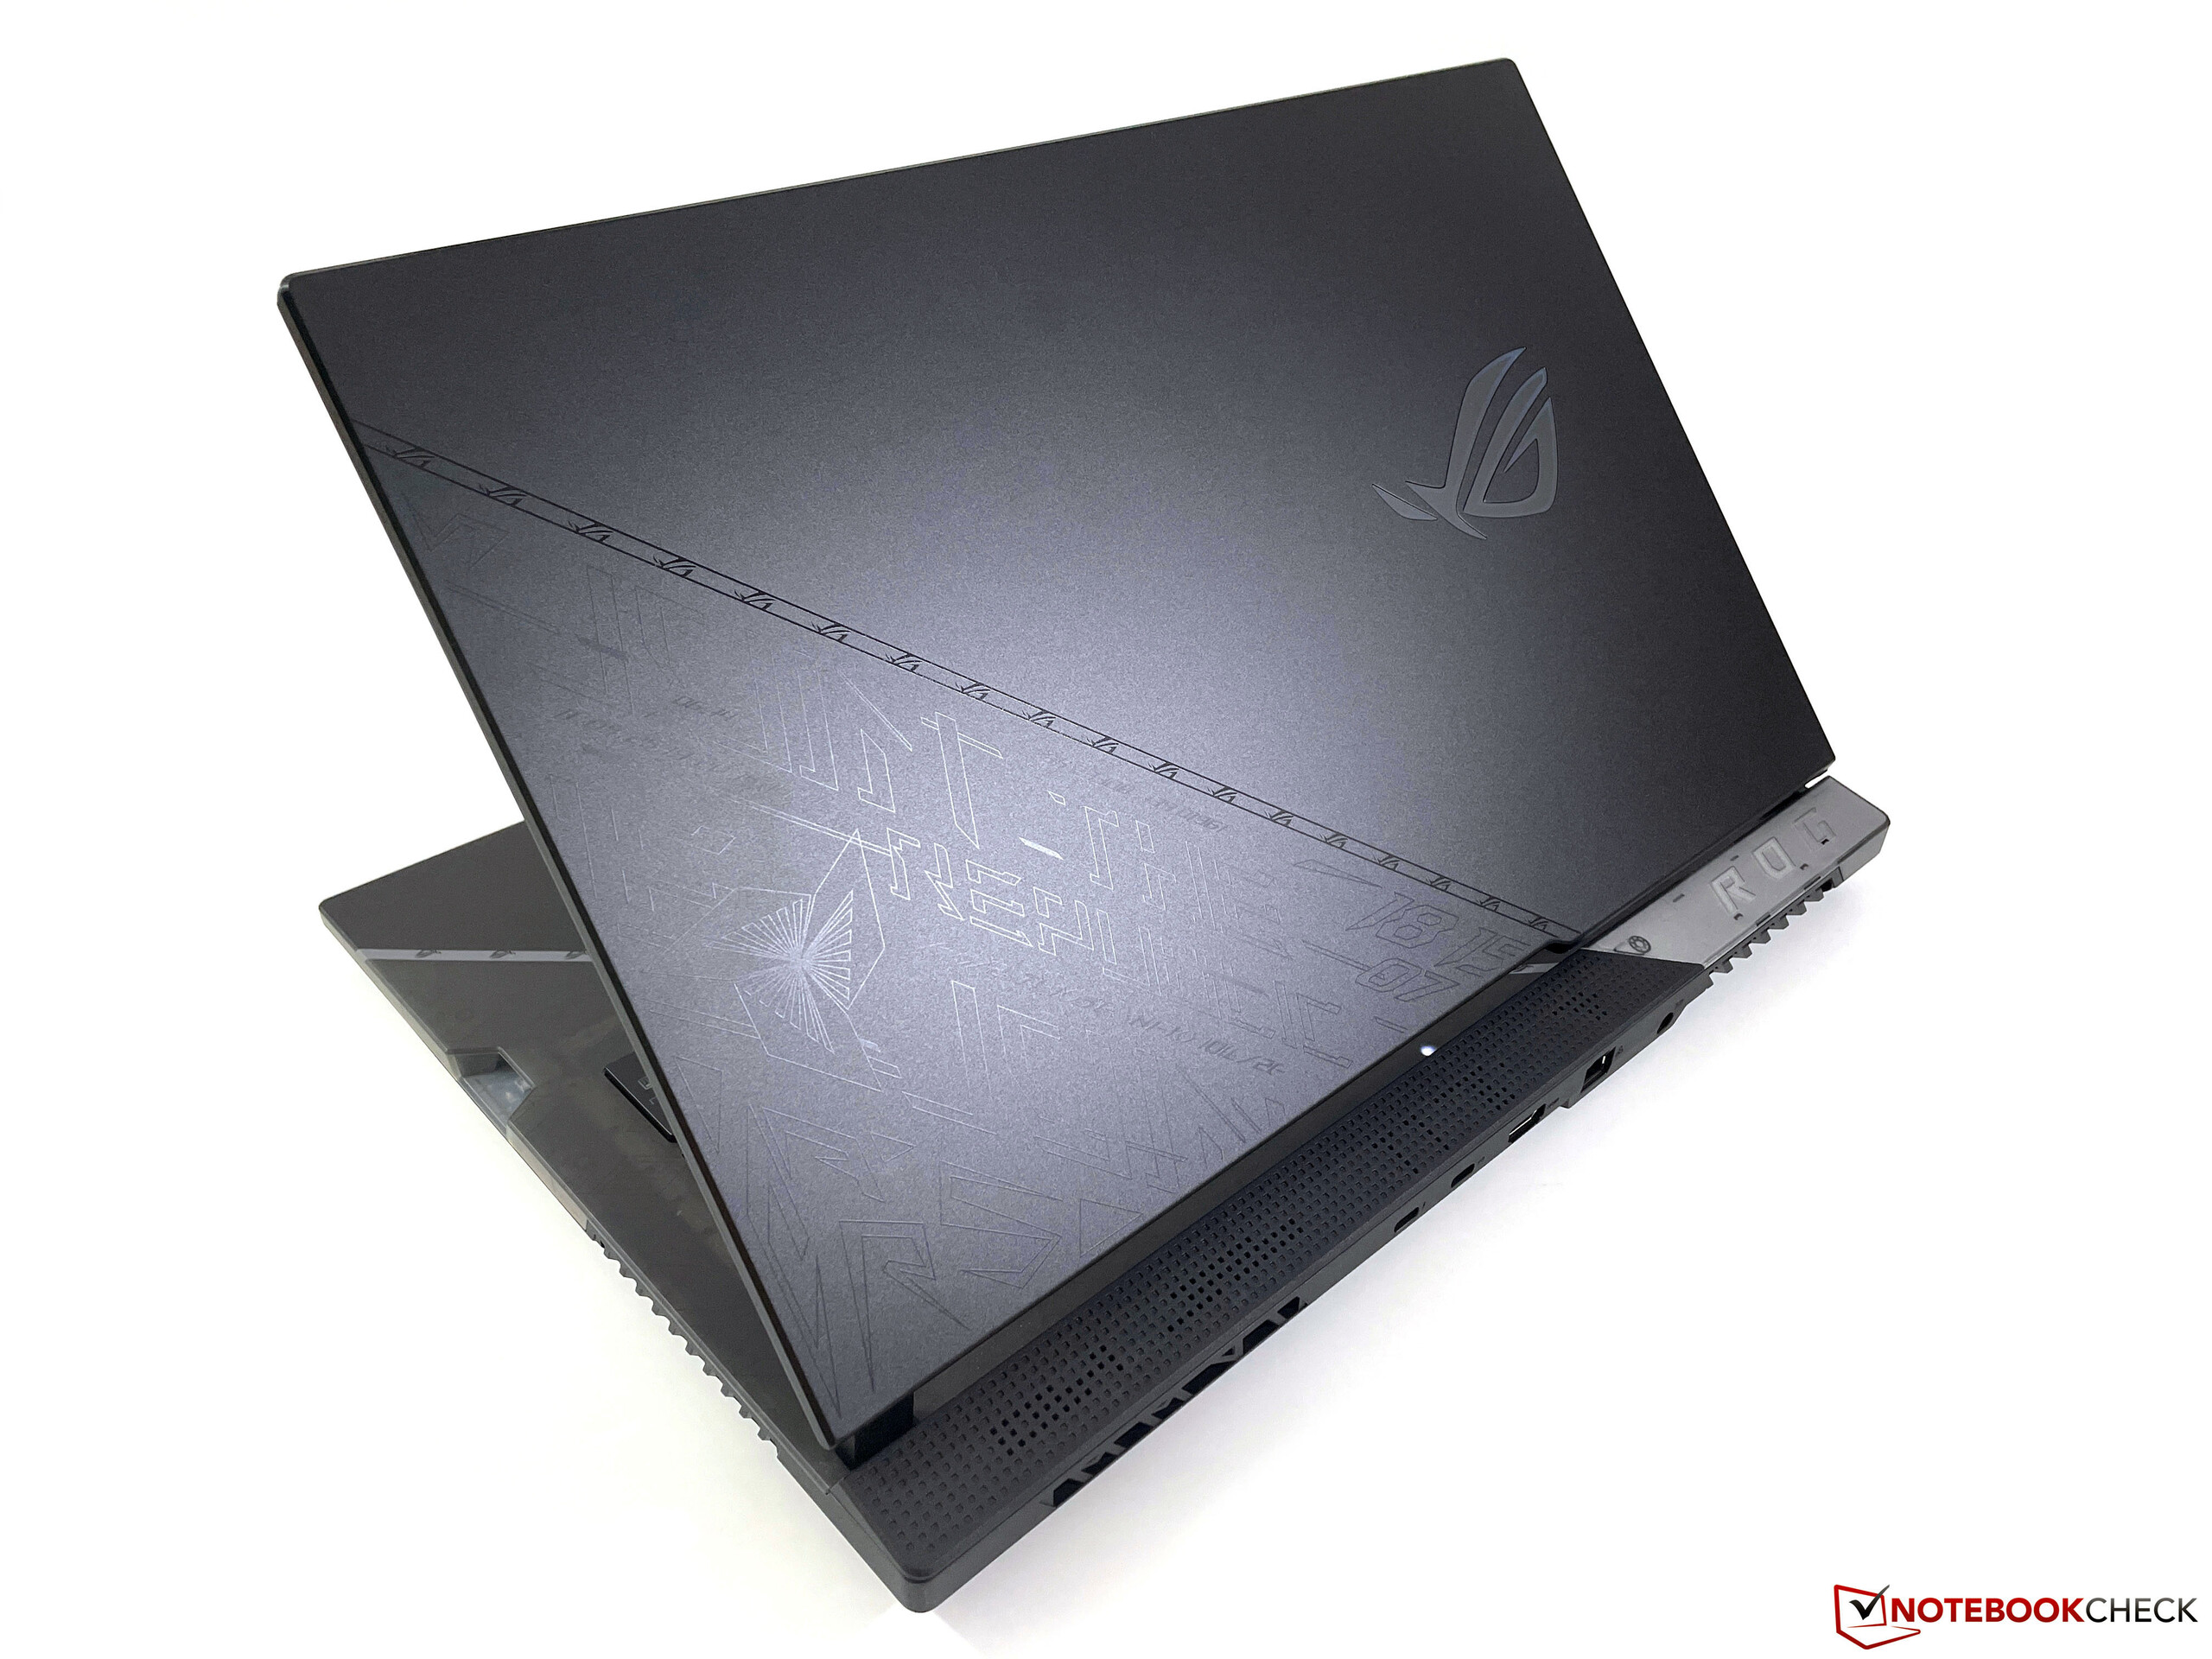
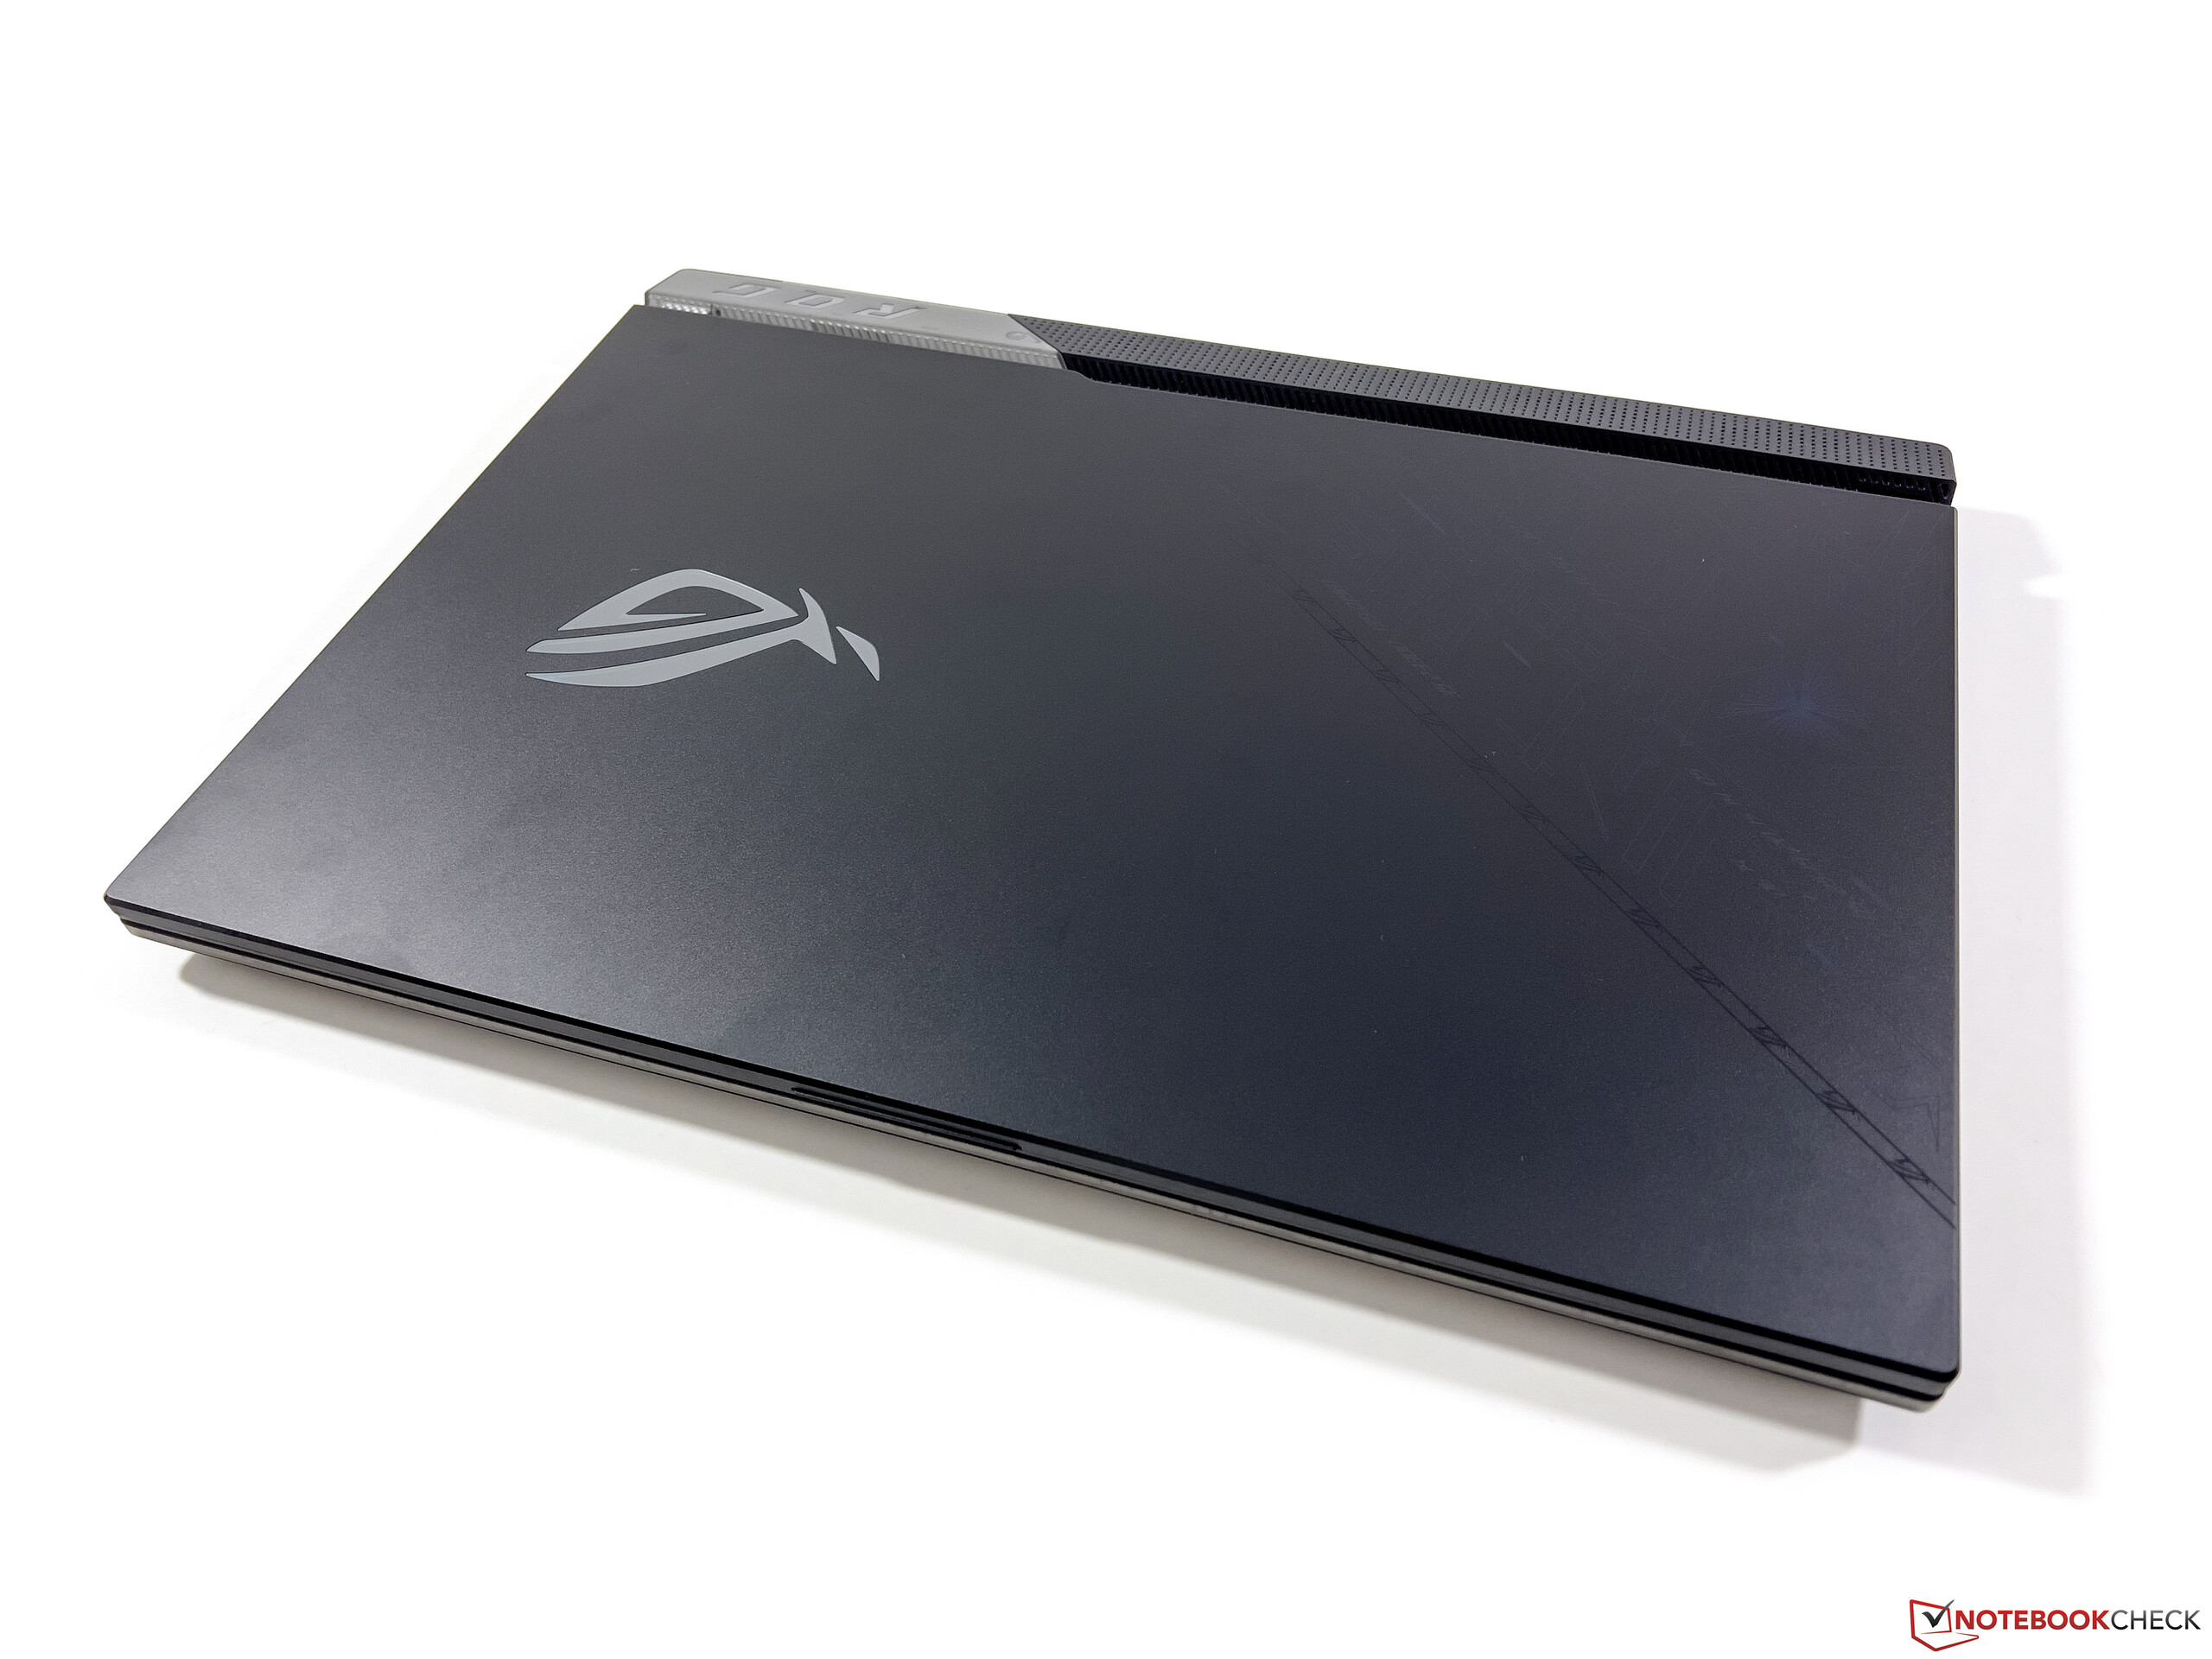
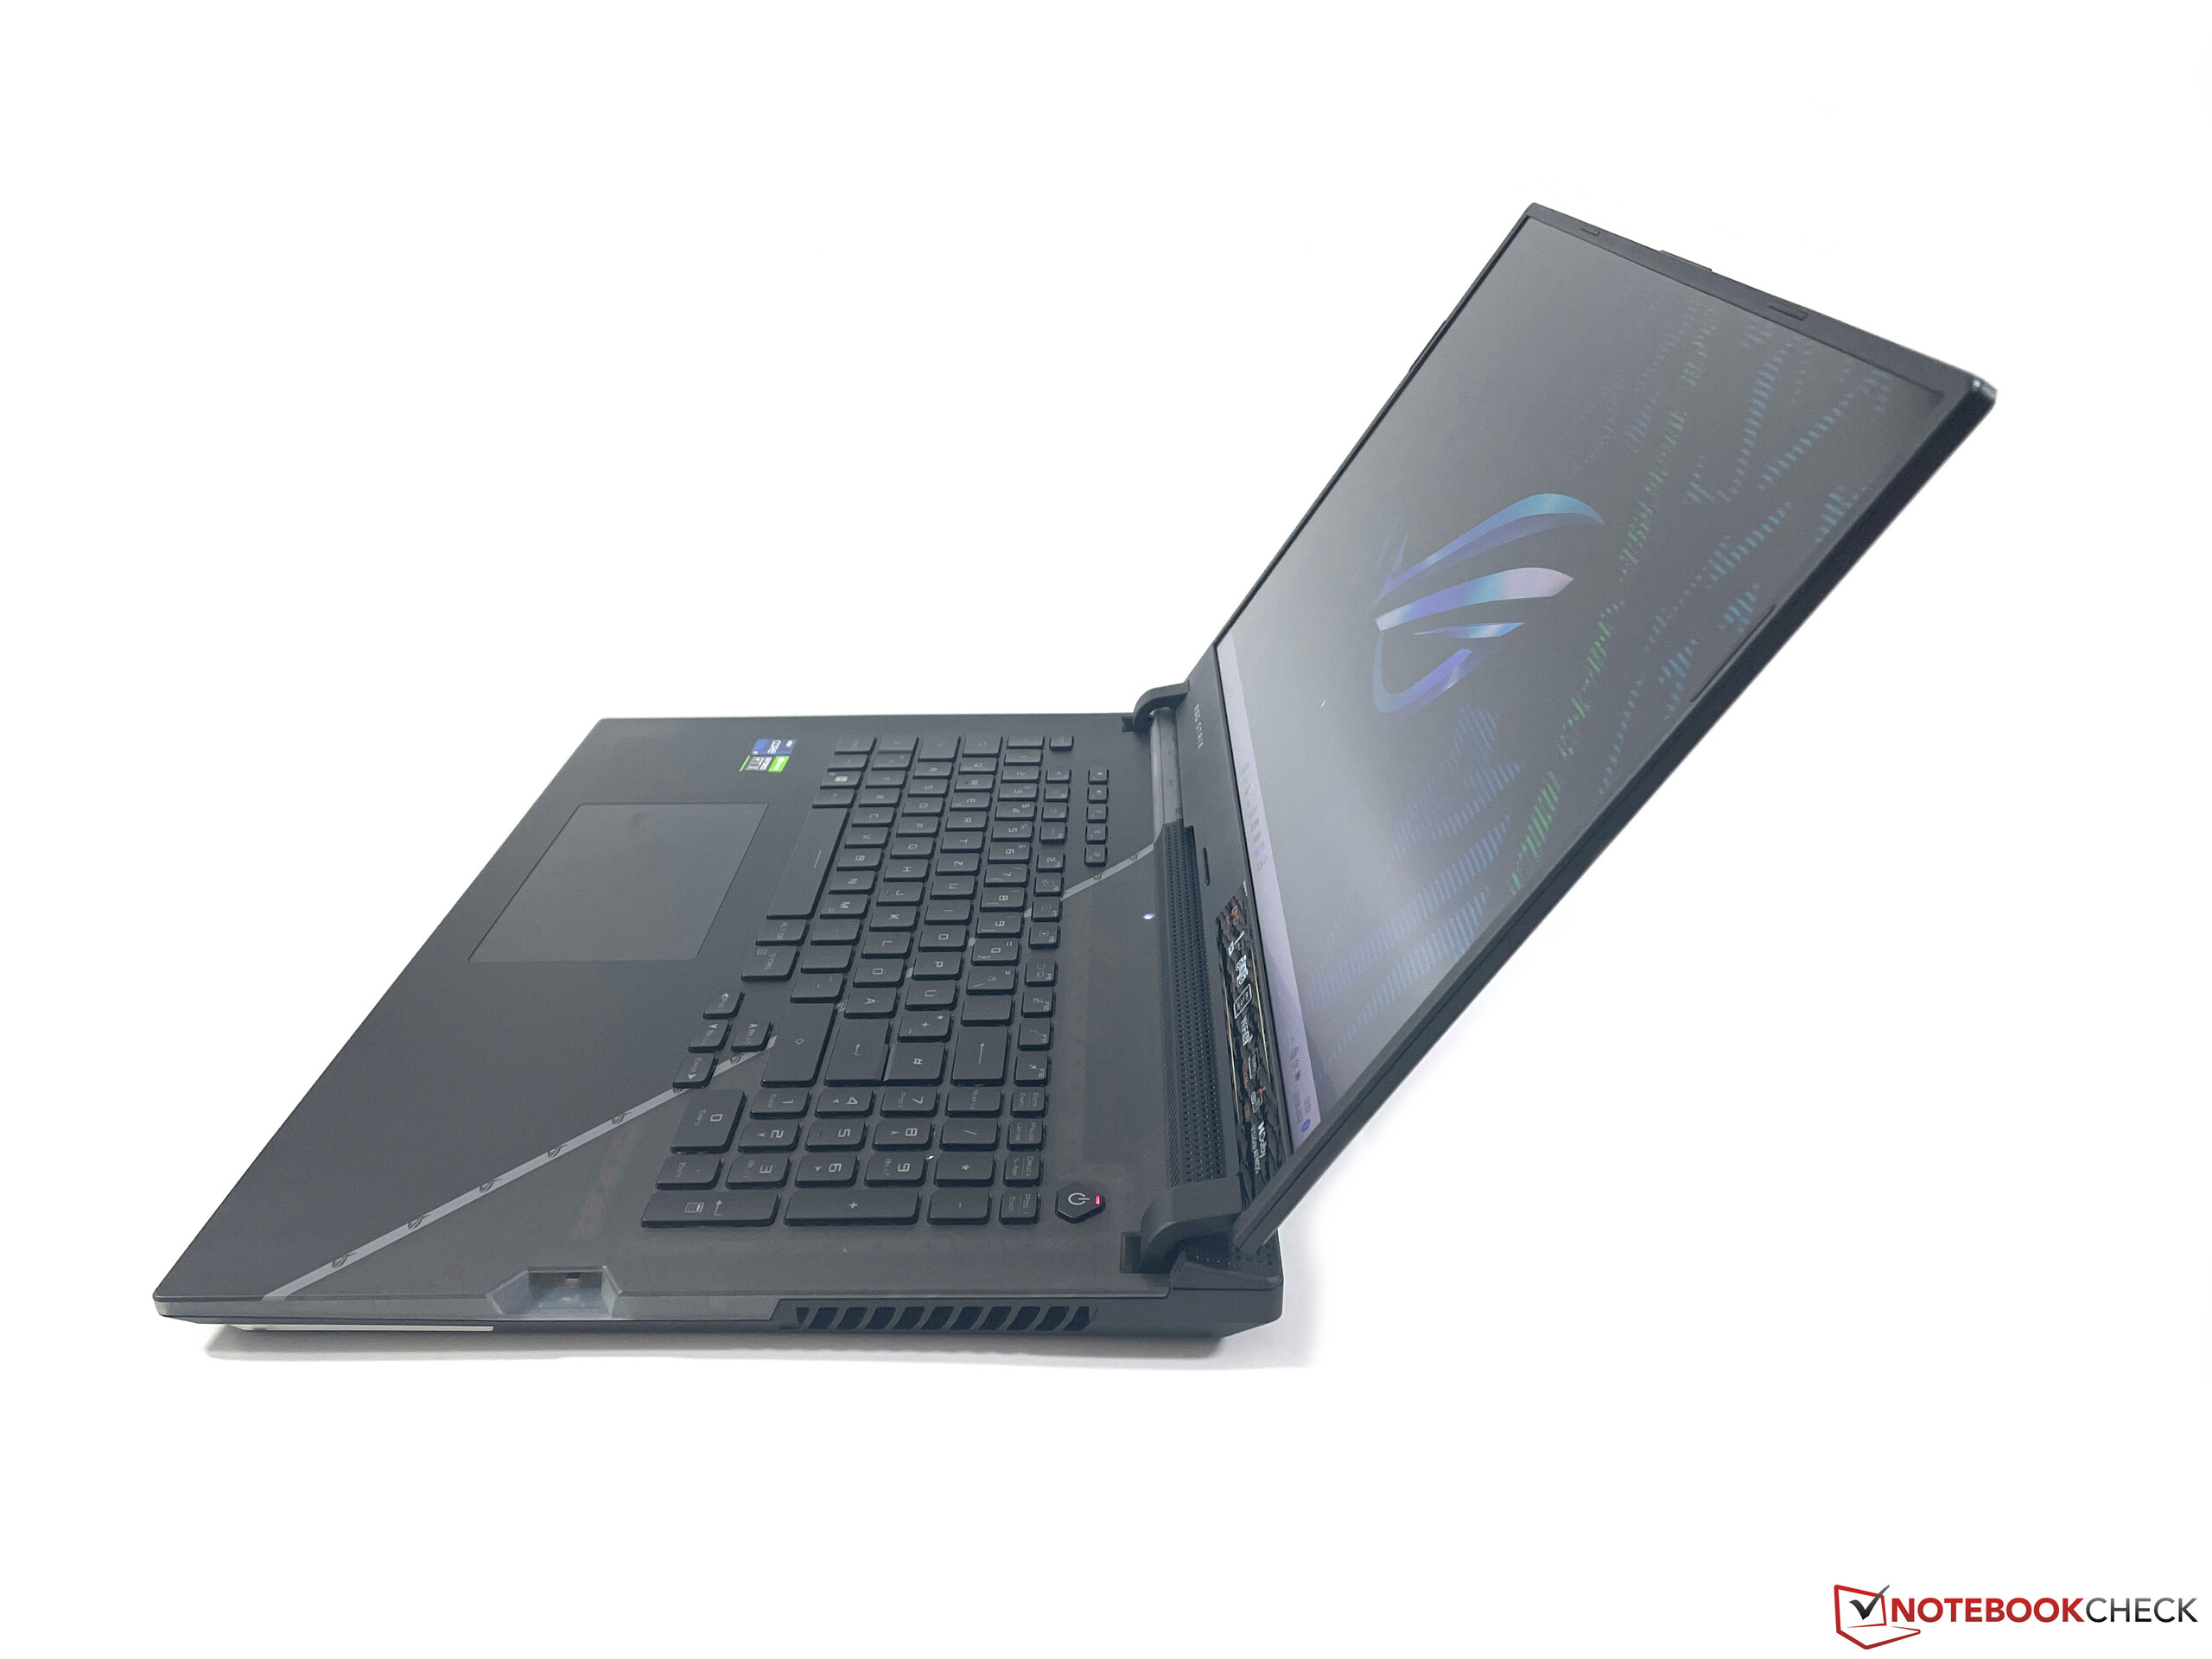
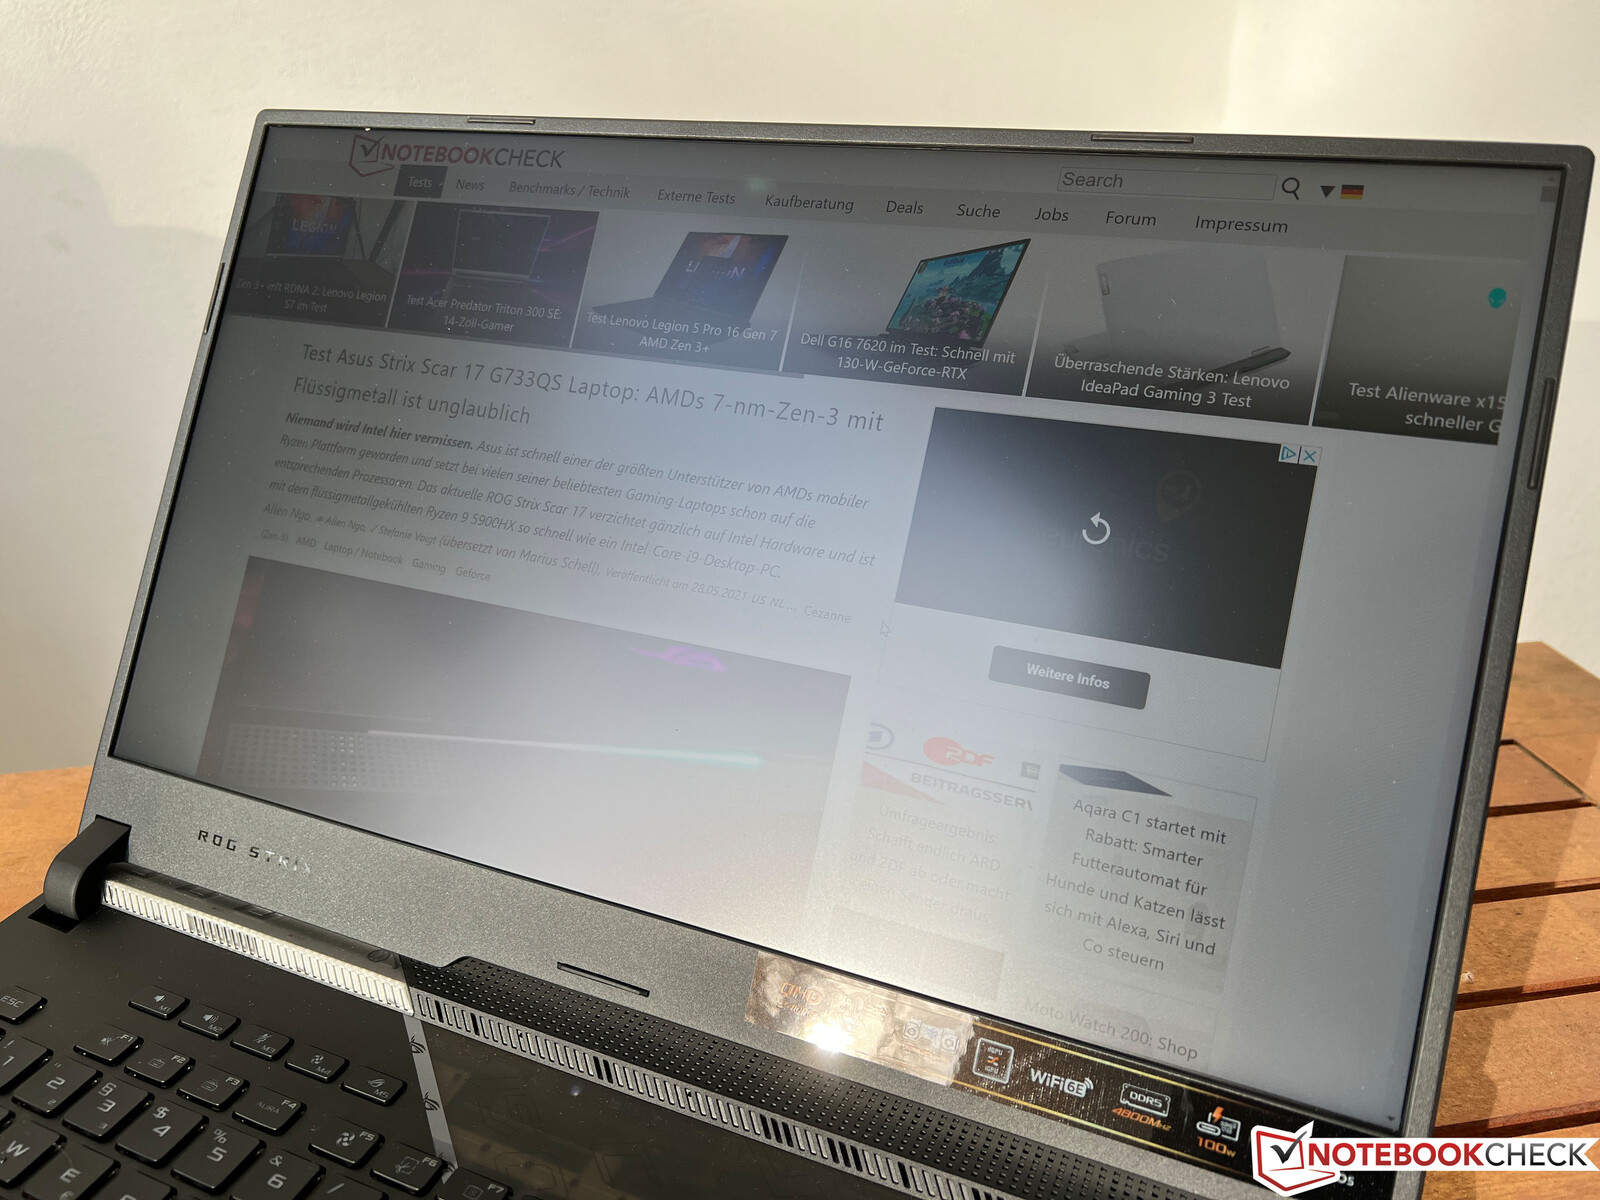
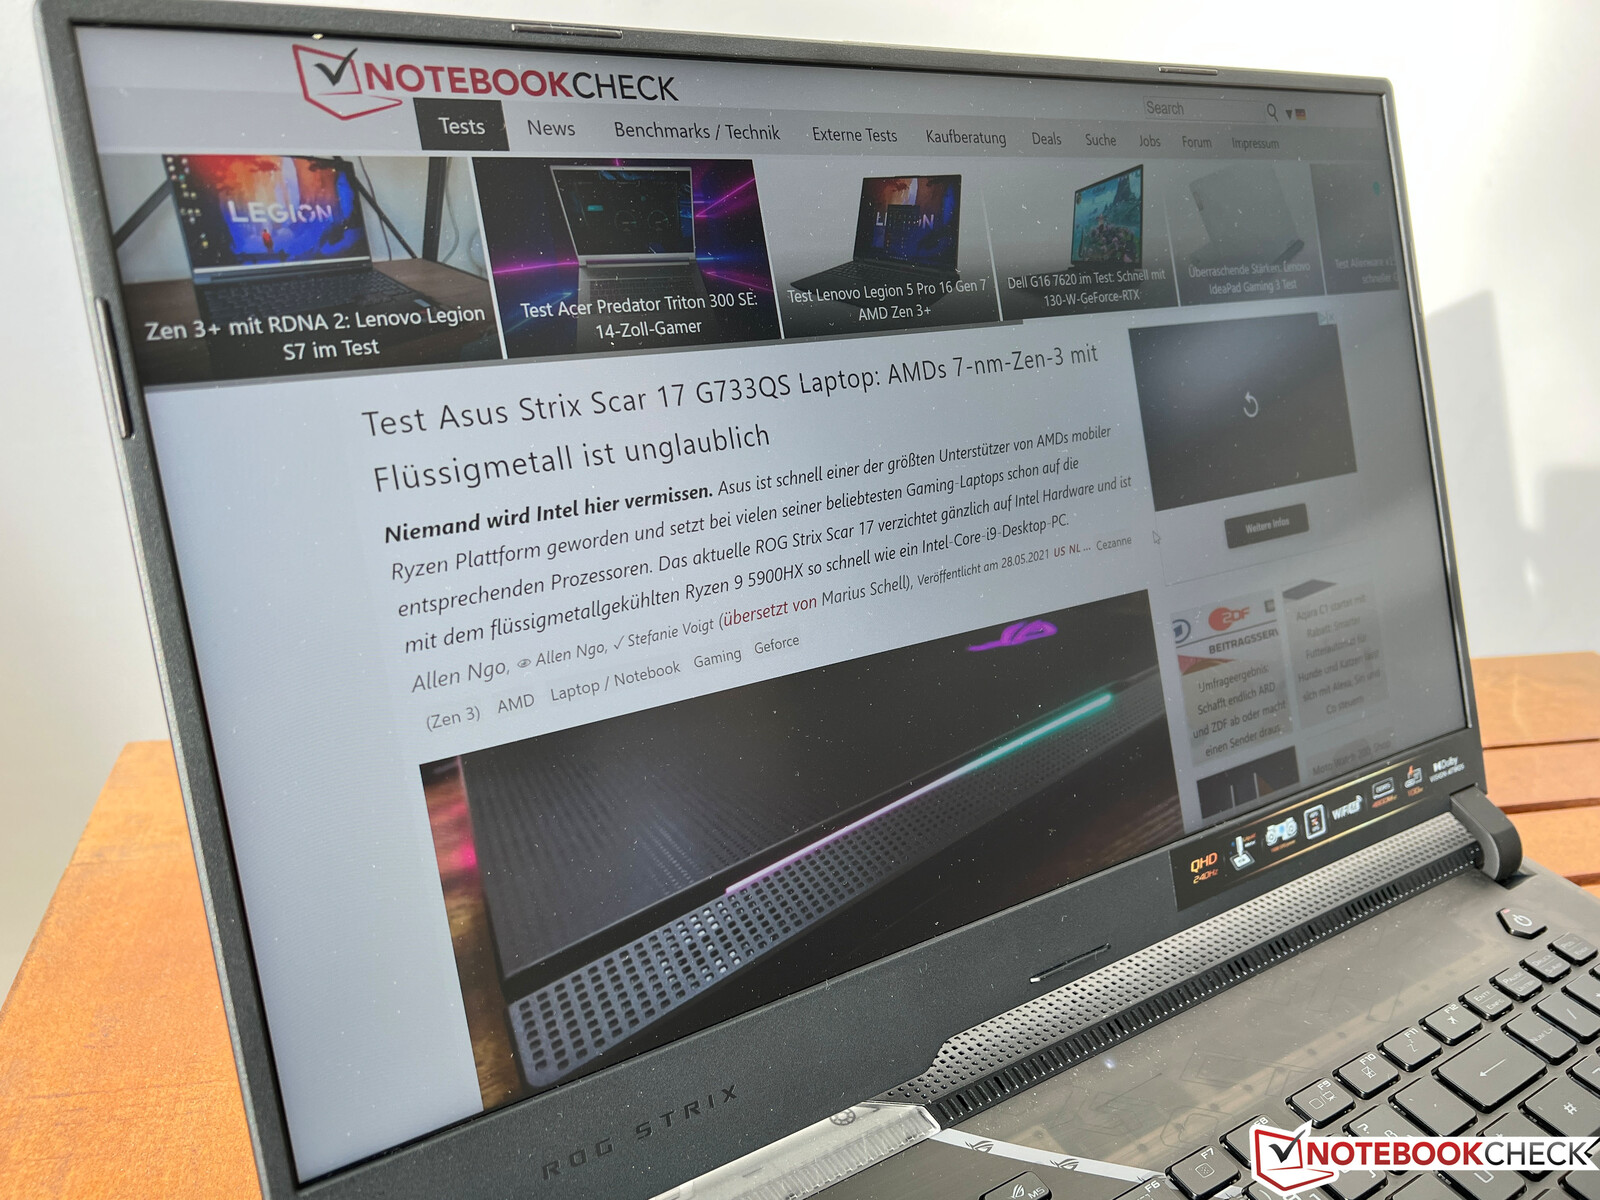
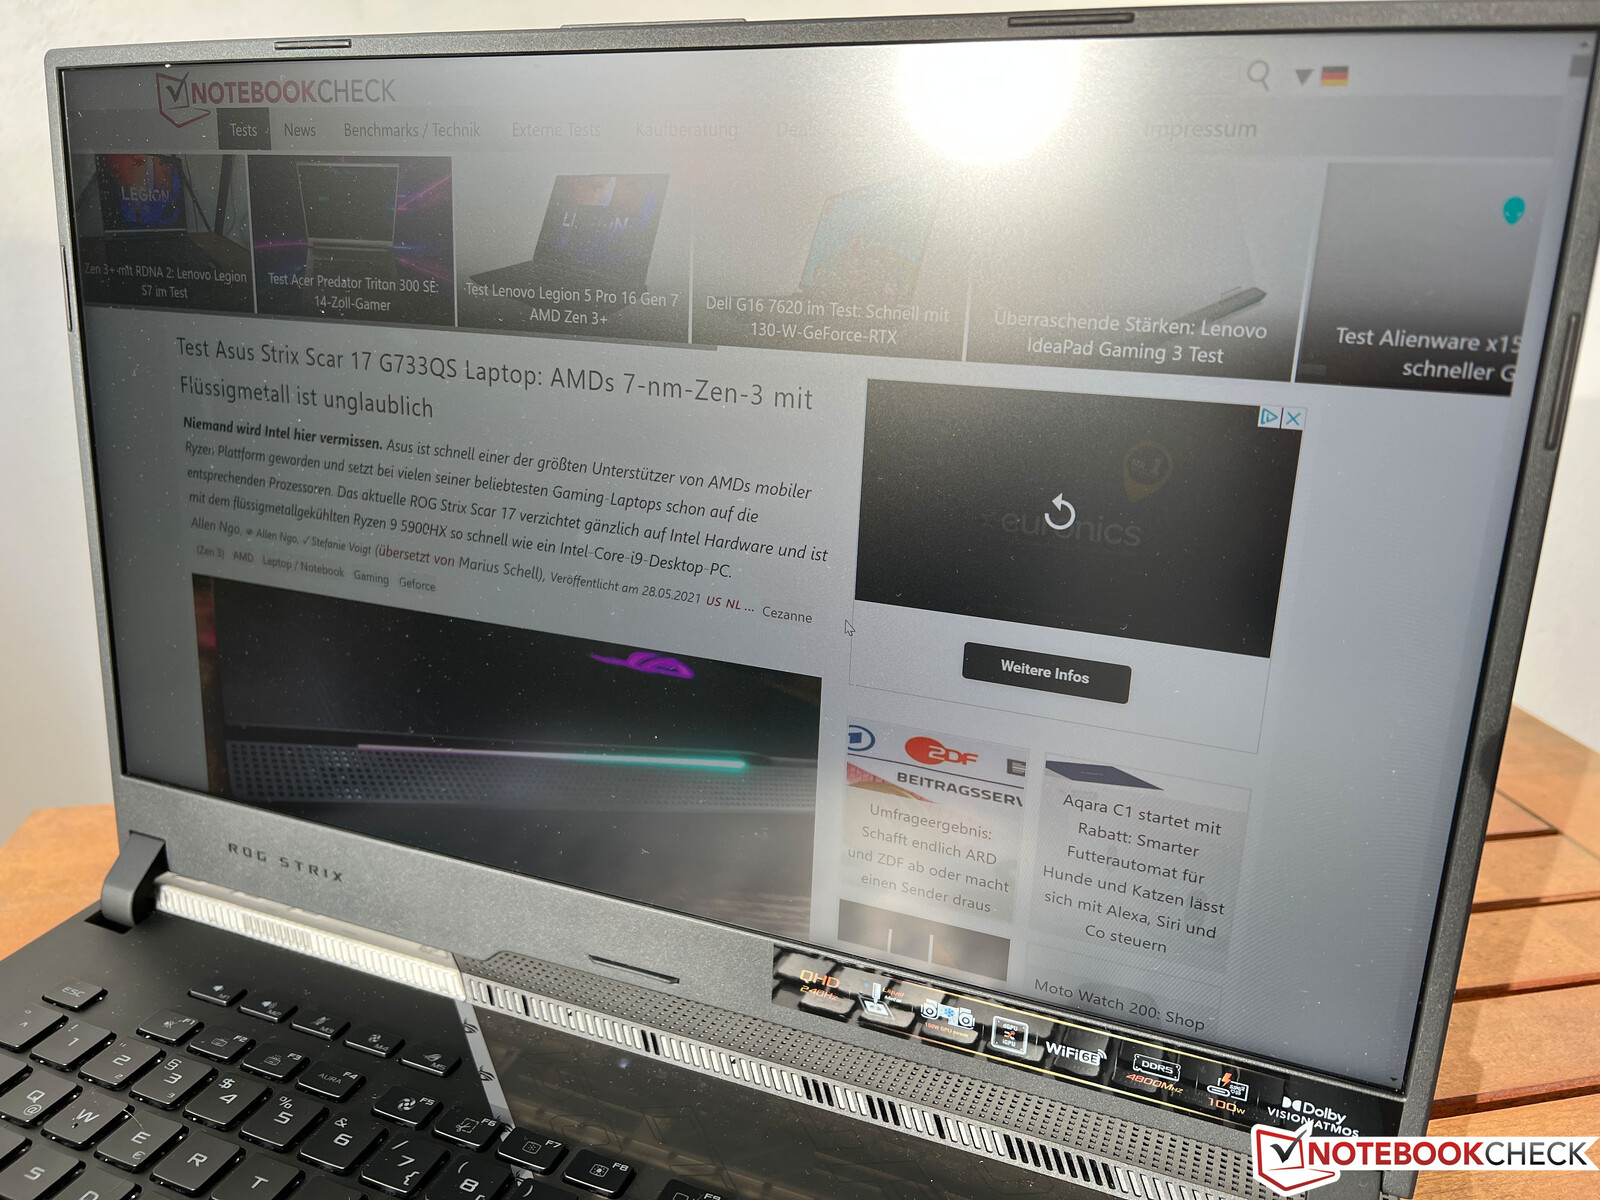
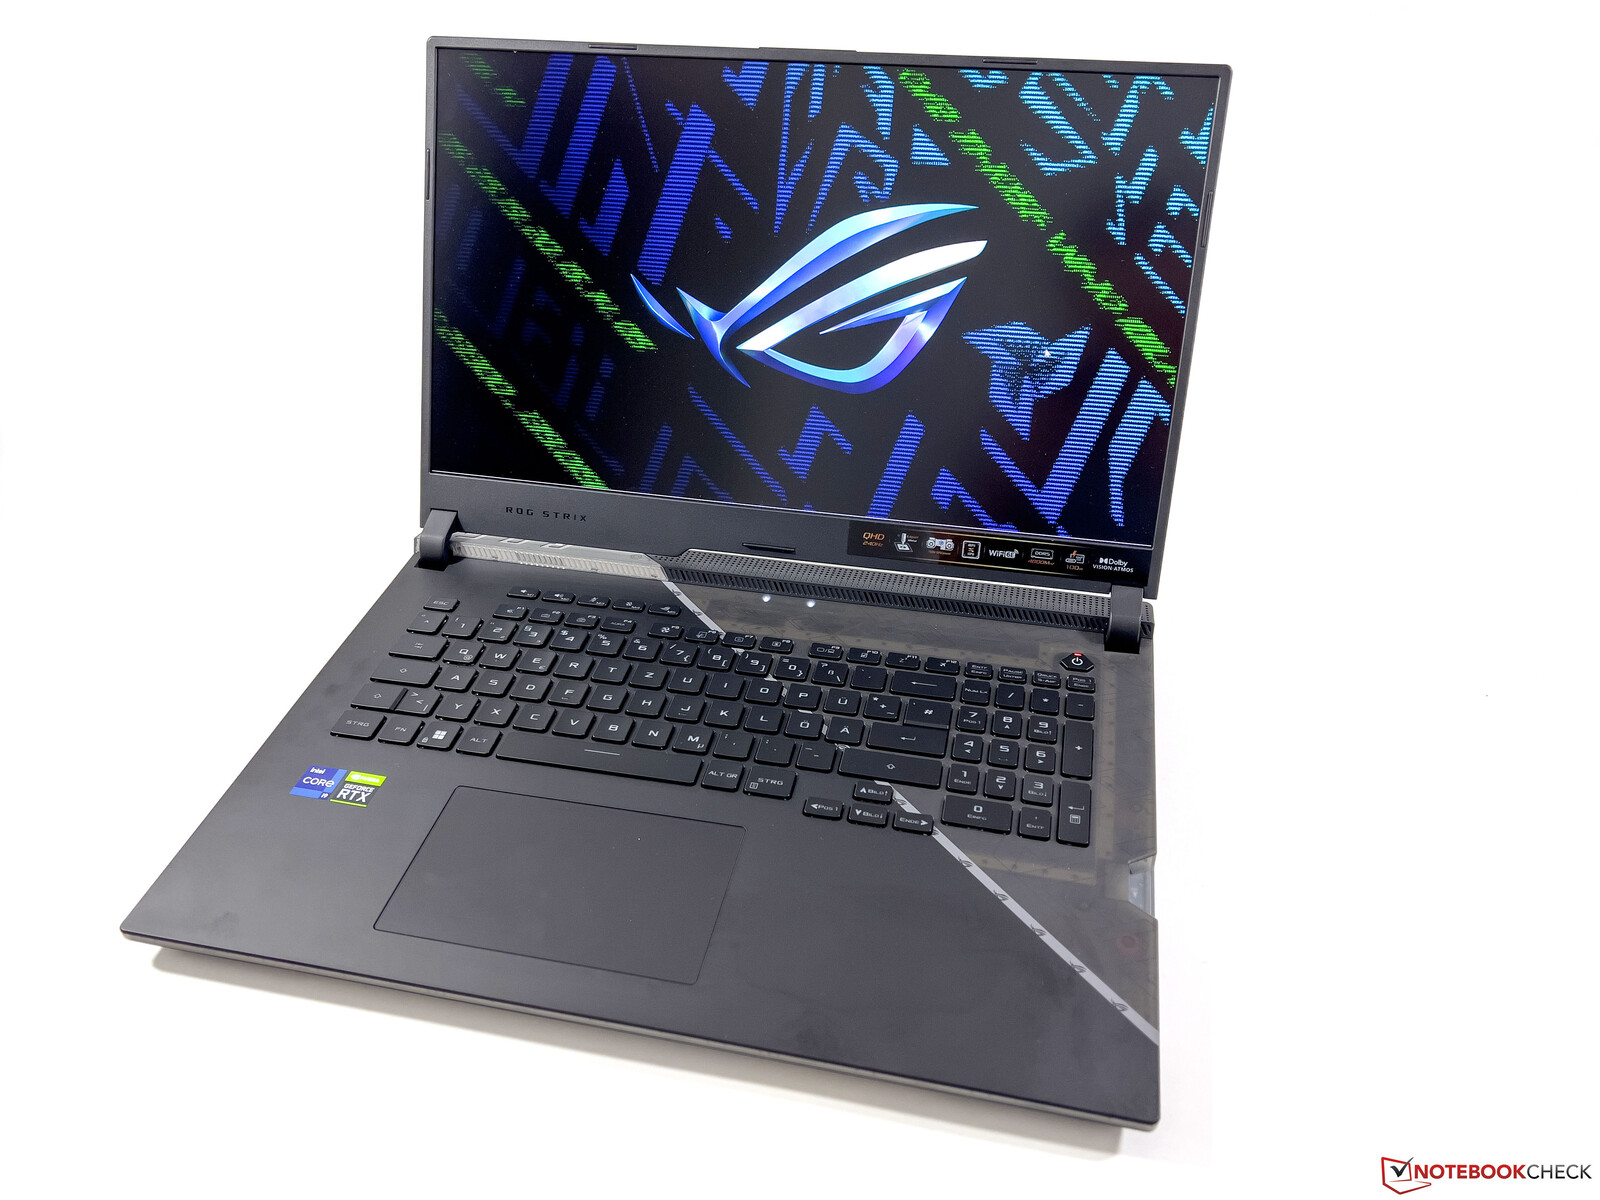
Case - Laptop da gioco con un design che si distingue e un'ampia illuminazione
Il ROG Strix Scar 17 è chiaramente un portatile da gioco che non nasconde affatto le sue ambizioni. Il case è in gran parte identico al g733QS dello scorso annoe una parte dell'unità di base è di nuovo trasparente. Inoltre, sono presenti elementi ampiamente illuminati e alcuni elementi di design o espedienti aggiuntivi, come la speciale scritta sul coperchio che diventa visibile solo se illuminata da una luce UV
La qualità del case in plastica è complessivamente buona, anche se le superfici continuano a essere soggette a impronte digitali e si possono sentire occasionalmente lievi scricchiolii quando si apre il display, ad esempio. La stabilità della spessa unità di base è discreta, ma è ancora possibile esercitare una minima pressione sull'unità di base nell'area centrale della tastiera. Sebbene il coperchio del display, relativamente sottile, faccia un buon lavoro, la cerniera non è ancora in grado di evitare qualche lieve oscillazione dopo aver spostato il portatile, ad esempio.
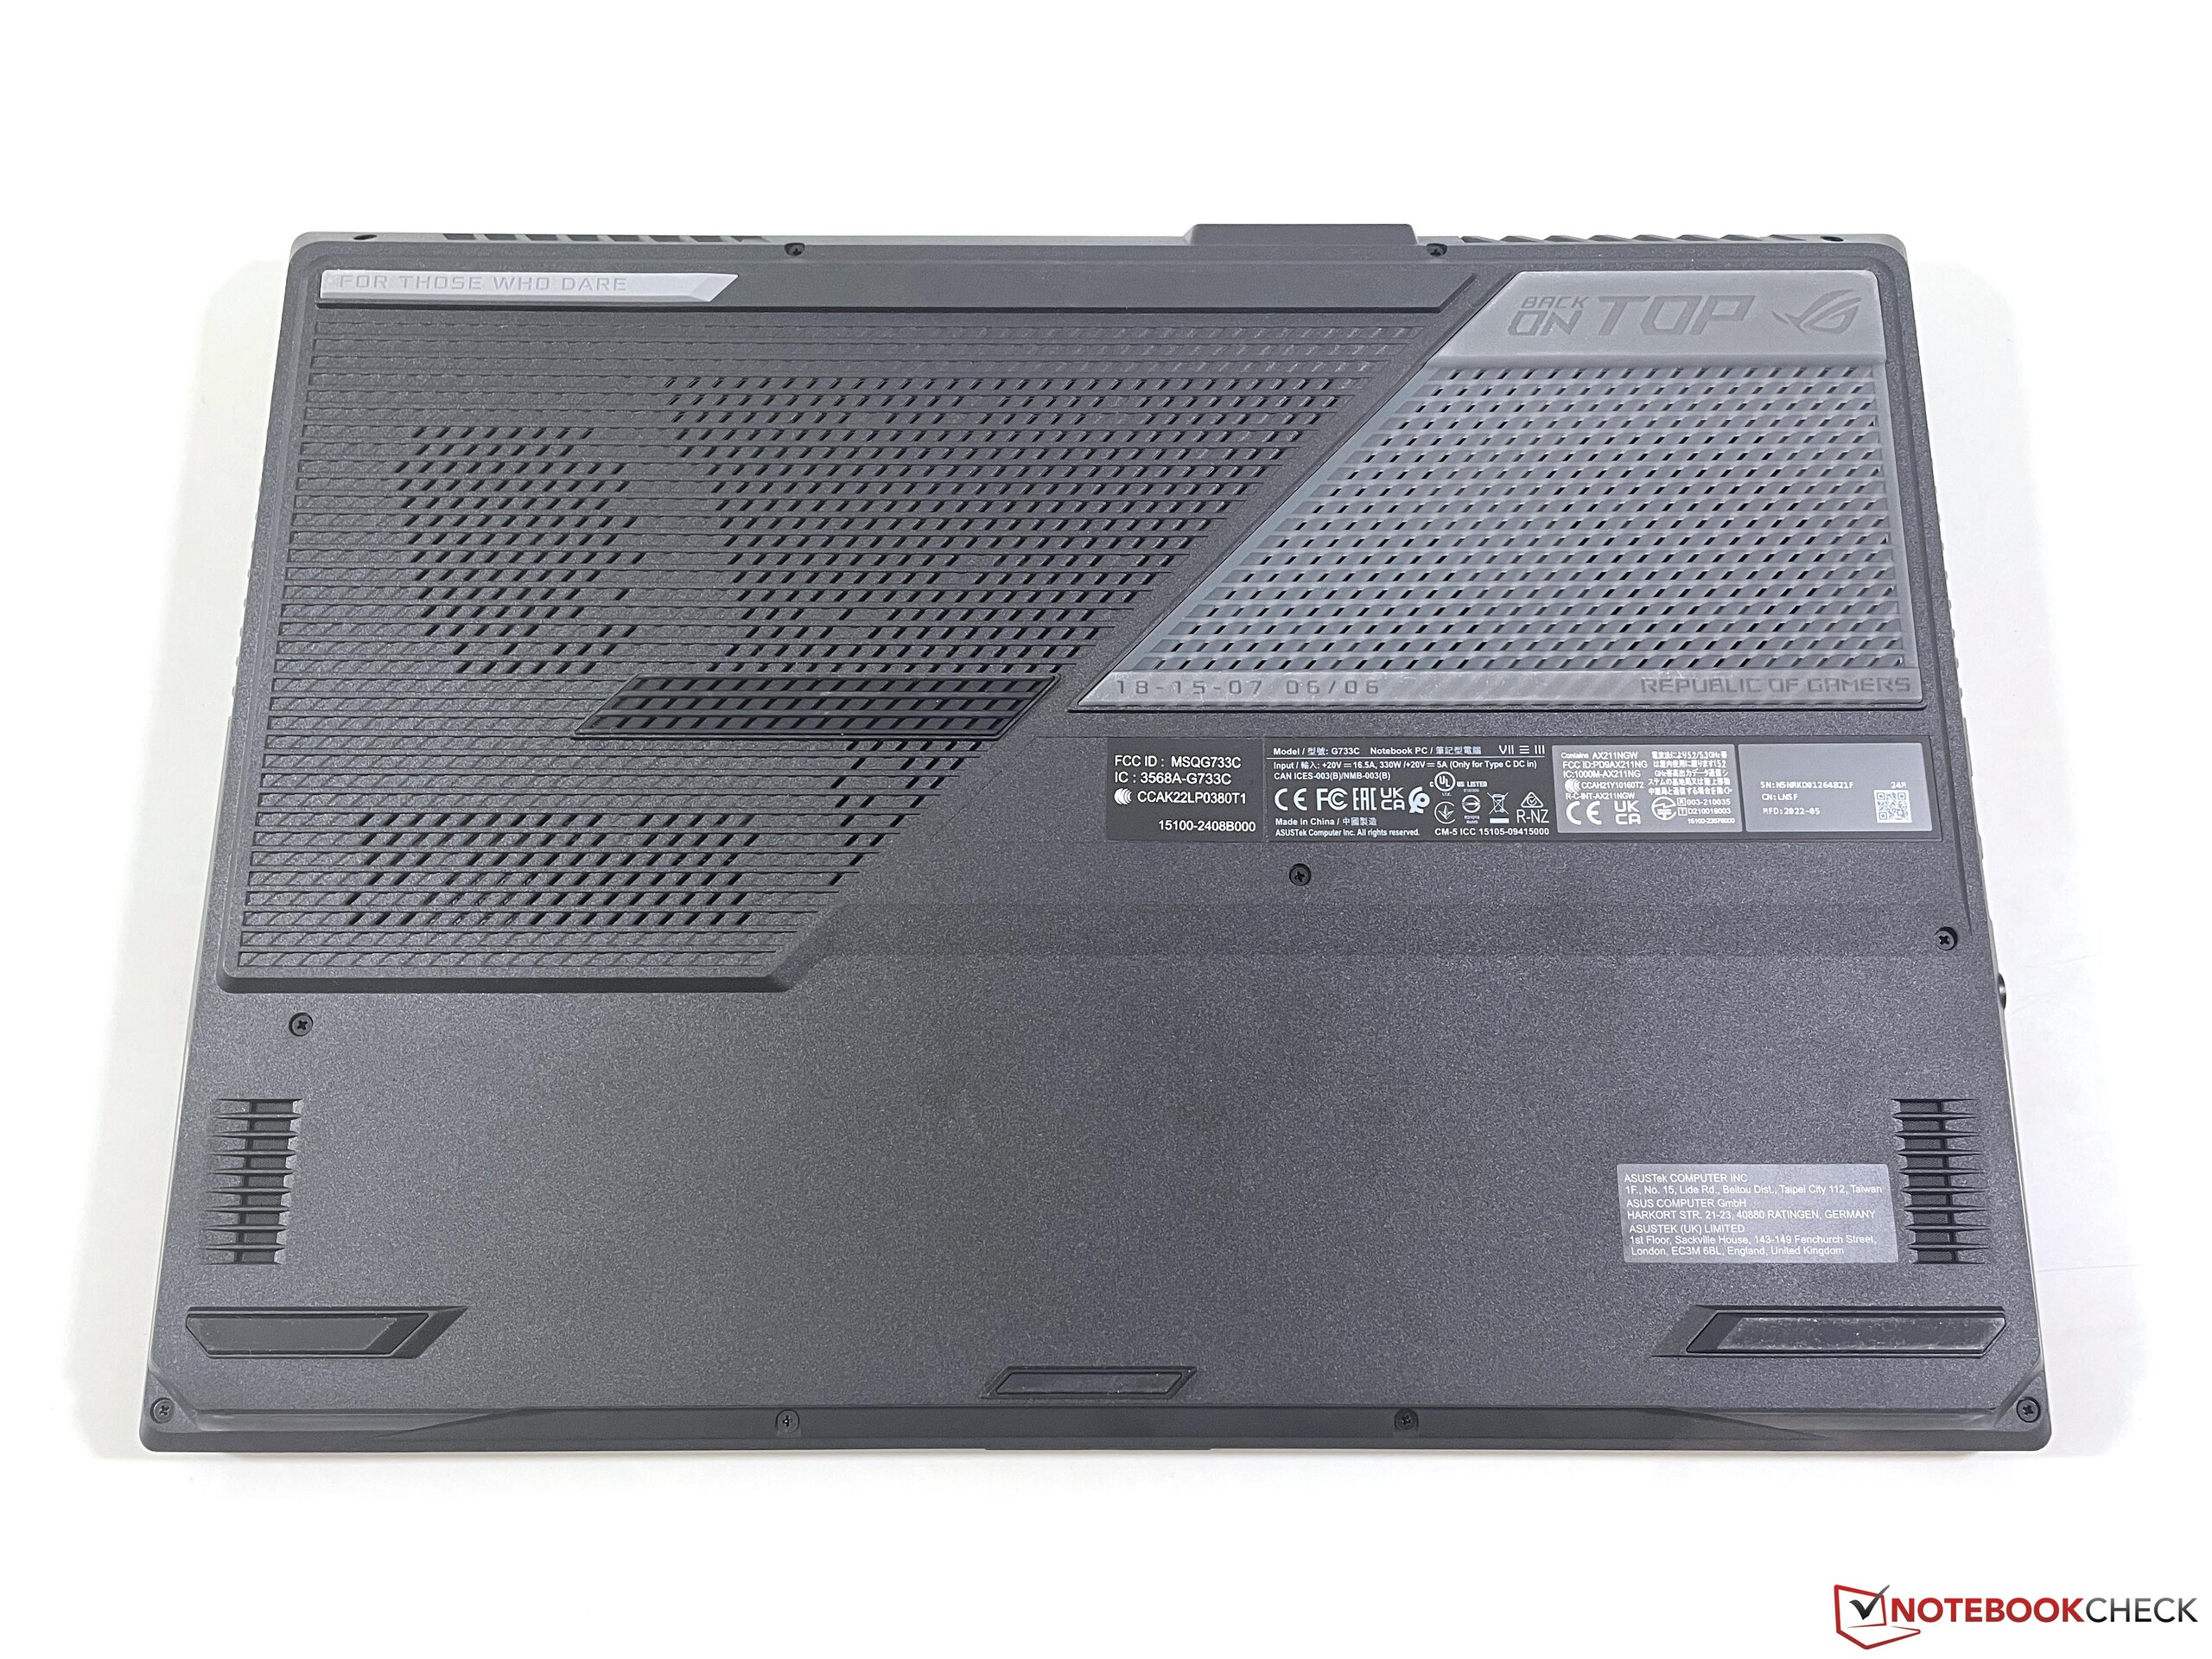
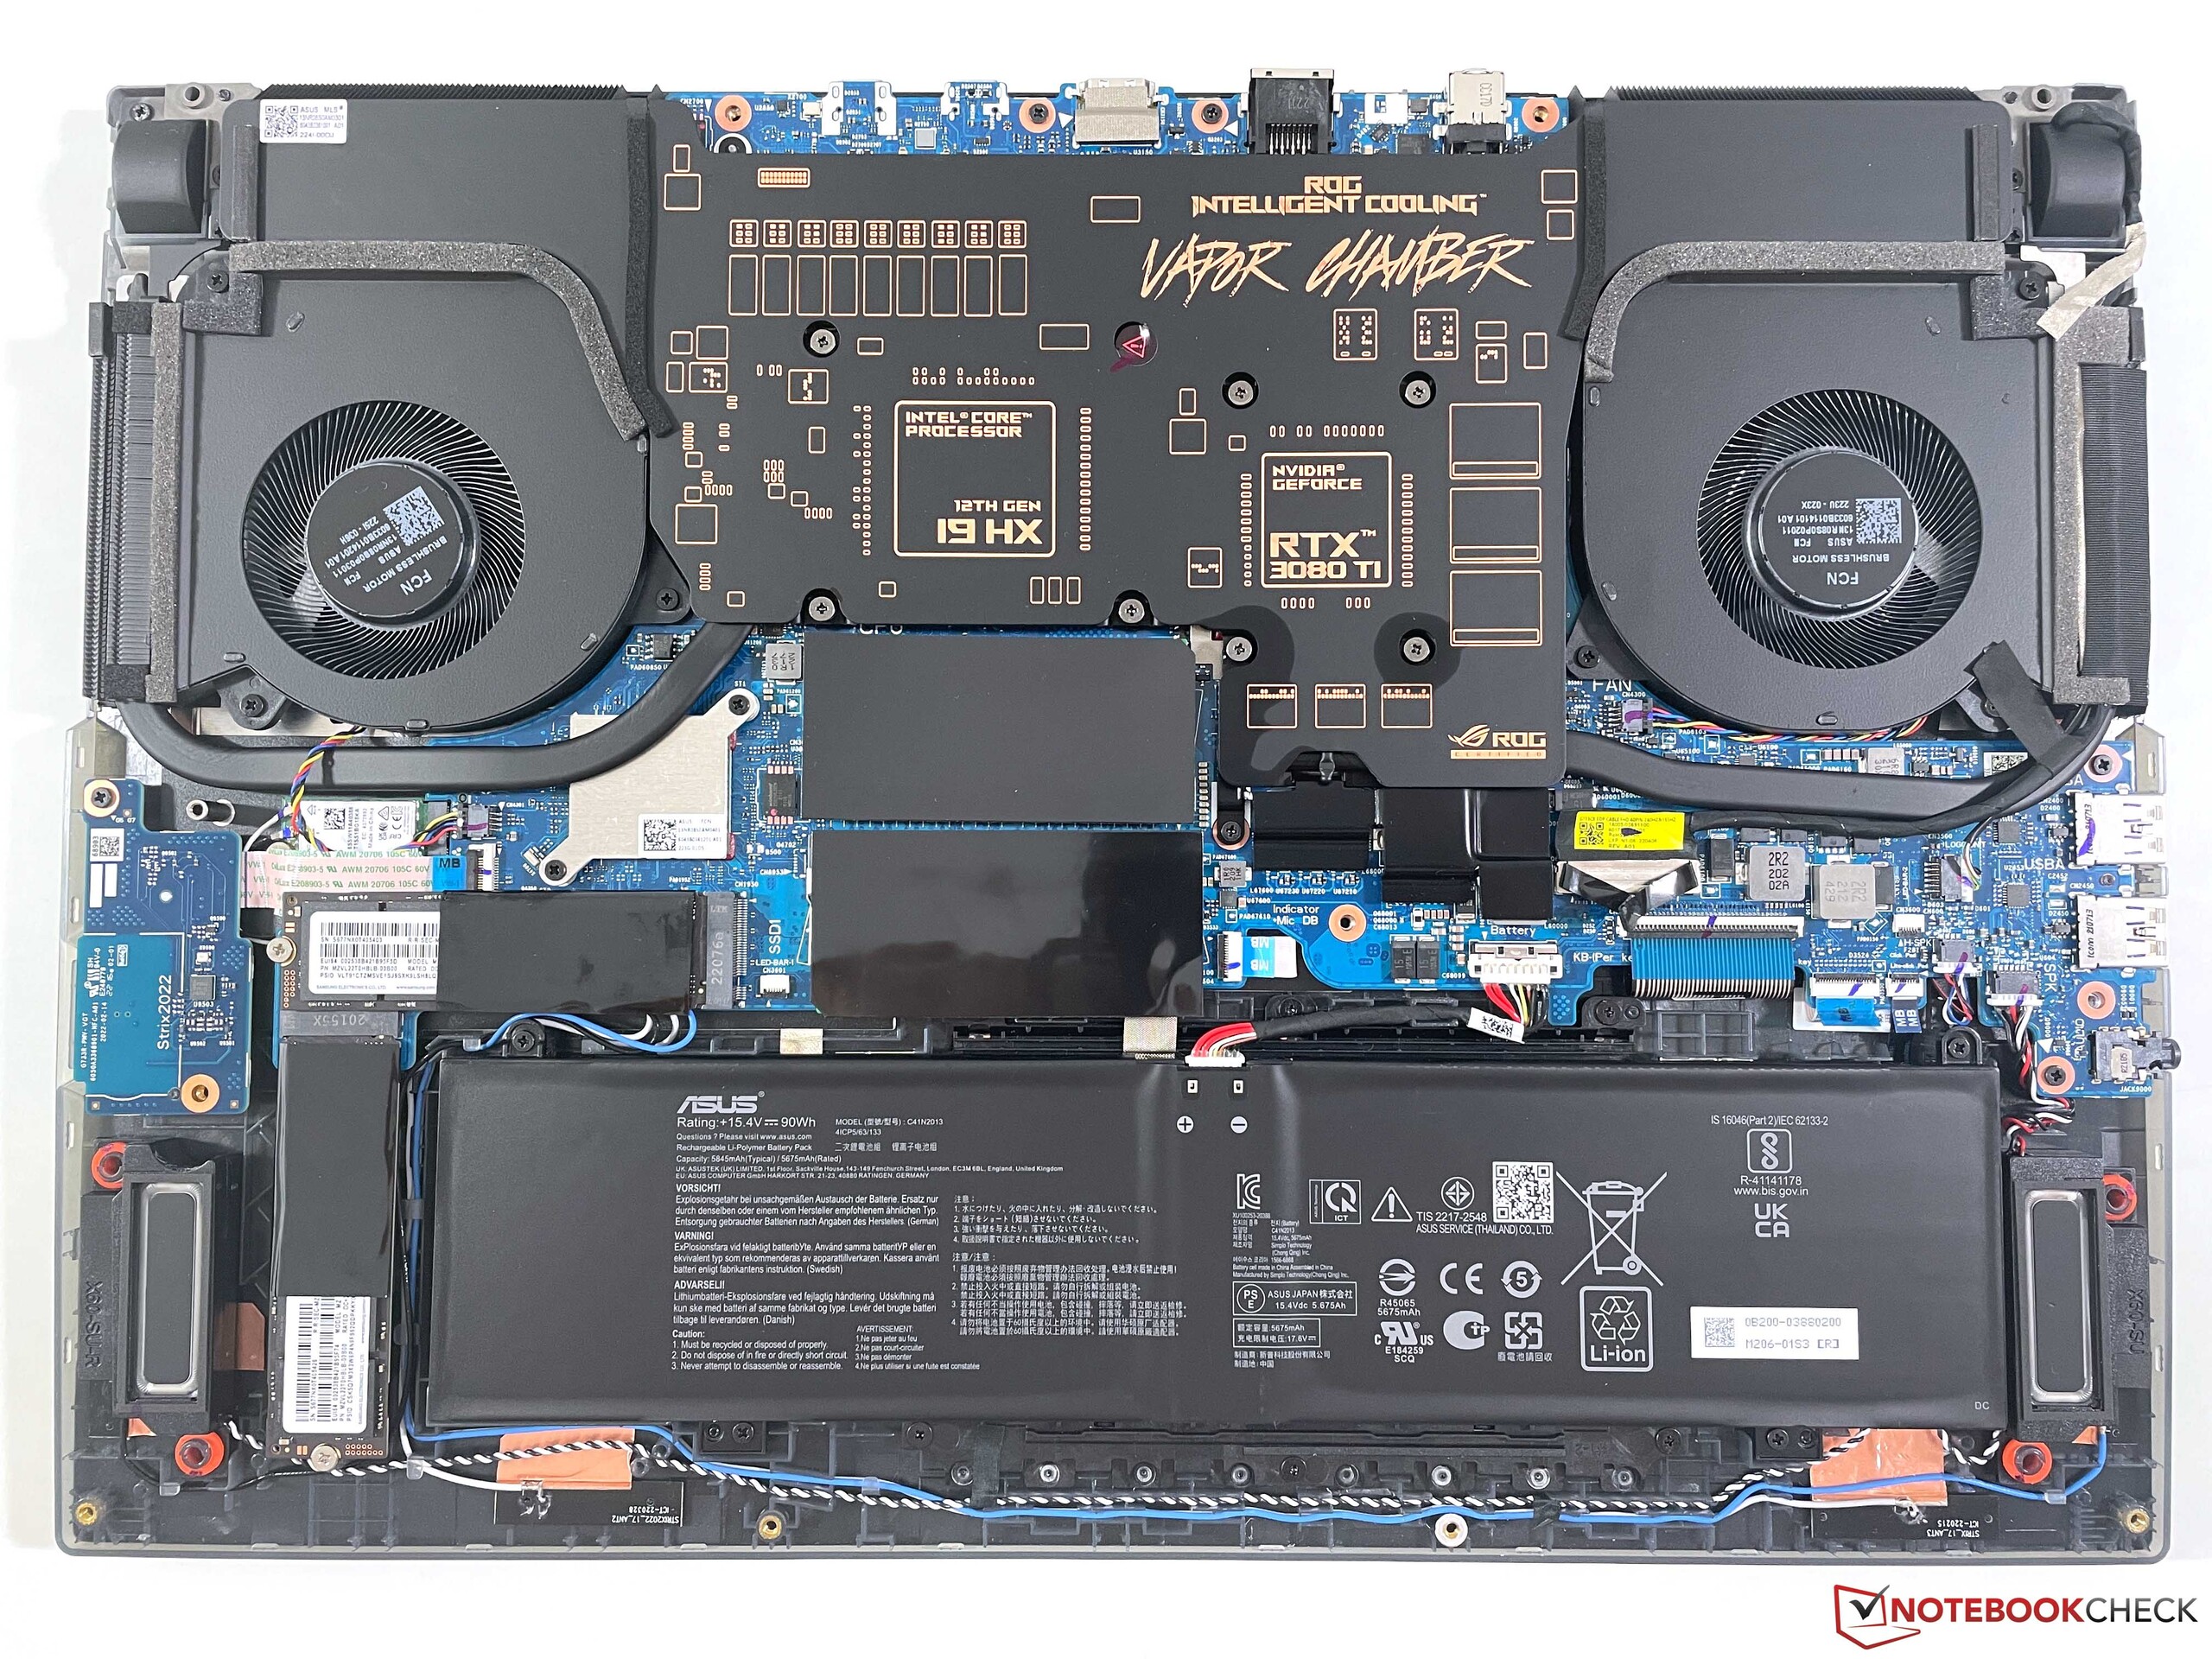
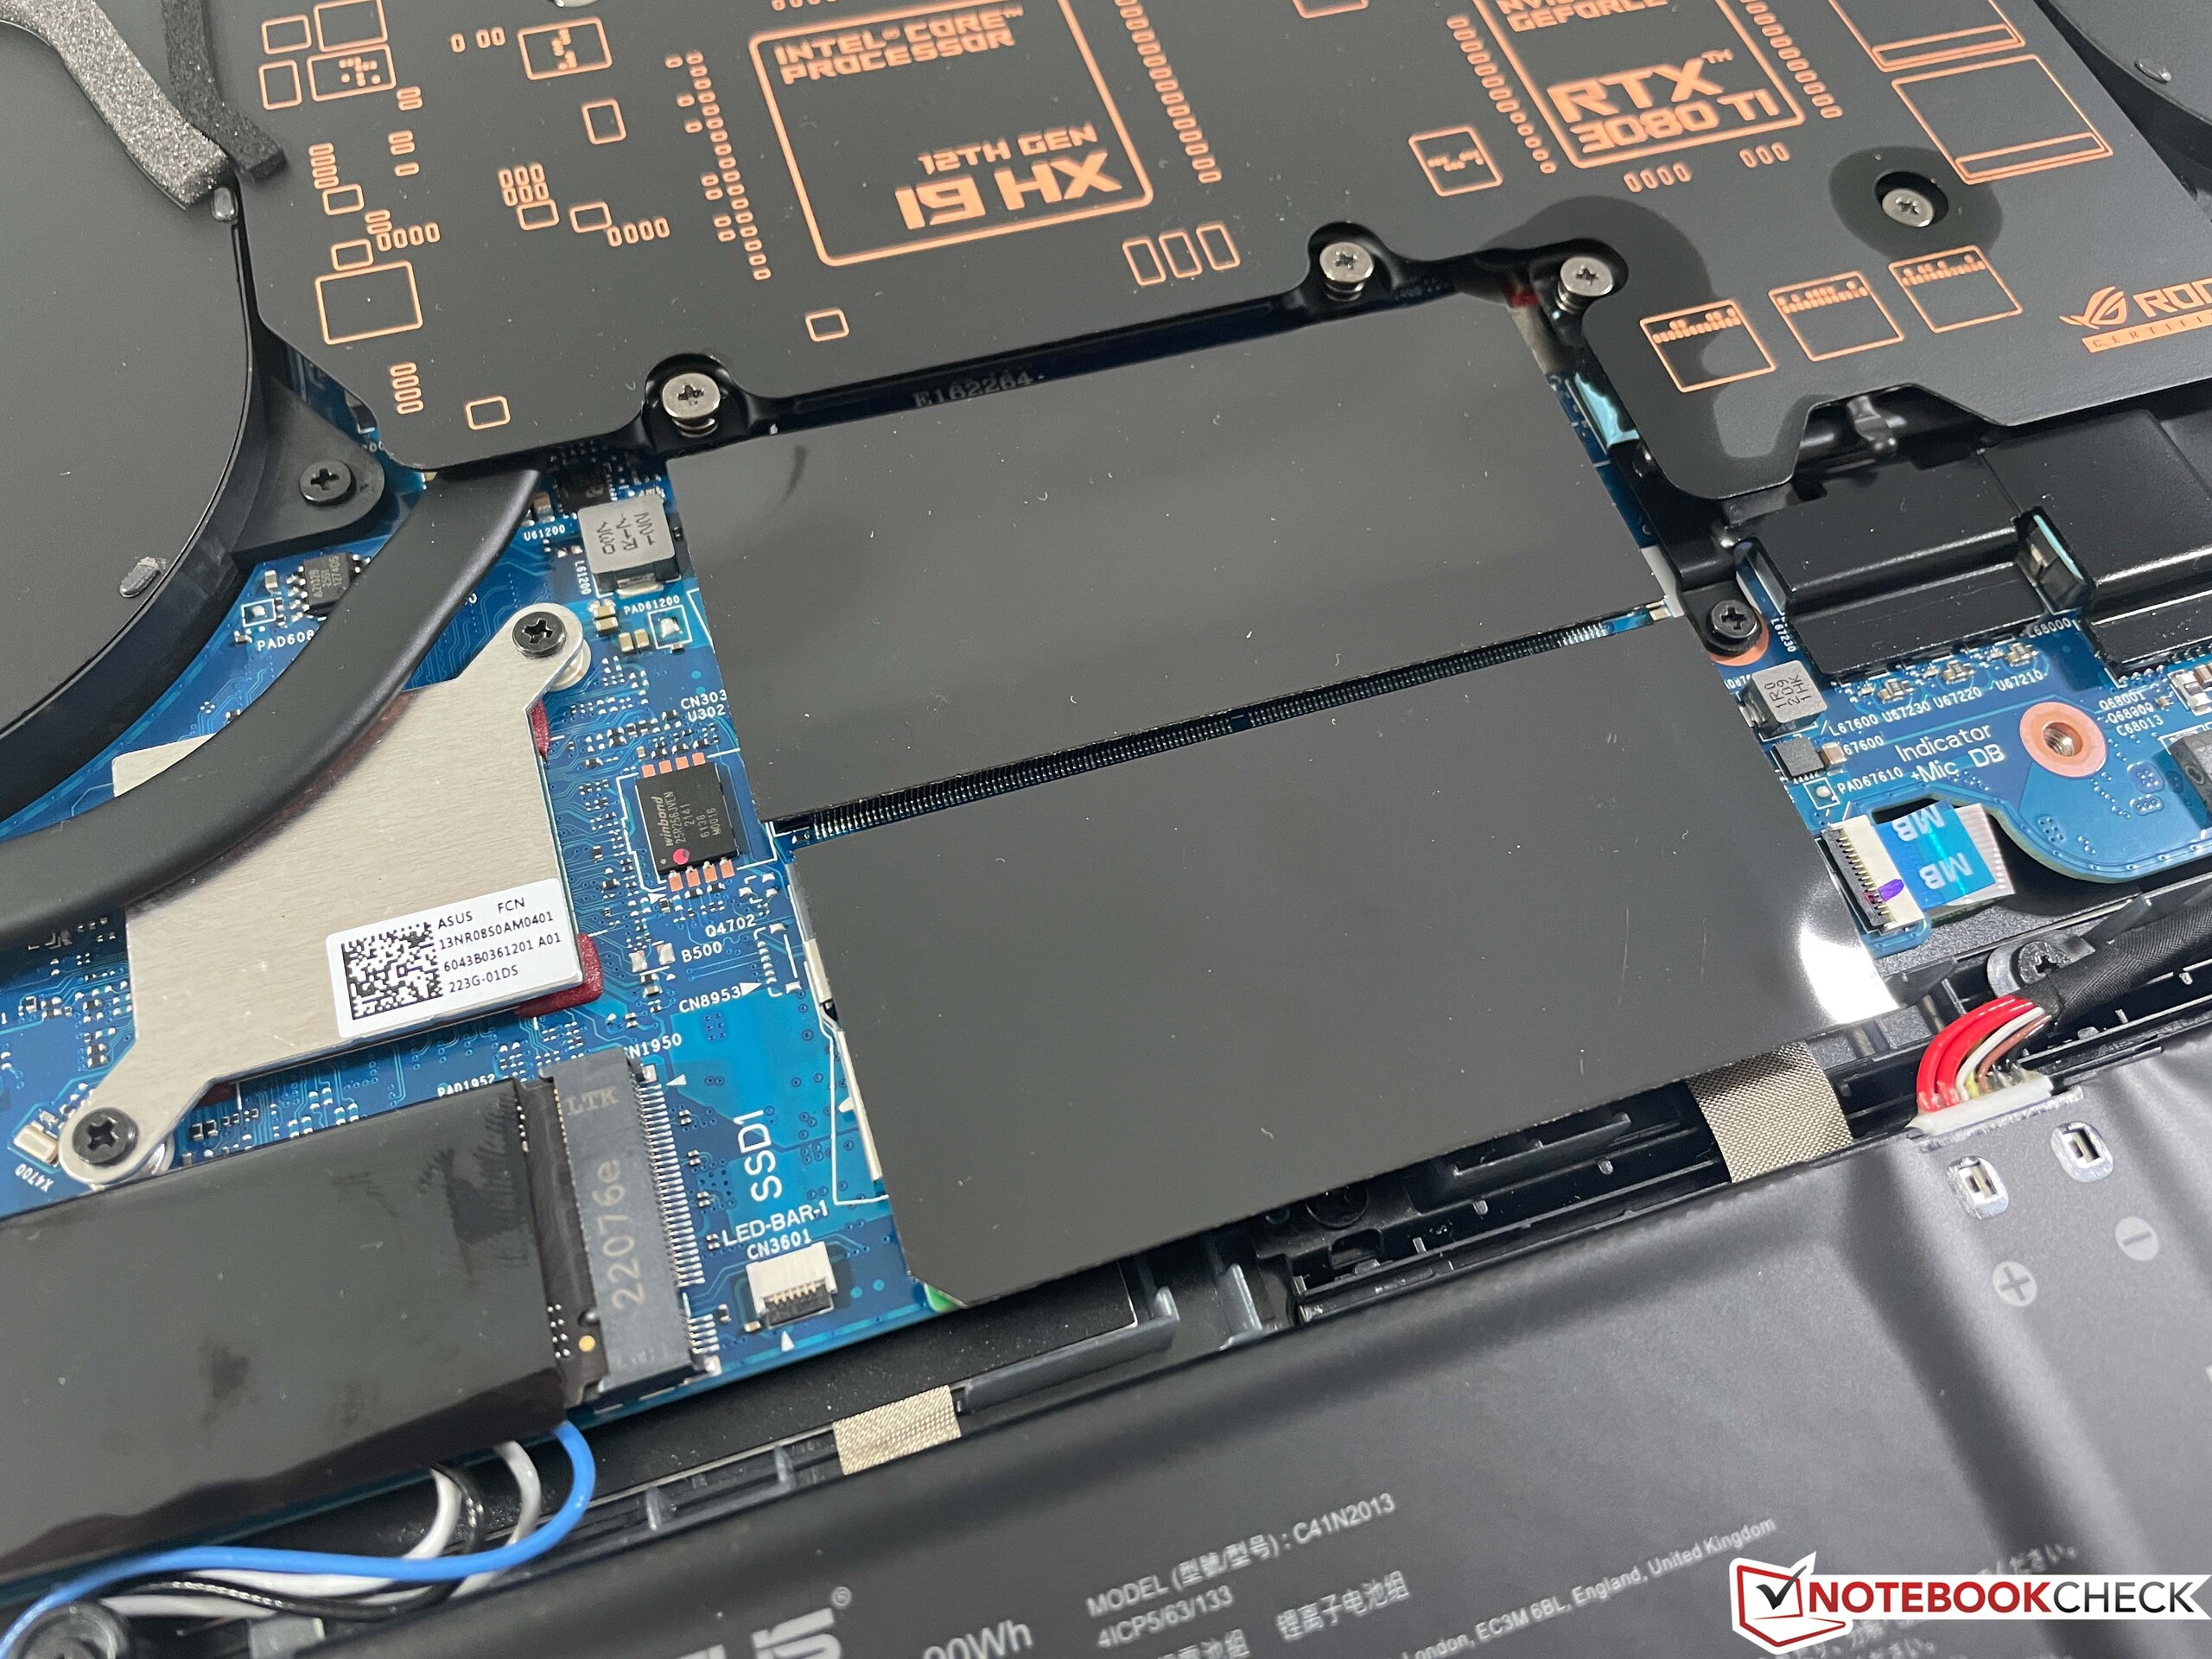
Anche se il coperchio inferiore del case può essere rimosso, bisogna fare attenzione. Poiché l'illuminazione è integrata nella parte, è necessario scollegare due piccoli cavi piatti prima di poter rimuovere il coperchio. Con l'accesso alle ventole, alle due unità SSD, ai due moduli RAM e al modulo WLAN, le opzioni di manutenzione sono buone.
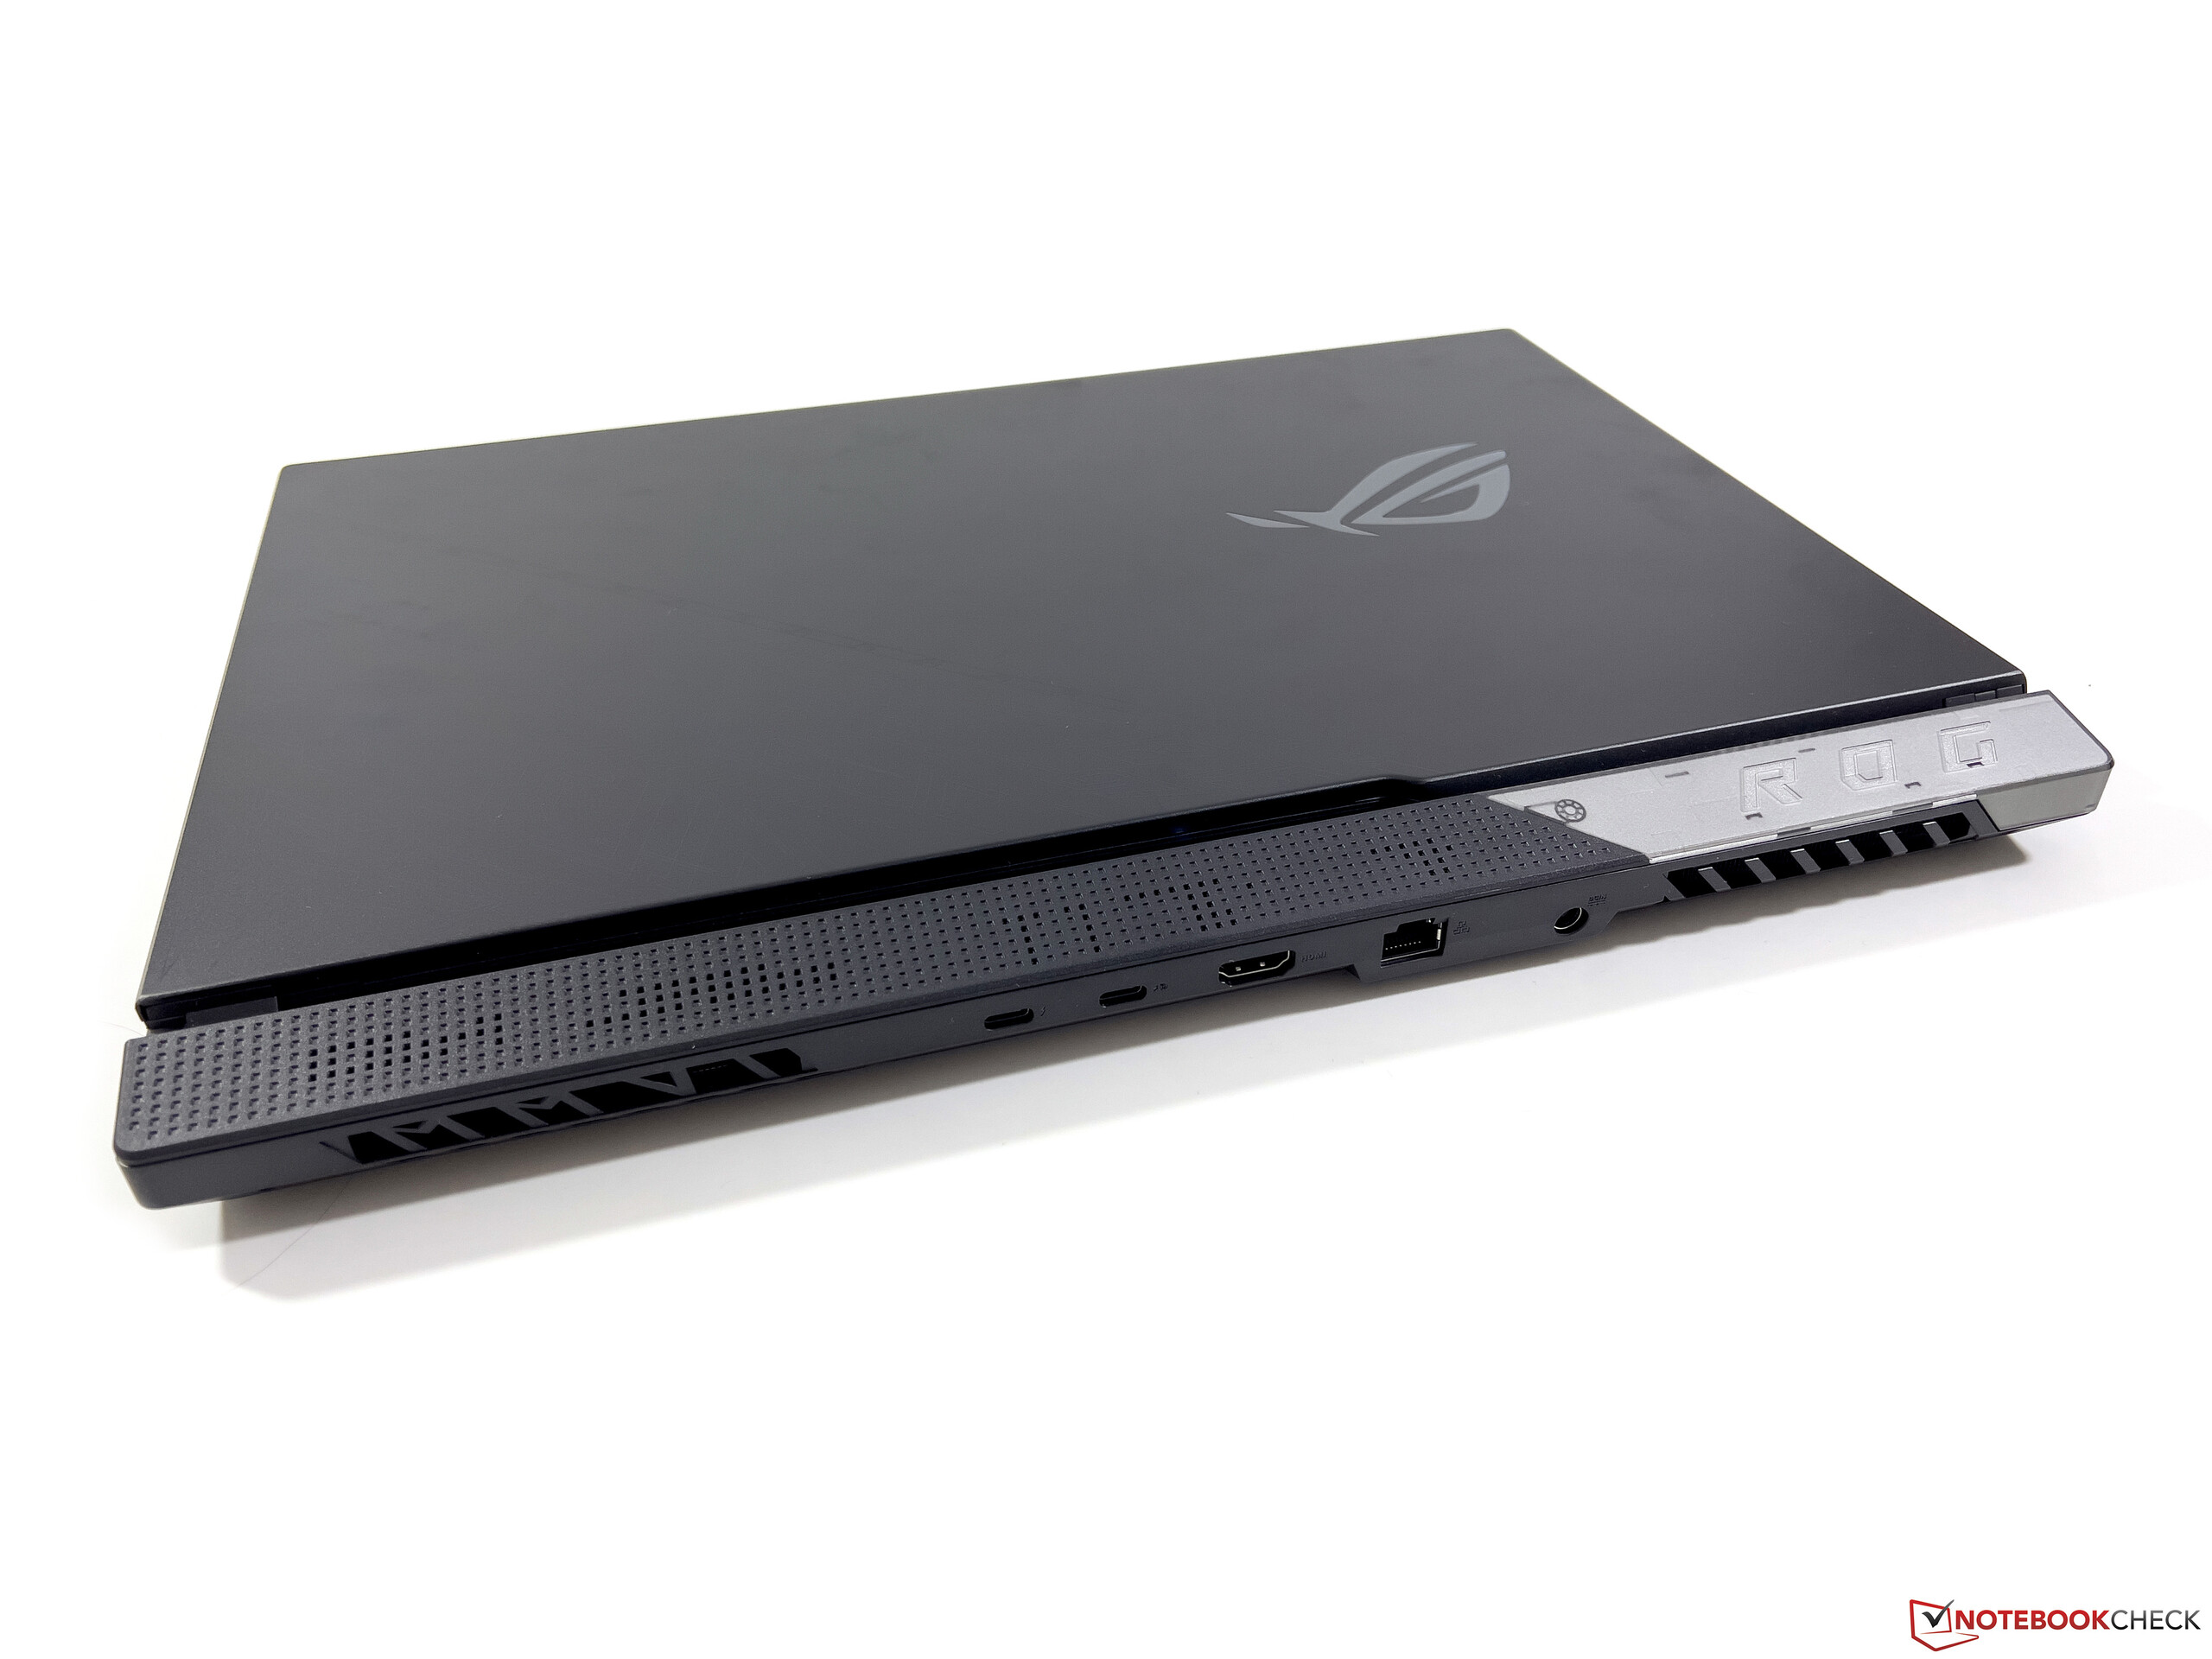
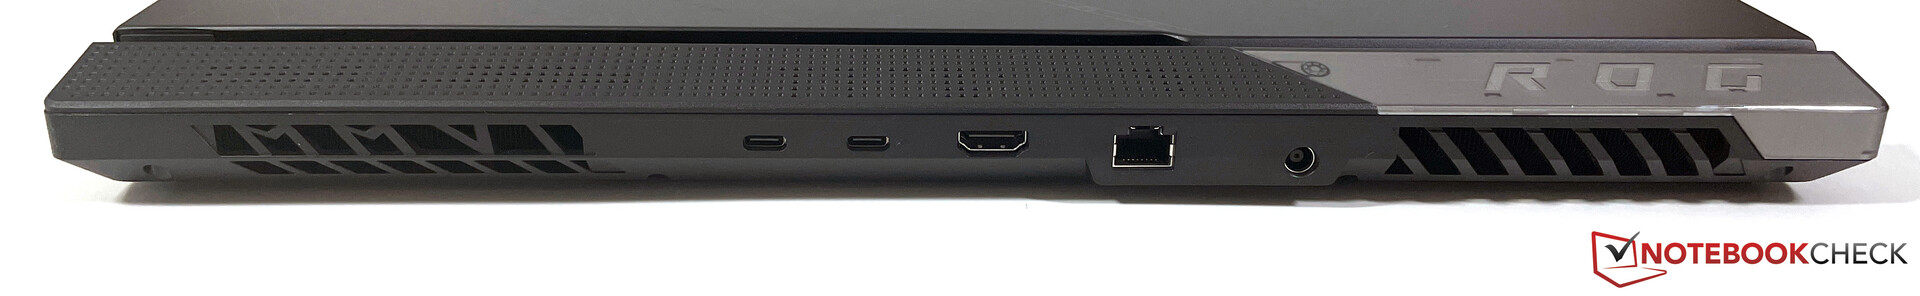
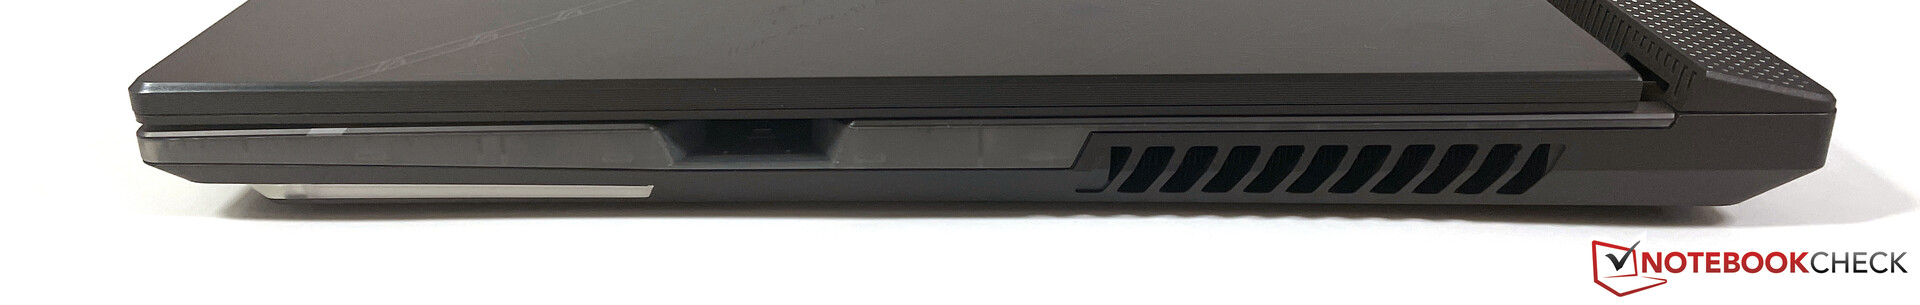
Attrezzatura - ROG Strix Scar 17 con HDMI 2.1 e Wi-Fi 6E
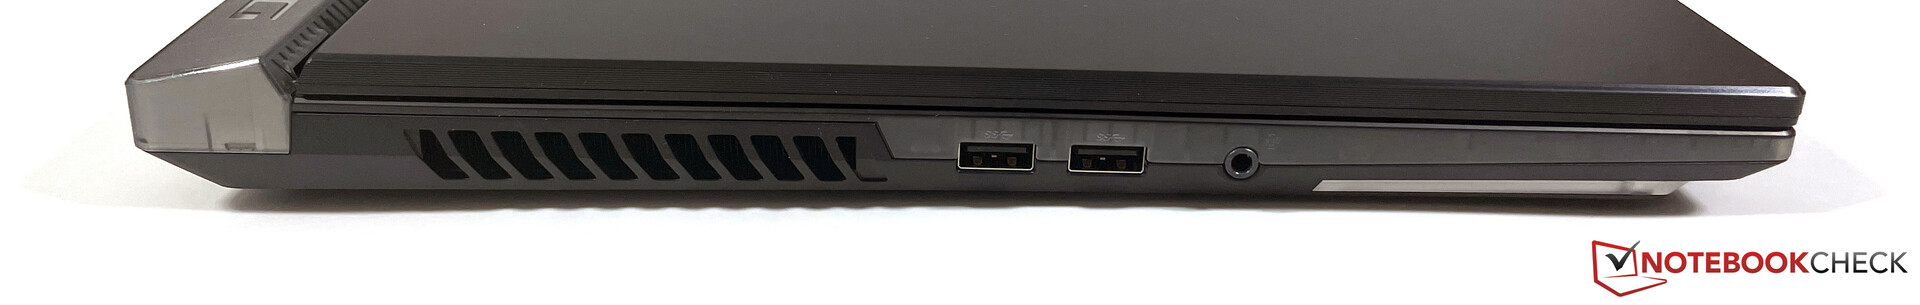
Oltre alla connessione Thunderbolt, il G733CX offre una porta HDMI 2.1 e la porta USB sul retro può essere utilizzata per la ricarica in viaggio (max. 100 watt). La maggior parte delle connessioni si trova sul retro, mentre sul lato sinistro sono presenti solo due normali porte USB-A e la porta audio da 3,5 mm. Il lato destro offre anche uno slot per Asus Keystone, che consente di memorizzare le impostazioni e i dati del sistema.
Le prestazioni della WLAN con Intel AX211 sono molto buone e siamo riusciti a collegarci senza problemi alla rete a 6 GHz del nostro router Asus di riferimento. È presente anche una connessione Ethernet a 2,5 Gbit/s per le connessioni cablate. Gli utenti del ROG Strix Scar 17 devono rinunciare alla webcam, ma se necessario il produttore offre una webcam esterna corrispondente (ROG Eye S).
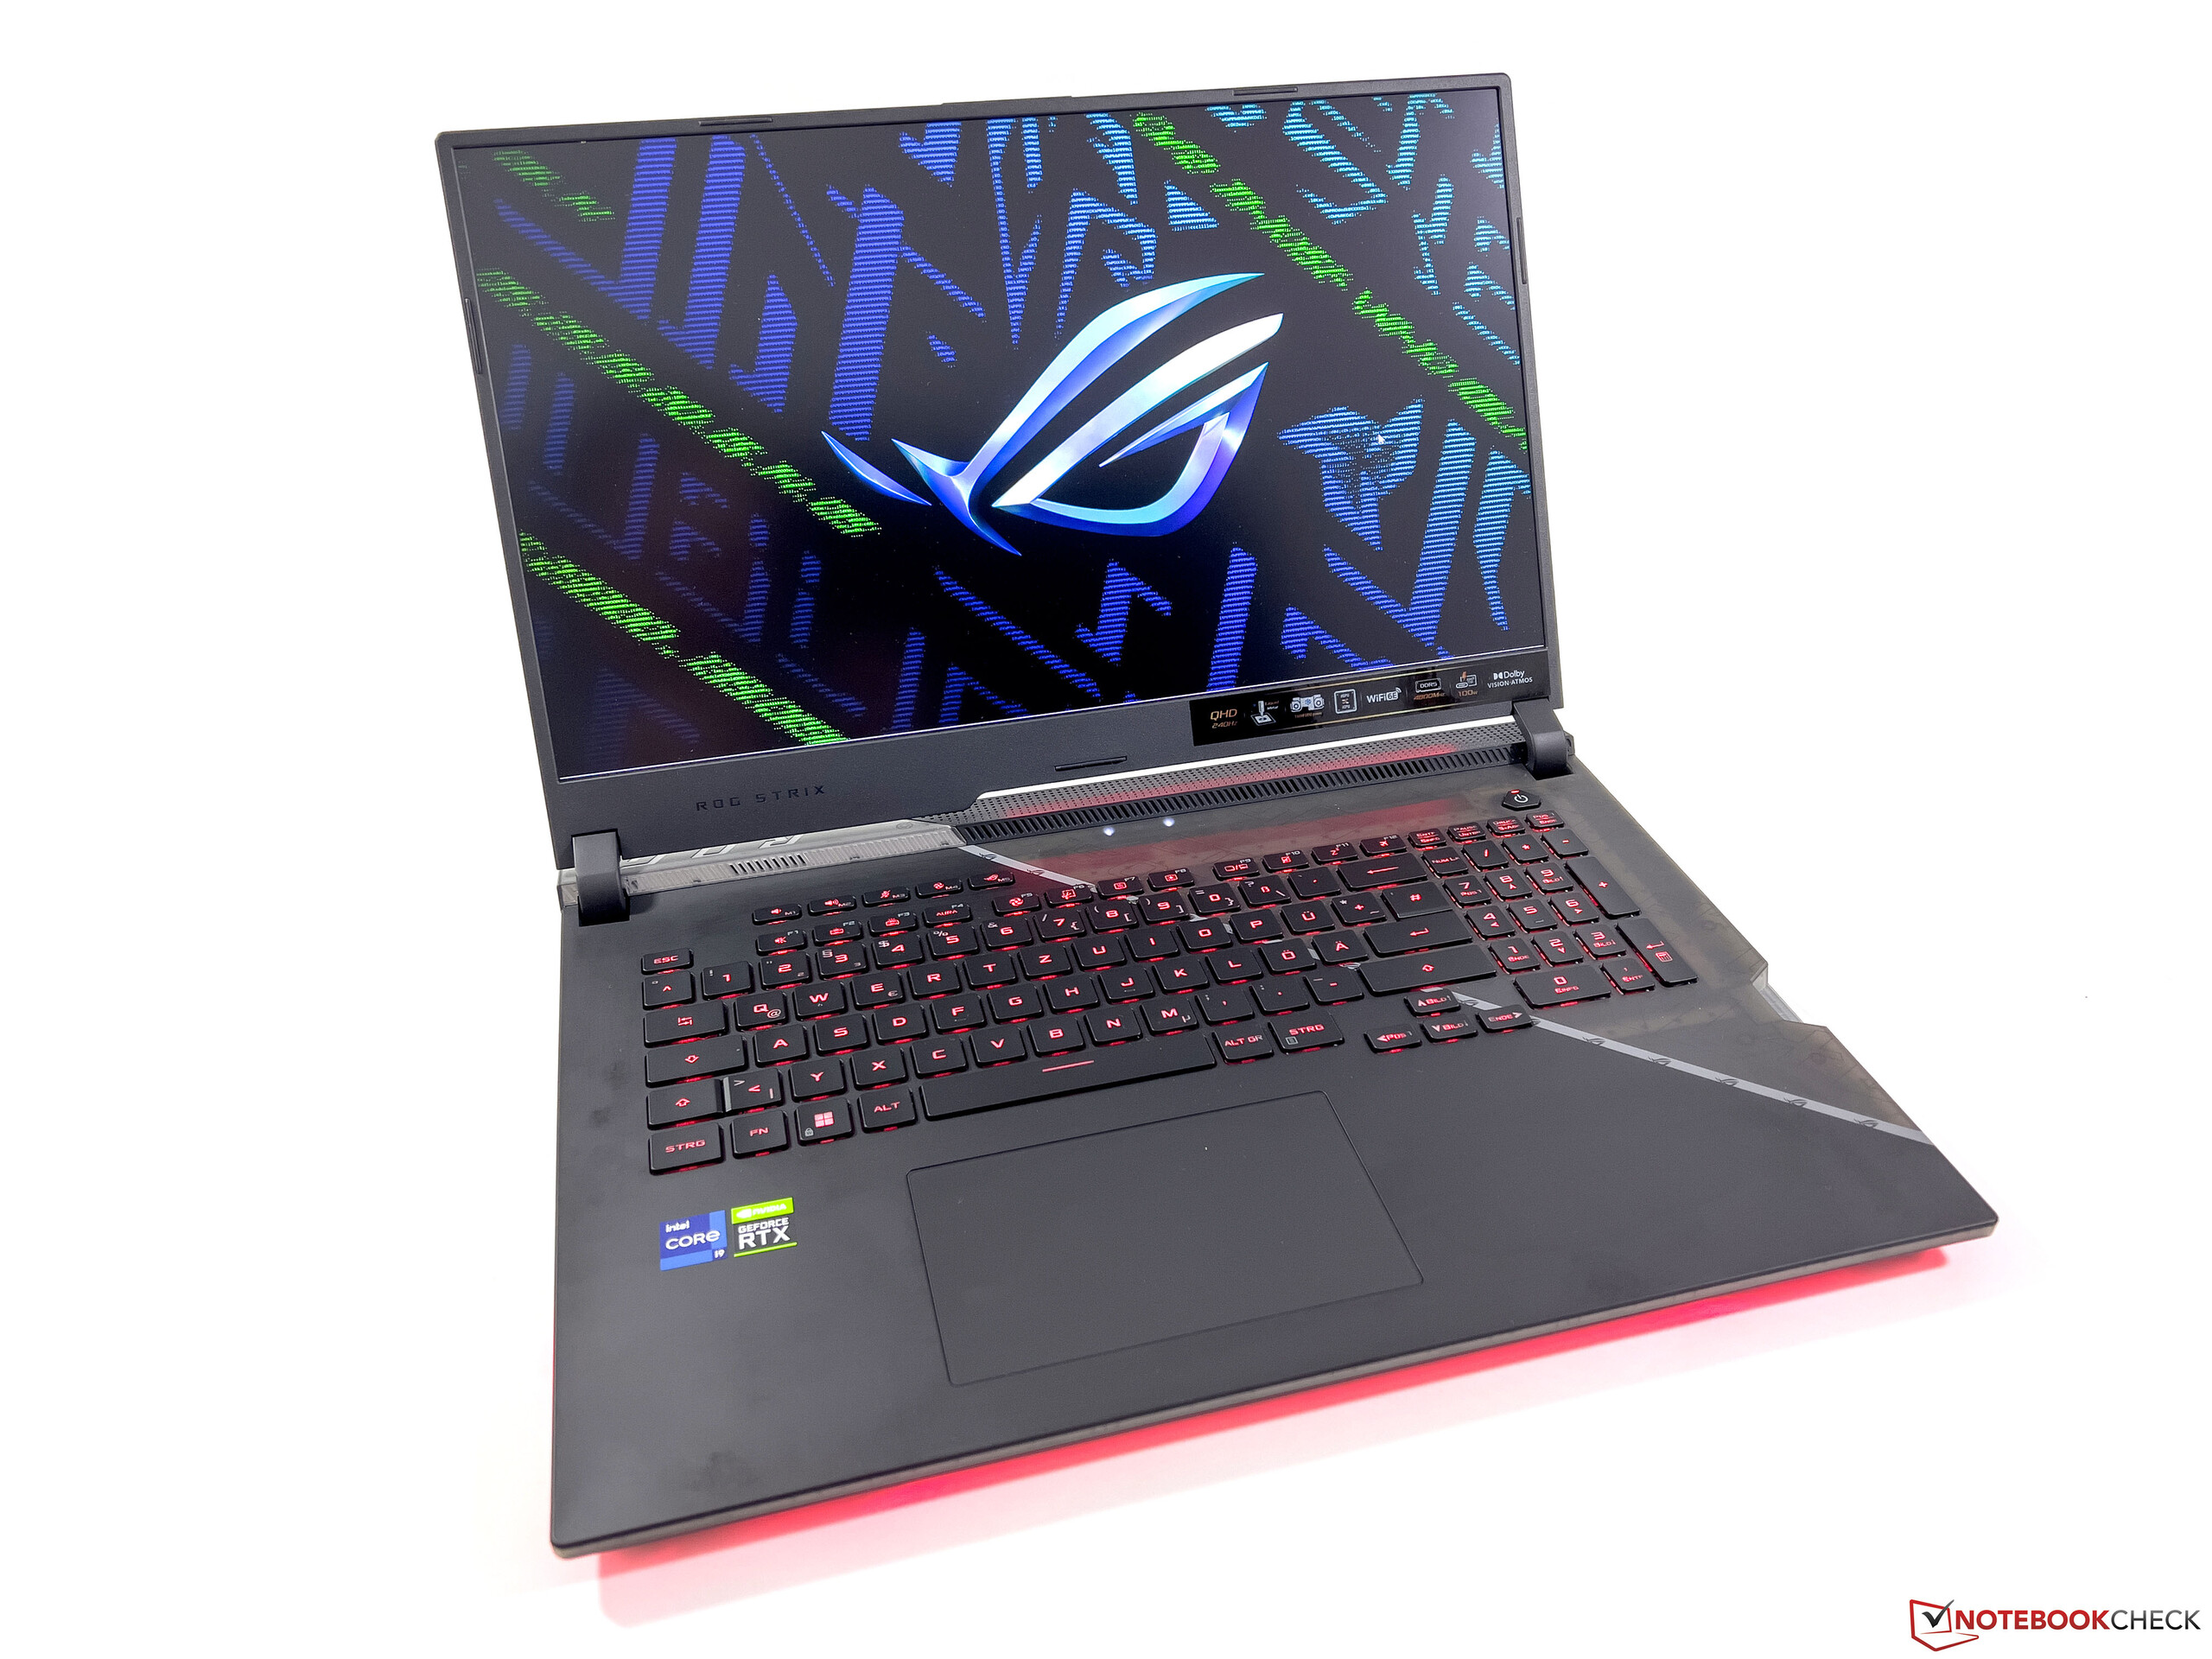
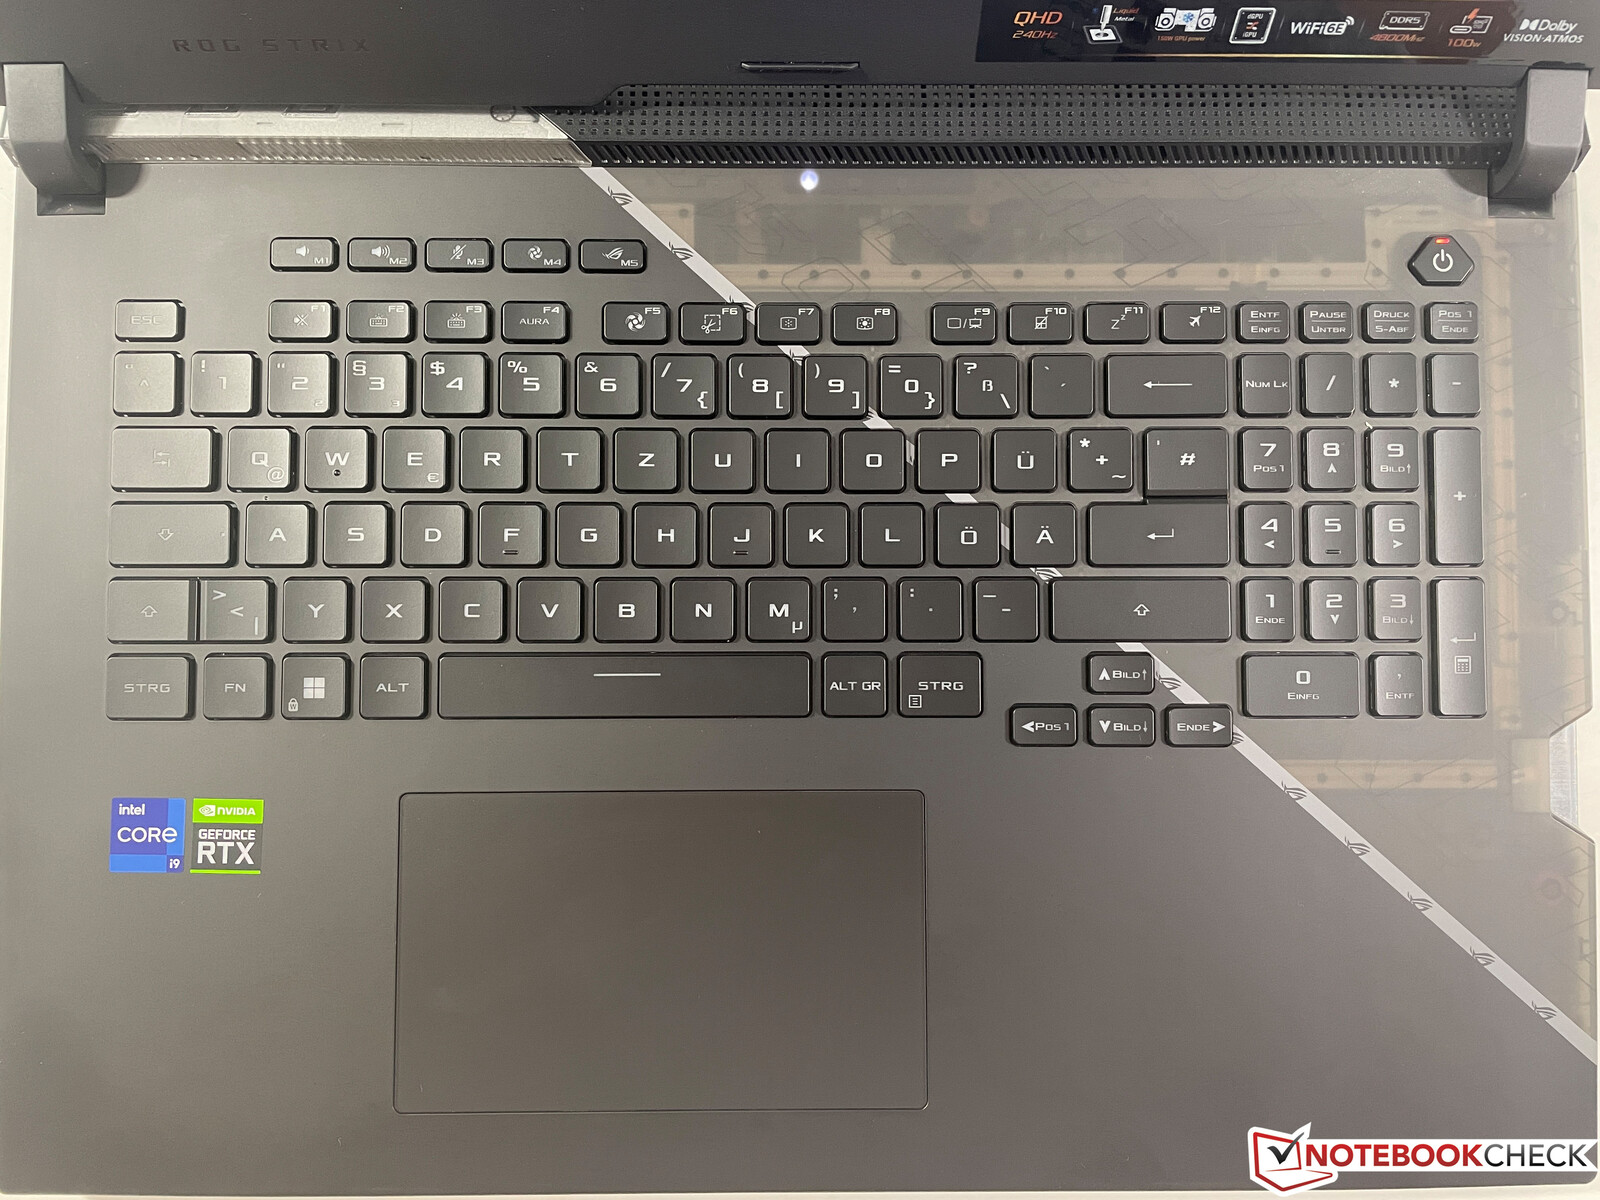
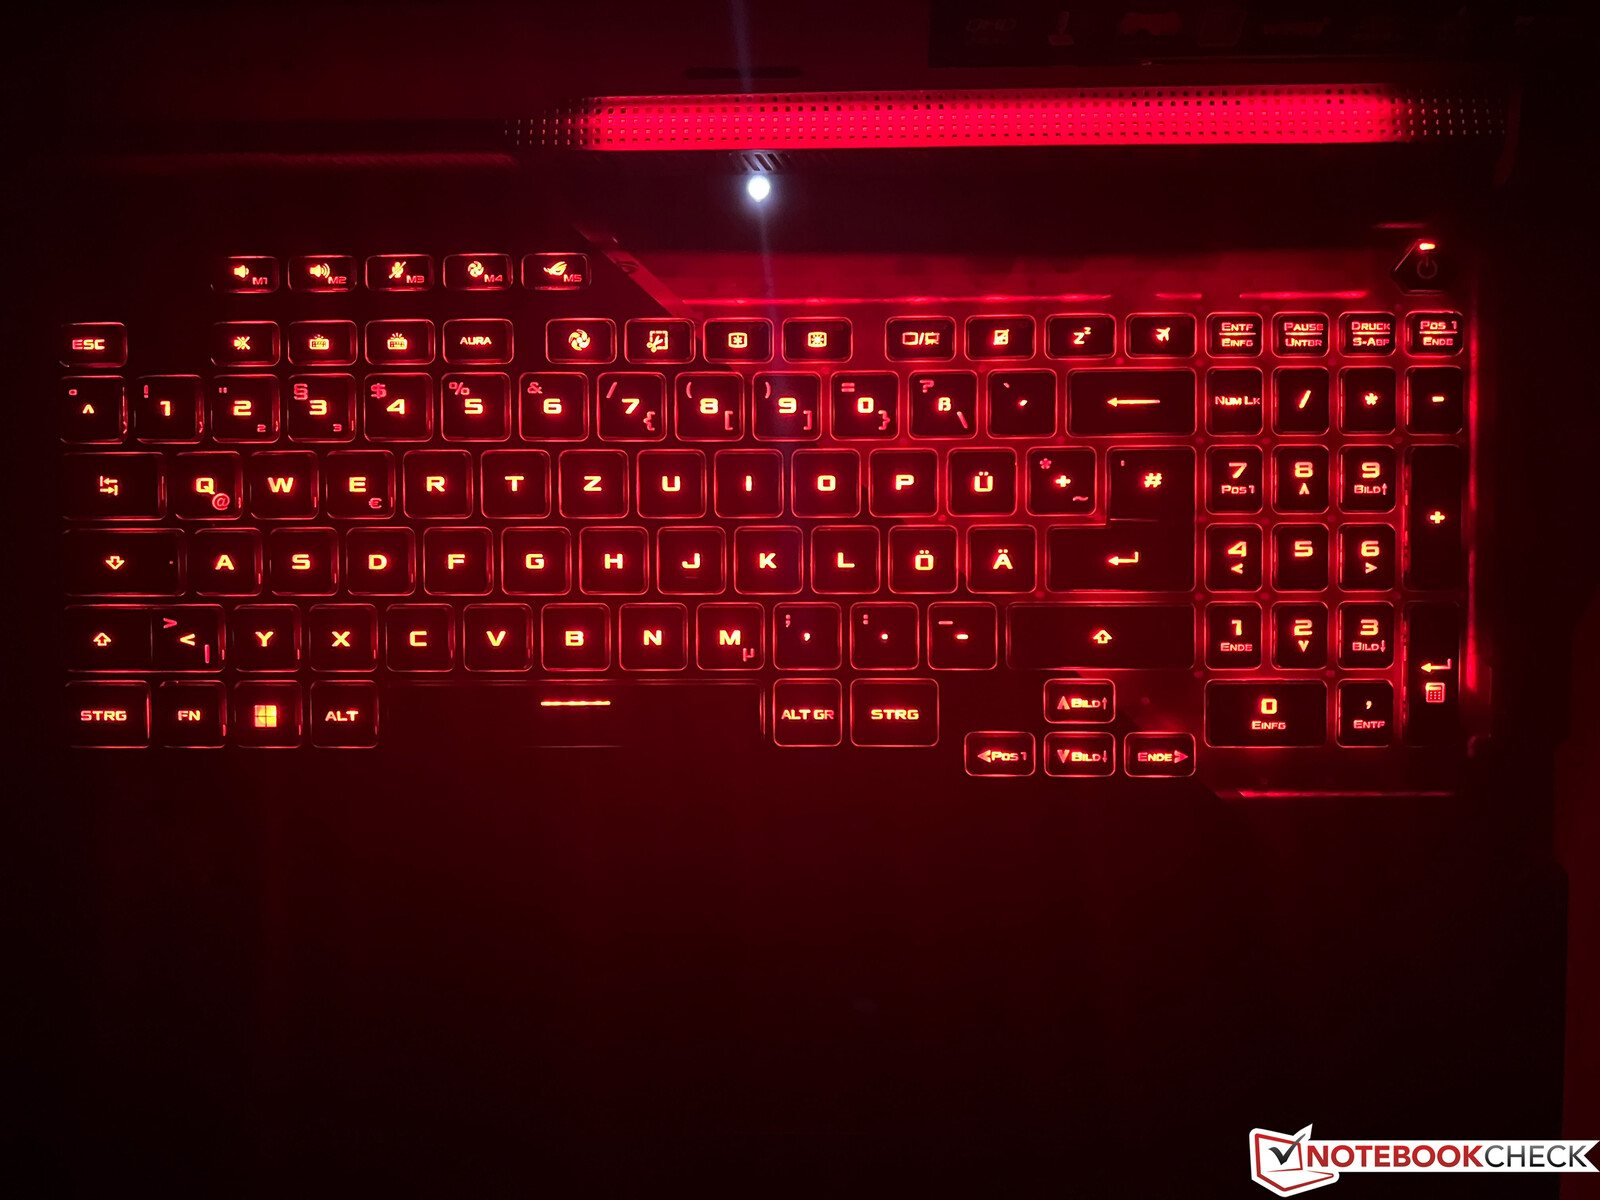
Dispositivi di input - Asus con una buona tastiera
Asus ha cambiato nuovamente il layout della tastiera, che ora utilizza un layout più convenzionale con tasti speciali più piccoli. È presente anche un blocco numeri "regolare", il che significa che i tasti freccia sono stati spostati leggermente a sinistra e sono ora più piccoli. Questo non piace a tutti gli utenti. Tuttavia, la qualità della tastiera è molto buona, grazie al mozzo lungo 2 mm, e si può sbizzarrire con l'illuminazione, che consente di configurare ogni tasto separatamente, comprese le modalità specifiche per i giochi tramite la tecnologia AuraSync. Il grande ClickPad offre buone caratteristiche di scorrevolezza e funziona in modo affidabile, ma è anche piuttosto rumoroso quando lo si preme.
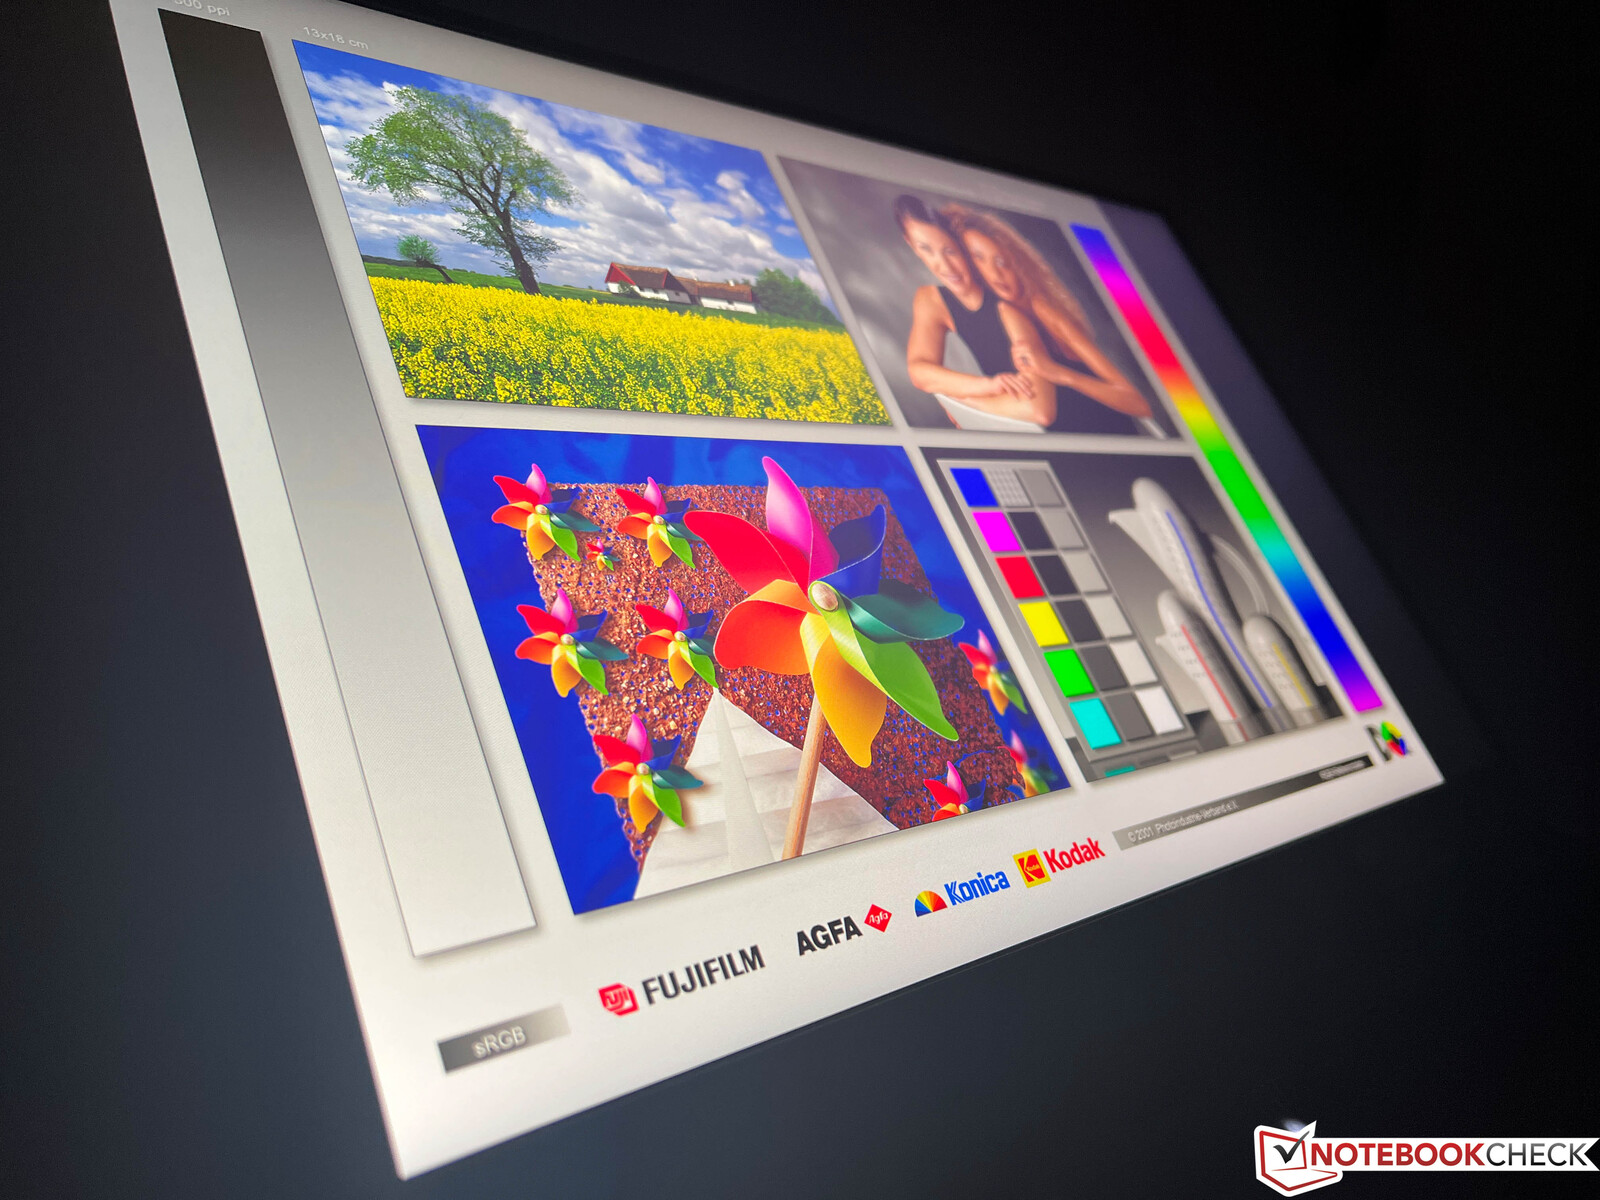
Display - QHD con 240 Hz
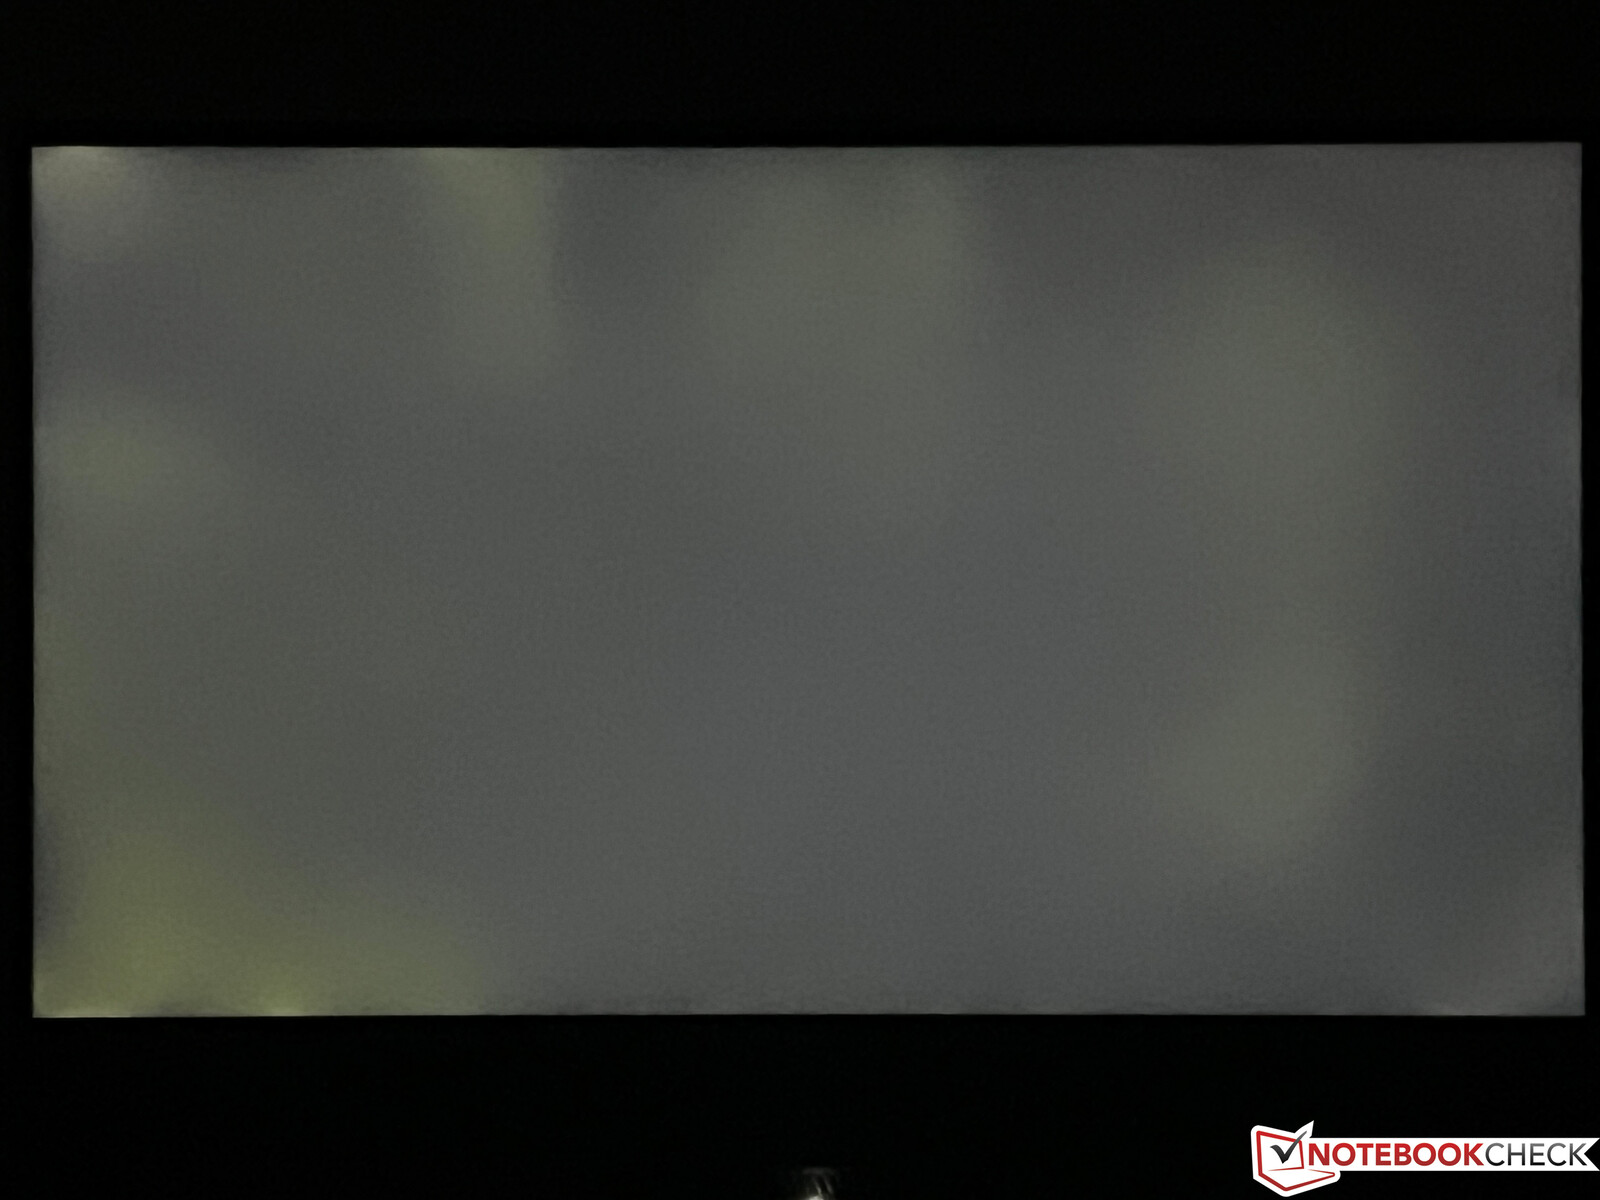
Oltre al pannello Full-HD a 360 Hz che abbiamo testato lo scorso anno sullo Scar 17 G733QS scar 17 G733QS dello scorso anno, Asus offre anche un pannello QHD con frequenza di aggiornamento di 240 Hzasus offre anche un pannello QHD con frequenza di aggiornamento di 240 Hz, che è il pannello presente nella nostra unità di prova. L'impressione soggettiva dell'immagine del pannello IPS opaco (2560 x 1440 pixel, 16:9) è molto buona e, oltre al Dolby Vision HDR, è supportato anche l'Adaptive Sync. I tempi di risposta sono estremamente rapidi e non viene utilizzato il PWM. La luminosità è di circa 300 cd/m² in media, che è anche lo stesso livello del pannello Full-HD con 360 Hz. D'altra parte, il valore del nero è un po' alto, il che si traduce anche in un rapporto di contrasto mediocre, pari a circa 1.000:1.
| |||||||||||||||||||||||||
Distribuzione della luminosità: 87 %
Al centro con la batteria: 320 cd/m²
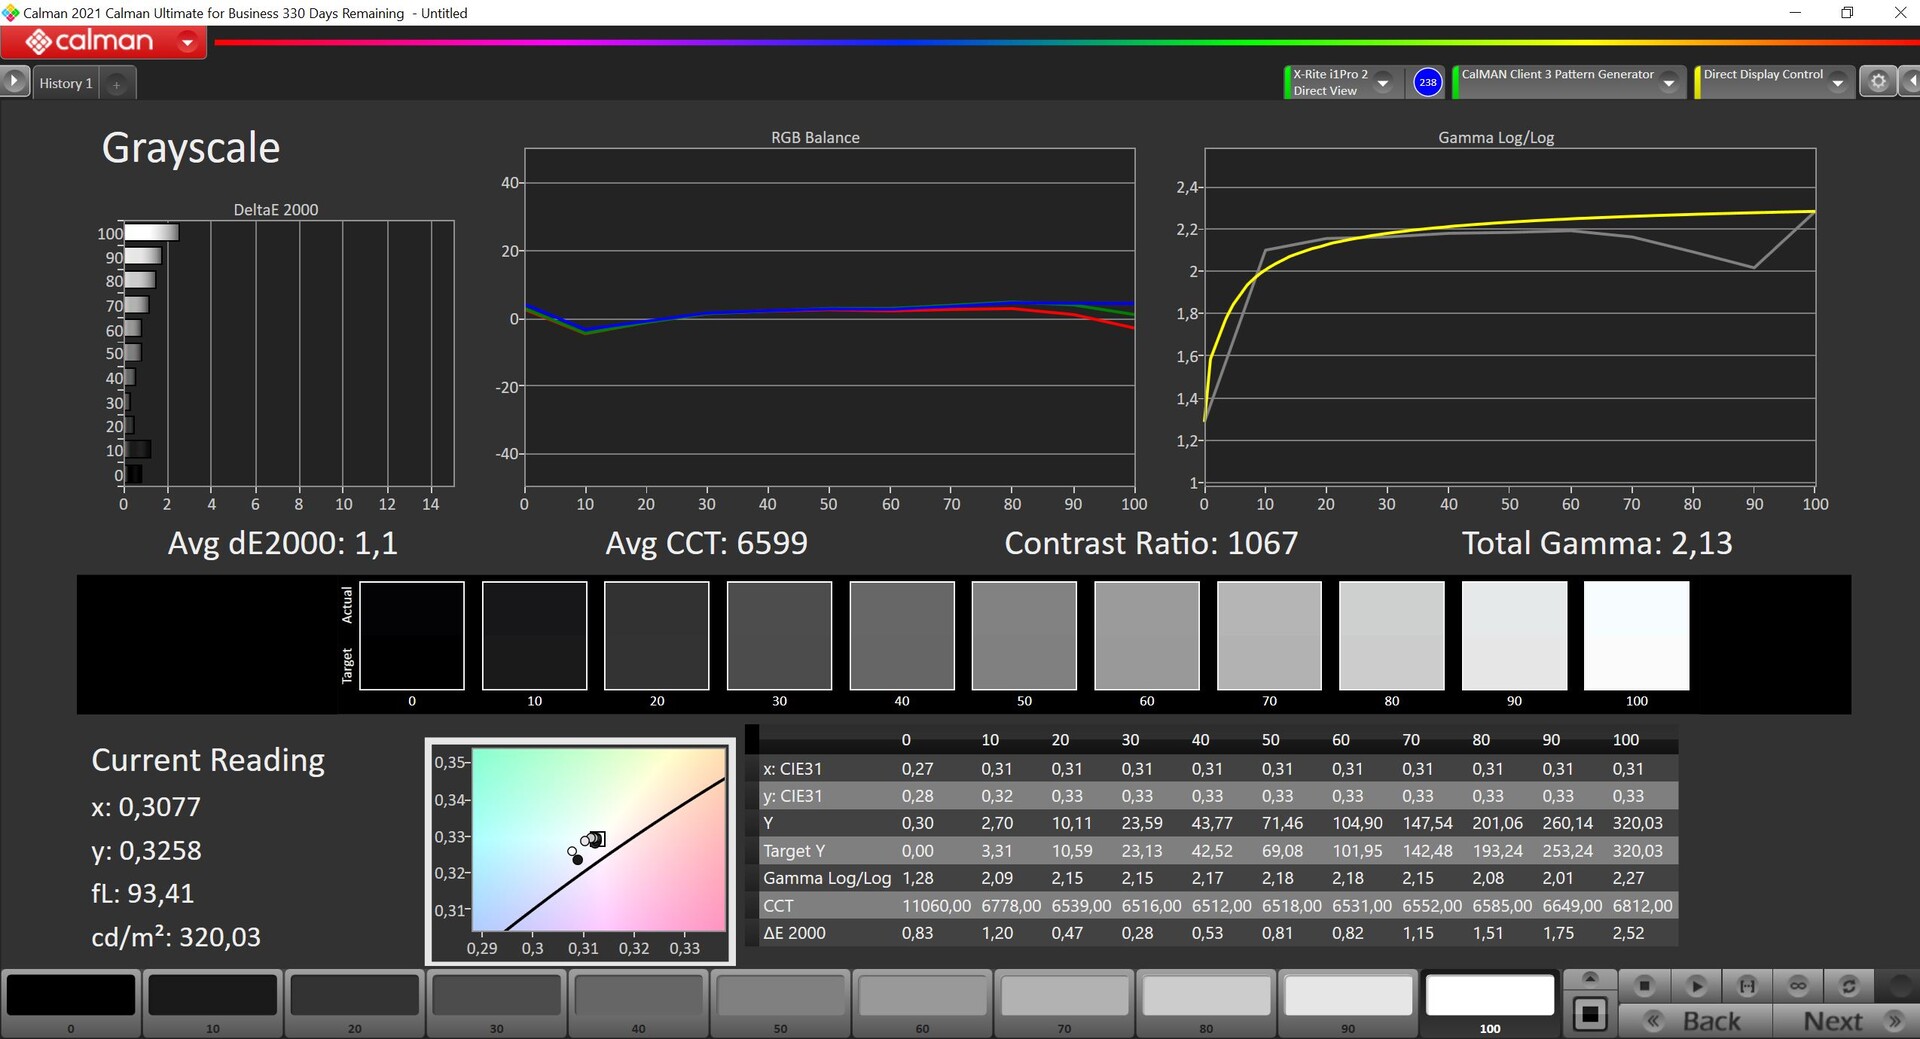
Contrasto: 1067:1 (Nero: 0.3 cd/m²)
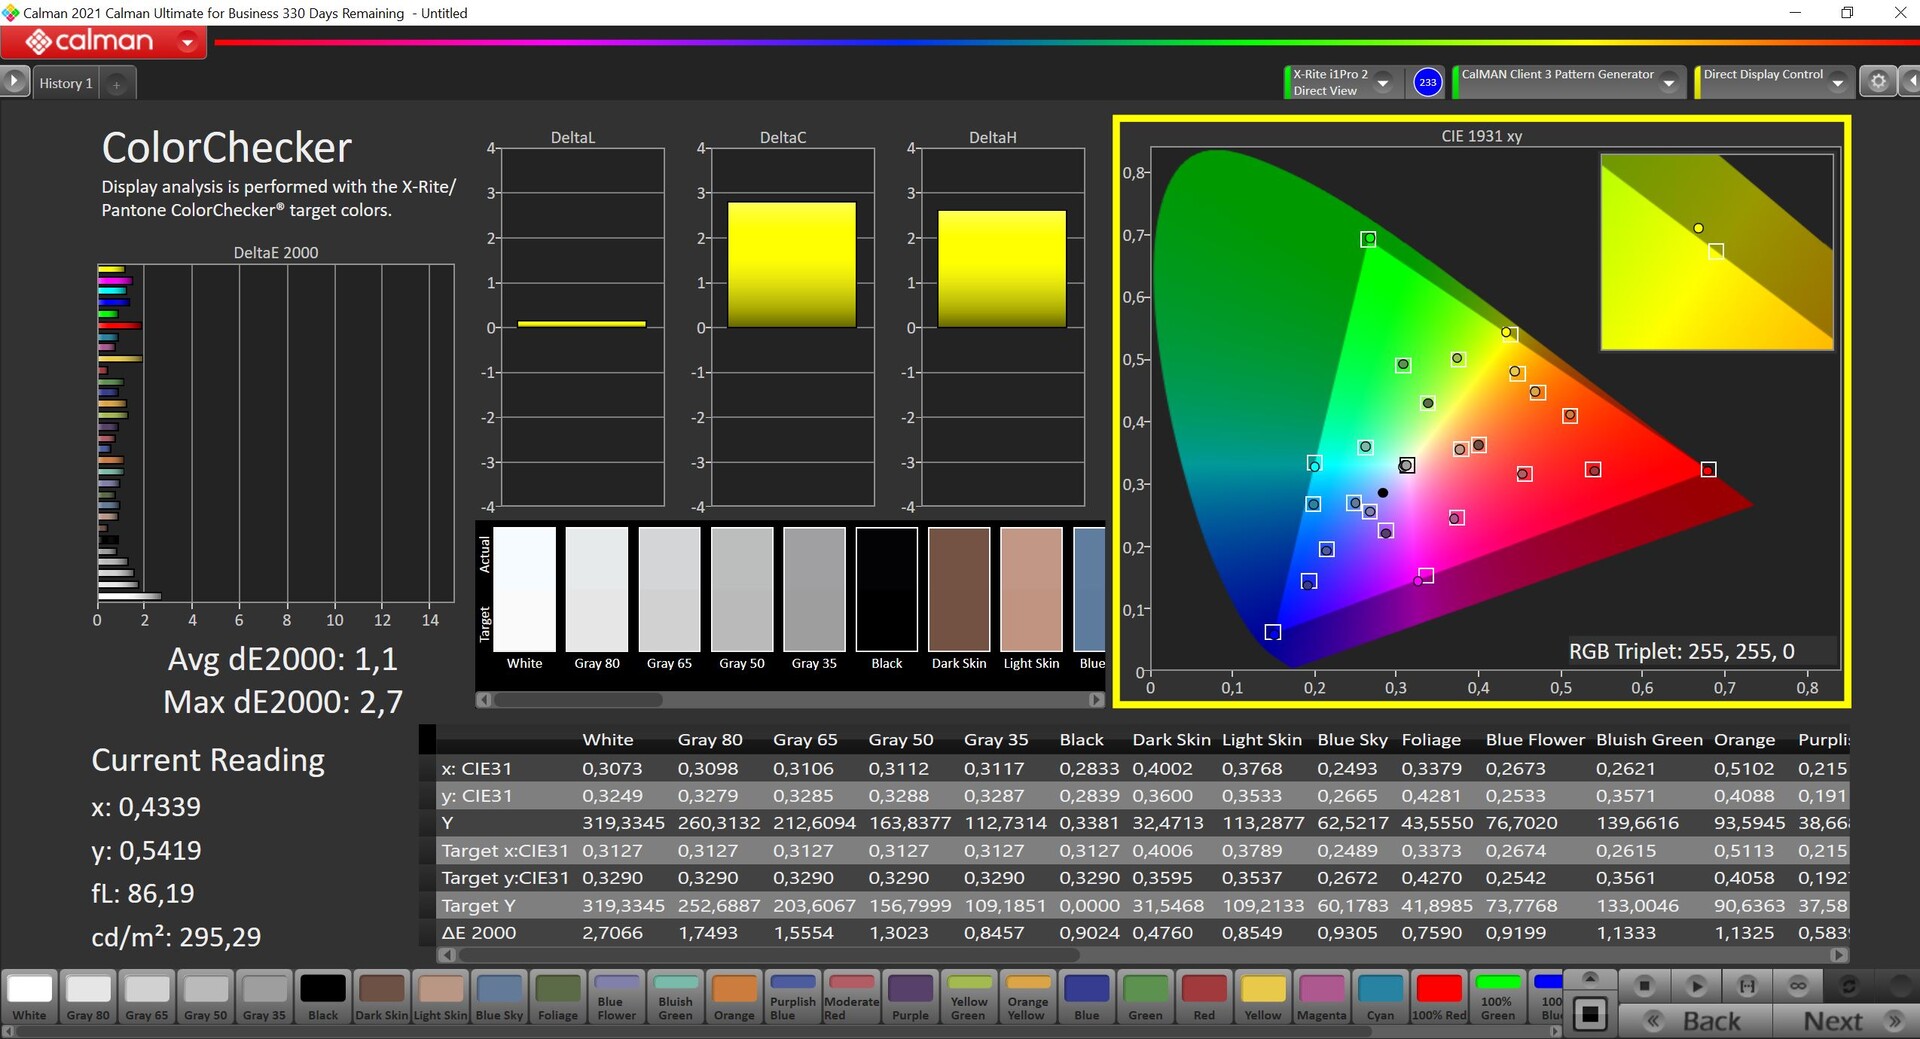
ΔE ColorChecker Calman: 1.1 | ∀{0.5-29.43 Ø4.71}
ΔE Greyscale Calman: 1.1 | ∀{0.09-98 Ø4.96}
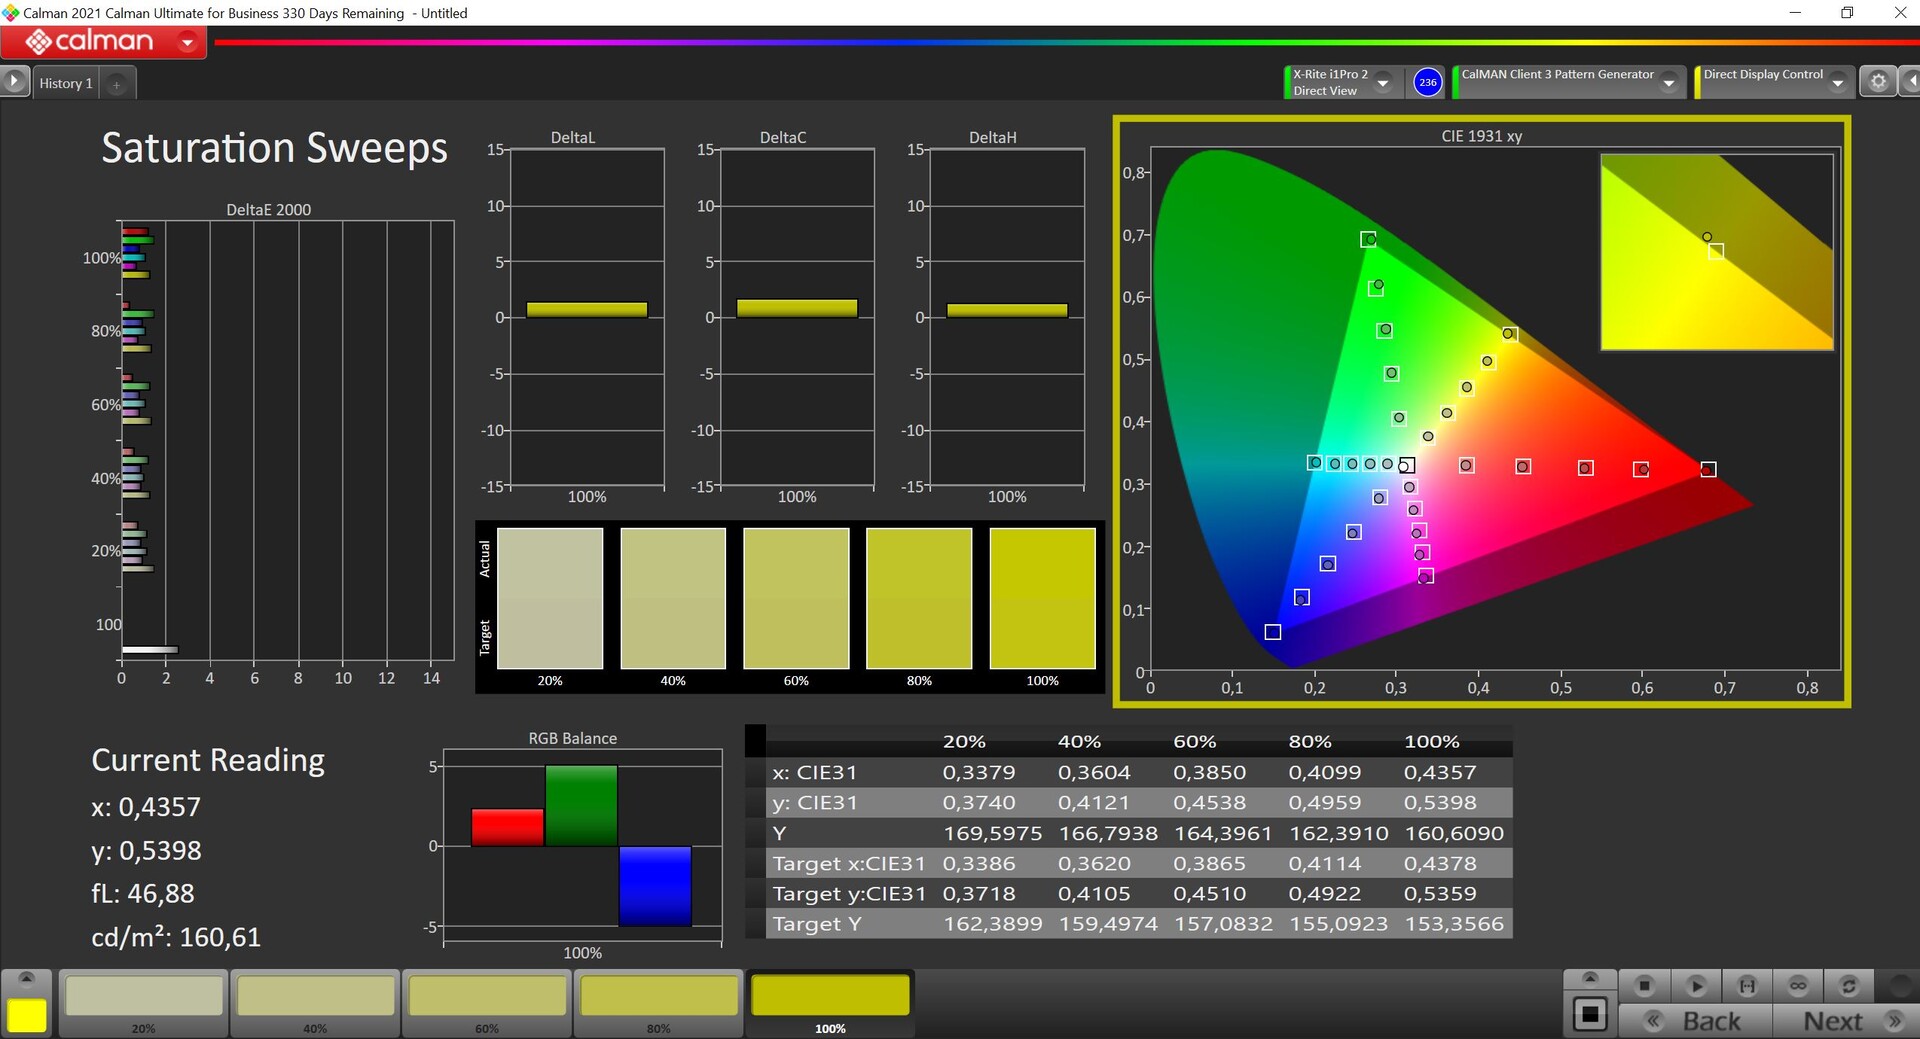
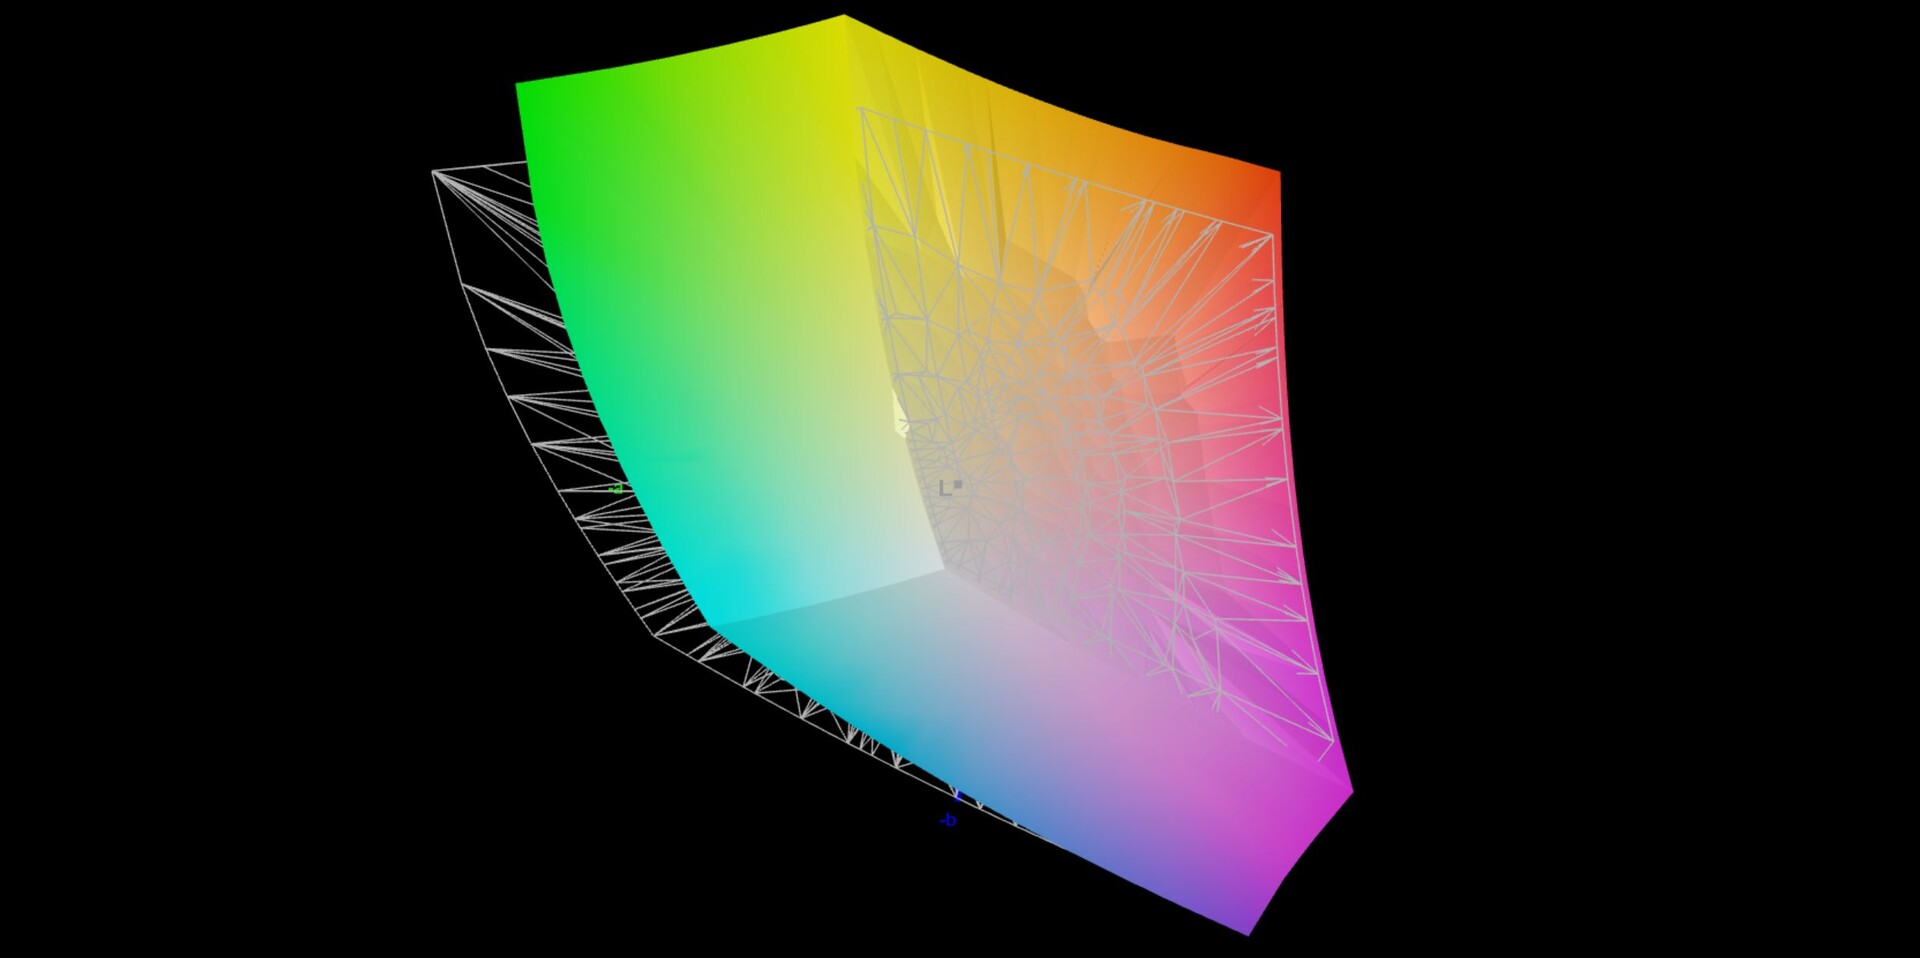
84.8% AdobeRGB 1998 (Argyll 3D)
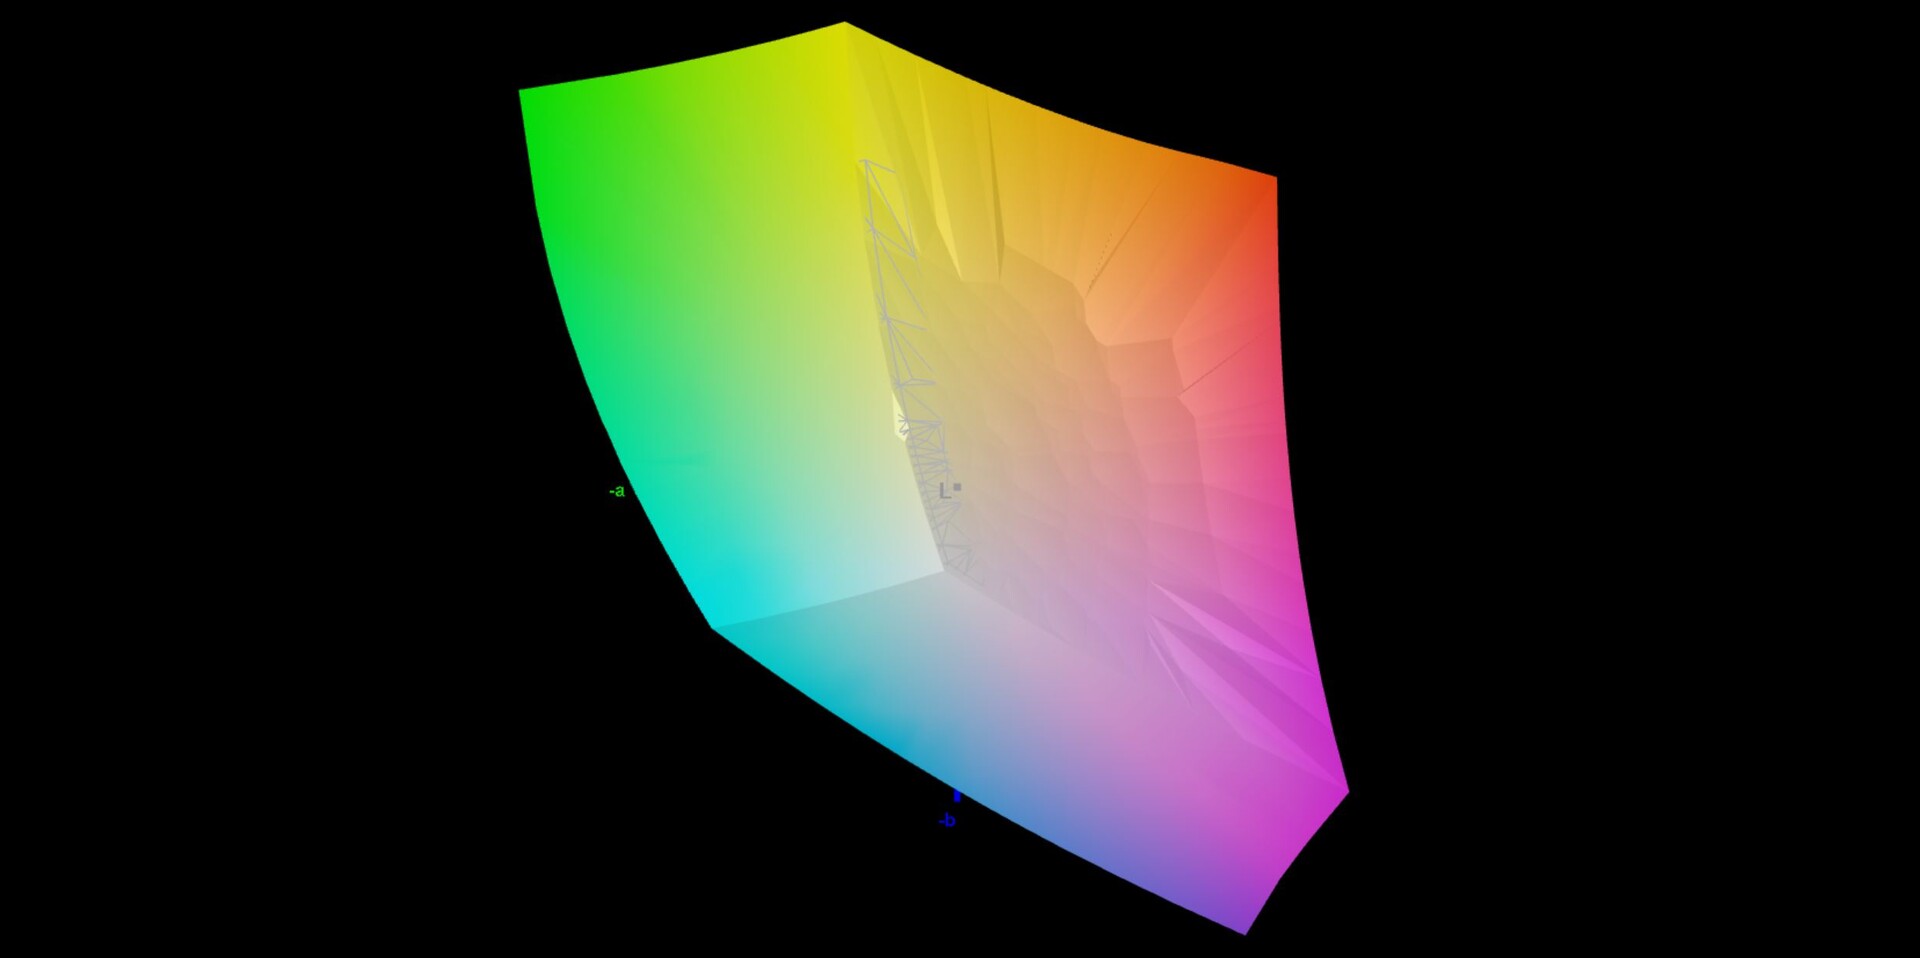
99.9% sRGB (Argyll 3D)
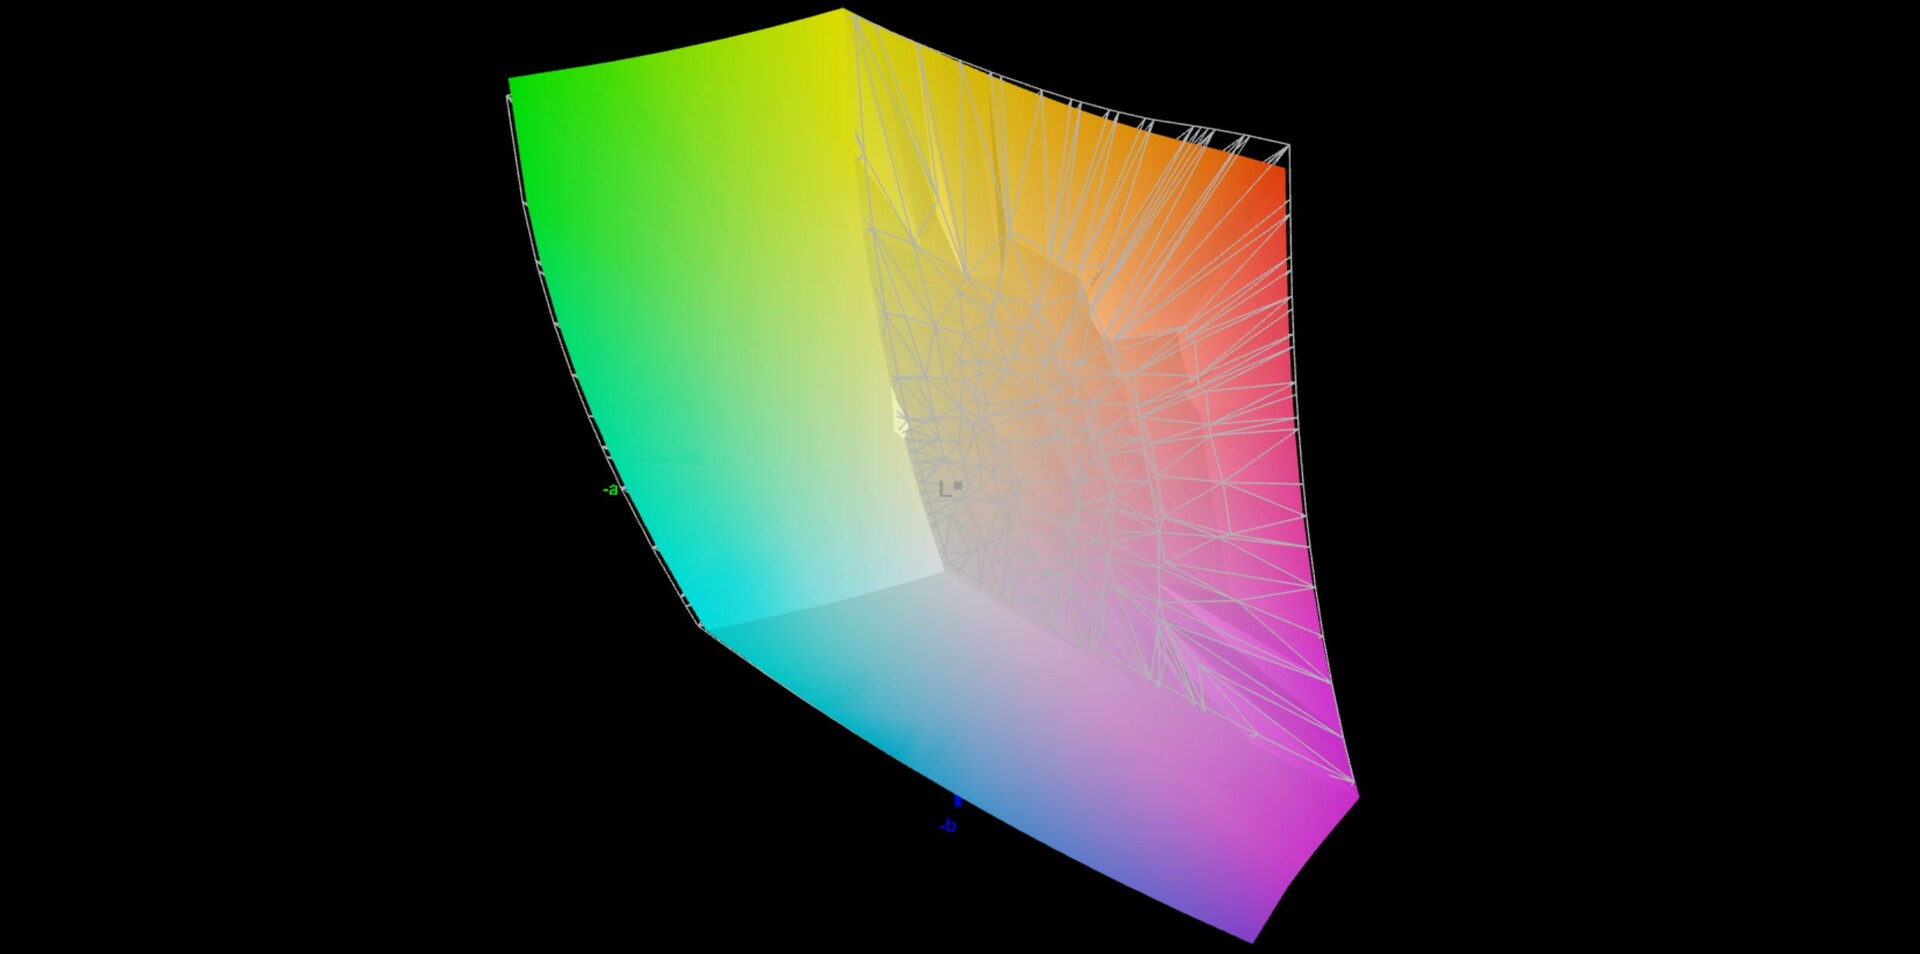
97.1% Display P3 (Argyll 3D)
Gamma: 2.13
CCT: 6599 K
| Asus ROG Strix Scar 17 SE G733CX-LL014W NE173QHM-NZ2, IPS, 2560x1440, 17.3" | Lenovo Legion 7 16IAX7-82TD004SGE NE160QDM-NY1, IPS, 2560x1600, 16" | MSI Titan GT77 12UHS Sharp SHP1544 LQ173M1JW08, IPS-Level, 1920x1080, 17.3" | Schenker XMG Neo 17 M22 BOE0A99, IPS, 2560x1600, 17" | Alienware x17 R2 P48E AU Optronics B173HAN, IPS, 1920x1080, 17.3" | Asus Strix Scar 17 G733QSA-XS99 AU Optronics B173HAN05.4, IPS, 1920x1080, 17.3" | |
|---|---|---|---|---|---|---|
| Display | -16% | -14% | -16% | -8% | -14% | |
| Display P3 Coverage (%) | 97.1 | 69.3 -29% | 70.8 -27% | 69 -29% | 79.2 -18% | 71 -27% |
| sRGB Coverage (%) | 99.9 | 98.2 -2% | 98.9 -1% | 99.8 0% | 99.8 0% | 99.4 -1% |
| AdobeRGB 1998 Coverage (%) | 84.8 | 70.8 -17% | 73 -14% | 69.6 -18% | 79.6 -6% | 72.2 -15% |
| Response Times | -38% | 48% | -25% | -55% | -12% | |
| Response Time Grey 50% / Grey 80% * (ms) | 5.7 ? | 12.6 ? -121% | 3.03 ? 47% | 10.8 ? -89% | 12.4 ? -118% | 6.6 ? -16% |
| Response Time Black / White * (ms) | 10.1 ? | 5.6 ? 45% | 5.28 ? 48% | 6.1 ? 40% | 9.2 ? 9% | 10.8 ? -7% |
| PWM Frequency (Hz) | ||||||
| Screen | -41% | -63% | -9% | -89% | -25% | |
| Brightness middle (cd/m²) | 320 | 547 71% | 280 -12% | 415 30% | 365.4 14% | 303.8 -5% |
| Brightness (cd/m²) | 303 | 523 73% | 275 -9% | 399 32% | 344 14% | 292 -4% |
| Brightness Distribution (%) | 87 | 88 1% | 79 -9% | 90 3% | 85 -2% | 85 -2% |
| Black Level * (cd/m²) | 0.3 | 0.44 -47% | 0.4 -33% | 0.43 -43% | 0.29 3% | 0.23 23% |
| Contrast (:1) | 1067 | 1243 16% | 700 -34% | 965 -10% | 1260 18% | 1321 24% |
| Colorchecker dE 2000 * | 1.1 | 2.1 -91% | 2.1 -91% | 1.44 -31% | 3.17 -188% | 1.87 -70% |
| Colorchecker dE 2000 max. * | 2.7 | 7 -159% | 5.83 -116% | 2.33 14% | 7.69 -185% | 3.26 -21% |
| Greyscale dE 2000 * | 1.1 | 3.2 -191% | 3.3 -200% | 1.8 -64% | 5.3 -382% | 2.7 -145% |
| Gamma | 2.13 103% | 2.23 99% | 2.13 103% | 2.132 103% | 2.18 101% | 2.26 97% |
| CCT | 6599 98% | 6979 93% | 7060 92% | 6327 103% | 5879 111% | 6436 101% |
| Colorchecker dE 2000 calibrated * | 0.9 | 1.58 | 0.89 | 0.51 | 1.45 | |
| Color Space (Percent of AdobeRGB 1998) (%) | 65.6 | |||||
| Color Space (Percent of sRGB) (%) | 99.4 | |||||
| Media totale (Programma / Settaggio) | -32% /
-35% | -10% /
-35% | -17% /
-13% | -51% /
-65% | -17% /
-20% |
* ... Meglio usare valori piccoli
Il display copre lo spazio colore P3 e la nostra analisi con il software professionale CalMAN mostra che lo schermo è già molto preciso allo stato di consegna. Inoltre, non c'è alcuna sfumatura di colore e la nostra calibrazione non ha portato ad alcun miglioramento aggiuntivo, quindi non offriamo un profilo per voi. Questo pannello QHD è adatto all'elaborazione di immagini e video senza alcuna limitazione.
Tempi di risposta del Display
| ↔ Tempi di risposta dal Nero al Bianco | ||
|---|---|---|
| 10.1 ms ... aumenta ↗ e diminuisce ↘ combinato | ↗ 5 ms Incremento | 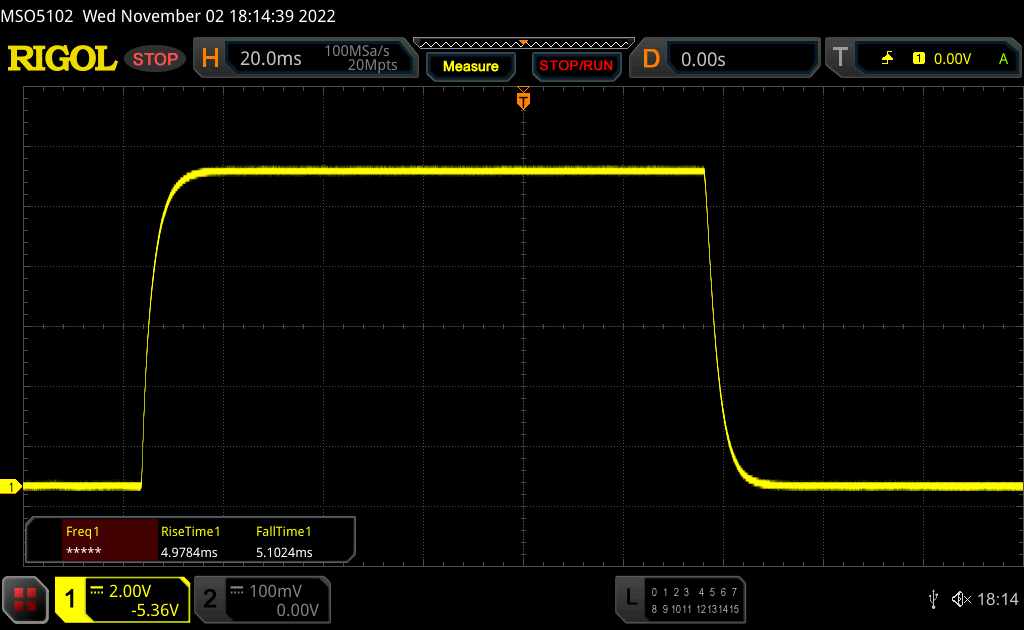 |
| ↘ 5.1 ms Calo | ||
| Lo schermo mostra buoni tempi di risposta durante i nostri tests, ma potrebbe essere troppo lento per i gamers competitivi. In confronto, tutti i dispositivi di test variano da 0.1 (minimo) a 240 (massimo) ms. » 28 % di tutti i dispositivi è migliore. Questo significa che i tempi di risposta rilevati sono migliori rispettto alla media di tutti i dispositivi testati (19.8 ms). | ||
| ↔ Tempo di risposta dal 50% Grigio all'80% Grigio | ||
| 5.7 ms ... aumenta ↗ e diminuisce ↘ combinato | ↗ 2.7 ms Incremento | 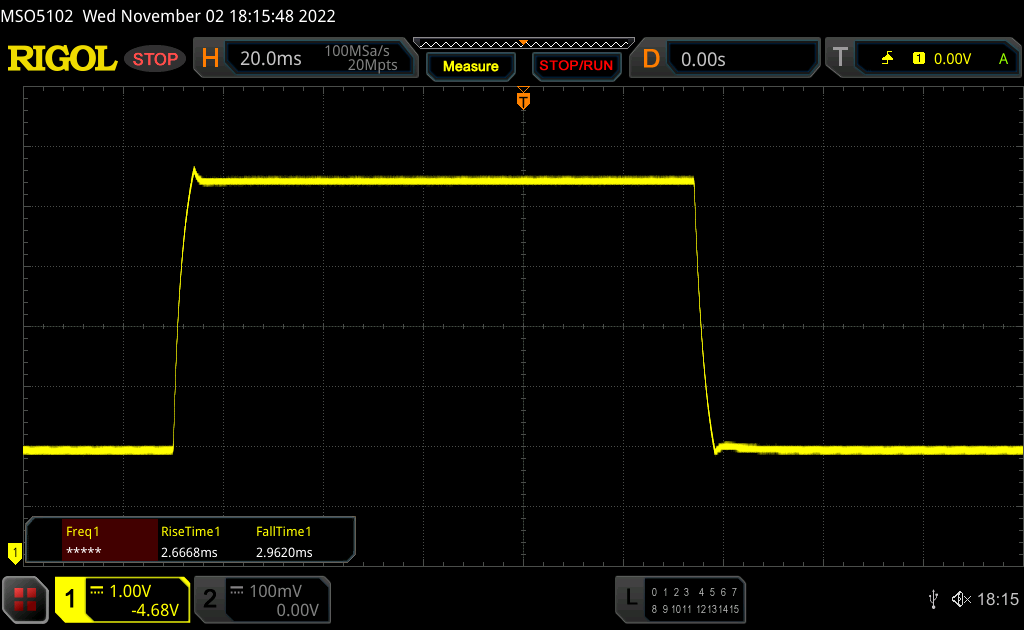 |
| ↘ 3 ms Calo | ||
| Lo schermo ha mostrato valori di risposta molto veloci nei nostri tests ed è molto adatto per i gaming veloce. In confronto, tutti i dispositivi di test variano da 0.165 (minimo) a 636 (massimo) ms. » 18 % di tutti i dispositivi è migliore. Questo significa che i tempi di risposta rilevati sono migliori rispettto alla media di tutti i dispositivi testati (30.9 ms). | ||
Sfarfallio dello schermo / PWM (Pulse-Width Modulation)
| flickering dello schermo / PWM non rilevato | 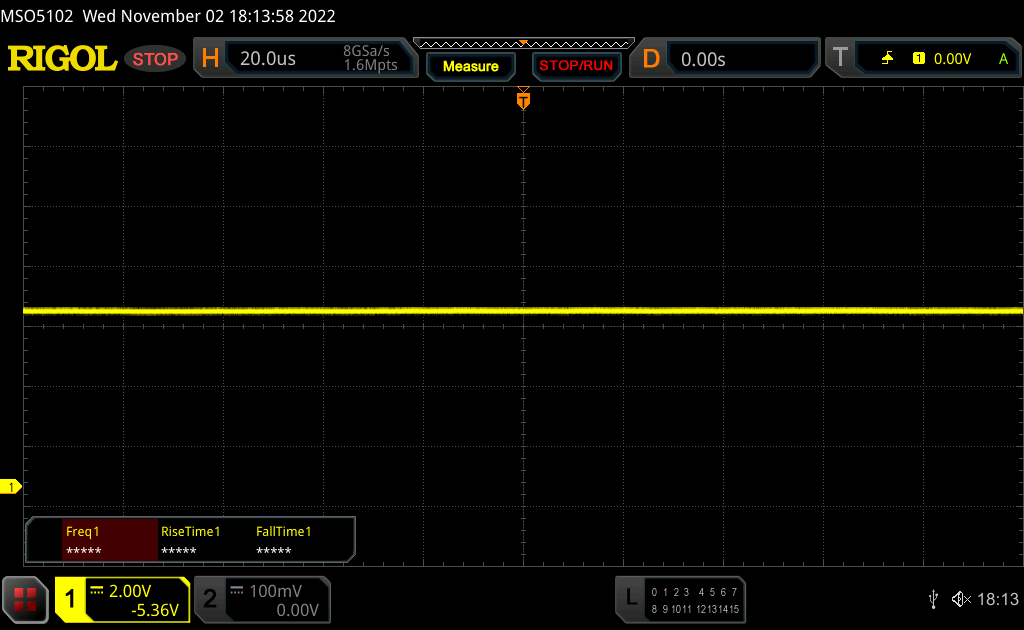 | ||
In confronto: 52 % di tutti i dispositivi testati non utilizza PWM per ridurre la luminosita' del display. Se è rilevato PWM, una media di 7741 (minimo: 5 - massimo: 343500) Hz è stata rilevata. | |||
Prestazioni - Intel HX con i freni azionati
Condizioni di prova
Il software ROG offre ampie opzioni di configurazione e profili di alimentazione. Ad esempio, è possibile disattivare completamente la GPU integrata (MUX) o impostare manualmente i valori di potenza per la CPU e la GPU. Per i nostri benchmark e le misurazioni riportate di seguito, utilizziamo il profilo Performance, in quanto rende già disponibili tutte le prestazioni della GPU. Anche se le prestazioni della CPU sono leggermente superiori in modalità Turbo, questo non giustifica, a nostro avviso, il rumore della ventola significativamente più elevato.
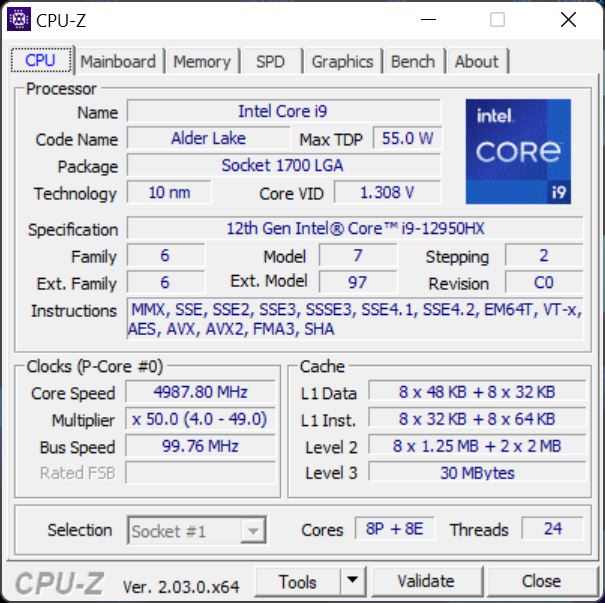
Processore - Core i9-12950HX
IlIntel Core i9-12950HX è attualmente il processore mobile più veloce di Intel. Anche se è in grado di consumare fino a 175 watt, nella nostra unità di test rimane lontano da questo valore. Invece, vediamo un consumo massimo di 115 watt (anche in modalità Turbo), e a un certo punto il valore si stabilizza a 70 watt (105 watt in modalità Turbo). Sebbene le prestazioni della CPU non siano affatto male, è possibile ottenere questo risultato anche con un normale Core i9, e il sovrapprezzo per il chip HX non vale la spesa aggiuntiva
Nel funzionamento a batteria, il consumo energetico è limitato a 35 watt, con prestazioni multi-core ridotte di circa il 40%. Ulteriori benchmark della CPU sono disponibili nella la nostra sezione tecnica corrispondente.
Cinebench R15 Multi Constant Load Test
Cinebench R23: Multi Core | Single Core
Cinebench R20: CPU (Multi Core) | CPU (Single Core)
Cinebench R15: CPU Multi 64Bit | CPU Single 64Bit
Blender: v2.79 BMW27 CPU
7-Zip 18.03: 7z b 4 | 7z b 4 -mmt1
Geekbench 5.5: Multi-Core | Single-Core
HWBOT x265 Benchmark v2.2: 4k Preset
LibreOffice : 20 Documents To PDF
R Benchmark 2.5: Overall mean
| CPU Performance rating | |
| Media della classe Gaming | |
| Lenovo Legion 7 16IAX7-82TD004SGE | |
| MSI Titan GT77 12UHS | |
| Asus ROG Strix Scar 17 SE G733CX-LL014W | |
| Media Intel Core i9-12950HX | |
| Alienware x17 R2 P48E | |
| Schenker XMG Neo 17 M22 | |
| Asus Strix Scar 17 G733QSA-XS99 | |
| Cinebench R23 / Multi Core | |
| Media della classe Gaming (10488 - 42661, n=104, ultimi 2 anni) | |
| MSI Titan GT77 12UHS | |
| Lenovo Legion 7 16IAX7-82TD004SGE | |
| Asus ROG Strix Scar 17 SE G733CX-LL014W | |
| Media Intel Core i9-12950HX (16277 - 23113, n=7) | |
| Alienware x17 R2 P48E | |
| Schenker XMG Neo 17 M22 | |
| Asus Strix Scar 17 G733QSA-XS99 | |
| Cinebench R23 / Single Core | |
| Media della classe Gaming (1601 - 2415, n=104, ultimi 2 anni) | |
| Lenovo Legion 7 16IAX7-82TD004SGE | |
| MSI Titan GT77 12UHS | |
| Alienware x17 R2 P48E | |
| Asus ROG Strix Scar 17 SE G733CX-LL014W | |
| Media Intel Core i9-12950HX (1465 - 1922, n=7) | |
| Schenker XMG Neo 17 M22 | |
| Asus Strix Scar 17 G733QSA-XS99 | |
| Cinebench R20 / CPU (Multi Core) | |
| Media della classe Gaming (4029 - 16433, n=103, ultimi 2 anni) | |
| MSI Titan GT77 12UHS | |
| Lenovo Legion 7 16IAX7-82TD004SGE | |
| Media Intel Core i9-12950HX (6625 - 8777, n=7) | |
| Asus ROG Strix Scar 17 SE G733CX-LL014W | |
| Alienware x17 R2 P48E | |
| Schenker XMG Neo 17 M22 | |
| Asus Strix Scar 17 G733QSA-XS99 | |
| Cinebench R20 / CPU (Single Core) | |
| Media della classe Gaming (622 - 913, n=103, ultimi 2 anni) | |
| Lenovo Legion 7 16IAX7-82TD004SGE | |
| Asus ROG Strix Scar 17 SE G733CX-LL014W | |
| MSI Titan GT77 12UHS | |
| Alienware x17 R2 P48E | |
| Media Intel Core i9-12950HX (703 - 741, n=7) | |
| Schenker XMG Neo 17 M22 | |
| Asus Strix Scar 17 G733QSA-XS99 | |
| Cinebench R15 / CPU Multi 64Bit | |
| Media della classe Gaming (1578 - 6330, n=102, ultimi 2 anni) | |
| MSI Titan GT77 12UHS | |
| Lenovo Legion 7 16IAX7-82TD004SGE | |
| Asus ROG Strix Scar 17 SE G733CX-LL014W | |
| Media Intel Core i9-12950HX (2464 - 3530, n=7) | |
| Alienware x17 R2 P48E | |
| Schenker XMG Neo 17 M22 | |
| Asus Strix Scar 17 G733QSA-XS99 | |
| Cinebench R15 / CPU Single 64Bit | |
| Media della classe Gaming (188.8 - 350, n=103, ultimi 2 anni) | |
| Lenovo Legion 7 16IAX7-82TD004SGE | |
| MSI Titan GT77 12UHS | |
| Asus ROG Strix Scar 17 SE G733CX-LL014W | |
| Alienware x17 R2 P48E | |
| Media Intel Core i9-12950HX (167 - 276, n=7) | |
| Schenker XMG Neo 17 M22 | |
| Asus Strix Scar 17 G733QSA-XS99 | |
| Blender / v2.79 BMW27 CPU | |
| Asus Strix Scar 17 G733QSA-XS99 | |
| Schenker XMG Neo 17 M22 | |
| Asus ROG Strix Scar 17 SE G733CX-LL014W | |
| Alienware x17 R2 P48E | |
| Media Intel Core i9-12950HX (138 - 193, n=7) | |
| Lenovo Legion 7 16IAX7-82TD004SGE | |
| Media della classe Gaming (79 - 330, n=101, ultimi 2 anni) | |
| MSI Titan GT77 12UHS | |
| 7-Zip 18.03 / 7z b 4 | |
| Media della classe Gaming (33491 - 148086, n=102, ultimi 2 anni) | |
| Lenovo Legion 7 16IAX7-82TD004SGE | |
| MSI Titan GT77 12UHS | |
| Media Intel Core i9-12950HX (65637 - 85019, n=7) | |
| Asus ROG Strix Scar 17 SE G733CX-LL014W | |
| Alienware x17 R2 P48E | |
| Schenker XMG Neo 17 M22 | |
| Asus Strix Scar 17 G733QSA-XS99 | |
| 7-Zip 18.03 / 7z b 4 -mmt1 | |
| Media della classe Gaming (4824 - 7436, n=102, ultimi 2 anni) | |
| Lenovo Legion 7 16IAX7-82TD004SGE | |
| MSI Titan GT77 12UHS | |
| Asus ROG Strix Scar 17 SE G733CX-LL014W | |
| Media Intel Core i9-12950HX (6022 - 6318, n=7) | |
| Schenker XMG Neo 17 M22 | |
| Alienware x17 R2 P48E | |
| Asus Strix Scar 17 G733QSA-XS99 | |
| Geekbench 5.5 / Multi-Core | |
| Media della classe Gaming (6460 - 28263, n=102, ultimi 2 anni) | |
| Lenovo Legion 7 16IAX7-82TD004SGE | |
| MSI Titan GT77 12UHS | |
| Asus ROG Strix Scar 17 SE G733CX-LL014W | |
| Media Intel Core i9-12950HX (14028 - 16009, n=7) | |
| Alienware x17 R2 P48E | |
| Schenker XMG Neo 17 M22 | |
| Asus Strix Scar 17 G733QSA-XS99 | |
| Geekbench 5.5 / Single-Core | |
| Media della classe Gaming (1403 - 2474, n=102, ultimi 2 anni) | |
| MSI Titan GT77 12UHS | |
| Media Intel Core i9-12950HX (1847 - 1945, n=7) | |
| Alienware x17 R2 P48E | |
| Lenovo Legion 7 16IAX7-82TD004SGE | |
| Asus ROG Strix Scar 17 SE G733CX-LL014W | |
| Schenker XMG Neo 17 M22 | |
| Asus Strix Scar 17 G733QSA-XS99 | |
| HWBOT x265 Benchmark v2.2 / 4k Preset | |
| Media della classe Gaming (11.5 - 44.4, n=102, ultimi 2 anni) | |
| MSI Titan GT77 12UHS | |
| Lenovo Legion 7 16IAX7-82TD004SGE | |
| Asus ROG Strix Scar 17 SE G733CX-LL014W | |
| Media Intel Core i9-12950HX (18.6 - 26.5, n=7) | |
| Alienware x17 R2 P48E | |
| Schenker XMG Neo 17 M22 | |
| Asus Strix Scar 17 G733QSA-XS99 | |
| LibreOffice / 20 Documents To PDF | |
| Schenker XMG Neo 17 M22 | |
| Media della classe Gaming (33.2 - 88.8, n=102, ultimi 2 anni) | |
| Asus Strix Scar 17 G733QSA-XS99 | |
| Alienware x17 R2 P48E | |
| Media Intel Core i9-12950HX (34.7 - 45.4, n=7) | |
| MSI Titan GT77 12UHS | |
| Asus ROG Strix Scar 17 SE G733CX-LL014W | |
| Lenovo Legion 7 16IAX7-82TD004SGE | |
| R Benchmark 2.5 / Overall mean | |
| Asus Strix Scar 17 G733QSA-XS99 | |
| Schenker XMG Neo 17 M22 | |
| Media Intel Core i9-12950HX (0.4251 - 0.4515, n=7) | |
| Alienware x17 R2 P48E | |
| Asus ROG Strix Scar 17 SE G733CX-LL014W | |
| Media della classe Gaming (0.3439 - 0.59, n=102, ultimi 2 anni) | |
| Lenovo Legion 7 16IAX7-82TD004SGE | |
| MSI Titan GT77 12UHS | |
* ... Meglio usare valori piccoli
AIDA64: FP32 Ray-Trace | FPU Julia | CPU SHA3 | CPU Queen | FPU SinJulia | FPU Mandel | CPU AES | CPU ZLib | FP64 Ray-Trace | CPU PhotoWorxx
| Performance rating | |
| Media della classe Gaming | |
| MSI Titan GT77 12UHS | |
| Asus ROG Strix Scar 17 SE G733CX-LL014W | |
| Media Intel Core i9-12950HX | |
| Schenker XMG Neo 17 M22 | |
| Asus Strix Scar 17 G733QSA-XS99 | |
| Lenovo Legion 7 16IAX7-82TD004SGE | |
| Alienware x17 R2 P48E | |
| AIDA64 / FP32 Ray-Trace | |
| Media della classe Gaming (10227 - 85542, n=102, ultimi 2 anni) | |
| MSI Titan GT77 12UHS | |
| Media Intel Core i9-12950HX (15499 - 22868, n=7) | |
| Asus ROG Strix Scar 17 SE G733CX-LL014W | |
| Schenker XMG Neo 17 M22 | |
| Asus Strix Scar 17 G733QSA-XS99 | |
| Lenovo Legion 7 16IAX7-82TD004SGE | |
| Alienware x17 R2 P48E | |
| AIDA64 / FPU Julia | |
| Media della classe Gaming (51376 - 372155, n=102, ultimi 2 anni) | |
| MSI Titan GT77 12UHS | |
| Asus Strix Scar 17 G733QSA-XS99 | |
| Schenker XMG Neo 17 M22 | |
| Media Intel Core i9-12950HX (77846 - 115907, n=7) | |
| Asus ROG Strix Scar 17 SE G733CX-LL014W | |
| Lenovo Legion 7 16IAX7-82TD004SGE | |
| Alienware x17 R2 P48E | |
| AIDA64 / CPU SHA3 | |
| Media della classe Gaming (2180 - 10115, n=102, ultimi 2 anni) | |
| MSI Titan GT77 12UHS | |
| Lenovo Legion 7 16IAX7-82TD004SGE | |
| Asus ROG Strix Scar 17 SE G733CX-LL014W | |
| Media Intel Core i9-12950HX (3426 - 5069, n=7) | |
| Alienware x17 R2 P48E | |
| Asus Strix Scar 17 G733QSA-XS99 | |
| Schenker XMG Neo 17 M22 | |
| AIDA64 / CPU Queen | |
| Media della classe Gaming (49785 - 173351, n=86, ultimi 2 anni) | |
| Alienware x17 R2 P48E | |
| Asus ROG Strix Scar 17 SE G733CX-LL014W | |
| Media Intel Core i9-12950HX (102752 - 104726, n=7) | |
| Asus Strix Scar 17 G733QSA-XS99 | |
| MSI Titan GT77 12UHS | |
| Schenker XMG Neo 17 M22 | |
| Lenovo Legion 7 16IAX7-82TD004SGE | |
| AIDA64 / FPU SinJulia | |
| Media della classe Gaming (4424 - 33636, n=102, ultimi 2 anni) | |
| Lenovo Legion 7 16IAX7-82TD004SGE | |
| MSI Titan GT77 12UHS | |
| Schenker XMG Neo 17 M22 | |
| Asus Strix Scar 17 G733QSA-XS99 | |
| Media Intel Core i9-12950HX (10134 - 12823, n=7) | |
| Asus ROG Strix Scar 17 SE G733CX-LL014W | |
| Alienware x17 R2 P48E | |
| AIDA64 / FPU Mandel | |
| Media della classe Gaming (25115 - 196829, n=102, ultimi 2 anni) | |
| Asus Strix Scar 17 G733QSA-XS99 | |
| Schenker XMG Neo 17 M22 | |
| MSI Titan GT77 12UHS | |
| Media Intel Core i9-12950HX (37146 - 57340, n=7) | |
| Asus ROG Strix Scar 17 SE G733CX-LL014W | |
| Lenovo Legion 7 16IAX7-82TD004SGE | |
| Alienware x17 R2 P48E | |
| AIDA64 / CPU AES | |
| MSI Titan GT77 12UHS | |
| Asus ROG Strix Scar 17 SE G733CX-LL014W | |
| Schenker XMG Neo 17 M22 | |
| Asus Strix Scar 17 G733QSA-XS99 | |
| Lenovo Legion 7 16IAX7-82TD004SGE | |
| Media Intel Core i9-12950HX (72599 - 181128, n=7) | |
| Media della classe Gaming (39258 - 247074, n=102, ultimi 2 anni) | |
| Alienware x17 R2 P48E | |
| AIDA64 / CPU ZLib | |
| Media della classe Gaming (574 - 2531, n=102, ultimi 2 anni) | |
| Lenovo Legion 7 16IAX7-82TD004SGE | |
| MSI Titan GT77 12UHS | |
| Asus ROG Strix Scar 17 SE G733CX-LL014W | |
| Alienware x17 R2 P48E | |
| Media Intel Core i9-12950HX (996 - 1417, n=7) | |
| Asus Strix Scar 17 G733QSA-XS99 | |
| Schenker XMG Neo 17 M22 | |
| AIDA64 / FP64 Ray-Trace | |
| Media della classe Gaming (5509 - 45446, n=102, ultimi 2 anni) | |
| MSI Titan GT77 12UHS | |
| Media Intel Core i9-12950HX (8455 - 12432, n=7) | |
| Asus ROG Strix Scar 17 SE G733CX-LL014W | |
| Asus Strix Scar 17 G733QSA-XS99 | |
| Schenker XMG Neo 17 M22 | |
| Lenovo Legion 7 16IAX7-82TD004SGE | |
| Alienware x17 R2 P48E | |
| AIDA64 / CPU PhotoWorxx | |
| Media della classe Gaming (12271 - 89891, n=102, ultimi 2 anni) | |
| Asus ROG Strix Scar 17 SE G733CX-LL014W | |
| MSI Titan GT77 12UHS | |
| Media Intel Core i9-12950HX (35479 - 42655, n=7) | |
| Lenovo Legion 7 16IAX7-82TD004SGE | |
| Alienware x17 R2 P48E | |
| Schenker XMG Neo 17 M22 | |
| Asus Strix Scar 17 G733QSA-XS99 | |
Prestazioni del sistema
Le prestazioni soggettive sono eccellenti, come confermano anche i buoni risultati dei benchmark. Non abbiamo notato alcun problema durante i test.
CrossMark: Overall | Productivity | Creativity | Responsiveness
| PCMark 10 / Score | |
| Lenovo Legion 7 16IAX7-82TD004SGE | |
| Media della classe Gaming (5828 - 12414, n=93, ultimi 2 anni) | |
| MSI Titan GT77 12UHS | |
| Alienware x17 R2 P48E | |
| Asus ROG Strix Scar 17 SE G733CX-LL014W | |
| Media Intel Core i9-12950HX, NVIDIA GeForce RTX 3080 Ti Laptop GPU (n=1) | |
| Asus Strix Scar 17 G733QSA-XS99 | |
| Schenker XMG Neo 17 M22 | |
| PCMark 10 / Essentials | |
| Alienware x17 R2 P48E | |
| Lenovo Legion 7 16IAX7-82TD004SGE | |
| MSI Titan GT77 12UHS | |
| Media della classe Gaming (8810 - 11935, n=97, ultimi 2 anni) | |
| Asus Strix Scar 17 G733QSA-XS99 | |
| Asus ROG Strix Scar 17 SE G733CX-LL014W | |
| Media Intel Core i9-12950HX, NVIDIA GeForce RTX 3080 Ti Laptop GPU (n=1) | |
| Schenker XMG Neo 17 M22 | |
| PCMark 10 / Productivity | |
| Media della classe Gaming (6845 - 25323, n=95, ultimi 2 anni) | |
| Lenovo Legion 7 16IAX7-82TD004SGE | |
| MSI Titan GT77 12UHS | |
| Alienware x17 R2 P48E | |
| Asus ROG Strix Scar 17 SE G733CX-LL014W | |
| Media Intel Core i9-12950HX, NVIDIA GeForce RTX 3080 Ti Laptop GPU (n=1) | |
| Asus Strix Scar 17 G733QSA-XS99 | |
| Schenker XMG Neo 17 M22 | |
| PCMark 10 / Digital Content Creation | |
| Lenovo Legion 7 16IAX7-82TD004SGE | |
| Media della classe Gaming (7602 - 19954, n=95, ultimi 2 anni) | |
| MSI Titan GT77 12UHS | |
| Alienware x17 R2 P48E | |
| Asus ROG Strix Scar 17 SE G733CX-LL014W | |
| Media Intel Core i9-12950HX, NVIDIA GeForce RTX 3080 Ti Laptop GPU (n=1) | |
| Asus Strix Scar 17 G733QSA-XS99 | |
| Schenker XMG Neo 17 M22 | |
| CrossMark / Overall | |
| Lenovo Legion 7 16IAX7-82TD004SGE | |
| Asus ROG Strix Scar 17 SE G733CX-LL014W | |
| Media Intel Core i9-12950HX, NVIDIA GeForce RTX 3080 Ti Laptop GPU (n=1) | |
| MSI Titan GT77 12UHS | |
| Media della classe Gaming (1366 - 2409, n=94, ultimi 2 anni) | |
| Alienware x17 R2 P48E | |
| Schenker XMG Neo 17 M22 | |
| CrossMark / Productivity | |
| Lenovo Legion 7 16IAX7-82TD004SGE | |
| MSI Titan GT77 12UHS | |
| Asus ROG Strix Scar 17 SE G733CX-LL014W | |
| Media Intel Core i9-12950HX, NVIDIA GeForce RTX 3080 Ti Laptop GPU (n=1) | |
| Media della classe Gaming (1386 - 2254, n=94, ultimi 2 anni) | |
| Alienware x17 R2 P48E | |
| Schenker XMG Neo 17 M22 | |
| CrossMark / Creativity | |
| Asus ROG Strix Scar 17 SE G733CX-LL014W | |
| Media Intel Core i9-12950HX, NVIDIA GeForce RTX 3080 Ti Laptop GPU (n=1) | |
| Lenovo Legion 7 16IAX7-82TD004SGE | |
| MSI Titan GT77 12UHS | |
| Media della classe Gaming (1343 - 2786, n=94, ultimi 2 anni) | |
| Alienware x17 R2 P48E | |
| Schenker XMG Neo 17 M22 | |
| CrossMark / Responsiveness | |
| Lenovo Legion 7 16IAX7-82TD004SGE | |
| MSI Titan GT77 12UHS | |
| Asus ROG Strix Scar 17 SE G733CX-LL014W | |
| Media Intel Core i9-12950HX, NVIDIA GeForce RTX 3080 Ti Laptop GPU (n=1) | |
| Media della classe Gaming (1226 - 2334, n=94, ultimi 2 anni) | |
| Alienware x17 R2 P48E | |
| Schenker XMG Neo 17 M22 | |
| PCMark 10 Score | 7208 punti | |
Aiuto | ||
| AIDA64 / Memory Copy | |
| Media della classe Gaming (21750 - 129946, n=102, ultimi 2 anni) | |
| MSI Titan GT77 12UHS | |
| Lenovo Legion 7 16IAX7-82TD004SGE | |
| Asus ROG Strix Scar 17 SE G733CX-LL014W | |
| Media Intel Core i9-12950HX (59731 - 64732, n=7) | |
| Alienware x17 R2 P48E | |
| Schenker XMG Neo 17 M22 | |
| Asus Strix Scar 17 G733QSA-XS99 | |
| AIDA64 / Memory Read | |
| Media della classe Gaming (22956 - 118858, n=102, ultimi 2 anni) | |
| Lenovo Legion 7 16IAX7-82TD004SGE | |
| Asus ROG Strix Scar 17 SE G733CX-LL014W | |
| Media Intel Core i9-12950HX (59744 - 70359, n=7) | |
| MSI Titan GT77 12UHS | |
| Alienware x17 R2 P48E | |
| Schenker XMG Neo 17 M22 | |
| Asus Strix Scar 17 G733QSA-XS99 | |
| AIDA64 / Memory Write | |
| Media della classe Gaming (22297 - 135096, n=102, ultimi 2 anni) | |
| Asus ROG Strix Scar 17 SE G733CX-LL014W | |
| Lenovo Legion 7 16IAX7-82TD004SGE | |
| Media Intel Core i9-12950HX (57750 - 67899, n=7) | |
| MSI Titan GT77 12UHS | |
| Schenker XMG Neo 17 M22 | |
| Alienware x17 R2 P48E | |
| Asus Strix Scar 17 G733QSA-XS99 | |
| AIDA64 / Memory Latency | |
| Media della classe Gaming (75.3 - 165.4, n=102, ultimi 2 anni) | |
| Alienware x17 R2 P48E | |
| Schenker XMG Neo 17 M22 | |
| MSI Titan GT77 12UHS | |
| Media Intel Core i9-12950HX (84.5 - 92.2, n=7) | |
| Lenovo Legion 7 16IAX7-82TD004SGE | |
| Asus ROG Strix Scar 17 SE G733CX-LL014W | |
| Asus Strix Scar 17 G733QSA-XS99 | |
* ... Meglio usare valori piccoli
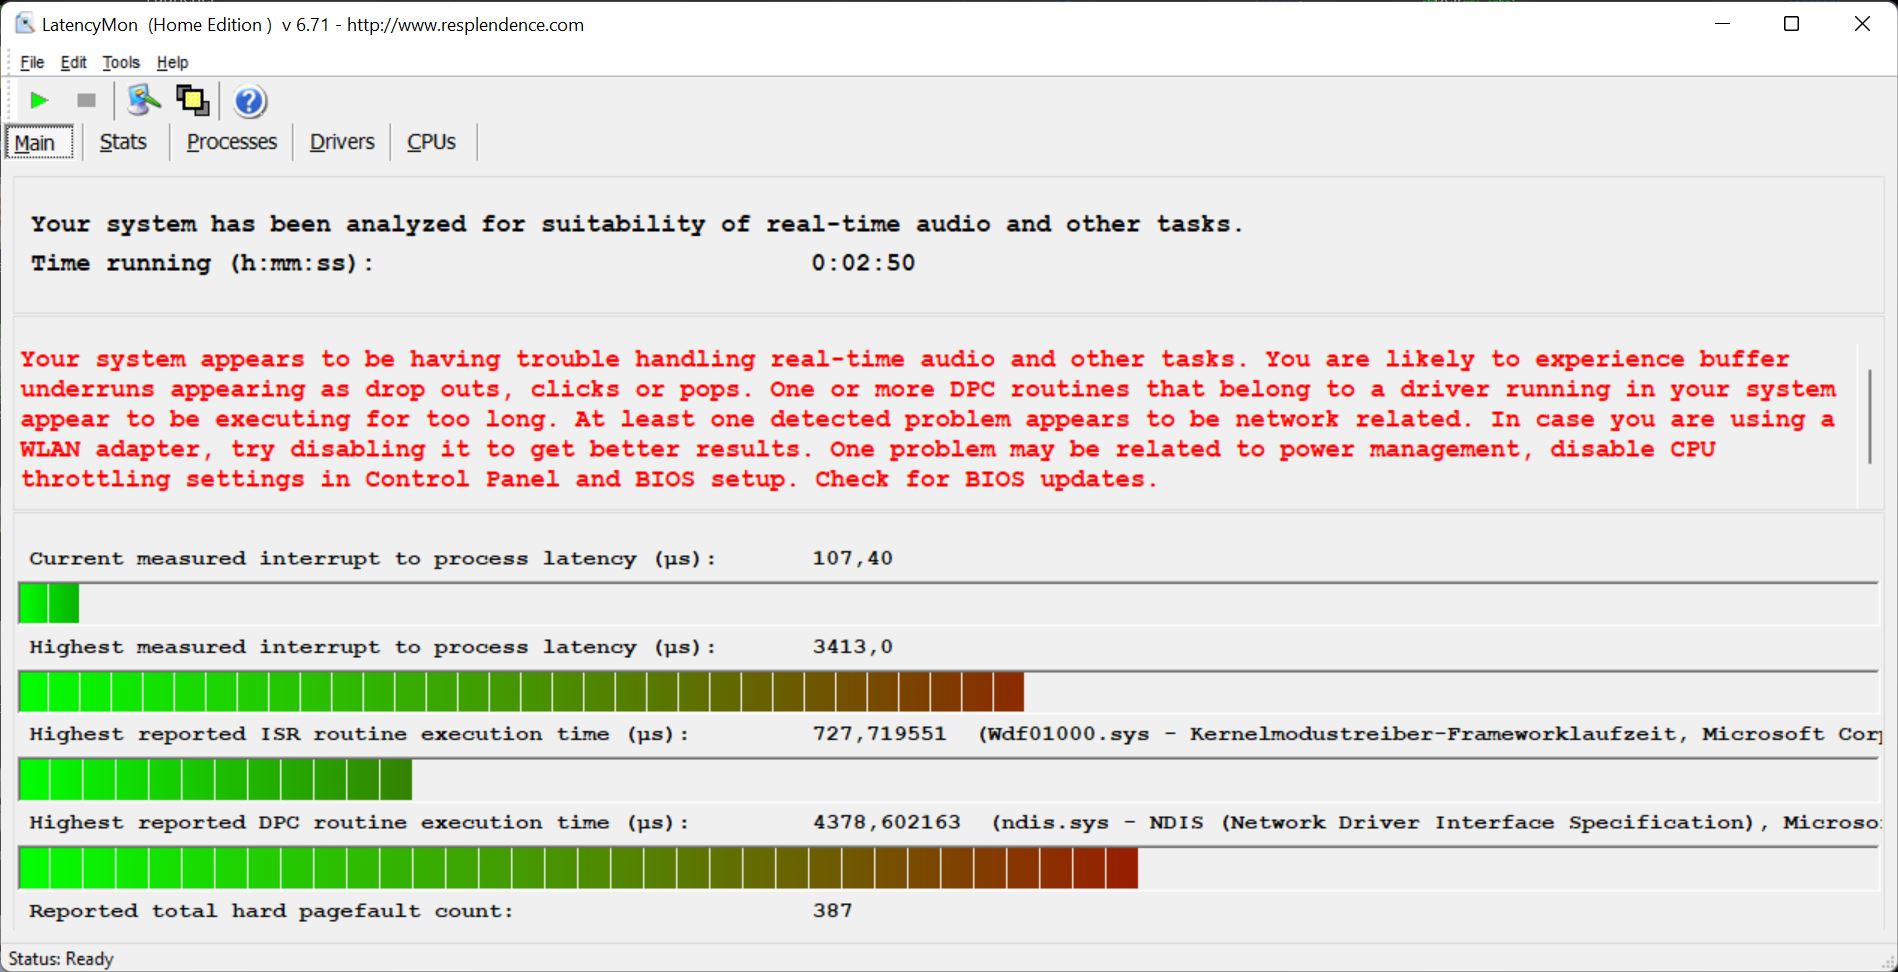
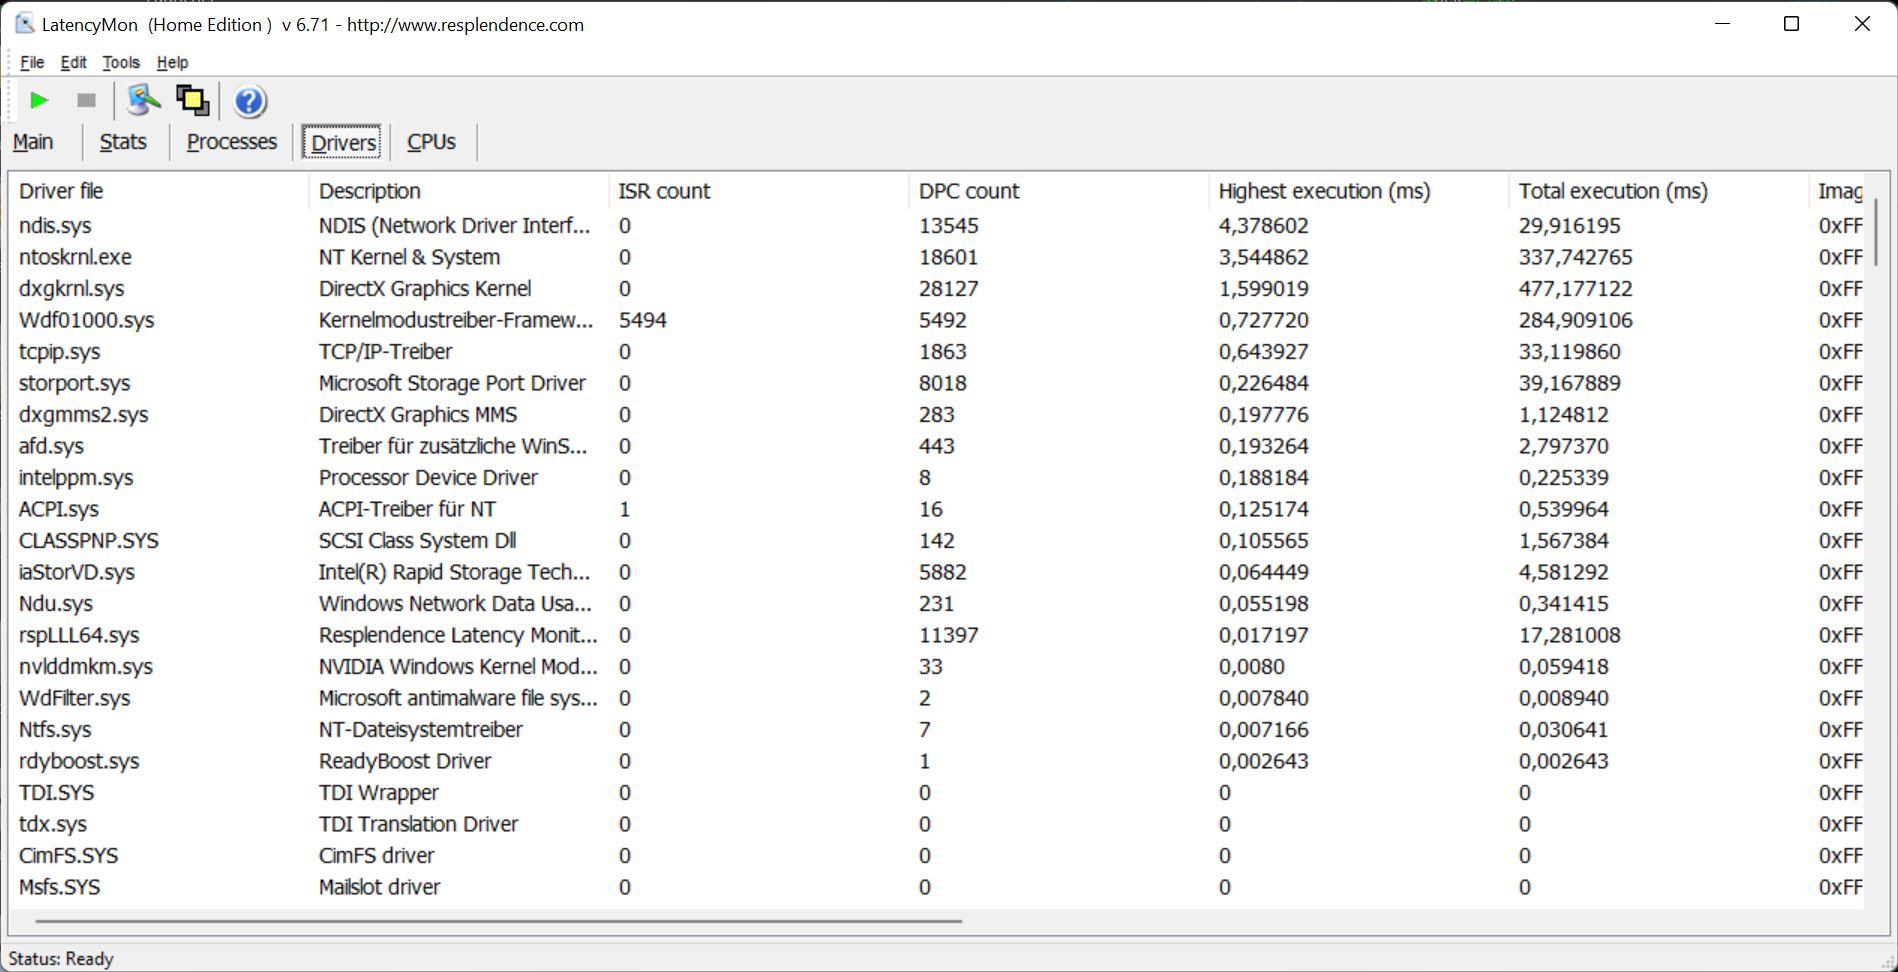
Latenze DPC
Nel nostro test di latenza standardizzato (navigazione in Internet, video YouTube 4K, carico della CPU), la nostra unità di prova con la sua versione del BIOS presenta alcuni problemi, quindi non è adatta all'elaborazione di video e audio in tempo reale.
| DPC Latencies / LatencyMon - interrupt to process latency (max), Web, Youtube, Prime95 | |
| Schenker XMG Neo 17 M22 | |
| Asus ROG Strix Scar 17 SE G733CX-LL014W | |
| MSI Titan GT77 12UHS | |
| MSI Titan GT77 12UHS | |
| Lenovo Legion 7 16IAX7-82TD004SGE | |
| Alienware x17 R2 P48E | |
| Asus Strix Scar 17 G733QSA-XS99 | |
* ... Meglio usare valori piccoli
Soluzione di stoccaggio
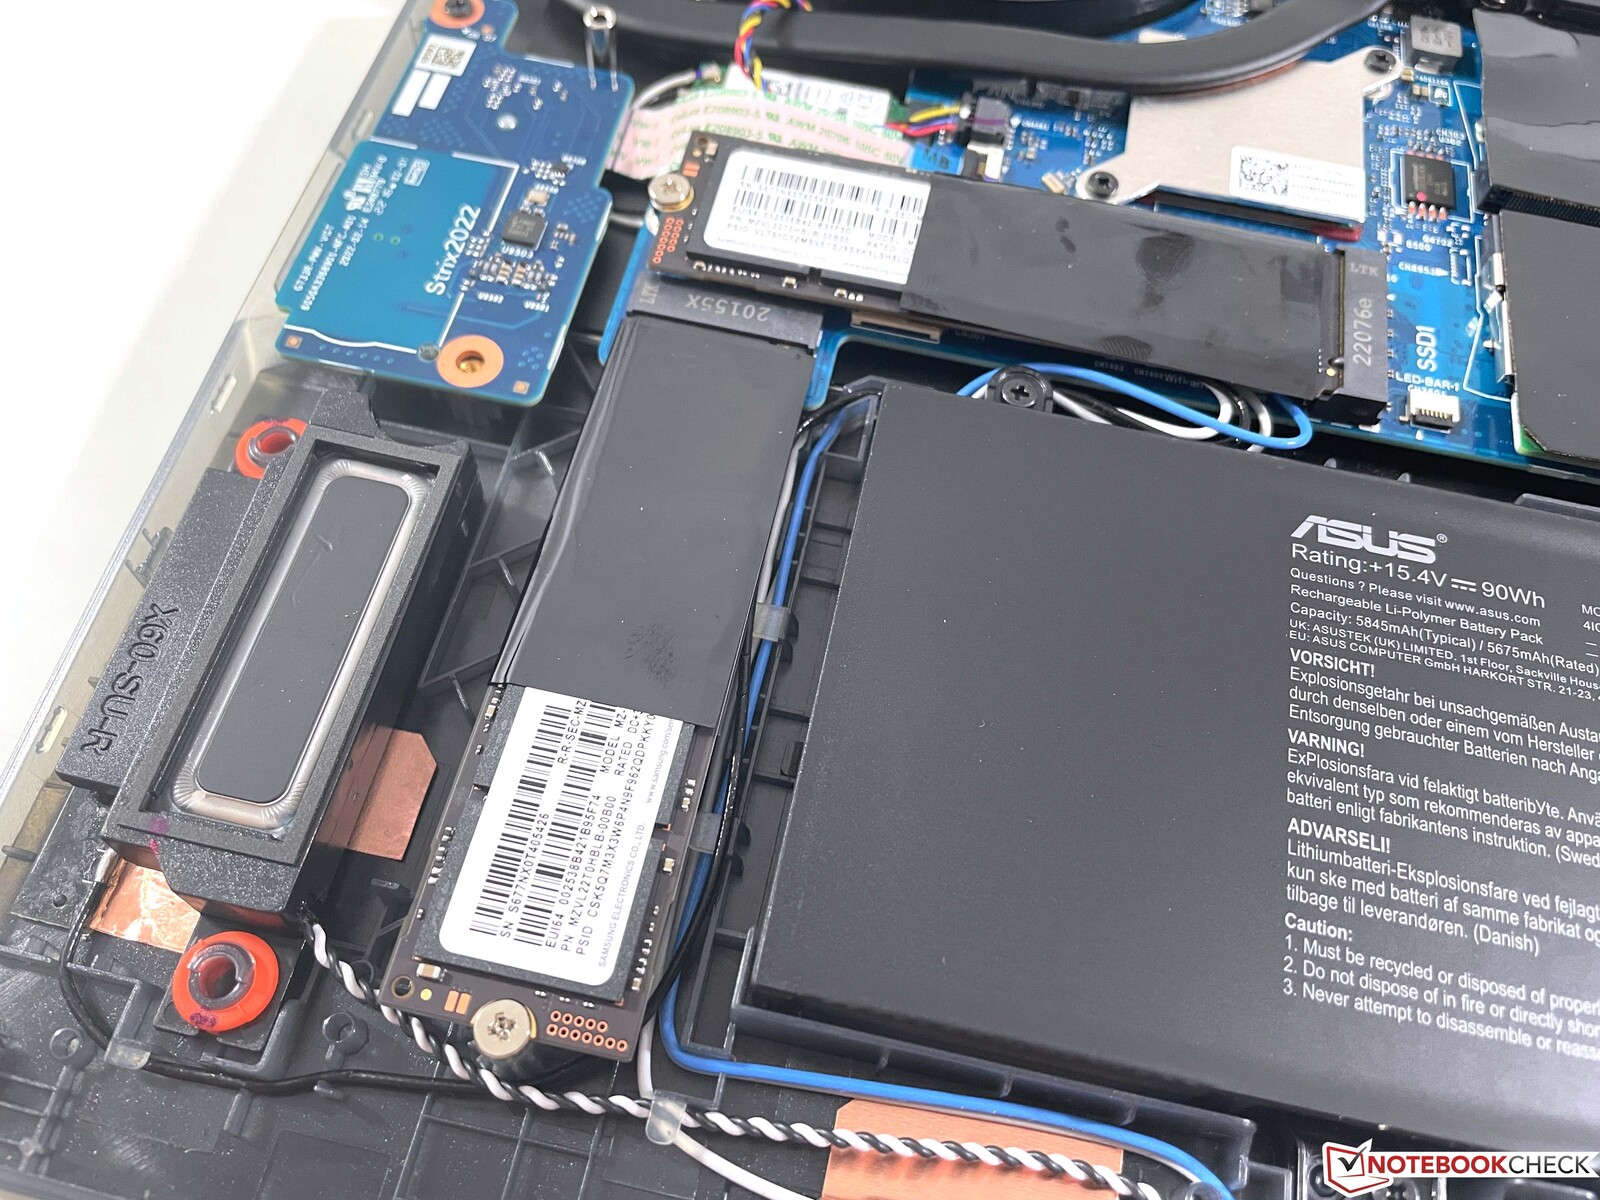
Asus utilizza due veloci SSD da 2 TB di Samsung (PM91A) in una configurazione RAID 0. Questo permette di ottenere velocità di trasferimento estremamente elevate, pari a oltre 10 GB/s. Questo consente velocità di trasferimento estremamente elevate, superiori a 10 GB/s. Tuttavia, le prestazioni non rimangono stabili sotto carico costante, ma calano in modo massiccio. Ma questo non dovrebbe causare limitazioni durante i giochi di tutti i giorni. Potete trovare altri benchmark sulle unità SSD qui.

* ... Meglio usare valori piccoli
Disk Throttling: DiskSpd Read Loop, Queue Depth 8
Scheda grafica
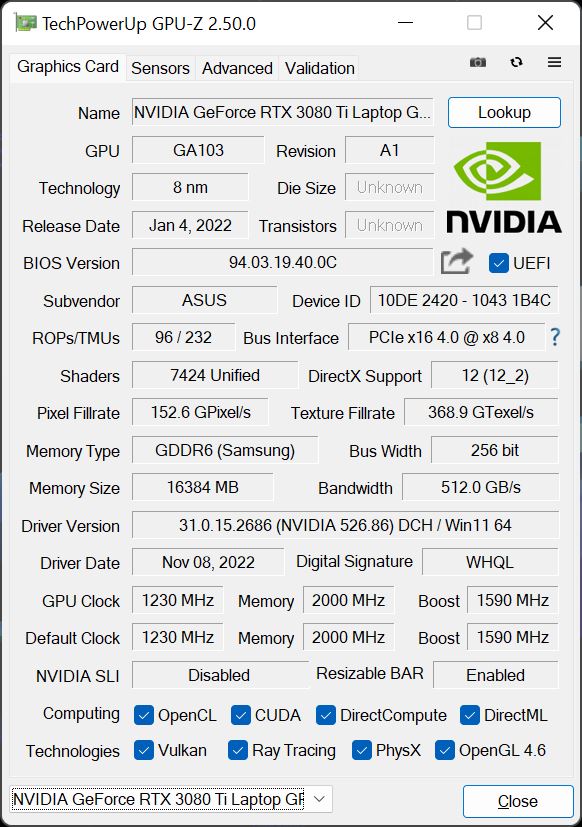
Asus utilizza laGeForce RTX 3080 Ti con un TGP di 150 watt, e la GPU è anche in grado di utilizzare 25 watt aggiuntivi di Dynamic Boost dal processore. Raggiunge questo valore (175 watt) anche in modalità Performance, quindi non è necessario utilizzare la modalità Turbo. È presente anche un MUX che consente di disattivare completamente la GPU integrata (richiede un riavvio), il che migliora le latenze durante il gioco ma non ha un grande effetto sulle prestazioni grafiche in sé
Le prestazioni grafiche rientrano nel gruppo dei top performer e sono anche superiori ai valori medi della RTX 3080 Ti nel nostro database. Inoltre, le prestazioni grafiche rimangono completamente stabili. Il test di stress 3DMark Time Spy è stato superato senza problemi e non si è verificato alcun calo di prestazioni nemmeno nel test di carico costante The Witcher 3. Le prestazioni di gioco sono facilmente sufficienti per ottenere i massimi dettagli nella risoluzione nativa QHD, anche nei giochi più impegnativi.
Nel funzionamento a batteria, la GPU può consumare al massimo 44 watt, il che corrisponde a un calo delle prestazioni di circa il 70%. È possibile trovare altri benchmark della GPU qui.
| 3DMark 11 Performance | 35997 punti | |
| 3DMark Fire Strike Score | 28793 punti | |
| 3DMark Time Spy Score | 12904 punti | |
Aiuto | ||
| Blender / v3.3 Classroom OPTIX/RTX | |
| Media NVIDIA GeForce RTX 3080 Ti Laptop GPU (20 - 28, n=13) | |
| Lenovo Legion 7 16IAX7-82TD004SGE | |
| Asus ROG Strix Scar 17 SE G733CX-LL014W | |
| MSI Titan GT77 12UHS | |
| Media della classe Gaming (9 - 32, n=103, ultimi 2 anni) | |
| Blender / v3.3 Classroom CUDA | |
| Lenovo Legion 7 16IAX7-82TD004SGE | |
| Media NVIDIA GeForce RTX 3080 Ti Laptop GPU (32 - 41, n=13) | |
| Asus ROG Strix Scar 17 SE G733CX-LL014W | |
| Media della classe Gaming (15 - 228, n=103, ultimi 2 anni) | |
| MSI Titan GT77 12UHS | |
| Blender / v3.3 Classroom CPU | |
| Asus ROG Strix Scar 17 SE G733CX-LL014W | |
| Media NVIDIA GeForce RTX 3080 Ti Laptop GPU (261 - 429, n=13) | |
| Lenovo Legion 7 16IAX7-82TD004SGE | |
| MSI Titan GT77 12UHS | |
| Media della classe Gaming (122 - 565, n=99, ultimi 2 anni) | |
* ... Meglio usare valori piccoli
| The Witcher 3 - 1920x1080 Ultra Graphics & Postprocessing (HBAO+) | |
| Media della classe Gaming (104.7 - 240, n=7, ultimi 2 anni) | |
| MSI Titan GT77 12UHS | |
| Alienware x17 R2 P48E | |
| Schenker XMG Neo 17 M22 | |
| Asus ROG Strix Scar 17 SE G733CX-LL014W | |
| Lenovo Legion 7 16IAX7-82TD004SGE | |
| Media NVIDIA GeForce RTX 3080 Ti Laptop GPU (30 - 130.6, n=43) | |
| Asus Strix Scar 17 G733QSA-XS99 | |
| F1 22 | |
| 1920x1080 Ultra High Preset AA:T AF:16x | |
| Schenker XMG Neo 17 M22 | |
| Media NVIDIA GeForce RTX 3080 Ti Laptop GPU (78.9 - 91, n=4) | |
| MSI Titan GT77 12UHS | |
| Asus ROG Strix Scar 17 SE G733CX-LL014W | |
| Media della classe Gaming (40.1 - 121.2, n=4, ultimi 2 anni) | |
| 2560x1440 Ultra High Preset AA:T AF:16x | |
| Schenker XMG Neo 17 M22 | |
| Media NVIDIA GeForce RTX 3080 Ti Laptop GPU (52.9 - 62, n=2) | |
| Media della classe Gaming (42 - 77.8, n=3, ultimi 2 anni) | |
| Asus ROG Strix Scar 17 SE G733CX-LL014W | |
The Witcher 3 FPS Chart
| basso | medio | alto | ultra | QHD | |
|---|---|---|---|---|---|
| GTA V (2015) | 186.8 | 180.7 | 126.7 | 114.1 | |
| The Witcher 3 (2015) | 118.8 | ||||
| Dota 2 Reborn (2015) | 211 | 191 | 180.8 | 169.8 | |
| Final Fantasy XV Benchmark (2018) | 173.3 | 156.2 | 118.5 | 92.8 | |
| X-Plane 11.11 (2018) | 165.3 | 143.5 | 116.2 | ||
| Strange Brigade (2018) | 236 | 211 | 157.7 | ||
| F1 2021 (2021) | 236 | 211 | 132.8 | 106.2 | |
| Cyberpunk 2077 1.6 (2022) | 103 | 101 | 98 | 87 | 56 |
| F1 22 (2022) | 235 | 235 | 199.7 | 78.9 | 52.9 |
| Call of Duty Modern Warfare 2 2022 (2022) | 135 | 109 | 107 | 78 |
Emissioni e gestione dell'energia
Livelli di rumore
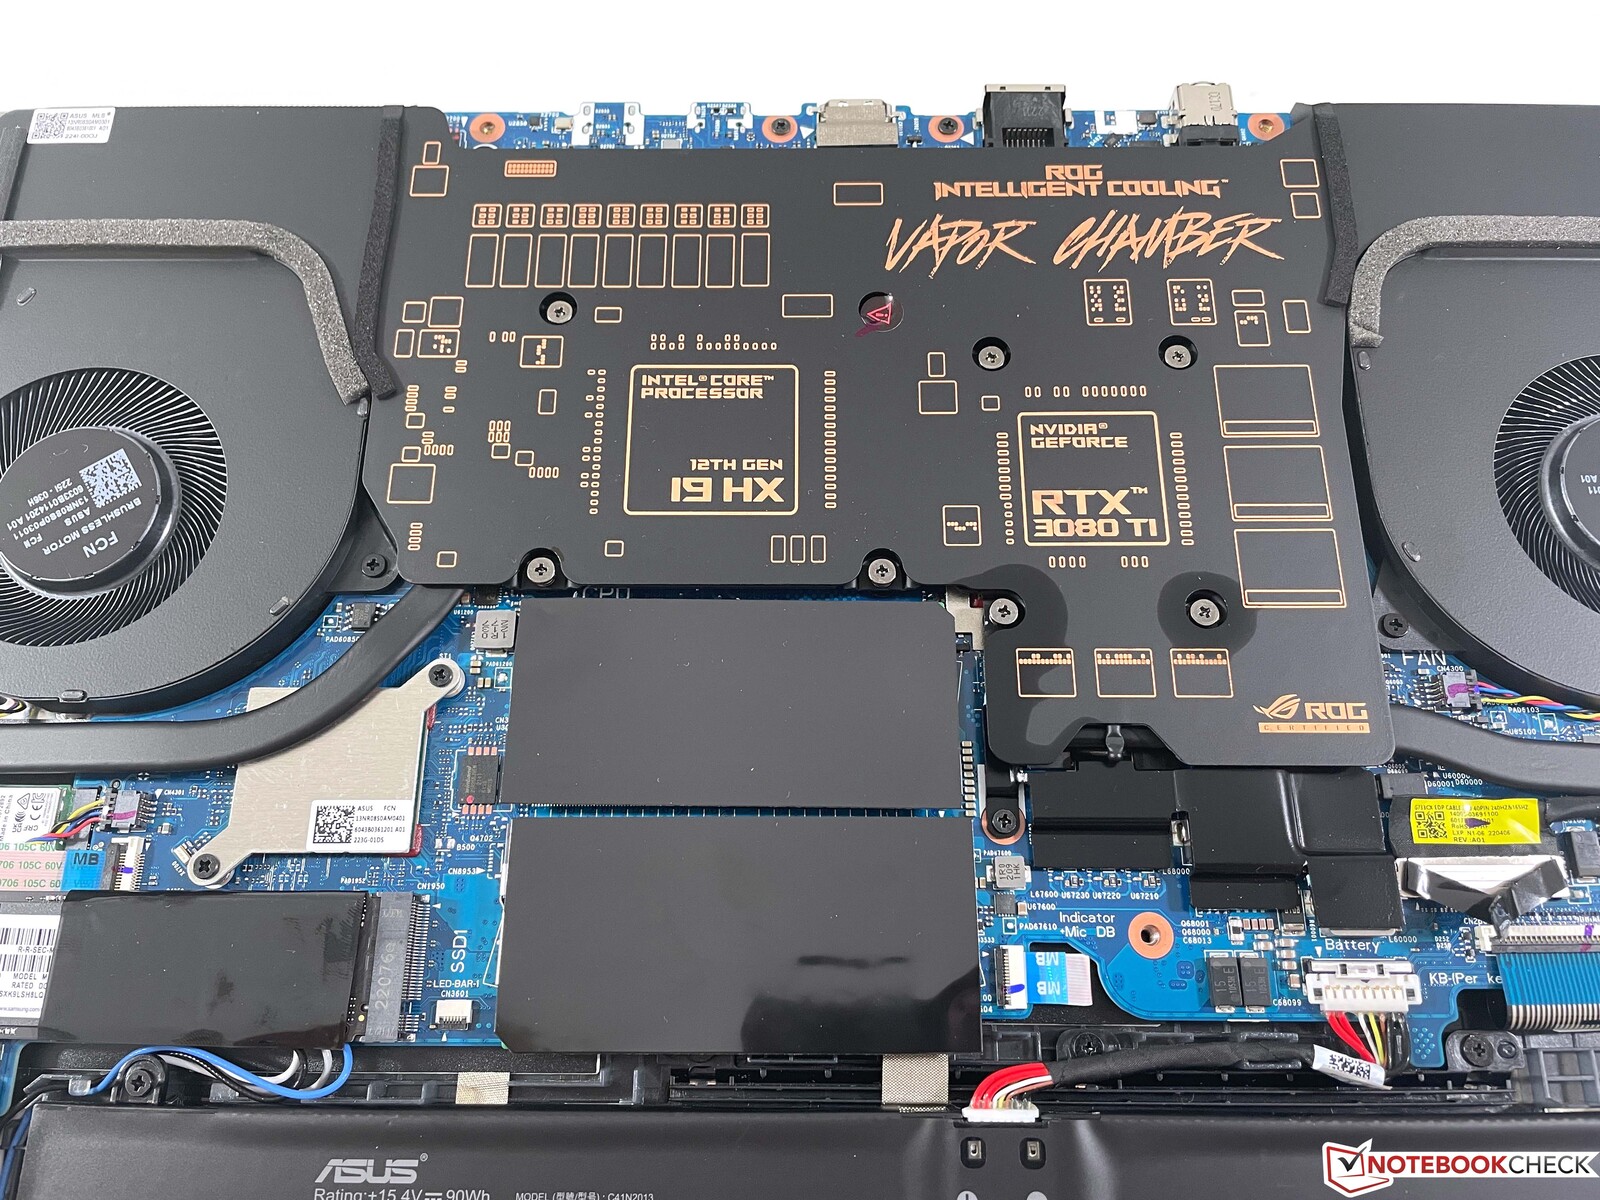
Asus utilizza un sistema di raffreddamento a camera di vapore. Anche nella modalità di alimentazione Performance, il dispositivo rimane relativamente silenzioso e siamo riusciti a misurare un massimo di 46 dB(A) durante lo stress test e durante il gioco. Naturalmente questo valore è ancora notevole, ma la nostra unità di test è comunque significativamente più silenziosa rispetto alla concorrenza. In modalità Turbo, le prestazioni di gioco sono solo insignificantemente superiori, ma le due ventole in funzione producono un forte rumore di 54 dB(A). Durante il funzionamento in idle, le ventole rimangono spesso spente, ma notiamo quasi sempre alcuni rumori elettronici silenziosi. Sotto carico, si avverte anche un certo fruscio della bobina proveniente dalla GPU.
Rumorosità
| Idle |
| 23.9 / 23.9 / 23.9 dB(A) |
| Sotto carico |
| 34.3 / 45.9 dB(A) |
 | ||
30 dB silenzioso 40 dB(A) udibile 50 dB(A) rumoroso |
||
min: | ||
| Asus ROG Strix Scar 17 SE G733CX-LL014W GeForce RTX 3080 Ti Laptop GPU, i9-12950HX, Samsung PM9A1 MZVL22T0HBLB | Lenovo Legion 7 16IAX7-82TD004SGE GeForce RTX 3080 Ti Laptop GPU, i9-12900HX, Micron 3400 1TB MTFDKBA1T0TFH | MSI Titan GT77 12UHS GeForce RTX 3080 Ti Laptop GPU, i9-12900HX, Samsung PM9A1 MZVL21T0HCLR | Schenker XMG Neo 17 M22 GeForce RTX 3080 Ti Laptop GPU, R9 6900HX, Samsung SSD 980 Pro 1TB MZ-V8P1T0BW | Alienware x17 R2 P48E GeForce RTX 3080 Ti Laptop GPU, i9-12900HK, 2x Samsung PM9A1 1TB (RAID 0) | Asus Strix Scar 17 G733QSA-XS99 GeForce RTX 3080 Laptop GPU, R9 5900HX, 2x Samsung PM981a MZVLB1T0HBLR (RAID 0) | |
|---|---|---|---|---|---|---|
| Noise | -19% | -9% | -27% | 1% | -4% | |
| off /ambiente * (dB) | 23.9 | 24.5 -3% | 21.9 8% | 26 -9% | 22.7 5% | 25 -5% |
| Idle Minimum * (dB) | 23.9 | 24.5 -3% | 24.53 -3% | 26 -9% | 23.1 3% | 25.2 -5% |
| Idle Average * (dB) | 23.9 | 30 -26% | 24.53 -3% | 29 -21% | 23.1 3% | 25.2 -5% |
| Idle Maximum * (dB) | 23.9 | 32.5 -36% | 24.53 -3% | 40 -67% | 23.1 3% | 25.2 -5% |
| Load Average * (dB) | 34.3 | 43.9 -28% | 46.25 -35% | 47 -37% | 31.9 7% | 30.7 10% |
| Load Maximum * (dB) | 45.9 | 54.2 -18% | 54.25 -18% | 54 -18% | 52.5 -14% | 51.3 -12% |
| Witcher 3 ultra * (dB) | 48.8 | 56.86 | 52 | 52.5 | 51.3 |
* ... Meglio usare valori piccoli
Temperatura
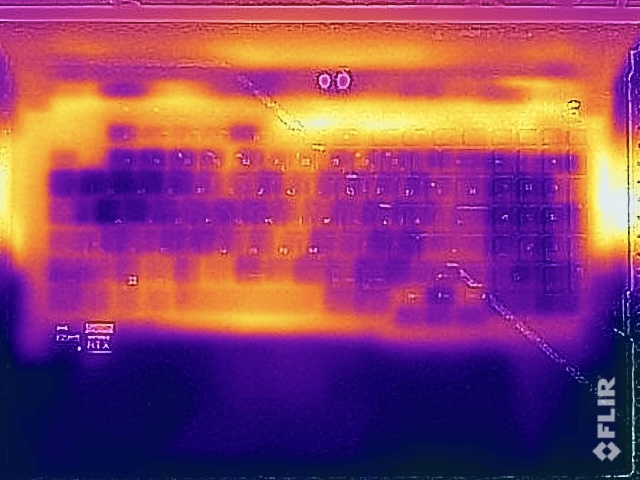
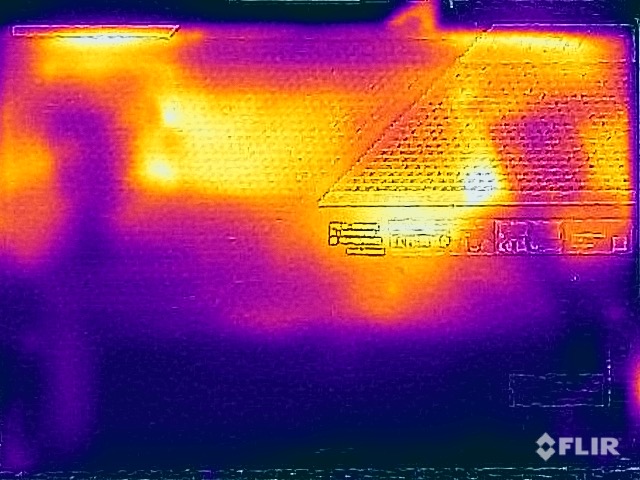
Nonostante le ventole relativamente silenziose, le temperature superficiali non destano alcuna preoccupazione. Anche se in alcuni punti isolati si misurano più di 50 °C (122 °F) sotto carico, la tastiera rimane molto fresca e non ci sono limitazioni durante il gioco
Durante lo stress test, la GPU riceve un trattamento preferenziale, funzionando stabilmente a 150 watt non appena il processore si è stabilizzato a circa 36 watt. Non c'è alcuna riduzione delle prestazioni subito dopo lo stress test.
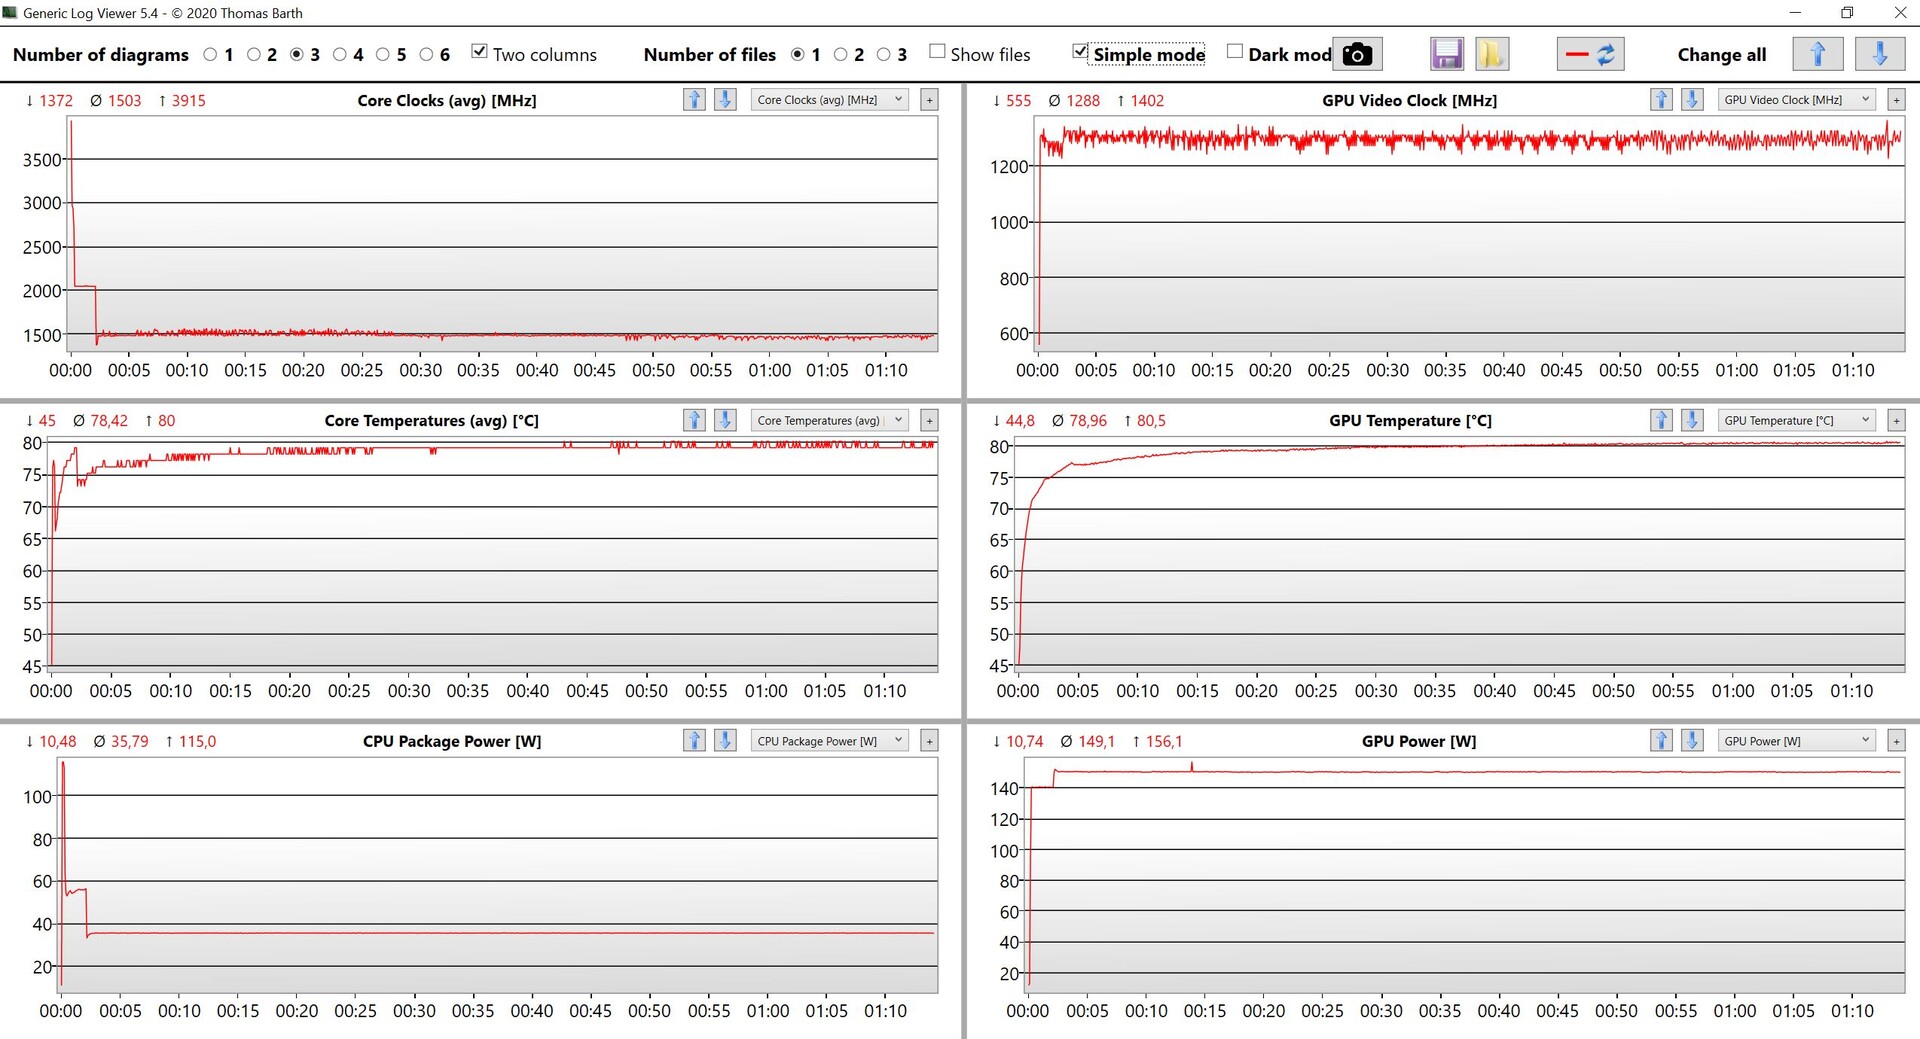
(-) La temperatura massima sul lato superiore è di 48.8 °C / 120 F, rispetto alla media di 40.4 °C / 105 F, che varia da 21.2 a 68.8 °C per questa classe Gaming.
(-) Il lato inferiore si riscalda fino ad un massimo di 52.4 °C / 126 F, rispetto alla media di 43.2 °C / 110 F
(+) In idle, la temperatura media del lato superiore è di 28.6 °C / 83 F, rispetto alla media deld ispositivo di 33.9 °C / 93 F.
(±) Riproducendo The Witcher 3, la temperatura media per il lato superiore e' di 35.1 °C / 95 F, rispetto alla media del dispositivo di 33.9 °C / 93 F.
(+) I poggiapolsi e il touchpad sono piu' freddi della temperatura della pelle con un massimo di 26 °C / 78.8 F e sono quindi freddi al tatto.
(+) La temperatura media della zona del palmo della mano di dispositivi simili e'stata di 28.8 °C / 83.8 F (+2.8 °C / 5 F).
| Asus ROG Strix Scar 17 SE G733CX-LL014W Intel Core i9-12950HX, NVIDIA GeForce RTX 3080 Ti Laptop GPU | Lenovo Legion 7 16IAX7-82TD004SGE Intel Core i9-12900HX, NVIDIA GeForce RTX 3080 Ti Laptop GPU | MSI Titan GT77 12UHS Intel Core i9-12900HX, NVIDIA GeForce RTX 3080 Ti Laptop GPU | Schenker XMG Neo 17 M22 AMD Ryzen 9 6900HX, NVIDIA GeForce RTX 3080 Ti Laptop GPU | Alienware x17 R2 P48E Intel Core i9-12900HK, NVIDIA GeForce RTX 3080 Ti Laptop GPU | Asus Strix Scar 17 G733QSA-XS99 AMD Ryzen 9 5900HX, NVIDIA GeForce RTX 3080 Laptop GPU | |
|---|---|---|---|---|---|---|
| Heat | -8% | -3% | 1% | 7% | 4% | |
| Maximum Upper Side * (°C) | 48.8 | 44.4 9% | 40.8 16% | 49 -0% | 49.6 -2% | 40 18% |
| Maximum Bottom * (°C) | 52.4 | 60.8 -16% | 52.4 -0% | 52 1% | 42.4 19% | 39.8 24% |
| Idle Upper Side * (°C) | 30.4 | 33.8 -11% | 34.6 -14% | 30 1% | 29.2 4% | 34.6 -14% |
| Idle Bottom * (°C) | 34.1 | 38.8 -14% | 38.4 -13% | 33 3% | 32 6% | 38.4 -13% |
* ... Meglio usare valori piccoli
Altoparlanti
Il sistema audio è composto da un totale di quattro moduli che producono un suono potente e spazioso. Anche se gli altoparlanti non sono i più forti del mercato, la qualità è complessivamente molto buona. Tuttavia, a causa del forte rumore della ventola durante il gioco, consigliamo comunque di utilizzare delle cuffie.
Asus ROG Strix Scar 17 SE G733CX-LL014W analisi audio
(±) | potenza degli altiparlanti media ma buona (73.3 dB)
Bassi 100 - 315 Hz
(±) | bassi ridotti - in media 6.2% inferiori alla media
(±) | la linearità dei bassi è media (7.5% delta rispetto alla precedente frequenza)
Medi 400 - 2000 Hz
(+) | medi bilanciati - solo only 2% rispetto alla media
(+) | medi lineari (3.9% delta rispetto alla precedente frequenza)
Alti 2 - 16 kHz
(+) | Alti bilanciati - appena 3.5% dalla media
(±) | la linearità degli alti è media (9.3% delta rispetto alla precedente frequenza)
Nel complesso 100 - 16.000 Hz
(+) | suono nel complesso lineare (13.6% differenza dalla media)
Rispetto alla stessa classe
» 20% di tutti i dispositivi testati in questa classe è stato migliore, 7% simile, 73% peggiore
» Il migliore ha avuto un delta di 6%, medio di 18%, peggiore di 132%
Rispetto a tutti i dispositivi testati
» 15% di tutti i dispositivi testati in questa classe è stato migliore, 4% similare, 81% peggiore
» Il migliore ha avuto un delta di 4%, medio di 23%, peggiore di 134%
MSI Titan GT77 12UHS analisi audio
(+) | gli altoparlanti sono relativamente potenti (83.4 dB)
Bassi 100 - 315 Hz
(-) | quasi nessun basso - in media 71.8% inferiori alla media
(+) | bassi in lineaa (0% delta rispetto alla precedente frequenza)
Medi 400 - 2000 Hz
(-) | quasi nessun tono medio - circa 71.8% inferiore alla media
(+) | medi lineari (0% delta rispetto alla precedente frequenza)
Alti 2 - 16 kHz
(-) | alti quasi assenti - circa 71.8% inferiori alla media
(+) | alti lineari (0% delta rispetto alla precedente frequenza)
Nel complesso 100 - 16.000 Hz
(-) | suono nel complesso non lineare (107.7% di differenza rispetto alla media
Rispetto alla stessa classe
» 100% di tutti i dispositivi testati in questa classe è stato migliore, 0% simile, 0% peggiore
» Il migliore ha avuto un delta di 6%, medio di 18%, peggiore di 132%
Rispetto a tutti i dispositivi testati
» 96% di tutti i dispositivi testati in questa classe è stato migliore, 0% similare, 4% peggiore
» Il migliore ha avuto un delta di 4%, medio di 23%, peggiore di 134%
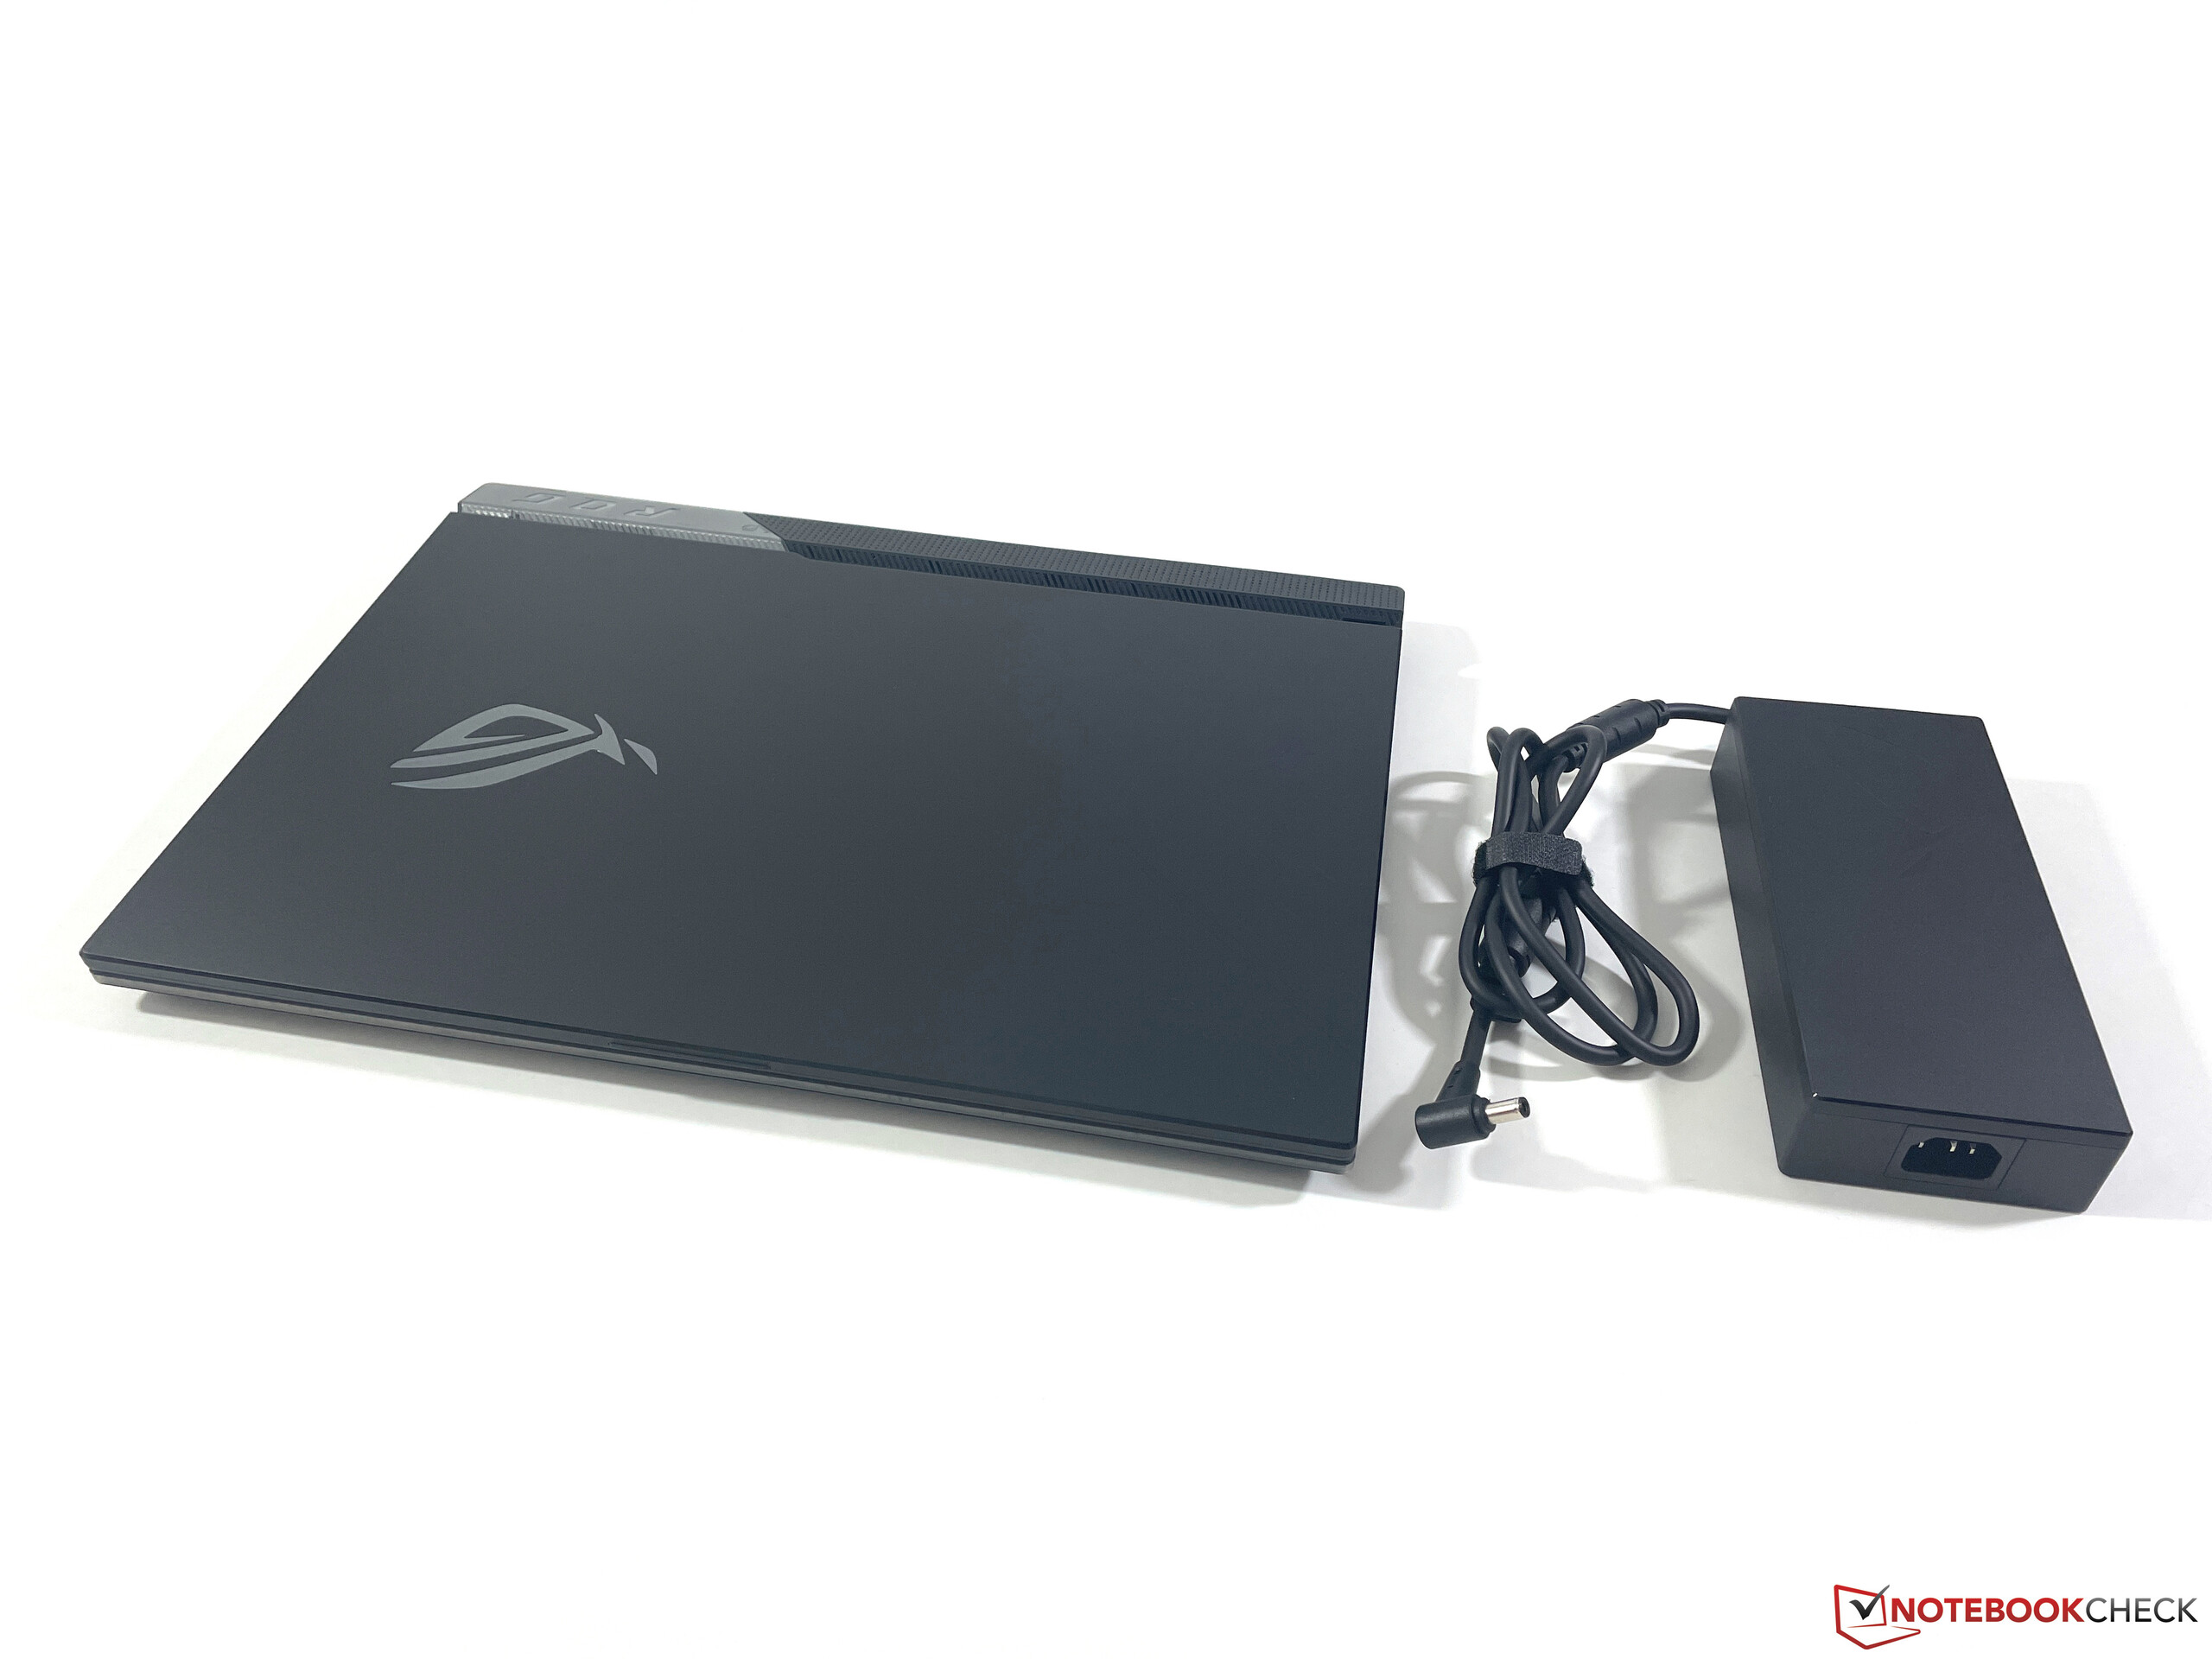
Consumo di energia
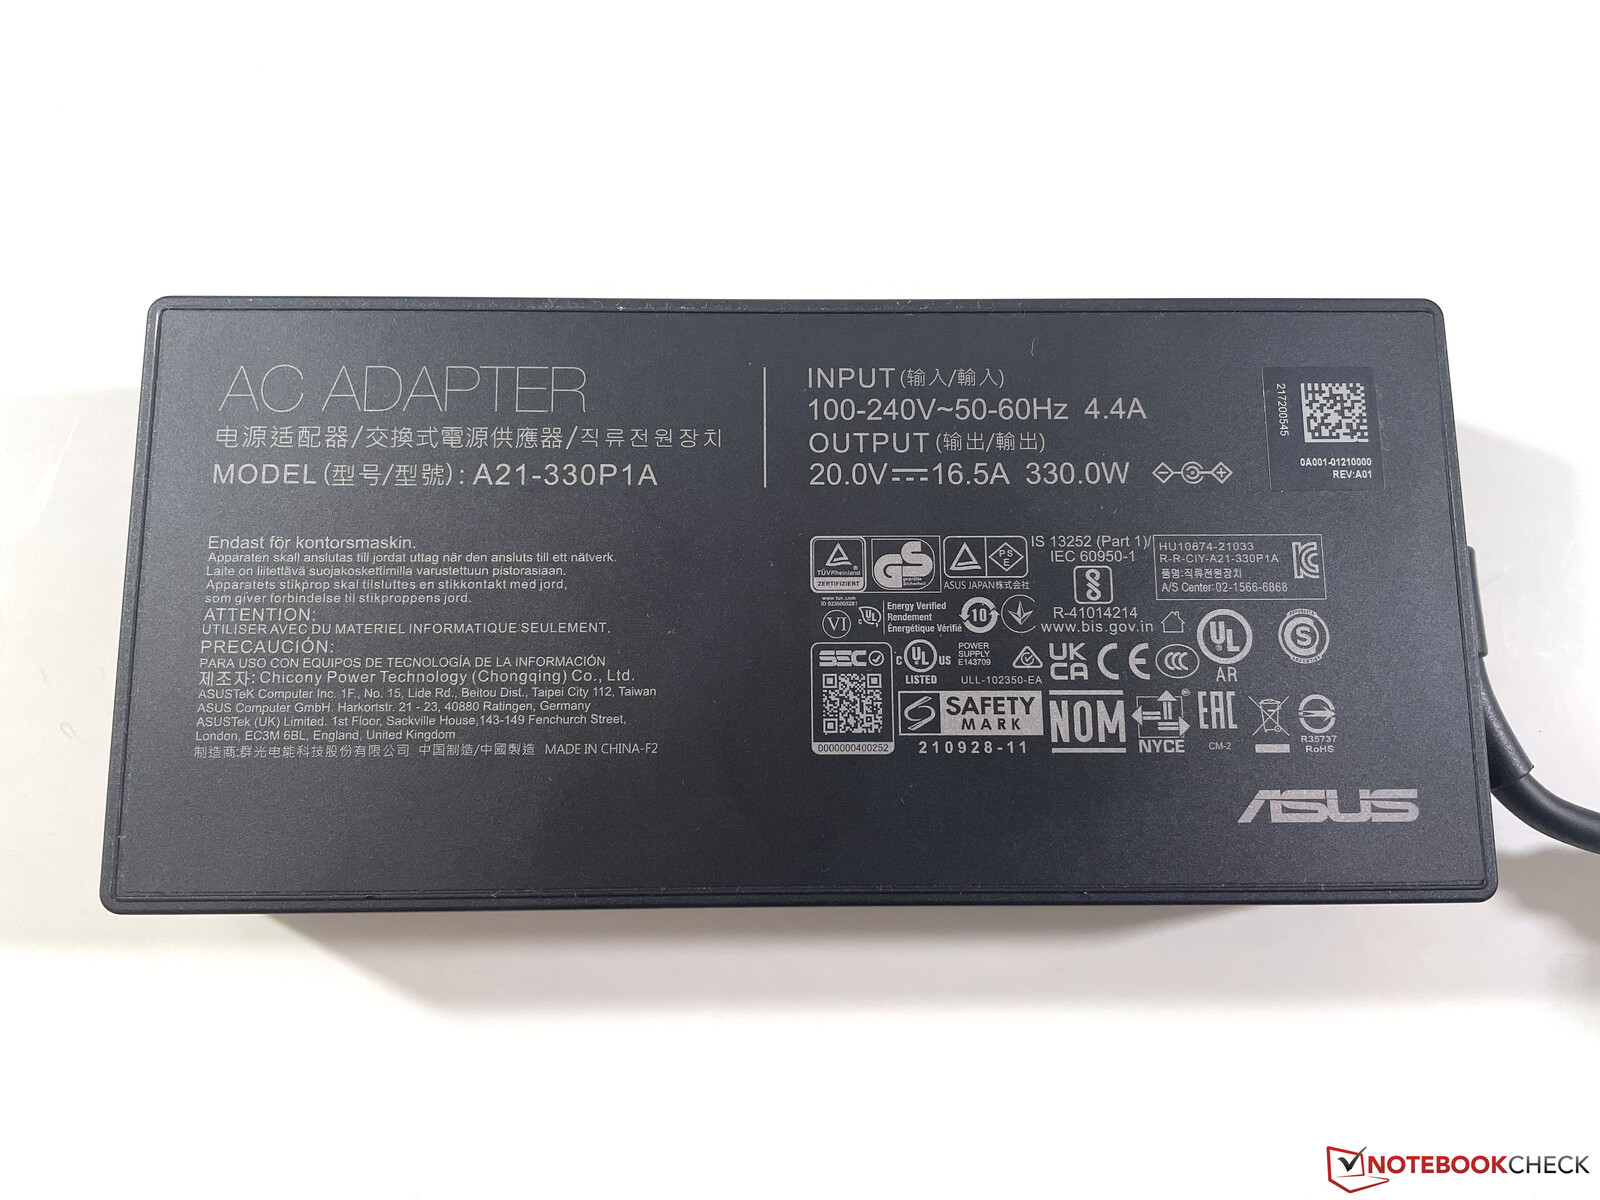
Il ROG Strix Scar 17 SE non è un portatile molto efficiente, il che non sorprende se si considera il potente hardware. Abbiamo già misurato fino a 27 watt durante il funzionamento inattivo, mentre durante il gioco il valore aumenta a circa 230 watt. L'alimentatore da 330 watt è quindi sufficientemente grande. Anche il consumo in standby è piuttosto elevato, pari a 2,6 watt, ma ciò è dovuto agli effetti di illuminazione attivati di default.
| Off / Standby | |
| Idle | |
| Sotto carico |
|
Leggenda:
min: | |
Power Consumption The Witcher 3 / Stress Test
Power Consumption With External Monitor
Durata della batteria
Nel nostro test di autonomia WLAN a 150 cd/m², che corrisponde al 48% della luminosità massima, la nostra unità di prova ha resistito solo per circa 4 ore. Considerando gli alti valori di consumo, questo non è molto sorprendente. Alcuni dei concorrenti durano molto di più, se si ha la necessità di superare i tempi di assenza dalla presa di corrente. È possibile giocare per circa un'ora, ma solo con una significativa riduzione delle prestazioni. Sono necessari circa 100 minuti per ricaricare completamente la batteria da 90 W, con l'80% della capacità già disponibile dopo circa 53 minuti.
Pro
Contro
Verdetto - Un portatile da gioco veloce e completamente equipaggiato
L'attuale Asus ROG Strix Scar 17 SE offre davvero tutto ciò che il cuore di un giocatore desidera. Un veloce pannello QHD con 240 Hz insieme alla RTX 3080 Ti di GeForce, che offre anche una potenza sufficiente per la risoluzione nativa con i massimi dettagli. Anche se le prestazioni della CPU sono buone per un portatile da gioco, il potenziale del processore HX non può essere sfruttato appieno. È quindi consigliabile risparmiare il sovrapprezzo per il processore più potente e scegliere un normale Core i9
Altri vantaggi sono i colori molto accurati, se si deve lavorare direttamente sull'elaborazione video, ad esempio, le temperature di superficie moderate e le ventole relativamente silenziose durante il gioco. Anche se è disponibile una modalità Turbo, che diventa significativamente più rumorosa, non ha un grande impatto sulle prestazioni di gioco, quindi non vale la pena a nostro avviso
Il nuovo Asus ROG Strix Scar 17 SE offre molte prestazioni e caratteristiche di gioco, ma dovreste risparmiare il sovrapprezzo per il processore Intel HX.
I concorrenti nel mercato dei giochi offrono specifiche di prestazioni simili, ma anche display più luminosi in parti e case meno appariscenti. Inoltre, i rumori elettronici possono diventare fastidiosi a lungo andare.
Prezzo e disponibilità
La nostra configurazione di prova del ROG Strix Scar 17 SE è disponibile su Amazon al prezzo di 3899 dollarie una configurazione più piccola con il normale Core i9-12900H è disponibile anche su per 2278 dollari.
Asus ROG Strix Scar 17 SE G733CX-LL014W
- 11/18/2022 v7 (old)
Andreas Osthoff
Price comparison

