Notebookcheck Logo

Analisi dell'AMD Ryzen 9 7945HX3D Zen4 - Il processore gaming mobile più veloce grazie alla V-Cache 3D

Prestazioni migliori in 1080p e QHD. Nel campo dei PC desktop, i processori AMD con cache 3D esistono da tempo, ma l'annuncio del Ryzen 9 7945HX3D segna l'arrivo sul mercato del primo processore mobile con V-Cache 3D. Secondo AMD, questo è ora il processore da gioco più veloce - che abbiamo analizzato.

All'inizio di aprile abbiamo potuto testare il nuovo processore mobile Processore mobile Ryzen 9 7945HXche è un diretto concorrente del chip di fascia alta di Intel, ilCore i9-13980HX. I risultati sono stati conclusivi, in quanto le prestazioni multi-core sono risultate superiori, ma la vera star dello spettacolo è stata l'efficienza. Mentre le CPU Intel consumano fino a 170 watt, il Ryzen 9 7945HX offre prestazioni comparabili con un consumo di soli 80-100 watt.

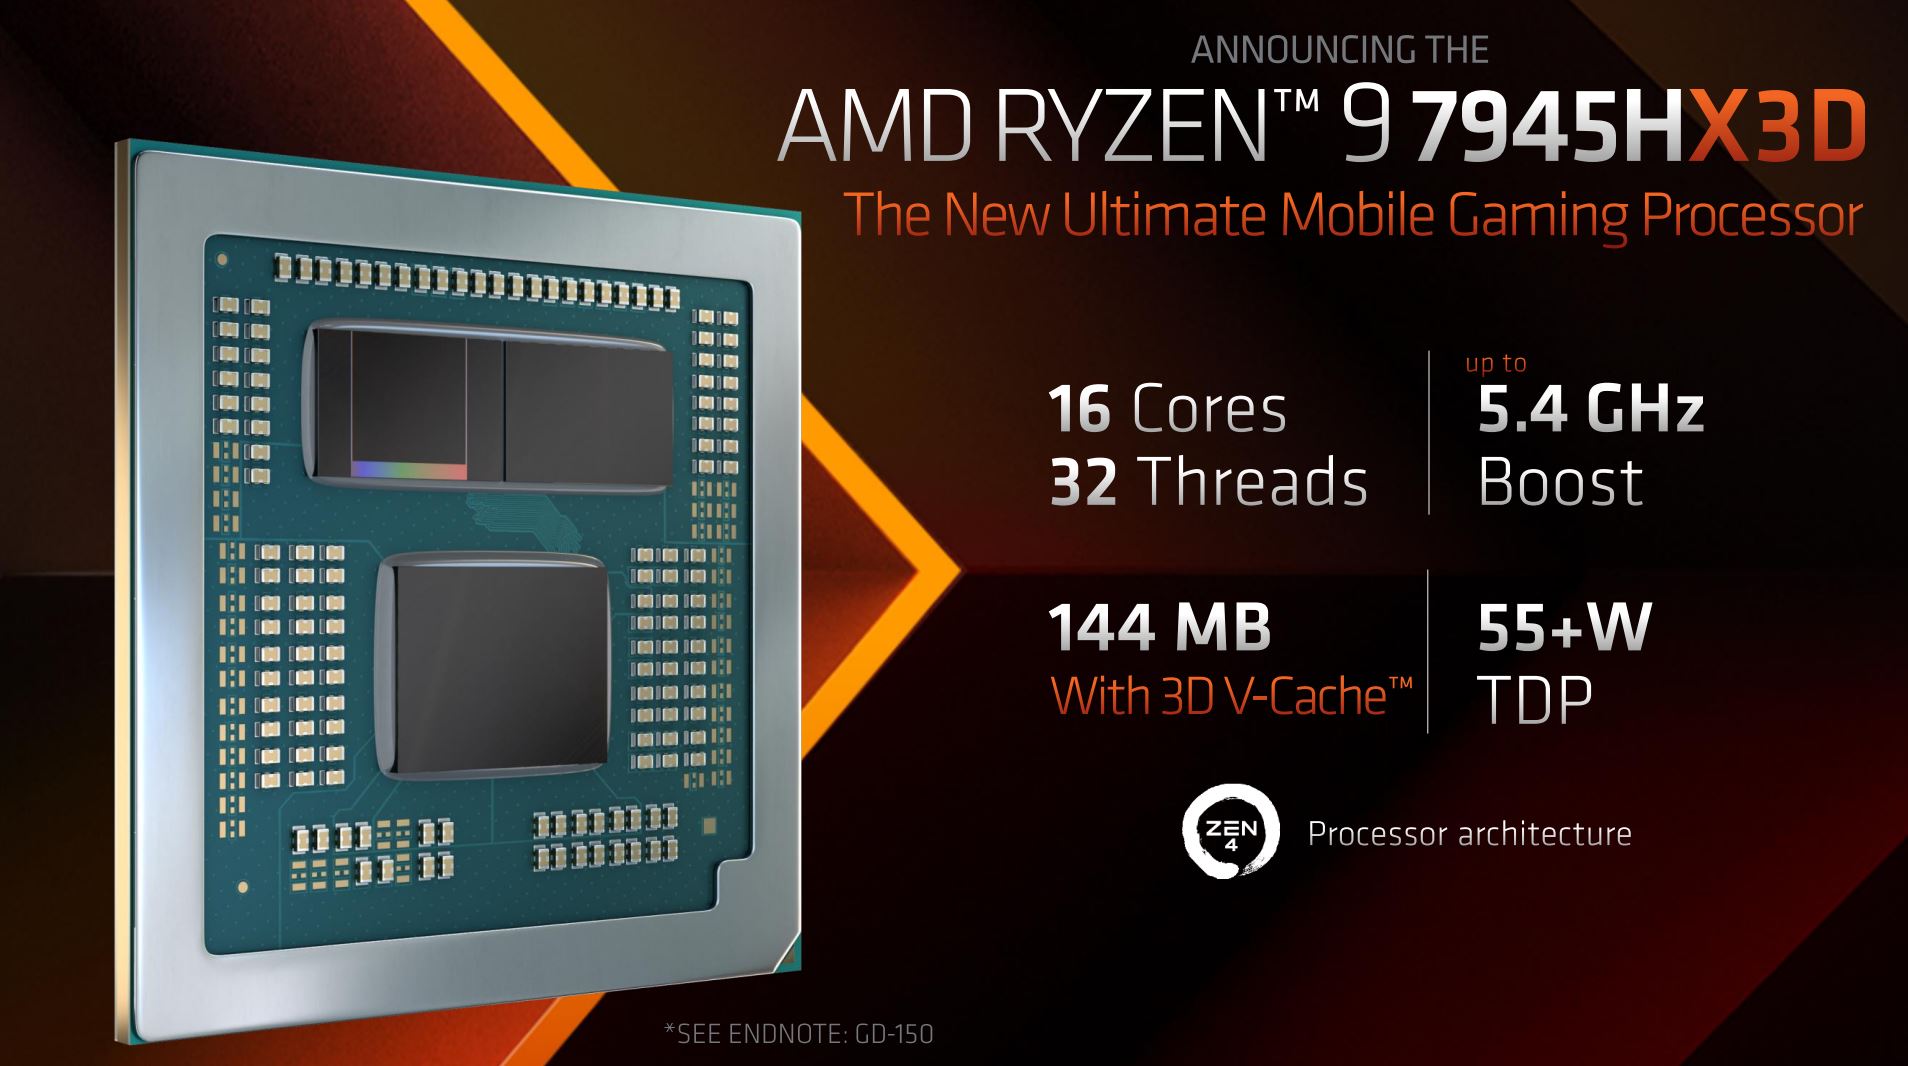
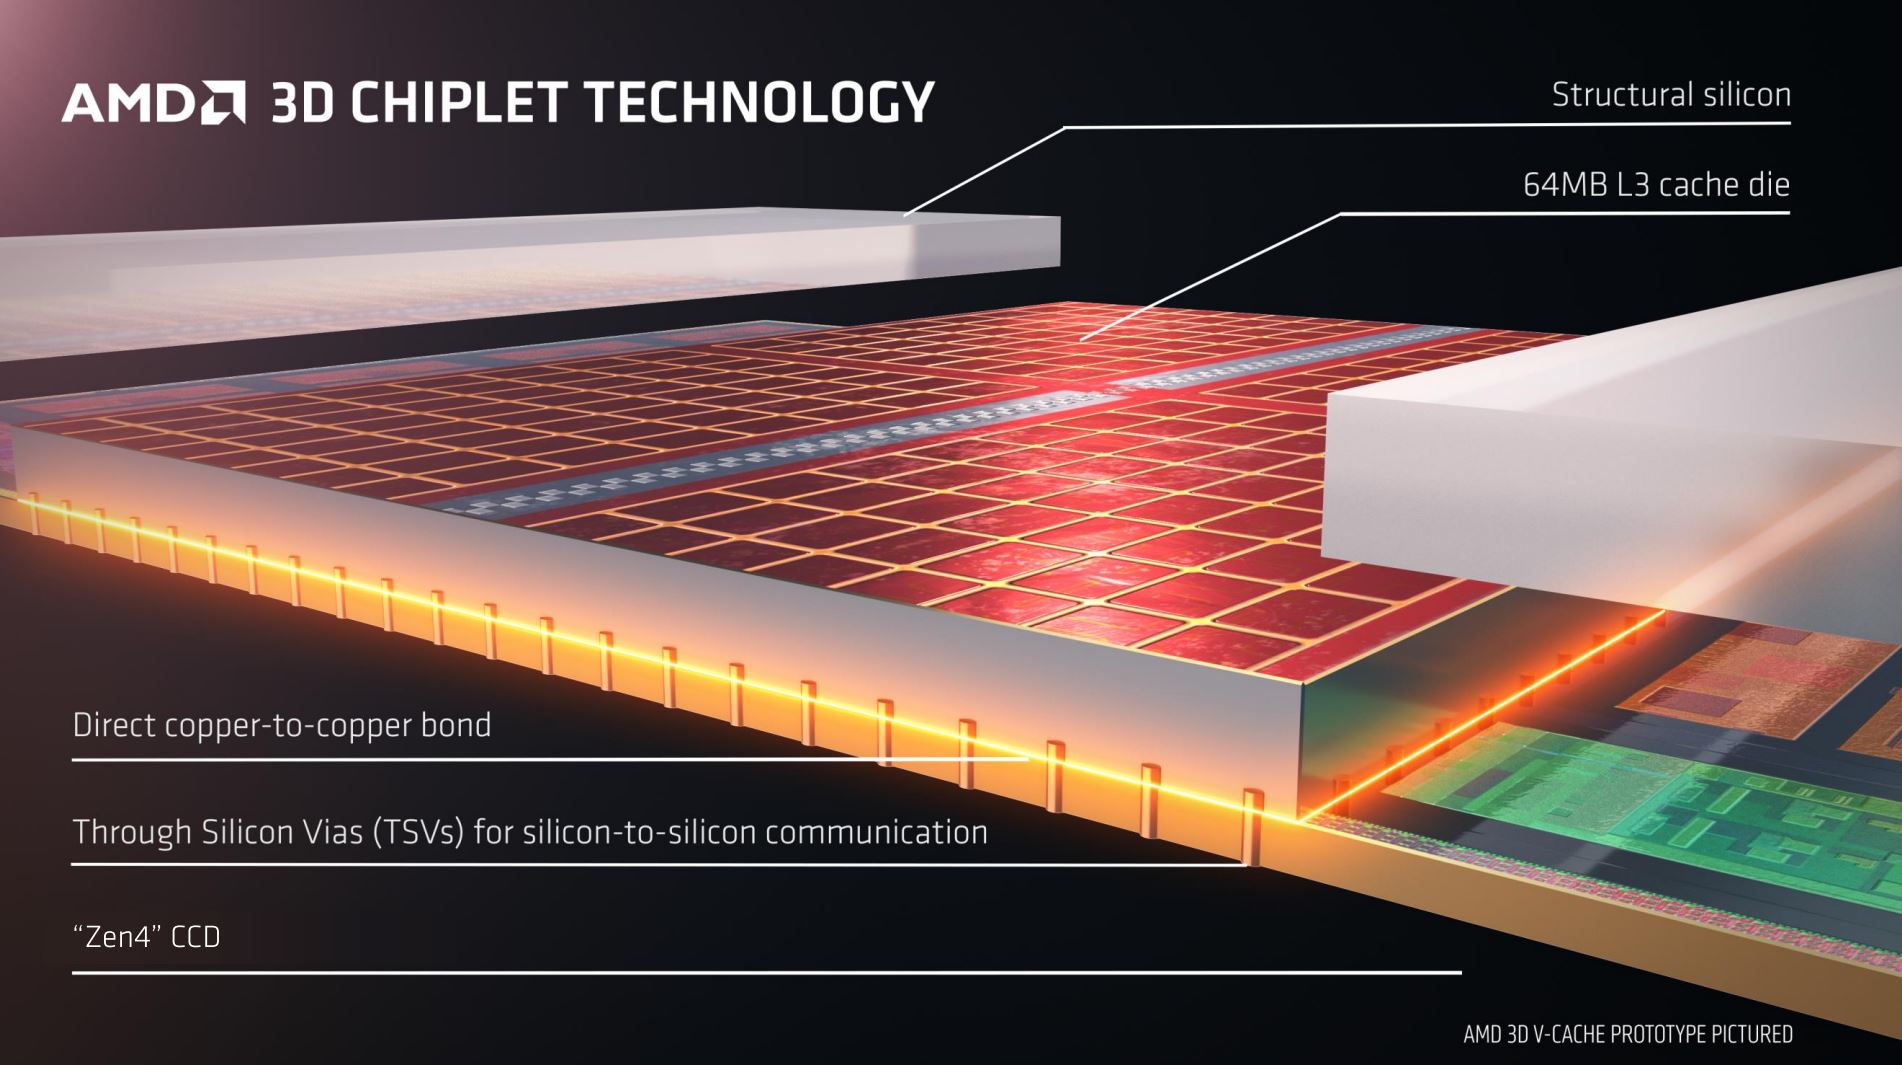
AMD offre già dallo scorso anno CPU desktop con 3D V-Cache e ora il Ryzen 9 7945HX3D è il primo processore mobile dotato di questa tecnologia. A parte la nuova 3D V-Cache (64 MB aggiuntivi), le specifiche sono identiche a quelle del Ryzen 9 7945HX normale, ovvero 16 core/32 thread con un clock massimo di 5,4 GHz. Nel caso del 7945HX3D, la sua normale cache (80 MB di cache L2/L3) è stata ampliata con altri 64 MB di cache L3. Il modulo di cache aggiuntivo è situato direttamente sul CCD Zen4, che è leggermente più sottile del CCD Zen4 normale, con un'altezza di costruzione identica. Oltre alla cache aggiuntiva, è dotato di un silicone strutturale che consente all'unità di raffreddamento di occupare l'intera superficie. Soprattutto in caso di frame rate elevati, questo dovrebbe migliorare le prestazioni, in quanto il tempo di accesso può essere ridotto e i nuovi dati possono essere forniti più rapidamente.

3D V-Cache (fonte: AMD)

AMD sostiene inoltre che la 3D V-Cache ha un effetto positivo sui bassi valori di TDP secondo i test interni e ha confrontato 70 e 40 watt con e senza 3D V-Cache. Tuttavia, non possiamo verificarlo con i nostri sistemi di test. Il Ryzen 9 7945HX3D è attualmente disponibile solo nel nuovo Asus ROG Strix SCAR 17 X3D.

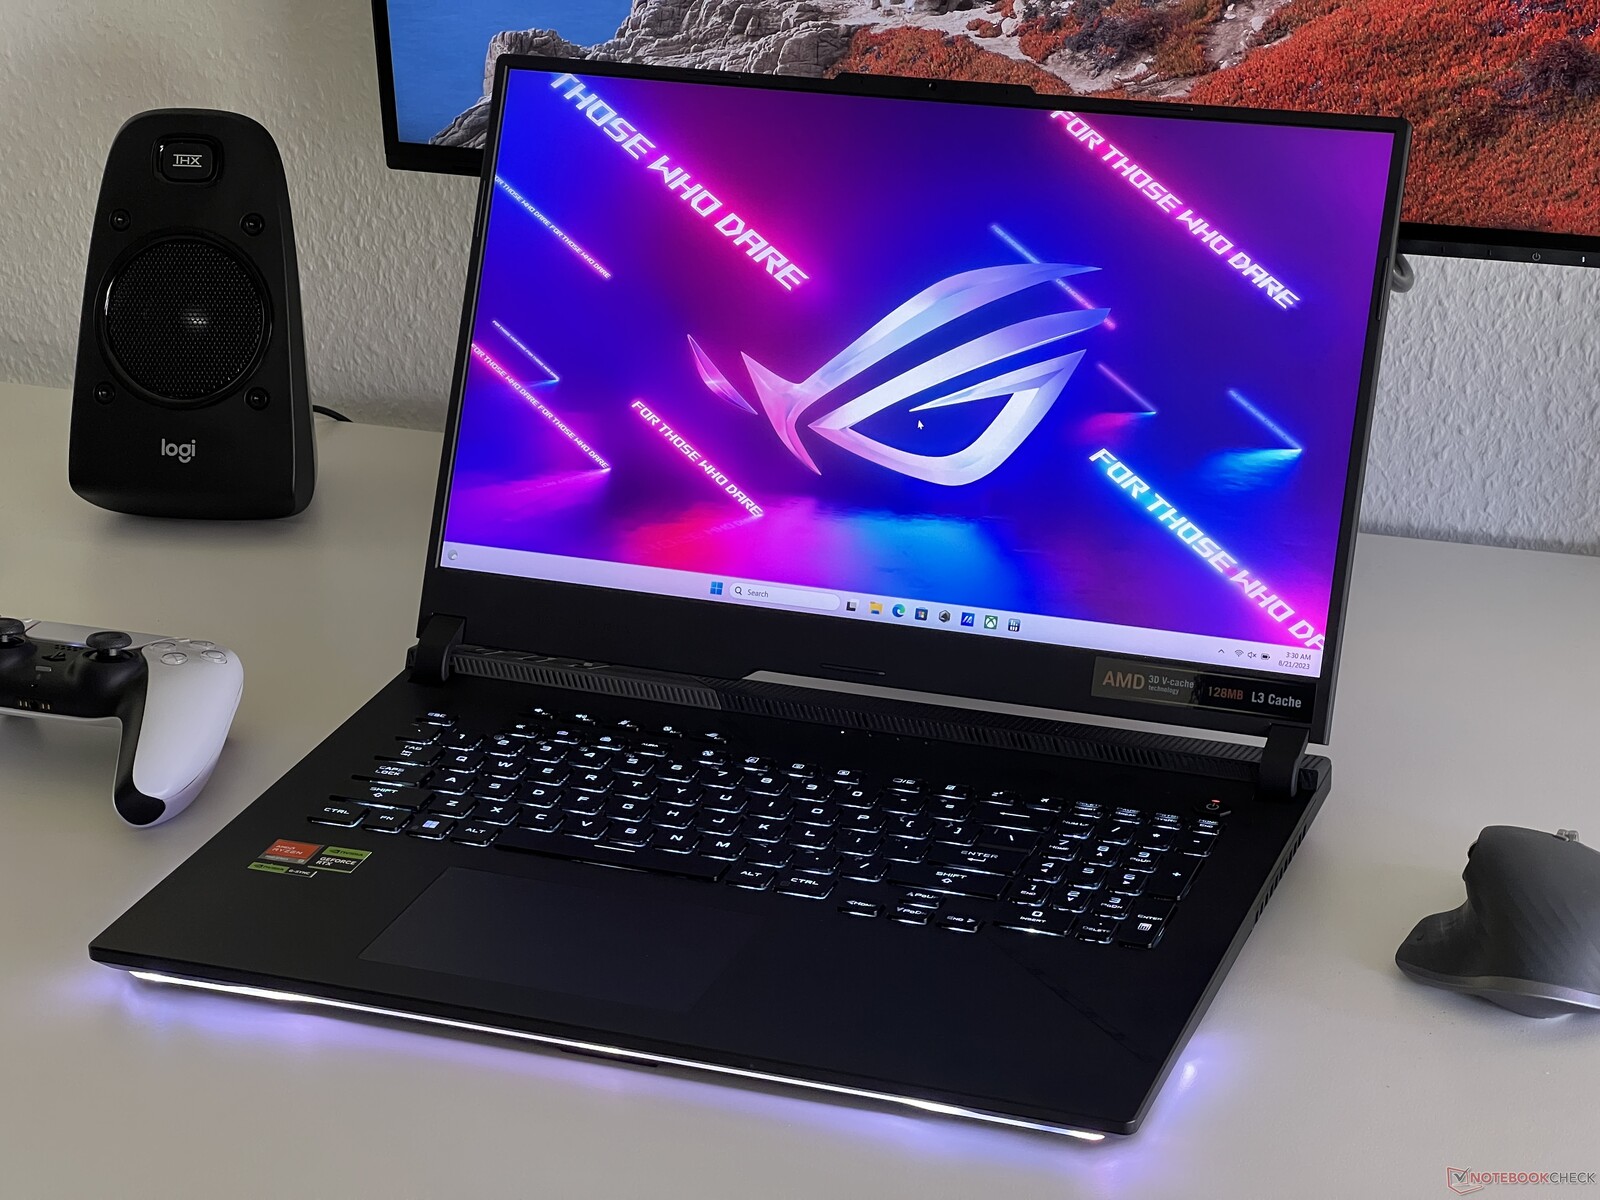
Sistema di prova - Asus ROG Strix SCAR 17 X3D

Asus ROG Strix SCAR 17 X3D

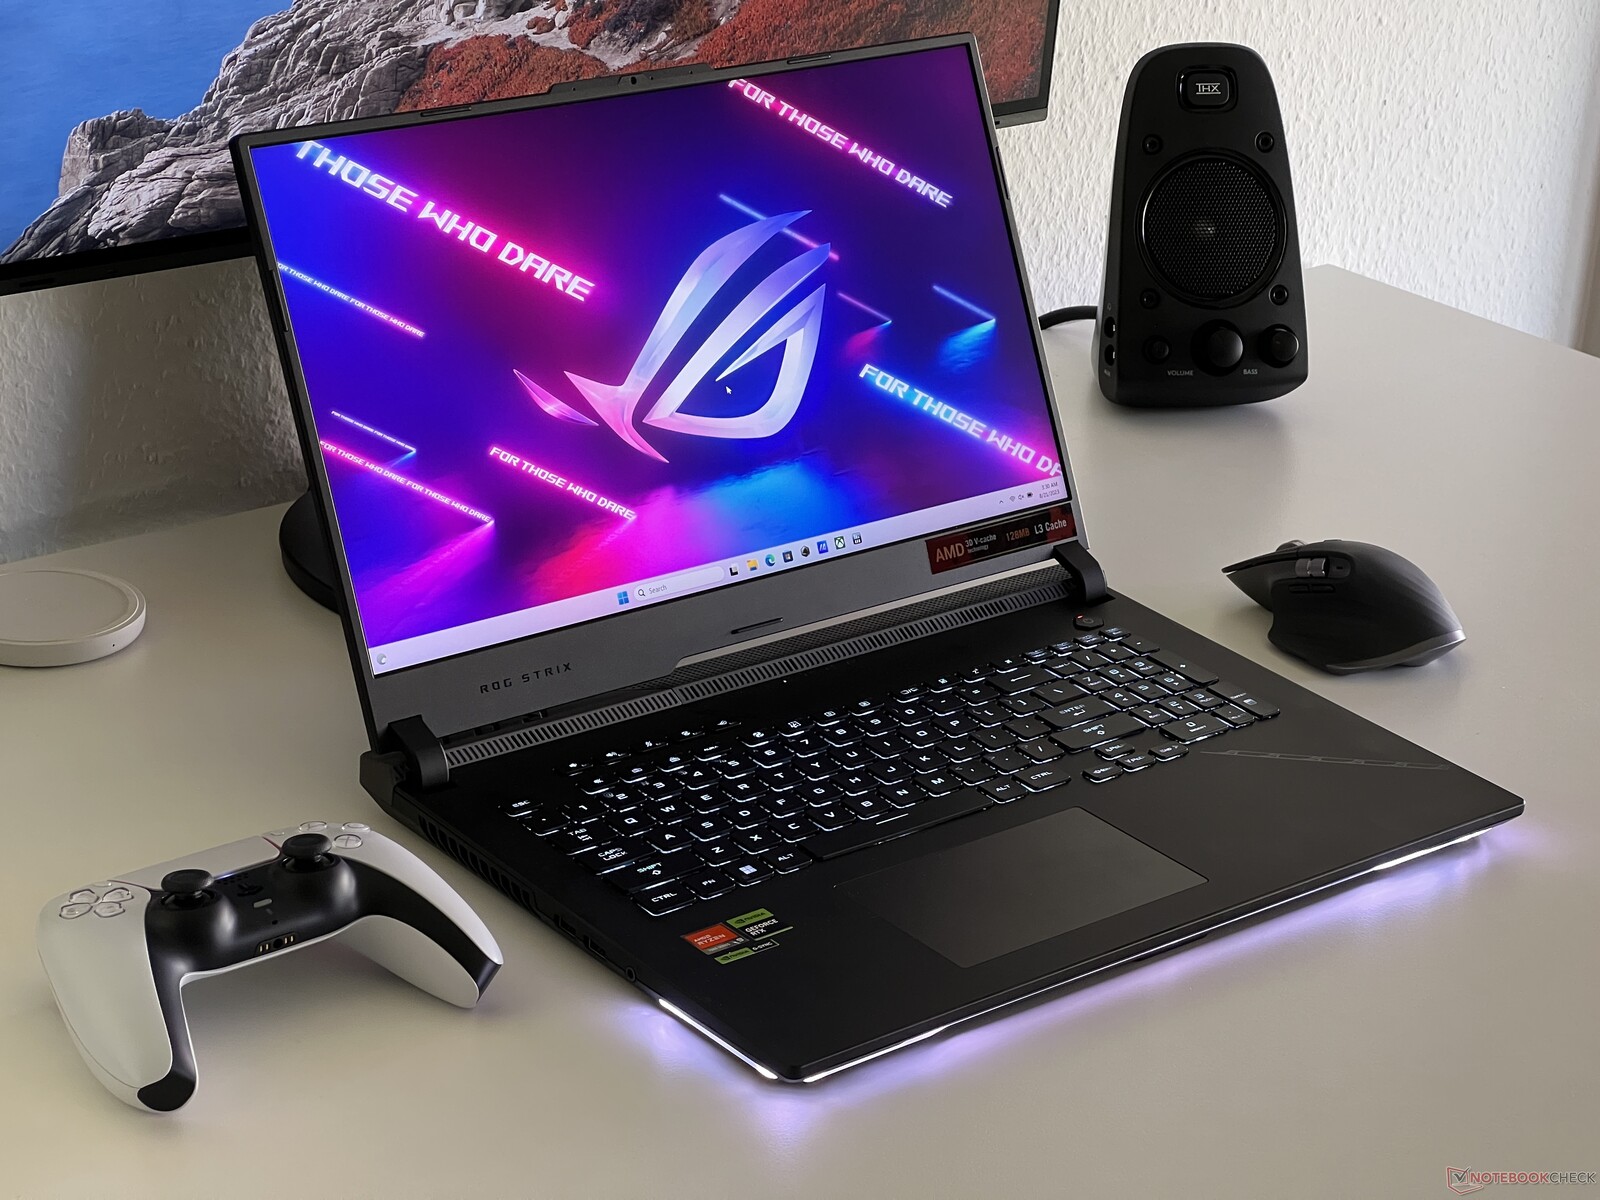
L'Asus ROG Strix SCAR 17 X3D è attualmente l'unico portatile da gioco dotato del nuovo Ryzen 9 7945HX3Dad entrare nel mercato. Abbiamo già testato lo SCAR 17 con il normaleRyzen 9 7945HXe, a parte il processore, la sua configurazione con laGeForce RTX 4090 Laptope il pannello QHD a 240 Hz è identica. A causa della struttura superficiale del nuovo processore, Asus non può più utilizzare il metallo liquido per dissipare il calore: questo si nota se si osservano i valori massimi di consumo energetico. Il Ryzen 9 7945HX3D assorbe 115 watt per un periodo di tempo molto breve, poi si bilancia a 100 watt.

Nota bene: per le nostre misurazioni dell'efficienza, abbiamo utilizzato i tassi di consumo su un monitor esterno per escludere il display interno come fattore di influenza. Come già visto sull'ultimo ROG Strix SCAR 17, tutte le uscite del display passano attraverso la GPU dedicata che, di conseguenza, è sempre attiva non appena si utilizza un monitor esterno. Naturalmente, ciò influisce in una certa misura sulle misurazioni, soprattutto per quanto riguarda l'efficienza single-core.

Prestazioni single-core

Le sue prestazioni in single-core sono praticamente identiche a quelle del normale Ryzen 9 7945HX e, a loro volta, sono notevolmente più veloci dei vecchi modelli Zen3 come ilRyzen 9 6900HX. Il Core i9-13900HX di IntelCore i9-13900HXdi Intel è anch'esso paragonabile - solo ilCore i9-13980HXbeneficia in totale del turbo single-core.

CPU Performance Rating: Percent
Cinebench R23: Single Core
Cinebench R20: CPU (Single Core)
Cinebench R15: CPU Single 64Bit
7-Zip 18.03: 7z b 4 -mmt1
Geekbench 5.5: Single-Core
CPU Performance Rating
Intel Core i9-13980HX
MSI Titan GT77 HX 13VI
98.5 pt
AMD Ryzen 9 7945HX3D
Asus ROG Strix Scar 17 G733PYV-LL053X
96 pt
Intel Core i9-13950HX
MSI Titan GT77 HX 13VI
95.4 pt
AMD Ryzen 9 7945HX
Asus Zephyrus Duo 16 GX650PY-NM006W
95.2 pt
Intel Core i9-13900HX
Lenovo Legion Pro 7 16IRX8H
94.7 pt
AMD Ryzen 9 7945HX
Asus ROG Strix G17 G713PI
94.6 pt
Intel Core i9-13900HX
SCHENKER XMG Neo 16 Raptor Lake
93 pt
AMD Ryzen 9 7945HX
Asus ROG Strix G17 G713PI
91.8 pt
Intel Core i9-13950HX
Razer Blade 16 Early 2023
88.2 pt
Intel Core i9-12900HX
MSI Titan GT77 12UHS
87.9 pt
AMD Ryzen 9 6900HX
SCHENKER XMG Neo 17 M22
75.3 pt
AMD Ryzen 9 6900HX
Asus ROG Zephyrus Duo 16 GX650RX
74.9 pt
Apple M2 Max -1!
Apple MacBook Pro 16 2023 M2 Max
74.9 pt
Cinebench R23 / Single Core
Intel Core i9-13980HX
MSI Titan GT77 HX 13VI
2169 Points +12%
Intel Core i9-13950HX
MSI Titan GT77 HX 13VI
2100 Points +9%
Intel Core i9-13900HX
SCHENKER XMG Neo 16 Raptor Lake
2055 Points +6%
Intel Core i9-13900HX
Lenovo Legion Pro 7 16IRX8H
2043 Points +6%
Intel Core i9-13950HX
Razer Blade 16 Early 2023
2029 Points +5%
AMD Ryzen 9 7945HX
Asus Zephyrus Duo 16 GX650PY-NM006W
1940 Points 0%
AMD Ryzen 9 7945HX
Asus ROG Strix G17 G713PI (Turbo Mode)
1936 Points 0%
AMD Ryzen 9 7945HX3D
Asus ROG Strix Scar 17 G733PYV-LL053X
1935 Points
Intel Core i9-12900HX
MSI Titan GT77 12UHS
1913 Points -1%
AMD Ryzen 9 7945HX
Asus ROG Strix G17 G713PI
1863 Points -4%
Apple M2 Max
Apple MacBook Pro 16 2023 M2 Max
1625 Points -16%
AMD Ryzen 9 6900HX
Asus ROG Zephyrus Duo 16 GX650RX
1566 Points -19%
AMD Ryzen 9 6900HX
SCHENKER XMG Neo 17 M22
1557 Points -20%
Cinebench R20 / CPU (Single Core)
Intel Core i9-13980HX
MSI Titan GT77 HX 13VI
825 Points +9%
Intel Core i9-13950HX
MSI Titan GT77 HX 13VI
803 Points +6%
Intel Core i9-13900HX
Lenovo Legion Pro 7 16IRX8H
788 Points +4%
Intel Core i9-13900HX
SCHENKER XMG Neo 16 Raptor Lake
756 Points 0%
AMD Ryzen 9 7945HX
Asus Zephyrus Duo 16 GX650PY-NM006W
756 Points 0%
AMD Ryzen 9 7945HX3D
Asus ROG Strix Scar 17 G733PYV-LL053X
755 Points
AMD Ryzen 9 7945HX
Asus ROG Strix G17 G713PI (Turbo Mode)
753 Points 0%
Intel Core i9-13950HX
Razer Blade 16 Early 2023
742 Points -2%
Intel Core i9-12900HX
MSI Titan GT77 12UHS
738 Points -2%
AMD Ryzen 9 7945HX
Asus ROG Strix G17 G713PI
712 Points -6%
AMD Ryzen 9 6900HX
SCHENKER XMG Neo 17 M22
605 Points -20%
AMD Ryzen 9 6900HX
Asus ROG Zephyrus Duo 16 GX650RX
595 Points -21%
Apple M2 Max
Apple MacBook Pro 16 2023 M2 Max
460 Points -39%
Cinebench R15 / CPU Single 64Bit
Intel Core i9-13980HX
MSI Titan GT77 HX 13VI
312 Points 0%
AMD Ryzen 9 7945HX3D
Asus ROG Strix Scar 17 G733PYV-LL053X
311 Points
AMD Ryzen 9 7945HX
Asus Zephyrus Duo 16 GX650PY-NM006W
307 Points -1%
Intel Core i9-13900HX
Lenovo Legion Pro 7 16IRX8H
301 Points -3%
AMD Ryzen 9 7945HX
Asus ROG Strix G17 G713PI (Turbo Mode)
301 Points -3%
Intel Core i9-13950HX
MSI Titan GT77 HX 13VI
300 Points -4%
Intel Core i9-13900HX
SCHENKER XMG Neo 16 Raptor Lake
295 Points -5%
Intel Core i9-13900HX
SCHENKER XMG Neo 16 Raptor Lake
294 Points -5%
AMD Ryzen 9 7945HX
Asus ROG Strix G17 G713PI
294 Points -5%
Intel Core i9-12900HX
MSI Titan GT77 12UHS
278 Points -11%
Intel Core i9-13950HX
Razer Blade 16 Early 2023
274 Points -12%
AMD Ryzen 9 6900HX
Asus ROG Zephyrus Duo 16 GX650RX
249 Points -20%
AMD Ryzen 9 6900HX
SCHENKER XMG Neo 17 M22
248 Points -20%
Apple M2 Max
Apple MacBook Pro 16 2023 M2 Max
239 Points -23%
7-Zip 18.03 / 7z b 4 -mmt1
AMD Ryzen 9 7945HX3D
Asus ROG Strix Scar 17 G733PYV-LL053X
7573 MIPS
AMD Ryzen 9 7945HX
Asus ROG Strix G17 G713PI (Turbo Mode)
7379 MIPS -3%
AMD Ryzen 9 7945HX
Asus ROG Strix G17 G713PI
7332 MIPS -3%
AMD Ryzen 9 7945HX
Asus Zephyrus Duo 16 GX650PY-NM006W
7319 MIPS -3%
Intel Core i9-13900HX
Lenovo Legion Pro 7 16IRX8H
7035 MIPS -7%
Intel Core i9-13980HX
MSI Titan GT77 HX 13VI
7018 MIPS -7%
Intel Core i9-13950HX
MSI Titan GT77 HX 13VI
6897 MIPS -9%
Intel Core i9-13900HX
SCHENKER XMG Neo 16 Raptor Lake
6800 MIPS -10%
Intel Core i9-13950HX
Razer Blade 16 Early 2023
6445 MIPS -15%
Intel Core i9-12900HX
MSI Titan GT77 12UHS
6256 MIPS -17%
AMD Ryzen 9 6900HX
SCHENKER XMG Neo 17 M22
5872 MIPS -22%
AMD Ryzen 9 6900HX
Asus ROG Zephyrus Duo 16 GX650RX
5727 MIPS -24%
Geekbench 5.5 / Single-Core
Intel Core i9-13980HX
MSI Titan GT77 HX 13VI
2139 Points 0%
AMD Ryzen 9 7945HX3D
Asus ROG Strix Scar 17 G733PYV-LL053X
2133 Points
AMD Ryzen 9 7945HX
Asus Zephyrus Duo 16 GX650PY-NM006W
2132 Points 0%
AMD Ryzen 9 7945HX
Asus ROG Strix G17 G713PI (Turbo Mode)
2103 Points -1%
AMD Ryzen 9 7945HX
Asus ROG Strix G17 G713PI
2053 Points -4%
Intel Core i9-13950HX
MSI Titan GT77 HX 13VI
2043 Points -4%
Intel Core i9-13900HX
Lenovo Legion Pro 7 16IRX8H
2025 Points -5%
Intel Core i9-13900HX
SCHENKER XMG Neo 16 Raptor Lake
2023 Points -5%
Apple M2 Max
Apple MacBook Pro 16 2023 M2 Max
1978 Points -7%
Intel Core i9-12900HX
MSI Titan GT77 12UHS
1923 Points -10%
Intel Core i9-13950HX
Razer Blade 16 Early 2023
1805 Points -15%
AMD Ryzen 9 6900HX
Asus ROG Zephyrus Duo 16 GX650RX
1594 Points -25%
AMD Ryzen 9 6900HX
SCHENKER XMG Neo 17 M22
1590 Points -25%
CPU Performance Rating: Percent
Cinebench R23: Single Core
Cinebench R20: CPU (Single Core)
Cinebench R15: CPU Single 64Bit
7-Zip 18.03: 7z b 4 -mmt1
Geekbench 5.5: Single-Core

Quando si guardano i risultati, non si può dimenticare che il core AMD Zen4 consuma circa 27 watt sotto carico single-core, mentre il core ad alte prestazioni delle nuove CPU Raptor Lake HX consuma 34-36 watt. Ciò significa che l'efficienza pura della CPU di AMD è migliore di quella di Intel. Il fatto che la GPU Nvidia dedicata fosse attiva per le nostre misurazioni del consumo energetico utilizzando un monitor esterno, ovviamente, ha distorto i nostri risultati - è importante tenerlo a mente. Per completezza, tuttavia, abbiamo incluso questi valori. Questo potrebbe essere visto come un dato positivo, in quanto anche con la dGPU attivata, il nostro dispositivo di prova con il nuovo Ryzen 9 7945HX3D era allo stesso livello dei chip Intel Raptor Lake HX, che avevano una iGPU inattiva durante le misurazioni.

Power Consumption / Cinebench R23 Single Power Efficiency - external Monitor
Apple M2 Max
Apple MacBook Pro 16 2023 M2 Max
71.9 Points per Watt +167%
Intel Core i9-13950HX
MSI Titan GT77 HX 13VI
28.5 Points per Watt +6%
AMD Ryzen 9 7945HX
Asus ROG Strix G17 G713PI
28.2 Points per Watt +5%
Intel Core i9-12900HX
MSI Titan GT77 12UHS
27.8 Points per Watt +3%
AMD Ryzen 9 7945HX3D
Asus ROG Strix Scar 17 G733PYV-LL053X
26.9 Points per Watt
AMD Ryzen 9 7945HX
Asus ROG Strix G17 G713PI
26.8 Points per Watt 0%
AMD Ryzen 9 7945HX
Asus Zephyrus Duo 16 GX650PY-NM006W
26.4 Points per Watt -2%
Power Consumption / Cinebench R23 Single (external Monitor)
Intel Core i9-13950HX
MSI Titan GT77 HX 13VI
73.8 (69.8min, 70.2P1 - 100.2max) Watt * -3%
AMD Ryzen 9 7945HX
Asus Zephyrus Duo 16 GX650PY-NM006W
73.4 (69.8min, 69.9P1 - 99.9max) Watt * -2%
AMD Ryzen 9 7945HX
Asus ROG Strix G17 G713PI (Turbo Mode)
72.2 (62.6min, 63.8P1 - 92.5max) Watt * -0%
AMD Ryzen 9 7945HX3D
Asus ROG Strix Scar 17 G733PYV-LL053X
71.9 (70.8min, 71P1 - 86max) Watt *
Intel Core i9-12900HX
MSI Titan GT77 12UHS
68.7 (63.7min, 64.8P1 - 87.6max) Watt * +4%
AMD Ryzen 9 7945HX
Asus ROG Strix G17 G713PI
66.1 (57.7min, 58.2P1 - 93.6max) Watt * +8%
Apple M2 Max
Apple MacBook Pro 16 2023 M2 Max
22.6 (17.4min, 18.2P1 - 29.7max) Watt * +69%

* ... Meglio usare valori piccoli

Prestazioni multi-core

Durante il test multi-core, ci siamo resi conto del suo raffreddamento leggermente debole: in questo caso, il nuovo Ryzen 9 7945HX3D ha evitato per poco di poter competere con i modelli dotati del normale Ryzen 9 7945HX. In totale, il nuovo processore Zen4 con 3D V-Cache è ancora in vantaggio rispetto ai concorrenti Intel che, inoltre, consumano più energia. Tuttavia, se si desiderano le massime prestazioni della CPU, si dovrebbe optare per un dispositivo con il normale Ryzen 9 7945HX che utilizza metallo liquido.

CPU Performance Rating: Percent
Cinebench R23: Multi Core
Cinebench R20: CPU (Multi Core)
Cinebench R15: CPU Multi 64Bit
Blender: v2.79 BMW27 CPU
7-Zip 18.03: 7z b 4
Geekbench 5.5: Multi-Core
CPU Performance Rating
AMD Ryzen 9 7945HX
Asus ROG Strix G17 G713PI
91.8 pt
AMD Ryzen 9 7945HX
Asus Zephyrus Duo 16 GX650PY-NM006W
90.5 pt
AMD Ryzen 9 7945HX3D
Asus ROG Strix Scar 17 G733PYV-LL053X
89.4 pt
Intel Core i9-13950HX
MSI Titan GT77 HX 13VI
87.3 pt
Intel Core i9-13980HX
MSI Titan GT77 HX 13VI
86.3 pt
Intel Core i9-13900HX
Lenovo Legion Pro 7 16IRX8H
82.5 pt
AMD Ryzen 9 7945HX
Asus ROG Strix G17 G713PI
81.4 pt
Intel Core i9-13900HX
SCHENKER XMG Neo 16 Raptor Lake
80.3 pt
Intel Core i9-13950HX
Razer Blade 16 Early 2023
72.1 pt
Intel Core i9-12900HX
MSI Titan GT77 12UHS
60.7 pt
Apple M2 Max -2!
Apple MacBook Pro 16 2023 M2 Max
45.4 pt
AMD Ryzen 9 6900HX
Asus ROG Zephyrus Duo 16 GX650RX
35.9 pt
Cinebench R23 / Multi Core
AMD Ryzen 9 7945HX
Asus Zephyrus Duo 16 GX650PY-NM006W
34521 (32987.6min - 34521.3max) Points +5%
AMD Ryzen 9 7945HX
Asus ROG Strix G17 G713PI (Turbo Mode)
34202 Points +4%
Intel Core i9-13950HX
MSI Titan GT77 HX 13VI
33277 Points +2%
Intel Core i9-13980HX
MSI Titan GT77 HX 13VI
33052 Points +1%
AMD Ryzen 9 7945HX3D
Asus ROG Strix Scar 17 G733PYV-LL053X
32782 Points
AMD Ryzen 9 7945HX
Asus ROG Strix G17 G713PI
32379 Points -1%
Intel Core i9-13900HX
Lenovo Legion Pro 7 16IRX8H
30162 Points -8%
Intel Core i9-13900HX
SCHENKER XMG Neo 16 Raptor Lake
28707 (26191.7min - 28706.8max) Points -12%
Intel Core i9-13900HX
SCHENKER XMG Neo 16 Raptor Lake
28010 (26406.1min - 28009.8max) Points -15%
Intel Core i9-13900HX
SCHENKER XMG Neo 16 Raptor Lake
26703 Points -19%
Intel Core i9-13950HX
Razer Blade 16 Early 2023
26736 (22394.1min - 26736.1max) Points -18%
Intel Core i9-12900HX
MSI Titan GT77 12UHS
22982 Points -30%
Apple M2 Max
Apple MacBook Pro 16 2023 M2 Max
14767 Points -55%
AMD Ryzen 9 6900HX
Asus ROG Zephyrus Duo 16 GX650RX
14085 Points -57%
Cinebench R20 / CPU (Multi Core)
AMD Ryzen 9 7945HX
Asus ROG Strix G17 G713PI (Turbo Mode)
13769 Points +6%
AMD Ryzen 9 7945HX
Asus Zephyrus Duo 16 GX650PY-NM006W
13457 Points +3%
AMD Ryzen 9 7945HX3D
Asus ROG Strix Scar 17 G733PYV-LL053X
13033 Points
Intel Core i9-13950HX
MSI Titan GT77 HX 13VI
12648 Points -3%
Intel Core i9-13980HX
MSI Titan GT77 HX 13VI
12437 Points -5%
Intel Core i9-13900HX
Lenovo Legion Pro 7 16IRX8H
11500 Points -12%
Intel Core i9-13900HX
SCHENKER XMG Neo 16 Raptor Lake
11289 Points -13%
AMD Ryzen 9 7945HX
Asus ROG Strix G17 G713PI
10025 Points -23%
Intel Core i9-13950HX
Razer Blade 16 Early 2023
8697 Points -33%
Intel Core i9-12900HX
MSI Titan GT77 12UHS
8667 Points -33%
AMD Ryzen 9 6900HX
Asus ROG Zephyrus Duo 16 GX650RX
5489 Points -58%
Apple M2 Max
Apple MacBook Pro 16 2023 M2 Max
4044 Points -69%
Cinebench R15 / CPU Multi 64Bit
AMD Ryzen 9 7945HX
Asus ROG Strix G17 G713PI (Turbo Mode)
5663 Points +1%
AMD Ryzen 9 7945HX3D
Asus ROG Strix Scar 17 G733PYV-LL053X
5600 (5177.32min - 5599.89max) Points
AMD Ryzen 9 7945HX
Asus Zephyrus Duo 16 GX650PY-NM006W
5554 (5255.55min - 5554.01max) Points -1%
Intel Core i9-13950HX
MSI Titan GT77 HX 13VI
5227 (4889.98min - 5226.71max) Points -7%
AMD Ryzen 9 7945HX
Asus ROG Strix G17 G713PI
5205 (4749.47min - 5204.94max) Points -7%
Intel Core i9-13980HX
MSI Titan GT77 HX 13VI
5172 (4917.63min - 5171.97max) Points -8%
Intel Core i9-13900HX
SCHENKER XMG Neo 16 Raptor Lake
4913 Points -12%
Intel Core i9-13900HX
SCHENKER XMG Neo 16 Raptor Lake
4875 (4298.3min - 4875.08max) Points -13%
Intel Core i9-13900HX
Lenovo Legion Pro 7 16IRX8H
4819 (4429.68min - 4819.28max) Points -14%
Intel Core i9-13950HX
Razer Blade 16 Early 2023
4529 (4463.29min - 4528.99max) Points -19%
Intel Core i9-12900HX
MSI Titan GT77 12UHS
3570 (3259.45min - 3569.52max) Points -36%
AMD Ryzen 9 6900HX
Asus ROG Zephyrus Duo 16 GX650RX
2292 Points -59%
Apple M2 Max
Apple MacBook Pro 16 2023 M2 Max
2074 (2068.47min, 2068.57P1 - 2081.27max) Points -63%
Blender / v2.79 BMW27 CPU
AMD Ryzen 9 6900HX
Asus ROG Zephyrus Duo 16 GX650RX
220 Seconds * -132%
Intel Core i9-12900HX
MSI Titan GT77 12UHS
147 Seconds * -55%
Intel Core i9-13950HX
Razer Blade 16 Early 2023
114 Seconds * -20%
Intel Core i9-13900HX
SCHENKER XMG Neo 16 Raptor Lake
111 Seconds * -17%
Intel Core i9-13900HX
Lenovo Legion Pro 7 16IRX8H
105 Seconds * -11%
Intel Core i9-13980HX
MSI Titan GT77 HX 13VI
101 Seconds * -6%
Intel Core i9-13950HX
MSI Titan GT77 HX 13VI
100 Seconds * -5%
AMD Ryzen 9 7945HX
Asus ROG Strix G17 G713PI
100 Seconds * -5%
AMD Ryzen 9 7945HX
Asus ROG Strix G17 G713PI (Turbo Mode)
95 Seconds * -0%
AMD Ryzen 9 7945HX3D
Asus ROG Strix Scar 17 G733PYV-LL053X
95 Seconds *
AMD Ryzen 9 7945HX
Asus Zephyrus Duo 16 GX650PY-NM006W
93 Seconds * +2%
7-Zip 18.03 / 7z b 4
AMD Ryzen 9 7945HX
Asus ROG Strix G17 G713PI (Turbo Mode)
140471 MIPS +3%
AMD Ryzen 9 7945HX3D
Asus ROG Strix Scar 17 G733PYV-LL053X
136201 MIPS
AMD Ryzen 9 7945HX
Asus Zephyrus Duo 16 GX650PY-NM006W
135927 MIPS 0%
Intel Core i9-13950HX
MSI Titan GT77 HX 13VI
127295 MIPS -7%
Intel Core i9-13980HX
MSI Titan GT77 HX 13VI
125720 MIPS -8%
AMD Ryzen 9 7945HX
Asus ROG Strix G17 G713PI
123364 MIPS -9%
Intel Core i9-13900HX
Lenovo Legion Pro 7 16IRX8H
122254 MIPS -10%
Intel Core i9-13900HX
SCHENKER XMG Neo 16 Raptor Lake
118715 MIPS -13%
Intel Core i9-13950HX
Razer Blade 16 Early 2023
109330 MIPS -20%
Intel Core i9-12900HX
MSI Titan GT77 12UHS
86234 MIPS -37%
AMD Ryzen 9 6900HX
Asus ROG Zephyrus Duo 16 GX650RX
64457 MIPS -53%
Geekbench 5.5 / Multi-Core
Intel Core i9-13900HX
Lenovo Legion Pro 7 16IRX8H
21058 Points +6%
Intel Core i9-13900HX
SCHENKER XMG Neo 16 Raptor Lake
20784 Points +5%
Intel Core i9-13950HX
MSI Titan GT77 HX 13VI
20634 Points +4%
Intel Core i9-13980HX
MSI Titan GT77 HX 13VI
20329 Points +2%
AMD Ryzen 9 7945HX
Asus ROG Strix G17 G713PI (Turbo Mode)
19954 Points 0%
AMD Ryzen 9 7945HX3D
Asus ROG Strix Scar 17 G733PYV-LL053X
19875 Points
AMD Ryzen 9 7945HX
Asus Zephyrus Duo 16 GX650PY-NM006W
19583 Points -1%
AMD Ryzen 9 7945HX
Asus ROG Strix G17 G713PI
18372 Points -8%
Intel Core i9-13950HX
Razer Blade 16 Early 2023
18152 Points -9%
Intel Core i9-12900HX
MSI Titan GT77 12UHS
16250 Points -18%
Apple M2 Max
Apple MacBook Pro 16 2023 M2 Max
15348 Points -23%
AMD Ryzen 9 6900HX
Asus ROG Zephyrus Duo 16 GX650RX
10167 Points -49%
CPU Performance Rating: Percent
Cinebench R23: Multi Core
Cinebench R20: CPU (Multi Core)
Cinebench R15: CPU Multi 64Bit
Blender: v2.79 BMW27 CPU
7-Zip 18.03: 7z b 4
Geekbench 5.5: Multi-Core

* ... Meglio usare valori piccoli

Quando si guarda all'efficienza, bisogna ricordare che la GPU dedicata era attiva. A causa del suo consumo totale più elevato, l'influenza è minore rispetto ai test single-core. Il nuovo Ryzen 9 7945HX3D ha superato entrambe le CPU 7945HX normali in modalità turbo, il che è il solo risultato dei limiti di potenza più bassi. Se entrambi avessero limiti di potenza identici (ad esempio 100 watt), l'efficienza dei due modelli sarebbe paragonabile. In questo caso, si nota anche il vantaggio di AMD rispetto a Intel, le cui CPU richiedono semplicemente più energia per offrire livelli di prestazioni simili. Apple con il suo processoreProcessore M2 Maxè leggermente in vantaggio, ma in totale offre prestazioni massime nettamente inferiori.

Power Consumption / Cinebench R23 Multi Power Efficiency - external Monitor
Apple M2 Max
Apple MacBook Pro 16 2023 M2 Max
233 Points per Watt +13%
AMD Ryzen 9 7945HX3D
Asus ROG Strix Scar 17 G733PYV-LL053X
207 Points per Watt
AMD Ryzen 9 7945HX
Asus Zephyrus Duo 16 GX650PY-NM006W
194.4 Points per Watt -6%
AMD Ryzen 9 7945HX
Asus ROG Strix G17 G713PI
191.1 Points per Watt -8%
Intel Core i9-13950HX
Razer Blade 16 Early 2023 RTX 4090
144.1 Points per Watt -30%
Intel Core i9-13950HX
MSI Titan GT77 HX 13VI
135.3 Points per Watt -35%
Intel Core i9-12900HX
MSI Titan GT77 12UHS
122.6 Points per Watt -41%
Power Consumption / Cinebench R23 Multi (external Monitor)
Intel Core i9-13950HX
MSI Titan GT77 HX 13VI
246 (227min, 227P1 - 264max) Watt * -55%
Intel Core i9-13950HX
Razer Blade 16 Early 2023 RTX 4090
197.3 (191.9min, 192.7P1 - 200max) Watt * -24%
Intel Core i9-12900HX
MSI Titan GT77 12UHS
187.5 (166.8min, 167.1P1 - 230max) Watt * -18%
Intel Core i9-13900HX
SCHENKER XMG Neo 16 E23
182.4 (172.3min, 172.3P1 - 207max) Watt * -15%
AMD Ryzen 9 7945HX
Asus ROG Strix G17 G713PI (Turbo Mode)
179 (171.5min, 171.8P1 - 181.3max) Watt * -13%
AMD Ryzen 9 7945HX
Asus Zephyrus Duo 16 GX650PY-NM006W
177.6 (166.7min, 166.8P1 - 187.3max) Watt * -12%
AMD Ryzen 9 7945HX3D
Asus ROG Strix Scar 17 G733PYV-LL053X
158.5 (149.9min, 150.4P1 - 171.1max) Watt *
Intel Core i7-13700HX
Aorus 15X ASF
148.3 (116.3min, 116.3P1 - 185.2max) Watt * +6%
Apple M2 Max
Apple MacBook Pro 16 2023 M2 Max
63.5 (61.8min, 62.1P1 - 67.8max) Watt * +60%

* ... Meglio usare valori piccoli

Prestazioni con limiti di potenza inferiori

Siamo stati in grado di impostare nuovi limiti di potenza fissi per il processore tramite la modalità manuale presente nel software Armoury Crate del dispositivo di test - purtroppo, siamo stati più limitati con il 7945HX3D. A causa del suo raffreddamento più debole, il processore non è riuscito nemmeno a completare il breve test Cinebench R23 con un limite fisso di 115 watt - inoltre, questa volta, l'applicazione ha consentito solo un valore minimo di 65 watt. Entrambi i risultati, a 100 e 80 watt, sono allo stesso livello del normale Ryzen 9 7945HX. Si può anche dire che il Ryzen 9 7945HX3D offre prestazioni migliori a 80 watt rispetto all'Intel Core i9-13980HX a 150 watt.

Cinebench R23 Multi
Limite di potenza Core i9-13900HX Core i9-13950HX Core i9-13980HX Ryzen 9 7945HX Ryzen 9 7945HX3D
170 watt 31.958 31.903
150 watt 30.655 30.623
130 watt 28.239 29.141 29.281 34.202
115 watt 27.369 28.199 28.073 33.361
100 watt 25.942 26.653 26.507 32.947 32.977
80 watt 23.216 23.950 23.766 30.907 30.804
55 watt 18.843 19.772 19.478 26.045

Prestazioni di gioco a 1080p

Veniamo ora ai benchmark di gioco, dove abbiamo dato un'occhiata alla risoluzione Full HD. In questo caso, il nuovo Ryzen 9 7945HX3D è stato davvero in grado di mostrare i suoi vantaggi in molti giochi - abbiamo persino notato che a volte è in vantaggio di due cifre percentuali. In Far Cry 5, abbiamo notato un enorme miglioramento del 36% rispetto al Ryzen 9 7945HX normale e alle CPU HX di Intel. In alcuni giochi non abbiamo riscontrato alcun miglioramento, come ad esempio in The Witcher 3 e Call of Duty Modern Warfare 2.

The Witcher 3 - 1920x1080 Ultra Graphics & Postprocessing (HBAO+)
Alienware m18 R1
Intel Core i9-13980HX, NVIDIA GeForce RTX 4090 Laptop GPU
213.9 (205min) fps +3%
Asus ROG Strix Scar 17 G733PYV-LL053X
AMD Ryzen 9 7945HX3D, NVIDIA GeForce RTX 4090 Laptop GPU
207 fps
SCHENKER Key 17 Pro (Early 23)
Intel Core i9-13900HX, NVIDIA GeForce RTX 4090 Laptop GPU
206 (176min) fps 0%
Asus ROG Strix Scar 17 G733PY-XS96
AMD Ryzen 9 7945HX, NVIDIA GeForce RTX 4090 Laptop GPU
203.8 (186min) fps -2%
Lenovo Legion Pro 7 RTX4090
Intel Core i9-13900HX, NVIDIA GeForce RTX 4090 Laptop GPU
200 (174min) fps -3%
MSI Titan GT77 HX 13VI
Intel Core i9-13950HX, NVIDIA GeForce RTX 4090 Laptop GPU
198.9 (190min, 191P1) fps -4%
Lenovo Legion Pro 5 16ARX8
AMD Ryzen 7 7745HX, NVIDIA GeForce RTX 4070 Laptop GPU
119.8 (114min) fps -42%
Media della classe Gaming
  (8.61 - 216, n=228, ultimi 2 anni)
117.3 fps -43%
GTA V - 1920x1080 Highest Settings possible AA:4xMSAA + FX AF:16x
Asus ROG Strix Scar 17 G733PYV-LL053X
AMD Ryzen 9 7945HX3D, NVIDIA GeForce RTX 4090 Laptop GPU
167.7 (1.87min, 111.1P1) fps
Alienware m18 R1
Intel Core i9-13980HX, NVIDIA GeForce RTX 4090 Laptop GPU
149 (3.13min, 111.1P1) fps -11%
Lenovo Legion Pro 7 RTX4090
Intel Core i9-13900HX, NVIDIA GeForce RTX 4090 Laptop GPU
143.6 (4.39min, 100P1) fps -14%
SCHENKER Key 17 Pro (Early 23)
Intel Core i9-13900HX, NVIDIA GeForce RTX 4090 Laptop GPU
142.3 (4.44min, 100P1) fps -15%
Asus ROG Strix Scar 18 2023 G834JY-N6005W
Intel Core i9-13980HX, NVIDIA GeForce RTX 4090 Laptop GPU
141.3 (4.69min, 100P1) fps -16%
MSI Titan GT77 HX 13VI
Intel Core i9-13950HX, NVIDIA GeForce RTX 4090 Laptop GPU
140.9 (3.54min, 83.3P1) fps -16%
Lenovo Legion Pro 5 16ARX8
AMD Ryzen 7 7745HX, NVIDIA GeForce RTX 4070 Laptop GPU
119.9 (3.81min, 76.9P1) fps -29%
Asus ROG Strix Scar 17 G733PY-XS96
AMD Ryzen 9 7945HX, NVIDIA GeForce RTX 4090 Laptop GPU
112.6 (4.54min, 71.4P1) fps -33%
Media della classe Gaming
  (6.38 - 167.7, n=219, ultimi 2 anni)
107.7 fps -36%
Final Fantasy XV Benchmark - 1920x1080 High Quality
Alienware m18 R1
Intel Core i9-13980HX, NVIDIA GeForce RTX 4090 Laptop GPU
194.8 fps +8%
MSI Titan GT77 HX 13VI
Intel Core i9-13950HX, NVIDIA GeForce RTX 4090 Laptop GPU
187.4 fps +4%
SCHENKER Key 17 Pro (Early 23)
Intel Core i9-13900HX, NVIDIA GeForce RTX 4090 Laptop GPU
183.1 fps +2%
Lenovo Legion Pro 7 RTX4090
Intel Core i9-13900HX, NVIDIA GeForce RTX 4090 Laptop GPU
181.2 fps +1%
Asus ROG Strix Scar 17 G733PYV-LL053X
AMD Ryzen 9 7945HX3D, NVIDIA GeForce RTX 4090 Laptop GPU
180 fps
Asus ROG Strix Scar 18 2023 G834JY-N6005W
Intel Core i9-13980HX, NVIDIA GeForce RTX 4090 Laptop GPU
177.6 fps -1%
Asus ROG Strix Scar 17 G733PY-XS96
AMD Ryzen 9 7945HX, NVIDIA GeForce RTX 4090 Laptop GPU
163.9 fps -9%
Lenovo Legion Pro 5 16ARX8
AMD Ryzen 7 7745HX, NVIDIA GeForce RTX 4070 Laptop GPU
119.9 fps -33%
Media della classe Gaming
  (9.13 - 194.9, n=229, ultimi 2 anni)
111.6 fps -38%
Strange Brigade - 1920x1080 ultra AA:ultra AF:16
Asus ROG Strix Scar 17 G733PYV-LL053X
AMD Ryzen 9 7945HX3D, NVIDIA GeForce RTX 4090 Laptop GPU
420 (64.7min, 302P1) fps
SCHENKER Key 17 Pro (Early 23)
Intel Core i9-13900HX, NVIDIA GeForce RTX 4090 Laptop GPU
378 (20.6min, 257P1) fps -10%
MSI Titan GT77 HX 13VI
Intel Core i9-13950HX, NVIDIA GeForce RTX 4090 Laptop GPU
373 (29.9min, 272P1) fps -11%
Alienware m18 R1
Intel Core i9-13980HX, NVIDIA GeForce RTX 4090 Laptop GPU
373 (73.3min, 273P1) fps -11%
Asus ROG Strix Scar 18 2023 G834JY-N6005W
Intel Core i9-13980HX, NVIDIA GeForce RTX 4090 Laptop GPU
366 (29.1min, 263P1) fps -13%
Lenovo Legion Pro 7 RTX4090
Intel Core i9-13900HX, NVIDIA GeForce RTX 4090 Laptop GPU
347 (87.7min, 252P1) fps -17%
Lenovo Legion Pro 5 16ARX8
AMD Ryzen 7 7745HX, NVIDIA GeForce RTX 4070 Laptop GPU
223 (89min, 167.8P1) fps -47%
Media della classe Gaming
  (14.6 - 421, n=227, ultimi 2 anni)
207 fps -51%
Dota 2 Reborn - 1920x1080 ultra (3/3) best looking
Asus ROG Strix Scar 17 G733PYV-LL053X
AMD Ryzen 9 7945HX3D, NVIDIA GeForce RTX 4090 Laptop GPU
220 (175min) fps
Alienware m18 R1
Intel Core i9-13980HX, NVIDIA GeForce RTX 4090 Laptop GPU
194.2 (157.6min) fps -12%
Asus ROG Strix Scar 18 2023 G834JY-N6005W
Intel Core i9-13980HX, NVIDIA GeForce RTX 4090 Laptop GPU
190.2 (160.9min) fps -14%
MSI Titan GT77 HX 13VI
Intel Core i9-13950HX, NVIDIA GeForce RTX 4090 Laptop GPU
185.9 (157.5min) fps -15%
SCHENKER Key 17 Pro (Early 23)
Intel Core i9-13900HX, NVIDIA GeForce RTX 4090 Laptop GPU
182.5 (149.3min) fps -17%
Lenovo Legion Pro 7 RTX4090
Intel Core i9-13900HX, NVIDIA GeForce RTX 4090 Laptop GPU
182.1 (154.2min) fps -17%
Lenovo Legion Pro 5 16ARX8
AMD Ryzen 7 7745HX, NVIDIA GeForce RTX 4070 Laptop GPU
182 (152.8min) fps -17%
Media della classe Gaming
  (26.9 - 220, n=239, ultimi 2 anni)
143.1 fps -35%
Asus ROG Strix Scar 17 G733PY-XS96
AMD Ryzen 9 7945HX, NVIDIA GeForce RTX 4090 Laptop GPU
139 (118.5min) fps -37%
X-Plane 11.11 - 1920x1080 high (fps_test=3)
Asus ROG Strix Scar 17 G733PYV-LL053X
AMD Ryzen 9 7945HX3D, NVIDIA GeForce RTX 4090 Laptop GPU
166.2 fps
Alienware m18 R1
Intel Core i9-13980HX, NVIDIA GeForce RTX 4090 Laptop GPU
143.5 fps -14%
Asus ROG Strix Scar 18 2023 G834JY-N6005W
Intel Core i9-13980HX, NVIDIA GeForce RTX 4090 Laptop GPU
142.8 fps -14%
SCHENKER Key 17 Pro (Early 23)
Intel Core i9-13900HX, NVIDIA GeForce RTX 4090 Laptop GPU
136.6 fps -18%
Lenovo Legion Pro 7 RTX4090
Intel Core i9-13900HX, NVIDIA GeForce RTX 4090 Laptop GPU
136.4 fps -18%
MSI Titan GT77 HX 13VI
Intel Core i9-13950HX, NVIDIA GeForce RTX 4090 Laptop GPU
134.2 fps -19%
MSI Titan GT77 HX 13VI
Intel Core i9-13950HX, NVIDIA GeForce RTX 4090 Laptop GPU
134.1 fps -19%
Lenovo Legion Pro 5 16ARX8
AMD Ryzen 7 7745HX, NVIDIA GeForce RTX 4070 Laptop GPU
117.8 fps -29%
Media della classe Gaming
  (12.4 - 166.2, n=244, ultimi 2 anni)
102.2 fps -39%
Asus ROG Strix Scar 17 G733PY-XS96
AMD Ryzen 9 7945HX, NVIDIA GeForce RTX 4090 Laptop GPU
94.3 fps -43%
Shadow of the Tomb Raider - 1920x1080 Highest Preset AA:T
Asus ROG Strix Scar 17 G733PYV-LL053X
AMD Ryzen 9 7945HX3D, NVIDIA GeForce RTX 4090 Laptop GPU
271 fps
Asus ROG Strix Scar 17 G733PY-XS96
AMD Ryzen 9 7945HX, NVIDIA GeForce RTX 4090 Laptop GPU
228 fps -16%
MSI Titan GT77 HX 13VI
Intel Core i9-13950HX, NVIDIA GeForce RTX 4090 Laptop GPU
214 fps -21%
Lenovo Legion Pro 5 16ARX8
AMD Ryzen 7 7745HX, NVIDIA GeForce RTX 4070 Laptop GPU
168 fps -38%
Media della classe Gaming
  (27 - 271, n=30, ultimi 2 anni)
161.3 fps -40%
Asus ROG Strix Scar 18 2023 G834JY-N6005W
Intel Core i9-13980HX, NVIDIA GeForce RTX 4090 Laptop GPU
143.7 fps -47%
F1 22 - 1920x1080 Ultra High Preset AA:T AF:16x
Alienware m18 R1
Intel Core i9-13980HX, NVIDIA GeForce RTX 4090 Laptop GPU
144.7 (124min, 94P1) fps +6%
MSI Titan GT77 HX 13VI
Intel Core i9-13950HX, NVIDIA GeForce RTX 4090 Laptop GPU
138.2 (118min, 84P1) fps +2%
Asus ROG Strix Scar 17 G733PYV-LL053X
AMD Ryzen 9 7945HX3D, NVIDIA GeForce RTX 4090 Laptop GPU
135.9 (118min, 98P1) fps
Lenovo Legion Pro 7 RTX4090
Intel Core i9-13900HX, NVIDIA GeForce RTX 4090 Laptop GPU
129.2 (105min, 83P1) fps -5%
Asus ROG Strix Scar 18 2023 G834JY-N6005W
Intel Core i9-13980HX, NVIDIA GeForce RTX 4090 Laptop GPU
124.5 (107min, 87P1) fps -8%
Asus ROG Strix Scar 17 G733PY-XS96
AMD Ryzen 9 7945HX, NVIDIA GeForce RTX 4090 Laptop GPU
116.3 (86min, 73P1) fps -14%
Lenovo Legion Pro 5 16ARX8
AMD Ryzen 7 7745HX, NVIDIA GeForce RTX 4070 Laptop GPU
84.1 (71min, 59P1) fps -38%
Media della classe Gaming
  (13 - 144.7, n=109, ultimi 2 anni)
80.1 fps -41%
Far Cry 5 - 1920x1080 Ultra Preset AA:T
Asus ROG Strix Scar 17 G733PYV-LL053X
AMD Ryzen 9 7945HX3D, NVIDIA GeForce RTX 4090 Laptop GPU
218 fps
MSI Titan GT77 HX 13VI
Intel Core i9-13950HX, NVIDIA GeForce RTX 4090 Laptop GPU
160 fps -27%
Asus ROG Strix Scar 18 2023 G834JY-N6005W
Intel Core i9-13980HX, NVIDIA GeForce RTX 4090 Laptop GPU
158 (117min) fps -28%
Asus ROG Strix Scar 17 G733PY-XS96
AMD Ryzen 9 7945HX, NVIDIA GeForce RTX 4090 Laptop GPU
145 (106min) fps -33%
Media della classe Gaming
  (14 - 218, n=126, ultimi 2 anni)
126.3 fps -42%
Far Cry 6 - 1920x1080 Ultra Graphics Quality + HD Textures AA:T
Asus ROG Strix Scar 17 G733PYV-LL053X
AMD Ryzen 9 7945HX3D, NVIDIA GeForce RTX 4090 Laptop GPU
167 fps
MSI Titan GT77 HX 13VI
Intel Core i9-13950HX, NVIDIA GeForce RTX 4090 Laptop GPU
144 fps -14%
Asus ROG Strix Scar 17 G733PY-XS96
AMD Ryzen 9 7945HX, NVIDIA GeForce RTX 4090 Laptop GPU
112 (91min) fps -33%
Lenovo Legion Pro 5 16ARX8
AMD Ryzen 7 7745HX, NVIDIA GeForce RTX 4070 Laptop GPU
110 (74min) fps -34%
Media della classe Gaming
  (14.7 - 167, n=35, ultimi 2 anni)
98.8 fps -41%
Call of Duty Modern Warfare 2 2022 - 1920x1080 Extreme Quality Preset AA:T2X Filmic SM
Asus ROG Strix Scar 17 G733PYV-LL053X
AMD Ryzen 9 7945HX3D, NVIDIA GeForce RTX 4090 Laptop GPU
182 fps
Asus ROG Strix Scar 17 G733PY-XS96
AMD Ryzen 9 7945HX, NVIDIA GeForce RTX 4090 Laptop GPU
180 (103min) fps -1%
MSI Titan GT77 HX 13VI
Intel Core i9-13950HX, NVIDIA GeForce RTX 4090 Laptop GPU
176 fps -3%
Asus ROG Strix Scar 18 2023 G834JY-N6005W
Intel Core i9-13980HX, NVIDIA GeForce RTX 4090 Laptop GPU
170 (98P1) fps -7%
Media della classe Gaming
  (15 - 182, n=39, ultimi 2 anni)
114.2 fps -37%
Lenovo Legion Pro 5 16ARX8
AMD Ryzen 7 7745HX, NVIDIA GeForce RTX 4070 Laptop GPU
108 (61min) fps -41%
Cyberpunk 2077 1.6 - 1920x1080 Ultra Preset
Asus ROG Strix Scar 17 G733PYV-LL053X
AMD Ryzen 9 7945HX3D, NVIDIA GeForce RTX 4090 Laptop GPU
157 fps
MSI Titan GT77 HX 13VI
Intel Core i9-13950HX, NVIDIA GeForce RTX 4090 Laptop GPU
135 fps -14%
Asus ROG Strix Scar 17 G733PY-XS96
AMD Ryzen 9 7945HX, NVIDIA GeForce RTX 4090 Laptop GPU
133.8 (57.7min) fps -15%
Alienware m18 R1
Intel Core i9-13980HX, NVIDIA GeForce RTX 4090 Laptop GPU
127.92 (32.4min) fps -19%
Asus ROG Strix Scar 18 2023 G834JY-N6005W
Intel Core i9-13980HX, NVIDIA GeForce RTX 4090 Laptop GPU
119.7 (69min) fps -24%
Lenovo Legion Pro 5 16ARX8
AMD Ryzen 7 7745HX, NVIDIA GeForce RTX 4070 Laptop GPU
98.9 (35.5min) fps -37%
Media della classe Gaming
  (16.7 - 159.7, n=102, ultimi 2 anni)
86.7 fps -45%

Prestazioni di gioco QHD

Anche nella risoluzione QHD il nuovo processore ha mostrato alcuni vantaggi, anche se non così grandi come nella risoluzione 1080p. In generale, il Ryzen 9 7945HX3D offre ancora prestazioni migliori rispetto ai suoi concorrenti, anche in questo caso con percentuali a due cifre.

Shadow of the Tomb Raider - 2560x1440 Highest Preset AA:T
Asus ROG Strix Scar 17 G733PYV-LL053X
NVIDIA GeForce RTX 4090 Laptop GPU, R9 7945HX3D, SK hynix PC801 HFS001TEJ9X101N
199 fps
Asus ROG Strix Scar 17 G733PY-XS96
NVIDIA GeForce RTX 4090 Laptop GPU, R9 7945HX, SK hynix PC801 HFS001TEJ9X101N
190 fps -5%
MSI Titan GT77 HX 13VI
NVIDIA GeForce RTX 4090 Laptop GPU, i9-13950HX, Samsung PM9A1 MZVL22T0HBLB
187 fps -6%
Lenovo Legion Pro 7 RTX4090
NVIDIA GeForce RTX 4090 Laptop GPU, i9-13900HX, Samsung PM9A1 MZVL21T0HCLR
185 fps -7%
Far Cry 5 - 2560x1440 Ultra Preset AA:T
Asus ROG Strix Scar 17 G733PYV-LL053X
NVIDIA GeForce RTX 4090 Laptop GPU, R9 7945HX3D, SK hynix PC801 HFS001TEJ9X101N
194 fps
MSI Titan GT77 HX 13VI
NVIDIA GeForce RTX 4090 Laptop GPU, i9-13950HX, Samsung PM9A1 MZVL22T0HBLB
159 fps -18%
Asus ROG Strix Scar 17 G733PY-XS96
NVIDIA GeForce RTX 4090 Laptop GPU, R9 7945HX, SK hynix PC801 HFS001TEJ9X101N
142 (104min - 189max) fps -27%
Far Cry 6 - 2560x1440 Ultra Graphics Quality + HD Textures AA:T
Asus ROG Strix Scar 17 G733PYV-LL053X
NVIDIA GeForce RTX 4090 Laptop GPU, R9 7945HX3D, SK hynix PC801 HFS001TEJ9X101N
146 fps
MSI Titan GT77 HX 13VI
NVIDIA GeForce RTX 4090 Laptop GPU, i9-13950HX, Samsung PM9A1 MZVL22T0HBLB
135 fps -8%
Asus ROG Strix Scar 17 G733PY-XS96
NVIDIA GeForce RTX 4090 Laptop GPU, R9 7945HX, SK hynix PC801 HFS001TEJ9X101N
109 (88min - 120max) fps -25%
Final Fantasy XV Benchmark - 2560x1440 High Quality
MSI Titan GT77 HX 13VI
NVIDIA GeForce RTX 4090 Laptop GPU, i9-13950HX, Samsung PM9A1 MZVL22T0HBLB
162.9 fps +8%
Alienware m18 R1
NVIDIA GeForce RTX 4090 Laptop GPU, i9-13980HX, SK hynix PC801 HFS001TEJ9X101N
159.5 fps +5%
SCHENKER Key 17 Pro (Early 23)
NVIDIA GeForce RTX 4090 Laptop GPU, i9-13900HX, Samsung 990 Pro 2 TB MZVL72T0HDLB
156.4 fps +3%
Lenovo Legion Pro 7 RTX4090
NVIDIA GeForce RTX 4090 Laptop GPU, i9-13900HX, Samsung PM9A1 MZVL21T0HCLR
154 fps +2%
Asus ROG Strix Scar 17 G733PYV-LL053X
NVIDIA GeForce RTX 4090 Laptop GPU, R9 7945HX3D, SK hynix PC801 HFS001TEJ9X101N
151.2 fps
Asus ROG Strix Scar 17 G733PY-XS96
NVIDIA GeForce RTX 4090 Laptop GPU, R9 7945HX, SK hynix PC801 HFS001TEJ9X101N
151 fps 0%
GTA V - 2560x1440 Highest Settings possible AA:4xMSAA + FX AF:16x
Asus ROG Strix Scar 17 G733PYV-LL053X
NVIDIA GeForce RTX 4090 Laptop GPU, R9 7945HX3D, SK hynix PC801 HFS001TEJ9X101N
160.6 (2.82min, 111.1P1 - 363max) fps
Alienware m18 R1
NVIDIA GeForce RTX 4090 Laptop GPU, i9-13980HX, SK hynix PC801 HFS001TEJ9X101N
145.5 (2.46min, 111.1P1 - 281max) fps -9%
SCHENKER Key 17 Pro (Early 23)
NVIDIA GeForce RTX 4090 Laptop GPU, i9-13900HX, Samsung 990 Pro 2 TB MZVL72T0HDLB
141.5 (28.6min, 100P1 - 268max) fps -12%
MSI Titan GT77 HX 13VI
NVIDIA GeForce RTX 4090 Laptop GPU, i9-13950HX, Samsung PM9A1 MZVL22T0HBLB
138.5 (3.45min, 76.9P1 - 256max) fps -14%
Lenovo Legion Pro 7 RTX4090
NVIDIA GeForce RTX 4090 Laptop GPU, i9-13900HX, Samsung PM9A1 MZVL21T0HCLR
137.7 (3.84min, 90.9P1 - 304max) fps -14%
Asus ROG Strix Scar 17 G733PY-XS96
NVIDIA GeForce RTX 4090 Laptop GPU, R9 7945HX, SK hynix PC801 HFS001TEJ9X101N
114.8 (5.12min, 71.4P1 - 204max) fps -29%
F1 22 - 2560x1440 Ultra High Preset AA:T AF:16x
Alienware m18 R1
NVIDIA GeForce RTX 4090 Laptop GPU, i9-13980HX, SK hynix PC801 HFS001TEJ9X101N
92.2 (79min, 74P1 - 106max) fps 0%
Asus ROG Strix Scar 17 G733PY-XS96
NVIDIA GeForce RTX 4090 Laptop GPU, R9 7945HX, SK hynix PC801 HFS001TEJ9X101N
92.1 (75min, 60P1 - 107max) fps 0%
Asus ROG Strix Scar 17 G733PYV-LL053X
NVIDIA GeForce RTX 4090 Laptop GPU, R9 7945HX3D, SK hynix PC801 HFS001TEJ9X101N
91.8 (78min, 76P1 - 105max) fps
MSI Titan GT77 HX 13VI
NVIDIA GeForce RTX 4090 Laptop GPU, i9-13950HX, Samsung PM9A1 MZVL22T0HBLB
90.1 (78min, 71P1 - 104max) fps -2%
Lenovo Legion Pro 7 RTX4090
NVIDIA GeForce RTX 4090 Laptop GPU, i9-13900HX, Samsung PM9A1 MZVL21T0HCLR
85.2 (72min, 40P1 - 96max) fps -7%
Call of Duty Modern Warfare 2 2022 - 2560x1440 Extreme Quality Preset AA:T2X Filmic SM
Asus ROG Strix Scar 17 G733PYV-LL053X
NVIDIA GeForce RTX 4090 Laptop GPU, R9 7945HX3D, SK hynix PC801 HFS001TEJ9X101N
136 fps
MSI Titan GT77 HX 13VI
NVIDIA GeForce RTX 4090 Laptop GPU, i9-13950HX, Samsung PM9A1 MZVL22T0HBLB
135 fps -1%
Asus ROG Strix Scar 17 G733PY-XS96
NVIDIA GeForce RTX 4090 Laptop GPU, R9 7945HX, SK hynix PC801 HFS001TEJ9X101N
135 (69min) fps -1%
Lenovo Legion Pro 7 RTX4090
NVIDIA GeForce RTX 4090 Laptop GPU, i9-13900HX, Samsung PM9A1 MZVL21T0HCLR
132 (67min) fps -3%
Cyberpunk 2077 1.6 - 2560x1440 Ultra Preset
Asus ROG Strix Scar 17 G733PYV-LL053X
NVIDIA GeForce RTX 4090 Laptop GPU, R9 7945HX3D, SK hynix PC801 HFS001TEJ9X101N
116 fps
Asus ROG Strix Scar 17 G733PY-XS96
NVIDIA GeForce RTX 4090 Laptop GPU, R9 7945HX, SK hynix PC801 HFS001TEJ9X101N
104.3 (34.5min - 159.2max) fps -10%
Alienware m18 R1
NVIDIA GeForce RTX 4090 Laptop GPU, i9-13980HX, SK hynix PC801 HFS001TEJ9X101N
102.16 (48.9min - 193.9max) fps -12%
Lenovo Legion Pro 7 RTX4090
NVIDIA GeForce RTX 4090 Laptop GPU, i9-13900HX, Samsung PM9A1 MZVL21T0HCLR
100.93 (30.73min - 162.33max) fps -13%
MSI Titan GT77 HX 13VI
NVIDIA GeForce RTX 4090 Laptop GPU, i9-13950HX, Samsung PM9A1 MZVL22T0HBLB
98 fps -16%

Prestazioni di gioco 4K

Alla risoluzione 4K, il nuovo Ryzen 9 7945HX3D non offre alcun vantaggio rispetto al normale Ryzen 9 7945HX o ai processori mobile HX di Intel, anche se tutti i modelli si sono comportati in modo molto simile.

Shadow of the Tomb Raider - 3840x2160 Highest Preset AA:T
Lenovo Legion Pro 7 RTX4090
NVIDIA GeForce RTX 4090 Laptop GPU, i9-13900HX, Samsung PM9A1 MZVL21T0HCLR
120 fps +15%
Asus ROG Strix Scar 17 G733PY-XS96
NVIDIA GeForce RTX 4090 Laptop GPU, R9 7945HX, SK hynix PC801 HFS001TEJ9X101N
104 fps 0%
Asus ROG Strix Scar 17 G733PYV-LL053X
NVIDIA GeForce RTX 4090 Laptop GPU, R9 7945HX3D, SK hynix PC801 HFS001TEJ9X101N
104 fps
MSI Titan GT77 HX 13VI
NVIDIA GeForce RTX 4090 Laptop GPU, i9-13950HX, Samsung PM9A1 MZVL22T0HBLB
103 fps -1%
Far Cry 5 - 3840x2160 Ultra Preset AA:T
MSI Titan GT77 HX 13VI
NVIDIA GeForce RTX 4090 Laptop GPU, i9-13950HX, Samsung PM9A1 MZVL22T0HBLB
113 fps +3%
Asus ROG Strix Scar 17 G733PYV-LL053X
NVIDIA GeForce RTX 4090 Laptop GPU, R9 7945HX3D, SK hynix PC801 HFS001TEJ9X101N
110 fps
Asus ROG Strix Scar 17 G733PY-XS96
NVIDIA GeForce RTX 4090 Laptop GPU, R9 7945HX, SK hynix PC801 HFS001TEJ9X101N
108 (97min - 124max) fps -2%
Far Cry 6 - 3840x2160 Ultra Graphics Quality + HD Textures AA:T
MSI Titan GT77 HX 13VI
NVIDIA GeForce RTX 4090 Laptop GPU, i9-13950HX, Samsung PM9A1 MZVL22T0HBLB
89 fps +1%
Asus ROG Strix Scar 17 G733PYV-LL053X
NVIDIA GeForce RTX 4090 Laptop GPU, R9 7945HX3D, SK hynix PC801 HFS001TEJ9X101N
88 fps
Asus ROG Strix Scar 17 G733PY-XS96
NVIDIA GeForce RTX 4090 Laptop GPU, R9 7945HX, SK hynix PC801 HFS001TEJ9X101N
82 (73min - 89max) fps -7%
Final Fantasy XV Benchmark - 3840x2160 High Quality
MSI Titan GT77 HX 13VI
NVIDIA GeForce RTX 4090 Laptop GPU, i9-13950HX, Samsung PM9A1 MZVL22T0HBLB
94.7 fps +11%
Asus ROG Strix Scar 17 G733PY-XS96
NVIDIA GeForce RTX 4090 Laptop GPU, R9 7945HX, SK hynix PC801 HFS001TEJ9X101N
93.3 fps +10%
Alienware m18 R1
NVIDIA GeForce RTX 4090 Laptop GPU, i9-13980HX, SK hynix PC801 HFS001TEJ9X101N
92.6 fps +9%
SCHENKER Key 17 Pro (Early 23)
NVIDIA GeForce RTX 4090 Laptop GPU, i9-13900HX, Samsung 990 Pro 2 TB MZVL72T0HDLB
91.9 fps +8%
Lenovo Legion Pro 7 RTX4090
NVIDIA GeForce RTX 4090 Laptop GPU, i9-13900HX, Samsung PM9A1 MZVL21T0HCLR
91.7 fps +8%
Asus ROG Strix Scar 17 G733PYV-LL053X
NVIDIA GeForce RTX 4090 Laptop GPU, R9 7945HX3D, SK hynix PC801 HFS001TEJ9X101N
85 fps
GTA V - 3840x2160 High/On (Advanced Graphics Off) AA:FX AF:8x
Asus ROG Strix Scar 17 G733PYV-LL053X
NVIDIA GeForce RTX 4090 Laptop GPU, R9 7945HX3D, SK hynix PC801 HFS001TEJ9X101N
182.7 (1.878min, 125P1 - 564max) fps
Alienware m18 R1
NVIDIA GeForce RTX 4090 Laptop GPU, i9-13980HX, SK hynix PC801 HFS001TEJ9X101N
176.4 (1.959min, 111.1P1 - 452max) fps -3%
MSI Titan GT77 HX 13VI
NVIDIA GeForce RTX 4090 Laptop GPU, i9-13950HX, Samsung PM9A1 MZVL22T0HBLB
175.7 (2.91min, 111.1P1 - 424max) fps -4%
Lenovo Legion Pro 7 RTX4090
NVIDIA GeForce RTX 4090 Laptop GPU, i9-13900HX, Samsung PM9A1 MZVL21T0HCLR
173.6 (2.41min, 111.1P1 - 427max) fps -5%
Asus ROG Strix Scar 17 G733PY-XS96
NVIDIA GeForce RTX 4090 Laptop GPU, R9 7945HX, SK hynix PC801 HFS001TEJ9X101N
170.5 (3.62min, 111.1P1 - 289max) fps -7%
SCHENKER Key 17 Pro (Early 23)
NVIDIA GeForce RTX 4090 Laptop GPU, i9-13900HX, Samsung 990 Pro 2 TB MZVL72T0HDLB
167.9 (3.06min, 111.1P1 - 495max) fps -8%
F1 22 - 3840x2160 Ultra High Preset AA:T AF:16x
Lenovo Legion Pro 7 RTX4090
NVIDIA GeForce RTX 4090 Laptop GPU, i9-13900HX, Samsung PM9A1 MZVL21T0HCLR
45.9 (39min, 37P1 - 53max) fps +2%
Asus ROG Strix Scar 17 G733PY-XS96
NVIDIA GeForce RTX 4090 Laptop GPU, R9 7945HX, SK hynix PC801 HFS001TEJ9X101N
45.8 (39min, 38P1 - 52max) fps +2%
Alienware m18 R1
NVIDIA GeForce RTX 4090 Laptop GPU, i9-13980HX, SK hynix PC801 HFS001TEJ9X101N
45.5 (38min, 37P1 - 52max) fps +1%
Asus ROG Strix Scar 17 G733PYV-LL053X
NVIDIA GeForce RTX 4090 Laptop GPU, R9 7945HX3D, SK hynix PC801 HFS001TEJ9X101N
45 (38min, 38P1 - 51max) fps
MSI Titan GT77 HX 13VI
NVIDIA GeForce RTX 4090 Laptop GPU, i9-13950HX, Samsung PM9A1 MZVL22T0HBLB
44.9 (38min, 37P1 - 52max) fps 0%
Call of Duty Modern Warfare 2 2022 - 3840x2160 Extreme Quality Preset AA:T2X Filmic SM
MSI Titan GT77 HX 13VI
NVIDIA GeForce RTX 4090 Laptop GPU, i9-13950HX, Samsung PM9A1 MZVL22T0HBLB
85 fps +2%
Asus ROG Strix Scar 17 G733PYV-LL053X
NVIDIA GeForce RTX 4090 Laptop GPU, R9 7945HX3D, SK hynix PC801 HFS001TEJ9X101N
83 fps
Asus ROG Strix Scar 17 G733PY-XS96
NVIDIA GeForce RTX 4090 Laptop GPU, R9 7945HX, SK hynix PC801 HFS001TEJ9X101N
82 (39min) fps -1%
Lenovo Legion Pro 7 RTX4090
NVIDIA GeForce RTX 4090 Laptop GPU, i9-13900HX, Samsung PM9A1 MZVL21T0HCLR
82 (38min) fps -1%
Cyberpunk 2077 1.6 - 3840x2160 Ultra Preset
MSI Titan GT77 HX 13VI
NVIDIA GeForce RTX 4090 Laptop GPU, i9-13950HX, Samsung PM9A1 MZVL22T0HBLB
56 fps +10%
Asus ROG Strix Scar 17 G733PYV-LL053X
NVIDIA GeForce RTX 4090 Laptop GPU, R9 7945HX3D, SK hynix PC801 HFS001TEJ9X101N
51 fps
Lenovo Legion Pro 7 RTX4090
NVIDIA GeForce RTX 4090 Laptop GPU, i9-13900HX, Samsung PM9A1 MZVL21T0HCLR
50.05 (28.38min - 104.95max) fps -2%
Alienware m18 R1
NVIDIA GeForce RTX 4090 Laptop GPU, i9-13980HX, SK hynix PC801 HFS001TEJ9X101N
49.99 (36.8min - 91.2max) fps -2%
Asus ROG Strix Scar 17 G733PY-XS96
NVIDIA GeForce RTX 4090 Laptop GPU, R9 7945HX, SK hynix PC801 HFS001TEJ9X101N
48.6 (32.3min - 68.3max) fps -5%

Verdetto - Il Ryzen 9 7945HX3D è il processore da gioco più veloce

L'AMD Ryzen 9 7945HX3D nel nuovo Asus ROG Strix SCAR 17 X3D

Dopo i nostri test, è chiaro che il nuovo Ryzen 9 7945HX3D di AMD è il processore da gioco più veloce. La sua V-Cache 3D aggiuntiva si fa notare soprattutto con la risoluzione Full HD e offre un vantaggio considerevole (a volte con percentuali a due cifre) in molti giochi rispetto al normale Ryzen 9 7945HX e ai processori mobile HX di Intel. Si tratta di prestazioni notevoli, ma c'è da chiedersi se gli utenti di un portatile da gioco di fascia alta giocheranno davvero a giochi con risoluzione di 1080p. Ad esempio, il dispositivo di prova Asus ROG Strix SCAR 17 è dotato di un pannello QHD e, sebbene abbiamo notato un vantaggio in alcuni giochi, la differenza rispetto ad altri processori si riduce. Il gioco in 4K al più tardi non è in grado di offrire alcun miglioramento.

Il nuovo AMD Ryzen 9 7945HX3D è la CPU mobile da gioco più veloce sul mercato che offre anche la V-Cache 3D e ha un vantaggio particolarmente ampio rispetto ai suoi concorrenti quando si tratta di giocare in risoluzione 1080p. Il suo vantaggio diventa più limitato con la risoluzione QHD.

Nel complesso, le prestazioni della CPU pura sono identiche a quelle del normale Ryzen 9 7945HX e soprattutto l'efficienza multi-core rispetto ai processori HX di Intel è fenomenale. Anche con un limite di potenza fisso di 80 watt, il Ryzen è ancora più veloce del Core i9-13980HX di Intel a 150 watt. Lo stesso si può dire per il normale Ryzen 9 7945HX senza V-Cache 3D. Il nuovo processore presenta uno svantaggio: A causa della struttura superficiale del processore HX3D, non è possibile utilizzare metallo liquido. Il raffreddamento più debole lo rende evidente, in quanto lo SCAR 17 con il normale Ryzen 9 7945HX ha un po' di vantaggio quando si tratta di prestazioni massime della CPU.

Please share our article, every link counts!
> Recensioni e prove di notebook, tablets e smartphones > Recensioni e prove > Recensioni e prove > Analisi dell'AMD Ryzen 9 7945HX3D Zen4 - Il processore gaming mobile più veloce grazie alla V-Cache 3D
Redaktion, 2023-08-23 (Update: 2023-09- 1)