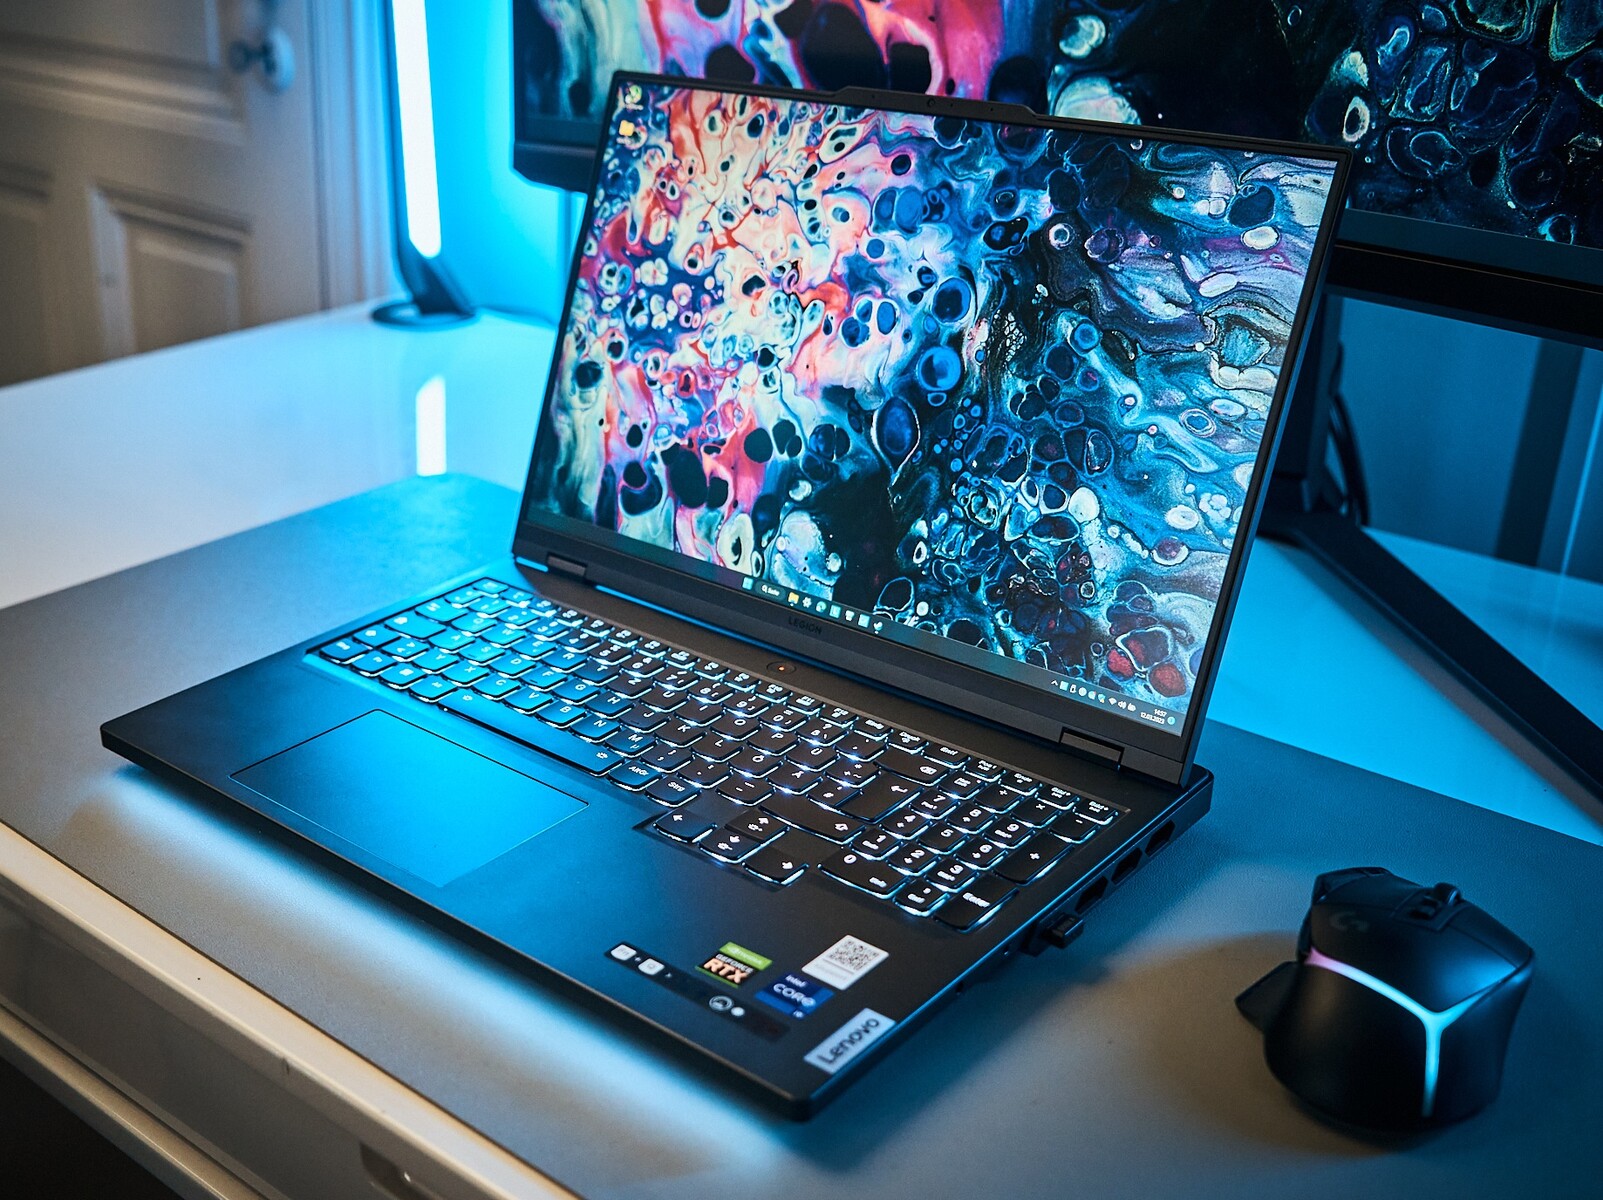
Recensione del portatile Lenovo Legion Pro 7 16: Piena potenza di gioco grazie alla RTX 4090

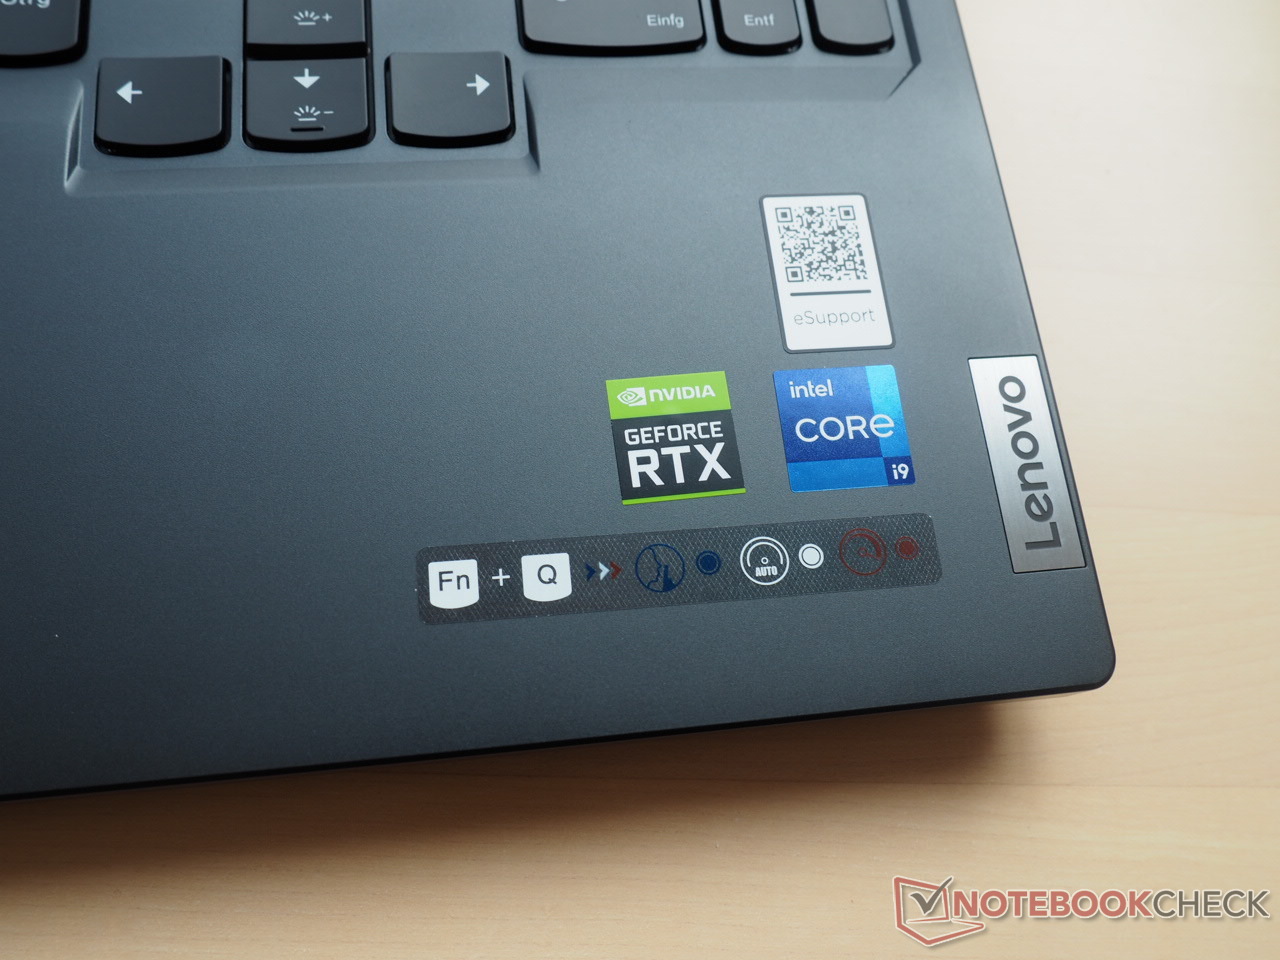
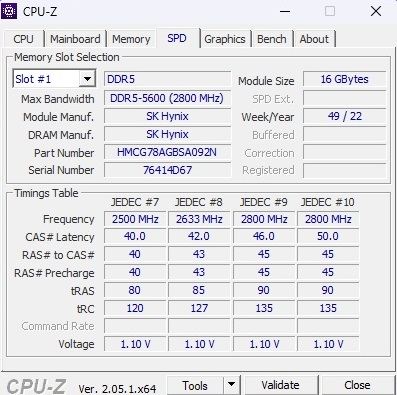
Questo Legion Pro 7 16IRX8H non è solo uno dei notebook da gioco più potenti ma anche uno dei più costosi. Attualmente si devono pagare almeno 4.500 euro per la combinazione di Core i9-13900HX, GeForce RTX 409032 GB di RAM (2x 16 GB DDR5-5600), 2 TB di memoria di massa (2x 1 TB NVMe SSD) e display da 240 Hz (2660 x 1600 pixel). Ogni giocatore deve decidere se vuole o meno sostenere l'attuale politica dei prezzi del produttore, che sembra non essere correlata ad alcuna inflazione.
I concorrenti del Legion Pro 7 includono altri gamer di fascia alta con RTX 4090 da 16 e 17 pollici, come il Razer Blade 16, il XMG Neo 16, l' Asus Strix Scar 17 e la MSI Titan GT77. Il modello gemello più economico con RTX 4080 appare anche nelle tabelle come dispositivo di confronto.
Potenziali concorrenti a confronto
Punteggio | Data | Modello | Peso | Altezza | Dimensione | Risoluzione | Prezzo |
|---|---|---|---|---|---|---|---|
| 88.8 % v7 (old) | 06/2023 | Lenovo Legion Pro 7 RTX4090 i9-13900HX, GeForce RTX 4090 Laptop GPU | 2.7 kg | 26 mm | 16.00" | 2560x1600 | |
| 89.8 % v7 (old) | 03/2023 | Razer Blade 16 Early 2023 RTX 4090 i9-13950HX, GeForce RTX 4090 Laptop GPU | 2.5 kg | 21.99 mm | 16.00" | 3840x2400 | |
| 88.3 % v7 (old) | 04/2023 | Asus ROG Strix Scar 17 G733PY-XS96 R9 7945HX, GeForce RTX 4090 Laptop GPU | 2.9 kg | 28.3 mm | 17.30" | 2560x1440 | |
| 87.7 % v7 (old) | 04/2023 | Schenker XMG Neo 16 E23 i9-13900HX, GeForce RTX 4090 Laptop GPU | 2.5 kg | 29.9 mm | 16.00" | 2560x1600 | |
| 89 % v7 (old) | 02/2023 | MSI Titan GT77 HX 13VI i9-13950HX, GeForce RTX 4090 Laptop GPU | 3.5 kg | 23 mm | 17.30" | 3840x2160 | |
| 89.4 % v7 (old) | 02/2023 | Lenovo Legion Pro 7 16IRX8H i9-13900HX, GeForce RTX 4080 Laptop GPU | 2.7 kg | 26 mm | 16.00" | 2560x1600 |
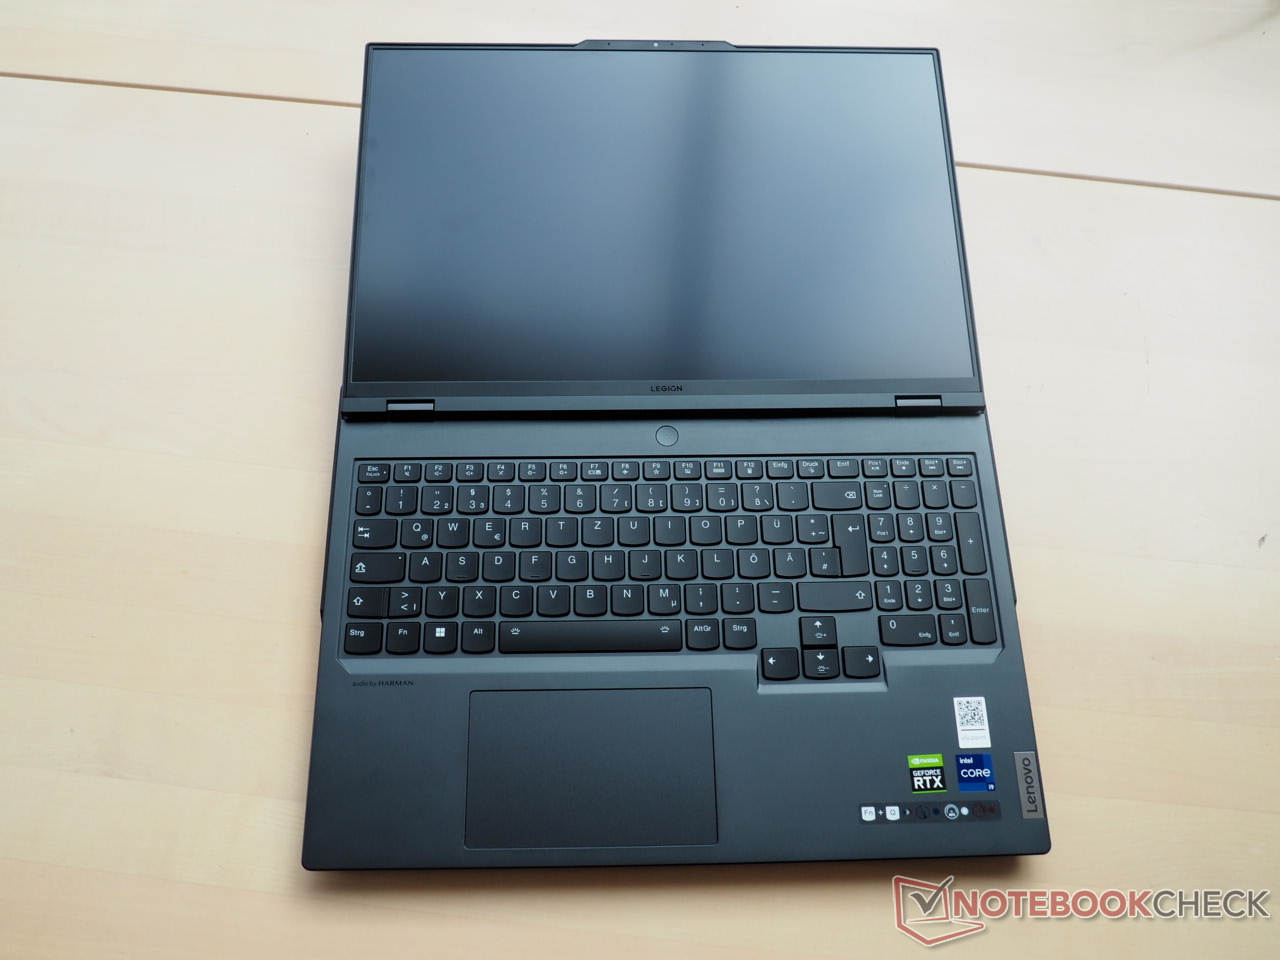
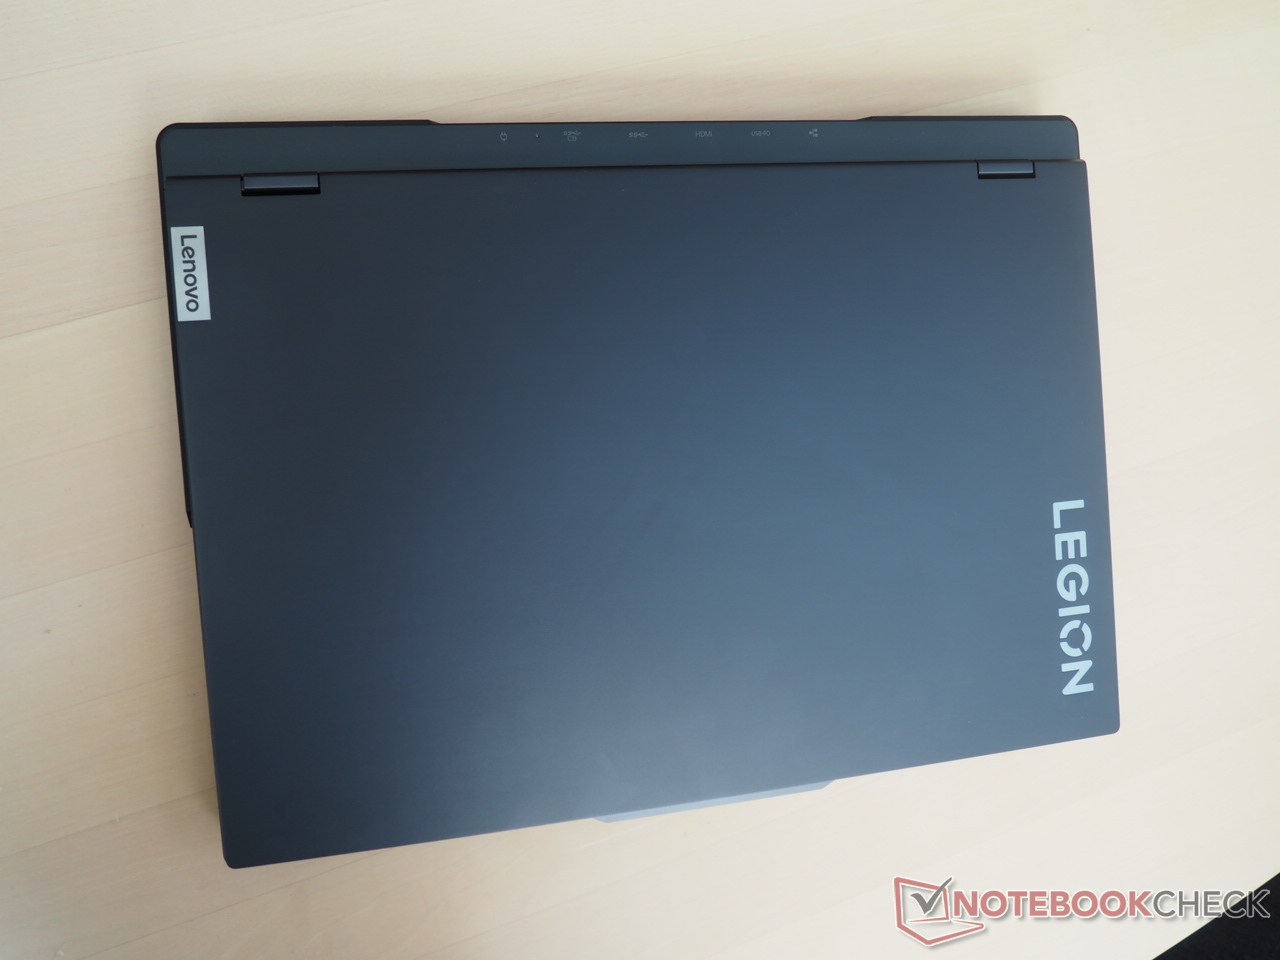
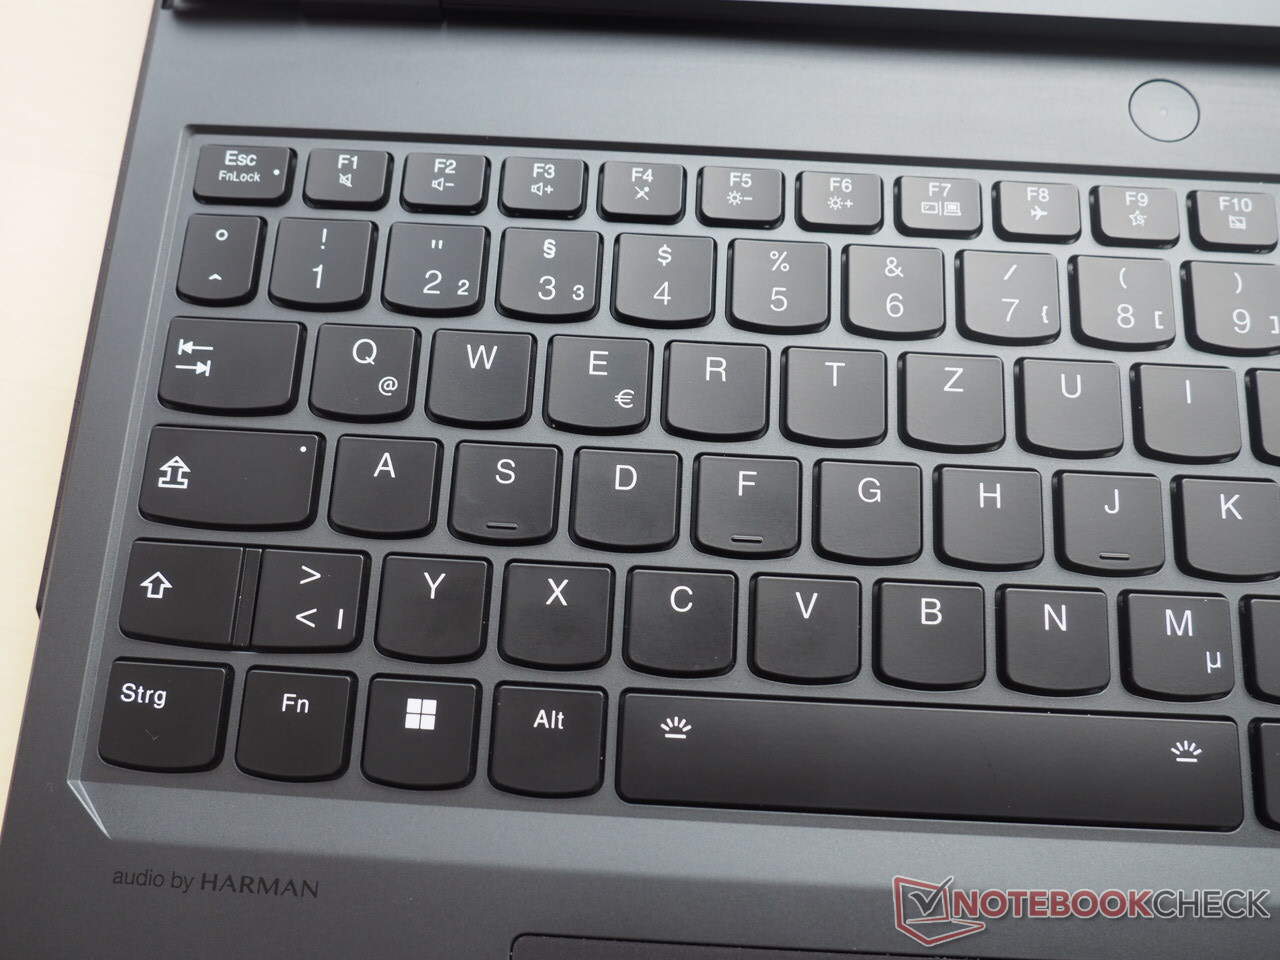
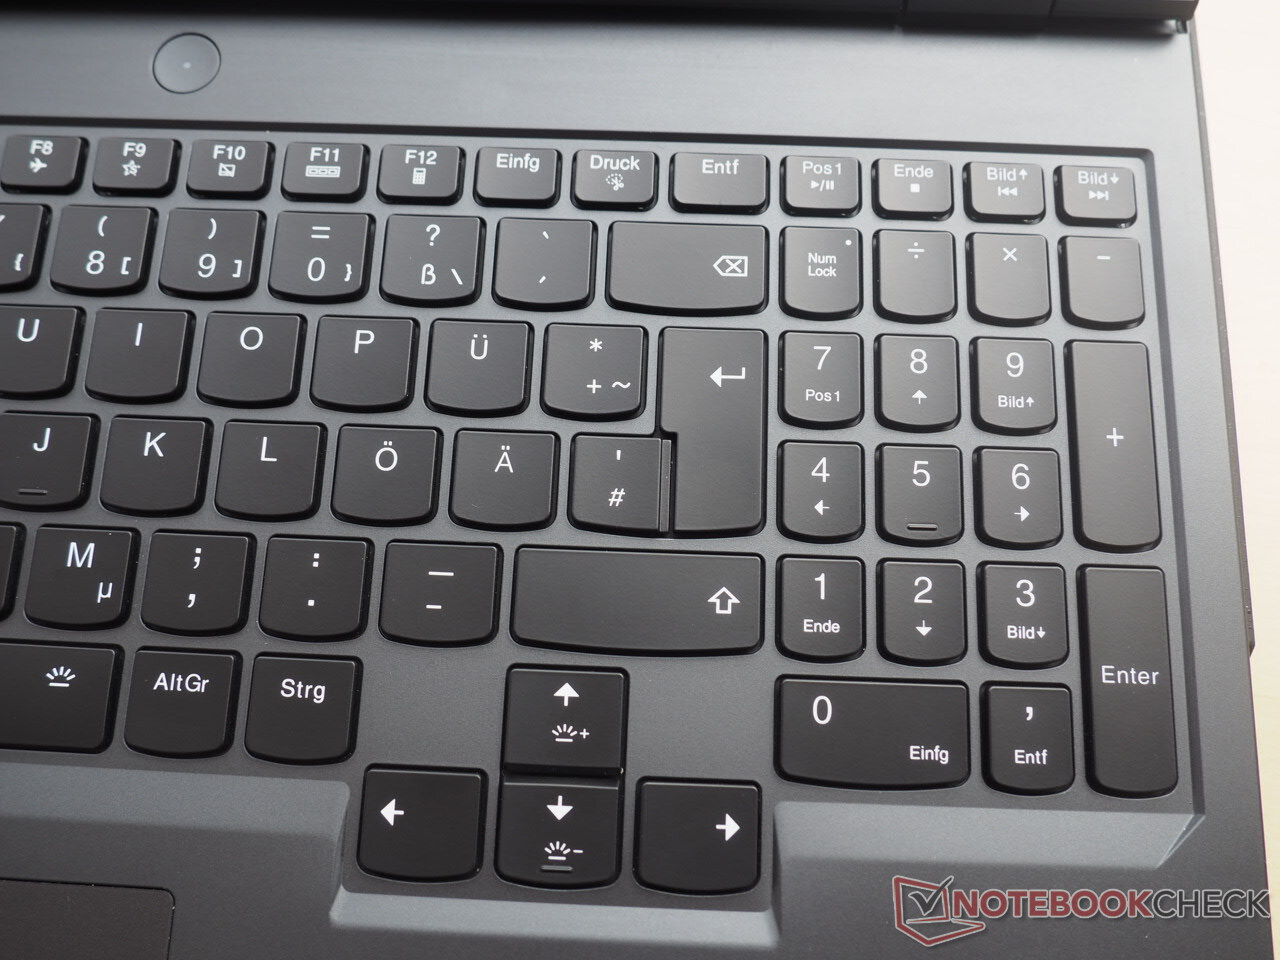
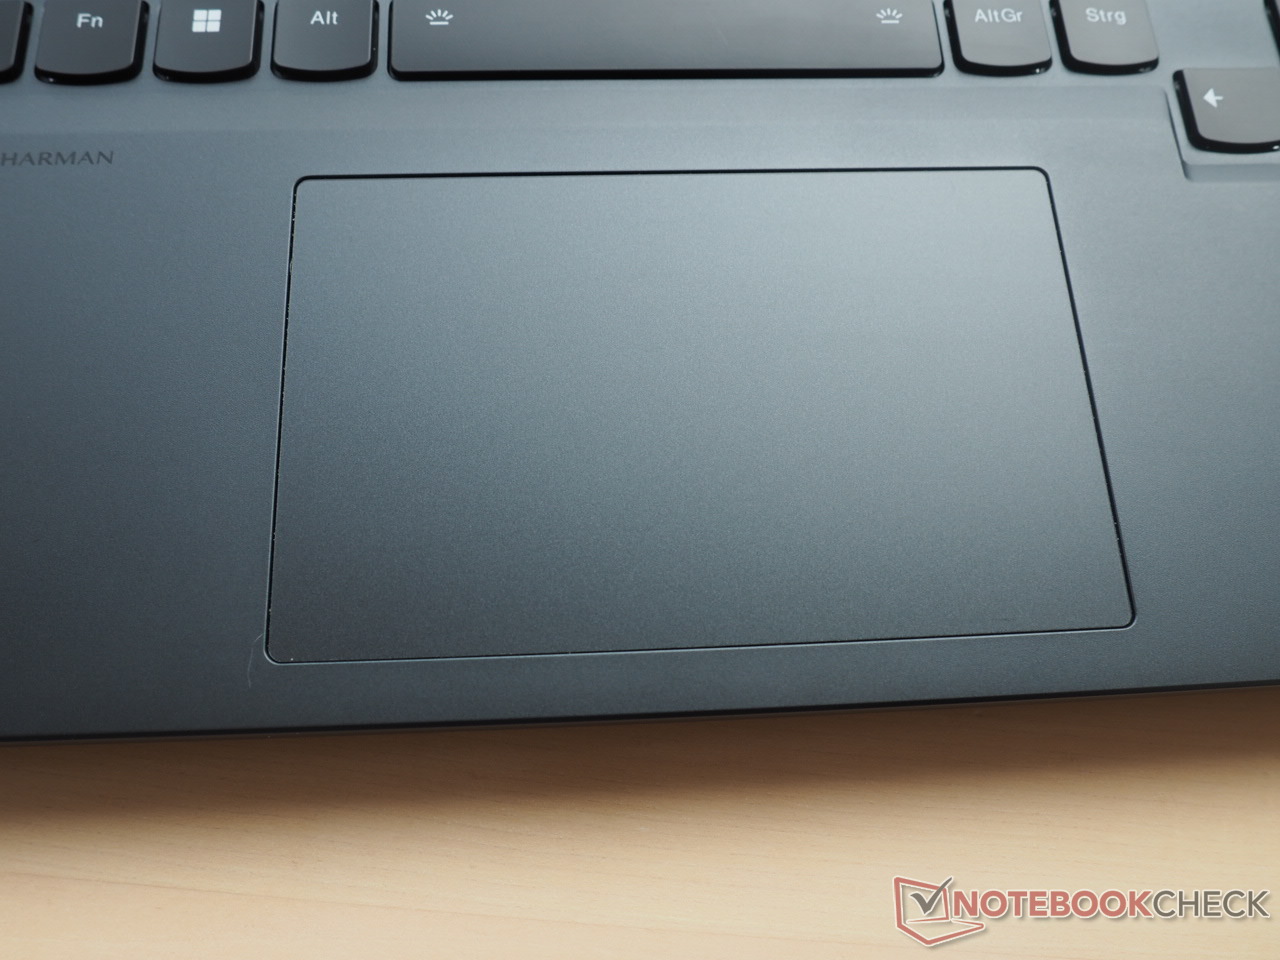
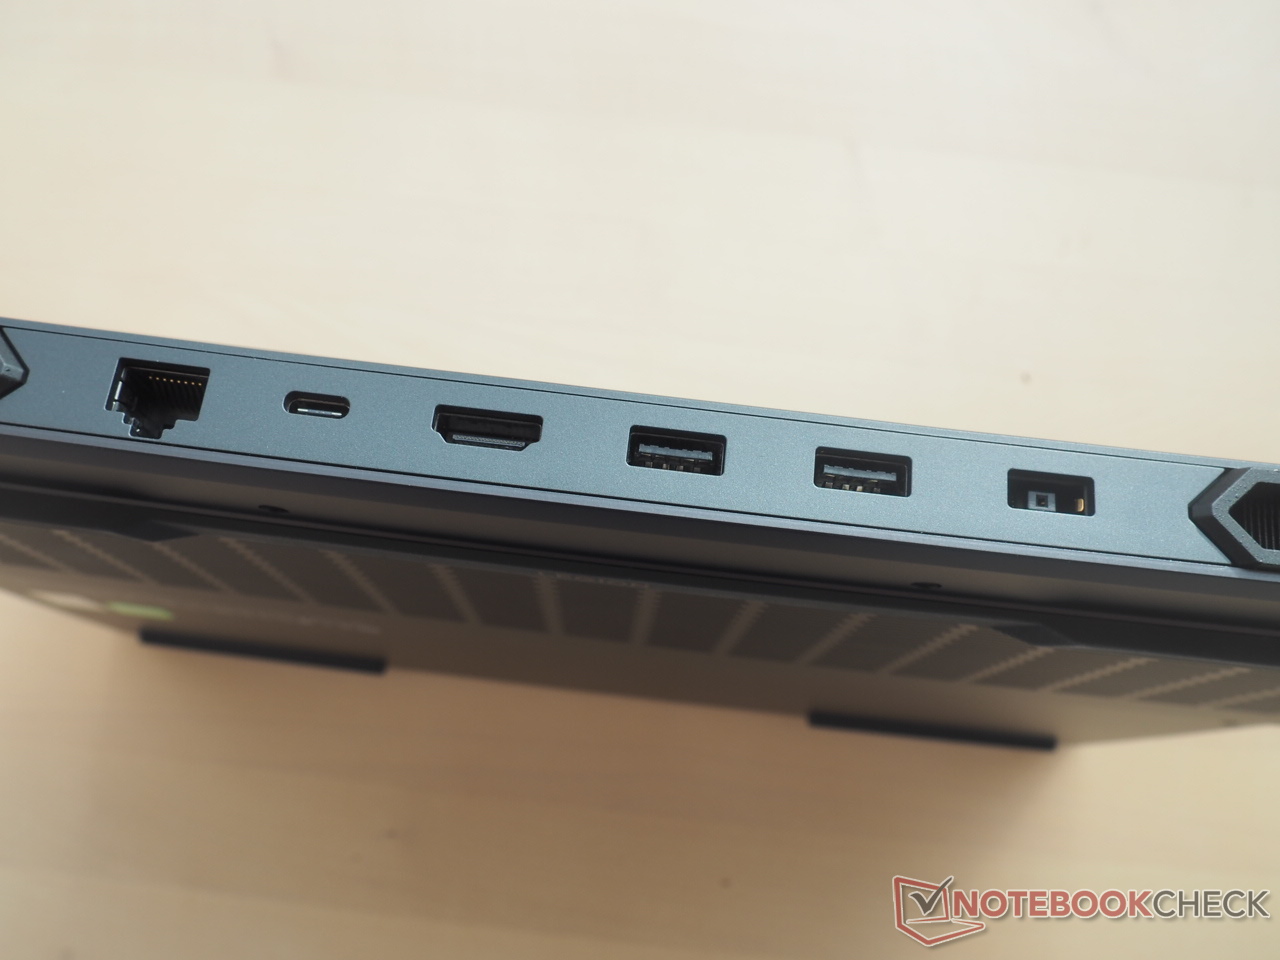
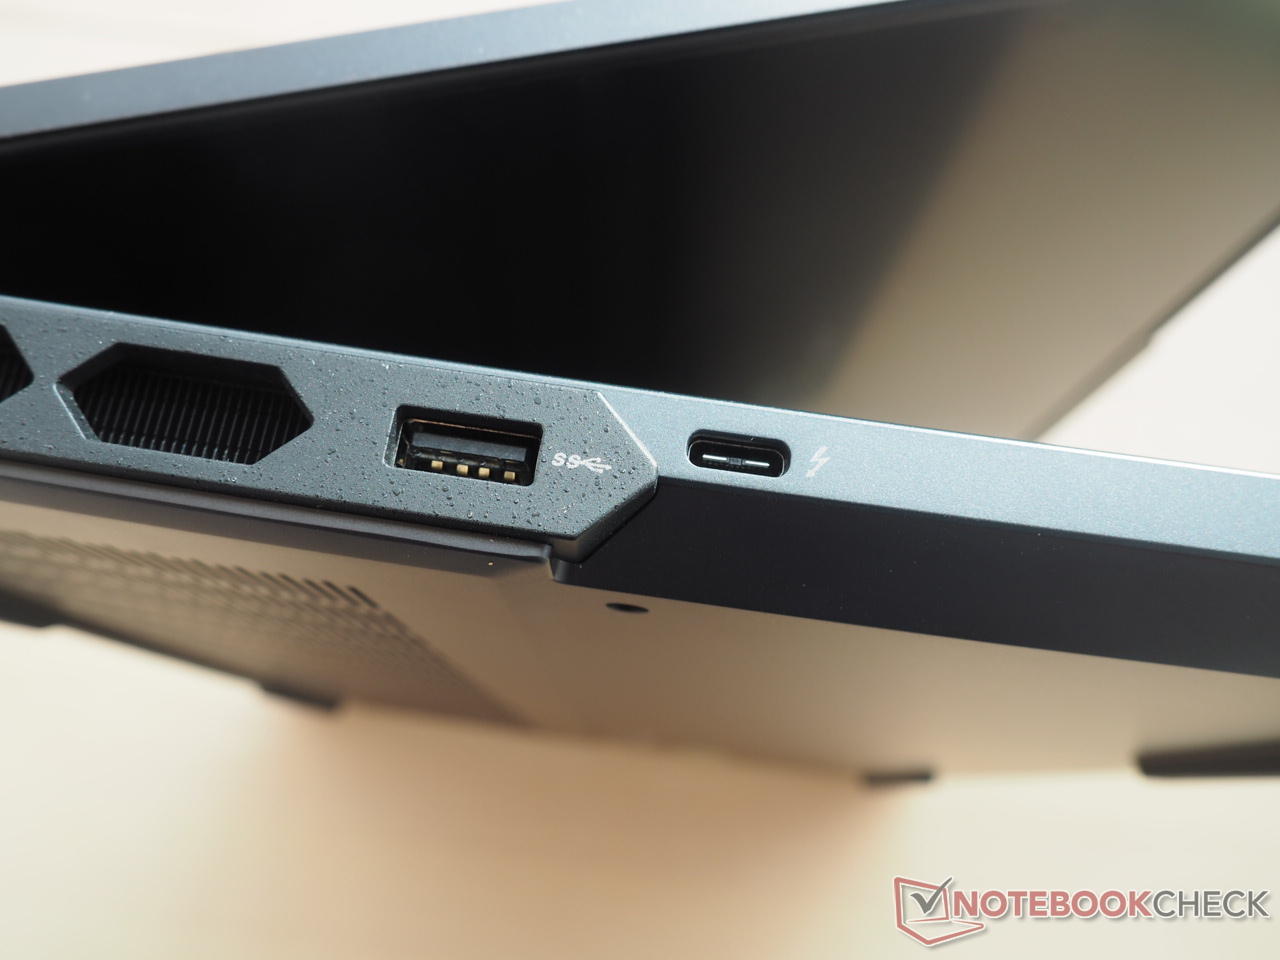
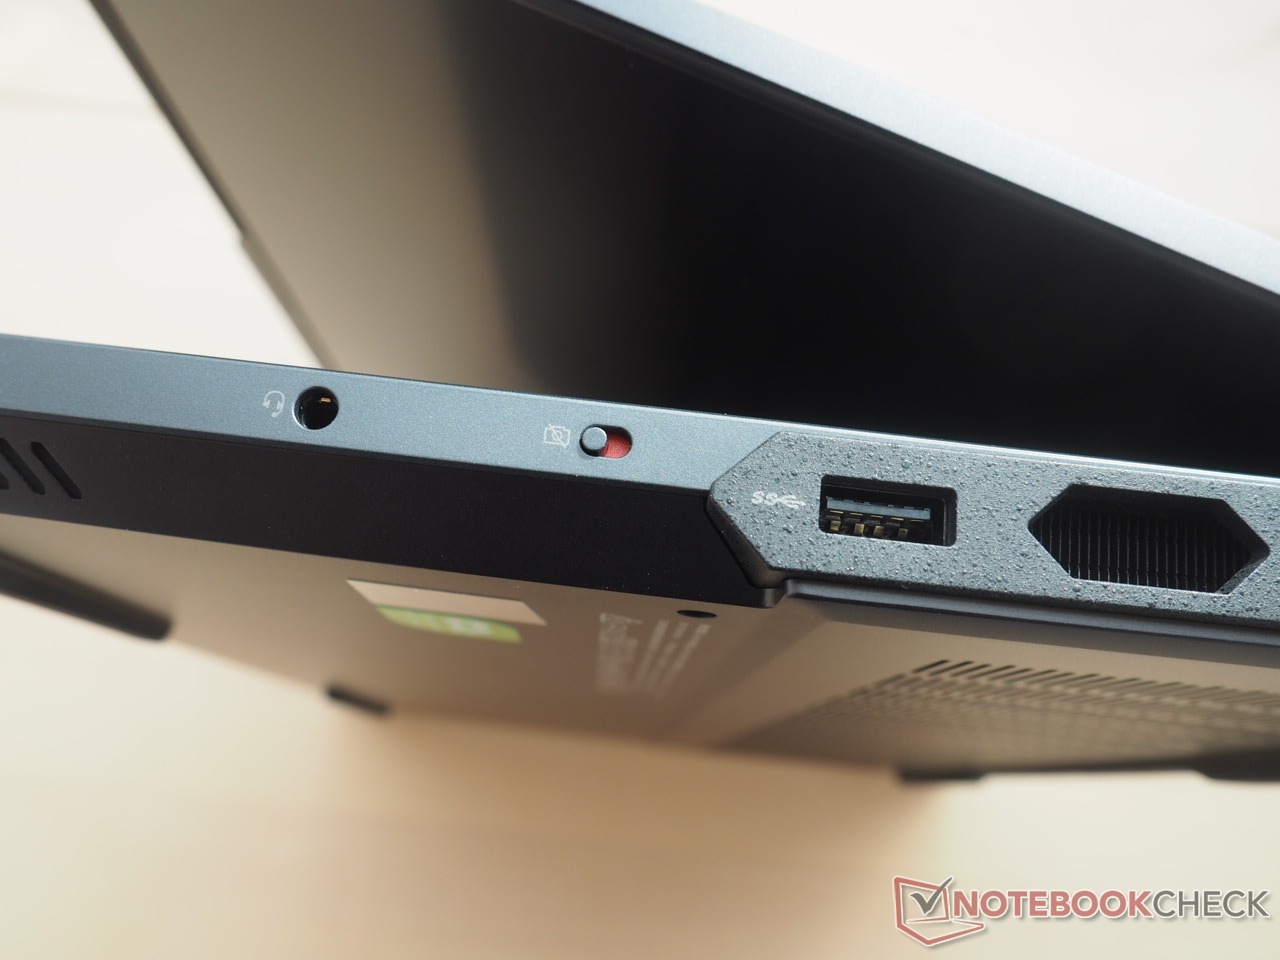
Poiché la struttura del case è identica a quella della variante già testata, in questo articolo non entreremo nuovamente nei dettagli dello chassis, delle porte e dei dispositivi di input. Potete trovare le informazioni corrispondenti nella recensione collegata.
Comunicazione
Webcam


Display
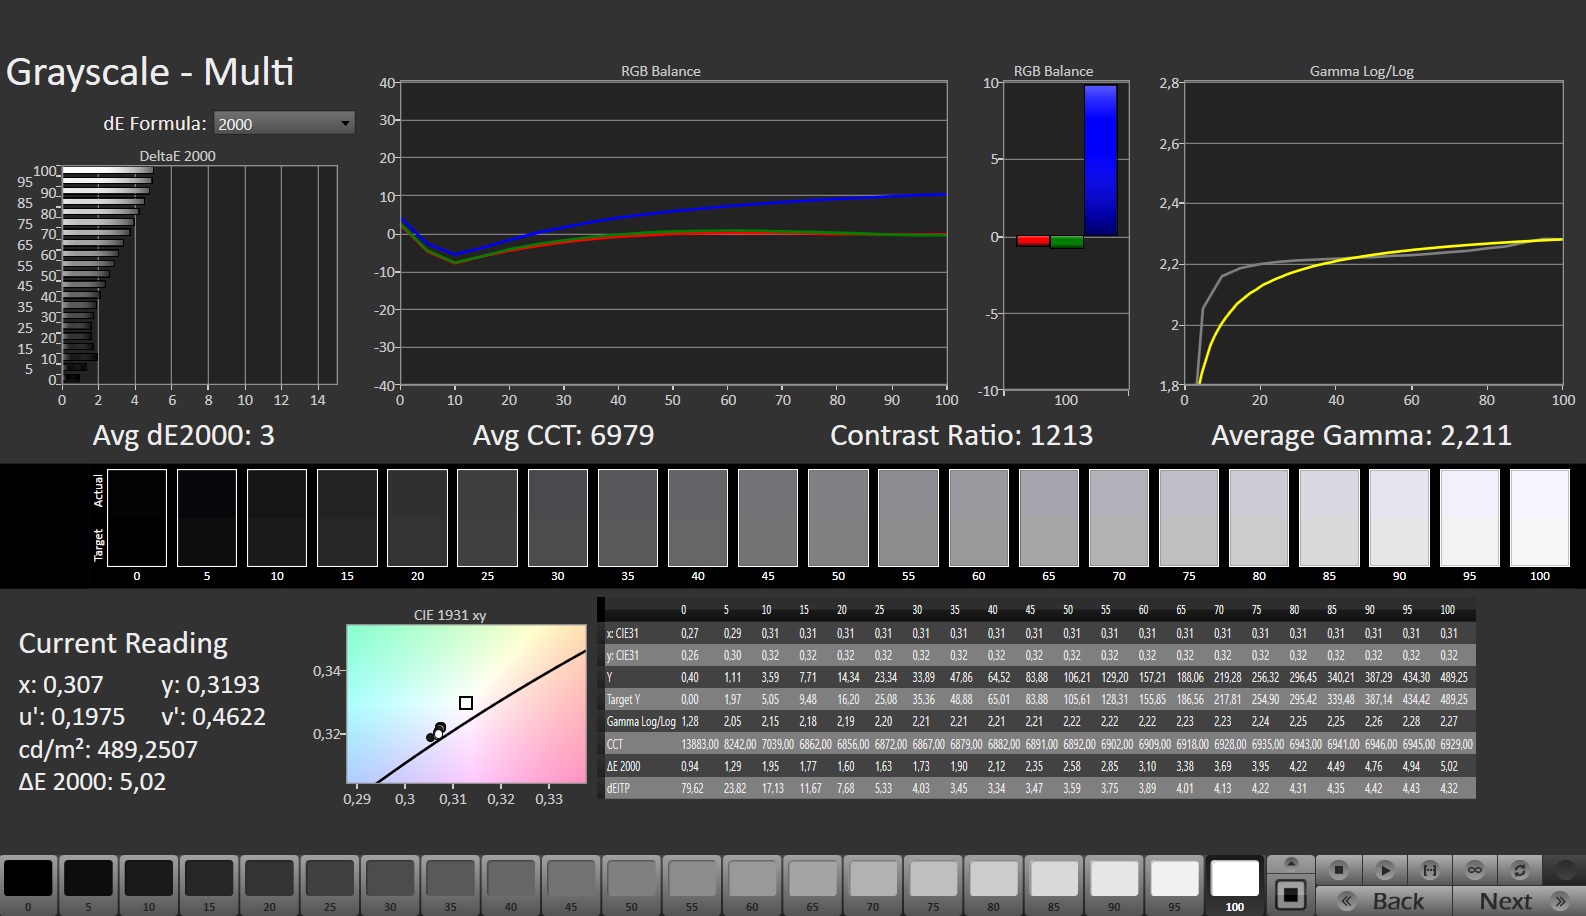
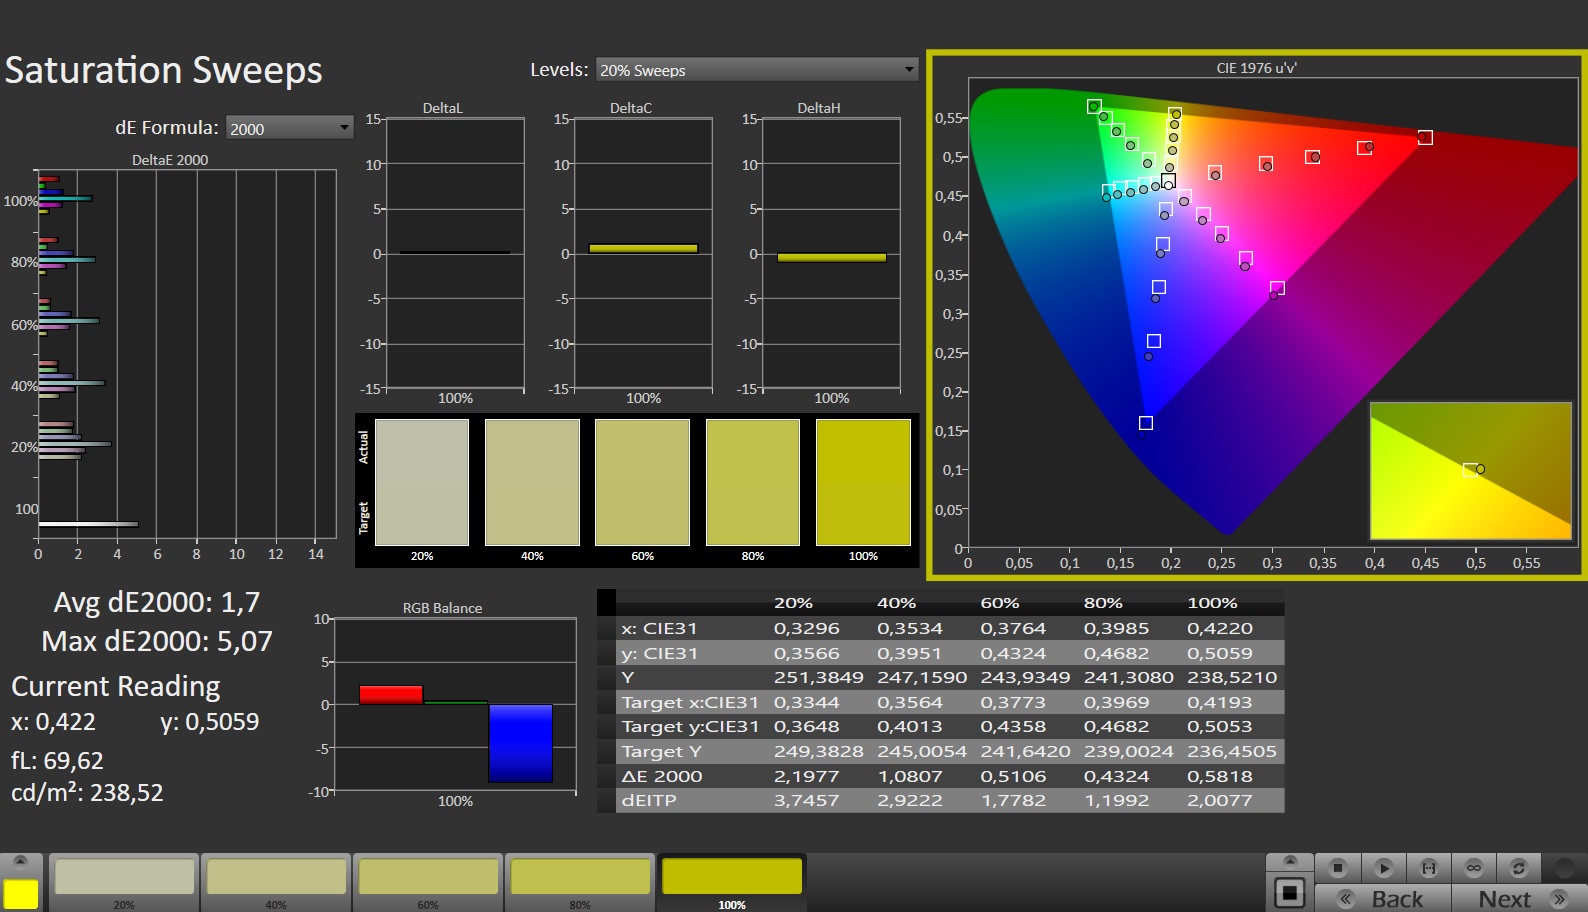
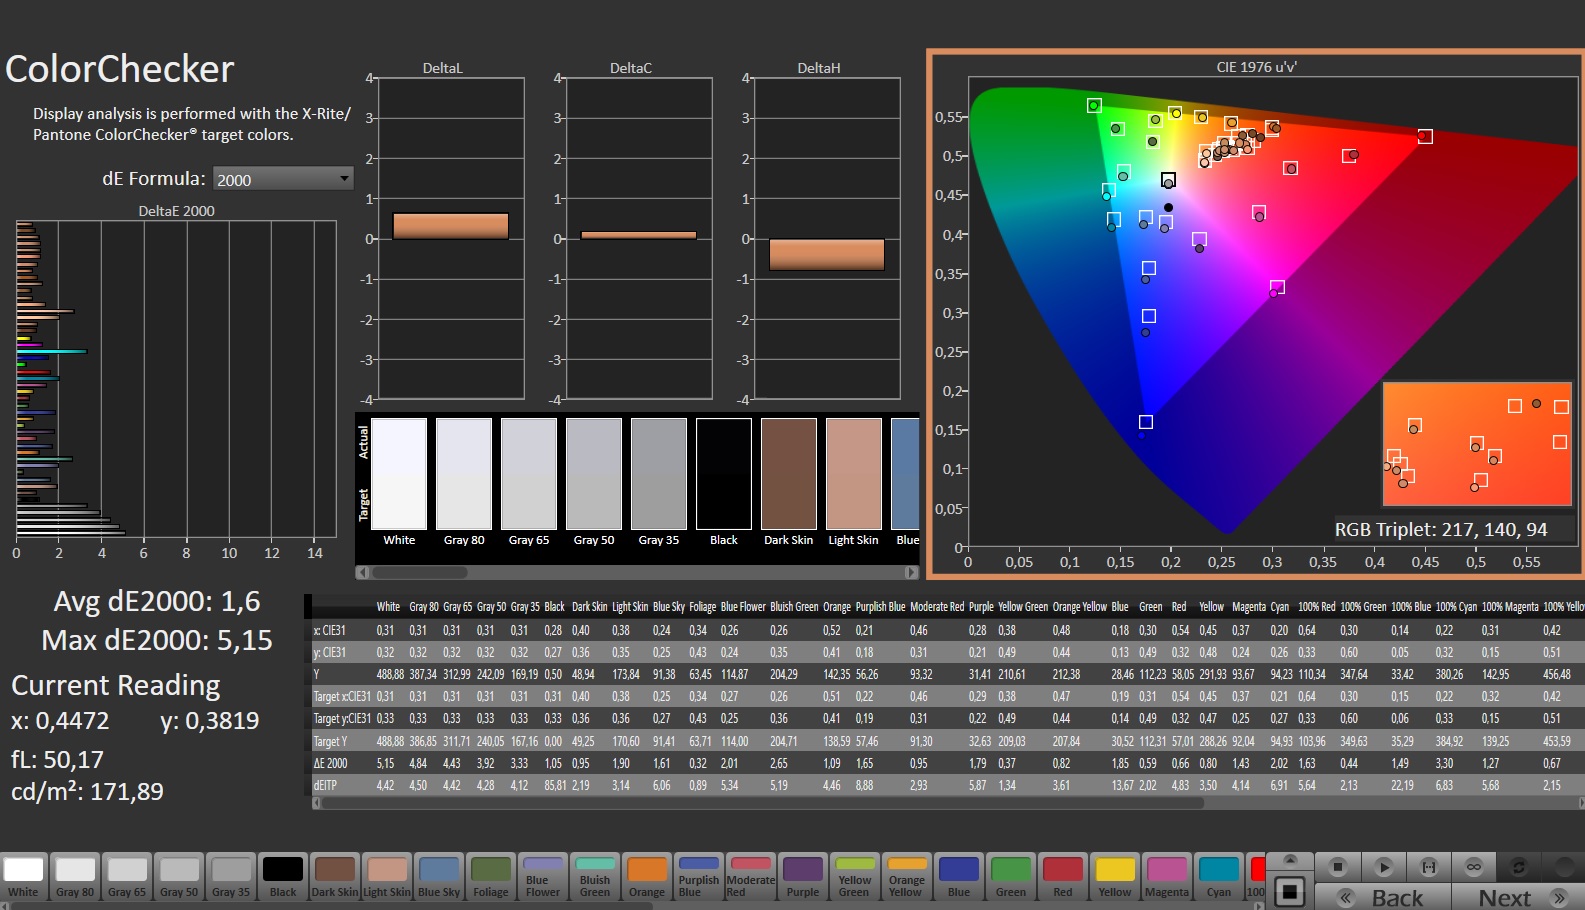
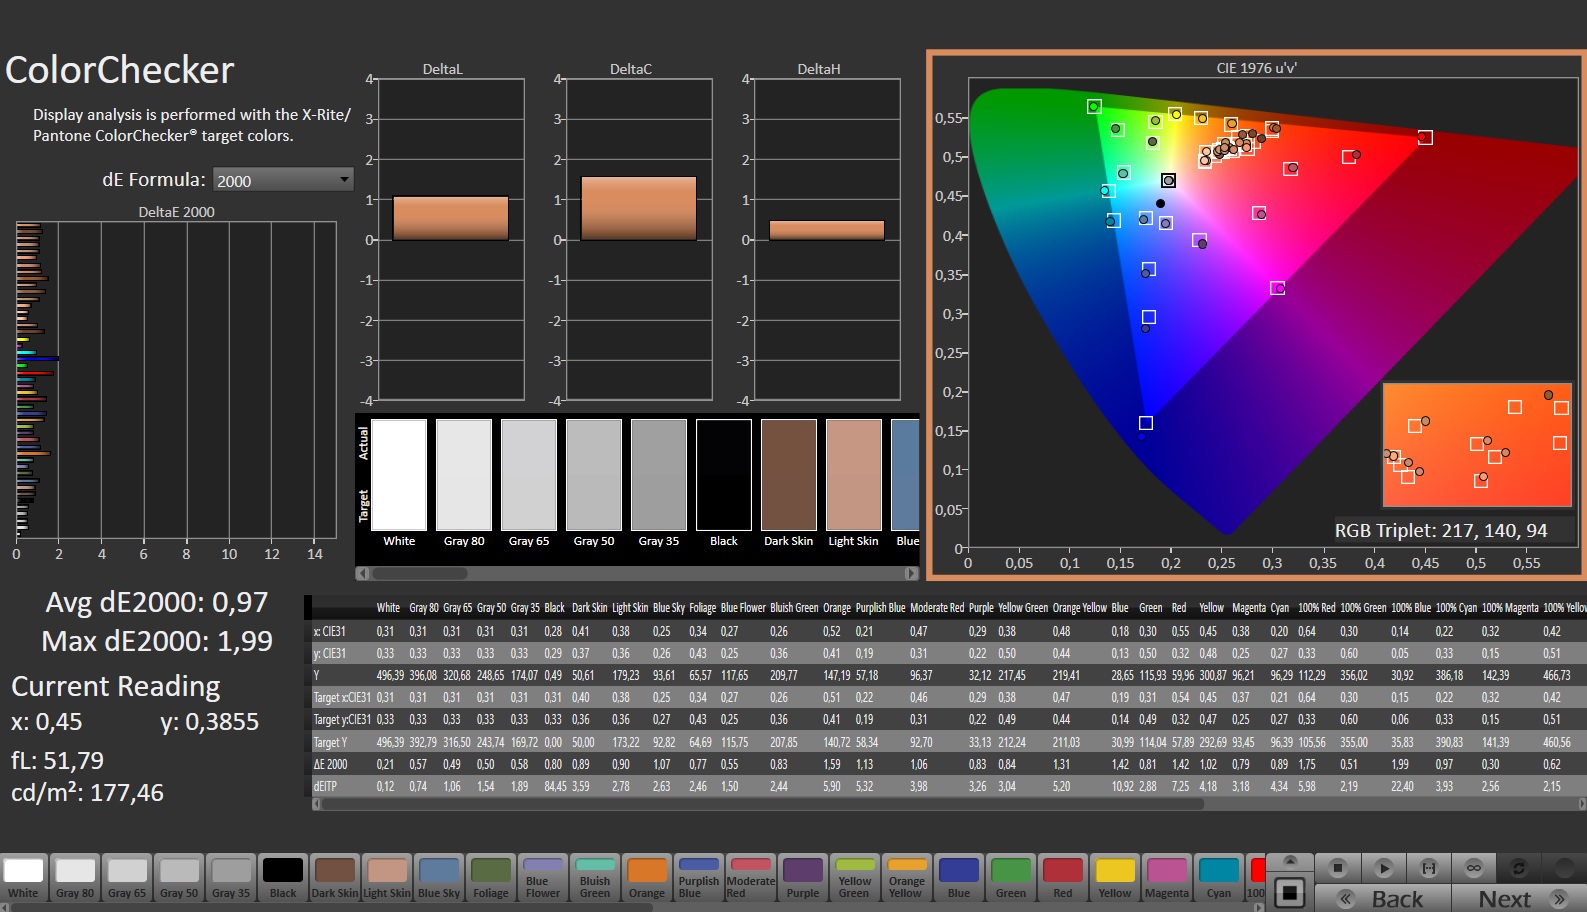
Oltre all'involucro, anche il display è identico alla versione 4080. Questa è un'ottima notizia, dato che il nostro ultimo test ha confermato che lo schermo WQXGA è impressionante sotto quasi tutti gli aspetti.
| |||||||||||||||||||||||||
Distribuzione della luminosità: 91 %
Al centro con la batteria: 491 cd/m²
Contrasto: 1228:1 (Nero: 0.4 cd/m²)
ΔE ColorChecker Calman: 1.6 | ∀{0.5-29.43 Ø4.71}
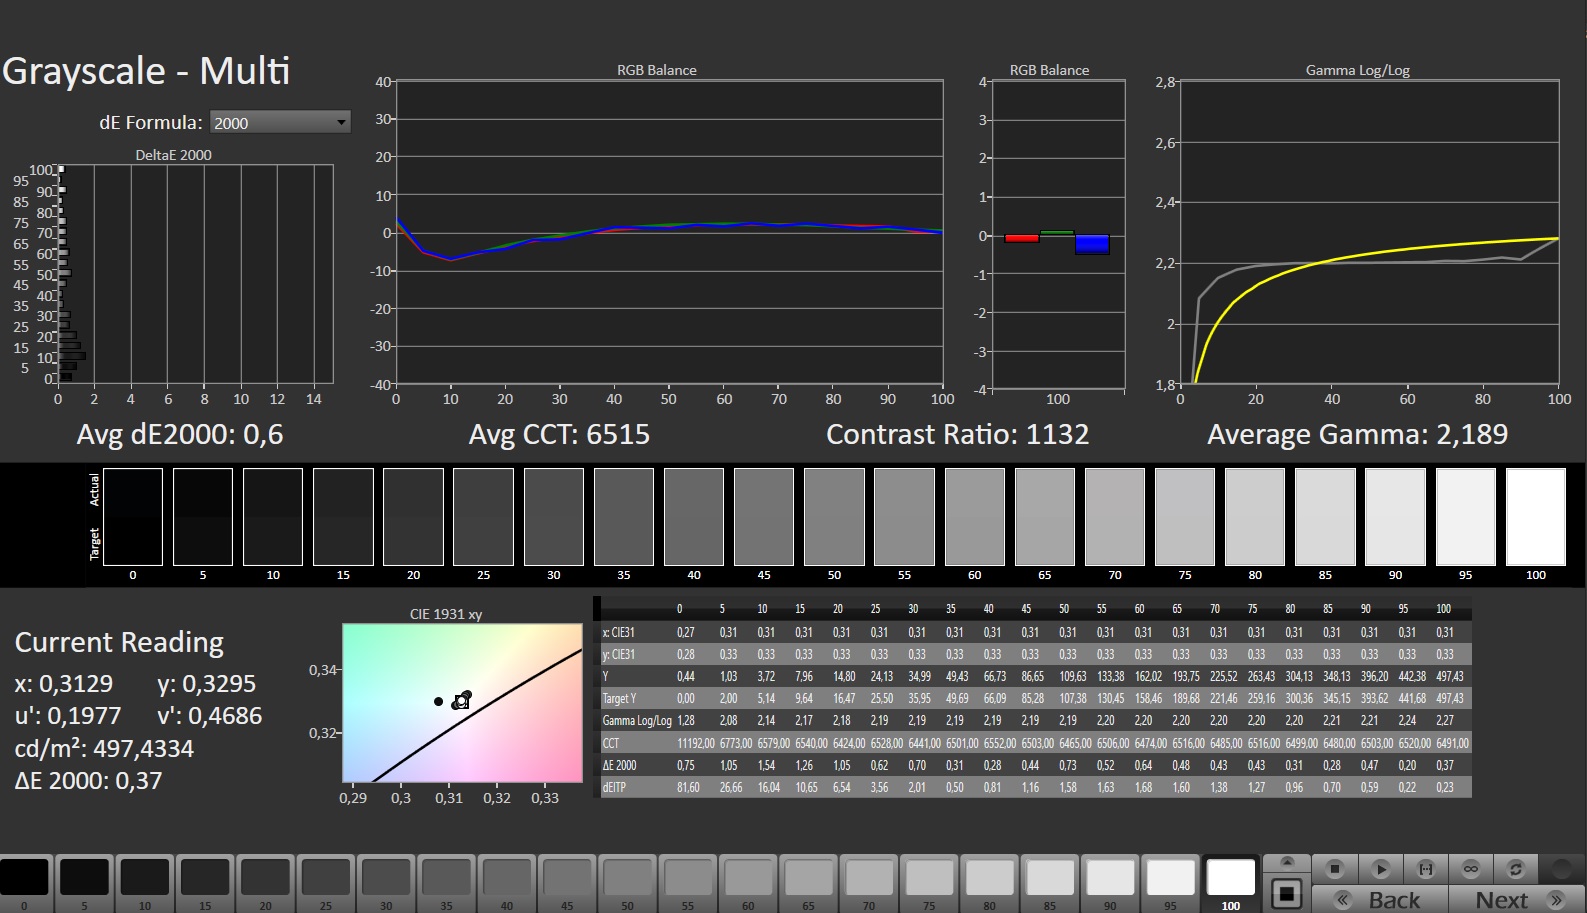
calibrated: 0.97
ΔE Greyscale Calman: 3 | ∀{0.09-98 Ø4.96}
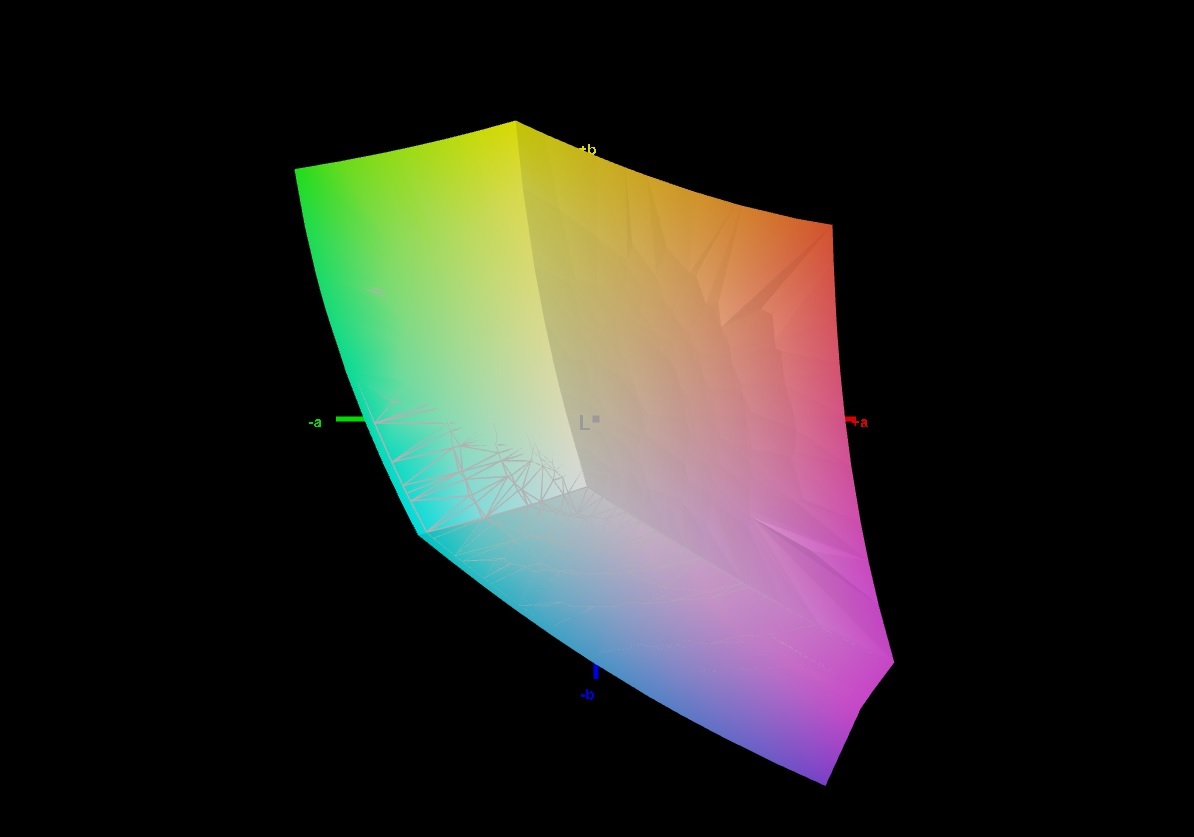
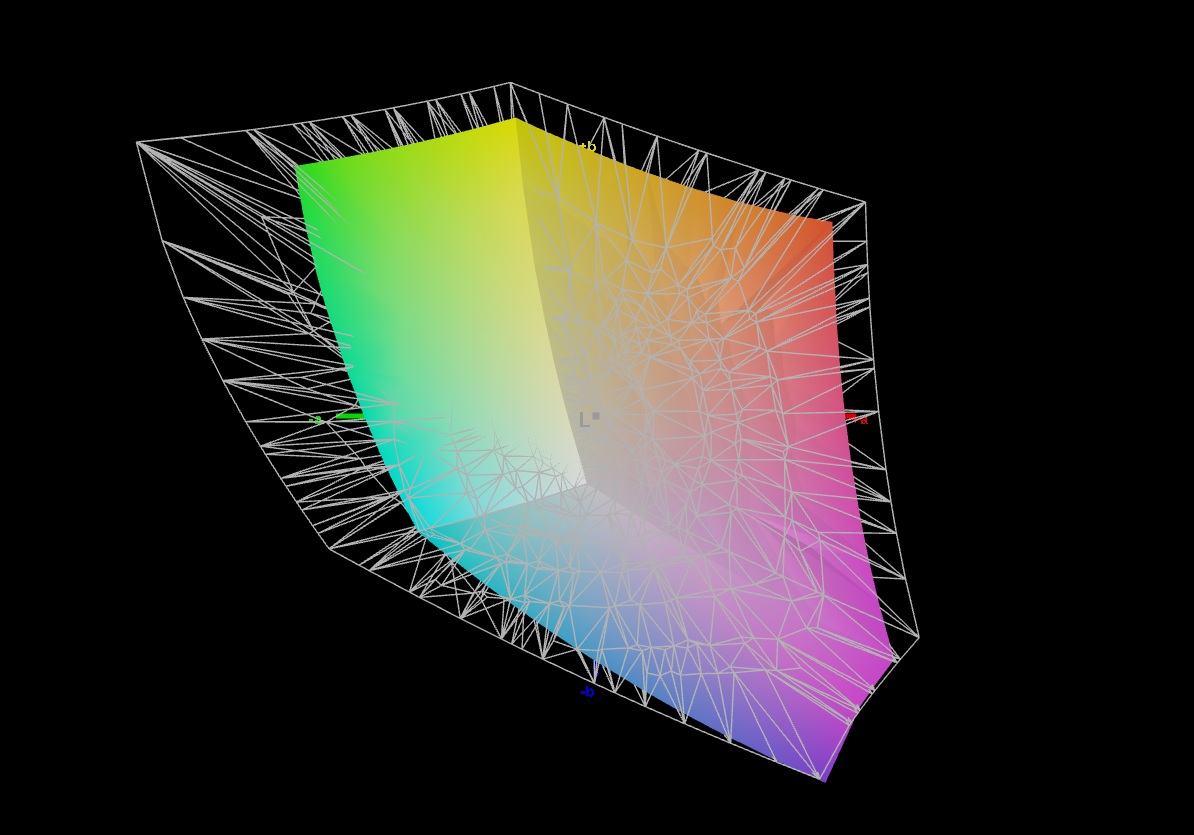
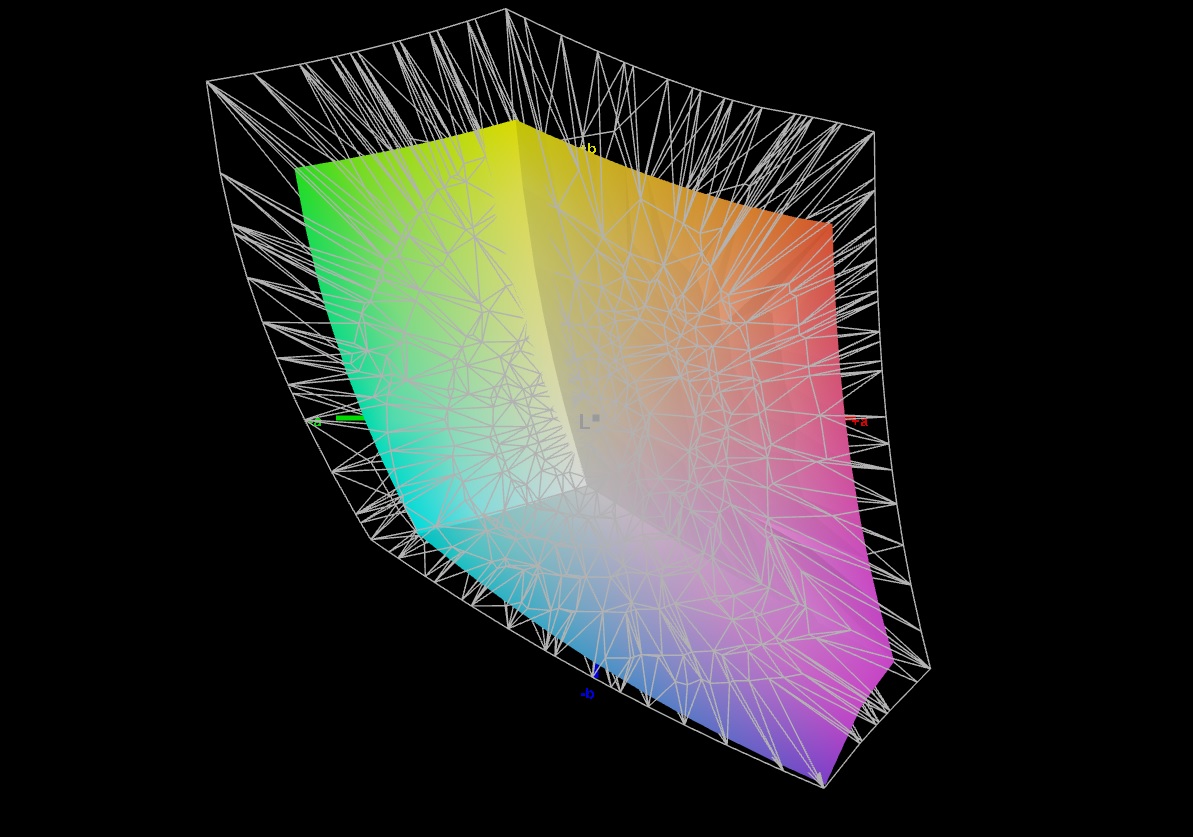
71.6% AdobeRGB 1998 (Argyll 3D)
99.8% sRGB (Argyll 3D)
69.5% Display P3 (Argyll 3D)
Gamma: 2.211
CCT: 6979 K
| Lenovo Legion Pro 7 RTX4090 MNG007DA2-3 (CSO1628), IPS, 2560x1600, 16" | Razer Blade 16 Early 2023 RTX 4090 AUO B160ZAN01.U, mini-LED, 3840x2400, 16" | Asus ROG Strix Scar 17 G733PY-XS96 NE173QHM-NZ2, IPS, 2560x1440, 17.3" | Schenker XMG Neo 16 E23 BOE0AF0 NE160QDM-NZ1, IPS, 2560x1600, 16" | MSI Titan GT77 HX 13VI B173ZAN06.C, Mini-LED, 3840x2160, 17.3" | Lenovo Legion Pro 7 16IRX8H MNG007DA2-3 (CSO1628), IPS, 2560x1600, 16" | |
|---|---|---|---|---|---|---|
| Display | 24% | 20% | -3% | 22% | -1% | |
| Display P3 Coverage (%) | 69.5 | 99.9 44% | 98 41% | 67.3 -3% | 94.9 37% | 69.1 -1% |
| sRGB Coverage (%) | 99.8 | 100 0% | 100 0% | 96.7 -3% | 99.9 0% | 99.7 0% |
| AdobeRGB 1998 Coverage (%) | 71.6 | 90.9 27% | 85.6 20% | 68.9 -4% | 92.4 29% | 71.2 -1% |
| Response Times | -622% | -53% | -60% | -365% | -21% | |
| Response Time Grey 50% / Grey 80% * (ms) | 10.9 ? | 10.2 ? 6% | 6.2 ? 43% | 14.5 ? -33% | 38.4 ? -252% | 12.3 ? -13% |
| Response Time Black / White * (ms) | 4.6 ? | 62.04 ? -1249% | 11.4 ? -148% | 8.6 ? -87% | 26.6 ? -478% | 5.9 ? -28% |
| PWM Frequency (Hz) | 2420 ? | 2380 ? | ||||
| Screen | 1412% | 11% | -5% | 54786% | 21% | |
| Brightness middle (cd/m²) | 491 | 730 49% | 322.5 -34% | 372 -24% | 606 23% | 511 4% |
| Brightness (cd/m²) | 472 | 729 54% | 317 -33% | 349 -26% | 602 28% | 469 -1% |
| Brightness Distribution (%) | 91 | 94 3% | 86 -5% | 88 -3% | 93 2% | 86 -5% |
| Black Level * (cd/m²) | 0.4 | 0.0045 99% | 0.29 28% | 0.32 20% | 0.0001 100% | 0.4 -0% |
| Contrast (:1) | 1228 | 162222 13110% | 1112 -9% | 1163 -5% | 6060000 493385% | 1278 4% |
| Colorchecker dE 2000 * | 1.6 | 5.65 -253% | 1.15 28% | 2.06 -29% | 4.8 -200% | 0.95 41% |
| Colorchecker dE 2000 max. * | 5.15 | 10.11 -96% | 3.03 41% | 3 42% | 8.2 -59% | 2.07 60% |
| Colorchecker dE 2000 calibrated * | 0.97 | 1.85 -91% | 0.56 42% | 1.5 -55% | 1.8 -86% | 0.91 6% |
| Greyscale dE 2000 * | 3 | 8.1 -170% | 1.7 43% | 1.9 37% | 6.5 -117% | 0.6 80% |
| Gamma | 2.211 100% | 1.98 111% | 2.27 97% | 2.312 95% | 2.63 84% | 2.176 101% |
| CCT | 6979 93% | 5874 111% | 6299 103% | 6747 96% | 6596 99% | 6545 99% |
| Media totale (Programma / Settaggio) | 271% /
824% | -7% /
4% | -23% /
-12% | 18148% /
35172% | -0% /
10% |
* ... Meglio usare valori piccoli
Non importa se la luminosità (~470 cd/m²), il contrasto (~1.230:1) o la precisione del colore (DeltaE medio 1,6): I valori misurati rendono più che giustizia a un pannello IPS. Anche il tempo di risposta è piacevole, non da ultimo grazie alla frequenza di aggiornamento di 240 Hz. C'è spazio per migliorare lo spazio colore. Sebbene il 100% di sRGB sia sufficiente per un notebook da gioco, circa il 72% di copertura AdobeRGB e il 70% DCI-P3 sono un po' scarsi per gli utenti professionali. Altri concorrenti offrono risultati migliori (vedi tabella).
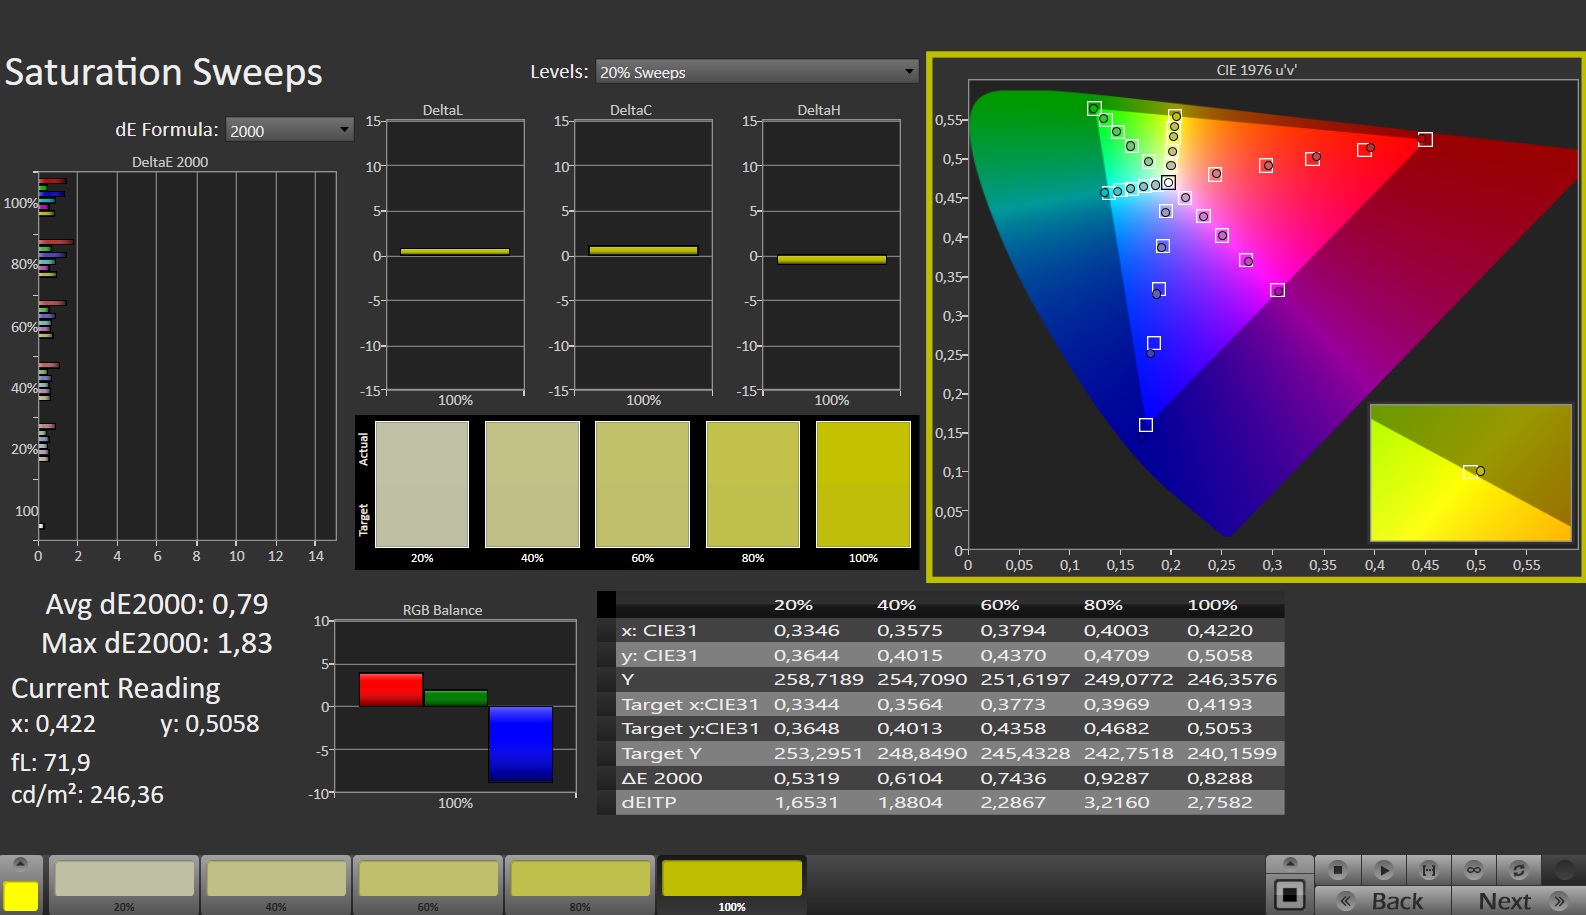
Nel complesso, il display fa un'impressione da buona a molto buona, anche se non è tecnicamente all'altezza di un pannello mini-LED come quello del Razer Blade 16 e dell'MSI Titan GT 77.
Tempi di risposta del Display
| ↔ Tempi di risposta dal Nero al Bianco | ||
|---|---|---|
| 4.6 ms ... aumenta ↗ e diminuisce ↘ combinato | ↗ 1.6 ms Incremento | 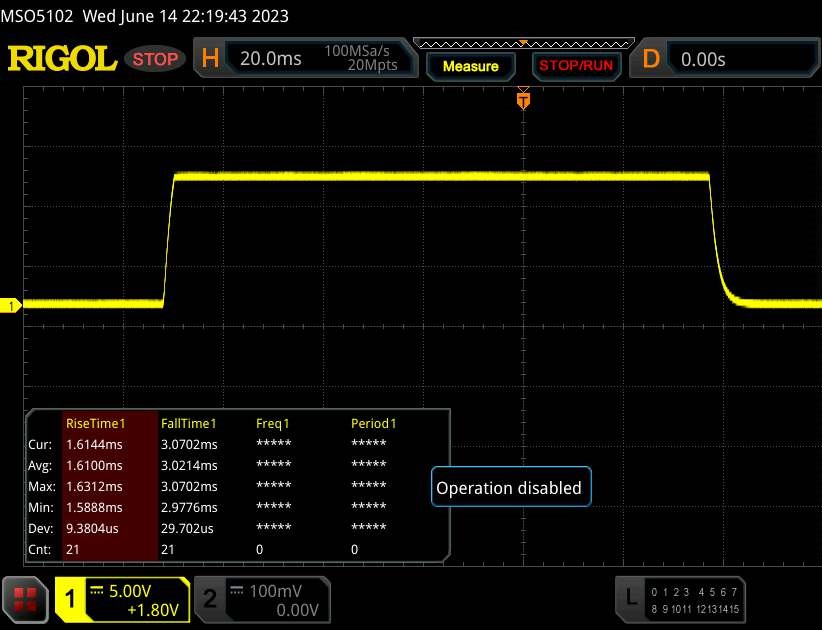 |
| ↘ 3 ms Calo | ||
| Lo schermo ha mostrato valori di risposta molto veloci nei nostri tests ed è molto adatto per i gaming veloce. In confronto, tutti i dispositivi di test variano da 0.1 (minimo) a 240 (massimo) ms. » 17 % di tutti i dispositivi è migliore. Questo significa che i tempi di risposta rilevati sono migliori rispettto alla media di tutti i dispositivi testati (19.8 ms). | ||
| ↔ Tempo di risposta dal 50% Grigio all'80% Grigio | ||
| 10.9 ms ... aumenta ↗ e diminuisce ↘ combinato | ↗ 5.1 ms Incremento | 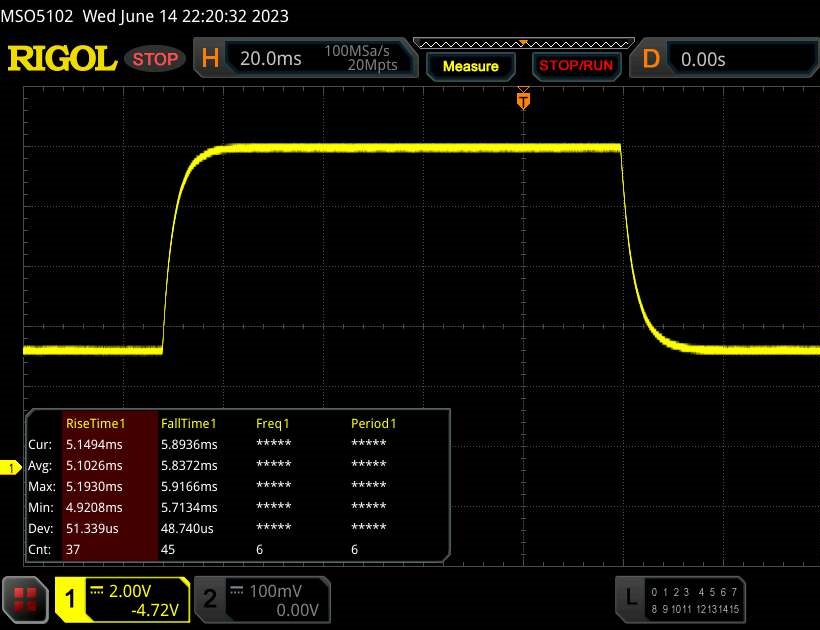 |
| ↘ 5.8 ms Calo | ||
| Lo schermo mostra buoni tempi di risposta durante i nostri tests, ma potrebbe essere troppo lento per i gamers competitivi. In confronto, tutti i dispositivi di test variano da 0.165 (minimo) a 636 (massimo) ms. » 25 % di tutti i dispositivi è migliore. Questo significa che i tempi di risposta rilevati sono migliori rispettto alla media di tutti i dispositivi testati (31 ms). | ||
Sfarfallio dello schermo / PWM (Pulse-Width Modulation)
| flickering dello schermo / PWM non rilevato | 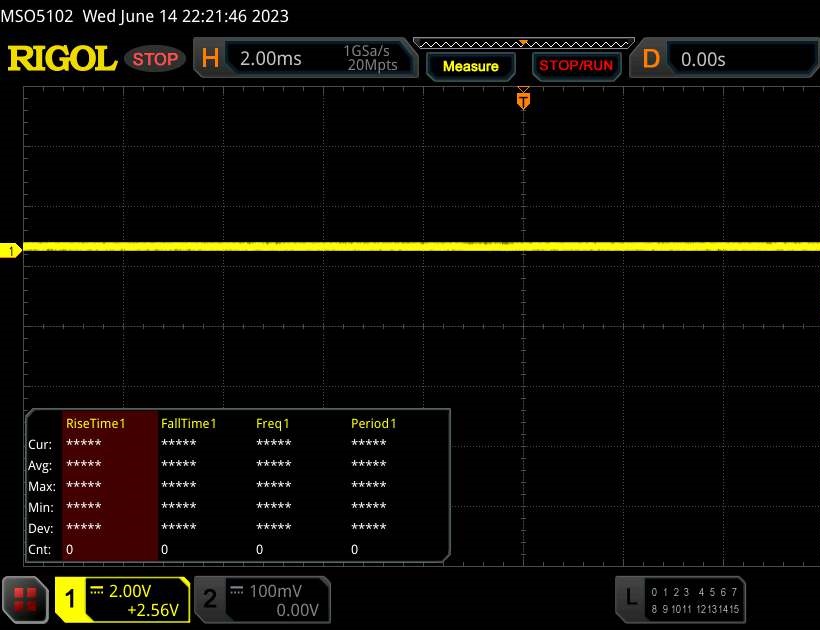 | ||
In confronto: 52 % di tutti i dispositivi testati non utilizza PWM per ridurre la luminosita' del display. Se è rilevato PWM, una media di 7757 (minimo: 5 - massimo: 343500) Hz è stata rilevata. | |||
Prestazioni
Il Legion Pro 7 16IRX8H si colloca nella fascia alta in termini di prezzo e prestazioni. Il 16 pollici offre riserve sufficienti per essere ben preparati per i nuovi giochi dei prossimi anni. Mentre la CPU e la GPU sono saldate (come di consueto nei portatili moderni), la memoria di lavoro e la memoria di massa possono essere sostituite se necessario.
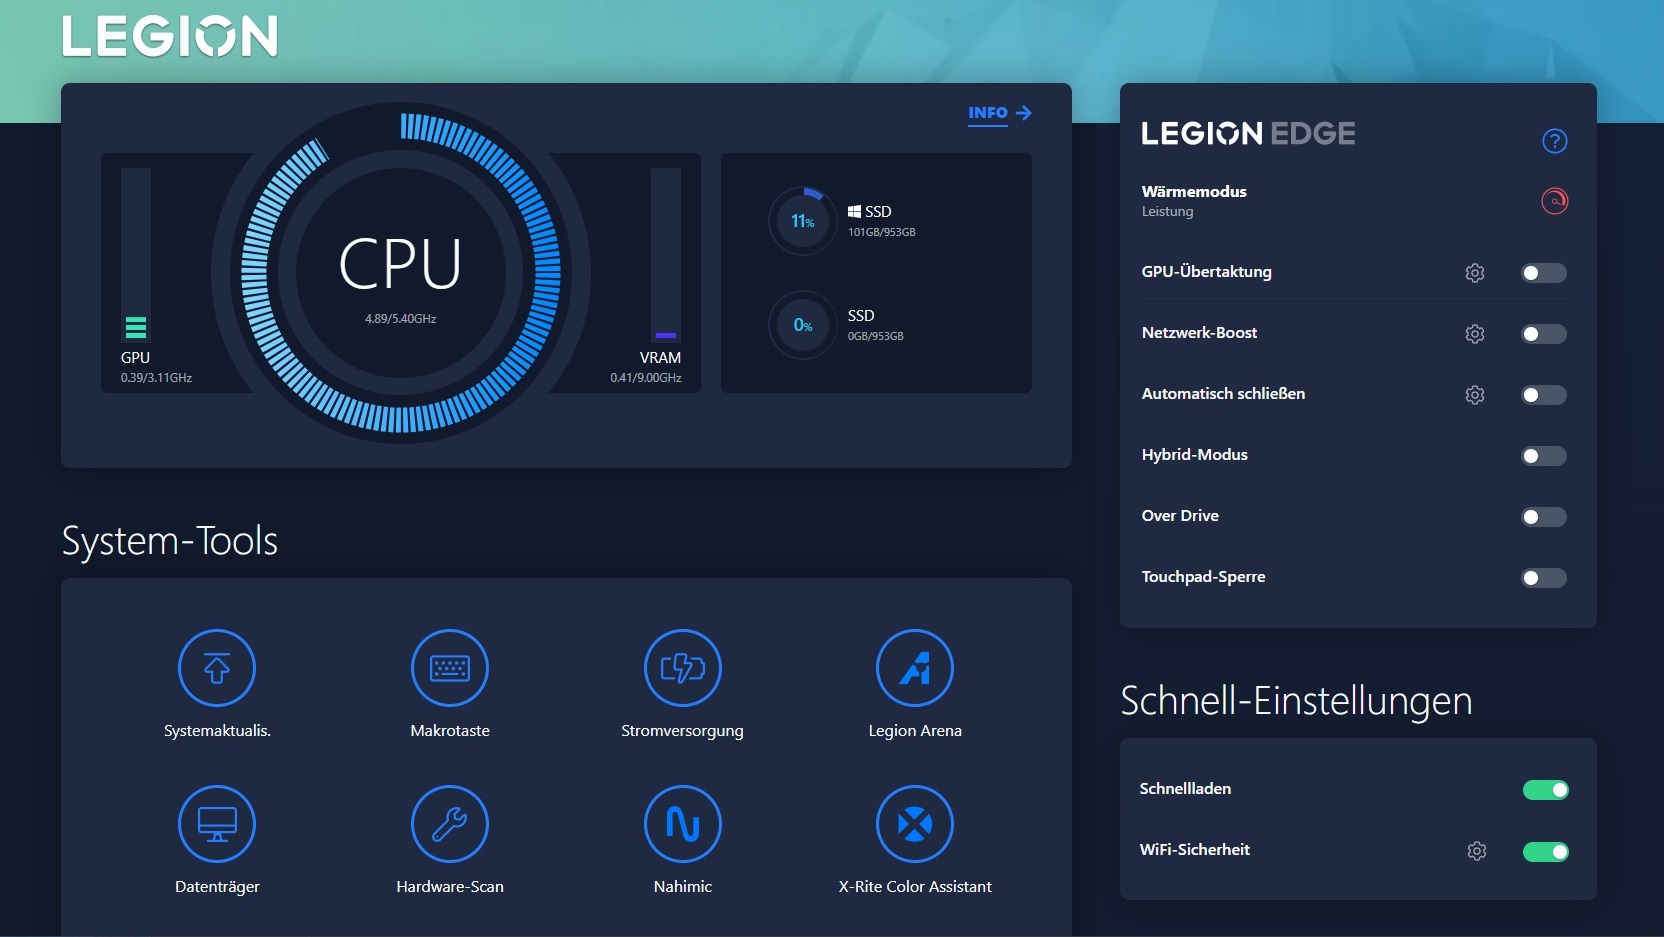
Condizioni di prova
Il software Lenovo Vantage precaricato contiene molte opzioni per la personalizzazione del sistema. La modalità Calore e la modalità ibrida opzionale sono particolarmente importanti. Ad eccezione delle misurazioni della batteria (Bilanciato con commutazione grafica), tutti i nostri test sono stati eseguiti in modalità Prestazioni con una dGPU sempre attiva.
| Modalità Silenziosa | Modalità Bilanciata | Modalità Performance | |
| CPU PL1 (HWiNFO) | 55 W | 80 W | 130 W |
| CPU PL2 (HWiNFO) | 65 W | 119 W | 185 W |
| Rumore (Witcher 3 @FHD/Ultra) | ~37 dB(A) | ~47 dB(A) | ~53 dB(A) |
| Prestazioni (Witcher 3 @FHD/Ultra) | 40 FPS (bloccato) | ~160 FPS | ~200 FPS |
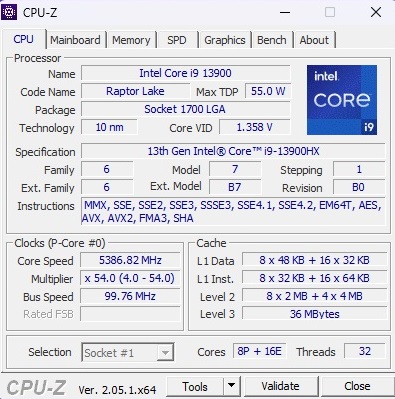
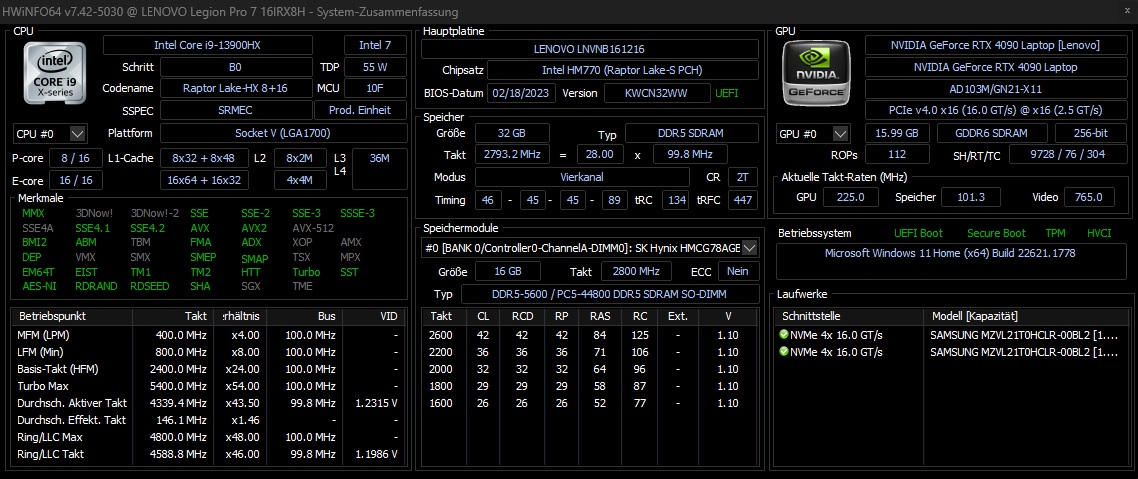
Processore
Come previsto, il Core i9-13900HX offre prestazioni molto simili al modello RTX 4080. Anche le prestazioni del chip Raptor Lake sono abbastanza costanti su periodi più lunghi (vedi ciclo Cinebench). In generale, la CPU ha prestazioni leggermente superiori alla media del 13900HX determinata finora. Intel combina 8 core di prestazioni con Hyper-Threading e 16 core di efficienza senza HT, il che significa 32 thread paralleli in totale.
Cinebench R15 Multi Loop
* ... Meglio usare valori piccoli
AIDA64: FP32 Ray-Trace | FPU Julia | CPU SHA3 | CPU Queen | FPU SinJulia | FPU Mandel | CPU AES | CPU ZLib | FP64 Ray-Trace | CPU PhotoWorxx
| Performance rating | |
| Asus ROG Strix Scar 17 G733PY-XS96 | |
| MSI Titan GT77 HX 13VI | |
| Lenovo Legion Pro 7 RTX4090 | |
| Lenovo Legion Pro 7 16IRX8H | |
| Schenker XMG Neo 16 E23 | |
| Media della classe Gaming | |
| Media Intel Core i9-13900HX | |
| Razer Blade 16 Early 2023 RTX 4090 | |
| AIDA64 / FP32 Ray-Trace | |
| Asus ROG Strix Scar 17 G733PY-XS96 | |
| Media della classe Gaming (10227 - 85542, n=105, ultimi 2 anni) | |
| MSI Titan GT77 HX 13VI | |
| Lenovo Legion Pro 7 RTX4090 | |
| Lenovo Legion Pro 7 16IRX8H | |
| Media Intel Core i9-13900HX (17589 - 27615, n=22) | |
| Schenker XMG Neo 16 E23 | |
| Razer Blade 16 Early 2023 RTX 4090 | |
| AIDA64 / FPU Julia | |
| Asus ROG Strix Scar 17 G733PY-XS96 | |
| MSI Titan GT77 HX 13VI | |
| Media della classe Gaming (51376 - 238426, n=105, ultimi 2 anni) | |
| Lenovo Legion Pro 7 RTX4090 | |
| Lenovo Legion Pro 7 16IRX8H | |
| Media Intel Core i9-13900HX (88686 - 137015, n=22) | |
| Schenker XMG Neo 16 E23 | |
| Razer Blade 16 Early 2023 RTX 4090 | |
| AIDA64 / CPU SHA3 | |
| Asus ROG Strix Scar 17 G733PY-XS96 | |
| MSI Titan GT77 HX 13VI | |
| Lenovo Legion Pro 7 16IRX8H | |
| Lenovo Legion Pro 7 RTX4090 | |
| Media della classe Gaming (2180 - 10115, n=105, ultimi 2 anni) | |
| Schenker XMG Neo 16 E23 | |
| Media Intel Core i9-13900HX (4362 - 7029, n=22) | |
| Razer Blade 16 Early 2023 RTX 4090 | |
| AIDA64 / CPU Queen | |
| Asus ROG Strix Scar 17 G733PY-XS96 | |
| MSI Titan GT77 HX 13VI | |
| Razer Blade 16 Early 2023 RTX 4090 | |
| Schenker XMG Neo 16 E23 | |
| Lenovo Legion Pro 7 RTX4090 | |
| Lenovo Legion Pro 7 16IRX8H | |
| Media Intel Core i9-13900HX (125644 - 141385, n=22) | |
| Media della classe Gaming (49785 - 173351, n=90, ultimi 2 anni) | |
| AIDA64 / FPU SinJulia | |
| Asus ROG Strix Scar 17 G733PY-XS96 | |
| MSI Titan GT77 HX 13VI | |
| Lenovo Legion Pro 7 16IRX8H | |
| Lenovo Legion Pro 7 RTX4090 | |
| Media Intel Core i9-13900HX (12334 - 17179, n=22) | |
| Schenker XMG Neo 16 E23 | |
| Media della classe Gaming (4424 - 33636, n=105, ultimi 2 anni) | |
| Razer Blade 16 Early 2023 RTX 4090 | |
| AIDA64 / FPU Mandel | |
| Asus ROG Strix Scar 17 G733PY-XS96 | |
| Media della classe Gaming (25115 - 128721, n=105, ultimi 2 anni) | |
| MSI Titan GT77 HX 13VI | |
| Lenovo Legion Pro 7 RTX4090 | |
| Lenovo Legion Pro 7 16IRX8H | |
| Media Intel Core i9-13900HX (43850 - 69202, n=22) | |
| Schenker XMG Neo 16 E23 | |
| Razer Blade 16 Early 2023 RTX 4090 | |
| AIDA64 / CPU AES | |
| Schenker XMG Neo 16 E23 | |
| Razer Blade 16 Early 2023 RTX 4090 | |
| Asus ROG Strix Scar 17 G733PY-XS96 | |
| Media Intel Core i9-13900HX (89413 - 237881, n=22) | |
| MSI Titan GT77 HX 13VI | |
| Lenovo Legion Pro 7 RTX4090 | |
| Lenovo Legion Pro 7 16IRX8H | |
| Media della classe Gaming (39258 - 247074, n=105, ultimi 2 anni) | |
| AIDA64 / CPU ZLib | |
| Asus ROG Strix Scar 17 G733PY-XS96 | |
| MSI Titan GT77 HX 13VI | |
| Lenovo Legion Pro 7 16IRX8H | |
| Lenovo Legion Pro 7 RTX4090 | |
| Schenker XMG Neo 16 E23 | |
| Media Intel Core i9-13900HX (1284 - 1958, n=22) | |
| Razer Blade 16 Early 2023 RTX 4090 | |
| Media della classe Gaming (574 - 2531, n=105, ultimi 2 anni) | |
| AIDA64 / FP64 Ray-Trace | |
| Asus ROG Strix Scar 17 G733PY-XS96 | |
| Media della classe Gaming (5509 - 45446, n=105, ultimi 2 anni) | |
| MSI Titan GT77 HX 13VI | |
| Lenovo Legion Pro 7 16IRX8H | |
| Lenovo Legion Pro 7 RTX4090 | |
| Media Intel Core i9-13900HX (9481 - 15279, n=22) | |
| Schenker XMG Neo 16 E23 | |
| Razer Blade 16 Early 2023 RTX 4090 | |
| AIDA64 / CPU PhotoWorxx | |
| Razer Blade 16 Early 2023 RTX 4090 | |
| Lenovo Legion Pro 7 RTX4090 | |
| Schenker XMG Neo 16 E23 | |
| Lenovo Legion Pro 7 16IRX8H | |
| Media Intel Core i9-13900HX (42994 - 51994, n=22) | |
| Media della classe Gaming (12271 - 89891, n=105, ultimi 2 anni) | |
| MSI Titan GT77 HX 13VI | |
| Asus ROG Strix Scar 17 G733PY-XS96 | |
Prestazioni del sistema
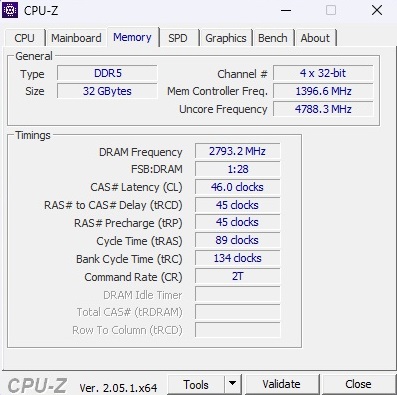
Anche la potenza del sistema è ad un livello molto alto: 8.158 punti in PCMark 10 sono superiori di qualche punto percentuale rispetto al risultato del modello RTX 4080. Anche i risultati dei benchmark della memoria di lavoro DDR5 sono impressionanti in confronto.
CrossMark: Overall | Productivity | Creativity | Responsiveness
| PCMark 10 / Score | |
| MSI Titan GT77 HX 13VI | |
| Asus ROG Strix Scar 17 G733PY-XS96 | |
| Media Intel Core i9-13900HX, NVIDIA GeForce RTX 4090 Laptop GPU (7690 - 9331, n=8) | |
| Media della classe Gaming (5828 - 12414, n=93, ultimi 2 anni) | |
| Schenker XMG Neo 16 E23 | |
| Lenovo Legion Pro 7 RTX4090 | |
| Lenovo Legion Pro 7 16IRX8H | |
| Razer Blade 16 Early 2023 RTX 4090 | |
| PCMark 10 / Essentials | |
| MSI Titan GT77 HX 13VI | |
| Lenovo Legion Pro 7 16IRX8H | |
| Media Intel Core i9-13900HX, NVIDIA GeForce RTX 4090 Laptop GPU (10972 - 11983, n=8) | |
| Asus ROG Strix Scar 17 G733PY-XS96 | |
| Lenovo Legion Pro 7 RTX4090 | |
| Schenker XMG Neo 16 E23 | |
| Razer Blade 16 Early 2023 RTX 4090 | |
| Media della classe Gaming (8810 - 11935, n=97, ultimi 2 anni) | |
| PCMark 10 / Productivity | |
| Media della classe Gaming (6845 - 25323, n=95, ultimi 2 anni) | |
| Lenovo Legion Pro 7 16IRX8H | |
| Media Intel Core i9-13900HX, NVIDIA GeForce RTX 4090 Laptop GPU (9038 - 11680, n=8) | |
| Asus ROG Strix Scar 17 G733PY-XS96 | |
| MSI Titan GT77 HX 13VI | |
| Schenker XMG Neo 16 E23 | |
| Lenovo Legion Pro 7 RTX4090 | |
| Razer Blade 16 Early 2023 RTX 4090 | |
| PCMark 10 / Digital Content Creation | |
| MSI Titan GT77 HX 13VI | |
| Asus ROG Strix Scar 17 G733PY-XS96 | |
| Schenker XMG Neo 16 E23 | |
| Lenovo Legion Pro 7 RTX4090 | |
| Media della classe Gaming (7602 - 19954, n=95, ultimi 2 anni) | |
| Media Intel Core i9-13900HX, NVIDIA GeForce RTX 4090 Laptop GPU (10605 - 16395, n=8) | |
| Razer Blade 16 Early 2023 RTX 4090 | |
| Lenovo Legion Pro 7 16IRX8H | |
| CrossMark / Overall | |
| MSI Titan GT77 HX 13VI | |
| Schenker XMG Neo 16 E23 | |
| Media Intel Core i9-13900HX, NVIDIA GeForce RTX 4090 Laptop GPU (1825 - 2295, n=8) | |
| Razer Blade 16 Early 2023 RTX 4090 | |
| Asus ROG Strix Scar 17 G733PY-XS96 | |
| Media della classe Gaming (1366 - 2409, n=94, ultimi 2 anni) | |
| CrossMark / Productivity | |
| MSI Titan GT77 HX 13VI | |
| Media Intel Core i9-13900HX, NVIDIA GeForce RTX 4090 Laptop GPU (1666 - 2166, n=8) | |
| Schenker XMG Neo 16 E23 | |
| Razer Blade 16 Early 2023 RTX 4090 | |
| Media della classe Gaming (1386 - 2254, n=94, ultimi 2 anni) | |
| Asus ROG Strix Scar 17 G733PY-XS96 | |
| CrossMark / Creativity | |
| Schenker XMG Neo 16 E23 | |
| MSI Titan GT77 HX 13VI | |
| Media Intel Core i9-13900HX, NVIDIA GeForce RTX 4090 Laptop GPU (2162 - 2514, n=8) | |
| Asus ROG Strix Scar 17 G733PY-XS96 | |
| Media della classe Gaming (1343 - 2786, n=94, ultimi 2 anni) | |
| Razer Blade 16 Early 2023 RTX 4090 | |
| CrossMark / Responsiveness | |
| MSI Titan GT77 HX 13VI | |
| Media Intel Core i9-13900HX, NVIDIA GeForce RTX 4090 Laptop GPU (1441 - 2275, n=8) | |
| Razer Blade 16 Early 2023 RTX 4090 | |
| Schenker XMG Neo 16 E23 | |
| Media della classe Gaming (1226 - 2334, n=94, ultimi 2 anni) | |
| Asus ROG Strix Scar 17 G733PY-XS96 | |
| PCMark 10 Score | 8158 punti | |
Aiuto | ||
| AIDA64 / Memory Copy | |
| Razer Blade 16 Early 2023 RTX 4090 | |
| Lenovo Legion Pro 7 RTX4090 | |
| Lenovo Legion Pro 7 16IRX8H | |
| Schenker XMG Neo 16 E23 | |
| Media Intel Core i9-13900HX (67716 - 79193, n=22) | |
| Media della classe Gaming (21750 - 129946, n=105, ultimi 2 anni) | |
| MSI Titan GT77 HX 13VI | |
| Asus ROG Strix Scar 17 G733PY-XS96 | |
| AIDA64 / Memory Read | |
| Lenovo Legion Pro 7 RTX4090 | |
| Razer Blade 16 Early 2023 RTX 4090 | |
| Lenovo Legion Pro 7 16IRX8H | |
| Schenker XMG Neo 16 E23 | |
| Media Intel Core i9-13900HX (73998 - 88462, n=22) | |
| Media della classe Gaming (22956 - 118858, n=105, ultimi 2 anni) | |
| MSI Titan GT77 HX 13VI | |
| Asus ROG Strix Scar 17 G733PY-XS96 | |
| AIDA64 / Memory Write | |
| Lenovo Legion Pro 7 RTX4090 | |
| Razer Blade 16 Early 2023 RTX 4090 | |
| Media della classe Gaming (22297 - 135096, n=105, ultimi 2 anni) | |
| Media Intel Core i9-13900HX (65472 - 77045, n=22) | |
| Schenker XMG Neo 16 E23 | |
| Lenovo Legion Pro 7 16IRX8H | |
| MSI Titan GT77 HX 13VI | |
| Asus ROG Strix Scar 17 G733PY-XS96 | |
| AIDA64 / Memory Latency | |
| Media della classe Gaming (75.3 - 259, n=105, ultimi 2 anni) | |
| MSI Titan GT77 HX 13VI | |
| Razer Blade 16 Early 2023 RTX 4090 | |
| Schenker XMG Neo 16 E23 | |
| Media Intel Core i9-13900HX (75.3 - 91.1, n=22) | |
| Lenovo Legion Pro 7 RTX4090 | |
| Lenovo Legion Pro 7 16IRX8H | |
| Asus ROG Strix Scar 17 G733PY-XS96 | |
* ... Meglio usare valori piccoli
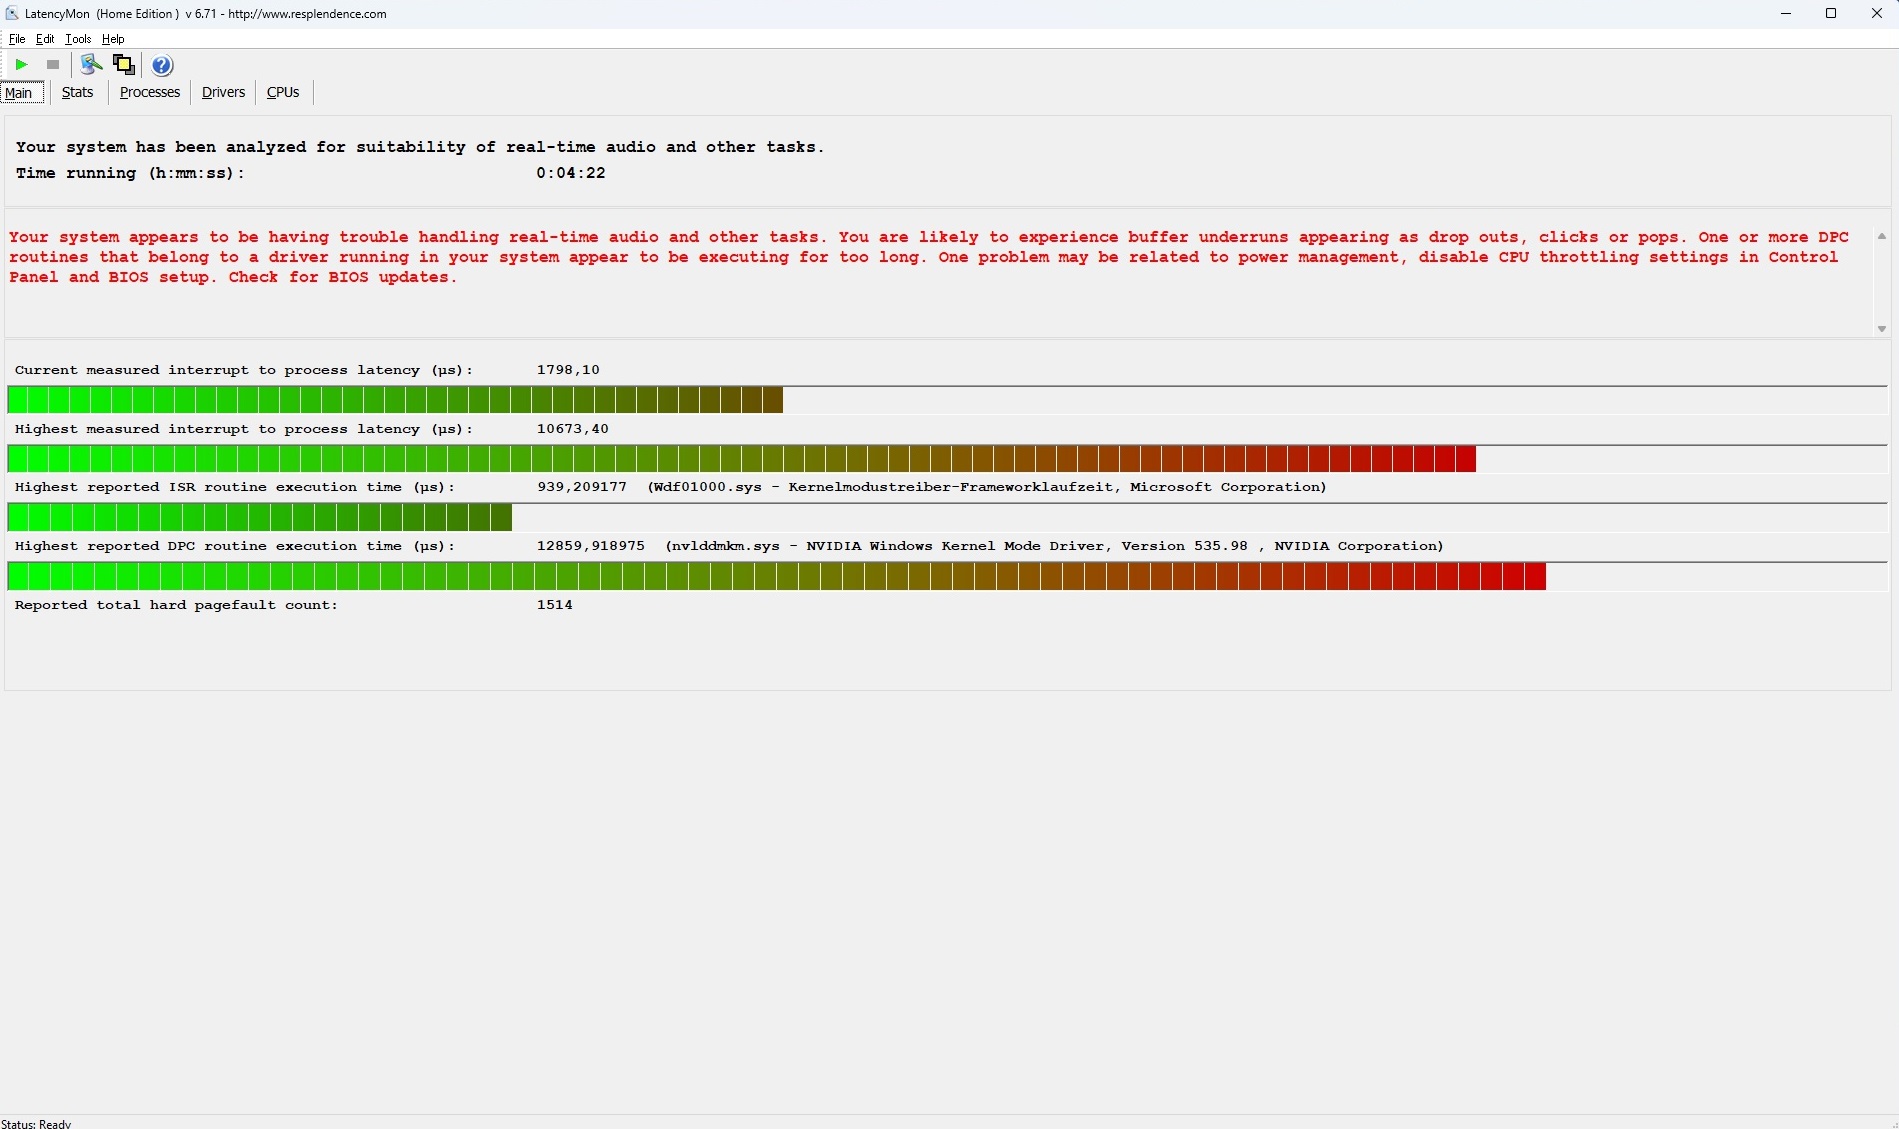
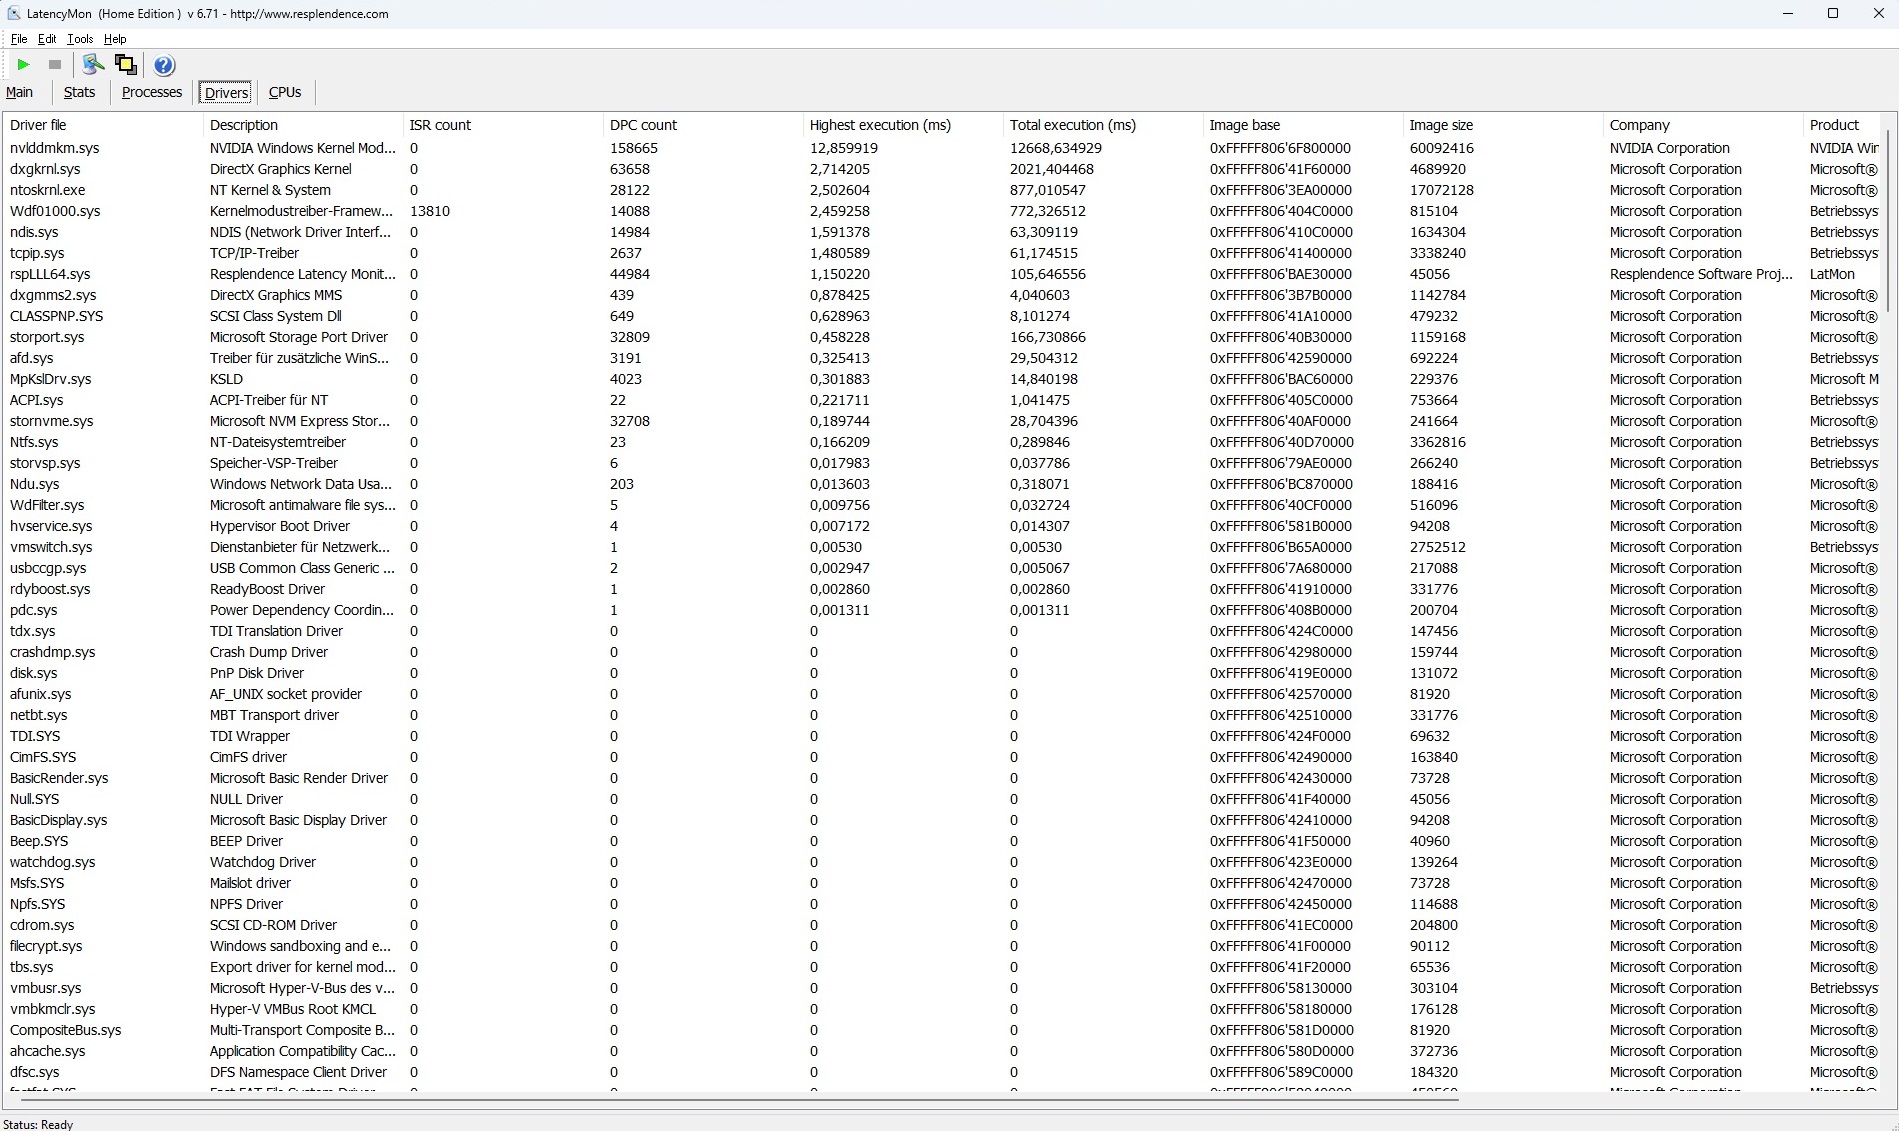
Latenze DPC
La configurazione di prova non si comporta altrettanto bene in termini di latenze. Secondo lo strumento LatencyMon, il 16-incher non è adatto all'editing audio e video in tempo reale nel suo stato di fornitura a causa dei valori estremamente elevati. È interessante notare che le latenze erano significativamente più basse nella versione RTX 4080.
| DPC Latencies / LatencyMon - interrupt to process latency (max), Web, Youtube, Prime95 | |
| Lenovo Legion Pro 7 RTX4090 | |
| Schenker XMG Neo 16 E23 | |
| MSI Titan GT77 HX 13VI | |
| Asus ROG Strix Scar 17 G733PY-XS96 | |
| Lenovo Legion Pro 7 16IRX8H | |
* ... Meglio usare valori piccoli
Memoria di massa
Invece di installare un'unità SSD più grande, Lenovo utilizza semplicemente due unità SSD da 1 TB del modello più economico Legion, che occupano completamente gli slot M.2. Il popolare Samsung PM9A1 ottiene ottimi risultati, ma spesso deve fare i conti con fluttuazioni o cali più marcati durante i periodi di carico più lunghi - come nel caso del Pro 7. Tuttavia, questo fenomeno riguarda anche le SSD NVMe di altri produttori (vedere il grafico).

* ... Meglio usare valori piccoli
Continuous read: DiskSpd Read Loop, Queue Depth 8
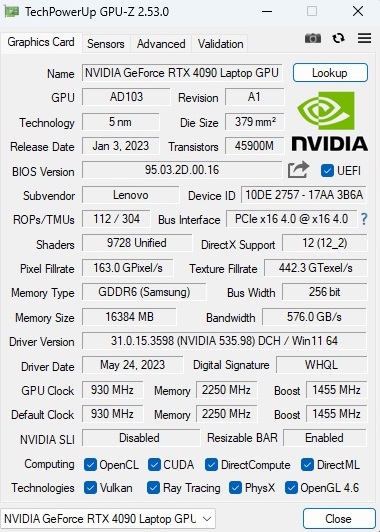
Scheda grafica
La GeForce RTX 4090 è attualmente la scheda grafica di gioco mobile più veloce. Il modello di punta della generazione Ada-Lovelace di Nvidia è dotato di 9.728 shader e 16 GB di memoria GDDR6. Quando si tratta di benchmark sintetici, la Legion Pro 7 si colloca a metà strada tra la concorrenza della RTX 4090, che conta anche su un TGP massimo di 175 watt (incluso Dynamic Boost).
| 3DMark 11 Performance | 44779 punti | |
| 3DMark Fire Strike Score | 34742 punti | |
| 3DMark Time Spy Score | 20039 punti | |
Aiuto | ||
* ... Meglio usare valori piccoli
Prestazioni di gioco
Il 16 pollici mostra i suoi muscoli soprattutto nei test di gioco. I titoli attuali girano senza problemi alla risoluzione nativa (i nostri benchmark QHD sono stati creati con 2.560 x 1.440 anziché 2.560 x 1.600 pixel) anche con i dettagli massimi, e quasi sempre si raggiungono più di 60 FPS. Anche su schermi 4K, le impostazioni complete di solito non rappresentano un problema, anche senza l'aiuto di DLSS o Frame Generation.
| The Witcher 3 - 1920x1080 Ultra Graphics & Postprocessing (HBAO+) | |
| Schenker XMG Neo 16 E23 | |
| Asus ROG Strix Scar 17 G733PY-XS96 | |
| Lenovo Legion Pro 7 RTX4090 | |
| MSI Titan GT77 HX 13VI | |
| Media NVIDIA GeForce RTX 4090 Laptop GPU (139.2 - 216, n=35) | |
| Media della classe Gaming (104.7 - 240, n=7, ultimi 2 anni) | |
| Lenovo Legion Pro 7 16IRX8H | |
| Razer Blade 16 Early 2023 RTX 4090 | |
| Call of Duty Modern Warfare 2 2022 | |
| 3840x2160 Extreme Quality Preset AA:T2X Filmic SM | |
| MSI Titan GT77 HX 13VI | |
| Asus ROG Strix Scar 17 G733PY-XS96 | |
| Lenovo Legion Pro 7 RTX4090 | |
| Media NVIDIA GeForce RTX 4090 Laptop GPU (63 - 86, n=12) | |
| Razer Blade 16 Early 2023 RTX 4090 | |
| Lenovo Legion Pro 7 16IRX8H | |
| 2560x1440 Extreme Quality Preset AA:T2X Filmic SM | |
| MSI Titan GT77 HX 13VI | |
| Asus ROG Strix Scar 17 G733PY-XS96 | |
| Lenovo Legion Pro 7 RTX4090 | |
| Media NVIDIA GeForce RTX 4090 Laptop GPU (104 - 137, n=14) | |
| Razer Blade 16 Early 2023 RTX 4090 | |
| Lenovo Legion Pro 7 16IRX8H | |
| A Plague Tale Requiem | |
| 3840x2160 Ultra Preset | |
| Lenovo Legion Pro 7 RTX4090 | |
| Media NVIDIA GeForce RTX 4090 Laptop GPU (33.1 - 43.8, n=3) | |
| Lenovo Legion Pro 7 16IRX8H | |
| 2560x1440 Ultra Preset | |
| Lenovo Legion Pro 7 RTX4090 | |
| Media NVIDIA GeForce RTX 4090 Laptop GPU (58.9 - 77.2, n=3) | |
| Lenovo Legion Pro 7 16IRX8H | |
| Spider-Man Miles Morales | |
| 3840x2160 Very High Preset AA:T | |
| MSI Titan GT77 HX 13VI | |
| Lenovo Legion Pro 7 RTX4090 | |
| Media NVIDIA GeForce RTX 4090 Laptop GPU (65.7 - 84.3, n=7) | |
| Lenovo Legion Pro 7 16IRX8H | |
| 2560x1440 Very High Preset AA:T | |
| MSI Titan GT77 HX 13VI | |
| Lenovo Legion Pro 7 RTX4090 | |
| Media NVIDIA GeForce RTX 4090 Laptop GPU (93.3 - 119.8, n=7) | |
| Lenovo Legion Pro 7 16IRX8H | |
Come di consueto, abbiamo testato se le prestazioni della GPU rimangono costanti sotto un carico più lungo con Il Witcher 3. Analogamente alla concorrenza, non abbiamo notato cali di prestazioni o simili, a parte piccole fluttuazioni.
Witcher 3 FPS-Diagramm
| basso | medio | alto | ultra | QHD | 4K | |
|---|---|---|---|---|---|---|
| GTA V (2015) | 186.3 | 186.9 | 184.9 | 143.6 | 137.7 | 173.6 |
| The Witcher 3 (2015) | 200 | |||||
| Dota 2 Reborn (2015) | 230 | 204 | 193.9 | 182.1 | 175.1 | |
| Final Fantasy XV Benchmark (2018) | 223 | 212 | 181.2 | 154 | 91.7 | |
| X-Plane 11.11 (2018) | 201 | 177.7 | 136.4 | 111.7 | ||
| Strange Brigade (2018) | 439 | 369 | 359 | 347 | 302 | 158.4 |
| Shadow of the Tomb Raider (2018) | 185 | 120 | ||||
| Cyberpunk 2077 1.6 (2022) | 100.93 | 50.05 | ||||
| F1 22 (2022) | 301 | 303 | 279 | 129.2 | 85.2 | 45.9 |
| A Plague Tale Requiem (2022) | 77.2 | 43.8 | ||||
| Call of Duty Modern Warfare 2 2022 (2022) | 132 | 82 | ||||
| Spider-Man Miles Morales (2022) | 108.1 | 80 | ||||
| The Witcher 3 v4 (2023) | 101.2 | 48.7 | ||||
| The Last of Us (2023) | 85.8 | 45.7 |
Emissioni
Emissioni acustiche
Il grande svantaggio di componenti di fascia alta così potenti è, senza dubbio, lo sviluppo del rumore. In modalità Performance, il 16 pollici diventa rumoroso nelle applicazioni 3D tra i 48 dB(A) (3DMark 06 medio) e i 55 dB(A) (stress test massimo). Nei giochi, ci si può aspettare circa 53 dB(A), che sono molto fastidiosi anche senza cuffie. La situazione è molto più rilassata in idle. Sebbene le ventole diventino occasionalmente un po' rumorose (ad esempio durante l'avvio), una media di 28-30 dB(A) è accettabile, soprattutto perché è possibile utilizzare la modalità Silenziosa o Bilanciata, se lo si desidera.
Rumorosità
| Idle |
| 28 / 30 / 38 dB(A) |
| Sotto carico |
| 48 / 55 dB(A) |
 | ||
30 dB silenzioso 40 dB(A) udibile 50 dB(A) rumoroso |
||
min: | ||
| Lenovo Legion Pro 7 RTX4090 i9-13900HX, GeForce RTX 4090 Laptop GPU | Razer Blade 16 Early 2023 RTX 4090 i9-13950HX, GeForce RTX 4090 Laptop GPU | Asus ROG Strix Scar 17 G733PY-XS96 R9 7945HX, GeForce RTX 4090 Laptop GPU | Schenker XMG Neo 16 E23 i9-13900HX, GeForce RTX 4090 Laptop GPU | MSI Titan GT77 HX 13VI i9-13950HX, GeForce RTX 4090 Laptop GPU | Lenovo Legion Pro 7 16IRX8H i9-13900HX, GeForce RTX 4080 Laptop GPU | |
|---|---|---|---|---|---|---|
| Noise | 18% | 14% | -10% | 1% | 4% | |
| off /ambiente * (dB) | 25 | 20.84 17% | 22.7 9% | 25 -0% | 24.6 2% | 24 4% |
| Idle Minimum * (dB) | 28 | 23.65 16% | 23.5 16% | 31 -11% | 29.2 -4% | 26 7% |
| Idle Average * (dB) | 30 | 23.65 21% | 27.7 8% | 33 -10% | 29.2 3% | 28 7% |
| Idle Maximum * (dB) | 38 | 23.65 38% | 27.7 27% | 42 -11% | 29.2 23% | 34 11% |
| Load Average * (dB) | 48 | 43.35 10% | 30.5 36% | 58 -21% | 50.7 -6% | 47 2% |
| Witcher 3 ultra * (dB) | 53 | 46.7 12% | 51.4 3% | 57 -8% | 53.3 -1% | 55 -4% |
| Load Maximum * (dB) | 55 | 46.72 15% | 54.1 2% | 59 -7% | 61 -11% | 56 -2% |
* ... Meglio usare valori piccoli
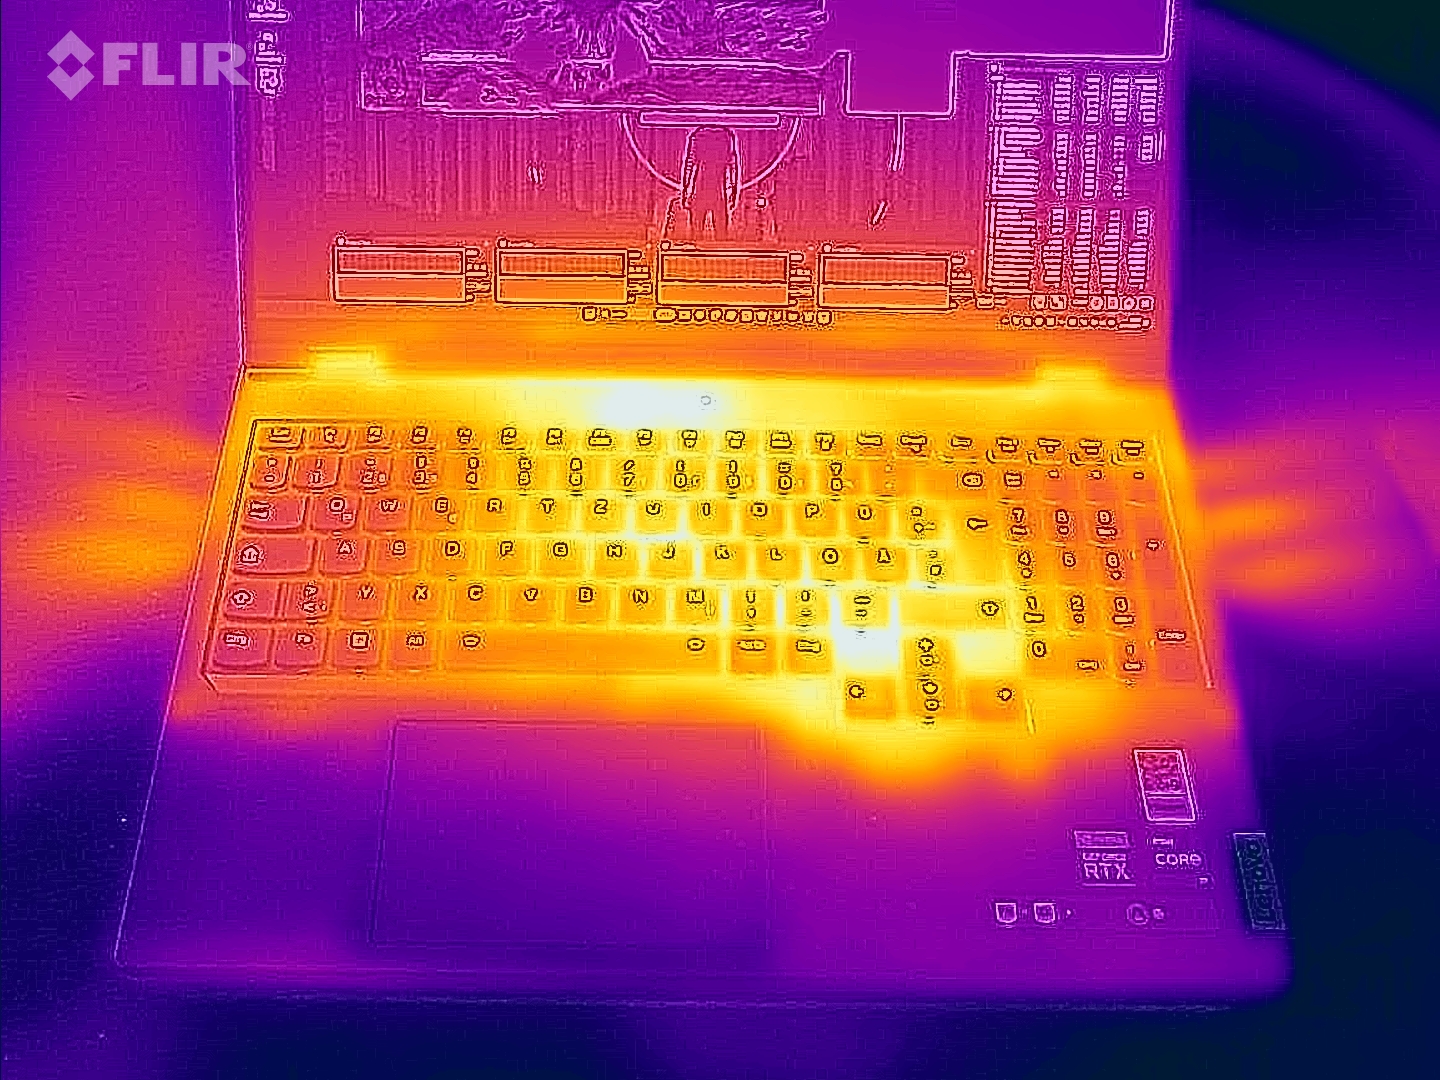
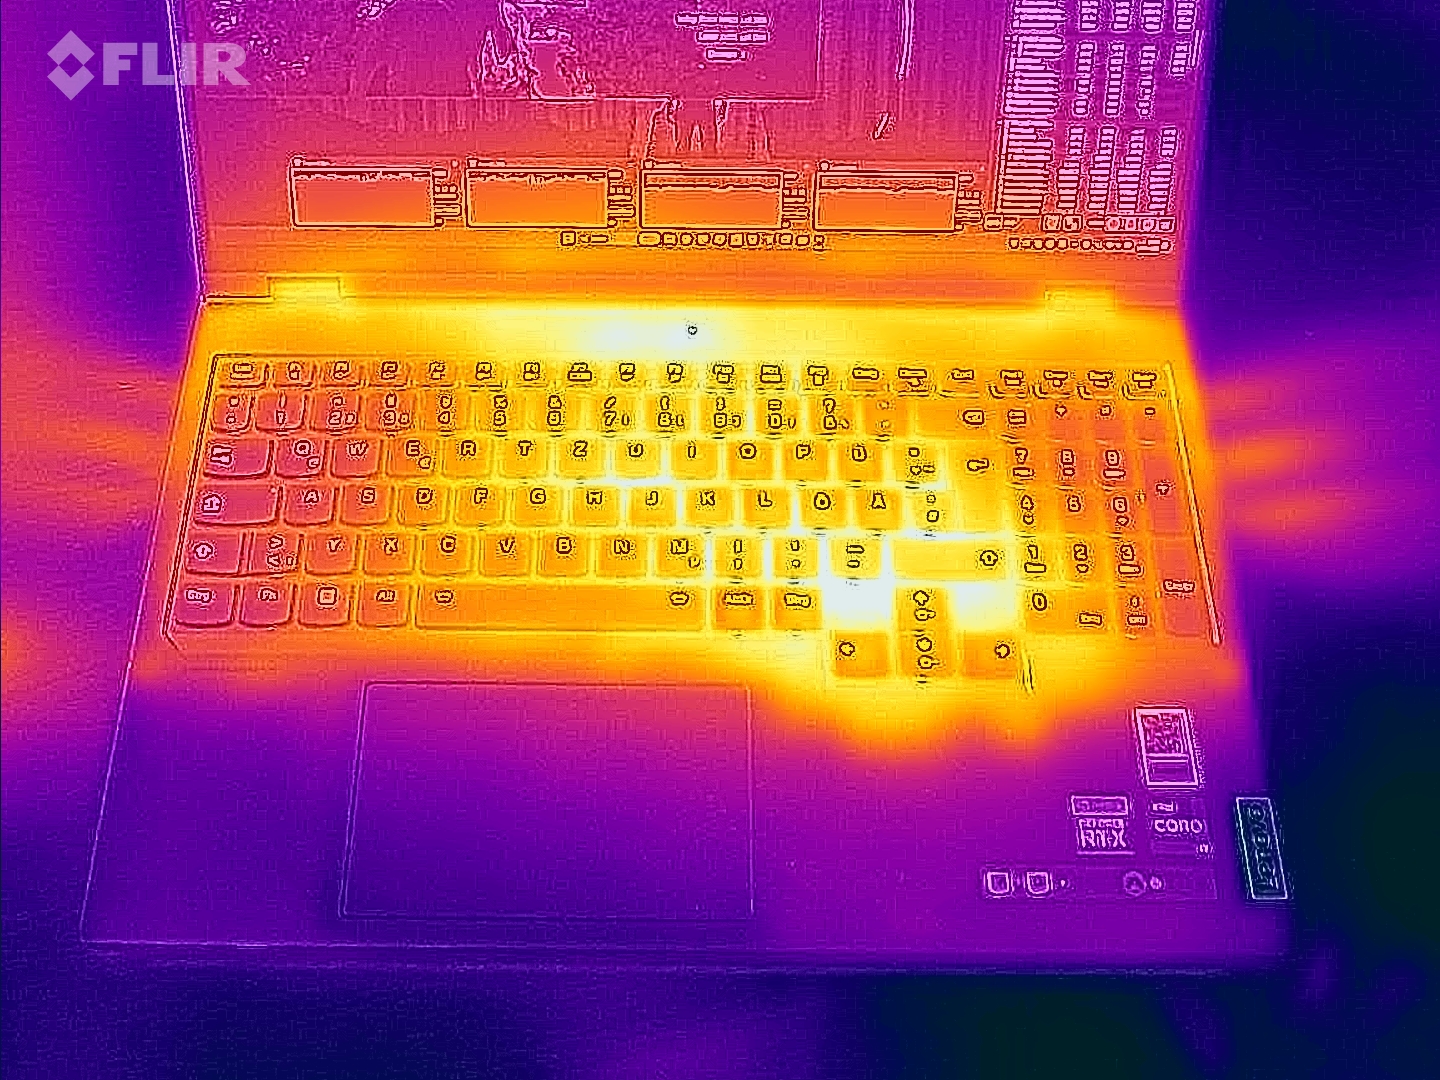
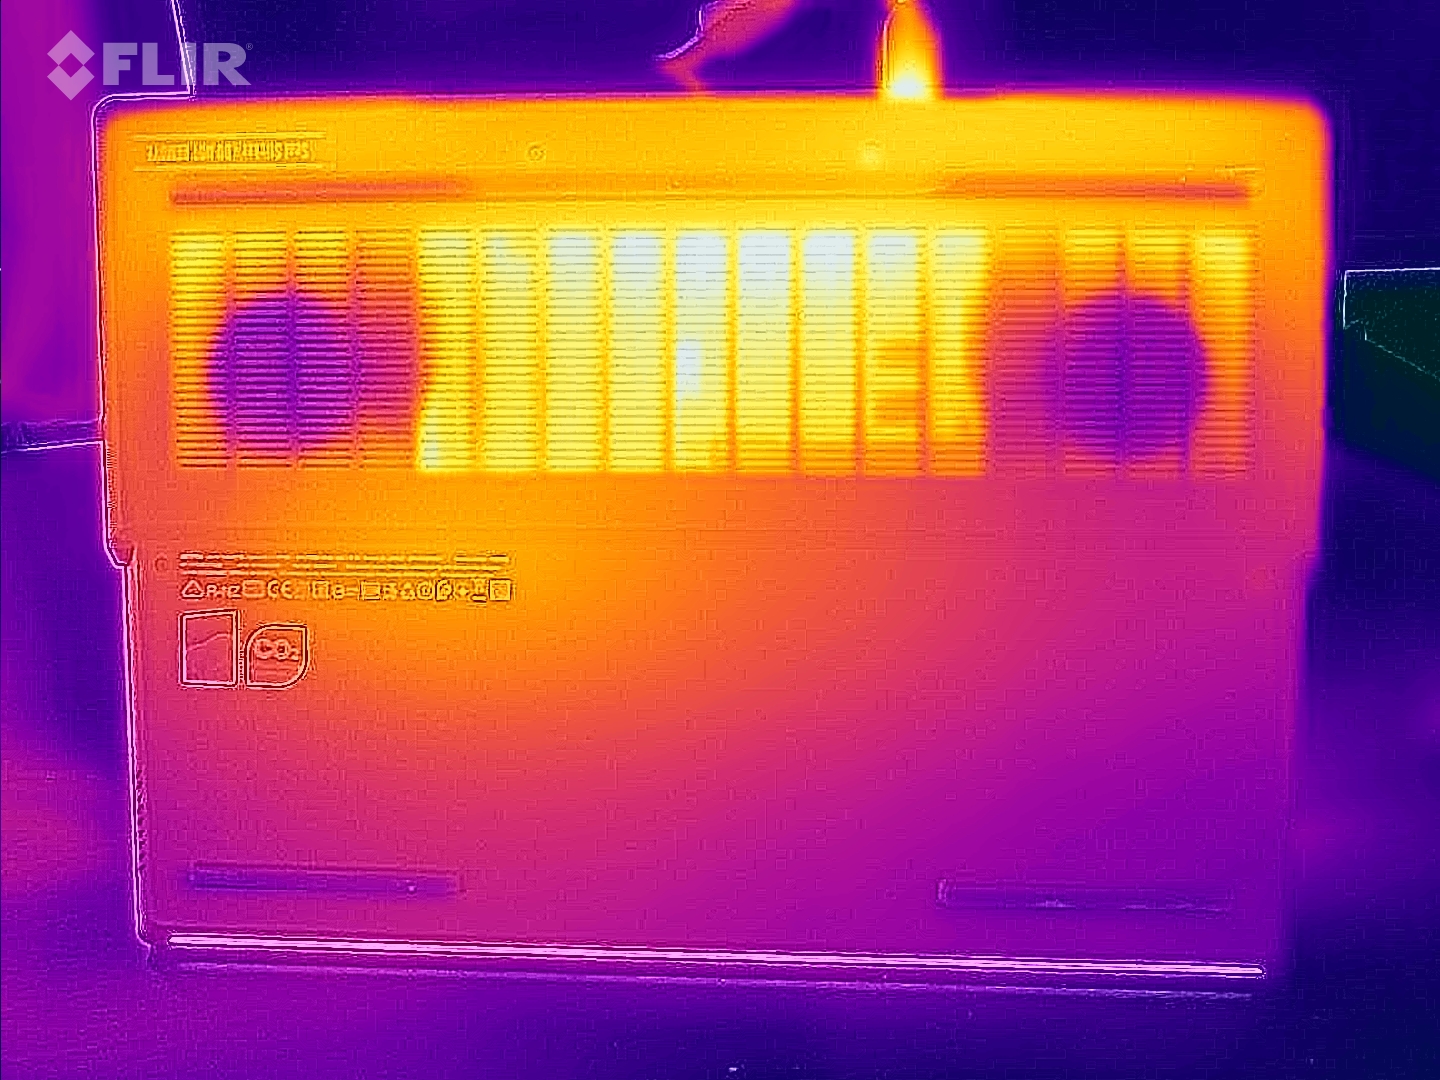
Temperatura
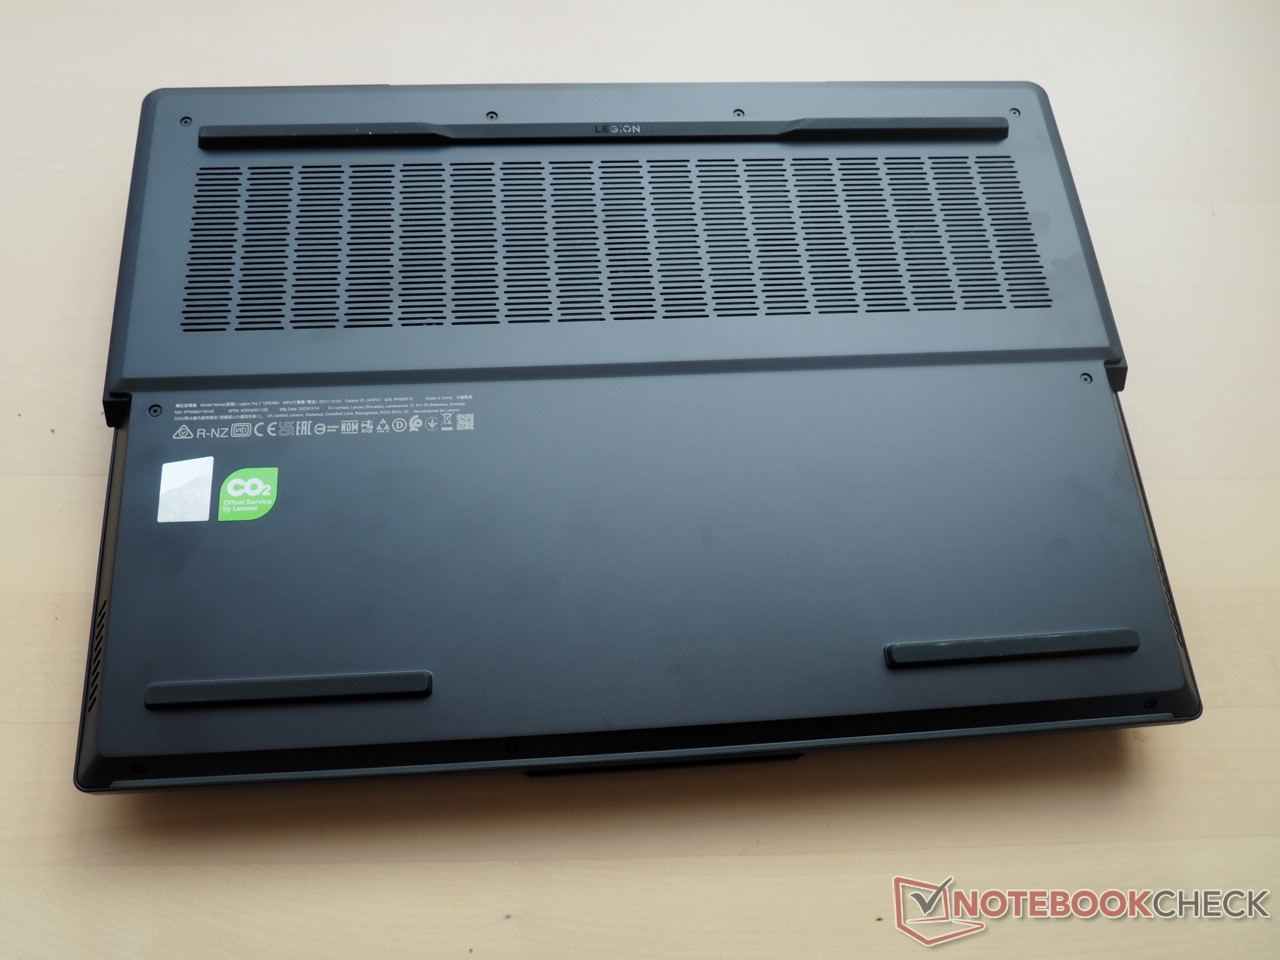
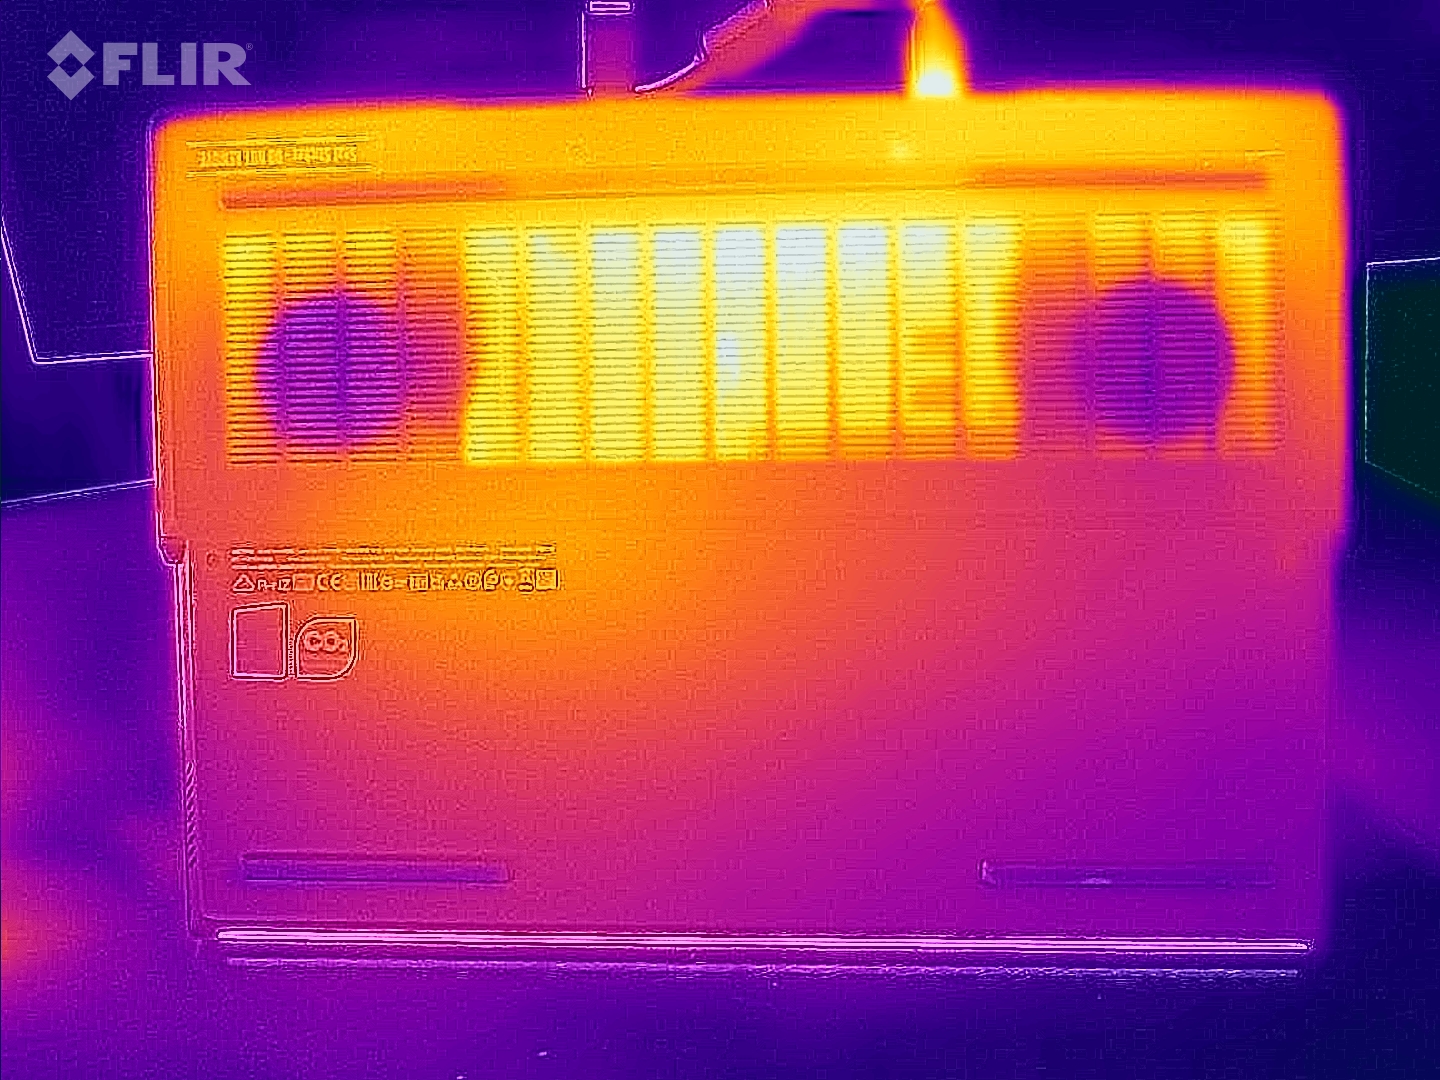
Il case si scalda più della concorrenza con un massimo di 53 °C nella parte superiore e fino a 59 °C in quella inferiore. L'andamento della temperatura rimane entro i limiti in modalità idle. Il poggiapolsi, ad esempio, raggiunge circa 29 °C, una temperatura moderata.
(-) La temperatura massima sul lato superiore è di 53 °C / 127 F, rispetto alla media di 40.4 °C / 105 F, che varia da 21.2 a 68.8 °C per questa classe Gaming.
(-) Il lato inferiore si riscalda fino ad un massimo di 59 °C / 138 F, rispetto alla media di 43.2 °C / 110 F
(+) In idle, la temperatura media del lato superiore è di 31 °C / 88 F, rispetto alla media deld ispositivo di 33.9 °C / 93 F.
(-) Riproducendo The Witcher 3, la temperatura media per il lato superiore e' di 45.4 °C / 114 F, rispetto alla media del dispositivo di 33.9 °C / 93 F.
(-) I poggiapolsi e il touchpad possono diventare molto caldi al tatto con un massimo di 45 °C / 113 F.
(-) La temperatura media della zona del palmo della mano di dispositivi simili e'stata di 28.8 °C / 83.8 F (-16.2 °C / -29.2 F).
| Lenovo Legion Pro 7 RTX4090 Intel Core i9-13900HX, NVIDIA GeForce RTX 4090 Laptop GPU | Razer Blade 16 Early 2023 RTX 4090 Intel Core i9-13950HX, NVIDIA GeForce RTX 4090 Laptop GPU | Asus ROG Strix Scar 17 G733PY-XS96 AMD Ryzen 9 7945HX, NVIDIA GeForce RTX 4090 Laptop GPU | Schenker XMG Neo 16 E23 Intel Core i9-13900HX, NVIDIA GeForce RTX 4090 Laptop GPU | MSI Titan GT77 HX 13VI Intel Core i9-13950HX, NVIDIA GeForce RTX 4090 Laptop GPU | Lenovo Legion Pro 7 16IRX8H Intel Core i9-13900HX, NVIDIA GeForce RTX 4080 Laptop GPU | |
|---|---|---|---|---|---|---|
| Heat | 7% | 25% | 14% | 20% | 1% | |
| Maximum Upper Side * (°C) | 53 | 52 2% | 34.6 35% | 50 6% | 40.6 23% | 48 9% |
| Maximum Bottom * (°C) | 59 | 47.6 19% | 35.6 40% | 51 14% | 41.1 30% | 49 17% |
| Idle Upper Side * (°C) | 34 | 33 3% | 27.2 20% | 28 18% | 26.2 23% | 40 -18% |
| Idle Bottom * (°C) | 32 | 30.6 4% | 30 6% | 26 19% | 30.3 5% | 33 -3% |
* ... Meglio usare valori piccoli
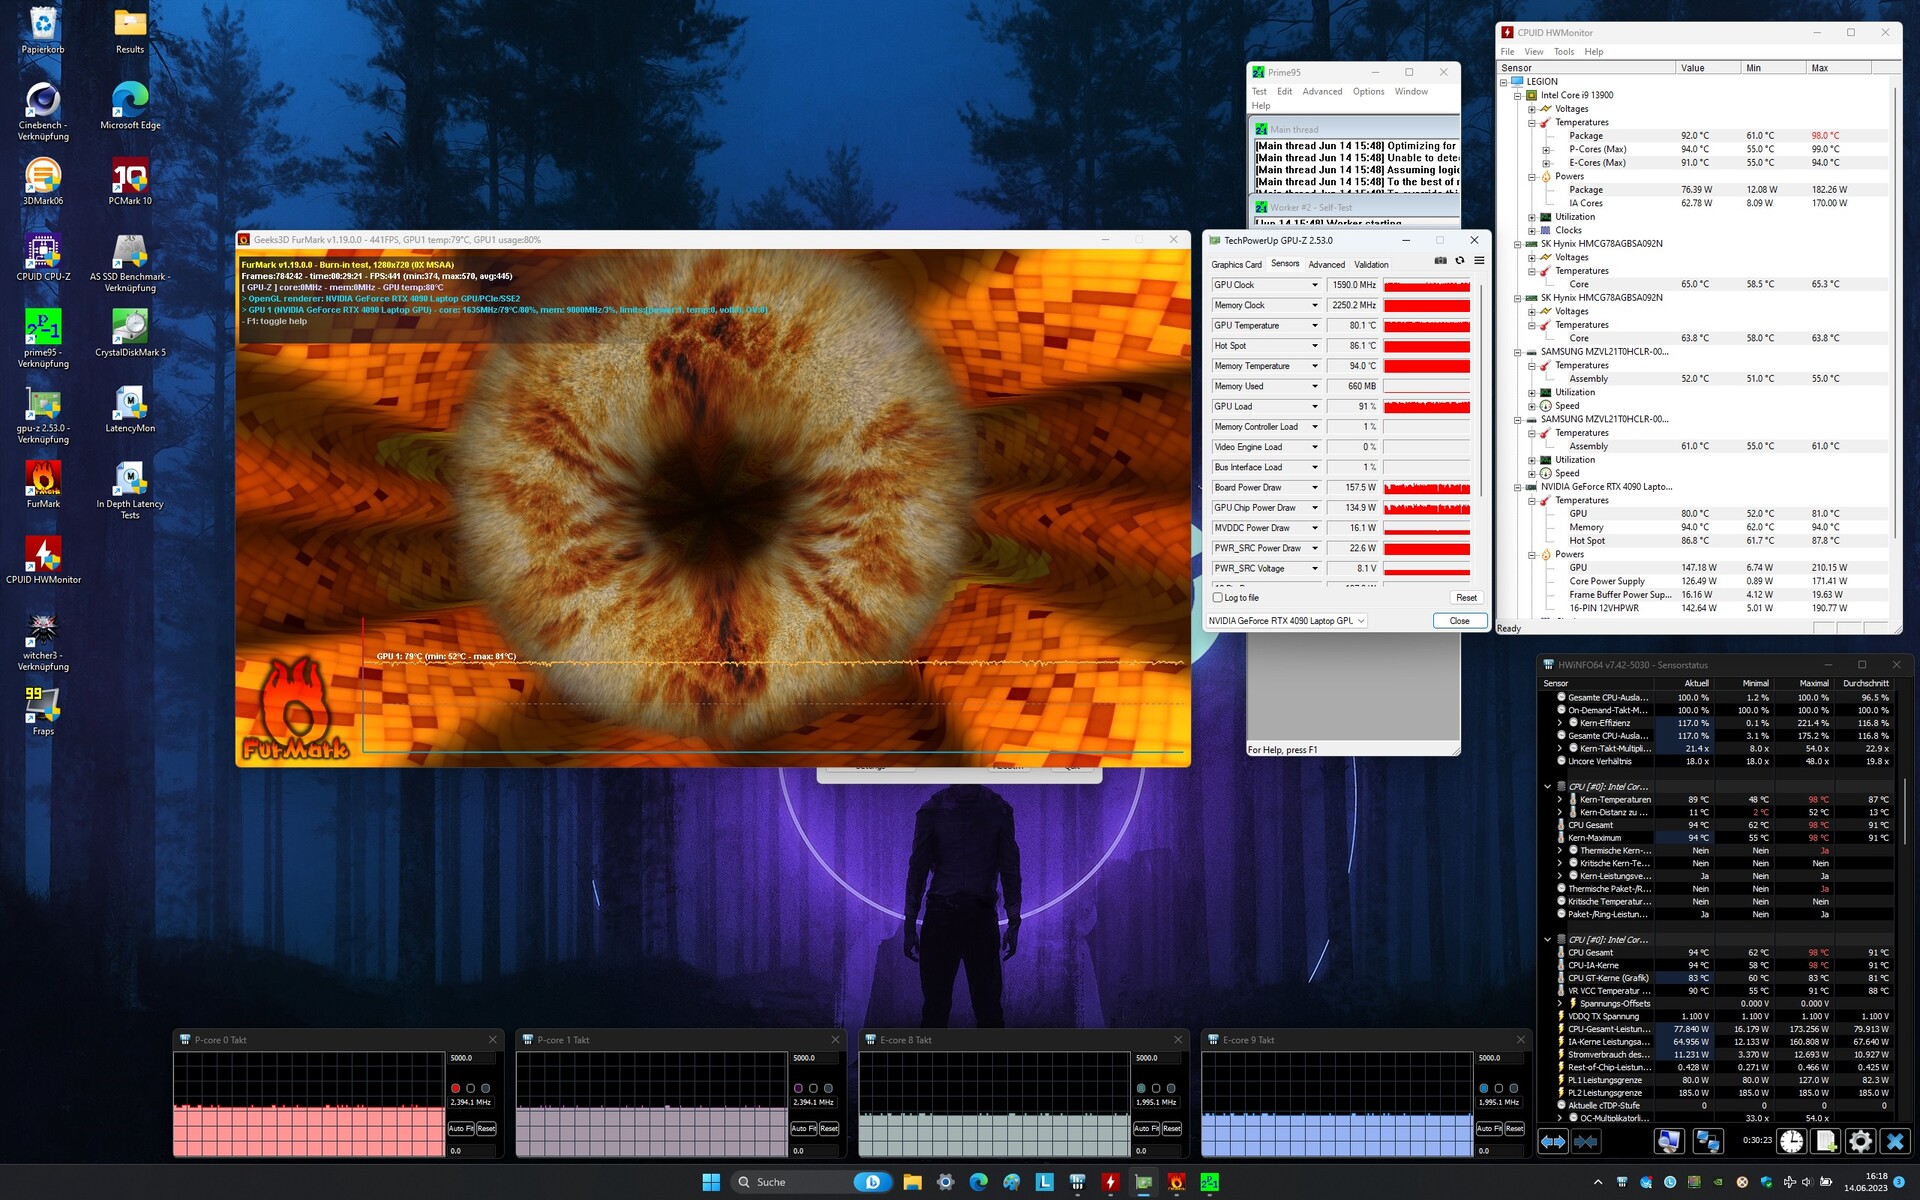
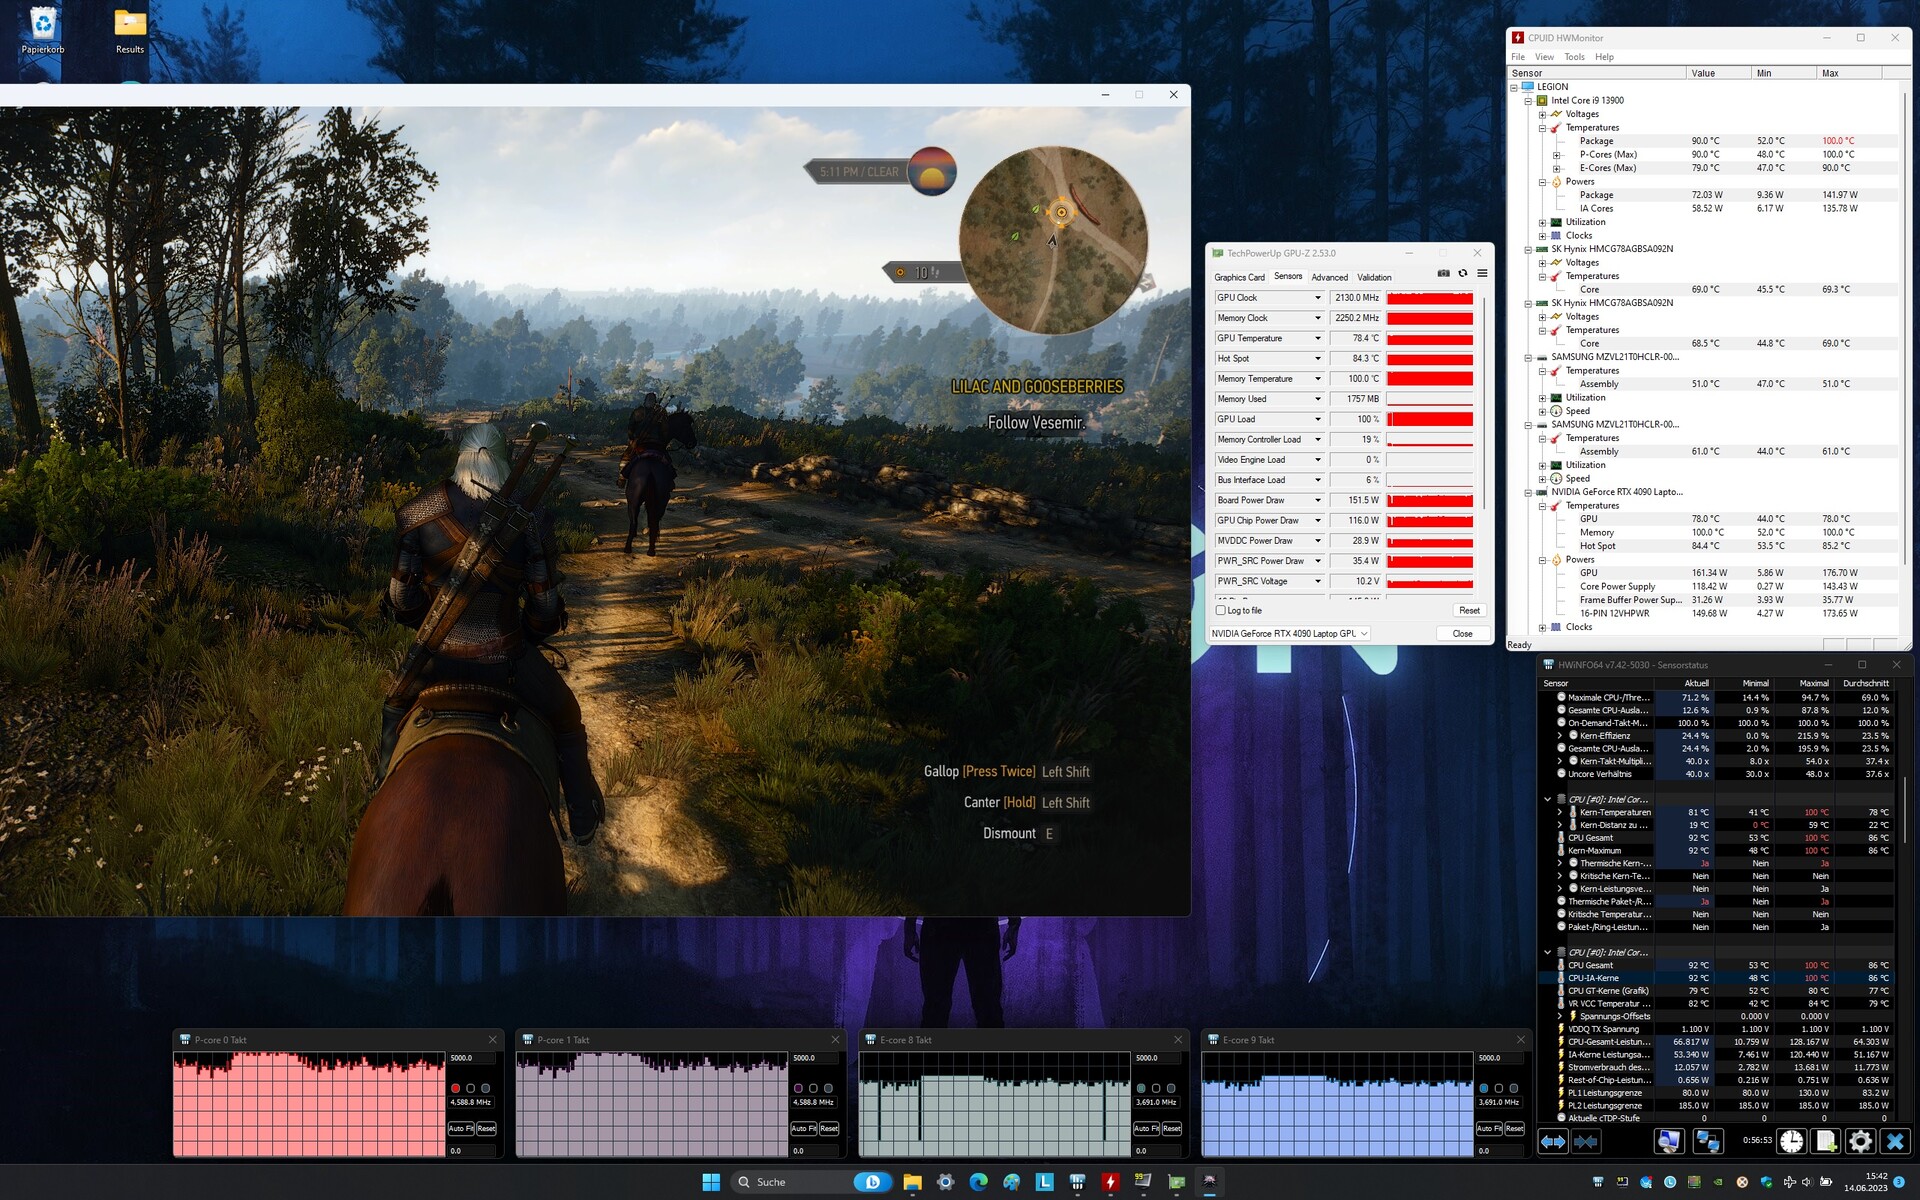
Test da sforzo
Non ci sono stati problemi nei test di stress con gli strumenti FurMark e Prime95. Sebbene la CPU si sia surriscaldata relativamente, superando i 90 °C, non è scesa al di sotto del clock di base. La GPU (~80 °C) si è comportata in modo simile.
Altoparlante
Lenovo Legion Pro 7 RTX4090 analisi audio
(+) | gli altoparlanti sono relativamente potenti (82 dB)
Bassi 100 - 315 Hz
(±) | bassi ridotti - in media 5.6% inferiori alla media
(+) | bassi in lineaa (6.8% delta rispetto alla precedente frequenza)
Medi 400 - 2000 Hz
(+) | medi bilanciati - solo only 4.8% rispetto alla media
(+) | medi lineari (5.1% delta rispetto alla precedente frequenza)
Alti 2 - 16 kHz
(+) | Alti bilanciati - appena 1.7% dalla media
(+) | alti lineari (4% delta rispetto alla precedente frequenza)
Nel complesso 100 - 16.000 Hz
(+) | suono nel complesso lineare (8.7% differenza dalla media)
Rispetto alla stessa classe
» 3% di tutti i dispositivi testati in questa classe è stato migliore, 1% simile, 97% peggiore
» Il migliore ha avuto un delta di 6%, medio di 18%, peggiore di 132%
Rispetto a tutti i dispositivi testati
» 3% di tutti i dispositivi testati in questa classe è stato migliore, 1% similare, 97% peggiore
» Il migliore ha avuto un delta di 4%, medio di 23%, peggiore di 134%
Razer Blade 16 Early 2023 RTX 4090 analisi audio
(±) | potenza degli altiparlanti media ma buona (75 dB)
Bassi 100 - 315 Hz
(±) | bassi ridotti - in media 13.4% inferiori alla media
(±) | la linearità dei bassi è media (14.8% delta rispetto alla precedente frequenza)
Medi 400 - 2000 Hz
(±) | medi elevati - circa 5.3% superiore alla media
(+) | medi lineari (3.8% delta rispetto alla precedente frequenza)
Alti 2 - 16 kHz
(+) | Alti bilanciati - appena 3.4% dalla media
(+) | alti lineari (4.2% delta rispetto alla precedente frequenza)
Nel complesso 100 - 16.000 Hz
(±) | la linearità complessiva del suono è media (15.6% di differenza rispetto alla media
Rispetto alla stessa classe
» 36% di tutti i dispositivi testati in questa classe è stato migliore, 6% simile, 58% peggiore
» Il migliore ha avuto un delta di 6%, medio di 18%, peggiore di 132%
Rispetto a tutti i dispositivi testati
» 23% di tutti i dispositivi testati in questa classe è stato migliore, 5% similare, 72% peggiore
» Il migliore ha avuto un delta di 4%, medio di 23%, peggiore di 134%
Gestione dell'alimentazione
Consumo di energia
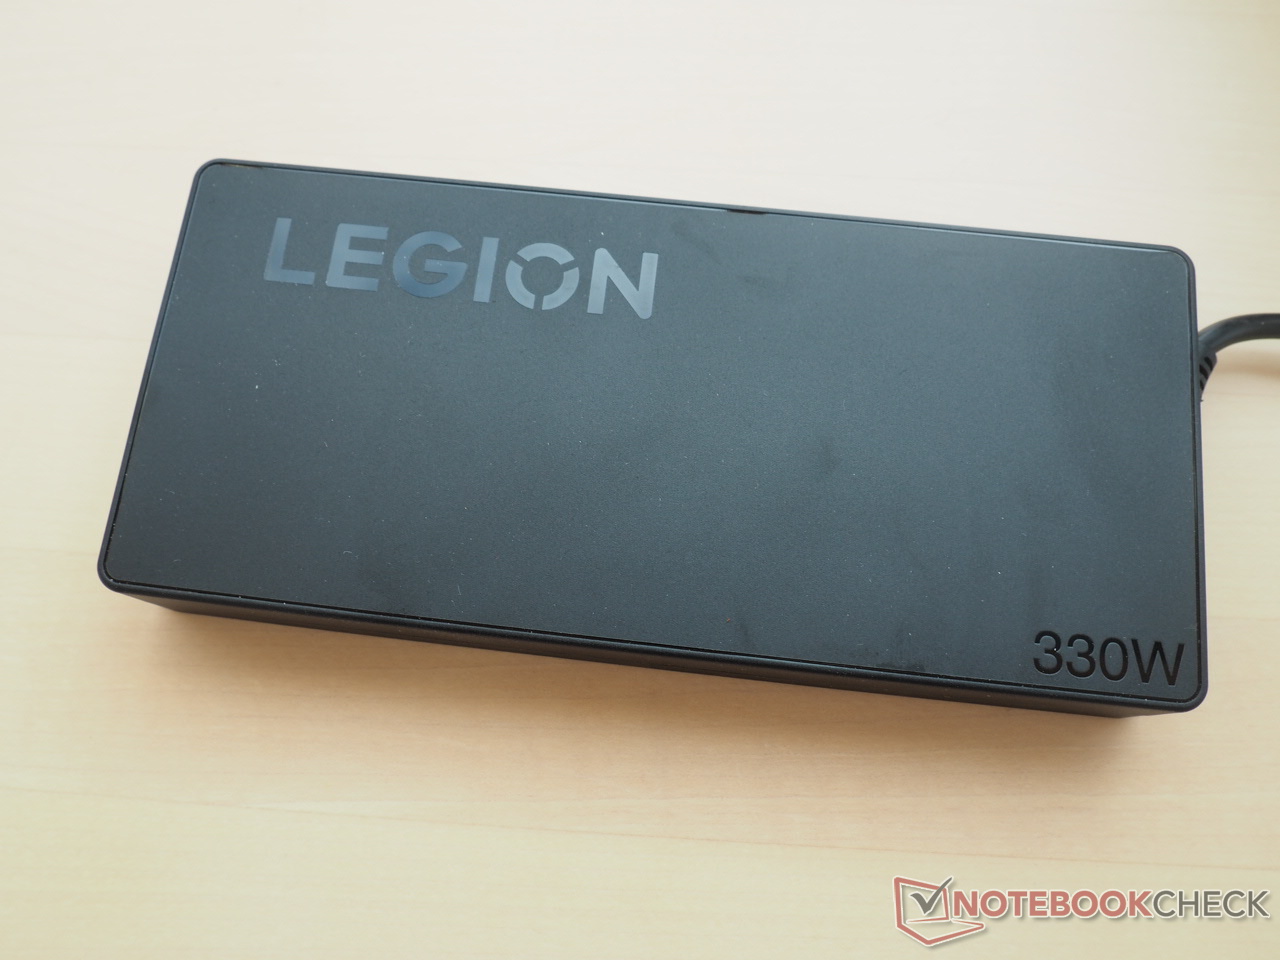
Anche se alcuni rivali consumano meno, il consumo energetico è tipico di un dispositivo RTX 4090. Mentre abbiamo misurato da 20 a 35 watt in modalità idle, il consumo è stato compreso tra 136 e 320 watt sotto carico. Pertanto, l'alimentatore da 330 watt in dotazione è sufficientemente dimensionato.
| Off / Standby | |
| Idle | |
| Sotto carico |
|
Leggenda:
min: | |
| Lenovo Legion Pro 7 RTX4090 i9-13900HX, GeForce RTX 4090 Laptop GPU | Razer Blade 16 Early 2023 RTX 4090 i9-13950HX, GeForce RTX 4090 Laptop GPU | Asus ROG Strix Scar 17 G733PY-XS96 R9 7945HX, GeForce RTX 4090 Laptop GPU | Schenker XMG Neo 16 E23 i9-13900HX, GeForce RTX 4090 Laptop GPU | MSI Titan GT77 HX 13VI i9-13950HX, GeForce RTX 4090 Laptop GPU | Lenovo Legion Pro 7 16IRX8H i9-13900HX, GeForce RTX 4080 Laptop GPU | Media della classe Gaming | |
|---|---|---|---|---|---|---|---|
| Power Consumption | -11% | 8% | 14% | 10% | 6% | 26% | |
| Idle Minimum * (Watt) | 20 | 27.5 -38% | 14.5 27% | 8 60% | 14 30% | 18 10% | 13 ? 35% |
| Idle Average * (Watt) | 25 | 34.4 -38% | 21.1 16% | 18 28% | 21.6 14% | 24 4% | 18.7 ? 25% |
| Idle Maximum * (Watt) | 35 | 35.4 -1% | 42.8 -22% | 28 20% | 24.8 29% | 32 9% | 24.3 ? 31% |
| Load Average * (Watt) | 136 | 147.8 -9% | 116.7 14% | 133 2% | 122.5 10% | 130 4% | 110.2 ? 19% |
| Witcher 3 ultra * (Watt) | 282 | 256 9% | 278 1% | 294 -4% | 265 6% | 260 8% | |
| Load Maximum * (Watt) | 320 | 286.7 10% | 279.6 13% | 399 -25% | 418 -31% | 320 -0% | 258 ? 19% |
* ... Meglio usare valori piccoli
Power consumption Witcher 3 / Stresstest
Power consumption external monitor
Durata della batteria
La durata della batteria del Legion Pro 7 non è né cattiva né particolarmente buona. Il 16 pollici ha gestito il nostro test pratico WLAN con luminosità del display ridotta a 150 cd/m² per circa 5 ore.
| Lenovo Legion Pro 7 RTX4090 i9-13900HX, GeForce RTX 4090 Laptop GPU, 99.9 Wh | Razer Blade 16 Early 2023 RTX 4090 i9-13950HX, GeForce RTX 4090 Laptop GPU, 95.2 Wh | Asus ROG Strix Scar 17 G733PY-XS96 R9 7945HX, GeForce RTX 4090 Laptop GPU, 90 Wh | Schenker XMG Neo 16 E23 i9-13900HX, GeForce RTX 4090 Laptop GPU, 99 Wh | MSI Titan GT77 HX 13VI i9-13950HX, GeForce RTX 4090 Laptop GPU, 99.9 Wh | Lenovo Legion Pro 7 16IRX8H i9-13900HX, GeForce RTX 4080 Laptop GPU, 99.9 Wh | Media della classe Gaming | |
|---|---|---|---|---|---|---|---|
| Autonomia della batteria | 14% | -20% | 31% | 4% | 0% | 39% | |
| WiFi v1.3 (h) | 5.1 | 5.8 14% | 4.1 -20% | 6.7 31% | 5.3 4% | 5.1 0% | 7.11 ? 39% |
| H.264 (h) | 8.4 | 5.8 | 6 | 8.32 ? | |||
| Witcher 3 ultra (h) | 1.6 | 1.4 | |||||
| Load (h) | 1.4 | 1.4 | 2.1 | 1.502 ? | |||
| Reader / Idle (h) | 6.4 | 8.16 ? |
Pro
Contro
Il verdetto
Chi è in grado di accettare il prezzo esorbitante di almeno 4.500 euro, troverà nel Legion Pro 7 un gamer di fascia alta quasi completamente riuscito nel formato da 16 pollici.
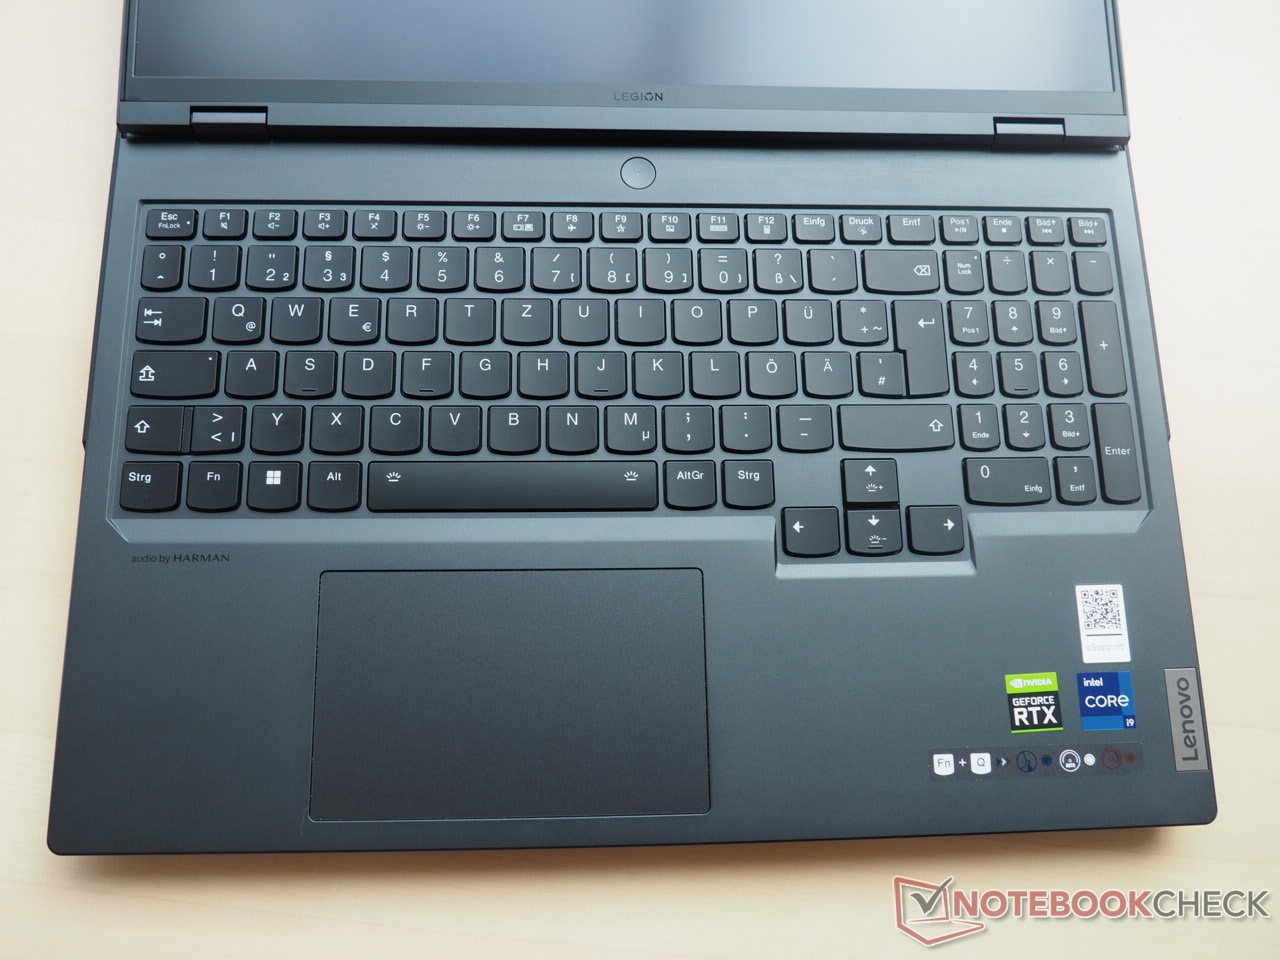
Lenovo non punta solo su uno chassis stabile e di alta qualità, ma anche su buoni dispositivi di input. Anche la connettività (inclusa Thunderbolt 4) e il display WQXGA soddisferanno la maggior parte degli acquirenti. Lo schermo 16:10 (240 Hz) offre, tra le altre cose, una buona luminosità, un'accuratezza dei colori convincente e tempi di risposta brevi per gli standard IPS.
Tra gli aspetti negativi, abbiamo - come purtroppo è comune per i notebook di fascia alta - una temperatura molto elevata e uno sviluppo del rumore sotto carico. Senza cuffie, la modalità prestazioni non è una gioia. Si consiglia di utilizzare la modalità Silenziosa o Bilanciata.
Nel complesso, il Legion Pro 7 con RTX 4090 - come il modello RTX 4080 - ottiene ancora un'ottima valutazione e quindi appartiene ai migliori portatili di fascia alta sul mercato.
Se volete un computer più silenzioso e/o più leggero, dovreste dare un'occhiata al modello Blade 16. Il concorrente di Razer ha ottenuto un punteggio leggermente migliore nel test.
Prezzo e disponibilità
Lenovo Legion Pro 7 RTX4090
- 06/16/2023 v7 (old)
Florian Glaser
Transparency
La selezione dei dispositivi da recensire viene effettuata dalla nostra redazione. Il campione di prova è stato fornito all'autore come prestito dal produttore o dal rivenditore ai fini di questa recensione. L'istituto di credito non ha avuto alcuna influenza su questa recensione, né il produttore ne ha ricevuto una copia prima della pubblicazione. Non vi era alcun obbligo di pubblicare questa recensione. In quanto società mediatica indipendente, Notebookcheck non è soggetta all'autorità di produttori, rivenditori o editori.
Ecco come Notebookcheck esegue i test
Ogni anno, Notebookcheck esamina in modo indipendente centinaia di laptop e smartphone utilizzando procedure standardizzate per garantire che tutti i risultati siano comparabili. Da circa 20 anni sviluppiamo continuamente i nostri metodi di prova e nel frattempo stabiliamo gli standard di settore. Nei nostri laboratori di prova, tecnici ed editori esperti utilizzano apparecchiature di misurazione di alta qualità. Questi test comportano un processo di validazione in più fasi. Il nostro complesso sistema di valutazione si basa su centinaia di misurazioni e parametri di riferimento ben fondati, che mantengono l'obiettività.Price comparison
