Recensione dell' Asus ROG Strix Scar 18 2023 G834JY - Laptop gaming con RTX 4090
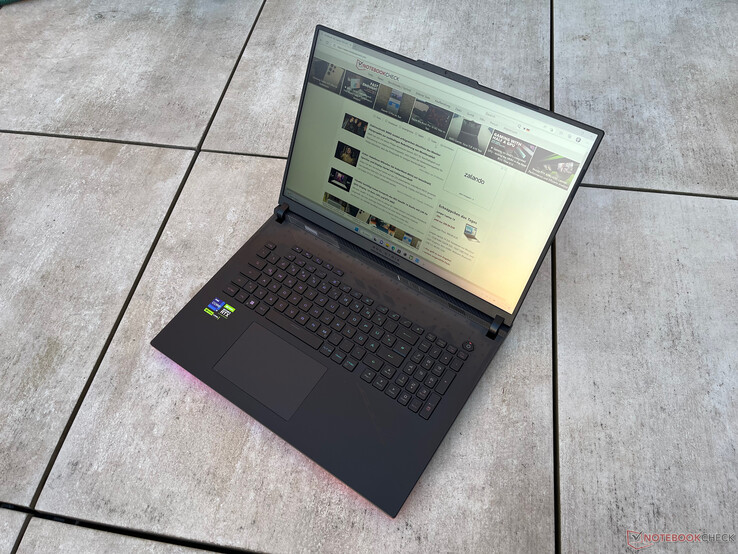
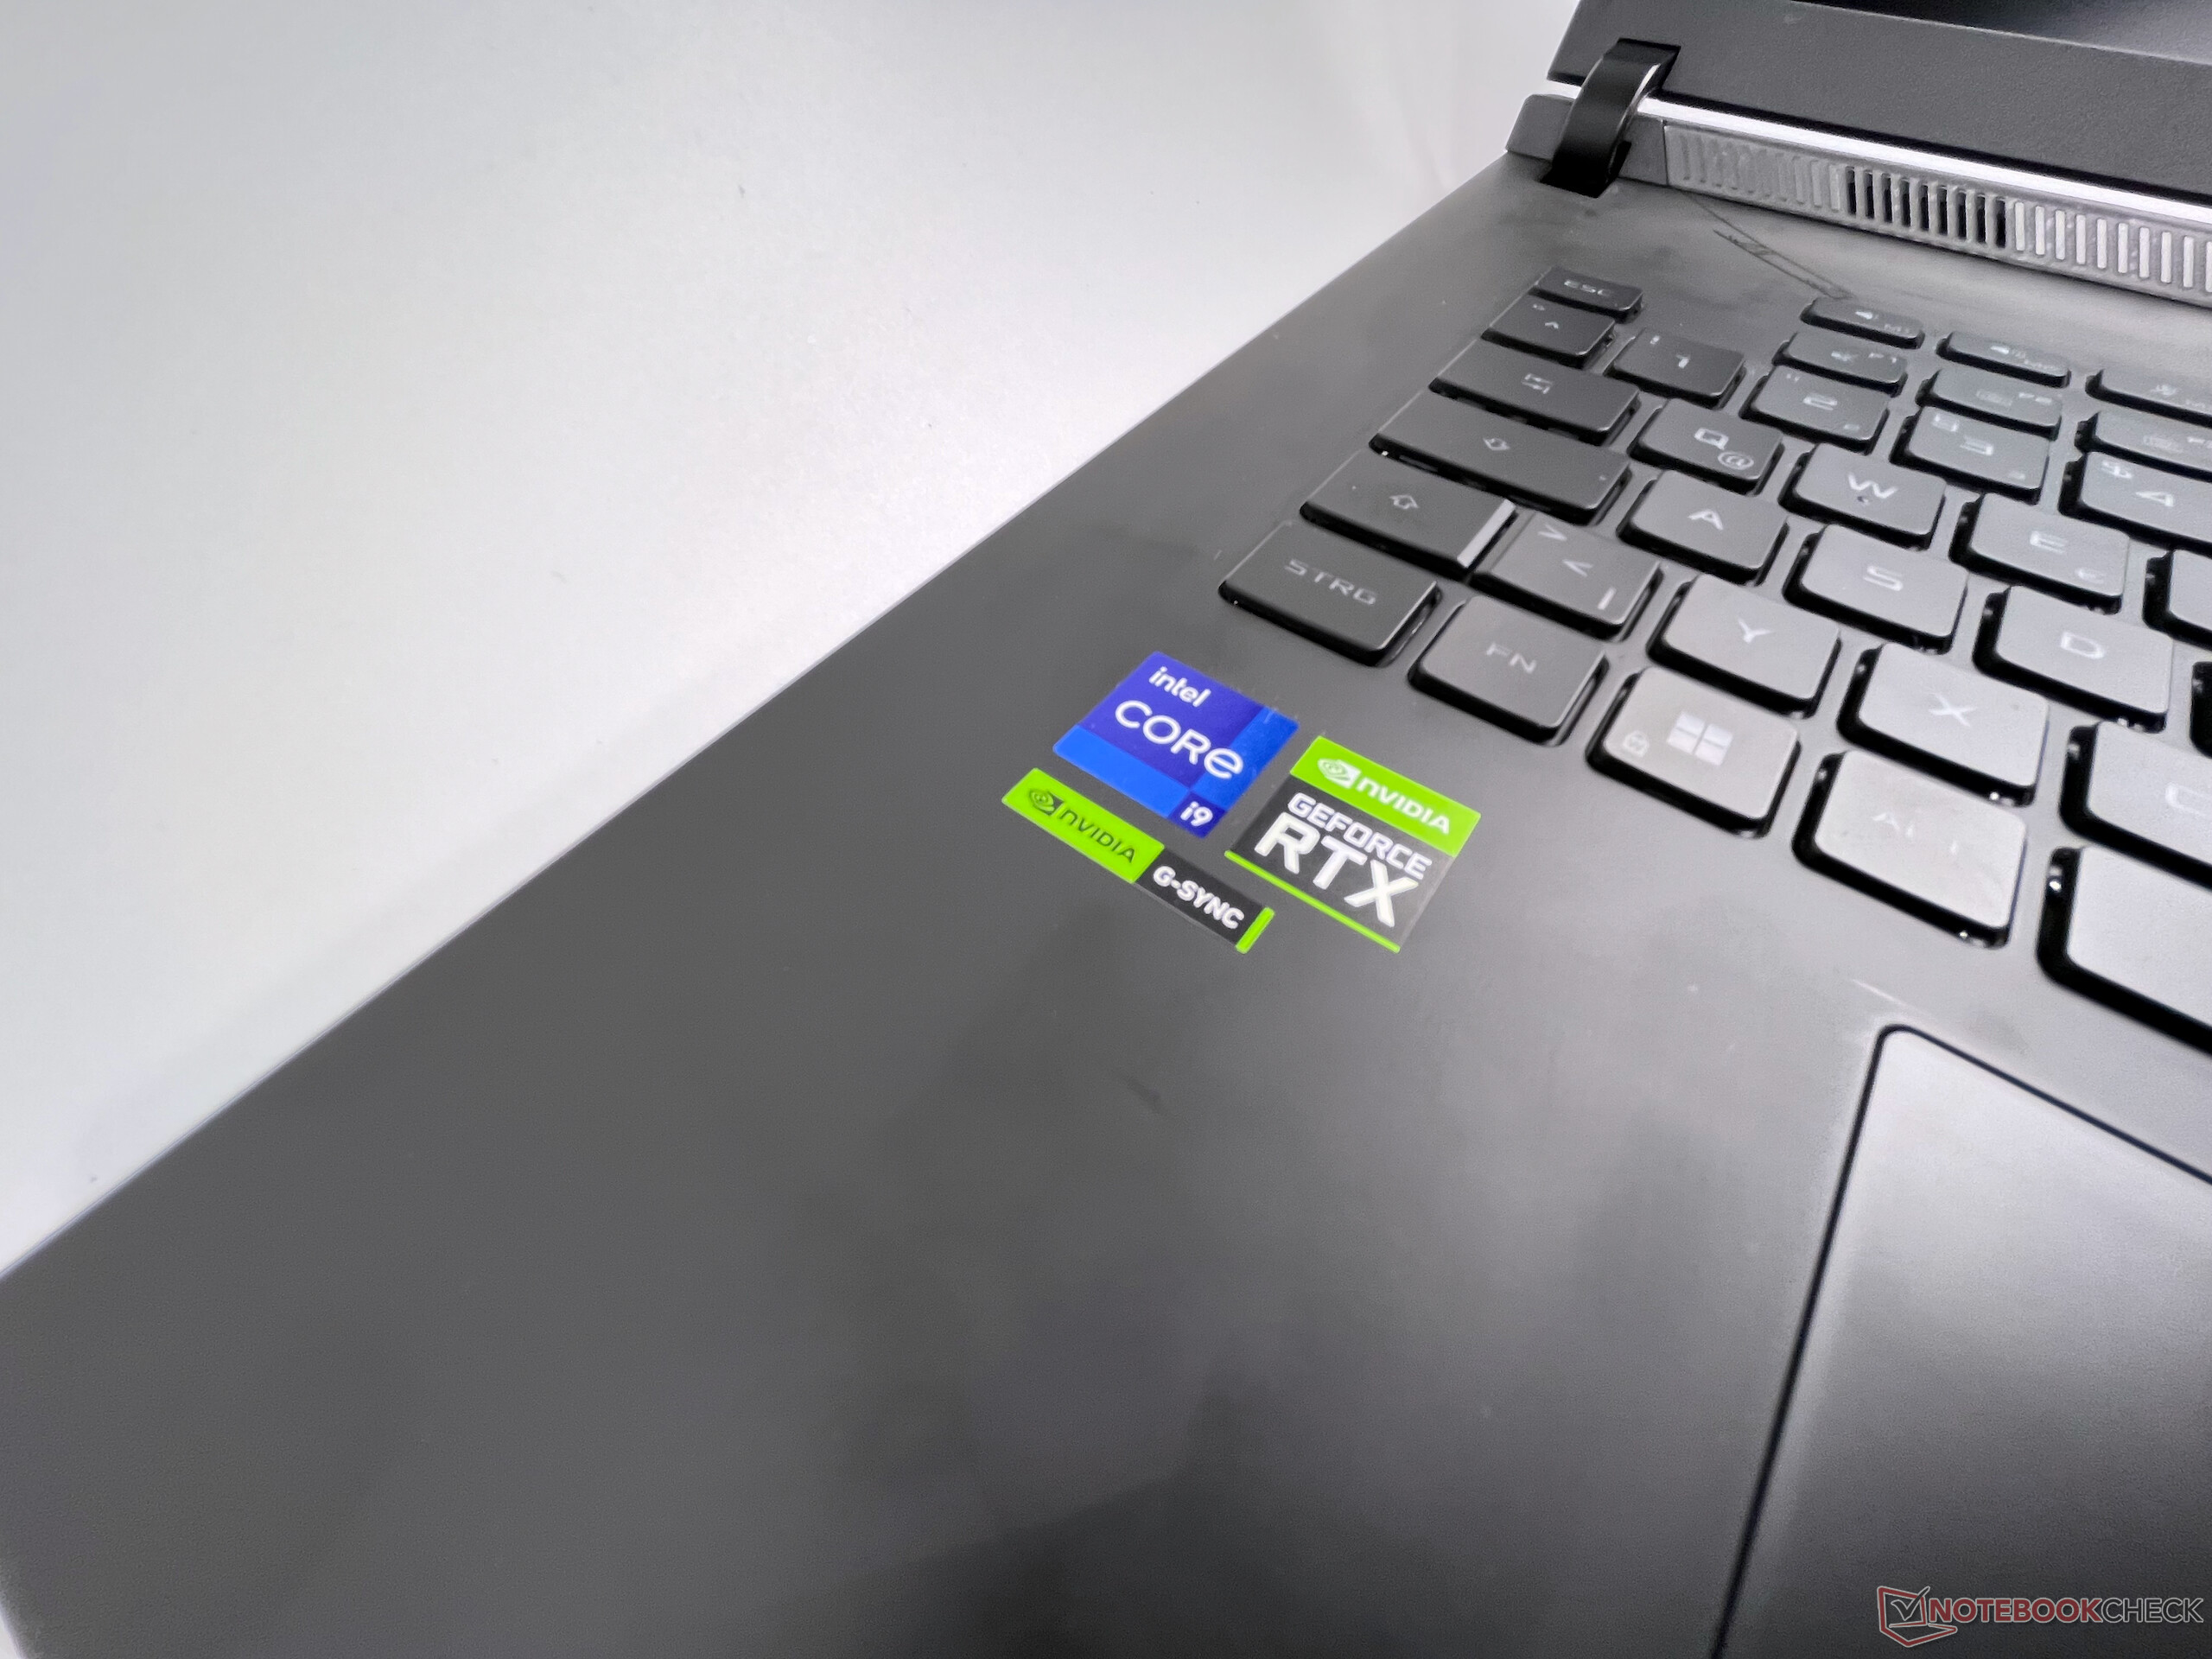
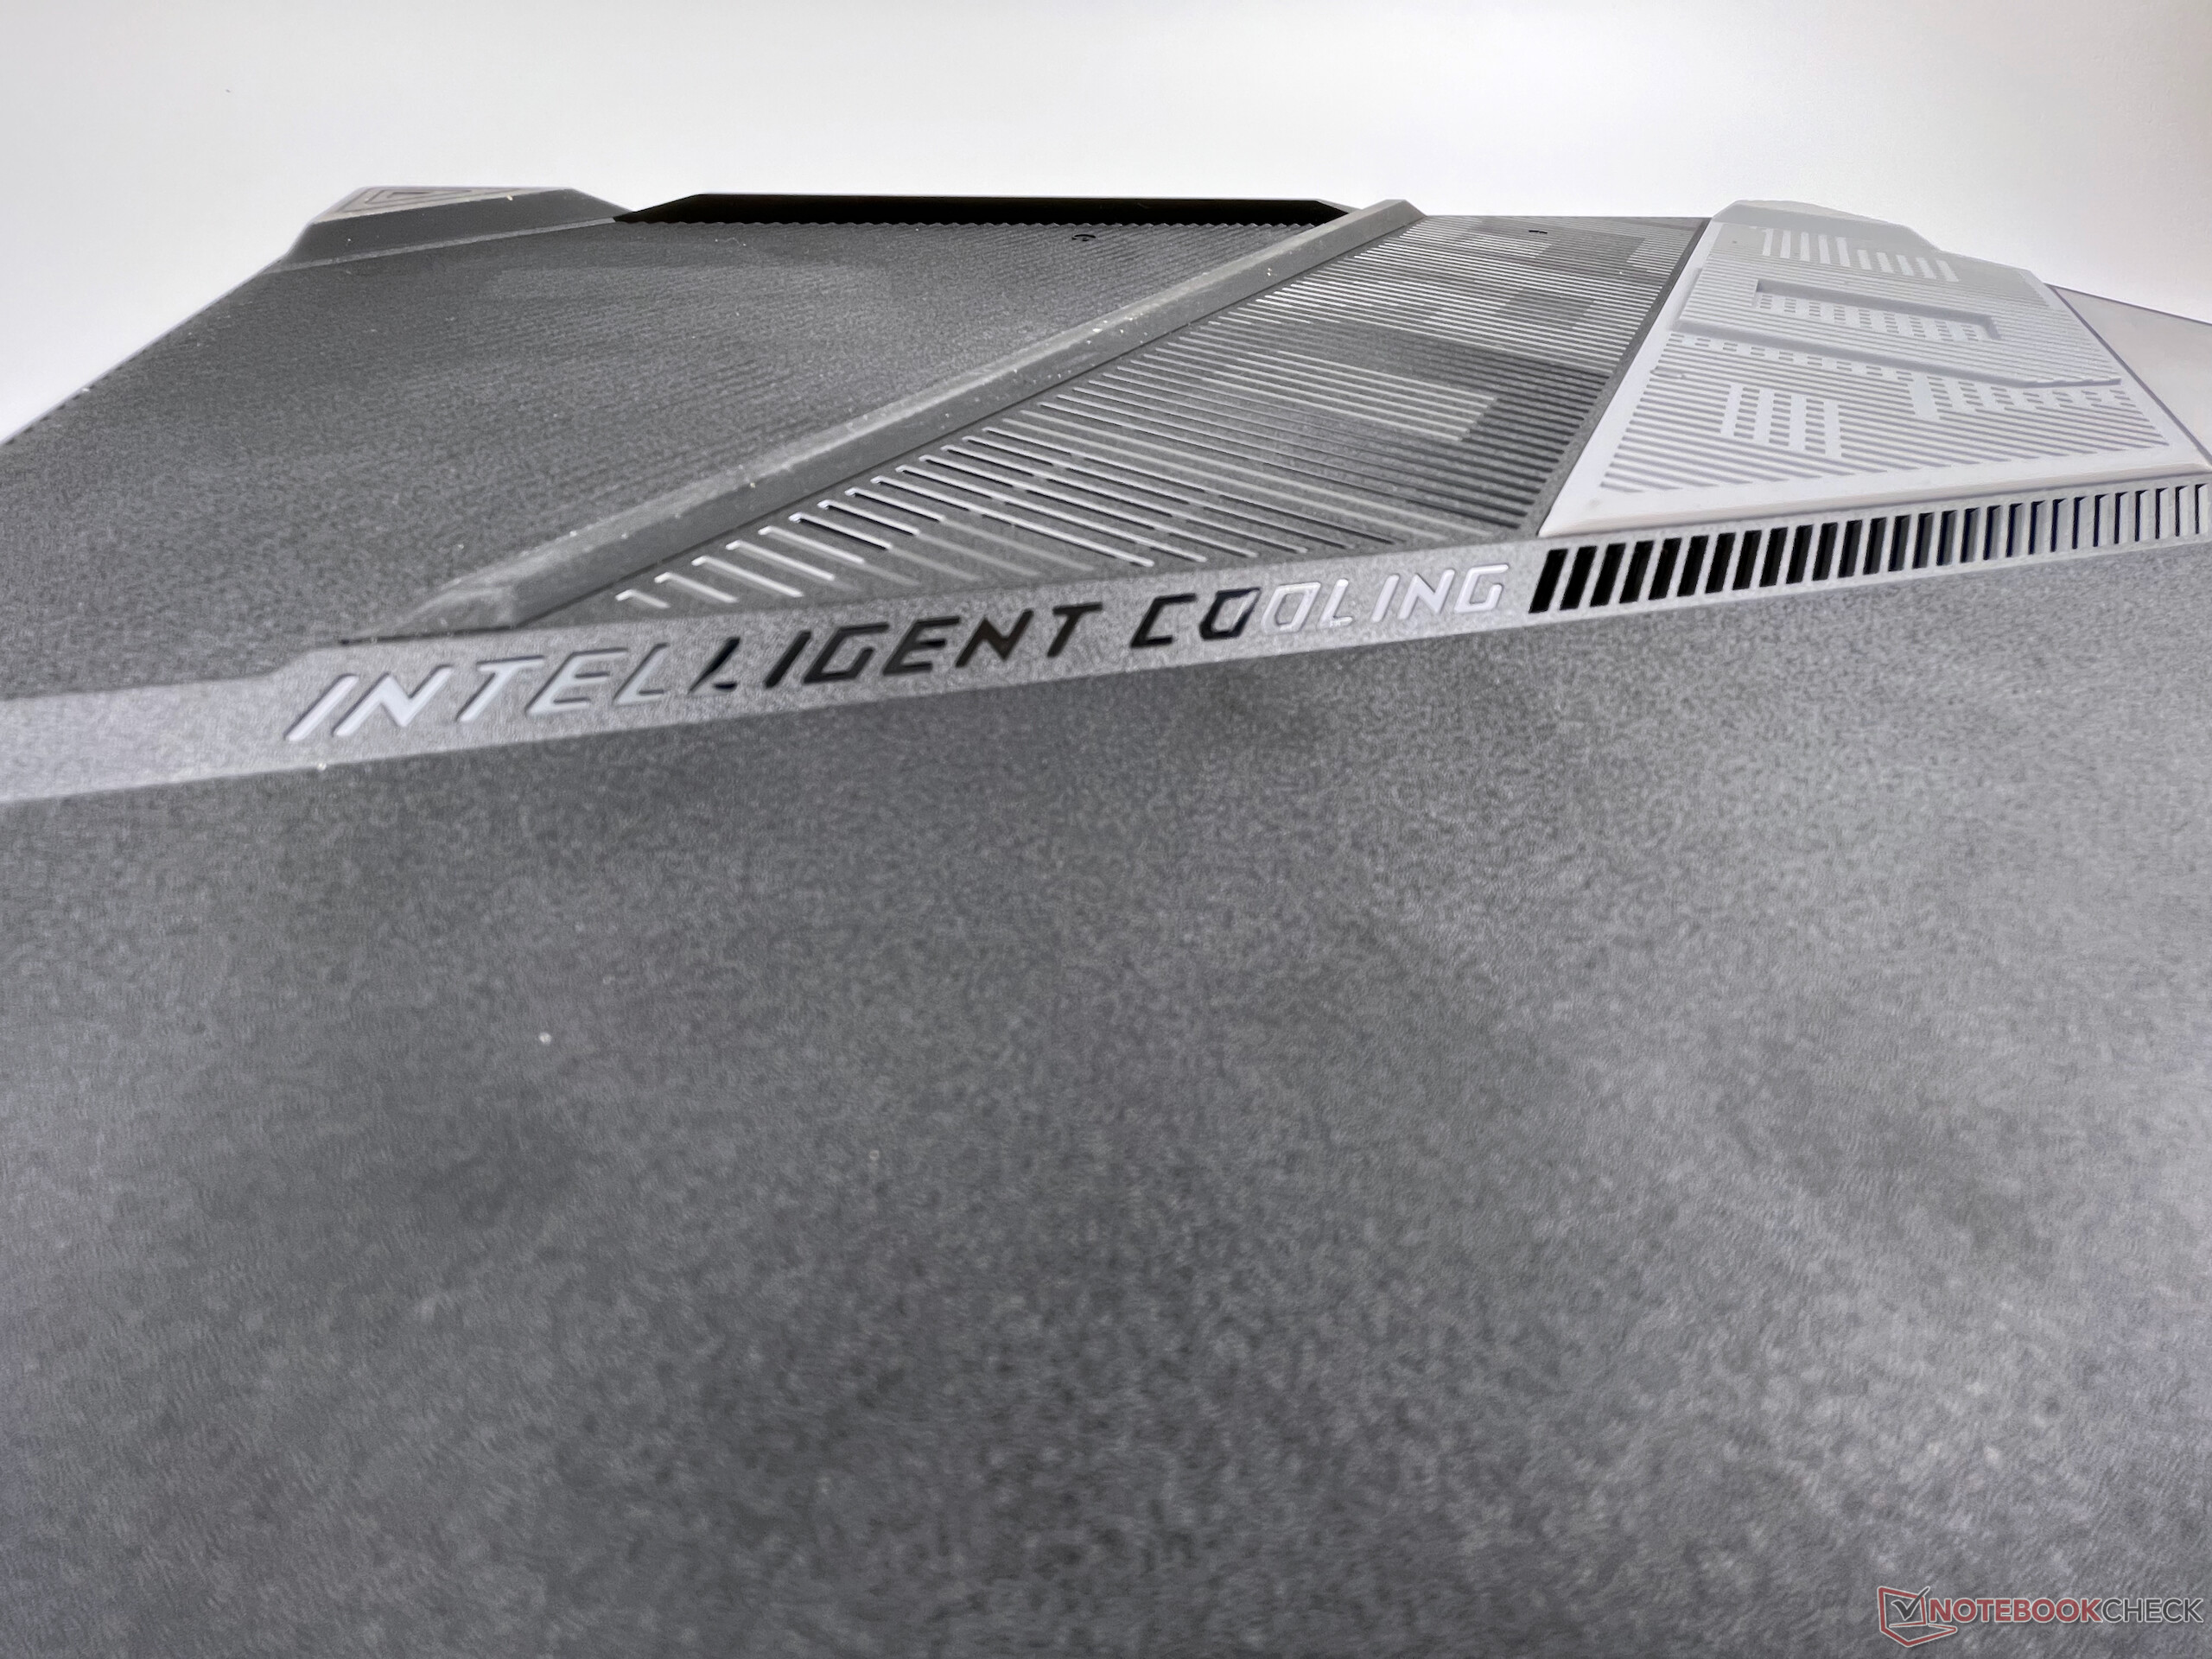
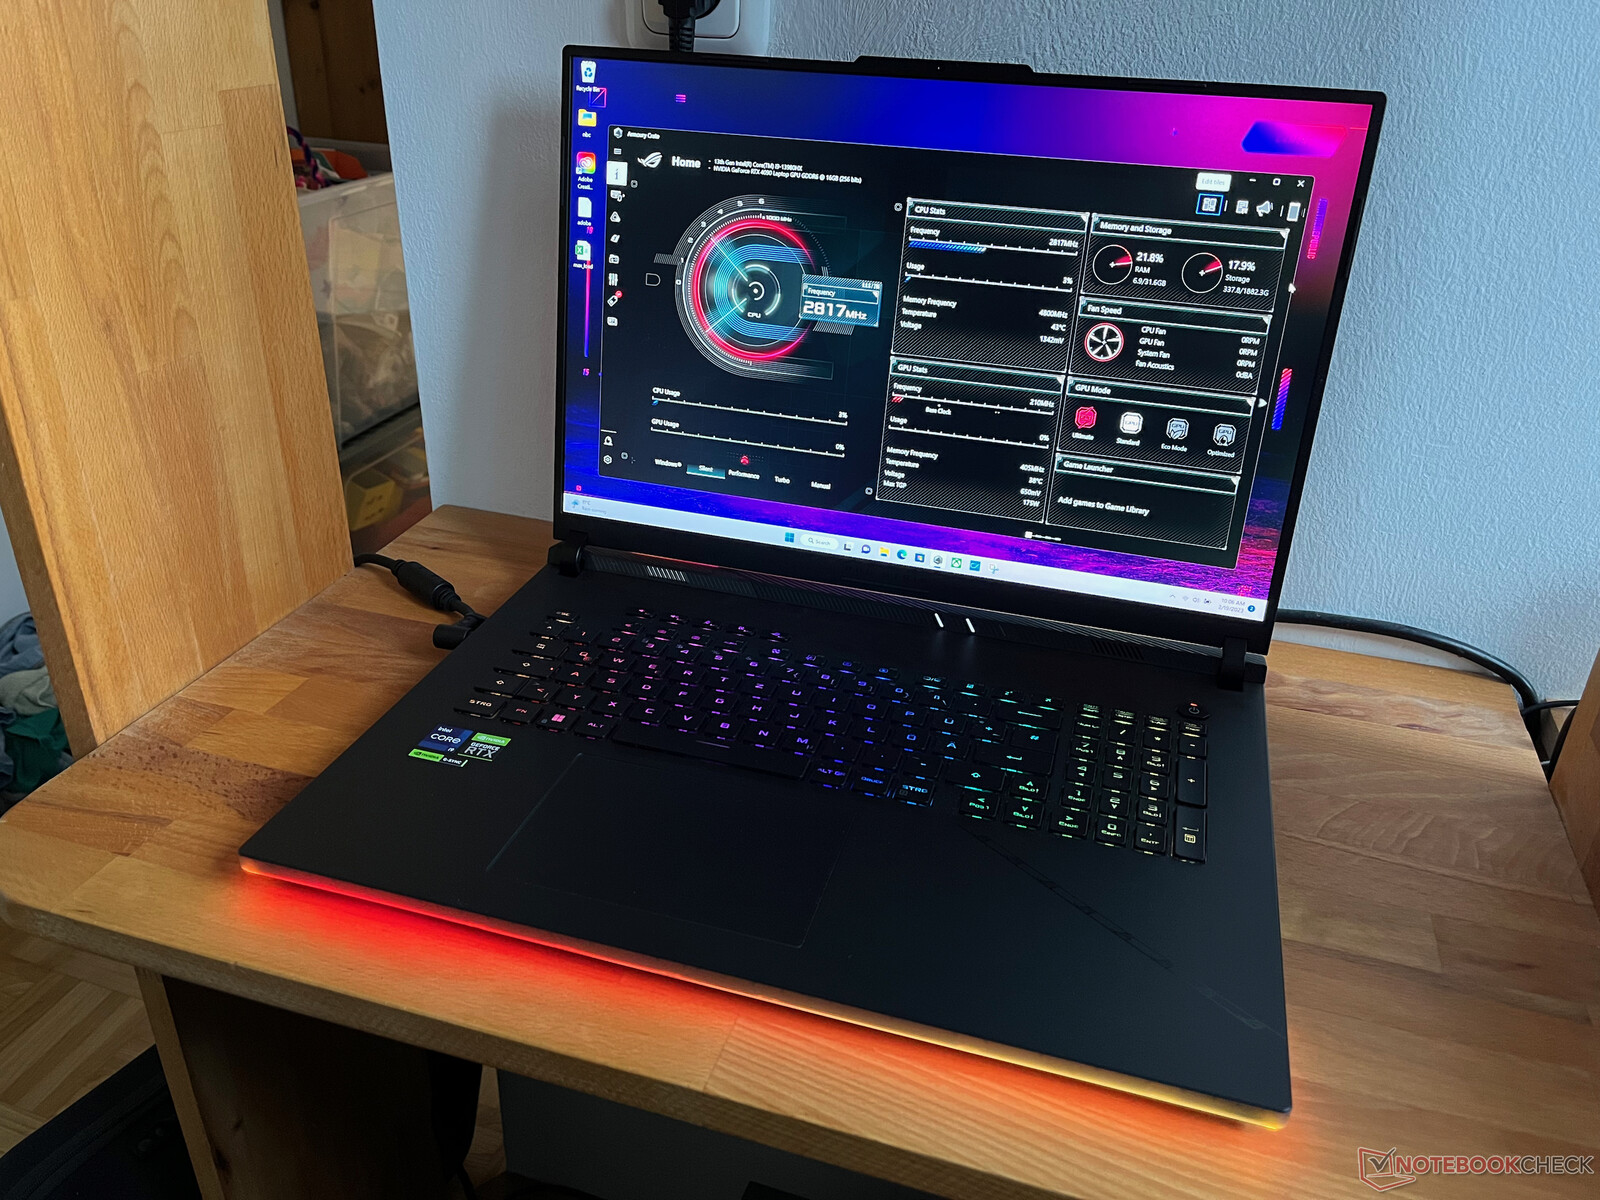
Con il ROG Strix Scar 18, Asus si unisce alla tendenza del revival dei mostri da gioco da 18 pollici. Per il lancio, c'è un nuovo case con la RTX 4080e RTX 4090utilizzate dalla nostra unità di test. In termini di CPU, Asus utilizza la nuova serie HX, il che significa che si ottengono i componenti per laptop più veloci attualmente disponibili sul mercato. Il grande case non solo è completamente utilizzato dal display QHD+ da 18 pollici, ma ospita anche un nuovo sistema di raffreddamento con tre ventole, che dovrebbe tenere sotto controllo i componenti più assetati di energia. Nel test che segue, diamo uno sguardo dettagliato al G834JY-N6005W con RTX 4090, 32 GB di RAM GDDR5 e 2 SSD da 1 TB attualmente disponibile in Inghilterra.
Potenziali concorrenti a confronto
Punteggio | Data | Modello | Peso | Altezza | Dimensione | Risoluzione | Prezzo |
|---|---|---|---|---|---|---|---|
| 86.6 % v7 (old) | 02/2023 | Asus ROG Strix Scar 18 2023 G834JY-N6005W i9-13980HX, GeForce RTX 4090 Laptop GPU | 3.1 kg | 30.8 mm | 18.00" | 2560x1600 | |
| 89 % v7 (old) | 02/2023 | MSI Titan GT77 HX 13VI i9-13950HX, GeForce RTX 4090 Laptop GPU | 3.5 kg | 23 mm | 17.30" | 3840x2160 | |
| 89.4 % v7 (old) | 02/2023 | Lenovo Legion Pro 7 16IRX8H i9-13900HX, GeForce RTX 4080 Laptop GPU | 2.7 kg | 26 mm | 16.00" | 2560x1600 | |
| 91.2 % v7 (old) | 02/2023 | Razer Blade 16 Early 2023 i9-13950HX, GeForce RTX 4080 Laptop GPU | 2.4 kg | 21.99 mm | 16.00" | 2560x1600 | |
| 86.9 % v7 (old) | 11/2022 | Asus ROG Strix Scar 17 SE G733CX-LL014W i9-12950HX, GeForce RTX 3080 Ti Laptop GPU | 2.9 kg | 28.3 mm | 17.30" | 2560x1440 | |
| 88.3 % v7 (old) | 08/2022 | MSI Titan GT77 12UHS i9-12900HX, GeForce RTX 3080 Ti Laptop GPU | 3.3 kg | 23 mm | 17.30" | 1920x1080 | |
| 85.4 % v7 (old) | 03/2023 | HP Omen 17-ck2097ng i9-13900HX, GeForce RTX 4080 Laptop GPU | 2.8 kg | 27 mm | 17.30" | 2560x1440 |
Caso
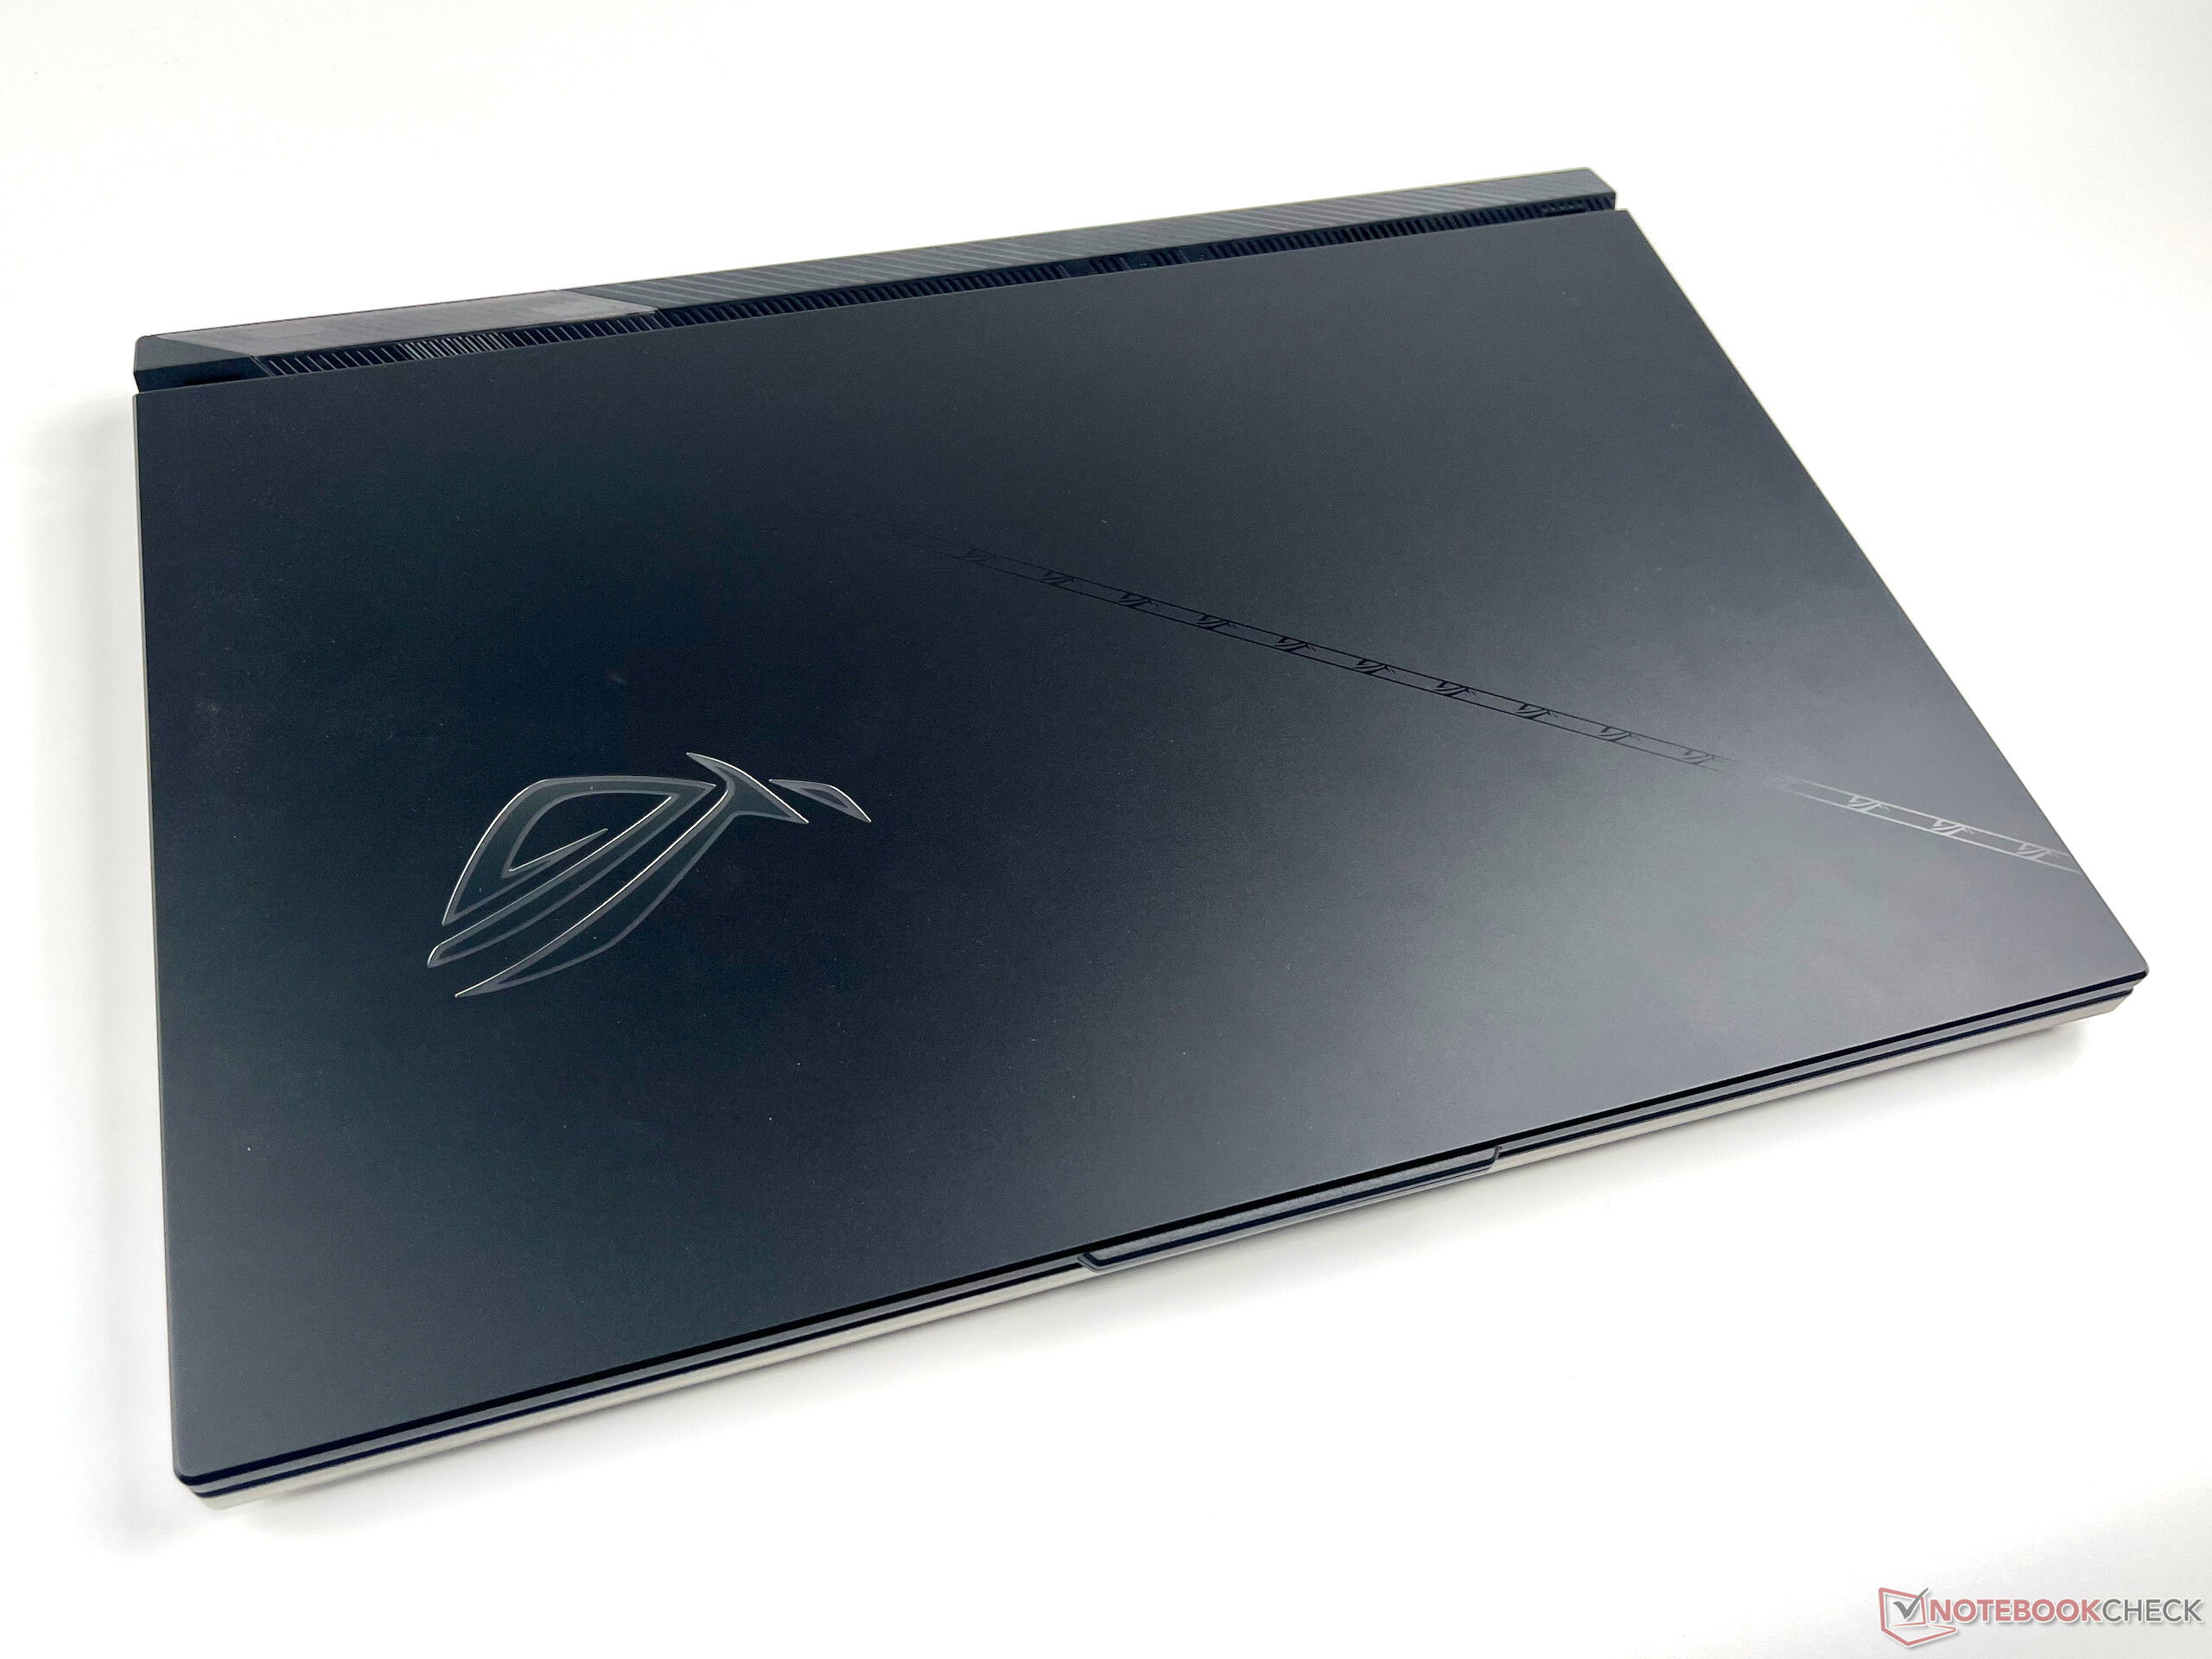
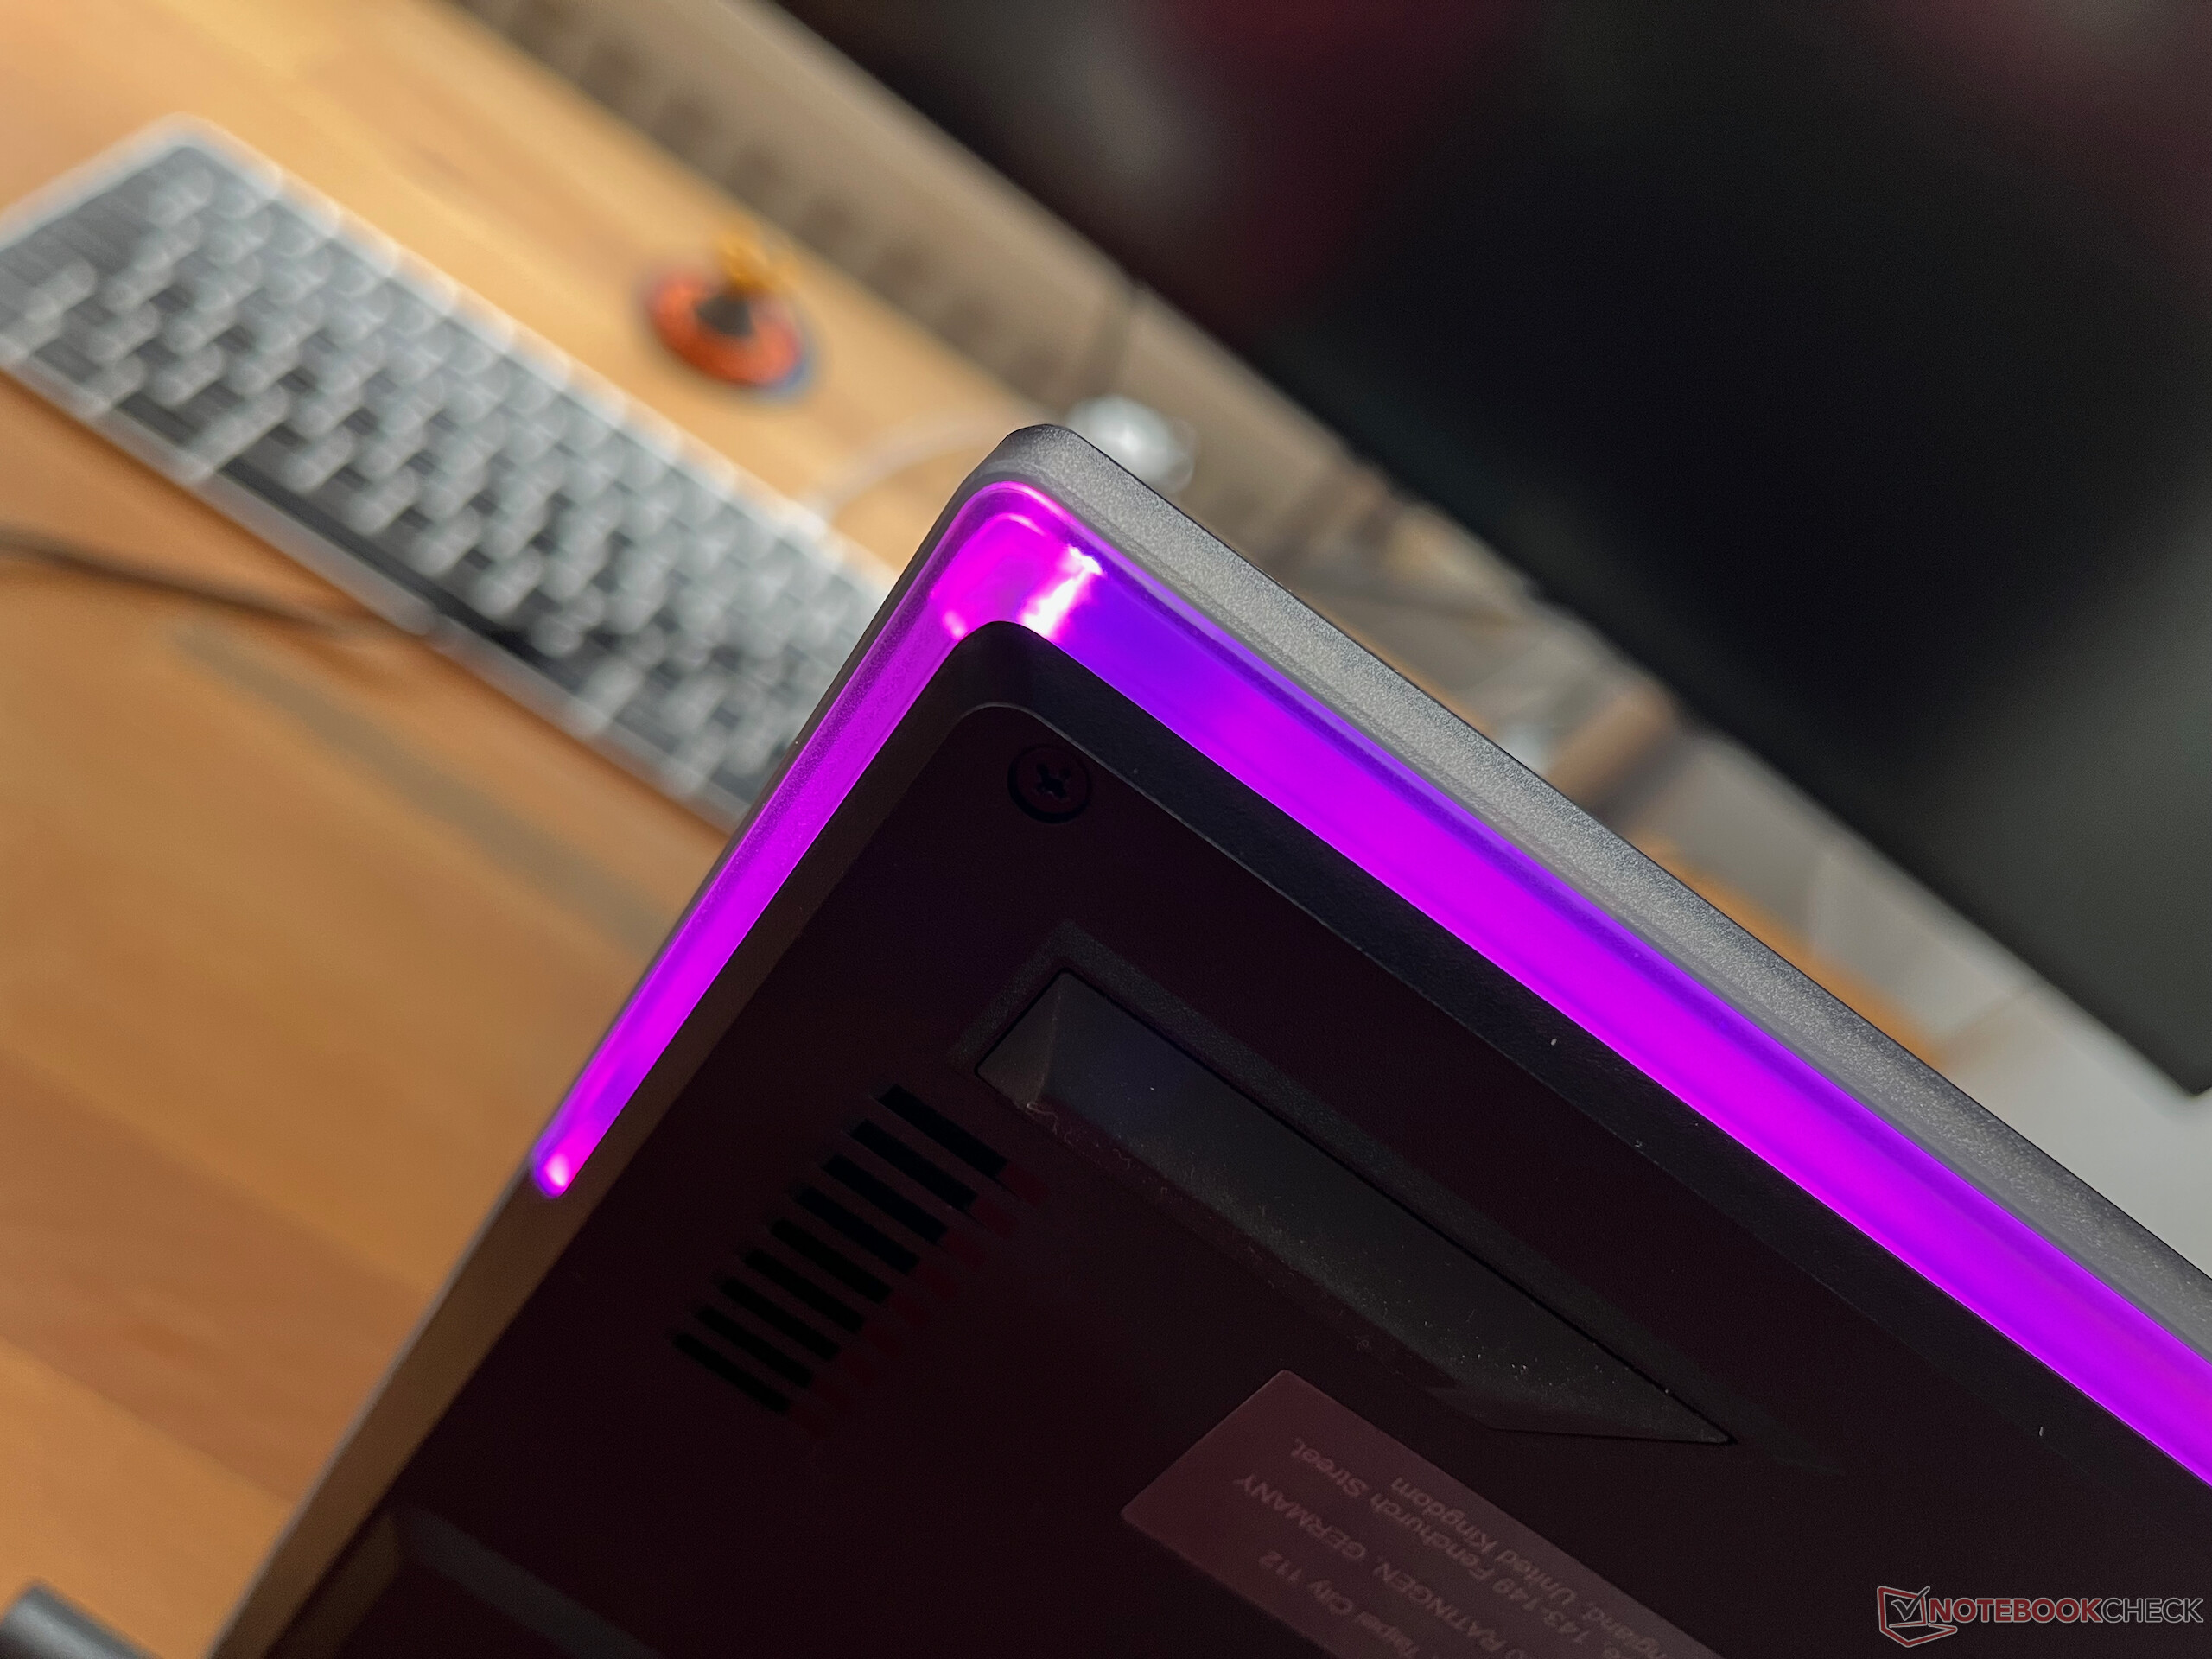
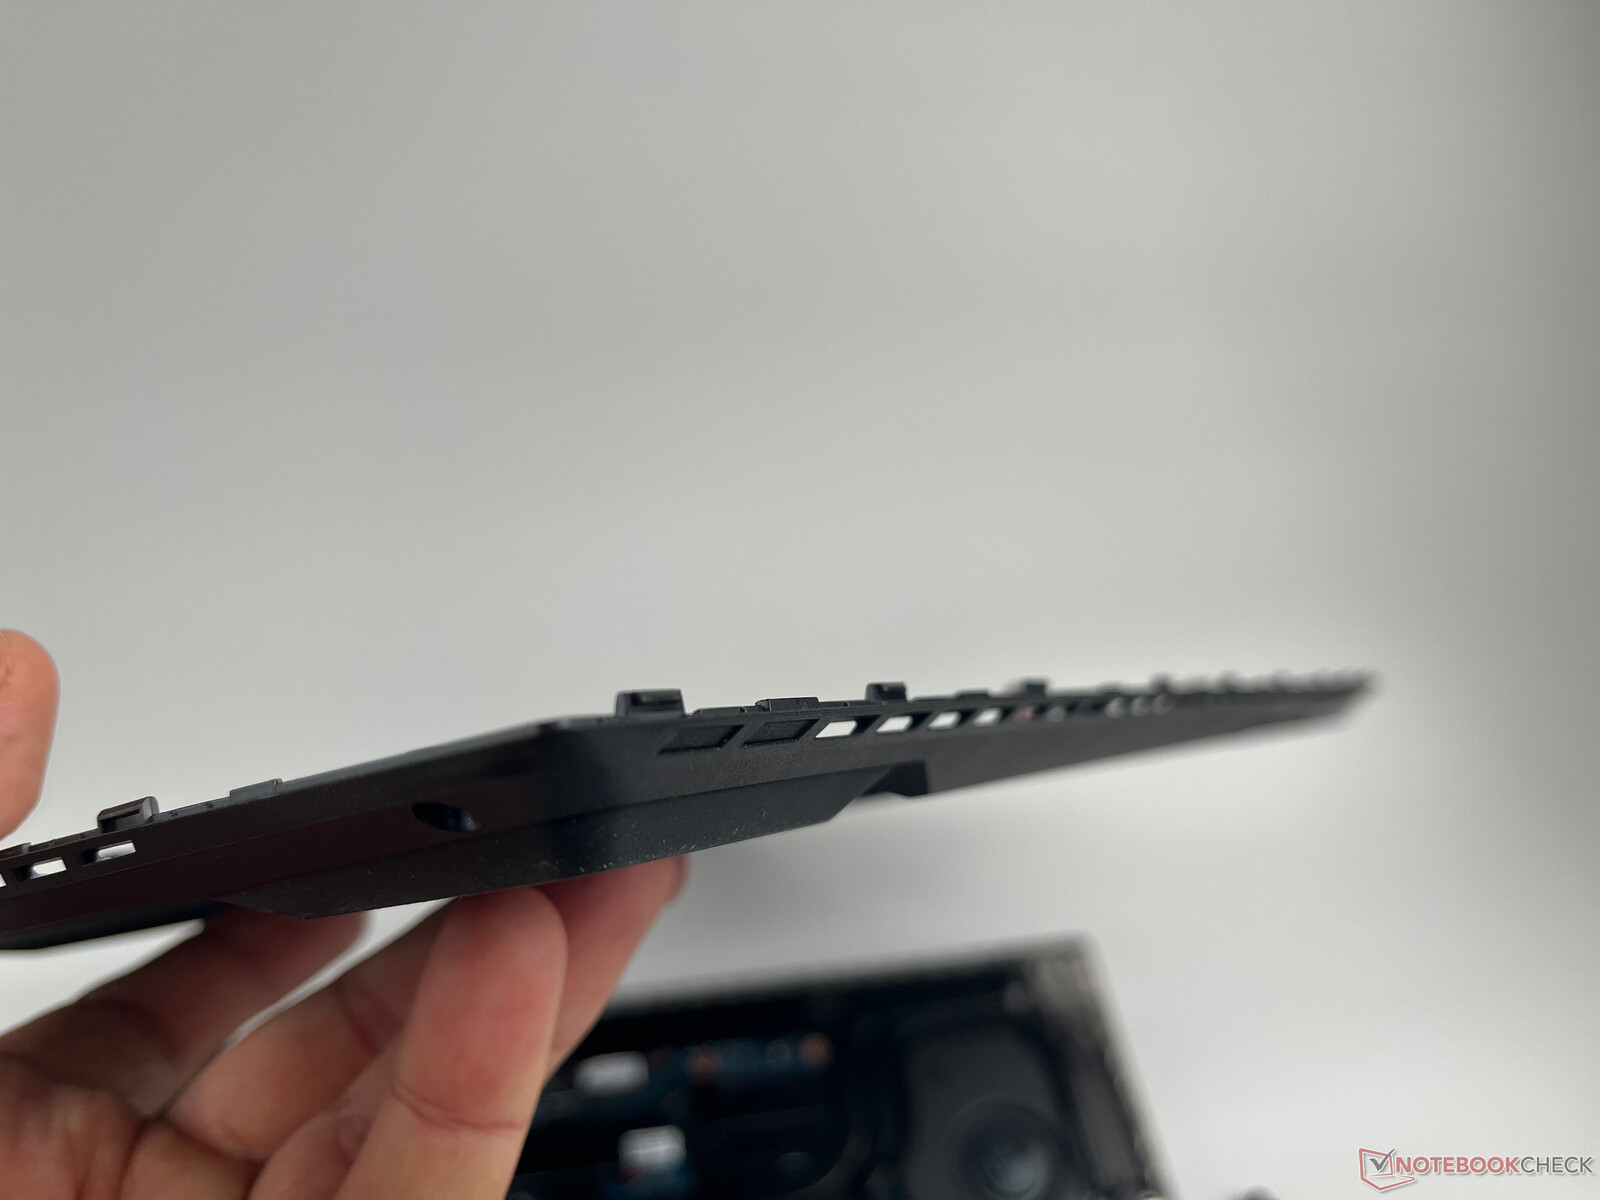
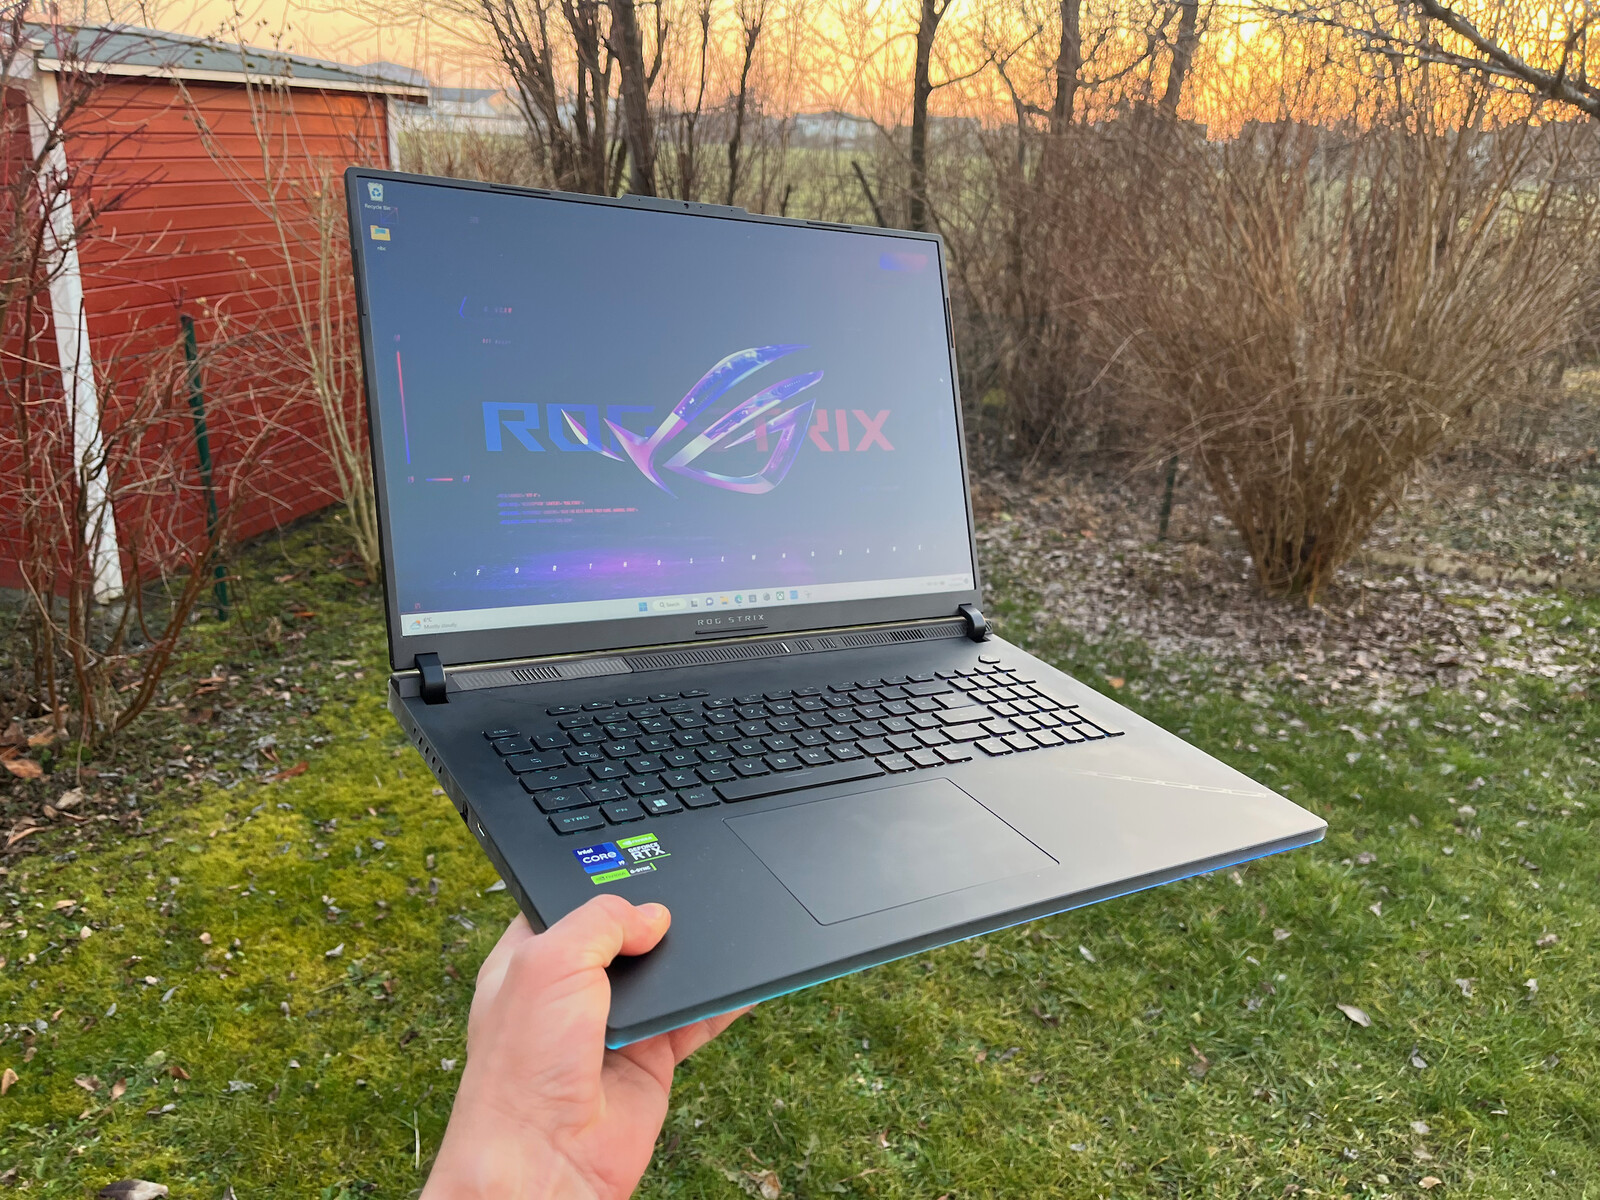
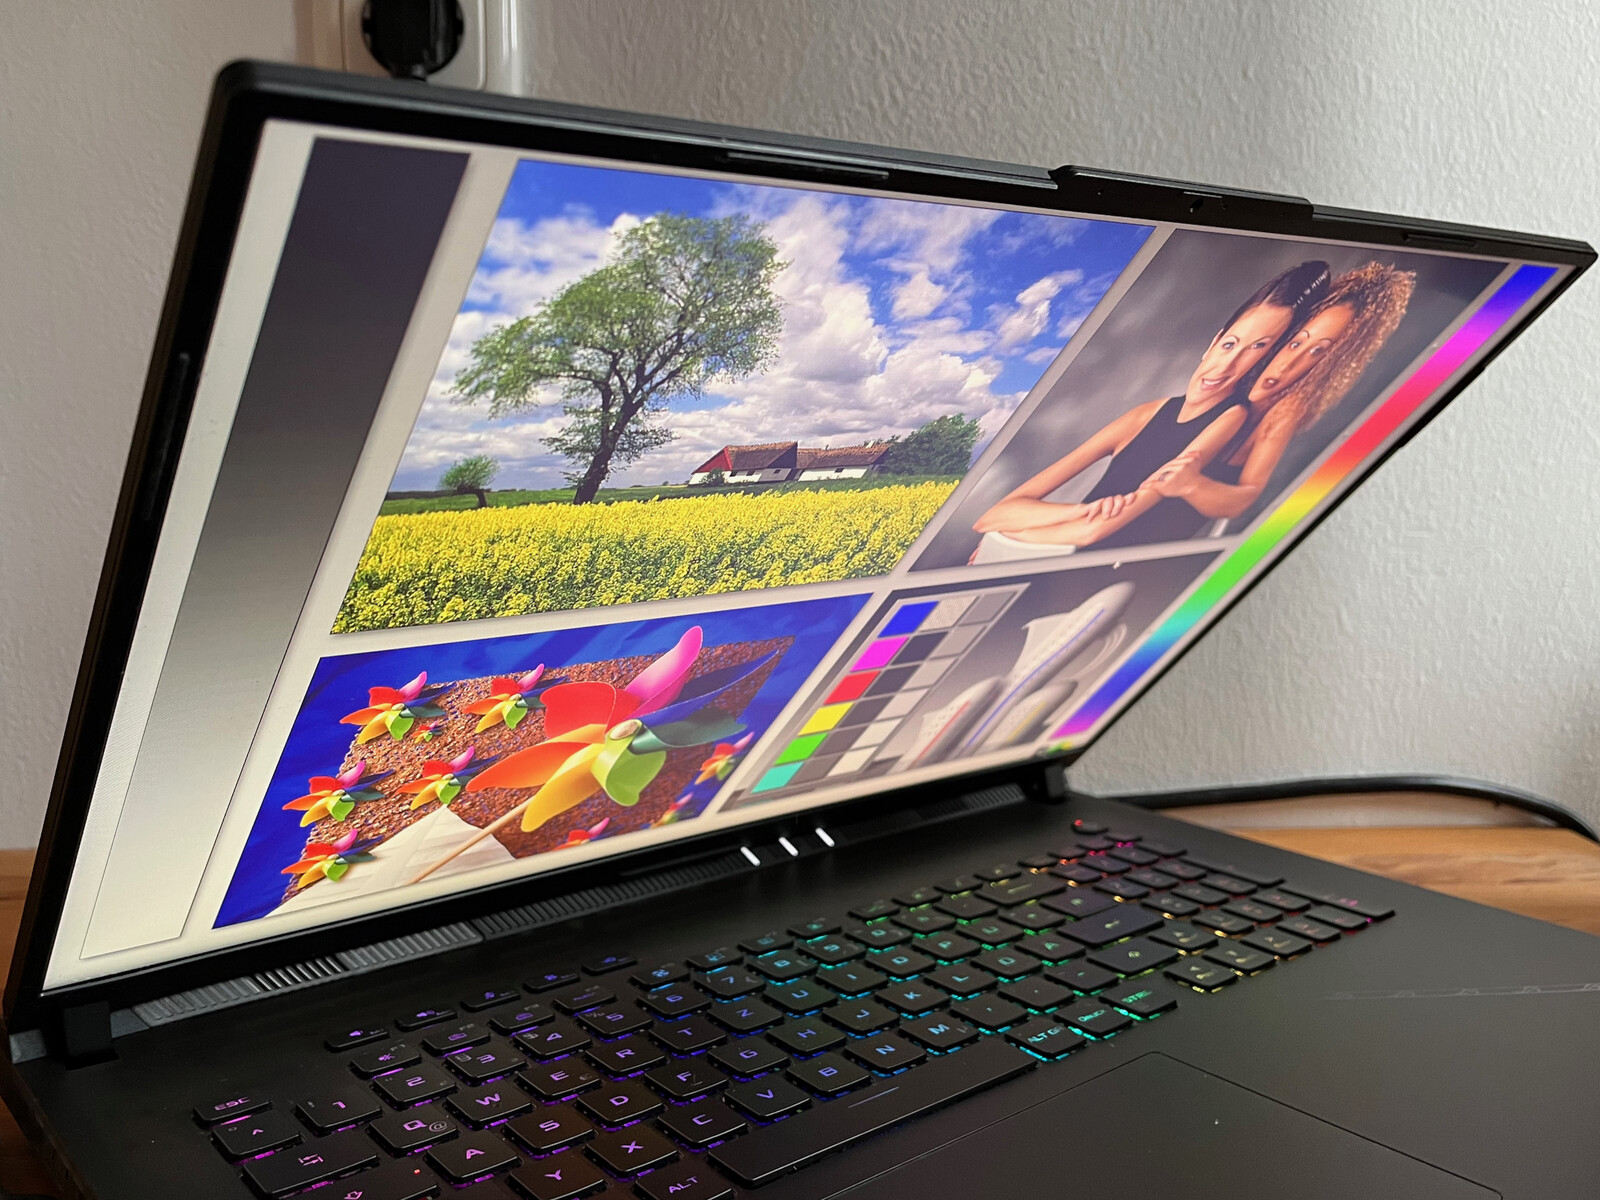
Il case dovrebbe essere un punto di forza grazie all'uso massiccio di LED RGB e di elementi trasparenti. Allo stesso tempo, il design di base è relativamente discreto e abbastanza attraente. Solo le superfici trasparenti sui lati sembrano un po' cheap. La base stessa è realizzata in plastica e non dà una sensazione di alta qualità. Inoltre, si deforma leggermente quando la si solleva. D'altra parte, il coperchio del display in alluminio è molto più stabile e protegge sufficientemente il display.
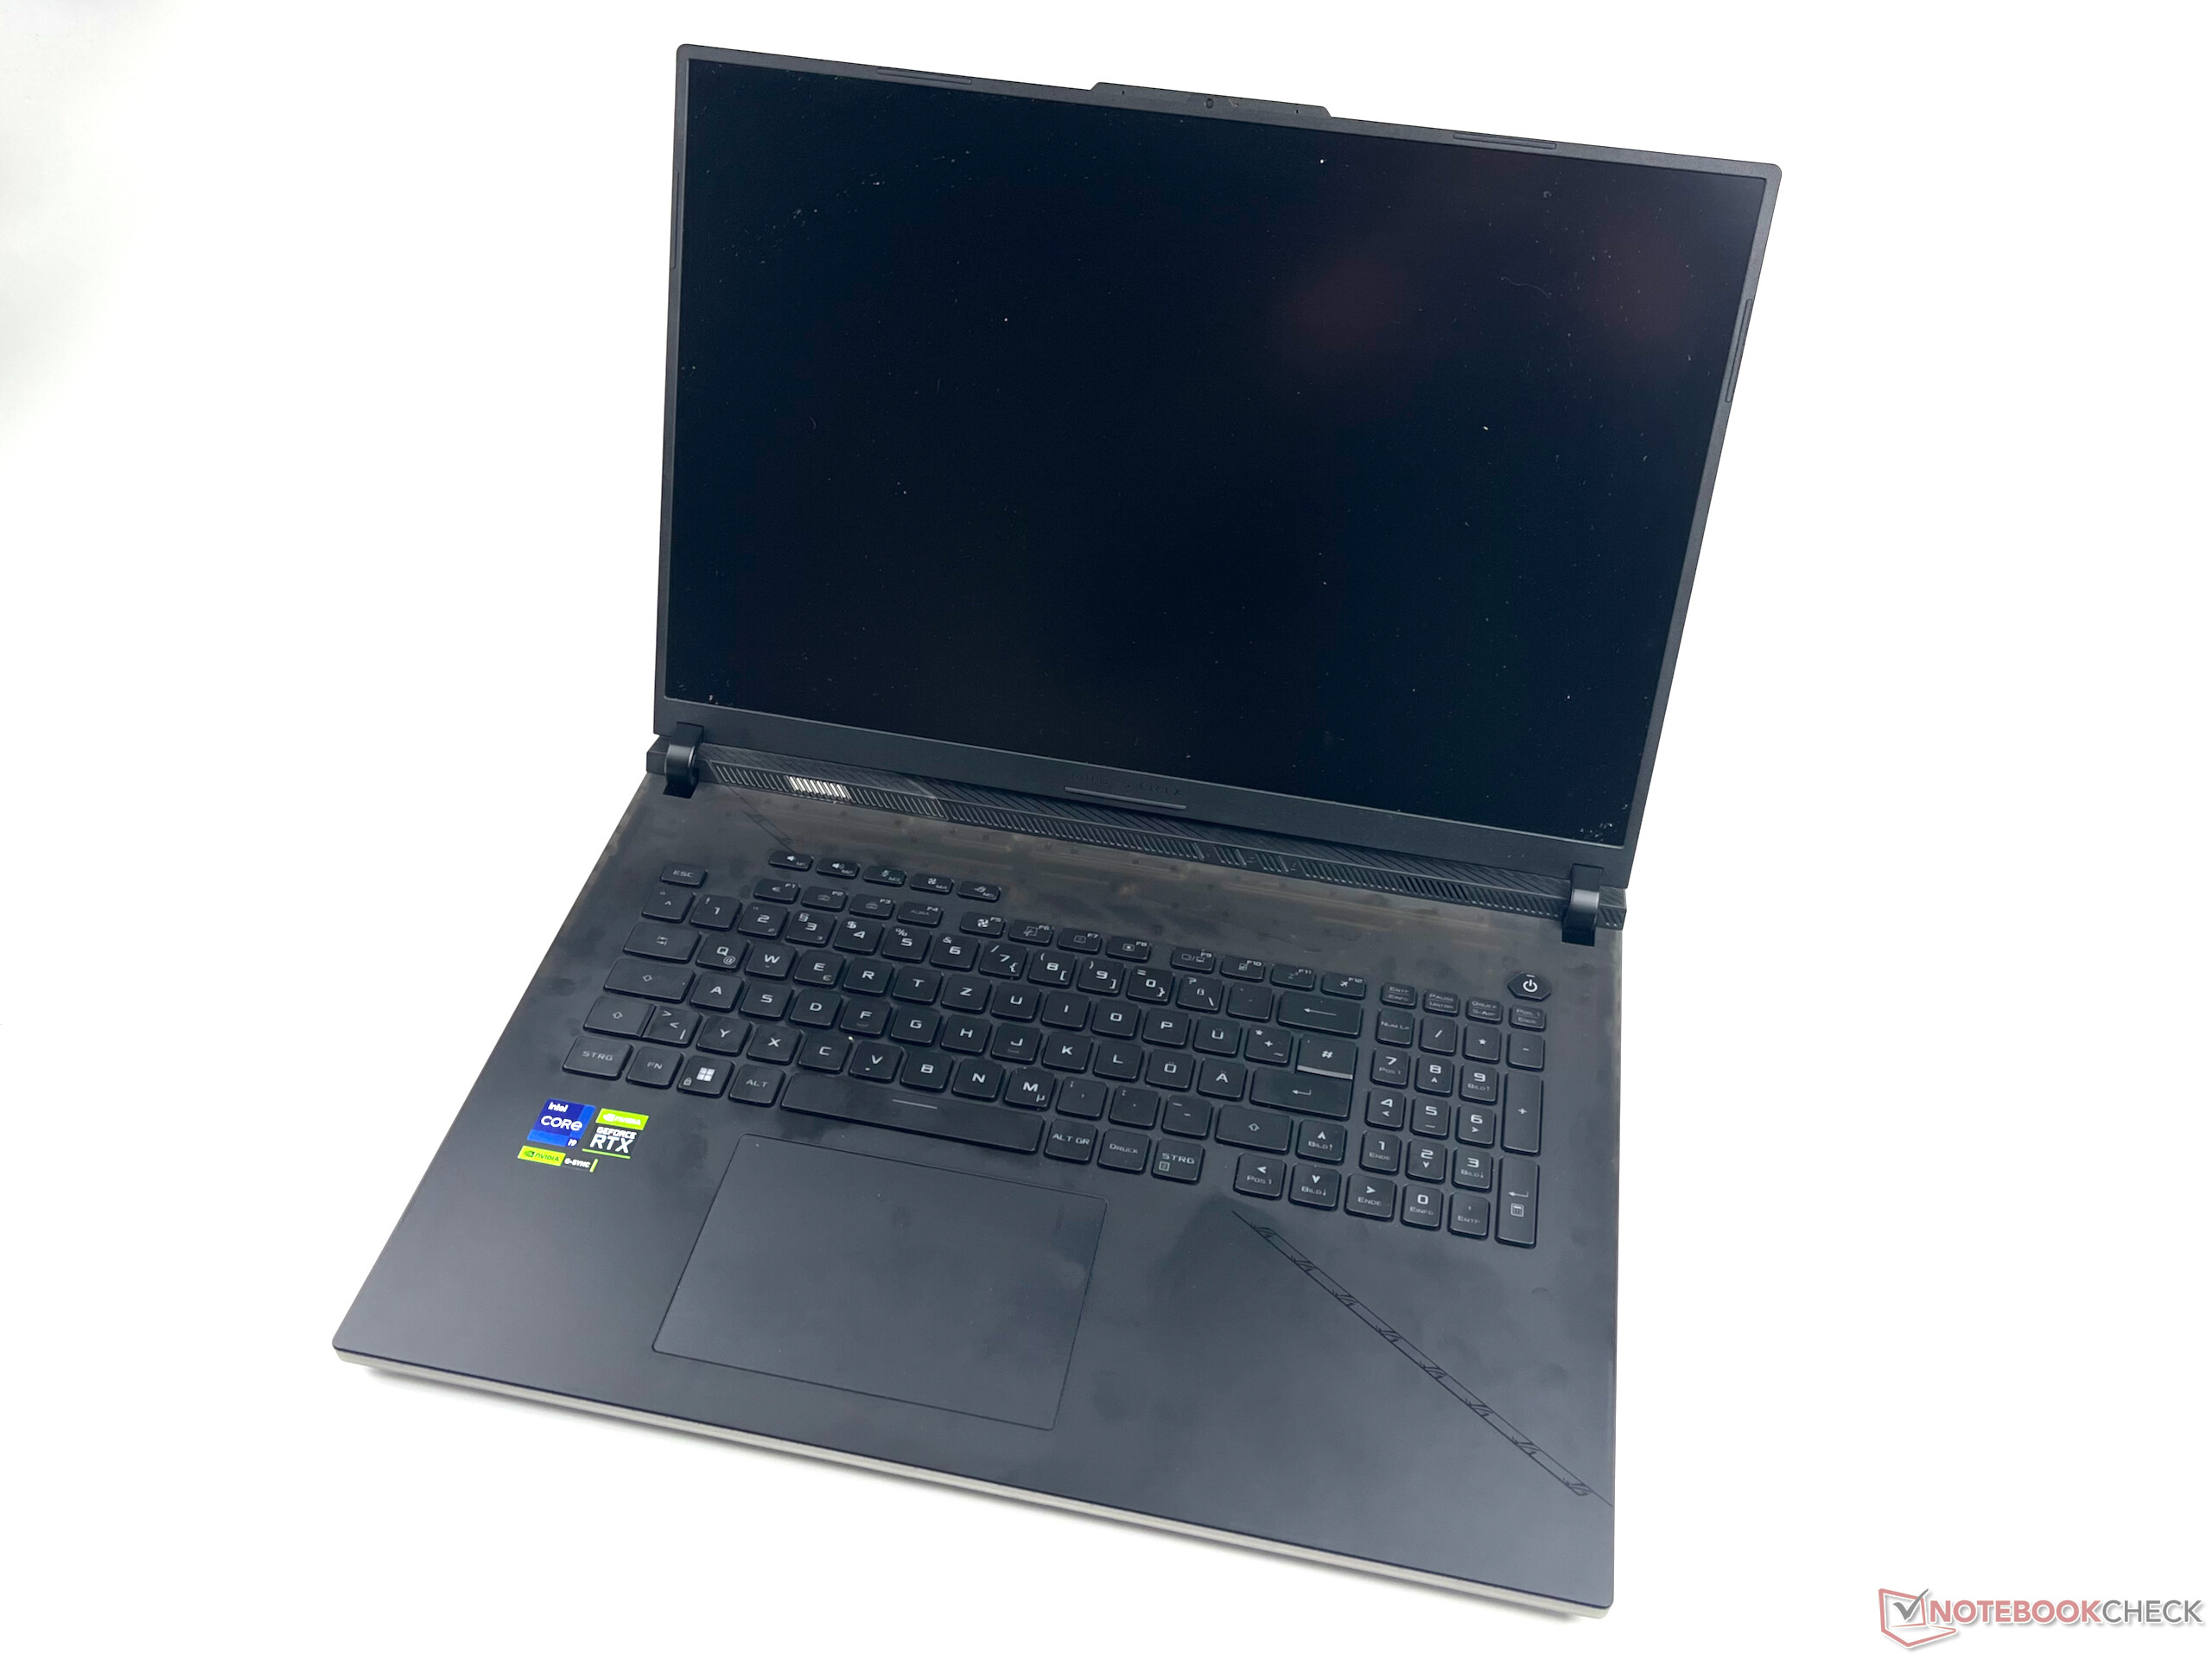
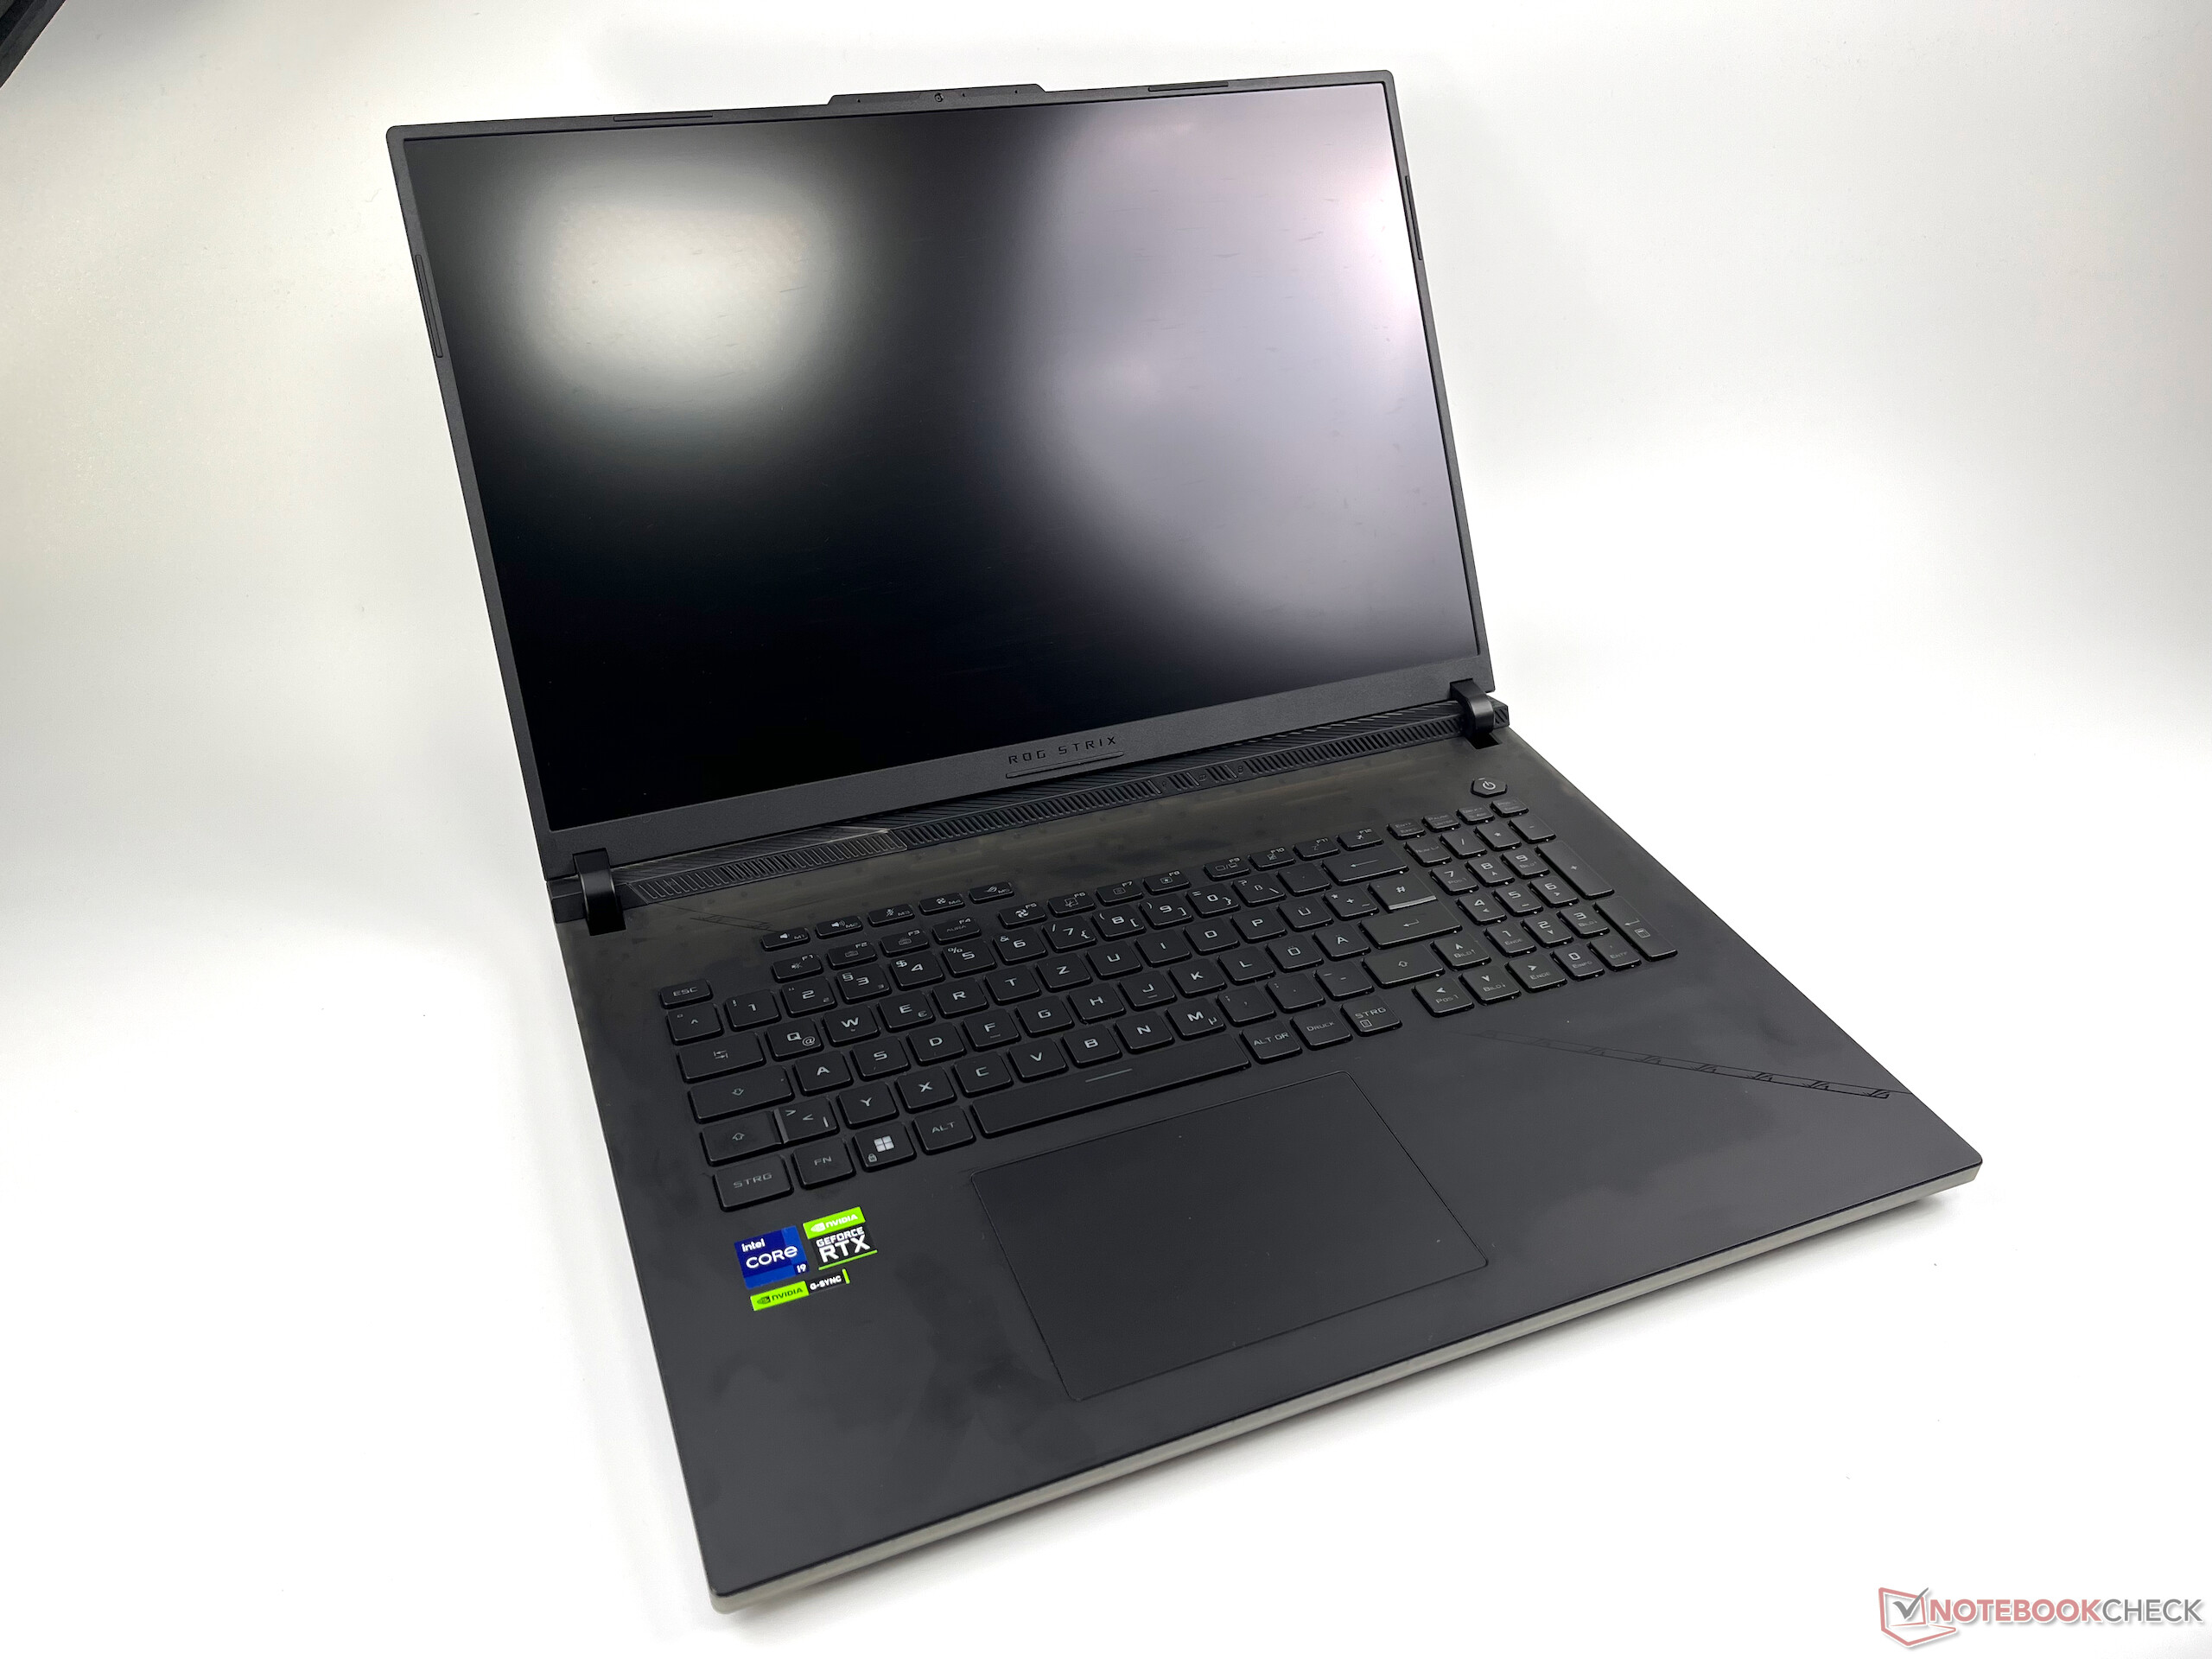

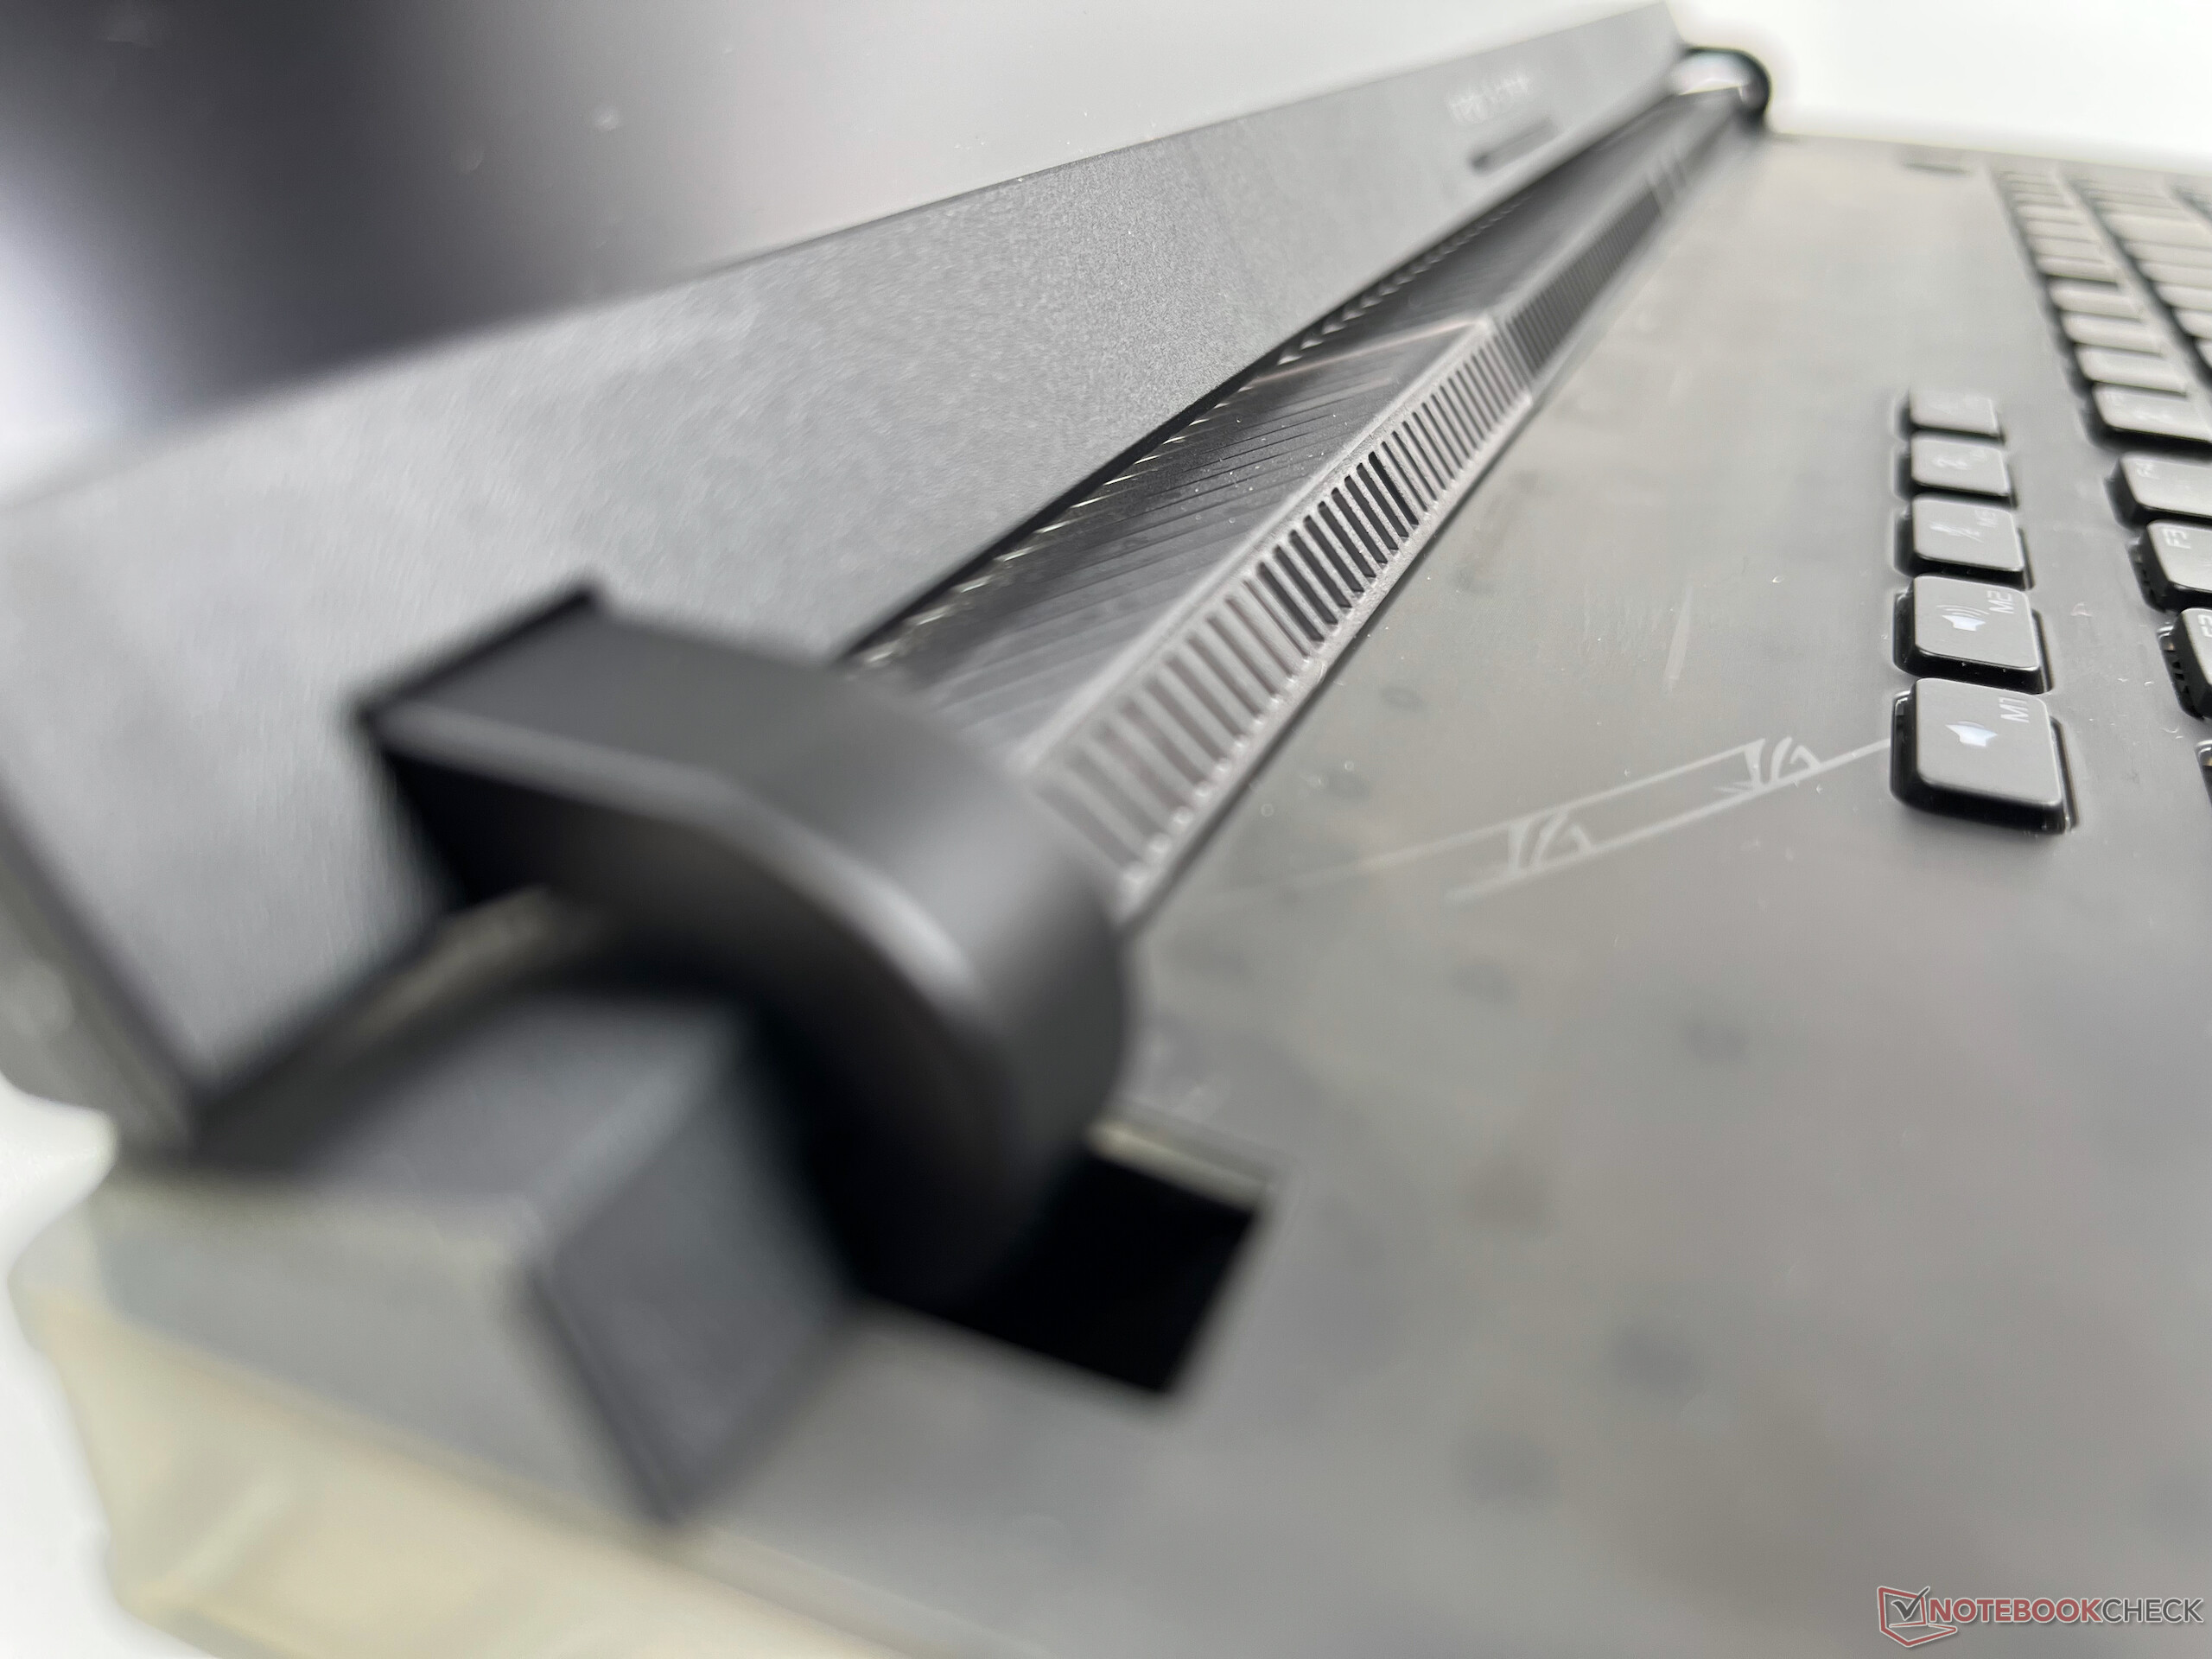
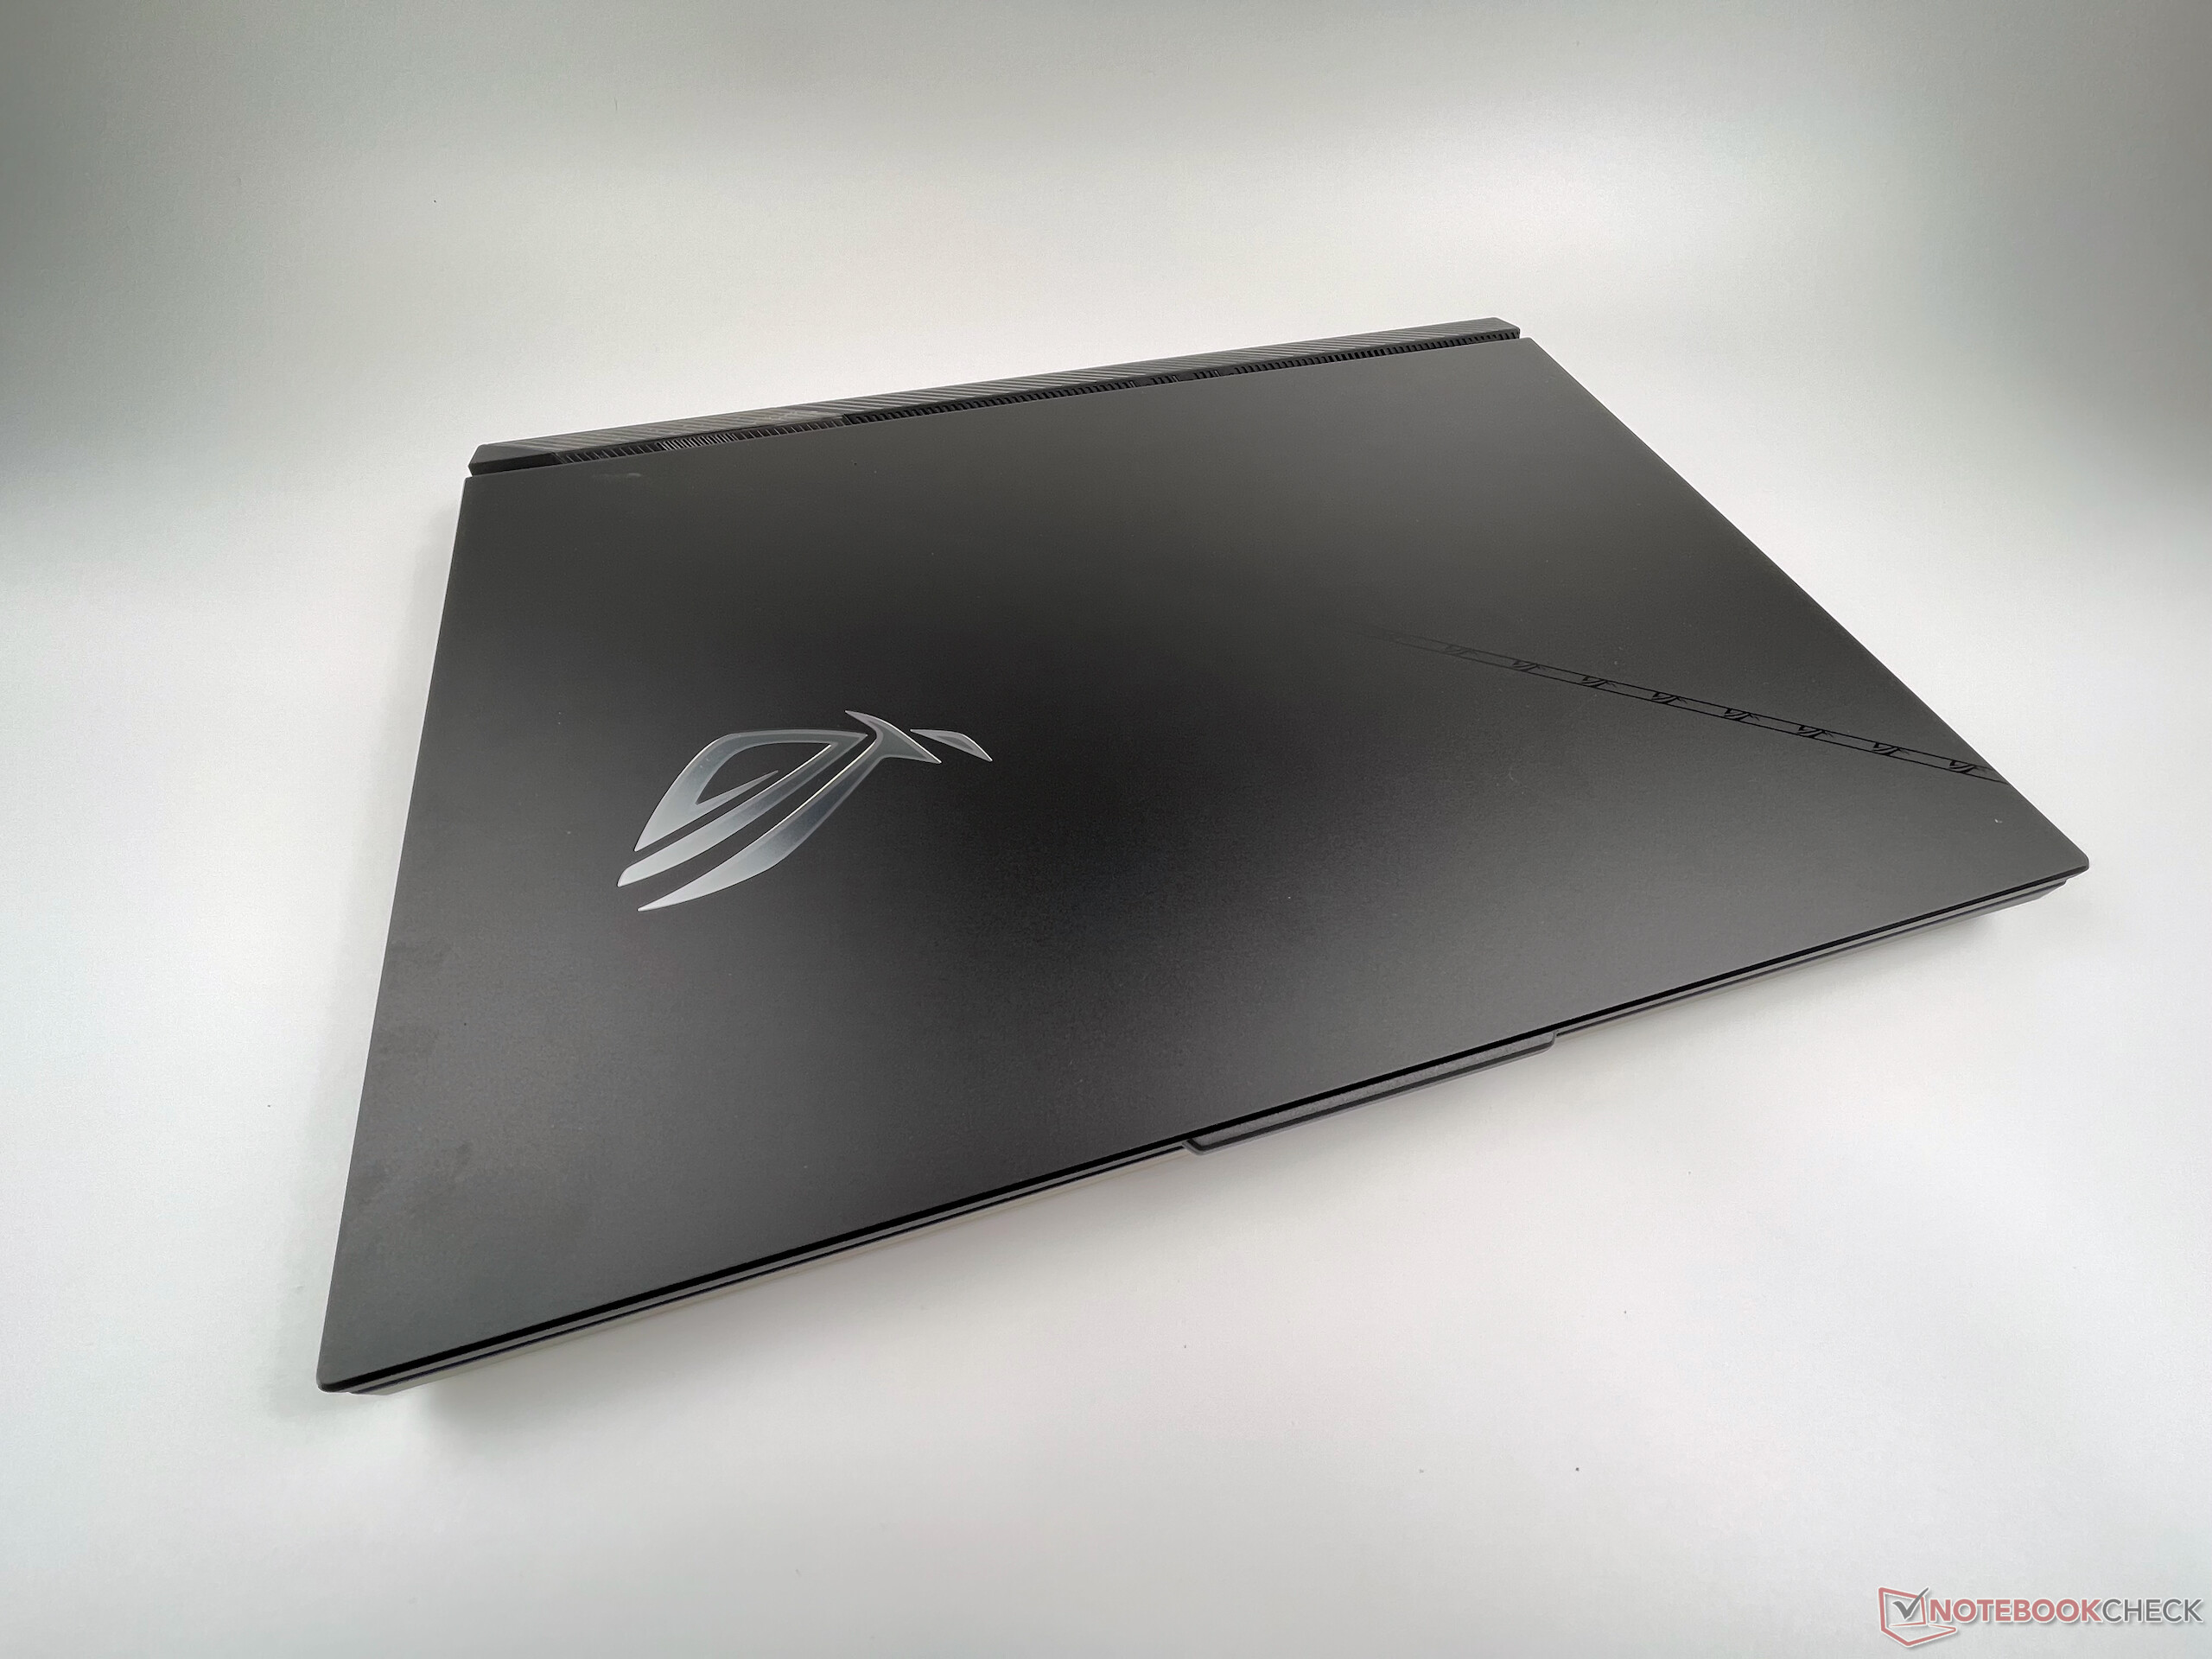
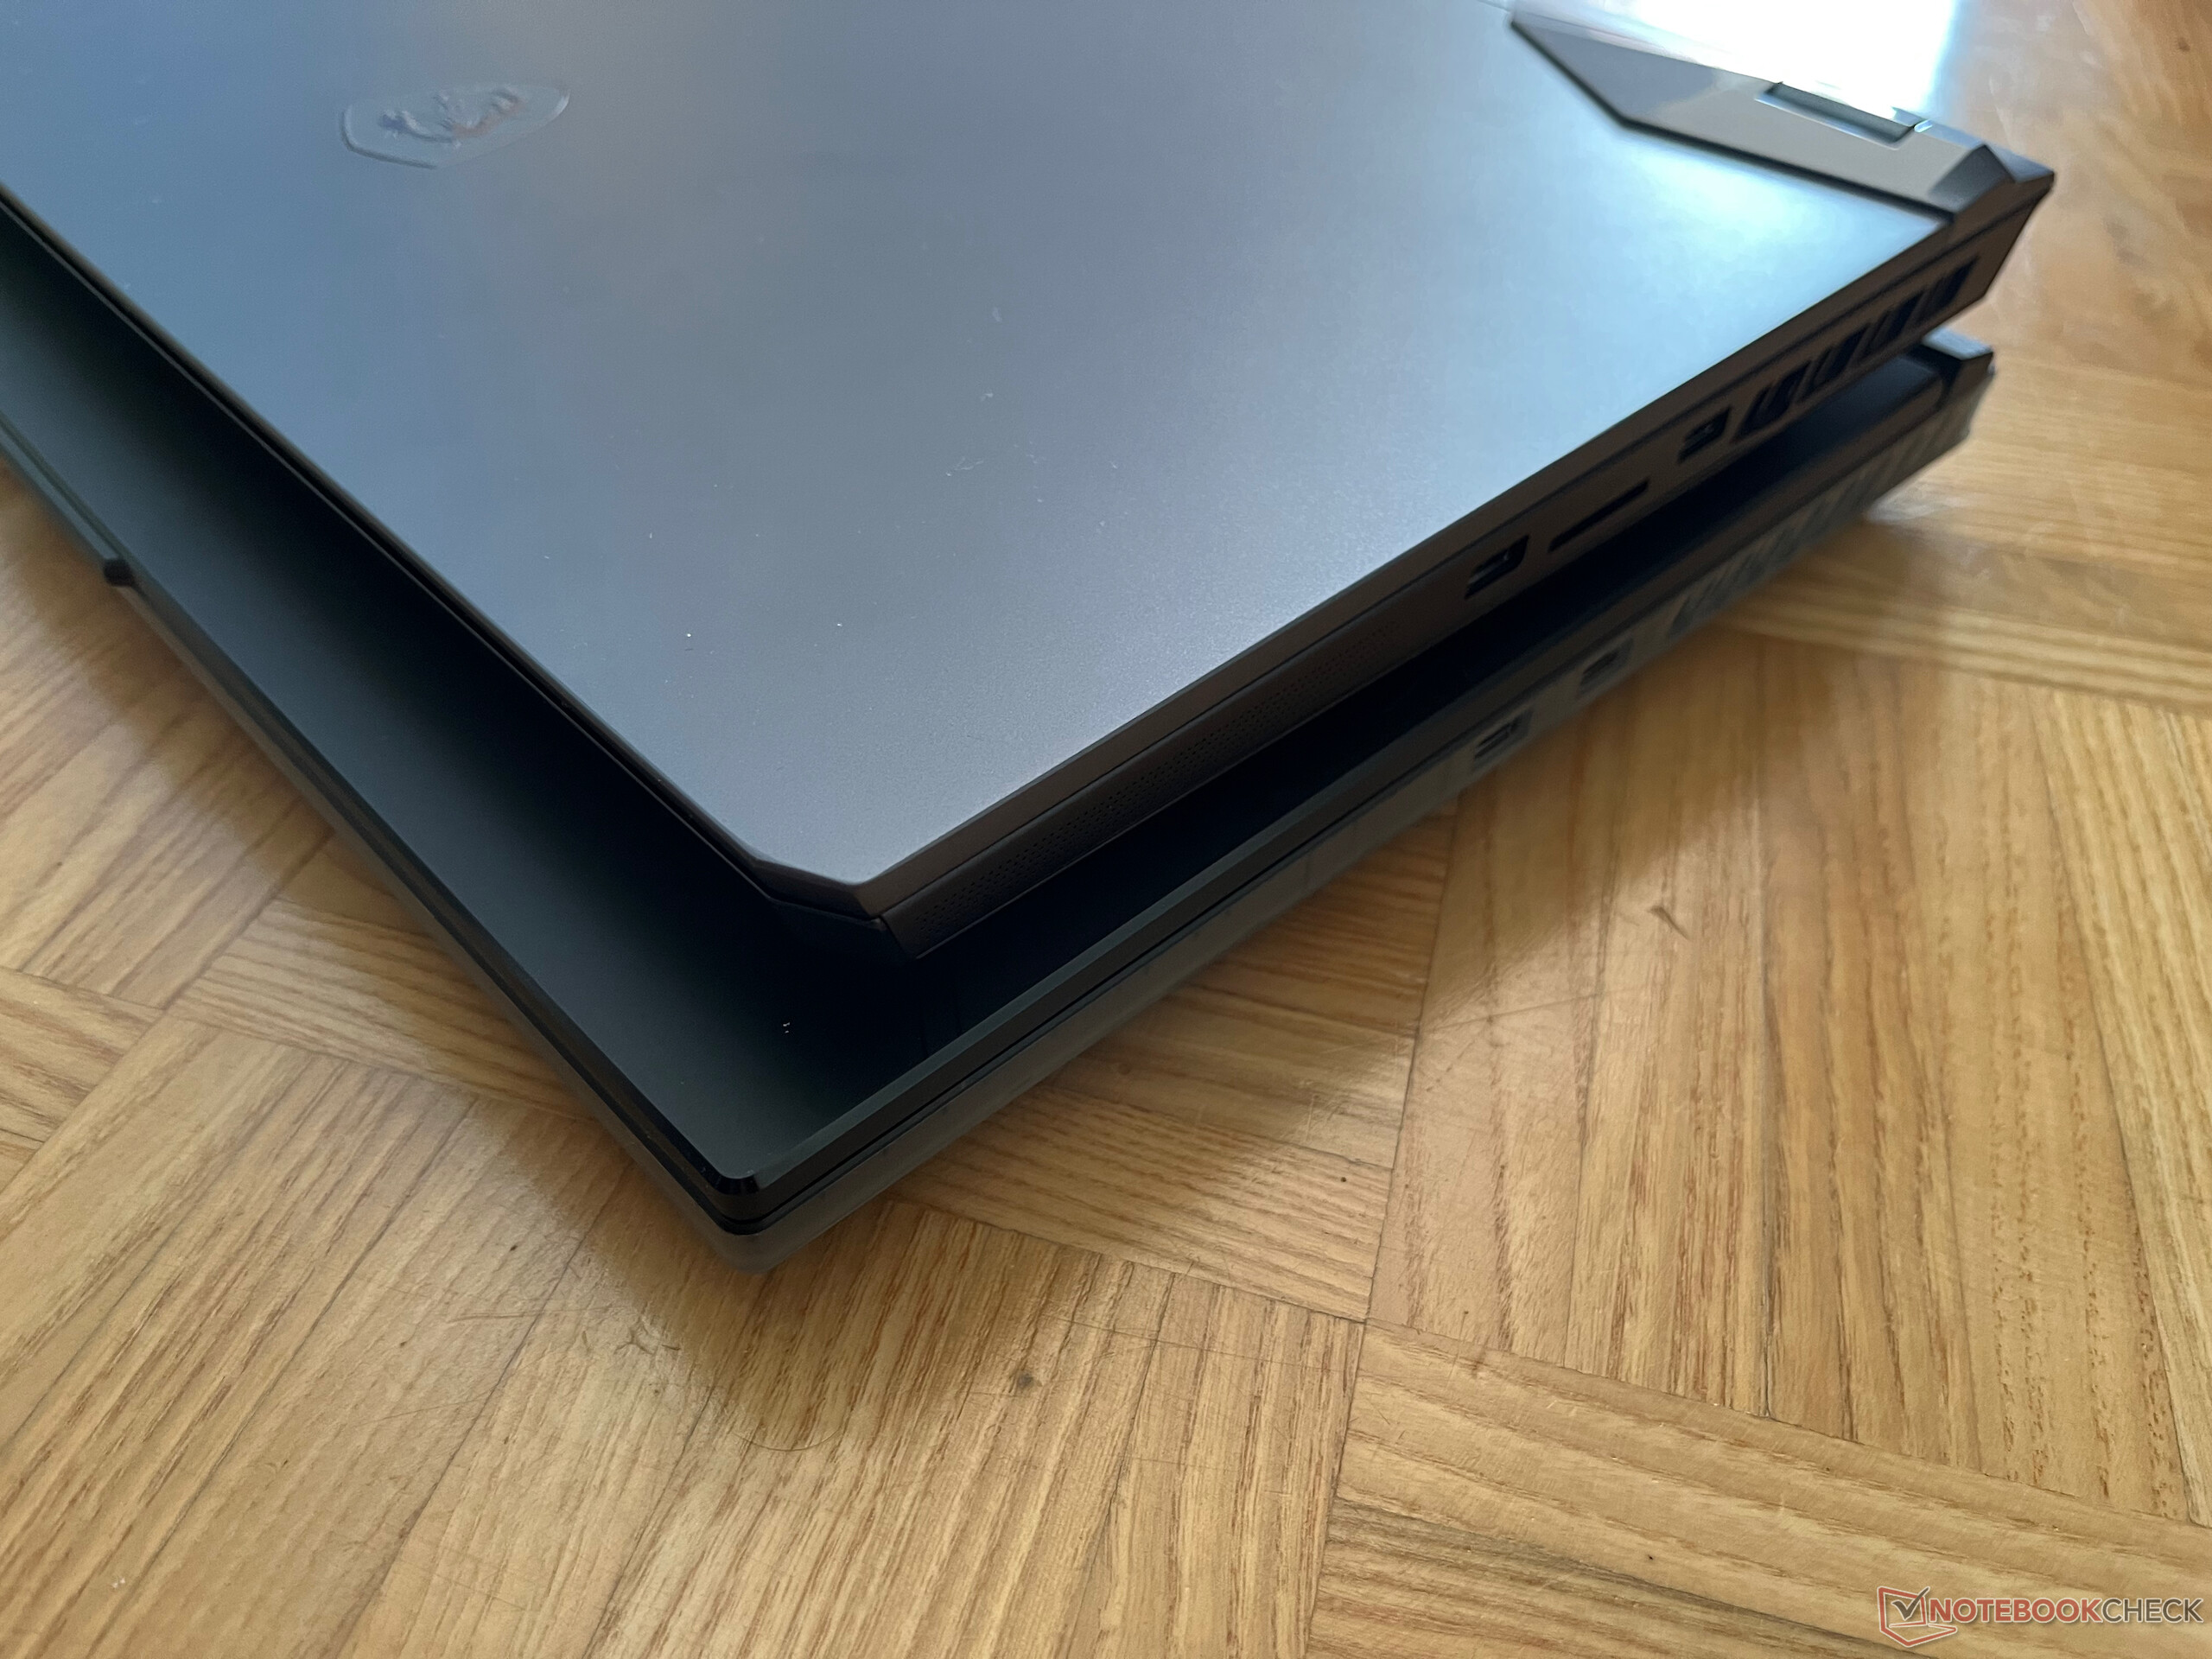
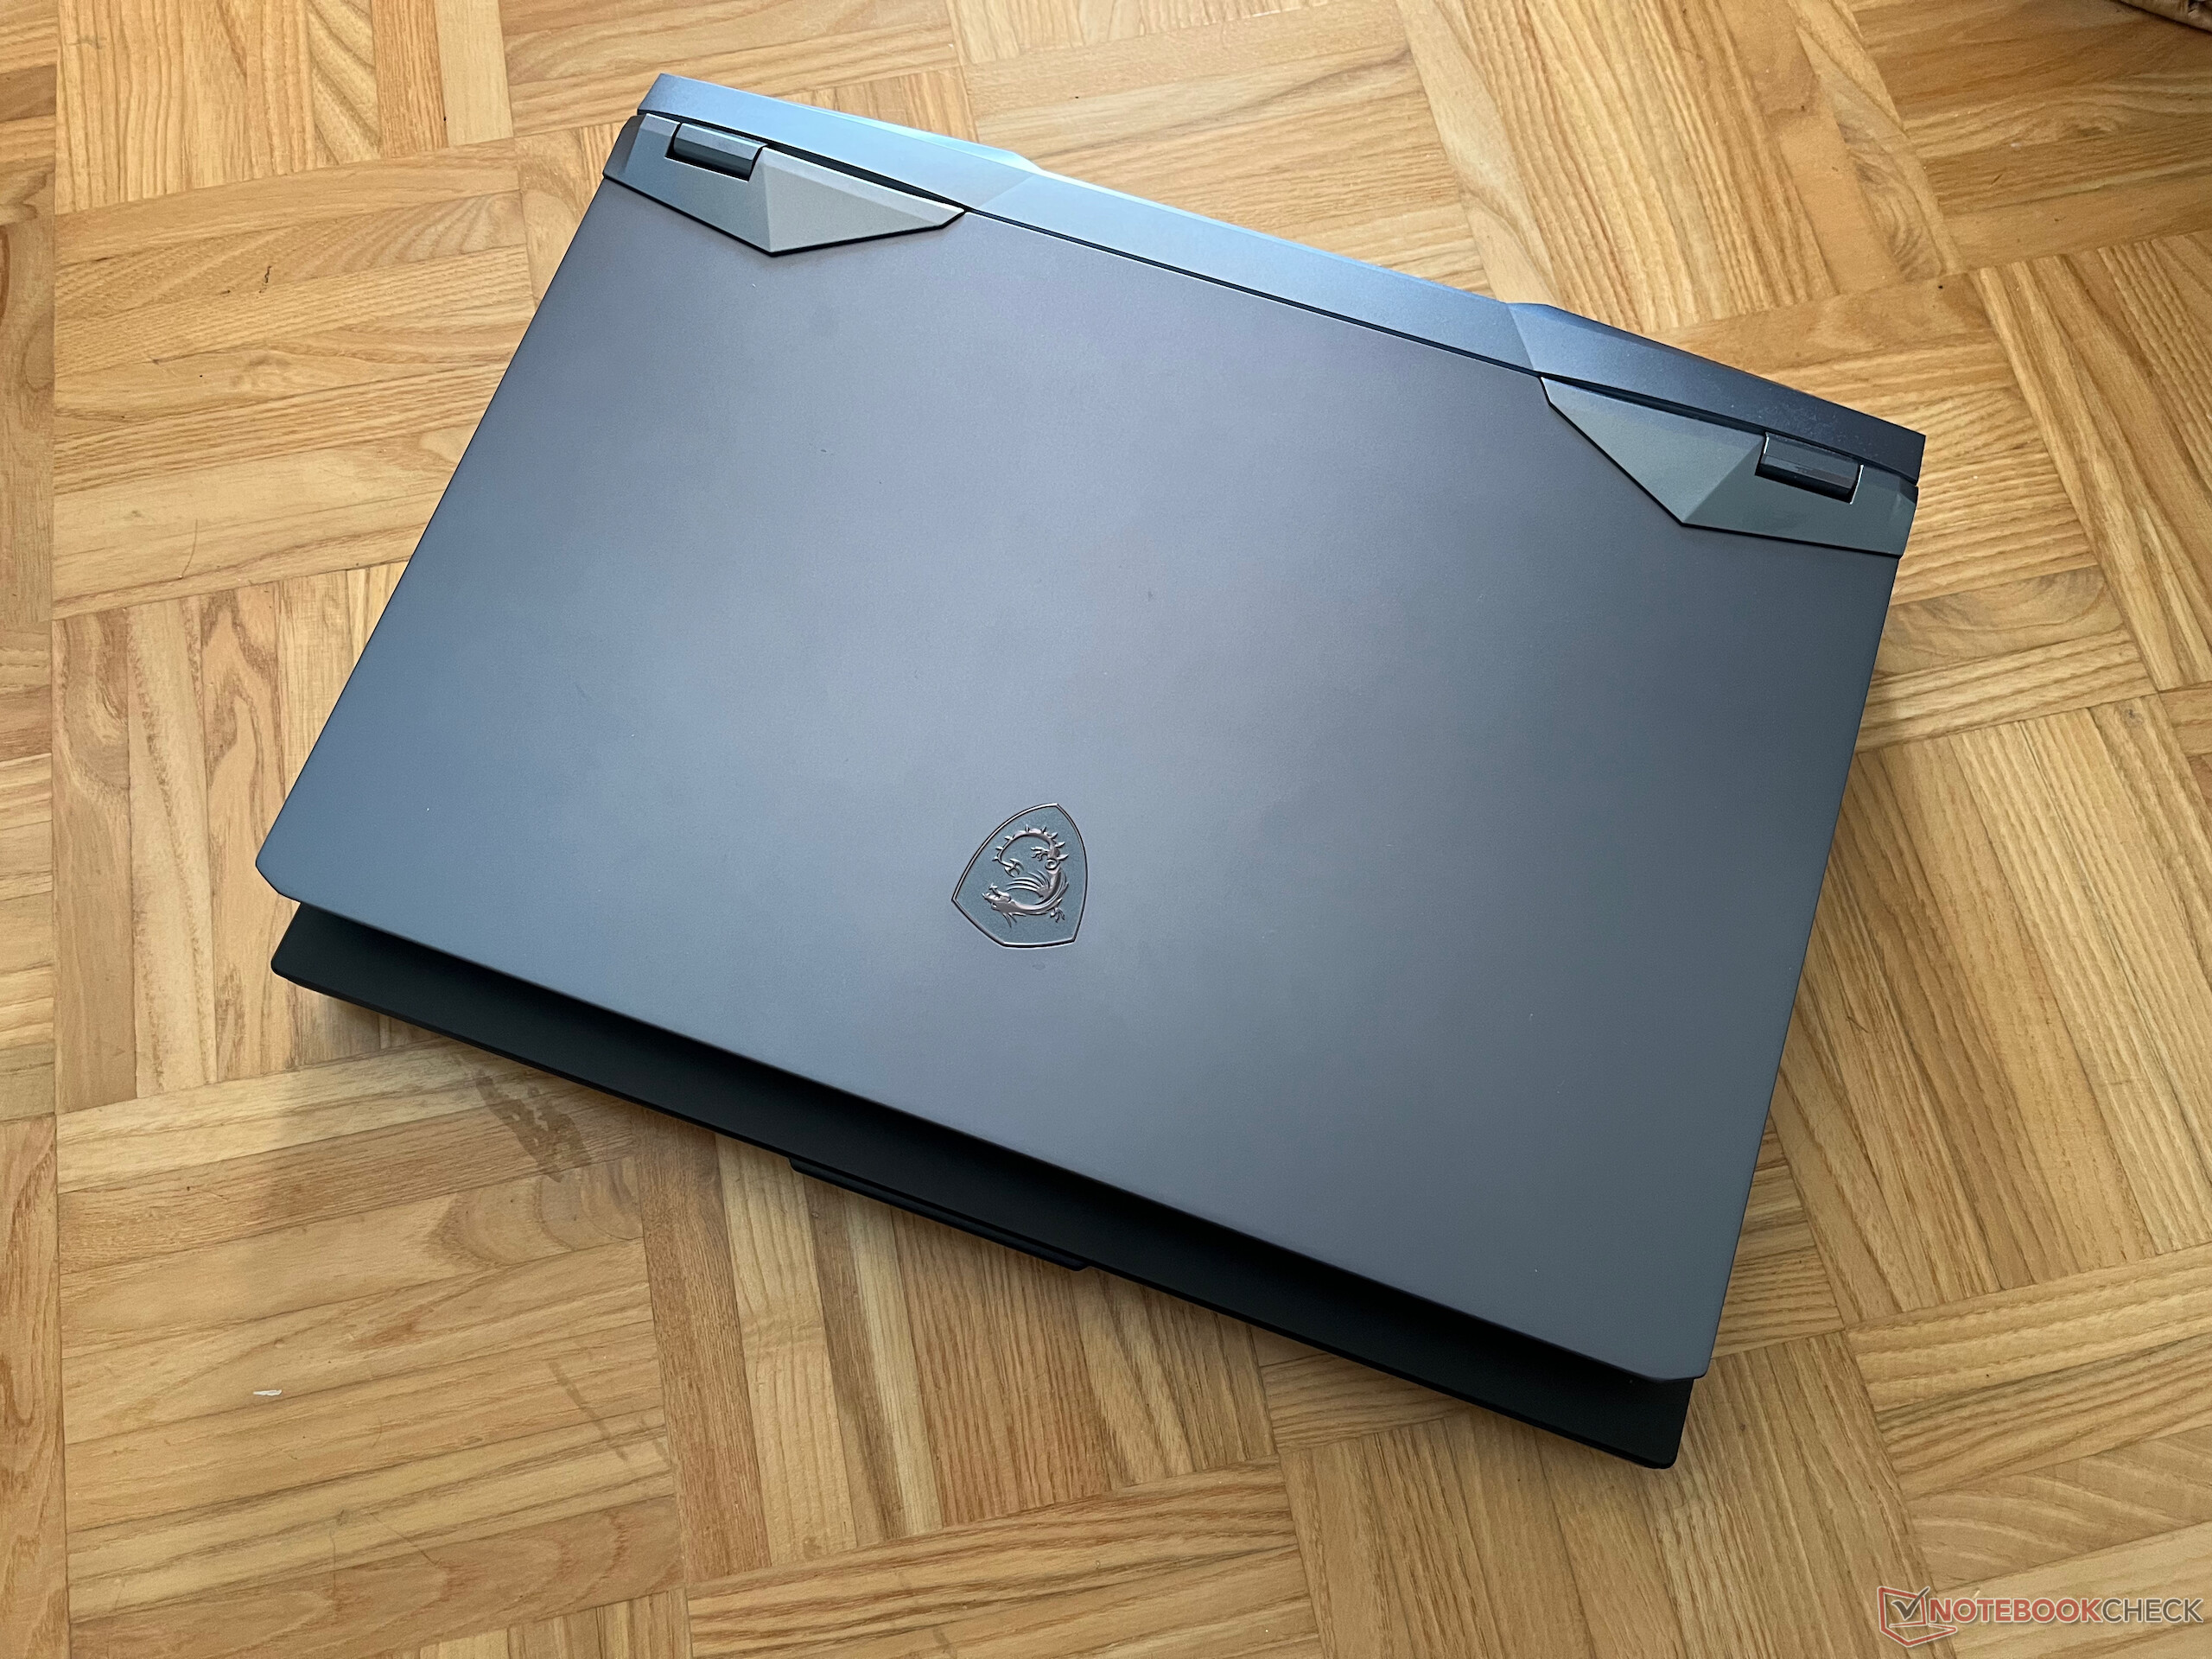
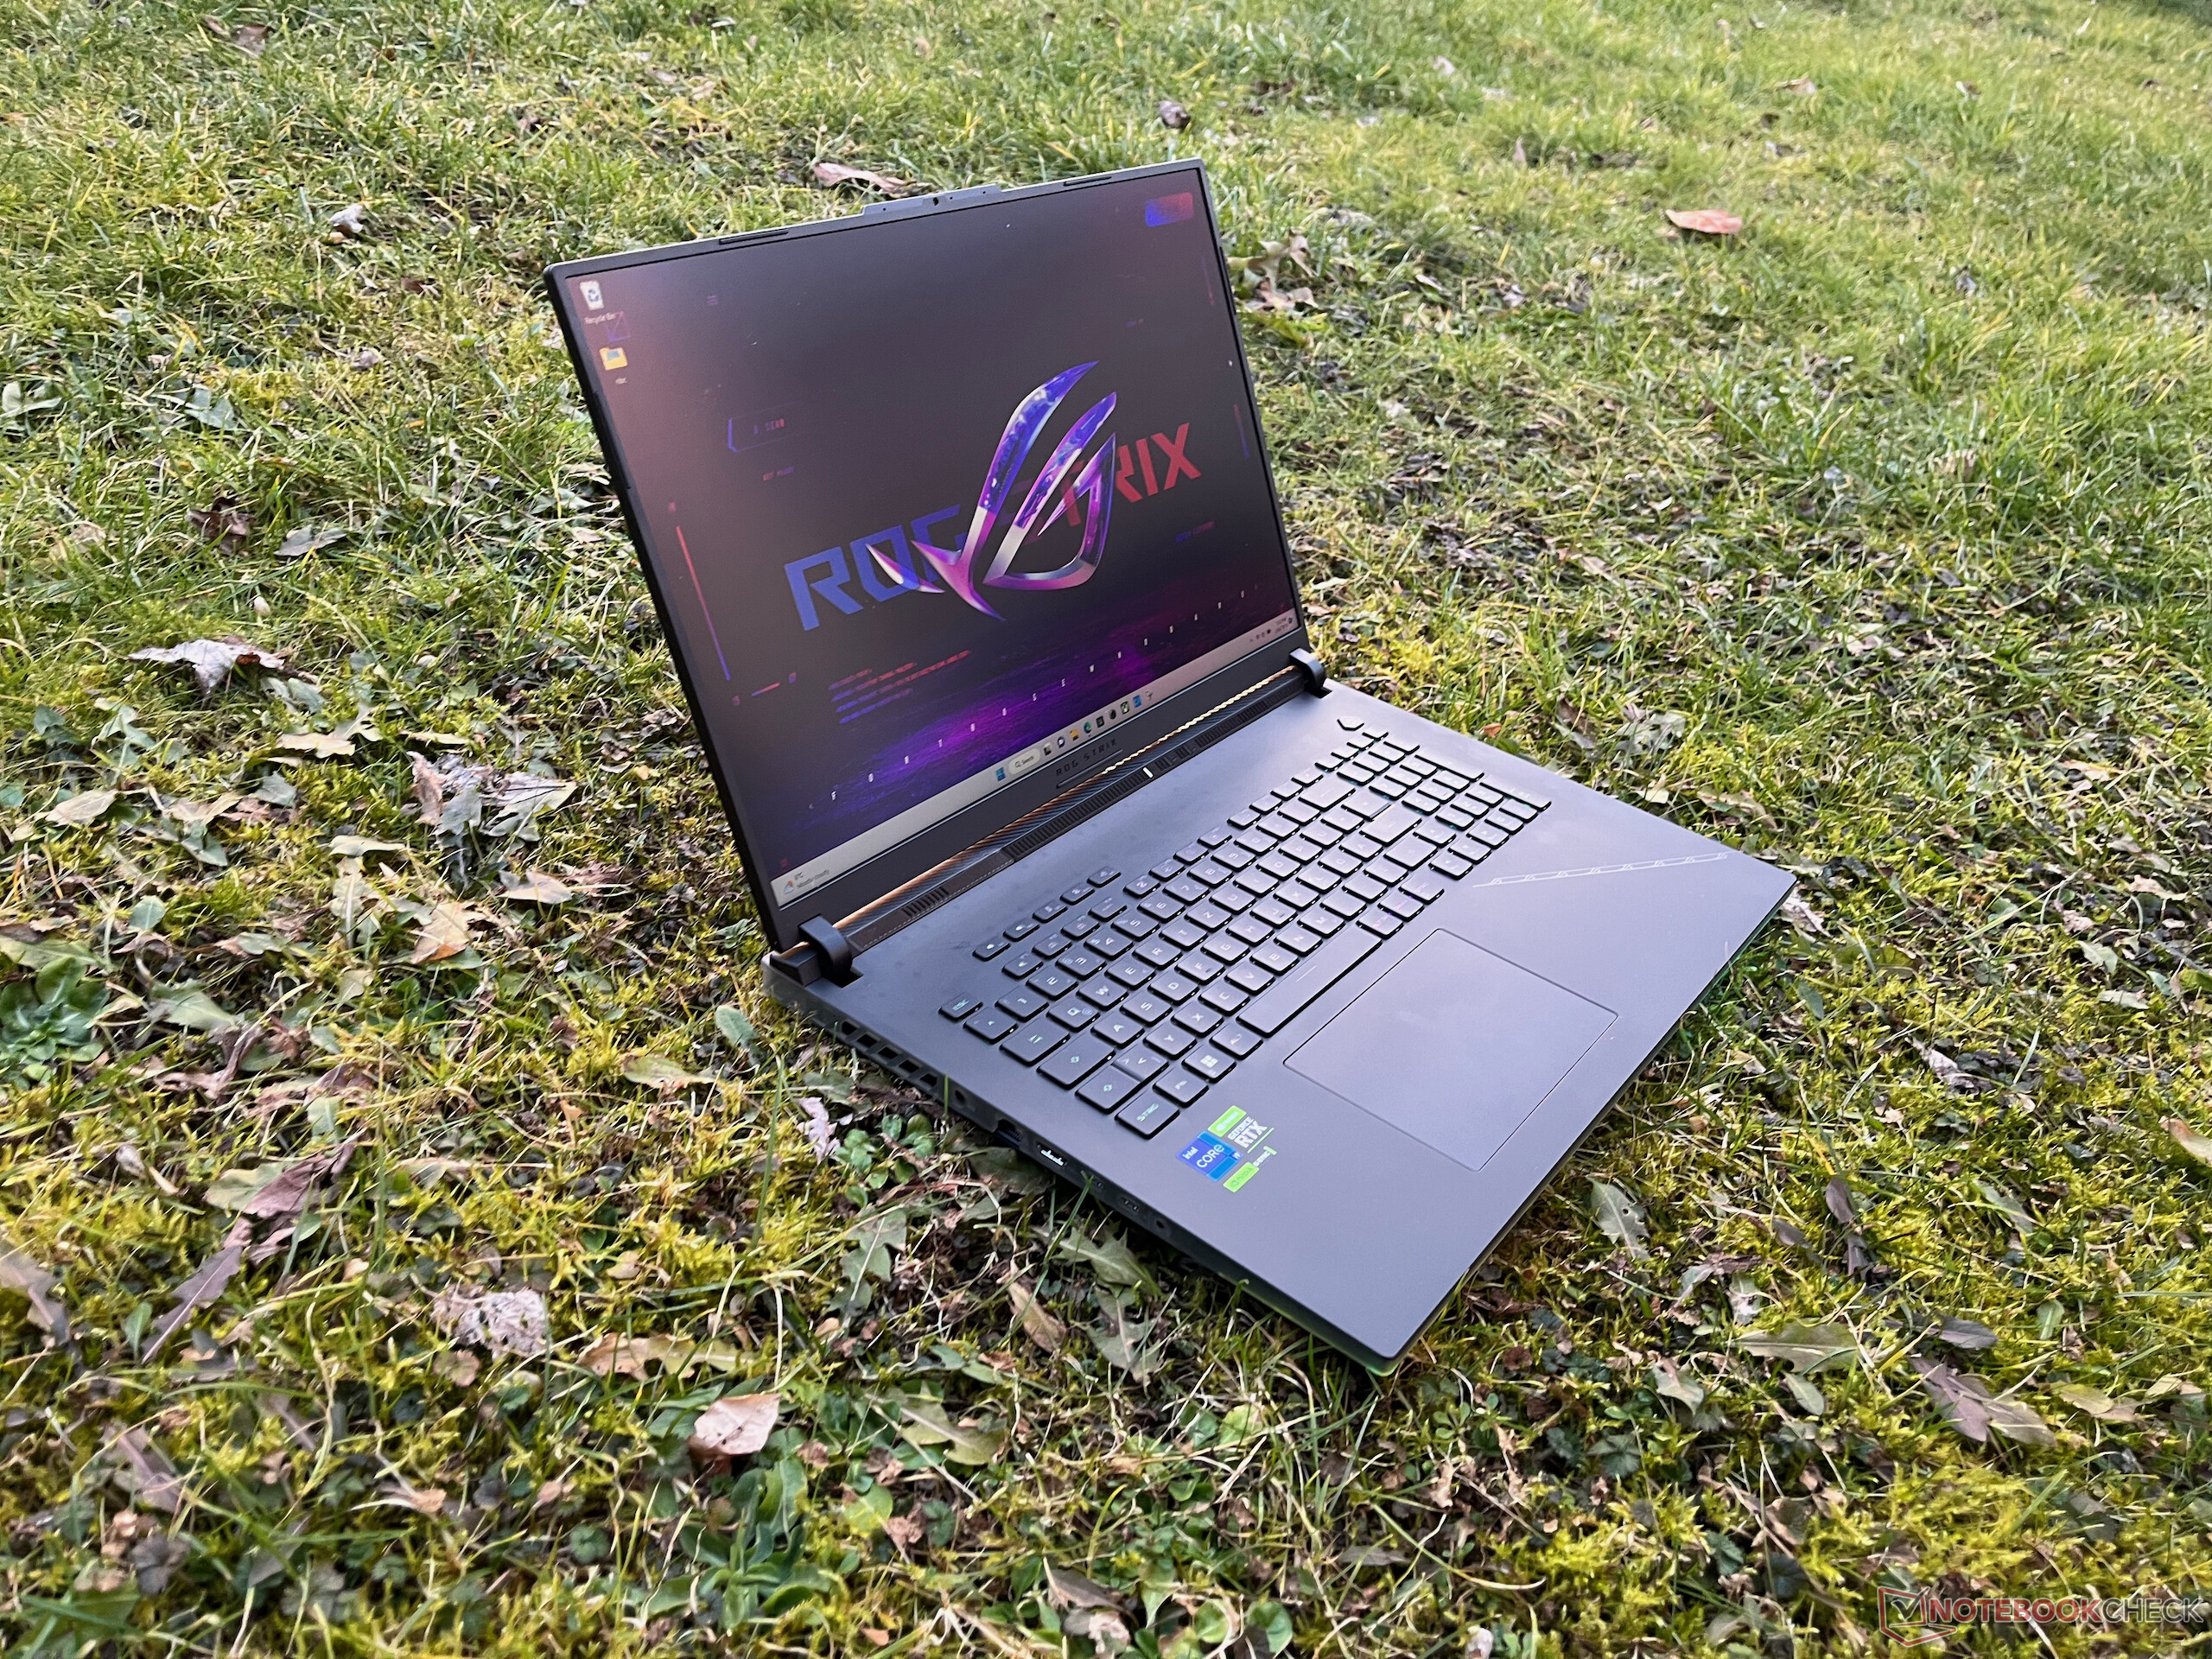
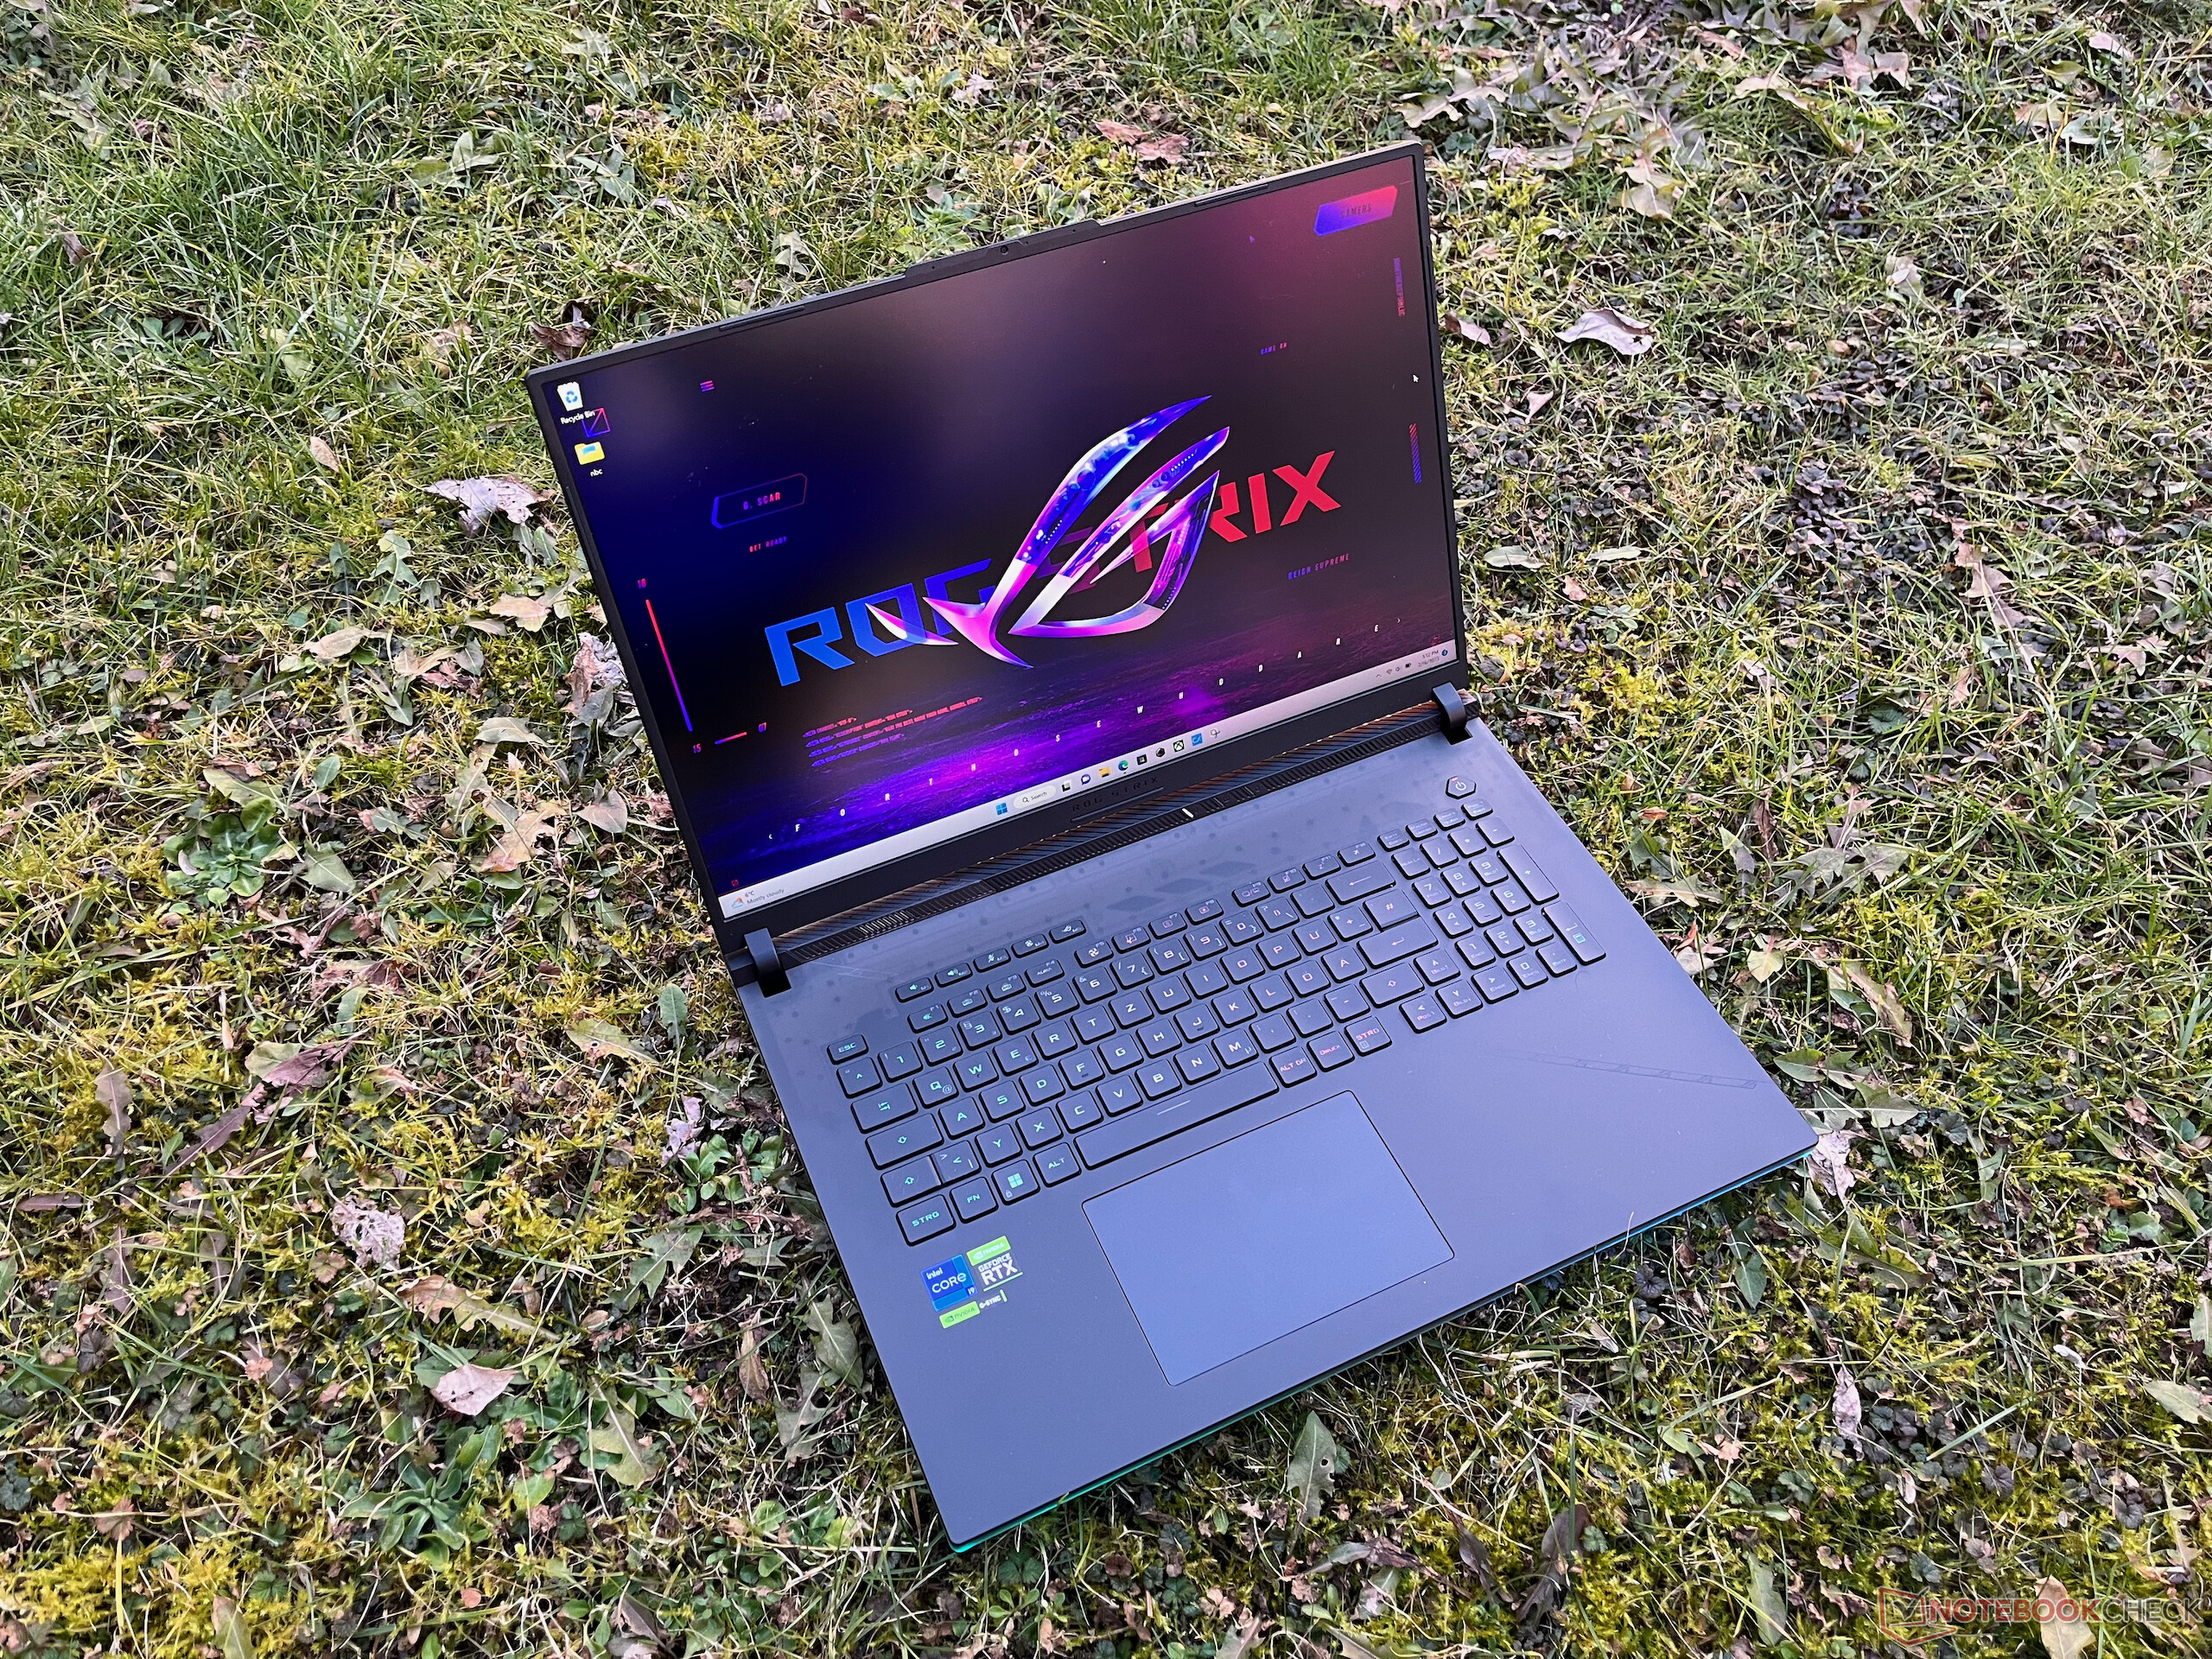
Le dimensioni del case sono determinate dal gigantesco display da 18 pollici, che supera di gran lunga la maggior parte dei portatili da 17 pollici. D'altra parte, l'unità di base non è così massiccia, facendo apparire il portatile un po' più piccolo di quanto non sia in realtà.
Attrezzatura
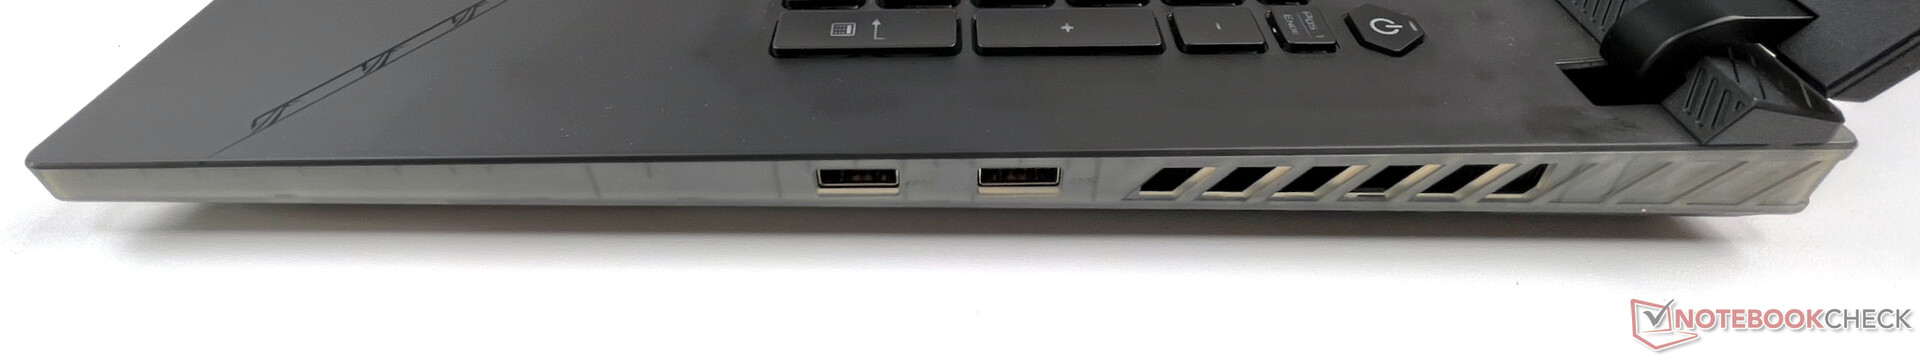
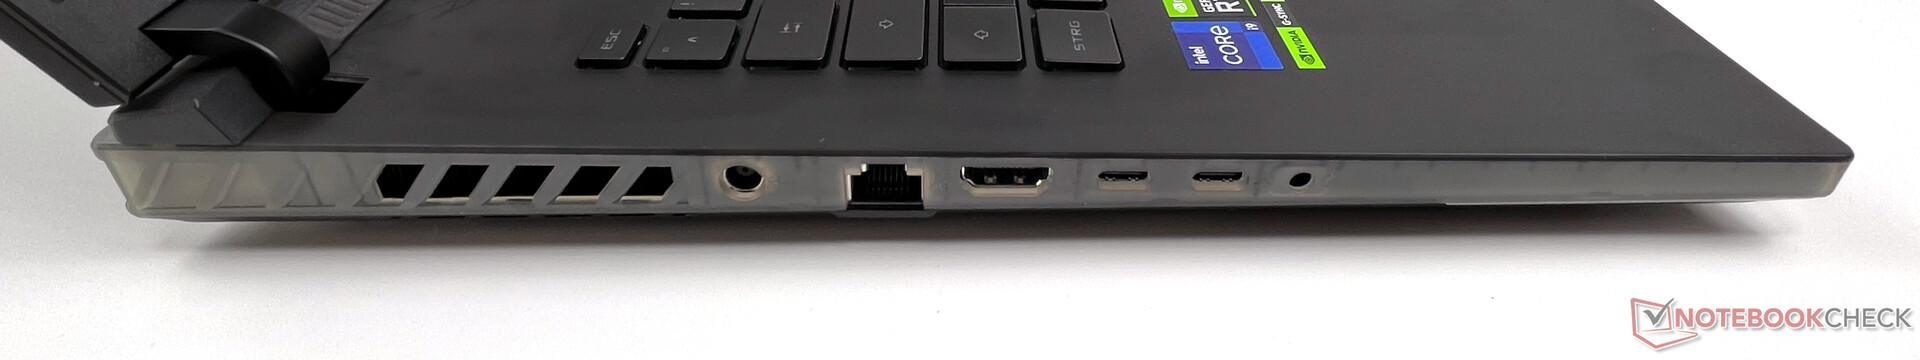
Tutte le porte si trovano sui lati destro e sinistro del telaio. Inoltre, entrambe le connessioni USB-A sono posizionate sul lato destro verso il centro, rendendo la posizione dei cavi non ideale per chi usa il mouse con la mano destra. Per gli utenti mancini, il cavo di rete sarebbe d'intralcio.
Abbiamo anche alcune lamentele sulla dotazione di connessioni. Solo una delle due porte USB-C supporta Thunderbolt, mentre l'altra supporta Power Delivery con alcune limitazioni. Nel nostro test, il caricatore del MacBook Air M1 è stato in grado di caricare il portatile a 30 watt, ma senza la notifica in Windows. L'Anker Nano 2 da 45 watt non ha caricato affatto il portatile. Tra gli aspetti positivi, ricordiamo la connessione di rete a 2,5 Gbit.
Comunicazione
In termini di opzioni di comunicazione, Asus offre una veloce scheda Intel Wi-Fi 6E AX211 in formato M.2 per le connessioni wireless e un chip Realtek RTL8125 per le connessioni LAN cablate a 2,5-Gbit. Entrambi hanno funzionato senza problemi nel nostro test, ma la scheda AX211 non ha trovato la rete a 6-GHz del nostro router Asus ROG Rapture GT-AX11000. Purtroppo, nel nostro test il Wi-Fi 6E continua a non trovare la rete.
D'altra parte, le velocità di trasmissione dei dati nella rete Wi-Fi 6 sono eccellenti e senza cadute.
Webcam
La webcam HD 720p integrata soddisfa purtroppo solo le esigenze più basse di videotelefonia. Le buone condizioni di luce sono importanti, poiché i risultati ottenuti in controluce o al buio sono difficilmente utilizzabili.


")
")
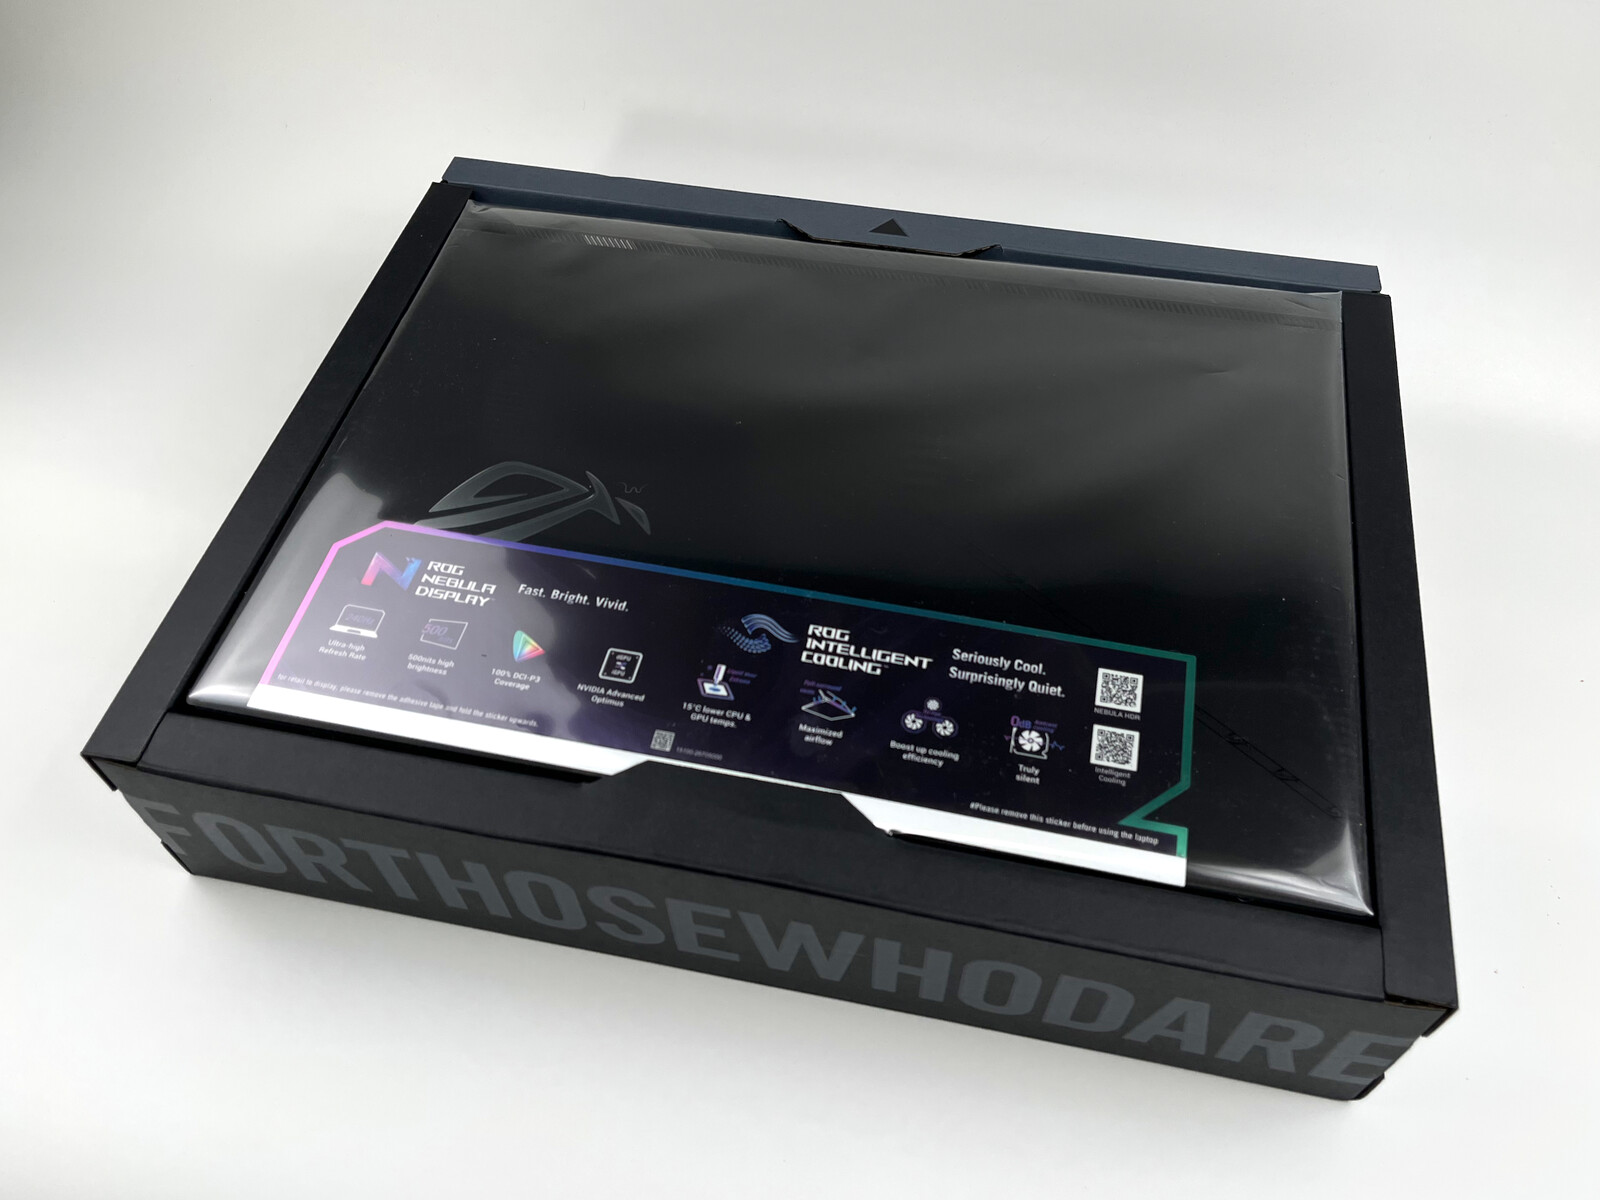
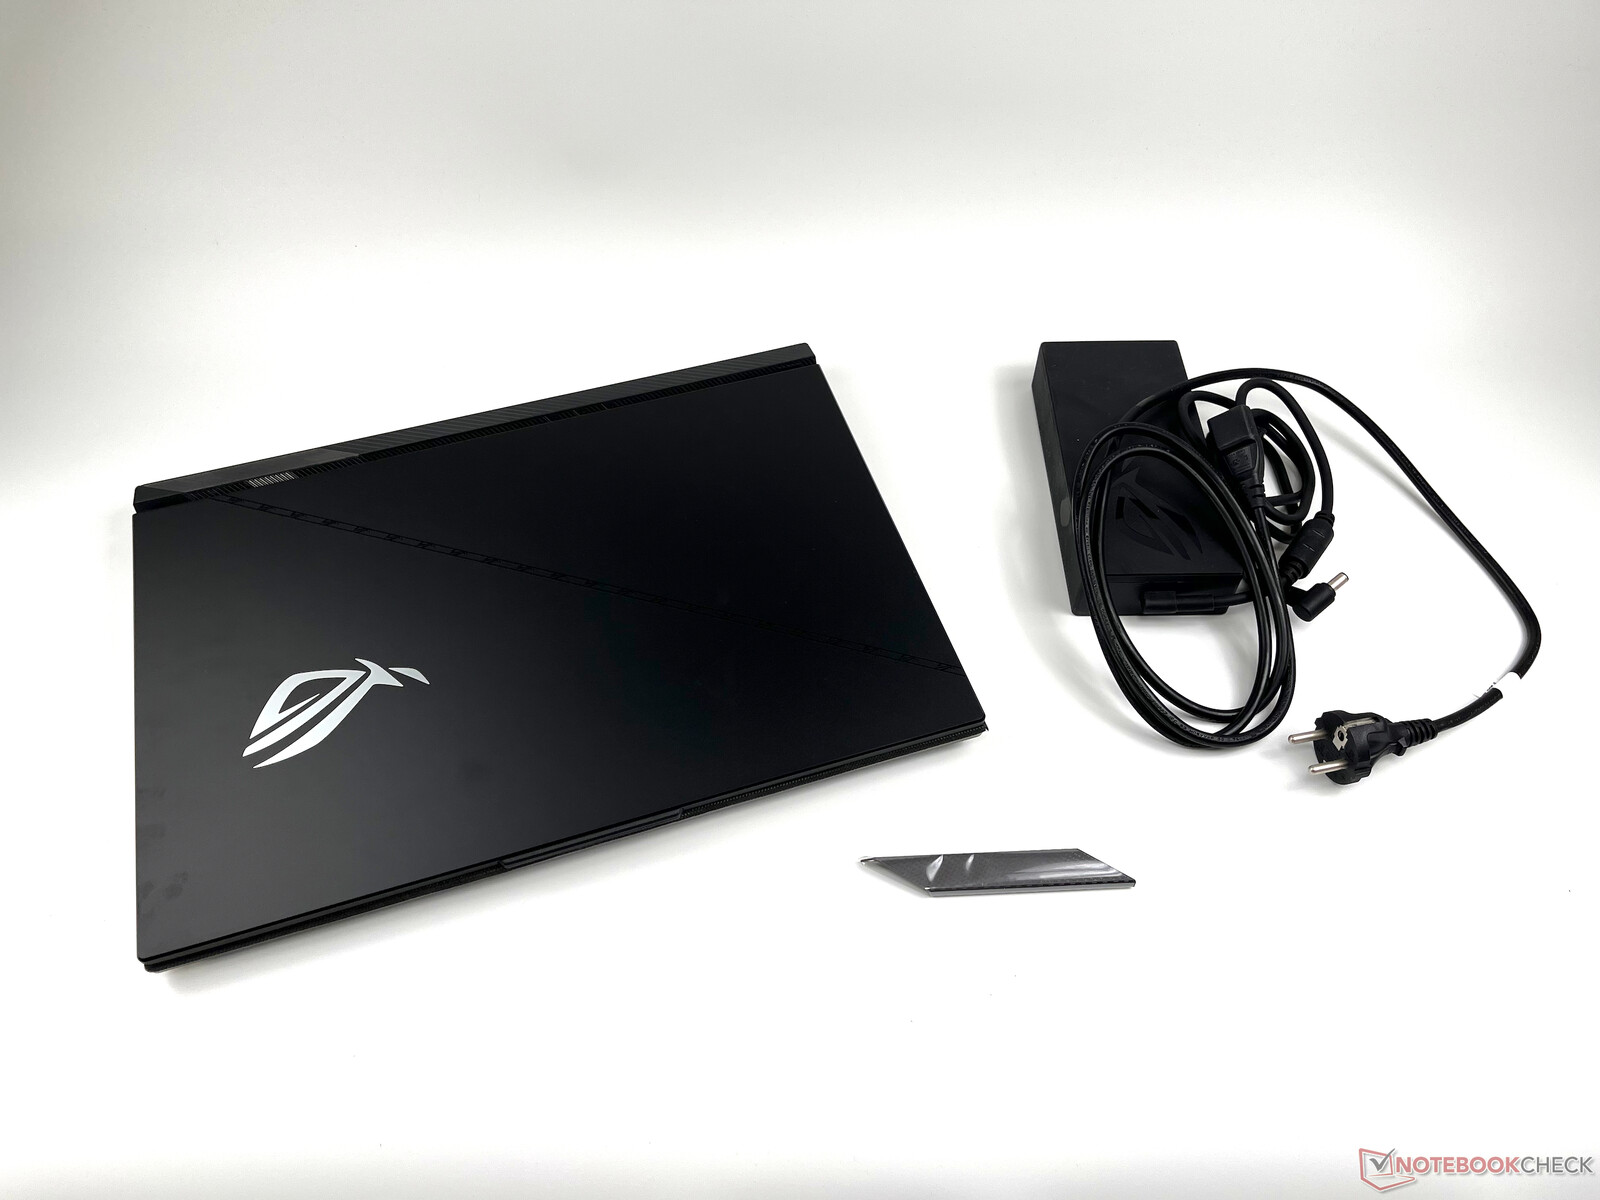
Accessori
La confezione include solo un "Armor Cap" aggiuntivo, che può essere sostituito a sinistra sotto il display. Il cappuccio è fissato magneticamente e potrebbe essere stato pensato per offrire un'opzione di personalizzazione del dispositivo.
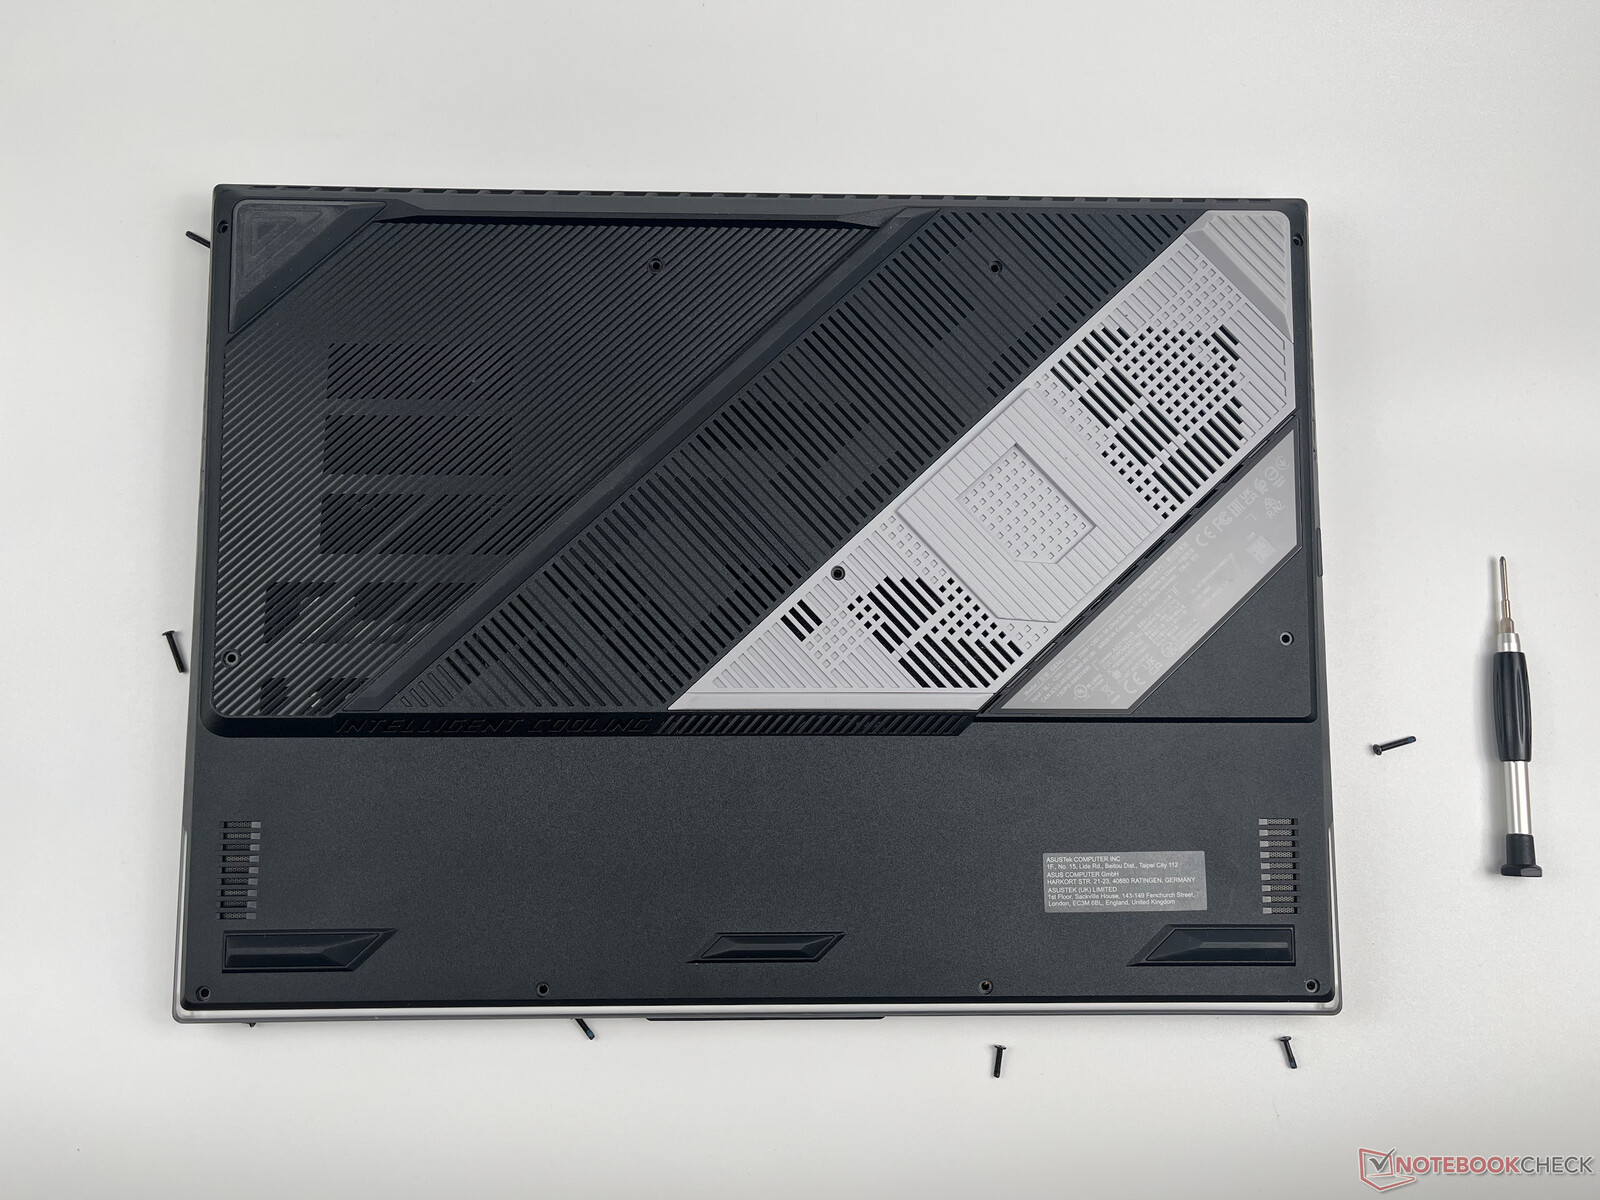
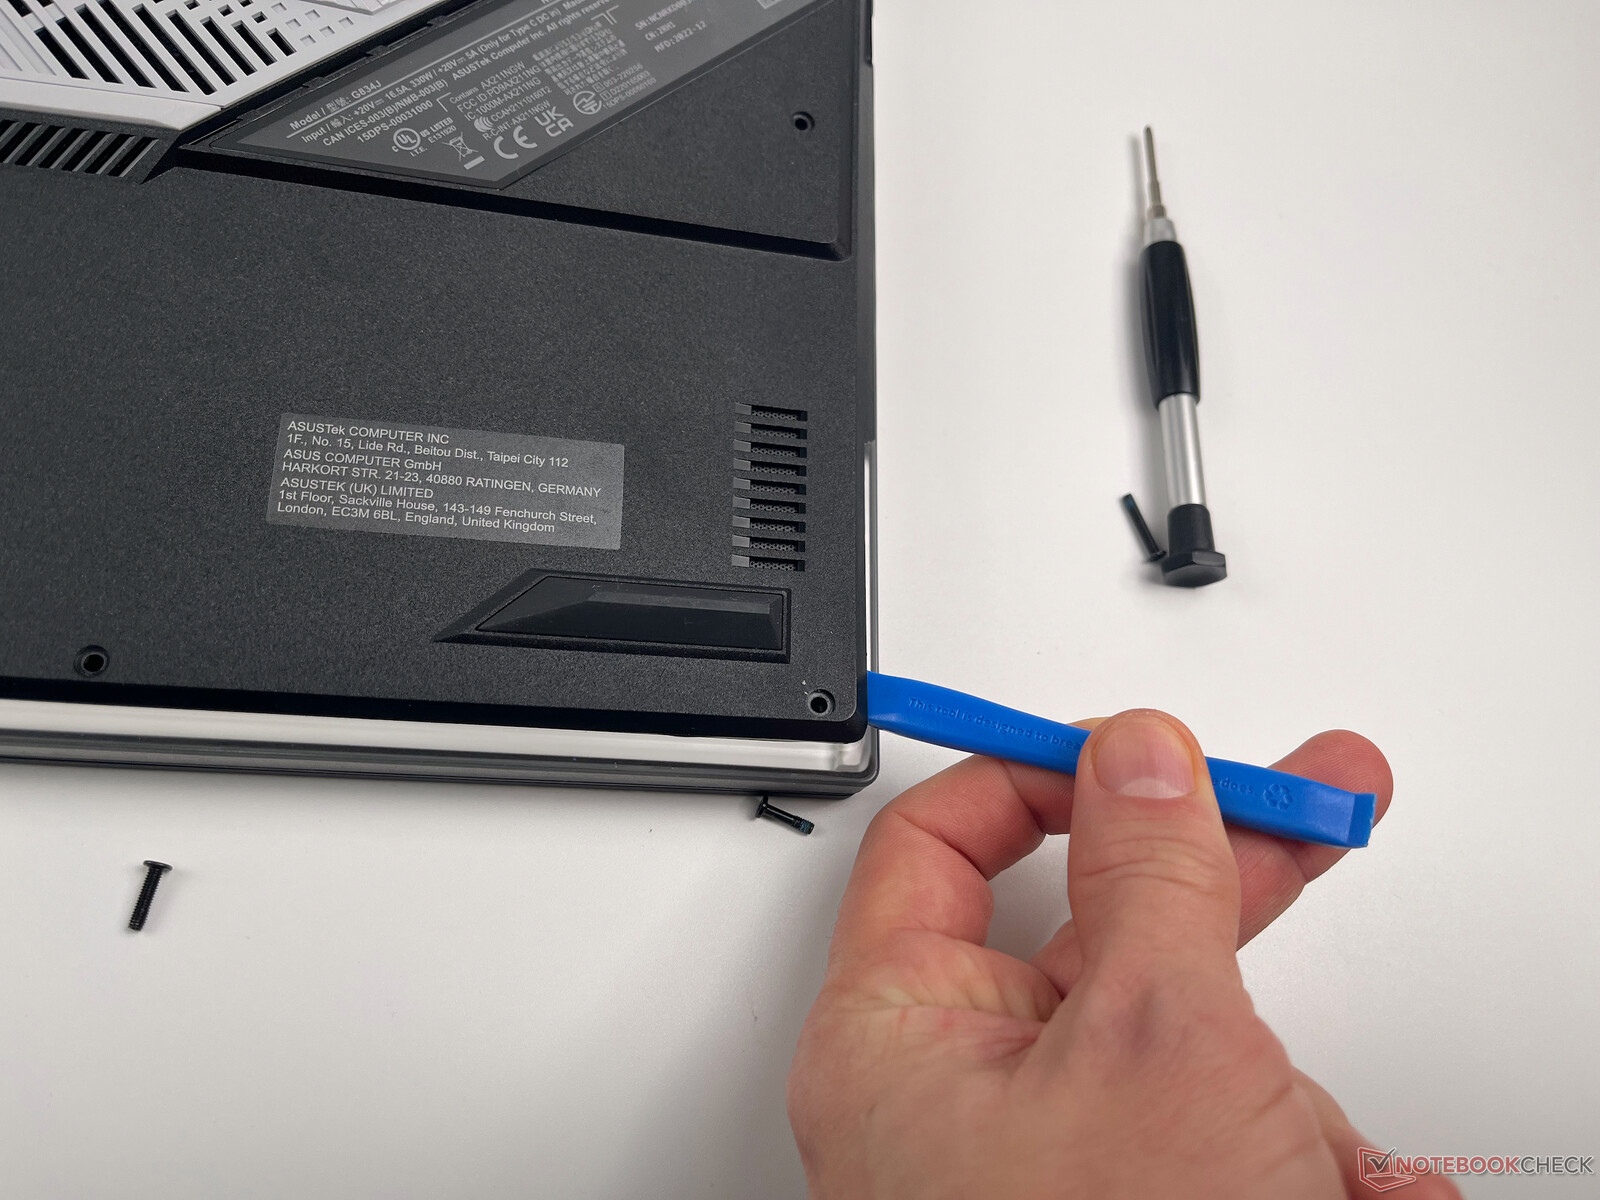
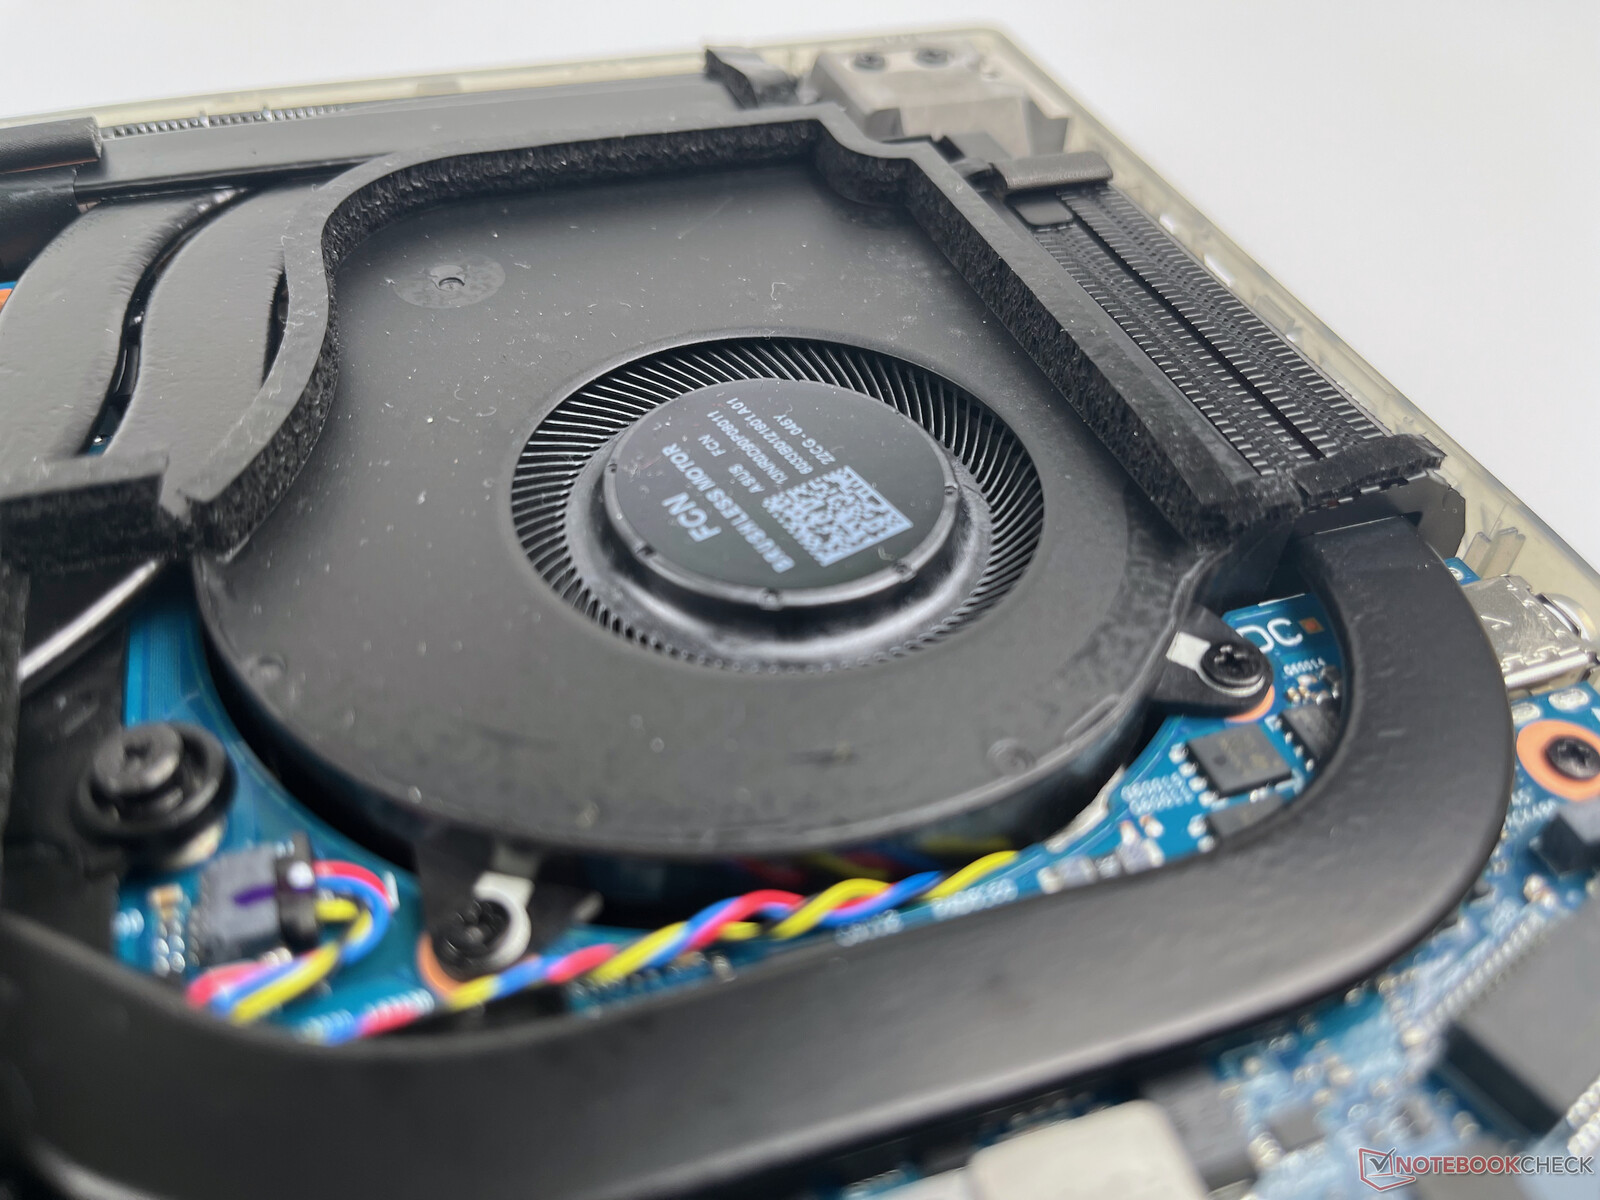
Manutenzione
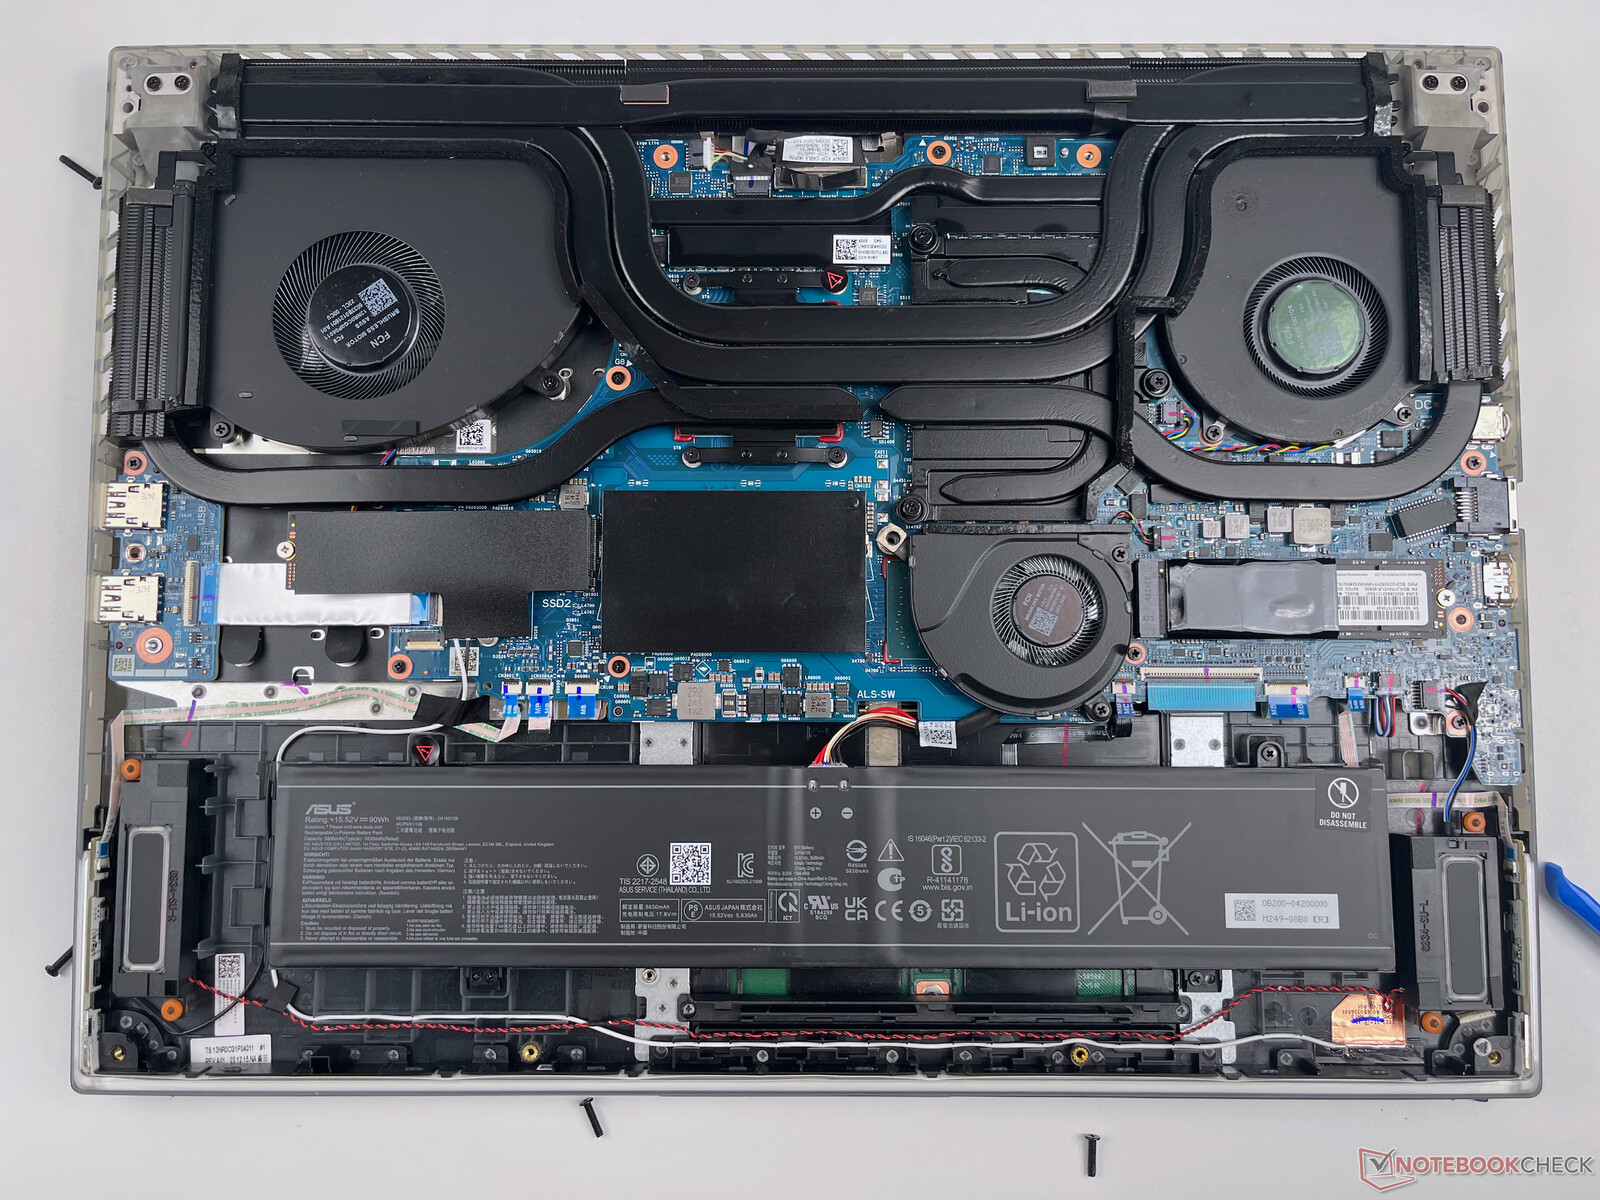
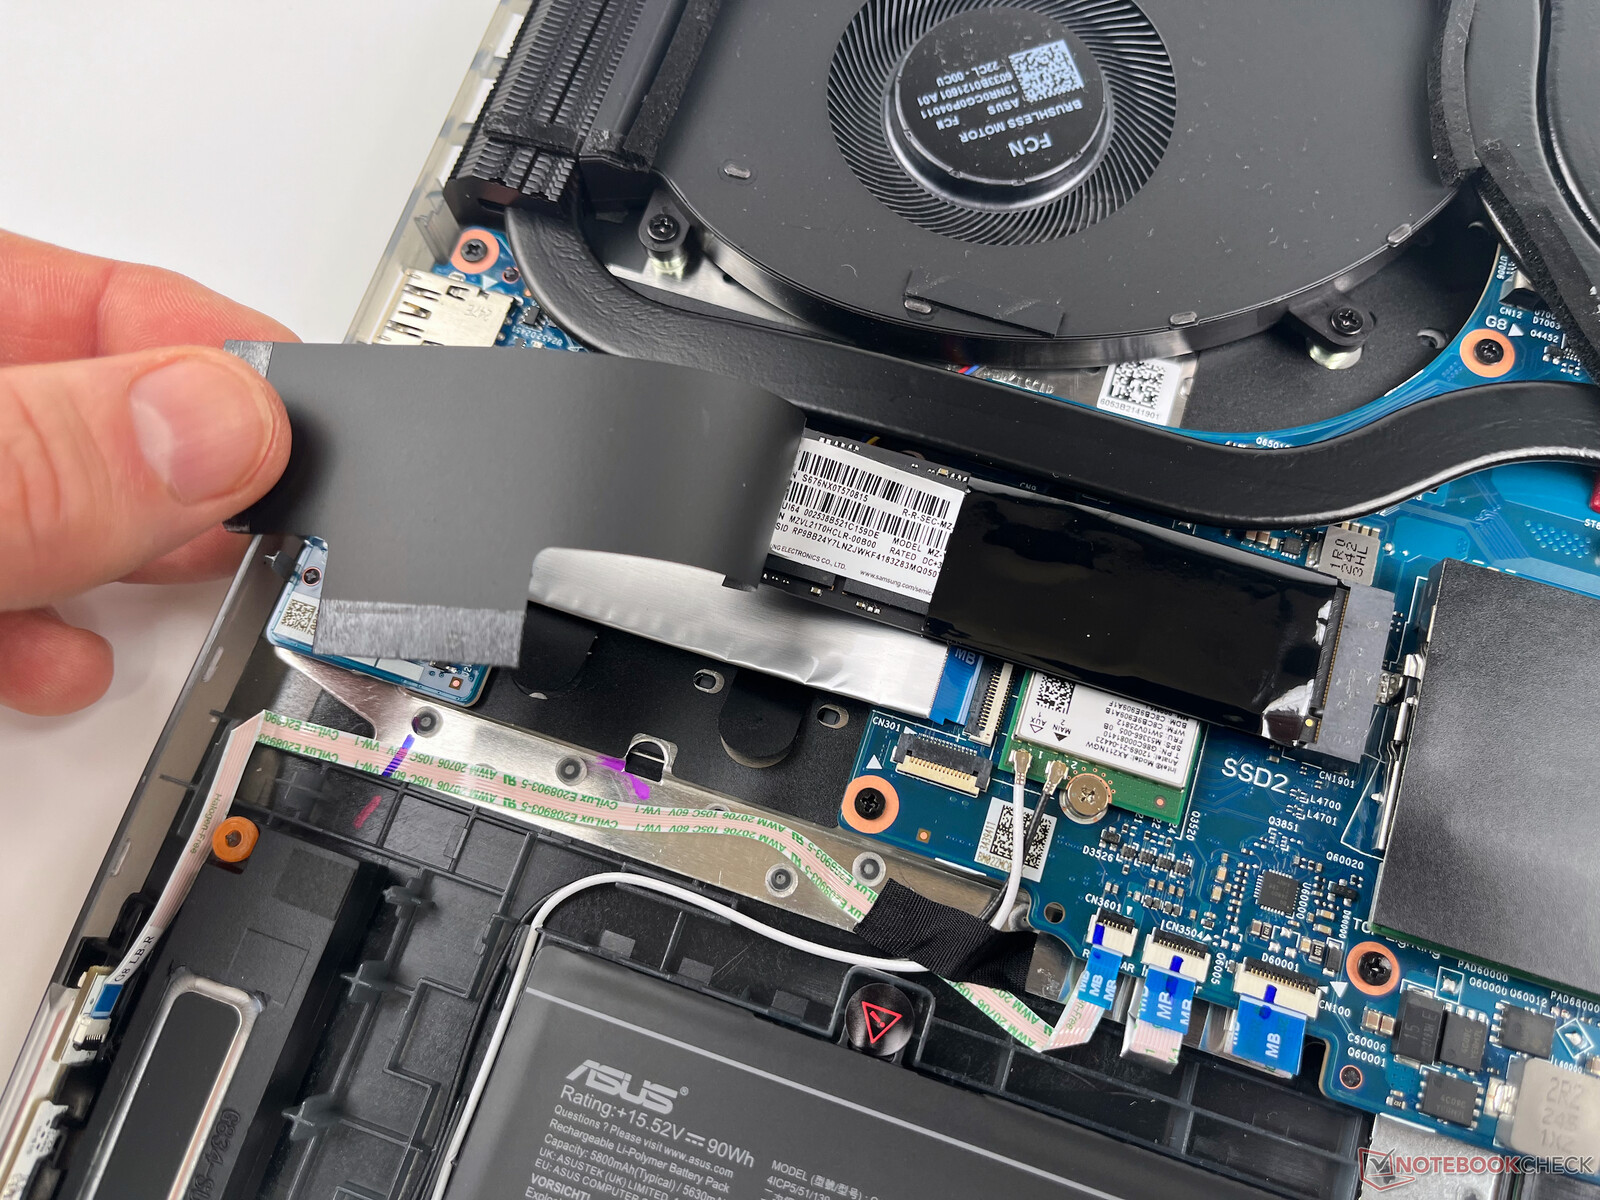
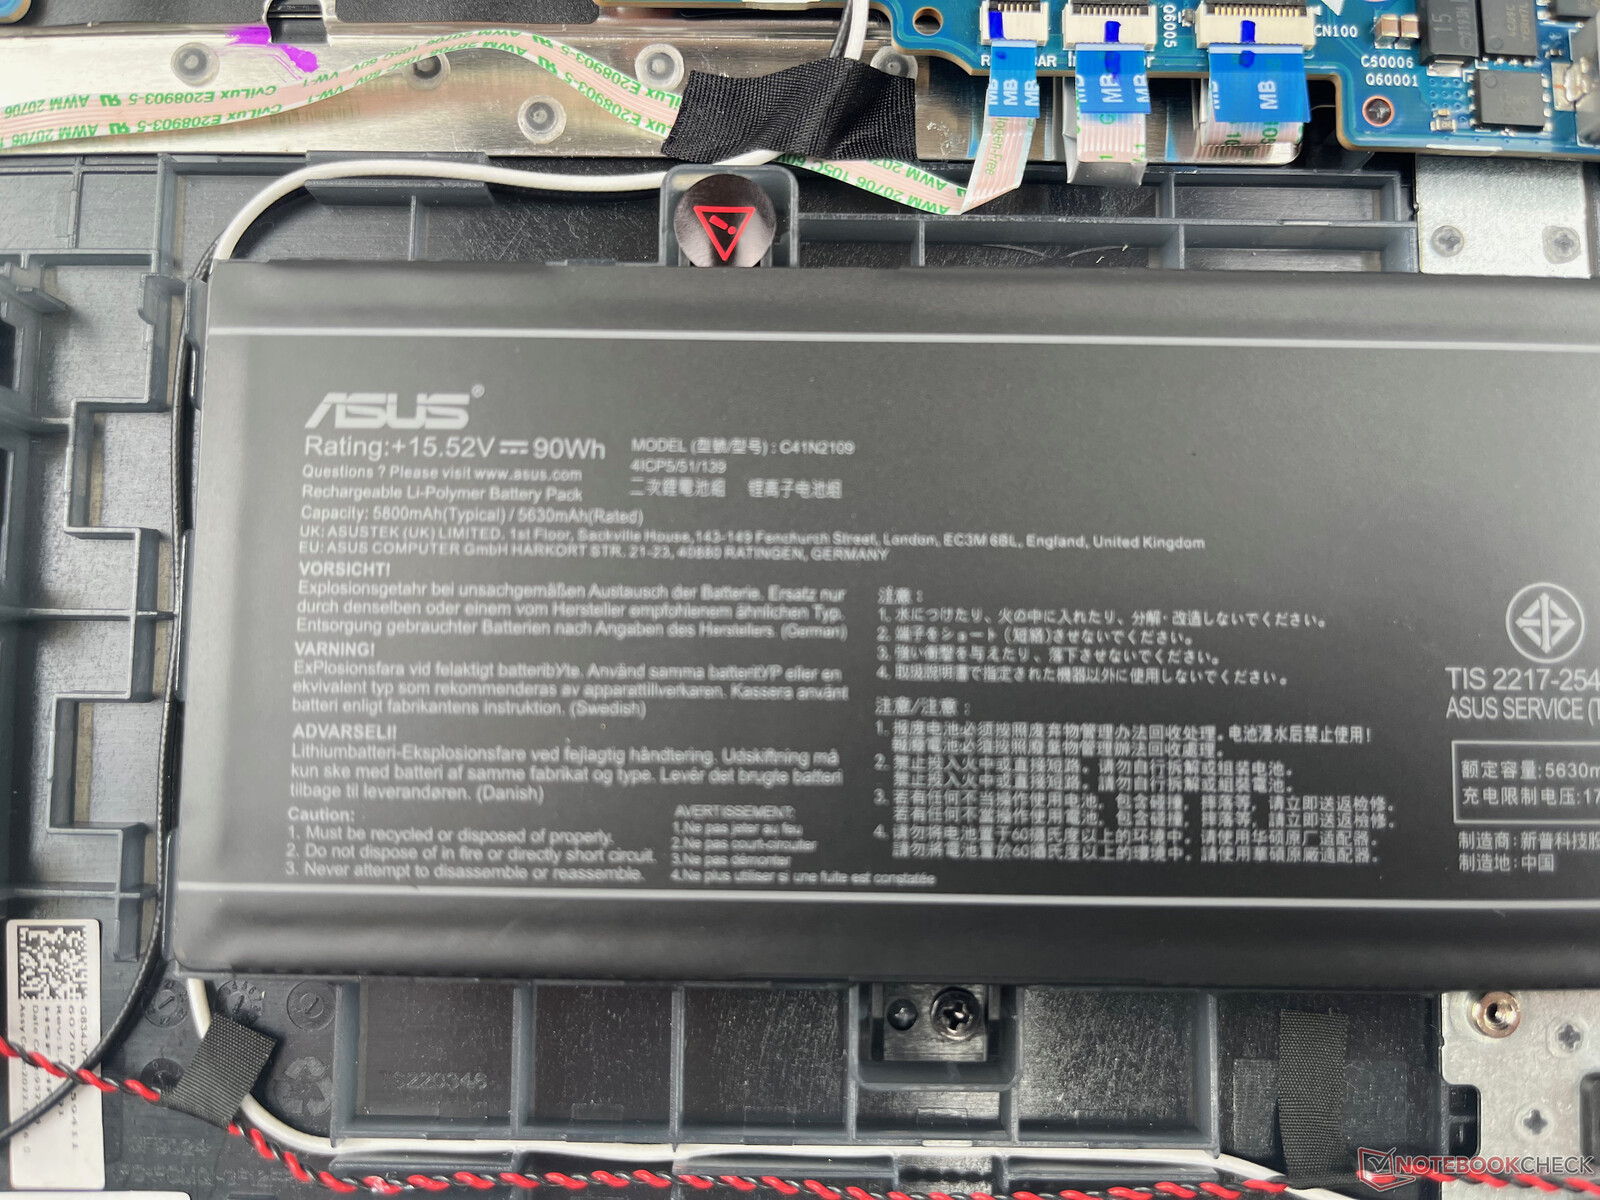
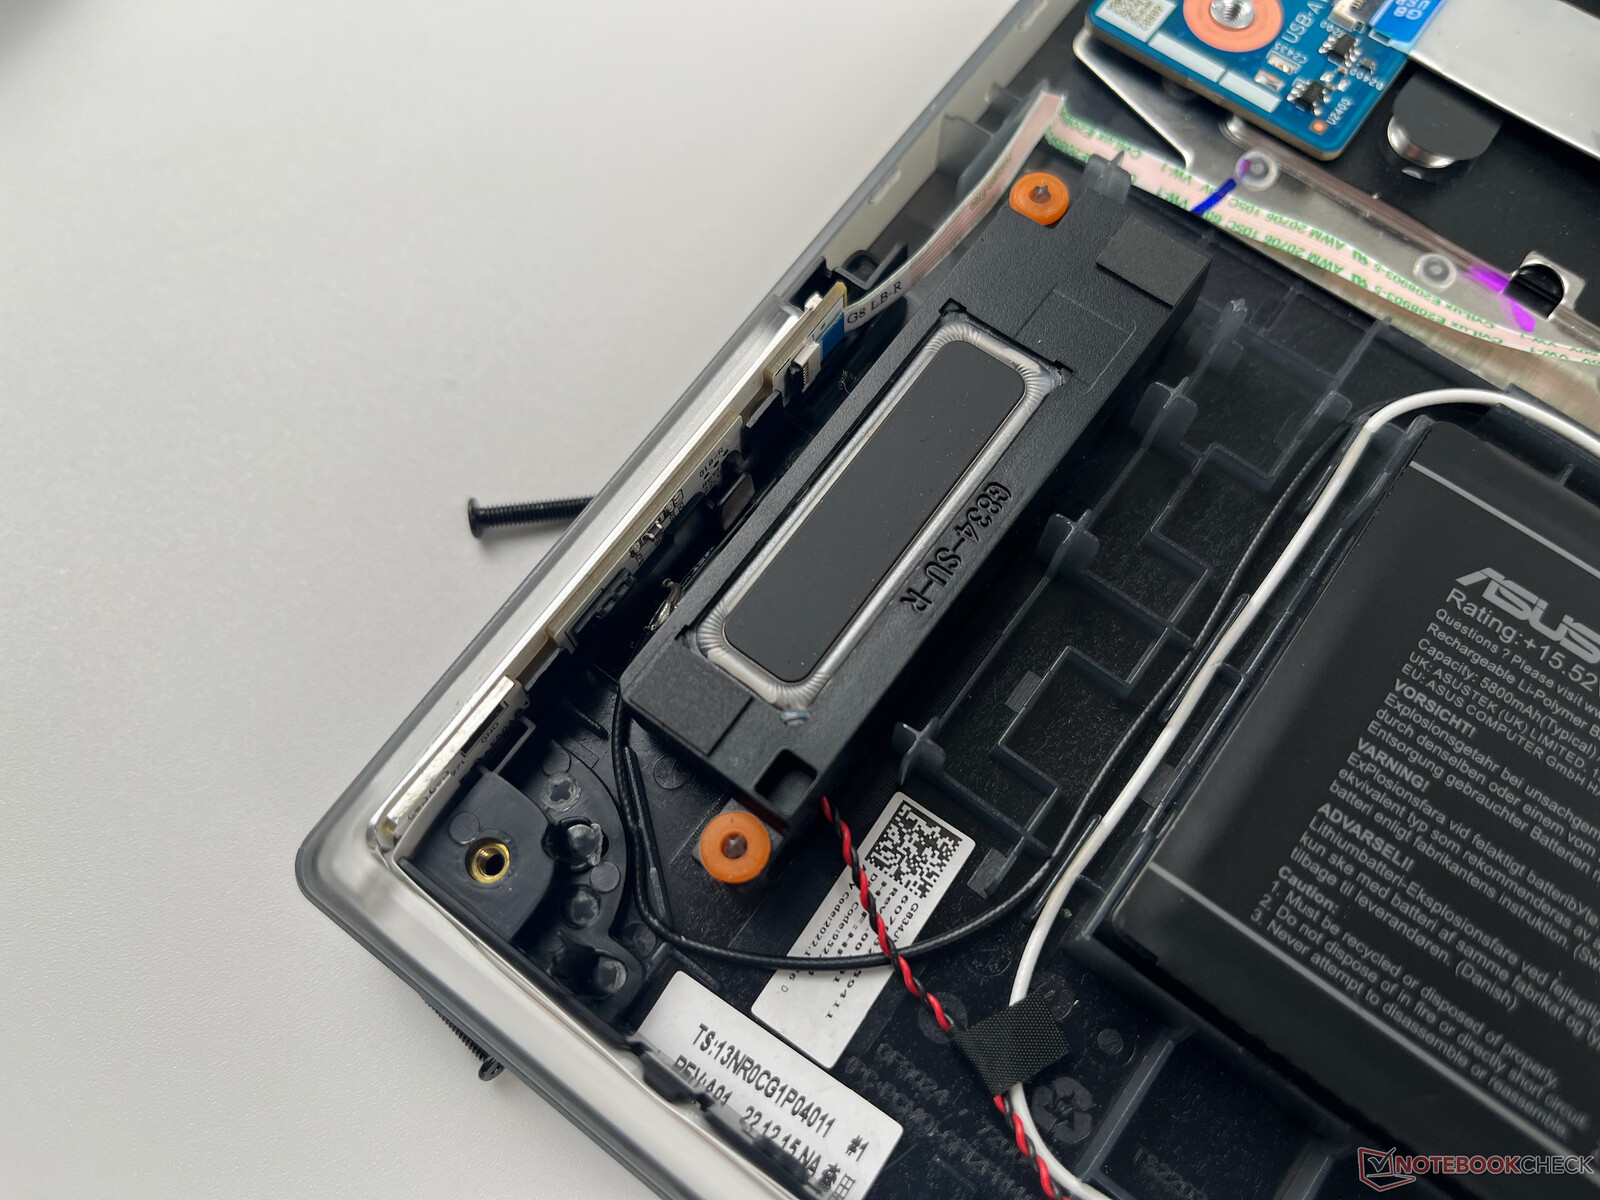
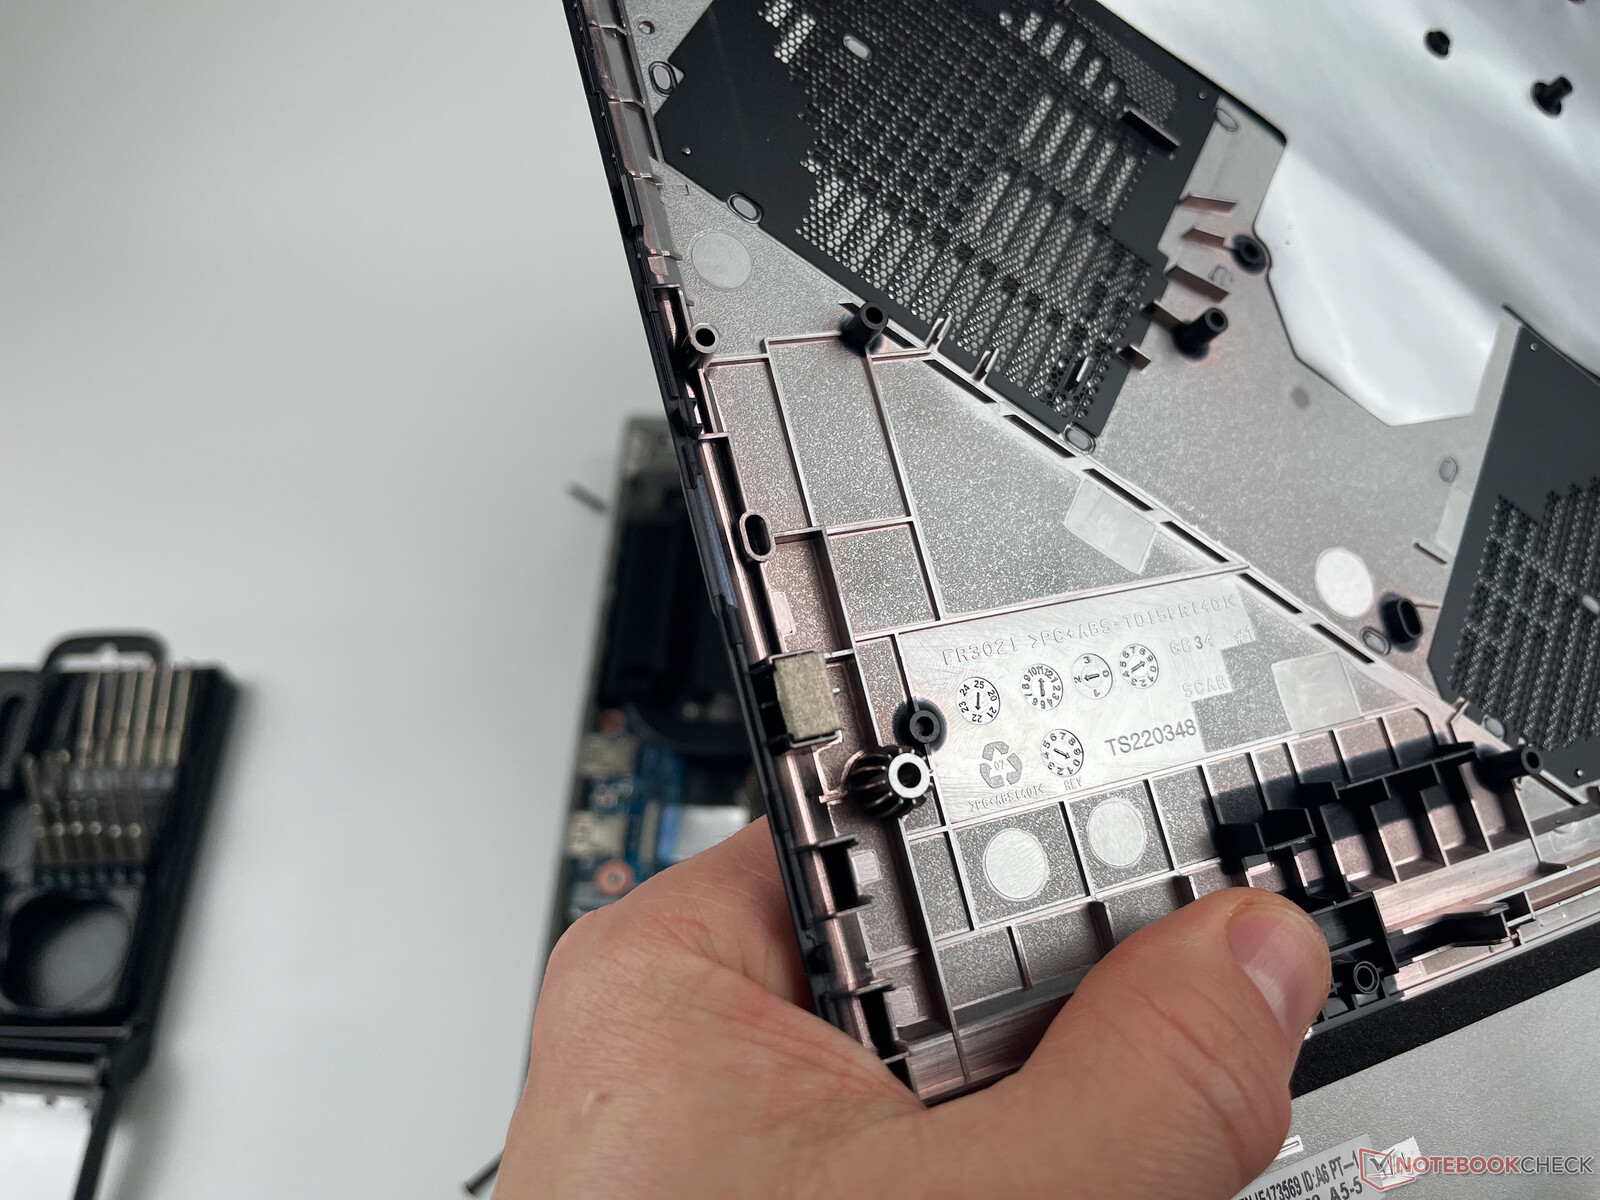
L'interno della serie ROG Strix G18 è accessibile con relativa facilità dal fondo del case. Per prima cosa è necessario rimuovere le numerose viti Philips e poi allentare le clip di plastica sui bordi con un attrezzo per fare leva. L'operazione è stata relativamente semplice con la nostra unità di prova (partendo dagli angoli anteriori) e fortunatamente nessuna delle clip in plastica si è rotta durante l'apertura del case.
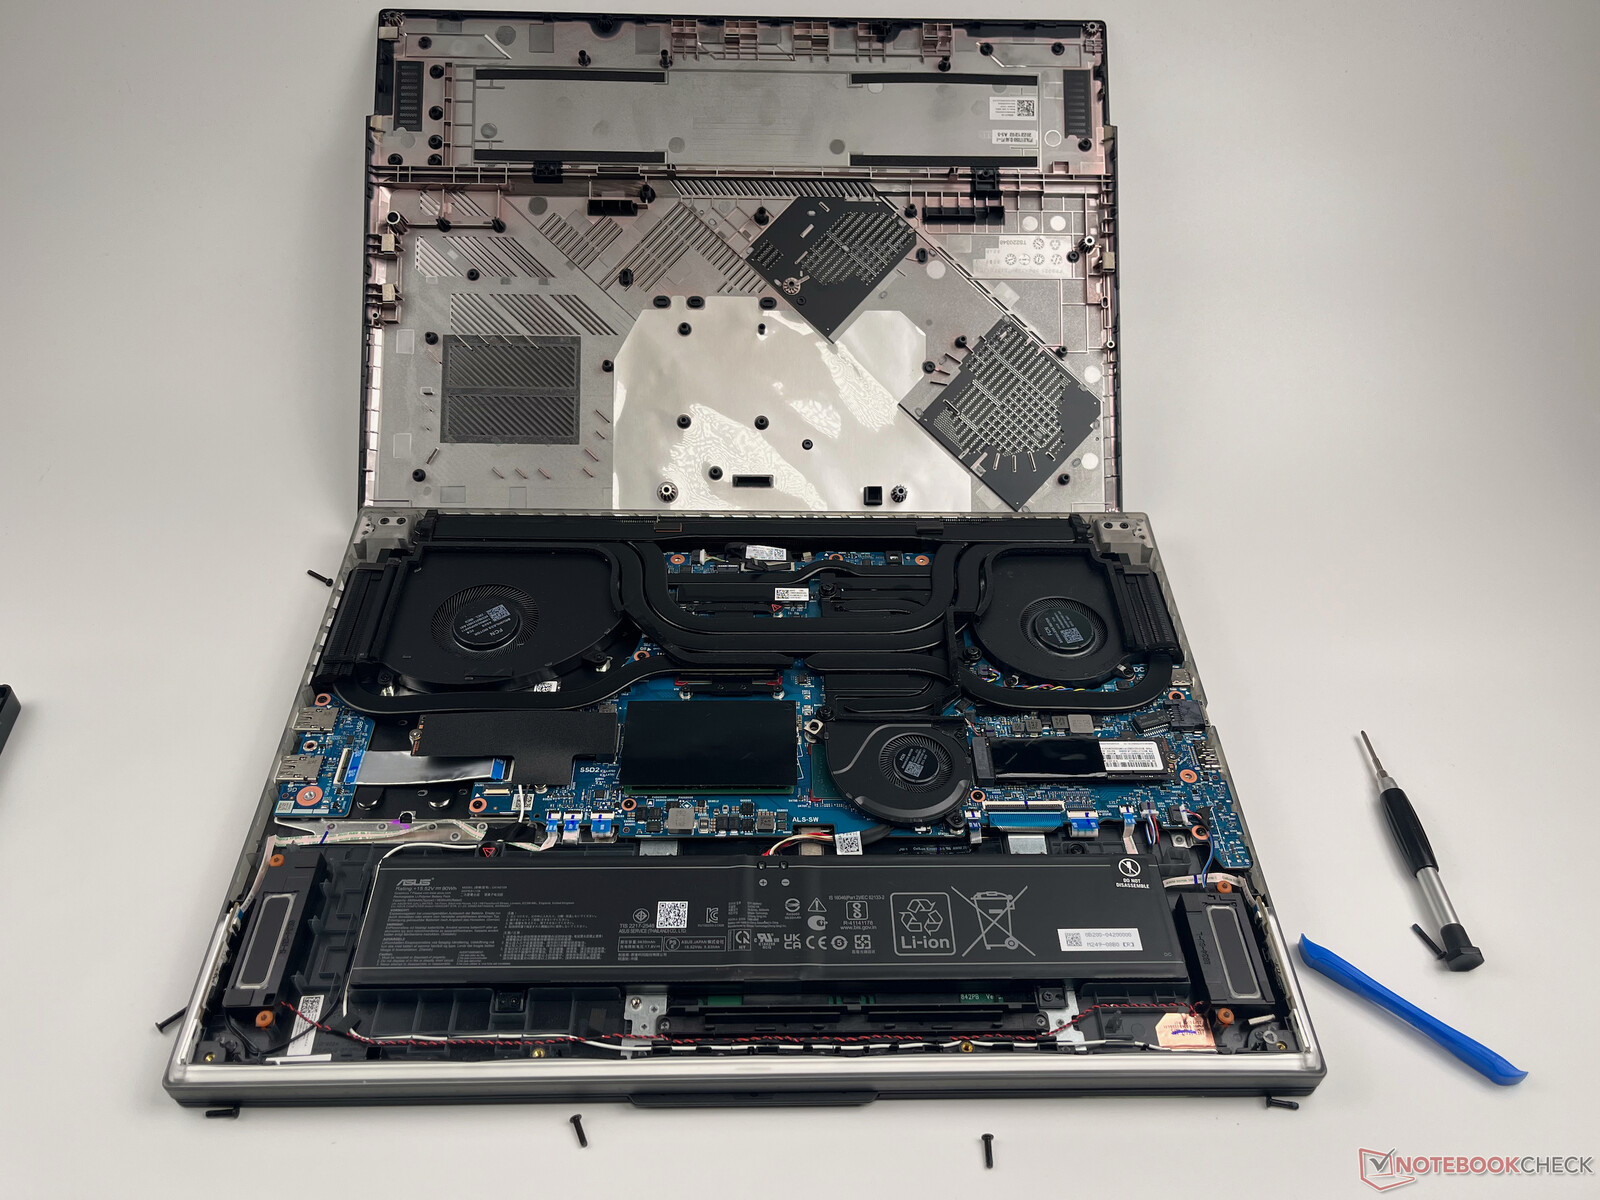
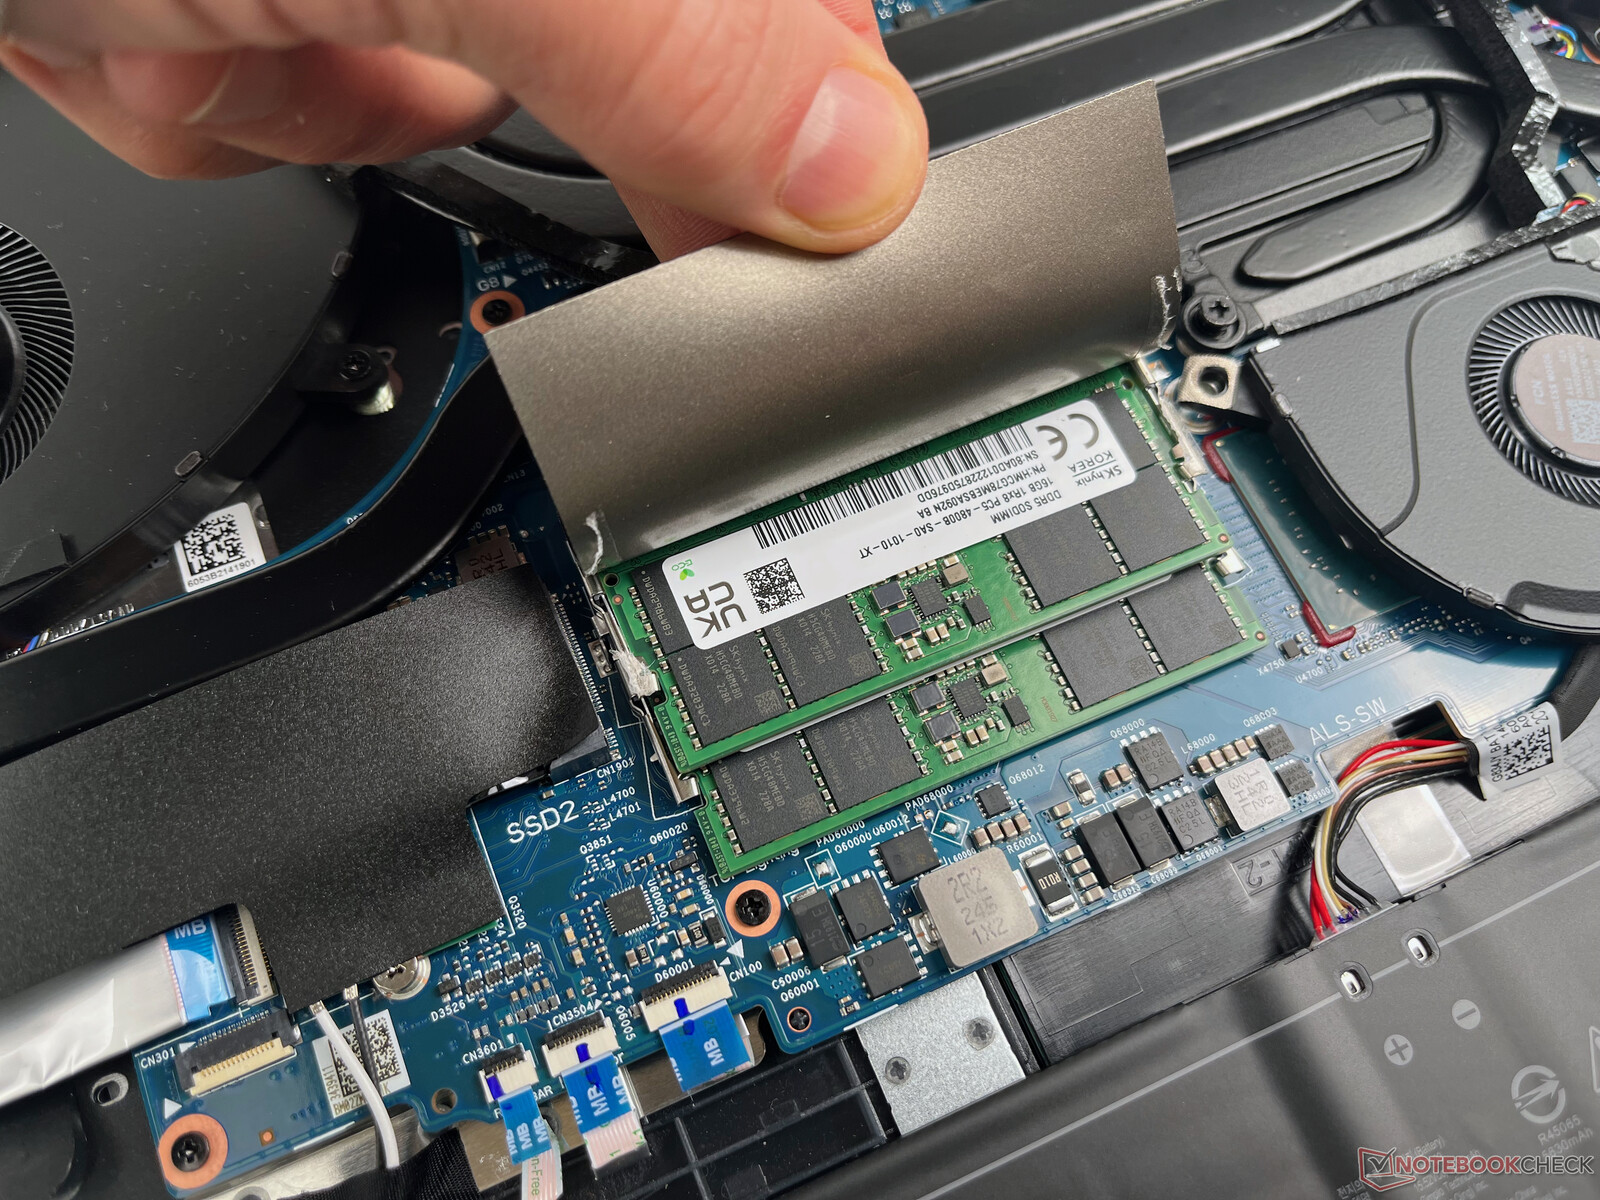
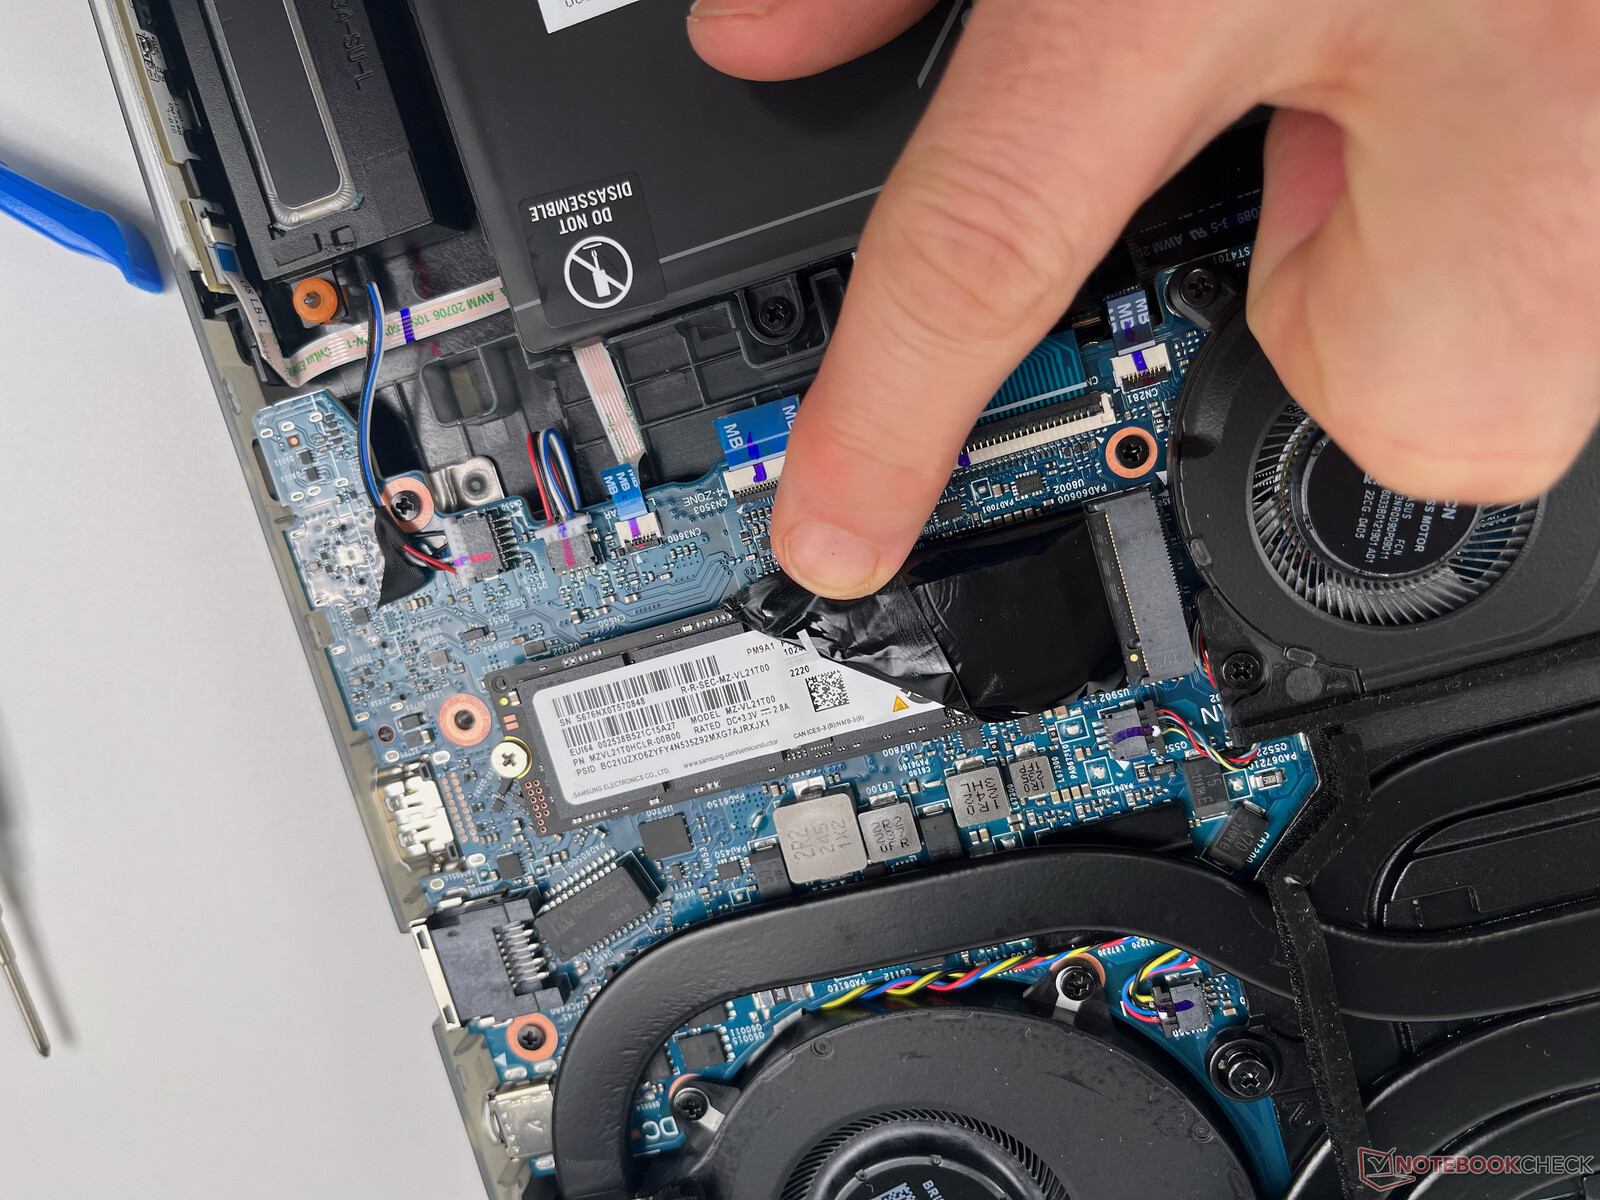
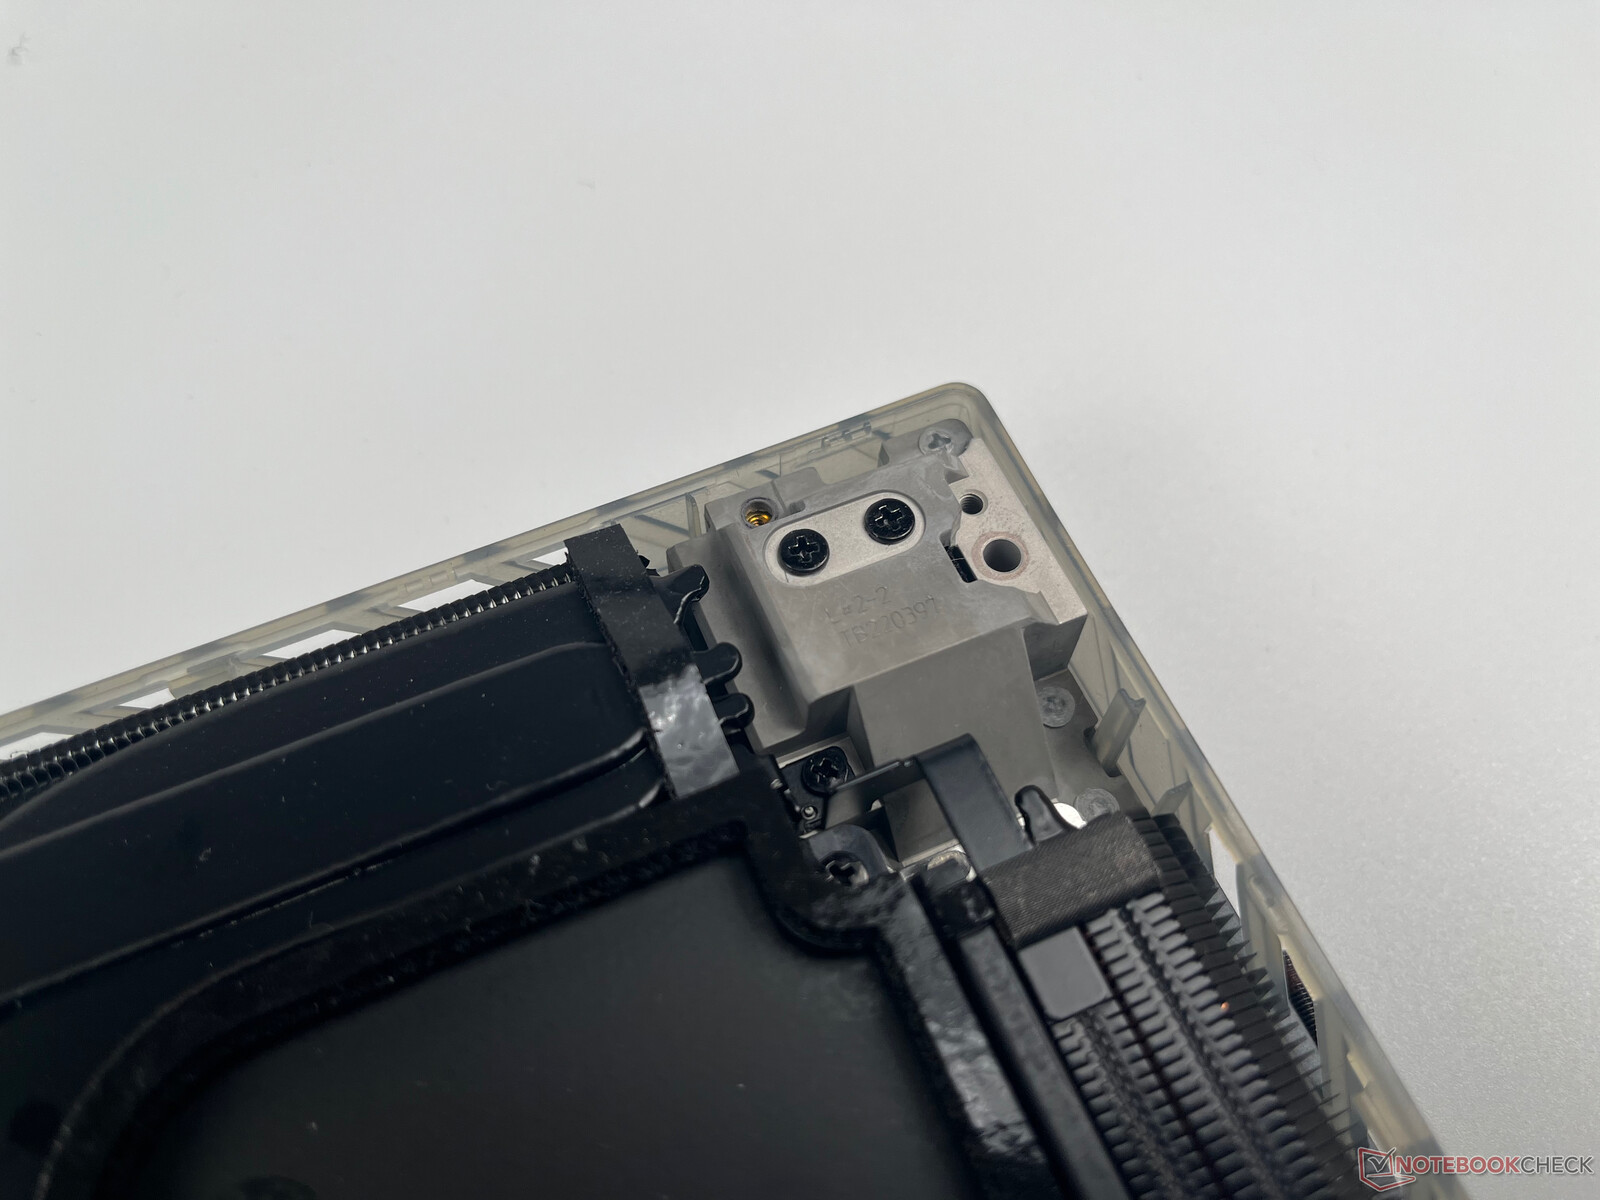
All'interno del portatile troviamo due slot M.2-2280 per SSD PCIe (entrambi occupati per il sistema RAID-0), uno slot M.2 per la scheda WLAN e due slot di memoria (entrambi occupati) per un massimo di 64 GB di RAM GDDR5. Tutte le ventole sono accessibili e possono essere pulite facilmente. La batteria è avvitata nel case, quindi dovrebbe essere relativamente facile da sostituire.
Garanzia
Asus offre solo la consueta garanzia di un anno (due anni per i modelli offerti in Germania). Non viene menzionata una garanzia per i pezzi di ricambio o simili.
Input Devices
Tastiera
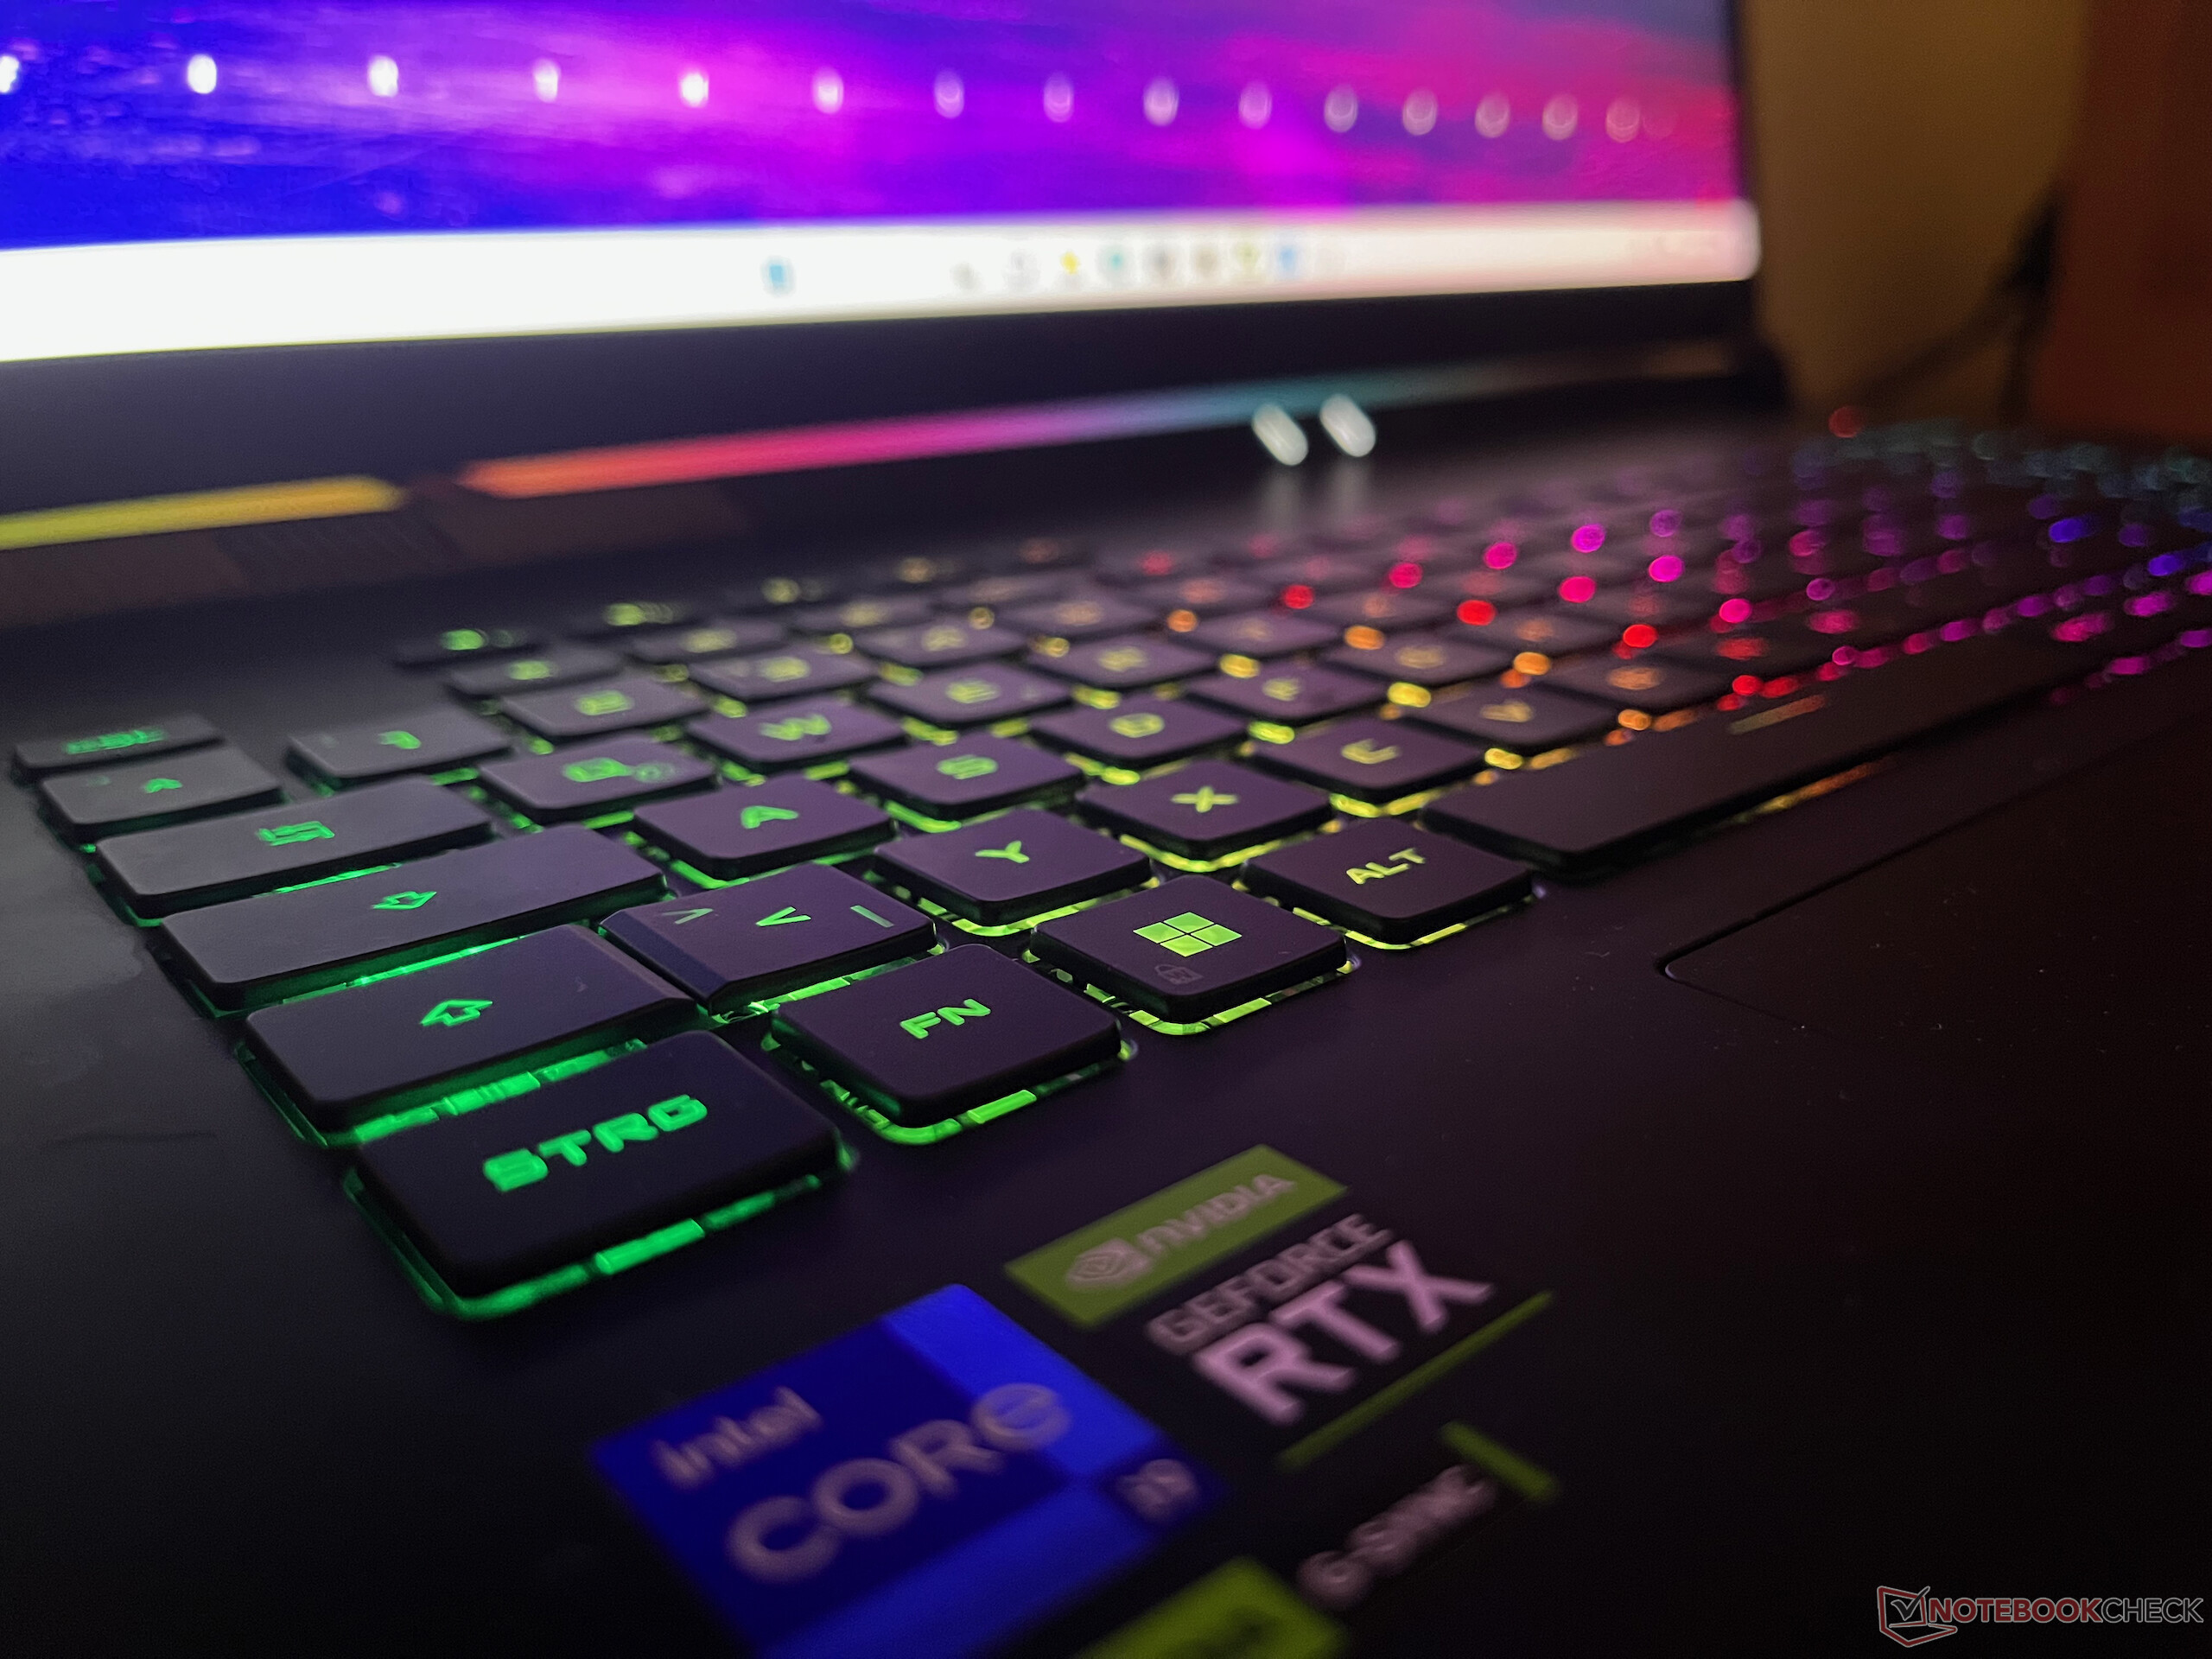
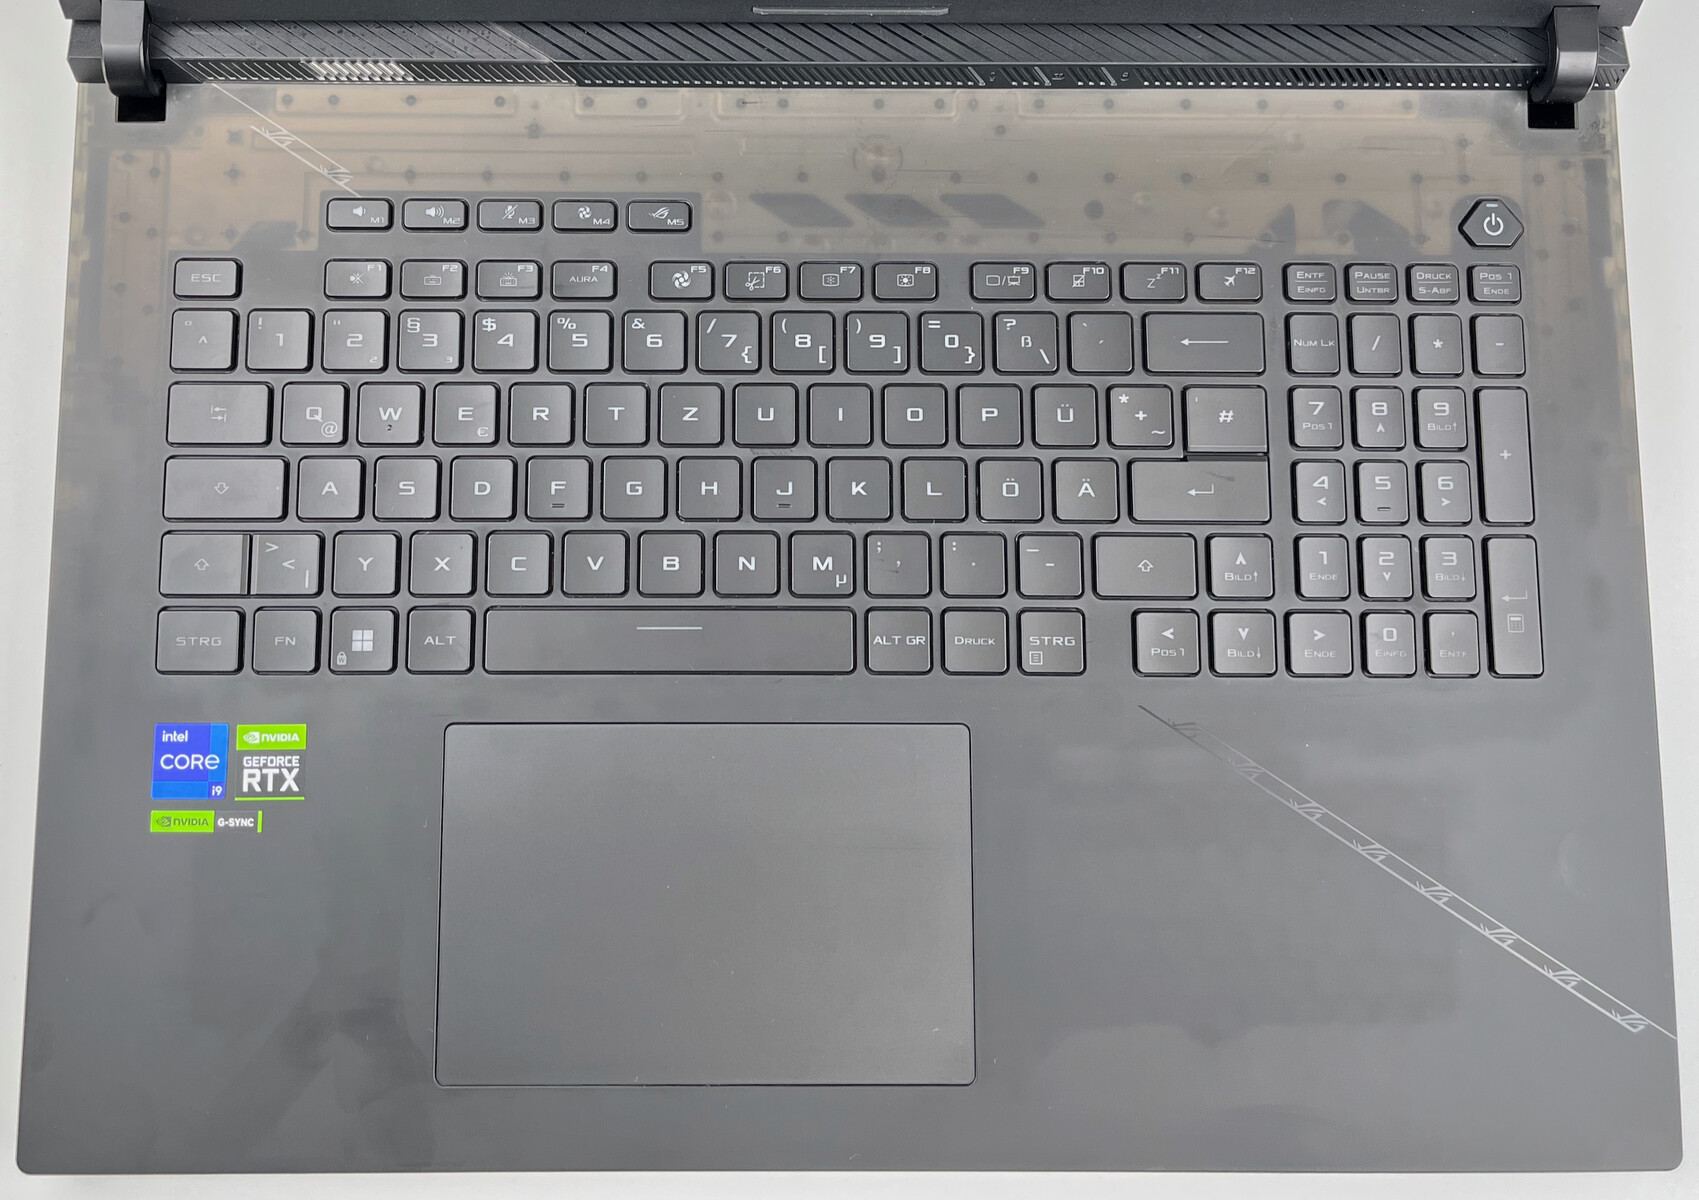
Oltre al blocco numerico, la tastiera full-size qui utilizzata comprende anche cinque tasti speciali sopra la riga F1-F12 a doppio uso. I tasti speciali offrono una corsa sufficiente e una corsa silenziosa. Durante il primo test di digitazione, l'autore ha raggiunto un buon livello di 85 parole al minuto con una precisione del 96%. La retroilluminazione RGB integrata dei tasti separati può essere personalizzata con numerose animazioni. Nel test del rollover di n tasti, non notiamo alcuna limitazione (24 tasti simultanei raggiunti al massimo).
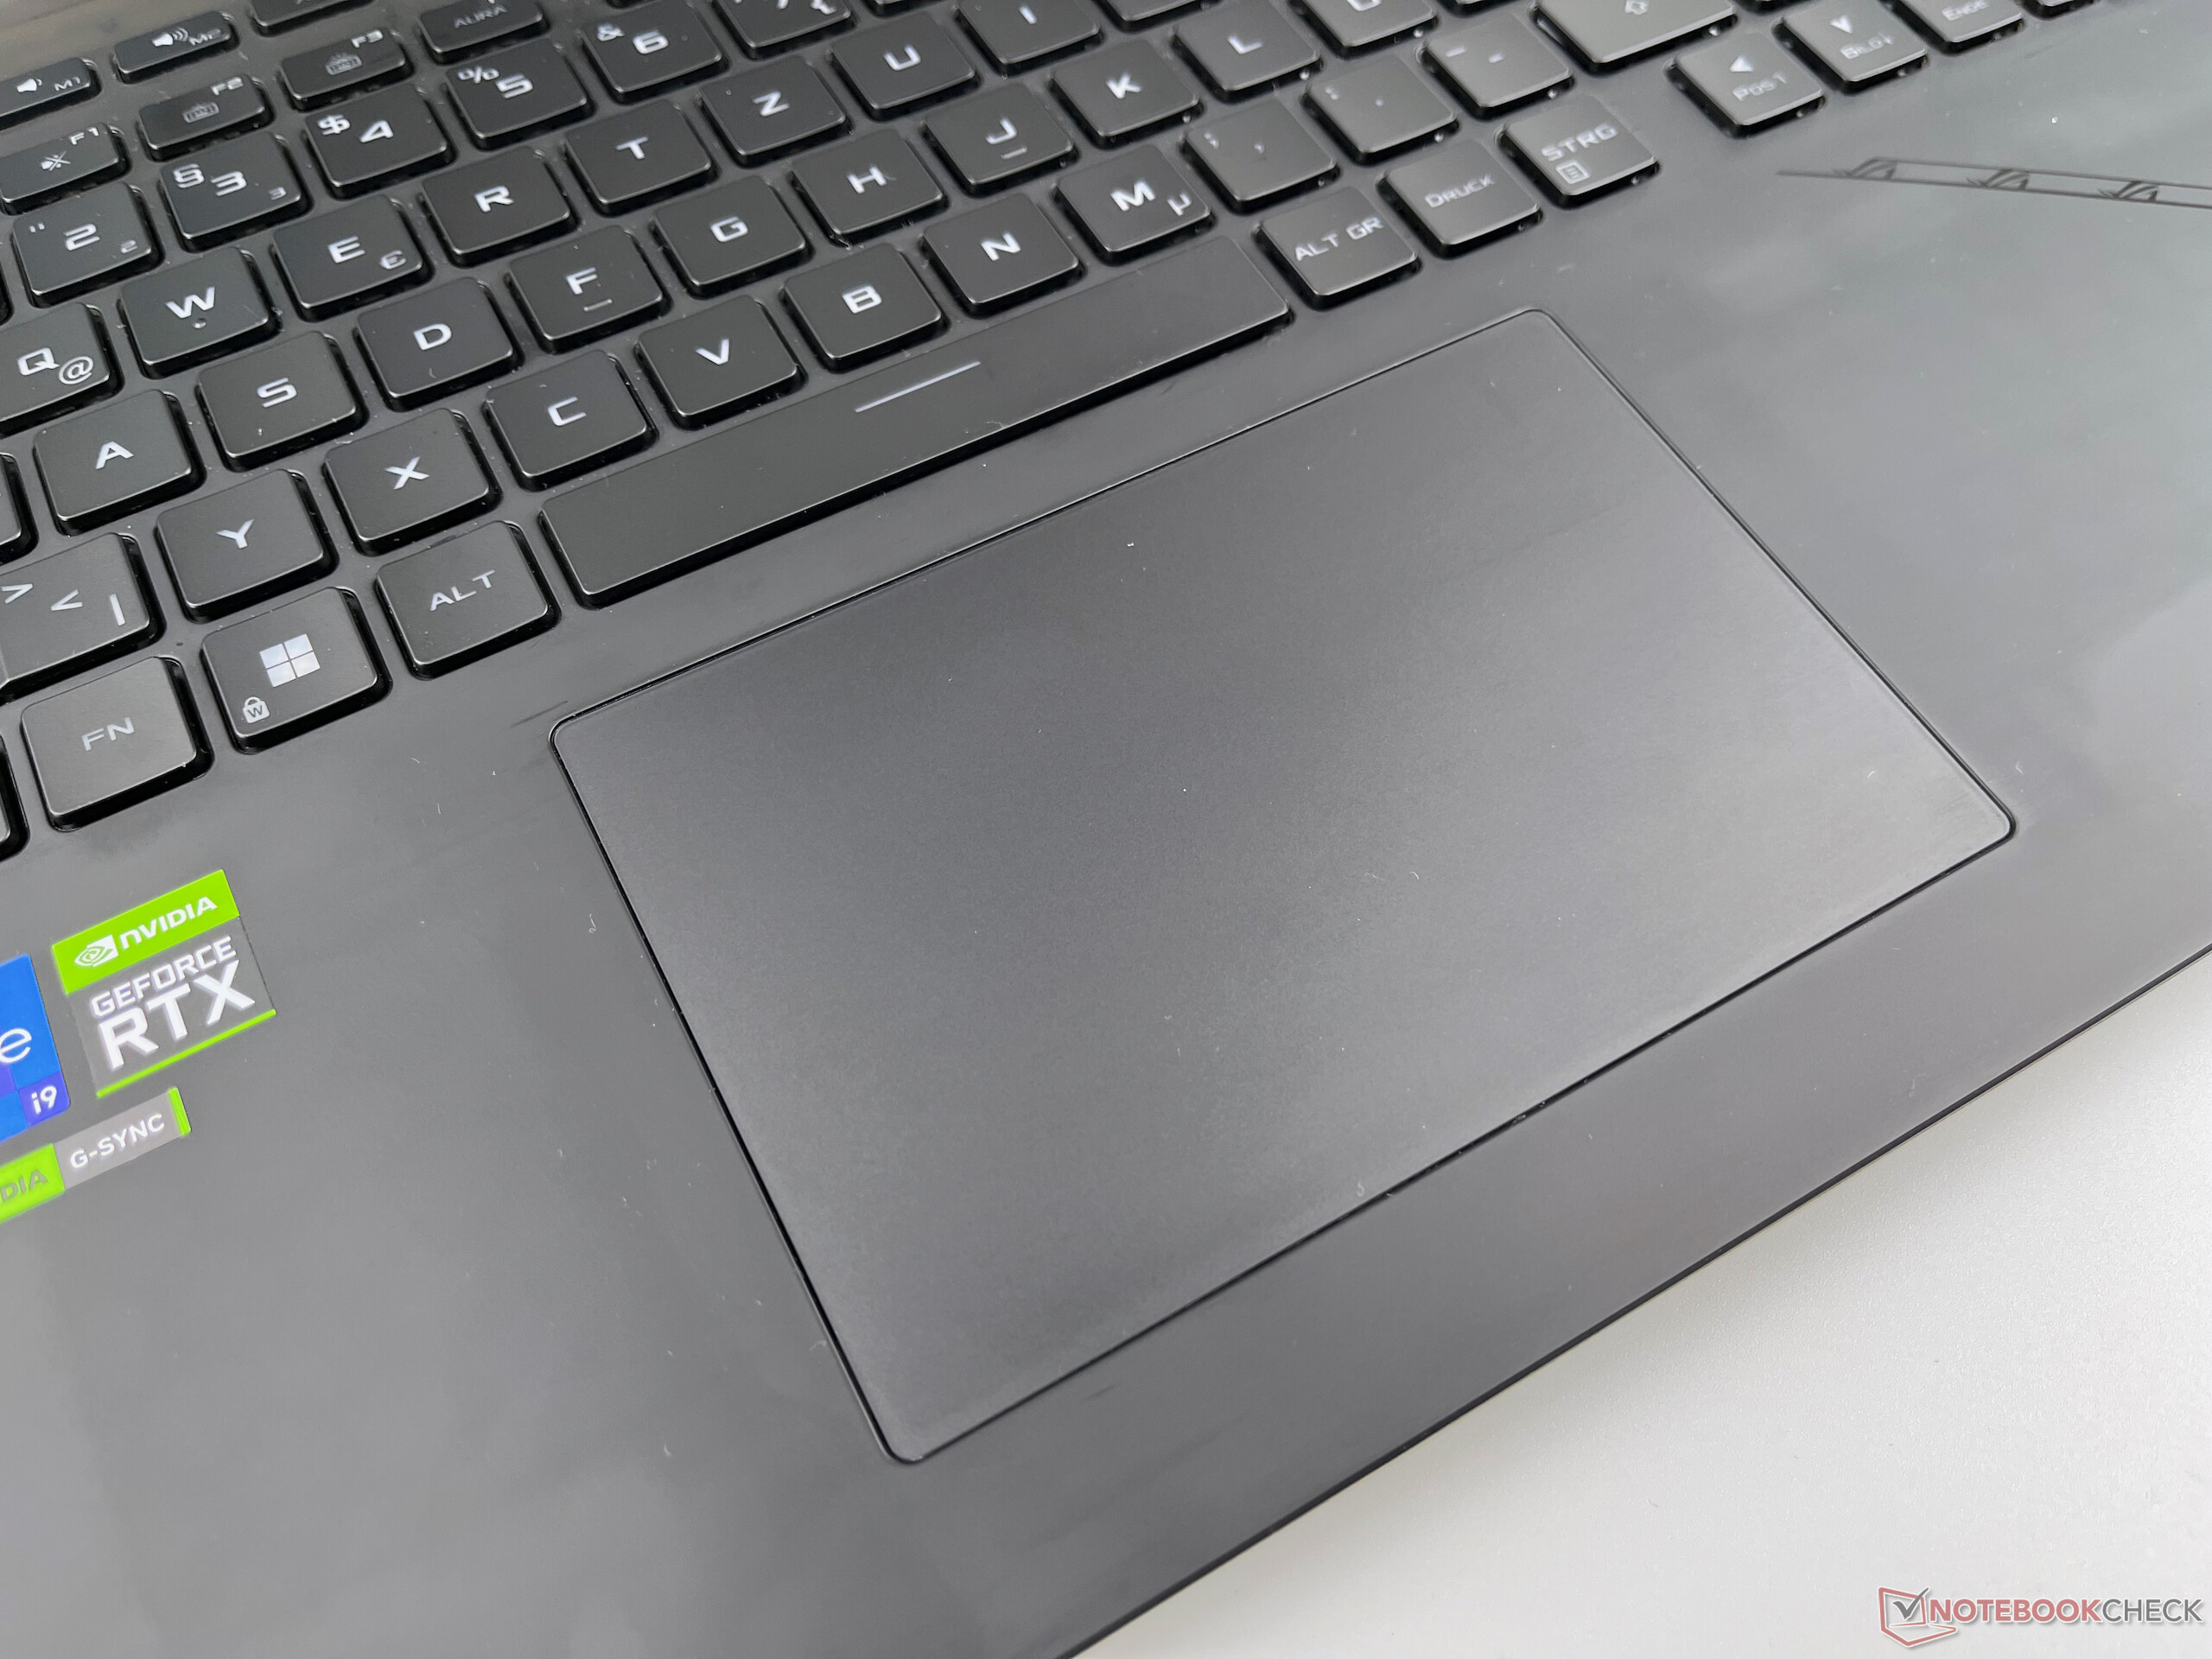
Touchpad
L'ampio touchpad offre una superficie in vetro e ottime caratteristiche di scorrevolezza. Il multitouch ha funzionato perfettamente nel nostro test e anche i 4/5 inferiori dell'area possono essere cliccati comodamente. Tuttavia, un clic nell'angolo inferiore destro viene spesso riconosciuto come una pressione del tasto destro del mouse, portando ad alcuni input errati.
Display
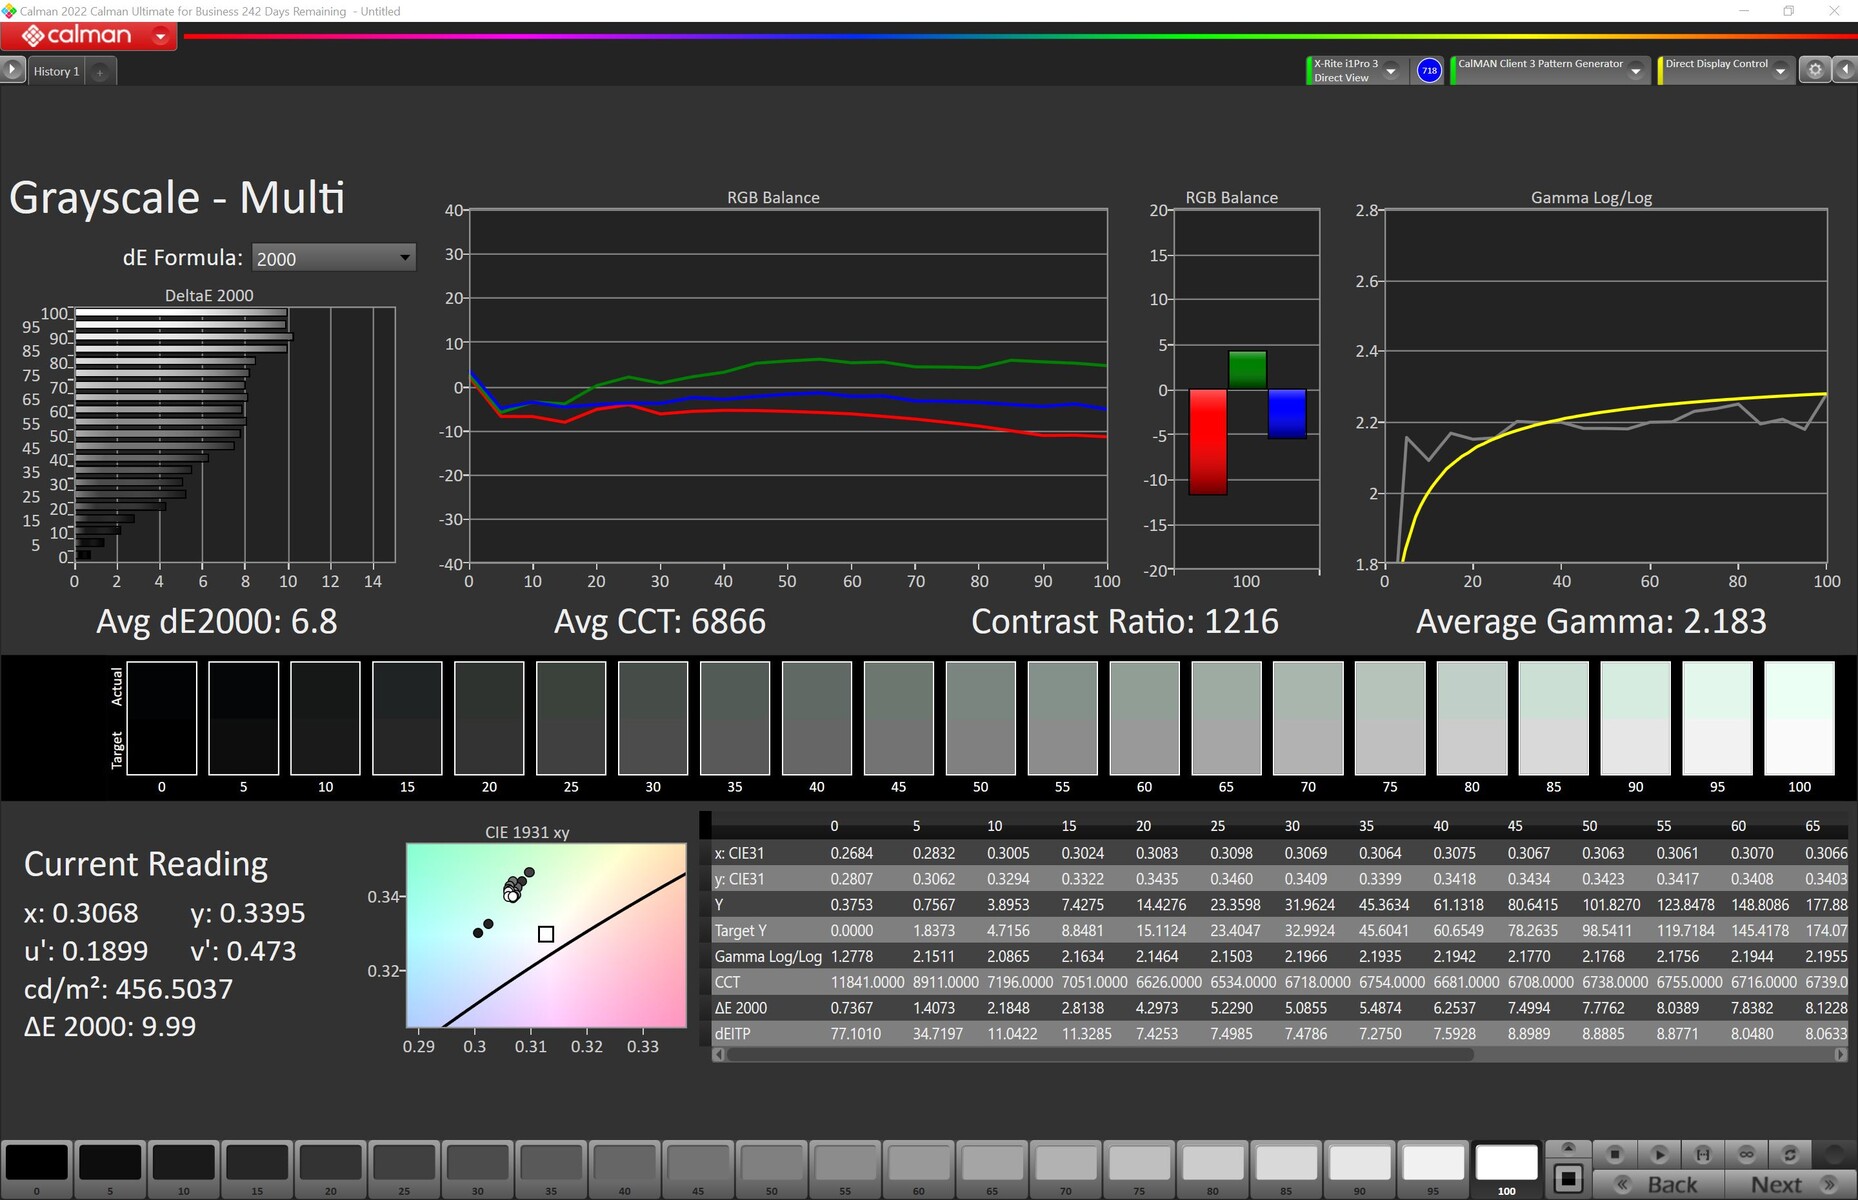
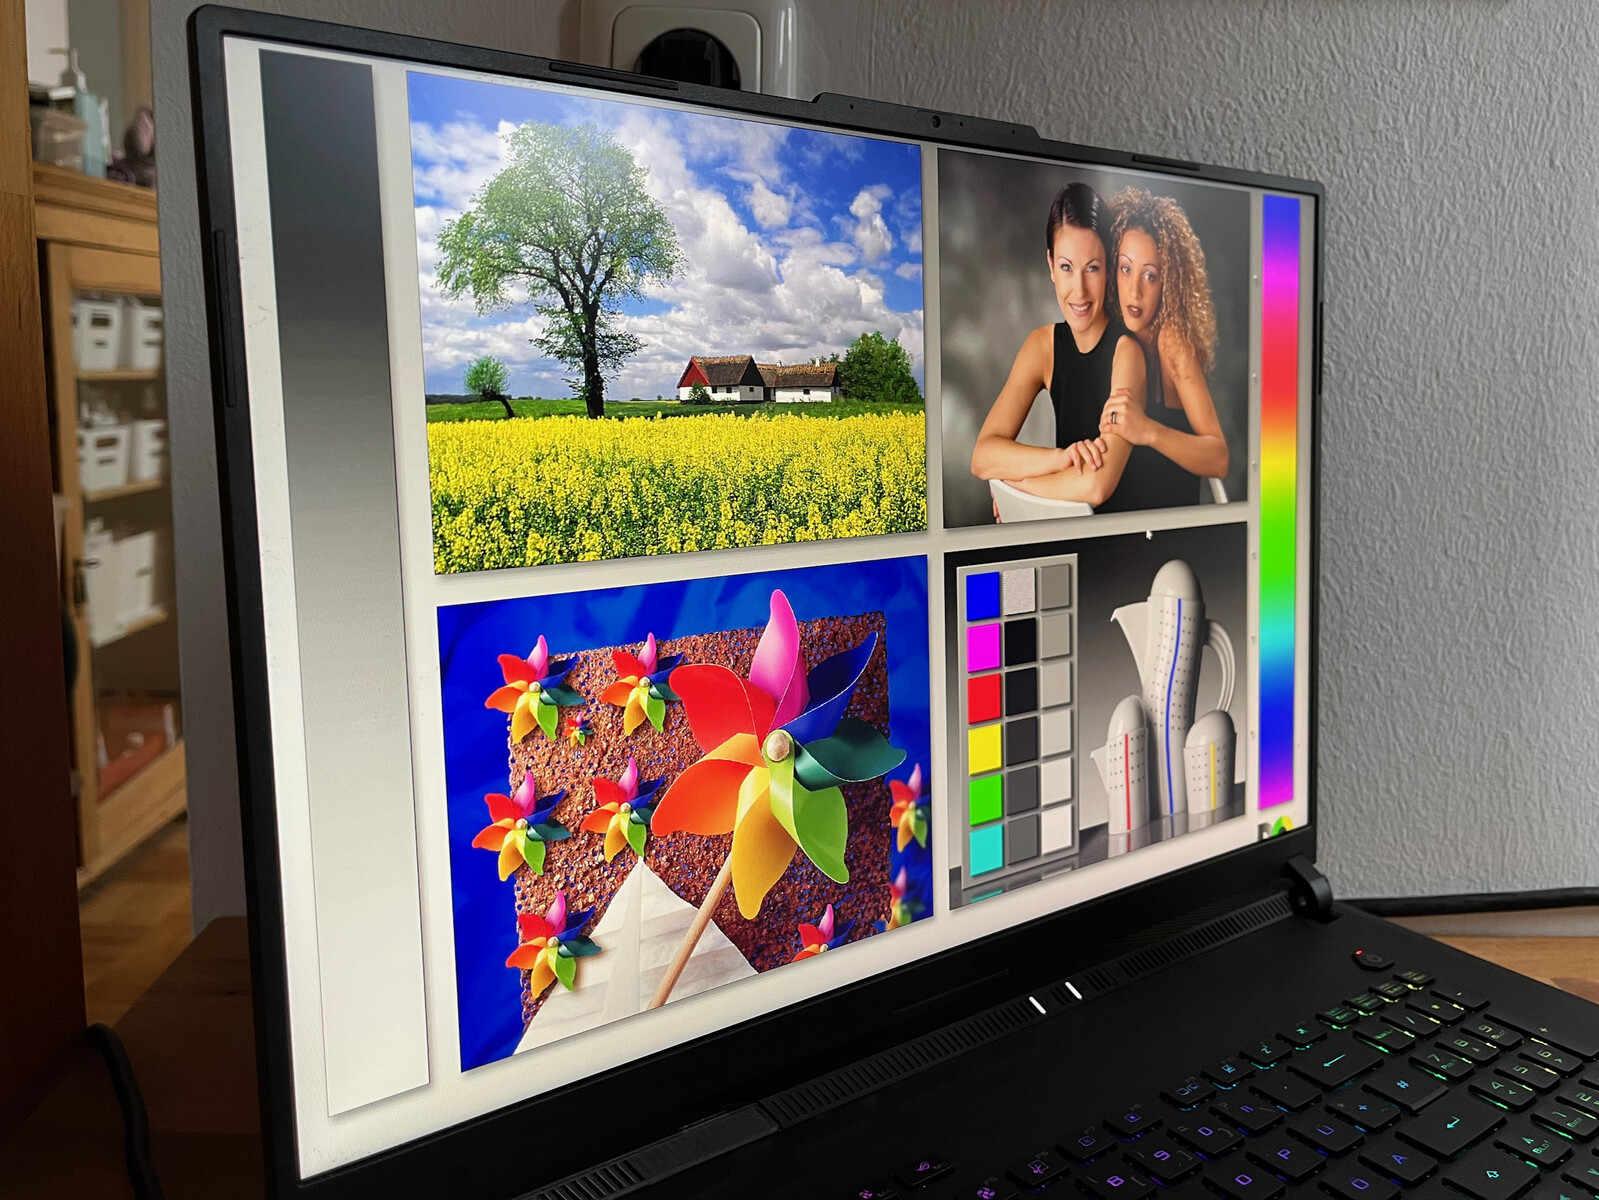
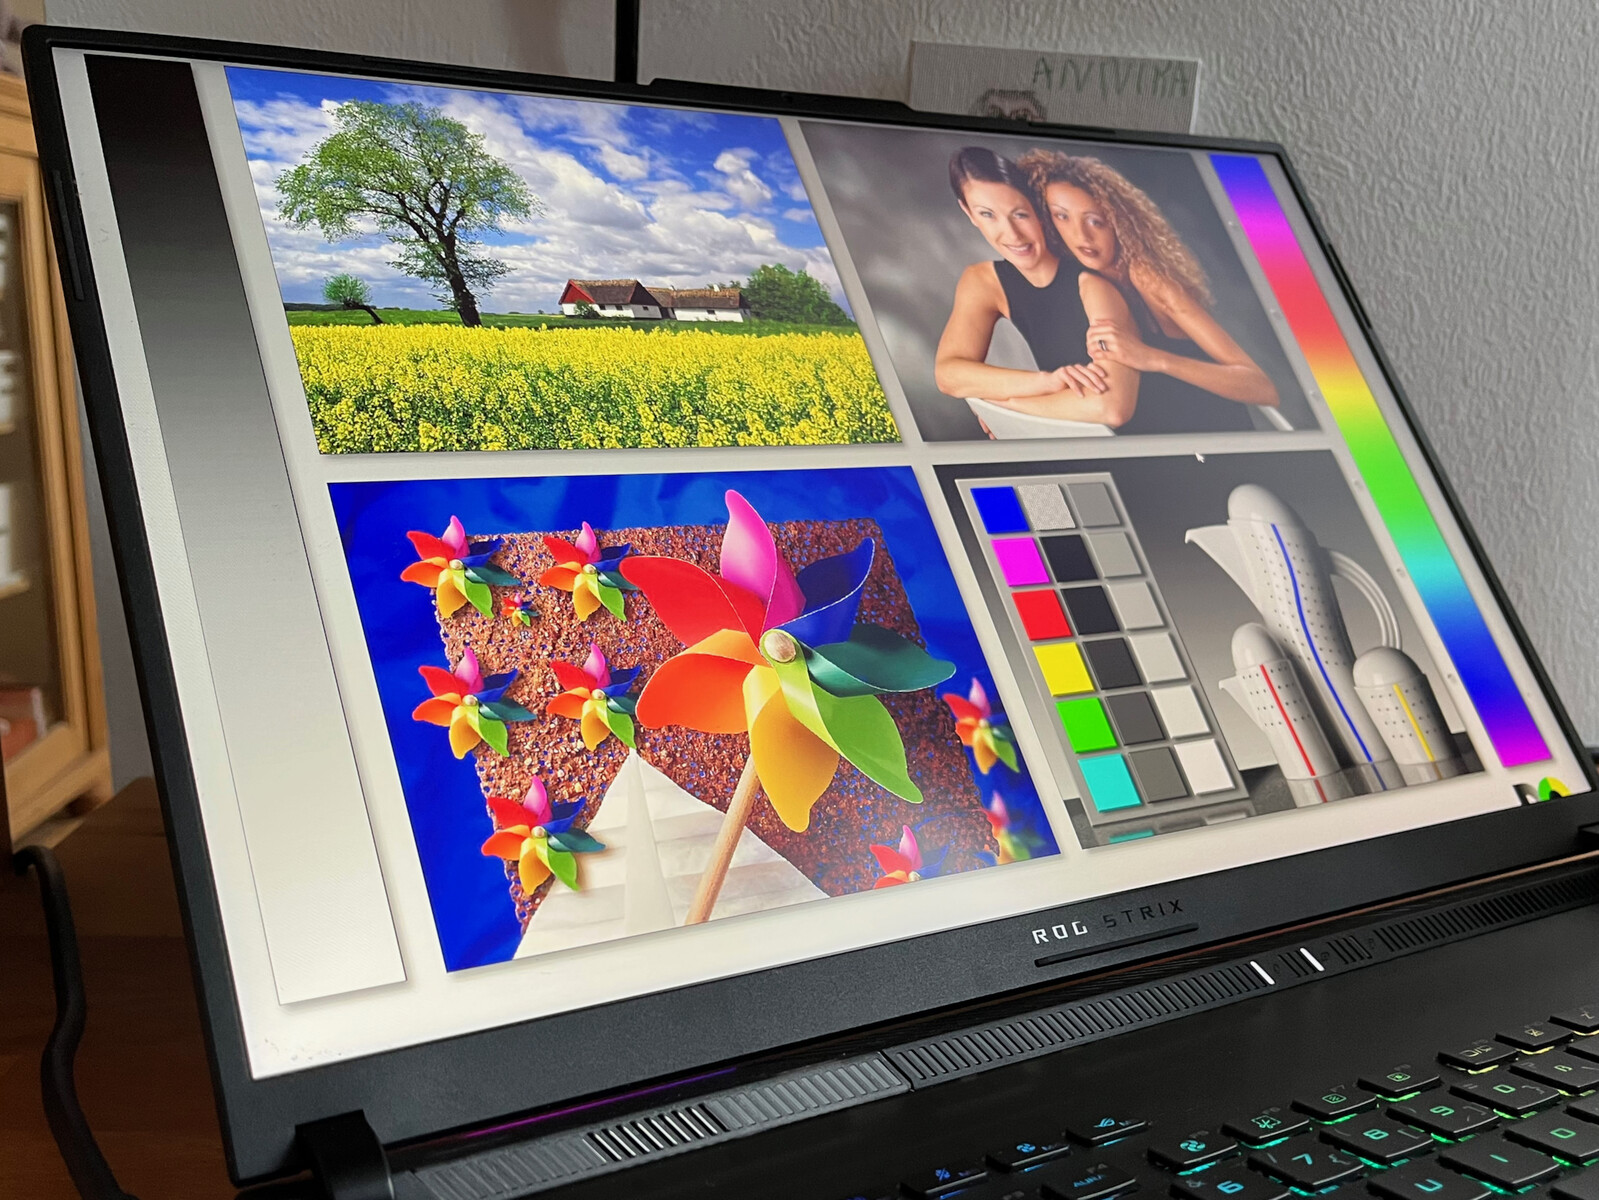
Secondo la scheda tecnica, il nuovo display da 18 pollici vanta numerose caratteristiche come G-Sync, 240 Hz, QHD+, tempi di risposta rapidi di 3 ms e copertura dello spazio colore DCI-P3. In termini di luminosità, il grande display da 18 pollici non raggiunge i 500 nit promessi. Tuttavia, la luminosità è sempre sufficiente in ambienti chiusi e anche la distribuzione della luminosità è buona (86%). La nostra unità di test non ha mostrato alcuna perdita di luminosità visibile.
| |||||||||||||||||||||||||
Distribuzione della luminosità: 86 %
Al centro con la batteria: 490 cd/m²
Contrasto: 907:1 (Nero: 0.54 cd/m²)
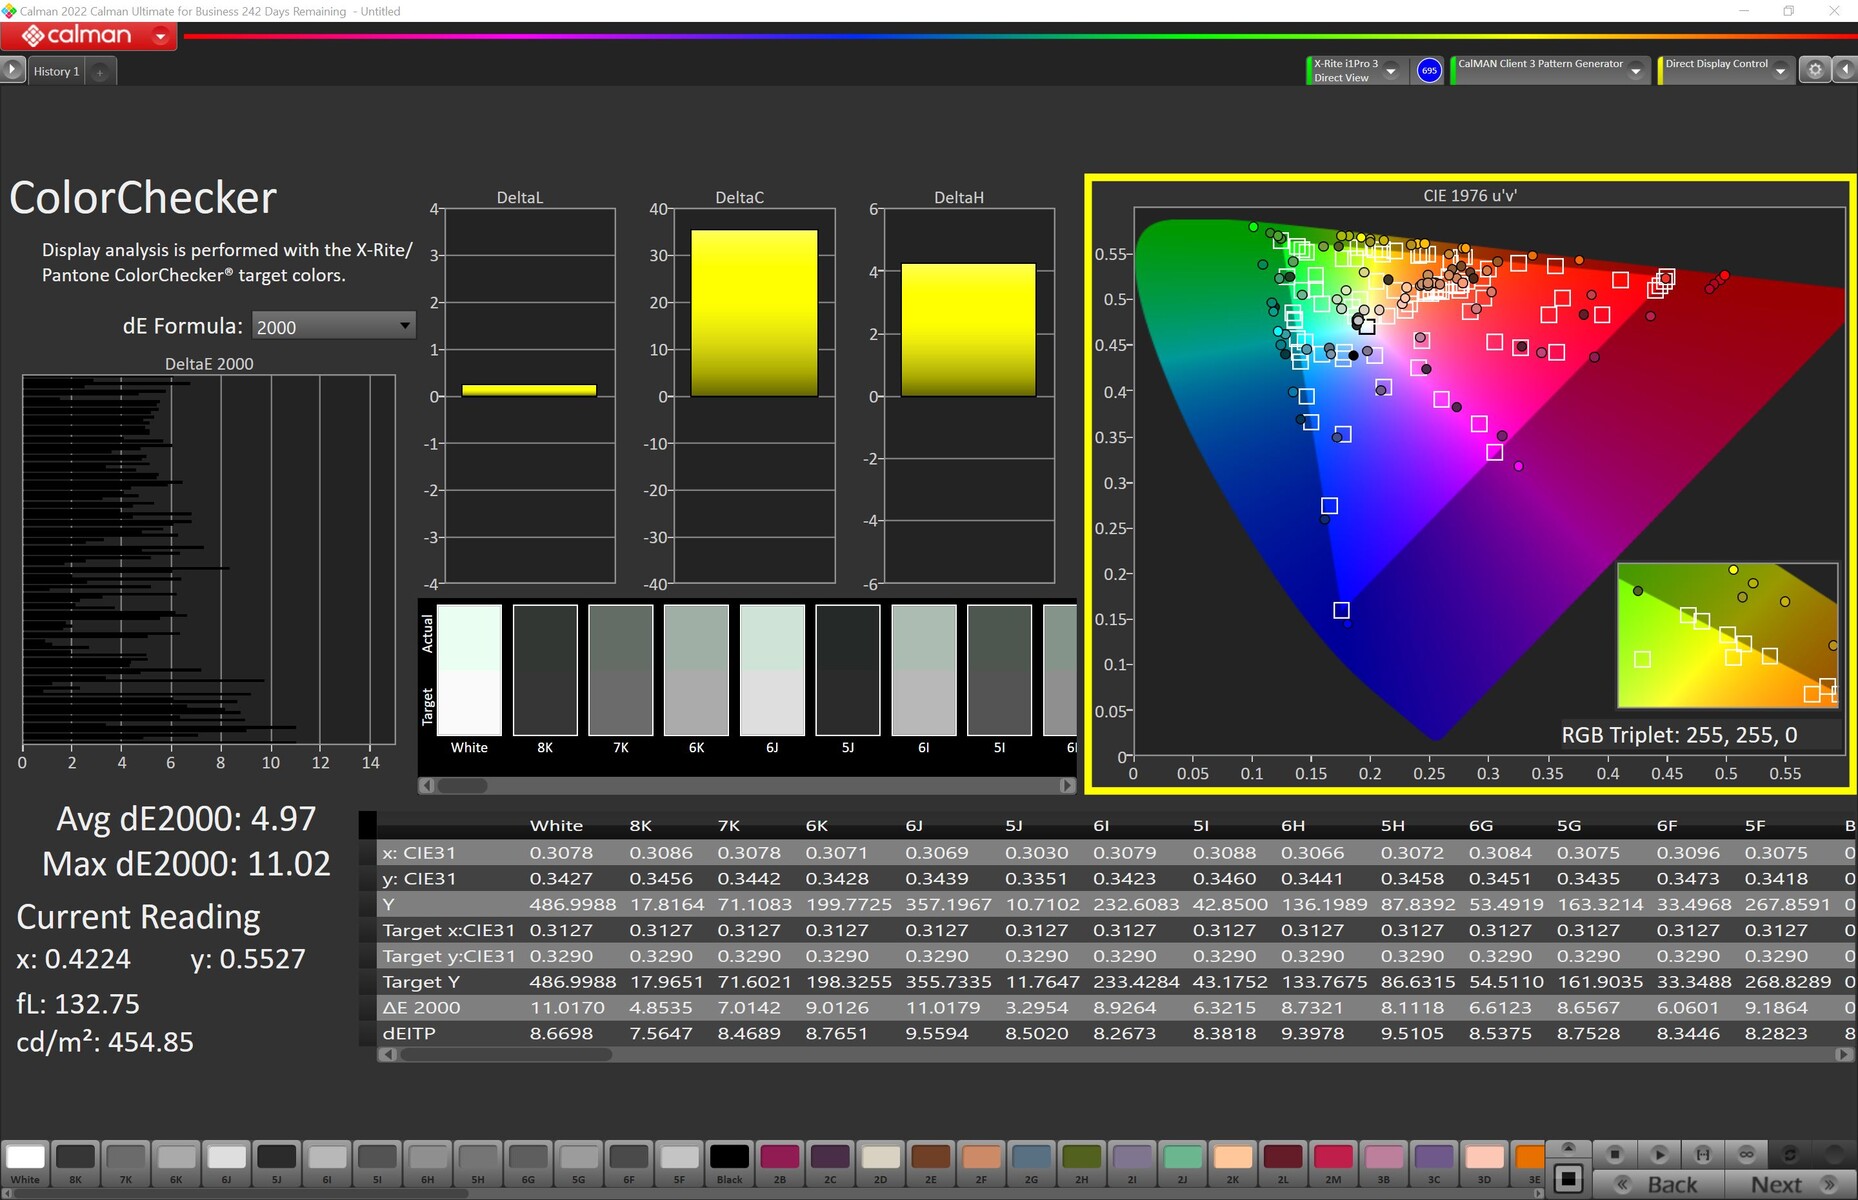
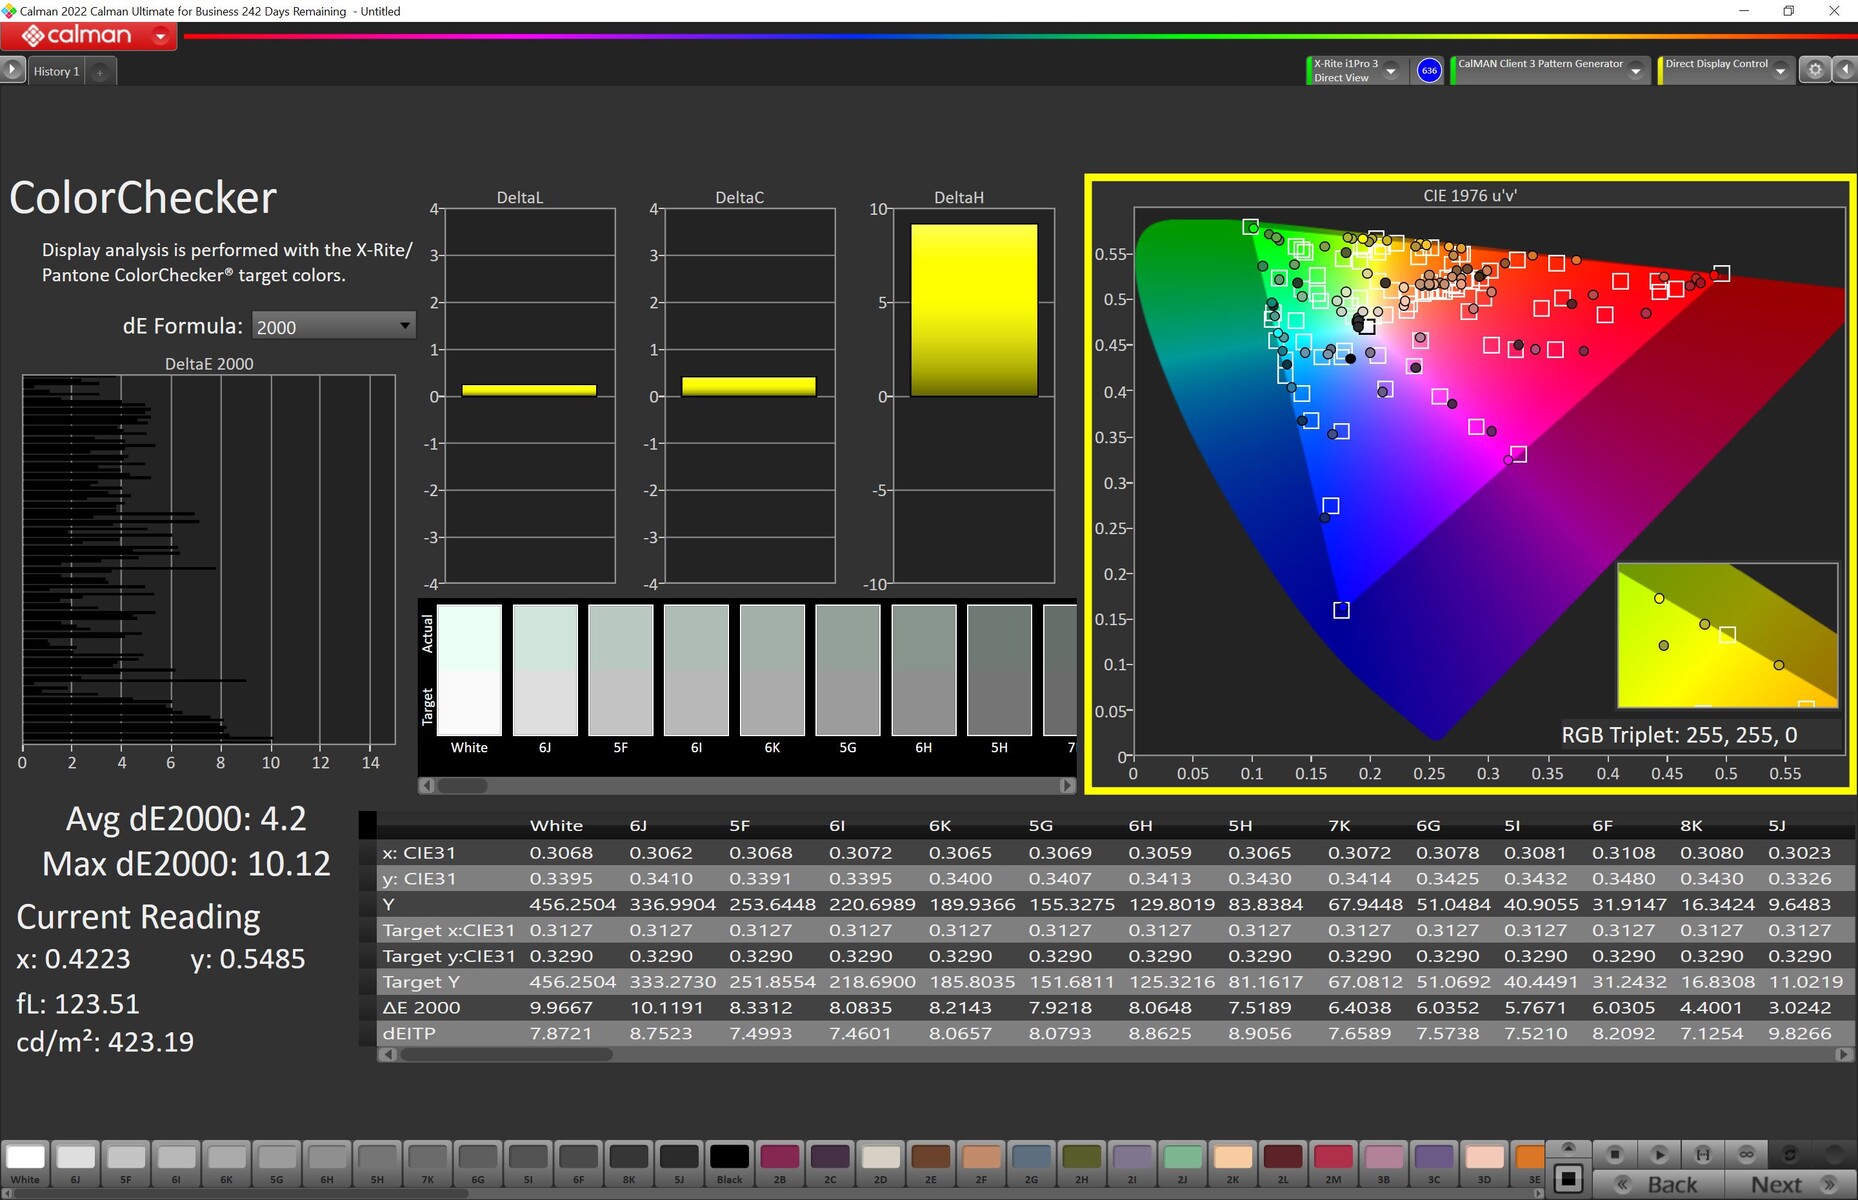
ΔE ColorChecker Calman: 4.97 | ∀{0.5-29.43 Ø4.71}
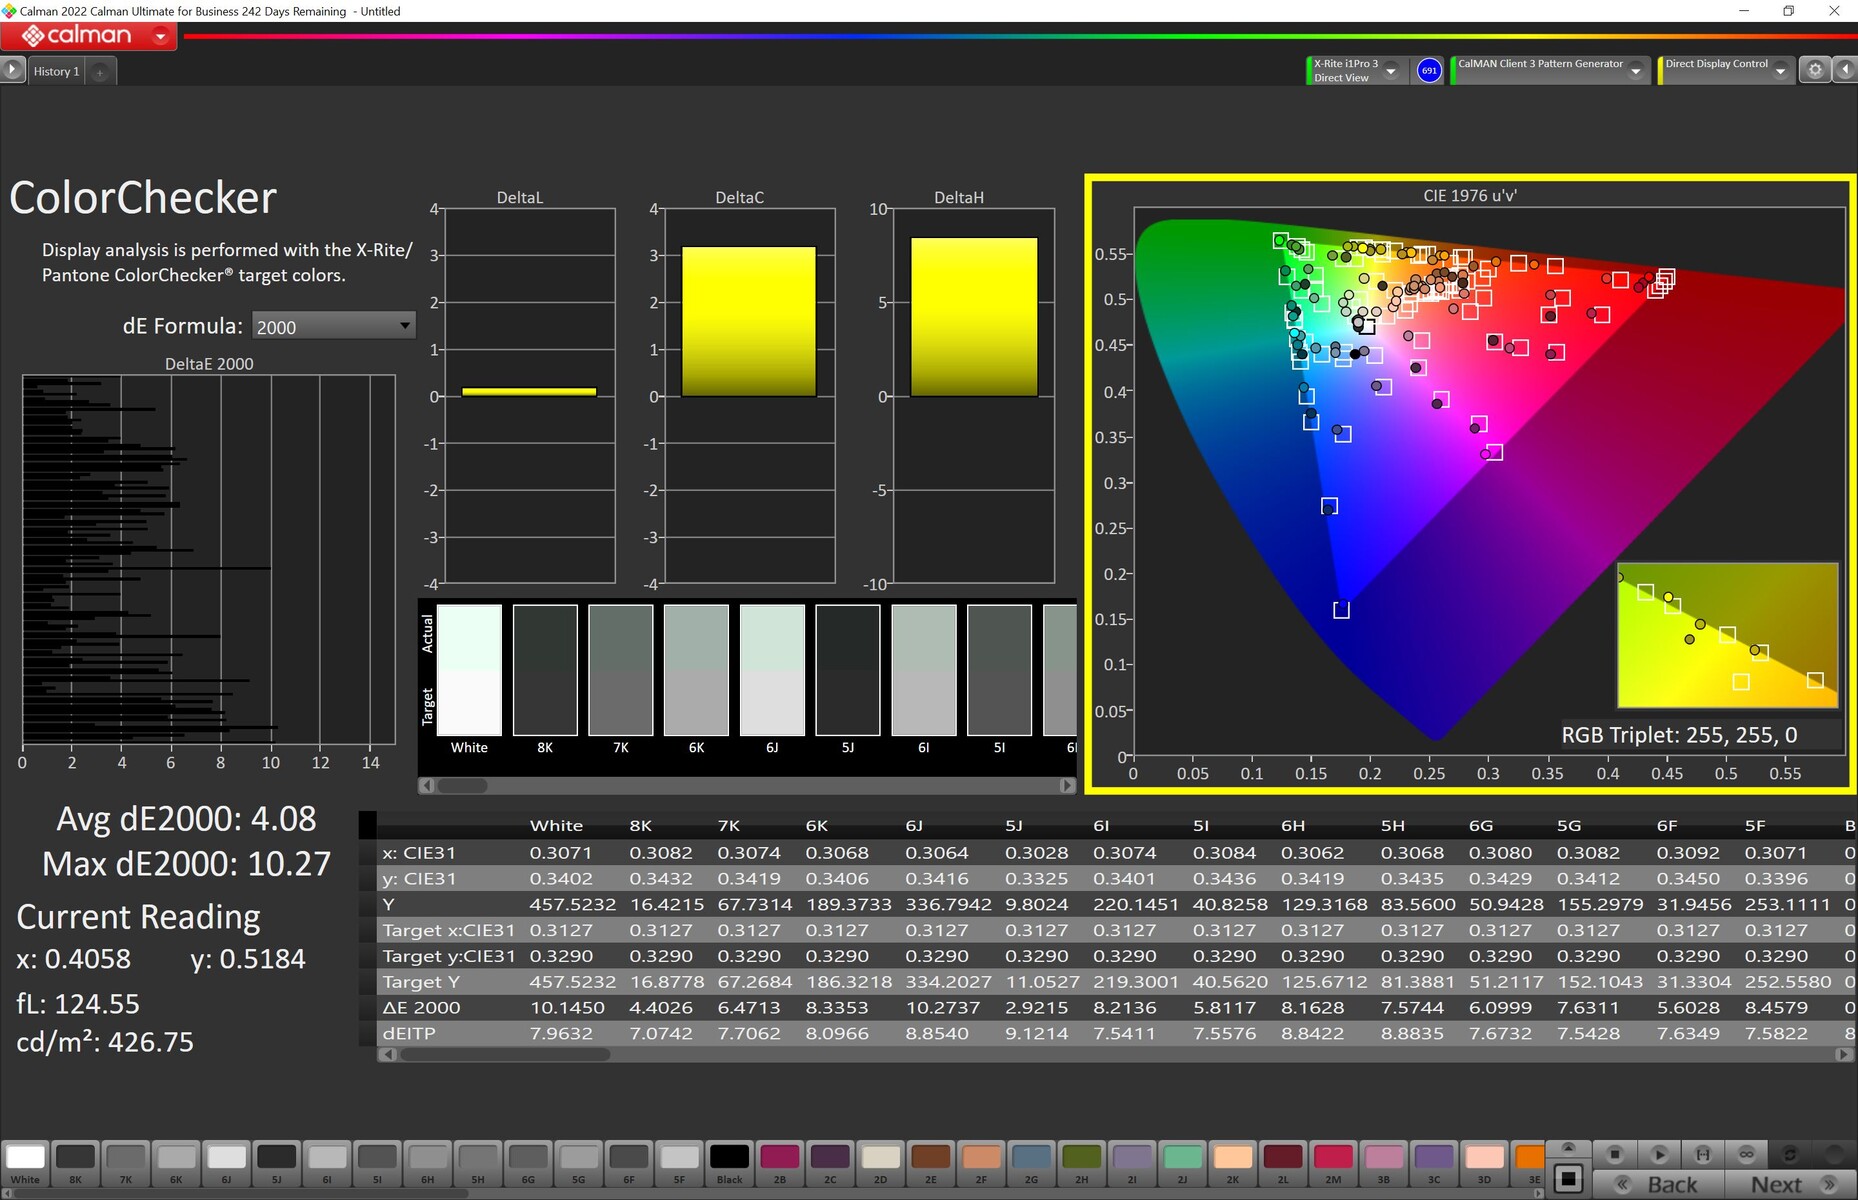
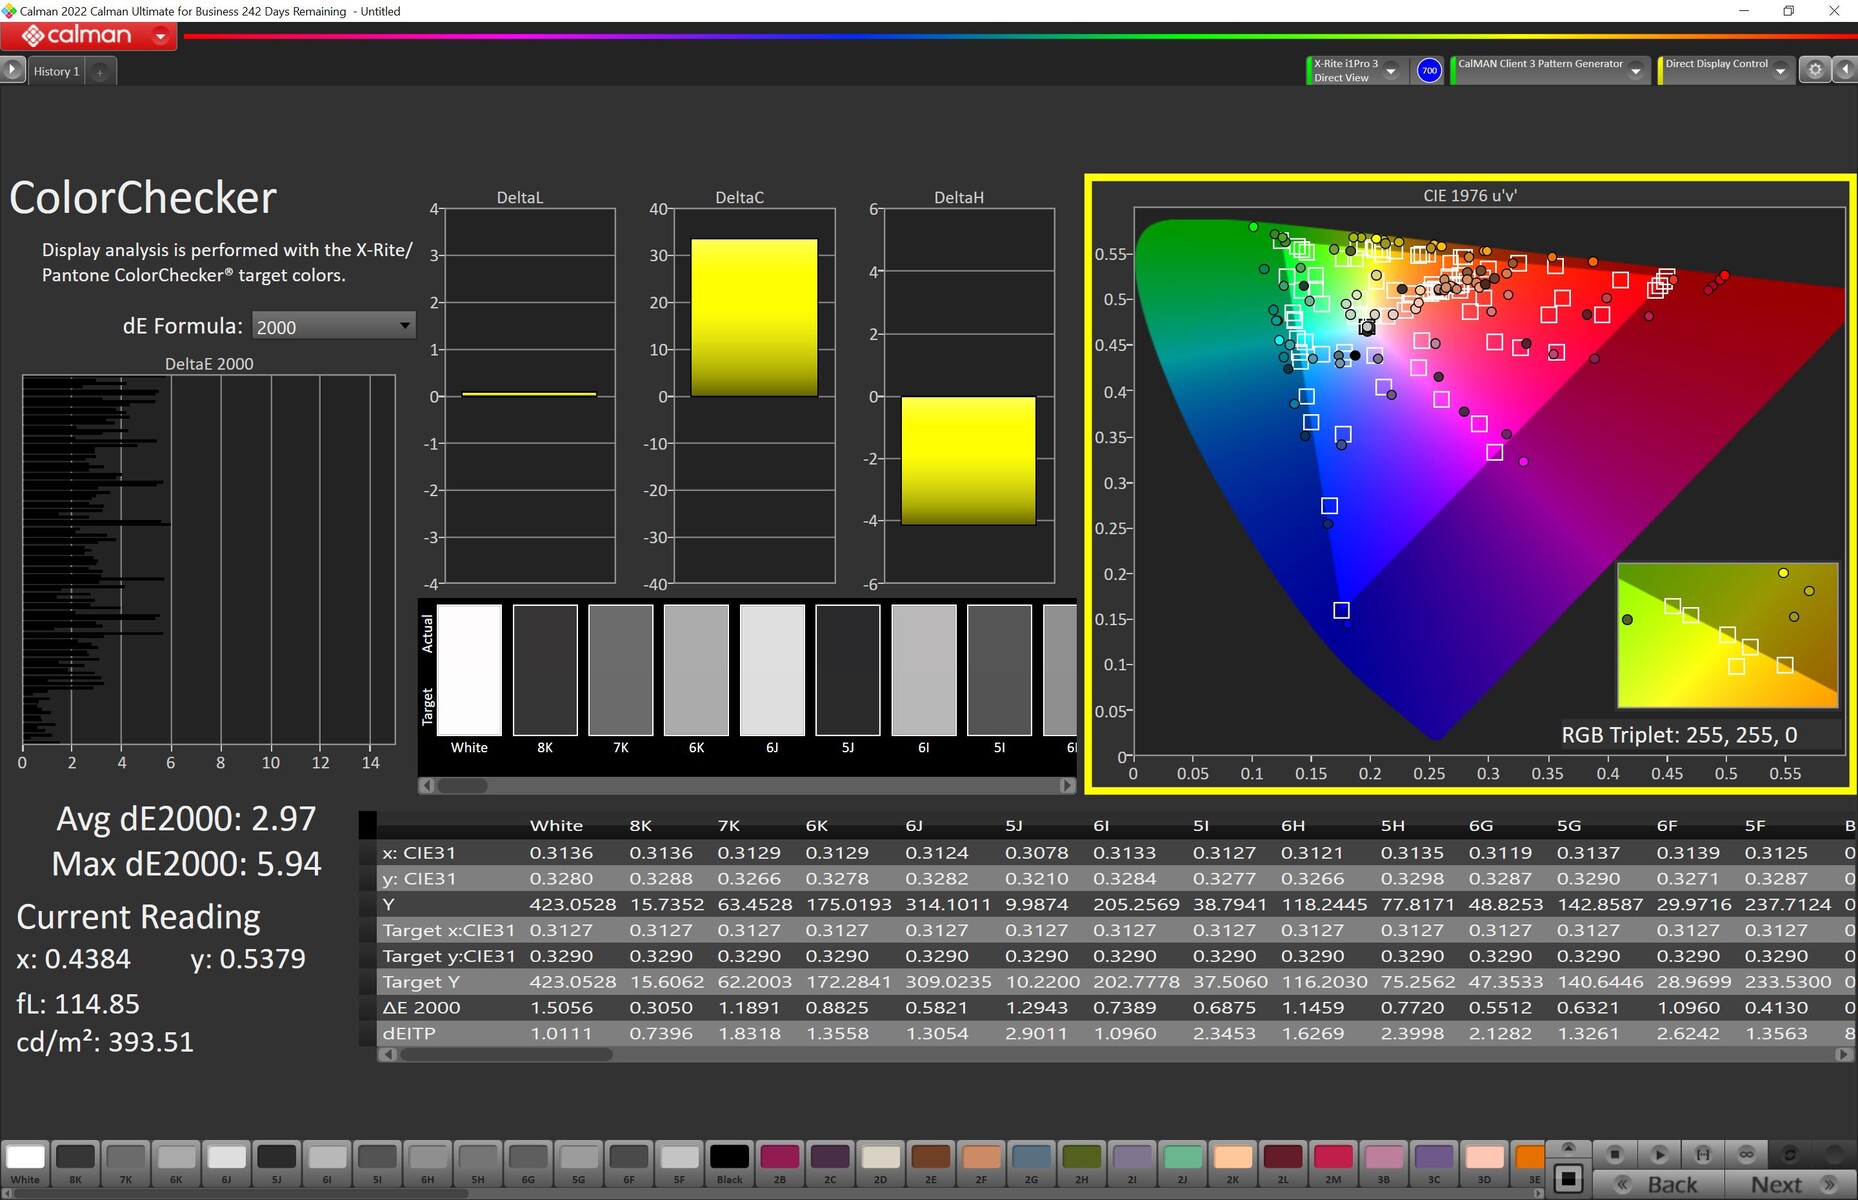
calibrated: 2.97
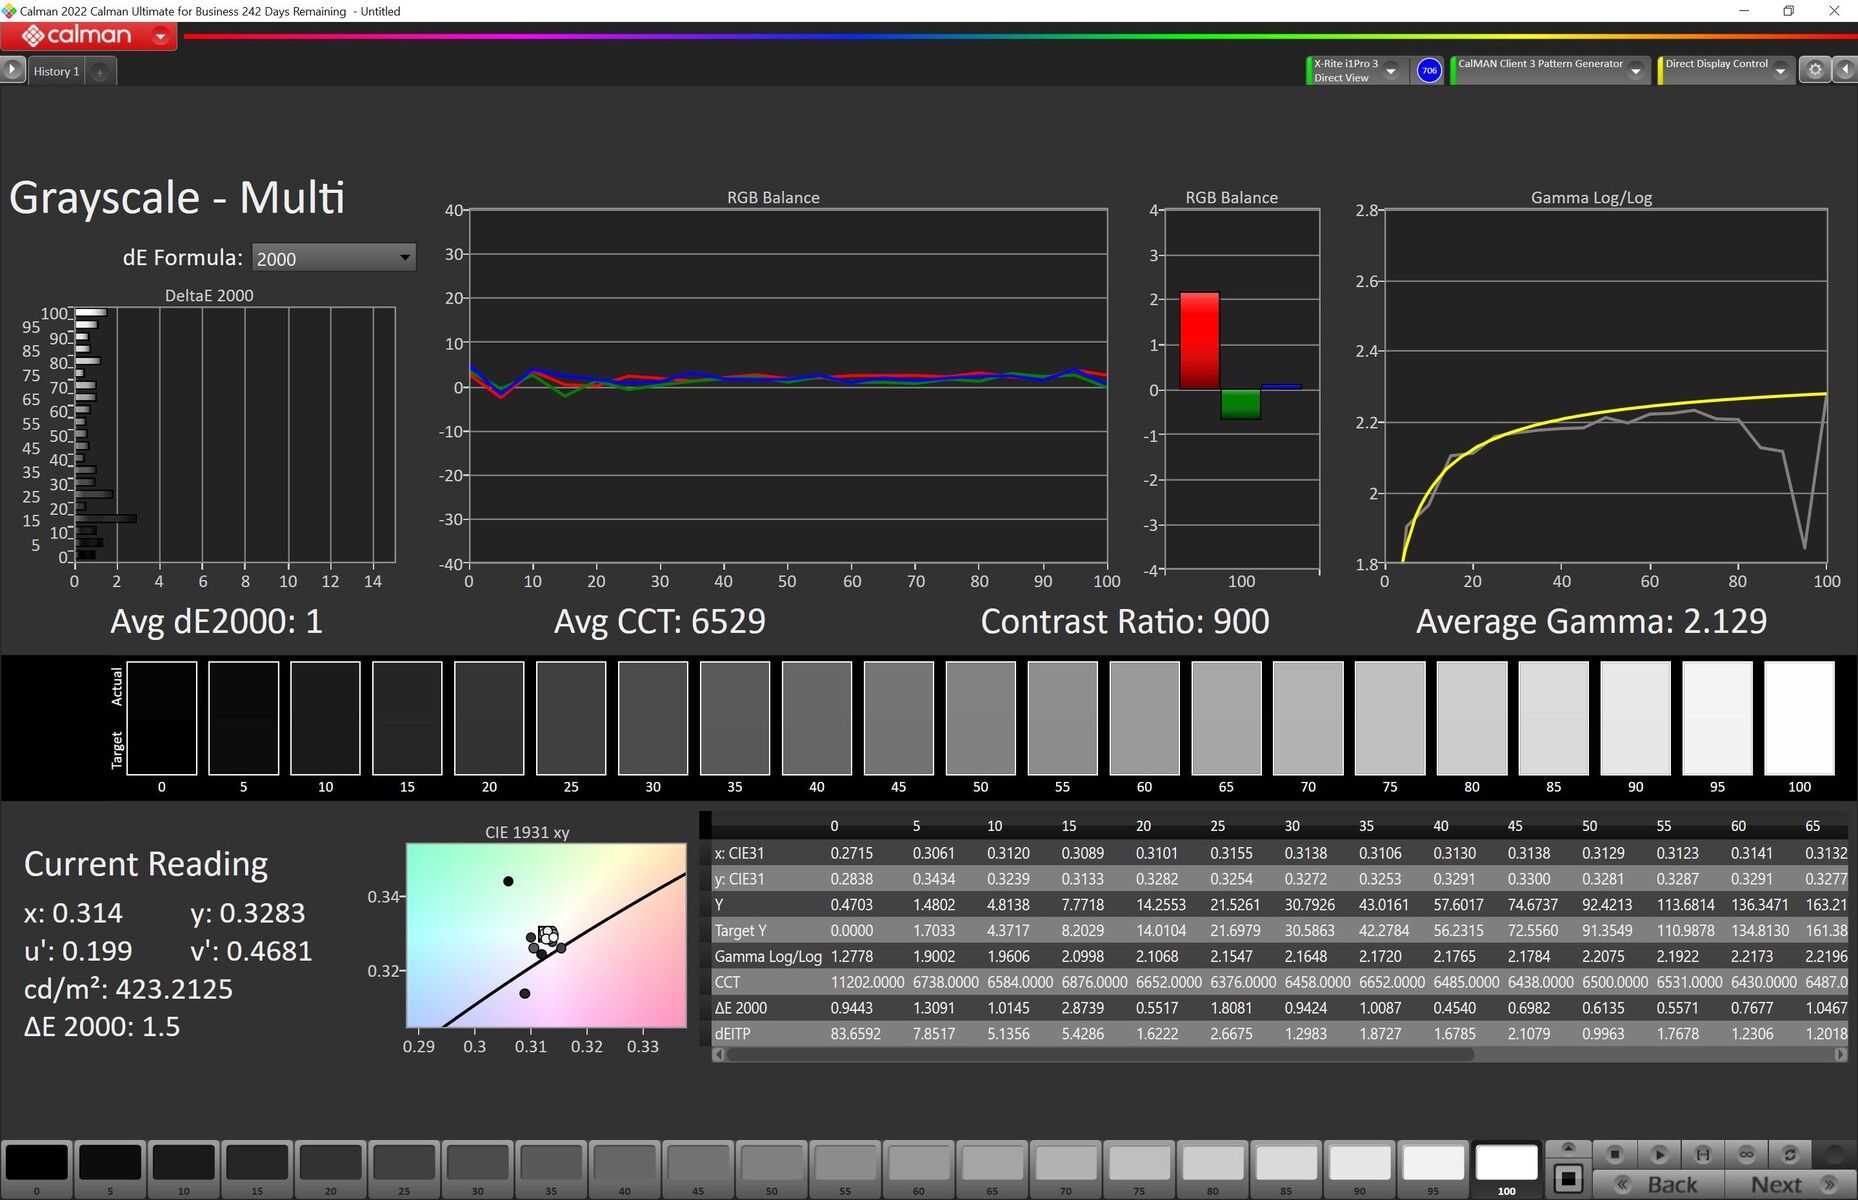
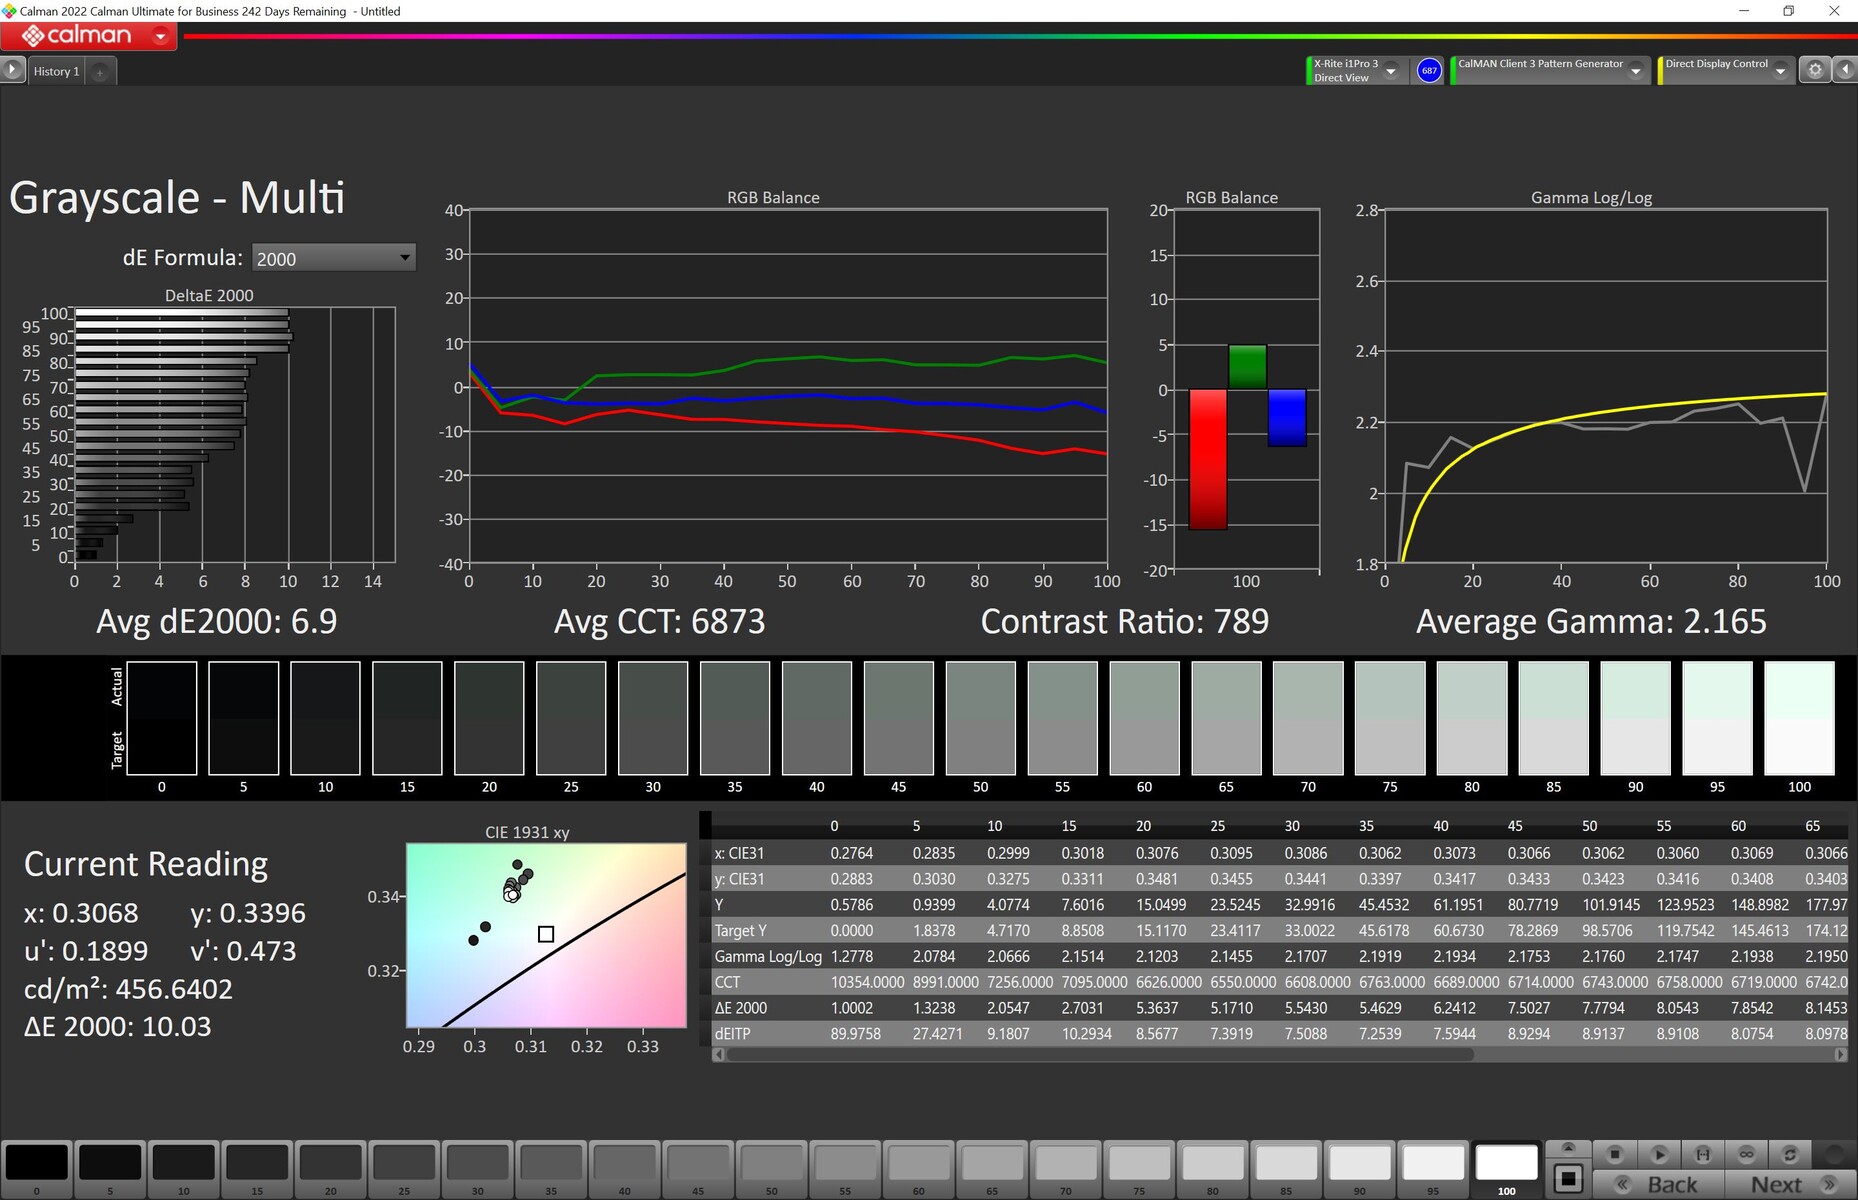
ΔE Greyscale Calman: 7.2 | ∀{0.09-98 Ø4.96}
100% sRGB (Calman 2D)
84.9% AdobeRGB 1998 (Argyll 3D)
99.9% sRGB (Argyll 3D)
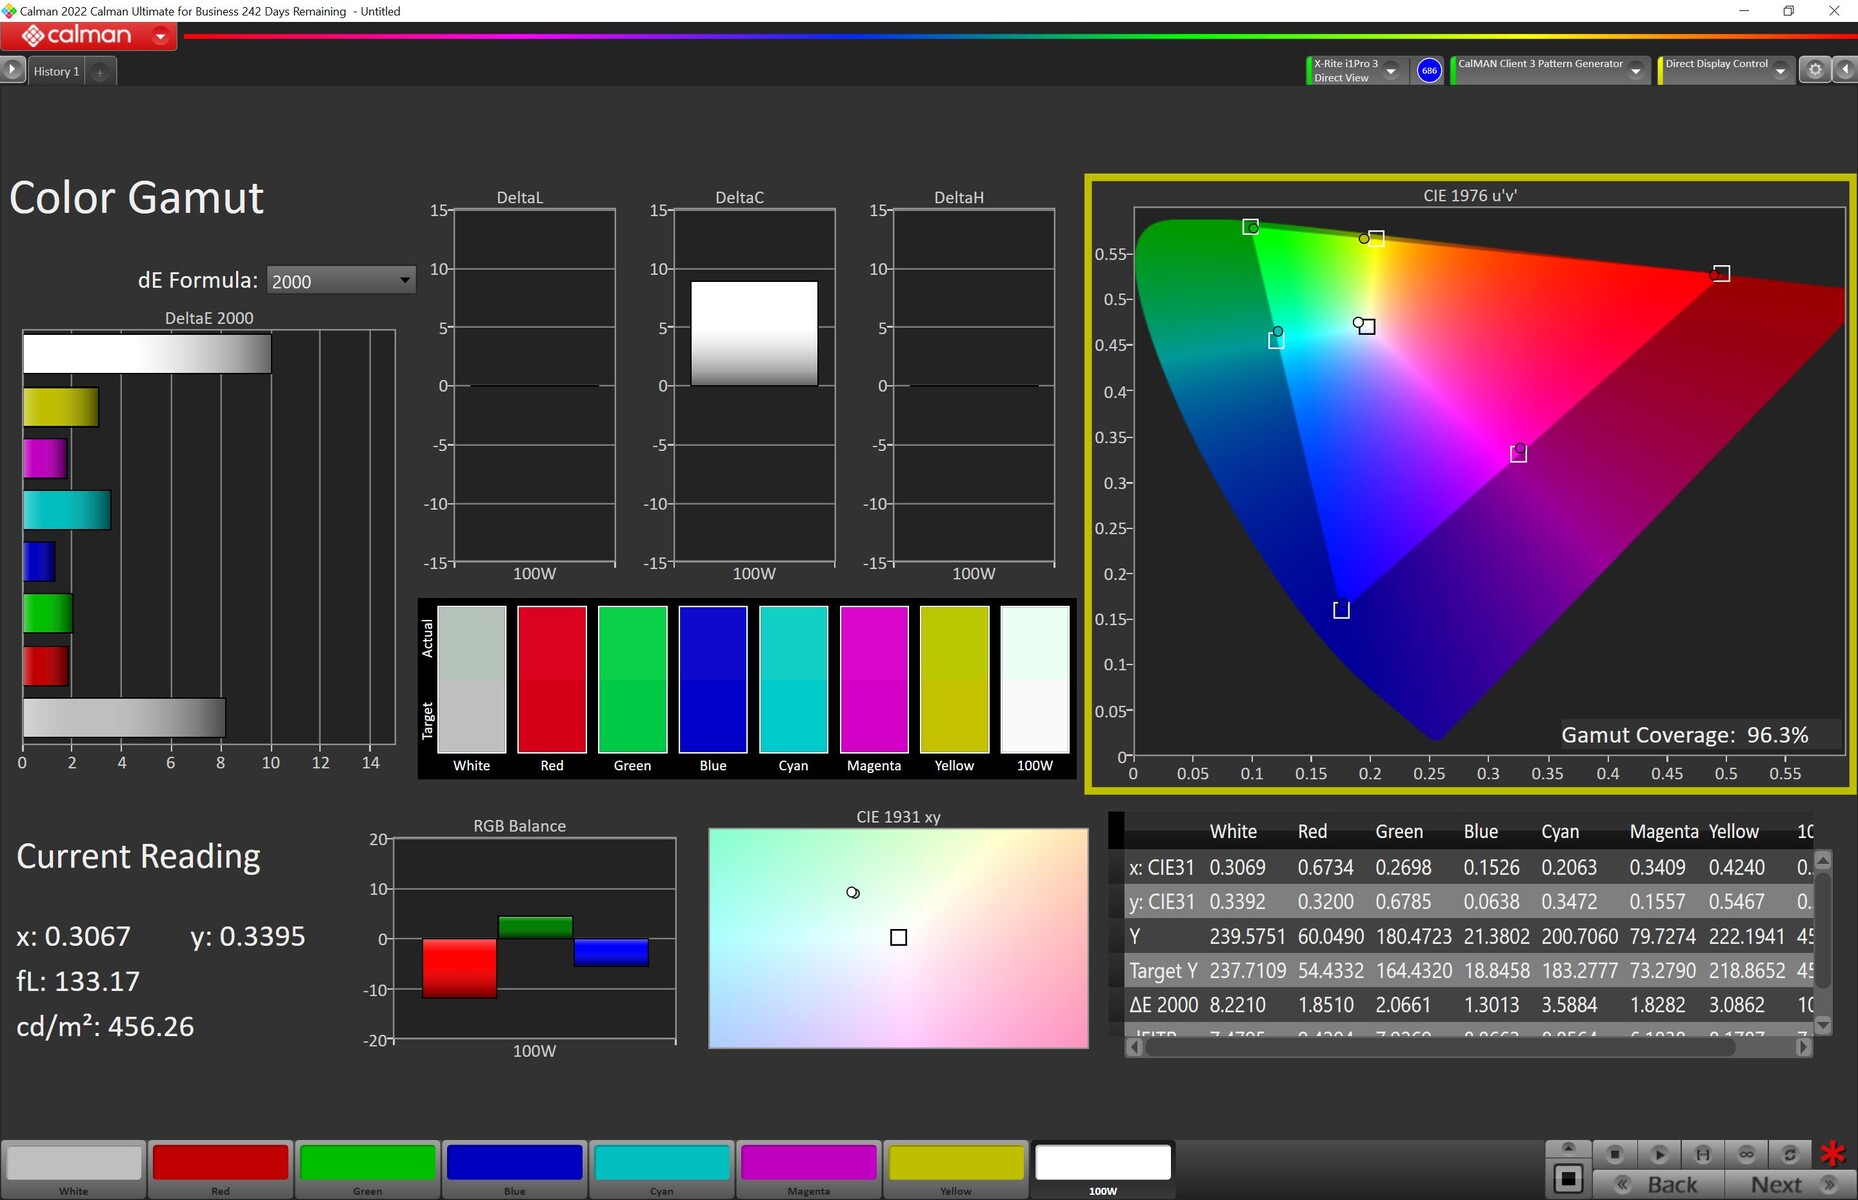
97.2% Display P3 (Argyll 3D)
Gamma: 2.161
CCT: 6515 K
| Asus ROG Strix Scar 18 2023 G834JY-N6005W NE180QDM-NZ2, IPS, 2560x1600, 18" | Razer Blade 18 RTX 4070 AU Optronics B180QAN01.0, IPS, 2560x1600, 18" | MSI Titan GT77 HX 13VI B173ZAN06.C, Mini-LED, 3840x2160, 17.3" | Asus ROG Strix Scar 17 SE G733CX-LL014W NE173QHM-NZ2, IPS, 2560x1440, 17.3" | |
|---|---|---|---|---|
| Display | 0% | 2% | 0% | |
| Display P3 Coverage (%) | 97.2 | 96.9 0% | 94.9 -2% | 97.1 0% |
| sRGB Coverage (%) | 99.9 | 99.8 0% | 99.9 0% | 99.9 0% |
| AdobeRGB 1998 Coverage (%) | 84.9 | 85.3 0% | 92.4 9% | 84.8 0% |
| Response Times | 15% | -410% | -11% | |
| Response Time Grey 50% / Grey 80% * (ms) | 5.41 ? | 4.2 ? 22% | 38.4 ? -610% | 5.7 ? -5% |
| Response Time Black / White * (ms) | 8.62 ? | 8 ? 7% | 26.6 ? -209% | 10.1 ? -17% |
| PWM Frequency (Hz) | 2380 ? | |||
| Screen | 22% | 74253% | 29% | |
| Brightness middle (cd/m²) | 490 | 549.6 12% | 606 24% | 320 -35% |
| Brightness (cd/m²) | 468 | 524 12% | 602 29% | 303 -35% |
| Brightness Distribution (%) | 86 | 89 3% | 93 8% | 87 1% |
| Black Level * (cd/m²) | 0.54 | 0.53 2% | 0.0001 100% | 0.3 44% |
| Contrast (:1) | 907 | 1037 14% | 6060000 668037% | 1067 18% |
| Colorchecker dE 2000 * | 4.97 | 3.32 33% | 4.8 3% | 1.1 78% |
| Colorchecker dE 2000 max. * | 11.02 | 6.63 40% | 8.2 26% | 2.7 75% |
| Colorchecker dE 2000 calibrated * | 2.97 | 2.7 9% | 1.8 39% | |
| Greyscale dE 2000 * | 7.2 | 2 72% | 6.5 10% | 1.1 85% |
| Gamma | 2.161 102% | 2.29 96% | 2.63 84% | 2.13 103% |
| CCT | 6515 100% | 6319 103% | 6596 99% | 6599 98% |
| Media totale (Programma / Settaggio) | 12% /
16% | 24615% /
47676% | 6% /
16% |
* ... Meglio usare valori piccoli
Lo spazio colore misurato copre lo spazio colore Display-P3 al 97% ed è quindi adatto anche a compiti impegnativi (dopo una calibrazione). In termini di precisione del colore, il risultato dipende dalla preimpostazione utilizzata. Nello strumento Armory Crate, Asus offre quattro diverse modalità sotto GameVisual: Nativa, sRGB, DCI-P3 e Display P3. In modalità nativa, il display della nostra unità di prova presentava una tinta blu facilmente percepibile e misurabile, che si manifestava anche come un valore ΔE di quasi 5. Dopo la calibrazione con il nostro i1Pro 3, abbiamo ottenuto un risultato significativamente migliore, soprattutto nei valori estremi. Dopo la calibrazione, il display è adatto anche all'elaborazione delle immagini.

Nel pannello NE180QDM-NZ2 qui utilizzato, la luminosità del display non è controllata tramite PWM e non abbiamo notato alcuno sfarfallio con il nostro dispositivo di misurazione (su tutti i livelli di luminosità). Abbiamo potuto confermare il tempo di risposta di 3 ms promesso durante i cambi di grigio. Per ottenere questo risultato, Asus utilizza un overdrive minimo, ma non abbiamo notato alcun effetto negativo. In combinazione con la frequenza di aggiornamento di 240 Hz, il display è quindi ideale per i giochi.
Tempi di risposta del Display
| ↔ Tempi di risposta dal Nero al Bianco | ||
|---|---|---|
| 8.62 ms ... aumenta ↗ e diminuisce ↘ combinato | ↗ 3.68 ms Incremento | 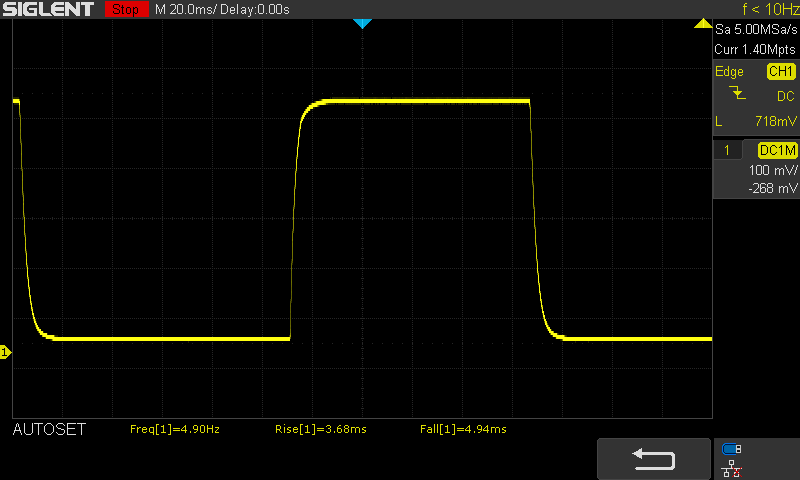 |
| ↘ 4.94 ms Calo | ||
| Lo schermo mostra veloci tempi di risposta durante i nostri tests e dovrebbe esere adatto al gaming In confronto, tutti i dispositivi di test variano da 0.1 (minimo) a 240 (massimo) ms. » 24 % di tutti i dispositivi è migliore. Questo significa che i tempi di risposta rilevati sono migliori rispettto alla media di tutti i dispositivi testati (19.8 ms). | ||
| ↔ Tempo di risposta dal 50% Grigio all'80% Grigio | ||
| 5.41 ms ... aumenta ↗ e diminuisce ↘ combinato | ↗ 2.57 ms Incremento | 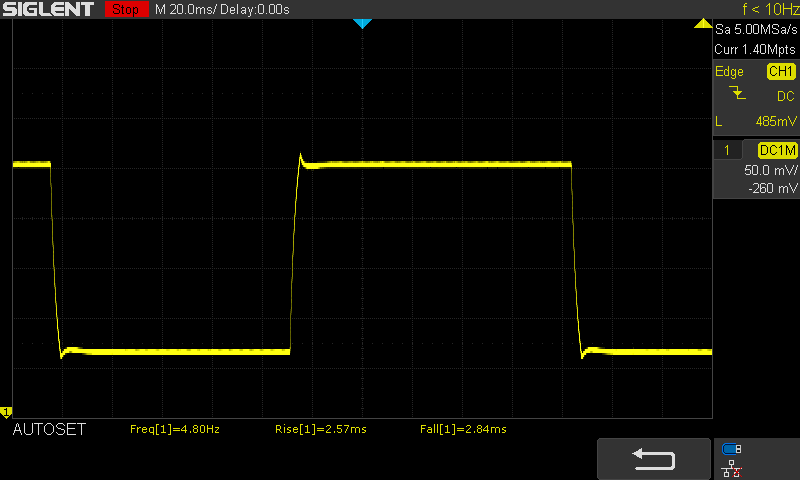 |
| ↘ 2.84 ms Calo | ||
| Lo schermo ha mostrato valori di risposta molto veloci nei nostri tests ed è molto adatto per i gaming veloce. In confronto, tutti i dispositivi di test variano da 0.165 (minimo) a 636 (massimo) ms. » 18 % di tutti i dispositivi è migliore. Questo significa che i tempi di risposta rilevati sono migliori rispettto alla media di tutti i dispositivi testati (30.9 ms). | ||
Sfarfallio dello schermo / PWM (Pulse-Width Modulation)
| flickering dello schermo / PWM non rilevato |  | ||
In confronto: 52 % di tutti i dispositivi testati non utilizza PWM per ridurre la luminosita' del display. Se è rilevato PWM, una media di 7741 (minimo: 5 - massimo: 343500) Hz è stata rilevata. | |||
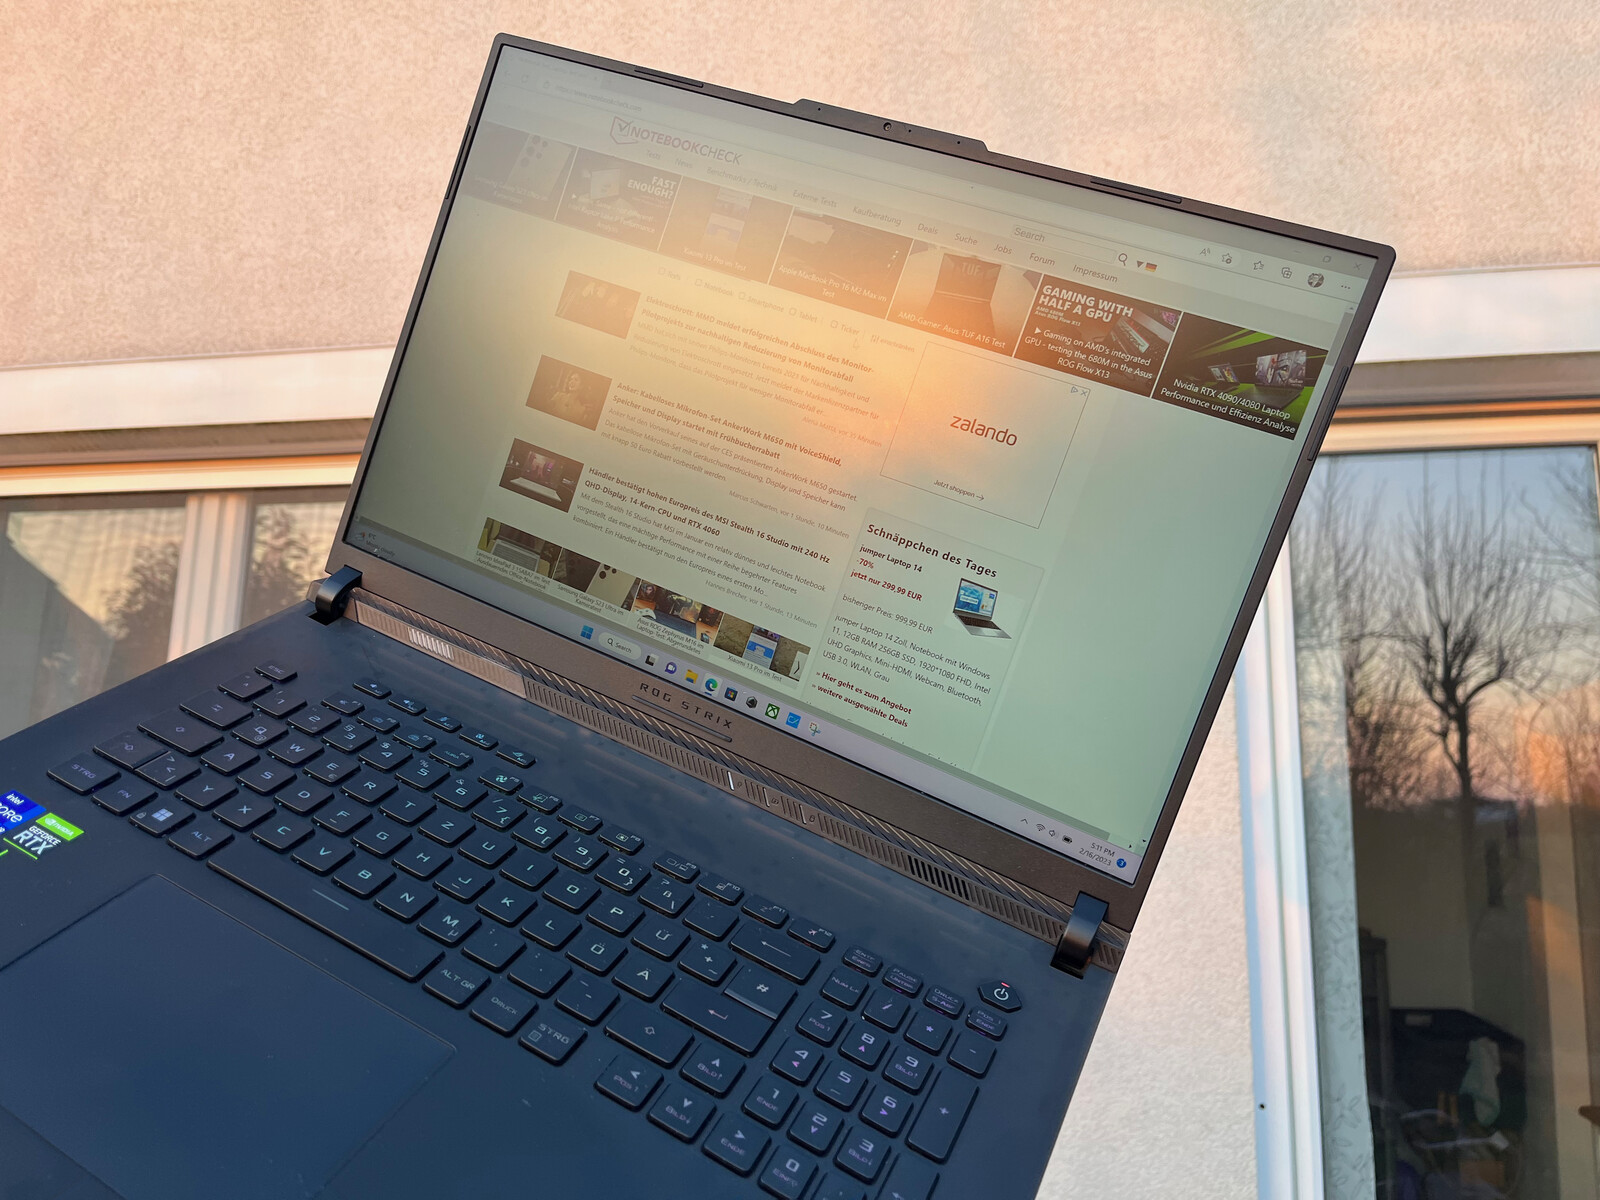
Grazie alla superficie opaca del display e alla buona luminosità massima, il ROG Strix Scar 18 può teoricamente essere utilizzato anche all'aperto. Sebbene quasi 500 nit siano insufficienti per il sole estivo, sono abbastanza sufficienti all'ombra o al sole della sera, come nella nostra immagine.
Grazie al pannello IPS, gli angoli di visione sono eccellenti. La perdita di luminosità dovuta ad angoli di visione elevati rimane nei limiti e le distorsioni del colore non sono percepibili a livello soggettivo.

Prestazioni
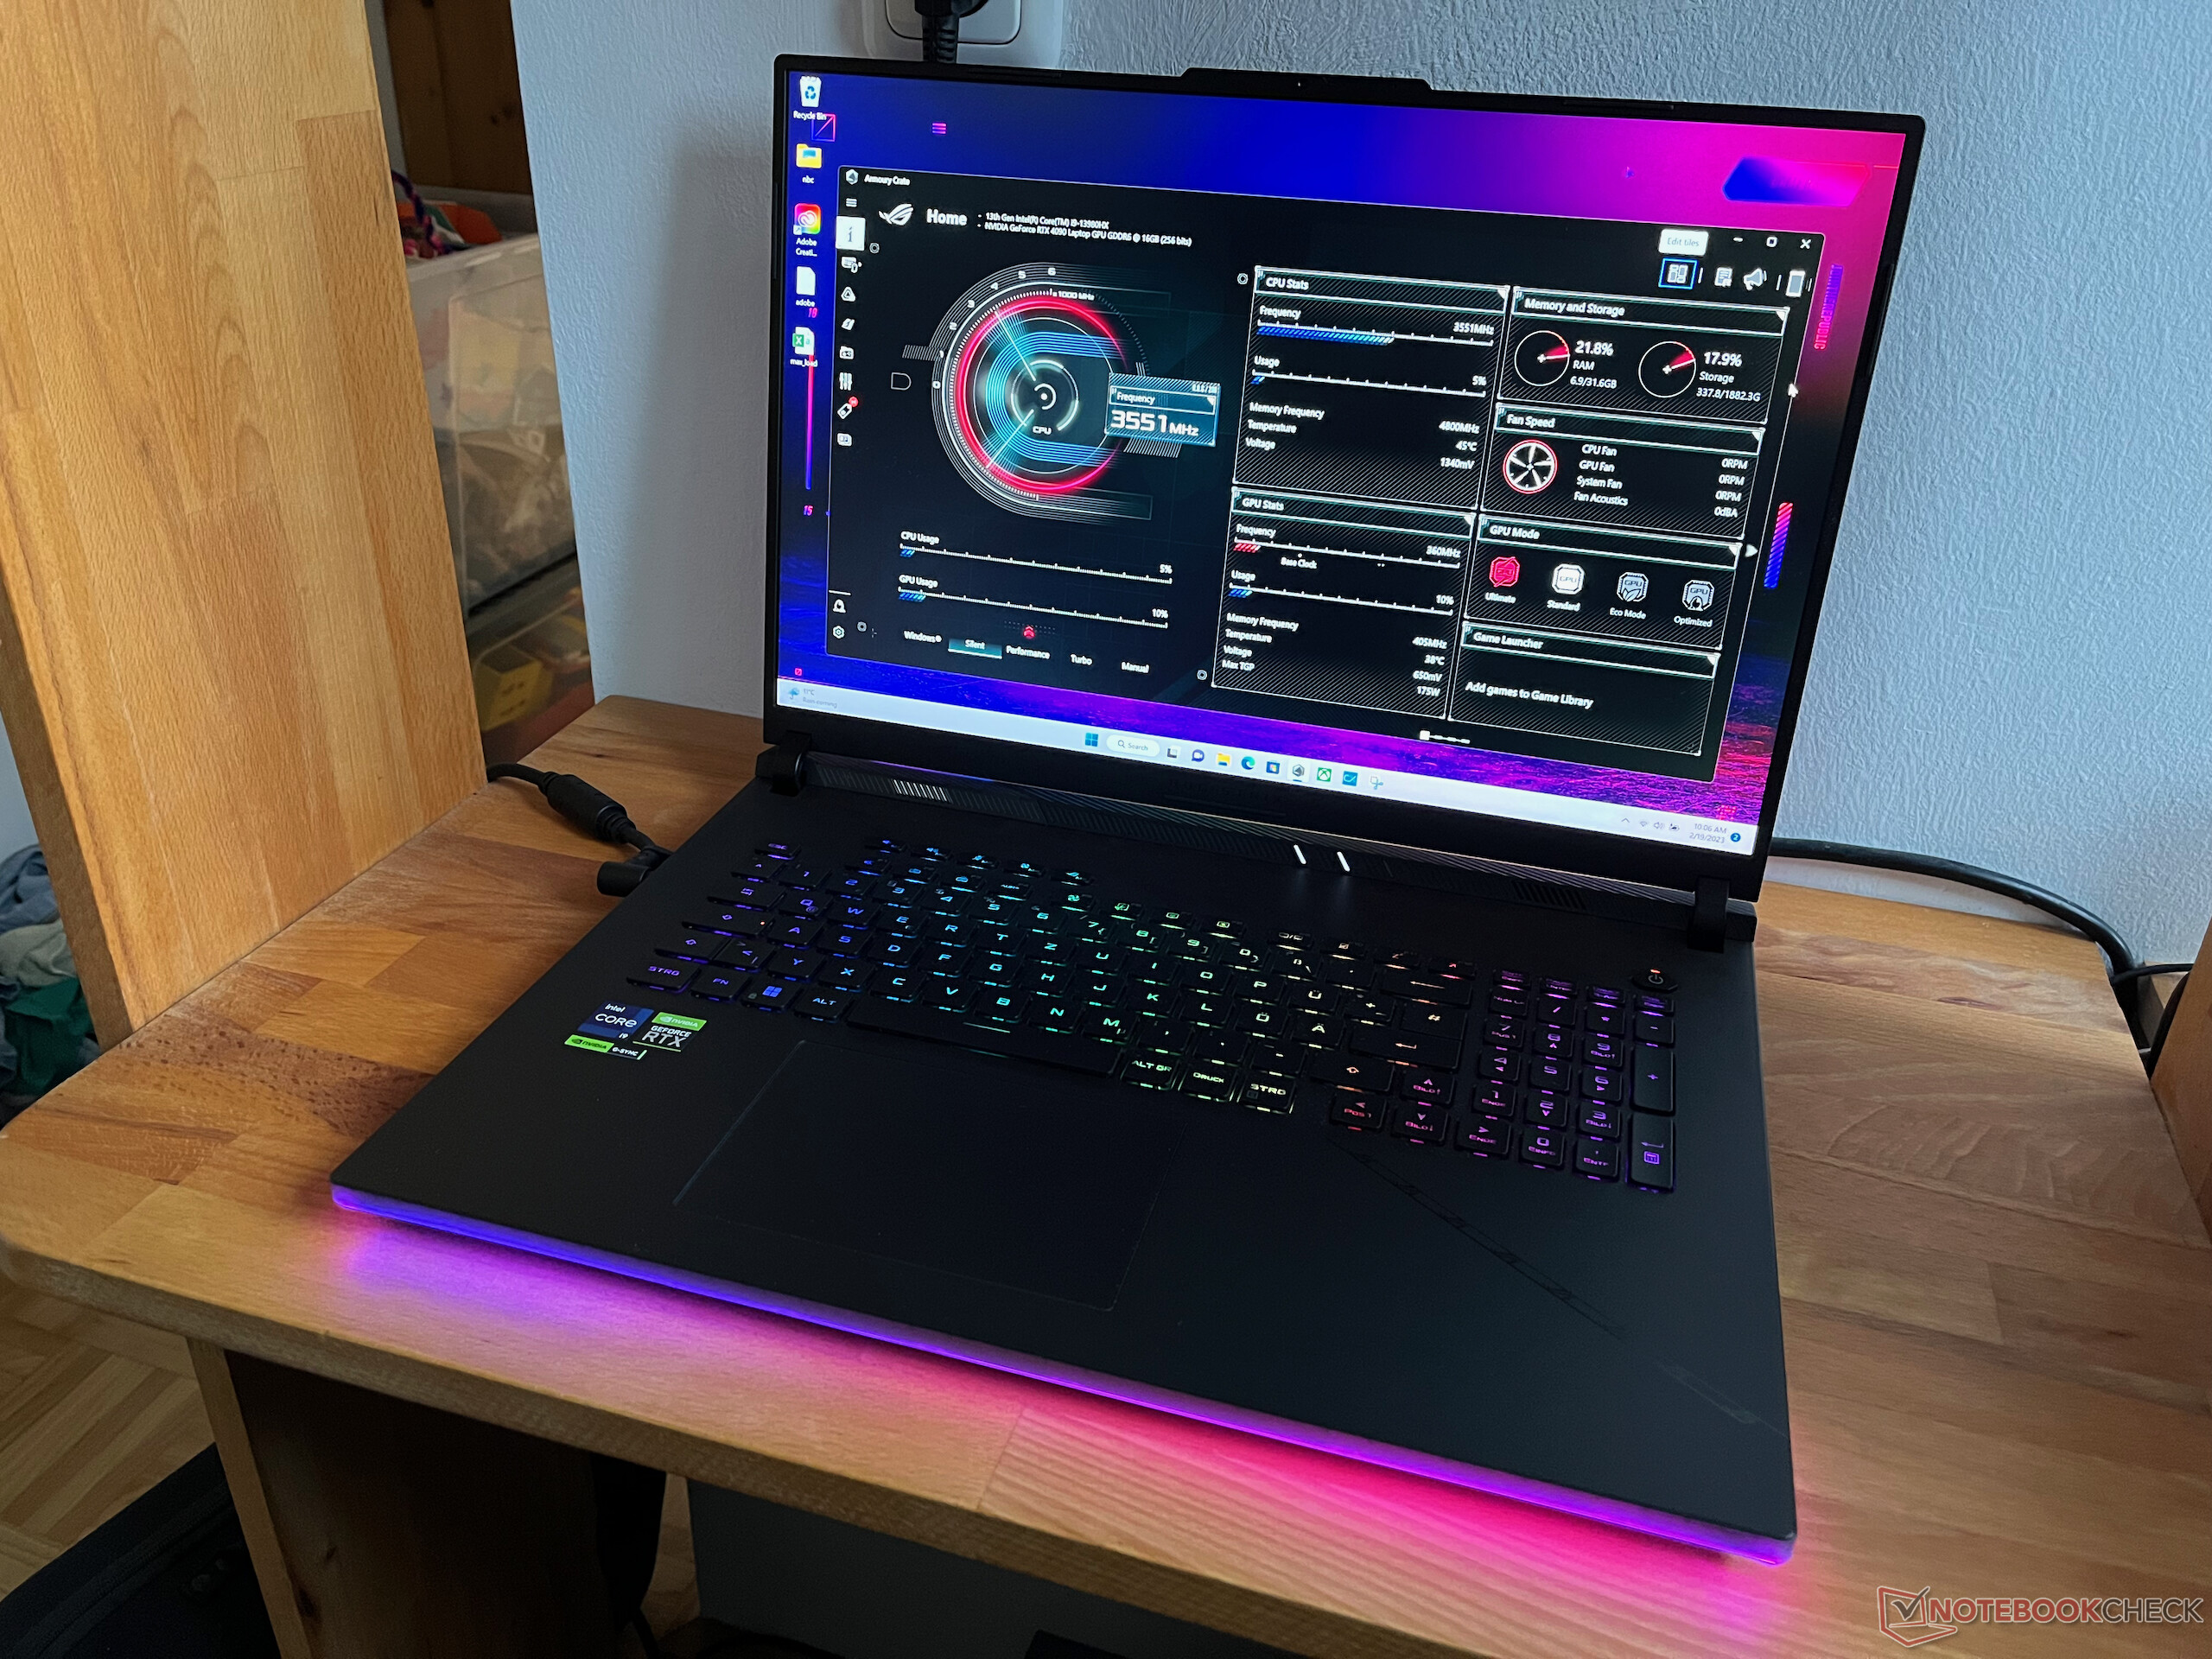
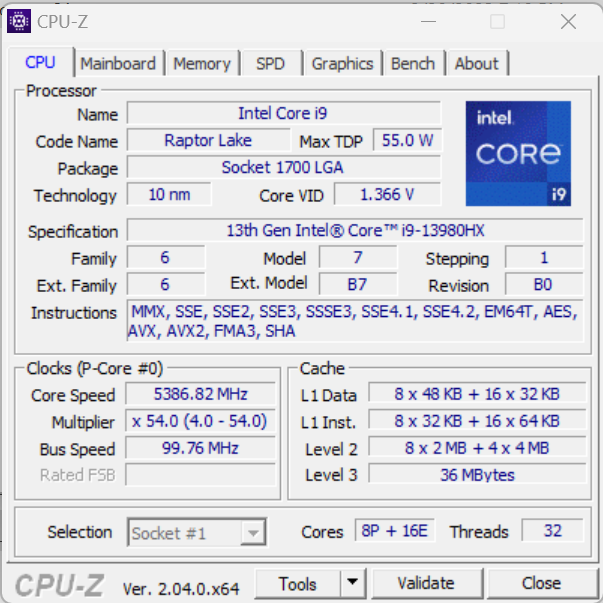
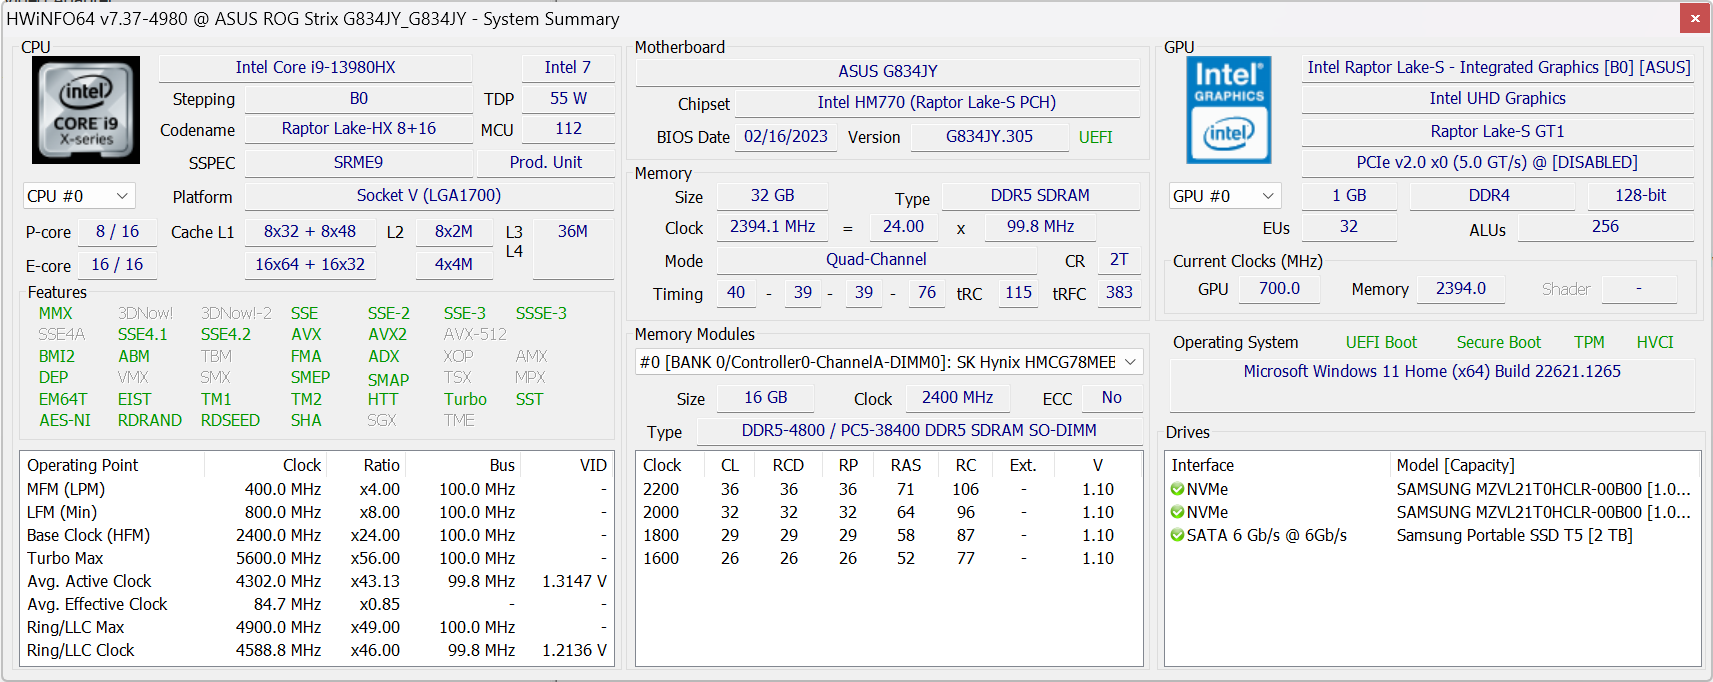
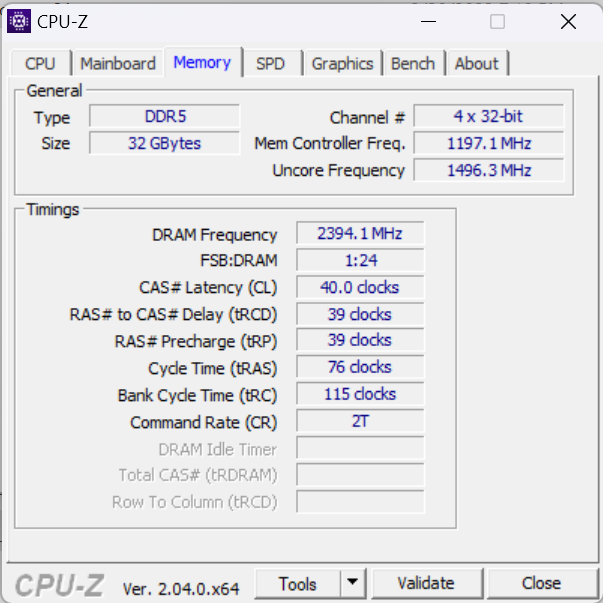
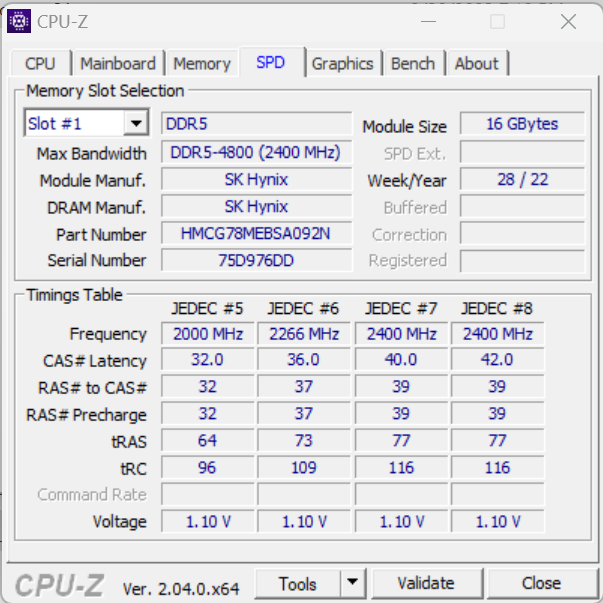
La nostra unità di prova dello Scar 18 è in grado di ottenere diversi punteggi nelle misurazioni delle prestazioni. Asus utilizza la scheda grafica mobile attualmente più veloce, la RTX 4090 di GeForce, consentendo anche un consumo massimo di 175 watt. Asus non ha tagliato i ponti nemmeno con il processore, utilizzando il modello mobile top di Intel. IlIntel Core i9-13980HXè basato sulla nuova serie Raptor Lake e offre 24 core e un boost massimo di ben 5,6 GHz. Anche la quantità di memoria è notevole, con 32 GB di RAM DDR5. Tuttavia, con 4800 MB/s la velocità di archiviazione è leggermente inferiore rispetto ad alcuni modelli della concorrenza. Infine, sono presenti anche due unità SSD da 1 TB in un sistema RAID-0.
Condizioni di prova
Abbiamo eseguito i nostri test sulle prestazioni in modalità Turbo e Ultimate GPU. Con questa modalità, la connessione RTX 4090 viene fissata tramite MUX e overcloccata minimamente di 50 MHz. Inoltre, abbiamo testato anche la modalità Performance (predefinita nello stato di consegna) e la modalità GPU Standard (commutazione MSHybrid Optimus).
Processore
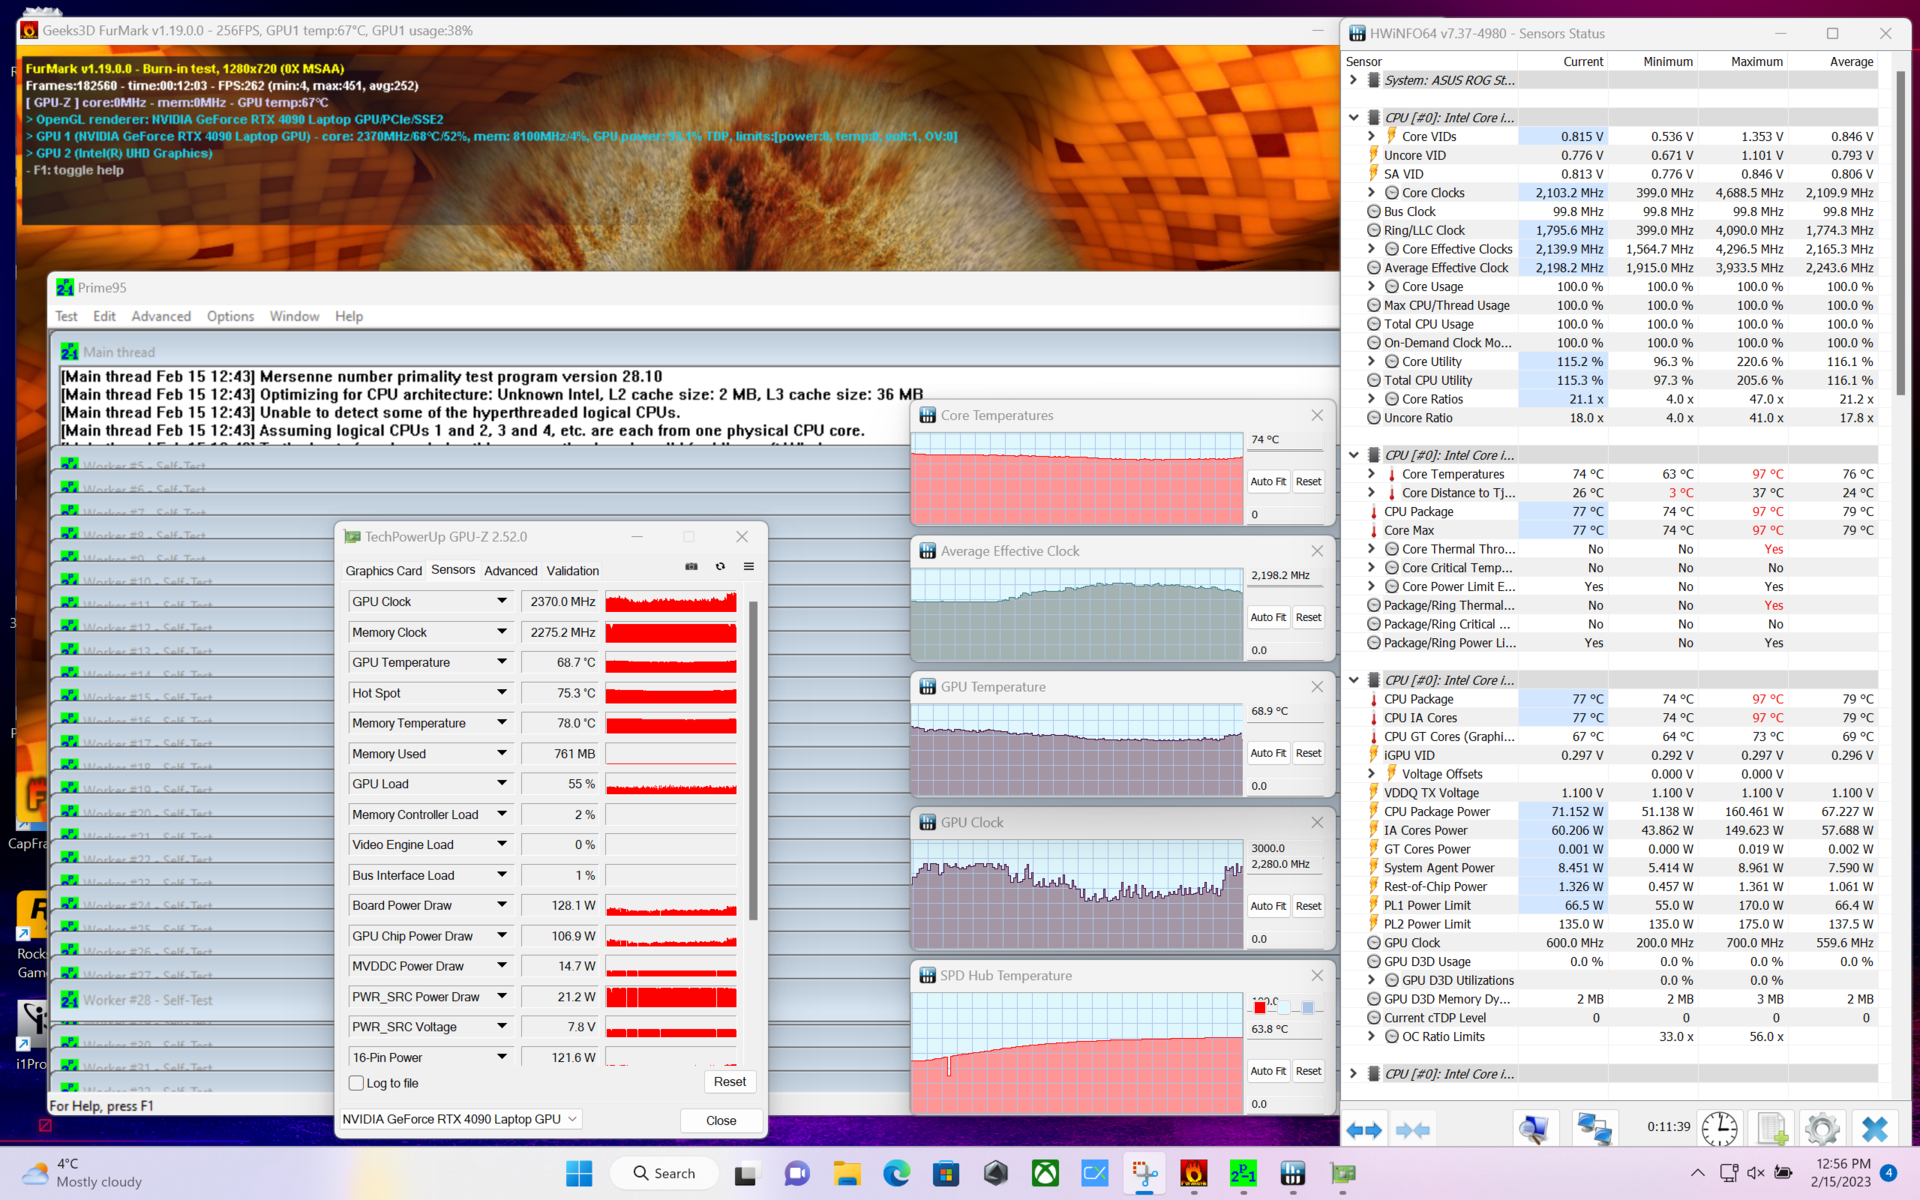
IlIntel Core i9-13980HX è l'attuale modello di punta di Intel per i computer portatili. Si basa sulla nuova serie Raptor Lake ed è tecnicamente paragonabile al processore desktop Core i9-13900K per desktop. La CPU contiene 8 core Raptor Cove Performance con Hyper-Threading e una velocità di clock fino a 5,6 GHz. I core Gracemont Efficiency, più piccoli, non offrono l'Hyper-Threading e hanno una velocità di clock fino a 4 GHz. Complessivamente, la CPU è in grado di utilizzare 32 MB di cache di livello 2 ed è specificata da Intel con un TDP di 157 watt (PL2) e 55 watt (PL1). Asus specifica che la CPU funziona a 65 watt (PL1), ma i valori PL1 e PL2 in HWInfo64 mostrano 175 watt. Nei benchmark, la CPU inizia a 175 watt e poi raggiunge il limite termico a 96 °C (205 °F), dopodiché il TDP si abbassa a 135 watt. In modalità Silent, il TDP si abbassa a 100W / 65W, portando anche a prestazioni significativamente ridotte.
Nei nostri benchmark sui processori, l'i9-13980HX del ROG Strix 18 riesce a piazzarsi appena davanti alle CPU 13900HX e 13950HX della concorrenza. Tuttavia, questo vale solo per la modalità Turbo, mentre in modalità Performance lo Strix Scar 18 si posiziona solo a metà del campo delle nuove CPU 13000HX. Ma anche in questo caso, i dispositivi più vecchi con processori i9-12950HX sono ancora chiaramente superati.
Cinebench R15 Multi Constant Load Test
Cinebench R23: Multi Core | Single Core
Cinebench R20: CPU (Multi Core) | CPU (Single Core)
Cinebench R15: CPU Multi 64Bit | CPU Single 64Bit
Blender: v2.79 BMW27 CPU
7-Zip 18.03: 7z b 4 | 7z b 4 -mmt1
Geekbench 5.5: Multi-Core | Single-Core
HWBOT x265 Benchmark v2.2: 4k Preset
LibreOffice : 20 Documents To PDF
R Benchmark 2.5: Overall mean
| CPU Performance rating | |
| Intel Core i9-13900K @253W | |
| Intel NUC13 Raptor Canyon | |
| Asus ROG Strix Scar 18 2023 G834JY-N6005W | |
| MSI Titan GT77 HX 13VI | |
| Lenovo Legion Pro 7 16IRX8H | |
| Media Intel Core i9-13980HX | |
| Razer Blade 18 RTX 4070 | |
| Schenker XMG Neo 16 Raptor Lake | |
| Asus ROG Strix Scar 18 2023 G834JY-N6005W | |
| Razer Blade 16 Early 2023 | |
| Media della classe Gaming | |
| MSI Raider GE77 HX 12UHS | |
| Asus ROG Strix Scar 17 SE G733CX-LL014W | |
| Dell Precision 7000 7670 Performance | |
| Cinebench R23 / Multi Core | |
| Intel Core i9-13900K @253W | |
| MSI Titan GT77 HX 13VI | |
| Intel NUC13 Raptor Canyon | |
| Asus ROG Strix Scar 18 2023 G834JY-N6005W | |
| Media Intel Core i9-13980HX (28301 - 33052, n=11) | |
| Lenovo Legion Pro 7 16IRX8H | |
| Schenker XMG Neo 16 Raptor Lake | |
| Schenker XMG Neo 16 Raptor Lake | |
| Schenker XMG Neo 16 Raptor Lake | |
| Razer Blade 18 RTX 4070 | |
| Asus ROG Strix Scar 18 2023 G834JY-N6005W | |
| Media della classe Gaming (10488 - 42661, n=104, ultimi 2 anni) | |
| Razer Blade 16 Early 2023 | |
| MSI Raider GE77 HX 12UHS | |
| Asus ROG Strix Scar 17 SE G733CX-LL014W | |
| Dell Precision 7000 7670 Performance | |
| Cinebench R23 / Single Core | |
| Intel Core i9-13900K @253W | |
| Intel NUC13 Raptor Canyon | |
| Asus ROG Strix Scar 18 2023 G834JY-N6005W | |
| MSI Titan GT77 HX 13VI | |
| Asus ROG Strix Scar 18 2023 G834JY-N6005W | |
| Media Intel Core i9-13980HX (1825 - 2169, n=9) | |
| Razer Blade 18 RTX 4070 | |
| Schenker XMG Neo 16 Raptor Lake | |
| Lenovo Legion Pro 7 16IRX8H | |
| Razer Blade 16 Early 2023 | |
| Media della classe Gaming (1601 - 2415, n=104, ultimi 2 anni) | |
| MSI Raider GE77 HX 12UHS | |
| Asus ROG Strix Scar 17 SE G733CX-LL014W | |
| Dell Precision 7000 7670 Performance | |
| Cinebench R20 / CPU (Multi Core) | |
| Intel Core i9-13900K @253W | |
| Intel NUC13 Raptor Canyon | |
| MSI Titan GT77 HX 13VI | |
| Asus ROG Strix Scar 18 2023 G834JY-N6005W | |
| Media Intel Core i9-13980HX (10353 - 12437, n=10) | |
| Lenovo Legion Pro 7 16IRX8H | |
| Schenker XMG Neo 16 Raptor Lake | |
| Razer Blade 18 RTX 4070 | |
| Media della classe Gaming (4029 - 16433, n=103, ultimi 2 anni) | |
| Asus ROG Strix Scar 18 2023 G834JY-N6005W | |
| MSI Raider GE77 HX 12UHS | |
| Razer Blade 16 Early 2023 | |
| Asus ROG Strix Scar 17 SE G733CX-LL014W | |
| Dell Precision 7000 7670 Performance | |
| Cinebench R20 / CPU (Single Core) | |
| Intel Core i9-13900K @253W | |
| Intel NUC13 Raptor Canyon | |
| Asus ROG Strix Scar 18 2023 G834JY-N6005W | |
| MSI Titan GT77 HX 13VI | |
| Asus ROG Strix Scar 18 2023 G834JY-N6005W | |
| Razer Blade 18 RTX 4070 | |
| Media Intel Core i9-13980HX (717 - 825, n=10) | |
| Lenovo Legion Pro 7 16IRX8H | |
| Media della classe Gaming (622 - 913, n=103, ultimi 2 anni) | |
| Schenker XMG Neo 16 Raptor Lake | |
| MSI Raider GE77 HX 12UHS | |
| Razer Blade 16 Early 2023 | |
| Asus ROG Strix Scar 17 SE G733CX-LL014W | |
| Dell Precision 7000 7670 Performance | |
| Cinebench R15 / CPU Multi 64Bit | |
| Intel Core i9-13900K @253W | |
| Intel NUC13 Raptor Canyon | |
| MSI Titan GT77 HX 13VI | |
| Schenker XMG Neo 16 Raptor Lake | |
| Schenker XMG Neo 16 Raptor Lake | |
| Lenovo Legion Pro 7 16IRX8H | |
| Asus ROG Strix Scar 18 2023 G834JY-N6005W | |
| Media Intel Core i9-13980HX (4358 - 5172, n=11) | |
| Razer Blade 16 Early 2023 | |
| Razer Blade 18 RTX 4070 | |
| Asus ROG Strix Scar 18 2023 G834JY-N6005W | |
| Media della classe Gaming (1578 - 6330, n=102, ultimi 2 anni) | |
| MSI Raider GE77 HX 12UHS | |
| Asus ROG Strix Scar 17 SE G733CX-LL014W | |
| Dell Precision 7000 7670 Performance | |
| Cinebench R15 / CPU Single 64Bit | |
| Intel Core i9-13900K @253W | |
| Intel NUC13 Raptor Canyon | |
| Asus ROG Strix Scar 18 2023 G834JY-N6005W | |
| Asus ROG Strix Scar 18 2023 G834JY-N6005W | |
| Media Intel Core i9-13980HX (289 - 312, n=11) | |
| Lenovo Legion Pro 7 16IRX8H | |
| MSI Titan GT77 HX 13VI | |
| Media della classe Gaming (188.8 - 350, n=103, ultimi 2 anni) | |
| Razer Blade 18 RTX 4070 | |
| Schenker XMG Neo 16 Raptor Lake | |
| Schenker XMG Neo 16 Raptor Lake | |
| MSI Raider GE77 HX 12UHS | |
| Asus ROG Strix Scar 17 SE G733CX-LL014W | |
| Razer Blade 16 Early 2023 | |
| Dell Precision 7000 7670 Performance | |
| Blender / v2.79 BMW27 CPU | |
| Dell Precision 7000 7670 Performance | |
| Asus ROG Strix Scar 17 SE G733CX-LL014W | |
| MSI Raider GE77 HX 12UHS | |
| Media della classe Gaming (79 - 330, n=101, ultimi 2 anni) | |
| Razer Blade 16 Early 2023 | |
| Asus ROG Strix Scar 18 2023 G834JY-N6005W | |
| Schenker XMG Neo 16 Raptor Lake | |
| Razer Blade 18 RTX 4070 | |
| Media Intel Core i9-13980HX (97 - 136, n=10) | |
| Lenovo Legion Pro 7 16IRX8H | |
| Asus ROG Strix Scar 18 2023 G834JY-N6005W | |
| Intel NUC13 Raptor Canyon | |
| MSI Titan GT77 HX 13VI | |
| Intel Core i9-13900K @253W | |
| 7-Zip 18.03 / 7z b 4 | |
| Intel Core i9-13900K @253W | |
| MSI Titan GT77 HX 13VI | |
| Intel NUC13 Raptor Canyon | |
| Asus ROG Strix Scar 18 2023 G834JY-N6005W | |
| Lenovo Legion Pro 7 16IRX8H | |
| Schenker XMG Neo 16 Raptor Lake | |
| Media Intel Core i9-13980HX (104616 - 129804, n=10) | |
| Razer Blade 18 RTX 4070 | |
| Asus ROG Strix Scar 18 2023 G834JY-N6005W | |
| Razer Blade 16 Early 2023 | |
| Media della classe Gaming (33491 - 148086, n=102, ultimi 2 anni) | |
| MSI Raider GE77 HX 12UHS | |
| Asus ROG Strix Scar 17 SE G733CX-LL014W | |
| Dell Precision 7000 7670 Performance | |
| 7-Zip 18.03 / 7z b 4 -mmt1 | |
| Intel Core i9-13900K @253W | |
| Intel NUC13 Raptor Canyon | |
| Asus ROG Strix Scar 18 2023 G834JY-N6005W | |
| Lenovo Legion Pro 7 16IRX8H | |
| Asus ROG Strix Scar 18 2023 G834JY-N6005W | |
| Media Intel Core i9-13980HX (6230 - 7163, n=10) | |
| MSI Titan GT77 HX 13VI | |
| Razer Blade 18 RTX 4070 | |
| Schenker XMG Neo 16 Raptor Lake | |
| Media della classe Gaming (4824 - 7436, n=102, ultimi 2 anni) | |
| Razer Blade 16 Early 2023 | |
| MSI Raider GE77 HX 12UHS | |
| Asus ROG Strix Scar 17 SE G733CX-LL014W | |
| Dell Precision 7000 7670 Performance | |
| Geekbench 5.5 / Multi-Core | |
| Intel Core i9-13900K @253W | |
| Intel NUC13 Raptor Canyon | |
| Lenovo Legion Pro 7 16IRX8H | |
| Asus ROG Strix Scar 18 2023 G834JY-N6005W | |
| Schenker XMG Neo 16 Raptor Lake | |
| MSI Titan GT77 HX 13VI | |
| Media Intel Core i9-13980HX (18475 - 22200, n=10) | |
| Razer Blade 18 RTX 4070 | |
| Asus ROG Strix Scar 18 2023 G834JY-N6005W | |
| Razer Blade 16 Early 2023 | |
| Media della classe Gaming (6460 - 28263, n=102, ultimi 2 anni) | |
| MSI Raider GE77 HX 12UHS | |
| Asus ROG Strix Scar 17 SE G733CX-LL014W | |
| Dell Precision 7000 7670 Performance | |
| Geekbench 5.5 / Single-Core | |
| Intel Core i9-13900K @253W | |
| Asus ROG Strix Scar 18 2023 G834JY-N6005W | |
| Intel NUC13 Raptor Canyon | |
| Asus ROG Strix Scar 18 2023 G834JY-N6005W | |
| Media della classe Gaming (1403 - 2474, n=102, ultimi 2 anni) | |
| Media Intel Core i9-13980HX (1796 - 2139, n=10) | |
| MSI Titan GT77 HX 13VI | |
| Razer Blade 18 RTX 4070 | |
| Lenovo Legion Pro 7 16IRX8H | |
| Schenker XMG Neo 16 Raptor Lake | |
| MSI Raider GE77 HX 12UHS | |
| Dell Precision 7000 7670 Performance | |
| Asus ROG Strix Scar 17 SE G733CX-LL014W | |
| Razer Blade 16 Early 2023 | |
| HWBOT x265 Benchmark v2.2 / 4k Preset | |
| Intel Core i9-13900K @253W | |
| Intel NUC13 Raptor Canyon | |
| Asus ROG Strix Scar 18 2023 G834JY-N6005W | |
| MSI Titan GT77 HX 13VI | |
| Lenovo Legion Pro 7 16IRX8H | |
| Media Intel Core i9-13980HX (27 - 33.4, n=9) | |
| Razer Blade 18 RTX 4070 | |
| Schenker XMG Neo 16 Raptor Lake | |
| Asus ROG Strix Scar 18 2023 G834JY-N6005W | |
| Media della classe Gaming (11.5 - 44.4, n=102, ultimi 2 anni) | |
| Razer Blade 16 Early 2023 | |
| MSI Raider GE77 HX 12UHS | |
| Asus ROG Strix Scar 17 SE G733CX-LL014W | |
| Dell Precision 7000 7670 Performance | |
| LibreOffice / 20 Documents To PDF | |
| Media della classe Gaming (33.2 - 88.8, n=102, ultimi 2 anni) | |
| Razer Blade 16 Early 2023 | |
| MSI Titan GT77 HX 13VI | |
| Schenker XMG Neo 16 Raptor Lake | |
| Lenovo Legion Pro 7 16IRX8H | |
| Dell Precision 7000 7670 Performance | |
| Razer Blade 18 RTX 4070 | |
| Media Intel Core i9-13980HX (35 - 51.4, n=10) | |
| MSI Raider GE77 HX 12UHS | |
| Intel NUC13 Raptor Canyon | |
| Asus ROG Strix Scar 18 2023 G834JY-N6005W | |
| Asus ROG Strix Scar 18 2023 G834JY-N6005W | |
| Asus ROG Strix Scar 17 SE G733CX-LL014W | |
| Intel Core i9-13900K @253W | |
| R Benchmark 2.5 / Overall mean | |
| Dell Precision 7000 7670 Performance | |
| Asus ROG Strix Scar 17 SE G733CX-LL014W | |
| MSI Raider GE77 HX 12UHS | |
| Media della classe Gaming (0.3439 - 0.59, n=102, ultimi 2 anni) | |
| Razer Blade 16 Early 2023 | |
| MSI Titan GT77 HX 13VI | |
| Lenovo Legion Pro 7 16IRX8H | |
| Media Intel Core i9-13980HX (0.3793 - 0.4462, n=10) | |
| Razer Blade 18 RTX 4070 | |
| Asus ROG Strix Scar 18 2023 G834JY-N6005W | |
| Intel NUC13 Raptor Canyon | |
| Schenker XMG Neo 16 Raptor Lake | |
| Asus ROG Strix Scar 18 2023 G834JY-N6005W | |
| Intel Core i9-13900K @253W | |
Cinebench R23: Multi Core | Single Core
Cinebench R20: CPU (Multi Core) | CPU (Single Core)
Cinebench R15: CPU Multi 64Bit | CPU Single 64Bit
Blender: v2.79 BMW27 CPU
7-Zip 18.03: 7z b 4 | 7z b 4 -mmt1
Geekbench 5.5: Multi-Core | Single-Core
HWBOT x265 Benchmark v2.2: 4k Preset
LibreOffice : 20 Documents To PDF
R Benchmark 2.5: Overall mean
* ... Meglio usare valori piccoli
AIDA64: FP32 Ray-Trace | FPU Julia | CPU SHA3 | CPU Queen | FPU SinJulia | FPU Mandel | CPU AES | CPU ZLib | FP64 Ray-Trace | CPU PhotoWorxx
| Performance rating | |
| Intel Core i9-13900K @253W | |
| Intel NUC13 Raptor Canyon | |
| Asus ROG Strix Scar 18 2023 G834JY-N6005W | |
| MSI Titan GT77 HX 13VI | |
| Media della classe Gaming | |
| Lenovo Legion Pro 7 16IRX8H | |
| Media Intel Core i9-13980HX | |
| Schenker XMG Neo 16 Raptor Lake | |
| Razer Blade 18 RTX 4070 | |
| Asus ROG Strix Scar 18 2023 G834JY-N6005W | |
| Razer Blade 16 Early 2023 | |
| MSI Raider GE77 HX 12UHS | |
| Asus ROG Strix Scar 17 SE G733CX-LL014W | |
| Dell Precision 7000 7670 Performance | |
| AIDA64 / FP32 Ray-Trace | |
| Intel Core i9-13900K @253W | |
| Media della classe Gaming (10227 - 85542, n=102, ultimi 2 anni) | |
| MSI Titan GT77 HX 13VI | |
| Asus ROG Strix Scar 18 2023 G834JY-N6005W | |
| Intel NUC13 Raptor Canyon | |
| Schenker XMG Neo 16 Raptor Lake | |
| Lenovo Legion Pro 7 16IRX8H | |
| Media Intel Core i9-13980HX (21332 - 29553, n=9) | |
| Razer Blade 18 RTX 4070 | |
| Razer Blade 16 Early 2023 | |
| Razer Blade 16 Early 2023 | |
| Razer Blade 16 Early 2023 | |
| Asus ROG Strix Scar 18 2023 G834JY-N6005W | |
| MSI Raider GE77 HX 12UHS | |
| Asus ROG Strix Scar 17 SE G733CX-LL014W | |
| Dell Precision 7000 7670 Performance | |
| AIDA64 / FPU Julia | |
| Intel Core i9-13900K @253W | |
| Media della classe Gaming (51376 - 372155, n=102, ultimi 2 anni) | |
| MSI Titan GT77 HX 13VI | |
| Intel NUC13 Raptor Canyon | |
| Asus ROG Strix Scar 18 2023 G834JY-N6005W | |
| Lenovo Legion Pro 7 16IRX8H | |
| Media Intel Core i9-13980HX (108001 - 148168, n=9) | |
| Razer Blade 18 RTX 4070 | |
| Schenker XMG Neo 16 Raptor Lake | |
| Asus ROG Strix Scar 18 2023 G834JY-N6005W | |
| Razer Blade 16 Early 2023 | |
| Razer Blade 16 Early 2023 | |
| Razer Blade 16 Early 2023 | |
| MSI Raider GE77 HX 12UHS | |
| Asus ROG Strix Scar 17 SE G733CX-LL014W | |
| Dell Precision 7000 7670 Performance | |
| AIDA64 / CPU SHA3 | |
| Intel Core i9-13900K @253W | |
| MSI Titan GT77 HX 13VI | |
| Asus ROG Strix Scar 18 2023 G834JY-N6005W | |
| Intel NUC13 Raptor Canyon | |
| Lenovo Legion Pro 7 16IRX8H | |
| Schenker XMG Neo 16 Raptor Lake | |
| Media Intel Core i9-13980HX (5264 - 7142, n=9) | |
| Media della classe Gaming (2180 - 10115, n=102, ultimi 2 anni) | |
| Razer Blade 16 Early 2023 | |
| Razer Blade 16 Early 2023 | |
| Razer Blade 16 Early 2023 | |
| Razer Blade 18 RTX 4070 | |
| Asus ROG Strix Scar 18 2023 G834JY-N6005W | |
| MSI Raider GE77 HX 12UHS | |
| Asus ROG Strix Scar 17 SE G733CX-LL014W | |
| Dell Precision 7000 7670 Performance | |
| AIDA64 / CPU Queen | |
| Intel Core i9-13900K @253W | |
| Intel NUC13 Raptor Canyon | |
| Asus ROG Strix Scar 18 2023 G834JY-N6005W | |
| Asus ROG Strix Scar 18 2023 G834JY-N6005W | |
| MSI Titan GT77 HX 13VI | |
| Media Intel Core i9-13980HX (126758 - 143409, n=9) | |
| Razer Blade 18 RTX 4070 | |
| Schenker XMG Neo 16 Raptor Lake | |
| Razer Blade 16 Early 2023 | |
| Razer Blade 16 Early 2023 | |
| Lenovo Legion Pro 7 16IRX8H | |
| Media della classe Gaming (49785 - 173351, n=86, ultimi 2 anni) | |
| Asus ROG Strix Scar 17 SE G733CX-LL014W | |
| Dell Precision 7000 7670 Performance | |
| MSI Raider GE77 HX 12UHS | |
| AIDA64 / FPU SinJulia | |
| Intel Core i9-13900K @253W | |
| Intel NUC13 Raptor Canyon | |
| Asus ROG Strix Scar 18 2023 G834JY-N6005W | |
| MSI Titan GT77 HX 13VI | |
| Schenker XMG Neo 16 Raptor Lake | |
| Media Intel Core i9-13980HX (13785 - 17117, n=9) | |
| Razer Blade 18 RTX 4070 | |
| Asus ROG Strix Scar 18 2023 G834JY-N6005W | |
| Razer Blade 16 Early 2023 | |
| Razer Blade 16 Early 2023 | |
| Razer Blade 16 Early 2023 | |
| Lenovo Legion Pro 7 16IRX8H | |
| Media della classe Gaming (4424 - 33636, n=102, ultimi 2 anni) | |
| MSI Raider GE77 HX 12UHS | |
| Asus ROG Strix Scar 17 SE G733CX-LL014W | |
| Dell Precision 7000 7670 Performance | |
| AIDA64 / FPU Mandel | |
| Intel Core i9-13900K @253W | |
| Media della classe Gaming (25115 - 196829, n=102, ultimi 2 anni) | |
| MSI Titan GT77 HX 13VI | |
| Asus ROG Strix Scar 18 2023 G834JY-N6005W | |
| Intel NUC13 Raptor Canyon | |
| Lenovo Legion Pro 7 16IRX8H | |
| Media Intel Core i9-13980HX (53398 - 73758, n=9) | |
| Schenker XMG Neo 16 Raptor Lake | |
| Razer Blade 18 RTX 4070 | |
| Asus ROG Strix Scar 18 2023 G834JY-N6005W | |
| Razer Blade 16 Early 2023 | |
| Razer Blade 16 Early 2023 | |
| Razer Blade 16 Early 2023 | |
| MSI Raider GE77 HX 12UHS | |
| Asus ROG Strix Scar 17 SE G733CX-LL014W | |
| Dell Precision 7000 7670 Performance | |
| AIDA64 / CPU AES | |
| Intel Core i9-13900K @253W | |
| MSI Raider GE77 HX 12UHS | |
| Asus ROG Strix Scar 17 SE G733CX-LL014W | |
| Razer Blade 16 Early 2023 | |
| Razer Blade 16 Early 2023 | |
| Razer Blade 16 Early 2023 | |
| MSI Titan GT77 HX 13VI | |
| Asus ROG Strix Scar 18 2023 G834JY-N6005W | |
| Intel NUC13 Raptor Canyon | |
| Lenovo Legion Pro 7 16IRX8H | |
| Media Intel Core i9-13980HX (105169 - 136520, n=9) | |
| Schenker XMG Neo 16 Raptor Lake | |
| Razer Blade 18 RTX 4070 | |
| Asus ROG Strix Scar 18 2023 G834JY-N6005W | |
| Media della classe Gaming (39258 - 247074, n=102, ultimi 2 anni) | |
| Dell Precision 7000 7670 Performance | |
| AIDA64 / CPU ZLib | |
| Intel Core i9-13900K @253W | |
| MSI Titan GT77 HX 13VI | |
| Asus ROG Strix Scar 18 2023 G834JY-N6005W | |
| Intel NUC13 Raptor Canyon | |
| Lenovo Legion Pro 7 16IRX8H | |
| Media Intel Core i9-13980HX (1513 - 2039, n=9) | |
| Schenker XMG Neo 16 Raptor Lake | |
| Razer Blade 16 Early 2023 | |
| Razer Blade 16 Early 2023 | |
| Razer Blade 16 Early 2023 | |
| Razer Blade 18 RTX 4070 | |
| Asus ROG Strix Scar 18 2023 G834JY-N6005W | |
| Media della classe Gaming (574 - 2531, n=102, ultimi 2 anni) | |
| MSI Raider GE77 HX 12UHS | |
| Asus ROG Strix Scar 17 SE G733CX-LL014W | |
| Dell Precision 7000 7670 Performance | |
| AIDA64 / FP64 Ray-Trace | |
| Intel Core i9-13900K @253W | |
| Media della classe Gaming (5509 - 45446, n=102, ultimi 2 anni) | |
| MSI Titan GT77 HX 13VI | |
| Asus ROG Strix Scar 18 2023 G834JY-N6005W | |
| Intel NUC13 Raptor Canyon | |
| Lenovo Legion Pro 7 16IRX8H | |
| Media Intel Core i9-13980HX (11431 - 16325, n=9) | |
| Schenker XMG Neo 16 Raptor Lake | |
| Razer Blade 18 RTX 4070 | |
| Razer Blade 16 Early 2023 | |
| Razer Blade 16 Early 2023 | |
| Razer Blade 16 Early 2023 | |
| Asus ROG Strix Scar 18 2023 G834JY-N6005W | |
| MSI Raider GE77 HX 12UHS | |
| Asus ROG Strix Scar 17 SE G733CX-LL014W | |
| Dell Precision 7000 7670 Performance | |
| AIDA64 / CPU PhotoWorxx | |
| Razer Blade 16 Early 2023 | |
| Razer Blade 16 Early 2023 | |
| Razer Blade 16 Early 2023 | |
| Razer Blade 18 RTX 4070 | |
| Intel Core i9-13900K @253W | |
| Lenovo Legion Pro 7 16IRX8H | |
| MSI Raider GE77 HX 12UHS | |
| Media Intel Core i9-13980HX (37069 - 52949, n=9) | |
| Intel NUC13 Raptor Canyon | |
| Media della classe Gaming (12271 - 89891, n=102, ultimi 2 anni) | |
| Schenker XMG Neo 16 Raptor Lake | |
| Asus ROG Strix Scar 18 2023 G834JY-N6005W | |
| Asus ROG Strix Scar 18 2023 G834JY-N6005W | |
| Dell Precision 7000 7670 Performance | |
| Asus ROG Strix Scar 17 SE G733CX-LL014W | |
| MSI Titan GT77 HX 13VI | |
AIDA64: FP32 Ray-Trace | FPU Julia | CPU SHA3 | CPU Queen | FPU SinJulia | FPU Mandel | CPU AES | CPU ZLib | FP64 Ray-Trace | CPU PhotoWorxx
Prestazioni del sistema
Il potente hardware è in grado di ottenere risultati anche nelle prestazioni generali del sistema. In PCMark 10, lo Scar 18 raggiunge una posizione di vertice che attualmente è superata solo a malapena da potenti desktop e dalla MSI Titan GT77 HX 13VI. Anche in CrossMark il risultato si colloca nella classe superiore. Anche se alcuni portatili sono in grado di posizionarsi davanti allo Strix Scar 18, la distanza è molto ridotta, al massimo del 4% (con l'MSI Titan GT77 12UHS attualmente come portatile più veloce e il desktop più veloce che ottiene un risultato superiore del 24%).
Nel benchmark dello storage, si può facilmente notare l'impatto dello storage DDR5-4800. I sistemi con la memoria principale DDR5-5600 più veloce, come il Razer Blade 16, sono ancora in grado di ottenere un vantaggio significativo. Questa è una delle poche aree in cui Asus non utilizza i componenti più veloci disponibili, ma l'impatto è relativamente basso nella pratica.
CrossMark: Overall | Productivity | Creativity | Responsiveness
| PCMark 10 / Score | |
| Intel NUC13 Raptor Canyon | |
| MSI Titan GT77 HX 13VI | |
| Media Intel Core i9-13980HX, NVIDIA GeForce RTX 4090 Laptop GPU (8650 - 9068, n=4) | |
| Asus ROG Strix Scar 18 2023 G834JY-N6005W | |
| Media della classe Gaming (5828 - 12414, n=93, ultimi 2 anni) | |
| Razer Blade 16 Early 2023 | |
| Lenovo Legion Pro 7 16IRX8H | |
| Razer Blade 18 RTX 4070 | |
| Asus ROG Strix Scar 17 SE G733CX-LL014W | |
| MSI Raider GE77 HX 12UHS | |
| Dell Precision 7000 7670 Performance | |
| PCMark 10 / Essentials | |
| MSI Titan GT77 HX 13VI | |
| Lenovo Legion Pro 7 16IRX8H | |
| Razer Blade 18 RTX 4070 | |
| Intel NUC13 Raptor Canyon | |
| Dell Precision 7000 7670 Performance | |
| Media Intel Core i9-13980HX, NVIDIA GeForce RTX 4090 Laptop GPU (11215 - 11644, n=3) | |
| Razer Blade 16 Early 2023 | |
| Media della classe Gaming (8810 - 11935, n=97, ultimi 2 anni) | |
| Asus ROG Strix Scar 17 SE G733CX-LL014W | |
| MSI Raider GE77 HX 12UHS | |
| PCMark 10 / Productivity | |
| Media della classe Gaming (6845 - 25323, n=95, ultimi 2 anni) | |
| Intel NUC13 Raptor Canyon | |
| Lenovo Legion Pro 7 16IRX8H | |
| Media Intel Core i9-13980HX, NVIDIA GeForce RTX 4090 Laptop GPU (10125 - 11067, n=3) | |
| Asus ROG Strix Scar 17 SE G733CX-LL014W | |
| MSI Titan GT77 HX 13VI | |
| MSI Raider GE77 HX 12UHS | |
| Razer Blade 18 RTX 4070 | |
| Razer Blade 16 Early 2023 | |
| Dell Precision 7000 7670 Performance | |
| PCMark 10 / Digital Content Creation | |
| MSI Titan GT77 HX 13VI | |
| Intel NUC13 Raptor Canyon | |
| Media Intel Core i9-13980HX, NVIDIA GeForce RTX 4090 Laptop GPU (15052 - 16012, n=3) | |
| Razer Blade 16 Early 2023 | |
| Media della classe Gaming (7602 - 19954, n=95, ultimi 2 anni) | |
| Razer Blade 18 RTX 4070 | |
| Lenovo Legion Pro 7 16IRX8H | |
| Asus ROG Strix Scar 17 SE G733CX-LL014W | |
| MSI Raider GE77 HX 12UHS | |
| Dell Precision 7000 7670 Performance | |
| CrossMark / Overall | |
| Intel Core i9-13900K @253W | |
| Intel NUC13 Raptor Canyon | |
| MSI Raider GE77 HX 12UHS | |
| MSI Titan GT77 HX 13VI | |
| Razer Blade 18 RTX 4070 | |
| Asus ROG Strix Scar 17 SE G733CX-LL014W | |
| Asus ROG Strix Scar 18 2023 G834JY-N6005W | |
| Media Intel Core i9-13980HX, NVIDIA GeForce RTX 4090 Laptop GPU (1935 - 2176, n=4) | |
| Asus ROG Strix Scar 18 2023 G834JY-N6005W | |
| Schenker XMG Neo 16 Raptor Lake | |
| Media della classe Gaming (1366 - 2409, n=94, ultimi 2 anni) | |
| Dell Precision 7000 7670 Performance | |
| Razer Blade 16 Early 2023 | |
| CrossMark / Productivity | |
| Intel Core i9-13900K @253W | |
| Intel NUC13 Raptor Canyon | |
| MSI Raider GE77 HX 12UHS | |
| MSI Titan GT77 HX 13VI | |
| Razer Blade 18 RTX 4070 | |
| Asus ROG Strix Scar 17 SE G733CX-LL014W | |
| Asus ROG Strix Scar 18 2023 G834JY-N6005W | |
| Media Intel Core i9-13980HX, NVIDIA GeForce RTX 4090 Laptop GPU (1764 - 2005, n=4) | |
| Asus ROG Strix Scar 18 2023 G834JY-N6005W | |
| Media della classe Gaming (1386 - 2254, n=94, ultimi 2 anni) | |
| Schenker XMG Neo 16 Raptor Lake | |
| Dell Precision 7000 7670 Performance | |
| Razer Blade 16 Early 2023 | |
| CrossMark / Creativity | |
| Intel Core i9-13900K @253W | |
| Intel NUC13 Raptor Canyon | |
| Asus ROG Strix Scar 18 2023 G834JY-N6005W | |
| MSI Titan GT77 HX 13VI | |
| Media Intel Core i9-13980HX, NVIDIA GeForce RTX 4090 Laptop GPU (2267 - 2469, n=4) | |
| Razer Blade 18 RTX 4070 | |
| Asus ROG Strix Scar 18 2023 G834JY-N6005W | |
| Schenker XMG Neo 16 Raptor Lake | |
| Asus ROG Strix Scar 17 SE G733CX-LL014W | |
| MSI Raider GE77 HX 12UHS | |
| Media della classe Gaming (1343 - 2786, n=94, ultimi 2 anni) | |
| Dell Precision 7000 7670 Performance | |
| Razer Blade 16 Early 2023 | |
| CrossMark / Responsiveness | |
| Intel Core i9-13900K @253W | |
| MSI Raider GE77 HX 12UHS | |
| Asus ROG Strix Scar 17 SE G733CX-LL014W | |
| Intel NUC13 Raptor Canyon | |
| Razer Blade 18 RTX 4070 | |
| MSI Titan GT77 HX 13VI | |
| Media della classe Gaming (1226 - 2334, n=94, ultimi 2 anni) | |
| Media Intel Core i9-13980HX, NVIDIA GeForce RTX 4090 Laptop GPU (1556 - 1904, n=4) | |
| Asus ROG Strix Scar 18 2023 G834JY-N6005W | |
| Asus ROG Strix Scar 18 2023 G834JY-N6005W | |
| Schenker XMG Neo 16 Raptor Lake | |
| Dell Precision 7000 7670 Performance | |
| Razer Blade 16 Early 2023 | |
CrossMark: Overall | Productivity | Creativity | Responsiveness
| PCMark 10 Score | 8764 punti | |
Aiuto | ||
| AIDA64 / Memory Copy | |
| Razer Blade 16 Early 2023 | |
| Razer Blade 16 Early 2023 | |
| Razer Blade 16 Early 2023 | |
| Lenovo Legion Pro 7 16IRX8H | |
| Razer Blade 18 RTX 4070 | |
| Intel Core i9-13900K @253W | |
| Media della classe Gaming (21750 - 129946, n=102, ultimi 2 anni) | |
| Media Intel Core i9-13980HX (62189 - 80776, n=9) | |
| MSI Raider GE77 HX 12UHS | |
| Intel NUC13 Raptor Canyon | |
| Asus ROG Strix Scar 18 2023 G834JY-N6005W | |
| Schenker XMG Neo 16 Raptor Lake | |
| Asus ROG Strix Scar 18 2023 G834JY-N6005W | |
| Dell Precision 7000 7670 Performance | |
| MSI Titan GT77 HX 13VI | |
| Asus ROG Strix Scar 17 SE G733CX-LL014W | |
| AIDA64 / Memory Read | |
| Razer Blade 16 Early 2023 | |
| Razer Blade 16 Early 2023 | |
| Razer Blade 16 Early 2023 | |
| Razer Blade 18 RTX 4070 | |
| Lenovo Legion Pro 7 16IRX8H | |
| Intel Core i9-13900K @253W | |
| Media Intel Core i9-13980HX (62624 - 89096, n=9) | |
| Schenker XMG Neo 16 Raptor Lake | |
| Asus ROG Strix Scar 18 2023 G834JY-N6005W | |
| Asus ROG Strix Scar 18 2023 G834JY-N6005W | |
| Media della classe Gaming (22956 - 118858, n=102, ultimi 2 anni) | |
| Intel NUC13 Raptor Canyon | |
| MSI Raider GE77 HX 12UHS | |
| Asus ROG Strix Scar 17 SE G733CX-LL014W | |
| Dell Precision 7000 7670 Performance | |
| MSI Titan GT77 HX 13VI | |
| AIDA64 / Memory Write | |
| Razer Blade 16 Early 2023 | |
| Razer Blade 16 Early 2023 | |
| Razer Blade 16 Early 2023 | |
| Media della classe Gaming (22297 - 135096, n=102, ultimi 2 anni) | |
| Razer Blade 18 RTX 4070 | |
| Intel Core i9-13900K @253W | |
| Lenovo Legion Pro 7 16IRX8H | |
| Media Intel Core i9-13980HX (59912 - 79917, n=9) | |
| Intel NUC13 Raptor Canyon | |
| Schenker XMG Neo 16 Raptor Lake | |
| Asus ROG Strix Scar 18 2023 G834JY-N6005W | |
| MSI Raider GE77 HX 12UHS | |
| Asus ROG Strix Scar 18 2023 G834JY-N6005W | |
| Asus ROG Strix Scar 17 SE G733CX-LL014W | |
| Dell Precision 7000 7670 Performance | |
| MSI Titan GT77 HX 13VI | |
| AIDA64 / Memory Latency | |
| Media della classe Gaming (75.3 - 165.4, n=102, ultimi 2 anni) | |
| Razer Blade 16 Early 2023 | |
| Razer Blade 16 Early 2023 | |
| Razer Blade 16 Early 2023 | |
| Intel NUC13 Raptor Canyon | |
| MSI Titan GT77 HX 13VI | |
| Schenker XMG Neo 16 Raptor Lake | |
| Asus ROG Strix Scar 18 2023 G834JY-N6005W | |
| Asus ROG Strix Scar 18 2023 G834JY-N6005W | |
| Media Intel Core i9-13980HX (79.4 - 93.2, n=9) | |
| Asus ROG Strix Scar 17 SE G733CX-LL014W | |
| Dell Precision 7000 7670 Performance | |
| Razer Blade 18 RTX 4070 | |
| MSI Raider GE77 HX 12UHS | |
| Lenovo Legion Pro 7 16IRX8H | |
| Intel Core i9-13900K @253W | |
* ... Meglio usare valori piccoli
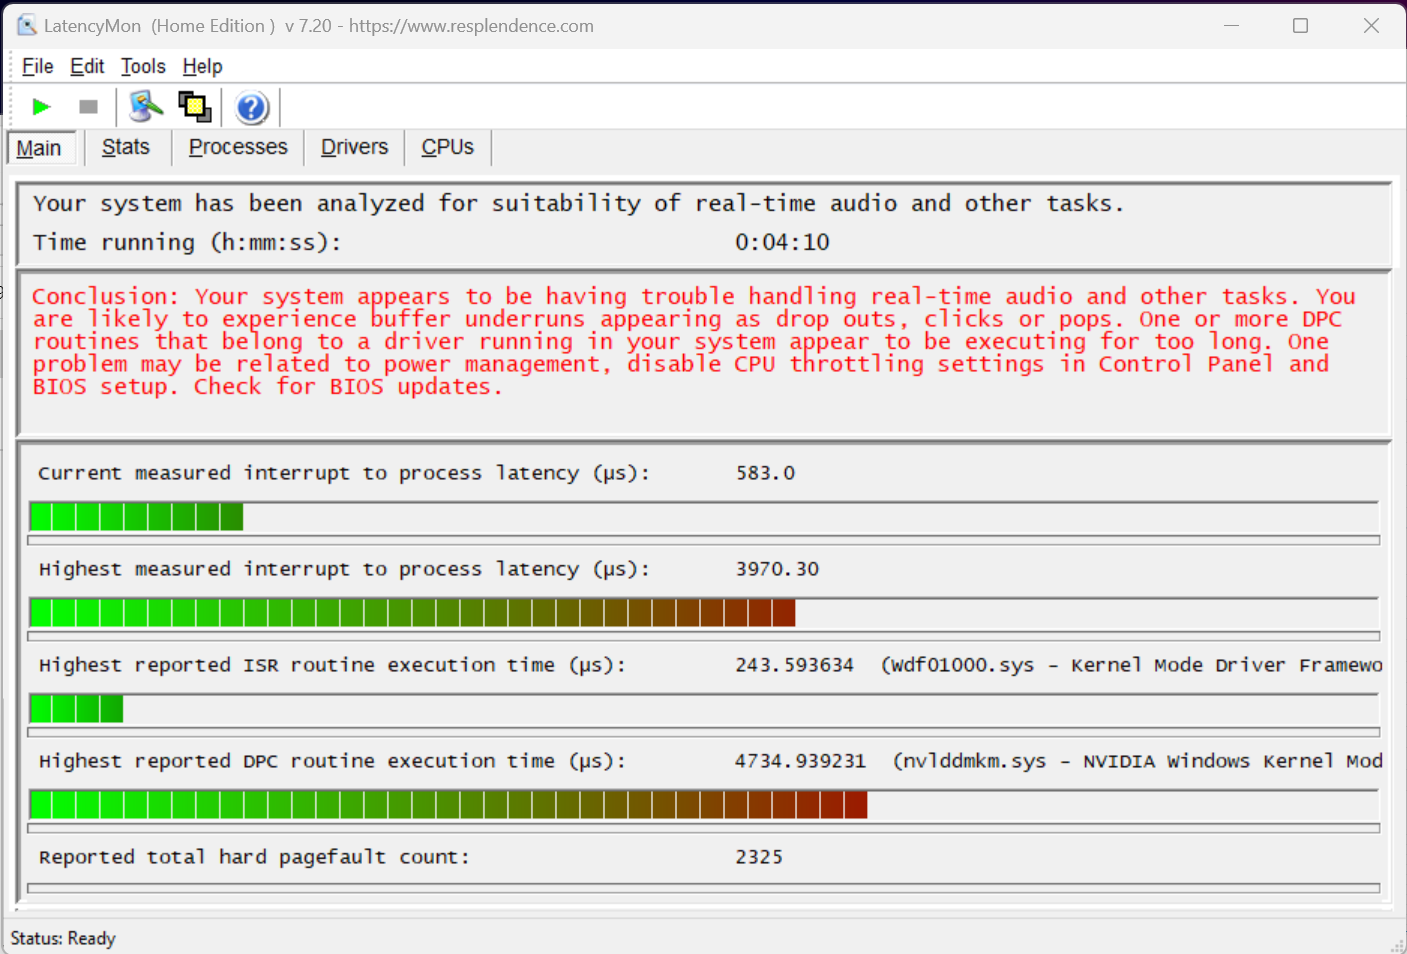
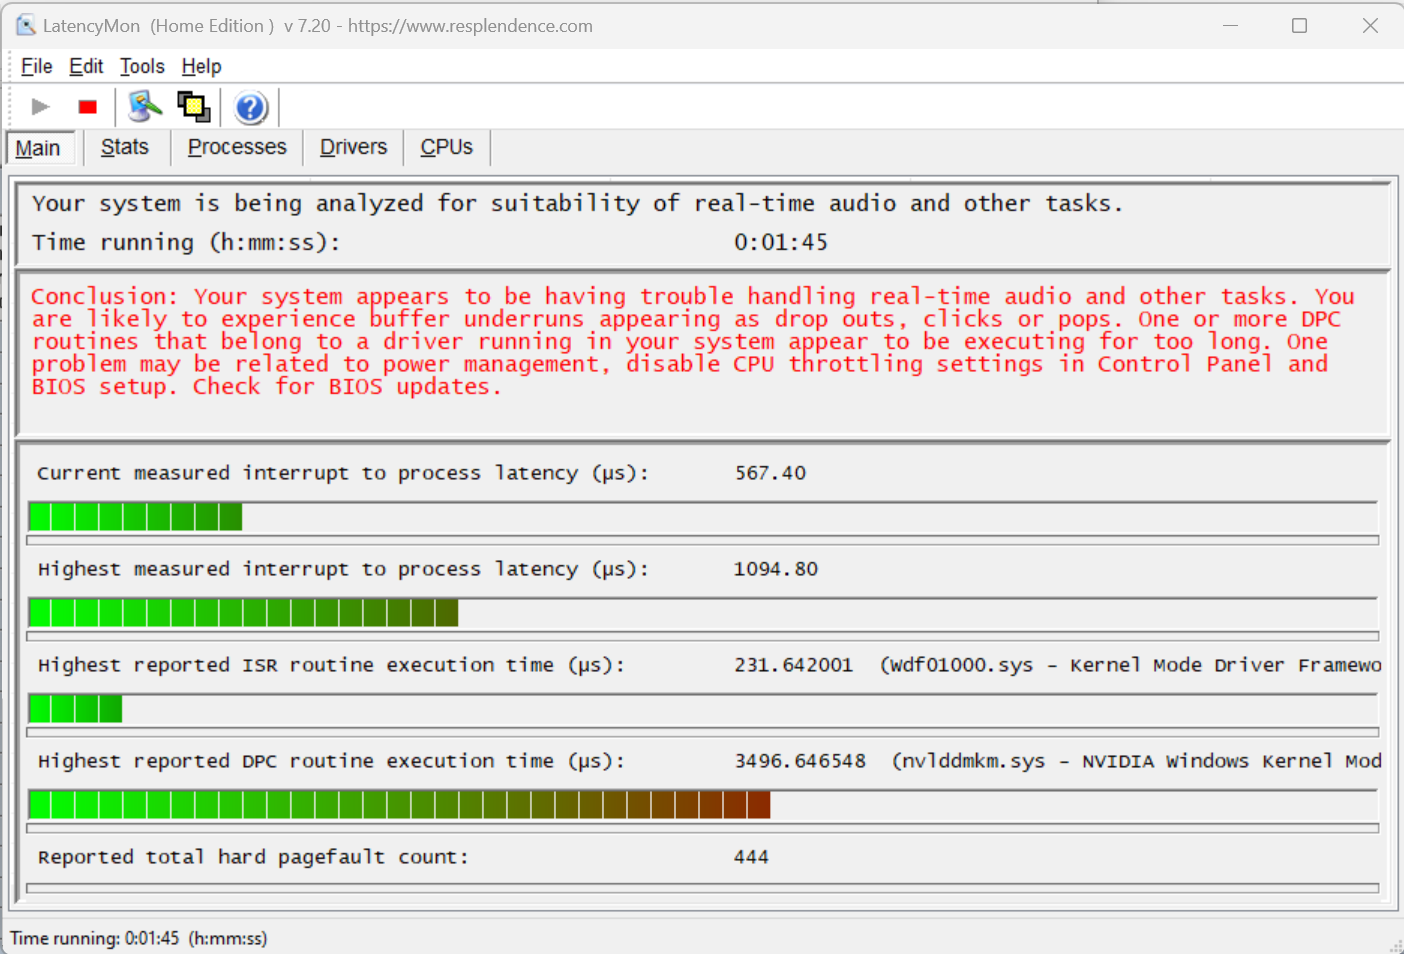
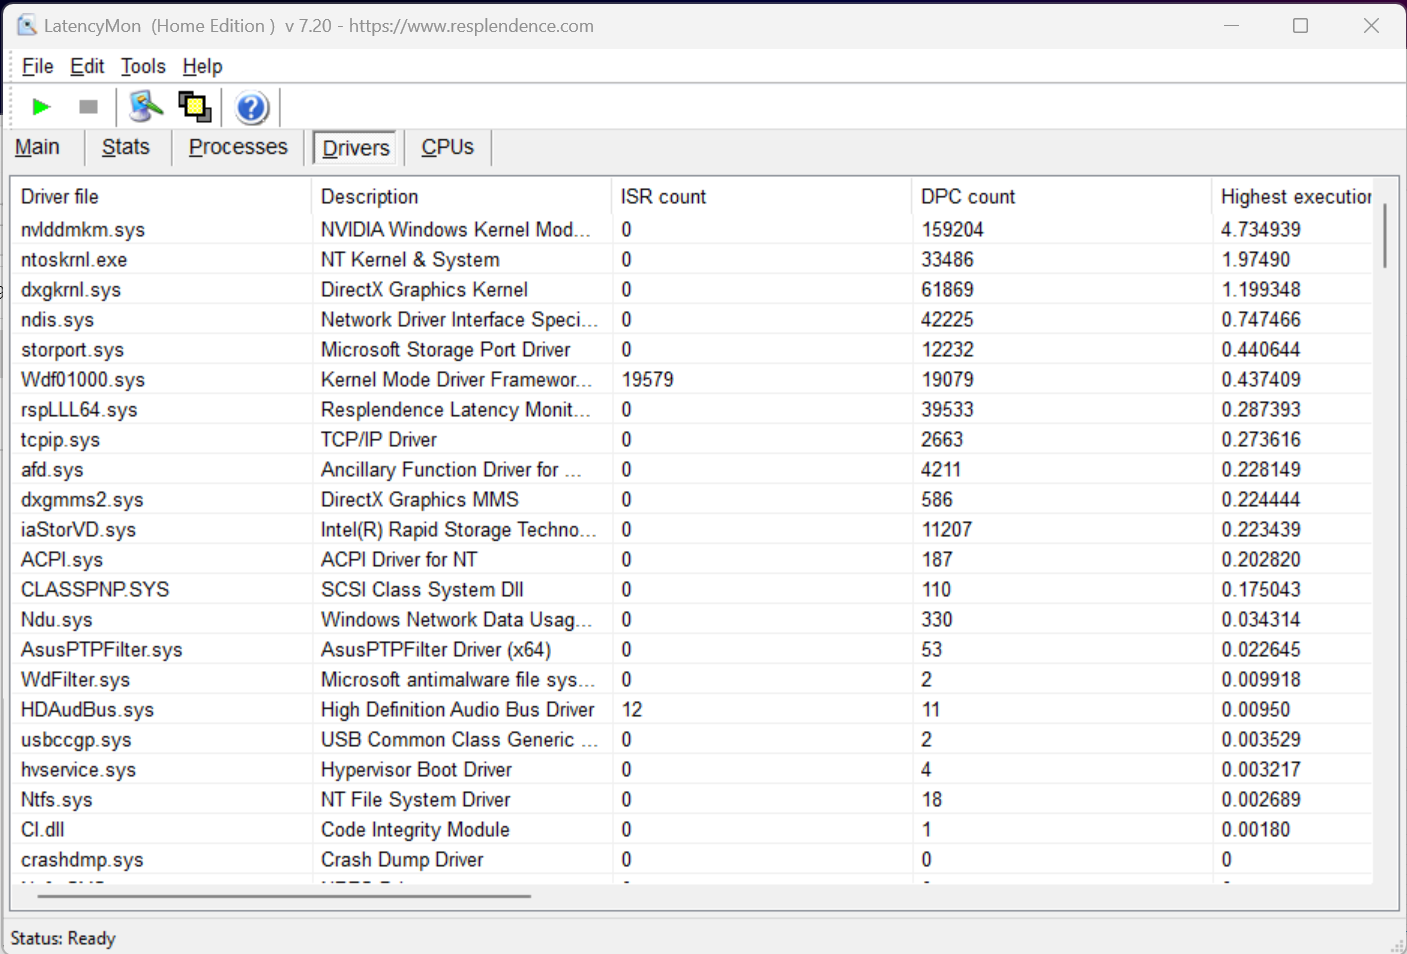
Latenze DPC
Per quanto riguarda le latenze DPC, il portatile Asus si colloca solo a metà classifica tra tutti i portatili testati. Secondo LatencyMon, il driver Nvidia è in difetto, il che può creare qualche problema nelle applicazioni in tempo reale. Abbiamo eseguito i nostri test in modalità Turbo con GPU Ultimate (senza Optimus), che in teoria è più adatta della modalità ibrida o della modalità di risparmio energetico. Purtroppo, le deboli prestazioni DPC non sono un'eccezione in questa classe di dispositivi.
| DPC Latencies / LatencyMon - interrupt to process latency (max), Web, Youtube, Prime95 | |
| MSI Titan GT77 HX 13VI | |
| Asus ROG Strix Scar 17 SE G733CX-LL014W | |
| Razer Blade 16 Early 2023 | |
| Dell Precision 7000 7670 Performance | |
| MSI Raider GE77 HX 12UHS | |
| Razer Blade 18 RTX 4070 | |
| Asus ROG Strix Scar 18 2023 G834JY-N6005W | |
| Lenovo Legion Pro 7 16IRX8H | |
* ... Meglio usare valori piccoli
Soluzione di stoccaggio
Asus utilizza due veloci SSD Samsung PM9A1, ciascuna con 1 TB di memoria, in un sistema RAID-0 nello Scar 18 G834JY-N6005W. Anche se la velocità aumenta leggermente, aumentano anche la probabilità di guasti e il consumo energetico. Tuttavia, nel confronto con il Legion 5 Pro 16IAH7H con lo stesso sistema RAID, l'Asus Scar viene superato - anche con un margine significativo. Ma questo non è dovuto a problemi termici, e le prestazioni rimangono costanti sotto carico costante.

* ... Meglio usare valori piccoli
Disk Throttling: DiskSpd Read Loop, Queue Depth 8
Scheda grafica
Il pezzo forte dell'Asus ROG Strix Scar 18 è chiaramente la GPU Nvidia RTX 4090 GPU per computer portatili Nvidia GeForce RTX 4090. Sebbene il nome suggerisca una somiglianza con la GPU RTX 4090 per desktopla versione mobile è legata alla RTX 4080 per desktop (stesso chip), e le prestazioni rimangono inferiori a quelle di una rTX 4070 Ti per desktop. Ma almeno Asus offre la versione più veloce della RTX 4090 Mobile con 175 watt TGP (150 watt + 25 watt Dynamic Boost) e addirittura overclocca la GPU di 50 MHz.
Rispetto alla RTX 4090 del modelloMSI Titan GT77 HX 13VIlo Strix G18 si colloca ancora appena dietro, nonostante l'overclock. Anche i laptop con RTX 4080 Ti sono chiaramente superati, e i laptop con la vecchia GPU RTX 3080 Tirimangono molto indietro.
| 3DMark 06 Standard Score | 67702 punti | |
| 3DMark 11 Performance | 46985 punti | |
| 3DMark Ice Storm Standard Score | 277937 punti | |
| 3DMark Cloud Gate Standard Score | 70984 punti | |
| 3DMark Fire Strike Score | 36408 punti | |
| 3DMark Fire Strike Extreme Score | 24278 punti | |
| 3DMark Time Spy Score | 20166 punti | |
Aiuto | ||
* ... Meglio usare valori piccoli
Prestazioni di gioco
I benchmark di gioco rivelano un quadro simile a quello dei benchmark sintetici. Come caratteristica speciale, la serie RTX 4000 offre ora anche il supporto per DLSS 3 con frame generation. Nei giochi supportati, la RTX 4090 è in grado di ottenere un significativo aumento dei frame rate. Questo rende possibile anche gli effetti di raytracing in 4K con frame rate fluidi. Tuttavia, i 240 Hz del display possono essere sfruttati appieno solo nei giochi meno impegnativi con la risoluzione nativa di 2.560 x 1.600 pixel.
| GTA V - 1920x1080 Highest AA:4xMSAA + FX AF:16x | |
| Intel NUC13 Raptor Canyon | |
| Lenovo Legion Pro 7 16IRX8H | |
| Asus ROG Strix Scar 18 2023 G834JY-N6005W | |
| Asus ROG Strix Scar 18 2023 G834JY-N6005W | |
| MSI Titan GT77 HX 13VI | |
| Razer Blade 16 Early 2023 | |
| Schenker XMG Neo 16 Raptor Lake | |
| MSI Raider GE77 HX 12UHS | |
| Media della classe Gaming (67.1 - 186.9, n=90, ultimi 2 anni) | |
| Asus ROG Strix Scar 17 SE G733CX-LL014W | |
| Razer Blade 18 RTX 4070 | |
| Dell Precision 7000 7670 Performance | |
| Final Fantasy XV Benchmark - 1920x1080 High Quality | |
| MSI Titan GT77 HX 13VI | |
| Schenker XMG Neo 16 Raptor Lake | |
| Intel NUC13 Raptor Canyon | |
| Asus ROG Strix Scar 18 2023 G834JY-N6005W | |
| Asus ROG Strix Scar 18 2023 G834JY-N6005W | |
| Lenovo Legion Pro 7 16IRX8H | |
| Razer Blade 16 Early 2023 | |
| Media della classe Gaming (64.2 - 215, n=91, ultimi 2 anni) | |
| MSI Raider GE77 HX 12UHS | |
| Asus ROG Strix Scar 17 SE G733CX-LL014W | |
| Razer Blade 18 RTX 4070 | |
| Dell Precision 7000 7670 Performance | |
| Strange Brigade - 1920x1080 ultra AA:ultra AF:16 | |
| MSI Titan GT77 HX 13VI | |
| Asus ROG Strix Scar 18 2023 G834JY-N6005W | |
| Intel NUC13 Raptor Canyon | |
| Schenker XMG Neo 16 Raptor Lake | |
| Asus ROG Strix Scar 18 2023 G834JY-N6005W | |
| Razer Blade 16 Early 2023 | |
| Lenovo Legion Pro 7 16IRX8H | |
| Media della classe Gaming (113.6 - 458, n=83, ultimi 2 anni) | |
| Asus ROG Strix Scar 17 SE G733CX-LL014W | |
| MSI Raider GE77 HX 12UHS | |
| Razer Blade 18 RTX 4070 | |
| Dell Precision 7000 7670 Performance | |
| Dota 2 Reborn - 1920x1080 ultra (3/3) best looking | |
| Intel NUC13 Raptor Canyon | |
| Razer Blade 16 Early 2023 | |
| Asus ROG Strix Scar 18 2023 G834JY-N6005W | |
| Asus ROG Strix Scar 18 2023 G834JY-N6005W | |
| MSI Titan GT77 HX 13VI | |
| Lenovo Legion Pro 7 16IRX8H | |
| Razer Blade 18 RTX 4070 | |
| Schenker XMG Neo 16 Raptor Lake | |
| Asus ROG Strix Scar 17 SE G733CX-LL014W | |
| MSI Raider GE77 HX 12UHS | |
| Media della classe Gaming (84.8 - 252, n=104, ultimi 2 anni) | |
| Dell Precision 7000 7670 Performance | |
Nel nostro test di carico con The Witcher 3 e anche nello stress test 3DMark Time Spy, l'Asus G834JY mantiene prestazioni stabili senza cali. Le fluttuazioni visibili in Witcher 3 sono dovute ai cambiamenti tra giorno e notte.
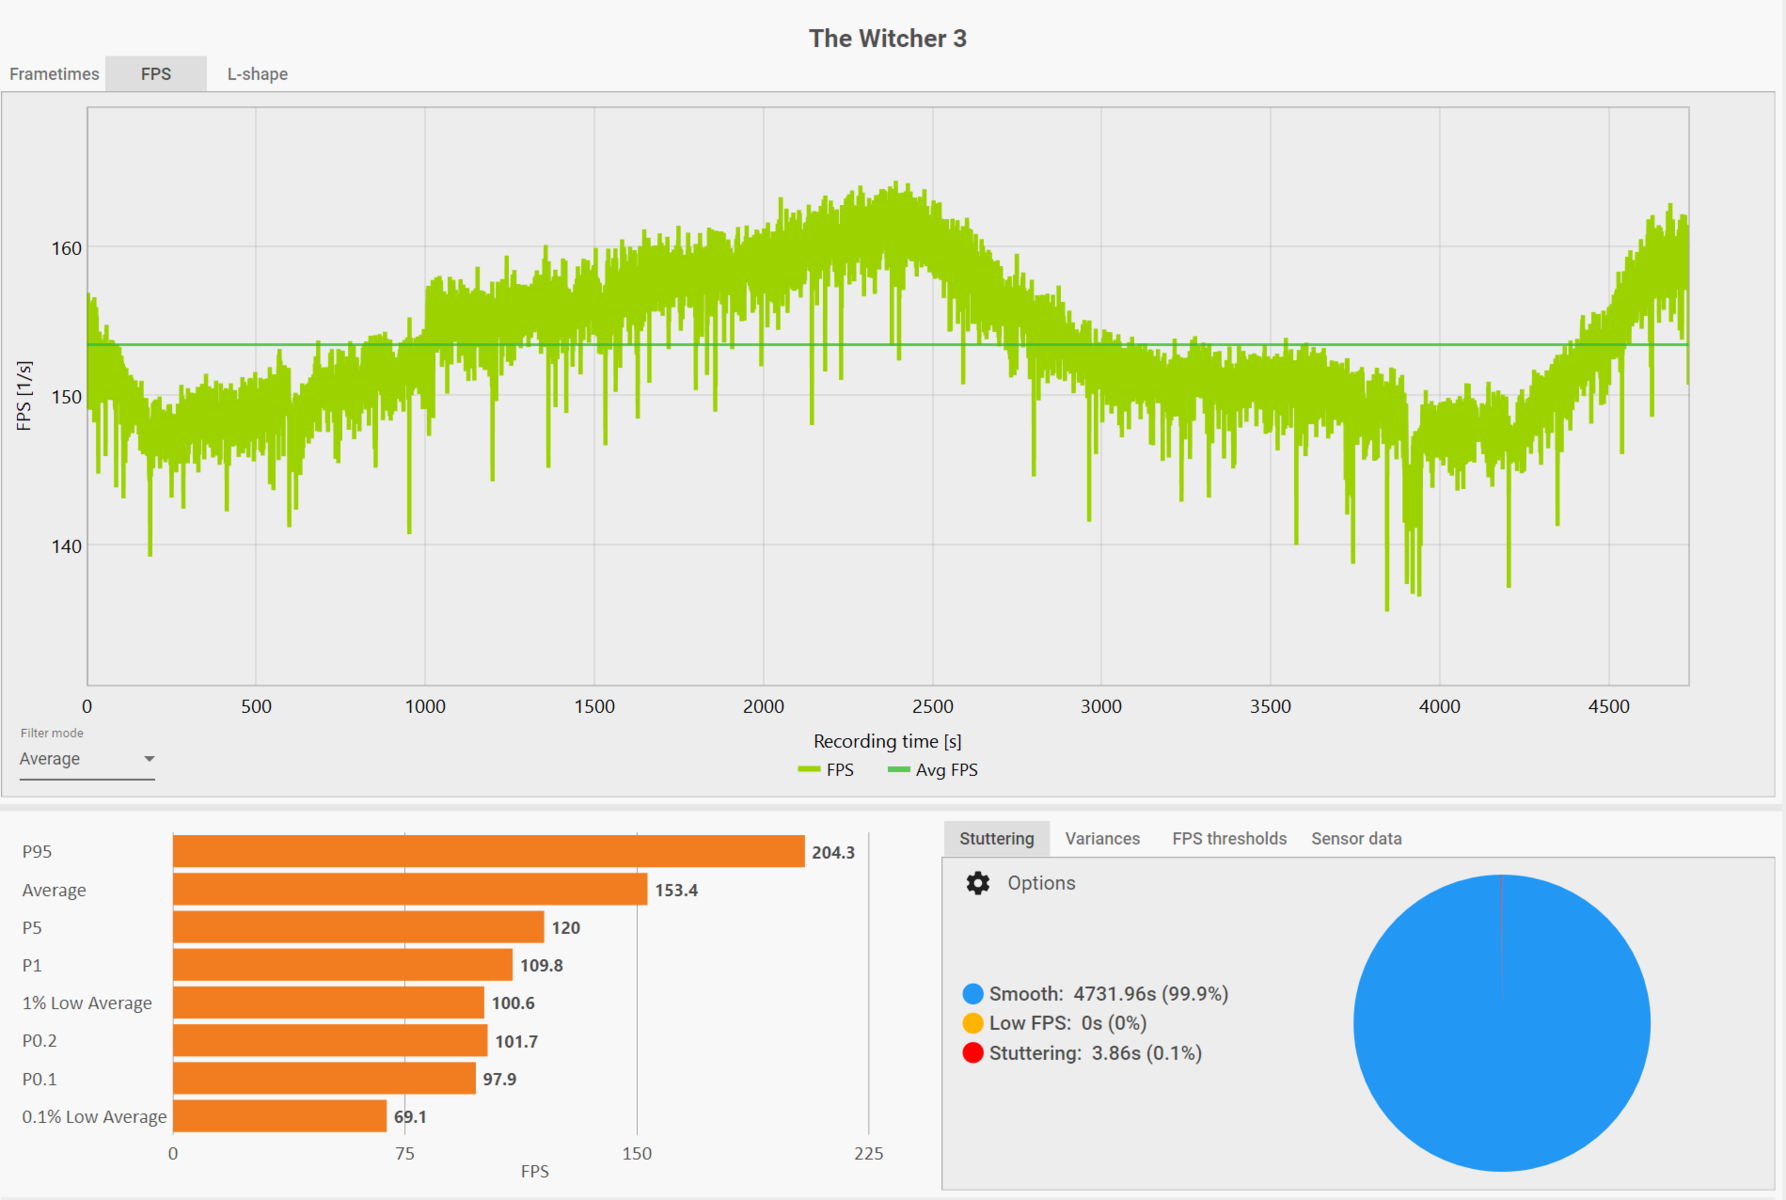
The Witcher 3 FPS Chart
| basso | medio | alto | ultra | QHD | 4K DLSS | 4K | |
|---|---|---|---|---|---|---|---|
| Counter-Strike: GO (2012) | 516 | 314 | |||||
| GTA V (2015) | 187.4 | 185.7 | 184.8 | 141.3 | 139.1 | 175.7 | |
| Dota 2 Reborn (2015) | 237 | 207.7 | 201.75 | 190.2 | 178.6 | ||
| Deus Ex Mankind Divided (2016) | 169 | ||||||
| Final Fantasy XV Benchmark (2018) | 224 | 208 | 177.6 | 146.7 | 90.1 | ||
| X-Plane 11.11 (2018) | 211 | 186.8 | 142.8 | ||||
| Far Cry 5 (2018) | 197 | 181 | 172 | 158 | 153 | 107 | |
| Strange Brigade (2018) | 496 | 403 | 386 | 366 | 292 | 154.7 | |
| Shadow of the Tomb Raider (2018) | 143.7 | 121.2 | 87.3 | ||||
| Control (2019) | 184.4 | 123.2 | 72.6 | ||||
| Horizon Zero Dawn (2020) | 184 | 154 | 145 | 127 | 92 | ||
| Flight Simulator 2020 (2020) | 74 | 74 | 96.8 | 51.2 | |||
| Battlefield 2042 (2021) | 172.6 | 138.9 | 85.4 | ||||
| Halo Infinite (2021) | 128.9 | 77 | 57.3 | ||||
| Elden Ring (2022) | 60 | 60 | 60 | 60 | 60 | 60 | |
| Cyberpunk 2077 1.6 (2022) | 119.7 | 94.5 | |||||
| Vampire Bloodhunt (2022) | 290 | 242 | 138.3 | ||||
| F1 22 (2022) | 319 | 308 | 273 | 124.5 | 75 | 42.4 | |
| FIFA 23 (2022) | 183.7 | 182.6 | 162.4 | ||||
| A Plague Tale Requiem (2022) | 96.8 | 72 | 82.3 | 41 | |||
| Uncharted Legacy of Thieves Collection (2022) | 108.2 | 103.1 | 62.9 | ||||
| Call of Duty Modern Warfare 2 2022 (2022) | 170 | 127 | 112 | 81 | |||
| Spider-Man Miles Morales (2022) | 109.1 | 103.8 | 73.2 | ||||
| Need for Speed Unbound (2022) | 124.2 | 111.8 | 84.3 | ||||
| High On Life (2023) | 180.3 | 120.2 | 52 | ||||
| The Witcher 3 v4 (2023) | 137.6 | 96.6 | 49 |
Emissioni
Livelli di rumore
Sotto carico, le tre ventole integrate lottano con i potenti componenti. Anche se le caratteristiche di rumorosità rimangono molto confortevoli, fino a 55,8 dB (ventole a 4900, 5500 e 6400 RPM) è ancora molto forte. Durante il gioco, il suono dei buoni altoparlanti può essere un po' affogato, il che suggerisce l'uso di cuffie. Se si utilizza il display da 240 Hz nel gioco e si raggiungono frame rate elevati, la nostra unità di prova purtroppo produce un fruscio della bobina chiaramente percepibile. Questo è udibile a partire da 100 fps e può diventare un po' fastidioso, a seconda del gioco.
Durante il funzionamento inattivo, le tre ventole possono anche rimanere spente per lunghi periodi di tempo, ma solo in modalità silenziosa e quando si utilizza la GPU integrata. Tuttavia, nella maggior parte dei casi non rimangono completamente spente durante la navigazione, ma i livelli più bassi delle ventole a 2000-3000 giri/min. sono comodamente silenziosi con meno di 33 dB(A).
Rumorosità
| Idle |
| 23.9 / 32.6 / 32.6 dB(A) |
| Sotto carico |
| 35.9 / 55.8 dB(A) |
 | ||
30 dB silenzioso 40 dB(A) udibile 50 dB(A) rumoroso |
||
min: | ||
| Asus ROG Strix Scar 18 2023 G834JY-N6005W GeForce RTX 4090 Laptop GPU, i9-13980HX, 2x Samsung PM9A1 MZVL21T0HCLR (RAID 0) | Razer Blade 18 RTX 4070 GeForce RTX 4070 Laptop GPU, i9-13950HX, SSSTC CA6-8D1024 | Lenovo Legion Pro 7 16IRX8H GeForce RTX 4080 Laptop GPU, i9-13900HX, Samsung PM9A1 MZVL21T0HCLR | Razer Blade 16 Early 2023 GeForce RTX 4080 Laptop GPU, i9-13950HX, SSSTC CA6-8D1024 | MSI Titan GT77 HX 13VI GeForce RTX 4090 Laptop GPU, i9-13950HX, Samsung PM9A1 MZVL22T0HBLB | MSI Raider GE77 HX 12UHS GeForce RTX 3080 Ti Laptop GPU, i9-12900HX, Samsung PM9A1 MZVL22T0HBLB | Asus ROG Strix Scar 17 SE G733CX-LL014W GeForce RTX 3080 Ti Laptop GPU, i9-12950HX, Samsung PM9A1 MZVL22T0HBLB | |
|---|---|---|---|---|---|---|---|
| Noise | 8% | -5% | 11% | -9% | -17% | 13% | |
| off /ambiente * (dB) | 23.9 | 23.5 2% | 24 -0% | 23 4% | 24.6 -3% | 26 -9% | 23.9 -0% |
| Idle Minimum * (dB) | 23.9 | 23.8 -0% | 26 -9% | 23 4% | 29.2 -22% | 26 -9% | 23.9 -0% |
| Idle Average * (dB) | 32.6 | 23.8 27% | 28 14% | 23 29% | 29.2 10% | 34 -4% | 23.9 27% |
| Idle Maximum * (dB) | 32.6 | 26.8 18% | 34 -4% | 23.6 28% | 29.2 10% | 46 -41% | 23.9 27% |
| Load Average * (dB) | 35.9 | 37.3 -4% | 47 -31% | 39 -9% | 50.7 -41% | 50 -39% | 34.3 4% |
| Load Maximum * (dB) | 55.8 | 53.5 4% | 56 -0% | 51.3 8% | 61 -9% | 57 -2% | 45.9 18% |
| Witcher 3 ultra * (dB) | 48 | 55 | 51.6 | 53.3 | 55 |
* ... Meglio usare valori piccoli
Temperature
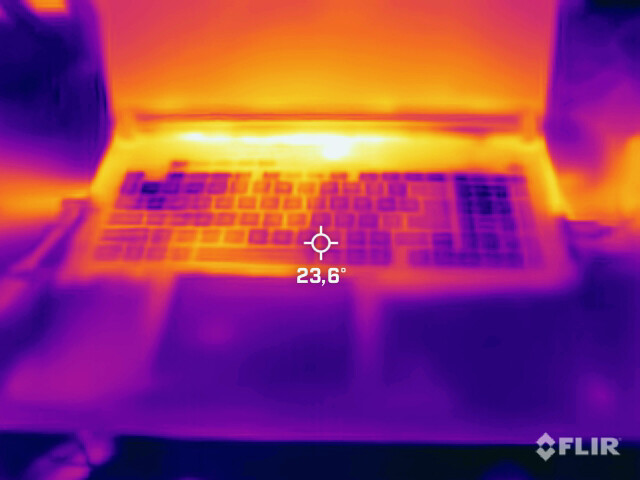
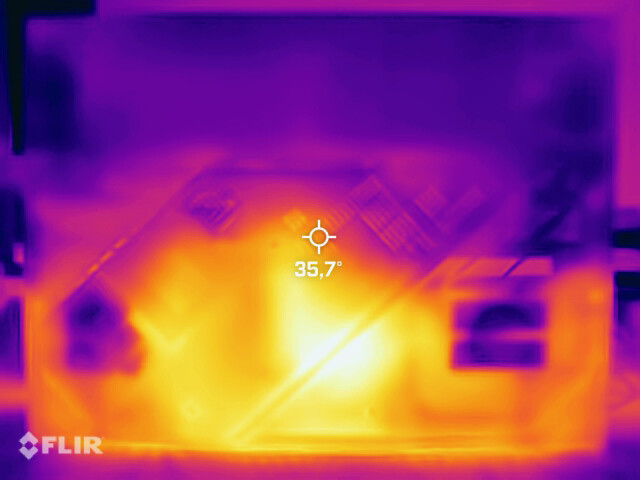
Per quanto riguarda le temperature, i risultati sono contrastanti. Le aree del case che vengono toccate, come i poggiapolsi e la tastiera, rimangono confortevolmente fresche, anche durante gli scenari di stress più lunghi. Ma il punto caldo nell'area superiore del case diventa relativamente caldo fino a 55 °C (131 °F) durante il gioco.
(-) La temperatura massima sul lato superiore è di 54 °C / 129 F, rispetto alla media di 40.4 °C / 105 F, che varia da 21.2 a 68.8 °C per questa classe Gaming.
(-) Il lato inferiore si riscalda fino ad un massimo di 46 °C / 115 F, rispetto alla media di 43.2 °C / 110 F
(+) In idle, la temperatura media del lato superiore è di 27.2 °C / 81 F, rispetto alla media deld ispositivo di 33.9 °C / 93 F.
(±) Riproducendo The Witcher 3, la temperatura media per il lato superiore e' di 36 °C / 97 F, rispetto alla media del dispositivo di 33.9 °C / 93 F.
(+) I poggiapolsi e il touchpad sono piu' freddi della temperatura della pelle con un massimo di 28 °C / 82.4 F e sono quindi freddi al tatto.
(±) La temperatura media della zona del palmo della mano di dispositivi simili e'stata di 28.8 °C / 83.8 F (+0.8 °C / 1.4 F).
| Asus ROG Strix Scar 18 2023 G834JY-N6005W Intel Core i9-13980HX, NVIDIA GeForce RTX 4090 Laptop GPU | Razer Blade 16 Early 2023 Intel Core i9-13950HX, NVIDIA GeForce RTX 4080 Laptop GPU | MSI Titan GT77 HX 13VI Intel Core i9-13950HX, NVIDIA GeForce RTX 4090 Laptop GPU | MSI Raider GE77 HX 12UHS Intel Core i9-12900HX, NVIDIA GeForce RTX 3080 Ti Laptop GPU | Asus ROG Strix Scar 17 SE G733CX-LL014W Intel Core i9-12950HX, NVIDIA GeForce RTX 3080 Ti Laptop GPU | |
|---|---|---|---|---|---|
| Heat | 9% | 13% | -23% | -4% | |
| Maximum Upper Side * (°C) | 54 | 40 26% | 40.6 25% | 53 2% | 48.8 10% |
| Maximum Bottom * (°C) | 46 | 37.6 18% | 41.1 11% | 58 -26% | 52.4 -14% |
| Idle Upper Side * (°C) | 30 | 32.4 -8% | 26.2 13% | 38 -27% | 30.4 -1% |
| Idle Bottom * (°C) | 31 | 31.4 -1% | 30.3 2% | 43 -39% | 34.1 -10% |
* ... Meglio usare valori piccoli
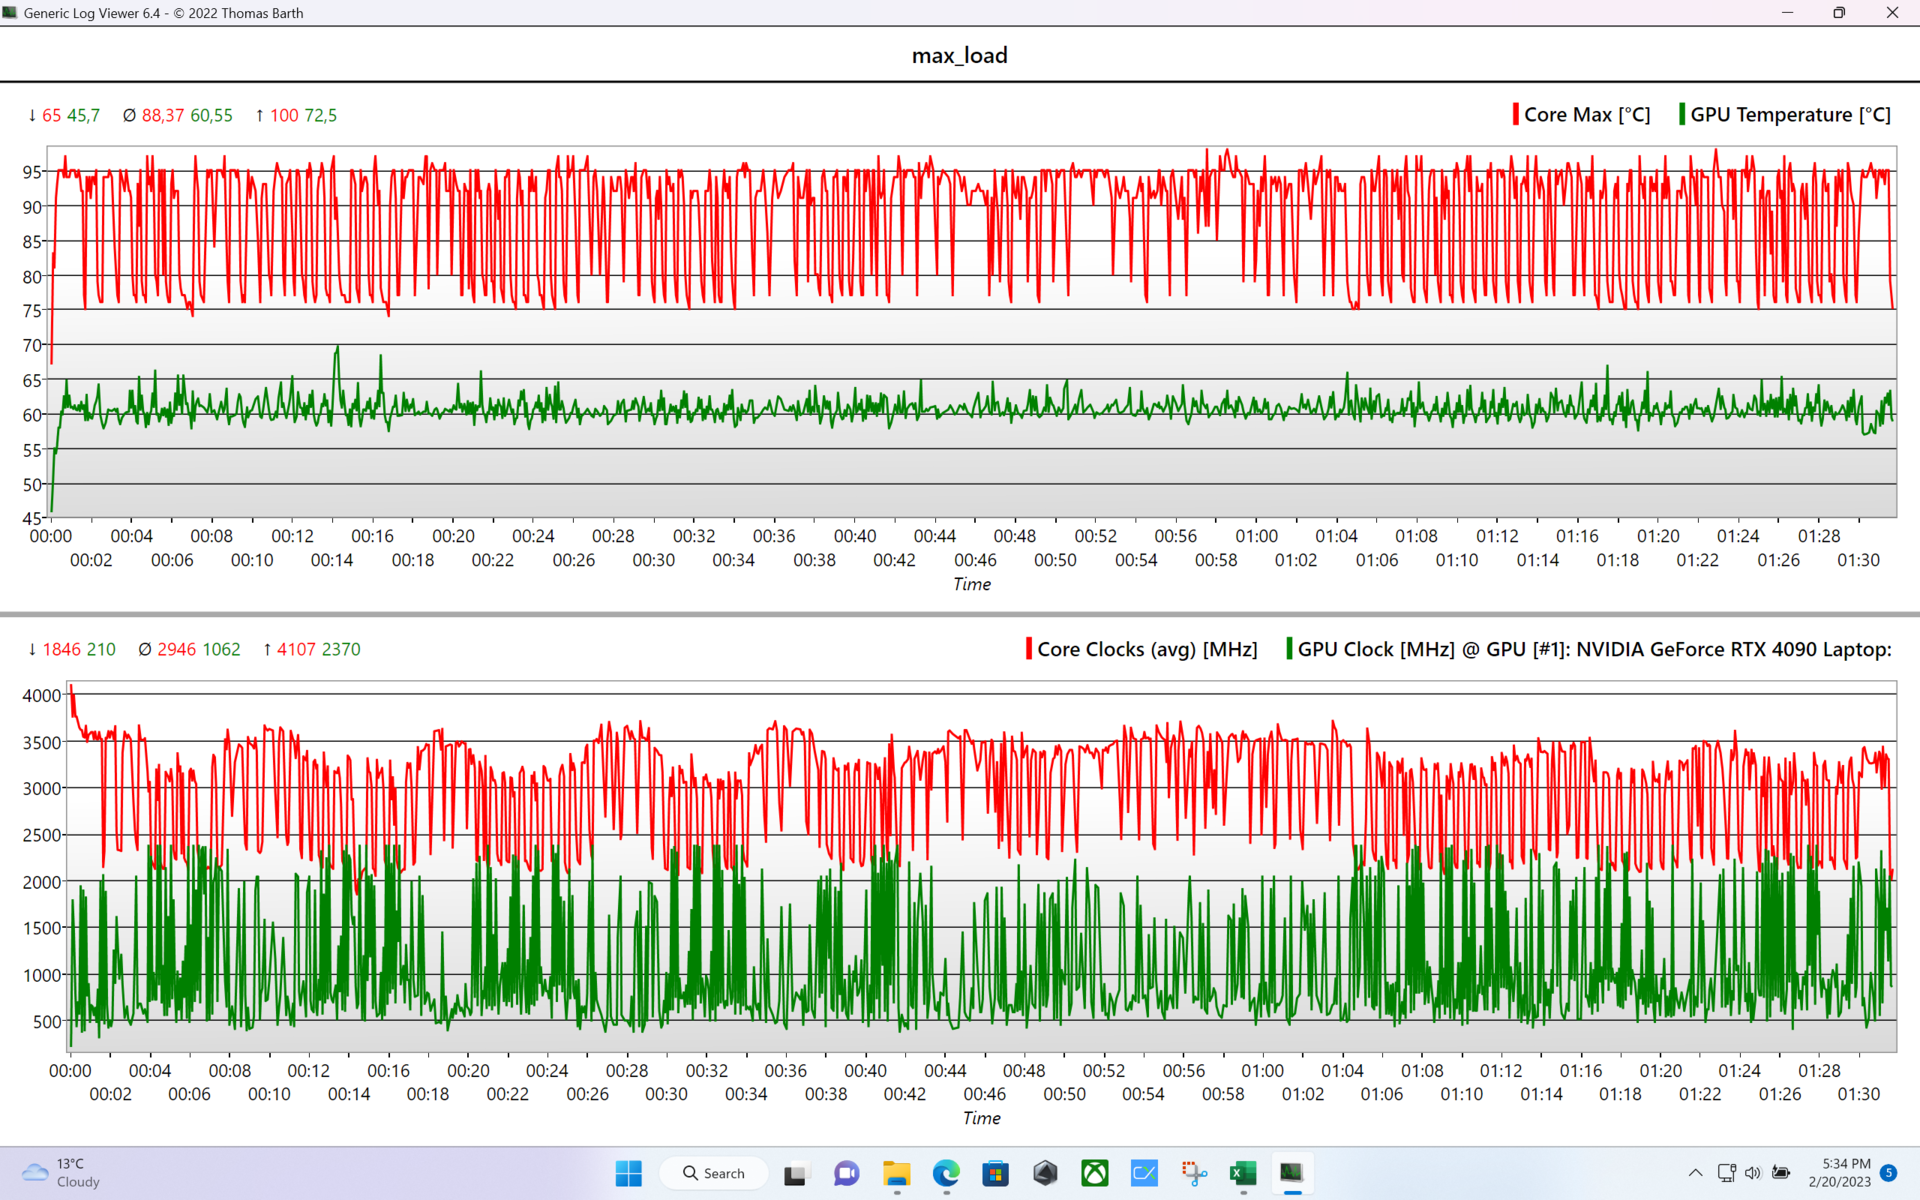
Stress test
Le temperature interne della CPU variano fortemente durante lo stress test. Ciò può essere ricondotto alle velocità di clock costantemente regolate che spingono la CPU vicino alla soglia dei 100 °C (212 °F). Per quanto riguarda la GPU, la situazione è molto meno critica e la RTX 4090 raggiunge solo una temperatura massima di 70 °C (158 °F).
Durante il gioco, le temperature della CPU rimangono leggermente meno estreme. Misurano tra 81 °C (178 °F, Cyberpunk 2077) e 90 °C (194 °F, The Witcher 3). D'altra parte, tra i 72 °C (162 °F, Cyberpunk 2077) e i 77 °C (171 °F, The Witcher 3), la GPU diventa leggermente più calda rispetto allo stress test.
| Clock CPU E-Cores (GHz) | Clock CPU P-Cores(GHz) | Clock GPU (MHz) | Temperatura media della CPU (°C) | Temperatura media della GPU (°C) | |
| Sistema inattivo (silenzioso) | 1,4 | 1,8 | 0 | 42 | 0 |
| Sistema al minimo (Turbo) | 1,6 | 2,1 | 210 | 44 | 39 |
| Prime95 Stress (Turbo) | 3 | 3,5 | 210 | 92 | 56 |
| Prime95 + FurMark Stress (Turbo) | 1,6 | 2,1 | 2260 | 80 | 73 |
| Witcher 3 Stress | 3,7 | 4,6 | 1995 | 90 | 77 |
Altoparlanti
Gli altoparlanti integrati sono relativamente pesanti sui bassi, ma offrono prestazioni soggettivamente interessanti, adatte allo scopo di gioco del portatile. Anche in condizioni quotidiane, il volume massimo è sufficientemente alto.
Asus ROG Strix Scar 18 2023 G834JY-N6005W analisi audio
(+) | gli altoparlanti sono relativamente potenti (82.7 dB)
Bassi 100 - 315 Hz
(+) | bassi buoni - solo 4.8% dalla media
(±) | la linearità dei bassi è media (7% delta rispetto alla precedente frequenza)
Medi 400 - 2000 Hz
(±) | medi elevati - circa 9% superiore alla media
(+) | medi lineari (5% delta rispetto alla precedente frequenza)
Alti 2 - 16 kHz
(+) | Alti bilanciati - appena 3.7% dalla media
(+) | alti lineari (6.1% delta rispetto alla precedente frequenza)
Nel complesso 100 - 16.000 Hz
(±) | la linearità complessiva del suono è media (19% di differenza rispetto alla media
Rispetto alla stessa classe
» 64% di tutti i dispositivi testati in questa classe è stato migliore, 8% simile, 28% peggiore
» Il migliore ha avuto un delta di 6%, medio di 18%, peggiore di 132%
Rispetto a tutti i dispositivi testati
» 45% di tutti i dispositivi testati in questa classe è stato migliore, 7% similare, 47% peggiore
» Il migliore ha avuto un delta di 4%, medio di 23%, peggiore di 134%
Apple MacBook Pro 16 2021 M1 Pro analisi audio
(+) | gli altoparlanti sono relativamente potenti (84.7 dB)
Bassi 100 - 315 Hz
(+) | bassi buoni - solo 3.8% dalla media
(+) | bassi in lineaa (5.2% delta rispetto alla precedente frequenza)
Medi 400 - 2000 Hz
(+) | medi bilanciati - solo only 1.3% rispetto alla media
(+) | medi lineari (2.1% delta rispetto alla precedente frequenza)
Alti 2 - 16 kHz
(+) | Alti bilanciati - appena 1.9% dalla media
(+) | alti lineari (2.7% delta rispetto alla precedente frequenza)
Nel complesso 100 - 16.000 Hz
(+) | suono nel complesso lineare (4.6% differenza dalla media)
Rispetto alla stessa classe
» 0% di tutti i dispositivi testati in questa classe è stato migliore, 0% simile, 100% peggiore
» Il migliore ha avuto un delta di 5%, medio di 17%, peggiore di 45%
Rispetto a tutti i dispositivi testati
» 0% di tutti i dispositivi testati in questa classe è stato migliore, 0% similare, 100% peggiore
» Il migliore ha avuto un delta di 4%, medio di 23%, peggiore di 134%
Gestione dell'alimentazione
Consumo di energia
A causa del potente hardware, il consumo energetico del sistema è molto elevato. Ciò che spicca è il consumo molto elevato in standby, che si alterna sempre tra 5 e 10 watt. La colpa potrebbe essere anche dell'illuminazione a LED con animazione anche durante lo standby.
| Off / Standby | |
| Idle | |
| Sotto carico |
|
Leggenda:
min: | |
| Asus ROG Strix Scar 18 2023 G834JY-N6005W i9-13980HX, GeForce RTX 4090 Laptop GPU, 2x Samsung PM9A1 MZVL21T0HCLR (RAID 0), IPS, 2560x1600, 18" | Razer Blade 16 Early 2023 i9-13950HX, GeForce RTX 4080 Laptop GPU, SSSTC CA6-8D1024, IPS, 2560x1600, 16" | MSI Titan GT77 HX 13VI i9-13950HX, GeForce RTX 4090 Laptop GPU, Samsung PM9A1 MZVL22T0HBLB, Mini-LED, 3840x2160, 17.3" | MSI Raider GE77 HX 12UHS i9-12900HX, GeForce RTX 3080 Ti Laptop GPU, Samsung PM9A1 MZVL22T0HBLB, IPS, 3840x2160, 17.3" | Asus ROG Strix Scar 17 SE G733CX-LL014W i9-12950HX, GeForce RTX 3080 Ti Laptop GPU, Samsung PM9A1 MZVL22T0HBLB, IPS, 2560x1440, 17.3" | Media della classe Gaming | |
|---|---|---|---|---|---|---|
| Power Consumption | 9% | 13% | 15% | 6% | 28% | |
| Idle Minimum * (Watt) | 17.3 | 15.2 12% | 14 19% | 13 25% | 19.3 -12% | 13.1 ? 24% |
| Idle Average * (Watt) | 27 | 22.8 16% | 21.6 20% | 19 30% | 26.5 2% | 19 ? 30% |
| Idle Maximum * (Watt) | 46 | 49.8 -8% | 24.8 46% | 29 37% | 27.1 41% | 24.6 ? 47% |
| Load Average * (Watt) | 133 | 121.2 9% | 122.5 8% | 143 -8% | 141 -6% | 111.3 ? 16% |
| Load Maximum * (Watt) | 329 | 273.7 17% | 418 -27% | 352 -7% | 307.9 6% | 260 ? 21% |
| Witcher 3 ultra * (Watt) | 242 | 265 | 247 | 225 |
* ... Meglio usare valori piccoli
Power Consumption The Witcher 3 / Stress Test
Power Consumption with External Monitor
Durata della batteria
A causa dei componenti affamati di energia, la batteria da 90 W non è in grado di produrre valori record. In modalità Optimus (con GPU disattivata), profilo Silenzioso e con la luminosità abbassata a 150 cd/m², è ancora possibile lavorare per diverse ore in assenza di rete. Il nostro test WLAN ha funzionato per poco più di 7 ore in questa modalità. Tuttavia, se si vuole giocare in modalità batteria, non solo bisogna accontentarsi di prestazioni notevolmente ridotte, ma la durata della batteria è durata solo un'ora circa nel nostro test (senza limitazione del frame rate) con The Witcher 3.
La batteria si è ricaricata completamente dopo 1 ora e 40 minuti con il sistema spento o 1 ora e 45 minuti con il sistema inattivo. L'alimentatore forniva un massimo di 117 watt in quel momento.
| Asus ROG Strix Scar 18 2023 G834JY-N6005W i9-13980HX, GeForce RTX 4090 Laptop GPU, 90 Wh | Razer Blade 16 Early 2023 i9-13950HX, GeForce RTX 4080 Laptop GPU, 95.2 Wh | MSI Titan GT77 HX 13VI i9-13950HX, GeForce RTX 4090 Laptop GPU, 99.9 Wh | MSI Raider GE77 HX 12UHS i9-12900HX, GeForce RTX 3080 Ti Laptop GPU, 99.99 Wh | Asus ROG Strix Scar 17 SE G733CX-LL014W i9-12950HX, GeForce RTX 3080 Ti Laptop GPU, 90 Wh | Media della classe Gaming | |
|---|---|---|---|---|---|---|
| Autonomia della batteria | 21% | 6% | 30% | -41% | 28% | |
| H.264 (h) | 7 | 6 -14% | 6.5 -7% | 8.27 ? 18% | ||
| WiFi v1.3 (h) | 7.1 | 6.1 -14% | 5.3 -25% | 5.4 -24% | 4.2 -41% | 7.08 ? 0% |
| Witcher 3 ultra (h) | 0.9 | |||||
| Load (h) | 0.9 | 1.4 56% | 1.4 56% | 2 122% | 1.496 ? 66% | |
| Reader / Idle (h) | 8.9 | 9.8 | 7.84 ? |
Pro
Contro
Il verdetto
L'Asus ROG Strix SCAR 18 (2023) G834JY è un portatile da gioco di fascia alta che Asus ha equipaggiato con i componenti mobili più potenti attualmente disponibili. L'ampio case ospita un ottimo display da 18 pollici che offre ai giocatori tempi di risposta rapidi, G-SYNC e una buona qualità dell'immagine. Ma il punto forte del G834JY è sicuramente il potente hardware con un Core i9-13980HX, una GPU GeForce RTX 4090 Laptop (175 W TGP) e un SSD RAID-0 NVMe. Sebbene questi componenti producano un'enorme quantità di calore sotto carico, Asus lo tiene sotto controllo con un sistema di raffreddamento a tre ventole, heat pipe a camera di vapore e pasta metallica liquida.
Il ROG Strix SCAR 18 è un pacchetto completo con prestazioni impressionanti a un prezzo elevato.
I nostri unici punti di lamentela sono minori, come il fruscio della bobina della nostra unità di test con frame rate elevati, la pessima webcam o il posizionamento delle porte, che in alcuni casi non è ottimale.
Come alternative, è possibile ottenere i modelli da 18 pollici con GPU RTX 4090 di Alienware (m18 R1) e Razer (Blade 18). MSI offre il poco più veloce Titan GT77 HX 13VI con display da 17 pollici. Chi può accontentarsi di prestazioni leggermente inferiori può dare un'occhiata ai modelli basati su RTX 4080, che sono decisamente più convenienti. Anche la versione G834JZ dello Scar 18 potrebbe rappresentare un'alternativa interessante.
Prezzo e disponibilità
Il G834JY-N6000W che abbiamo testato è attualmente disponibile solo in Inghilterra al prezzo di £3999,99 (prezzo di listino). Alcuni negozi statunitensi offrono il modello G834JY-XS97 attualmente a 3899,99 dollari(Asus ha esaurito le scorte) e Amazon offre il G834JY-XS97 a 5390 dollari.
Asus ROG Strix Scar 18 2023 G834JY-N6005W
- 03/07/2023 v7 (old)
Klaus Hinum
Transparency
La selezione dei dispositivi da recensire viene effettuata dalla nostra redazione. Il campione di prova è stato fornito all'autore come prestito dal produttore o dal rivenditore ai fini di questa recensione. L'istituto di credito non ha avuto alcuna influenza su questa recensione, né il produttore ne ha ricevuto una copia prima della pubblicazione. Non vi era alcun obbligo di pubblicare questa recensione. In quanto società mediatica indipendente, Notebookcheck non è soggetta all'autorità di produttori, rivenditori o editori.
Ecco come Notebookcheck esegue i test
Ogni anno, Notebookcheck esamina in modo indipendente centinaia di laptop e smartphone utilizzando procedure standardizzate per garantire che tutti i risultati siano comparabili. Da circa 20 anni sviluppiamo continuamente i nostri metodi di prova e nel frattempo stabiliamo gli standard di settore. Nei nostri laboratori di prova, tecnici ed editori esperti utilizzano apparecchiature di misurazione di alta qualità. Questi test comportano un processo di validazione in più fasi. Il nostro complesso sistema di valutazione si basa su centinaia di misurazioni e parametri di riferimento ben fondati, che mantengono l'obiettività.Price comparison

