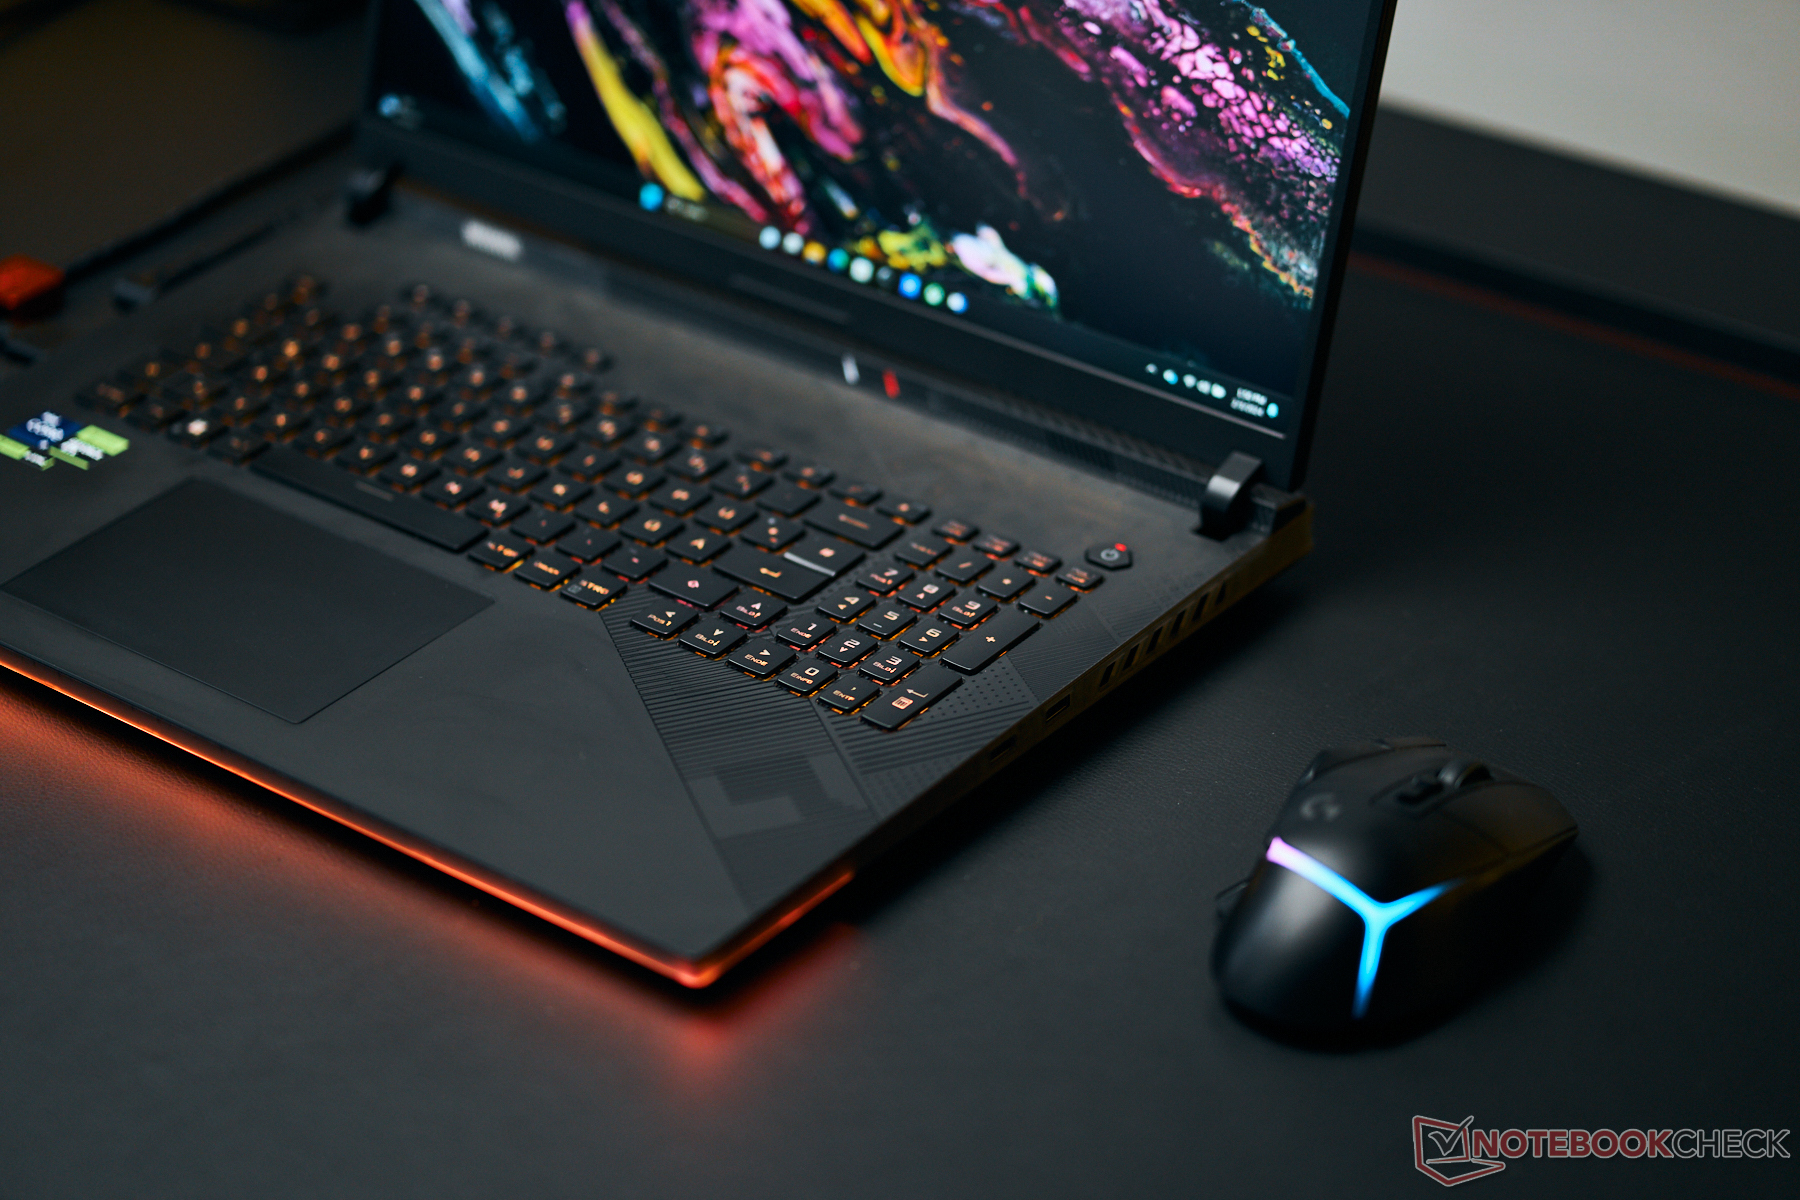
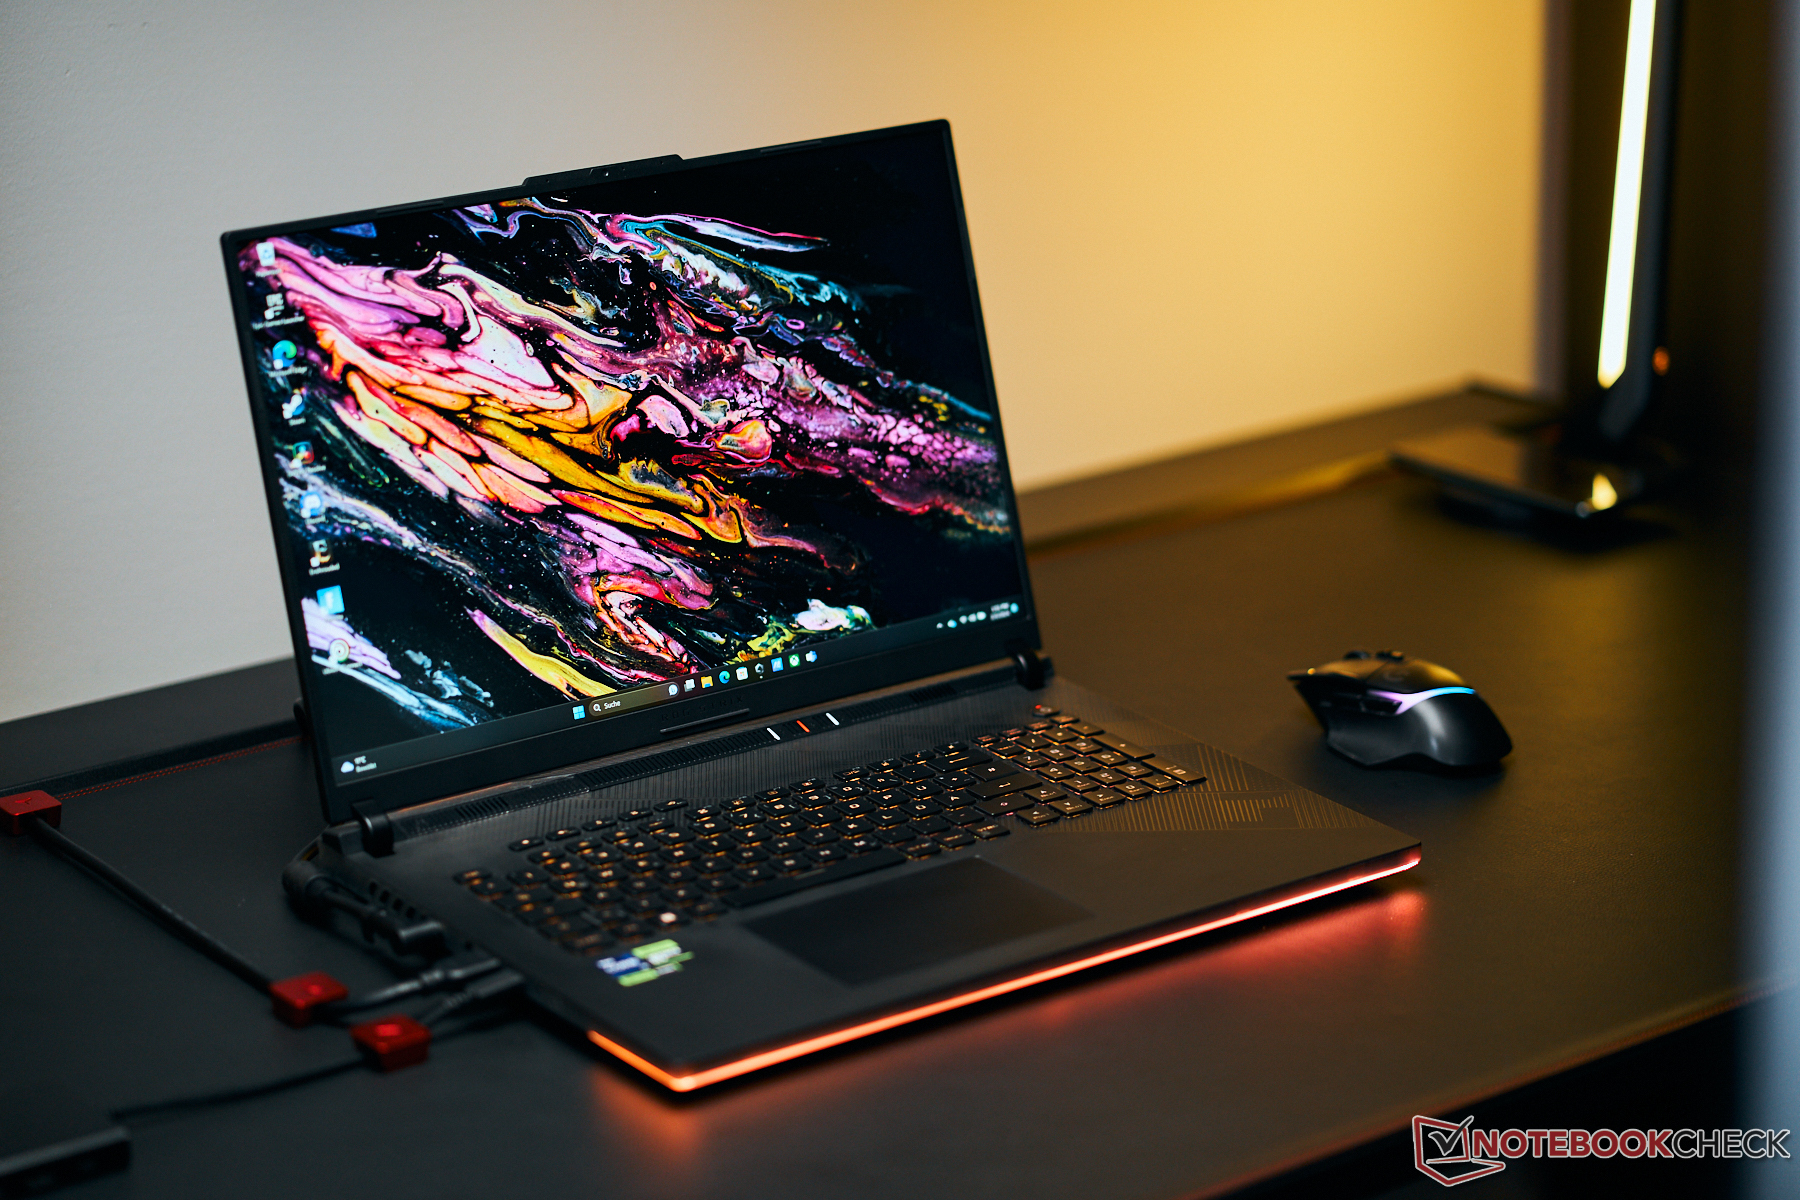
Recensione dell'Asus ROG Strix Scar 18 (2024): Computer portatile per il gaming con RTX 4090 e pannello mini-LED
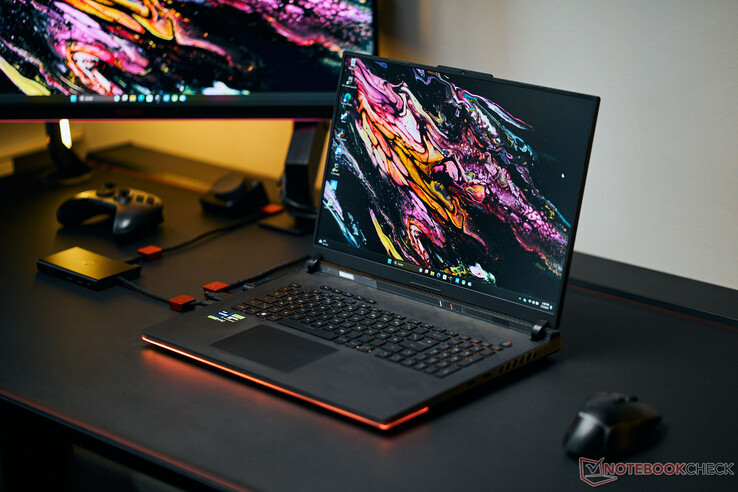
Con ROG Strix Scar 18, ASUS si rivolge ai giocatori e ai creatori che non mancano di fondi necessari: La nostra configurazione di prova del campione di fascia alta è disponibile a partire da circa 4.500 Euro (~$4.848). Il prezzo è spinto a tali altezze dal potente hardware e da un display mini-LED molto luminoso nel formato 16:10 con colori accurati e una diagonale di 18 pollici. I concorrenti includono dispositivi come Alienware m18 R1il Acer Predator Helios 18il Razer Blade 18e il MSI Titan 18 HX A14VIG.
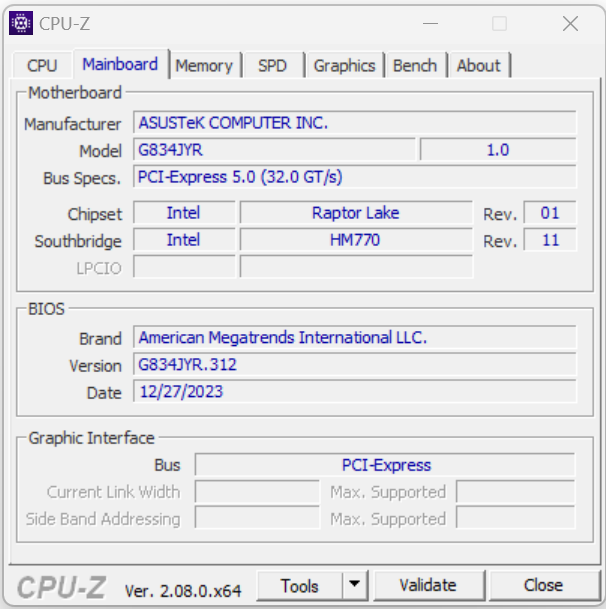
Il computer portatile è il fratello del Scar 18 che abbiamo testato lo scorso anno e condivide una struttura identica. Oltre al display, la generazione della CPU rappresenta l'unico cambiamento, con Raptor Lake Refresh che sostituisce Raptor Lake.
Potenziali concorrenti a confronto
Punteggio | Data | Modello | Peso | Altezza | Dimensione | Risoluzione | Prezzo |
|---|---|---|---|---|---|---|---|
| 88.3 % v7 (old) | 02/2024 | Asus ROG Strix Scar 18 G834JYR (2024) i9-14900HX, GeForce RTX 4090 Laptop GPU | 3.1 kg | 30.8 mm | 18.00" | 2560x1600 | |
| 89.2 % v7 (old) | 11/2023 | Alienware m18 R1 AMD R9 7945HX, Radeon RX 7900M | 3.9 kg | 26.7 mm | 18.00" | 1920x1200 | |
| 90.7 % v7 (old) | 04/2023 | Alienware m18 R1 i9-13980HX, GeForce RTX 4090 Laptop GPU | 3.9 kg | 26.7 mm | 18.00" | 1920x1200 | |
| 88.3 % v7 (old) | 10/2023 | Acer Predator Helios 18 N23Q2 i9-13900HX, GeForce RTX 4080 Laptop GPU | 3.2 kg | 29.15 mm | 18.00" | 2560x1600 | |
| 91.4 % v7 (old) | 02/2023 | Razer Blade 18 RTX 4070 i9-13950HX, GeForce RTX 4070 Laptop GPU | 3 kg | 21.9 mm | 18.00" | 2560x1600 | |
| 88.8 % v7 (old) | 01/2024 | MSI Titan 18 HX A14VIG i9-14900HX, GeForce RTX 4090 Laptop GPU | 3.6 kg | 32.1 mm | 18.00" | 3840x2400 |
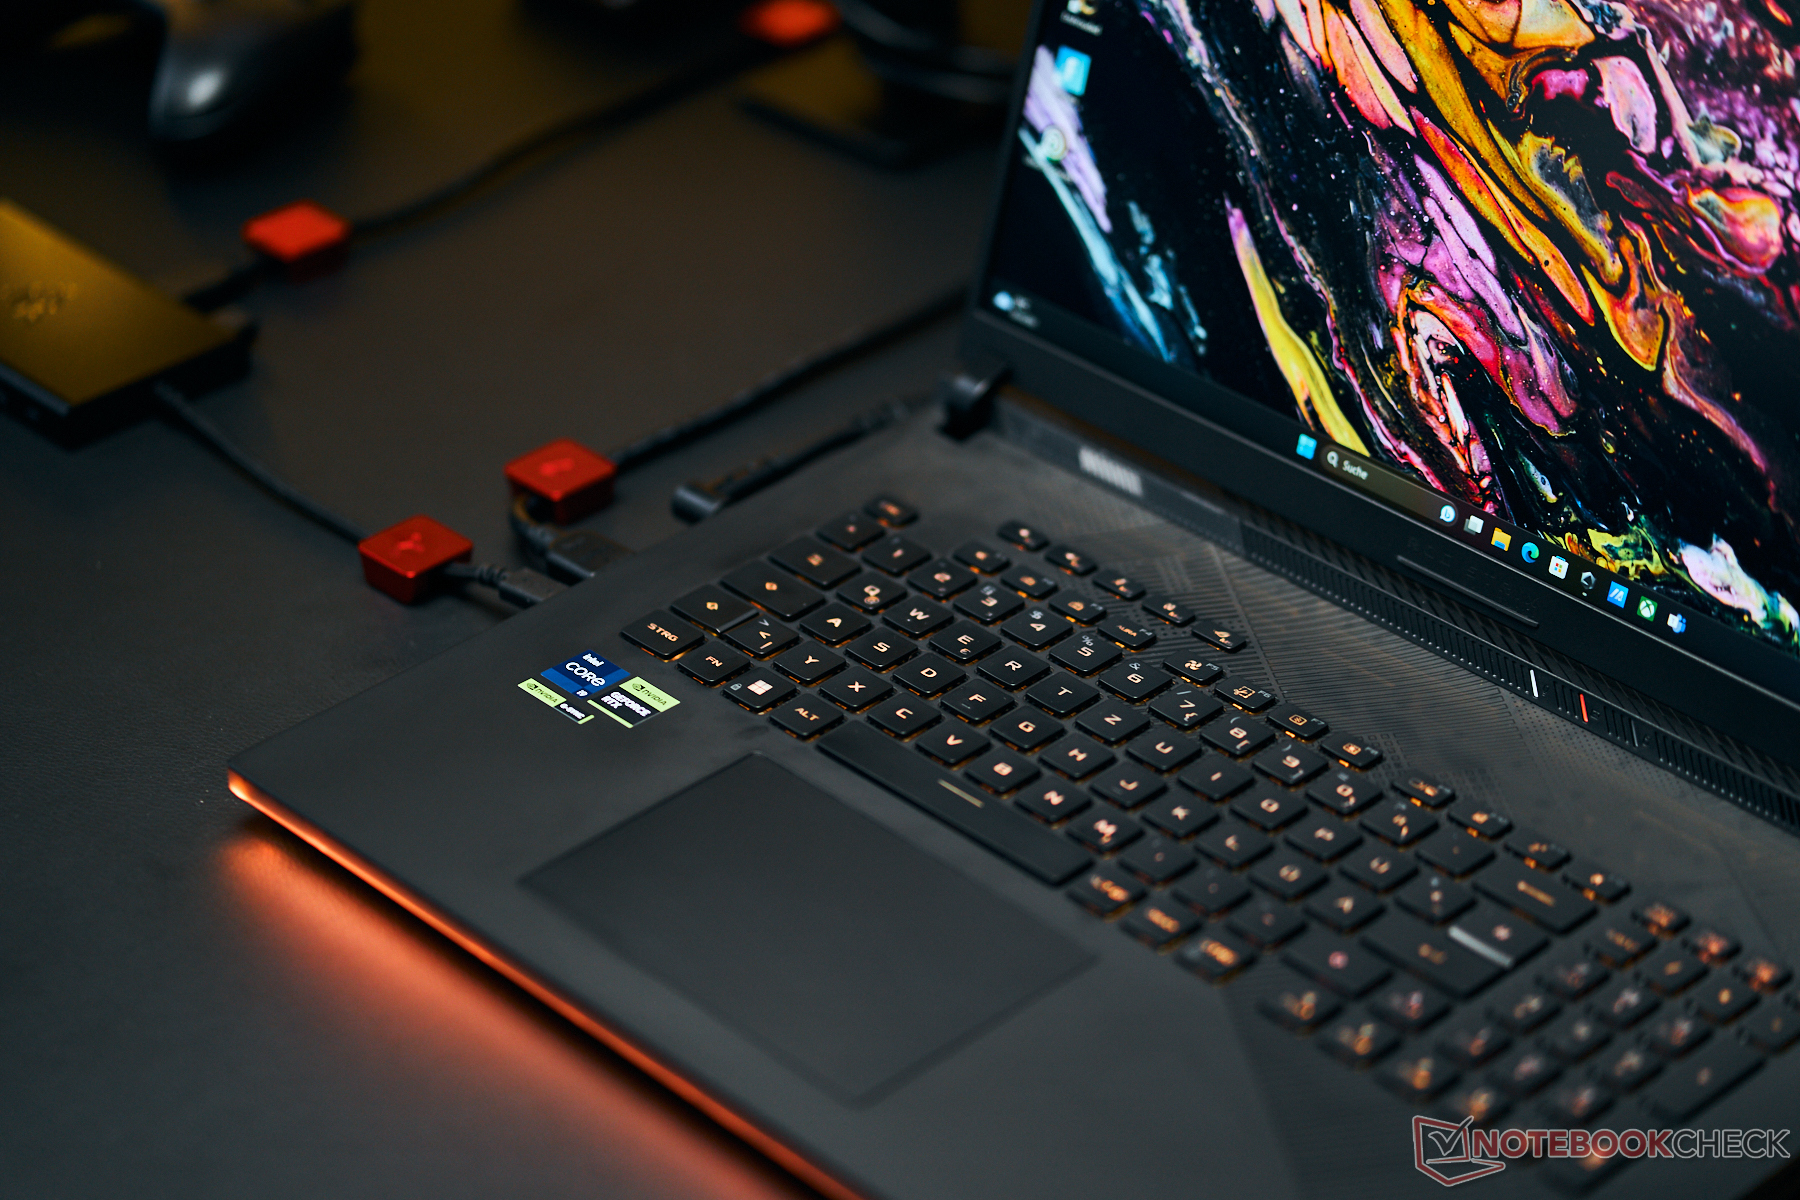
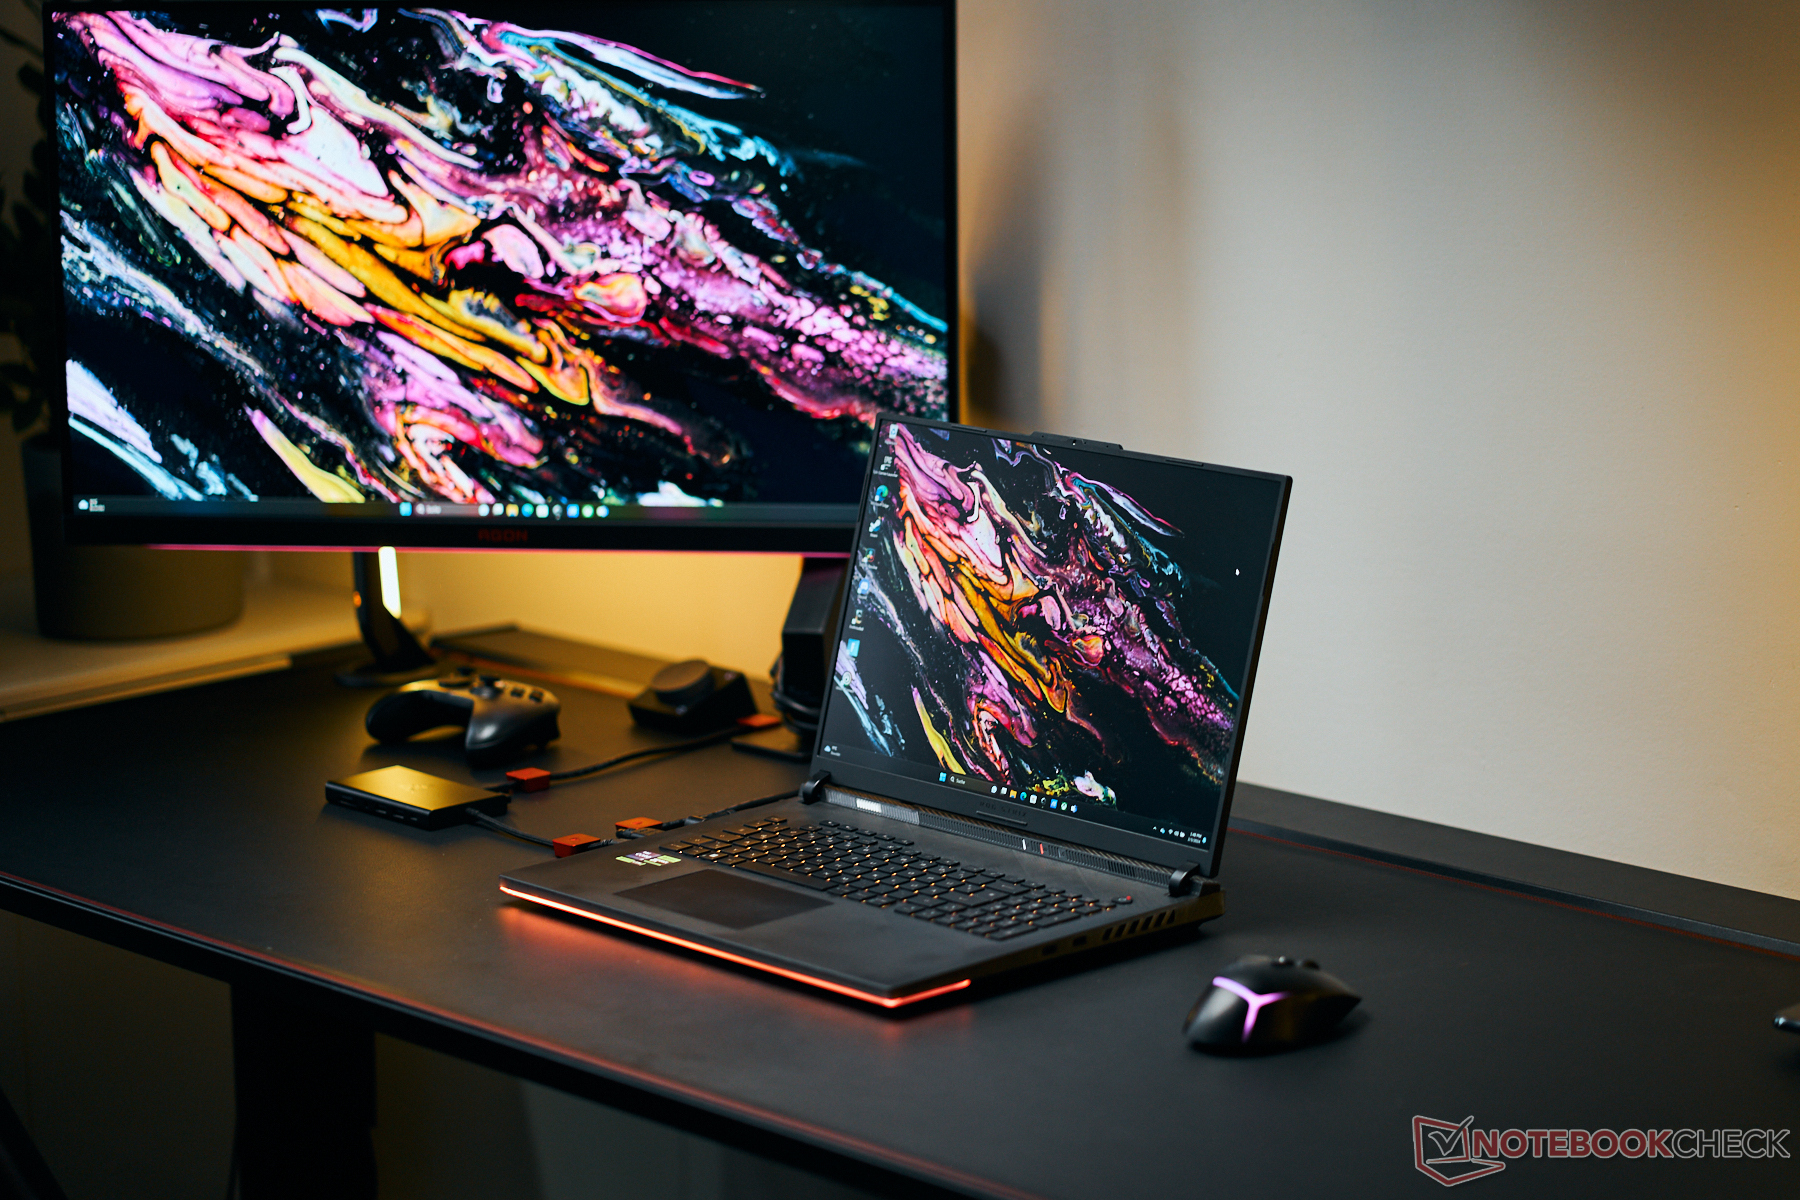
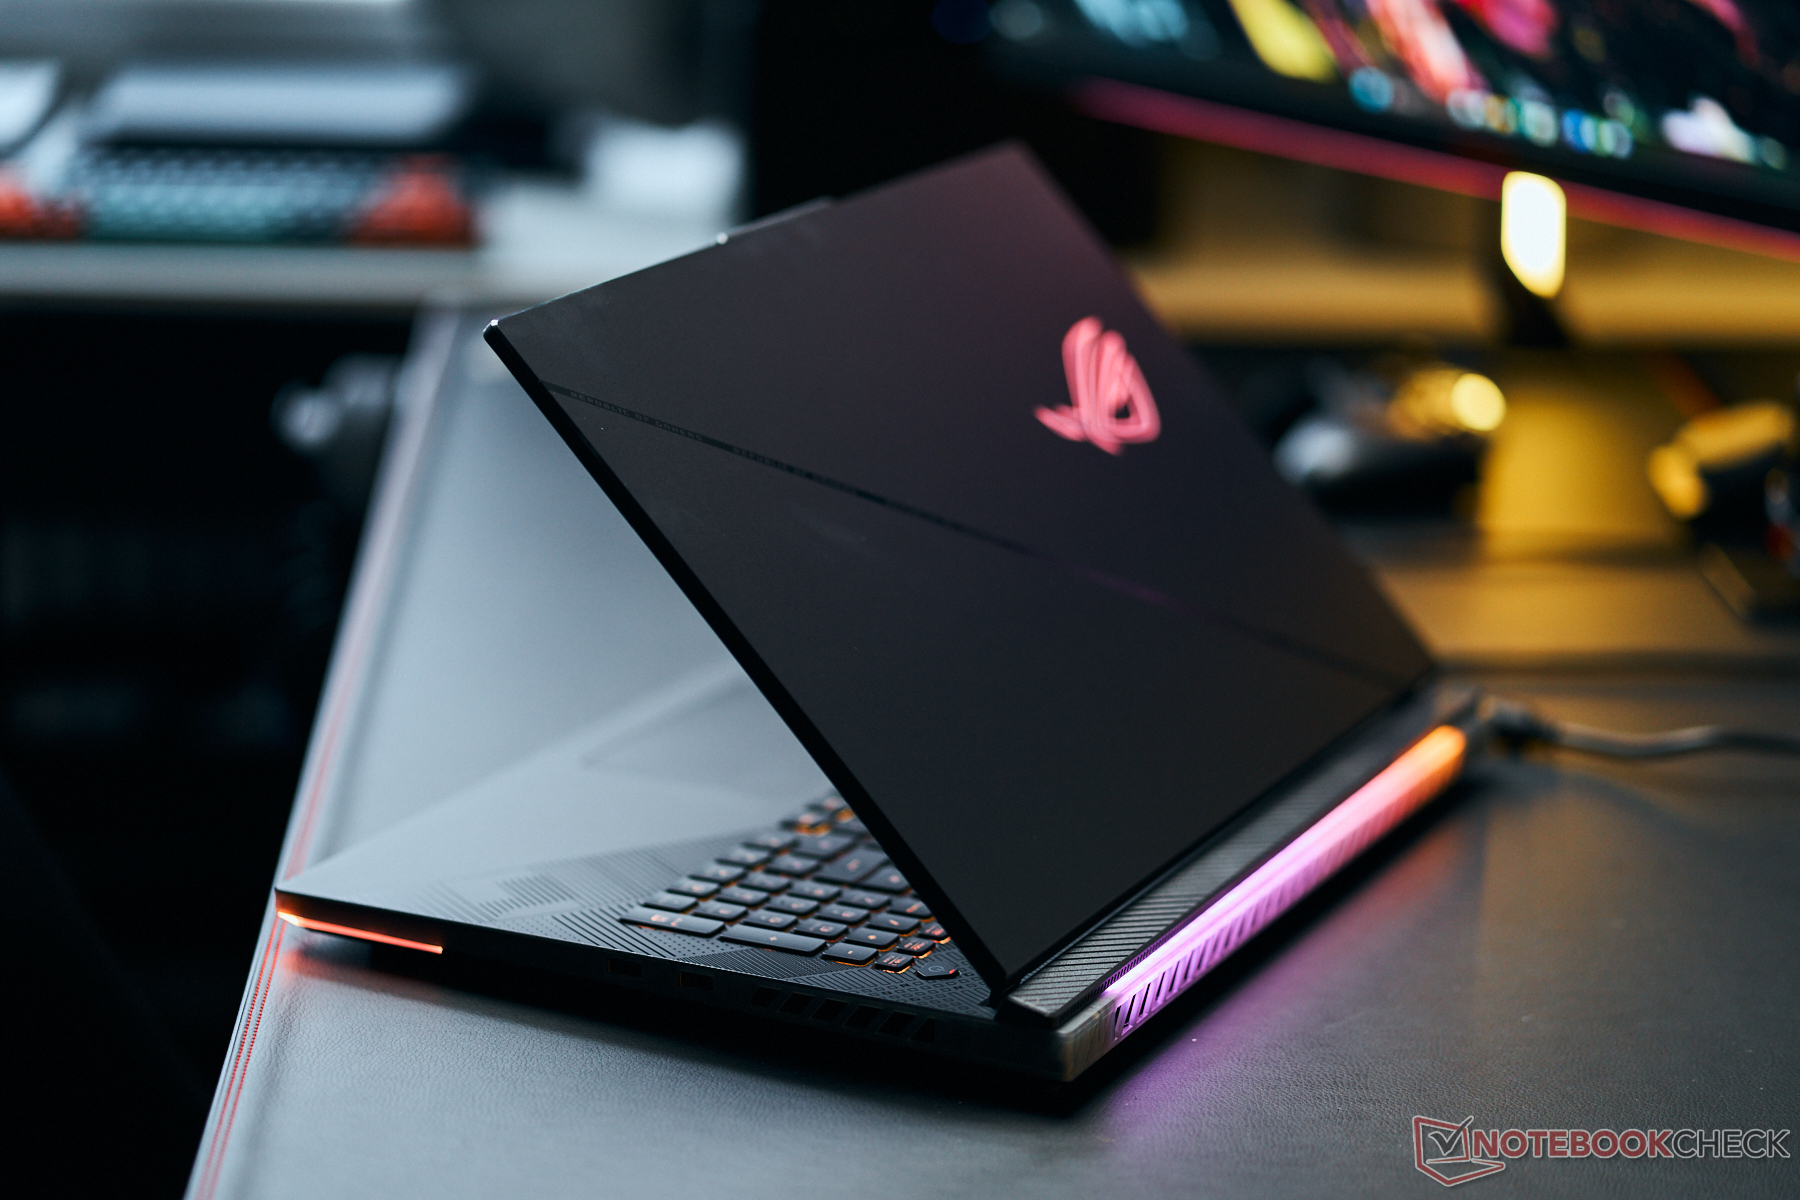
Custodia - Molta plastica e solo poco alluminio
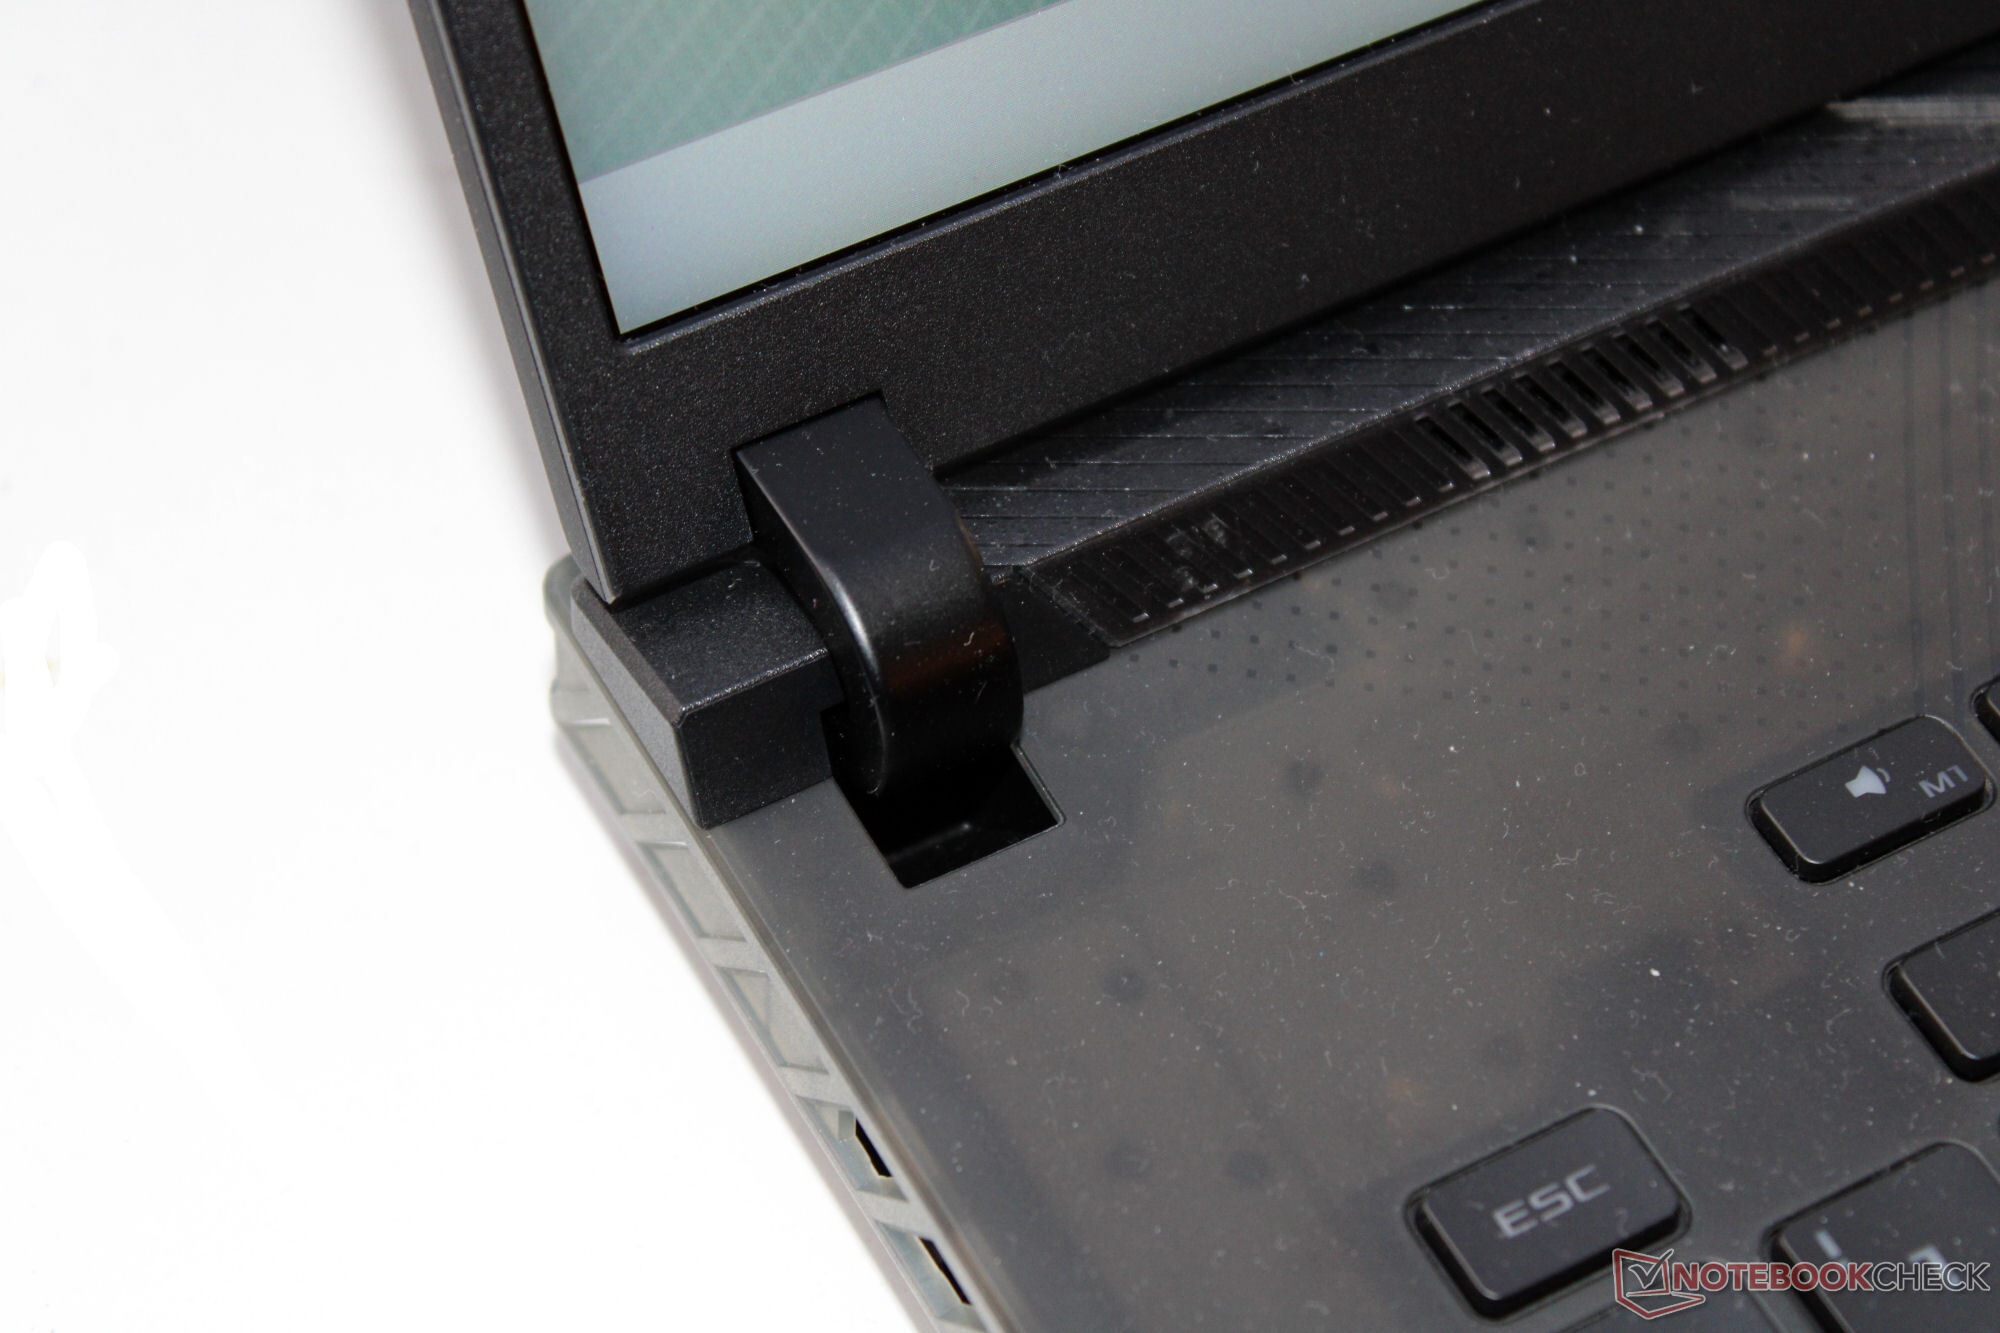
Nonostante il prezzo elevato, l'uso di materiali di alta qualità rimane limitato: solo il retro del coperchio del display dello Scar è in alluminio e il resto dei componenti è in plastica. Alcune parti della plastica (sopra la tastiera e sui lati corti) lasciano trasparire un po' di luce. Le bande LED sulla parte anteriore e posteriore e il logo illuminato sul coperchio del display danno un po' di vita al case nero.
Non notiamo alcun difetto nella lavorazione e gli spazi tra i materiali sono piccoli e uniformi. Mentre il coperchio può essere ruotato solo leggermente, la risposta dell'unità base è più marcata. Un computer portatile costoso che costa diverse migliaia di euro dovrebbe fare meglio in questo caso. La pressione sul coperchio del display non causa alcun artefatto di immagine. Le cerniere mantengono il coperchio saldamente in posizione, ma il display oscilla leggermente quando si sposta il portatile. L'angolo di apertura massimo è di 130 gradi e può essere aperto con una sola mano.
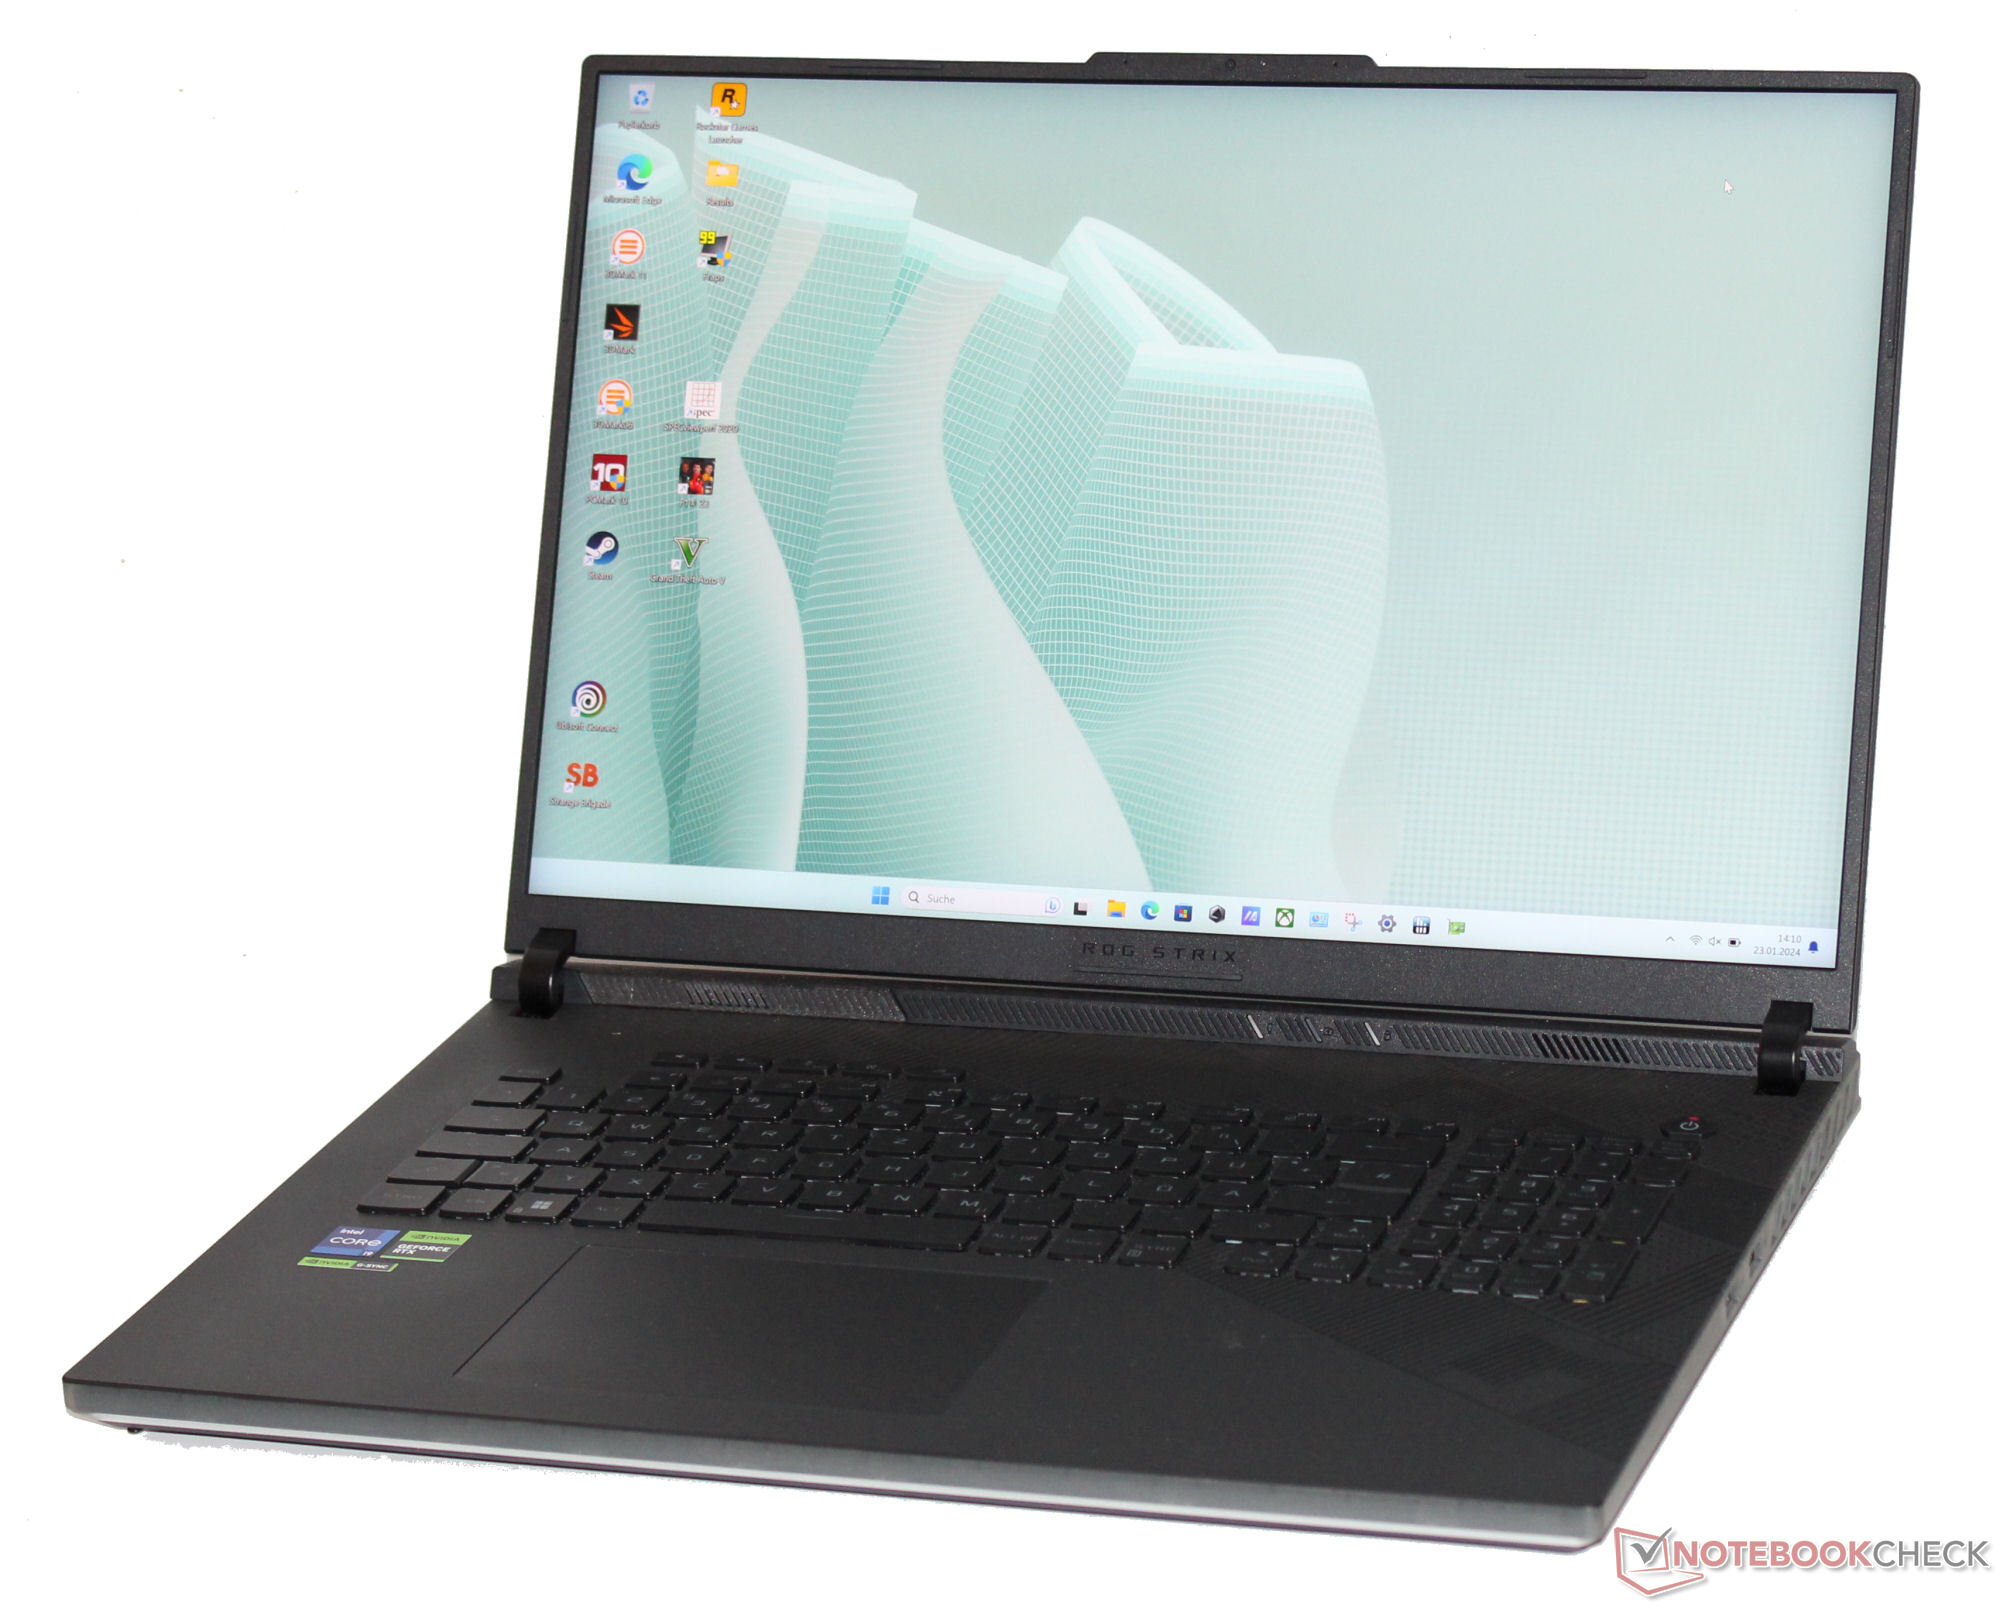
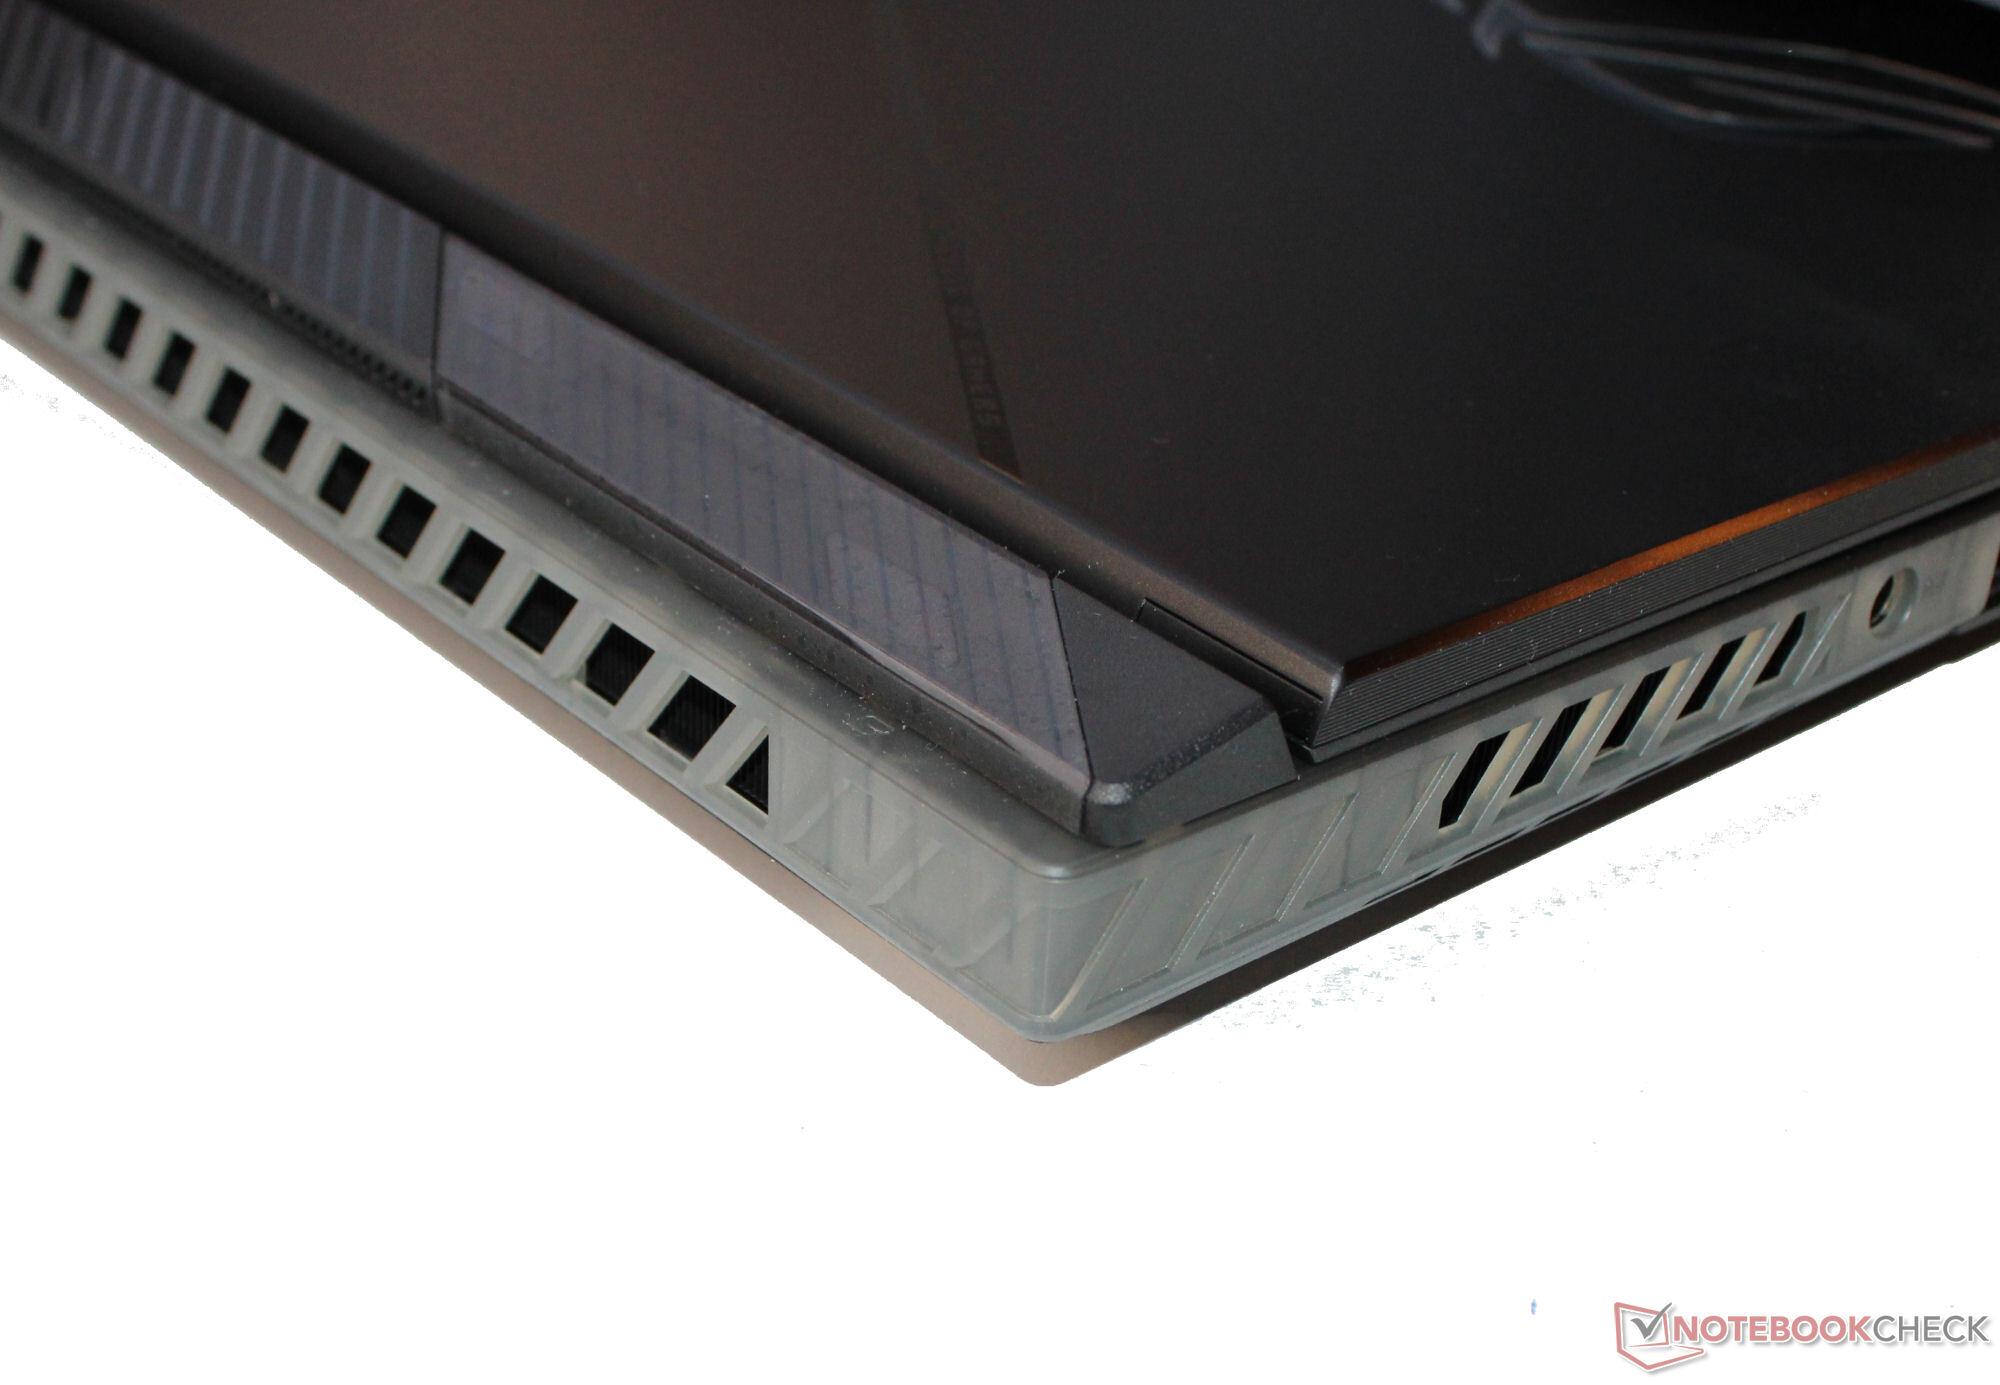
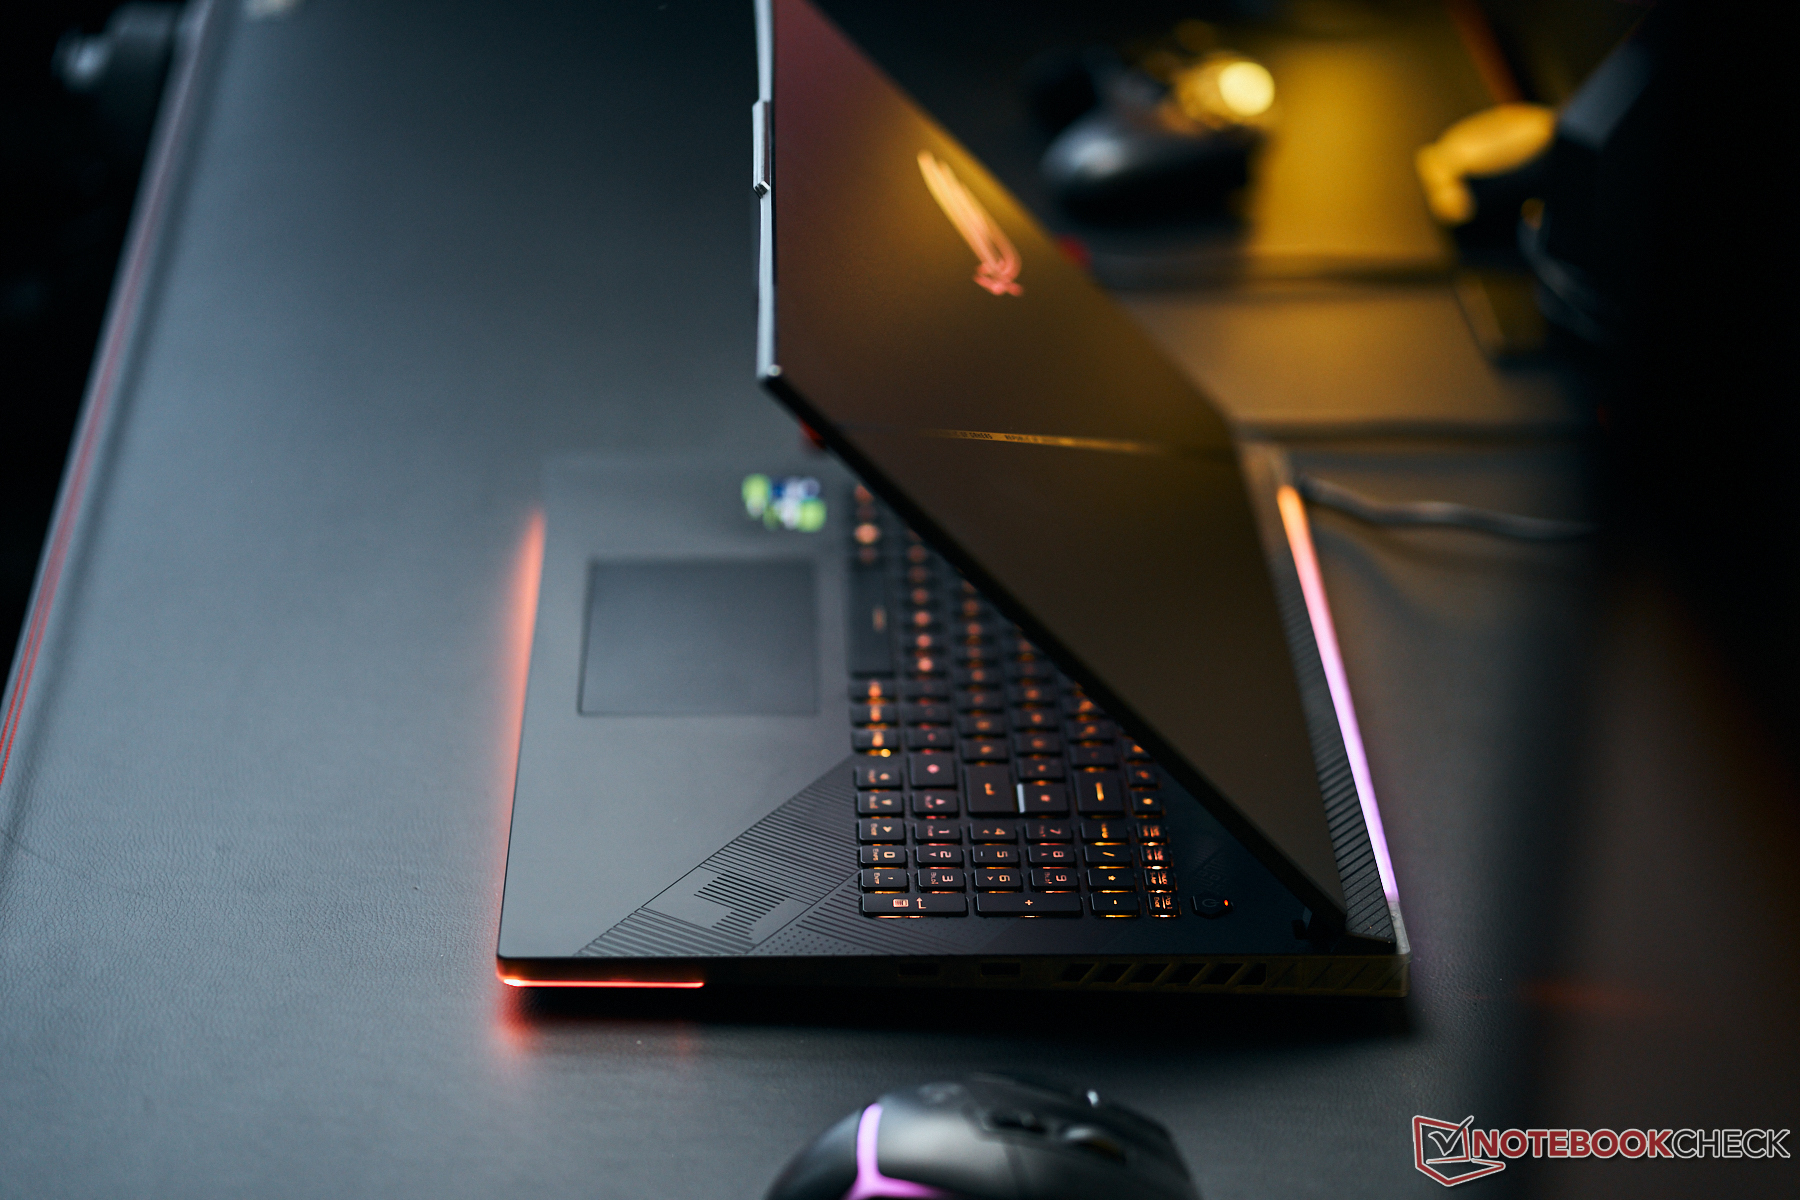
Lo Scar 18 è uno dei dispositivi più compatti e leggeri nel nostro campo di confronto ed è superato solo dal Blade 18 in questi aspetti.
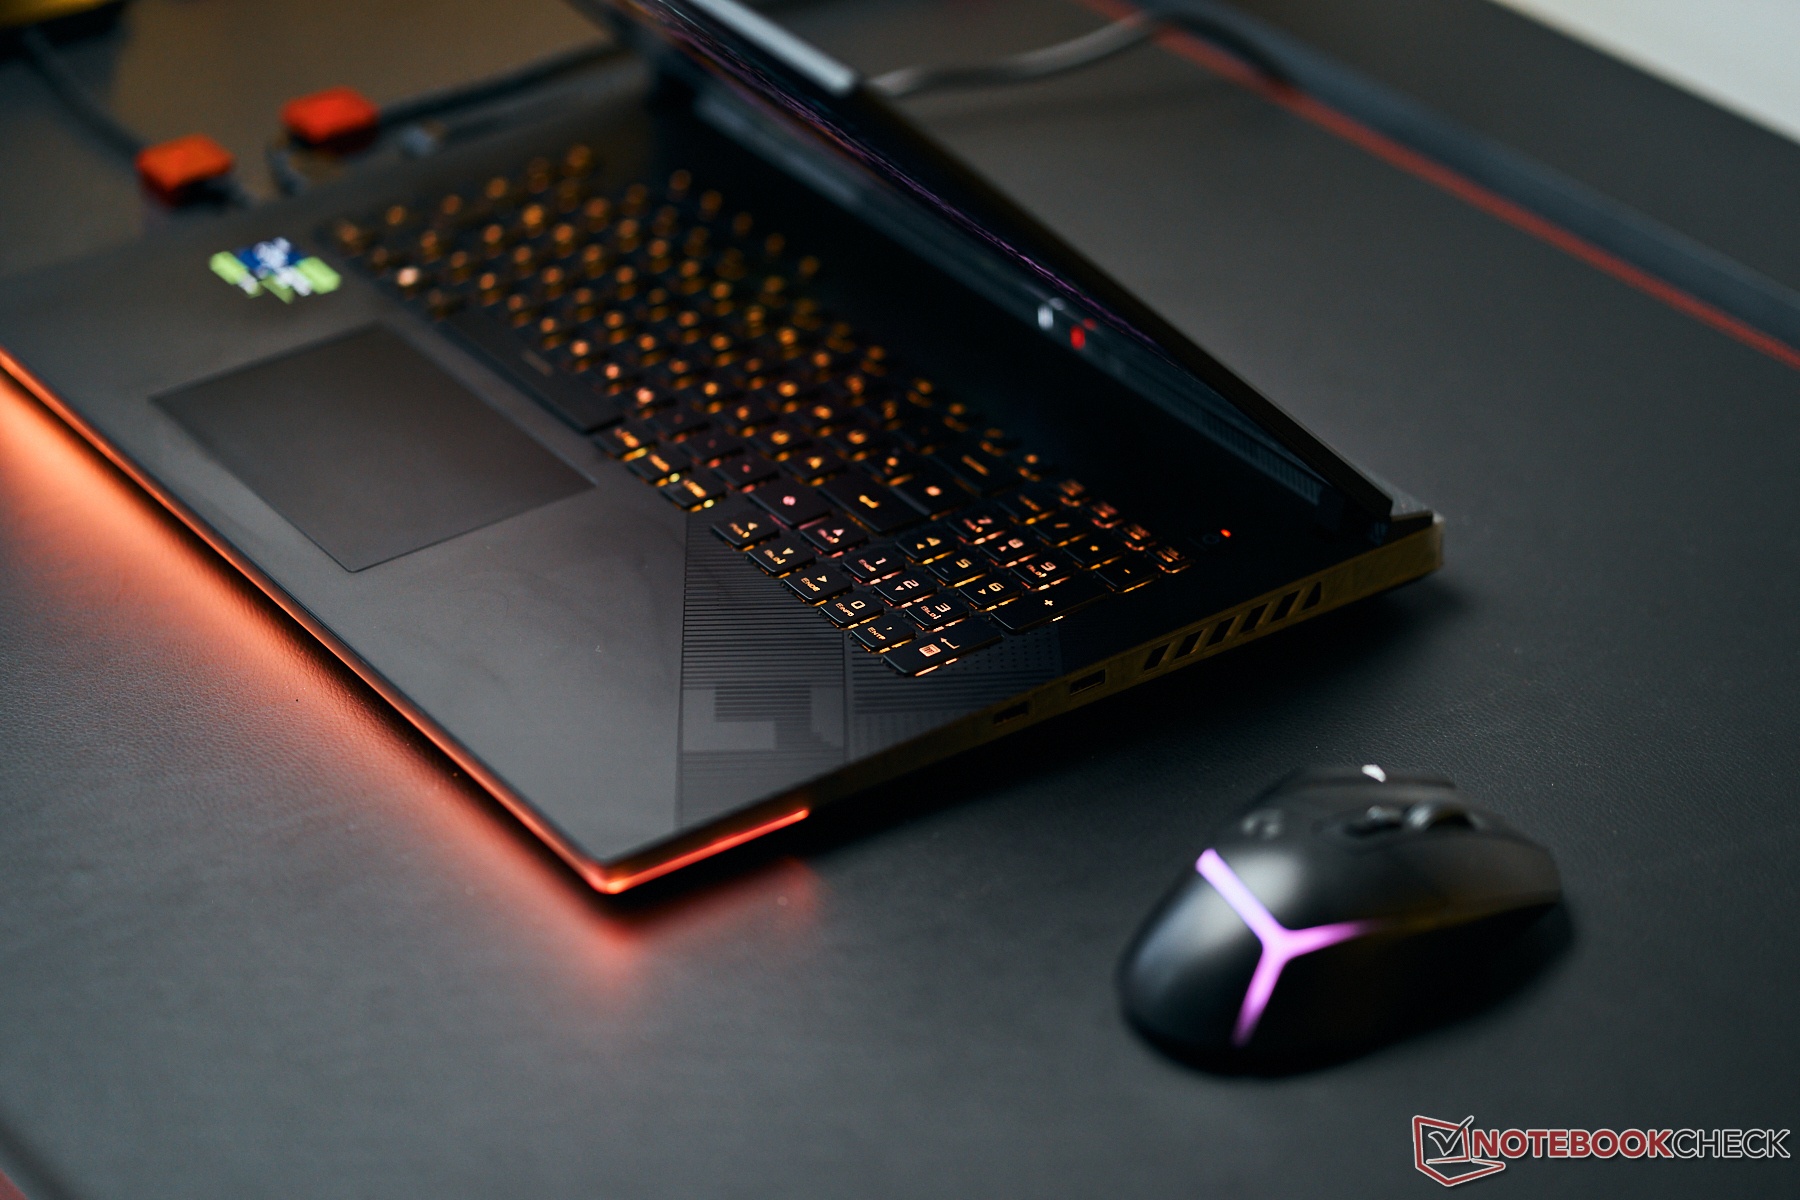
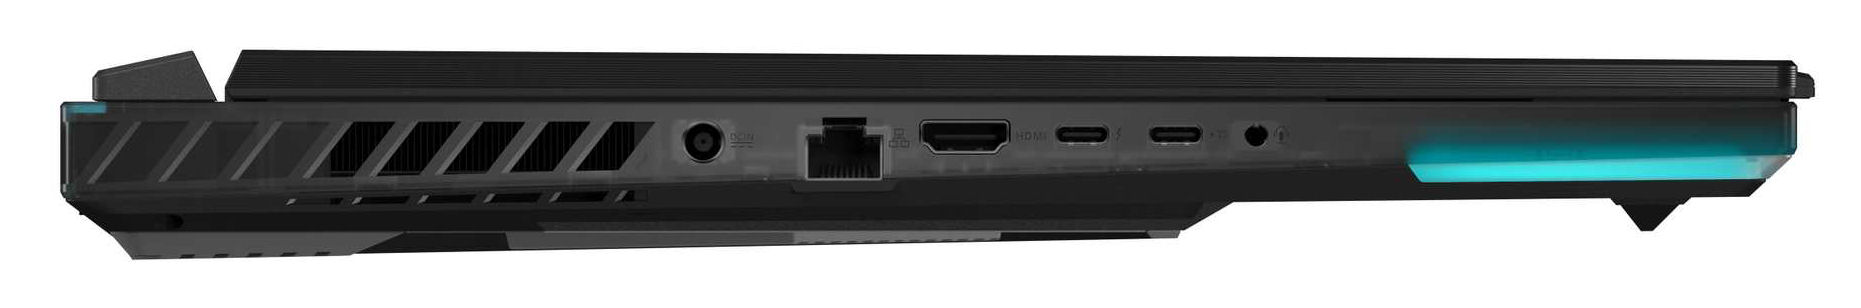
Apparecchiature - Asus Strix offre Thunderbolt 4
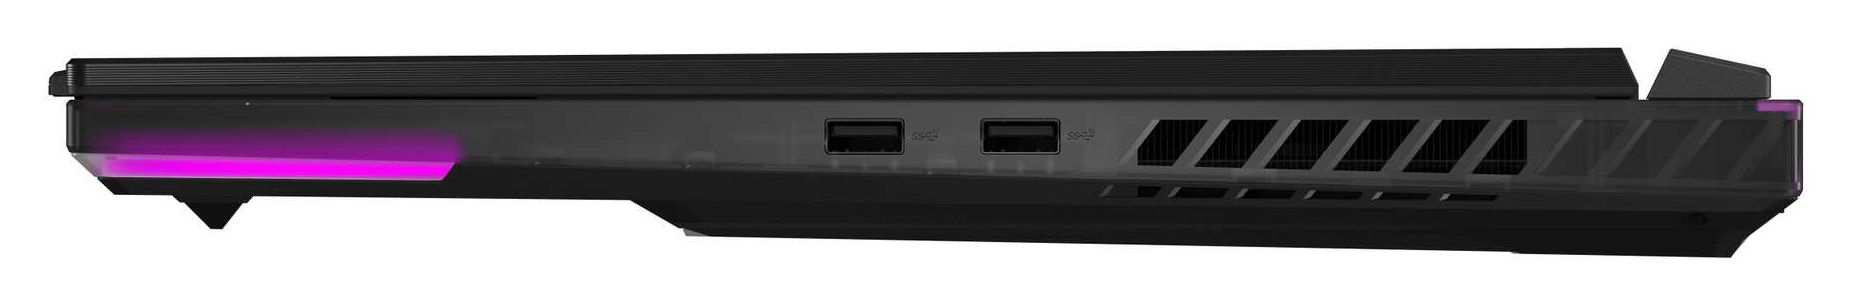
Il portatile Asus offre due porte USB-A (USB 3.2 Gen 2) e due porte USB-C (1x Thunderbolt 4, 1x USB 3.2 Gen 2). Entrambe le porte USB-C sono in grado di emettere un segnale DisplayPort, e la porta USB 3.2 Gen 2 supporta anche Power Delivery. Le connessioni sono completate da una porta HDMI, una porta audio e una porta Gigabit Ethernet. Il portatile non include un lettore di schede di memoria.
Non ci sono porte sul retro del portatile e tutte le porte sono posizionate sui lati sinistro e destro del case. I cavi che corrono verso il retro bloccherebbero alcune delle aperture delle ventole sui lati del laptop. È il caso, ad esempio, del cavo di alimentazione (spina di alimentazione angolata). Gli utenti destrorsi potrebbero essere infastiditi solo dalle porte USB-A che sono posizionate solo sul lato destro.
Comunicazione
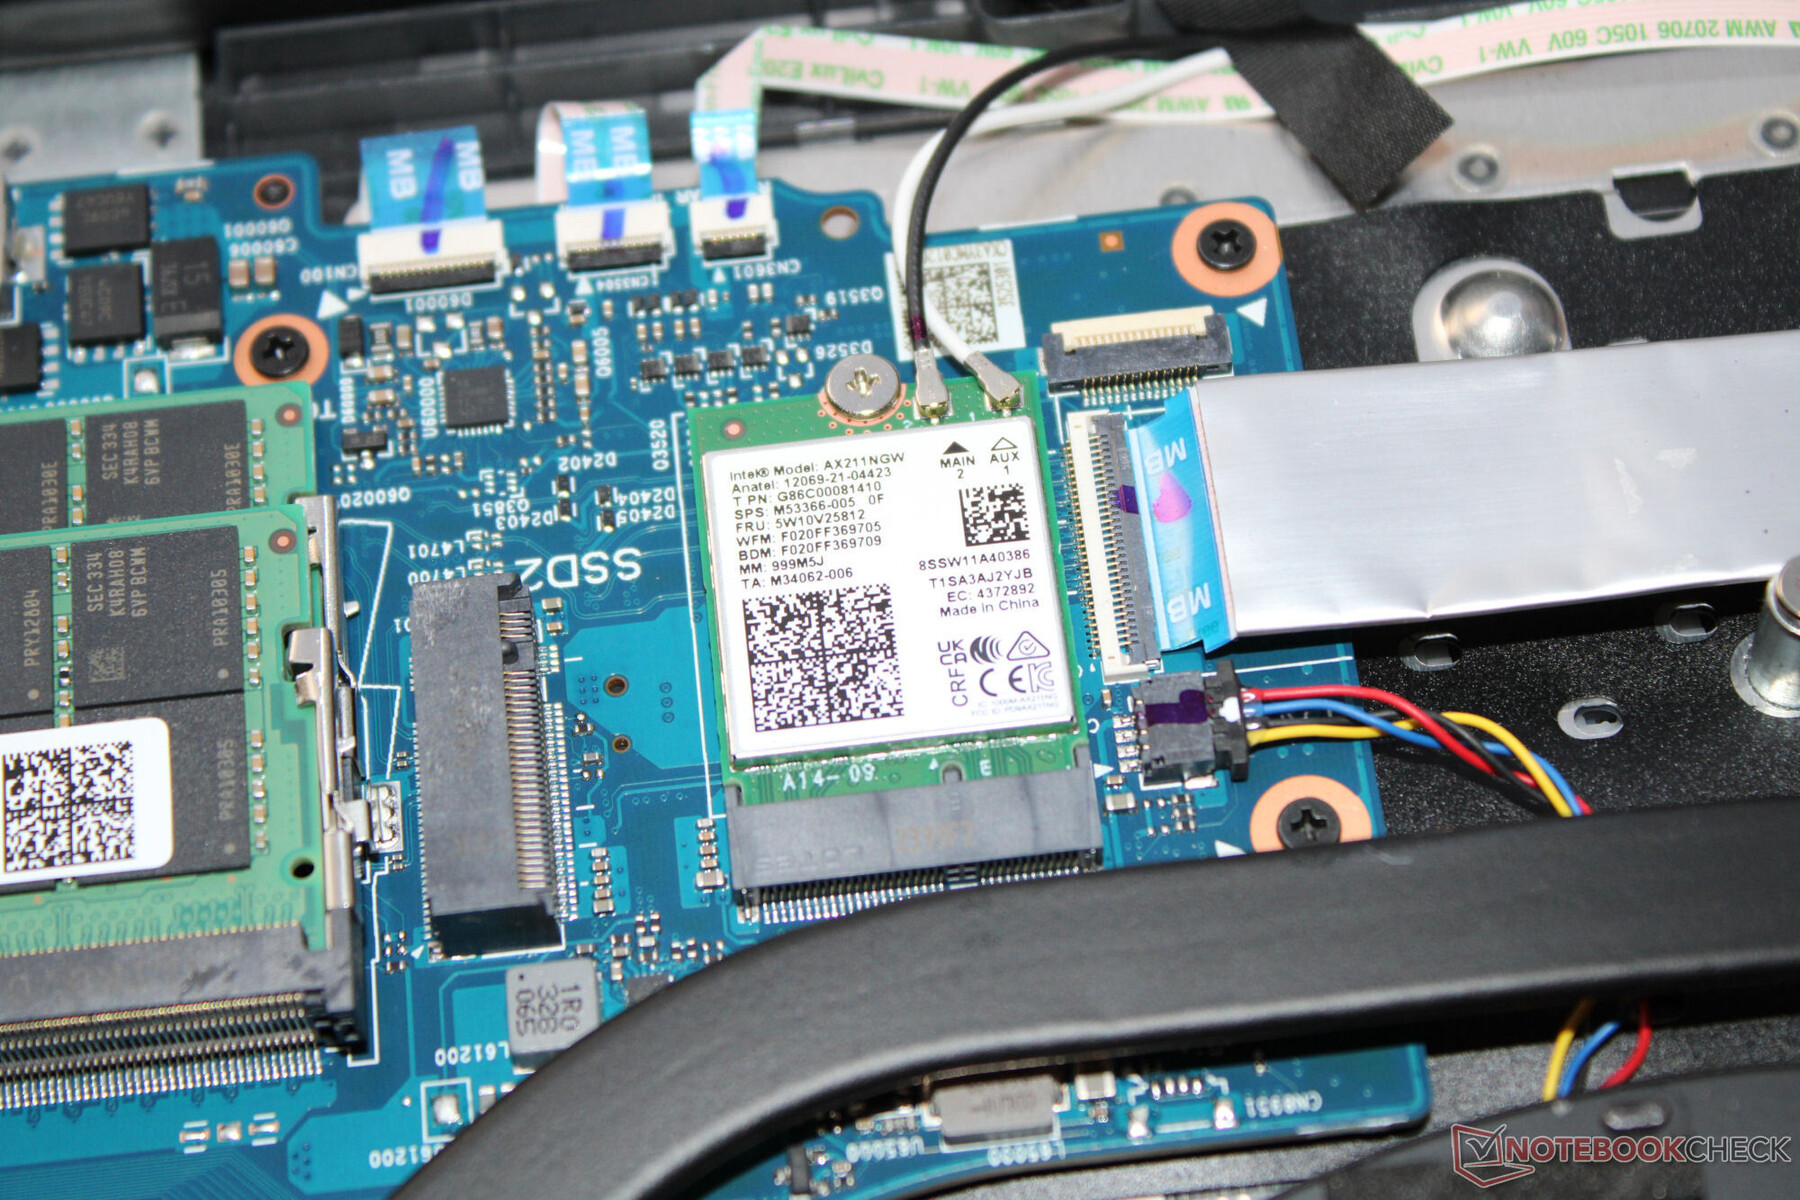
In condizioni ottimali (nessun altro dispositivo Wi-Fi nelle vicinanze, distanza ravvicinata tra il portatile e il PC server), il portatile raggiunge velocità di trasferimento Wi-Fi da buone a molto buone. Lo Strix utilizza un chip Wi-Fi 6E (Intel AX211), mentre le connessioni cablate sono gestite da un controller Realtek (RTL8125; 2,5 Gbit/s).
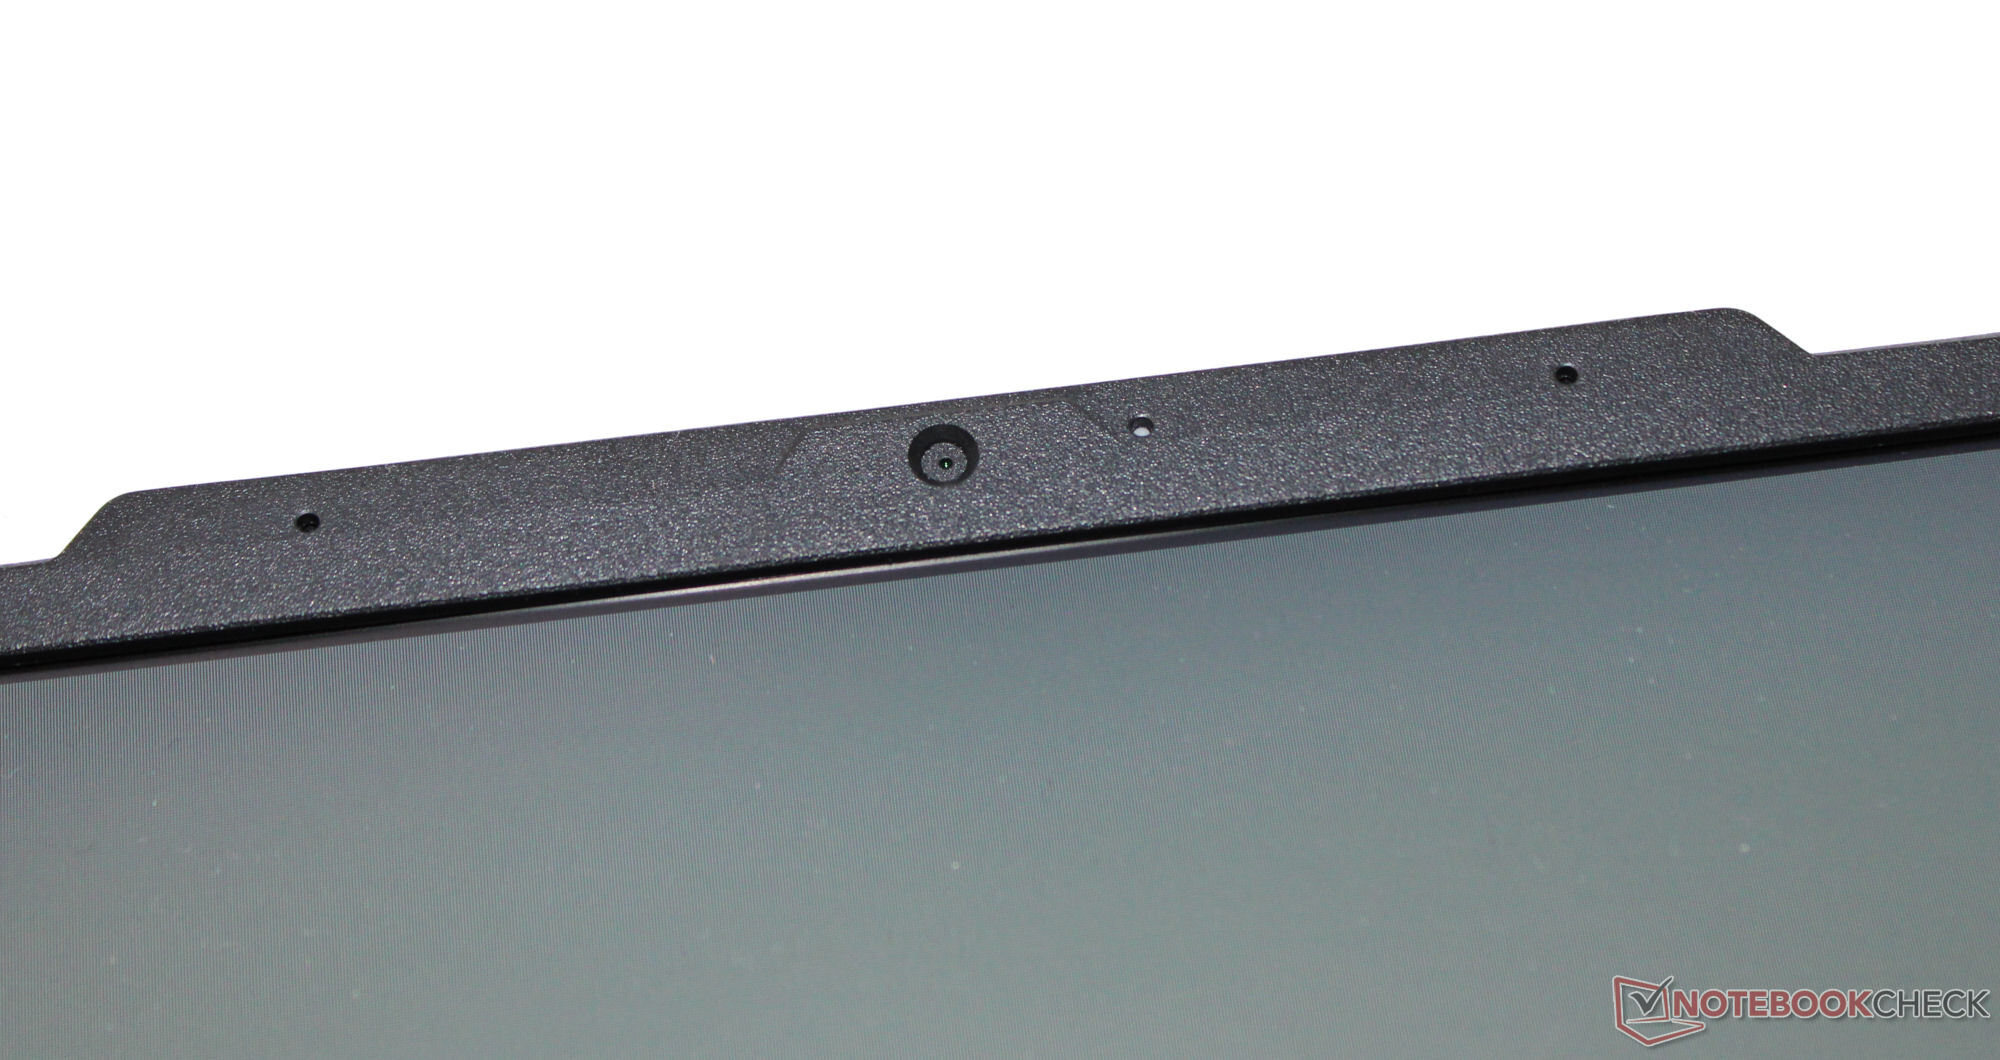
Webcam
Sebbene Asus utilizzi per lo più hardware di alta qualità, la webcam è un'eccezione: qui viene utilizzato solo un misero modello da 0,9 MP (max. 1280x720 pixel). La qualità dell'immagine non è convincente, ma una deviazione del colore di circa 8 (DeltaE target < 3) va comunque bene. La fotocamera non include un otturatore manuale.

 GeForce RTX 4090 Laptop GPU, i9-14900HX, Samsung PM9A1a MZVL22T0HDLB")
 GeForce RTX 4090 Laptop GPU, i9-14900HX, Samsung PM9A1a MZVL22T0HDLB")
Accessori
Il portatile non include altri accessori oltre ai soliti documenti.
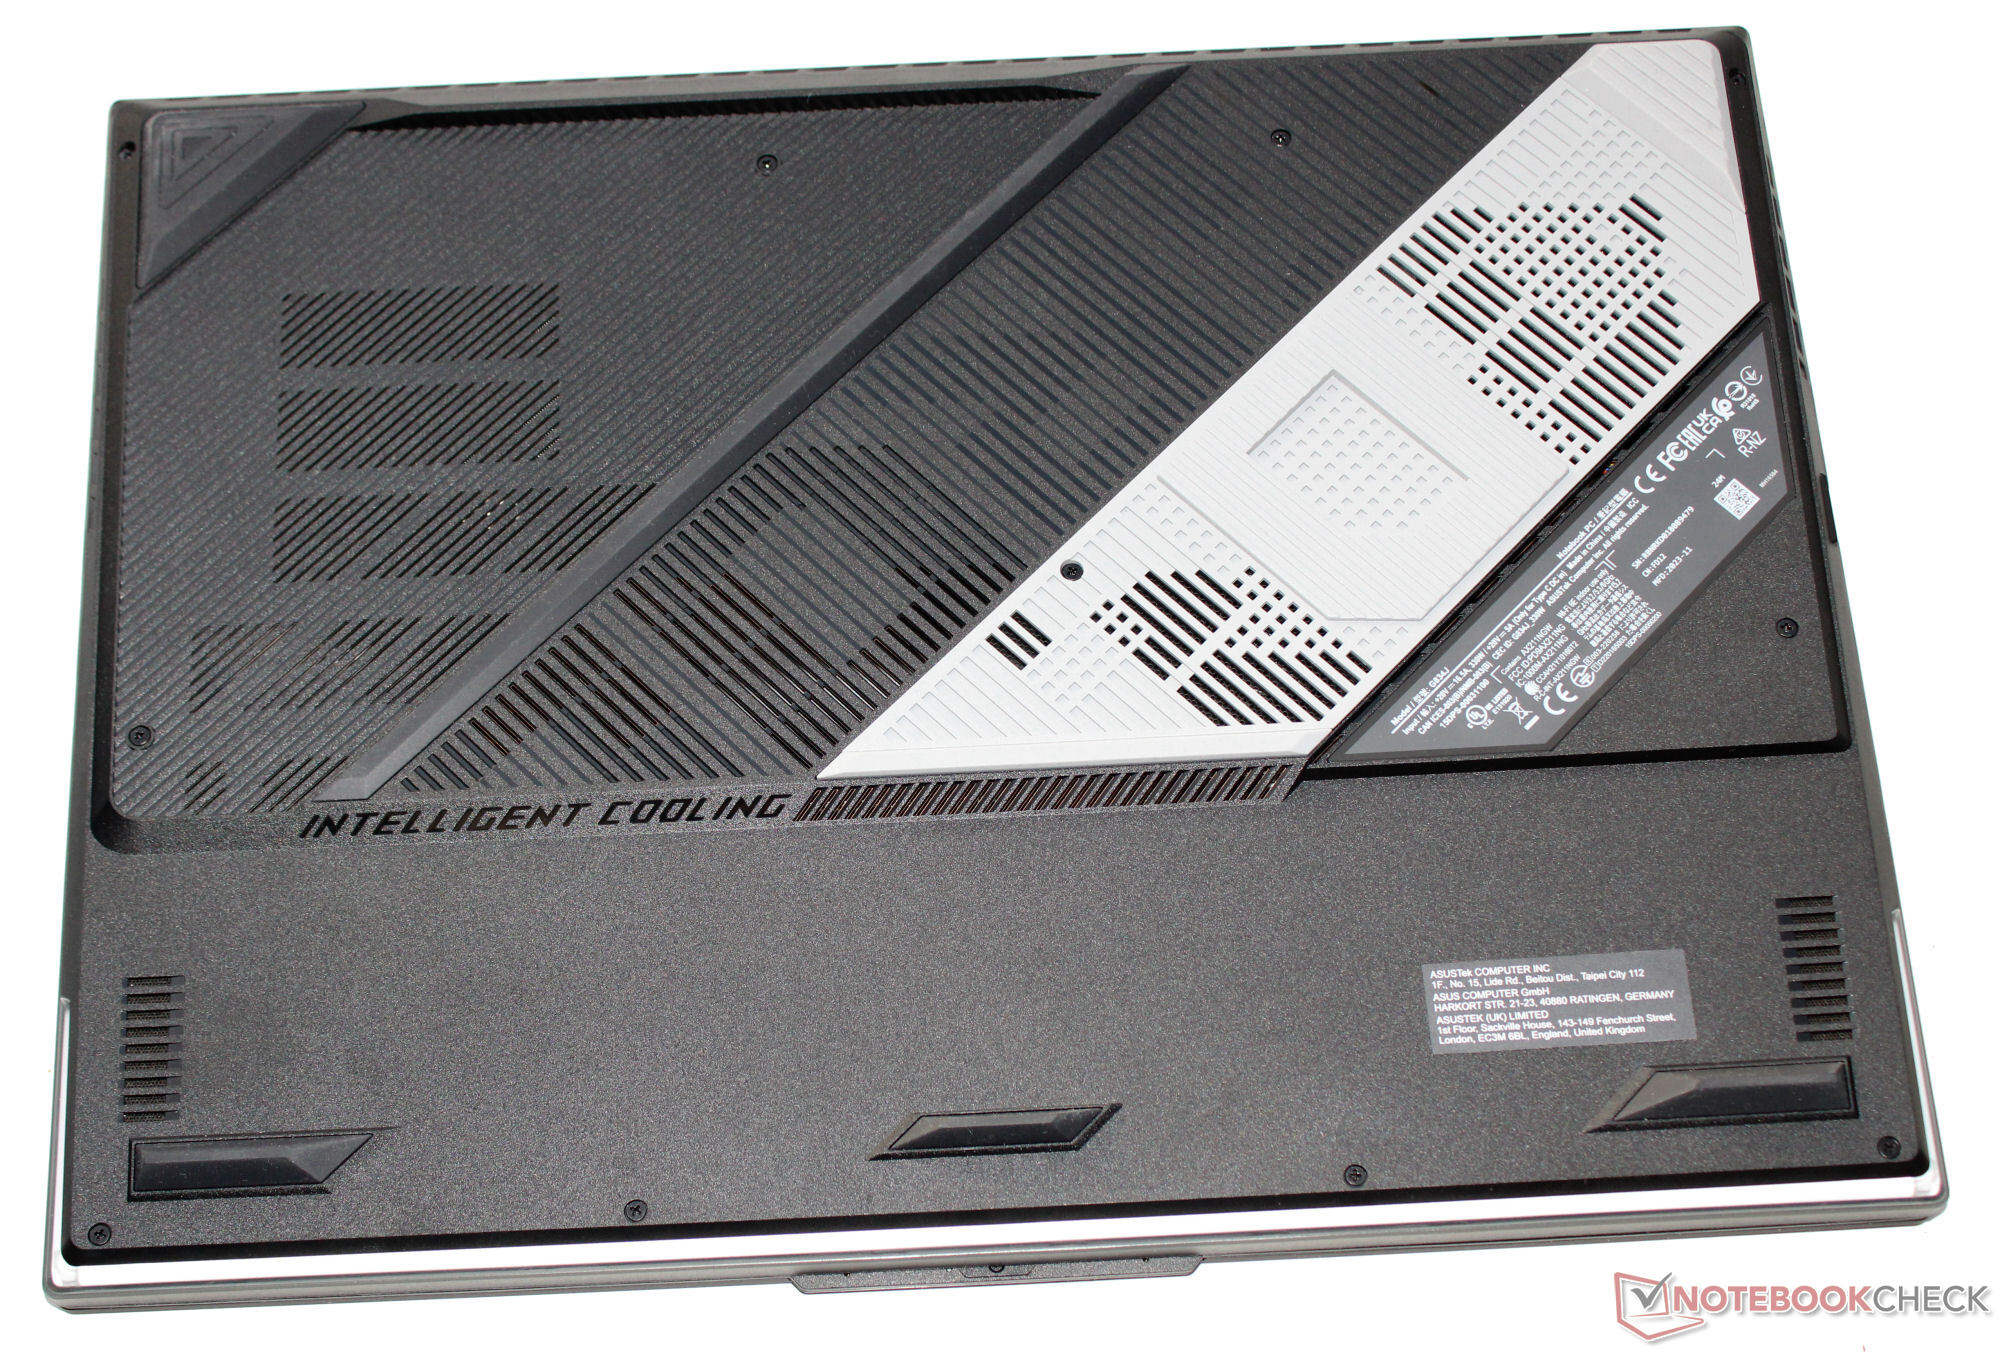
Manutenzione
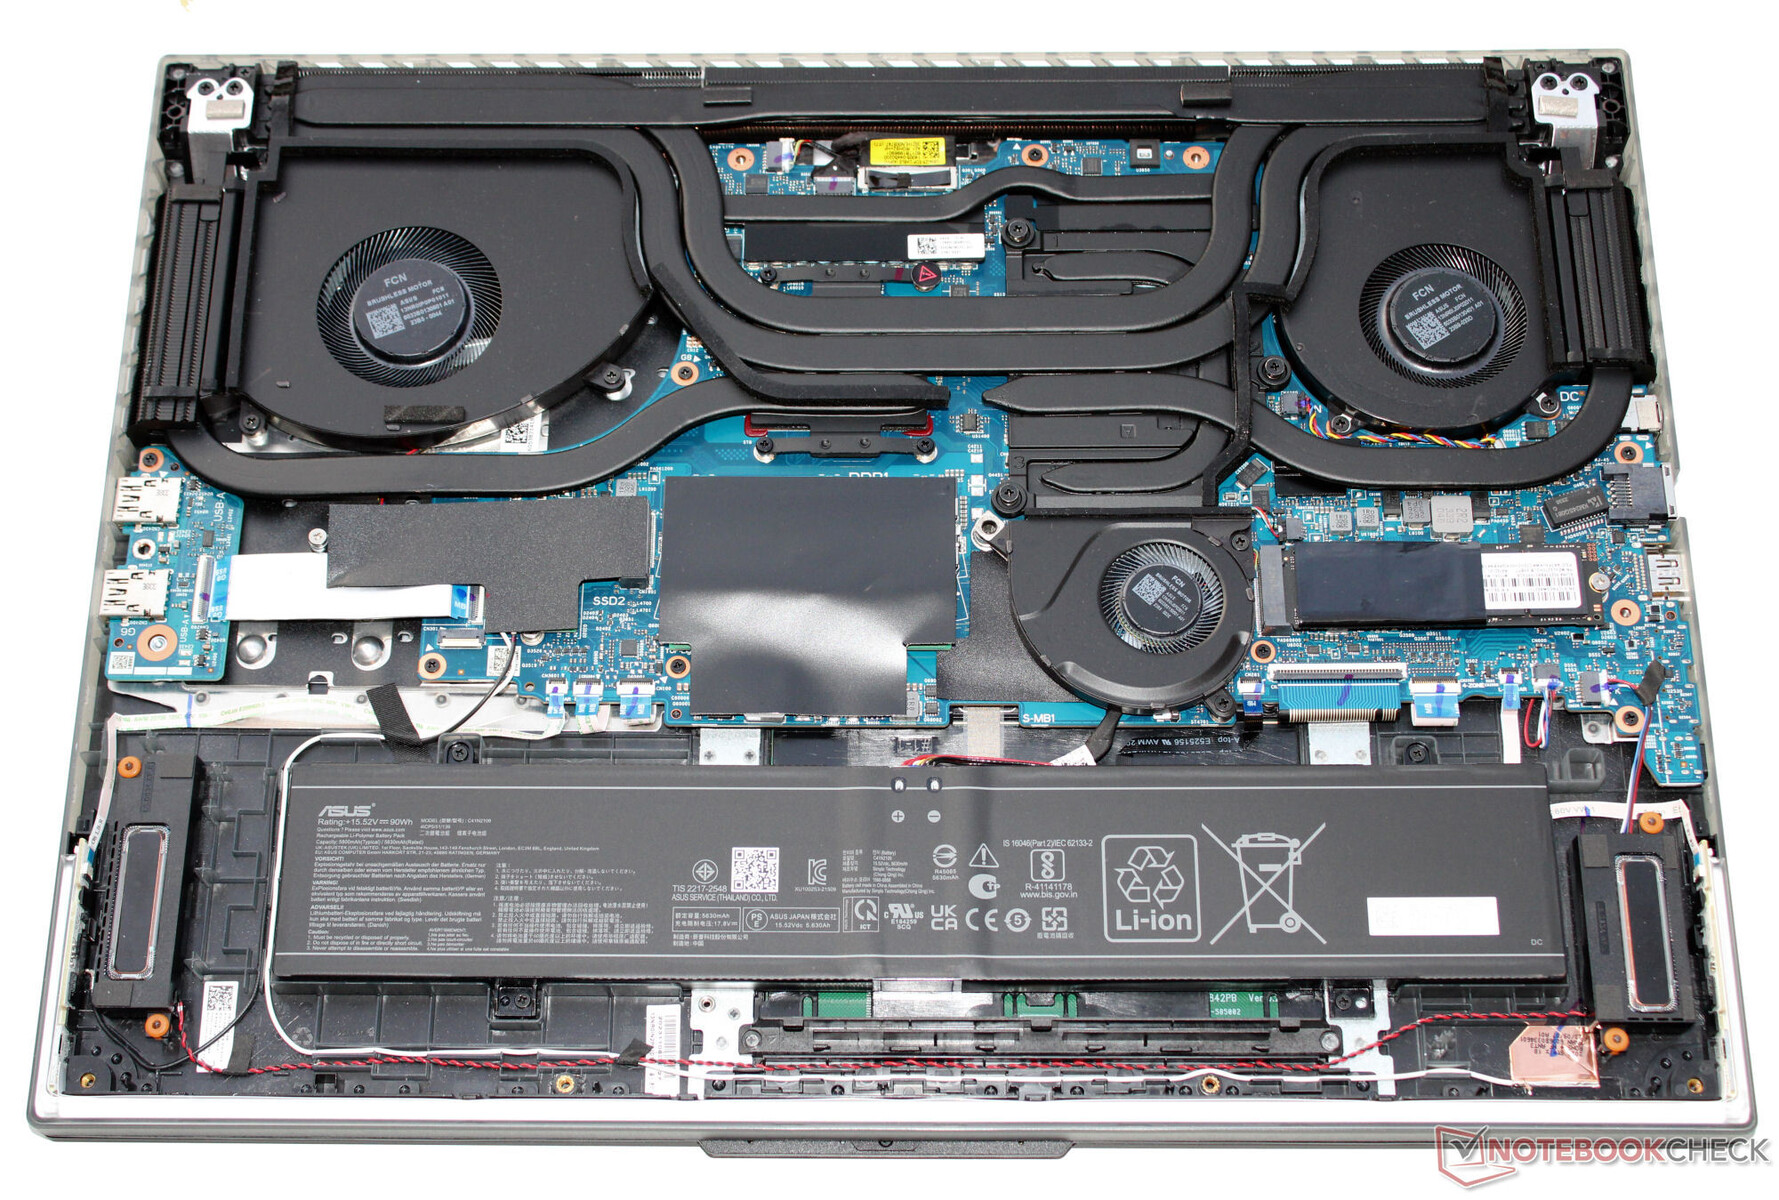
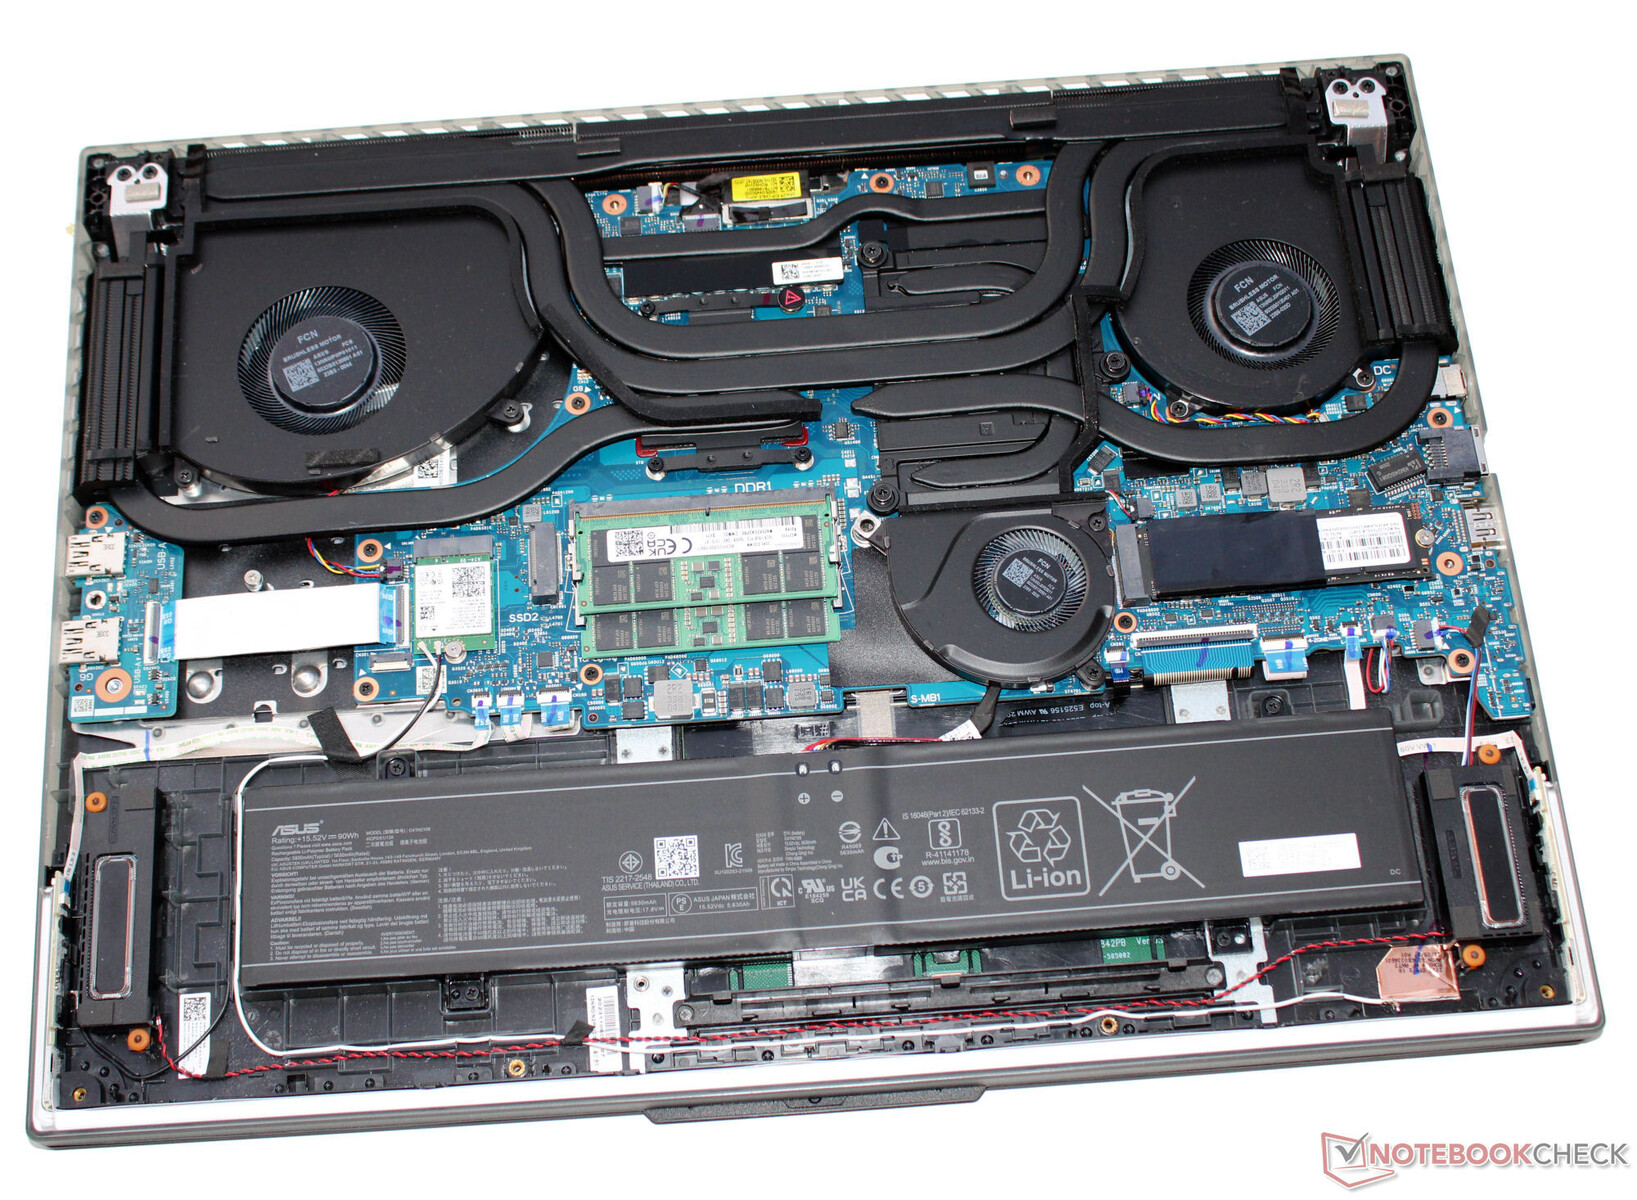
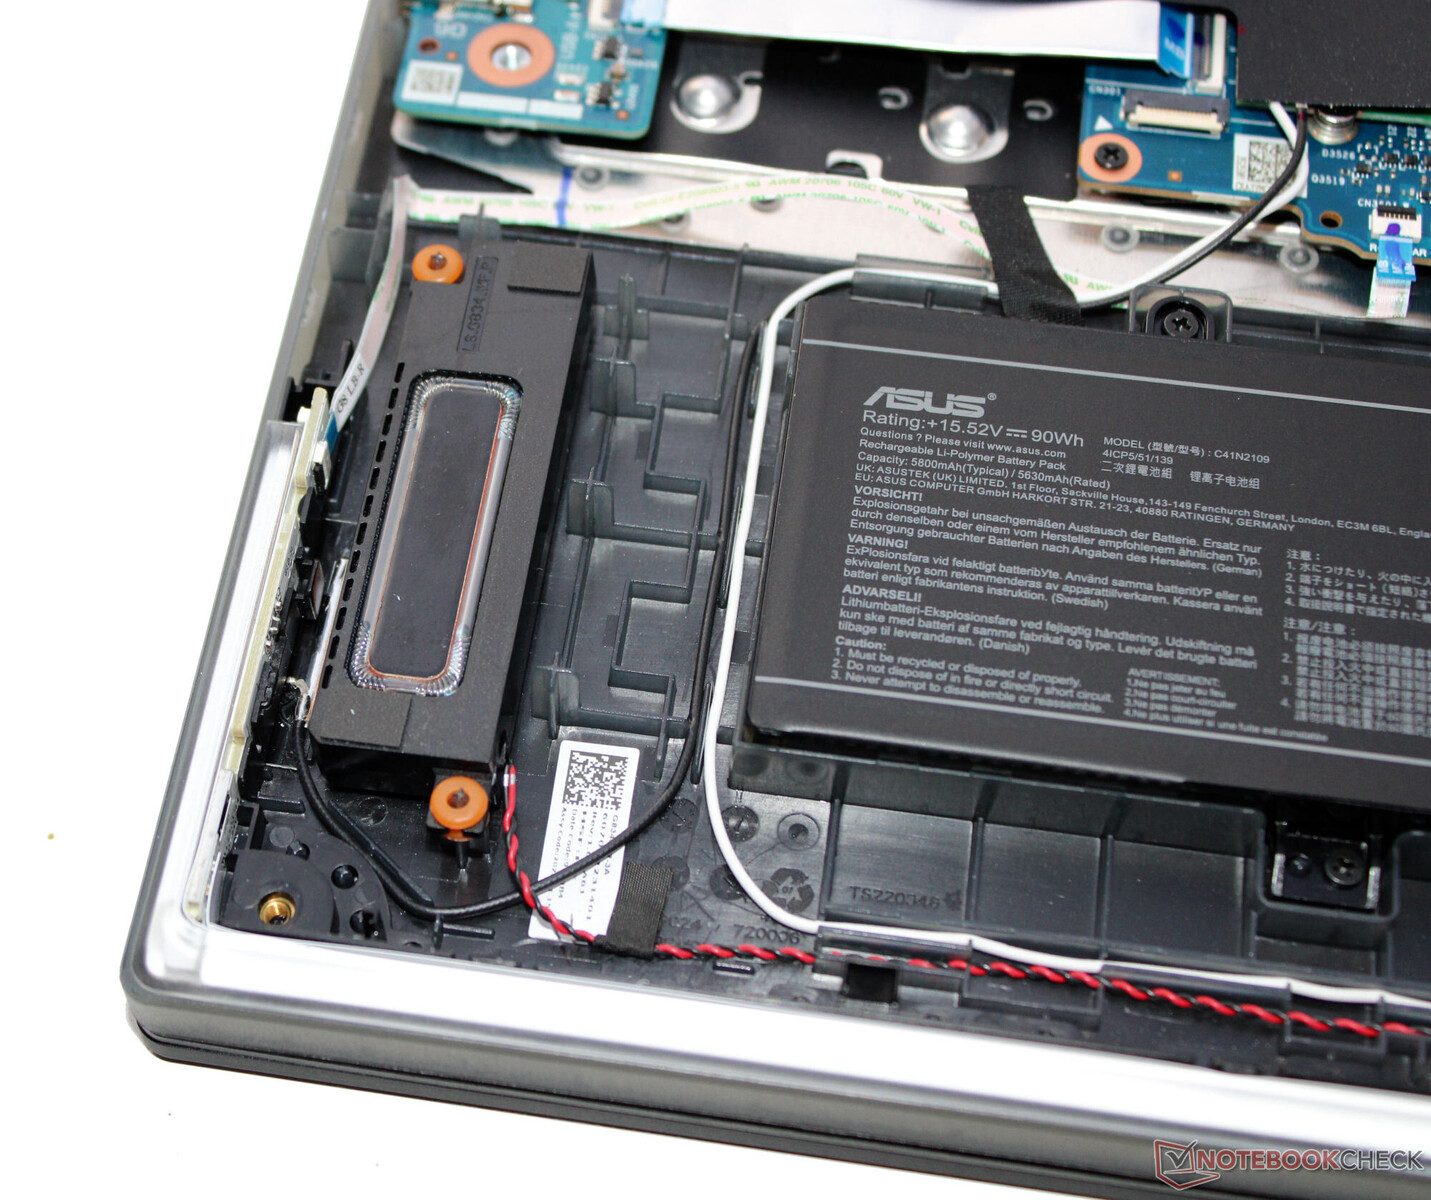
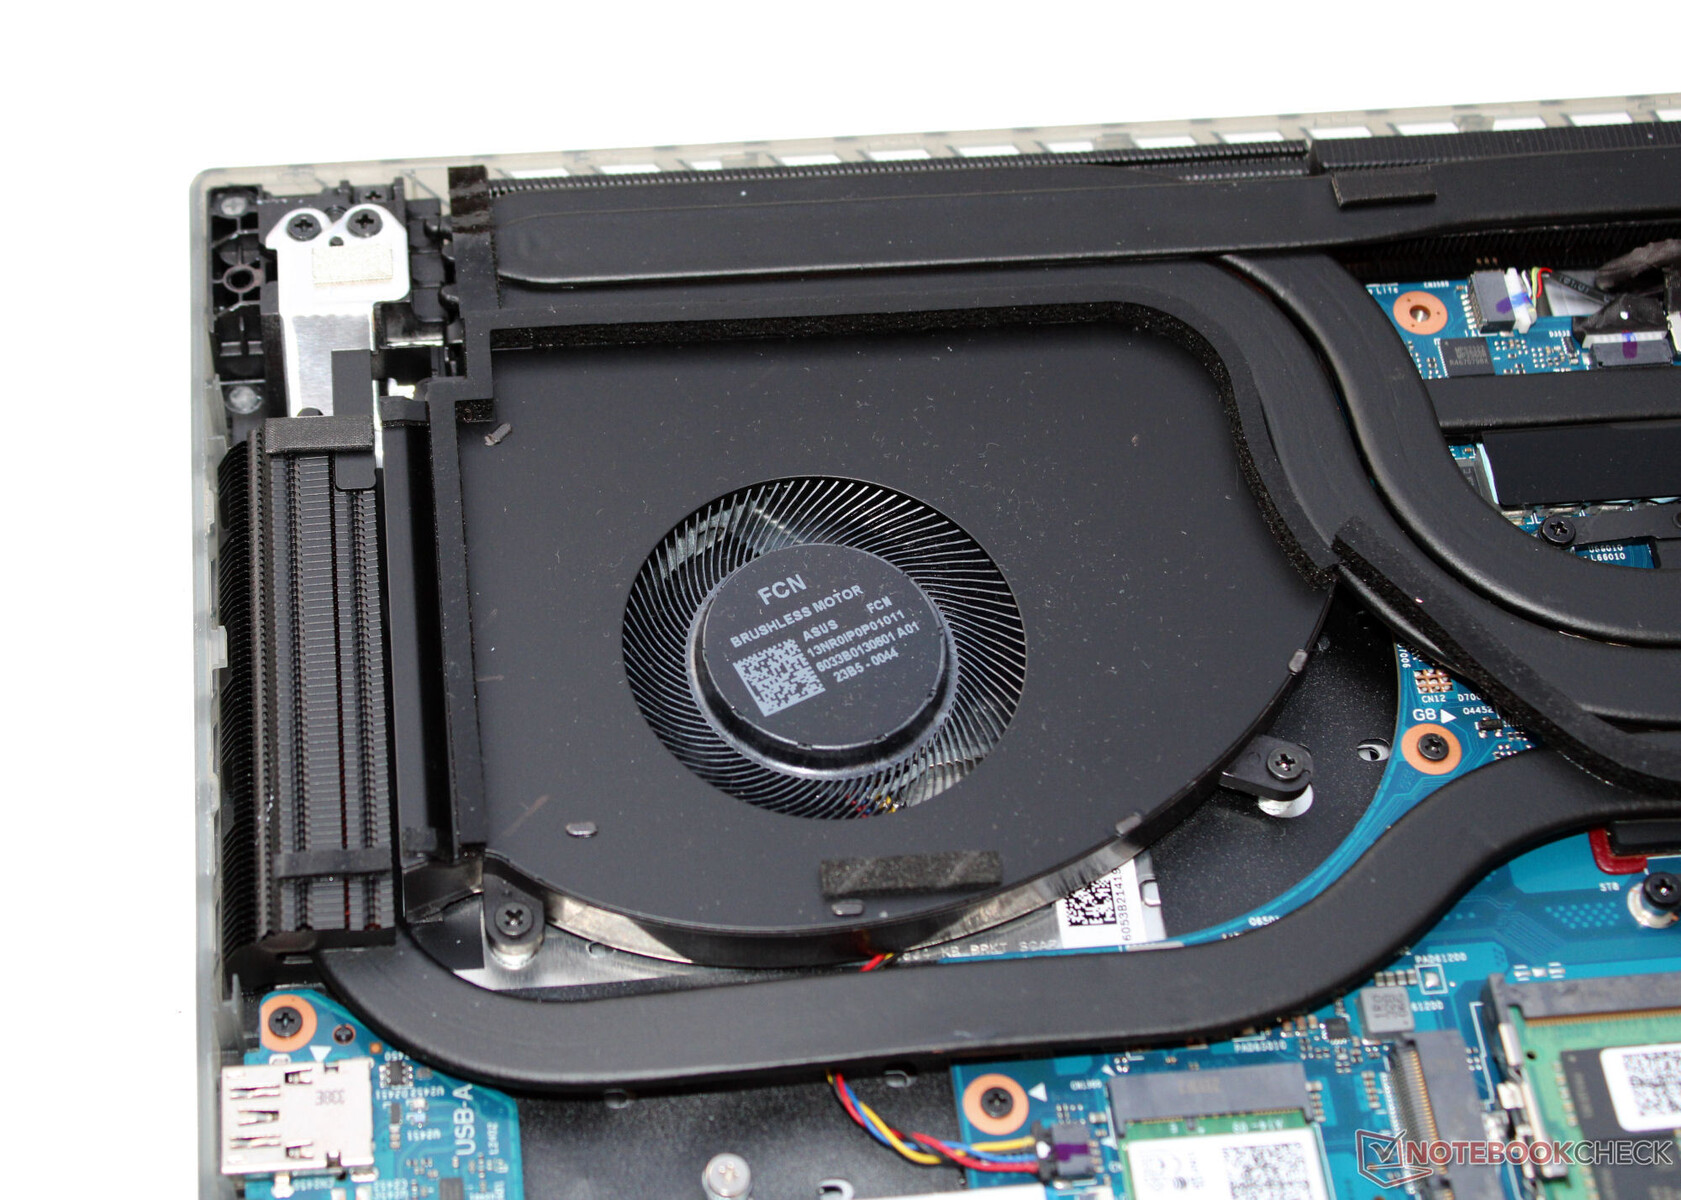
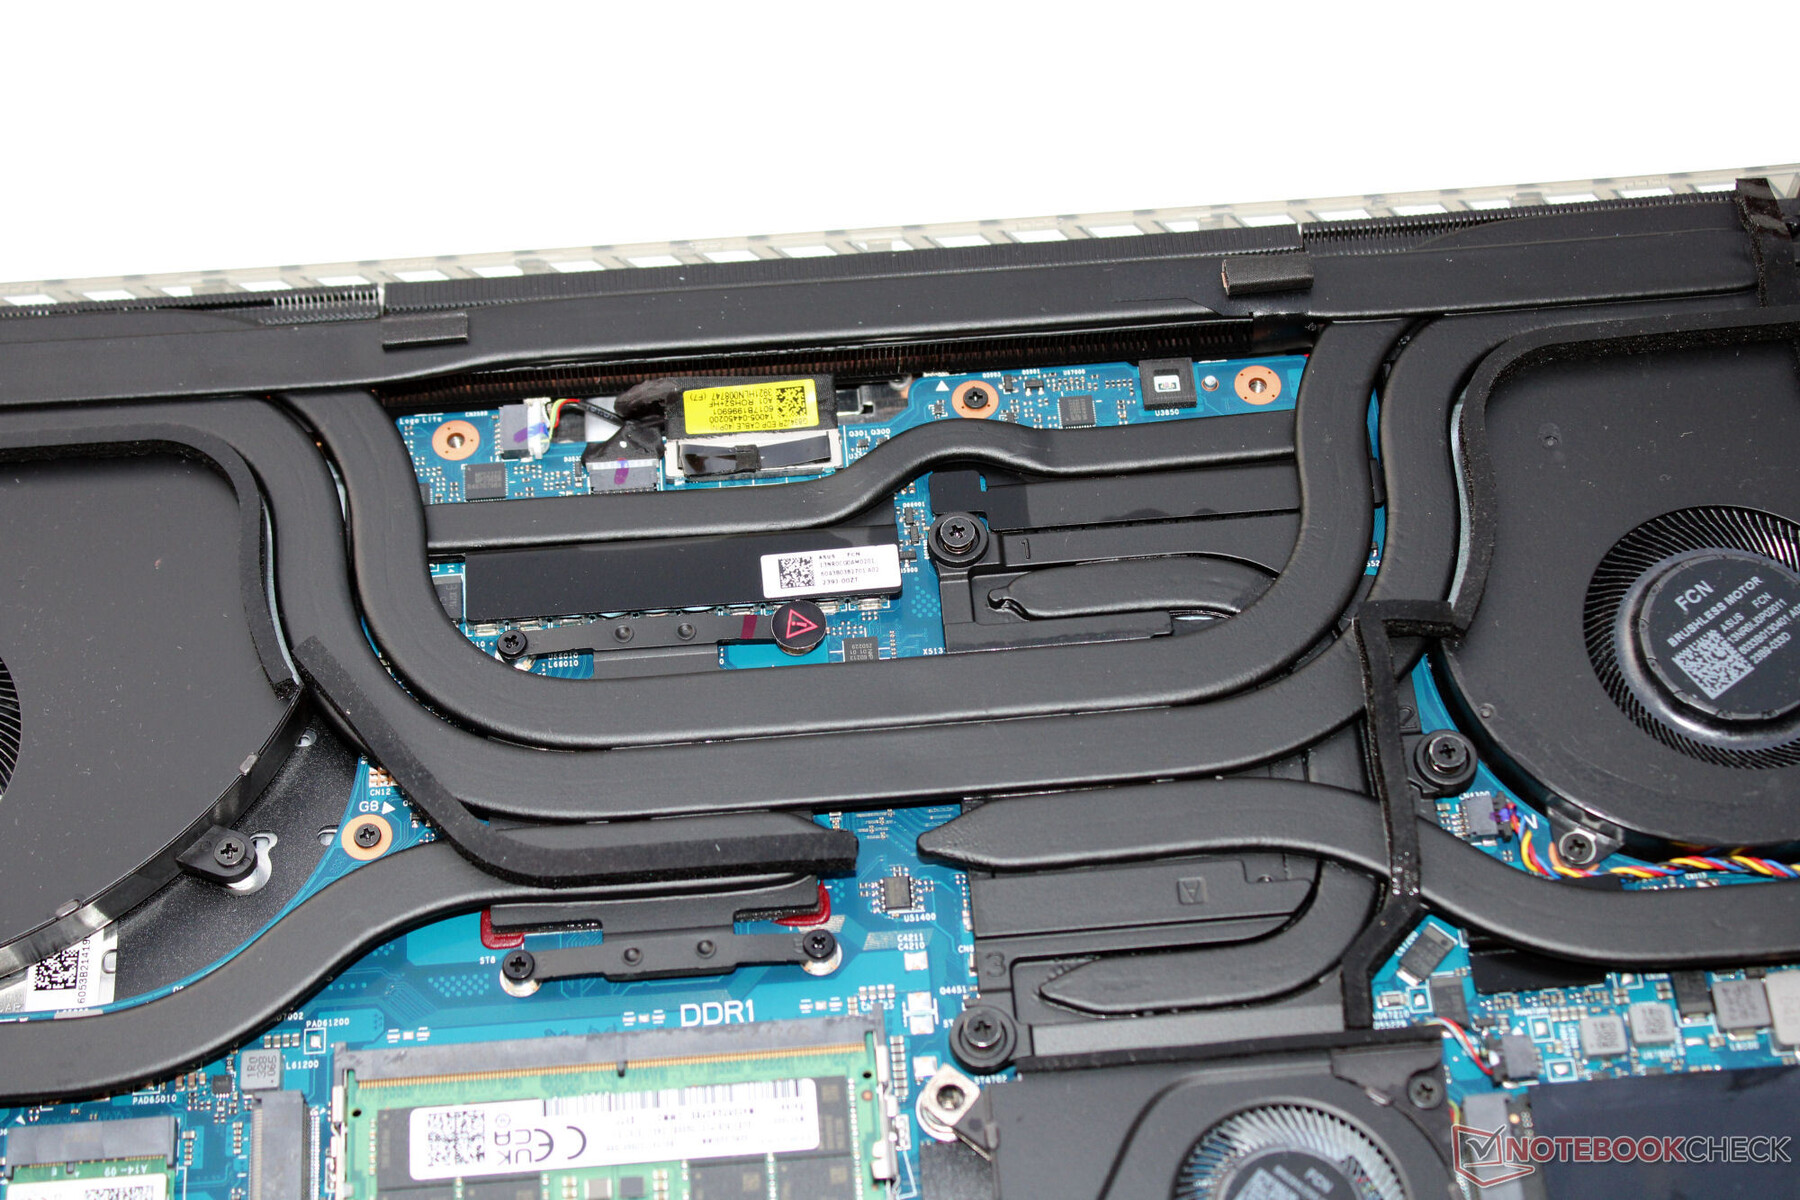
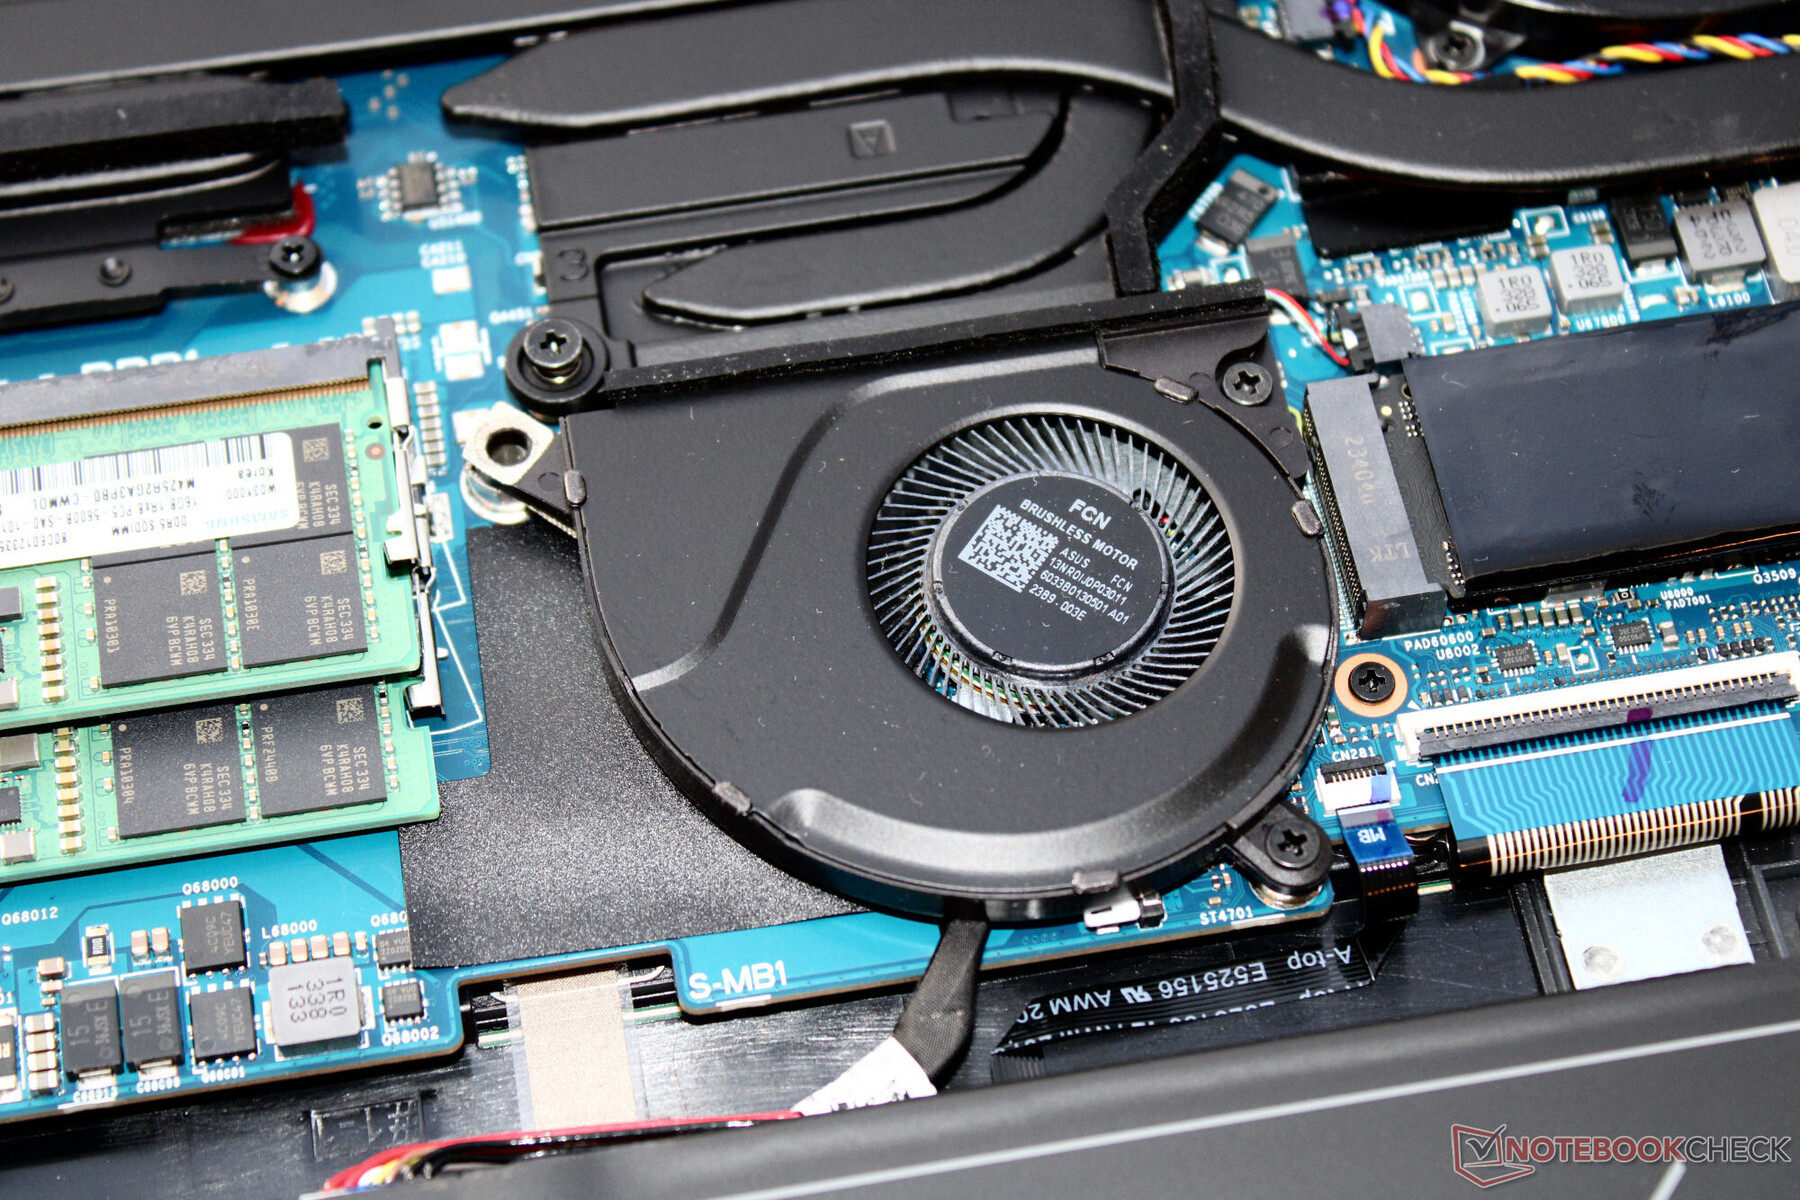
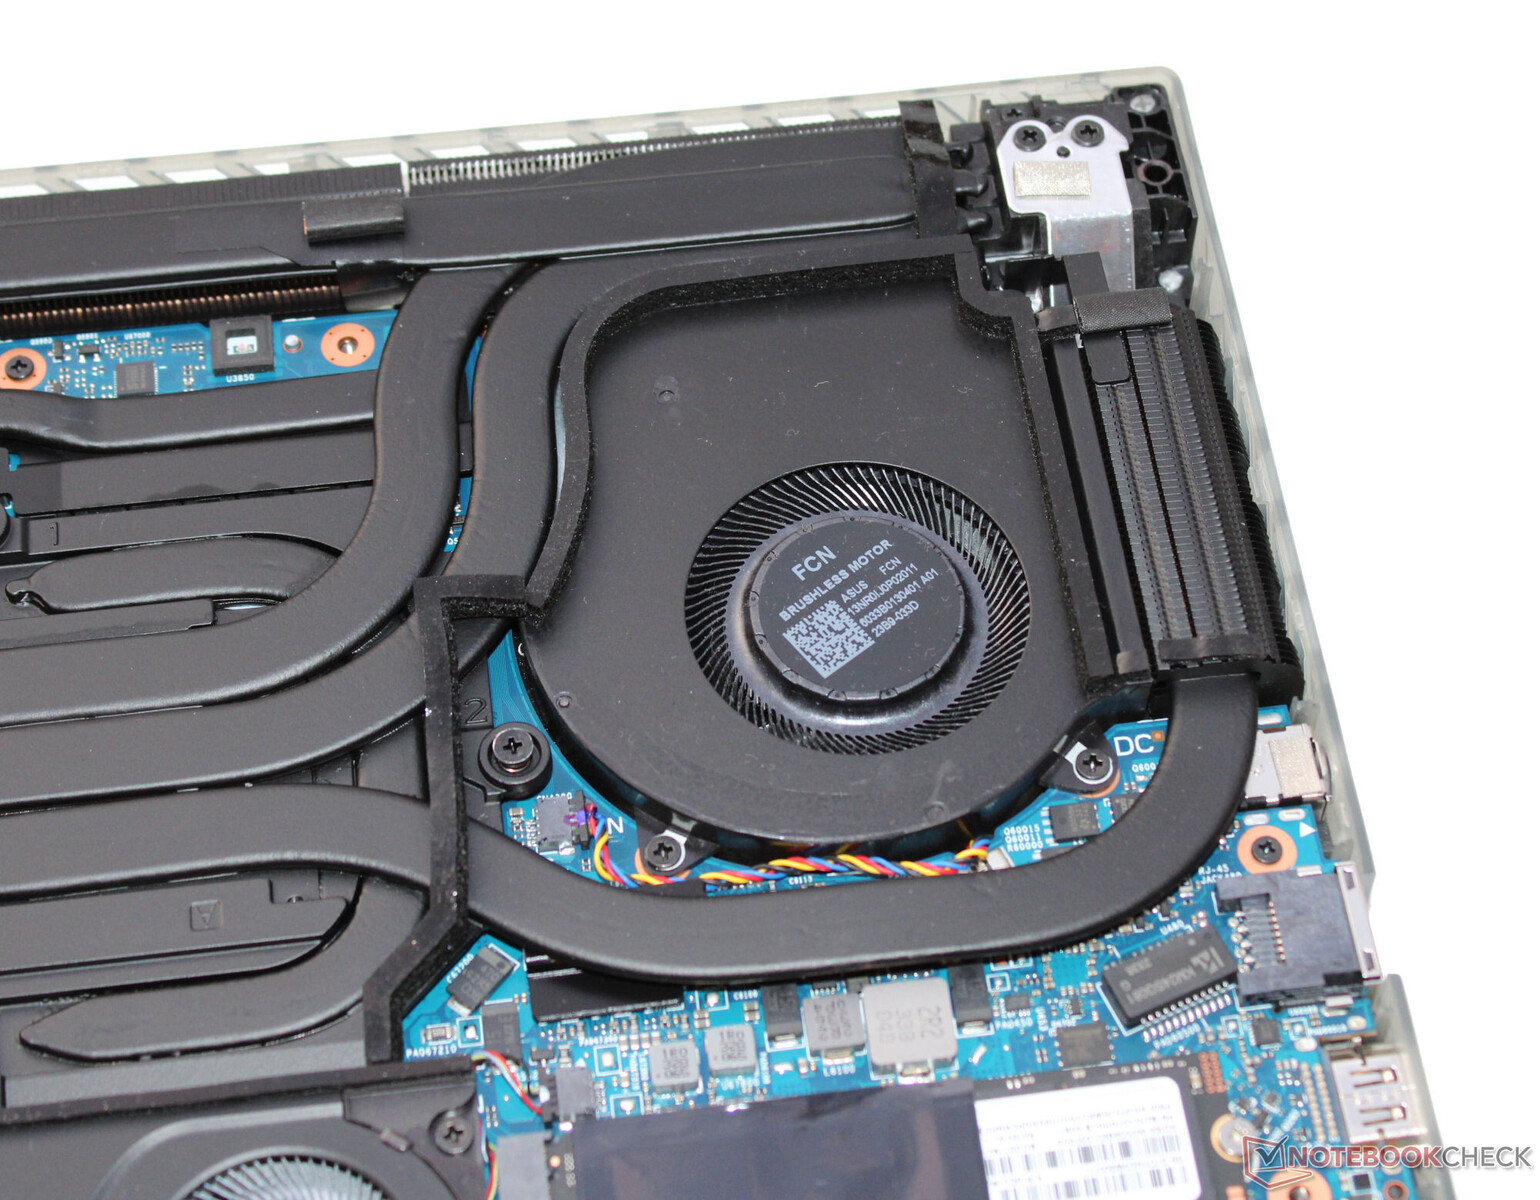
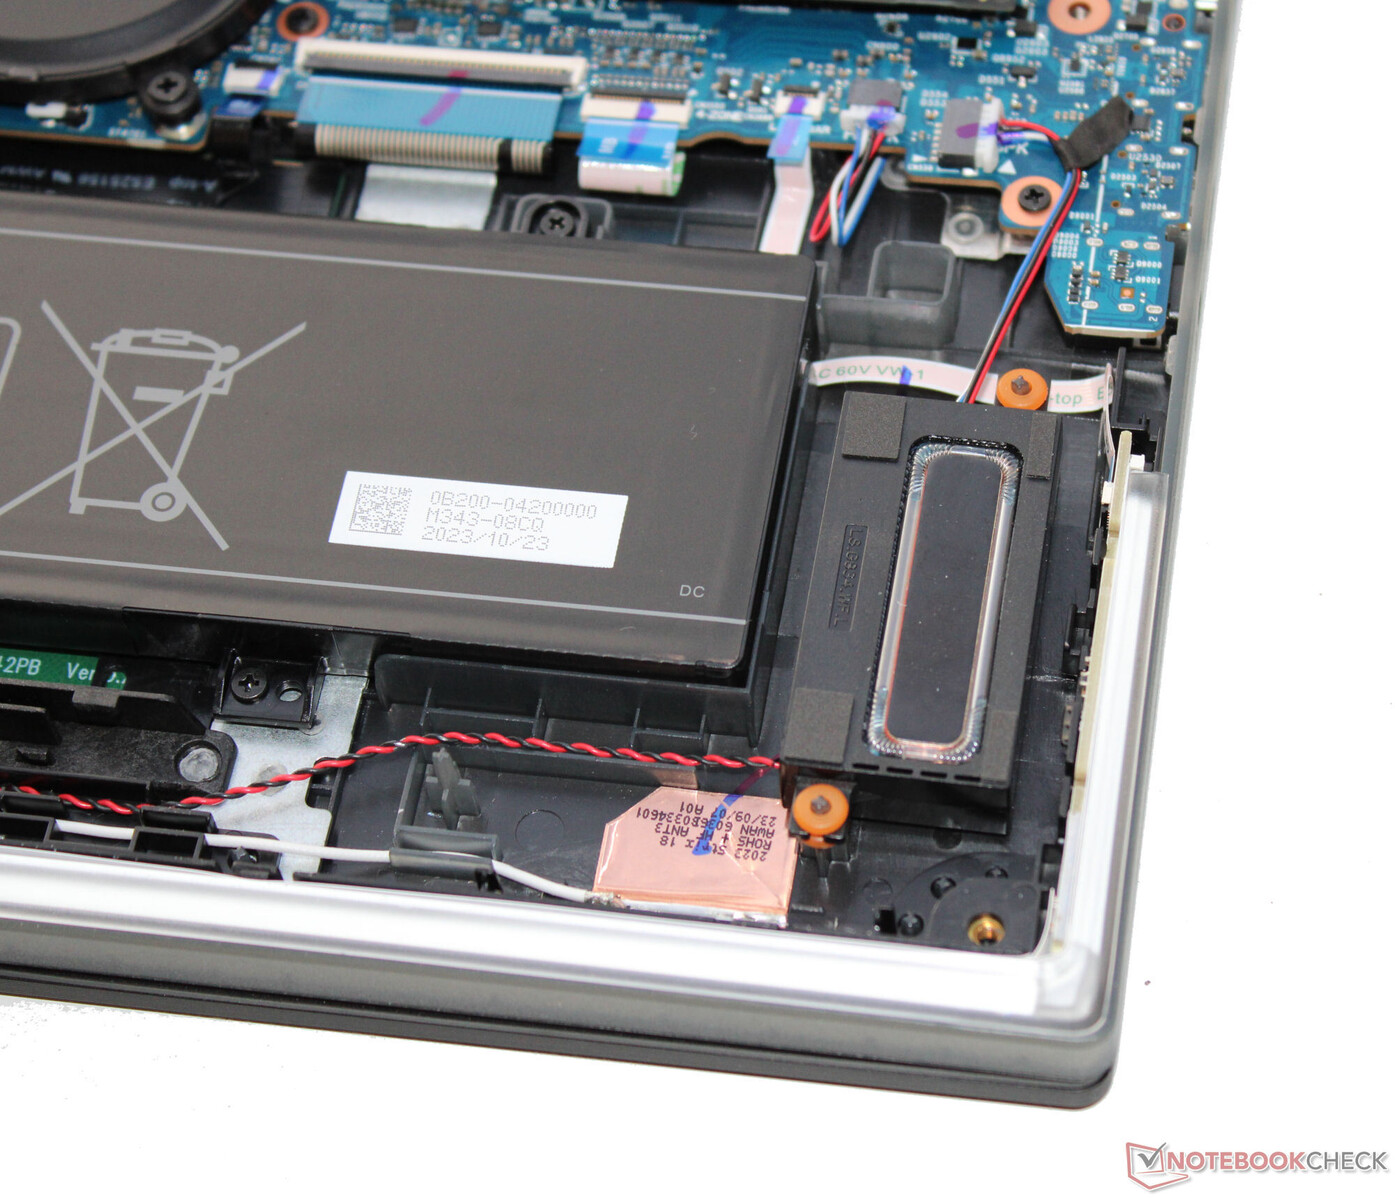
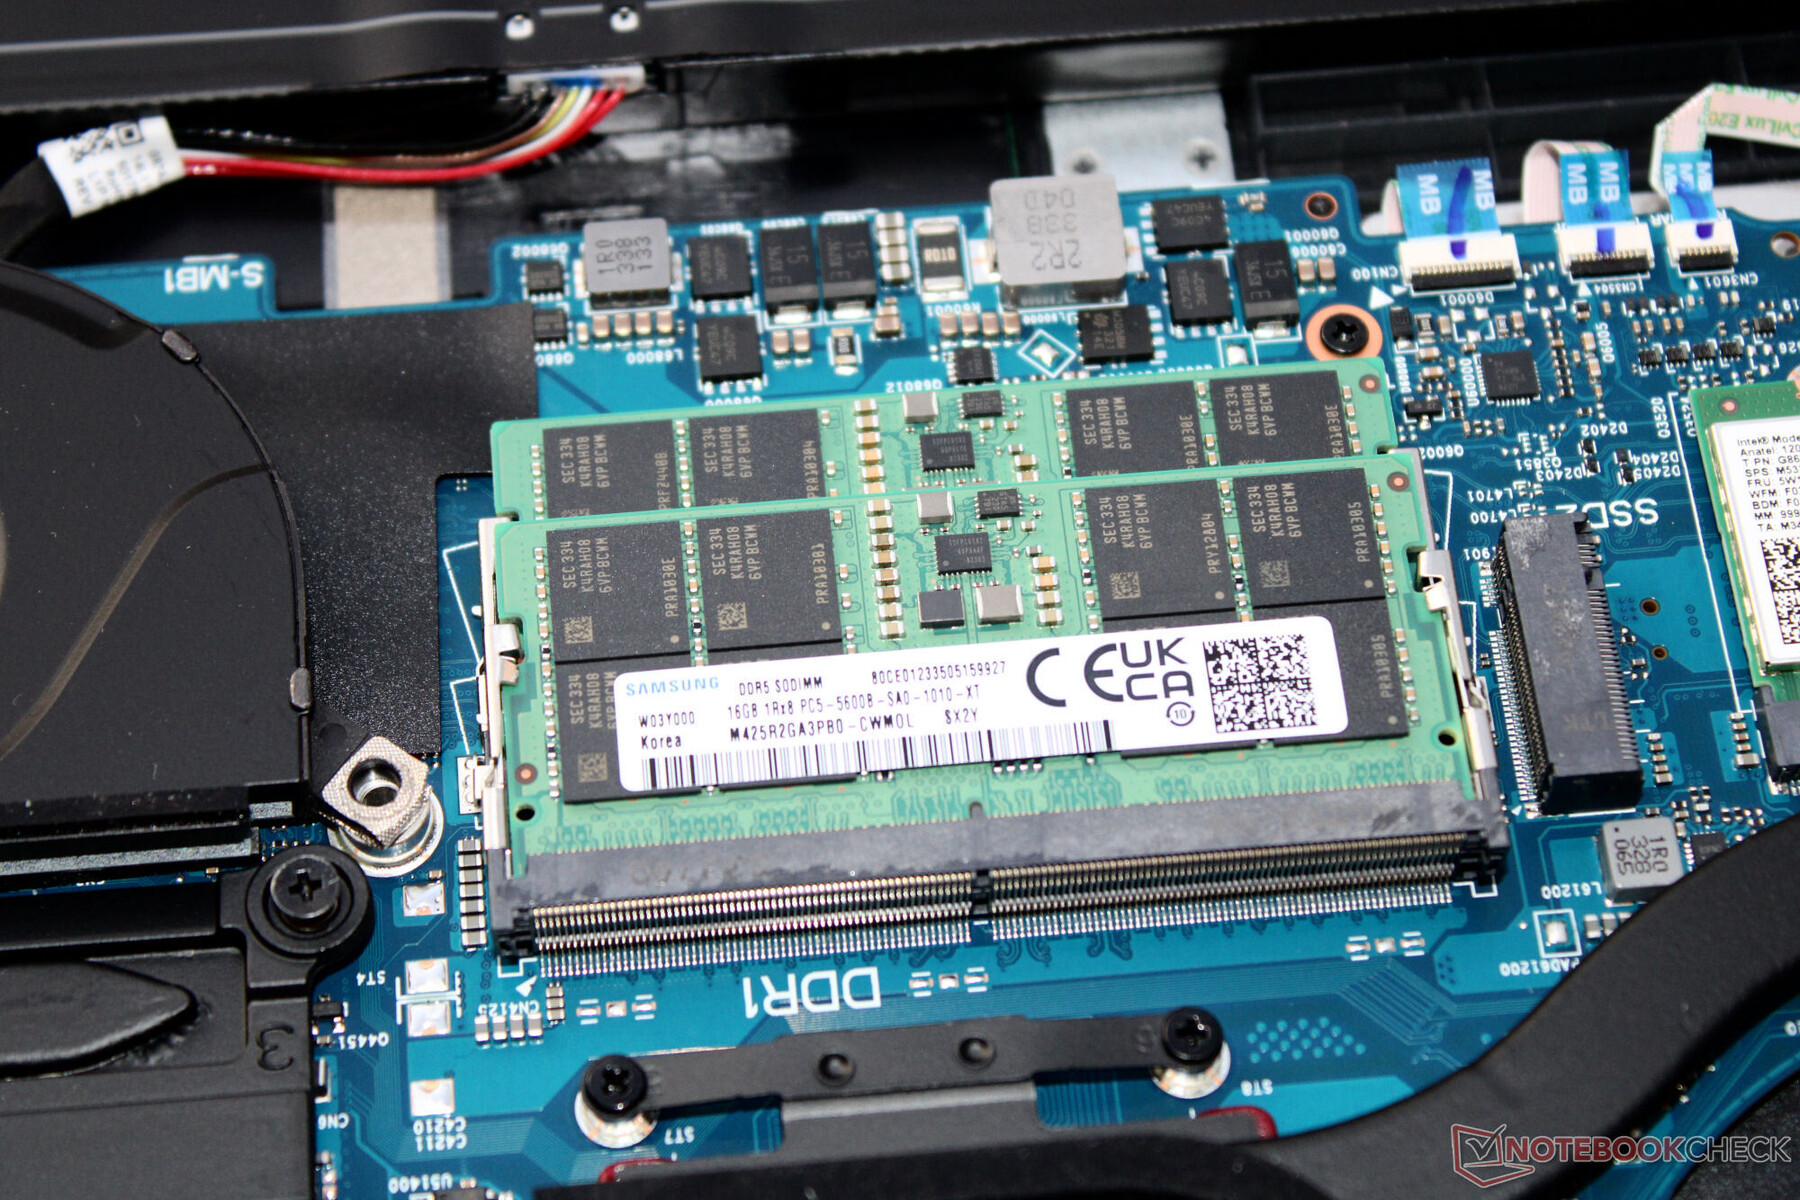
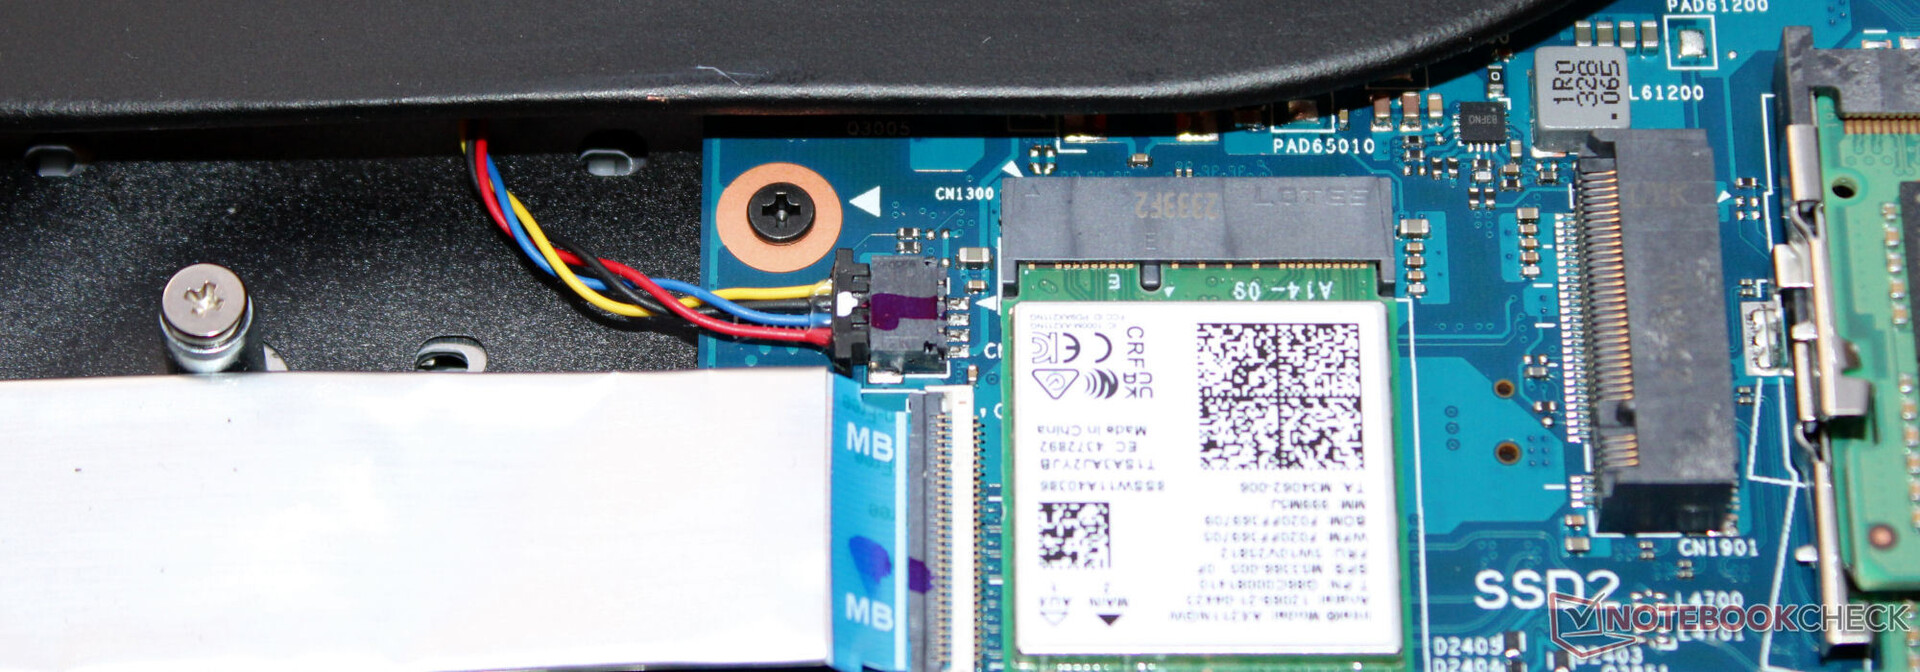
Per aprire il portatile, deve rimuovere tutte le viti sul fondo del telaio. Quindi può sollevare la piastra del case con un attrezzo per fare leva. Dopo aver rimosso la piastra del case, si accede ai banchi di memoria (occupati), all'SSD (PCIe 4, M.2-2280), al secondo slot SSD (PCIe 4, M.2-2280), al modulo WLAN, alla batteria del BIOS, alle ventole e alla batteria (avvitata, non incollata).
La tastiera non può essere sostituita facilmente. Per farlo, dovrebbe sostituire l'intera parte superiore della base, il che richiederebbe di smontare completamente il portatile.
Garanzia
Asus offre una garanzia di due anni per il portatile da 18 pollici in Germania. Un'estensione della garanzia a tre anni costerebbe circa 200 Euro (~$215).
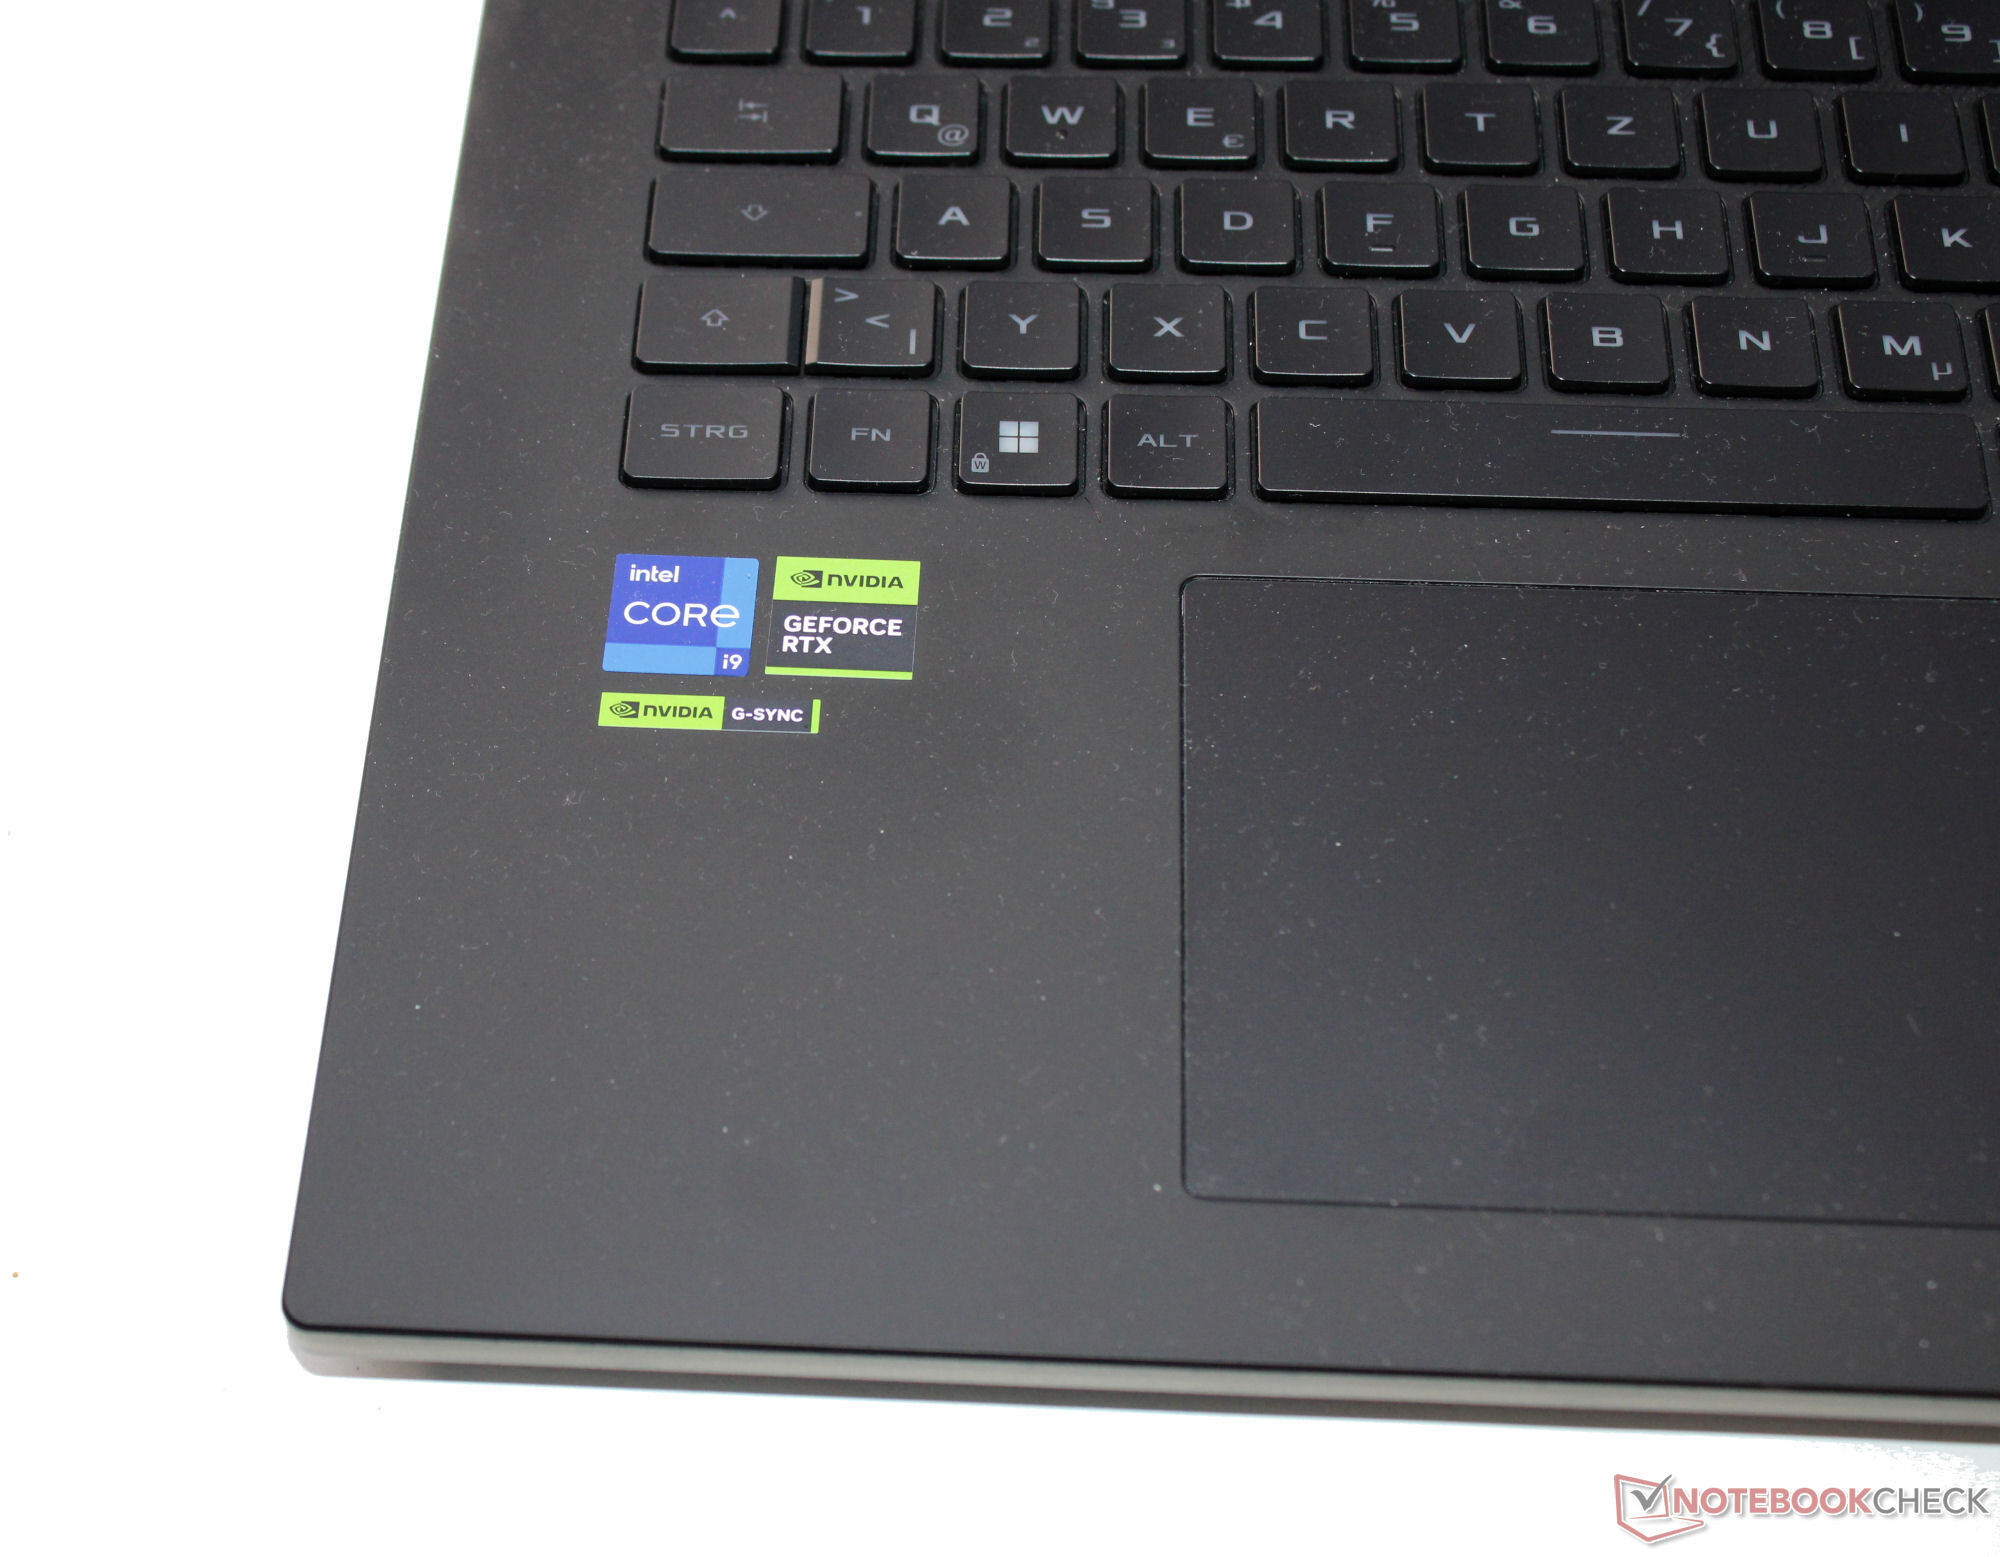
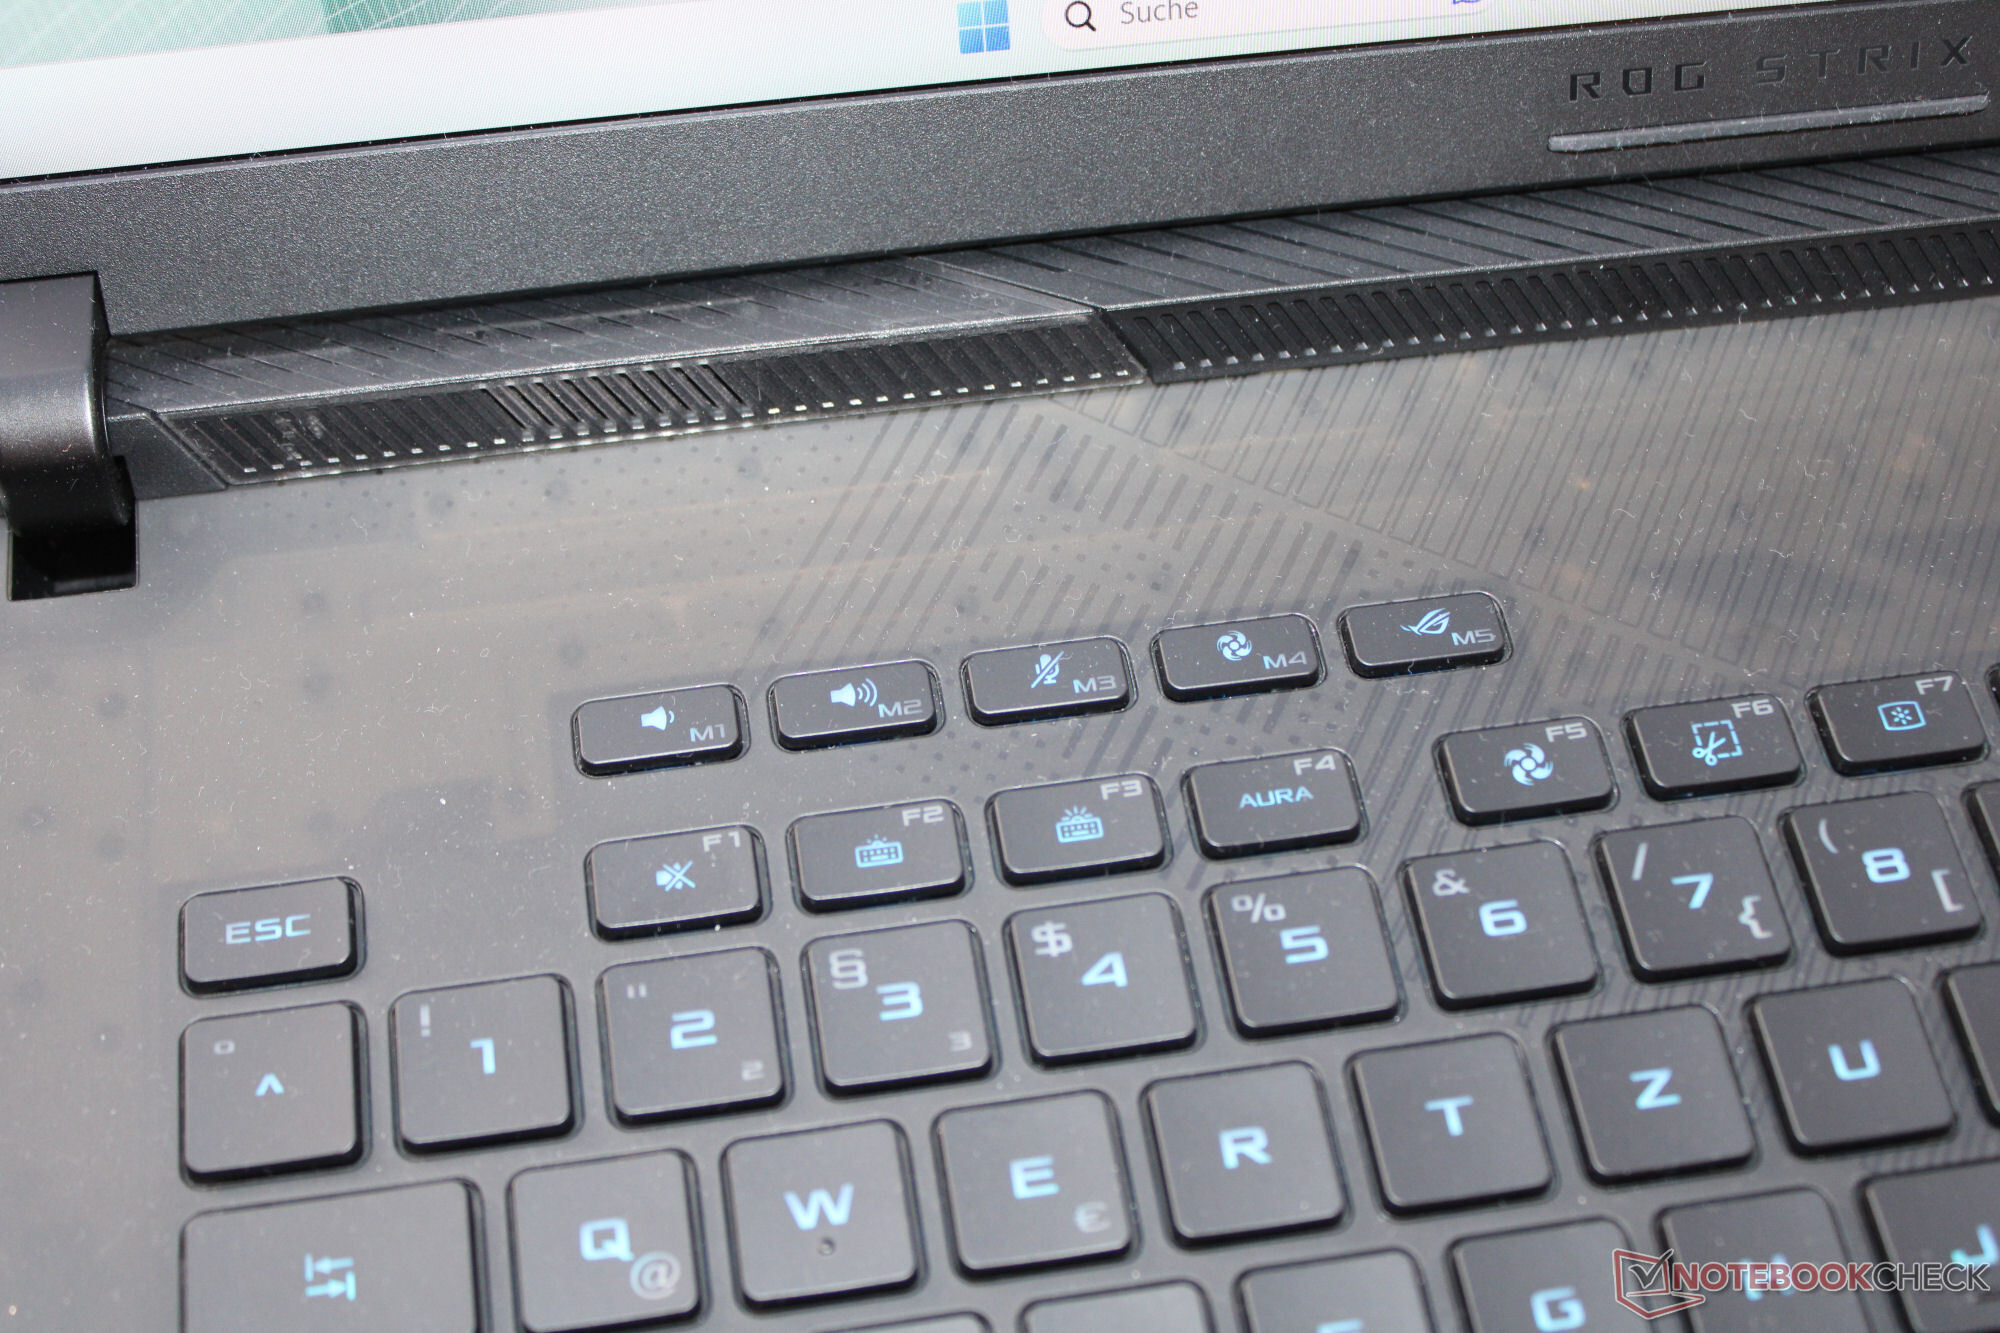
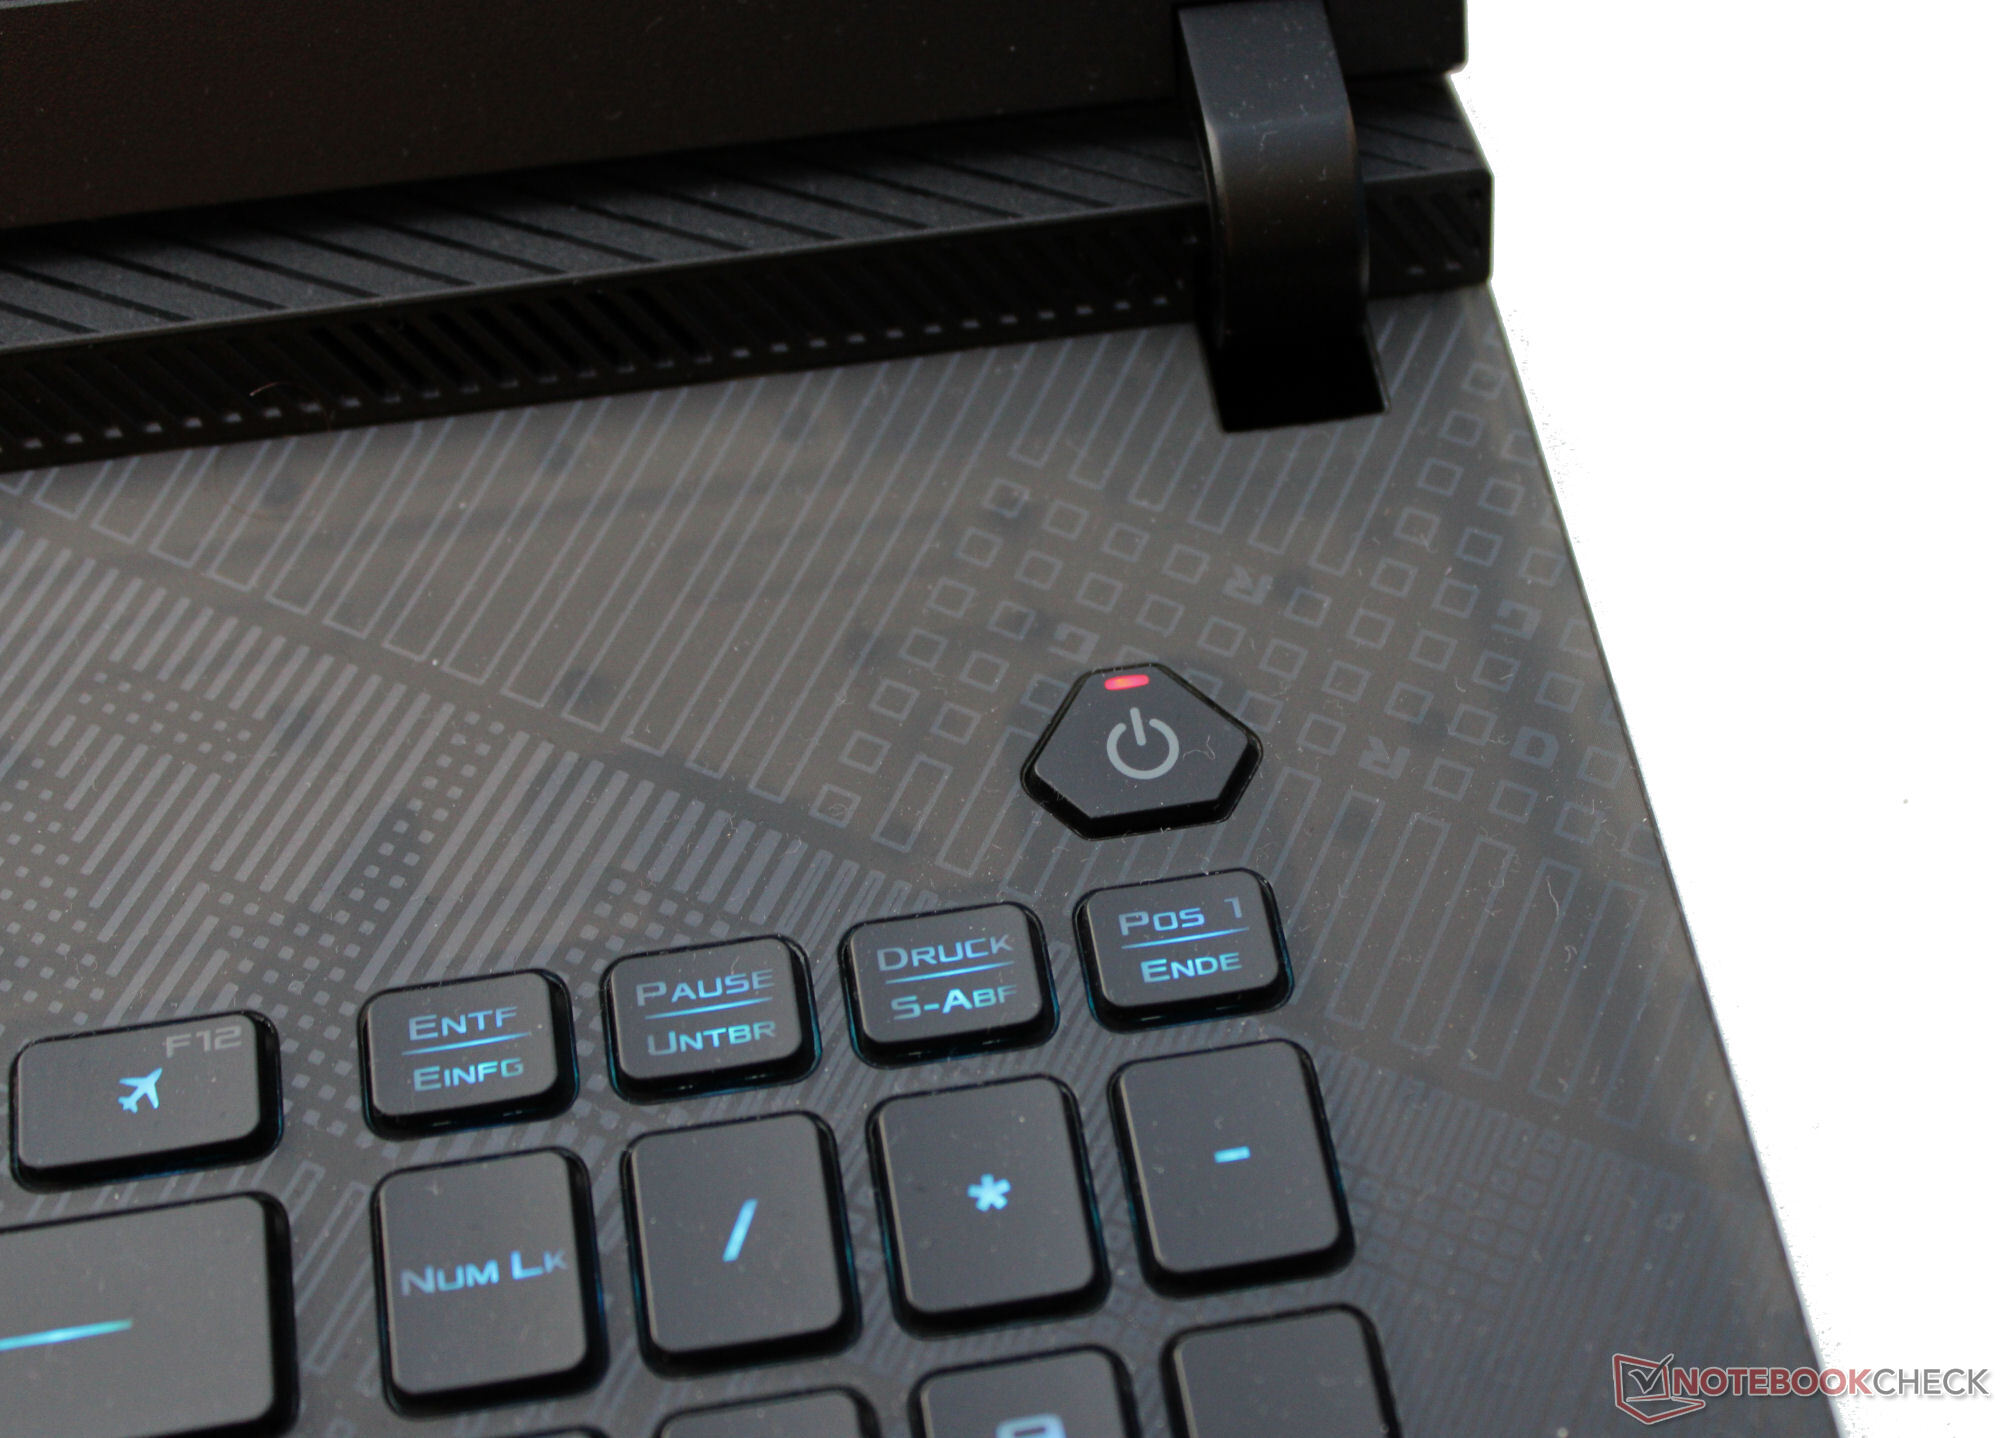
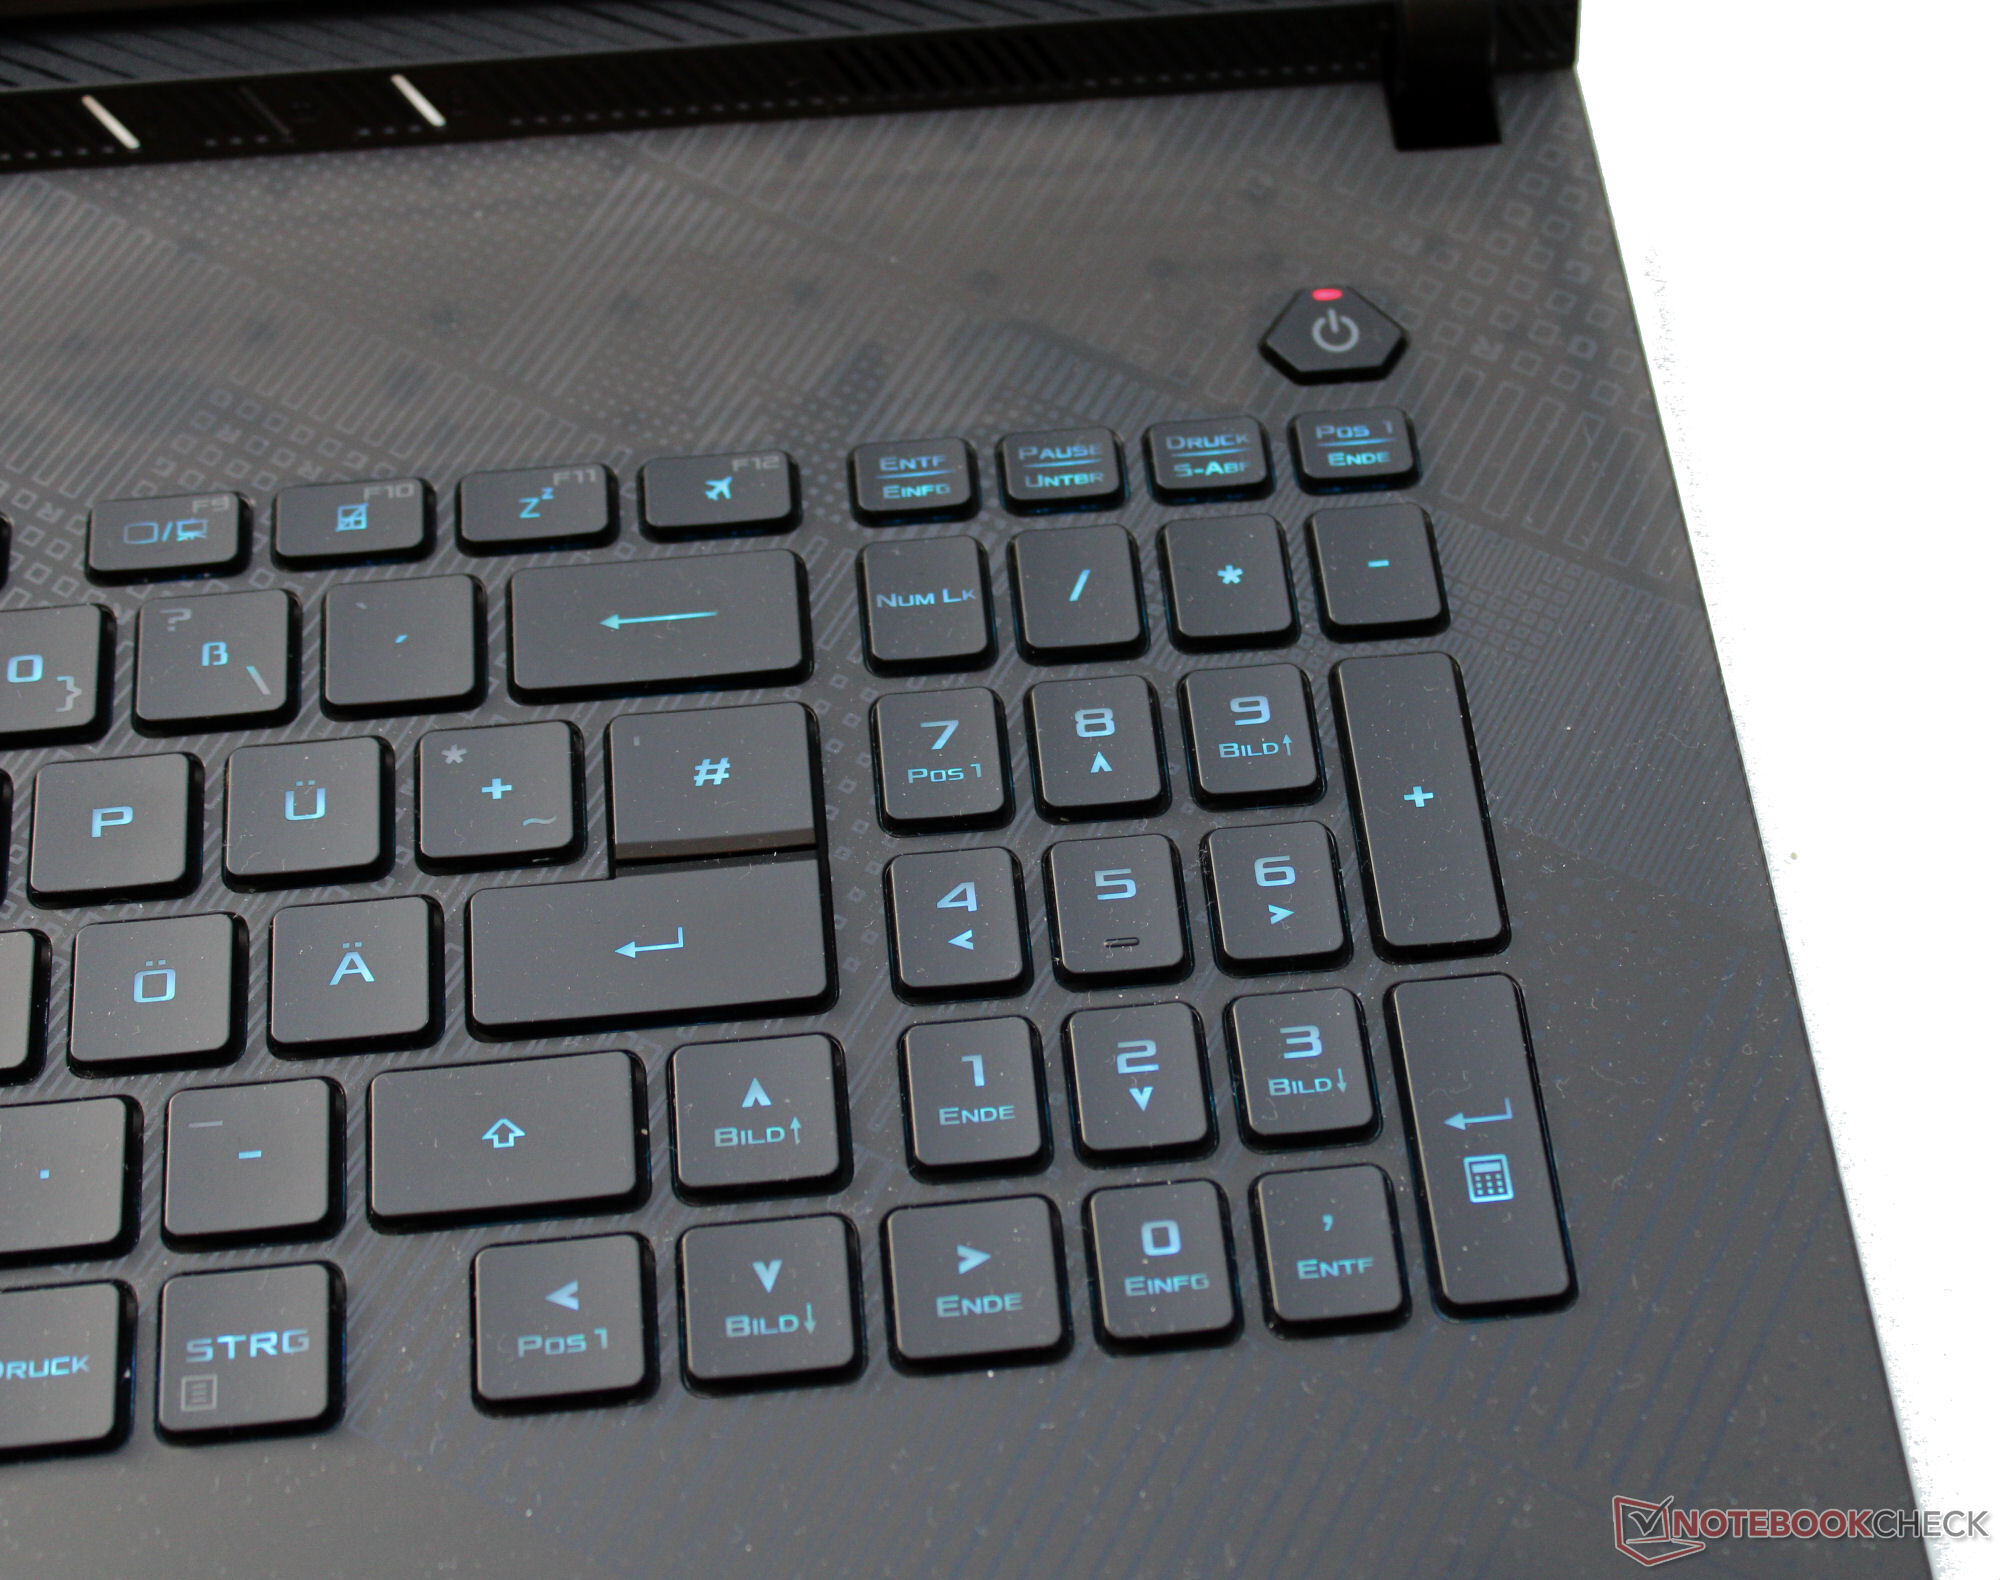
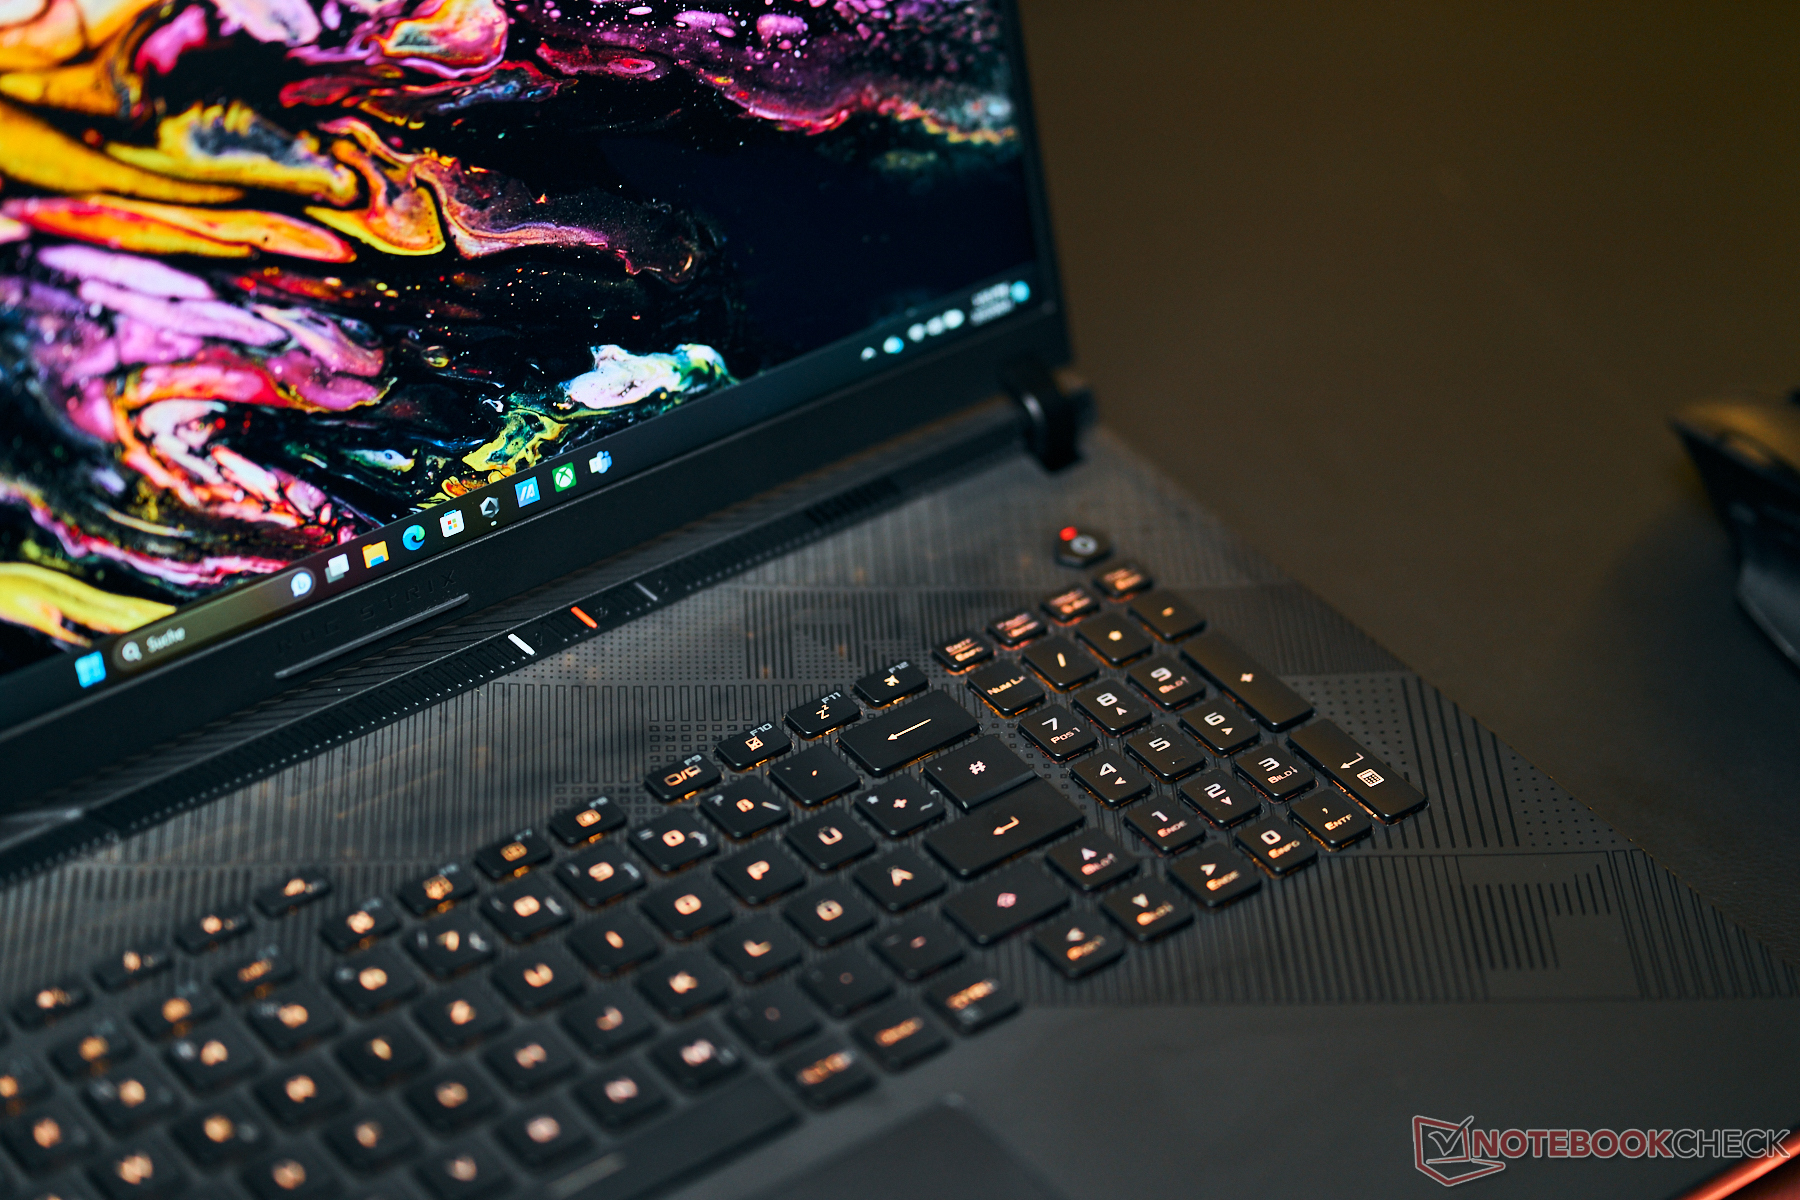
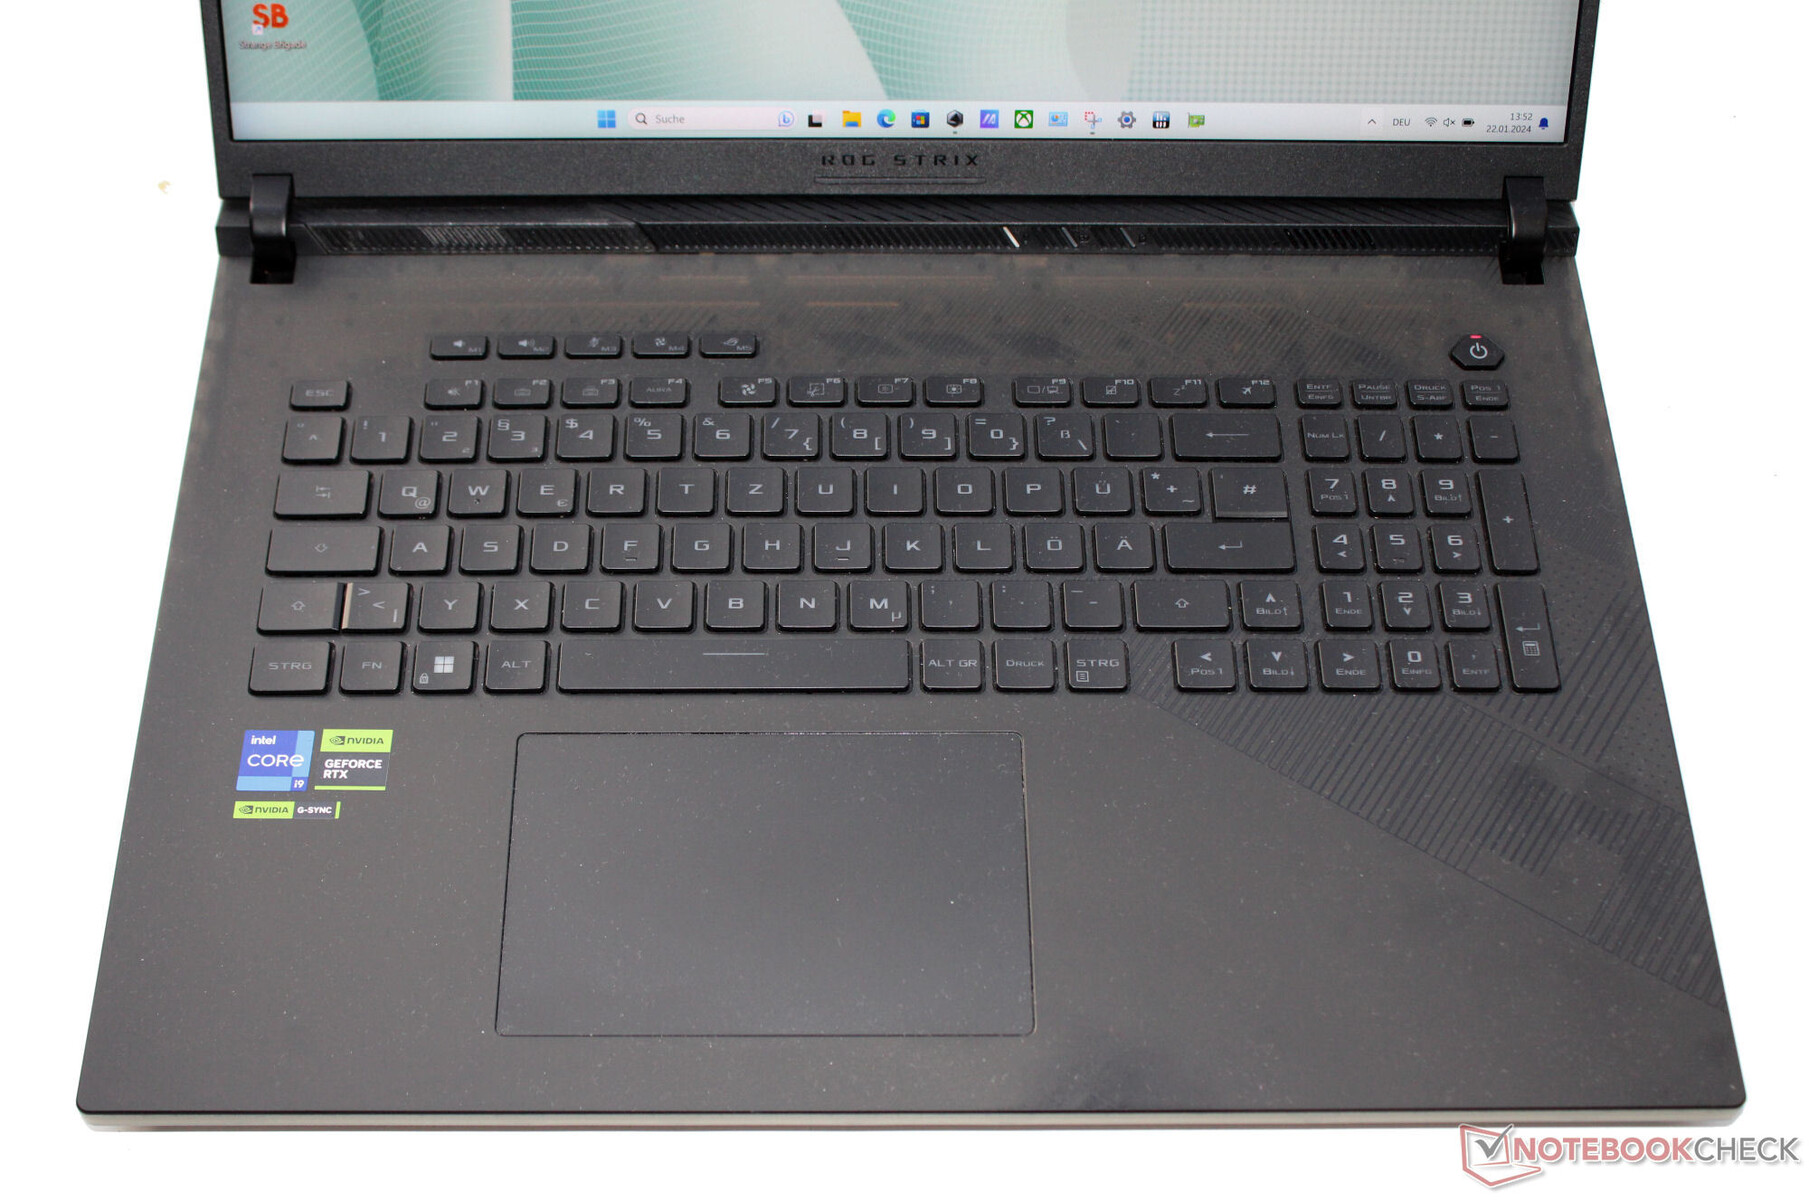
Dispositivi di input - Computer Asus con illuminazione RGB a tasto singolo
Tastiera
I tasti concavi della tastiera chiclet illuminata offrono una corsa media e un punto di pressione chiaro. La resistenza dei tasti è sostanzialmente buona, ma avrebbe potuto risultare leggermente più nitida a livello soggettivo. Durante la digitazione, la metà destra della tastiera presenta un certo cedimento che, nella migliore delle ipotesi, è minimo. Tuttavia, questo non si è rivelato un ostacolo. Un aspetto positivo è che tutti e quattro i tasti freccia hanno una dimensione regolare. Nel complesso, Asus offre una tastiera adatta alle attività quotidiane.
Touchpad
Un ClickPad (~13 x 8,5 cm, ~5,1 x 3,35 pollici), la cui superficie liscia facilita lo scorrimento delle dita, serve come sostituto del mouse. Offre una corsa breve e un punto di pressione chiaro.
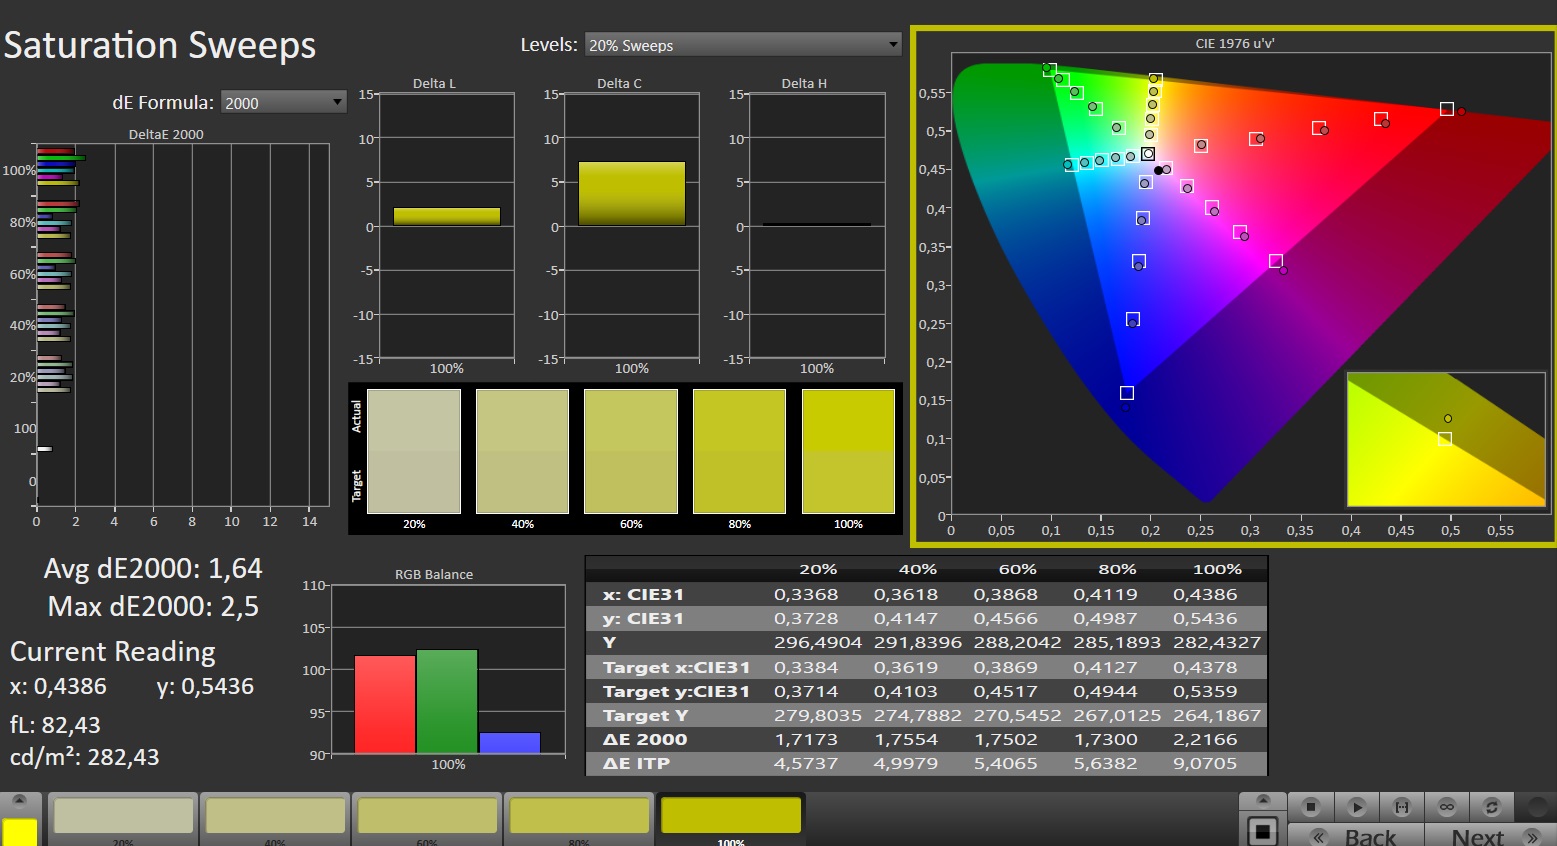
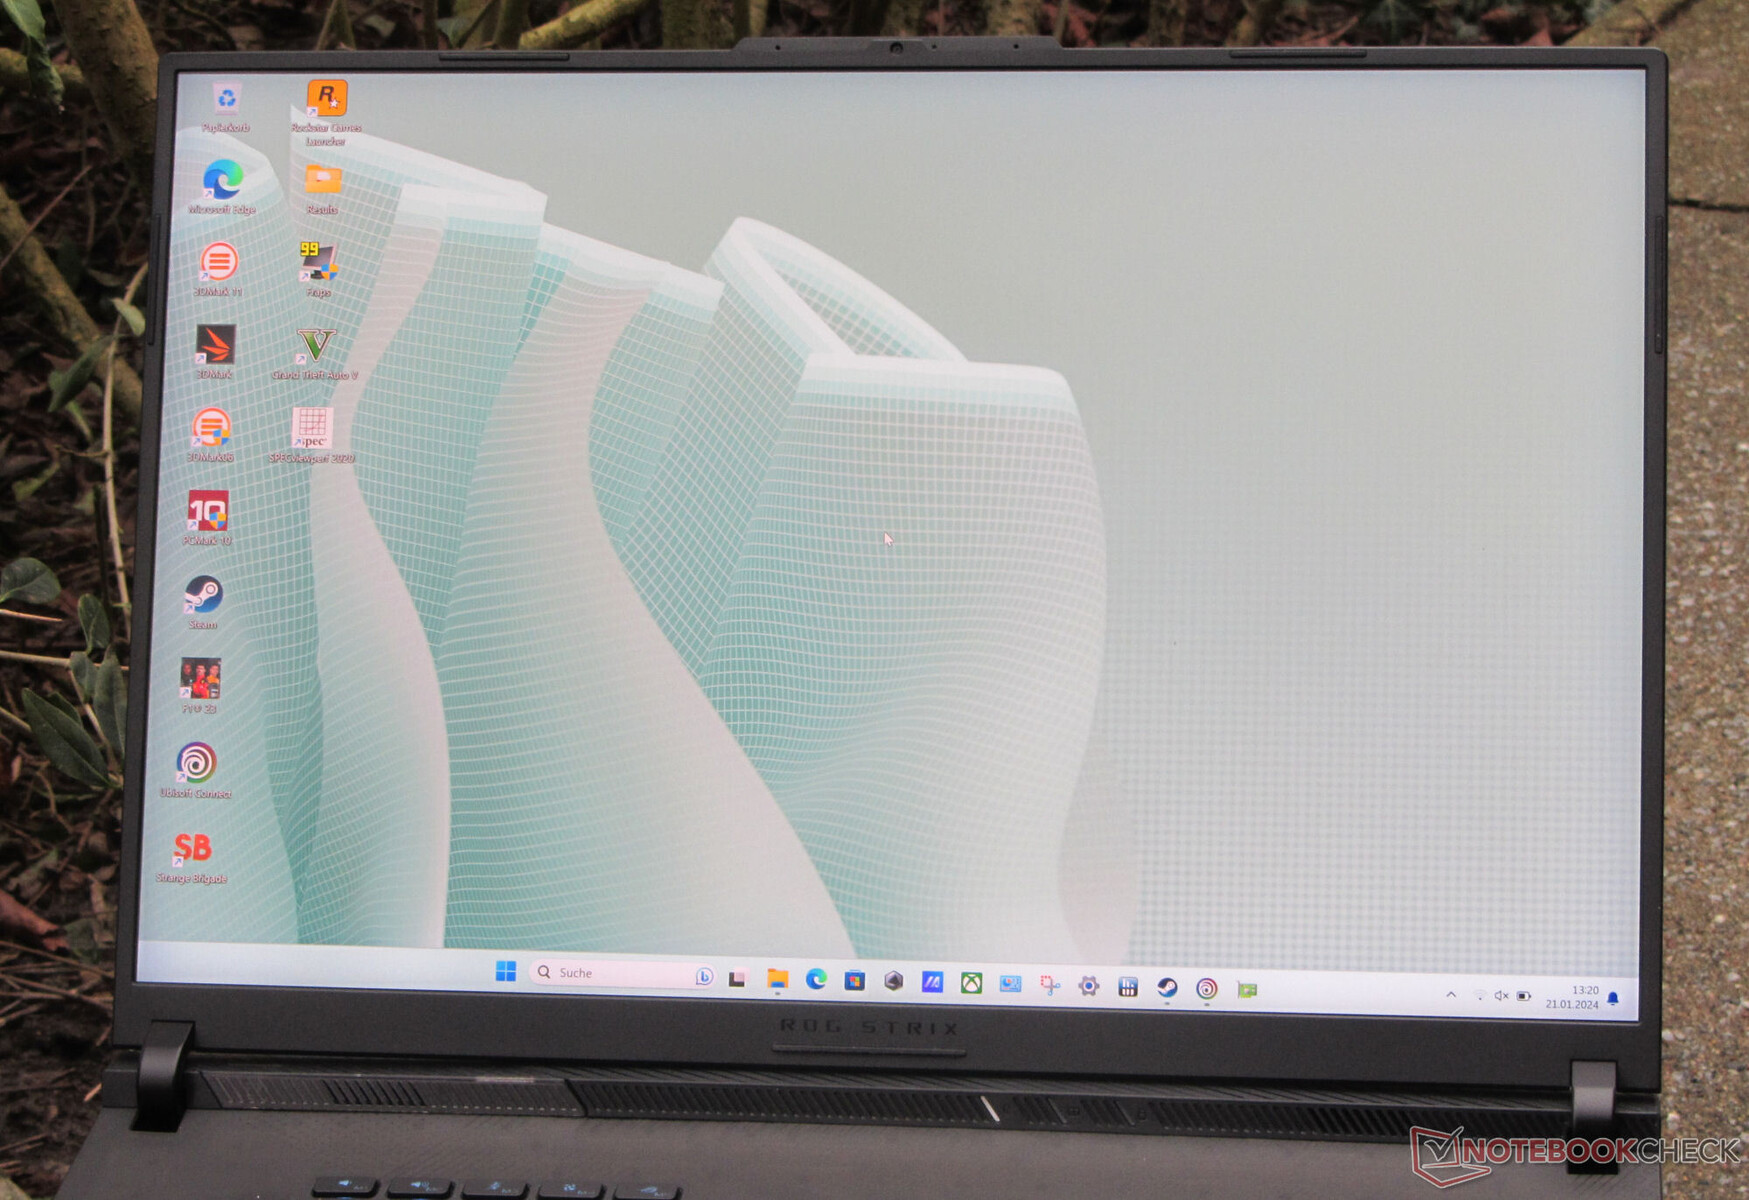
Display - Mini-LED con copertura dello spazio colore DCI-P3
Lo Scar 18 offre un display mini-LED da 18 pollici (2560x1600 pixel) in formato 16:10. I suoi aspetti positivi sono l'elevata luminosità, l'eccellente contrasto e valore del nero e la superficie opaca. Il veloce pannello a 240 Hz supporta anche HDR e G-Sync.
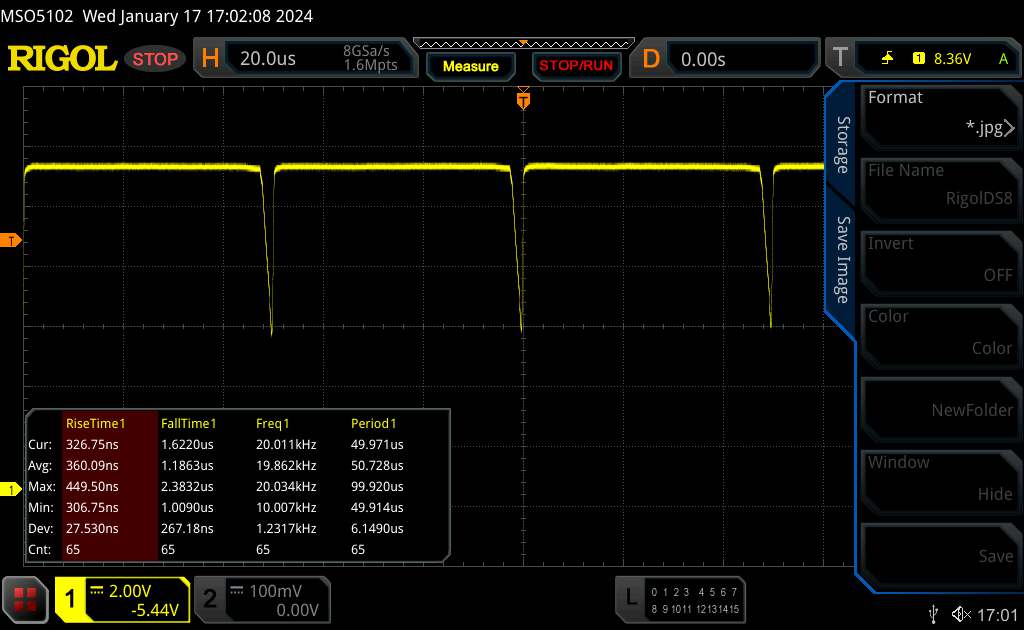
D'altra parte, il display non è completamente privo di sfarfallio PWM, anche se non dovrebbe avere un ruolo importante nel funzionamento quotidiano: Abbiamo misurato uno sfarfallio ad alta frequenza (5.733 Hz) a valori di luminosità inferiori a 94 cd/m².
| |||||||||||||||||||||||||
Distribuzione della luminosità: 89 %
Al centro con la batteria: 937 cd/m²
Contrasto: 14197:1 (Nero: 0.066 cd/m²)
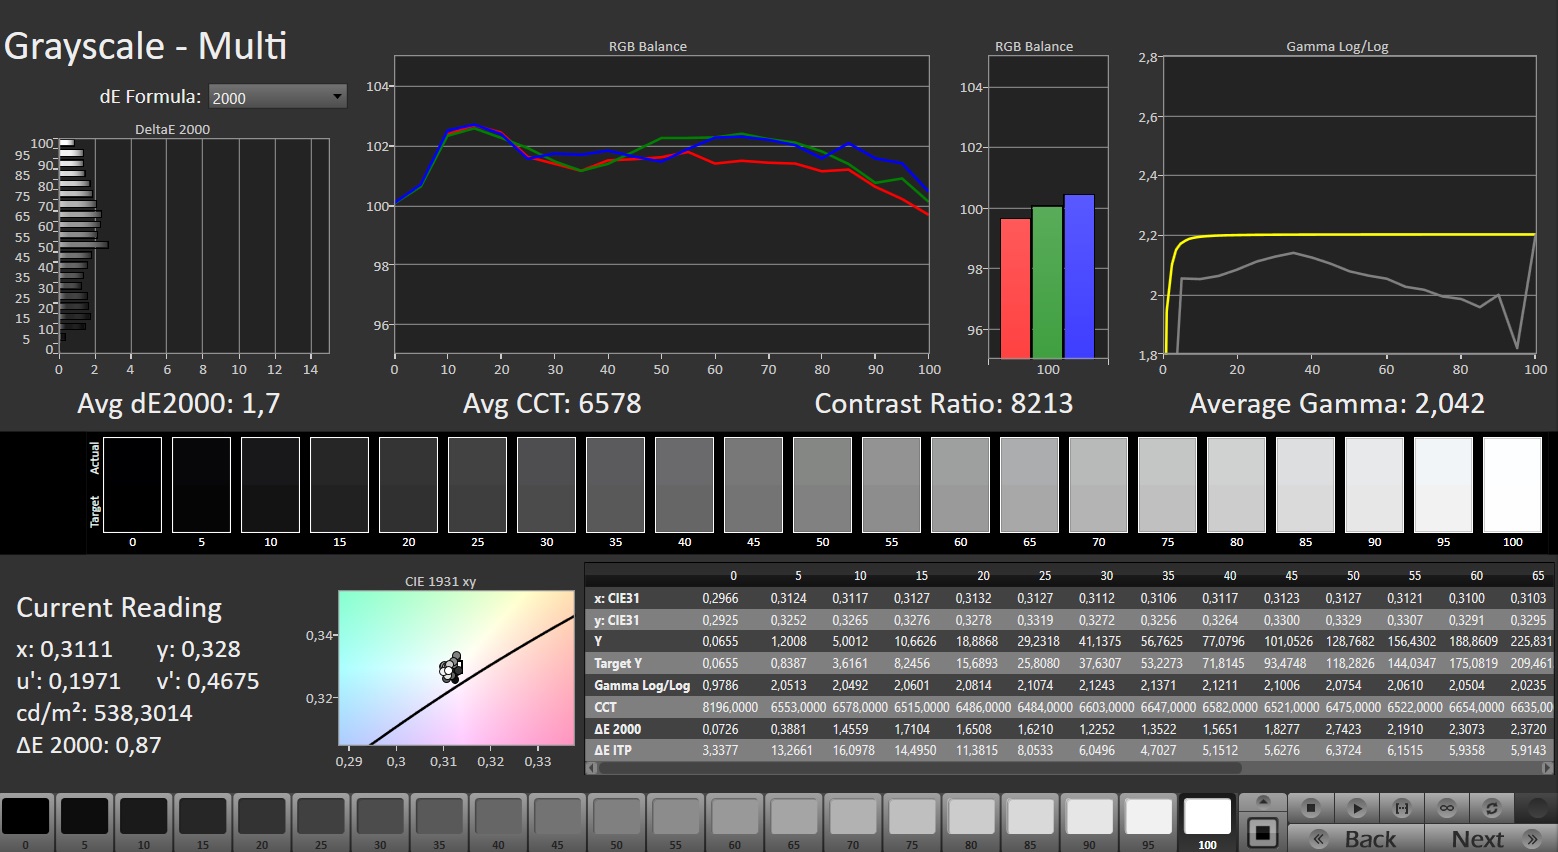
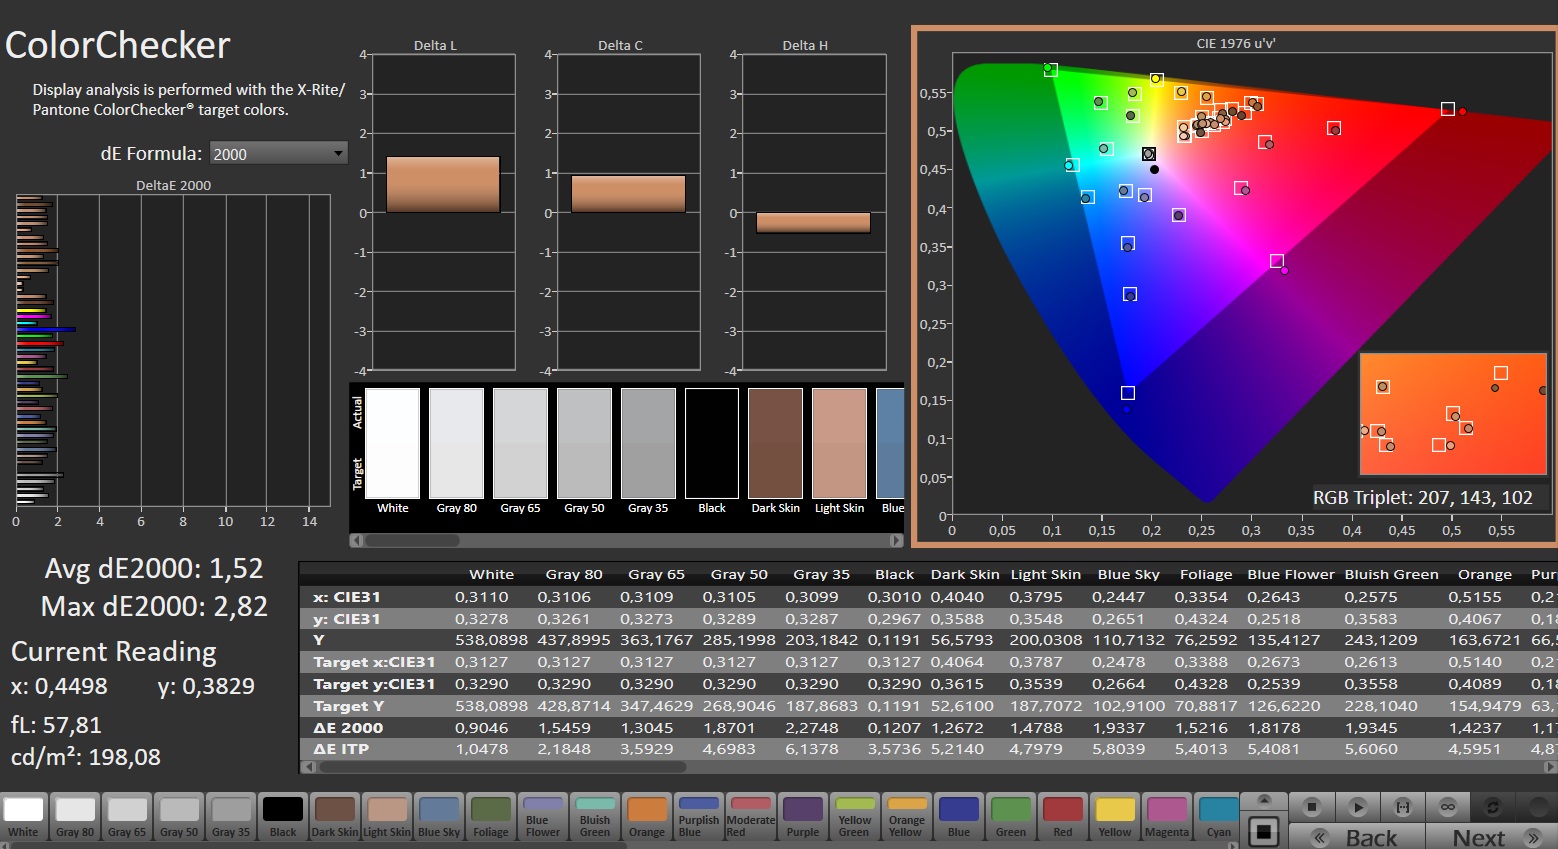
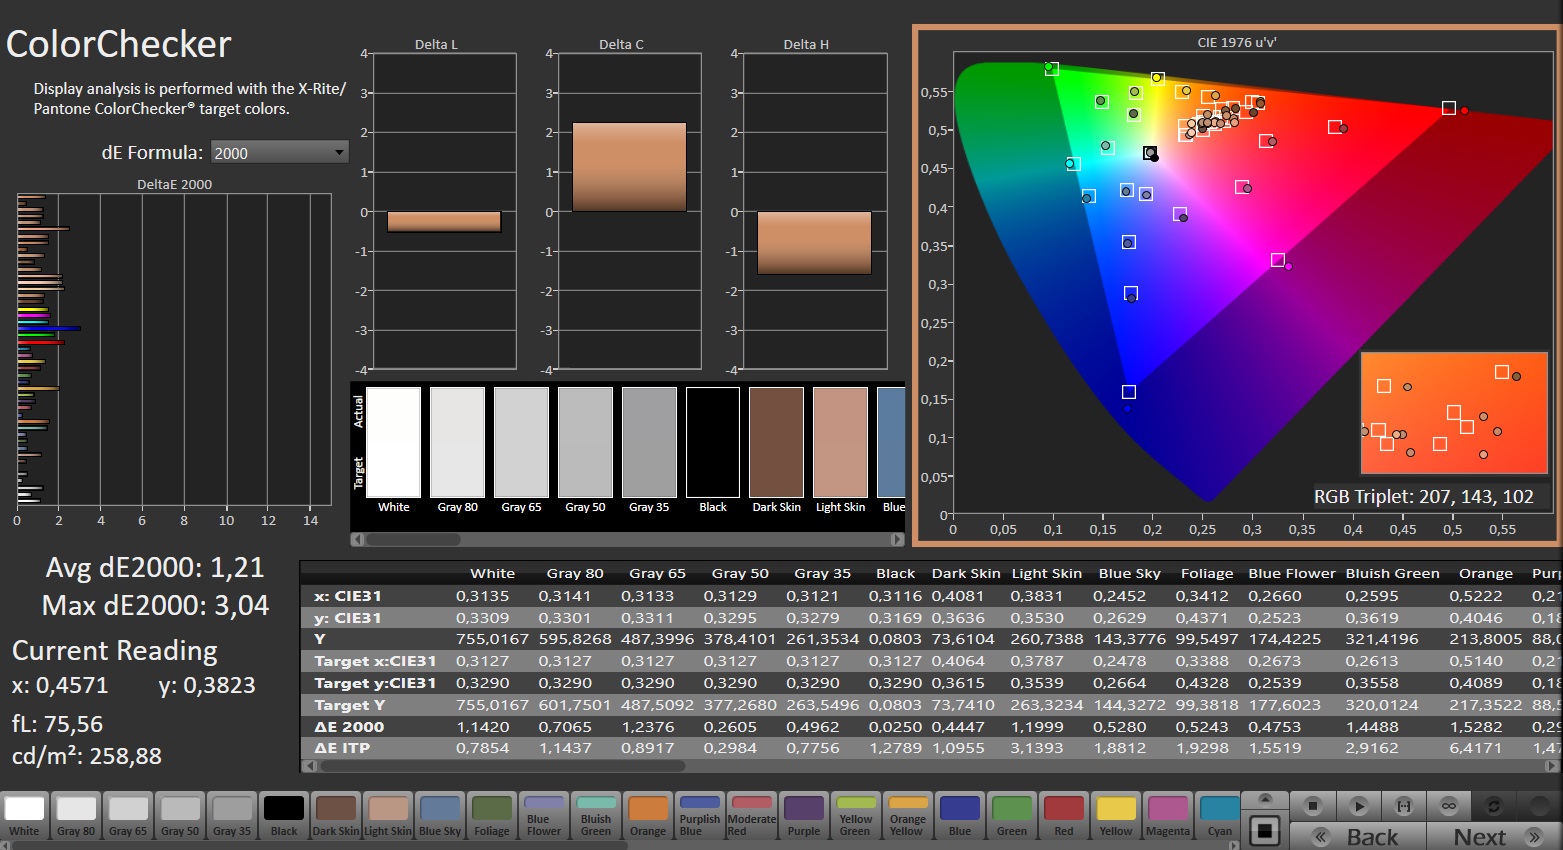
ΔE ColorChecker Calman: 1.52 | ∀{0.5-29.43 Ø4.71}
calibrated: 1.21
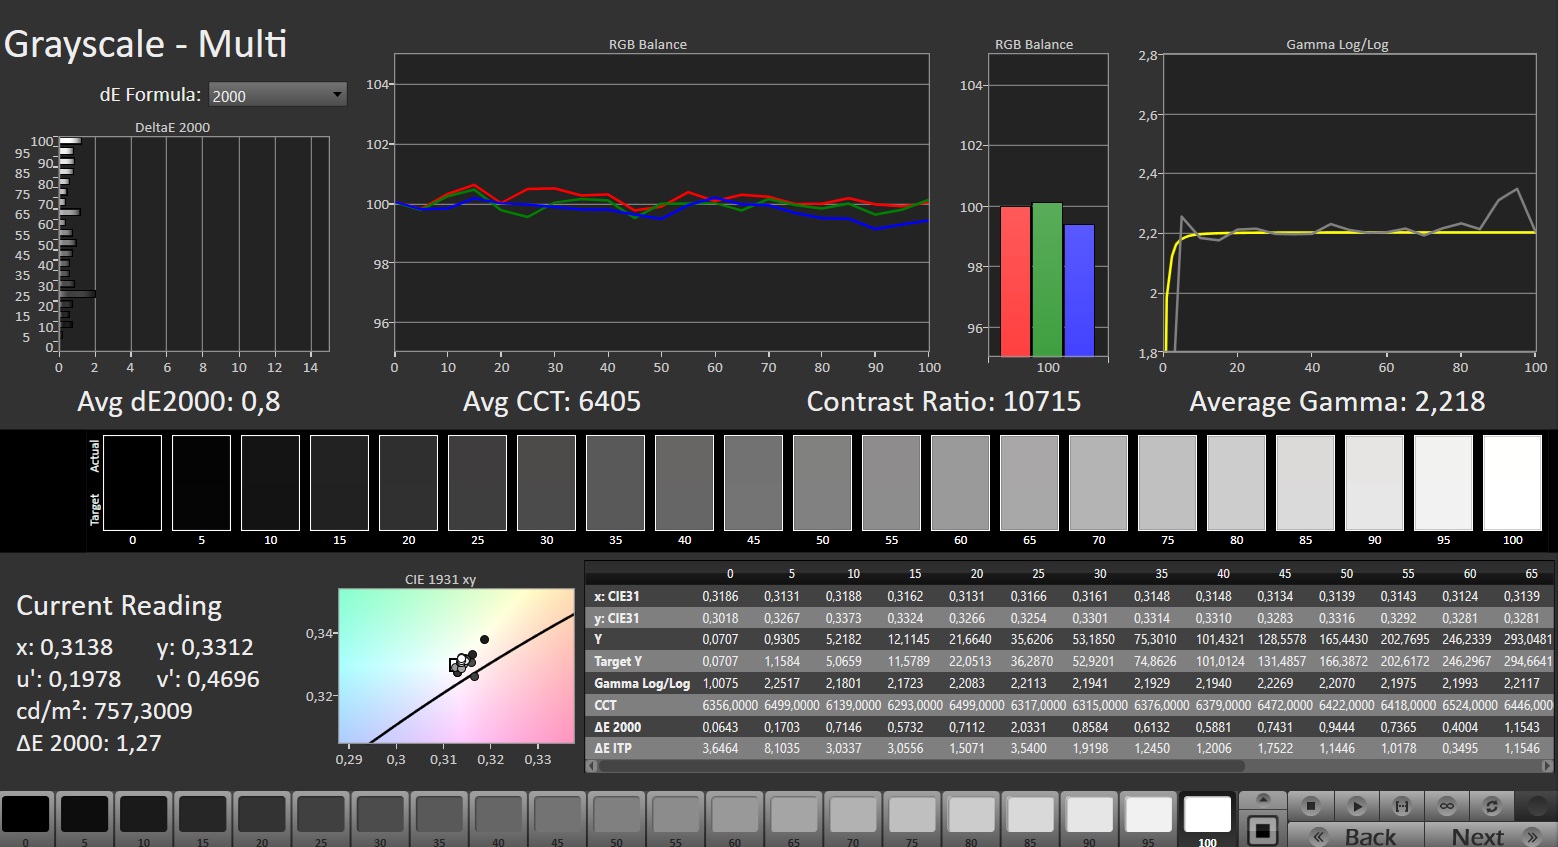
ΔE Greyscale Calman: 1.7 | ∀{0.09-98 Ø4.96}
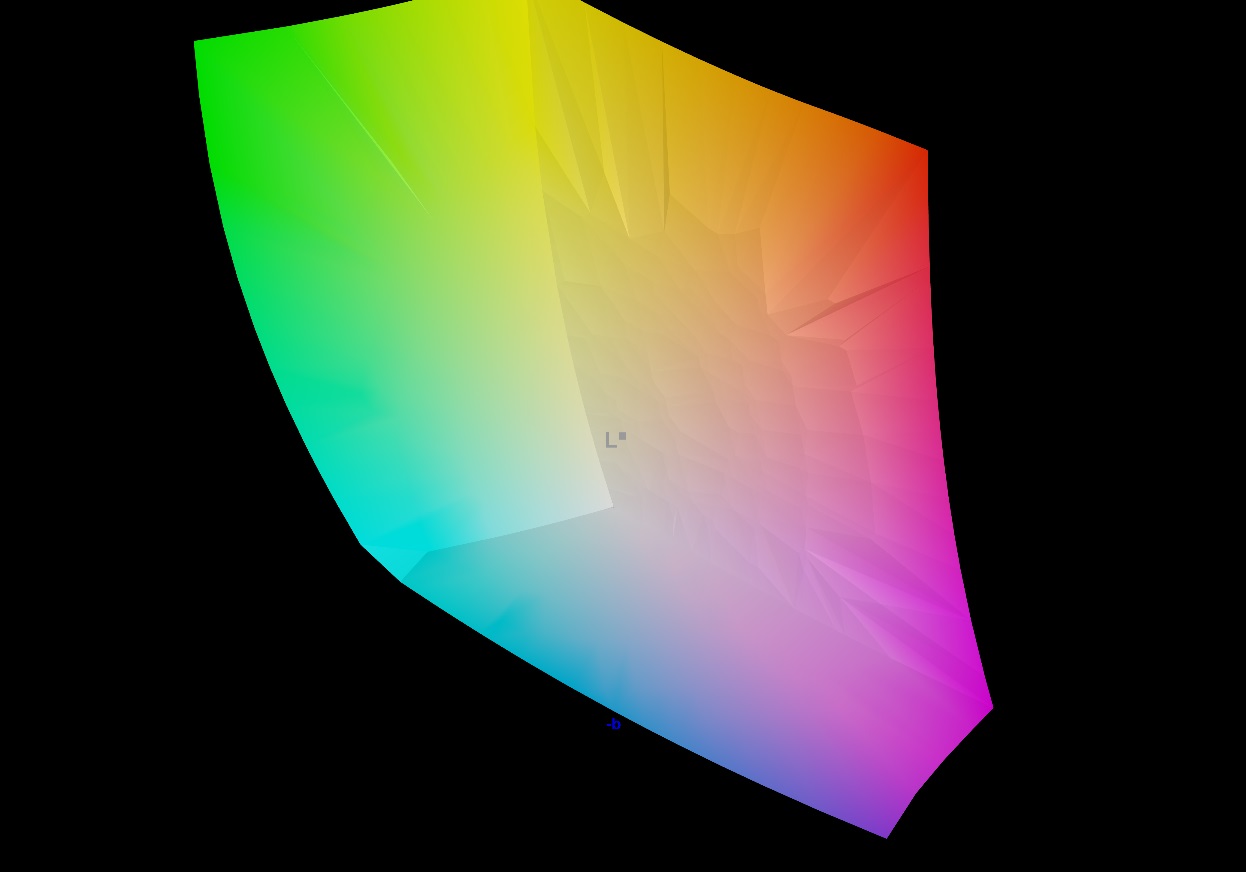
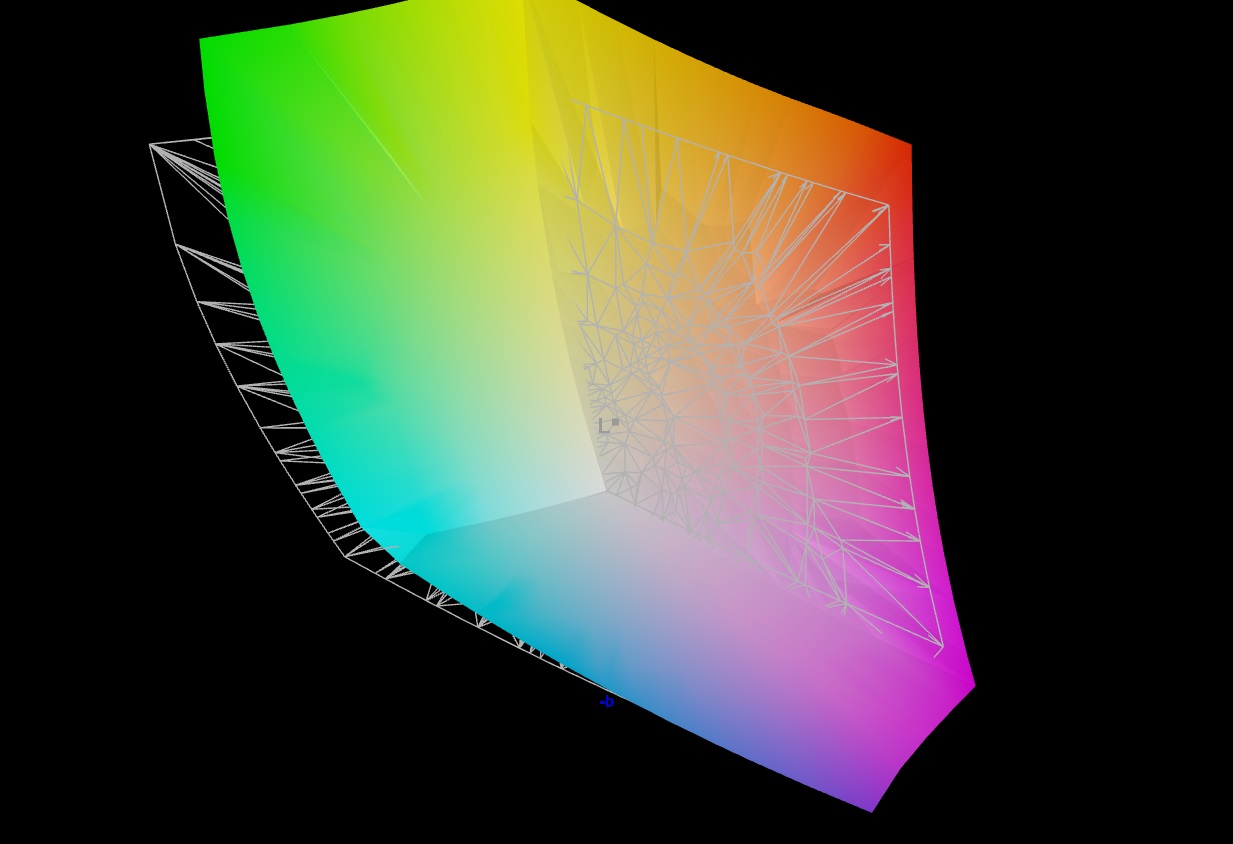
90% AdobeRGB 1998 (Argyll 3D)
100% sRGB (Argyll 3D)
99.9% Display P3 (Argyll 3D)
Gamma: 2.042
CCT: 6578 K
| Asus ROG Strix Scar 18 G834JYR (2024) BOE NE180QDM-NM1, Mini LED, 2560x1600, 18" | Alienware m18 R1 AMD BOE NE18NZ1, IPS, 1920x1200, 18" | Alienware m18 R1 Chi Mei 180JME, IPS, 1920x1200, 18" | Acer Predator Helios 18 N23Q2 AUO45A8 (B180QAN01.2), IPS, 2560x1600, 18" | Razer Blade 18 RTX 4070 AU Optronics B180QAN01.0, IPS, 2560x1600, 18" | MSI Titan 18 HX A14VIG AU Optronics B180ZAN01.0, Mini-LED, 3840x2400, 18" | Asus ROG Strix Scar 18 2023 G834JY-N6005W NE180QDM-NZ2, IPS, 2560x1600, 18" | |
|---|---|---|---|---|---|---|---|
| Display | -1% | -1% | 1% | -3% | -2% | -3% | |
| Display P3 Coverage (%) | 99.9 | 98.5 -1% | 97.7 -2% | 99.8 0% | 96.9 -3% | 98.1 -2% | 97.2 -3% |
| sRGB Coverage (%) | 100 | 99.7 0% | 100 0% | 100 0% | 99.8 0% | 99.8 0% | 99.9 0% |
| AdobeRGB 1998 Coverage (%) | 90 | 88.7 -1% | 89.8 0% | 91.8 2% | 85.3 -5% | 86.2 -4% | 84.9 -6% |
| Response Times | 44% | 41% | -15% | 45% | -318% | 37% | |
| Response Time Grey 50% / Grey 80% * (ms) | 12 ? | 2.8 ? 77% | 3 ? 75% | 7.6 ? 37% | 4.2 ? 65% | 8.6 ? 28% | 5.41 ? 55% |
| Response Time Black / White * (ms) | 10.7 ? | 9.6 ? 10% | 9.9 ? 7% | 17.8 ? -66% | 8 ? 25% | 81.8 ? -664% | 8.62 ? 19% |
| PWM Frequency (Hz) | 5733 ? | 2509 | 2592 ? | ||||
| Screen | -42% | -64% | -114% | -142% | -85% | -211% | |
| Brightness middle (cd/m²) | 937 | 319.6 -66% | 372.8 -60% | 360 -62% | 549.6 -41% | 467.5 -50% | 490 -48% |
| Brightness (cd/m²) | 934 | 304 -67% | 367 -61% | 355 -62% | 524 -44% | 459 -51% | 468 -50% |
| Brightness Distribution (%) | 89 | 87 -2% | 97 9% | 92 3% | 89 0% | 90 1% | 86 -3% |
| Black Level * (cd/m²) | 0.066 | 0.25 -279% | 0.32 -385% | 0.21 -218% | 0.53 -703% | 0.54 -718% | |
| Contrast (:1) | 14197 | 1278 -91% | 1165 -92% | 1714 -88% | 1037 -93% | 907 -94% | |
| Colorchecker dE 2000 * | 1.52 | 1.22 20% | 1.92 -26% | 3.82 -151% | 3.32 -118% | 3.77 -148% | 4.97 -227% |
| Colorchecker dE 2000 max. * | 2.82 | 3.1 -10% | 3.65 -29% | 7.38 -162% | 6.63 -135% | 6.12 -117% | 11.02 -291% |
| Colorchecker dE 2000 calibrated * | 1.21 | 0.47 61% | 0.51 58% | 2.24 -85% | 2.7 -123% | 2.94 -143% | 2.97 -145% |
| Greyscale dE 2000 * | 1.7 | 0.8 53% | 1.5 12% | 5.06 -198% | 2 -18% | 3.2 -88% | 7.2 -324% |
| Gamma | 2.042 108% | 2.23 99% | 2.34 94% | 2.52 87% | 2.29 96% | 2.43 91% | 2.161 102% |
| CCT | 6578 99% | 6471 100% | 6607 98% | 5657 115% | 6319 103% | 6478 100% | 6515 100% |
| Media totale (Programma / Settaggio) | 0% /
-21% | -8% /
-35% | -43% /
-75% | -33% /
-85% | -135% /
-103% | -59% /
-131% |
* ... Meglio usare valori piccoli
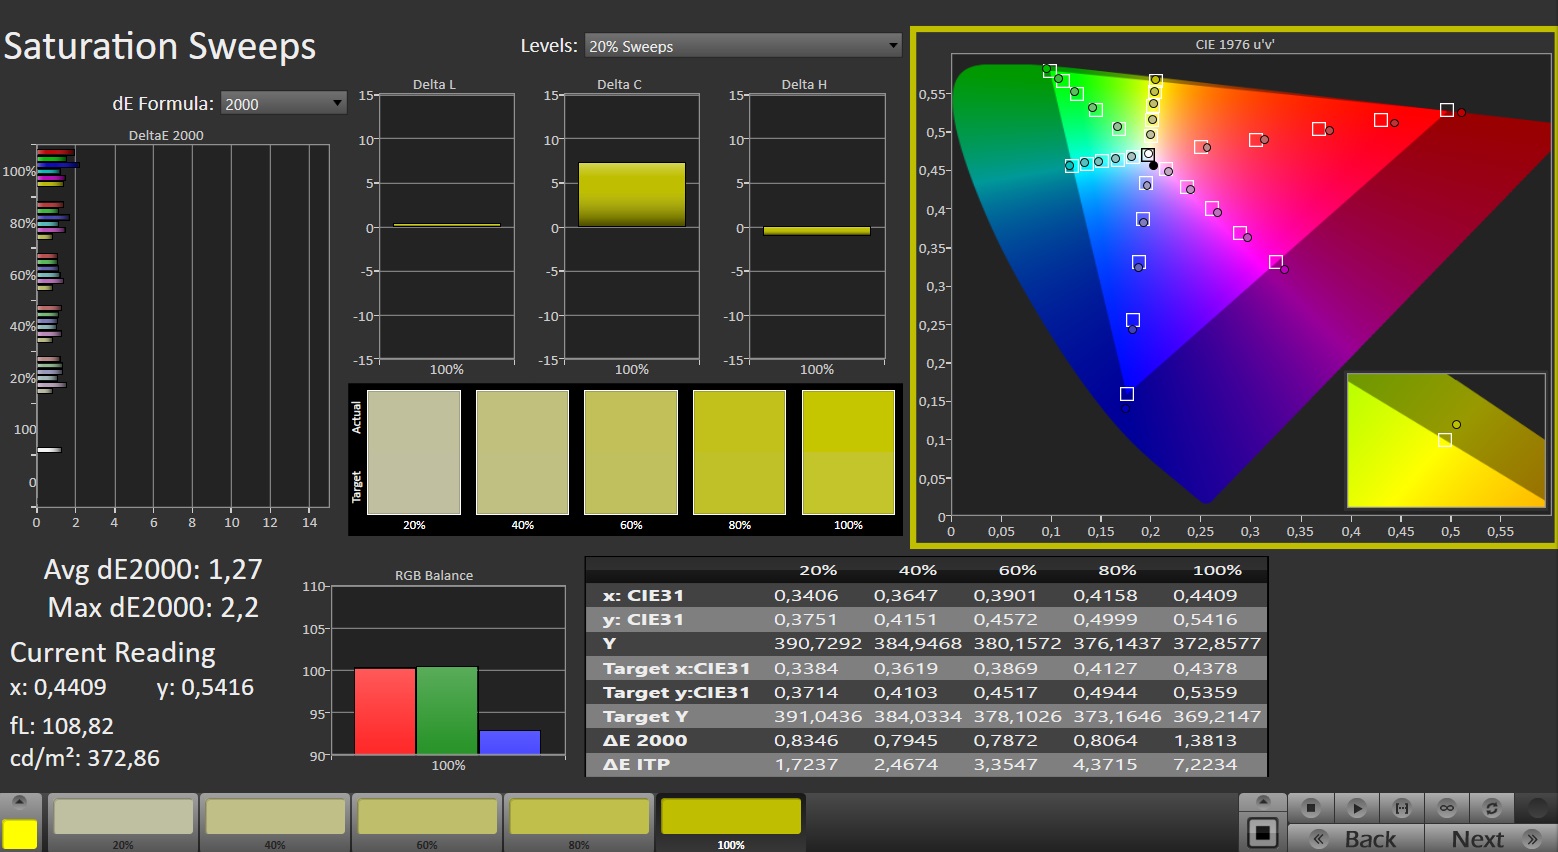
L'accuratezza del colore è un dato di fatto, con gli spazi colore sRGB e DCI-P3 coperti completamente e lo spazio colore Adobe RGB al 90%. Grazie alla certificazione Pantone, la riproduzione del colore è già molto buona allo stato di consegna, e con una deviazione di 1,52 si raggiunge l'obiettivo di DeltaE < 3. Sebbene una calibrazione aggiuntiva permetta di ottenere un leggero miglioramento, questo riguarda principalmente una scala di grigi più equilibrata.

Tempi di risposta del Display
| ↔ Tempi di risposta dal Nero al Bianco | ||
|---|---|---|
| 10.7 ms ... aumenta ↗ e diminuisce ↘ combinato | ↗ 7.6 ms Incremento | 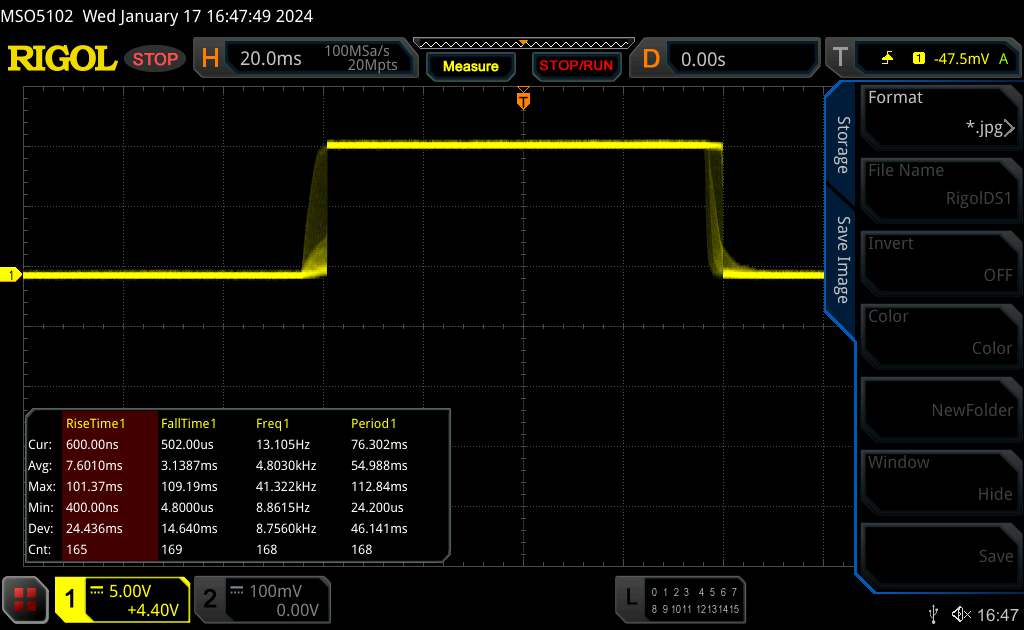 |
| ↘ 3.1 ms Calo | ||
| Lo schermo mostra buoni tempi di risposta durante i nostri tests, ma potrebbe essere troppo lento per i gamers competitivi. In confronto, tutti i dispositivi di test variano da 0.1 (minimo) a 240 (massimo) ms. » 29 % di tutti i dispositivi è migliore. Questo significa che i tempi di risposta rilevati sono migliori rispettto alla media di tutti i dispositivi testati (19.8 ms). | ||
| ↔ Tempo di risposta dal 50% Grigio all'80% Grigio | ||
| 12 ms ... aumenta ↗ e diminuisce ↘ combinato | ↗ 8 ms Incremento | |
| ↘ 4 ms Calo | ||
| Lo schermo mostra buoni tempi di risposta durante i nostri tests, ma potrebbe essere troppo lento per i gamers competitivi. In confronto, tutti i dispositivi di test variano da 0.165 (minimo) a 636 (massimo) ms. » 25 % di tutti i dispositivi è migliore. Questo significa che i tempi di risposta rilevati sono migliori rispettto alla media di tutti i dispositivi testati (31 ms). | ||
Sfarfallio dello schermo / PWM (Pulse-Width Modulation)
| flickering dello schermo / PWM rilevato | 5733 Hz | |
| ≤ 94 luminosita' cd/m² | ||
Il display sfarfalla a 5733 Hz (Probabilmente a causa dell'uso di PWM) Flickering rilevato ad una luminosita' di 94 cd/m² o inferiore. Non dovrebbe verificarsi flickering o PWM sopra questo valore di luminosita'. La frequenza di 5733 Hz è abbastanza alta, quindi la maggioranza degli utenti sensibili al PWM non dovrebbero notare alcun flickering. Il flickering di verifica con settaggi di luminosita' relativamente bassa, quindi un utilizzo prolungato a questi livelli o a livelli ingeriori potrebbe causare stanchezza agli occhi. In confronto: 52 % di tutti i dispositivi testati non utilizza PWM per ridurre la luminosita' del display. Se è rilevato PWM, una media di 7757 (minimo: 5 - massimo: 343500) Hz è stata rilevata. | ||
Il pannello IPS ha angoli di visione stabili e può essere letto da quasi tutte le angolazioni. L'elevata luminosità massima consente anche di leggere i contenuti dello schermo all'aperto.

Prestazioni - Lo Scar 18 offre un hardware di alto livello
Asus ROG Strix Scar 18 è un computer portatile di fascia alta nel formato da 18 pollici. Le prestazioni di calcolo necessarie sono fornite da Raptor Lake Refresh e dall'hardware Ada Lovelace. I prezzi partono da 3.600 Euro (~$3.878), e la nostra attuale unità di prova è disponibile a circa 4.500 Euro (~$4.848).
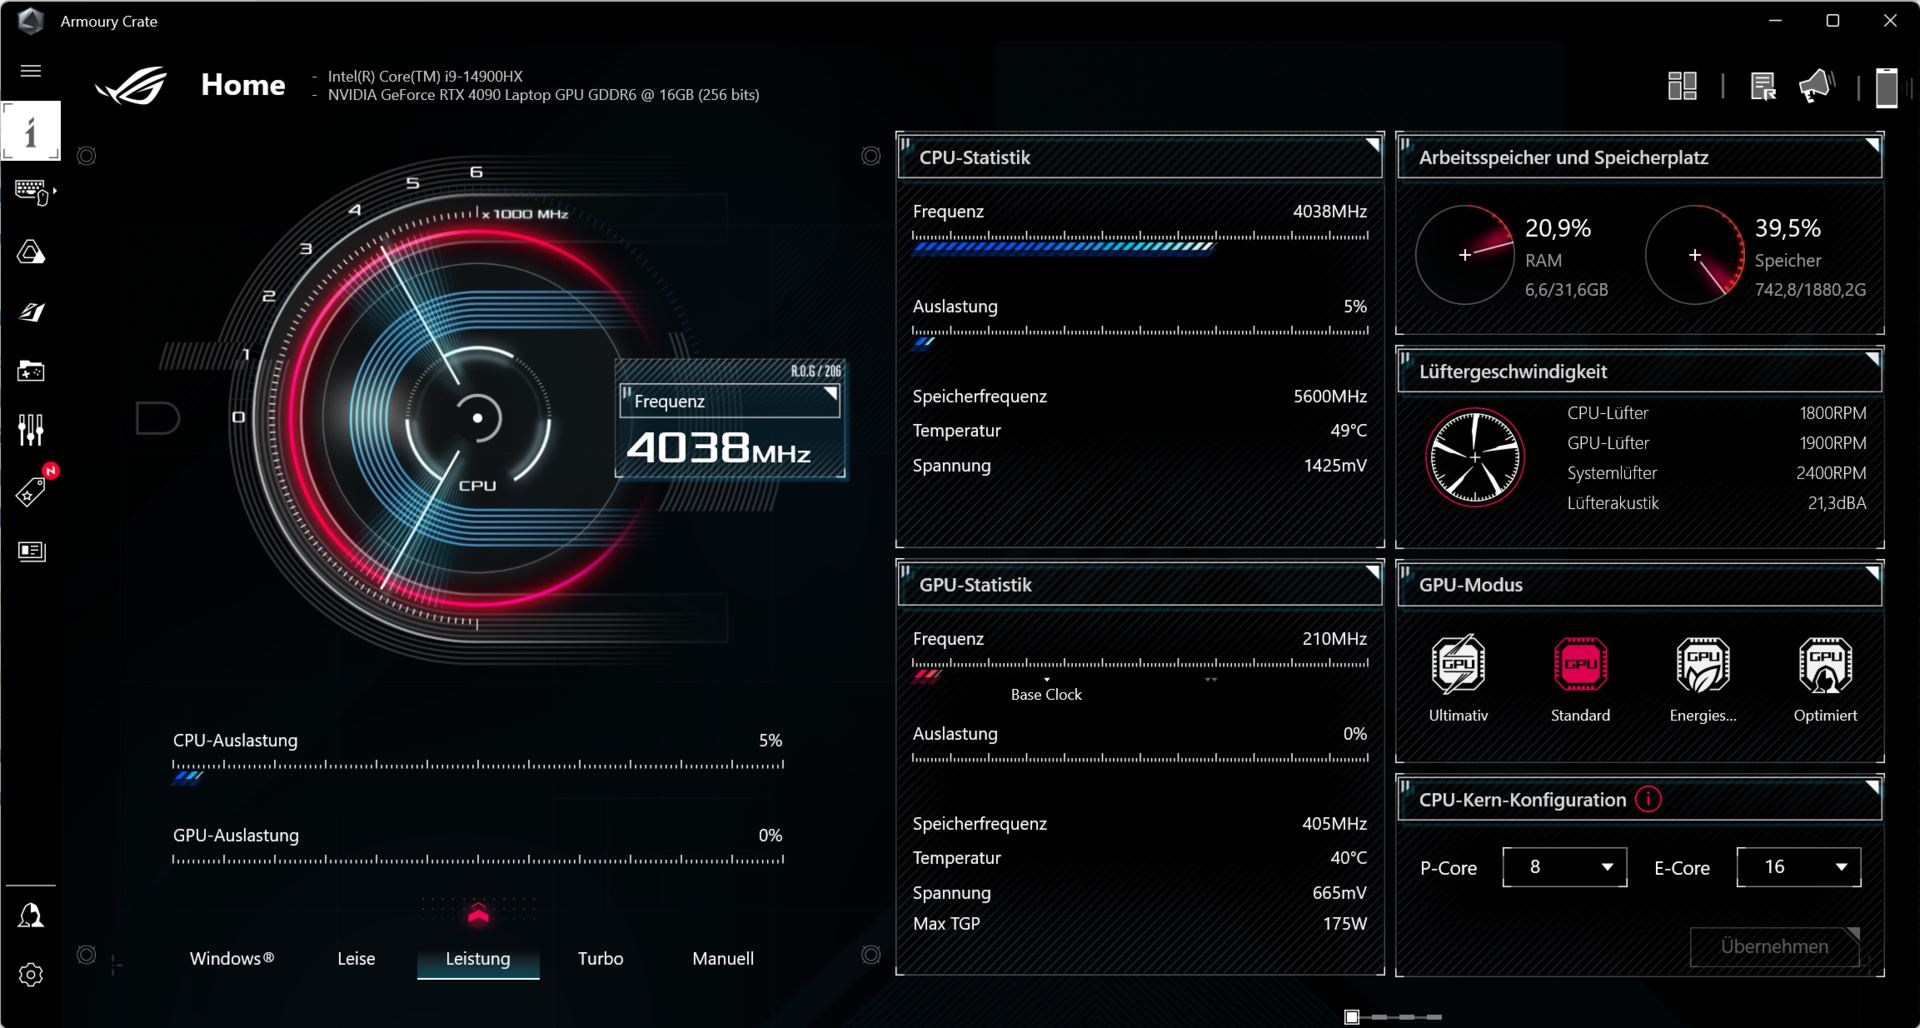
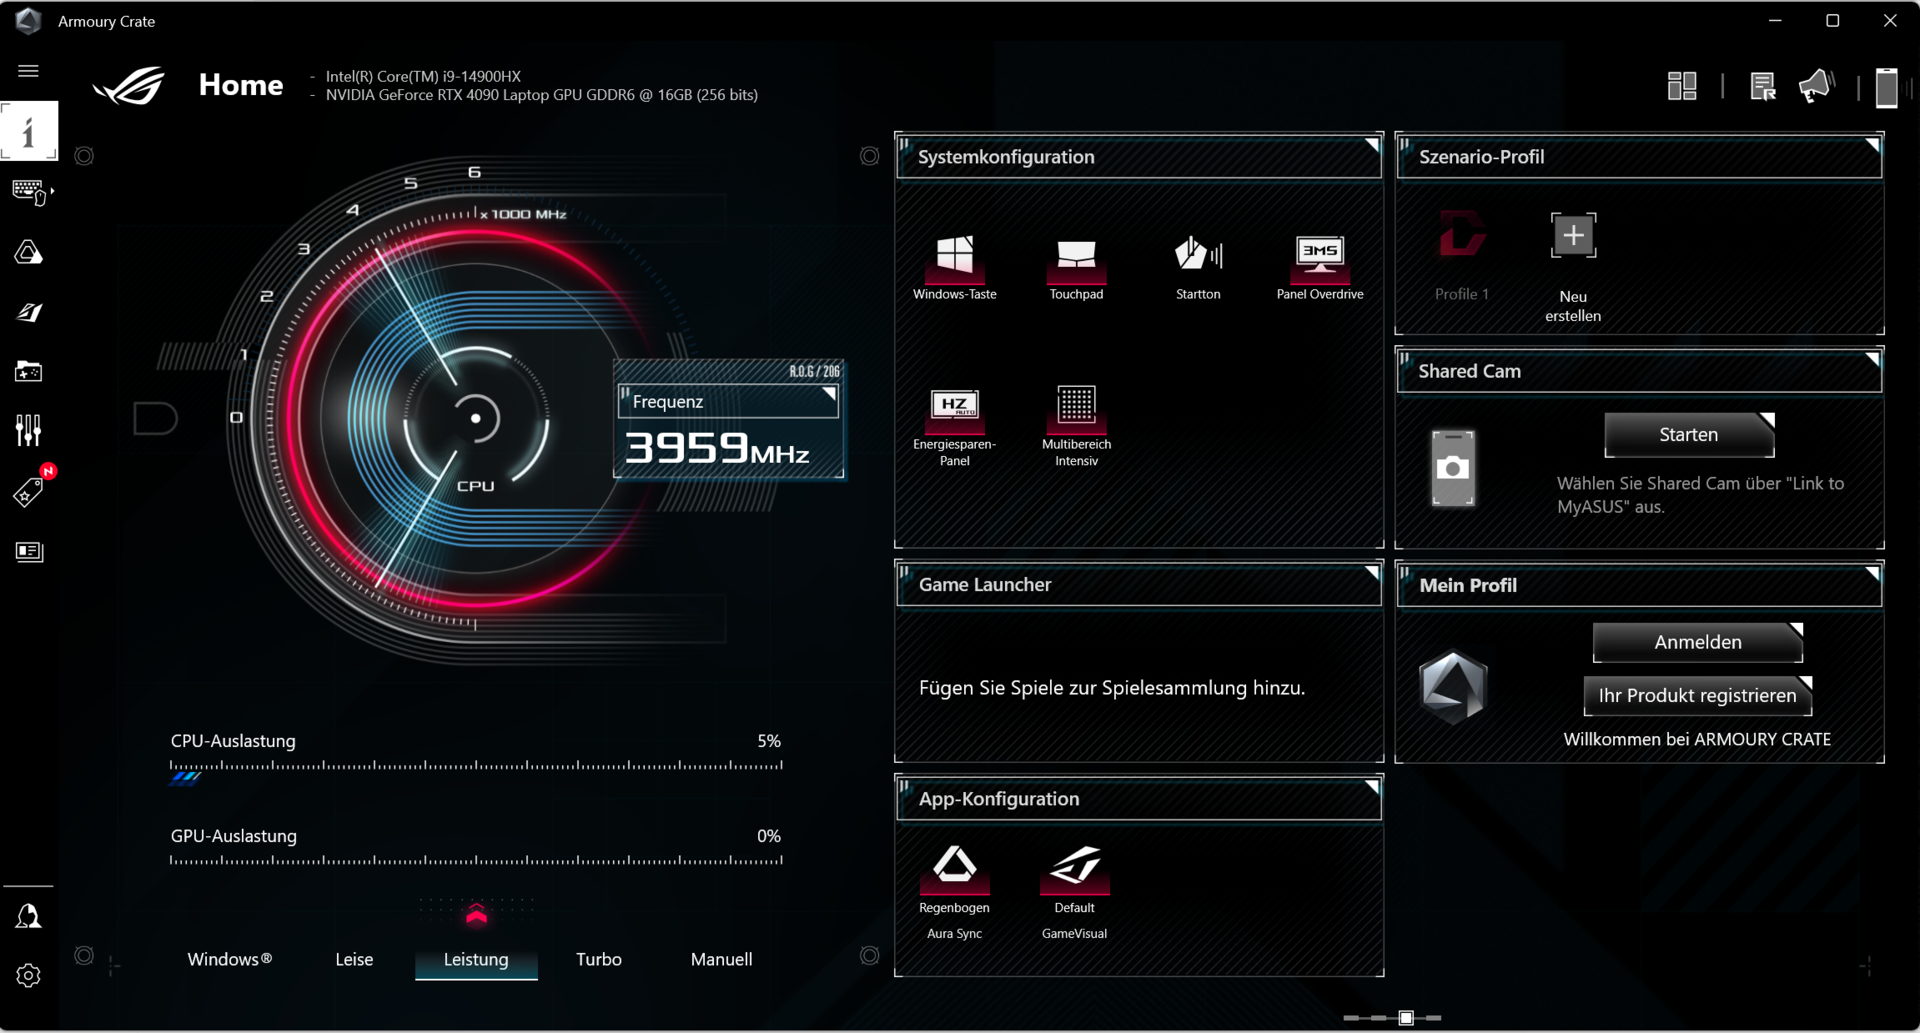
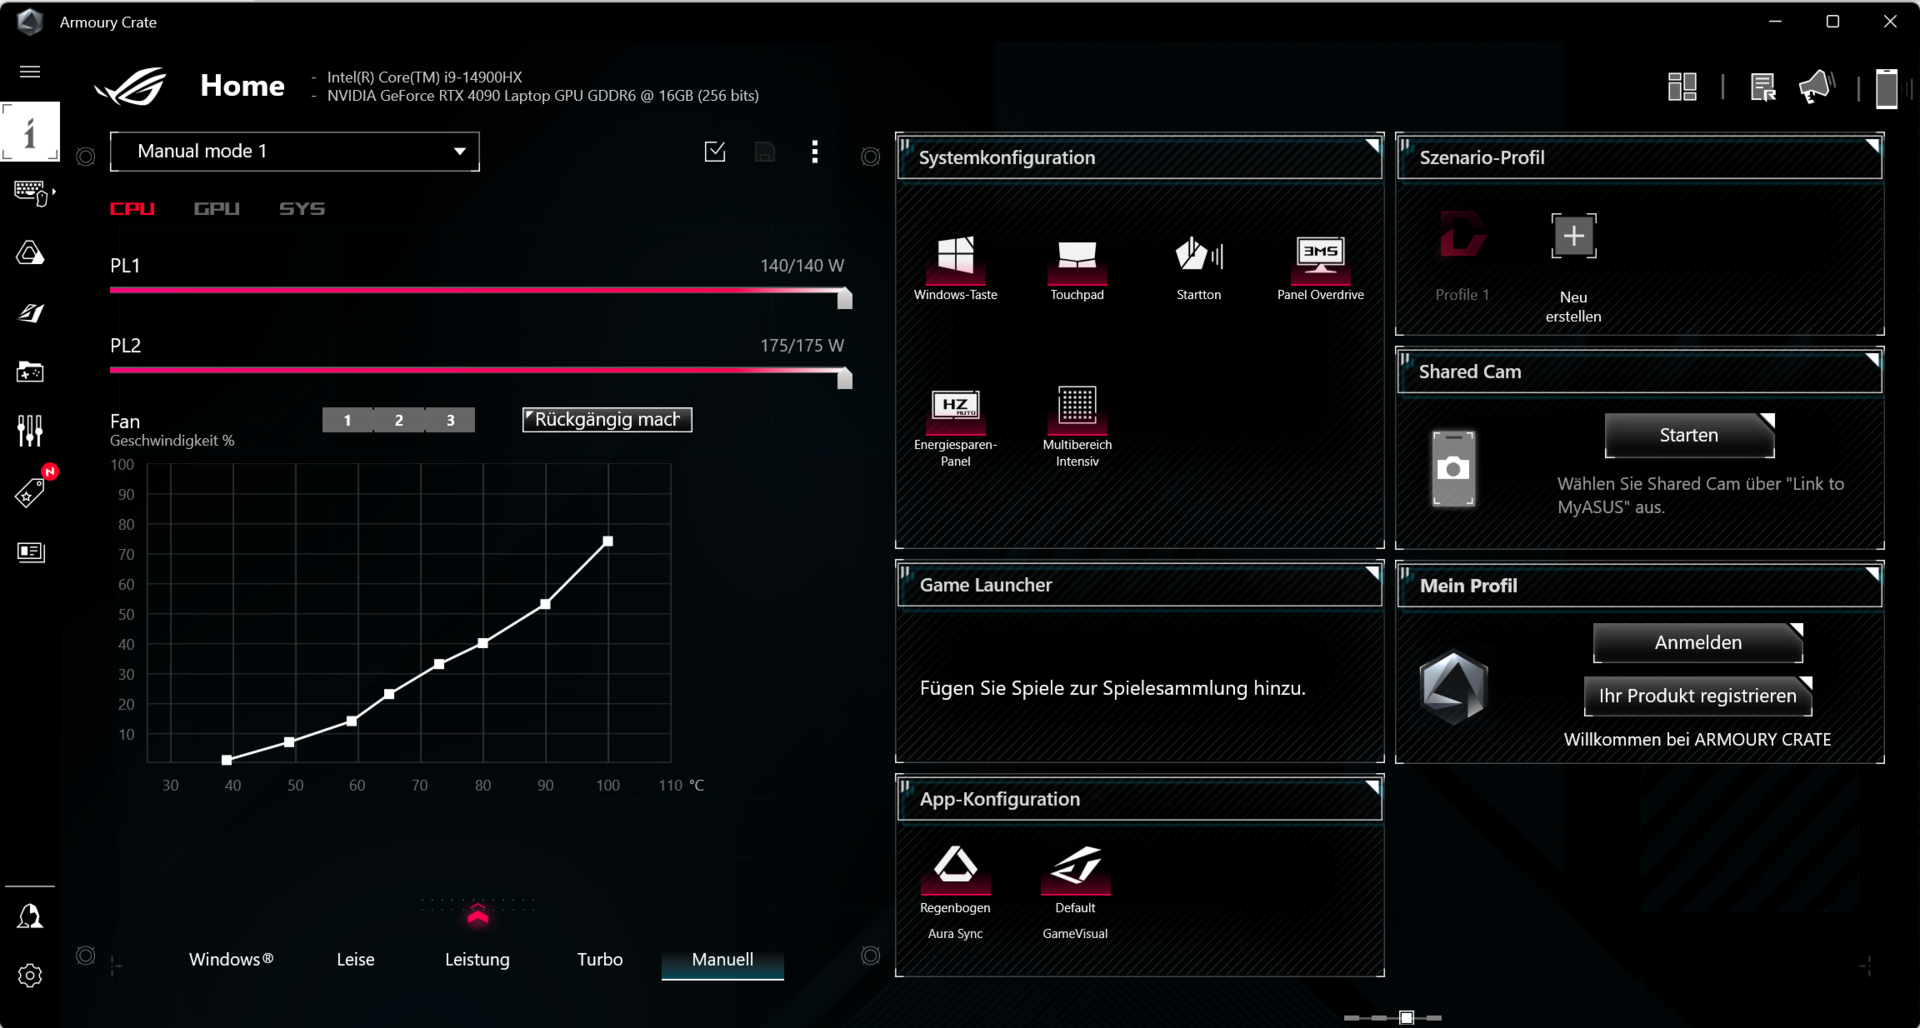
Condizioni del test
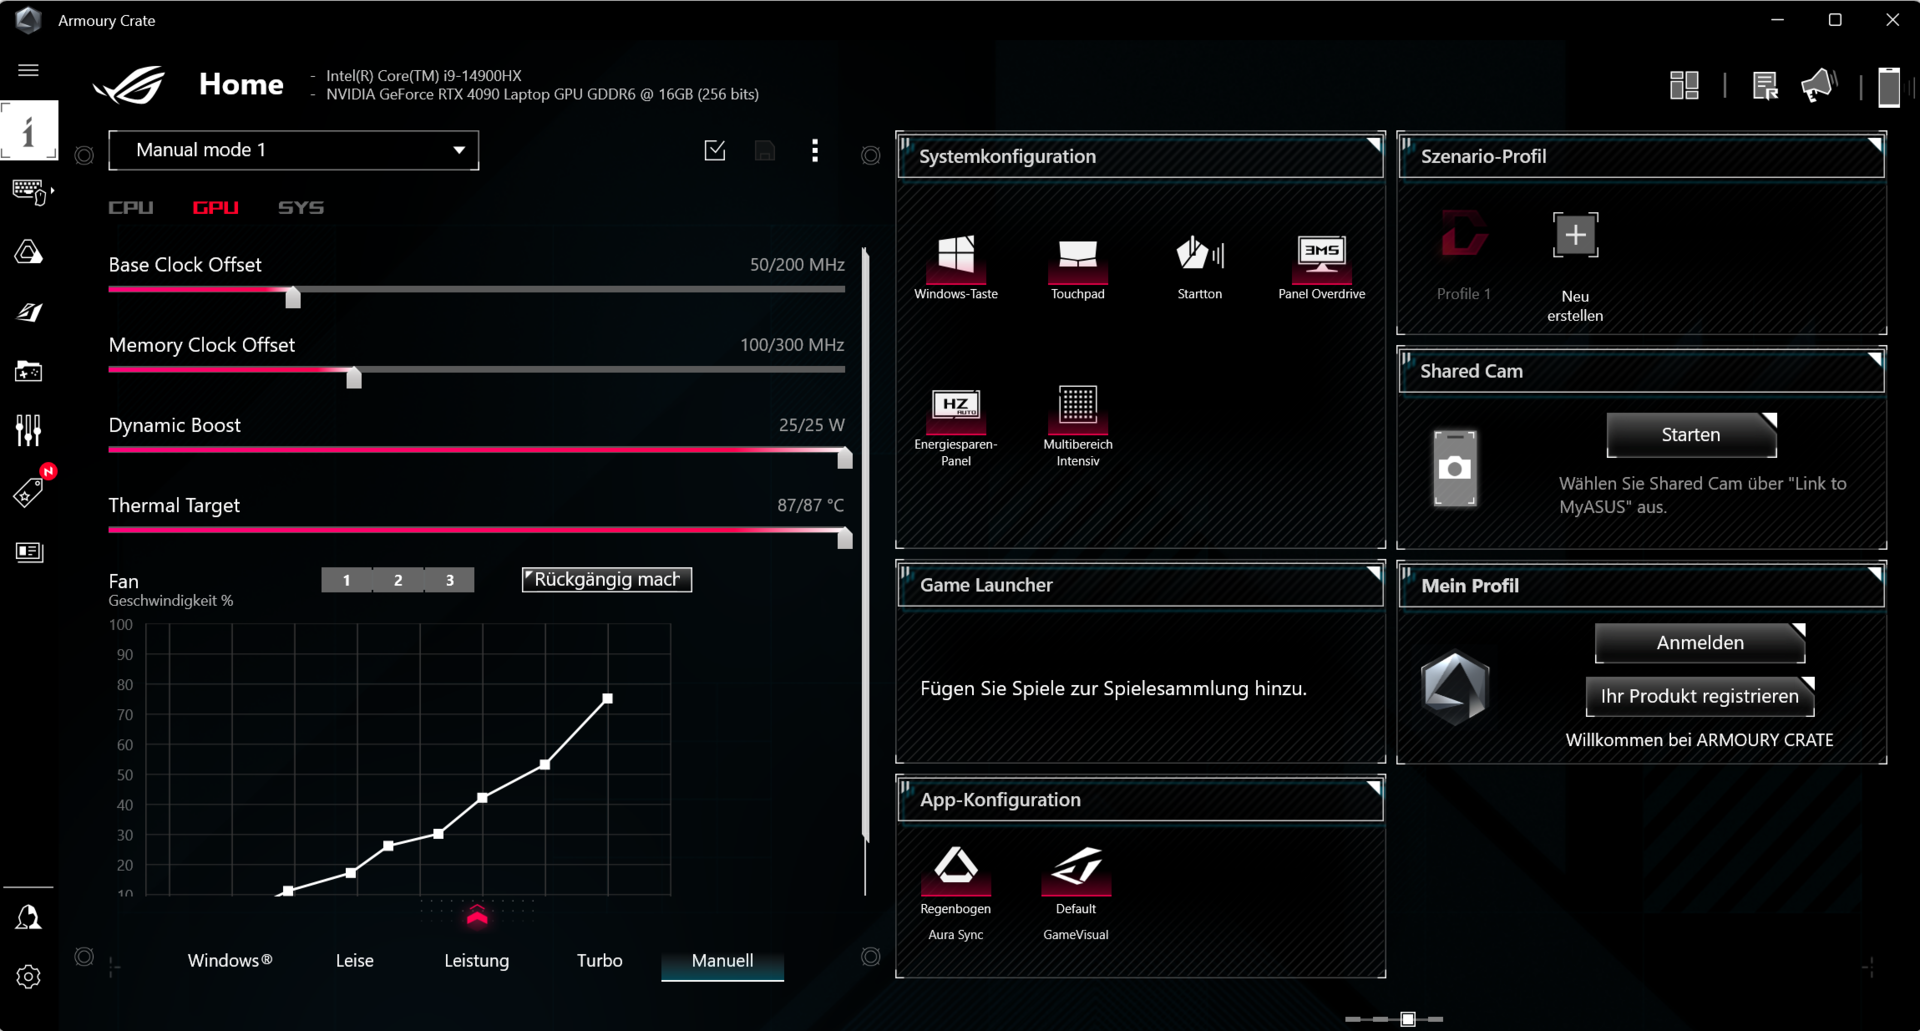
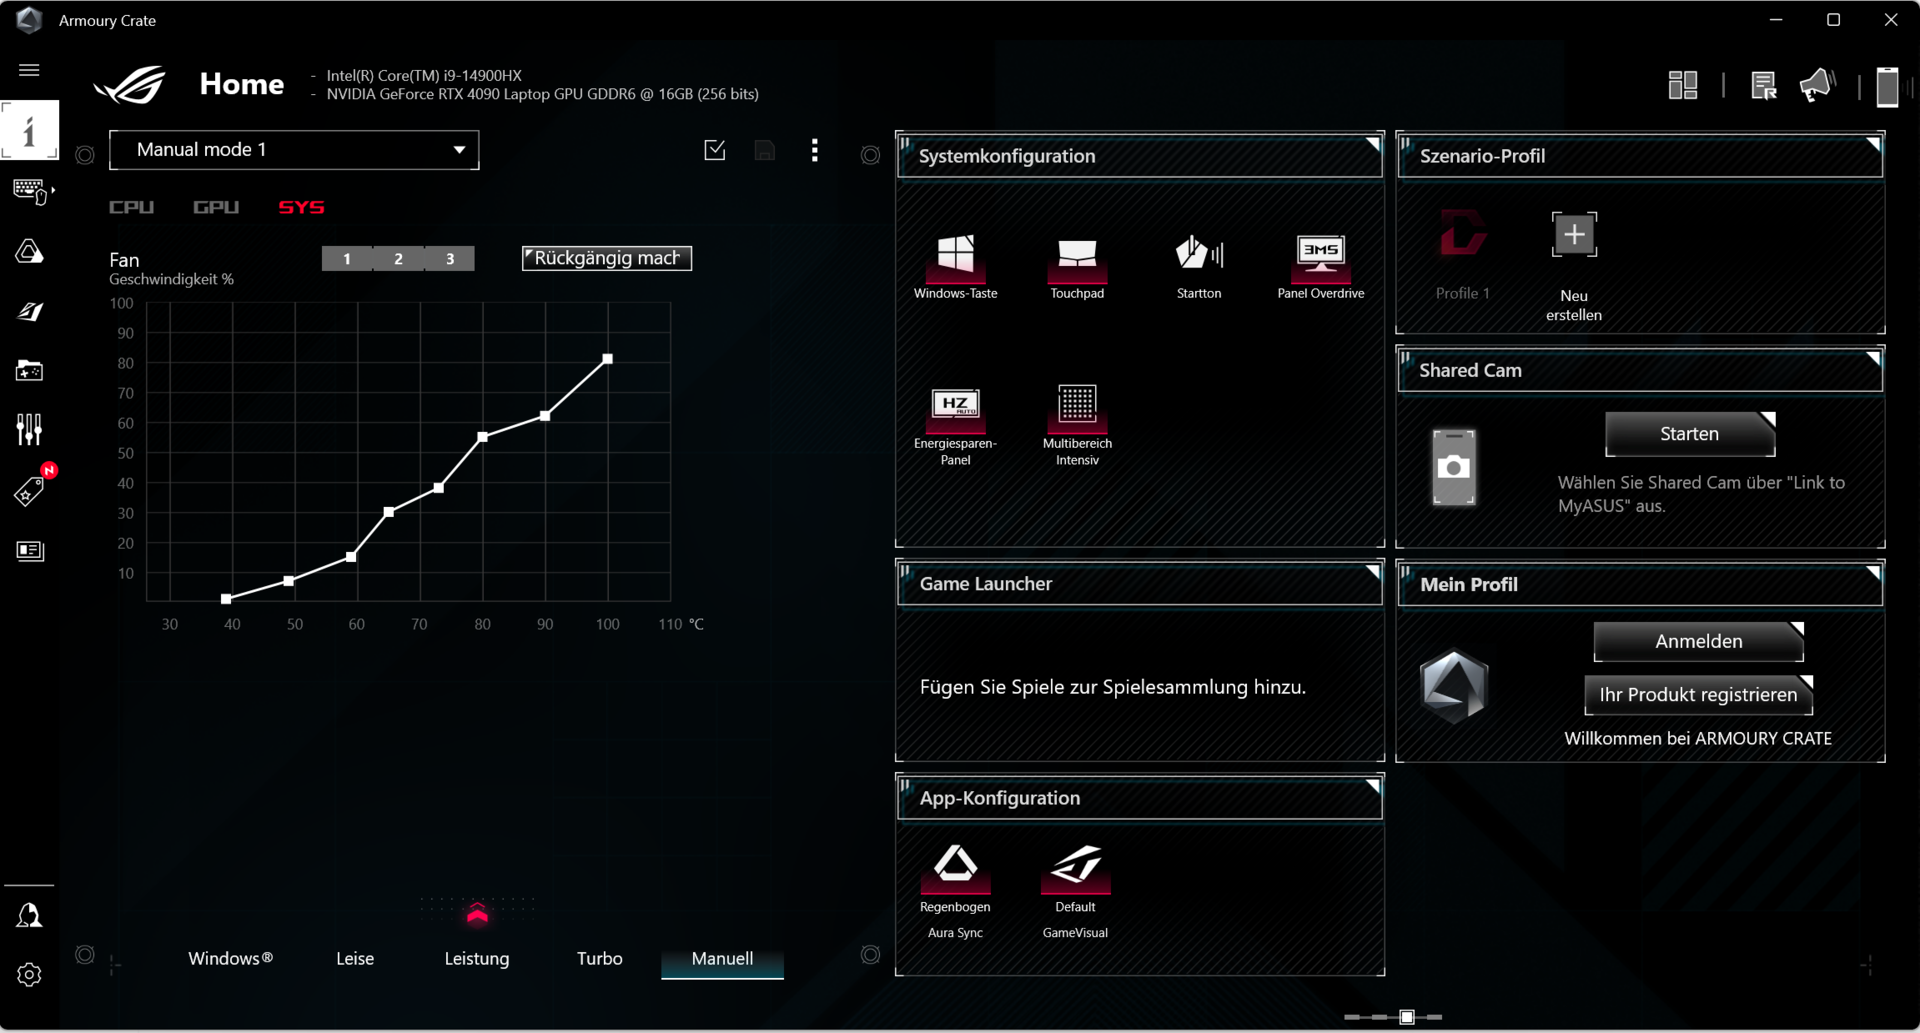
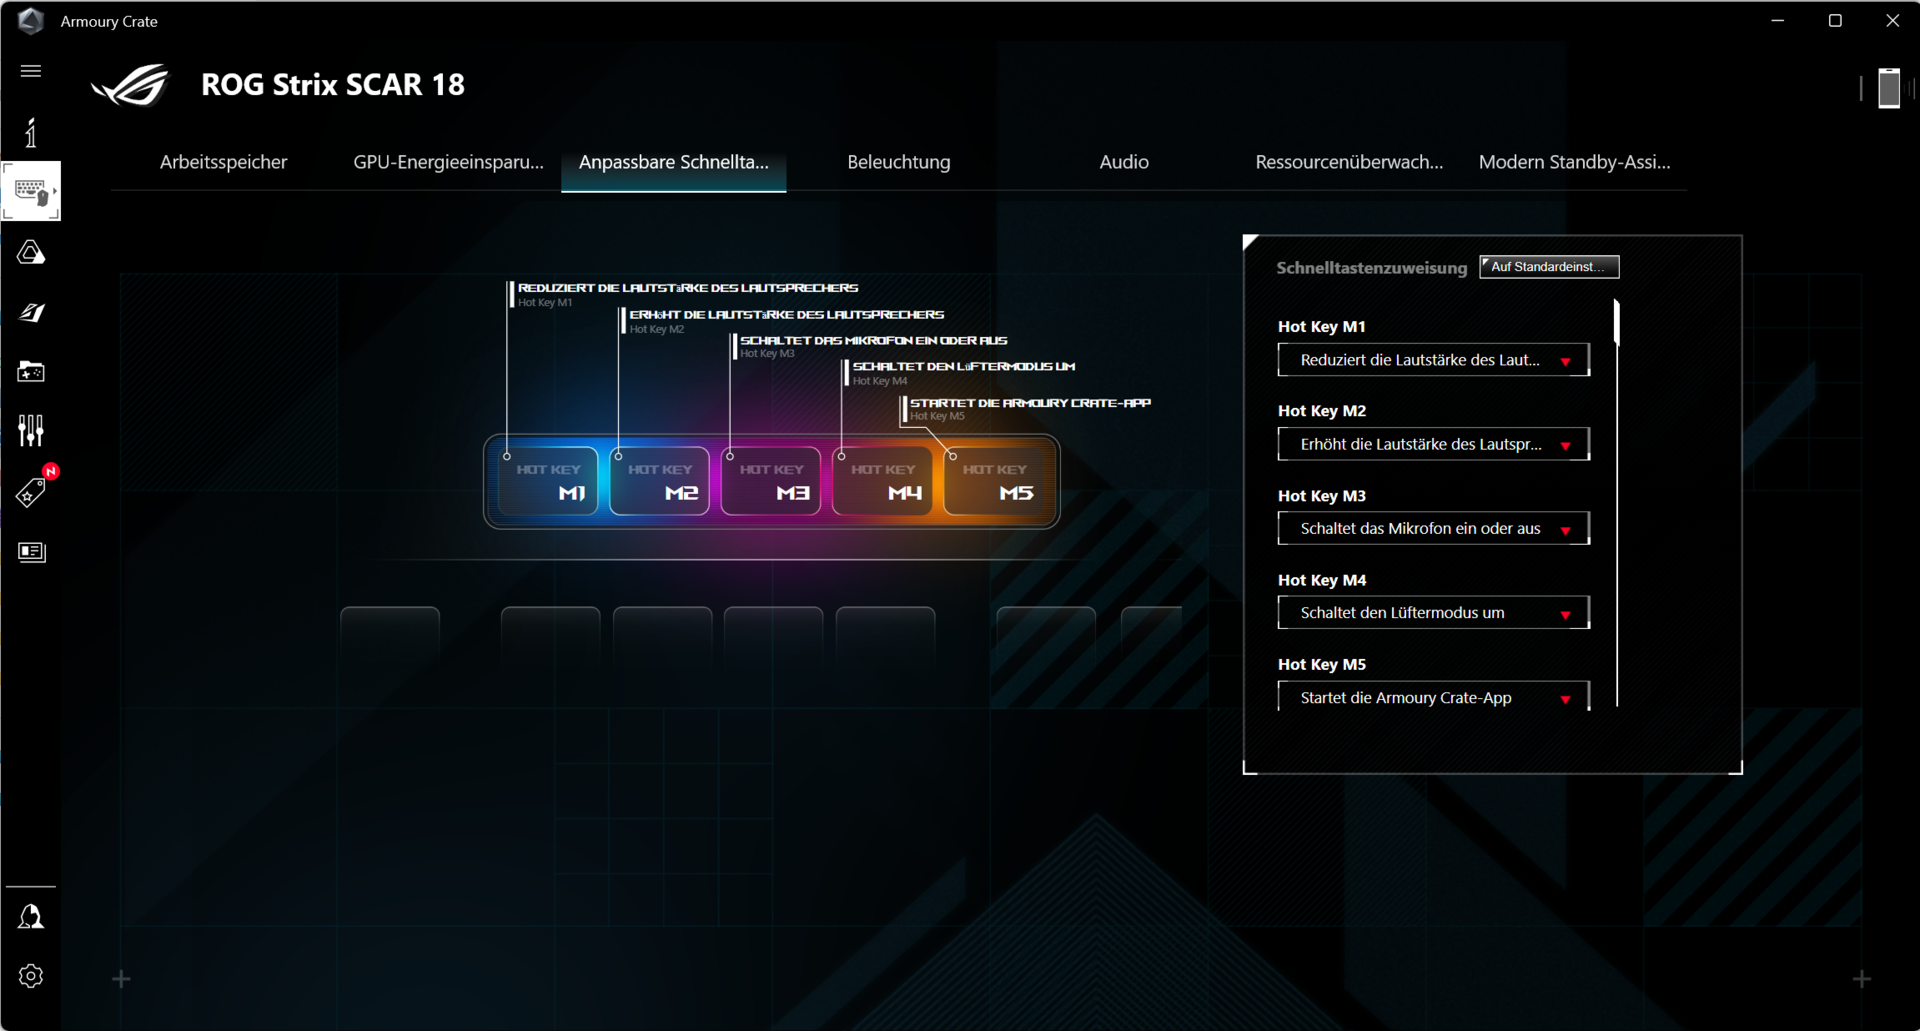
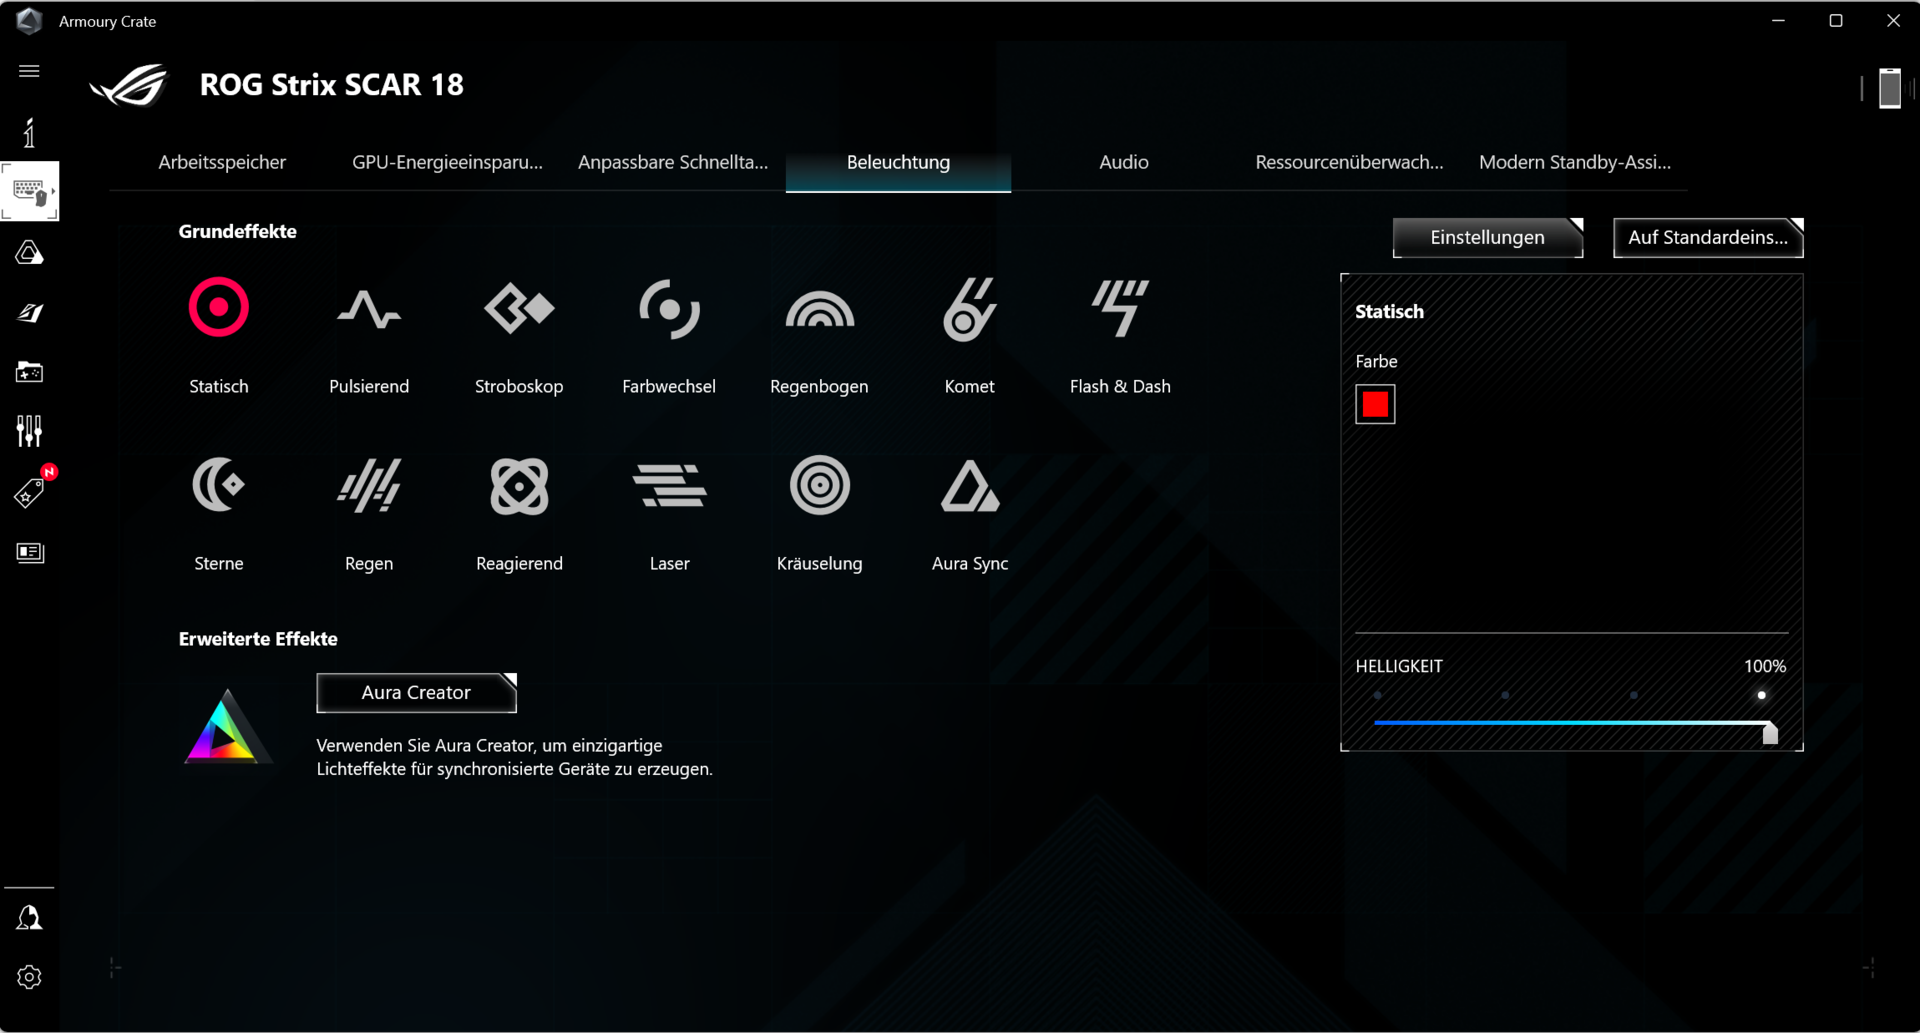
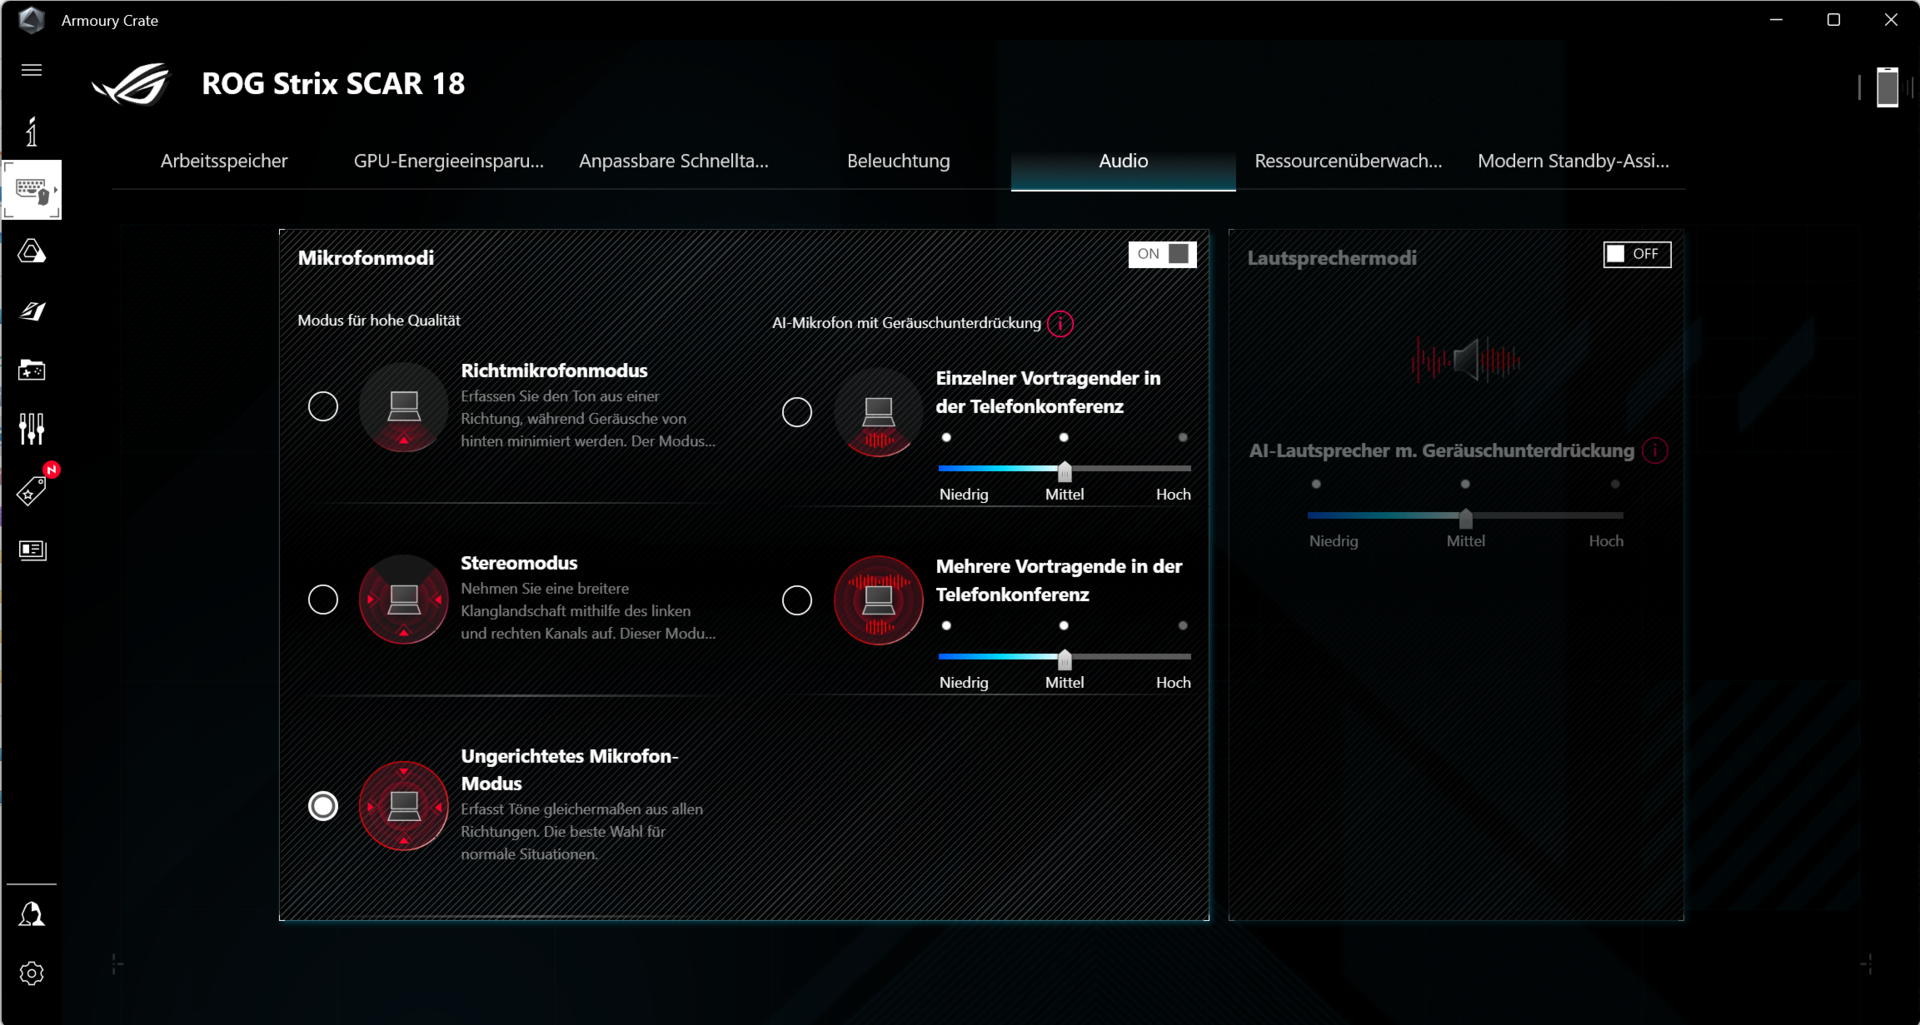
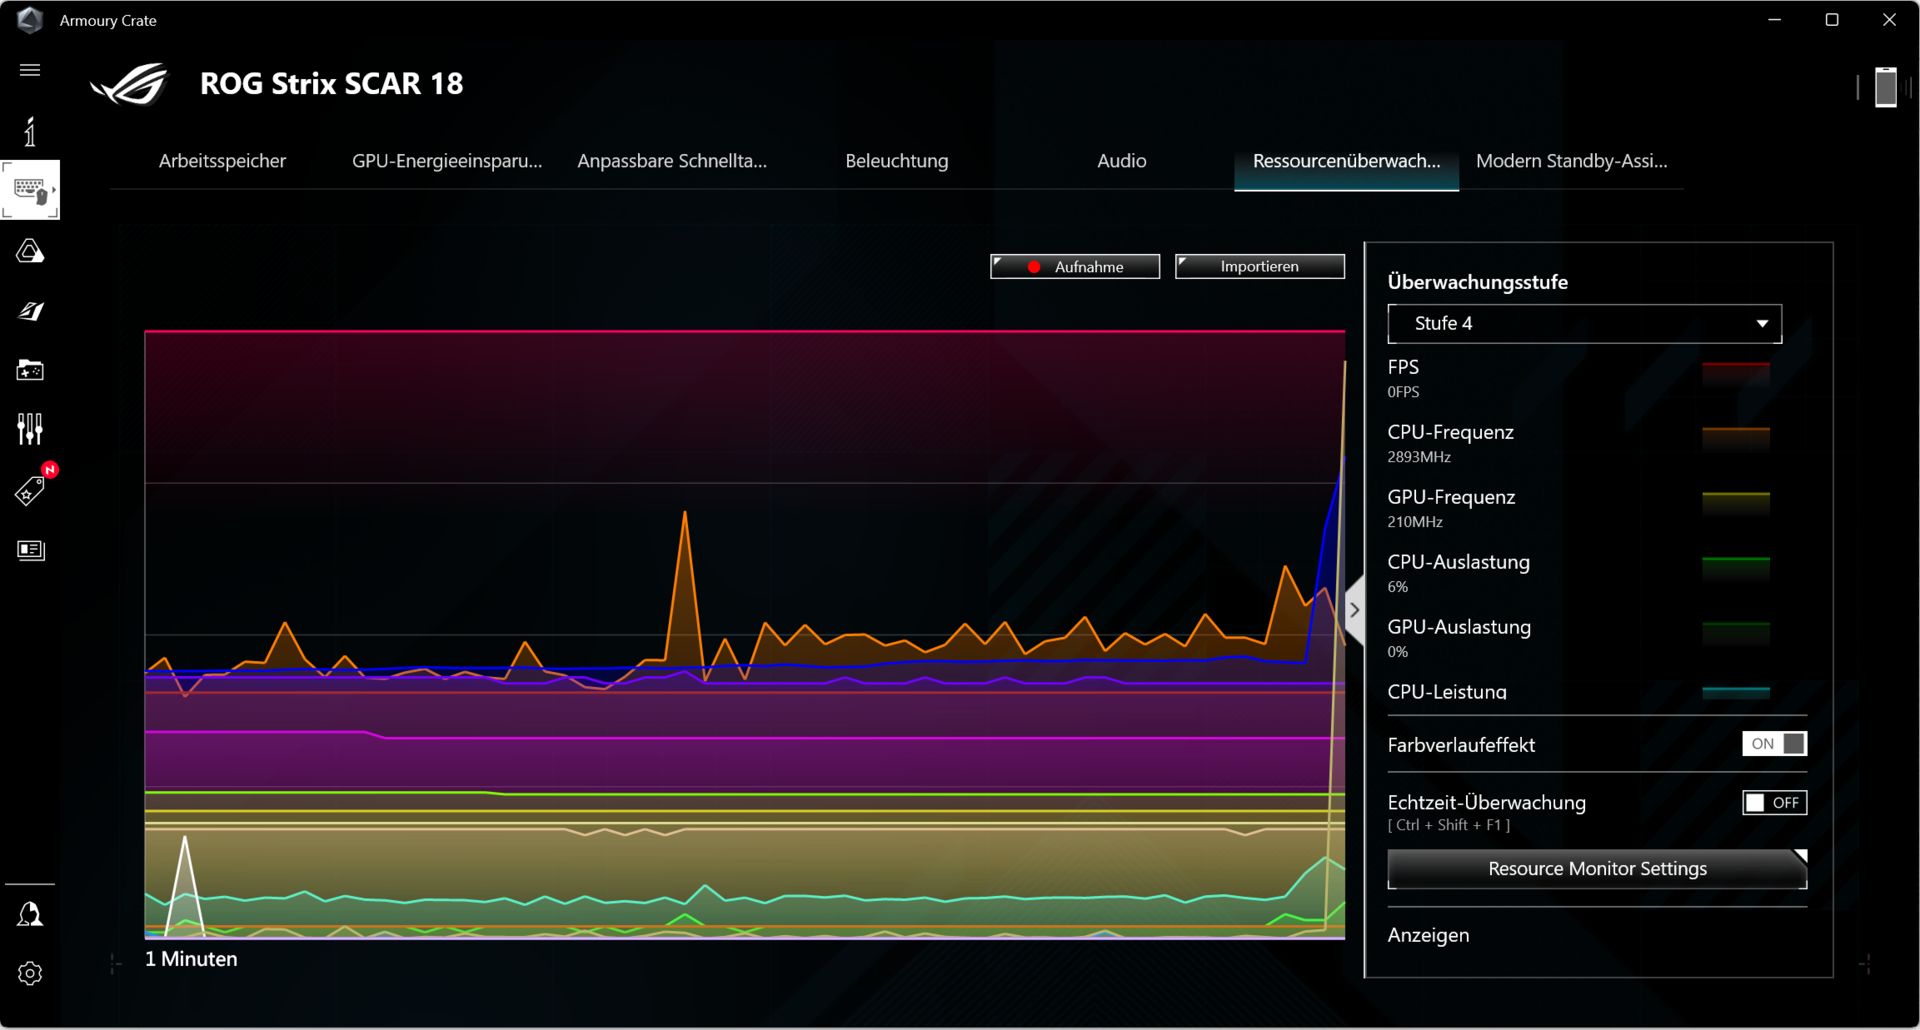
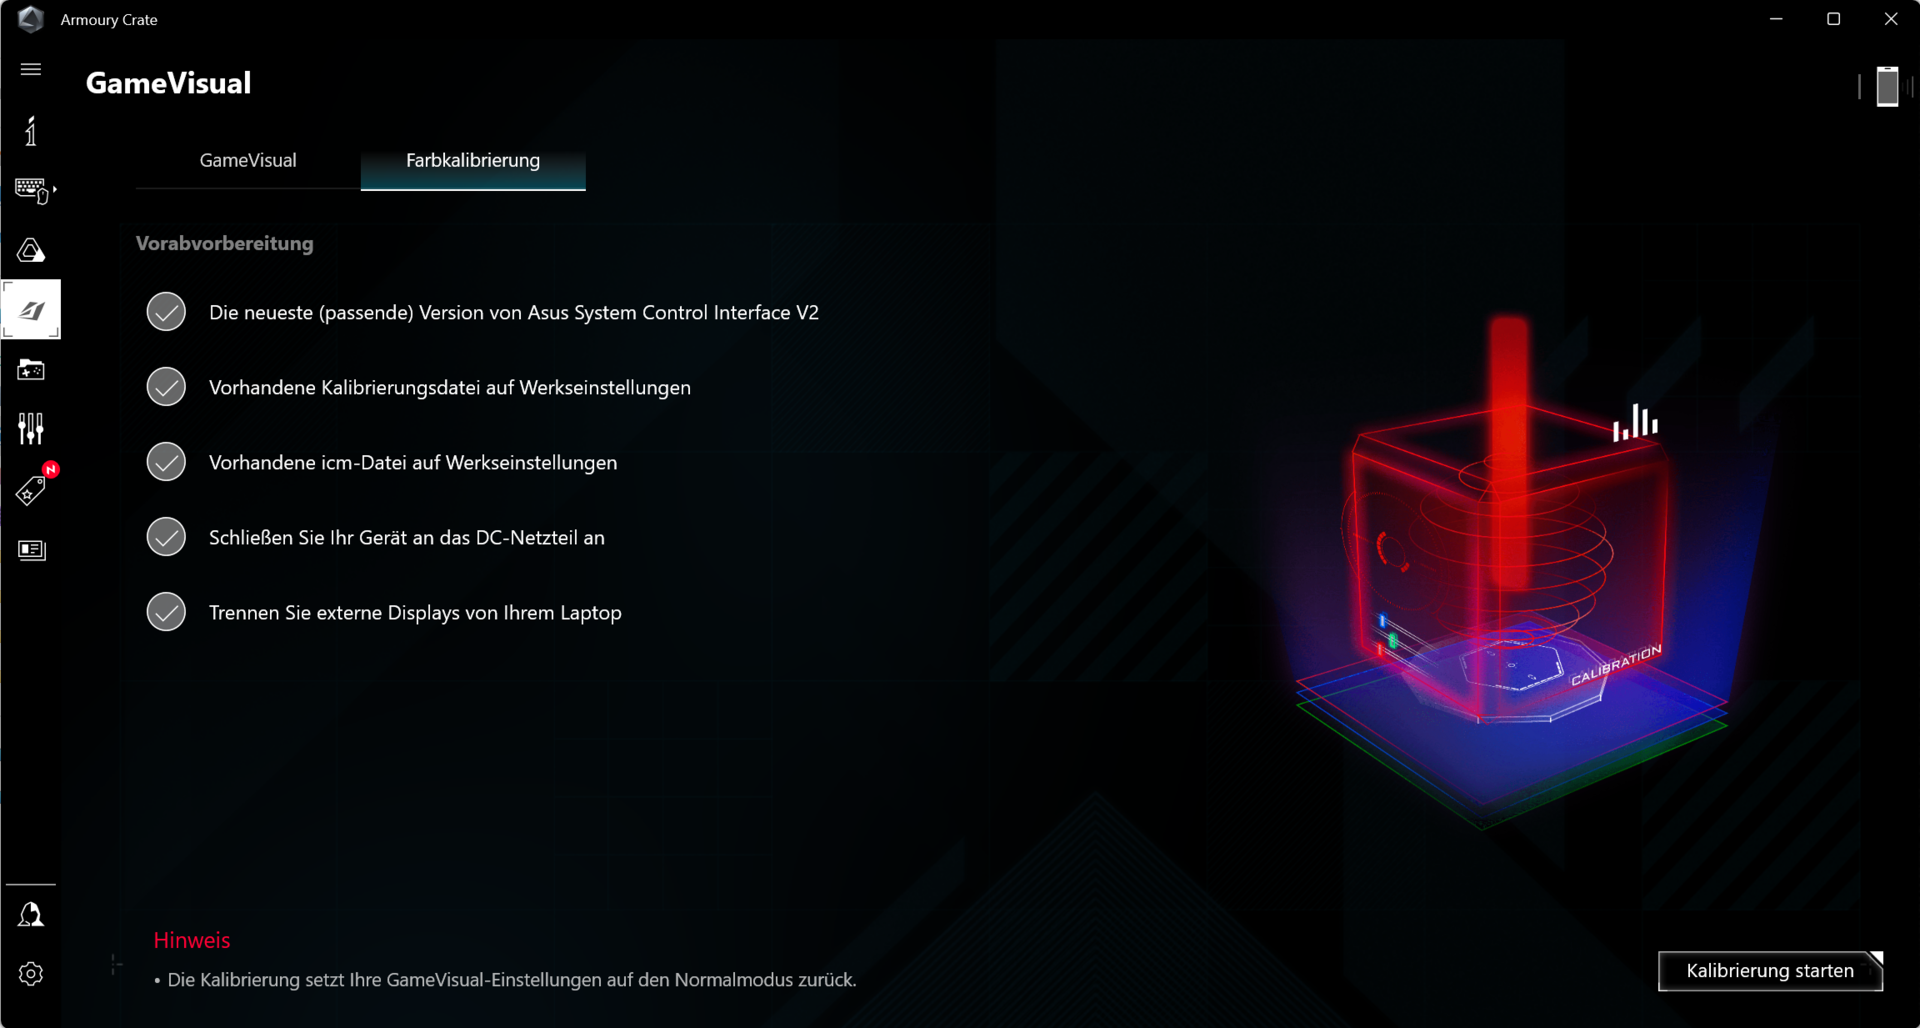
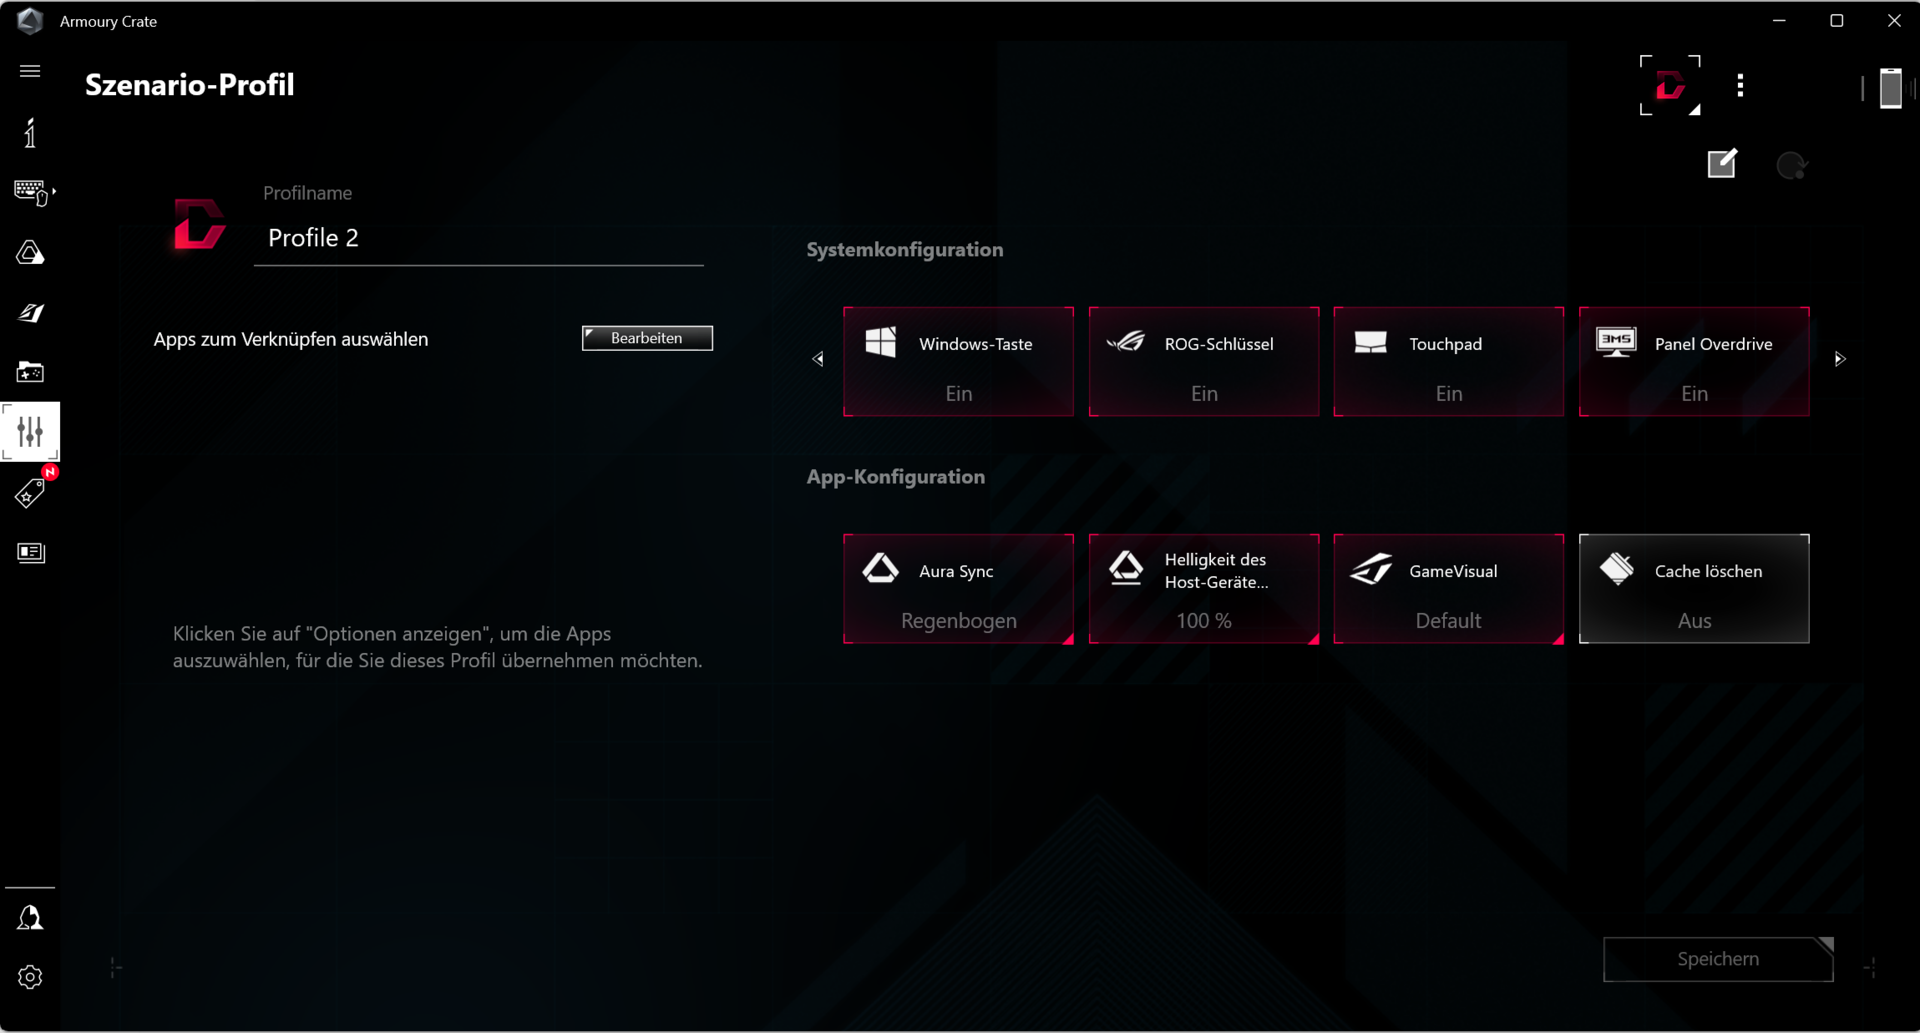
Sono disponibili tre modalità di alimentazione preconfigurate da Asus (vedere tabella), e può passare da una all'altra utilizzando la combinazione di tasti Fn + F5. Utilizziamo "Prestazioni" per i nostri benchmark e "Silenzioso" per i nostri test della batteria. La modalità GPU è impostata su "Standard". Il centro di controllo ("Armory Crate") del portatile consente di creare profili individuali ("Manuale"), compresa l'impostazione dei Limiti di potenza, del Boost dinamico e delle curve della ventola.
| Prestazioni | Turbo | Silenzioso | |
|---|---|---|---|
| Limite di potenza 1 (HWInfo) | 110 Watt | 175 Watt | 65 Watt |
| Limite di potenza 2 (HWInfo) | 120 Watt | 175 Watt | 100 Watt |
| Rumore (Il Witcher 3) | 50 dB(A) | 56 dB(A) | 35 dB(A) |
| Prestazioni (Il Witcher 3) | ~188 fps | ~183 fps | ~68 fps |
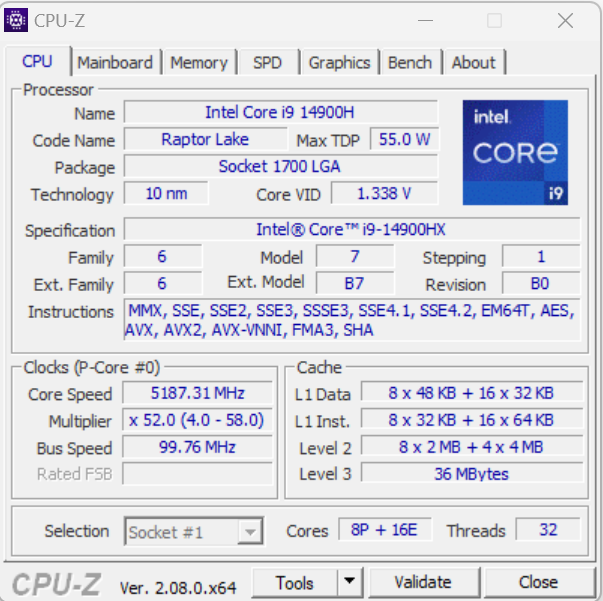
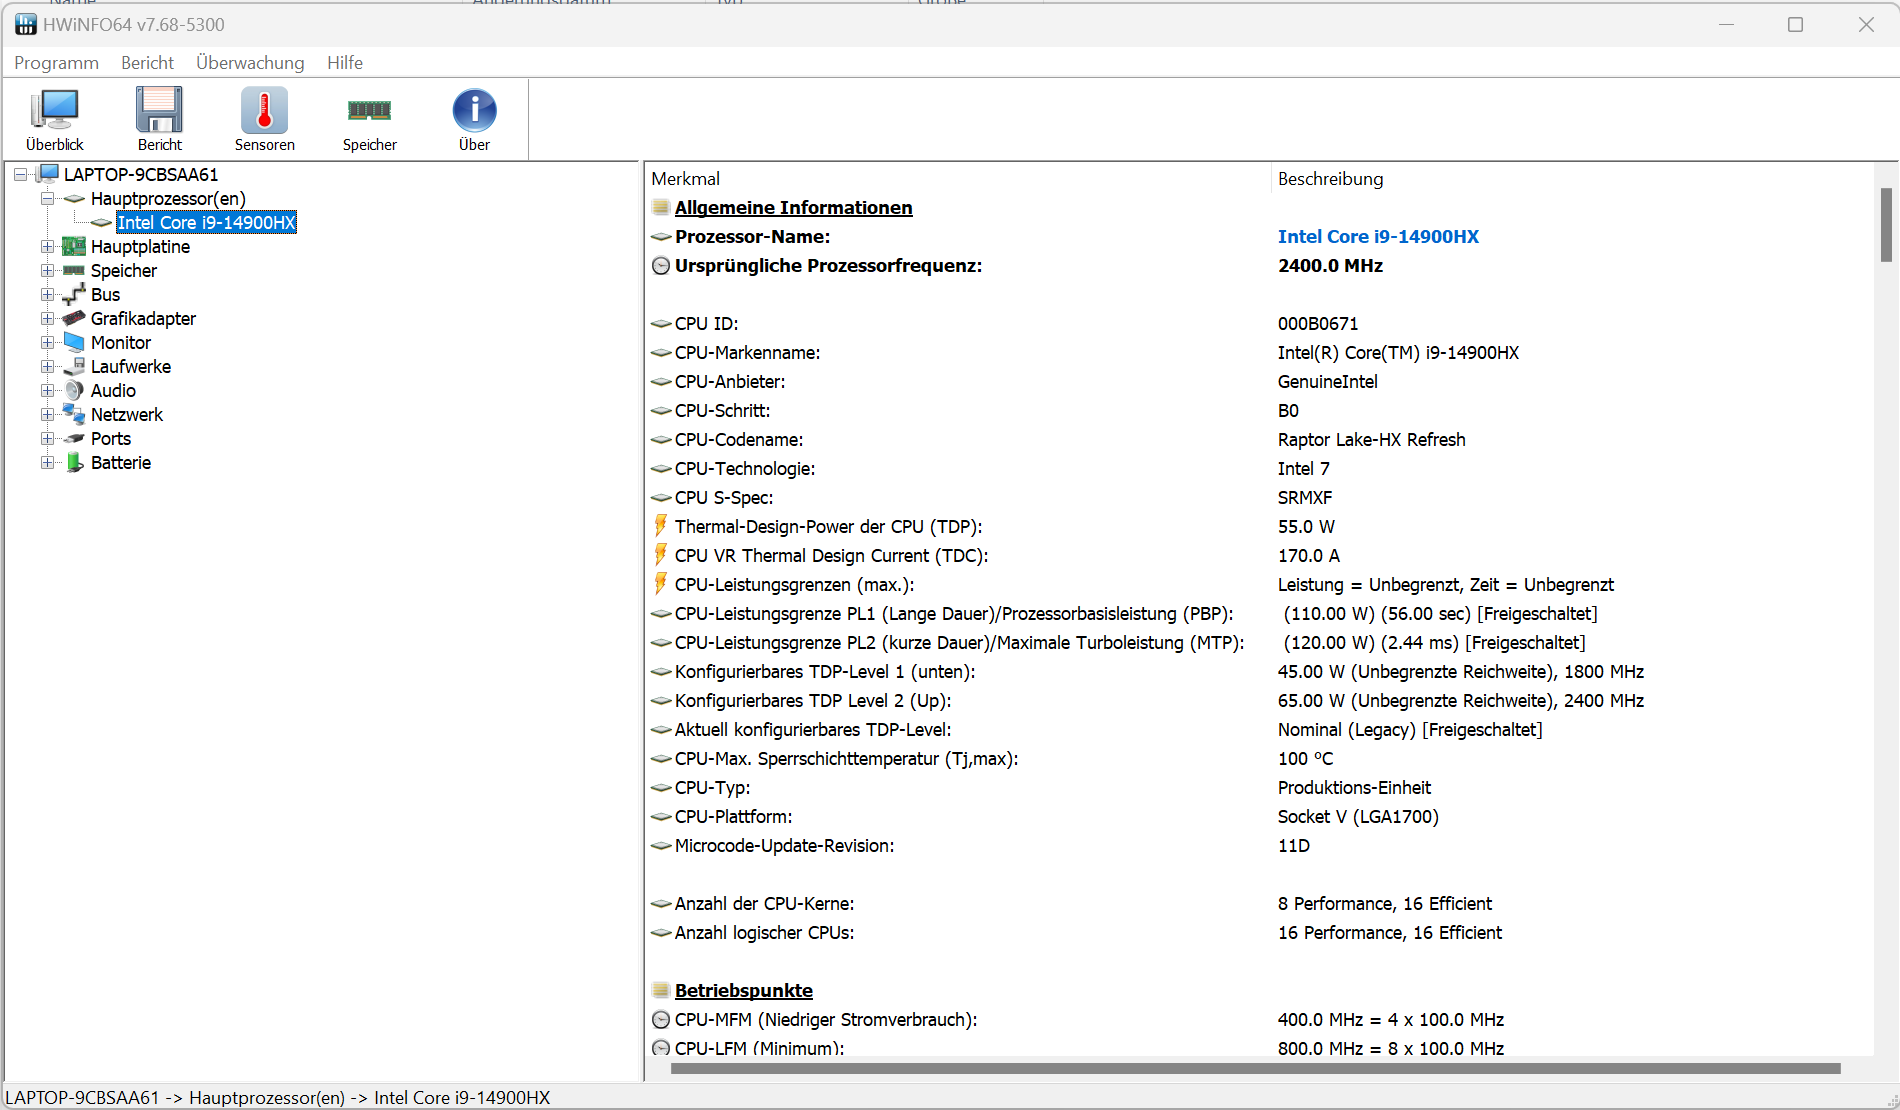
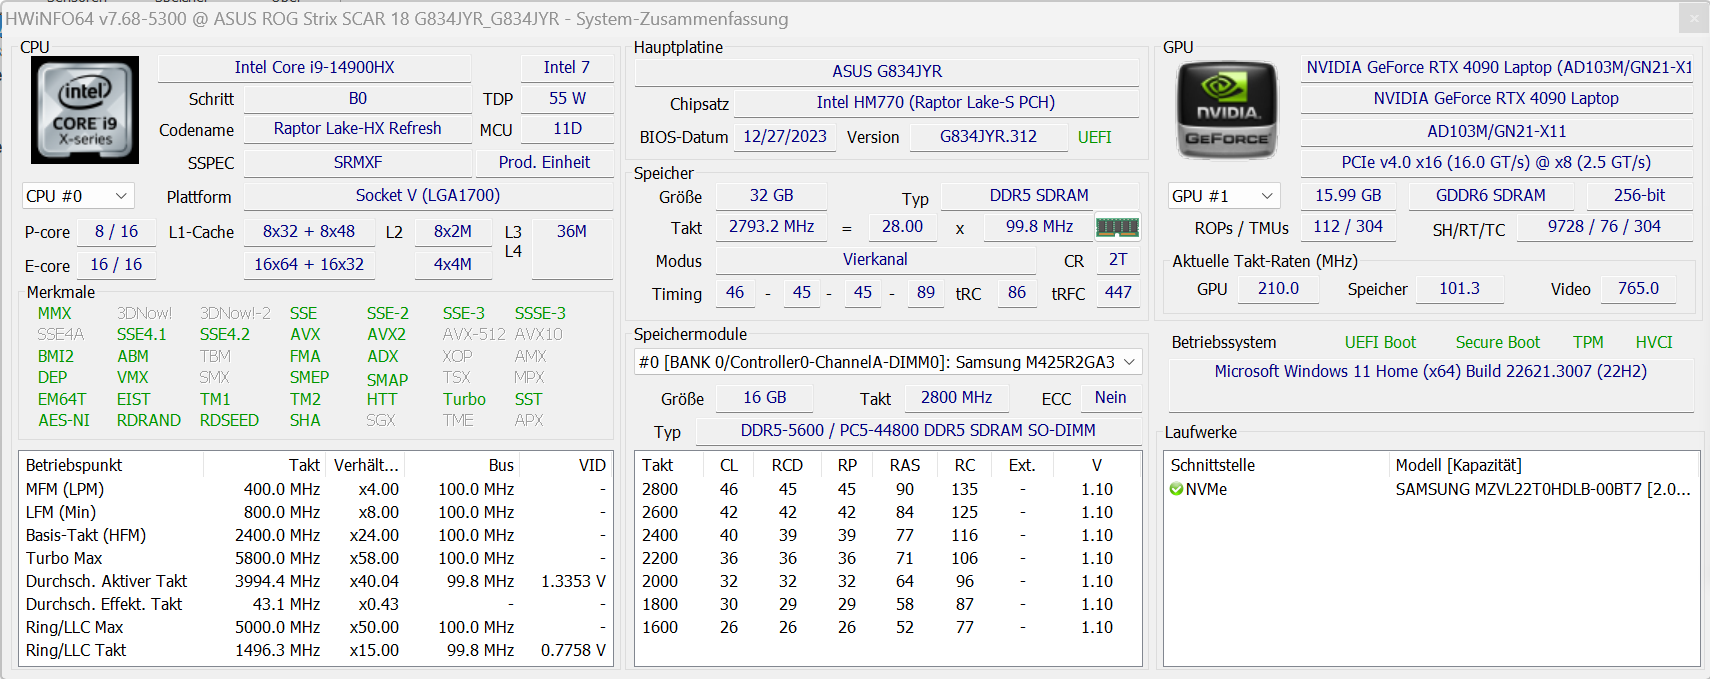
Processore
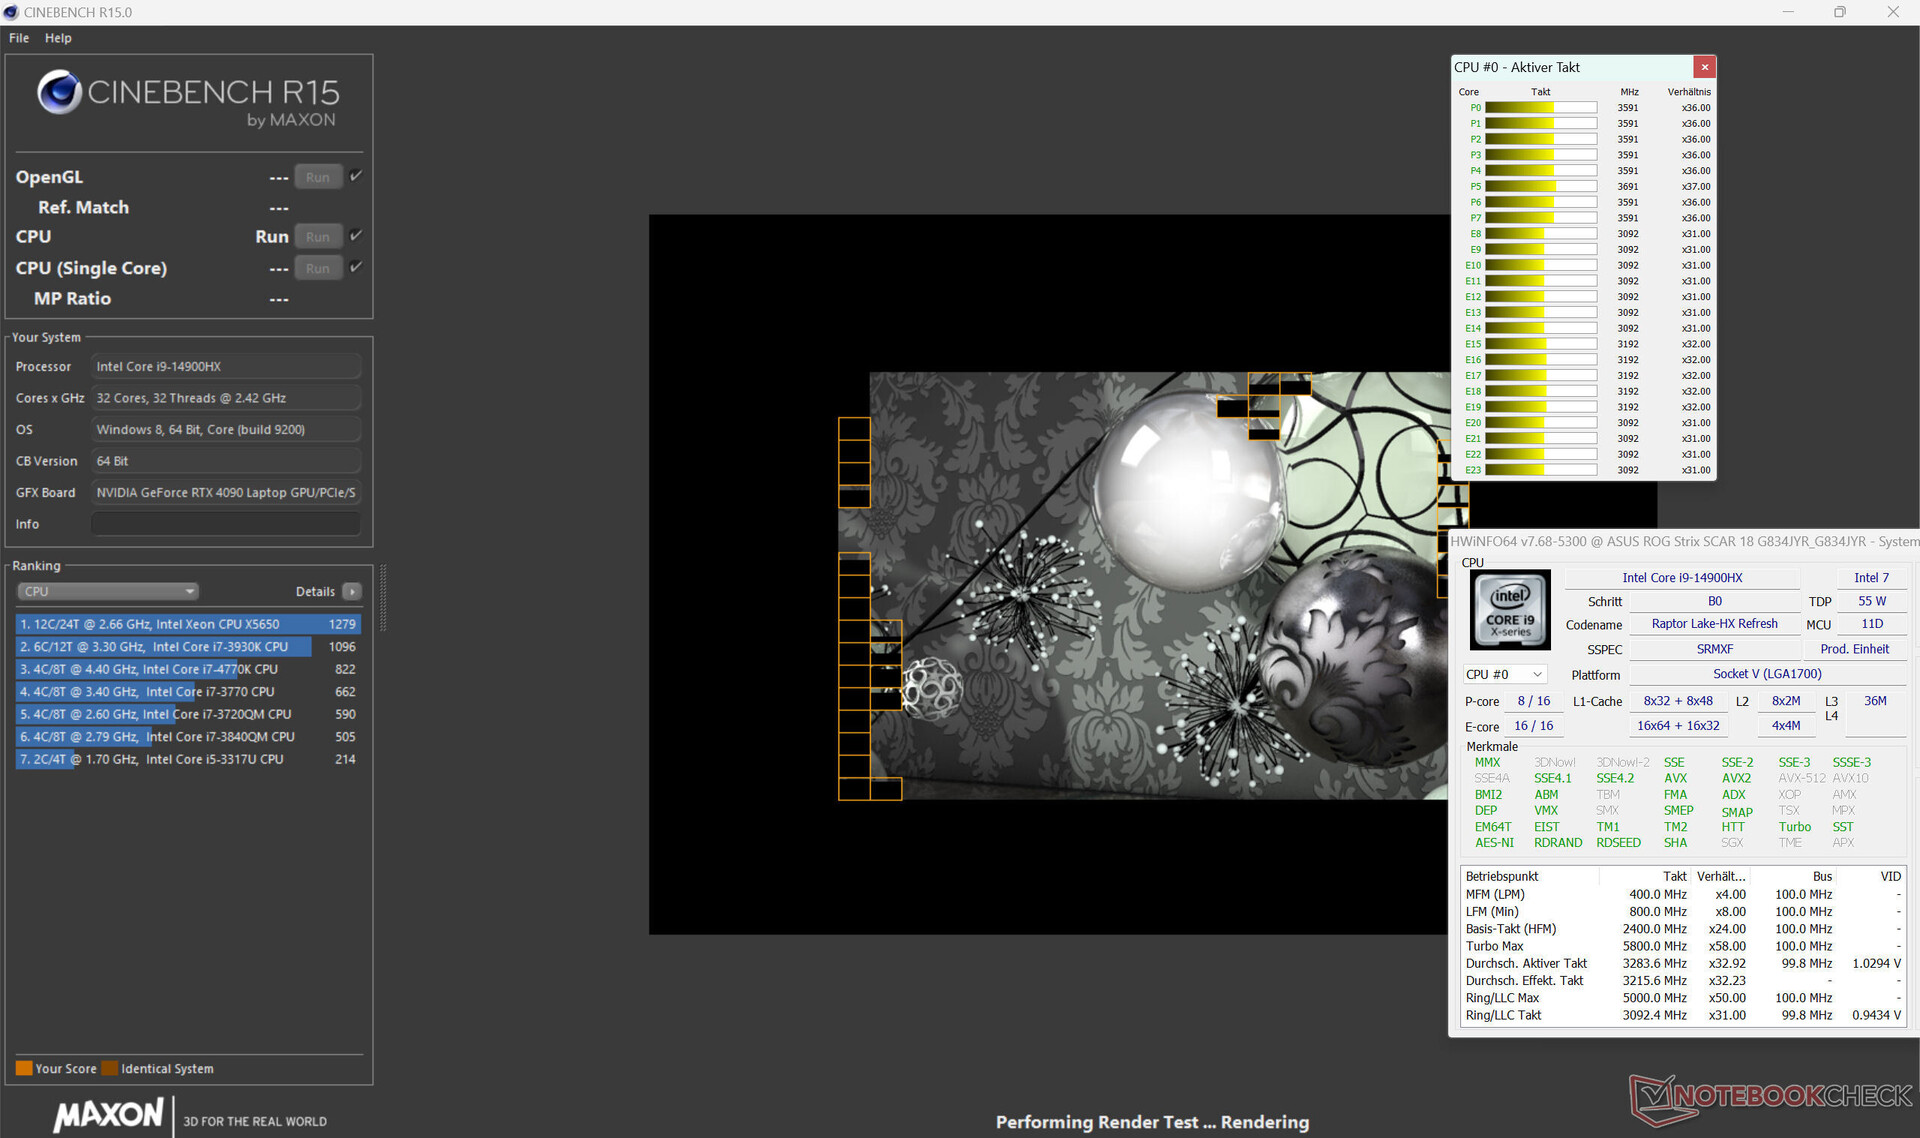
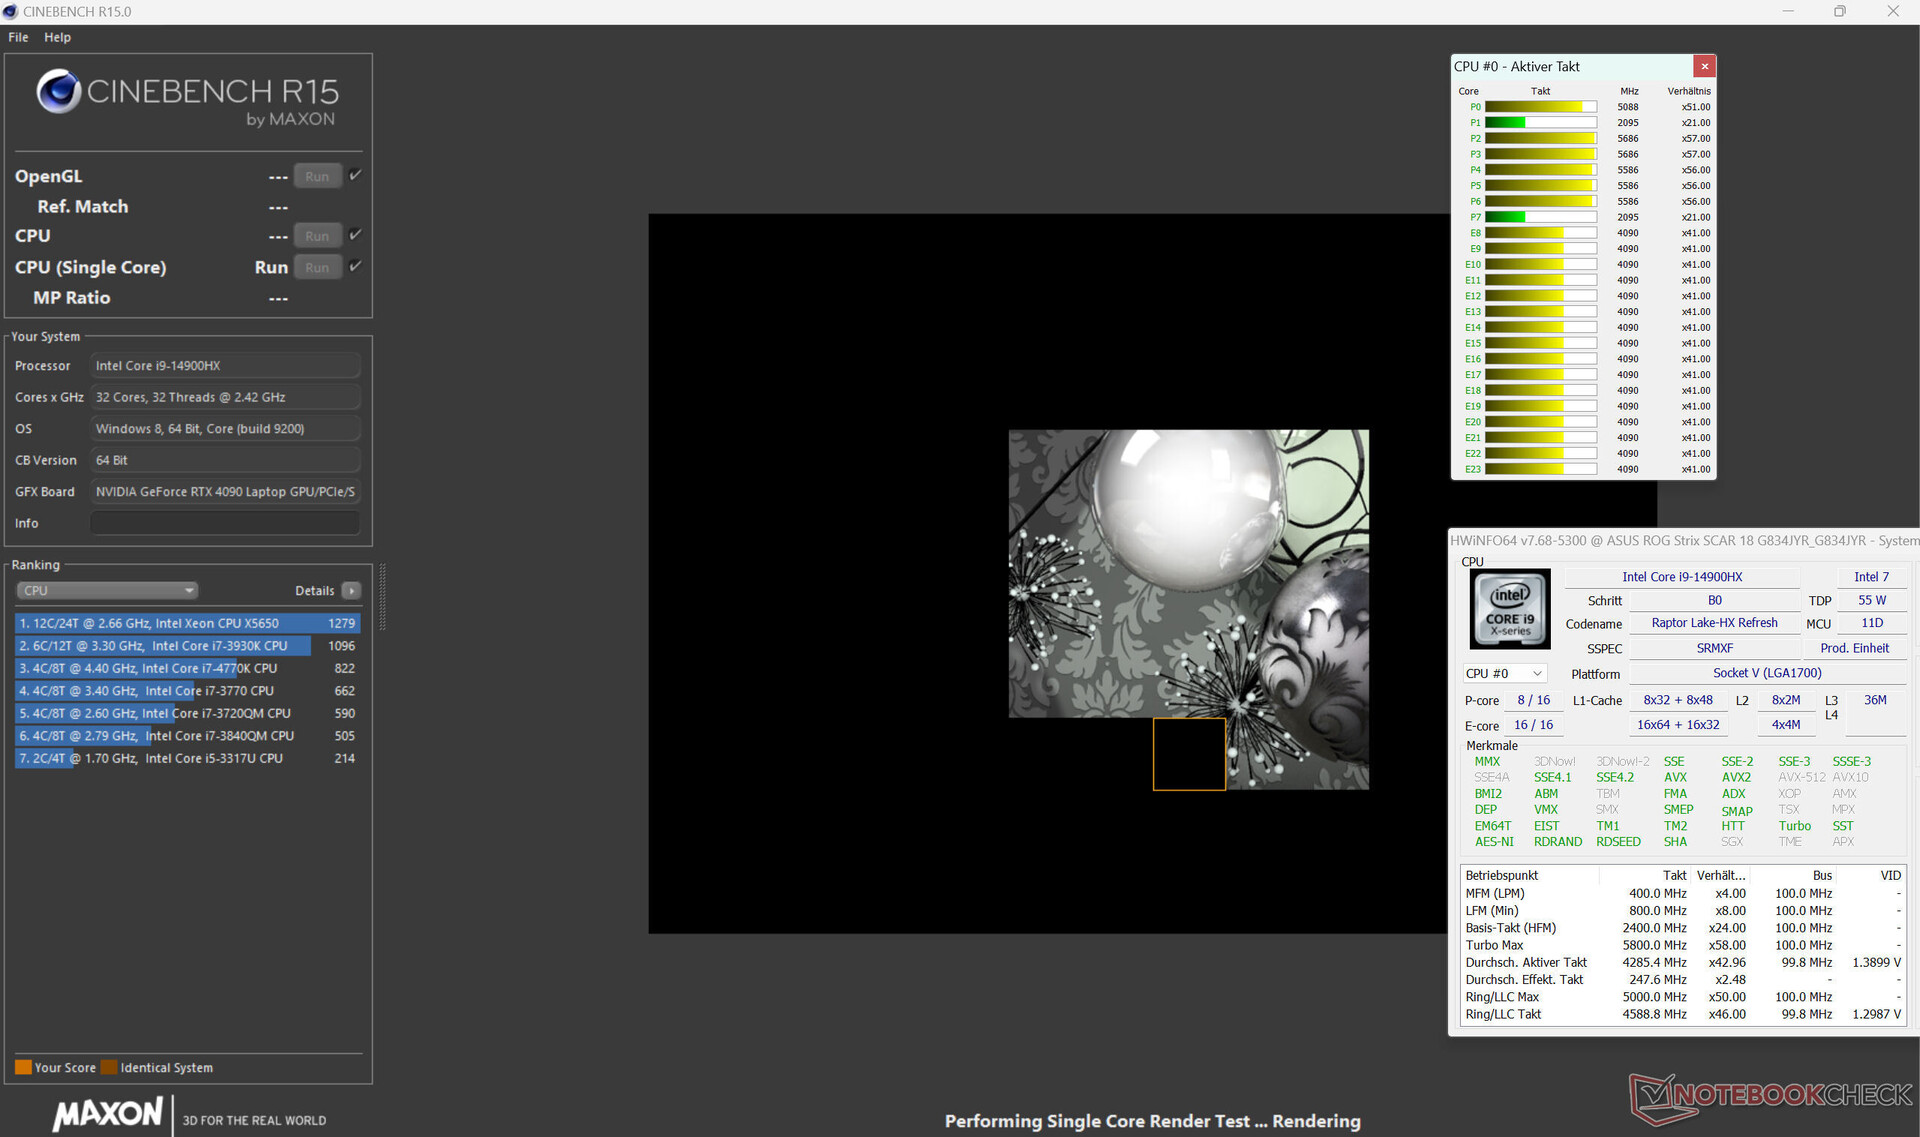
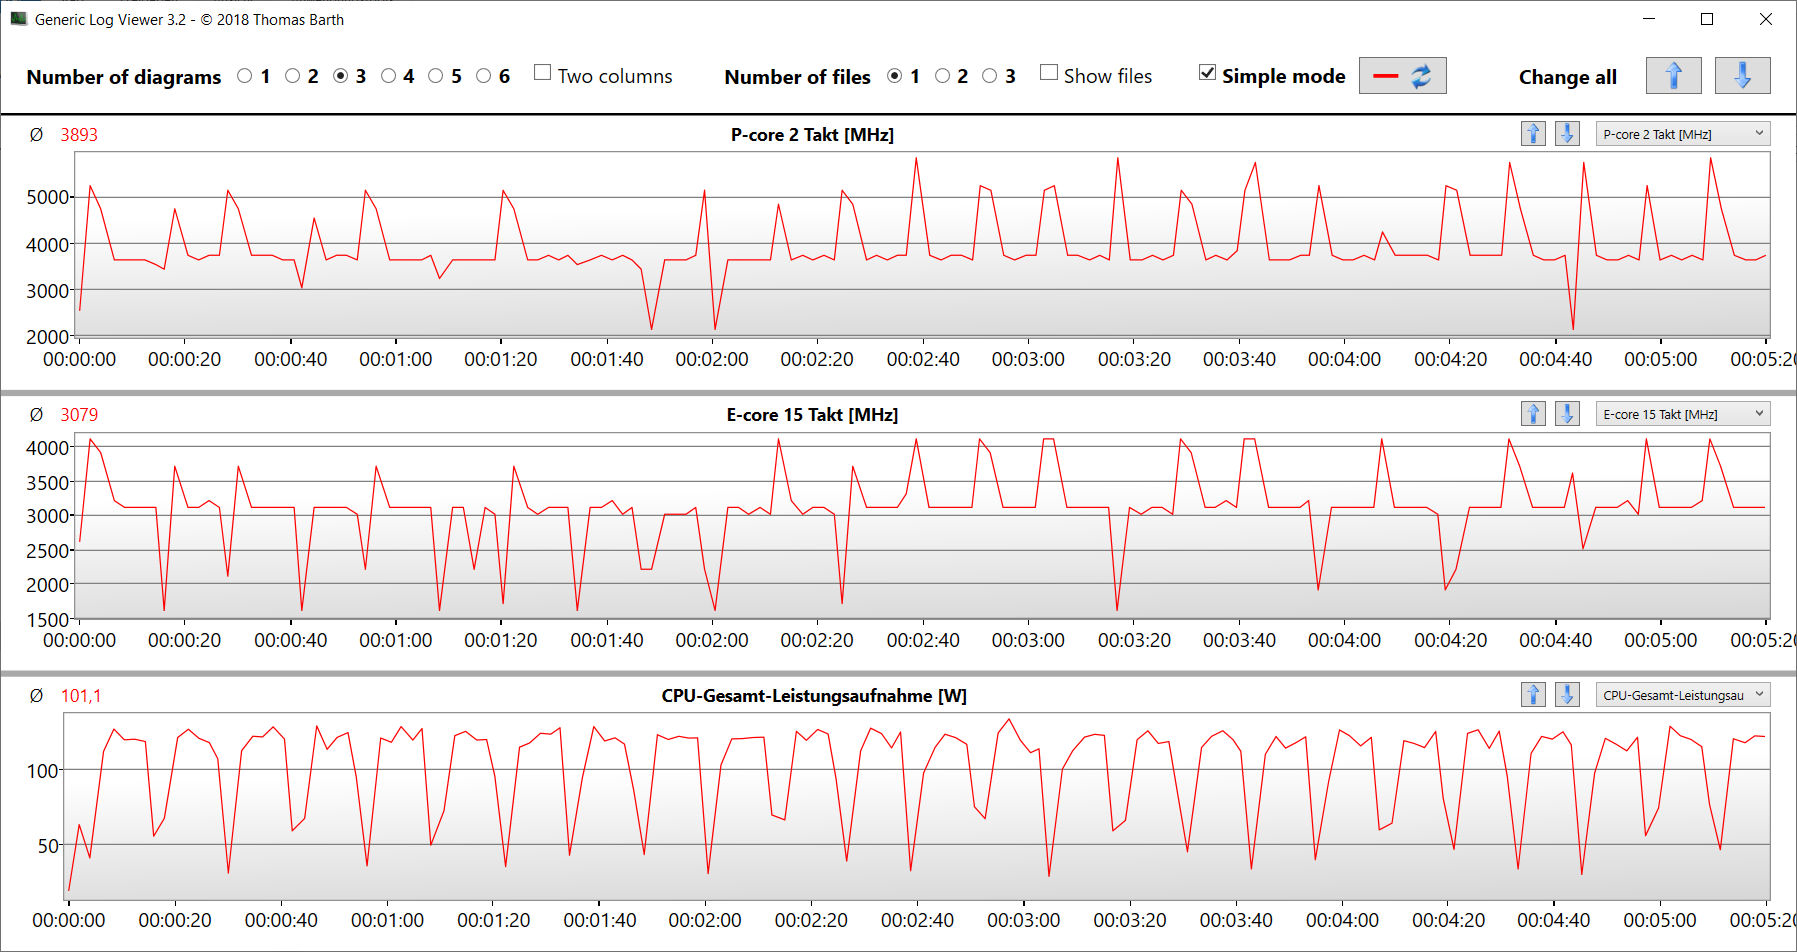
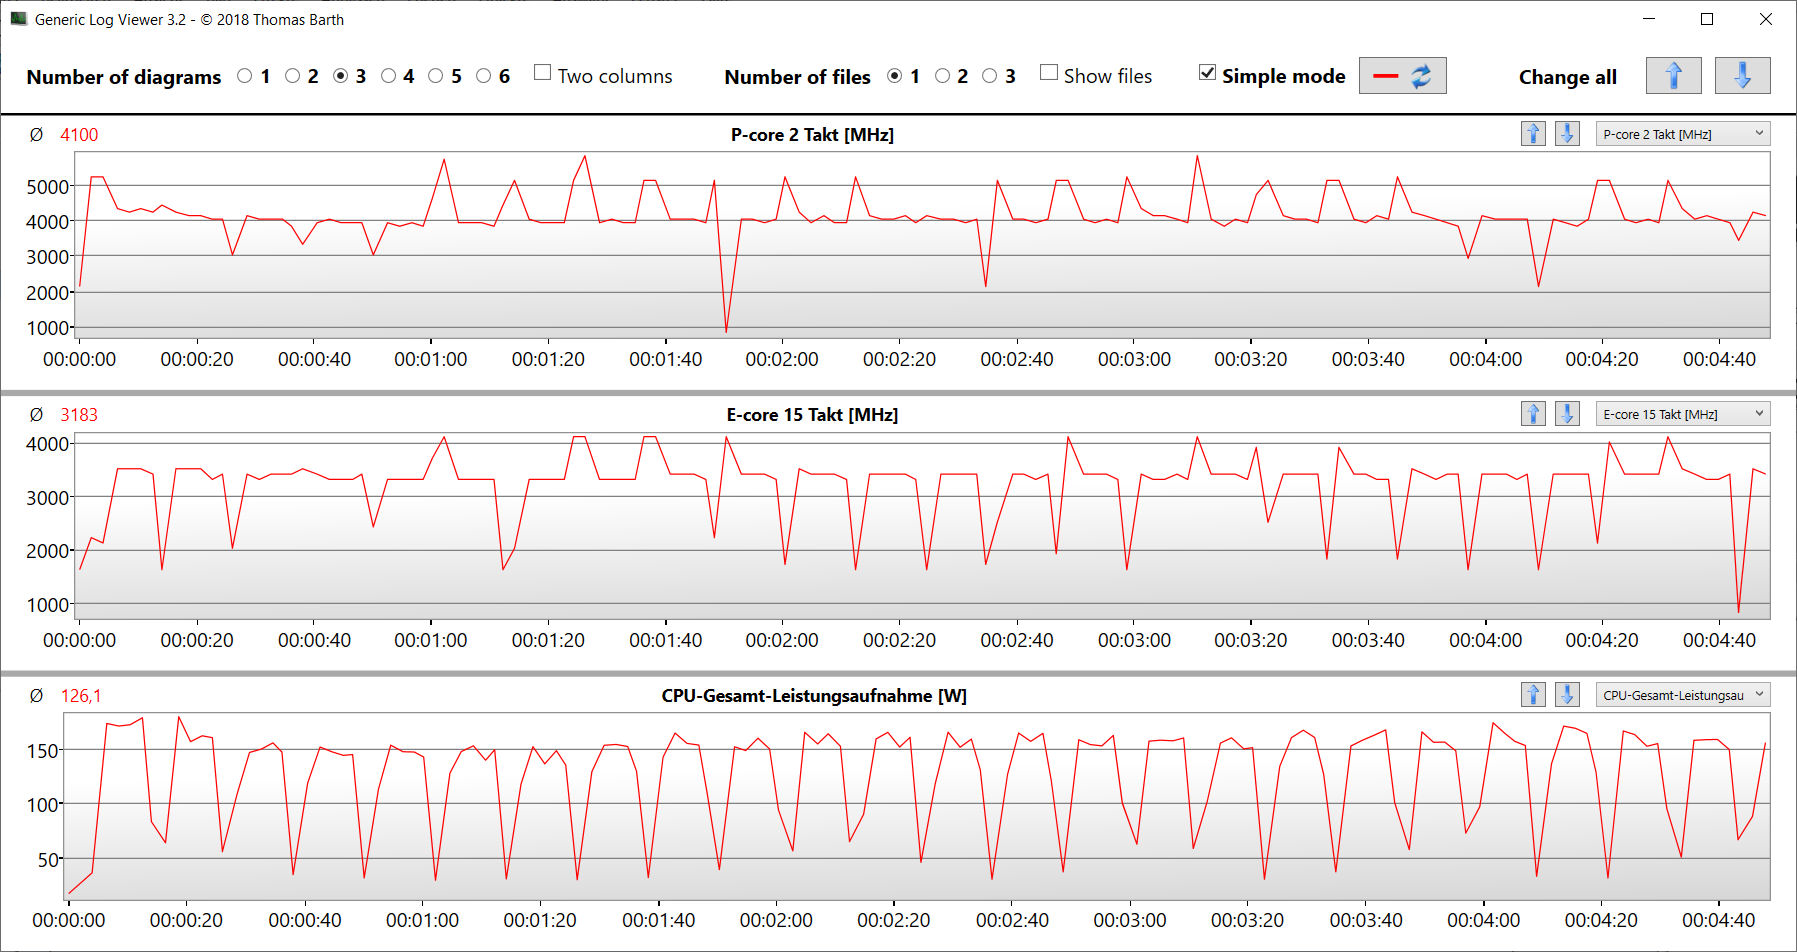
I 24 core della CPU (8P + 16E = 32 thread) del Core i9-14900HX (Raptor Lake) raggiungono velocità di clock massime di 5,8 GHz (core P) e 4,1 GHz (core E). La CPU risponde al carico multithread costante (CB15 Loop) con una velocità Turbo che rimane costantemente elevata. Può trovare maggiori informazioni sul Core i9 nella nostra analisi.
La selezione del profilo energetico influenza solo in modo limitato le prestazioni single-thread, ma ha un'influenza maggiore sulle prestazioni multithread. Selezionando "Performance" si ottengono valori di benchmark inferiori alla media della CPU determinata finora, mentre "Turbo" aumenta i risultati leggermente al di sopra della media. Le prestazioni single-thread, che sono più rilevanti nel funzionamento quotidiano, si attestano sullo stesso livello nel funzionamento a rete e a batteria, ma le prestazioni multithread si riducono notevolmente nel funzionamento a batteria.
Cinebench R15 Multi Constant Load Test
| CPU Performance rating - Percent | |
| Alienware m18 R1 AMD | |
| Asus ROG Strix Scar 18 G834JYR (2024) | |
| Asus ROG Strix Scar 18 2023 G834JY-N6005W -2! | |
| Alienware m18 R1 -2! | |
| MSI Titan 18 HX A14VIG | |
| Acer Predator Helios 18 N23Q2 | |
| Asus ROG Strix Scar 18 G834JYR (2024) | |
| Media Intel Core i9-14900HX | |
| Razer Blade 18 RTX 4070 -2! | |
| Media della classe Gaming | |
| Cinebench R20 | |
| CPU (Multi Core) | |
| Alienware m18 R1 AMD | |
| Alienware m18 R1 | |
| Asus ROG Strix Scar 18 G834JYR (2024) (Turbo) | |
| MSI Titan 18 HX A14VIG | |
| Asus ROG Strix Scar 18 2023 G834JY-N6005W | |
| Acer Predator Helios 18 N23Q2 | |
| Media Intel Core i9-14900HX (6579 - 13832, n=37) | |
| Razer Blade 18 RTX 4070 | |
| Asus ROG Strix Scar 18 G834JYR (2024) | |
| Media della classe Gaming (4029 - 16433, n=106, ultimi 2 anni) | |
| CPU (Single Core) | |
| Asus ROG Strix Scar 18 G834JYR (2024) (Turbo) | |
| Asus ROG Strix Scar 18 G834JYR (2024) | |
| Asus ROG Strix Scar 18 2023 G834JY-N6005W | |
| Media Intel Core i9-14900HX (657 - 859, n=37) | |
| MSI Titan 18 HX A14VIG | |
| Alienware m18 R1 | |
| Acer Predator Helios 18 N23Q2 | |
| Razer Blade 18 RTX 4070 | |
| Media della classe Gaming (442 - 913, n=106, ultimi 2 anni) | |
| Alienware m18 R1 AMD | |
| Cinebench R15 | |
| CPU Multi 64Bit | |
| Alienware m18 R1 AMD | |
| Alienware m18 R1 | |
| MSI Titan 18 HX A14VIG | |
| Asus ROG Strix Scar 18 2023 G834JY-N6005W | |
| Asus ROG Strix Scar 18 G834JYR (2024) (Turbo) | |
| Acer Predator Helios 18 N23Q2 | |
| Razer Blade 18 RTX 4070 | |
| Media Intel Core i9-14900HX (3263 - 5589, n=38) | |
| Asus ROG Strix Scar 18 G834JYR (2024) | |
| Media della classe Gaming (1578 - 6330, n=105, ultimi 2 anni) | |
| CPU Single 64Bit | |
| Asus ROG Strix Scar 18 2023 G834JY-N6005W | |
| Alienware m18 R1 AMD | |
| Asus ROG Strix Scar 18 G834JYR (2024) (Turbo) | |
| Media Intel Core i9-14900HX (247 - 323, n=37) | |
| Alienware m18 R1 | |
| Asus ROG Strix Scar 18 G834JYR (2024) | |
| MSI Titan 18 HX A14VIG | |
| Razer Blade 18 RTX 4070 | |
| Media della classe Gaming (188.8 - 350, n=106, ultimi 2 anni) | |
| Acer Predator Helios 18 N23Q2 | |
| Blender - v2.79 BMW27 CPU | |
| Media della classe Gaming (79 - 330, n=104, ultimi 2 anni) | |
| Media Intel Core i9-14900HX (91 - 206, n=37) | |
| Asus ROG Strix Scar 18 G834JYR (2024) | |
| Razer Blade 18 RTX 4070 | |
| Asus ROG Strix Scar 18 G834JYR (2024) (Turbo) | |
| Acer Predator Helios 18 N23Q2 | |
| MSI Titan 18 HX A14VIG | |
| Asus ROG Strix Scar 18 2023 G834JY-N6005W | |
| Alienware m18 R1 | |
| Alienware m18 R1 AMD | |
| Geekbench 6.7 | |
| Multi-Core | |
| Asus ROG Strix Scar 18 G834JYR (2024) (6.2.1, Turbo) | |
| Acer Predator Helios 18 N23Q2 | |
| Asus ROG Strix Scar 18 G834JYR (2024) (6.2.1) | |
| Media Intel Core i9-14900HX (13158 - 19665, n=37) | |
| MSI Titan 18 HX A14VIG (6.2.1) | |
| Alienware m18 R1 AMD | |
| Media della classe Gaming (6625 - 22850, n=106, ultimi 2 anni) | |
| Single-Core | |
| Asus ROG Strix Scar 18 G834JYR (2024) (6.2.1, Turbo) | |
| Asus ROG Strix Scar 18 G834JYR (2024) (6.2.1) | |
| Media Intel Core i9-14900HX (2419 - 3129, n=37) | |
| Acer Predator Helios 18 N23Q2 | |
| Alienware m18 R1 AMD | |
| Media della classe Gaming (1490 - 3259, n=106, ultimi 2 anni) | |
| MSI Titan 18 HX A14VIG (6.2.1) | |
| HWBOT x265 Benchmark v2.2 - 4k Preset | |
| Alienware m18 R1 AMD | |
| Asus ROG Strix Scar 18 2023 G834JY-N6005W | |
| Alienware m18 R1 | |
| Asus ROG Strix Scar 18 G834JYR (2024) (Turbo) | |
| Razer Blade 18 RTX 4070 | |
| MSI Titan 18 HX A14VIG | |
| Acer Predator Helios 18 N23Q2 | |
| Media Intel Core i9-14900HX (16.8 - 38.9, n=37) | |
| Asus ROG Strix Scar 18 G834JYR (2024) | |
| Media della classe Gaming (11.5 - 44.4, n=105, ultimi 2 anni) | |
| LibreOffice - 20 Documents To PDF | |
| Media della classe Gaming (33.2 - 88.8, n=105, ultimi 2 anni) | |
| Acer Predator Helios 18 N23Q2 | |
| Alienware m18 R1 | |
| MSI Titan 18 HX A14VIG (6.3.4.2) | |
| Asus ROG Strix Scar 18 G834JYR (2024) (6.3.4.2) | |
| Razer Blade 18 RTX 4070 | |
| Media Intel Core i9-14900HX (19 - 85.1, n=37) | |
| Alienware m18 R1 AMD (6.3.4.2) | |
| Asus ROG Strix Scar 18 G834JYR (2024) (6.3.4.2, Turbo) | |
| Asus ROG Strix Scar 18 2023 G834JY-N6005W | |
| R Benchmark 2.5 - Overall mean | |
| Media della classe Gaming (0.3439 - 0.759, n=106, ultimi 2 anni) | |
| Alienware m18 R1 AMD | |
| Acer Predator Helios 18 N23Q2 | |
| Razer Blade 18 RTX 4070 | |
| Asus ROG Strix Scar 18 G834JYR (2024) | |
| Alienware m18 R1 | |
| MSI Titan 18 HX A14VIG | |
| Media Intel Core i9-14900HX (0.3604 - 0.4859, n=37) | |
| Asus ROG Strix Scar 18 2023 G834JY-N6005W | |
| Asus ROG Strix Scar 18 G834JYR (2024) (Turbo) | |
* ... Meglio usare valori piccoli
AIDA64: FP32 Ray-Trace | FPU Julia | CPU SHA3 | CPU Queen | FPU SinJulia | FPU Mandel | CPU AES | CPU ZLib | FP64 Ray-Trace | CPU PhotoWorxx
| Performance rating | |
| Alienware m18 R1 AMD | |
| Acer Predator Helios 18 N23Q2 | |
| Alienware m18 R1 | |
| MSI Titan 18 HX A14VIG | |
| Asus ROG Strix Scar 18 2023 G834JY-N6005W | |
| Asus ROG Strix Scar 18 G834JYR (2024) | |
| Razer Blade 18 RTX 4070 | |
| Asus ROG Strix Scar 18 G834JYR (2024) | |
| Media della classe Gaming | |
| Media Intel Core i9-14900HX | |
| AIDA64 / FP32 Ray-Trace | |
| Alienware m18 R1 AMD (v6.85.6300) | |
| Media della classe Gaming (10227 - 85542, n=105, ultimi 2 anni) | |
| Alienware m18 R1 (v6.85.6300) | |
| MSI Titan 18 HX A14VIG (v6.92.6600) | |
| Asus ROG Strix Scar 18 2023 G834JY-N6005W (v6.85.6300) | |
| Acer Predator Helios 18 N23Q2 (v6.85.6300) | |
| Asus ROG Strix Scar 18 G834JYR (2024) (v6.92.6600, Turbo) | |
| Razer Blade 18 RTX 4070 (v6.85.6300) | |
| Asus ROG Strix Scar 18 G834JYR (2024) (v6.92.6600) | |
| Media Intel Core i9-14900HX (13098 - 33474, n=36) | |
| AIDA64 / FPU Julia | |
| Alienware m18 R1 AMD (v6.85.6300) | |
| MSI Titan 18 HX A14VIG (v6.92.6600) | |
| Alienware m18 R1 (v6.85.6300) | |
| Media della classe Gaming (51376 - 238426, n=105, ultimi 2 anni) | |
| Asus ROG Strix Scar 18 2023 G834JY-N6005W (v6.85.6300) | |
| Asus ROG Strix Scar 18 G834JYR (2024) (v6.92.6600, Turbo) | |
| Acer Predator Helios 18 N23Q2 (v6.85.6300) | |
| Razer Blade 18 RTX 4070 (v6.85.6300) | |
| Asus ROG Strix Scar 18 G834JYR (2024) (v6.92.6600) | |
| Media Intel Core i9-14900HX (67573 - 166040, n=36) | |
| AIDA64 / CPU SHA3 | |
| Alienware m18 R1 AMD (v6.85.6300) | |
| MSI Titan 18 HX A14VIG (v6.92.6600) | |
| Alienware m18 R1 (v6.85.6300) | |
| Asus ROG Strix Scar 18 2023 G834JY-N6005W (v6.85.6300) | |
| Acer Predator Helios 18 N23Q2 (v6.85.6300) | |
| Asus ROG Strix Scar 18 G834JYR (2024) (v6.92.6600, Turbo) | |
| Media della classe Gaming (2180 - 10115, n=105, ultimi 2 anni) | |
| Razer Blade 18 RTX 4070 (v6.85.6300) | |
| Asus ROG Strix Scar 18 G834JYR (2024) (v6.92.6600) | |
| Media Intel Core i9-14900HX (3589 - 7979, n=36) | |
| AIDA64 / CPU Queen | |
| Alienware m18 R1 AMD (v6.85.6300) | |
| MSI Titan 18 HX A14VIG (v6.92.6600) | |
| Alienware m18 R1 (v6.85.6300) | |
| Asus ROG Strix Scar 18 G834JYR (2024) (v6.92.6600) | |
| Asus ROG Strix Scar 18 G834JYR (2024) (v6.92.6600, Turbo) | |
| Asus ROG Strix Scar 18 2023 G834JY-N6005W (v6.85.6300) | |
| Media Intel Core i9-14900HX (118405 - 148966, n=36) | |
| Razer Blade 18 RTX 4070 (v6.85.6300) | |
| Acer Predator Helios 18 N23Q2 (v6.85.6300) | |
| Media della classe Gaming (49785 - 173351, n=90, ultimi 2 anni) | |
| AIDA64 / FPU SinJulia | |
| Alienware m18 R1 AMD (v6.85.6300) | |
| MSI Titan 18 HX A14VIG (v6.92.6600) | |
| Asus ROG Strix Scar 18 2023 G834JY-N6005W (v6.85.6300) | |
| Alienware m18 R1 (v6.85.6300) | |
| Asus ROG Strix Scar 18 G834JYR (2024) (v6.92.6600, Turbo) | |
| Asus ROG Strix Scar 18 G834JYR (2024) (v6.92.6600) | |
| Razer Blade 18 RTX 4070 (v6.85.6300) | |
| Acer Predator Helios 18 N23Q2 (v6.85.6300) | |
| Media Intel Core i9-14900HX (10475 - 18517, n=36) | |
| Media della classe Gaming (4424 - 33636, n=105, ultimi 2 anni) | |
| AIDA64 / FPU Mandel | |
| Alienware m18 R1 AMD (v6.85.6300) | |
| Alienware m18 R1 (v6.85.6300) | |
| Media della classe Gaming (25115 - 128721, n=105, ultimi 2 anni) | |
| MSI Titan 18 HX A14VIG (v6.92.6600) | |
| Asus ROG Strix Scar 18 2023 G834JY-N6005W (v6.85.6300) | |
| Acer Predator Helios 18 N23Q2 (v6.85.6300) | |
| Asus ROG Strix Scar 18 G834JYR (2024) (v6.92.6600, Turbo) | |
| Razer Blade 18 RTX 4070 (v6.85.6300) | |
| Asus ROG Strix Scar 18 G834JYR (2024) (v6.92.6600) | |
| Media Intel Core i9-14900HX (32543 - 83662, n=36) | |
| AIDA64 / CPU AES | |
| Acer Predator Helios 18 N23Q2 (v6.85.6300) | |
| Alienware m18 R1 AMD (v6.85.6300) | |
| Media Intel Core i9-14900HX (86964 - 241777, n=36) | |
| MSI Titan 18 HX A14VIG (v6.92.6600) | |
| Alienware m18 R1 (v6.85.6300) | |
| Asus ROG Strix Scar 18 2023 G834JY-N6005W (v6.85.6300) | |
| Asus ROG Strix Scar 18 G834JYR (2024) (v6.92.6600, Turbo) | |
| Asus ROG Strix Scar 18 G834JYR (2024) (v6.92.6600) | |
| Razer Blade 18 RTX 4070 (v6.85.6300) | |
| Media della classe Gaming (39258 - 247074, n=105, ultimi 2 anni) | |
| AIDA64 / CPU ZLib | |
| Alienware m18 R1 AMD (v6.85.6300) | |
| MSI Titan 18 HX A14VIG (v6.92.6600) | |
| Asus ROG Strix Scar 18 2023 G834JY-N6005W (v6.85.6300) | |
| Alienware m18 R1 (v6.85.6300) | |
| Acer Predator Helios 18 N23Q2 (v6.85.6300) | |
| Asus ROG Strix Scar 18 G834JYR (2024) (v6.92.6600, Turbo) | |
| Razer Blade 18 RTX 4070 (v6.85.6300) | |
| Media Intel Core i9-14900HX (1054 - 2292, n=36) | |
| Asus ROG Strix Scar 18 G834JYR (2024) | |
| Media della classe Gaming (574 - 2531, n=105, ultimi 2 anni) | |
| AIDA64 / FP64 Ray-Trace | |
| Alienware m18 R1 AMD (v6.85.6300) | |
| Media della classe Gaming (5509 - 45446, n=105, ultimi 2 anni) | |
| Alienware m18 R1 (v6.85.6300) | |
| MSI Titan 18 HX A14VIG (v6.92.6600) | |
| Asus ROG Strix Scar 18 2023 G834JY-N6005W (v6.85.6300) | |
| Acer Predator Helios 18 N23Q2 (v6.85.6300) | |
| Asus ROG Strix Scar 18 G834JYR (2024) (v6.92.6600, Turbo) | |
| Razer Blade 18 RTX 4070 (v6.85.6300) | |
| Asus ROG Strix Scar 18 G834JYR (2024) (v6.92.6600) | |
| Media Intel Core i9-14900HX (6809 - 18349, n=36) | |
| AIDA64 / CPU PhotoWorxx | |
| Alienware m18 R1 (v6.85.6300) | |
| Acer Predator Helios 18 N23Q2 (v6.85.6300) | |
| Asus ROG Strix Scar 18 G834JYR (2024) (v6.92.6600) | |
| Asus ROG Strix Scar 18 G834JYR (2024) (v6.92.6600, Turbo) | |
| Razer Blade 18 RTX 4070 (v6.85.6300) | |
| Media Intel Core i9-14900HX (23903 - 54702, n=36) | |
| Media della classe Gaming (12271 - 89891, n=105, ultimi 2 anni) | |
| Asus ROG Strix Scar 18 2023 G834JY-N6005W (v6.85.6300) | |
| Alienware m18 R1 AMD (v6.85.6300) | |
| MSI Titan 18 HX A14VIG (v6.92.6600) | |
Prestazioni del sistema
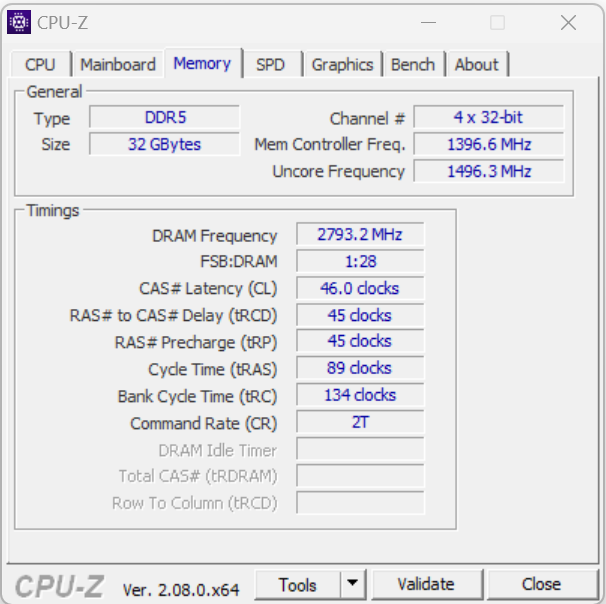
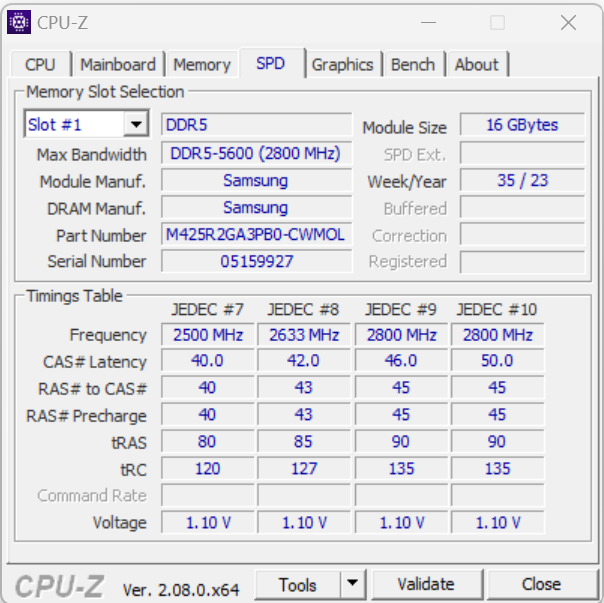
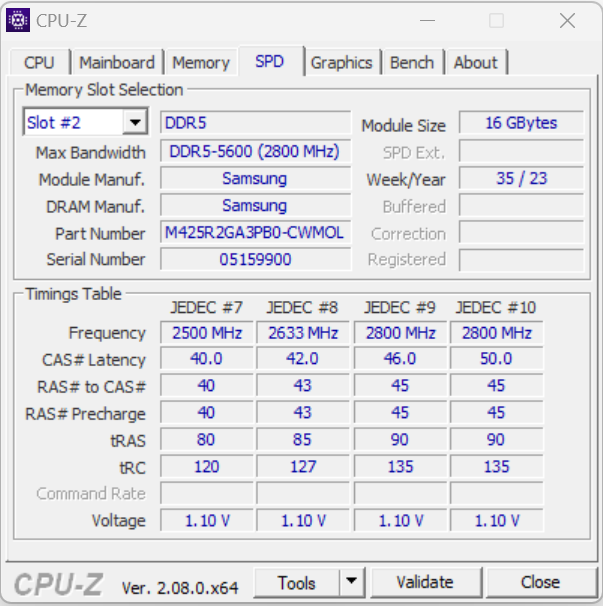
Il sistema, che funziona in modo fluido, non mostra alcuna carenza nelle prestazioni di calcolo e il portatile gestisce in modo impeccabile i giochi, il rendering e altri compiti. Le velocità di trasferimento della memoria di lavoro si attestano su un livello normale per una RAM DDR5-5600.
CrossMark: Overall | Productivity | Creativity | Responsiveness
WebXPRT 3: Overall
WebXPRT 4: Overall
Mozilla Kraken 1.1: Total
| PCMark 10 / Score | |
| Alienware m18 R1 AMD | |
| MSI Titan 18 HX A14VIG | |
| Asus ROG Strix Scar 18 G834JYR (2024) | |
| Asus ROG Strix Scar 18 2023 G834JY-N6005W | |
| Alienware m18 R1 | |
| Media Intel Core i9-14900HX, NVIDIA GeForce RTX 4090 Laptop GPU (8230 - 9234, n=13) | |
| Acer Predator Helios 18 N23Q2 | |
| Media della classe Gaming (5828 - 12414, n=93, ultimi 2 anni) | |
| Razer Blade 18 RTX 4070 | |
| PCMark 10 / Essentials | |
| Alienware m18 R1 AMD | |
| Razer Blade 18 RTX 4070 | |
| MSI Titan 18 HX A14VIG | |
| Asus ROG Strix Scar 18 G834JYR (2024) | |
| Alienware m18 R1 | |
| Media Intel Core i9-14900HX, NVIDIA GeForce RTX 4090 Laptop GPU (10778 - 11628, n=13) | |
| Acer Predator Helios 18 N23Q2 | |
| Media della classe Gaming (8810 - 11935, n=97, ultimi 2 anni) | |
| PCMark 10 / Productivity | |
| Alienware m18 R1 AMD | |
| Media della classe Gaming (6845 - 25323, n=95, ultimi 2 anni) | |
| Media Intel Core i9-14900HX, NVIDIA GeForce RTX 4090 Laptop GPU (9458 - 11759, n=13) | |
| Asus ROG Strix Scar 18 G834JYR (2024) | |
| Acer Predator Helios 18 N23Q2 | |
| MSI Titan 18 HX A14VIG | |
| Alienware m18 R1 | |
| Razer Blade 18 RTX 4070 | |
| PCMark 10 / Digital Content Creation | |
| Alienware m18 R1 AMD | |
| MSI Titan 18 HX A14VIG | |
| Alienware m18 R1 | |
| Asus ROG Strix Scar 18 G834JYR (2024) | |
| Media Intel Core i9-14900HX, NVIDIA GeForce RTX 4090 Laptop GPU (13219 - 16462, n=13) | |
| Acer Predator Helios 18 N23Q2 | |
| Media della classe Gaming (7602 - 19954, n=95, ultimi 2 anni) | |
| Razer Blade 18 RTX 4070 | |
| CrossMark / Overall | |
| Asus ROG Strix Scar 18 G834JYR (2024) | |
| Acer Predator Helios 18 N23Q2 | |
| Alienware m18 R1 | |
| Razer Blade 18 RTX 4070 | |
| Media Intel Core i9-14900HX, NVIDIA GeForce RTX 4090 Laptop GPU (1877 - 2344, n=10) | |
| Asus ROG Strix Scar 18 2023 G834JY-N6005W | |
| Media della classe Gaming (1366 - 2409, n=94, ultimi 2 anni) | |
| Alienware m18 R1 AMD | |
| MSI Titan 18 HX A14VIG | |
| CrossMark / Productivity | |
| Acer Predator Helios 18 N23Q2 | |
| Asus ROG Strix Scar 18 G834JYR (2024) | |
| Alienware m18 R1 | |
| Razer Blade 18 RTX 4070 | |
| Media Intel Core i9-14900HX, NVIDIA GeForce RTX 4090 Laptop GPU (1738 - 2162, n=10) | |
| Asus ROG Strix Scar 18 2023 G834JY-N6005W | |
| Media della classe Gaming (1386 - 2254, n=94, ultimi 2 anni) | |
| Alienware m18 R1 AMD | |
| MSI Titan 18 HX A14VIG | |
| CrossMark / Creativity | |
| Asus ROG Strix Scar 18 G834JYR (2024) | |
| Alienware m18 R1 | |
| Asus ROG Strix Scar 18 2023 G834JY-N6005W | |
| Acer Predator Helios 18 N23Q2 | |
| Razer Blade 18 RTX 4070 | |
| Media Intel Core i9-14900HX, NVIDIA GeForce RTX 4090 Laptop GPU (2195 - 2660, n=10) | |
| Media della classe Gaming (1343 - 2786, n=94, ultimi 2 anni) | |
| Alienware m18 R1 AMD | |
| MSI Titan 18 HX A14VIG | |
| CrossMark / Responsiveness | |
| Acer Predator Helios 18 N23Q2 | |
| Asus ROG Strix Scar 18 G834JYR (2024) | |
| Alienware m18 R1 | |
| Razer Blade 18 RTX 4070 | |
| Media Intel Core i9-14900HX, NVIDIA GeForce RTX 4090 Laptop GPU (1478 - 2327, n=10) | |
| Media della classe Gaming (1226 - 2334, n=94, ultimi 2 anni) | |
| Asus ROG Strix Scar 18 2023 G834JY-N6005W | |
| Alienware m18 R1 AMD | |
| MSI Titan 18 HX A14VIG | |
| WebXPRT 3 / Overall | |
| Alienware m18 R1 AMD | |
| Razer Blade 18 RTX 4070 | |
| Alienware m18 R1 | |
| Asus ROG Strix Scar 18 2023 G834JY-N6005W | |
| MSI Titan 18 HX A14VIG | |
| Media Intel Core i9-14900HX, NVIDIA GeForce RTX 4090 Laptop GPU (279 - 339, n=10) | |
| Asus ROG Strix Scar 18 G834JYR (2024) | |
| Acer Predator Helios 18 N23Q2 | |
| Media della classe Gaming (220 - 532, n=98, ultimi 2 anni) | |
| WebXPRT 4 / Overall | |
| Asus ROG Strix Scar 18 2023 G834JY-N6005W | |
| Alienware m18 R1 | |
| Asus ROG Strix Scar 18 G834JYR (2024) | |
| Razer Blade 18 RTX 4070 | |
| Alienware m18 R1 AMD | |
| Media Intel Core i9-14900HX, NVIDIA GeForce RTX 4090 Laptop GPU (246 - 309, n=8) | |
| MSI Titan 18 HX A14VIG | |
| Media della classe Gaming (165 - 354, n=98, ultimi 2 anni) | |
| Mozilla Kraken 1.1 / Total | |
| Razer Blade 18 RTX 4070 | |
| Alienware m18 R1 AMD | |
| Media della classe Gaming (391 - 590, n=100, ultimi 2 anni) | |
| Alienware m18 R1 | |
| Acer Predator Helios 18 N23Q2 | |
| Media Intel Core i9-14900HX, NVIDIA GeForce RTX 4090 Laptop GPU (428 - 535, n=11) | |
| MSI Titan 18 HX A14VIG | |
| Asus ROG Strix Scar 18 G834JYR (2024) | |
| Asus ROG Strix Scar 18 2023 G834JY-N6005W | |
* ... Meglio usare valori piccoli
| PCMark 10 Score | 8801 punti | |
Aiuto | ||
| AIDA64 / Memory Copy | |
| Asus ROG Strix Scar 18 G834JYR (2024) | |
| Alienware m18 R1 | |
| Acer Predator Helios 18 N23Q2 | |
| Razer Blade 18 RTX 4070 | |
| Media Intel Core i9-14900HX (38028 - 83392, n=36) | |
| Media della classe Gaming (21750 - 129946, n=105, ultimi 2 anni) | |
| Asus ROG Strix Scar 18 2023 G834JY-N6005W | |
| MSI Titan 18 HX A14VIG | |
| Alienware m18 R1 AMD | |
| AIDA64 / Memory Read | |
| Alienware m18 R1 | |
| Asus ROG Strix Scar 18 G834JYR (2024) | |
| Acer Predator Helios 18 N23Q2 | |
| Razer Blade 18 RTX 4070 | |
| Media Intel Core i9-14900HX (43306 - 87568, n=36) | |
| Asus ROG Strix Scar 18 2023 G834JY-N6005W | |
| Media della classe Gaming (22956 - 118858, n=105, ultimi 2 anni) | |
| Alienware m18 R1 AMD | |
| MSI Titan 18 HX A14VIG | |
| AIDA64 / Memory Write | |
| Alienware m18 R1 | |
| Asus ROG Strix Scar 18 G834JYR (2024) | |
| Media della classe Gaming (22297 - 135096, n=105, ultimi 2 anni) | |
| Razer Blade 18 RTX 4070 | |
| Acer Predator Helios 18 N23Q2 | |
| Media Intel Core i9-14900HX (37146 - 80589, n=36) | |
| Asus ROG Strix Scar 18 2023 G834JY-N6005W | |
| Alienware m18 R1 AMD | |
| MSI Titan 18 HX A14VIG | |
| AIDA64 / Memory Latency | |
| Media della classe Gaming (75.3 - 259, n=105, ultimi 2 anni) | |
| MSI Titan 18 HX A14VIG | |
| Alienware m18 R1 AMD | |
| Asus ROG Strix Scar 18 2023 G834JY-N6005W | |
| Media Intel Core i9-14900HX (76.1 - 105, n=36) | |
| Razer Blade 18 RTX 4070 | |
| Acer Predator Helios 18 N23Q2 | |
| Asus ROG Strix Scar 18 G834JYR (2024) | |
| Alienware m18 R1 | |
* ... Meglio usare valori piccoli
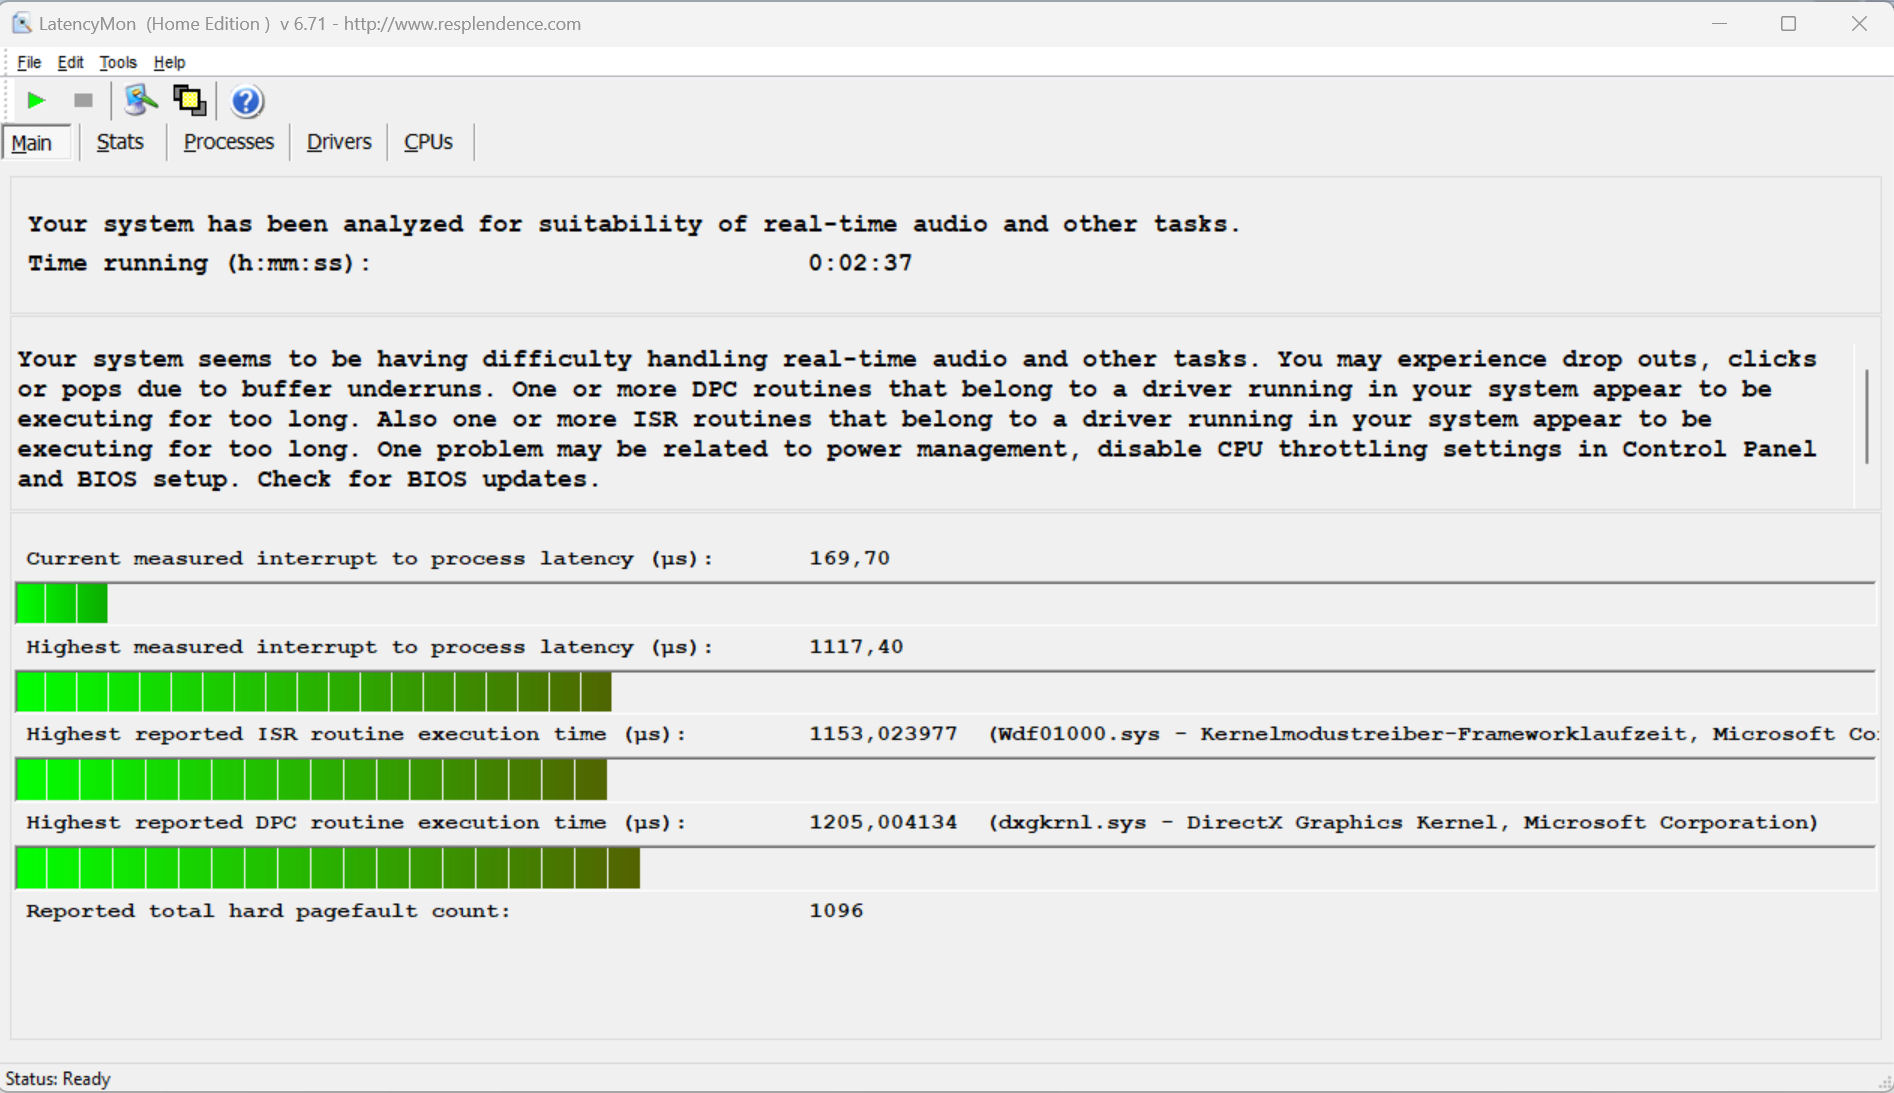
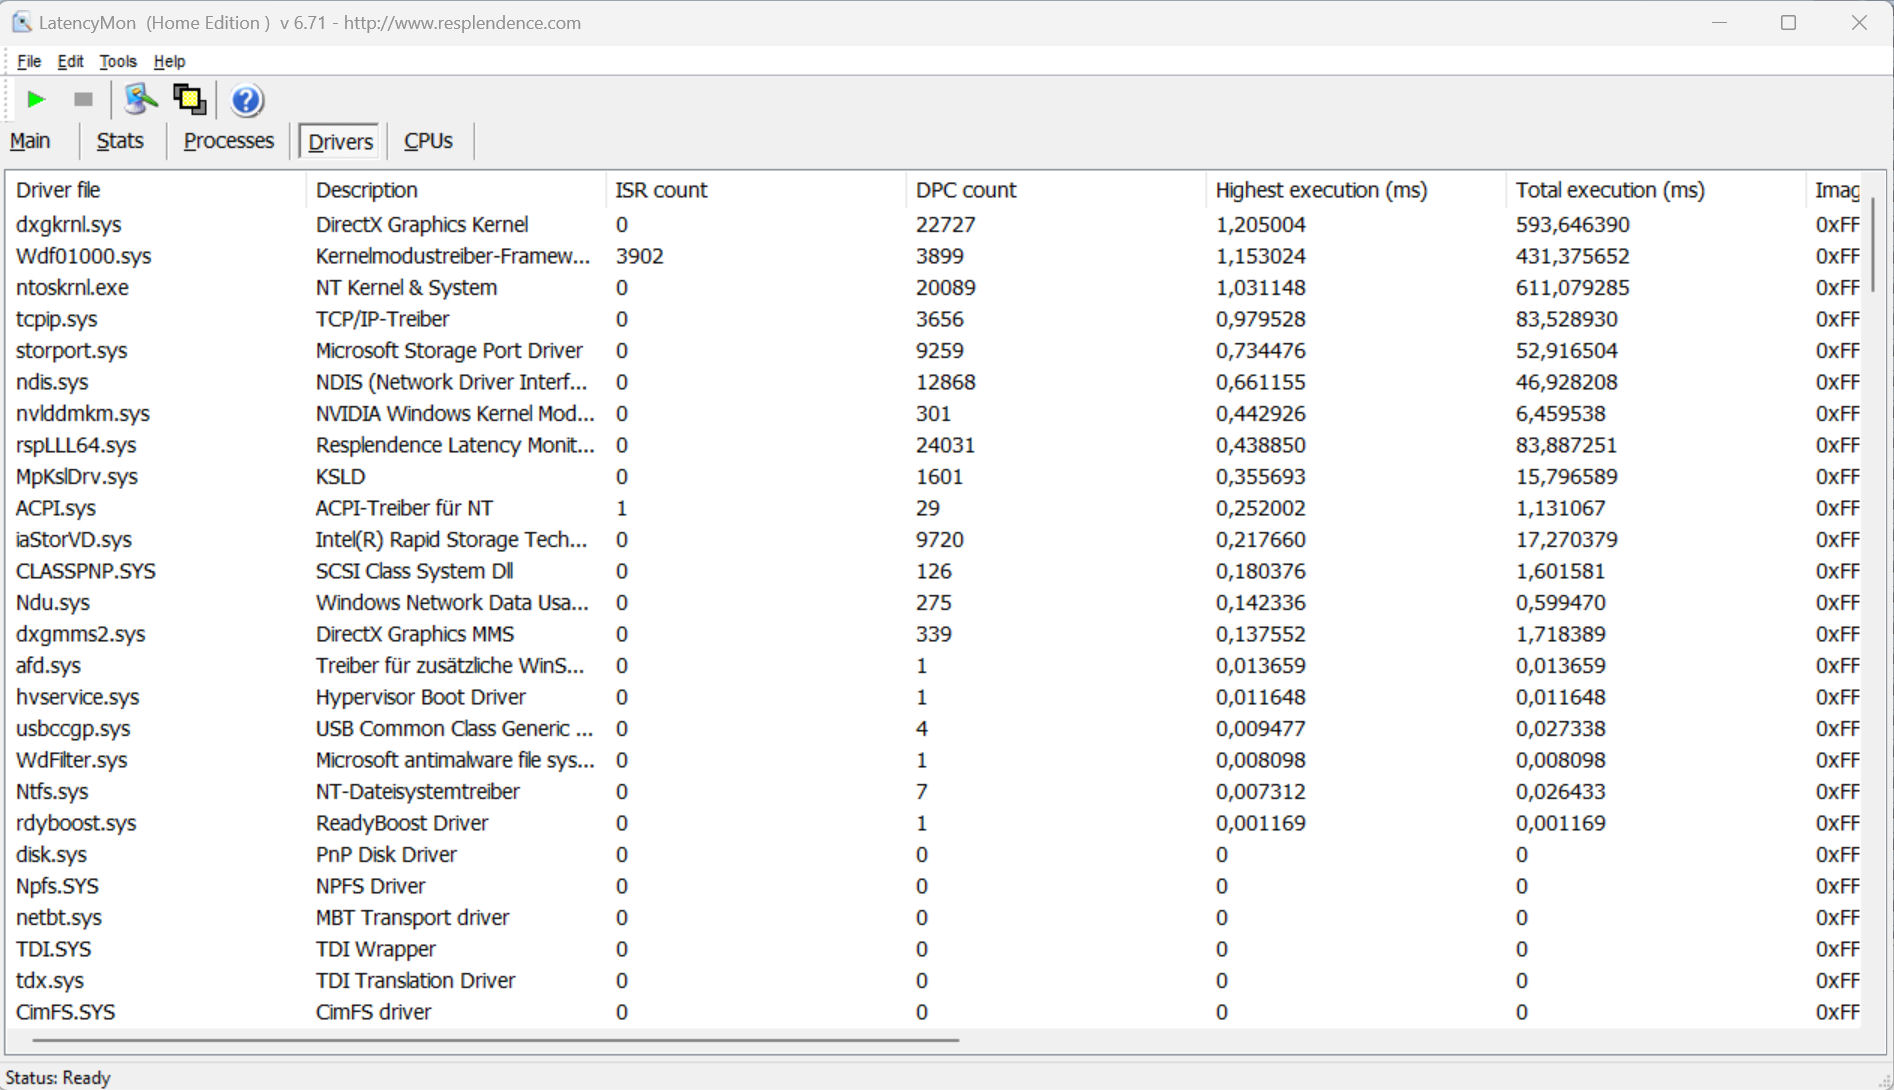
Latenze DPC
Il test standardizzato Latency Monitor (con navigazione web, riproduzione video 4k e Prime95 ad alto carico) rivela alcuni comportamenti evidenti, e il sistema non sembra essere adatto all'elaborazione video e audio in tempo reale. I futuri aggiornamenti del software potrebbero apportare dei miglioramenti o addirittura peggiorare la situazione.
| DPC Latencies / LatencyMon - interrupt to process latency (max), Web, Youtube, Prime95 | |
| Acer Predator Helios 18 N23Q2 | |
| Alienware m18 R1 | |
| MSI Titan 18 HX A14VIG | |
| Razer Blade 18 RTX 4070 | |
| Alienware m18 R1 AMD | |
| Asus ROG Strix Scar 18 G834JYR (2024) | |
| Asus ROG Strix Scar 18 2023 G834JY-N6005W | |
* ... Meglio usare valori piccoli
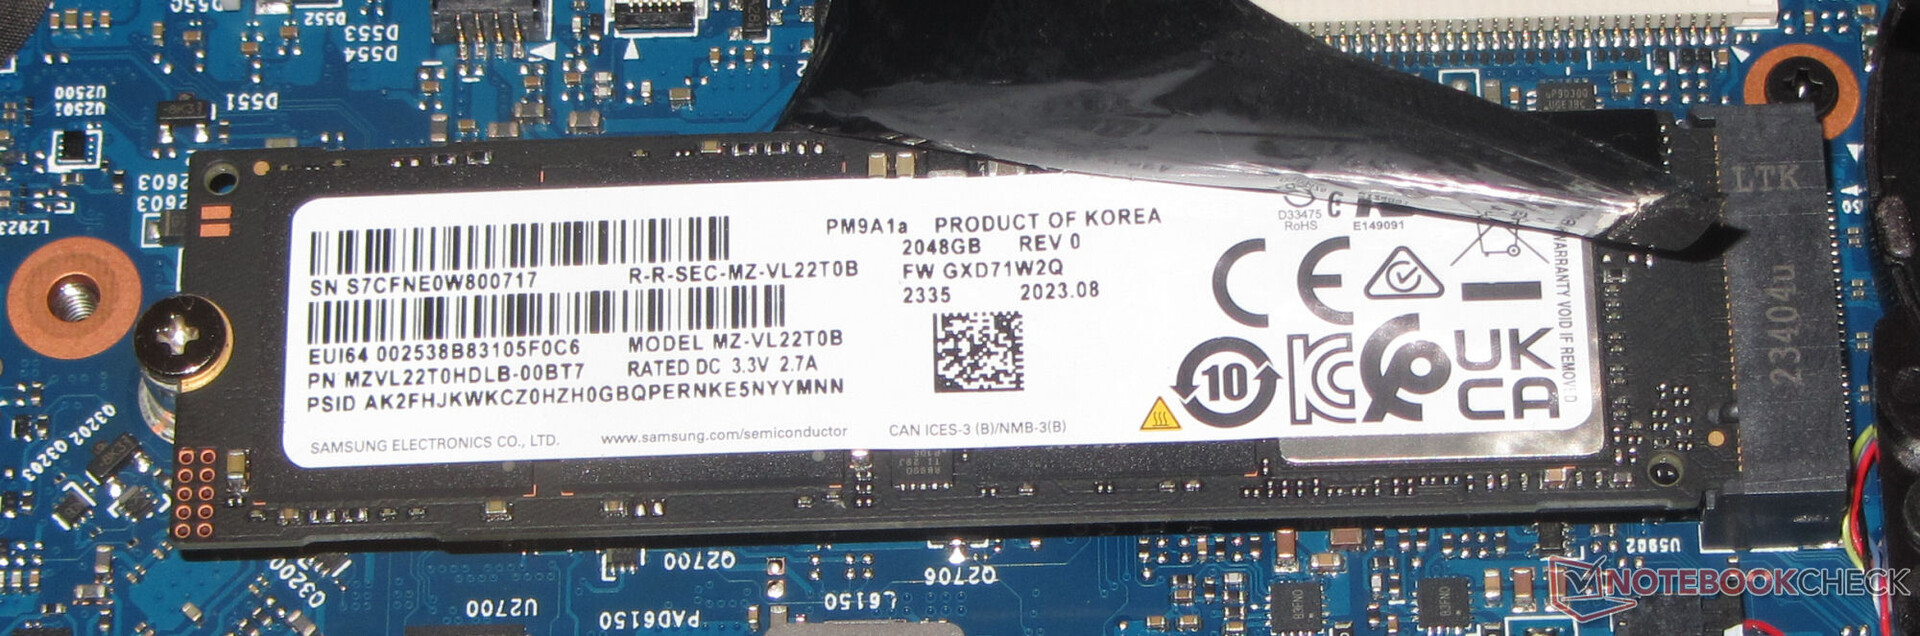
Soluzione di archiviazione
La Scar 18 può accettare un totale di due SSD PCIe 4 nel formato M.2-2280, con il supporto di RAID-0. L'SSD Samsung da 2 TB della nostra unità di prova offre velocità di trasferimento dati eccellenti. Un altro aspetto positivo è l'assenza di throttling termico.

* ... Meglio usare valori piccoli
Disk Throttling: DiskSpd Read Loop, Queue Depth 8
Scheda grafica
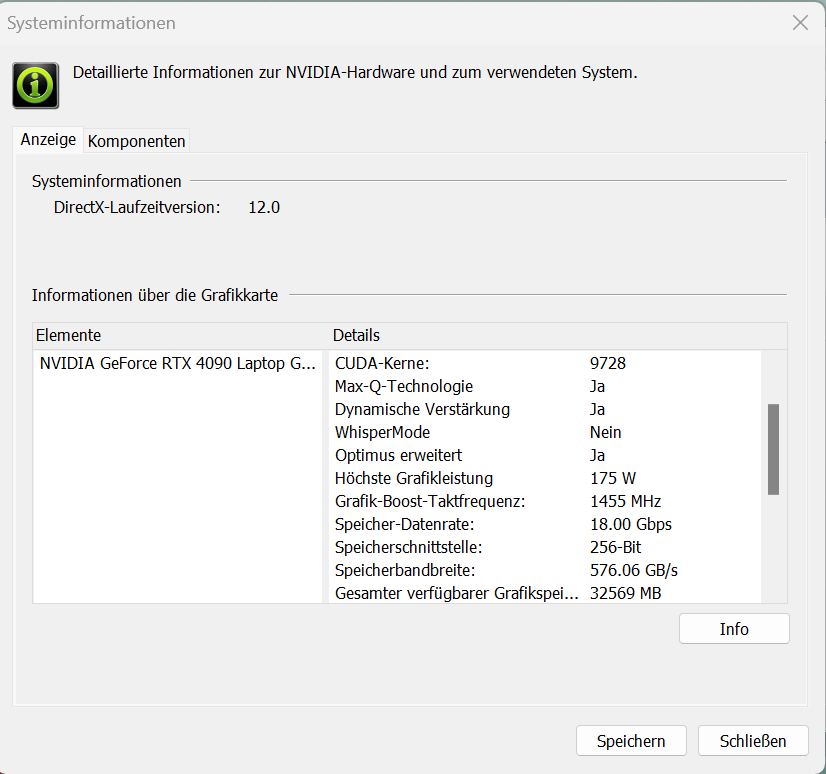
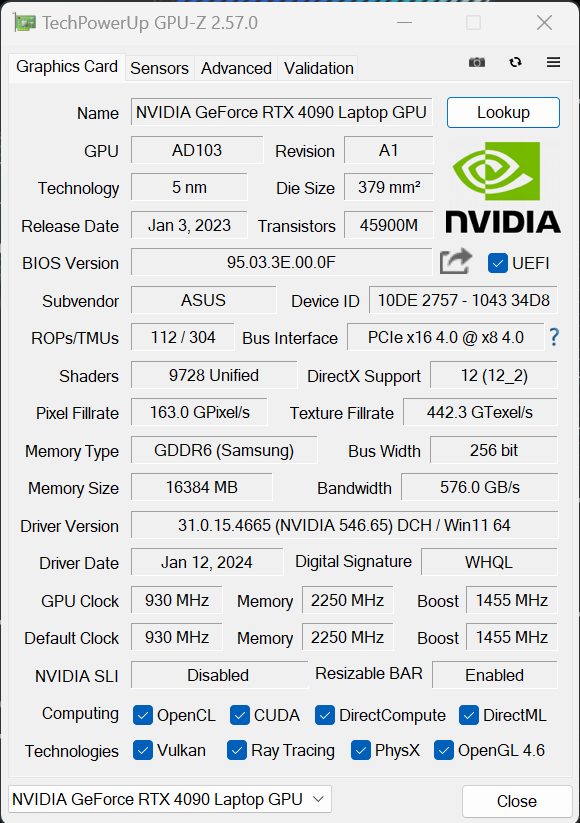
Con la GeForce RTX 4090asus utilizza l'attuale modello di punta di Nvidia tra le GPU mobili. Offre 9.728 unità shader, un bus di archiviazione a 256 bit e può anche utilizzare la veloce memoria GDDR6 (16.384 MB). Alla RTX 4090 viene concesso un TGP massimo di 175 watt (150 W + 25 W Dynamic Boost) - non è possibile fare di più.
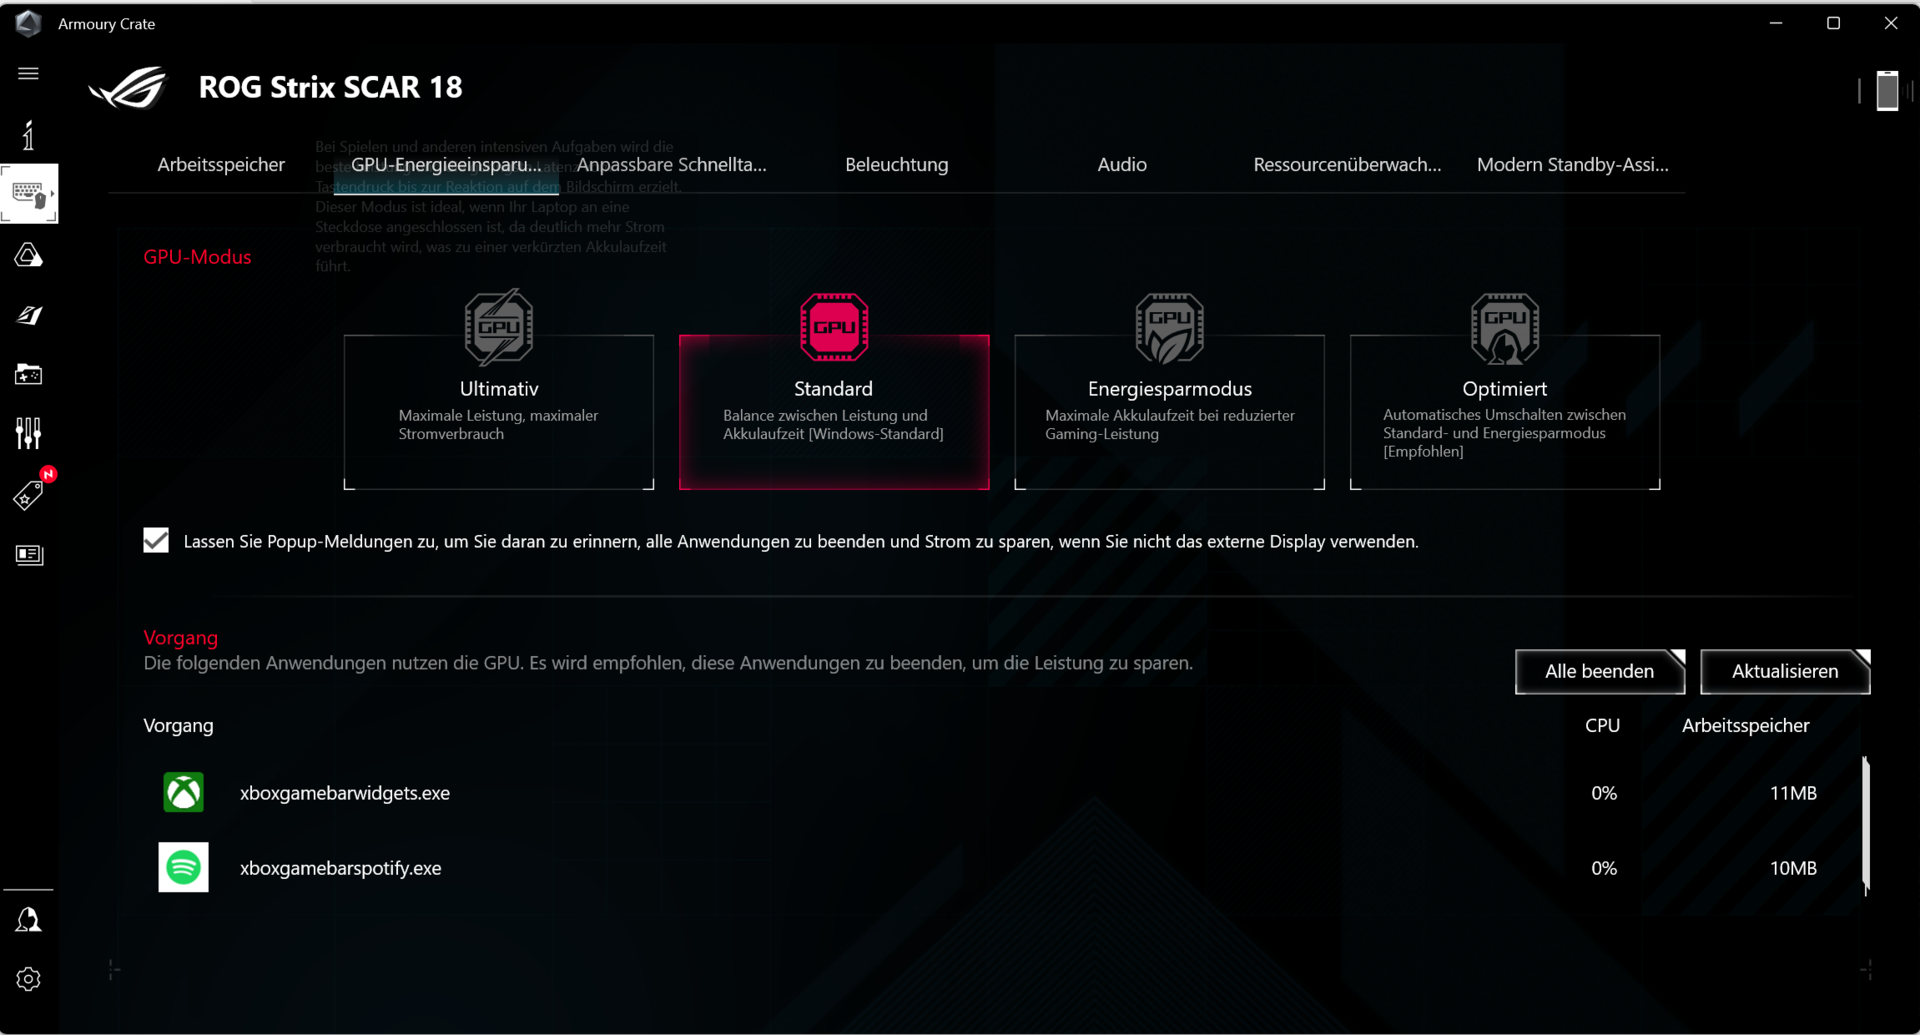
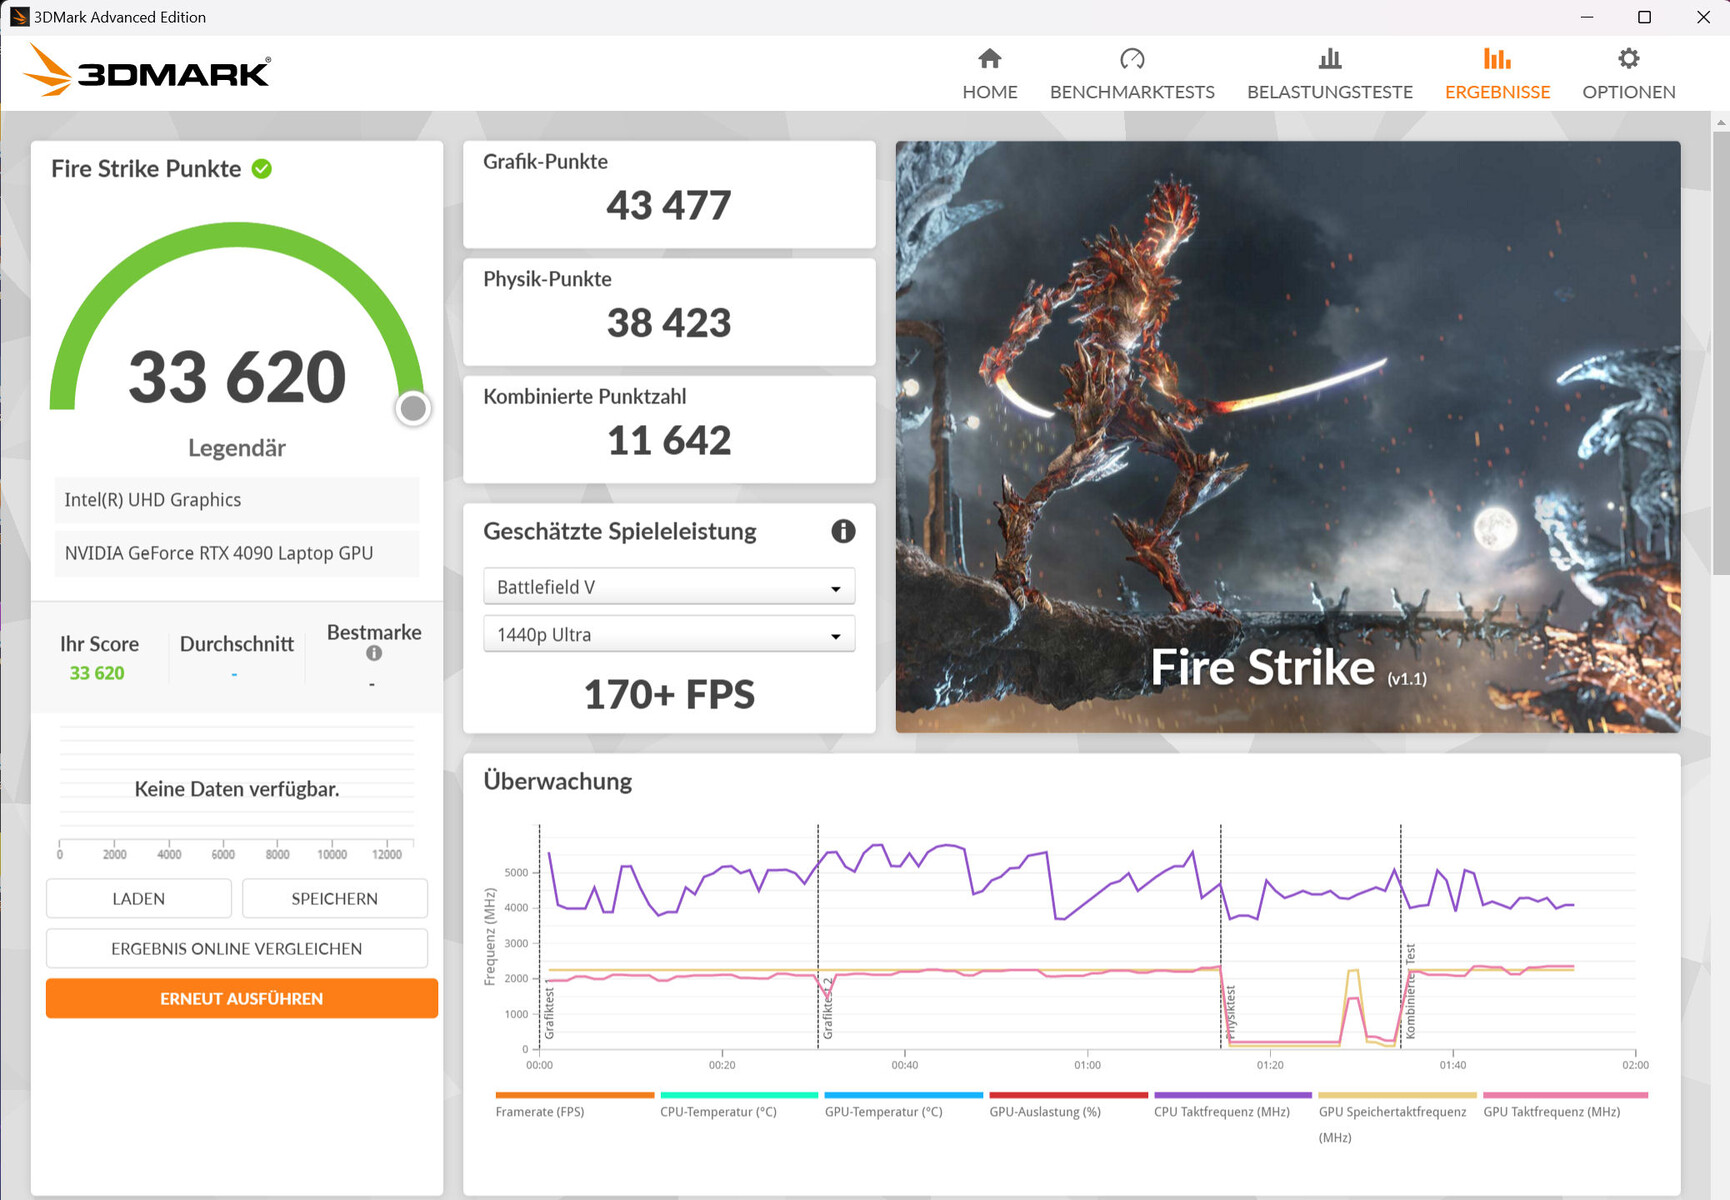
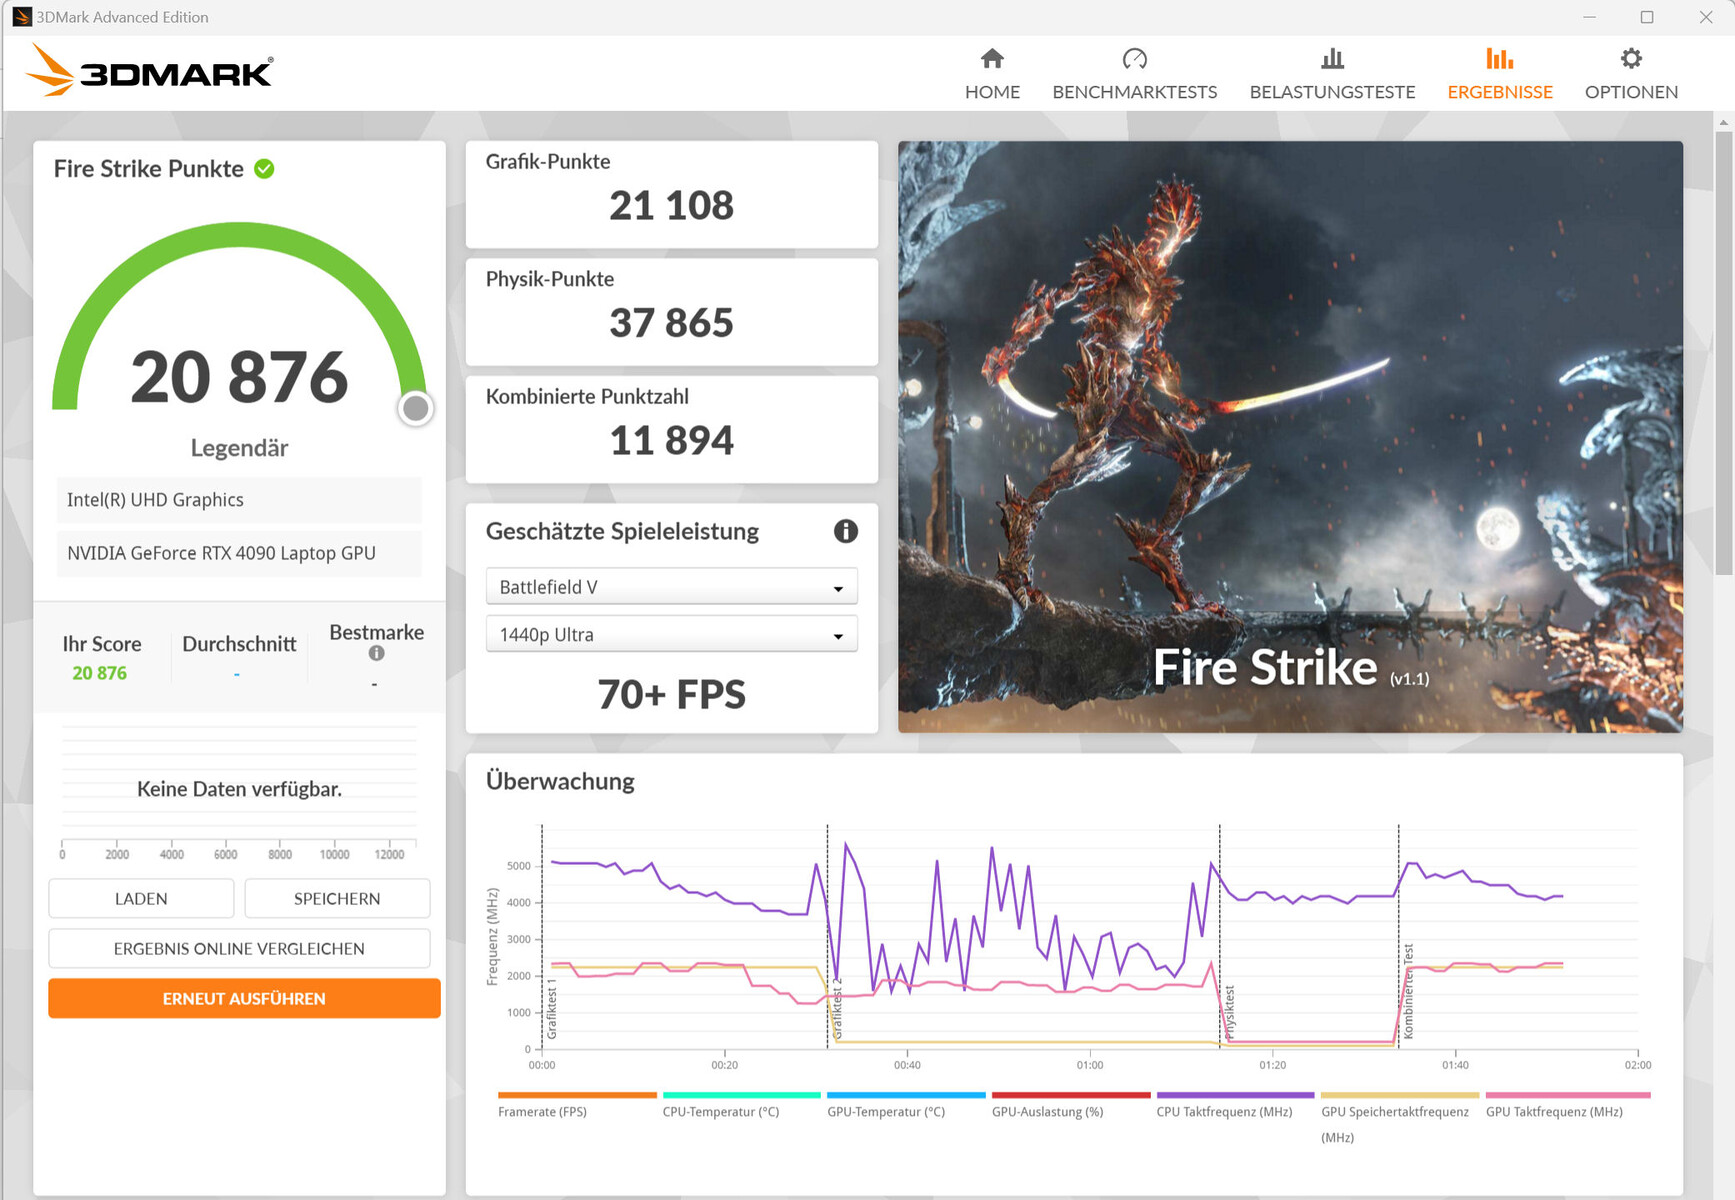
In modalità "Performance", i risultati del benchmark si collocano al di sotto della media determinata per la RTX 4090 fino ad ora, mentre con "Turbo" si ottengono valori allo stesso livello della media. L'Optimus avanzato è supportato, e il passaggio tra dGPU e Optimus non richiede un riavvio.


| 3DMark 11 Performance | 42985 punti | |
| 3DMark Cloud Gate Standard Score | 65110 punti | |
| 3DMark Fire Strike Score | 33620 punti | |
| 3DMark Time Spy Score | 19507 punti | |
Aiuto | ||
| V-Ray Benchmark Next 4.10 | |
| GPU | |
| Asus ROG Strix Scar 18 2023 G834JY-N6005W (v4.10.07 ) | |
| Media NVIDIA GeForce RTX 4090 Laptop GPU (873 - 1334, n=30) | |
| Asus ROG Strix Scar 18 G834JYR (2024) (v4.10.07 ) | |
| Acer Predator Helios 18 N23Q2 (v4.10.07 ) | |
| Media della classe Gaming (427 - 1627, n=99, ultimi 2 anni) | |
| CPU | |
| Asus ROG Strix Scar 18 2023 G834JY-N6005W (v4.10.07 ) | |
| Acer Predator Helios 18 N23Q2 (v4.10.07 ) | |
| Media NVIDIA GeForce RTX 4090 Laptop GPU (18206 - 37629, n=30) | |
| Asus ROG Strix Scar 18 G834JYR (2024) (v4.10.07 ) | |
| Media della classe Gaming (10048 - 45327, n=97, ultimi 2 anni) | |
* ... Meglio usare valori piccoli
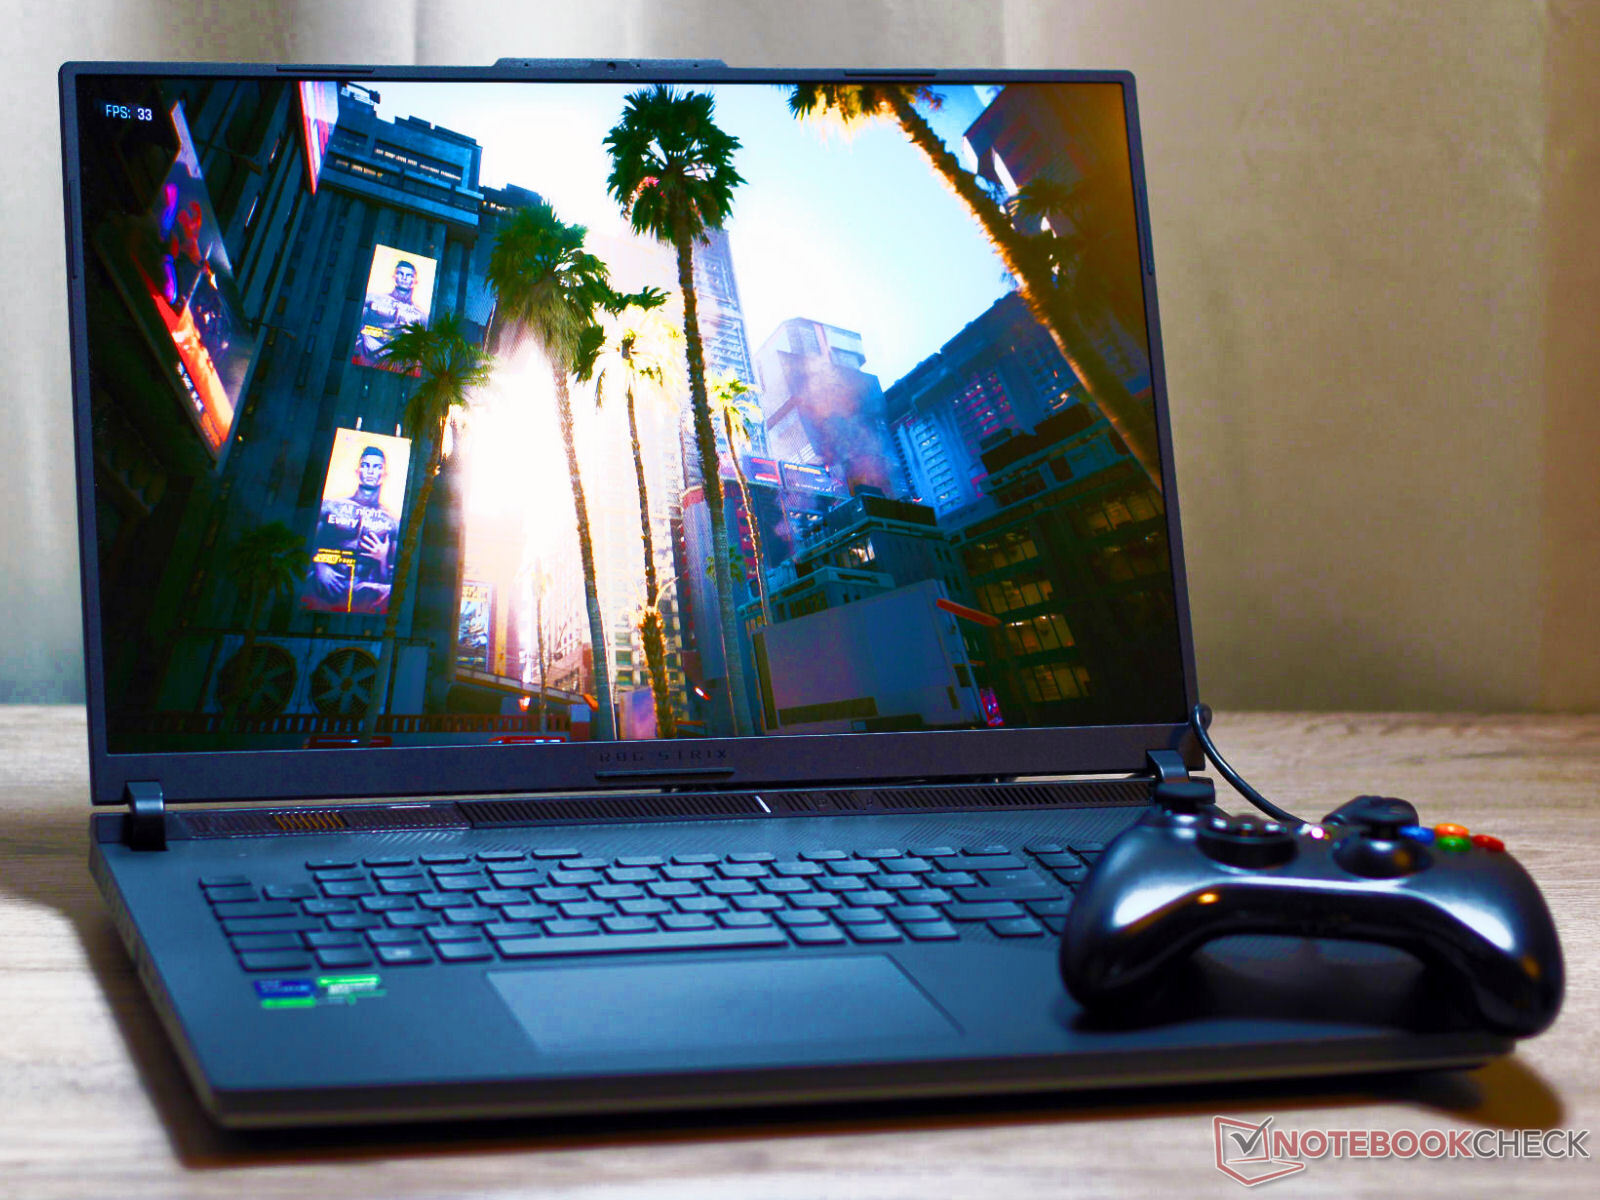
Prestazioni di gioco
La Scar 18 consente di giocare in QHD+ con le impostazioni massime. È possibile utilizzare risoluzioni più elevate se si collega il monitor corrispondente. I giochi con supporto per DLSS 3 e Frame Generation consentono impostazioni massime ed effetti di raytracing aggiuntivi in risoluzione 4k.
In modalità "Performance", le frequenze dei fotogrammi dei nostri giochi testati sono inferiori alla media RTX 4090 determinata finora. Selezionando "Turbo" si può ottenere un leggero aumento, e lo stesso vale per la modalità GPU "Ultimate".
| The Witcher 3 - 1920x1080 Ultra Graphics & Postprocessing (HBAO+) | |
| Alienware m18 R1 | |
| MSI Titan 18 HX A14VIG | |
| Media NVIDIA GeForce RTX 4090 Laptop GPU (139.2 - 216, n=35) | |
| Media della classe Gaming (104.7 - 240, n=7, ultimi 2 anni) | |
| Asus ROG Strix Scar 18 G834JYR (2024) | |
| Acer Predator Helios 18 N23Q2 | |
| Alienware m18 R1 AMD | |
| Razer Blade 18 RTX 4070 | |
| Call of Duty Modern Warfare 3 2023 | |
| 1920x1080 Extreme Preset | |
| Media NVIDIA GeForce RTX 4090 Laptop GPU (148 - 205, n=7) | |
| Asus ROG Strix Scar 18 G834JYR (2024) | |
| Media della classe Gaming (27 - 95, n=2, ultimi 2 anni) | |
| 2560x1440 Extreme Preset | |
| Asus ROG Strix Scar 18 G834JYR (2024) | |
| Media NVIDIA GeForce RTX 4090 Laptop GPU (113 - 162, n=7) | |
| Media della classe Gaming (n=1ultimi 2 anni) | |
| The Finals | |
| 1920x1080 Epic Preset | |
| Asus ROG Strix Scar 18 G834JYR (2024) | |
| Media NVIDIA GeForce RTX 4090 Laptop GPU (174.1 - 211, n=2) | |
| Media della classe Gaming (n=1ultimi 2 anni) | |
| 2560x1440 Epic Preset | |
| Asus ROG Strix Scar 18 G834JYR (2024) | |
| Media NVIDIA GeForce RTX 4090 Laptop GPU (137.2 - 147.4, n=2) | |
| Media della classe Gaming (n=1ultimi 2 anni) | |
| 1920x1080 Epic Preset + Epic RTX Global Illumination | |
| Asus ROG Strix Scar 18 G834JYR (2024) | |
| Media NVIDIA GeForce RTX 4090 Laptop GPU (159.8 - 190.8, n=2) | |
| Palworld | |
| 1920x1080 Epic Preset AA:TSR | |
| Asus ROG Strix Scar 18 G834JYR (2024) | |
| Media NVIDIA GeForce RTX 4090 Laptop GPU (138.8 - 150.9, n=2) | |
| Media della classe Gaming (n=1ultimi 2 anni) | |
| 2560x1440 Epic Preset AA:TSR | |
| Asus ROG Strix Scar 18 G834JYR (2024) | |
| Media NVIDIA GeForce RTX 4090 Laptop GPU (110.5 - 119.8, n=2) | |
| Enshrouded | |
| 1920x1080 Max. Quality AA:FX | |
| Media NVIDIA GeForce RTX 4090 Laptop GPU (79 - 101.5, n=3) | |
| Asus ROG Strix Scar 18 G834JYR (2024) | |
| Media della classe Gaming (n=1ultimi 2 anni) | |
| 2560x1440 Max. Quality AA:FX | |
| Asus ROG Strix Scar 18 G834JYR (2024) | |
| Media NVIDIA GeForce RTX 4090 Laptop GPU (61.8 - 76, n=3) | |
Per valutare se le frequenze dei fotogrammi rimangono abbastanza costanti in un periodo di tempo più lungo, abbiamo eseguito il gioco "The Witcher 3" per circa 60 minuti in risoluzione Full-HD con le impostazioni di qualità massime. Il personaggio di gioco non viene spostato. Non osserviamo alcun calo della frequenza dei fotogrammi.
The Witcher 3 FPS Chart
| basso | medio | alto | ultra | QHD | |
|---|---|---|---|---|---|
| GTA V (2015) | 187.5 | 187.1 | 181.2 | 136 | 129.6 |
| The Witcher 3 (2015) | 579.6 | 501.7 | 342.8 | 189.4 | 151.5 |
| Dota 2 Reborn (2015) | 219 | 194.5 | 173.9 | 161.3 | |
| Final Fantasy XV Benchmark (2018) | 221 | 198.1 | 166.1 | 143.6 | |
| X-Plane 11.11 (2018) | 197.9 | 172.4 | 136.8 | ||
| Far Cry 5 (2018) | 176 | 163 | 156 | 145 | 145 |
| Strange Brigade (2018) | 429 | 350 | 341 | 331 | 279 |
| Starfield (2023) | 112.7 | 100 | 84.2 | 78.4 | 66 |
| Cyberpunk 2077 (2023) | 134.8 | 121.5 | 117.7 | 112.1 | 83.8 |
| Call of Duty Modern Warfare 3 2023 (2023) | 229 | 210 | 169 | 162 | 162 |
| The Finals (2023) | 228 | 216 | 214 | 211 | 147.4 |
| Palworld (2024) | 211 | 180.9 | 151.3 | 150.9 | 119.8 |
| Enshrouded (2024) | 135.2 | 120.1 | 100.8 | 87.6 | 68.9 |
Emissioni - Il G834JYR è in grado di funzionare in modo silenzioso
Emissioni di rumore
A pieno carico, il livello di rumore aumenta fino a 52 dB(A) in modalità "Performance". Con la modalità "Turbo", il valore aumenta ancora di più, e il confronto con lo Scar 18 del 2023 mostra la stessa cosa. Anche il suo funzionamento può essere più silenzioso in generale: se rinuncia alle prestazioni selezionando la modalità "Silenzioso", il livello di rumore diminuisce a 35 dB(A). Durante l'inattività o nel funzionamento quotidiano (Ufficio, Internet), spesso solo una delle due ventole è in funzione e occasionalmente entrambe rimangono silenziose, in particolare quando si utilizza il profilo "Silenzioso".
Rumorosità
| Idle |
| 27 / 28 / 32 dB(A) |
| Sotto carico |
| 50 / 52 dB(A) |
 | ||
30 dB silenzioso 40 dB(A) udibile 50 dB(A) rumoroso |
||
min: | ||
| Asus ROG Strix Scar 18 G834JYR (2024) i9-14900HX, GeForce RTX 4090 Laptop GPU | Alienware m18 R1 AMD R9 7945HX, Radeon RX 7900M | Alienware m18 R1 i9-13980HX, GeForce RTX 4090 Laptop GPU | Acer Predator Helios 18 N23Q2 i9-13900HX, GeForce RTX 4080 Laptop GPU | Razer Blade 18 RTX 4070 i9-13950HX, GeForce RTX 4070 Laptop GPU | MSI Titan 18 HX A14VIG i9-14900HX, GeForce RTX 4090 Laptop GPU | Asus ROG Strix Scar 18 2023 G834JY-N6005W i9-13980HX, GeForce RTX 4090 Laptop GPU | |
|---|---|---|---|---|---|---|---|
| Noise | 8% | 12% | 6% | 10% | 5% | 2% | |
| off /ambiente * (dB) | 24 | 22.4 7% | 22.8 5% | 23 4% | 23.5 2% | 22.8 5% | 23.9 -0% |
| Idle Minimum * (dB) | 27 | 23 15% | 23 15% | 23 15% | 23.8 12% | 23.8 12% | 23.9 11% |
| Idle Average * (dB) | 28 | 23.4 16% | 23 18% | 23 18% | 23.8 15% | 23.8 15% | 32.6 -16% |
| Idle Maximum * (dB) | 32 | 33.5 -5% | 23 28% | 23 28% | 26.8 16% | 28 12% | 32.6 -2% |
| Load Average * (dB) | 50 | 33.5 33% | 35.6 29% | 45.26 9% | 37.3 25% | 38 24% | 35.9 28% |
| Witcher 3 ultra * (dB) | 50 | 53.6 -7% | 51.3 -3% | 59.82 -20% | 48 4% | 57.3 -15% | |
| Load Maximum * (dB) | 52 | 53.6 -3% | 56.7 -9% | 59.94 -15% | 53.5 -3% | 62.8 -21% | 55.8 -7% |
* ... Meglio usare valori piccoli
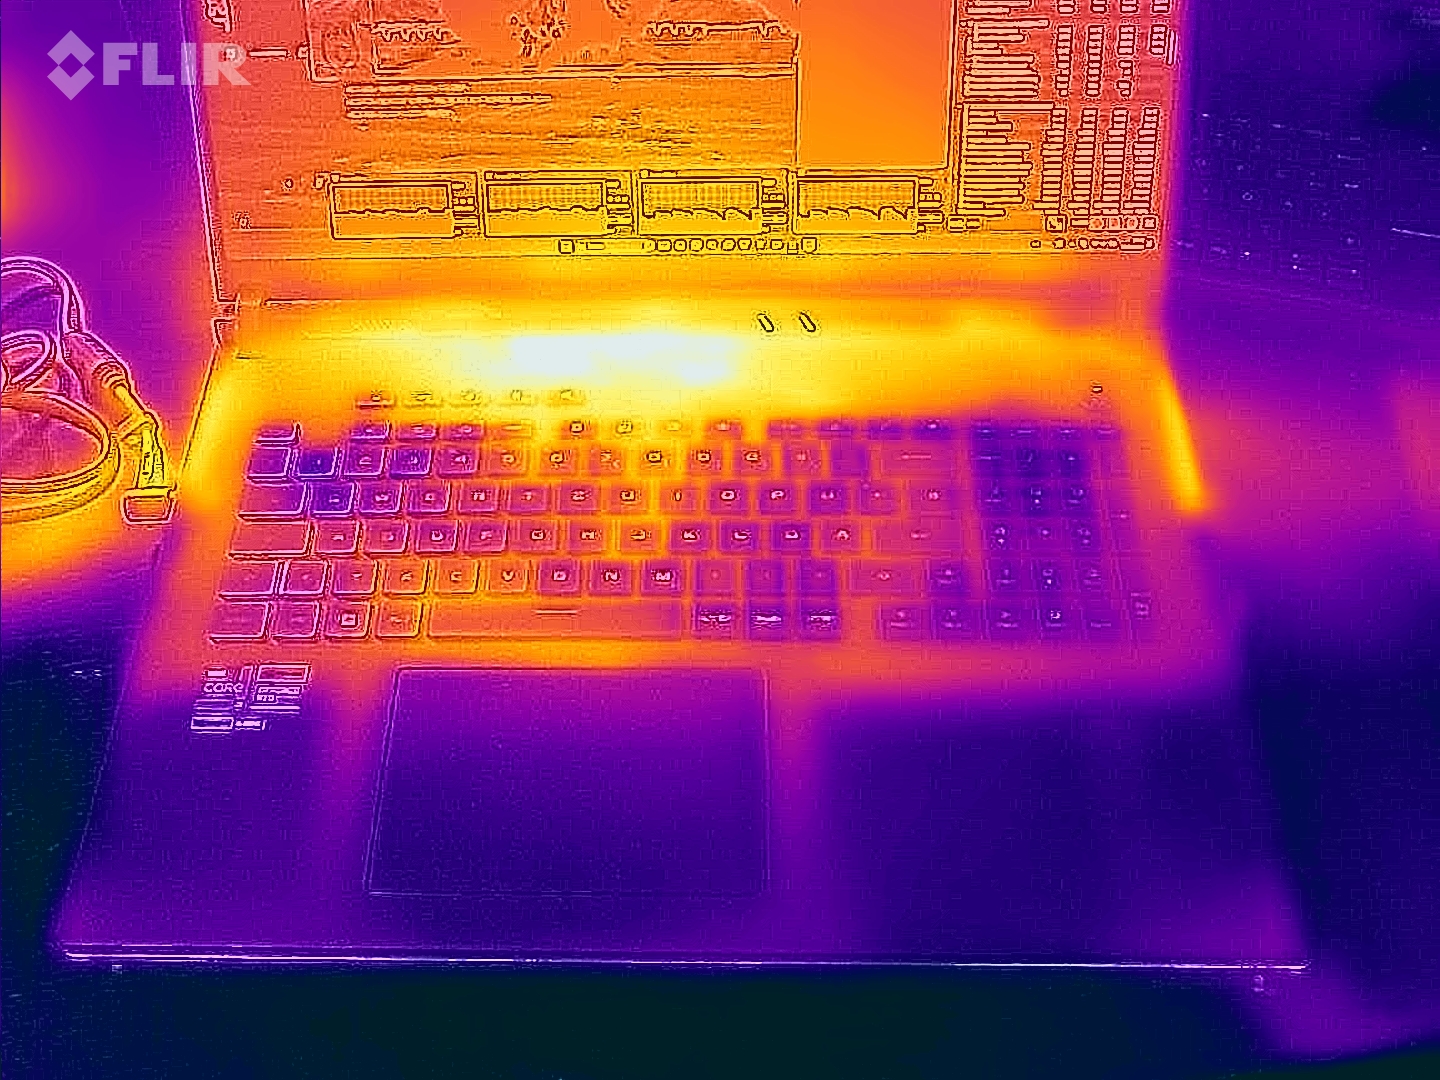
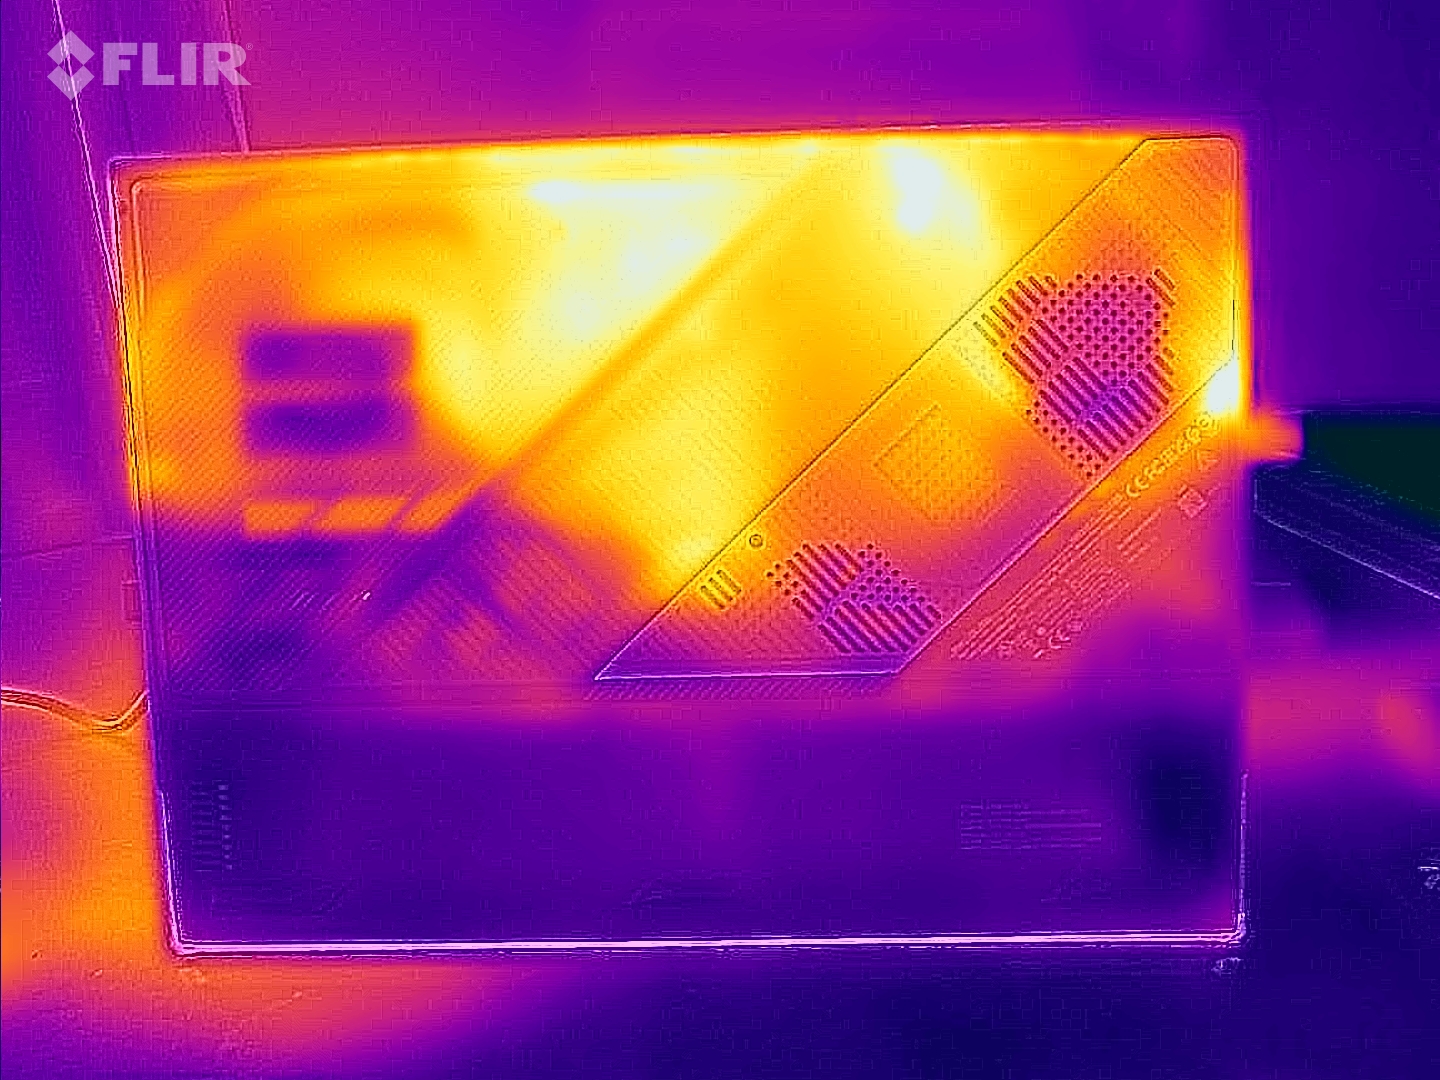
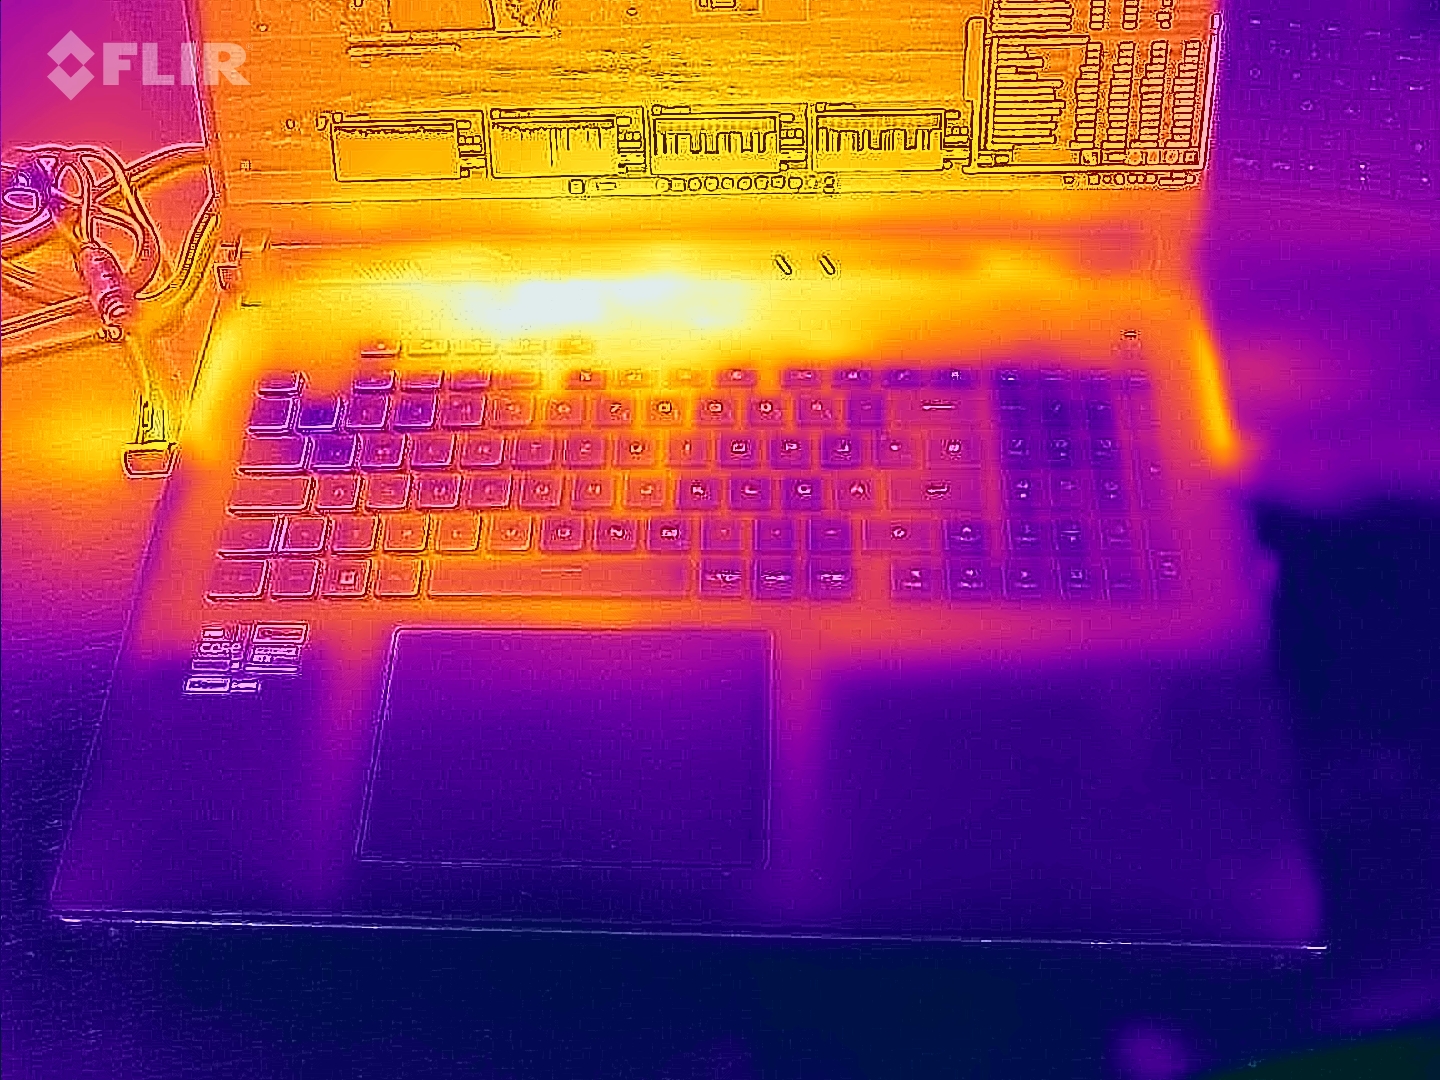
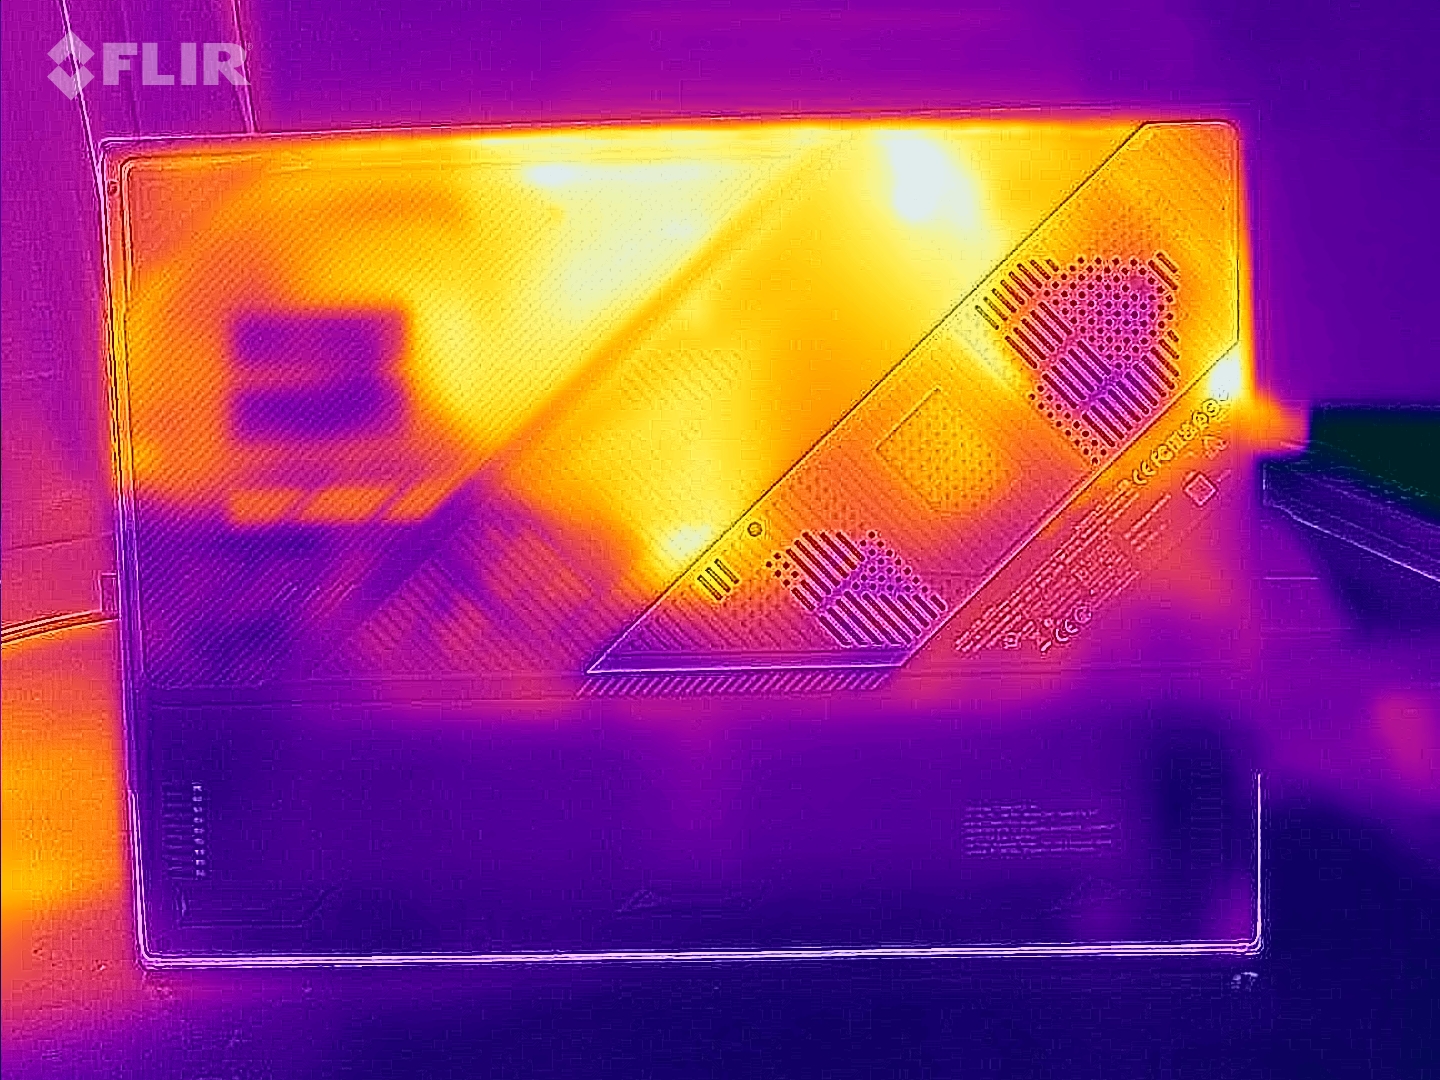
Le temperature
Il test di stress e il test Witcher 3 comportano un riscaldamento evidente ma non eccessivo del portatile. In alcuni punti, si raggiungono valori superiori a 50 ºC (122 ºF). Tuttavia, durante il funzionamento quotidiano (Office, Internet), le temperature rimangono nell'intervallo verde.
(-) La temperatura massima sul lato superiore è di 49 °C / 120 F, rispetto alla media di 40.4 °C / 105 F, che varia da 21.2 a 68.8 °C per questa classe Gaming.
(-) Il lato inferiore si riscalda fino ad un massimo di 47 °C / 117 F, rispetto alla media di 43.2 °C / 110 F
(+) In idle, la temperatura media del lato superiore è di 27.3 °C / 81 F, rispetto alla media deld ispositivo di 33.9 °C / 93 F.
(-) Riproducendo The Witcher 3, la temperatura media per il lato superiore e' di 39.1 °C / 102 F, rispetto alla media del dispositivo di 33.9 °C / 93 F.
(+) I poggiapolsi e il touchpad raggiungono la temperatura massima della pelle (35 °C / 95 F) e quindi non sono caldi.
(-) La temperatura media della zona del palmo della mano di dispositivi simili e'stata di 28.8 °C / 83.8 F (-6.2 °C / -11.2 F).
| Asus ROG Strix Scar 18 G834JYR (2024) Intel Core i9-14900HX, NVIDIA GeForce RTX 4090 Laptop GPU | Alienware m18 R1 AMD AMD Ryzen 9 7945HX, AMD Radeon RX 7900M | Alienware m18 R1 Intel Core i9-13980HX, NVIDIA GeForce RTX 4090 Laptop GPU | Acer Predator Helios 18 N23Q2 Intel Core i9-13900HX, NVIDIA GeForce RTX 4080 Laptop GPU | Razer Blade 18 RTX 4070 Intel Core i9-13950HX, NVIDIA GeForce RTX 4070 Laptop GPU | MSI Titan 18 HX A14VIG Intel Core i9-14900HX, NVIDIA GeForce RTX 4090 Laptop GPU | Asus ROG Strix Scar 18 2023 G834JY-N6005W Intel Core i9-13980HX, NVIDIA GeForce RTX 4090 Laptop GPU | |
|---|---|---|---|---|---|---|---|
| Heat | 8% | 13% | -8% | 7% | 2% | -3% | |
| Maximum Upper Side * (°C) | 49 | 40.2 18% | 39 20% | 35 29% | 39.2 20% | 37.8 23% | 54 -10% |
| Maximum Bottom * (°C) | 47 | 37.4 20% | 36.4 23% | 56 -19% | 35.6 24% | 37.6 20% | 46 2% |
| Idle Upper Side * (°C) | 29 | 31.6 -9% | 29.2 -1% | 34 -17% | 31.8 -10% | 34.8 -20% | 30 -3% |
| Idle Bottom * (°C) | 31 | 30.6 1% | 27.8 10% | 39 -26% | 33.2 -7% | 36 -16% | 31 -0% |
* ... Meglio usare valori piccoli
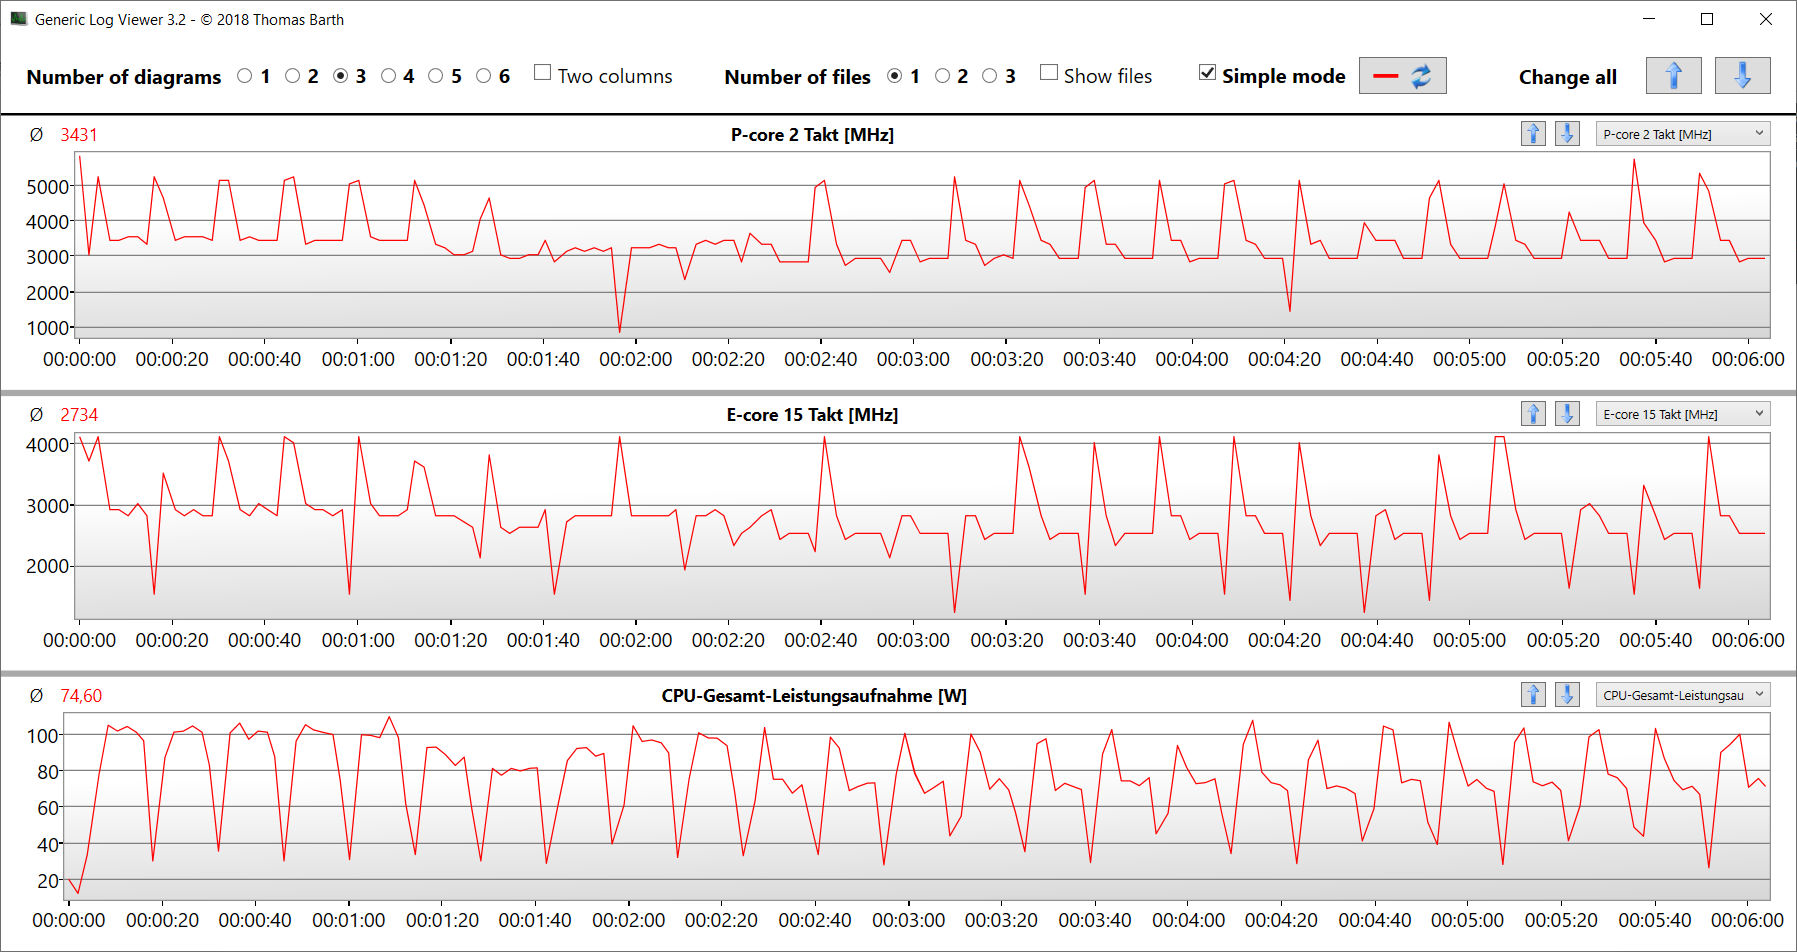
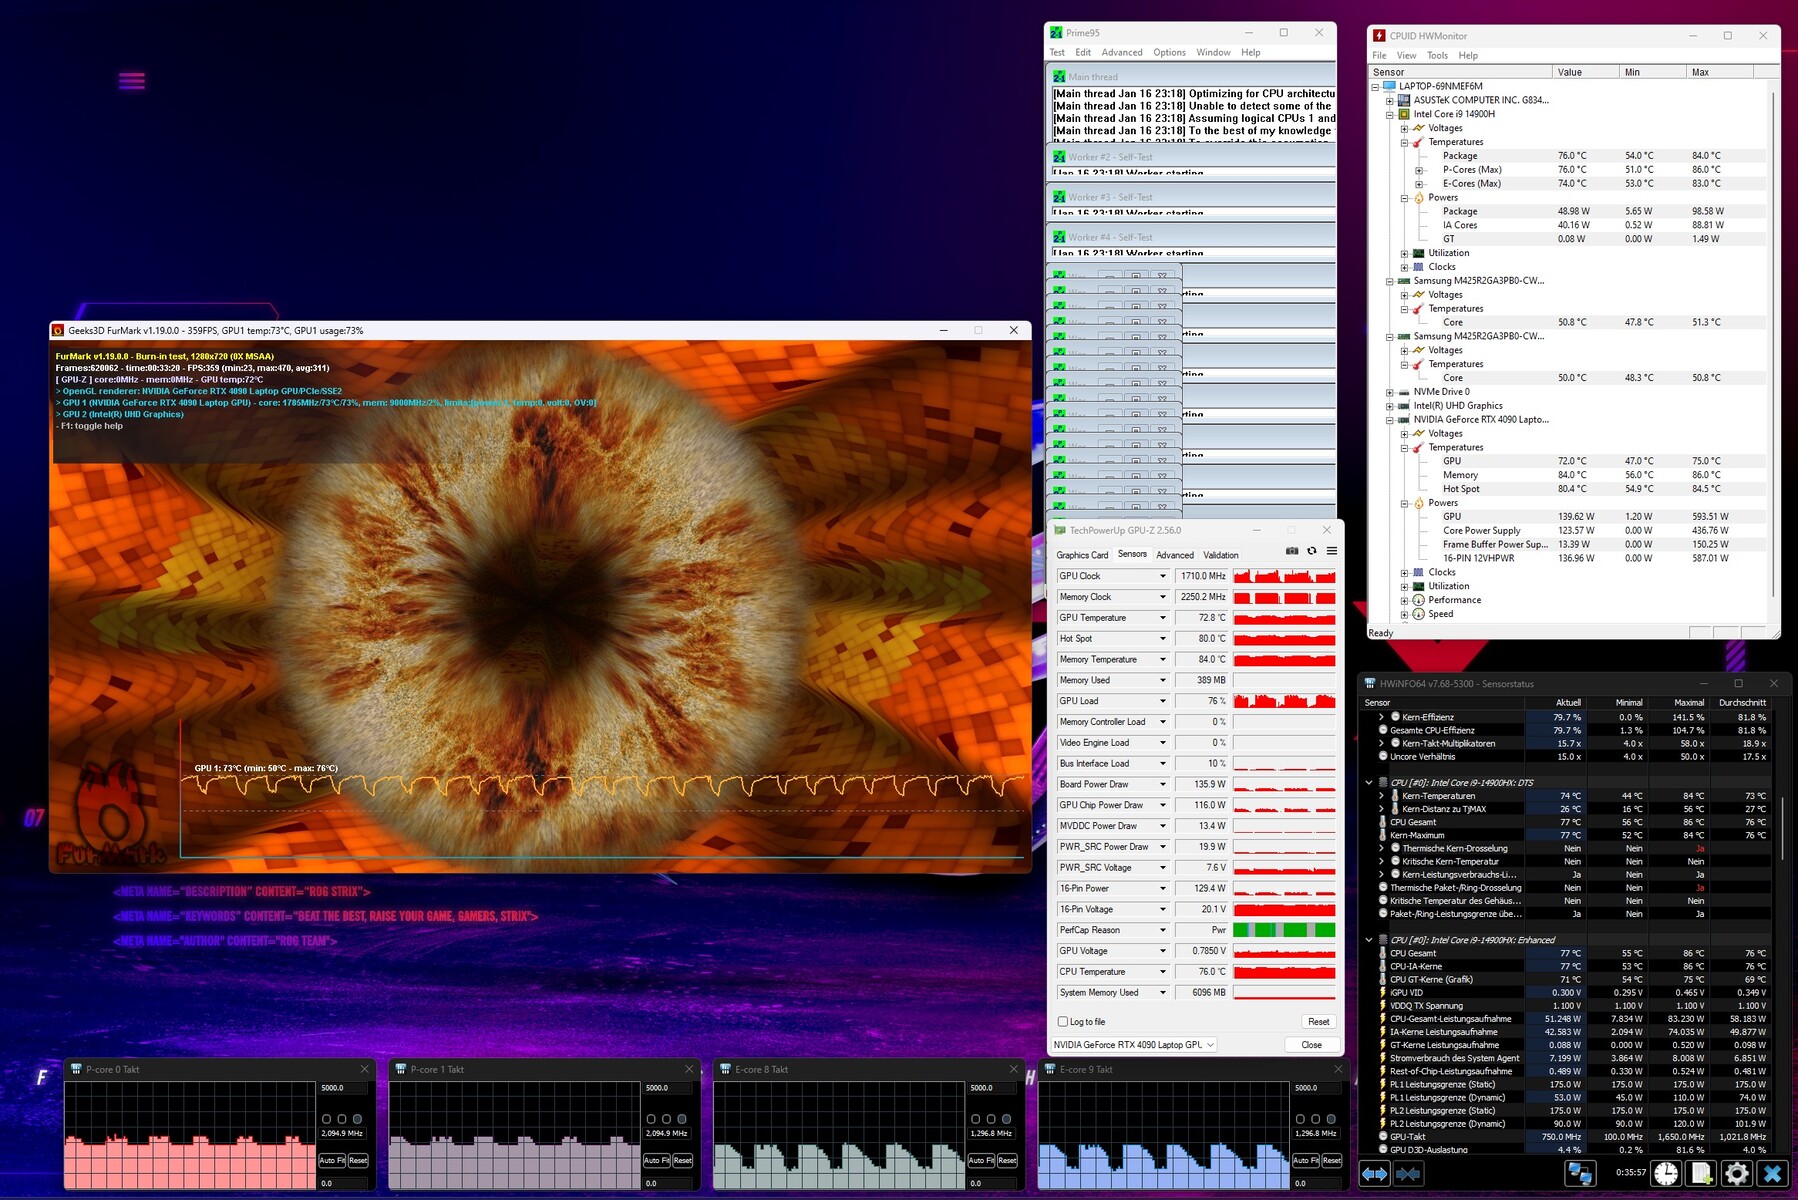
Test da sforzo
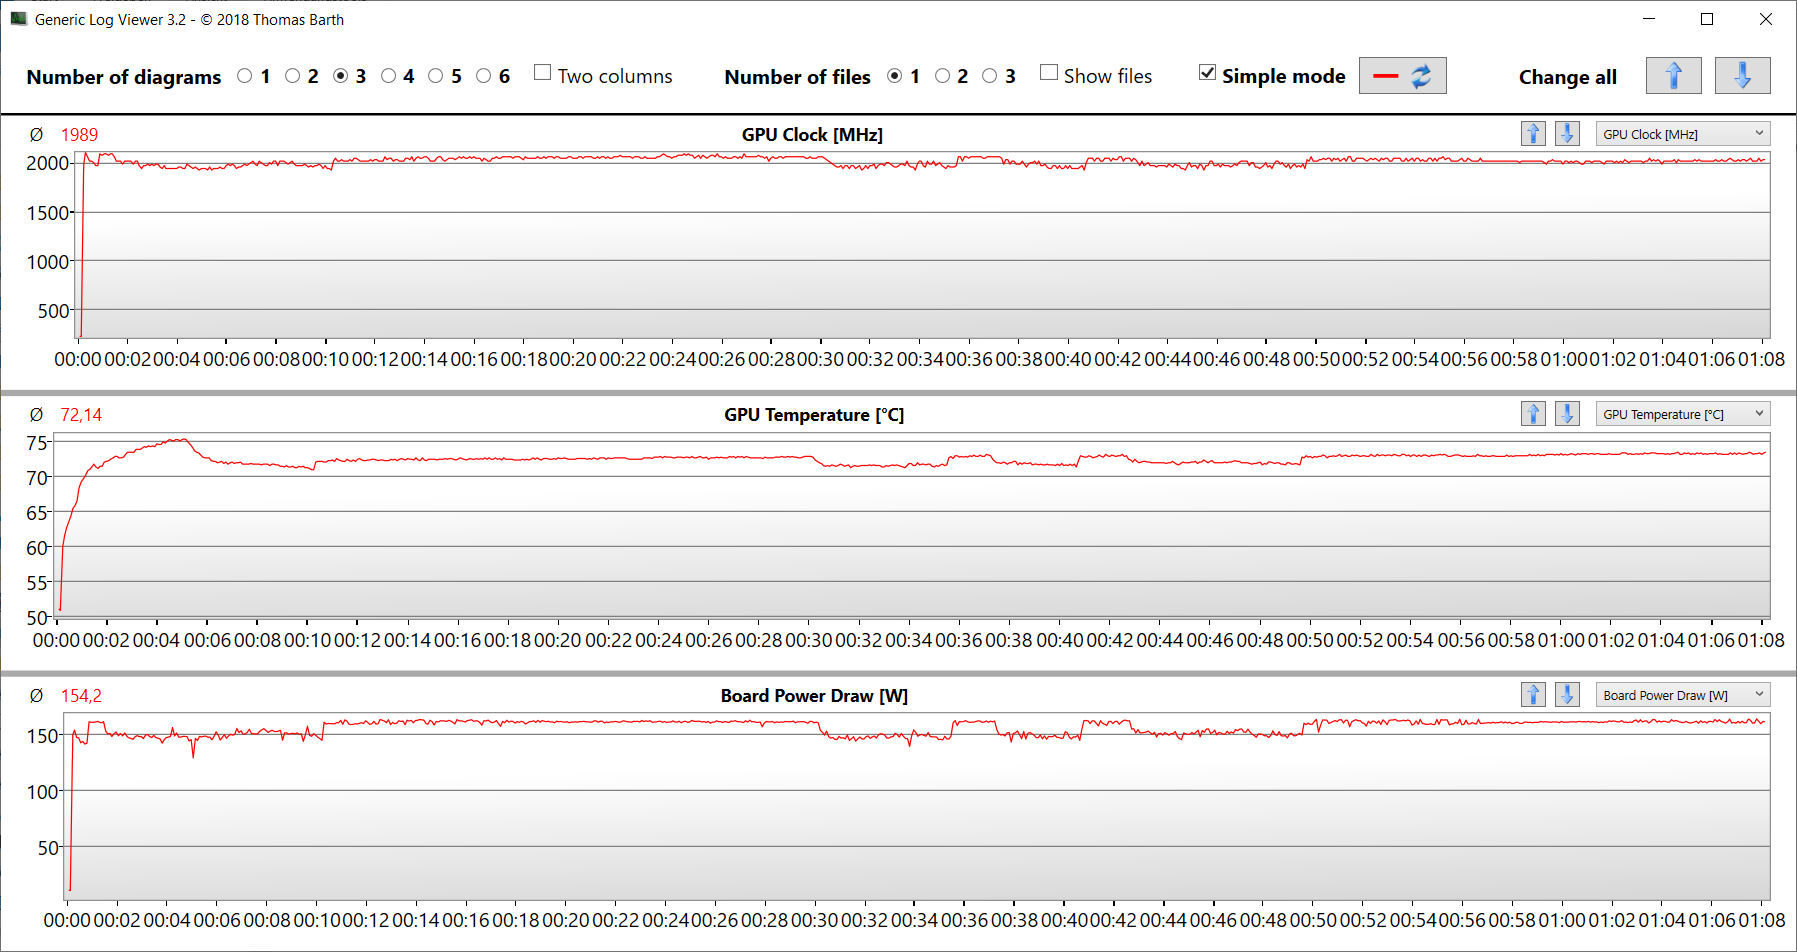
Il test di stress (con Prime95 e Furmark in esecuzione costante) rappresenta uno scenario estremo per valutare la stabilità del sistema a pieno carico. La CPU raggiunge velocità massime da 2,5 a 2,6 GHz (core P) e da 2,2 a 2,3 GHz (core E). La GPU (da 1,9 a 2 GHz) inizia il test quasi alla massima velocità e la velocità scende leggermente man mano che il test prosegue. Inoltre, la GPU viene regolarmente strozzata in modo significativo.
Altoparlanti
I quattro altoparlanti producono insieme un suono molto decente. Per un'esperienza sonora ancora migliore, può utilizzare una cuffia o degli altoparlanti esterni.
Asus ROG Strix Scar 18 G834JYR (2024) analisi audio
(+) | gli altoparlanti sono relativamente potenti (82 dB)
Bassi 100 - 315 Hz
(±) | bassi ridotti - in media 5.6% inferiori alla media
(+) | bassi in lineaa (6.8% delta rispetto alla precedente frequenza)
Medi 400 - 2000 Hz
(±) | medi elevati - circa 5.7% superiore alla media
(+) | medi lineari (2.8% delta rispetto alla precedente frequenza)
Alti 2 - 16 kHz
(±) | alti ridotti - circa 7.2% inferiori alla media
(±) | la linearità degli alti è media (7.2% delta rispetto alla precedente frequenza)
Nel complesso 100 - 16.000 Hz
(+) | suono nel complesso lineare (13% differenza dalla media)
Rispetto alla stessa classe
» 18% di tutti i dispositivi testati in questa classe è stato migliore, 3% simile, 79% peggiore
» Il migliore ha avuto un delta di 6%, medio di 18%, peggiore di 132%
Rispetto a tutti i dispositivi testati
» 13% di tutti i dispositivi testati in questa classe è stato migliore, 3% similare, 85% peggiore
» Il migliore ha avuto un delta di 4%, medio di 23%, peggiore di 134%
MSI Titan 18 HX A14VIG analisi audio
(+) | gli altoparlanti sono relativamente potenti (89.2 dB)
Bassi 100 - 315 Hz
(-) | quasi nessun basso - in media 17.6% inferiori alla media
(±) | la linearità dei bassi è media (8% delta rispetto alla precedente frequenza)
Medi 400 - 2000 Hz
(+) | medi bilanciati - solo only 1.8% rispetto alla media
(+) | medi lineari (3.7% delta rispetto alla precedente frequenza)
Alti 2 - 16 kHz
(+) | Alti bilanciati - appena 1.2% dalla media
(+) | alti lineari (2% delta rispetto alla precedente frequenza)
Nel complesso 100 - 16.000 Hz
(+) | suono nel complesso lineare (9.9% differenza dalla media)
Rispetto alla stessa classe
» 5% di tutti i dispositivi testati in questa classe è stato migliore, 2% simile, 94% peggiore
» Il migliore ha avuto un delta di 6%, medio di 18%, peggiore di 132%
Rispetto a tutti i dispositivi testati
» 4% di tutti i dispositivi testati in questa classe è stato migliore, 1% similare, 95% peggiore
» Il migliore ha avuto un delta di 4%, medio di 23%, peggiore di 134%
Gestione dell'alimentazione - L'Asus ROG raggiunge un'autonomia abbastanza buona
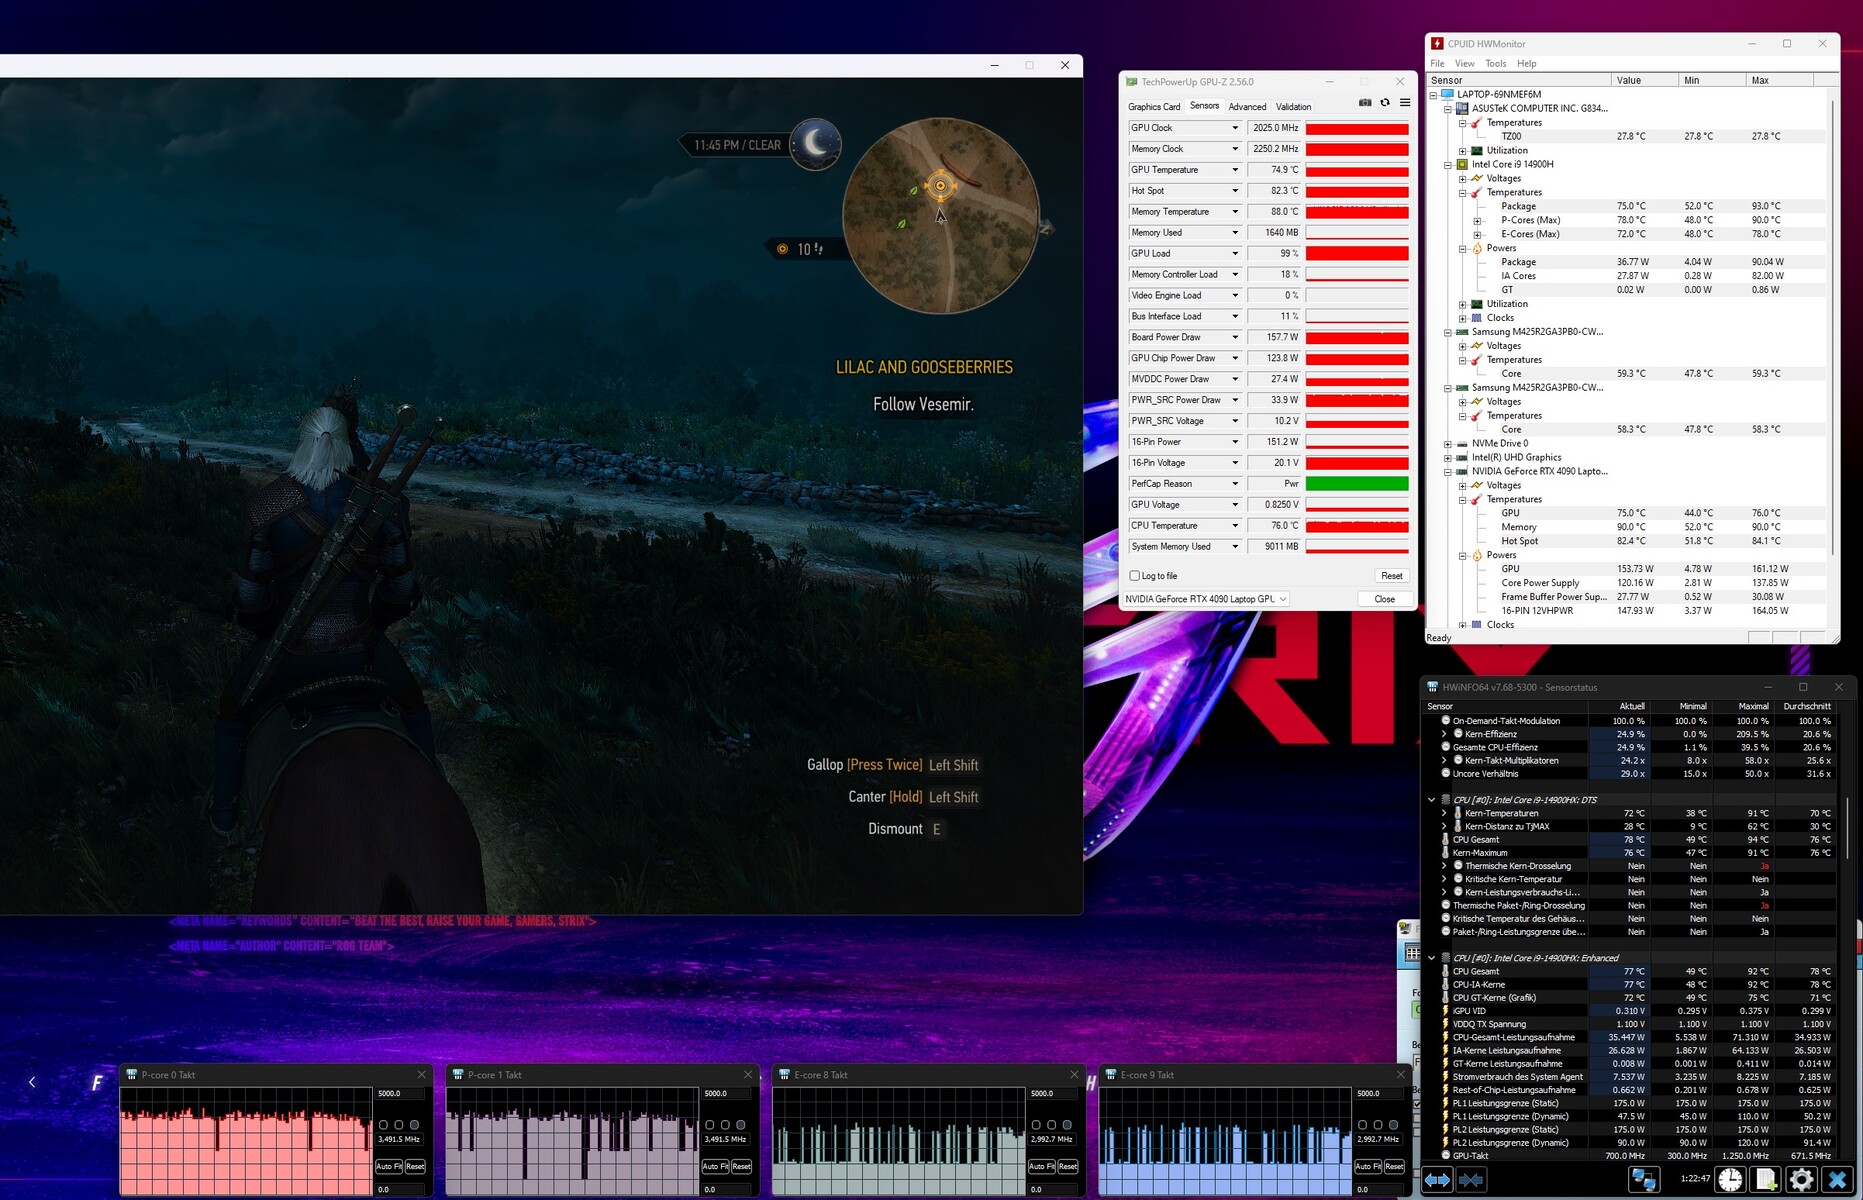
Consumo di energia
Durante il test Witcher 3, il consumo energetico rimane costante a un livello atteso, mentre durante lo stress test il consumo varia. Questa variazione può essere ricondotta a una riduzione significativa della velocità della GPU che si verifica regolarmente. Il caricatore da 330 Watt fornisce una quantità di energia sufficiente.
| Off / Standby | |
| Idle | |
| Sotto carico |
|
Leggenda:
min: | |
| Asus ROG Strix Scar 18 G834JYR (2024) i9-14900HX, GeForce RTX 4090 Laptop GPU | Alienware m18 R1 AMD R9 7945HX, Radeon RX 7900M | Alienware m18 R1 i9-13980HX, GeForce RTX 4090 Laptop GPU | Acer Predator Helios 18 N23Q2 i9-13900HX, GeForce RTX 4080 Laptop GPU | Razer Blade 18 RTX 4070 i9-13950HX, GeForce RTX 4070 Laptop GPU | MSI Titan 18 HX A14VIG i9-14900HX, GeForce RTX 4090 Laptop GPU | Asus ROG Strix Scar 18 2023 G834JY-N6005W i9-13980HX, GeForce RTX 4090 Laptop GPU | Media della classe Gaming | |
|---|---|---|---|---|---|---|---|---|
| Power Consumption | -112% | -48% | -4% | -40% | -40% | -35% | 6% | |
| Idle Minimum * (Watt) | 14 | 30.3 -116% | 21.6 -54% | 16 -14% | 24.5 -75% | 13.2 6% | 17.3 -24% | 13 ? 7% |
| Idle Average * (Watt) | 17 | 55.6 -227% | 25.2 -48% | 19 -12% | 34.1 -101% | 25.4 -49% | 27 -59% | 19 ? -12% |
| Idle Maximum * (Watt) | 24 | 101.1 -321% | 56.7 -136% | 21.3 11% | 47.7 -99% | 53.5 -123% | 46 -92% | 24.6 ? -3% |
| Load Average * (Watt) | 143 | 160.3 -12% | 164.1 -15% | 124 13% | 140 2% | 151.4 -6% | 133 7% | 110.7 ? 23% |
| Witcher 3 ultra * (Watt) | 251 | 216 14% | 311 -24% | 289 -15% | 202 20% | 336 -34% | ||
| Load Maximum * (Watt) | 302 | 332.1 -10% | 338.9 -12% | 319 -6% | 261 14% | 395.2 -31% | 329 -9% | 259 ? 14% |
* ... Meglio usare valori piccoli
Power Consumption The Witcher 3 / Stress Test
Power Consumption With External Monitor
Durata della batteria
Nel nostro test WLAN di caricamento di siti web tramite script e nel test video di riproduzione del cortometraggio Big Buck Bunny (codifica H.264, FHD) in un ciclo costante, il portatile da 18 pollici raggiunge tempi di esecuzione di 7:41 h e 7:27 h rispettivamente. Quindi lo Scar 18 offre valori molto buoni nel complesso ed è in grado di superare i concorrenti con margini significativi, nonostante le loro batterie siano in parte più grandi.
| Asus ROG Strix Scar 18 G834JYR (2024) i9-14900HX, GeForce RTX 4090 Laptop GPU, 90 Wh | Alienware m18 R1 AMD R9 7945HX, Radeon RX 7900M, 97 Wh | Alienware m18 R1 i9-13980HX, GeForce RTX 4090 Laptop GPU, 97 Wh | Acer Predator Helios 18 N23Q2 i9-13900HX, GeForce RTX 4080 Laptop GPU, 90 Wh | Razer Blade 18 RTX 4070 i9-13950HX, GeForce RTX 4070 Laptop GPU, 91.7 Wh | MSI Titan 18 HX A14VIG i9-14900HX, GeForce RTX 4090 Laptop GPU, 99.9 Wh | Asus ROG Strix Scar 18 2023 G834JY-N6005W i9-13980HX, GeForce RTX 4090 Laptop GPU, 90 Wh | Media della classe Gaming | |
|---|---|---|---|---|---|---|---|---|
| Autonomia della batteria | -61% | -45% | -16% | -26% | -32% | -15% | 0% | |
| Reader / Idle (h) | 10.2 | 4.5 -56% | 5.6 -45% | 7 -31% | 5.9 -42% | 8.27 ? -19% | ||
| H.264 (h) | 7.5 | 4.8 -36% | 7 -7% | 8.32 ? 11% | ||||
| WiFi v1.3 (h) | 7.7 | 1.4 -82% | 4.3 -44% | 4.4 -43% | 4 -48% | 4.2 -45% | 7.1 -8% | 7.11 ? -8% |
| Load (h) | 1.3 | 0.7 -46% | 0.7 -46% | 1.7 31% | 1.3 0% | 1.2 -8% | 0.9 -31% | 1.502 ? 16% |
| Witcher 3 ultra (h) | 0.9 |
Pro
Contro
Verdetto - C'è spazio per i miglioramenti
L'elaborazione di video e immagini, lo streaming, il rendering e il gioco sono inclusi nei principali scenari di utilizzo del portatile. Mentre la GeForce RTX 4090 e Core i9-14900HX offrono le prestazioni necessarie, non raggiungono nuovi record. Le emissioni si attestano sui livelli elevati che sono abituali per questa classe di dispositivi.
Con ROG Strix Scar 18 (2024), Asus offre un potente computer portatile di fascia alta ad un prezzo elevato.
Il punto forte del portatile è il suo display mini-LED (2560x1600 pixel, DCI-P3, Dolby Vision, 240 Hz) con una diagonale di 18 pollici nel formato 16:10. I suoi aspetti positivi sono la luminosità massima e il livello di emissioni che sono normali per questo dispositivo. I suoi aspetti positivi includono una luminosità massima di quasi 1.000 cd/m², un ottimo valore del nero e un'elevata precisione del colore.
Le porte USB-C (1x USB 3.2 Gen 2, 1x Thunderbolt 4) facilitano la sua integrazione nelle configurazioni di lavoro esistenti e aprono alcune opzioni di espansione, come una GPU esterna o una docking station. Entrambe le porte USB-C possono essere utilizzate per l'uscita del segnale DisplayPort e la porta USB 3.2 Gen 2 supporta anche Power Delivery. Tutto questo è accompagnato da un'ottima durata della batteria.
Un'alternativa potrebbe essere il MSI Titan 18 HX A14VIGche è in grado di ottenere prestazioni leggermente superiori dalla stessa combinazione CPU/GPU, offre un display mini-LED 4k e dispone di due porte TB4. Tuttavia, il laptop MSI non si avvicina alla durata della batteria dello Strix.
Prezzo e disponibilità
L'Asus ROG Strix Scar 18 (2024) è disponibile per circa 3.000 dollari presso il negozio Asus e allo stesso prezzo anche da Amazon, per esempio. Una configurazione simile alla nostra unità di prova è disponibile a ~$3.900 da Amazon.
Asus ROG Strix Scar 18 G834JYR (2024)
- 02/07/2024 v7 (old)
Sascha Mölck
Transparency
La selezione dei dispositivi da recensire viene effettuata dalla nostra redazione. Il campione di prova è stato fornito all'autore come prestito dal produttore o dal rivenditore ai fini di questa recensione. L'istituto di credito non ha avuto alcuna influenza su questa recensione, né il produttore ne ha ricevuto una copia prima della pubblicazione. Non vi era alcun obbligo di pubblicare questa recensione. In quanto società mediatica indipendente, Notebookcheck non è soggetta all'autorità di produttori, rivenditori o editori.
Ecco come Notebookcheck esegue i test
Ogni anno, Notebookcheck esamina in modo indipendente centinaia di laptop e smartphone utilizzando procedure standardizzate per garantire che tutti i risultati siano comparabili. Da circa 20 anni sviluppiamo continuamente i nostri metodi di prova e nel frattempo stabiliamo gli standard di settore. Nei nostri laboratori di prova, tecnici ed editori esperti utilizzano apparecchiature di misurazione di alta qualità. Questi test comportano un processo di validazione in più fasi. Il nostro complesso sistema di valutazione si basa su centinaia di misurazioni e parametri di riferimento ben fondati, che mantengono l'obiettività.Price comparison

