Recensione del portatile Alienware m18 R1: Debutto delle prestazioni di AMD Radeon RX 7900M

Essendo il primo laptop da gioco da 18 pollici di Alienware in oltre un decennio, Dell sta puntando tutto sulla serie Alienware M18 R1, offrendo opzioni Intel, AMD e Nvidia su tutta la linea, in modo da attirare il maggior numero possibile di giocatori. Gli utenti possono scegliere tra Intel-Nvidia, AMD-Nvidia o AMD-AMD quando si tratta di CPU e GPU, il che è molto insolito per un portatile da gioco.
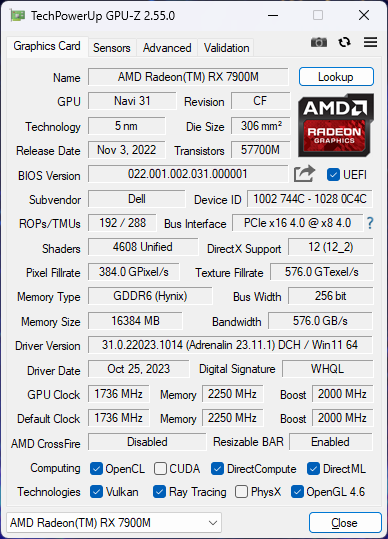
La nostra unità in recensione è l'ultima configurazione AMD-AMD e una delle prime disponibili ad offrire la Radeon RX 7900M RNDA3 da 180 W come alternativa alla RTX 4080 mobile GeForce in carica. Forse la cosa più importante è che la nuova GPU AMD è inferiore alla configurazione RTX 4090 di 1.200 dollari, a parità di altre opzioni, per un prezzo finale di 2.300 dollari, come da recensione.
Le alternative all'Alienware m18 R1 includono altri portatili da gioco da 18 pollici di fascia alta, come l'Asus ROG Strix Scar 18, Razer Blade 18oAcer Predator Helios 18. MSI non offre ancora nessun portatile da gioco moderno da 18 pollici al momento.
Altre recensioni di Dell:
Potenziali concorrenti a confronto
Punteggio | Data | Modello | Peso | Altezza | Dimensione | Risoluzione | Prezzo |
|---|---|---|---|---|---|---|---|
| 89.2 % v7 (old) | 11/2023 | Alienware m18 R1 AMD R9 7945HX, Radeon RX 7900M | 3.9 kg | 26.7 mm | 18.00" | 1920x1200 | |
| 90.7 % v7 (old) | 04/2023 | Alienware m18 R1 i9-13980HX, GeForce RTX 4090 Laptop GPU | 3.9 kg | 26.7 mm | 18.00" | 1920x1200 | |
| 88.3 % v7 (old) | 10/2023 | Acer Predator Helios 18 N23Q2 i9-13900HX, GeForce RTX 4080 Laptop GPU | 3.2 kg | 29.15 mm | 18.00" | 2560x1600 | |
| 91.4 % v7 (old) | 02/2023 | Razer Blade 18 RTX 4070 i9-13950HX, GeForce RTX 4070 Laptop GPU | 3 kg | 21.9 mm | 18.00" | 2560x1600 | |
| 86.6 % v7 (old) | 02/2023 | Asus ROG Strix Scar 18 2023 G834JY-N6005W i9-13980HX, GeForce RTX 4090 Laptop GPU | 3.1 kg | 30.8 mm | 18.00" | 2560x1600 | |
v (old) | MSI Raider GE78 HX 13VI i9-13980HX, GeForce RTX 4090 Laptop GPU | 17.30" | 2560x1600 |
Caso
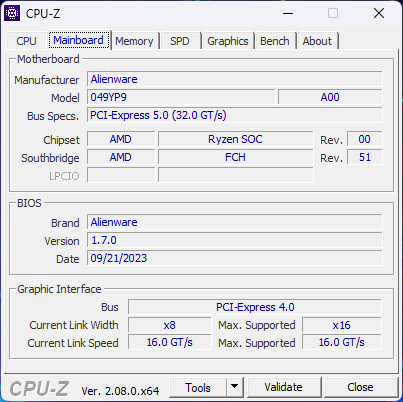
Le versioni Intel e AMD di Alienware m18 R1 condividono lo stesso design del telaio e le stesse opzioni di colore. Pertanto, l'unico modo rapido e semplice per distinguere visivamente i due modelli è cercare i loghi Thunderbolt accanto alle porte USB-C sul retro. Consulti la nostra recensione sulla configurazione Configurazione Intel-Nvidia per saperne di più sulle caratteristiche fisiche di Alienware m18 R1.
L'USB4 non è purtroppo supportato.
Lettore di schede SD
| SD Card Reader | |
| average JPG Copy Test (av. of 3 runs) | |
| Razer Blade 18 RTX 4070 (Angelibird AV Pro V60) | |
| Alienware m18 R1 (Angelibird AV Pro V60) | |
| Alienware m18 R1 AMD (Toshiba Exceria Pro SDXC 64 GB UHS-II) | |
| Acer Predator Helios 18 N23Q2 | |
| MSI GE78HX 13VH-070US (Angelibird AV Pro V60) | |
| maximum AS SSD Seq Read Test (1GB) | |
| Alienware m18 R1 AMD (Toshiba Exceria Pro SDXC 64 GB UHS-II) | |
| Alienware m18 R1 (Angelibird AV Pro V60) | |
| Razer Blade 18 RTX 4070 (Angelibird AV Pro V60) | |
| MSI GE78HX 13VH-070US (Angelibird AV Pro V60) | |
| Acer Predator Helios 18 N23Q2 | |
Comunicazione
Webcam


Manutenzione
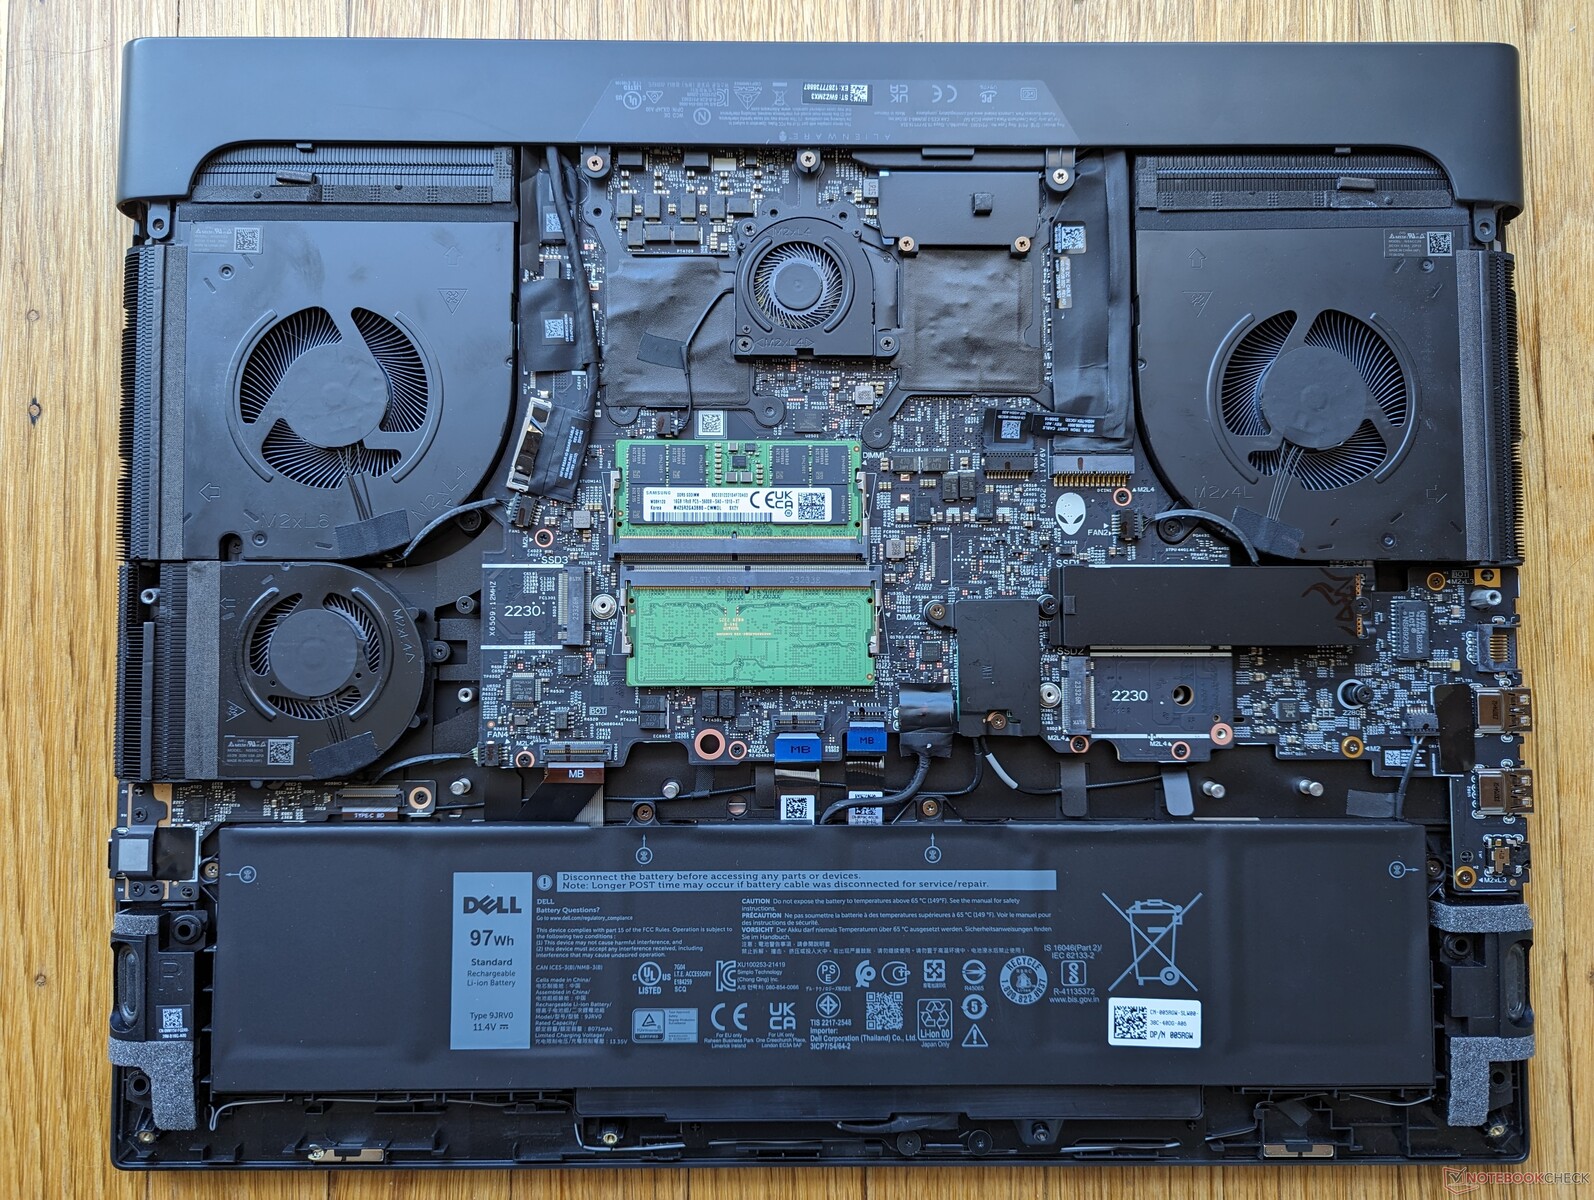
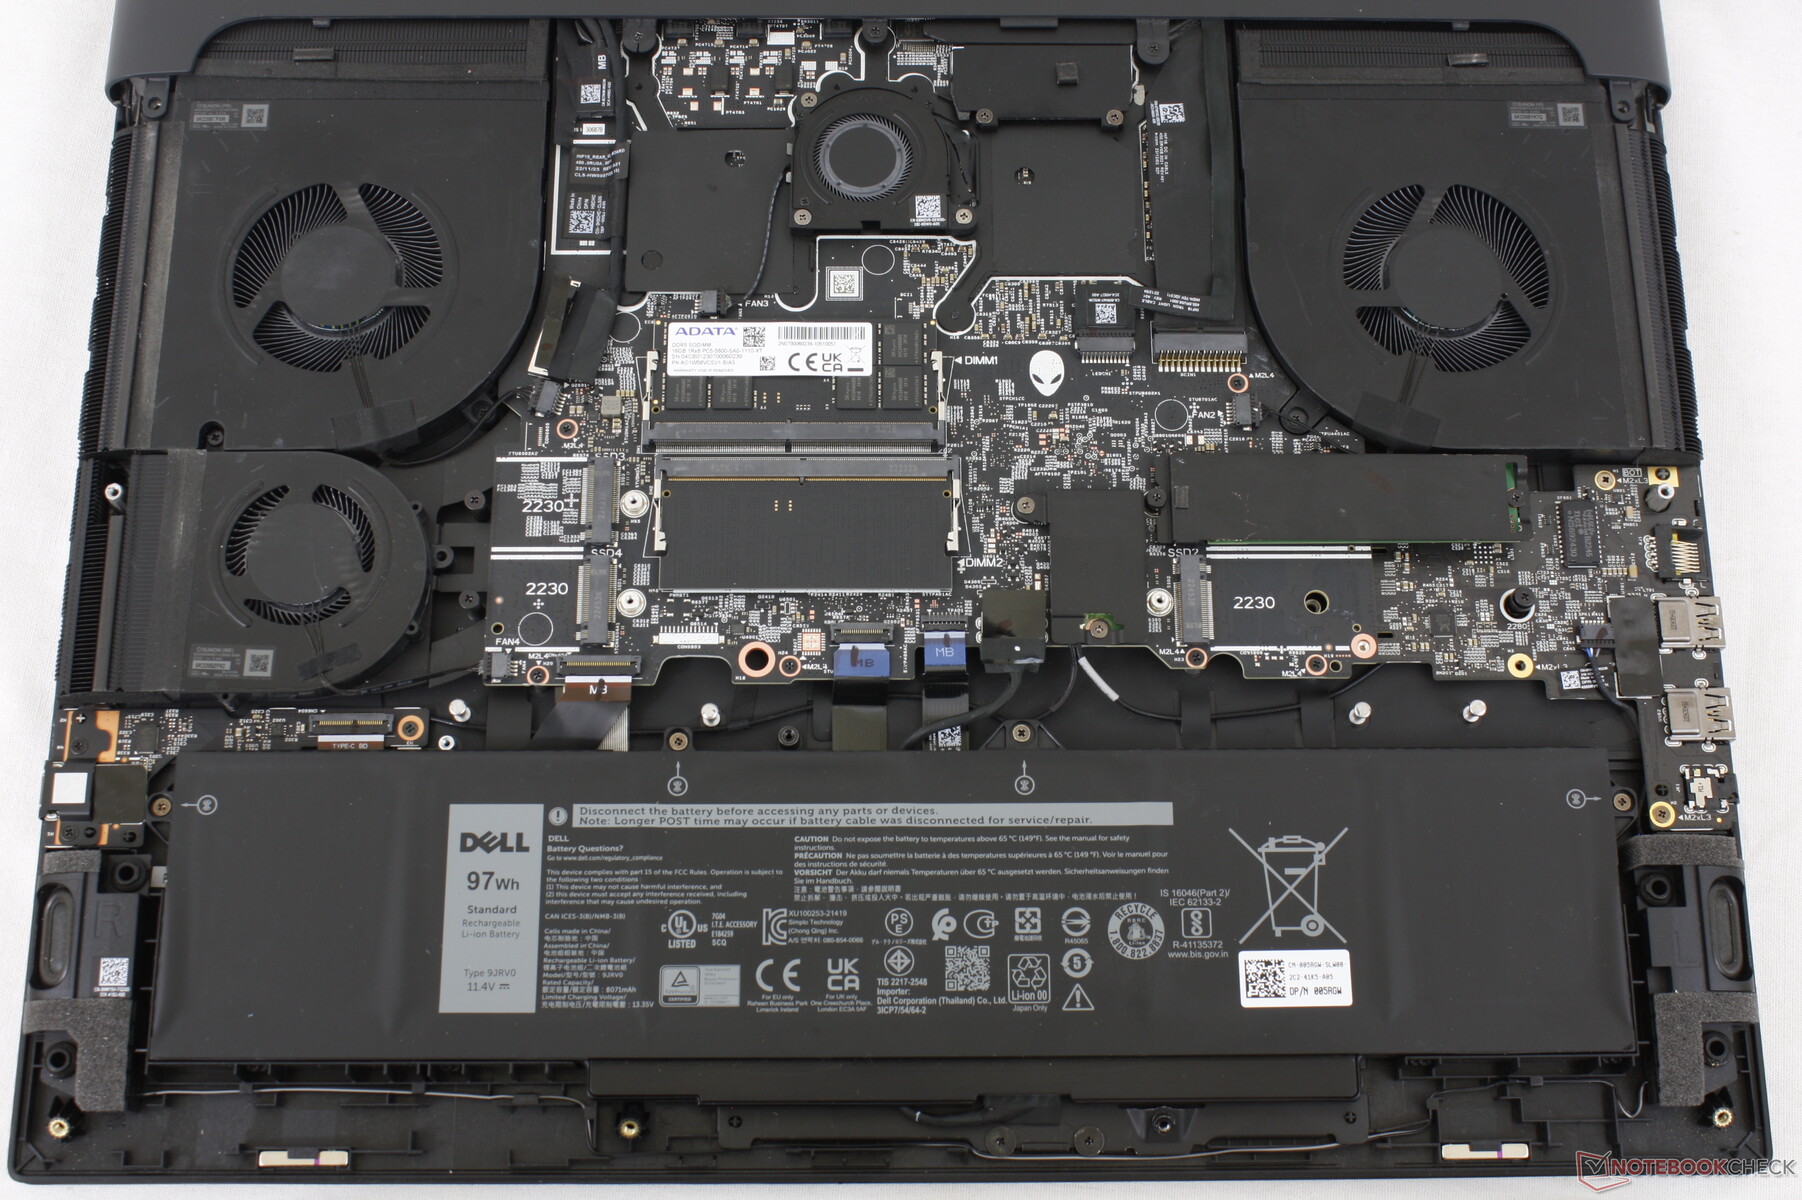
La configurazione AMD-AMD supporta solo fino a tre SSD M.2 NVMe, mentre la configurazione Intel-Nvidia ne supporta fino a quattro, come mostrano le immagini di confronto qui sotto. Le loro caratteristiche interne sono altrimenti identiche.
Accessori e garanzia
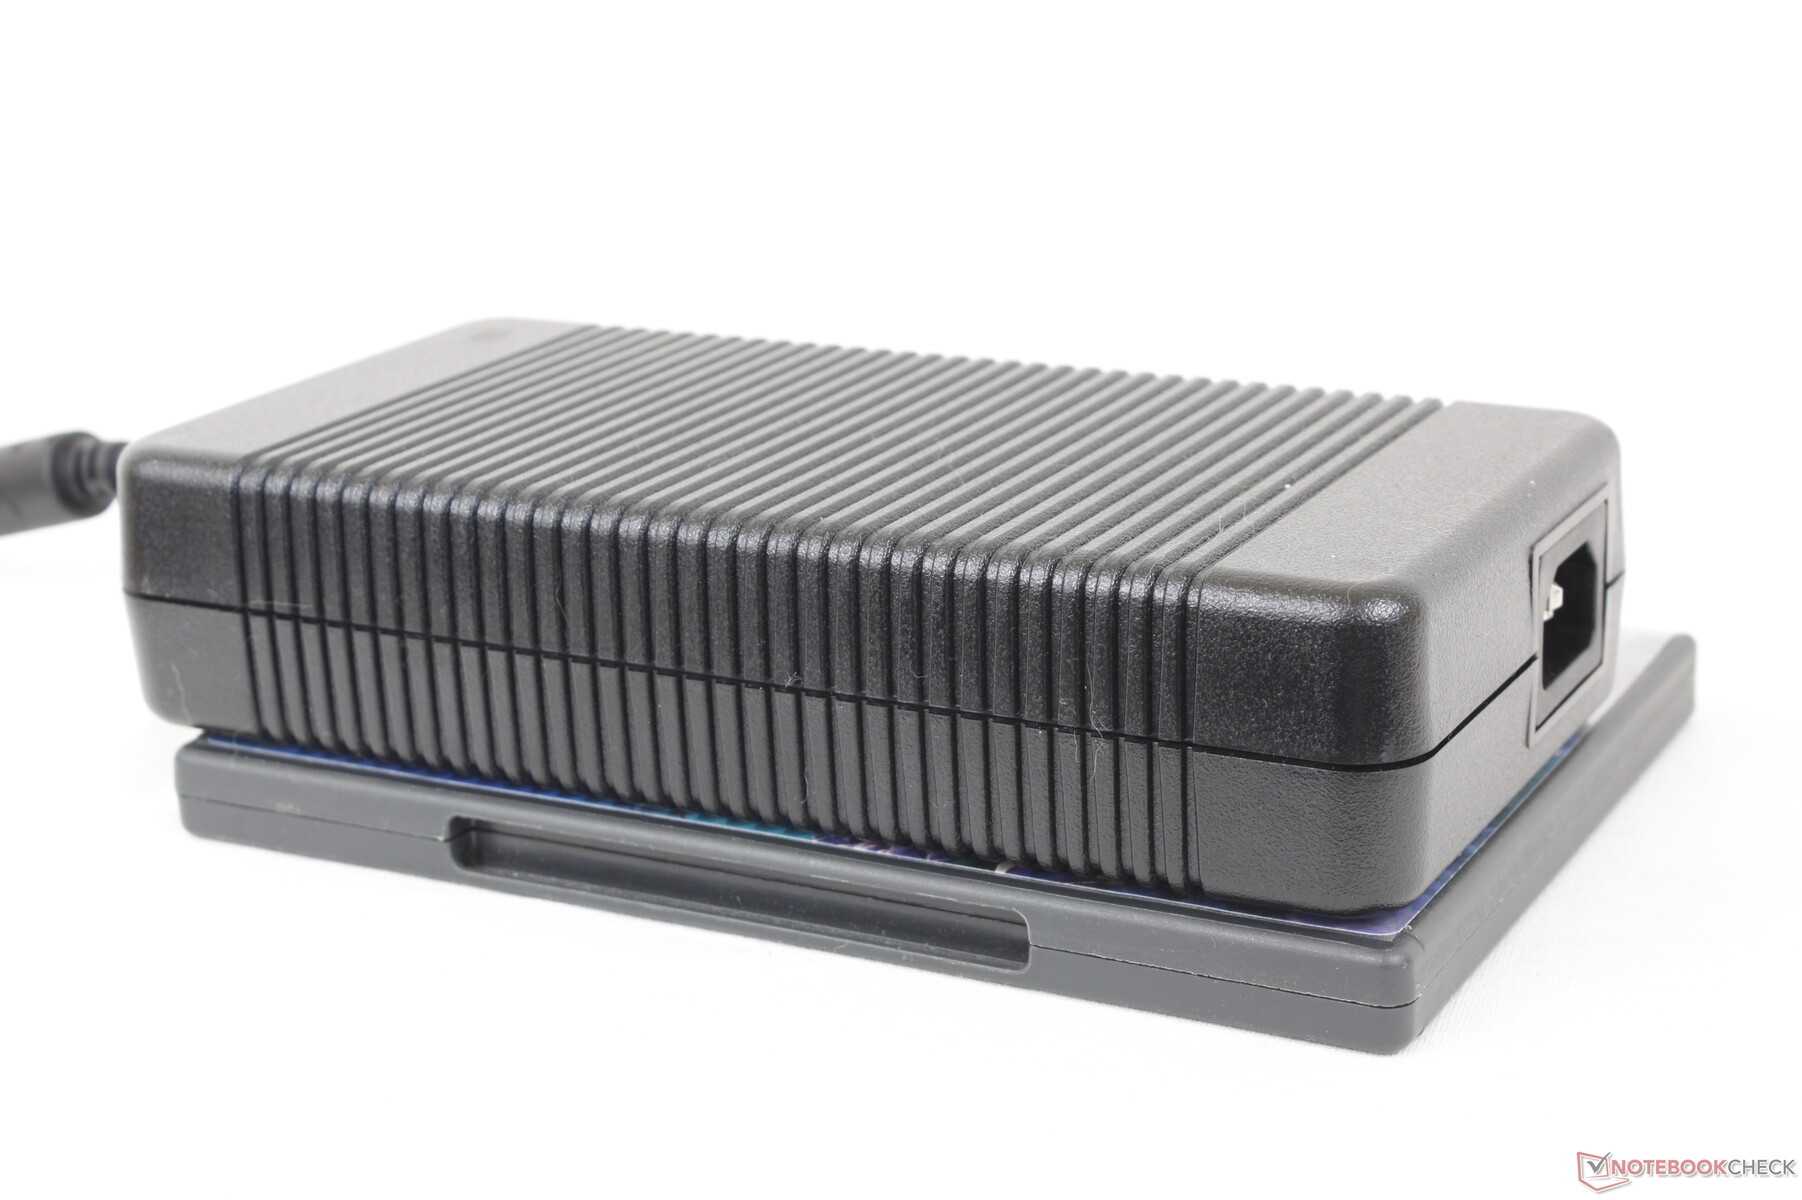
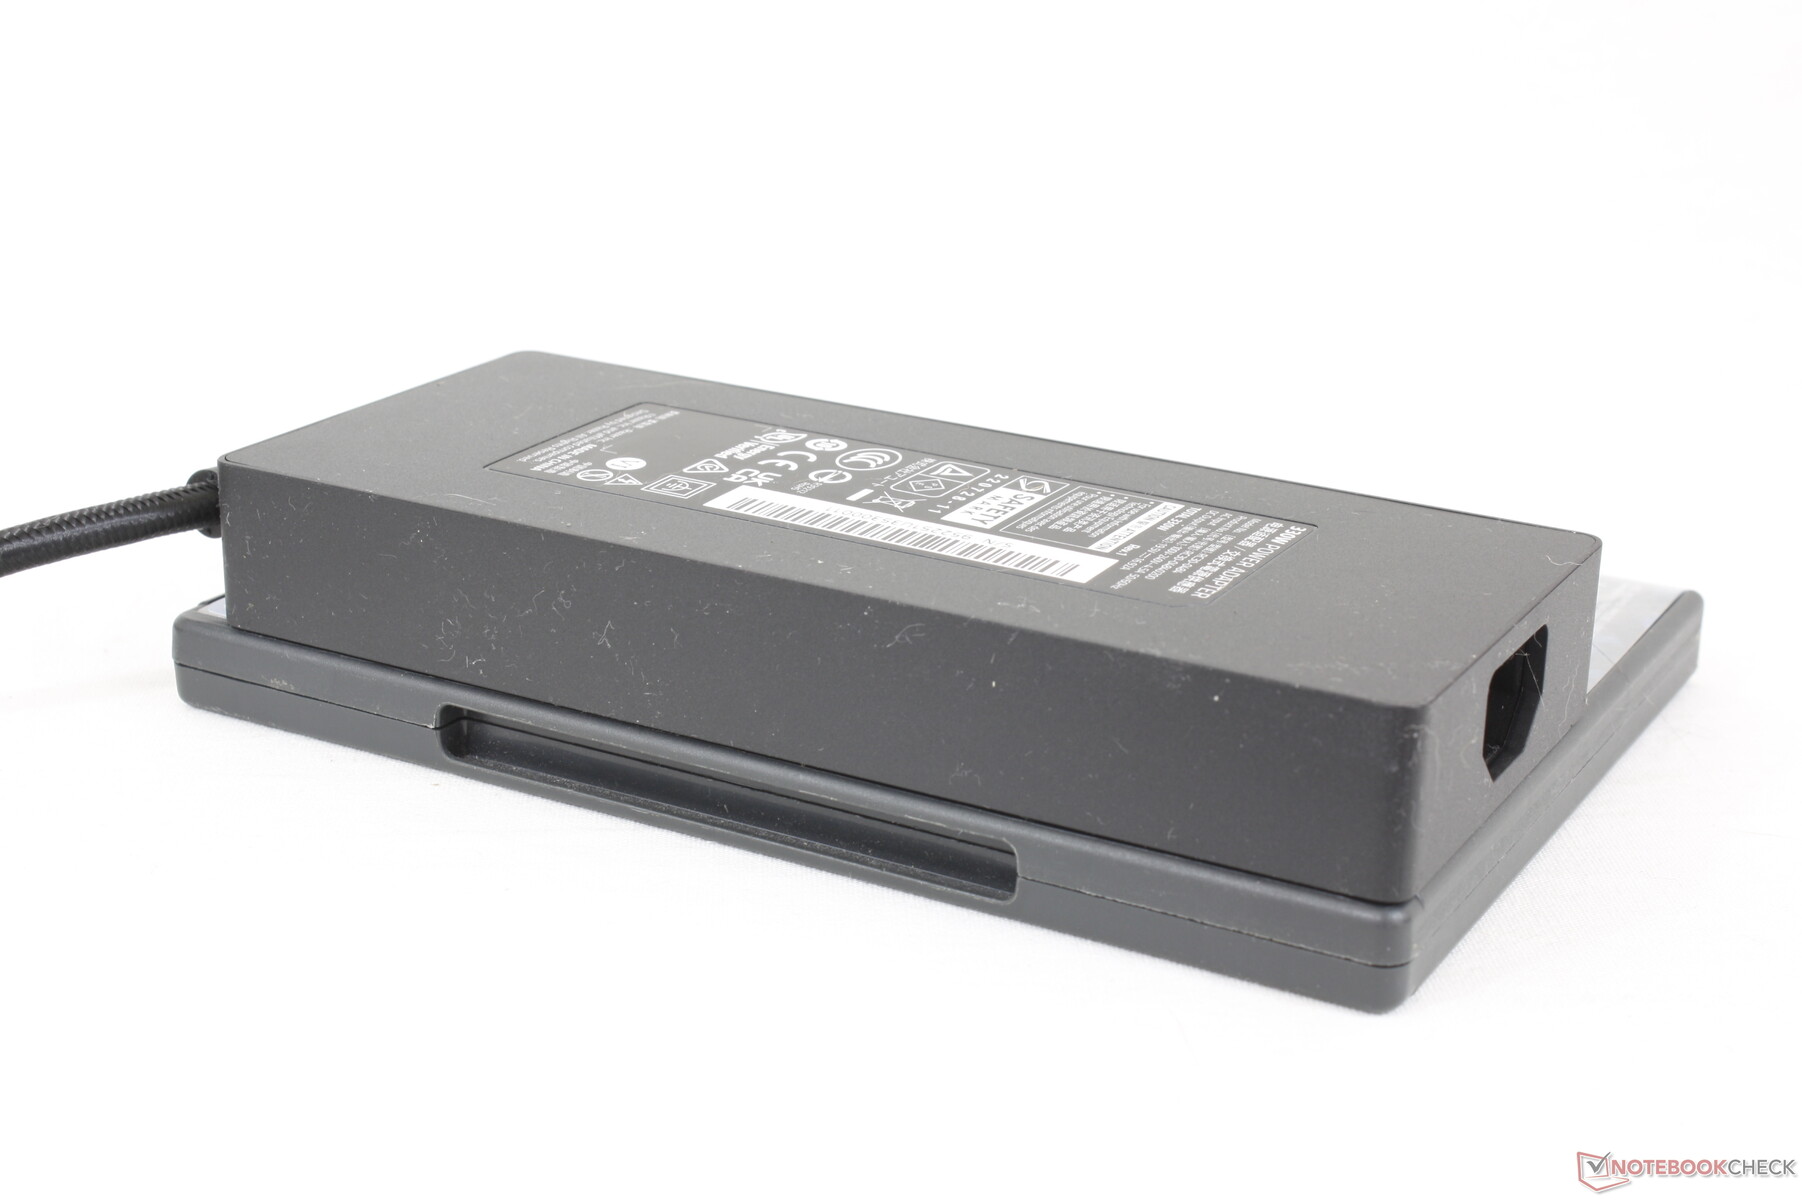
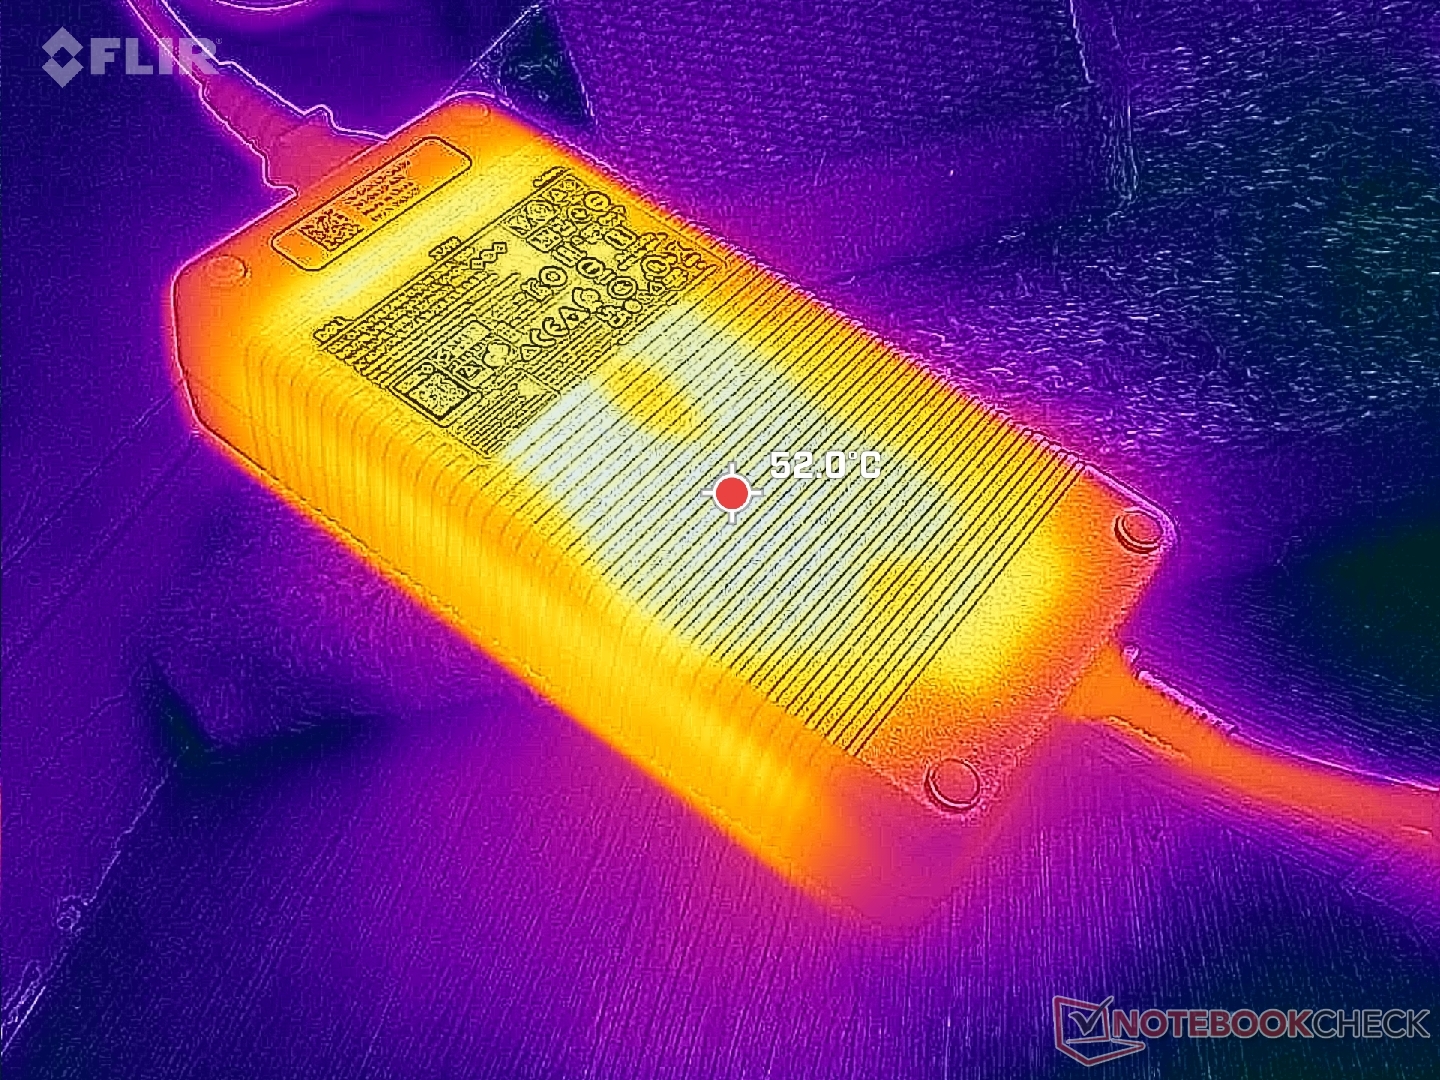
Dell deve ancora passare agli adattatori CA GaN, che possono offrire una maggiore potenza per volume rispetto agli adattatori CA tradizionali. L'adattatore CA da 330 W incluso è quindi molto ingombrante rispetto agli adattatori CA GaN da 330 W che attualmente vengono forniti con la maggior parte dei computer portatili Razer Blade.
La garanzia limitata standard di un anno si applica se acquistata negli Stati Uniti.
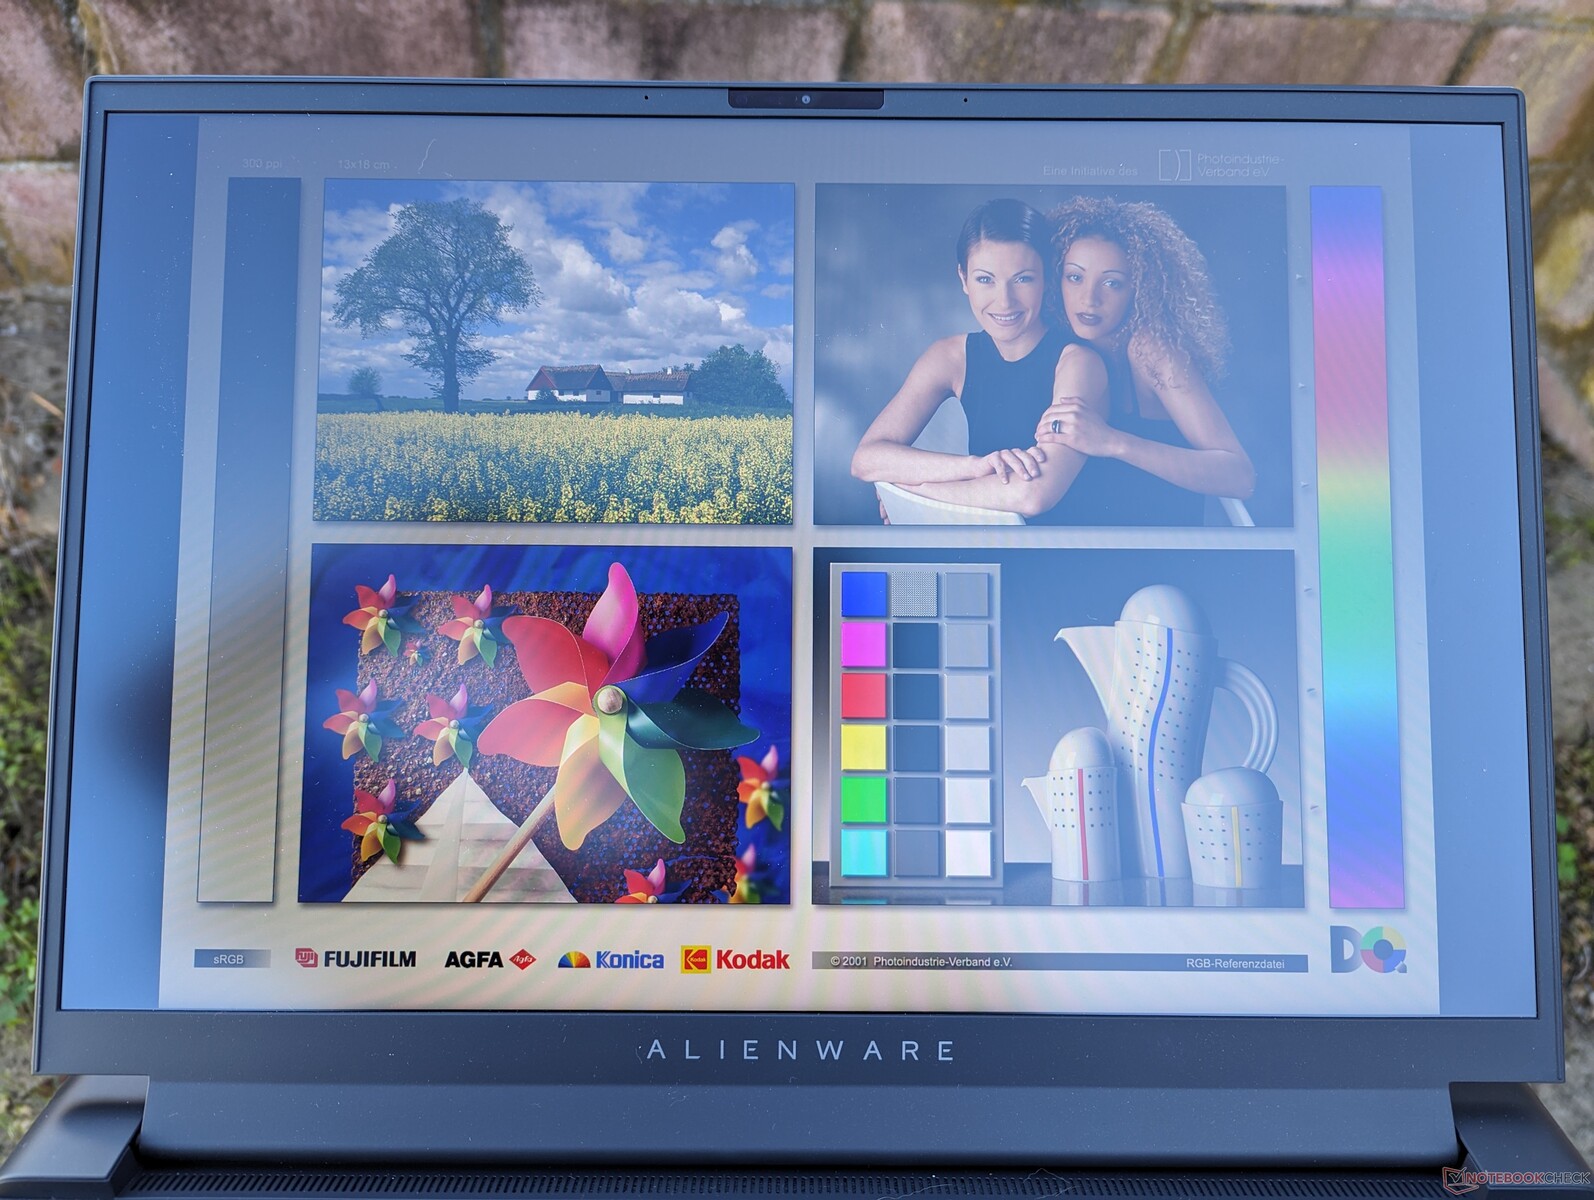
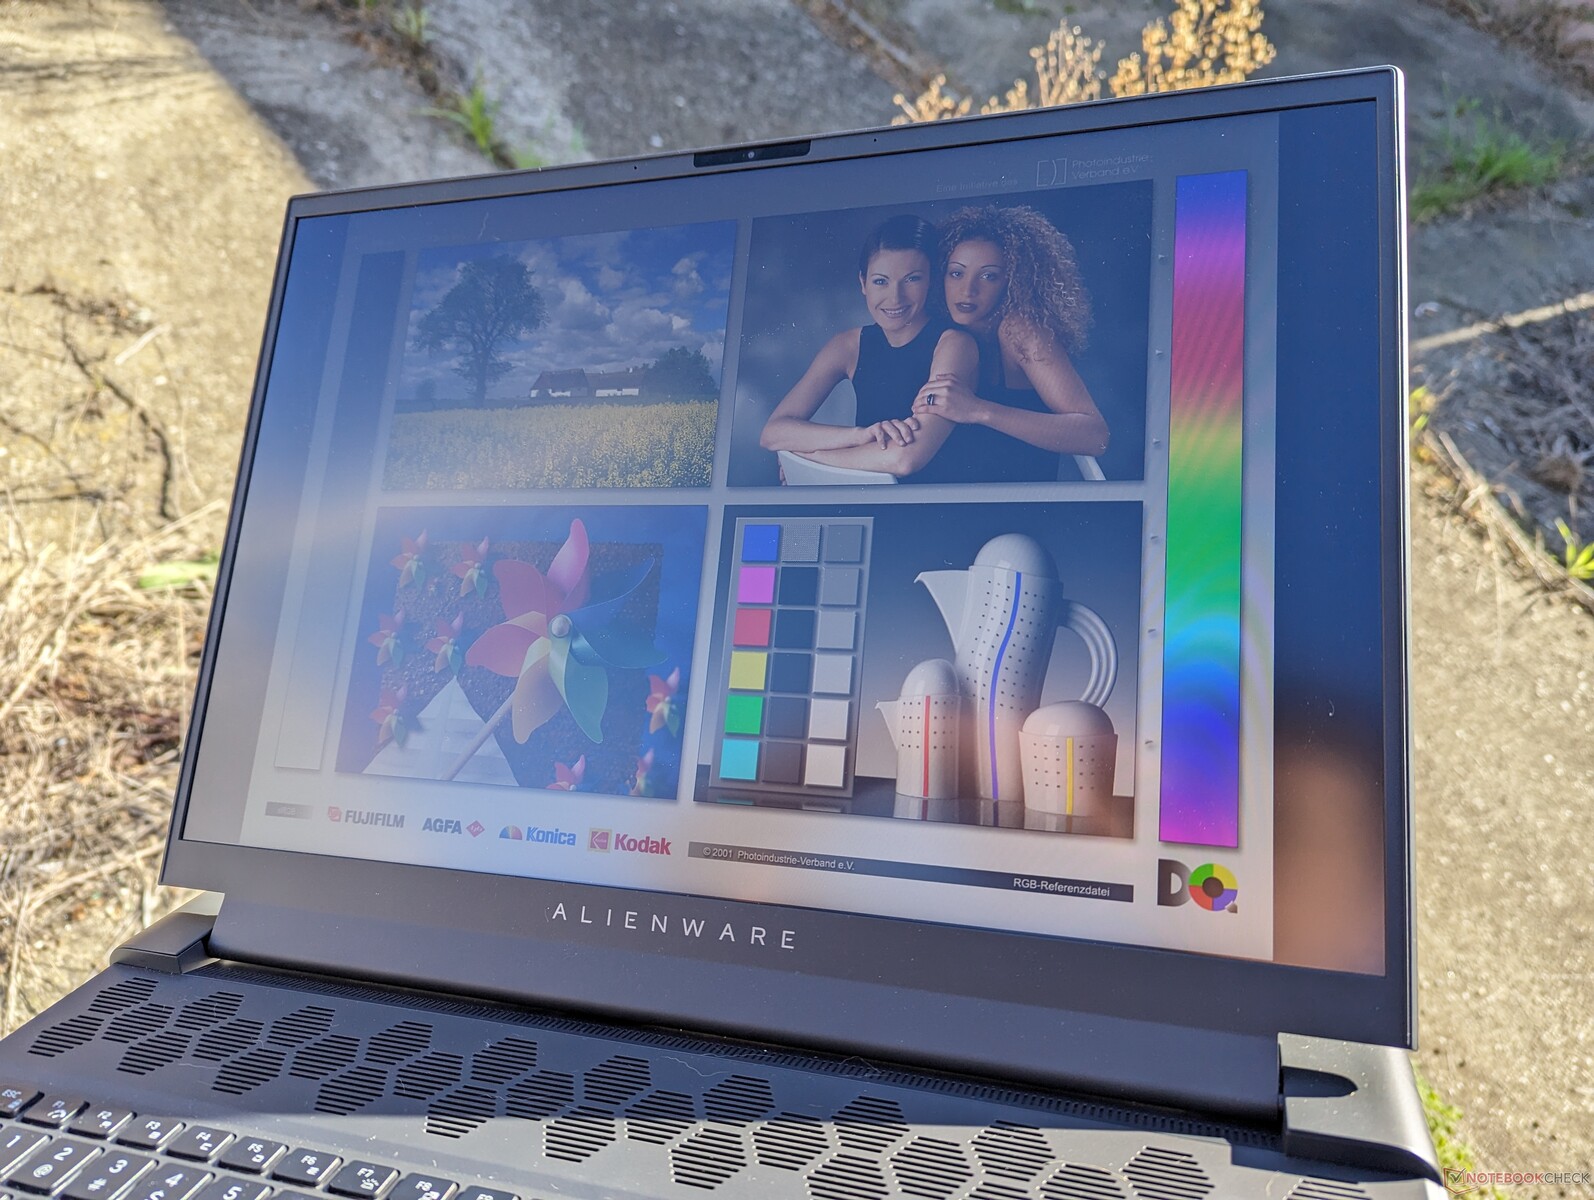
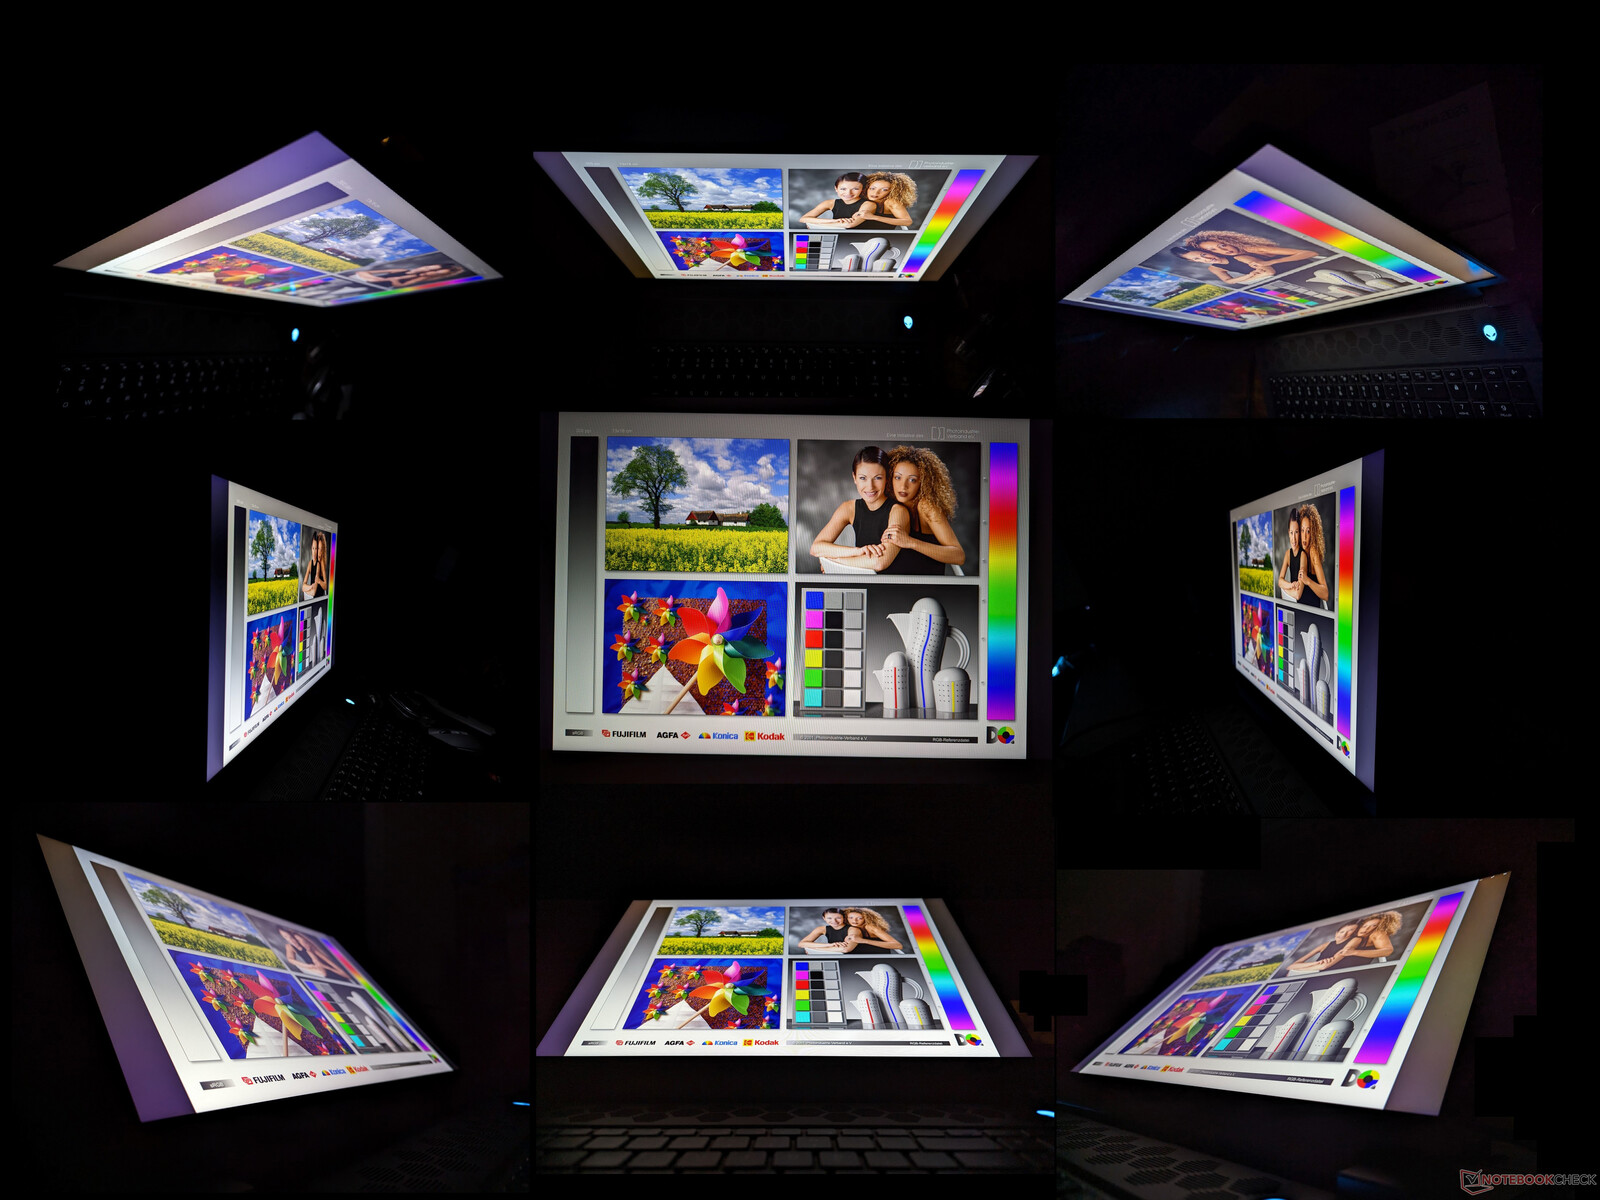
Display
Sono disponibili due opzioni di display FreeSync, come segue:
- 1920 x 1200, 480 Hz, 100% DCI-P3, IPS
- 2560 x 1600, 165 Hz, 100% DCI-P3, IPS
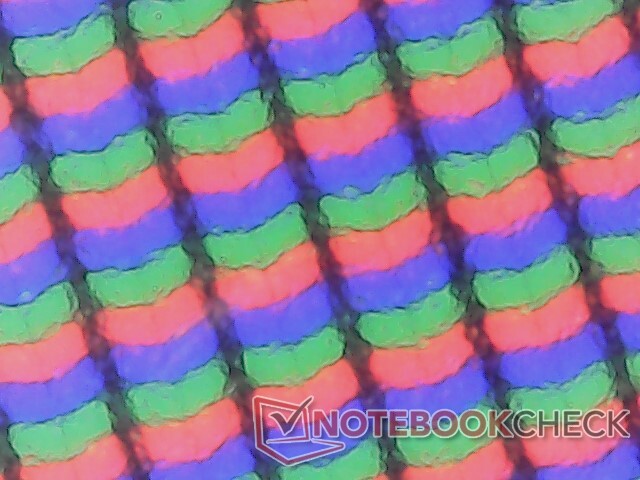
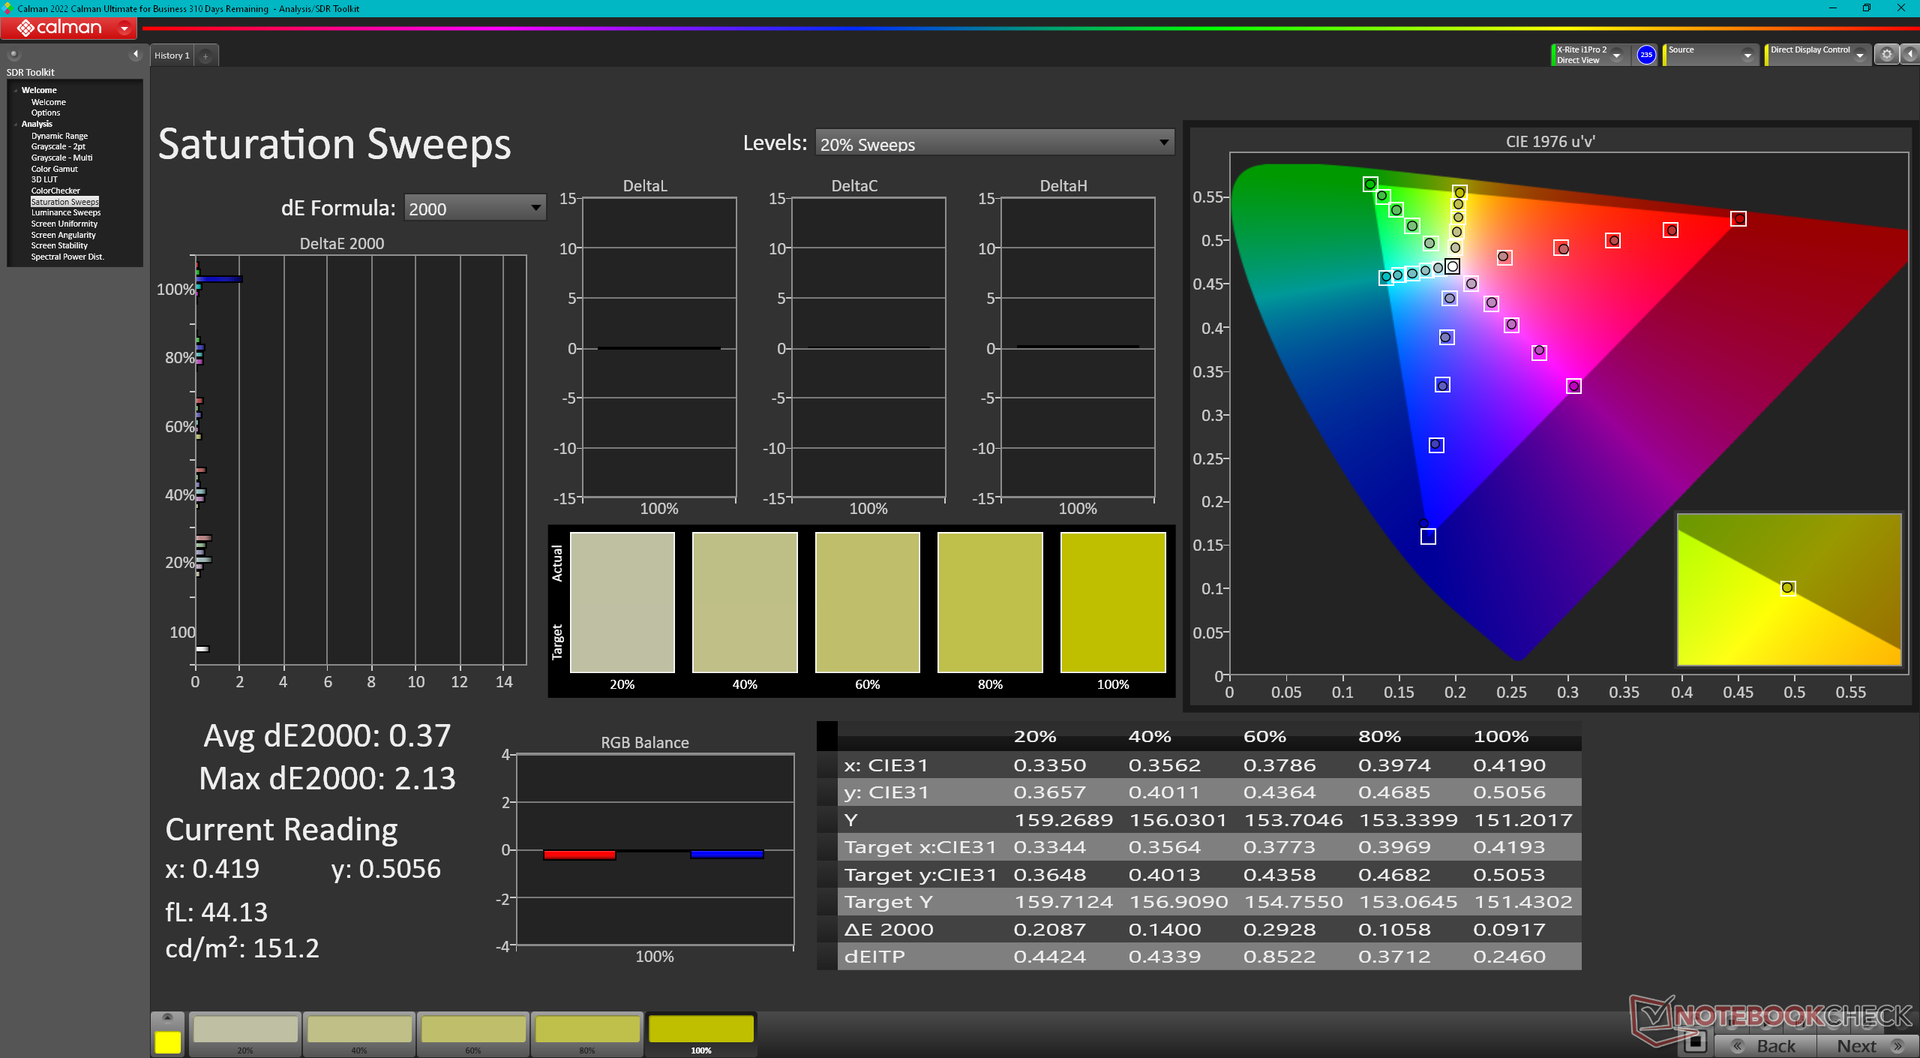
La nostra configurazione utilizza il pannello in grassetto qui sopra, proprio come nella nostra precedente configurazione Intel-Nvidia. Tuttavia, il fornitore del pannello è diverso questa volta (BOE vs. Chi Mei), il che suggerisce che Dell si sta rifornendo di pannelli a 480 Hz da più fornitori per la sua serie Alienware m18. Fortunatamente non ci sono grandi differenze tra loro in termini di copertura del colore, tempi di risposta o contrasto, per un'esperienza visiva molto simile.
La frequenza di aggiornamento di 480 Hz è la più veloce disponibile sui computer portatili al momento in cui scriviamo, per un movimento estremamente fluido con un ghosting minimo. Tuttavia, i vantaggi delle frequenze di aggiornamento veloci diventano sempre più marginali man mano che si sale di livello. Potrebbe quindi valere la pena di prendere in considerazione l'opzione a risoluzione più alta, 1600p, anche se la frequenza di aggiornamento è più lenta, perché 165 Hz è comunque un'esperienza fluida come la seta.
Vale la pena notare che la frequenza di aggiornamento nativa di 480 Hz può essere impostata a 240 Hz o 120 Hz tramite Windows, ma non più bassa. È un peccato che non ci sia un'opzione a 60 Hz, poiché le frequenze di aggiornamento elevate incidono sul consumo energetico, come dimostrerà la nostra sezione sulla gestione dell'energia.
Stranamente, il modello viene calibrato in base allo spettro sRGB, anche se supporta i colori DCI-P3 completi. Ciò si verifica anche nella nostra configurazione Intel-Nvidia.
| |||||||||||||||||||||||||
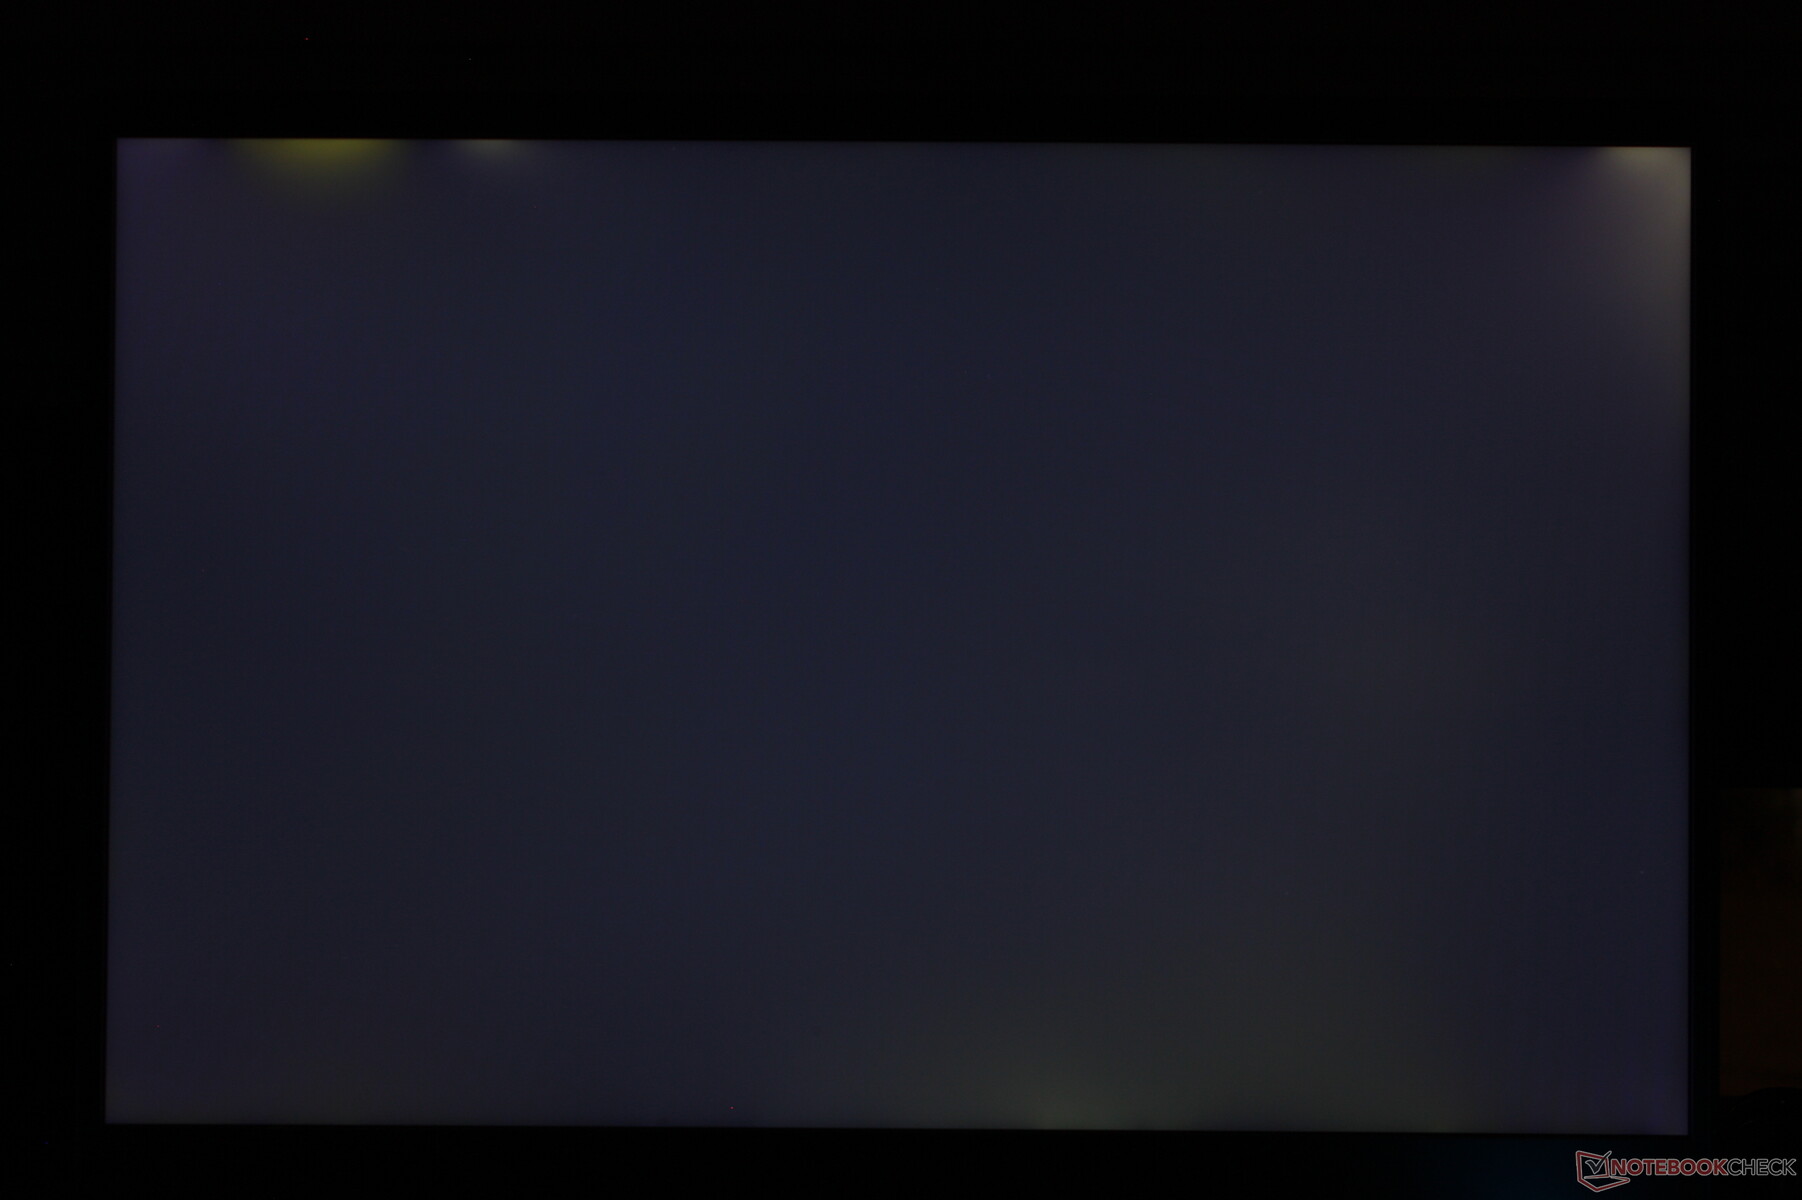
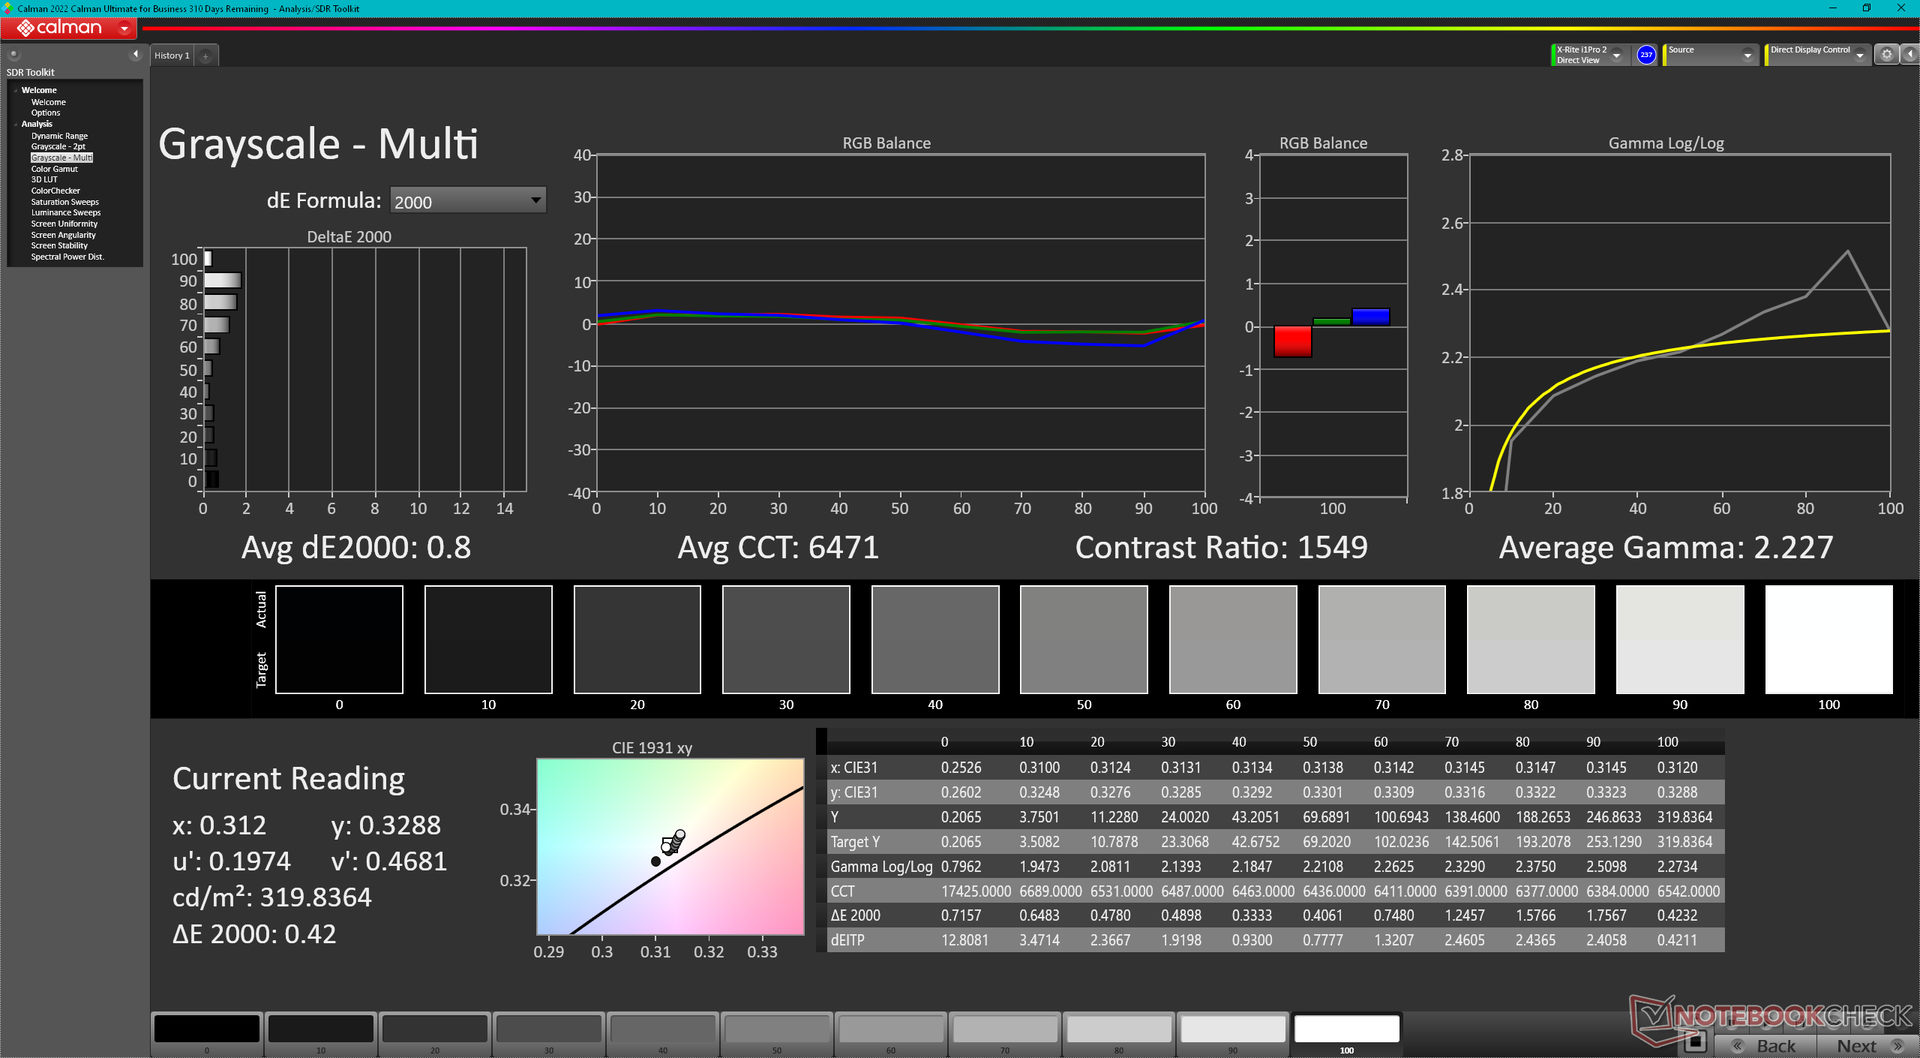
Distribuzione della luminosità: 87 %
Al centro con la batteria: 319.6 cd/m²
Contrasto: 1278:1 (Nero: 0.25 cd/m²)
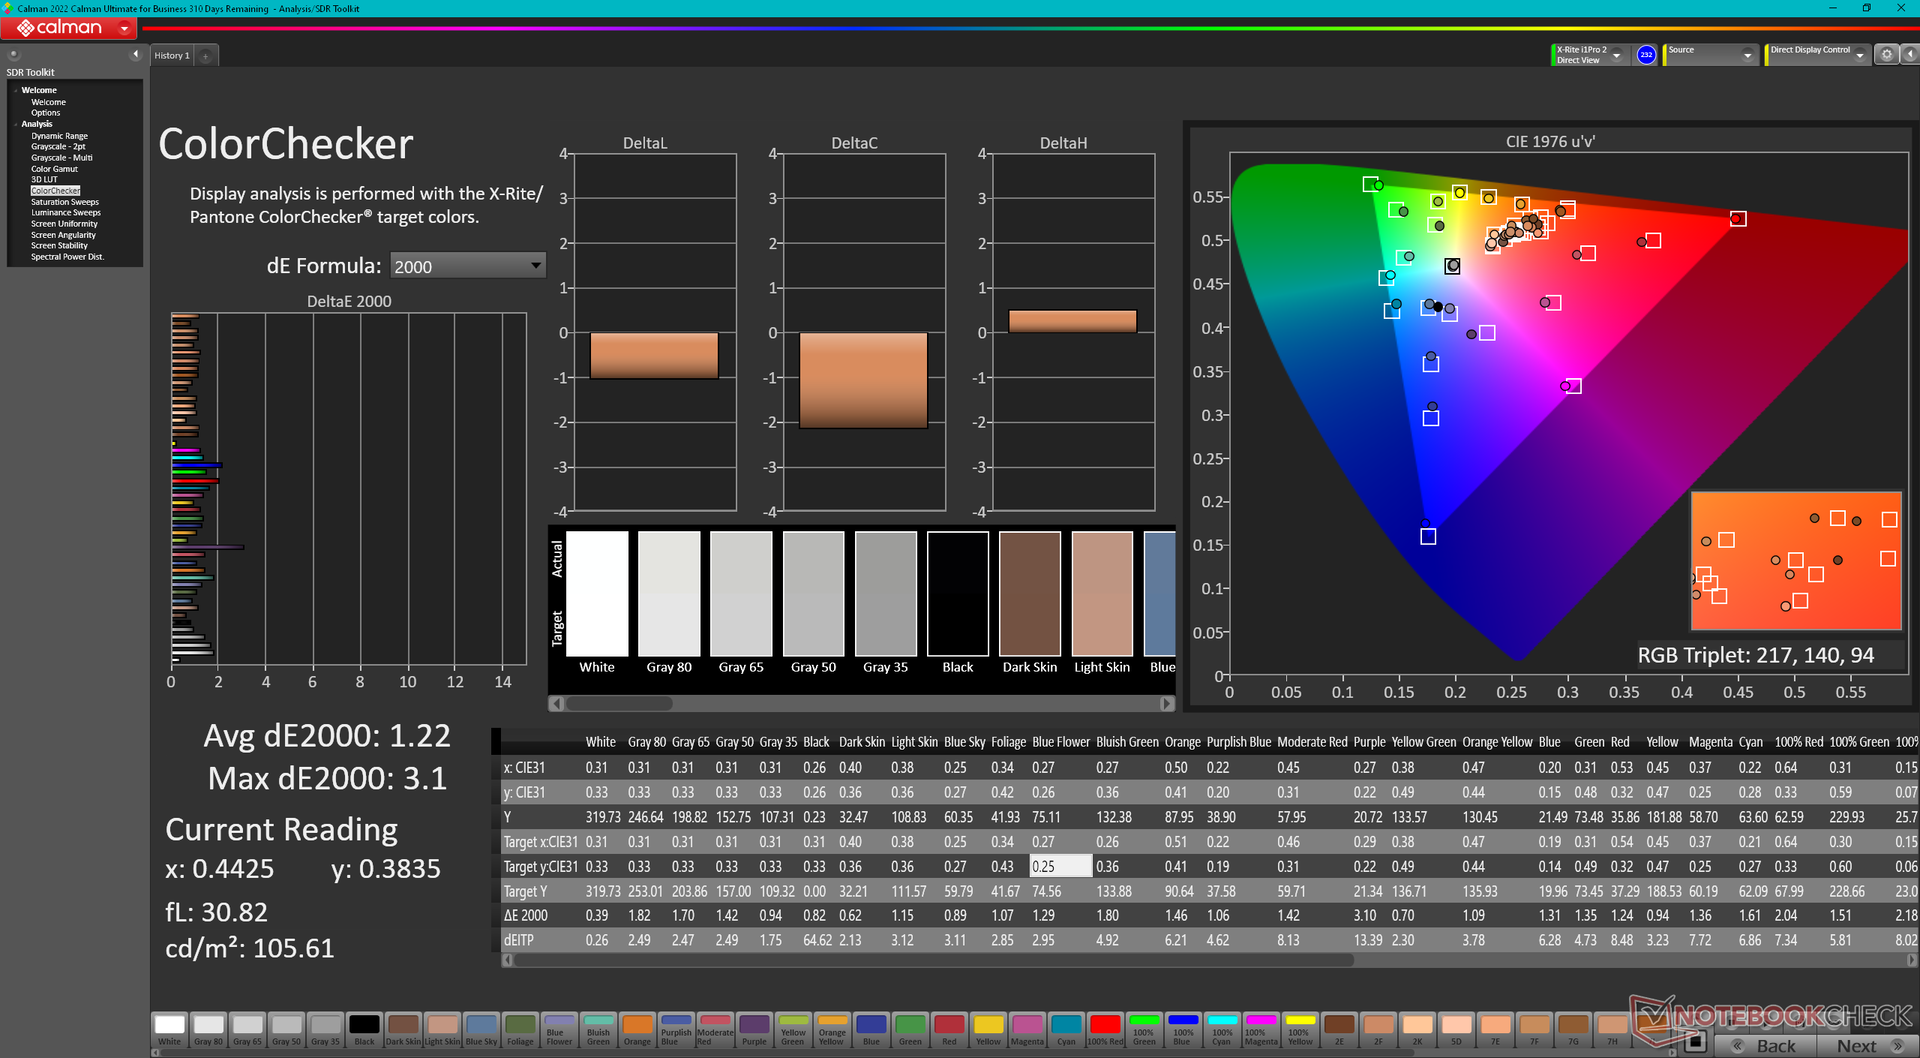
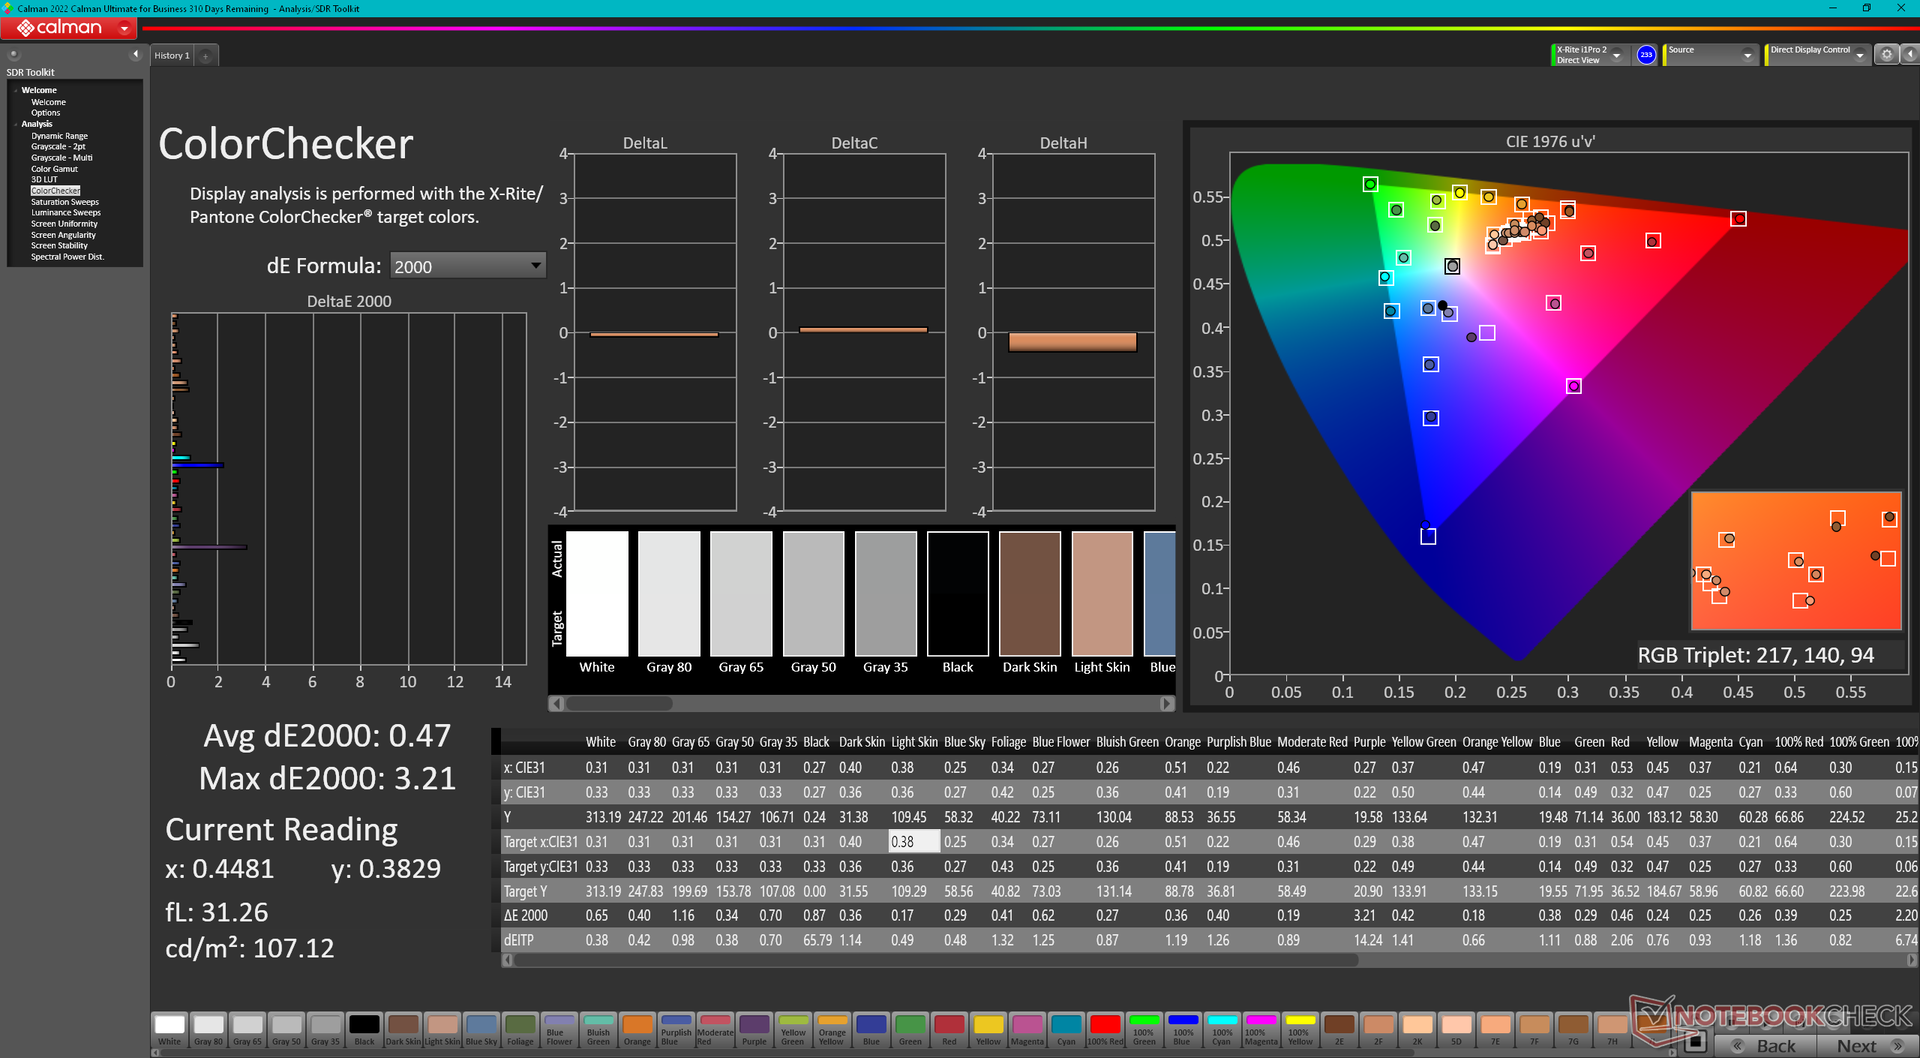
ΔE ColorChecker Calman: 1.22 | ∀{0.5-29.43 Ø4.72}
calibrated: 0.47
ΔE Greyscale Calman: 0.8 | ∀{0.09-98 Ø4.97}
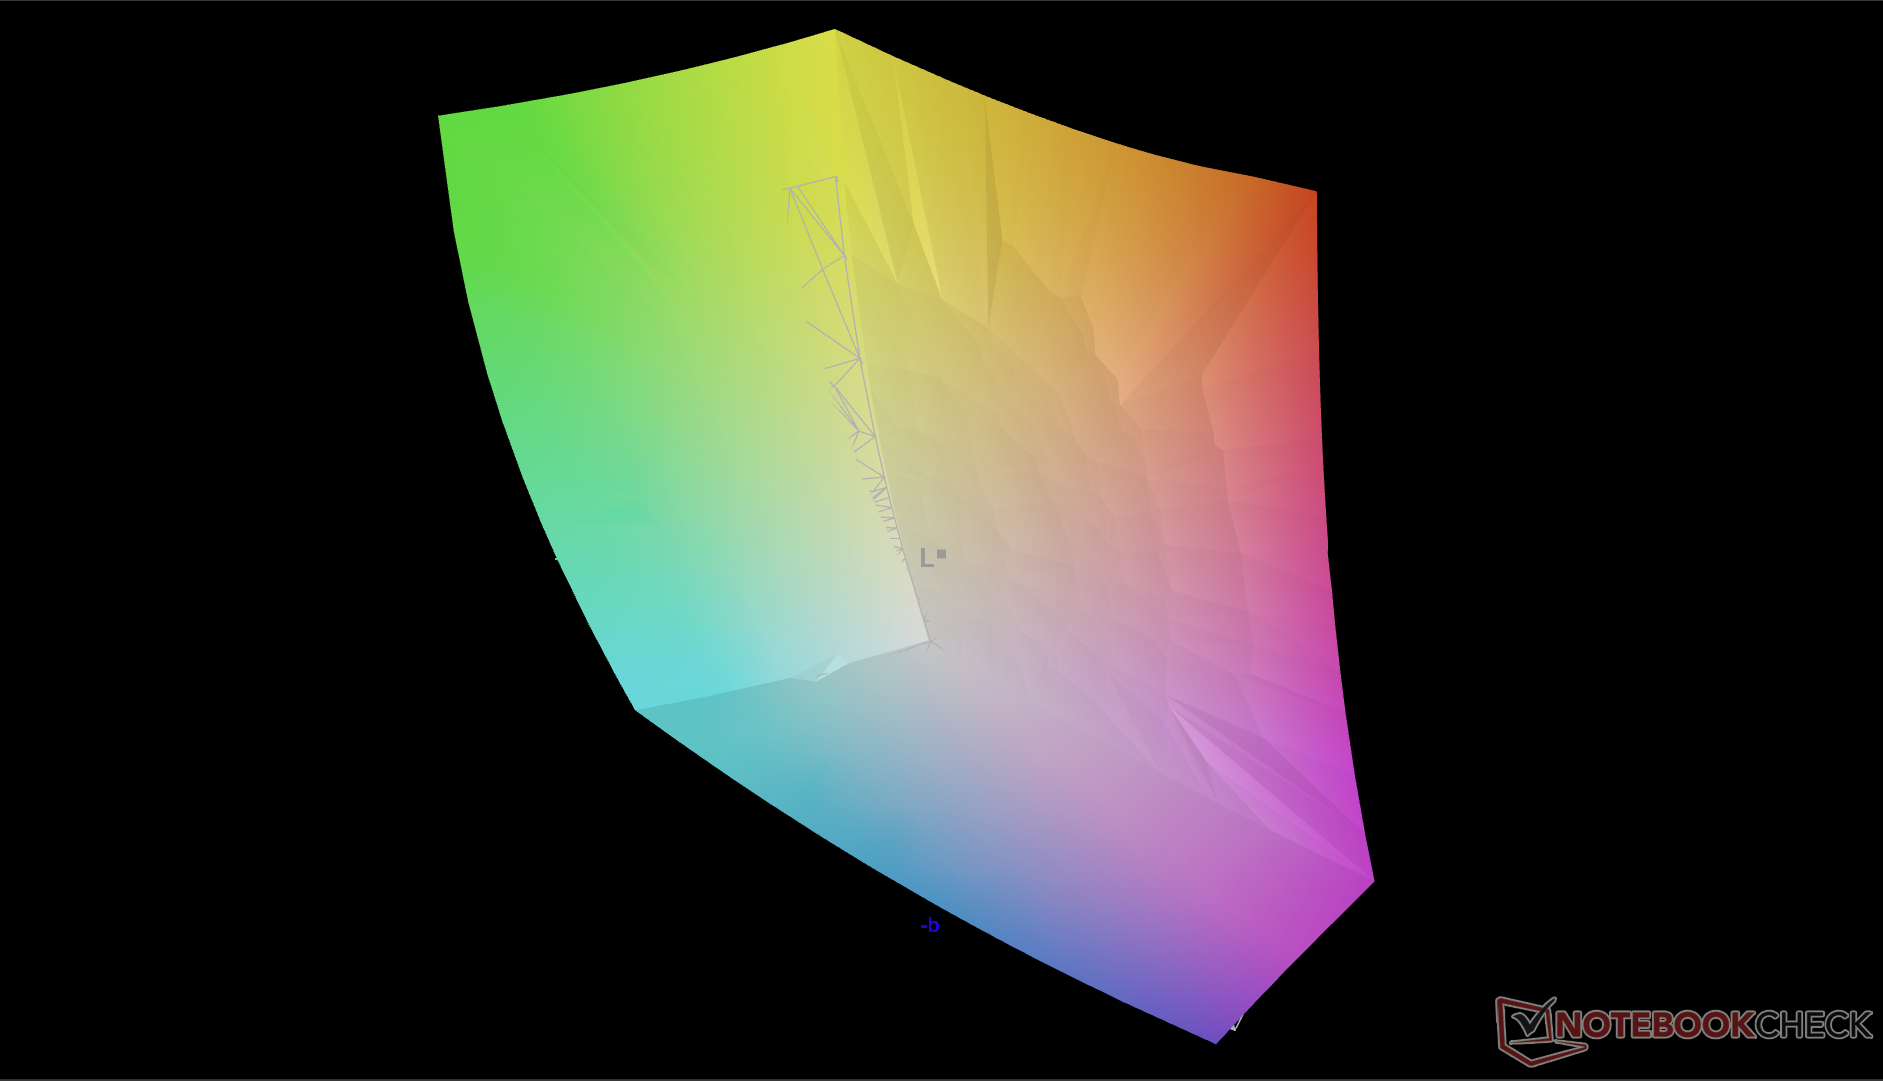
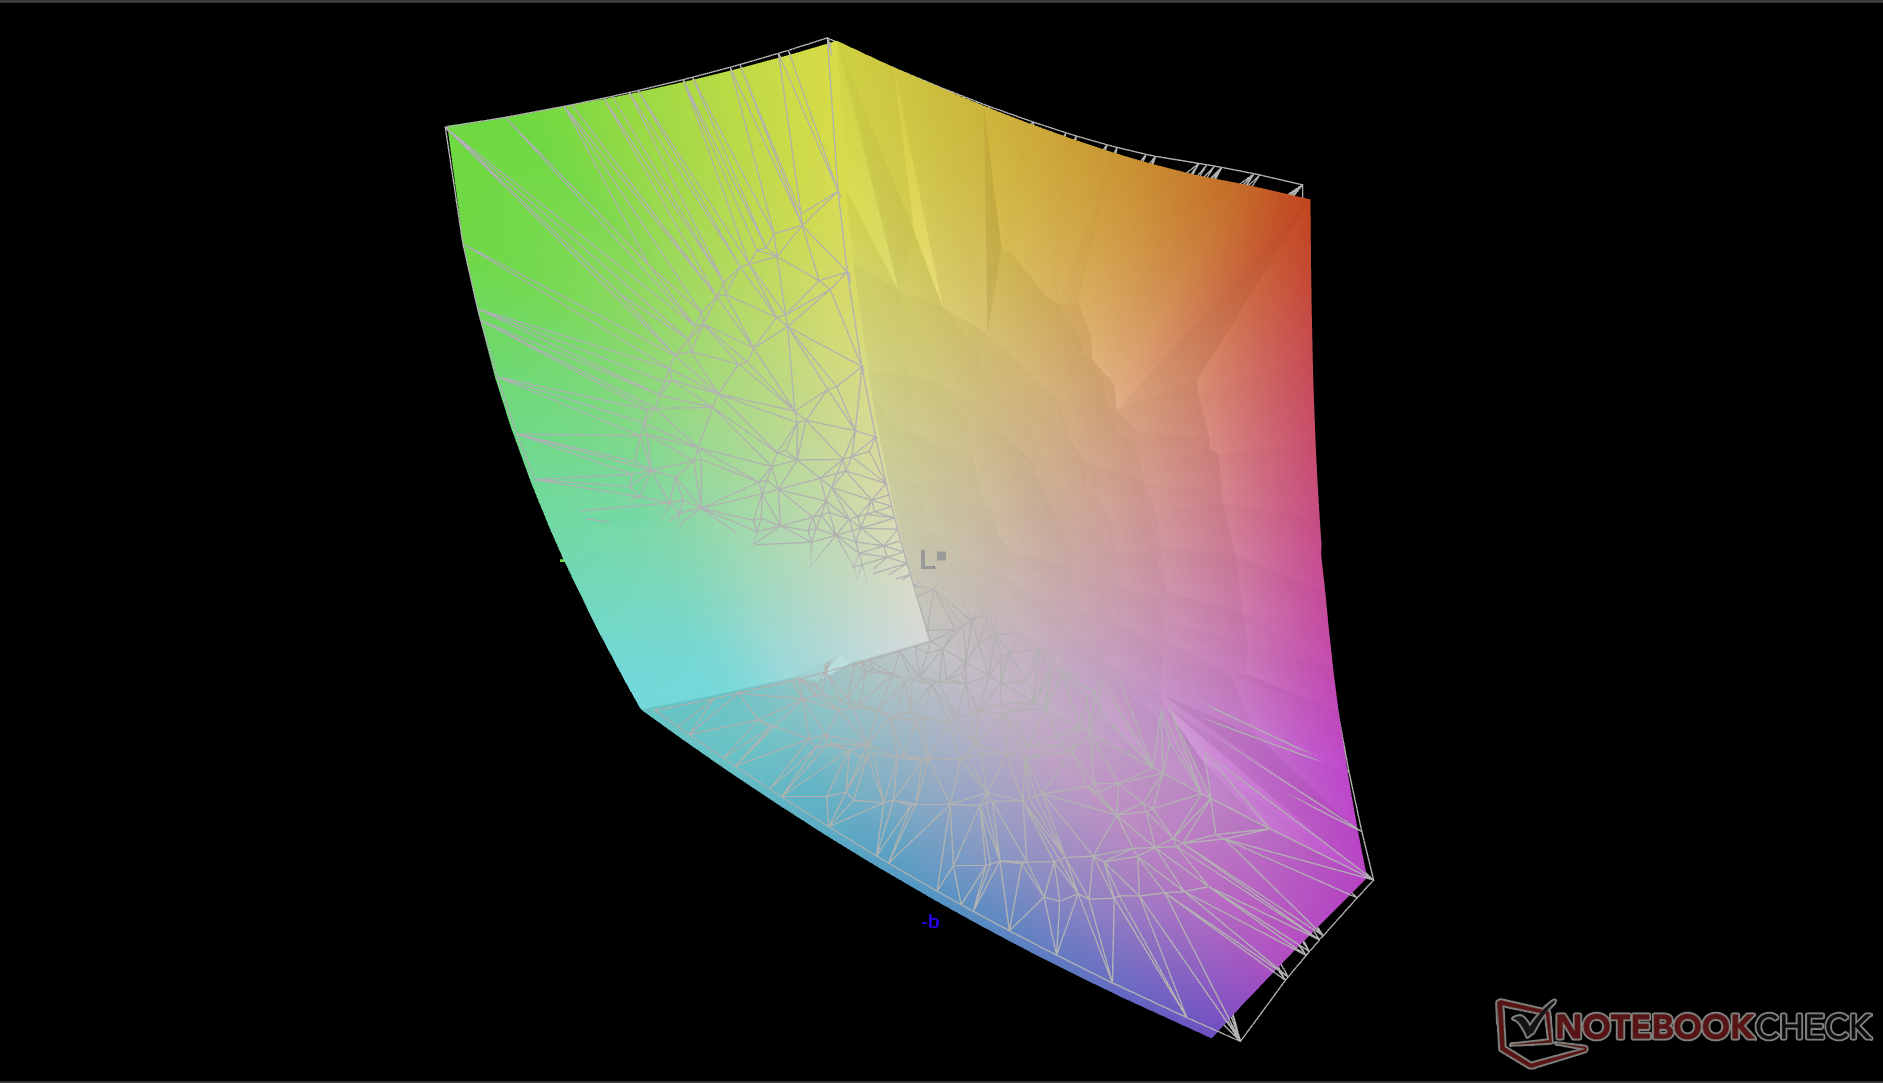
88.7% AdobeRGB 1998 (Argyll 3D)
99.7% sRGB (Argyll 3D)
98.5% Display P3 (Argyll 3D)
Gamma: 2.23
CCT: 6471 K
| Alienware m18 R1 AMD BOE NE18NZ1, IPS, 1920x1200, 18" | Alienware m18 R1 Chi Mei 180JME, IPS, 1920x1200, 18" | Acer Predator Helios 18 N23Q2 AUO45A8 (B180QAN01.2), IPS, 2560x1600, 18" | Razer Blade 18 RTX 4070 AU Optronics B180QAN01.0, IPS, 2560x1600, 18" | Asus ROG Strix Scar 18 2023 G834JY-N6005W NE180QDM-NZ2, IPS, 2560x1600, 18" | MSI GE78HX 13VH-070US AU Optronics B170QAN01.2, IPS, 2560x1600, 17" | |
|---|---|---|---|---|---|---|
| Display | 0% | 1% | -2% | -2% | -1% | |
| Display P3 Coverage (%) | 98.5 | 97.7 -1% | 99.8 1% | 96.9 -2% | 97.2 -1% | 97.6 -1% |
| sRGB Coverage (%) | 99.7 | 100 0% | 100 0% | 99.8 0% | 99.9 0% | 99.9 0% |
| AdobeRGB 1998 Coverage (%) | 88.7 | 89.8 1% | 91.8 3% | 85.3 -4% | 84.9 -4% | 86.5 -2% |
| Response Times | -5% | -128% | -17% | -42% | -9% | |
| Response Time Grey 50% / Grey 80% * (ms) | 2.8 ? | 3 ? -7% | 7.6 ? -171% | 4.2 ? -50% | 5.41 ? -93% | 4.2 ? -50% |
| Response Time Black / White * (ms) | 9.6 ? | 9.9 ? -3% | 17.8 ? -85% | 8 ? 17% | 8.62 ? 10% | 6.4 ? 33% |
| PWM Frequency (Hz) | 2509 | |||||
| Screen | -18% | -130% | -99% | -215% | -145% | |
| Brightness middle (cd/m²) | 319.6 | 372.8 17% | 360 13% | 549.6 72% | 490 53% | 398.6 25% |
| Brightness (cd/m²) | 304 | 367 21% | 355 17% | 524 72% | 468 54% | 384 26% |
| Brightness Distribution (%) | 87 | 97 11% | 92 6% | 89 2% | 86 -1% | 89 2% |
| Black Level * (cd/m²) | 0.25 | 0.32 -28% | 0.21 16% | 0.53 -112% | 0.54 -116% | 0.46 -84% |
| Contrast (:1) | 1278 | 1165 -9% | 1714 34% | 1037 -19% | 907 -29% | 867 -32% |
| Colorchecker dE 2000 * | 1.22 | 1.92 -57% | 3.82 -213% | 3.32 -172% | 4.97 -307% | 4.05 -232% |
| Colorchecker dE 2000 max. * | 3.1 | 3.65 -18% | 7.38 -138% | 6.63 -114% | 11.02 -255% | 8.68 -180% |
| Colorchecker dE 2000 calibrated * | 0.47 | 0.51 -9% | 2.24 -377% | 2.7 -474% | 2.97 -532% | 1.02 -117% |
| Greyscale dE 2000 * | 0.8 | 1.5 -88% | 5.06 -532% | 2 -150% | 7.2 -800% | 6.5 -713% |
| Gamma | 2.23 99% | 2.34 94% | 2.52 87% | 2.29 96% | 2.161 102% | 2.11 104% |
| CCT | 6471 100% | 6607 98% | 5657 115% | 6319 103% | 6515 100% | 7518 86% |
| Media totale (Programma / Settaggio) | -8% /
-12% | -86% /
-102% | -39% /
-67% | -86% /
-144% | -52% /
-95% |
* ... Meglio usare valori piccoli
I valori medi di DeltaE sono ben al di sotto di 2 e suggeriscono che la calibrazione per l'utente finale non sarà necessaria per la maggior parte degli utenti.


Tempi di risposta del Display
| ↔ Tempi di risposta dal Nero al Bianco | ||
|---|---|---|
| 9.6 ms ... aumenta ↗ e diminuisce ↘ combinato | ↗ 4.9 ms Incremento | 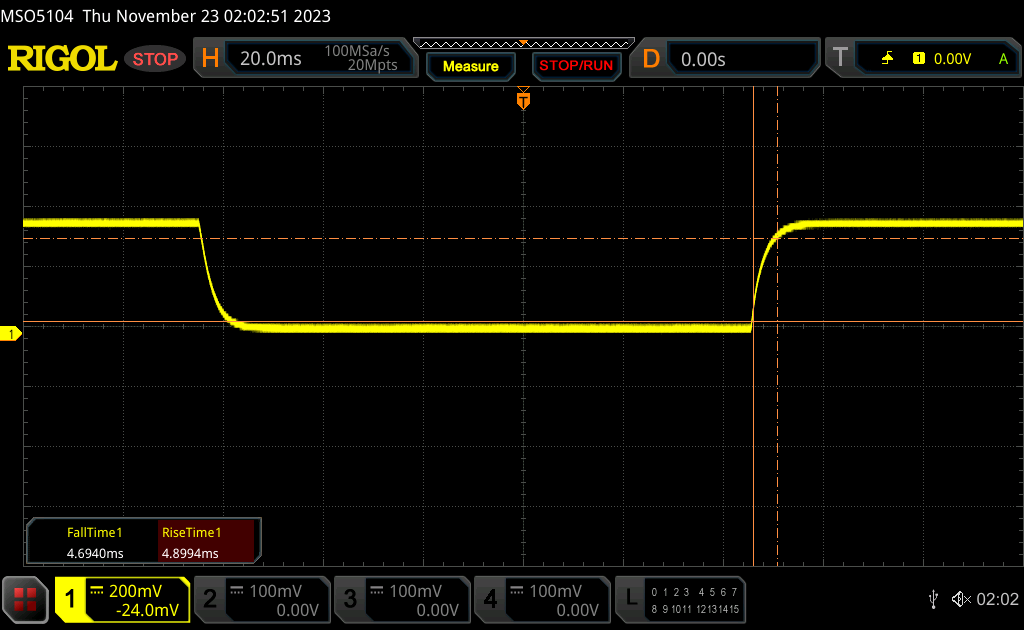 |
| ↘ 4.7 ms Calo | ||
| Lo schermo mostra veloci tempi di risposta durante i nostri tests e dovrebbe esere adatto al gaming In confronto, tutti i dispositivi di test variano da 0.1 (minimo) a 240 (massimo) ms. » 26 % di tutti i dispositivi è migliore. Questo significa che i tempi di risposta rilevati sono migliori rispettto alla media di tutti i dispositivi testati (19.8 ms). | ||
| ↔ Tempo di risposta dal 50% Grigio all'80% Grigio | ||
| 2.8 ms ... aumenta ↗ e diminuisce ↘ combinato | ↗ 1.2 ms Incremento | 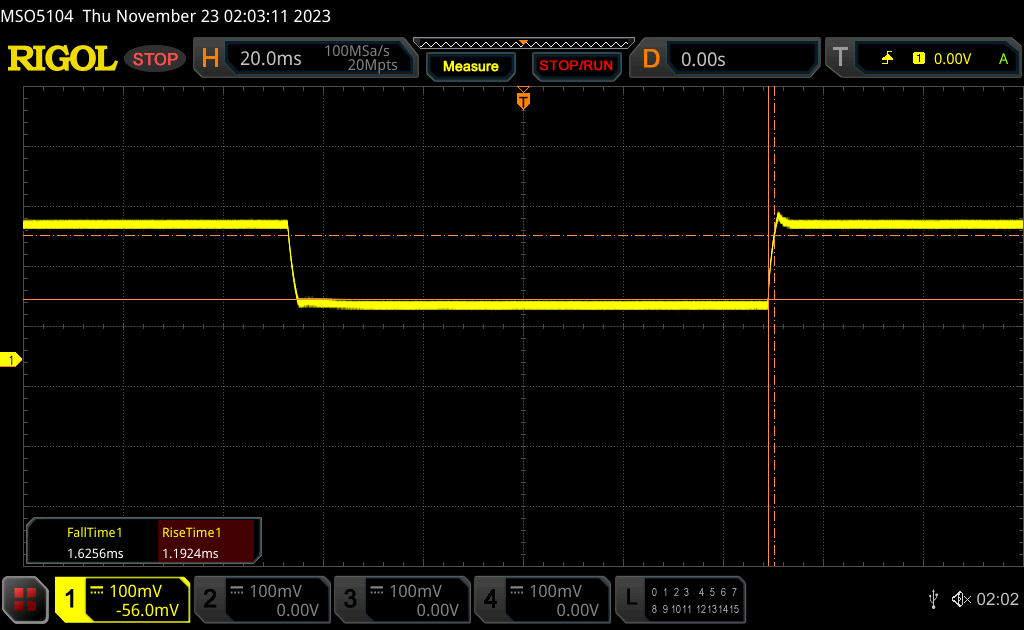 |
| ↘ 1.6 ms Calo | ||
| Lo schermo ha mostrato valori di risposta molto veloci nei nostri tests ed è molto adatto per i gaming veloce. In confronto, tutti i dispositivi di test variano da 0.165 (minimo) a 636 (massimo) ms. » 12 % di tutti i dispositivi è migliore. Questo significa che i tempi di risposta rilevati sono migliori rispettto alla media di tutti i dispositivi testati (31 ms). | ||
Sfarfallio dello schermo / PWM (Pulse-Width Modulation)
| flickering dello schermo / PWM non rilevato |  | ||
In confronto: 52 % di tutti i dispositivi testati non utilizza PWM per ridurre la luminosita' del display. Se è rilevato PWM, una media di 7747 (minimo: 5 - massimo: 343500) Hz è stata rilevata. | |||
Prestazioni
Condizioni del test
Abbiamo impostato Alienware Command Center sulla modalità Overdrive prima di eseguire i benchmark qui sotto. La familiarità con Command Center è fondamentale per controllare le funzioni specifiche del portatile, tra cui l'illuminazione RGB, i profili di alimentazione e i profili specifici per i giochi.
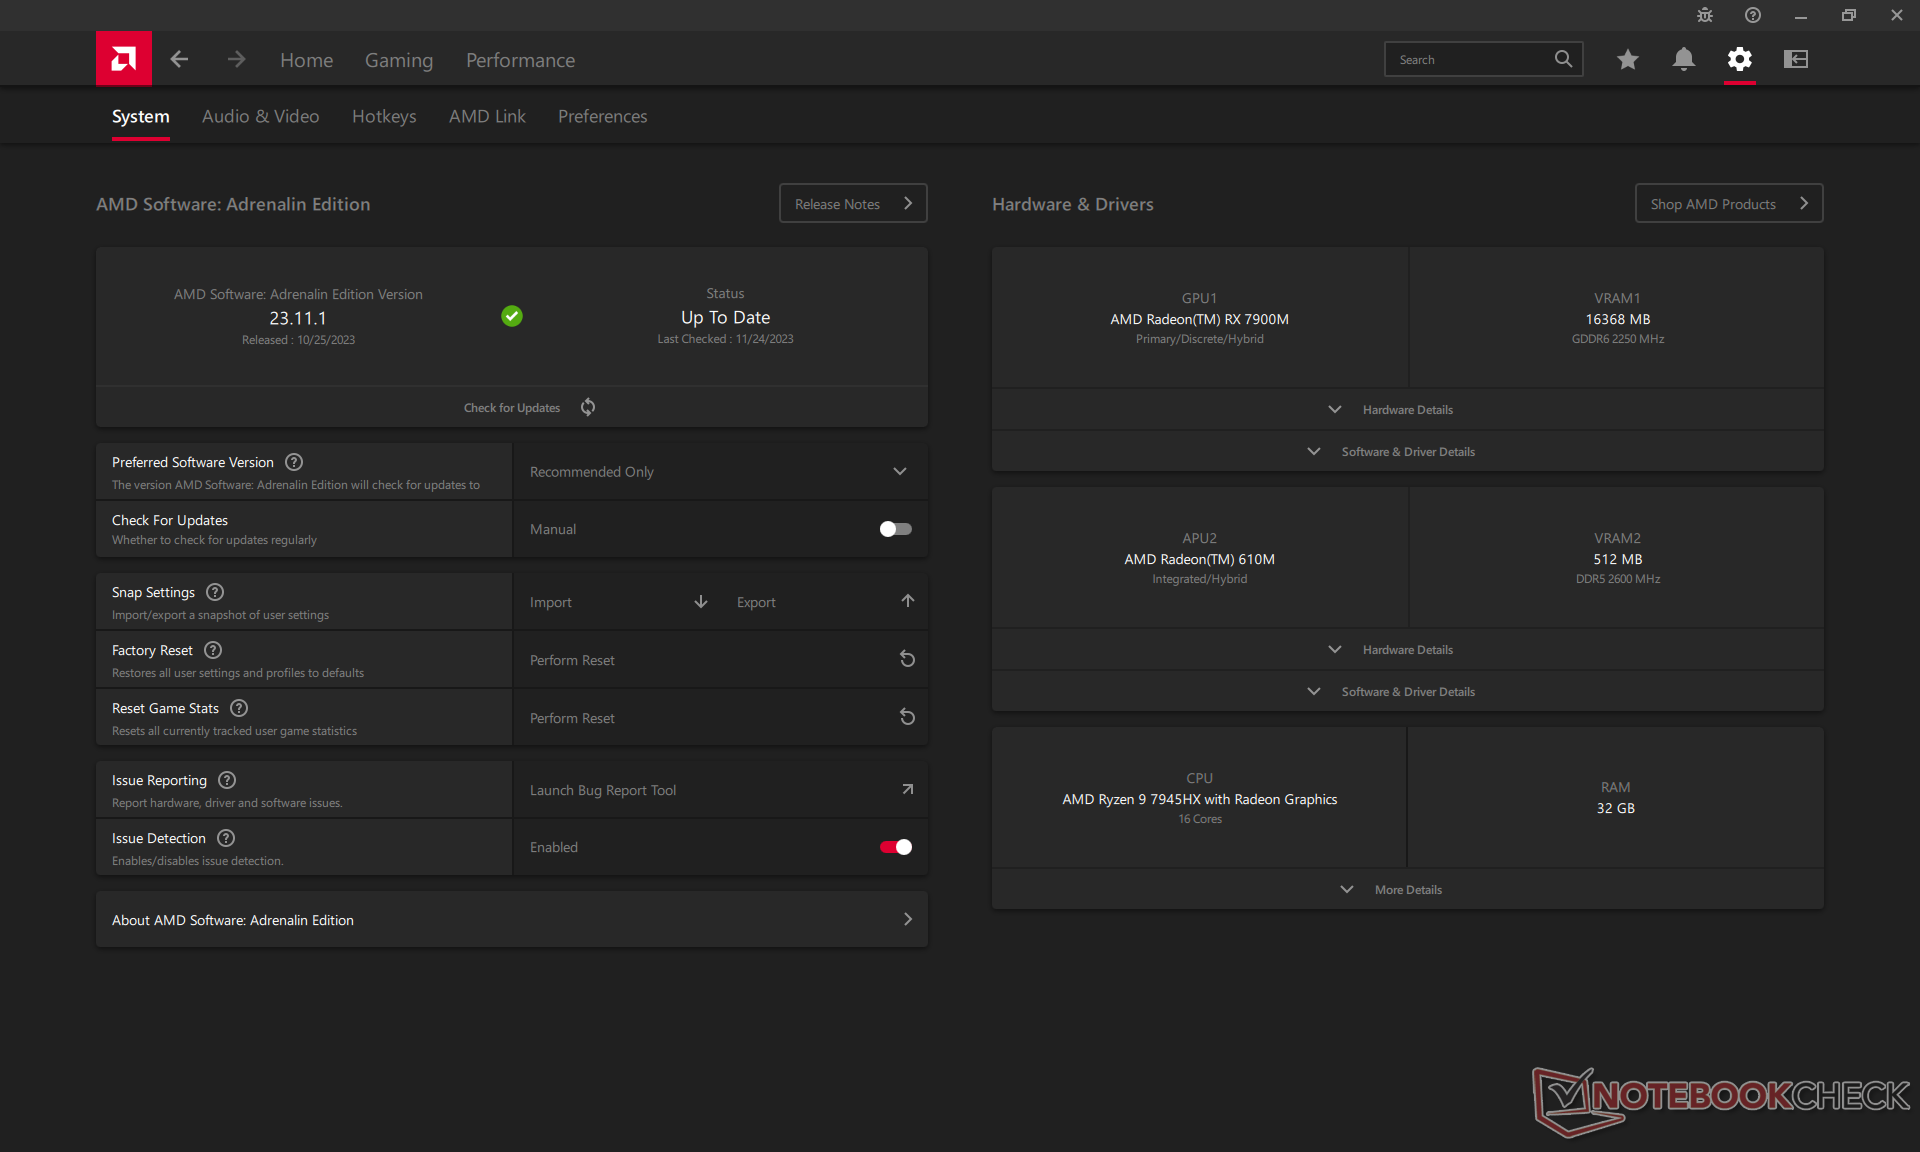
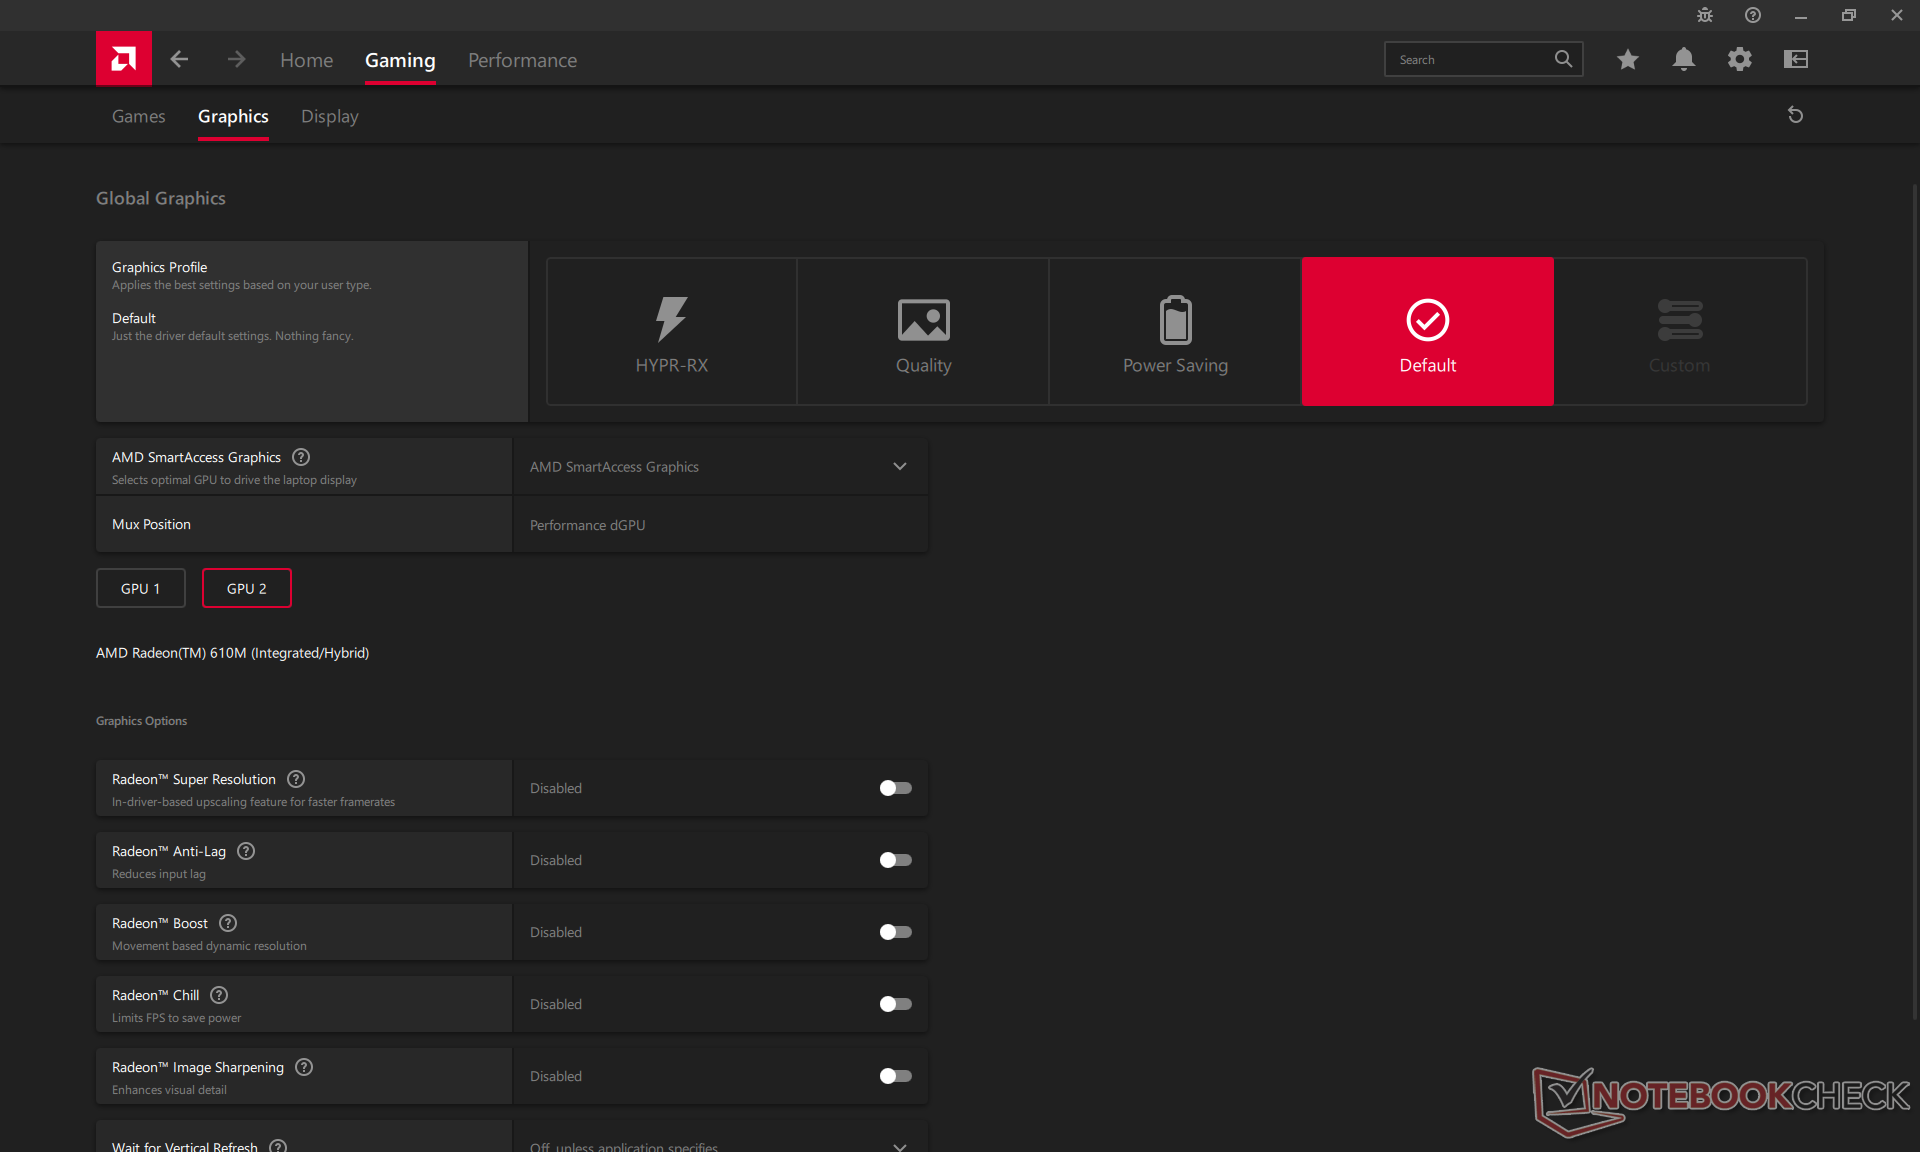
Si consiglia anche di scaricare AMD Adrenalin per ottenere i driver della GPU più recenti e per attivare/disattivare tutte le funzioni della GPU.
Processore
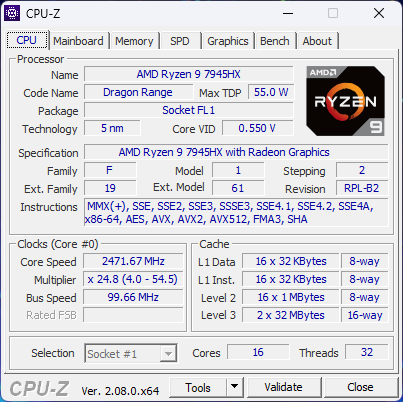
Le prestazioni della CPU sono il classico rapporto tra AMD e Intel, dove il nostro Ryzen 9 7945HX offre prestazioni multi-thread grezze superiori del 5-10% rispetto al concorrenteCore i9-13980HX mentre è dal 5 al 10 percento più lento nelle prestazioni single-thread. È sostanzialmente alla pari con il recente Ryzen 9 7945HX3D per essere uno dei processori mobili più veloci disponibili. Passando al processore Ryzen 9 7845HX o Ryzen 7 7745HX dovrebbe ridurre le prestazioni del processore rispettivamente del 20-25% e del 40-50%.
La sostenibilità delle prestazioni è eccellente, come dimostrano i punteggi costanti durante l'esecuzione di CineBench R15 xT in loop.
Cinebench R15 Multi Loop
Cinebench R23: Multi Core | Single Core
Cinebench R20: CPU (Multi Core) | CPU (Single Core)
Cinebench R15: CPU Multi 64Bit | CPU Single 64Bit
Blender: v2.79 BMW27 CPU
7-Zip 18.03: 7z b 4 | 7z b 4 -mmt1
Geekbench 5.5: Multi-Core | Single-Core
HWBOT x265 Benchmark v2.2: 4k Preset
LibreOffice : 20 Documents To PDF
R Benchmark 2.5: Overall mean
* ... Meglio usare valori piccoli
AIDA64: FP32 Ray-Trace | FPU Julia | CPU SHA3 | CPU Queen | FPU SinJulia | FPU Mandel | CPU AES | CPU ZLib | FP64 Ray-Trace | CPU PhotoWorxx
| Performance rating | |
| Alienware m18 R1 AMD | |
| Media AMD Ryzen 9 7945HX | |
| Acer Predator Helios 18 N23Q2 | |
| Alienware m18 R1 | |
| MSI GE78HX 13VH-070US | |
| Asus ROG Strix Scar 18 2023 G834JY-N6005W | |
| Razer Blade 18 RTX 4070 | |
| AIDA64 / FP32 Ray-Trace | |
| Alienware m18 R1 AMD | |
| Media AMD Ryzen 9 7945HX (50388 - 60169, n=7) | |
| Alienware m18 R1 | |
| Asus ROG Strix Scar 18 2023 G834JY-N6005W | |
| MSI GE78HX 13VH-070US | |
| Acer Predator Helios 18 N23Q2 | |
| Razer Blade 18 RTX 4070 | |
| AIDA64 / FPU Julia | |
| Alienware m18 R1 AMD | |
| Media AMD Ryzen 9 7945HX (201874 - 252486, n=7) | |
| Alienware m18 R1 | |
| MSI GE78HX 13VH-070US | |
| Asus ROG Strix Scar 18 2023 G834JY-N6005W | |
| Acer Predator Helios 18 N23Q2 | |
| Razer Blade 18 RTX 4070 | |
| AIDA64 / CPU SHA3 | |
| Alienware m18 R1 AMD | |
| Media AMD Ryzen 9 7945HX (8525 - 10389, n=7) | |
| Alienware m18 R1 | |
| Asus ROG Strix Scar 18 2023 G834JY-N6005W | |
| MSI GE78HX 13VH-070US | |
| Acer Predator Helios 18 N23Q2 | |
| Razer Blade 18 RTX 4070 | |
| AIDA64 / CPU Queen | |
| Alienware m18 R1 AMD | |
| Media AMD Ryzen 9 7945HX (175041 - 200651, n=7) | |
| Alienware m18 R1 | |
| Asus ROG Strix Scar 18 2023 G834JY-N6005W | |
| MSI GE78HX 13VH-070US | |
| Razer Blade 18 RTX 4070 | |
| Acer Predator Helios 18 N23Q2 | |
| AIDA64 / FPU SinJulia | |
| Alienware m18 R1 AMD | |
| Media AMD Ryzen 9 7945HX (28794 - 32988, n=7) | |
| Asus ROG Strix Scar 18 2023 G834JY-N6005W | |
| MSI GE78HX 13VH-070US | |
| Alienware m18 R1 | |
| Razer Blade 18 RTX 4070 | |
| Acer Predator Helios 18 N23Q2 | |
| AIDA64 / FPU Mandel | |
| Alienware m18 R1 AMD | |
| Media AMD Ryzen 9 7945HX (105740 - 134044, n=7) | |
| Alienware m18 R1 | |
| Asus ROG Strix Scar 18 2023 G834JY-N6005W | |
| MSI GE78HX 13VH-070US | |
| Acer Predator Helios 18 N23Q2 | |
| Razer Blade 18 RTX 4070 | |
| AIDA64 / CPU AES | |
| Acer Predator Helios 18 N23Q2 | |
| Media AMD Ryzen 9 7945HX (126790 - 325960, n=7) | |
| Alienware m18 R1 AMD | |
| Alienware m18 R1 | |
| MSI GE78HX 13VH-070US | |
| Asus ROG Strix Scar 18 2023 G834JY-N6005W | |
| Razer Blade 18 RTX 4070 | |
| AIDA64 / CPU ZLib | |
| Alienware m18 R1 AMD | |
| Media AMD Ryzen 9 7945HX (2022 - 2409, n=7) | |
| MSI GE78HX 13VH-070US | |
| Asus ROG Strix Scar 18 2023 G834JY-N6005W | |
| Alienware m18 R1 | |
| Acer Predator Helios 18 N23Q2 | |
| Razer Blade 18 RTX 4070 | |
| AIDA64 / FP64 Ray-Trace | |
| Alienware m18 R1 AMD | |
| Media AMD Ryzen 9 7945HX (26875 - 31796, n=7) | |
| Alienware m18 R1 | |
| Asus ROG Strix Scar 18 2023 G834JY-N6005W | |
| MSI GE78HX 13VH-070US | |
| Acer Predator Helios 18 N23Q2 | |
| Razer Blade 18 RTX 4070 | |
| AIDA64 / CPU PhotoWorxx | |
| Alienware m18 R1 | |
| Acer Predator Helios 18 N23Q2 | |
| MSI GE78HX 13VH-070US | |
| Razer Blade 18 RTX 4070 | |
| Asus ROG Strix Scar 18 2023 G834JY-N6005W | |
| Media AMD Ryzen 9 7945HX (31421 - 40095, n=7) | |
| Alienware m18 R1 AMD | |
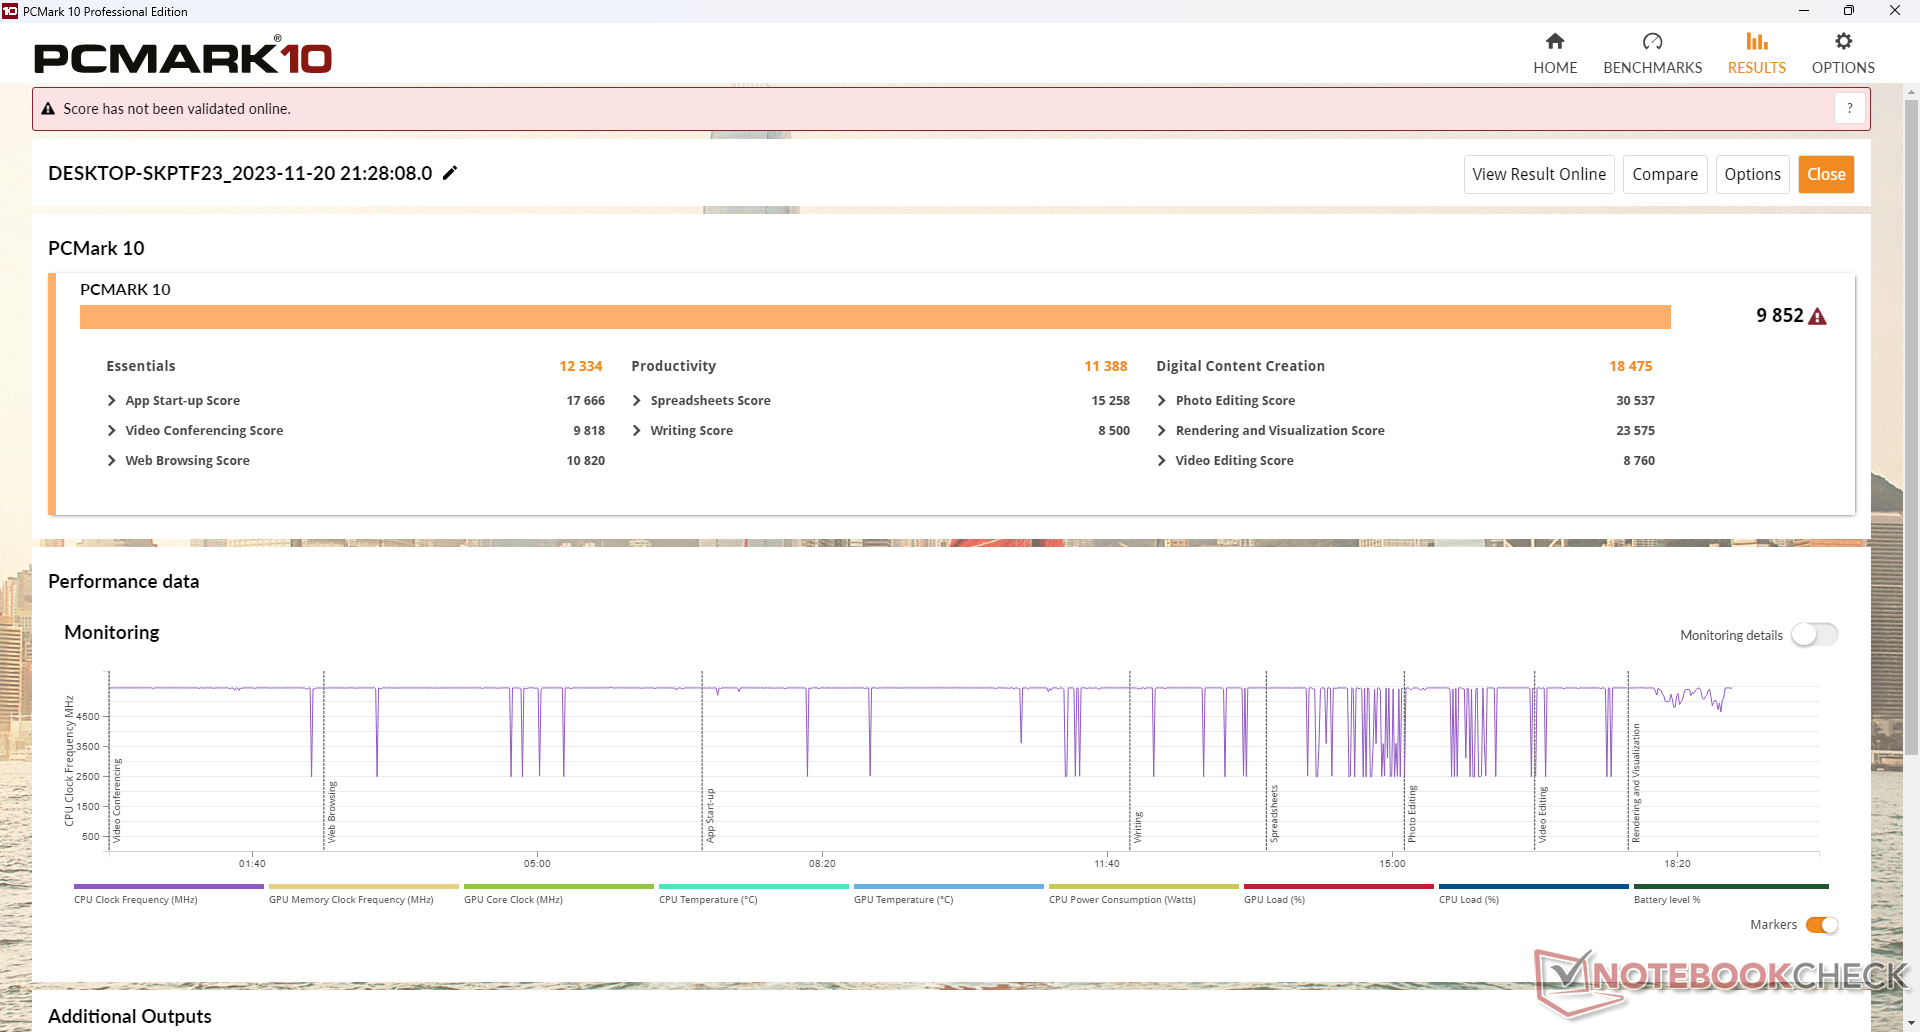
Prestazioni del sistema
I risultati di PCMark sono tra i più alti di qualsiasi computer portatile da gioco, e collocano il nostro Alienware m18 alla pari con alcune delle alternative Intel-Nvidia più veloci. Purtroppo, l'esperienza dell'utente è meno che stellare nella pratica, a causa di tutti i bug che abbiamo osservato. Alcuni di essi sono degni di nota:
- Il display principale a volte si spegneva senza motivo ed era necessario un riavvio
- Mancato avvio se è collegato un monitor esterno
- Mancata esecuzione dei benchmark 3DMark Speed Way e Blender Classroom HIP/AMD
- Consumo di energia insolitamente elevato quando è in modalità Standby
Questi problemi si sono verificati più di una volta anche con gli ultimi aggiornamenti di Windows e i driver AMD installati al momento della scrittura (31.0.22023.1014).
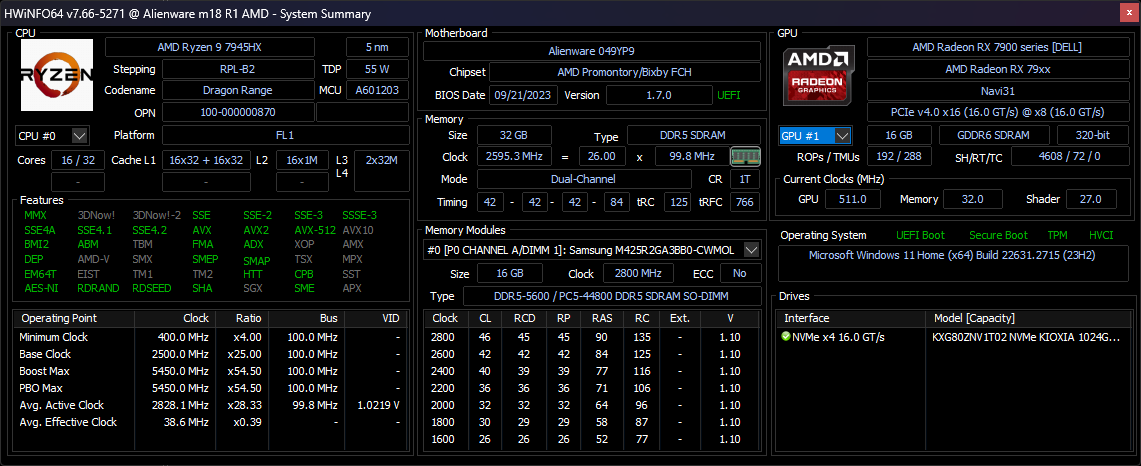
Anche le prestazioni della memoria sono notevolmente più lente rispetto a molti computer portatili da gioco basati su Intel. Questo non sembra essere un caso, dato che anche il nostro Asus ROG Strix Scar 17 con la stessa CPU Ryzen 9 del nostro Alienware restituisce numeri altrettanto bassi.
CrossMark: Overall | Productivity | Creativity | Responsiveness
| PCMark 10 / Score | |
| Alienware m18 R1 AMD | |
| Media AMD Ryzen 9 7945HX, AMD Radeon RX 7900M (n=1) | |
| MSI GE78HX 13VH-070US | |
| Asus ROG Strix Scar 18 2023 G834JY-N6005W | |
| Alienware m18 R1 | |
| Acer Predator Helios 18 N23Q2 | |
| Razer Blade 18 RTX 4070 | |
| PCMark 10 / Essentials | |
| Alienware m18 R1 AMD | |
| Media AMD Ryzen 9 7945HX, AMD Radeon RX 7900M (n=1) | |
| Razer Blade 18 RTX 4070 | |
| MSI GE78HX 13VH-070US | |
| Alienware m18 R1 | |
| Acer Predator Helios 18 N23Q2 | |
| PCMark 10 / Productivity | |
| Alienware m18 R1 AMD | |
| Media AMD Ryzen 9 7945HX, AMD Radeon RX 7900M (n=1) | |
| Acer Predator Helios 18 N23Q2 | |
| MSI GE78HX 13VH-070US | |
| Alienware m18 R1 | |
| Razer Blade 18 RTX 4070 | |
| PCMark 10 / Digital Content Creation | |
| Alienware m18 R1 AMD | |
| Media AMD Ryzen 9 7945HX, AMD Radeon RX 7900M (n=1) | |
| Alienware m18 R1 | |
| MSI GE78HX 13VH-070US | |
| Acer Predator Helios 18 N23Q2 | |
| Razer Blade 18 RTX 4070 | |
| CrossMark / Overall | |
| Acer Predator Helios 18 N23Q2 | |
| Alienware m18 R1 | |
| Razer Blade 18 RTX 4070 | |
| Asus ROG Strix Scar 18 2023 G834JY-N6005W | |
| Alienware m18 R1 AMD | |
| Media AMD Ryzen 9 7945HX, AMD Radeon RX 7900M (n=1) | |
| MSI GE78HX 13VH-070US | |
| CrossMark / Productivity | |
| Acer Predator Helios 18 N23Q2 | |
| Alienware m18 R1 | |
| Razer Blade 18 RTX 4070 | |
| Asus ROG Strix Scar 18 2023 G834JY-N6005W | |
| MSI GE78HX 13VH-070US | |
| Alienware m18 R1 AMD | |
| Media AMD Ryzen 9 7945HX, AMD Radeon RX 7900M (n=1) | |
| CrossMark / Creativity | |
| Alienware m18 R1 | |
| Asus ROG Strix Scar 18 2023 G834JY-N6005W | |
| Acer Predator Helios 18 N23Q2 | |
| Razer Blade 18 RTX 4070 | |
| Alienware m18 R1 AMD | |
| Media AMD Ryzen 9 7945HX, AMD Radeon RX 7900M (n=1) | |
| MSI GE78HX 13VH-070US | |
| CrossMark / Responsiveness | |
| Acer Predator Helios 18 N23Q2 | |
| Alienware m18 R1 | |
| Razer Blade 18 RTX 4070 | |
| MSI GE78HX 13VH-070US | |
| Asus ROG Strix Scar 18 2023 G834JY-N6005W | |
| Alienware m18 R1 AMD | |
| Media AMD Ryzen 9 7945HX, AMD Radeon RX 7900M (n=1) | |
| PCMark 10 Score | 9852 punti | |
Aiuto | ||
| AIDA64 / Memory Latency | |
| Alienware m18 R1 AMD | |
| Asus ROG Strix Scar 18 2023 G834JY-N6005W | |
| Asus ROG Strix Scar 17 G733PYV-LL053X | |
| Razer Blade 18 RTX 4070 | |
| MSI GE78HX 13VH-070US | |
| Media AMD Ryzen 9 7945HX (77.1 - 91.3, n=7) | |
| Acer Predator Helios 18 N23Q2 | |
| Alienware m18 R1 | |
* ... Meglio usare valori piccoli
Latenza DPC
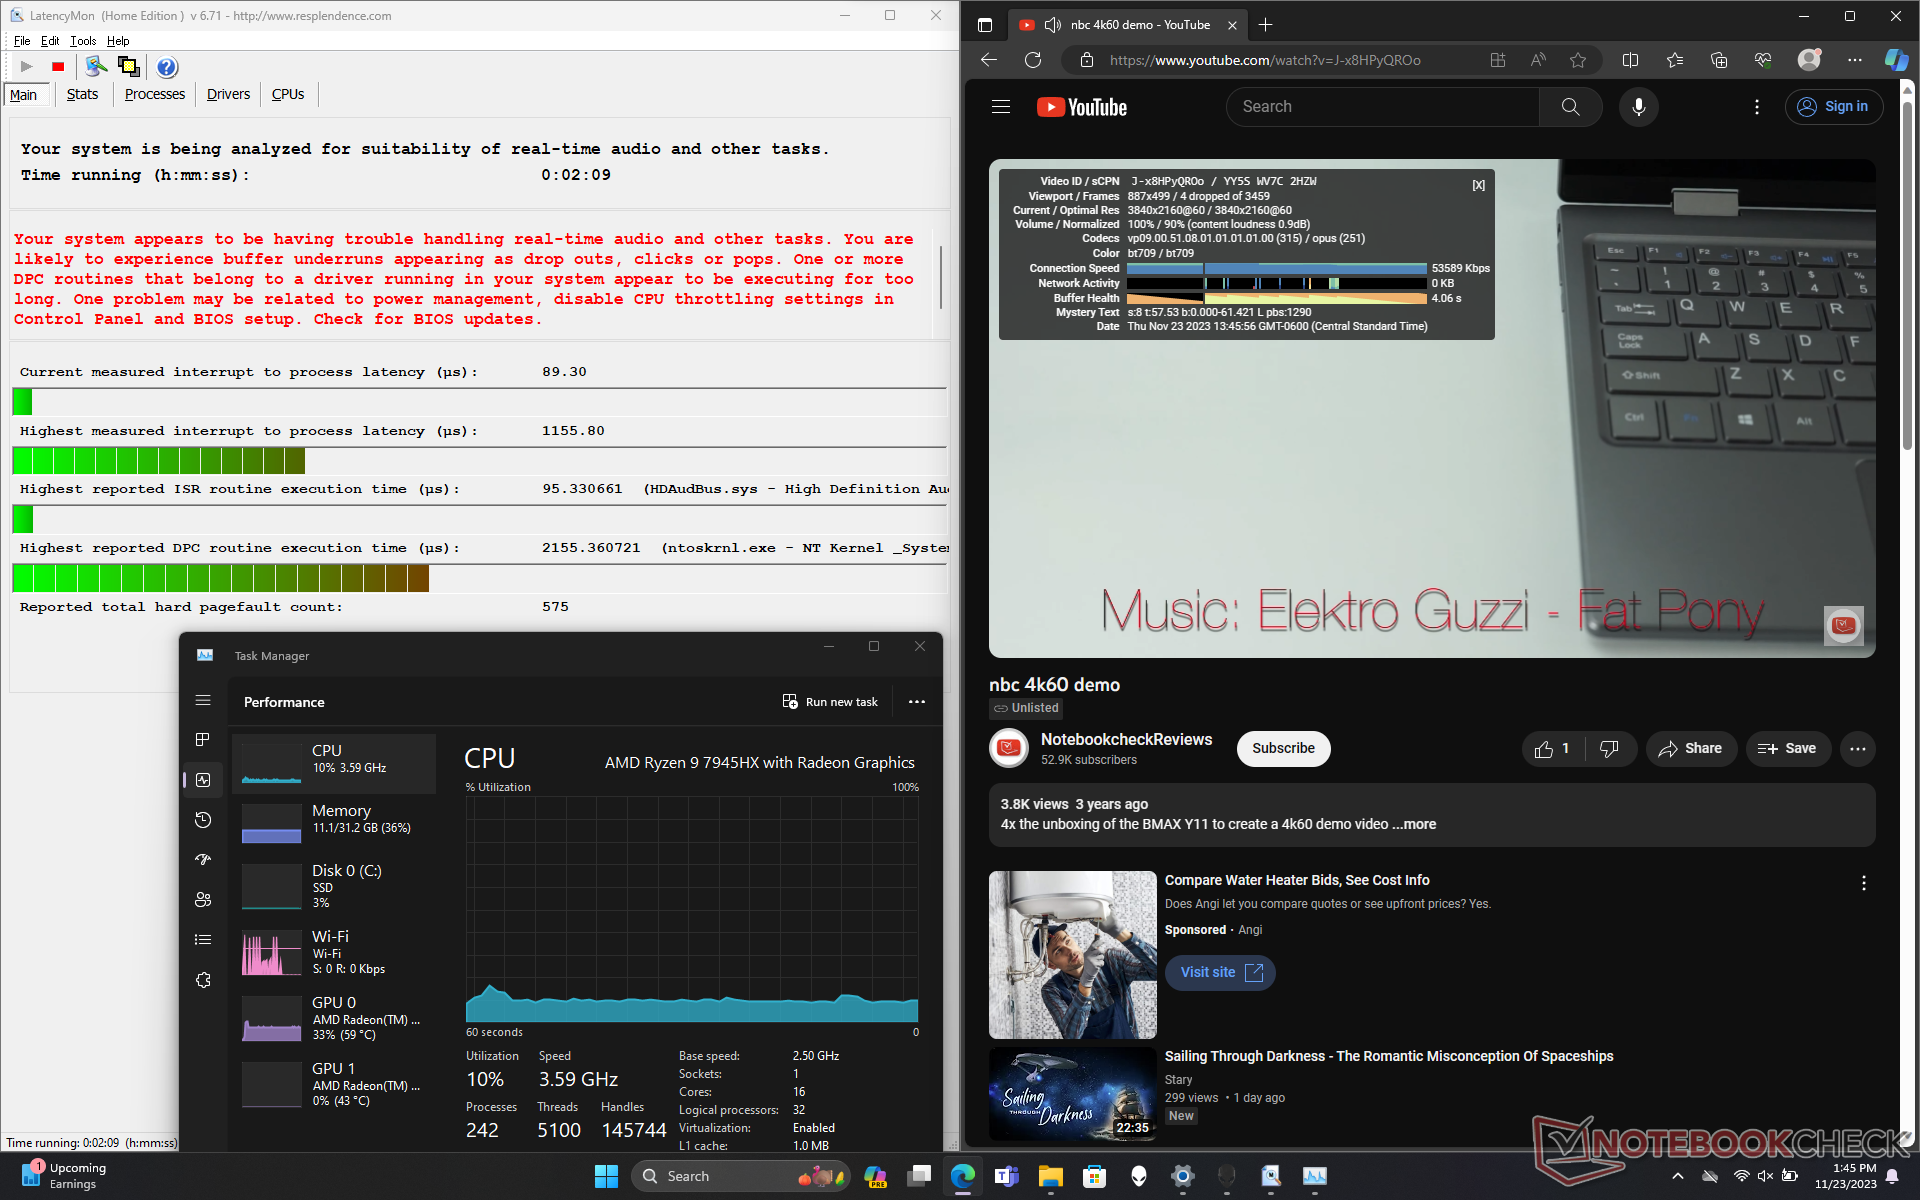
LatencyMon rivela lievi problemi di DPC quando si aprono più schede del browser della nostra homepage, il che non è insolito. la riproduzione di video 4K a 60 FPS potrebbe essere migliore, tuttavia, in quanto siamo in grado di registrare 4 fotogrammi caduti all'interno di una finestra di 60 secondi, rispetto agli 0 del Blade 18 Blade 18.
| DPC Latencies / LatencyMon - interrupt to process latency (max), Web, Youtube, Prime95 | |
| Acer Predator Helios 18 N23Q2 | |
| MSI GE78HX 13VH-070US | |
| Alienware m18 R1 | |
| Razer Blade 18 RTX 4070 | |
| Alienware m18 R1 AMD | |
| Asus ROG Strix Scar 18 2023 G834JY-N6005W | |
* ... Meglio usare valori piccoli
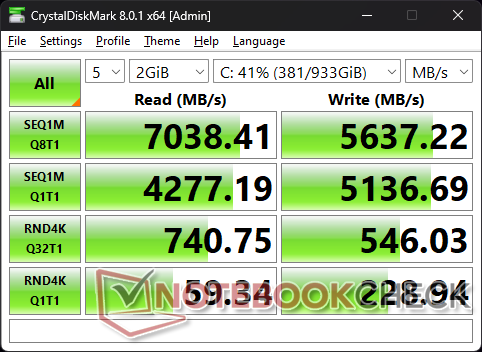
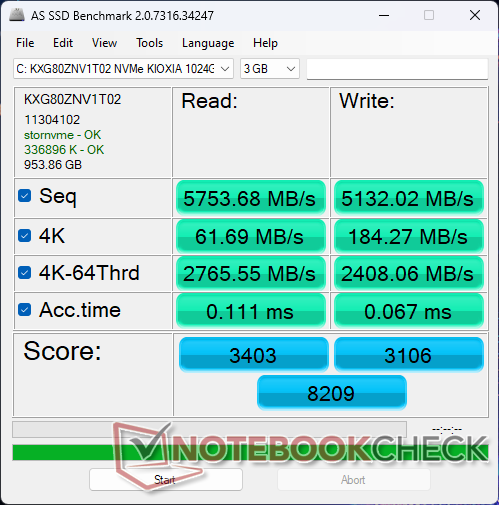
Dispositivi di archiviazione
Il modello da 1 TBKioxia XG8 KXG80ZNV1T02 è un SSD PCIe4 x4 NVMe di fascia alta, simile alla serie Samsung PM9A1. La nostra unità non ha mostrato problemi di throttling, mantenendo elevate velocità di trasferimento di ~6300 MB/s per periodi prolungati.

| Drive Performance rating - Percent | |
| Alienware m18 R1 | |
| Acer Predator Helios 18 N23Q2 | |
| MSI GE78HX 13VH-070US | |
| Razer Blade 18 RTX 4070 | |
| Alienware m18 R1 AMD | |
| Asus ROG Strix Scar 18 2023 G834JY-N6005W | |
* ... Meglio usare valori piccoli
Disk Throttling: DiskSpd Read Loop, Queue Depth 8
Prestazioni della GPU
AMD sta commercializzando la Radeon RX 7900M come concorrente diretto della GeForce RTX 4080 mobile e pensiamo che sia un confronto molto corretto. i risultati di 3DMark sono alla pari con la RTX 4080 nell'Alienware m16 R1 Alienware m16 R1 se non leggermente più veloci nel test Fire Strike basato su DX11. Il salto di prestazioni grezze rispetto alla Radeon RX 6850M XT è significativo: circa il 40-60%. Prima del lancio della Radeon RX 7900M, AMD non aveva una vera risposta alle RTX 4070, 4080 o 4090 mobili.
L'accelerazione RT è sempre stata un punto debole della serie Radeon, ma questo è migliorato in modo sostanziale per la Radeon RX 7900M. Il nostro punteggio di Port Royal è di circa il 10% rispetto a una RTX 4080 mobile GeForce e rappresenta un aumento da 2x a 2,5x rispetto alla Radeon RX 6800M. In precedenza, l'abilitazione di RT non era mai stata raccomandata su un computer portatile alimentato da Radeon, a causa dell'immensa perdita di prestazioni, ma la Radeon RX 7900M è la svolta che i fan di AMD stavano aspettando.
L'esecuzione in modalità Performance o Bilanciata invece che in modalità Overdrive riduce le prestazioni di pochi punti percentuali, come mostra la nostra tabella dei risultati Fire Strike qui sotto. Le piccole differenze sono degne di nota, poiché le differenze di rumore della ventola tra queste modalità sono significative, come illustrato nella nostra sezione Rumore del sistema qui sotto.
| Profilo di potenza | Punteggio Fisica | Punteggio grafico | Punteggio combinato |
| Modalità Overdrive | 39027 | 50241 | 16256 |
| Modalità Performance | 37979 (-3%) | 47187 (-6%) | 16523 (-0%) |
| Modalità Bilanciata | 37590 (-4%) | 48170 (-4%) | 16382 (-0%) |
| Alimentazione a batteria | 31494 (-19%) | 10735 (-79%) | 4174 (-74%) |
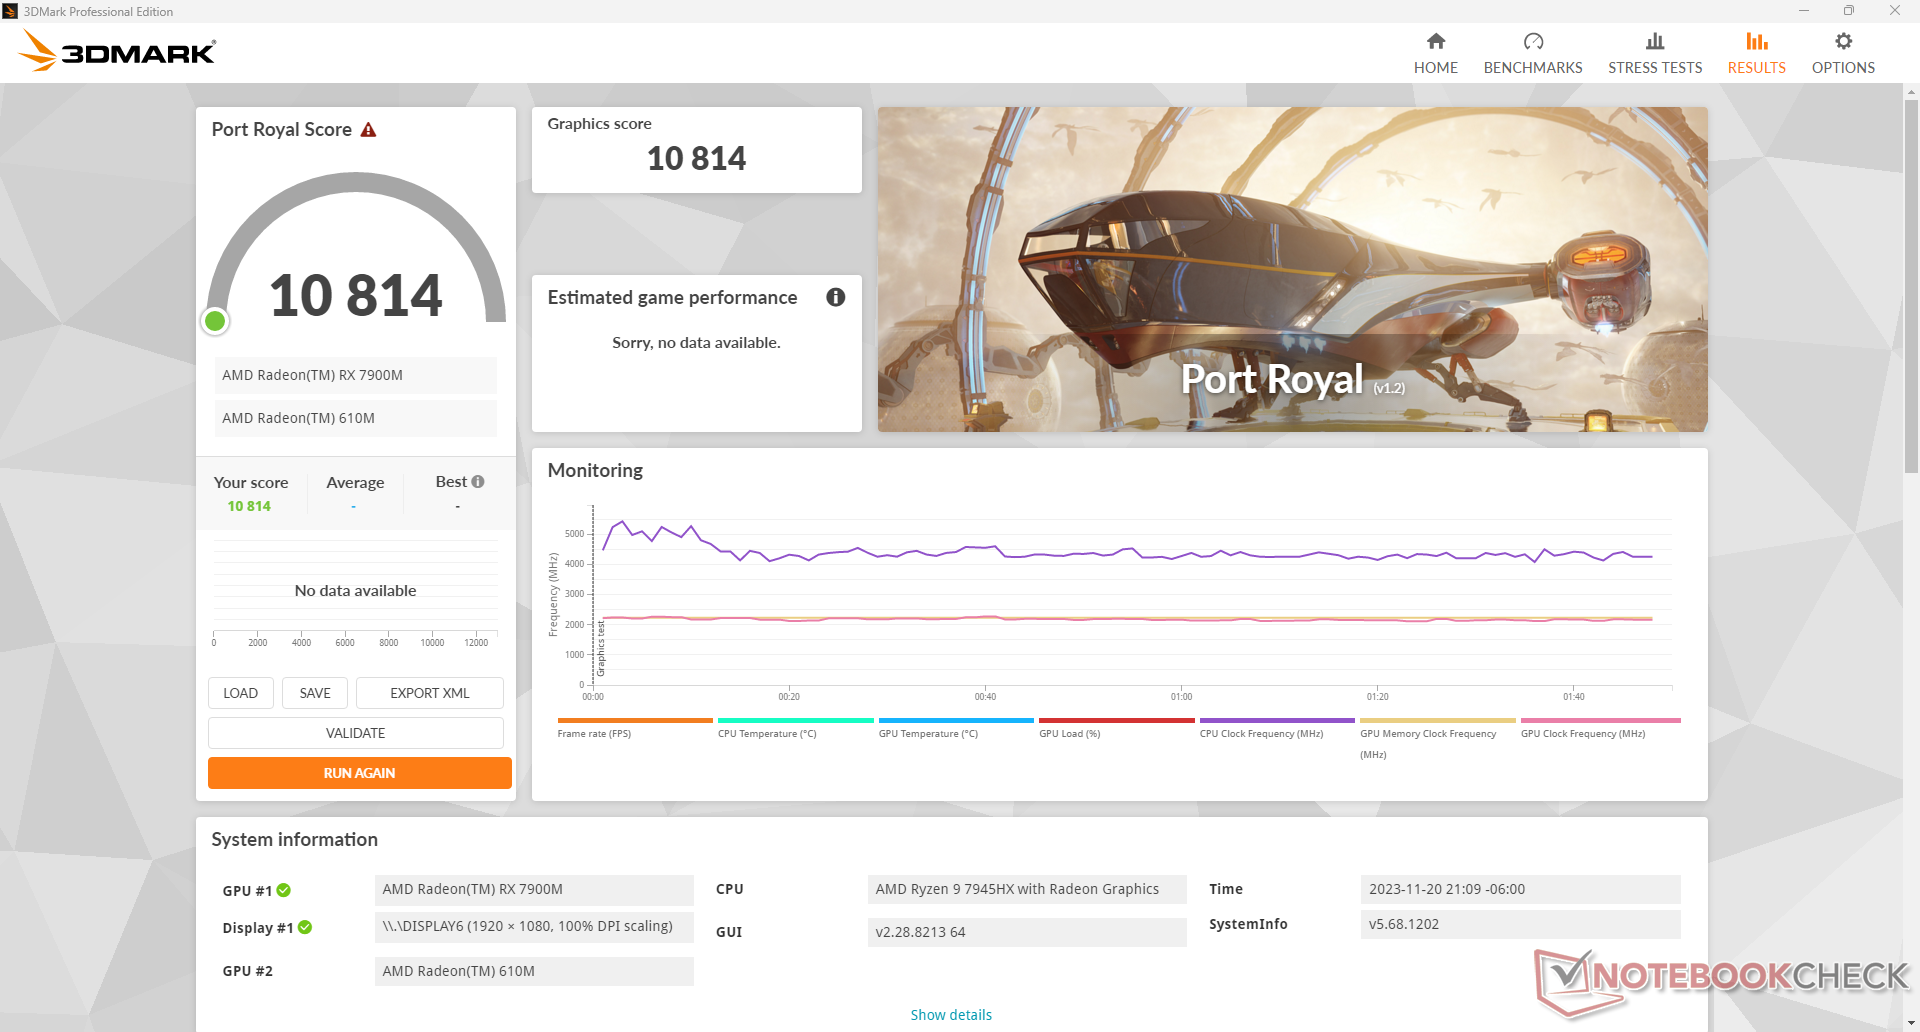
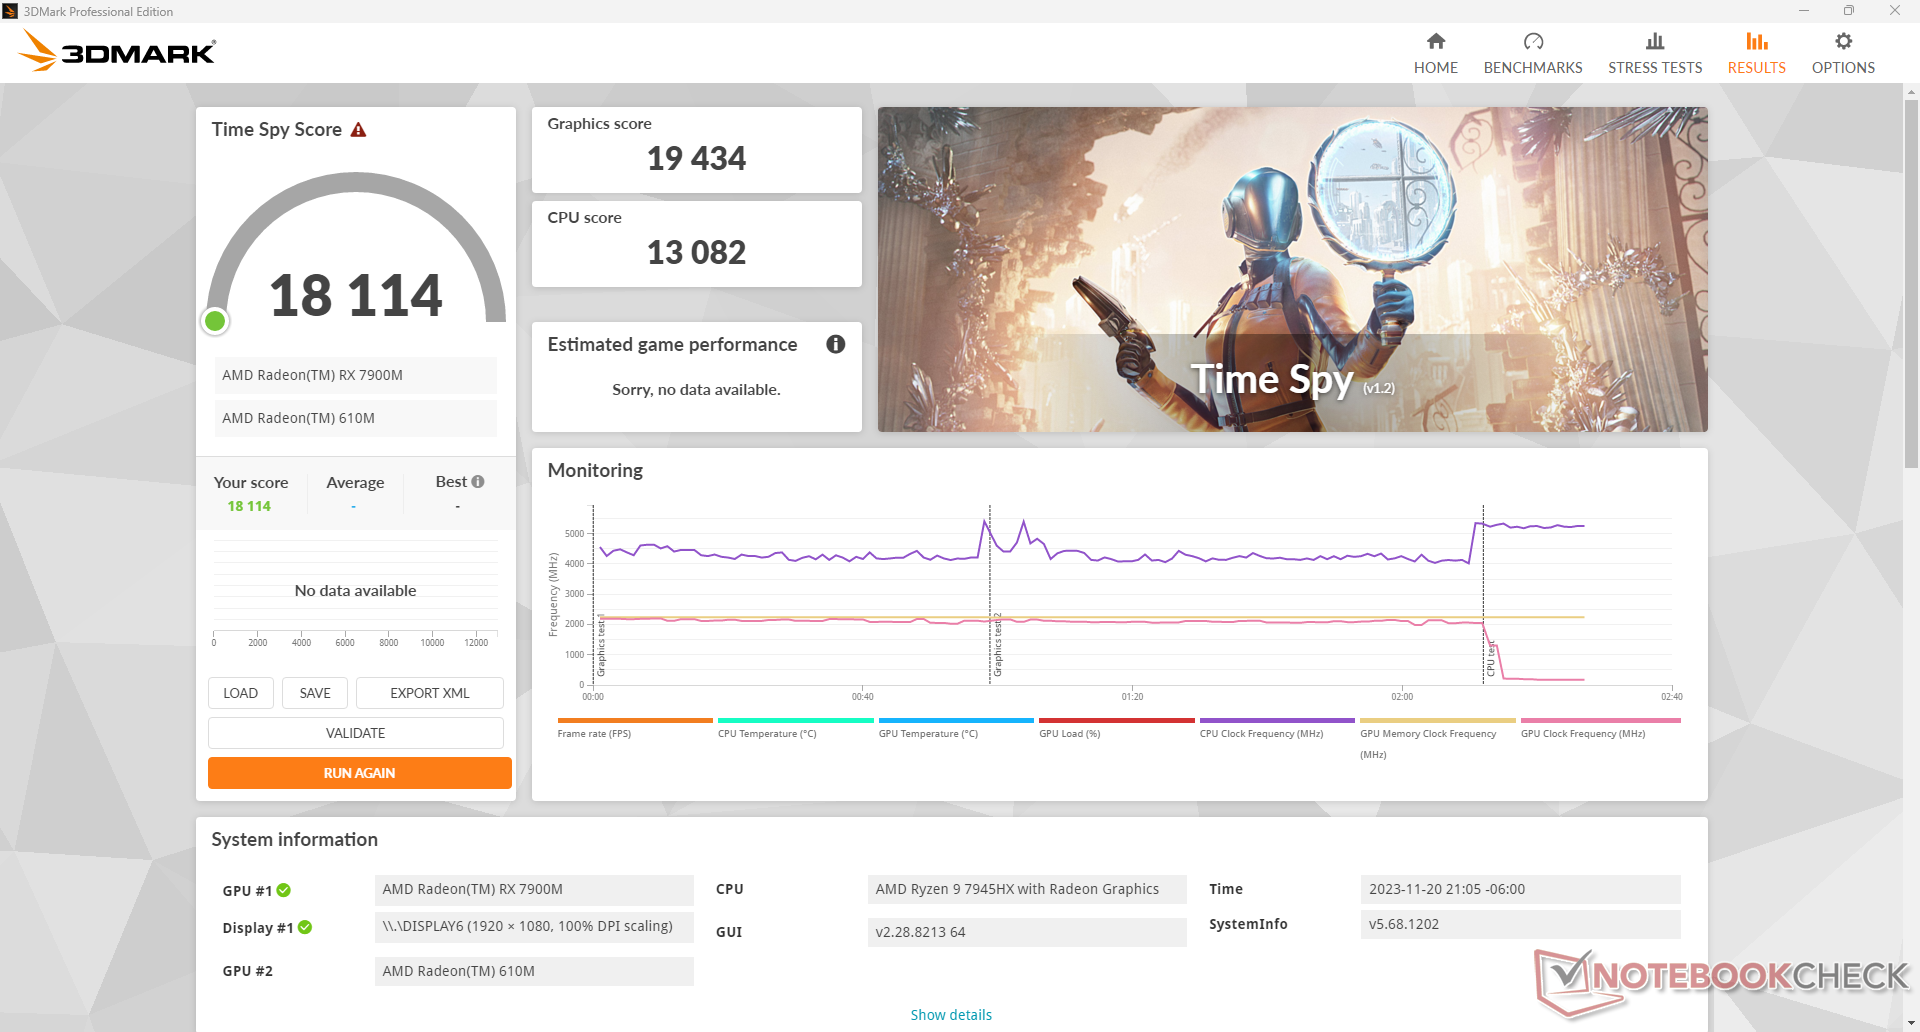
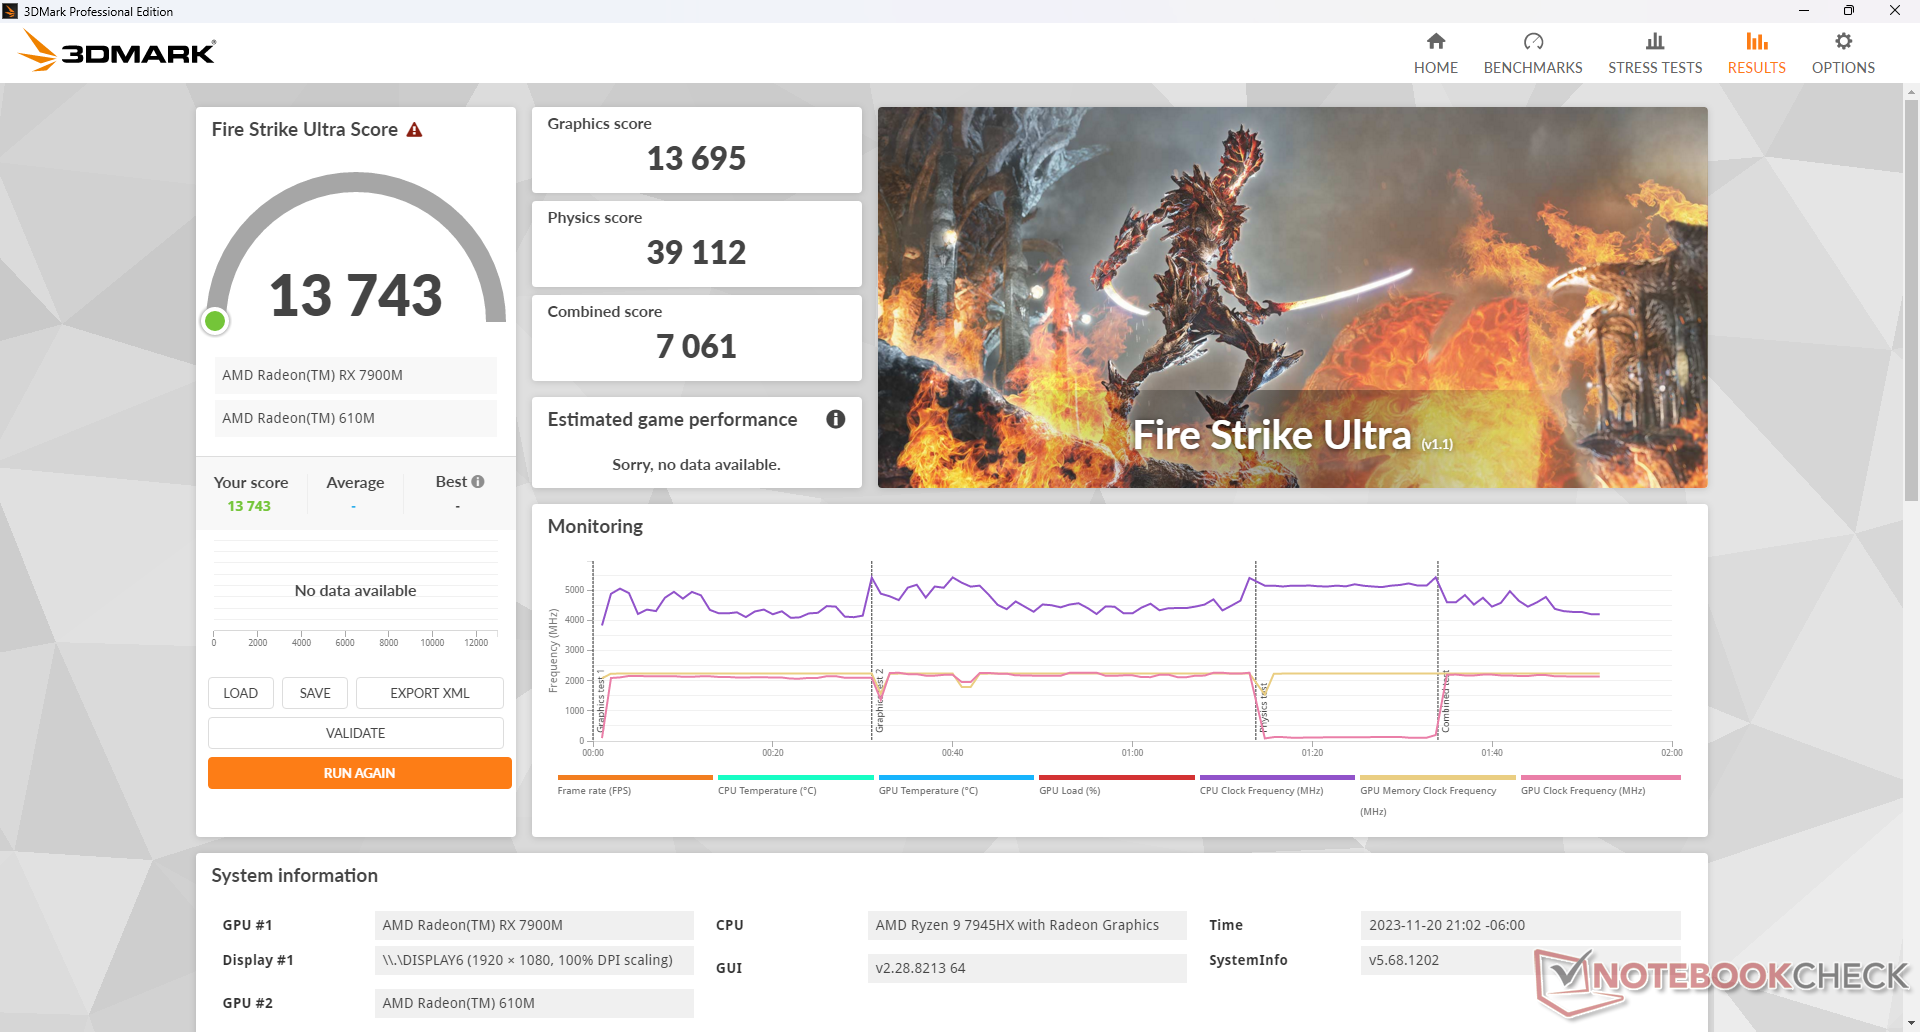
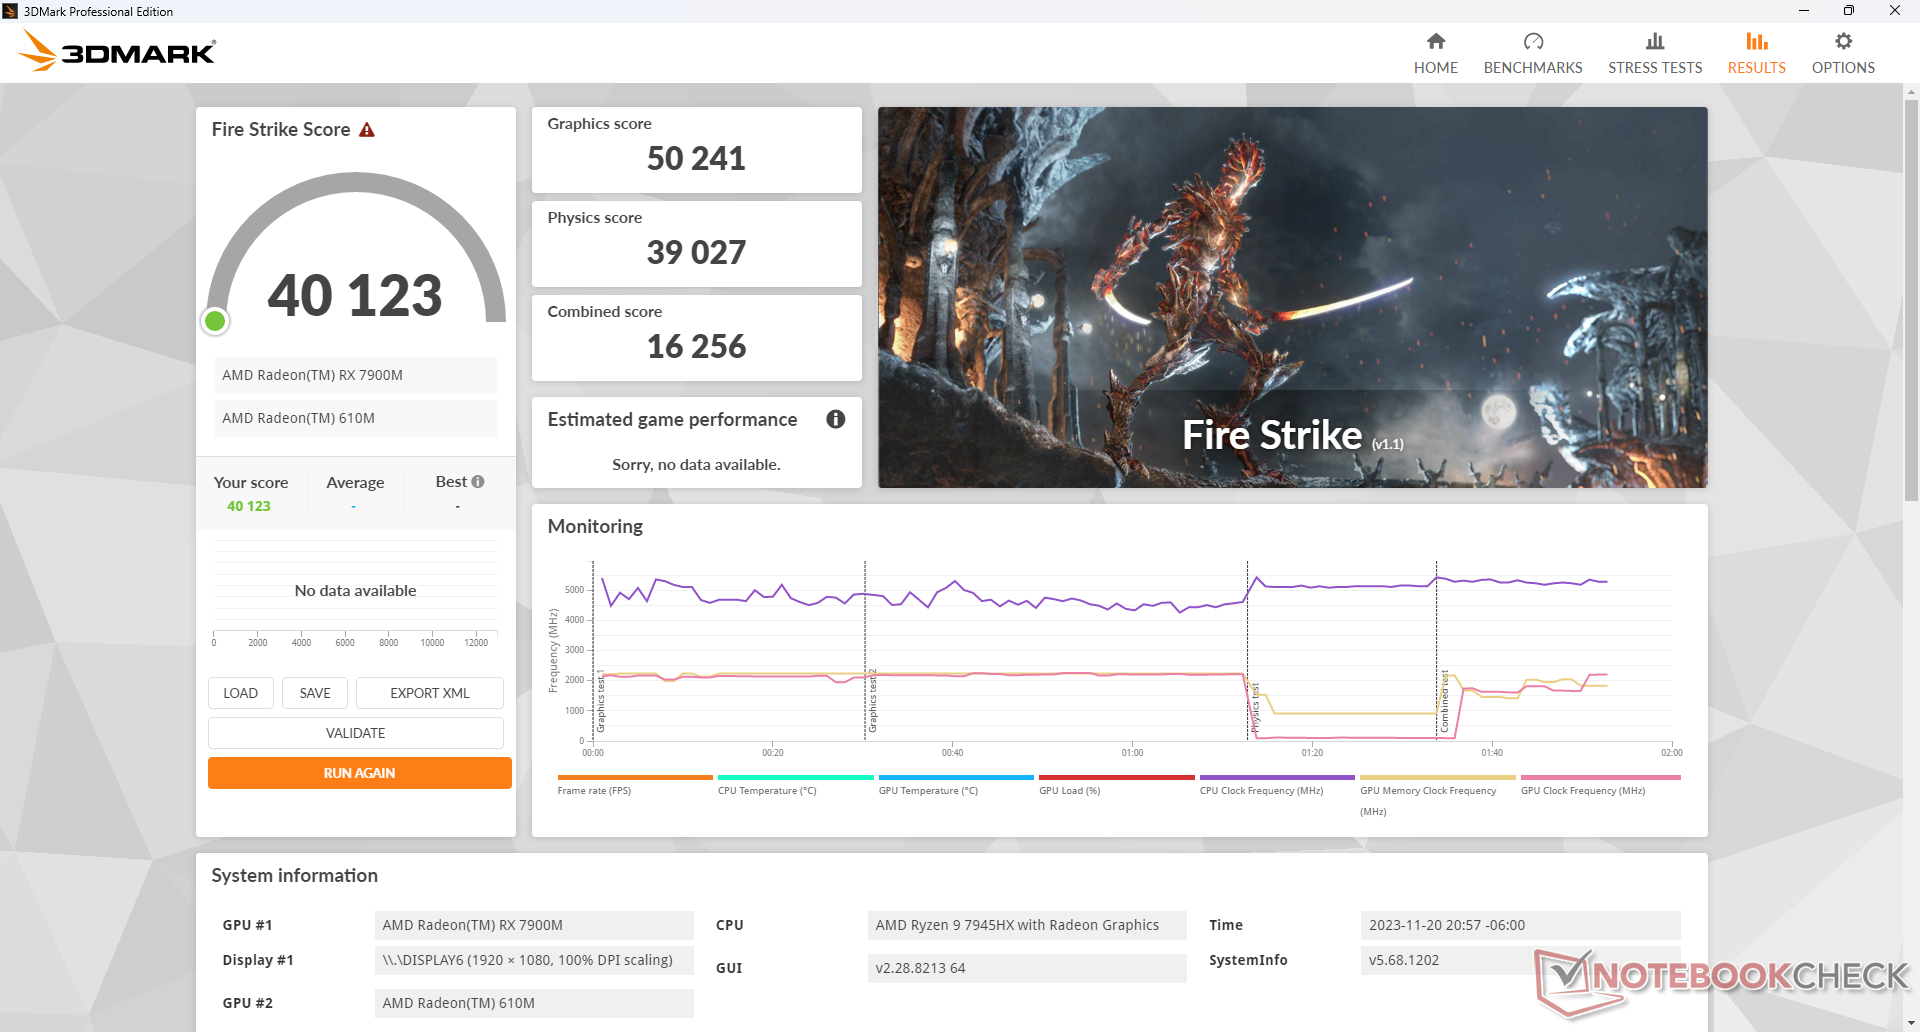
| 3DMark 11 Performance | 41670 punti | |
| 3DMark Fire Strike Score | 40123 punti | |
| 3DMark Time Spy Score | 18114 punti | |
Aiuto | ||
* ... Meglio usare valori piccoli
Prestazioni di gioco
I risultati di 3DMark si traducono bene in prestazioni di gioco effettive. Le frequenze dei fotogrammi durante i test di Cyberpunk 2077 o F1 22 sarebbero a una sola cifra percentuale rispetto alla RTX 4080 mobile nella maggior parte degli scenari. Se si attiva l'RT, tuttavia, il calo delle prestazioni sarà ancora più marcato rispetto alla GPU Nvidia concorrente. Ad esempio, il nostro Alienware funzionerebbe il 15 e il 35 percento più lentamente della RTX 4080 mobile quando si attiva l'RT in F1 22 e Cyberpunk 2077, rispettivamente, anche se le due GPU sono altrimenti molto vicine quando l'RT è disattivato.
AMD ha introdotto FSR 3 insieme al lancio della Radeon RX 7900M come risposta diretta a DLSS 3. Molto simile alla soluzione di Nvidia, la tecnologia di upscaling prevede sia la generazione di fotogrammi che la riduzione della latenza per compensare l'elevato impatto sulle prestazioni quando RT è abilitato. Purtroppo, FSR 3 è attualmente agli inizi e quasi nessun gioco supporta la funzione, mentre il numero di giochi che supportano DLSS 3 ha avuto molto più tempo per crescere. Nemmeno Cyberpunk 2077 supporta l'FSR 3 al momento in cui scriviamo. Altri giochi saranno aggiornati con il supporto FSR 3 nel 2024 e oltre. Nel frattempo, i possessori dovranno arrangiarsi con l'FSR 2, più vecchio ma più ampiamente supportato.
Vale la pena di notare che non abbiamo riscontrato alcun bug che rompesse il gioco, nonostante tutti i problemi che abbiamo notato nella sezione Prestazioni del sistema di cui sopra. Altri giochi saranno testati e aggiunti all'elenco sottostante nel corso del tempo.
| Performance rating - Percent | |
| Alienware m18 R1 | |
| Asus ROG Strix Scar 18 2023 G834JY-N6005W -1! | |
| Acer Predator Helios 18 N23Q2 | |
| Alienware m18 R1 AMD | |
| MSI GE78HX 13VH-070US | |
| Razer Blade 18 RTX 4070 | |
| The Witcher 3 - 1920x1080 Ultra Graphics & Postprocessing (HBAO+) | |
| Alienware m18 R1 | |
| MSI GE78HX 13VH-070US | |
| Acer Predator Helios 18 N23Q2 | |
| Alienware m18 R1 AMD | |
| Razer Blade 18 RTX 4070 | |
| GTA V - 1920x1080 Highest AA:4xMSAA + FX AF:16x | |
| Acer Predator Helios 18 N23Q2 | |
| Alienware m18 R1 | |
| Asus ROG Strix Scar 18 2023 G834JY-N6005W | |
| Razer Blade 18 RTX 4070 | |
| Alienware m18 R1 AMD | |
| MSI GE78HX 13VH-070US | |
| Final Fantasy XV Benchmark - 1920x1080 High Quality | |
| Alienware m18 R1 | |
| Acer Predator Helios 18 N23Q2 | |
| Asus ROG Strix Scar 18 2023 G834JY-N6005W | |
| Alienware m18 R1 AMD | |
| MSI GE78HX 13VH-070US | |
| Razer Blade 18 RTX 4070 | |
| Strange Brigade - 1920x1080 ultra AA:ultra AF:16 | |
| Alienware m18 R1 | |
| Asus ROG Strix Scar 18 2023 G834JY-N6005W | |
| Alienware m18 R1 AMD | |
| Acer Predator Helios 18 N23Q2 | |
| MSI GE78HX 13VH-070US | |
| Razer Blade 18 RTX 4070 | |
| Dota 2 Reborn - 1920x1080 ultra (3/3) best looking | |
| Alienware m18 R1 | |
| Asus ROG Strix Scar 18 2023 G834JY-N6005W | |
| Acer Predator Helios 18 N23Q2 | |
| Razer Blade 18 RTX 4070 | |
| Alienware m18 R1 AMD | |
| MSI GE78HX 13VH-070US | |
| Tiny Tina's Wonderlands | |
| 1920x1080 Badass Preset (DX12) | |
| Alienware m18 R1 | |
| AMD Radeon RX 7900 GRE | |
| Alienware m16 R1 AMD | |
| Alienware m18 R1 AMD | |
| Media AMD Radeon RX 7900M (n=1) | |
| Asus TUF Gaming A16 FA617XS | |
| Corsair Voyager a1600 | |
| Asus ROG Zephyrus G14 GA402RJ | |
| 2560x1440 Badass Preset (DX12) | |
| Alienware m18 R1 | |
| AMD Radeon RX 7900 GRE | |
| Alienware m16 R1 AMD | |
| Alienware m18 R1 AMD | |
| Media AMD Radeon RX 7900M (n=1) | |
| Corsair Voyager a1600 | |
| Asus ROG Zephyrus G14 GA402RJ | |
| 3840x2160 Badass Preset (DX12) | |
| Alienware m18 R1 | |
| AMD Radeon RX 7900 GRE | |
| Alienware m16 R1 AMD | |
| Alienware m18 R1 AMD | |
| Media AMD Radeon RX 7900M (n=1) | |
| Corsair Voyager a1600 | |
| Ratchet & Clank Rift Apart | |
| 1920x1080 Very High Preset AA:T | |
| AMD Radeon RX 7900 GRE | |
| Alienware m18 R1 AMD | |
| Media AMD Radeon RX 7900M (n=1) | |
| 2560x1440 Very High Preset AA:T | |
| AMD Radeon RX 7900 GRE | |
| Alienware m18 R1 AMD | |
| Media AMD Radeon RX 7900M (n=1) | |
| 3840x2160 Very High Preset AA:T | |
| AMD Radeon RX 7900 GRE | |
| Alienware m18 R1 AMD | |
| Media AMD Radeon RX 7900M (n=1) | |
| 1920x1080 Very High Preset + Very High Raytracing AA:T | |
| Alienware m18 R1 AMD | |
| Media AMD Radeon RX 7900M (n=1) | |
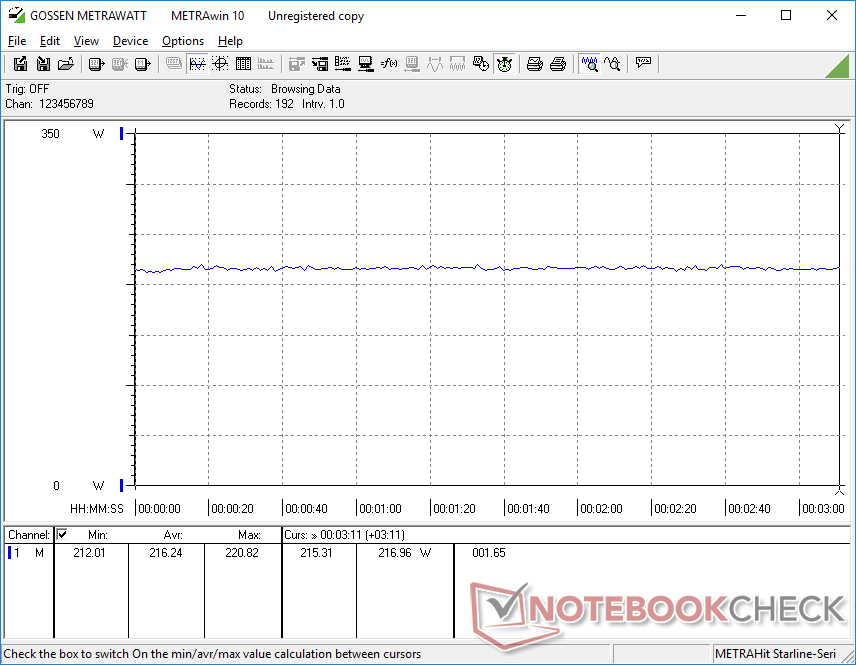
Le prestazioni occasionalmente scendevano a 70 FPS da un massimo di ~180 FPS quando era al minimo Witcher 3 come mostra il grafico sottostante. Durante il gioco, i cali di prestazioni si manifestano come stutter anche quando non ci sono movimenti di gioco. Ciò si verifica con una frequenza tale da suggerire un problema di sottofondo che deve essere risolto.
Il bug delle prestazioni non si è verificato quando si è ripetuto questo test sulla configurazione Intel-Nvidia dello stesso modello Alienware.
Witcher 3 FPS Chart
| basso | medio | alto | ultra | QHD | 4K | |
|---|---|---|---|---|---|---|
| GTA V (2015) | 172.9 | 105 | 105.6 | 146 | ||
| The Witcher 3 (2015) | 167.7 | 116 | ||||
| Dota 2 Reborn (2015) | 162.8 | 146.2 | 122.5 | |||
| Final Fantasy XV Benchmark (2018) | 152.8 | 114.6 | 69.3 | |||
| X-Plane 11.11 (2018) | 83.7 | 64.3 | ||||
| Far Cry 5 (2018) | 128 | 123 | 103 | |||
| Strange Brigade (2018) | 344 | 249 | 130.5 | |||
| Shadow of the Tomb Raider (2018) | 207 | 198 | 139 | 76 | ||
| Cyberpunk 2077 1.6 (2022) | 135 | 93.3 | 44.3 | |||
| Tiny Tina's Wonderlands (2022) | 150.2 | 106.8 | 56 | |||
| F1 22 (2022) | 296 | 102.8 | 69.3 | 36.1 | ||
| Ratchet & Clank Rift Apart (2023) | 86.2 | 83.6 | 54.8 | |||
| Baldur's Gate 3 (2023) | 152.4 | 152.6 | 118.5 | 65.8 | ||
| Cyberpunk 2077 (2023) | 130.7 | 129.6 | 85.2 | 37.7 | ||
| Alan Wake 2 (2023) | 104.8 | 71.7 | 37.3 |
Emissioni
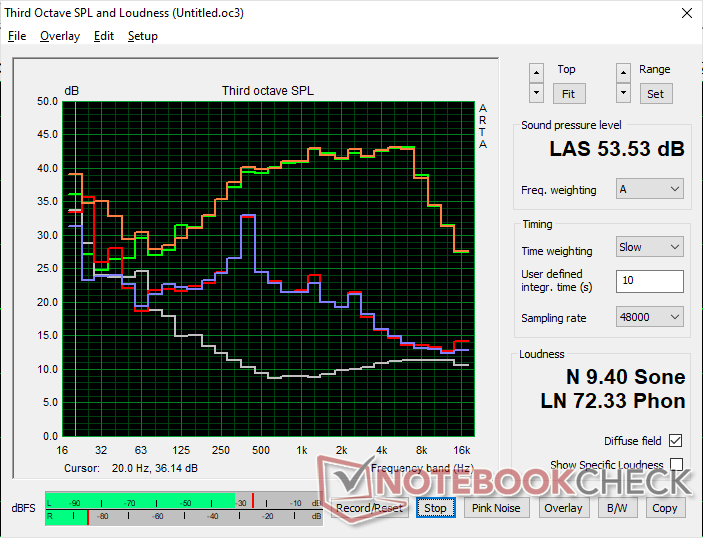
Rumore del sistema
Non ci sono grandi differenze di rumore delle ventole tra le nostre configurazioni Intel e AMD. Tuttavia, questo non è necessariamente un bene, in quanto le ventole della nostra unità AMD pulsavano piuttosto frequentemente e apparentemente senza motivo durante la navigazione sul web o lo streaming di video. Il sistema funzionava in modo silenzioso a 23 dB(A) e poi pulsava bruscamente fino a 33,5 dB(A), anche con i profili di alimentazione Silenzioso o Batteria.
È interessante notare che non ci sono differenze di rumore della ventola tra i profili di alimentazione Bilanciato e Prestazioni, in quanto siamo stati in grado di registrare un massimo di 48 dB(A) durante il gioco su entrambi i profili. Giocare in modalità Overdrive, tuttavia, fa salire il rumore della ventola a 54 dB(A). Gli utenti potrebbero quindi prendere in considerazione la possibilità di giocare in modalità Performance per ottenere ventole sensibilmente più silenziose, anche se ciò significa sacrificare dal 5 al 10 percento delle prestazioni.
Non si aspetti che l'Alienware sia molto più silenzioso di altri portatili da gioco da 18 pollici, nonostante abbia un numero di ventole due volte superiore. Il sistema continua ad avere un volume superiore a 50 dB(A) durante il gioco, il che richiede praticamente un buon paio di cuffie.
Rumorosità
| Idle |
| 23 / 23.4 / 33.5 dB(A) |
| Sotto carico |
| 33.5 / 53.6 dB(A) |
 | ||
30 dB silenzioso 40 dB(A) udibile 50 dB(A) rumoroso |
||
min: | ||
| Alienware m18 R1 AMD Radeon RX 7900M, R9 7945HX, Kioxia XG8 KXG80ZNV1T02 | Alienware m18 R1 GeForce RTX 4090 Laptop GPU, i9-13980HX, SK hynix PC801 HFS001TEJ9X101N | Acer Predator Helios 18 N23Q2 GeForce RTX 4080 Laptop GPU, i9-13900HX, Samsung PM9A1 MZVL22T0HBLB | Razer Blade 18 RTX 4070 GeForce RTX 4070 Laptop GPU, i9-13950HX, SSSTC CA6-8D1024 | Asus ROG Strix Scar 18 2023 G834JY-N6005W GeForce RTX 4090 Laptop GPU, i9-13980HX, 2x Samsung PM9A1 MZVL21T0HCLR (RAID 0) | MSI GE78HX 13VH-070US GeForce RTX 4080 Laptop GPU, i9-13950HX, Samsung PM9A1 MZVL22T0HBLB | |
|---|---|---|---|---|---|---|
| Noise | 3% | -4% | 1% | -10% | -8% | |
| off /ambiente * (dB) | 22.4 | 22.8 -2% | 23 -3% | 23.5 -5% | 23.9 -7% | 23.4 -4% |
| Idle Minimum * (dB) | 23 | 23 -0% | 23 -0% | 23.8 -3% | 23.9 -4% | 24.2 -5% |
| Idle Average * (dB) | 23.4 | 23 2% | 23 2% | 23.8 -2% | 32.6 -39% | 25.6 -9% |
| Idle Maximum * (dB) | 33.5 | 23 31% | 23 31% | 26.8 20% | 32.6 3% | 31 7% |
| Load Average * (dB) | 33.5 | 35.6 -6% | 45.26 -35% | 37.3 -11% | 35.9 -7% | 43.3 -29% |
| Witcher 3 ultra * (dB) | 53.6 | 51.3 4% | 59.82 -12% | 48 10% | 56.3 -5% | |
| Load Maximum * (dB) | 53.6 | 56.7 -6% | 59.94 -12% | 53.5 -0% | 55.8 -4% | 59.1 -10% |
* ... Meglio usare valori piccoli
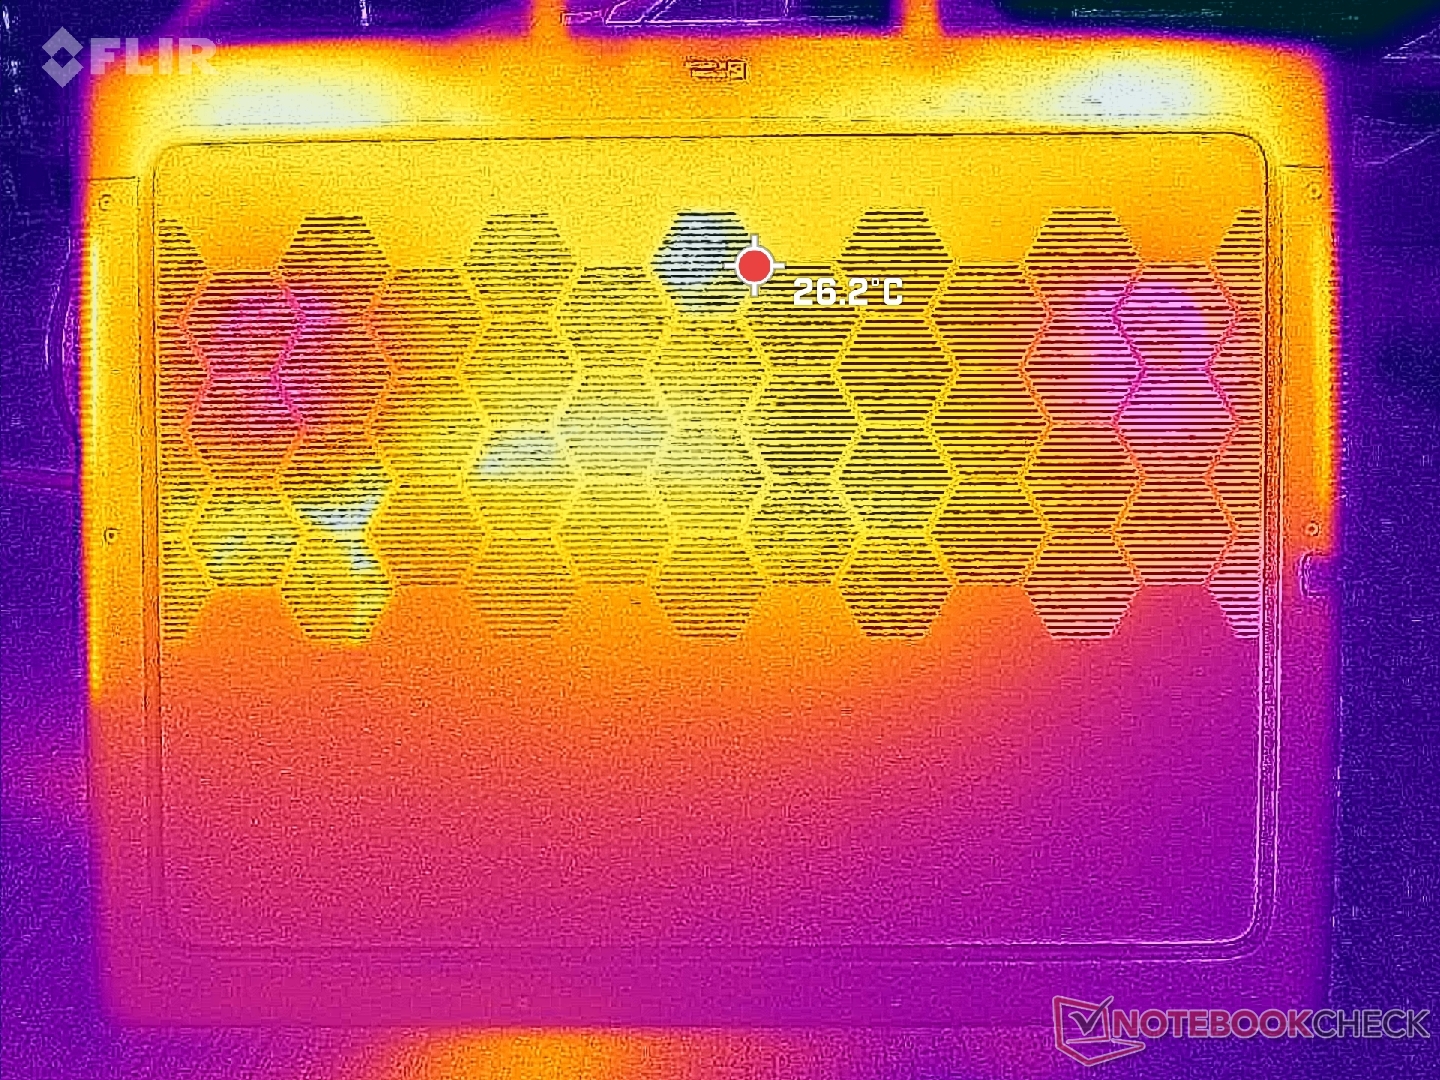
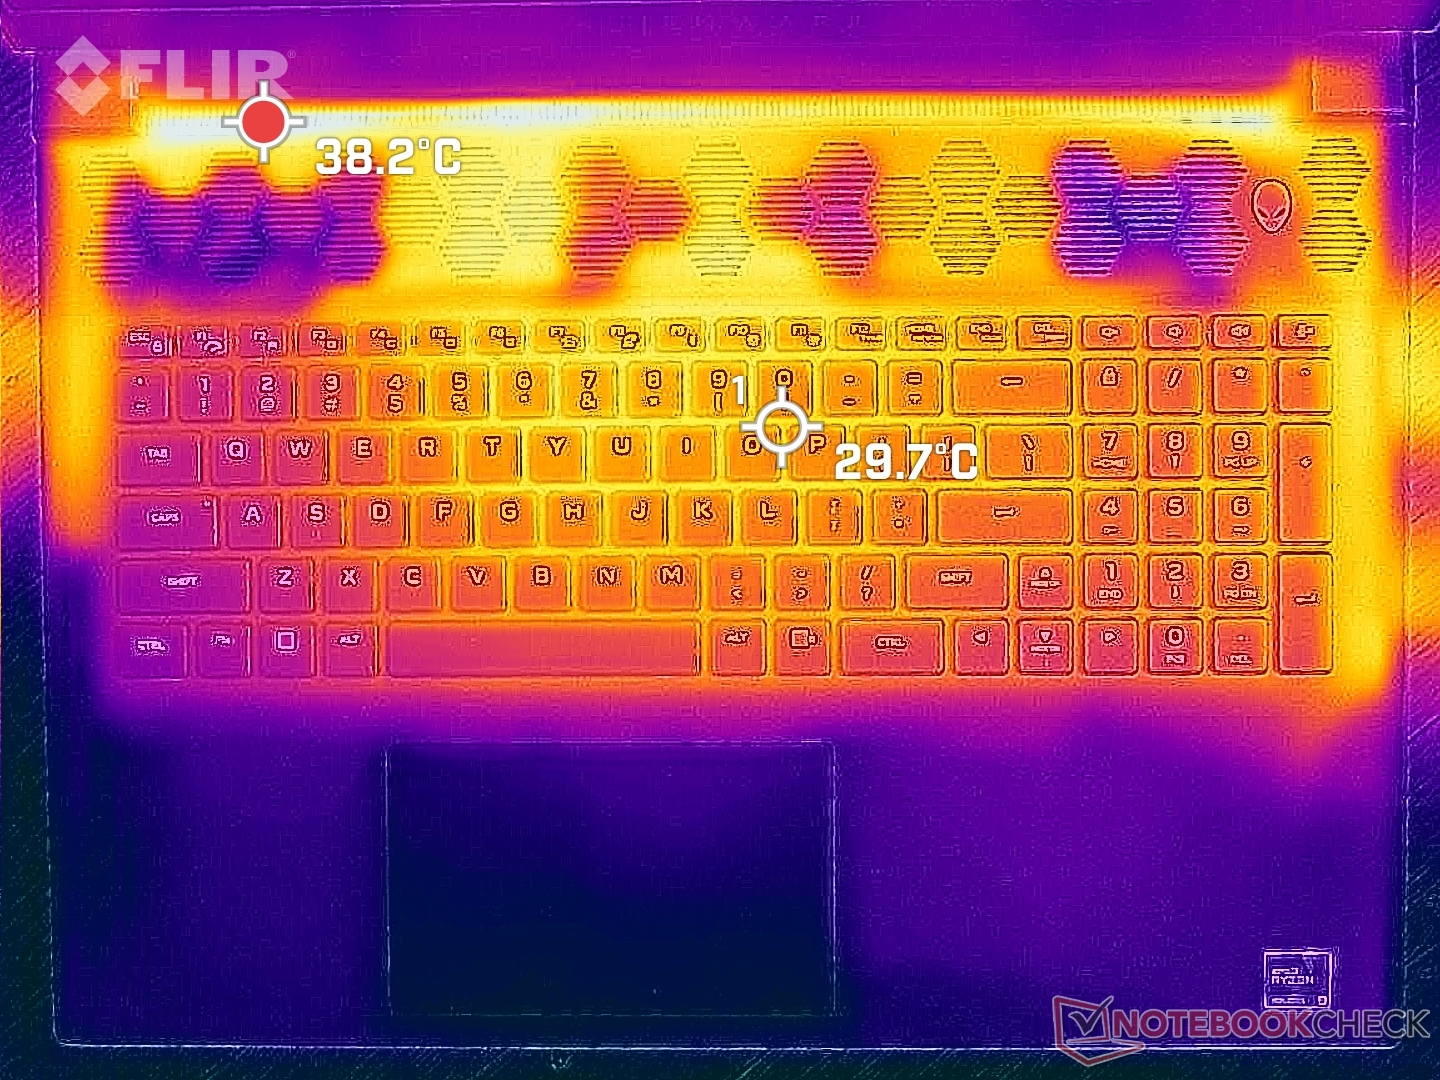
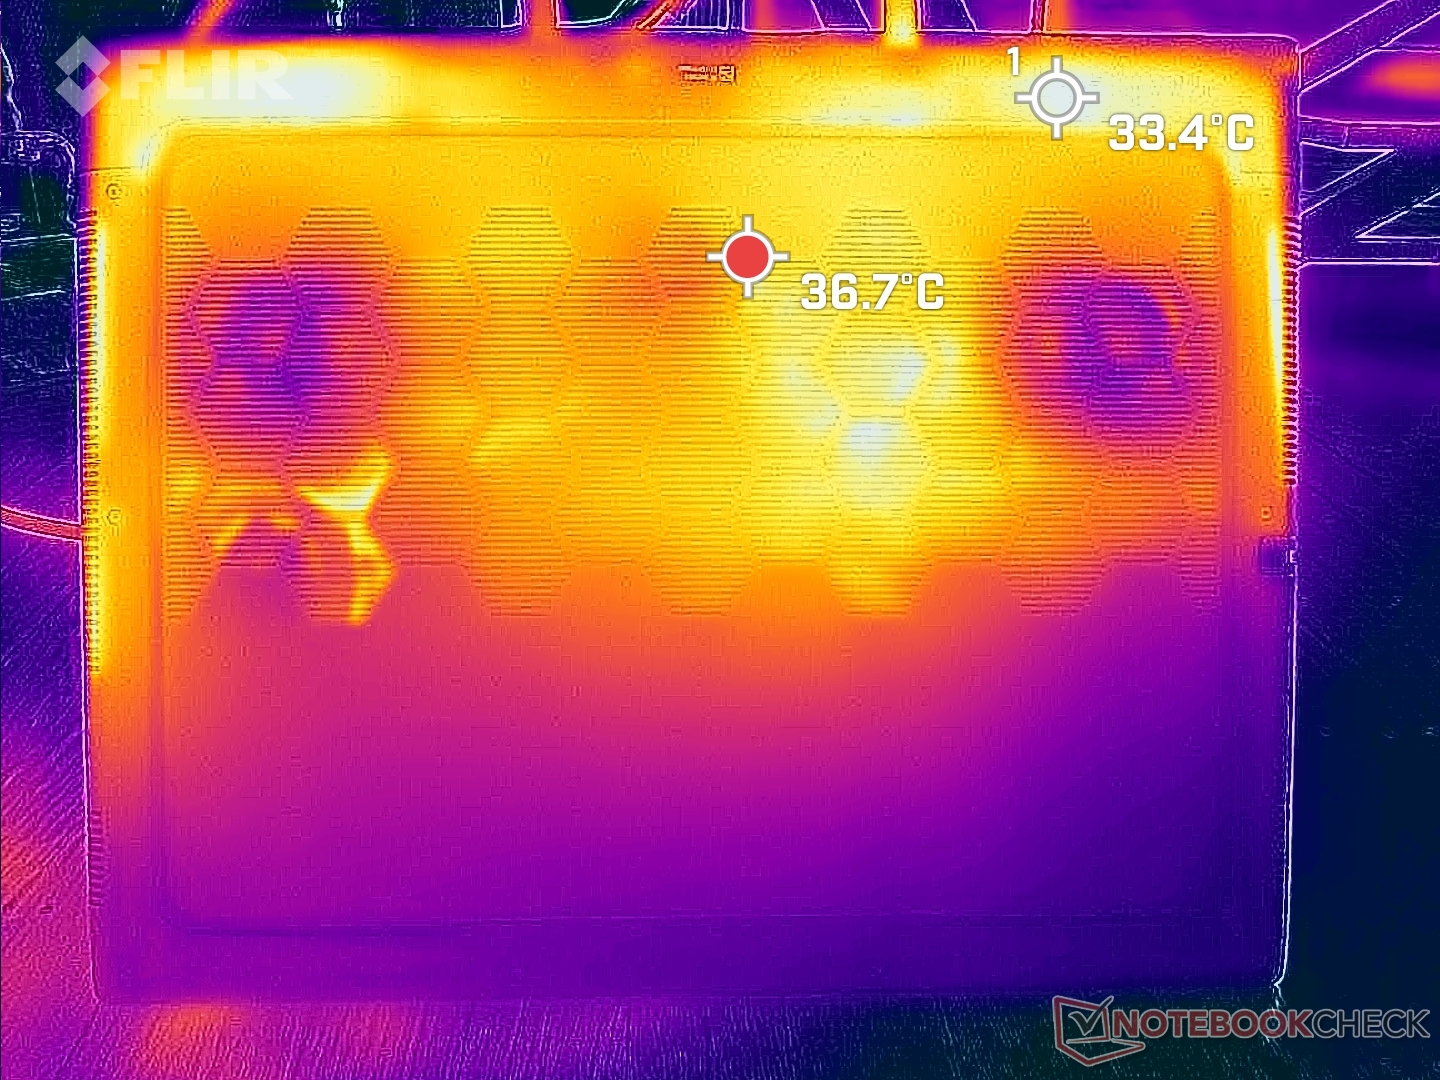
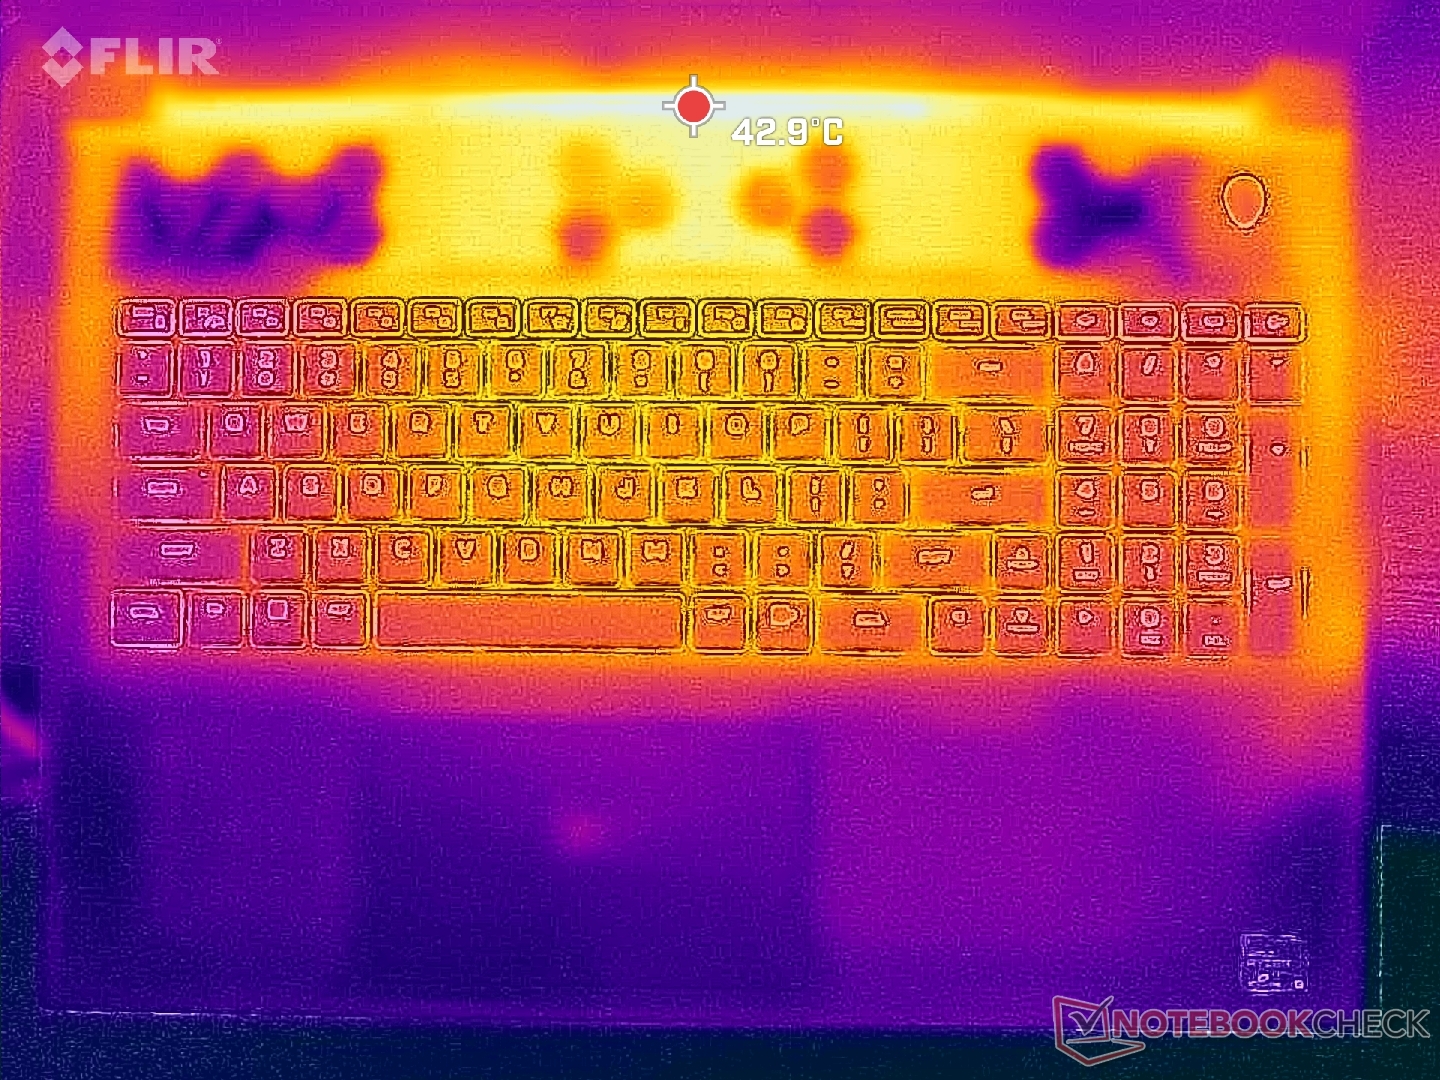
Temperatura
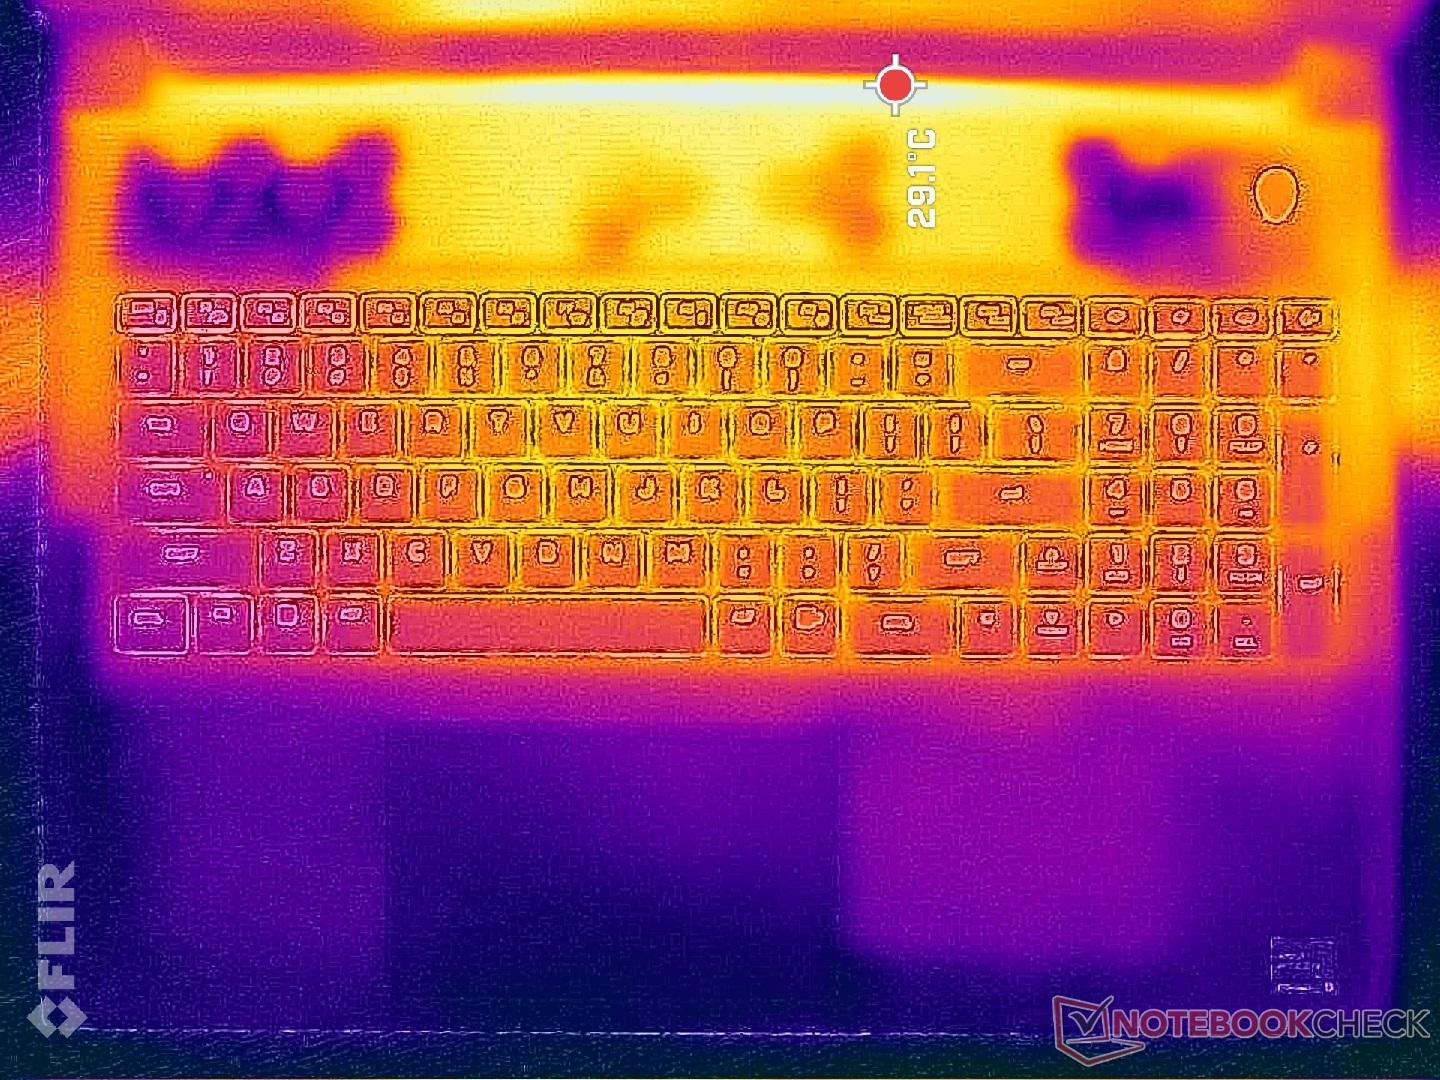
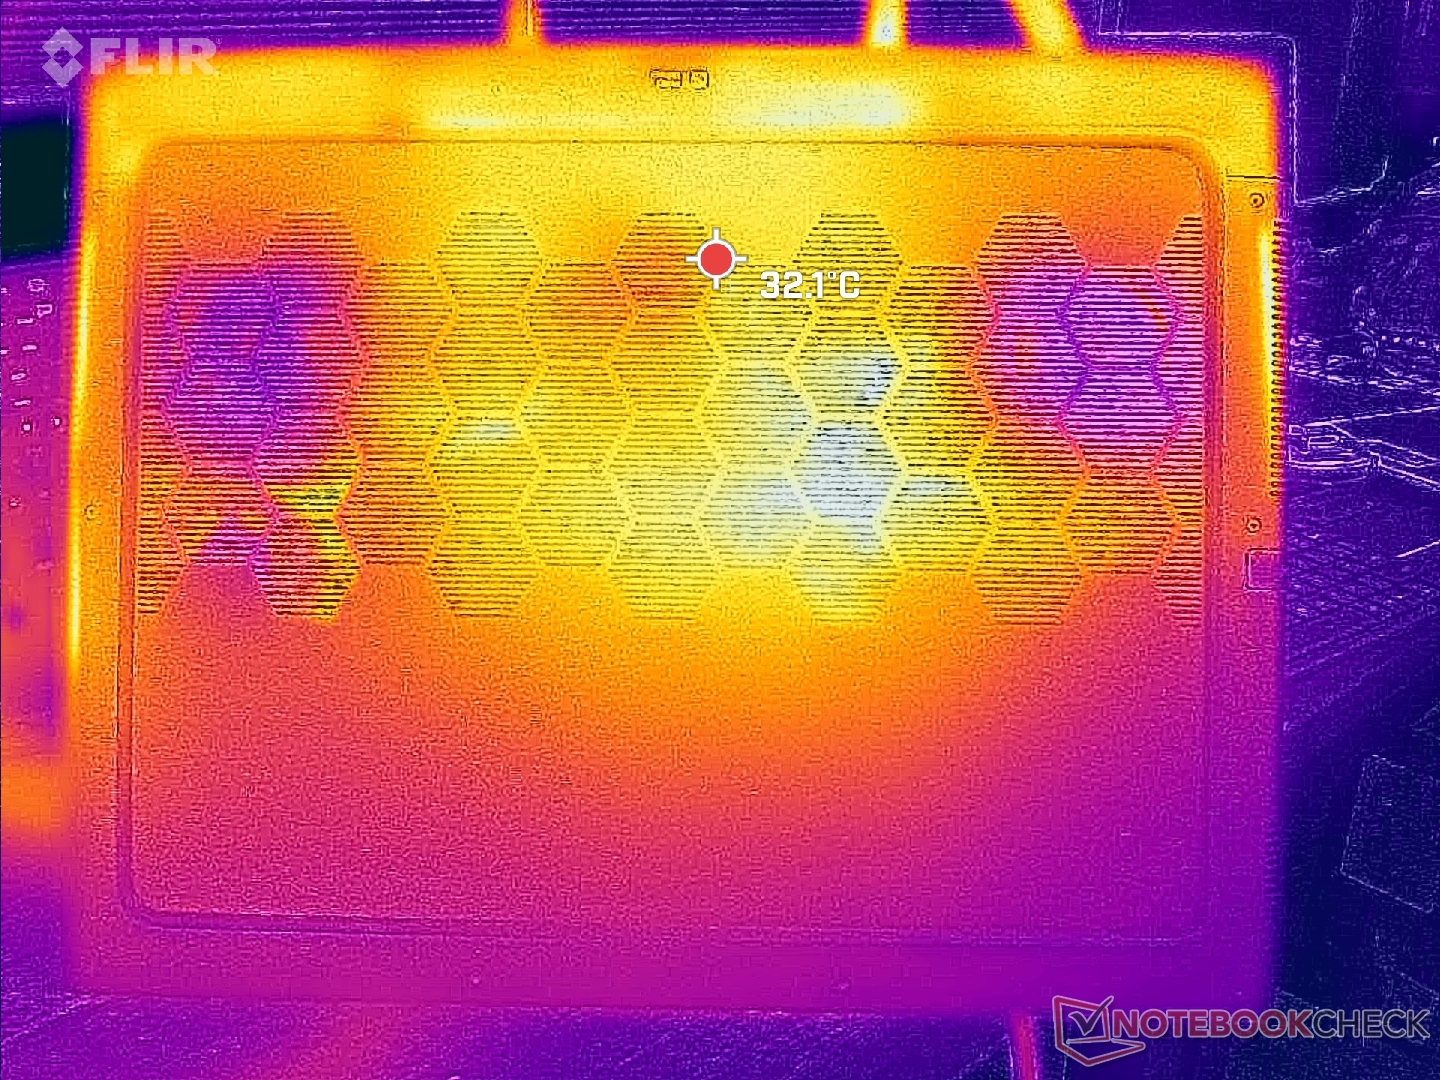
Le temperature di superficie sono simili a quelle che abbiamo registrato sulla configurazione Intel-Nvidia e rimangono più fresche di quanto ci si potrebbe aspettare grazie alle grandi dimensioni dello schermo, alle ampie griglie di ventilazione, all'ampio design posteriore e all'elevato numero di ventole interne. I poggiapolsi e la tastiera non diventano mai fastidiosamente caldi al tatto durante il gioco, a differenza delle superfici più calde dei computer portatili da gioco più piccoli come il Razer Blade 16.
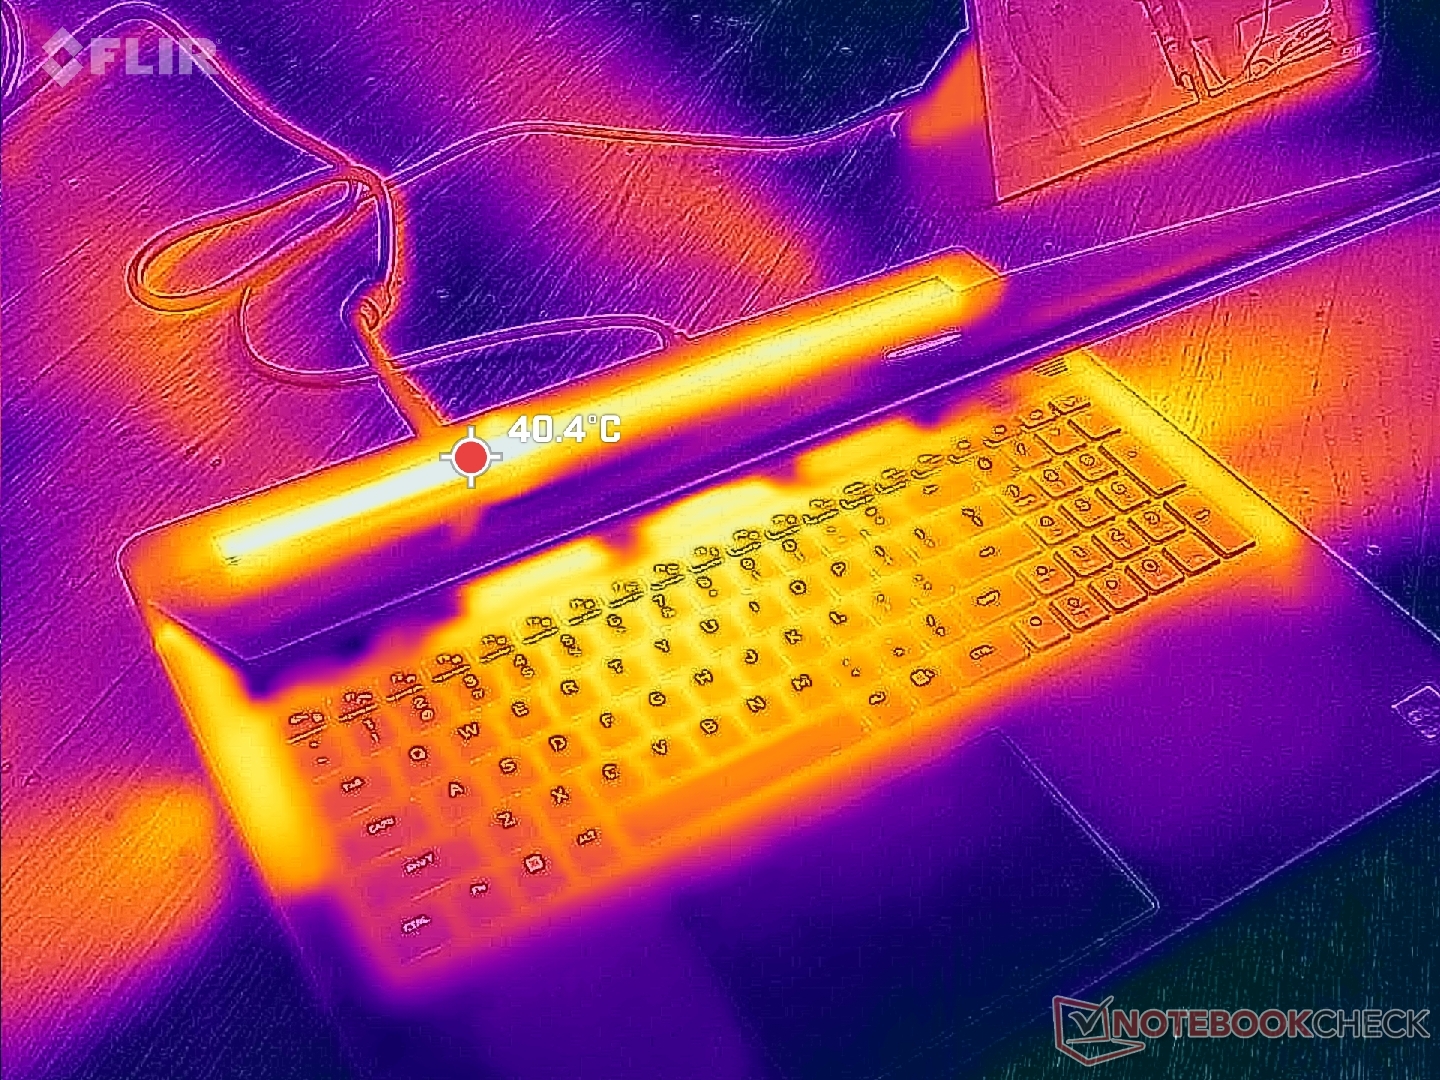
(±) La temperatura massima sul lato superiore è di 40.2 °C / 104 F, rispetto alla media di 40.4 °C / 105 F, che varia da 21.2 a 68.8 °C per questa classe Gaming.
(+) Il lato inferiore si riscalda fino ad un massimo di 37.4 °C / 99 F, rispetto alla media di 43.2 °C / 110 F
(+) In idle, la temperatura media del lato superiore è di 26.6 °C / 80 F, rispetto alla media deld ispositivo di 33.9 °C / 93 F.
(+) Riproducendo The Witcher 3, la temperatura media per il lato superiore e' di 30.6 °C / 87 F, rispetto alla media del dispositivo di 33.9 °C / 93 F.
(+) I poggiapolsi e il touchpad sono piu' freddi della temperatura della pelle con un massimo di 24.6 °C / 76.3 F e sono quindi freddi al tatto.
(+) La temperatura media della zona del palmo della mano di dispositivi simili e'stata di 28.8 °C / 83.8 F (+4.2 °C / 7.5 F).
| Alienware m18 R1 AMD AMD Ryzen 9 7945HX, AMD Radeon RX 7900M | Alienware m18 R1 Intel Core i9-13980HX, NVIDIA GeForce RTX 4090 Laptop GPU | Acer Predator Helios 18 N23Q2 Intel Core i9-13900HX, NVIDIA GeForce RTX 4080 Laptop GPU | Razer Blade 18 RTX 4070 Intel Core i9-13950HX, NVIDIA GeForce RTX 4070 Laptop GPU | Asus ROG Strix Scar 18 2023 G834JY-N6005W Intel Core i9-13980HX, NVIDIA GeForce RTX 4090 Laptop GPU | MSI GE78HX 13VH-070US Intel Core i9-13950HX, NVIDIA GeForce RTX 4080 Laptop GPU | |
|---|---|---|---|---|---|---|
| Heat | 6% | -18% | -1% | -13% | -3% | |
| Maximum Upper Side * (°C) | 40.2 | 39 3% | 35 13% | 39.2 2% | 54 -34% | 37.4 7% |
| Maximum Bottom * (°C) | 37.4 | 36.4 3% | 56 -50% | 35.6 5% | 46 -23% | 45 -20% |
| Idle Upper Side * (°C) | 31.6 | 29.2 8% | 34 -8% | 31.8 -1% | 30 5% | 29.8 6% |
| Idle Bottom * (°C) | 30.6 | 27.8 9% | 39 -27% | 33.2 -8% | 31 -1% | 32.4 -6% |
* ... Meglio usare valori piccoli
Test da sforzo
La temperatura della CPU e l'assorbimento di potenza del pacchetto durante lo stress Prime95 si assestano rispettivamente a ~97 C e ~145 W, che in realtà è molto simile a quanto abbiamo osservato sulla configurazione Intel con il Core i9-13980HK. Il Turbo Boost è comunque più alto e più aggressivo con la CPU Intel all'inizio del test, come dimostra la nostra sezione sul consumo energetico.
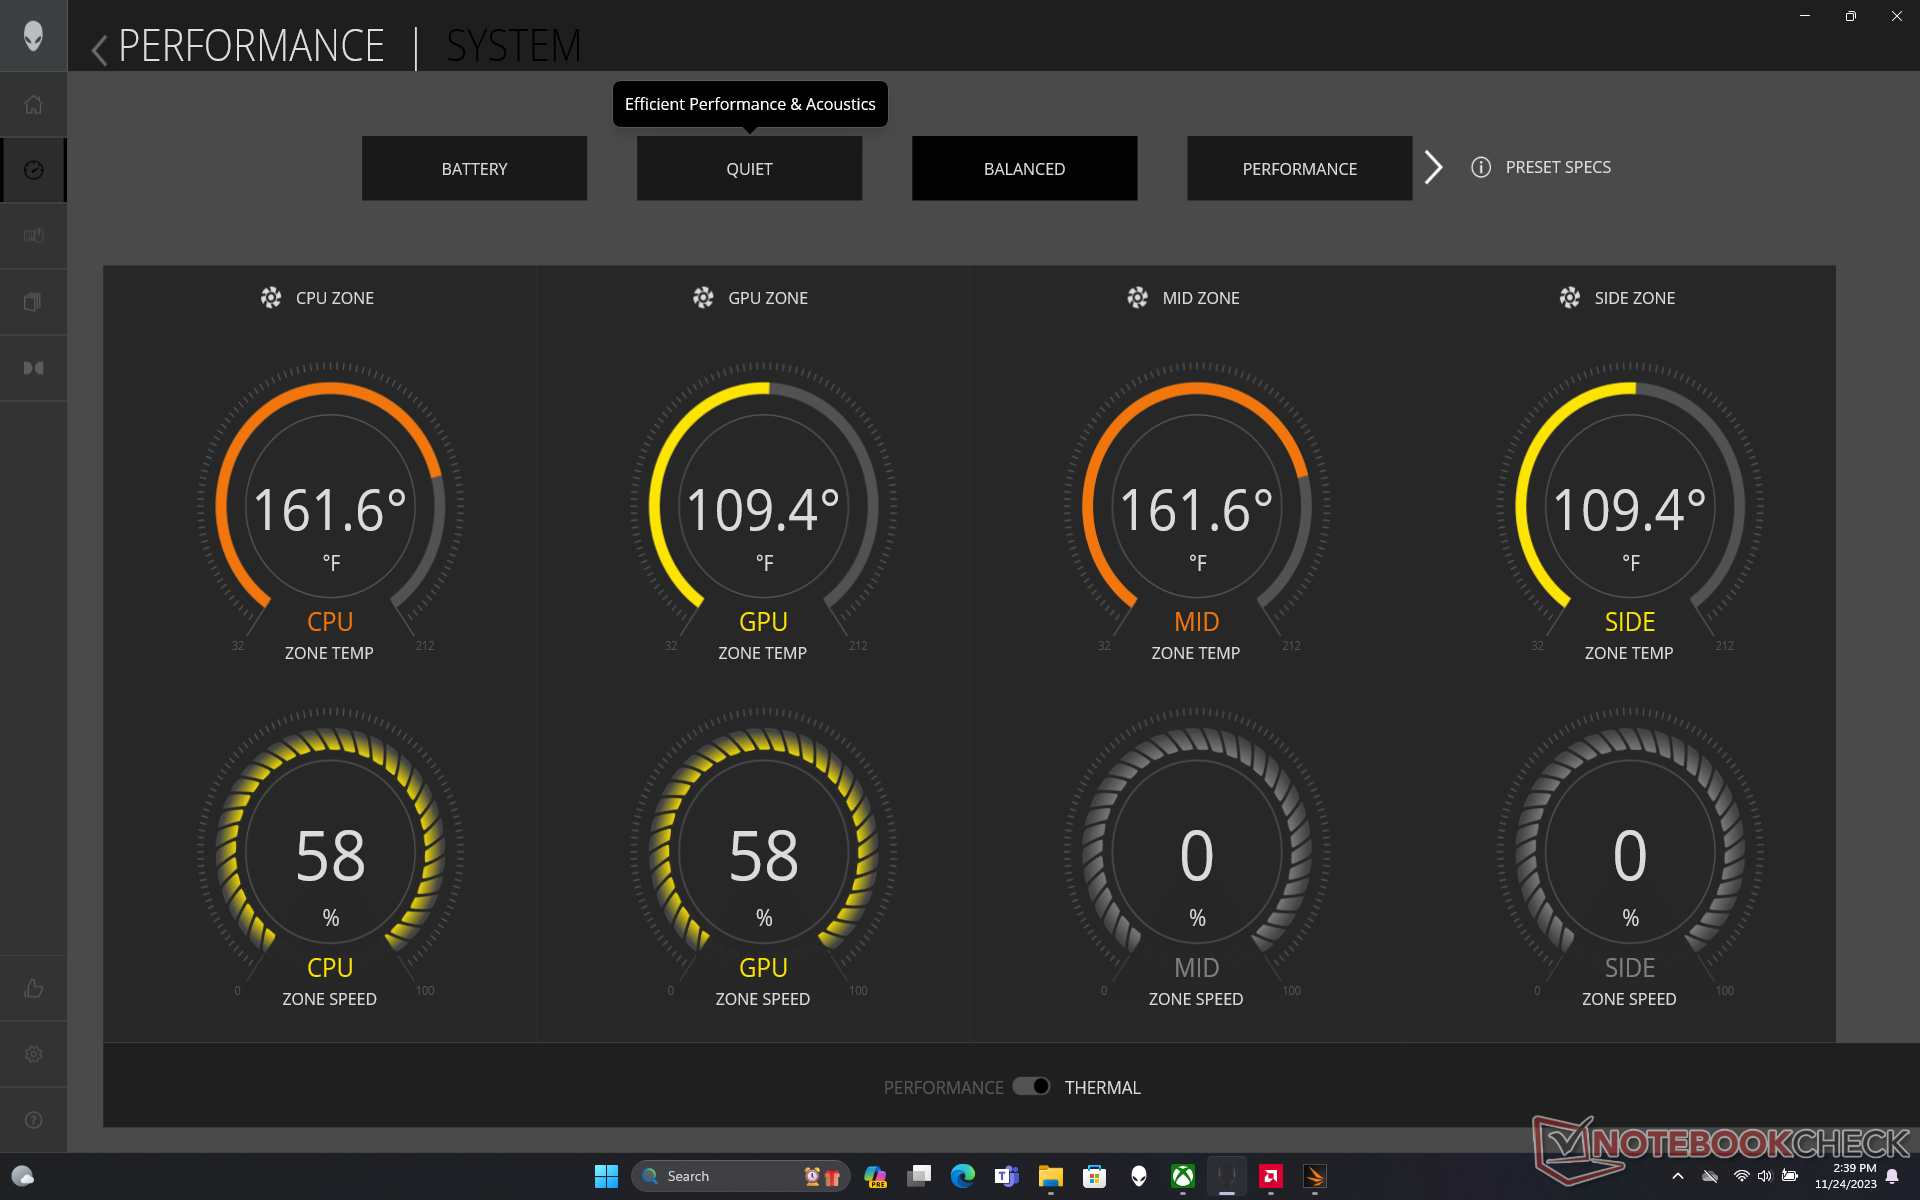
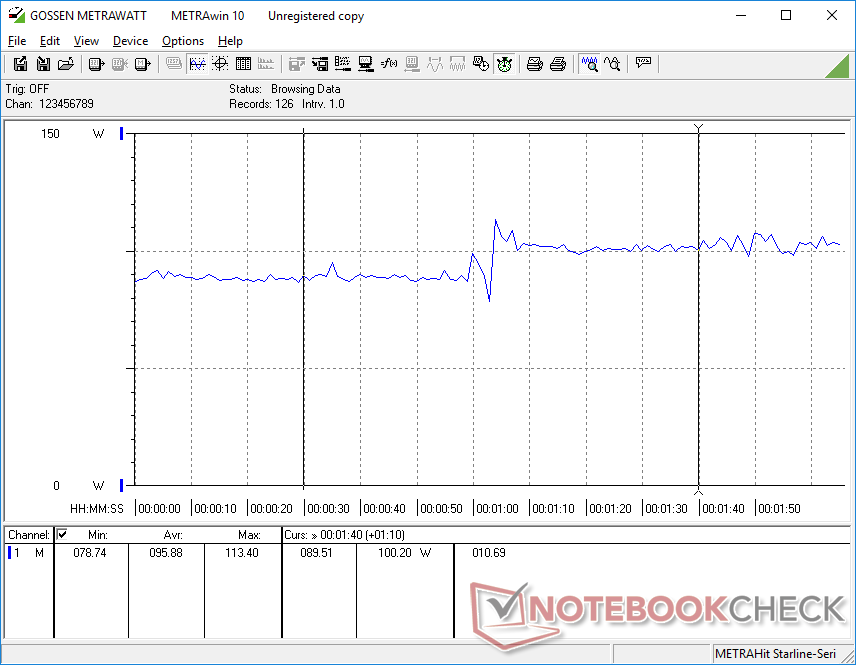
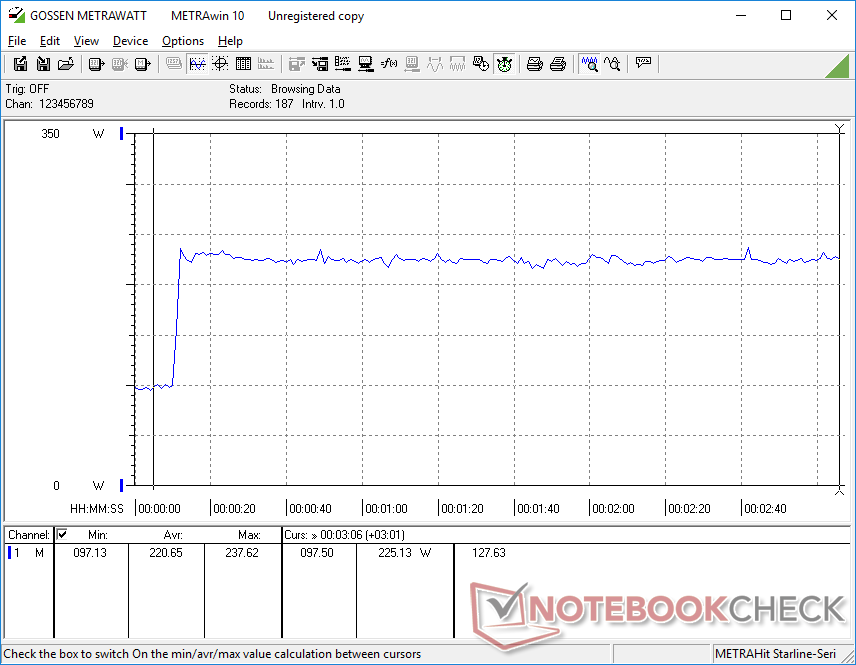
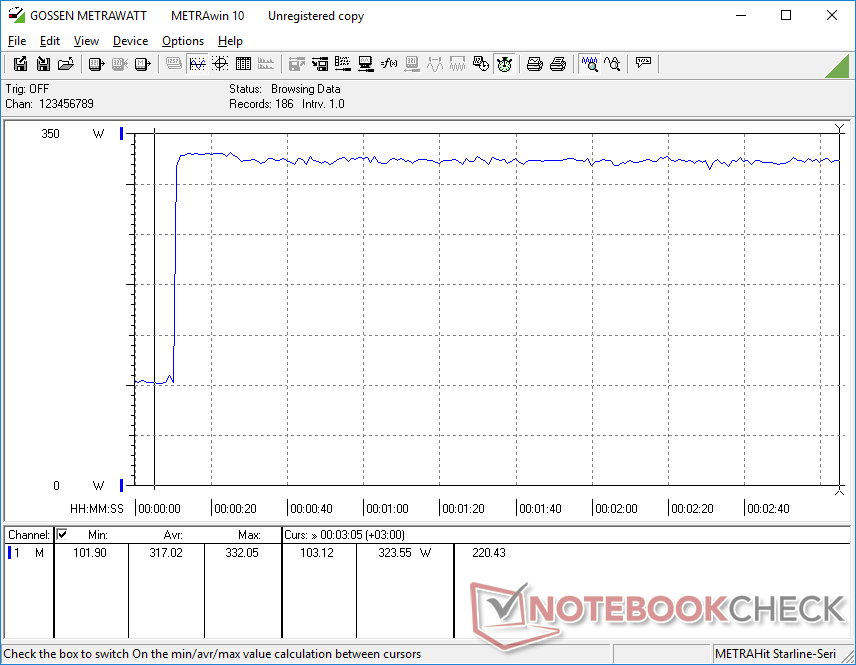
AMD pubblicizza un TGP di 180 W, che possiamo raggiungere quando si esegue la modalità Witcher 3 in modalità Overdrive. Scendendo alla modalità Bilanciata o alla modalità Prestazioni, tuttavia, il tetto del TGP si abbassa a 165 W, come mostrano gli screenshot qui sotto. Le velocità di clock della GPU sono leggermente più basse, il che si correla con i nostri punteggi di Fire Strike menzionati sopra, il che significa che la modalità Overdrive, molto rumorosa, è obbligatoria per ottenere le massime prestazioni.
Ripetendo il Witcher 3 con la nostra configurazione Intel-Nvidia RTX 4090 si otterrebbe un assorbimento di potenza della scheda GPU relativamente inferiore, pari a 161 W, per mostrare prestazioni superiori per watt rispetto alla nostra Radeon RX 7900M.
Si noti che le temperature della CPU e della GPU sono leggermente più basse quando si gioca in modalità Overdrive rispetto alla modalità Bilanciata o Performance, poiché le ventole funzionano in modo sensibilmente più rumoroso.
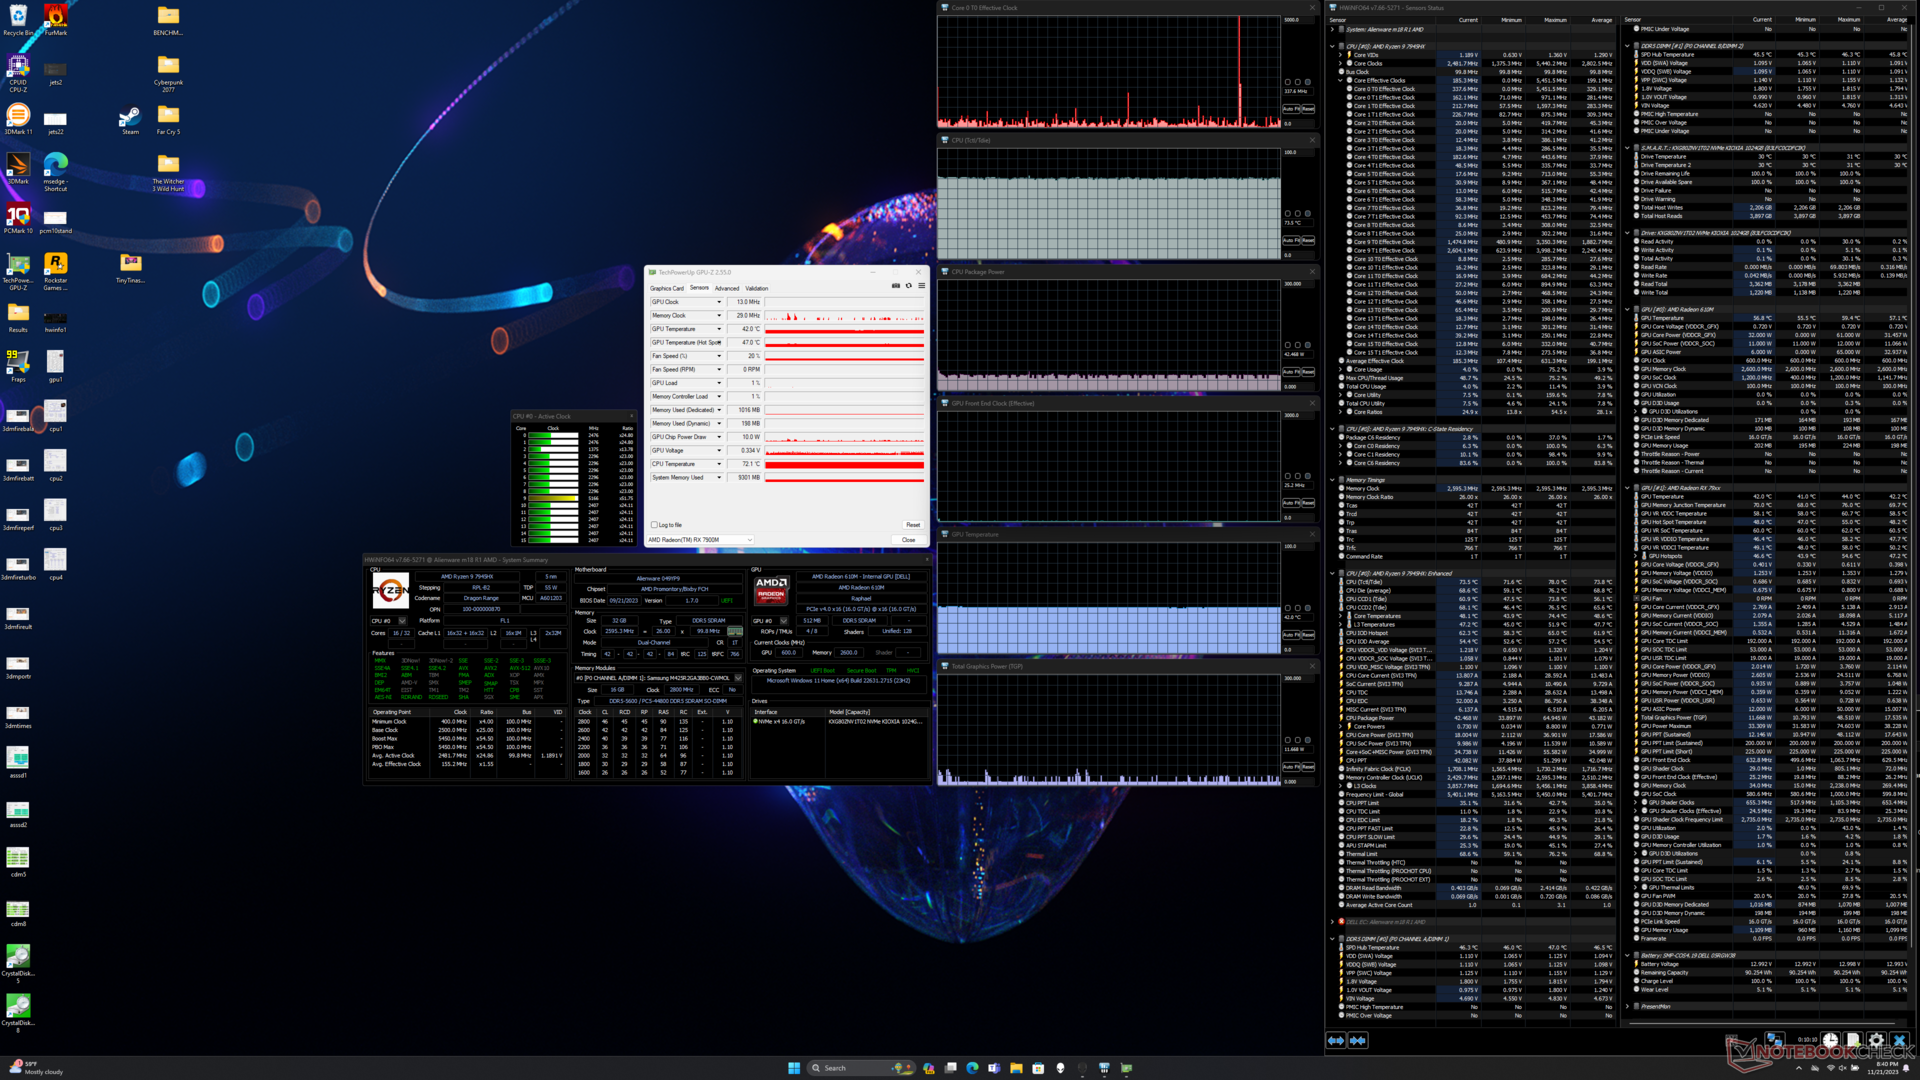
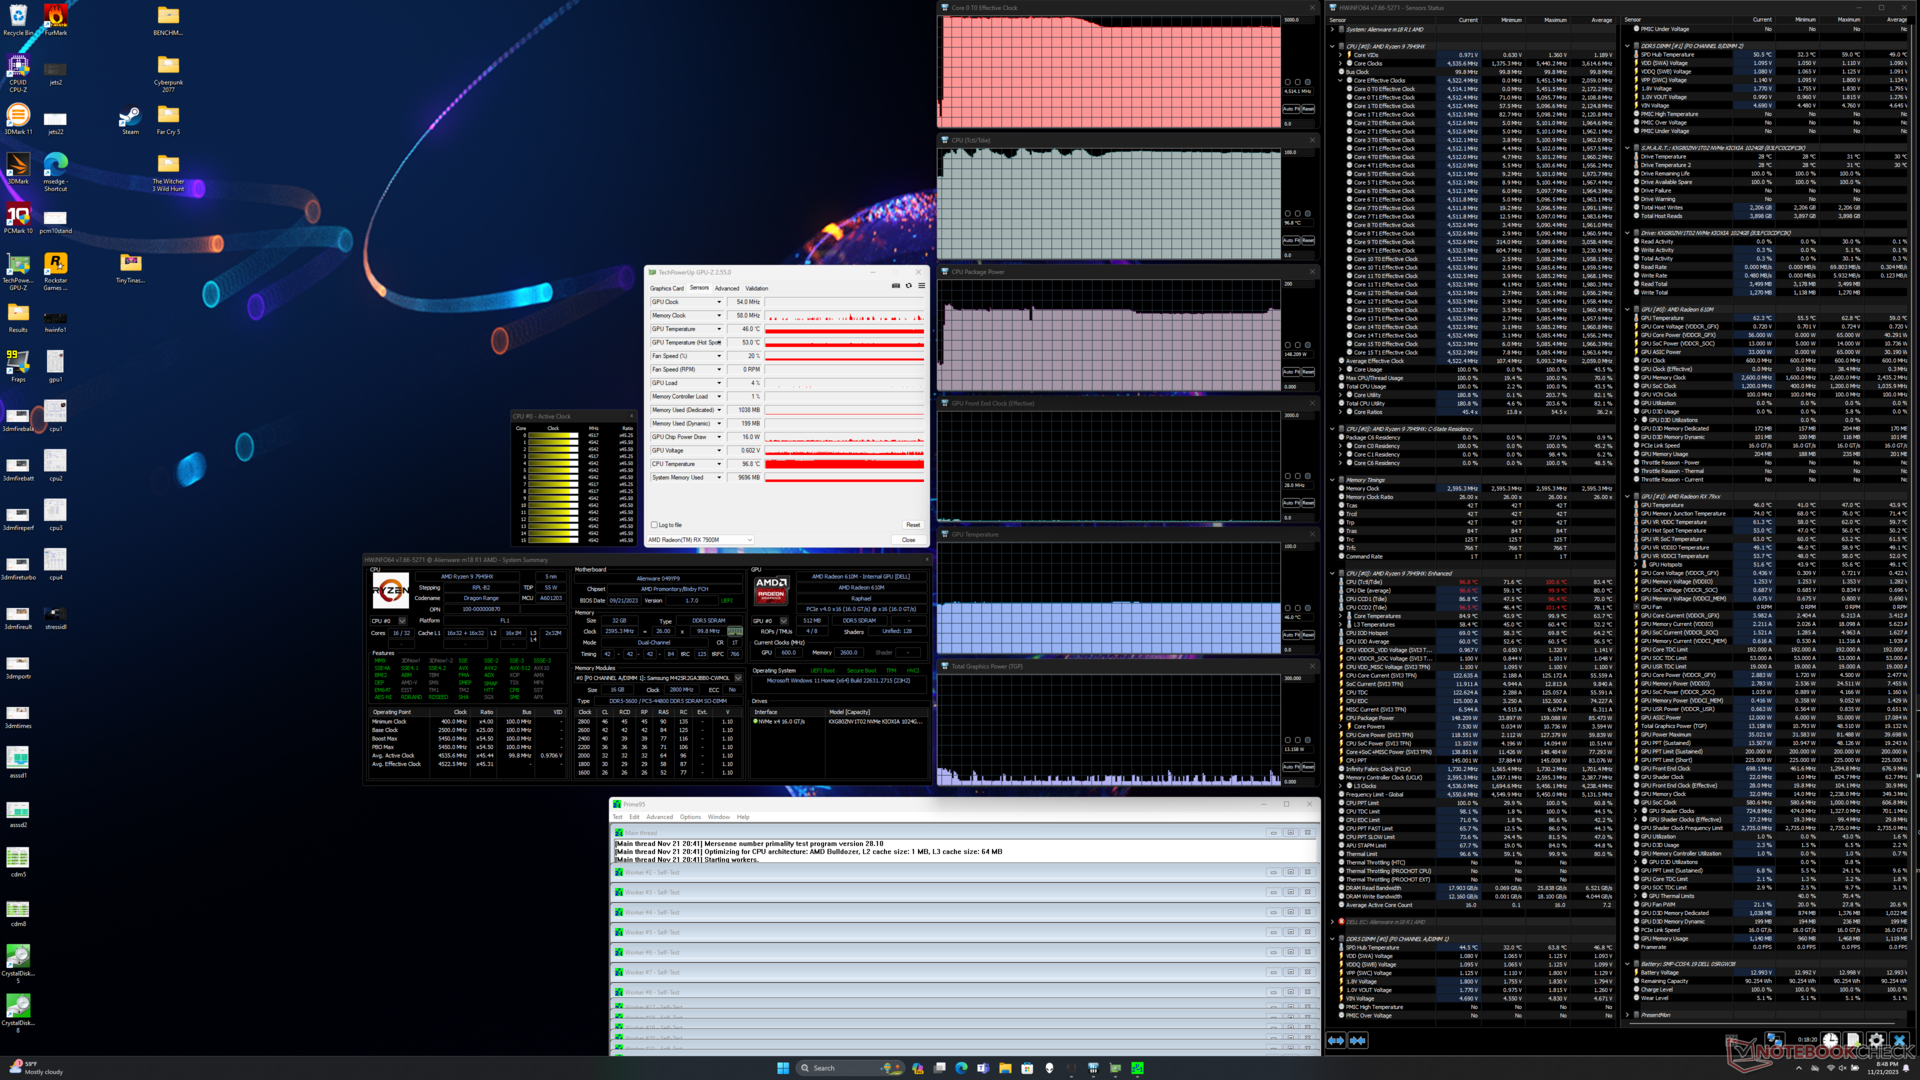
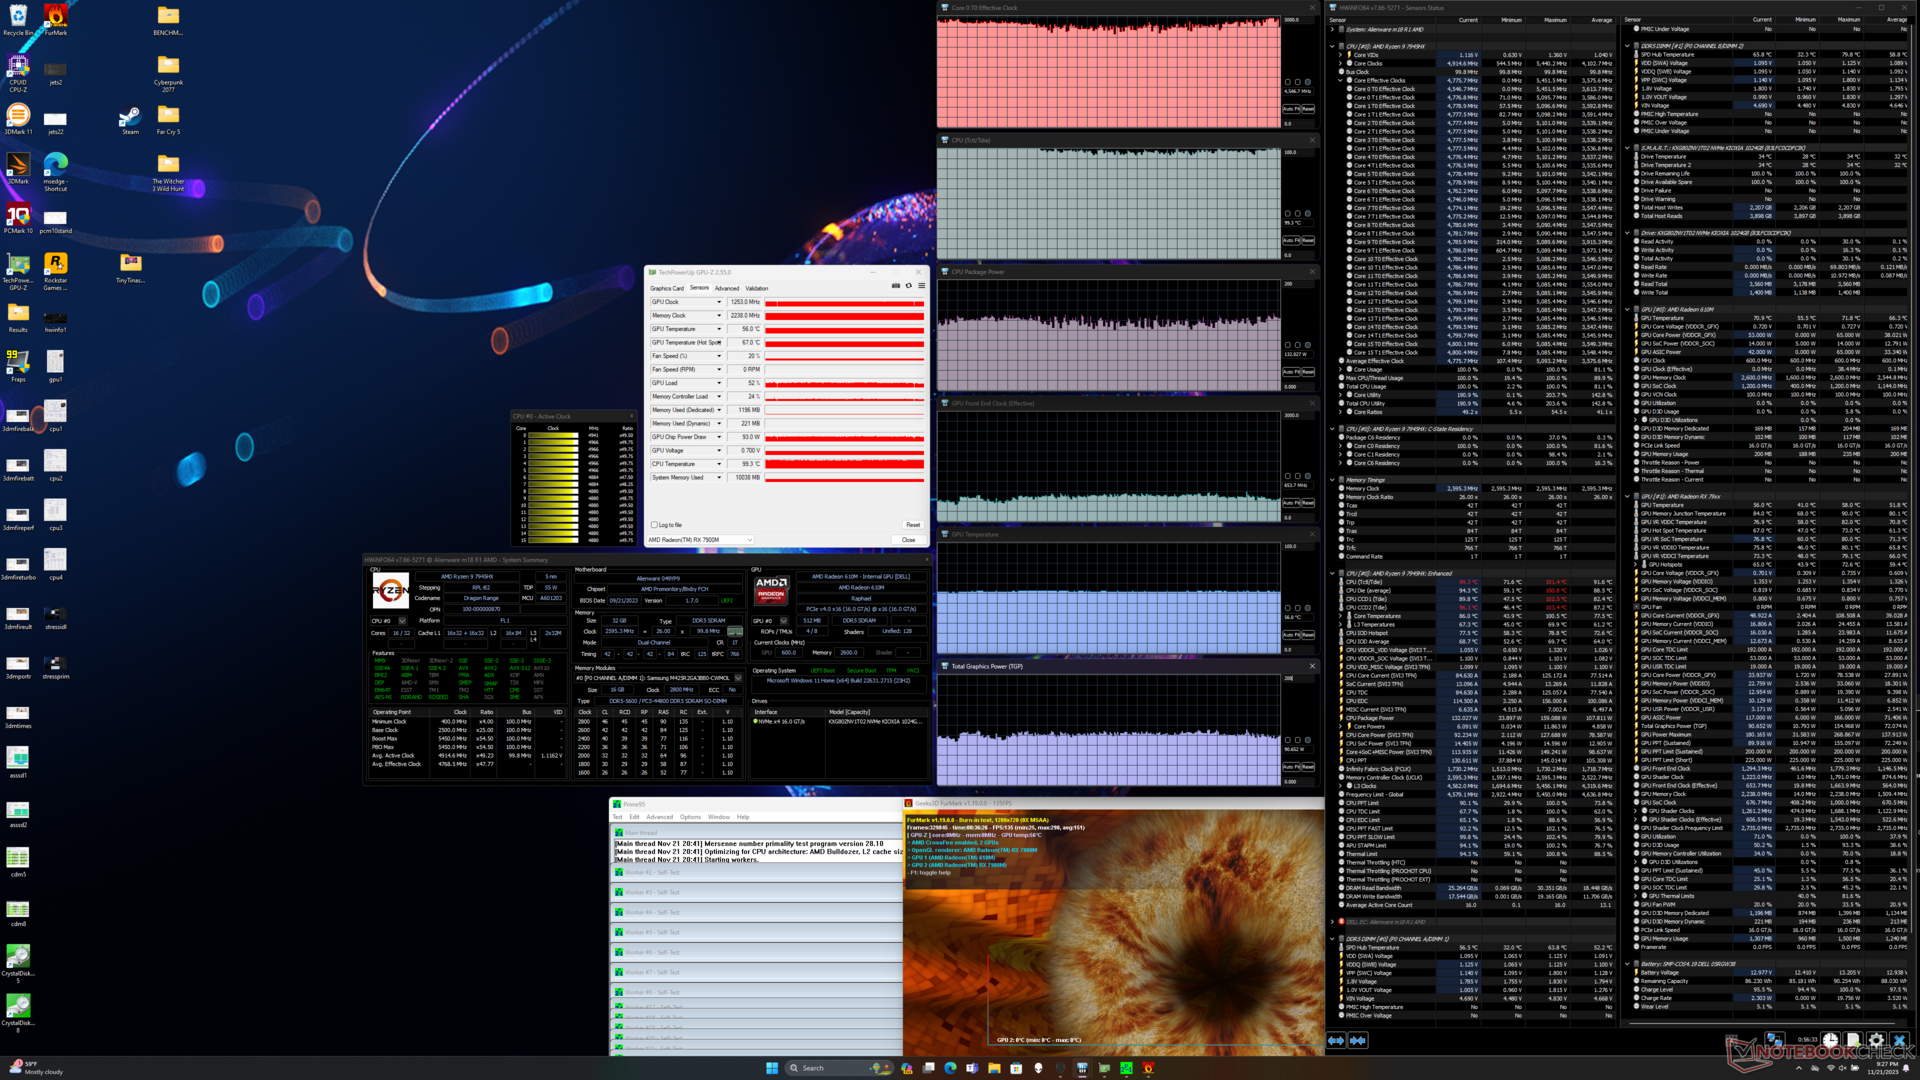
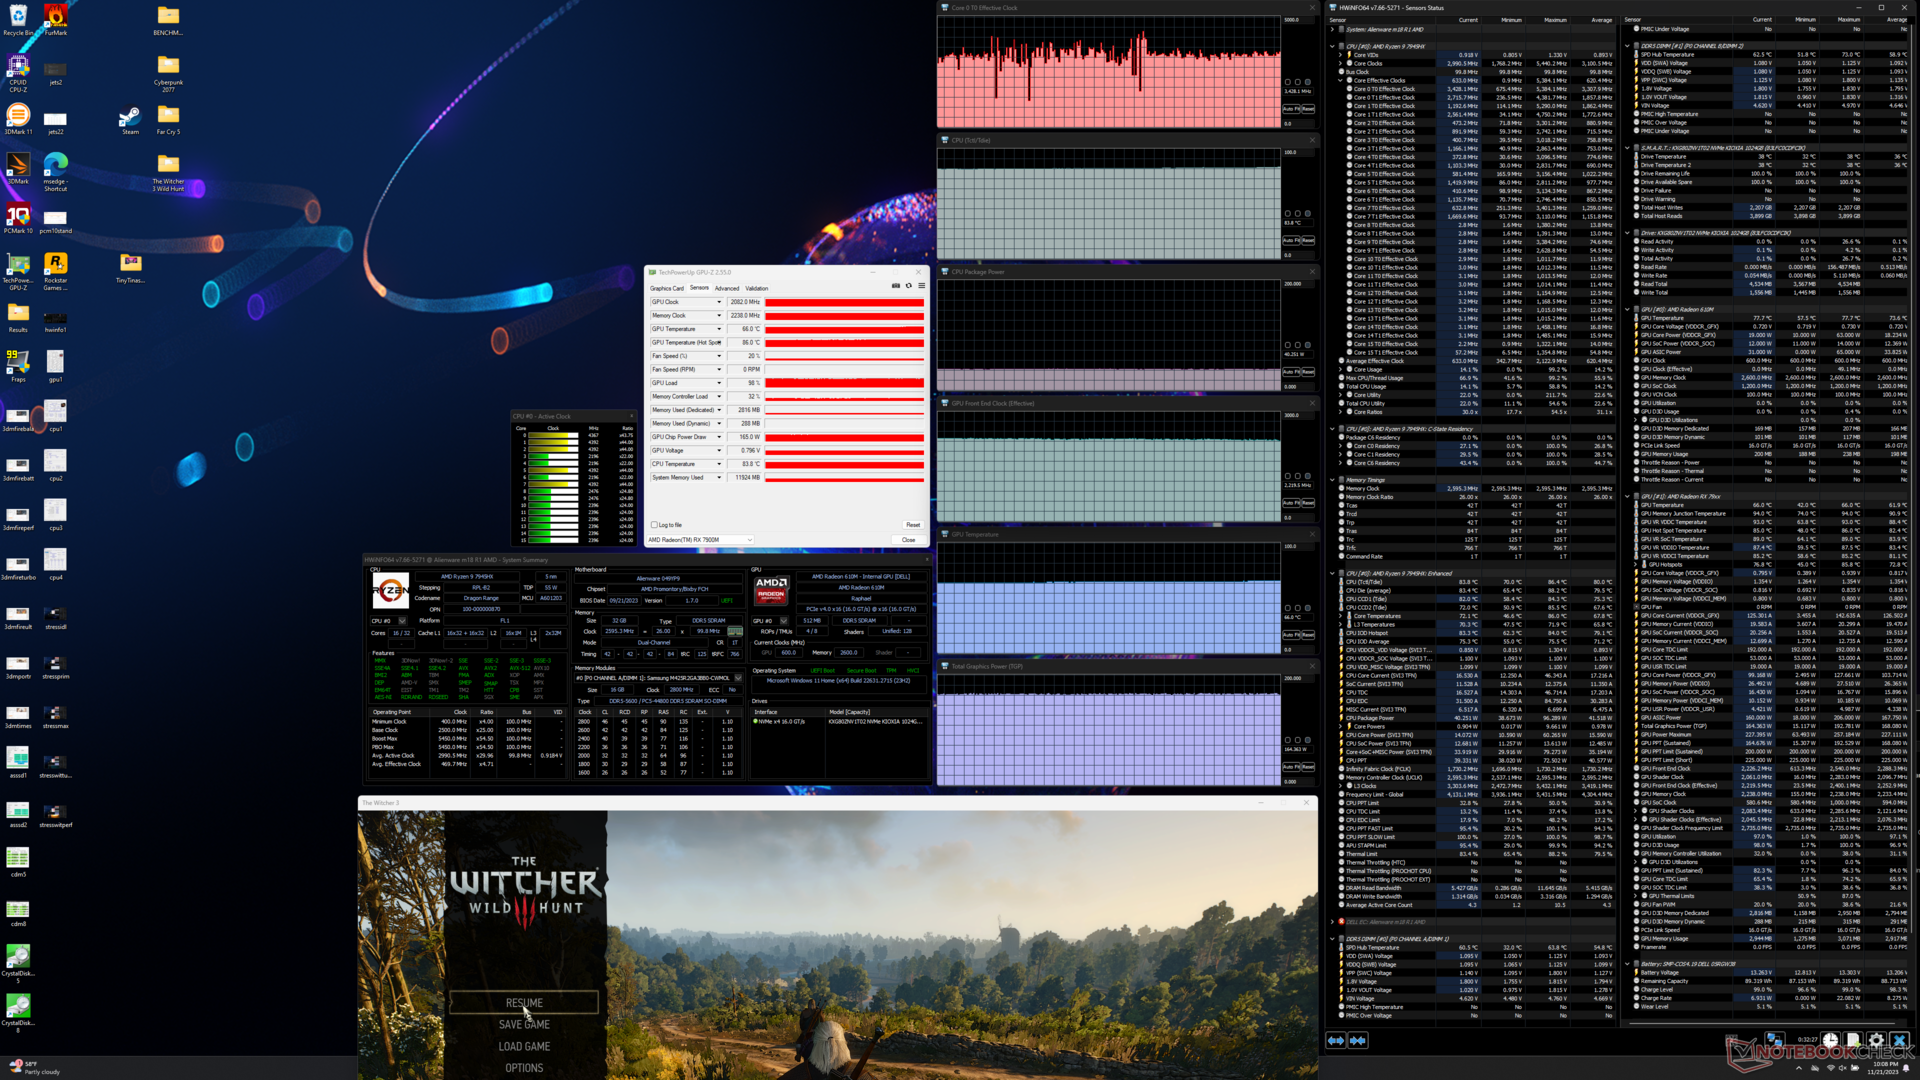
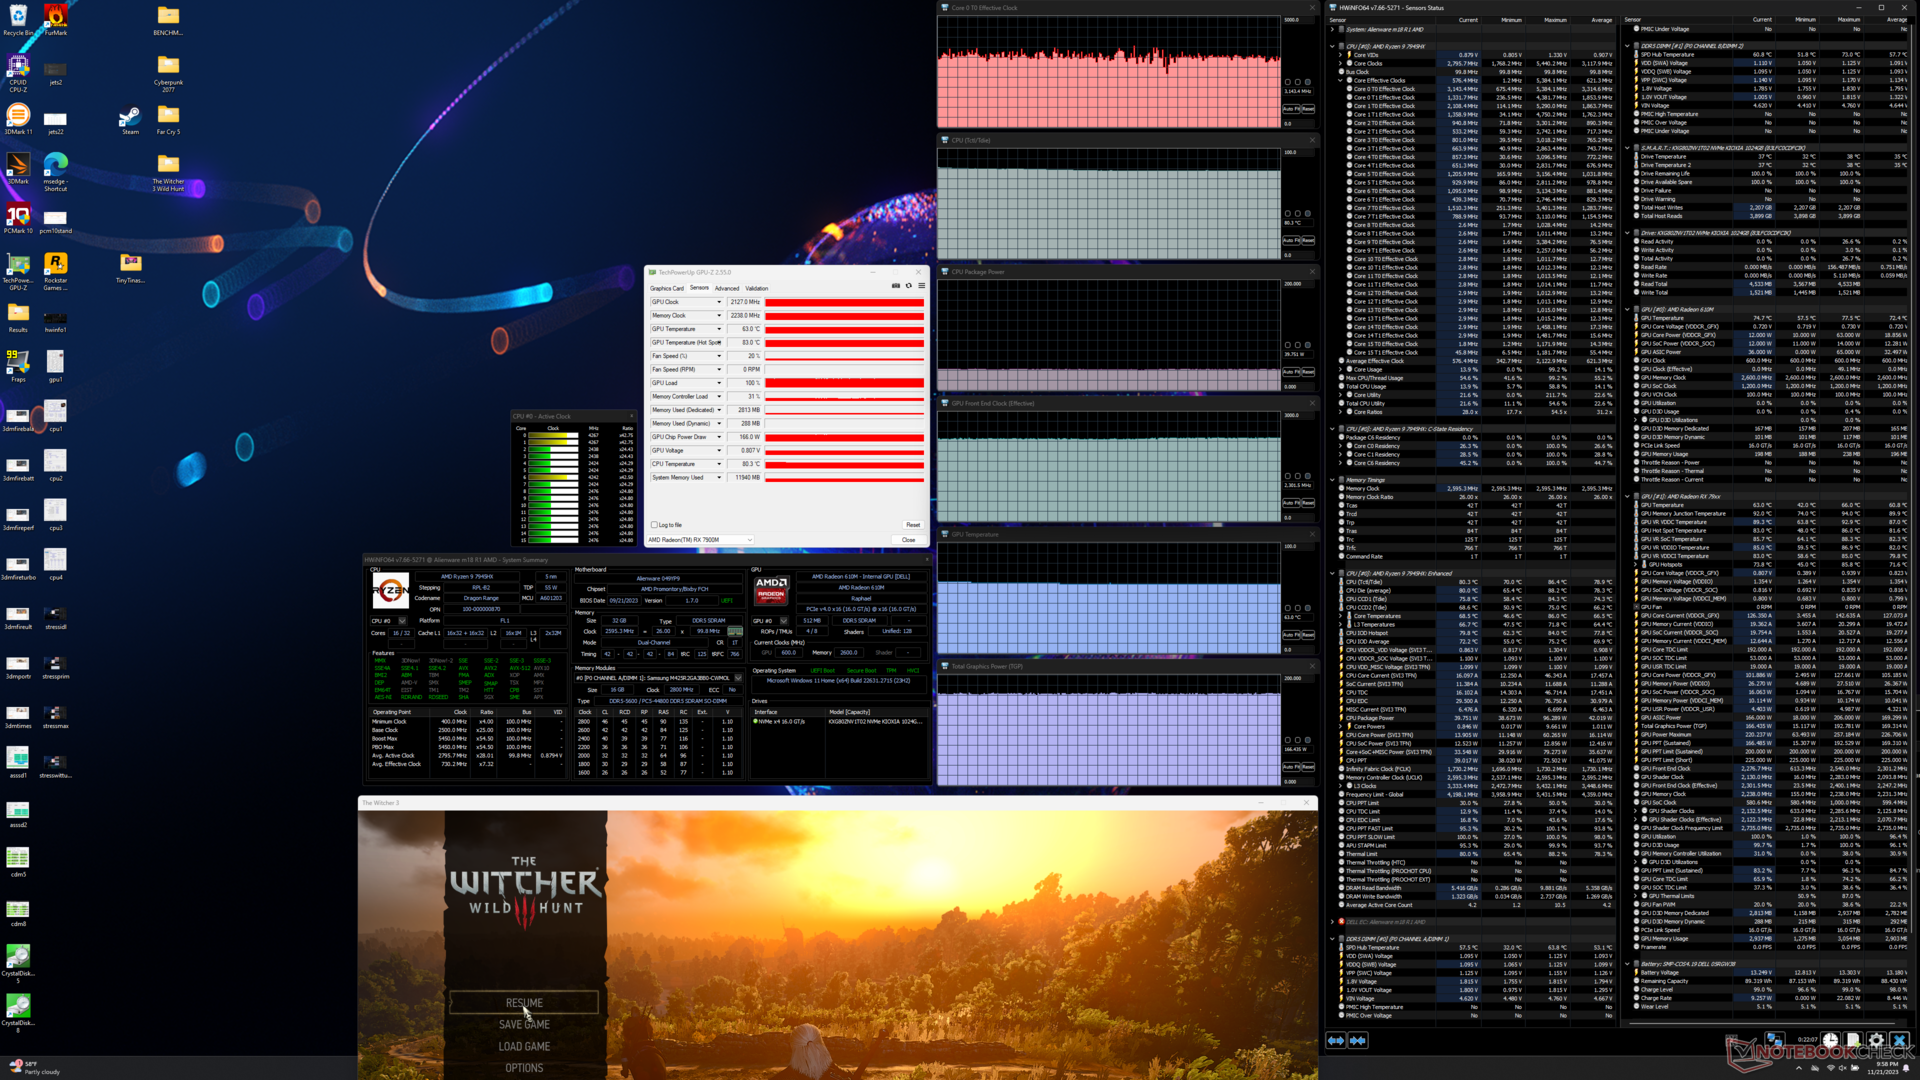
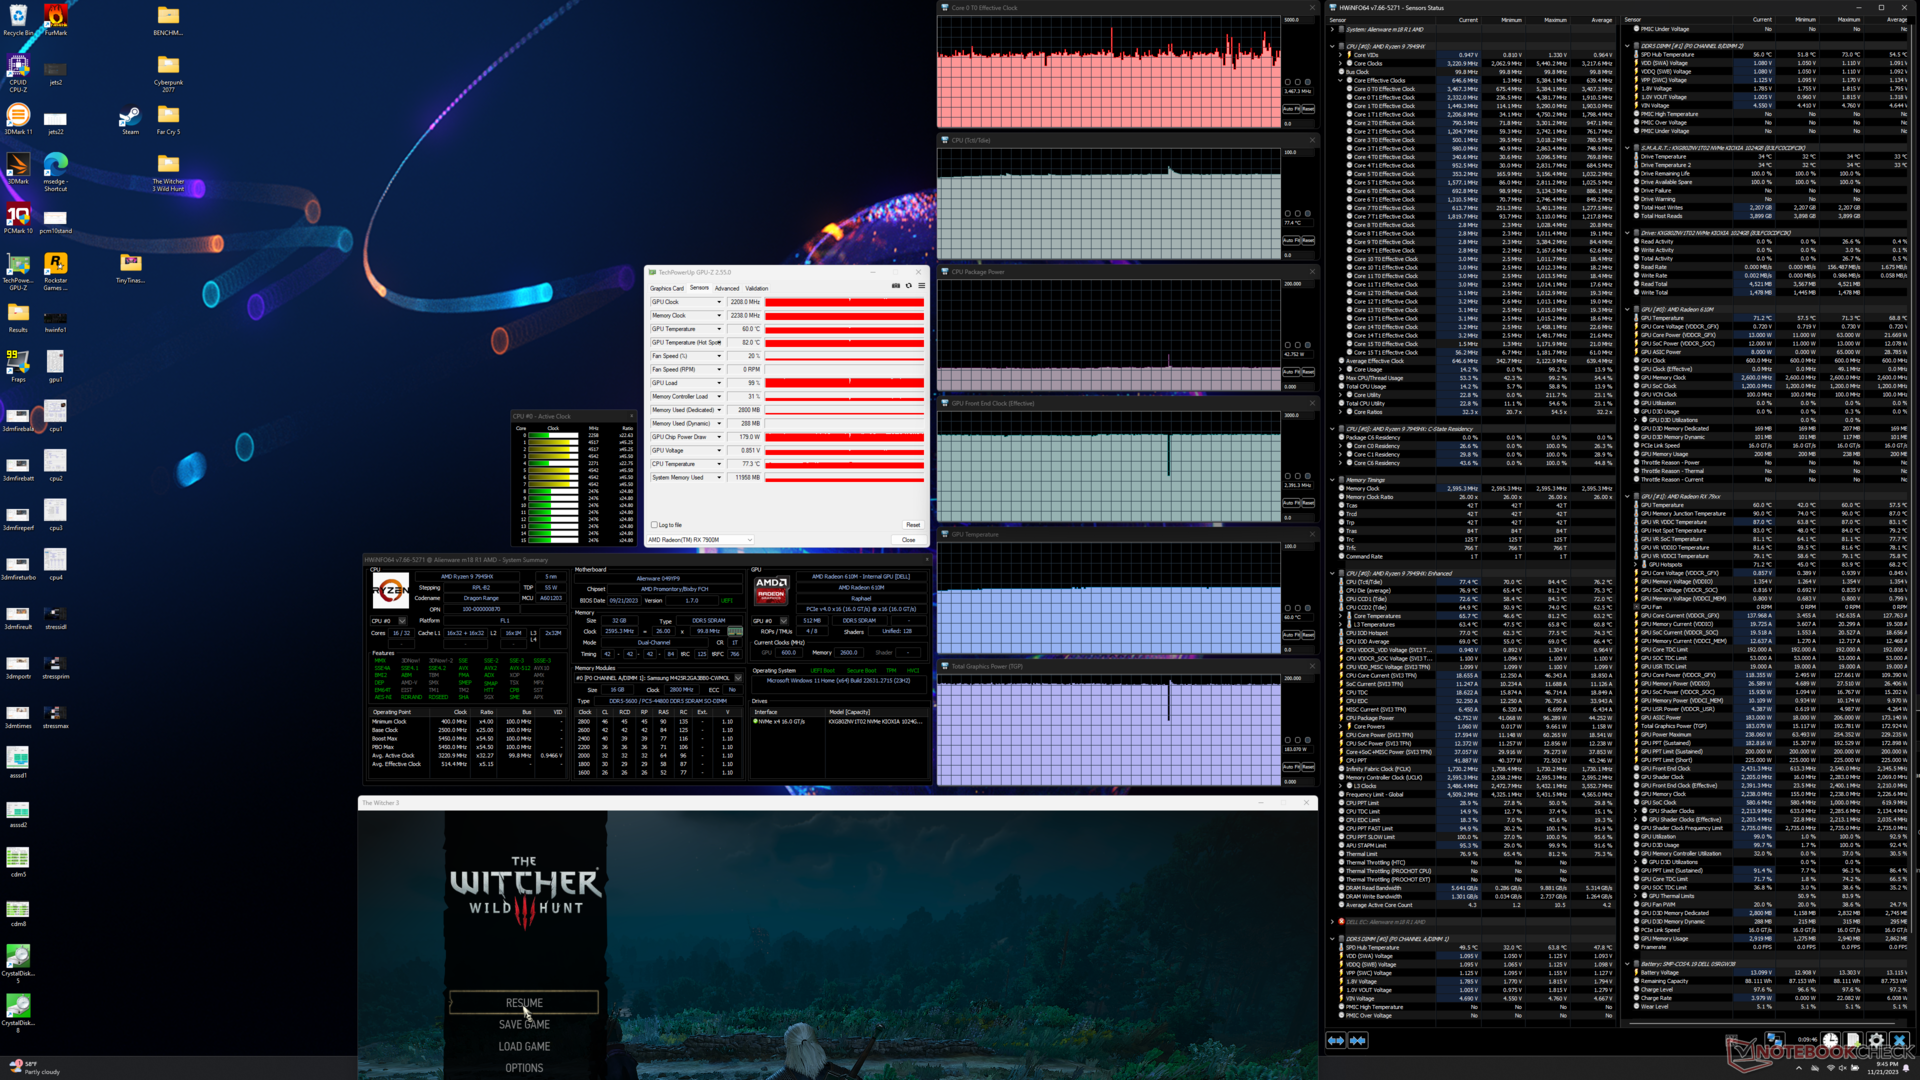
| Clock della CPU (GHz) | Clock della GPU (MHz) | Temperatura media della CPU (°C) | Temperatura media della GPU (°C) | |
| Sistema inattivo | -- | -- | 74 | 47 |
| Stress Prime95 | 4,5 - 4,9 | -- | 97 | 53 |
| StressPrime95 + FurMark | ~4,6 | 1253 | 99 | 67 |
| Witcher 3 Stress (modalità Overdrive) | ~3,5 | 2208 | 77 | 82 |
| Witcher 3 Stress (modalità Performance) | ~3,2 | 2127 | 80 | 83 |
| Witcher 3 Stress (modalità Bilanciata) | ~3,4 | 2082 | 84 | 86 |
Altoparlanti
Alienware m18 R1 AMD analisi audio
(+) | gli altoparlanti sono relativamente potenti (84.2 dB)
Bassi 100 - 315 Hz
(-) | quasi nessun basso - in media 22.7% inferiori alla media
(-) | bassi non lineari (15.8% delta rispetto alla precedente frequenza)
Medi 400 - 2000 Hz
(+) | medi bilanciati - solo only 1.5% rispetto alla media
(+) | medi lineari (3.8% delta rispetto alla precedente frequenza)
Alti 2 - 16 kHz
(+) | Alti bilanciati - appena 3.6% dalla media
(+) | alti lineari (5.5% delta rispetto alla precedente frequenza)
Nel complesso 100 - 16.000 Hz
(±) | la linearità complessiva del suono è media (16.5% di differenza rispetto alla media
Rispetto alla stessa classe
» 42% di tutti i dispositivi testati in questa classe è stato migliore, 7% simile, 51% peggiore
» Il migliore ha avuto un delta di 6%, medio di 18%, peggiore di 132%
Rispetto a tutti i dispositivi testati
» 28% di tutti i dispositivi testati in questa classe è stato migliore, 6% similare, 66% peggiore
» Il migliore ha avuto un delta di 4%, medio di 23%, peggiore di 134%
Apple MacBook Pro 16 2021 M1 Pro analisi audio
(+) | gli altoparlanti sono relativamente potenti (84.7 dB)
Bassi 100 - 315 Hz
(+) | bassi buoni - solo 3.8% dalla media
(+) | bassi in lineaa (5.2% delta rispetto alla precedente frequenza)
Medi 400 - 2000 Hz
(+) | medi bilanciati - solo only 1.3% rispetto alla media
(+) | medi lineari (2.1% delta rispetto alla precedente frequenza)
Alti 2 - 16 kHz
(+) | Alti bilanciati - appena 1.9% dalla media
(+) | alti lineari (2.7% delta rispetto alla precedente frequenza)
Nel complesso 100 - 16.000 Hz
(+) | suono nel complesso lineare (4.6% differenza dalla media)
Rispetto alla stessa classe
» 0% di tutti i dispositivi testati in questa classe è stato migliore, 0% simile, 100% peggiore
» Il migliore ha avuto un delta di 5%, medio di 17%, peggiore di 45%
Rispetto a tutti i dispositivi testati
» 0% di tutti i dispositivi testati in questa classe è stato migliore, 0% similare, 100% peggiore
» Il migliore ha avuto un delta di 4%, medio di 23%, peggiore di 134%
Gestione dell'energia
Consumo di energia
Il consumo energetico è un tira e molla tra le configurazioni AMD-AMD e Intel-Nvidia dell'Alienware m18 R1. Da un lato, il Ryzen 7 7945HX è più efficiente del Core i9-13980HX; è in grado di completare il benchmark CineBench R15 xT all'incirca nello stesso tempo del Core i9, pur richiedendo da 50 a 60 W in meno di energia dalla rete elettrica. D'altra parte, la Radeon RX 7900M è meno efficiente della GeForce RTX 4080 o 4090; l'esecuzione di FurMark, ad esempio, richiederebbe circa 50 W in più sulla nostra configurazione AMD. Le prestazioni complessive per watt possono quindi orientarsi verso una configurazione piuttosto che l'altra, a seconda dell'intensità delle applicazioni della CPU o della GPU.
L'esecuzione simultanea della CPU e della GPU al 100 percento di utilizzo assorbirebbe comunque fino a 333 W dall'ampio adattatore CA da 330 W, proprio come abbiamo osservato nella configurazione Intel-Nvidia. Tuttavia, la CPU Intel Core i9 tende ad assorbire più energia rispetto al nostro Ryzen 9 e quindi il consumo energetico complessivo tende ad essere più elevato rispetto alla nostra configurazione interamente AMD quando si gioca. Questo si può osservare durante l'esecuzione Witcher 3 come mostra la tabella sottostante.
Il consumo quando è al minimo sul desktop non è ottimizzato, il che può contribuire alla durata molto breve della batteria. A volte siamo in grado di misurare un livello di consumo fino a 101 W, anche quando il profilo energetico è bilanciato e non ci sono applicazioni attive in esecuzione. Anche il consumo in modalità standby sarebbe molto elevato, con 25 W, mentre dovrebbe essere più vicino a 1 o 2 watt.
Consigliamo di ridurre la frequenza di aggiornamento da 480 Hz a 120 Hz se il consumo energetico è un problema, poiché questa semplice modifica può far risparmiare fino a 11 W, come mostra il grafico sottostante. È un peccato che questo particolare pannello non offra opzioni di frequenza di aggiornamento variabile.
| Off / Standby | |
| Idle | |
| Sotto carico |
|
Leggenda:
min: | |
| Alienware m18 R1 AMD R9 7945HX, Radeon RX 7900M, Kioxia XG8 KXG80ZNV1T02, IPS, 1920x1200, 18" | HP Omen 16-wf000 i7-13700HX, GeForce RTX 4080 Laptop GPU, SK hynix PC801 HFS002TEJ9X101N, IPS, 2560x1440, 16.1" | Alienware m18 R1 i9-13980HX, GeForce RTX 4090 Laptop GPU, SK hynix PC801 HFS001TEJ9X101N, IPS, 1920x1200, 18" | Acer Predator Helios 18 N23Q2 i9-13900HX, GeForce RTX 4080 Laptop GPU, Samsung PM9A1 MZVL22T0HBLB, IPS, 2560x1600, 18" | Razer Blade 18 RTX 4070 i9-13950HX, GeForce RTX 4070 Laptop GPU, SSSTC CA6-8D1024, IPS, 2560x1600, 18" | MSI GE78HX 13VH-070US i9-13950HX, GeForce RTX 4080 Laptop GPU, Samsung PM9A1 MZVL22T0HBLB, IPS, 2560x1600, 17" | |
|---|---|---|---|---|---|---|
| Power Consumption | 32% | 13% | 31% | 25% | 29% | |
| Idle Minimum * (Watt) | 30.3 | 21.8 28% | 21.6 29% | 16 47% | 24.5 19% | 16.1 47% |
| Idle Average * (Watt) | 55.6 | 26 53% | 25.2 55% | 19 66% | 34.1 39% | 24 57% |
| Idle Maximum * (Watt) | 101.1 | 36 64% | 56.7 44% | 21.3 79% | 47.7 53% | 34 66% |
| Load Average * (Watt) | 160.3 | 115.5 28% | 164.1 -2% | 124 23% | 140 13% | 123.6 23% |
| Witcher 3 ultra * (Watt) | 216 | 214 1% | 311 -44% | 289 -34% | 202 6% | 286 -32% |
| Load Maximum * (Watt) | 332.1 | 269.7 19% | 338.9 -2% | 319 4% | 261 21% | 285.7 14% |
* ... Meglio usare valori piccoli
Power Consumption Witcher 3 / Stresstest
Power Consumption external Monitor
Durata della batteria
I tempi di esecuzione sono molto scarsi anche per un grande portatile da gioco. Anche nello scenario migliore, con tutto letteralmente spento o impostato al minimo (AlienFX disattivato, luminosità minima del display, frequenza di aggiornamento di 120 Hz, nessuna applicazione in esecuzione, wireless disattivato, modalità Risparmio batteria), siamo riusciti a registrare solo poco meno di 4,5 ore di autonomia prima dello spegnimento automatico. Questo si riduce a soli 95 minuti durante la navigazione sul web, rispetto all' Acer Predator Helios 18 o Razer Blade 18, che possono durare qualche ora in più.
La ricarica da vuoto a pieno regime con l'adattatore CA incluso richiede circa 2-2,5 ore. Il modello non supporta la ricarica tramite USB-C, a differenza della maggior parte degli altri portatili da gioco moderni, e quindi è essenzialmente legato al gigantesco adattatore CA da 330 W quando viaggia.
| Alienware m18 R1 AMD R9 7945HX, Radeon RX 7900M, 97 Wh | Alienware m18 R1 i9-13980HX, GeForce RTX 4090 Laptop GPU, 97 Wh | Acer Predator Helios 18 N23Q2 i9-13900HX, GeForce RTX 4080 Laptop GPU, 90 Wh | Razer Blade 18 RTX 4070 i9-13950HX, GeForce RTX 4070 Laptop GPU, 91.7 Wh | Asus ROG Strix Scar 18 2023 G834JY-N6005W i9-13980HX, GeForce RTX 4090 Laptop GPU, 90 Wh | MSI GE78HX 13VH-070US i9-13950HX, GeForce RTX 4080 Laptop GPU, 99 Wh | |
|---|---|---|---|---|---|---|
| Autonomia della batteria | 77% | 179% | 109% | 218% | 171% | |
| Reader / Idle (h) | 4.5 | 5.6 24% | 7 56% | 7.3 62% | ||
| WiFi v1.3 (h) | 1.4 | 4.3 207% | 4.4 214% | 4 186% | 7.1 407% | 6.1 336% |
| Load (h) | 0.7 | 0.7 0% | 1.7 143% | 1.3 86% | 0.9 29% | 1.5 114% |
| H.264 (h) | 4.8 | 7 | ||||
| Witcher 3 ultra (h) | 0.9 |
Pro
Contro
Verdetto - Lo sfidante mobile GeForce RTX 4080 che stavamo aspettando
Al momento, la configurazione Core i9-13900HX/RTX 4080 dell'Alienware m18 R1 con 32 GB di RAM, 1 TB di SSD e display 1200p costa 2950 dollari. Nel frattempo, la configurazione Ryzen 9 7945HX/RX 7900M con la stessa RAM, SSD e display costa 2300 dollari. L'opzione interamente AMD offre prestazioni più veloci della CPU e quasi le stesse prestazioni della GPU per quasi 700 dollari in meno. Inutile dire che le prestazioni per dollaro sono chiaramente il punto di vendita più forte della nuova SKU AMD e uno dei motivi più importanti per saltare Intel e Nvidia. La differenza di prezzo è così grande che si potrebbero persino trascurare tutti i problemi che abbiamo riscontrato sulla nostra prima unità di prova solo per risparmiare centinaia di dollari.
I portatili da gioco con GeForce RTX 4080 hanno goduto di prezzi gonfiati per tutto l'anno. L'efficientissima AMD Radeon RX 7900M è il giusto concorrente per riportare finalmente i prezzi sulla terra.
Tuttavia, i bug non sono insignificanti. Lo spegnimento del display, i problemi di avvio, i salti di fotogrammi nella riproduzione video, i balbettii durante il gioco e il consumo energetico insolitamente elevato quando è al minimo devono essere assolutamente affrontati. Di conseguenza, non c'è una corsa folle per acquistare l'Alienware m18 R1 interamente AMD, mentre aspettiamo che le correzioni e il supporto FSR 3 si diffondano lentamente nel tempo.
Ci sono ancora motivi per scegliere Intel-Nvidia rispetto ad AMD-AMD, una volta risolti tutti i bug. Per quanto impressionante possa essere la Radeon 7900M, la RTX 4080 mobile è ancora più veloce in media, soprattutto se le piace giocare con RT abilitato. Coloro che vogliono il meglio e la massima velocità, a prescindere dal costo, dovrebbero quindi attenersi alla serie GeForce. Per il resto di noi mortali con un budget più limitato, la Radeon 7900M sembra una solida alternativa alla costosa RTX 4080 che molti stavano aspettando. Speriamo che la GPU faccia la sua comparsa su molti altri computer portatili da gioco nel prossimo futuro, e non solo su alcuni selezionati.
Prezzo e disponibilità
Dell sta spedendo direttamente l'Alienware m18 R1 in tutti i livelli di configurazione. In alternativa, Best Buy offre la configurazione Ryzen 9/7900M a 2.800 dollari.
Alienware m18 R1 AMD
- 11/26/2023 v7 (old)
Allen Ngo
Transparency
La selezione dei dispositivi da recensire viene effettuata dalla nostra redazione. Il campione di prova è stato fornito all'autore come prestito dal produttore o dal rivenditore ai fini di questa recensione. L'istituto di credito non ha avuto alcuna influenza su questa recensione, né il produttore ne ha ricevuto una copia prima della pubblicazione. Non vi era alcun obbligo di pubblicare questa recensione. In quanto società mediatica indipendente, Notebookcheck non è soggetta all'autorità di produttori, rivenditori o editori.
Ecco come Notebookcheck esegue i test
Ogni anno, Notebookcheck esamina in modo indipendente centinaia di laptop e smartphone utilizzando procedure standardizzate per garantire che tutti i risultati siano comparabili. Da circa 20 anni sviluppiamo continuamente i nostri metodi di prova e nel frattempo stabiliamo gli standard di settore. Nei nostri laboratori di prova, tecnici ed editori esperti utilizzano apparecchiature di misurazione di alta qualità. Questi test comportano un processo di validazione in più fasi. Il nostro complesso sistema di valutazione si basa su centinaia di misurazioni e parametri di riferimento ben fondati, che mantengono l'obiettività.Price comparison

