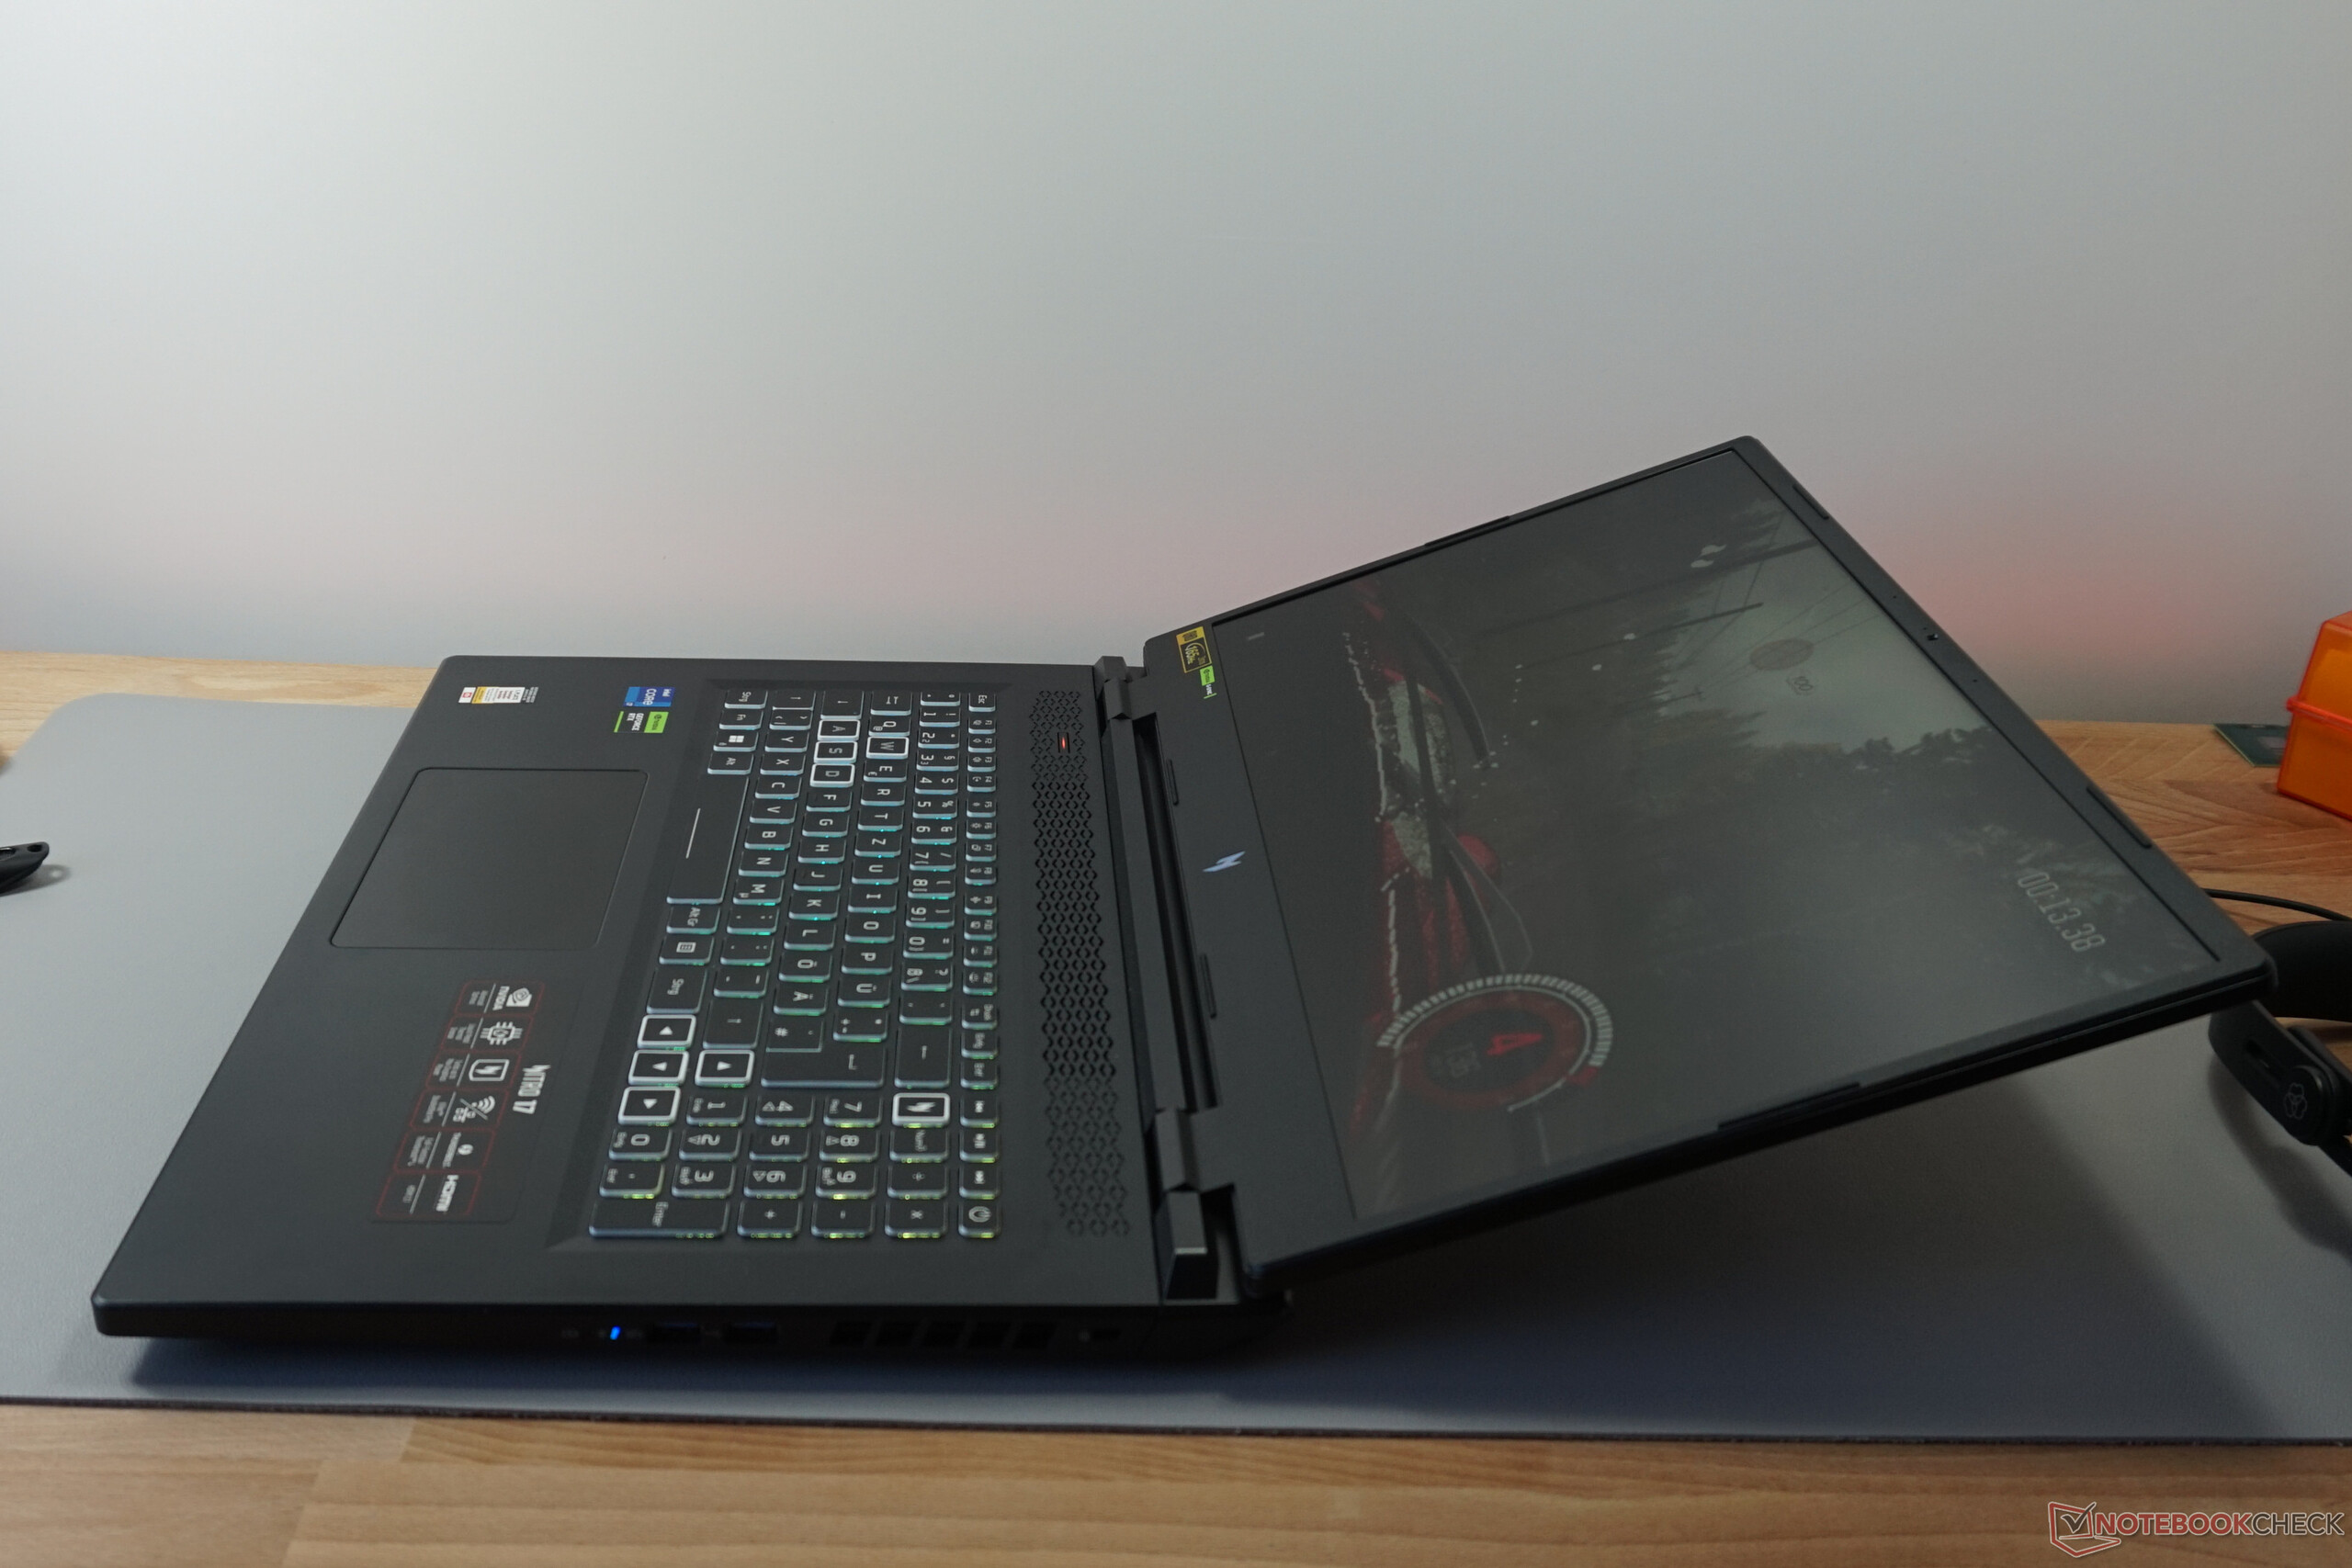
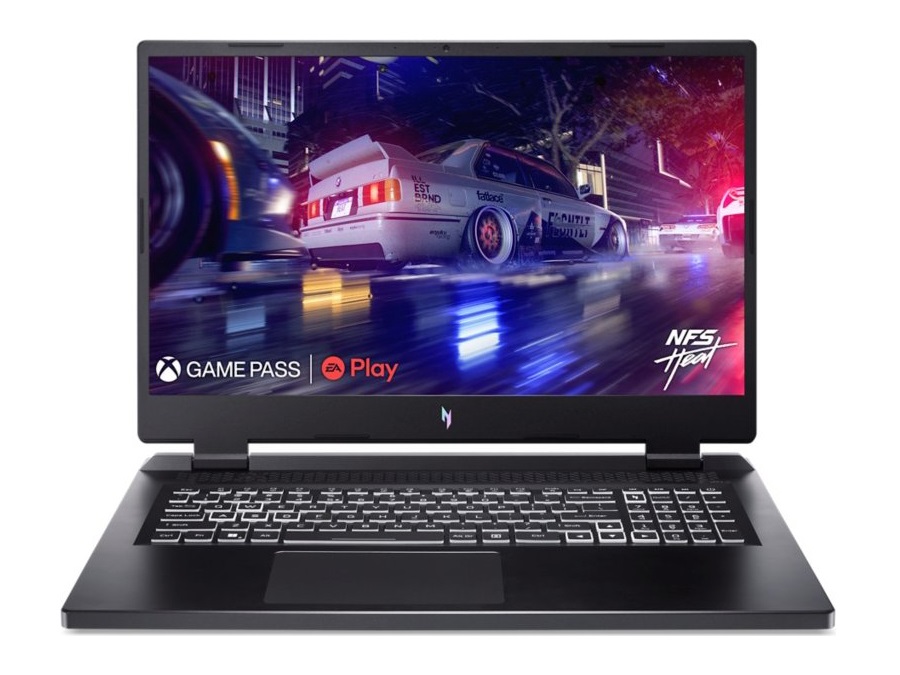
Recensione dell'Acer Nitro 17 Ryzen edition: portatile per il gaming QHD con RTX 4070
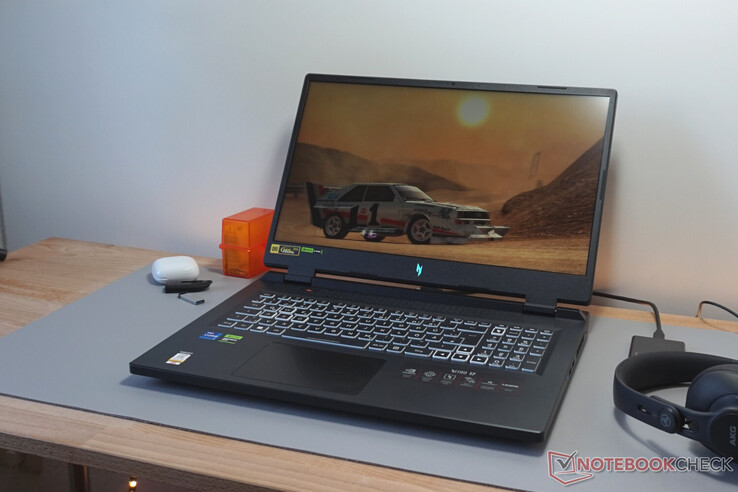
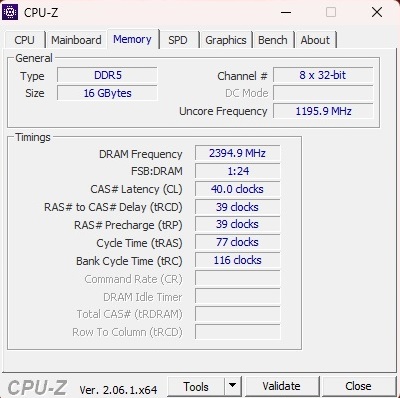
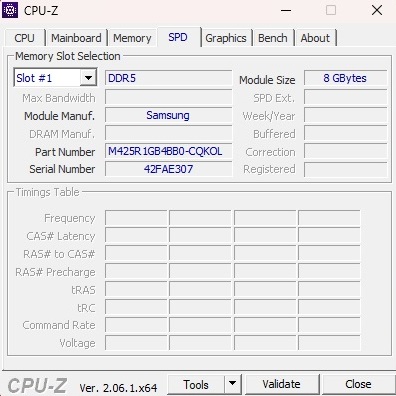
Dopo aver testato in precedenza un modello con ilCore i7-13700HeGeForce RTX 4060ora diamo un'occhiata al fratello di prezzo simile del portatile, il modello AN17-41-R9LN con processore AMD e una RTX 4070 leggermente più potente.GeForce RTX 4070(Analogamente alla versione Intel, come schermo viene utilizzato un pannello QHD 16:9 con una frequenza di aggiornamento di 165 Hz e una risoluzione di 2.560 x 1.440 pixel. Inoltre, sono installati 2x 8 GB di RAM DDR5-4800 e un SSD NVMe da 1 TB. Anche per quanto riguarda il sistema operativo non ci sono sorprese: il portatile ha installato Windows 11 Home.
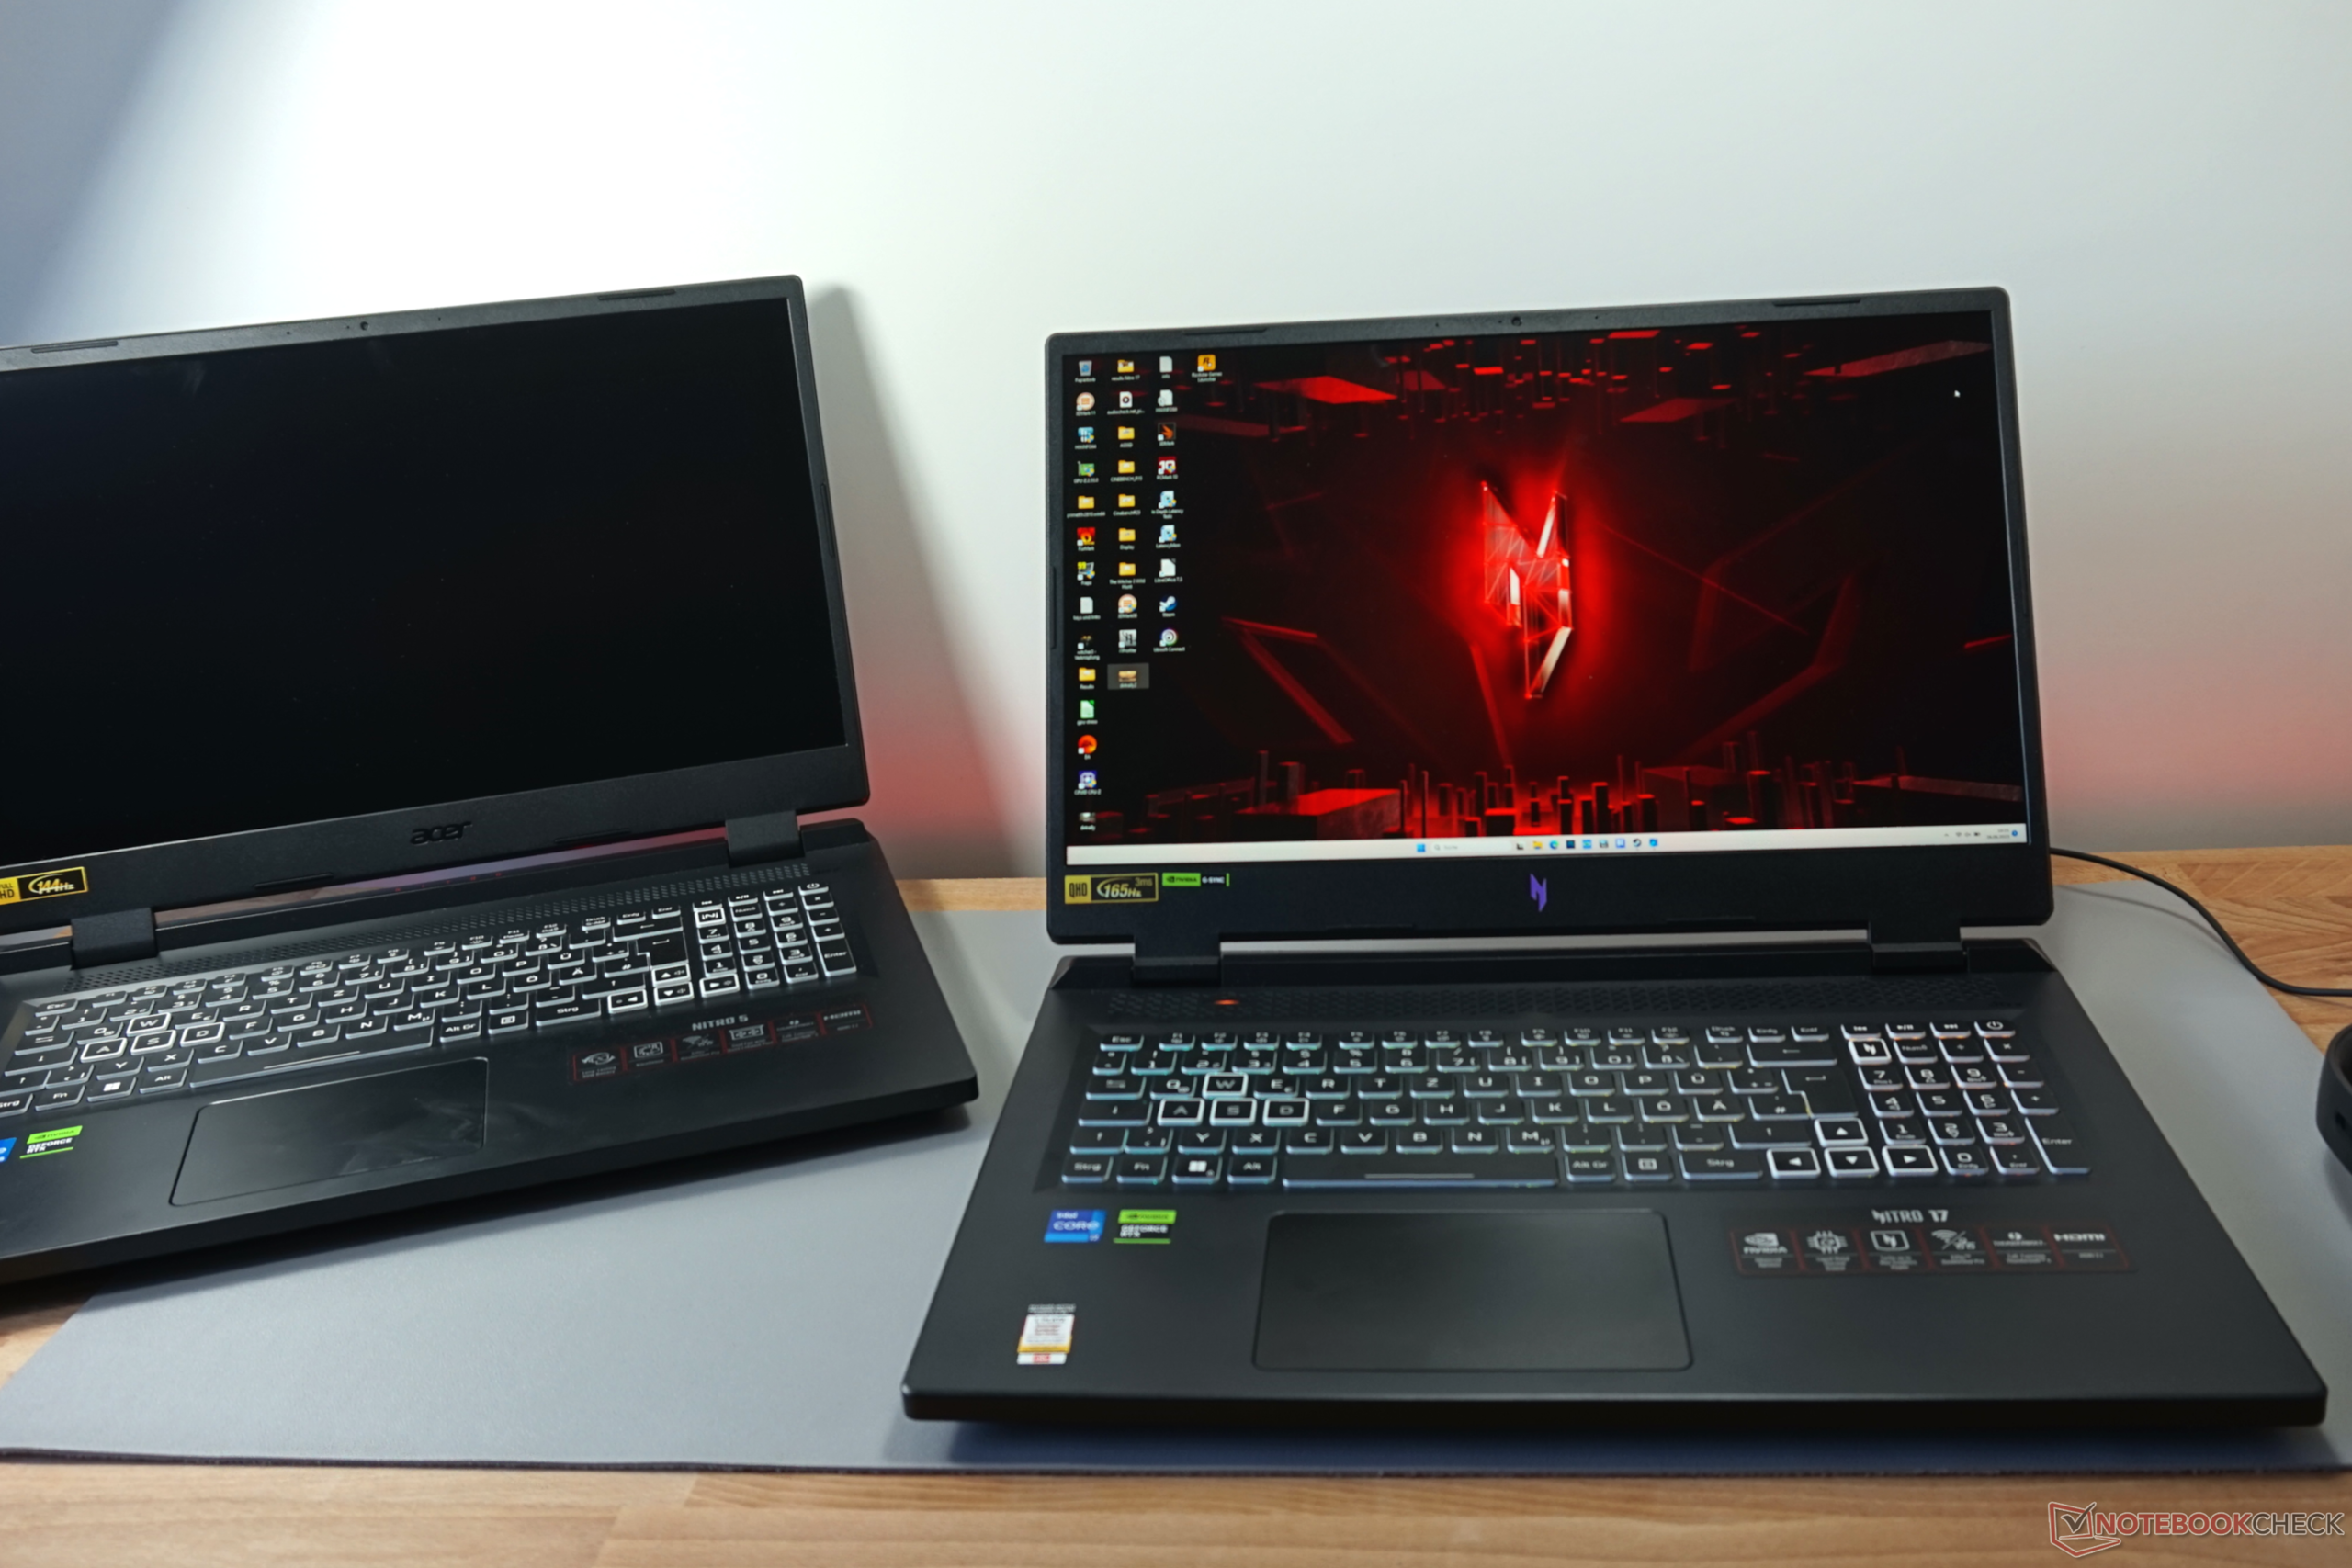
Tra i concorrenti del Nitro 17 ci sono altri portatili da gioco da 17 pollici con RTX 4070, come ad esempio il modelloMSI Pulse 17 B13VGK, ilSchenker XMG Focus 17 (E23)o il Asus ROG Strix G17 G713PI- tutti presenti nelle tabelle come dispositivi di confronto.
Potenziali concorrenti a confronto
Punteggio | Data | Modello | Peso | Altezza | Dimensione | Risoluzione | Prezzo |
|---|---|---|---|---|---|---|---|
| 86.9 % v7 (old) | 09/2023 | Acer Nitro 17 AN17-41-R9LN R7 7735HS, GeForce RTX 4070 Laptop GPU | 3 kg | 29 mm | 17.30" | 2560x1440 | |
| 87.2 % v7 (old) | 07/2023 | Acer Nitro 17 AN17-51-71ER i7-13700H, GeForce RTX 4060 Laptop GPU | 3 kg | 30.3 mm | 17.30" | 2560x1440 | |
| 86.3 % v7 (old) | 07/2023 | MSI Pulse 17 B13VGK i7-13700H, GeForce RTX 4070 Laptop GPU | 2.7 kg | 27.2 mm | 17.30" | 1920x1080 | |
| 85.9 % v7 (old) | 06/2023 | Schenker XMG Focus 17 (E23) i9-13900HX, GeForce RTX 4070 Laptop GPU | 2.9 kg | 29.3 mm | 17.30" | 2560x1440 | |
| 88.4 % v7 (old) | 04/2023 | Asus ROG Strix G17 G713PI R9 7945HX, GeForce RTX 4070 Laptop GPU | 2.8 kg | 30.7 mm | 17.30" | 2560x1440 |
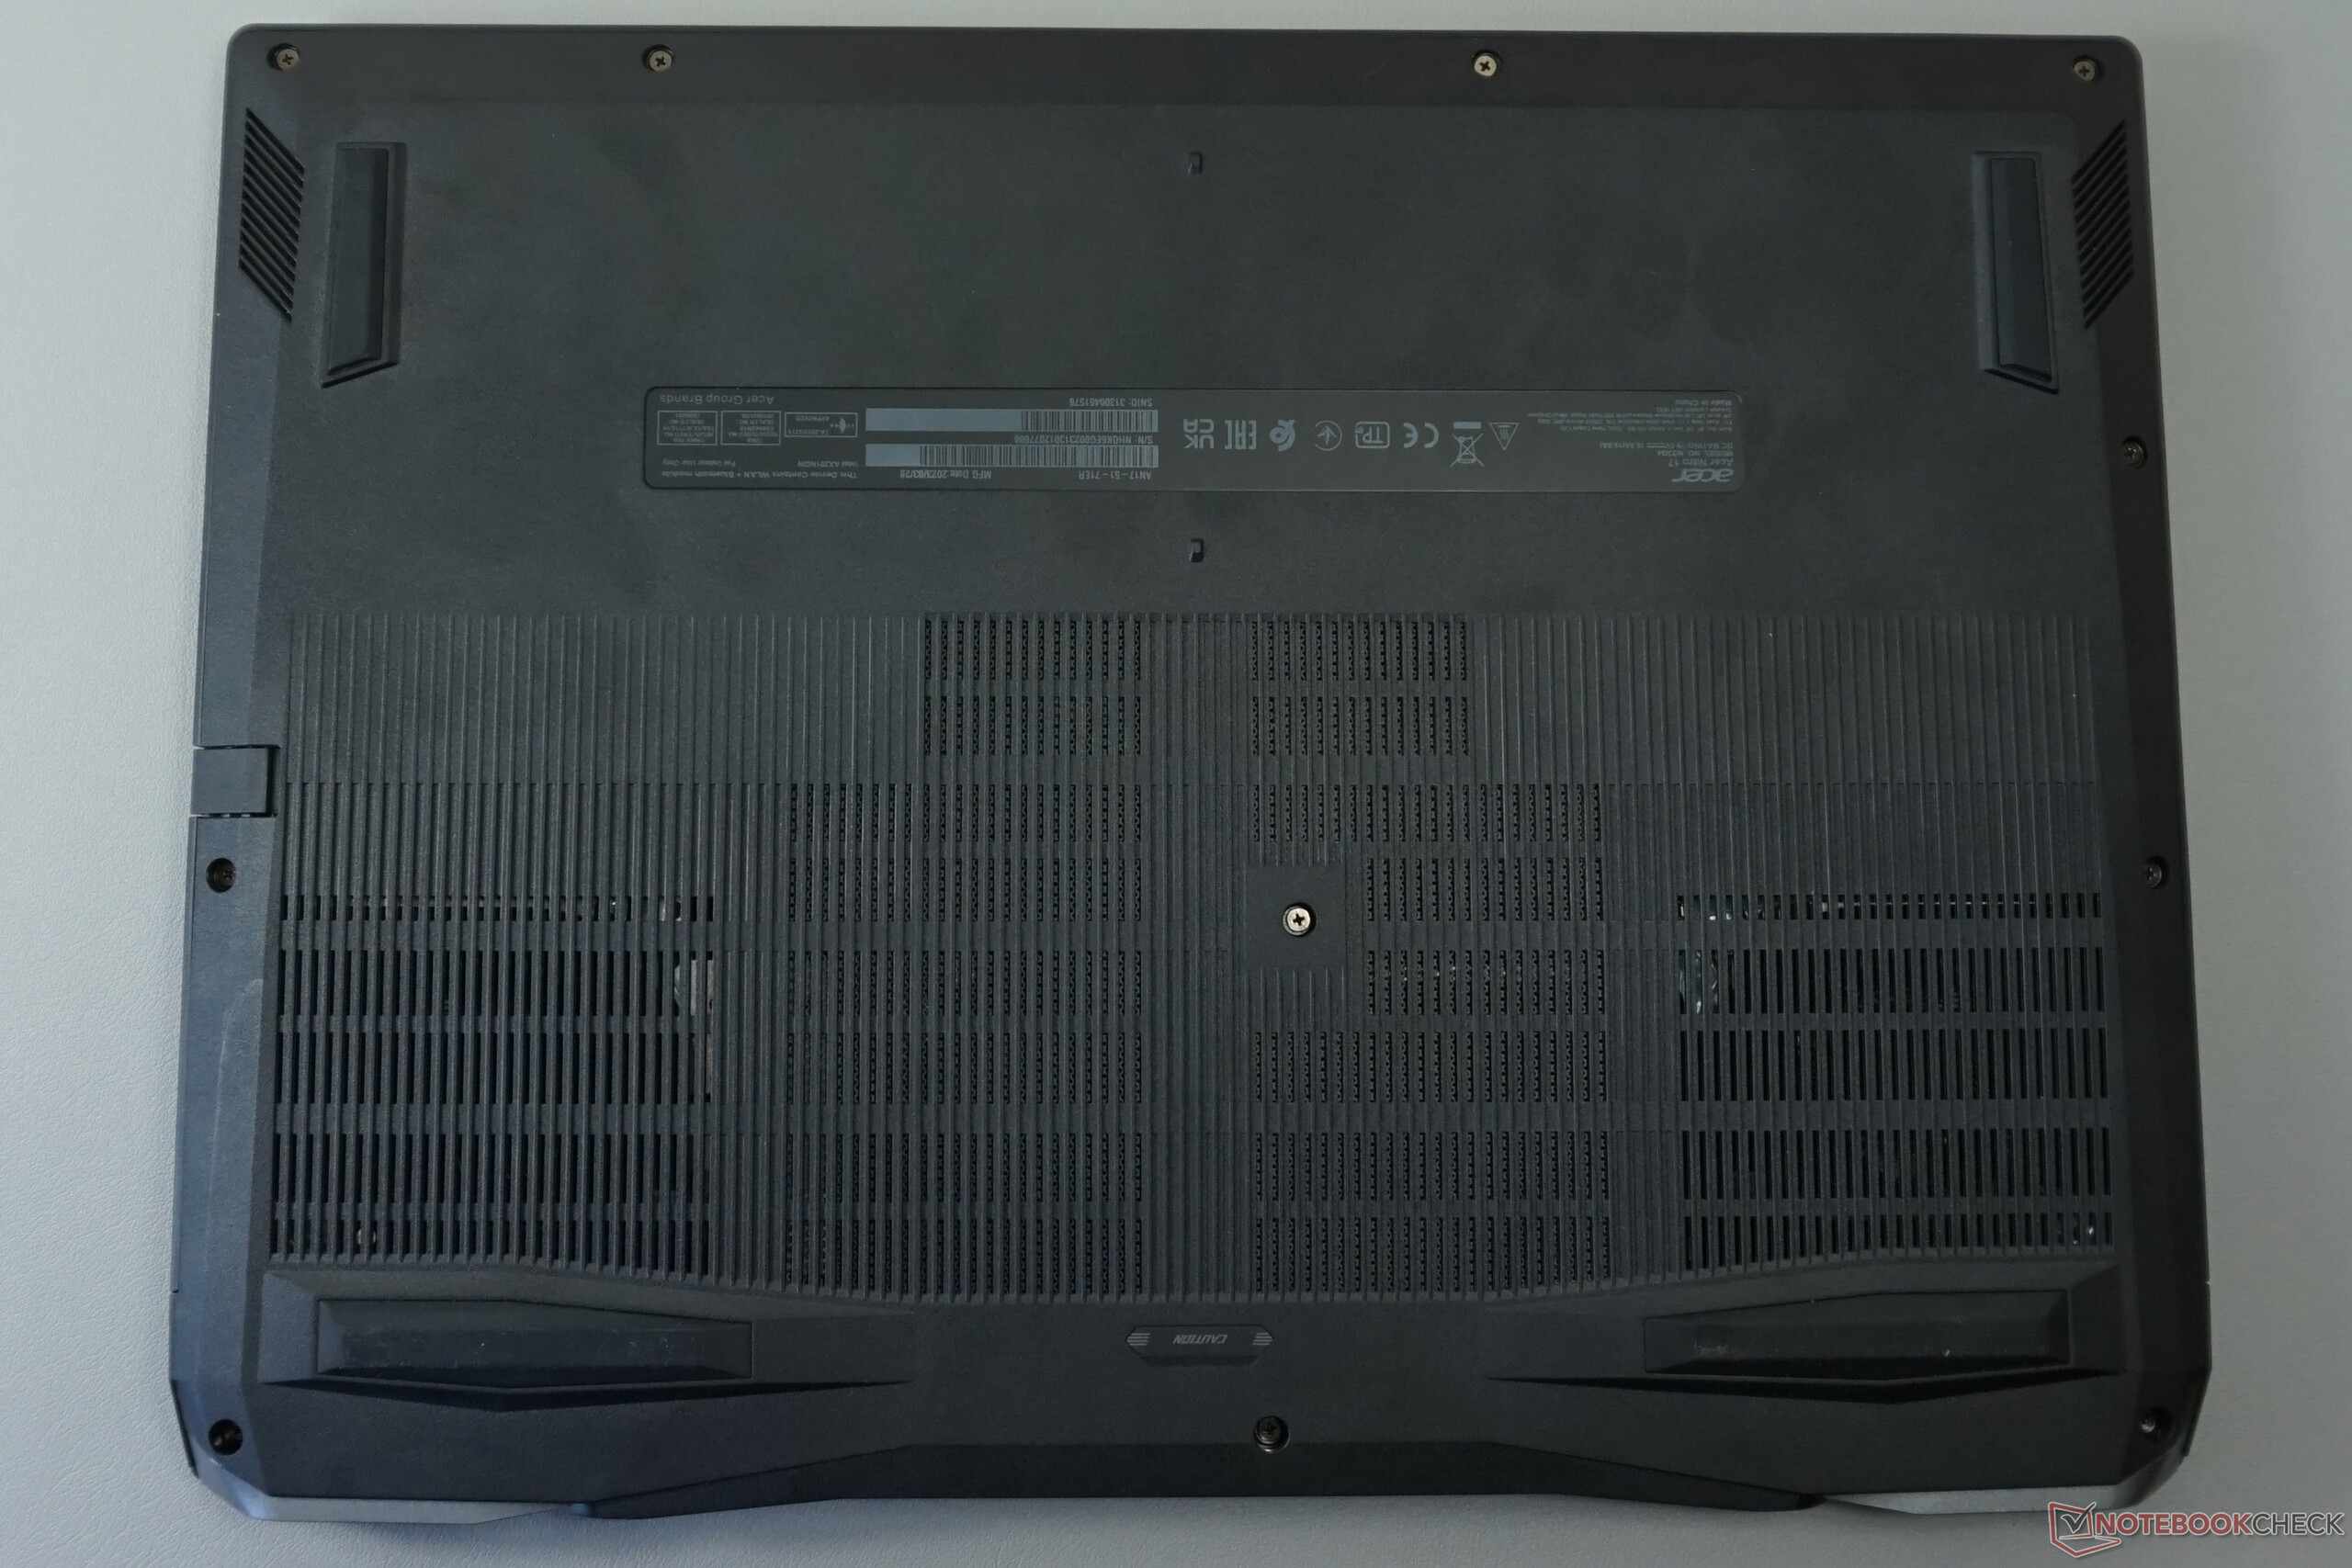
Poiché il case del dispositivo è identico a quello della controparte Intel, a parte le opzioni di connettività (la variante AMD non ha una porta Thunderbolt 4 e dispone invece di 2x USB 4), in questo articolo non approfondiremo ulteriormente il case, le caratteristiche e i dispositivi di input. Potete trovare le informazioni corrispondenti nella recensione del modello AN17-51-71ER.
Lettore di schede SD
| SD Card Reader | |
| average JPG Copy Test (av. of 3 runs) | |
| Media della classe Gaming (20.9 - 210, n=55, ultimi 2 anni) | |
| Schenker XMG Focus 17 (E23) | |
| Acer Nitro 17 AN17-41-R9LN (AV PRO microSD 128 GB V60) | |
| Acer Nitro 17 AN17-51-71ER | |
| maximum AS SSD Seq Read Test (1GB) | |
| Media della classe Gaming (25.5 - 261, n=52, ultimi 2 anni) | |
| Schenker XMG Focus 17 (E23) | |
| Acer Nitro 17 AN17-41-R9LN (AV PRO microSD 128 GB V60) | |
| Acer Nitro 17 AN17-51-71ER | |
Comunicazione
Webcam


Display
Il modello AMD presenta lo stesso display QHD della versione Intel, che apprezziamo per i buoni risultati di misurazione e i valori delle immagini.
| |||||||||||||||||||||||||
Distribuzione della luminosità: 88 %
Al centro con la batteria: 350 cd/m²
Contrasto: 1000:1 (Nero: 0.35 cd/m²)
ΔE ColorChecker Calman: 2.03 | ∀{0.5-29.43 Ø4.73}
calibrated: 0.56
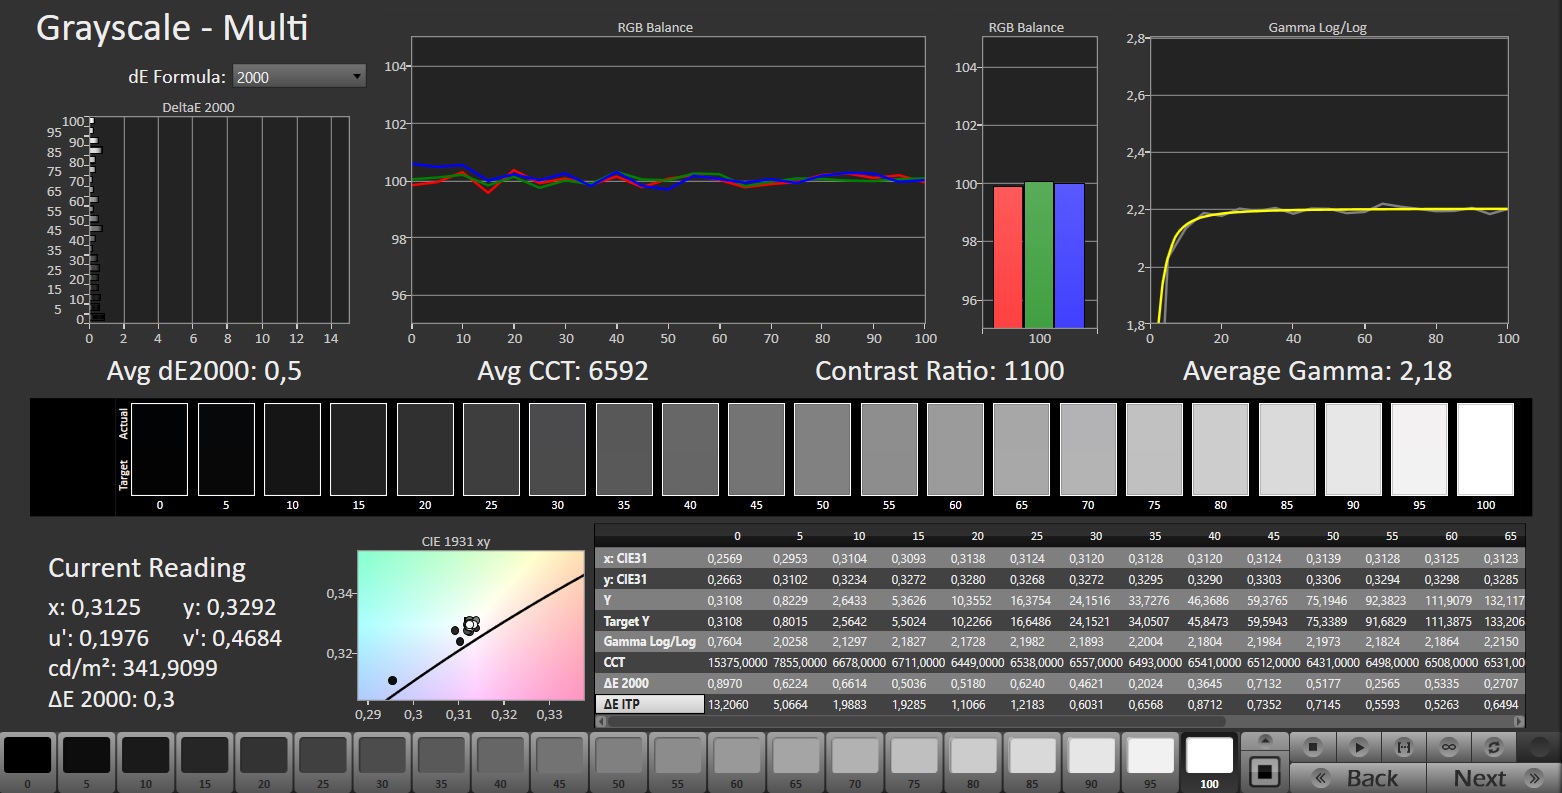
ΔE Greyscale Calman: 2.4 | ∀{0.09-98 Ø4.97}
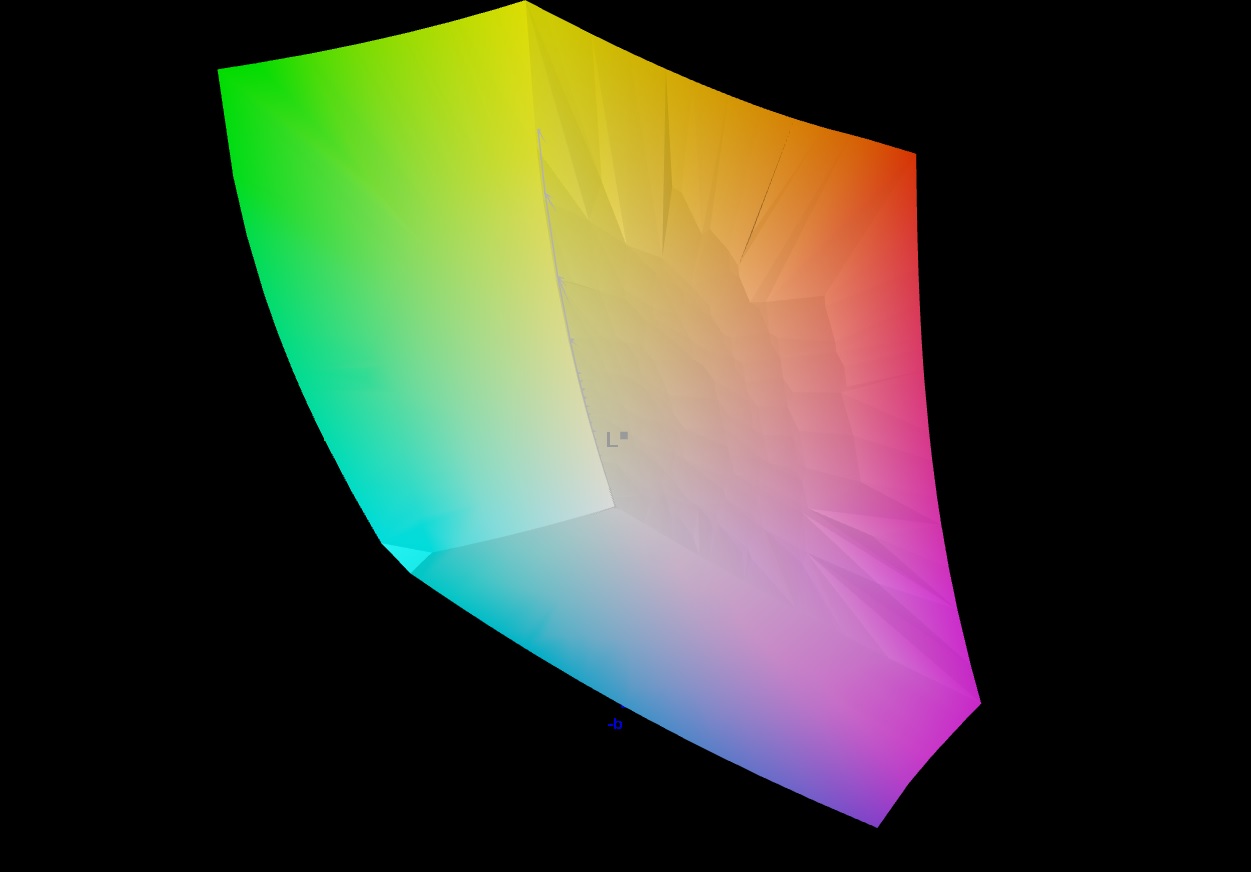
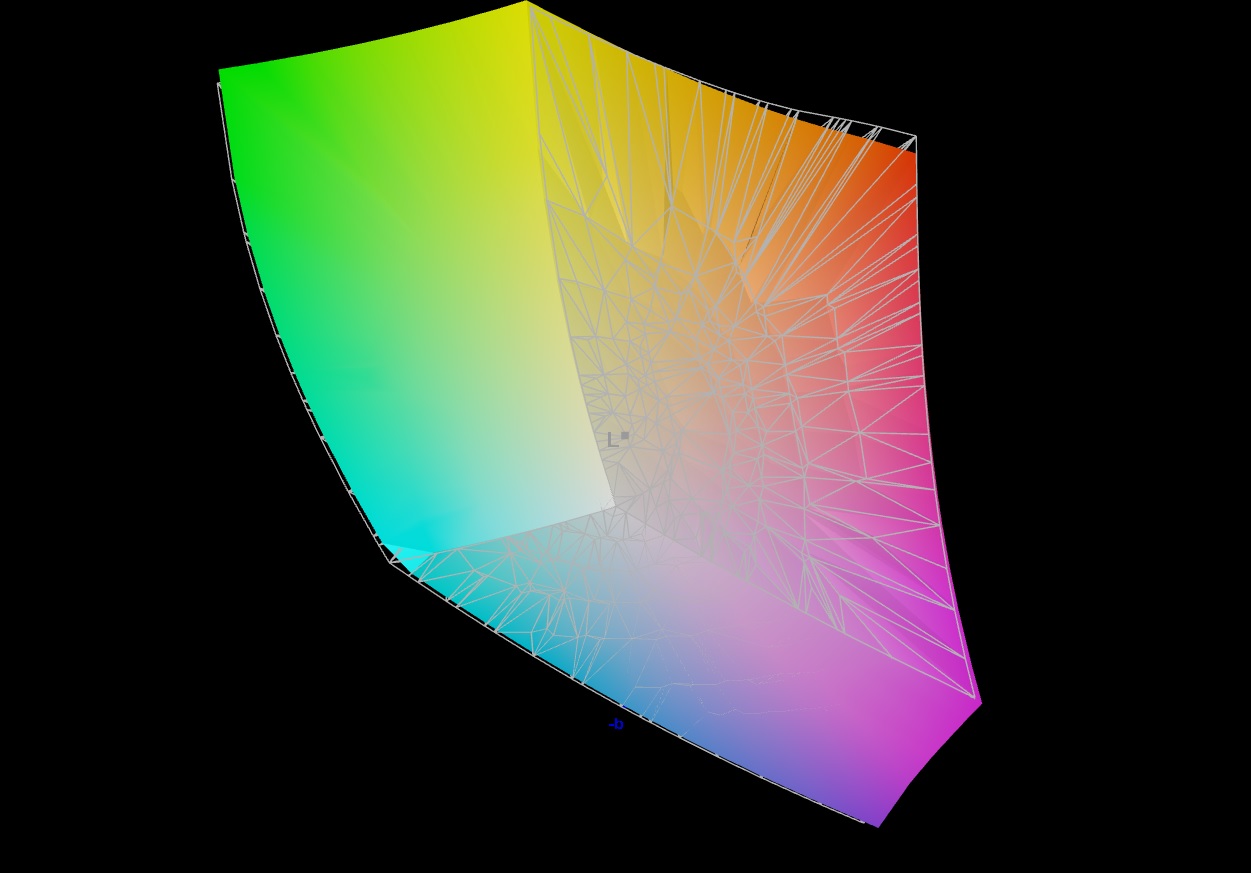
86% AdobeRGB 1998 (Argyll 3D)
100% sRGB (Argyll 3D)
98% Display P3 (Argyll 3D)
Gamma: 2.071
CCT: 6961 K
| Acer Nitro 17 AN17-41-R9LN NE173QHM-NY6 (BOE0B7C), IPS, 2560x1440, 17.3" | Acer Nitro 17 AN17-51-71ER BOE0B7C NE173QHM-NY6, , 2560x1440, 17.3" | MSI Pulse 17 B13VGK AU Optronics B173HAN04.9, IPS, 1920x1080, 17.3" | Schenker XMG Focus 17 (E23) BOE09F9 NE173QHM-NZ1, IPS, 2560x1440, 17.3" | Asus ROG Strix G17 G713PI BOE0B69, IPS, 2560x1440, 17.3" | |
|---|---|---|---|---|---|
| Display | 0% | -53% | -1% | 0% | |
| Display P3 Coverage (%) | 98 | 98.3 0% | 38.4 -61% | 96.6 -1% | 98.3 0% |
| sRGB Coverage (%) | 100 | 100 0% | 57.5 -43% | 99.9 0% | 100 0% |
| AdobeRGB 1998 Coverage (%) | 86 | 85.7 0% | 39.7 -54% | 84.5 -2% | 85.9 0% |
| Response Times | 2% | -146% | -21% | 32% | |
| Response Time Grey 50% / Grey 80% * (ms) | 14.3 ? | 14.8 ? -3% | 31.2 ? -118% | 16.4 ? -15% | 5.3 ? 63% |
| Response Time Black / White * (ms) | 8.6 ? | 8 ? 7% | 23.6 ? -174% | 10.8 ? -26% | 8.6 ? -0% |
| PWM Frequency (Hz) | |||||
| Screen | -86% | -112% | -7% | 11% | |
| Brightness middle (cd/m²) | 350 | 361 3% | 254 -27% | 349 0% | 327 -7% |
| Brightness (cd/m²) | 337 | 326 -3% | 250 -26% | 318 -6% | 320 -5% |
| Brightness Distribution (%) | 88 | 87 -1% | 91 3% | 82 -7% | 89 1% |
| Black Level * (cd/m²) | 0.35 | 0.6 -71% | 0.14 60% | 0.56 -60% | 0.38 -9% |
| Contrast (:1) | 1000 | 602 -40% | 1814 81% | 623 -38% | 861 -14% |
| Colorchecker dE 2000 * | 2.03 | 3.83 -89% | 4.52 -123% | 1.08 47% | 1.01 50% |
| Colorchecker dE 2000 max. * | 5.02 | 5.71 -14% | 21.22 -323% | 3.05 39% | 4.01 20% |
| Colorchecker dE 2000 calibrated * | 0.56 | 3.48 -521% | 4.52 -707% | 1.08 -93% | 0.41 27% |
| Greyscale dE 2000 * | 2.4 | 3.29 -37% | 1 58% | 1.14 52% | 1.6 33% |
| Gamma | 2.071 106% | 2.29 96% | 2.44 90% | 2.41 91% | 2.168 101% |
| CCT | 6961 93% | 6679 97% | 6502 100% | 6687 97% | 6659 98% |
| Media totale (Programma / Settaggio) | -28% /
-55% | -104% /
-104% | -10% /
-8% | 14% /
11% |
* ... Meglio usare valori piccoli
Il suo pannello IPS non è forse il più luminoso, con una media di 337 cd/m², ma finché si rimane in ambienti chiusi, i suoi livelli di luminosità vanno bene. Anche i tempi di reazione, il valore del nero (0,35 cd/m²) e il contrasto (1.000:1) non sono un motivo per nascondere il portatile alla concorrenza, anche se c'è ancora un po' di margine di miglioramento.
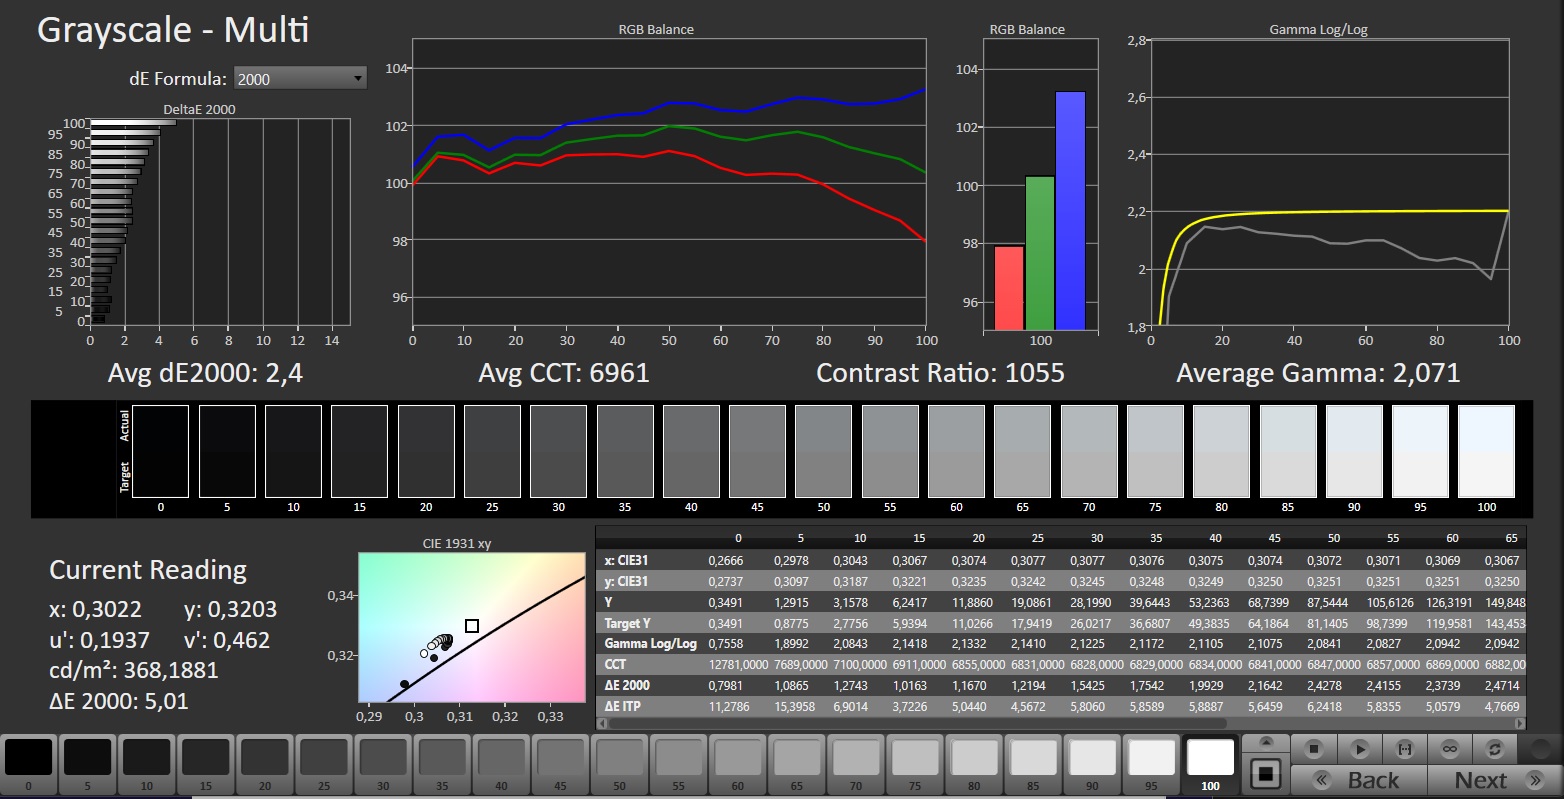
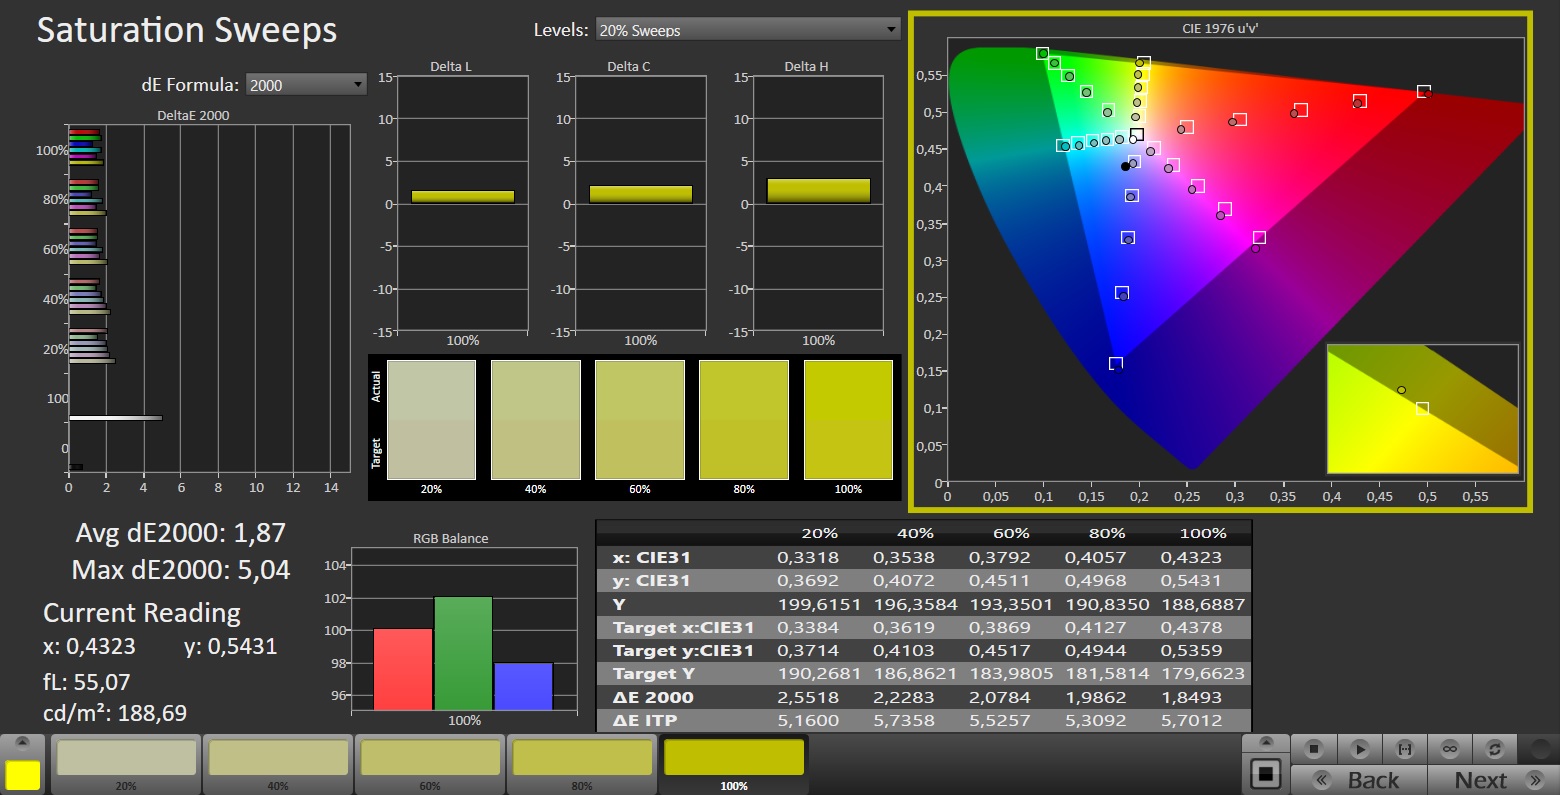
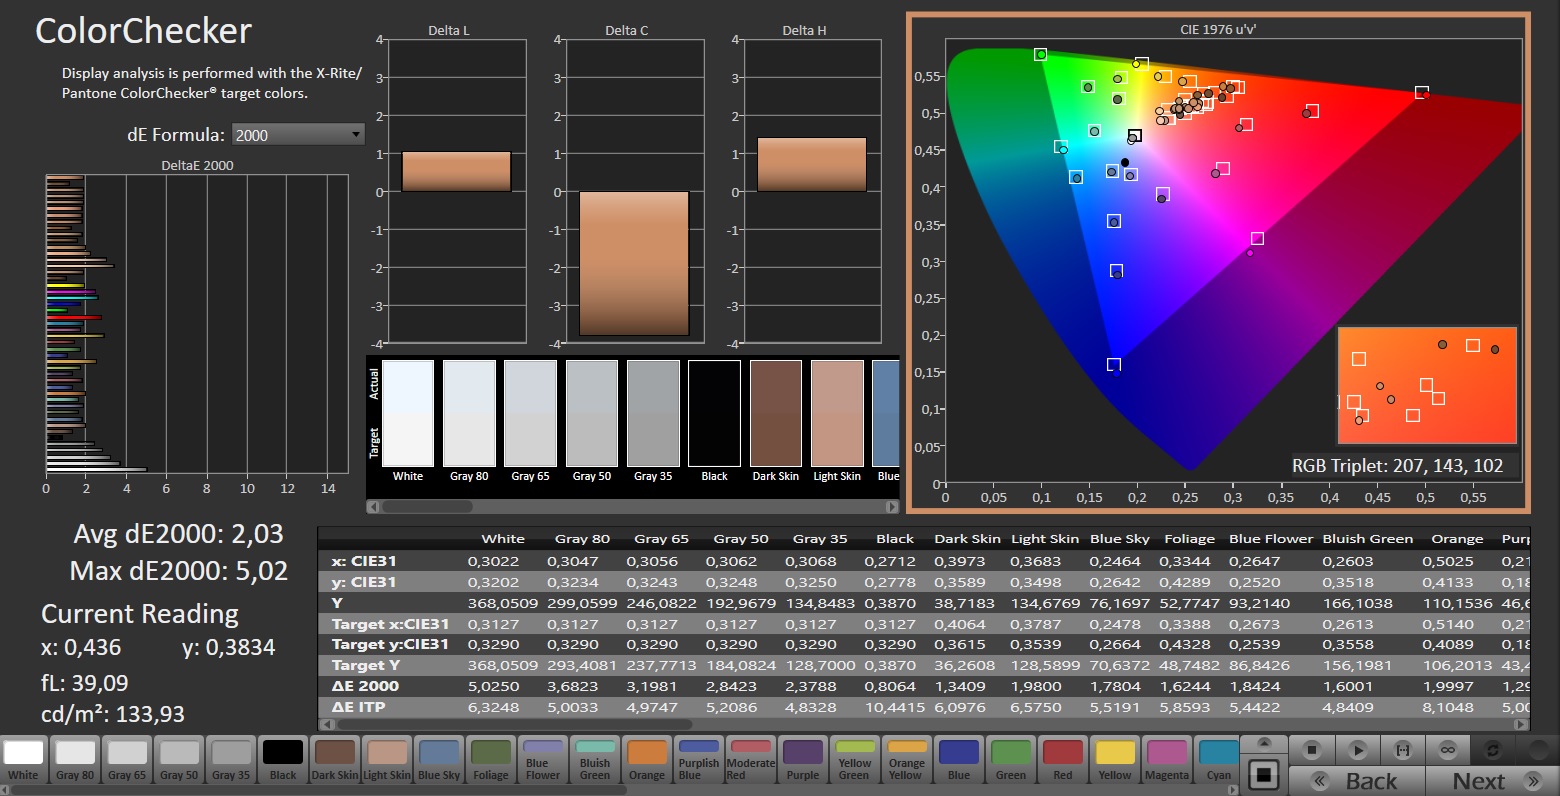
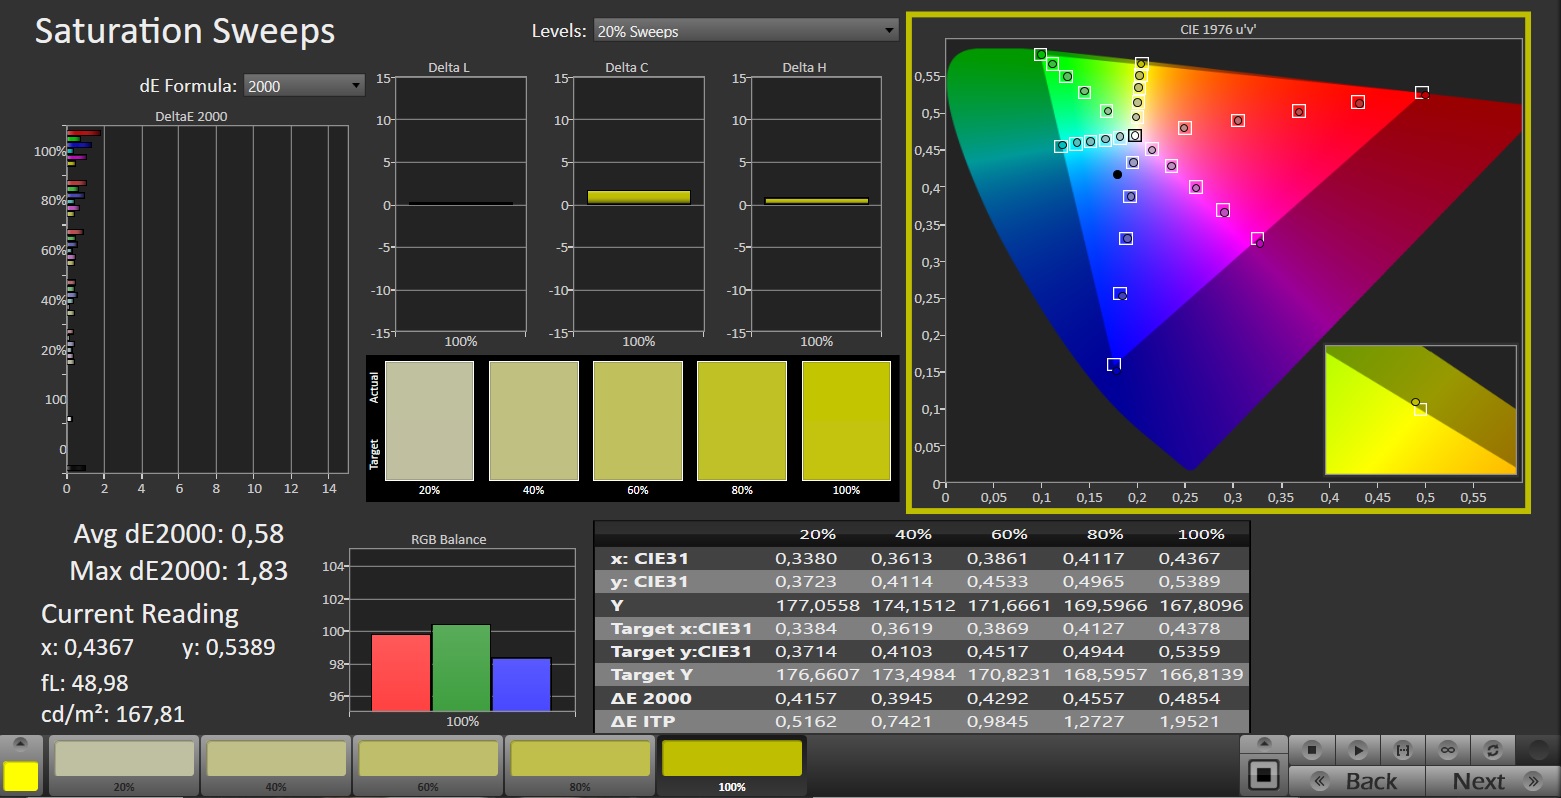
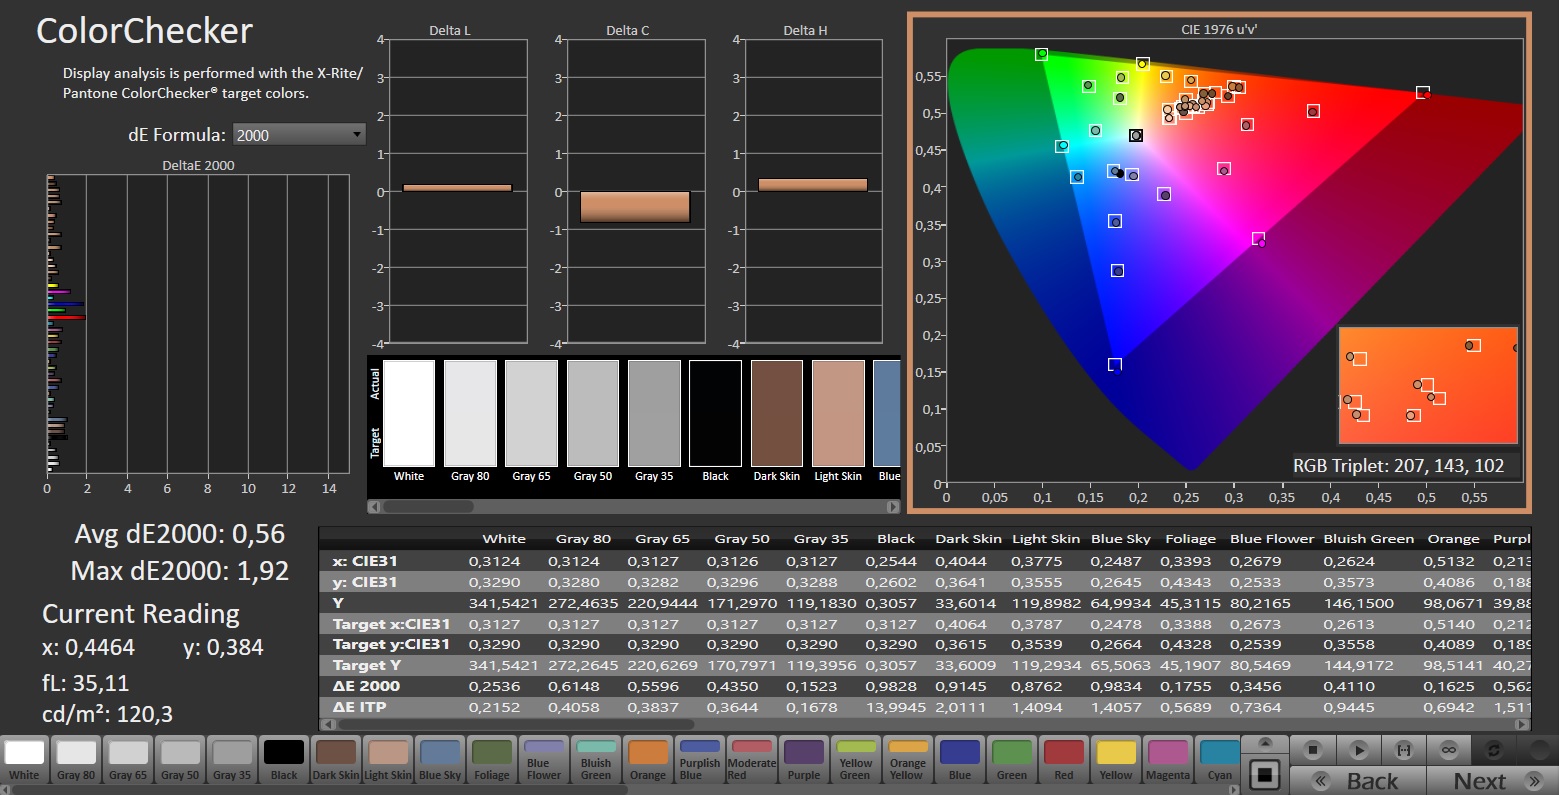
Per un portatile da gioco, gli spazi colore (100% sRGB, 98% P3 e 86% AdobeRGB) sono insolitamente buoni. Anche l'accuratezza del colore è buona e non richiede molta calibrazione.

Gli angoli di visione del portatile sono tipici di un pannello IPS, quindi abbastanza buoni. Sfortunatamente, il nostro dispositivo di prova ha avuto un problema di screen bleeding lungo i bordi del display.
Tempi di risposta del Display
| ↔ Tempi di risposta dal Nero al Bianco | ||
|---|---|---|
| 8.6 ms ... aumenta ↗ e diminuisce ↘ combinato | ↗ 3.8 ms Incremento | 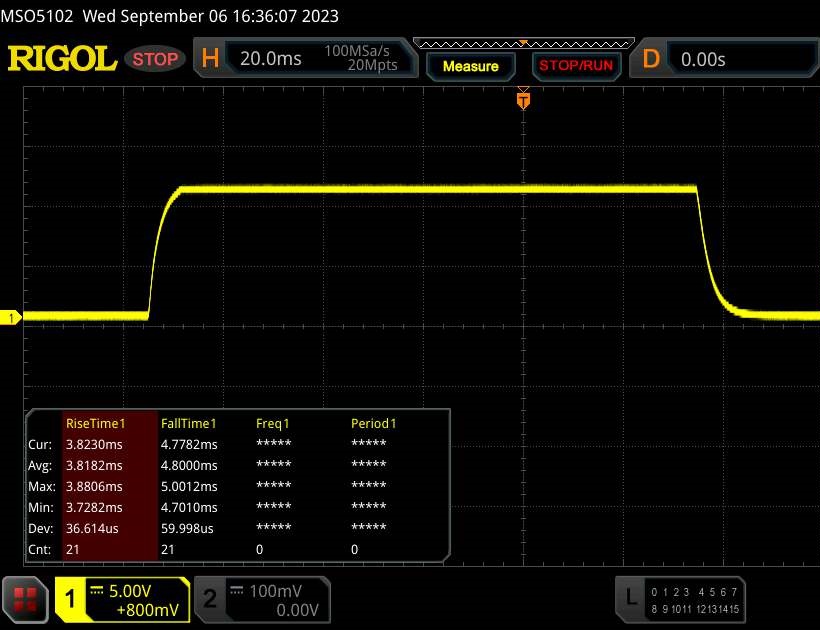 |
| ↘ 4.8 ms Calo | ||
| Lo schermo mostra veloci tempi di risposta durante i nostri tests e dovrebbe esere adatto al gaming In confronto, tutti i dispositivi di test variano da 0.1 (minimo) a 240 (massimo) ms. » 24 % di tutti i dispositivi è migliore. Questo significa che i tempi di risposta rilevati sono migliori rispettto alla media di tutti i dispositivi testati (19.9 ms). | ||
| ↔ Tempo di risposta dal 50% Grigio all'80% Grigio | ||
| 14.3 ms ... aumenta ↗ e diminuisce ↘ combinato | ↗ 7.1 ms Incremento |  |
| ↘ 7.2 ms Calo | ||
| Lo schermo mostra buoni tempi di risposta durante i nostri tests, ma potrebbe essere troppo lento per i gamers competitivi. In confronto, tutti i dispositivi di test variano da 0.165 (minimo) a 636 (massimo) ms. » 28 % di tutti i dispositivi è migliore. Questo significa che i tempi di risposta rilevati sono migliori rispettto alla media di tutti i dispositivi testati (31.1 ms). | ||
Sfarfallio dello schermo / PWM (Pulse-Width Modulation)
| flickering dello schermo / PWM non rilevato |  | ||
In confronto: 52 % di tutti i dispositivi testati non utilizza PWM per ridurre la luminosita' del display. Se è rilevato PWM, una media di 7801 (minimo: 5 - massimo: 343500) Hz è stata rilevata. | |||
Prestazioni
Anche se ilRyzen 7 7735HSdeve accontentarsi della vecchia architettura Zen 3+ (alcuni modelli 7000 si affidano già a Zen 4), il Nitro 17 AN17-41-R9LN rientra comunque nella fascia media superiore. I 16 GB di RAM e l'SSD da 1 TB non sono più un punto di forza nell'anno 2023, ma sono ancora adeguati.
Condizioni di test
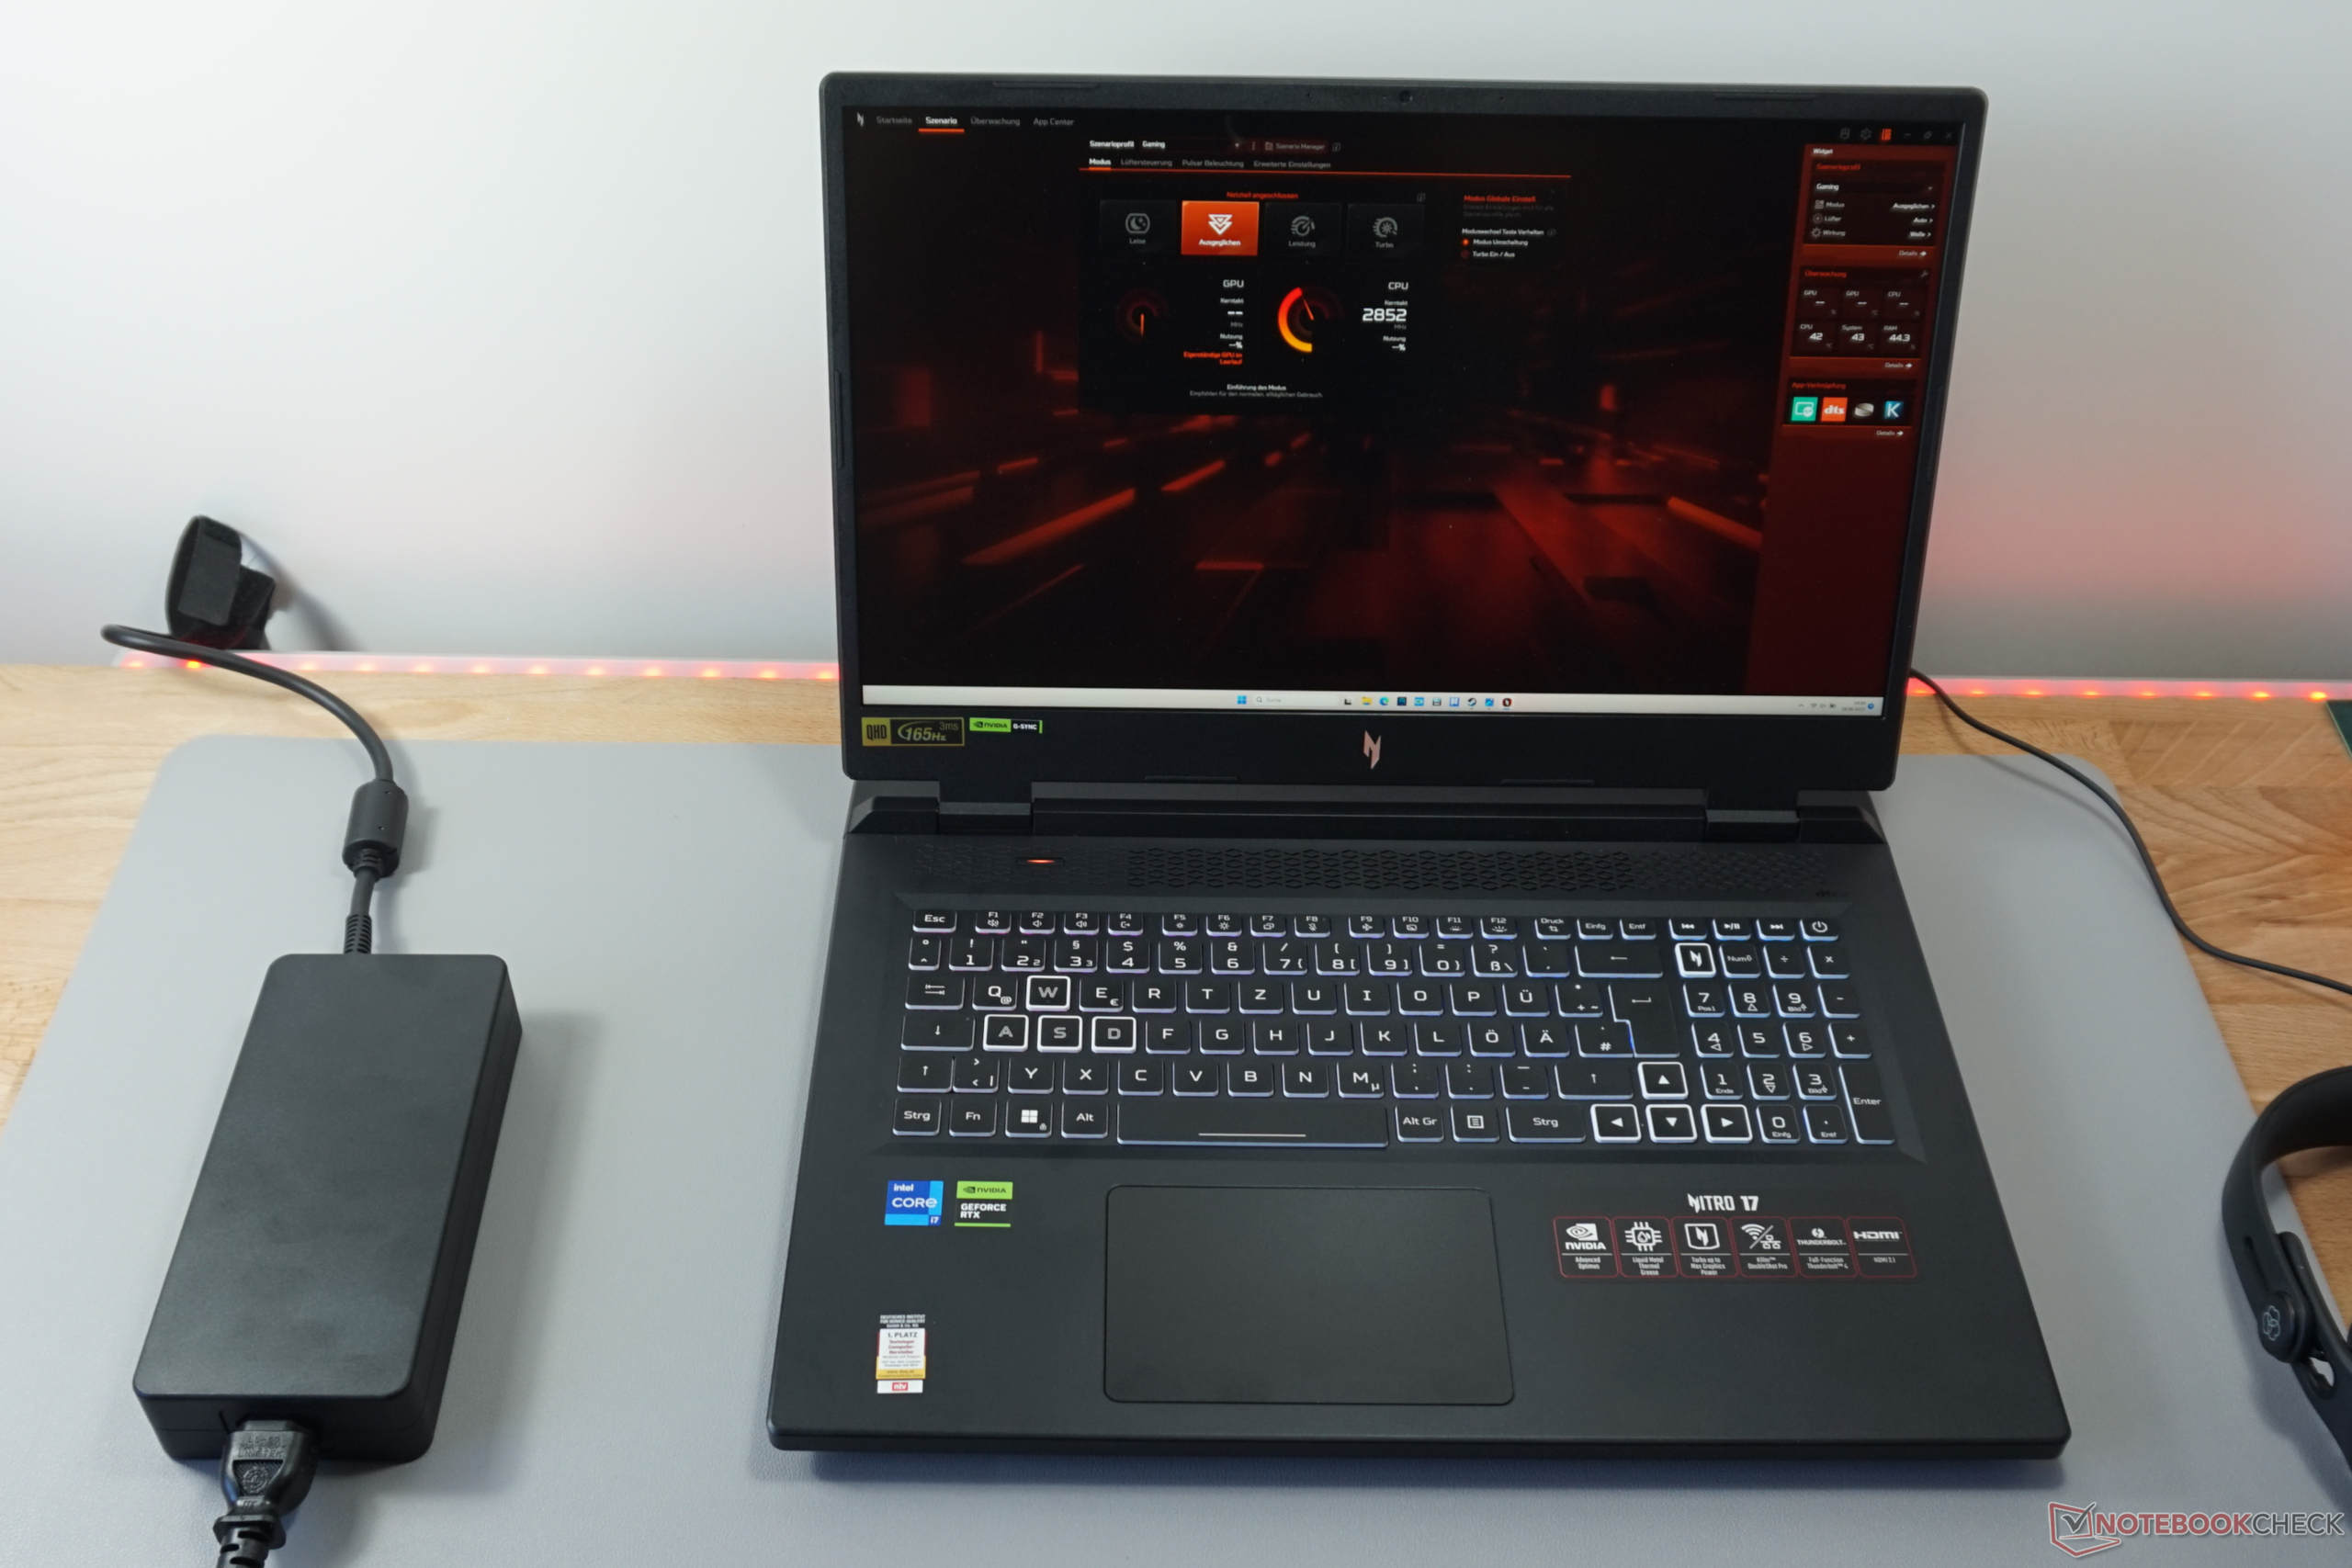
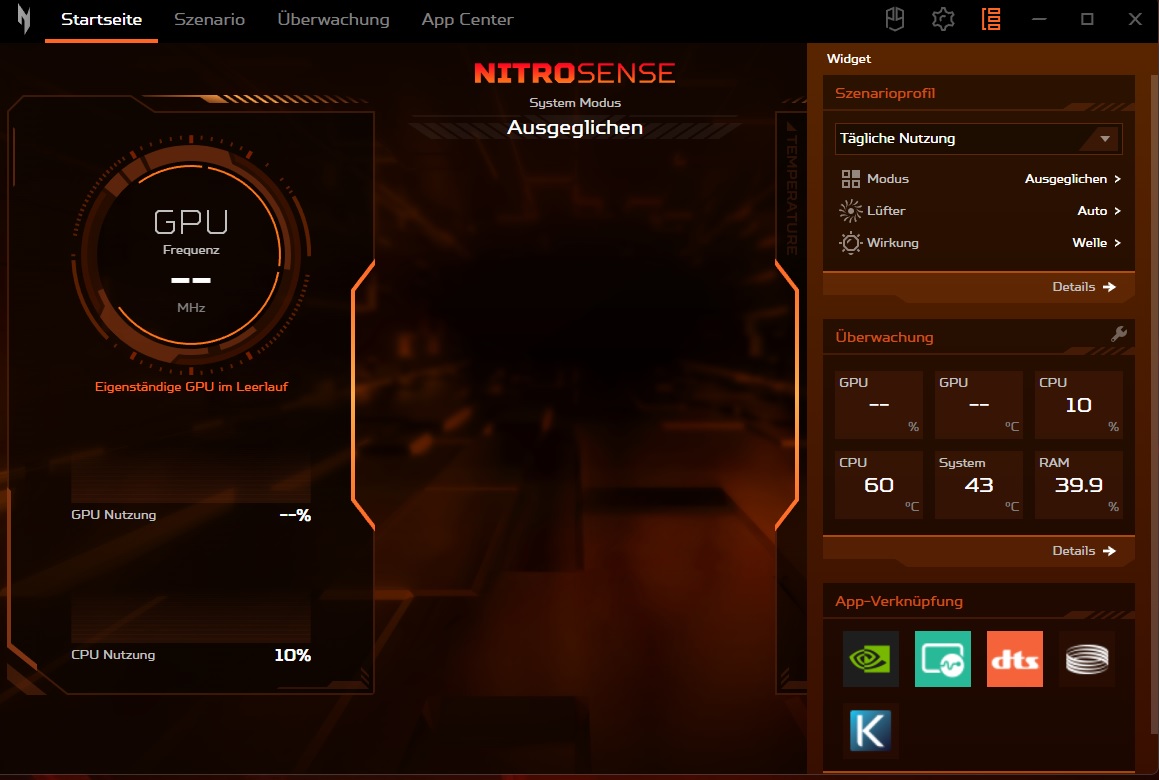
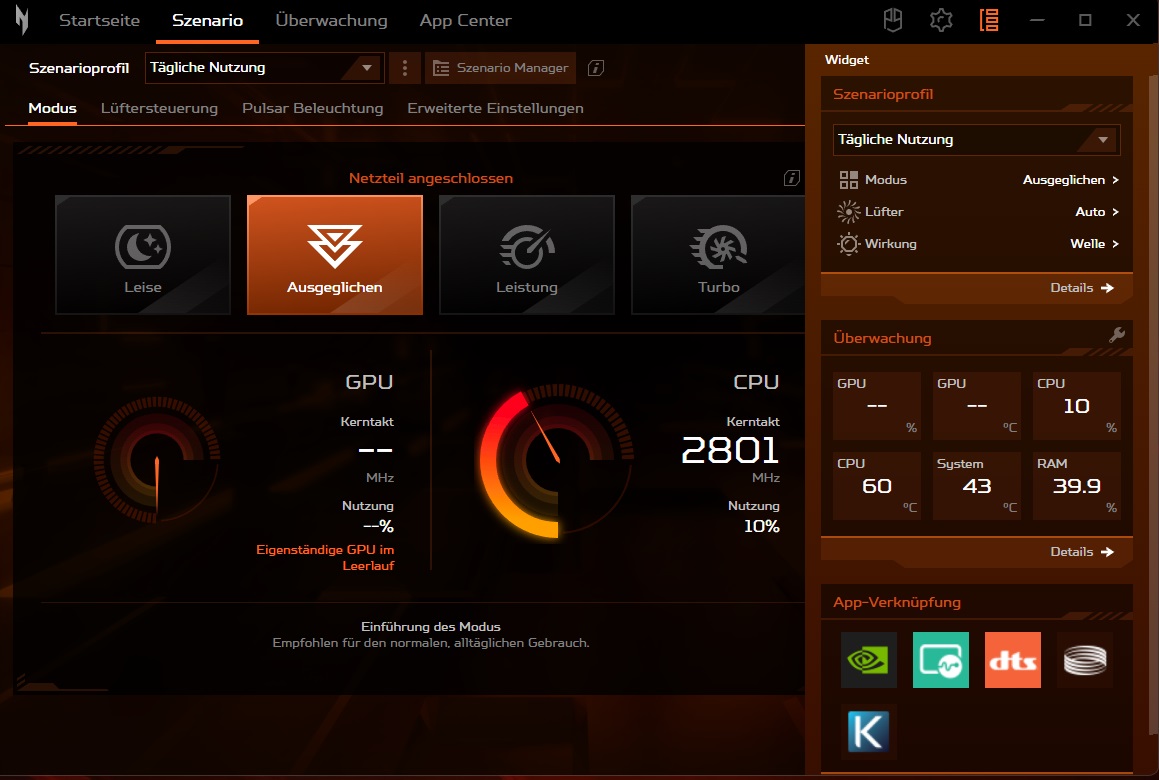
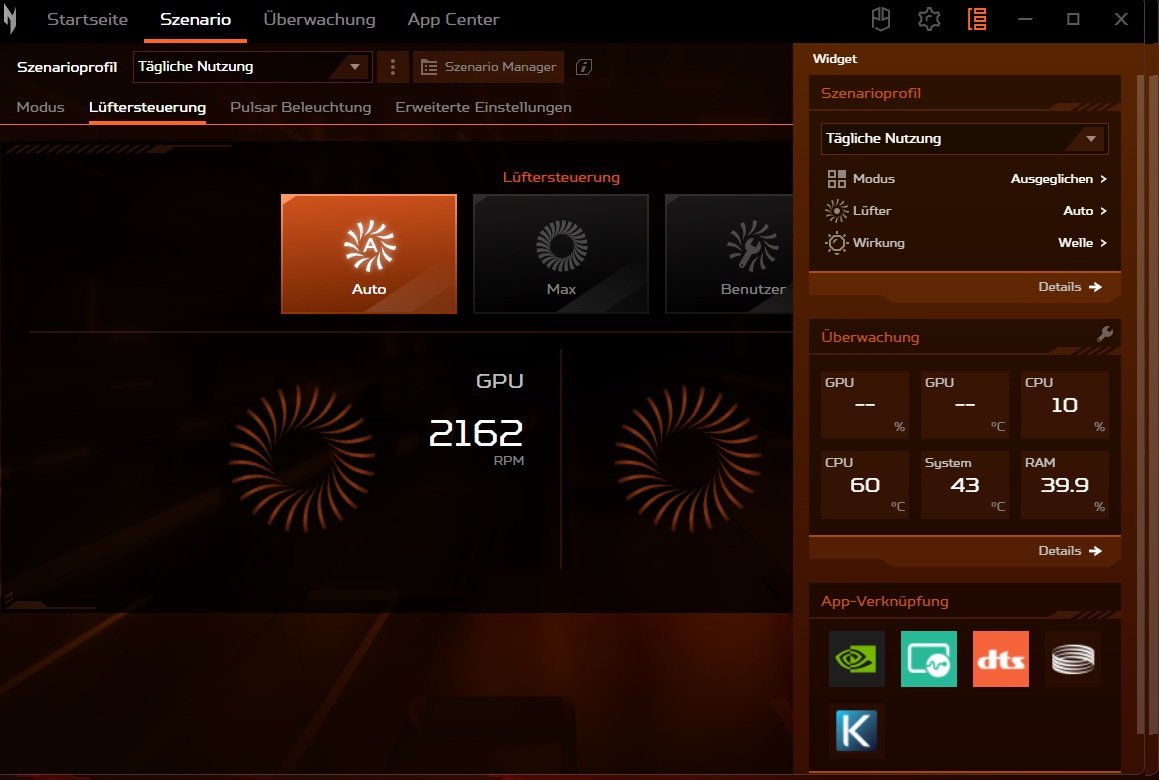
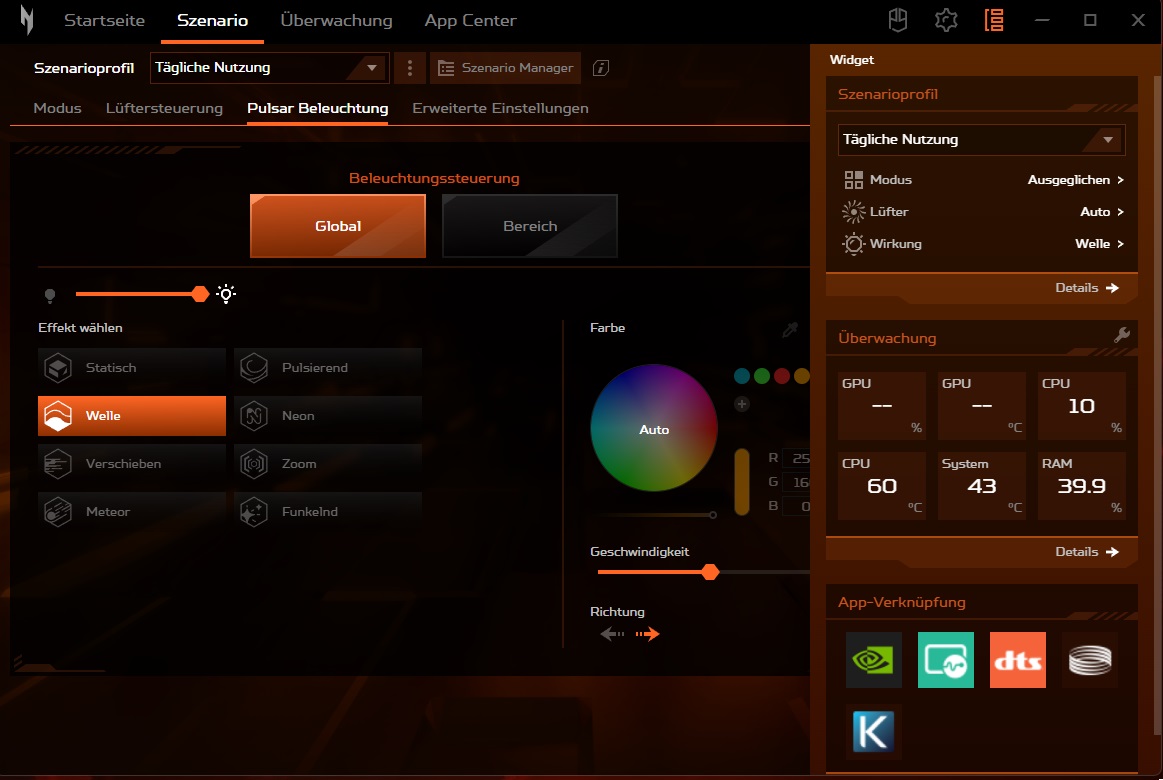
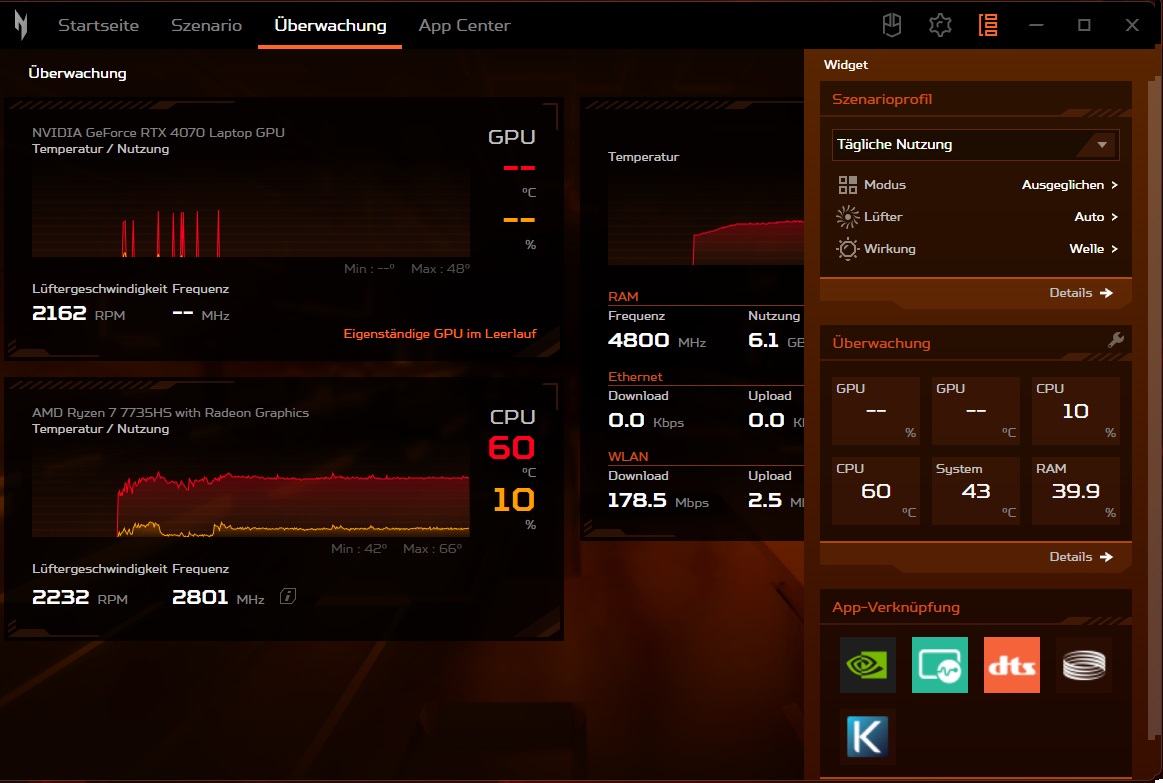
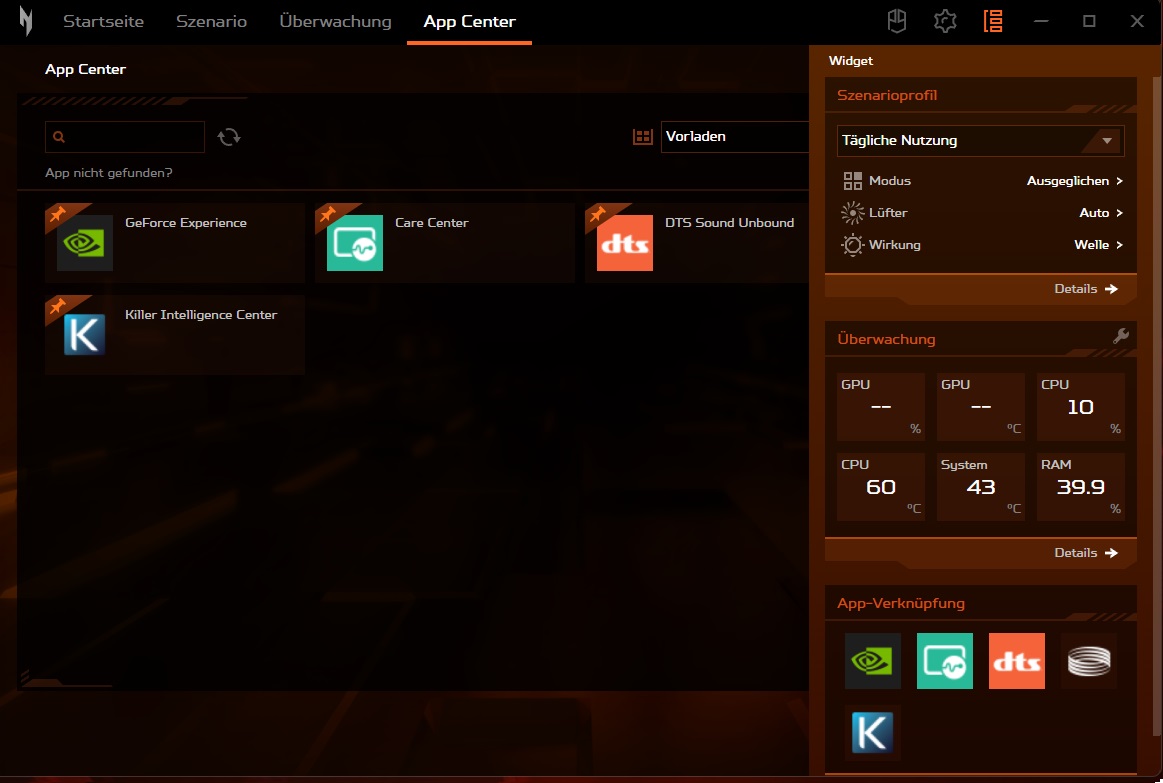
Acer ha preinstallato uno strumento chiamato Nitro Sense, che può essere utilizzato per apportare numerose modifiche al sistema (ad esempio l'illuminazione della tastiera). Le diverse modalità di prestazioni sono particolarmente importanti per l'uso quotidiano. Poiché non è stato possibile determinare un reale aumento del frame rate a partire dalle applicazioni 3D, ma le emissioni acustiche sono aumentate in modo significativo, abbiamo eseguito tutte le misurazioni in modalità Bilanciata, che rappresenta il punto di forza, per così dire. Il controllo della ventola era sempre in modalità automatica.
| Witcher 3 (FHD/Ultra) | Silenzioso | Bilanciato | Prestazioni | Turbo |
|---|---|---|---|---|
| Prestazioni | 60 - 100 fps | ~110 fps | ~111 fps | ~112 fps |
| Rumore | ~38 dB(A) | ~44 dB(A) | ~54 dB(A) | ~61 dB(A) |
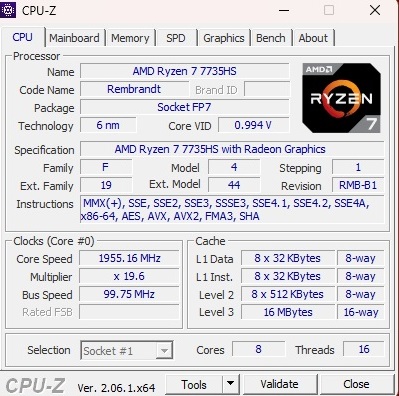
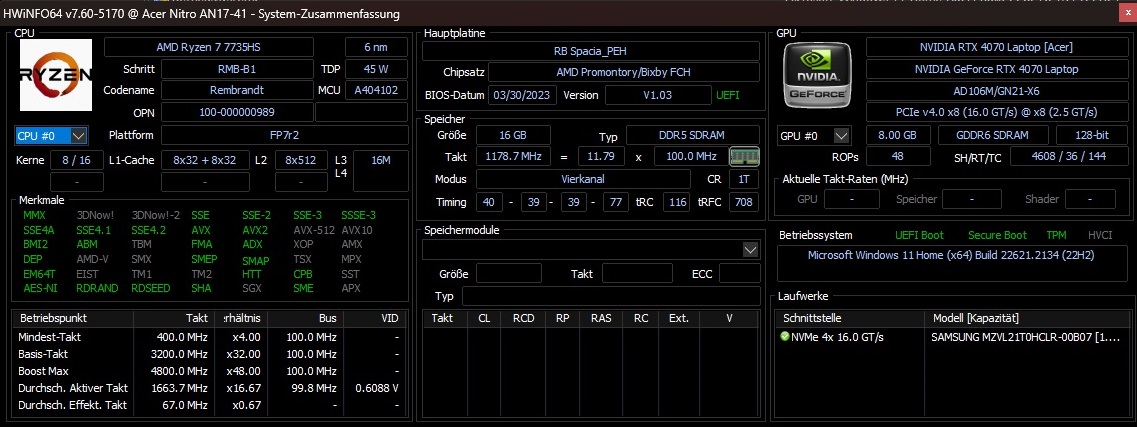
Processore
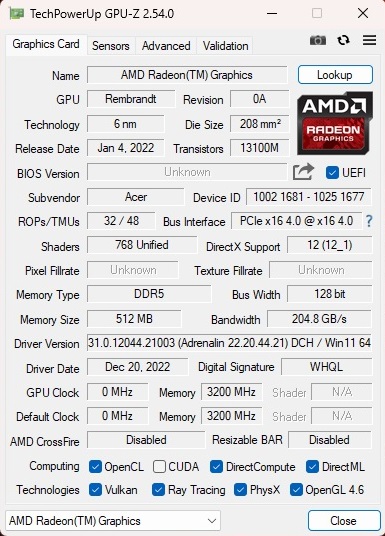
Ryzen 7 7735HS è un processore octa-core con 16 MB di cache L3 e può elaborare fino a 16 thread contemporaneamente grazie a SMT. AMD ha indicato che il modello a 6 nm ha una frequenza di clock compresa tra 3,2 e 4,75 GHz sotto carico, che non è né poco né tanto. Uno dei suoi maggiori vantaggi è l'iGPU relativamente potente. Durante le attività non impegnative (il dispositivo supporta Advanced Optimus), solo laRadeon 680M integrata nel processore, che può competere con le vecchie GPU entry-level e in parte anche con quelle di fascia media.
Il Ryzen 7 7735HS si è comportato bene ma non in modo eccessivo durante i benchmark. Le sue prestazioni sono state (come previsto) leggermente peggiori rispetto al suo concorrente Intel (più costoso), il Core i7-13700H, che dispone di 14 core e può elaborare 20 thread contemporaneamente. Rispetto a unCore i9-13900HXo a unRyzen 9 7945HXcon architettura Zen 4, il 7735HS non ha avuto alcuna possibilità e ha fatto un po' peggio. Nonostante ciò, le prestazioni della CPU sono rimaste molto costanti secondo il nostro ciclo Cinebench, cosa che non si può dire per tutti gli altri portatili.
Cinebench R15 Multi continuous test
* ... Meglio usare valori piccoli
AIDA64: FP32 Ray-Trace | FPU Julia | CPU SHA3 | CPU Queen | FPU SinJulia | FPU Mandel | CPU AES | CPU ZLib | FP64 Ray-Trace | CPU PhotoWorxx
| Performance rating | |
| Asus ROG Strix G17 G713PI | |
| Media della classe Gaming | |
| Schenker XMG Focus 17 (E23) | |
| Acer Nitro 17 AN17-51-71ER | |
| MSI Pulse 17 B13VGK | |
| Acer Nitro 17 AN17-41-R9LN | |
| Media AMD Ryzen 7 7735HS | |
| AIDA64 / FP32 Ray-Trace | |
| Asus ROG Strix G17 G713PI | |
| Media della classe Gaming (10227 - 85542, n=110, ultimi 2 anni) | |
| Schenker XMG Focus 17 (E23) | |
| MSI Pulse 17 B13VGK | |
| Acer Nitro 17 AN17-51-71ER | |
| Acer Nitro 17 AN17-41-R9LN | |
| Media AMD Ryzen 7 7735HS (11831 - 17161, n=16) | |
| AIDA64 / FPU Julia | |
| Asus ROG Strix G17 G713PI | |
| Media della classe Gaming (51376 - 238426, n=110, ultimi 2 anni) | |
| Schenker XMG Focus 17 (E23) | |
| Acer Nitro 17 AN17-41-R9LN | |
| Media AMD Ryzen 7 7735HS (75370 - 105483, n=16) | |
| MSI Pulse 17 B13VGK | |
| Acer Nitro 17 AN17-51-71ER | |
| AIDA64 / CPU SHA3 | |
| Asus ROG Strix G17 G713PI | |
| Media della classe Gaming (2180 - 9817, n=110, ultimi 2 anni) | |
| Schenker XMG Focus 17 (E23) | |
| Acer Nitro 17 AN17-51-71ER | |
| MSI Pulse 17 B13VGK | |
| Acer Nitro 17 AN17-41-R9LN | |
| Media AMD Ryzen 7 7735HS (2499 - 3494, n=16) | |
| AIDA64 / CPU Queen | |
| Asus ROG Strix G17 G713PI | |
| Schenker XMG Focus 17 (E23) | |
| Media della classe Gaming (49785 - 173351, n=101, ultimi 2 anni) | |
| Acer Nitro 17 AN17-41-R9LN | |
| Acer Nitro 17 AN17-51-71ER | |
| Media AMD Ryzen 7 7735HS (87486 - 108729, n=15) | |
| MSI Pulse 17 B13VGK | |
| AIDA64 / FPU SinJulia | |
| Asus ROG Strix G17 G713PI | |
| Media della classe Gaming (4424 - 33636, n=110, ultimi 2 anni) | |
| Schenker XMG Focus 17 (E23) | |
| Acer Nitro 17 AN17-41-R9LN | |
| Media AMD Ryzen 7 7735HS (11233 - 13097, n=16) | |
| MSI Pulse 17 B13VGK | |
| Acer Nitro 17 AN17-51-71ER | |
| AIDA64 / FPU Mandel | |
| Asus ROG Strix G17 G713PI | |
| Media della classe Gaming (25115 - 128721, n=110, ultimi 2 anni) | |
| Acer Nitro 17 AN17-41-R9LN | |
| Schenker XMG Focus 17 (E23) | |
| Media AMD Ryzen 7 7735HS (41400 - 58232, n=16) | |
| MSI Pulse 17 B13VGK | |
| Acer Nitro 17 AN17-51-71ER | |
| AIDA64 / CPU AES | |
| Asus ROG Strix G17 G713PI | |
| Acer Nitro 17 AN17-51-71ER | |
| Media della classe Gaming (39258 - 247074, n=110, ultimi 2 anni) | |
| Schenker XMG Focus 17 (E23) | |
| MSI Pulse 17 B13VGK | |
| Media AMD Ryzen 7 7735HS (44013 - 137629, n=16) | |
| Acer Nitro 17 AN17-41-R9LN | |
| AIDA64 / CPU ZLib | |
| Asus ROG Strix G17 G713PI | |
| Schenker XMG Focus 17 (E23) | |
| Media della classe Gaming (574 - 2531, n=110, ultimi 2 anni) | |
| Acer Nitro 17 AN17-51-71ER | |
| MSI Pulse 17 B13VGK | |
| Acer Nitro 17 AN17-41-R9LN | |
| Media AMD Ryzen 7 7735HS (651 - 906, n=16) | |
| AIDA64 / FP64 Ray-Trace | |
| Asus ROG Strix G17 G713PI | |
| Media della classe Gaming (5509 - 45446, n=110, ultimi 2 anni) | |
| Schenker XMG Focus 17 (E23) | |
| MSI Pulse 17 B13VGK | |
| Acer Nitro 17 AN17-51-71ER | |
| Acer Nitro 17 AN17-41-R9LN | |
| Media AMD Ryzen 7 7735HS (1459 - 9094, n=16) | |
| AIDA64 / CPU PhotoWorxx | |
| Schenker XMG Focus 17 (E23) | |
| Media della classe Gaming (12271 - 89891, n=110, ultimi 2 anni) | |
| MSI Pulse 17 B13VGK | |
| Acer Nitro 17 AN17-51-71ER | |
| Asus ROG Strix G17 G713PI | |
| Acer Nitro 17 AN17-41-R9LN | |
| Media AMD Ryzen 7 7735HS (17524 - 30542, n=16) | |
Prestazioni del sistema
Le prestazioni di sistema del portatile sono state sufficientemente buone da consentirgli di posizionarsi a metà strada tra i dispositivi di confronto. 7.240 punti in PCMark 10 lo rendono un sistema agile e capace di tutto.
CrossMark: Overall | Productivity | Creativity | Responsiveness
| PCMark 10 / Score | |
| Media della classe Gaming (5828 - 11574, n=96, ultimi 2 anni) | |
| MSI Pulse 17 B13VGK | |
| Asus ROG Strix G17 G713PI | |
| Acer Nitro 17 AN17-41-R9LN | |
| Media AMD Ryzen 7 7735HS, NVIDIA GeForce RTX 4070 Laptop GPU (7220 - 7240, n=2) | |
| Acer Nitro 17 AN17-51-71ER | |
| Schenker XMG Focus 17 (E23) | |
| PCMark 10 / Essentials | |
| Asus ROG Strix G17 G713PI | |
| Acer Nitro 17 AN17-41-R9LN | |
| Media della classe Gaming (8810 - 12600, n=100, ultimi 2 anni) | |
| Media AMD Ryzen 7 7735HS, NVIDIA GeForce RTX 4070 Laptop GPU (10579 - 10690, n=2) | |
| MSI Pulse 17 B13VGK | |
| Acer Nitro 17 AN17-51-71ER | |
| Schenker XMG Focus 17 (E23) | |
| PCMark 10 / Productivity | |
| Asus ROG Strix G17 G713PI | |
| MSI Pulse 17 B13VGK | |
| Media della classe Gaming (6845 - 18766, n=98, ultimi 2 anni) | |
| Schenker XMG Focus 17 (E23) | |
| Media AMD Ryzen 7 7735HS, NVIDIA GeForce RTX 4070 Laptop GPU (8893 - 9146, n=2) | |
| Acer Nitro 17 AN17-41-R9LN | |
| Acer Nitro 17 AN17-51-71ER | |
| PCMark 10 / Digital Content Creation | |
| Media della classe Gaming (7602 - 19657, n=98, ultimi 2 anni) | |
| Acer Nitro 17 AN17-51-71ER | |
| MSI Pulse 17 B13VGK | |
| Acer Nitro 17 AN17-41-R9LN | |
| Media AMD Ryzen 7 7735HS, NVIDIA GeForce RTX 4070 Laptop GPU (10558 - 10834, n=2) | |
| Schenker XMG Focus 17 (E23) | |
| Asus ROG Strix G17 G713PI | |
| CrossMark / Overall | |
| Asus ROG Strix G17 G713PI | |
| Schenker XMG Focus 17 (E23) | |
| Media della classe Gaming (1366 - 2409, n=98, ultimi 2 anni) | |
| MSI Pulse 17 B13VGK | |
| Acer Nitro 17 AN17-51-71ER | |
| Media AMD Ryzen 7 7735HS, NVIDIA GeForce RTX 4070 Laptop GPU (n=1) | |
| CrossMark / Productivity | |
| Asus ROG Strix G17 G713PI | |
| Schenker XMG Focus 17 (E23) | |
| Media della classe Gaming (1386 - 2254, n=98, ultimi 2 anni) | |
| MSI Pulse 17 B13VGK | |
| Acer Nitro 17 AN17-51-71ER | |
| Media AMD Ryzen 7 7735HS, NVIDIA GeForce RTX 4070 Laptop GPU (n=1) | |
| CrossMark / Creativity | |
| Asus ROG Strix G17 G713PI | |
| Schenker XMG Focus 17 (E23) | |
| Media della classe Gaming (1343 - 2729, n=98, ultimi 2 anni) | |
| MSI Pulse 17 B13VGK | |
| Acer Nitro 17 AN17-51-71ER | |
| Media AMD Ryzen 7 7735HS, NVIDIA GeForce RTX 4070 Laptop GPU (n=1) | |
| CrossMark / Responsiveness | |
| MSI Pulse 17 B13VGK | |
| Schenker XMG Focus 17 (E23) | |
| Media della classe Gaming (1226 - 2334, n=98, ultimi 2 anni) | |
| Asus ROG Strix G17 G713PI | |
| Acer Nitro 17 AN17-51-71ER | |
| Media AMD Ryzen 7 7735HS, NVIDIA GeForce RTX 4070 Laptop GPU (n=1) | |
| PCMark 10 Score | 7240 punti | |
Aiuto | ||
| AIDA64 / Memory Copy | |
| Schenker XMG Focus 17 (E23) | |
| Media della classe Gaming (21750 - 129946, n=110, ultimi 2 anni) | |
| MSI Pulse 17 B13VGK | |
| Acer Nitro 17 AN17-51-71ER | |
| Asus ROG Strix G17 G713PI | |
| Acer Nitro 17 AN17-41-R9LN | |
| Media AMD Ryzen 7 7735HS (30324 - 52012, n=16) | |
| AIDA64 / Memory Read | |
| Schenker XMG Focus 17 (E23) | |
| Media della classe Gaming (22956 - 118858, n=110, ultimi 2 anni) | |
| MSI Pulse 17 B13VGK | |
| Acer Nitro 17 AN17-51-71ER | |
| Asus ROG Strix G17 G713PI | |
| Acer Nitro 17 AN17-41-R9LN | |
| Media AMD Ryzen 7 7735HS (33938 - 51856, n=16) | |
| AIDA64 / Memory Write | |
| Media della classe Gaming (22297 - 135096, n=110, ultimi 2 anni) | |
| Schenker XMG Focus 17 (E23) | |
| Acer Nitro 17 AN17-51-71ER | |
| MSI Pulse 17 B13VGK | |
| Asus ROG Strix G17 G713PI | |
| Acer Nitro 17 AN17-41-R9LN | |
| Media AMD Ryzen 7 7735HS (33175 - 55284, n=16) | |
| AIDA64 / Memory Latency | |
| Acer Nitro 17 AN17-51-71ER | |
| Media della classe Gaming (75.3 - 259, n=110, ultimi 2 anni) | |
| MSI Pulse 17 B13VGK | |
| Media AMD Ryzen 7 7735HS (78.2 - 109.8, n=16) | |
| Schenker XMG Focus 17 (E23) | |
| Acer Nitro 17 AN17-41-R9LN | |
| Asus ROG Strix G17 G713PI | |
* ... Meglio usare valori piccoli
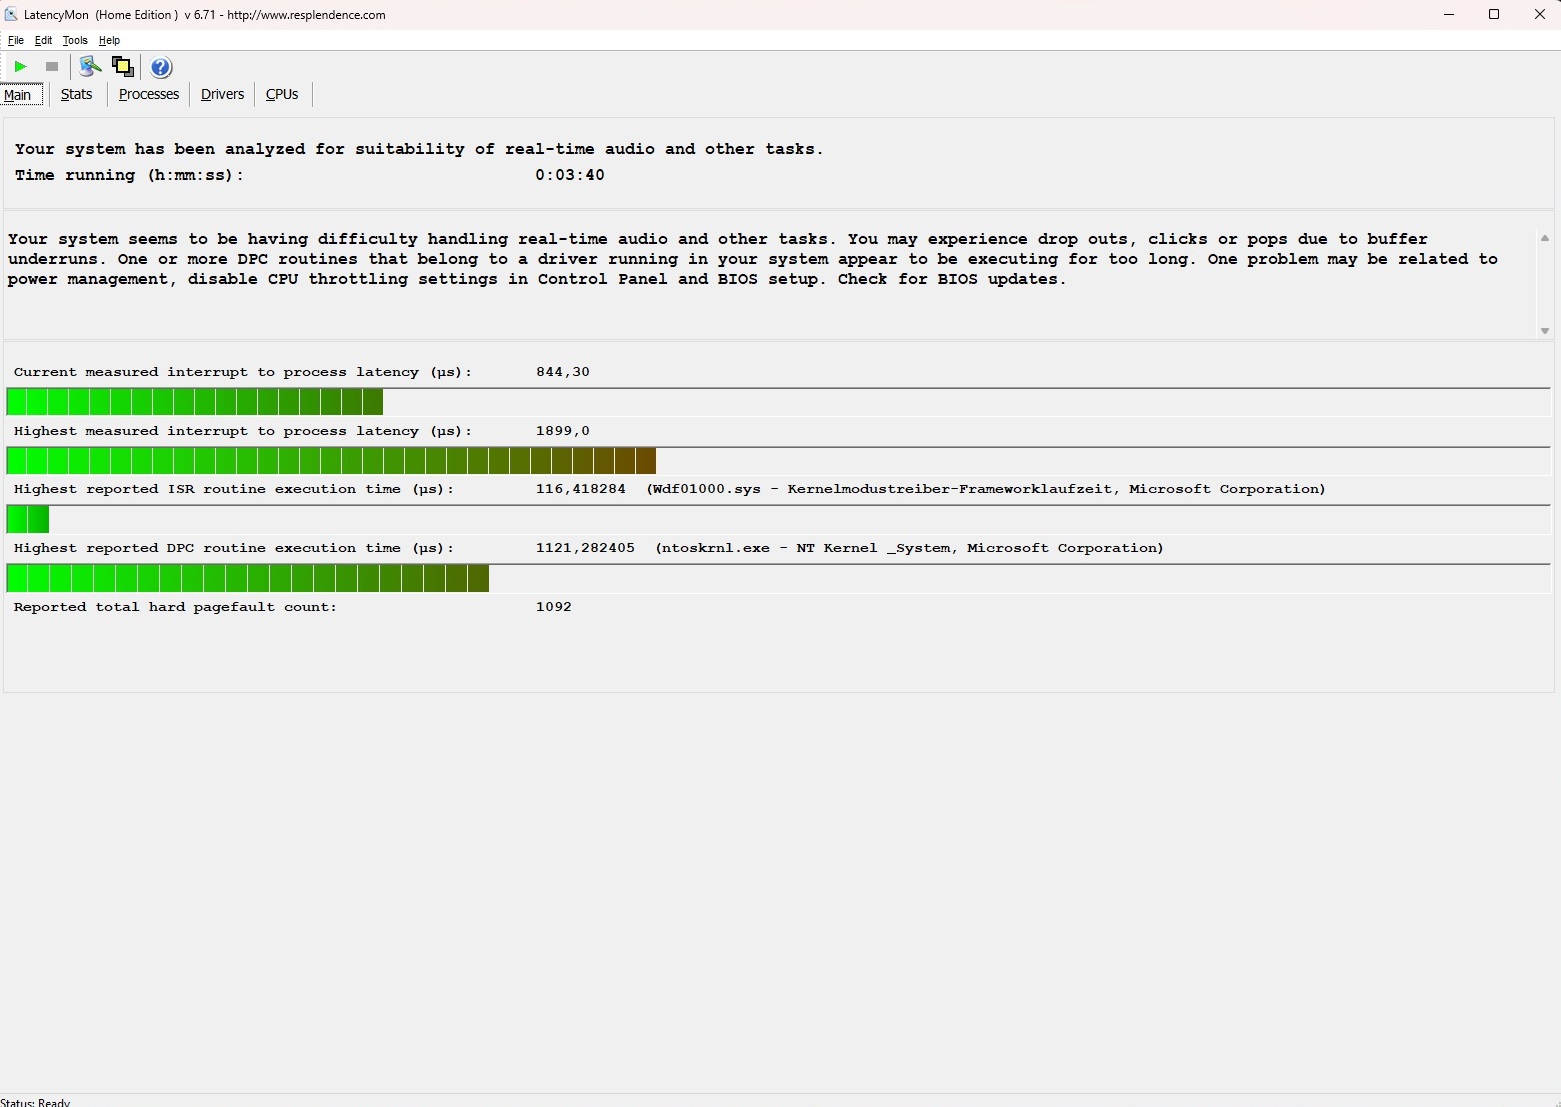
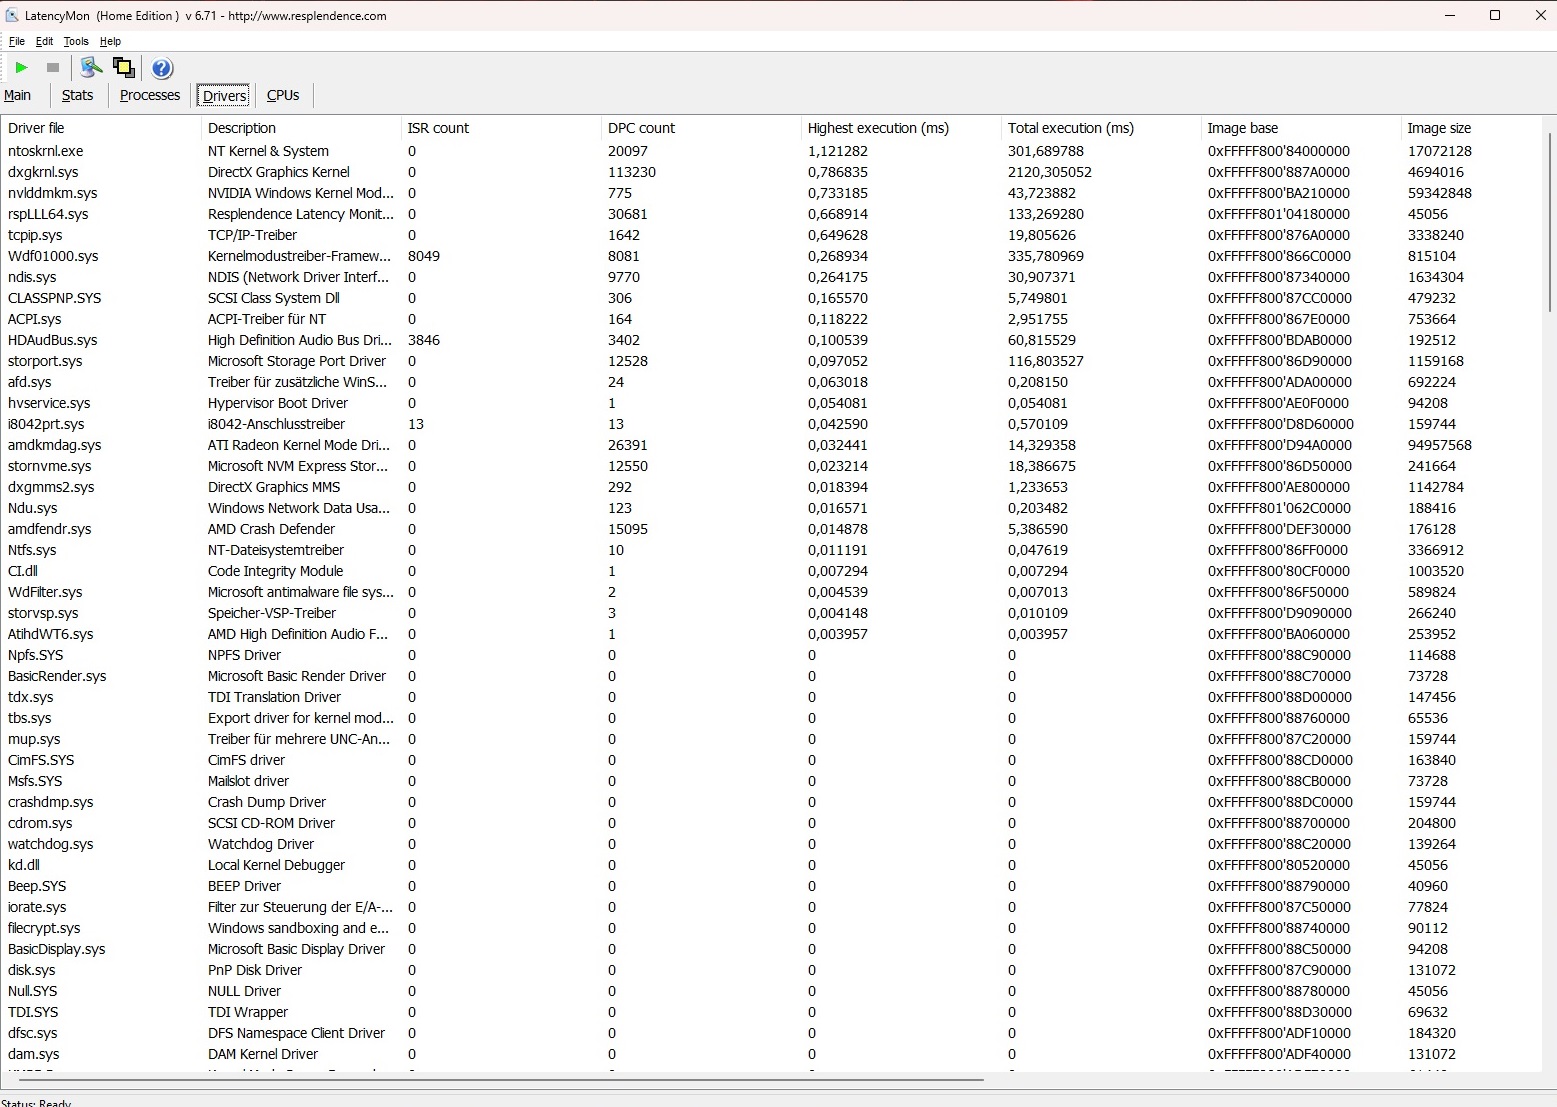
Latenza DPC
Il Nitro 17 deve accettare le critiche per le sue elevate latenze. Secondo lo strumento LatencyMon, il laptop è solo condizionatamente adatto all'editing video e audio in tempo reale nello stato in cui è stato consegnato.
| DPC Latencies / LatencyMon - interrupt to process latency (max), Web, Youtube, Prime95 | |
| Acer Nitro 17 AN17-41-R9LN | |
| Asus ROG Strix G17 G713PI | |
| Acer Nitro 17 AN17-51-71ER | |
| MSI Pulse 17 B13VGK | |
| Schenker XMG Focus 17 (E23) | |
* ... Meglio usare valori piccoli
Dispositivi di archiviazione
Il portatile è dotato di un'unità NVMe di Samsung. Il modello PM9A1 ha fornito ottimi risultati nel benchmark AS SSD e nelle velocità di lettura e scrittura. Purtroppo, le sue prestazioni sono calate notevolmente dopo un po' e sono rimaste molto instabili (vedere DiskSpd-Loop).

* ... Meglio usare valori piccoli
Reading continuous performance: DiskSpd Read Loop, Queue Depth 8
Scheda grafica
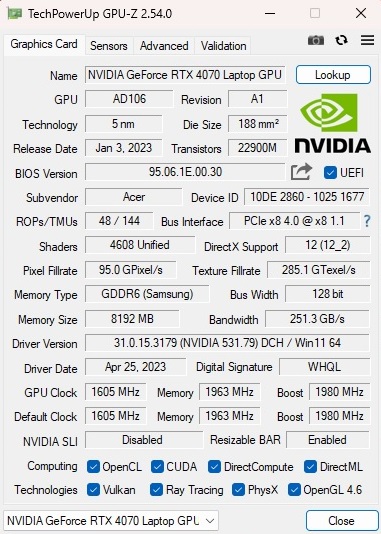
La GeForce RTX 4070 della generazione Ada Lovelace di Nvidia si occupa dei calcoli grafici complessi. A causa della RAM limitata (8 GB GDDR6) e dell'interfaccia relativamente stretta (128 bit), classificheremmo questo portatile da gioco come un dispositivo di fascia media superiore e non di fascia alta. La RTX 4070 ha un TGP di 140 watt, che è il massimo per questo chip grafico.
I risultati dei benchmark sono stati relativamente poco spettacolari, in quanto le prestazioni della GPU del Nitro 17 sono circa uguali alla media della RTX 4070. La vittoria sulle prestazioni del modello RTX 4060 è limitata, come si può vedere nella nostra tabella.
| 3DMark Performance rating - Percent | |
| Media della classe Gaming | |
| Schenker XMG Focus 17 (E23) -1! | |
| Asus ROG Strix G17 G713PI -1! | |
| MSI Pulse 17 B13VGK | |
| Media NVIDIA GeForce RTX 4070 Laptop GPU | |
| Acer Nitro 17 AN17-41-R9LN | |
| Acer Nitro 17 AN17-51-71ER -1! | |
| 3DMark 11 Performance | 30265 punti | |
| 3DMark Ice Storm Standard Score | 215395 punti | |
| 3DMark Cloud Gate Standard Score | 59285 punti | |
| 3DMark Fire Strike Score | 25639 punti | |
| 3DMark Time Spy Score | 10950 punti | |
Aiuto | ||
* ... Meglio usare valori piccoli
Prestazioni di gioco
La situazione è simile quando si tratta di giochi. Anche in questo caso, le prestazioni sono state simili alla media determinata in precedenza e la RTX 4070 ha fatto appena meglio della RTX 4060 in alcuni casi.
| The Witcher 3 - 1920x1080 Ultra Graphics & Postprocessing (HBAO+) | |
| Media della classe Gaming (95 - 240, n=8, ultimi 2 anni) | |
| Asus ROG Strix G17 G713PI | |
| Schenker XMG Focus 17 (E23) | |
| Media NVIDIA GeForce RTX 4070 Laptop GPU (69.8 - 133.7, n=57) | |
| Acer Nitro 17 AN17-41-R9LN | |
| MSI Pulse 17 B13VGK | |
| Acer Nitro 17 AN17-51-71ER | |
Se ci si limita alla risoluzione Full HD, ovvero 1.920 x 1.080 pixel, anche i giochi più impegnativi come Immortals of Aveum possono essere eseguiti al massimo dei dettagli e raggiungere almeno 40 FPS. La maggior parte dei giochi viene eseguita a più di 60 FPS in FHD. La RTX 4070 è anche abbastanza forte per la risoluzione QHD nativa, con poche eccezioni, e la frequenza di aggiornamento di 165 Hz del display viene utilizzata raramente.
| Armored Core 6 - 2560x1440 Maximum Preset | |
| XMG Pro 15 E23 | |
| Media NVIDIA GeForce RTX 4070 Laptop GPU (76.2 - 85, n=2) | |
| Acer Nitro 17 AN17-41-R9LN | |
| Media della classe Gaming (n=1ultimi 2 anni) | |
| Immortals of Aveum - 2560x1440 Ultra AF:16x | |
| XMG Pro 15 E23 | |
| Media NVIDIA GeForce RTX 4070 Laptop GPU (32 - 35, n=2) | |
| Acer Nitro 17 AN17-41-R9LN | |
| Atlas Fallen - 2560x1440 Very High Preset | |
| XMG Pro 15 E23 | |
| Media NVIDIA GeForce RTX 4070 Laptop GPU (80.6 - 89.5, n=2) | |
| Acer Nitro 17 AN17-41-R9LN | |
| Baldur's Gate 3 - 2560x1440 Ultra Preset AA:T | |
| Media della classe Gaming (56.5 - 175.5, n=85, ultimi 2 anni) | |
| Media NVIDIA GeForce RTX 4070 Laptop GPU (54.4 - 89.6, n=25) | |
| XMG Pro 15 E23 | |
| Acer Nitro 17 AN17-41-R9LN | |
| Ratchet & Clank Rift Apart - 2560x1440 Very High Preset AA:T | |
| XMG Pro 15 E23 | |
| Media NVIDIA GeForce RTX 4070 Laptop GPU (48.7 - 49.1, n=3) | |
| Acer Nitro 17 AN17-41-R9LN | |
| Sons of the Forest - 2560x1440 Ultra Preset AA:T | |
| Media NVIDIA GeForce RTX 4070 Laptop GPU (61 - 69.5, n=2) | |
| Acer Nitro 17 AN17-41-R9LN | |
| Atomic Heart - 2560x1440 Atomic Preset | |
| Media NVIDIA GeForce RTX 4070 Laptop GPU (51.6 - 58.9, n=3) | |
| Acer Nitro 17 AN17-41-R9LN | |
Abbiamo testato il comportamento del 3D per un periodo di circa 60 minuti con l'aiuto di The Witcher 3 (FHD/Ultra). Dalla tabella sottostante si può notare che non ci sono stati cali di frame rate.
Witcher 3 FPS diagram
| basso | medio | alto | ultra | QHD | |
|---|---|---|---|---|---|
| GTA V (2015) | 168.5 | 152.8 | 94.4 | ||
| The Witcher 3 (2015) | 110 | ||||
| Dota 2 Reborn (2015) | 135.8 | 122.8 | 114.5 | 108.3 | |
| Final Fantasy XV Benchmark (2018) | 144.4 | 106.3 | |||
| X-Plane 11.11 (2018) | 106.3 | 98 | 78.4 | ||
| Strange Brigade (2018) | 278 | 225 | 195 | ||
| Atomic Heart (2023) | 132.5 | 95 | 74.2 | 51.6 | |
| Sons of the Forest (2023) | 73.3 | 71.9 | 71.1 | 61 | |
| Ratchet & Clank Rift Apart (2023) | 72.3 | 60.2 | 56.3 | 48.7 | |
| Atlas Fallen (2023) | 124.7 | 119.9 | 105.3 | 80.6 | |
| Immortals of Aveum (2023) | 57.1 | 46.9 | 32 | ||
| Armored Core 6 (2023) | 92.1 | 91.1 | 87.2 | 76.2 | |
| Baldur's Gate 3 (2023) | 113.9 | 95.3 | 94.4 | 62.5 |
Emissioni
Emissioni acustiche
Mentre i livelli di emissione sonora erano piuttosto fastidiosi in modalità Performance (54 dB) e Turbo (61 dB), le ventole erano ancora udibili in modalità Balanced (44 dB), ma non in modo fastidioso. Pertanto, consigliamo di utilizzare questa impostazione. In modalità idle, il notebook da 17 pollici si comporta generalmente in modo abbastanza silenzioso. Le ventole sono completamente spente o si sente solo un leggero fruscio. Raramente le ventole girano in modo fastidioso.
Rumorosità
| Idle |
| 25 / 27 / 29 dB(A) |
| Sotto carico |
| 42 / 45 dB(A) |
 | ||
30 dB silenzioso 40 dB(A) udibile 50 dB(A) rumoroso |
||
min: | ||
| Acer Nitro 17 AN17-41-R9LN R7 7735HS, GeForce RTX 4070 Laptop GPU | Acer Nitro 17 AN17-51-71ER i7-13700H, GeForce RTX 4060 Laptop GPU | MSI Pulse 17 B13VGK i7-13700H, GeForce RTX 4070 Laptop GPU | Schenker XMG Focus 17 (E23) i9-13900HX, GeForce RTX 4070 Laptop GPU | Asus ROG Strix G17 G713PI R9 7945HX, GeForce RTX 4070 Laptop GPU | |
|---|---|---|---|---|---|
| Noise | -4% | 7% | -10% | -5% | |
| off /ambiente * (dB) | 24 | 24 -0% | 24 -0% | 24 -0% | 25 -4% |
| Idle Minimum * (dB) | 25 | 24 4% | 24 4% | 24 4% | 26 -4% |
| Idle Average * (dB) | 27 | 24 11% | 24 11% | 24 11% | 29 -7% |
| Idle Maximum * (dB) | 29 | 32.32 -11% | 24 17% | 26.47 9% | 30 -3% |
| Load Average * (dB) | 42 | 35.18 16% | 32.49 23% | 55.72 -33% | 46 -10% |
| Witcher 3 ultra * (dB) | 44 | 54.78 -25% | 46.51 -6% | 57.94 -32% | 46 -5% |
| Load Maximum * (dB) | 45 | 54.78 -22% | 46.51 -3% | 57.94 -29% | 47 -4% |
* ... Meglio usare valori piccoli
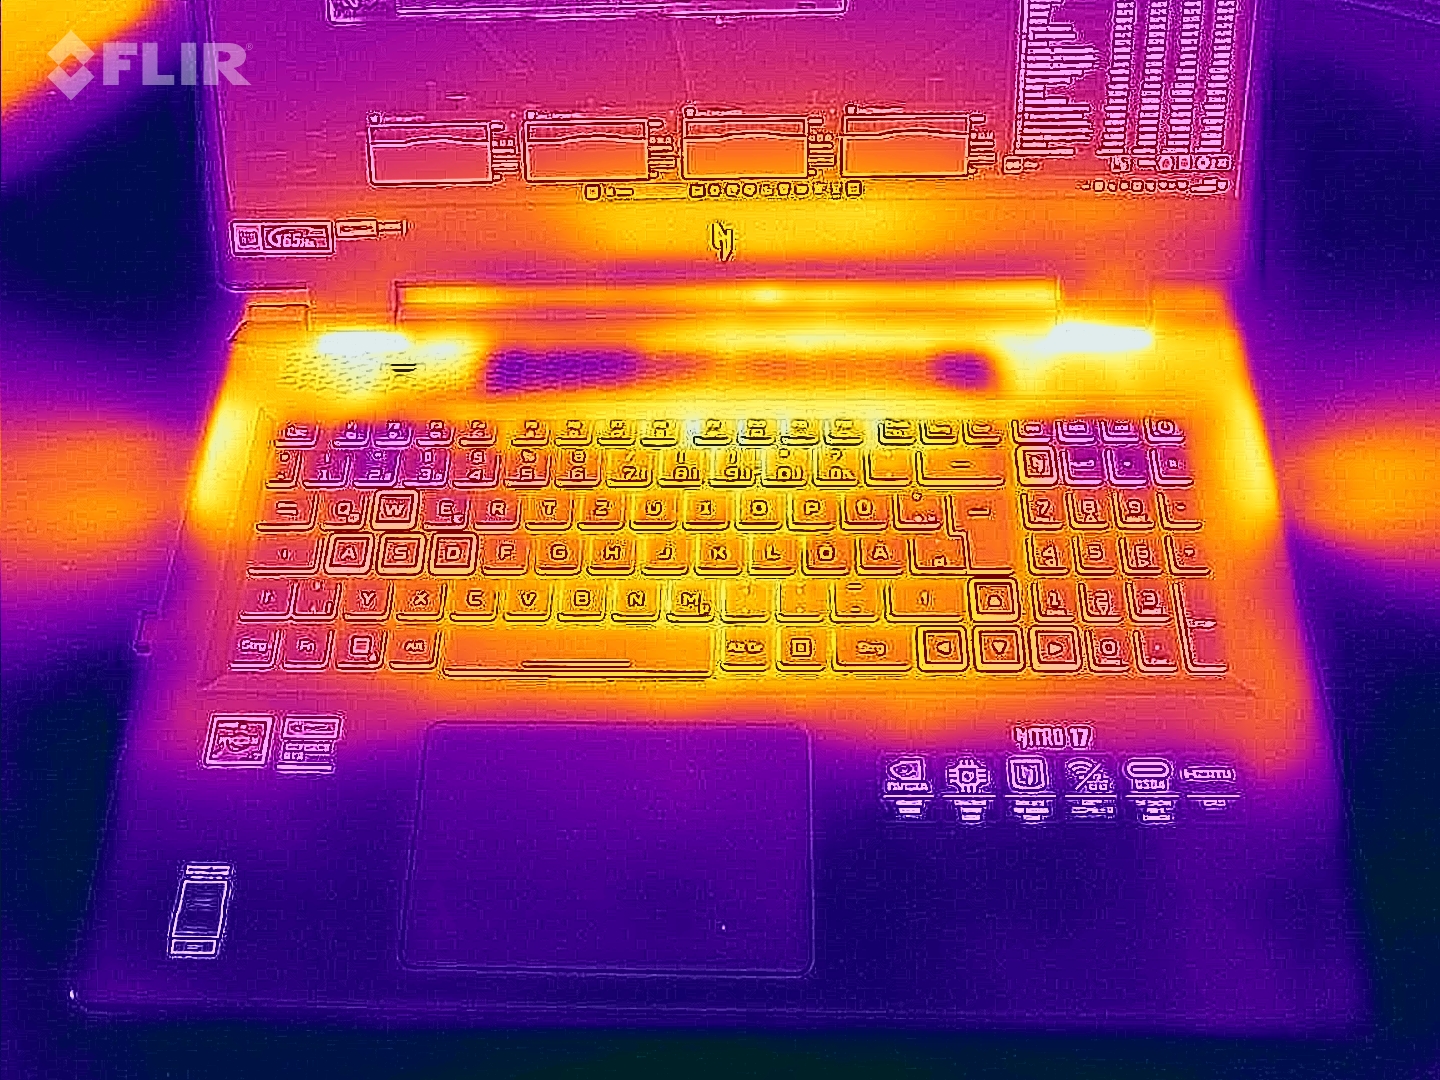
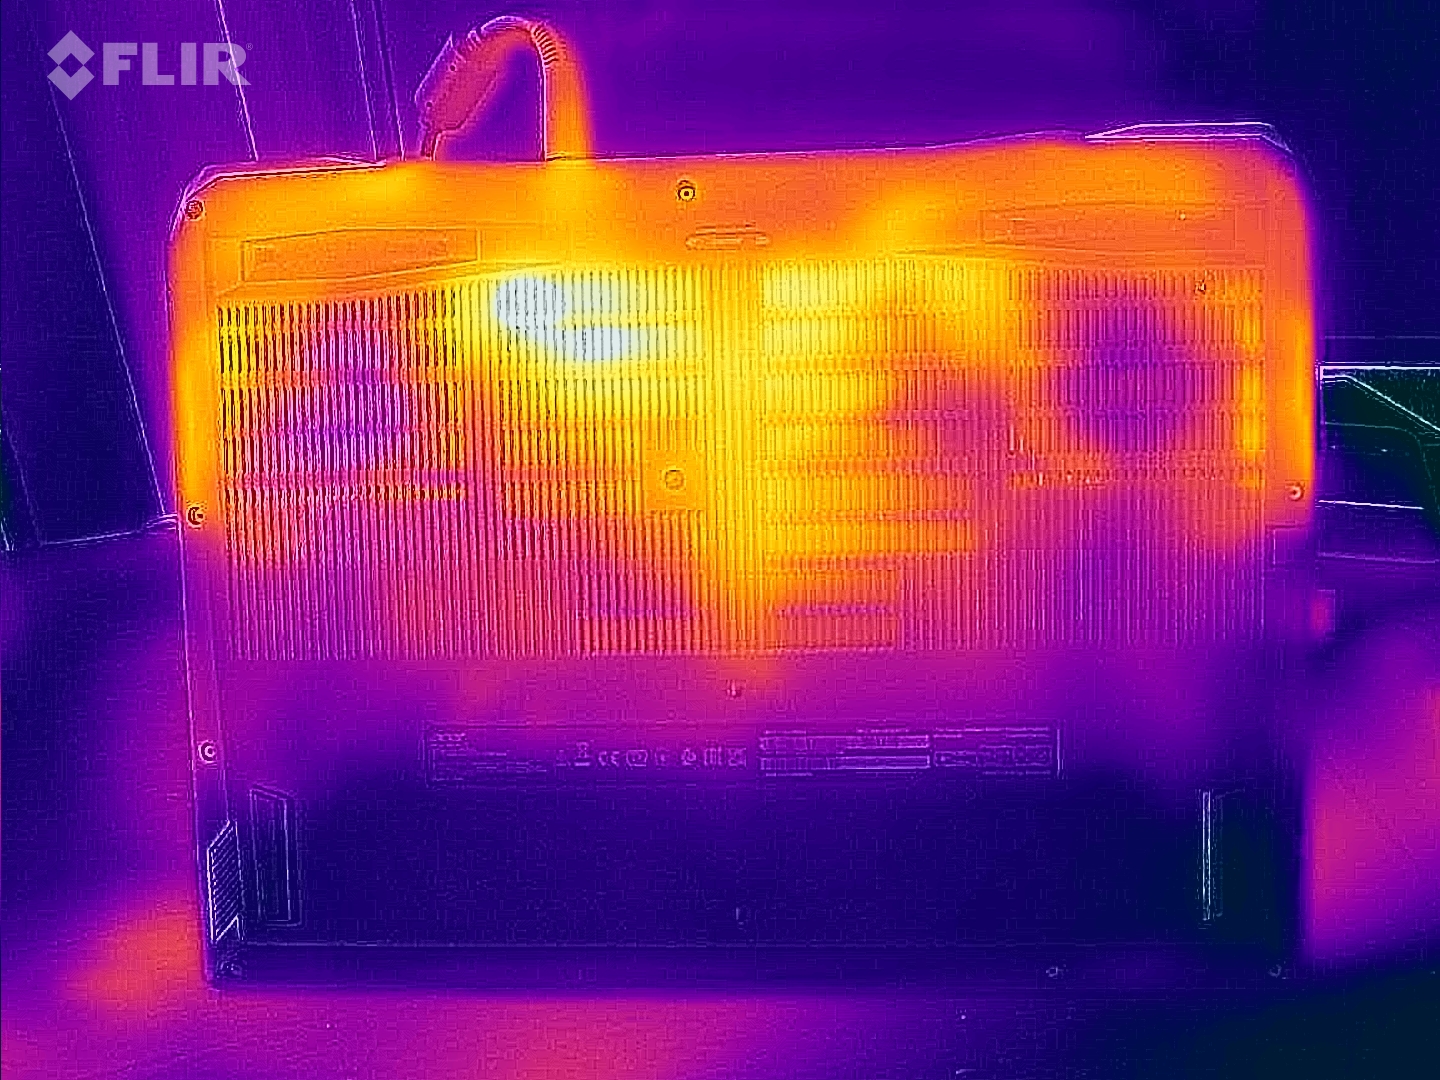
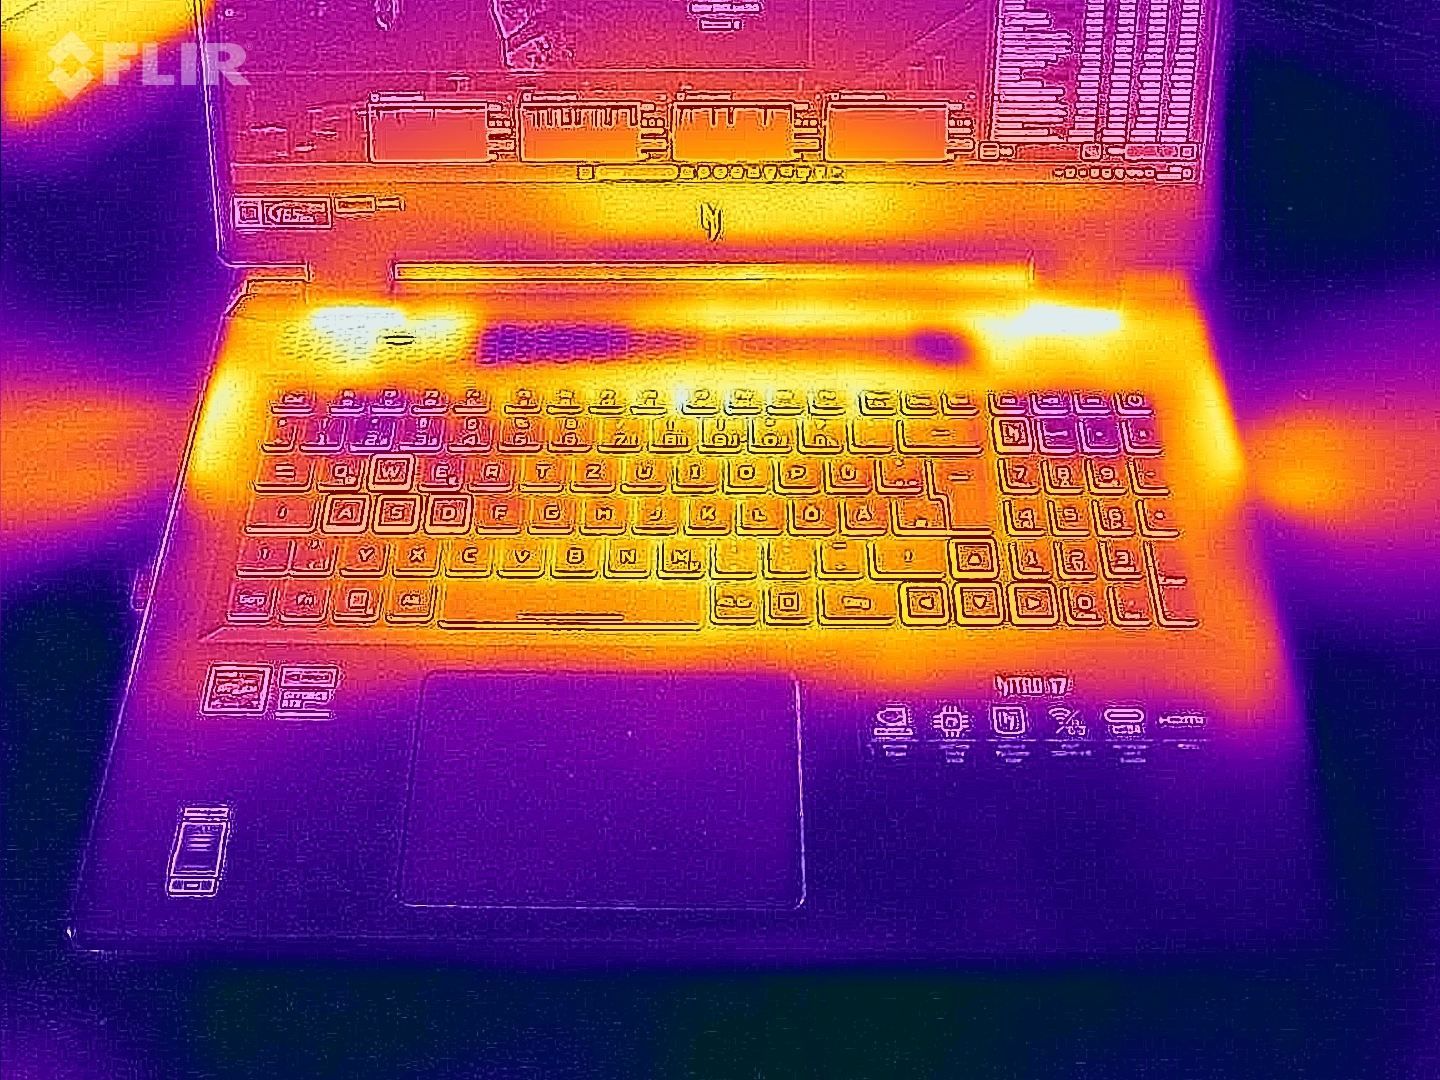
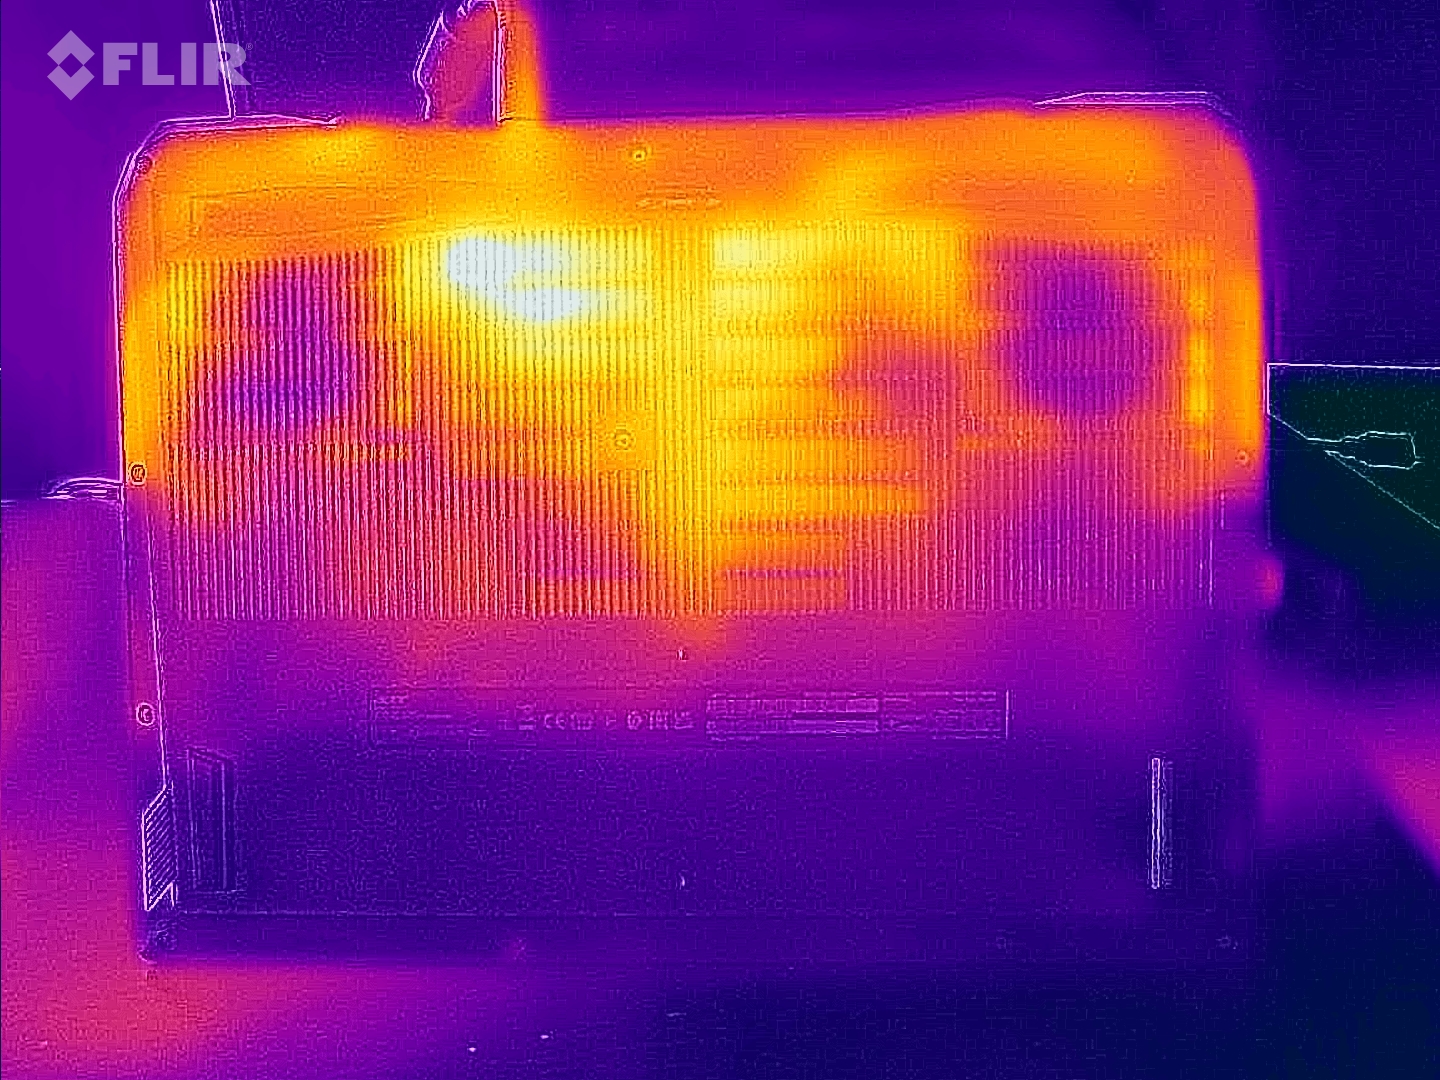
Temperatura
Le temperature del portatile sono simili a quelle dei suoi concorrenti. Durante il Witcher 3 test di gioco, abbiamo notato un massimo di 46 °C sulla parte superiore del case e un massimo di 55 °C su quella inferiore. In modalità idle, l'intero case rimane abbastanza fresco. Abbiamo misurato temperature per lo più inferiori ai 30 °C.
(-) La temperatura massima sul lato superiore è di 47 °C / 117 F, rispetto alla media di 40.4 °C / 105 F, che varia da 21.2 a 68.8 °C per questa classe Gaming.
(-) Il lato inferiore si riscalda fino ad un massimo di 53 °C / 127 F, rispetto alla media di 43.2 °C / 110 F
(+) In idle, la temperatura media del lato superiore è di 28.4 °C / 83 F, rispetto alla media deld ispositivo di 33.9 °C / 93 F.
(-) Riproducendo The Witcher 3, la temperatura media per il lato superiore e' di 38.1 °C / 101 F, rispetto alla media del dispositivo di 33.9 °C / 93 F.
(+) I poggiapolsi e il touchpad raggiungono la temperatura massima della pelle (34 °C / 93.2 F) e quindi non sono caldi.
(-) La temperatura media della zona del palmo della mano di dispositivi simili e'stata di 28.8 °C / 83.8 F (-5.2 °C / -9.4 F).
| Acer Nitro 17 AN17-41-R9LN AMD Ryzen 7 7735HS, NVIDIA GeForce RTX 4070 Laptop GPU | Acer Nitro 17 AN17-51-71ER Intel Core i7-13700H, NVIDIA GeForce RTX 4060 Laptop GPU | MSI Pulse 17 B13VGK Intel Core i7-13700H, NVIDIA GeForce RTX 4070 Laptop GPU | Schenker XMG Focus 17 (E23) Intel Core i9-13900HX, NVIDIA GeForce RTX 4070 Laptop GPU | Asus ROG Strix G17 G713PI AMD Ryzen 9 7945HX, NVIDIA GeForce RTX 4070 Laptop GPU | |
|---|---|---|---|---|---|
| Heat | -3% | -1% | -13% | 4% | |
| Maximum Upper Side * (°C) | 47 | 46 2% | 48 -2% | 50 -6% | 42 11% |
| Maximum Bottom * (°C) | 53 | 51 4% | 50 6% | 56 -6% | 41 23% |
| Idle Upper Side * (°C) | 30 | 34 -13% | 30 -0% | 37 -23% | 33 -10% |
| Idle Bottom * (°C) | 31 | 33 -6% | 33 -6% | 36 -16% | 34 -10% |
* ... Meglio usare valori piccoli
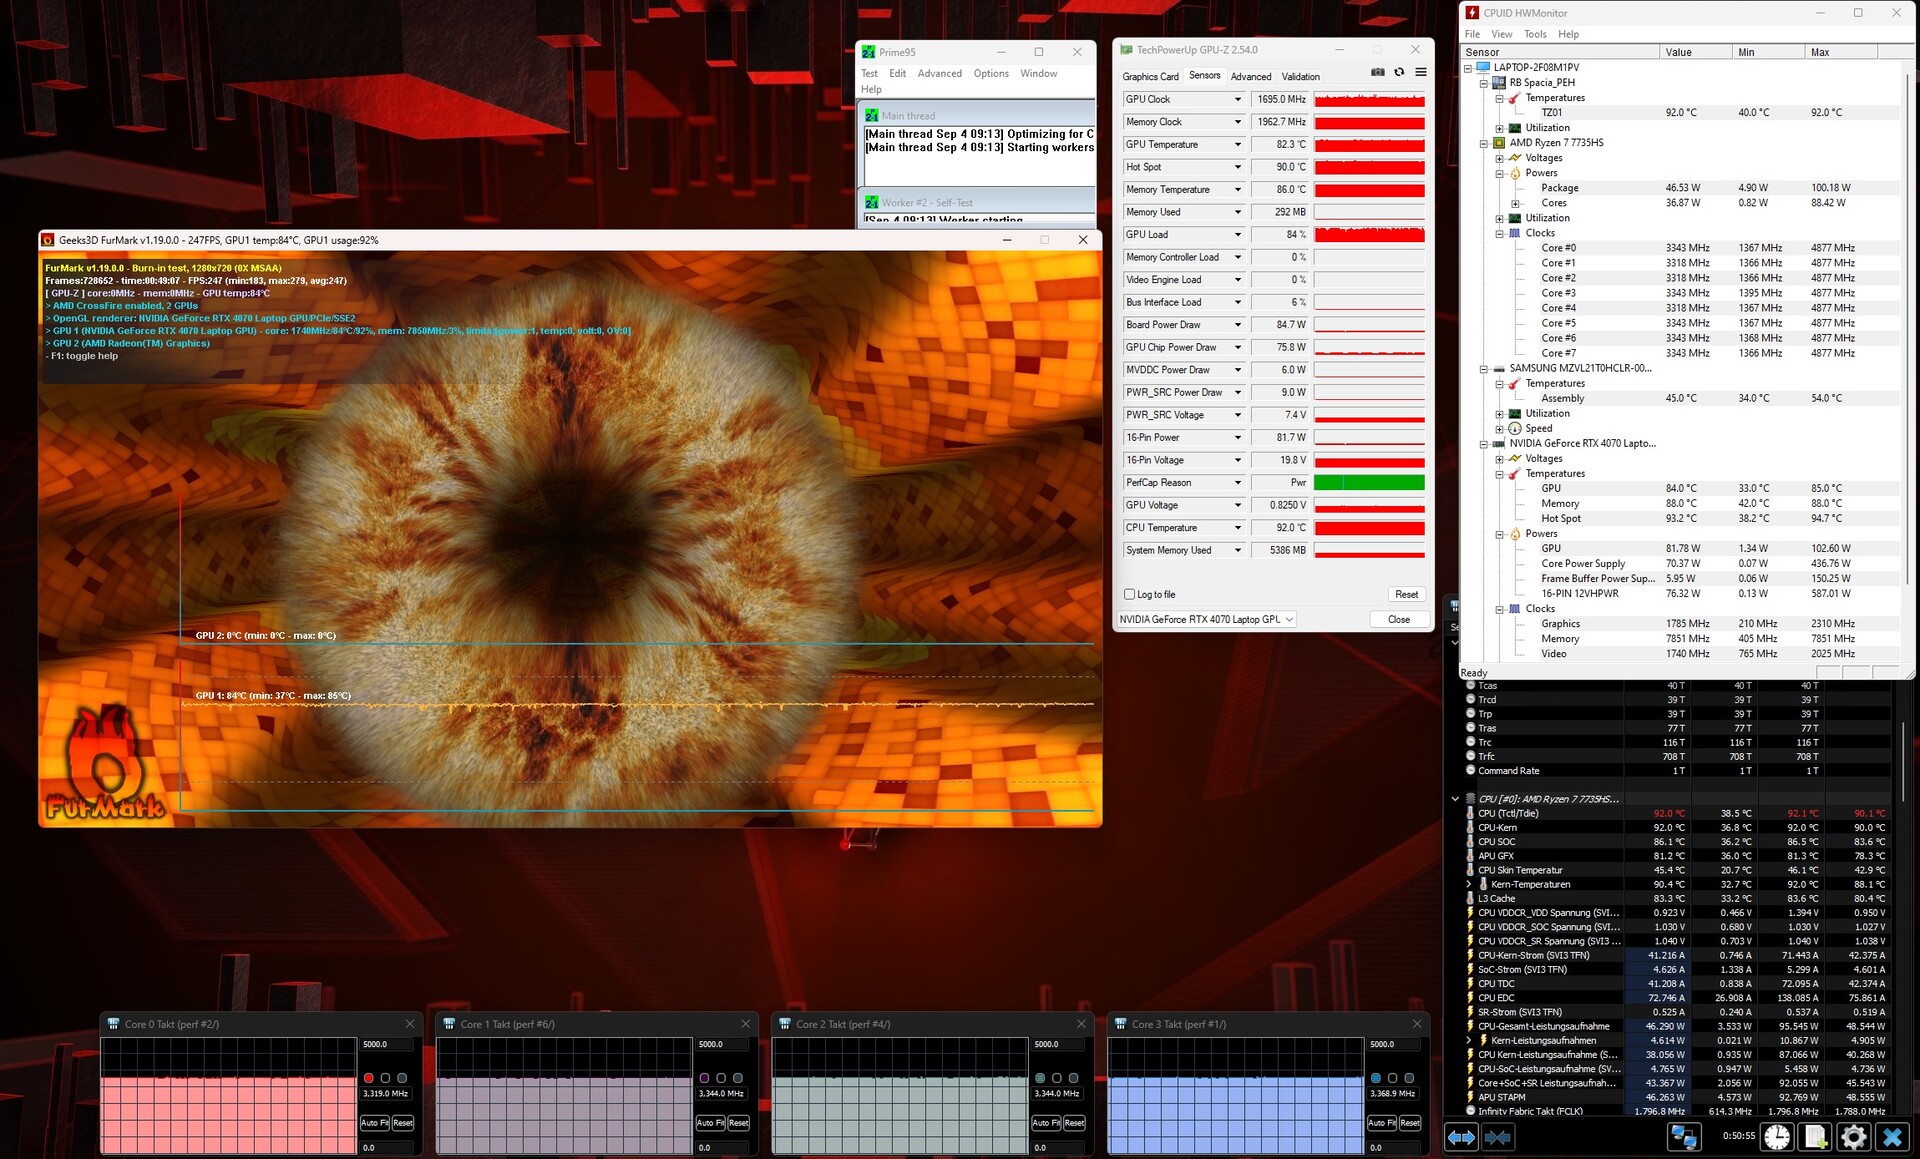
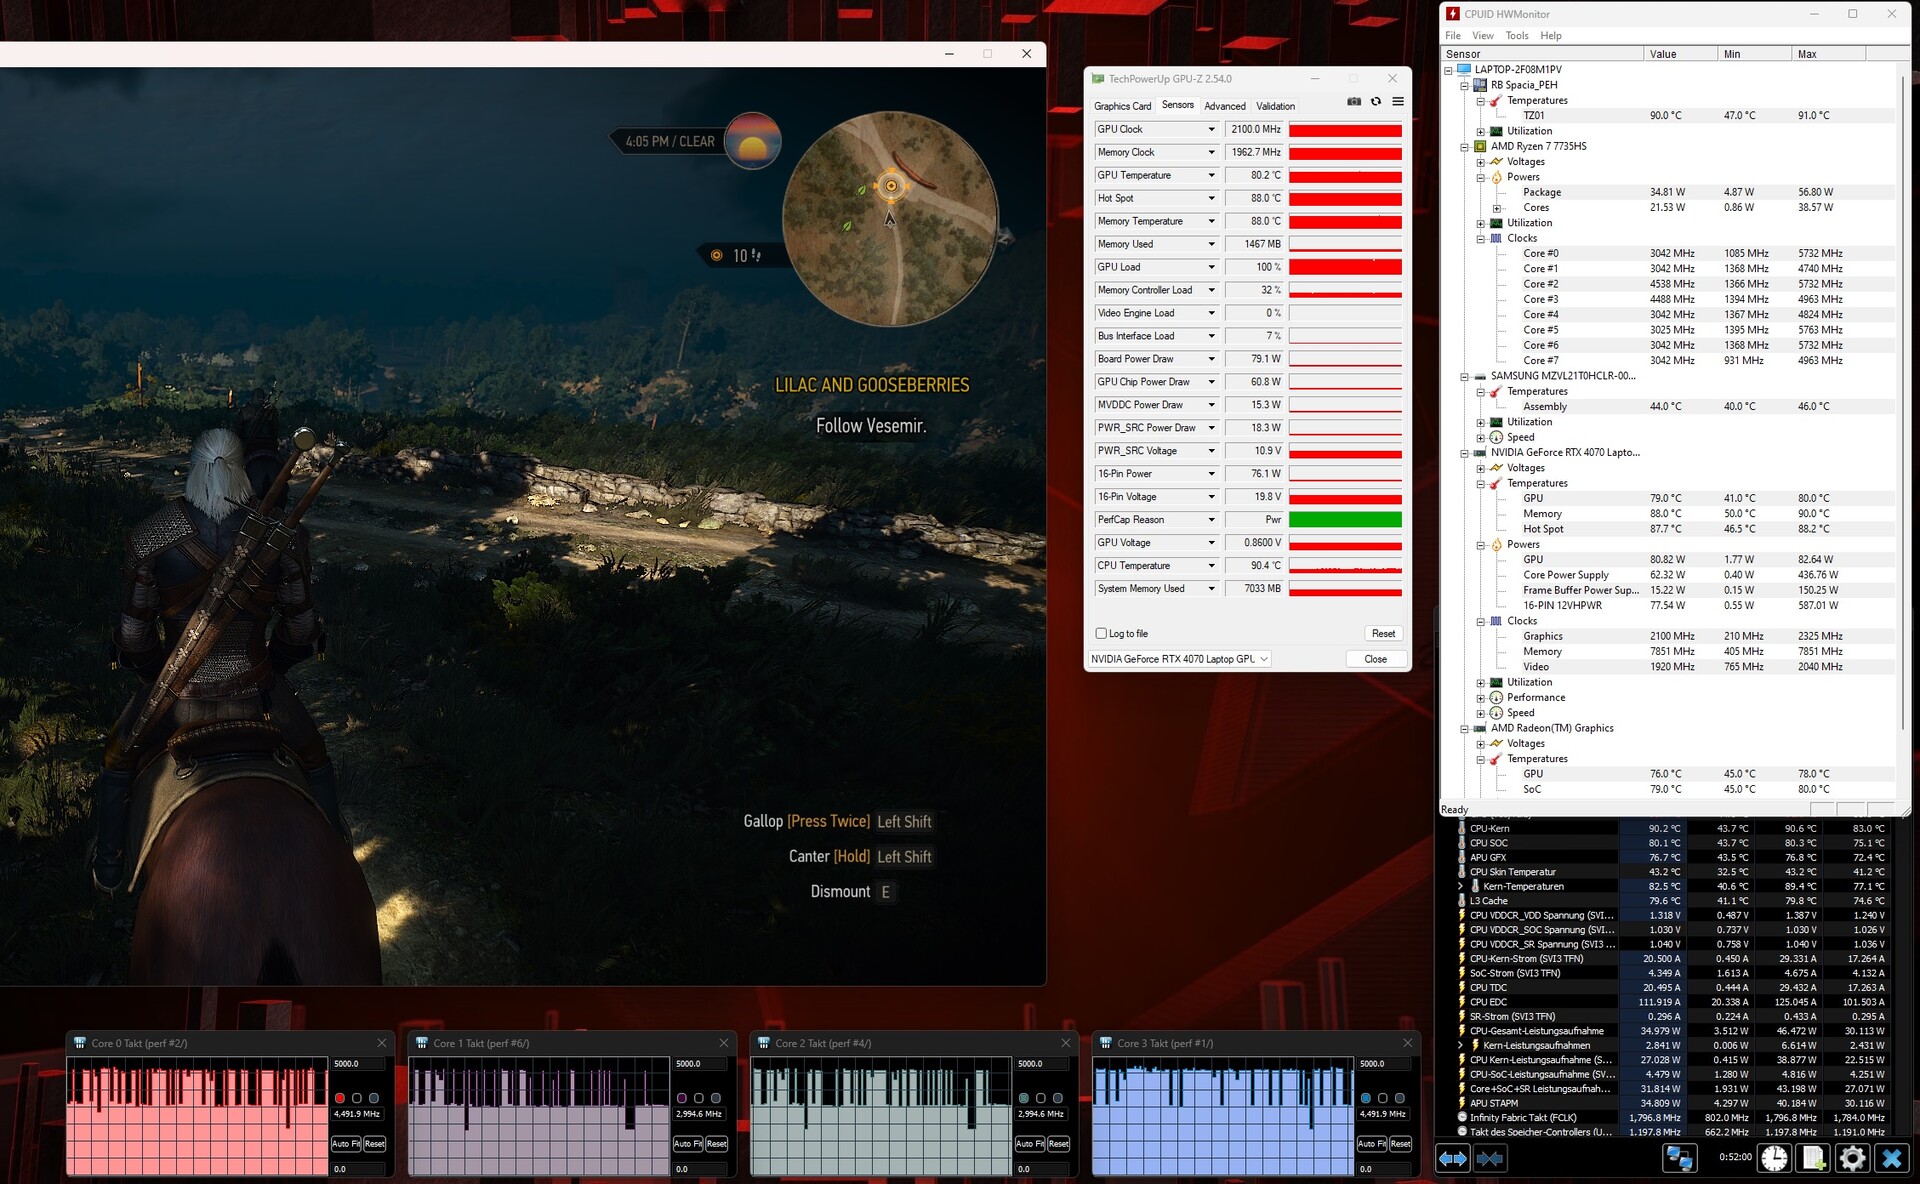
Test da sforzo
Lo stress test con gli strumenti Furmark e Prime95 non ha riservato brutte sorprese. Mentre il Ryzen 7 7735HS si è stabilizzato a circa 3,3 GHz (ma si è scaldato parecchio, intorno ai 90 °C), l'RTX 4070 si è trovato a suo agio a 1.700 MHz e a poco più di 80 °C.
Altoparlanti
Acer Nitro 17 AN17-41-R9LN analisi audio
(+) | gli altoparlanti sono relativamente potenti (83 dB)
Bassi 100 - 315 Hz
(-) | quasi nessun basso - in media 28.6% inferiori alla media
(±) | la linearità dei bassi è media (14.2% delta rispetto alla precedente frequenza)
Medi 400 - 2000 Hz
(+) | medi bilanciati - solo only 1.4% rispetto alla media
(+) | medi lineari (4% delta rispetto alla precedente frequenza)
Alti 2 - 16 kHz
(+) | Alti bilanciati - appena 4.3% dalla media
(+) | alti lineari (3.3% delta rispetto alla precedente frequenza)
Nel complesso 100 - 16.000 Hz
(±) | la linearità complessiva del suono è media (17.7% di differenza rispetto alla media
Rispetto alla stessa classe
» 52% di tutti i dispositivi testati in questa classe è stato migliore, 10% simile, 38% peggiore
» Il migliore ha avuto un delta di 6%, medio di 18%, peggiore di 132%
Rispetto a tutti i dispositivi testati
» 35% di tutti i dispositivi testati in questa classe è stato migliore, 8% similare, 57% peggiore
» Il migliore ha avuto un delta di 4%, medio di 24%, peggiore di 134%
MSI Pulse 17 B13VGK analisi audio
(+) | gli altoparlanti sono relativamente potenti (85.01 dB)
Bassi 100 - 315 Hz
(±) | bassi ridotti - in media 13.2% inferiori alla media
(±) | la linearità dei bassi è media (12.3% delta rispetto alla precedente frequenza)
Medi 400 - 2000 Hz
(±) | medi elevati - circa 9.4% superiore alla media
(+) | medi lineari (5.7% delta rispetto alla precedente frequenza)
Alti 2 - 16 kHz
(+) | Alti bilanciati - appena 2.9% dalla media
(+) | alti lineari (6.7% delta rispetto alla precedente frequenza)
Nel complesso 100 - 16.000 Hz
(±) | la linearità complessiva del suono è media (15.8% di differenza rispetto alla media
Rispetto alla stessa classe
» 37% di tutti i dispositivi testati in questa classe è stato migliore, 7% simile, 56% peggiore
» Il migliore ha avuto un delta di 6%, medio di 18%, peggiore di 132%
Rispetto a tutti i dispositivi testati
» 24% di tutti i dispositivi testati in questa classe è stato migliore, 5% similare, 71% peggiore
» Il migliore ha avuto un delta di 4%, medio di 24%, peggiore di 134%
Gestione dell'alimentazione
Consumo di energia
I consumi energetici del portatile erano quelli previsti. 10-16 watt di consumo in idle e 79-220 watt di consumo sotto carico potrebbero anche provenire da un dispositivo con un i7-13700H. Non riusciamo a capire perché Acer abbia incluso nel portatile un ingombrante alimentatore da 330 watt. Un modello più compatto da 230 watt sarebbe andato bene lo stesso.
| Off / Standby | |
| Idle | |
| Sotto carico |
|
Leggenda:
min: | |
| Acer Nitro 17 AN17-41-R9LN R7 7735HS, GeForce RTX 4070 Laptop GPU | Acer Nitro 17 AN17-51-71ER i7-13700H, GeForce RTX 4060 Laptop GPU | MSI Pulse 17 B13VGK i7-13700H, GeForce RTX 4070 Laptop GPU | Schenker XMG Focus 17 (E23) i9-13900HX, GeForce RTX 4070 Laptop GPU | Asus ROG Strix G17 G713PI R9 7945HX, GeForce RTX 4070 Laptop GPU | Media della classe Gaming | |
|---|---|---|---|---|---|---|
| Power Consumption | -3% | 12% | -71% | -50% | -42% | |
| Idle Minimum * (Watt) | 10 | 8.3 17% | 9 10% | 17 -70% | 15 -50% | 13.3 ? -33% |
| Idle Average * (Watt) | 11 | 13.5 -23% | 10.2 7% | 18 -64% | 20 -82% | 19 ? -73% |
| Idle Maximum * (Watt) | 16 | 14.8 7% | 10.8 32% | 25.8 -61% | 29 -81% | 24.5 ? -53% |
| Load Average * (Watt) | 79 | 77 3% | 72 9% | 178 -125% | 121 -53% | 108.1 ? -37% |
| Witcher 3 ultra * (Watt) | 147.5 | 154 -4% | 130 12% | 265 -80% | 179.8 -22% | |
| Load Maximum * (Watt) | 220 | 263 -20% | 221 -0% | 275 -25% | 246 -12% | 254 ? -15% |
* ... Meglio usare valori piccoli
Power consumption Witcher 3 / stress test
Power consumption with external monitor
Tempi di esecuzione
La batteria da 90 Wh compete con i suoi rivali di MSI (Pulse 17) e Asus (Strix G17). Grazie alla potente batteria e alla commutazione grafica integrata, ci si aspetta buoni tempi di esecuzione da questo portatile. È interessante notare che i tassi sono significativamente inferiori a quelli della controparte Intel. Nel nostro test WLAN in condizioni reali, con la luminosità del display ridotta a 150 cd/m², l'edizione AMD è durata solo poco meno di 5 ore invece di 8 (sospettiamo meccanismi di risparmio energetico difettosi o non ottimali in modalità batteria).
| Acer Nitro 17 AN17-41-R9LN R7 7735HS, GeForce RTX 4070 Laptop GPU, 90 Wh | Acer Nitro 17 AN17-51-71ER i7-13700H, GeForce RTX 4060 Laptop GPU, 90 Wh | MSI Pulse 17 B13VGK i7-13700H, GeForce RTX 4070 Laptop GPU, 90 Wh | Schenker XMG Focus 17 (E23) i9-13900HX, GeForce RTX 4070 Laptop GPU, 73 Wh | Asus ROG Strix G17 G713PI R9 7945HX, GeForce RTX 4070 Laptop GPU, 90 Wh | Media della classe Gaming | |
|---|---|---|---|---|---|---|
| Autonomia della batteria | 58% | 73% | -25% | -17% | 35% | |
| WiFi v1.3 (h) | 5.2 | 8.2 58% | 9 73% | 3.9 -25% | 4.3 -17% | 7.01 ? 35% |
| H.264 (h) | 6.9 | 3.1 | 2.8 | 8.26 ? | ||
| Witcher 3 ultra (h) | 2.5 | 1 | 1.1 | |||
| Load (h) | 2.2 | 1 | 1.47 ? |
Pro
Contro
Il verdetto
Per la maggior parte, il Nitro 17 AN17-41-R9LN di Acer è un impressionante portatile da gioco da 17 pollici. La combinazione di una CPU AMD (Ryzen 7 7735HS) e una GPU Nvidia (GeForce RTX 4070) crea una bella armonia, sufficiente a far girare la maggior parte dei giochi alla risoluzione nativa di 2.560 x 1.440 con le impostazioni massime. Tuttavia, non è il massimo della resistenza al futuro a causa dei suoi 8 GB scarsi di VRAM.
Per molti altri aspetti, il produttore ha fornito un buon portatile da gioco. Le opzioni di connettività e i dispositivi di input dovrebbero essere sufficienti per la maggior parte degli acquirenti. Un display QHD colorato e relativamente veloce completa la configurazione.
Le emissioni acustiche del portatile dipendono, come sempre, dalla modalità in uso. Nel nostro test, l'impostazione "bilanciata" ha mostrato il miglior compromesso tra prestazioni e rumore.
Acer potrebbe migliorare un po' il case e la qualità del suono del Nitro 17. Il sistema 2.0 integrato è carente. Il sistema 2.0 integrato manca di molti bassi. Anche le latenze del portatile e la durata della batteria (notevolmente inferiore rispetto alla versione Intel) sono problemi che il produttore potrebbe risolvere.
Nonostante le prestazioni della CPU più deboli e le prestazioni 3D appena migliori rispetto al modello RTX 4060 basato su Intel, raccomandiamo comunque di scegliere il modello AMD, dato che la maggior parte dei giochi è notoriamente limitata dalla GPU.
Un'alternativa uguale o leggermente migliore potrebbe essere Asus ROG Strix G17 G713PI che dispone anche di una RTX 4070 - ma ha anche installato un Ryzen 9 7945HX CPU più moderno e notevolmente più veloce. A sua volta, costa anche di più.
Prezzo e disponibilità
L'Acer Nitro 17 AN17-41-R9LN con Ryzen 7 7735HS, GeForce RTX 4070 e display QHD è disponibile su Amazon a circa 1.900 dollari.
Acer Nitro 17 AN17-41-R9LN
- 09/07/2023 v7 (old)
Florian Glaser
Transparency
La selezione dei dispositivi da recensire viene effettuata dalla nostra redazione. Il campione di prova è stato fornito all'autore come prestito dal produttore o dal rivenditore ai fini di questa recensione. L'istituto di credito non ha avuto alcuna influenza su questa recensione, né il produttore ne ha ricevuto una copia prima della pubblicazione. Non vi era alcun obbligo di pubblicare questa recensione. In quanto società mediatica indipendente, Notebookcheck non è soggetta all'autorità di produttori, rivenditori o editori.
Ecco come Notebookcheck esegue i test
Ogni anno, Notebookcheck esamina in modo indipendente centinaia di laptop e smartphone utilizzando procedure standardizzate per garantire che tutti i risultati siano comparabili. Da circa 20 anni sviluppiamo continuamente i nostri metodi di prova e nel frattempo stabiliamo gli standard di settore. Nei nostri laboratori di prova, tecnici ed editori esperti utilizzano apparecchiature di misurazione di alta qualità. Questi test comportano un processo di validazione in più fasi. Il nostro complesso sistema di valutazione si basa su centinaia di misurazioni e parametri di riferimento ben fondati, che mantengono l'obiettività.Price comparison

