Recensione Dell XPS 13 Plus 9320 Core i7-1360P 2023: leggermente migliore rispetto all'anno scorso

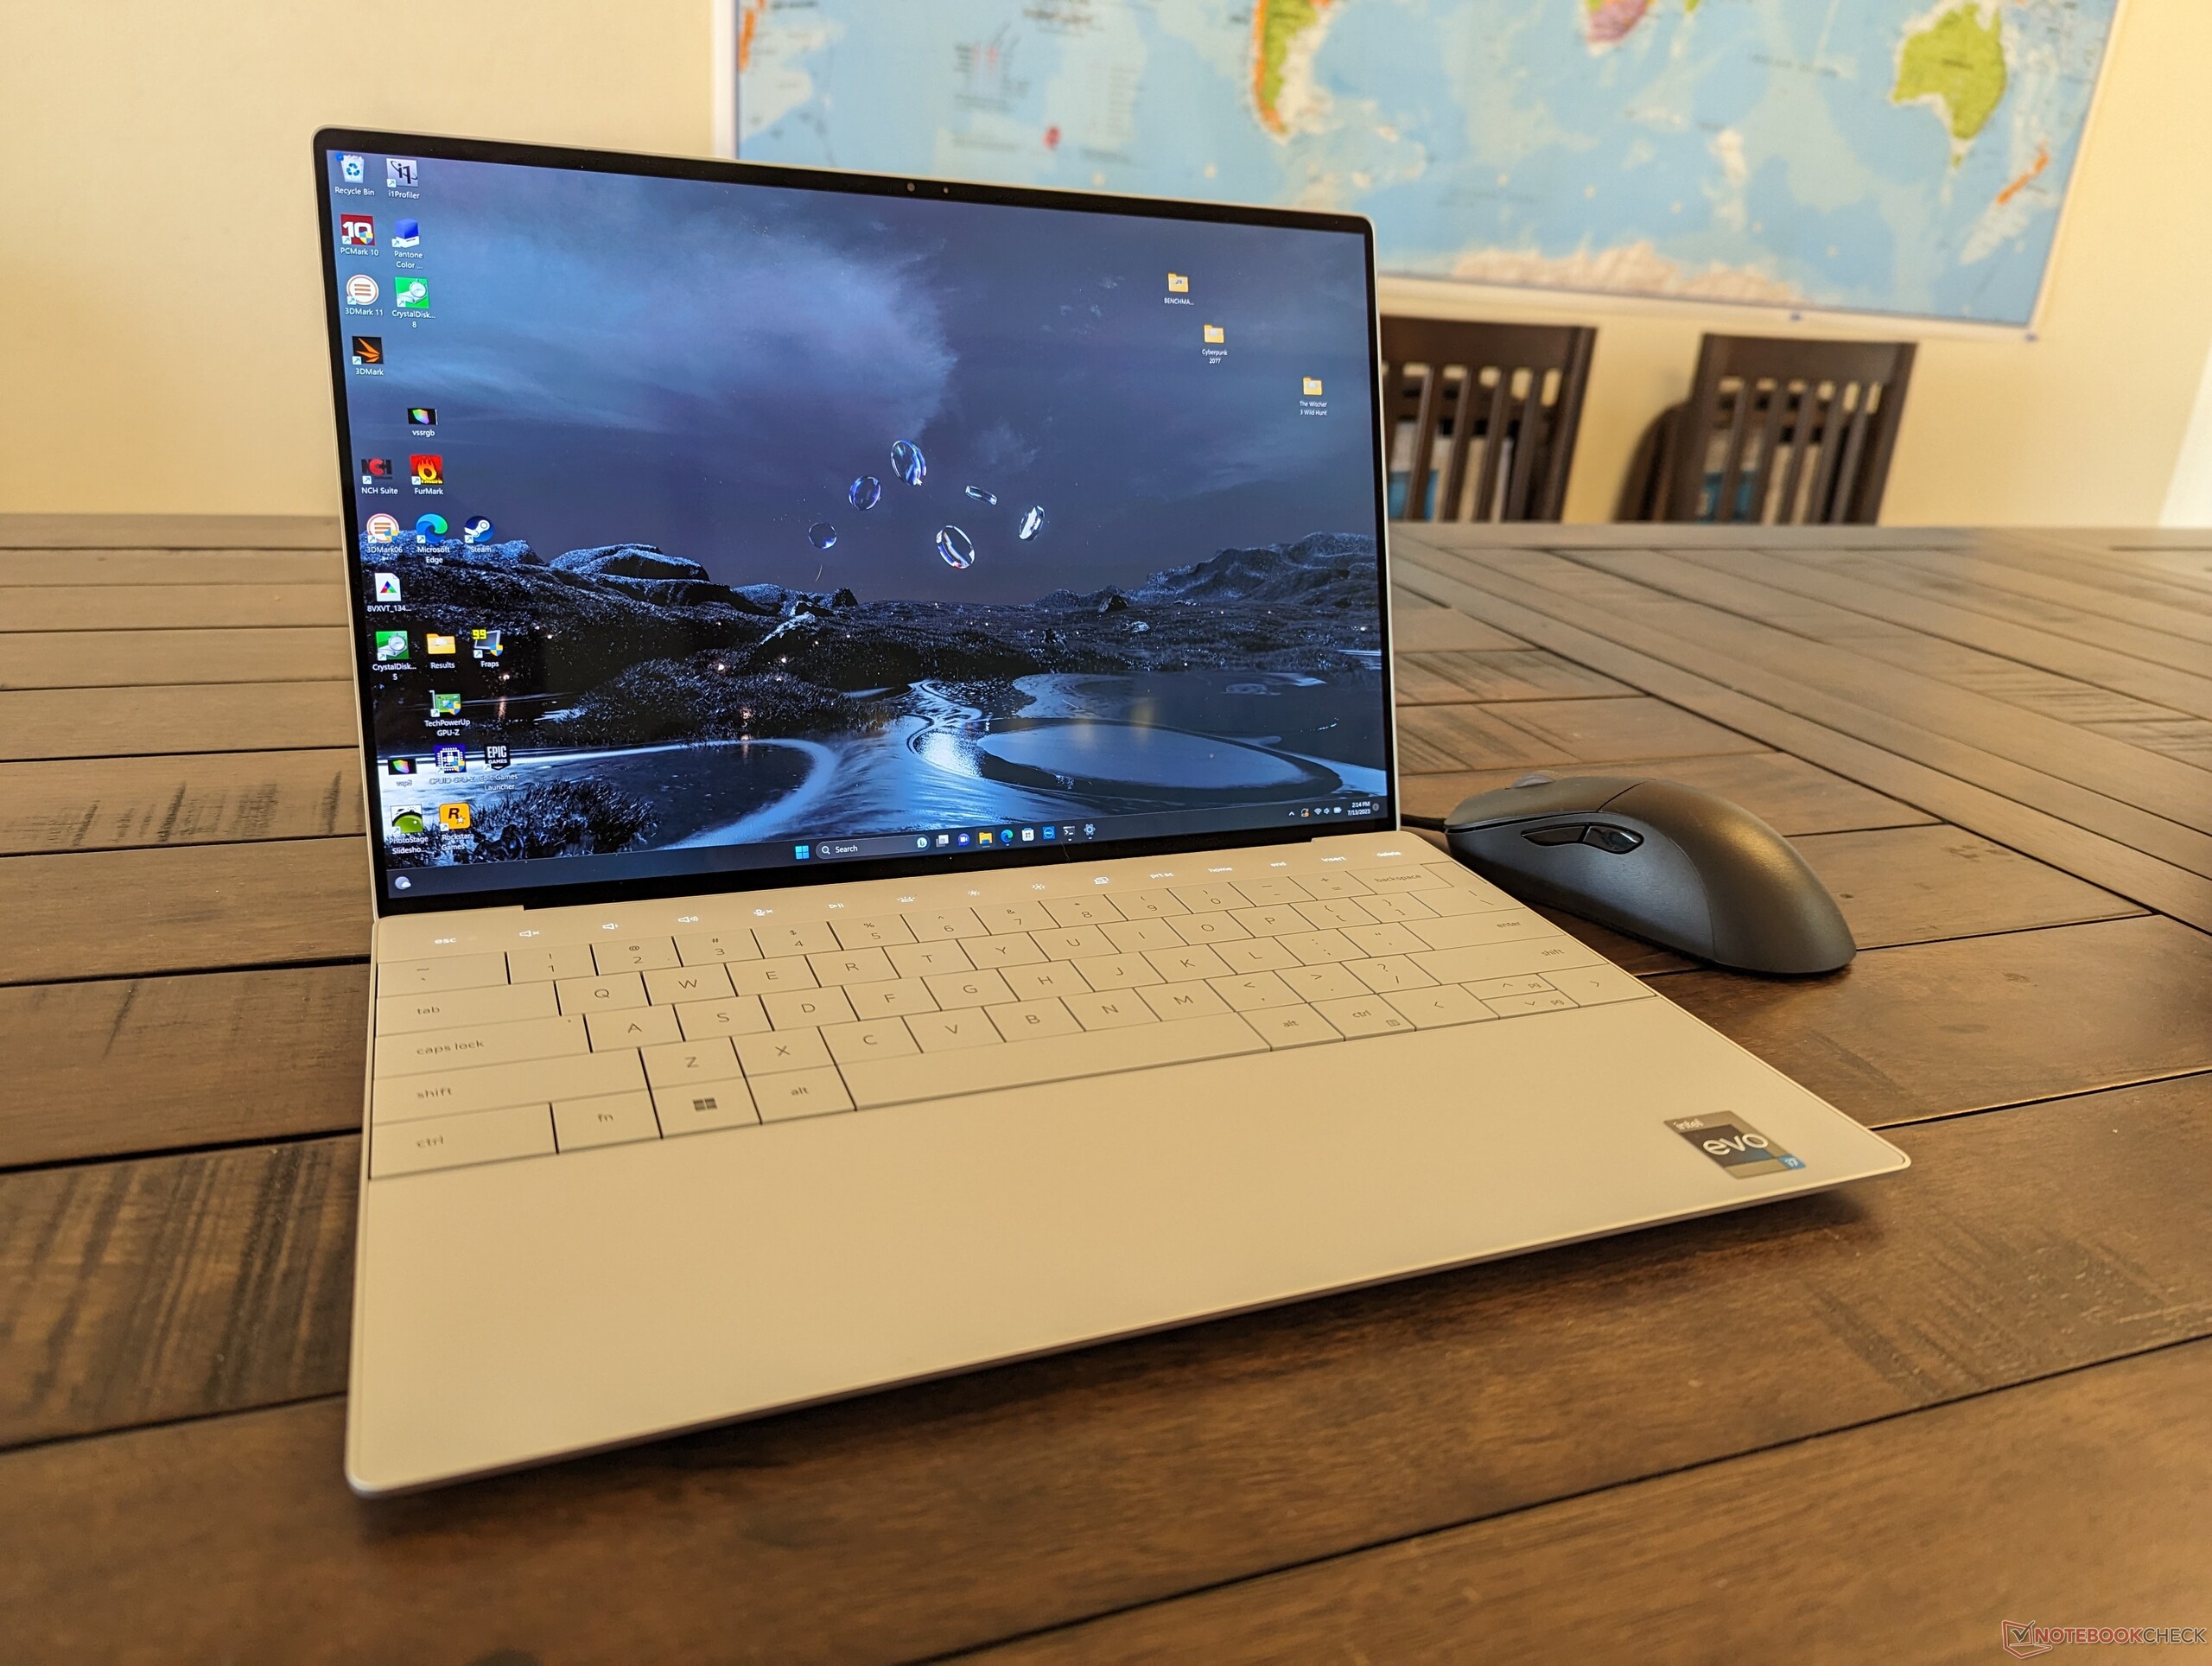
L'XPS 13 Plus 9320 2023 è l'aggiornamento di quest'anno del modello originale del 2022. Utilizza lo stesso design del telaio, ma con le nuove opzioni di CPU Raptor Lake di 13a generazione in sostituzione delle vecchie opzioni Alder Lake di 12a generazione. Per il resto non ci sono cambiamenti esteriori e quindi vi consigliamo di consultare la la nostra recensione del modello 2022 per saperne di più sulle caratteristiche fisiche dell'XPS 13 Plus.
La nostra configurazione è una SKU di fascia media con schermo touchscreen OLED da 13,4 pollici e 3,5K (3456 x 2160) e 16 GB di RAM veloce LPDDR5 a 6000 MHz per circa 1300 dollari. Altre SKU possono essere dotate di pannelli da 1200p o 2400p, ma tutte sono attualmente disponibili con lo stesso processore Core i7-1360P.
Tra le alternative all'XPS 13 Plus ci sono altri subnotebook da 13 pollici di punta come il modelloFramework Laptop 13.5,HP Spectre x360 13.5o il Lenovo ThinkPad X13 G3.
Altre recensioni Dell:
Potenziali concorrenti a confronto
Punteggio | Data | Modello | Peso | Altezza | Dimensione | Risoluzione | Prezzo |
|---|---|---|---|---|---|---|---|
| 87.4 % v7 (old) | 07/2023 | Dell XPS 13 Plus 9320 Core i7-1360P i7-1360P, Iris Xe G7 96EUs | 1.3 kg | 15.3 mm | 13.40" | 3456x2160 | |
| 87.3 % v7 (old) | 09/2022 | Dell XPS 13 Plus 9320 i7-1280P OLED i7-1280P, Iris Xe G7 96EUs | 1.3 kg | 15.28 mm | 13.40" | 3456x2160 | |
| 85.9 % v7 (old) | 11/2019 | Dell XPS 13 7390 Core i7-10710U i7-10710U, UHD Graphics 620 | 1.2 kg | 11.6 mm | 13.30" | 3840x2160 | |
| 86.2 % v7 (old) | 05/2023 | Framework Laptop 13.5 13th Gen Intel i7-1370P, Iris Xe G7 96EUs | 1.3 kg | 15.85 mm | 13.50" | 2256x1504 | |
| 89.1 % v7 (old) | 06/2023 | Lenovo ThinkPad X13 Yoga G3 21AW003UGE i7-1265U, Iris Xe G7 96EUs | 1.2 kg | 15.9 mm | 13.30" | 2560x1600 | |
| 90.3 % v7 (old) | 08/2022 | HP Spectre x360 13.5 14t-ef000 i7-1255U, Iris Xe G7 96EUs | 1.4 kg | 17 mm | 13.50" | 3000x2000 |
Caso
Comunicazione
| Networking | |
| iperf3 transmit AX12 | |
| Dell XPS 13 7390 Core i7-10710U | |
| iperf3 receive AX12 | |
| Dell XPS 13 7390 Core i7-10710U | |
| iperf3 transmit AXE11000 | |
| Dell XPS 13 Plus 9320 Core i7-1360P | |
| Framework Laptop 13.5 13th Gen Intel | |
| Lenovo ThinkPad X13 Yoga G3 21AW003UGE | |
| iperf3 receive AXE11000 | |
| Lenovo ThinkPad X13 Yoga G3 21AW003UGE | |
| Dell XPS 13 Plus 9320 Core i7-1360P | |
| Framework Laptop 13.5 13th Gen Intel | |
| iperf3 transmit AXE11000 6GHz | |
| HP Spectre x360 13.5 14t-ef000 | |
| Framework Laptop 13.5 13th Gen Intel | |
| Dell XPS 13 Plus 9320 Core i7-1360P | |
| iperf3 receive AXE11000 6GHz | |
| Framework Laptop 13.5 13th Gen Intel | |
| Dell XPS 13 Plus 9320 Core i7-1360P | |
| HP Spectre x360 13.5 14t-ef000 | |
Webcam
Non ci sono modifiche alla webcam da 1 MP, mentre alcuni modelli concorrenti come l' HP Spectre sono già passati a sensori di qualità superiore da 5 MP.


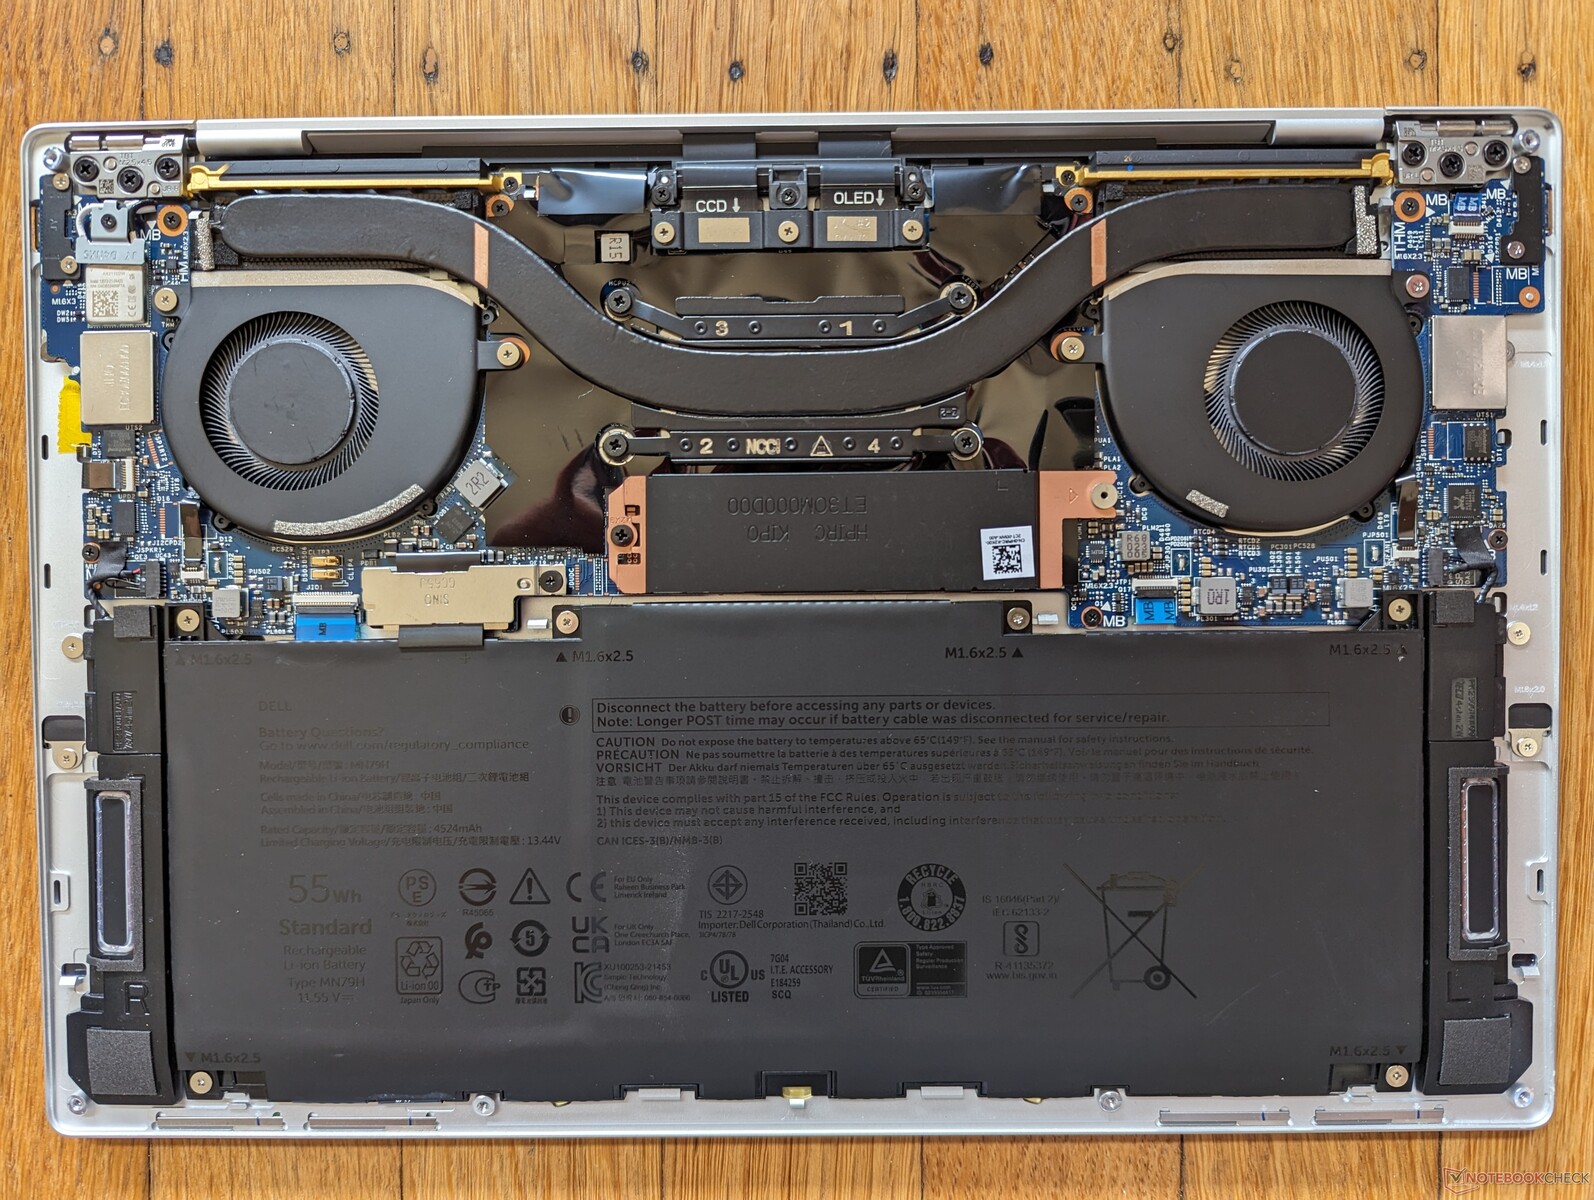
Manutenzione
Display
Sono disponibili quattro opzioni di display:
- 1920 x 1200, 60 Hz, IPS, non touch, opaco, 500 nit
- 1920 x 1200, 60 Hz, IPS, touch, opaco, 500 nits
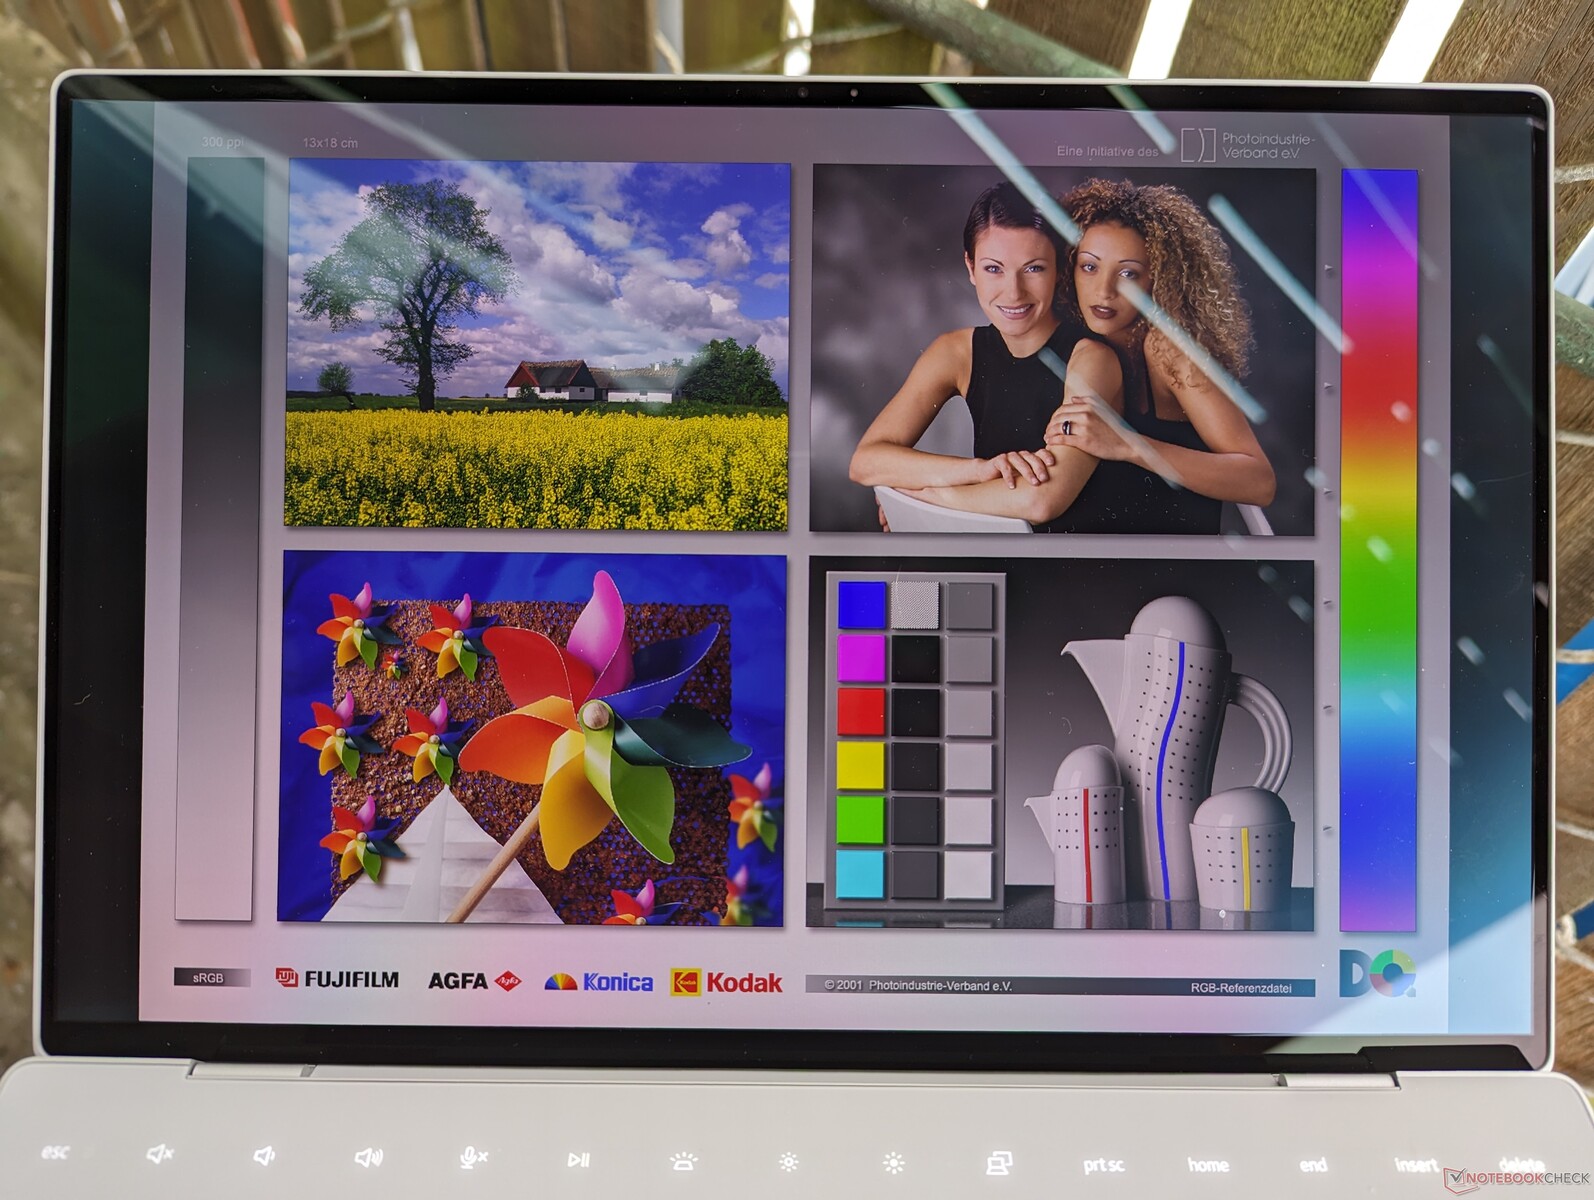
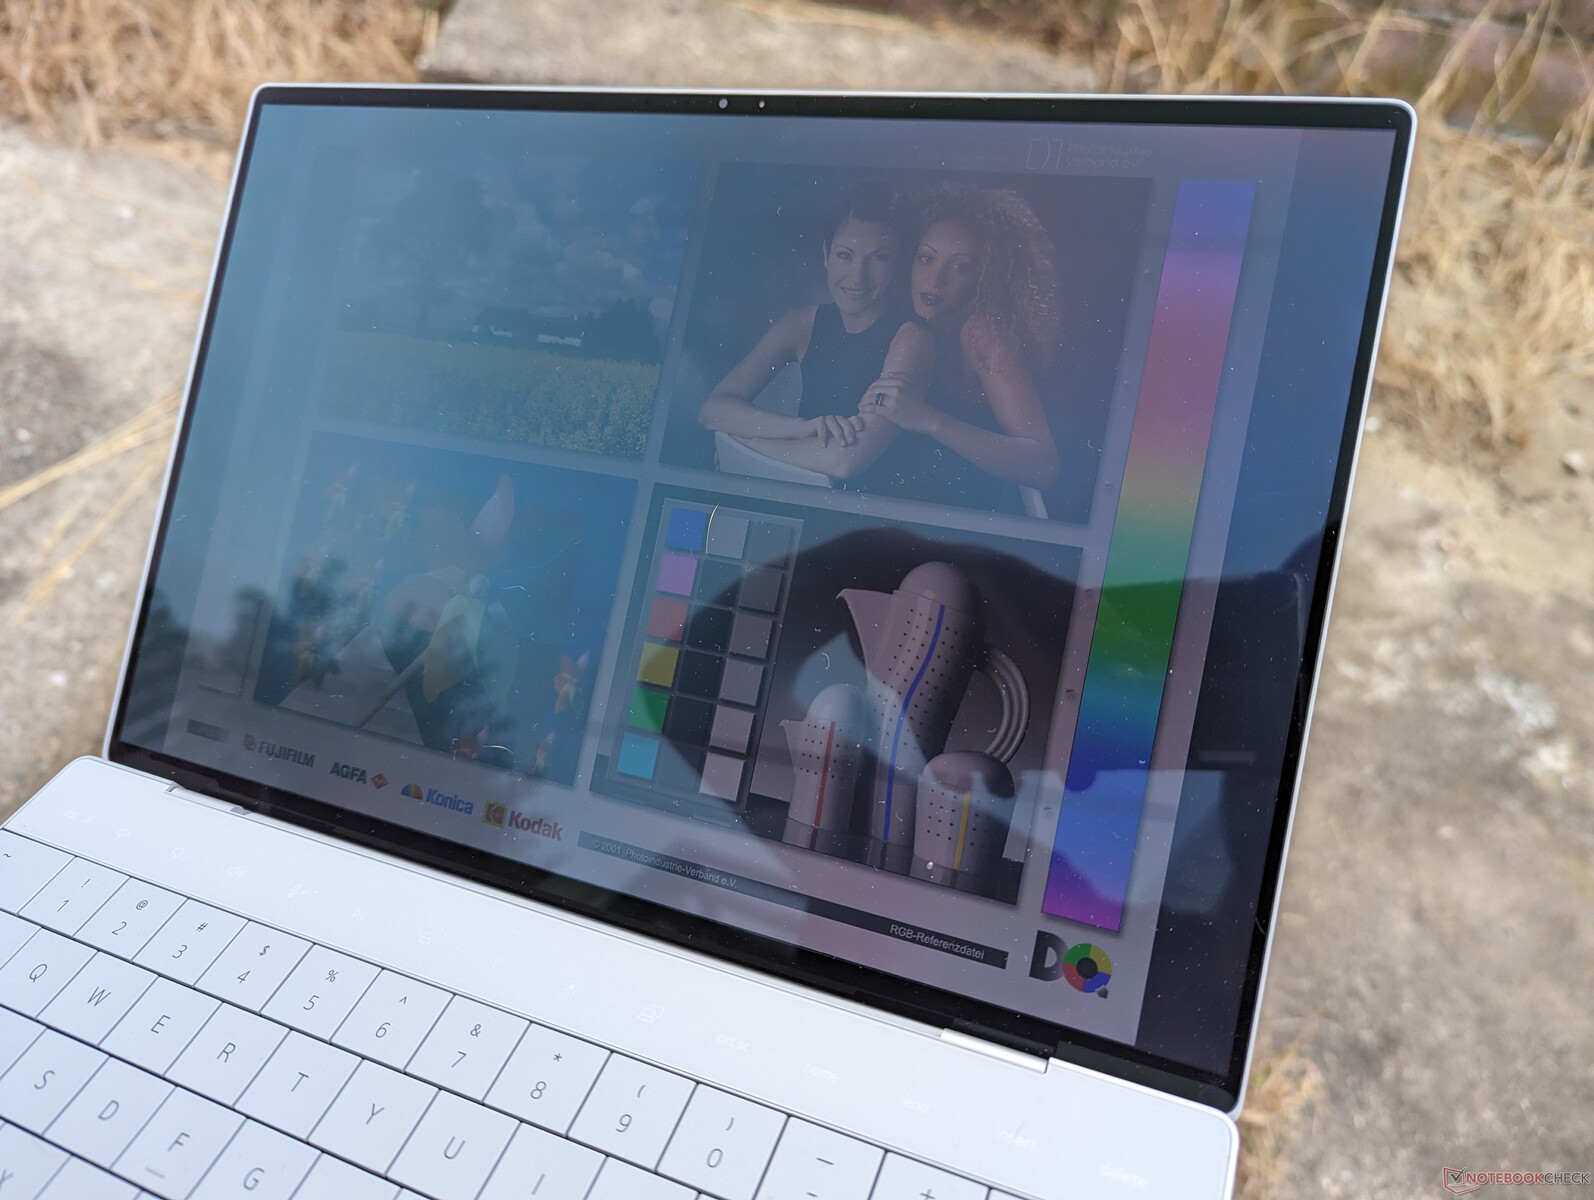
- 3456 x 2160, 60 Hz, OLED, touch, lucido, 400 nits
- 3840 x 2400, 60 Hz, IPS, touch, lucido, 500 nits
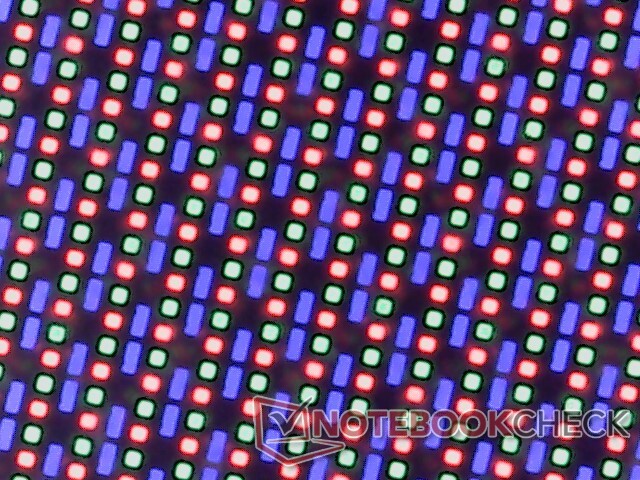
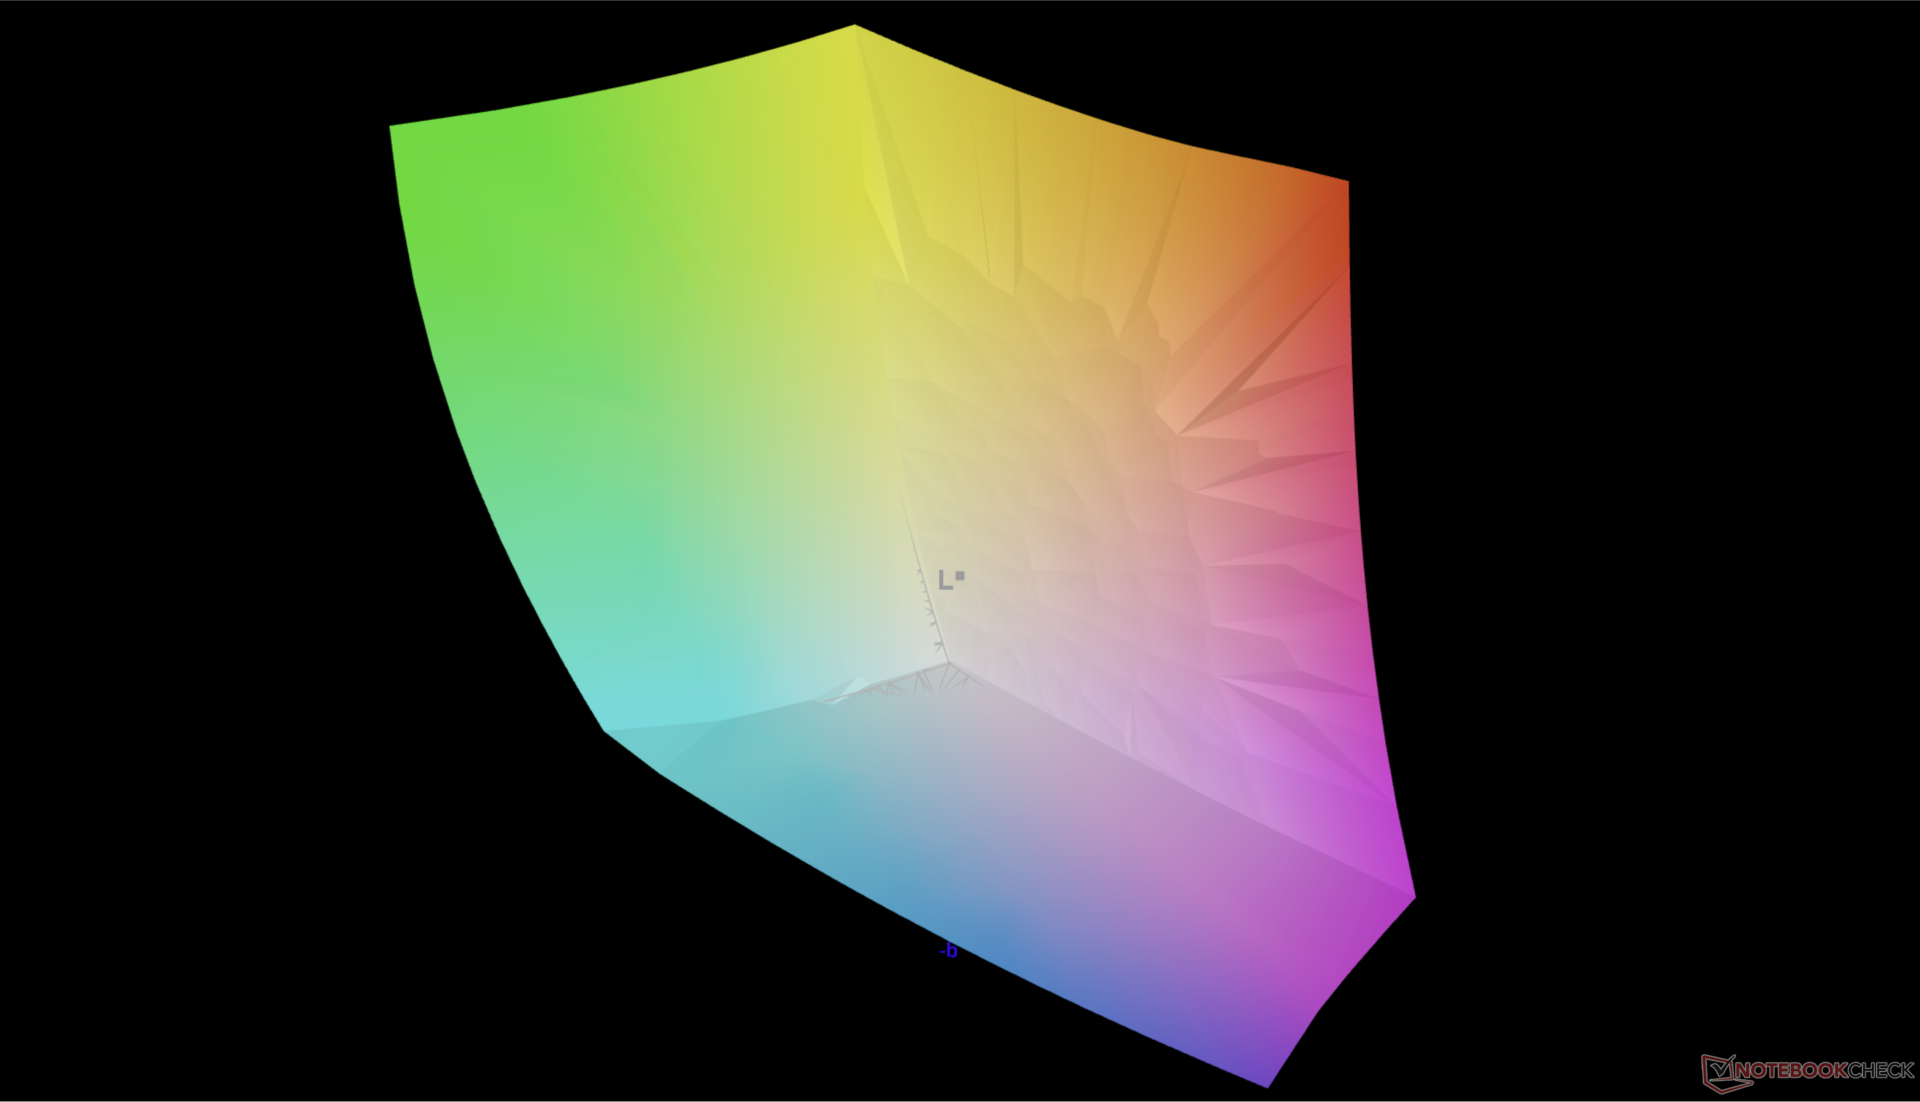
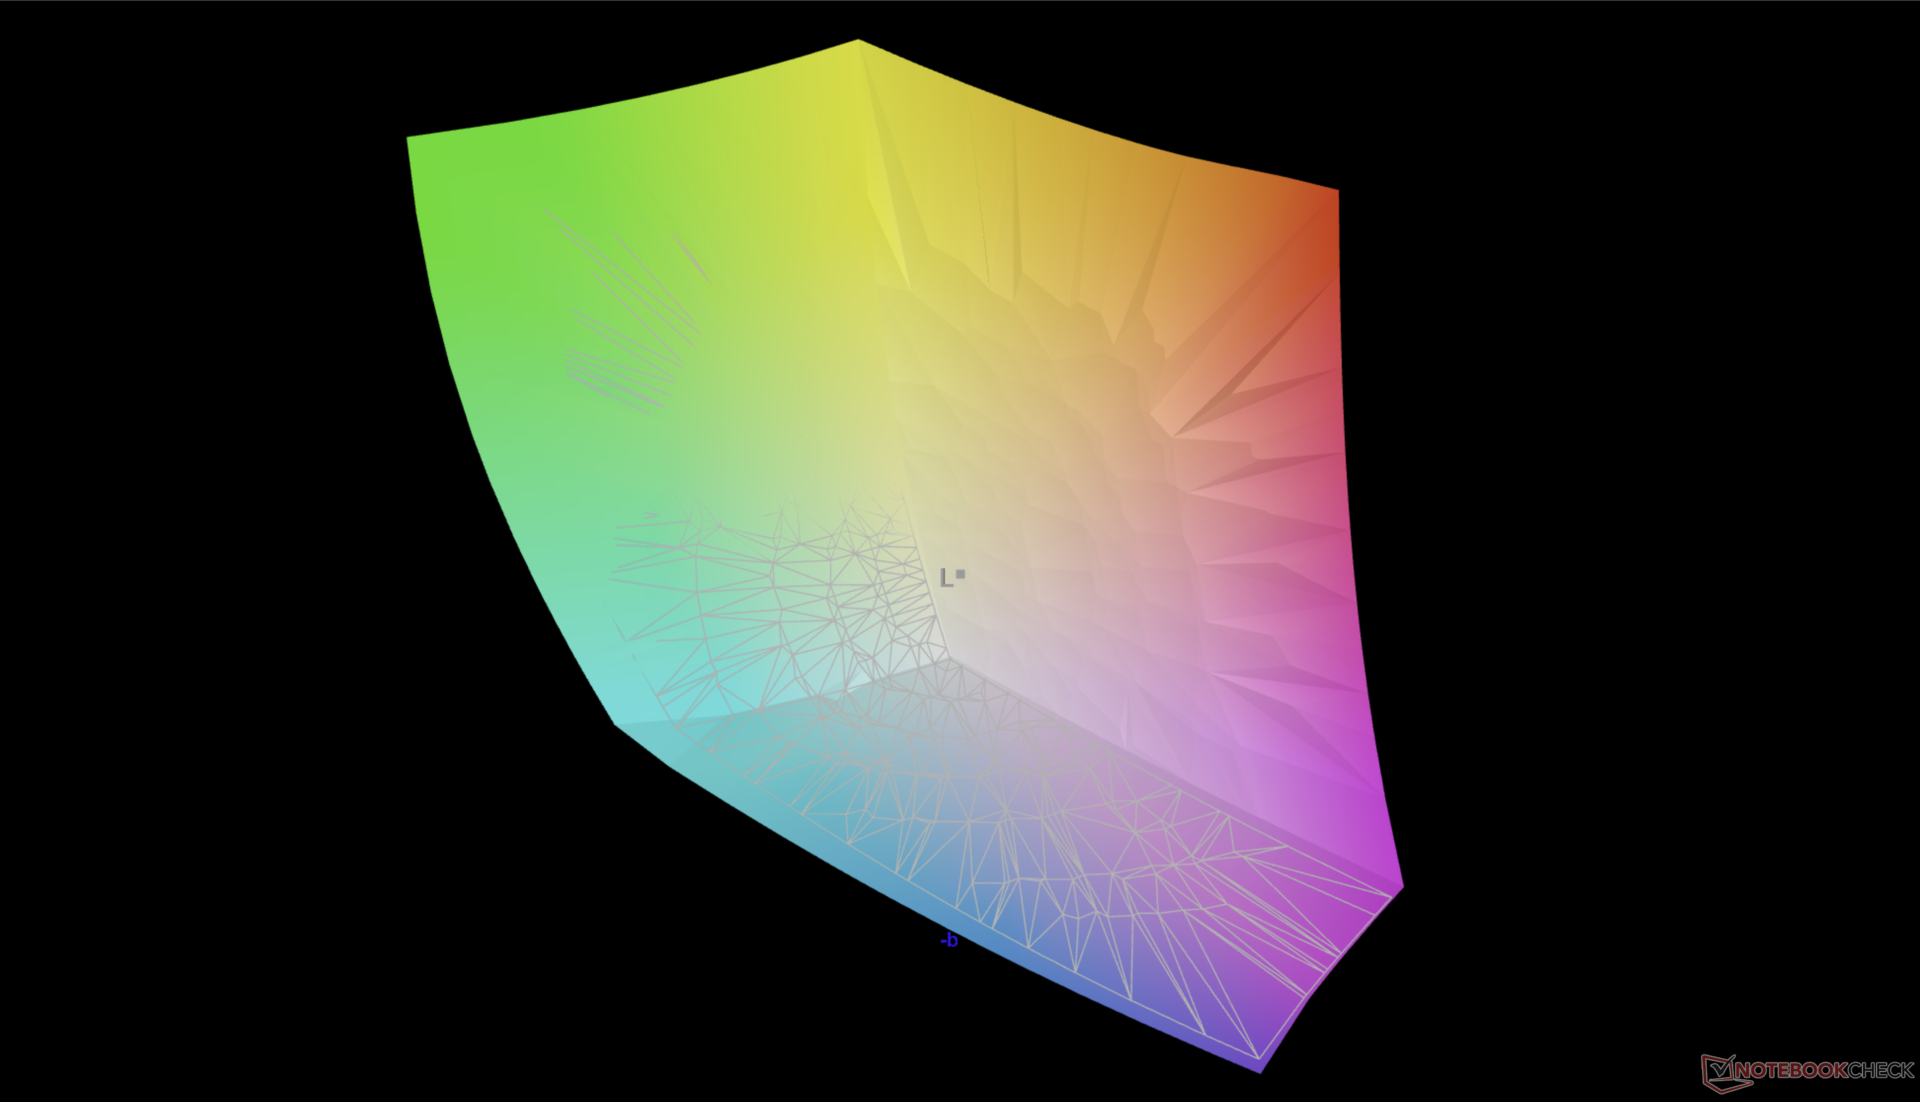
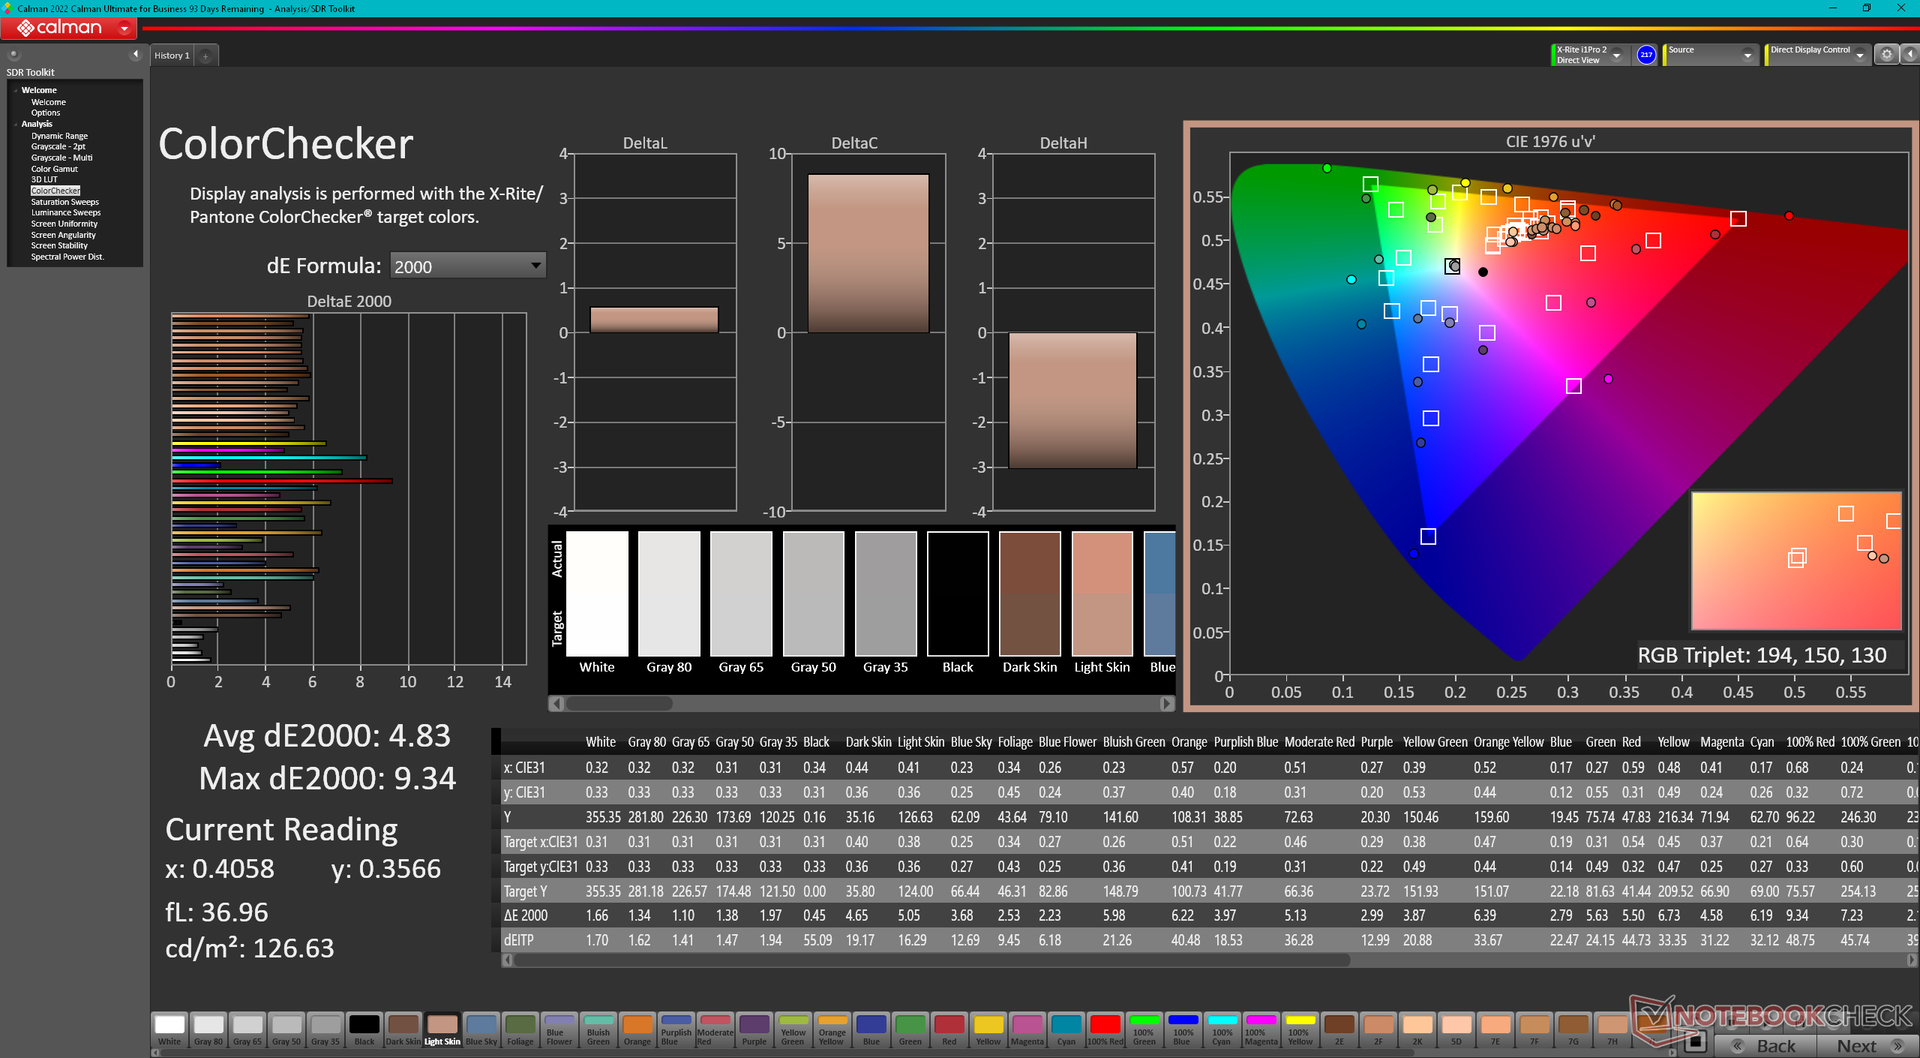
La nostra configurazione OLED utilizza lo stesso pannello Samsung 134XK04 presente nelle SKU OLED dello scorso anno sKU OLED dell'anno scorso e quindi l'esperienza visiva rimane identica. I possessori ottengono una copertura sRGB del 99% come minimo, indipendentemente dall'opzione selezionata, in base alle nostre esperienze con tutti e tre risoluzione opzioni di risoluzione.

| |||||||||||||||||||||||||
Distribuzione della luminosità: 96 %
Al centro con la batteria: 361.7 cd/m²
Contrasto: ∞:1 (Nero: 0 cd/m²)
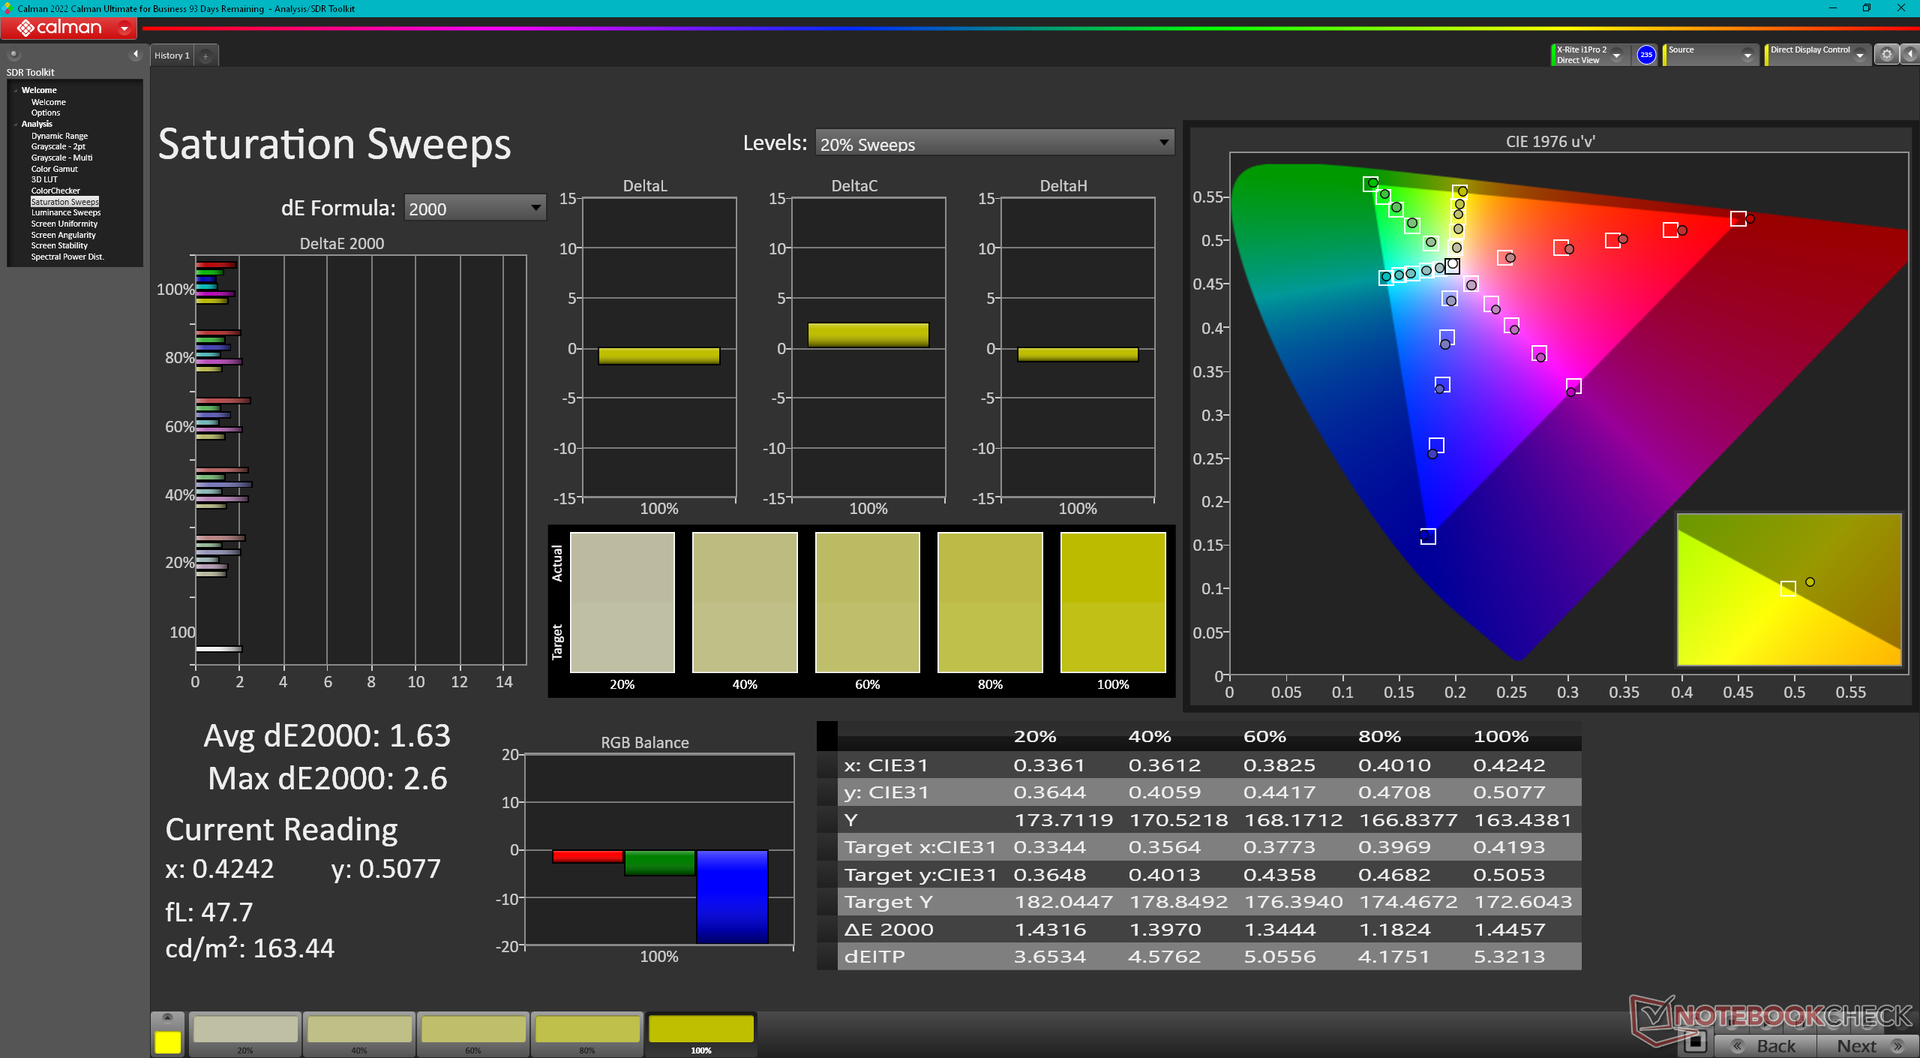
ΔE ColorChecker Calman: 4.83 | ∀{0.5-29.43 Ø4.71}
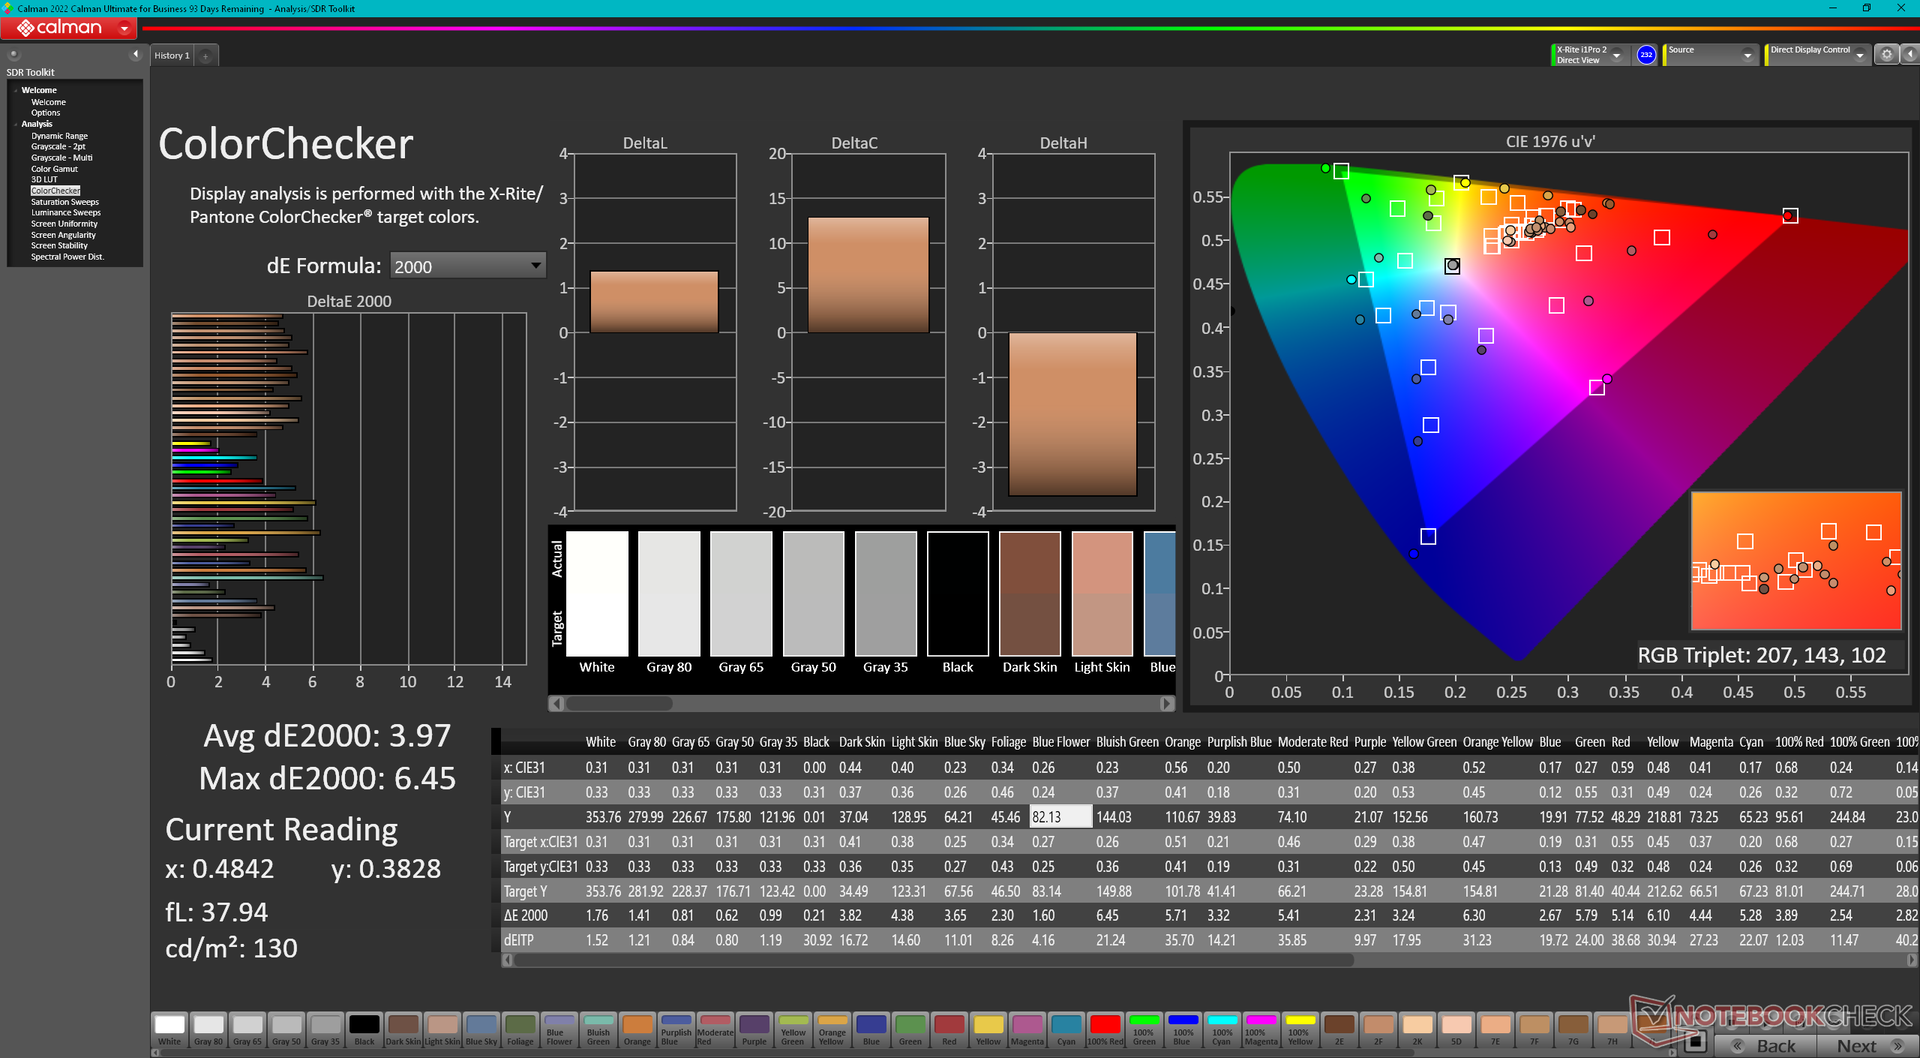
calibrated: 3.97
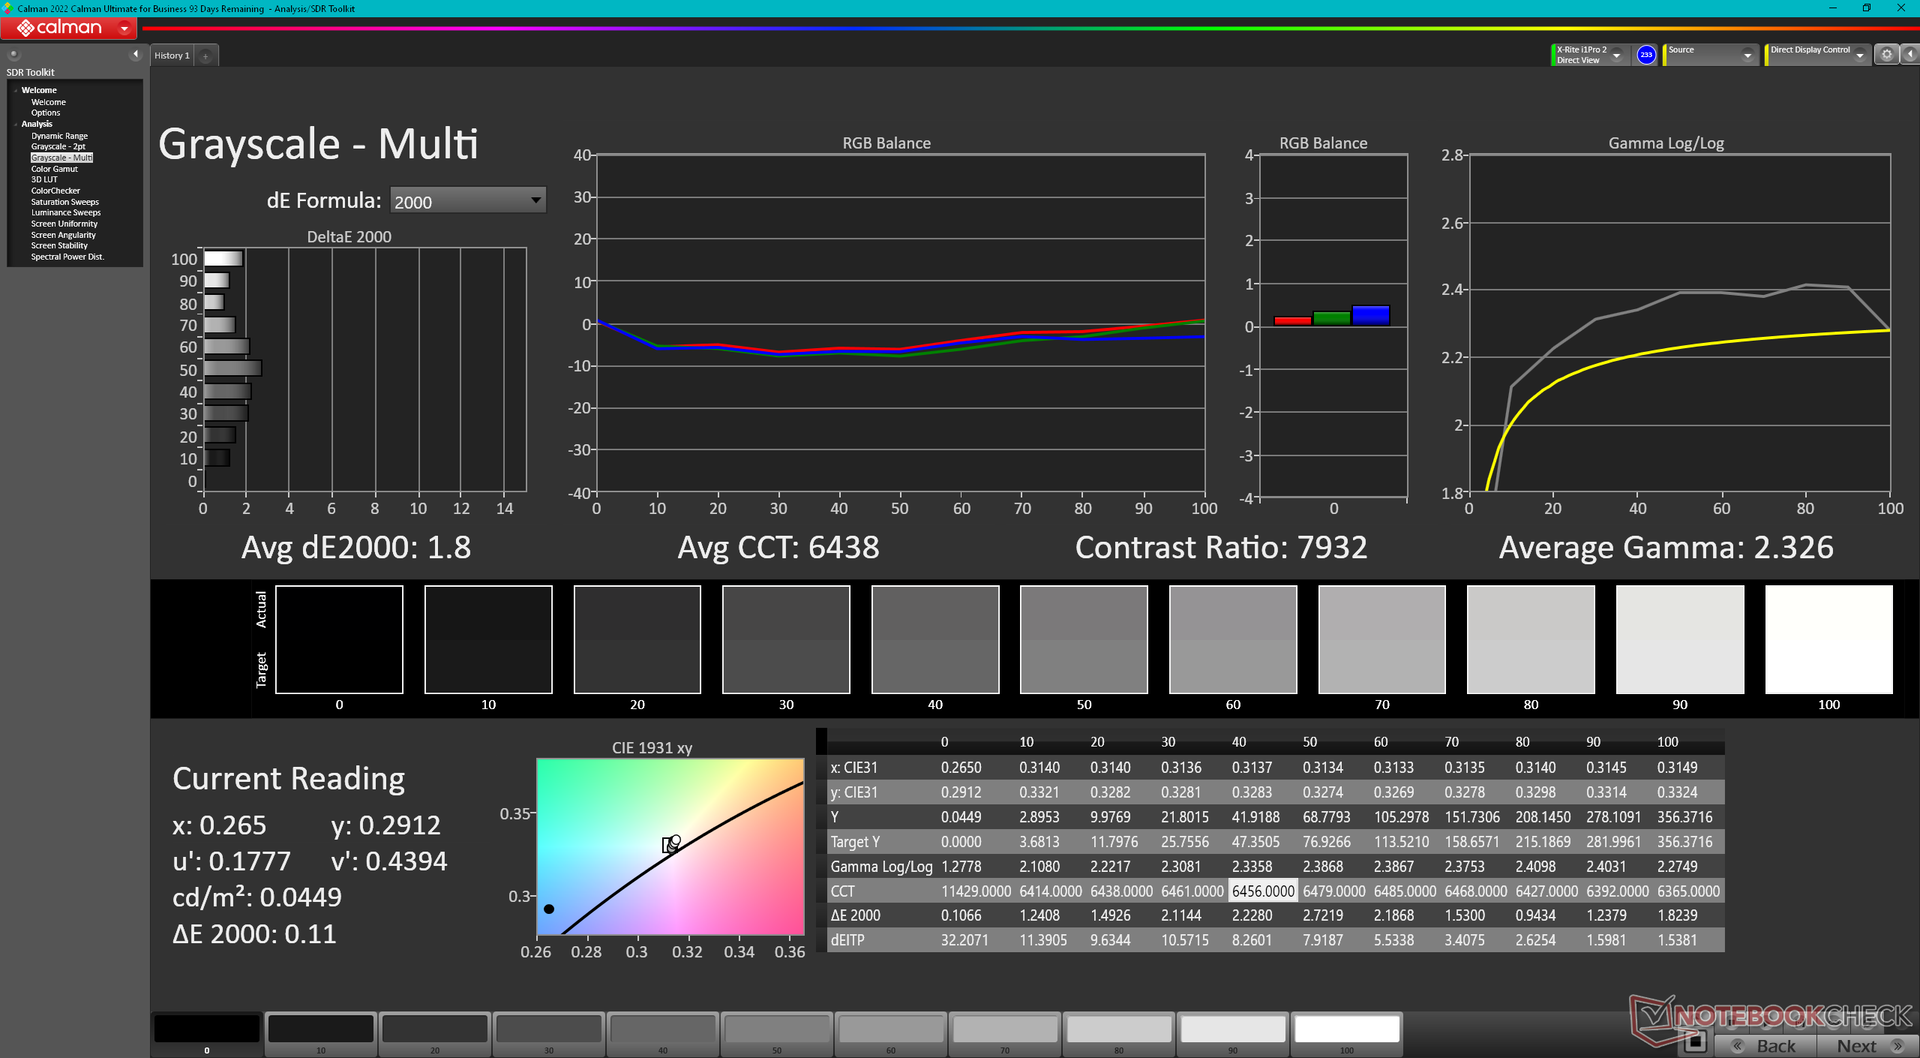
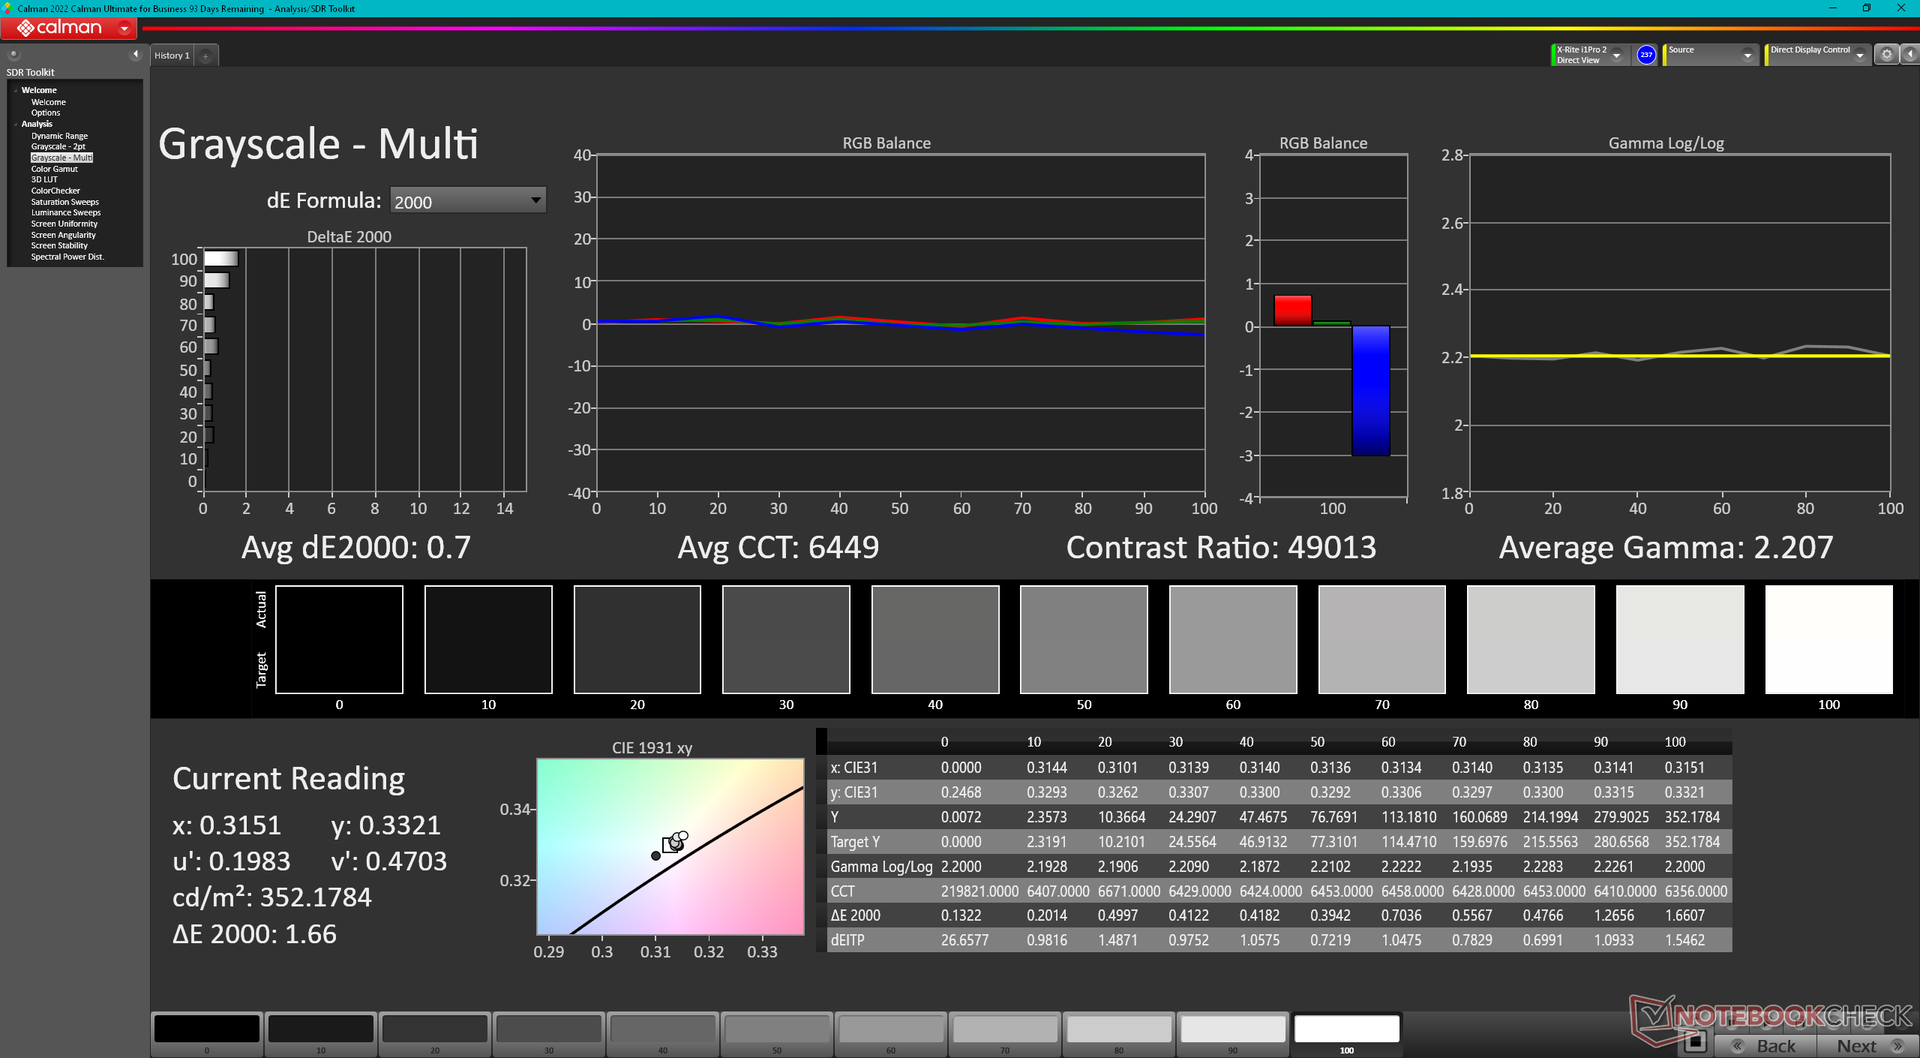
ΔE Greyscale Calman: 1.8 | ∀{0.09-98 Ø4.96}
96.8% AdobeRGB 1998 (Argyll 3D)
100% sRGB (Argyll 3D)
99.7% Display P3 (Argyll 3D)
Gamma: 2.33
CCT: 6438 K
| Dell XPS 13 Plus 9320 Core i7-1360P Samsung 134XK04, OLED, 3456x2160, 13.4" | Dell XPS 13 Plus 9320 i7-1280P OLED Samsung 134XK04, OLED, 3456x2160, 13.4" | Dell XPS 13 7390 Core i7-10710U AU Optronics B133ZAN, Dell P/N: 90NTH, IPS, 3840x2160, 13.3" | Framework Laptop 13.5 13th Gen Intel BOE CQ NE135FBM-N41, IPS, 2256x1504, 13.5" | Lenovo ThinkPad X13 Yoga G3 21AW003UGE LP133WQ1-SPF2, IPS LED, 2560x1600, 13.3" | HP Spectre x360 13.5 14t-ef000 SDC4160, OLED, 3000x2000, 13.5" | |
|---|---|---|---|---|---|---|
| Display | 1% | -25% | -20% | -20% | -2% | |
| Display P3 Coverage (%) | 99.7 | 99.5 0% | 63.4 -36% | 68.9 -31% | 68 -32% | 99.9 0% |
| sRGB Coverage (%) | 100 | 100 0% | 93.7 -6% | 97.5 -2% | 98.6 -1% | 100 0% |
| AdobeRGB 1998 Coverage (%) | 96.8 | 98.4 2% | 64.3 -34% | 71.1 -27% | 69.5 -28% | 90.8 -6% |
| Response Times | -10% | -1891% | -1965% | -1617% | 5% | |
| Response Time Grey 50% / Grey 80% * (ms) | 2.18 ? | 2.6 ? -19% | 51.6 ? -2267% | 54.9 ? -2418% | 45.9 ? -2006% | 1.9 ? 13% |
| Response Time Black / White * (ms) | 2.08 ? | 2.1 ? -1% | 33.6 ? -1515% | 33.5 ? -1511% | 27.6 ? -1227% | 2.16 ? -4% |
| PWM Frequency (Hz) | 238.6 ? | 59.5 | 60.2 ? | |||
| Screen | 14% | -39% | 2% | 23% | 9% | |
| Brightness middle (cd/m²) | 361.7 | 371.8 3% | 408.2 13% | 503 39% | 438 21% | 351.7 -3% |
| Brightness (cd/m²) | 367 | 374 2% | 399 9% | 472 29% | 399 9% | 351 -4% |
| Brightness Distribution (%) | 96 | 98 2% | 89 -7% | 87 -9% | 84 -12% | 87 -9% |
| Black Level * (cd/m²) | 0.39 | 0.36 | 0.29 | |||
| Colorchecker dE 2000 * | 4.83 | 2.37 51% | 4.6 5% | 3.38 30% | 1.8 63% | 1.78 63% |
| Colorchecker dE 2000 max. * | 9.34 | 6.1 35% | 11.84 -27% | 7.08 24% | 4 57% | 6.14 34% |
| Colorchecker dE 2000 calibrated * | 3.97 | 2.03 49% | 1.21 70% | 0.8 80% | ||
| Greyscale dE 2000 * | 1.8 | 2 -11% | 7.5 -317% | 4.8 -167% | 2.8 -56% | 2.3 -28% |
| Gamma | 2.33 94% | 2.29 96% | 2.12 104% | 2.13 103% | 2.24 98% | 2.11 104% |
| CCT | 6438 101% | 6261 104% | 7966 82% | 6235 104% | 6785 96% | 6683 97% |
| Contrast (:1) | 1047 | 1397 | 1510 | |||
| Color Space (Percent of AdobeRGB 1998) (%) | 59.5 | |||||
| Color Space (Percent of sRGB) (%) | 93.5 | |||||
| Media totale (Programma / Settaggio) | 2% /
6% | -652% /
-344% | -661% /
-331% | -538% /
-261% | 4% /
5% |
* ... Meglio usare valori piccoli
Tempi di risposta del Display
| ↔ Tempi di risposta dal Nero al Bianco | ||
|---|---|---|
| 2.08 ms ... aumenta ↗ e diminuisce ↘ combinato | ↗ 0.98 ms Incremento | 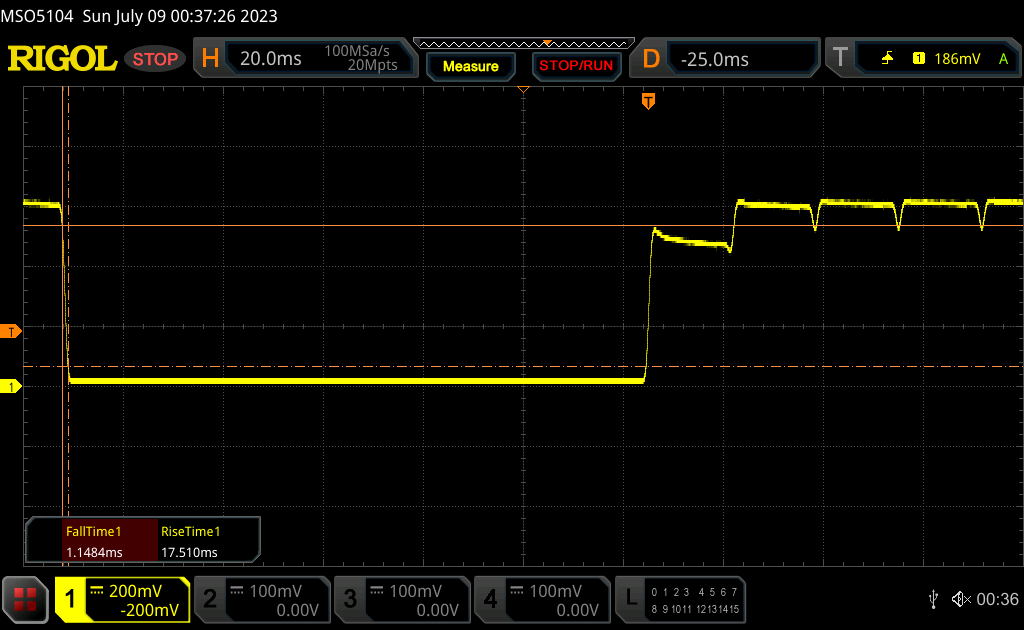 |
| ↘ 1.1 ms Calo | ||
| Lo schermo ha mostrato valori di risposta molto veloci nei nostri tests ed è molto adatto per i gaming veloce. In confronto, tutti i dispositivi di test variano da 0.1 (minimo) a 240 (massimo) ms. » 12 % di tutti i dispositivi è migliore. Questo significa che i tempi di risposta rilevati sono migliori rispettto alla media di tutti i dispositivi testati (19.8 ms). | ||
| ↔ Tempo di risposta dal 50% Grigio all'80% Grigio | ||
| 2.18 ms ... aumenta ↗ e diminuisce ↘ combinato | ↗ 1.2 ms Incremento | 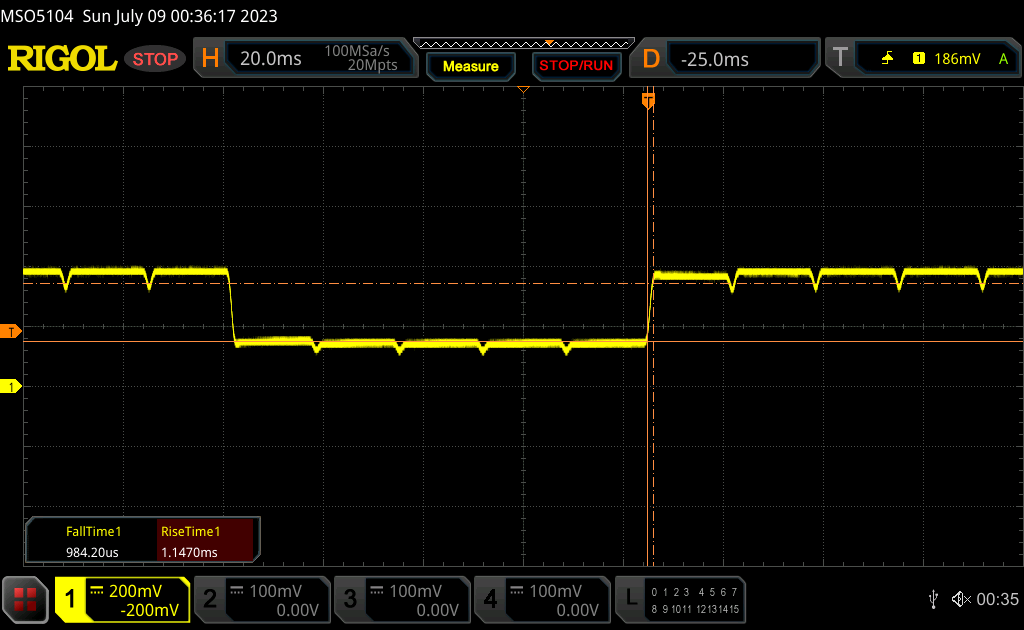 |
| ↘ 0.98 ms Calo | ||
| Lo schermo ha mostrato valori di risposta molto veloci nei nostri tests ed è molto adatto per i gaming veloce. In confronto, tutti i dispositivi di test variano da 0.165 (minimo) a 636 (massimo) ms. » 11 % di tutti i dispositivi è migliore. Questo significa che i tempi di risposta rilevati sono migliori rispettto alla media di tutti i dispositivi testati (30.9 ms). | ||
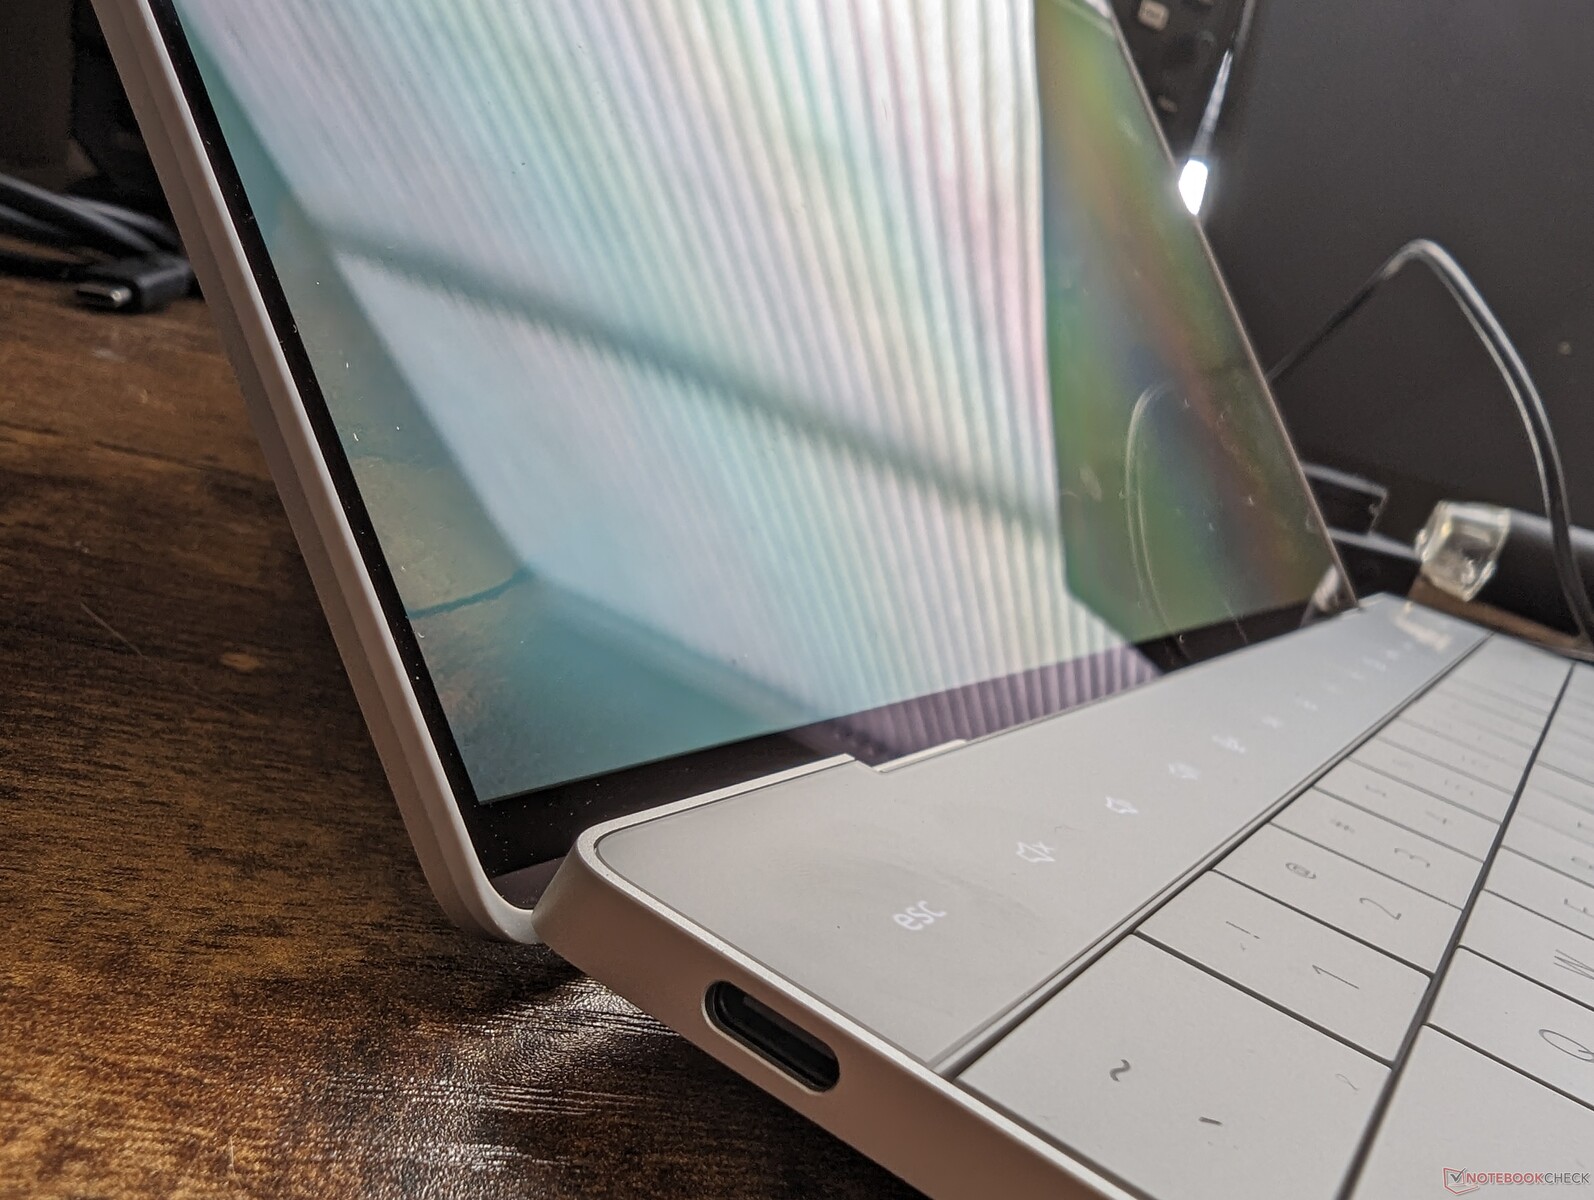
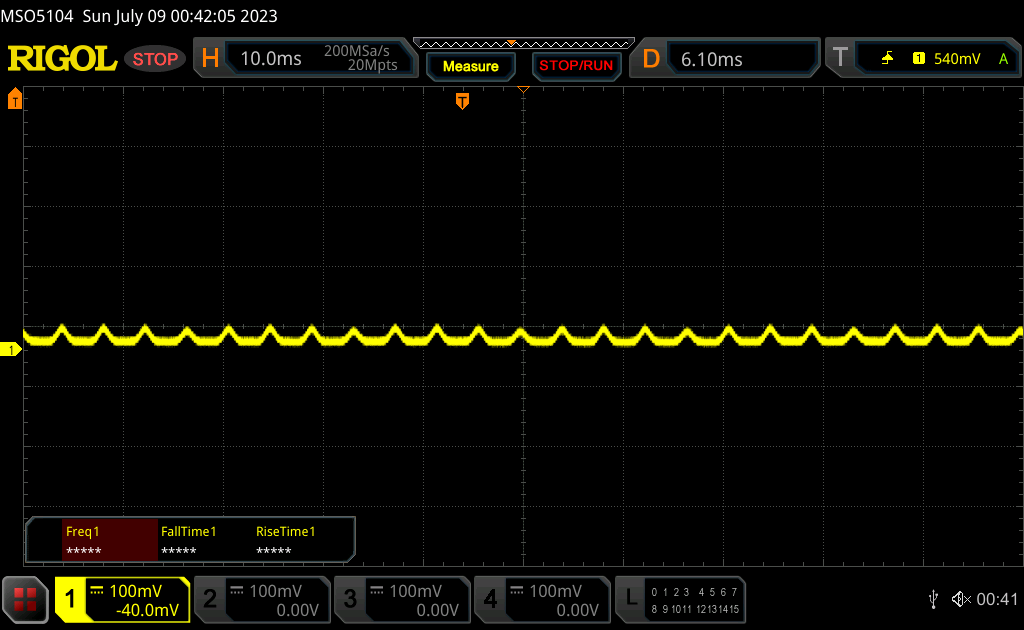
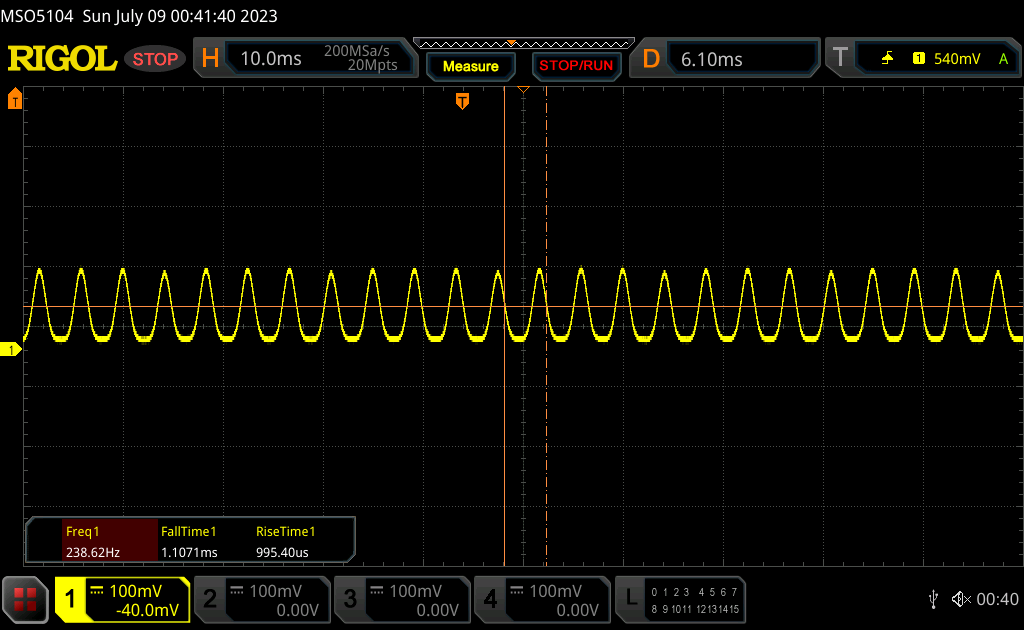
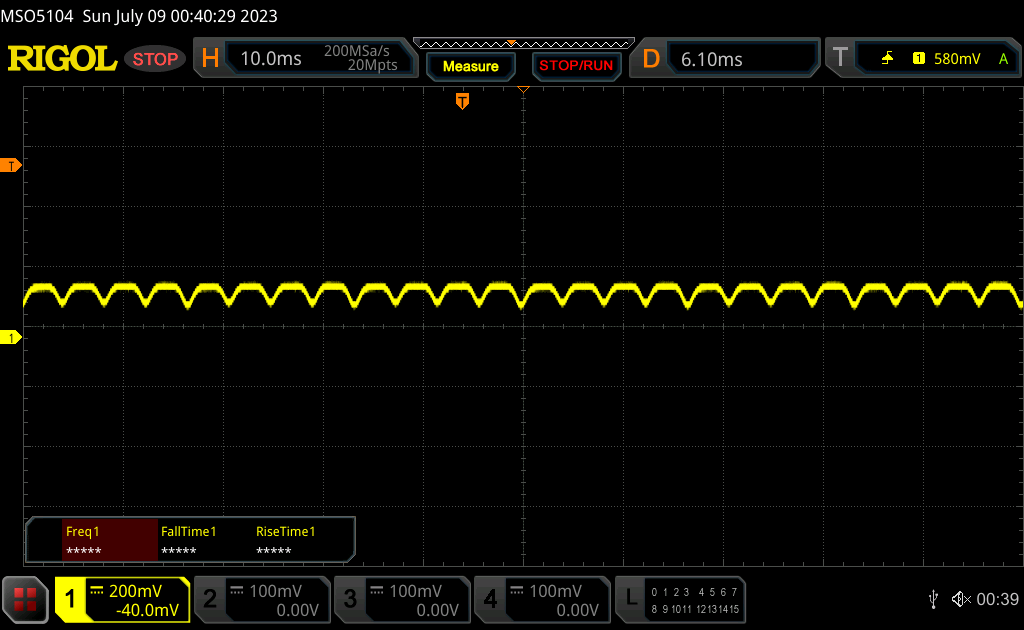
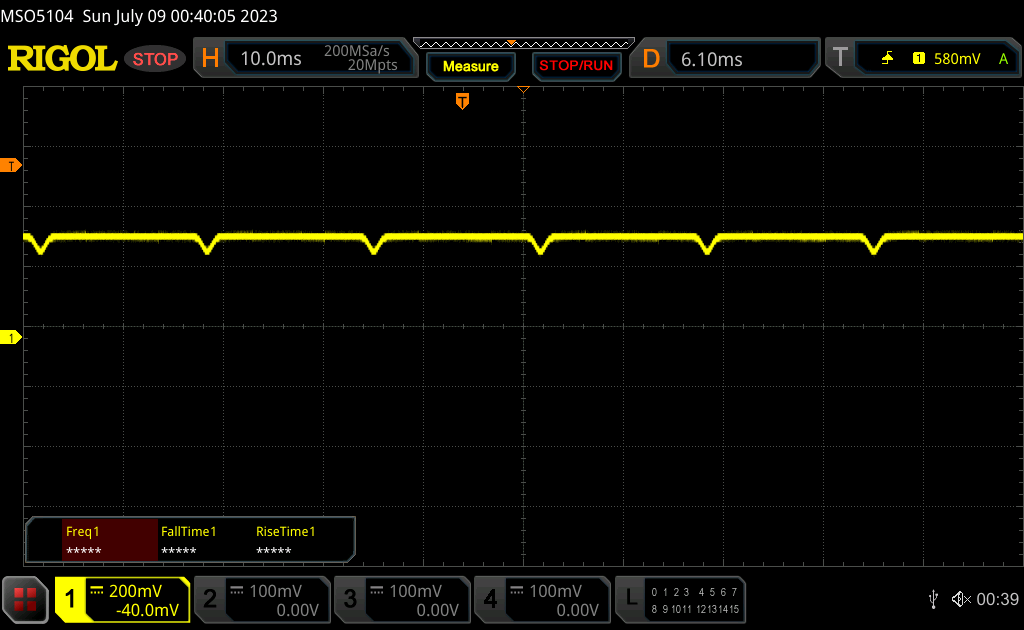
Sfarfallio dello schermo / PWM (Pulse-Width Modulation)
| flickering dello schermo / PWM rilevato | 238.6 Hz | ≤ 100 % settaggio luminosita' | 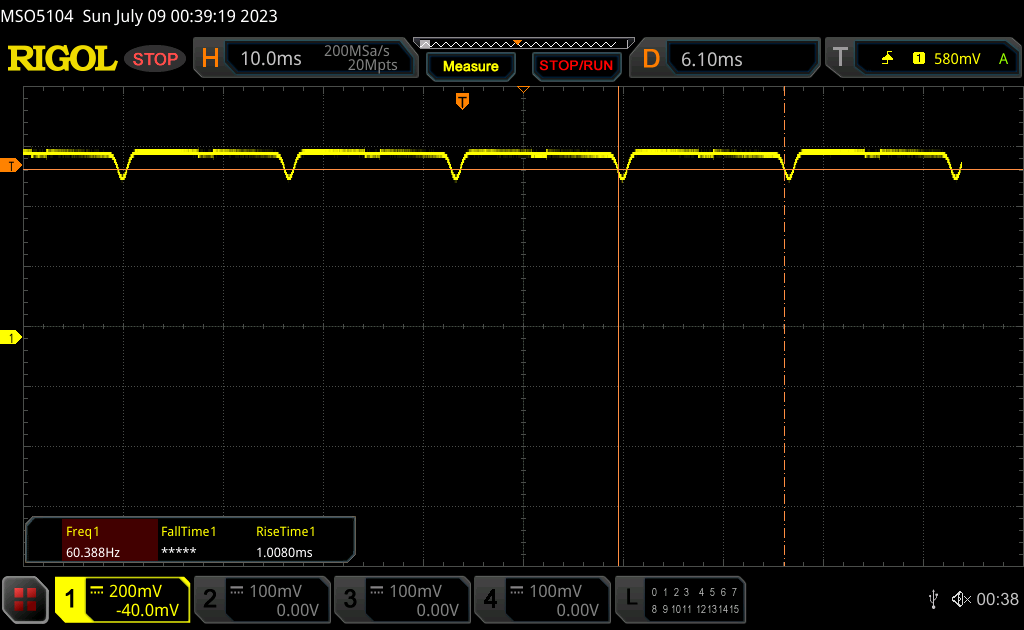 |
Il display sfarfalla a 238.6 Hz (Probabilmente a causa dell'uso di PWM) Flickering rilevato ad una luminosita' di 100 % o inferiore. Non dovrebbe verificarsi flickering o PWM sopra questo valore di luminosita'. La frequenza di 238.6 Hz è relativamente bassa, quindi gli utenti sensibili potrebbero notare il flickering ed accusare stanchezza agli occhi a questo livello di luminosità e a livelli inferiori. In confronto: 52 % di tutti i dispositivi testati non utilizza PWM per ridurre la luminosita' del display. Se è rilevato PWM, una media di 7741 (minimo: 5 - massimo: 343500) Hz è stata rilevata. | |||
La modulazione a larghezza di impulso o sfarfallio è ancora presente sulla maggior parte dei livelli di luminosità. Abbiamo rilevato una frequenza di 238,6 Hz dallo 0% al 52% di luminosità e di 60 Hz dal 53% di luminosità al massimo. Le opzioni IPS alternative non dovrebbero presentare sfarfallii o PWM.

Prestazioni
Condizioni di test
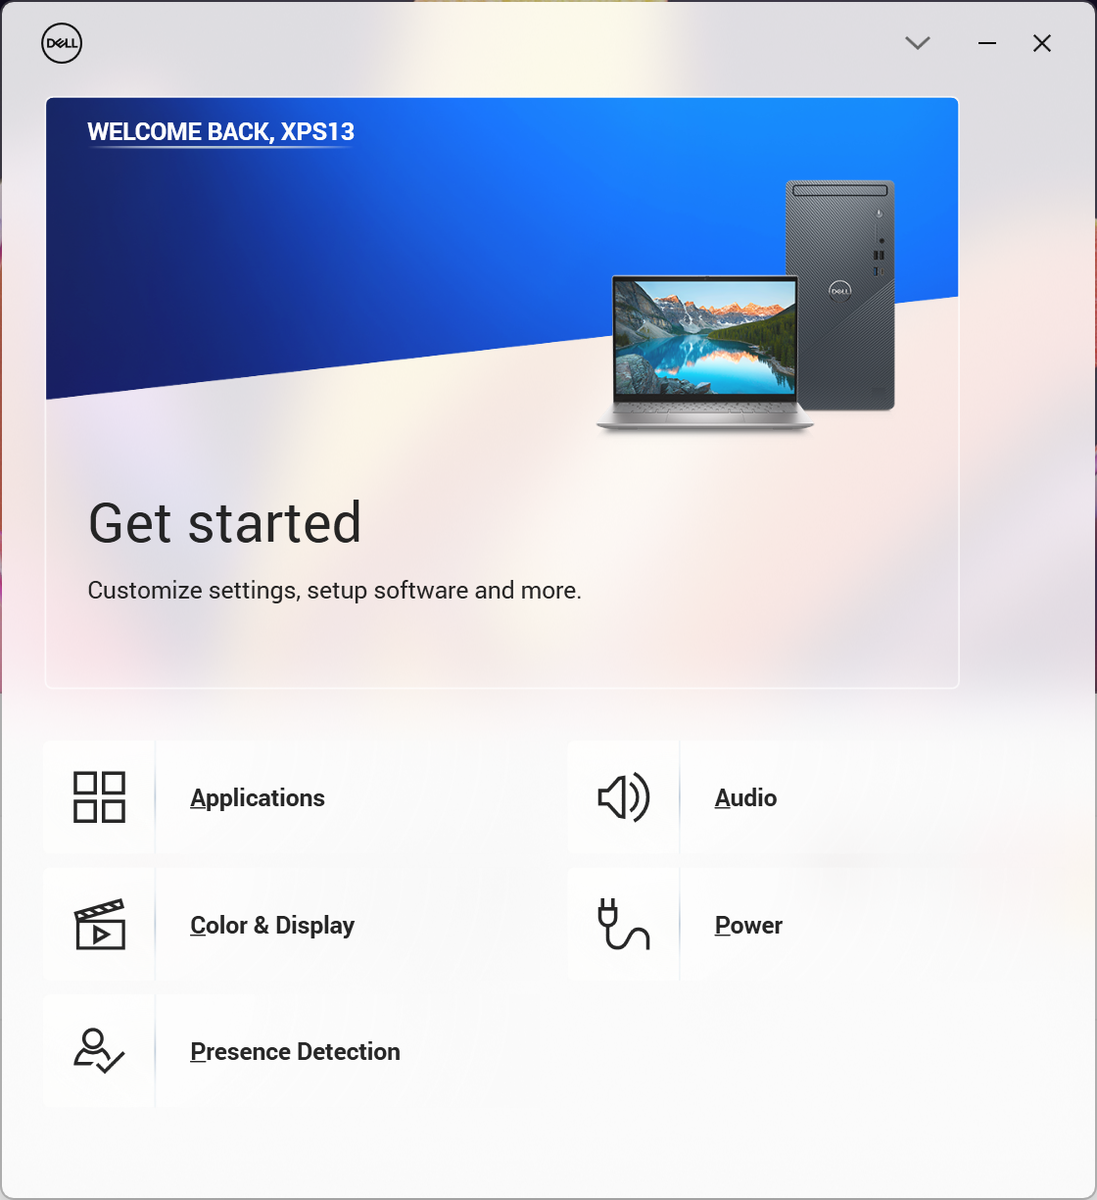
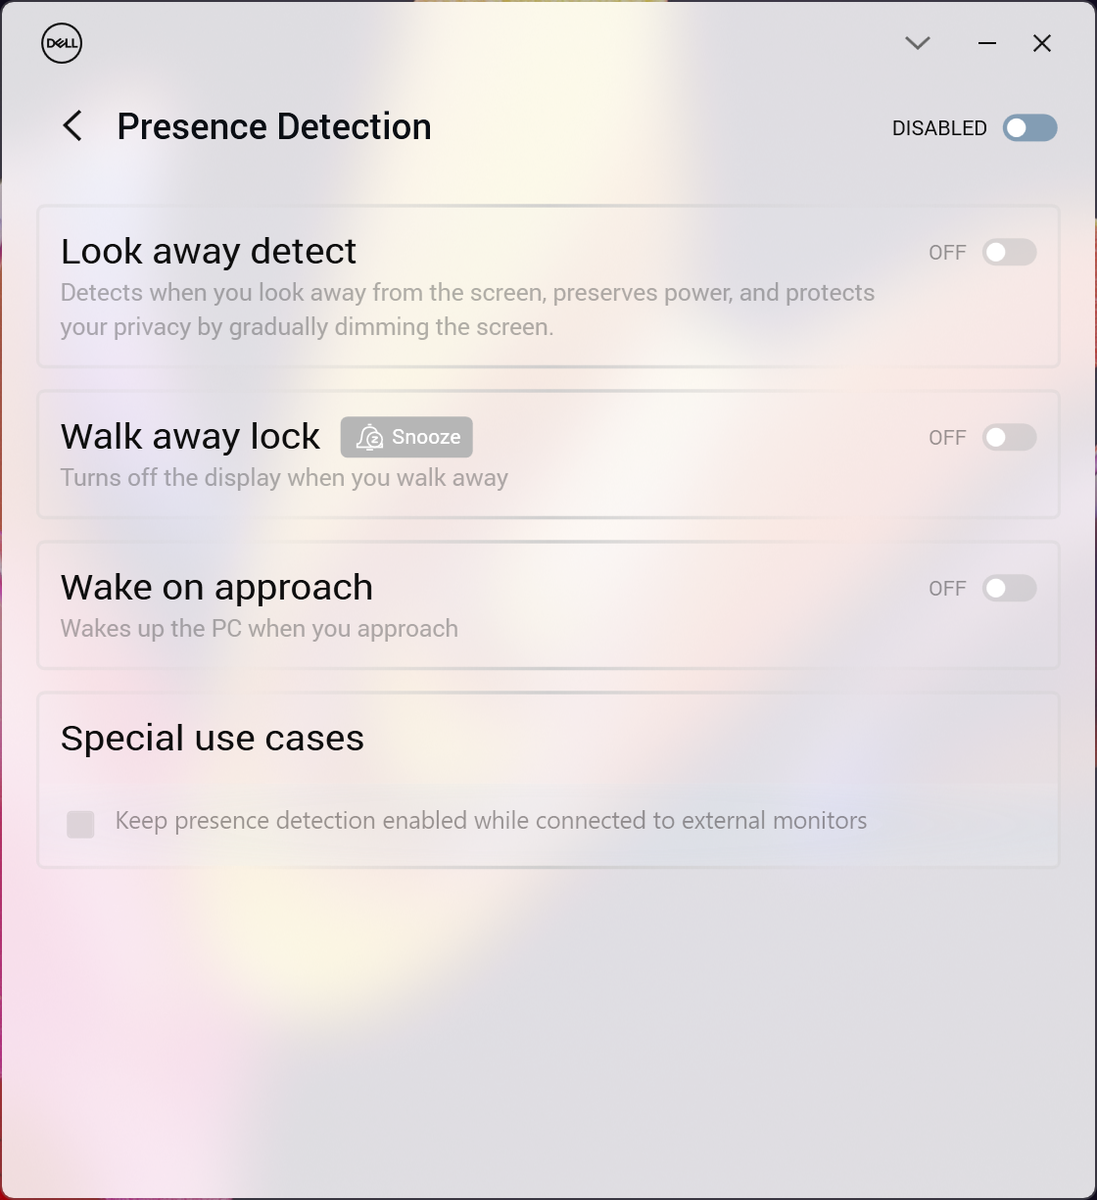
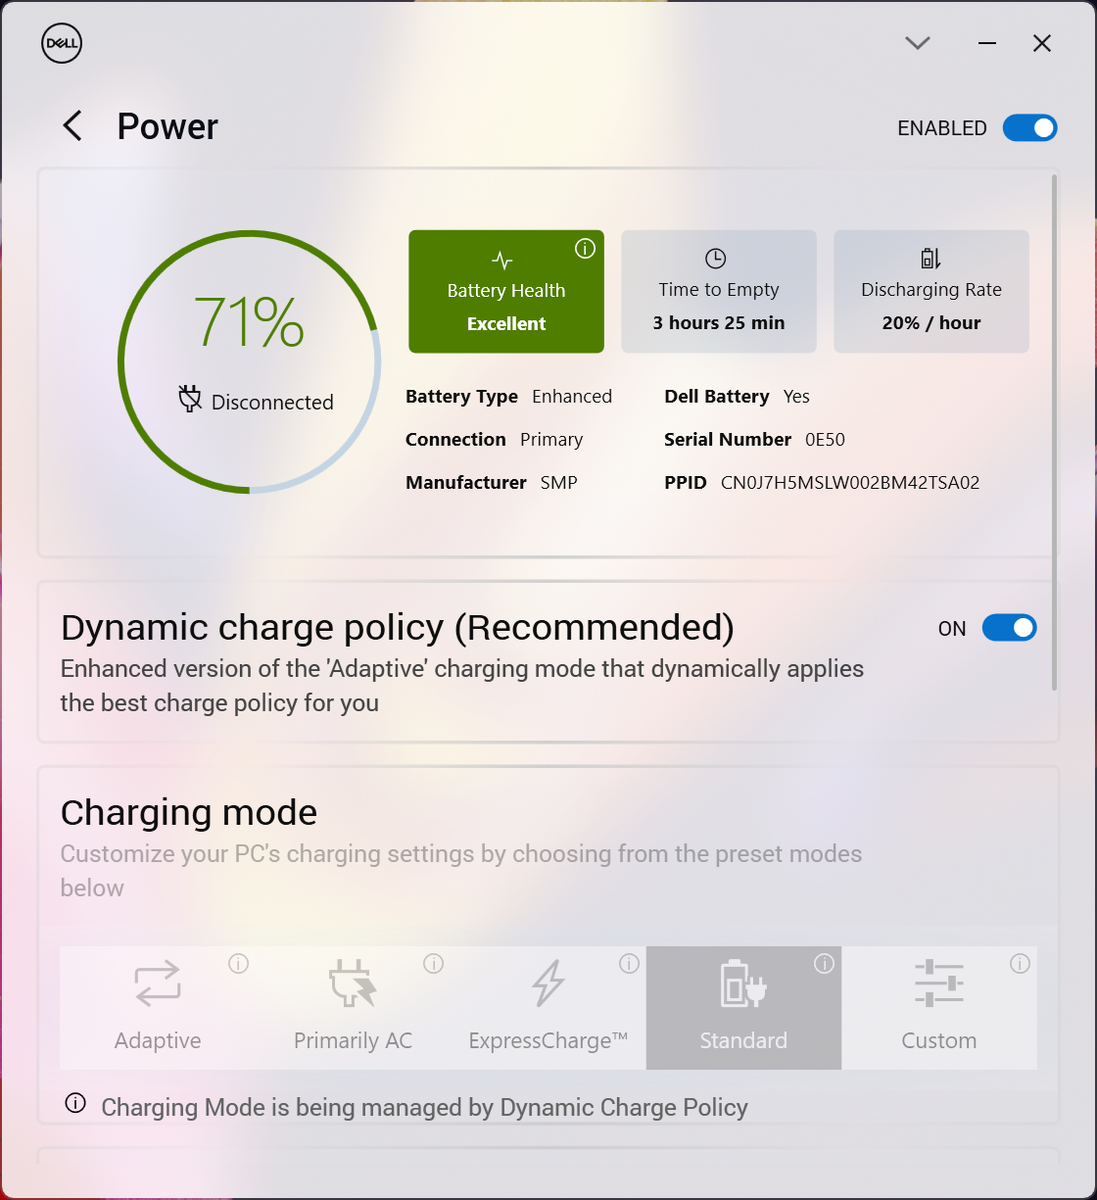
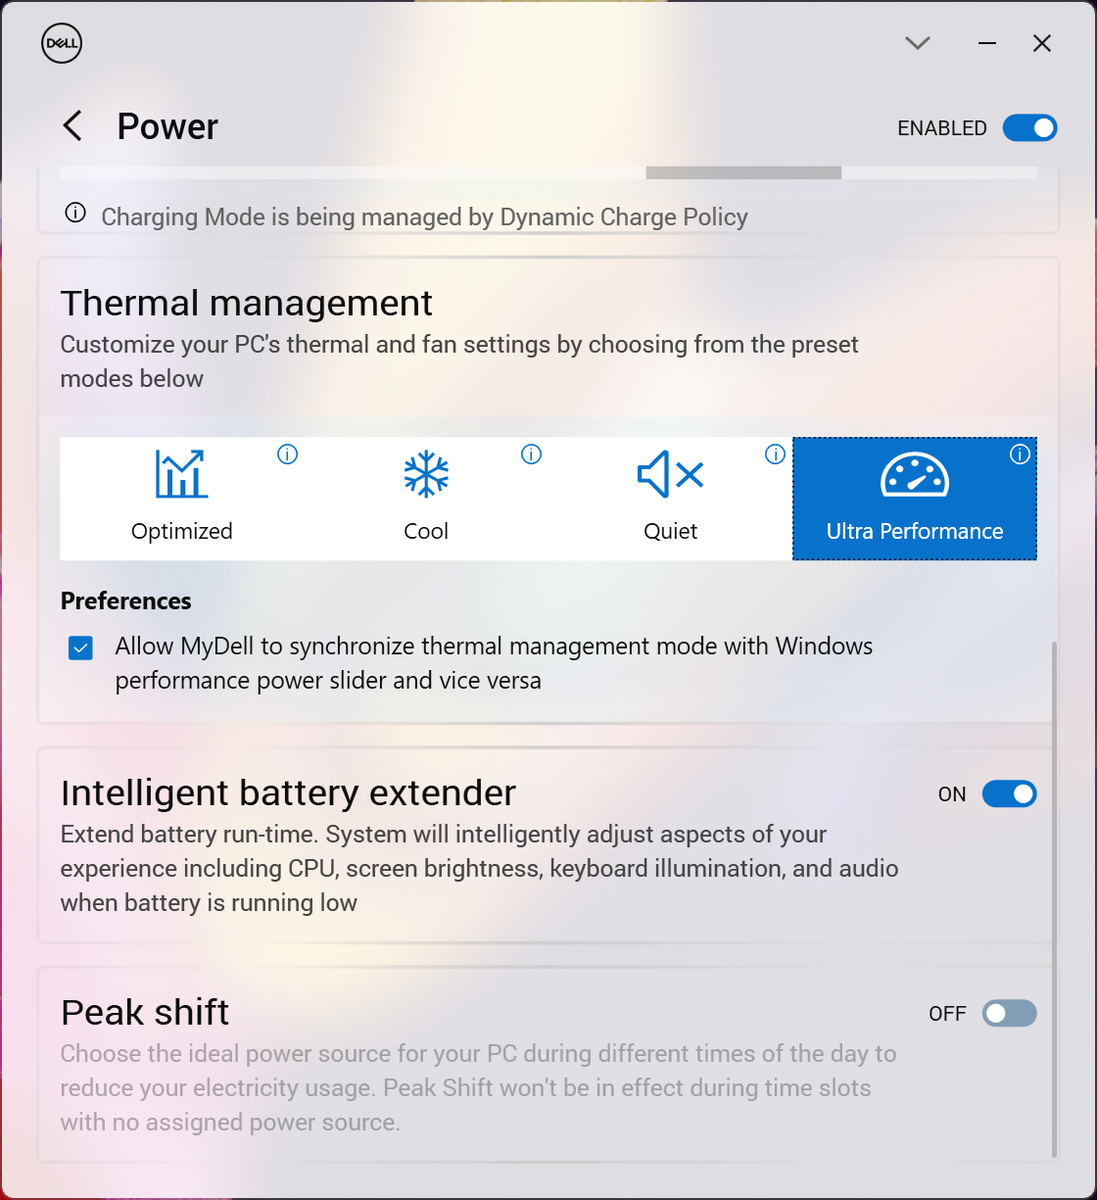
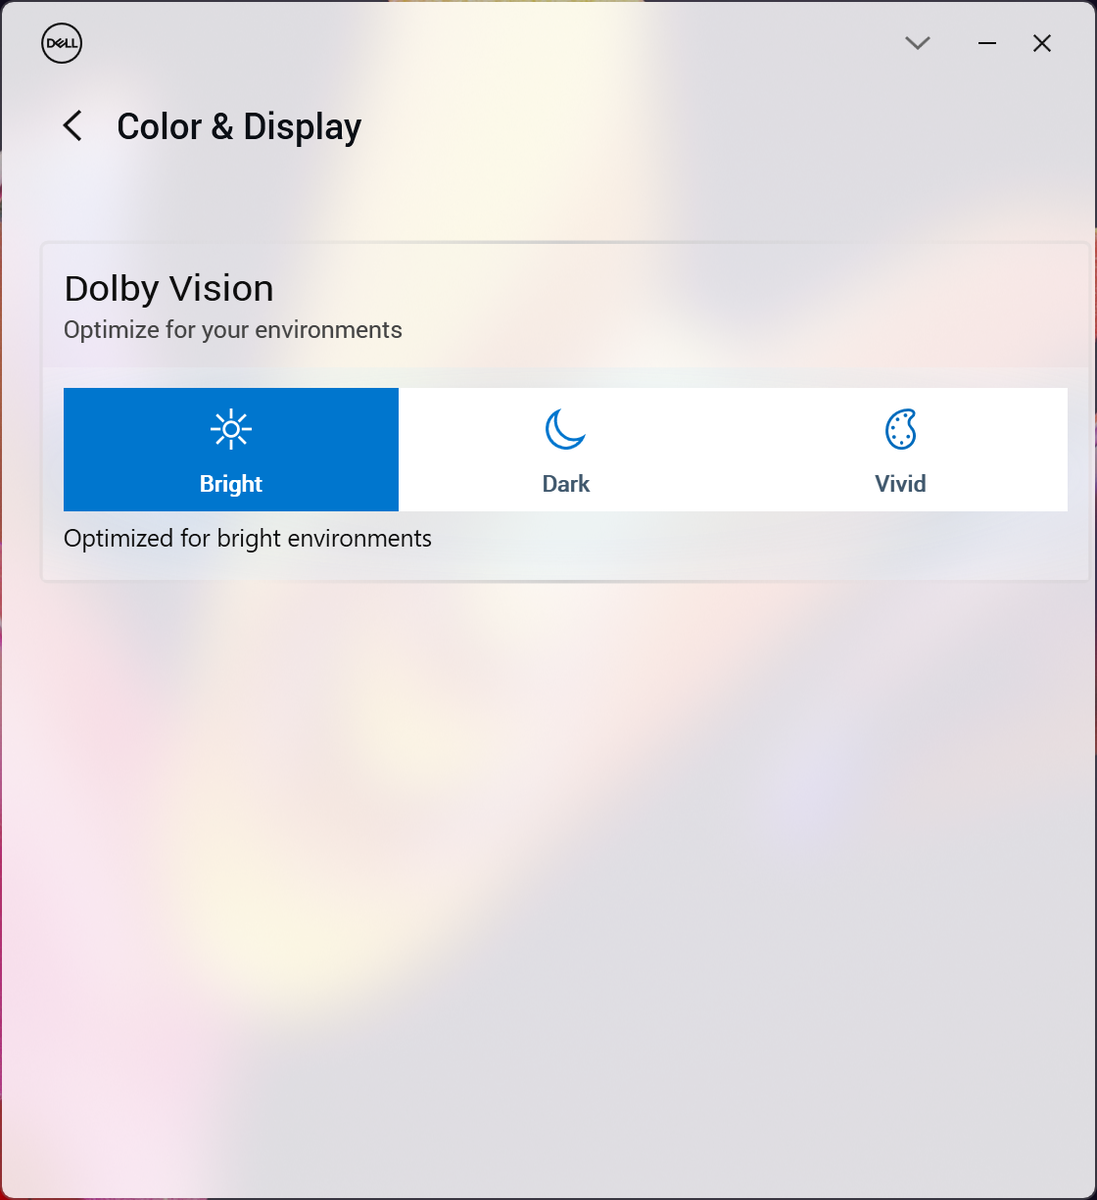
Abbiamo impostato la nostra unità in modalità Ultra Performance tramite il software MyDell riprogettato prima di eseguire i benchmark qui sotto. MyDell è l'equivalente XPS del software Optimizer che viene fornito con molti modelli Latitude e quindi integra funzioni simili come i profili di prestazioni, le abitudini di ricarica e il rilevamento della presenza. I profili di alimentazione Dell possono essere sincronizzati con i profili standard di Windows, a differenza di quanto avviene con la maggior parte degli altri portatili.
Processore
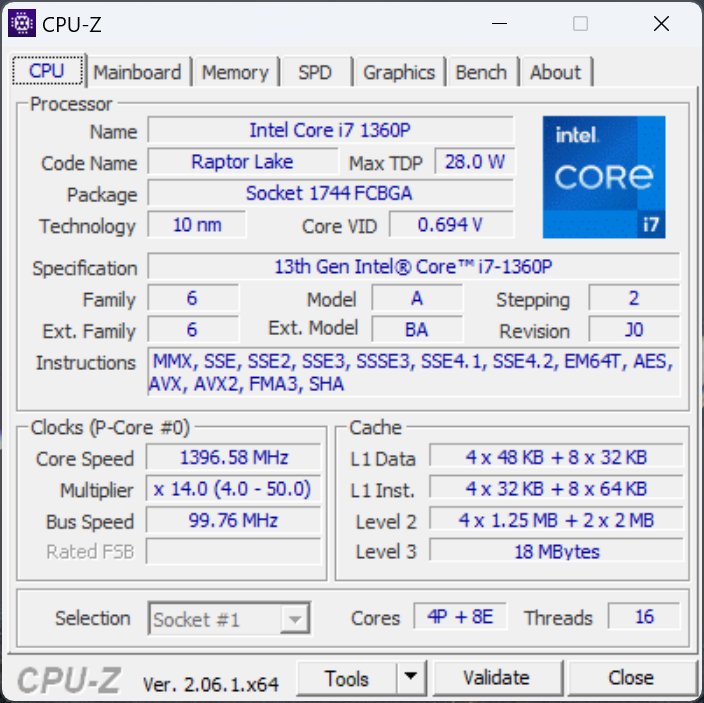
Prestazioni multi-thread del nostro Core i7-1360P di 13a generazione Core i7-1360P è quasi identica a quella del Core i7-1280P di 12a generazione Core i7-1280P del 2022 XPS 13 Plus. Anche il comportamento in Turbo Boost è lo stesso, come dimostrano i risultati del test CineBench R15 xT qui sotto. IlLenovo Yoga 9 14IRP G8che monta lo stesso Core i7-1360P, è in grado di sostenere velocità di clock Turbo Boost leggermente superiori per un periodo più lungo nell'ambito dello stesso test.
Mentre le prestazioni multi-thread non sono cambiate rispetto all'anno precedente, le prestazioni single-thread sono aumentate di circa il 10-15% rispetto al Core i7-1280P. Tuttavia, questo non dovrebbe avere un grande impatto sui carichi di lavoro quotidiani, dato che la maggior parte delle applicazioni moderne sono multi-thread.
Cinebench R15 Multi Loop
Cinebench R20: CPU (Multi Core) | CPU (Single Core)
Cinebench R23: Multi Core | Single Core
Cinebench R15: CPU Multi 64Bit | CPU Single 64Bit
Blender: v2.79 BMW27 CPU
7-Zip 18.03: 7z b 4 | 7z b 4 -mmt1
Geekbench 5.5: Multi-Core | Single-Core
HWBOT x265 Benchmark v2.2: 4k Preset
LibreOffice : 20 Documents To PDF
R Benchmark 2.5: Overall mean
* ... Meglio usare valori piccoli
AIDA64: FP32 Ray-Trace | FPU Julia | CPU SHA3 | CPU Queen | FPU SinJulia | FPU Mandel | CPU AES | CPU ZLib | FP64 Ray-Trace | CPU PhotoWorxx
| Performance rating | |
| Framework Laptop 13.5 13th Gen Intel | |
| Dell XPS 13 Plus 9320 i7-1280P OLED | |
| Dell XPS 13 Plus 9320 Core i7-1360P | |
| HP Spectre x360 13.5 14t-ef000 | |
| Lenovo ThinkPad X13 Yoga G3 21AW003UGE | |
| AIDA64 / FP32 Ray-Trace | |
| Framework Laptop 13.5 13th Gen Intel | |
| Dell XPS 13 Plus 9320 i7-1280P OLED | |
| Dell XPS 13 Plus 9320 Core i7-1360P | |
| Lenovo ThinkPad X13 Yoga G3 21AW003UGE | |
| HP Spectre x360 13.5 14t-ef000 | |
| AIDA64 / FPU Julia | |
| Framework Laptop 13.5 13th Gen Intel | |
| Dell XPS 13 Plus 9320 i7-1280P OLED | |
| Dell XPS 13 Plus 9320 Core i7-1360P | |
| Lenovo ThinkPad X13 Yoga G3 21AW003UGE | |
| HP Spectre x360 13.5 14t-ef000 | |
| AIDA64 / CPU SHA3 | |
| Framework Laptop 13.5 13th Gen Intel | |
| Dell XPS 13 Plus 9320 i7-1280P OLED | |
| Dell XPS 13 Plus 9320 Core i7-1360P | |
| Lenovo ThinkPad X13 Yoga G3 21AW003UGE | |
| HP Spectre x360 13.5 14t-ef000 | |
| AIDA64 / CPU Queen | |
| Framework Laptop 13.5 13th Gen Intel | |
| Dell XPS 13 Plus 9320 i7-1280P OLED | |
| Dell XPS 13 Plus 9320 Core i7-1360P | |
| Lenovo ThinkPad X13 Yoga G3 21AW003UGE | |
| HP Spectre x360 13.5 14t-ef000 | |
| AIDA64 / FPU SinJulia | |
| Framework Laptop 13.5 13th Gen Intel | |
| Dell XPS 13 Plus 9320 i7-1280P OLED | |
| Dell XPS 13 Plus 9320 Core i7-1360P | |
| Lenovo ThinkPad X13 Yoga G3 21AW003UGE | |
| HP Spectre x360 13.5 14t-ef000 | |
| AIDA64 / FPU Mandel | |
| Framework Laptop 13.5 13th Gen Intel | |
| Dell XPS 13 Plus 9320 i7-1280P OLED | |
| Dell XPS 13 Plus 9320 Core i7-1360P | |
| Lenovo ThinkPad X13 Yoga G3 21AW003UGE | |
| HP Spectre x360 13.5 14t-ef000 | |
| AIDA64 / CPU AES | |
| Framework Laptop 13.5 13th Gen Intel | |
| HP Spectre x360 13.5 14t-ef000 | |
| Dell XPS 13 Plus 9320 i7-1280P OLED | |
| Dell XPS 13 Plus 9320 Core i7-1360P | |
| Lenovo ThinkPad X13 Yoga G3 21AW003UGE | |
| AIDA64 / CPU ZLib | |
| Framework Laptop 13.5 13th Gen Intel | |
| Dell XPS 13 Plus 9320 Core i7-1360P | |
| Dell XPS 13 Plus 9320 i7-1280P OLED | |
| Lenovo ThinkPad X13 Yoga G3 21AW003UGE | |
| HP Spectre x360 13.5 14t-ef000 | |
| AIDA64 / FP64 Ray-Trace | |
| Framework Laptop 13.5 13th Gen Intel | |
| Dell XPS 13 Plus 9320 i7-1280P OLED | |
| Dell XPS 13 Plus 9320 Core i7-1360P | |
| HP Spectre x360 13.5 14t-ef000 | |
| Lenovo ThinkPad X13 Yoga G3 21AW003UGE | |
| AIDA64 / CPU PhotoWorxx | |
| Dell XPS 13 Plus 9320 Core i7-1360P | |
| Dell XPS 13 Plus 9320 i7-1280P OLED | |
| HP Spectre x360 13.5 14t-ef000 | |
| Lenovo ThinkPad X13 Yoga G3 21AW003UGE | |
| Framework Laptop 13.5 13th Gen Intel | |
Prestazioni del sistema
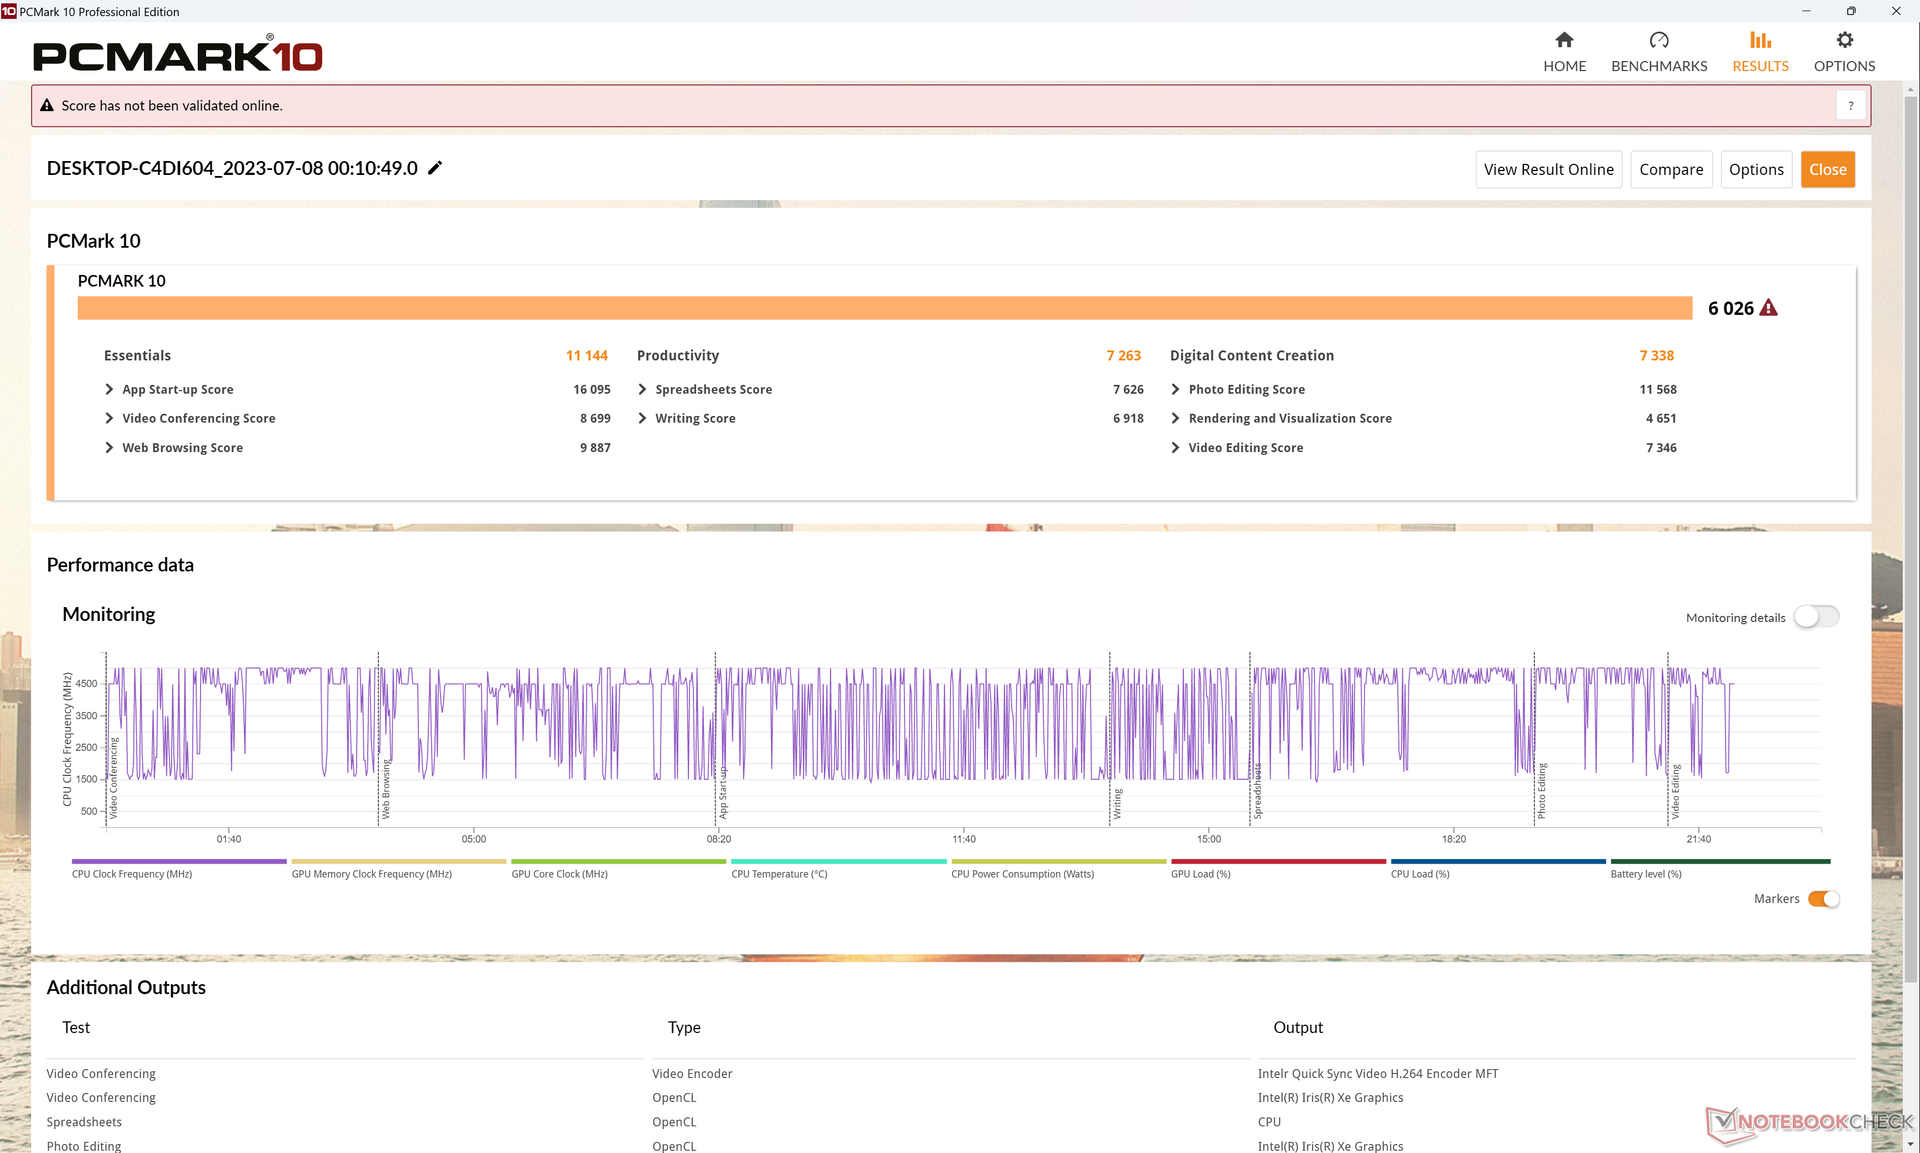
I risultati di PCMark sono leggermente ma costantemente superiori a quelli dell'XPS 13 Plus dello scorso anno di una sola cifra percentuale, probabilmente grazie alla RAM più veloce e alle prestazioni leggermente più elevate in single-thread.
CrossMark: Overall | Productivity | Creativity | Responsiveness
| PCMark 10 / Digital Content Creation | |
| Framework Laptop 13.5 13th Gen Intel | |
| Dell XPS 13 Plus 9320 Core i7-1360P | |
| Media Intel Core i7-1360P (5723 - 9597, n=16) | |
| Dell XPS 13 Plus 9320 i7-1280P OLED | |
| HP Spectre x360 13.5 14t-ef000 | |
| Lenovo ThinkPad X13 Yoga G3 21AW003UGE | |
| Dell XPS 13 7390 Core i7-10710U | |
| CrossMark / Overall | |
| Dell XPS 13 Plus 9320 Core i7-1360P | |
| Dell XPS 13 Plus 9320 i7-1280P OLED | |
| Framework Laptop 13.5 13th Gen Intel | |
| Media Intel Core i7-1360P (1527 - 1891, n=15) | |
| HP Spectre x360 13.5 14t-ef000 | |
| Lenovo ThinkPad X13 Yoga G3 21AW003UGE | |
| CrossMark / Productivity | |
| Framework Laptop 13.5 13th Gen Intel | |
| Dell XPS 13 Plus 9320 Core i7-1360P | |
| Dell XPS 13 Plus 9320 i7-1280P OLED | |
| Media Intel Core i7-1360P (1503 - 1842, n=15) | |
| HP Spectre x360 13.5 14t-ef000 | |
| Lenovo ThinkPad X13 Yoga G3 21AW003UGE | |
| CrossMark / Creativity | |
| Dell XPS 13 Plus 9320 Core i7-1360P | |
| Dell XPS 13 Plus 9320 i7-1280P OLED | |
| Framework Laptop 13.5 13th Gen Intel | |
| Media Intel Core i7-1360P (1558 - 2003, n=15) | |
| HP Spectre x360 13.5 14t-ef000 | |
| Lenovo ThinkPad X13 Yoga G3 21AW003UGE | |
| CrossMark / Responsiveness | |
| Media Intel Core i7-1360P (1311 - 1899, n=15) | |
| Dell XPS 13 Plus 9320 i7-1280P OLED | |
| Dell XPS 13 Plus 9320 Core i7-1360P | |
| Framework Laptop 13.5 13th Gen Intel | |
| HP Spectre x360 13.5 14t-ef000 | |
| Lenovo ThinkPad X13 Yoga G3 21AW003UGE | |
| PCMark 10 Score | 6026 punti | |
Aiuto | ||
| AIDA64 / Memory Copy | |
| Dell XPS 13 Plus 9320 Core i7-1360P | |
| Dell XPS 13 Plus 9320 i7-1280P OLED | |
| Media Intel Core i7-1360P (44299 - 72748, n=16) | |
| HP Spectre x360 13.5 14t-ef000 | |
| Lenovo ThinkPad X13 Yoga G3 21AW003UGE | |
| Framework Laptop 13.5 13th Gen Intel | |
| AIDA64 / Memory Read | |
| Dell XPS 13 Plus 9320 i7-1280P OLED | |
| Dell XPS 13 Plus 9320 Core i7-1360P | |
| HP Spectre x360 13.5 14t-ef000 | |
| Media Intel Core i7-1360P (44751 - 68945, n=16) | |
| Lenovo ThinkPad X13 Yoga G3 21AW003UGE | |
| Framework Laptop 13.5 13th Gen Intel | |
| AIDA64 / Memory Write | |
| Dell XPS 13 Plus 9320 Core i7-1360P | |
| Media Intel Core i7-1360P (45887 - 93331, n=16) | |
| HP Spectre x360 13.5 14t-ef000 | |
| Dell XPS 13 Plus 9320 i7-1280P OLED | |
| Framework Laptop 13.5 13th Gen Intel | |
| Lenovo ThinkPad X13 Yoga G3 21AW003UGE | |
| AIDA64 / Memory Latency | |
| Dell XPS 13 Plus 9320 i7-1280P OLED | |
| Lenovo ThinkPad X13 Yoga G3 21AW003UGE | |
| Dell XPS 13 Plus 9320 Core i7-1360P | |
| Media Intel Core i7-1360P (85 - 110.5, n=16) | |
| HP Spectre x360 13.5 14t-ef000 | |
| Framework Laptop 13.5 13th Gen Intel | |
* ... Meglio usare valori piccoli
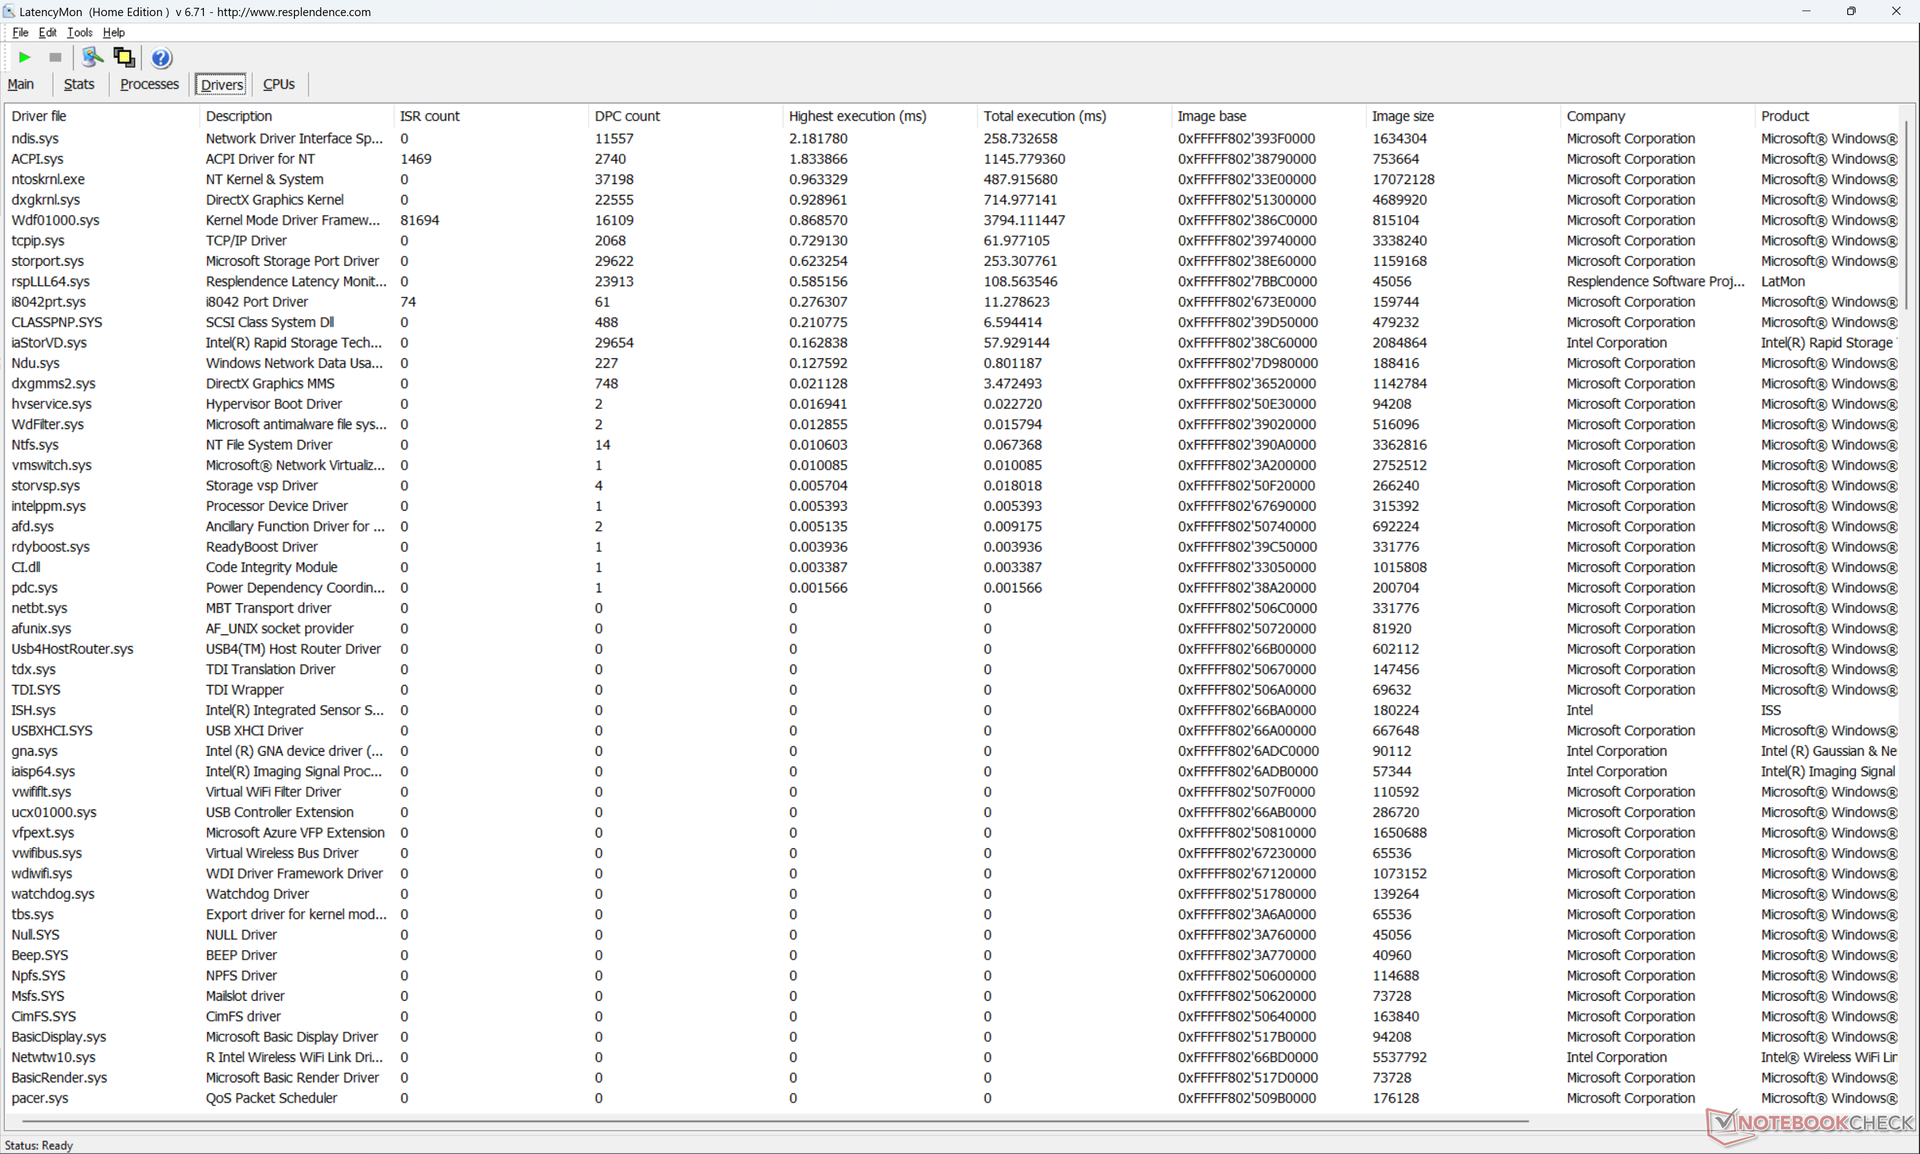
Latenza DPC
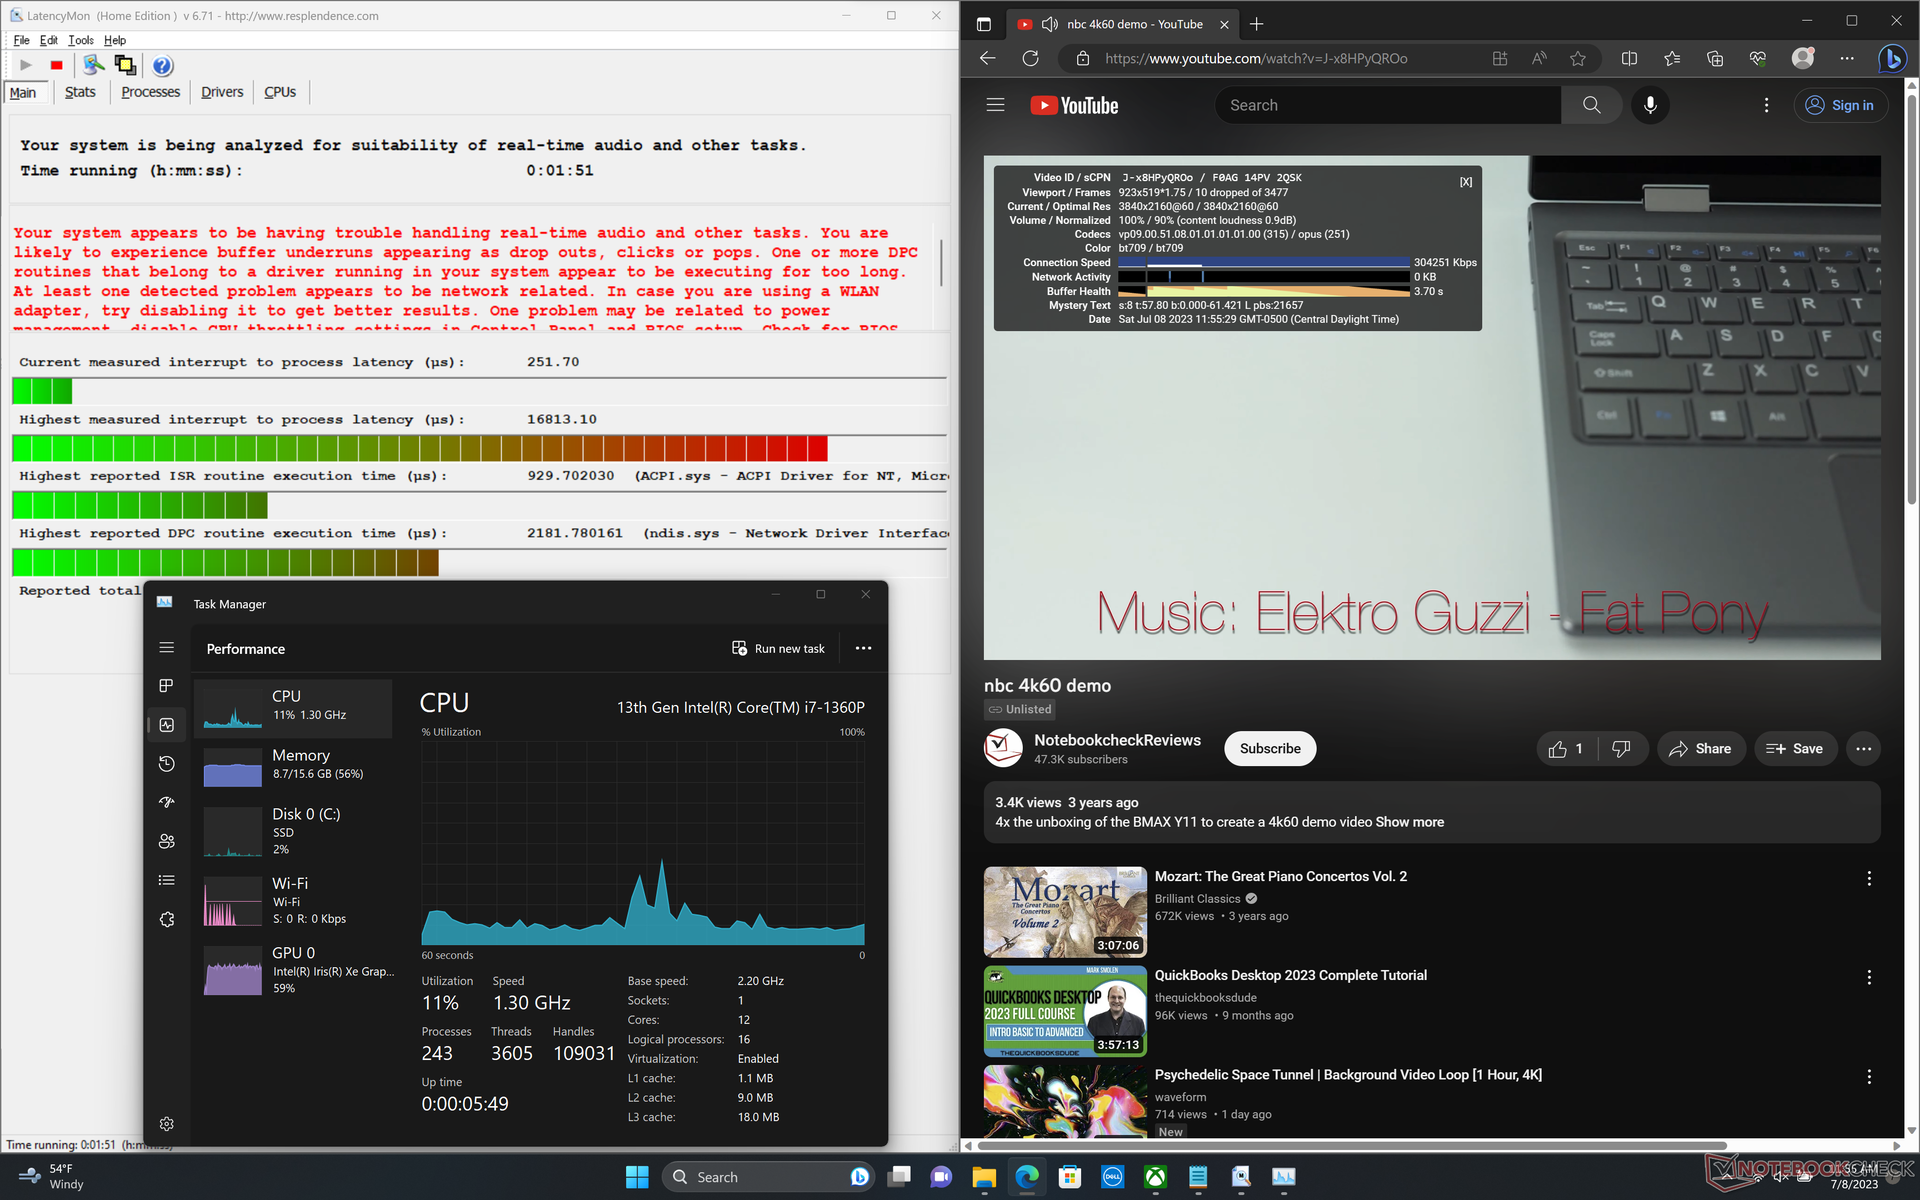
La nostra unità mostrava problemi di latenza quando si aprivano più schede del browser o la homepage, anche dopo vari tentativi. anche la riproduzione di video 4K a 60 FPS è risultata imperfetta, con 10 fotogrammi caduti durante il nostro video di prova della durata di un minuto. Potrebbe trattarsi di un bug del nuovo modello 2023, dato che nessuna delle nostre tre unità di prova 2022 ha mostrato questi problemi.
| DPC Latencies / LatencyMon - interrupt to process latency (max), Web, Youtube, Prime95 | |
| Dell XPS 13 Plus 9320 Core i7-1360P | |
| Lenovo ThinkPad X13 Yoga G3 21AW003UGE | |
| Dell XPS 13 Plus 9320 i5-1240p | |
| Dell XPS 13 Plus 9320 4K | |
| HP Spectre x360 13.5 14t-ef000 | |
| Dell XPS 13 Plus 9320 i7-1280P OLED | |
| Framework Laptop 13.5 13th Gen Intel | |
* ... Meglio usare valori piccoli
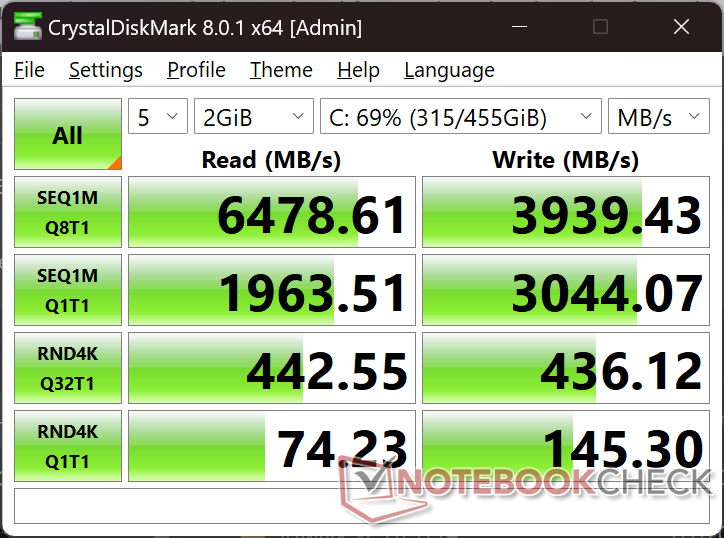
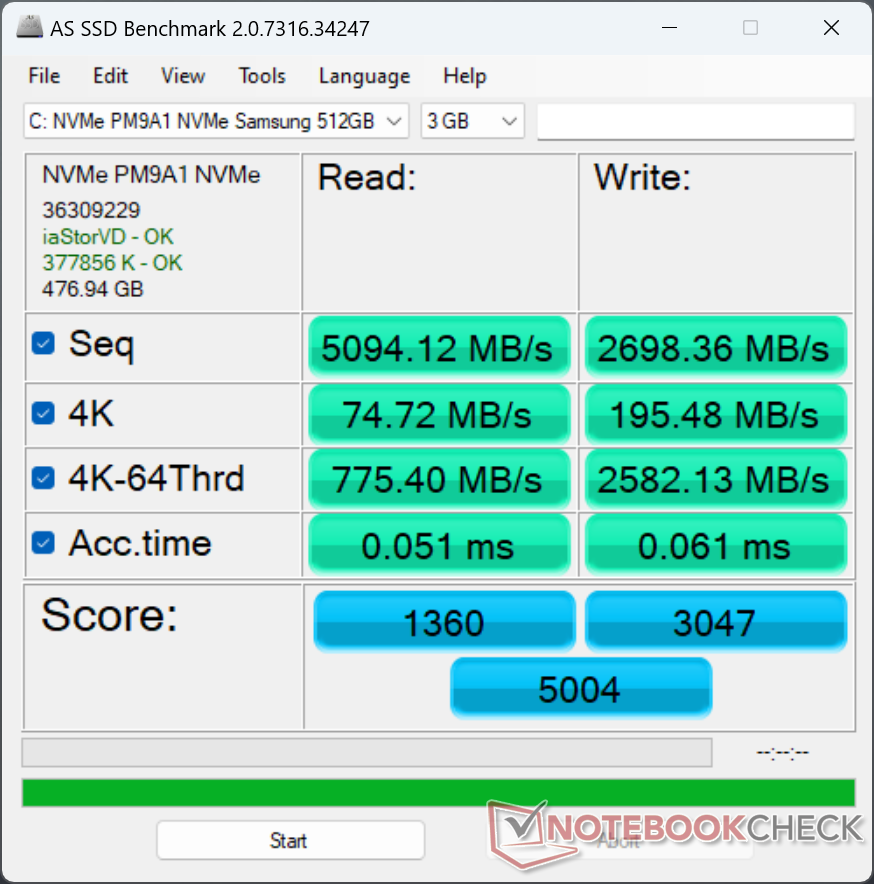
Dispositivi di archiviazione
Le unità SSD della serie XPS 13 Plus possono provenire da Samsung, Micron o Western Digital. Per questa unità in particolare, il nostro SSD è il modello Samsung PM9A1 PCIe4 x4 che offre velocità di lettura e scrittura sequenziali di quasi 7000 MB/s e 4000 MB/s, rispettivamente. Sfortunatamente, le prestazioni dell'unità si sono ridotte a 2000 MB/s quando è stata sottoposta a stress, come mostrano i risultati del test DiskSpd di seguito. Ripetendo i test non si ottengono miglioramenti. Al contrario, la stessa unità nel nostro XPS 13 Plus 2022 non ha mostrato alcun rallentamento delle prestazioni. Non siamo sicuri di quali siano le cause specifiche, in quanto non sono state apportate modifiche al diffusore di calore dell'unità SSD, per quanto ne sappiamo.

* ... Meglio usare valori piccoli
Disk Throttling: DiskSpd Read Loop, Queue Depth 8
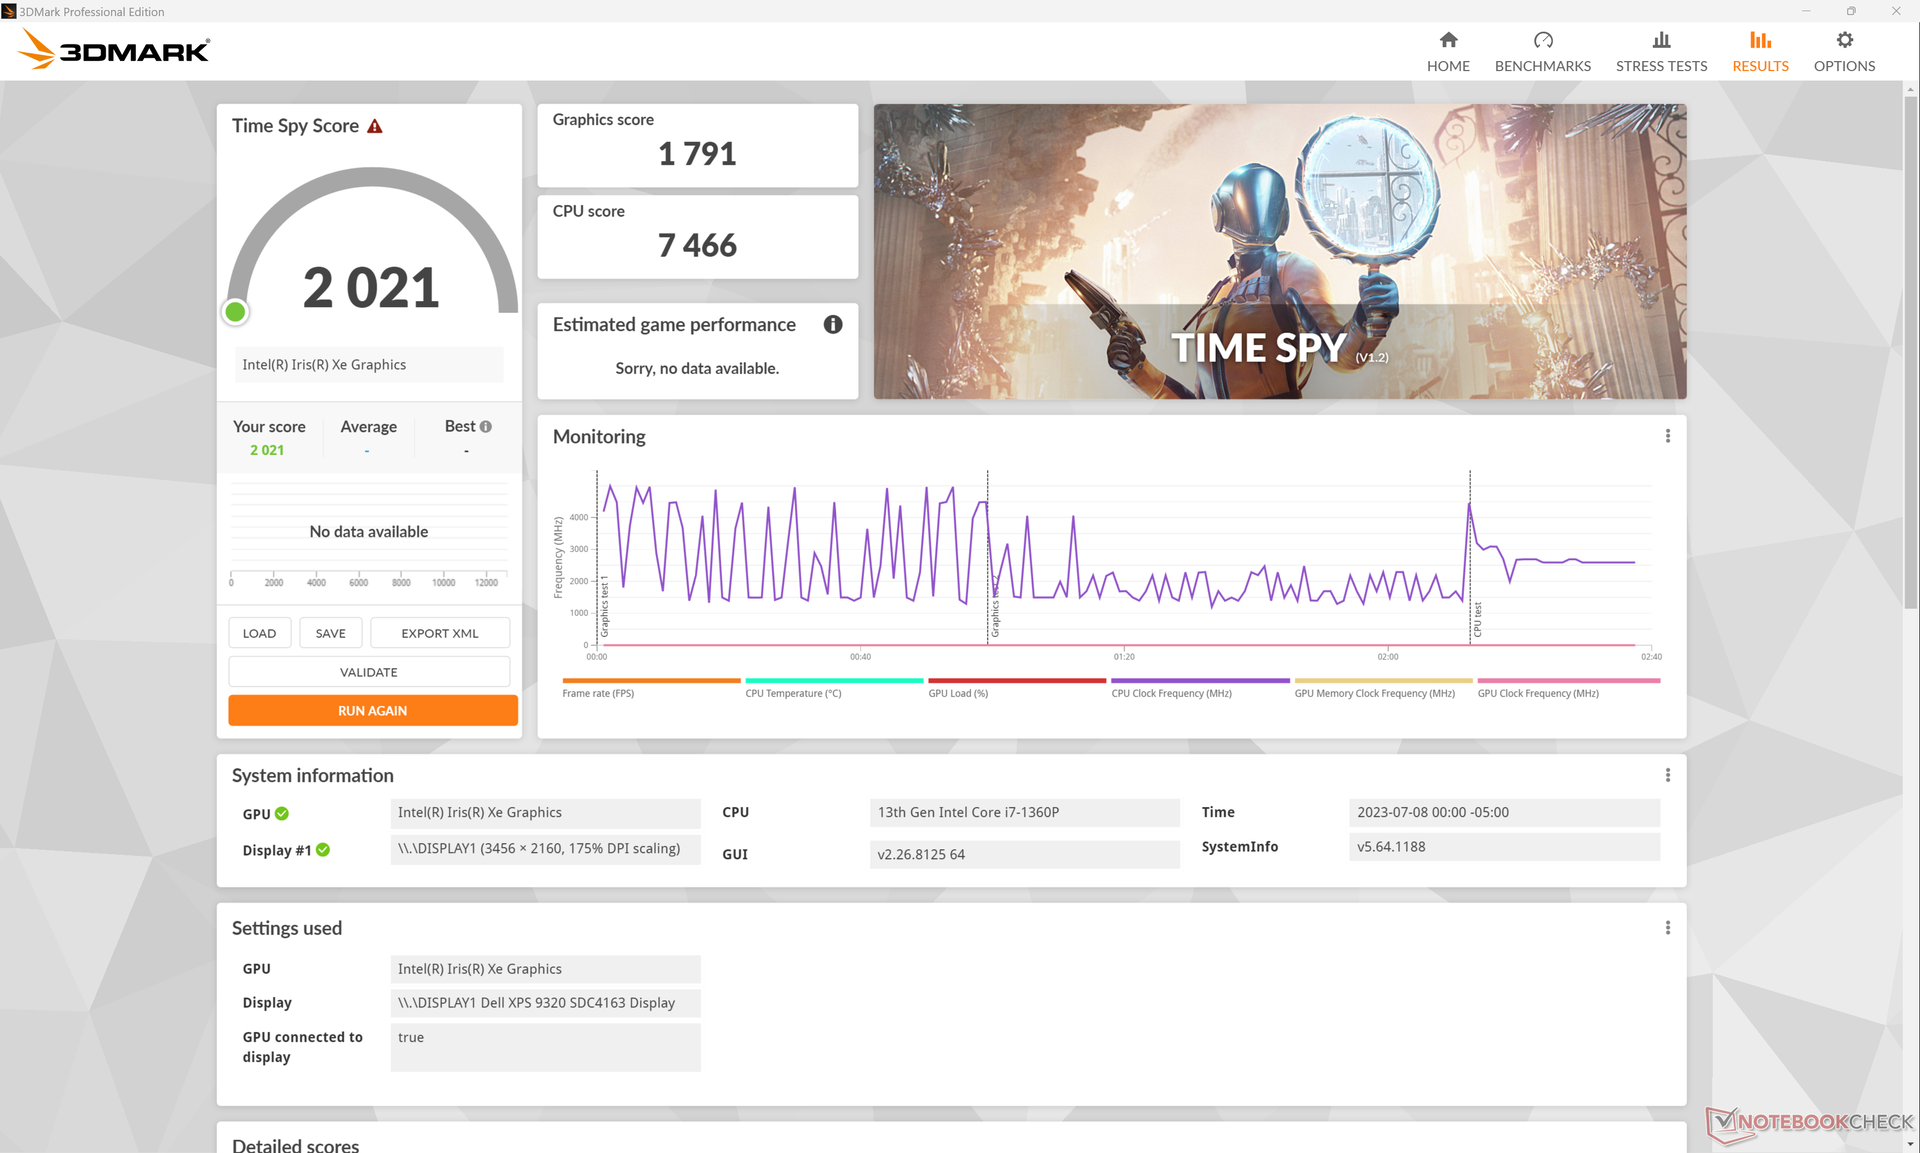
Prestazioni della GPU
Il Iris Xe 96 EUs rimane la soluzione grafica integrata più veloce di Intel, nonostante abbia ormai un paio d'anni. La versione di quest'anno è leggermente più veloce di quella dell'anno scorso di alcuni punti percentuali grazie al piccolo aumento della velocità di clock della memoria, ma è ancora inferiore alla concorrente Radeon 680M o 780M.
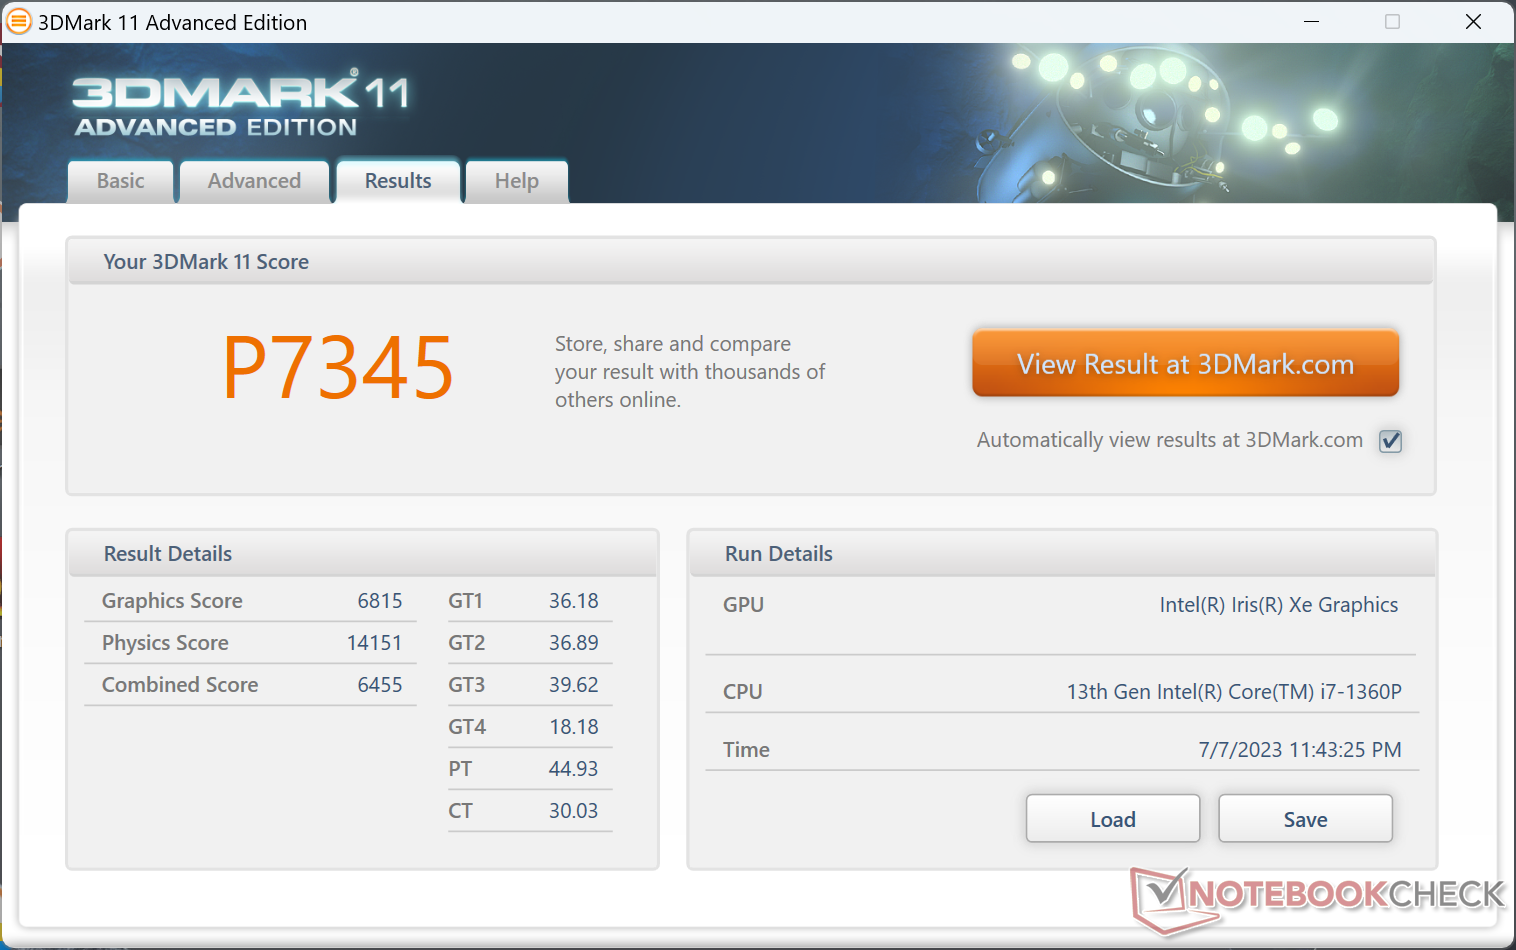
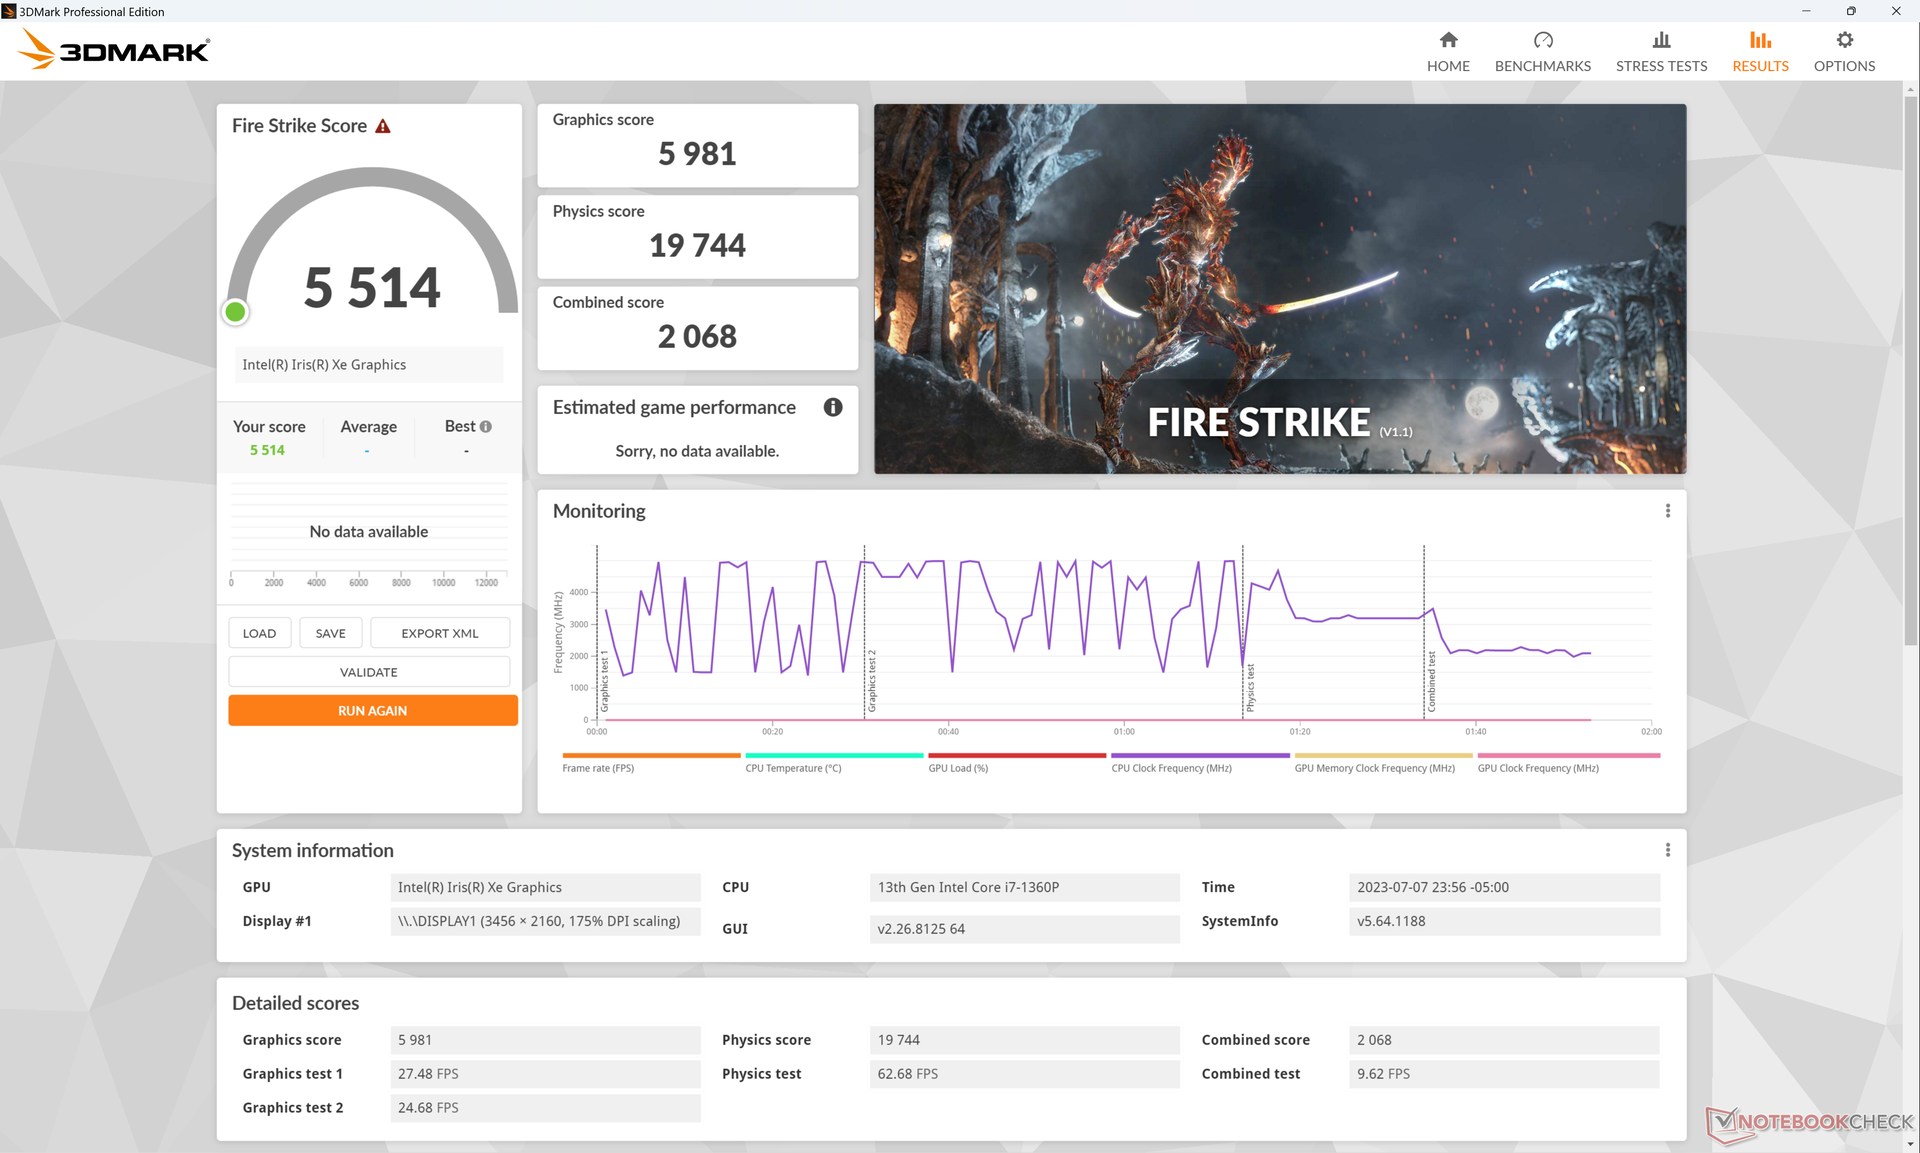
| 3DMark 11 Performance | 7345 punti | |
| 3DMark Fire Strike Score | 5514 punti | |
| 3DMark Time Spy Score | 2021 punti | |
Aiuto | ||
* ... Meglio usare valori piccoli
| Tiny Tina's Wonderlands | |
| 1920x1080 Low Preset (DX12) | |
| Framework Laptop 13.5 13th Gen Intel | |
| Media Intel Iris Xe Graphics G7 96EUs (22.3 - 53, n=32) | |
| Dell XPS 13 Plus 9320 Core i7-1360P | |
| 1920x1080 Medium Preset (DX12) | |
| Framework Laptop 13.5 13th Gen Intel | |
| Dell XPS 13 Plus 9320 Core i7-1360P | |
| Media Intel Iris Xe Graphics G7 96EUs (17 - 40.1, n=30) | |
| 1920x1080 High Preset (DX12) | |
| Framework Laptop 13.5 13th Gen Intel | |
| Dell XPS 13 Plus 9320 Core i7-1360P | |
| Media Intel Iris Xe Graphics G7 96EUs (10.6 - 24.1, n=29) | |
| 1920x1080 Badass Preset (DX12) | |
| Framework Laptop 13.5 13th Gen Intel | |
| Dell XPS 13 Plus 9320 Core i7-1360P | |
| Media Intel Iris Xe Graphics G7 96EUs (8.4 - 18.4, n=26) | |
| 1280x720 Lowest Preset (DX12) | |
| Dell XPS 13 Plus 9320 Core i7-1360P | |
| Media Intel Iris Xe Graphics G7 96EUs (25.9 - 67.3, n=32) | |
Witcher 3 FPS Chart
| basso | medio | alto | ultra | QHD | |
|---|---|---|---|---|---|
| GTA V (2015) | 130.6 | 105.3 | 26.6 | 11.6 | 7.35 |
| The Witcher 3 (2015) | 86.7 | 56.1 | 33.9 | 15.4 | |
| Dota 2 Reborn (2015) | 125.6 | 97.7 | 68.7 | 61.6 | |
| Final Fantasy XV Benchmark (2018) | 44.5 | 25.2 | 17.5 | ||
| X-Plane 11.11 (2018) | 42.7 | 36.2 | 33.2 | ||
| Strange Brigade (2018) | 93.9 | 43.8 | 35.4 | 27.5 | |
| Cyberpunk 2077 1.6 (2022) | 20.8 | 17.3 | 13.6 | 11 | |
| Tiny Tina's Wonderlands (2022) | 29.6 | 23.7 | 15.2 | 12.2 | |
| F1 22 (2022) | 47.5 | 42.8 | 31.9 | 24.1 |
Emissioni
Rumore del sistema
Sebbene non siano state apportate modifiche alla soluzione di raffreddamento o ai livelli di rumorosità delle ventole, siamo riusciti a percepire un leggero fruscio della bobina della nostra unità di prova avvicinando l'orecchio ai tasti della tastiera. Per il resto, le ventole sono al minimo o appena udibili con carichi leggeri, come la navigazione web o l'elaborazione di testi.
Rumorosità
| Idle |
| 24 / 24 / 24.4 dB(A) |
| Sotto carico |
| 37 / 42 dB(A) |
 | ||
30 dB silenzioso 40 dB(A) udibile 50 dB(A) rumoroso |
||
min: | ||
| Dell XPS 13 Plus 9320 Core i7-1360P Iris Xe G7 96EUs, i7-1360P, Samsung PM9A1 MZVL2512HCJQ | Dell XPS 13 Plus 9320 i7-1280P OLED Iris Xe G7 96EUs, i7-1280P, WDC PC SN810 512GB | Dell XPS 13 7390 Core i7-10710U UHD Graphics 620, i7-10710U, SK Hynix PC601 NVMe 512 GB | Framework Laptop 13.5 13th Gen Intel Iris Xe G7 96EUs, i7-1370P, WD PC SN740 SDDPNQD-1T00 | Lenovo ThinkPad X13 Yoga G3 21AW003UGE Iris Xe G7 96EUs, i7-1265U, Samsung PM9A1 MZVL2512HCJQ | HP Spectre x360 13.5 14t-ef000 Iris Xe G7 96EUs, i7-1255U, Micron 3400 1TB MTFDKBA1T0TFH | |
|---|---|---|---|---|---|---|
| Noise | 3% | -12% | -6% | -2% | 7% | |
| off /ambiente * (dB) | 23.7 | 23.4 1% | 28 -18% | 23.2 2% | 23.22 2% | 23.5 1% |
| Idle Minimum * (dB) | 24 | 23.4 2% | 28 -17% | 23.2 3% | 23.2 3% | 23.5 2% |
| Idle Average * (dB) | 24 | 23.4 2% | 28 -17% | 23.2 3% | 23.2 3% | 23.5 2% |
| Idle Maximum * (dB) | 24.4 | 23.4 4% | 28 -15% | 23.2 5% | 28.6 -17% | 23.5 4% |
| Load Average * (dB) | 37 | 35 5% | 33.7 9% | 45.3 -22% | 39.8 -8% | 27 27% |
| Witcher 3 ultra * (dB) | 42.1 | 41.6 1% | 47.9 -14% | 41.8 1% | 36.2 14% | |
| Load Maximum * (dB) | 42 | 39.9 5% | 46.5 -11% | 49.2 -17% | 40.6 3% | 42.4 -1% |
* ... Meglio usare valori piccoli
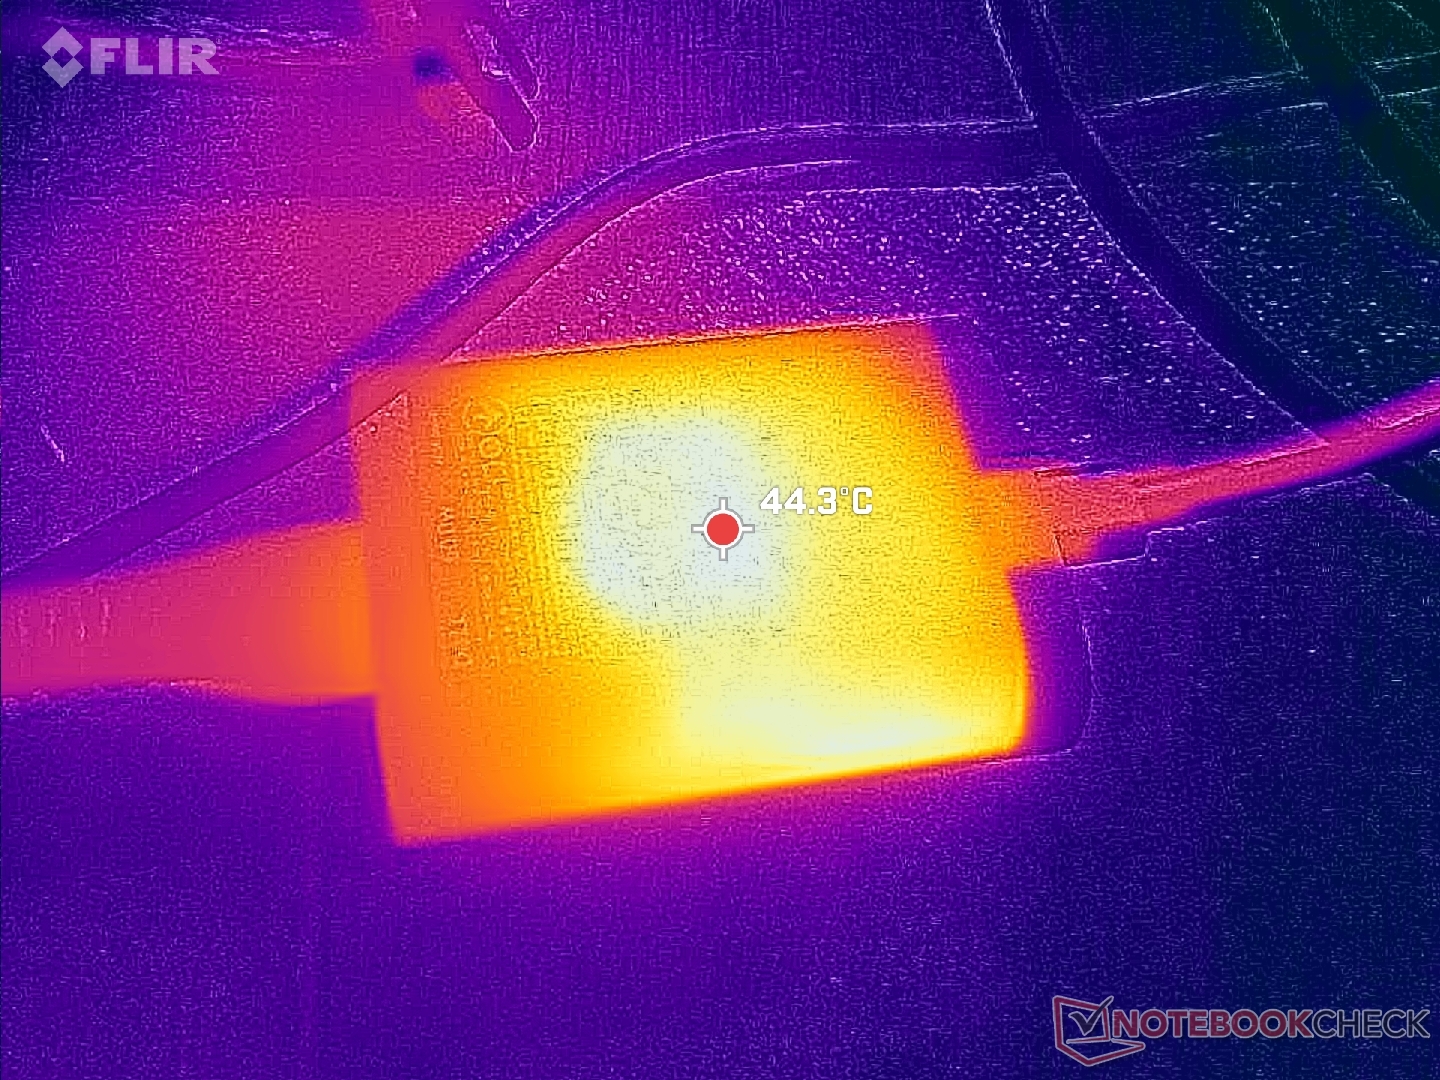
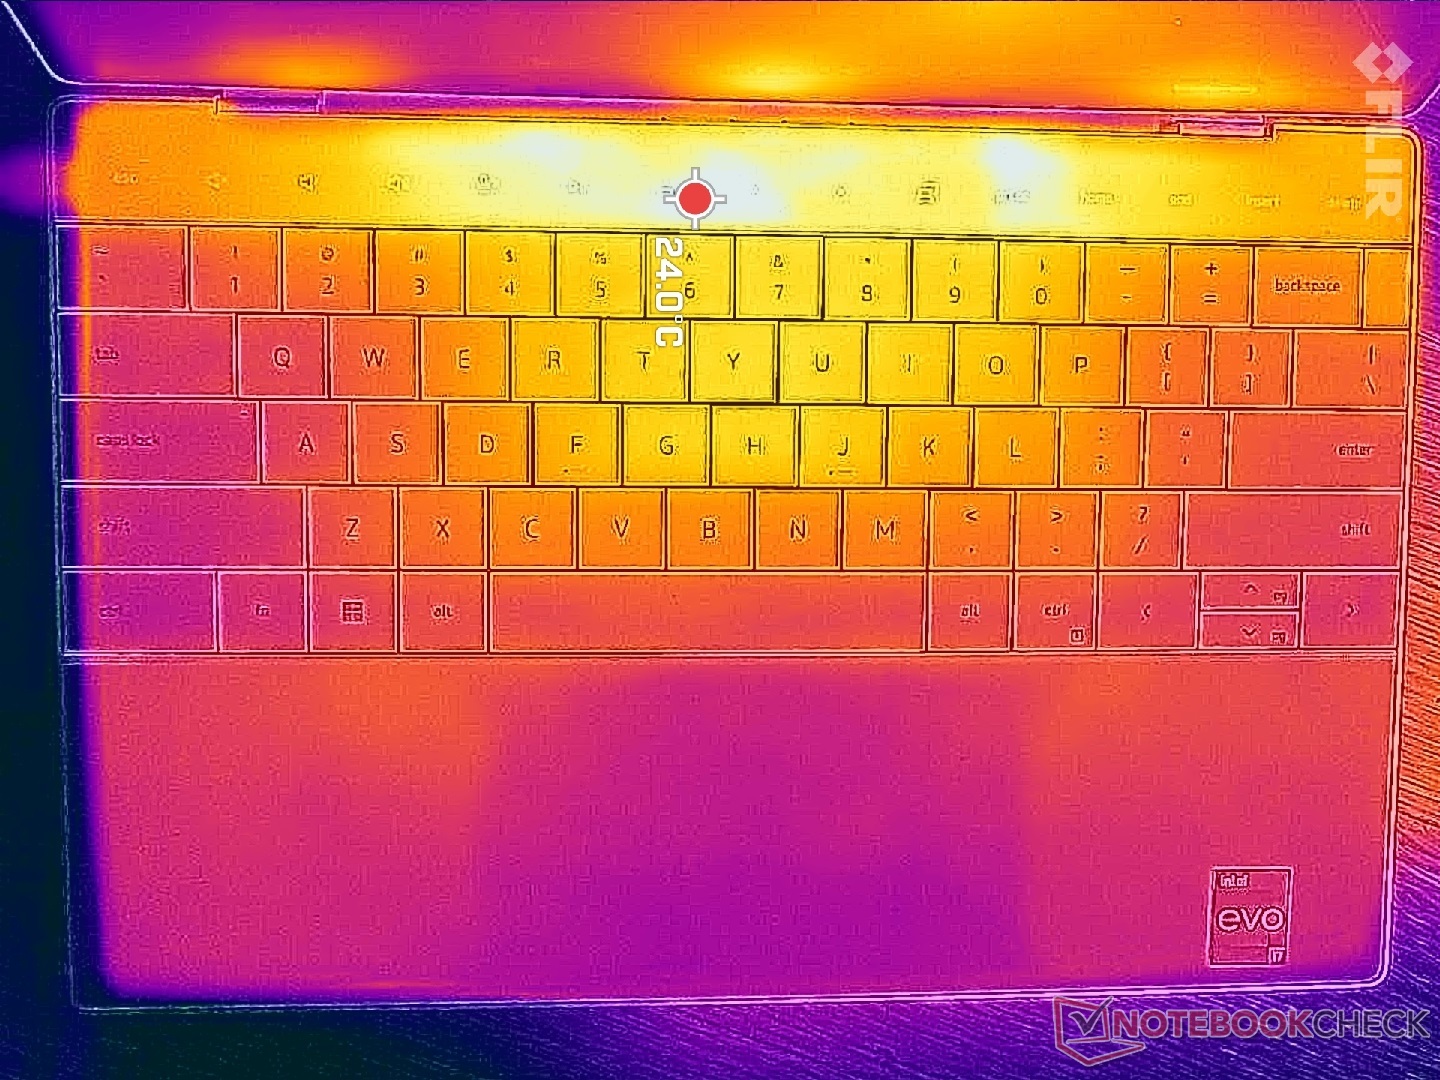
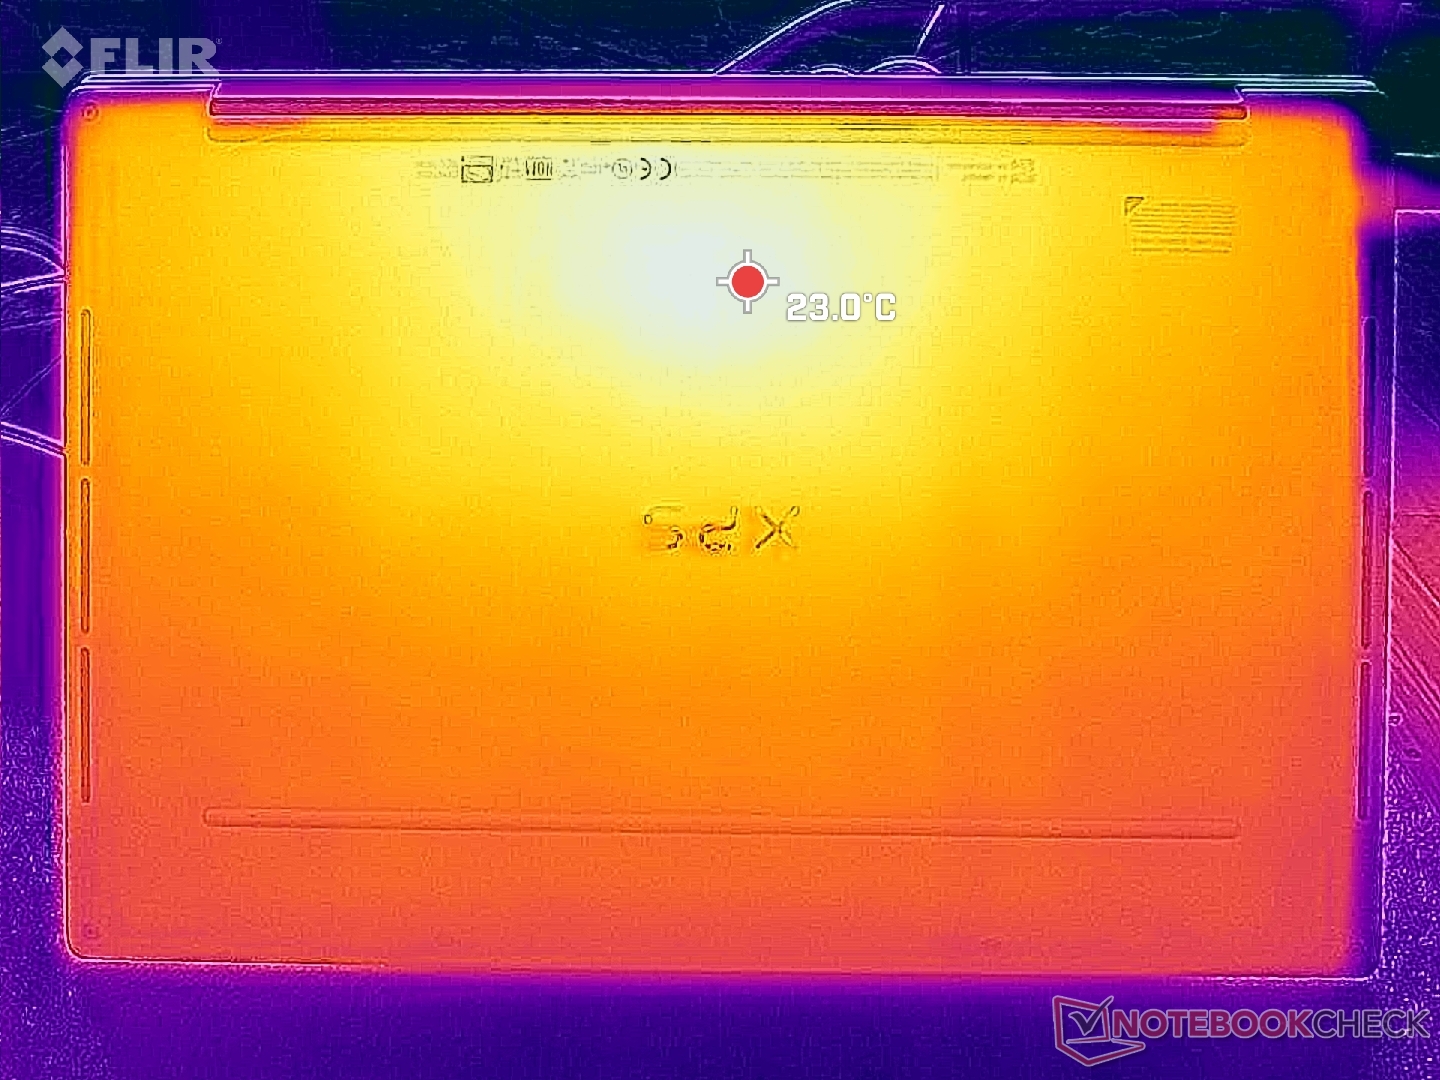
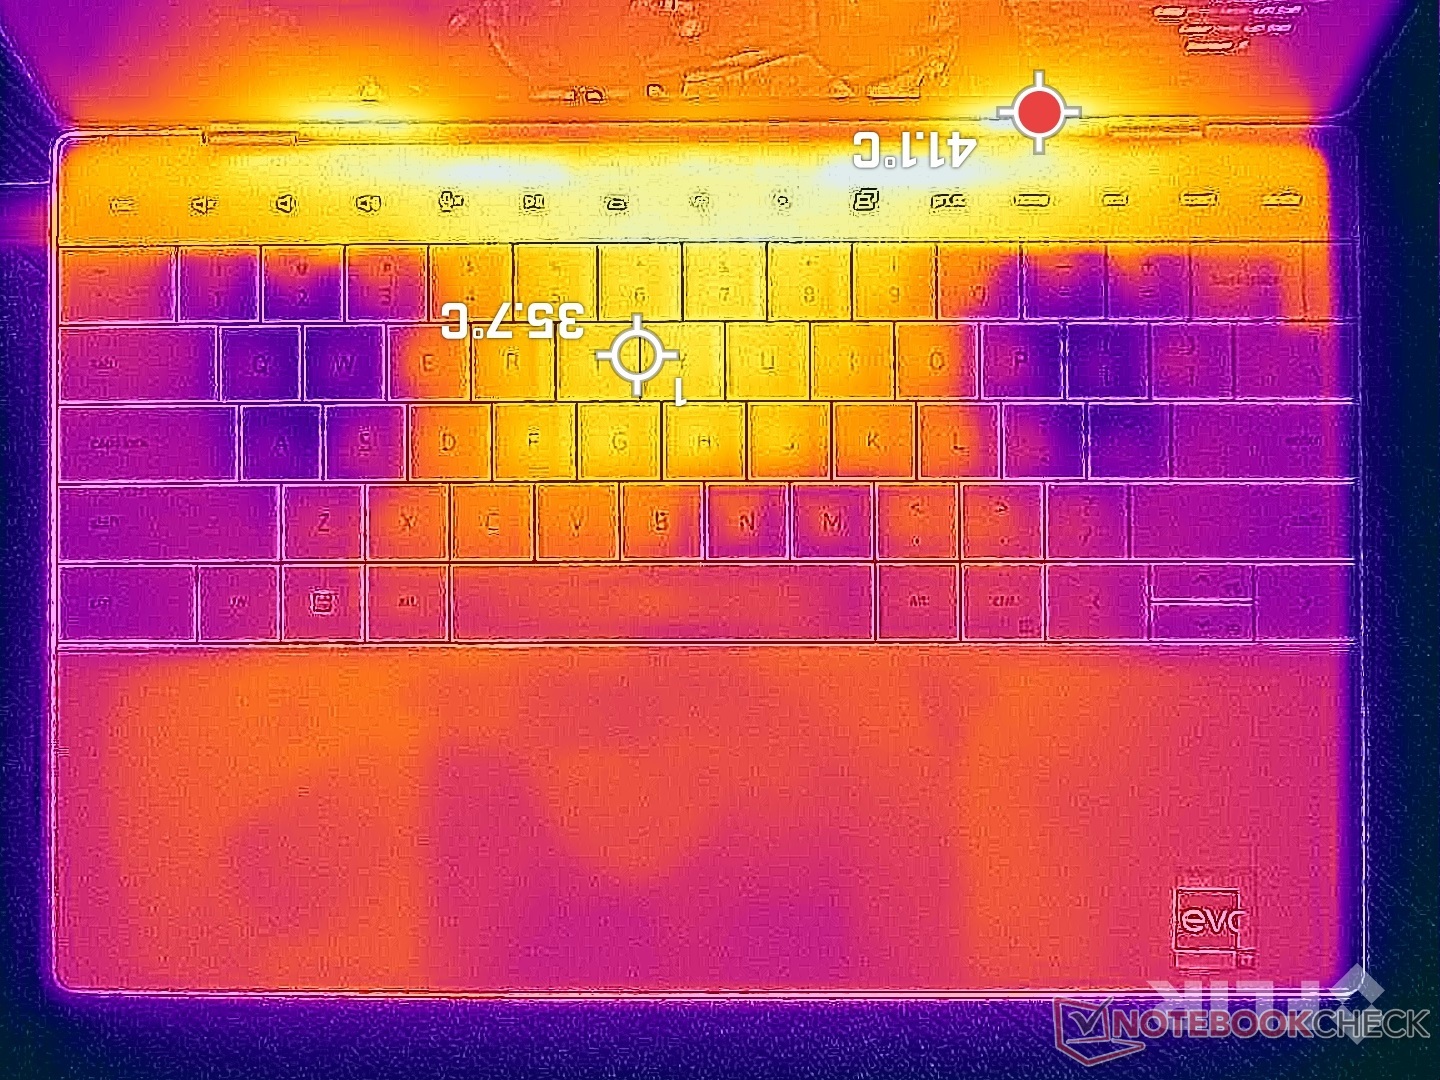
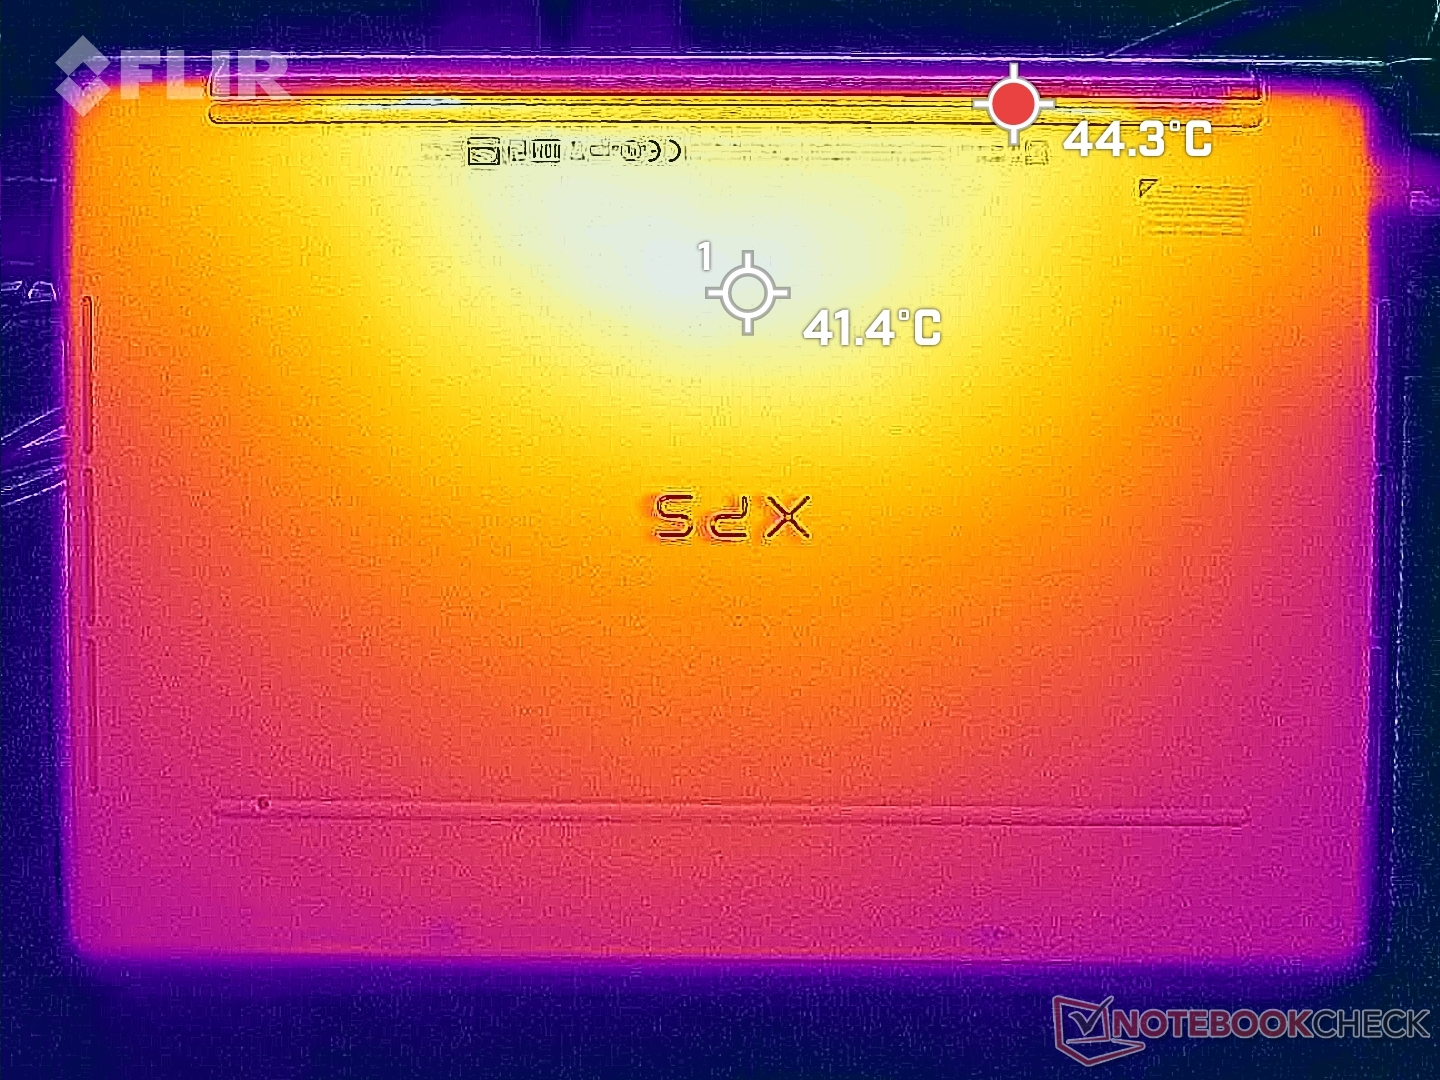
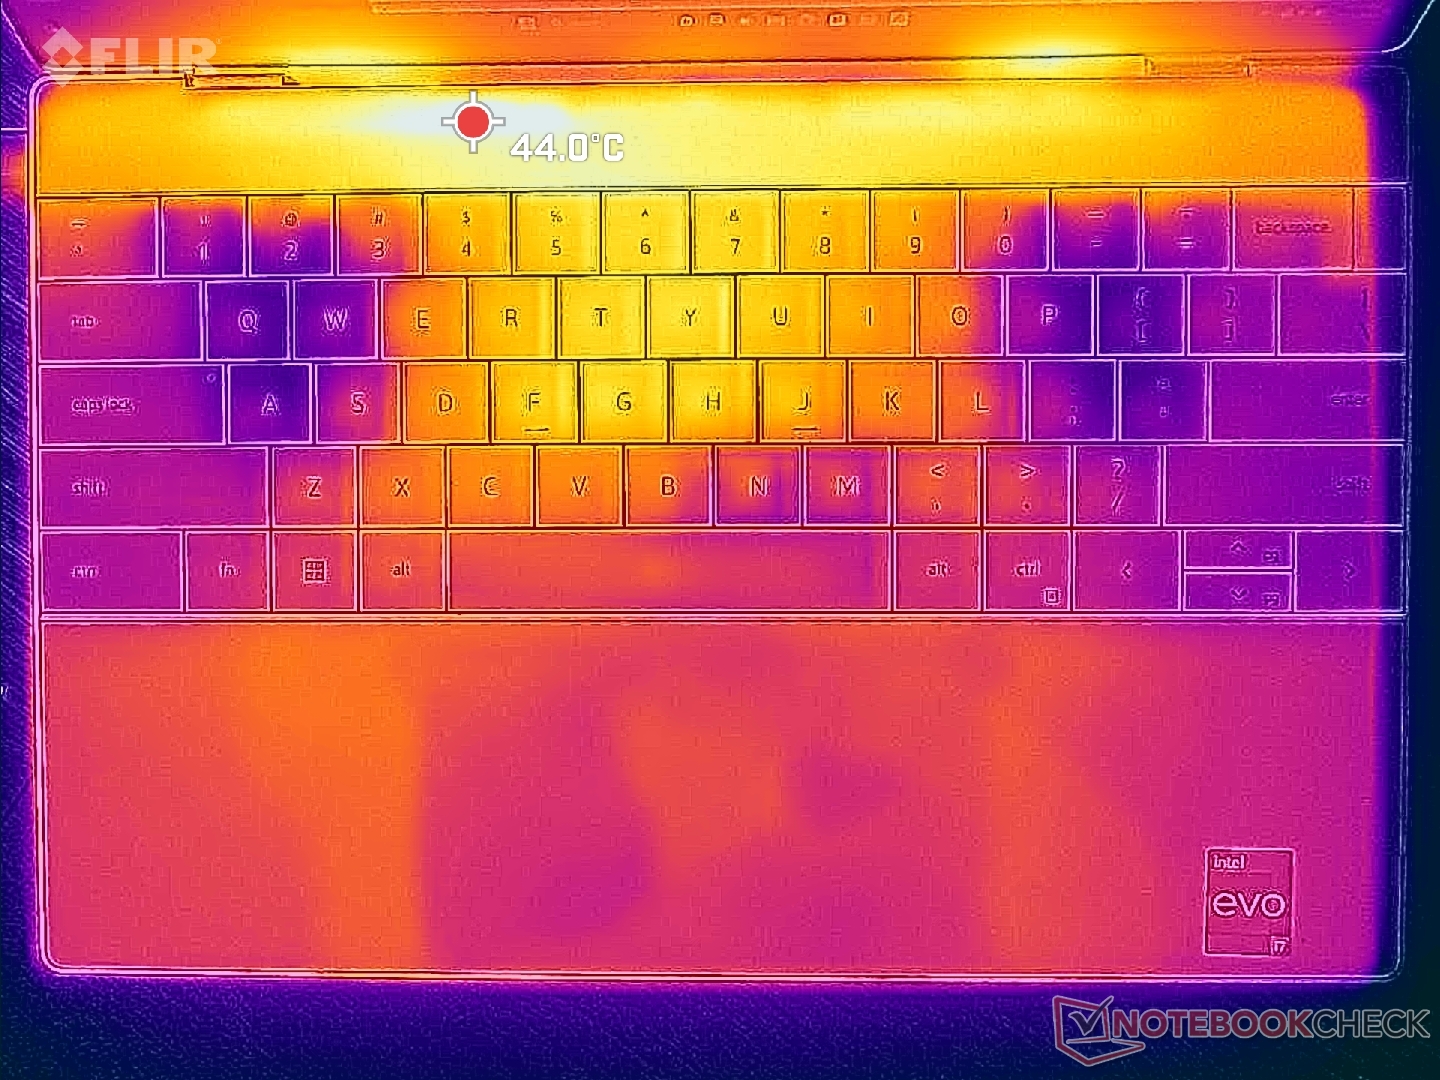
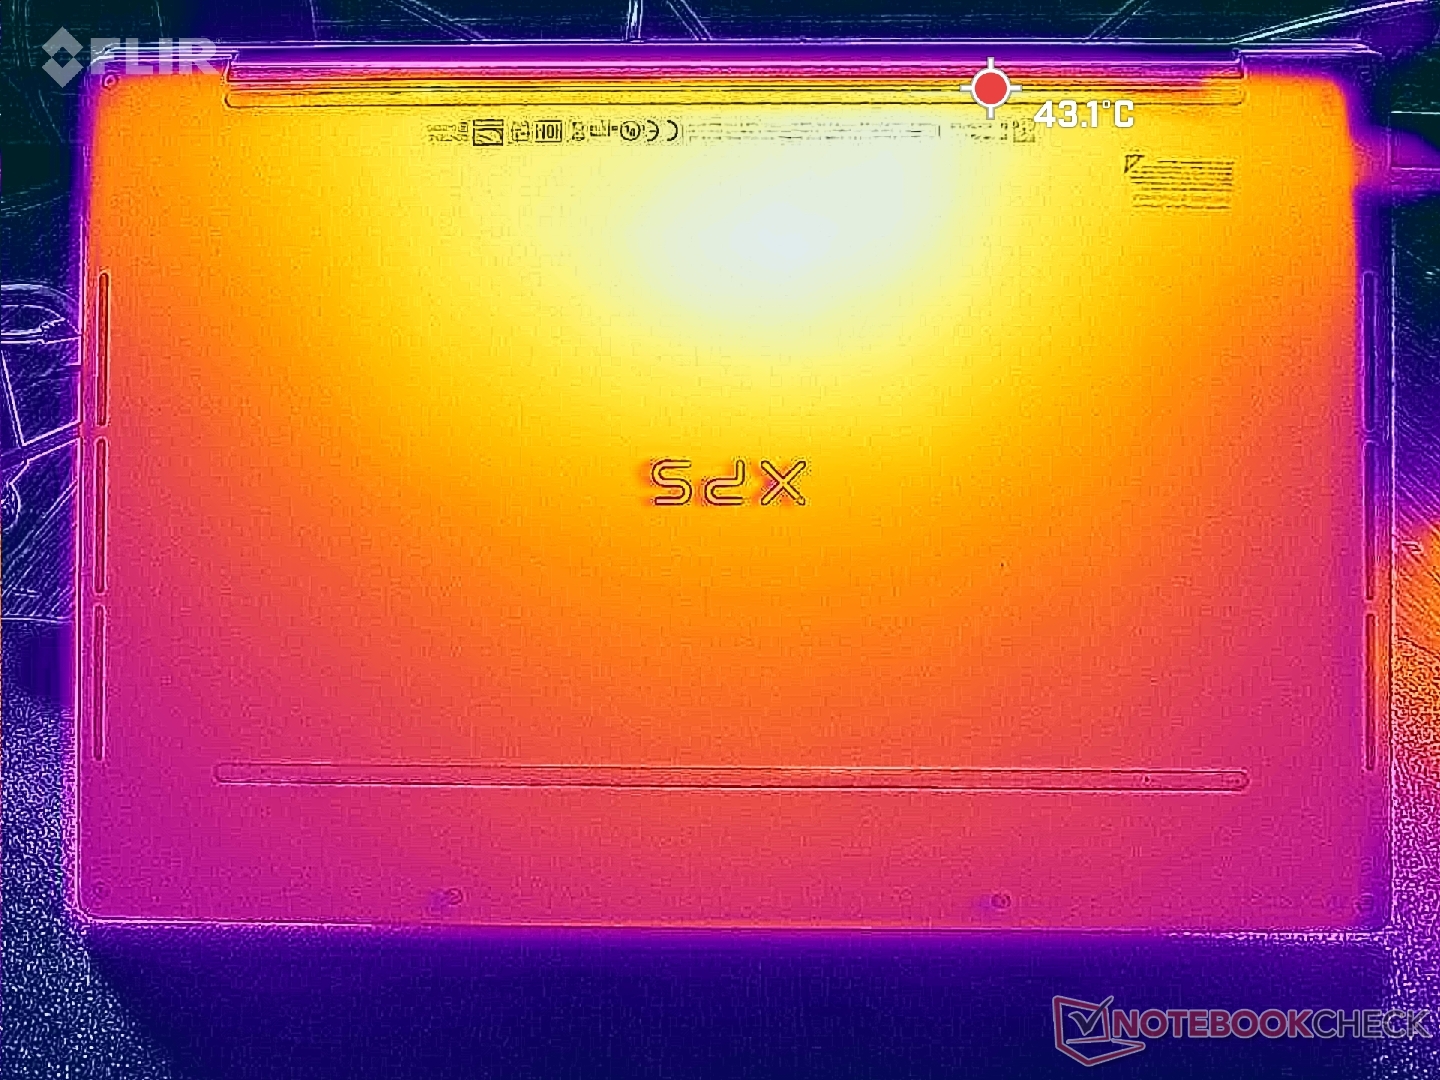
Temperatura
Le temperature di superficie possono essere molto elevate a causa del profilo sottile, della CPU Core-P e della mancanza di griglie di ventilazione sul pannello inferiore. I punti caldi possono raggiungere i 45 C, rispetto ai 35 C del più lento HP Dragonfly Folio 13.5 G3 HP Dragonfly Folio 13.5 G3.
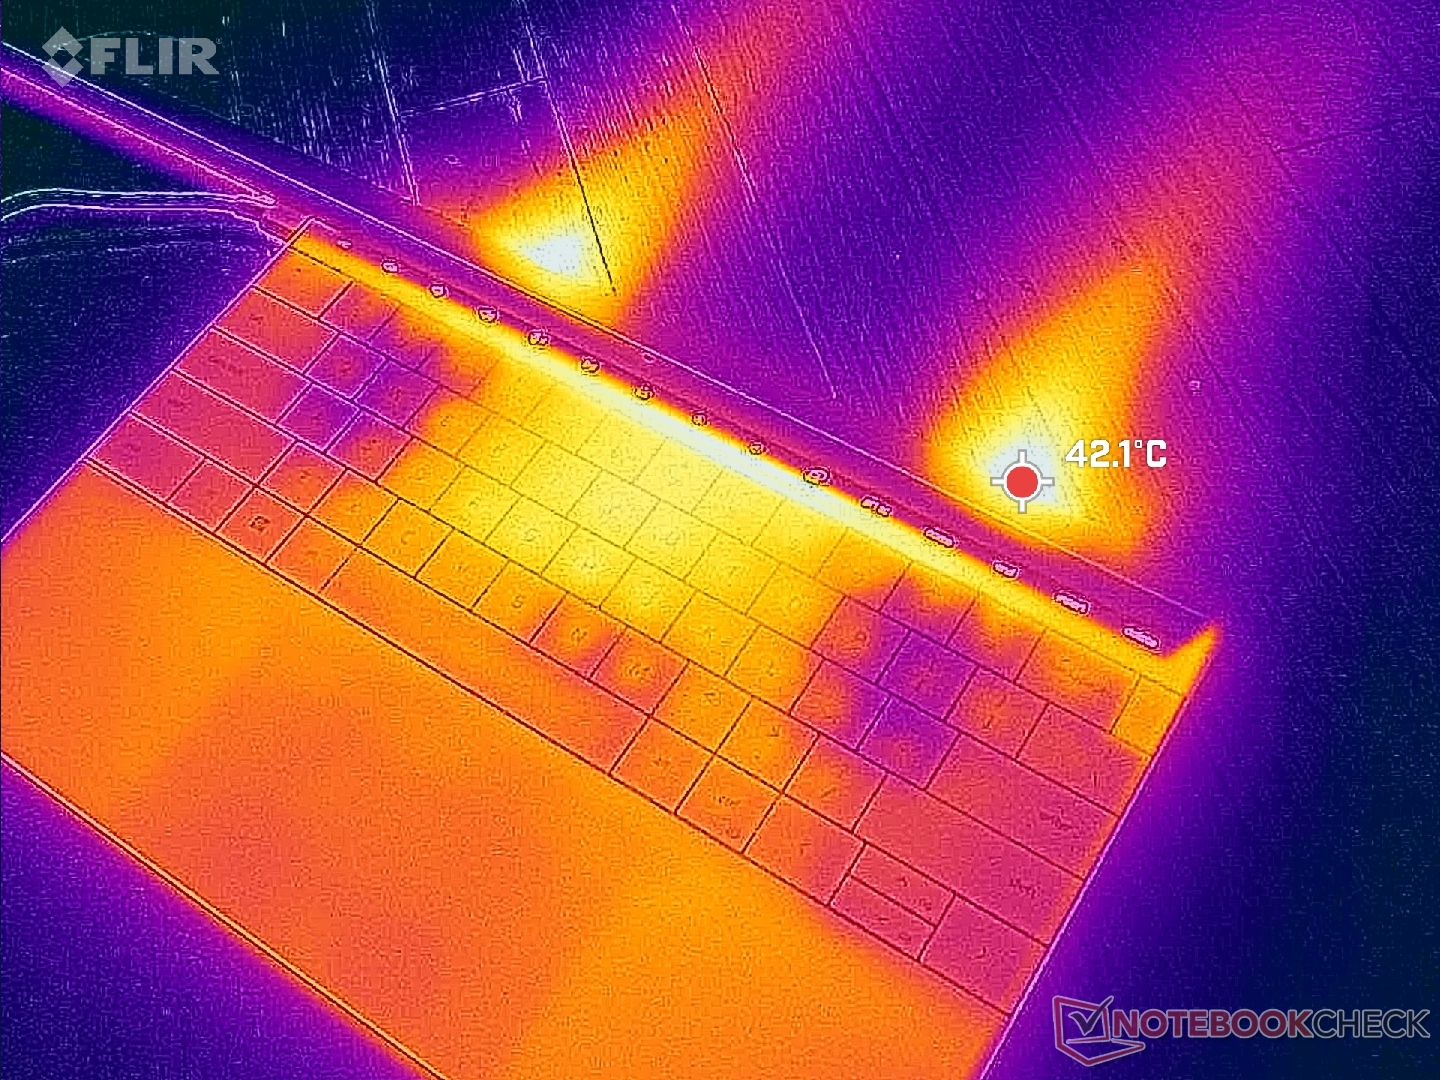
(±) La temperatura massima sul lato superiore è di 43.8 °C / 111 F, rispetto alla media di 35.9 °C / 97 F, che varia da 21.4 a 59 °C per questa classe Subnotebook.
(±) Il lato inferiore si riscalda fino ad un massimo di 44.4 °C / 112 F, rispetto alla media di 39.2 °C / 103 F
(+) In idle, la temperatura media del lato superiore è di 22.4 °C / 72 F, rispetto alla media deld ispositivo di 30.8 °C / 87 F.
(±) Riproducendo The Witcher 3, la temperatura media per il lato superiore e' di 32.9 °C / 91 F, rispetto alla media del dispositivo di 30.8 °C / 87 F.
(+) I poggiapolsi e il touchpad raggiungono la temperatura massima della pelle (32.6 °C / 90.7 F) e quindi non sono caldi.
(-) La temperatura media della zona del palmo della mano di dispositivi simili e'stata di 28.2 °C / 82.8 F (-4.4 °C / -7.9 F).
| Dell XPS 13 Plus 9320 Core i7-1360P Intel Core i7-1360P, Intel Iris Xe Graphics G7 96EUs | Dell XPS 13 Plus 9320 i5-1240p Intel Core i5-1240P, Intel Iris Xe Graphics G7 80EUs | Dell XPS 13 7390 Core i7-10710U Intel Core i7-10710U, Intel UHD Graphics 620 | Framework Laptop 13.5 13th Gen Intel Intel Core i7-1370P, Intel Iris Xe Graphics G7 96EUs | Lenovo ThinkPad X13 Yoga G3 21AW003UGE Intel Core i7-1265U, Intel Iris Xe Graphics G7 96EUs | HP Spectre x360 13.5 14t-ef000 Intel Core i7-1255U, Intel Iris Xe Graphics G7 96EUs | |
|---|---|---|---|---|---|---|
| Heat | -41% | -13% | 1% | -25% | 14% | |
| Maximum Upper Side * (°C) | 43.8 | 47.6 -9% | 44.6 -2% | 38.2 13% | 52.2 -19% | 36.4 17% |
| Maximum Bottom * (°C) | 44.4 | 57 -28% | 49.2 -11% | 41.4 7% | 50.2 -13% | 37 17% |
| Idle Upper Side * (°C) | 24 | 38.8 -62% | 28.2 -18% | 25.8 -8% | 32 -33% | 20.8 13% |
| Idle Bottom * (°C) | 25.2 | 41 -63% | 30.2 -20% | 27.6 -10% | 33.6 -33% | 22.6 10% |
* ... Meglio usare valori piccoli
Stress test
Quando è stato sottoposto a Prime95, i limiti PL2 e PL1 del Core i7-1360P sono esattamente gli stessi che abbiamo osservato sull'XPS 13 Plus alimentato dal Core i7-1280P dello scorso anno, rispettivamente con 64 W e 34 W. Le frequenze di clock aumentavano fino a 3,6 GHz per il primo secondo circa, prima di scendere e infine stabilizzarsi a 2,3 GHz e 90 C. La temperatura molto calda della CPU è in parte responsabile delle elevate temperature superficiali menzionate in precedenza.
Il funzionamento a batteria non influisce sulle prestazioni. Un test 3DMark 11 con l'alimentazione a batteria avrebbe dato come risultato essenzialmente gli stessi punteggi ottenuti con l'alimentazione di rete.
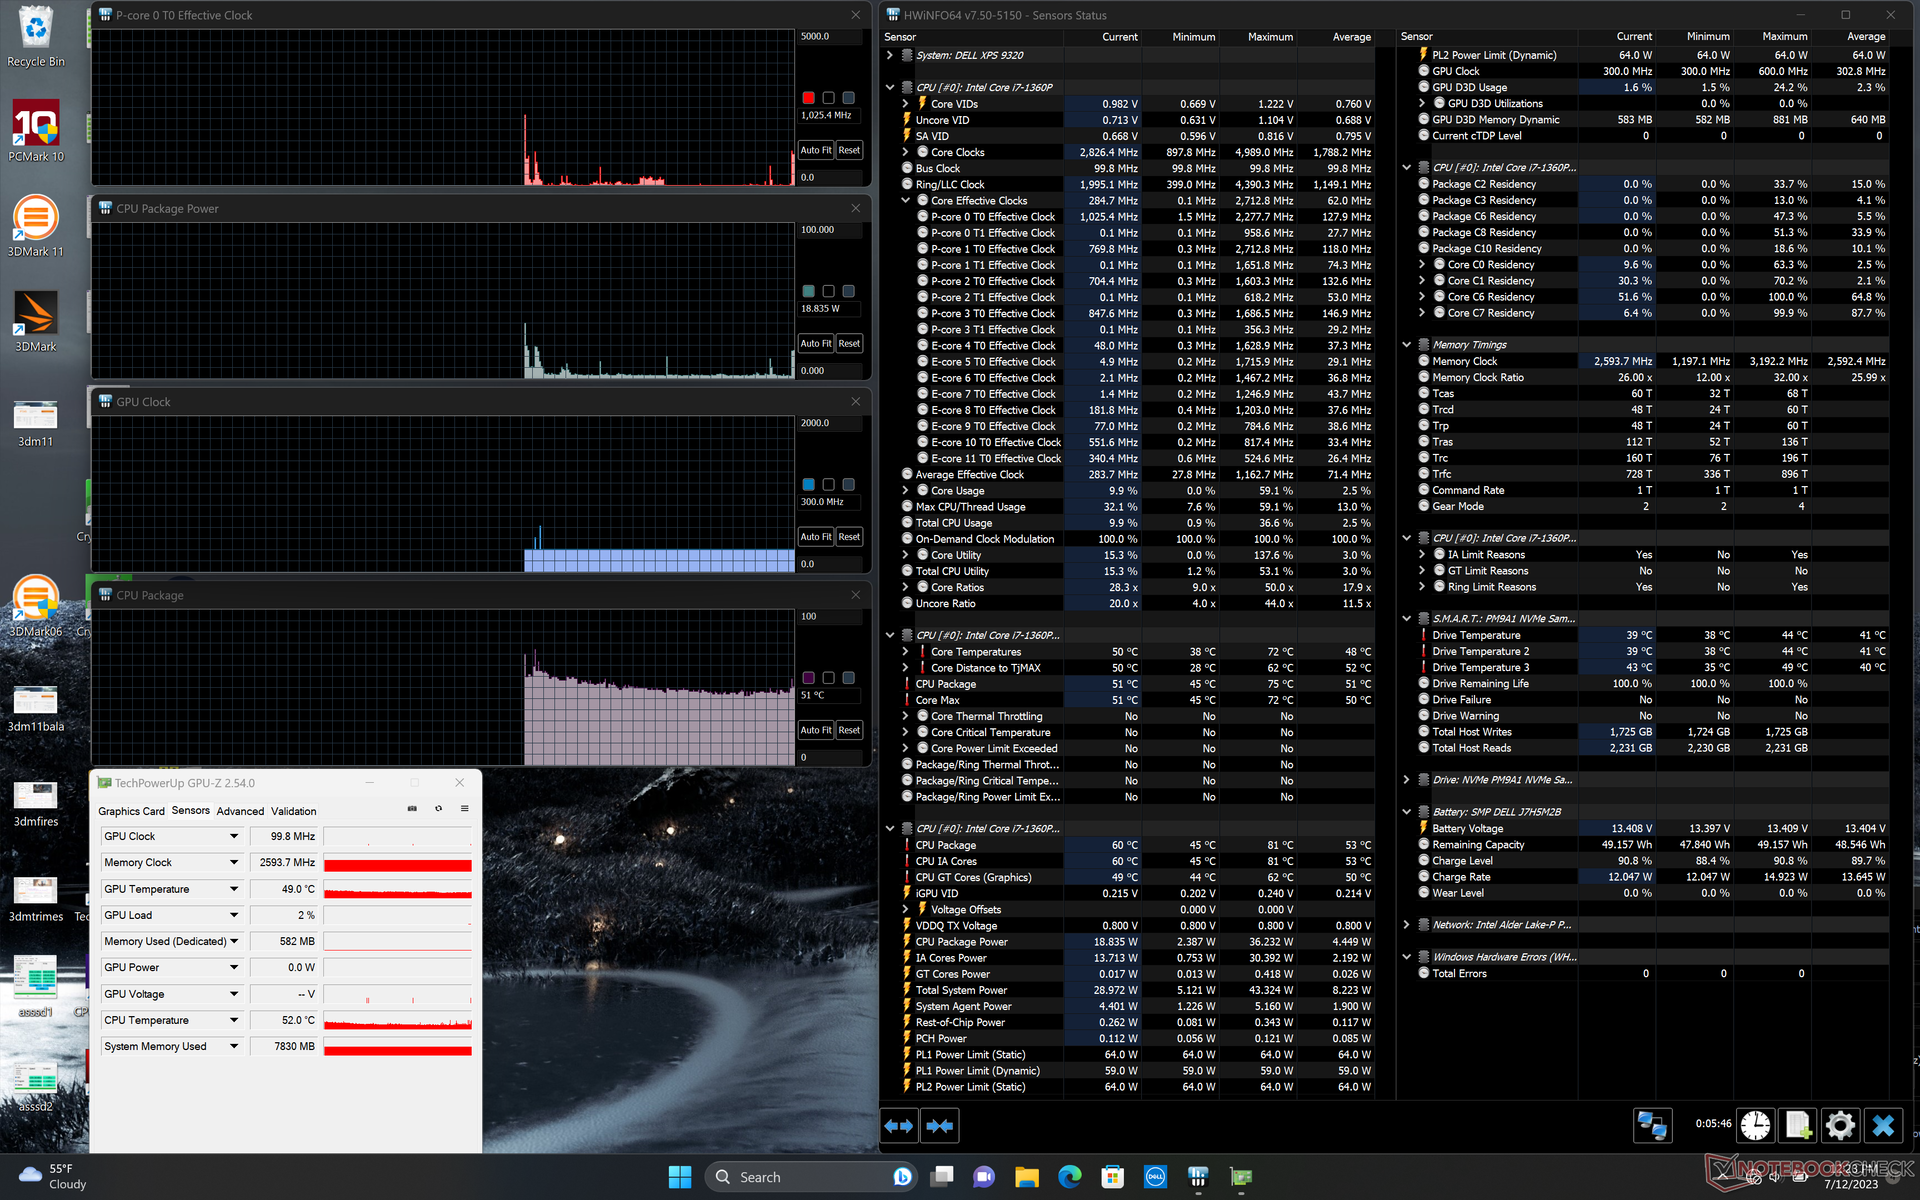
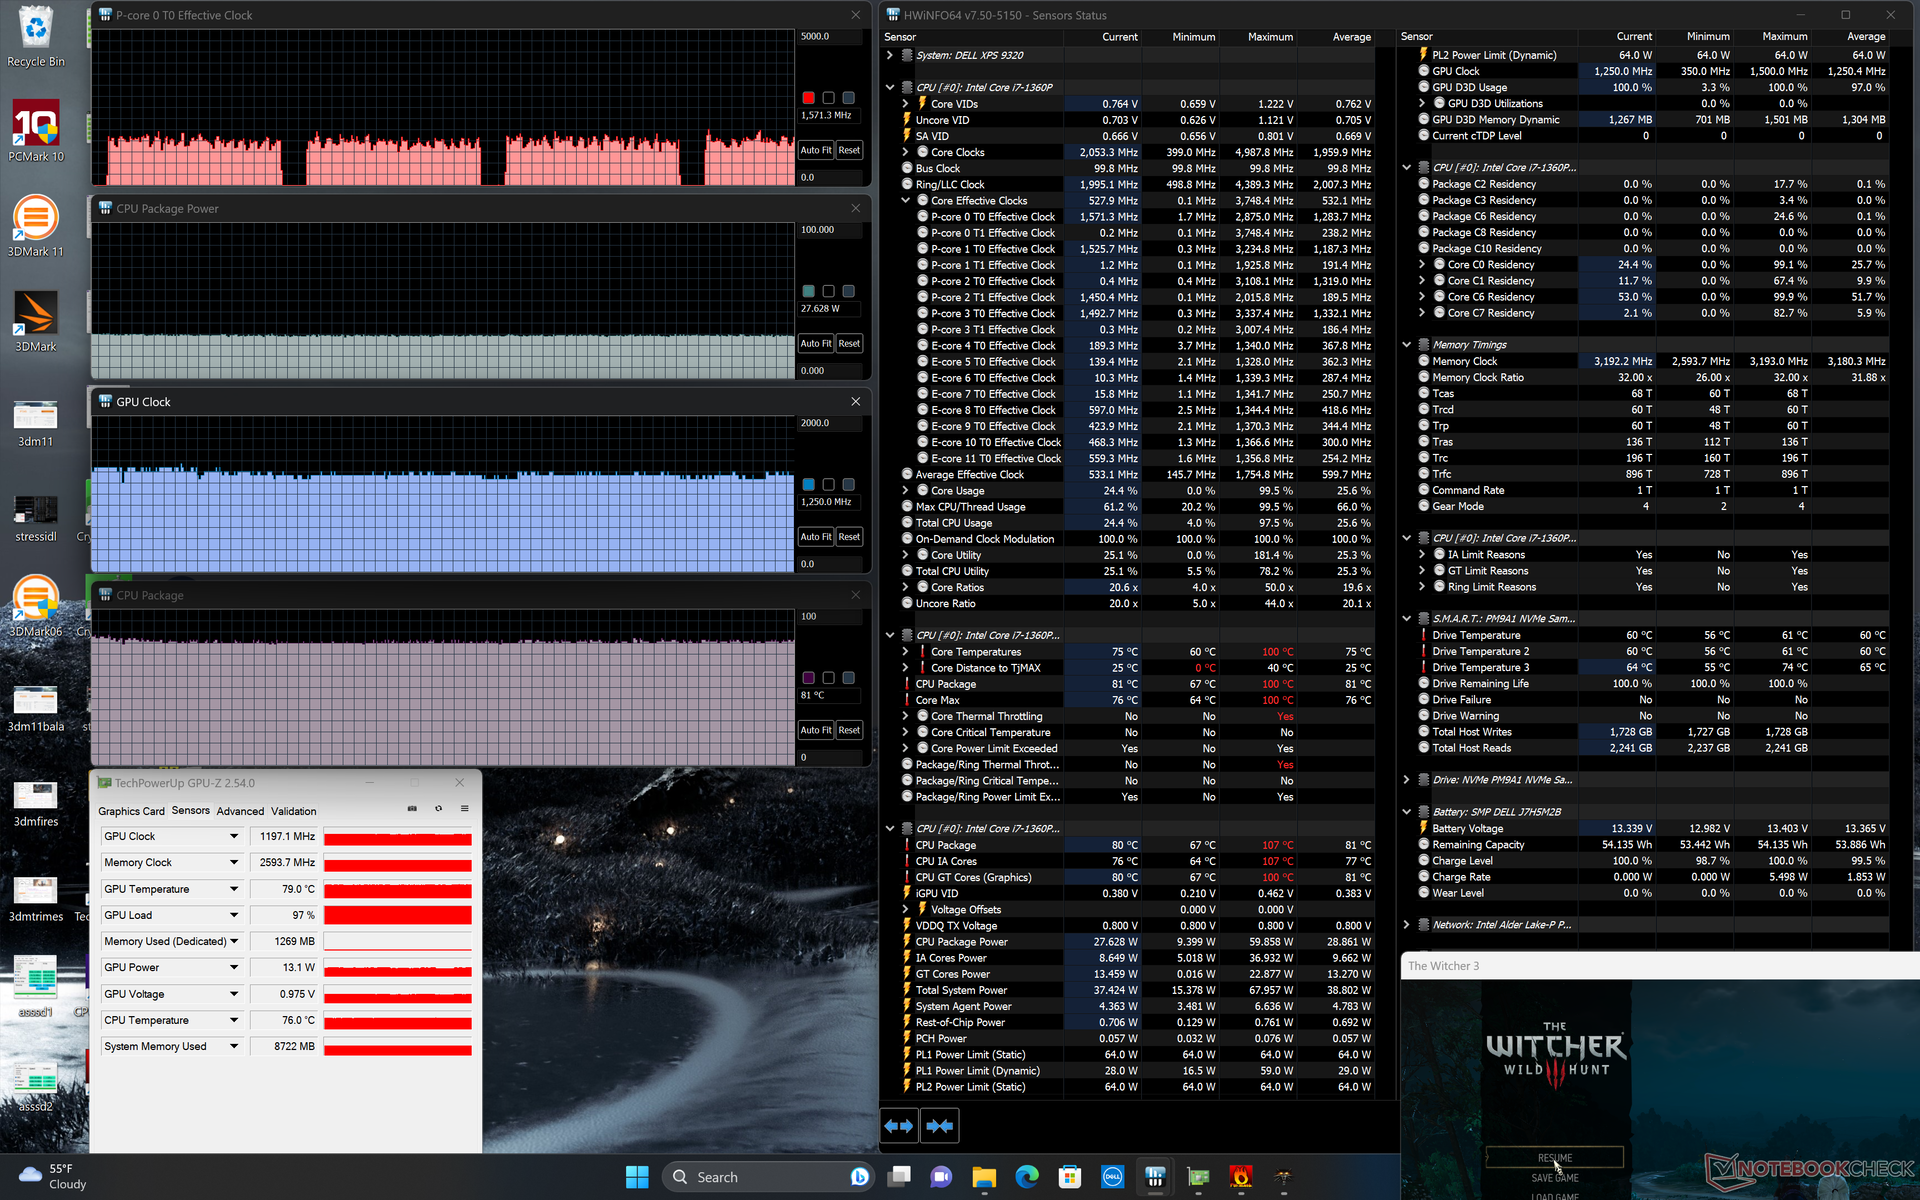
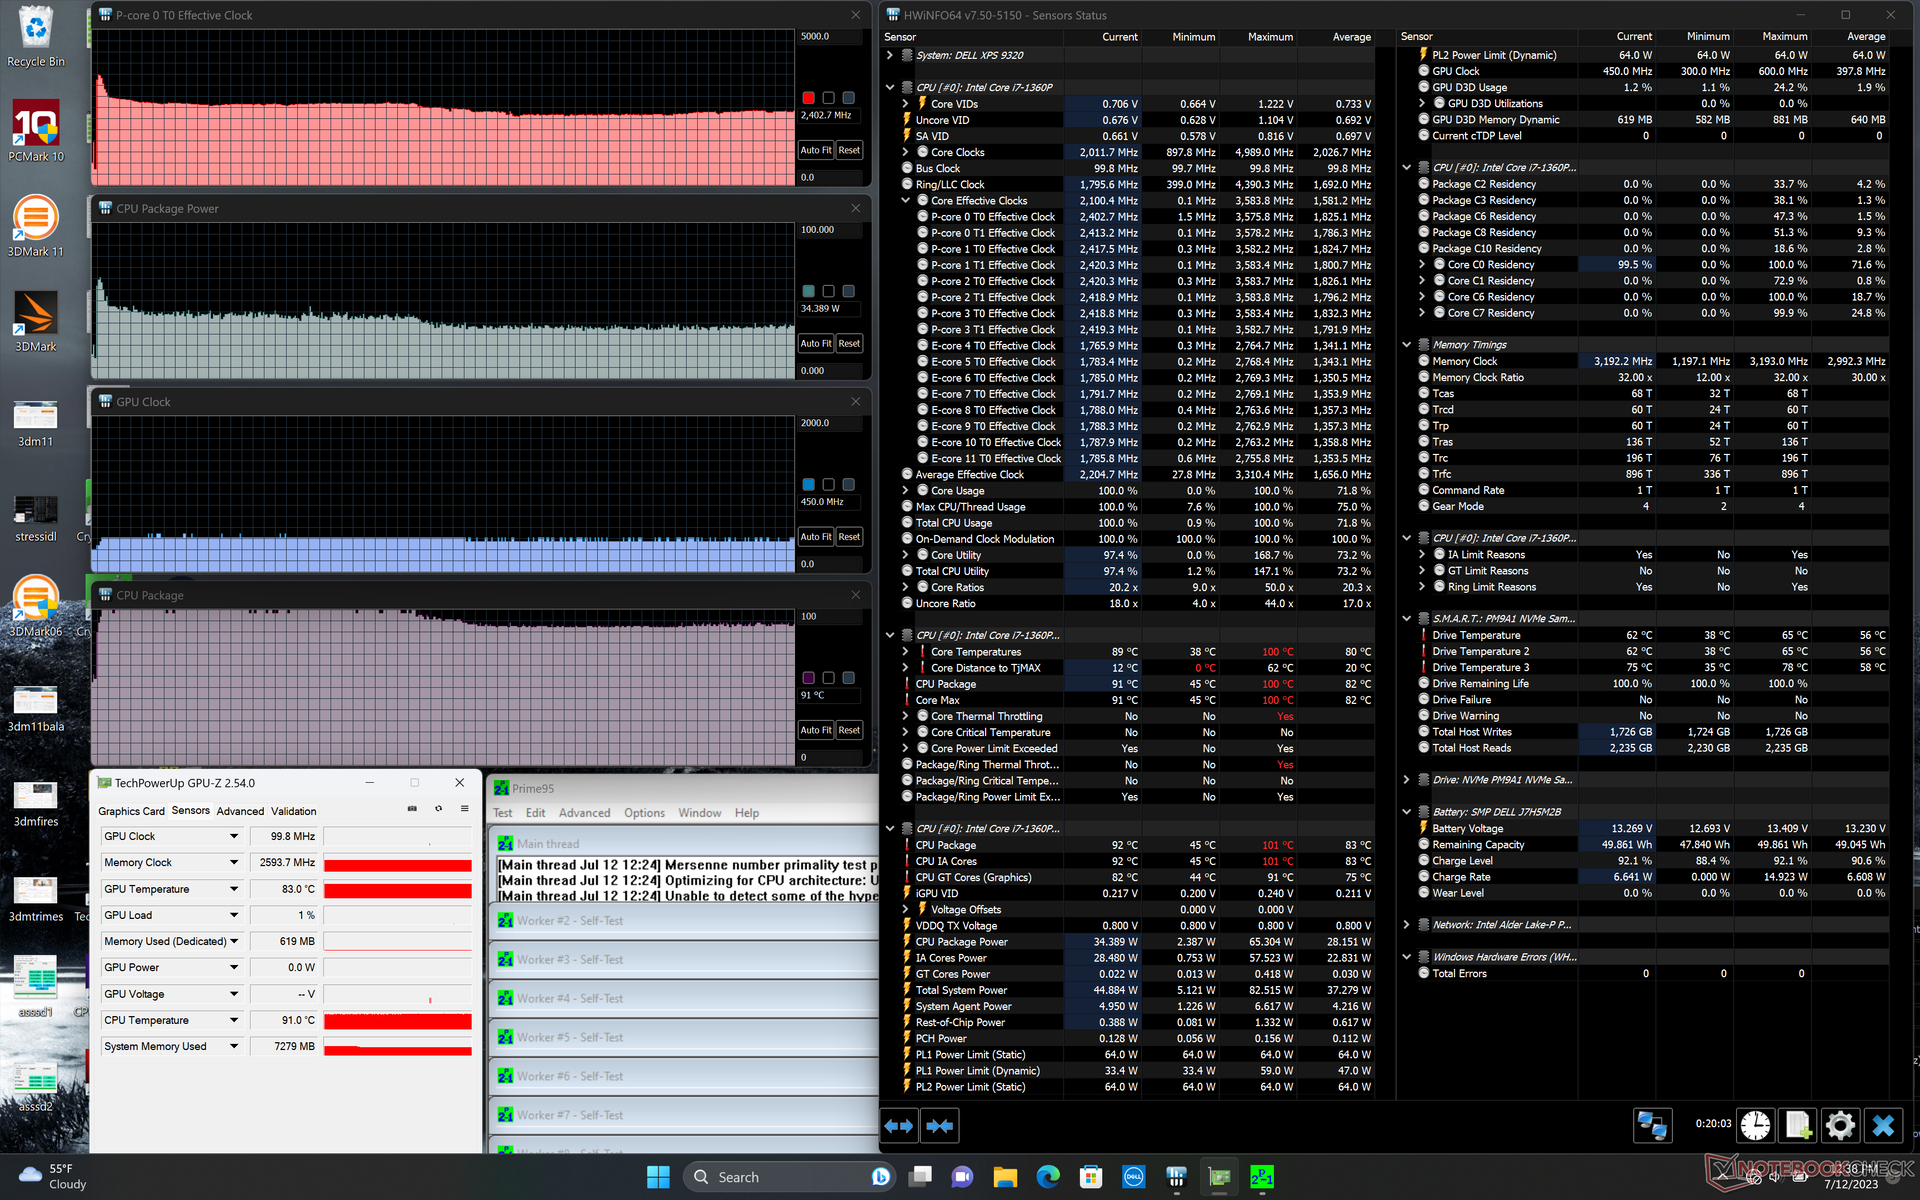
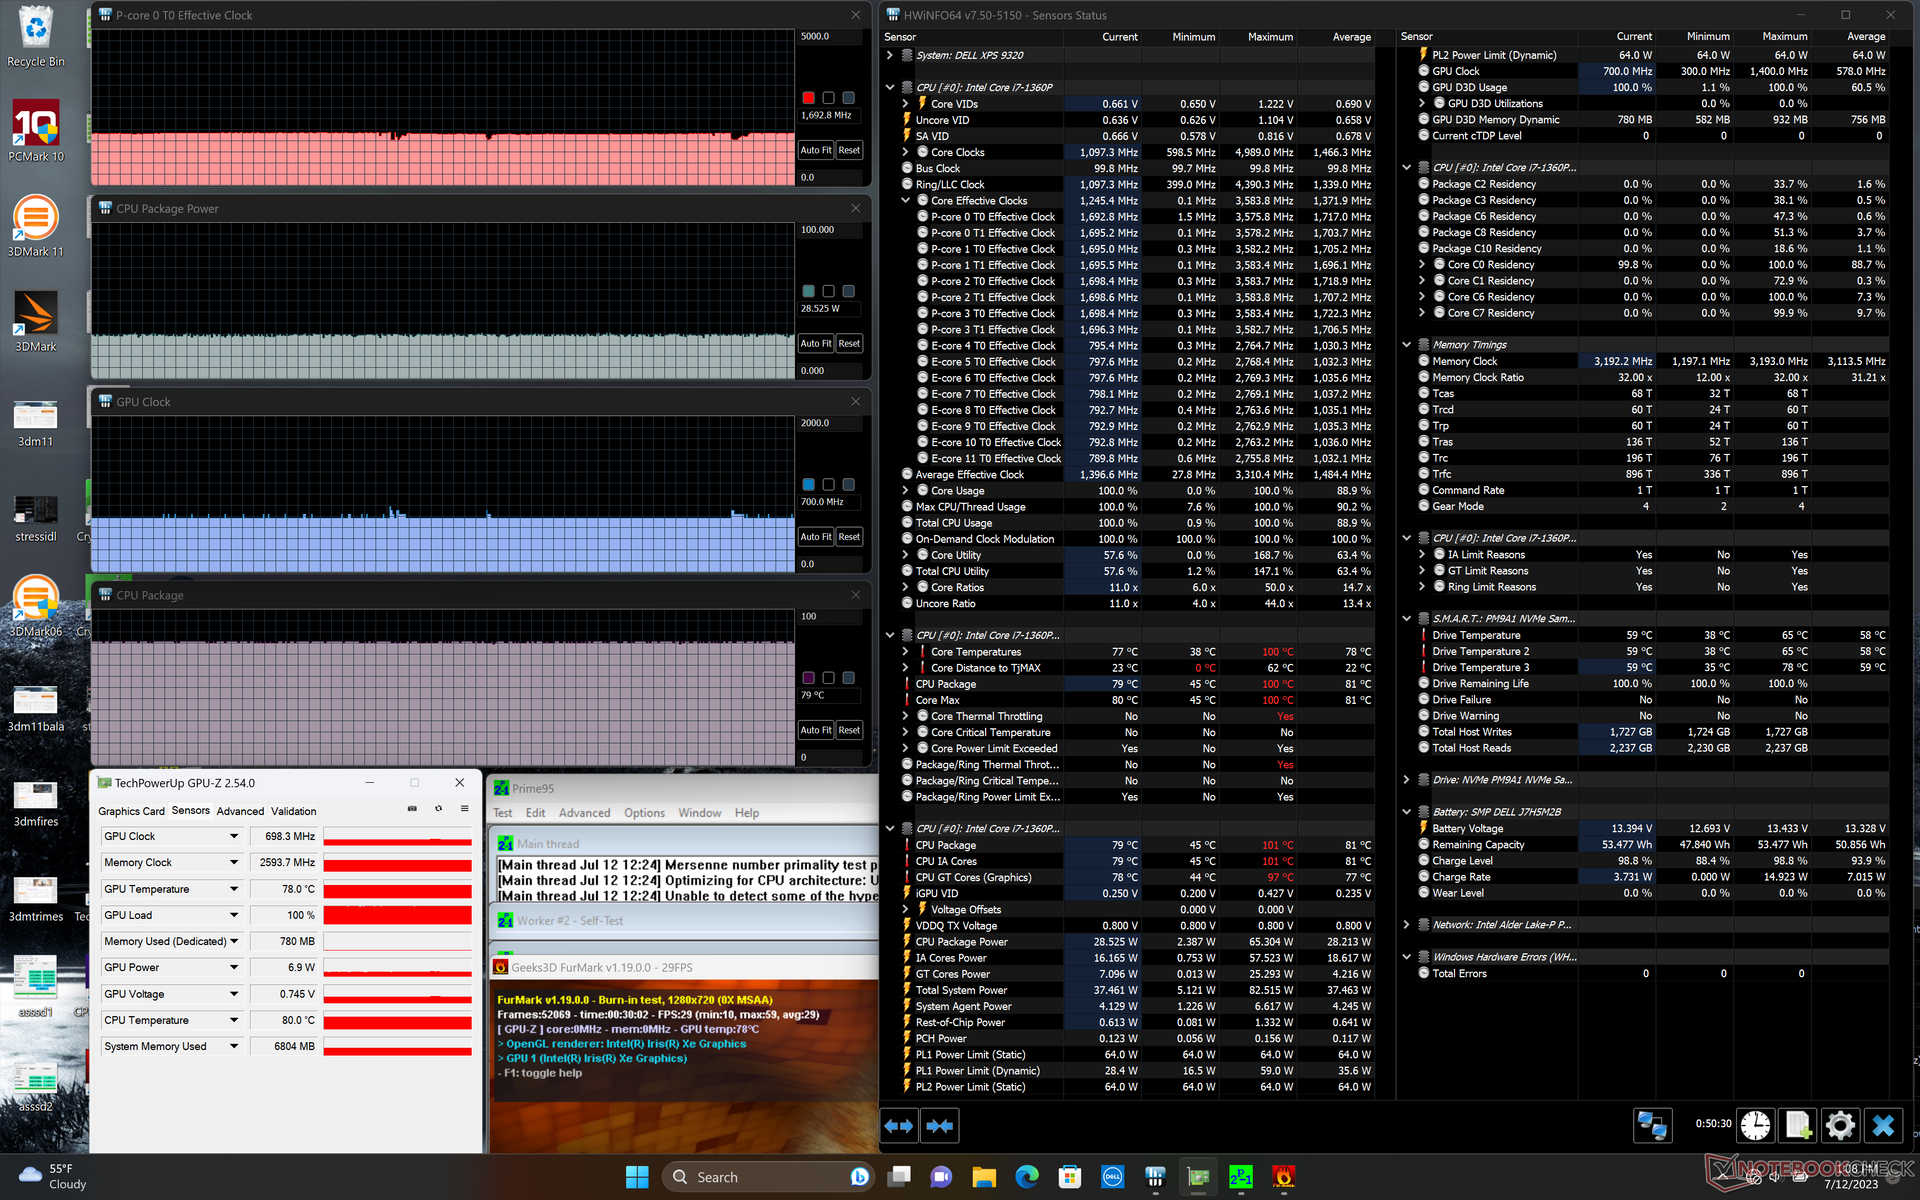
| Clock della CPU (GHz) | Clock della GPU (MHz) | Temperatura media della CPU (°C) | |
| Sistema inattivo | -- | -- | 51 |
| Stress Prime95 | 2,4 | -- | 91 |
| Prime95 + FurMark Stress | 1,7 | 700 | 79 |
| Witcher 3 Stress | ~1,6 | 1250 | 81 |
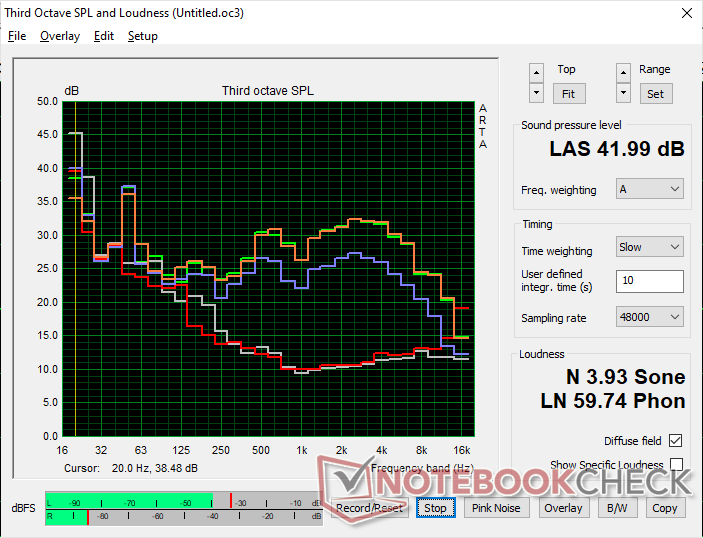
Altoparlanti
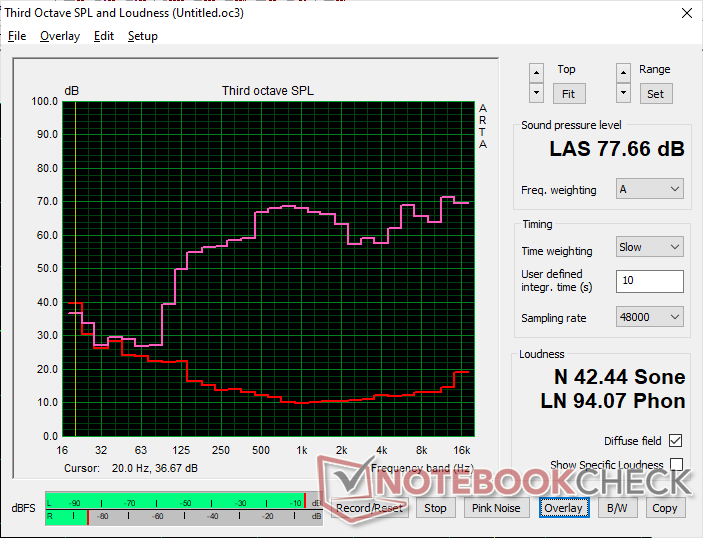
Dell XPS 13 Plus 9320 Core i7-1360P analisi audio
(±) | potenza degli altiparlanti media ma buona (77.7 dB)
Bassi 100 - 315 Hz
(±) | bassi ridotti - in media 10.8% inferiori alla media
(±) | la linearità dei bassi è media (10.2% delta rispetto alla precedente frequenza)
Medi 400 - 2000 Hz
(+) | medi bilanciati - solo only 3.6% rispetto alla media
(+) | medi lineari (3.8% delta rispetto alla precedente frequenza)
Alti 2 - 16 kHz
(+) | Alti bilanciati - appena 3.6% dalla media
(±) | la linearità degli alti è media (7.4% delta rispetto alla precedente frequenza)
Nel complesso 100 - 16.000 Hz
(+) | suono nel complesso lineare (13.2% differenza dalla media)
Rispetto alla stessa classe
» 22% di tutti i dispositivi testati in questa classe è stato migliore, 5% simile, 74% peggiore
» Il migliore ha avuto un delta di 5%, medio di 18%, peggiore di 53%
Rispetto a tutti i dispositivi testati
» 14% di tutti i dispositivi testati in questa classe è stato migliore, 3% similare, 84% peggiore
» Il migliore ha avuto un delta di 4%, medio di 23%, peggiore di 134%
Apple MacBook Pro 16 2021 M1 Pro analisi audio
(+) | gli altoparlanti sono relativamente potenti (84.7 dB)
Bassi 100 - 315 Hz
(+) | bassi buoni - solo 3.8% dalla media
(+) | bassi in lineaa (5.2% delta rispetto alla precedente frequenza)
Medi 400 - 2000 Hz
(+) | medi bilanciati - solo only 1.3% rispetto alla media
(+) | medi lineari (2.1% delta rispetto alla precedente frequenza)
Alti 2 - 16 kHz
(+) | Alti bilanciati - appena 1.9% dalla media
(+) | alti lineari (2.7% delta rispetto alla precedente frequenza)
Nel complesso 100 - 16.000 Hz
(+) | suono nel complesso lineare (4.6% differenza dalla media)
Rispetto alla stessa classe
» 0% di tutti i dispositivi testati in questa classe è stato migliore, 0% simile, 100% peggiore
» Il migliore ha avuto un delta di 5%, medio di 17%, peggiore di 45%
Rispetto a tutti i dispositivi testati
» 0% di tutti i dispositivi testati in questa classe è stato migliore, 0% similare, 100% peggiore
» Il migliore ha avuto un delta di 4%, medio di 23%, peggiore di 134%
Gestione dell'energia
Consumo di energia
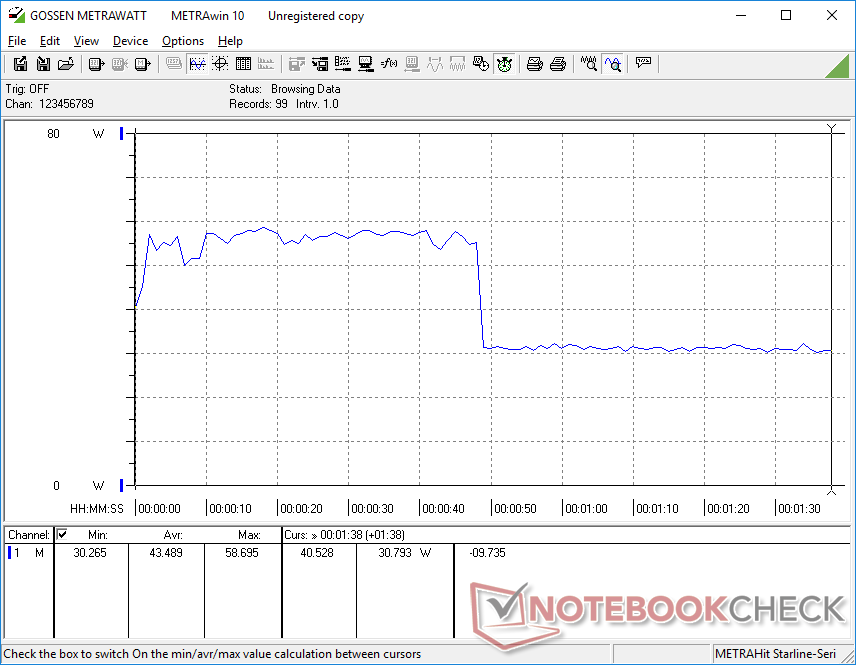
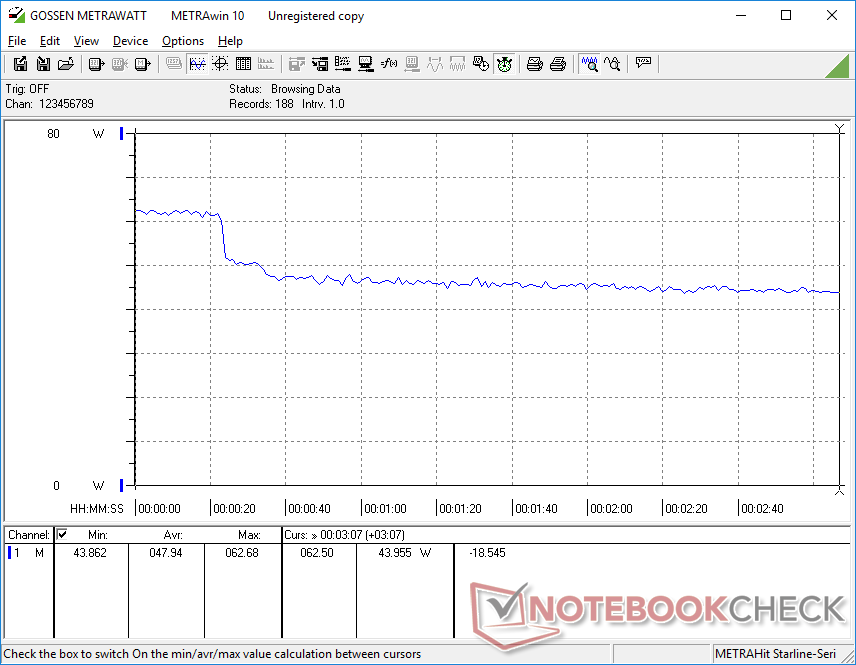
Il consumo al minimo su desktop può variare da 6 a 14 W, un intervallo più ampio rispetto alla maggior parte dei subnotebook, a causa del display OLED più esigente. Come descritto nel nostro articolo quideterminati colori richiedono più energia su un pannello OLED, mentre il consumo energetico è indipendente dal colore su un IPS.
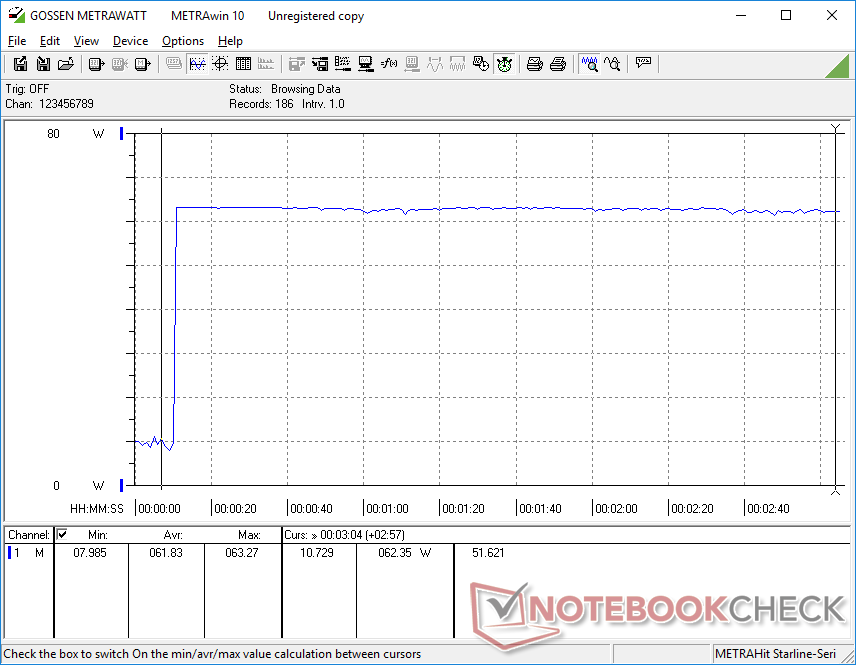
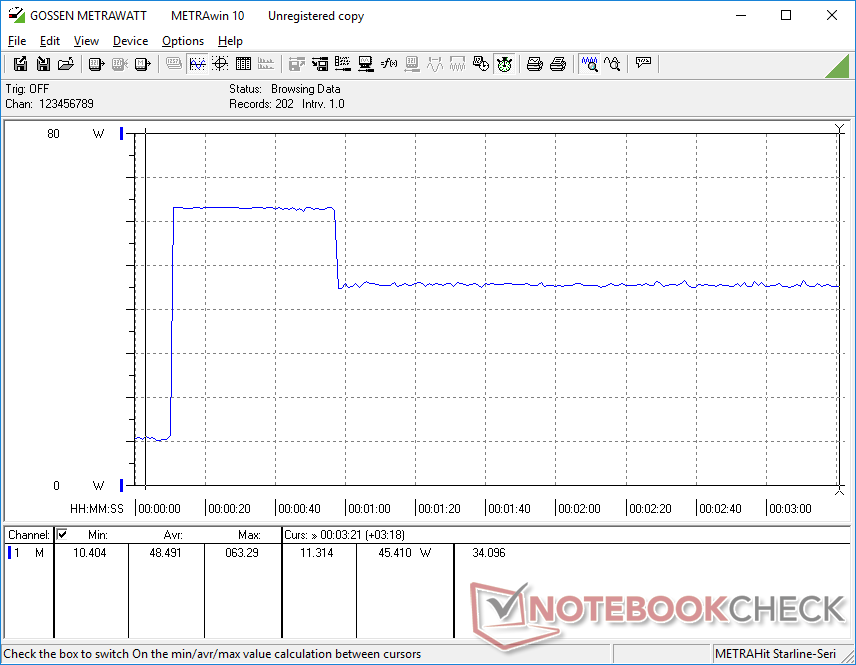
Il consumo energetico complessivo è comunque simile a quello del modello dell'anno scorso, nonostante la CPU di nuova generazione. L'esecuzione di Prime95, ad esempio, richiederebbe circa 63 W da ciascun sistema, il che significa che le prestazioni per watt del Core i7-1360P di 13a generazione non sono migliori di quelle del Core i7-1280P di 12a generazione.
| Off / Standby | |
| Idle | |
| Sotto carico |
|
Leggenda:
min: | |
| Dell XPS 13 Plus 9320 Core i7-1360P i7-1360P, Iris Xe G7 96EUs, Samsung PM9A1 MZVL2512HCJQ, OLED, 3456x2160, 13.4" | Dell XPS 13 Plus 9320 i7-1280P OLED i7-1280P, Iris Xe G7 96EUs, WDC PC SN810 512GB, OLED, 3456x2160, 13.4" | Dell XPS 13 7390 Core i7-10710U i7-10710U, UHD Graphics 620, SK Hynix PC601 NVMe 512 GB, IPS, 3840x2160, 13.3" | Framework Laptop 13.5 13th Gen Intel i7-1370P, Iris Xe G7 96EUs, WD PC SN740 SDDPNQD-1T00, IPS, 2256x1504, 13.5" | Lenovo ThinkPad X13 Yoga G3 21AW003UGE i7-1265U, Iris Xe G7 96EUs, Samsung PM9A1 MZVL2512HCJQ, IPS LED, 2560x1600, 13.3" | HP Spectre x360 13.5 14t-ef000 i7-1255U, Iris Xe G7 96EUs, Micron 3400 1TB MTFDKBA1T0TFH, OLED, 3000x2000, 13.5" | |
|---|---|---|---|---|---|---|
| Power Consumption | -5% | 16% | 10% | 7% | 16% | |
| Idle Minimum * (Watt) | 6.9 | 6.5 6% | 4.7 32% | 2.9 58% | 4.6 33% | 4 42% |
| Idle Average * (Watt) | 7.4 | 7.8 -5% | 8.3 -12% | 6.3 15% | 7.9 -7% | 4.9 34% |
| Idle Maximum * (Watt) | 13.6 | 13 4% | 9 34% | 9.9 27% | 8.9 35% | 12.5 8% |
| Load Average * (Watt) | 43.5 | 56.6 -30% | 42 3% | 56.2 -29% | 56.1 -29% | 48.1 -11% |
| Witcher 3 ultra * (Watt) | 48 | 49.2 -3% | 56.6 -18% | 40.4 16% | 35.8 25% | |
| Load Maximum * (Watt) | 63.3 | 63 -0% | 49 23% | 60.8 4% | 66.1 -4% | 65.2 -3% |
* ... Meglio usare valori piccoli
Power Consumption Witcher 3 / Stresstest
Power Consumption external Monitor
Durata della batteria
I tempi di esecuzione sono quasi identici a quelli della configurazione Core i7-1260P dell'anno scorso, con circa 7,5 ore di navigazione nel mondo reale.
La ricarica da vuoto a pieno regime con l'adattatore in dotazione richiede poco più di 2 ore.
| Dell XPS 13 Plus 9320 Core i7-1360P i7-1360P, Iris Xe G7 96EUs, 55 Wh | Dell XPS 13 Plus 9320 i7-1280P OLED i7-1280P, Iris Xe G7 96EUs, 55 Wh | Dell XPS 13 7390 Core i7-10710U i7-10710U, UHD Graphics 620, 52 Wh | Framework Laptop 13.5 13th Gen Intel i7-1370P, Iris Xe G7 96EUs, 61 Wh | Lenovo ThinkPad X13 Yoga G3 21AW003UGE i7-1265U, Iris Xe G7 96EUs, 52.8 Wh | HP Spectre x360 13.5 14t-ef000 i7-1255U, Iris Xe G7 96EUs, 66 Wh | |
|---|---|---|---|---|---|---|
| Autonomia della batteria | -21% | 15% | 21% | 11% | 10% | |
| WiFi v1.3 (h) | 7.3 | 5.8 -21% | 8.4 15% | 8.8 21% | 8.1 11% | 8 10% |
| Load (h) | 1.9 | 2.2 | ||||
| Reader / Idle (h) | 20.4 |
Pro
Contro
Verdetto - Saltate la versione del 2023 e prendete quella del 2022
Il XPS 13 Plus è stato introdotto solo l'anno scorso e quindi l'aggiornamento di quest'anno è prevedibilmente minore. Sarebbe irrealistico ipotizzare aggiornamenti radicali dello chassis o degli interni in questo momento, ma il refresh del 2023 è purtroppo dimenticabile se si considera che non offre quasi nessun vantaggio in termini di prestazioni del processore o di prestazioni per watt rispetto all'anno precedente. Inoltre, altri aspetti sembrano incoerenti, come i salti di frame durante la riproduzione video e l'SSD in throttling. Tutti i principali vantaggi e svantaggi dell'XPS 13 Plus 9320 originale sono ancora validi per la versione 2023.
Il 13° Core i7-1360P sembra un rebrand del Core i7-1280P di 12° generazione. Gli acquirenti interessati potrebbero quindi prendere in considerazione l'XPS 13 Plus 9320 originale del 2022 invece della versione più recente del 2023.
Se siete sul mercato per l'XPS 13 Plus 9320, vi consigliamo il modello originale del 2022 perché è meno costoso e offre essenzialmente le stesse prestazioni della versione 2023. Gli acquirenti possono invece investire i soldi risparmiati in caratteristiche più tangibili come più RAM, più spazio di archiviazione o un display a risoluzione più elevata.
Prezzo e disponibilità
Dell distribuisce ora l'XPS 13 Plus 9320 a partire da 1150 dollari per la configurazione base FHD fino a 1750 dollari per la configurazione 4K UHD.
Dell XPS 13 Plus 9320 Core i7-1360P
- 07/16/2023 v7 (old)
Allen Ngo
Transparency
La selezione dei dispositivi da recensire viene effettuata dalla nostra redazione. Il campione di prova è stato fornito all'autore come prestito dal produttore o dal rivenditore ai fini di questa recensione. L'istituto di credito non ha avuto alcuna influenza su questa recensione, né il produttore ne ha ricevuto una copia prima della pubblicazione. Non vi era alcun obbligo di pubblicare questa recensione. In quanto società mediatica indipendente, Notebookcheck non è soggetta all'autorità di produttori, rivenditori o editori.
Ecco come Notebookcheck esegue i test
Ogni anno, Notebookcheck esamina in modo indipendente centinaia di laptop e smartphone utilizzando procedure standardizzate per garantire che tutti i risultati siano comparabili. Da circa 20 anni sviluppiamo continuamente i nostri metodi di prova e nel frattempo stabiliamo gli standard di settore. Nei nostri laboratori di prova, tecnici ed editori esperti utilizzano apparecchiature di misurazione di alta qualità. Questi test comportano un processo di validazione in più fasi. Il nostro complesso sistema di valutazione si basa su centinaia di misurazioni e parametri di riferimento ben fondati, che mantengono l'obiettività.Price comparison

