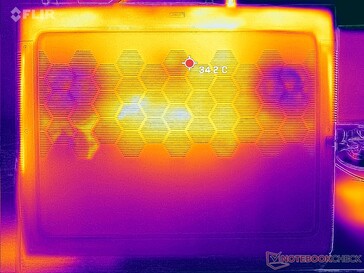
Notebookcheck Logo

Recensione del portatile Alienware m18 R2: Salto dal Core i9-13980HX all'i9-14900HX
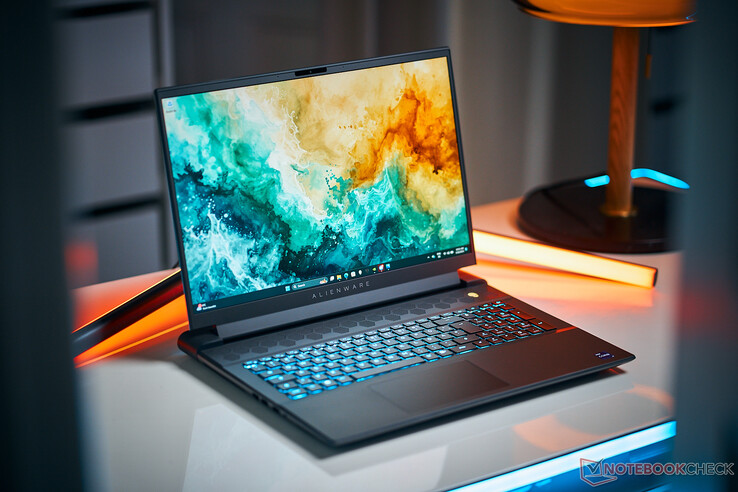
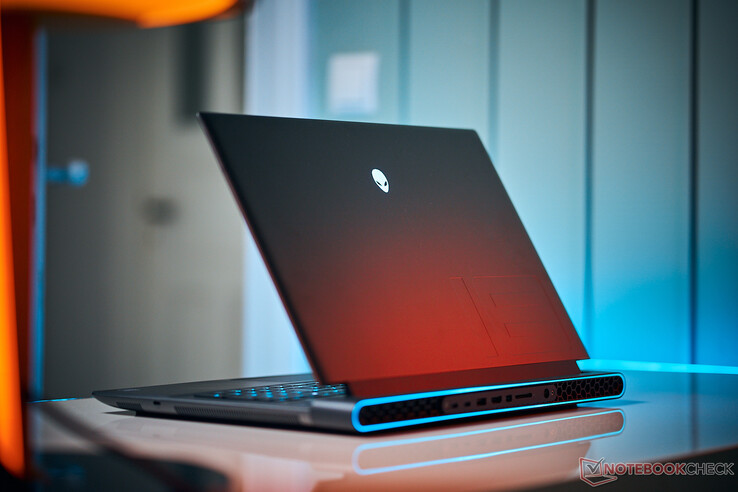
Un passo laterale per la serie. Può essere chiamato Alienware m18 R2, ma è più simile all'Alienware m18 R1.1. La CPU e la GPU hanno prestazioni identiche a quelle del modello dell'anno scorso, senza miglioramenti significativi rispetto all'anno precedente. Risparmi qualche centinaio di dollari optando invece per la versione m18 R1.
Dell Alienware m18 R2

Dell ha rinnovato la serie Alienware m18 quest'anno con il nuovo m18 R2. A differenza del salto dal modello m16 R1 al modello m16 R2tuttavia, l'm18 R2 utilizza lo stesso design dello chassis del suo predecessore, ma con le nuove CPU Raptor Lake-HX Core ix-14000HX che sostituiscono le opzioni Core ix-13000HX più vecchie. Quasi tutto il resto rimane invariato, per cui consigliamo di consultare le nostre recensioni esistenti sull' m18 R1 e m18 R1 AMD per saperne di più sulle caratteristiche fisiche dell'm18 r2.

La nostra unità in recensione è la configurazione di fascia più alta con CPU Core i9-14900HX, GPU RTX 4090 da 175 W GeForce, display IPS da 1600p 165 Hz e tastiera meccanica CherryMX a bassissimo profilo per circa 3200 dollari. Altre SKU possono includere il Core i7-14650HX, RTX 4060, display 1200p 480 Hz e tastiera standard a membrana a partire da poco meno di 2000 dollari.

Altre recensioni di Alienware:

Alienware m18 R2 (m18 Serie)
Processore
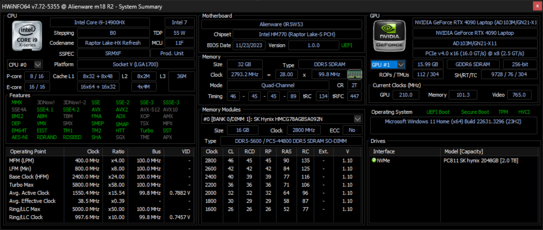
Intel Core i9-14900HX 24 x 1.6 - 5.8 GHz, 180 W PL2 / Short Burst, 144 W PL1 / Sustained, Raptor Lake-HX Refresh
Scheda grafica
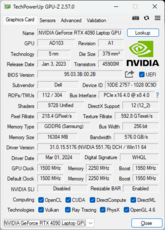
NVIDIA GeForce RTX 4090 Laptop GPU - 16 GB VRAM, Core: 1950 MHz, Memoria: 2250 MHz, 175 W TDP, GDDR6, 551.76, Advanced Optimus, MUX
Memoria
32 GB 
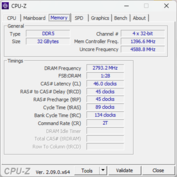
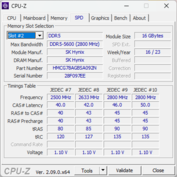
, SK Hynix, DDR5-5600, 46-45-45-89, Dual-Channel
Schermo
18.00 pollici 16:10, 2560 x 1600 pixel 168 PPI, BOE NE18NZ1, IPS, Controller: BOE0AFB, Dell P/N: HF1FV, lucido: no, HDR, 165 Hz, Adaptive Sync
Scheda madre
Intel HM770 (Raptor Lake-S PCH)
Harddisk
SK Hynix PC811 HFS002TEM9X152N, 2048 GB 
Scheda audio
Intel Raptor Lake-S PCH - cAVS
Porte di connessione
6 USB 3.0 / 3.1, 2 USB 3.1 Gen 2, 2 USB 4.0 40 Gbps, 2 Thunderbolt, 1 HDMI, 3 DisplayPort, Connessioni Audio: 3.5 mm headset, Lettore schede: SD
Rete
Intel Killer E5000 (10/100/1000/2500/5000MBit/s), Intel Killer Wi-Fi 7 BE1750x BE200NGW (), Bluetooth 5.4
Dimensioni
altezza x larghezza x profondità (in mm): 26.7 x 410.3 x 319.9
Batteria
97 Wh polimeri di litio
Sistema Operativo
Microsoft Windows 11 Home
Camera
Webcam: 1080p30
Fotocamera Principale: 2 MPix
Altre caratteristiche
Casse: Stereo, 2W x2, Tastiera: Chiclet, Illuminazione Tastiera: si, Alienware Command Center, Update, Digital Delivery, 12 Mesi Garanzia
Peso
3.955 kg, Alimentazione: 1.076 kg
Prezzo
3300 USD
Nota: il produttore potrebbe usare componenti di fornitori diversi pannelli dei diplay, drive o banchi di memoria con specifiche simili.


Potenziali concorrenti a confrontos

Punteggio
Data
Modello
Peso
Altezza
Dimensione
Risoluzione
Miglior Prezzo
89.5 %
03/2024
Alienware m18 R2
i9-14900HX, NVIDIA GeForce RTX 4090 Laptop GPU
4 kg26.7 mm18.00"2560x1600
89.2 %
11/2023
Alienware m18 R1 AMD
R9 7945HX, Radeon RX 7900M
3.9 kg26.7 mm18.00"1920x1200
90.7 %
04/2023
Alienware m18 R1
i9-13980HX, NVIDIA GeForce RTX 4090 Laptop GPU
3.9 kg26.7 mm18.00"1920x1200
88.8 %
01/2024
MSI Titan 18 HX A14VIG
i9-14900HX, NVIDIA GeForce RTX 4090 Laptop GPU
3.6 kg32.1 mm18.00"3840x2400
87.4 %
03/2023
Asus ROG Strix G18 G814JI
i7-13650HX, NVIDIA GeForce RTX 4070 Laptop GPU
3 kg31 mm18.00"2560x1600
88.3 %
10/2023
Acer Predator Helios 18 N23Q2
i9-13900HX, NVIDIA GeForce RTX 4080 Laptop GPU
3.2 kg29.15 mm18.00"2560x1600

Case - Ancora grande con un ponte termico posteriore

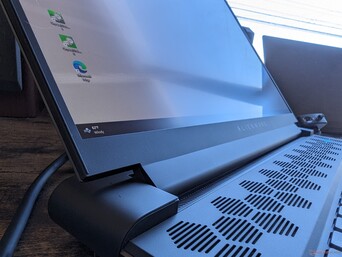
La porta RJ-45 quest'anno è stata aggiornata dal Killer E3000 al Killer E5000 per una velocità di trasmissione doppia (2,5 Gbps contro 5 Gbps). Per il resto, il design esterno rimane lo stesso di prima.

Confronto delle dimensioni

410.3 mm 319.9 mm 26.7 mm 4 kg410.3 mm 319.9 mm 26.7 mm 3.9 kg410.3 mm 319.9 mm 26.7 mm 3.9 kg404 mm 307.5 mm 32.1 mm 3.6 kg405 mm 311.6 mm 29.15 mm 3.2 kg399 mm 294 mm 31 mm 3 kg297 mm 210 mm 1 mm 5.7 g

Lettore di schede SD

SD Card Reader
average JPG Copy Test (av. of 3 runs)
Alienware m18 R1
Intel Core i9-13980HX (Angelibird AV Pro V60)
190.7 MB/s 0%
Alienware m18 R2
Intel Core i9-14900HX (Toshiba Exceria Pro SDXC 64 GB UHS-II)
190.3 MB/s
Alienware m18 R1 AMD
AMD Ryzen 9 7945HX (Toshiba Exceria Pro SDXC 64 GB UHS-II)
177.5 MB/s -7%
MSI Titan 18 HX A14VIG
Intel Core i9-14900HX (Toshiba Exceria Pro SDXC 64 GB UHS-II)
83.8 MB/s -56%
Acer Predator Helios 18 N23Q2
Intel Core i9-13900HX
72 (60.61min - 73.13max) MB/s -62%
maximum AS SSD Seq Read Test (1GB)
Alienware m18 R1 AMD
AMD Ryzen 9 7945HX (Toshiba Exceria Pro SDXC 64 GB UHS-II)
230.5 MB/s +5%
Alienware m18 R2
Intel Core i9-14900HX (Toshiba Exceria Pro SDXC 64 GB UHS-II)
219.7 MB/s
Alienware m18 R1
Intel Core i9-13980HX (Angelibird AV Pro V60)
208.5 MB/s -5%
MSI Titan 18 HX A14VIG
Intel Core i9-14900HX (Toshiba Exceria Pro SDXC 64 GB UHS-II)
91.5 MB/s -58%
Acer Predator Helios 18 N23Q2
Intel Core i9-13900HX
85.99 MB/s -61%

Comunicazione

Networking
iperf3 transmit AXE11000
Asus ROG Strix G18 G814JI
Intel Wi-Fi 6E AX211
1586 (803min - 1641max) MBit/s +101%
Alienware m18 R1 AMD
Qualcomm WCN685x
1460 (1310min - 1543max) MBit/s +85%
Alienware m18 R1
Killer Wi-Fi 6E AX1675i 160MHz Wireless Network Adapter
1272 (922min - 1396max) MBit/s +61%
MSI Titan 18 HX A14VIG
Intel Killer Wi-Fi 7 BE1750x BE200NGW
1011 (514min - 1160max) MBit/s +28%
Acer Predator Helios 18 N23Q2
Killer Wi-Fi 6E AX1675i 160MHz Wireless Network Adapter
942 (475min - 985max) MBit/s +19%
Alienware m18 R2
Intel Killer Wi-Fi 7 BE1750x BE200NGW
791 (736min - 894max) MBit/s
iperf3 receive AXE11000
Asus ROG Strix G18 G814JI
Intel Wi-Fi 6E AX211
1611 (839min - 1699max) MBit/s +17%
Alienware m18 R1 AMD
Qualcomm WCN685x
1461 (766min - 1548max) MBit/s +6%
Alienware m18 R2
Intel Killer Wi-Fi 7 BE1750x BE200NGW
1381 (1277min - 1427max) MBit/s
Alienware m18 R1
Killer Wi-Fi 6E AX1675i 160MHz Wireless Network Adapter
1155 (761min - 1320max) MBit/s -16%
MSI Titan 18 HX A14VIG
Intel Killer Wi-Fi 7 BE1750x BE200NGW
1116 (932min - 1352max) MBit/s -19%
Acer Predator Helios 18 N23Q2
Killer Wi-Fi 6E AX1675i 160MHz Wireless Network Adapter
872 (330min - 895max) MBit/s -37%
iperf3 transmit AXE11000 6GHz
Alienware m18 R1 AMD
Qualcomm WCN685x
1862 (960min - 1973max) MBit/s +187%
Acer Predator Helios 18 N23Q2
Killer Wi-Fi 6E AX1675i 160MHz Wireless Network Adapter
1593 (1545min - 1627max) MBit/s +146%
Alienware m18 R1
Killer Wi-Fi 6E AX1675i 160MHz Wireless Network Adapter
1495 (758min - 1574max) MBit/s +131%
MSI Titan 18 HX A14VIG
Intel Killer Wi-Fi 7 BE1750x BE200NGW
1096 (900min - 1242max) MBit/s +69%
Alienware m18 R2
Intel Killer Wi-Fi 7 BE1750x BE200NGW
648 (595min - 759max) MBit/s
iperf3 receive AXE11000 6GHz
Alienware m18 R1 AMD
Qualcomm WCN685x
1619 (818min - 1660max) MBit/s +25%
Acer Predator Helios 18 N23Q2
Killer Wi-Fi 6E AX1675i 160MHz Wireless Network Adapter
1473 (1448min - 1490max) MBit/s +14%
MSI Titan 18 HX A14VIG
Intel Killer Wi-Fi 7 BE1750x BE200NGW
1379 (709min - 1426max) MBit/s +7%
Alienware m18 R1
Killer Wi-Fi 6E AX1675i 160MHz Wireless Network Adapter
1360 (1300min - 1413max) MBit/s +5%
Alienware m18 R2
Intel Killer Wi-Fi 7 BE1750x BE200NGW
1292 (1215min - 1327max) MBit/s
0501001502002503003504004505005506006507007508008509009501000105011001150120012501300Tooltip
Alienware m18 R2; iperf3 transmit AXE11000 6GHz; iperf 3.1.3: Ø648 (595-759)
Alienware m18 R2; iperf3 receive AXE11000 6GHz; iperf 3.1.3: Ø1291 (1215-1327)

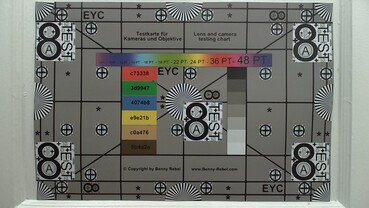
Webcam

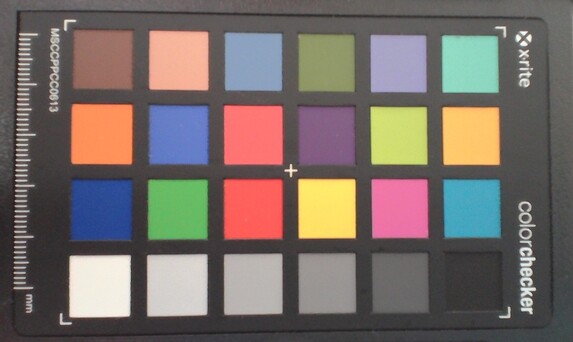
ColorChecker
12.5 ∆E
10.7 ∆E
13.7 ∆E
19.2 ∆E
12.2 ∆E
7.5 ∆E
11 ∆E
13.2 ∆E
14.5 ∆E
13.6 ∆E
10.4 ∆E
9.8 ∆E
5.5 ∆E
12.1 ∆E
21.3 ∆E
7.6 ∆E
13.8 ∆E
11.9 ∆E
5.4 ∆E
3.1 ∆E
6.6 ∆E
10.3 ∆E
8 ∆E
1.7 ∆E
ColorChecker Alienware m18 R2: 10.67 ∆E min: 1.73 - max: 21.29 ∆E

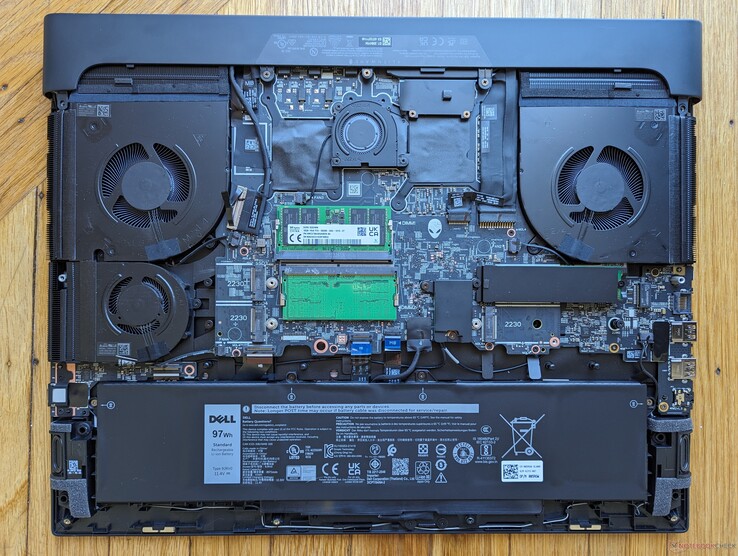
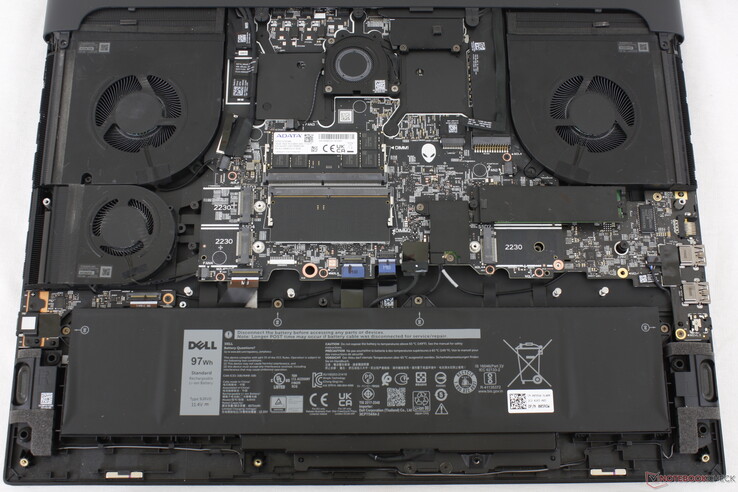
Manutenzione

Alienware m18 R2
Alienware m18 R2
Alienware m18 R1 per un confronto

Display - 1200p o 1600p?

Il pannello opaco non è granuloso come l'opzione a 1200p, grazie ai PPI più elevati di 1600p

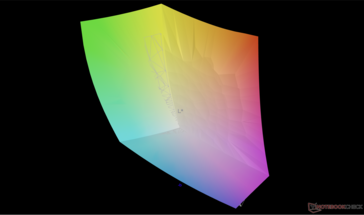
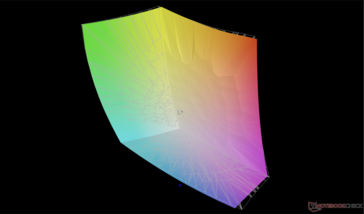
È interessante notare che il nome del pannello sulla nostra configurazione m18 R2 è lo stesso della nostra configurazione m18 R1, anche se le risoluzioni native sono diverse (1600p contro 1200p) e le frequenze di aggiornamento (165 Hz contro 480 Hz). Entrambi i pannelli offrono colori P3 simili, tempi di risposta rapidi e rapporti di contrasto decenti di ~1000:1.

Dopo aver visto entrambi i pannelli, raccomandiamo l'opzione 1600p, poiché 1200p su uno schermo da 18 pollici non è molto nitido, mentre la frequenza di aggiornamento di 480 Hz offre solo vantaggi marginali rispetto a 165 Hz per la maggior parte dei casi d'uso.

La risoluzione dinamica di Windows non è supportata e quindi la frequenza di aggiornamento è fissa a 165 Hz o 60 Hz sul sistema operativo. Tuttavia, G-Sync è ancora supportato quando si eseguono giochi in modalità dGPU. L'HDR non è supportato poiché la retroilluminazione non è abbastanza luminosa per soddisfare i requisiti HDR. In effetti, il nostro display a 1600p è persino leggermente più debole in media rispetto alla configurazione a 1200p.

Display opaco, senza opzioni lucide, OLED o mini-LED
Sanguinamento moderato e irregolare della retroilluminazione
312.3
cd/m²
293.2
cd/m²
303.6
cd/m²
279.1
cd/m²
271.8
cd/m²
260.4
cd/m²
263.1
cd/m²
244.8
cd/m²
246
cd/m²
Distribuzione della luminosità
BOE NE18NZ1 tested with X-Rite i1Pro 2
Massima: 312.3 cd/m² (Nits) Media: 274.9 cd/m² Minimum: 15.2 cd/m²
Distribuzione della luminosità: 78 %
Al centro con la batteria: 271.8 cd/m²
Contrasto: 1007:1 (Nero: 0.27 cd/m²)
ΔE Color 2.48 | 0.5-29.43 Ø5, calibrated: 0.56
ΔE Greyscale 3.7 | 0.57-98 Ø5.3
88.9% AdobeRGB 1998 (Argyll 2.2.0 3D)
99.5% sRGB (Argyll 2.2.0 3D)
97.8% Display P3 (Argyll 2.2.0 3D)
Gamma: 2.2
Alienware m18 R2
BOE NE18NZ1, IPS, 2560x1600, 18.00
Alienware m18 R1 AMD
BOE NE18NZ1, IPS, 1920x1200, 18.00
Alienware m18 R1
Chi Mei 180JME, IPS, 1920x1200, 18.00
MSI Titan 18 HX A14VIG
AU Optronics B180ZAN01.0, Mini-LED, 3840x2400, 18.00
Asus ROG Strix G18 G814JI
NE180QDM-NZ2 (BOE0B35), IPS, 2560x1600, 18.00
Acer Predator Helios 18 N23Q2
AUO45A8 (B180QAN01.2), IPS, 2560x1600, 18.00
Display
0%
1%
-1%
-1%
2%
Display P3 Coverage
97.8
98.5
1%
97.7
0%
98.1
0%
98.1
0%
99.8
2%
sRGB Coverage
99.5
99.7
0%
100
1%
99.8
0%
99.9
0%
100
1%
AdobeRGB 1998 Coverage
88.9
88.7
0%
89.8
1%
86.2
-3%
85.6
-4%
91.8
3%
Response Times
28%
24%
-375%
4%
-57%
Response Time Grey 50% / Grey 80% *
5.3 ?(2.2, 3.1)
2.8 ?(1.2, 1.6)
47%
3 ?(1.5, 1.5)
43%
8.6 ?(4.2, 4.4)
-62%
5.6 ?(2.7, 2.9)
-6%
7.6 ?(4.4, 3.2)
-43%
Response Time Black / White *
10.4 ?(4.8, 5.6)
9.6 ?(4.9, 4.7)
8%
9.9 ?(5.4, 4.5)
5%
81.8 ?(76, 5.8)
-687%
9 ?(4, 5)
13%
17.8 ?(15.6, 2.2)
-71%
PWM Frequency
2592 ?(100)
2509
Screen
29%
24%
-45%
9%
-28%
Brightness middle
271.8
319.6
18%
372.8
37%
467.5
72%
471
73%
360
32%
Brightness
275
304
11%
367
33%
459
67%
422
53%
355
29%
Brightness Distribution
78
87
12%
97
24%
90
15%
83
6%
92
18%
Black Level *
0.27
0.25
7%
0.32
-19%
0.47
-74%
0.21
22%
Contrast
1007
1278
27%
1165
16%
1002
0%
1714
70%
Colorchecker dE 2000 *
2.48
1.22
51%
1.92
23%
3.77
-52%
2.05
17%
3.82
-54%
Colorchecker dE 2000 max. *
5.59
3.1
45%
3.65
35%
6.12
-9%
4.15
26%
7.38
-32%
Colorchecker dE 2000 calibrated *
0.56
0.47
16%
0.51
9%
2.94
-425%
0.8
-43%
2.24
-300%
Greyscale dE 2000 *
3.7
0.8
78%
1.5
59%
3.2
14%
2.8
24%
5.06
-37%
Gamma
2.2 100%
2.23 99%
2.34 94%
2.43 91%
2.204 100%
2.52 87%
CCT
6355 102%
6471 100%
6607 98%
6478 100%
7122 91%
5657 115%
Media totale (Programma / Settaggio)
19% / 23%
16% / 19%
-140% / -89%
4% / 6%
-28% / -26%

* ... Meglio usare valori piccoli

rispetto a sRGB
rispetto a sRGB
contro P3
contro P3

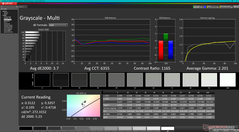
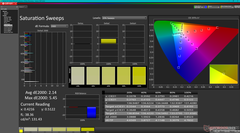
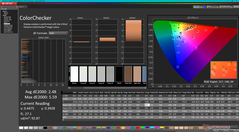
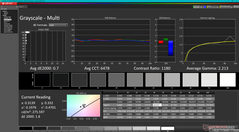
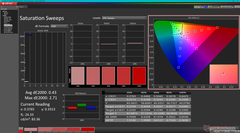
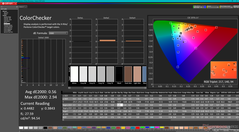
La scala di grigi e i colori sono abbastanza precisi, anche se il display non viene fornito pre-calibrato. La calibrazione del pannello da parte nostra migliorerebbe i valori deltaE medi a <1 per sfruttare meglio i colori P3 completi. Il nostro profilo ICM calibrato è disponibile gratuitamente per il download qui sopra.

Scala di grigi prima della calibrazione
Sweep di saturazione prima della calibrazione
ColorChecker prima della calibrazione
Scala di grigi dopo la calibrazione
Sweep di saturazione dopo la calibrazione
ColorChecker dopo la calibrazione

Tempi di risposta del Display

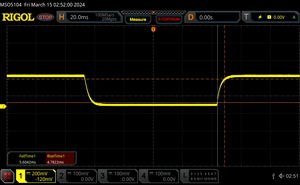
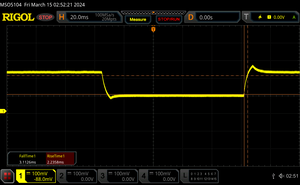
I tempi di risposta del display mostrano quanto sia veloce lo schermo a cambaire da un colore all'altro. Tempi di risposta lenti possono creare sovrapposizioni negloi oggetti in movimento. Specialmente i giocatori patiti del 3D dovrebbero usare uno schermo con tempi di risposta bassi.
       Tempi di risposta dal Nero al Bianco
10.4 ms ... aumenta ↗ e diminuisce ↘ combinato↗ 4.8 ms Incremento
↘ 5.6 ms Calo
Lo schermo mostra buoni tempi di risposta durante i nostri tests, ma potrebbe essere troppo lento per i gamers competitivi.
In confronto, tutti i dispositivi di test variano da 0.1 (minimo) a 240 (massimo) ms. » 23 % di tutti i dispositivi è migliore.
Questo significa che i tempi di risposta rilevati sono migliori rispettto alla media di tutti i dispositivi testati (21.5 ms).
       Tempo di risposta dal 50% Grigio all'80% Grigio
5.3 ms ... aumenta ↗ e diminuisce ↘ combinato↗ 2.2 ms Incremento
↘ 3.1 ms Calo
Lo schermo ha mostrato valori di risposta molto veloci nei nostri tests ed è molto adatto per i gaming veloce.
In confronto, tutti i dispositivi di test variano da 0.2 (minimo) a 636 (massimo) ms. » 12 % di tutti i dispositivi è migliore.
Questo significa che i tempi di risposta rilevati sono migliori rispettto alla media di tutti i dispositivi testati (33.7 ms).

Sfarfallio dello schermo / PWM (Pulse-Width Modulation)

Per ridurre la luminosità dello schermo, alcuni portatili accendono e spengono la retroilluminazione in rapida successione - un metodo chiamato Pulse Width Modulation (PWM). Questa frequenza di ciclo a livello ideale non dovrebbe essere percepibile dall'occhi umano. Se tale frequenza è troppo bassa, gli utenti con occhi sensibili potrebbero stancarsi gli occhi o avere mal di testa o anche notare uno sfarfallio.
flickering dello schermo / PWM non rilevato

In confronto: 53 % di tutti i dispositivi testati non utilizza PWM per ridurre la luminosita' del display. Se è rilevato PWM, una media di 17903 (minimo: 5 - massimo: 3846000) Hz è stata rilevata.

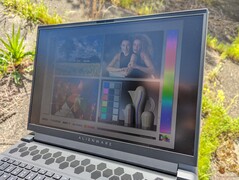
All'aperto, sotto la luce del sole
All'aperto, all'ombra
All'aperto, sotto la luce del sole
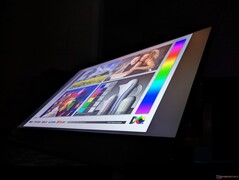
Ampi angoli di visione IPS

Prestazioni - Aggiornamento Raptor Lake-HX


Condizioni del test

Abbiamo impostato Alienware Command Center sulla modalità Overdrive e Windows sulla modalità Prestazioni prima di eseguire i benchmark qui sotto. Abbiamo anche impostato il sistema in modalità dGPU tramite il Pannello di controllo Nvidia. Optimus avanzato e MUX sono supportati, il che significa che non è necessario riavviare il sistema quando si passa dall'iGPU alla dGPU.

Vale la pena notare che abbiamo riscontrato alcuni bug sulla nostra unità, tutti relativi alla modalità Sleep. A volte il sistema non entrava correttamente in modalità Sleep quando si chiudeva il coperchio e di conseguenza diventava molto caldo senza motivo. Se ciò dovesse accadere durante un viaggio, la batteria potrebbe esaurirsi senza alcun preavviso. Inoltre, a volte lo schermo si blocca per alcuni secondi al risveglio dalla modalità Sleep. Sospettiamo che si tratti di un problema legato al MUX o alla commutazione automatica della GPU.

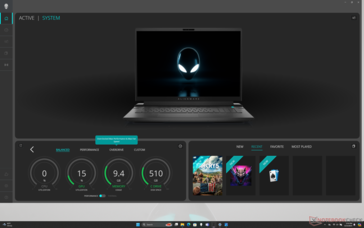
Schermata iniziale del Centro di comando Alienware
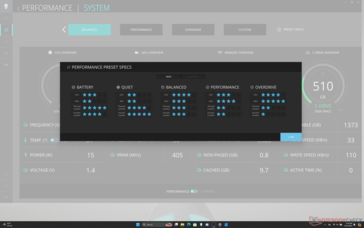
I cinque diversi profili di potenza riassunti con le stelle di valutazione
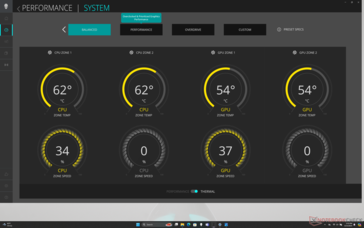
I parametri vitali del sistema in tempo reale, ma senza la possibilità di esportare le letture
AlienFX controlla l'illuminazione RGB

Processore

Il Core i9-14900HX è un rebrand del modello Core i9-13900HX e quindi le differenze di prestazioni tra loro sono minime, nella migliore delle ipotesi. Infatti, il Core i9-13980HX nell'm18 R1 dello scorso anno superava costantemente il nostro i9-14900HX di qualche punto percentuale nei carichi di lavoro multi-thread.

Il downgrade al Core i7-14700HX o al Core i7-14650HX dovrebbe ridurre le prestazioni del processore rispettivamente del 25-30% e del 30-35%. Queste CPU inferiori sono anche rebrand dei vecchi Core i7-13700HX e Core i7-14750HX.

Cinebench R15 Multi Loop

02805608401120140016801960224025202800308033603640392042004480476050405320Tooltip
Alienware m18 R2 Intel Core i9-14900HX: Ø4743 (4458.81-4807.11)
Alienware m18 R1 AMD AMD Ryzen 9 7945HX: Ø5466 (5377.07-5540.93)
Alienware m18 R1 Intel Core i9-13980HX: Ø4934 (4579.8-4989.4)
MSI Titan 18 HX A14VIG Intel Core i9-14900HX: Ø4753 (4700.35-4782.4)
Asus ROG Strix G18 G814JI Intel Core i7-13650HX: Ø3111 (3067.01-3136.03)
Acer Predator Helios 18 N23Q2 Intel Core i9-13900HX: Ø4541 (4495.39-4584.53)
CPU Performance Rating: Percent
Cinebench R23: Multi Core | Single Core
Cinebench R20: CPU (Multi Core) | CPU (Single Core)
Cinebench R15: CPU Multi 64Bit | CPU Single 64Bit
Blender: v2.79 BMW27 CPU
7-Zip 18.03: 7z b 4 | 7z b 4 -mmt1
Geekbench 6.2: Multi-Core | Single-Core
Geekbench 5.5: Multi-Core | Single-Core
HWBOT x265 Benchmark v2.2: 4k Preset
LibreOffice : 20 Documents To PDF
R Benchmark 2.5: Overall mean
CPU Performance Rating
Alienware m18 R1 AMD
AMD Ryzen 9 7945HX
85 pt
Alienware m18 R2
Intel Core i9-14900HX
84.1 pt
Alienware m18 R1 -2!
Intel Core i9-13980HX
81.4 pt
MSI Titan 18 HX A14VIG
Intel Core i9-14900HX
80.5 pt
Acer Predator Helios 18 N23Q2
Intel Core i9-13900HX
80.1 pt
Media Intel Core i9-14900HX
 
79.6 pt
Razer Blade 18 RTX 4070 -2!
Intel Core i9-13950HX
76.8 pt
Asus TUF Gaming A17 FA707XI-NS94
AMD Ryzen 9 7940HS
60.7 pt
Asus ROG Strix G18 G814JI -2!
Intel Core i7-13650HX
60 pt
SCHENKER XMG Apex 17 (Late 23)
AMD Ryzen 7 7840HS
58.7 pt
Acer Nitro 17 AN17-51-71ER -2!
Intel Core i7-13700H
49.9 pt
Acer Nitro 17 AN17-41-R9LN
AMD Ryzen 7 7735HS
47.5 pt
Cinebench R23 / Multi Core
Alienware m18 R1 AMD
AMD Ryzen 9 7945HX
34613 (33896.2min - 34613.2max) Points +10%
Alienware m18 R1
Intel Core i9-13980HX
32601 (28888.6min - 32601.4max) Points +4%
MSI Titan 18 HX A14VIG
Intel Core i9-14900HX
32428 (29693.8min - 32428.3max) Points +3%
Alienware m18 R2
Intel Core i9-14900HX
31391 (28656min - 31390.7max) Points
Acer Predator Helios 18 N23Q2
Intel Core i9-13900HX
30631 Points -2%
Media Intel Core i9-14900HX
  (20702 - 32996, n=22)
28890 Points -8%
Razer Blade 18 RTX 4070
Intel Core i9-13950HX
28681 (25585.5min - 28680.9max) Points -9%
Asus ROG Strix G18 G814JI
Intel Core i7-13650HX
21006 Points -33%
Acer Nitro 17 AN17-51-71ER
Intel Core i7-13700H
18843 Points -40%
Asus TUF Gaming A17 FA707XI-NS94
AMD Ryzen 9 7940HS
17623 (17398.8min - 17622.8max) Points -44%
SCHENKER XMG Apex 17 (Late 23)
AMD Ryzen 7 7840HS
15872 Points -49%
Acer Nitro 17 AN17-41-R9LN
AMD Ryzen 7 7735HS
14087 Points -55%
Cinebench R23 / Single Core
Alienware m18 R2
Intel Core i9-14900HX
2235 Points
Media Intel Core i9-14900HX
  (2043 - 2235, n=22)
2174 Points -3%
MSI Titan 18 HX A14VIG
Intel Core i9-14900HX
2143 Points -4%
Alienware m18 R1
Intel Core i9-13980HX
2106 Points -6%
Acer Predator Helios 18 N23Q2
Intel Core i9-13900HX
2093 Points -6%
Razer Blade 18 RTX 4070
Intel Core i9-13950HX
2076 Points -7%
Alienware m18 R1 AMD
AMD Ryzen 9 7945HX
1948 Points -13%
Asus ROG Strix G18 G814JI
Intel Core i7-13650HX
1903 Points -15%
Asus TUF Gaming A17 FA707XI-NS94
AMD Ryzen 9 7940HS
1832 Points -18%
SCHENKER XMG Apex 17 (Late 23)
AMD Ryzen 7 7840HS
1777 Points -20%
Acer Nitro 17 AN17-41-R9LN
AMD Ryzen 7 7735HS
1569 Points -30%
Acer Nitro 17 AN17-51-71ER
Intel Core i7-13700H
1549 Points -31%
Cinebench R20 / CPU (Multi Core)
Alienware m18 R1 AMD
AMD Ryzen 9 7945HX
13308 Points +13%
Alienware m18 R1
Intel Core i9-13980HX
12423 Points +5%
MSI Titan 18 HX A14VIG
Intel Core i9-14900HX
12103 Points +2%
Alienware m18 R2
Intel Core i9-14900HX
11816 Points
Acer Predator Helios 18 N23Q2
Intel Core i9-13900HX
11726 Points -1%
Media Intel Core i9-14900HX
  (8427 - 12419, n=22)
10988 Points -7%
Razer Blade 18 RTX 4070
Intel Core i9-13950HX
10919 Points -8%
Asus ROG Strix G18 G814JI
Intel Core i7-13650HX
7999 Points -32%
Acer Nitro 17 AN17-51-71ER
Intel Core i7-13700H
7041 Points -40%
Asus TUF Gaming A17 FA707XI-NS94
AMD Ryzen 9 7940HS
6894 Points -42%
SCHENKER XMG Apex 17 (Late 23)
AMD Ryzen 7 7840HS
6208 Points -47%
Acer Nitro 17 AN17-41-R9LN
AMD Ryzen 7 7735HS
5408 Points -54%
Cinebench R20 / CPU (Single Core)
Alienware m18 R2
Intel Core i9-14900HX
853 Points
Media Intel Core i9-14900HX
  (779 - 859, n=22)
832 Points -2%
MSI Titan 18 HX A14VIG
Intel Core i9-14900HX
823 Points -4%
Alienware m18 R1
Intel Core i9-13980HX
807 Points -5%
Acer Predator Helios 18 N23Q2
Intel Core i9-13900HX
804 Points -6%
Razer Blade 18 RTX 4070
Intel Core i9-13950HX
797 Points -7%
Alienware m18 R1 AMD
AMD Ryzen 9 7945HX
747 Points -12%
Asus ROG Strix G18 G814JI
Intel Core i7-13650HX
728 Points -15%
Asus TUF Gaming A17 FA707XI-NS94
AMD Ryzen 9 7940HS
714 Points -16%
SCHENKER XMG Apex 17 (Late 23)
AMD Ryzen 7 7840HS
690 Points -19%
Acer Nitro 17 AN17-41-R9LN
AMD Ryzen 7 7735HS
611 Points -28%
Acer Nitro 17 AN17-51-71ER
Intel Core i7-13700H
594 Points -30%
Cinebench R15 / CPU Multi 64Bit
Alienware m18 R1 AMD
AMD Ryzen 9 7945HX
5541 (5377.07min - 5540.93max) Points +15%
Alienware m18 R1
Intel Core i9-13980HX
4989 (4579.8min - 4989.4max) Points +4%
Alienware m18 R2
Intel Core i9-14900HX
4807 (4458.81min - 4807.11max) Points
MSI Titan 18 HX A14VIG
Intel Core i9-14900HX
4782 (4700.35min - 4782.4max) Points -1%
Acer Predator Helios 18 N23Q2
Intel Core i9-13900HX
4585 (4495.39min - 4584.53max) Points -5%
Razer Blade 18 RTX 4070
Intel Core i9-13950HX
4481 Points -7%
Media Intel Core i9-14900HX
  (3263 - 4875, n=23)
4391 Points -9%
Asus ROG Strix G18 G814JI
Intel Core i7-13650HX
3136 (3067.01min - 3136.03max) Points -35%
Acer Nitro 17 AN17-51-71ER
Intel Core i7-13700H
2894 (2664.71min - 2893.73max) Points -40%
Asus TUF Gaming A17 FA707XI-NS94
AMD Ryzen 9 7940HS
2817 (2741.98min - 2817.3max) Points -41%
SCHENKER XMG Apex 17 (Late 23)
AMD Ryzen 7 7840HS
2484 Points -48%
Acer Nitro 17 AN17-41-R9LN
AMD Ryzen 7 7735HS
2296 (2231.27min - 2296.34max) Points -52%
Cinebench R15 / CPU Single 64Bit
Alienware m18 R2
Intel Core i9-14900HX
318 Points
Alienware m18 R1 AMD
AMD Ryzen 9 7945HX
309 Points -3%
Media Intel Core i9-14900HX
  (287 - 320, n=23)
308 Points -3%
Alienware m18 R1
Intel Core i9-13980HX
303 Points -5%
MSI Titan 18 HX A14VIG
Intel Core i9-14900HX
300 Points -6%
Razer Blade 18 RTX 4070
Intel Core i9-13950HX
297 Points -7%
Acer Predator Helios 18 N23Q2
Intel Core i9-13900HX
295 Points -7%
Asus TUF Gaming A17 FA707XI-NS94
AMD Ryzen 9 7940HS
287 Points -10%
Asus ROG Strix G18 G814JI
Intel Core i7-13650HX
275 Points -14%
SCHENKER XMG Apex 17 (Late 23)
AMD Ryzen 7 7840HS
274 Points -14%
Acer Nitro 17 AN17-41-R9LN
AMD Ryzen 7 7735HS
251 Points -21%
Acer Nitro 17 AN17-51-71ER
Intel Core i7-13700H
223 Points -30%
Blender / v2.79 BMW27 CPU
Acer Nitro 17 AN17-41-R9LN
AMD Ryzen 7 7735HS
222 Seconds * -118%
SCHENKER XMG Apex 17 (Late 23)
AMD Ryzen 7 7840HS
199 Seconds * -95%
Asus TUF Gaming A17 FA707XI-NS94
AMD Ryzen 9 7940HS
183 Seconds * -79%
Acer Nitro 17 AN17-51-71ER
Intel Core i7-13700H
182 Seconds * -78%
Asus ROG Strix G18 G814JI
Intel Core i7-13650HX
158 Seconds * -55%
Media Intel Core i9-14900HX
  (102 - 164, n=22)
119.3 Seconds * -17%
Razer Blade 18 RTX 4070
Intel Core i9-13950HX
111 Seconds * -9%
Acer Predator Helios 18 N23Q2
Intel Core i9-13900HX
106 Seconds * -4%
MSI Titan 18 HX A14VIG
Intel Core i9-14900HX
104 Seconds * -2%
Alienware m18 R2
Intel Core i9-14900HX
102 Seconds *
Alienware m18 R1
Intel Core i9-13980HX
97 Seconds * +5%
Alienware m18 R1 AMD
AMD Ryzen 9 7945HX
87 Seconds * +15%
7-Zip 18.03 / 7z b 4
Alienware m18 R1 AMD
AMD Ryzen 9 7945HX
140493 MIPS +14%
Alienware m18 R1
Intel Core i9-13980HX
129804 MIPS +6%
Alienware m18 R2
Intel Core i9-14900HX
122772 MIPS
MSI Titan 18 HX A14VIG
Intel Core i9-14900HX
121266 MIPS -1%
Acer Predator Helios 18 N23Q2
Intel Core i9-13900HX
119590 MIPS -3%
Razer Blade 18 RTX 4070
Intel Core i9-13950HX
116665 MIPS -5%
Media Intel Core i9-14900HX
  (87555 - 127108, n=22)
112369 MIPS -8%
Asus ROG Strix G18 G814JI
Intel Core i7-13650HX
80057 MIPS -35%
Asus TUF Gaming A17 FA707XI-NS94
AMD Ryzen 9 7940HS
72749 MIPS -41%
Acer Nitro 17 AN17-51-71ER
Intel Core i7-13700H
71260 MIPS -42%
SCHENKER XMG Apex 17 (Late 23)
AMD Ryzen 7 7840HS
71102 MIPS -42%
Acer Nitro 17 AN17-41-R9LN
AMD Ryzen 7 7735HS
61495 MIPS -50%
7-Zip 18.03 / 7z b 4 -mmt1
Alienware m18 R1 AMD
AMD Ryzen 9 7945HX
7381 MIPS +4%
Alienware m18 R2
Intel Core i9-14900HX
7103 MIPS
Media Intel Core i9-14900HX
  (6206 - 7508, n=22)
7091 MIPS 0%
Acer Predator Helios 18 N23Q2
Intel Core i9-13900HX
6977 MIPS -2%
Alienware m18 R1
Intel Core i9-13980HX
6889 MIPS -3%
Razer Blade 18 RTX 4070
Intel Core i9-13950HX
6880 MIPS -3%
SCHENKER XMG Apex 17 (Late 23)
AMD Ryzen 7 7840HS
6697 MIPS -6%
Asus TUF Gaming A17 FA707XI-NS94
AMD Ryzen 9 7940HS
6642 MIPS -6%
MSI Titan 18 HX A14VIG
Intel Core i9-14900HX
6504 MIPS -8%
Asus ROG Strix G18 G814JI
Intel Core i7-13650HX
6125 MIPS -14%
Acer Nitro 17 AN17-41-R9LN
AMD Ryzen 7 7735HS
5797 MIPS -18%
Acer Nitro 17 AN17-51-71ER
Intel Core i7-13700H
4933 MIPS -31%
Geekbench 6.2 / Multi-Core
Alienware m18 R2
Intel Core i9-14900HX
18233 Points
Acer Predator Helios 18 N23Q2
Intel Core i9-13900HX
18014 Points -1%
Media Intel Core i9-14900HX
  (15849 - 18643, n=22)
17541 Points -4%
MSI Titan 18 HX A14VIG
Intel Core i9-14900HX
16652 Points -9%
Alienware m18 R1 AMD
AMD Ryzen 9 7945HX
16316 Points -11%
SCHENKER XMG Apex 17 (Late 23)
AMD Ryzen 7 7840HS
13128 Points -28%
Asus TUF Gaming A17 FA707XI-NS94
AMD Ryzen 9 7940HS
12447 Points -32%
Acer Nitro 17 AN17-41-R9LN
AMD Ryzen 7 7735HS
10348 Points -43%
Geekbench 6.2 / Single-Core
Alienware m18 R2
Intel Core i9-14900HX
3057 Points
Media Intel Core i9-14900HX
  (2800 - 3095, n=22)
2993 Points -2%
Acer Predator Helios 18 N23Q2
Intel Core i9-13900HX
2892 Points -5%
Alienware m18 R1 AMD
AMD Ryzen 9 7945HX
2876 Points -6%
MSI Titan 18 HX A14VIG
Intel Core i9-14900HX
2843 Points -7%
Asus TUF Gaming A17 FA707XI-NS94
AMD Ryzen 9 7940HS
2730 Points -11%
SCHENKER XMG Apex 17 (Late 23)
AMD Ryzen 7 7840HS
2706 Points -11%
Acer Nitro 17 AN17-41-R9LN
AMD Ryzen 7 7735HS
2115 Points -31%
Geekbench 5.5 / Multi-Core
Alienware m18 R1
Intel Core i9-13980HX
22200 Points +4%
Alienware m18 R2
Intel Core i9-14900HX
21284 Points
Acer Predator Helios 18 N23Q2
Intel Core i9-13900HX
20566 Points -3%
Razer Blade 18 RTX 4070
Intel Core i9-13950HX
20036 Points -6%
Alienware m18 R1 AMD
AMD Ryzen 9 7945HX
19802 Points -7%
Media Intel Core i9-14900HX
  (8618 - 21606, n=22)
19375 Points -9%
MSI Titan 18 HX A14VIG
Intel Core i9-14900HX
19137 Points -10%
Asus ROG Strix G18 G814JI
Intel Core i7-13650HX
14367 Points -32%
Acer Nitro 17 AN17-51-71ER
Intel Core i7-13700H
13090 Points -38%
SCHENKER XMG Apex 17 (Late 23)
AMD Ryzen 7 7840HS
12077 Points -43%
Asus TUF Gaming A17 FA707XI-NS94
AMD Ryzen 9 7940HS
11399 Points -46%
Acer Nitro 17 AN17-41-R9LN
AMD Ryzen 7 7735HS
9694 Points -54%
Geekbench 5.5 / Single-Core
Alienware m18 R2
Intel Core i9-14900HX
2193 Points
Alienware m18 R1 AMD
AMD Ryzen 9 7945HX
2124 Points -3%
Media Intel Core i9-14900HX
  (1669 - 2210, n=22)
2099 Points -4%
MSI Titan 18 HX A14VIG
Intel Core i9-14900HX
2098 Points -4%
Alienware m18 R1
Intel Core i9-13980HX
2062 Points -6%
Acer Predator Helios 18 N23Q2
Intel Core i9-13900HX
2054 Points -6%
Razer Blade 18 RTX 4070
Intel Core i9-13950HX
2035 Points -7%
Asus TUF Gaming A17 FA707XI-NS94
AMD Ryzen 9 7940HS
2014 Points -8%
SCHENKER XMG Apex 17 (Late 23)
AMD Ryzen 7 7840HS
1941 Points -11%
Asus ROG Strix G18 G814JI
Intel Core i7-13650HX
1838 Points -16%
Acer Nitro 17 AN17-41-R9LN
AMD Ryzen 7 7735HS
1554 Points -29%
Acer Nitro 17 AN17-51-71ER
Intel Core i7-13700H
1527 Points -30%
HWBOT x265 Benchmark v2.2 / 4k Preset
Alienware m18 R1 AMD
AMD Ryzen 9 7945HX
37.5 fps +17%
Alienware m18 R1
Intel Core i9-13980HX
33.1 fps +3%
Alienware m18 R2
Intel Core i9-14900HX
32.1 fps
Razer Blade 18 RTX 4070
Intel Core i9-13950HX
31 fps -3%
MSI Titan 18 HX A14VIG
Intel Core i9-14900HX
30.9 fps -4%
Acer Predator Helios 18 N23Q2
Intel Core i9-13900HX
30.7 fps -4%
Media Intel Core i9-14900HX
  (22.7 - 34.4, n=22)
29.5 fps -8%
Asus ROG Strix G18 G814JI
Intel Core i7-13650HX
23.6 fps -26%
Asus TUF Gaming A17 FA707XI-NS94
AMD Ryzen 9 7940HS
21.8 fps -32%
SCHENKER XMG Apex 17 (Late 23)
AMD Ryzen 7 7840HS
20.4 fps -36%
Acer Nitro 17 AN17-51-71ER
Intel Core i7-13700H
19.9 fps -38%
Acer Nitro 17 AN17-41-R9LN
AMD Ryzen 7 7735HS
17 fps -47%
LibreOffice / 20 Documents To PDF
Acer Nitro 17 AN17-41-R9LN
AMD Ryzen 7 7735HS
63.8 s * -42%
Asus ROG Strix G18 G814JI
Intel Core i7-13650HX
58.8 s * -31%
Acer Nitro 17 AN17-51-71ER
Intel Core i7-13700H
55.8 s * -25%
Acer Predator Helios 18 N23Q2
Intel Core i9-13900HX
49.5 s * -10%
Asus TUF Gaming A17 FA707XI-NS94
AMD Ryzen 9 7940HS
49.4 s * -10%
SCHENKER XMG Apex 17 (Late 23)
AMD Ryzen 7 7840HS
47.2 s * -5%
Alienware m18 R1
Intel Core i9-13980HX
46.7 s * -4%
MSI Titan 18 HX A14VIG
Intel Core i9-14900HX
46.2 s * -3%
Media Intel Core i9-14900HX
  (33.9 - 85.1, n=22)
45 s * -0%
Alienware m18 R2
Intel Core i9-14900HX
44.8 s *
Razer Blade 18 RTX 4070
Intel Core i9-13950HX
43.4 s * +3%
Alienware m18 R1 AMD
AMD Ryzen 9 7945HX
41.8 s * +7%
R Benchmark 2.5 / Overall mean
Acer Nitro 17 AN17-51-71ER
Intel Core i7-13700H
0.536 sec * -42%
Acer Nitro 17 AN17-41-R9LN
AMD Ryzen 7 7735HS
0.4911 sec * -30%
Asus ROG Strix G18 G814JI
Intel Core i7-13650HX
0.4398 sec * -17%
SCHENKER XMG Apex 17 (Late 23)
AMD Ryzen 7 7840HS
0.4288 sec * -14%
Asus TUF Gaming A17 FA707XI-NS94
AMD Ryzen 9 7940HS
0.4278 sec * -14%
Alienware m18 R1 AMD
AMD Ryzen 9 7945HX
0.4145 sec * -10%
Acer Predator Helios 18 N23Q2
Intel Core i9-13900HX
0.3997 sec * -6%
Razer Blade 18 RTX 4070
Intel Core i9-13950HX
0.3955 sec * -5%
Alienware m18 R1
Intel Core i9-13980HX
0.3931 sec * -4%
MSI Titan 18 HX A14VIG
Intel Core i9-14900HX
0.3919 sec * -4%
Media Intel Core i9-14900HX
  (0.3609 - 0.4225, n=22)
0.3824 sec * -2%
Alienware m18 R2
Intel Core i9-14900HX
0.3767 sec *

* ... Meglio usare valori piccoli

Cinebench R15 CPU Multi 64Bit
4807 Points
Cinebench R15 OpenGL 64Bit
275 fps
Cinebench R15 Ref. Match 64Bit
99.6 %
Cinebench R15 CPU Single 64Bit
318 Points
Aiuto
Performance Rating
Alienware m18 R1 AMD
AMD Ryzen 9 7945HX, Radeon RX 7900M
92.9 pt
Acer Predator Helios 18 N23Q2
Intel Core i9-13900HX, NVIDIA GeForce RTX 4080 Laptop GPU
65.5 pt
Alienware m18 R1
Intel Core i9-13980HX, NVIDIA GeForce RTX 4090 Laptop GPU
64.5 pt
Alienware m18 R2
Intel Core i9-14900HX, NVIDIA GeForce RTX 4090 Laptop GPU
63.3 pt
MSI Titan 18 HX A14VIG
Intel Core i9-14900HX, NVIDIA GeForce RTX 4090 Laptop GPU
62.3 pt
Media Intel Core i9-14900HX
 
57.6 pt
Asus ROG Strix G18 G814JI
Intel Core i7-13650HX, NVIDIA GeForce RTX 4070 Laptop GPU
43.8 pt
AIDA64 / FP32 Ray-Trace
Alienware m18 R1 AMD
AMD Ryzen 9 7945HX, Radeon RX 7900M
60169 KRay/s +105%
Alienware m18 R1
Intel Core i9-13980HX, NVIDIA GeForce RTX 4090 Laptop GPU
29553 KRay/s +1%
MSI Titan 18 HX A14VIG
Intel Core i9-14900HX, NVIDIA GeForce RTX 4090 Laptop GPU
29351 KRay/s 0%
Alienware m18 R2
Intel Core i9-14900HX, NVIDIA GeForce RTX 4090 Laptop GPU
29280 KRay/s
Acer Predator Helios 18 N23Q2
Intel Core i9-13900HX, NVIDIA GeForce RTX 4080 Laptop GPU
27414 KRay/s -6%
Media Intel Core i9-14900HX
  (17244 - 29351, n=21)
25012 KRay/s -15%
Asus ROG Strix G18 G814JI
Intel Core i7-13650HX, NVIDIA GeForce RTX 4070 Laptop GPU
20012 KRay/s -32%
AIDA64 / FPU Julia
Alienware m18 R1 AMD
AMD Ryzen 9 7945HX, Radeon RX 7900M
252486 Points +77%
MSI Titan 18 HX A14VIG
Intel Core i9-14900HX, NVIDIA GeForce RTX 4090 Laptop GPU
148888 Points +4%
Alienware m18 R1
Intel Core i9-13980HX, NVIDIA GeForce RTX 4090 Laptop GPU
148168 Points +4%
Alienware m18 R2
Intel Core i9-14900HX, NVIDIA GeForce RTX 4090 Laptop GPU
142791 Points
Acer Predator Helios 18 N23Q2
Intel Core i9-13900HX, NVIDIA GeForce RTX 4080 Laptop GPU
137015 Points -4%
Media Intel Core i9-14900HX
  (88537 - 148888, n=21)
125095 Points -12%
Asus ROG Strix G18 G814JI
Intel Core i7-13650HX, NVIDIA GeForce RTX 4070 Laptop GPU
97317 Points -32%
AIDA64 / CPU SHA3
Alienware m18 R1 AMD
AMD Ryzen 9 7945HX, Radeon RX 7900M
10389 MB/s +46%
MSI Titan 18 HX A14VIG
Intel Core i9-14900HX, NVIDIA GeForce RTX 4090 Laptop GPU
7229 MB/s +2%
Alienware m18 R1
Intel Core i9-13980HX, NVIDIA GeForce RTX 4090 Laptop GPU
7142 MB/s +1%
Alienware m18 R2
Intel Core i9-14900HX, NVIDIA GeForce RTX 4090 Laptop GPU
7095 MB/s
Acer Predator Helios 18 N23Q2
Intel Core i9-13900HX, NVIDIA GeForce RTX 4080 Laptop GPU
6889 MB/s -3%
Media Intel Core i9-14900HX
  (4267 - 7229, n=21)
6155 MB/s -13%
Asus ROG Strix G18 G814JI
Intel Core i7-13650HX, NVIDIA GeForce RTX 4070 Laptop GPU
4487 MB/s -37%
AIDA64 / CPU Queen
Alienware m18 R1 AMD
AMD Ryzen 9 7945HX, Radeon RX 7900M
200651 Points +44%
MSI Titan 18 HX A14VIG
Intel Core i9-14900HX, NVIDIA GeForce RTX 4090 Laptop GPU
148773 Points +7%
Alienware m18 R1
Intel Core i9-13980HX, NVIDIA GeForce RTX 4090 Laptop GPU
141758 Points +2%
Alienware m18 R2
Intel Core i9-14900HX, NVIDIA GeForce RTX 4090 Laptop GPU
139323 Points
Media Intel Core i9-14900HX
  (118405 - 148773, n=21)
138444 Points -1%
Acer Predator Helios 18 N23Q2
Intel Core i9-13900HX, NVIDIA GeForce RTX 4080 Laptop GPU
135396 Points -3%
Asus ROG Strix G18 G814JI
Intel Core i7-13650HX, NVIDIA GeForce RTX 4070 Laptop GPU
110093 Points -21%
AIDA64 / FPU SinJulia
Alienware m18 R1 AMD
AMD Ryzen 9 7945HX, Radeon RX 7900M
32988 Points +103%
MSI Titan 18 HX A14VIG
Intel Core i9-14900HX, NVIDIA GeForce RTX 4090 Laptop GPU
18256 Points +12%
Alienware m18 R1
Intel Core i9-13980HX, NVIDIA GeForce RTX 4090 Laptop GPU
16656 Points +2%
Alienware m18 R2
Intel Core i9-14900HX, NVIDIA GeForce RTX 4090 Laptop GPU
16279 Points
Acer Predator Helios 18 N23Q2
Intel Core i9-13900HX, NVIDIA GeForce RTX 4080 Laptop GPU
16046 Points -1%
Media Intel Core i9-14900HX
  (12217 - 18256, n=21)
15313 Points -6%
Asus ROG Strix G18 G814JI
Intel Core i7-13650HX, NVIDIA GeForce RTX 4070 Laptop GPU
10616 Points -35%
AIDA64 / FPU Mandel
Alienware m18 R1 AMD
AMD Ryzen 9 7945HX, Radeon RX 7900M
134044 Points +85%
Alienware m18 R1
Intel Core i9-13980HX, NVIDIA GeForce RTX 4090 Laptop GPU
73758 Points +2%
Alienware m18 R2
Intel Core i9-14900HX, NVIDIA GeForce RTX 4090 Laptop GPU
72594 Points
MSI Titan 18 HX A14VIG
Intel Core i9-14900HX, NVIDIA GeForce RTX 4090 Laptop GPU
72355 Points 0%
Acer Predator Helios 18 N23Q2
Intel Core i9-13900HX, NVIDIA GeForce RTX 4080 Laptop GPU
68687 Points -5%
Media Intel Core i9-14900HX
  (43302 - 72594, n=21)
61340 Points -16%
Asus ROG Strix G18 G814JI
Intel Core i7-13650HX, NVIDIA GeForce RTX 4070 Laptop GPU
48323 Points -33%
AIDA64 / CPU AES
Acer Predator Helios 18 N23Q2
Intel Core i9-13900HX, NVIDIA GeForce RTX 4080 Laptop GPU
237881 MB/s +77%
Alienware m18 R1 AMD
AMD Ryzen 9 7945HX, Radeon RX 7900M
149040 MB/s +11%
MSI Titan 18 HX A14VIG
Intel Core i9-14900HX, NVIDIA GeForce RTX 4090 Laptop GPU
138830 MB/s +3%
Alienware m18 R1
Intel Core i9-13980HX, NVIDIA GeForce RTX 4090 Laptop GPU
136520 MB/s +1%
Alienware m18 R2
Intel Core i9-14900HX, NVIDIA GeForce RTX 4090 Laptop GPU
134675 MB/s
Media Intel Core i9-14900HX
  (86964 - 241777, n=21)
133793 MB/s -1%
Asus ROG Strix G18 G814JI
Intel Core i7-13650HX, NVIDIA GeForce RTX 4070 Laptop GPU
85111 MB/s -37%
AIDA64 / CPU ZLib
Alienware m18 R1 AMD
AMD Ryzen 9 7945HX, Radeon RX 7900M
2409 MB/s +17%
MSI Titan 18 HX A14VIG
Intel Core i9-14900HX, NVIDIA GeForce RTX 4090 Laptop GPU
2149 MB/s +5%
Alienware m18 R2
Intel Core i9-14900HX, NVIDIA GeForce RTX 4090 Laptop GPU
2053 MB/s
Alienware m18 R1
Intel Core i9-13980HX, NVIDIA GeForce RTX 4090 Laptop GPU
2003 MB/s -2%
Acer Predator Helios 18 N23Q2
Intel Core i9-13900HX, NVIDIA GeForce RTX 4080 Laptop GPU
1913 MB/s -7%
Media Intel Core i9-14900HX
  (1265 - 2149, n=21)
1795 MB/s -13%
Asus ROG Strix G18 G814JI
Intel Core i7-13650HX, NVIDIA GeForce RTX 4070 Laptop GPU
1251 MB/s -39%
AIDA64 / FP64 Ray-Trace
Alienware m18 R1 AMD
AMD Ryzen 9 7945HX, Radeon RX 7900M
31796 KRay/s +97%
Alienware m18 R1
Intel Core i9-13980HX, NVIDIA GeForce RTX 4090 Laptop GPU
16325 KRay/s +1%
Alienware m18 R2
Intel Core i9-14900HX, NVIDIA GeForce RTX 4090 Laptop GPU
16128 KRay/s
MSI Titan 18 HX A14VIG
Intel Core i9-14900HX, NVIDIA GeForce RTX 4090 Laptop GPU
16104 KRay/s 0%
Acer Predator Helios 18 N23Q2
Intel Core i9-13900HX, NVIDIA GeForce RTX 4080 Laptop GPU
15014 KRay/s -7%
Media Intel Core i9-14900HX
  (9170 - 16128, n=21)
13466 KRay/s -17%
Asus ROG Strix G18 G814JI
Intel Core i7-13650HX, NVIDIA GeForce RTX 4070 Laptop GPU
10900 KRay/s -32%
AIDA64 / CPU PhotoWorxx
Alienware m18 R1
Intel Core i9-13980HX, NVIDIA GeForce RTX 4090 Laptop GPU
52949 MPixel/s +7%
Acer Predator Helios 18 N23Q2
Intel Core i9-13900HX, NVIDIA GeForce RTX 4080 Laptop GPU
50394 MPixel/s +1%
Alienware m18 R2
Intel Core i9-14900HX, NVIDIA GeForce RTX 4090 Laptop GPU
49716 MPixel/s
Media Intel Core i9-14900HX
  (33960 - 51118, n=21)
48343 MPixel/s -3%
Asus ROG Strix G18 G814JI
Intel Core i7-13650HX, NVIDIA GeForce RTX 4070 Laptop GPU
41319 MPixel/s -17%
Alienware m18 R1 AMD
AMD Ryzen 9 7945HX, Radeon RX 7900M
34957 MPixel/s -30%
MSI Titan 18 HX A14VIG
Intel Core i9-14900HX, NVIDIA GeForce RTX 4090 Laptop GPU
33960 MPixel/s -32%

Test da sforzo

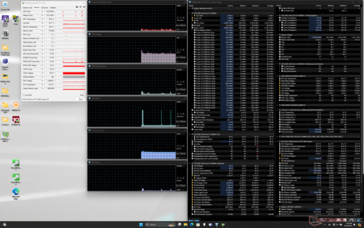
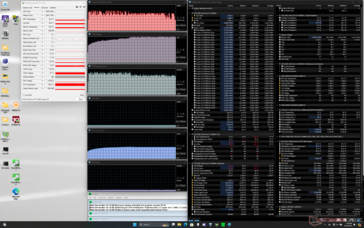
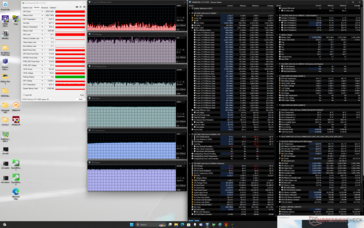
La temperatura del core durante lo stress Prime95 si stabilizza a 100 C, simile a quella che abbiamo osservato sull'm18 R1 dello scorso anno, nonostante il passaggio a un processore più recente. Le frequenze di clock sembrano fluttuare più frequentemente sull'i9-14900HX, tuttavia, il che potrebbe spiegare le sue prestazioni leggermente più lente rispetto all'i9-13980HX, come menzionato sopra.

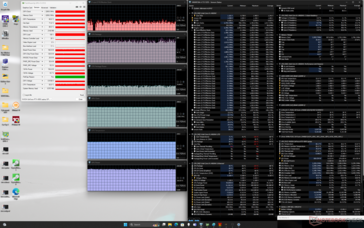
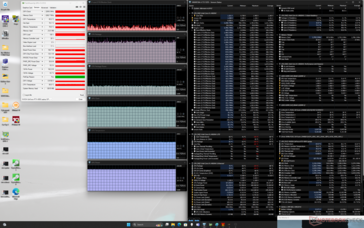
Le velocità di clock della GPU e l'assorbimento di potenza della scheda cambiano appena quando si passa dalle modalità Balanced, Performance e Overdrive, in linea con i risultati del nostro test Fire Strike nella sezione Prestazioni della GPU qui sotto. Questo comportamento è diverso da quello della maggior parte degli altri portatili da gioco, dove il divario di prestazioni tra le modalità Bilanciata e Prestazioni è maggiore.

Sistema inattivo
Sistema inattivo
Stress Prime95
Stress Prime95
Stress di Prime95+FurMark
Witcher 3 stress (modalità bilanciata)
Witcher 3 stress (modalità Performance)
Witcher 3 stress (modalità Overdrive)
Clock della CPU (GHz) Clock della GPU (MHz) Temperatura media della CPU (°C) Temperatura media della GPU (°C)
Sistema inattivo -- -- 36 27
Stress Prime95 2,1 - 3,3 -- 99 46
Prime95 + FurMark Stress 1,7 - 3,7 1350 - 2370 74 - 100 54 - 61
Witcher 3 Stress (modalità Bilanciata) ~1,7 2295 ~84 66
Witcher 3 Stress (modalità Performance) ~1,4 2310 ~82 65
Witcher 3 Stress (modalità Overdrive) ~1,0 2310 ~87 64

Prestazioni del sistema

PCMark 10 Standard
PCMark 10 Standard
PCMark 10 / Score
Alienware m18 R1 AMD
Radeon RX 7900M, R9 7945HX, Kioxia XG8 KXG80ZNV1T02
9852 Points +7%
Alienware m18 R2
NVIDIA GeForce RTX 4090 Laptop GPU, i9-14900HX, SK Hynix PC811 HFS002TEM9X152N
9234 Points
MSI Titan 18 HX A14VIG
NVIDIA GeForce RTX 4090 Laptop GPU, i9-14900HX, 2x Samsung PM9A1a MZVL22T0HDLB (RAID 0)
8968 Points -3%
Alienware m18 R1
NVIDIA GeForce RTX 4090 Laptop GPU, i9-13980HX, SK hynix PC801 HFS001TEJ9X101N
8758 Points -5%
Media Intel Core i9-14900HX, NVIDIA GeForce RTX 4090 Laptop GPU
  (8201 - 9234, n=8)
8668 Points -6%
Acer Predator Helios 18 N23Q2
NVIDIA GeForce RTX 4080 Laptop GPU, i9-13900HX, Samsung PM9A1 MZVL22T0HBLB
8549 Points -7%
Asus ROG Strix G18 G814JI
NVIDIA GeForce RTX 4070 Laptop GPU, i7-13650HX, Micron 2400 MTFDKBA1T0QFM
6404 Points -31%
PCMark 10 / Essentials
Alienware m18 R1 AMD
Radeon RX 7900M, R9 7945HX, Kioxia XG8 KXG80ZNV1T02
12334 Points +8%
MSI Titan 18 HX A14VIG
NVIDIA GeForce RTX 4090 Laptop GPU, i9-14900HX, 2x Samsung PM9A1a MZVL22T0HDLB (RAID 0)
11628 Points +2%
Alienware m18 R2
NVIDIA GeForce RTX 4090 Laptop GPU, i9-14900HX, SK Hynix PC811 HFS002TEM9X152N
11415 Points
Alienware m18 R1
NVIDIA GeForce RTX 4090 Laptop GPU, i9-13980HX, SK hynix PC801 HFS001TEJ9X101N
11242 Points -2%
Media Intel Core i9-14900HX, NVIDIA GeForce RTX 4090 Laptop GPU
  (10871 - 11628, n=8)
11190 Points -2%
Acer Predator Helios 18 N23Q2
NVIDIA GeForce RTX 4080 Laptop GPU, i9-13900HX, Samsung PM9A1 MZVL22T0HBLB
10982 Points -4%
Asus ROG Strix G18 G814JI
NVIDIA GeForce RTX 4070 Laptop GPU, i7-13650HX, Micron 2400 MTFDKBA1T0QFM
9768 Points -14%
PCMark 10 / Productivity
Alienware m18 R2
NVIDIA GeForce RTX 4090 Laptop GPU, i9-14900HX, SK Hynix PC811 HFS002TEM9X152N
11415 Points
Alienware m18 R1 AMD
Radeon RX 7900M, R9 7945HX, Kioxia XG8 KXG80ZNV1T02
11388 Points 0%
Media Intel Core i9-14900HX, NVIDIA GeForce RTX 4090 Laptop GPU
  (9951 - 11759, n=8)
10707 Points -6%
Acer Predator Helios 18 N23Q2
NVIDIA GeForce RTX 4080 Laptop GPU, i9-13900HX, Samsung PM9A1 MZVL22T0HBLB
10488 Points -8%
MSI Titan 18 HX A14VIG
NVIDIA GeForce RTX 4090 Laptop GPU, i9-14900HX, 2x Samsung PM9A1a MZVL22T0HDLB (RAID 0)
10225 Points -10%
Alienware m18 R1
NVIDIA GeForce RTX 4090 Laptop GPU, i9-13980HX, SK hynix PC801 HFS001TEJ9X101N
10125 Points -11%
Asus ROG Strix G18 G814JI
NVIDIA GeForce RTX 4070 Laptop GPU, i7-13650HX, Micron 2400 MTFDKBA1T0QFM
8886 Points -22%
PCMark 10 / Digital Content Creation
Alienware m18 R1 AMD
Radeon RX 7900M, R9 7945HX, Kioxia XG8 KXG80ZNV1T02
18475 Points +13%
MSI Titan 18 HX A14VIG
NVIDIA GeForce RTX 4090 Laptop GPU, i9-14900HX, 2x Samsung PM9A1a MZVL22T0HDLB (RAID 0)
16462 Points 0%
Alienware m18 R2
NVIDIA GeForce RTX 4090 Laptop GPU, i9-14900HX, SK Hynix PC811 HFS002TEM9X152N
16398 Points
Alienware m18 R1
NVIDIA GeForce RTX 4090 Laptop GPU, i9-13980HX, SK hynix PC801 HFS001TEJ9X101N
16012 Points -2%
Media Intel Core i9-14900HX, NVIDIA GeForce RTX 4090 Laptop GPU
  (13219 - 16462, n=8)
14791 Points -10%
Acer Predator Helios 18 N23Q2
NVIDIA GeForce RTX 4080 Laptop GPU, i9-13900HX, Samsung PM9A1 MZVL22T0HBLB
14720 Points -10%
Asus ROG Strix G18 G814JI
NVIDIA GeForce RTX 4070 Laptop GPU, i7-13650HX, Micron 2400 MTFDKBA1T0QFM
8212 Points -50%
CrossMark / Overall
Acer Predator Helios 18 N23Q2
NVIDIA GeForce RTX 4080 Laptop GPU, i9-13900HX, Samsung PM9A1 MZVL22T0HBLB
2194 Points +6%
Alienware m18 R1
NVIDIA GeForce RTX 4090 Laptop GPU, i9-13980HX, SK hynix PC801 HFS001TEJ9X101N
2176 Points +5%
Media Intel Core i9-14900HX, NVIDIA GeForce RTX 4090 Laptop GPU
  (1877 - 2238, n=7)
2123 Points +2%
Alienware m18 R2
NVIDIA GeForce RTX 4090 Laptop GPU, i9-14900HX, SK Hynix PC811 HFS002TEM9X152N
2073 Points
Alienware m18 R1 AMD
Radeon RX 7900M, R9 7945HX, Kioxia XG8 KXG80ZNV1T02
1929 Points -7%
MSI Titan 18 HX A14VIG
NVIDIA GeForce RTX 4090 Laptop GPU, i9-14900HX, 2x Samsung PM9A1a MZVL22T0HDLB (RAID 0)
1877 Points -9%
CrossMark / Productivity
Acer Predator Helios 18 N23Q2
NVIDIA GeForce RTX 4080 Laptop GPU, i9-13900HX, Samsung PM9A1 MZVL22T0HBLB
2059 Points +9%
Alienware m18 R1
NVIDIA GeForce RTX 4090 Laptop GPU, i9-13980HX, SK hynix PC801 HFS001TEJ9X101N
2005 Points +7%
Media Intel Core i9-14900HX, NVIDIA GeForce RTX 4090 Laptop GPU
  (1738 - 2113, n=7)
1980 Points +5%
Alienware m18 R2
NVIDIA GeForce RTX 4090 Laptop GPU, i9-14900HX, SK Hynix PC811 HFS002TEM9X152N
1881 Points
Alienware m18 R1 AMD
Radeon RX 7900M, R9 7945HX, Kioxia XG8 KXG80ZNV1T02
1793 Points -5%
MSI Titan 18 HX A14VIG
NVIDIA GeForce RTX 4090 Laptop GPU, i9-14900HX, 2x Samsung PM9A1a MZVL22T0HDLB (RAID 0)
1738 Points -8%
CrossMark / Creativity
Alienware m18 R1
NVIDIA GeForce RTX 4090 Laptop GPU, i9-13980HX, SK hynix PC801 HFS001TEJ9X101N
2469 Points +3%
Acer Predator Helios 18 N23Q2
NVIDIA GeForce RTX 4080 Laptop GPU, i9-13900HX, Samsung PM9A1 MZVL22T0HBLB
2411 Points +1%
Alienware m18 R2
NVIDIA GeForce RTX 4090 Laptop GPU, i9-14900HX, SK Hynix PC811 HFS002TEM9X152N
2393 Points
Media Intel Core i9-14900HX, NVIDIA GeForce RTX 4090 Laptop GPU
  (2195 - 2543, n=7)
2384 Points 0%
Alienware m18 R1 AMD
Radeon RX 7900M, R9 7945HX, Kioxia XG8 KXG80ZNV1T02
2212 Points -8%
MSI Titan 18 HX A14VIG
NVIDIA GeForce RTX 4090 Laptop GPU, i9-14900HX, 2x Samsung PM9A1a MZVL22T0HDLB (RAID 0)
2195 Points -8%
CrossMark / Responsiveness
Acer Predator Helios 18 N23Q2
NVIDIA GeForce RTX 4080 Laptop GPU, i9-13900HX, Samsung PM9A1 MZVL22T0HBLB
1998 Points +11%
Alienware m18 R1
NVIDIA GeForce RTX 4090 Laptop GPU, i9-13980HX, SK hynix PC801 HFS001TEJ9X101N
1904 Points +5%
Media Intel Core i9-14900HX, NVIDIA GeForce RTX 4090 Laptop GPU
  (1478 - 2327, n=7)
1863 Points +3%
Alienware m18 R2
NVIDIA GeForce RTX 4090 Laptop GPU, i9-14900HX, SK Hynix PC811 HFS002TEM9X152N
1806 Points
Alienware m18 R1 AMD
Radeon RX 7900M, R9 7945HX, Kioxia XG8 KXG80ZNV1T02
1594 Points -12%
MSI Titan 18 HX A14VIG
NVIDIA GeForce RTX 4090 Laptop GPU, i9-14900HX, 2x Samsung PM9A1a MZVL22T0HDLB (RAID 0)
1478 Points -18%
WebXPRT 3 / Overall
Alienware m18 R1 AMD
Radeon RX 7900M, R9 7945HX, Kioxia XG8 KXG80ZNV1T02
387 Points +19%
Alienware m18 R1
NVIDIA GeForce RTX 4090 Laptop GPU, i9-13980HX, SK hynix PC801 HFS001TEJ9X101N
338 Points +4%
Media Intel Core i9-14900HX, NVIDIA GeForce RTX 4090 Laptop GPU
  (322 - 339, n=7)
329 Points +1%
MSI Titan 18 HX A14VIG
NVIDIA GeForce RTX 4090 Laptop GPU, i9-14900HX, 2x Samsung PM9A1a MZVL22T0HDLB (RAID 0)
327 Points 0%
Alienware m18 R2
NVIDIA GeForce RTX 4090 Laptop GPU, i9-14900HX, SK Hynix PC811 HFS002TEM9X152N
326 Points
Acer Predator Helios 18 N23Q2
NVIDIA GeForce RTX 4080 Laptop GPU, i9-13900HX, Samsung PM9A1 MZVL22T0HBLB
320 Points -2%
Asus ROG Strix G18 G814JI
NVIDIA GeForce RTX 4070 Laptop GPU, i7-13650HX, Micron 2400 MTFDKBA1T0QFM
312 Points -4%
Asus ROG Strix G18 G814JI
NVIDIA GeForce RTX 4070 Laptop GPU, i7-13650HX, Micron 2400 MTFDKBA1T0QFM
312 Points -4%
WebXPRT 4 / Overall
Alienware m18 R2
NVIDIA GeForce RTX 4090 Laptop GPU, i9-14900HX, SK Hynix PC811 HFS002TEM9X152N
309 Points
Alienware m18 R1
NVIDIA GeForce RTX 4090 Laptop GPU, i9-13980HX, SK hynix PC801 HFS001TEJ9X101N
306 Points -1%
Media Intel Core i9-14900HX, NVIDIA GeForce RTX 4090 Laptop GPU
  (287 - 309, n=5)
301 Points -3%
Alienware m18 R1 AMD
Radeon RX 7900M, R9 7945HX, Kioxia XG8 KXG80ZNV1T02
295 Points -5%
MSI Titan 18 HX A14VIG
NVIDIA GeForce RTX 4090 Laptop GPU, i9-14900HX, 2x Samsung PM9A1a MZVL22T0HDLB (RAID 0)
287 Points -7%
Asus ROG Strix G18 G814JI
NVIDIA GeForce RTX 4070 Laptop GPU, i7-13650HX, Micron 2400 MTFDKBA1T0QFM
277 Points -10%
Asus ROG Strix G18 G814JI
NVIDIA GeForce RTX 4070 Laptop GPU, i7-13650HX, Micron 2400 MTFDKBA1T0QFM
277 Points -10%
Mozilla Kraken 1.1 / Total
Asus ROG Strix G18 G814JI
NVIDIA GeForce RTX 4070 Laptop GPU, i7-13650HX, Micron 2400 MTFDKBA1T0QFM
502 ms * -17%
Asus ROG Strix G18 G814JI
NVIDIA GeForce RTX 4070 Laptop GPU, i7-13650HX, Micron 2400 MTFDKBA1T0QFM
502 ms * -17%
Alienware m18 R1 AMD
Radeon RX 7900M, R9 7945HX, Kioxia XG8 KXG80ZNV1T02
459 ms * -7%
Alienware m18 R1
NVIDIA GeForce RTX 4090 Laptop GPU, i9-13980HX, SK hynix PC801 HFS001TEJ9X101N
456 ms * -6%
Acer Predator Helios 18 N23Q2
NVIDIA GeForce RTX 4080 Laptop GPU, i9-13900HX, Samsung PM9A1 MZVL22T0HBLB
456 ms * -6%
MSI Titan 18 HX A14VIG
NVIDIA GeForce RTX 4090 Laptop GPU, i9-14900HX, 2x Samsung PM9A1a MZVL22T0HDLB (RAID 0)
452 ms * -5%
Media Intel Core i9-14900HX, NVIDIA GeForce RTX 4090 Laptop GPU
  (430 - 467, n=8)
447 ms * -4%
Alienware m18 R2
NVIDIA GeForce RTX 4090 Laptop GPU, i9-14900HX, SK Hynix PC811 HFS002TEM9X152N
430 ms *

* ... Meglio usare valori piccoli

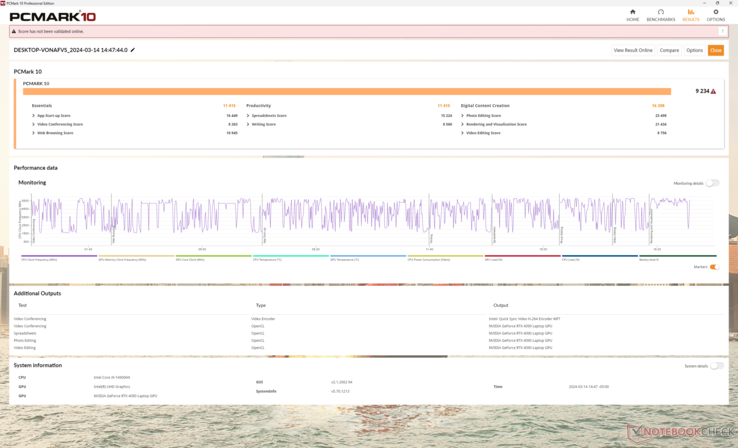
PCMark 10 Score
9234 punti
Aiuto
AIDA64 / Memory Copy
Alienware m18 R1
Intel Core i9-13980HX, NVIDIA GeForce RTX 4090 Laptop GPU
80776 MB/s +2%
Alienware m18 R2
Intel Core i9-14900HX, NVIDIA GeForce RTX 4090 Laptop GPU
79243 MB/s
Acer Predator Helios 18 N23Q2
Intel Core i9-13900HX, NVIDIA GeForce RTX 4080 Laptop GPU
78590 MB/s -1%
Media Intel Core i9-14900HX
  (56992 - 83392, n=21)
77561 MB/s -2%
Asus ROG Strix G18 G814JI
Intel Core i7-13650HX, NVIDIA GeForce RTX 4070 Laptop GPU
64308 MB/s -19%
MSI Titan 18 HX A14VIG
Intel Core i9-14900HX, NVIDIA GeForce RTX 4090 Laptop GPU
56992 MB/s -28%
Alienware m18 R1 AMD
AMD Ryzen 9 7945HX, Radeon RX 7900M
51423 MB/s -35%
AIDA64 / Memory Read
Alienware m18 R1
Intel Core i9-13980HX, NVIDIA GeForce RTX 4090 Laptop GPU
89096 MB/s +4%
Acer Predator Helios 18 N23Q2
Intel Core i9-13900HX, NVIDIA GeForce RTX 4080 Laptop GPU
86406 MB/s +1%
Alienware m18 R2
Intel Core i9-14900HX, NVIDIA GeForce RTX 4090 Laptop GPU
85791 MB/s
Media Intel Core i9-14900HX
  (54443 - 87507, n=21)
84156 MB/s -2%
Asus ROG Strix G18 G814JI
Intel Core i7-13650HX, NVIDIA GeForce RTX 4070 Laptop GPU
68497 MB/s -20%
Alienware m18 R1 AMD
AMD Ryzen 9 7945HX, Radeon RX 7900M
61564 MB/s -28%
MSI Titan 18 HX A14VIG
Intel Core i9-14900HX, NVIDIA GeForce RTX 4090 Laptop GPU
54443 MB/s -37%
AIDA64 / Memory Write
Alienware m18 R1
Intel Core i9-13980HX, NVIDIA GeForce RTX 4090 Laptop GPU
79917 MB/s +4%
Alienware m18 R2
Intel Core i9-14900HX, NVIDIA GeForce RTX 4090 Laptop GPU
77089 MB/s
Acer Predator Helios 18 N23Q2
Intel Core i9-13900HX, NVIDIA GeForce RTX 4080 Laptop GPU
75736 MB/s -2%
Media Intel Core i9-14900HX
  (51387 - 78199, n=21)
74471 MB/s -3%
Alienware m18 R1 AMD
AMD Ryzen 9 7945HX, Radeon RX 7900M
61092 MB/s -21%
Asus ROG Strix G18 G814JI
Intel Core i7-13650HX, NVIDIA GeForce RTX 4070 Laptop GPU
60111 MB/s -22%
MSI Titan 18 HX A14VIG
Intel Core i9-14900HX, NVIDIA GeForce RTX 4090 Laptop GPU
51387 MB/s -33%
AIDA64 / Memory Latency
MSI Titan 18 HX A14VIG
Intel Core i9-14900HX, NVIDIA GeForce RTX 4090 Laptop GPU
105 ns * -22%
Alienware m18 R1 AMD
AMD Ryzen 9 7945HX, Radeon RX 7900M
91.3 ns * -6%
Alienware m18 R2
Intel Core i9-14900HX, NVIDIA GeForce RTX 4090 Laptop GPU
86.4 ns *
Media Intel Core i9-14900HX
  (79.7 - 105, n=21)
84.2 ns * +3%
Asus ROG Strix G18 G814JI
Intel Core i7-13650HX, NVIDIA GeForce RTX 4070 Laptop GPU
83.7 ns * +3%
Acer Predator Helios 18 N23Q2
Intel Core i9-13900HX, NVIDIA GeForce RTX 4080 Laptop GPU
83.2 ns * +4%
Alienware m18 R1
Intel Core i9-13980HX, NVIDIA GeForce RTX 4090 Laptop GPU
79.4 ns * +8%

* ... Meglio usare valori piccoli

Latenza DPC

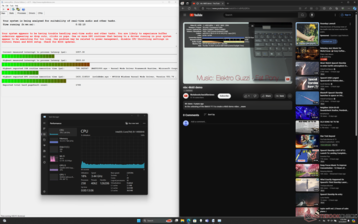
LatencyMon mostra lievi problemi di DPC, ma senza cadute di fotogrammi durante la riproduzione di video 4K60
Elenco dei conducenti
DPC Latencies / LatencyMon - interrupt to process latency (max), Web, Youtube, Prime95
Acer Predator Helios 18 N23Q2
NVIDIA GeForce RTX 4080 Laptop GPU, i9-13900HX, Samsung PM9A1 MZVL22T0HBLB
8290.5 μs * -195%
Alienware m18 R2
NVIDIA GeForce RTX 4090 Laptop GPU, i9-14900HX, SK Hynix PC811 HFS002TEM9X152N
2815.1 μs *
Alienware m18 R1
NVIDIA GeForce RTX 4090 Laptop GPU, i9-13980HX, SK hynix PC801 HFS001TEJ9X101N
2669.6 μs * +5%
MSI Titan 18 HX A14VIG
NVIDIA GeForce RTX 4090 Laptop GPU, i9-14900HX, 2x Samsung PM9A1a MZVL22T0HDLB (RAID 0)
2384.5 μs * +15%
Alienware m18 R1 AMD
Radeon RX 7900M, R9 7945HX, Kioxia XG8 KXG80ZNV1T02
1155.8 μs * +59%
Asus ROG Strix G18 G814JI
NVIDIA GeForce RTX 4070 Laptop GPU, i7-13650HX, Micron 2400 MTFDKBA1T0QFM
965.6 μs * +66%

* ... Meglio usare valori piccoli

Dispositivi di archiviazione

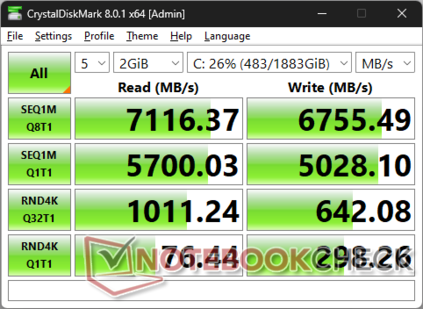
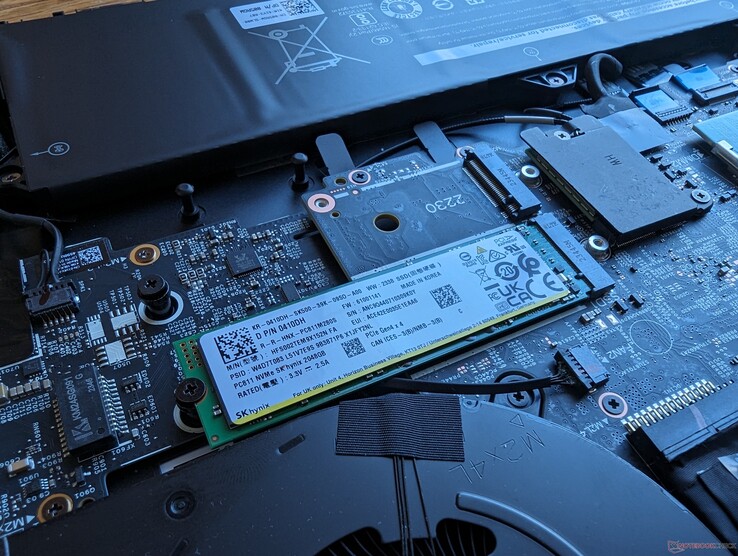
L'Alienware è uno dei primi a essere consegnato con il modello da 2 TB SK Hynix PC811 SSD PCIe4 x4 NVMe. Rispetto alla serie PC801, la serie PC811 incorpora 8D NAND flash invece di 4D NAND per una capacità di archiviazione complessivamente più densa e una migliore efficienza energetica. L'unità è in grado di sostenere velocità di trasferimento massime di ~7100 MB/s quando è sottoposta a stress, che è essenzialmente il limite delle prestazioni per le SSD PCIe4 x4 singolari.

Dell può configurare due unità da 4 TB per un totale di 8 TB di spazio di archiviazione.

CDM 8
CDM 8
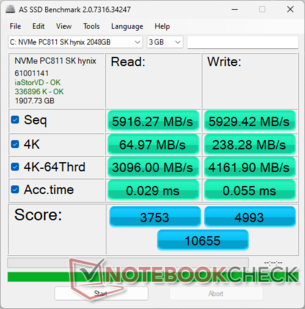
AS SSD
AS SSD
Supporto per un massimo di quattro SSD individuali
SK Hynix PC811 HFS002TEM9X152N
CDM 5/6 Read Seq Q32T1: 7125 MB/s
CDM 5/6 Write Seq Q32T1: 6758 MB/s
CDM 5/6 Read 4K Q32T1: 1009 MB/s
CDM 5/6 Write 4K Q32T1: 636.4 MB/s
CDM 5 Read Seq: 5723 MB/s
CDM 5 Write Seq: 5040 MB/s
CDM 5/6 Read 4K: 77.12 MB/s
CDM 5/6 Write 4K: 291.8 MB/s
Drive Performance Rating - Percent
Alienware m18 R2
SK Hynix PC811 HFS002TEM9X152N
84.7 pt
Alienware m18 R1
SK hynix PC801 HFS001TEJ9X101N
80.4 pt
Acer Predator Helios 18 N23Q2
Samsung PM9A1 MZVL22T0HBLB
74.3 pt
MSI Titan 18 HX A14VIG
2x Samsung PM9A1a MZVL22T0HDLB (RAID 0)
64.8 pt
Alienware m18 R1 AMD
Kioxia XG8 KXG80ZNV1T02
62.9 pt
Asus ROG Strix G18 G814JI
Micron 2400 MTFDKBA1T0QFM
34.4 pt
DiskSpd
seq read
Alienware m18 R2
SK Hynix PC811 HFS002TEM9X152N
5588 (5540.05min - 5587.65max) MB/s
MSI Titan 18 HX A14VIG
2x Samsung PM9A1a MZVL22T0HDLB (RAID 0)
5424 (5395.57min - 5423.86max) MB/s -3%
Acer Predator Helios 18 N23Q2
Samsung PM9A1 MZVL22T0HBLB
3975 (3933.84min - 3975.36max) MB/s -29%
Alienware m18 R1 AMD
Kioxia XG8 KXG80ZNV1T02
3504 (3460.3min - 3503.92max) MB/s -37%
Alienware m18 R1
SK hynix PC801 HFS001TEJ9X101N
3326 (3303.54min - 3326.08max) MB/s -40%
Asus ROG Strix G18 G814JI
Micron 2400 MTFDKBA1T0QFM
1870 (1827.25min - 1869.82max) MB/s -67%
seq write
MSI Titan 18 HX A14VIG
2x Samsung PM9A1a MZVL22T0HDLB (RAID 0)
7291 (7191.64min - 7291.38max) MB/s +41%
Alienware m18 R2
SK Hynix PC811 HFS002TEM9X152N
5153 (5139.7min - 5152.91max) MB/s
Alienware m18 R1 AMD
Kioxia XG8 KXG80ZNV1T02
4889 (4680.84min - 4888.75max) MB/s -5%
Alienware m18 R1
SK hynix PC801 HFS001TEJ9X101N
4849 (4812.78min - 4849.24max) MB/s -6%
Acer Predator Helios 18 N23Q2
Samsung PM9A1 MZVL22T0HBLB
4309 (4272.74min - 4308.62max) MB/s -16%
Asus ROG Strix G18 G814JI
Micron 2400 MTFDKBA1T0QFM
2166 (2094.01min - 2166.15max) MB/s -58%
seq q8 t1 read
MSI Titan 18 HX A14VIG
2x Samsung PM9A1a MZVL22T0HDLB (RAID 0)
13588 (10727.3min - 13588.3max) MB/s +91%
Acer Predator Helios 18 N23Q2
Samsung PM9A1 MZVL22T0HBLB
7115 (6689.03min - 7114.56max) MB/s 0%
Alienware m18 R2
SK Hynix PC811 HFS002TEM9X152N
7110 (6256.85min - 7110.18max) MB/s
Alienware m18 R1
SK hynix PC801 HFS001TEJ9X101N
6815 (6081.32min - 6815.12max) MB/s -4%
Alienware m18 R1 AMD
Kioxia XG8 KXG80ZNV1T02
6329 (5886.29min - 6328.58max) MB/s -11%
Asus ROG Strix G18 G814JI
Micron 2400 MTFDKBA1T0QFM
4239 (3584.87min - 4239.18max) MB/s -40%
seq q8 t1 write
MSI Titan 18 HX A14VIG
2x Samsung PM9A1a MZVL22T0HDLB (RAID 0)
10571 (10519.3min - 10571.3max) MB/s +56%
Alienware m18 R2
SK Hynix PC811 HFS002TEM9X152N
6779 (6710.47min - 6778.83max) MB/s
Alienware m18 R1
SK hynix PC801 HFS001TEJ9X101N
6097 (6073.79min - 6096.81max) MB/s -10%
Alienware m18 R1 AMD
Kioxia XG8 KXG80ZNV1T02
5398 (5134.26min - 5397.97max) MB/s -20%
Acer Predator Helios 18 N23Q2
Samsung PM9A1 MZVL22T0HBLB
5125 (5108.87min - 5125.2max) MB/s -24%
Asus ROG Strix G18 G814JI
Micron 2400 MTFDKBA1T0QFM
2982 (2920.07min - 2981.52max) MB/s -56%
4k q1 t1 read
Acer Predator Helios 18 N23Q2
Samsung PM9A1 MZVL22T0HBLB
75.7 (74.61min - 75.65max) MB/s 0%
Alienware m18 R2
SK Hynix PC811 HFS002TEM9X152N
75.4 (73.49min - 75.43max) MB/s
Alienware m18 R1
SK hynix PC801 HFS001TEJ9X101N
70.4 (69.8min - 70.36max) MB/s -7%
MSI Titan 18 HX A14VIG
2x Samsung PM9A1a MZVL22T0HDLB (RAID 0)
69.6 (68.6min - 69.57max) MB/s -8%
Alienware m18 R1 AMD
Kioxia XG8 KXG80ZNV1T02
65.8 (65.71min - 65.83max) MB/s -13%
Asus ROG Strix G18 G814JI
Micron 2400 MTFDKBA1T0QFM
30.6 (30.29min - 30.64max) MB/s -59%
4k q1 t1 write
Alienware m18 R2
SK Hynix PC811 HFS002TEM9X152N
300 (297.27min - 299.6max) MB/s
Alienware m18 R1
SK hynix PC801 HFS001TEJ9X101N
293 (278.18min - 292.65max) MB/s -2%
Acer Predator Helios 18 N23Q2
Samsung PM9A1 MZVL22T0HBLB
273 (271.42min - 272.88max) MB/s -9%
Alienware m18 R1 AMD
Kioxia XG8 KXG80ZNV1T02
219 (216.03min - 218.97max) MB/s -27%
MSI Titan 18 HX A14VIG
2x Samsung PM9A1a MZVL22T0HDLB (RAID 0)
152.1 (149.74min - 152.09max) MB/s -49%
Asus ROG Strix G18 G814JI
Micron 2400 MTFDKBA1T0QFM
116.3 (111.83min - 116.33max) MB/s -61%
4k q32 t16 read
Alienware m18 R2
SK Hynix PC811 HFS002TEM9X152N
6067 (5596.15min - 6066.73max) MB/s
Alienware m18 R1
SK hynix PC801 HFS001TEJ9X101N
5703 (5624.48min - 5703.41max) MB/s -6%
Acer Predator Helios 18 N23Q2
Samsung PM9A1 MZVL22T0HBLB
3829 (3376.24min - 3829.14max) MB/s -37%
Alienware m18 R1 AMD
Kioxia XG8 KXG80ZNV1T02
3829 (3814.3min - 3829.16max) MB/s -37%
MSI Titan 18 HX A14VIG
2x Samsung PM9A1a MZVL22T0HDLB (RAID 0)
1623 (1464.8min - 1623.24max) MB/s -73%
Asus ROG Strix G18 G814JI
Micron 2400 MTFDKBA1T0QFM
613 (588.72min - 613.33max) MB/s -90%
4k q32 t16 write
Alienware m18 R2
SK Hynix PC811 HFS002TEM9X152N
4176 (3805.57min - 4175.9max) MB/s
Alienware m18 R1
SK hynix PC801 HFS001TEJ9X101N
3719 (3569.84min - 3718.59max) MB/s -11%
Acer Predator Helios 18 N23Q2
Samsung PM9A1 MZVL22T0HBLB
3225 (3169.52min - 3224.75max) MB/s -23%
Alienware m18 R1 AMD
Kioxia XG8 KXG80ZNV1T02
2627 (2557.39min - 2627.4max) MB/s -37%
MSI Titan 18 HX A14VIG
2x Samsung PM9A1a MZVL22T0HDLB (RAID 0)
1377 (1306.51min - 1377.05max) MB/s -67%
Asus ROG Strix G18 G814JI
Micron 2400 MTFDKBA1T0QFM
441 (428.19min - 440.55max) MB/s -89%
AS SSD
Score Total
Alienware m18 R2
SK Hynix PC811 HFS002TEM9X152N
10655 Points
Alienware m18 R1
SK hynix PC801 HFS001TEJ9X101N
10562 Points -1%
Acer Predator Helios 18 N23Q2
Samsung PM9A1 MZVL22T0HBLB
8304 Points -22%
Alienware m18 R1 AMD
Kioxia XG8 KXG80ZNV1T02
8209 Points -23%
MSI Titan 18 HX A14VIG
2x Samsung PM9A1a MZVL22T0HDLB (RAID 0)
5369 Points -50%
Asus ROG Strix G18 G814JI
Micron 2400 MTFDKBA1T0QFM
4272 Points -60%
Score Read
Alienware m18 R2
SK Hynix PC811 HFS002TEM9X152N
3753 Points
Alienware m18 R1
SK hynix PC801 HFS001TEJ9X101N
3622 Points -3%
Alienware m18 R1 AMD
Kioxia XG8 KXG80ZNV1T02
3403 Points -9%
Acer Predator Helios 18 N23Q2
Samsung PM9A1 MZVL22T0HBLB
3329 Points -11%
MSI Titan 18 HX A14VIG
2x Samsung PM9A1a MZVL22T0HDLB (RAID 0)
2194 Points -42%
Asus ROG Strix G18 G814JI
Micron 2400 MTFDKBA1T0QFM
1294 Points -66%
Score Write
Alienware m18 R1
SK hynix PC801 HFS001TEJ9X101N
5110 Points +2%
Alienware m18 R2
SK Hynix PC811 HFS002TEM9X152N
4993 Points
Acer Predator Helios 18 N23Q2
Samsung PM9A1 MZVL22T0HBLB
3321 Points -33%
Alienware m18 R1 AMD
Kioxia XG8 KXG80ZNV1T02
3106 Points -38%
Asus ROG Strix G18 G814JI
Micron 2400 MTFDKBA1T0QFM
2387 Points -52%
MSI Titan 18 HX A14VIG
2x Samsung PM9A1a MZVL22T0HDLB (RAID 0)
2092 Points -58%
Seq Read
MSI Titan 18 HX A14VIG
2x Samsung PM9A1a MZVL22T0HDLB (RAID 0)
9576.8 MB/s +62%
Alienware m18 R2
SK Hynix PC811 HFS002TEM9X152N
5916.27 MB/s
Alienware m18 R1
SK hynix PC801 HFS001TEJ9X101N
5891.83 MB/s 0%
Alienware m18 R1 AMD
Kioxia XG8 KXG80ZNV1T02
5753.68 MB/s -3%
Acer Predator Helios 18 N23Q2
Samsung PM9A1 MZVL22T0HBLB
5423 MB/s -8%
Asus ROG Strix G18 G814JI
Micron 2400 MTFDKBA1T0QFM
3810.59 MB/s -36%
Seq Write
MSI Titan 18 HX A14VIG
2x Samsung PM9A1a MZVL22T0HDLB (RAID 0)
8685.54 MB/s +46%
Alienware m18 R2
SK Hynix PC811 HFS002TEM9X152N
5929.42 MB/s
Alienware m18 R1
SK hynix PC801 HFS001TEJ9X101N
5634.39 MB/s -5%
Alienware m18 R1 AMD
Kioxia XG8 KXG80ZNV1T02
5132.02 MB/s -13%
Acer Predator Helios 18 N23Q2
Samsung PM9A1 MZVL22T0HBLB
4360 MB/s -26%
Asus ROG Strix G18 G814JI
Micron 2400 MTFDKBA1T0QFM
2319.92 MB/s -61%
4K Read
Acer Predator Helios 18 N23Q2
Samsung PM9A1 MZVL22T0HBLB
86.4 MB/s +33%
Alienware m18 R1
SK hynix PC801 HFS001TEJ9X101N
65.13 MB/s 0%
Alienware m18 R2
SK Hynix PC811 HFS002TEM9X152N
64.97 MB/s
MSI Titan 18 HX A14VIG
2x Samsung PM9A1a MZVL22T0HDLB (RAID 0)
63.69 MB/s -2%
Alienware m18 R1 AMD
Kioxia XG8 KXG80ZNV1T02
61.69 MB/s -5%
Asus ROG Strix G18 G814JI
Micron 2400 MTFDKBA1T0QFM
37.91 MB/s -42%
4K Write
Acer Predator Helios 18 N23Q2
Samsung PM9A1 MZVL22T0HBLB
254 MB/s +7%
Alienware m18 R1
SK hynix PC801 HFS001TEJ9X101N
248.62 MB/s +4%
Alienware m18 R2
SK Hynix PC811 HFS002TEM9X152N
238.28 MB/s
Alienware m18 R1 AMD
Kioxia XG8 KXG80ZNV1T02
184.27 MB/s -23%
Asus ROG Strix G18 G814JI
Micron 2400 MTFDKBA1T0QFM
152.19 MB/s -36%
MSI Titan 18 HX A14VIG
2x Samsung PM9A1a MZVL22T0HDLB (RAID 0)
134.66 MB/s -43%
4K-64 Read
Alienware m18 R2
SK Hynix PC811 HFS002TEM9X152N
3096 MB/s
Alienware m18 R1
SK hynix PC801 HFS001TEJ9X101N
2967.47 MB/s -4%
Alienware m18 R1 AMD
Kioxia XG8 KXG80ZNV1T02
2765.55 MB/s -11%
Acer Predator Helios 18 N23Q2
Samsung PM9A1 MZVL22T0HBLB
2700 MB/s -13%
MSI Titan 18 HX A14VIG
2x Samsung PM9A1a MZVL22T0HDLB (RAID 0)
1172.14 MB/s -62%
Asus ROG Strix G18 G814JI
Micron 2400 MTFDKBA1T0QFM
874.66 MB/s -72%
4K-64 Write
Alienware m18 R1
SK hynix PC801 HFS001TEJ9X101N
4297.73 MB/s +3%
Alienware m18 R2
SK Hynix PC811 HFS002TEM9X152N
4161.9 MB/s
Acer Predator Helios 18 N23Q2
Samsung PM9A1 MZVL22T0HBLB
2630 MB/s -37%
Alienware m18 R1 AMD
Kioxia XG8 KXG80ZNV1T02
2408.06 MB/s -42%
Asus ROG Strix G18 G814JI
Micron 2400 MTFDKBA1T0QFM
2002.63 MB/s -52%
MSI Titan 18 HX A14VIG
2x Samsung PM9A1a MZVL22T0HDLB (RAID 0)
1088.59 MB/s -74%
Access Time Read
Alienware m18 R1 AMD
Kioxia XG8 KXG80ZNV1T02
0.111 ms * -283%
Asus ROG Strix G18 G814JI
Micron 2400 MTFDKBA1T0QFM
0.04 ms * -38%
MSI Titan 18 HX A14VIG
2x Samsung PM9A1a MZVL22T0HDLB (RAID 0)
0.036 ms * -24%
Alienware m18 R1
SK hynix PC801 HFS001TEJ9X101N
0.03 ms * -3%
Alienware m18 R2
SK Hynix PC811 HFS002TEM9X152N
0.029 ms *
Acer Predator Helios 18 N23Q2
Samsung PM9A1 MZVL22T0HBLB
0.025 ms * +14%
Access Time Write
Asus ROG Strix G18 G814JI
Micron 2400 MTFDKBA1T0QFM
0.12 ms * -118%
MSI Titan 18 HX A14VIG
2x Samsung PM9A1a MZVL22T0HDLB (RAID 0)
0.091 ms * -65%
Alienware m18 R1 AMD
Kioxia XG8 KXG80ZNV1T02
0.067 ms * -22%
Alienware m18 R2
SK Hynix PC811 HFS002TEM9X152N
0.055 ms *
Alienware m18 R1
SK hynix PC801 HFS001TEJ9X101N
0.052 ms * +5%
Acer Predator Helios 18 N23Q2
Samsung PM9A1 MZVL22T0HBLB
0.017 ms * +69%

* ... Meglio usare valori piccoli

Disk Throttling: DiskSpd Read Loop, Queue Depth 8

036072010801440180021602520288032403600396043204680504054005760612064806840Tooltip
Alienware m18 R2; diskspd 2.0.17 f: Ø7089 (6353.66-7123.8)

Prestazioni della GPU - Grafica TGP da 175 W

Il modello GeForce RTX 4090 da 175 W è tornato quest'anno senza grandi cambiamenti per ottenere le stesse prestazioni di gioco del modello m18 R1 dello scorso anno. Forse l'aspetto più importante è che ancora una volta non ci sono grandi differenze di prestazioni tra i profili Overdrive, Performance e Balanced, come mostra la nostra tabella dei risultati Fire Strike qui sotto.

Profilo di potenzaPunteggio graficoPunteggio FisicaPunteggio combinato
Modalità Overdrive13664422327665
Modalità Performance13579 (-0%)42217 (-0%)7541 (-2%)
Modalità Bilanciata13449 (-1%)40978 (-3%)7592 (-1%)
Potenza della batteria5116 (-63%)22857 (-46%)2102 (-73%)

Scendendo alla RTX 40804070 o 4060 si prevede una riduzione delle prestazioni grafiche di circa il 5-10 percento, il 30-35 percento e il 45-55 percento, rispettivamente. Il calo delle prestazioni è quindi più ampio tra RTX 4080 e RTX 4070.

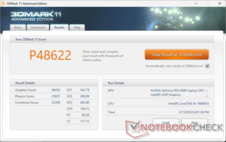
3DMark 11
3DMark 11
Fire Strike
Fire Strike
Fire Strike Ultra
Fire Strike Ultra
Port Royal
Port Royal
Time Spy
Time Spy
Via della velocità
Via della velocità
3DMark Performance Rating - Percent
Intel Core i7-14700K -2!
NVIDIA GeForce RTX 4090, Intel Core i7-14700K
100 pt
Alienware m18 R1
NVIDIA GeForce RTX 4090 Laptop GPU, Intel Core i9-13980HX
76.6 pt
MSI Titan 18 HX A14VIG
NVIDIA GeForce RTX 4090 Laptop GPU, Intel Core i9-14900HX
75.7 pt
Alienware m18 R2
NVIDIA GeForce RTX 4090 Laptop GPU, Intel Core i9-14900HX
75.4 pt
Media NVIDIA GeForce RTX 4090 Laptop GPU
 
71.9 pt
Alienware m18 R1 AMD -1!
AMD Radeon RX 7900M, AMD Ryzen 9 7945HX
62.1 pt
Acer Predator Helios 18 N23Q2 -2!
NVIDIA GeForce RTX 4080 Laptop GPU, Intel Core i9-13900HX
55.8 pt
Asus TUF Gaming A17 FA707XI-NS94
NVIDIA GeForce RTX 4070 Laptop GPU, AMD Ryzen 9 7940HS
44.5 pt
Razer Blade 18 RTX 4070
NVIDIA GeForce RTX 4070 Laptop GPU, Intel Core i9-13950HX
40.7 pt
Asus ROG Strix G18 G814JI -1!
NVIDIA GeForce RTX 4070 Laptop GPU, Intel Core i7-13650HX
39.8 pt
Acer Nitro 17 AN17-41-R9LN -1!
NVIDIA GeForce RTX 4070 Laptop GPU, AMD Ryzen 7 7735HS
37.8 pt
SCHENKER XMG Apex 17 (Late 23)
NVIDIA GeForce RTX 4060 Laptop GPU, AMD Ryzen 7 7840HS
36.7 pt
Acer Nitro 17 AN17-51-71ER -2!
NVIDIA GeForce RTX 4060 Laptop GPU, Intel Core i7-13700H
32.7 pt
3DMark 11 - 1280x720 Performance GPU
Intel Core i7-14700K
NVIDIA GeForce RTX 4090, Intel Core i7-14700K
103598 Points +50%
Alienware m18 R1
NVIDIA GeForce RTX 4090 Laptop GPU, Intel Core i9-13980HX
71383 Points +3%
Alienware m18 R2
NVIDIA GeForce RTX 4090 Laptop GPU, Intel Core i9-14900HX
69254 Points
Media NVIDIA GeForce RTX 4090 Laptop GPU
  (56764 - 73027, n=36)
65041 Points -6%
MSI Titan 18 HX A14VIG
NVIDIA GeForce RTX 4090 Laptop GPU, Intel Core i9-14900HX
63978 Points -8%
Alienware m18 R1 AMD
AMD Radeon RX 7900M, AMD Ryzen 9 7945HX
59943 Points -13%
Acer Predator Helios 18 N23Q2
NVIDIA GeForce RTX 4080 Laptop GPU, Intel Core i9-13900HX
59420 Points -14%
Asus TUF Gaming A17 FA707XI-NS94
NVIDIA GeForce RTX 4070 Laptop GPU, AMD Ryzen 9 7940HS
44546 Points -36%
Asus ROG Strix G18 G814JI
NVIDIA GeForce RTX 4070 Laptop GPU, Intel Core i7-13650HX
40413 Points -42%
Acer Nitro 17 AN17-41-R9LN
NVIDIA GeForce RTX 4070 Laptop GPU, AMD Ryzen 7 7735HS
40039 Points -42%
Razer Blade 18 RTX 4070
NVIDIA GeForce RTX 4070 Laptop GPU, Intel Core i9-13950HX
39733 Points -43%
SCHENKER XMG Apex 17 (Late 23)
NVIDIA GeForce RTX 4060 Laptop GPU, AMD Ryzen 7 7840HS
37294 Points -46%
Acer Nitro 17 AN17-51-71ER
NVIDIA GeForce RTX 4060 Laptop GPU, Intel Core i7-13700H
35731 Points -48%
3DMark
1920x1080 Fire Strike Graphics
Intel Core i7-14700K
NVIDIA GeForce RTX 4090, Intel Core i7-14700K
70246 Points +58%
MSI Titan 18 HX A14VIG
NVIDIA GeForce RTX 4090 Laptop GPU, Intel Core i9-14900HX
50532 Points +14%
Alienware m18 R1 AMD
AMD Radeon RX 7900M, AMD Ryzen 9 7945HX
50241 Points +13%
Alienware m18 R1
NVIDIA GeForce RTX 4090 Laptop GPU, Intel Core i9-13980HX
46998 Points +6%
Media NVIDIA GeForce RTX 4090 Laptop GPU
  (40220 - 53059, n=34)
46315 Points +4%
Alienware m18 R2
NVIDIA GeForce RTX 4090 Laptop GPU, Intel Core i9-14900HX
44492 Points
Acer Predator Helios 18 N23Q2
NVIDIA GeForce RTX 4080 Laptop GPU, Intel Core i9-13900HX
42829 Points -4%
Asus TUF Gaming A17 FA707XI-NS94
NVIDIA GeForce RTX 4070 Laptop GPU, AMD Ryzen 9 7940HS
30438 Points -32%
Acer Nitro 17 AN17-41-R9LN
NVIDIA GeForce RTX 4070 Laptop GPU, AMD Ryzen 7 7735HS
29349 Points -34%
Razer Blade 18 RTX 4070
NVIDIA GeForce RTX 4070 Laptop GPU, Intel Core i9-13950HX
28743 Points -35%
Asus ROG Strix G18 G814JI
NVIDIA GeForce RTX 4070 Laptop GPU, Intel Core i7-13650HX
28374 Points -36%
SCHENKER XMG Apex 17 (Late 23)
NVIDIA GeForce RTX 4060 Laptop GPU, AMD Ryzen 7 7840HS
27417 Points -38%
Acer Nitro 17 AN17-51-71ER
NVIDIA GeForce RTX 4060 Laptop GPU, Intel Core i7-13700H
25896 Points -42%
2560x1440 Time Spy Graphics
Intel Core i7-14700K
NVIDIA GeForce RTX 4090, Intel Core i7-14700K
37589 Points +69%
Alienware m18 R1
NVIDIA GeForce RTX 4090 Laptop GPU, Intel Core i9-13980HX
22547 Points +1%
Alienware m18 R2
NVIDIA GeForce RTX 4090 Laptop GPU, Intel Core i9-14900HX
22290 Points
MSI Titan 18 HX A14VIG
NVIDIA GeForce RTX 4090 Laptop GPU, Intel Core i9-14900HX
22256 Points 0%
Media NVIDIA GeForce RTX 4090 Laptop GPU
  (17620 - 23292, n=36)
20991 Points -6%
Alienware m18 R1 AMD
AMD Radeon RX 7900M, AMD Ryzen 9 7945HX
19434 Points -13%
Acer Predator Helios 18 N23Q2
NVIDIA GeForce RTX 4080 Laptop GPU, Intel Core i9-13900HX
18699 Points -16%
Asus TUF Gaming A17 FA707XI-NS94
NVIDIA GeForce RTX 4070 Laptop GPU, AMD Ryzen 9 7940HS
13166 Points -41%
Asus ROG Strix G18 G814JI
NVIDIA GeForce RTX 4070 Laptop GPU, Intel Core i7-13650HX
12111 Points -46%
Razer Blade 18 RTX 4070
NVIDIA GeForce RTX 4070 Laptop GPU, Intel Core i9-13950HX
11683 Points -48%
Acer Nitro 17 AN17-41-R9LN
NVIDIA GeForce RTX 4070 Laptop GPU, AMD Ryzen 7 7735HS
11062 Points -50%
SCHENKER XMG Apex 17 (Late 23)
NVIDIA GeForce RTX 4060 Laptop GPU, AMD Ryzen 7 7840HS
10500 Points -53%
Acer Nitro 17 AN17-51-71ER
NVIDIA GeForce RTX 4060 Laptop GPU, Intel Core i7-13700H
10347 Points -54%
2560x1440 Time Spy Score
Intel Core i7-14700K
NVIDIA GeForce RTX 4090, Intel Core i7-14700K
33810 Points +56%
Alienware m18 R2
NVIDIA GeForce RTX 4090 Laptop GPU, Intel Core i9-14900HX
21695 Points
Alienware m18 R1
NVIDIA GeForce RTX 4090 Laptop GPU, Intel Core i9-13980HX
21617 Points 0%
MSI Titan 18 HX A14VIG
NVIDIA GeForce RTX 4090 Laptop GPU, Intel Core i9-14900HX
21280 Points -2%
Media NVIDIA GeForce RTX 4090 Laptop GPU
  (15939 - 22014, n=36)
19811 Points -9%
Acer Predator Helios 18 N23Q2
NVIDIA GeForce RTX 4080 Laptop GPU, Intel Core i9-13900HX
18638 Points -14%
Alienware m18 R1 AMD
AMD Radeon RX 7900M, AMD Ryzen 9 7945HX
18114 Points -17%
Asus TUF Gaming A17 FA707XI-NS94
NVIDIA GeForce RTX 4070 Laptop GPU, AMD Ryzen 9 7940HS
12853 Points -41%
Asus ROG Strix G18 G814JI
NVIDIA GeForce RTX 4070 Laptop GPU, Intel Core i7-13650HX
12364 Points -43%
Razer Blade 18 RTX 4070
NVIDIA GeForce RTX 4070 Laptop GPU, Intel Core i9-13950HX
12062 Points -44%
Acer Nitro 17 AN17-41-R9LN
NVIDIA GeForce RTX 4070 Laptop GPU, AMD Ryzen 7 7735HS
10950 Points -50%
Acer Nitro 17 AN17-51-71ER
NVIDIA GeForce RTX 4060 Laptop GPU, Intel Core i7-13700H
10759 Points -50%
SCHENKER XMG Apex 17 (Late 23)
NVIDIA GeForce RTX 4060 Laptop GPU, AMD Ryzen 7 7840HS
10640 Points -51%
2560x1440 Port Royal Graphics
Alienware m18 R1
NVIDIA GeForce RTX 4090 Laptop GPU, Intel Core i9-13980HX
14225 Points +1%
MSI Titan 18 HX A14VIG
NVIDIA GeForce RTX 4090 Laptop GPU, Intel Core i9-14900HX
14201 Points +1%
Alienware m18 R2
NVIDIA GeForce RTX 4090 Laptop GPU, Intel Core i9-14900HX
14069 Points
Media NVIDIA GeForce RTX 4090 Laptop GPU
  (10798 - 14457, n=27)
13313 Points -5%
Alienware m18 R1 AMD
AMD Radeon RX 7900M, AMD Ryzen 9 7945HX
10814 Points -23%
Asus TUF Gaming A17 FA707XI-NS94
NVIDIA GeForce RTX 4070 Laptop GPU, AMD Ryzen 9 7940HS
7740 Points -45%
Asus ROG Strix G18 G814JI
NVIDIA GeForce RTX 4070 Laptop GPU, Intel Core i7-13650HX
7216 Points -49%
Razer Blade 18 RTX 4070
NVIDIA GeForce RTX 4070 Laptop GPU, Intel Core i9-13950HX
7078 Points -50%
Acer Nitro 17 AN17-41-R9LN
NVIDIA GeForce RTX 4070 Laptop GPU, AMD Ryzen 7 7735HS
6640 Points -53%
SCHENKER XMG Apex 17 (Late 23)
NVIDIA GeForce RTX 4060 Laptop GPU, AMD Ryzen 7 7840HS
5837 Points -59%
2560x1440 Speed Way Score
Alienware m18 R1
NVIDIA GeForce RTX 4090 Laptop GPU, Intel Core i9-13980HX
5794 Points 0%
Alienware m18 R2
NVIDIA GeForce RTX 4090 Laptop GPU, Intel Core i9-14900HX
5784 Points
MSI Titan 18 HX A14VIG
NVIDIA GeForce RTX 4090 Laptop GPU, Intel Core i9-14900HX
5726 Points -1%
Media NVIDIA GeForce RTX 4090 Laptop GPU
  (4401 - 5940, n=26)
5487 Points -5%
Asus TUF Gaming A17 FA707XI-NS94
NVIDIA GeForce RTX 4070 Laptop GPU, AMD Ryzen 9 7940HS
3095 Points -46%
Razer Blade 18 RTX 4070
NVIDIA GeForce RTX 4070 Laptop GPU, Intel Core i9-13950HX
2789 Points -52%
SCHENKER XMG Apex 17 (Late 23)
NVIDIA GeForce RTX 4060 Laptop GPU, AMD Ryzen 7 7840HS
2604 Points -55%
3DMark 11 Performance
48622 punti
3DMark Fire Strike Score
34966 punti
3DMark Time Spy Score
21695 punti
Aiuto
Blender
v3.3 Classroom HIP/AMD
Acer Nitro 17 AN17-41-R9LN
NVIDIA GeForce RTX 4070 Laptop GPU, AMD Ryzen 7 7735HS
330 Seconds *
v3.3 Classroom OPTIX/RTX
Asus ROG Strix G18 G814JI
NVIDIA GeForce RTX 4070 Laptop GPU, Intel Core i7-13650HX
24 Seconds * -100%
Acer Nitro 17 AN17-51-71ER
NVIDIA GeForce RTX 4060 Laptop GPU, Intel Core i7-13700H
23 Seconds * -92%
SCHENKER XMG Apex 17 (Late 23)
NVIDIA GeForce RTX 4060 Laptop GPU, AMD Ryzen 7 7840HS
22 Seconds * -83%
Acer Nitro 17 AN17-41-R9LN
NVIDIA GeForce RTX 4070 Laptop GPU, AMD Ryzen 7 7735HS
21 Seconds * -75%
Razer Blade 18 RTX 4070
NVIDIA GeForce RTX 4070 Laptop GPU, Intel Core i9-13950HX
20 Seconds * -67%
Asus TUF Gaming A17 FA707XI-NS94
NVIDIA GeForce RTX 4070 Laptop GPU, AMD Ryzen 9 7940HS
19 Seconds * -58%
Acer Predator Helios 18 N23Q2
NVIDIA GeForce RTX 4080 Laptop GPU, Intel Core i9-13900HX
14 Seconds * -17%
Alienware m18 R2
NVIDIA GeForce RTX 4090 Laptop GPU, Intel Core i9-14900HX
12 Seconds *
Media NVIDIA GeForce RTX 4090 Laptop GPU
  (9 - 19, n=34)
12 Seconds * -0%
MSI Titan 18 HX A14VIG
NVIDIA GeForce RTX 4090 Laptop GPU, Intel Core i9-14900HX
10 Seconds * +17%
Intel Core i7-14700K
NVIDIA GeForce RTX 4090, Intel Core i7-14700K
8 Seconds * +33%
v3.3 Classroom CUDA
Acer Nitro 17 AN17-51-71ER
NVIDIA GeForce RTX 4060 Laptop GPU, Intel Core i7-13700H
42 Seconds * -133%
SCHENKER XMG Apex 17 (Late 23)
NVIDIA GeForce RTX 4060 Laptop GPU, AMD Ryzen 7 7840HS
41 Seconds * -128%
Asus ROG Strix G18 G814JI
NVIDIA GeForce RTX 4070 Laptop GPU, Intel Core i7-13650HX
37 Seconds * -106%
Razer Blade 18 RTX 4070
NVIDIA GeForce RTX 4070 Laptop GPU, Intel Core i9-13950HX
36 Seconds * -100%
Acer Nitro 17 AN17-41-R9LN
NVIDIA GeForce RTX 4070 Laptop GPU, AMD Ryzen 7 7735HS
34 Seconds * -89%
Asus TUF Gaming A17 FA707XI-NS94
NVIDIA GeForce RTX 4070 Laptop GPU, AMD Ryzen 9 7940HS
32 Seconds * -78%
Acer Predator Helios 18 N23Q2
NVIDIA GeForce RTX 4080 Laptop GPU, Intel Core i9-13900HX
21 Seconds * -17%
Media NVIDIA GeForce RTX 4090 Laptop GPU
  (16 - 24, n=34)
18.4 Seconds * -2%
MSI Titan 18 HX A14VIG
NVIDIA GeForce RTX 4090 Laptop GPU, Intel Core i9-14900HX
18 Seconds * -0%
Alienware m18 R2
NVIDIA GeForce RTX 4090 Laptop GPU, Intel Core i9-14900HX
18 Seconds *
Alienware m18 R1
NVIDIA GeForce RTX 4090 Laptop GPU, Intel Core i9-13980HX
17 Seconds * +6%
Intel Core i7-14700K
NVIDIA GeForce RTX 4090, Intel Core i7-14700K
10 Seconds * +44%
v3.3 Classroom CPU
Acer Nitro 17 AN17-41-R9LN
NVIDIA GeForce RTX 4070 Laptop GPU, AMD Ryzen 7 7735HS
376 Seconds * -109%
SCHENKER XMG Apex 17 (Late 23)
NVIDIA GeForce RTX 4060 Laptop GPU, AMD Ryzen 7 7840HS
324 Seconds * -80%
Acer Nitro 17 AN17-51-71ER
NVIDIA GeForce RTX 4060 Laptop GPU, Intel Core i7-13700H
320 Seconds * -78%
Asus TUF Gaming A17 FA707XI-NS94
NVIDIA GeForce RTX 4070 Laptop GPU, AMD Ryzen 9 7940HS
291 Seconds * -62%
Asus ROG Strix G18 G814JI
NVIDIA GeForce RTX 4070 Laptop GPU, Intel Core i7-13650HX
273 Seconds * -52%
Media NVIDIA GeForce RTX 4090 Laptop GPU
  (144 - 287, n=34)
197.8 Seconds * -10%
Razer Blade 18 RTX 4070
NVIDIA GeForce RTX 4070 Laptop GPU, Intel Core i9-13950HX
196 Seconds * -9%
Acer Predator Helios 18 N23Q2
NVIDIA GeForce RTX 4080 Laptop GPU, Intel Core i9-13900HX
188 Seconds * -4%
Alienware m18 R2
NVIDIA GeForce RTX 4090 Laptop GPU, Intel Core i9-14900HX
180 Seconds *
MSI Titan 18 HX A14VIG
NVIDIA GeForce RTX 4090 Laptop GPU, Intel Core i9-14900HX
179 Seconds * +1%
Alienware m18 R1
NVIDIA GeForce RTX 4090 Laptop GPU, Intel Core i9-13980HX
170 Seconds * +6%
Intel Core i7-14700K
NVIDIA GeForce RTX 4090, Intel Core i7-14700K
155 Seconds * +14%
Alienware m18 R1 AMD
AMD Radeon RX 7900M, AMD Ryzen 9 7945HX
138 Seconds * +23%

* ... Meglio usare valori piccoli

Prestazioni di gioco

Le prestazioni di gioco rimangono le stesse dell'm18 R1, nonostante il cambio di CPU. La RTX 4090 si accoppia molto bene con il display a risoluzione 1600p quando si punta a frame rate superiori a 60 FPS.

Performance Rating - Percent
Alienware m18 R1
Intel Core i9-13980HX, NVIDIA GeForce RTX 4090 Laptop GPU
99.1 pt
Alienware m18 R2
Intel Core i9-14900HX, NVIDIA GeForce RTX 4090 Laptop GPU
94.6 pt
MSI Titan 18 HX A14VIG
Intel Core i9-14900HX, NVIDIA GeForce RTX 4090 Laptop GPU
93.7 pt
Acer Predator Helios 18 N23Q2
Intel Core i9-13900HX, NVIDIA GeForce RTX 4080 Laptop GPU
92.8 pt
Alienware m18 R1 AMD
AMD Ryzen 9 7945HX, AMD Radeon RX 7900M
74.8 pt
Asus ROG Strix G18 G814JI
Intel Core i7-13650HX, NVIDIA GeForce RTX 4070 Laptop GPU
67.3 pt
The Witcher 3 - 1920x1080 Ultra Graphics & Postprocessing (HBAO+)
Alienware m18 R1
Intel Core i9-13980HX, NVIDIA GeForce RTX 4090 Laptop GPU
213.9 (205min) fps +4%
MSI Titan 18 HX A14VIG
Intel Core i9-14900HX, NVIDIA GeForce RTX 4090 Laptop GPU
211.2 (165min) fps +3%
Alienware m18 R2
Intel Core i9-14900HX, NVIDIA GeForce RTX 4090 Laptop GPU
205.7 (193min) fps
Acer Predator Helios 18 N23Q2
Intel Core i9-13900HX, NVIDIA GeForce RTX 4080 Laptop GPU
175 fps -15%
Alienware m18 R1 AMD
AMD Ryzen 9 7945HX, AMD Radeon RX 7900M
167.7 (134min) fps -18%
Asus ROG Strix G18 G814JI
Intel Core i7-13650HX, NVIDIA GeForce RTX 4070 Laptop GPU
119 (100min) fps -42%
GTA V - 1920x1080 Highest Settings possible AA:4xMSAA + FX AF:16x
Acer Predator Helios 18 N23Q2
Intel Core i9-13900HX, NVIDIA GeForce RTX 4080 Laptop GPU
152.7 (3.46min, 111.1P1) fps +11%
Alienware m18 R1
Intel Core i9-13980HX, NVIDIA GeForce RTX 4090 Laptop GPU
149 (3.13min, 111.1P1) fps +9%
MSI Titan 18 HX A14VIG
Intel Core i9-14900HX, NVIDIA GeForce RTX 4090 Laptop GPU
139.2 (3.73min, 90.9P1) fps +2%
Alienware m18 R2
Intel Core i9-14900HX, NVIDIA GeForce RTX 4090 Laptop GPU
137 (7.81min, 83.3P1) fps
Asus ROG Strix G18 G814JI
Intel Core i7-13650HX, NVIDIA GeForce RTX 4070 Laptop GPU
117.2 (6.43min, 76.9P1) fps -14%
Alienware m18 R1 AMD
AMD Ryzen 9 7945HX, AMD Radeon RX 7900M
105 (4.76min, 62.5P1) fps -23%
Final Fantasy XV Benchmark - 1920x1080 High Quality
Alienware m18 R1
Intel Core i9-13980HX, NVIDIA GeForce RTX 4090 Laptop GPU
194.8 fps +1%
Alienware m18 R2
Intel Core i9-14900HX, NVIDIA GeForce RTX 4090 Laptop GPU
193.2 fps
MSI Titan 18 HX A14VIG
Intel Core i9-14900HX, NVIDIA GeForce RTX 4090 Laptop GPU
184 fps -5%
Acer Predator Helios 18 N23Q2
Intel Core i9-13900HX, NVIDIA GeForce RTX 4080 Laptop GPU
182.1 fps -6%
Alienware m18 R1 AMD
AMD Ryzen 9 7945HX, AMD Radeon RX 7900M
152.8 fps -21%
Asus ROG Strix G18 G814JI
Intel Core i7-13650HX, NVIDIA GeForce RTX 4070 Laptop GPU
115.5 fps -40%
Strange Brigade - 1920x1080 ultra AA:ultra AF:16
MSI Titan 18 HX A14VIG
Intel Core i9-14900HX, NVIDIA GeForce RTX 4090 Laptop GPU
385 (27.2min, 274P1) fps +4%
Alienware m18 R1
Intel Core i9-13980HX, NVIDIA GeForce RTX 4090 Laptop GPU
373 (73.3min, 273P1) fps +1%
Alienware m18 R2
Intel Core i9-14900HX, NVIDIA GeForce RTX 4090 Laptop GPU
369 (31.4min, 266P1) fps
Alienware m18 R1 AMD
AMD Ryzen 9 7945HX, AMD Radeon RX 7900M
344 (145.8min, 227P1) fps -7%
Acer Predator Helios 18 N23Q2
Intel Core i9-13900HX, NVIDIA GeForce RTX 4080 Laptop GPU
339 (38.9min, 245P1) fps -8%
Asus ROG Strix G18 G814JI
Intel Core i7-13650HX, NVIDIA GeForce RTX 4070 Laptop GPU
209 (45min, 152.5P1) fps -43%
Dota 2 Reborn - 1920x1080 ultra (3/3) best looking
Alienware m18 R1
Intel Core i9-13980HX, NVIDIA GeForce RTX 4090 Laptop GPU
194.2 (157.6min) fps +13%
Acer Predator Helios 18 N23Q2
Intel Core i9-13900HX, NVIDIA GeForce RTX 4080 Laptop GPU
186.4 (161.1min) fps +8%
MSI Titan 18 HX A14VIG
Intel Core i9-14900HX, NVIDIA GeForce RTX 4090 Laptop GPU
174.5 (151.1min) fps +2%
Alienware m18 R2
Intel Core i9-14900HX, NVIDIA GeForce RTX 4090 Laptop GPU
171.8 (143.6min) fps
Asus ROG Strix G18 G814JI
Intel Core i7-13650HX, NVIDIA GeForce RTX 4070 Laptop GPU
154.7 (134.1min) fps -10%
Alienware m18 R1 AMD
AMD Ryzen 9 7945HX, AMD Radeon RX 7900M
146.2 (121.3min) fps -15%
X-Plane 11.11 - 1920x1080 high (fps_test=3)
Alienware m18 R1
Intel Core i9-13980HX, NVIDIA GeForce RTX 4090 Laptop GPU
143.5 fps +2%
Alienware m18 R2
Intel Core i9-14900HX, NVIDIA GeForce RTX 4090 Laptop GPU
140.6 fps
Acer Predator Helios 18 N23Q2
Intel Core i9-13900HX, NVIDIA GeForce RTX 4080 Laptop GPU
139.5 fps -1%
MSI Titan 18 HX A14VIG
Intel Core i9-14900HX, NVIDIA GeForce RTX 4090 Laptop GPU
126.1 fps -10%
Asus ROG Strix G18 G814JI
Intel Core i7-13650HX, NVIDIA GeForce RTX 4070 Laptop GPU
112.6 fps -20%
Alienware m18 R1 AMD
AMD Ryzen 9 7945HX, AMD Radeon RX 7900M
83.7 fps -40%
Baldur's Gate 3
1920x1080 Ultra Preset
MSI Titan 18 HX A14VIG
Intel Core i9-14900HX, NVIDIA GeForce RTX 4090 Laptop GPU
207.7 fps +3%
Alienware m18 R2
Intel Core i9-14900HX, NVIDIA GeForce RTX 4090 Laptop GPU
202 fps
Media NVIDIA GeForce RTX 4090 Laptop GPU
  (160.5 - 208, n=5)
189.5 fps -6%
Alienware m18 R1 AMD
AMD Ryzen 9 7945HX, AMD Radeon RX 7900M
152.6 fps -24%
Asus TUF Gaming A17 FA707XI-NS94
AMD Ryzen 9 7940HS, NVIDIA GeForce RTX 4070 Laptop GPU
114.7 fps -43%
Acer Nitro 17 AN17-41-R9LN
AMD Ryzen 7 7735HS, NVIDIA GeForce RTX 4070 Laptop GPU
94.4 (35.7min, 43.2P0.1, 77.2P1) fps -53%
2560x1440 Ultra Preset
MSI Titan 18 HX A14VIG
Intel Core i9-14900HX, NVIDIA GeForce RTX 4090 Laptop GPU
155.2 fps +2%
Alienware m18 R2
Intel Core i9-14900HX, NVIDIA GeForce RTX 4090 Laptop GPU
151.6 fps
Media NVIDIA GeForce RTX 4090 Laptop GPU
  (119.2 - 155.2, n=5)
141.7 fps -7%
Alienware m18 R1 AMD
AMD Ryzen 9 7945HX, AMD Radeon RX 7900M
118.5 fps -22%
Asus TUF Gaming A17 FA707XI-NS94
AMD Ryzen 9 7940HS, NVIDIA GeForce RTX 4070 Laptop GPU
81.1 fps -47%
Acer Nitro 17 AN17-41-R9LN
AMD Ryzen 7 7735HS, NVIDIA GeForce RTX 4070 Laptop GPU
62.5 (26.8min, 34.9P0.1, 52.6P1) fps -59%
3840x2160 Ultra Preset
Alienware m18 R2
Intel Core i9-14900HX, NVIDIA GeForce RTX 4090 Laptop GPU
81.7 fps
MSI Titan 18 HX A14VIG
Intel Core i9-14900HX, NVIDIA GeForce RTX 4090 Laptop GPU
80.8 fps -1%
Media NVIDIA GeForce RTX 4090 Laptop GPU
  (66 - 81.7, n=5)
74.9 fps -8%
Alienware m18 R1 AMD
AMD Ryzen 9 7945HX, AMD Radeon RX 7900M
65.8 fps -19%
Asus TUF Gaming A17 FA707XI-NS94
AMD Ryzen 9 7940HS, NVIDIA GeForce RTX 4070 Laptop GPU
41.1 fps -50%
The Witcher 3
1920x1080 High Graphics & Postprocessing (Nvidia HairWorks Off)
Intel Core i7-14700K
Intel Core i7-14700K, NVIDIA GeForce RTX 4090
531 (483min, 484.28P1) fps +31%
Alienware m18 R1
Intel Core i9-13980HX, NVIDIA GeForce RTX 4090 Laptop GPU
441.6 (406min) fps +9%
MSI Titan 18 HX A14VIG
Intel Core i9-14900HX, NVIDIA GeForce RTX 4090 Laptop GPU
412.2 (387min) fps +2%
Alienware m18 R2
Intel Core i9-14900HX, NVIDIA GeForce RTX 4090 Laptop GPU
405.6 (374min) fps
Media NVIDIA GeForce RTX 4090 Laptop GPU
  (290 - 449, n=21)
379 fps -7%
Acer Predator Helios 18 N23Q2
Intel Core i9-13900HX, NVIDIA GeForce RTX 4080 Laptop GPU
368 fps -9%
Razer Blade 18 RTX 4070
Intel Core i9-13950HX, NVIDIA GeForce RTX 4070 Laptop GPU
240.9 (228min) fps -41%
Asus ROG Strix G18 G814JI
Intel Core i7-13650HX, NVIDIA GeForce RTX 4070 Laptop GPU
237 (202min) fps -42%
Acer Nitro 17 AN17-51-71ER
Intel Core i7-13700H, NVIDIA GeForce RTX 4060 Laptop GPU
210 fps -48%
SCHENKER XMG Apex 17 (Late 23)
AMD Ryzen 7 7840HS, NVIDIA GeForce RTX 4060 Laptop GPU
198.2 (180min) fps -51%
1920x1080 Ultra Graphics & Postprocessing (HBAO+)
Intel Core i7-14700K
Intel Core i7-14700K, NVIDIA GeForce RTX 4090
287 (259min, 261.1P1) fps +40%
Alienware m18 R1
Intel Core i9-13980HX, NVIDIA GeForce RTX 4090 Laptop GPU
213.9 (205min) fps +4%
MSI Titan 18 HX A14VIG
Intel Core i9-14900HX, NVIDIA GeForce RTX 4090 Laptop GPU
211.2 (165min) fps +3%
Alienware m18 R2
Intel Core i9-14900HX, NVIDIA GeForce RTX 4090 Laptop GPU
205.7 (193min) fps
Media NVIDIA GeForce RTX 4090 Laptop GPU
  (139.2 - 216, n=32)
197.4 fps -4%
Acer Predator Helios 18 N23Q2
Intel Core i9-13900HX, NVIDIA GeForce RTX 4080 Laptop GPU
175 fps -15%
Alienware m18 R1 AMD
AMD Ryzen 9 7945HX, AMD Radeon RX 7900M
167.7 (134min) fps -18%
Asus TUF Gaming A17 FA707XI-NS94
AMD Ryzen 9 7940HS, NVIDIA GeForce RTX 4070 Laptop GPU
120.7 (114min) fps -41%
Asus ROG Strix G18 G814JI
Intel Core i7-13650HX, NVIDIA GeForce RTX 4070 Laptop GPU
119 (100min) fps -42%
Razer Blade 18 RTX 4070
Intel Core i9-13950HX, NVIDIA GeForce RTX 4070 Laptop GPU
113.9 (110min) fps -45%
Acer Nitro 17 AN17-41-R9LN
AMD Ryzen 7 7735HS, NVIDIA GeForce RTX 4070 Laptop GPU
110 fps -47%
Acer Nitro 17 AN17-51-71ER
Intel Core i7-13700H, NVIDIA GeForce RTX 4060 Laptop GPU
105 fps -49%
SCHENKER XMG Apex 17 (Late 23)
AMD Ryzen 7 7840HS, NVIDIA GeForce RTX 4060 Laptop GPU
103.4 (91min) fps -50%
3840x2160 High Graphics & Postprocessing (Nvidia HairWorks Off)
Intel Core i7-14700K
Intel Core i7-14700K, NVIDIA GeForce RTX 4090
274 (238min, 243.89P1) fps +74%
Alienware m18 R1
Intel Core i9-13980HX, NVIDIA GeForce RTX 4090 Laptop GPU
165.6 (152min) fps +5%
MSI Titan 18 HX A14VIG
Intel Core i9-14900HX, NVIDIA GeForce RTX 4090 Laptop GPU
160.7 (148min) fps +2%
Alienware m18 R2
Intel Core i9-14900HX, NVIDIA GeForce RTX 4090 Laptop GPU
157.7 (149min) fps
Media NVIDIA GeForce RTX 4090 Laptop GPU
  (96.3 - 167.6, n=18)
145.8 fps -8%
Alienware m18 R1 AMD
AMD Ryzen 9 7945HX, AMD Radeon RX 7900M
116 (107min) fps -26%
Asus TUF Gaming A17 FA707XI-NS94
AMD Ryzen 9 7940HS, NVIDIA GeForce RTX 4070 Laptop GPU
75.2 (69min) fps -52%
Razer Blade 18 RTX 4070
Intel Core i9-13950HX, NVIDIA GeForce RTX 4070 Laptop GPU
72.5 (66min) fps -54%
GTA V
1920x1080 Highest Settings possible AA:4xMSAA + FX AF:16x
Acer Predator Helios 18 N23Q2
Intel Core i9-13900HX, NVIDIA GeForce RTX 4080 Laptop GPU
152.7 (3.46min, 111.1P1) fps +11%
Intel Core i7-14700K
Intel Core i7-14700K, NVIDIA GeForce RTX 4090
151.2 (3.55min, 83.3P1) fps +10%
Alienware m18 R1
Intel Core i9-13980HX, NVIDIA GeForce RTX 4090 Laptop GPU
149 (3.13min, 111.1P1) fps +9%
MSI Titan 18 HX A14VIG
Intel Core i9-14900HX, NVIDIA GeForce RTX 4090 Laptop GPU
139.2 (3.73min, 90.9P1) fps +2%
Media NVIDIA GeForce RTX 4090 Laptop GPU
  (91.1 - 167.7, n=35)
138.7 fps +1%
Alienware m18 R2
Intel Core i9-14900HX, NVIDIA GeForce RTX 4090 Laptop GPU
137 (7.81min, 83.3P1) fps
Razer Blade 18 RTX 4070
Intel Core i9-13950HX, NVIDIA GeForce RTX 4070 Laptop GPU
121.4 (3.6min, 76.9P1) fps -11%
Asus ROG Strix G18 G814JI
Intel Core i7-13650HX, NVIDIA GeForce RTX 4070 Laptop GPU
117.2 (6.43min, 76.9P1) fps -14%
Acer Nitro 17 AN17-51-71ER
Intel Core i7-13700H, NVIDIA GeForce RTX 4060 Laptop GPU
114.1 (4.15min, 66.7P1) fps -17%
Alienware m18 R1 AMD
AMD Ryzen 9 7945HX, AMD Radeon RX 7900M
105 (4.76min, 62.5P1) fps -23%
Acer Nitro 17 AN17-41-R9LN
AMD Ryzen 7 7735HS, NVIDIA GeForce RTX 4070 Laptop GPU
94.4 (13.1min, 66.7P1) fps -31%
2560x1440 Highest Settings possible AA:4xMSAA + FX AF:16x
Intel Core i7-14700K
Intel Core i7-14700K, NVIDIA GeForce RTX 4090
151.2 (2.91min, 83.3P1) fps +12%
Alienware m18 R1
Intel Core i9-13980HX, NVIDIA GeForce RTX 4090 Laptop GPU
145.5 (2.46min, 111.1P1) fps +8%
Acer Predator Helios 18 N23Q2
Intel Core i9-13900HX, NVIDIA GeForce RTX 4080 Laptop GPU
140.7 (4.4min, 100P1) fps +4%
Alienware m18 R2
Intel Core i9-14900HX, NVIDIA GeForce RTX 4090 Laptop GPU
134.7 (5.05min, 83.3P1) fps
Media NVIDIA GeForce RTX 4090 Laptop GPU
  (90.4 - 160.6, n=33)
133.8 fps -1%
Alienware m18 R1 AMD
AMD Ryzen 9 7945HX, AMD Radeon RX 7900M
105.6 (5.02min, 62.5P1) fps -22%
Razer Blade 18 RTX 4070
Intel Core i9-13950HX, NVIDIA GeForce RTX 4070 Laptop GPU
87.6 (4.62min, 55.6P1) fps -35%
3840x2160 Highest Settings possible AA:4xMSAA + FX AF:16x
Intel Core i7-14700K
Intel Core i7-14700K, NVIDIA GeForce RTX 4090
133.8 (5.14min, 83.3P1) fps +52%
Alienware m18 R2
Intel Core i9-14900HX, NVIDIA GeForce RTX 4090 Laptop GPU
88.2 (3.48min, 58.8P1) fps
Alienware m18 R1
Intel Core i9-13980HX, NVIDIA GeForce RTX 4090 Laptop GPU
86.9 (3.27min, 58.8P1) fps -1%
Media NVIDIA GeForce RTX 4090 Laptop GPU
  (60.1 - 90.9, n=18)
82.9 fps -6%
Alienware m18 R1 AMD
AMD Ryzen 9 7945HX, AMD Radeon RX 7900M
63.7 (8.69min, 45.5P1) fps -28%
Razer Blade 18 RTX 4070
Intel Core i9-13950HX, NVIDIA GeForce RTX 4070 Laptop GPU
38.2 (3.33min, 26.3P1) fps -57%
3840x2160 High/On (Advanced Graphics Off) AA:FX AF:8x
Intel Core i7-14700K
Intel Core i7-14700K, NVIDIA GeForce RTX 4090
185.9 (2.01min, 125P1) fps +6%
Alienware m18 R1
Intel Core i9-13980HX, NVIDIA GeForce RTX 4090 Laptop GPU
176.4 (1.959min, 111.1P1) fps +1%
Alienware m18 R2
Intel Core i9-14900HX, NVIDIA GeForce RTX 4090 Laptop GPU
174.9 (2.4min, 111.1P1) fps
Media NVIDIA GeForce RTX 4090 Laptop GPU
  (88.9 - 183.2, n=21)
165.7 fps -5%
Alienware m18 R1 AMD
AMD Ryzen 9 7945HX, AMD Radeon RX 7900M
146 (7.5min, 100P1) fps -17%
Razer Blade 18 RTX 4070
Intel Core i9-13950HX, NVIDIA GeForce RTX 4070 Laptop GPU
88.5 (5.15min, 58.8P1) fps -49%
Final Fantasy XV Benchmark
1920x1080 High Quality
Intel Core i7-14700K
Intel Core i7-14700K, NVIDIA GeForce RTX 4090
228 fps +18%
Alienware m18 R1
Intel Core i9-13980HX, NVIDIA GeForce RTX 4090 Laptop GPU
194.8 fps +1%
Alienware m18 R2
Intel Core i9-14900HX, NVIDIA GeForce RTX 4090 Laptop GPU
193.2 fps
MSI Titan 18 HX A14VIG
Intel Core i9-14900HX, NVIDIA GeForce RTX 4090 Laptop GPU
184 fps -5%
Acer Predator Helios 18 N23Q2
Intel Core i9-13900HX, NVIDIA GeForce RTX 4080 Laptop GPU
182.1 fps -6%
Media NVIDIA GeForce RTX 4090 Laptop GPU
  (122.2 - 194.9, n=35)
173.2 fps -10%
Alienware m18 R1 AMD
AMD Ryzen 9 7945HX, AMD Radeon RX 7900M
152.8 fps -21%
Asus TUF Gaming A17 FA707XI-NS94
AMD Ryzen 9 7940HS, NVIDIA GeForce RTX 4070 Laptop GPU
121.9 fps -37%
Asus ROG Strix G18 G814JI
Intel Core i7-13650HX, NVIDIA GeForce RTX 4070 Laptop GPU
115.5 fps -40%
Razer Blade 18 RTX 4070
Intel Core i9-13950HX, NVIDIA GeForce RTX 4070 Laptop GPU
115.2 fps -40%
Acer Nitro 17 AN17-41-R9LN
AMD Ryzen 7 7735HS, NVIDIA GeForce RTX 4070 Laptop GPU
106.3 fps -45%
SCHENKER XMG Apex 17 (Late 23)
AMD Ryzen 7 7840HS, NVIDIA GeForce RTX 4060 Laptop GPU
103.4 fps -46%
Acer Nitro 17 AN17-51-71ER
Intel Core i7-13700H, NVIDIA GeForce RTX 4060 Laptop GPU
103.3 fps -47%
2560x1440 High Quality
Intel Core i7-14700K
Intel Core i7-14700K, NVIDIA GeForce RTX 4090
219 fps +37%
Alienware m18 R2
Intel Core i9-14900HX, NVIDIA GeForce RTX 4090 Laptop GPU
160.1 fps
Alienware m18 R1
Intel Core i9-13980HX, NVIDIA GeForce RTX 4090 Laptop GPU
159.5 fps 0%
MSI Titan 18 HX A14VIG
Intel Core i9-14900HX, NVIDIA GeForce RTX 4090 Laptop GPU
158 fps -1%
Media NVIDIA GeForce RTX 4090 Laptop GPU
  (113 - 162.9, n=35)
147 fps -8%
Acer Predator Helios 18 N23Q2
Intel Core i9-13900HX, NVIDIA GeForce RTX 4080 Laptop GPU
136.6 fps -15%
Alienware m18 R1 AMD
AMD Ryzen 9 7945HX, AMD Radeon RX 7900M
114.6 fps -28%
Asus TUF Gaming A17 FA707XI-NS94
AMD Ryzen 9 7940HS, NVIDIA GeForce RTX 4070 Laptop GPU
88.9 fps -44%
Razer Blade 18 RTX 4070
Intel Core i9-13950HX, NVIDIA GeForce RTX 4070 Laptop GPU
82 fps -49%
SCHENKER XMG Apex 17 (Late 23)
AMD Ryzen 7 7840HS, NVIDIA GeForce RTX 4060 Laptop GPU
76.8 fps -52%
Acer Nitro 17 AN17-51-71ER
Intel Core i7-13700H, NVIDIA GeForce RTX 4060 Laptop GPU
73.7 fps -54%
3840x2160 High Quality
Intel Core i7-14700K
Intel Core i7-14700K, NVIDIA GeForce RTX 4090
159.2 fps +70%
Alienware m18 R2
Intel Core i9-14900HX, NVIDIA GeForce RTX 4090 Laptop GPU
93.8 fps
MSI Titan 18 HX A14VIG
Intel Core i9-14900HX, NVIDIA GeForce RTX 4090 Laptop GPU
93.6 fps 0%
Alienware m18 R1
Intel Core i9-13980HX, NVIDIA GeForce RTX 4090 Laptop GPU
92.6 fps -1%
Media NVIDIA GeForce RTX 4090 Laptop GPU
  (81.9 - 94.7, n=19)
89.9 fps -4%
Acer Predator Helios 18 N23Q2
Intel Core i9-13900HX, NVIDIA GeForce RTX 4080 Laptop GPU
79.4 fps -15%
Alienware m18 R1 AMD
AMD Ryzen 9 7945HX, AMD Radeon RX 7900M
69.3 fps -26%
Asus TUF Gaming A17 FA707XI-NS94
AMD Ryzen 9 7940HS, NVIDIA GeForce RTX 4070 Laptop GPU
49.4 fps -47%
Razer Blade 18 RTX 4070
Intel Core i9-13950HX, NVIDIA GeForce RTX 4070 Laptop GPU
46.6 fps -50%
X-Plane 11.11
1920x1080 high (fps_test=3)
Intel Core i7-14700K
Intel Core i7-14700K, NVIDIA GeForce RTX 4090
151.7 fps +8%
Alienware m18 R1
Intel Core i9-13980HX, NVIDIA GeForce RTX 4090 Laptop GPU
143.5 fps +2%
Alienware m18 R2
Intel Core i9-14900HX, NVIDIA GeForce RTX 4090 Laptop GPU
140.6 fps
Acer Predator Helios 18 N23Q2
Intel Core i9-13900HX, NVIDIA GeForce RTX 4080 Laptop GPU
139.5 fps -1%
Razer Blade 18 RTX 4070
Intel Core i9-13950HX, NVIDIA GeForce RTX 4070 Laptop GPU
137.9 fps -2%
Media NVIDIA GeForce RTX 4090 Laptop GPU
  (77.8 - 166.2, n=41)
131 fps -7%
MSI Titan 18 HX A14VIG
Intel Core i9-14900HX, NVIDIA GeForce RTX 4090 Laptop GPU
126.1 fps -10%
Asus ROG Strix G18 G814JI
Intel Core i7-13650HX, NVIDIA GeForce RTX 4070 Laptop GPU
112.6 fps -20%
Acer Nitro 17 AN17-51-71ER
Intel Core i7-13700H, NVIDIA GeForce RTX 4060 Laptop GPU
111.7 fps -21%
SCHENKER XMG Apex 17 (Late 23)
AMD Ryzen 7 7840HS, NVIDIA GeForce RTX 4060 Laptop GPU
88.2 fps -37%
Alienware m18 R1 AMD
AMD Ryzen 9 7945HX, AMD Radeon RX 7900M
83.7 fps -40%
Asus TUF Gaming A17 FA707XI-NS94
AMD Ryzen 9 7940HS, NVIDIA GeForce RTX 4070 Laptop GPU
80.7 fps -43%
Acer Nitro 17 AN17-41-R9LN
AMD Ryzen 7 7735HS, NVIDIA GeForce RTX 4070 Laptop GPU
78.4 fps -44%
3840x2160 high (fps_test=3)
Acer Predator Helios 18 N23Q2
Intel Core i9-13900HX, NVIDIA GeForce RTX 4080 Laptop GPU
143.7 fps +19%
Intel Core i7-14700K
Intel Core i7-14700K, NVIDIA GeForce RTX 4090
128.2 fps +6%
Alienware m18 R1
Intel Core i9-13980HX, NVIDIA GeForce RTX 4090 Laptop GPU
124 fps +3%
Alienware m18 R2
Intel Core i9-14900HX, NVIDIA GeForce RTX 4090 Laptop GPU
120.4 fps
Razer Blade 18 RTX 4070
Intel Core i9-13950HX, NVIDIA GeForce RTX 4070 Laptop GPU
117.7 fps -2%
Media NVIDIA GeForce RTX 4090 Laptop GPU
  (67.6 - 145.5, n=22)
113.3 fps -6%
MSI Titan 18 HX A14VIG
Intel Core i9-14900HX, NVIDIA GeForce RTX 4090 Laptop GPU
106.5 fps -12%
Asus TUF Gaming A17 FA707XI-NS94
AMD Ryzen 9 7940HS, NVIDIA GeForce RTX 4070 Laptop GPU
68.6 fps -43%
Alienware m18 R1 AMD
AMD Ryzen 9 7945HX, AMD Radeon RX 7900M
64.3 fps -47%
Far Cry 5
1920x1080 Ultra Preset AA:T
Alienware m18 R2
Intel Core i9-14900HX, NVIDIA GeForce RTX 4090 Laptop GPU
160 (124min) fps
Acer Predator Helios 18 N23Q2
Intel Core i9-13900HX, NVIDIA GeForce RTX 4080 Laptop GPU
158 fps -1%
MSI Titan 18 HX A14VIG
Intel Core i9-14900HX, NVIDIA GeForce RTX 4090 Laptop GPU
155 (116min) fps -3%
Media NVIDIA GeForce RTX 4090 Laptop GPU
  (123 - 218, n=18)
154.4 fps -3%
Intel Core i7-14700K
Intel Core i7-14700K, NVIDIA GeForce RTX 4090
154 (115min) fps -4%
Asus ROG Strix G18 G814JI
Intel Core i7-13650HX, NVIDIA GeForce RTX 4070 Laptop GPU
144 (105min) fps -10%
Acer Nitro 17 AN17-51-71ER
Intel Core i7-13700H, NVIDIA GeForce RTX 4060 Laptop GPU
142 (115min) fps -11%
SCHENKER XMG Apex 17 (Late 23)
AMD Ryzen 7 7840HS, NVIDIA GeForce RTX 4060 Laptop GPU
130 (100min) fps -19%
Alienware m18 R1 AMD
AMD Ryzen 9 7945HX, AMD Radeon RX 7900M
128 (92min) fps -20%
Asus TUF Gaming A17 FA707XI-NS94
AMD Ryzen 9 7940HS, NVIDIA GeForce RTX 4070 Laptop GPU
121 (96min) fps -24%
2560x1440 Ultra Preset AA:T
Acer Predator Helios 18 N23Q2
Intel Core i9-13900HX, NVIDIA GeForce RTX 4080 Laptop GPU
155 fps +1%
Intel Core i7-14700K
Intel Core i7-14700K, NVIDIA GeForce RTX 4090
155 (118min) fps +1%
Alienware m18 R2
Intel Core i9-14900HX, NVIDIA GeForce RTX 4090 Laptop GPU
154 (113min) fps
MSI Titan 18 HX A14VIG
Intel Core i9-14900HX, NVIDIA GeForce RTX 4090 Laptop GPU
152 (115min) fps -1%
Media NVIDIA GeForce RTX 4090 Laptop GPU
  (115 - 194, n=20)
150.3 fps -2%
Alienware m18 R1 AMD
AMD Ryzen 9 7945HX, AMD Radeon RX 7900M
123 (89min) fps -20%
Asus TUF Gaming A17 FA707XI-NS94
AMD Ryzen 9 7940HS, NVIDIA GeForce RTX 4070 Laptop GPU
114 (87min) fps -26%
SCHENKER XMG Apex 17 (Late 23)
AMD Ryzen 7 7840HS, NVIDIA GeForce RTX 4060 Laptop GPU
106 (96min) fps -31%
Acer Nitro 17 AN17-51-71ER
Intel Core i7-13700H, NVIDIA GeForce RTX 4060 Laptop GPU
101 (91min) fps -34%
3840x2160 Ultra Preset AA:T
Intel Core i7-14700K
Intel Core i7-14700K, NVIDIA GeForce RTX 4090
152 (118min) fps +36%
MSI Titan 18 HX A14VIG
Intel Core i9-14900HX, NVIDIA GeForce RTX 4090 Laptop GPU
112 (102min) fps 0%
Alienware m18 R2
Intel Core i9-14900HX, NVIDIA GeForce RTX 4090 Laptop GPU
112 (100min) fps
Media NVIDIA GeForce RTX 4090 Laptop GPU
  (75 - 113, n=11)
104.6 fps -7%
Alienware m18 R1 AMD
AMD Ryzen 9 7945HX, AMD Radeon RX 7900M
103 (91min) fps -8%
Asus TUF Gaming A17 FA707XI-NS94
AMD Ryzen 9 7940HS, NVIDIA GeForce RTX 4070 Laptop GPU
62 (54min) fps -45%
Dota 2 Reborn - 3840x2160 ultra (3/3) best looking
Intel Core i7-14700K
Intel Core i7-14700K, NVIDIA GeForce RTX 4090
198.1 (161.6min) fps +23%
Alienware m18 R1
Intel Core i9-13980HX, NVIDIA GeForce RTX 4090 Laptop GPU
190.2 (152.2min) fps +18%
Media NVIDIA GeForce RTX 4090 Laptop GPU
  (120.2 - 205, n=23)
169.4 fps +5%
MSI Titan 18 HX A14VIG
Intel Core i9-14900HX, NVIDIA GeForce RTX 4090 Laptop GPU
168.3 (143min) fps +5%
Alienware m18 R2
Intel Core i9-14900HX, NVIDIA GeForce RTX 4090 Laptop GPU
160.8 (134.2min) fps
Razer Blade 18 RTX 4070
Intel Core i9-13950HX, NVIDIA GeForce RTX 4070 Laptop GPU
145.5 (109.1min) fps -10%
Acer Predator Helios 18 N23Q2
Intel Core i9-13900HX, NVIDIA GeForce RTX 4080 Laptop GPU
131 (69.3min) fps -19%
Alienware m18 R1 AMD
AMD Ryzen 9 7945HX, AMD Radeon RX 7900M
122.5 (105.6min) fps -24%
Asus TUF Gaming A17 FA707XI-NS94
AMD Ryzen 9 7940HS, NVIDIA GeForce RTX 4070 Laptop GPU
112.2 (96.4min) fps -30%
Tiny Tina's Wonderlands
1920x1080 Badass Preset (DX12)
Intel Core i7-14700K
Intel Core i7-14700K, NVIDIA GeForce RTX 4090
277 fps +48%
Alienware m18 R1
Intel Core i9-13980HX, NVIDIA GeForce RTX 4090 Laptop GPU
187.7 fps 0%
Alienware m18 R2
Intel Core i9-14900HX, NVIDIA GeForce RTX 4090 Laptop GPU
187.5 fps
MSI Titan 18 HX A14VIG
Intel Core i9-14900HX, NVIDIA GeForce RTX 4090 Laptop GPU
182 fps -3%
Media NVIDIA GeForce RTX 4090 Laptop GPU
  (141.1 - 189.4, n=14)
174.3 fps -7%
Alienware m18 R1 AMD
AMD Ryzen 9 7945HX, AMD Radeon RX 7900M
150.2 fps -20%
Asus TUF Gaming A17 FA707XI-NS94
AMD Ryzen 9 7940HS, NVIDIA GeForce RTX 4070 Laptop GPU
109.4 fps -42%
2560x1440 Badass Preset (DX12)
Intel Core i7-14700K
Intel Core i7-14700K, NVIDIA GeForce RTX 4090
223 fps +68%
Alienware m18 R1
Intel Core i9-13980HX, NVIDIA GeForce RTX 4090 Laptop GPU
133.8 fps +1%
Alienware m18 R2
Intel Core i9-14900HX, NVIDIA GeForce RTX 4090 Laptop GPU
132.8 fps
MSI Titan 18 HX A14VIG
Intel Core i9-14900HX, NVIDIA GeForce RTX 4090 Laptop GPU
130.8 fps -2%
Media NVIDIA GeForce RTX 4090 Laptop GPU
  (103.4 - 137.8, n=14)
126.3 fps -5%
Alienware m18 R1 AMD
AMD Ryzen 9 7945HX, AMD Radeon RX 7900M
106.8 fps -20%
Asus TUF Gaming A17 FA707XI-NS94
AMD Ryzen 9 7940HS, NVIDIA GeForce RTX 4070 Laptop GPU
75.6 fps -43%
3840x2160 Badass Preset (DX12)
Intel Core i7-14700K
Intel Core i7-14700K, NVIDIA GeForce RTX 4090
127.9 fps +80%
Alienware m18 R1
Intel Core i9-13980HX, NVIDIA GeForce RTX 4090 Laptop GPU
71.3 fps 0%
Alienware m18 R2
Intel Core i9-14900HX, NVIDIA GeForce RTX 4090 Laptop GPU
71.2 fps
MSI Titan 18 HX A14VIG
Intel Core i9-14900HX, NVIDIA GeForce RTX 4090 Laptop GPU
71 fps 0%
Media NVIDIA GeForce RTX 4090 Laptop GPU
  (53.3 - 73.7, n=12)
68 fps -4%
Alienware m18 R1 AMD
AMD Ryzen 9 7945HX, AMD Radeon RX 7900M
56 fps -21%
Asus TUF Gaming A17 FA707XI-NS94
AMD Ryzen 9 7940HS, NVIDIA GeForce RTX 4070 Laptop GPU
35.5 fps -50%
F1 22
1920x1080 High Preset AA:T AF:16x
Intel Core i7-14700K
Intel Core i7-14700K, NVIDIA GeForce RTX 4090
351 (242min, 180P1) fps +27%
Alienware m18 R1
Intel Core i9-13980HX, NVIDIA GeForce RTX 4090 Laptop GPU
318 (231min, 173P1) fps +15%
Alienware m18 R1 AMD
AMD Ryzen 9 7945HX, AMD Radeon RX 7900M
296 (178min, 58P1) fps +7%
MSI Titan 18 HX A14VIG
Intel Core i9-14900HX, NVIDIA GeForce RTX 4090 Laptop GPU
280 (204min, 121P1) fps +1%
Alienware m18 R2
Intel Core i9-14900HX, NVIDIA GeForce RTX 4090 Laptop GPU
276 (204min, 115P1) fps
Media NVIDIA GeForce RTX 4090 Laptop GPU
  (199 - 322, n=19)
271 fps -2%
Asus TUF Gaming A17 FA707XI-NS94
AMD Ryzen 9 7940HS, NVIDIA GeForce RTX 4070 Laptop GPU
210 (167min, 128P1) fps -24%
Acer Nitro 17 AN17-51-71ER
Intel Core i7-13700H, NVIDIA GeForce RTX 4060 Laptop GPU
198.4 (168min, 115P1) fps -28%
1920x1080 Ultra High Preset AA:T AF:16x
Intel Core i7-14700K
Intel Core i7-14700K, NVIDIA GeForce RTX 4090
187 (149min, 119P1) fps +38%
Alienware m18 R1
Intel Core i9-13980HX, NVIDIA GeForce RTX 4090 Laptop GPU
144.7 (124min, 94P1) fps +7%
Alienware m18 R2
Intel Core i9-14900HX, NVIDIA GeForce RTX 4090 Laptop GPU
135.1 (113min, 61P1) fps
MSI Titan 18 HX A14VIG
Intel Core i9-14900HX, NVIDIA GeForce RTX 4090 Laptop GPU
132.7 (106min, 57P1) fps -2%
Media NVIDIA GeForce RTX 4090 Laptop GPU
  (70.3 - 144.7, n=25)
125.3 fps -7%
Alienware m18 R1 AMD
AMD Ryzen 9 7945HX, AMD Radeon RX 7900M
102.8 (73min, 73P1) fps -24%
Asus TUF Gaming A17 FA707XI-NS94
AMD Ryzen 9 7940HS, NVIDIA GeForce RTX 4070 Laptop GPU
83.8 (73min, 65P1) fps -38%
Acer Nitro 17 AN17-51-71ER
Intel Core i7-13700H, NVIDIA GeForce RTX 4060 Laptop GPU
64.2 (52min, 38P1) fps -52%
2560x1440 Ultra High Preset AA:T AF:16x
Intel Core i7-14700K
Intel Core i7-14700K, NVIDIA GeForce RTX 4090
151.1 (130min, 105P1) fps +65%
Alienware m18 R1
Intel Core i9-13980HX, NVIDIA GeForce RTX 4090 Laptop GPU
92.2 (79min, 74P1) fps +1%
Alienware m18 R2
Intel Core i9-14900HX, NVIDIA GeForce RTX 4090 Laptop GPU
91.4 (78min, 71P1) fps
MSI Titan 18 HX A14VIG
Intel Core i9-14900HX, NVIDIA GeForce RTX 4090 Laptop GPU
90.5 (78min, 71P1) fps -1%
Media NVIDIA GeForce RTX 4090 Laptop GPU
  (65.9 - 92.2, n=25)
86.1 fps -6%
Alienware m18 R1 AMD
AMD Ryzen 9 7945HX, AMD Radeon RX 7900M
69.3 (37min, 49P1) fps -24%
Asus TUF Gaming A17 FA707XI-NS94
AMD Ryzen 9 7940HS, NVIDIA GeForce RTX 4070 Laptop GPU
54.7 (47min, 46P1) fps -40%
Acer Nitro 17 AN17-51-71ER
Intel Core i7-13700H, NVIDIA GeForce RTX 4060 Laptop GPU
40.9 (31min, 29P1) fps -55%
3840x2160 Ultra High Preset AA:T AF:16x
Intel Core i7-14700K
Intel Core i7-14700K, NVIDIA GeForce RTX 4090
82.3 (71min, 70P1) fps +81%
Alienware m18 R1
Intel Core i9-13980HX, NVIDIA GeForce RTX 4090 Laptop GPU
45.5 (38min, 37P1) fps 0%
Alienware m18 R2
Intel Core i9-14900HX, NVIDIA GeForce RTX 4090 Laptop GPU
45.4 (38min, 37P1) fps
MSI Titan 18 HX A14VIG
Intel Core i9-14900HX, NVIDIA GeForce RTX 4090 Laptop GPU
44.6 (38min, 36P1) fps -2%
Media NVIDIA GeForce RTX 4090 Laptop GPU
  (36.8 - 46.1, n=18)
44.1 fps -3%
Alienware m18 R1 AMD
AMD Ryzen 9 7945HX, AMD Radeon RX 7900M
36.1 (24min, 25P1) fps -20%
Asus TUF Gaming A17 FA707XI-NS94
AMD Ryzen 9 7940HS, NVIDIA GeForce RTX 4070 Laptop GPU
26.5 (22min, 21P1) fps -42%
Cyberpunk 2077 2.0 Phantom Liberty
1920x1080 Ultra Preset (FSR off)
Intel Core i7-14700K
Intel Core i7-14700K, NVIDIA GeForce RTX 4090
166.3 (45.2min) fps +24%
Alienware m18 R2
Intel Core i9-14900HX, NVIDIA GeForce RTX 4090 Laptop GPU
133.9 (67.5min) fps
MSI Titan 18 HX A14VIG
Intel Core i9-14900HX, NVIDIA GeForce RTX 4090 Laptop GPU
129.8 (26.2min) fps -3%
Alienware m18 R1 AMD
AMD Ryzen 9 7945HX, AMD Radeon RX 7900M
129.6 (54.1min) fps -3%
Acer Predator Helios 18 N23Q2
Intel Core i9-13900HX, NVIDIA GeForce RTX 4080 Laptop GPU
127.13 (30.07min) fps -5%
Media NVIDIA GeForce RTX 4090 Laptop GPU
  (95.4 - 144.7, n=13)
122.7 fps -8%
Asus TUF Gaming A17 FA707XI-NS94
AMD Ryzen 9 7940HS, NVIDIA GeForce RTX 4070 Laptop GPU
86.3 (61.1min) fps -36%
2560x1440 Ultra Preset (FSR off)
Intel Core i7-14700K
Intel Core i7-14700K, NVIDIA GeForce RTX 4090
144.8 (80.6min) fps +54%
MSI Titan 18 HX A14VIG
Intel Core i9-14900HX, NVIDIA GeForce RTX 4090 Laptop GPU
94.5 (50.3min) fps 0%
Alienware m18 R2
Intel Core i9-14900HX, NVIDIA GeForce RTX 4090 Laptop GPU
94.1 (57.3min) fps
Media NVIDIA GeForce RTX 4090 Laptop GPU
  (83.4 - 103.9, n=13)
91.4 fps -3%
Alienware m18 R1 AMD
AMD Ryzen 9 7945HX, AMD Radeon RX 7900M
85.2 (59.4min) fps -9%
Acer Predator Helios 18 N23Q2
Intel Core i9-13900HX, NVIDIA GeForce RTX 4080 Laptop GPU
77.03 fps -18%
Asus TUF Gaming A17 FA707XI-NS94
AMD Ryzen 9 7940HS, NVIDIA GeForce RTX 4070 Laptop GPU
51.8 (39.2min) fps -45%
3840x2160 Ultra Preset (FSR off)
Intel Core i7-14700K
Intel Core i7-14700K, NVIDIA GeForce RTX 4090
71.8 (35.3min) fps +65%
MSI Titan 18 HX A14VIG
Intel Core i9-14900HX, NVIDIA GeForce RTX 4090 Laptop GPU
43.9 (27.1min) fps +1%
Media NVIDIA GeForce RTX 4090 Laptop GPU
  (37.4 - 50.6, n=7)
43.6 fps 0%
Alienware m18 R2
Intel Core i9-14900HX, NVIDIA GeForce RTX 4090 Laptop GPU
43.4 (30.4min) fps
Alienware m18 R1 AMD
AMD Ryzen 9 7945HX, AMD Radeon RX 7900M
37.7 (28.5min) fps -13%
Asus TUF Gaming A17 FA707XI-NS94
AMD Ryzen 9 7940HS, NVIDIA GeForce RTX 4070 Laptop GPU
22.3 (17.8min) fps -49%
1920x1080 Ray Tracing Ultra Preset (DLSS off)
Intel Core i7-14700K
Intel Core i7-14700K, NVIDIA GeForce RTX 4090
119.8 (13.9min) fps +68%
MSI Titan 18 HX A14VIG
Intel Core i9-14900HX, NVIDIA GeForce RTX 4090 Laptop GPU
73.6 (31.6min) fps +4%
Media NVIDIA GeForce RTX 4090 Laptop GPU
  (65.5 - 75.5, n=8)
71.5 fps +1%
Alienware m18 R2
Intel Core i9-14900HX, NVIDIA GeForce RTX 4090 Laptop GPU
71.1 (19.3min) fps
Asus TUF Gaming A17 FA707XI-NS94
AMD Ryzen 9 7940HS, NVIDIA GeForce RTX 4070 Laptop GPU
43.6 (33.4min) fps -39%
Alienware m18 R1 AMD
AMD Ryzen 9 7945HX, AMD Radeon RX 7900M
42.5 (32.6min) fps -40%
Strange Brigade
1920x1080 ultra AA:ultra AF:16
Intel Core i7-14700K
Intel Core i7-14700K, NVIDIA GeForce RTX 4090
463 (215min, 337P1) fps +25%
MSI Titan 18 HX A14VIG
Intel Core i9-14900HX, NVIDIA GeForce RTX 4090 Laptop GPU
385 (27.2min, 274P1) fps +4%
Alienware m18 R1
Intel Core i9-13980HX, NVIDIA GeForce RTX 4090 Laptop GPU
373 (73.3min, 273P1) fps +1%
Alienware m18 R2
Intel Core i9-14900HX, NVIDIA GeForce RTX 4090 Laptop GPU
369 (31.4min, 266P1) fps
Media NVIDIA GeForce RTX 4090 Laptop GPU
  (233 - 421, n=34)
355 fps -4%
Alienware m18 R1 AMD
AMD Ryzen 9 7945HX, AMD Radeon RX 7900M
344 (145.8min, 227P1) fps -7%
Acer Predator Helios 18 N23Q2
Intel Core i9-13900HX, NVIDIA GeForce RTX 4080 Laptop GPU
339 (38.9min, 245P1) fps -8%
Asus TUF Gaming A17 FA707XI-NS94
AMD Ryzen 9 7940HS, NVIDIA GeForce RTX 4070 Laptop GPU
214 (24.3min, 160.5P1) fps -42%
Asus ROG Strix G18 G814JI
Intel Core i7-13650HX, NVIDIA GeForce RTX 4070 Laptop GPU
209 (45min, 152.5P1) fps -43%
Razer Blade 18 RTX 4070
Intel Core i9-13950HX, NVIDIA GeForce RTX 4070 Laptop GPU
208 (39.5min, 154.8P1) fps -44%
Acer Nitro 17 AN17-51-71ER
Intel Core i7-13700H, NVIDIA GeForce RTX 4060 Laptop GPU
195.2 (34.4min, 140.1P1) fps -47%
Acer Nitro 17 AN17-41-R9LN
AMD Ryzen 7 7735HS, NVIDIA GeForce RTX 4070 Laptop GPU
195 (53.9min, 148.4P1) fps -47%
SCHENKER XMG Apex 17 (Late 23)
AMD Ryzen 7 7840HS, NVIDIA GeForce RTX 4060 Laptop GPU
190.1 (115.3min, 138.9P1) fps -48%
2560x1440 ultra AA:ultra AF:16
Intel Core i7-14700K
Intel Core i7-14700K, NVIDIA GeForce RTX 4090
454 (24.1min, 335P1) fps +47%
Alienware m18 R2
Intel Core i9-14900HX, NVIDIA GeForce RTX 4090 Laptop GPU
309 (45.6min, 236P1) fps
Alienware m18 R1
Intel Core i9-13980HX, NVIDIA GeForce RTX 4090 Laptop GPU
308 (67.2min, 238P1) fps 0%
MSI Titan 18 HX A14VIG
Intel Core i9-14900HX, NVIDIA GeForce RTX 4090 Laptop GPU
307 (102.6min, 235P1) fps -1%
Media NVIDIA GeForce RTX 4090 Laptop GPU
  (217 - 322, n=33)
288 fps -7%
Alienware m18 R1 AMD
AMD Ryzen 9 7945HX, AMD Radeon RX 7900M
249 (137.9min, 183.7P1) fps -19%
Acer Predator Helios 18 N23Q2
Intel Core i9-13900HX, NVIDIA GeForce RTX 4080 Laptop GPU
238 (38.1min, 184.1P1) fps -23%
Asus TUF Gaming A17 FA707XI-NS94
AMD Ryzen 9 7940HS, NVIDIA GeForce RTX 4070 Laptop GPU
139.3 (38.8min, 114.7P1) fps -55%
Razer Blade 18 RTX 4070
Intel Core i9-13950HX, NVIDIA GeForce RTX 4070 Laptop GPU
136.7 (54.8min, 112.1P1) fps -56%
Acer Nitro 17 AN17-51-71ER
Intel Core i7-13700H, NVIDIA GeForce RTX 4060 Laptop GPU
129.3 (59.9min, 102.7P1) fps -58%
SCHENKER XMG Apex 17 (Late 23)
AMD Ryzen 7 7840HS, NVIDIA GeForce RTX 4060 Laptop GPU
126.9 (95.1min, 103.6P1) fps -59%
3840x2160 ultra AA:ultra AF:16
Intel Core i7-14700K
Intel Core i7-14700K, NVIDIA GeForce RTX 4090
273 (58.6min, 221P1) fps +70%
Alienware m18 R2
Intel Core i9-14900HX, NVIDIA GeForce RTX 4090 Laptop GPU
160.2 (49.6min, 139.3P1) fps
Alienware m18 R1
Intel Core i9-13980HX, NVIDIA GeForce RTX 4090 Laptop GPU
159.8 (133.4min, 139.2P1) fps 0%
MSI Titan 18 HX A14VIG
Intel Core i9-14900HX, NVIDIA GeForce RTX 4090 Laptop GPU
156.1 (44.7min, 132P1) fps -3%
Media NVIDIA GeForce RTX 4090 Laptop GPU
  (126.3 - 298, n=22)
151.5 fps -5%
Alienware m18 R1 AMD
AMD Ryzen 9 7945HX, AMD Radeon RX 7900M
130.5 (79.1min, 110.9P1) fps -19%
Asus TUF Gaming A17 FA707XI-NS94
AMD Ryzen 9 7940HS, NVIDIA GeForce RTX 4070 Laptop GPU
72.6 (27.3min, 59.7P1) fps -55%
Razer Blade 18 RTX 4070
Intel Core i9-13950HX, NVIDIA GeForce RTX 4070 Laptop GPU
71.9 (29.8min, 61.4P1) fps -55%

Witcher 3 FPS Chart

0153045607590105120135150165180195Tooltip
Alienware m18 R2 i9-14900HX, NVIDIA GeForce RTX 4090 Laptop GPU: Ø196.9 (185-209)
basso medio alto ultraQHD4K DLSS4K
GTA V (2015) 185.2 181.6 179.6 137 134.7 174.9
The Witcher 3 (2015) 585.5 525.8 405.6 205.7 157.7
Dota 2 Reborn (2015) 217 190.1 181.5 171.8 160.8
Final Fantasy XV Benchmark (2018) 229 199.2 193.2 160.1 93.8
X-Plane 11.11 (2018) 201 180.1 140.6 120.4
Far Cry 5 (2018) 181 171 160 154 112
Strange Brigade (2018) 471 387 383 369 309 160.2
Tiny Tina's Wonderlands (2022) 348.6 285.3 227.2 187.5 132.8 71.2
F1 22 (2022) 305 295 276 135.1 91.4 45.4
Baldur's Gate 3 (2023) 246.9 222.5 206.7 202 151.6 81.7
Cyberpunk 2077 2.0 Phantom Liberty (2023) 149.3 148.7 142.9 133.9 94.1 43.4
Assassin's Creed Mirage (2023) 230 215 205 160 135 110 81
Alan Wake 2 (2023) 124.6 121.4 116.9 83.1 62.3 45.2
Call of Duty Modern Warfare 3 2023 (2023) 276 255 220 205 160 113 106
Avatar Frontiers of Pandora (2023) 162 150 131 103 70 63 36

Emissioni

Rumore del sistema

Non ci sono cambiamenti importanti nel comportamento del rumore della ventola. La cosa più importante da tenere a mente è che il rumore della ventola è leggermente più forte nelle modalità Performance e Overdrive rispetto alla modalità Bilanciata, anche se le prestazioni complessive sono generalmente le stesse tra le tre modalità. Ciò significa che può giocare in modalità Bilanciata o Performance per un'esperienza più silenziosa, senza dover sacrificare prestazioni di gioco significative. La modalità Overdrive dovrebbe invece essere riservata a scopi di overclocking.
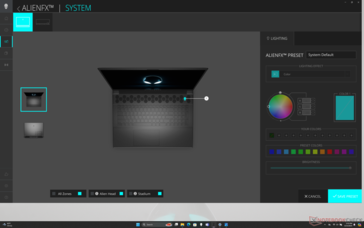
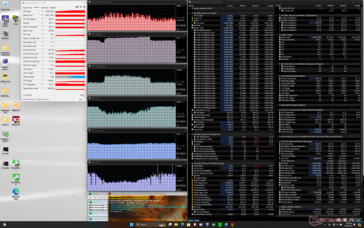
Profilo del rumore del ventilatore (Bianco: Sfondo, Rosso: Sistema inattivo, Blu: 3DMark 06, Arancione: Witcher 3 verde: Prime95+FurMark stress)

Rumorosità

Idle
23.8 / 26.1 / 31.5 dB(A)
Sotto carico
31.5 / 56.6 dB(A)
  red to green bar
 
 
30 dB
silenzioso
40 dB(A)
udibile
50 dB(A)
rumoroso
 
min: dark, med: mid, max: light   Earthworks M23R, Arta (15 cm di distanza)   Rumorosità ambientale: 23.6 dB(A)
dB(A) 0102030405060708090Deep BassMiddle BassHigh BassLower RangeMidsHigher MidsLower HighsMid HighsUpper HighsSuper Highs2035.530.63632.940.52529.324.723.323.228.33128.921.124.121.527.64026.723.527.420.628.85026.422.928.721.228.46331.328.128.228.432.48027.824.224.320.632.510028.322.421.418.630.412528.721.218.215.730.816030.420.517.413.83320033.322.2191536.225036.724.718.414.239.631536.924.418.414.840.940037.623.819.212.740.950038.52316.11241.463038.521.51410.942.980039.721.717.111.544.4100038.821.112.39.843.6125040.220.612.89.945.4160039.619.213.210.14520004019.413.310.445.5250040.122.312.211.145.5315038.31612.411.644.6400039.514.412.311.845.450004013.512.711.945.7630036.213.113.111.945.8800032.914.114.112.343.61000029.214.214.312.340.51250025.713.112.912.236.91600021.913.211.911.432.4SPL50.831.526.123.656.6N7.81.50.80.511.6median 37.6median 20.6median 14median 11.9median 42.9Delta4.642.61.15hearing rangehide median Fan NoiseAlienware m18 R2
Alienware m18 R2
NVIDIA GeForce RTX 4090 Laptop GPU, i9-14900HX, SK Hynix PC811 HFS002TEM9X152N
Alienware m18 R1 AMD
Radeon RX 7900M, R9 7945HX, Kioxia XG8 KXG80ZNV1T02
Alienware m18 R1
NVIDIA GeForce RTX 4090 Laptop GPU, i9-13980HX, SK hynix PC801 HFS001TEJ9X101N
MSI Titan 18 HX A14VIG
NVIDIA GeForce RTX 4090 Laptop GPU, i9-14900HX, 2x Samsung PM9A1a MZVL22T0HDLB (RAID 0)
Asus ROG Strix G18 G814JI
NVIDIA GeForce RTX 4070 Laptop GPU, i7-13650HX, Micron 2400 MTFDKBA1T0QFM
Acer Predator Helios 18 N23Q2
NVIDIA GeForce RTX 4080 Laptop GPU, i9-13900HX, Samsung PM9A1 MZVL22T0HBLB
Noise
1%
5%
-3%
-1%
-3%
off /ambiente *
23.6
22.4
5%
22.8
3%
22.8
3%
25
-6%
23
3%
Idle Minimum *
23.8
23
3%
23
3%
23.8
-0%
26
-9%
23
3%
Idle Average *
26.1
23.4
10%
23
12%
23.8
9%
28
-7%
23
12%
Idle Maximum *
31.5
33.5
-6%
23
27%
28
11%
29
8%
23
27%
Load Average *
31.5
33.5
-6%
35.6
-13%
38
-21%
41
-30%
45.26
-44%
Witcher 3 ultra *
52.1
53.6
-3%
51.3
2%
57.3
-10%
44
16%
59.82
-15%
Load Maximum *
56.6
53.6
5%
56.7
-0%
62.8
-11%
46
19%
59.94
-6%

* ... Meglio usare valori piccoli

Temperatura

Le temperature medie della superficie sono generalmente più fredde rispetto a quelle che abbiamo osservato sul Asus ROG Strix G18. I punti caldi sono relegati verso la parte posteriore del telaio per ridurre al minimo il contatto con la pelle.

Quattro serie di bocchette di scarico
Il nuovo adattatore CA è più piccolo rispetto a prima, ma può diventare molto più caldo, a oltre 54 C, durante il gioco
Carico massimo
 38 °C41.2 °C35 °C 
 33.6 °C36.4 °C33.4 °C 
 22 °C22 °C22.8 °C 
Massima: 41.2 °C
Media: 31.6 °C
31.2 °C32.4 °C31.6 °C
31 °C34.6 °C31.2 °C
23.4 °C24 °C23.4 °C
Massima: 34.6 °C
Media: 29.2 °C
Alimentazione (max)  45.4 °C | Temperatura della stanza 21 °C | Fluke 62 Mini IR Thermometer
(+) La temperatura media del lato superiore sotto carico massimo e' di 31.6 °C / 89 F, rispetto alla media di 33.8 °C / 93 F per i dispositivi di questa classe Gaming.
(±) La temperatura massima sul lato superiore è di 41.2 °C / 106 F, rispetto alla media di 40.4 °C / 105 F, che varia da 21.2 a 68.8 °C per questa classe Gaming.
(+) Il lato inferiore si riscalda fino ad un massimo di 34.6 °C / 94 F, rispetto alla media di 43.2 °C / 110 F
(±) In idle, la temperatura media del lato superiore è di 34.9 °C / 95 F, rispetto alla media deld ispositivo di 33.8 °C / 93 F.
(±) Riproducendo The Witcher 3, la temperatura media per il lato superiore e' di 32 °C / 90 F, rispetto alla media del dispositivo di 33.8 °C / 93 F.
(+) I poggiapolsi e il touchpad sono piu' freddi della temperatura della pelle con un massimo di 28.2 °C / 82.8 F e sono quindi freddi al tatto.
(±) La temperatura media della zona del palmo della mano di dispositivi simili e'stata di 28.9 °C / 84 F (+0.7 °C / 1.2 F).
Sistema inattivo (in alto)
Sistema inattivo (in basso)
Witcher 3 stress (in alto)
Witcher 3 stress (in basso)
Stress Prime95+FurMark (in alto)
Stress Prime95+FurMark (in basso)
Alienware m18 R2
Intel Core i9-14900HX, NVIDIA GeForce RTX 4090 Laptop GPU
Alienware m18 R1 AMD
AMD Ryzen 9 7945HX, AMD Radeon RX 7900M
Alienware m18 R1
Intel Core i9-13980HX, NVIDIA GeForce RTX 4090 Laptop GPU
MSI Titan 18 HX A14VIG
Intel Core i9-14900HX, NVIDIA GeForce RTX 4090 Laptop GPU
Asus ROG Strix G18 G814JI
Intel Core i7-13650HX, NVIDIA GeForce RTX 4070 Laptop GPU
Acer Predator Helios 18 N23Q2
Intel Core i9-13900HX, NVIDIA GeForce RTX 4080 Laptop GPU
Heat
13%
17%
9%
5%
-4%
Maximum Upper Side *
41.2
40.2
2%
39
5%
37.8
8%
45
-9%
35
15%
Maximum Bottom *
34.6
37.4
-8%
36.4
-5%
37.6
-9%
47
-36%
56
-62%
Idle Upper Side *
42.8
31.6
26%
29.2
32%
34.8
19%
28
35%
34
21%
Idle Bottom *
43.6
30.6
30%
27.8
36%
36
17%
31
29%
39
11%

* ... Meglio usare valori piccoli

Altoparlanti

Rumore rosa al massimo volume
dB(A) 0102030405060708090Deep BassMiddle BassHigh BassLower RangeMidsHigher MidsLower HighsMid HighsUpper HighsSuper Highs2032.63632.62522.123.322.13121.724.121.7402227.4225022.828.722.86324.528.224.58021.124.321.110021.321.421.312522.418.222.416038.417.438.420054.81954.82506518.46531565.418.465.440064.519.264.550066.616.166.663068.41468.480071.817.171.8100071.112.371.1125072.612.872.6160074.313.274.3200072.513.372.5250070.412.270.4315065.412.465.4400063.612.363.6500062.712.762.7630063.813.163.8800073.914.173.91000072.514.372.51250068.812.968.81600067.811.967.8SPL82.526.182.5N54.90.854.9median 66.6median 14median 66.6Delta8.12.68.126.325.821.422.12624.925.127.622.532.523.448.72655.818.860.922.167.2267019.372.317.674.217.774.319.575.31571.711.871.311.27410.574.21072.710.17210.67210.97511.374.811.671.71269.71269.612.371.112.669.61270.111.269.824.784.70.666.6median 12median 71.73.42.2hearing rangehide median Pink NoiseAlienware m18 R2Apple MacBook Pro 16 2021 M1 Pro
Diagramma frequenza (le caselle possono essere selezionate/deselezionate per confrontare i dispositivi)
Alienware m18 R2 analisi audio

(+) | gli altoparlanti sono relativamente potenti (82.5 dB)
Bassi 100 - 315 Hz
(-) | quasi nessun basso - in media 22.1% inferiori alla media
(±) | la linearità dei bassi è media (14% delta rispetto alla precedente frequenza)
Medi 400 - 2000 Hz
(+) | medi bilanciati - solo only 4.1% rispetto alla media
(+) | medi lineari (3.3% delta rispetto alla precedente frequenza)
Alti 2 - 16 kHz
(+) | Alti bilanciati - appena 4% dalla media
(+) | alti lineari (6.1% delta rispetto alla precedente frequenza)
Nel complesso 100 - 16.000 Hz
(±) | la linearità complessiva del suono è media (17% di differenza rispetto alla media
Rispetto alla stessa classe
» 42% di tutti i dispositivi testati in questa classe è stato migliore, 12% simile, 46% peggiore
» Il migliore ha avuto un delta di 6%, medio di 18%, peggiore di 132%
Rispetto a tutti i dispositivi testati
» 25% di tutti i dispositivi testati in questa classe è stato migliore, 7% similare, 67% peggiore
» Il migliore ha avuto un delta di 4%, medio di 25%, peggiore di 134%

Apple MacBook Pro 16 2021 M1 Pro analisi audio

(+) | gli altoparlanti sono relativamente potenti (84.7 dB)
Bassi 100 - 315 Hz
(+) | bassi buoni - solo 3.8% dalla media
(+) | bassi in lineaa (5.2% delta rispetto alla precedente frequenza)
Medi 400 - 2000 Hz
(+) | medi bilanciati - solo only 1.3% rispetto alla media
(+) | medi lineari (2.1% delta rispetto alla precedente frequenza)
Alti 2 - 16 kHz
(+) | Alti bilanciati - appena 1.9% dalla media
(+) | alti lineari (2.7% delta rispetto alla precedente frequenza)
Nel complesso 100 - 16.000 Hz
(+) | suono nel complesso lineare (4.6% differenza dalla media)
Rispetto alla stessa classe
» 0% di tutti i dispositivi testati in questa classe è stato migliore, 0% simile, 100% peggiore
» Il migliore ha avuto un delta di 5%, medio di 18%, peggiore di 45%
Rispetto a tutti i dispositivi testati
» 0% di tutti i dispositivi testati in questa classe è stato migliore, 0% similare, 100% peggiore
» Il migliore ha avuto un delta di 4%, medio di 25%, peggiore di 134%

Gestione dell'energia

Consumo di energia

In esecuzione Witcher 3 per rappresentare i carichi di gioco tipici, consumerebbe una media di 328 W, leggermente superiore a quella che abbiamo registrato sulla versione m18 R1 Intel dello scorso anno. Di conseguenza, non ci sono grandi guadagni in termini di prestazioni per watt, poiché l'hardware sottostante non è cambiato.

La novità di quest'anno è l'adattatore CA da 360 W di capacità superiore, mentre l'm18 R1 viene fornito con un adattatore da 330 W. Il nuovo adattatore è anche più piccolo (~18,9 x 8,6 x 2,6 cm contro ~19,5 x 9,8 x 4 cm) grazie al passaggio alla tecnologia GaN. L'adattatore di capacità superiore riduce le possibilità di throttling e consente una ricarica più rapida se si eseguono carichi impegnativi contemporaneamente.

(Nota dell'editore: questa sezione sarà aggiornata quando le riparazioni del nostro multimetro Metrahit Energy saranno completate. Ci scusiamo per l'inconveniente)

Consumo di corrente
 color bar
Leggenda: min: dark, med: mid, max: light        Metrahit Energy
Attualmente utilizziamo il Metrahit Energy, un multimetro digitale professionale per la misurazione della qualità della potenza e dell'energia monofase, per le nostre misurazioni.
Alienware m18 R2
i9-14900HX, NVIDIA GeForce RTX 4090 Laptop GPU, SK Hynix PC811 HFS002TEM9X152N, IPS, 2560x1600, 18.00
Alienware m18 R1 AMD
R9 7945HX, Radeon RX 7900M, Kioxia XG8 KXG80ZNV1T02, IPS, 1920x1200, 18.00
Alienware m18 R1
i9-13980HX, NVIDIA GeForce RTX 4090 Laptop GPU, SK hynix PC801 HFS001TEJ9X101N, IPS, 1920x1200, 18.00
MSI Titan 18 HX A14VIG
i9-14900HX, NVIDIA GeForce RTX 4090 Laptop GPU, 2x Samsung PM9A1a MZVL22T0HDLB (RAID 0), Mini-LED, 3840x2400, 18.00
Asus ROG Strix G18 G814JI
i7-13650HX, NVIDIA GeForce RTX 4070 Laptop GPU, Micron 2400 MTFDKBA1T0QFM, IPS, 2560x1600, 18.00
Acer Predator Helios 18 N23Q2
i9-13900HX, NVIDIA GeForce RTX 4080 Laptop GPU, Samsung PM9A1 MZVL22T0HBLB, IPS, 2560x1600, 18.00
Power Consumption
Idle Minimum *
30.3
21.6
13.2
8
16
Idle Average *
55.6
25.2
25.4
15
19
Idle Maximum *
101.1
56.7
53.5
26
21.3
Load Average *
160.3
164.1
151.4
102
124
Witcher 3 ultra *
216
311
336
178.6
289
Load Maximum *
332.1
338.9
395.2
267
319

* ... Meglio usare valori piccoli

Power Consumption Witcher 3 / Stresstest

020406080100120140160180200220240260280300320Tooltip
Alienware m18 R1 i9-13980HX, NVIDIA GeForce RTX 4090 Laptop GPU; Witcher 3 ultra: Ø311 (305-332)
Alienware m18 R1 i9-13980HX, NVIDIA GeForce RTX 4090 Laptop GPU; 1280x720 Prime95 28.10 and Furmark 1.25: Ø335 (326-339)
Alienware m18 R1 i9-13980HX, NVIDIA GeForce RTX 4090 Laptop GPU; Idle 150cd/m2: Ø24.9 (23.1-32.8)

Power Consumption external Monitor

020406080100120140160180200220240260280300320Tooltip
Alienware m18 R1 i9-13980HX, NVIDIA GeForce RTX 4090 Laptop GPU; Prime95 V2810 Stress (external Monitor): Ø262 (239-295)
Alienware m18 R1 i9-13980HX, NVIDIA GeForce RTX 4090 Laptop GPU; Cinebench R15 Multi (external Monitor): Ø291 (287-295)
Alienware m18 R1 i9-13980HX, NVIDIA GeForce RTX 4090 Laptop GPU; 1280x720 FurMark 1.19 GPU Stress Test (external Monitor): Ø264 (253-273)
Alienware m18 R1 i9-13980HX, NVIDIA GeForce RTX 4090 Laptop GPU; 1920x1080 The Witcher 3 ultra (external Monitor): Ø307 (301-330)
Alienware m18 R1 i9-13980HX, NVIDIA GeForce RTX 4090 Laptop GPU; Idle 1min (external Monitor): Ø23.2 (17.2-48.7)

Durata della batteria

I tempi di esecuzione rimangono più o meno gli stessi di prima, se non leggermente più lunghi di circa mezz'ora. Questo è in contrasto con la nostra configurazione m18 R1 AMD, che ha mostrato problemi di scaricamento della batteria durante i test.

La ricarica tramite USB-C non è ancora possibile.

Autonomia della batteria
WiFi Websurfing
4ore 50minuti
Alienware m18 R2
i9-14900HX, NVIDIA GeForce RTX 4090 Laptop GPU, 97 Wh
Alienware m18 R1 AMD
R9 7945HX, Radeon RX 7900M, 97 Wh
Alienware m18 R1
i9-13980HX, NVIDIA GeForce RTX 4090 Laptop GPU, 97 Wh
MSI Titan 18 HX A14VIG
i9-14900HX, NVIDIA GeForce RTX 4090 Laptop GPU, 99.9 Wh
Asus ROG Strix G18 G814JI
i7-13650HX, NVIDIA GeForce RTX 4070 Laptop GPU, 90 Wh
Acer Predator Helios 18 N23Q2
i9-13900HX, NVIDIA GeForce RTX 4080 Laptop GPU, 90 Wh
Autonomia della batteria
-71%
-10%
-13%
67%
-9%
WiFi v1.3
290
85
-71%
260
-10%
252
-13%
484
67%
264
-9%
Reader / Idle
268
334
353
702
Load
41
44
72
71
103
H.264
290

Pro

+ comoda tastiera meccanica a profilo ultra basso
+ grafica RTX da 175 W GeForce ad alte prestazioni
+ porta RJ-45 da 5 Gbps integrata
+ chassis rigido in metallo

Contro

- non ci sono vantaggi notevoli in termini di prestazioni rispetto al modello dello scorso anno
- il display presenta un moderato e irregolare effetto di retroilluminazione
- è più pesante di altri portatili da 18 pollici
- nessuna frequenza di aggiornamento variabile di Windows

Verdetto - Più simile a un Alienware m18 R1.1

Nella recensione: Alienware m18 R2

I portatili da gioco si trovano in una posizione difficile quest'anno. Le CPU Raptor Lake-HX refresh hanno prestazioni quasi identiche alle loro controparti 2023, mentre non è stato annunciato nulla di nuovo per soppiantare la RTX 4090 di un anno fa. Di conseguenza, i nuovi portatili da gioco come l'Alienware m18 R2 sono più o meno bloccati dall'utilizzo degli stessi componenti dei modelli dello scorso anno. Gli utenti del mercato di Alienware m18 R2 devono quindi aspettarsi livelli di prestazioni pari a quelli di Alienware m18 R1 Alienware m18 R1.

L'Alienware m18 R2 è un passo indietro rispetto all'Alienware m18 R1. È ancora uno dei portatili da gioco più veloci in circolazione, ma i miglioramenti rispetto all'anno precedente sono al massimo marginali.

Ci sono un paio di miglioramenti minori, come la porta RJ-45 più veloce, l'adattatore AC più piccolo e le nuove opzioni SSD, ma l'esperienza utente è essenzialmente la stessa. Consigliamo di prendere in considerazione l'm18 R1 prima dell'm18 R2, soprattutto perché l'm18 R1 è ora meno costoso.

Prezzo e disponibilità

Dell distribuisce ora l'Alienware m18 R2 a partire da 1900 dollari per la configurazione base con Core i7-14650HX, GeForce RTX 4060 e display 1600p165, fino a oltre 3200 dollari per la configurazione con Core i9-14900HX, RTX 4090 e display 1200p480.

Alienware m18 R2 - 03/22/2024 v7
Allen Ngo

Chassis
91 / 98 → 93%
Tastiera
91%
Dispositivo di puntamento
86%
Connettività
71 / 80 → 89%
Peso
50 / 10-66 → 72%
Batteria
63 / 95 → 66%
Display
85%
Prestazioni di gioco
100%
Prestazioni Applicazioni
98%
Temperatura
89 / 95 → 94%
Rumorosità
78 / 90 → 87%
Audio
80%
Fotocamera
44 / 85 → 51%
Media
79%
90%
Gaming - Media ponderata

Transparency

The present review sample was made available to the author as a loan by the manufacturer or a shop for the purposes of review. The lender had no influence on this review, nor did the manufacturer receive a copy of this review before publication. There was no obligation to publish this review.

Pricecompare

Please share our article, every link counts!
> Recensioni e prove di notebook, tablets e smartphones > Recensioni e prove > Recensioni e prove > Recensione del portatile Alienware m18 R2: Salto dal Core i9-13980HX all'i9-14900HX
Allen Ngo, 2024-03-23 (Update: 2024-03-23)