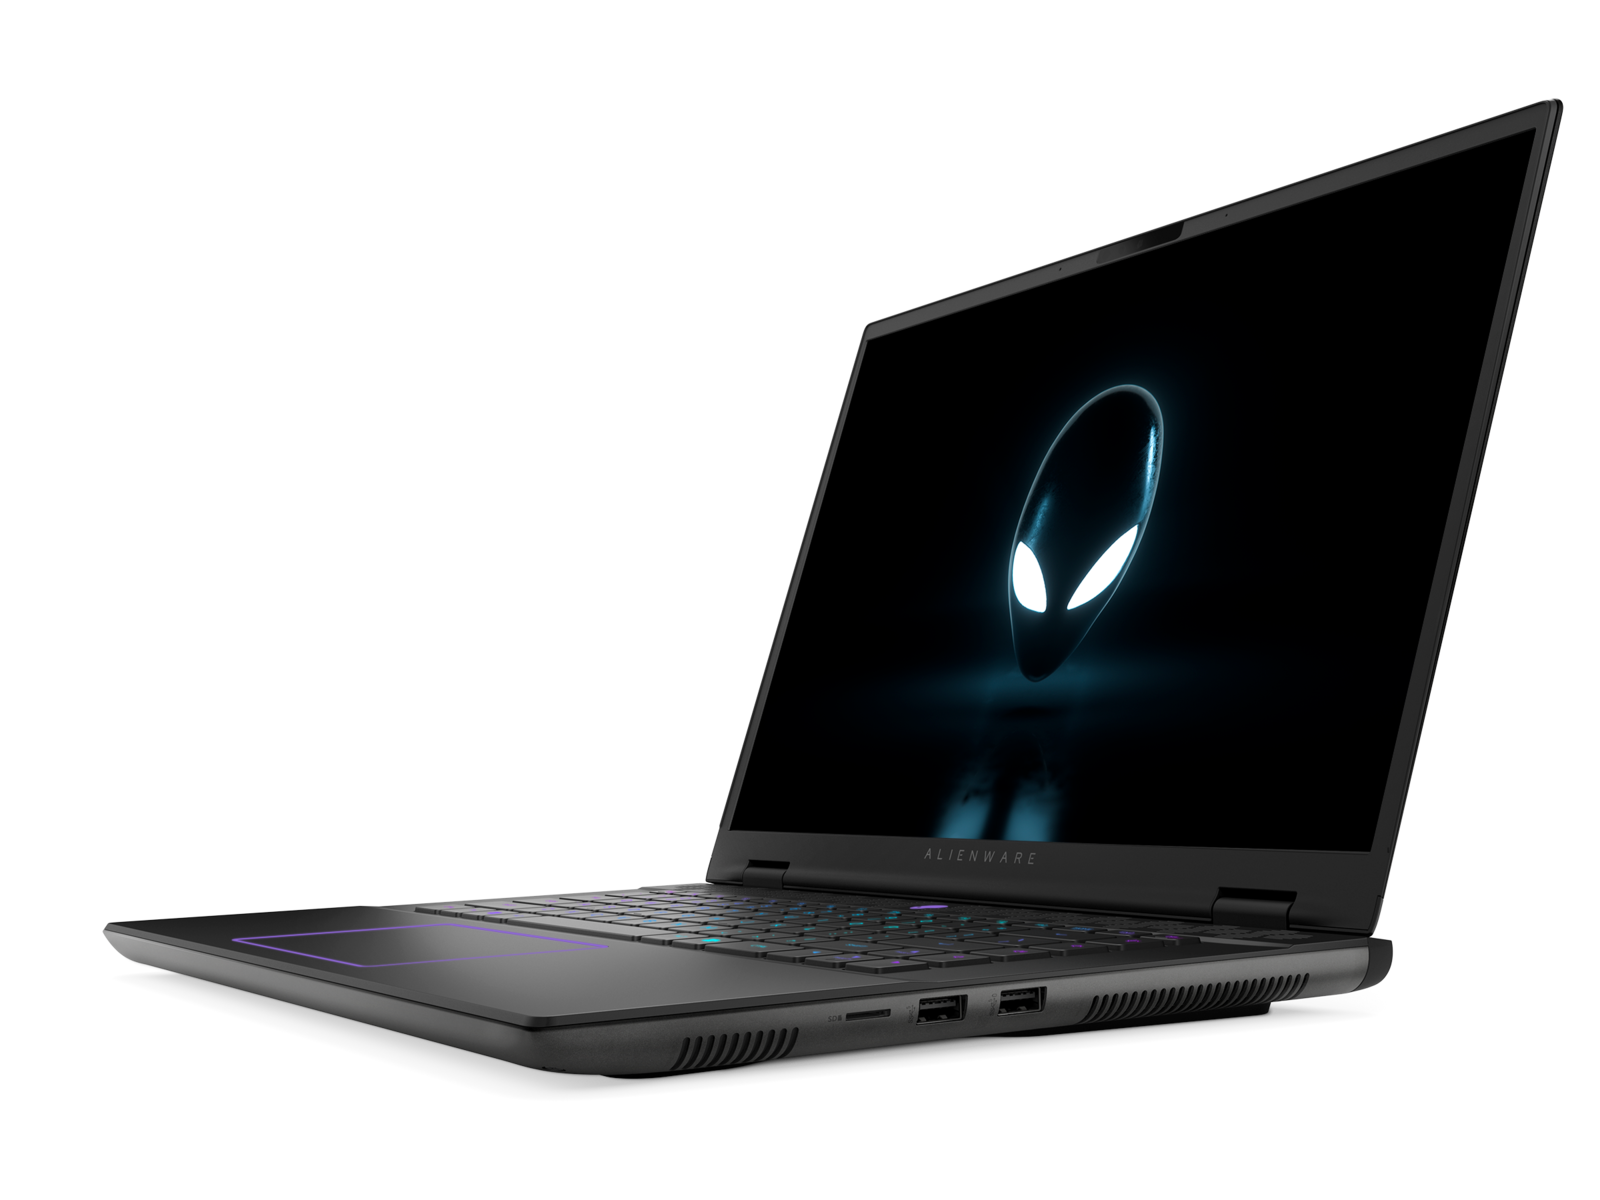
Recensione del computer portatile Alienware m16 R2: Cambiamenti grandi e rischiosi

L'Alienware m16 R2 succede al modello m16 R1ma non nel modo in cui ci si potrebbe aspettare. Il nuovo modello è una riprogettazione completa e un ripensamento della serie m16, nel tentativo di attrarre sia i giocatori che gli utenti generici, mentre gli altri prodotti Alienware sono rivolti ai giocatori hardcore. Già questo rende l'm16 R2 uno dei laptop Alienware più interessanti degli ultimi anni, poiché sacrifica alcune opzioni di CPU e GPU di fascia alta, altrimenti disponibili sull'm16 R1, a favore di un design più piccolo.
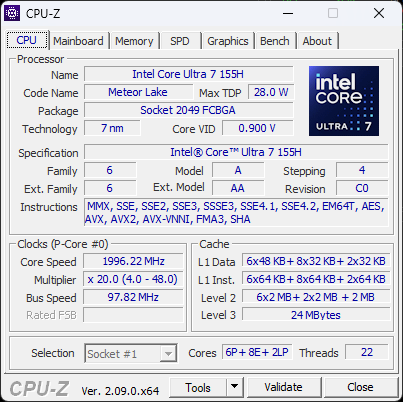
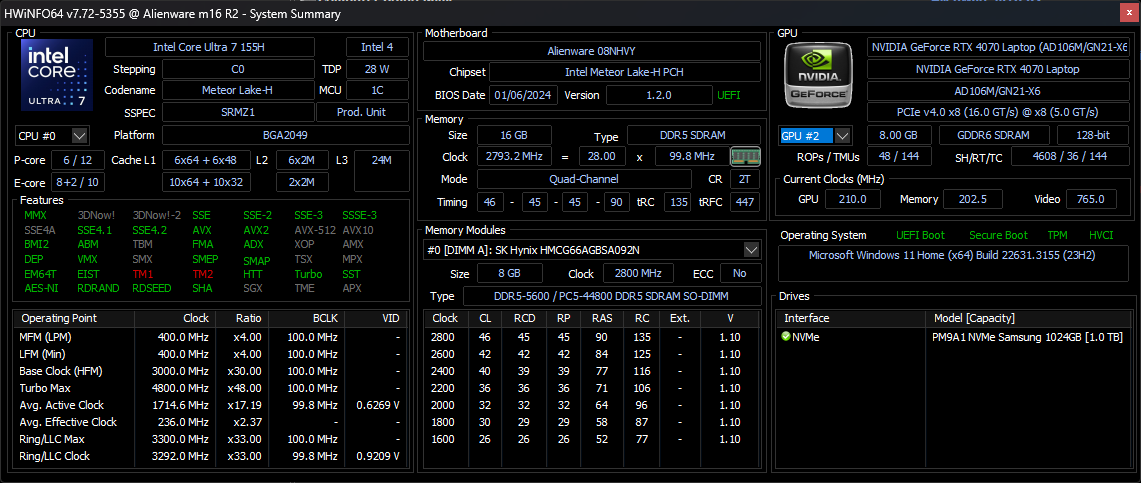
La nostra unità di recensione è una configurazione di fascia alta con CPU Meteor Lake-H Core Ultra 7 155H, GPU GeForce RTX 4070 e display IPS 1600p 240 Hz per circa 1850 dollari. Le SKU di fascia bassa possono essere configurate con RTX 4050 o 4060 e le SKU di fascia più alta includono il Core Ultra 9, ma tutte le configurazioni sono altrimenti limitate allo stesso display IPS da 1600p240 e alla sola RTX 4070.
Le alternative all'Alienware m16 R2 includono altri computer portatili da 16 pollici ad alte prestazioni come il Razer Blade 16, HP Omen Transcend 16, Asus ROG Zephyrus G16oppure Lenovo Legion Slim 7 16.
Altre recensioni di Alienware:
Potenziali concorrenti a confrontos
Punteggio | Data | Modello | Peso | Altezza | Dimensione | Risoluzione | Prezzo |
|---|---|---|---|---|---|---|---|
| 90.2 % v7 (old) | 03/2024 | Alienware m16 R2 Ultra 7 155H, GeForce RTX 4070 Laptop GPU | 2.5 kg | 23.5 mm | 16.00" | 2560x1600 | |
| 88.3 % v7 (old) | 09/2023 | Alienware m16 R1 Intel i7-13700HX, GeForce RTX 4060 Laptop GPU | 3 kg | 25.4 mm | 16.00" | 2560x1600 | |
| 88.4 % v7 (old) | 06/2023 | Alienware x16 R1 i9-13900HK, GeForce RTX 4080 Laptop GPU | 2.6 kg | 18.57 mm | 16.00" | 2560x1600 | |
| 88.4 % v7 (old) | 02/2024 | HP Omen Transcend 16-u1095ng i9-14900HX, GeForce RTX 4070 Laptop GPU | 2.3 kg | 20 mm | 16.00" | 2560x1600 | |
| 92.3 % v7 (old) | 02/2024 | Asus ROG Zephyrus G16 2024 GU605M Ultra 7 155H, GeForce RTX 4070 Laptop GPU | 1.8 kg | 16.4 mm | 16.00" | 2560x1600 | |
| 90.4 % v7 (old) | 11/2023 | Lenovo Legion Slim 7 16APH8 R7 7840HS, GeForce RTX 4060 Laptop GPU | 2.1 kg | 20 mm | 16.00" | 2560x1600 |
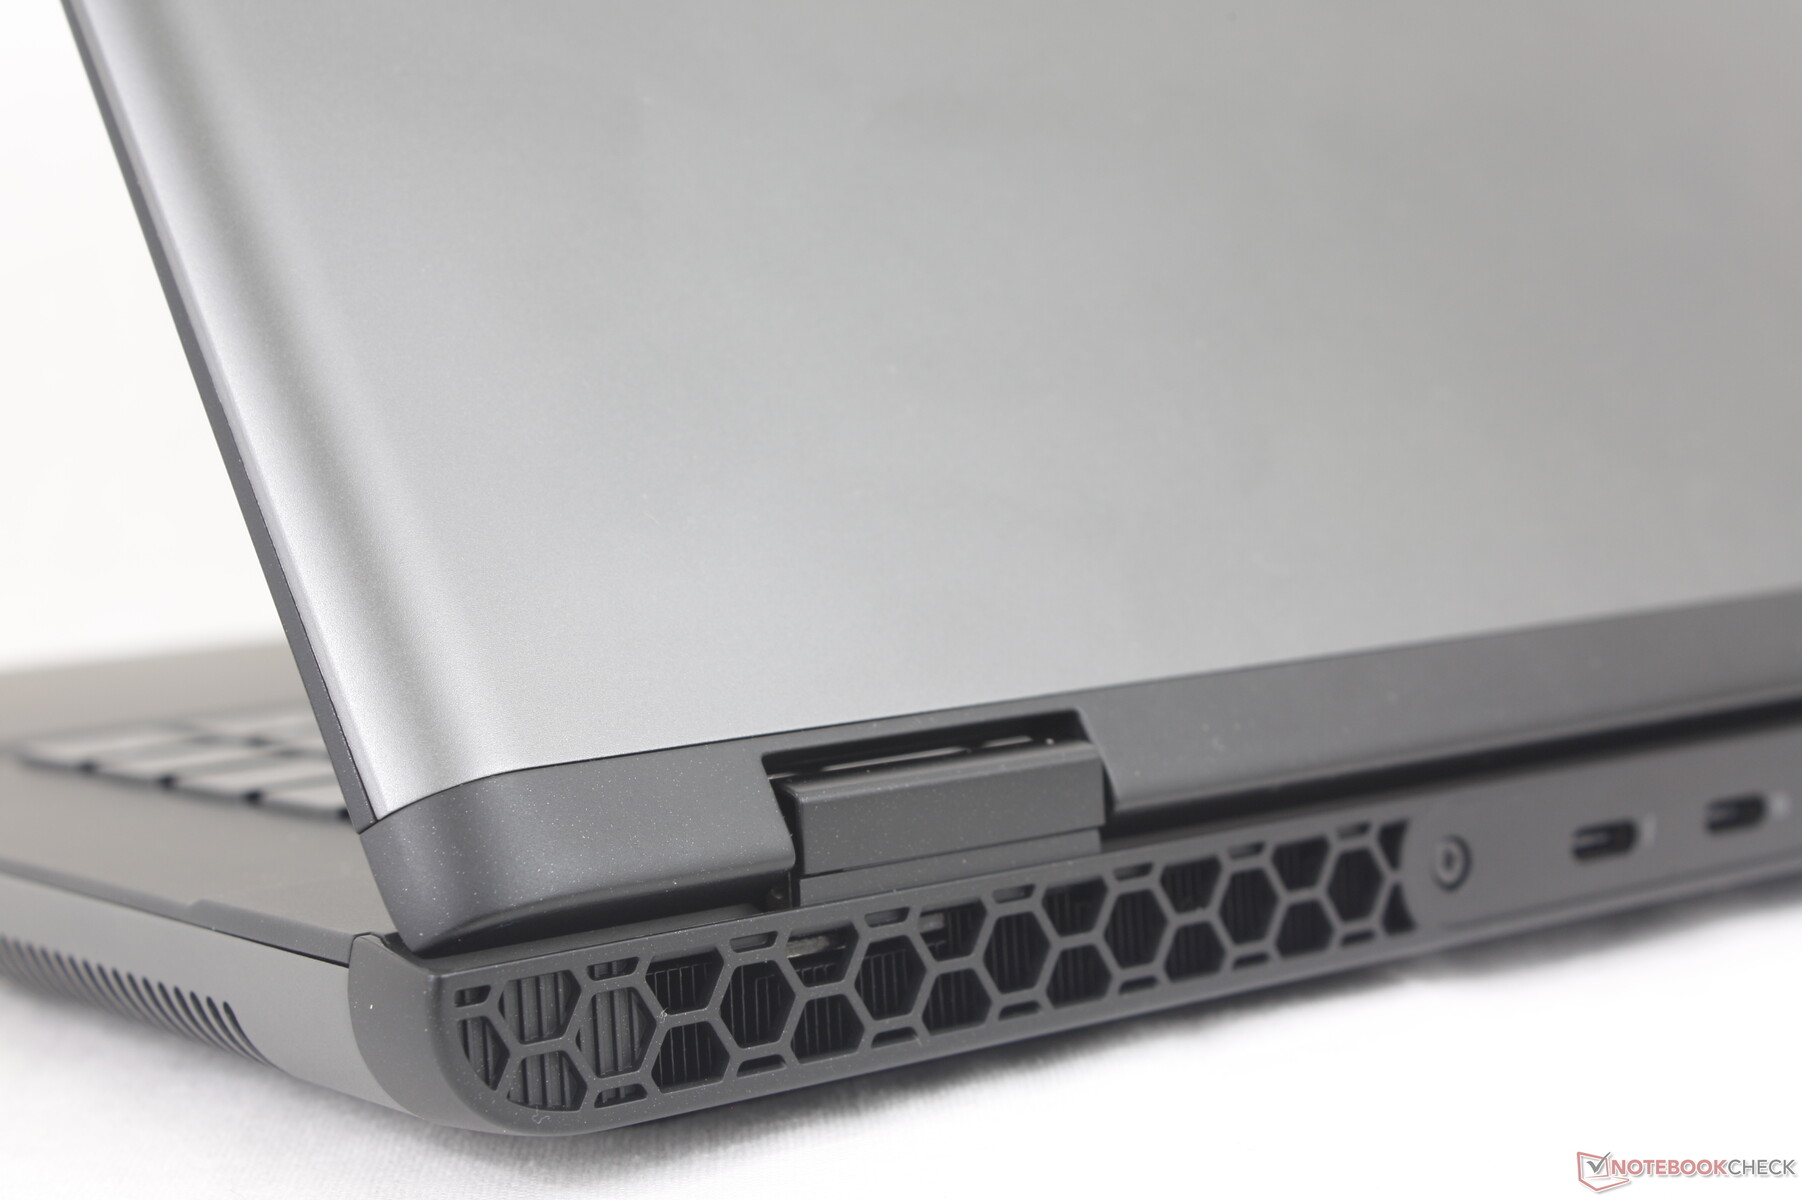
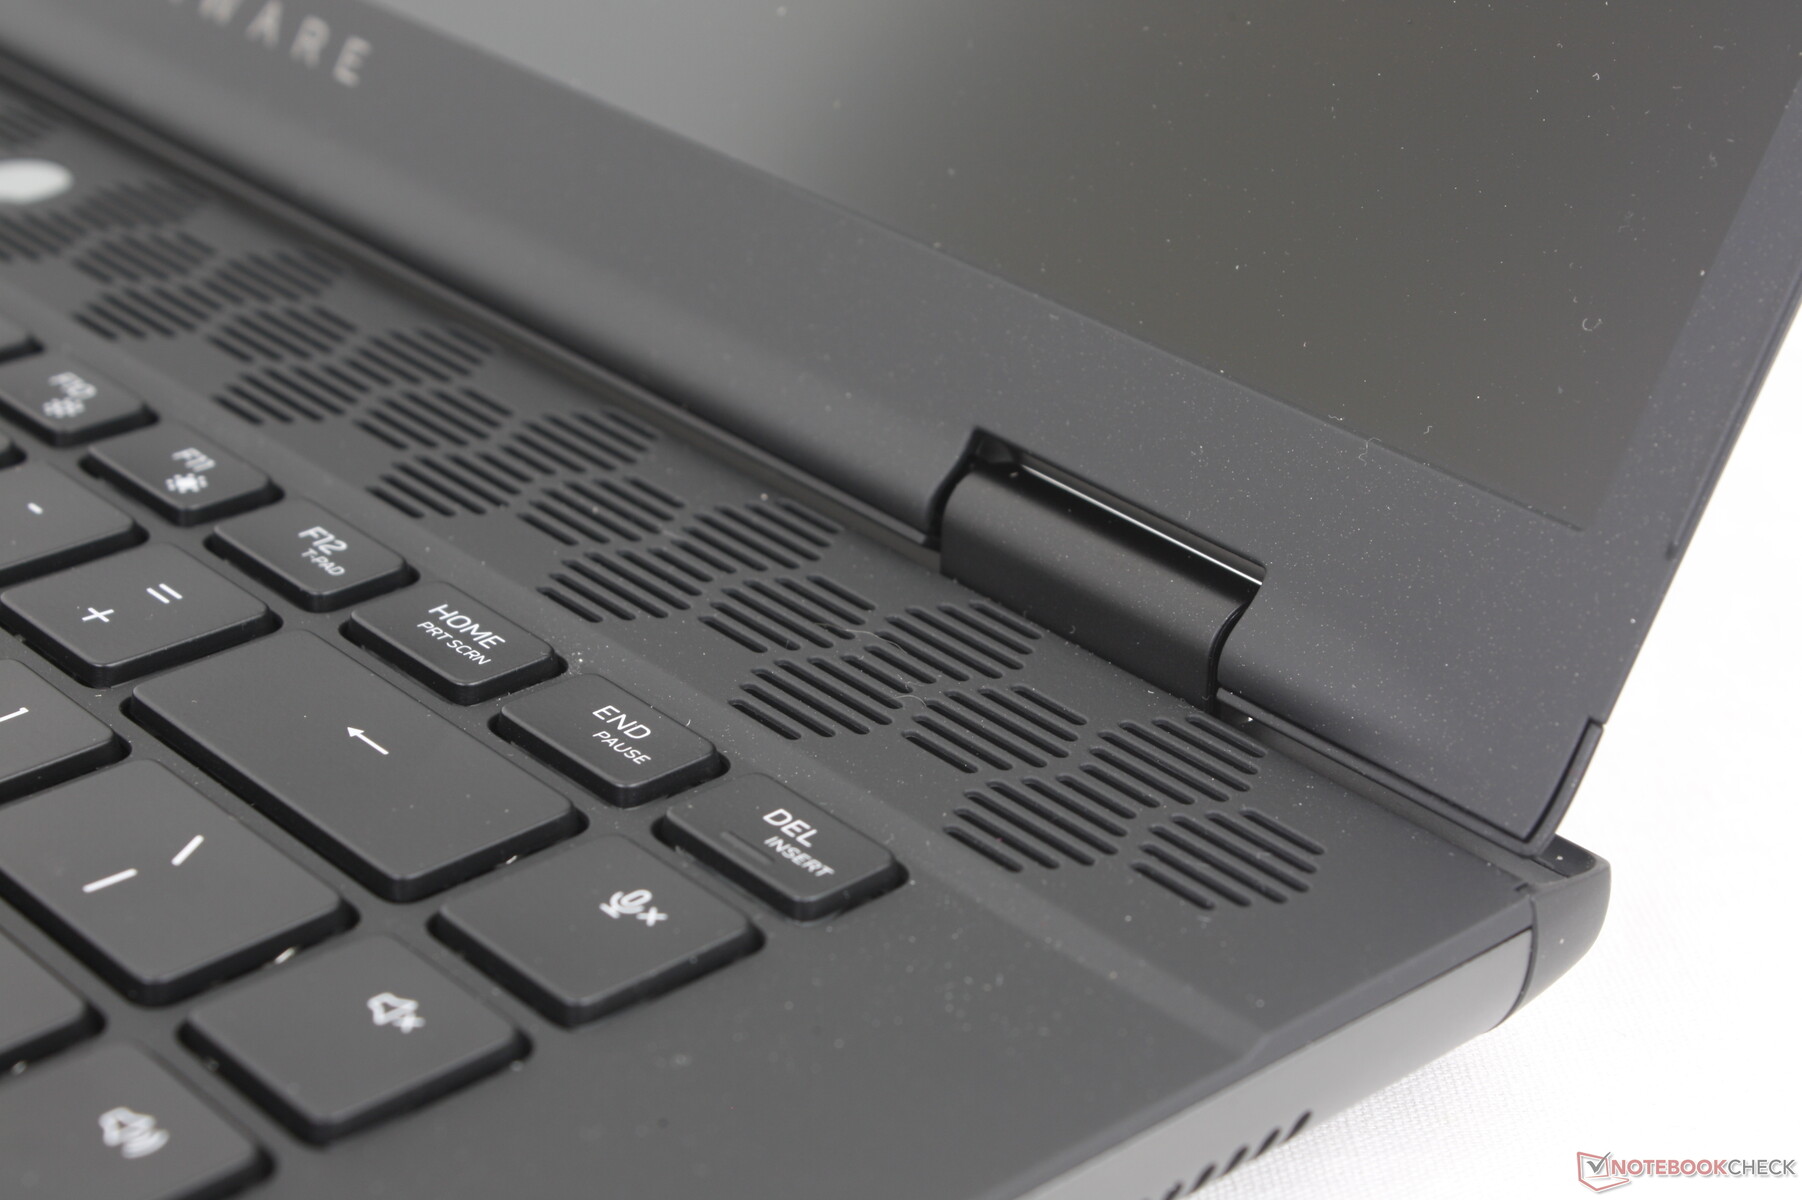
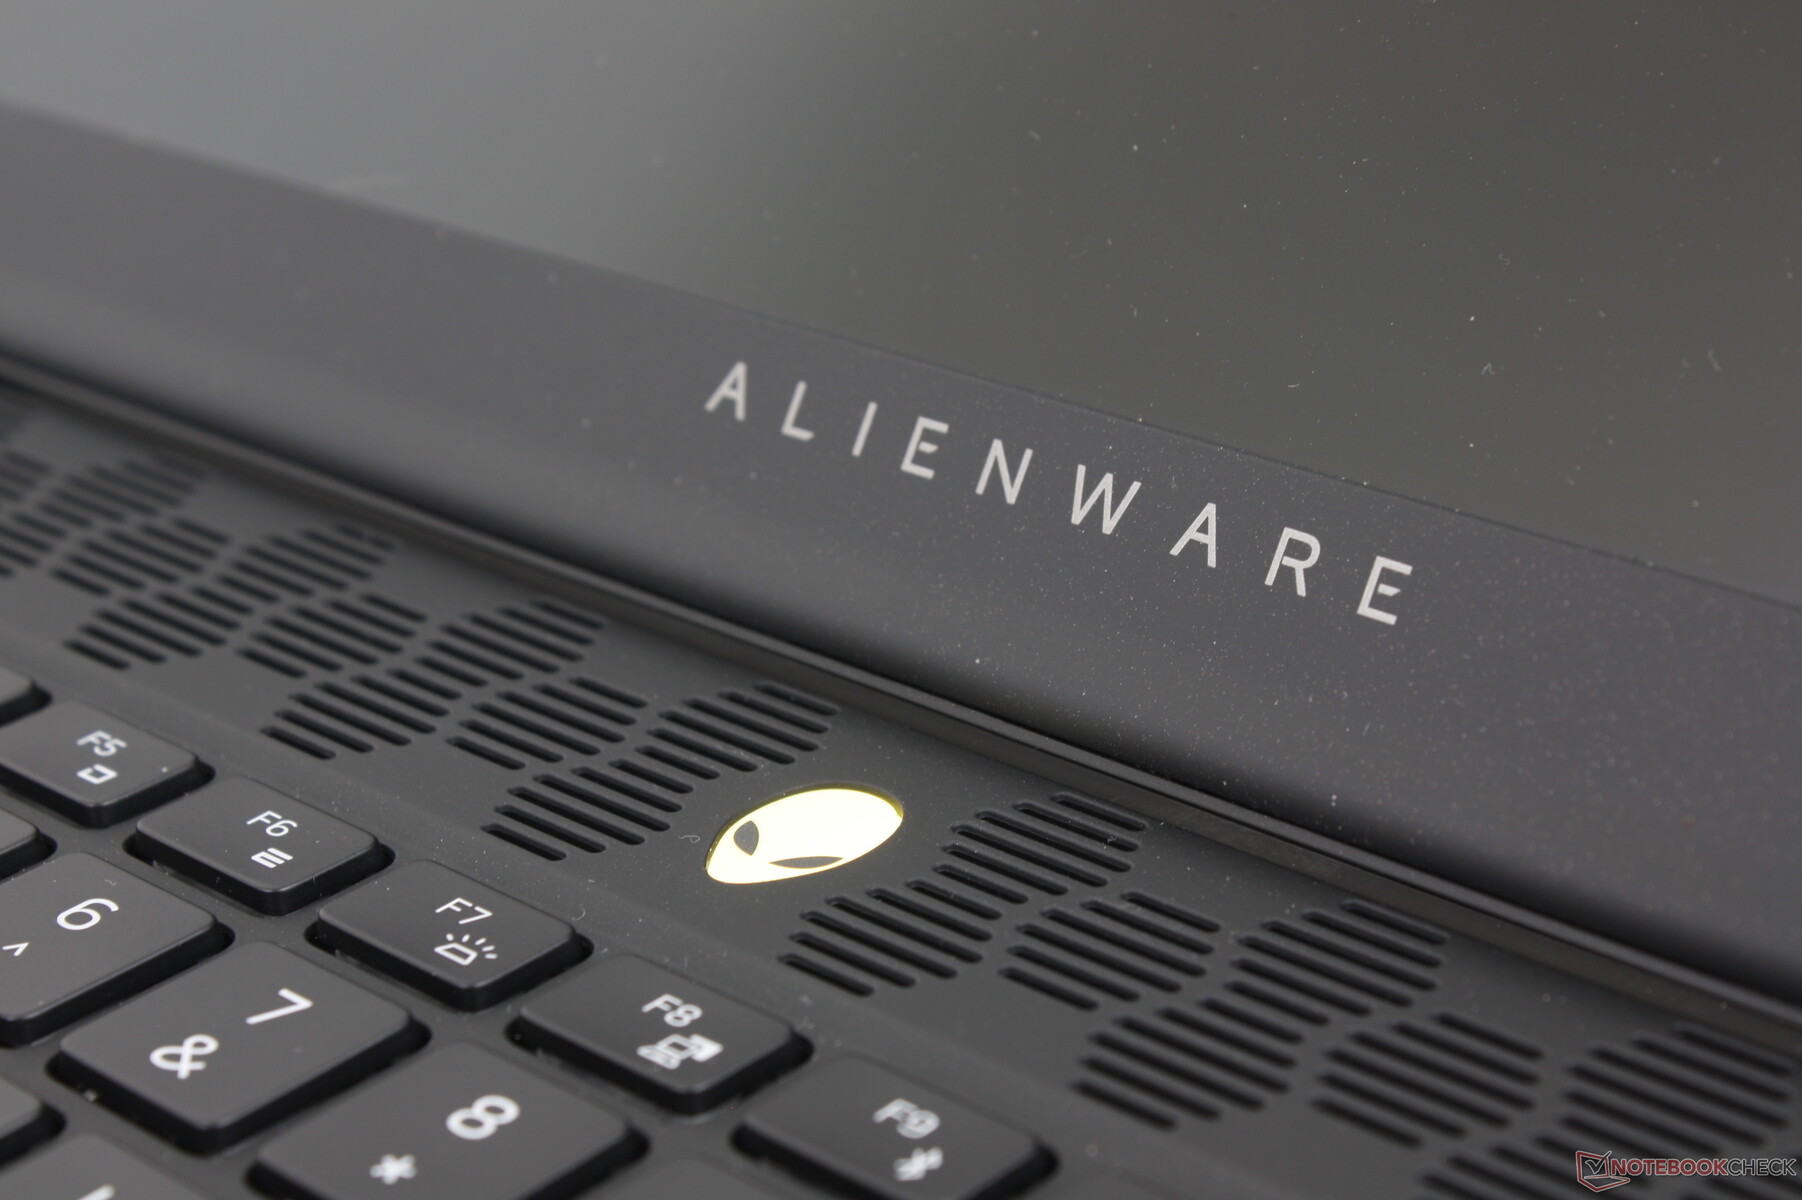
Caso - Leggenda 3.0 ridefinita
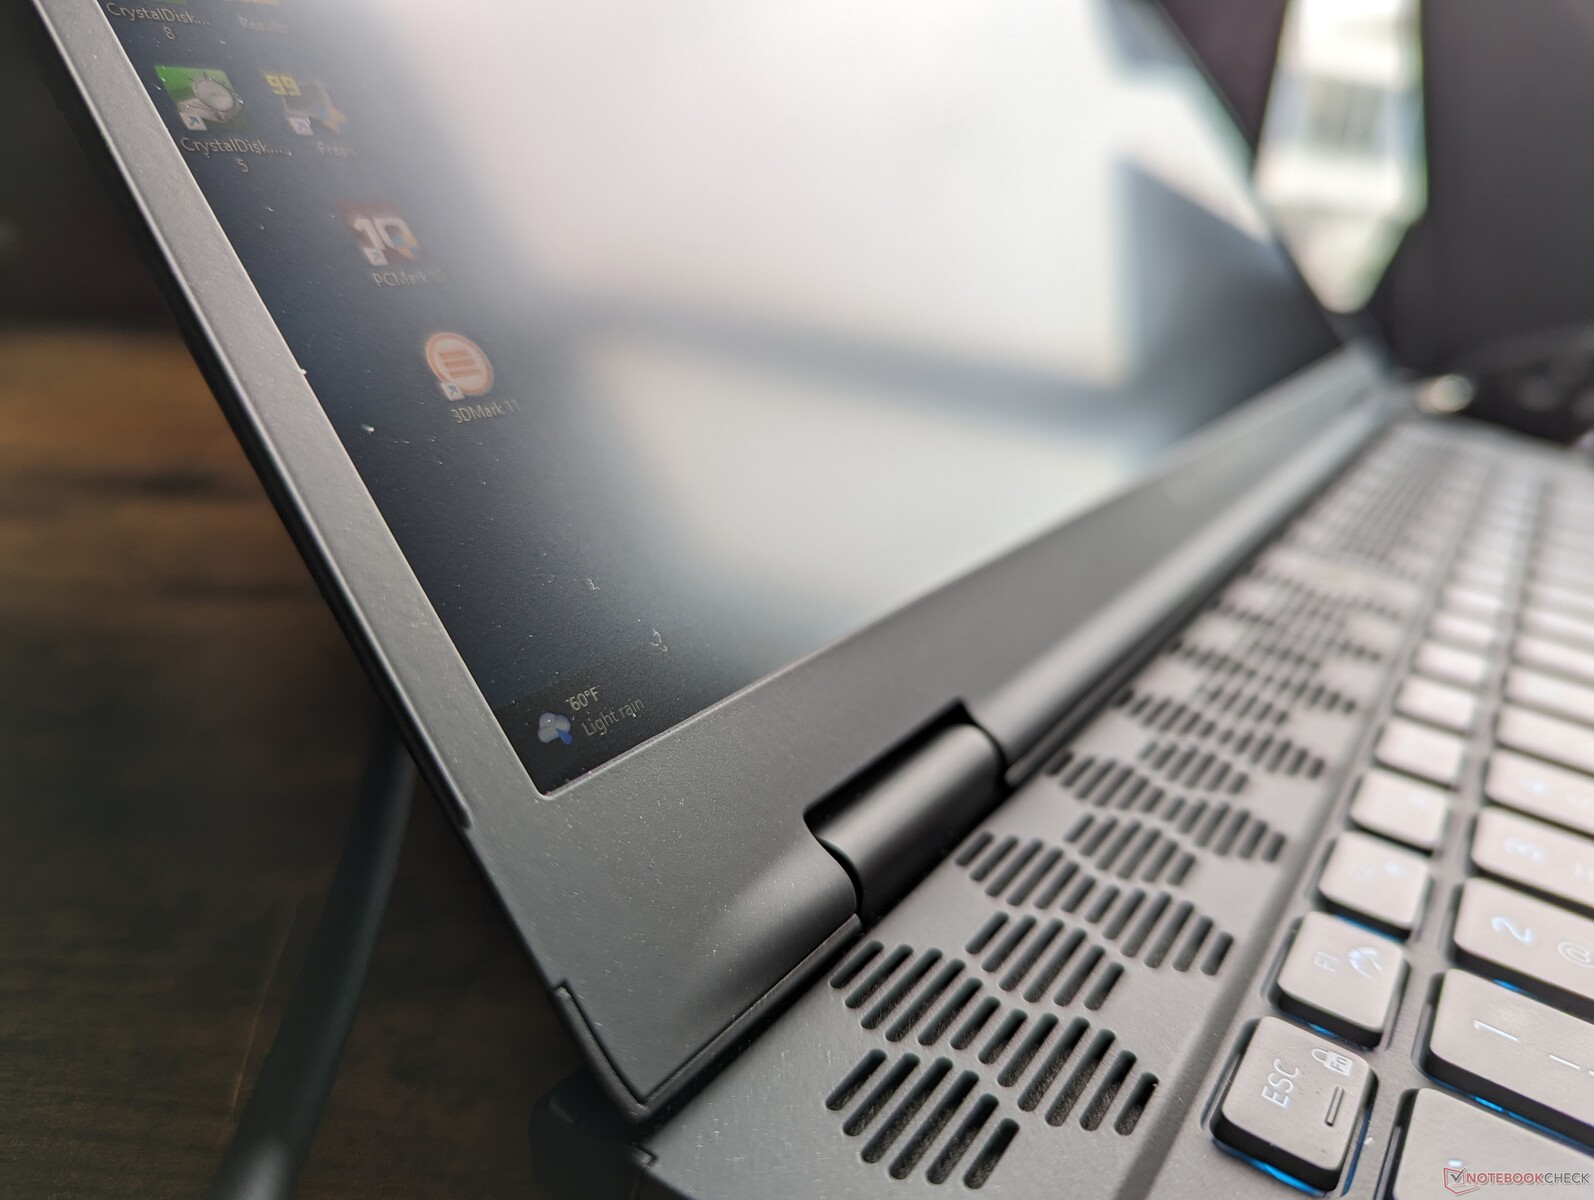
Il Alienware m16 R1 non ha nemmeno un anno di vita e Dell sta già introducendo un design dello chassis rivisto con l'm16 R2. Il cambiamento più notevole riguarda la rimozione del ponte termico sporgente lungo la parte posteriore, per un ingombro molto più ridotto rispetto a prima. L'anello LED RGB sul retro è stato eliminato e la tastiera è stata spostata verso l'alto per fare spazio a un poggiapolsi più grande e a un clickpad più ampio.
Per il resto, i materiali del telaio sono gli stessi di prima, con texture e impressioni simili. La rigidità non è cambiata in modo significativo e quindi l'unità è ancora abbastanza robusta da cima a fondo, senza scricchiolii o punti deboli evidenti.
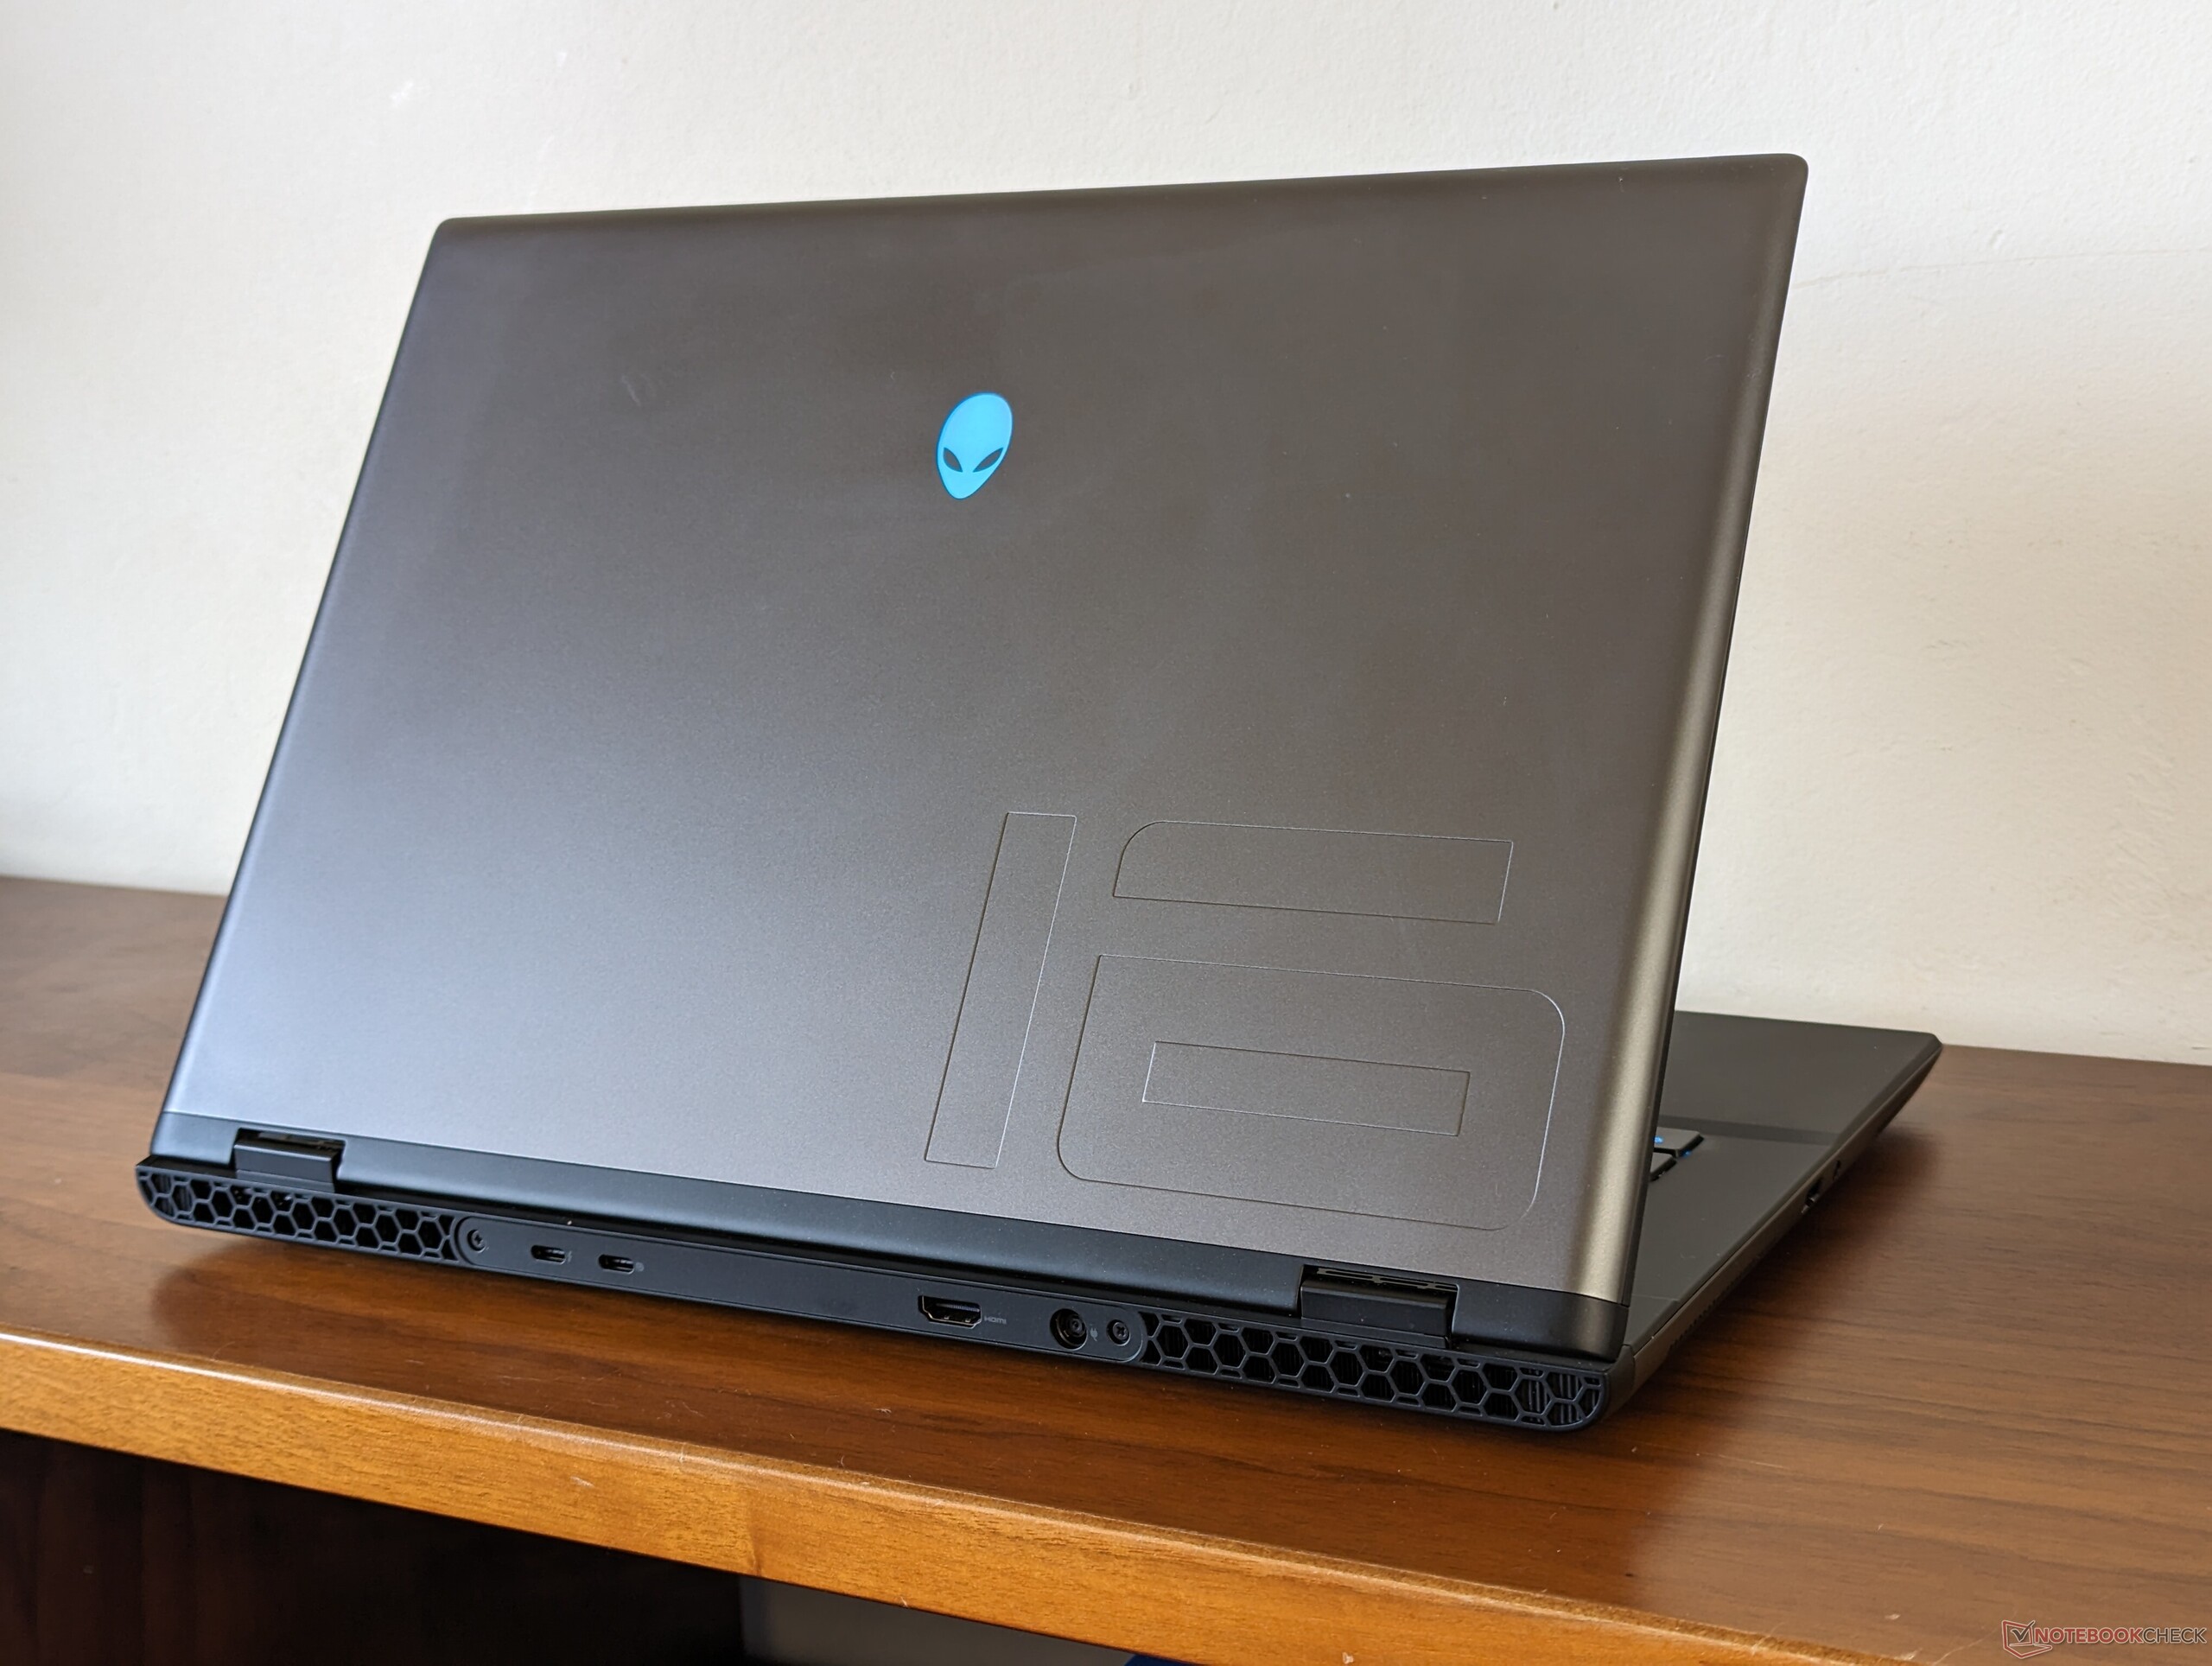
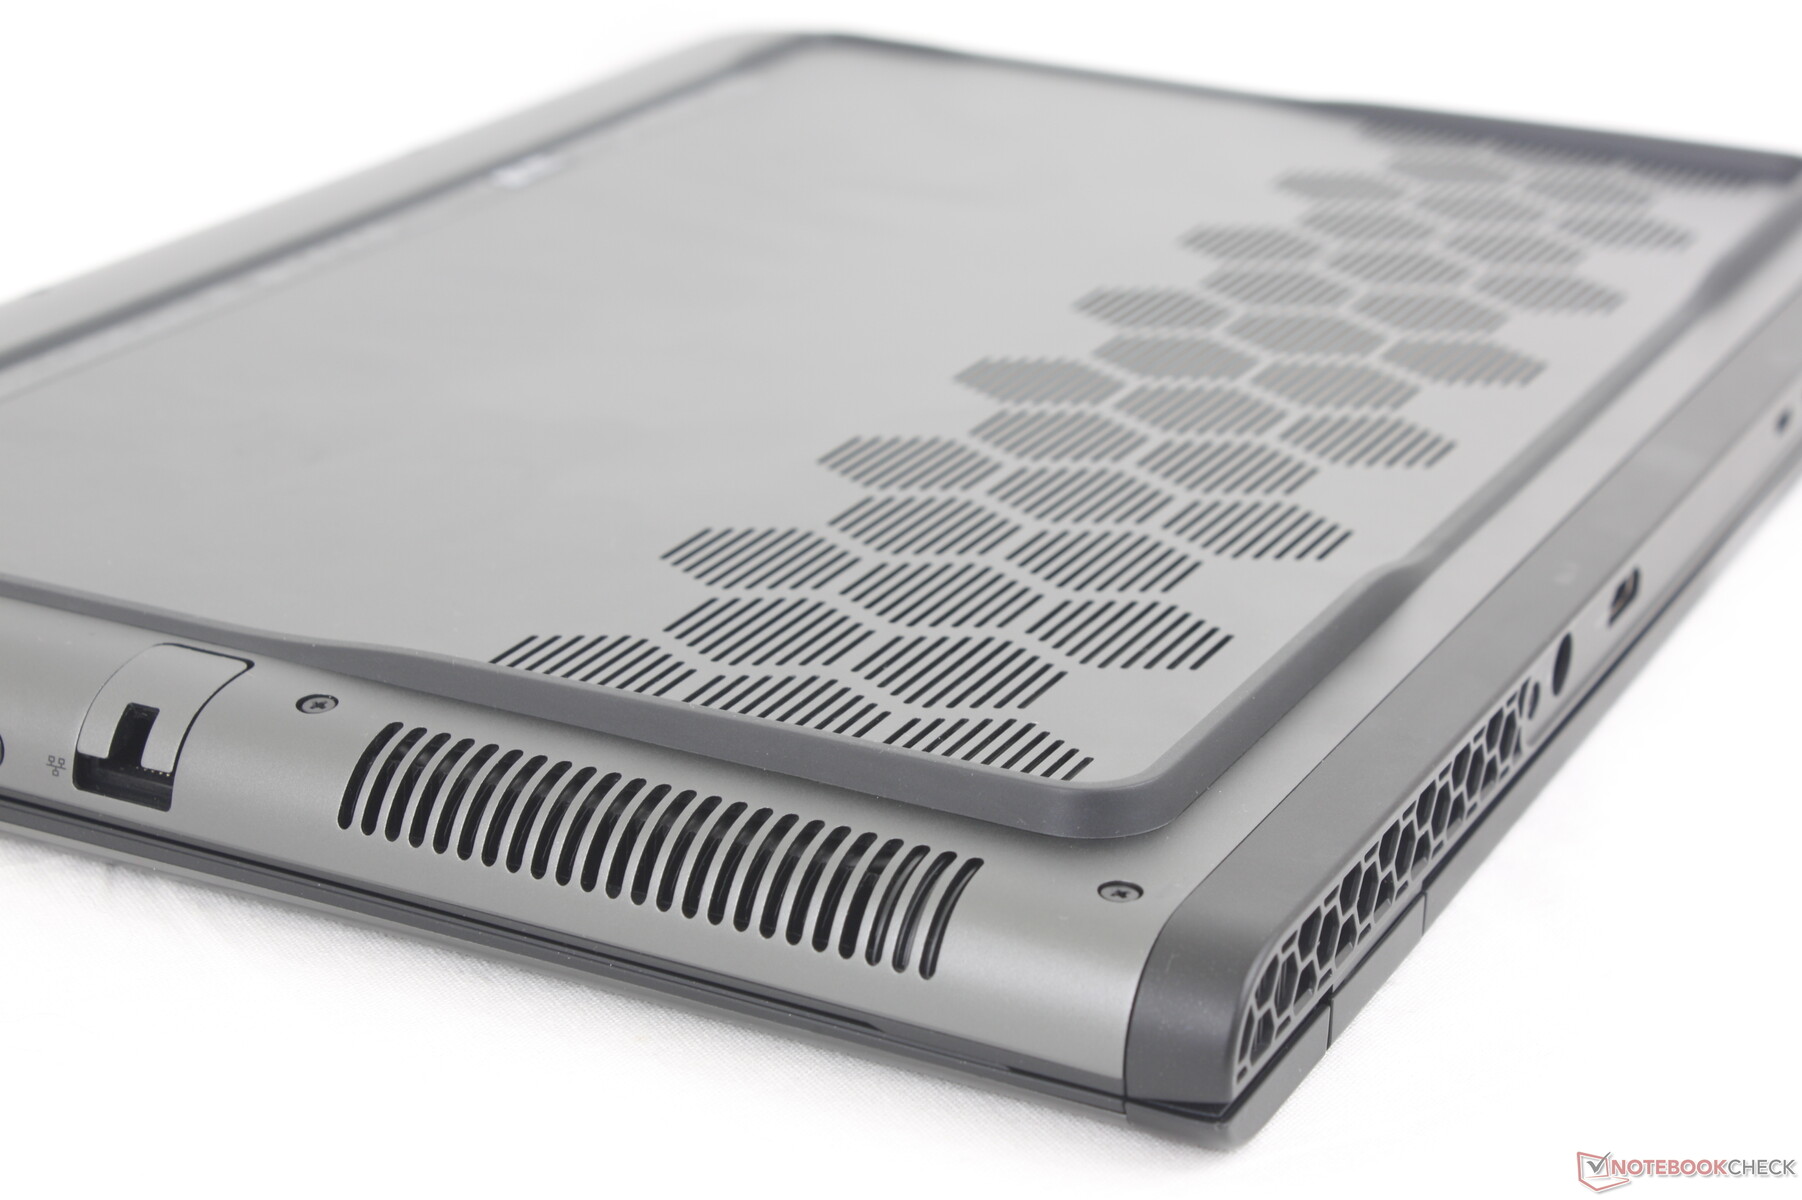
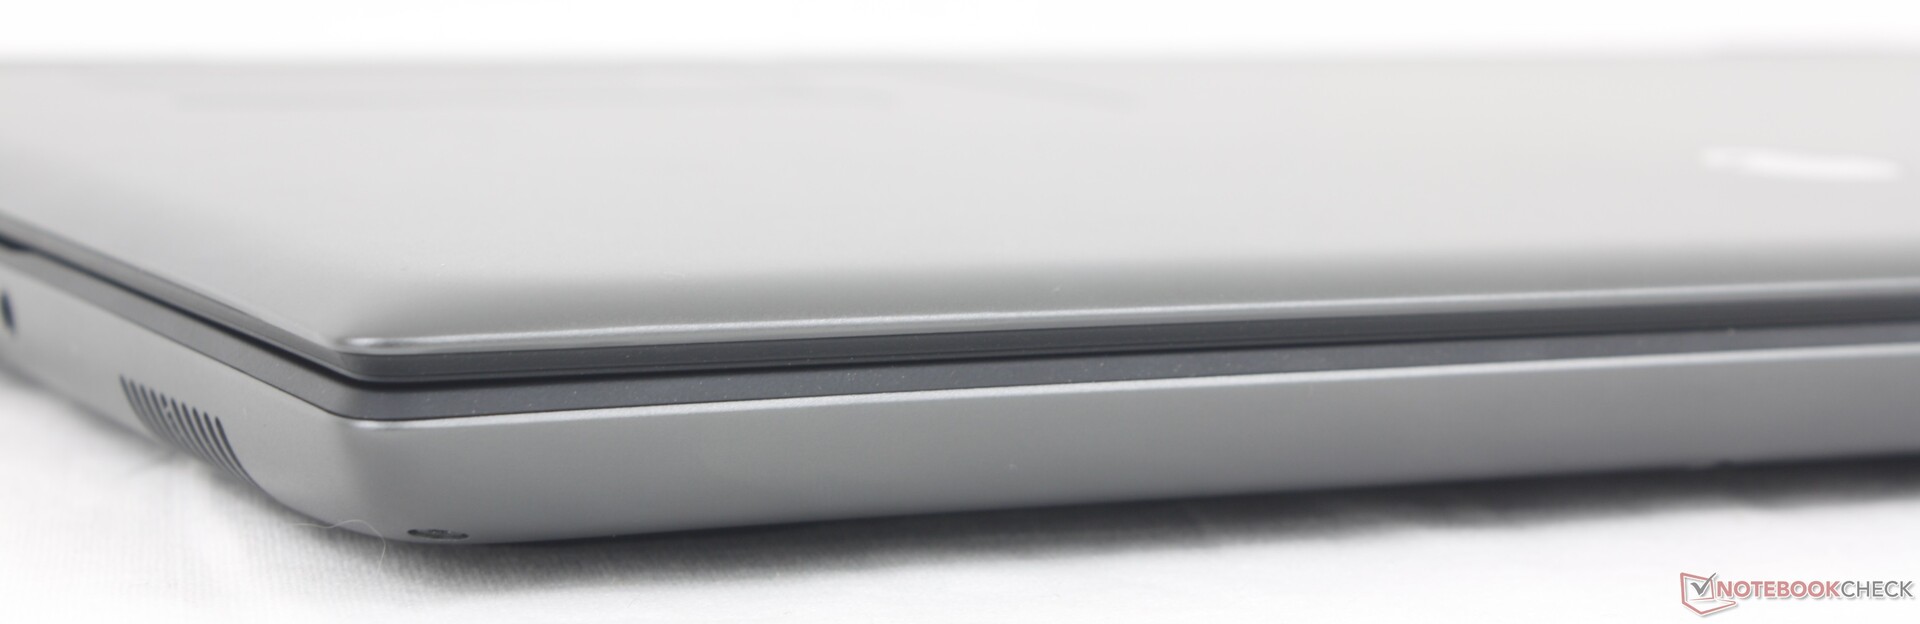
Le significative modifiche al telaio hanno comportato tagli significativi sia al peso che alle dimensioni. L'm16 R2 è circa il 17% più leggero e il 22% più piccolo dell'm16 R1, per una migliore portabilità. L'ingombro ridotto aiuta anche il sistema ad adattarsi agli zaini più piccoli, poiché le dimensioni più ampie dell'm16 R1 originale richiederebbero borse più grandi.
La riduzione delle dimensioni non è sufficiente a rendere l'm16 R2 il più piccolo della sua categoria, in quanto sia il Razer Blade 16 che il Razer Blade 16 sono più piccoli Razer Blade 16 e Asus Zephyrus G16 sono ancora più leggeri e più piccoli.
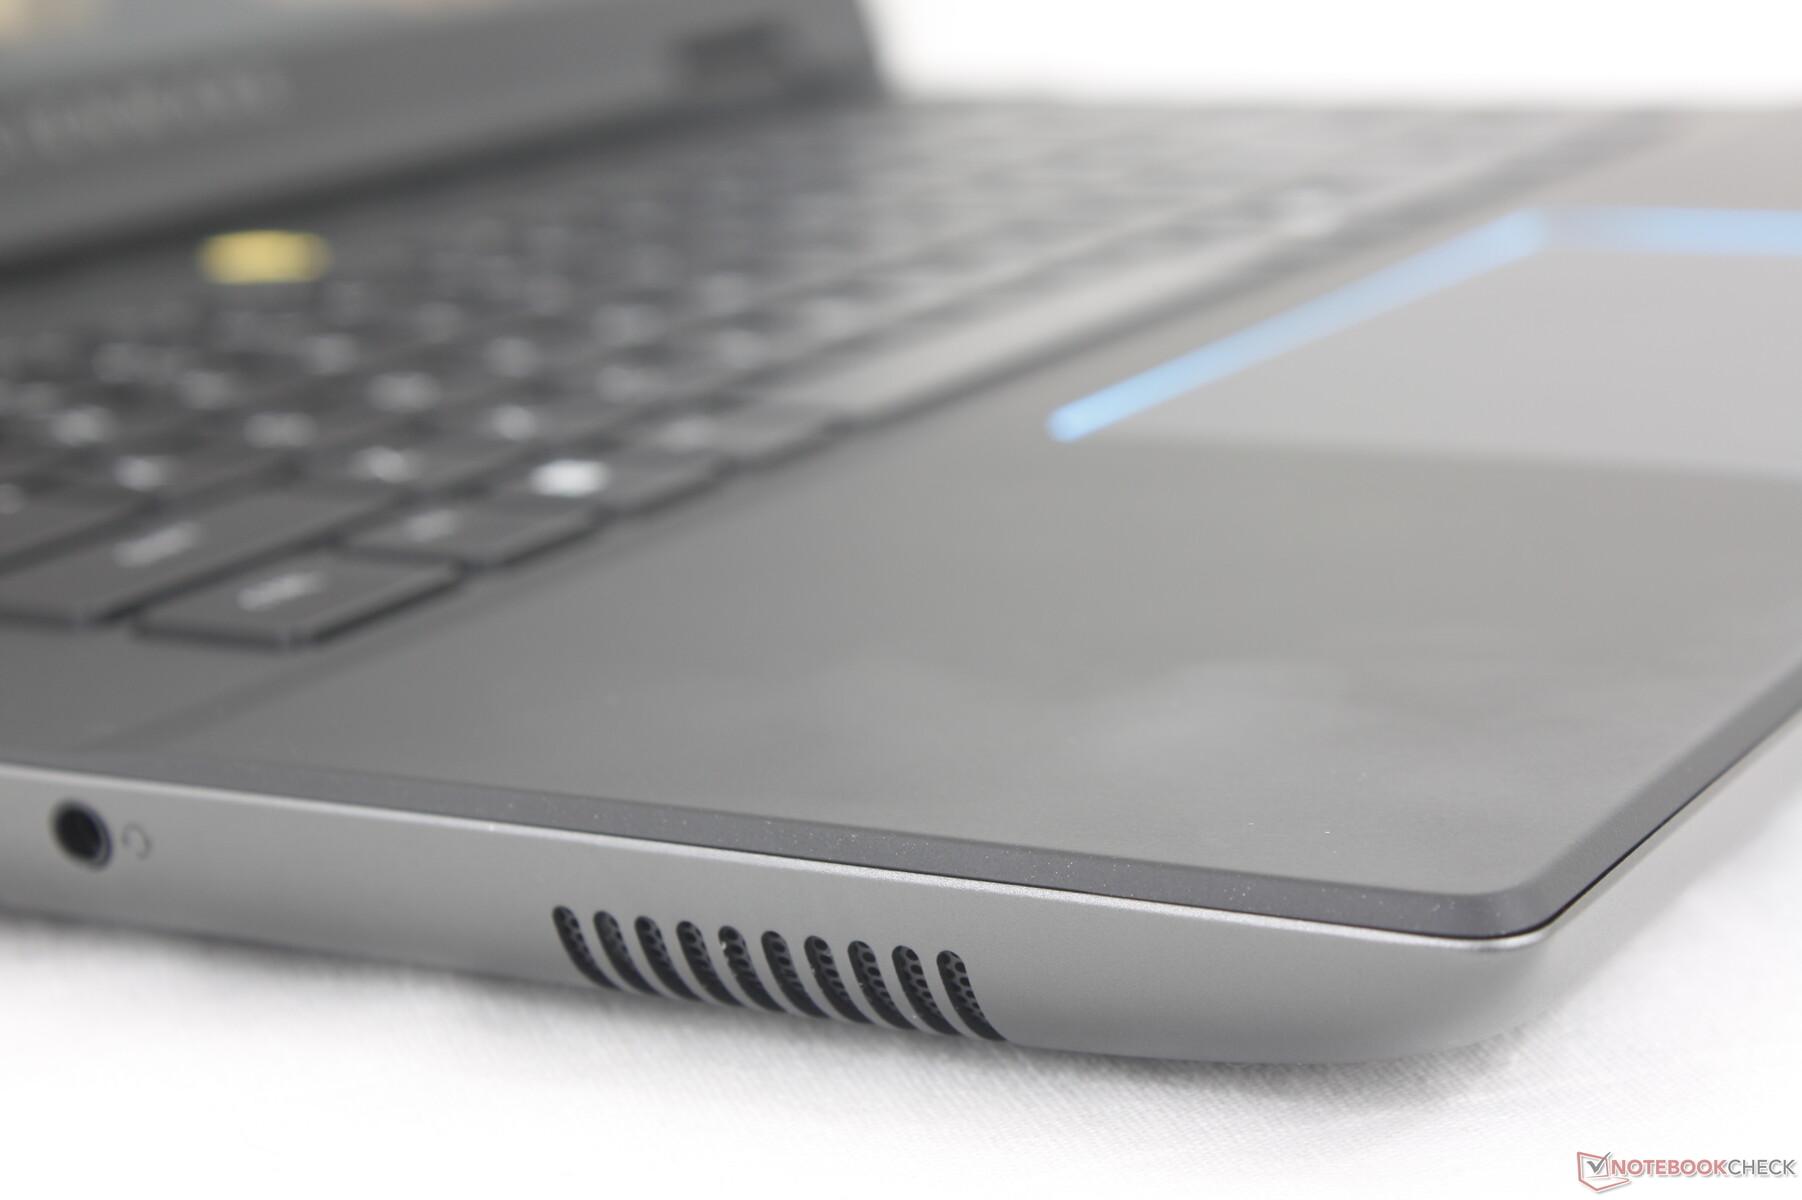
Connettività - Tutte le basi sono qui
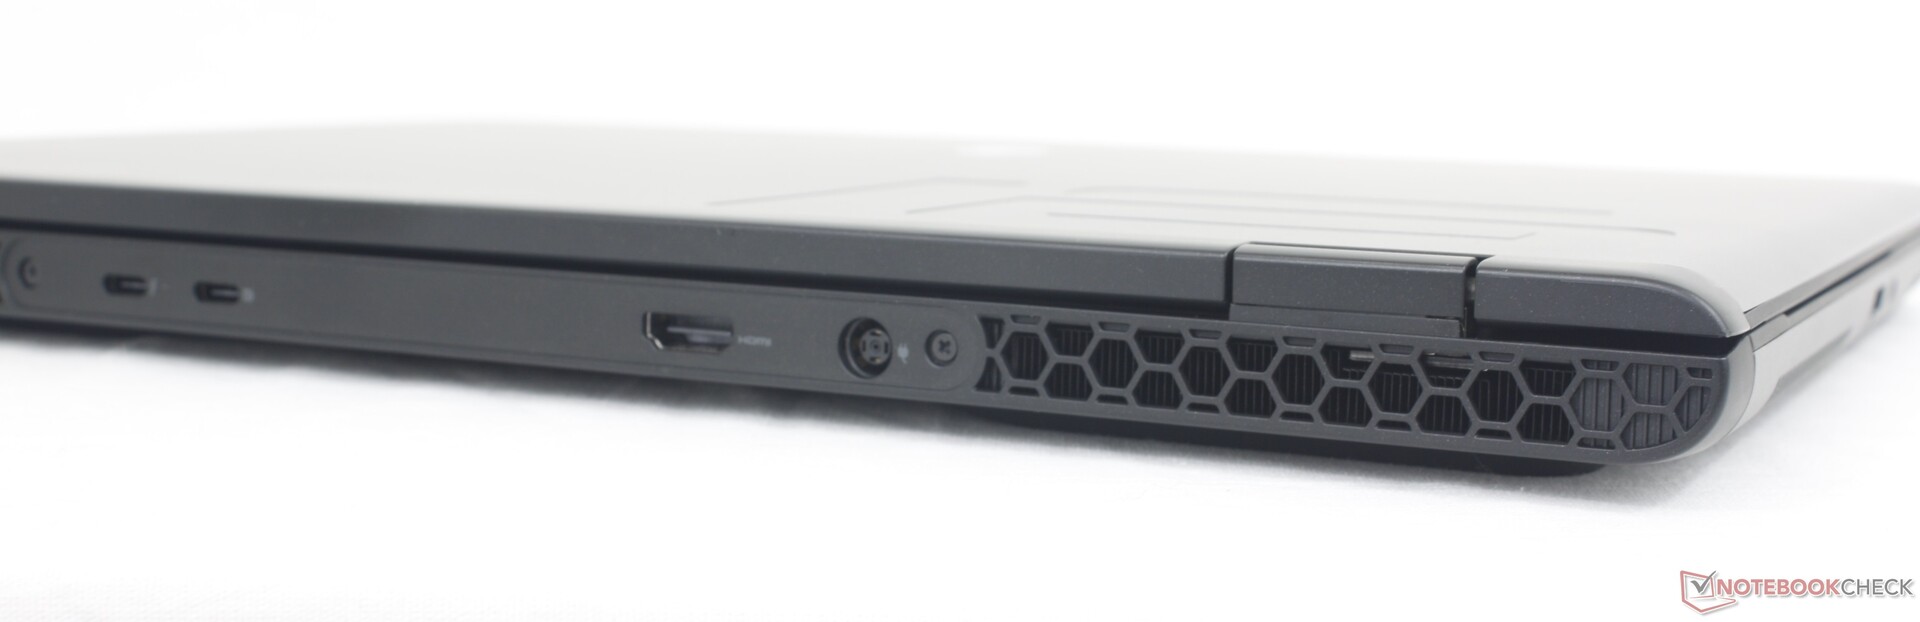
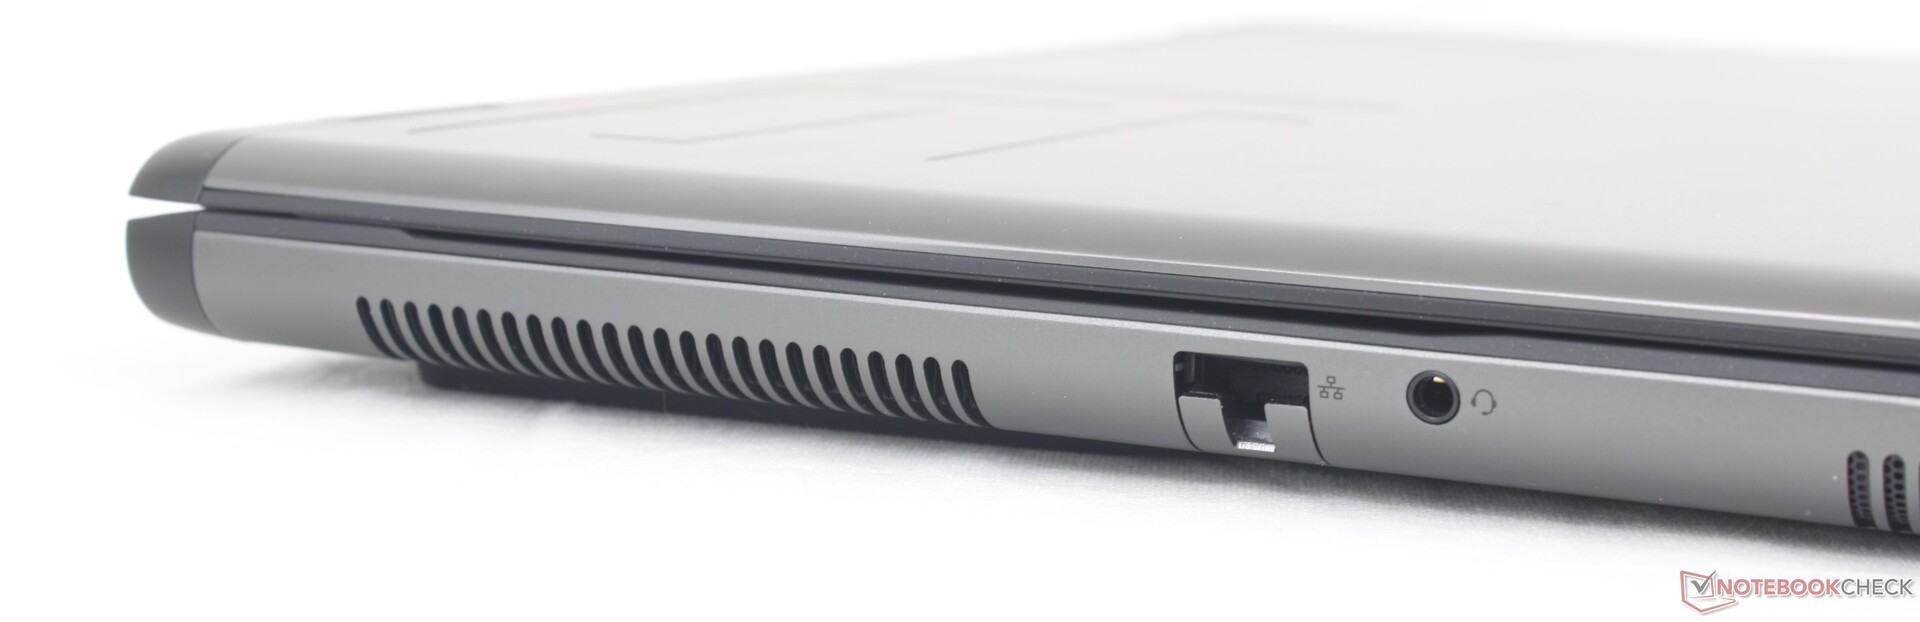
Tutte le porte dell'm16 R1 dello scorso anno sono tornate, tranne la mini-DisplayPort. Il posizionamento delle porte è cambiato: RJ-45 e il jack audio sono stati spostati sul bordo sinistro, mentre la maggior parte delle porte dell'm16 R1 si trovava in modo scomodo sul retro.
Tenga presente che solo una delle due porte USB-C supporta Power Delivery. Entrambe sono comunque compatibili con i monitor esterni.
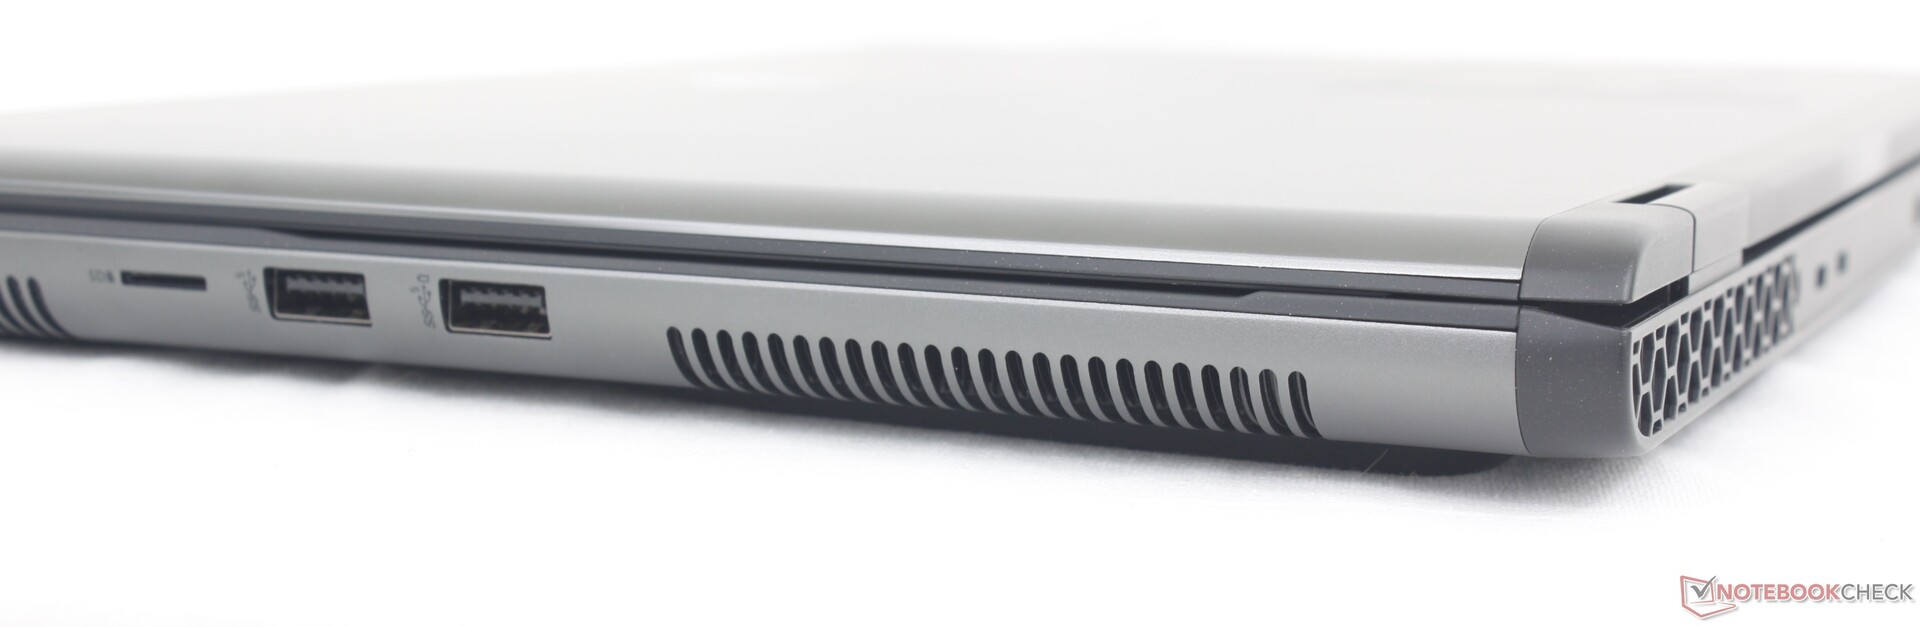
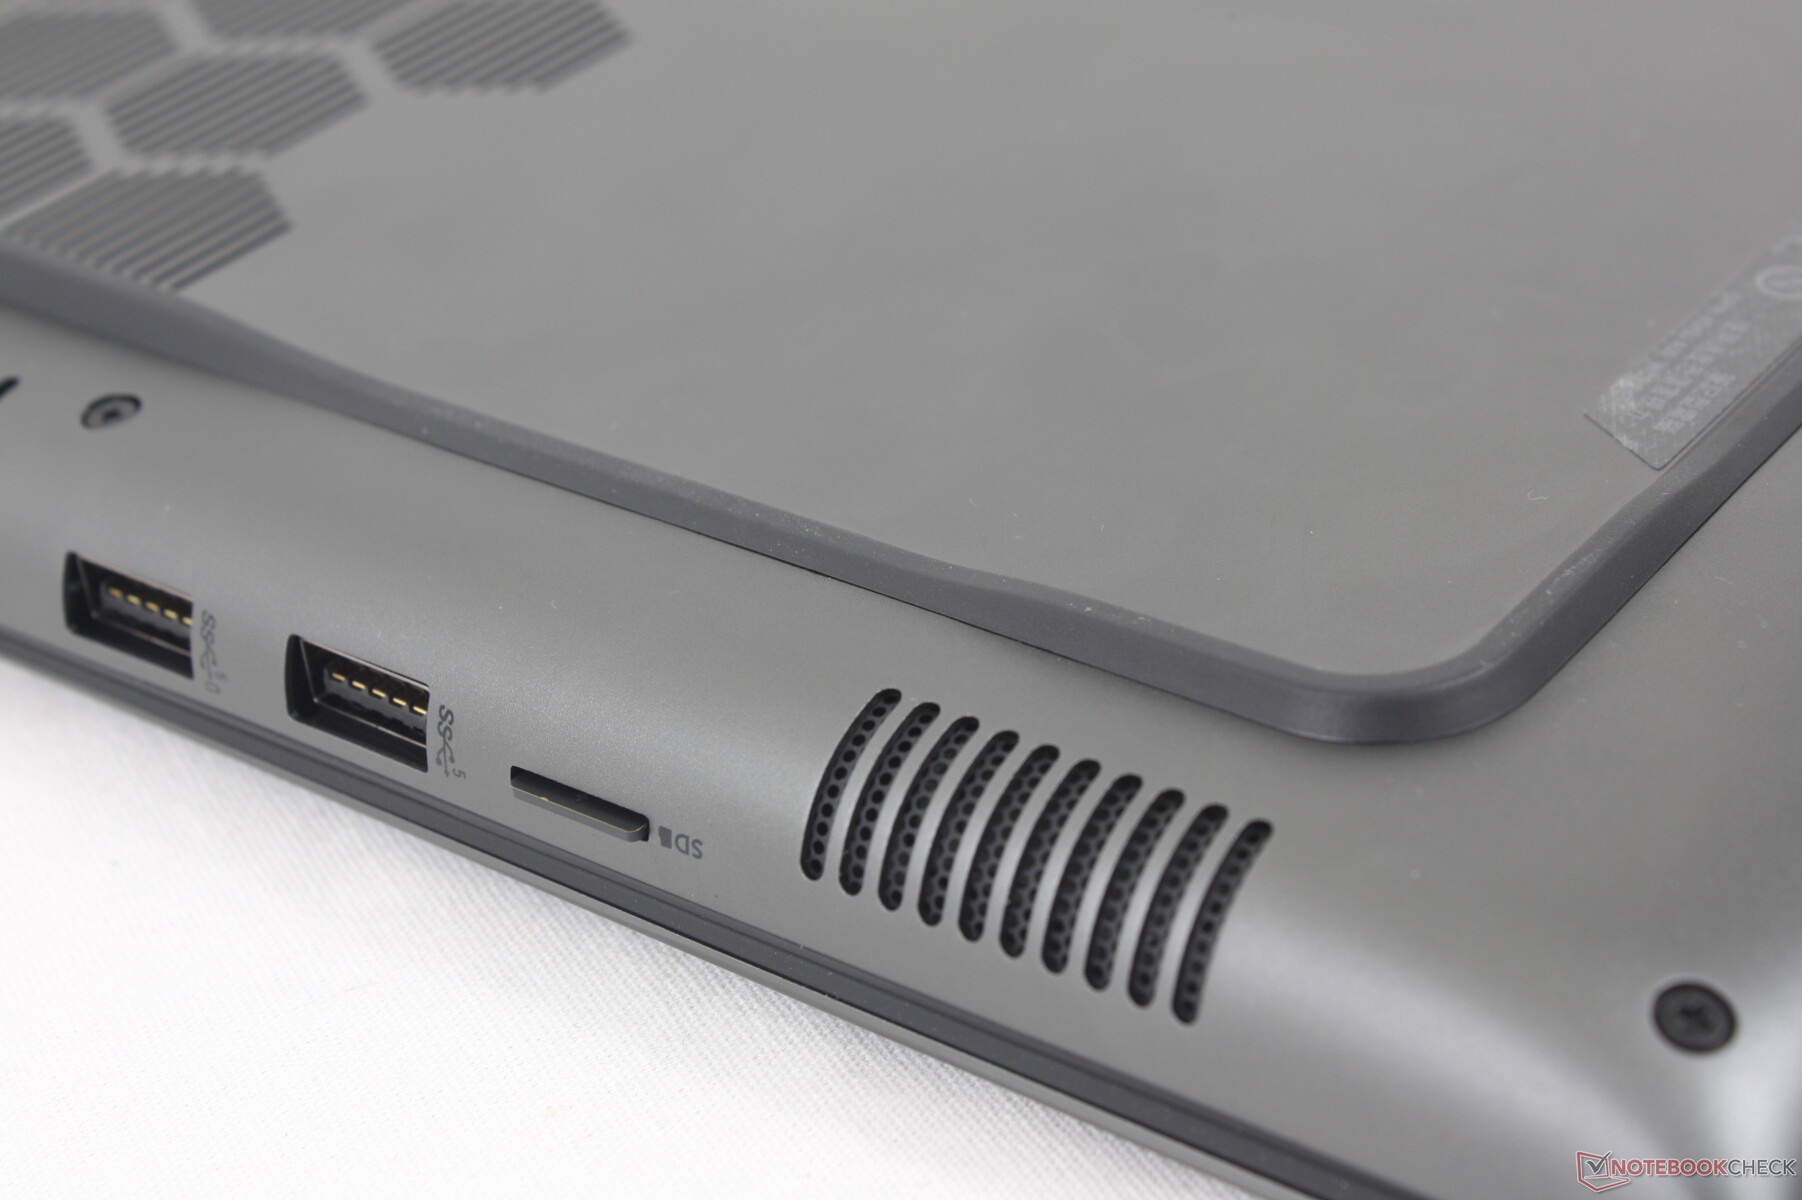
Lettore di schede SD
Mentre l'm16 R1 disponeva di un lettore SD full-size, l'm16 R2 ha purtroppo ripiegato su un lettore MicroSD, che potrebbe infastidire alcuni creatori di contenuti. Le velocità di trasferimento sono comunque circa le stesse che abbiamo registrato sull'm16 R1, nonostante il passaggio alla MicroSD.
| SD Card Reader | |
| average JPG Copy Test (av. of 3 runs) | |
| Alienware m16 R1 Intel (AV PRO microSD 128 GB V60) | |
| Lenovo Legion Slim 7 16APH8 (AV PRO microSD 128 GB V60) | |
| Asus ROG Zephyrus G16 2024 GU605M | |
| Alienware m16 R2 (AV PRO microSD 128 GB V60) | |
| Alienware x16 R1 (AV PRO microSD 128 GB V60) | |
| maximum AS SSD Seq Read Test (1GB) | |
| Alienware x16 R1 (AV PRO microSD 128 GB V60) | |
| Alienware m16 R2 (AV PRO microSD 128 GB V60) | |
| Alienware m16 R1 Intel (AV PRO microSD 128 GB V60) | |
| Asus ROG Zephyrus G16 2024 GU605M | |
| Lenovo Legion Slim 7 16APH8 (AV PRO microSD 128 GB V60) | |
Comunicazione
L'Intel Killer AX1675 è fornito di serie per la connettività Wi-Fi 6E, con l'opzione di passare al BE202 per la compatibilità Wi-Fi 7. Non abbiamo riscontrato alcun problema quando è stato abbinato al nostro router di prova Asus AXE11000.
| Networking | |
| iperf3 transmit AXE11000 | |
| Asus ROG Zephyrus G16 2024 GU605M | |
| HP Omen Transcend 16-u1095ng | |
| Alienware m16 R1 Intel | |
| Alienware m16 R2 | |
| Alienware x16 R1 | |
| Lenovo Legion Slim 7 16APH8 | |
| iperf3 receive AXE11000 | |
| Lenovo Legion Slim 7 16APH8 | |
| HP Omen Transcend 16-u1095ng | |
| Alienware m16 R1 Intel | |
| Asus ROG Zephyrus G16 2024 GU605M | |
| Alienware x16 R1 | |
| Alienware m16 R2 | |
| iperf3 transmit AXE11000 6GHz | |
| Alienware m16 R2 | |
| Alienware x16 R1 | |
| iperf3 receive AXE11000 6GHz | |
| Alienware m16 R2 | |
| Alienware x16 R1 | |
Webcam
La webcam da 2 MP è di serie con IR per il supporto di Windows Hello. Non c'è un otturatore integrato per la privacy.


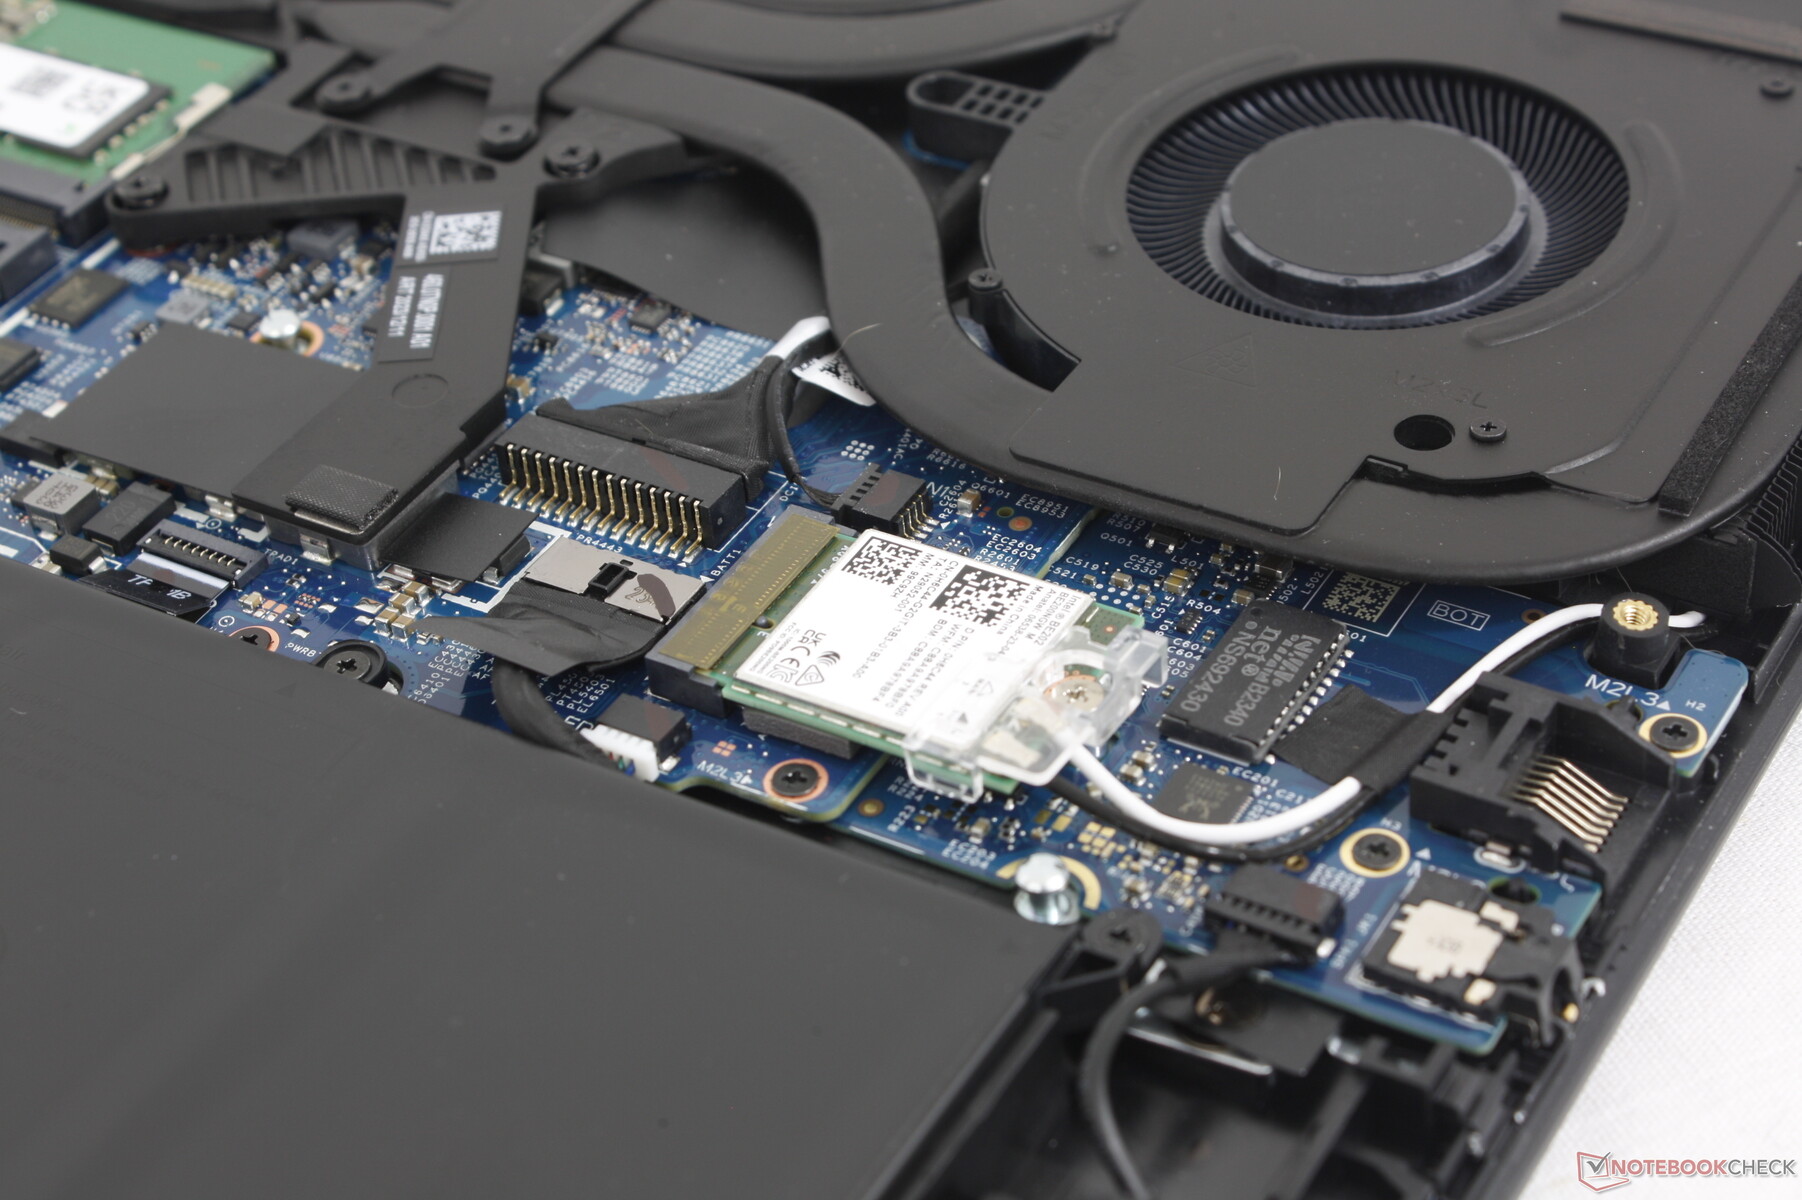
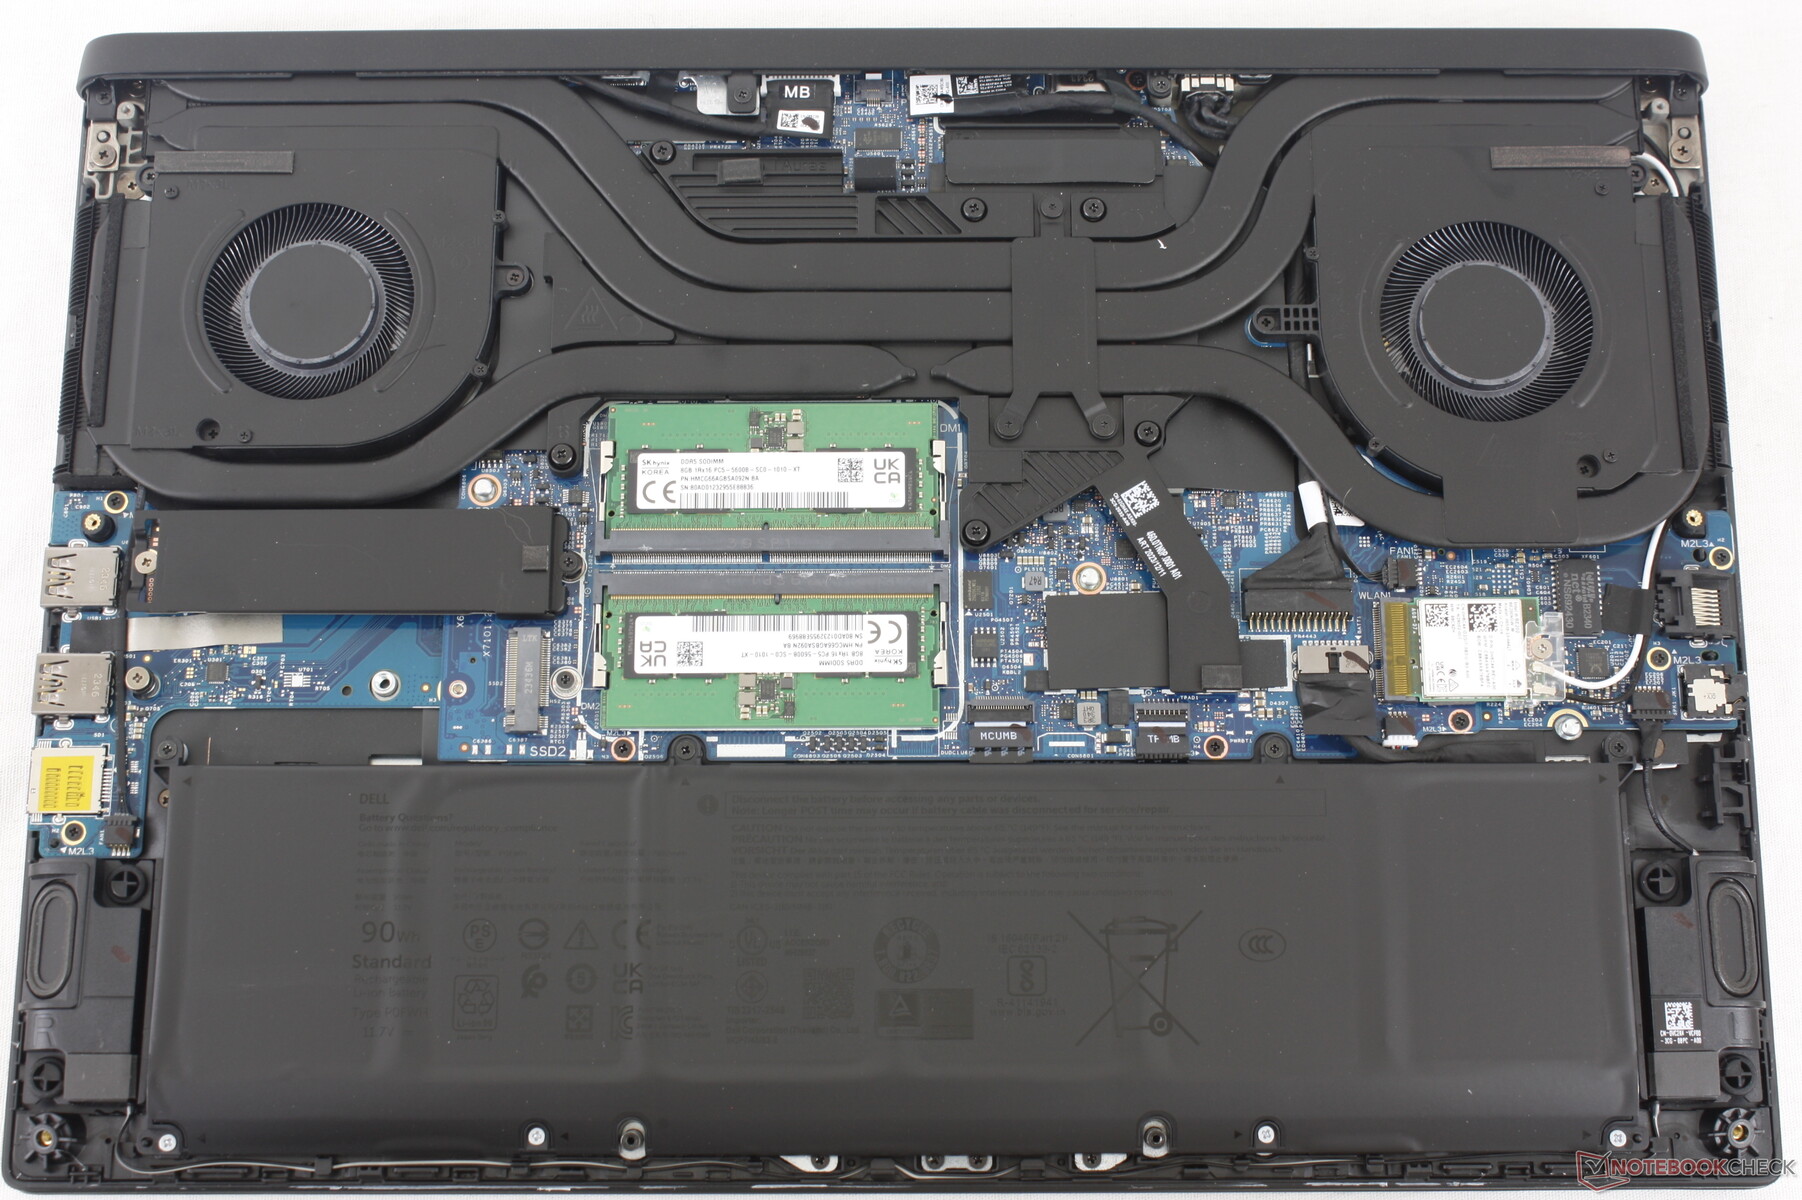
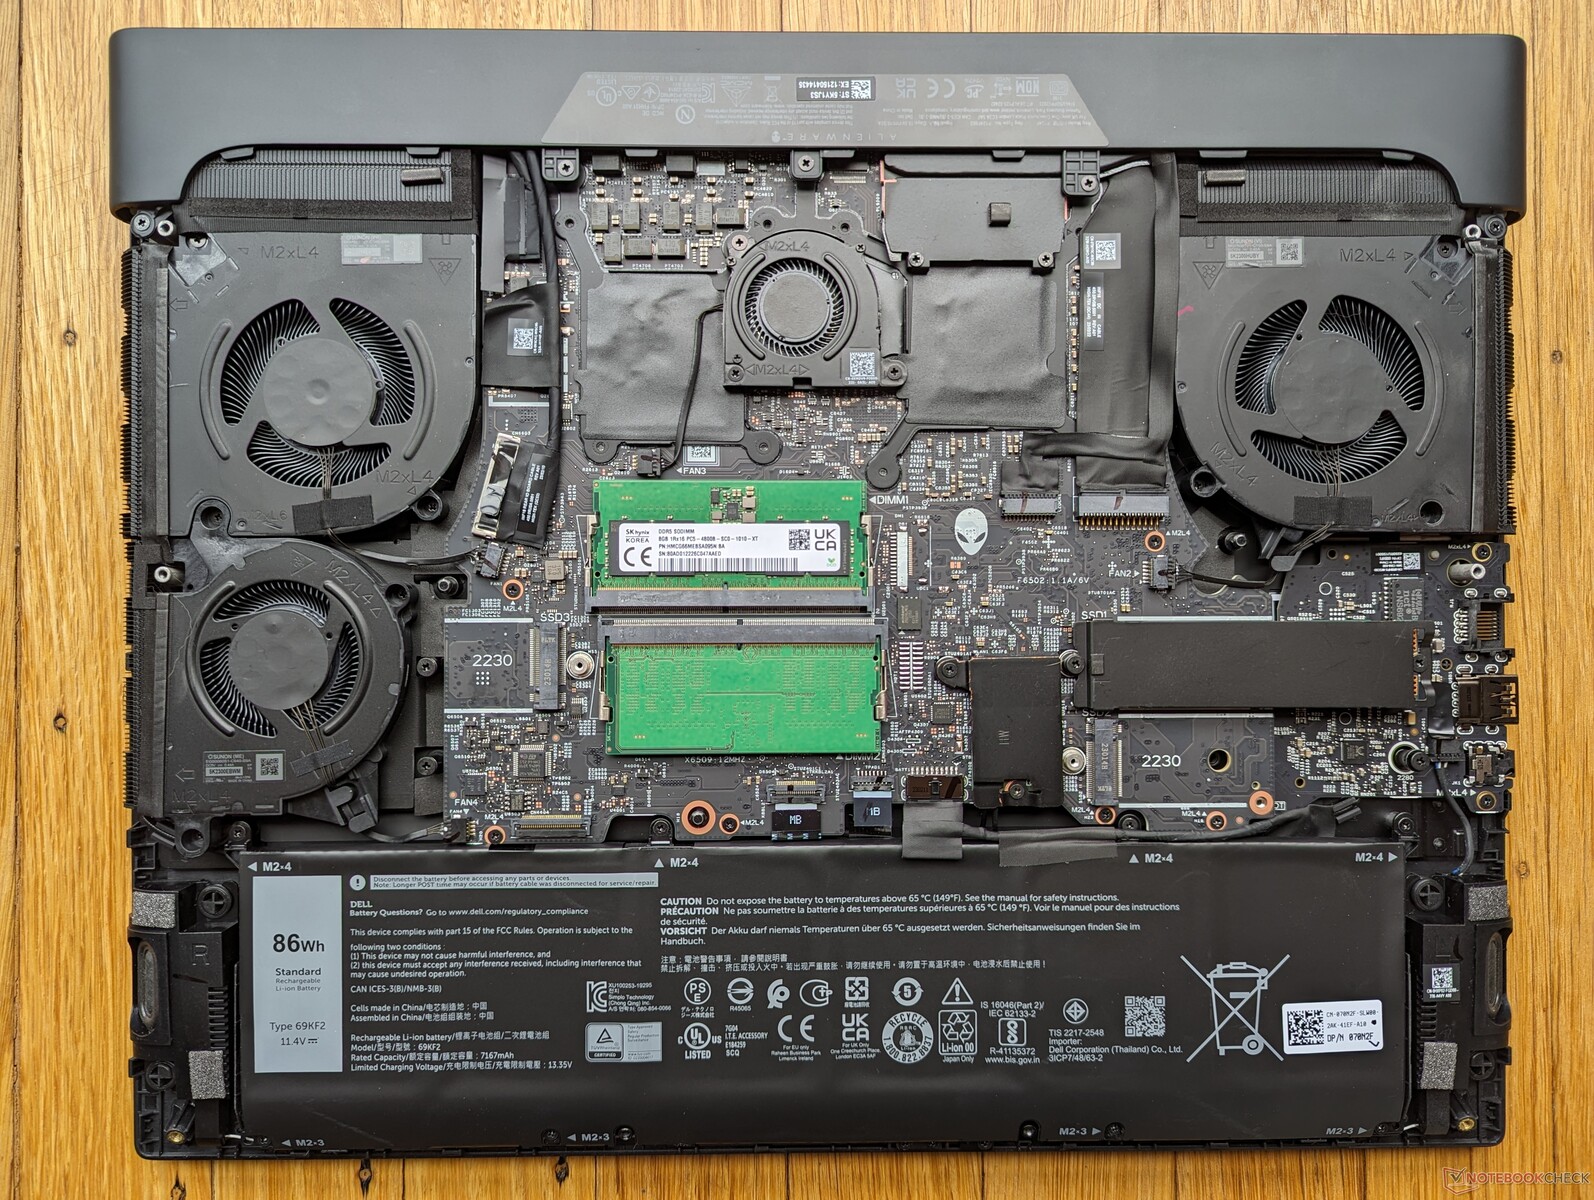
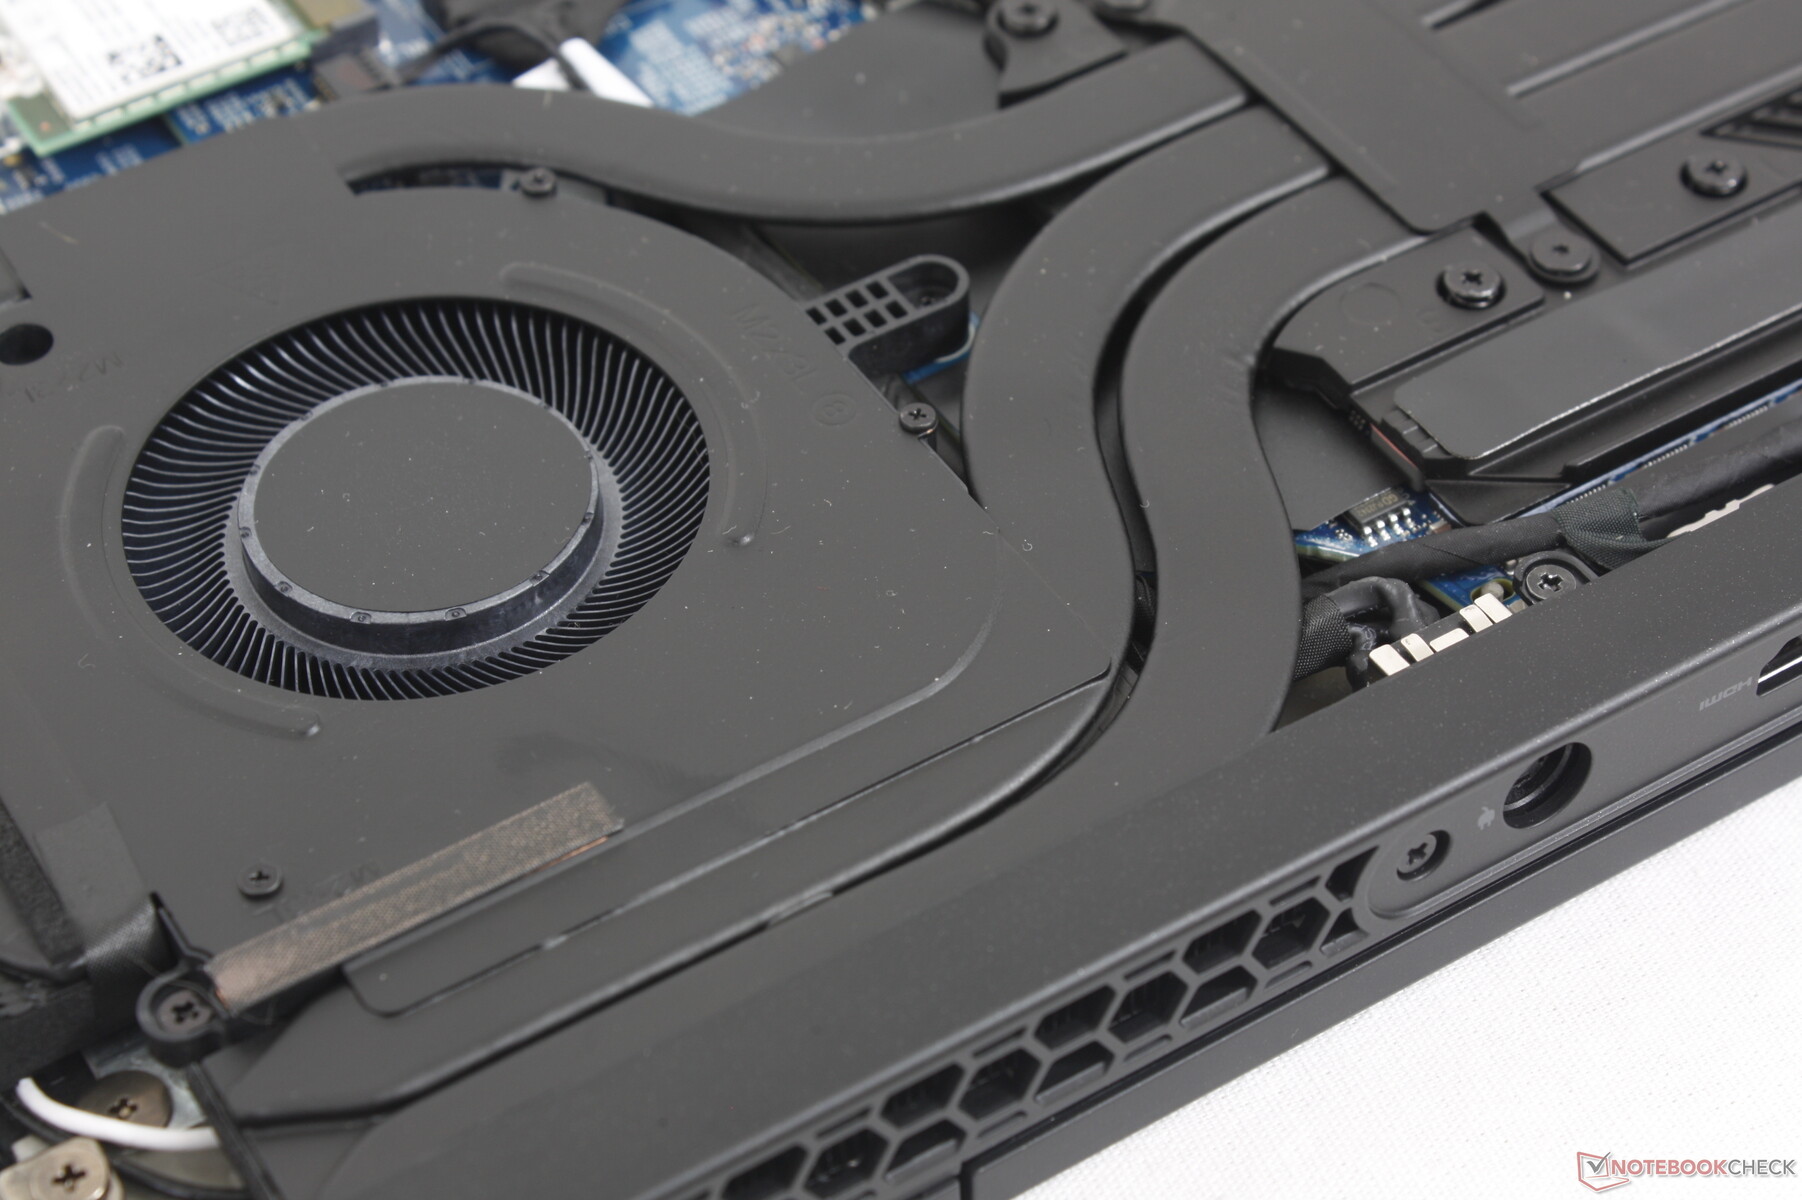
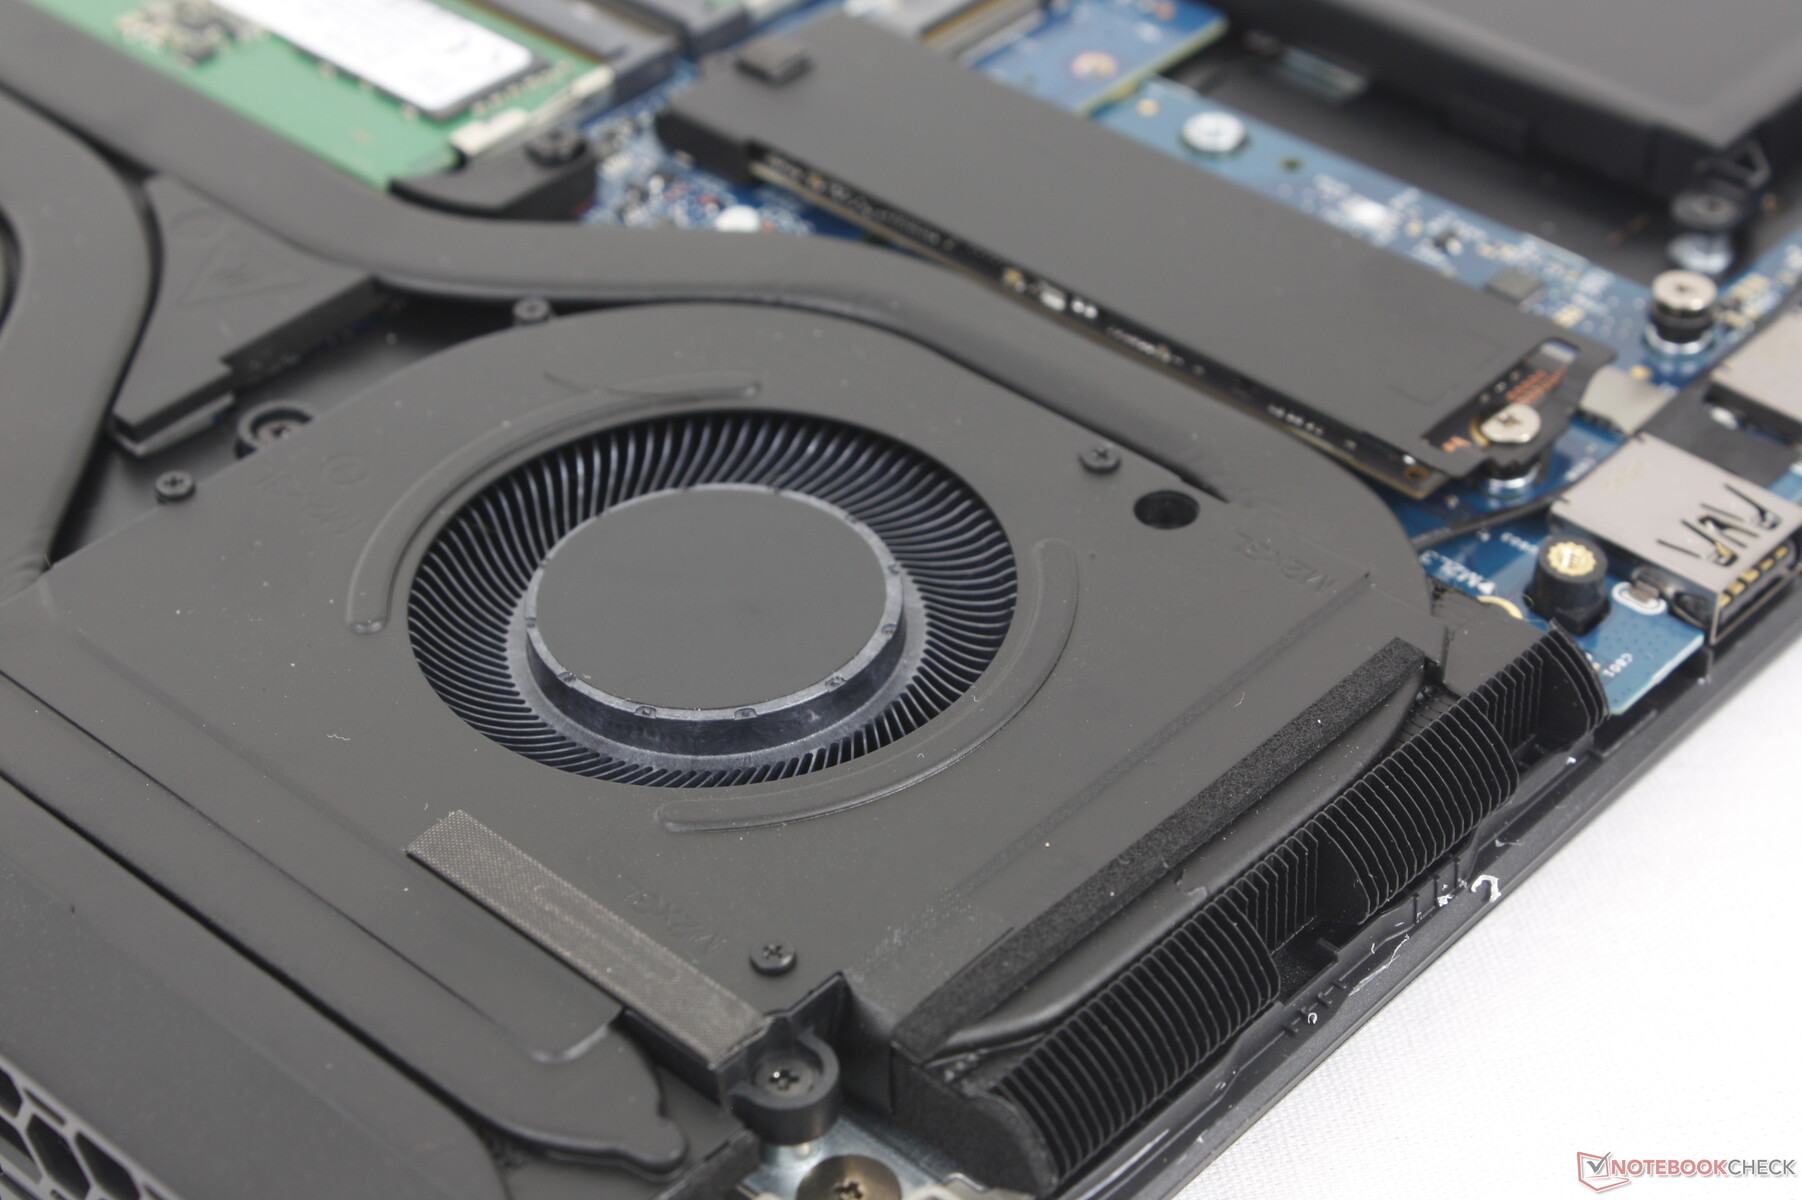
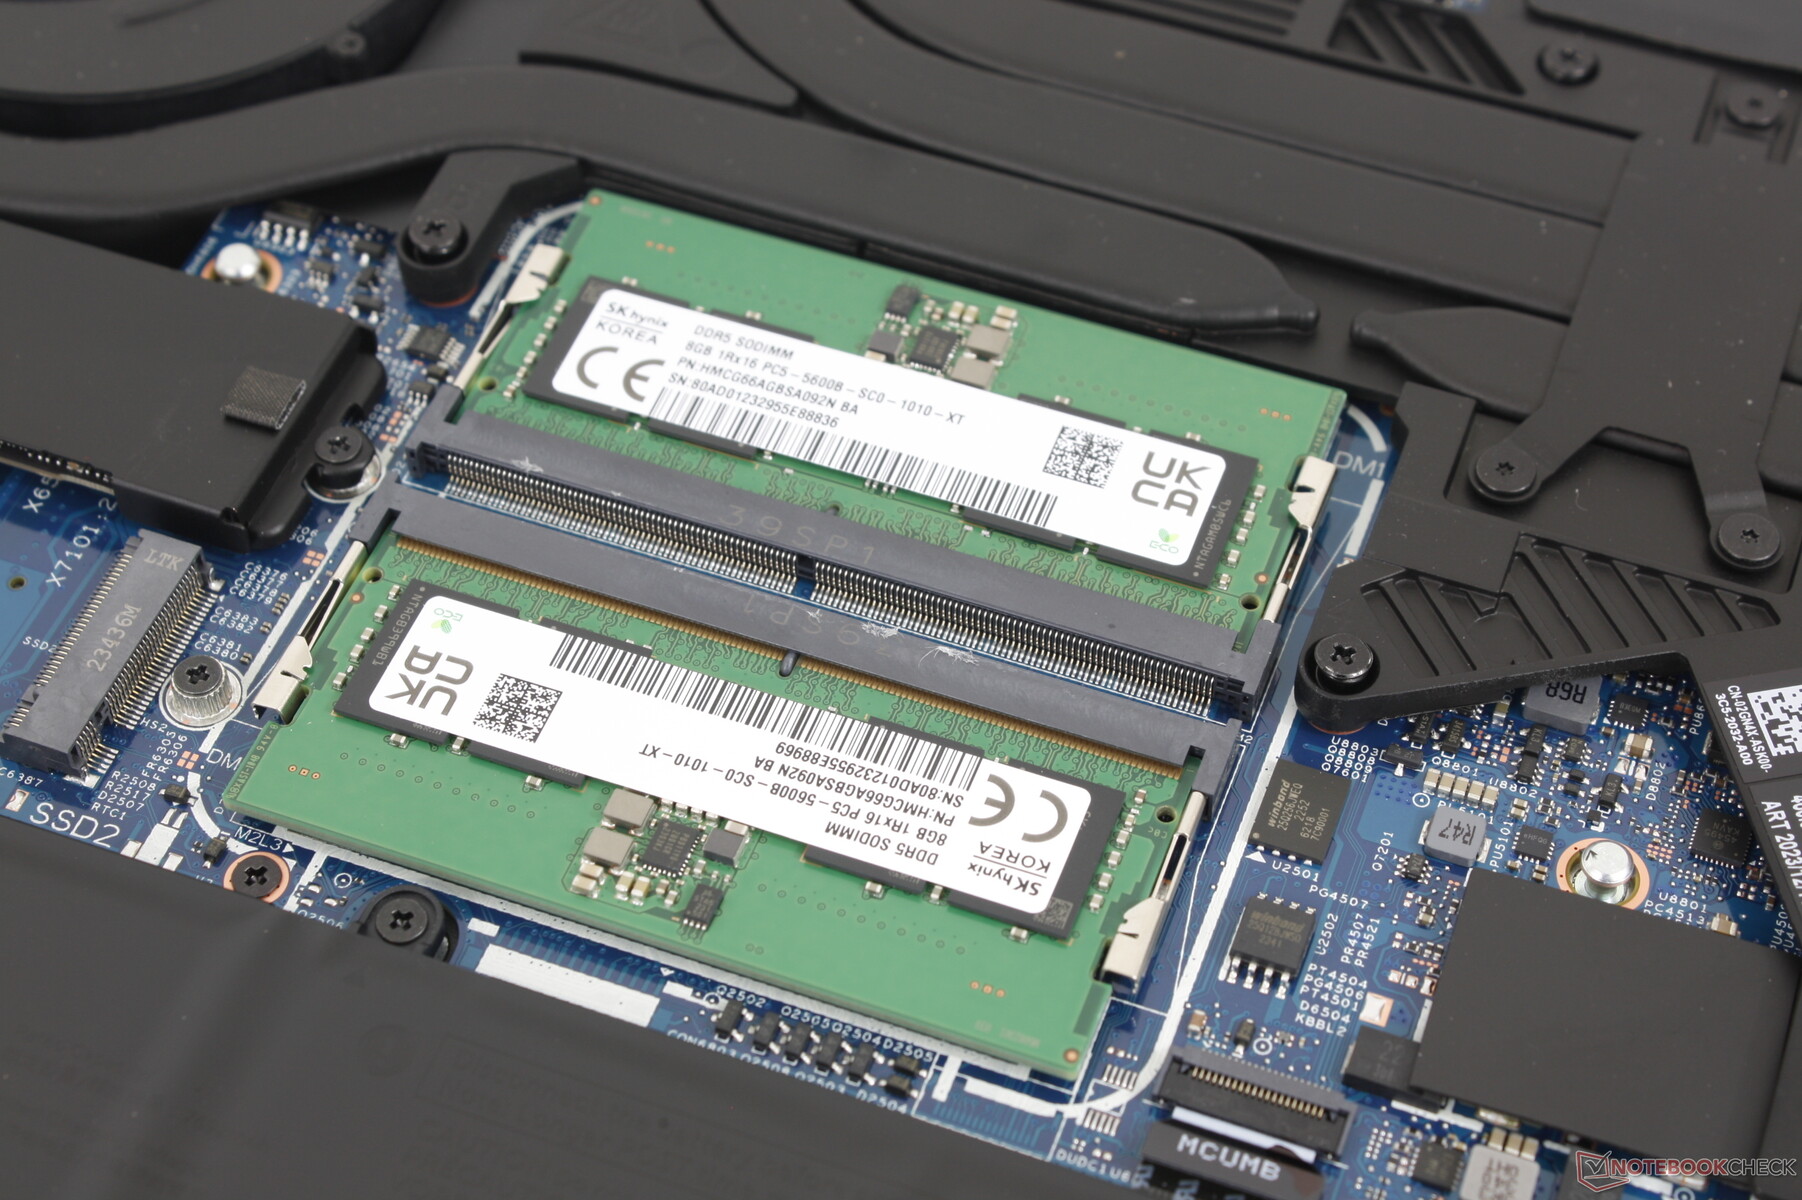
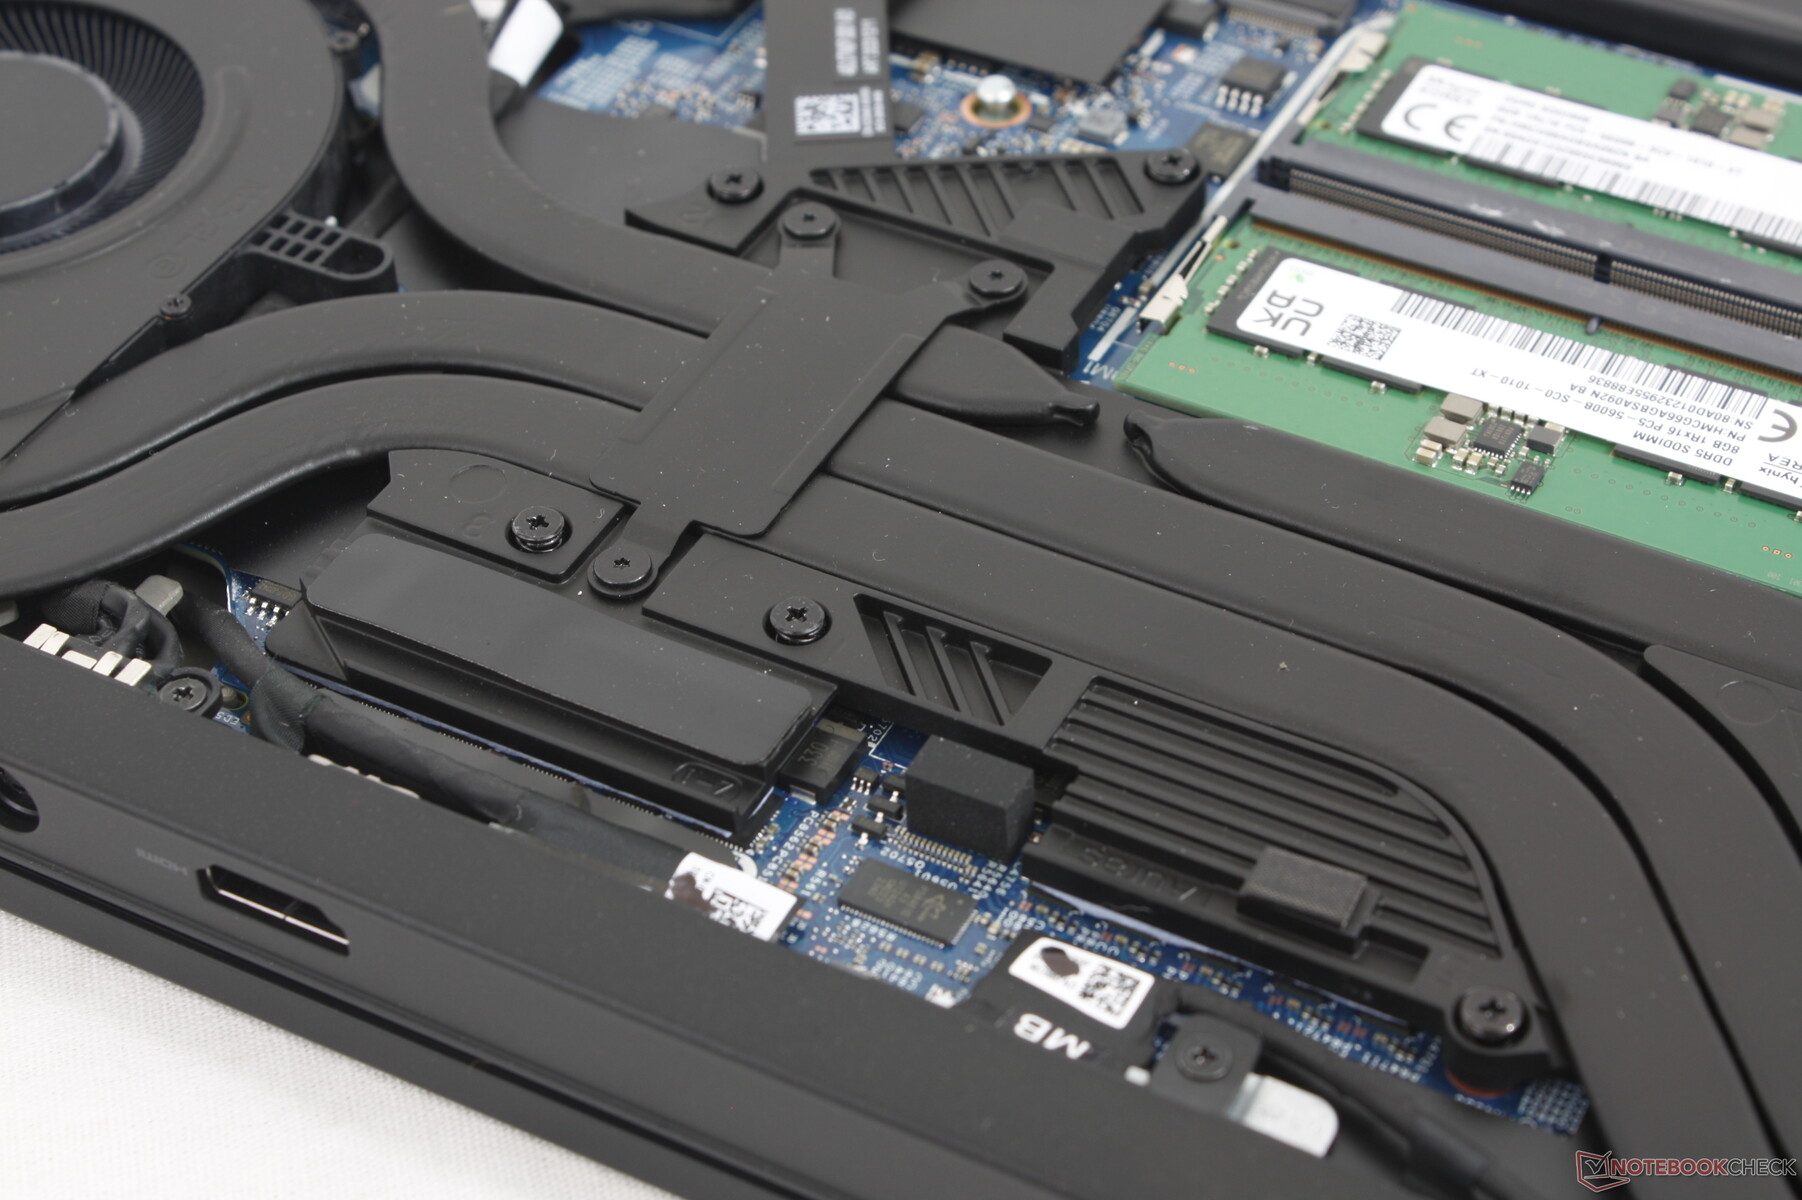
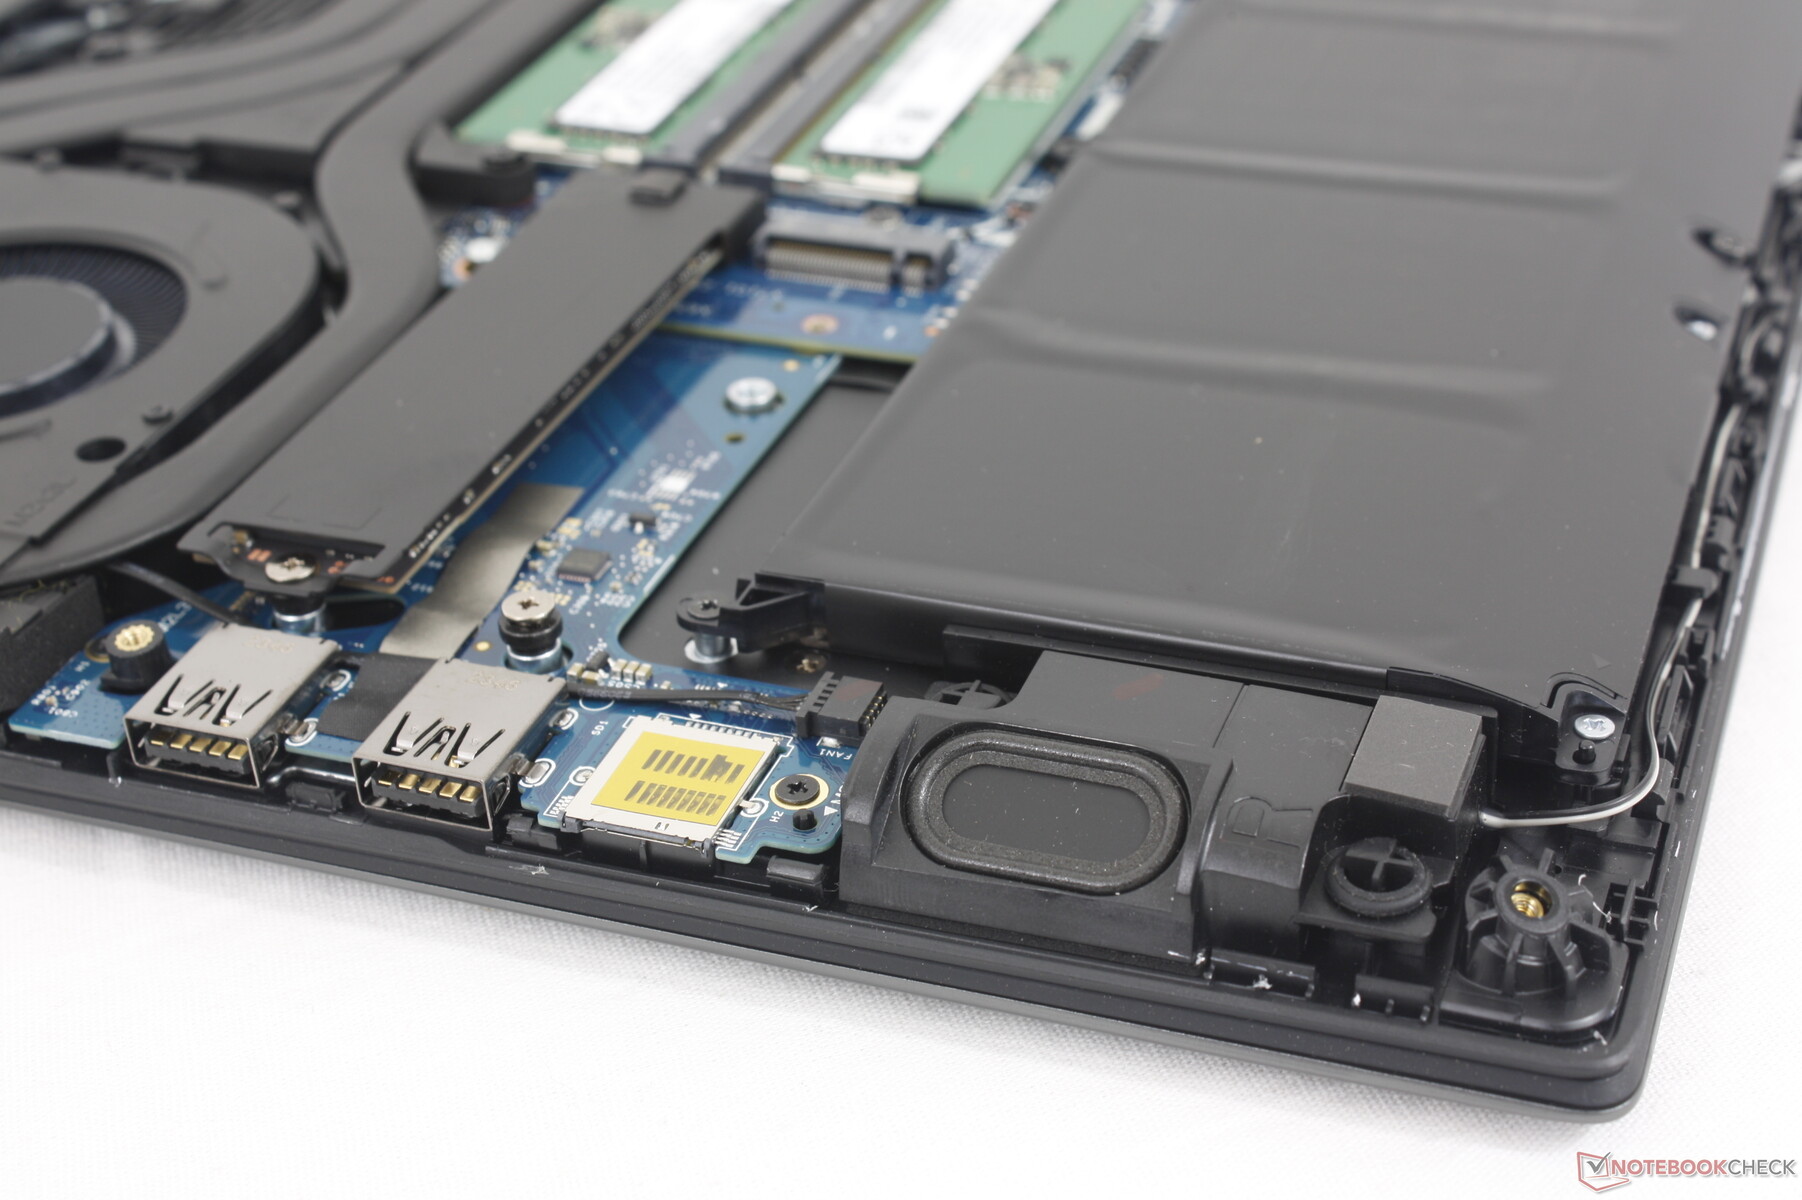
Manutenzione
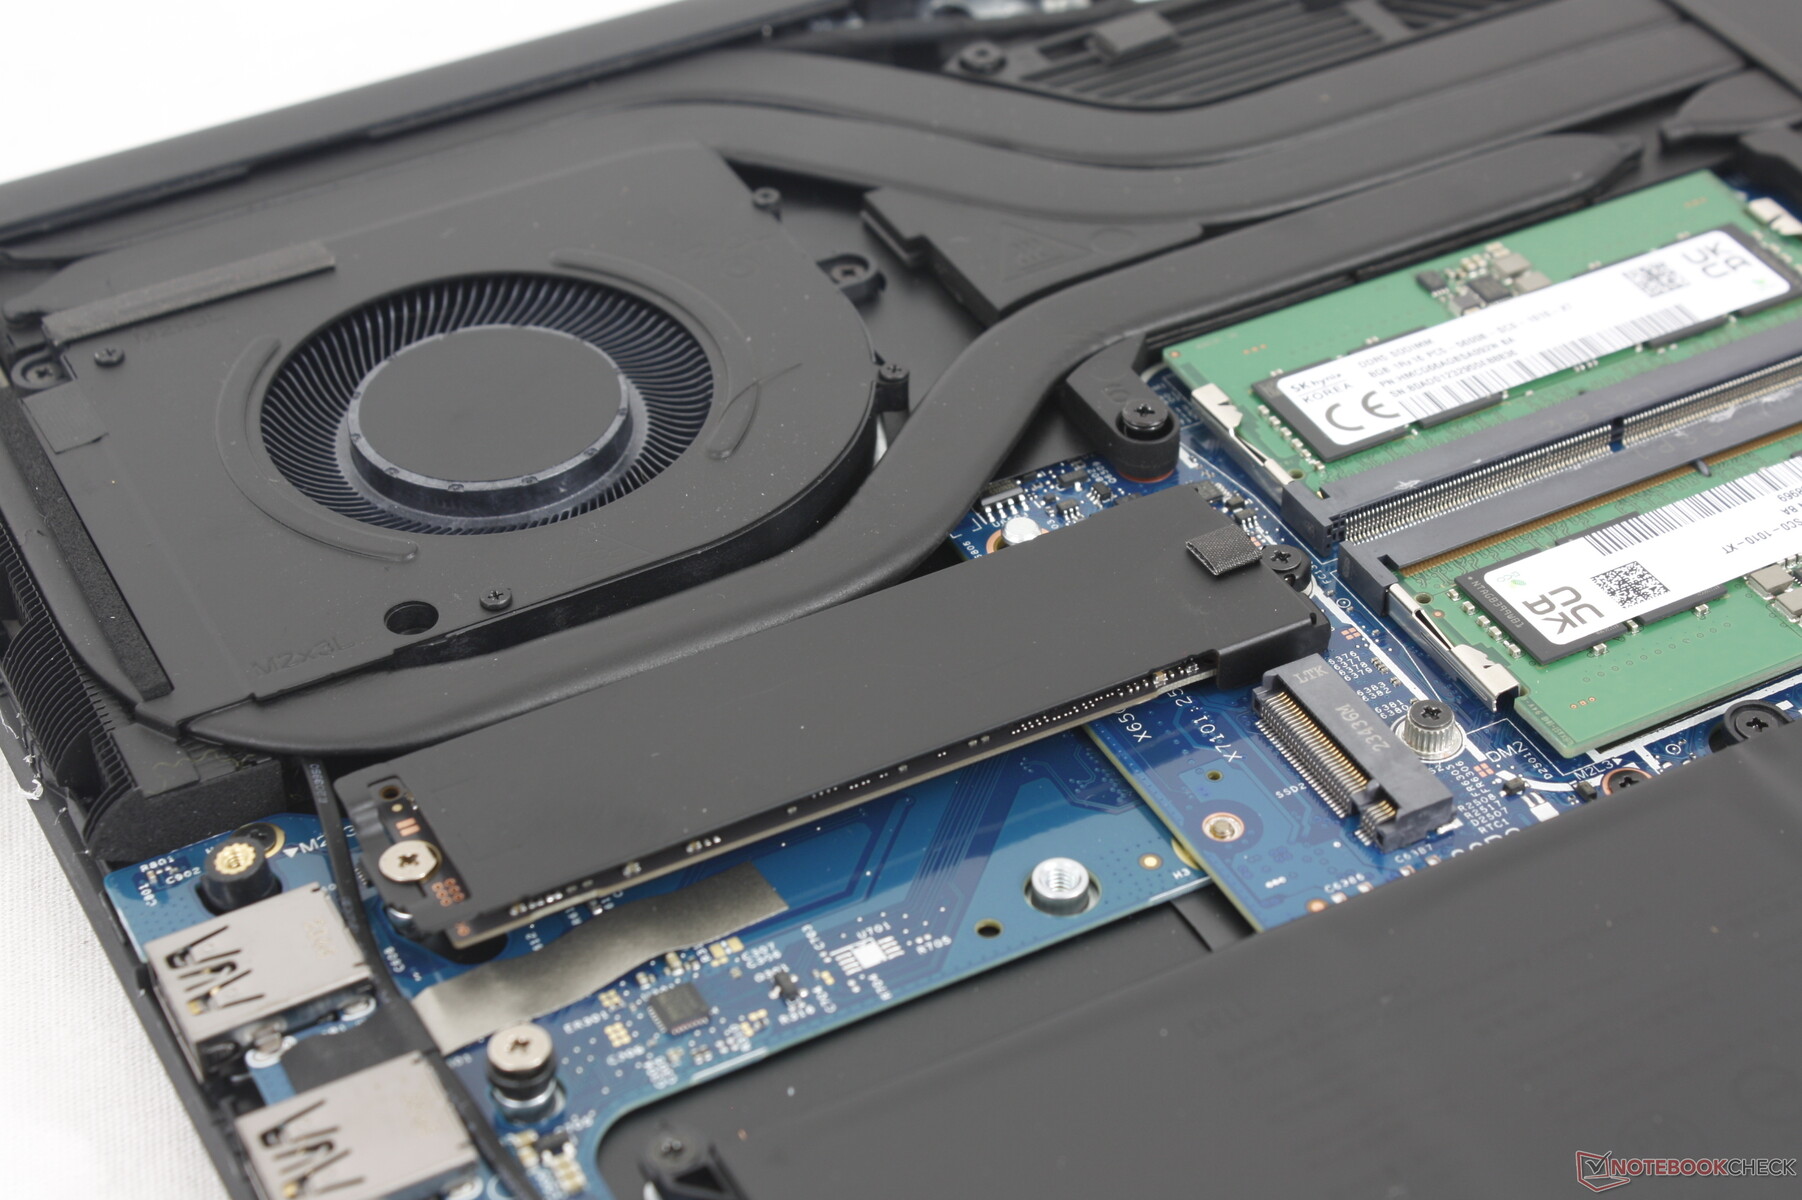
Il pannello inferiore è fissato da 8 viti Phillips per facilitare la manutenzione. La RAM e la WLAN continuano ad essere rimovibili, ma la configurazione dell'archiviazione è cambiata; il sistema ora supporta due SSD M.2 2280 invece di un M.2 2280 e due SSD M.2 2230 del design dello scorso anno.
Accessori e garanzia
La confezione di vendita include alcuni adesivi con il logo Alienware, oltre al consueto adattatore CA e alla documentazione cartacea. La garanzia limitata di un anno del produttore è standard, se acquistato negli Stati Uniti.
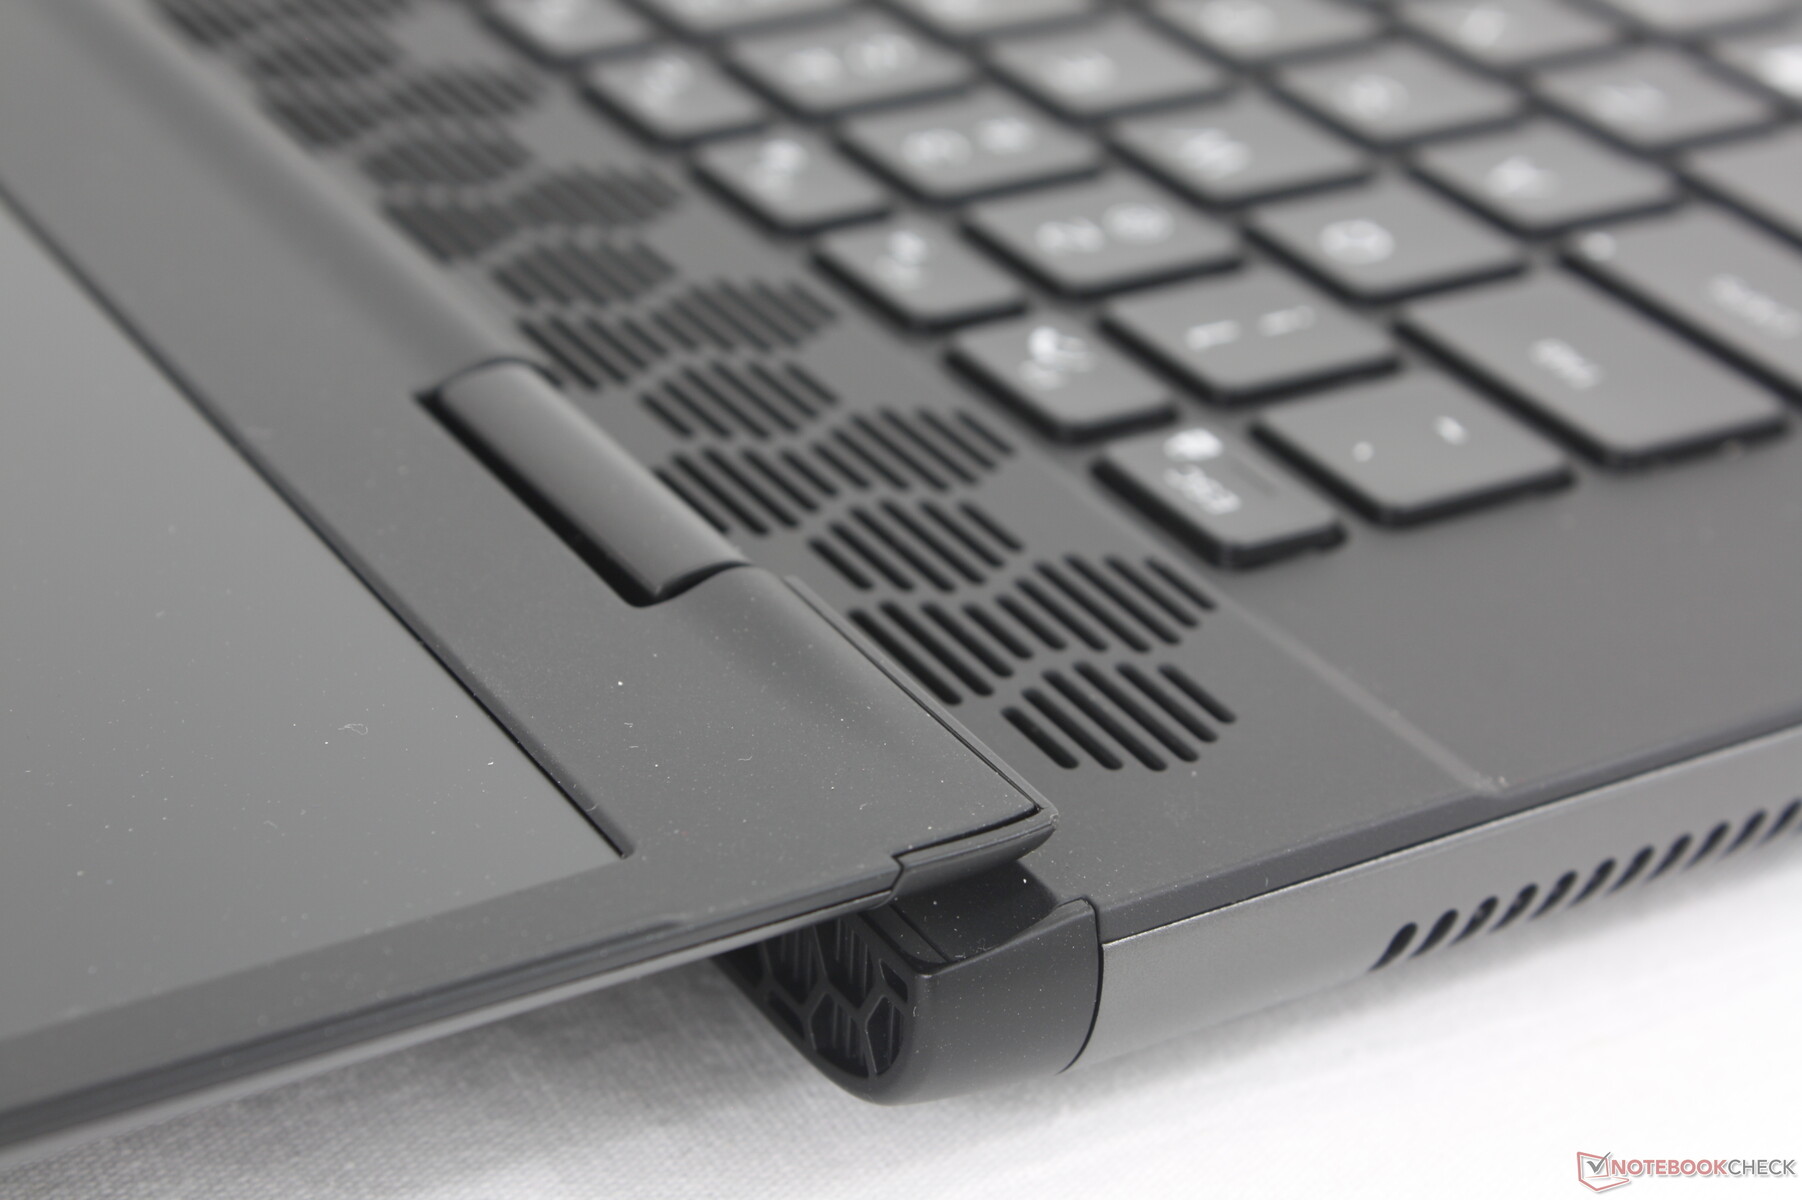
Dispositivi di input - Non è necessario che siano meccanici
Tastiera
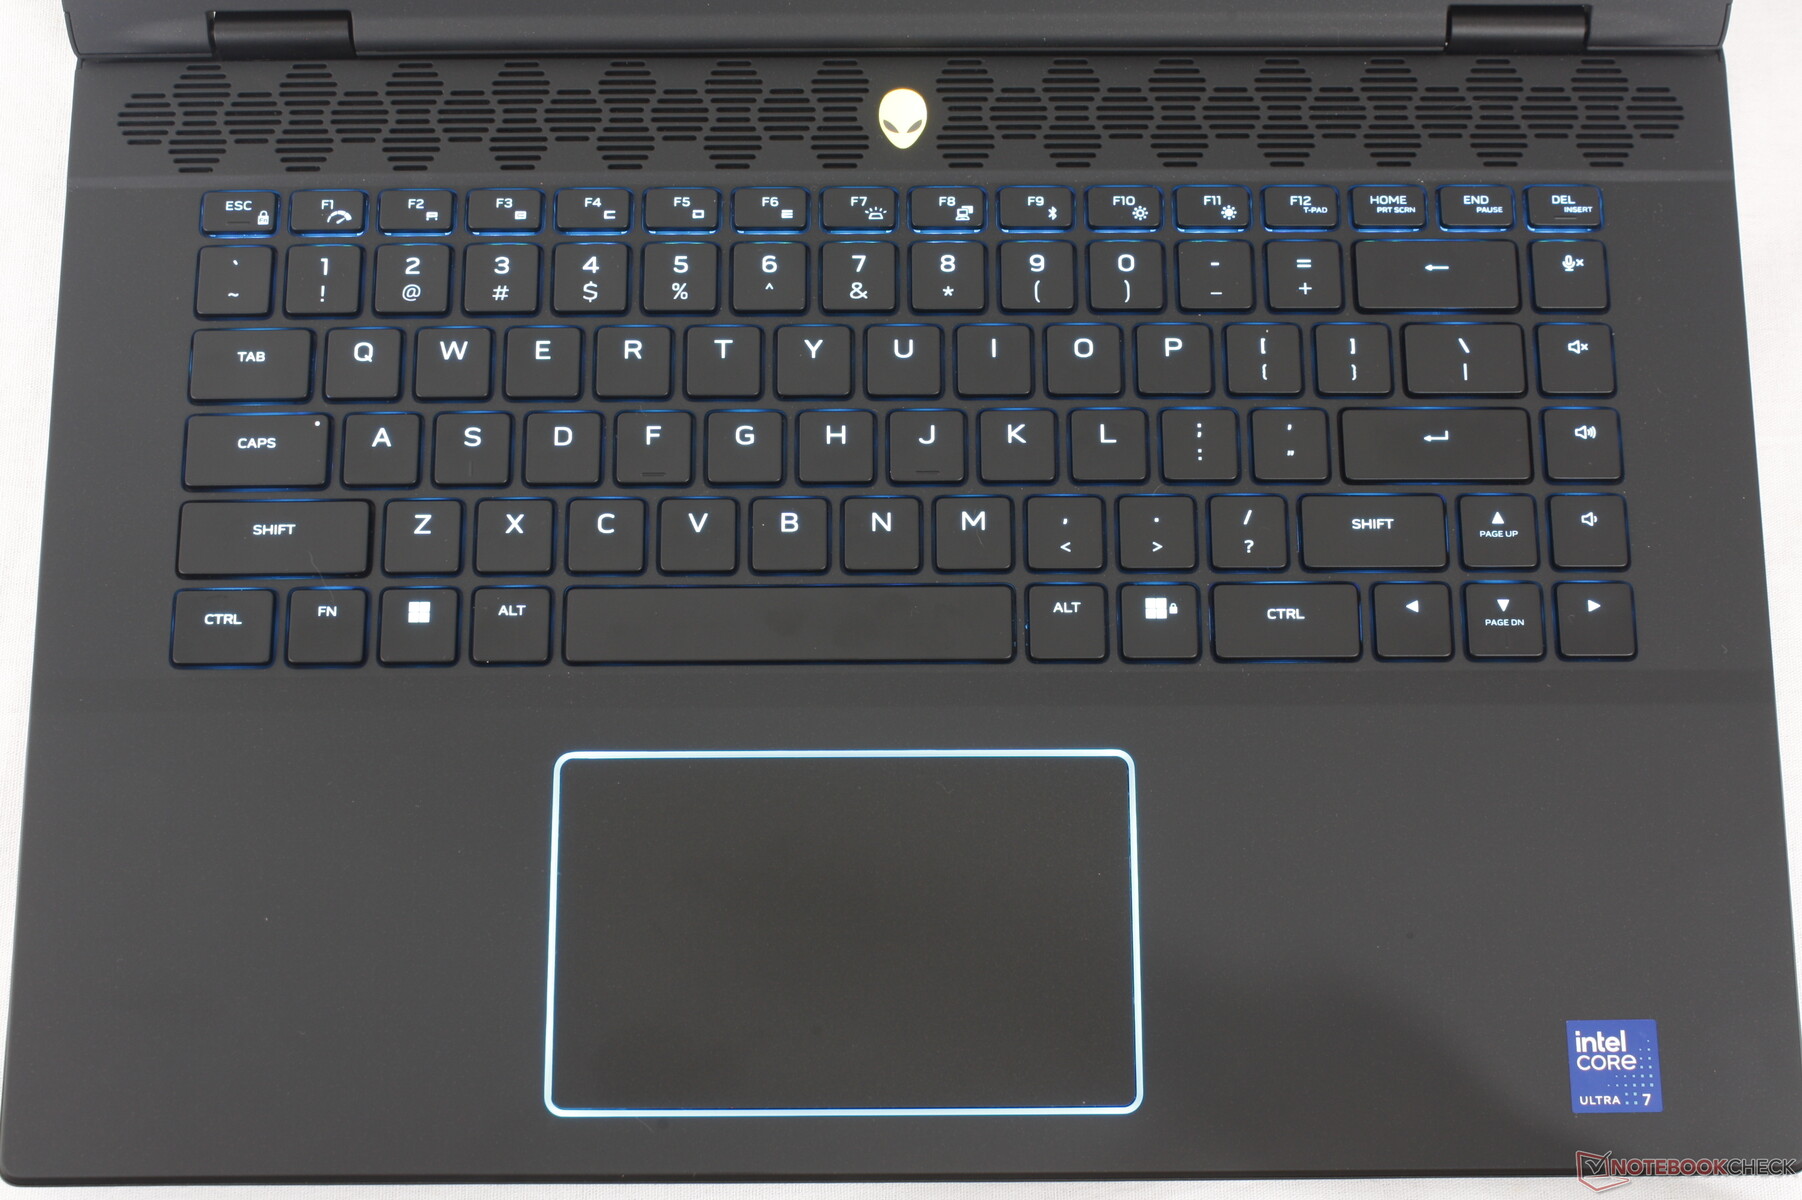
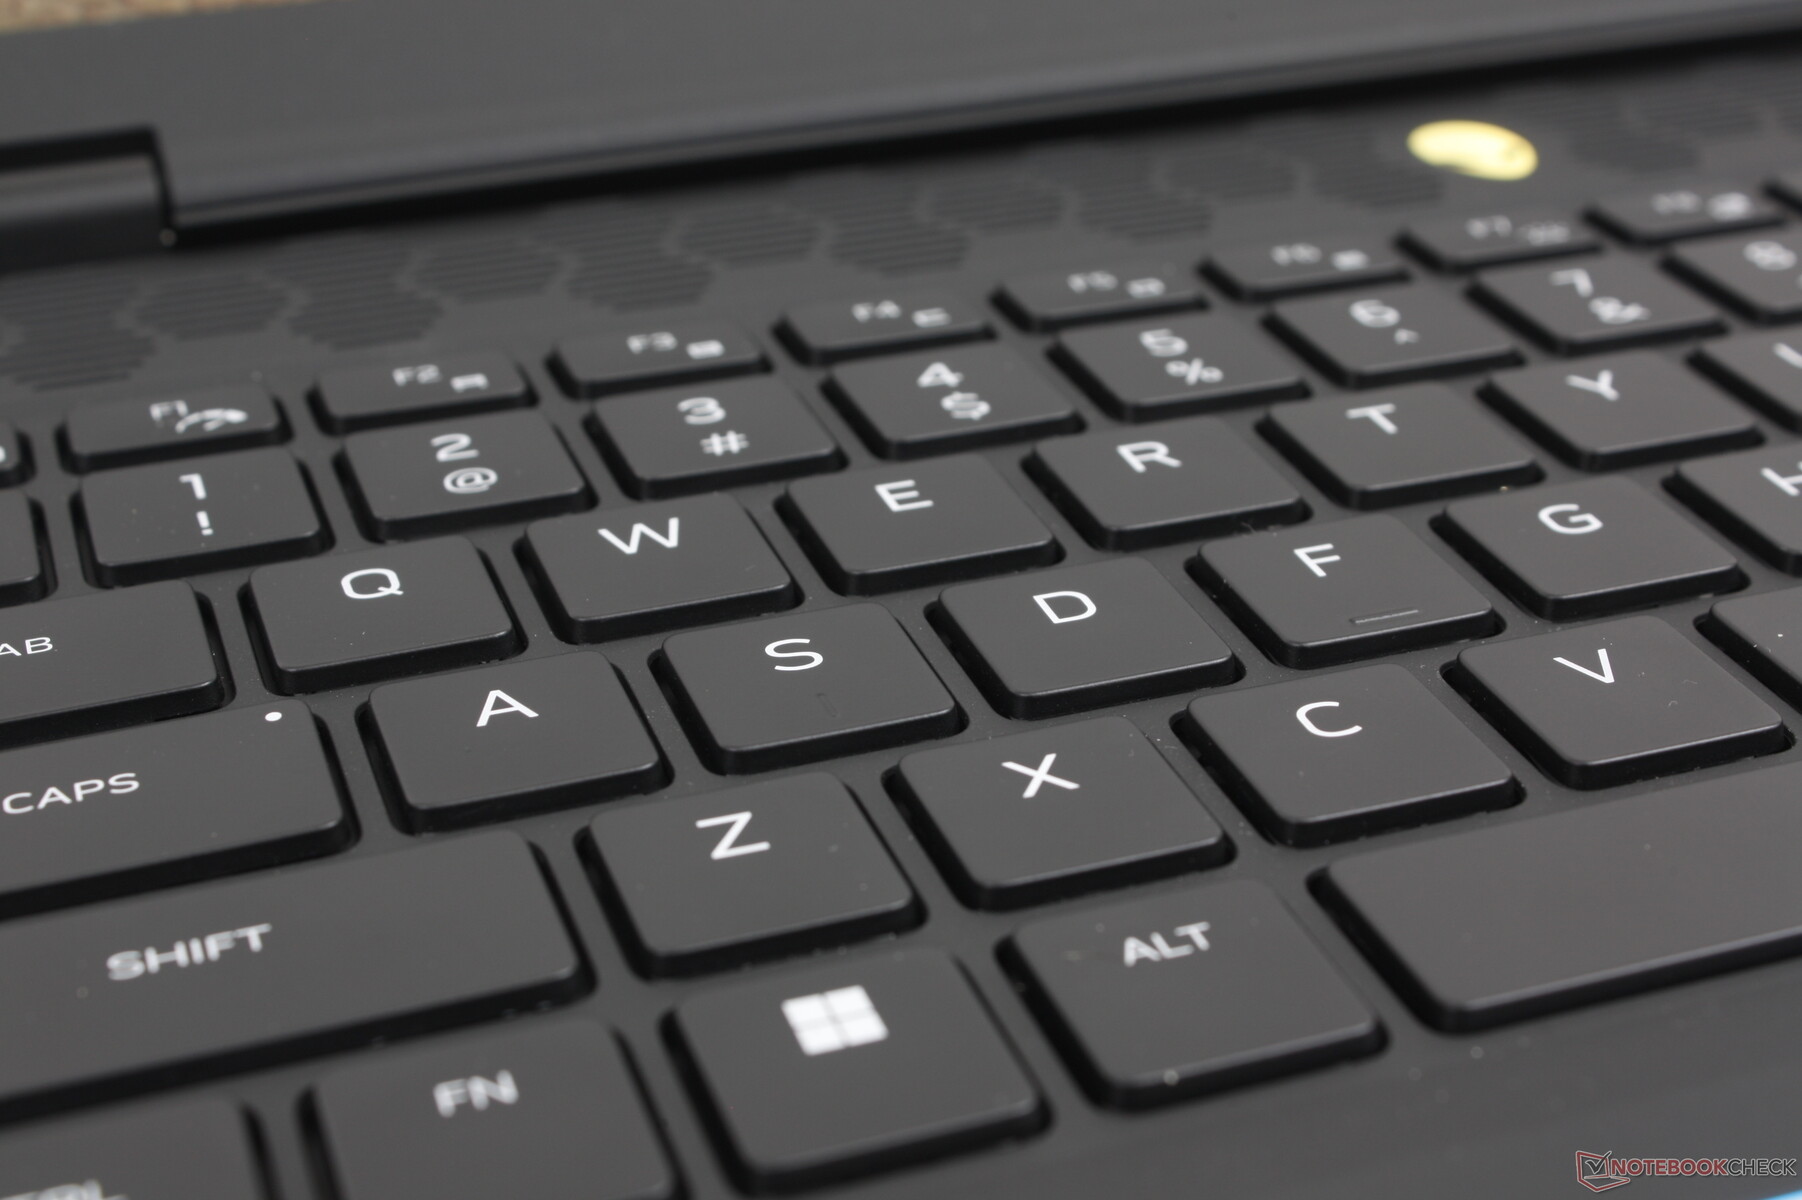
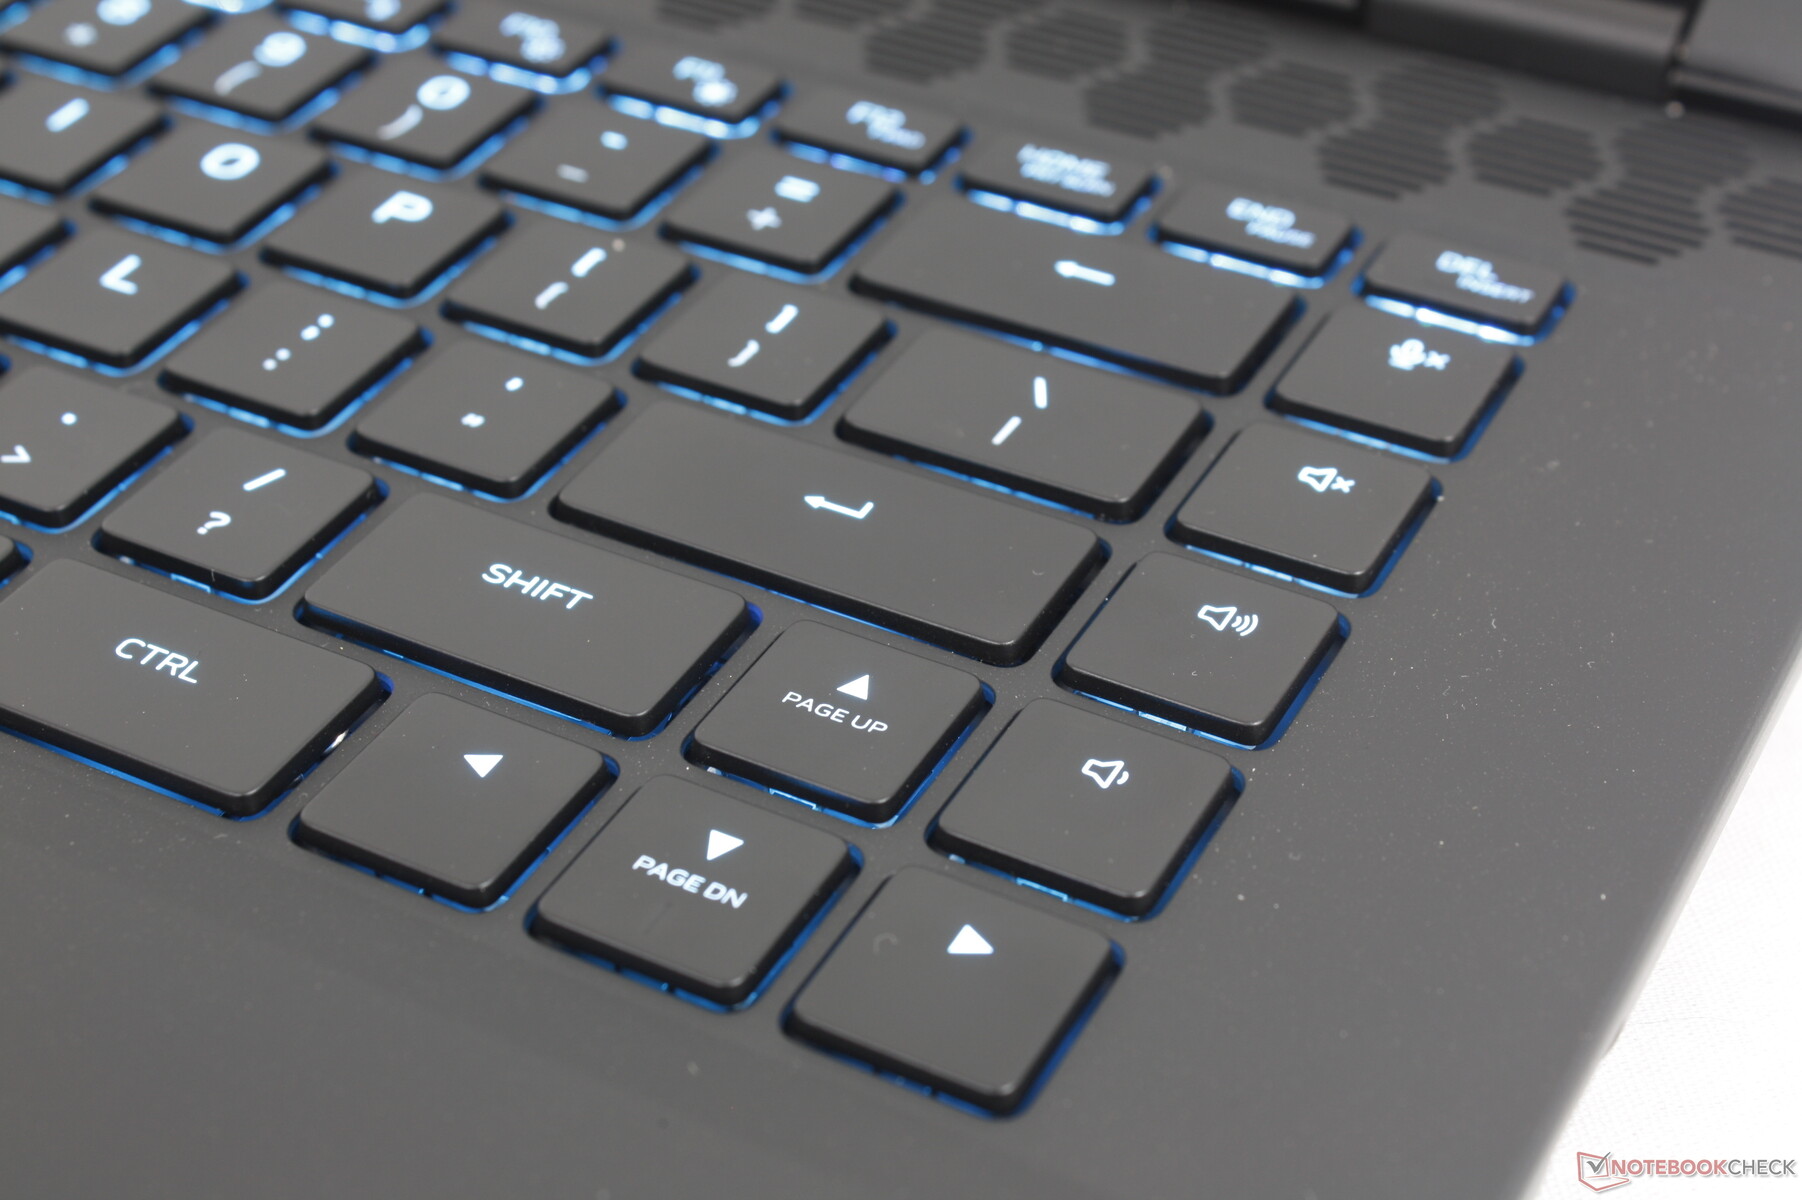
Il sistema utilizza tasti a membrana con un'escursione di 1,8 mm e nessuna opzione meccanica per mantenere il peso basso e rivolgersi a un pubblico più ampio oltre ai giocatori. Sono comunque comodi e più cliccabili di quanto ci si aspetti rispetto alle tastiere della maggior parte degli altri computer portatili da gioco, tra cui il modello MSI Raider GE68 o HP Omen Transcend 16. In particolare, i tasti Spazio e Invio sono molto più rumorosi e nitidi dei tasti QWERTY principali quando vengono premuti.
La novità di quest'anno della tastiera è una pratica funzione "Modalità Stealth" legata al tasto F2, che porta il sistema in modalità silenziosa senza dover prima lanciare Alienware Command Center. Per il resto, il layout della tastiera rimane identico a quello dell'm16 R1 originale.
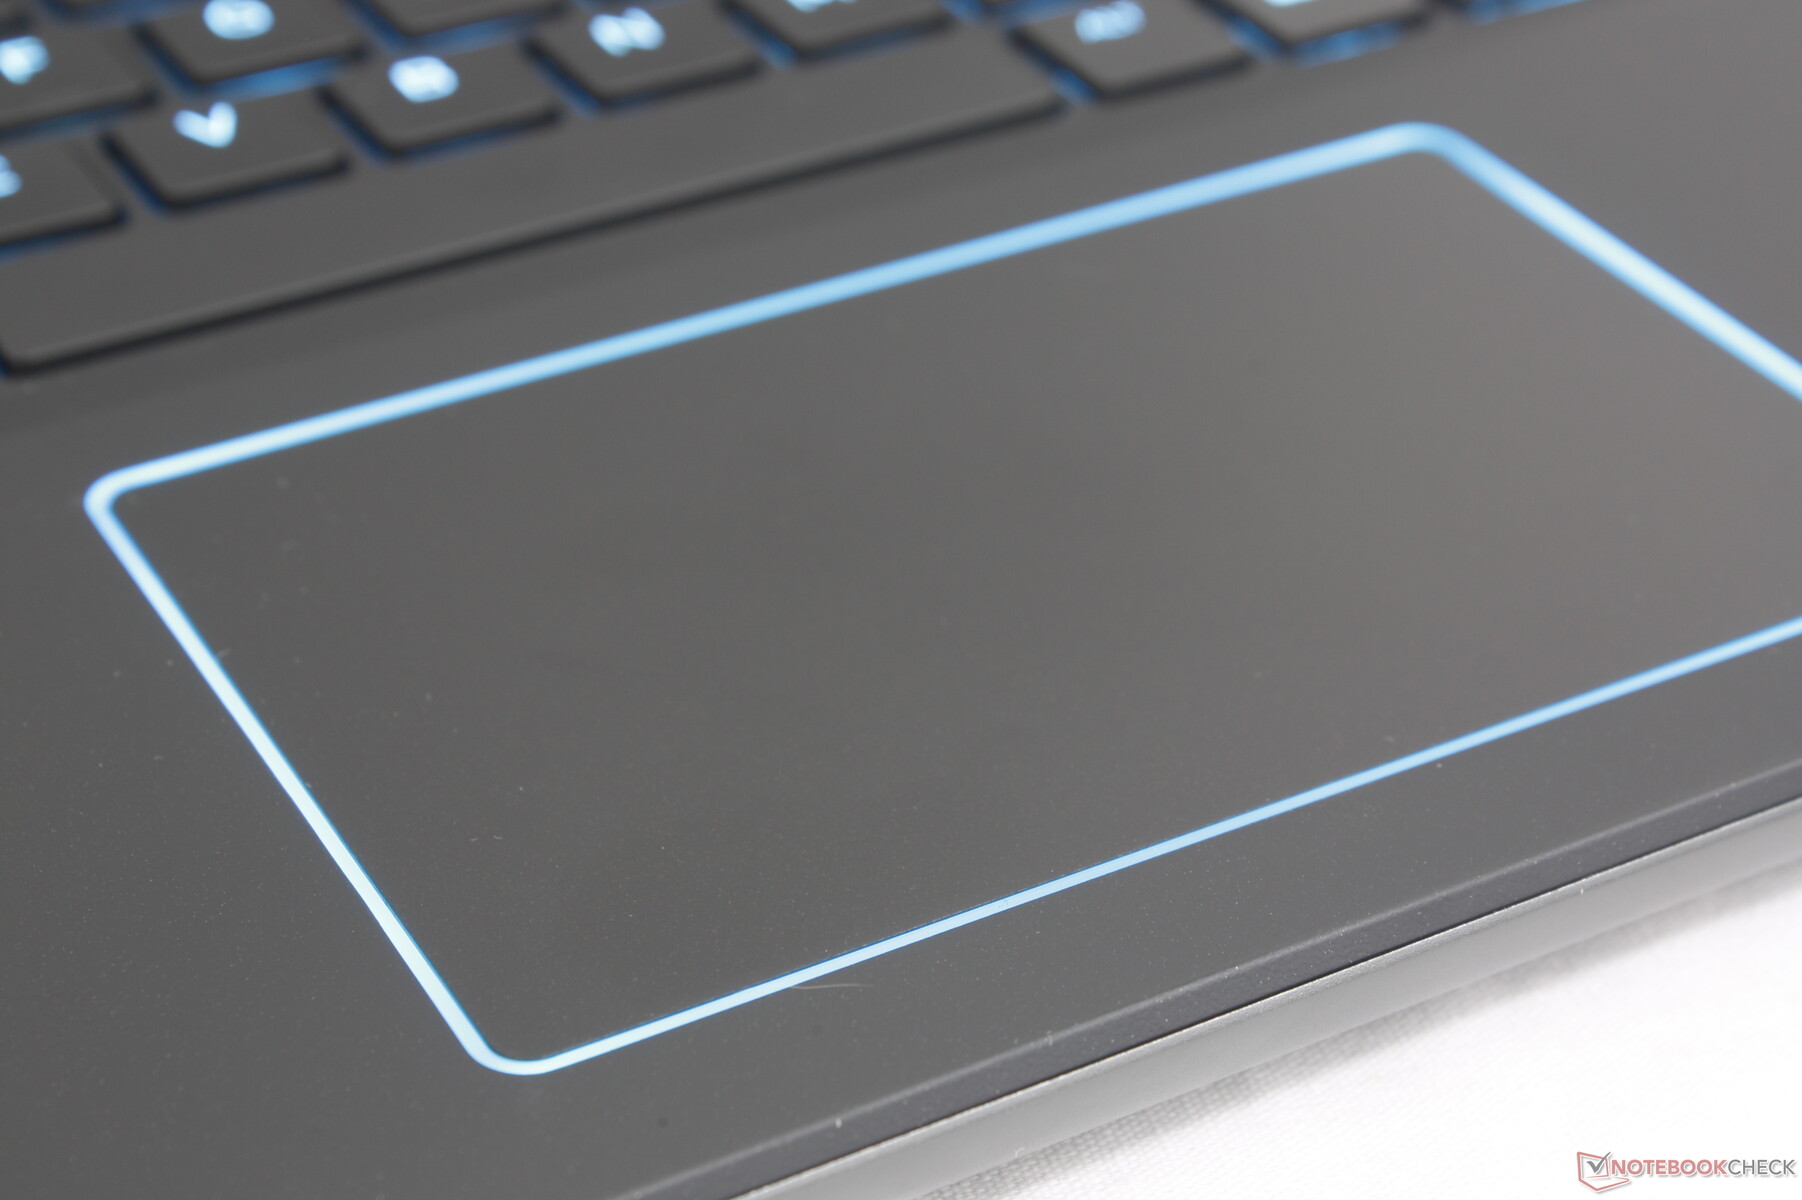
Touchpad
Il clickpad è leggermente più grande rispetto al modello dello scorso anno (11,5 x 7 cm contro 11,3 x 6,6 cm) e include una nuova illuminazione RGB lungo il perimetro. Tuttavia, il feedback quando fa clic continua ad essere spugnoso e molto superficiale, con una sensazione insoddisfacente. Funziona in modo sufficientemente affidabile per il puntamento e il clic di base, ma per le azioni più strette, come il trascinamento e il rilascio, si consiglia di utilizzare un mouse.
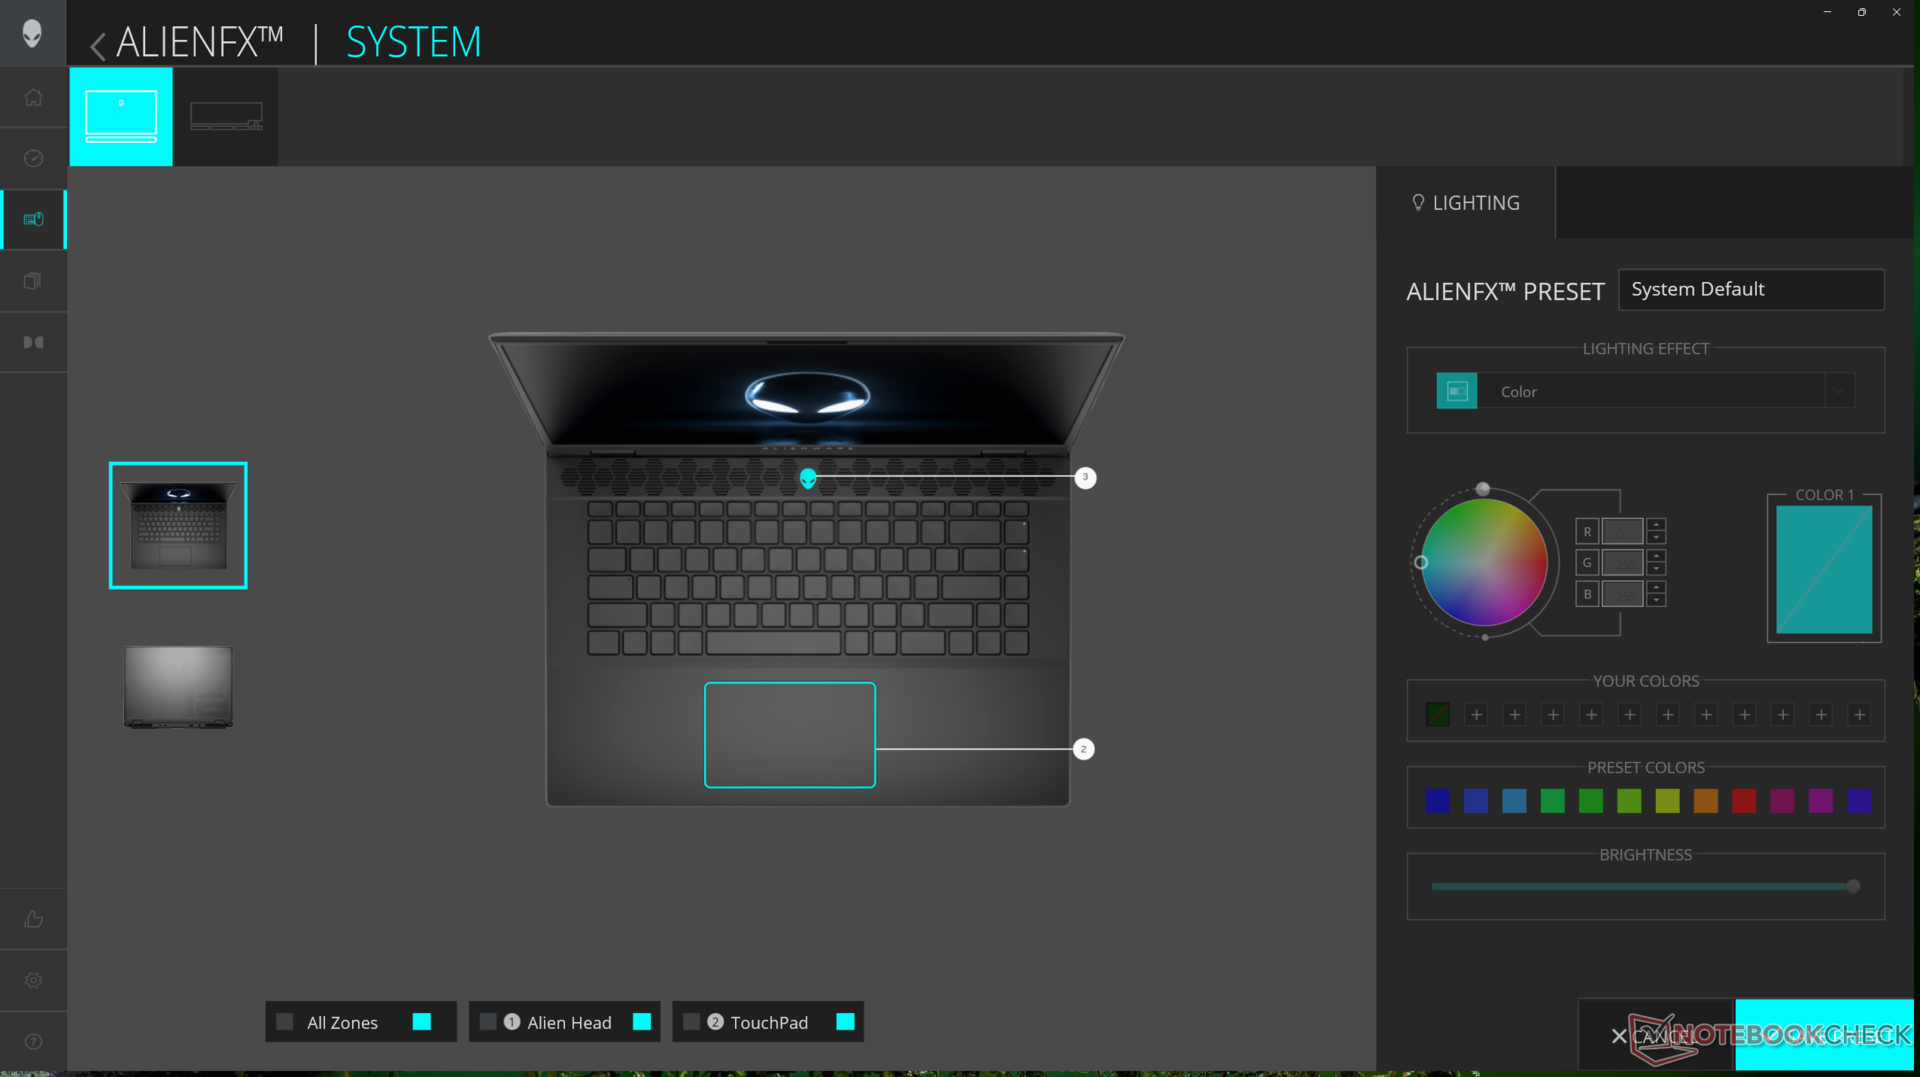
Purtroppo, l'illuminazione RGB può essere attivata o disattivata solo tramite il Centro di comando Alienware, poiché non esiste un tasto di scelta rapida per attivarla. La regolazione della luminosità dei tasti RGB non influisce sull'illuminazione intorno al clickpad.
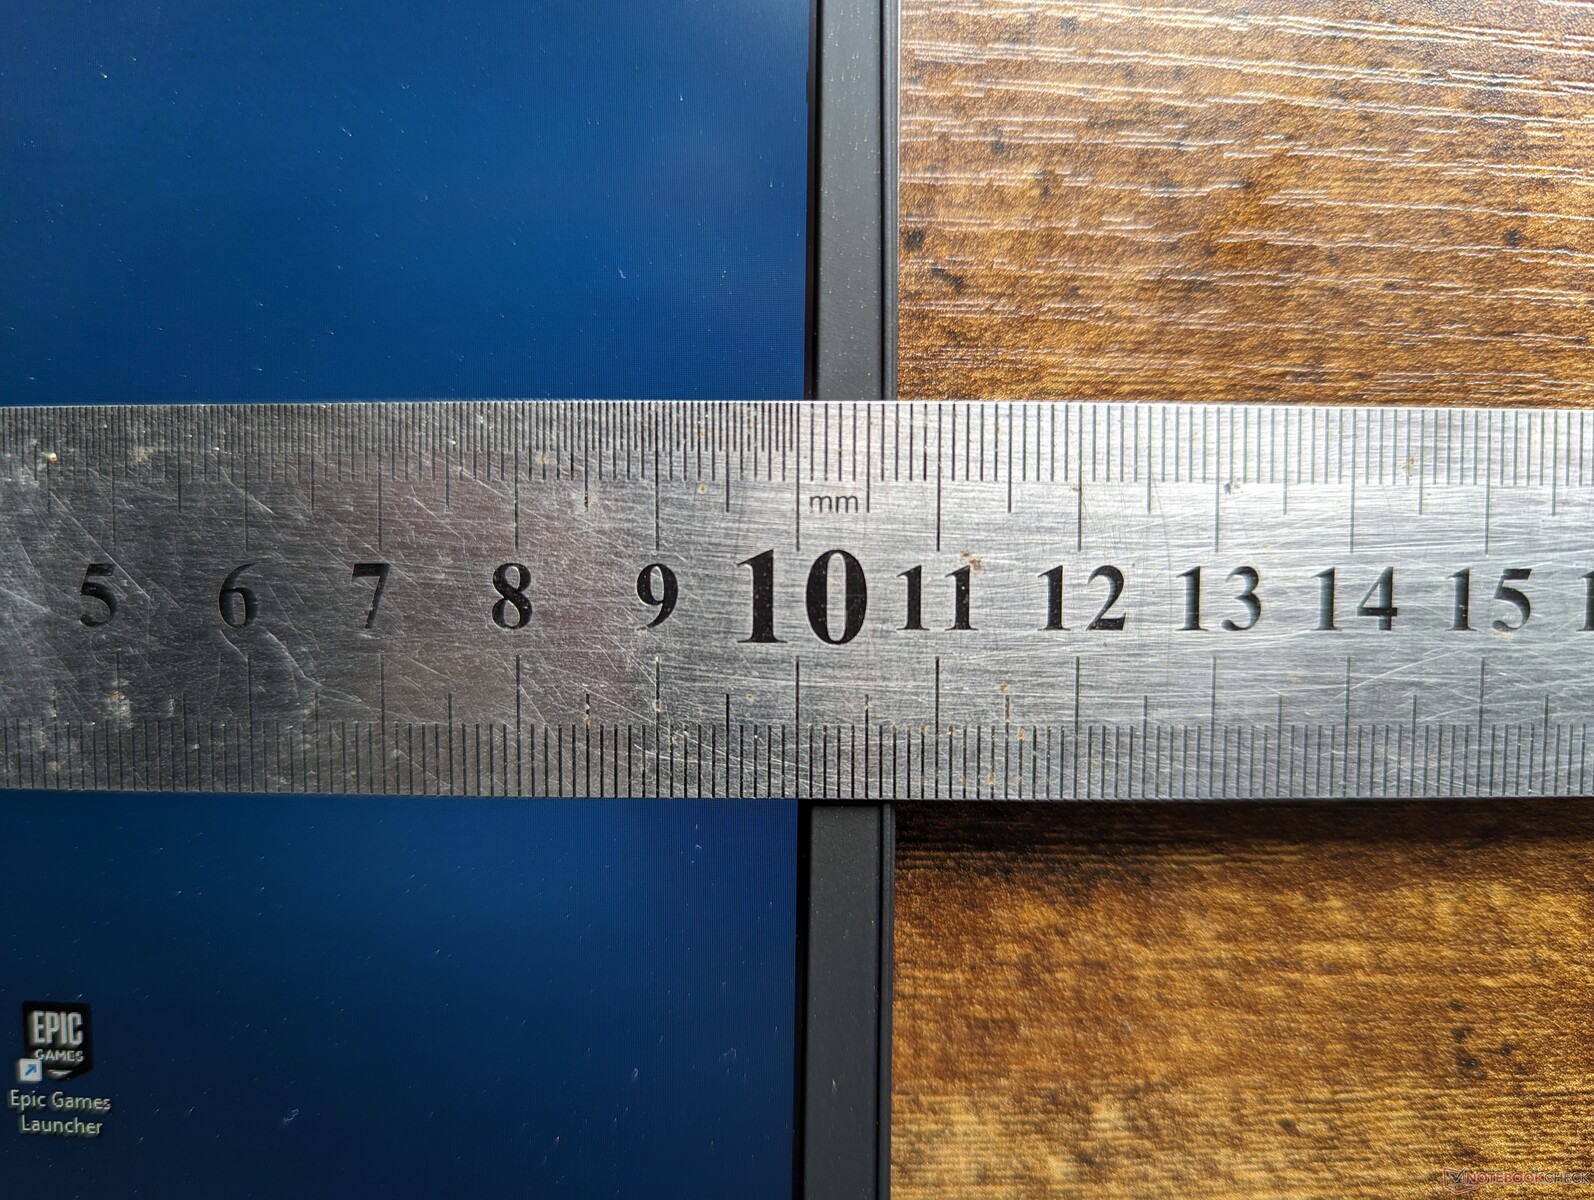
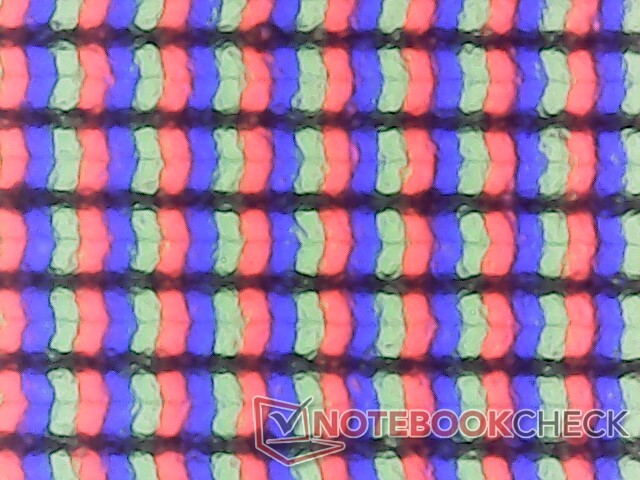
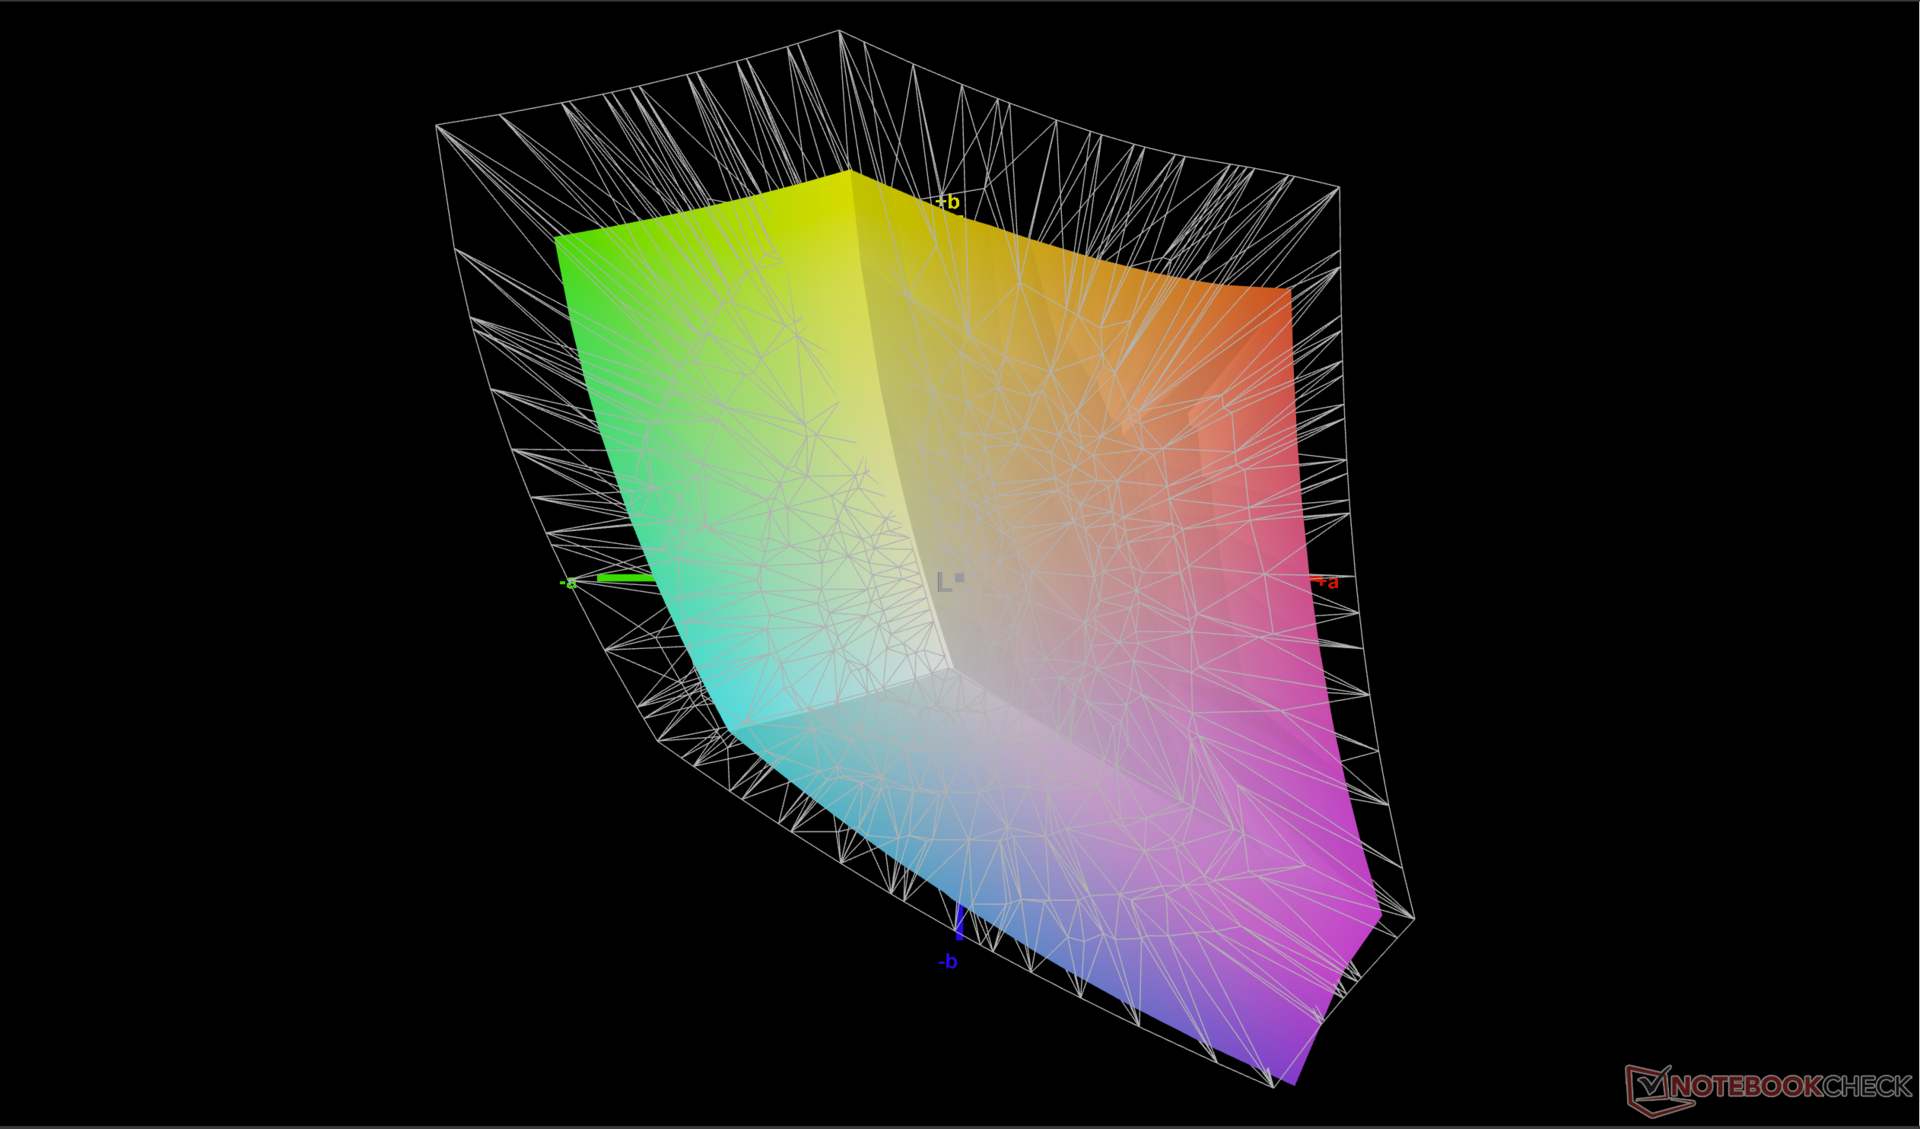
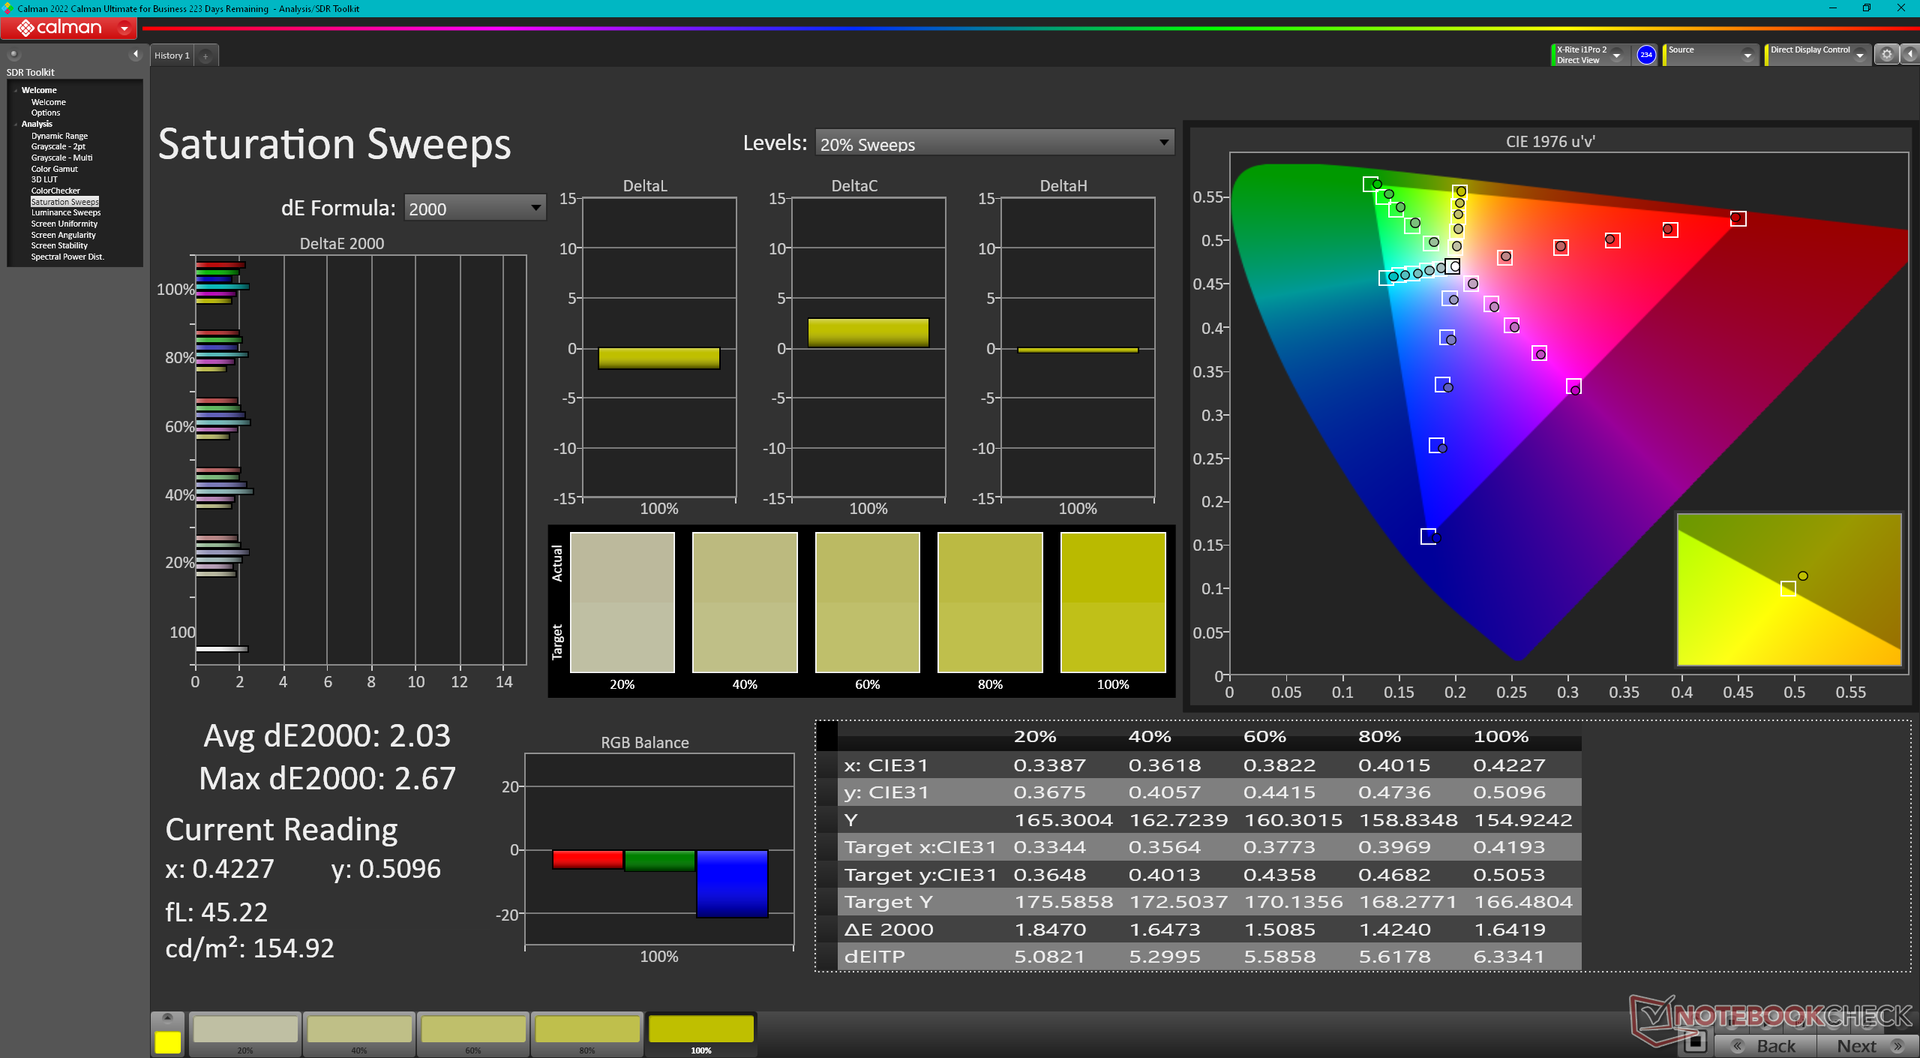
Display - 240 Hz e full sRGB ora standard
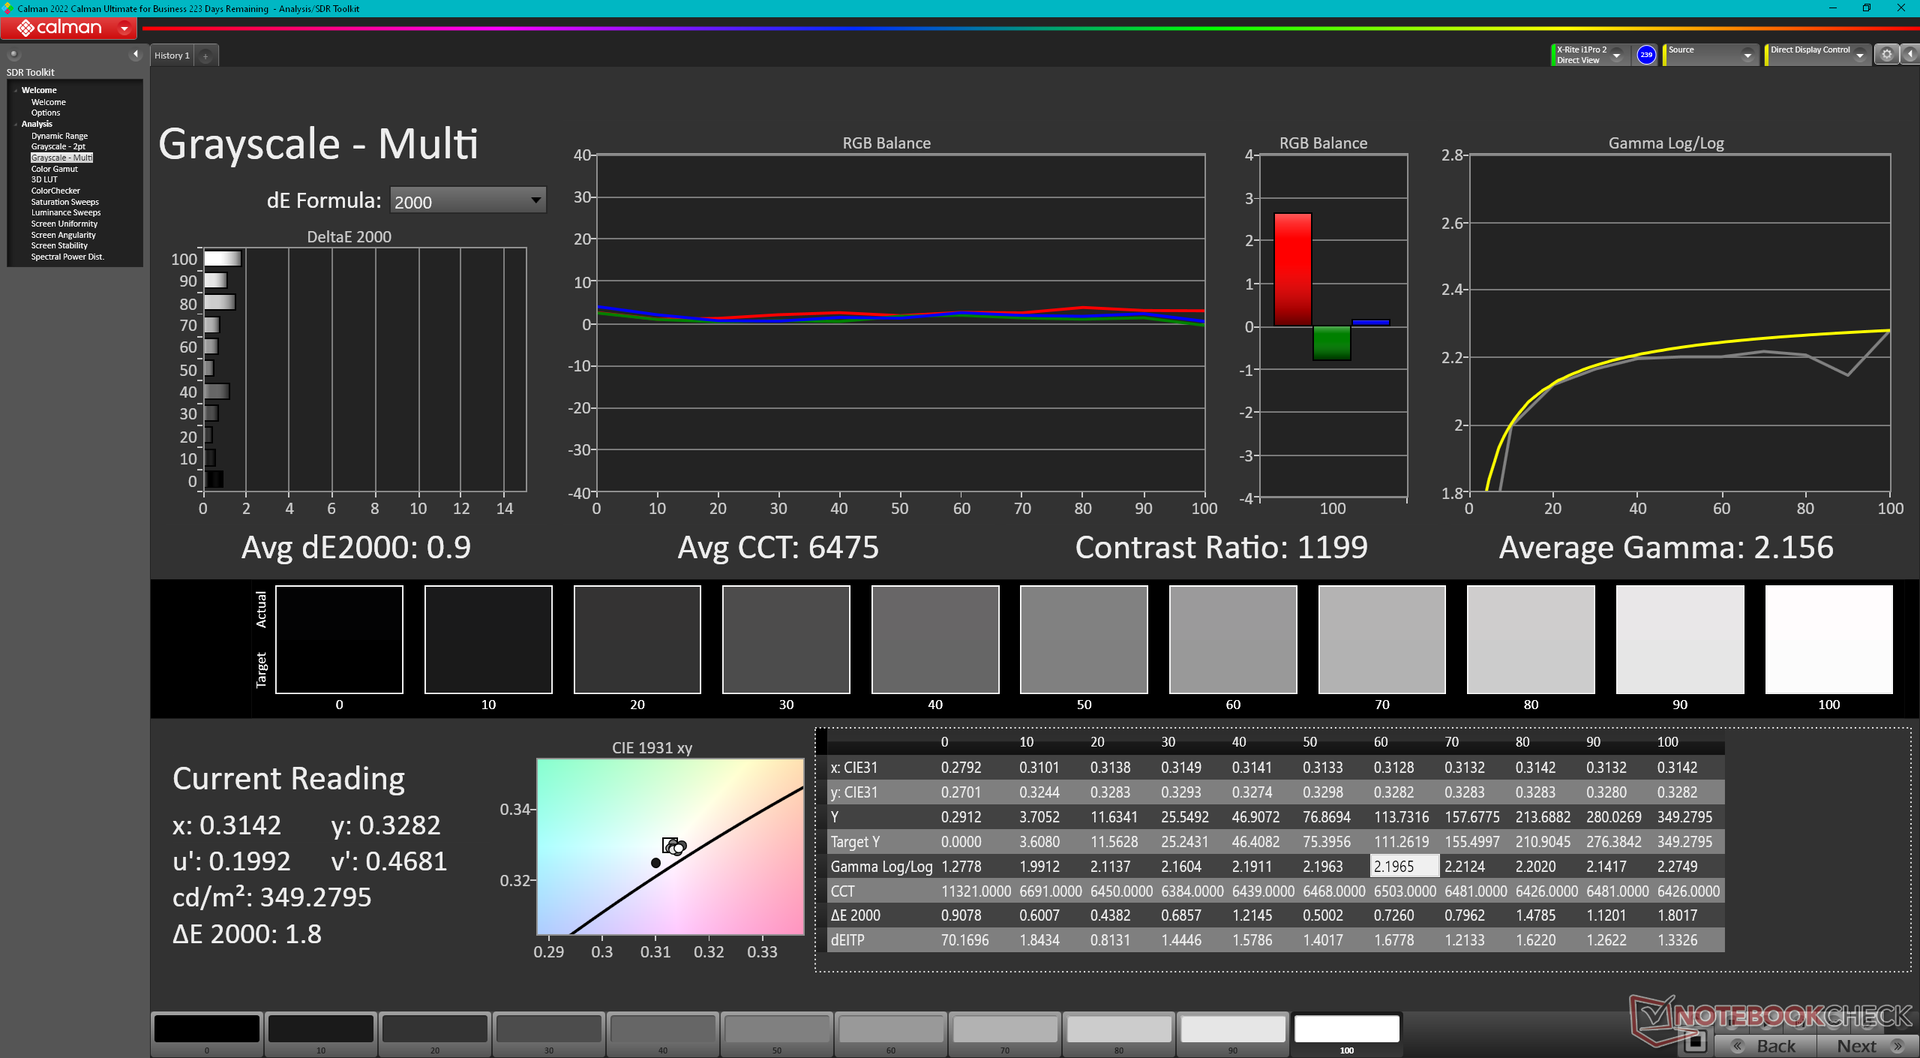
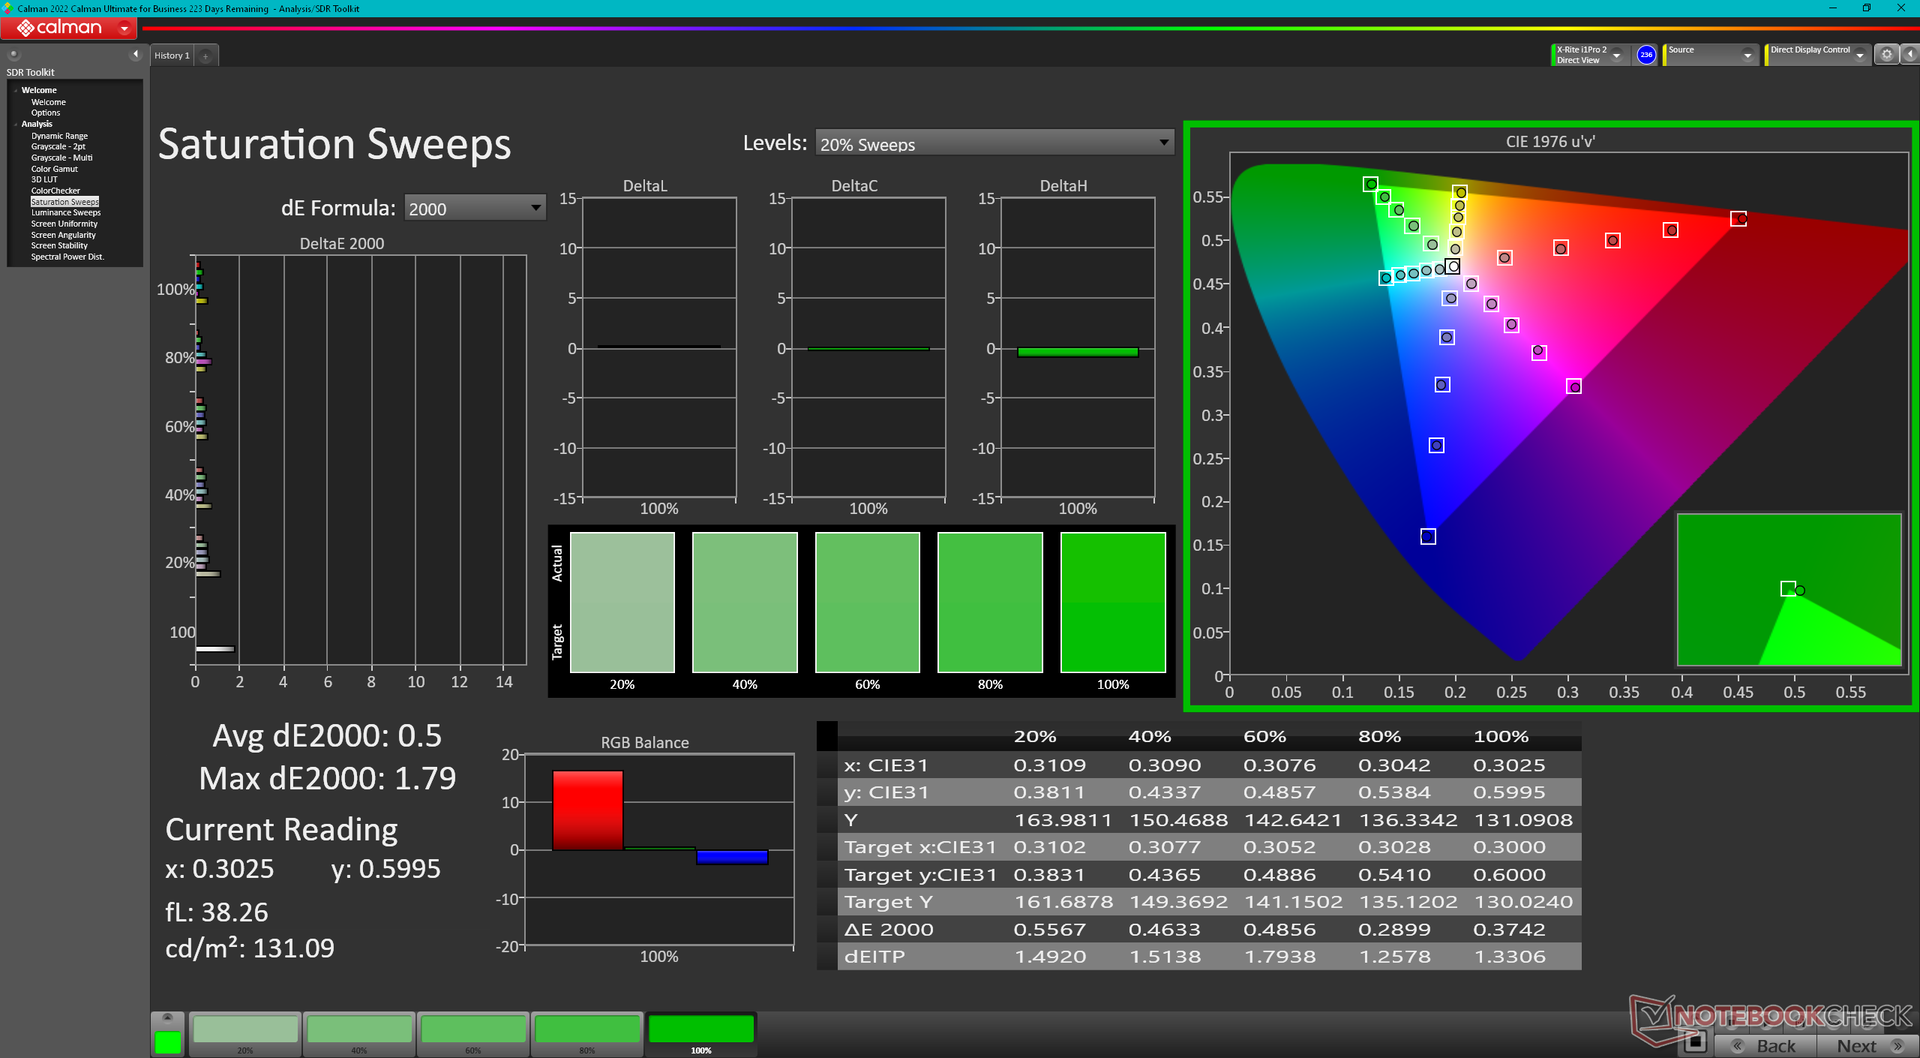
Il modello utilizza un pannello BOE NE16NYH, a differenza del BOE NE16NYB del modello m16 R1 dello scorso anno. Il pannello più recente ha una frequenza di aggiornamento nativa più veloce (240 Hz contro 165 Hz), mentre tutti gli altri attributi rimangono essenzialmente gli stessi, compresi i tempi di risposta rapidi in bianco e nero, il rapporto di contrasto ~1000:1, la copertura completa sRGB e la luminosità massima da 300 a 350 nit. Il display è adatto sia per il gioco che per l'editing amatoriale.
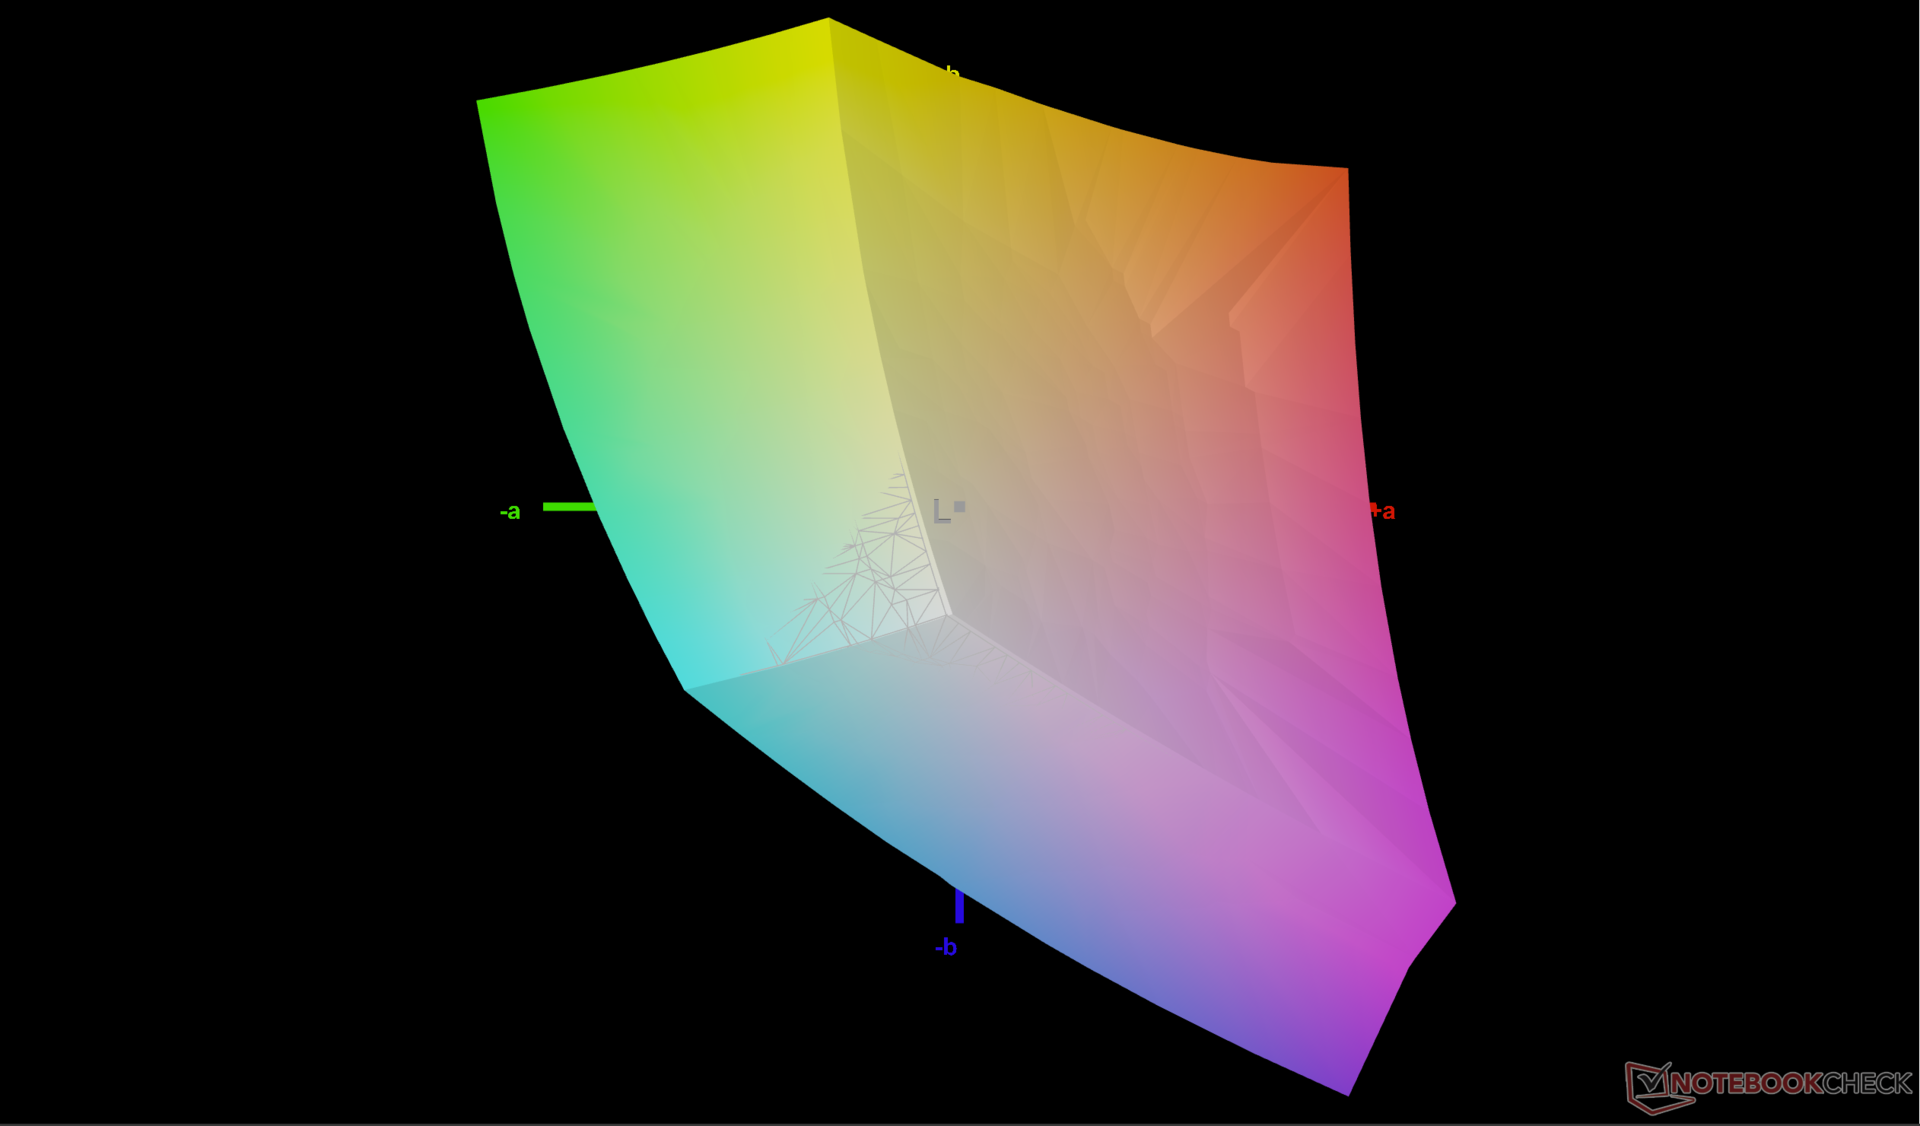
Per quanto il nuovo pannello possa essere fluido, mancano ancora i colori DCI-P3 e la frequenza di aggiornamento variabile di Windows. Il primo sarebbe stato interessante per gli editor grafici più professionali, mentre il secondo avrebbe migliorato la durata della batteria. I colori DCI-P3 completi sono disponibili su x16 R1, HP Omen Transcend 16, e Asus ROG Zephyrus G16. Anche l'HDR non è supportato, poiché il display non è abbastanza luminoso da soddisfare i prerequisiti HDR400+.
| |||||||||||||||||||||||||
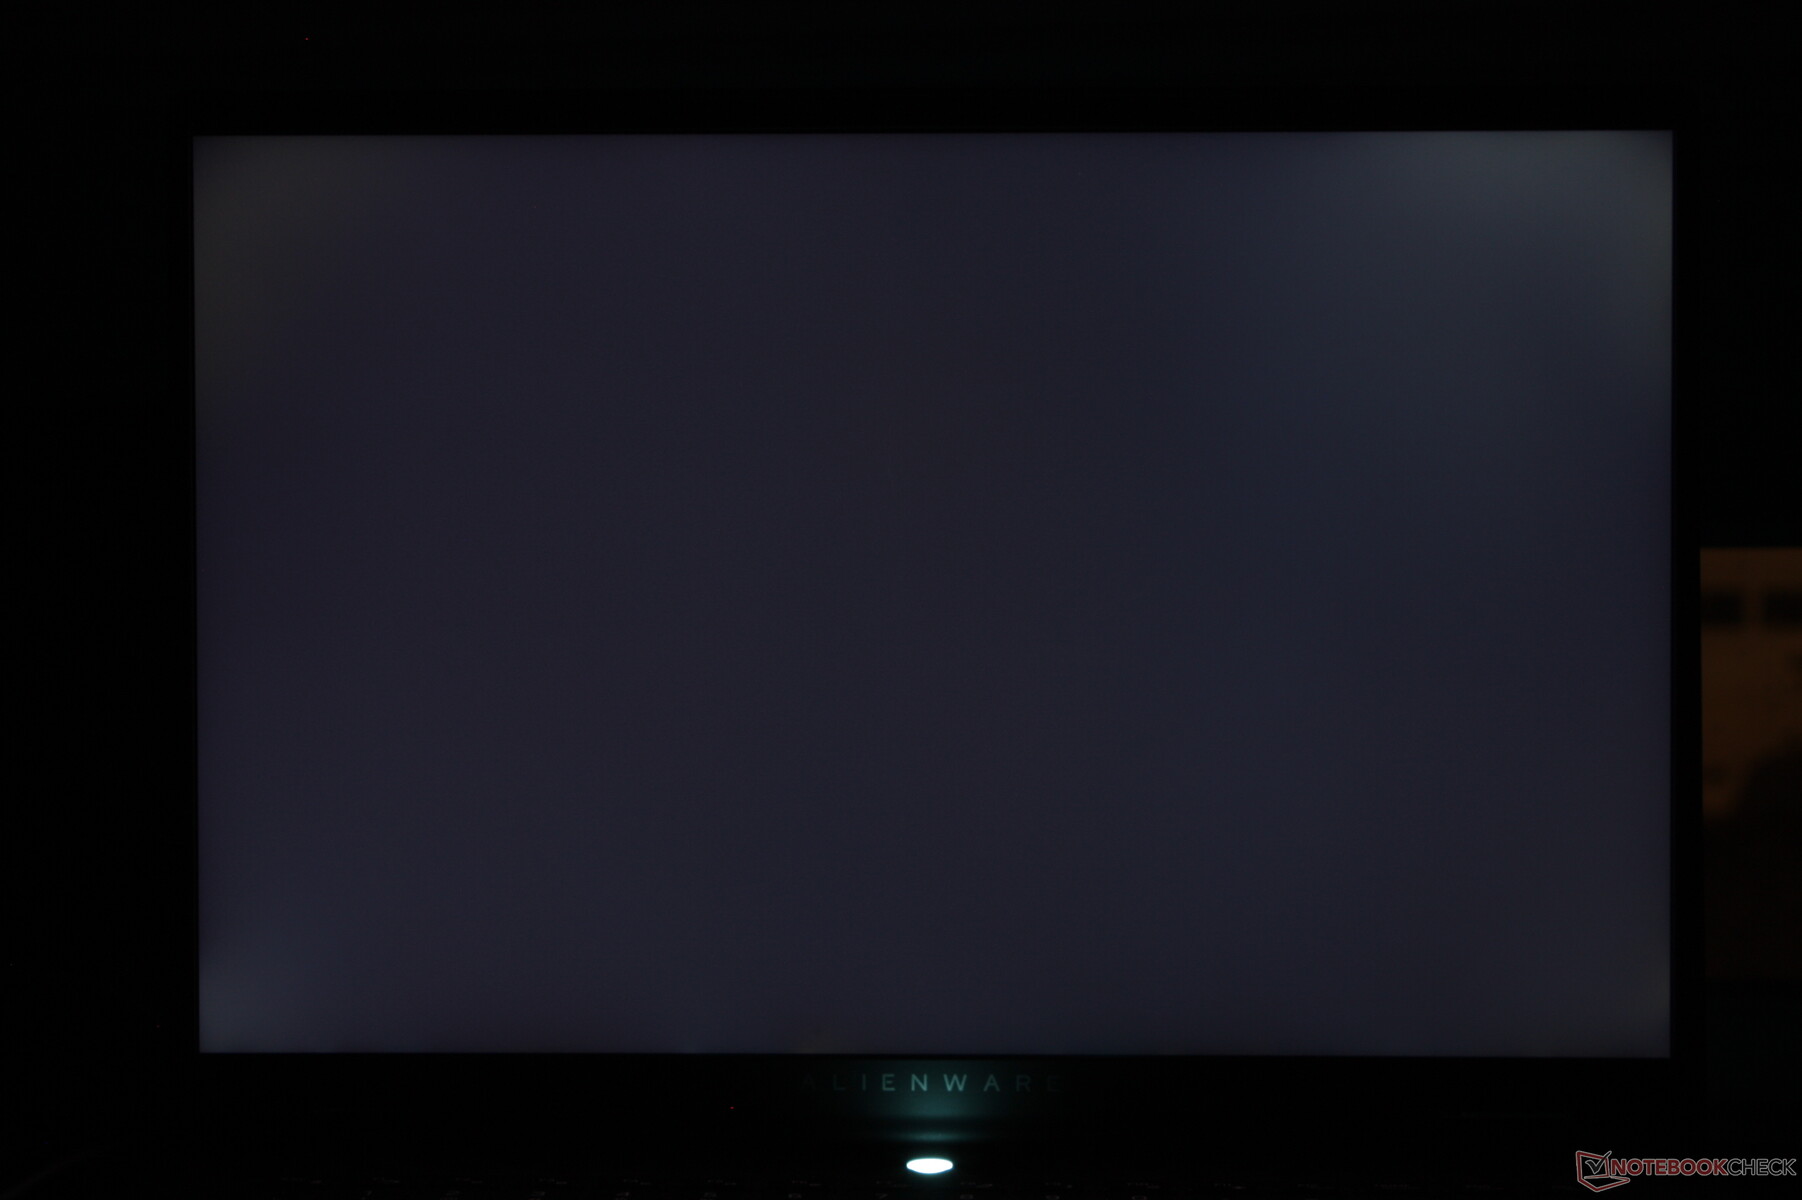
Distribuzione della luminosità: 87 %
Al centro con la batteria: 345.8 cd/m²
Contrasto: 1153:1 (Nero: 0.3 cd/m²)
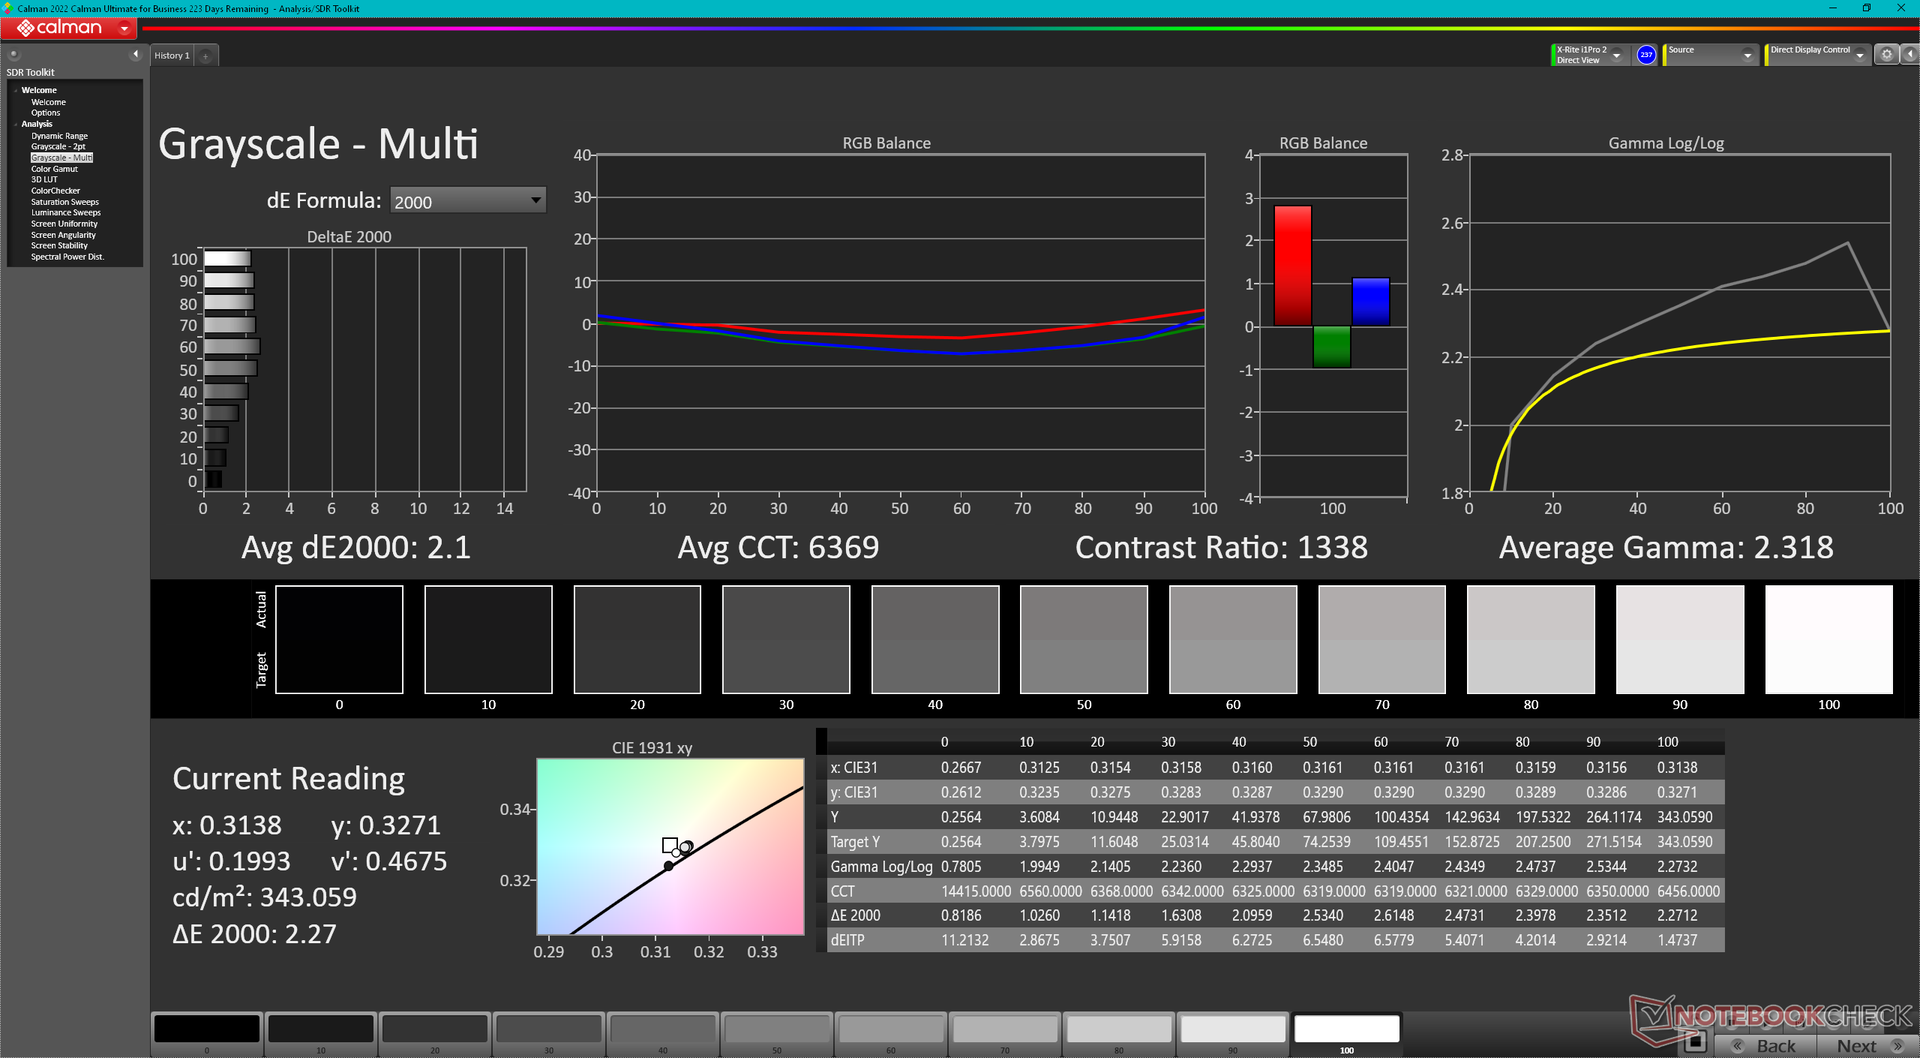
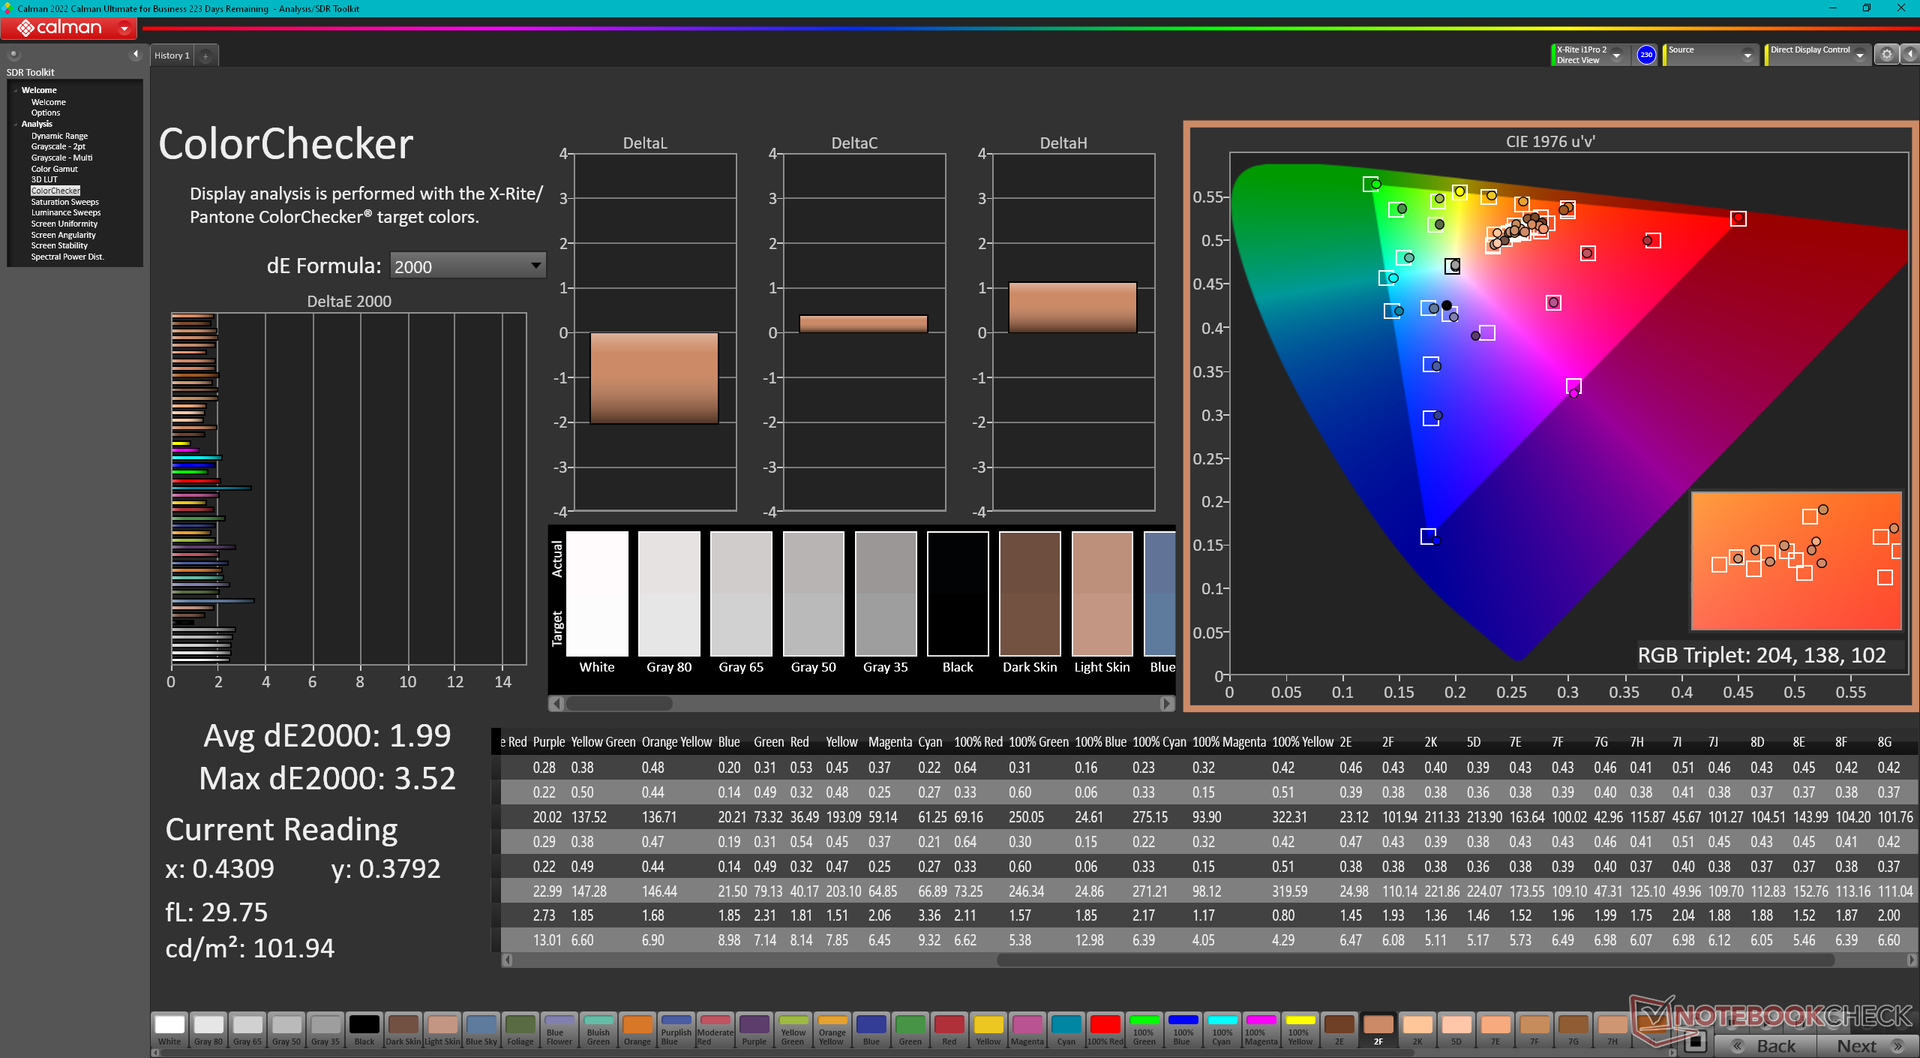
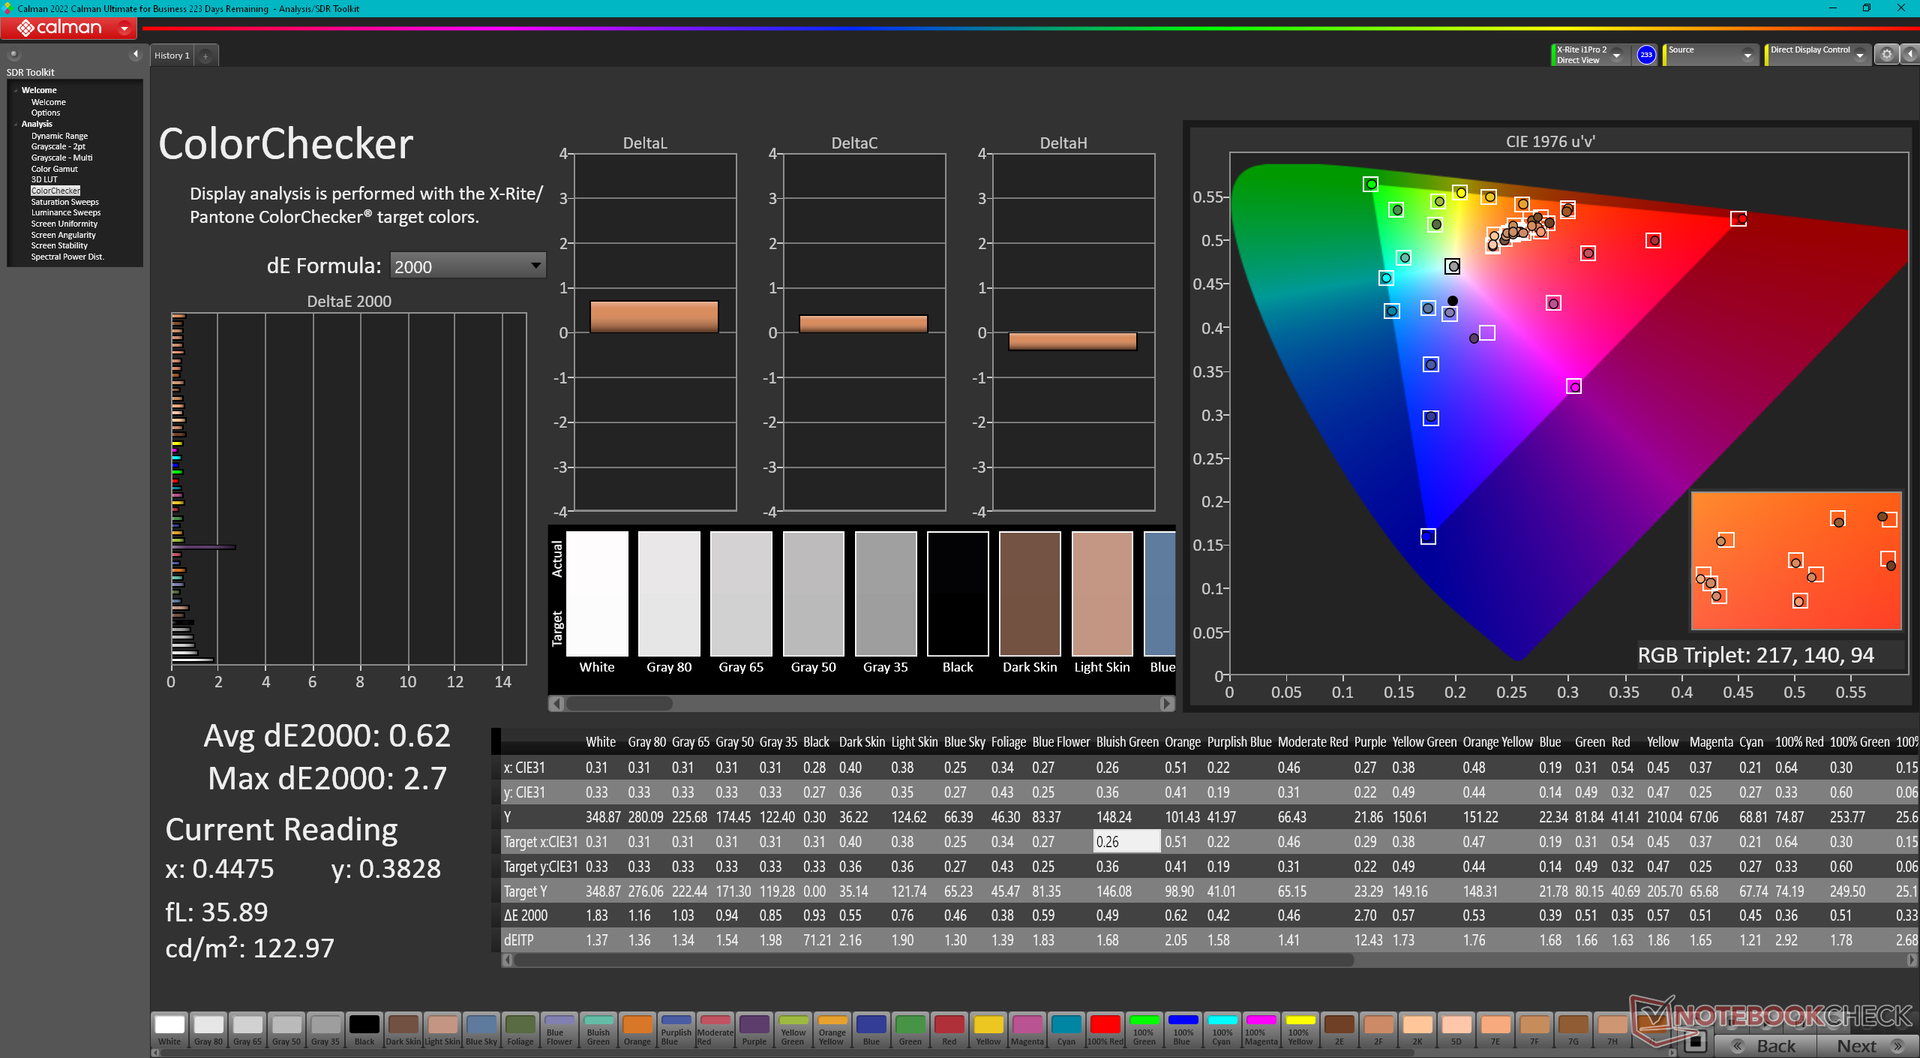
ΔE ColorChecker Calman: 1.99 | ∀{0.5-29.43 Ø4.72}
calibrated: 0.62
ΔE Greyscale Calman: 2.1 | ∀{0.09-98 Ø4.97}
71.4% AdobeRGB 1998 (Argyll 3D)
100% sRGB (Argyll 3D)
71% Display P3 (Argyll 3D)
Gamma: 2.32
CCT: 6369 K
| Alienware m16 R2 BOE NE16NYH, IPS, 2560x1600, 16" | Alienware m16 R1 Intel BOE NE16NYB, IPS, 2560x1600, 16" | Alienware x16 R1 BOE NE16NZ4, IPS, 2560x1600, 16" | HP Omen Transcend 16-u1095ng ATNA60DL02-0 (SDC41A4), OLED, 2560x1600, 16" | Asus ROG Zephyrus G16 2024 GU605M ATNA60DL01-0, OLED, 2560x1600, 16" | Lenovo Legion Slim 7 16APH8 BOE NE160QDM-NZ3, IPS, 2560x1600, 16" | |
|---|---|---|---|---|---|---|
| Display | -3% | 21% | 26% | 26% | 0% | |
| Display P3 Coverage (%) | 71 | 67.7 -5% | 99.2 40% | 99.8 41% | 99.9 41% | 70.3 -1% |
| sRGB Coverage (%) | 100 | 97.2 -3% | 100 0% | 100 0% | 100 0% | 99.6 0% |
| AdobeRGB 1998 Coverage (%) | 71.4 | 70 -2% | 88.6 24% | 97 36% | 96.9 36% | 72.4 1% |
| Response Times | 23% | -4% | 97% | 97% | -45% | |
| Response Time Grey 50% / Grey 80% * (ms) | 5.7 ? | 4 ? 30% | 5.1 ? 11% | 0.2 ? 96% | 0.22 ? 96% | 12.6 ? -121% |
| Response Time Black / White * (ms) | 8.7 ? | 7.3 ? 16% | 10.3 ? -18% | 0.2 ? 98% | 0.25 ? 97% | 5.9 ? 32% |
| PWM Frequency (Hz) | 120 ? | 960 ? | ||||
| Screen | -20% | -13% | 129% | 14% | 5% | |
| Brightness middle (cd/m²) | 345.8 | 306 -12% | 302.2 -13% | 390 13% | 416 20% | 545 58% |
| Brightness (cd/m²) | 337 | 302 -10% | 285 -15% | 392 16% | 418 24% | 502 49% |
| Brightness Distribution (%) | 87 | 89 2% | 89 2% | 98 13% | 96 10% | 82 -6% |
| Black Level * (cd/m²) | 0.3 | 0.3 -0% | 0.26 13% | 0.02 93% | 0.48 -60% | |
| Contrast (:1) | 1153 | 1020 -12% | 1162 1% | 19500 1591% | 1135 -2% | |
| Colorchecker dE 2000 * | 1.99 | 2.57 -29% | 1.63 18% | 1.94 3% | 1.6 20% | 1.36 32% |
| Colorchecker dE 2000 max. * | 3.52 | 4.26 -21% | 4.13 -17% | 4.26 -21% | 2.1 40% | 3.11 12% |
| Colorchecker dE 2000 calibrated * | 0.62 | 0.85 -37% | 1.17 -89% | 4.21 -579% | 1.04 -68% | |
| Greyscale dE 2000 * | 2.1 | 3.3 -57% | 2.5 -19% | 1.5 29% | 2.7 -29% | 1.4 33% |
| Gamma | 2.32 95% | 1.997 110% | 2.23 99% | 2.221 99% | 2.16 102% | 2.253 98% |
| CCT | 6369 102% | 6895 94% | 6590 99% | 6395 102% | 6331 103% | 6631 98% |
| Media totale (Programma / Settaggio) | 0% /
-10% | 1% /
-4% | 84% /
102% | 46% /
32% | -13% /
-3% |
* ... Meglio usare valori piccoli
Il display viene fornito ben calibrato, con valori medi di deltaE della scala di grigi e del colore di appena 2,1 e 1,99, rispettivamente. I risultati migliorerebbero ulteriormente, fino a <1 ciascuno, con un'ulteriore calibrazione con il nostro colorimetro X-Rite, ma questo non dovrebbe essere necessario per la maggior parte degli utenti. Il nostro profilo ICM calibrato è disponibile gratuitamente per il download qui sopra.
Tempi di risposta del Display
| ↔ Tempi di risposta dal Nero al Bianco | ||
|---|---|---|
| 8.7 ms ... aumenta ↗ e diminuisce ↘ combinato | ↗ 4.6 ms Incremento | 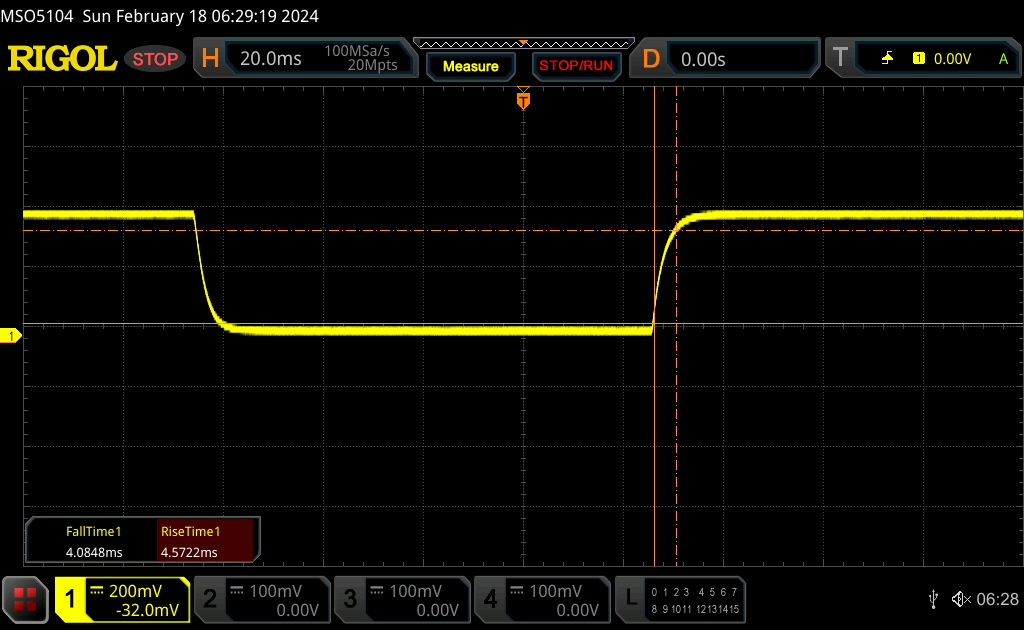 |
| ↘ 4.1 ms Calo | ||
| Lo schermo mostra veloci tempi di risposta durante i nostri tests e dovrebbe esere adatto al gaming In confronto, tutti i dispositivi di test variano da 0.1 (minimo) a 240 (massimo) ms. » 24 % di tutti i dispositivi è migliore. Questo significa che i tempi di risposta rilevati sono migliori rispettto alla media di tutti i dispositivi testati (19.8 ms). | ||
| ↔ Tempo di risposta dal 50% Grigio all'80% Grigio | ||
| 5.7 ms ... aumenta ↗ e diminuisce ↘ combinato | ↗ 2.6 ms Incremento | 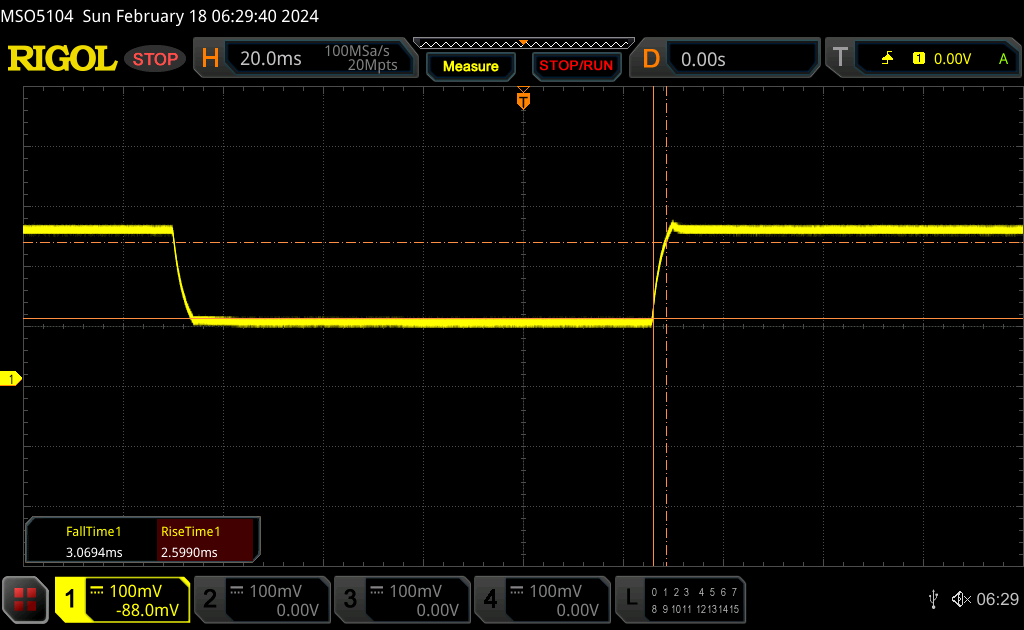 |
| ↘ 3.1 ms Calo | ||
| Lo schermo ha mostrato valori di risposta molto veloci nei nostri tests ed è molto adatto per i gaming veloce. In confronto, tutti i dispositivi di test variano da 0.165 (minimo) a 636 (massimo) ms. » 18 % di tutti i dispositivi è migliore. Questo significa che i tempi di risposta rilevati sono migliori rispettto alla media di tutti i dispositivi testati (31 ms). | ||
Sfarfallio dello schermo / PWM (Pulse-Width Modulation)
| flickering dello schermo / PWM non rilevato | 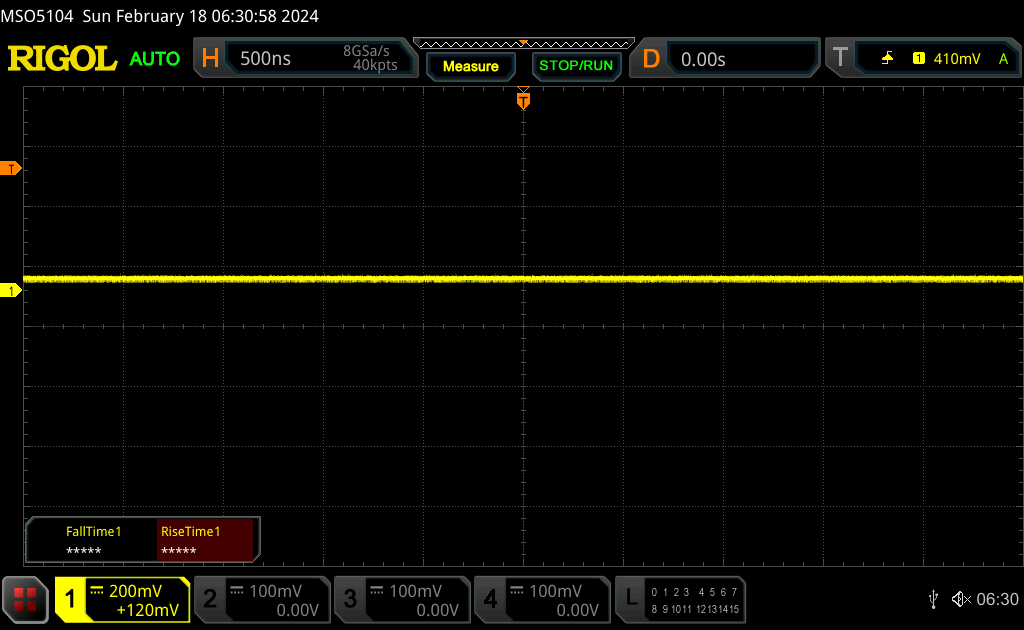 | ||
In confronto: 52 % di tutti i dispositivi testati non utilizza PWM per ridurre la luminosita' del display. Se è rilevato PWM, una media di 7747 (minimo: 5 - massimo: 343500) Hz è stata rilevata. | |||
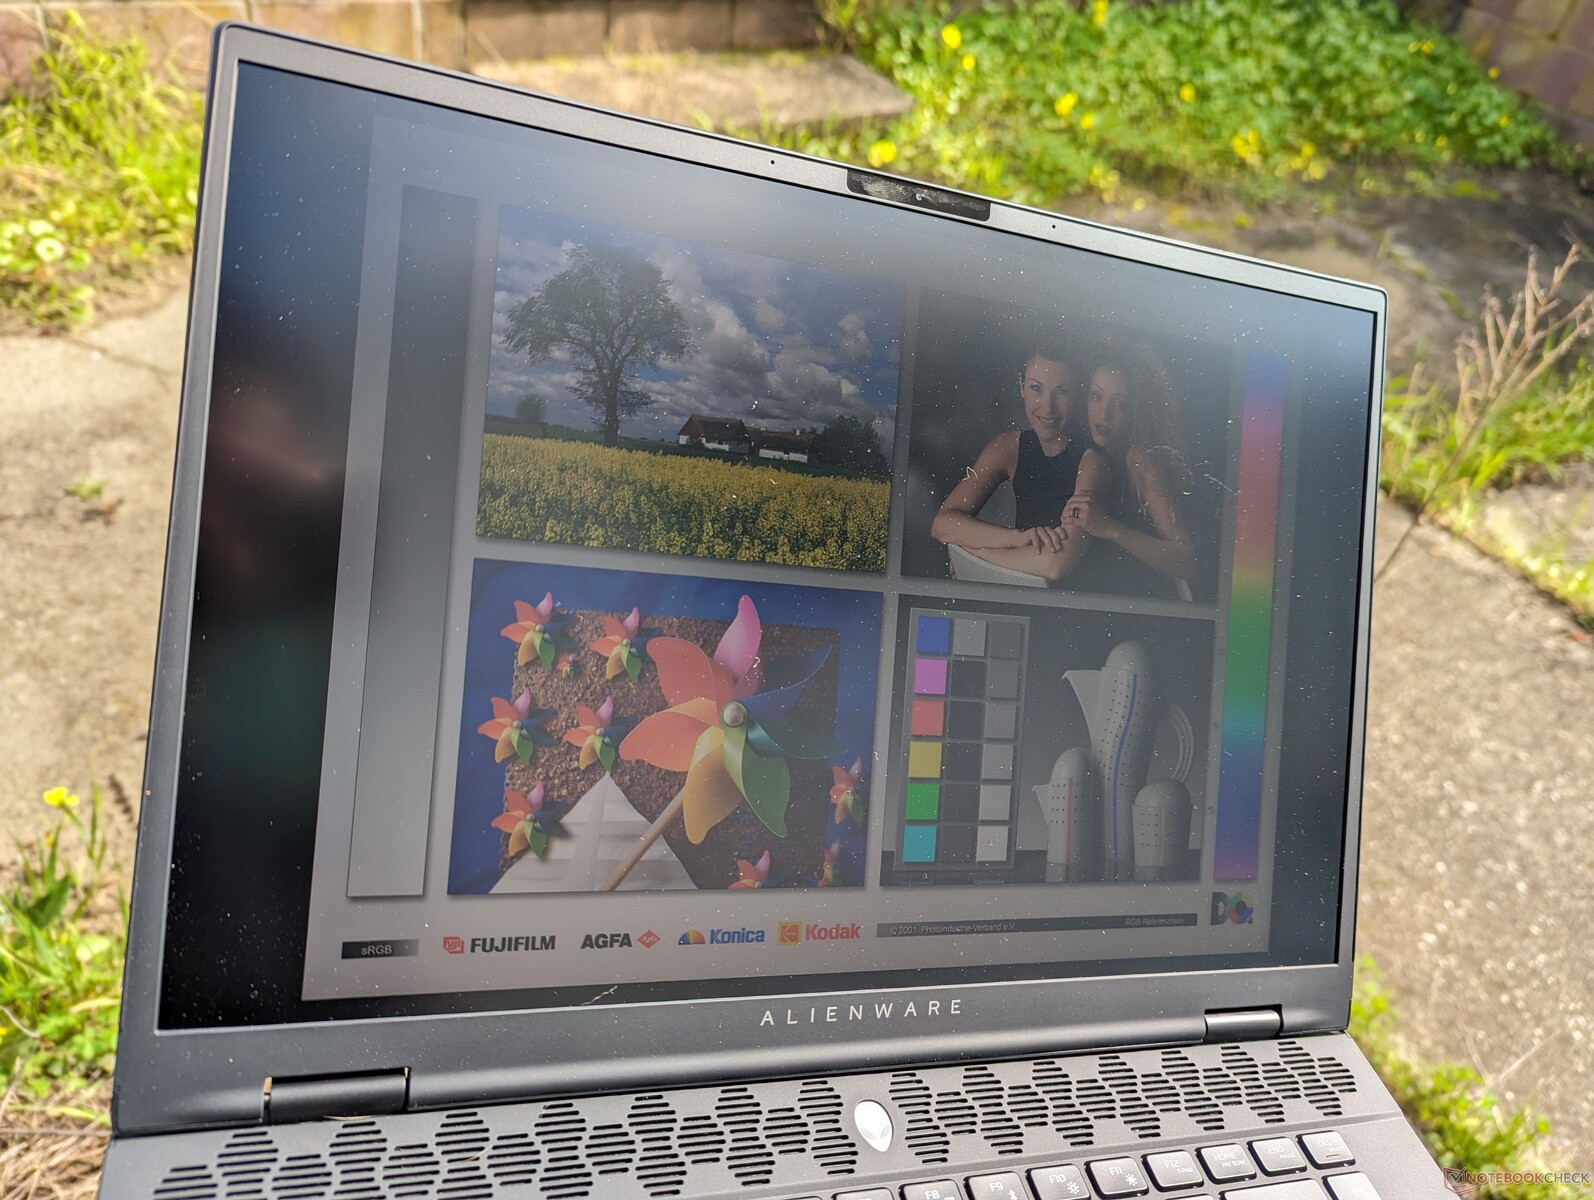
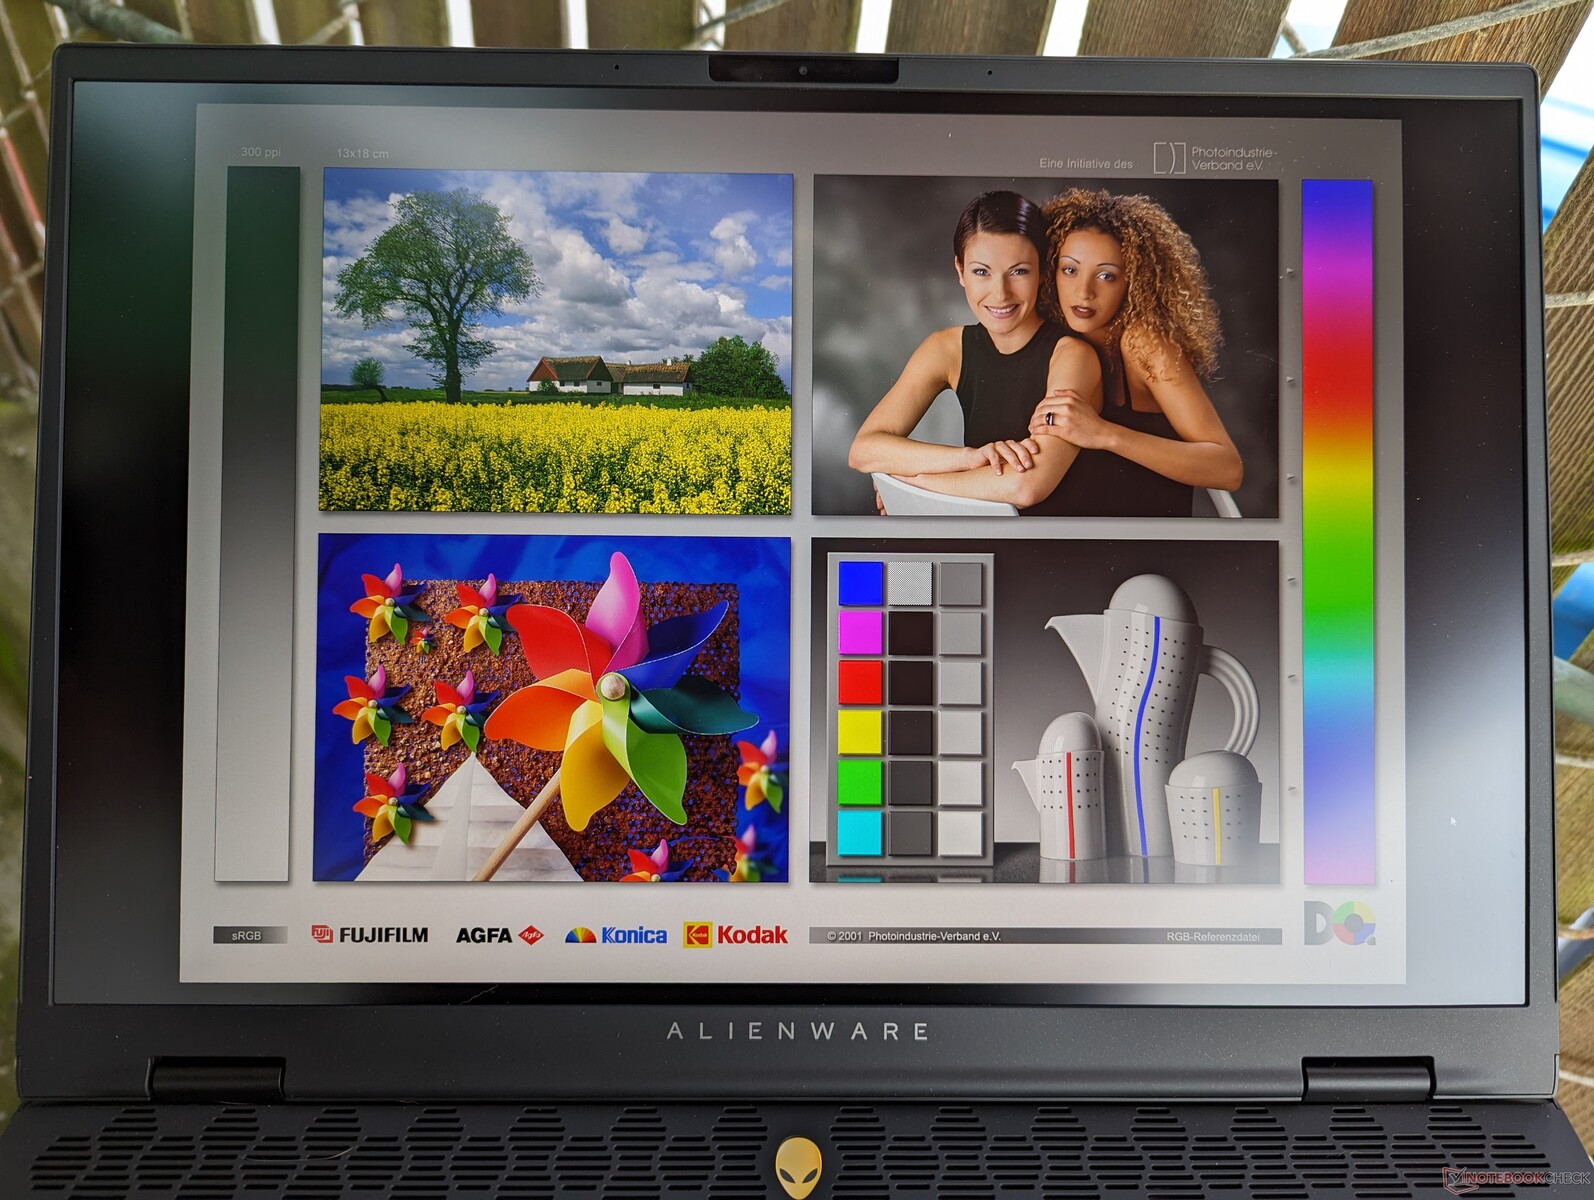
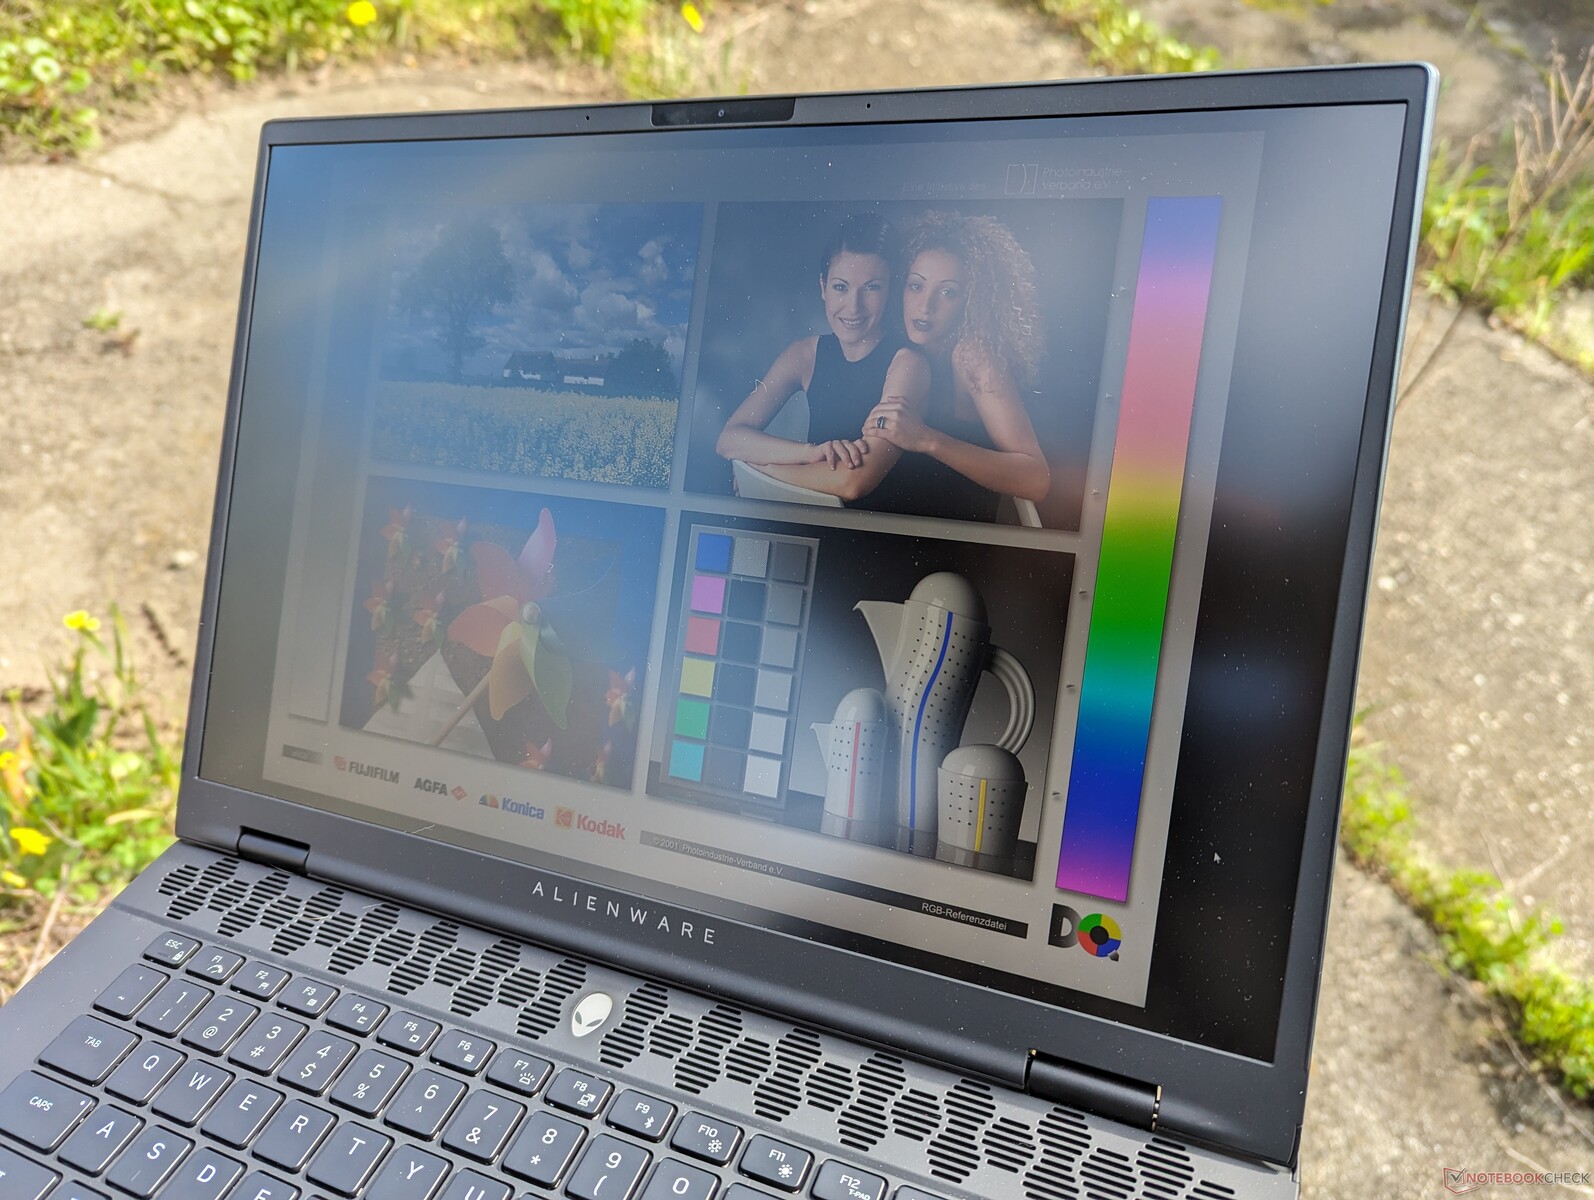
La visibilità all'aperto rimane più o meno la stessa di prima, per cui si consiglia di rimanere all'ombra quando possibile per ridurre l'abbagliamento e preservare i colori. Tuttavia, il peso ridotto e le dimensioni più piccole rendono il sistema più facile da maneggiare.
Prestazioni - Da Raptor Lake-HX a Meteor Lake-H
Condizioni del test
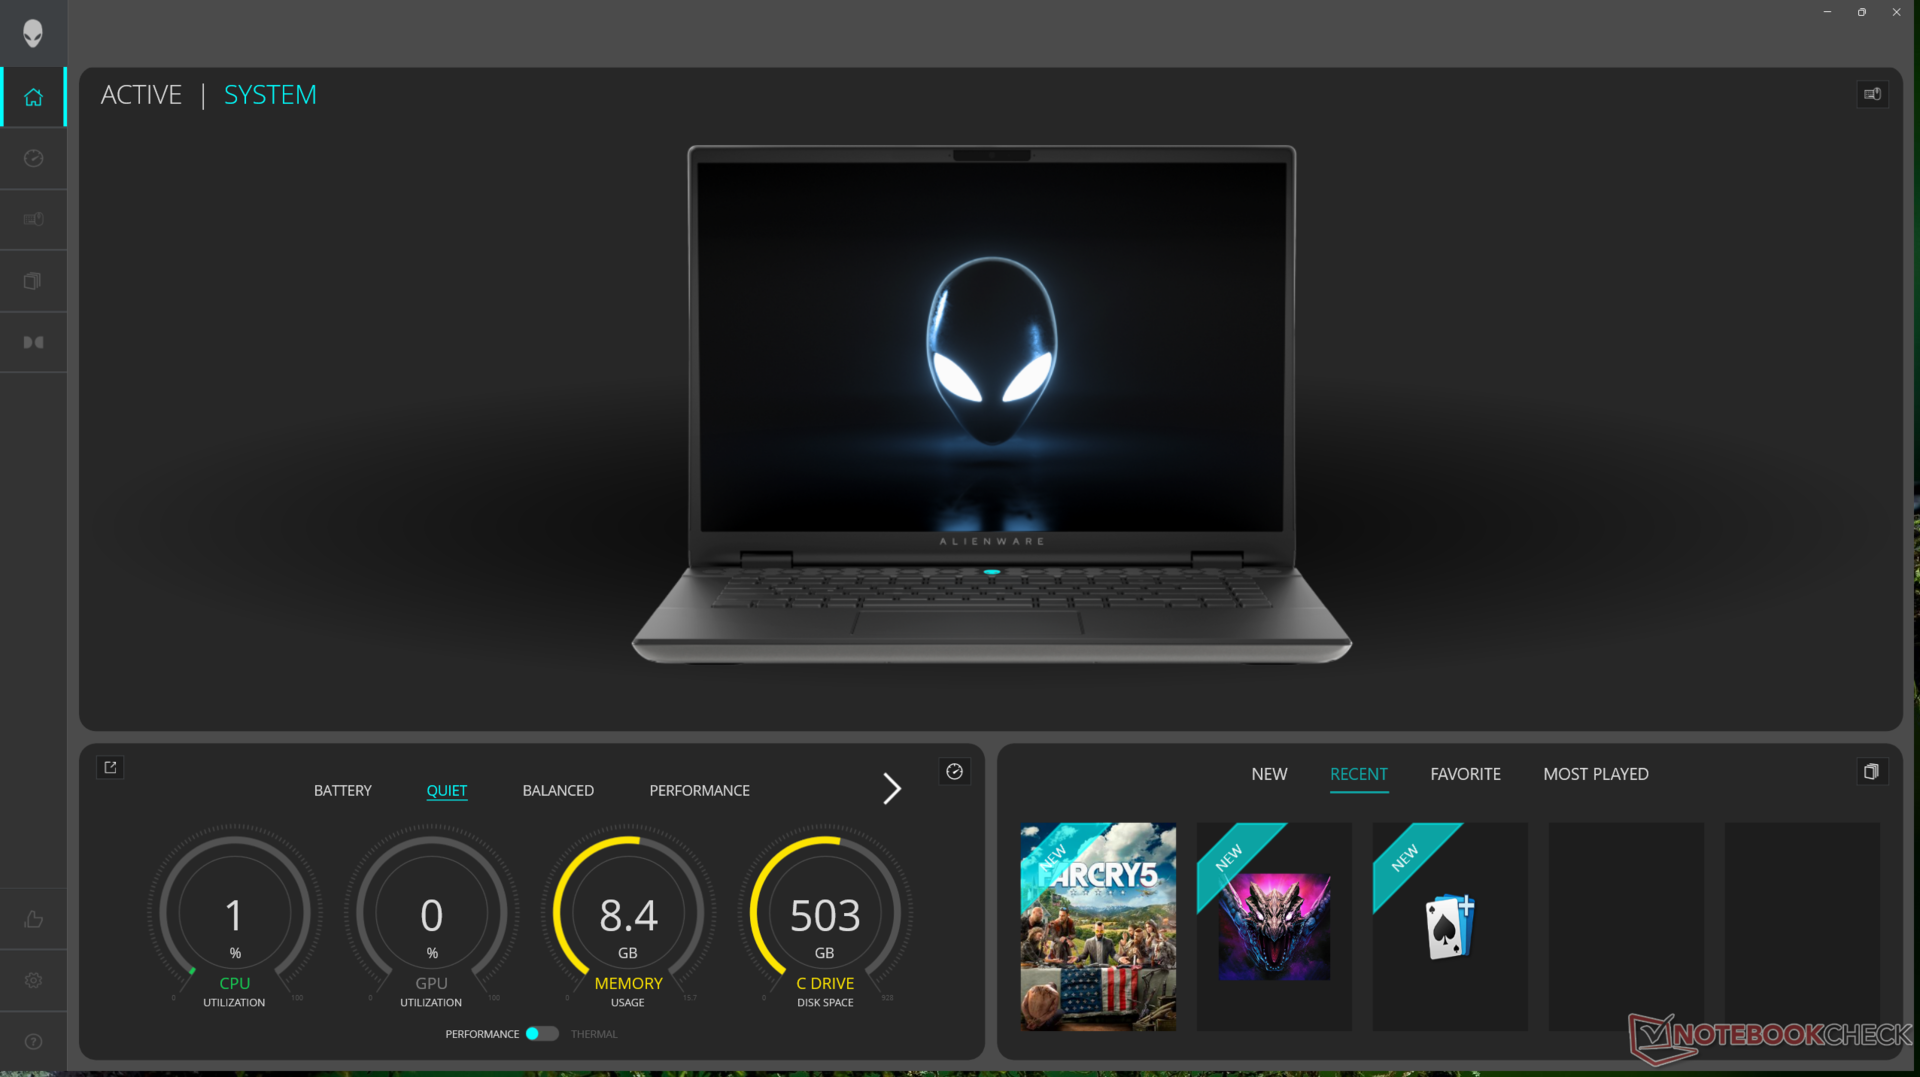
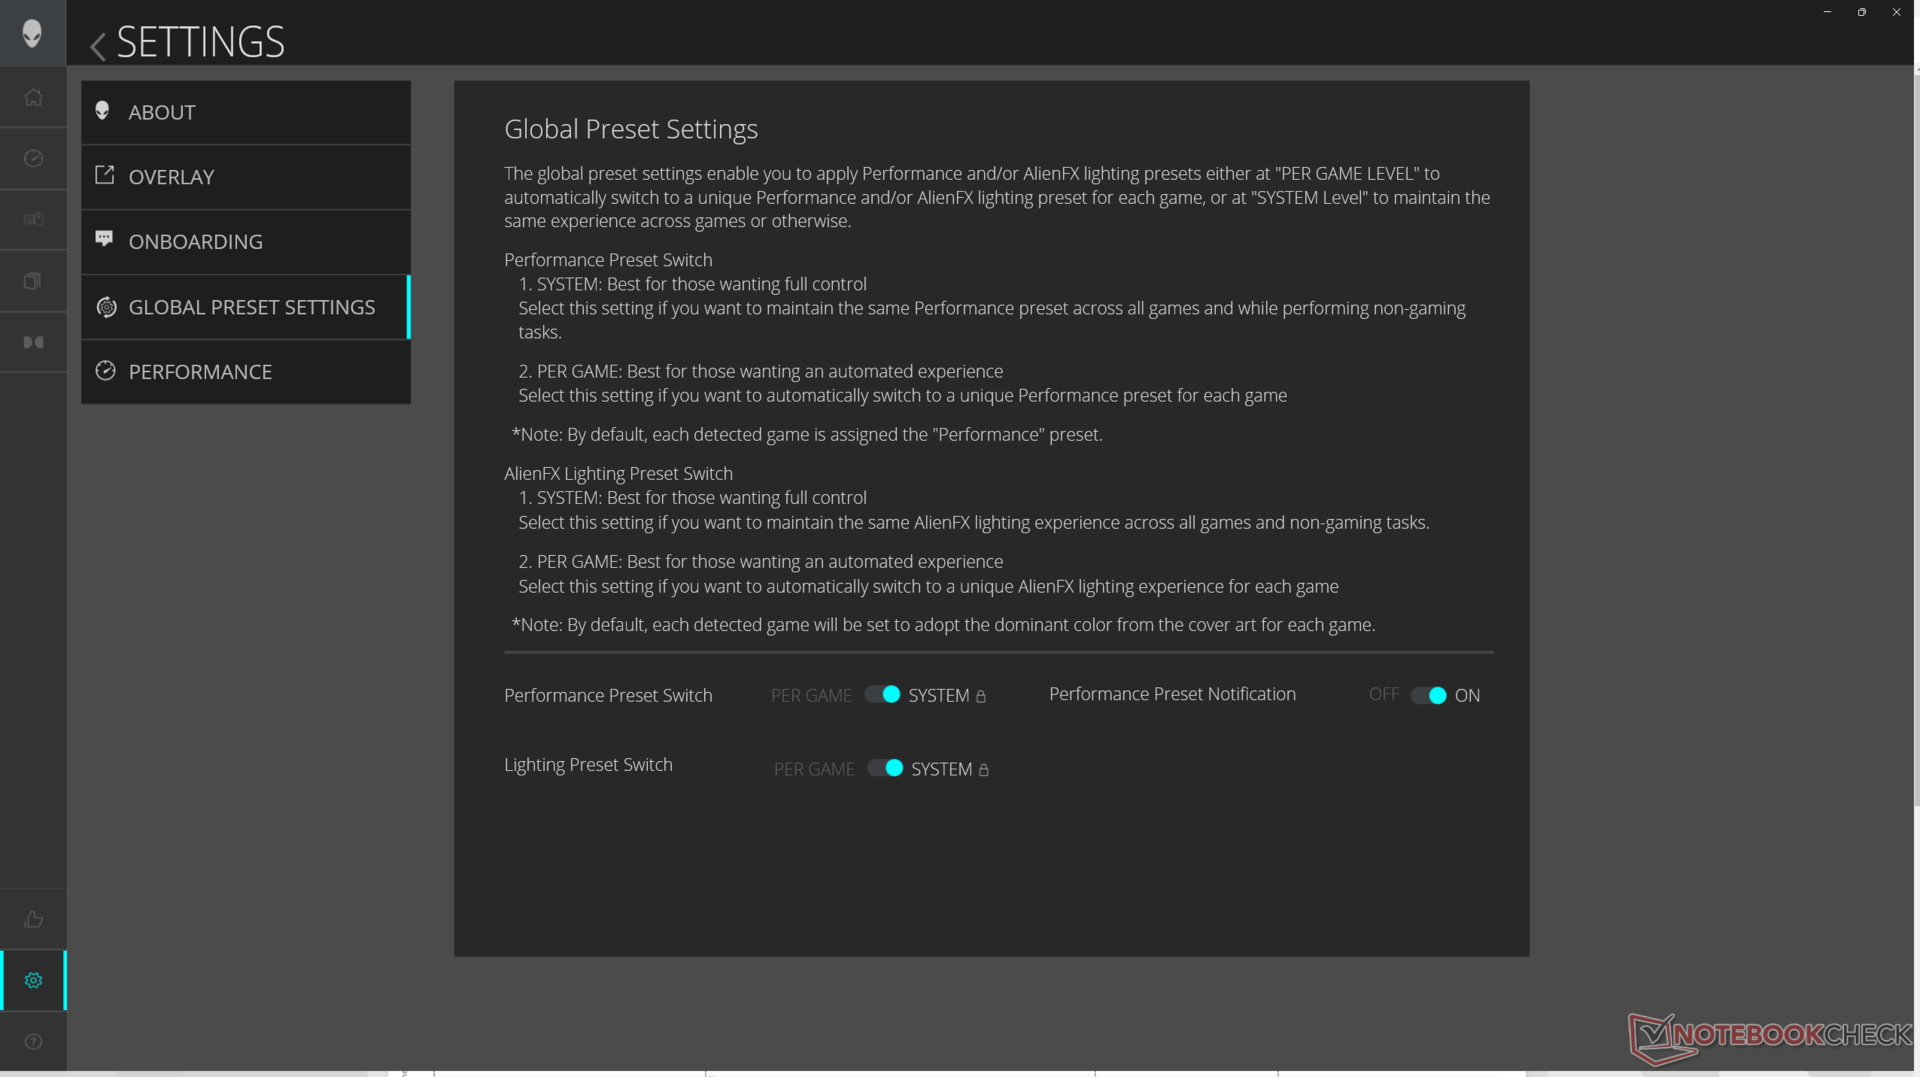
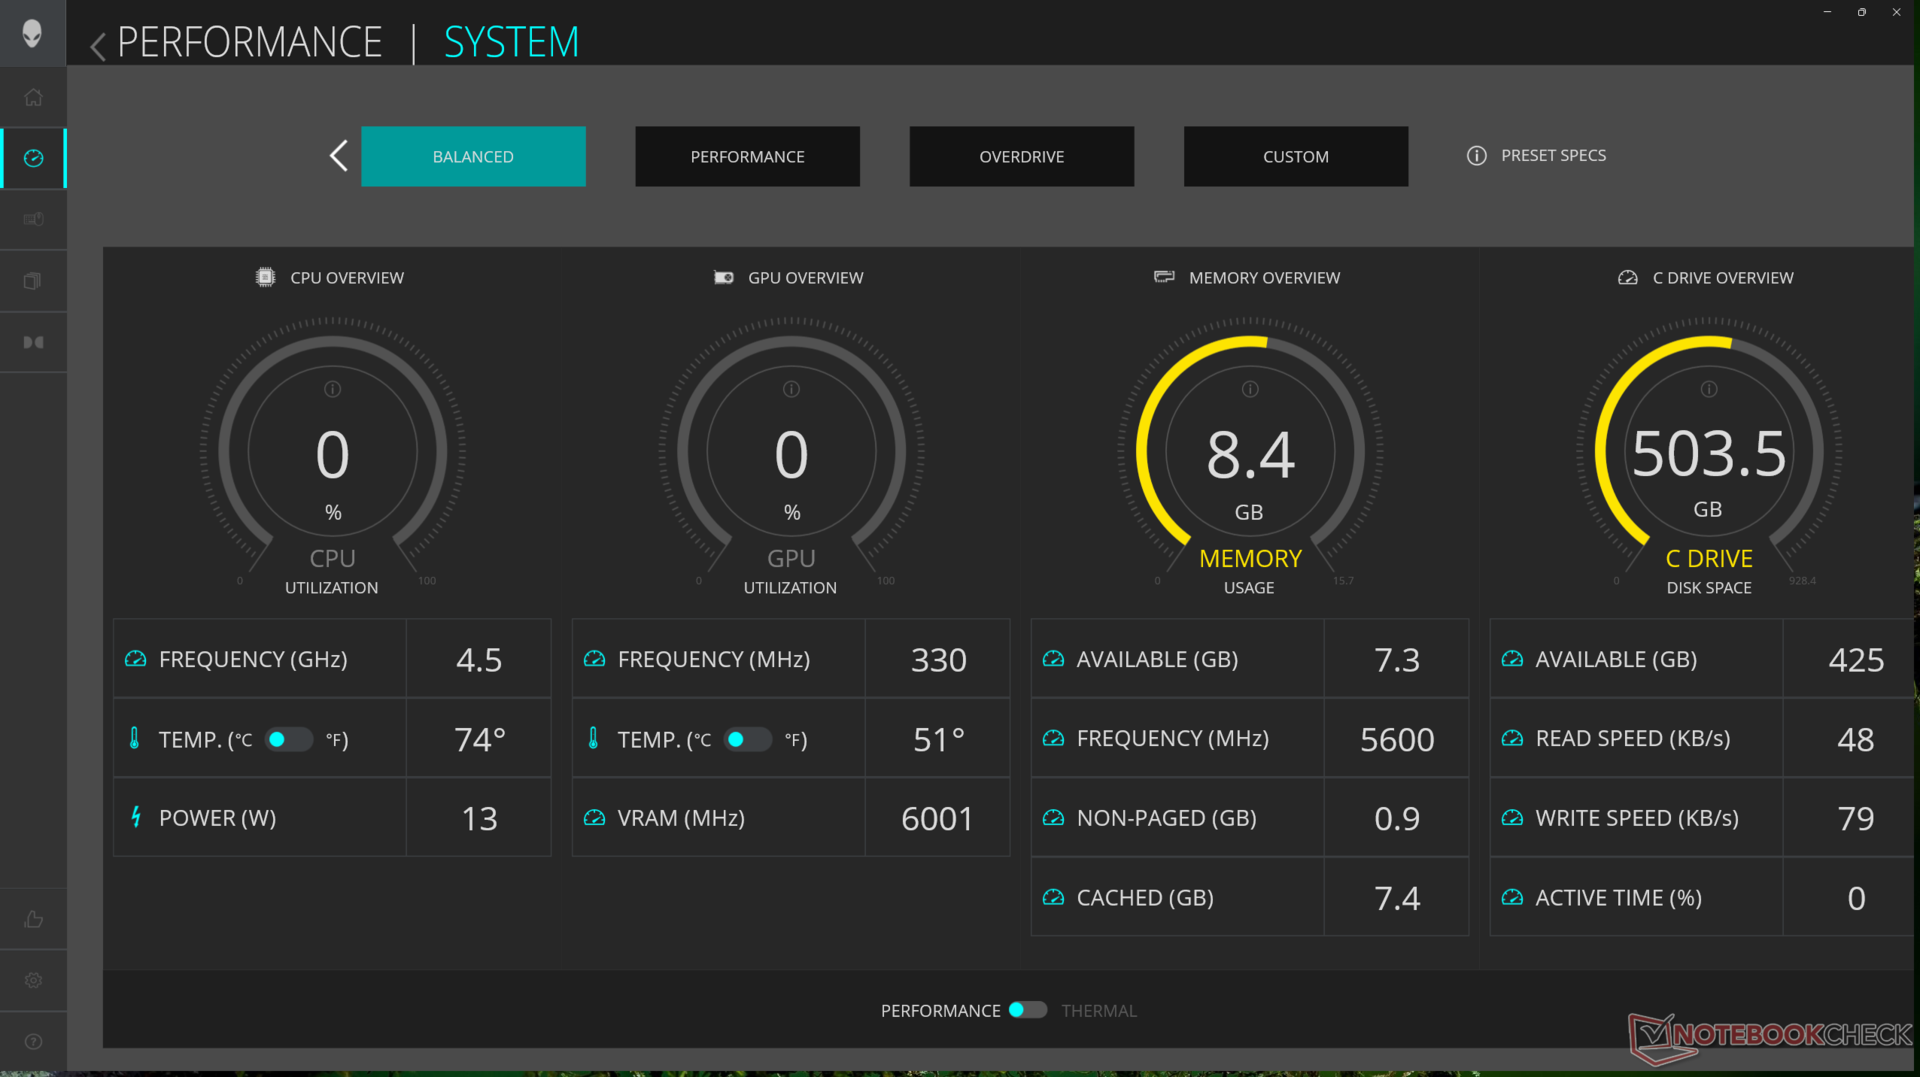
Abbiamo impostato Alienware Command Center (ACC) sulla modalità Overdrive e Nvidia Control Panel sulla modalità dGPU prima di eseguire i benchmark qui sotto. ACC è stato aggiornato per funzionare in modo molto più fluido e senza molti dei problemi che abbiamo riscontrato su m16 R1. Ad esempio, ora si avvia quasi immediatamente all'avvio, mentre le modalità del profilo della ventola e l'illuminazione RGB di AlienFX non cambiano più automaticamente senza prima avvisare l'utente.
Tuttavia, abbiamo riscontrato un bug per cui a volte il sistema non entra correttamente in modalità Sleep quando si chiude il coperchio, anche dopo aver controllato due volte le impostazioni di Windows Power. Questo portava a un portatile molto caldo e a una batteria completamente scarica poche ore dopo.
Sono supportati sia Advanced Optimus che G-Sync, il che significa che gli utenti possono passare dalla modalità iGPU a quella dGPU senza un riavvio soft. Si noti che il sistema deve essere impostato sulla modalità dGPU affinché G-Sync funzioni.
Processore
Il nostro Core Ultra 7 155H è più lento di circa il 10-15% rispetto al Core i7-13700HX sull'm16 R1 dello scorso anno, sia nelle operazioni a thread singolo che in quelle multi-thread. È sostanzialmente alla pari con il recente Ryzen 9 8945HS. Come in altre CPU Meteor Lake, il Core Ultra 7 155H integra una NPU per accelerare le attività AI come Microsoft Co-Pilot. Tuttavia, la maggior parte delle applicazioni AI al momento sono basate sul cloud e non hanno opzioni per essere eseguite localmente, quindi le capacità AI integrate della nuova CPU sono molto limitate al momento.
Nonostante il deficit di prestazioni rispetto al Core i7-13700HX, l'm16 R2 è in grado di eseguire il Core Ultra 7 155H in modo notevolmente più veloce rispetto ad altri computer portatili dotati dello stesso processore. Ad esempio, il Core Ultra 7 155H del recente MSI Prestige 16 funziona quasi il 20 percento più lentamente.
Dell afferma che intende offrire una SKU Ultra 9 185H nel prossimo futuro, che dovrebbe contribuire a ridurre il divario di prestazioni rispetto al Core i7-13700HX. I più esigenti Core i7-14700HX o Core i9-14900HX non sono offerti a causa delle limitazioni termiche; Dell ha dato priorità alla massimizzazione del TGP della GPU piuttosto che al TDP della CPU.
Cinebench R15 Multi Loop
Cinebench R23: Multi Core | Single Core
Cinebench R20: CPU (Multi Core) | CPU (Single Core)
Cinebench R15: CPU Multi 64Bit | CPU Single 64Bit
Blender: v2.79 BMW27 CPU
7-Zip 18.03: 7z b 4 | 7z b 4 -mmt1
Geekbench 6.7: Multi-Core | Single-Core
Geekbench 5.5: Multi-Core | Single-Core
HWBOT x265 Benchmark v2.2: 4k Preset
LibreOffice : 20 Documents To PDF
R Benchmark 2.5: Overall mean
| Geekbench 6.7 / Multi-Core | |
| Lenovo Legion 9 16IRX8 | |
| HP Omen Transcend 16-u1095ng | |
| Alienware m16 R1 Intel | |
| Razer Blade 14 RZ09-0508 | |
| Asus ROG Zephyrus G16 2024 GU605M | |
| Framework Laptop 16 | |
| Lenovo Legion Slim 7 16APH8 | |
| Alienware m16 R2 | |
| Alienware m16 R1 AMD | |
| Media Intel Core Ultra 7 155H (7732 - 13656, n=55) | |
| Geekbench 6.7 / Single-Core | |
| Lenovo Legion 9 16IRX8 | |
| HP Omen Transcend 16-u1095ng | |
| Alienware m16 R1 AMD | |
| Razer Blade 14 RZ09-0508 | |
| Alienware m16 R1 Intel | |
| Framework Laptop 16 | |
| Lenovo Legion Slim 7 16APH8 | |
| Asus ROG Zephyrus G16 2024 GU605M | |
| Alienware m16 R2 | |
| Media Intel Core Ultra 7 155H (1901 - 2473, n=52) | |
Cinebench R23: Multi Core | Single Core
Cinebench R20: CPU (Multi Core) | CPU (Single Core)
Cinebench R15: CPU Multi 64Bit | CPU Single 64Bit
Blender: v2.79 BMW27 CPU
7-Zip 18.03: 7z b 4 | 7z b 4 -mmt1
Geekbench 6.7: Multi-Core | Single-Core
Geekbench 5.5: Multi-Core | Single-Core
HWBOT x265 Benchmark v2.2: 4k Preset
LibreOffice : 20 Documents To PDF
R Benchmark 2.5: Overall mean
* ... Meglio usare valori piccoli
AIDA64: FP32 Ray-Trace | FPU Julia | CPU SHA3 | CPU Queen | FPU SinJulia | FPU Mandel | CPU AES | CPU ZLib | FP64 Ray-Trace | CPU PhotoWorxx
| Performance rating | |
| Lenovo Legion Slim 7 16APH8 | |
| Alienware m16 R1 Intel | |
| Alienware x16 R1 | |
| HP Omen Transcend 16-u1095ng | |
| Alienware m16 R2 | |
| Asus ROG Zephyrus G16 2024 GU605M | |
| Media Intel Core Ultra 7 155H | |
| AIDA64 / FP32 Ray-Trace | |
| Lenovo Legion Slim 7 16APH8 | |
| Alienware m16 R1 Intel | |
| Alienware m16 R2 | |
| Alienware x16 R1 | |
| HP Omen Transcend 16-u1095ng | |
| Asus ROG Zephyrus G16 2024 GU605M | |
| Media Intel Core Ultra 7 155H (6670 - 18470, n=50) | |
| AIDA64 / FPU Julia | |
| Lenovo Legion Slim 7 16APH8 | |
| Alienware m16 R1 Intel | |
| Alienware m16 R2 | |
| Alienware x16 R1 | |
| HP Omen Transcend 16-u1095ng | |
| Asus ROG Zephyrus G16 2024 GU605M | |
| Media Intel Core Ultra 7 155H (40905 - 93181, n=50) | |
| AIDA64 / CPU SHA3 | |
| Alienware m16 R1 Intel | |
| Lenovo Legion Slim 7 16APH8 | |
| HP Omen Transcend 16-u1095ng | |
| Alienware m16 R2 | |
| Alienware x16 R1 | |
| Asus ROG Zephyrus G16 2024 GU605M | |
| Media Intel Core Ultra 7 155H (1940 - 4436, n=50) | |
| AIDA64 / CPU Queen | |
| HP Omen Transcend 16-u1095ng | |
| Alienware x16 R1 | |
| Lenovo Legion Slim 7 16APH8 | |
| Alienware m16 R1 Intel | |
| Asus ROG Zephyrus G16 2024 GU605M | |
| Alienware m16 R2 | |
| Media Intel Core Ultra 7 155H (64698 - 94181, n=50) | |
| AIDA64 / FPU SinJulia | |
| Lenovo Legion Slim 7 16APH8 | |
| Alienware m16 R1 Intel | |
| HP Omen Transcend 16-u1095ng | |
| Alienware x16 R1 | |
| Asus ROG Zephyrus G16 2024 GU605M | |
| Alienware m16 R2 | |
| Media Intel Core Ultra 7 155H (5639 - 10647, n=50) | |
| AIDA64 / FPU Mandel | |
| Lenovo Legion Slim 7 16APH8 | |
| Alienware m16 R1 Intel | |
| Alienware m16 R2 | |
| Alienware x16 R1 | |
| HP Omen Transcend 16-u1095ng | |
| Asus ROG Zephyrus G16 2024 GU605M | |
| Media Intel Core Ultra 7 155H (18236 - 47685, n=50) | |
| AIDA64 / CPU AES | |
| Alienware m16 R1 Intel | |
| HP Omen Transcend 16-u1095ng | |
| Alienware m16 R2 | |
| Alienware x16 R1 | |
| Asus ROG Zephyrus G16 2024 GU605M | |
| Media Intel Core Ultra 7 155H (45713 - 152179, n=50) | |
| Lenovo Legion Slim 7 16APH8 | |
| AIDA64 / CPU ZLib | |
| Alienware m16 R1 Intel | |
| HP Omen Transcend 16-u1095ng | |
| Alienware x16 R1 | |
| Alienware m16 R2 | |
| Asus ROG Zephyrus G16 2024 GU605M | |
| Lenovo Legion Slim 7 16APH8 | |
| Media Intel Core Ultra 7 155H (557 - 1250, n=50) | |
| AIDA64 / FP64 Ray-Trace | |
| Lenovo Legion Slim 7 16APH8 | |
| Alienware m16 R1 Intel | |
| Alienware x16 R1 | |
| Alienware m16 R2 | |
| HP Omen Transcend 16-u1095ng | |
| Asus ROG Zephyrus G16 2024 GU605M | |
| Media Intel Core Ultra 7 155H (3569 - 9802, n=50) | |
| AIDA64 / CPU PhotoWorxx | |
| Alienware x16 R1 | |
| HP Omen Transcend 16-u1095ng | |
| Asus ROG Zephyrus G16 2024 GU605M | |
| Media Intel Core Ultra 7 155H (32719 - 54223, n=50) | |
| Lenovo Legion Slim 7 16APH8 | |
| Alienware m16 R2 | |
| Alienware m16 R1 Intel | |
Test da sforzo
Quando si esegue lo stress Prime95 in modalità Overdrive, la CPU sale a 4,6 GHz e 115 W per diversi secondi, prima di scendere costantemente e infine stabilizzarsi a 3,4 GHz e 102 W. La temperatura del core, tuttavia, è estremamente calda (100 C), il che suggerisce che la CPU sta già spingendo la soluzione di raffreddamento ai suoi limiti.
È interessante notare che non ci sono quasi cambiamenti nelle frequenze di clock della GPU o nell'assorbimento di potenza della scheda quando si esegue Witcher 3 in modalità Bilanciata, Performance o Overdrive, il che è in relazione con le nostre scoperte riportate di seguito nella sezione Prestazioni della GPU. Invece, la temperatura della GPU tende a diminuire quando si attiva la modalità Performance o Overdrive, a causa dei tetti della ventola più alti in queste modalità. In altre parole, le velocità di clock e il TGP in tempo reale rimarrebbero costanti, mentre il rumore della ventola cambierebbe. Potrebbero esserci delle piccole modifiche alle prestazioni della CPU tra le modalità, ma la maggior parte dei giochi non sono comunque vincolati alla CPU.
Vale la pena notare che mentre la GPU è valutata a 140 W TGP secondo il Pannello di controllo Nvidia, tende a stabilizzarsi a 106 W durante il gioco. Siamo riusciti a raggiungere un massimo temporaneo di 121 W.
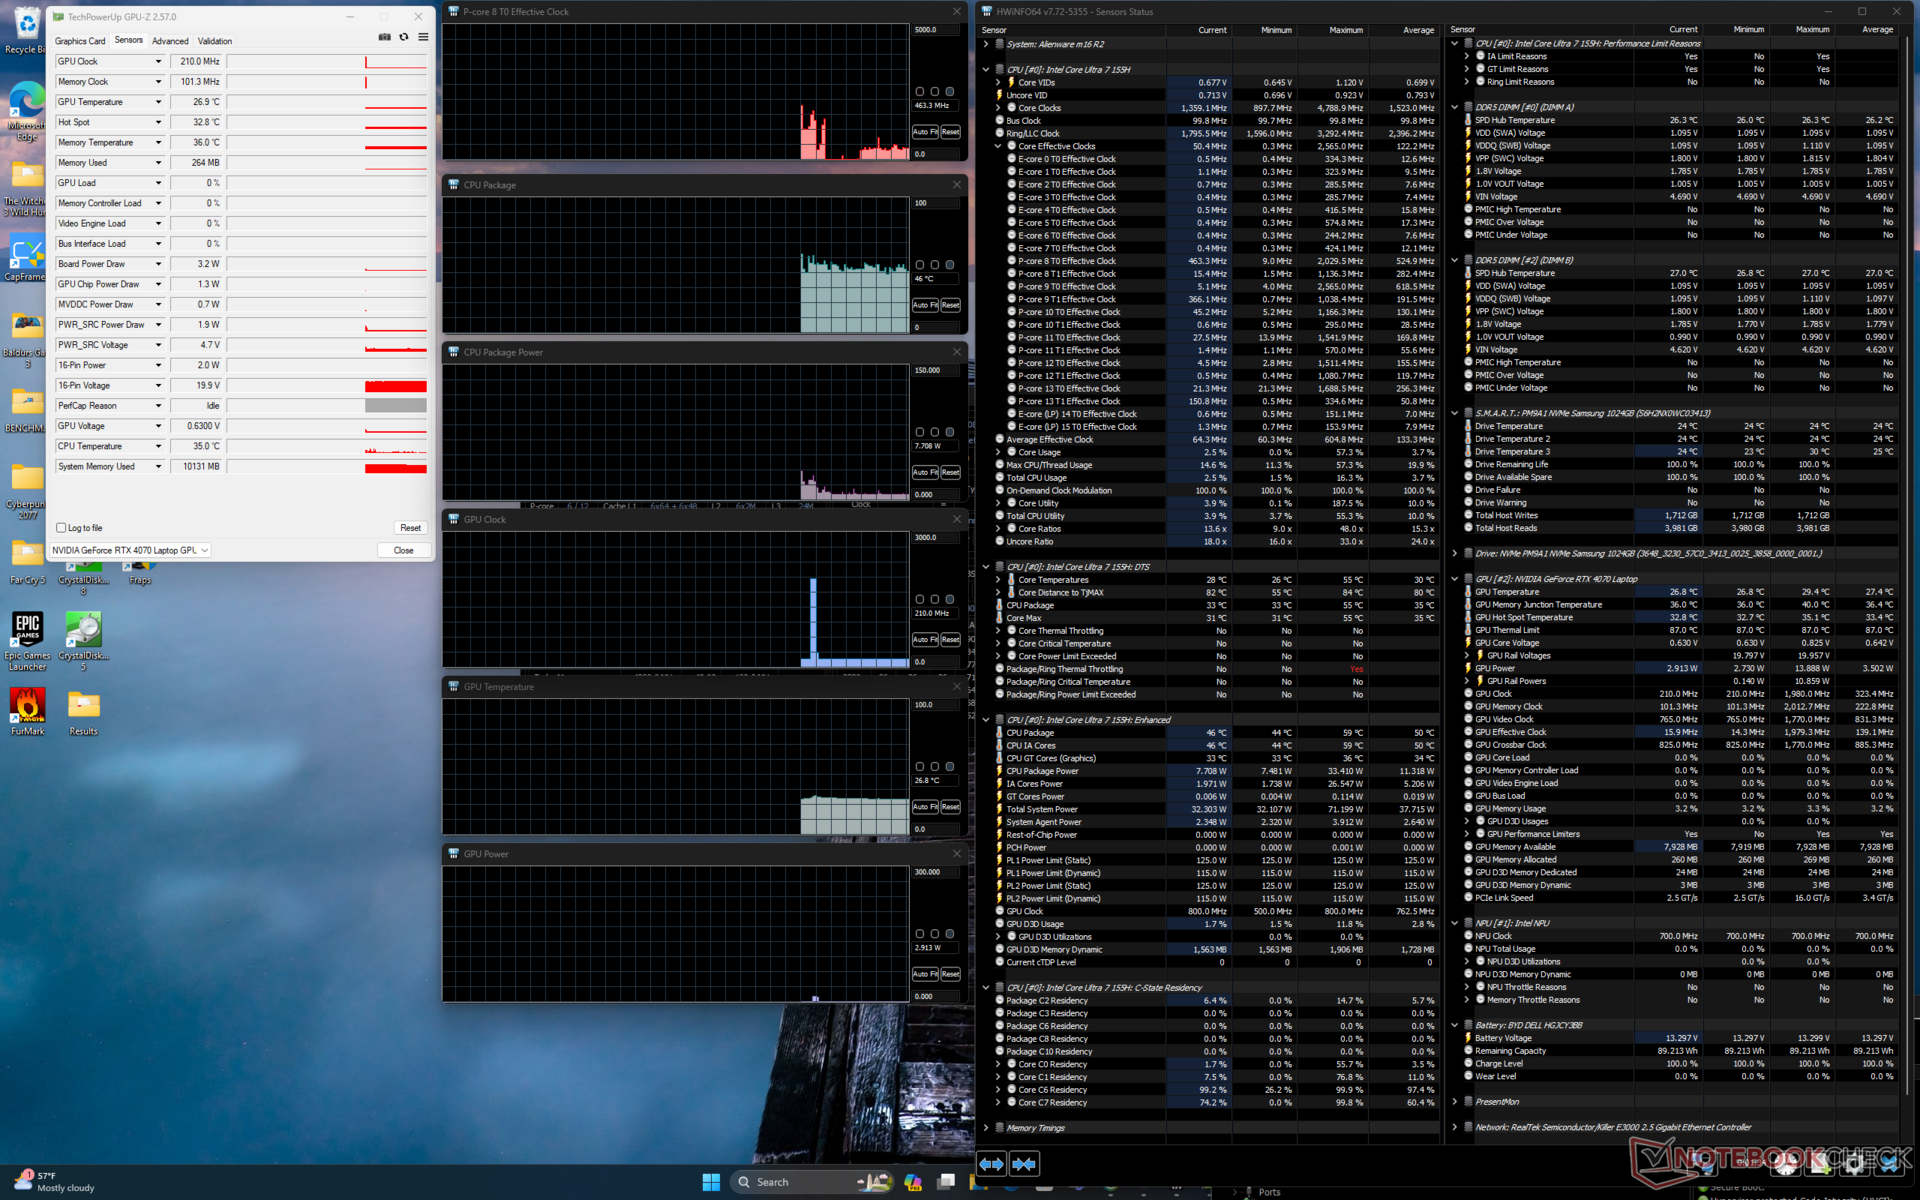
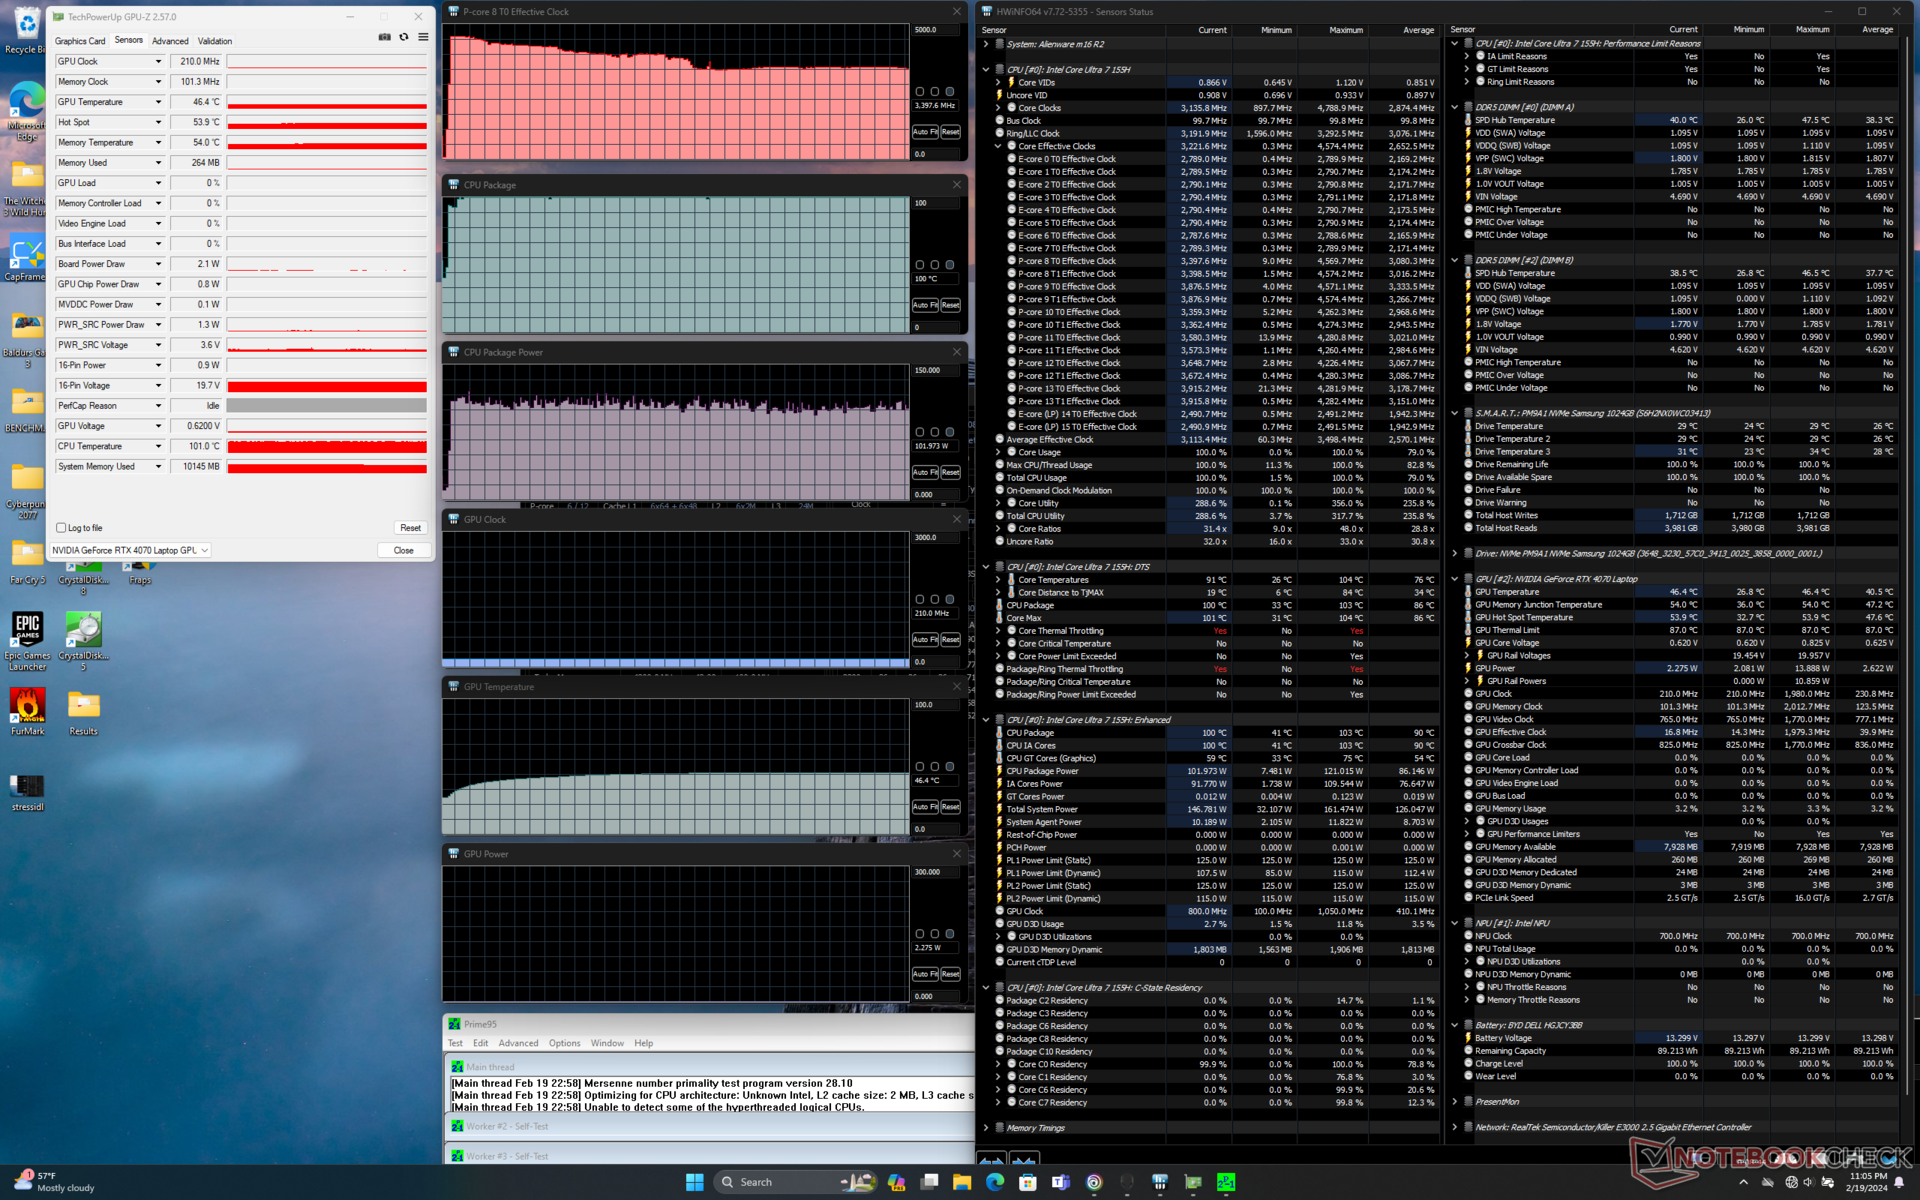
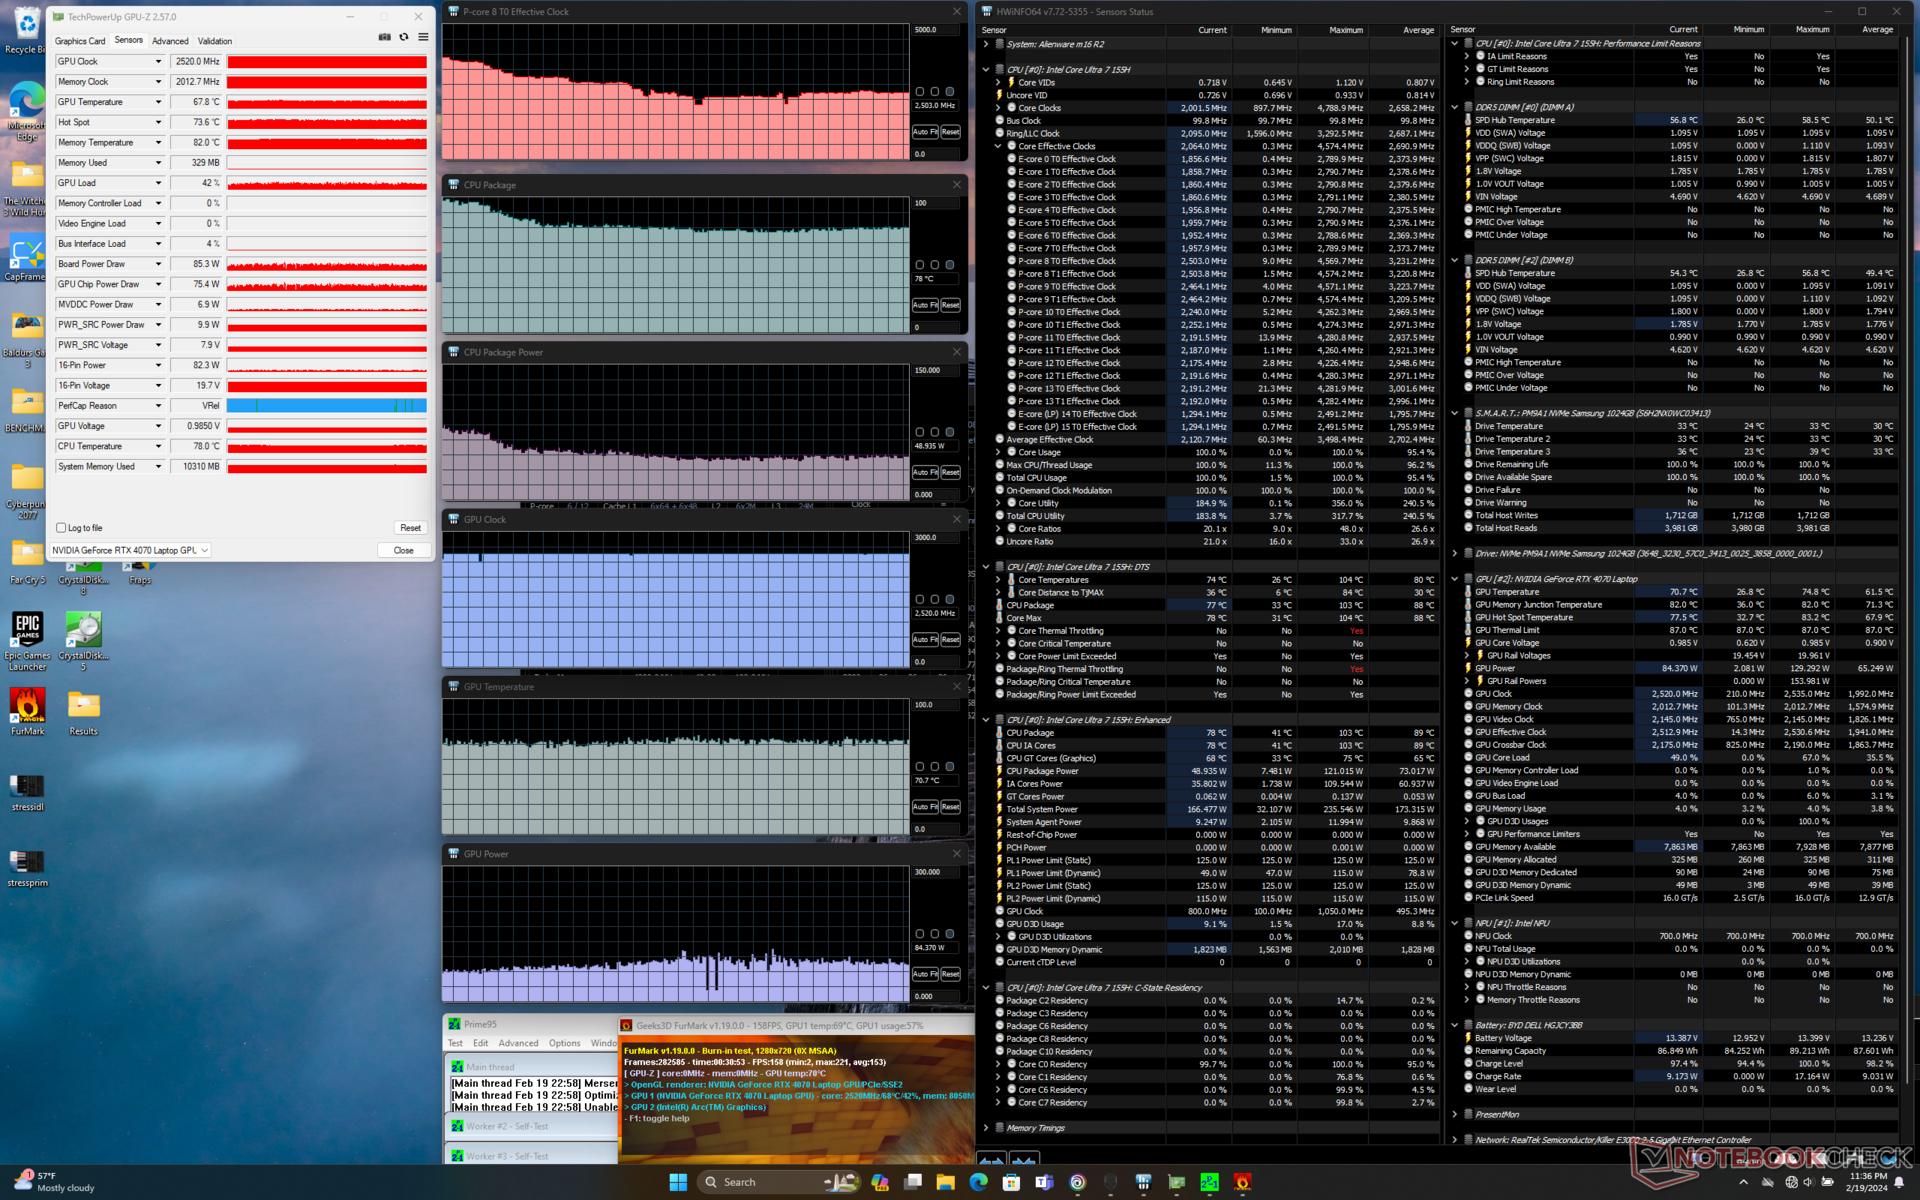

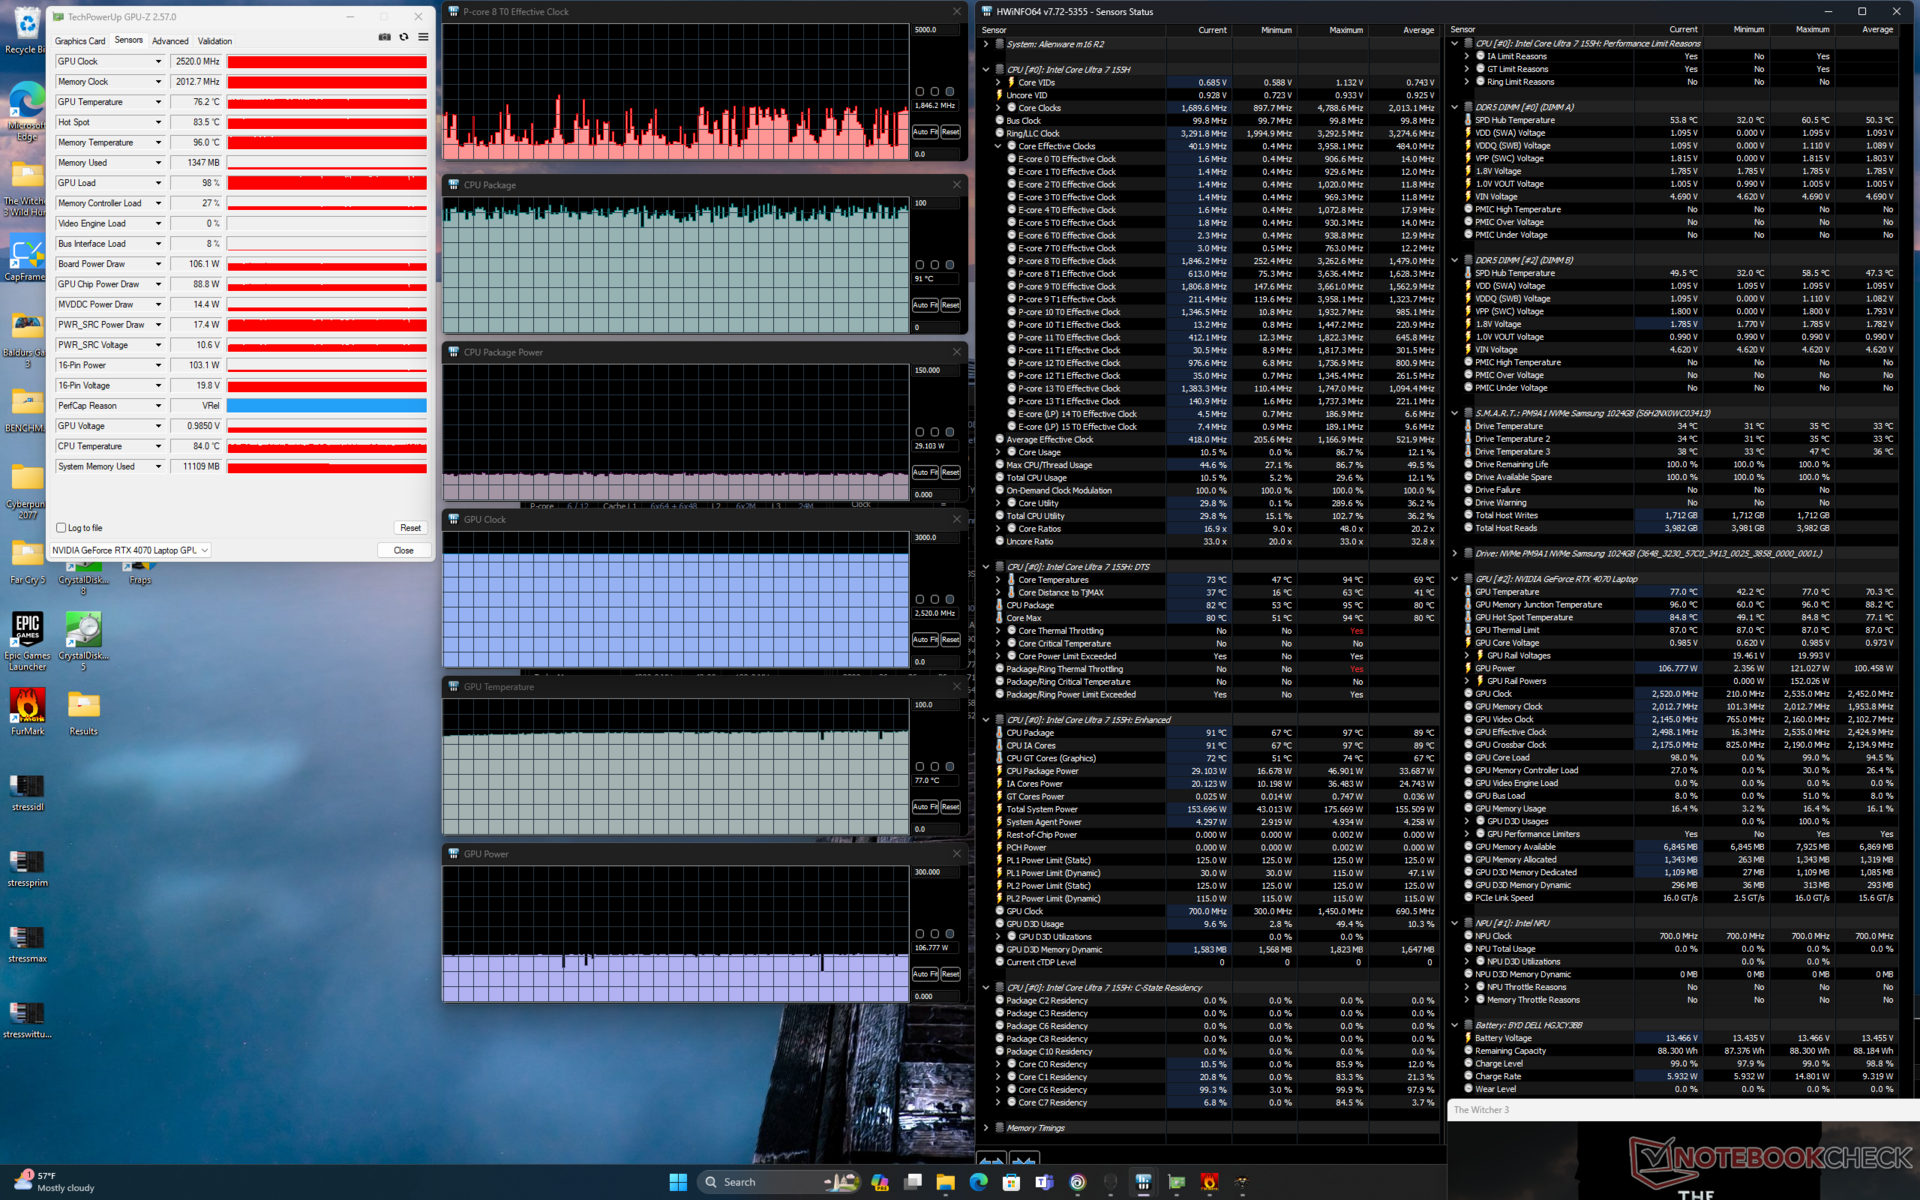
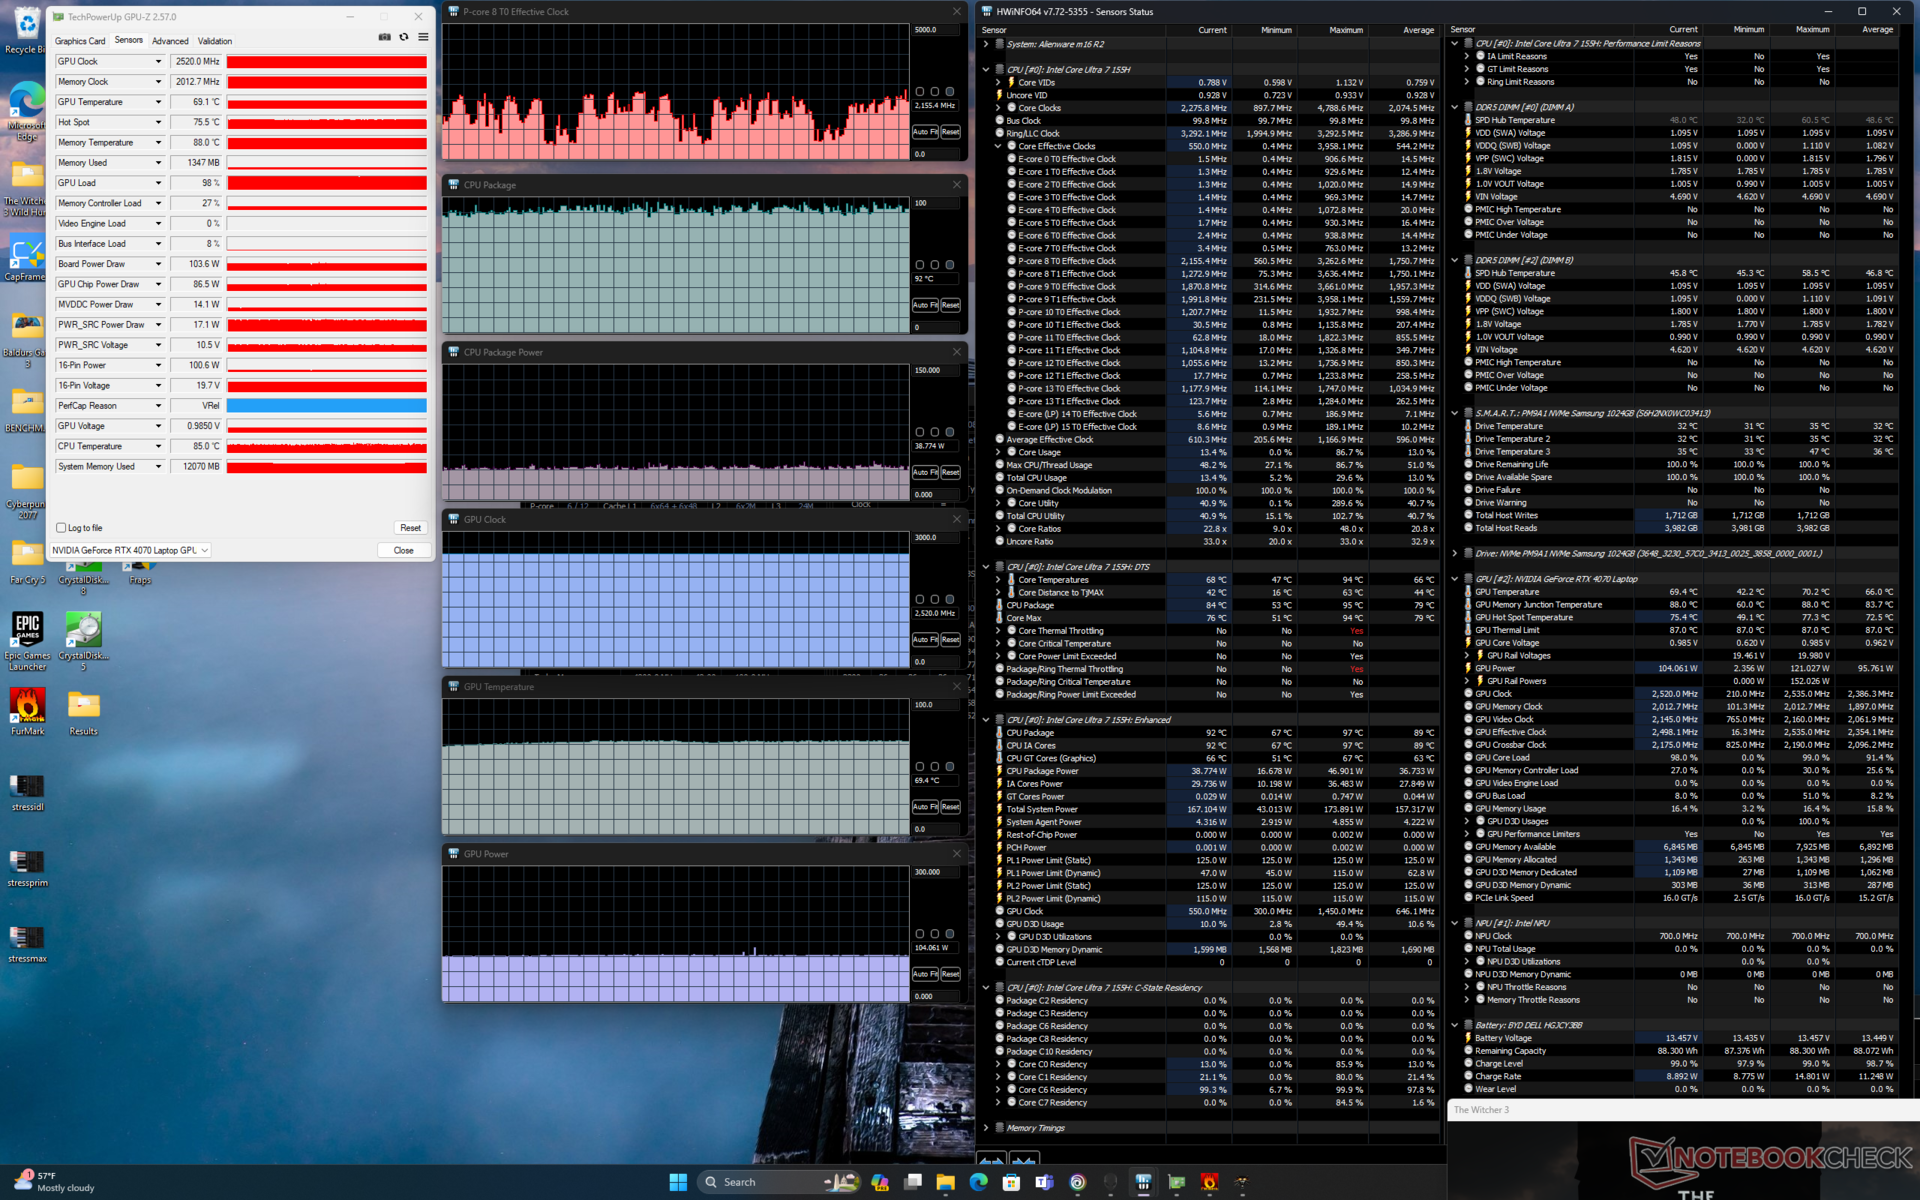
| Clock della CPU (GHz) | Clock della GPU (MHz) | Temperatura media della CPU (°C) | Temperatura media della GPU (°C) | |
| Sistema inattivo | -- | -- | 46 | 27 |
| Stress Prime95 | 3,4 | -- | 100 | 47 |
| Prime95 + FurMark Stress | 2,5 | 2520 | 78 | 71 |
| Witcher 3 Stress (modalità bilanciata) | ~1,8 | 2502 | 93 | 80 |
| Witcher 3 Stress (modalità Performance) | ~1,8 | 2520 | 91 | 77 |
| Witcher 3 Stress (modalità Overdrive) | ~2,0 | 2520 | 92 | 69 |
Prestazioni del sistema
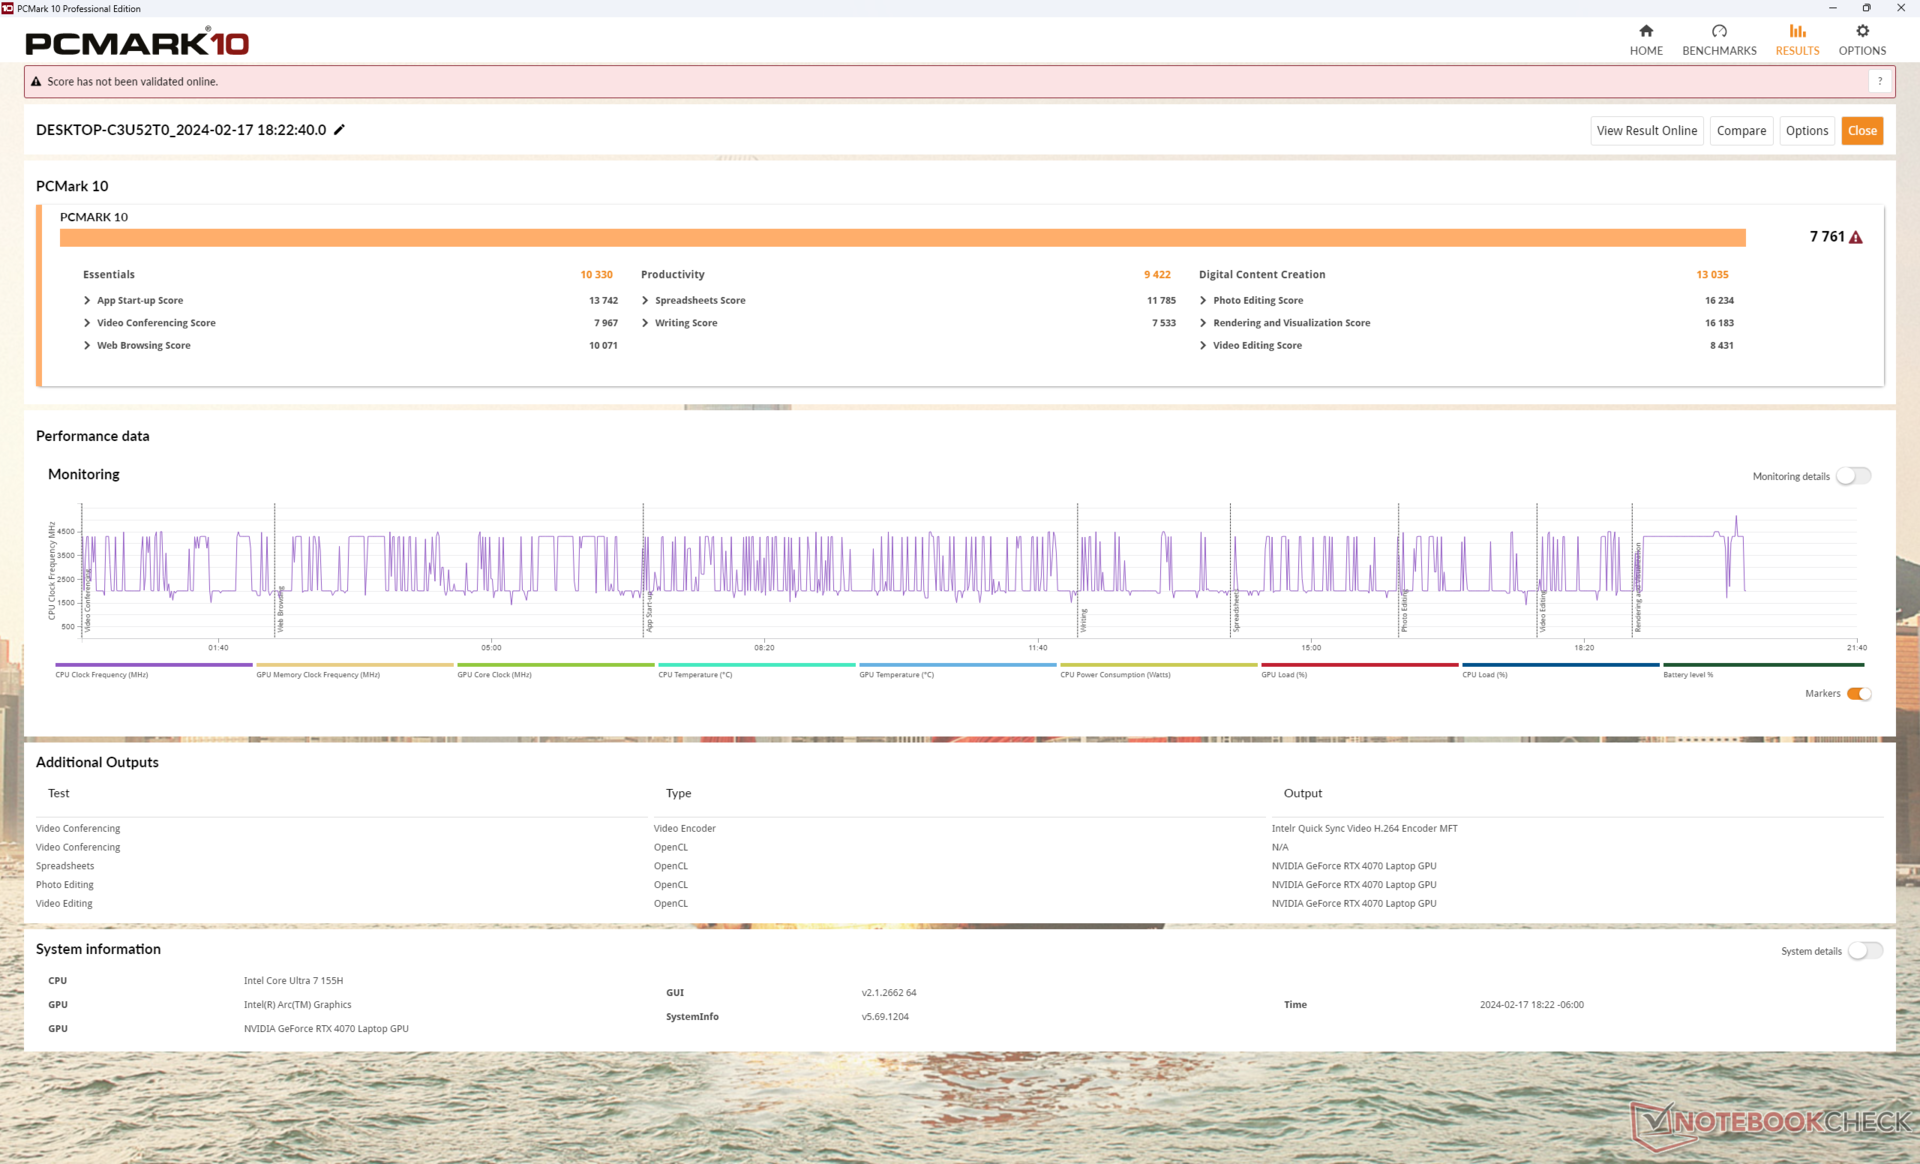
I risultati di PCMark 10 sono paragonabili a quelli di m16 R1, ad eccezione del nostro punteggio inferiore nel sottotest Creazione di contenuti digitali, poiché m16 R2 è dotato della RTX 4070 più lenta. Per il resto, le prestazioni del sistema sono molto simili e non mostrano guadagni significativi nella maggior parte dei carichi quotidiani, nonostante la CPU di nuova generazione.
CrossMark: Overall | Productivity | Creativity | Responsiveness
WebXPRT 3: Overall
WebXPRT 4: Overall
Mozilla Kraken 1.1: Total
| PCMark 10 / Score | |
| Alienware x16 R1 | |
| HP Omen Transcend 16-u1095ng | |
| Alienware m16 R2 | |
| Lenovo Legion Slim 7 16APH8 | |
| Media Intel Core Ultra 7 155H, NVIDIA GeForce RTX 4070 Laptop GPU (7084 - 7761, n=4) | |
| Alienware m16 R1 Intel | |
| Asus ROG Zephyrus G16 2024 GU605M | |
| PCMark 10 / Essentials | |
| Alienware x16 R1 | |
| Alienware m16 R1 Intel | |
| HP Omen Transcend 16-u1095ng | |
| Lenovo Legion Slim 7 16APH8 | |
| Alienware m16 R2 | |
| Media Intel Core Ultra 7 155H, NVIDIA GeForce RTX 4070 Laptop GPU (10038 - 10393, n=4) | |
| Asus ROG Zephyrus G16 2024 GU605M | |
| PCMark 10 / Productivity | |
| HP Omen Transcend 16-u1095ng | |
| Alienware x16 R1 | |
| Lenovo Legion Slim 7 16APH8 | |
| Alienware m16 R1 Intel | |
| Alienware m16 R2 | |
| Media Intel Core Ultra 7 155H, NVIDIA GeForce RTX 4070 Laptop GPU (9192 - 9518, n=4) | |
| Asus ROG Zephyrus G16 2024 GU605M | |
| PCMark 10 / Digital Content Creation | |
| Alienware x16 R1 | |
| Alienware m16 R2 | |
| HP Omen Transcend 16-u1095ng | |
| Media Intel Core Ultra 7 155H, NVIDIA GeForce RTX 4070 Laptop GPU (10100 - 13035, n=4) | |
| Lenovo Legion Slim 7 16APH8 | |
| Asus ROG Zephyrus G16 2024 GU605M | |
| Alienware m16 R1 Intel | |
| CrossMark / Overall | |
| Alienware m16 R1 Intel | |
| Alienware x16 R1 | |
| Alienware m16 R2 | |
| Media Intel Core Ultra 7 155H, NVIDIA GeForce RTX 4070 Laptop GPU (1687 - 1848, n=4) | |
| Asus ROG Zephyrus G16 2024 GU605M | |
| CrossMark / Productivity | |
| Alienware m16 R1 Intel | |
| Alienware x16 R1 | |
| Alienware m16 R2 | |
| Media Intel Core Ultra 7 155H, NVIDIA GeForce RTX 4070 Laptop GPU (1589 - 1750, n=4) | |
| Asus ROG Zephyrus G16 2024 GU605M | |
| CrossMark / Creativity | |
| Alienware m16 R1 Intel | |
| Alienware x16 R1 | |
| Asus ROG Zephyrus G16 2024 GU605M | |
| Media Intel Core Ultra 7 155H, NVIDIA GeForce RTX 4070 Laptop GPU (1860 - 2014, n=4) | |
| Alienware m16 R2 | |
| CrossMark / Responsiveness | |
| Alienware x16 R1 | |
| Alienware m16 R1 Intel | |
| Alienware m16 R2 | |
| Media Intel Core Ultra 7 155H, NVIDIA GeForce RTX 4070 Laptop GPU (1424 - 1683, n=4) | |
| Asus ROG Zephyrus G16 2024 GU605M | |
| WebXPRT 3 / Overall | |
| HP Omen Transcend 16-u1095ng | |
| Alienware m16 R1 Intel | |
| Alienware x16 R1 | |
| Alienware m16 R2 | |
| Asus ROG Zephyrus G16 2024 GU605M | |
| Media Intel Core Ultra 7 155H, NVIDIA GeForce RTX 4070 Laptop GPU (264 - 294, n=4) | |
| WebXPRT 4 / Overall | |
| Alienware m16 R1 Intel | |
| Alienware x16 R1 | |
| Alienware m16 R2 | |
| Asus ROG Zephyrus G16 2024 GU605M | |
| Media Intel Core Ultra 7 155H, NVIDIA GeForce RTX 4070 Laptop GPU (247 - 257, n=4) | |
| Mozilla Kraken 1.1 / Total | |
| Media Intel Core Ultra 7 155H, NVIDIA GeForce RTX 4070 Laptop GPU (546 - 568, n=3) | |
| Asus ROG Zephyrus G16 2024 GU605M | |
| Alienware m16 R2 | |
| Alienware m16 R1 Intel | |
| Alienware x16 R1 | |
| HP Omen Transcend 16-u1095ng | |
* ... Meglio usare valori piccoli
| PCMark 10 Score | 7761 punti | |
Aiuto | ||
| AIDA64 / Memory Copy | |
| Asus ROG Zephyrus G16 2024 GU605M | |
| Media Intel Core Ultra 7 155H (62397 - 96791, n=50) | |
| HP Omen Transcend 16-u1095ng | |
| Alienware x16 R1 | |
| Lenovo Legion Slim 7 16APH8 | |
| Alienware m16 R2 | |
| Alienware m16 R1 Intel | |
| AIDA64 / Memory Read | |
| Asus ROG Zephyrus G16 2024 GU605M | |
| HP Omen Transcend 16-u1095ng | |
| Media Intel Core Ultra 7 155H (60544 - 90647, n=50) | |
| Alienware m16 R2 | |
| Alienware x16 R1 | |
| Alienware m16 R1 Intel | |
| Lenovo Legion Slim 7 16APH8 | |
| AIDA64 / Memory Write | |
| Lenovo Legion Slim 7 16APH8 | |
| Alienware x16 R1 | |
| HP Omen Transcend 16-u1095ng | |
| Asus ROG Zephyrus G16 2024 GU605M | |
| Media Intel Core Ultra 7 155H (58692 - 93451, n=50) | |
| Alienware m16 R2 | |
| Alienware m16 R1 Intel | |
| AIDA64 / Memory Latency | |
| Media Intel Core Ultra 7 155H (116.2 - 233, n=50) | |
| Asus ROG Zephyrus G16 2024 GU605M | |
| Alienware m16 R2 | |
| Alienware x16 R1 | |
| Lenovo Legion Slim 7 16APH8 | |
| Alienware m16 R1 Intel | |
| HP Omen Transcend 16-u1095ng | |
* ... Meglio usare valori piccoli
Latenza DPC
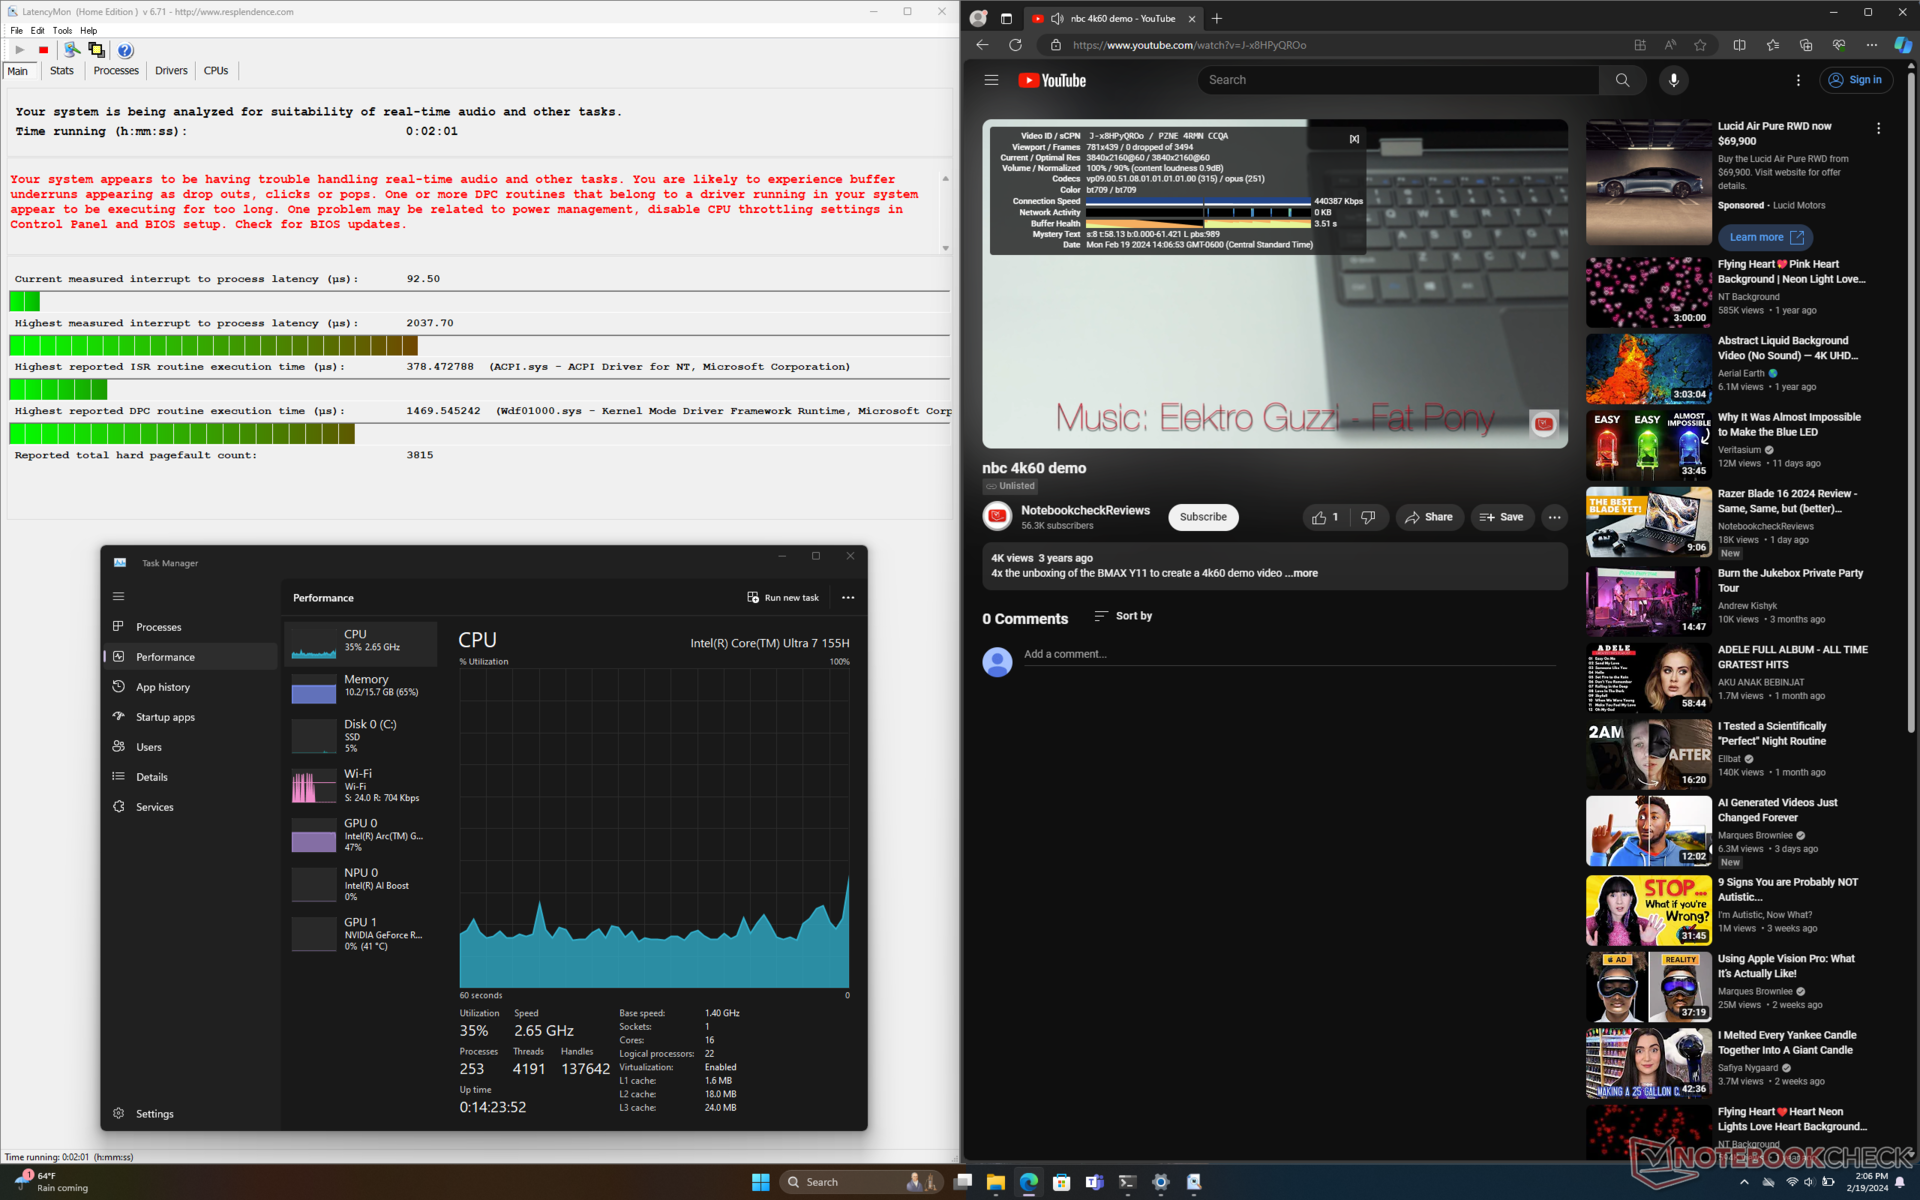
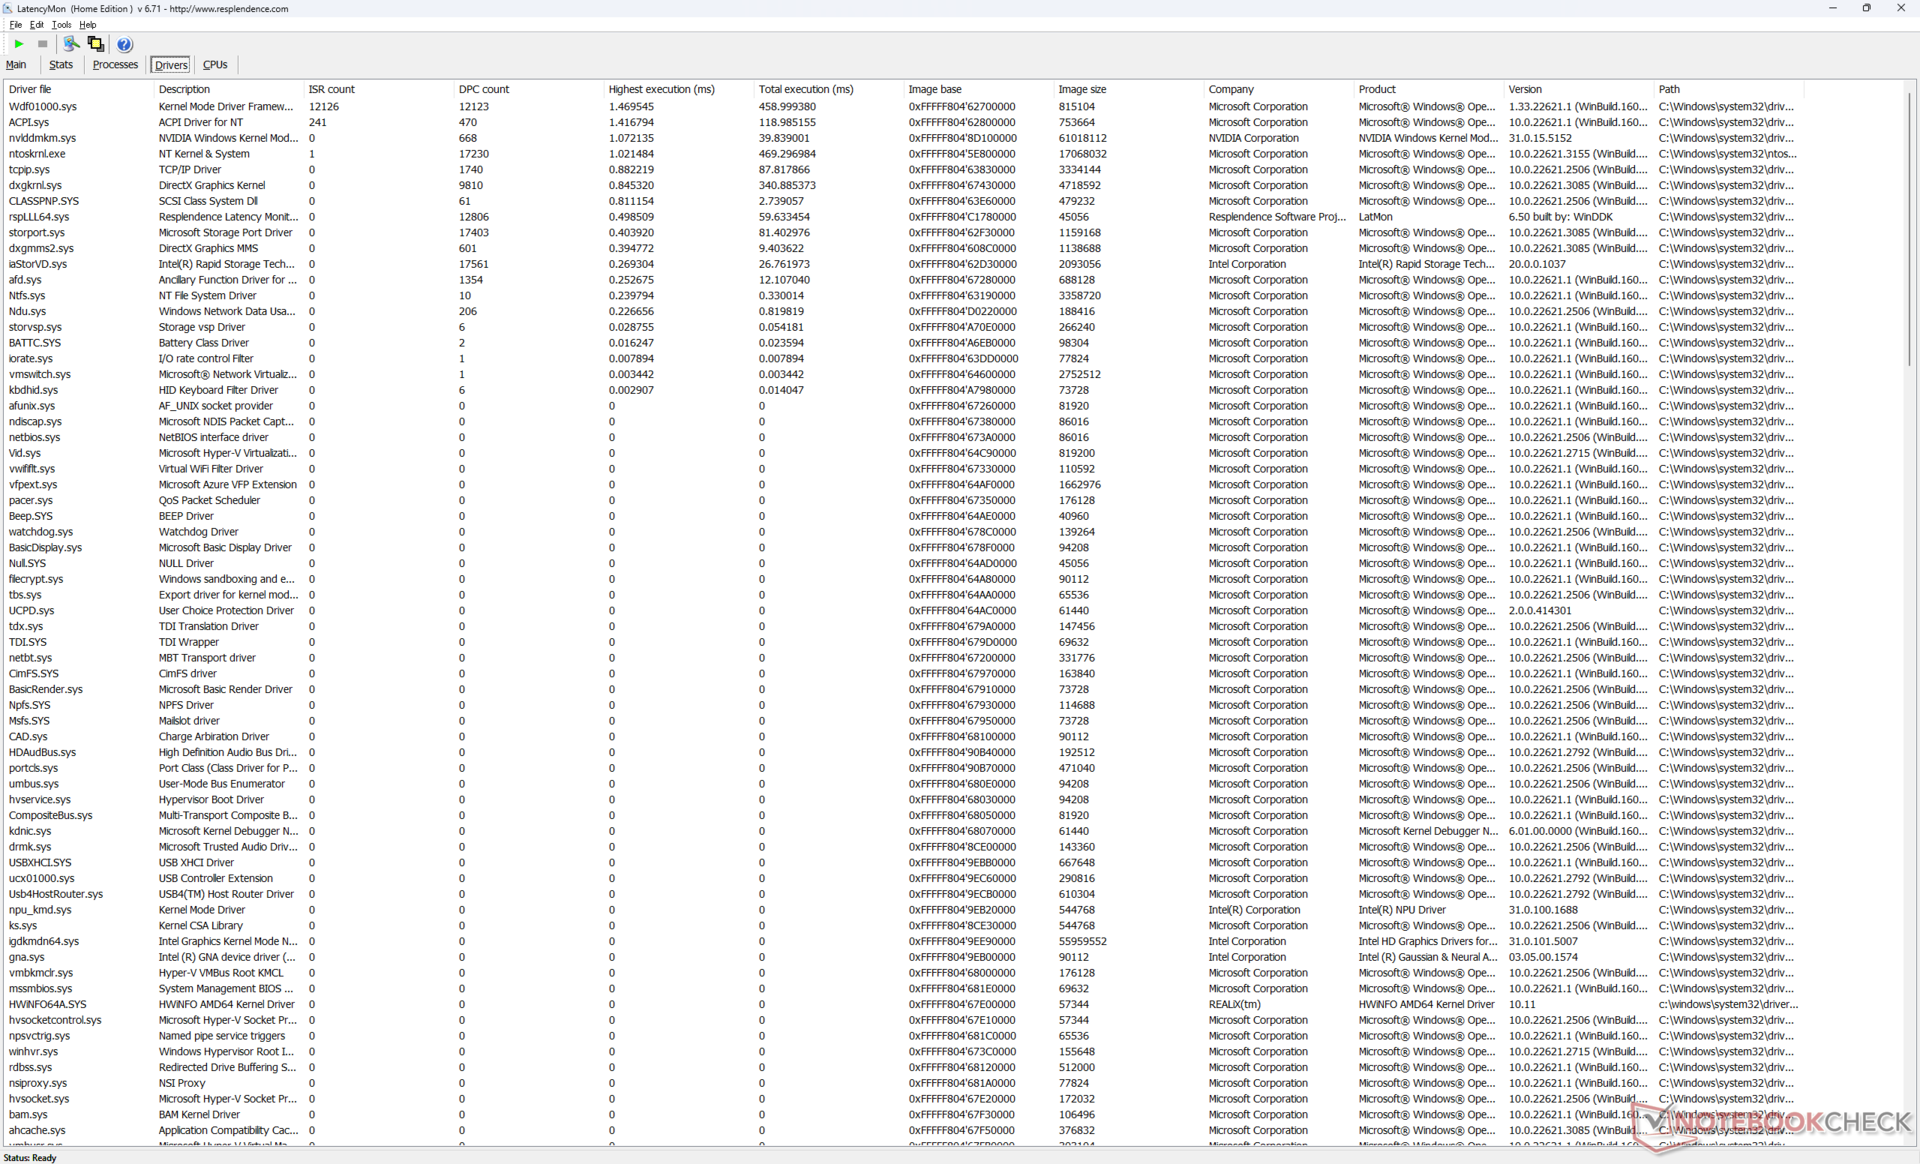
LatencyMon rivela problemi di DPC quando si aprono più schede della nostra homepage. la riproduzione di video 4K a 60 FPS è invece perfetta, senza alcuna perdita di fotogrammi.
| DPC Latencies / LatencyMon - interrupt to process latency (max), Web, Youtube, Prime95 | |
| Alienware m16 R1 Intel | |
| Asus ROG Zephyrus G16 2024 GU605M | |
| Alienware m16 R2 | |
| HP Omen Transcend 16-u1095ng | |
| Alienware x16 R1 | |
| Lenovo Legion Slim 7 16APH8 | |
* ... Meglio usare valori piccoli
Dispositivi di archiviazione
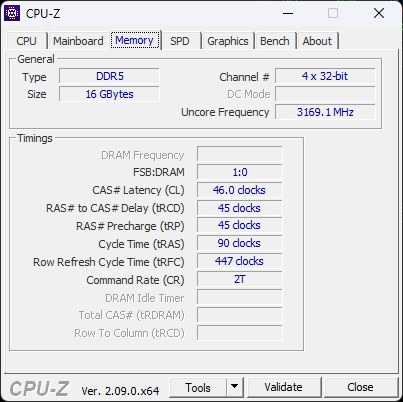
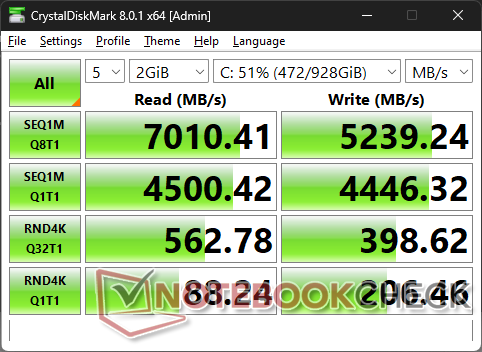
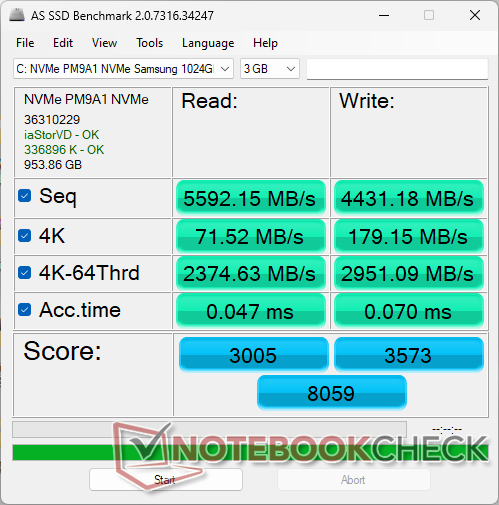
La nostra unità viene fornita con il Samsung PM9A1 SSD PCIe4 x4 NVMe al posto di Kioxia sull'm16 R1 dello scorso anno. L'unità non avrebbe problemi a mantenere la sua velocità di trasferimento massima di 7000 MB/s per periodi prolungati. Per ciascuno dei due slot M.2 2280 è incluso un diffusore di calore.

| Drive Performance rating - Percent | |
| Alienware x16 R1 | |
| Alienware m16 R2 | |
| Alienware m16 R1 Intel | |
| Lenovo Legion Slim 7 16APH8 | |
| HP Omen Transcend 16-u1095ng | |
| Asus ROG Zephyrus G16 2024 GU605M | |
* ... Meglio usare valori piccoli
Disk Throttling: DiskSpd Read Loop, Queue Depth 8
Prestazioni della GPU
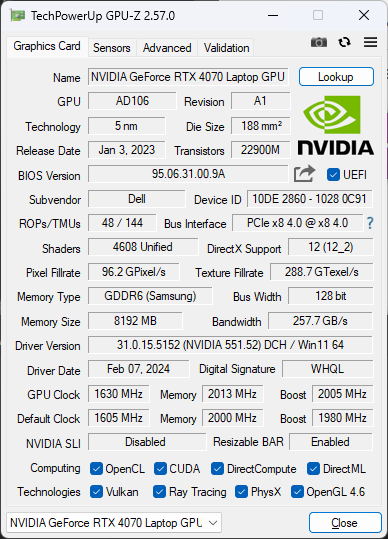
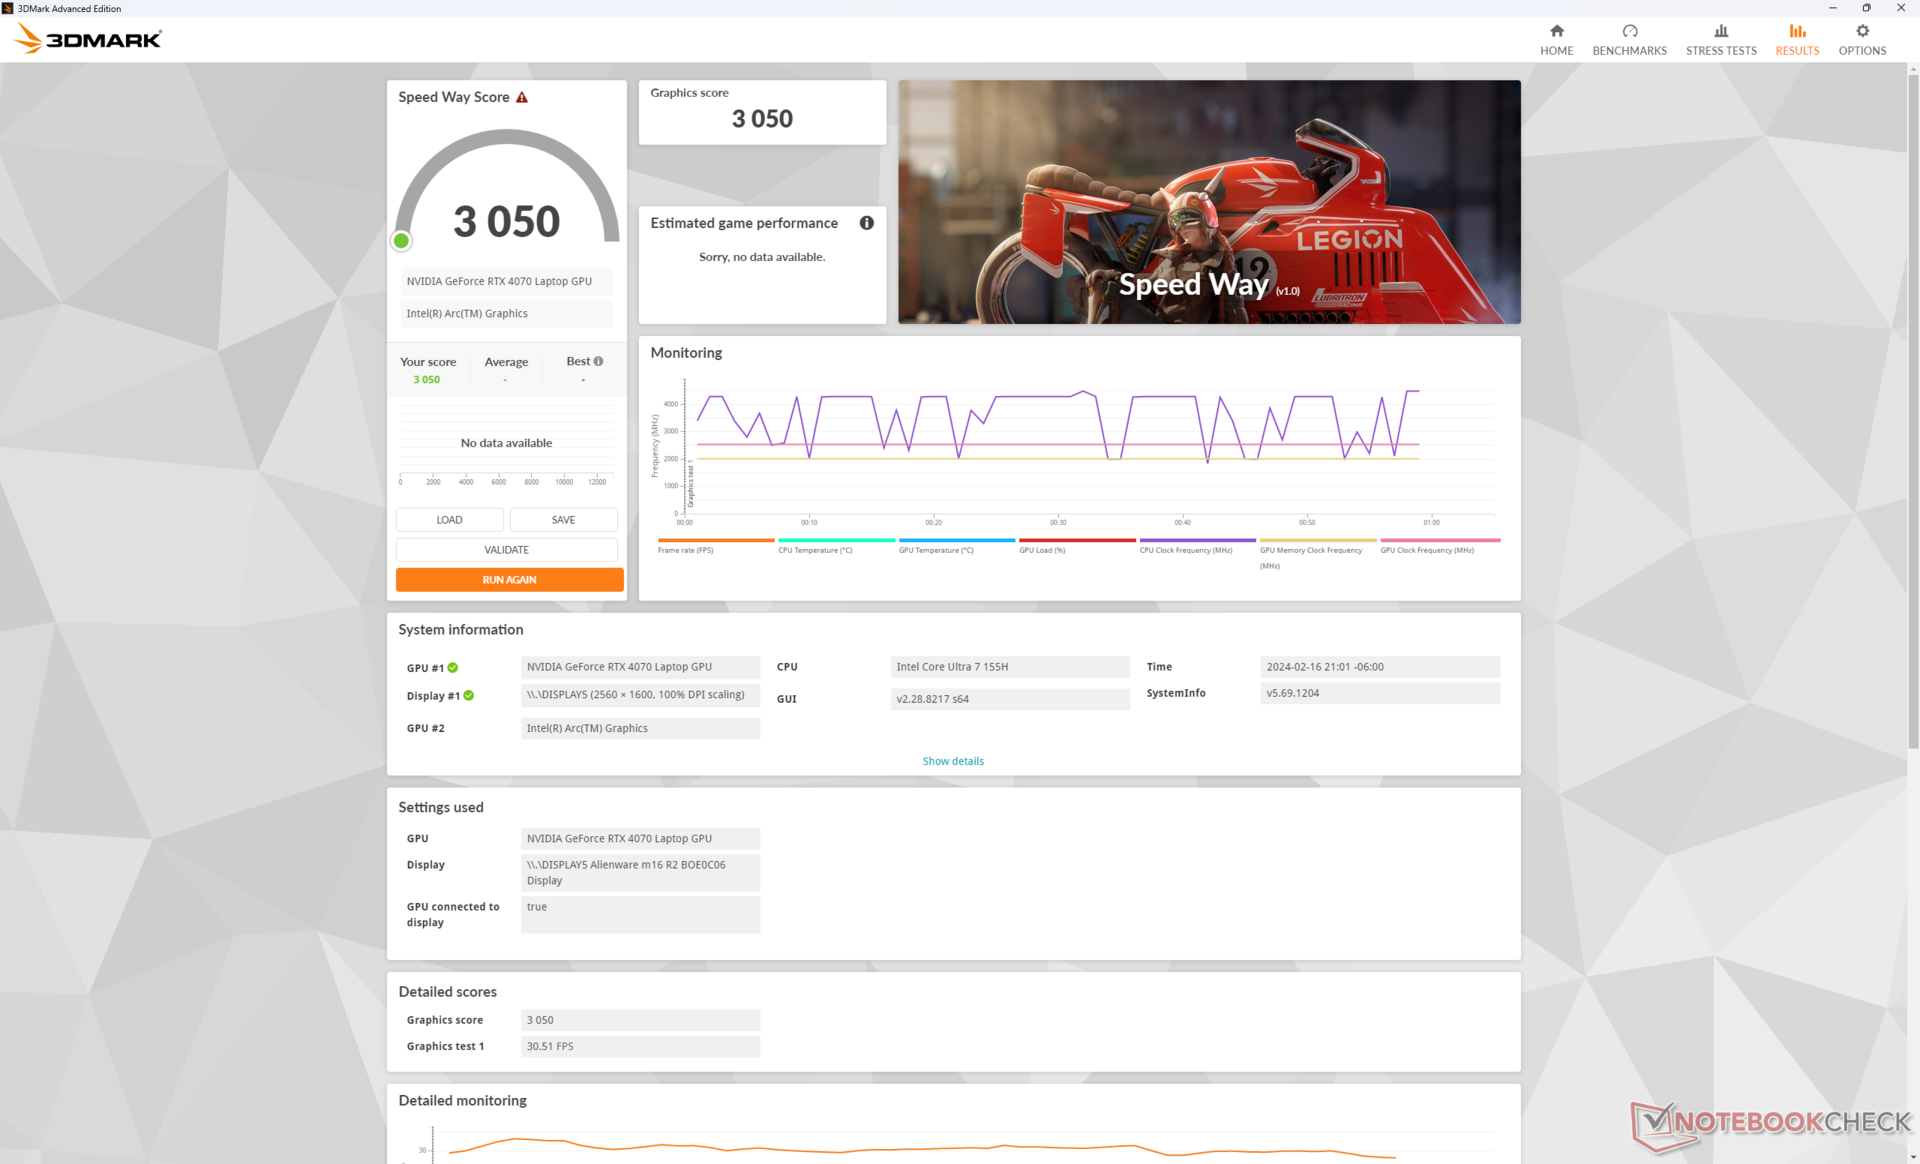
Le prestazioni grafiche del nostro laptop da 140 W GeForce RTX 4070 sono circa il 10% più veloci rispetto alla media dei laptop del nostro database dotati della stessa GPU. Sebbene sia un downgrade rispetto all'm16 R1 di ben il 30-45 percento a causa della mancanza di RTX 4080 o 4090 opzioni, è almeno positivo vedere che la RTX 4070 qui ha prestazioni migliori del previsto. Gli utenti che desiderano la RTX 4080 o 4090 dovranno invece prendere in considerazione la vecchia m16 R1 o la più costosa serie Alienware x16.
È interessante notare che le differenze di prestazioni tra le modalità Overdrive, Performance e Balanced sono minime. Questo è sorprendente, perché il passaggio alla modalità Bilanciata comporterebbe in genere una perdita di prestazioni dal 10 al 30 percento sulla maggior parte degli altri computer portatili da gioco, ma i punteggi di Fire Strike rimarrebbero quasi costanti sul nostro Alienware m16 R2. Dell ha sicuramente modificato i profili di rumore delle ventole e i conseguenti comportamenti delle prestazioni durante lo sviluppo di questo modello.
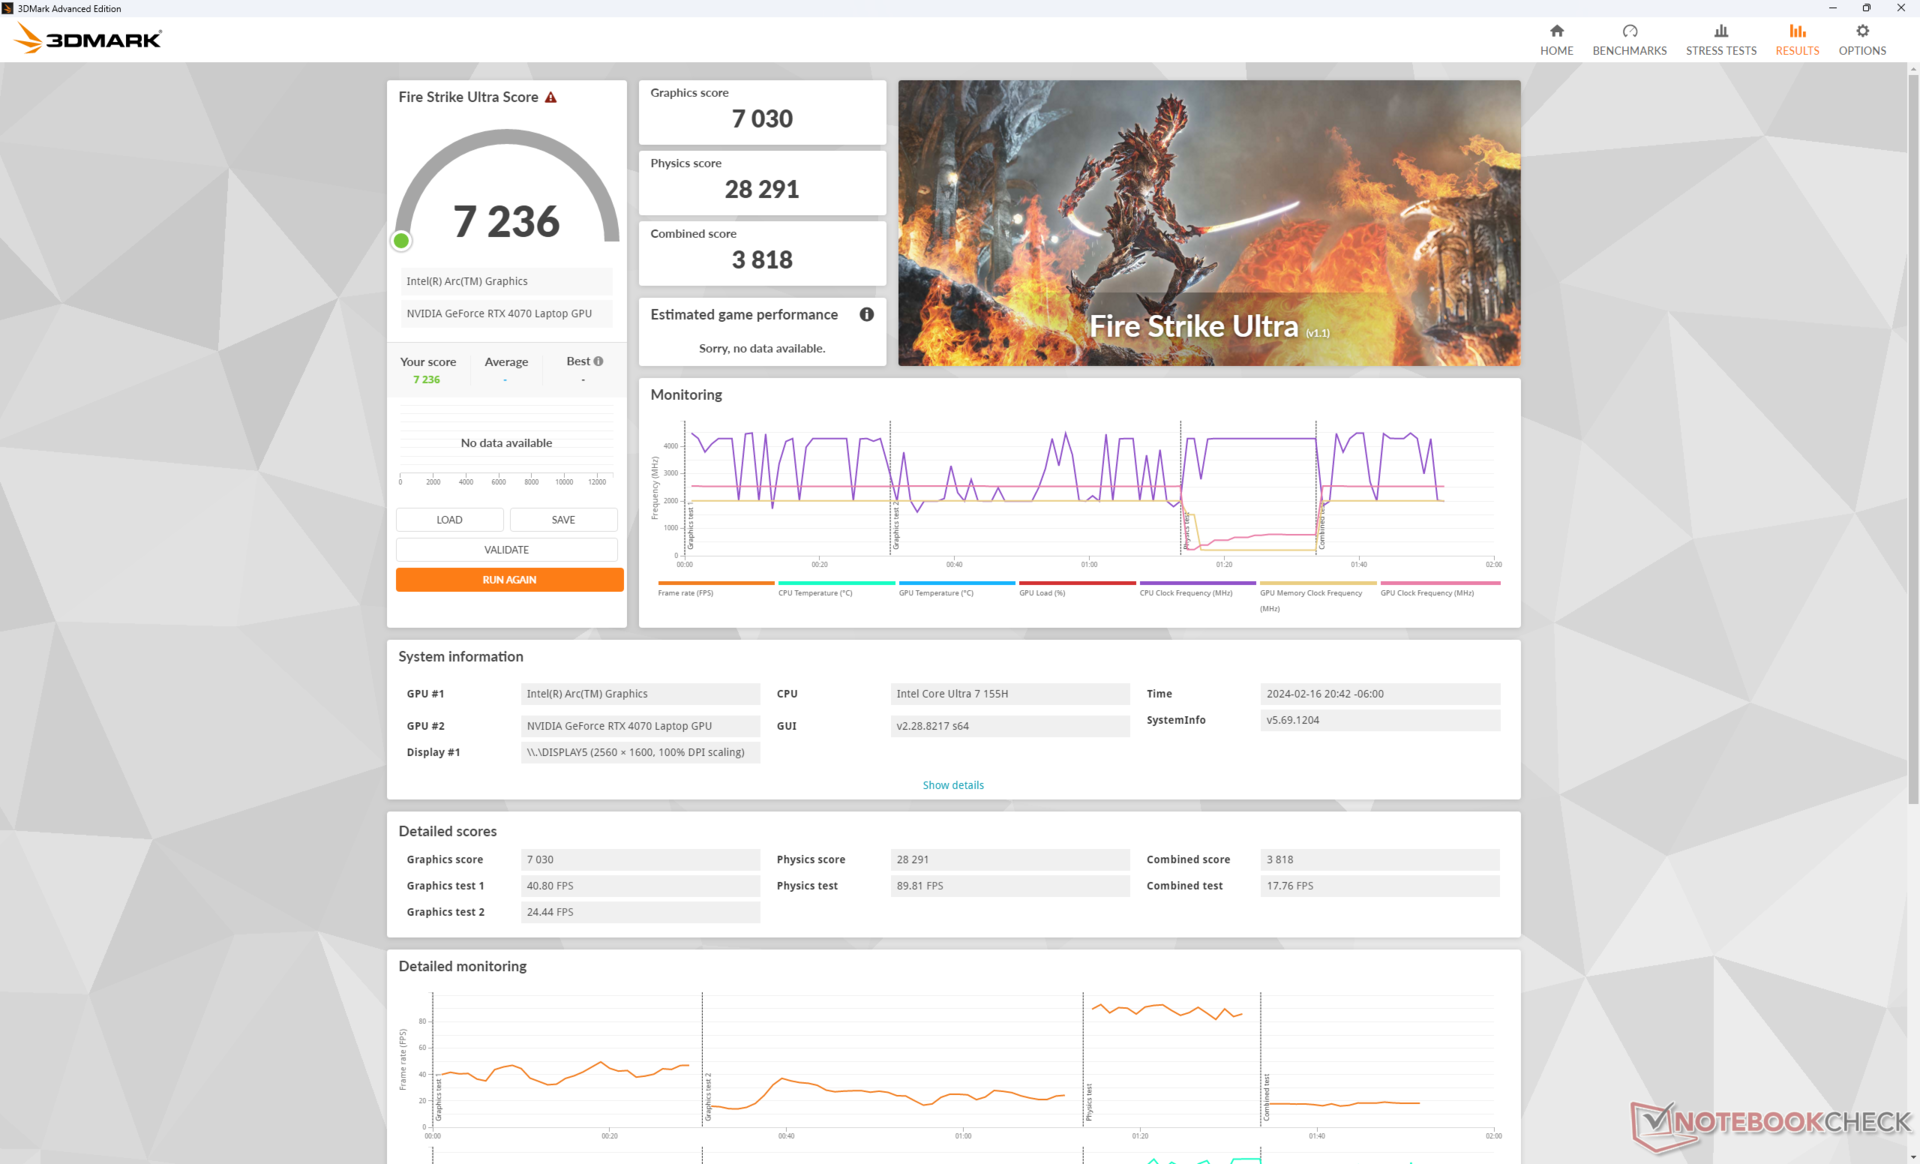
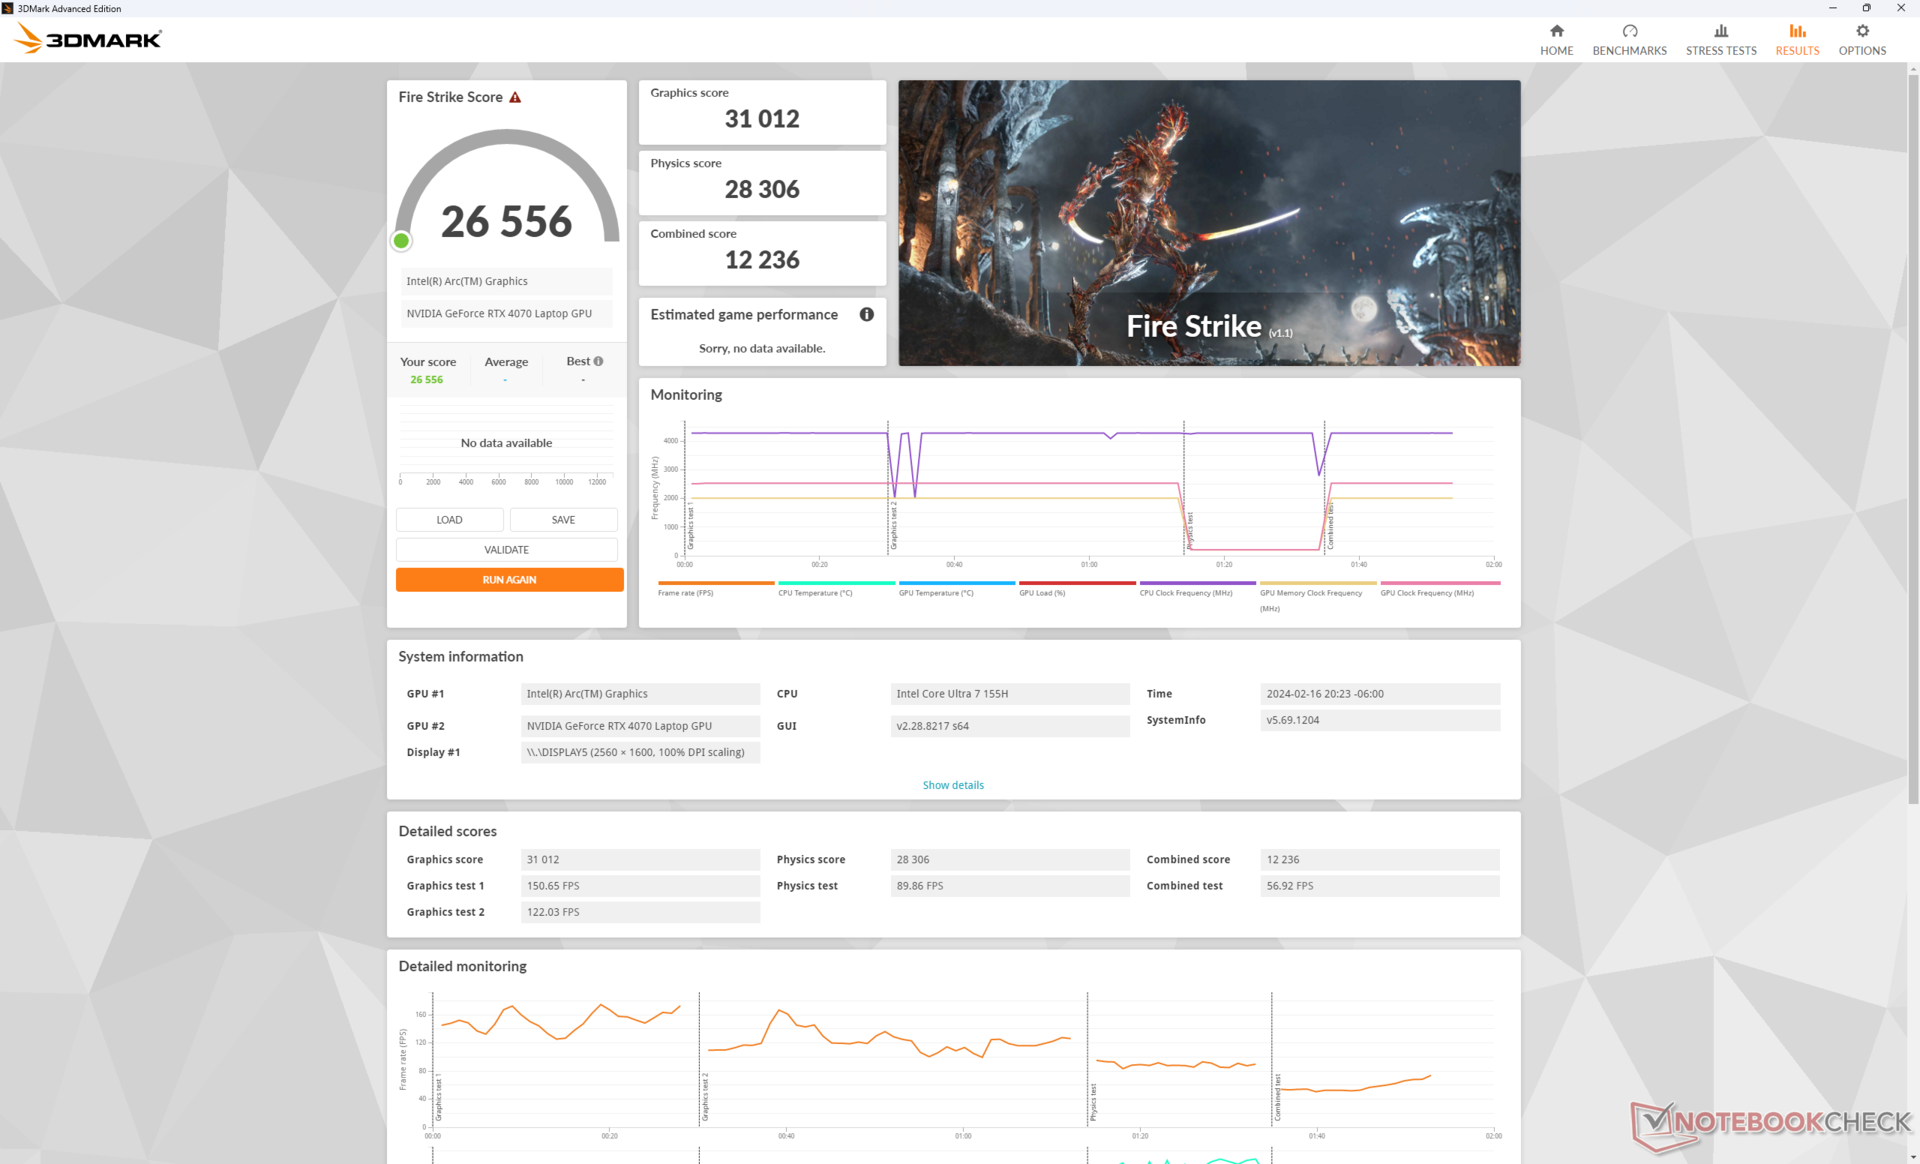
| Profilo di potenza | Punteggio grafico | Punteggio Fisica | Punteggio combinato |
| Modalità Overdrive | 30932 | 27306 | 12414 |
| Modalità Performance | 31012 (-0%) | 28306 (-0%) | 12236 (-0%) |
| Modalità Bilanciata | 30603 (-0%) | 28281 (-0%) | 12448 (-0%) |
| Alimentazione a batteria | 24398 (-21%) | 24684 (-10%) | 10088 (-19%) |
Declassamento alla RTX 4060 si prevede un impatto sulle prestazioni del 10-15%.
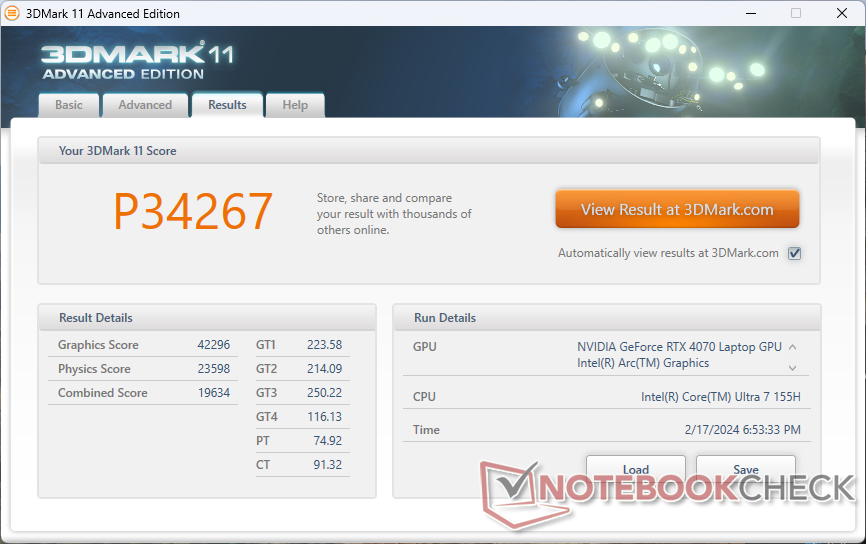
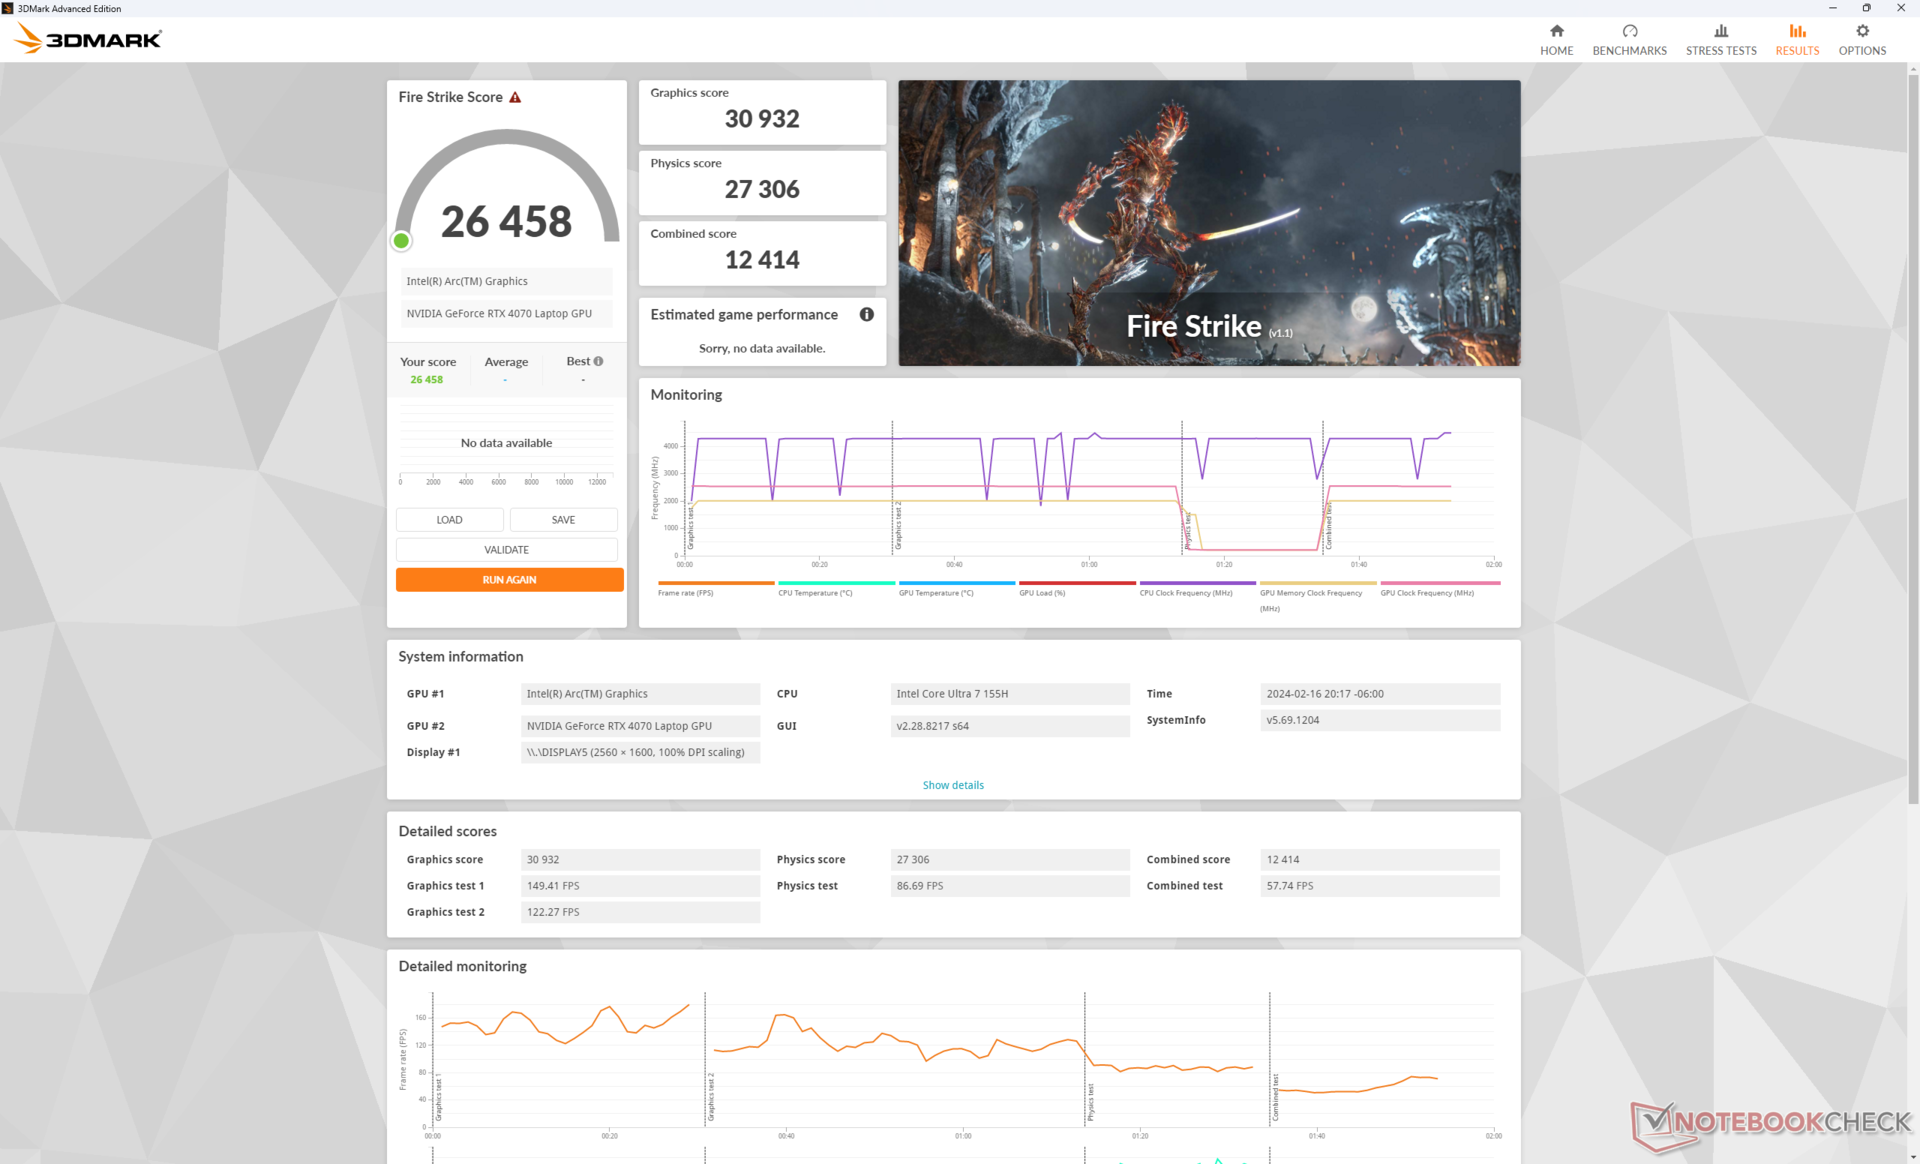
| 3DMark 11 Performance | 34267 punti | |
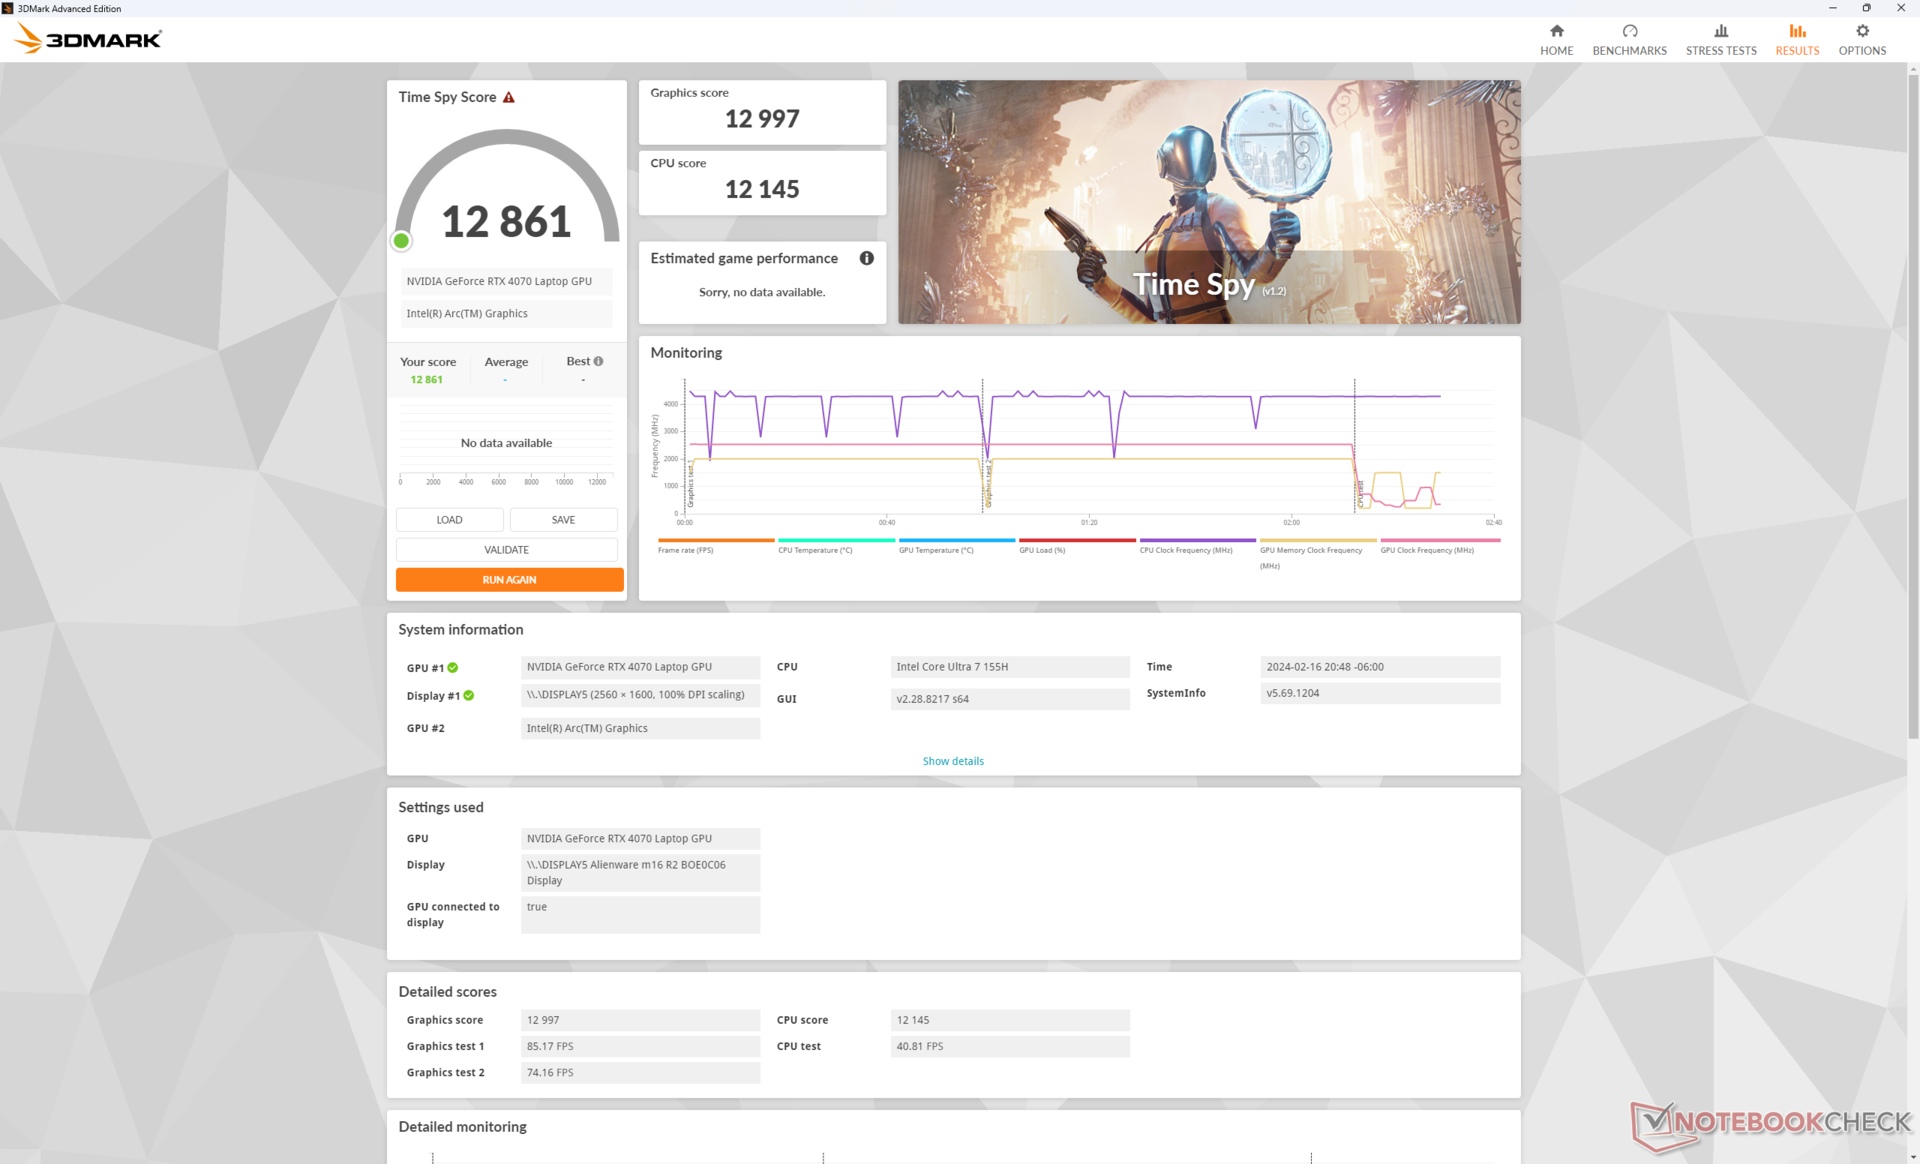
| 3DMark Fire Strike Score | 26458 punti | |
| 3DMark Time Spy Score | 12861 punti | |
Aiuto | ||
* ... Meglio usare valori piccoli
| F1 22 | |
| 1920x1080 Ultra High Preset AA:T AF:16x | |
| Lenovo Legion 9 16IRX8 | |
| Alienware m16 R1 AMD | |
| Alienware m16 R2 | |
| Media NVIDIA GeForce RTX 4070 Laptop GPU (39.2 - 88.7, n=32) | |
| Lenovo Legion 5 16IRX G9 | |
| HP Victus 16-r0076TX | |
| Framework Laptop 16 | |
| 2560x1440 Ultra High Preset AA:T AF:16x | |
| Lenovo Legion 9 16IRX8 | |
| Alienware m16 R1 AMD | |
| Alienware m16 R2 | |
| Media NVIDIA GeForce RTX 4070 Laptop GPU (10.6 - 58.8, n=30) | |
| Lenovo Legion 5 16IRX G9 | |
| Framework Laptop 16 | |
| 3840x2160 Ultra High Preset AA:T AF:16x | |
| Alienware m16 R1 AMD | |
| Alienware m16 R2 | |
| Media NVIDIA GeForce RTX 4070 Laptop GPU (4.7 - 27.6, n=15) | |
| Framework Laptop 16 | |
| The Witcher 3 | |
| 1920x1080 Ultra Graphics & Postprocessing (HBAO+) | |
| Lenovo Legion 9 16IRX8 | |
| Alienware m16 R1 AMD | |
| Alienware m16 R2 | |
| Lenovo Legion 7 16IAX7-82TD004SGE | |
| HP Omen Transcend 16-u1095ng | |
| Media NVIDIA GeForce RTX 4070 Laptop GPU (69.8 - 133.7, n=57) | |
| Asus ROG Zephyrus M16 GU603Z | |
| Lenovo Legion 5 16IRX G9 | |
| HP Victus 16-r0076TX | |
| Lenovo Legion S7 16ARHA7 | |
| Asus ROG Zephyrus M16 GU603H | |
| Dell G16 7620 | |
| Framework Laptop 16 | |
| 3840x2160 High Graphics & Postprocessing (Nvidia HairWorks Off) | |
| Alienware m16 R1 AMD | |
| Alienware m16 R2 | |
| Media NVIDIA GeForce RTX 4070 Laptop GPU (26.5 - 83.5, n=16) | |
| Framework Laptop 16 | |
| Tiny Tina's Wonderlands | |
| 1920x1080 Badass Preset (DX12) | |
| Lenovo Legion 9 16IRX8 | |
| Alienware m16 R1 AMD | |
| Alienware m16 R2 | |
| Media NVIDIA GeForce RTX 4070 Laptop GPU (58.6 - 115.9, n=18) | |
| Framework Laptop 16 | |
| 2560x1440 Badass Preset (DX12) | |
| Lenovo Legion 9 16IRX8 | |
| Alienware m16 R1 AMD | |
| Alienware m16 R2 | |
| Media NVIDIA GeForce RTX 4070 Laptop GPU (49.8 - 79.5, n=17) | |
| Framework Laptop 16 | |
| 3840x2160 Badass Preset (DX12) | |
| Alienware m16 R1 AMD | |
| Media NVIDIA GeForce RTX 4070 Laptop GPU (28.3 - 39.7, n=13) | |
| Alienware m16 R2 | |
| Framework Laptop 16 | |
| Baldur's Gate 3 | |
| 1920x1080 Ultra Preset AA:T | |
| Alienware m16 R2 | |
| Media NVIDIA GeForce RTX 4070 Laptop GPU (66.7 - 128.5, n=30) | |
| Framework Laptop 16 | |
| 2560x1440 Ultra Preset AA:T | |
| Alienware m16 R2 | |
| Media NVIDIA GeForce RTX 4070 Laptop GPU (54.4 - 89.6, n=25) | |
| Framework Laptop 16 | |
| 3840x2160 Ultra Preset AA:T | |
| Alienware m16 R2 | |
| Media NVIDIA GeForce RTX 4070 Laptop GPU (33.4 - 45.2, n=12) | |
| Framework Laptop 16 | |
| Cyberpunk 2077 | |
| 1920x1080 Ultra Preset (FSR off) | |
| Lenovo Legion 9 16IRX8 | |
| Alienware m16 R2 | |
| Lenovo Legion 5 16IRX G9 | |
| Media NVIDIA GeForce RTX 4070 Laptop GPU (30.7 - 90.7, n=40) | |
| Framework Laptop 16 | |
| 2560x1440 Ultra Preset (FSR off) | |
| Lenovo Legion 9 16IRX8 | |
| Alienware m16 R2 | |
| Lenovo Legion 5 16IRX G9 | |
| Media NVIDIA GeForce RTX 4070 Laptop GPU (24.8 - 57.1, n=37) | |
| Framework Laptop 16 | |
| 3840x2160 Ultra Preset (FSR off) | |
| Media NVIDIA GeForce RTX 4070 Laptop GPU (20.2 - 24, n=13) | |
| Alienware m16 R2 | |
| Framework Laptop 16 | |
Witcher 3 FPS Chart
| basso | medio | alto | ultra | QHD | 4K | |
|---|---|---|---|---|---|---|
| The Witcher 3 (2015) | 399.6 | 344.6 | 240.5 | 121.3 | 72 | |
| Dota 2 Reborn (2015) | 166.8 | 149 | 149.5 | 139.7 | 130.6 | |
| Final Fantasy XV Benchmark (2018) | 184.6 | 165.1 | 119.3 | 85.2 | 48.5 | |
| X-Plane 11.11 (2018) | 132.3 | 116 | 90.8 | 78.2 | ||
| Far Cry 5 (2018) | 146 | 134 | 123 | 115 | 61 | |
| Strange Brigade (2018) | 427 | 308 | 255 | 219 | 141.7 | 73.8 |
| Tiny Tina's Wonderlands (2022) | 244 | 202.8 | 138.3 | 107.6 | 74.6 | 34.8 |
| F1 22 (2022) | 235 | 225 | 217 | 83.6 | 52.9 | 26.6 |
| Baldur's Gate 3 (2023) | 168.7 | 148.9 | 129.3 | 128.5 | 88.3 | 44.3 |
| Cyberpunk 2077 (2023) | 125.7 | 114.1 | 95.6 | 83.1 | 52.7 | 21 |
Emissioni
Rumore del sistema
Il comportamento del rumore della ventola è migliorato in modo significativo rispetto all'm16 R1. Quando si esegue 3DMark 06 in modalità Bilanciata, ad esempio, l'm16 R2 rimane più silenzioso più a lungo, a 32 dB(A), mentre l'm16 R1 è inutilmente rumoroso, a 52 dB(A), per tutta la prima scena del benchmark. Questo rende l'm16 R2 più paragonabile a concorrenti come il modello Lenovo Legion Slim 7 in condizioni simili.
Il rumore della ventola durante il gioco è strettamente legato al profilo energetico selezionato. Ad esempio, il rumore della ventola si stabilizza a 52 dB(A), 54 dB(A) e 62 dB(A) quando si utilizza la modalità Bilanciata, Performance e Overdrive Witcher 3 in modalità Bilanciata, Performance e Overdrive, rispettivamente. Poiché le differenze di prestazioni tra queste tre modalità sono minime, come già detto, consigliamo di giocare in modalità Performance e di evitare la modalità Overdrive per la maggior parte degli scenari. I 62 dB(A) massimi sono molto più rumorosi di quelli che abbiamo registrato persino sul più potente Alienware x16 R1, ma questa modalità è principalmente destinata all'overclocking degli utenti finali; la modalità Performance è sufficiente per le impostazioni stock.
Rumorosità
| Idle |
| 25.3 / 25.3 / 25.3 dB(A) |
| Sotto carico |
| 31.7 / 62 dB(A) |
 | ||
30 dB silenzioso 40 dB(A) udibile 50 dB(A) rumoroso |
||
min: | ||
| Alienware m16 R2 GeForce RTX 4070 Laptop GPU, Ultra 7 155H, Samsung PM9A1 MZVL21T0HCLR | Alienware m16 R1 Intel GeForce RTX 4060 Laptop GPU, i7-13700HX, Kioxia KXG70ZNV512G | Alienware x16 R1 GeForce RTX 4080 Laptop GPU, i9-13900HK, SK hynix PC801 HFS001TEJ9X101N | HP Omen Transcend 16-u1095ng GeForce RTX 4070 Laptop GPU, i9-14900HX, Kioxia XG8 KXG80ZNV1T02 | Asus ROG Zephyrus G16 2024 GU605M GeForce RTX 4070 Laptop GPU, Ultra 7 155H, WD PC SN560 SDDPNQE-1T00 | Lenovo Legion Slim 7 16APH8 GeForce RTX 4060 Laptop GPU, R7 7840HS, WDC PC SN810 1TB | |
|---|---|---|---|---|---|---|
| Noise | -8% | 1% | -8% | 2% | 0% | |
| off /ambiente * (dB) | 24.7 | 25 -1% | 22.7 8% | 24 3% | 23.9 3% | 24 3% |
| Idle Minimum * (dB) | 25.3 | 25 1% | 23.1 9% | 29 -15% | 23.9 6% | 25 1% |
| Idle Average * (dB) | 25.3 | 26 -3% | 25.8 -2% | 30 -19% | 27.8 -10% | 28 -11% |
| Idle Maximum * (dB) | 25.3 | 27 -7% | 25.8 -2% | 31 -23% | 30.1 -19% | 31 -23% |
| Load Average * (dB) | 31.7 | 52 -64% | 39.3 -24% | 45 -42% | 34.2 -8% | 33 -4% |
| Witcher 3 ultra * (dB) | 53.8 | 51 5% | 49.9 7% | 44 18% | 46.4 14% | 47 13% |
| Load Maximum * (dB) | 62 | 53 15% | 54.8 12% | 47 24% | 46.4 25% | 49 21% |
* ... Meglio usare valori piccoli
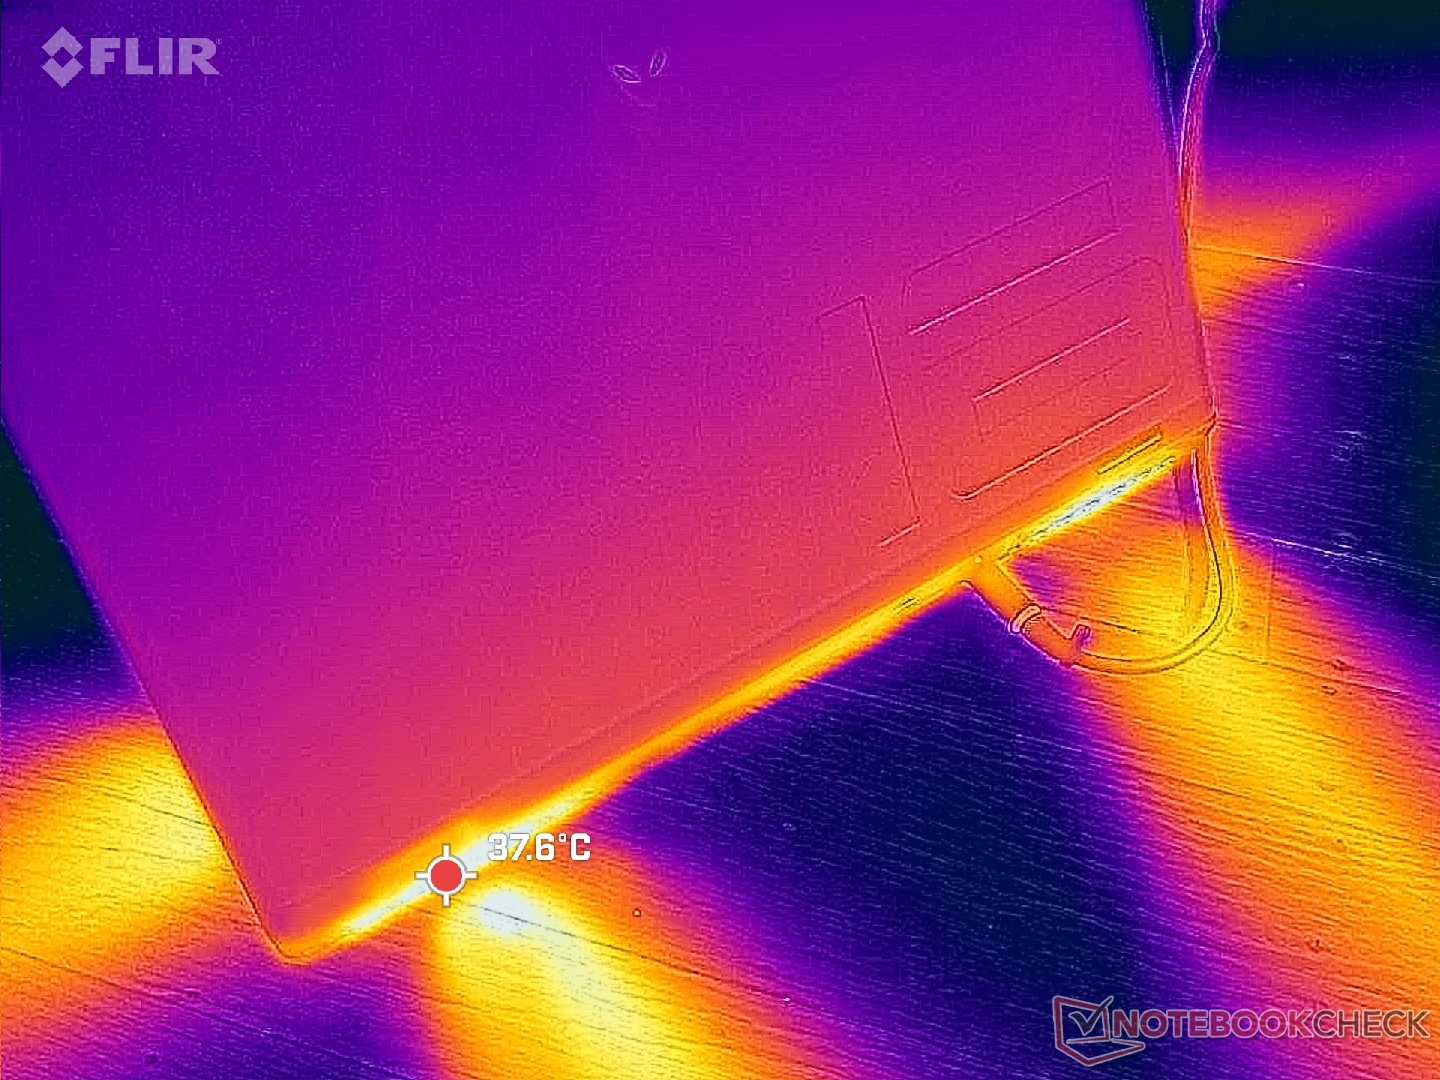
Temperatura
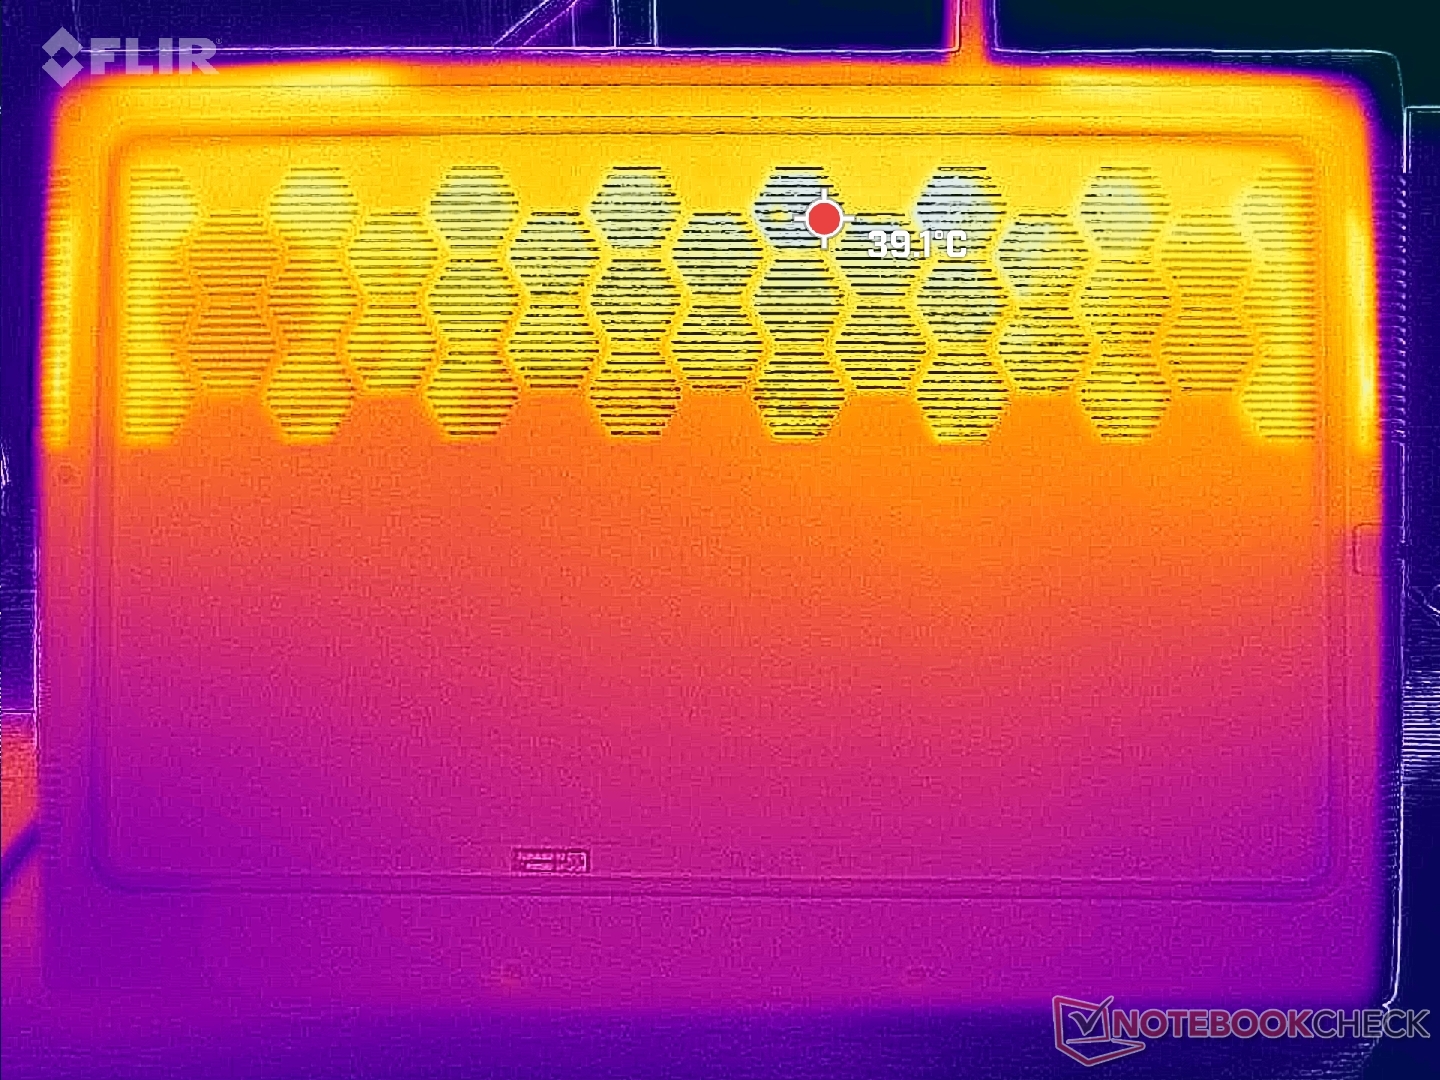
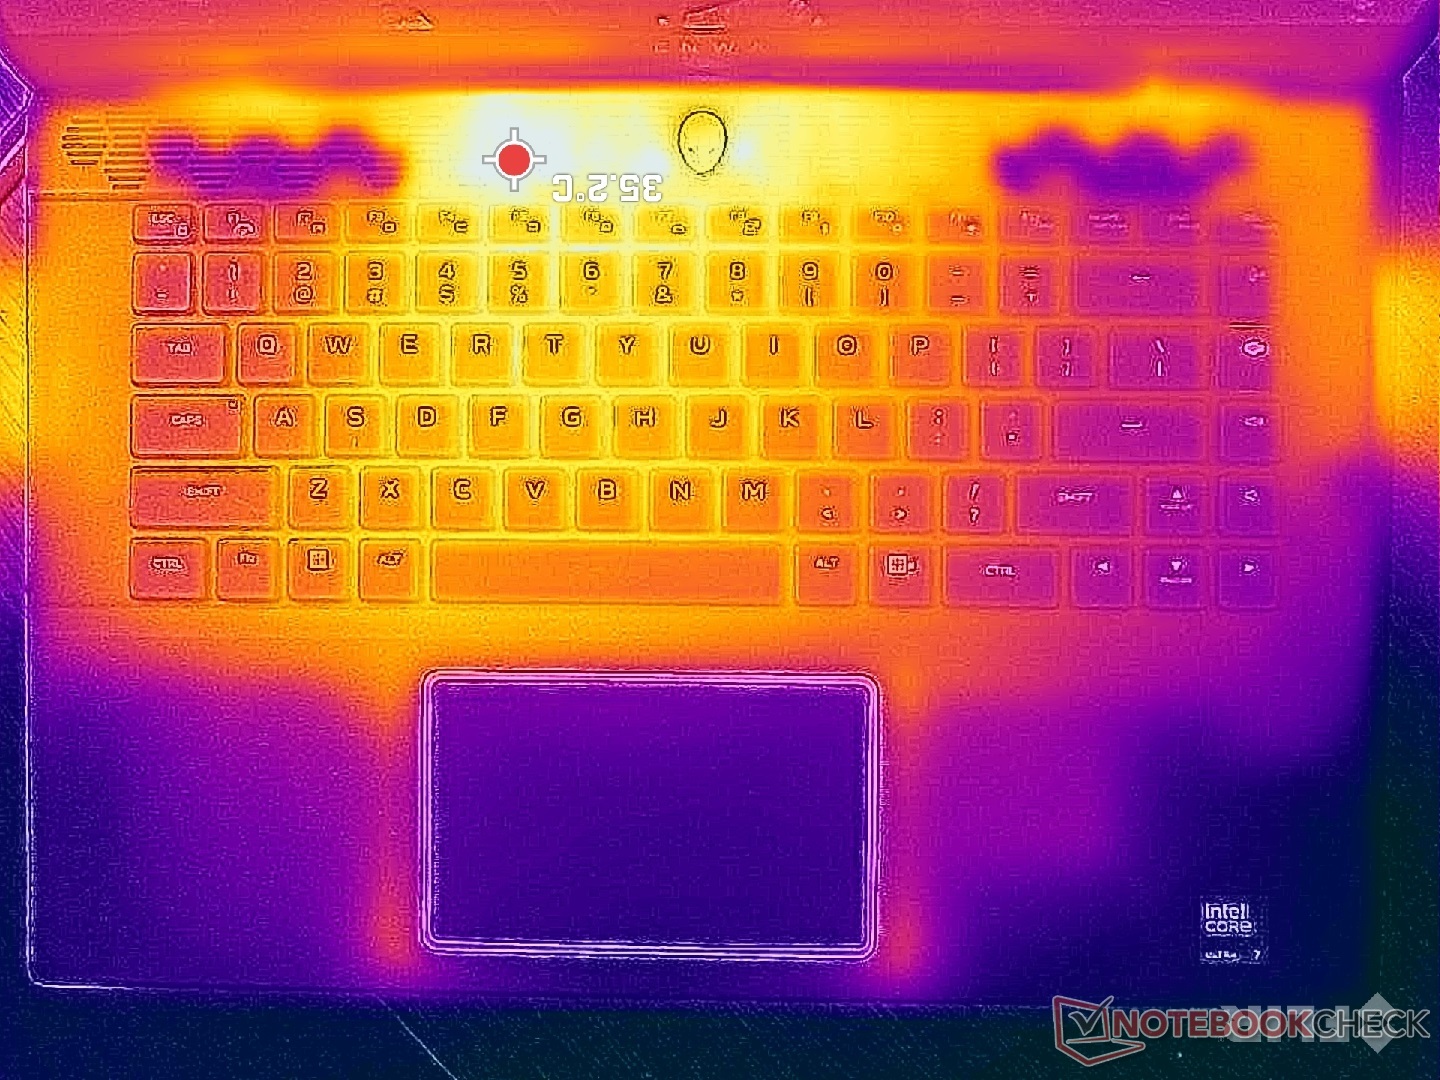
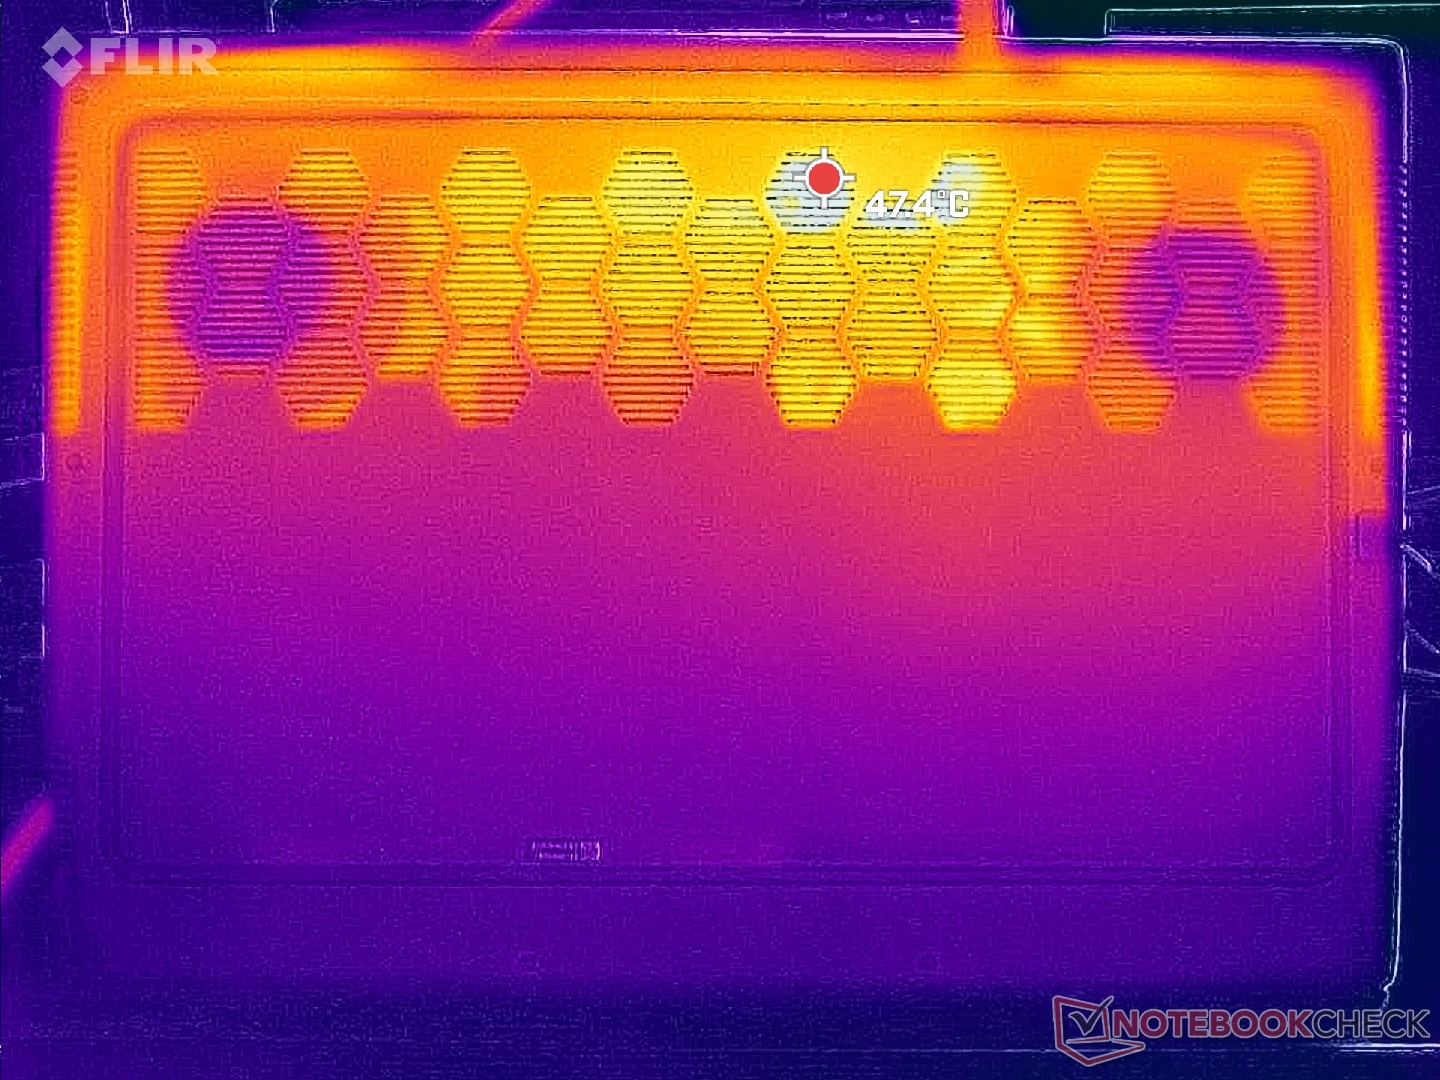
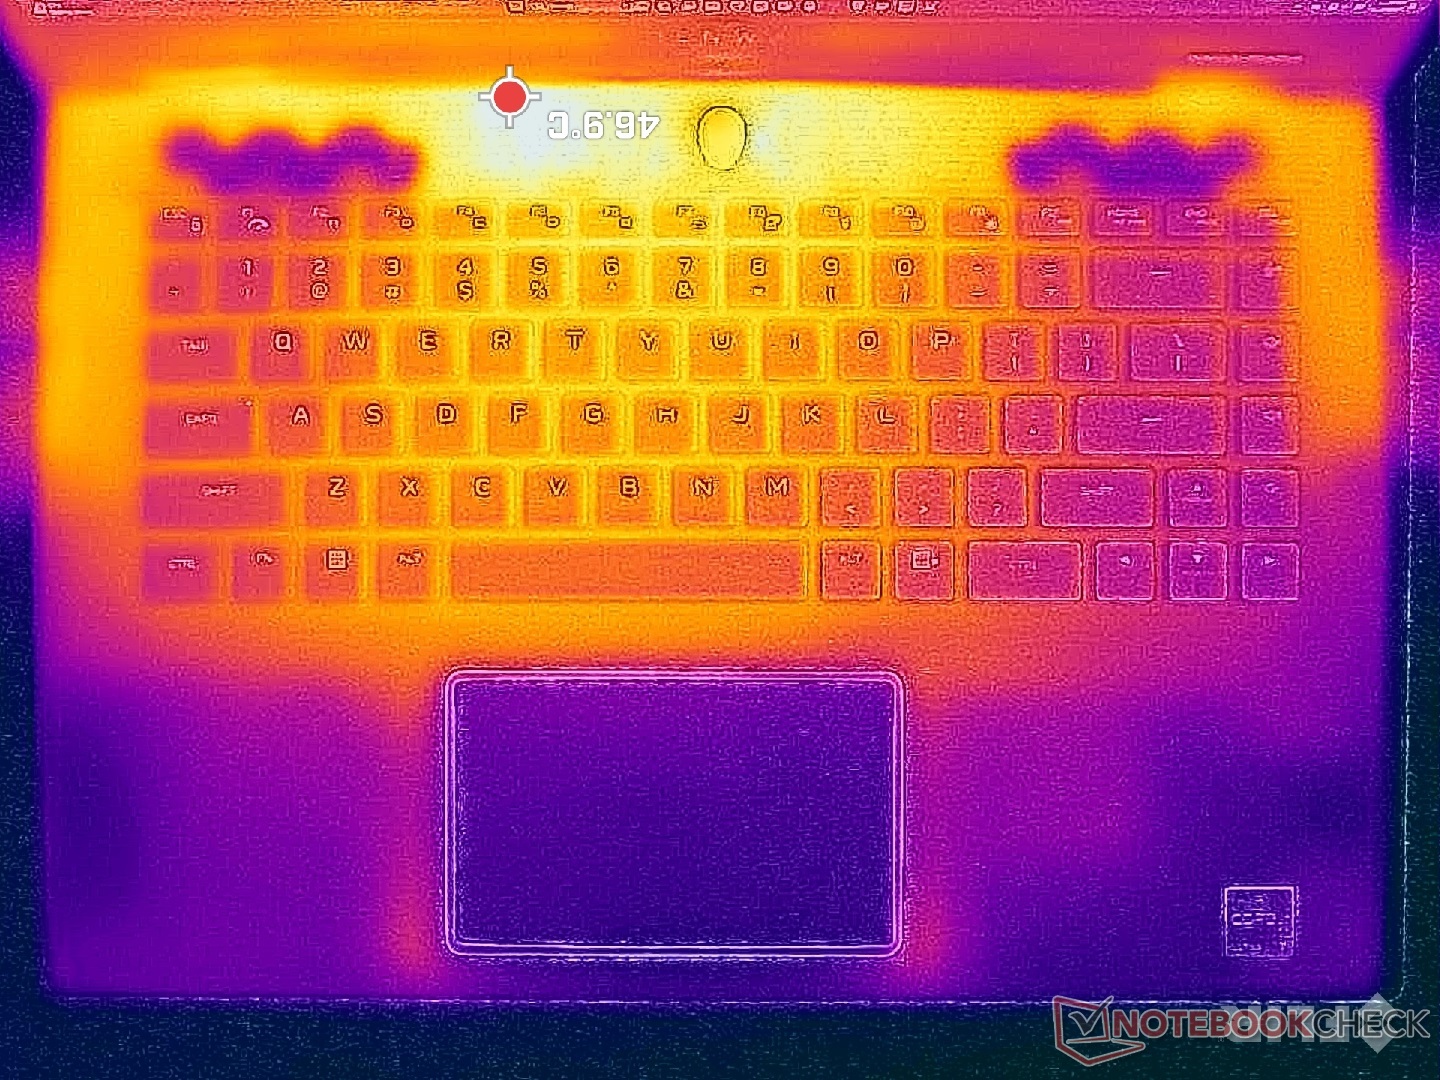
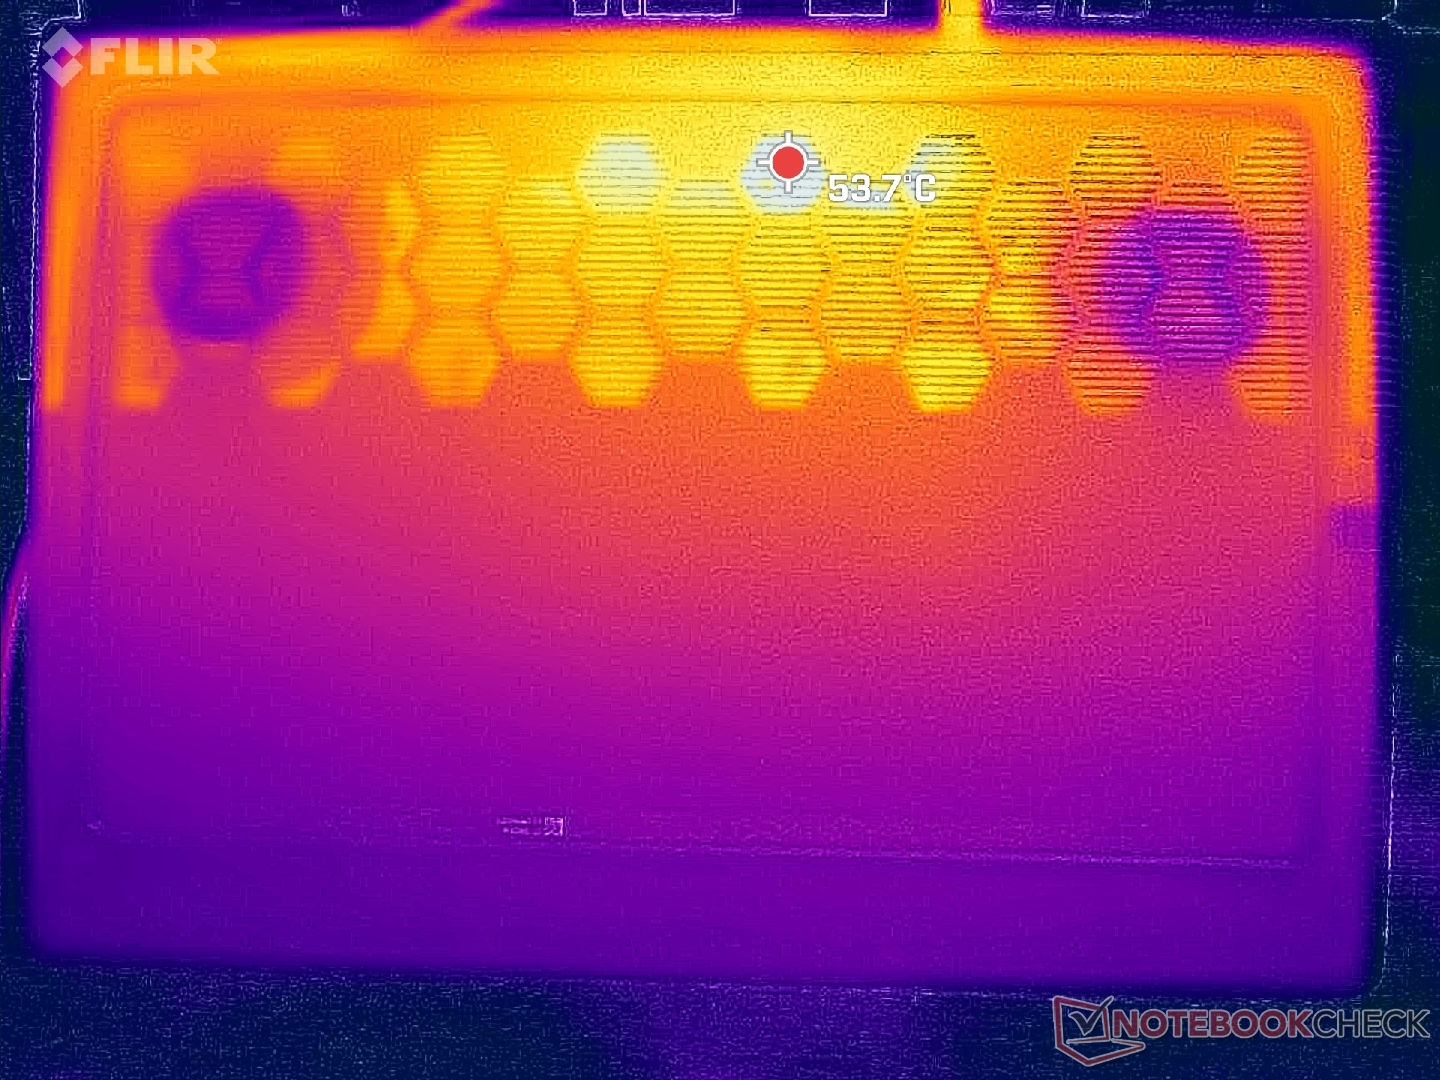
I punti caldi durante l'esecuzione di carichi impegnativi come i giochi sono concentrati verso la parte posteriore dello chassis, dove è improbabile che le mani tocchino. I poggiapolsi e la tastiera rimangono ragionevolmente freschi, rispettivamente nella fascia dei 20 C e dei 30 C, mentre la parte posteriore può avvicinarsi ai 50 C. Le temperature medie della superficie sono più calde rispetto a quelle che abbiamo registrato sul Blade 16 ma comunque più fresche rispetto a quelle del HP Omen Transcend 16 dove alcune aree possono raggiungere oltre 60 C.
(±) La temperatura massima sul lato superiore è di 44.8 °C / 113 F, rispetto alla media di 40.4 °C / 105 F, che varia da 21.2 a 68.8 °C per questa classe Gaming.
(-) Il lato inferiore si riscalda fino ad un massimo di 48 °C / 118 F, rispetto alla media di 43.2 °C / 110 F
(+) In idle, la temperatura media del lato superiore è di 30.9 °C / 88 F, rispetto alla media deld ispositivo di 33.9 °C / 93 F.
(+) Riproducendo The Witcher 3, la temperatura media per il lato superiore e' di 28.7 °C / 84 F, rispetto alla media del dispositivo di 33.9 °C / 93 F.
(+) I poggiapolsi e il touchpad sono piu' freddi della temperatura della pelle con un massimo di 27.2 °C / 81 F e sono quindi freddi al tatto.
(±) La temperatura media della zona del palmo della mano di dispositivi simili e'stata di 28.8 °C / 83.8 F (+1.6 °C / 2.8 F).

| Alienware m16 R2 Intel Core Ultra 7 155H, NVIDIA GeForce RTX 4070 Laptop GPU | Alienware m16 R1 Intel Intel Core i7-13700HX, NVIDIA GeForce RTX 4060 Laptop GPU | Alienware x16 R1 Intel Core i9-13900HK, NVIDIA GeForce RTX 4080 Laptop GPU | HP Omen Transcend 16-u1095ng Intel Core i9-14900HX, NVIDIA GeForce RTX 4070 Laptop GPU | Asus ROG Zephyrus G16 2024 GU605M Intel Core Ultra 7 155H, NVIDIA GeForce RTX 4070 Laptop GPU | Lenovo Legion Slim 7 16APH8 AMD Ryzen 7 7840HS, NVIDIA GeForce RTX 4060 Laptop GPU | |
|---|---|---|---|---|---|---|
| Heat | -3% | 3% | 3% | 10% | 8% | |
| Maximum Upper Side * (°C) | 44.8 | 49 -9% | 47.2 -5% | 49 -9% | 50.3 -12% | 46 -3% |
| Maximum Bottom * (°C) | 48 | 48 -0% | 47.8 -0% | 63 -31% | 48 -0% | 46 4% |
| Idle Upper Side * (°C) | 37.2 | 40 -8% | 36.8 1% | 30 19% | 28.8 23% | 33 11% |
| Idle Bottom * (°C) | 42 | 39 7% | 35.8 15% | 29 31% | 29.8 29% | 34 19% |
* ... Meglio usare valori piccoli
Altoparlanti
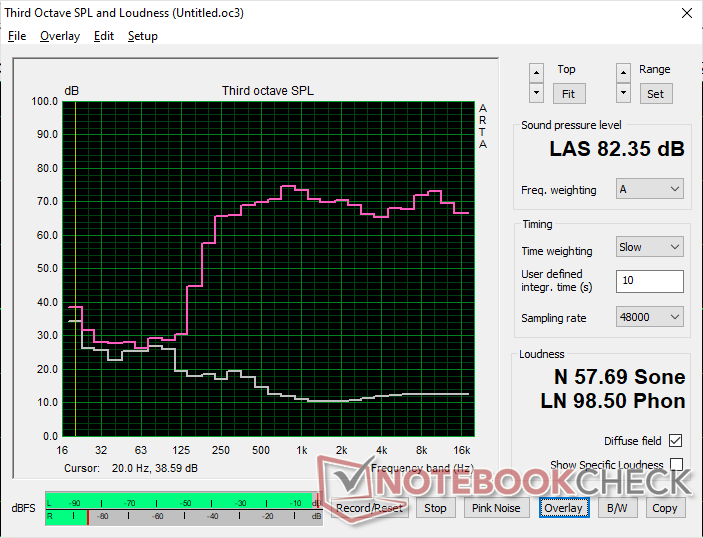
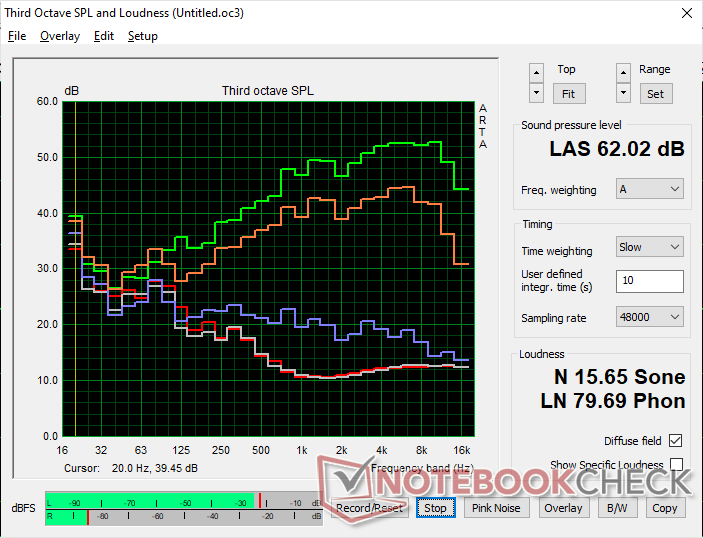
Alienware m16 R2 analisi audio
(+) | gli altoparlanti sono relativamente potenti (82.4 dB)
Bassi 100 - 315 Hz
(-) | quasi nessun basso - in media 20.1% inferiori alla media
(±) | la linearità dei bassi è media (11.1% delta rispetto alla precedente frequenza)
Medi 400 - 2000 Hz
(+) | medi bilanciati - solo only 2.2% rispetto alla media
(+) | medi lineari (3.1% delta rispetto alla precedente frequenza)
Alti 2 - 16 kHz
(+) | Alti bilanciati - appena 2.2% dalla media
(+) | alti lineari (3.5% delta rispetto alla precedente frequenza)
Nel complesso 100 - 16.000 Hz
(+) | suono nel complesso lineare (12.9% differenza dalla media)
Rispetto alla stessa classe
» 17% di tutti i dispositivi testati in questa classe è stato migliore, 4% simile, 79% peggiore
» Il migliore ha avuto un delta di 6%, medio di 18%, peggiore di 132%
Rispetto a tutti i dispositivi testati
» 12% di tutti i dispositivi testati in questa classe è stato migliore, 3% similare, 85% peggiore
» Il migliore ha avuto un delta di 4%, medio di 23%, peggiore di 134%
Apple MacBook Pro 16 2021 M1 Pro analisi audio
(+) | gli altoparlanti sono relativamente potenti (84.7 dB)
Bassi 100 - 315 Hz
(+) | bassi buoni - solo 3.8% dalla media
(+) | bassi in lineaa (5.2% delta rispetto alla precedente frequenza)
Medi 400 - 2000 Hz
(+) | medi bilanciati - solo only 1.3% rispetto alla media
(+) | medi lineari (2.1% delta rispetto alla precedente frequenza)
Alti 2 - 16 kHz
(+) | Alti bilanciati - appena 1.9% dalla media
(+) | alti lineari (2.7% delta rispetto alla precedente frequenza)
Nel complesso 100 - 16.000 Hz
(+) | suono nel complesso lineare (4.6% differenza dalla media)
Rispetto alla stessa classe
» 0% di tutti i dispositivi testati in questa classe è stato migliore, 0% simile, 100% peggiore
» Il migliore ha avuto un delta di 5%, medio di 17%, peggiore di 45%
Rispetto a tutti i dispositivi testati
» 0% di tutti i dispositivi testati in questa classe è stato migliore, 0% similare, 100% peggiore
» Il migliore ha avuto un delta di 4%, medio di 23%, peggiore di 134%
Gestione dell'energia - più snella e meno affamata di energia
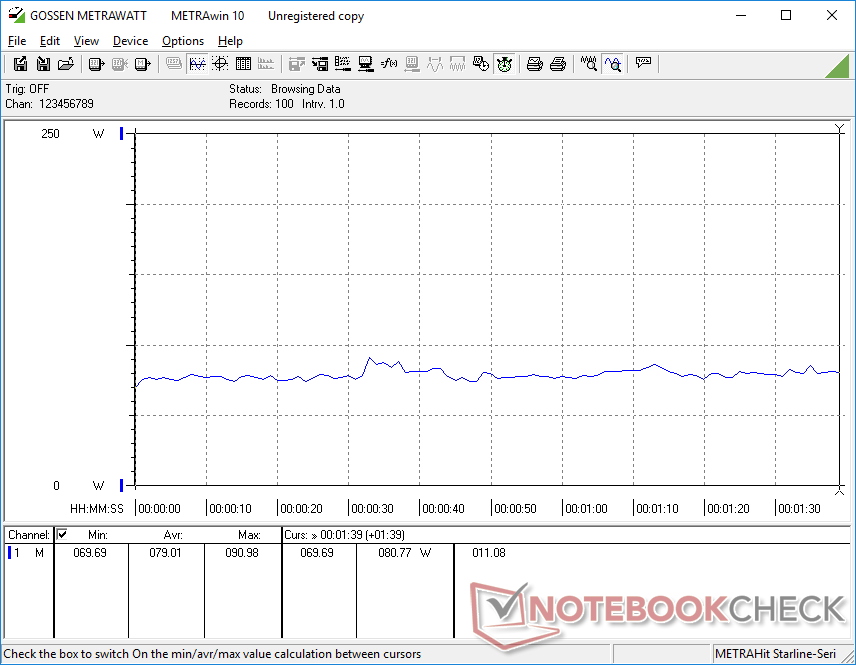
Consumo di energia
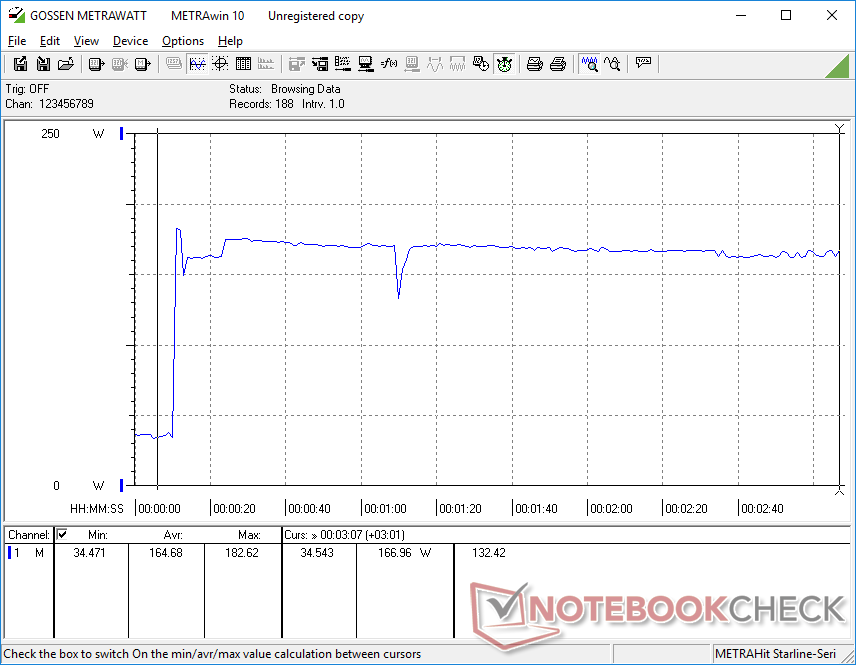
Il consumo di energia su desktop può essere di soli 8 W quando è impostata la luminosità minima sulla modalità Quiet e sulla modalità iGPU, o fino a 40 W quando è impostata la luminosità massima sulla modalità Overdrive e sulla modalità dGPU. Vorrà essere in modalità Bilanciata e iGPU quando la potenza extra non è necessaria per prolungare la durata della batteria, come illustrato nella prossima sezione.
Quando si gioca o si eseguono carichi pesanti per la CPU, il consumo complessivo diventa circa lo stesso di quello che abbiamo registrato sull'm16 R1 con RTX 4060, per prestazioni leggermente superiori per watt.
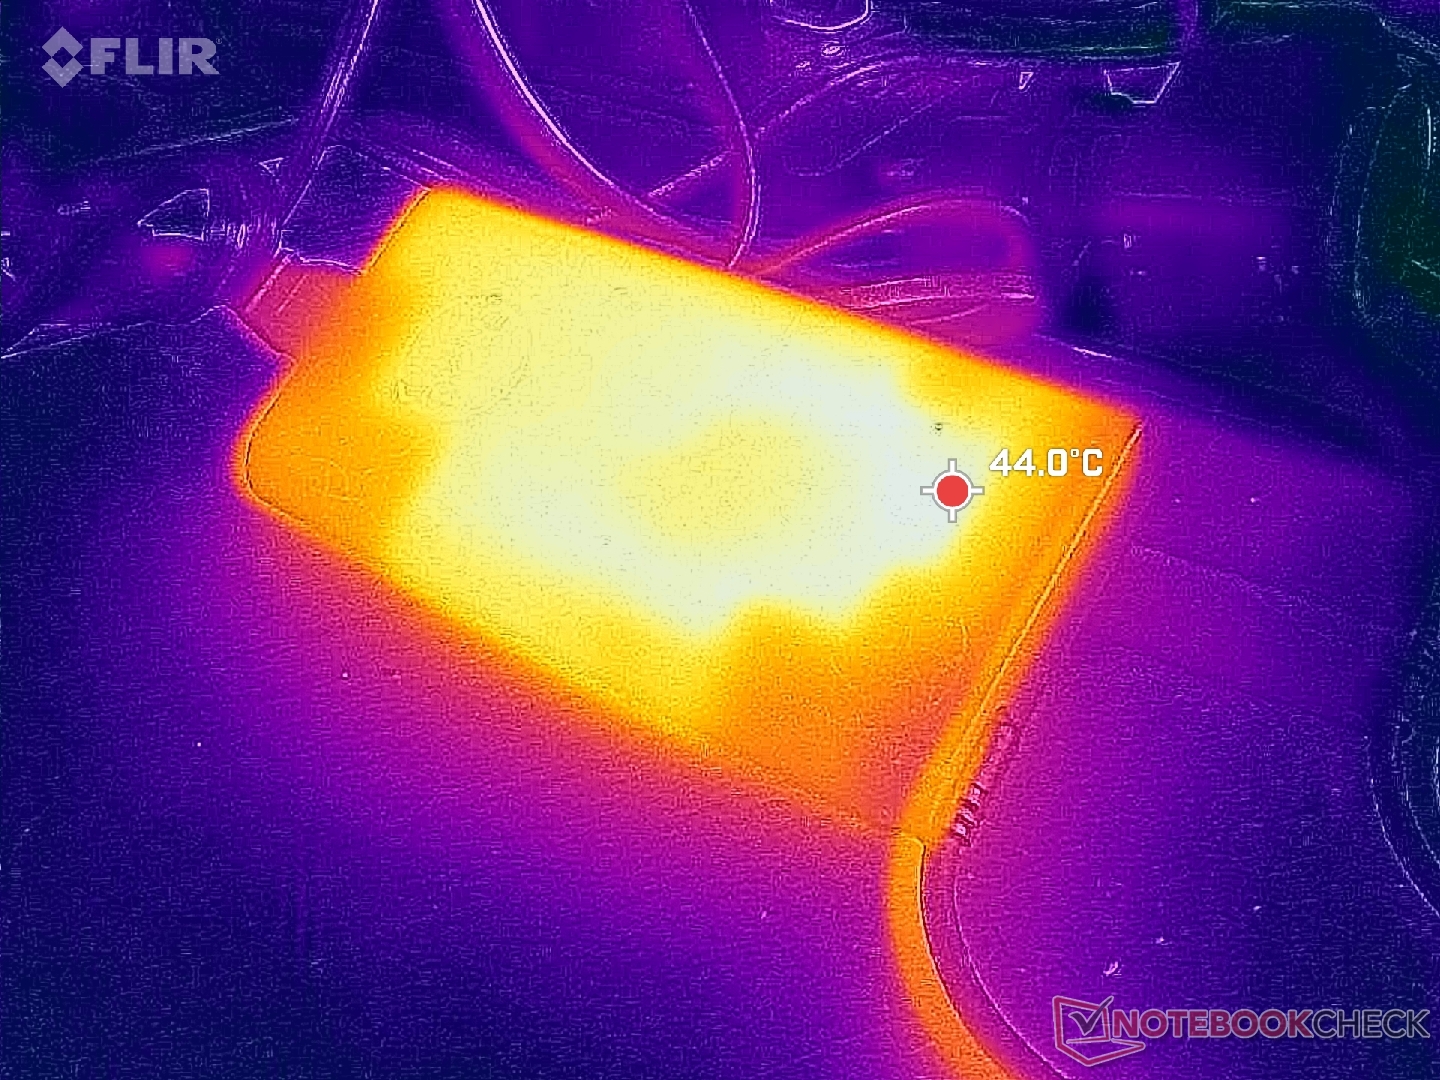
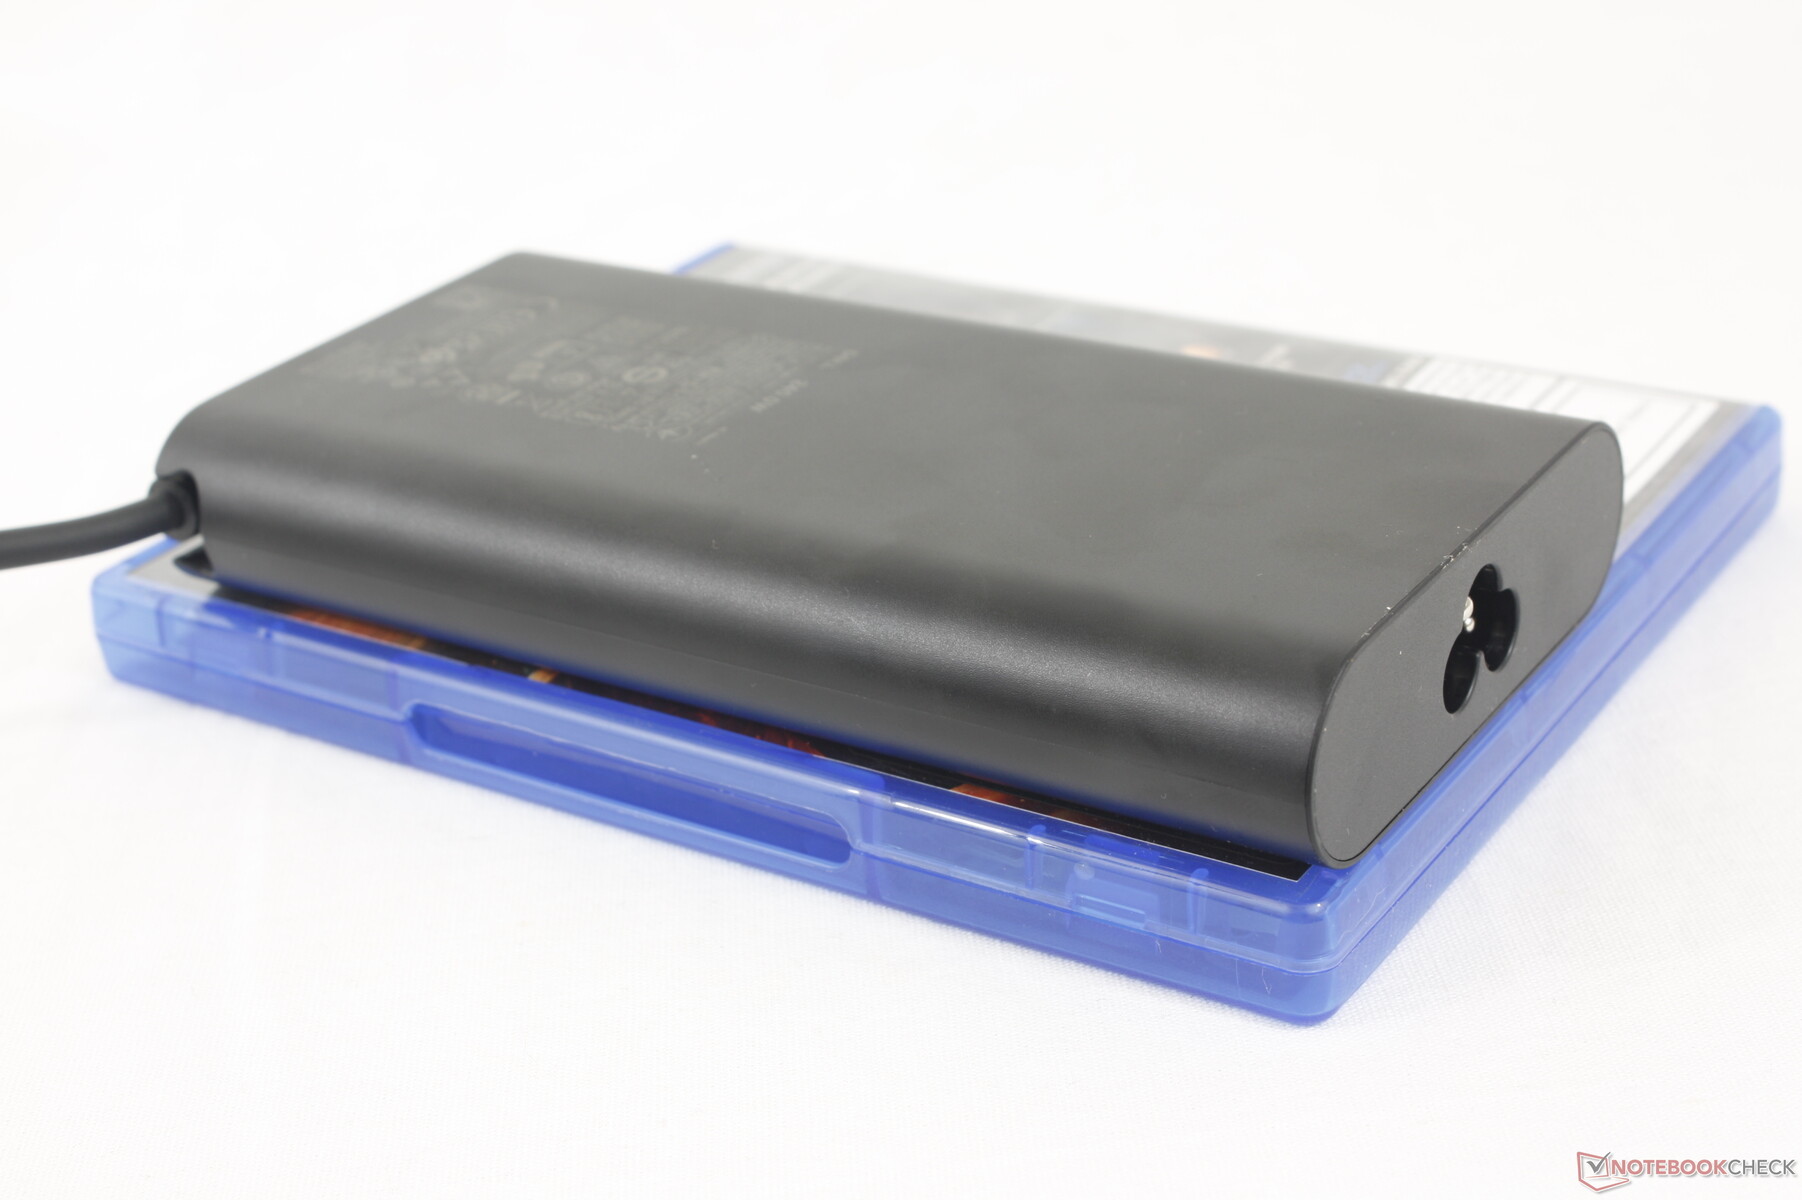
L'm16 R2 può essere configurato per essere fornito con un adattatore CA GaN da 240 W, di dimensioni ridotte (~15,2 x 7,7 x 2,3 cm), mentre l'm16 R1 viene fornito con uno più grande (~20 x 10 x 4,5 cm) da 330 W, per adattarsi alle configurazioni RTX 4080 e 4090. Alcune SKU, come la nostra, potrebbero invece essere fornite con un adattatore CA da 280 W.

| Off / Standby | |
| Idle | |
| Sotto carico |
|
Leggenda:
min: | |
| Alienware m16 R2 Ultra 7 155H, GeForce RTX 4070 Laptop GPU, Samsung PM9A1 MZVL21T0HCLR, IPS, 2560x1600, 16" | Alienware m16 R1 Intel i7-13700HX, GeForce RTX 4060 Laptop GPU, Kioxia KXG70ZNV512G, IPS, 2560x1600, 16" | Alienware x16 R1 i9-13900HK, GeForce RTX 4080 Laptop GPU, SK hynix PC801 HFS001TEJ9X101N, IPS, 2560x1600, 16" | HP Omen Transcend 16-u1095ng i9-14900HX, GeForce RTX 4070 Laptop GPU, Kioxia XG8 KXG80ZNV1T02, OLED, 2560x1600, 16" | Asus ROG Zephyrus G16 2024 GU605M Ultra 7 155H, GeForce RTX 4070 Laptop GPU, WD PC SN560 SDDPNQE-1T00, OLED, 2560x1600, 16" | Lenovo Legion Slim 7 16APH8 R7 7840HS, GeForce RTX 4060 Laptop GPU, WDC PC SN810 1TB, IPS, 2560x1600, 16" | |
|---|---|---|---|---|---|---|
| Power Consumption | -10% | -77% | -13% | 24% | -67% | |
| Idle Minimum * (Watt) | 8.1 | 10 -23% | 25.2 -211% | 10 -23% | 8.3 -2% | 33 -307% |
| Idle Average * (Watt) | 13 | 14 -8% | 29.9 -130% | 18 -38% | 12.5 4% | 35 -169% |
| Idle Maximum * (Watt) | 40.3 | 21 48% | 49.8 -24% | 32 21% | 12.8 68% | 45 -12% |
| Load Average * (Watt) | 79 | 119 -51% | 105.4 -33% | 128 -62% | 71.3 10% | 59 25% |
| Witcher 3 ultra * (Watt) | 188.1 | 186.7 1% | 263 -40% | 148.4 21% | 127.5 32% | 131 30% |
| Load Maximum * (Watt) | 254.9 | 323 -27% | 313.8 -23% | 242 5% | 169.1 34% | 177 31% |
* ... Meglio usare valori piccoli
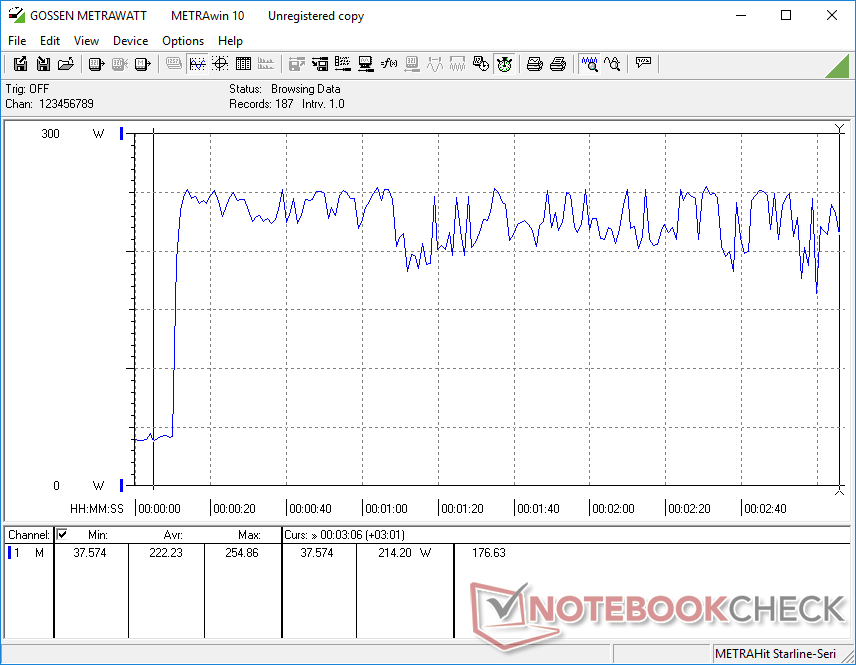
Power Consumption Witcher 3 / Stresstest
Power Consumption external Monitor
Durata della batteria
La capacità della batteria è in realtà leggermente maggiore quest'anno, con 90 Wh, nonostante il design dello chassis più piccolo. Sembra anche che Dell abbia risolto i problemi di durata della batteria che abbiamo riscontrato su molti vecchi computer portatili Alienware; la navigazione web in modalità Balanced e Optimus durava ben 8 ore, rispetto a quasi la metà di Alienware m16 R1. Il sistema può persino superare l'ultimo Asus ROG Zephyrus G16 GU605M di quasi un'ora.
La ricarica da vuoto a piena capacità richiede circa 90 minuti. In alternativa, la ricarica all'85% richiederebbe poco meno di 40 minuti. Il modello può essere ricaricato anche tramite adattatori USB-C generici, anche se molto più lentamente.
| Alienware m16 R2 Ultra 7 155H, GeForce RTX 4070 Laptop GPU, 90 Wh | Alienware m16 R1 Intel i7-13700HX, GeForce RTX 4060 Laptop GPU, 86 Wh | Alienware x16 R1 i9-13900HK, GeForce RTX 4080 Laptop GPU, 90 Wh | HP Omen Transcend 16-u1095ng i9-14900HX, GeForce RTX 4070 Laptop GPU, 97 Wh | Asus ROG Zephyrus G16 2024 GU605M Ultra 7 155H, GeForce RTX 4070 Laptop GPU, 90 Wh | Lenovo Legion Slim 7 16APH8 R7 7840HS, GeForce RTX 4060 Laptop GPU, 99.9 Wh | |
|---|---|---|---|---|---|---|
| Autonomia della batteria | -30% | -47% | -40% | 5% | -12% | |
| Reader / Idle (h) | 12.6 | 6.4 -49% | 7.3 -42% | |||
| WiFi v1.3 (h) | 8.1 | 4.8 -41% | 2.5 -69% | 4.9 -40% | 7.3 -10% | 7.1 -12% |
| Load (h) | 1 | 1 0% | 0.7 -30% | 1.2 20% | ||
| H.264 (h) | 5.6 | 11.2 |
Pro
Contro
Verdetto - Un nuovo equilibrio tra gioco e lavoro ibrido
Alienware m16 R2 è stato creato con un obiettivo chiaro in mente: essere più piccolo di Alienware m16 R1 Alienware m16 R1 anche se ciò significa compromettere le prestazioni. Il modello è sicuramente molto più portatile di prima, ma gli utenti perdono la grafica GeForce RTX 4080/4090, le CPU Core HX e i tasti meccanici. Dell spera che, eliminando queste caratteristiche di livello enthusiast a favore di un design più piccolo, il più snello m16 R2 possa attrarre un pubblico più ampio di lavoratori ibridi, studenti e giocatori mainstream che potrebbero aver saltato i modelli m16 R1 o x16 R1, più "hardcore" e meno adatti ai viaggi x16 R1.
Il risultato finale è un sistema che bilancia molto bene tutti i fronti, dalle prestazioni alla durata della batteria e alla portabilità, mentre l'm16 R1 si concentrava quasi esclusivamente sulle prestazioni a scapito del peso e dei tempi di esecuzione. Anche i livelli di rumore e il comportamento della ventola sono migliorati per essere più appropriati in classe o in ufficio, dove la potenza extra non è necessaria. Questo è sicuramente il portatile Alienware più completo che abbiamo testato, grazie a tutte le modifiche hardware e software.
Se si accontenta della grafica RTX 4060 o 4070 di GeForce, l'Alienware m16 R2 è facilmente la migliore opzione "jack-of-all-trades" della serie. Se ha bisogno di più potenza e vuole mantenere la portabilità, il più costoso Blade 16 è ancora la strada da percorrere.
Sebbene sia impressionante e spesso sorprendente, l'm16 R2 deve ancora affrontare una forte concorrenza nella categoria dei 16 pollici. Il Razer Blade 16ad esempio, è ancora più leggero, più piccolo e più veloce dell'm16 R2 e con colori DCI-P3 più profondi. Il Asus ROG Zephyrus G16 è altrettanto più leggero e con più opzioni di visualizzazione, ma le prestazioni della GPU sono leggermente inferiori. In questo scenario, Dell ha fissato il prezzo dell'Alienware m16 R2 in modo che sia meno costoso dei sistemi Razer e Asus.
Prezzo e disponibilità
Dell distribuisce ora l'Alienware m16 R2 a partire da 1650 dollari per la configurazione RTX 4060 o fino a 1850+ per la configurazione RTX 4070. La configurazione RTX 4050 entry-level è disponibile anche a 1500 dollari.
Alienware m16 R2
- 02/24/2024 v7 (old)
Allen Ngo
Transparency
La selezione dei dispositivi da recensire viene effettuata dalla nostra redazione. Il campione di prova è stato fornito all'autore come prestito dal produttore o dal rivenditore ai fini di questa recensione. L'istituto di credito non ha avuto alcuna influenza su questa recensione, né il produttore ne ha ricevuto una copia prima della pubblicazione. Non vi era alcun obbligo di pubblicare questa recensione. In quanto società mediatica indipendente, Notebookcheck non è soggetta all'autorità di produttori, rivenditori o editori.
Ecco come Notebookcheck esegue i test
Ogni anno, Notebookcheck esamina in modo indipendente centinaia di laptop e smartphone utilizzando procedure standardizzate per garantire che tutti i risultati siano comparabili. Da circa 20 anni sviluppiamo continuamente i nostri metodi di prova e nel frattempo stabiliamo gli standard di settore. Nei nostri laboratori di prova, tecnici ed editori esperti utilizzano apparecchiature di misurazione di alta qualità. Questi test comportano un processo di validazione in più fasi. Il nostro complesso sistema di valutazione si basa su centinaia di misurazioni e parametri di riferimento ben fondati, che mantengono l'obiettività.Price comparison

