Recensione del portatile MSI Prestige 16 B1MG: Dal Core i7 Xe al Core Ultra 7 Arc

MSI Prestige 16 AI B1MG da 16 pollici è uno dei primi computer portatili sul mercato con opzioni di CPU Core Ultra Meteor Lake di 14a generazione. Succede al precedente 15,6 pollici Prestige 15 con interni ed esterni rinnovati per un'esperienza d'uso del tutto nuova. La famiglia MSI Prestige è composta da computer portatili di fascia media superiore, che si collocano tra la fascia bassa e la fascia alta Famiglia Modern e la famiglia di fascia alta Famiglia Summit.
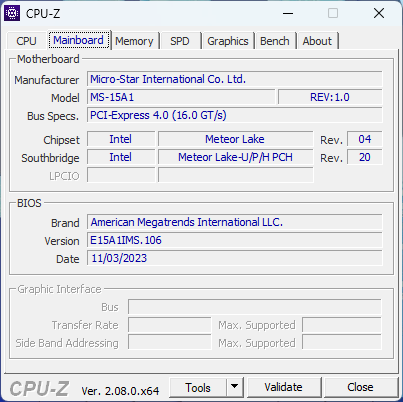
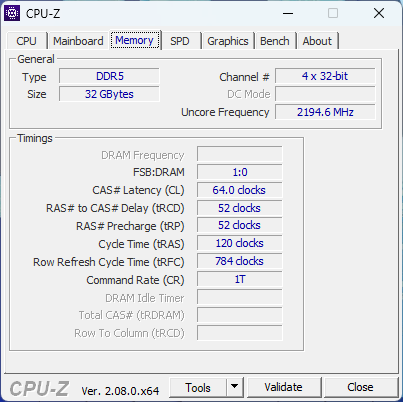
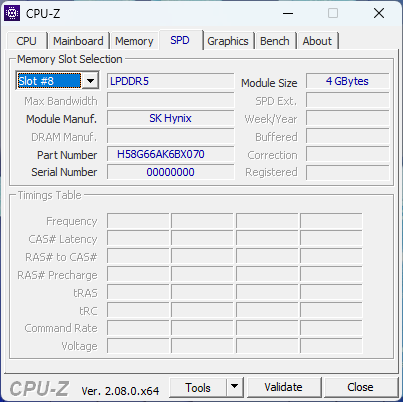
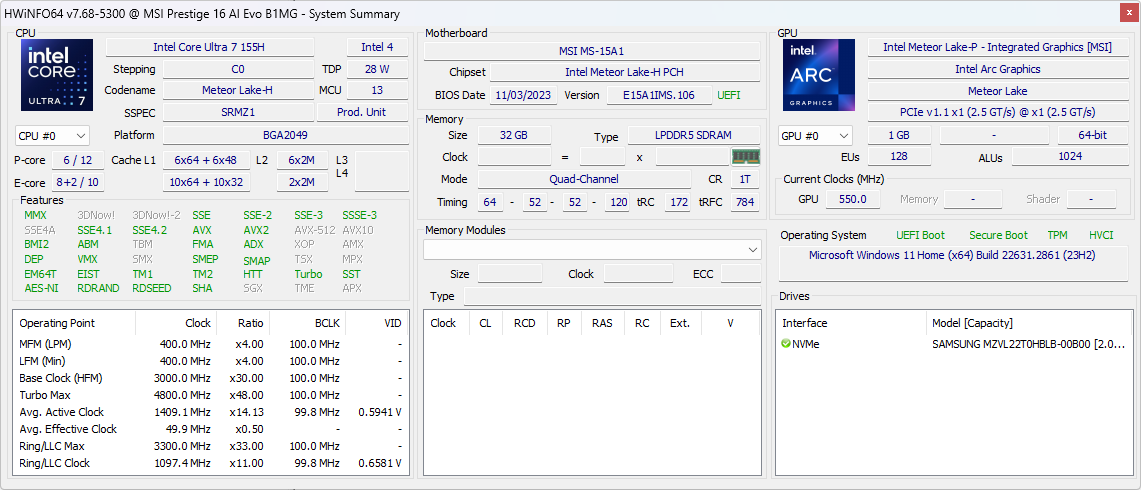
La nostra configurazione in esame è un'unità di vendita al dettaglio al prezzo di 1400 dollari USA con CPU Core Ultra 7 155H, grafica Arc 8 integrata, display IPS da 1600p, 32 GB di RAM LPDDR5-6400 MHz e SSD NVMe da 2 TB. Sono disponibili anche SKU di fascia più alta con Core Ultra 9 185H, grafica GeForce RTX 4060 o 4070, grafica Arc 370M e OLED 4K (2400p).
I concorrenti del Prestige 16 includono altri computer portatili sottili e leggeri per la multimedialità o per la creazione di contenuti, come la serie Serie Dell XPS, Asus VivoBook Pro 16,LG Gram 16 2-in-1o il Lenovo Yoga Pro 9i 16.
Altre recensioni di MSI:
Potenziali concorrenti a confronto
Punteggio | Data | Modello | Peso | Altezza | Dimensione | Risoluzione | Prezzo |
|---|---|---|---|---|---|---|---|
| 88.1 % v7 (old) | 12/2023 | MSI Prestige 16 B1MG-001US Ultra 7 155H, Arc 8-Core | 1.6 kg | 19.1 mm | 16.00" | 2560x1600 | |
| 85.4 % v7 (old) | 12/2022 | MSI Prestige 15 A12UD-093 i7-1280P, GeForce RTX 3050 Ti Laptop GPU | 1.8 kg | 20.1 mm | 15.60" | 3840x2160 | |
| 85.8 % v7 (old) | 11/2023 | LG Gram 2in1 16 16T90R - G.AA78G i7-1360P, Iris Xe G7 96EUs | 1.5 kg | 17.2 mm | 16.00" | 2560x1600 | |
| 85.7 % v7 (old) | 11/2023 | Lenovo ThinkBook 16 G6 ABP R5 7530U, Vega 7 | 1.8 kg | 17.5 mm | 16.00" | 1920x1200 | |
| 87.6 % v7 (old) | 11/2023 | Asus VivoBook Pro 16 K6602VU i9-13900H, GeForce RTX 4050 Laptop GPU | 1.9 kg | 19 mm | 16.00" | 3200x2000 | |
| 87.1 % v7 (old) | 08/2023 | Dell Inspiron 16 Plus 7630 i7-13700H, GeForce RTX 4060 Laptop GPU | 2.2 kg | 19.95 mm | 16.00" | 2560x1600 |
Custodia - Aspetto sottile, materiali sottili
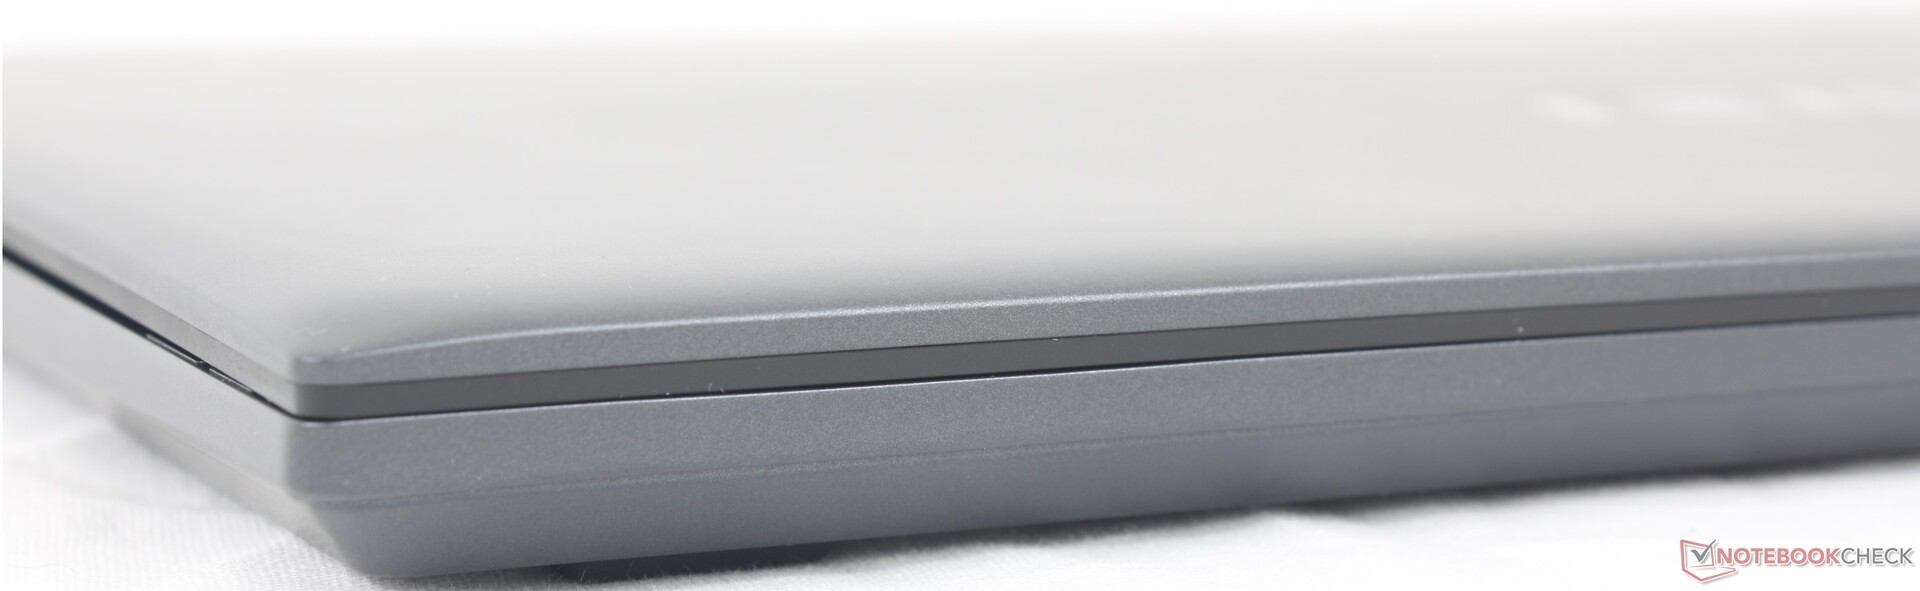
Il telaio in metallo è più solido e robusto di quello che si trova su un MSI Modern o un Asus VivoBook meno costoso. Facendo pressione sul centro della tastiera, ad esempio, la superficie si deforma appena. Il coperchio è relativamente più soggetto a torsioni e danni, soprattutto perché manca il rinforzo Gorilla Glass. Se si esercita una pressione sul centro del coperchio esterno, la sua superficie si deforma più di quanto vorremmo. In questo caso, alternative come l'HP Spectre o il Razer Blade sono molto più resistenti anche se più pesanti.
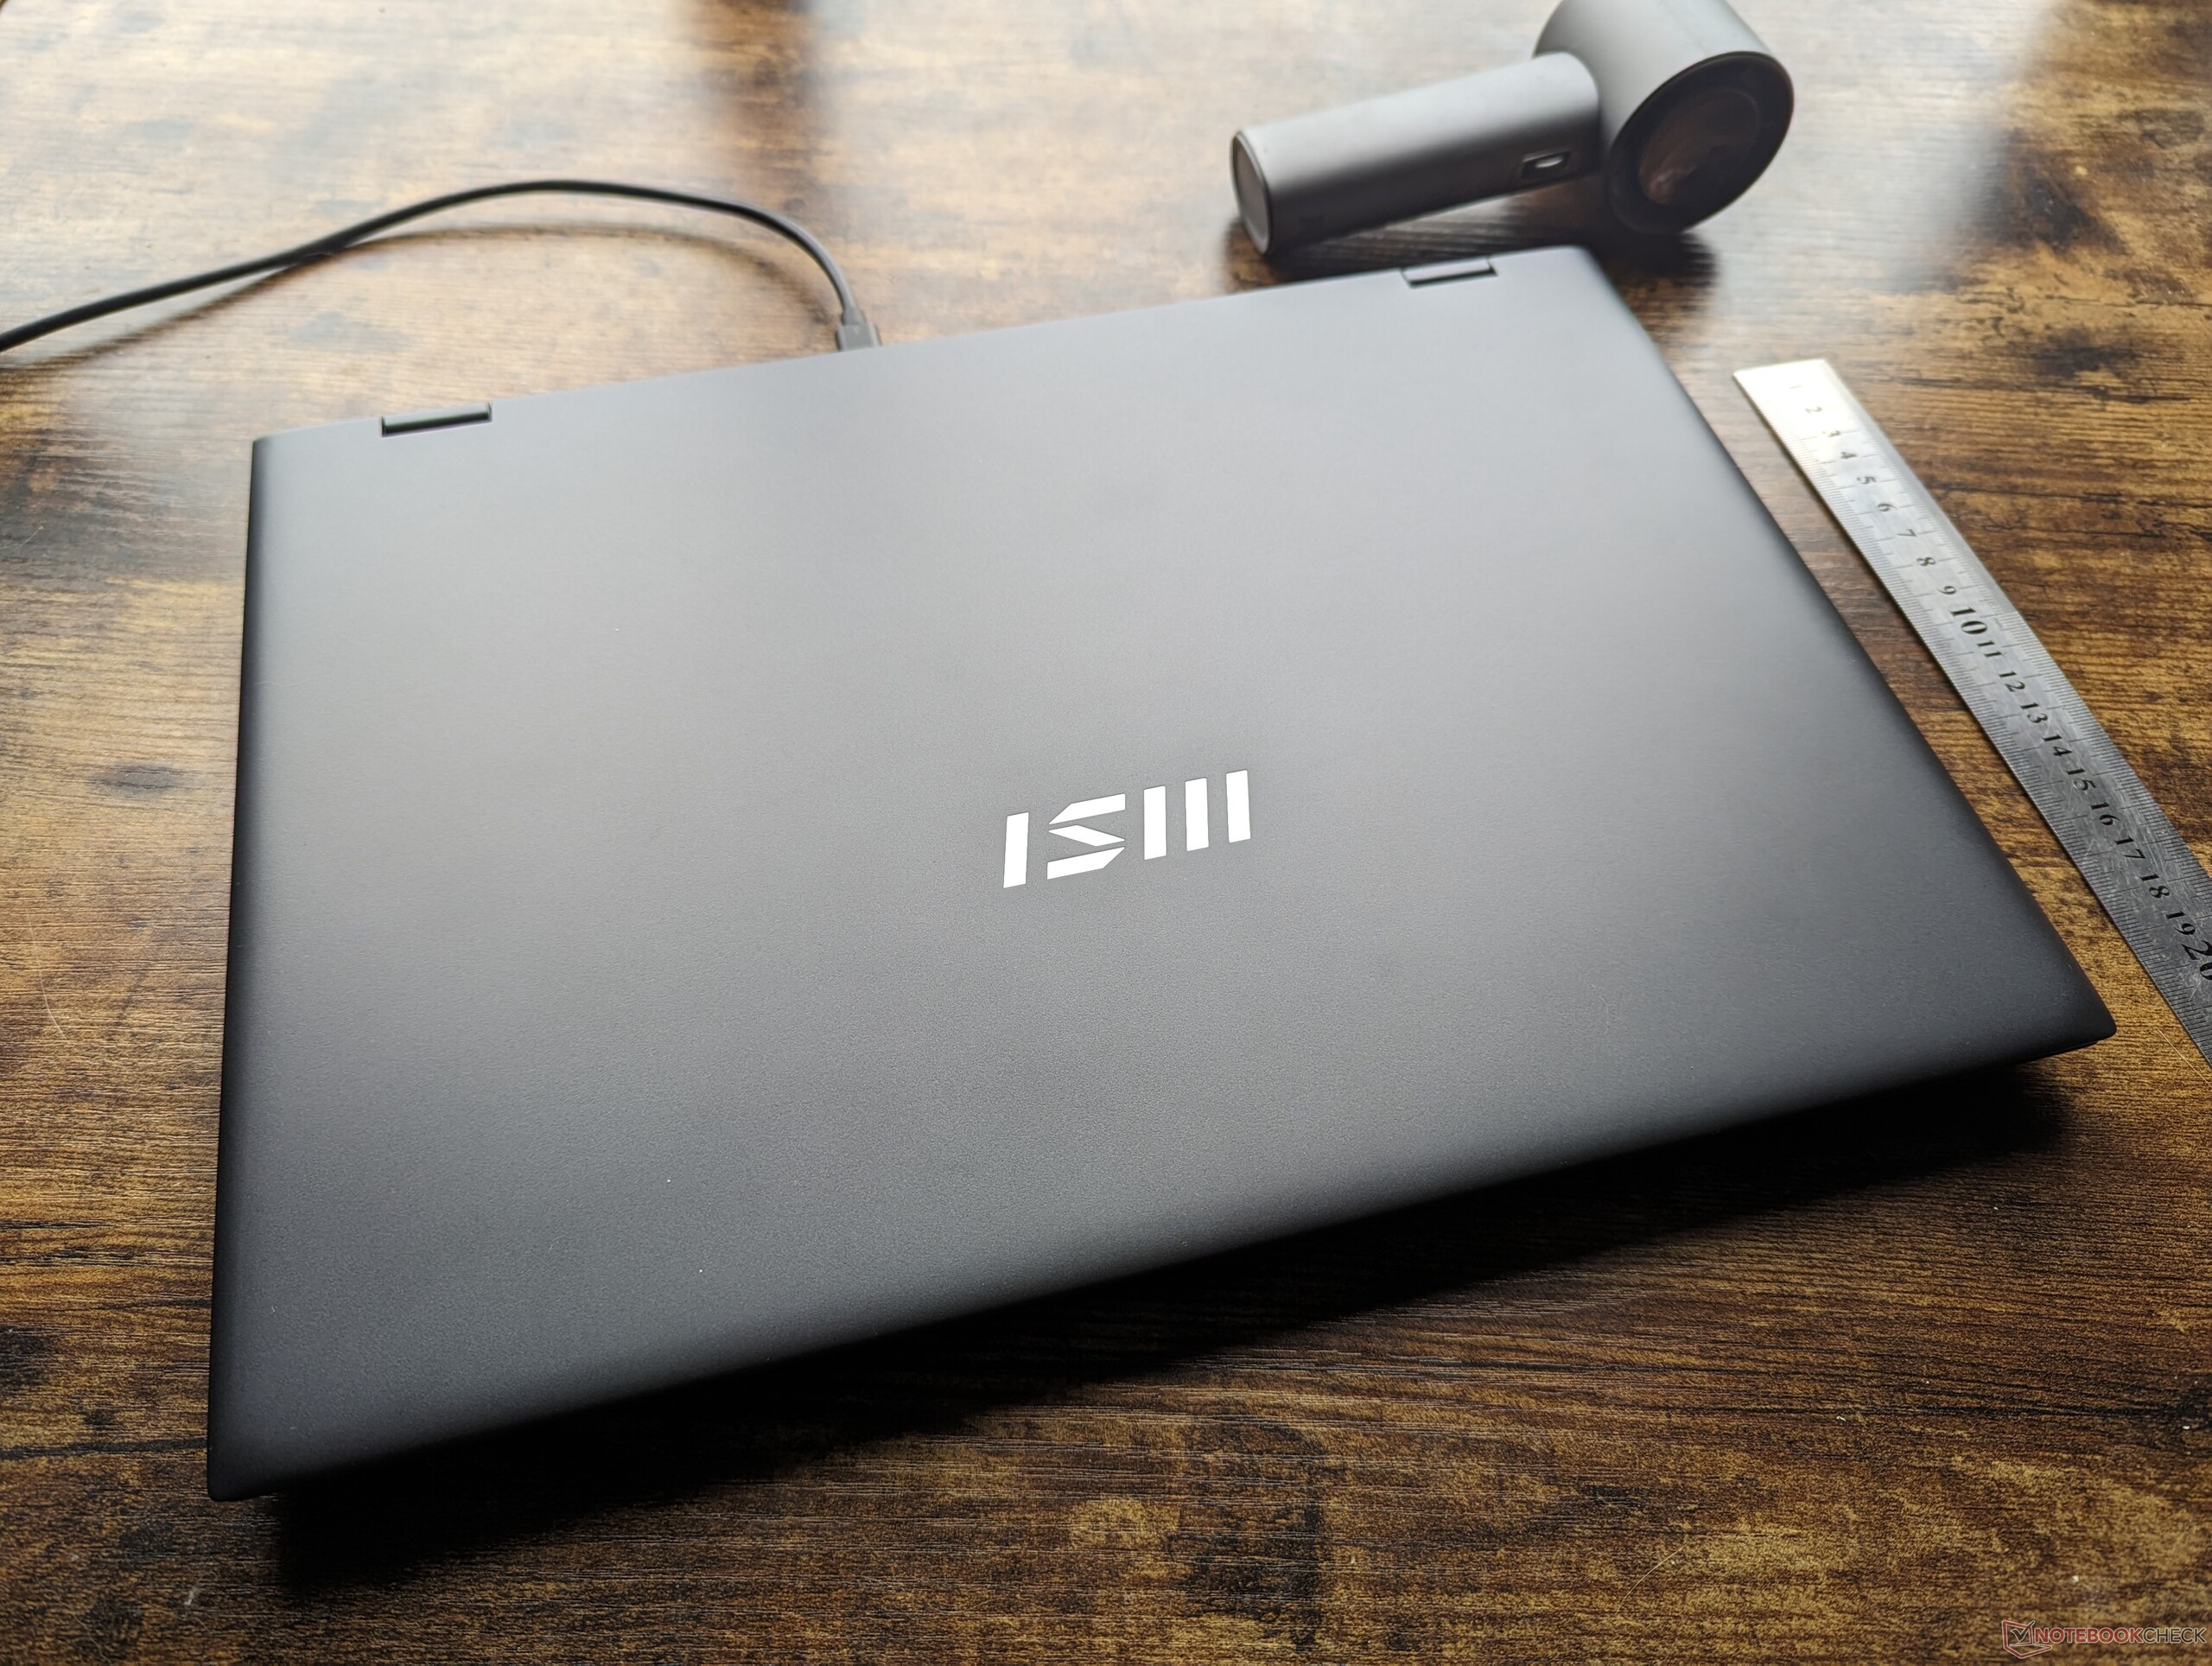
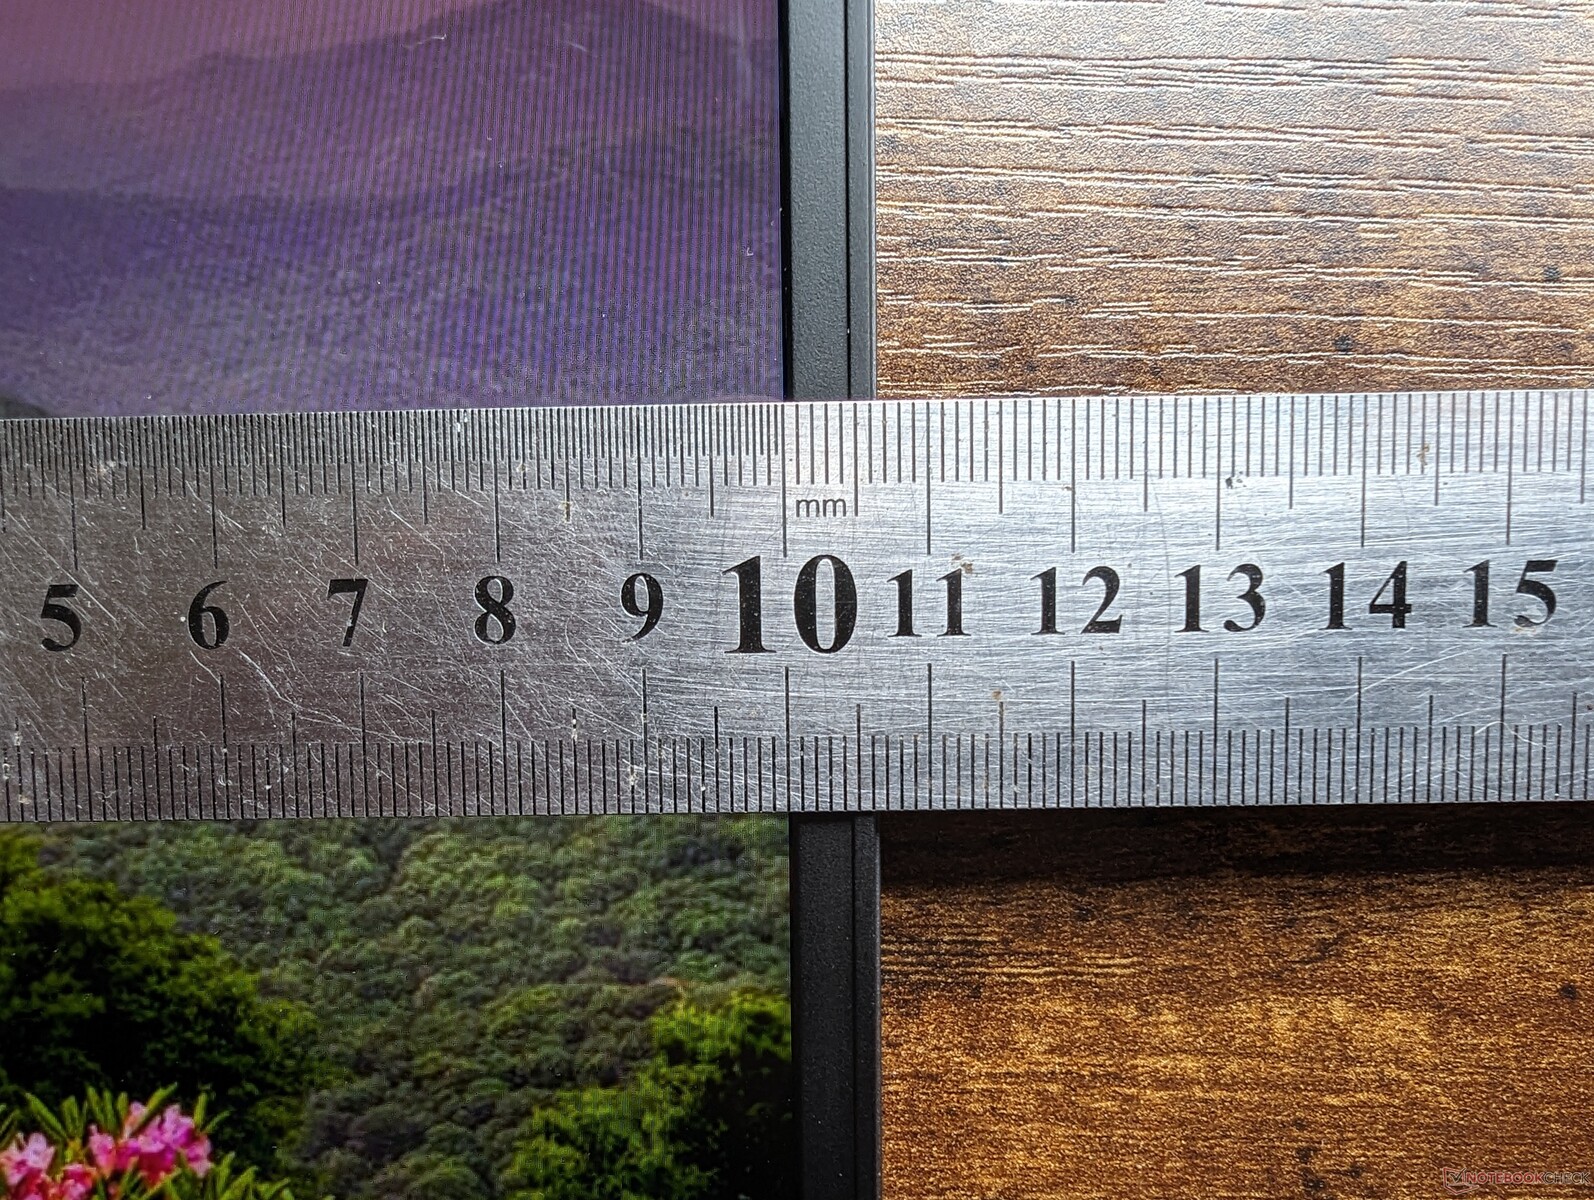
Il rapporto d'aspetto 16:10 più squadrato conferisce al Prestige 16 un ingombro maggiore rispetto al Prestige 15 uscente. Tuttavia, compensa la differenza con un profilo più sottile e un peso inferiore. Infatti, il Prestige 16 è uno dei computer portatili multimediali da 16 pollici più leggeri, in grado di rivaleggiare con il modello LG Gram 16 2-in-1. Tuttavia, ci aspettiamo che le SKU con grafica discreta siano un po' più pesanti.
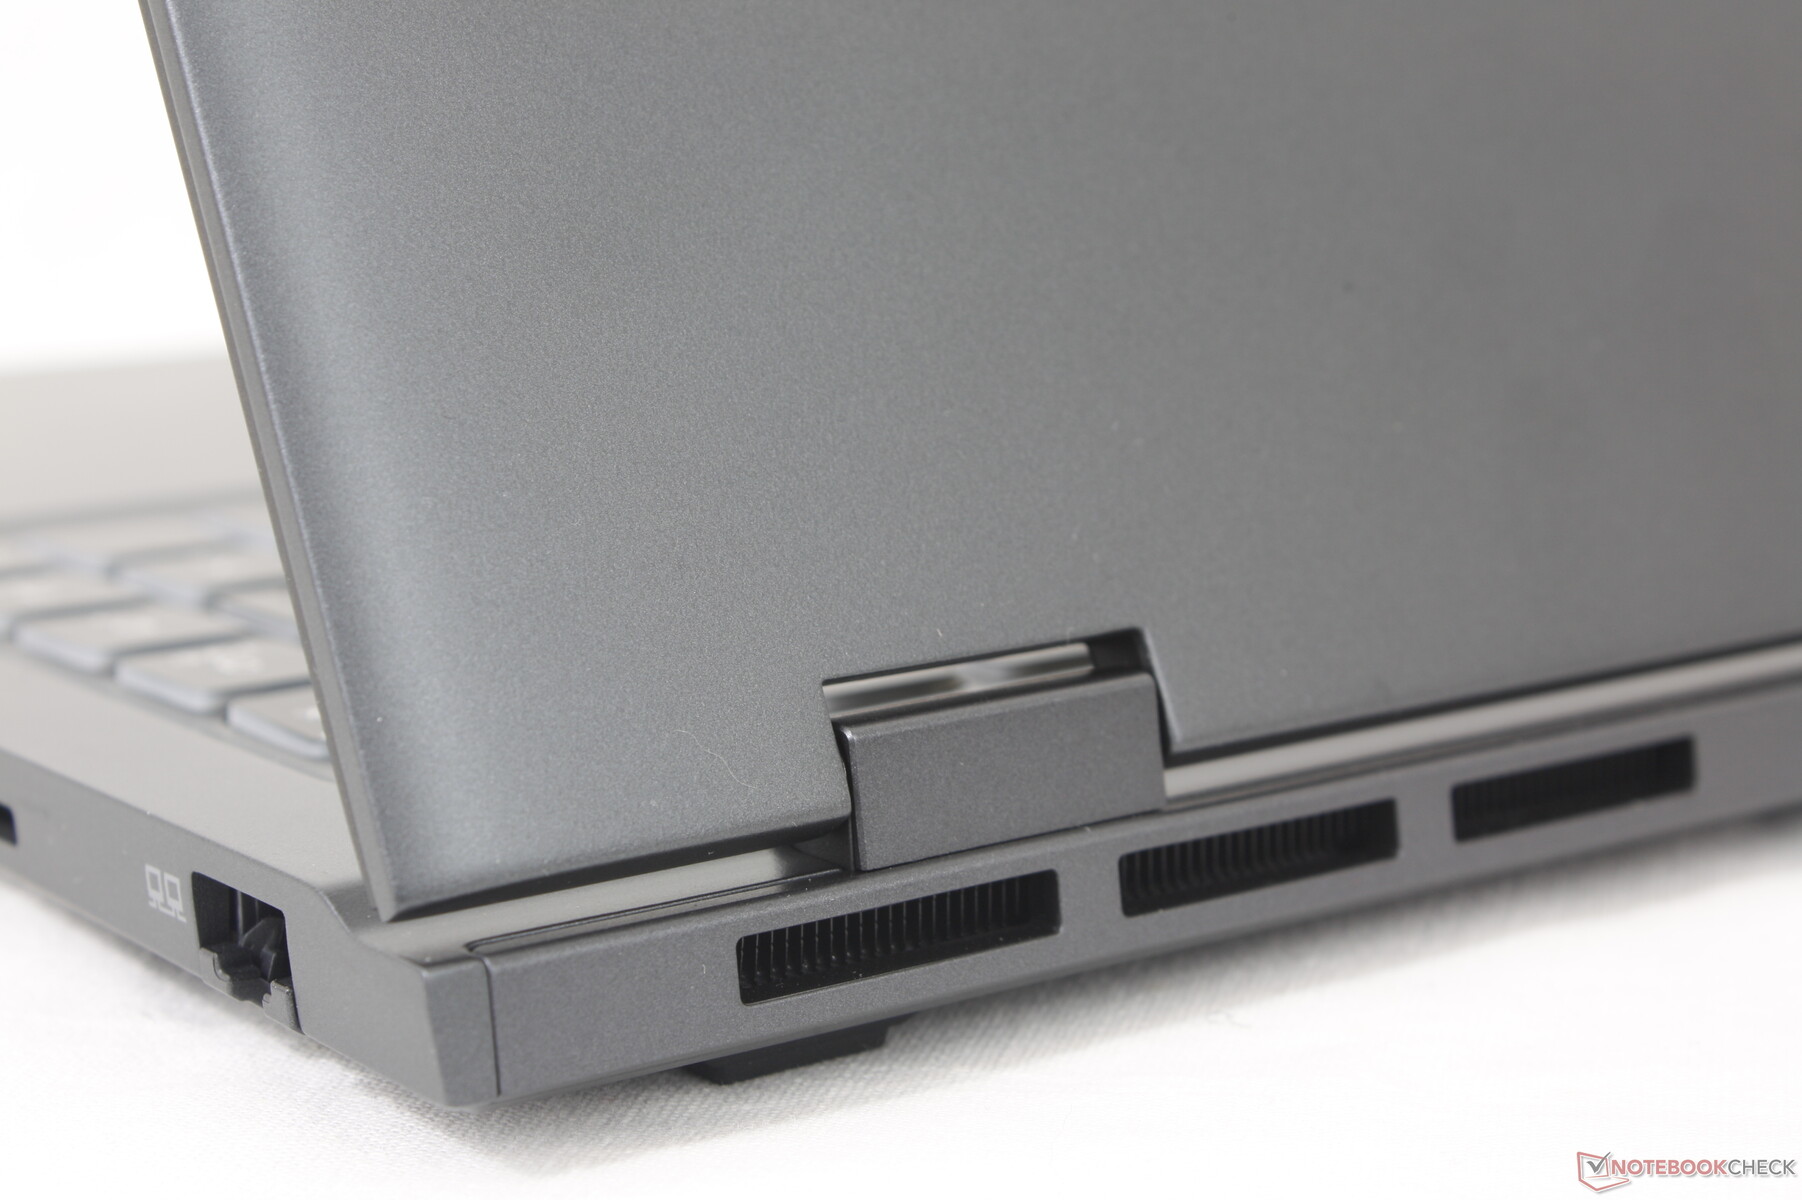
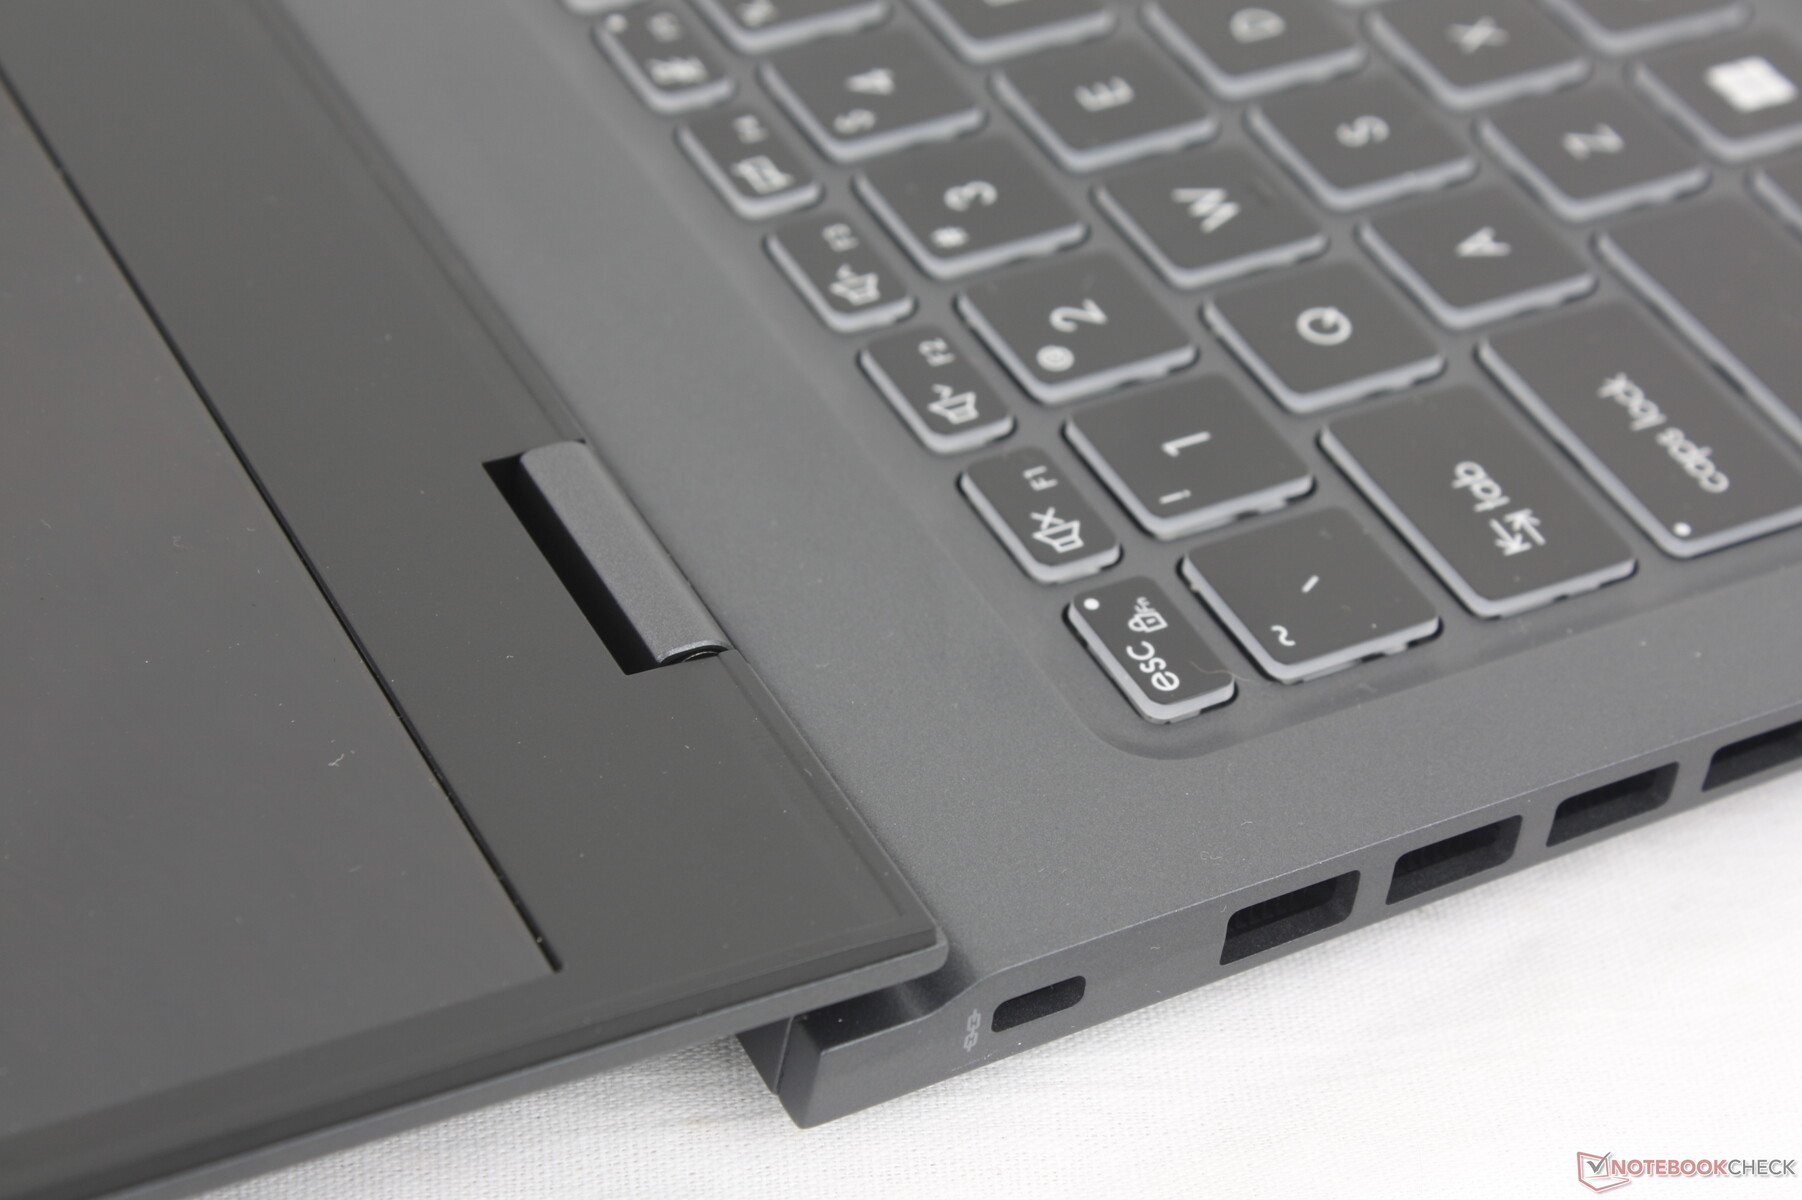
Connettività - Pronto per il Wi-Fi 7
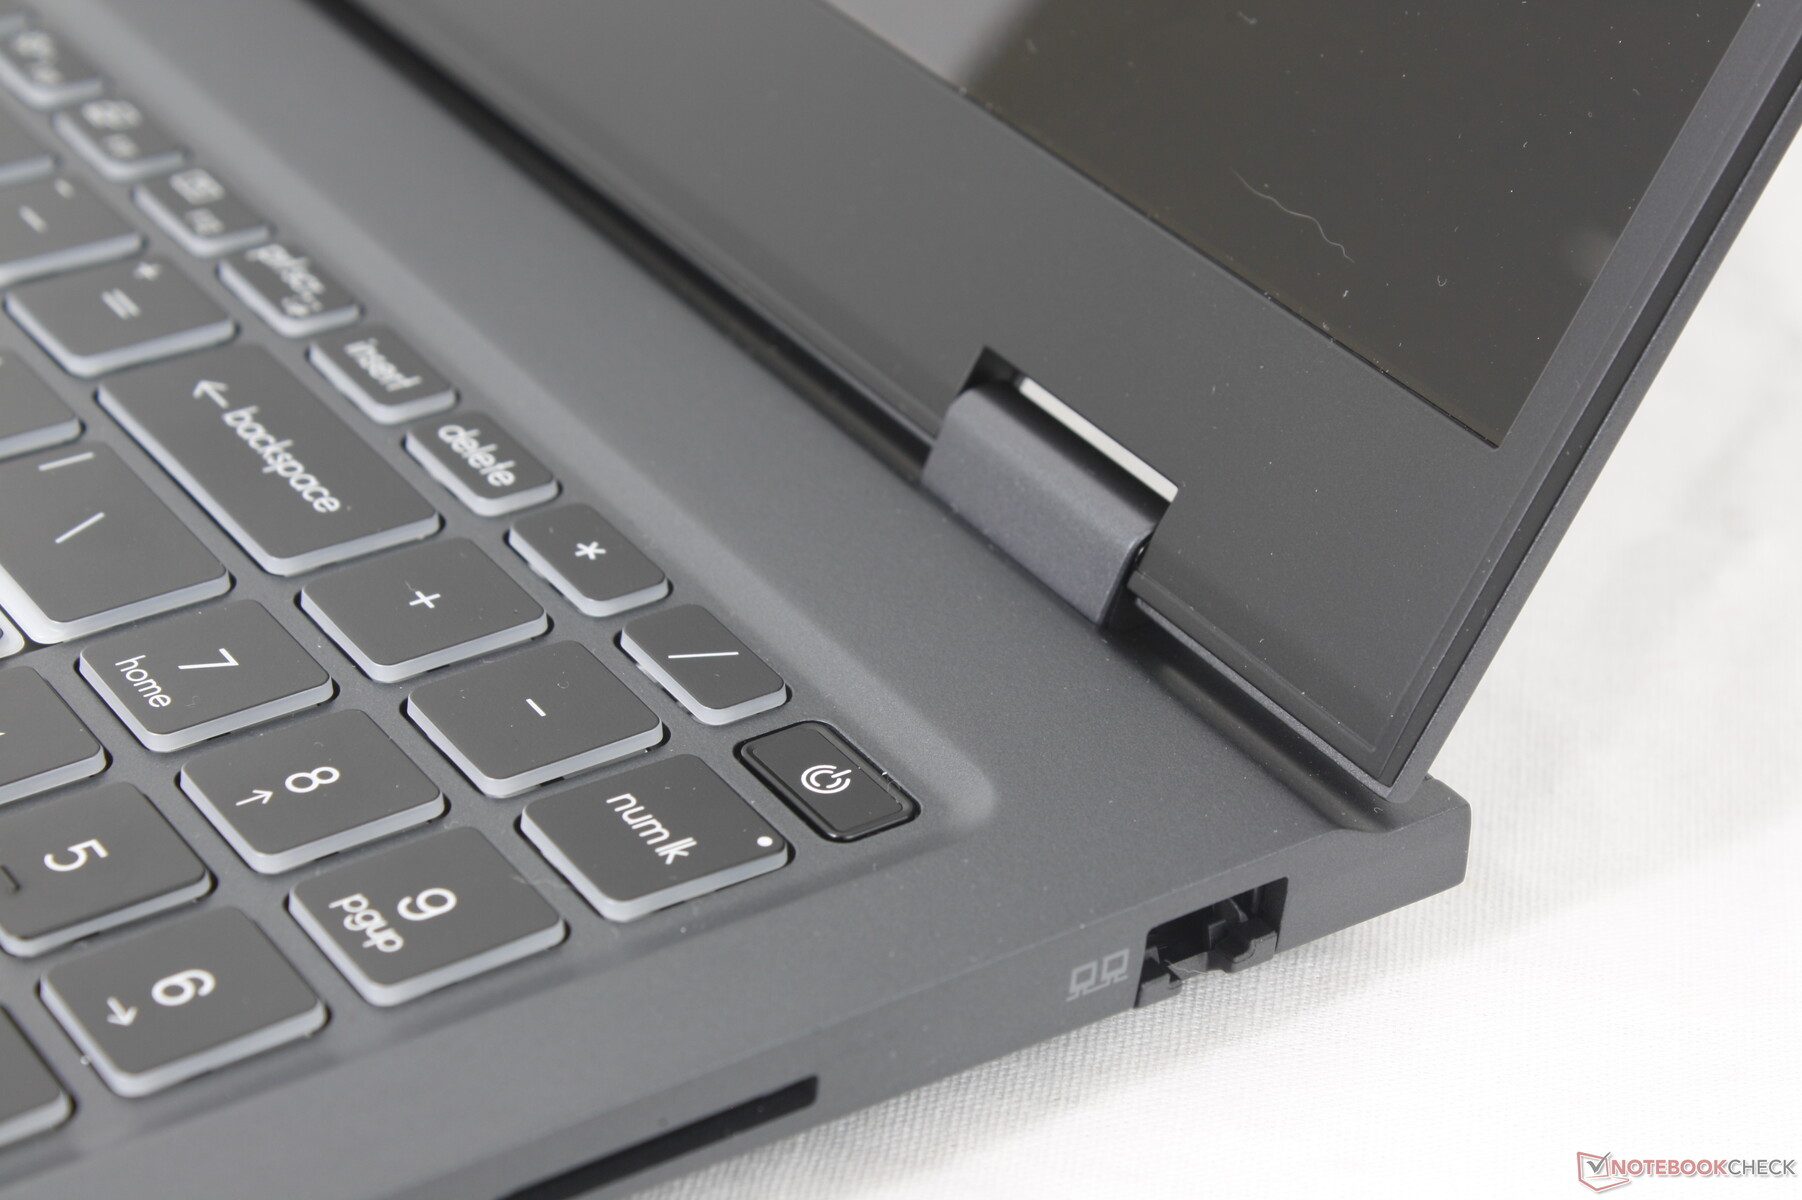
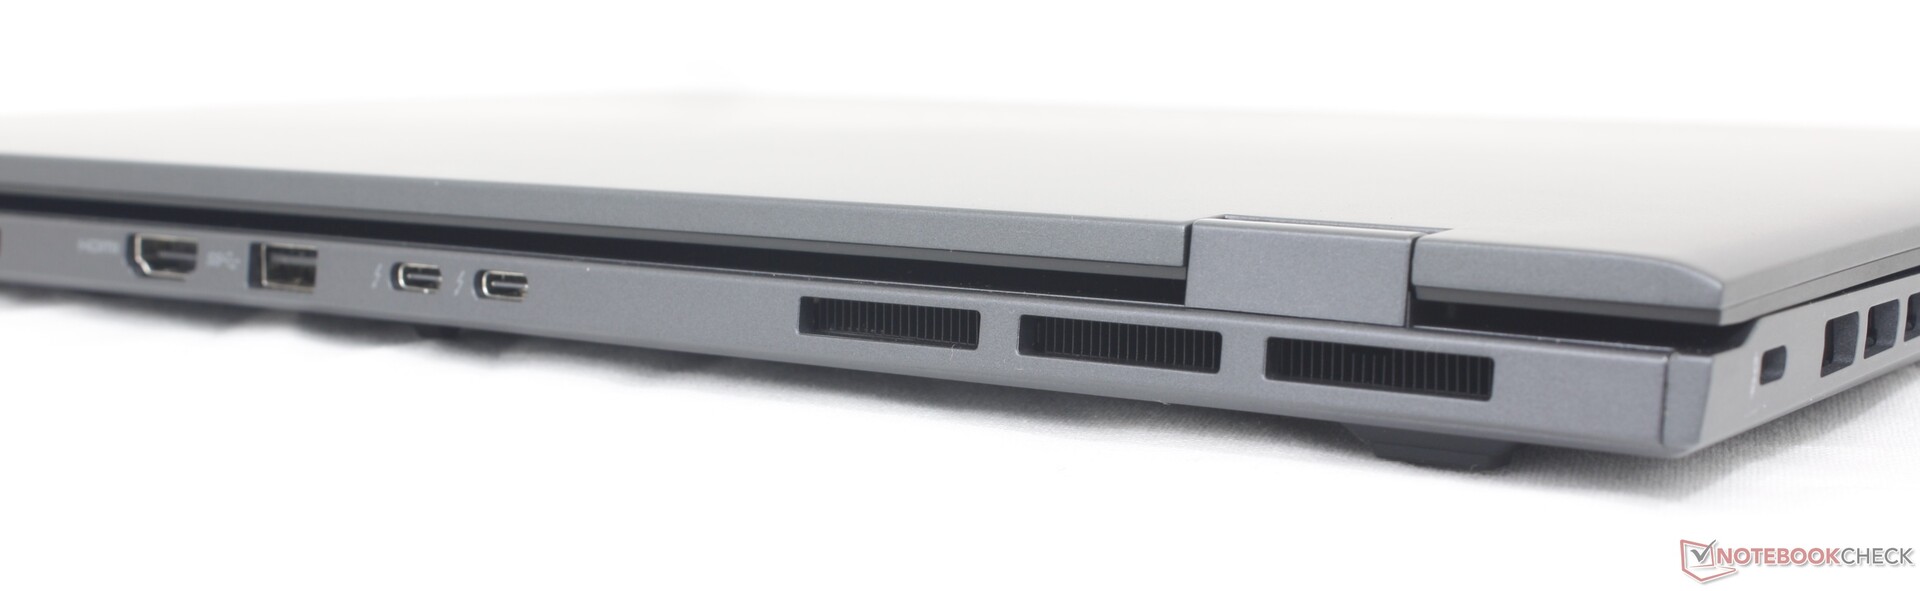
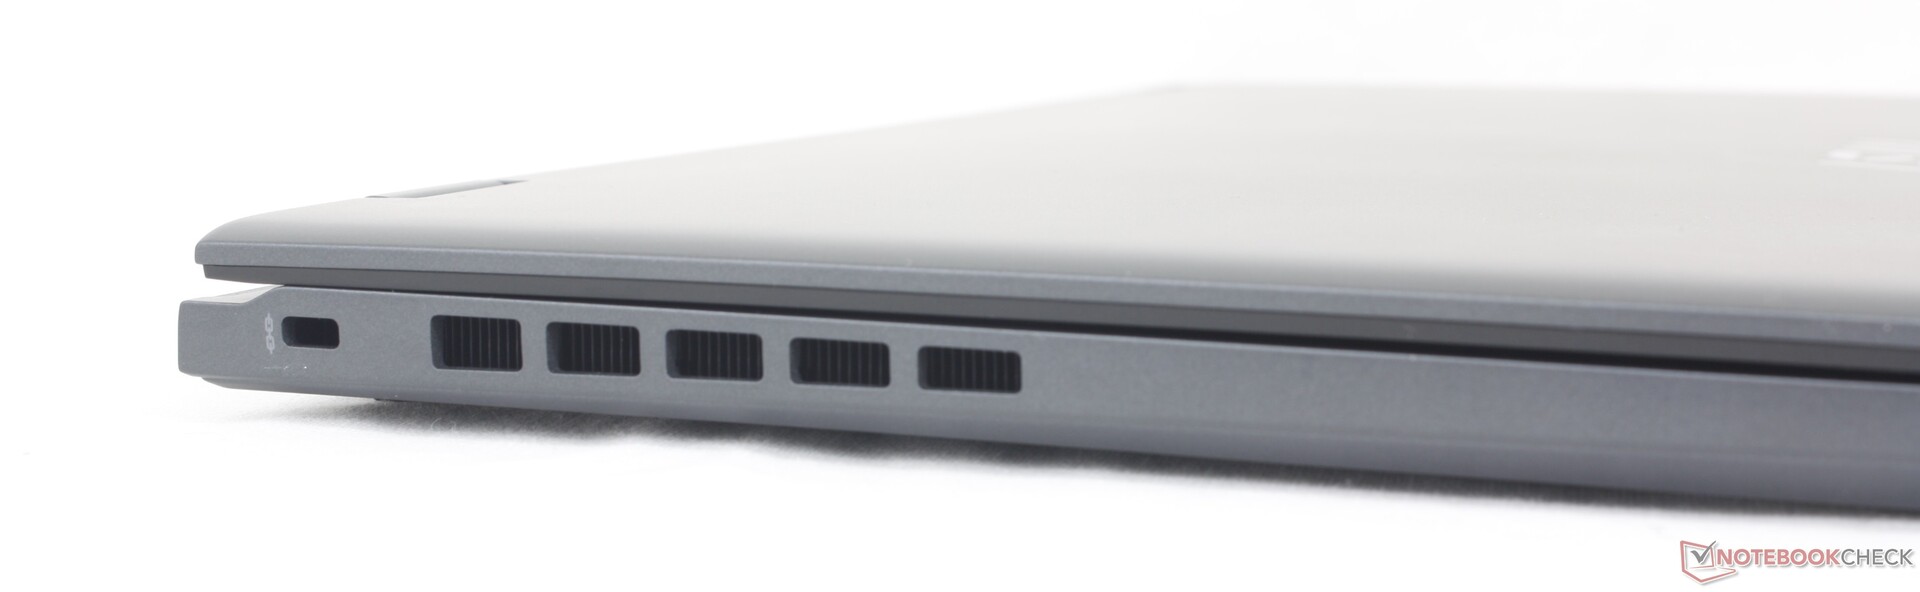
A differenza della maggior parte degli altri Ultrabook, le porte del Prestige 16 sono concentrate sul retro anziché sui lati. Questo approccio progettuale consente una migliore ventilazione lungo i lati, anche se a costo di una minore accessibilità delle porte. Le porte comunemente utilizzate come HDMI, USB-C e persino USB-A si trovano tutte sul retro, il che potrebbe non essere l'ideale per la maggior parte degli utenti.
Rispetto alla Prestige 15, la Prestige 16 ha sostituito una porta USB-A con una porta RJ-45. Le due porte Thunderbolt 4 rimangono intatte per le SKU con grafica integrata. Se configurate con grafica discreta, solo una delle due porte USB-C è compatibile con Thunderbolt.
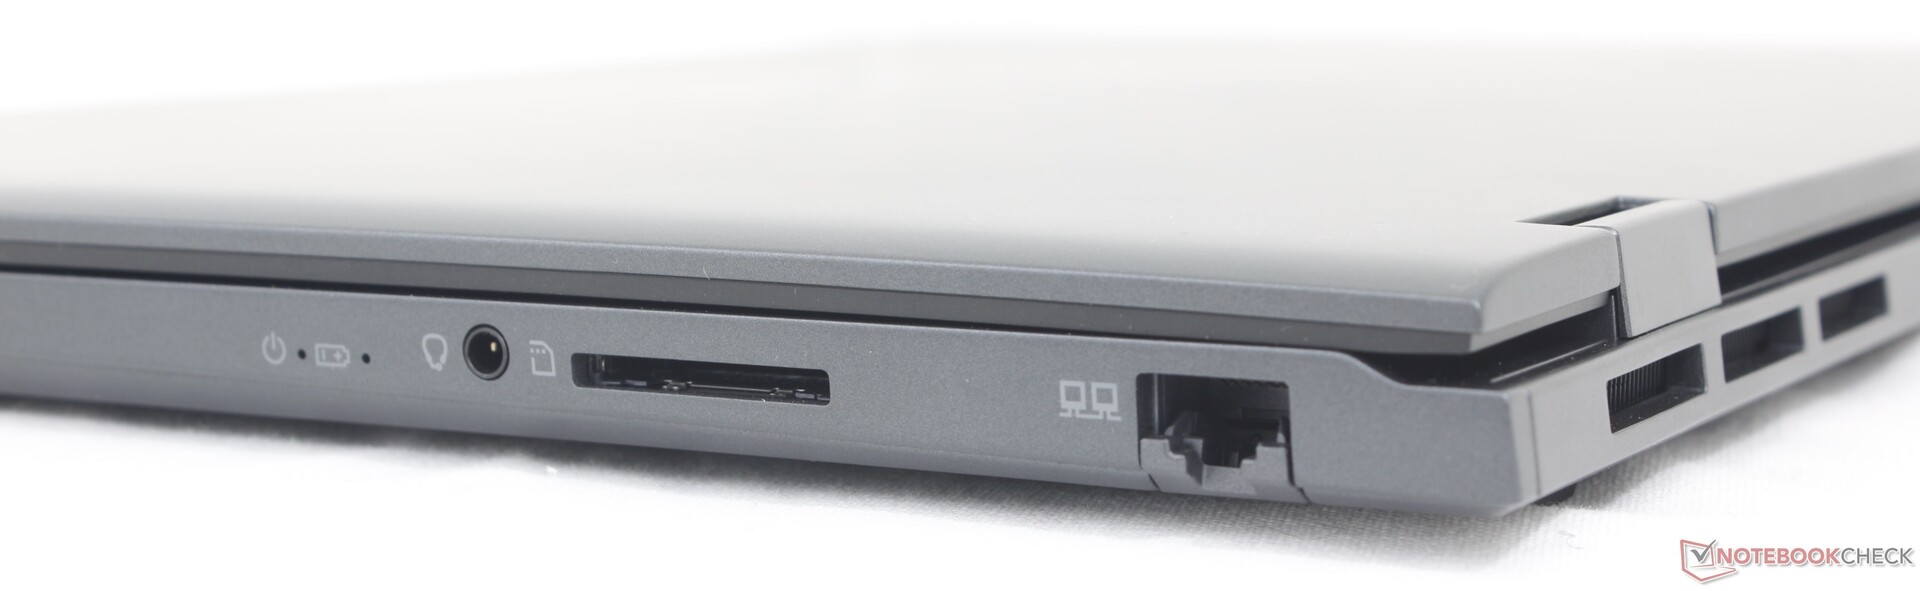
Lettore di schede SD
Il lettore di schede SD integrato è stato aggiornato per ottenere velocità molto più elevate. Il trasferimento di 1 GB di immagini dalla nostra scheda di test UHS-II al desktop richiede poco meno di 6 secondi, rispetto agli oltre 12 secondi della Prestige 15.
| SD Card Reader | |
| average JPG Copy Test (av. of 3 runs) | |
| MSI Prestige 16 B1MG-001US (Toshiba Exceria Pro SDXC 64 GB UHS-II) | |
| Asus VivoBook Pro 16 K6602VU (Angelbird AV Pro V60) | |
| Lenovo ThinkBook 16 G6 ABP (Angelbird AV Pro V60) | |
| MSI Prestige 15 A12UD-093 (AV Pro SD microSD 128 GB V60) | |
| LG Gram 2in1 16 16T90R - G.AA78G | |
| Dell Inspiron 16 Plus 7630 (AV Pro SD microSD 128 GB V60) | |
| maximum AS SSD Seq Read Test (1GB) | |
| Asus VivoBook Pro 16 K6602VU (Angelbird AV Pro V60) | |
| MSI Prestige 16 B1MG-001US (Toshiba Exceria Pro SDXC 64 GB UHS-II) | |
| Lenovo ThinkBook 16 G6 ABP (Angelbird AV Pro V60) | |
| MSI Prestige 15 A12UD-093 (AV Pro SD microSD 128 GB V60) | |
| Dell Inspiron 16 Plus 7630 (AV Pro SD microSD 128 GB V60) | |
| LG Gram 2in1 16 16T90R - G.AA78G | |
Comunicazione
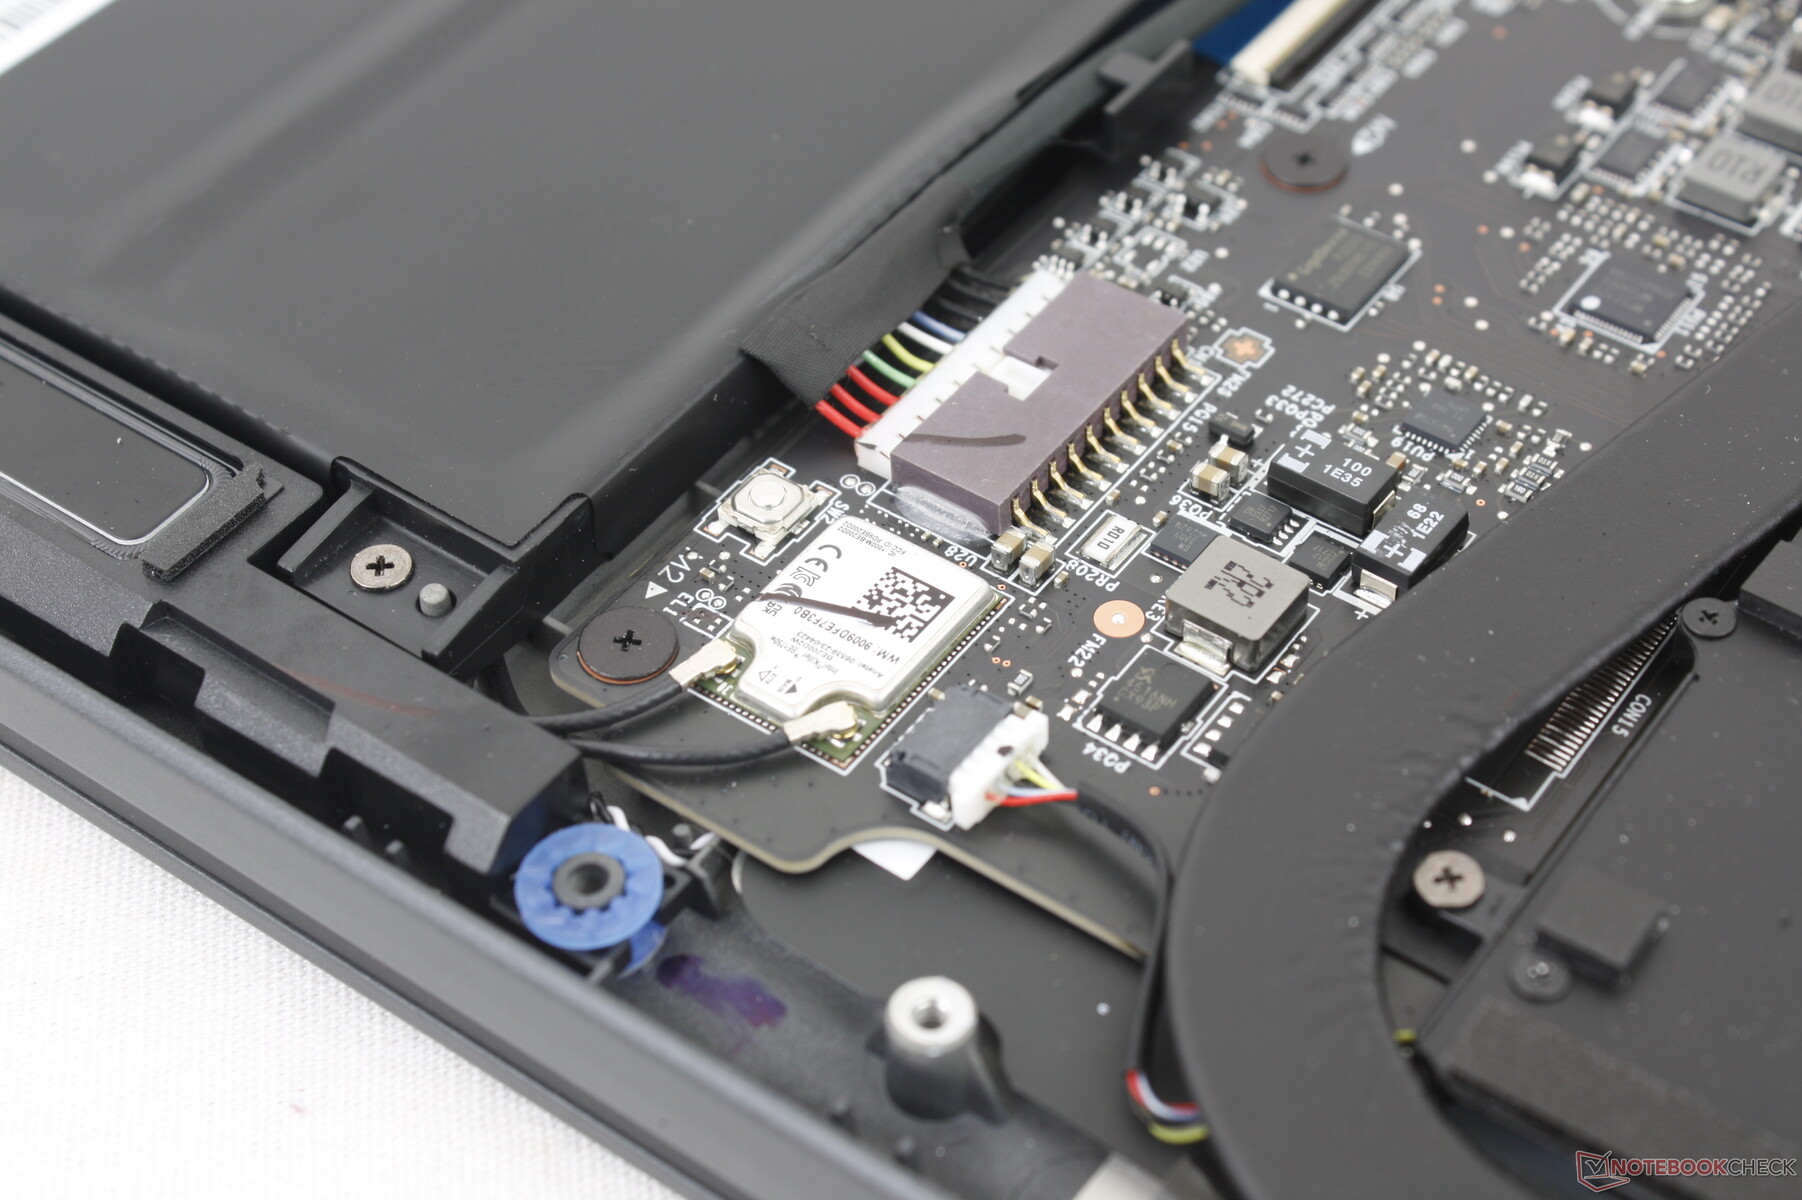
Il Prestige 16 è uno dei primi computer portatili ad essere fornito con il modulo WLAN Killer BE1750W per la compatibilità con Wi-Fi 7. Tuttavia, i router Wi-Fi 7 non sono ancora molto diffusi, per cui l'inclusione del Wi-Fi 7 al momento è più una sicurezza per il futuro che un vantaggio immediato. Tuttavia, non abbiamo riscontrato problemi di connettività quando è stato abbinato al nostro router di prova Wi-Fi 6E.
Webcam
Una webcam da 2 MP con IR e otturatore fisico per la privacy sono di serie. Alternative come il HP Spectre hanno già iniziato a distribuire sensori da 5 MP a risoluzione più elevata.


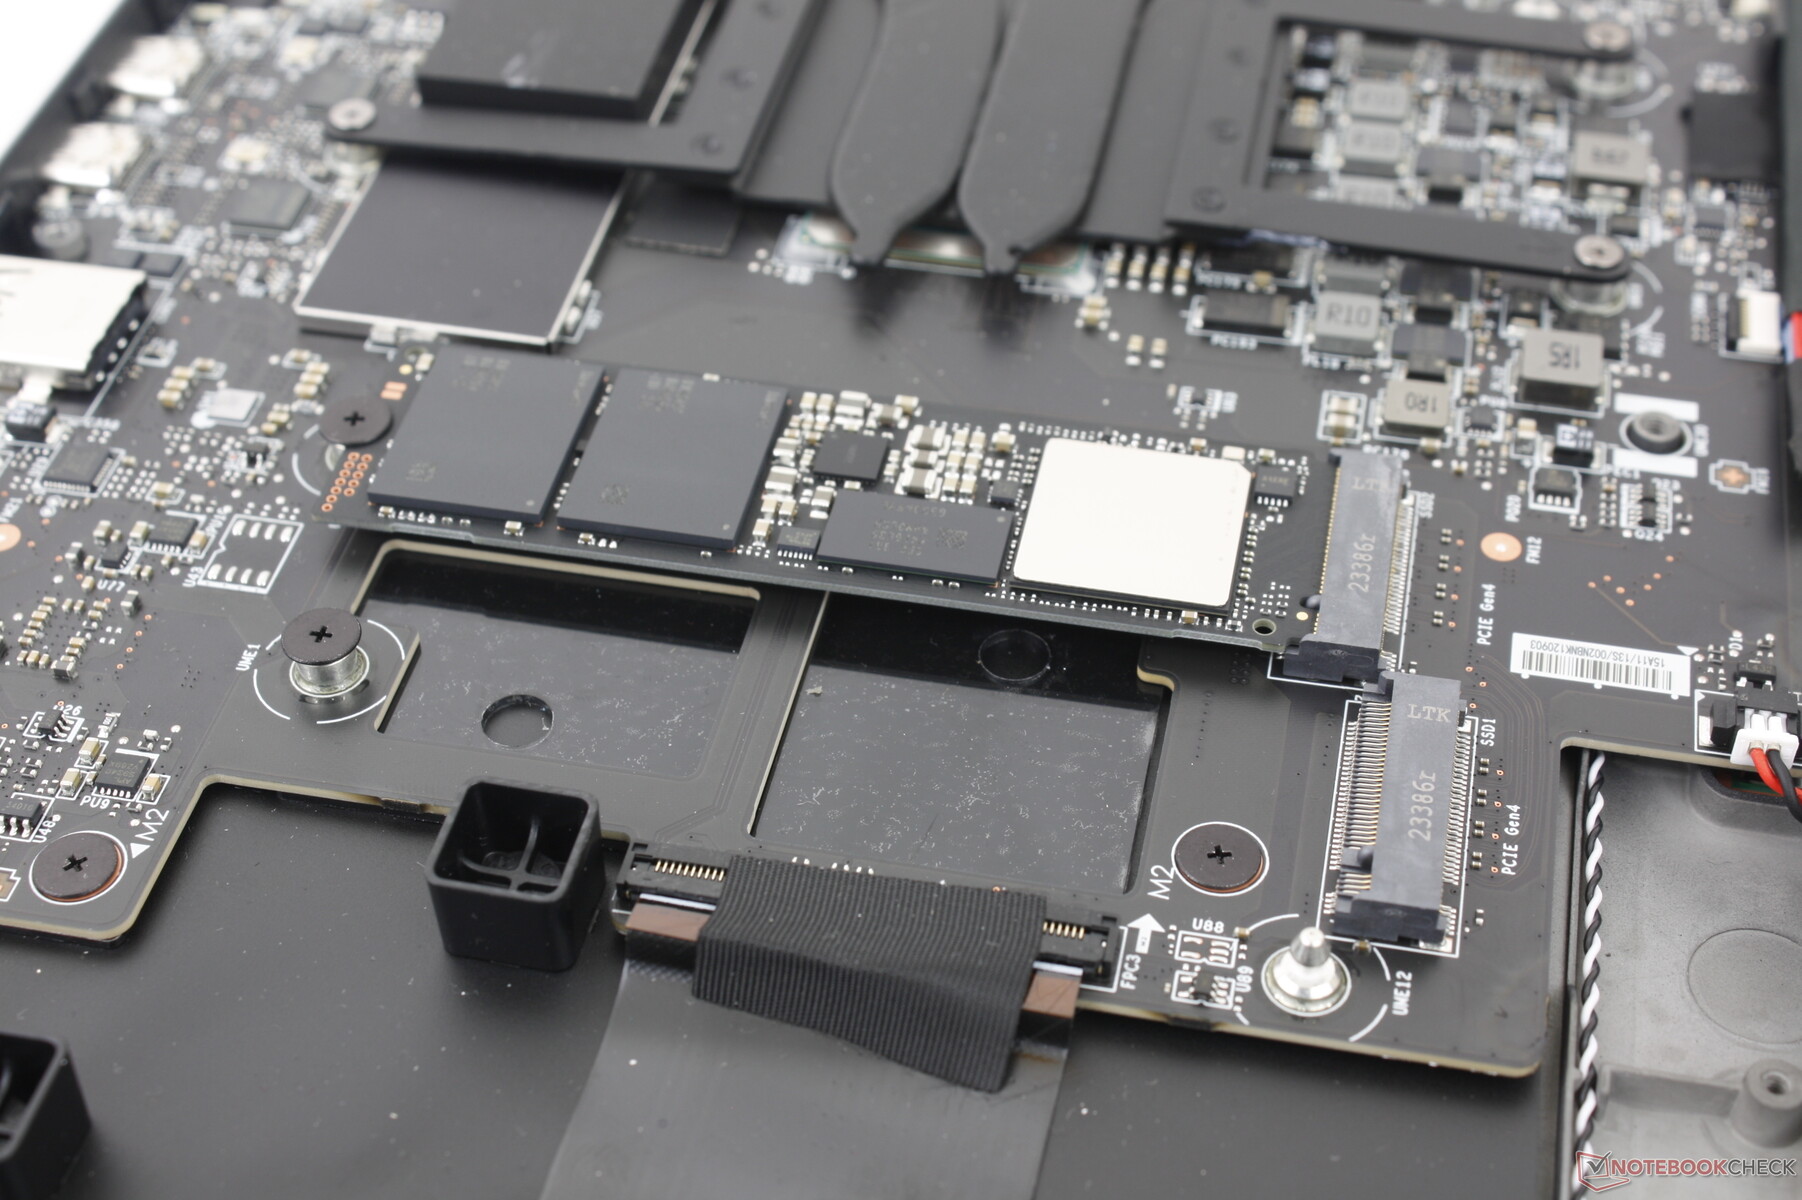
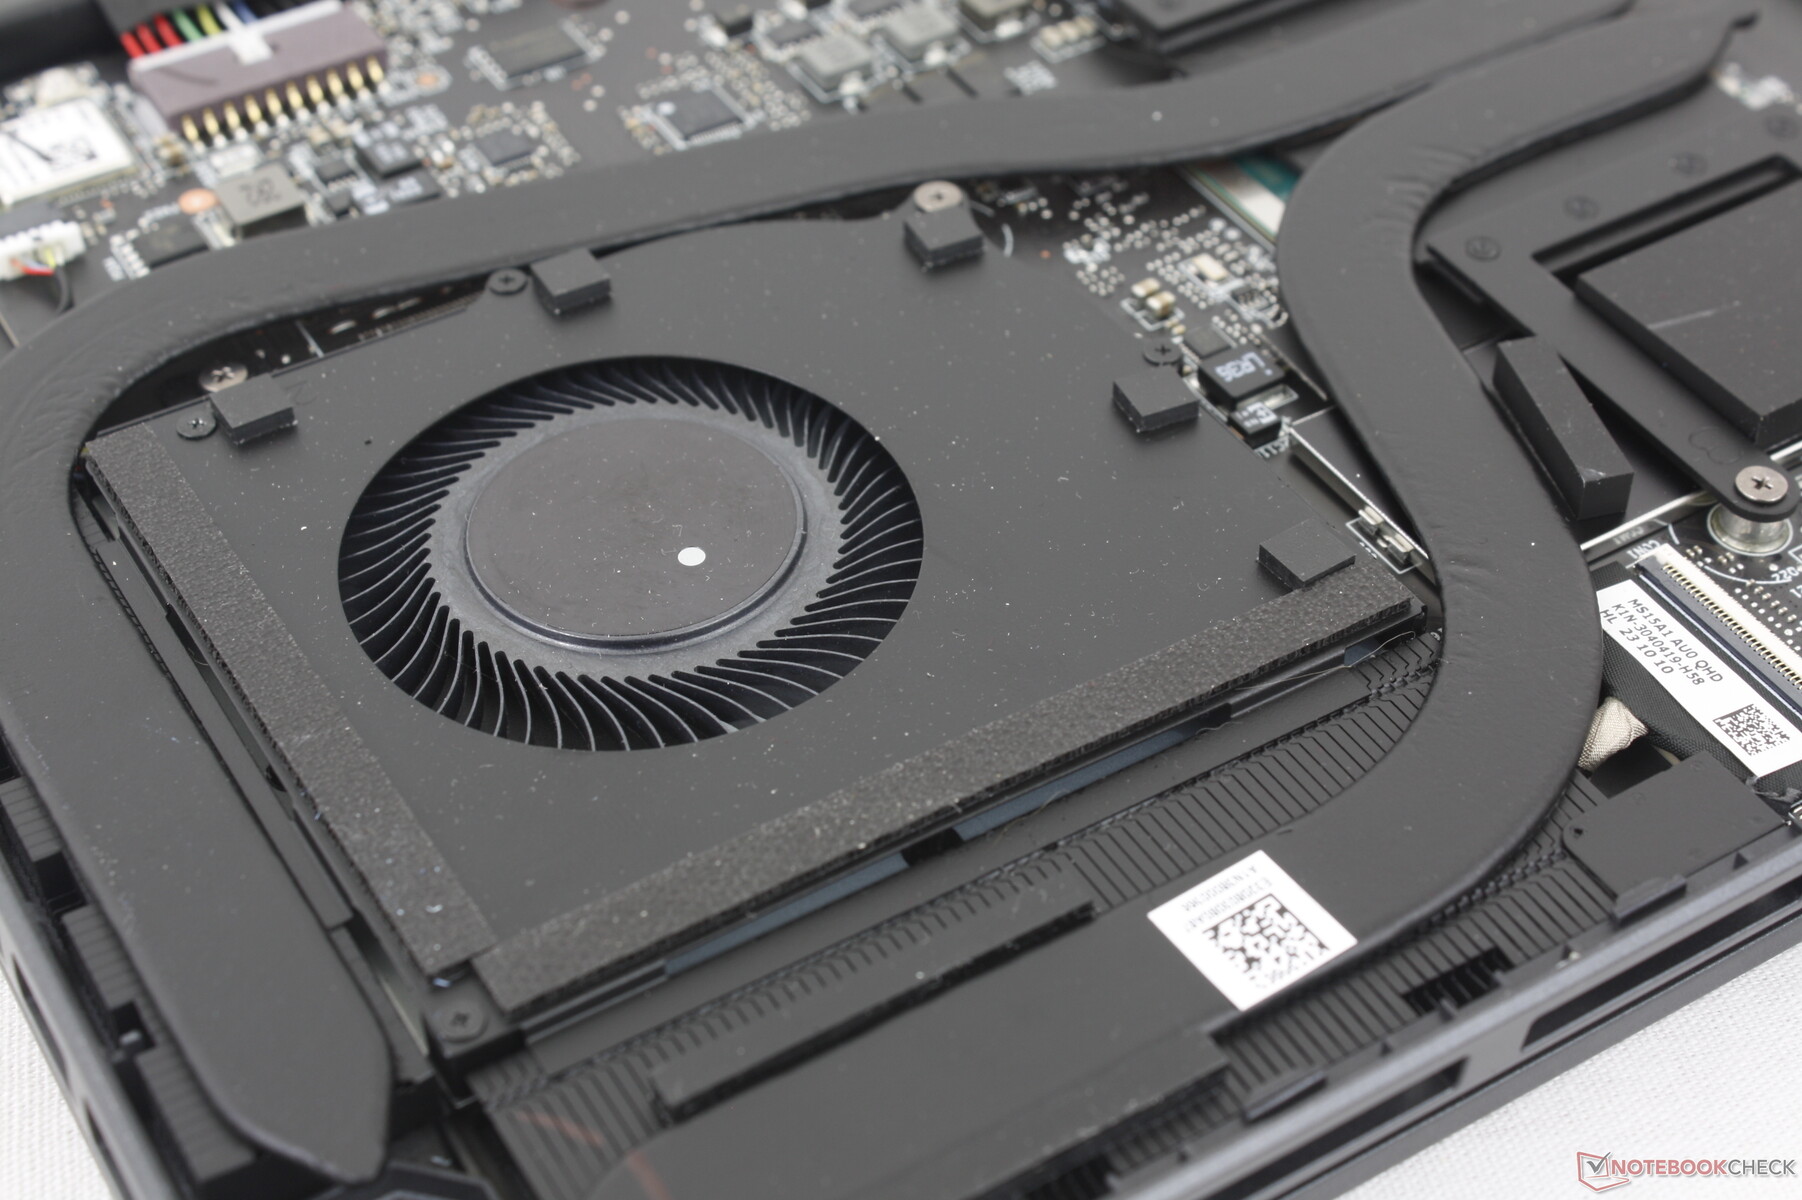
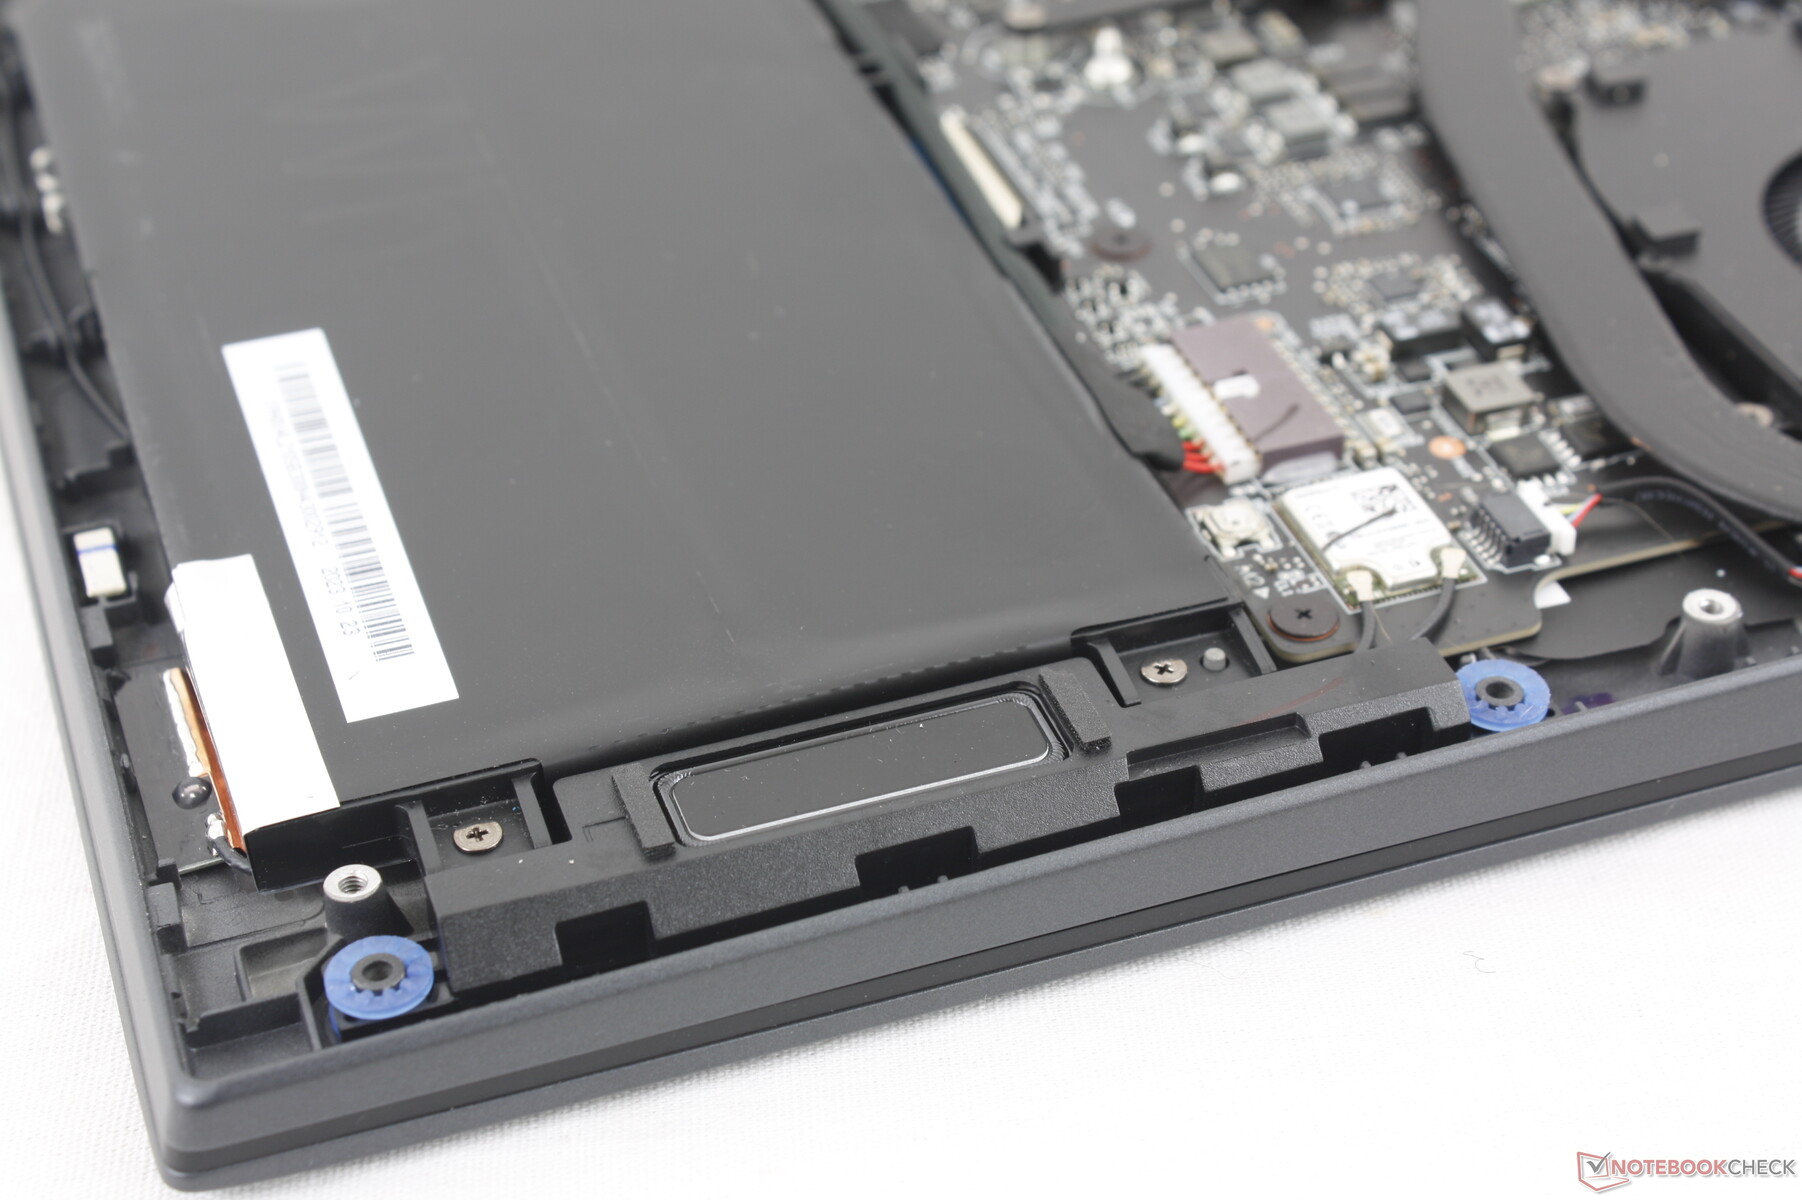
Manutenzione
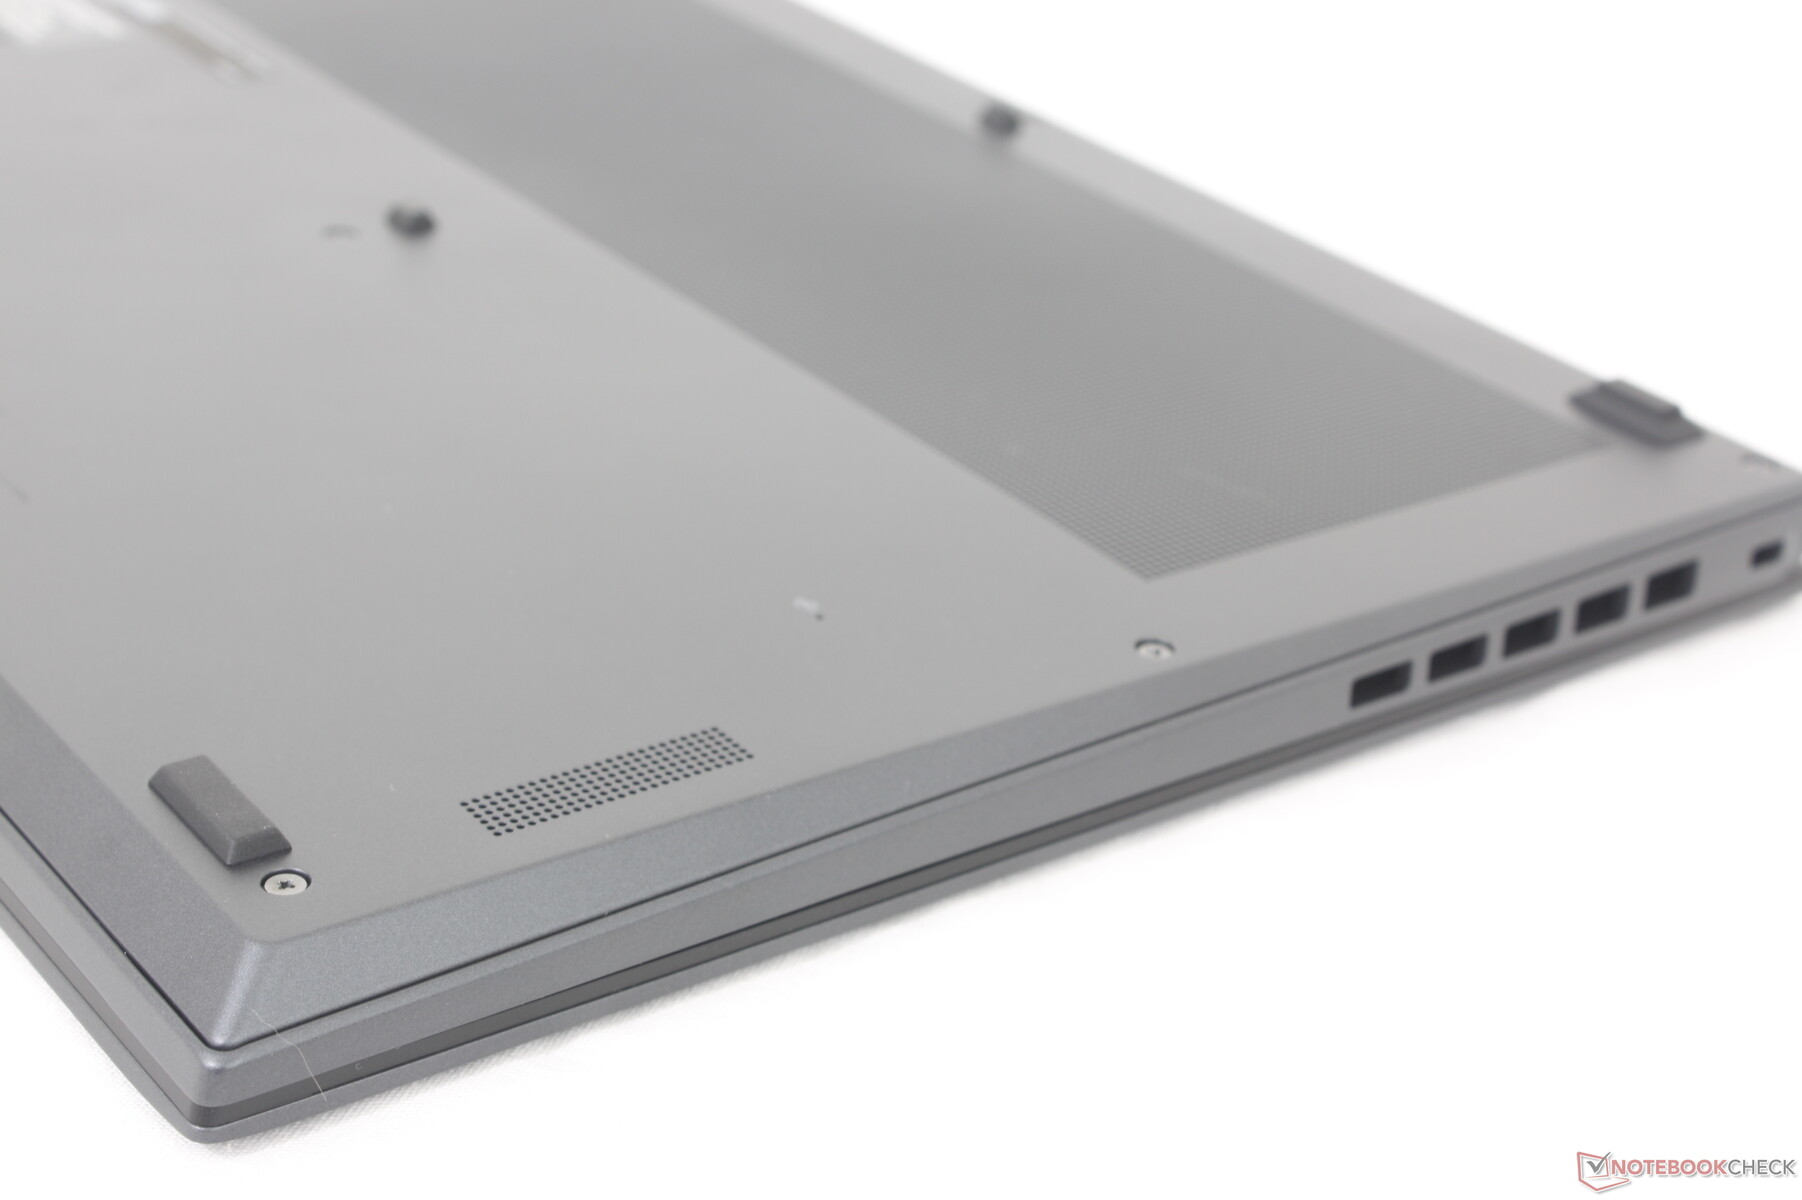
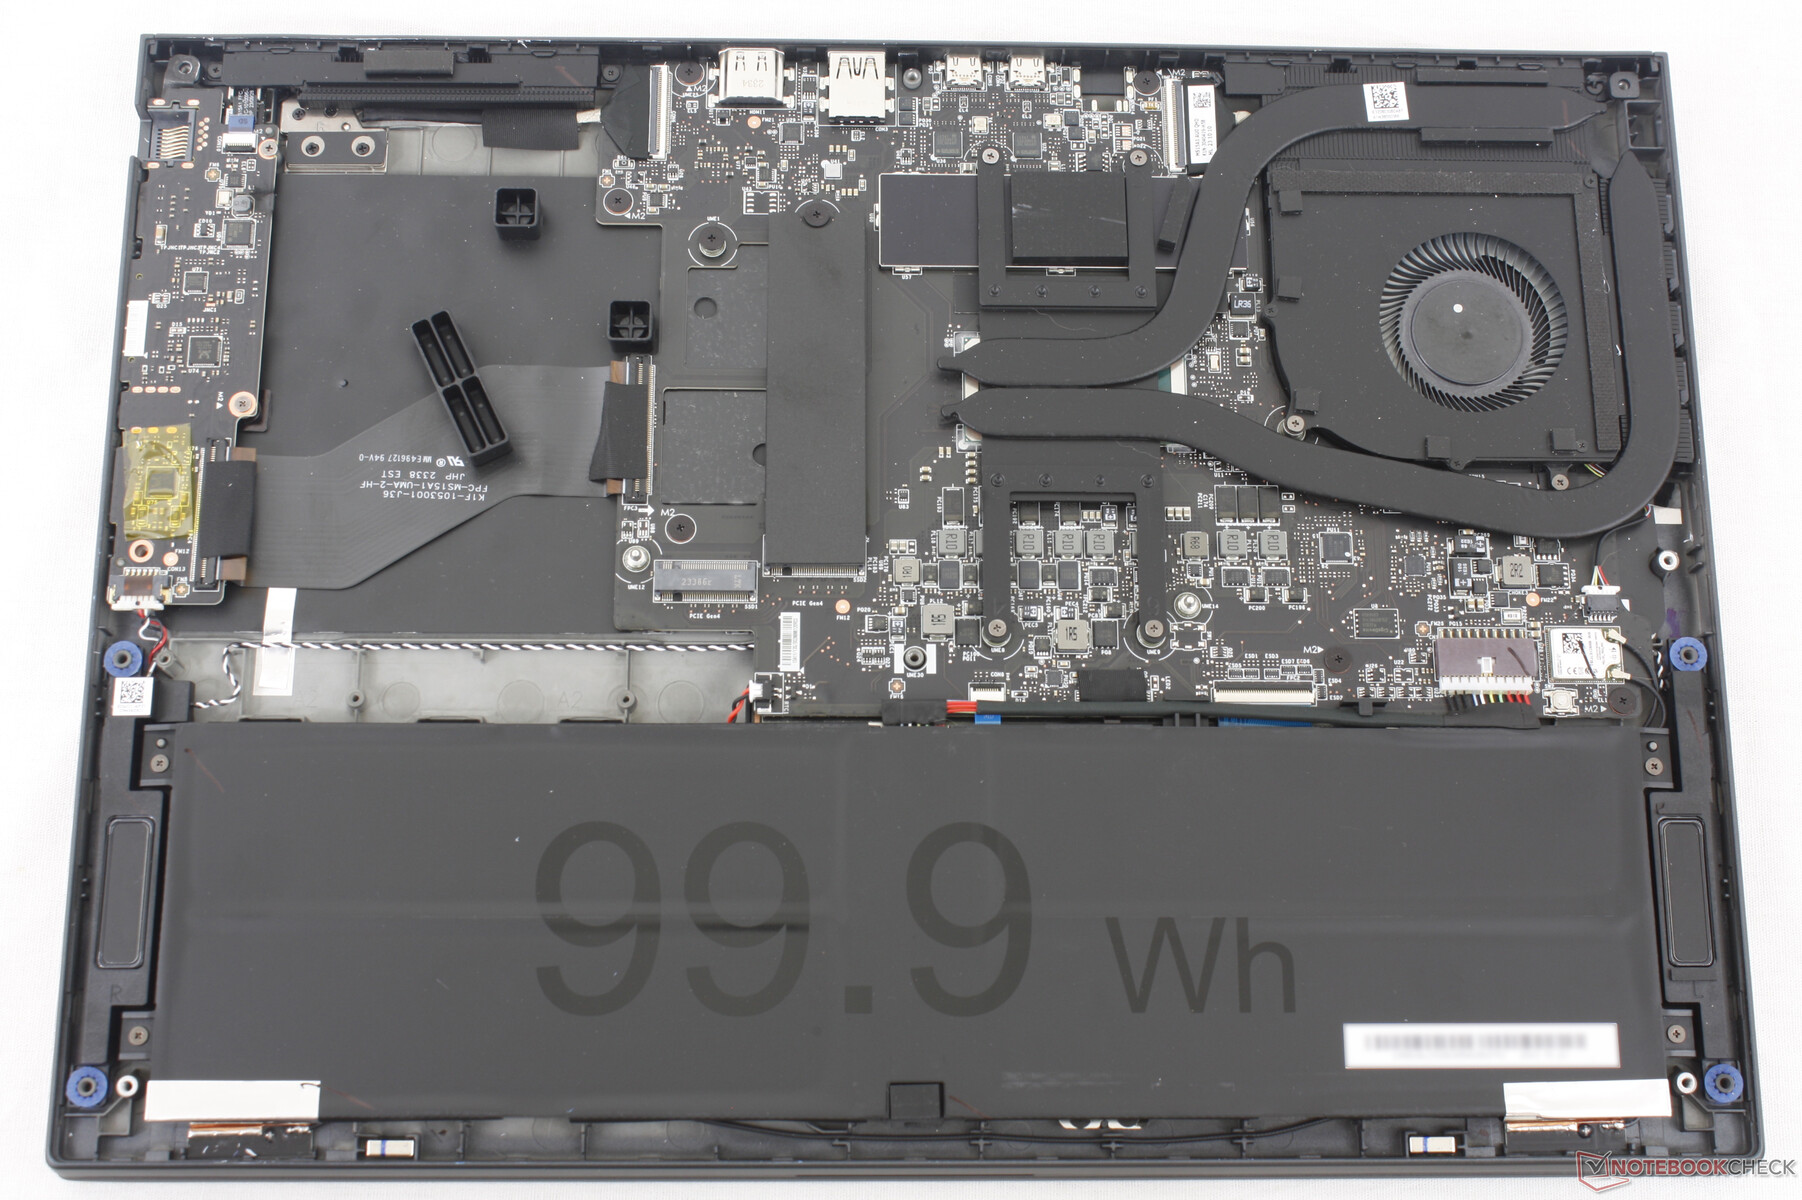
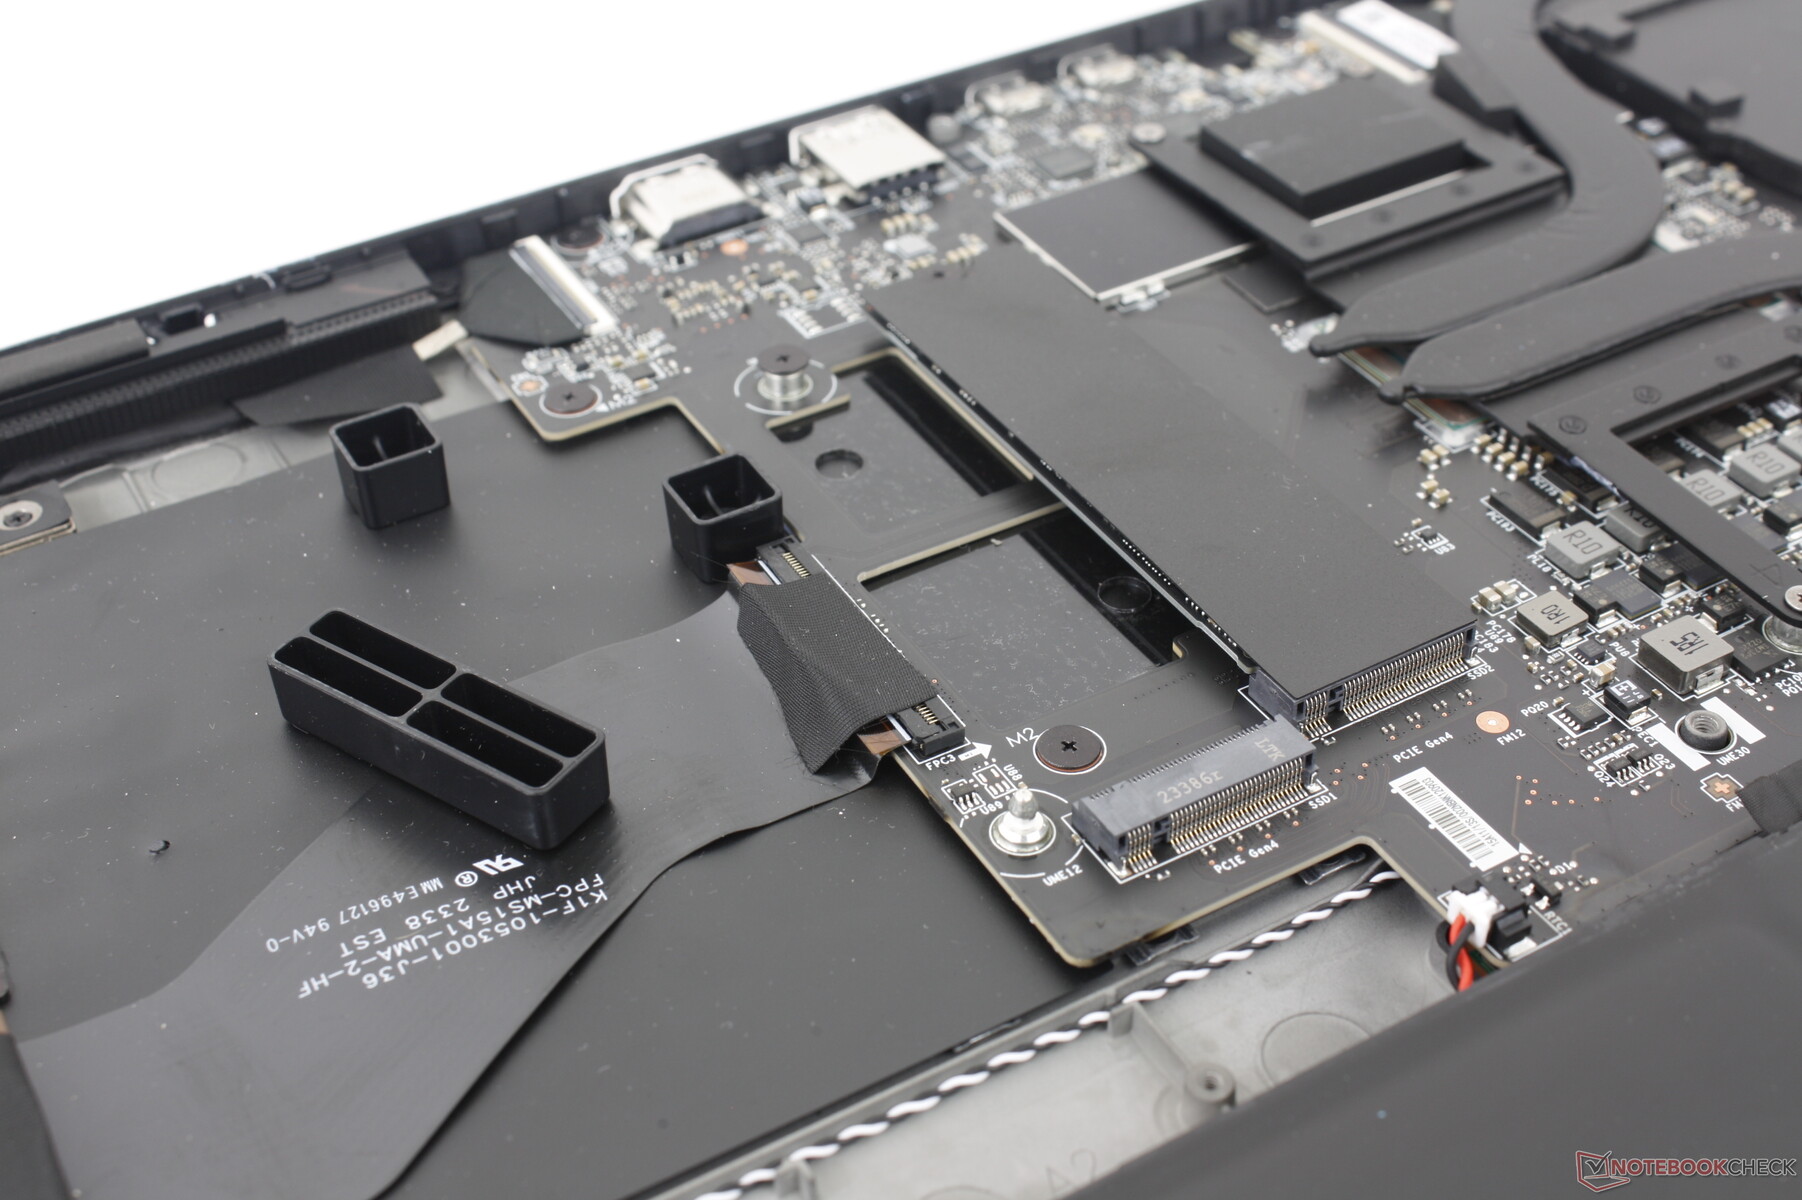
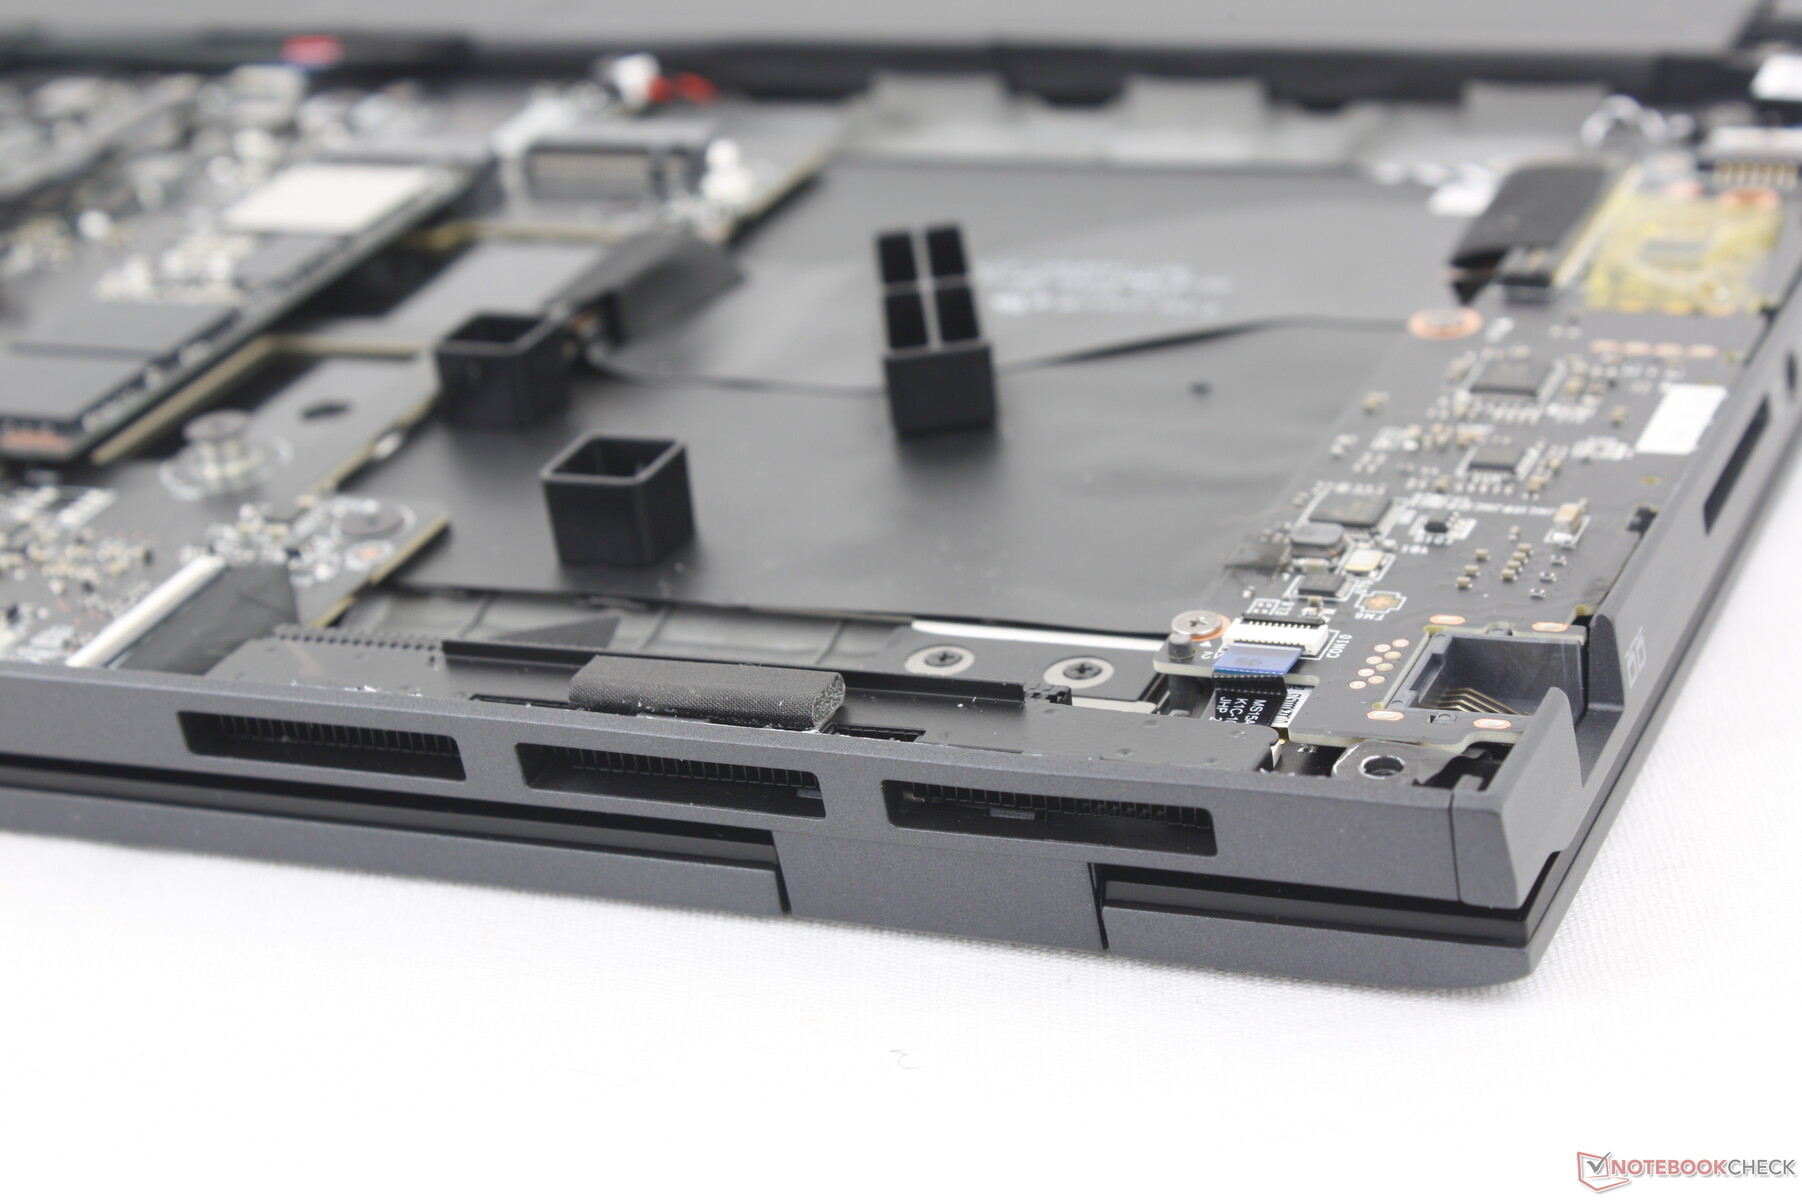
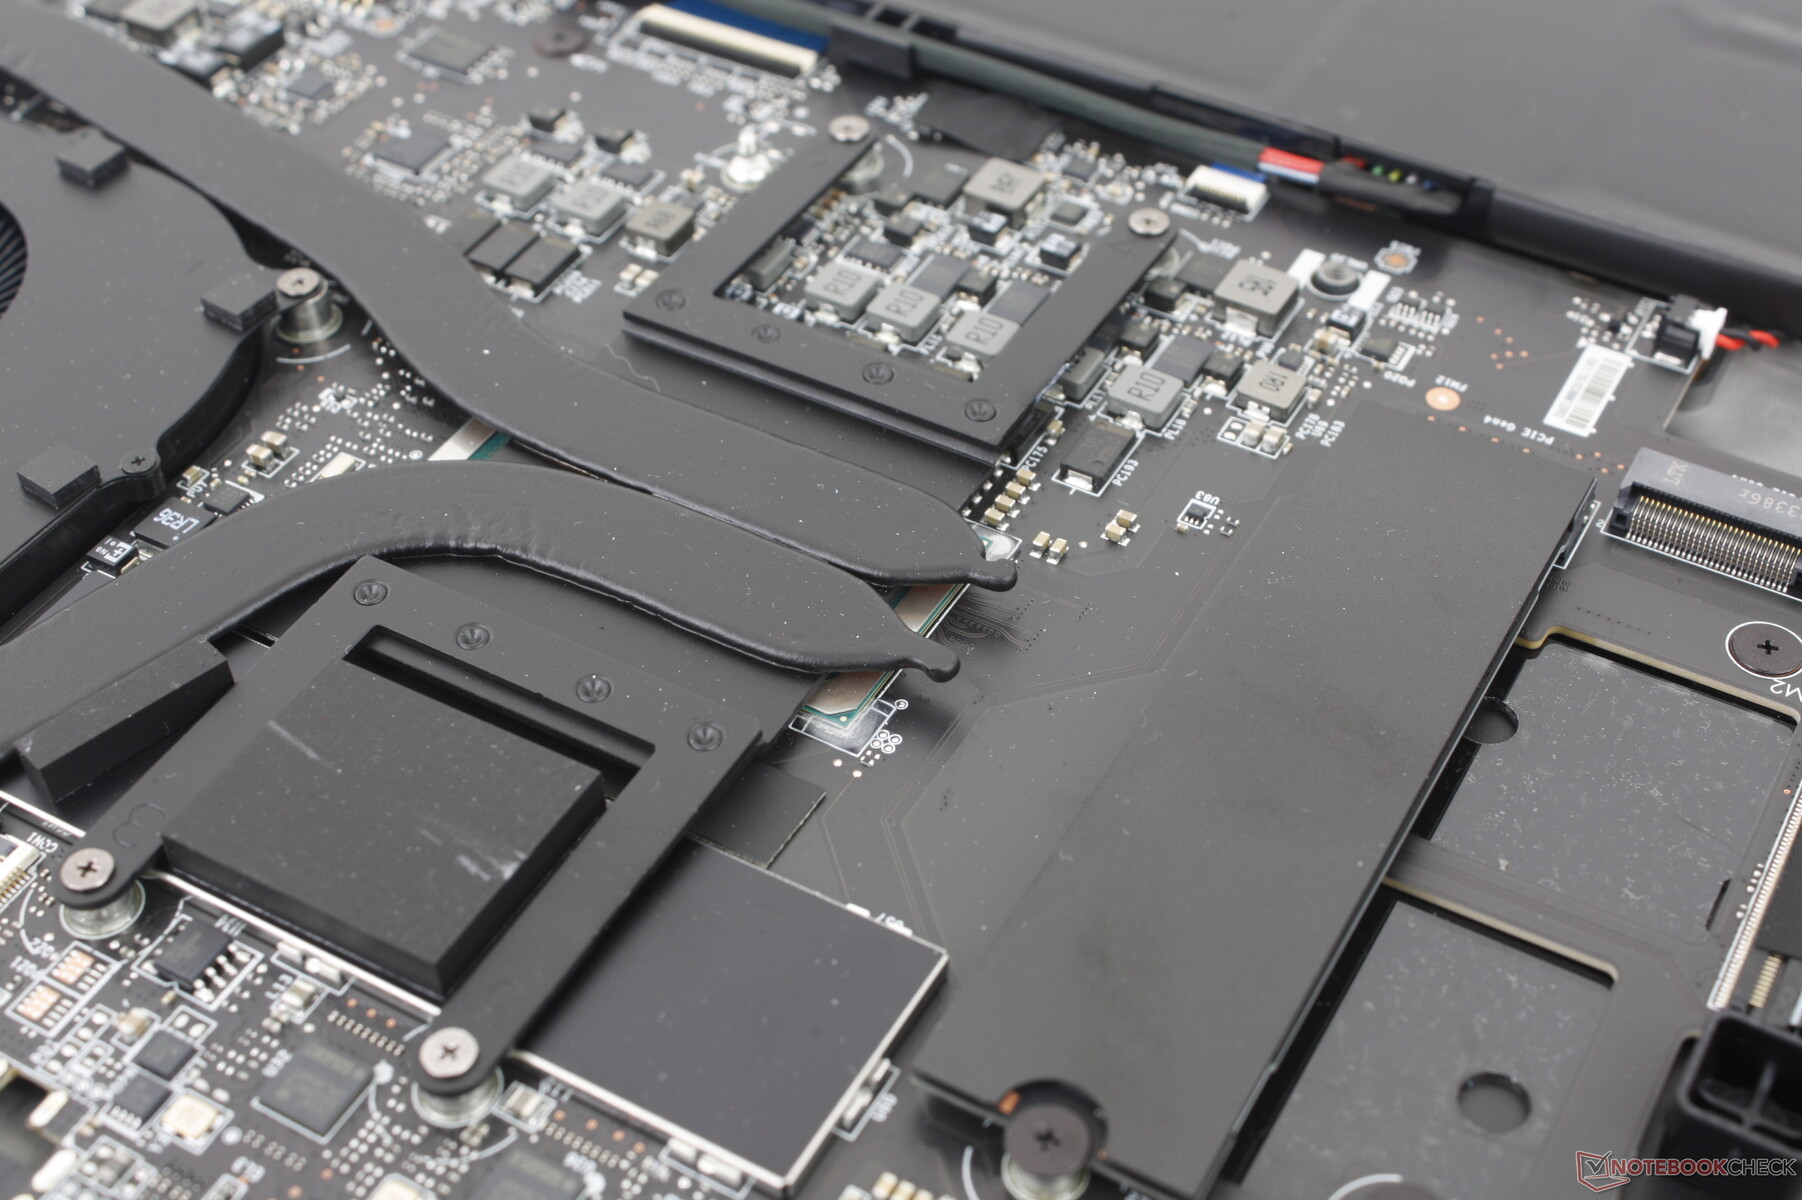
Il pannello inferiore si stacca abbastanza facilmente dopo aver rimosso le otto viti Phillips. Tenga presente che un adesivo del sigillo di fabbrica deve essere rotto per poter accedere ai componenti interni.
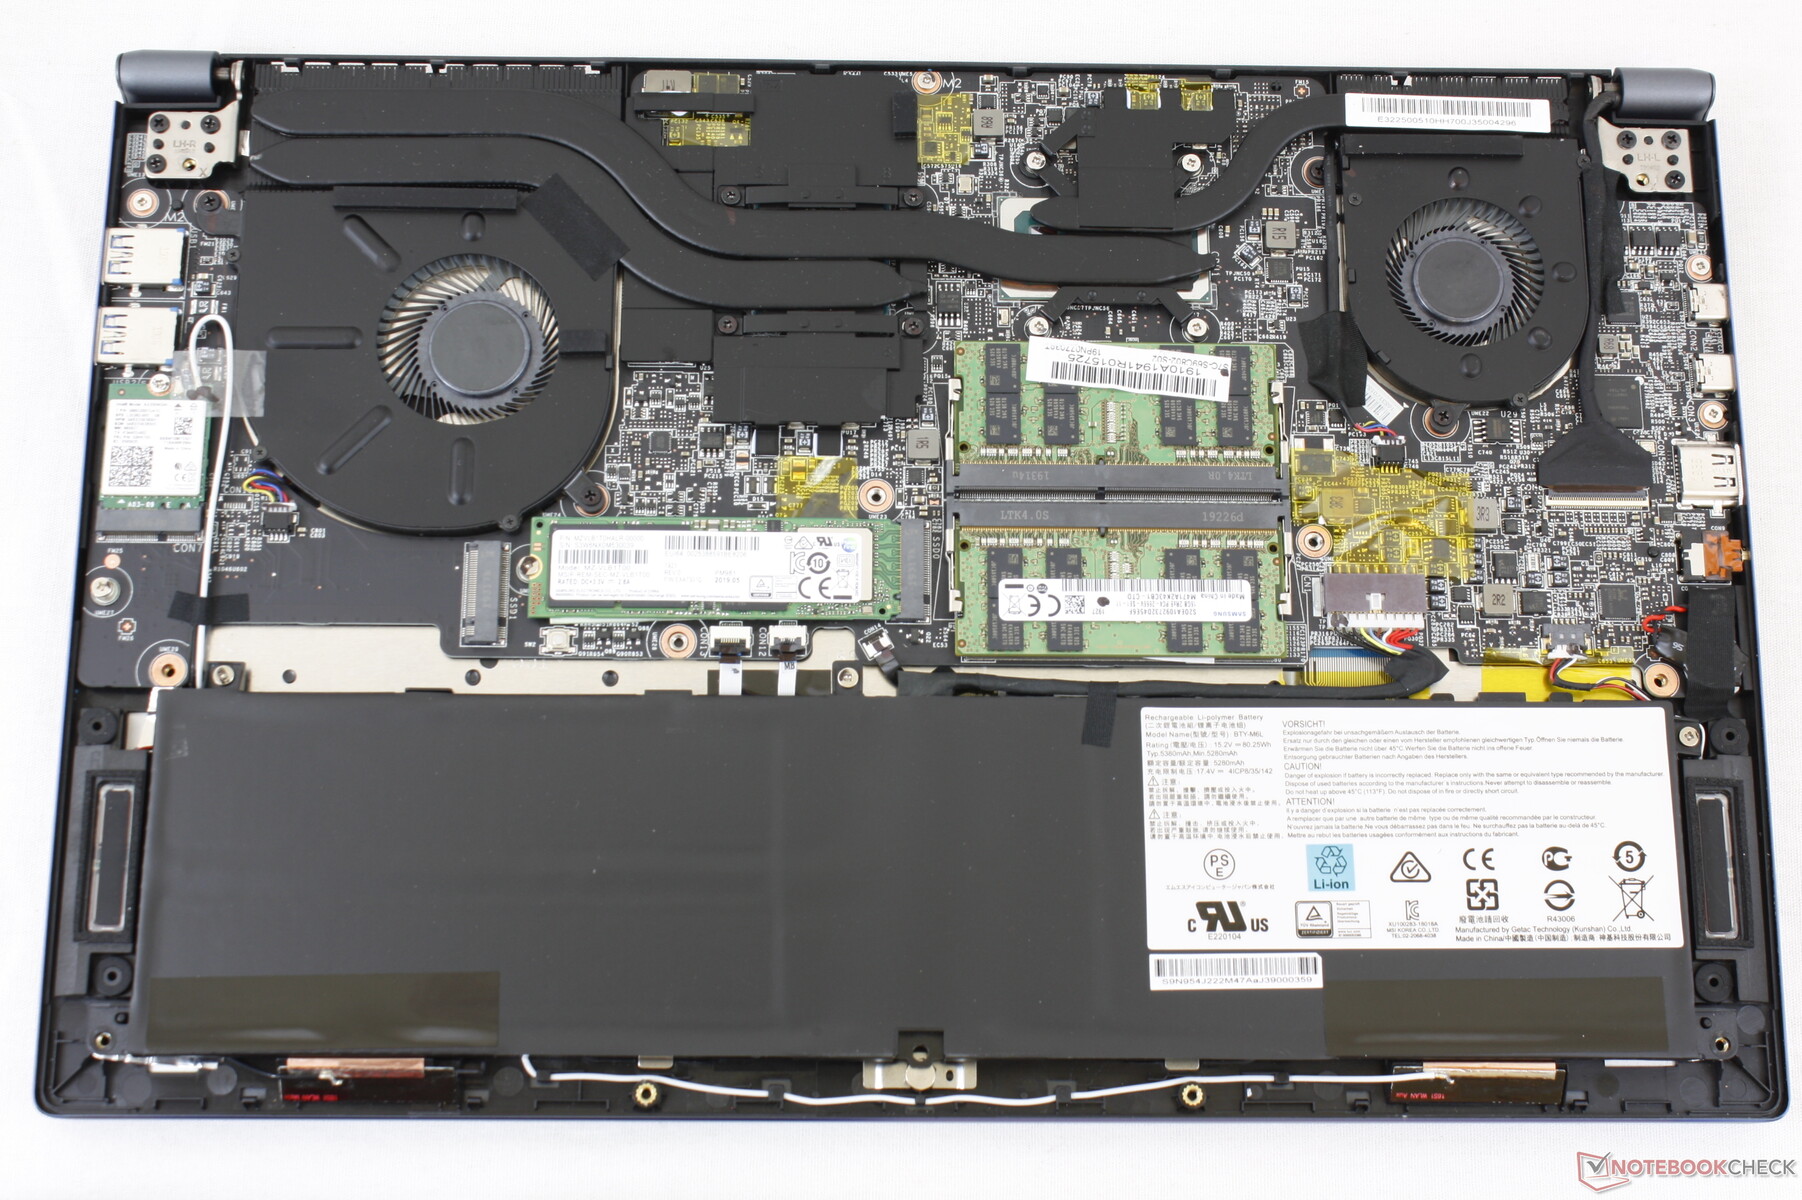
Una volta all'interno, i proprietari avranno accesso a due slot SSD M.2 2280 PCIe4 x4 NVMe, mentre i moduli RAM e WLAN sono tutti saldati. In confronto, tutti questi moduli sono rimovibili sul vecchio Prestige 15.
Si noti l'ampio spazio vuoto riservato alle SKU con grafica discreta. Il modello è dotato di più tubi di calore, di una ventola aggiuntiva e di SSD M.2 riorganizzati se configurato con una GPU dedicata.
Accessori e garanzia
La confezione non contiene altri extra oltre all'adattatore CA e alla documentazione. Se acquistato negli Stati Uniti, si applica la consueta garanzia limitata di un anno.
Dispositivi di input - più grandi di prima
Tastiera
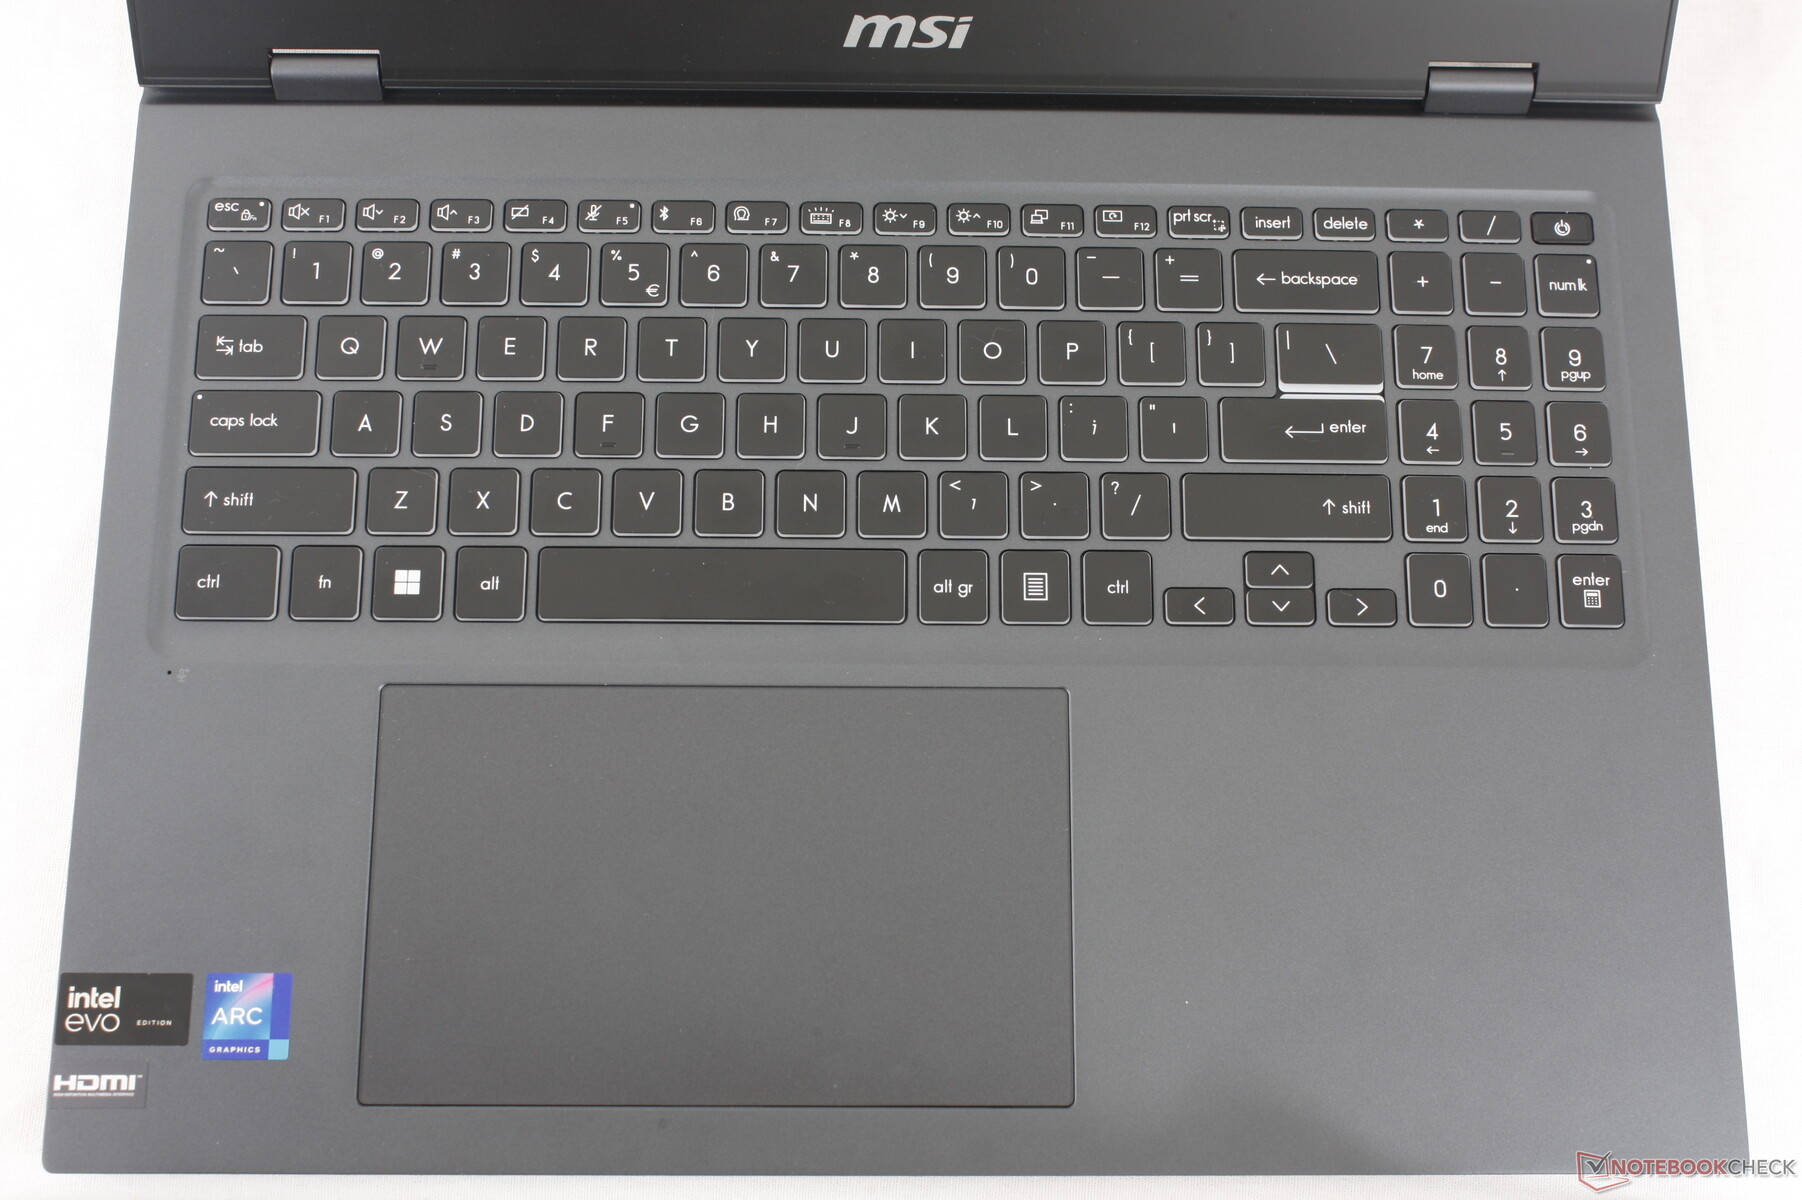
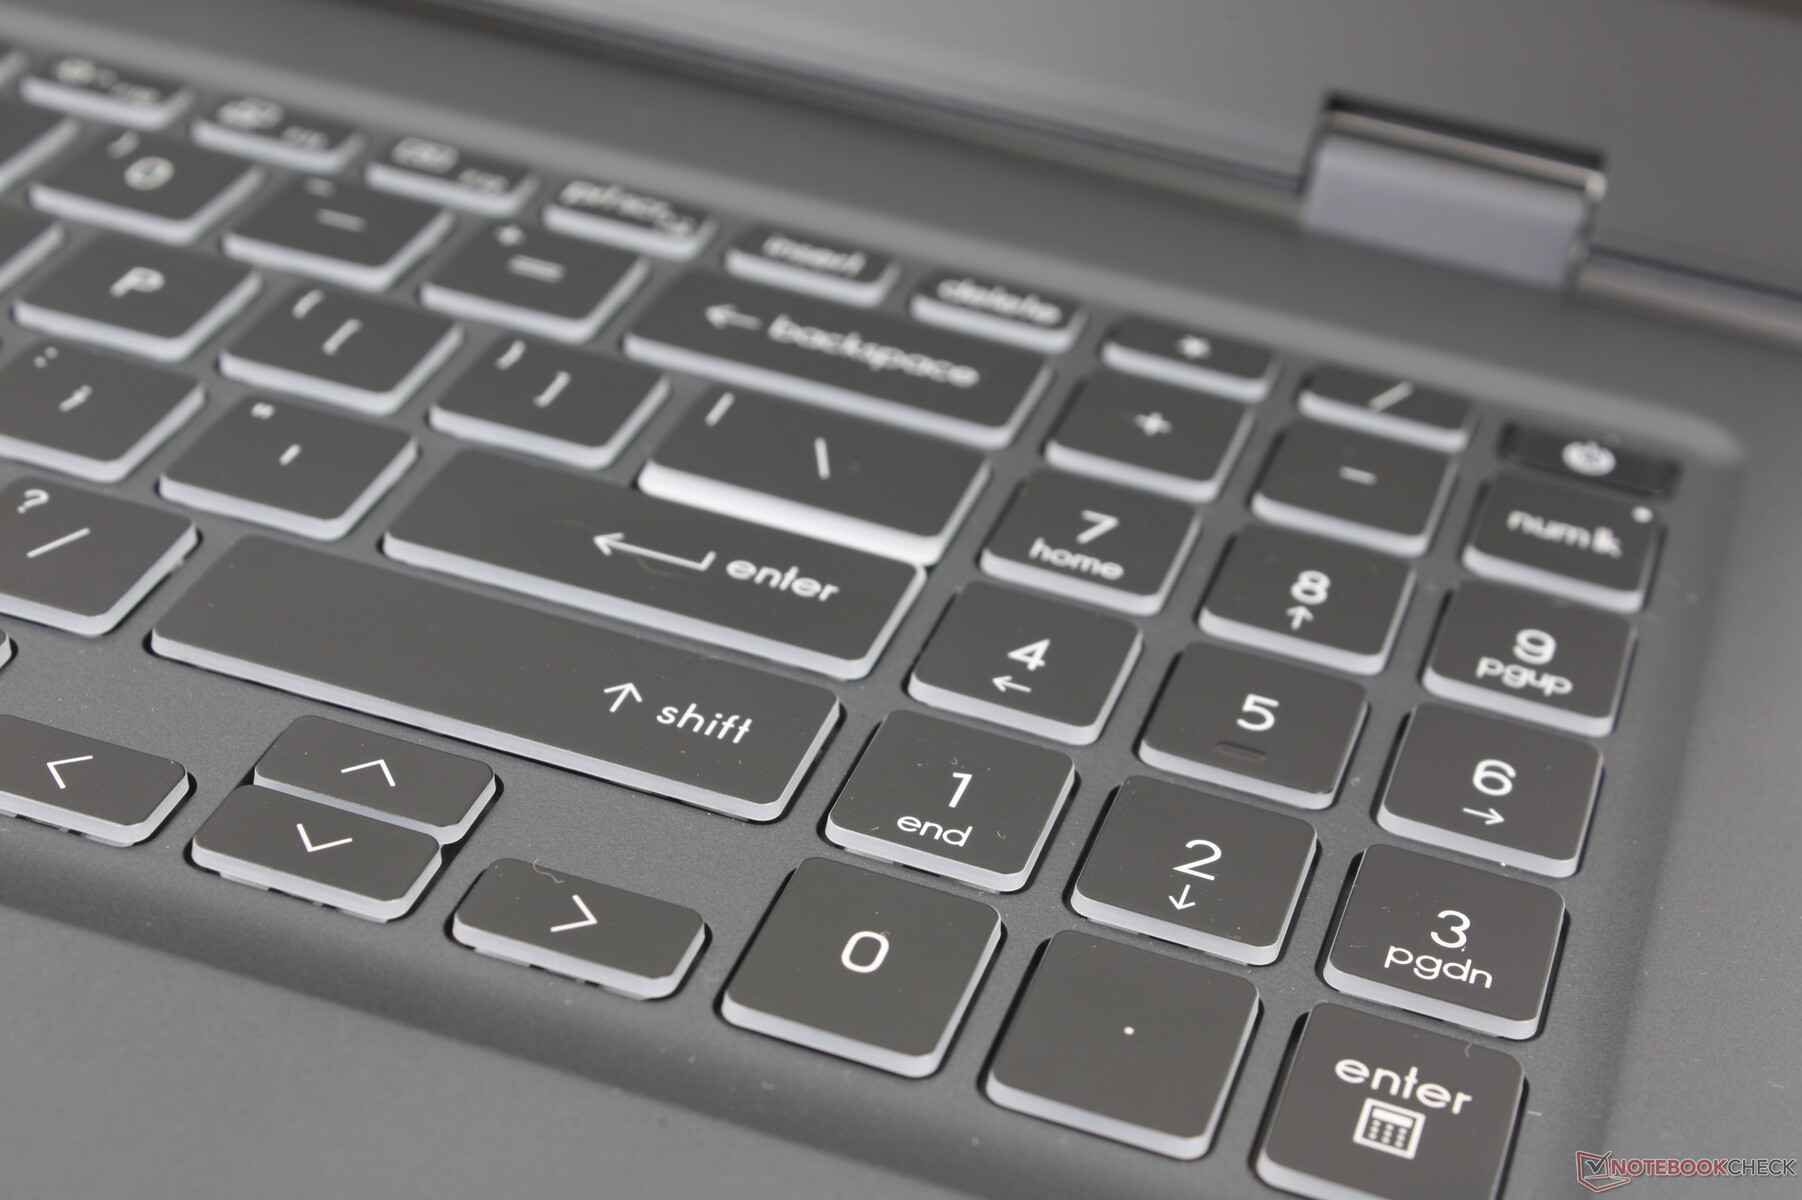
La tastiera è stata rinnovata per includere un tastierino numerico integrato. Per il resto, il feedback dei tasti è identico a quello del Prestige 15, per un'esperienza di digitazione simile, nonostante le modifiche al layout. Riteniamo che la corsa dei tasti sia ancora notevolmente inferiore rispetto ai tasti dei portatili da gioco MSI o della serie concorrente HP Spectre. Non sono eccessivamente morbidi o scomodi, ma un feedback più solido o più nitido ad ogni pressione non guasterebbe.
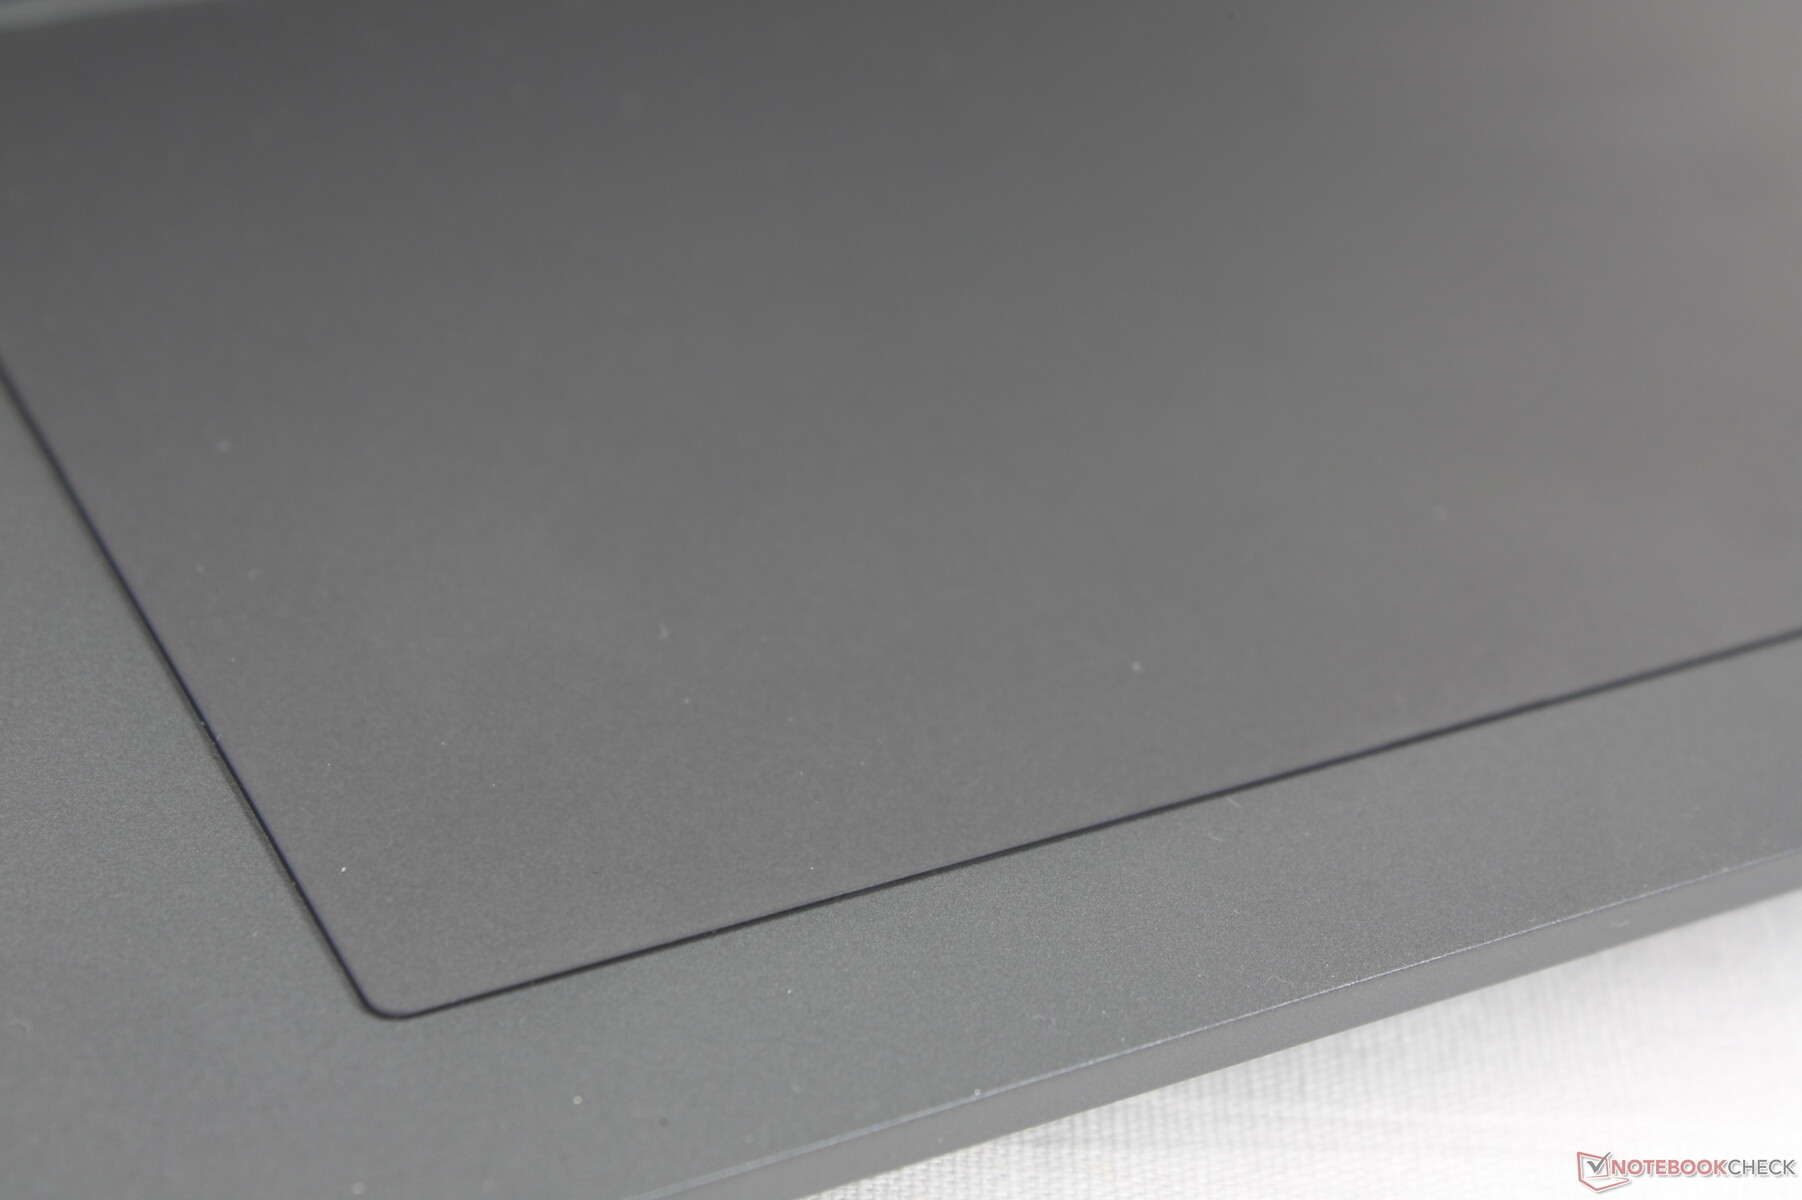
Touchpad
Il clickpad è ora molto più grande (15 x 9 cm) per ovviare alle dimensioni scomode e strette del clickpad sui vecchi modelli Prestige 15 design. La trazione è fluida e affidabile, senza impuntamenti anche quando scivola a velocità ridotta.
Il feedback quando fa clic è solo nella media, se non un po' spugnoso. La pressione richiede molta forza da parte del dito e quindi le azioni possono diventare stancanti senza un mouse esterno.

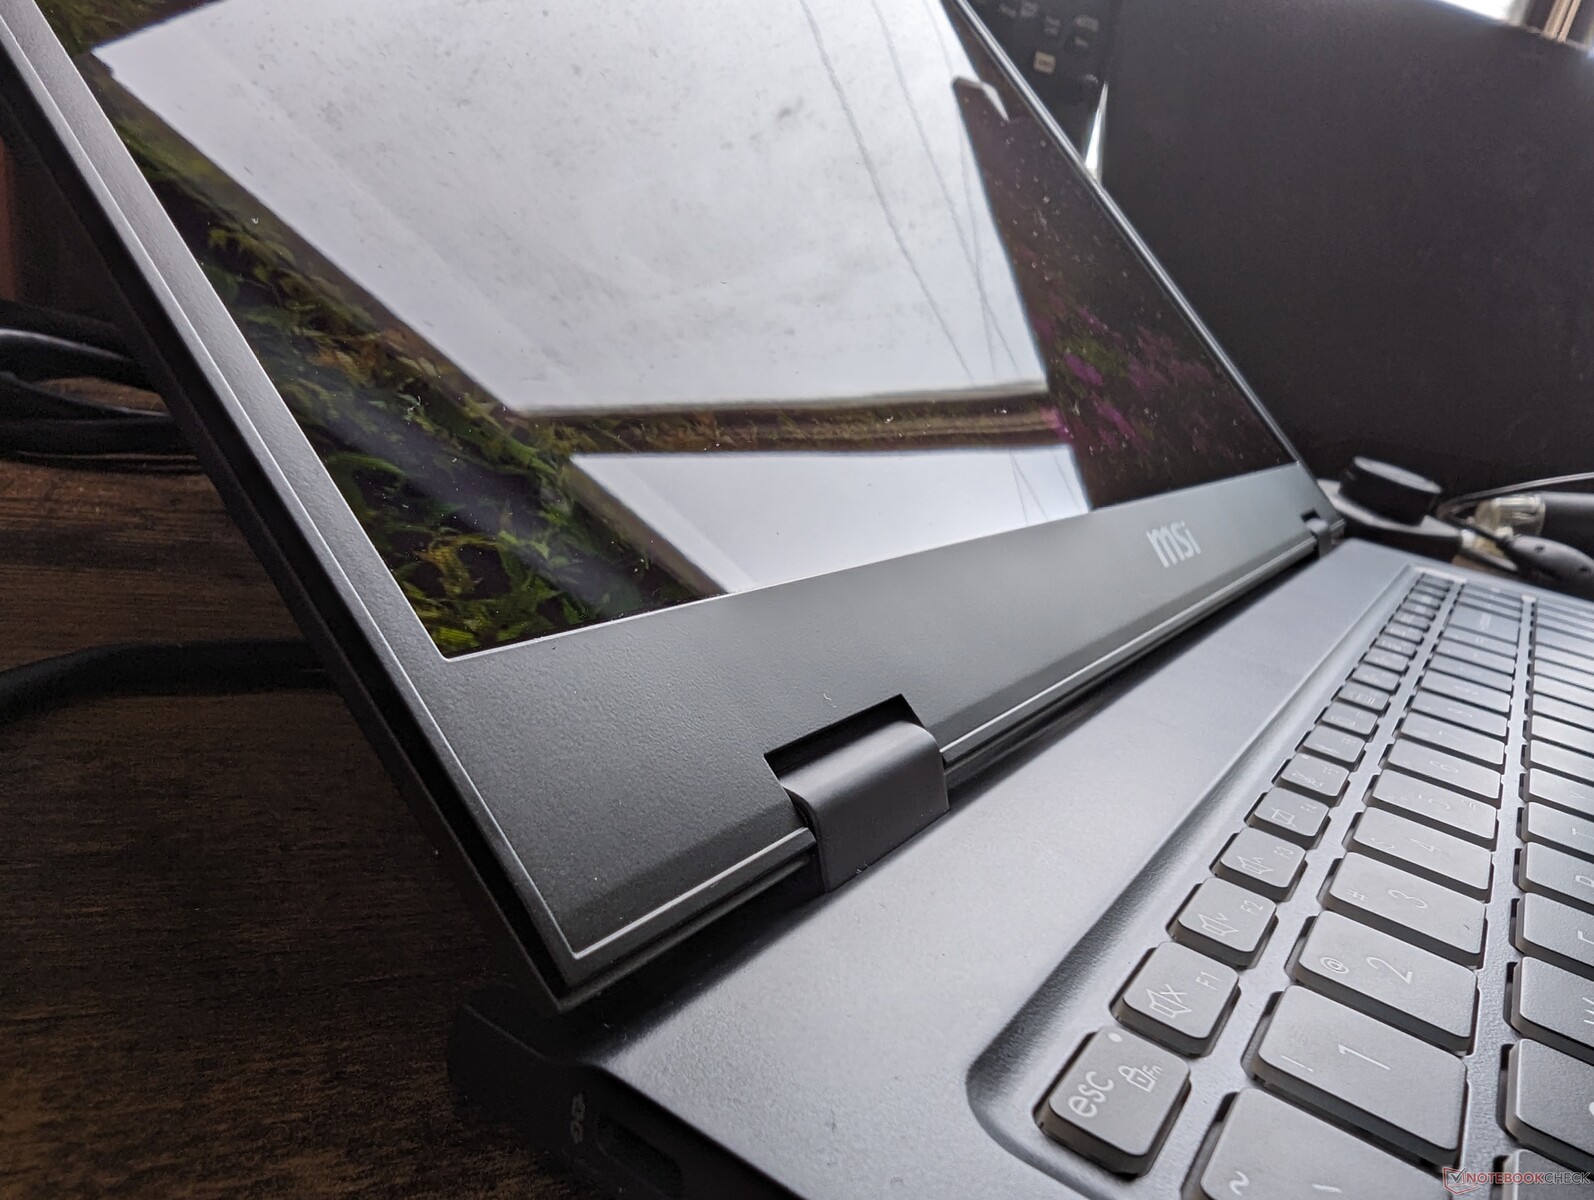
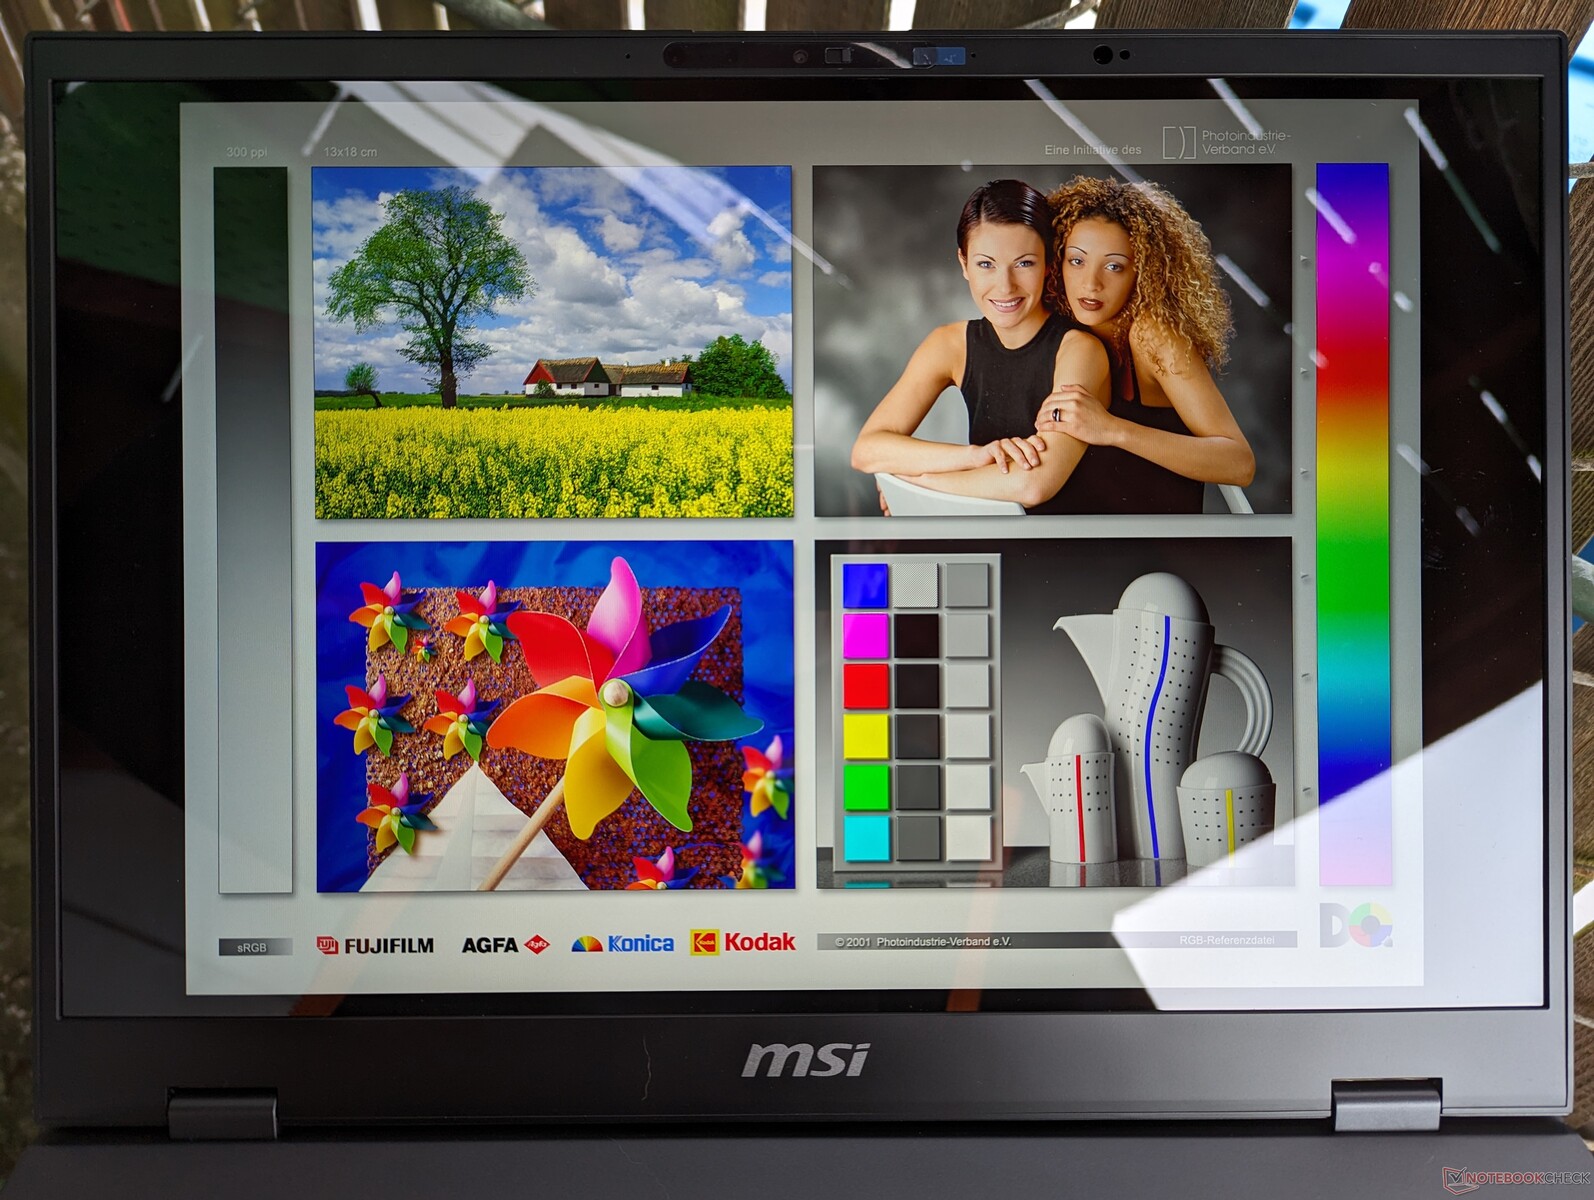
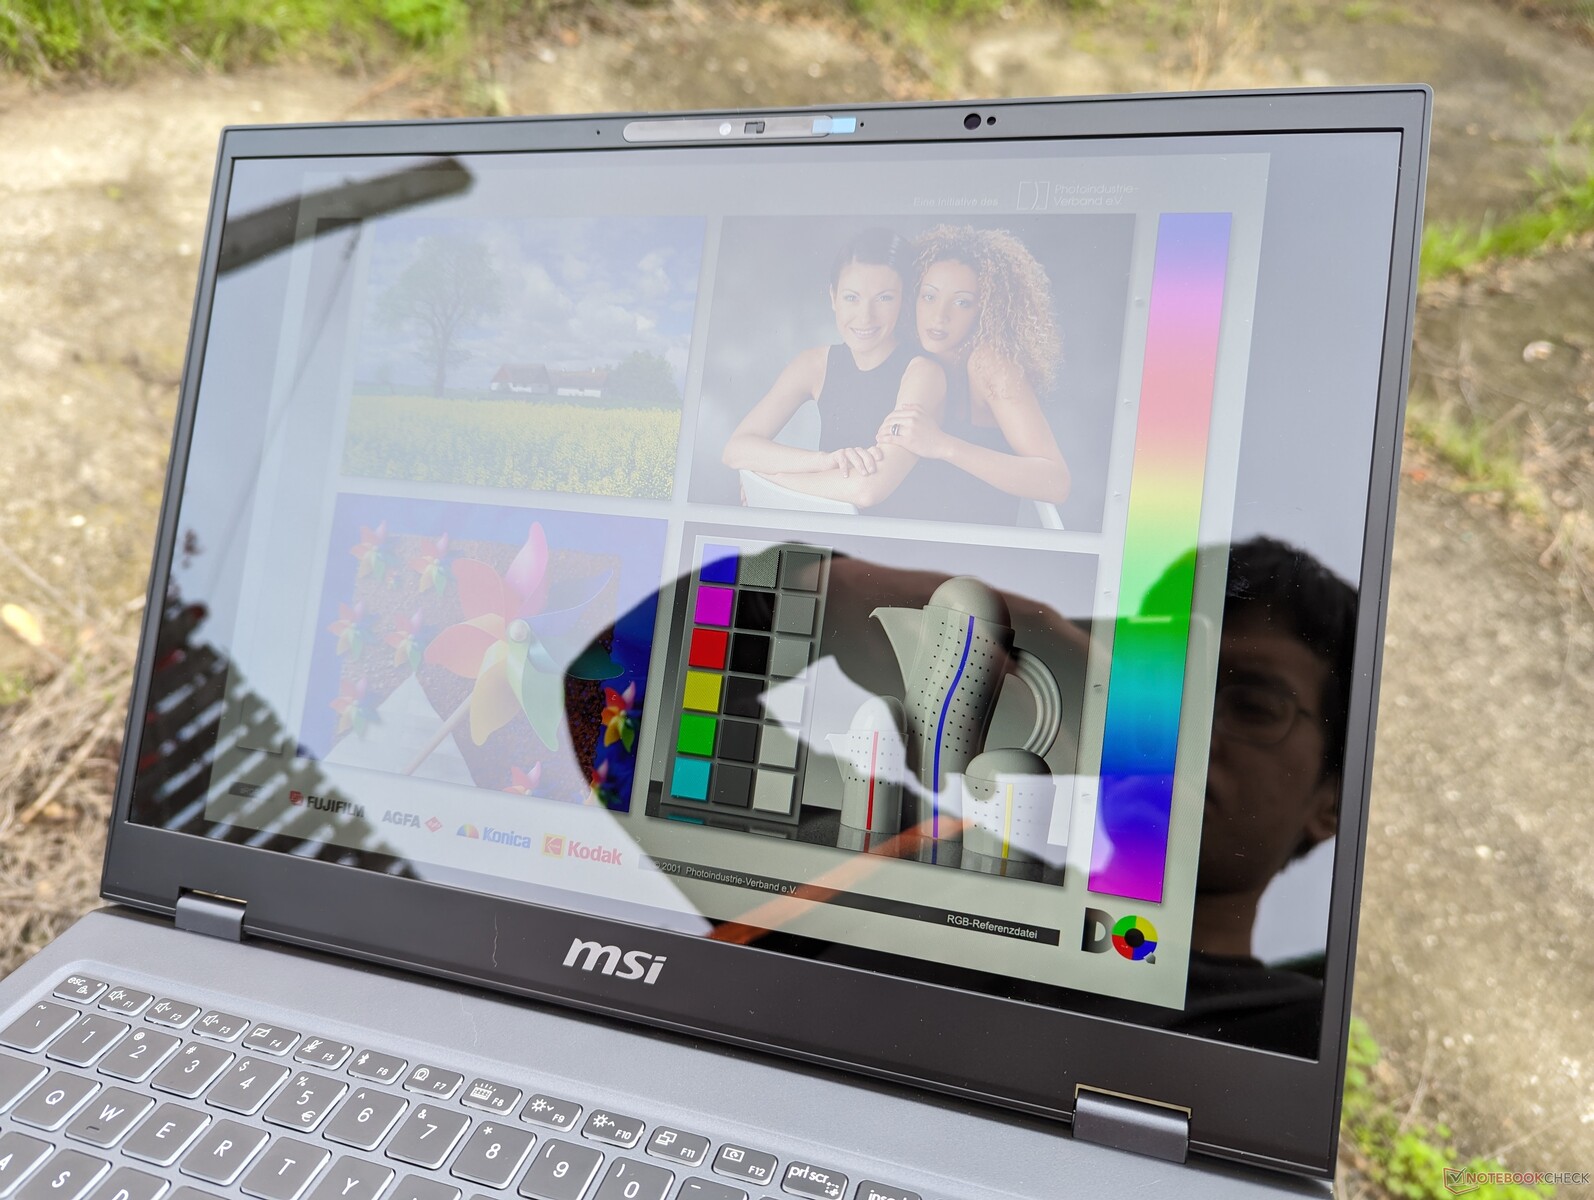
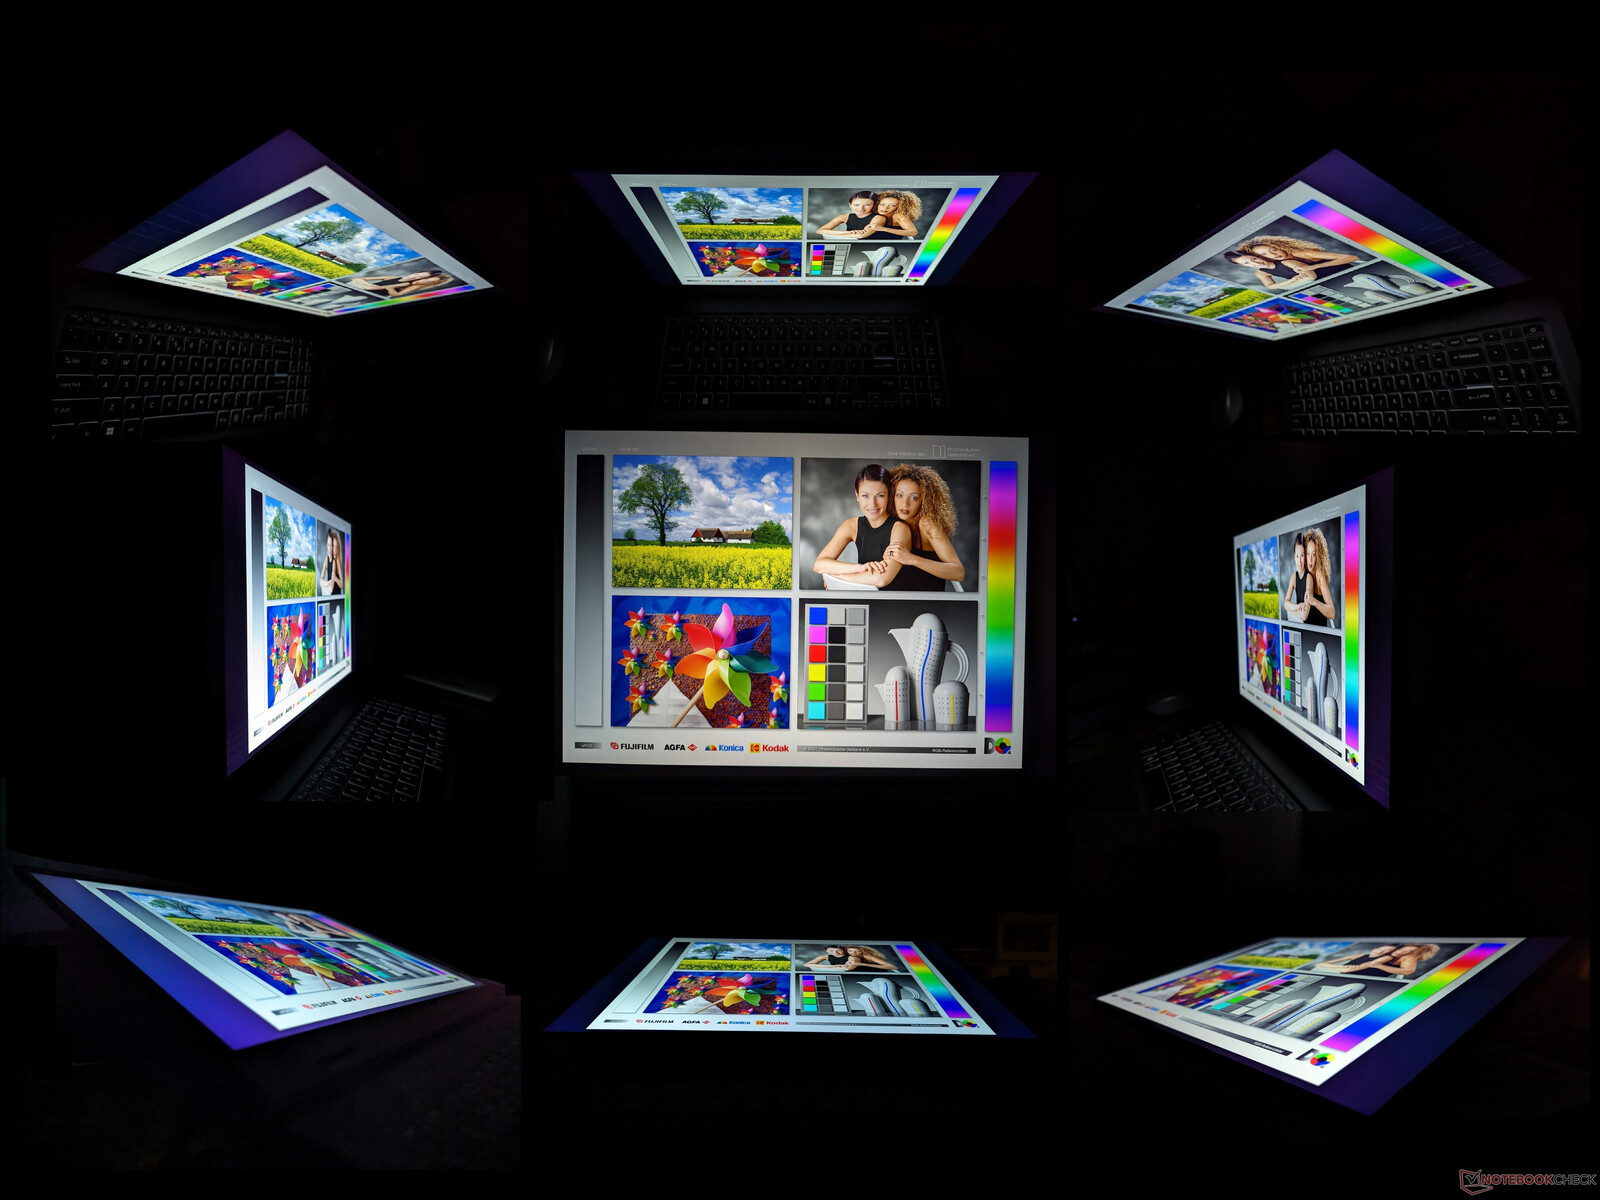
Display - DCI-P3 completo su tutte le SKU
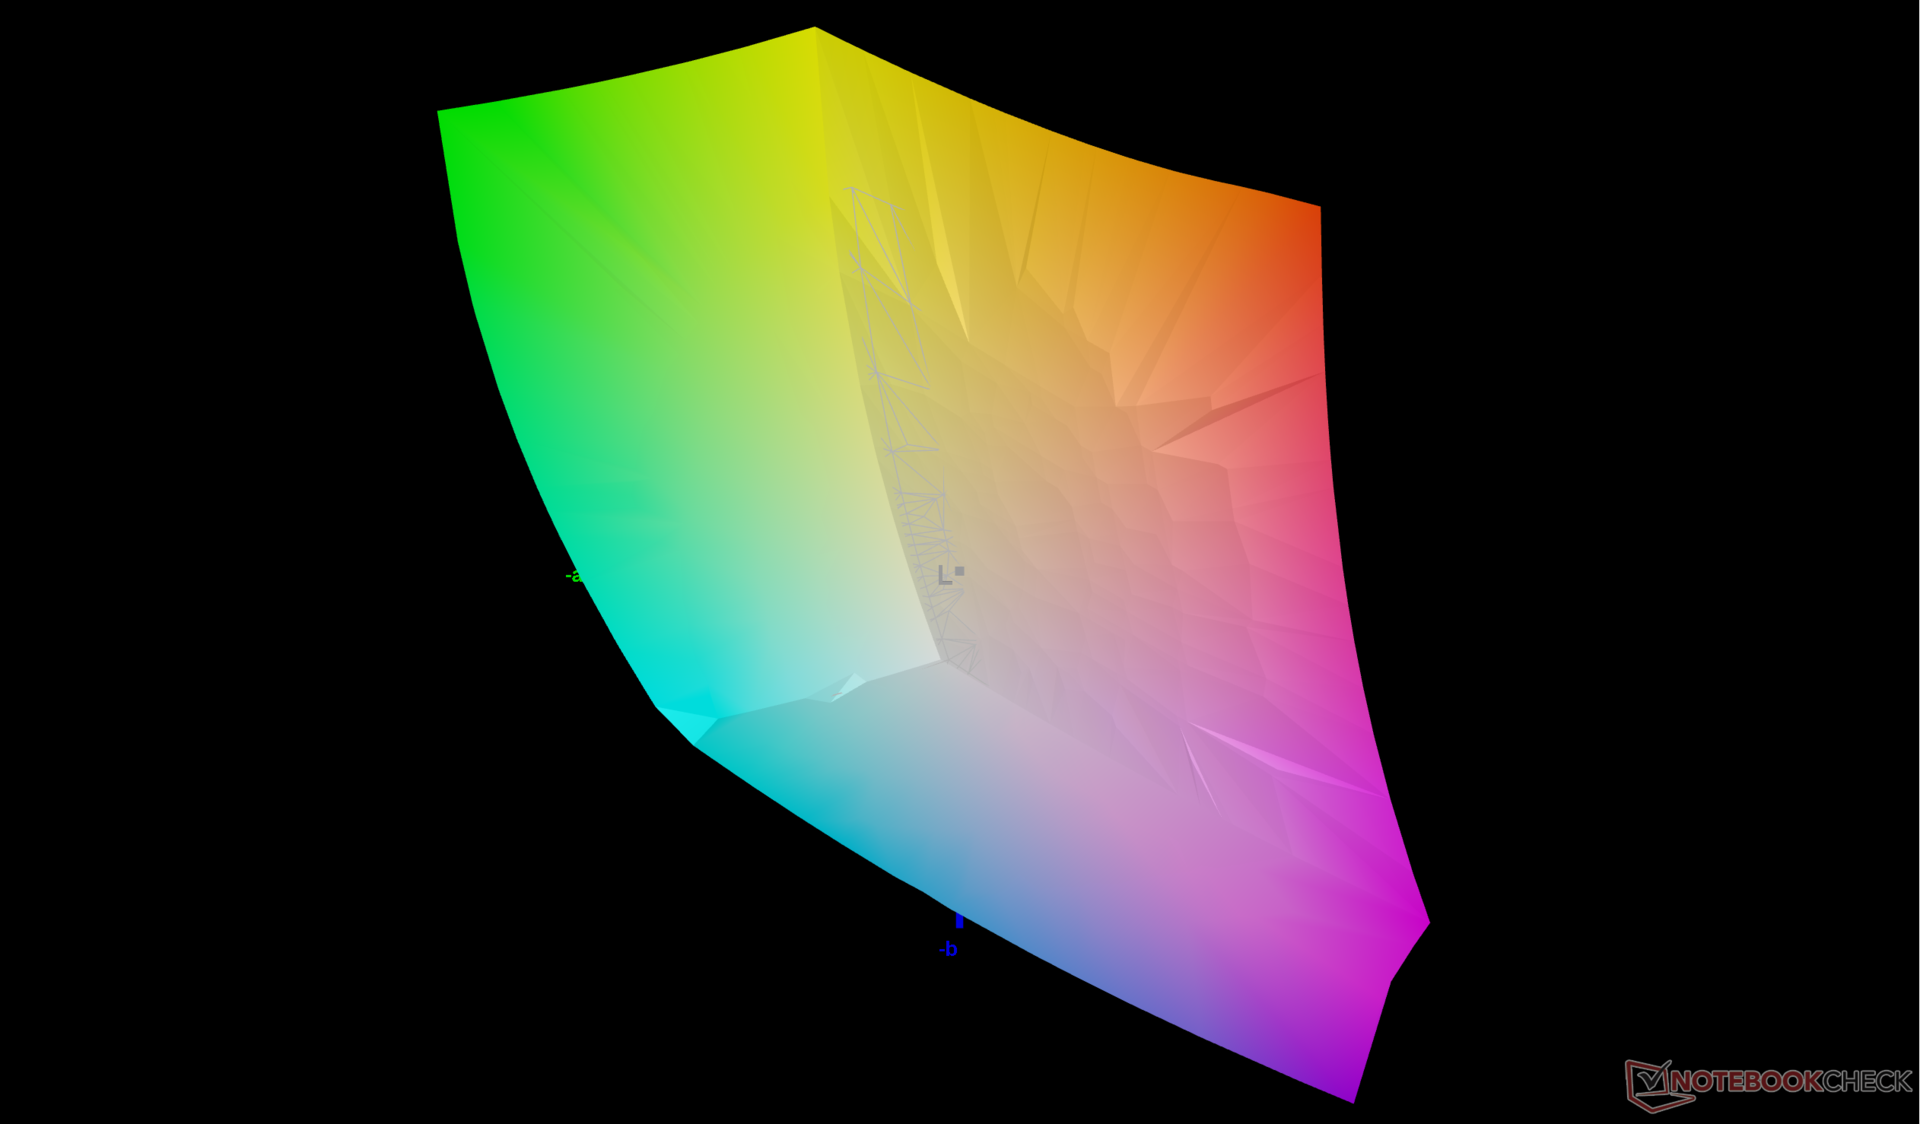
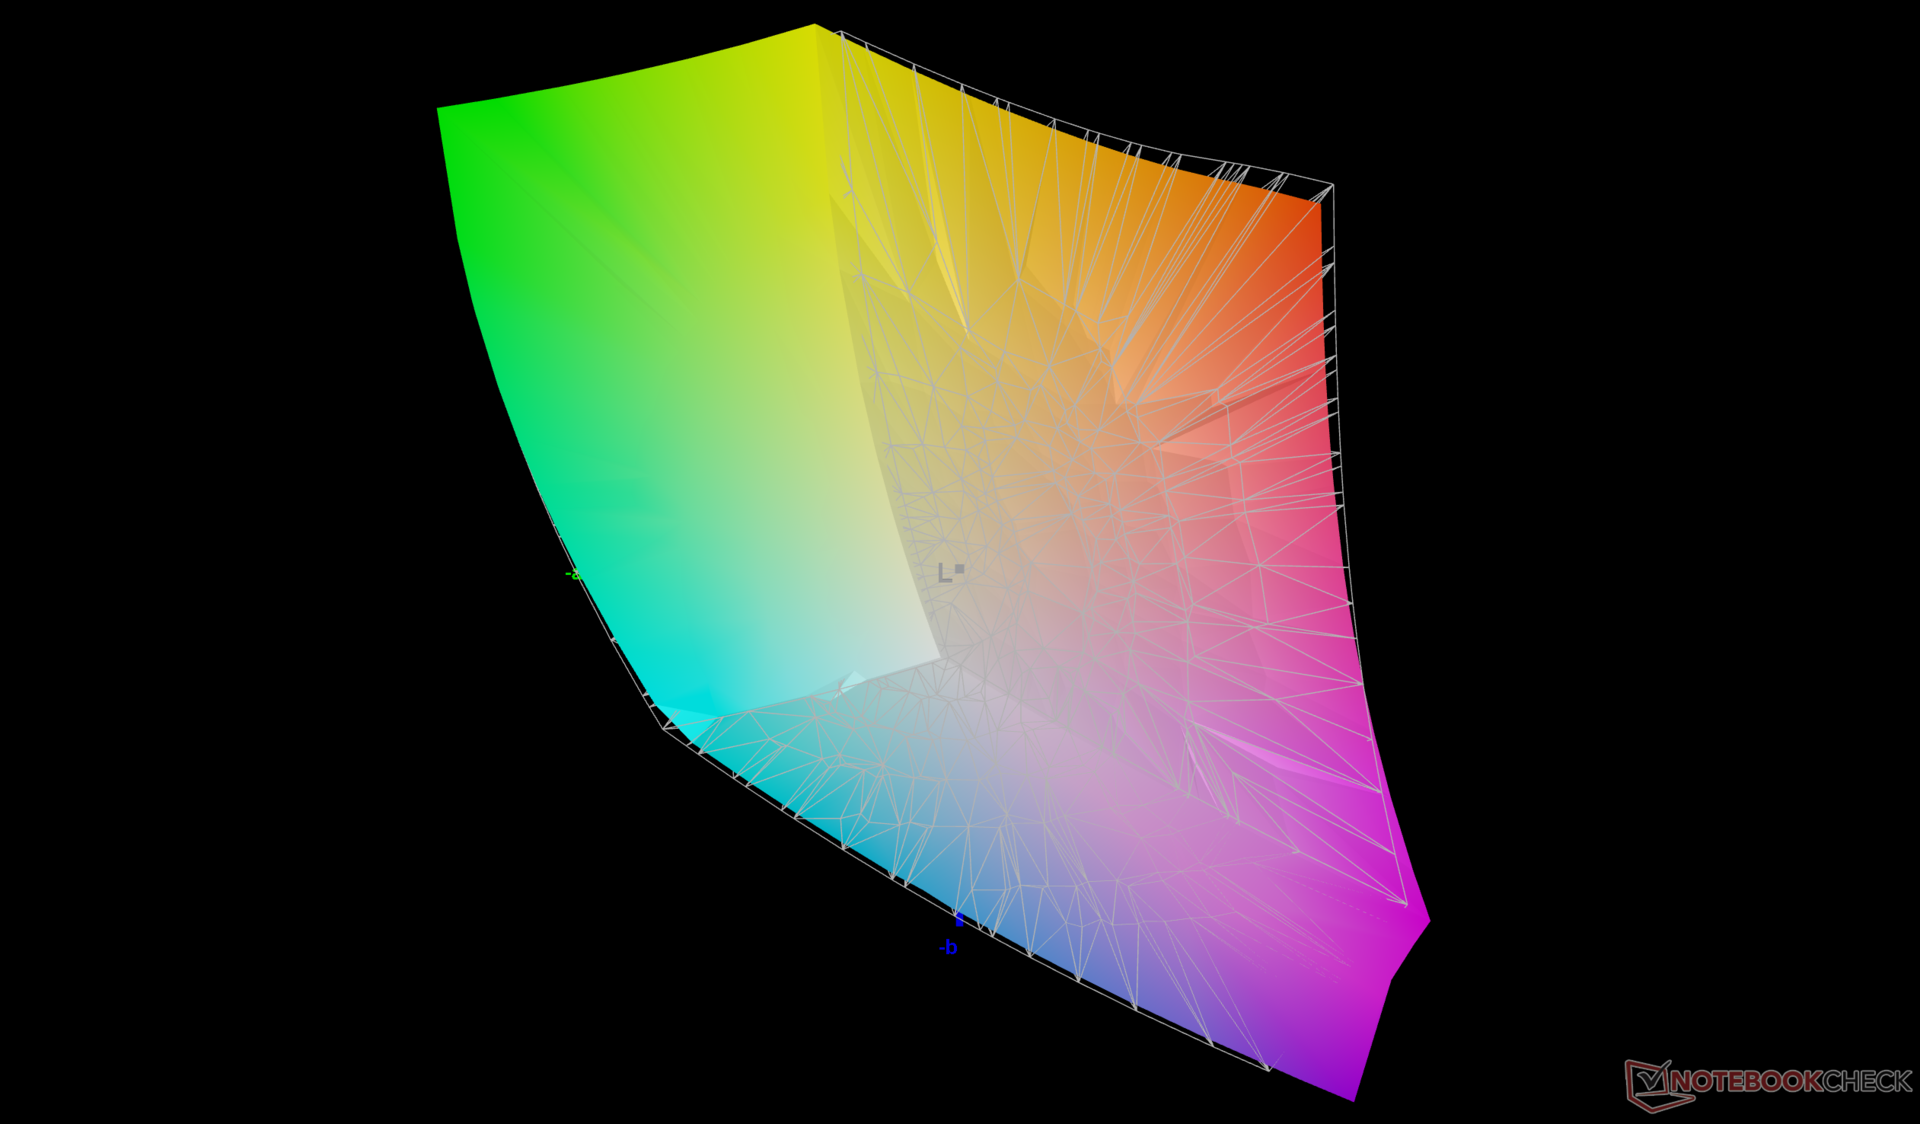
Il Prestige 16 è il primo nel nostro database ad essere dotato del pannello AU Optronics B160QAN03.R. Questo pannello IPS luminoso e brillante è di qualità molto elevata, con colori DCI-P3 completi e nessun problema di granulosità. Tuttavia, i tempi di risposta lenti in bianco e nero, la mancanza di sincronizzazione adattiva e la modesta frequenza di aggiornamento di 60 Hz lo rendono più adatto all'editing grafico che al gioco.
È disponibile una seconda opzione di display con OLED e una risoluzione nativa superiore. Nessuno dei due pannelli supporta la funzionalità touchscreen.


| |||||||||||||||||||||||||
Distribuzione della luminosità: 87 %
Al centro con la batteria: 473.6 cd/m²
Contrasto: 2493:1 (Nero: 0.19 cd/m²)
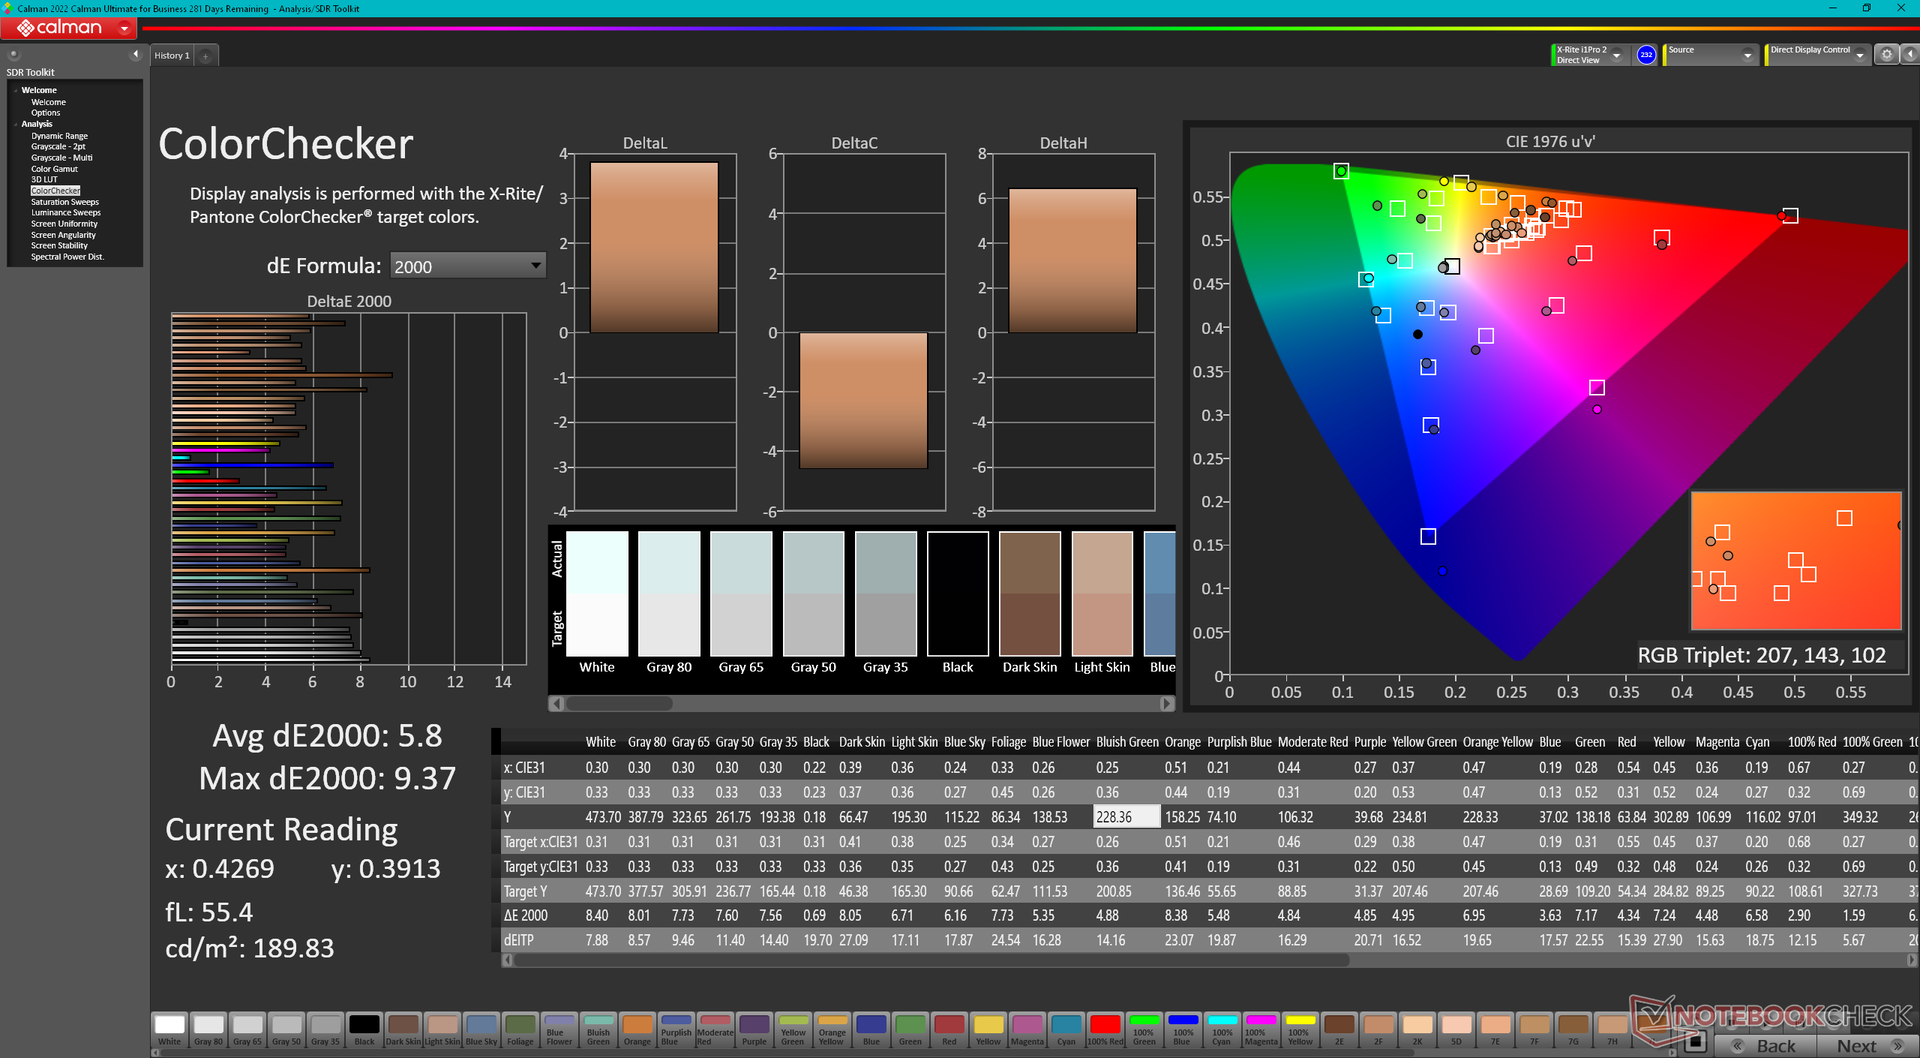
ΔE ColorChecker Calman: 5.9 | ∀{0.5-29.43 Ø4.71}
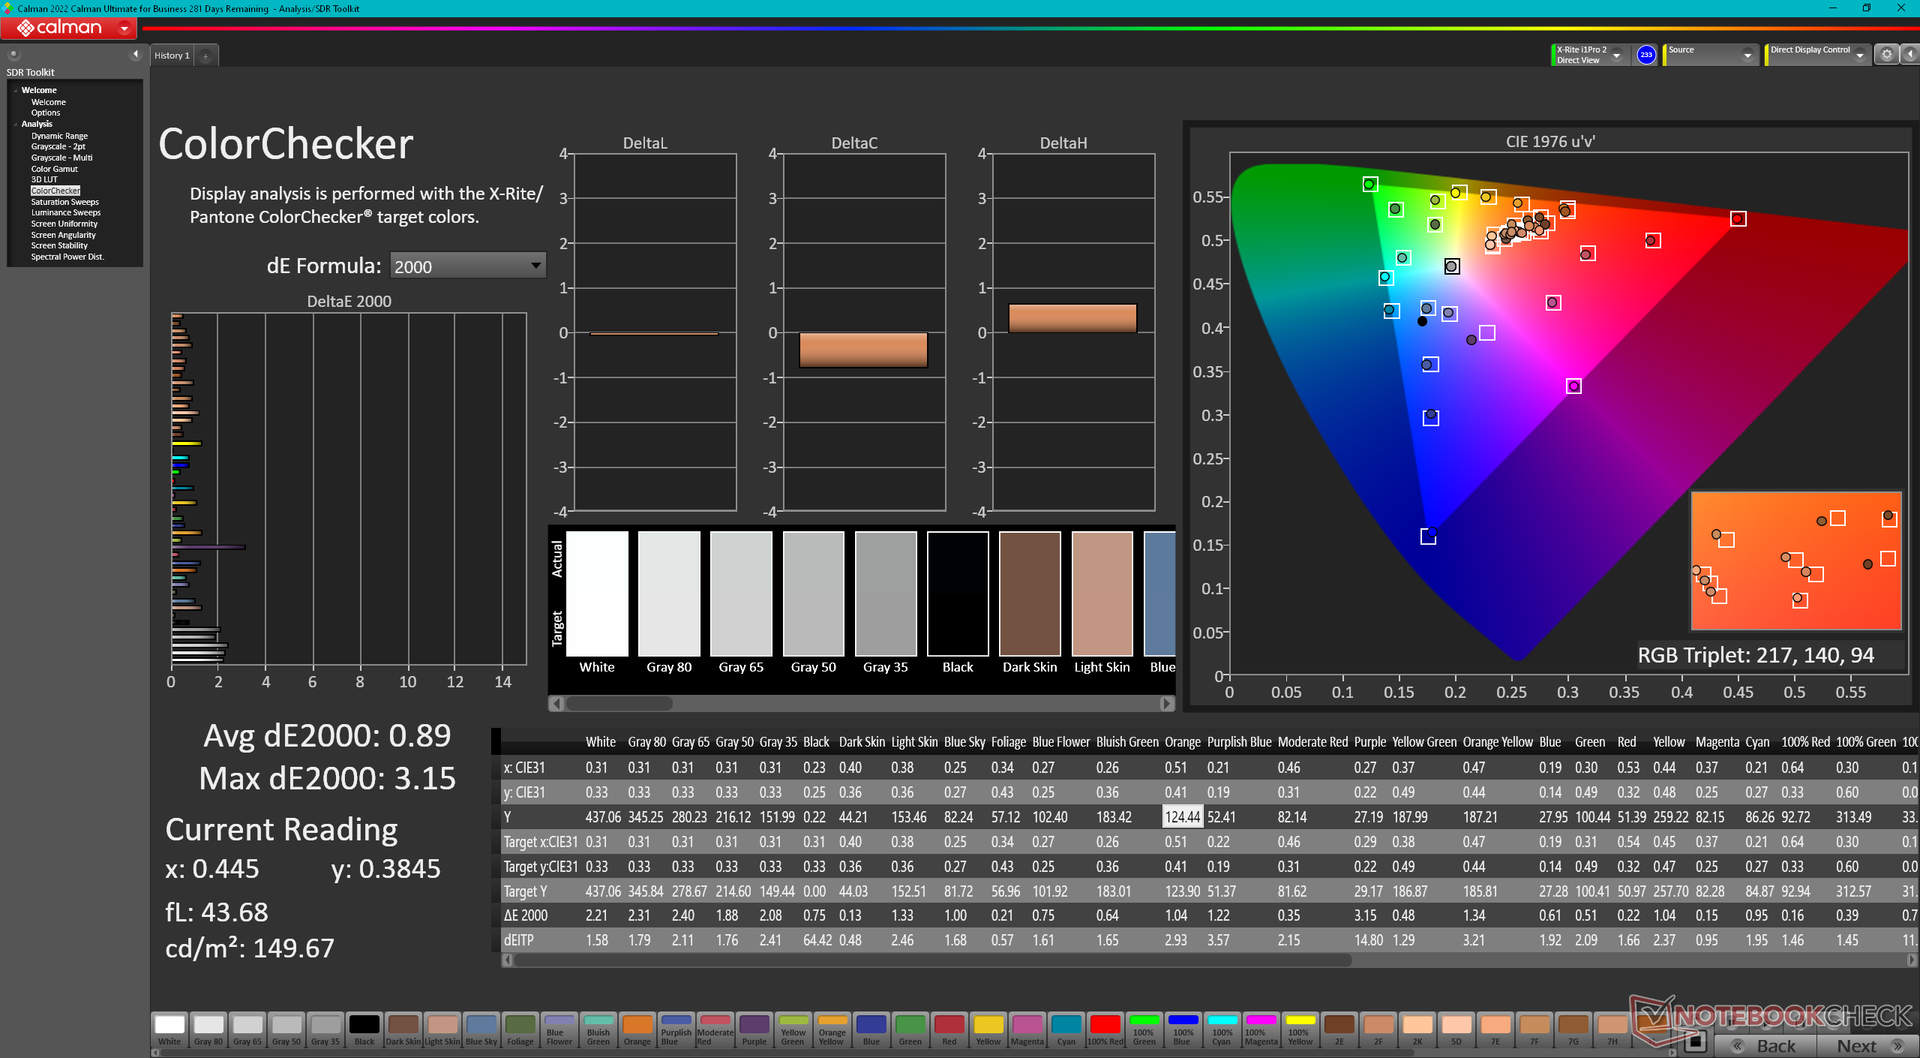
calibrated: 0.89
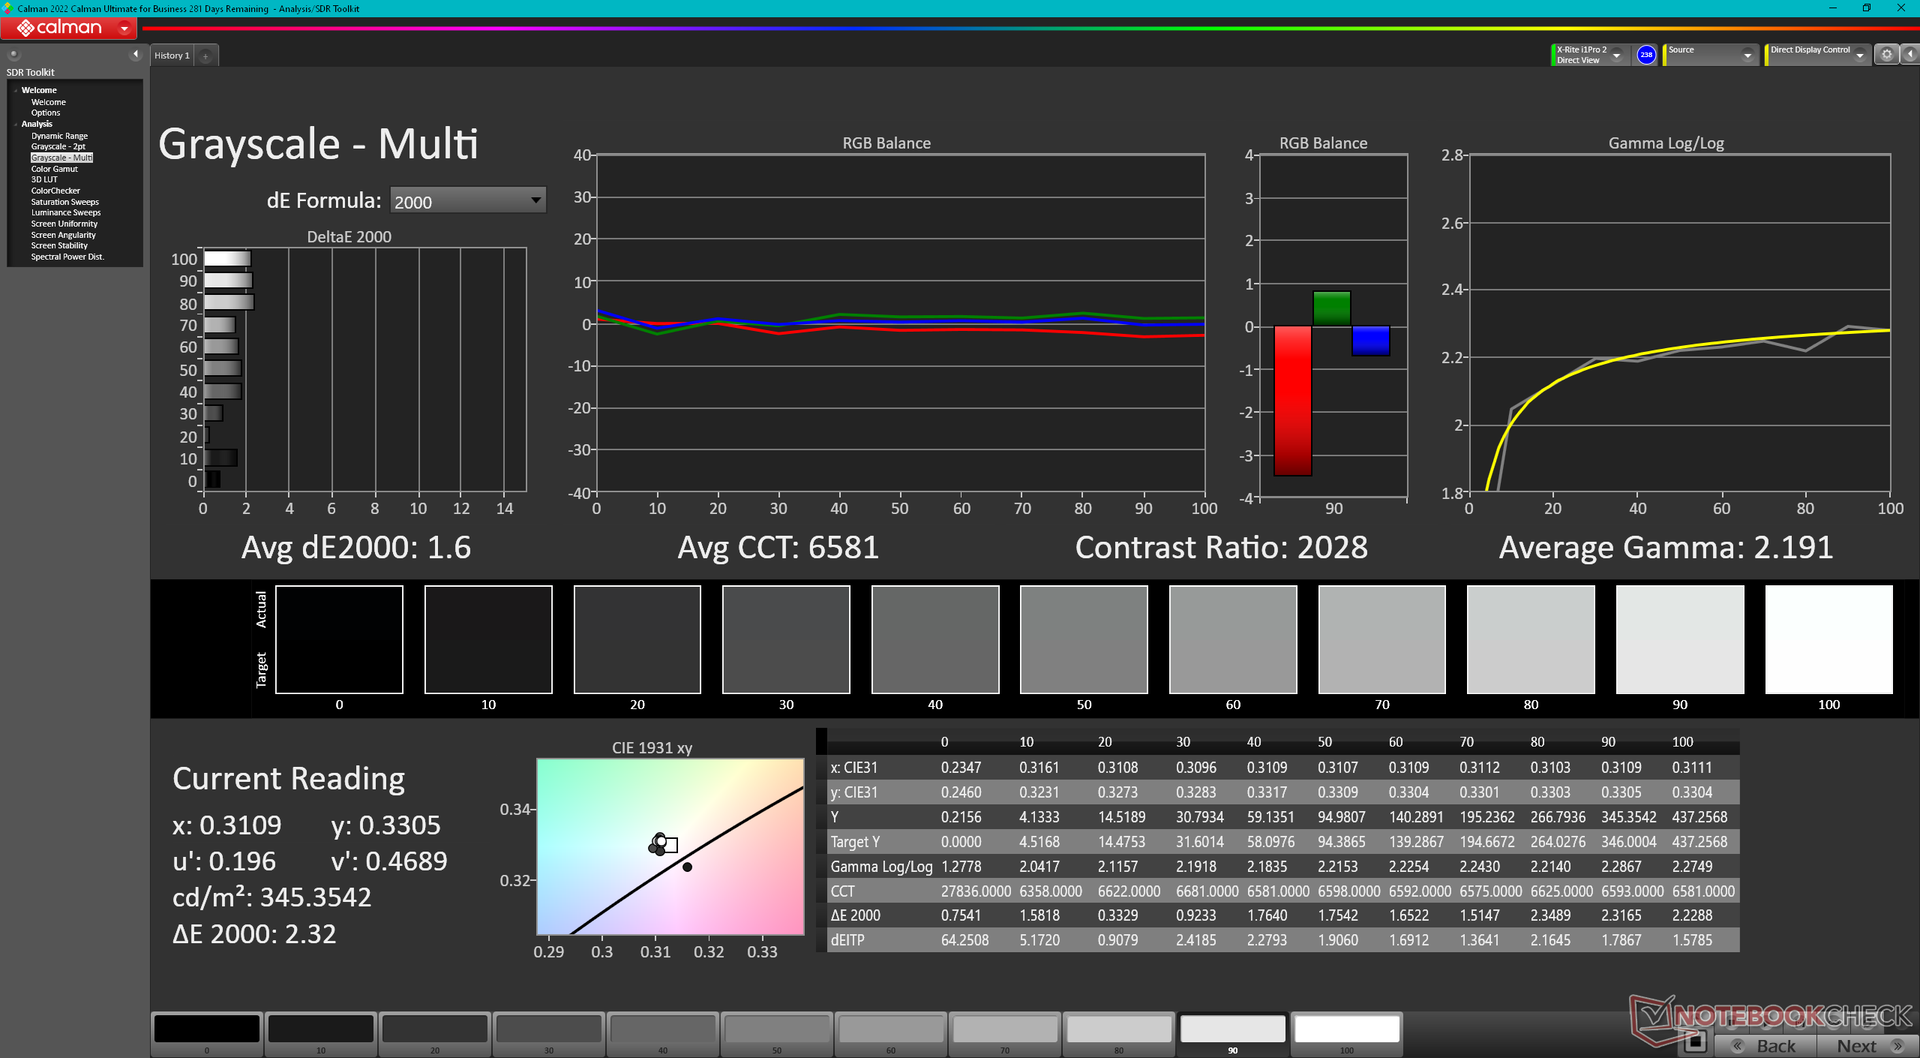
ΔE Greyscale Calman: 7.3 | ∀{0.09-98 Ø4.96}
84.6% AdobeRGB 1998 (Argyll 3D)
99.8% sRGB (Argyll 3D)
96.7% Display P3 (Argyll 3D)
Gamma: 1.9
CCT: 7260 K
| MSI Prestige 16 B1MG-001US AU Optronics B160QAN03.R, IPS, 2560x1600, 16" | MSI Prestige 15 A12UD-093 Sharp LQ156D1JW42, IPS, 3840x2160, 15.6" | LG Gram 2in1 16 16T90R - G.AA78G LP160WQ1-SPB2, IPS, 2560x1600, 16" | Lenovo ThinkBook 16 G6 ABP LEN160WUXGA, IPS, 1920x1200, 16" | Asus VivoBook Pro 16 K6602VU Samsung ATNA60BX01-1, OLED, 3200x2000, 16" | Dell Inspiron 16 Plus 7630 LG Philips 160WQ2, IPS, 2560x1600, 16" | |
|---|---|---|---|---|---|---|
| Display | -3% | 0% | -49% | 5% | -14% | |
| Display P3 Coverage (%) | 96.7 | 80.48 -17% | 96.5 0% | 40.4 -58% | 98.7 2% | 70.1 -28% |
| sRGB Coverage (%) | 99.8 | 96.95 -3% | 99.9 0% | 59.8 -40% | 99.7 0% | 99.6 0% |
| AdobeRGB 1998 Coverage (%) | 84.6 | 94.02 11% | 84.6 0% | 42 -50% | 96.5 14% | 72.3 -15% |
| Response Times | 10% | 30% | 32% | 80% | 29% | |
| Response Time Grey 50% / Grey 80% * (ms) | 49.4 ? | 51 ? -3% | 38.4 ? 22% | 32.8 ? 34% | 0.68 ? 99% | 35 ? 29% |
| Response Time Black / White * (ms) | 33.9 ? | 26 ? 23% | 21.4 ? 37% | 23.9 ? 29% | 13.2 ? 61% | 24.2 ? 29% |
| PWM Frequency (Hz) | 240 ? | |||||
| Screen | 27% | -19% | -83% | -13% | 0% | |
| Brightness middle (cd/m²) | 473.6 | 441 -7% | 329 -31% | 310 -35% | 353 -25% | 299.4 -37% |
| Brightness (cd/m²) | 456 | 416 -9% | 310 -32% | 290 -36% | 354 -22% | 290 -36% |
| Brightness Distribution (%) | 87 | 85 -2% | 88 1% | 86 -1% | 98 13% | 92 6% |
| Black Level * (cd/m²) | 0.19 | 0.155 18% | 0.39 -105% | 0.22 -16% | 0.21 -11% | |
| Contrast (:1) | 2493 | 2845 14% | 844 -66% | 1409 -43% | 1426 -43% | |
| Colorchecker dE 2000 * | 5.9 | 1.51 74% | 3.52 40% | 6.2 -5% | 4.23 28% | 4.25 28% |
| Colorchecker dE 2000 max. * | 9.37 | 3.56 62% | 6.96 26% | 24.7 -164% | 7.13 24% | 6.71 28% |
| Colorchecker dE 2000 calibrated * | 0.89 | 1.15 -29% | 5.3 -496% | 2.42 -172% | 0.52 42% | |
| Greyscale dE 2000 * | 7.3 | 2.49 66% | 5.75 21% | 3.8 48% | 2.5 66% | 5.5 25% |
| Gamma | 1.9 116% | 2.17 101% | 2.137 103% | 2.22 99% | 2.4 92% | 2.35 94% |
| CCT | 7260 90% | 6292 103% | 7584 86% | 6011 108% | 6642 98% | 6368 102% |
| Media totale (Programma / Settaggio) | 11% /
17% | 4% /
-8% | -33% /
-60% | 24% /
7% | 5% /
1% |
* ... Meglio usare valori piccoli
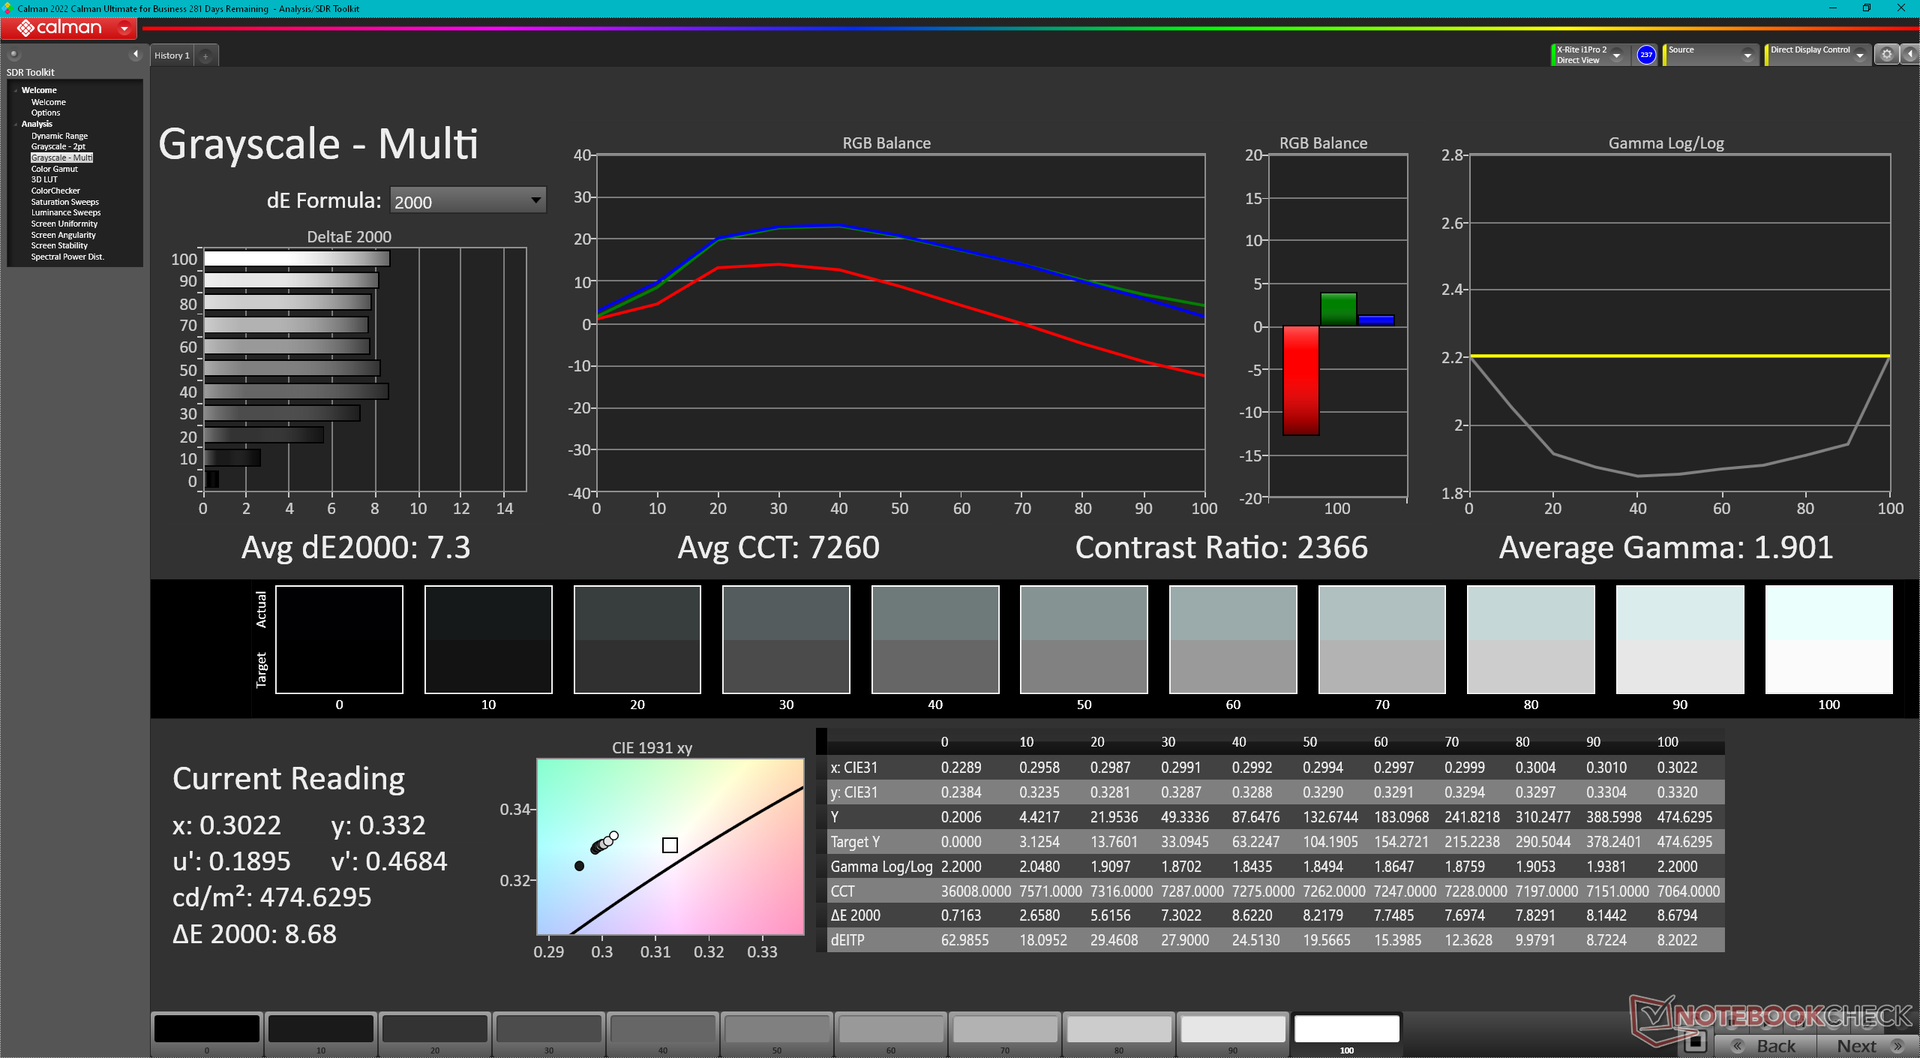
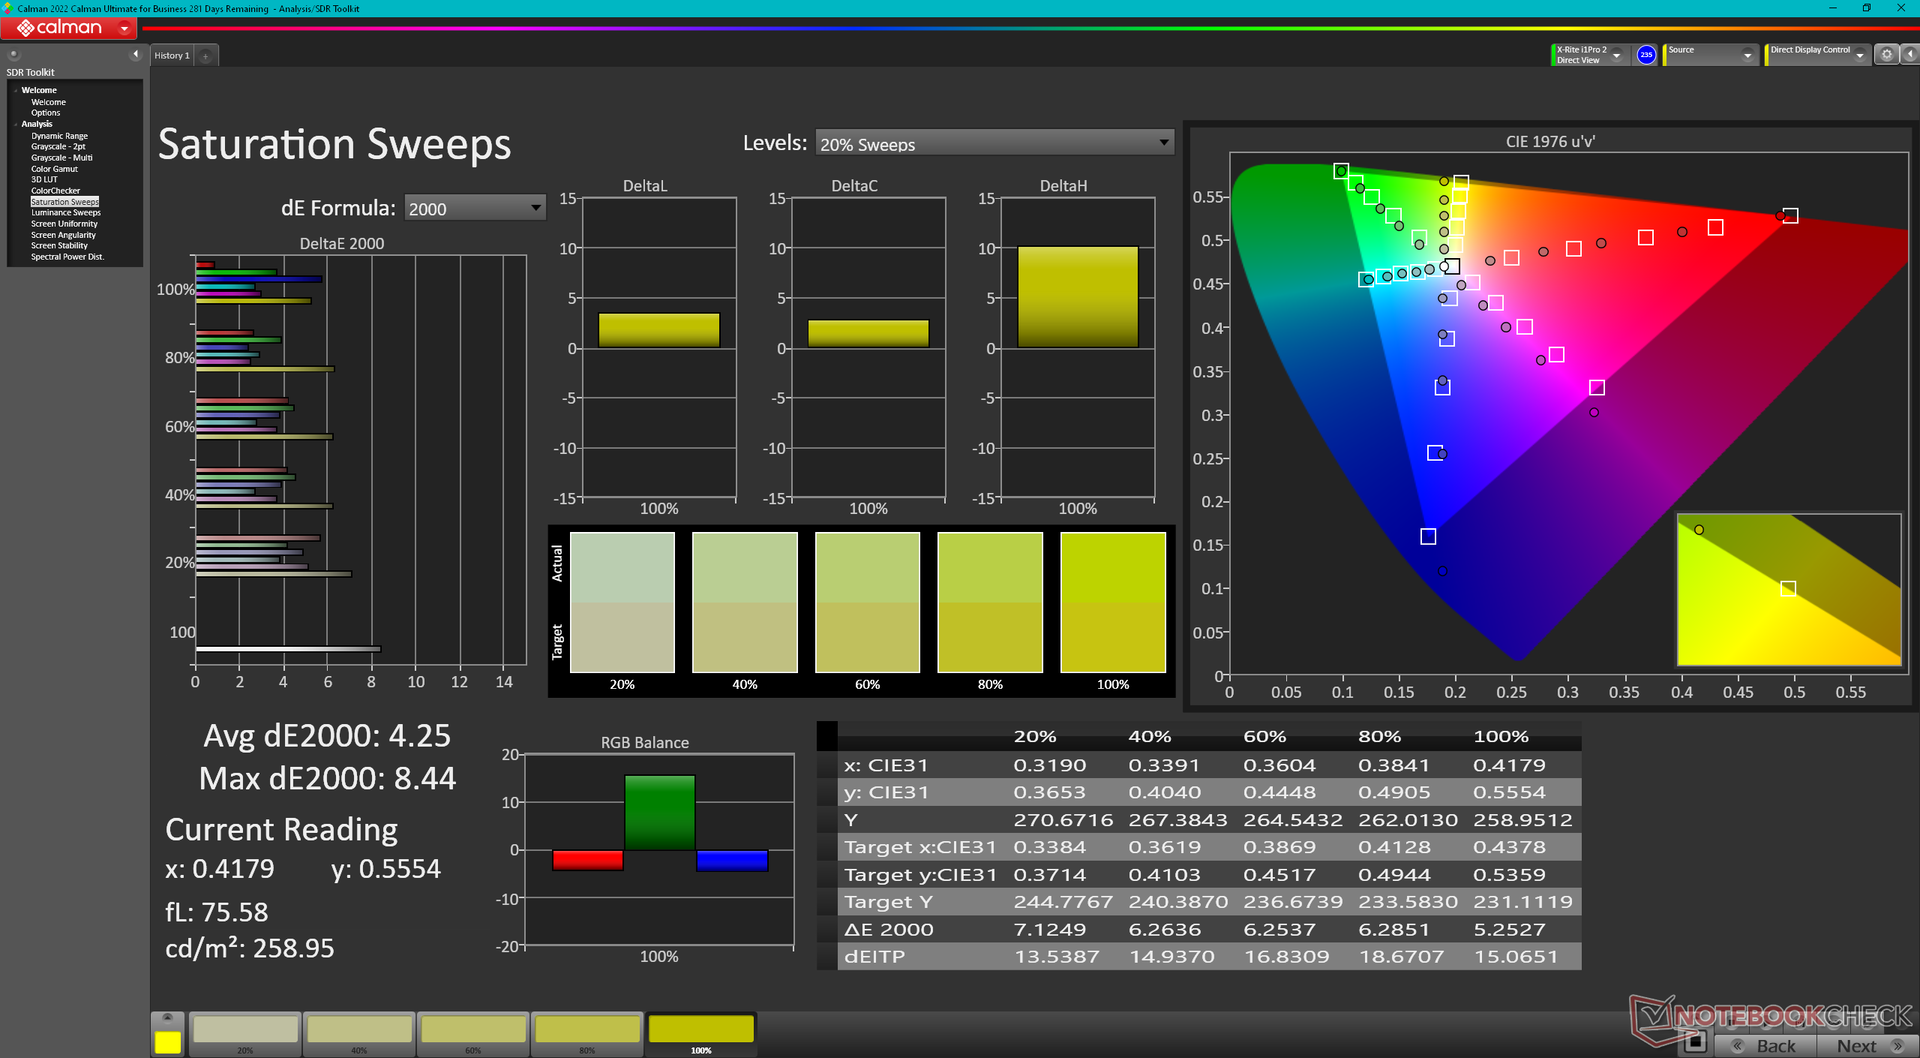
Il display non viene fornito pre-calibrato, il che è un peccato visto che tutte le SKU supportano i colori DCI-P3. La temperatura del colore è eccessivamente fredda per i valori medi di DeltaE della scala di grigi e del colore relativamente alti, rispettivamente di 7,3 e 5,8. La calibrazione del pannello da parte nostra farebbe scendere questi valori medi a <2 ciascuno. Il nostro profilo ICM calibrato è disponibile gratuitamente per il download qui sopra.
Tempi di risposta del Display
| ↔ Tempi di risposta dal Nero al Bianco | ||
|---|---|---|
| 33.9 ms ... aumenta ↗ e diminuisce ↘ combinato | ↗ 15.6 ms Incremento | 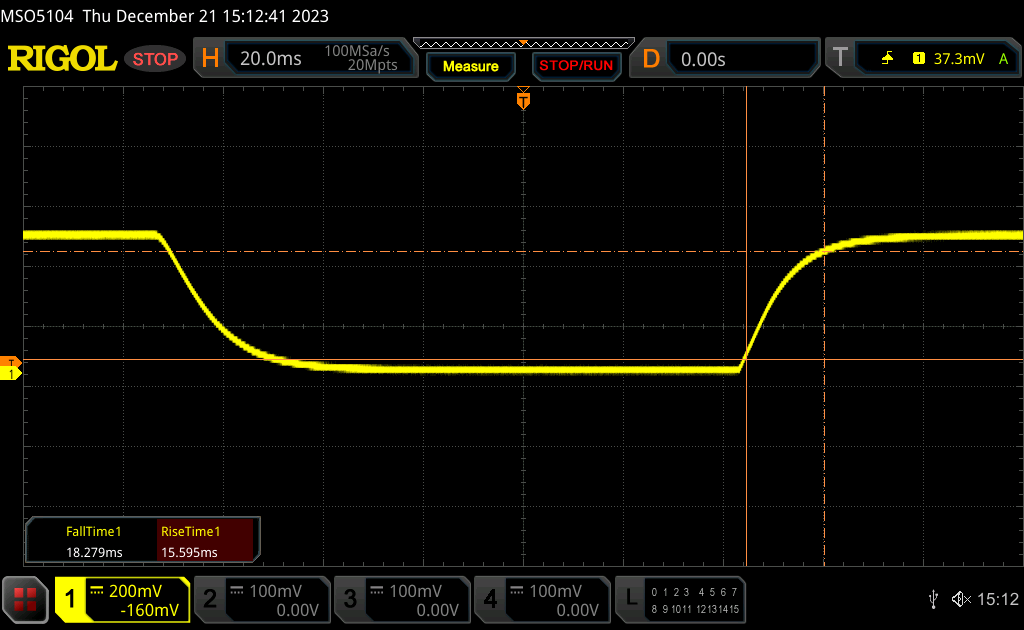 |
| ↘ 18.3 ms Calo | ||
| Lo schermo mostra tempi di risposta lenti nei nostri tests e sarà insoddisfacente per i gamers. In confronto, tutti i dispositivi di test variano da 0.1 (minimo) a 240 (massimo) ms. » 91 % di tutti i dispositivi è migliore. Questo significa che i tempi di risposta rilevati sono peggiori rispetto alla media di tutti i dispositivi testati (19.8 ms). | ||
| ↔ Tempo di risposta dal 50% Grigio all'80% Grigio | ||
| 49.4 ms ... aumenta ↗ e diminuisce ↘ combinato | ↗ 22.6 ms Incremento | 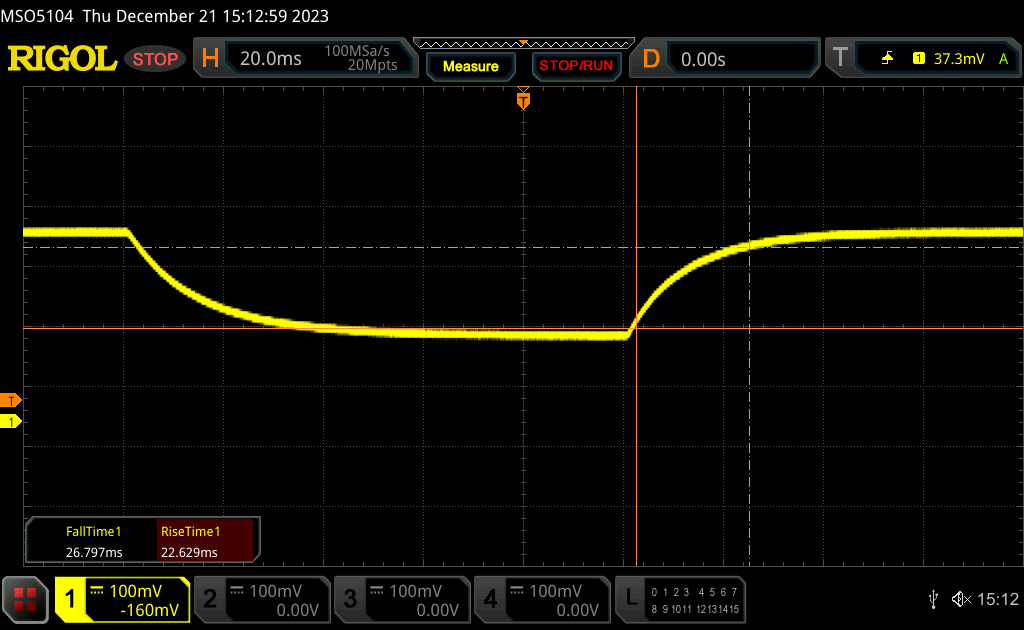 |
| ↘ 26.8 ms Calo | ||
| Lo schermo mostra tempi di risposta lenti nei nostri tests e sarà insoddisfacente per i gamers. In confronto, tutti i dispositivi di test variano da 0.165 (minimo) a 636 (massimo) ms. » 85 % di tutti i dispositivi è migliore. Questo significa che i tempi di risposta rilevati sono peggiori rispetto alla media di tutti i dispositivi testati (31 ms). | ||
Sfarfallio dello schermo / PWM (Pulse-Width Modulation)
| flickering dello schermo / PWM non rilevato | 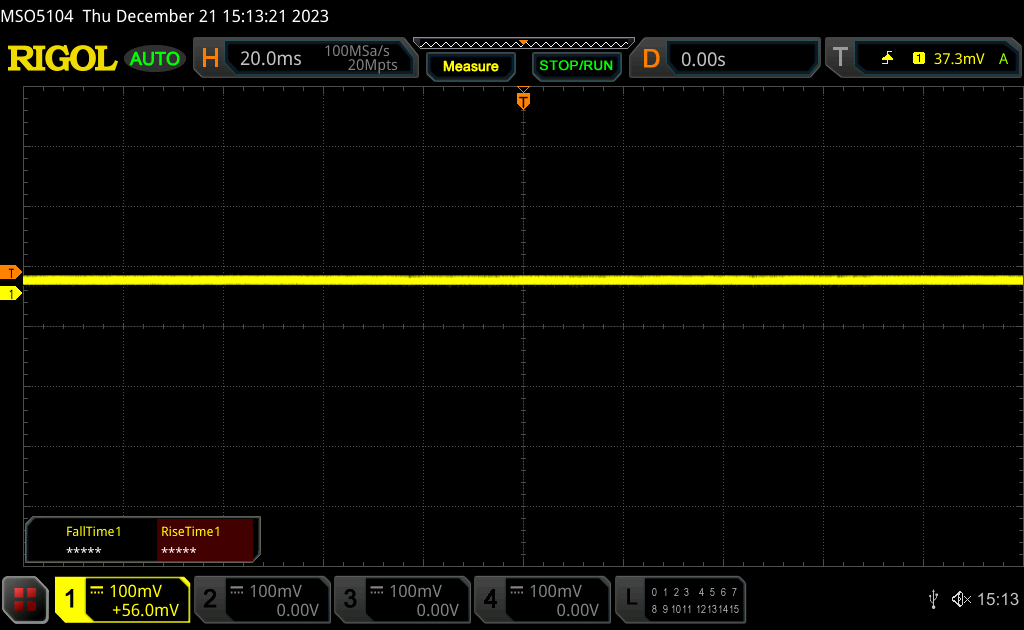 | ||
In confronto: 52 % di tutti i dispositivi testati non utilizza PWM per ridurre la luminosita' del display. Se è rilevato PWM, una media di 7757 (minimo: 5 - massimo: 343500) Hz è stata rilevata. | |||
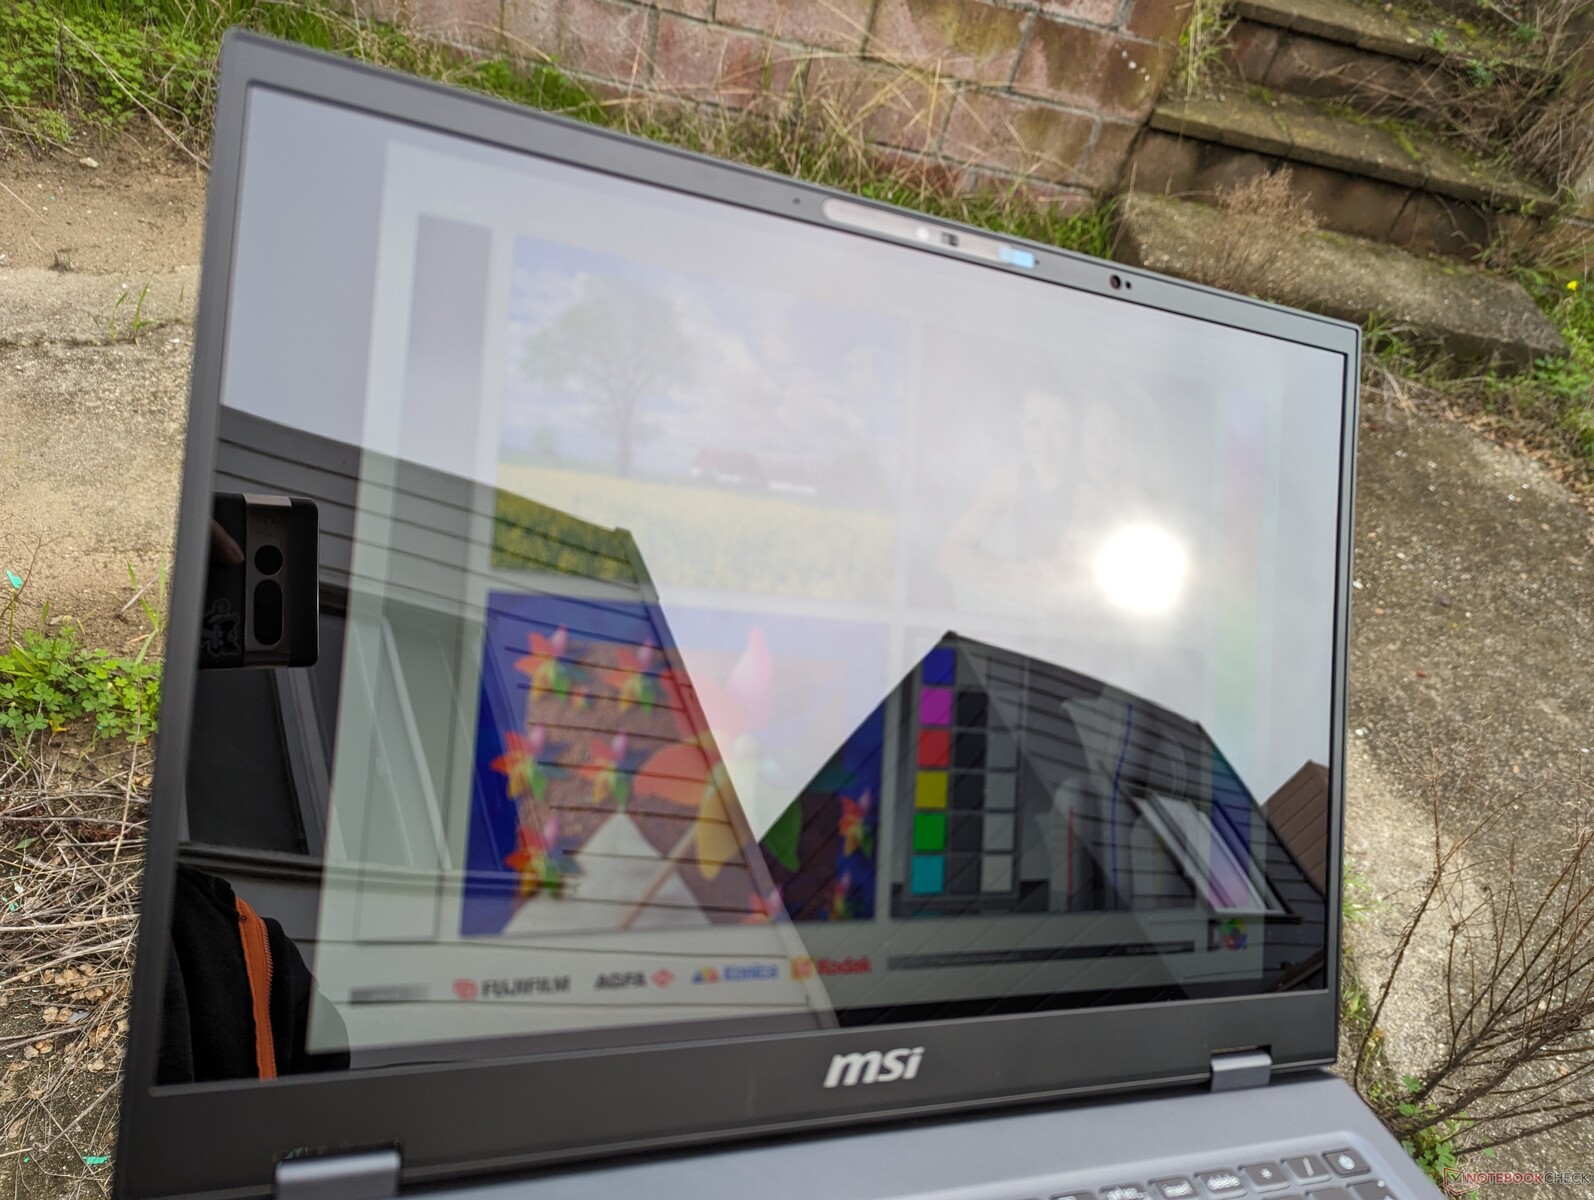
Lo schermo super-lucido può contribuire ad un'immagine più nitida, ma contribuisce anche ad un eccessivo bagliore nella maggior parte degli scenari di utilizzo, soprattutto se all'aperto. Lo schermo Mini-LED del MacBook Pro 16 è circa il 30 percento più luminoso del nostro MSI, per una visibilità generalmente migliore in presenza di un'illuminazione ambientale intensa.
Prestazioni - Un'ascesa vertiginosa
Condizioni del test
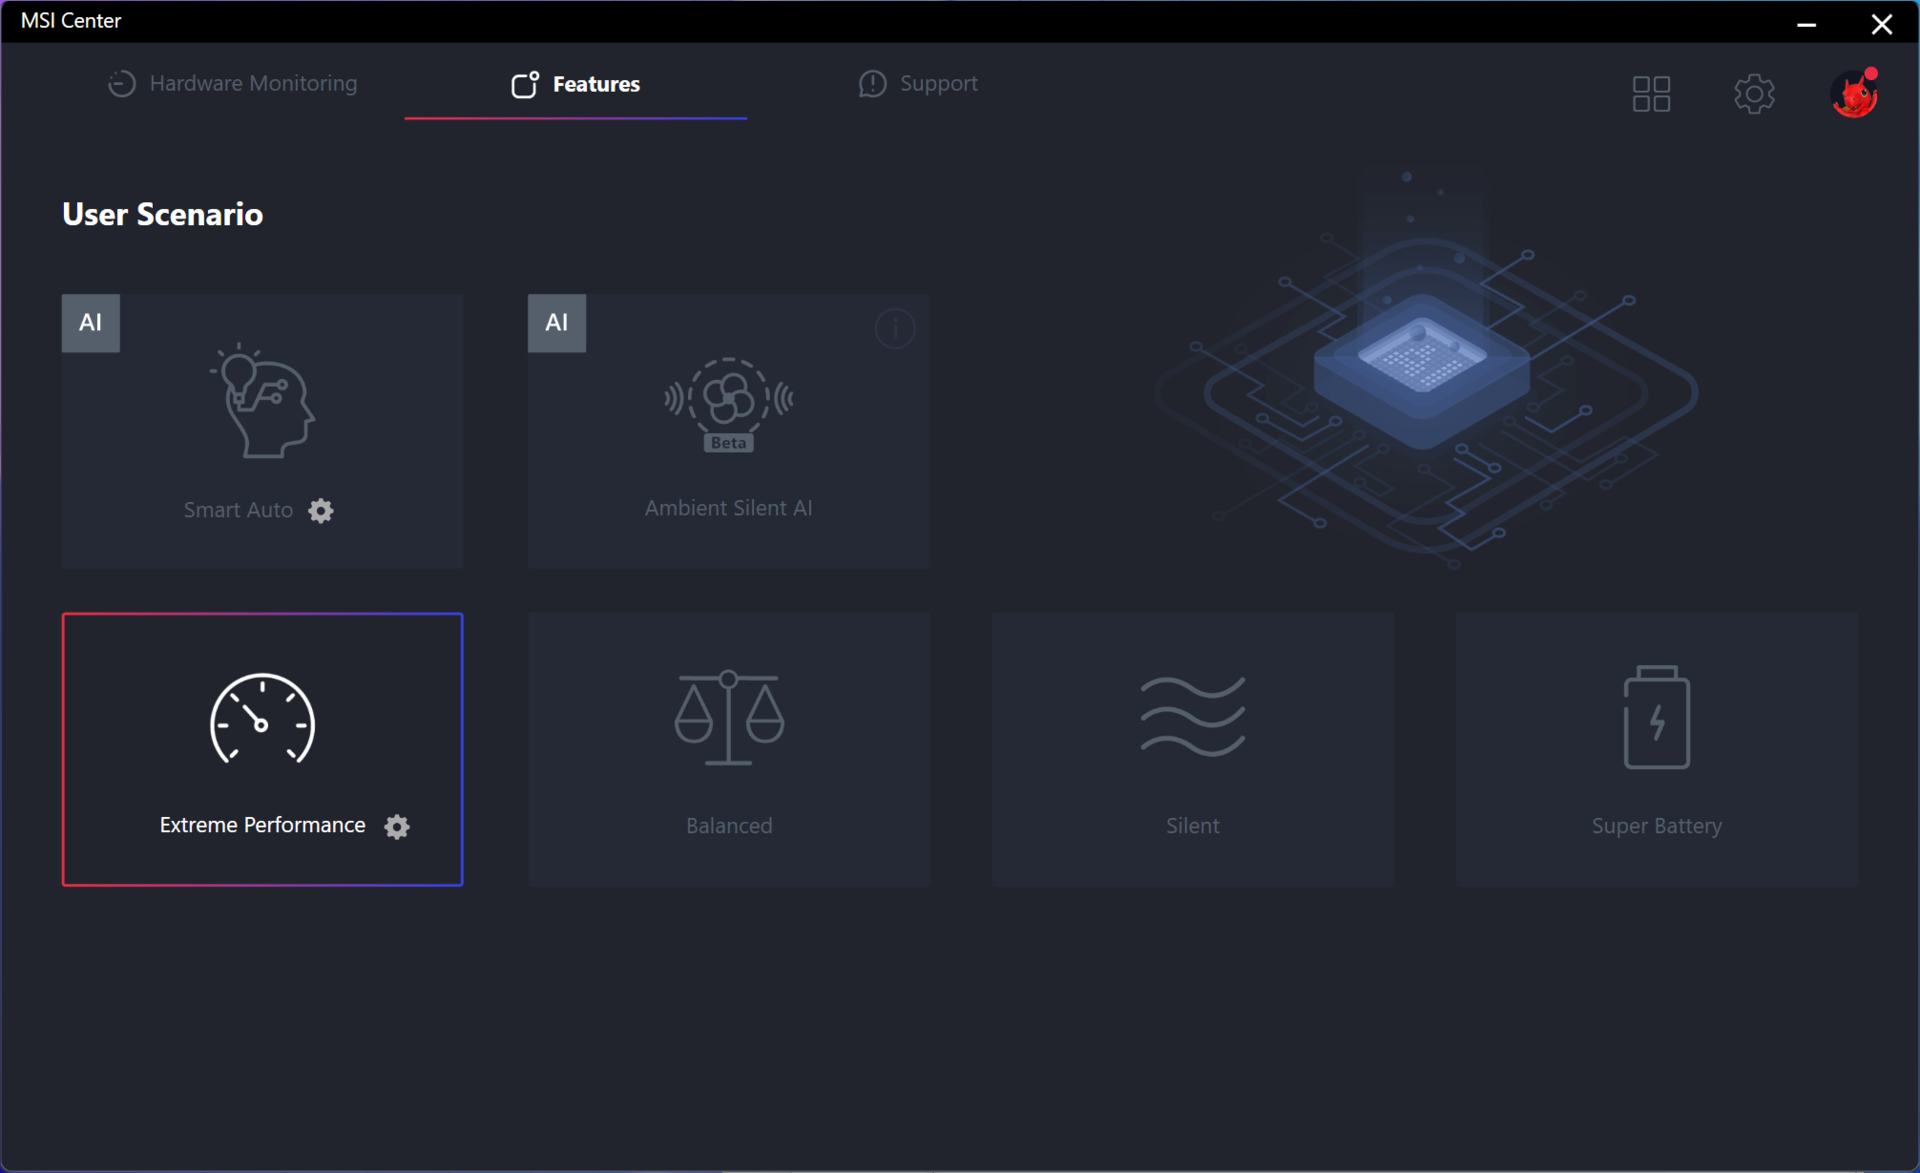
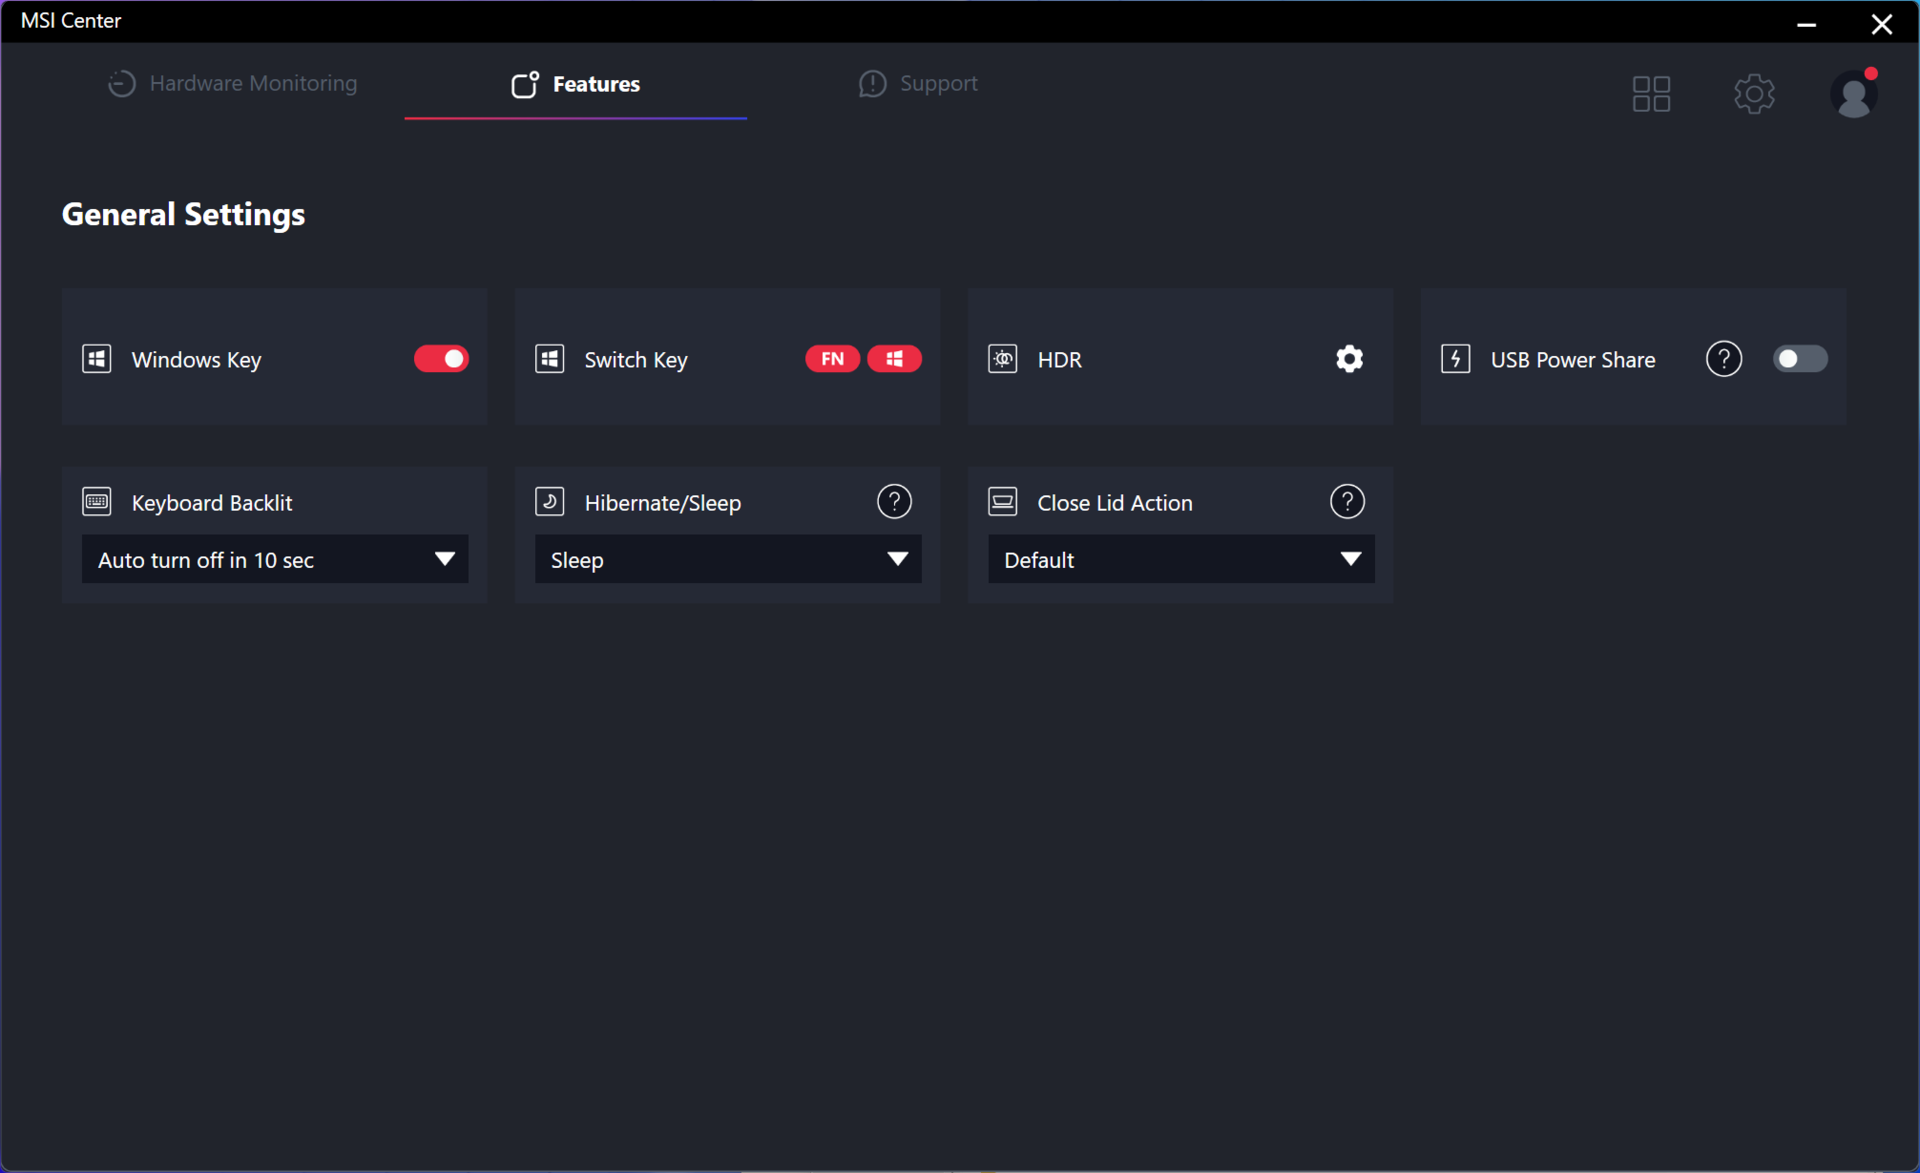
Abbiamo impostato Windows in modalità Prestazioni e MSI Center in modalità Prestazioni estreme prima di eseguire i benchmark qui sotto. I proprietari dovrebbero familiarizzare con MSI Center, in quanto è l'hub per gli aggiornamenti e le funzioni specifiche di MSI.
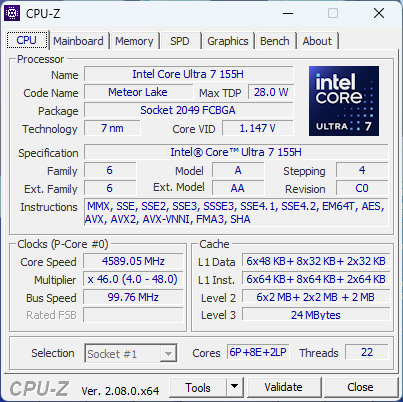
Processore
Le prestazioni della CPU sono un enorme balzo in avanti rispetto alle opzioni Core U e Core P della scorsa generazione. Il nostro Core Ultra 7 155H detiene un comodo vantaggio del 20-25 percento rispetto al Core i7-1360P e l'opzione più veloce della serie Zen 4 U di AMD, il Ryzen 7 7840U.
Gli utenti che si aspettano guadagni notevoli rispetto alle opzioni Core H di 13a generazione potrebbero rimanere delusi. Ad esempio, le prestazioni grezze single e multi-thread sono leggermente inferiori a quelle del Core i7-13700H. Le maggiori differenze tra i Core H di 13esima e 14esima generazione riguardano invece il miglioramento dell'iGPU e dell'accelerazione AI delle opzioni più recenti.
Un Core Ultra 9 185H di fascia alta Core Ultra 9 185H Di fascia più alta è disponibile per il Prestige 16, ma non ci aspettiamo che sia molto più veloce della nostra configurazione Core Ultra 7 155H, in quanto entrambe le CPU hanno lo stesso numero di core con solo leggere differenze nelle velocità di clock.
Cinebench R15 Multi Loop
Cinebench R23: Multi Core | Single Core
Cinebench R20: CPU (Multi Core) | CPU (Single Core)
Cinebench R15: CPU Multi 64Bit | CPU Single 64Bit
Blender: v2.79 BMW27 CPU
7-Zip 18.03: 7z b 4 | 7z b 4 -mmt1
Geekbench 5.5: Multi-Core | Single-Core
HWBOT x265 Benchmark v2.2: 4k Preset
LibreOffice : 20 Documents To PDF
R Benchmark 2.5: Overall mean
* ... Meglio usare valori piccoli
AIDA64: FP32 Ray-Trace | FPU Julia | CPU SHA3 | CPU Queen | FPU SinJulia | FPU Mandel | CPU AES | CPU ZLib | FP64 Ray-Trace | CPU PhotoWorxx
| Performance rating | |
| MSI Prestige 16 B1MG-001US | |
| Asus VivoBook Pro 16 K6602VU | |
| Media Intel Core Ultra 7 155H | |
| Dell Inspiron 16 Plus 7630 | |
| MSI Prestige 15 A12UD-093 | |
| LG Gram 2in1 16 16T90R - G.AA78G | |
| Lenovo ThinkBook 16 G6 ABP | |
| AIDA64 / FP32 Ray-Trace | |
| MSI Prestige 16 B1MG-001US | |
| Dell Inspiron 16 Plus 7630 | |
| Asus VivoBook Pro 16 K6602VU | |
| Media Intel Core Ultra 7 155H (6670 - 18470, n=50) | |
| Lenovo ThinkBook 16 G6 ABP | |
| MSI Prestige 15 A12UD-093 | |
| LG Gram 2in1 16 16T90R - G.AA78G | |
| LG Gram 2in1 16 16T90R - G.AA78G | |
| AIDA64 / FPU Julia | |
| MSI Prestige 16 B1MG-001US | |
| Asus VivoBook Pro 16 K6602VU | |
| Media Intel Core Ultra 7 155H (40905 - 93181, n=50) | |
| Lenovo ThinkBook 16 G6 ABP | |
| Dell Inspiron 16 Plus 7630 | |
| MSI Prestige 15 A12UD-093 | |
| LG Gram 2in1 16 16T90R - G.AA78G | |
| AIDA64 / CPU SHA3 | |
| MSI Prestige 16 B1MG-001US | |
| Asus VivoBook Pro 16 K6602VU | |
| Media Intel Core Ultra 7 155H (1940 - 4436, n=50) | |
| Dell Inspiron 16 Plus 7630 | |
| MSI Prestige 15 A12UD-093 | |
| LG Gram 2in1 16 16T90R - G.AA78G | |
| Lenovo ThinkBook 16 G6 ABP | |
| AIDA64 / CPU Queen | |
| Dell Inspiron 16 Plus 7630 | |
| Asus VivoBook Pro 16 K6602VU | |
| MSI Prestige 16 B1MG-001US | |
| Media Intel Core Ultra 7 155H (64698 - 94181, n=50) | |
| LG Gram 2in1 16 16T90R - G.AA78G | |
| MSI Prestige 15 A12UD-093 | |
| Lenovo ThinkBook 16 G6 ABP | |
| AIDA64 / FPU SinJulia | |
| MSI Prestige 16 B1MG-001US | |
| Lenovo ThinkBook 16 G6 ABP | |
| Media Intel Core Ultra 7 155H (5639 - 10647, n=50) | |
| Dell Inspiron 16 Plus 7630 | |
| Asus VivoBook Pro 16 K6602VU | |
| MSI Prestige 15 A12UD-093 | |
| LG Gram 2in1 16 16T90R - G.AA78G | |
| AIDA64 / FPU Mandel | |
| MSI Prestige 16 B1MG-001US | |
| Lenovo ThinkBook 16 G6 ABP | |
| Media Intel Core Ultra 7 155H (18236 - 47685, n=50) | |
| Asus VivoBook Pro 16 K6602VU | |
| Dell Inspiron 16 Plus 7630 | |
| MSI Prestige 15 A12UD-093 | |
| LG Gram 2in1 16 16T90R - G.AA78G | |
| AIDA64 / CPU AES | |
| Asus VivoBook Pro 16 K6602VU | |
| MSI Prestige 15 A12UD-093 | |
| LG Gram 2in1 16 16T90R - G.AA78G | |
| Media Intel Core Ultra 7 155H (45713 - 152179, n=50) | |
| MSI Prestige 16 B1MG-001US | |
| Dell Inspiron 16 Plus 7630 | |
| Lenovo ThinkBook 16 G6 ABP | |
| AIDA64 / CPU ZLib | |
| MSI Prestige 16 B1MG-001US | |
| Asus VivoBook Pro 16 K6602VU | |
| Media Intel Core Ultra 7 155H (557 - 1250, n=50) | |
| Dell Inspiron 16 Plus 7630 | |
| LG Gram 2in1 16 16T90R - G.AA78G | |
| MSI Prestige 15 A12UD-093 | |
| Lenovo ThinkBook 16 G6 ABP | |
| AIDA64 / FP64 Ray-Trace | |
| MSI Prestige 16 B1MG-001US | |
| Asus VivoBook Pro 16 K6602VU | |
| Dell Inspiron 16 Plus 7630 | |
| Media Intel Core Ultra 7 155H (3569 - 9802, n=50) | |
| Lenovo ThinkBook 16 G6 ABP | |
| MSI Prestige 15 A12UD-093 | |
| LG Gram 2in1 16 16T90R - G.AA78G | |
| AIDA64 / CPU PhotoWorxx | |
| Media Intel Core Ultra 7 155H (32719 - 54223, n=50) | |
| MSI Prestige 16 B1MG-001US | |
| MSI Prestige 15 A12UD-093 | |
| LG Gram 2in1 16 16T90R - G.AA78G | |
| Asus VivoBook Pro 16 K6602VU | |
| Dell Inspiron 16 Plus 7630 | |
| Lenovo ThinkBook 16 G6 ABP | |
Prestazioni del sistema
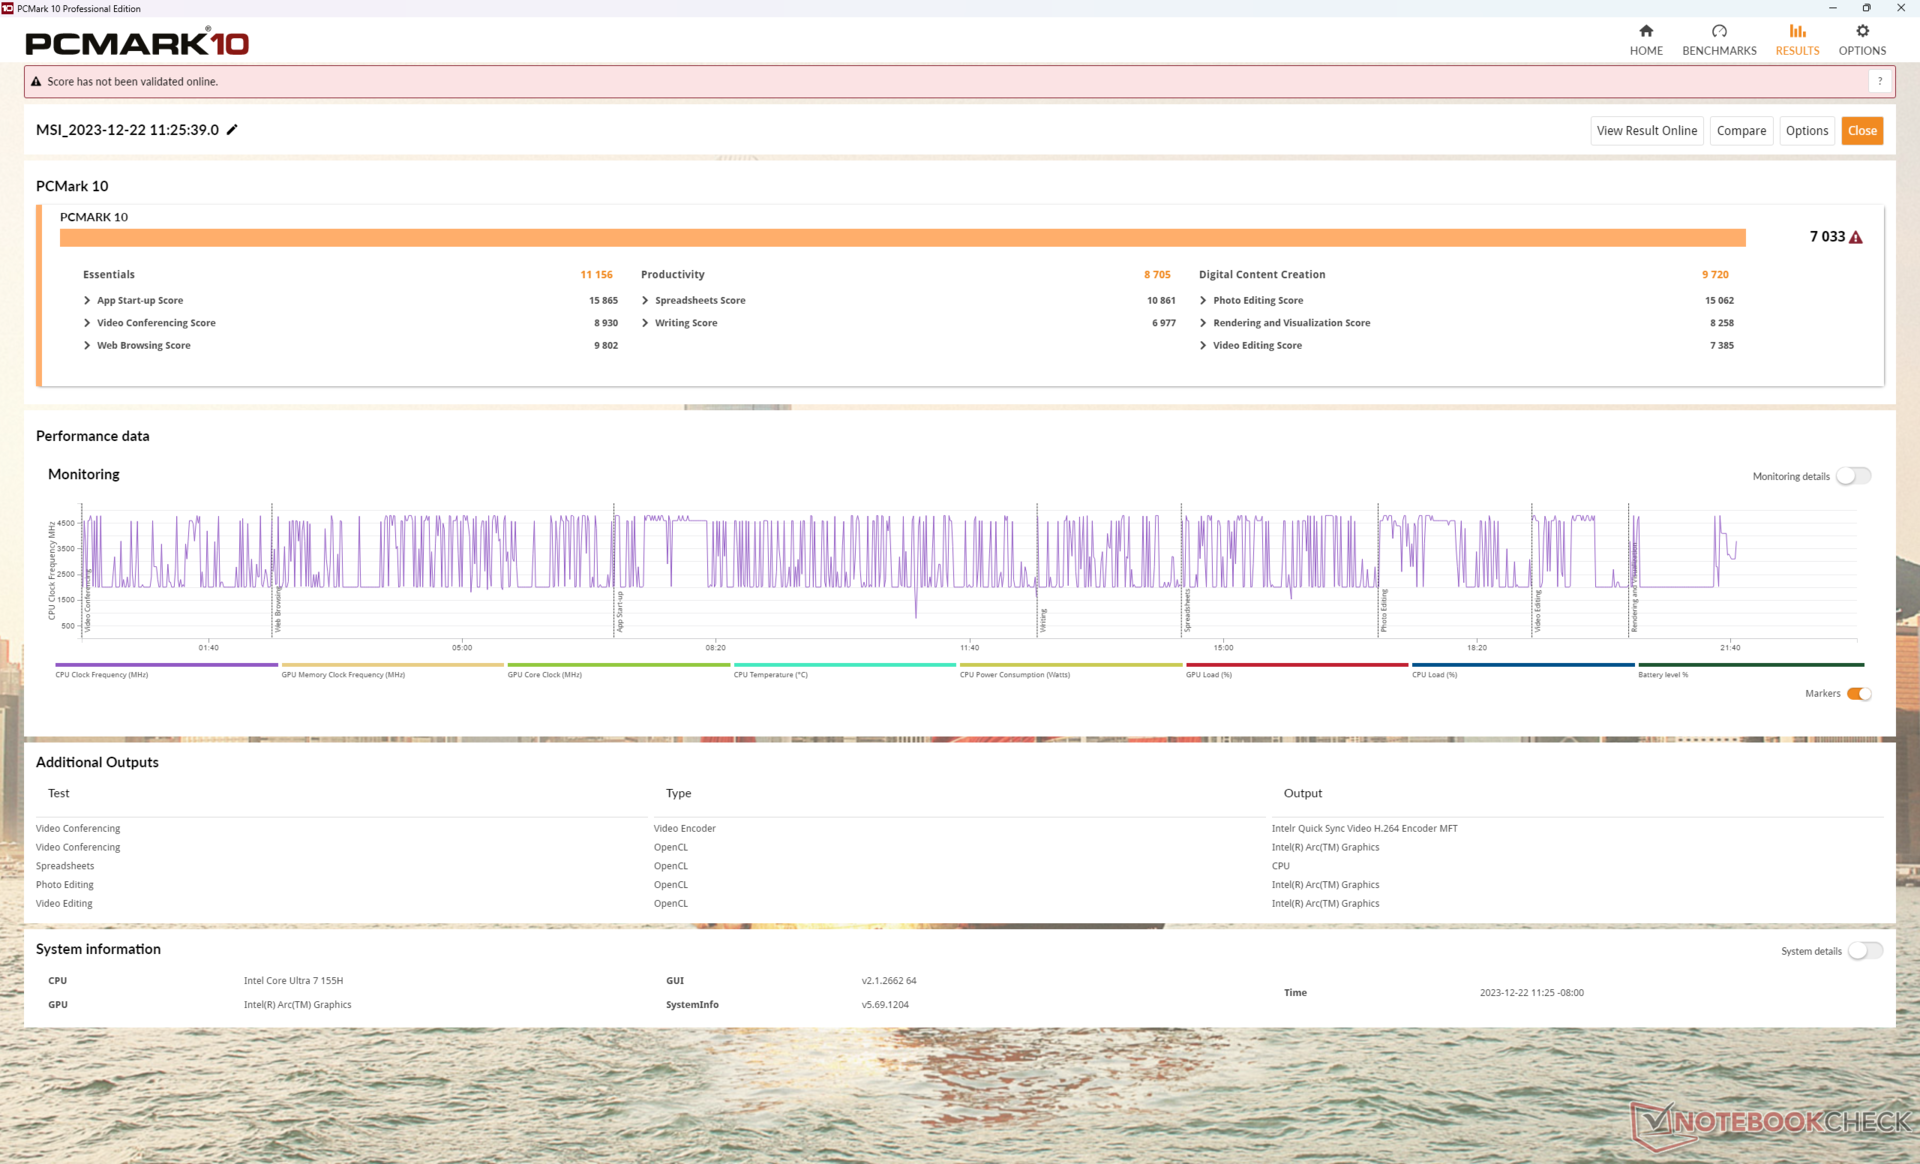
I risultati di PCMark sono paragonabili a quelli dei portatili multimediali con grafica discreta di fascia media, come l' Asus VivoBook Pro 16. Tuttavia, l'importanza dei punteggi è discutibile, in quanto i numeri sono difficili da confrontare direttamente tra i portatili con iGPU e dGPU.
La veloce RAM di sistema da 6400 MHz è degna di nota, soprattutto perché le prestazioni dell'iGPU sono strettamente legate alle prestazioni della RAM.
CrossMark: Overall | Productivity | Creativity | Responsiveness
WebXPRT 3: Overall
WebXPRT 4: Overall
Mozilla Kraken 1.1: Total
| PCMark 10 / Score | |
| Dell Inspiron 16 Plus 7630 | |
| Asus VivoBook Pro 16 K6602VU | |
| MSI Prestige 16 B1MG-001US | |
| Media Intel Core Ultra 7 155H, Intel Arc 8-Core iGPU (4809 - 7529, n=34) | |
| MSI Prestige 15 A12UD-093 | |
| Lenovo ThinkBook 16 G6 ABP | |
| LG Gram 2in1 16 16T90R - G.AA78G | |
| PCMark 10 / Essentials | |
| LG Gram 2in1 16 16T90R - G.AA78G | |
| Dell Inspiron 16 Plus 7630 | |
| MSI Prestige 16 B1MG-001US | |
| Lenovo ThinkBook 16 G6 ABP | |
| Media Intel Core Ultra 7 155H, Intel Arc 8-Core iGPU (7605 - 11289, n=34) | |
| Asus VivoBook Pro 16 K6602VU | |
| MSI Prestige 15 A12UD-093 | |
| PCMark 10 / Productivity | |
| Dell Inspiron 16 Plus 7630 | |
| Lenovo ThinkBook 16 G6 ABP | |
| MSI Prestige 15 A12UD-093 | |
| MSI Prestige 16 B1MG-001US | |
| Asus VivoBook Pro 16 K6602VU | |
| Media Intel Core Ultra 7 155H, Intel Arc 8-Core iGPU (6042 - 10591, n=34) | |
| LG Gram 2in1 16 16T90R - G.AA78G | |
| PCMark 10 / Digital Content Creation | |
| Dell Inspiron 16 Plus 7630 | |
| Asus VivoBook Pro 16 K6602VU | |
| MSI Prestige 16 B1MG-001US | |
| Media Intel Core Ultra 7 155H, Intel Arc 8-Core iGPU (4985 - 10709, n=34) | |
| MSI Prestige 15 A12UD-093 | |
| LG Gram 2in1 16 16T90R - G.AA78G | |
| Lenovo ThinkBook 16 G6 ABP | |
| CrossMark / Overall | |
| Dell Inspiron 16 Plus 7630 | |
| MSI Prestige 16 B1MG-001US | |
| Asus VivoBook Pro 16 K6602VU | |
| MSI Prestige 15 A12UD-093 | |
| Media Intel Core Ultra 7 155H, Intel Arc 8-Core iGPU (1366 - 1903, n=34) | |
| LG Gram 2in1 16 16T90R - G.AA78G | |
| Lenovo ThinkBook 16 G6 ABP | |
| CrossMark / Productivity | |
| Dell Inspiron 16 Plus 7630 | |
| MSI Prestige 16 B1MG-001US | |
| Asus VivoBook Pro 16 K6602VU | |
| MSI Prestige 15 A12UD-093 | |
| Media Intel Core Ultra 7 155H, Intel Arc 8-Core iGPU (1291 - 1798, n=33) | |
| LG Gram 2in1 16 16T90R - G.AA78G | |
| Lenovo ThinkBook 16 G6 ABP | |
| CrossMark / Creativity | |
| Dell Inspiron 16 Plus 7630 | |
| MSI Prestige 16 B1MG-001US | |
| Asus VivoBook Pro 16 K6602VU | |
| Media Intel Core Ultra 7 155H, Intel Arc 8-Core iGPU (1519 - 1929, n=33) | |
| MSI Prestige 15 A12UD-093 | |
| LG Gram 2in1 16 16T90R - G.AA78G | |
| Lenovo ThinkBook 16 G6 ABP | |
| CrossMark / Responsiveness | |
| MSI Prestige 15 A12UD-093 | |
| Dell Inspiron 16 Plus 7630 | |
| MSI Prestige 16 B1MG-001US | |
| Asus VivoBook Pro 16 K6602VU | |
| LG Gram 2in1 16 16T90R - G.AA78G | |
| Media Intel Core Ultra 7 155H, Intel Arc 8-Core iGPU (939 - 1802, n=33) | |
| Lenovo ThinkBook 16 G6 ABP | |
| WebXPRT 3 / Overall | |
| Dell Inspiron 16 Plus 7630 | |
| MSI Prestige 16 B1MG-001US | |
| Media Intel Core Ultra 7 155H, Intel Arc 8-Core iGPU (252 - 299, n=34) | |
| Lenovo ThinkBook 16 G6 ABP | |
| LG Gram 2in1 16 16T90R - G.AA78G | |
| MSI Prestige 15 A12UD-093 | |
| WebXPRT 4 / Overall | |
| Dell Inspiron 16 Plus 7630 | |
| MSI Prestige 16 B1MG-001US | |
| Media Intel Core Ultra 7 155H, Intel Arc 8-Core iGPU (166.4 - 309, n=29) | |
| Asus VivoBook Pro 16 K6602VU | |
| Lenovo ThinkBook 16 G6 ABP | |
| Mozilla Kraken 1.1 / Total | |
| MSI Prestige 15 A12UD-093 | |
| LG Gram 2in1 16 16T90R - G.AA78G | |
| Lenovo ThinkBook 16 G6 ABP | |
| Asus VivoBook Pro 16 K6602VU | |
| Media Intel Core Ultra 7 155H, Intel Arc 8-Core iGPU (517 - 614, n=35) | |
| MSI Prestige 16 B1MG-001US | |
| Dell Inspiron 16 Plus 7630 | |
* ... Meglio usare valori piccoli
| PCMark 10 Score | 7033 punti | |
Aiuto | ||
| AIDA64 / Memory Copy | |
| Media Intel Core Ultra 7 155H (62397 - 96791, n=50) | |
| MSI Prestige 16 B1MG-001US | |
| MSI Prestige 15 A12UD-093 | |
| LG Gram 2in1 16 16T90R - G.AA78G | |
| Dell Inspiron 16 Plus 7630 | |
| Asus VivoBook Pro 16 K6602VU | |
| Lenovo ThinkBook 16 G6 ABP | |
| AIDA64 / Memory Read | |
| Media Intel Core Ultra 7 155H (60544 - 90647, n=50) | |
| MSI Prestige 16 B1MG-001US | |
| Dell Inspiron 16 Plus 7630 | |
| Asus VivoBook Pro 16 K6602VU | |
| MSI Prestige 15 A12UD-093 | |
| LG Gram 2in1 16 16T90R - G.AA78G | |
| Lenovo ThinkBook 16 G6 ABP | |
| AIDA64 / Memory Write | |
| LG Gram 2in1 16 16T90R - G.AA78G | |
| MSI Prestige 16 B1MG-001US | |
| Media Intel Core Ultra 7 155H (58692 - 93451, n=50) | |
| MSI Prestige 15 A12UD-093 | |
| Asus VivoBook Pro 16 K6602VU | |
| Dell Inspiron 16 Plus 7630 | |
| Lenovo ThinkBook 16 G6 ABP | |
| AIDA64 / Memory Latency | |
| Media Intel Core Ultra 7 155H (116.2 - 233, n=50) | |
| MSI Prestige 16 B1MG-001US | |
| LG Gram 2in1 16 16T90R - G.AA78G | |
| MSI Prestige 15 A12UD-093 | |
| Lenovo ThinkBook 16 G6 ABP | |
| Dell Inspiron 16 Plus 7630 | |
| Asus VivoBook Pro 16 K6602VU | |
* ... Meglio usare valori piccoli
Latenza DPC
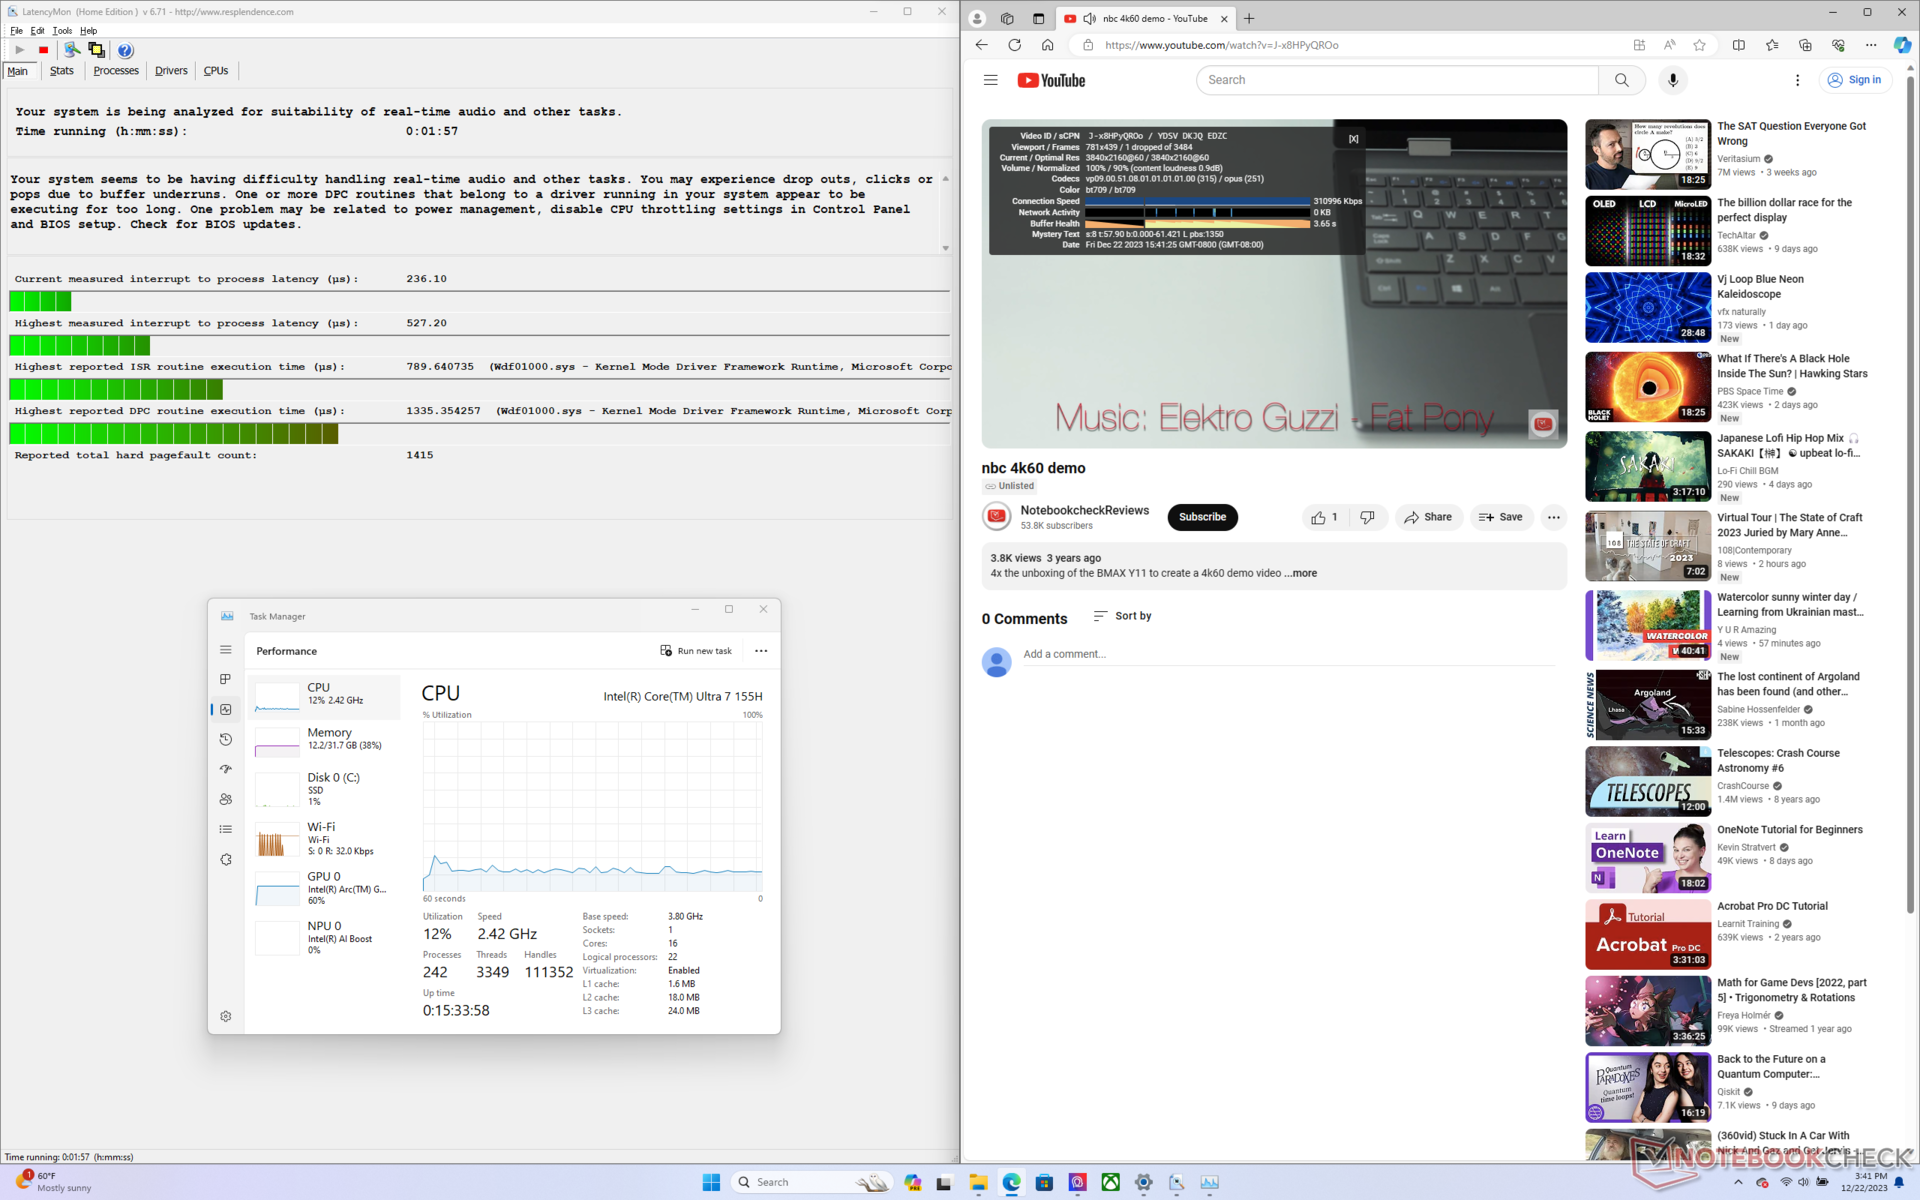
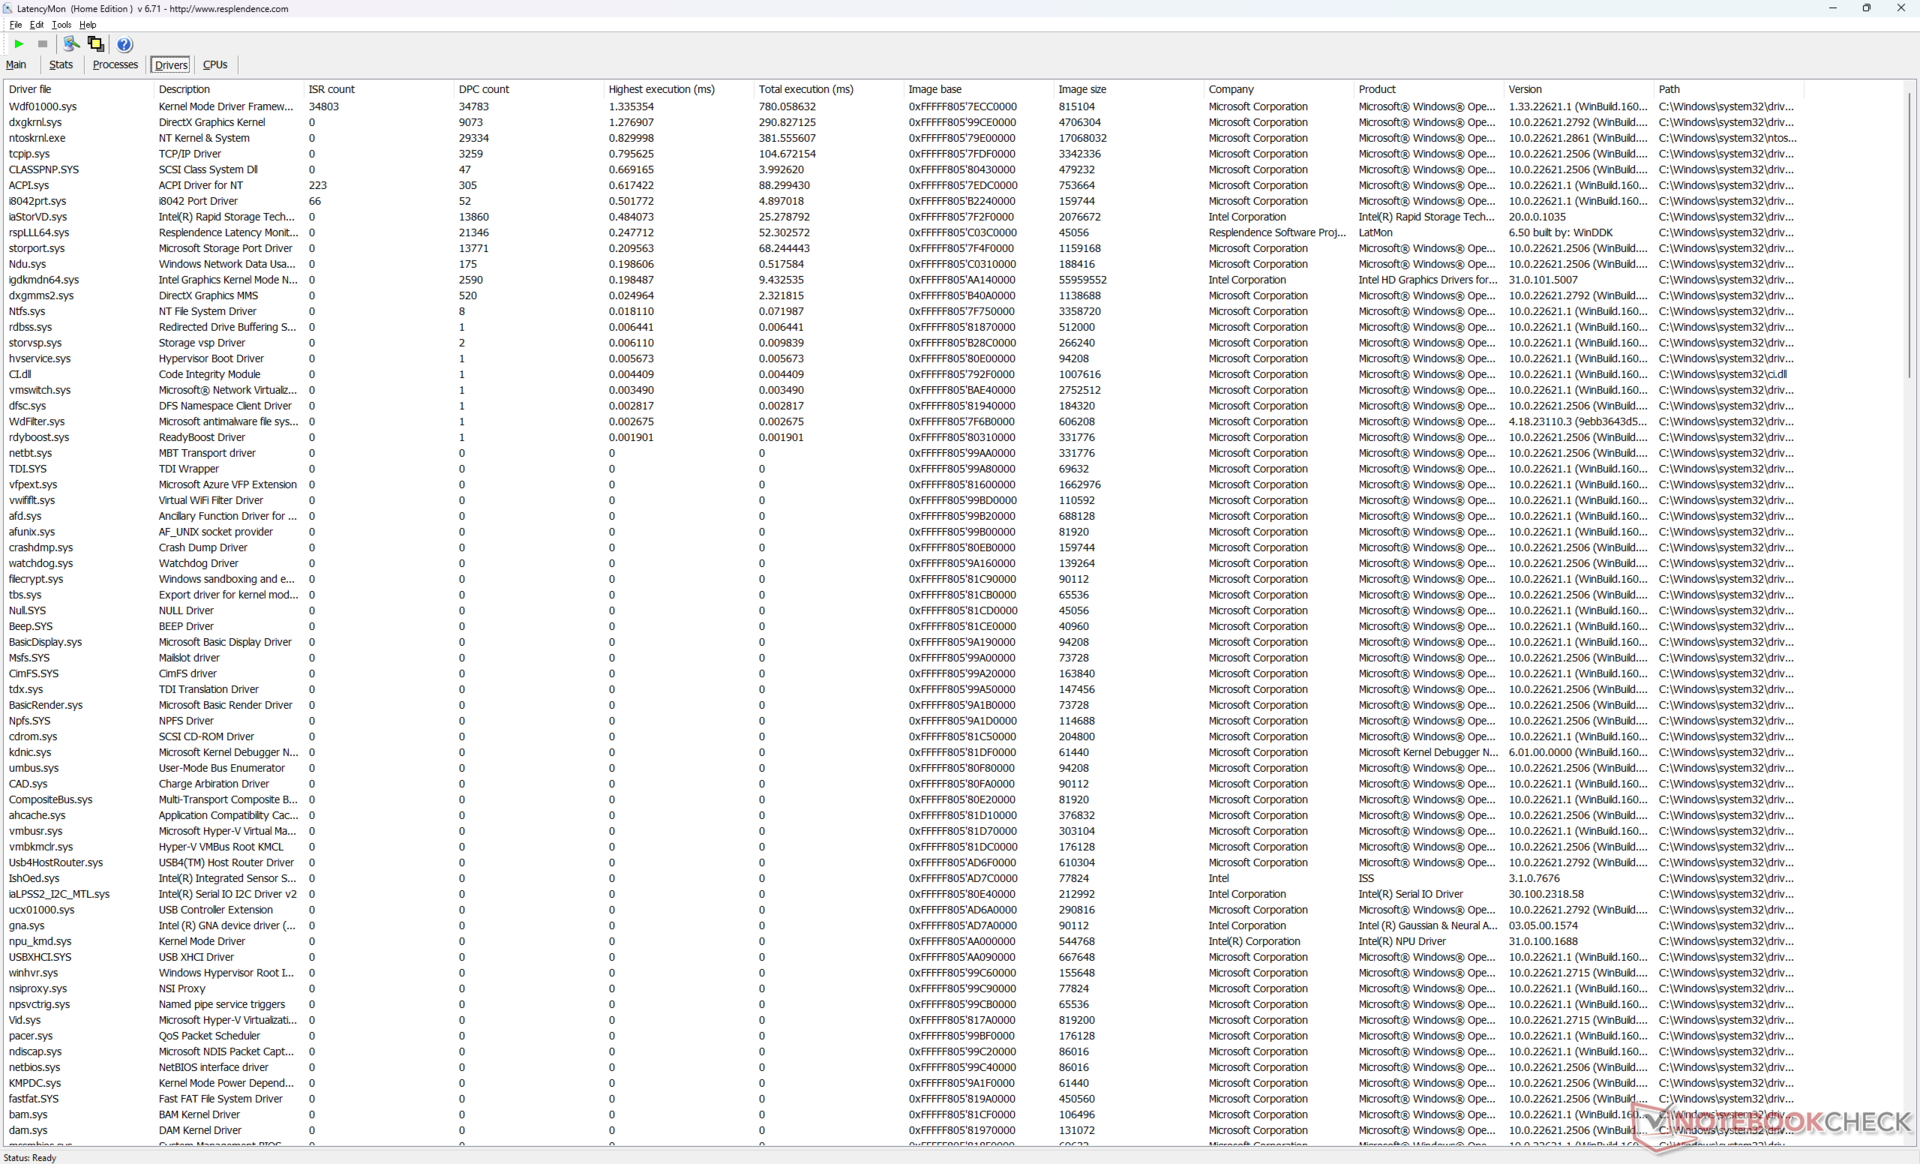
LatencyMon rivela solo piccoli problemi di DPC quando si aprono più schede del browser della nostra homepage. la riproduzione di video 4K a 60 FPS è quasi perfetta, con un solo fotogramma perso registrato durante un video di prova di 60 secondi.
| DPC Latencies / LatencyMon - interrupt to process latency (max), Web, Youtube, Prime95 | |
| LG Gram 2in1 16 16T90R - G.AA78G | |
| Asus VivoBook Pro 16 K6602VU | |
| MSI Prestige 15 A12UD-093 | |
| Lenovo ThinkBook 16 G6 ABP | |
| Dell Inspiron 16 Plus 7630 | |
| MSI Prestige 16 B1MG-001US | |
* ... Meglio usare valori piccoli
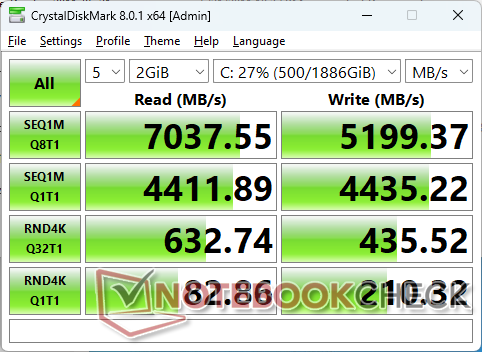
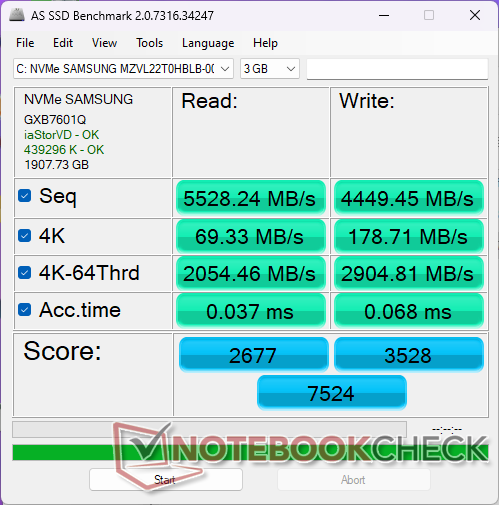
Dispositivi di archiviazione
La nostra unità è equipaggiata con un disco da 2 TB Samsung PM9A1 che è una delle più veloci unità SSD PCIe4 x4 NVMe di fascia consumer disponibili e un aggiornamento rispetto alla Micron 3400 sulla nostra vecchia Prestige 15. L'unità è in grado di mantenere velocità di ~7100 MB/s anche quando è sotto sforzo, il che è impressionante se si considera la sottigliezza dello chassis.

| Drive Performance rating - Percent | |
| MSI Prestige 16 B1MG-001US | |
| LG Gram 2in1 16 16T90R - G.AA78G | |
| MSI Prestige 15 A12UD-093 | |
| Dell Inspiron 16 Plus 7630 | |
| Lenovo ThinkBook 16 G6 ABP | |
| Asus VivoBook Pro 16 K6602VU | |
* ... Meglio usare valori piccoli
Disk Throttling: DiskSpd Read Loop, Queue Depth 8
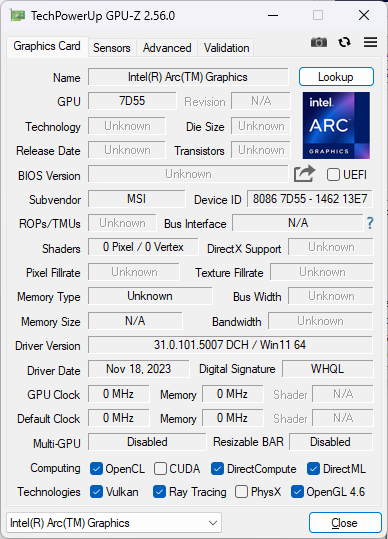
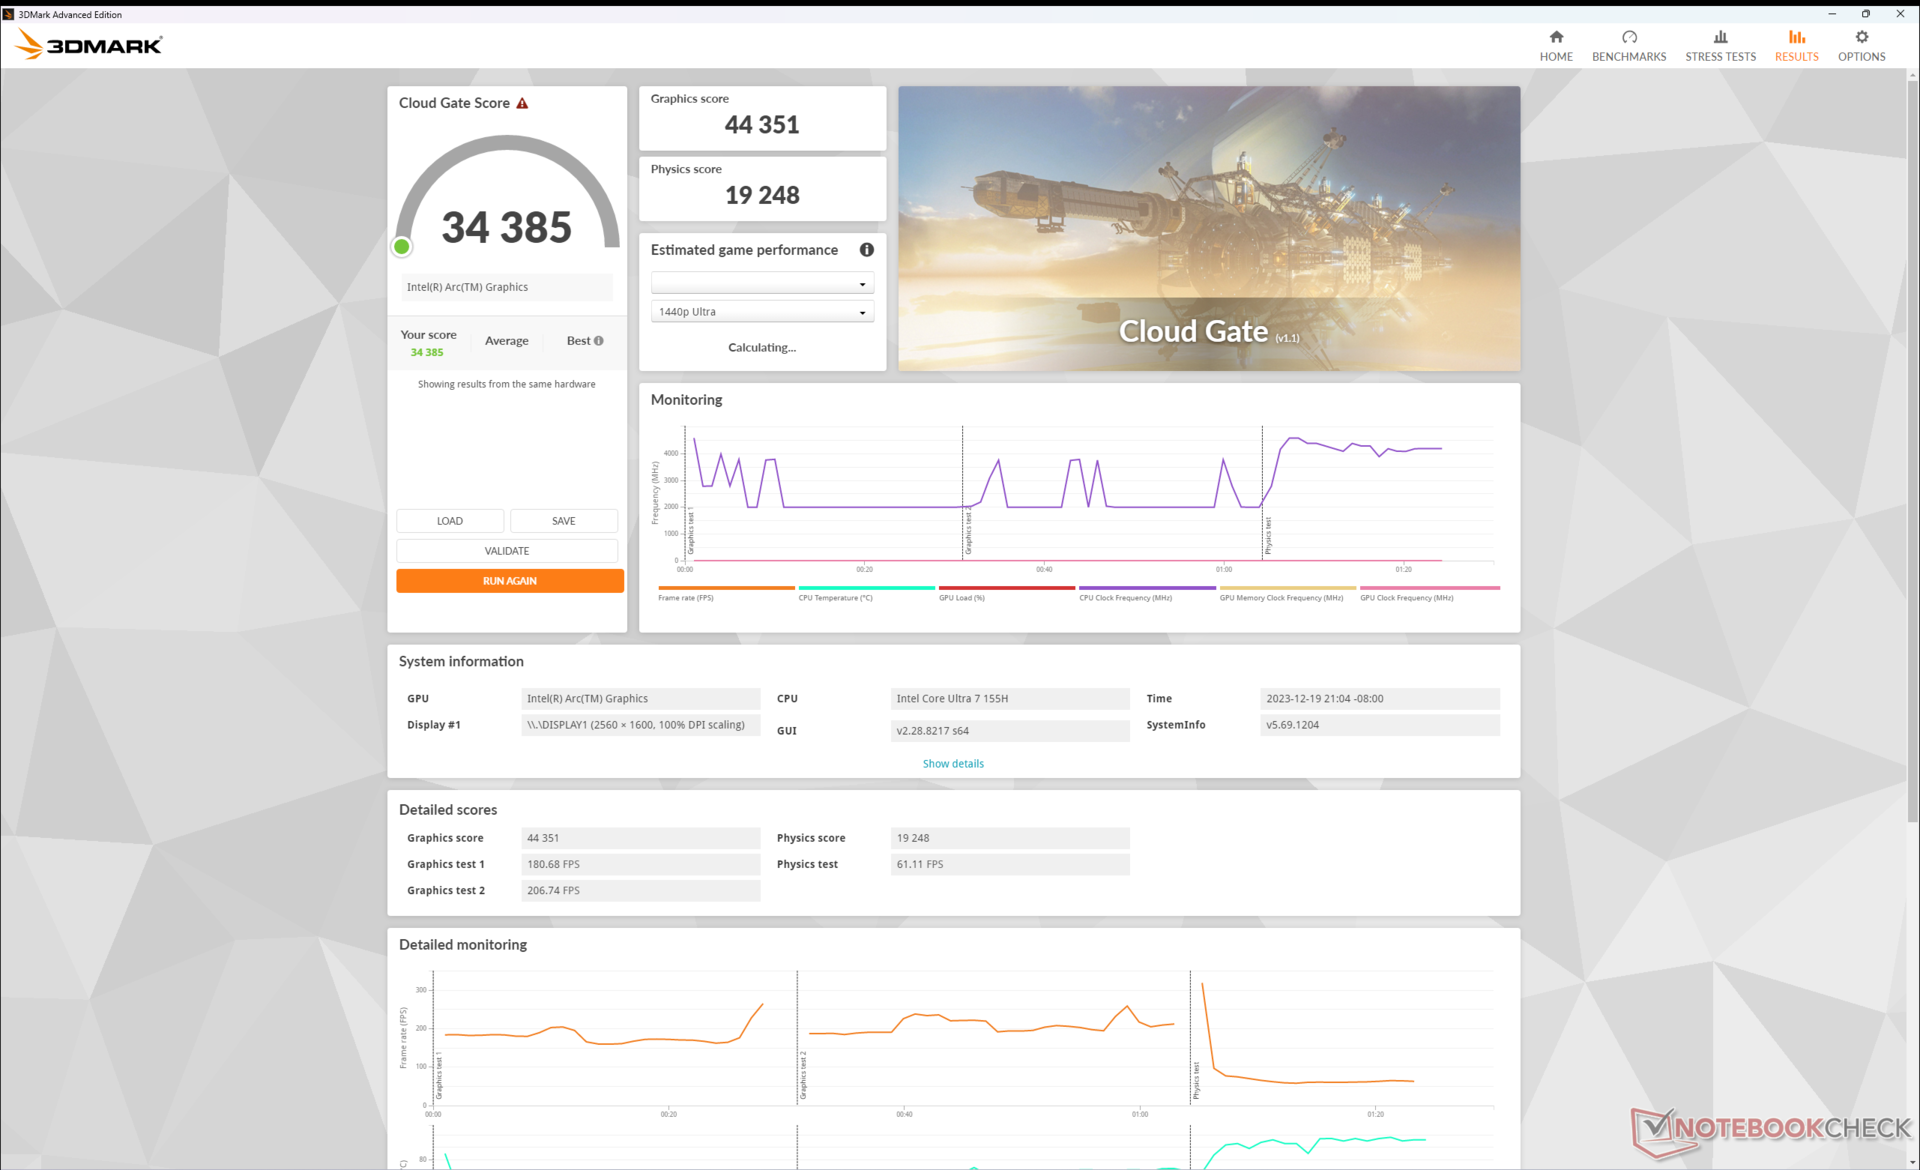
Prestazioni della GPU - Riconquistare la corona della grafica integrata
Dopo la stagnazione degli ultimi anni, Intel ha finalmente rinnovato la sua GPU integrata per essere più competitiva nei confronti della concorrente Radeon 680M e 780M serie Radeon 680M e 780M. i risultati di 3DMark mettono a confronto il nostro Arc 8 davanti alla Radeon 780M di circa il 20 percento o addirittura fino al 50 percento sui titoli supportati da DX12. Gli utenti che passano dalla comune Iris Xe 96 EU dovrebbero aspettarsi un aumento delle prestazioni grezze di circa 1,5x - 2x. Non è ancora al livello di una GeForce RTX 3050 Ti, ma i punteggi si avvicinano decisamente a una GeForce RTX 2050.
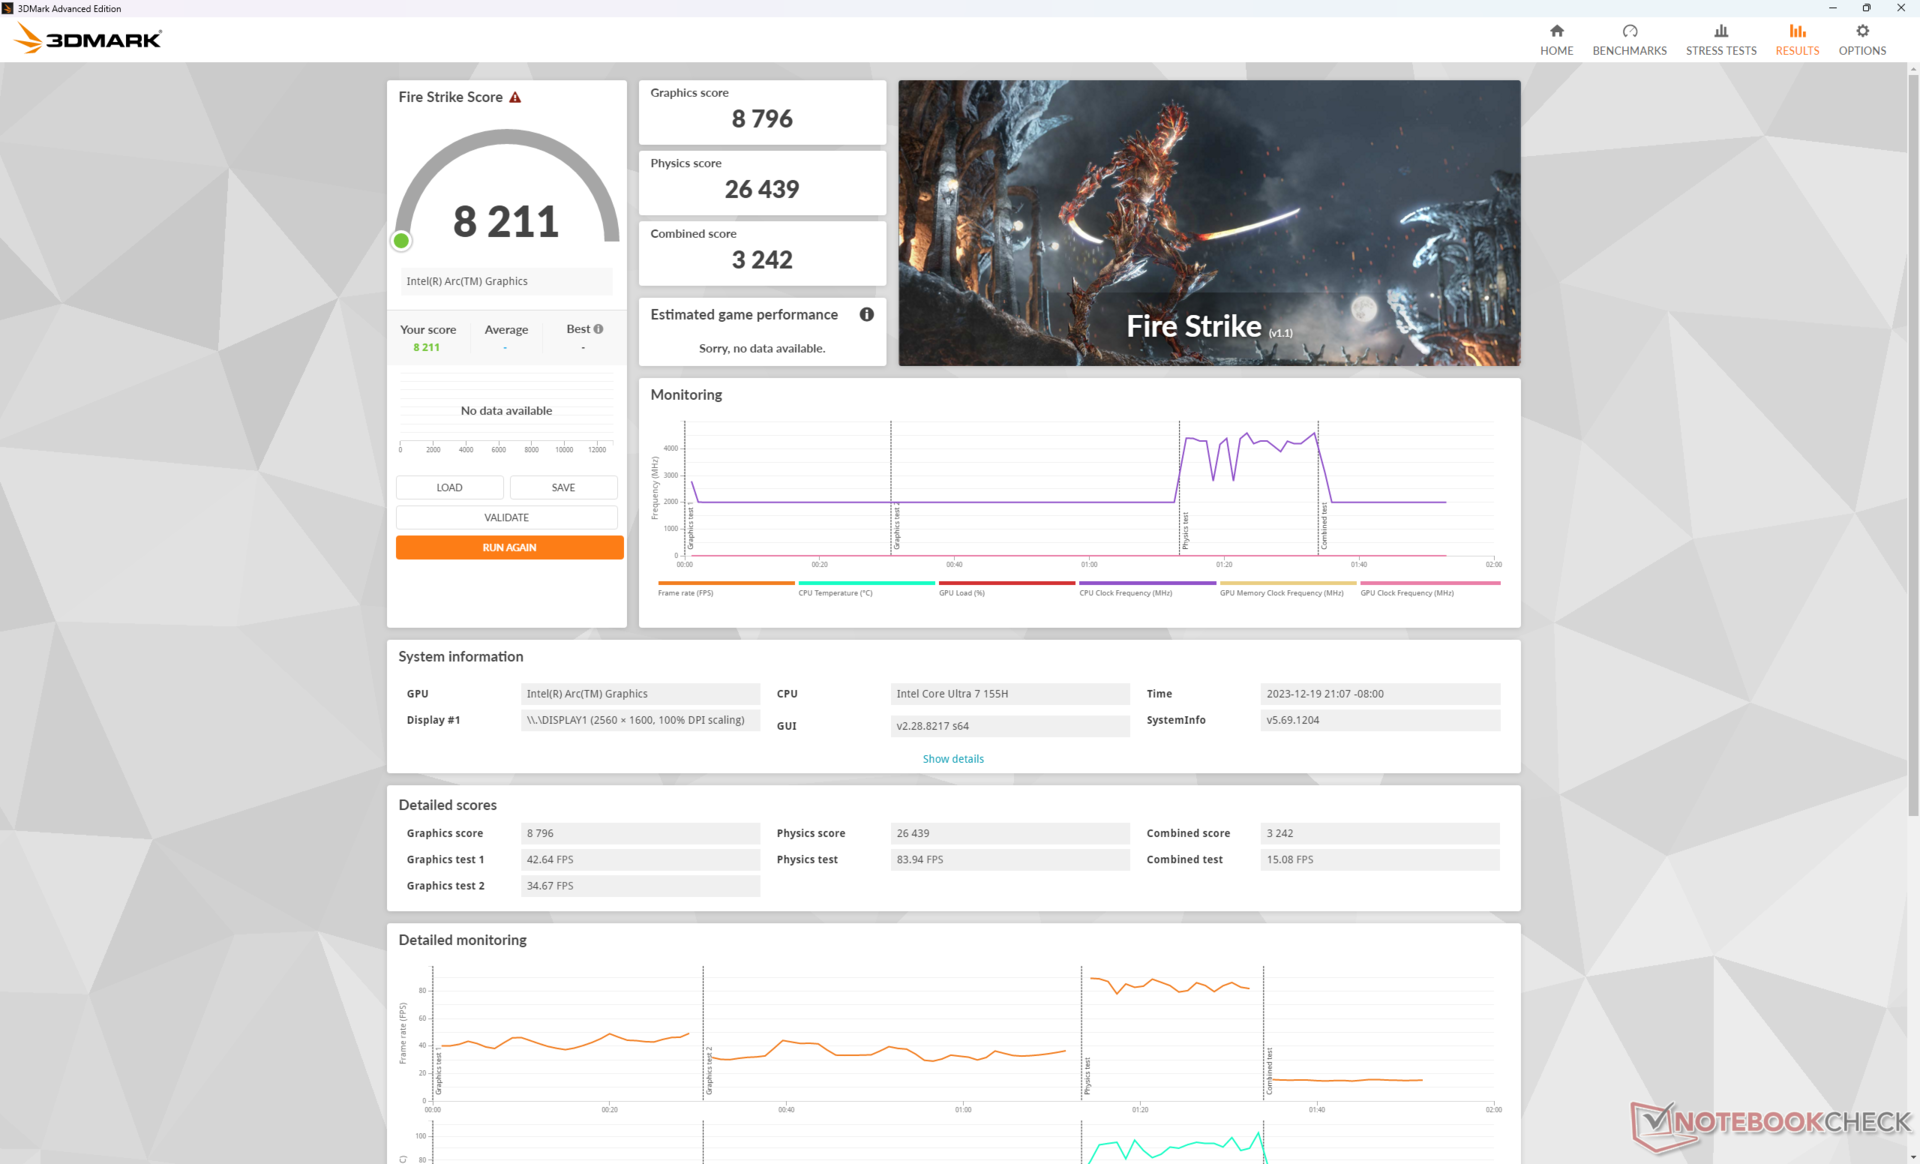
| Profilo di potenza | Punteggio di fisica | Punteggio grafico | Punteggio combinato |
| Prestazioni estreme (Cooler Boost attivato) | 26439 | 8796 | 3242 |
| Prestazioni estreme (Cooler Boost disattivato) | 26460 (-0%) | 8614 (-2%) | 3187 (-2%) |
| Modalità bilanciata | 25110 (-5%) | 8814 (-0%) | 3306 (-0%) |
| Modalità batteria | 21717 (-18%) | 7425 (-16%) | 2761 (-15%) |
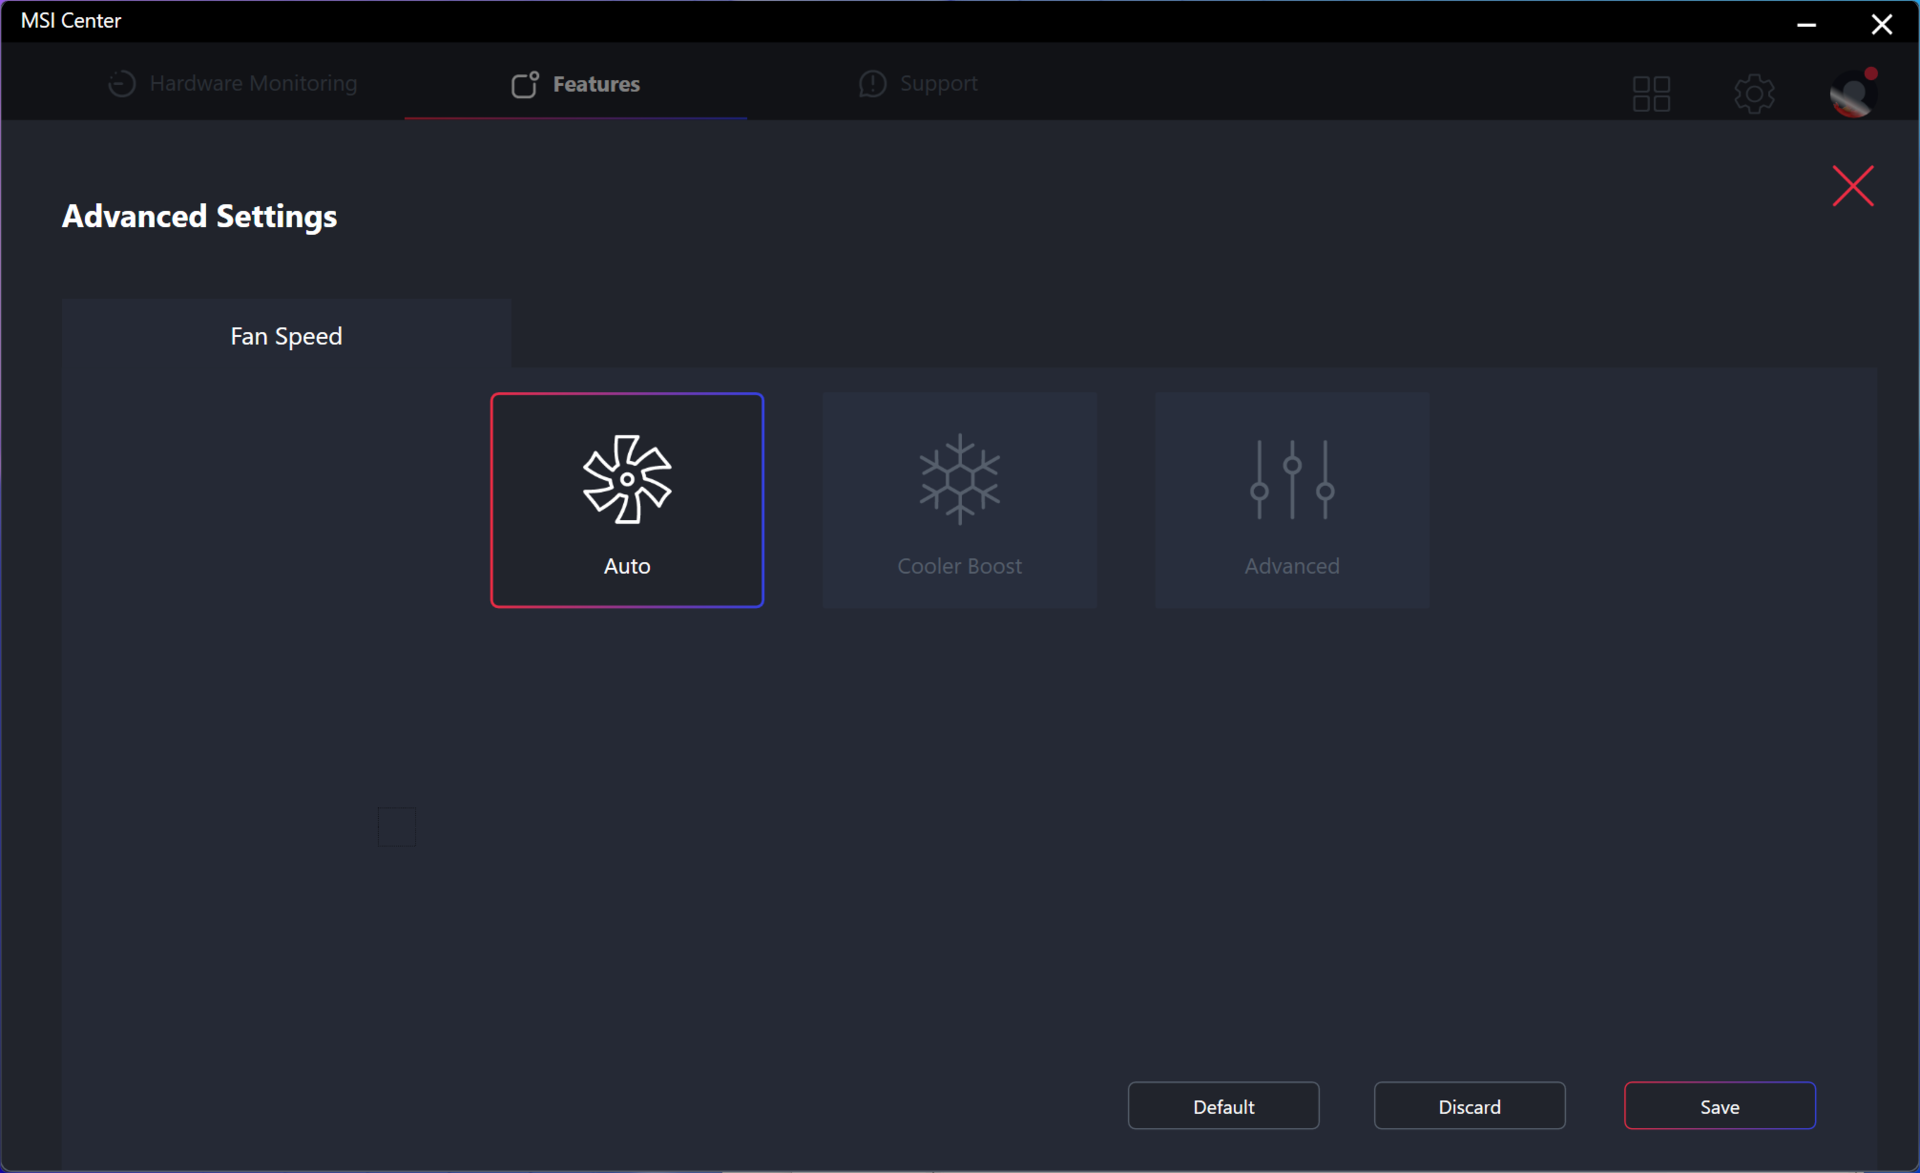
L'attivazione di Cooler Boost non sembra avere un impatto significativo sulle prestazioni, secondo la tabella dei risultati di Fire Strike. L'esecuzione in modalità Bilanciata avrebbe un impatto minimo sulle prestazioni della CPU, mentre la modalità Batteria ridurrebbe le prestazioni in modo più significativo, di circa il 15%.
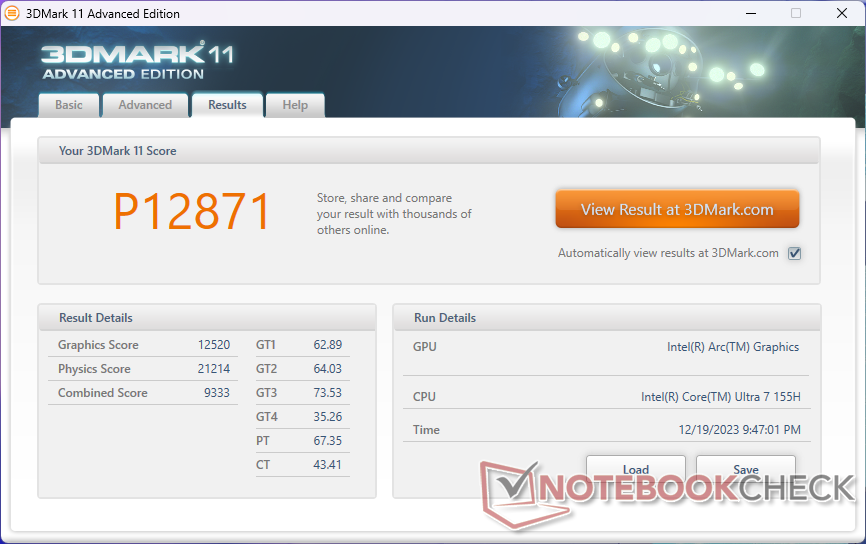
| 3DMark 11 Performance | 12871 punti | |
| 3DMark Cloud Gate Standard Score | 34385 punti | |
| 3DMark Fire Strike Score | 8211 punti | |
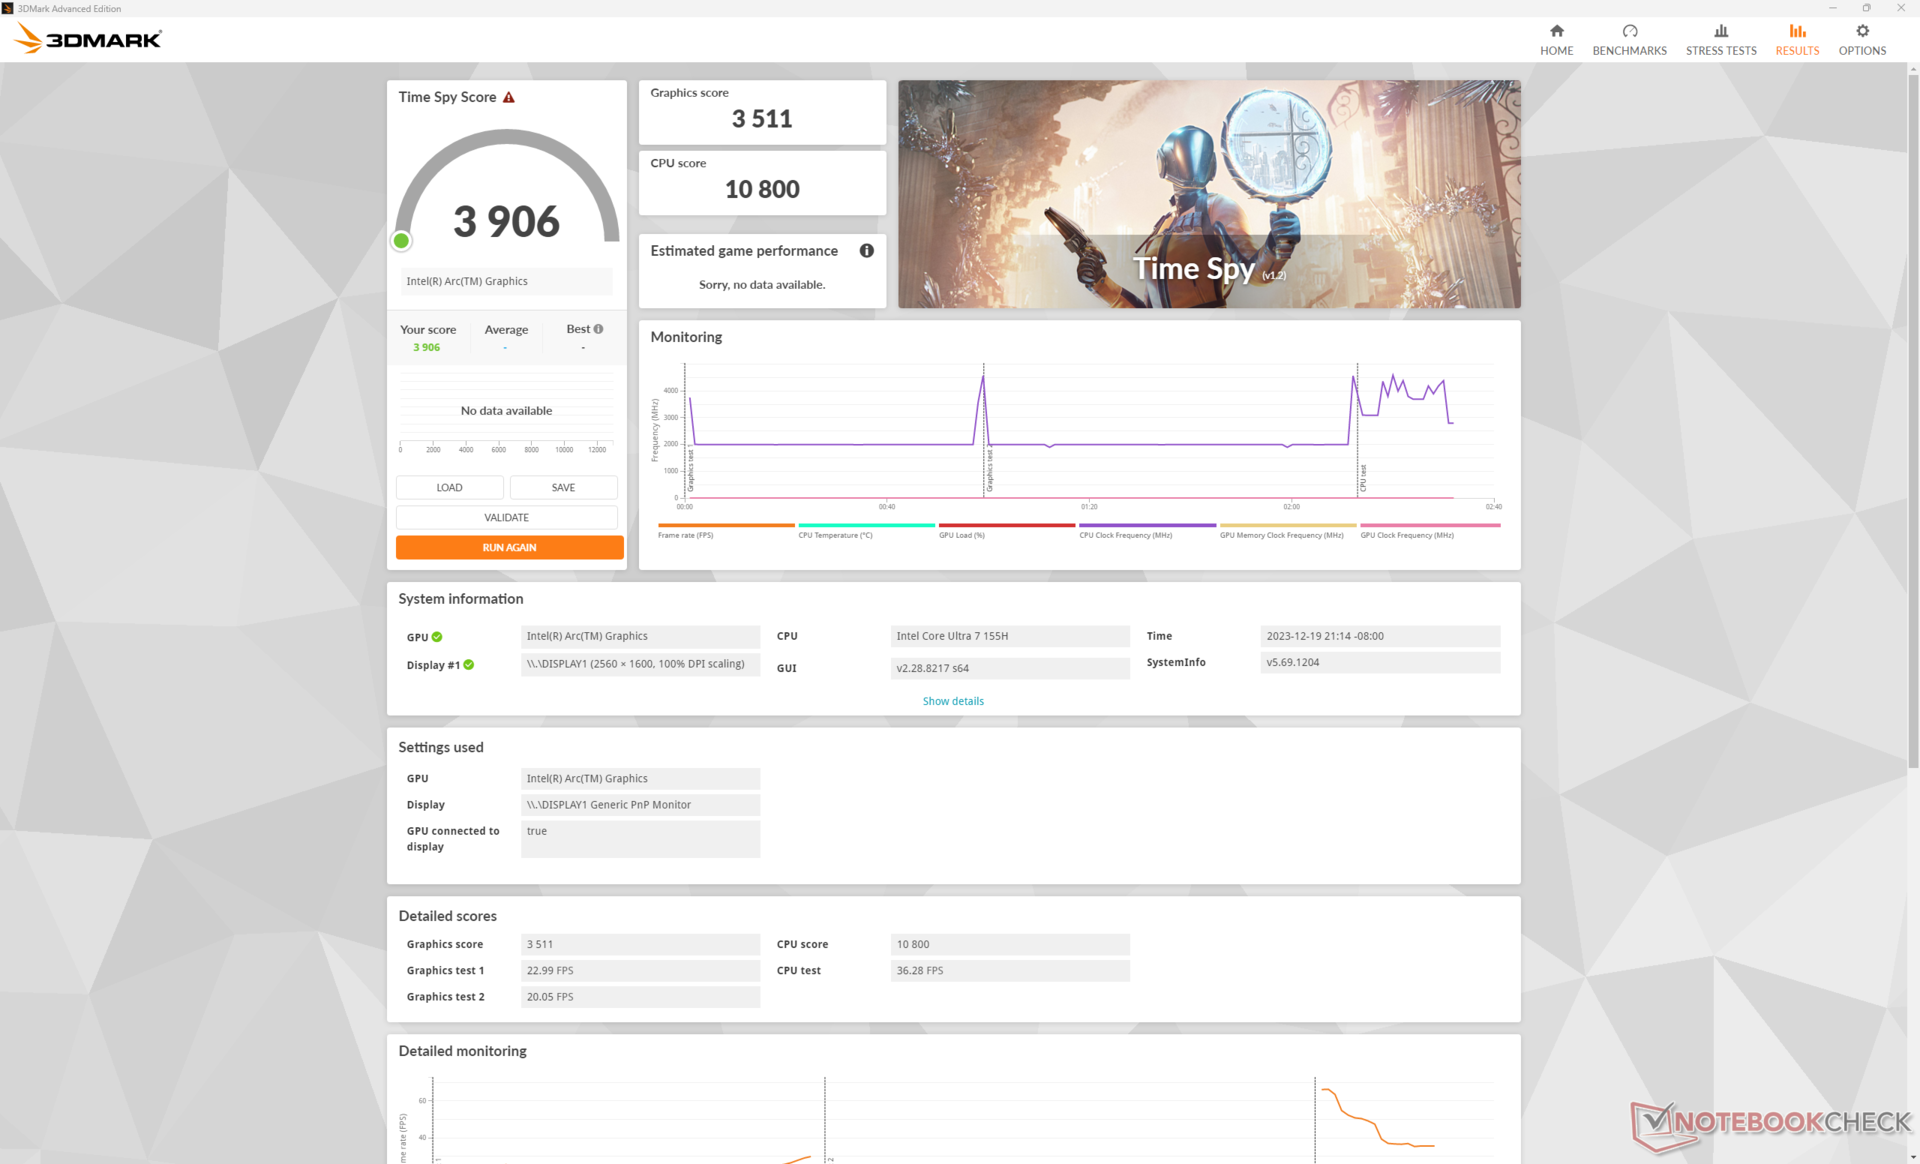
| 3DMark Time Spy Score | 3906 punti | |
Aiuto | ||
* ... Meglio usare valori piccoli
Prestazioni di gioco
Le prestazioni nel mondo reale durante l'esecuzione di giochi sono eccellenti, con risultati che rivaleggiano con la GeForce 3050 Ti della Prestige 15 dello scorso anno, come suggeriscono i risultati dei benchmark sintetici riportati sopra. Far Cry 5 e F1 22, per esempio, hanno prestazioni comprese tra il 5 e il 15 percento rispetto alla Prestige 15. Tenga presente che la GPU GeForce del Prestige 15 presentava problemi di throttling degni di nota, che impattavano notevolmente sulle sue prestazioni; la maggior parte degli altri computer portatili RTX 3050 Ti di GeForce, come l'Asus Vivobook Pro 16X e l'Asus Vivobook Pro 16X, sono stati in grado di offrire prestazioni migliori Asus Vivobook Pro 16Xeseguivano comunque i giochi in modo significativamente più veloce rispetto al nostro Arc 8 integrato.
Le prestazioni complessive sono comunque costantemente migliori rispetto alla Radeon 780M in tutti i giochi testati, di circa il 5-20%. Alcuni giochi DX12, come Tiny Tina's Wonderlands e F1 22, vengono eseguiti fino al 50-60% in più con la nuova GPU Intel.
| The Witcher 3 - 1920x1080 Ultra Graphics & Postprocessing (HBAO+) | |
| Dell Inspiron 16 Plus 7630 | |
| Asus VivoBook Pro 16 K6602VU | |
| MSI Prestige 16 B1MG-001US | |
| MSI Prestige 15 A12UD-093 | |
| LG Gram 2in1 16 16T90R - G.AA78G | |
| Lenovo ThinkBook 16 G6 ABP | |
| GTA V - 1920x1080 Highest AA:4xMSAA + FX AF:16x | |
| Asus VivoBook Pro 16 K6602VU | |
| MSI Prestige 15 A12UD-093 | |
| Lenovo ThinkBook 16 G6 ABP | |
| LG Gram 2in1 16 16T90R - G.AA78G | |
| Final Fantasy XV Benchmark - 1920x1080 High Quality | |
| Dell Inspiron 16 Plus 7630 | |
| Asus VivoBook Pro 16 K6602VU | |
| MSI Prestige 16 B1MG-001US | |
| MSI Prestige 15 A12UD-093 | |
| LG Gram 2in1 16 16T90R - G.AA78G | |
| Lenovo ThinkBook 16 G6 ABP | |
| Strange Brigade - 1920x1080 ultra AA:ultra AF:16 | |
| Dell Inspiron 16 Plus 7630 | |
| Asus VivoBook Pro 16 K6602VU | |
| MSI Prestige 16 B1MG-001US | |
| MSI Prestige 15 A12UD-093 | |
| LG Gram 2in1 16 16T90R - G.AA78G | |
| Lenovo ThinkBook 16 G6 ABP | |
| Dota 2 Reborn - 1920x1080 ultra (3/3) best looking | |
| Dell Inspiron 16 Plus 7630 | |
| Asus VivoBook Pro 16 K6602VU | |
| MSI Prestige 16 B1MG-001US | |
| MSI Prestige 15 A12UD-093 | |
| LG Gram 2in1 16 16T90R - G.AA78G | |
| Lenovo ThinkBook 16 G6 ABP | |
| X-Plane 11.11 - 1920x1080 high (fps_test=3) | |
| Dell Inspiron 16 Plus 7630 | |
| Asus VivoBook Pro 16 K6602VU | |
| MSI Prestige 15 A12UD-093 | |
| LG Gram 2in1 16 16T90R - G.AA78G | |
| MSI Prestige 16 B1MG-001US | |
| Lenovo ThinkBook 16 G6 ABP | |
| Baldur's Gate 3 | |
| 1280x720 Low Preset AA:SM | |
| MSI Prestige 16 B1MG-001US | |
| Media Intel Arc 8-Core iGPU (31.8 - 57.6, n=15) | |
| 1920x1080 Low Preset AA:SM | |
| MSI Prestige 16 B1MG-001US | |
| Media Intel Arc 8-Core iGPU (21 - 40.3, n=27) | |
| 1920x1080 Medium Preset AA:T | |
| MSI Prestige 16 B1MG-001US | |
| Media Intel Arc 8-Core iGPU (16.3 - 31.1, n=28) | |
| 1920x1080 High Preset AA:T | |
| MSI Prestige 16 B1MG-001US | |
| Media Intel Arc 8-Core iGPU (15.4 - 27.7, n=27) | |
| 1920x1080 Ultra Preset AA:T | |
| MSI Prestige 16 B1MG-001US | |
| Media Intel Arc 8-Core iGPU (14.2 - 26.2, n=26) | |
| Cyberpunk 2077 | |
| 1280x720 Low Preset (FSR off) | |
| MSI Prestige 16 B1MG-001US | |
| Media Intel Arc 8-Core iGPU (34.5 - 58, n=20) | |
| LG Gram 2in1 16 16T90R - G.AA78G | |
| 1920x1080 Low Preset (FSR off) | |
| MSI Prestige 16 B1MG-001US | |
| Media Intel Arc 8-Core iGPU (11.3 - 38, n=38) | |
| LG Gram 2in1 16 16T90R - G.AA78G | |
| 1920x1080 Medium Preset (FSR off) | |
| MSI Prestige 16 B1MG-001US | |
| Media Intel Arc 8-Core iGPU (9.42 - 31.4, n=36) | |
| LG Gram 2in1 16 16T90R - G.AA78G | |
| 1920x1080 High Preset (FSR off) | |
| MSI Prestige 16 B1MG-001US | |
| Media Intel Arc 8-Core iGPU (7.3 - 27.6, n=36) | |
| LG Gram 2in1 16 16T90R - G.AA78G | |
| 1920x1080 Ultra Preset (FSR off) | |
| MSI Prestige 16 B1MG-001US | |
| Media Intel Arc 8-Core iGPU (13 - 24.7, n=28) | |
| LG Gram 2in1 16 16T90R - G.AA78G | |
Witcher 3 FPS Chart
| basso | medio | alto | ultra | |
|---|---|---|---|---|
| The Witcher 3 (2015) | 135.6 | 88.2 | 54.1 | 25.2 |
| Dota 2 Reborn (2015) | 101.7 | 92.8 | 79.1 | 75.6 |
| Final Fantasy XV Benchmark (2018) | 61 | 37.3 | 24.6 | |
| X-Plane 11.11 (2018) | 52.2 | 46.7 | 37.8 | |
| Far Cry 5 (2018) | 63 | 39 | 36 | 34 |
| Strange Brigade (2018) | 179.5 | 71 | 57.8 | 46.1 |
| Tiny Tina's Wonderlands (2022) | 53.3 | 41.2 | 30.1 | 25.1 |
| F1 22 (2022) | 77.7 | 71.6 | 53.3 | 15.3 |
| Baldur's Gate 3 (2023) | 31.9 | 28.2 | 24.1 | 23.4 |
| Cyberpunk 2077 (2023) | 35.7 | 29.5 | 25.2 | 22.1 |
Emissioni - rumorose per un computer portatile con grafica integrata
Rumore del sistema
Il rumore della ventola è più silenzioso rispetto al Prestige 15 quando si utilizzano carichi inferiori, mentre è vero il contrario quando si utilizzano carichi più elevati. Durante la navigazione o lo streaming video, ad esempio, il rumore della ventola tende a variare tra 26 e 37 dB(A), rispetto ai 31-42 dB(A) del modello precedente. L'esecuzione di carichi impegnativi come Witcher 3 aumenterebbe il rumore della ventola a 46 dB(A) o addirittura a 53 dB(A) se Cooler Boost è attivo. La fascia media di 40 dB(A) è piuttosto rumorosa per un portatile che funziona solo con grafica integrata.
Ci aspettiamo che il rumore della ventola sulle SKU con grafica discreta si comporti in modo diverso da quello che abbiamo sperimentato sulla nostra unità di test iGPU.
Rumorosità
| Idle |
| 24.5 / 26.3 / 26.3 dB(A) |
| Sotto carico |
| 36.5 / 52.9 dB(A) |
 | ||
30 dB silenzioso 40 dB(A) udibile 50 dB(A) rumoroso |
||
min: | ||
| MSI Prestige 16 B1MG-001US Arc 8-Core, Ultra 7 155H, Samsung PM9A1 MZVL22T0HBLB | MSI Prestige 15 A12UD-093 GeForce RTX 3050 Ti Laptop GPU, i7-1280P, Micron 3400 1TB MTFDKBA1T0TFH | LG Gram 2in1 16 16T90R - G.AA78G Iris Xe G7 96EUs, i7-1360P, Samsung PM9A1 MZVL21T0HCLR | Lenovo ThinkBook 16 G6 ABP Vega 7, R5 7530U, SK hynix HFS512GEJ9X125N | Asus VivoBook Pro 16 K6602VU GeForce RTX 4050 Laptop GPU, i9-13900H, Micron 2400 MTFDKBA1T0QFM | Dell Inspiron 16 Plus 7630 GeForce RTX 4060 Laptop GPU, i7-13700H, WD PC SN740 SDDPTQD-1T00 | |
|---|---|---|---|---|---|---|
| Noise | -6% | 8% | 13% | -4% | 4% | |
| off /ambiente * (dB) | 24.5 | 26 -6% | 25.1 -2% | 24.3 1% | 20.96 14% | 23.2 5% |
| Idle Minimum * (dB) | 24.5 | 26 -6% | 25.1 -2% | 24.3 1% | 25.28 -3% | 23.2 5% |
| Idle Average * (dB) | 26.3 | 30.7 -17% | 25.1 5% | 24.3 8% | 25.28 4% | 23.2 12% |
| Idle Maximum * (dB) | 26.3 | 30.7 -17% | 26.1 1% | 24.3 8% | 25.28 4% | 23.2 12% |
| Load Average * (dB) | 36.5 | 41.9 -15% | 31.4 14% | 29.7 19% | 51.88 -42% | 35.1 4% |
| Witcher 3 ultra * (dB) | 46.3 | 41.1 11% | 32.1 31% | 49 -6% | 52.5 -13% | |
| Load Maximum * (dB) | 52.9 | 40.7 23% | 36.6 31% | 41.4 22% | 51.8 2% | 52.5 1% |
* ... Meglio usare valori piccoli
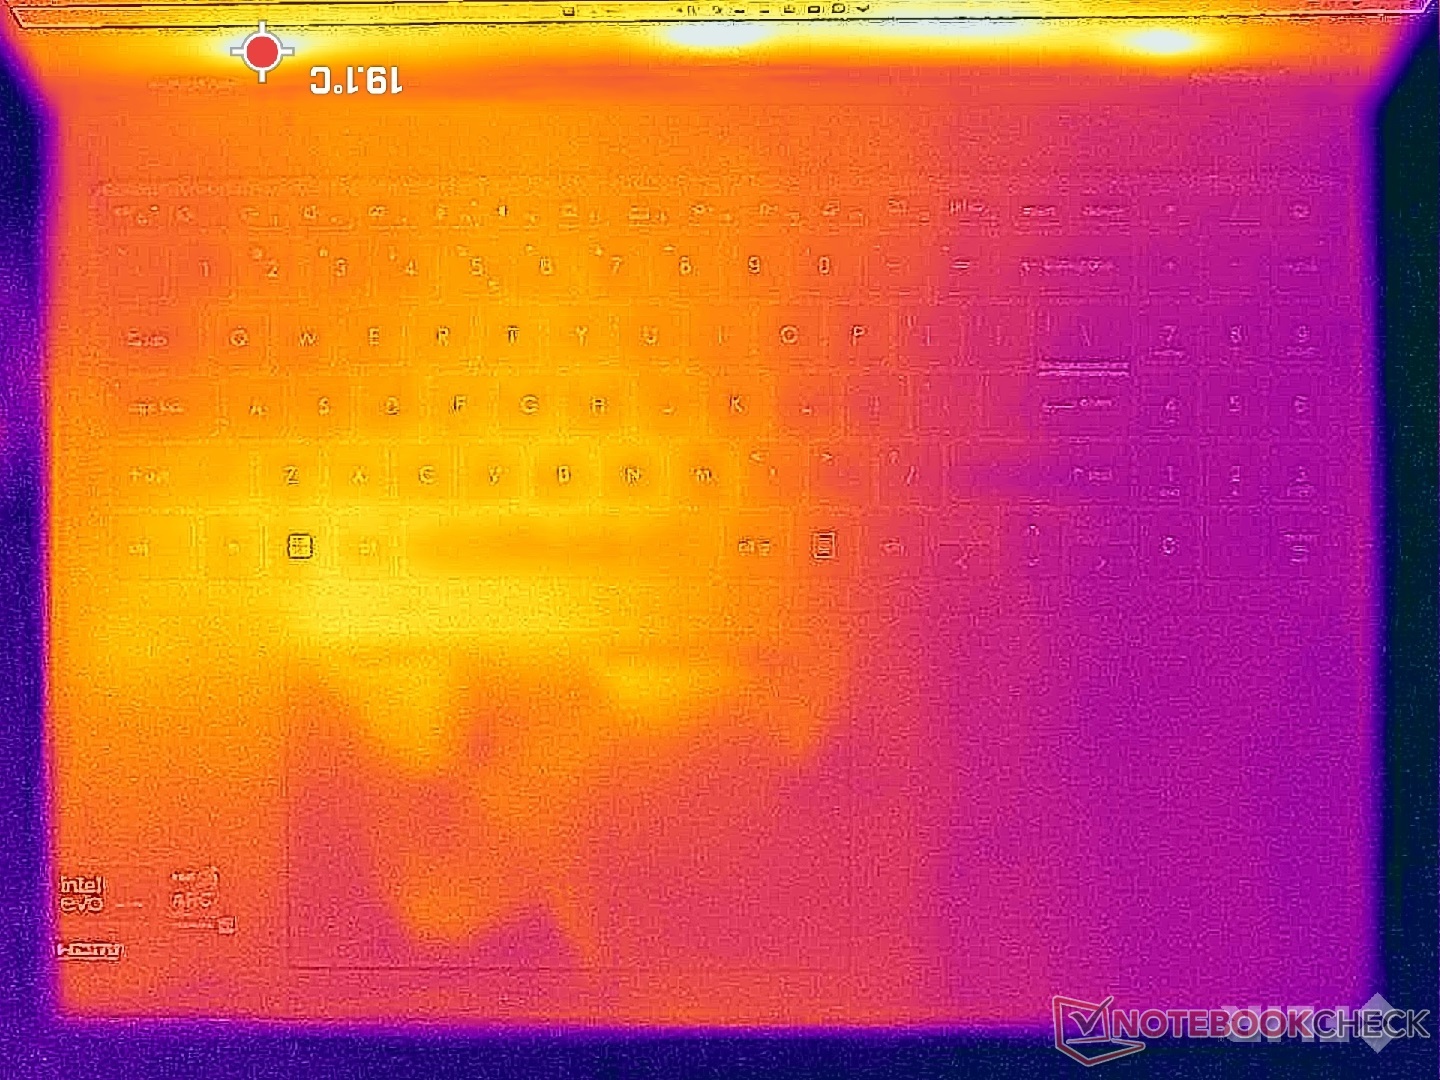
Temperatura
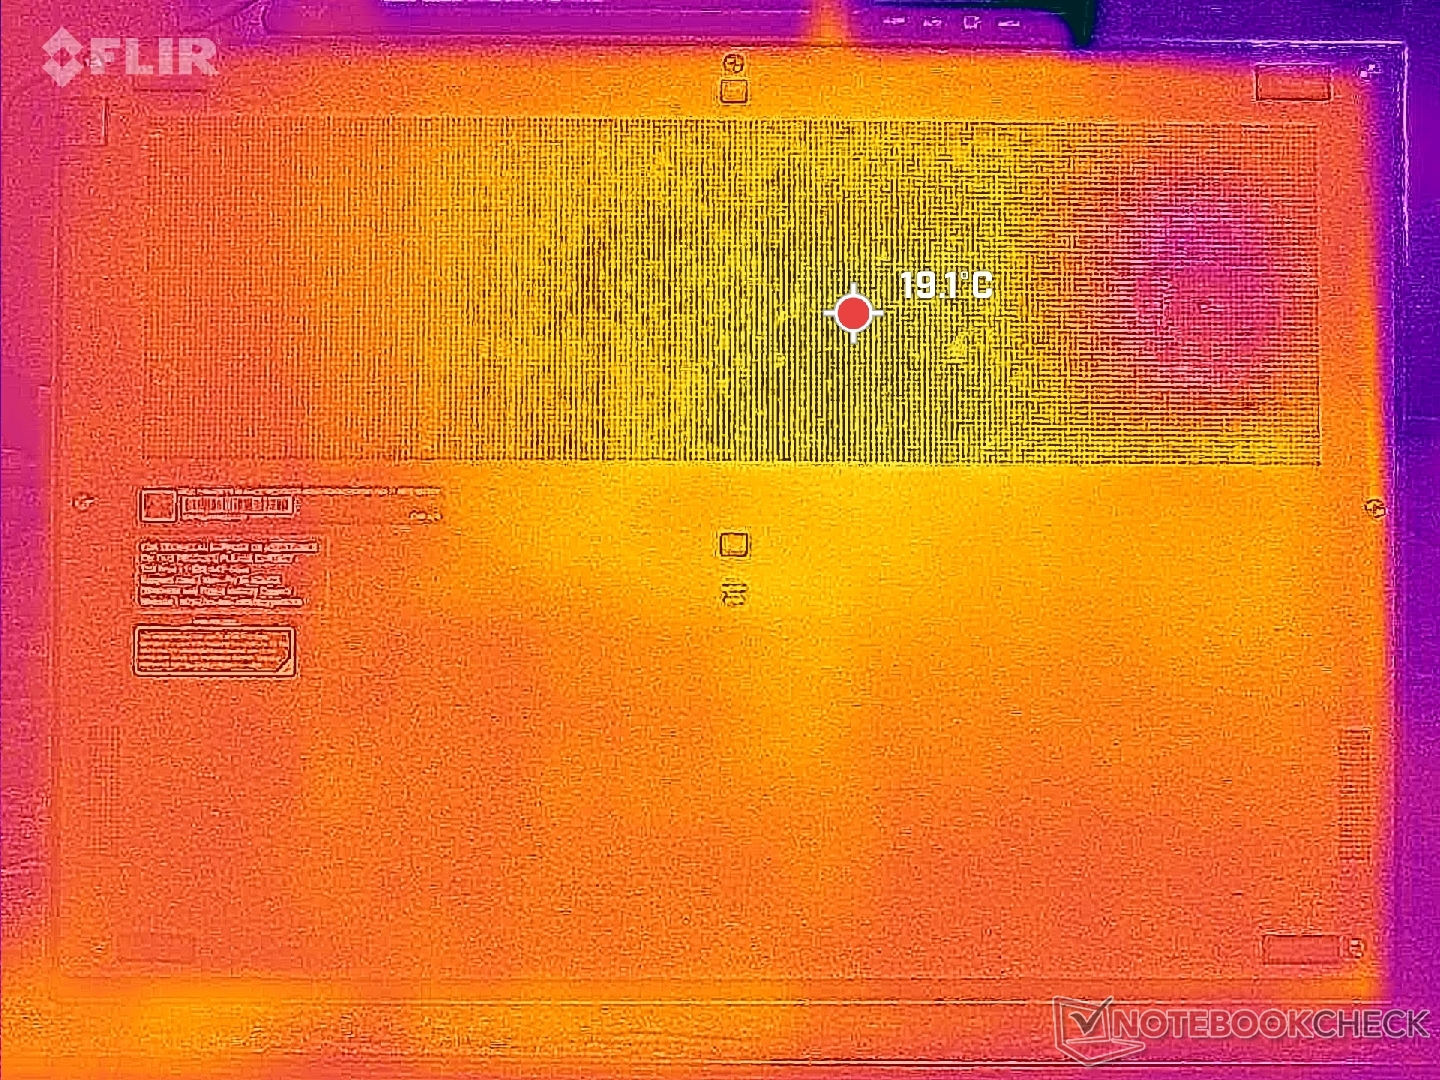
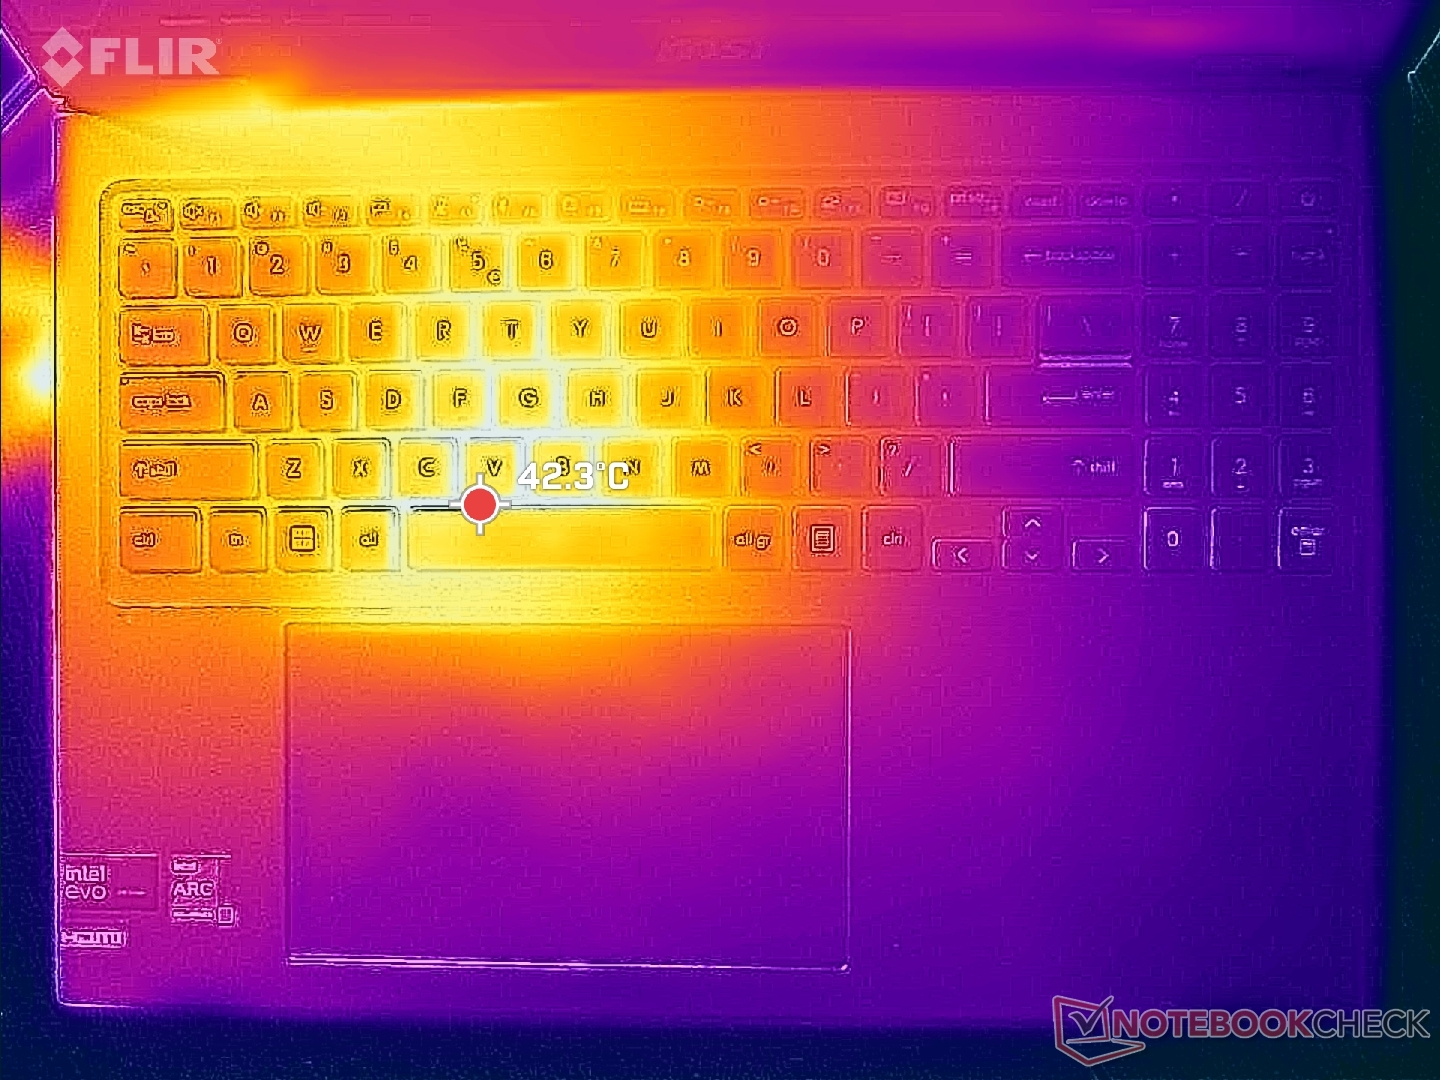
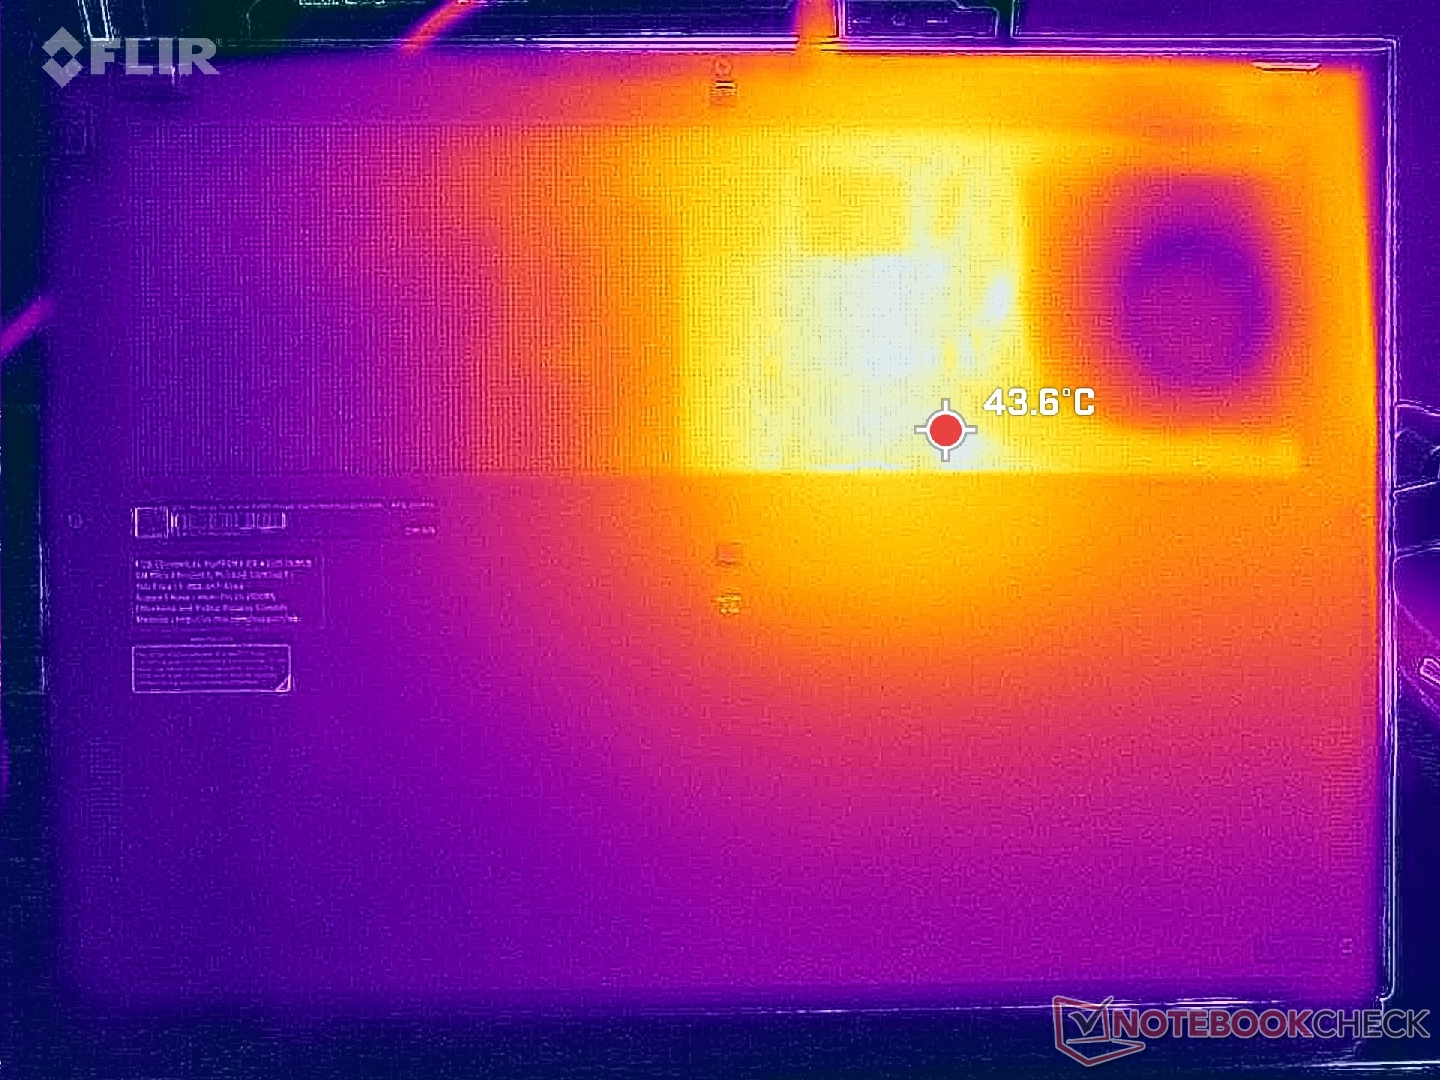
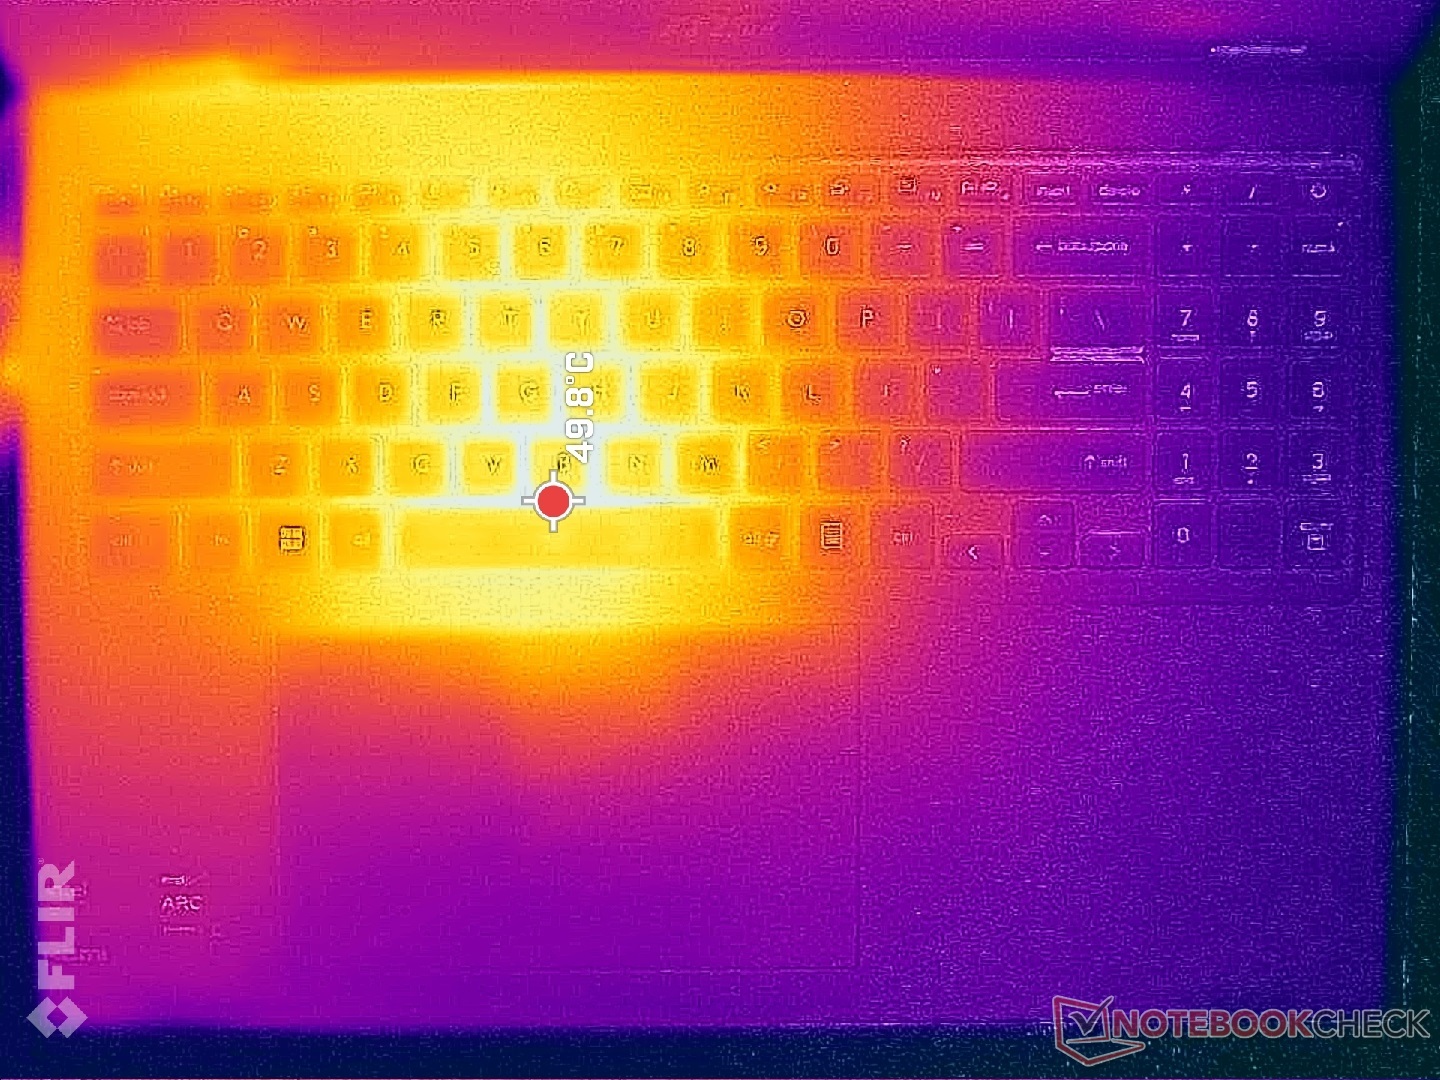
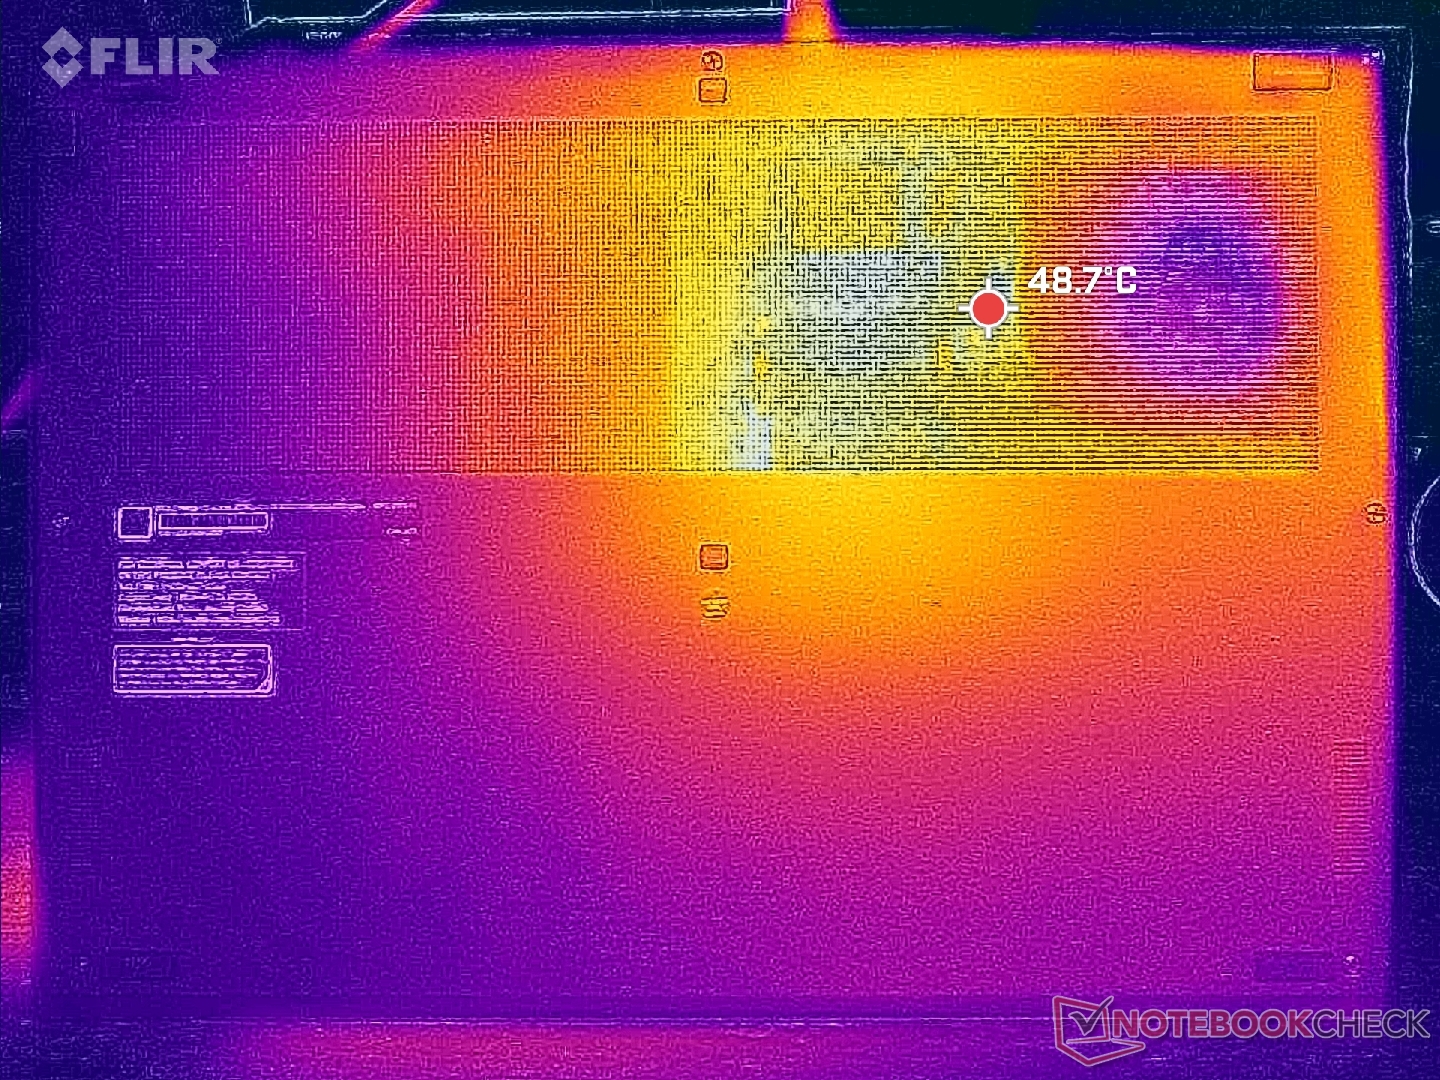
Le temperature di superficie sono più calde nella metà sinistra del portatile rispetto a quella destra, a causa del posizionamento della CPU e della soluzione di raffreddamento all'interno. Il punto caldo vicino al tasto Spazio può raggiungere i 50 C quando si eseguono carichi impegnativi, il che è simile al punto caldo sul Prestige 15 dello scorso anno con la GPU RTX dedicata GeForce. Di conseguenza, i tasti WASD possono risultare piuttosto caldi durante il gioco, ma i palmari e i tasti freccia rimangono molto più freschi. I computer portatili Prestige sono generalmente più caldi rispetto alla media degli Ultrabook sotto carico, grazie al loro design compatto, e il Prestige 16 non fa eccezione.
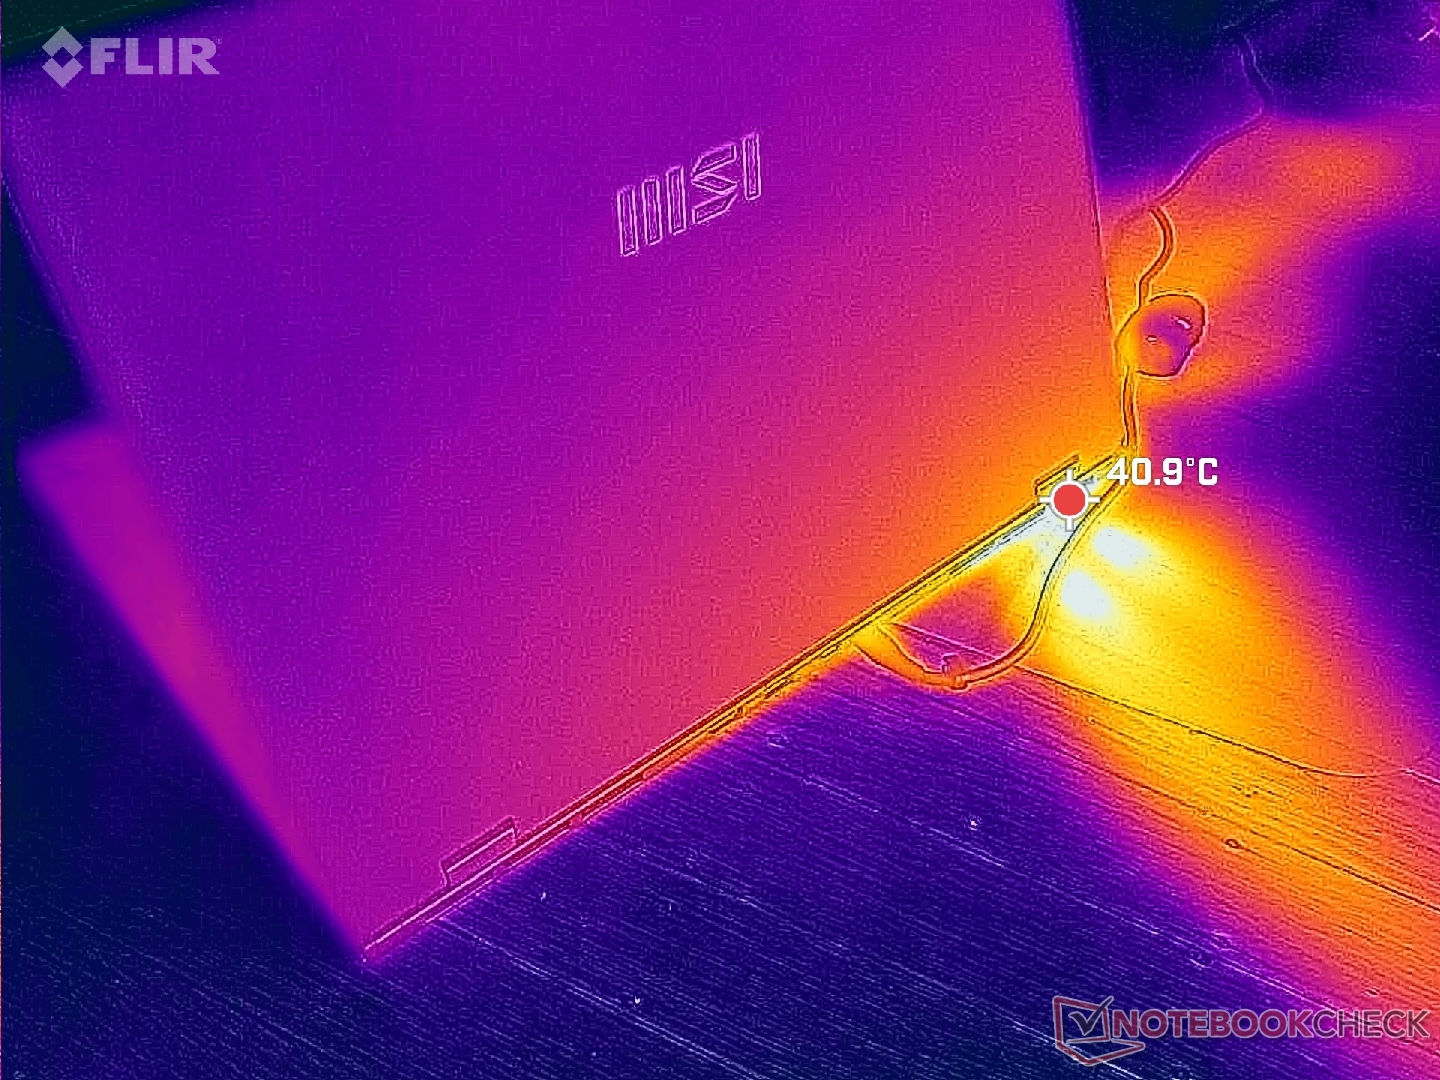
(-) La temperatura massima sul lato superiore è di 48.8 °C / 120 F, rispetto alla media di 36.8 °C / 98 F, che varia da 21 a 71 °C per questa classe Multimedia.
(-) Il lato inferiore si riscalda fino ad un massimo di 47.6 °C / 118 F, rispetto alla media di 39.1 °C / 102 F
(+) In idle, la temperatura media del lato superiore è di 23 °C / 73 F, rispetto alla media deld ispositivo di 31.3 °C / 88 F.
(±) Riproducendo The Witcher 3, la temperatura media per il lato superiore e' di 33.3 °C / 92 F, rispetto alla media del dispositivo di 31.3 °C / 88 F.
(+) I poggiapolsi e il touchpad sono piu' freddi della temperatura della pelle con un massimo di 30 °C / 86 F e sono quindi freddi al tatto.
(±) La temperatura media della zona del palmo della mano di dispositivi simili e'stata di 28.7 °C / 83.7 F (-1.3 °C / -2.3 F).
| MSI Prestige 16 B1MG-001US Intel Core Ultra 7 155H, Intel Arc 8-Core iGPU | MSI Prestige 15 A12UD-093 Intel Core i7-1280P, NVIDIA GeForce RTX 3050 Ti Laptop GPU | LG Gram 2in1 16 16T90R - G.AA78G Intel Core i7-1360P, Intel Iris Xe Graphics G7 96EUs | Lenovo ThinkBook 16 G6 ABP AMD Ryzen 5 7530U, AMD Radeon RX Vega 7 | Asus VivoBook Pro 16 K6602VU Intel Core i9-13900H, NVIDIA GeForce RTX 4050 Laptop GPU | Dell Inspiron 16 Plus 7630 Intel Core i7-13700H, NVIDIA GeForce RTX 4060 Laptop GPU | |
|---|---|---|---|---|---|---|
| Heat | -16% | -25% | -15% | -30% | -20% | |
| Maximum Upper Side * (°C) | 48.8 | 49 -0% | 55 -13% | 40.8 16% | 42.6 13% | 47.8 2% |
| Maximum Bottom * (°C) | 47.6 | 52.6 -11% | 55.4 -16% | 50.5 -6% | 48.4 -2% | 42.2 11% |
| Idle Upper Side * (°C) | 24.2 | 29.7 -23% | 34.9 -44% | 29.3 -21% | 39.4 -63% | 35.2 -45% |
| Idle Bottom * (°C) | 23.6 | 30.7 -30% | 30 -27% | 35.2 -49% | 39.8 -69% | 35 -48% |
* ... Meglio usare valori piccoli
Test da sforzo
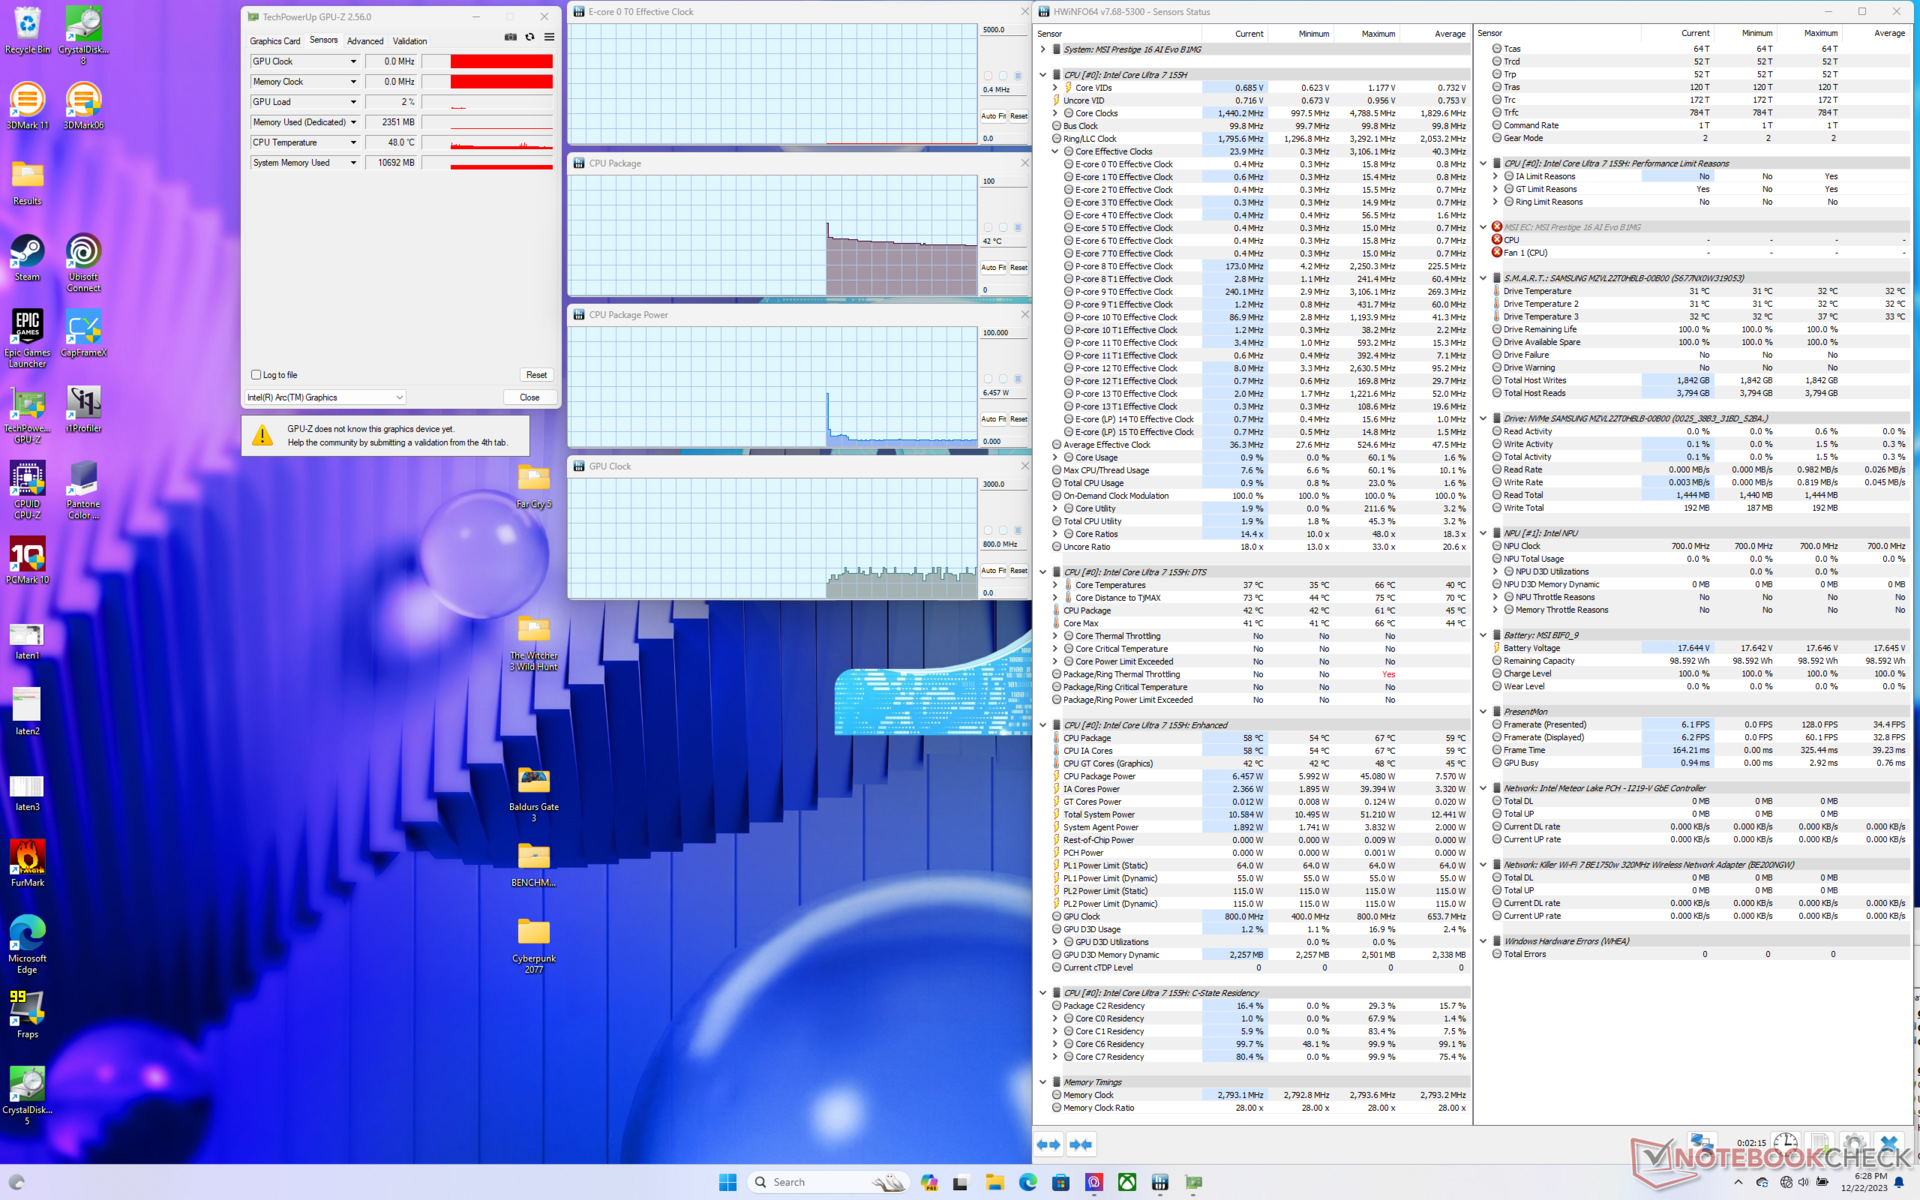
La potenza del pacchetto CPU ha raggiunto i 110 W, 2,8 GHz e 96 C per un paio di secondi quando si avvia lo stress Prime95, prima di scendere rapidamente e stabilizzarsi a 2,2 GHz, 44 W e 83 C. Questo intervallo è più caldo della media per un Ultrabook, ma è altrimenti tipico di un modello Prestige. L'Acer Swift Edge SFE16 Acer Swift Edge SFE16 con Ryzen 7 7840U, per esempio, si stabilizzerebbe a 64 C, mentre il Core H alimentato da Lenovo Slim Pro 9i 16IRP8 si stabilizzerebbe a 77 C ciascuno in condizioni simili.
L'esecuzione con Cooler Boost attivo non sembra avere un impatto sulle prestazioni. Ad esempio, la CPU si stabilizzerebbe a 85 C quando è in funzione con Cooler Boost disattivato Witcher 3 con Cooler Boost disattivato rispetto a 77 C con Cooler Boost attivato, mentre le velocità di clock della GPU rimarrebbero invariate. A meno che le temperature dei core non siano un problema, la modalità Cooler Boost non è generalmente necessaria per ottenere le massime prestazioni. Questa osservazione è in linea con le nostre esperienze su molti altri laptop MSI dotati di Cooler Boost.
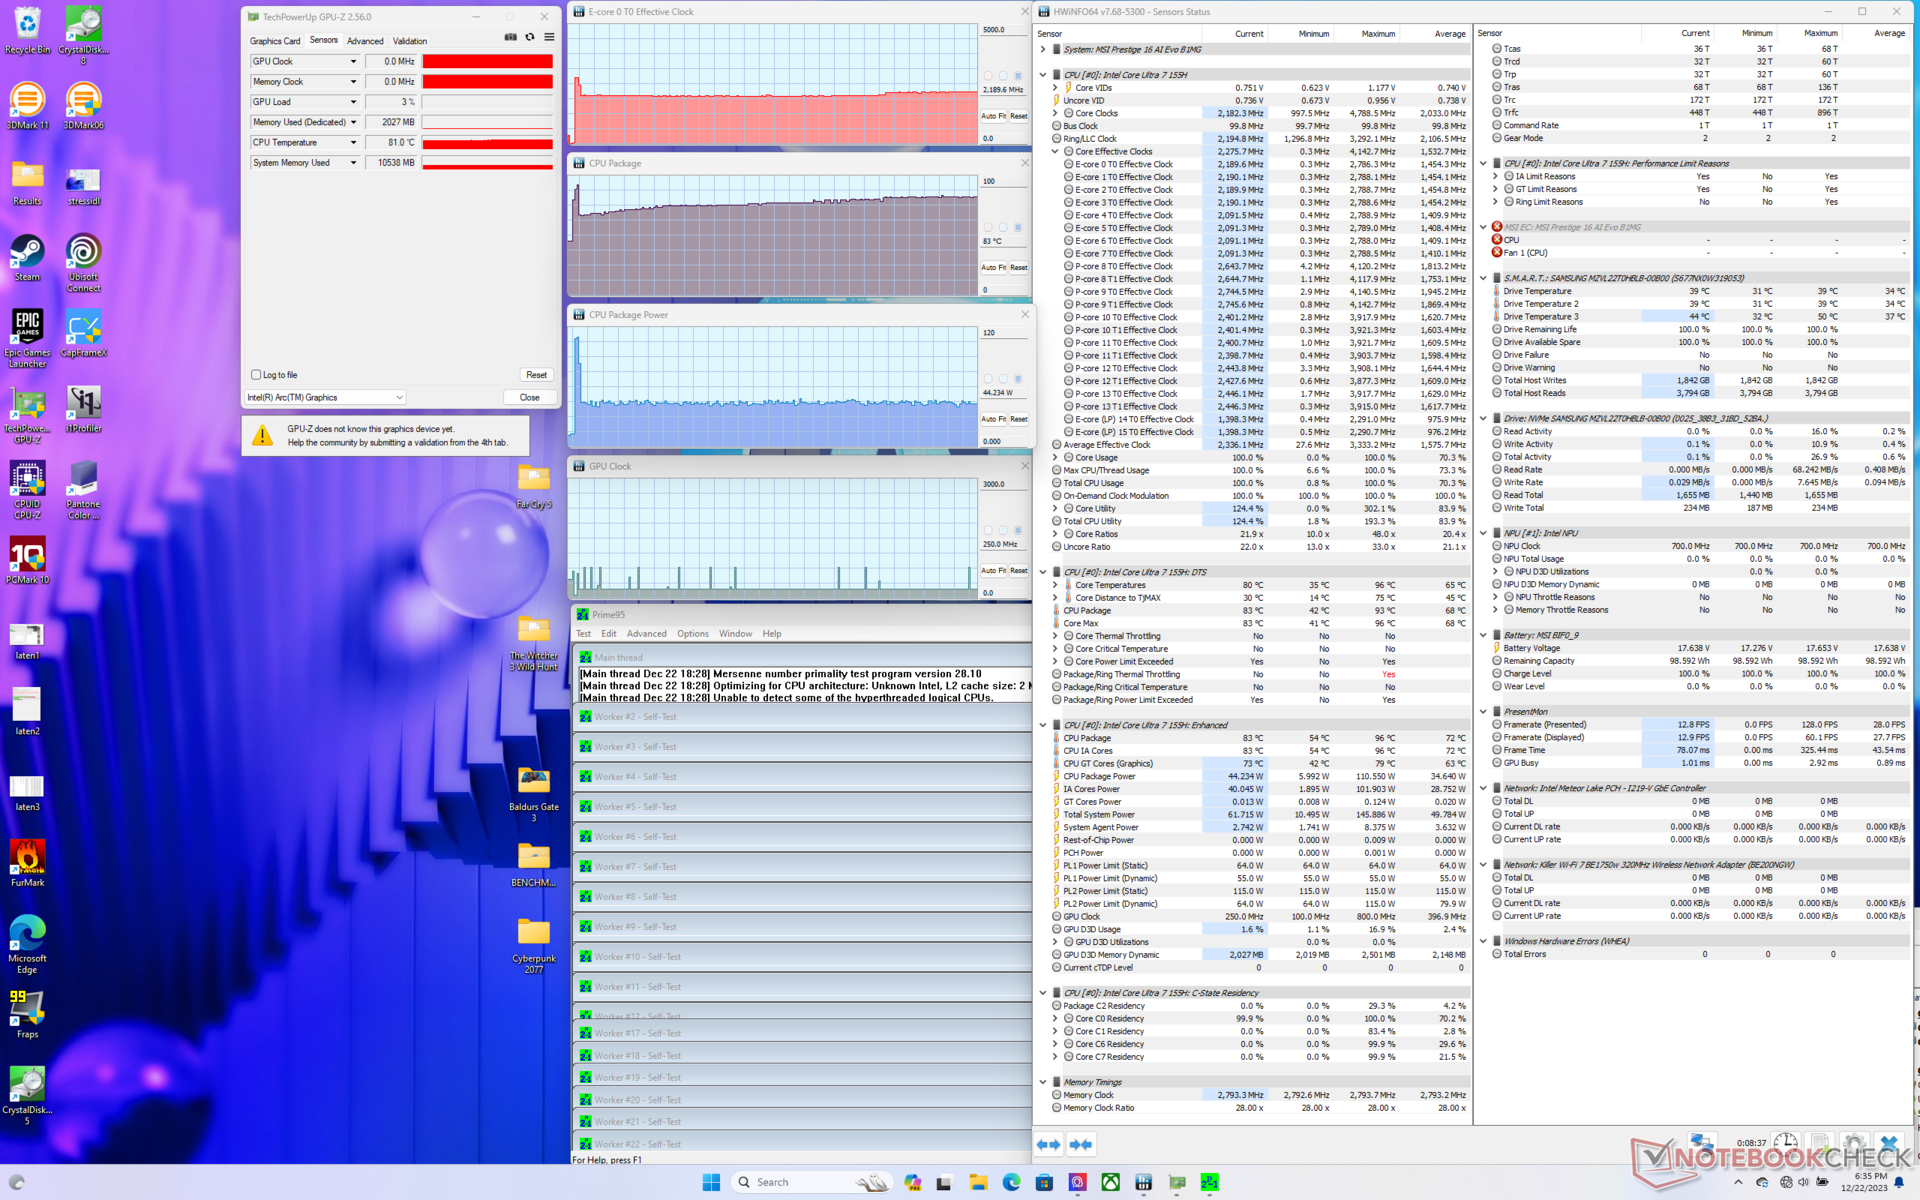
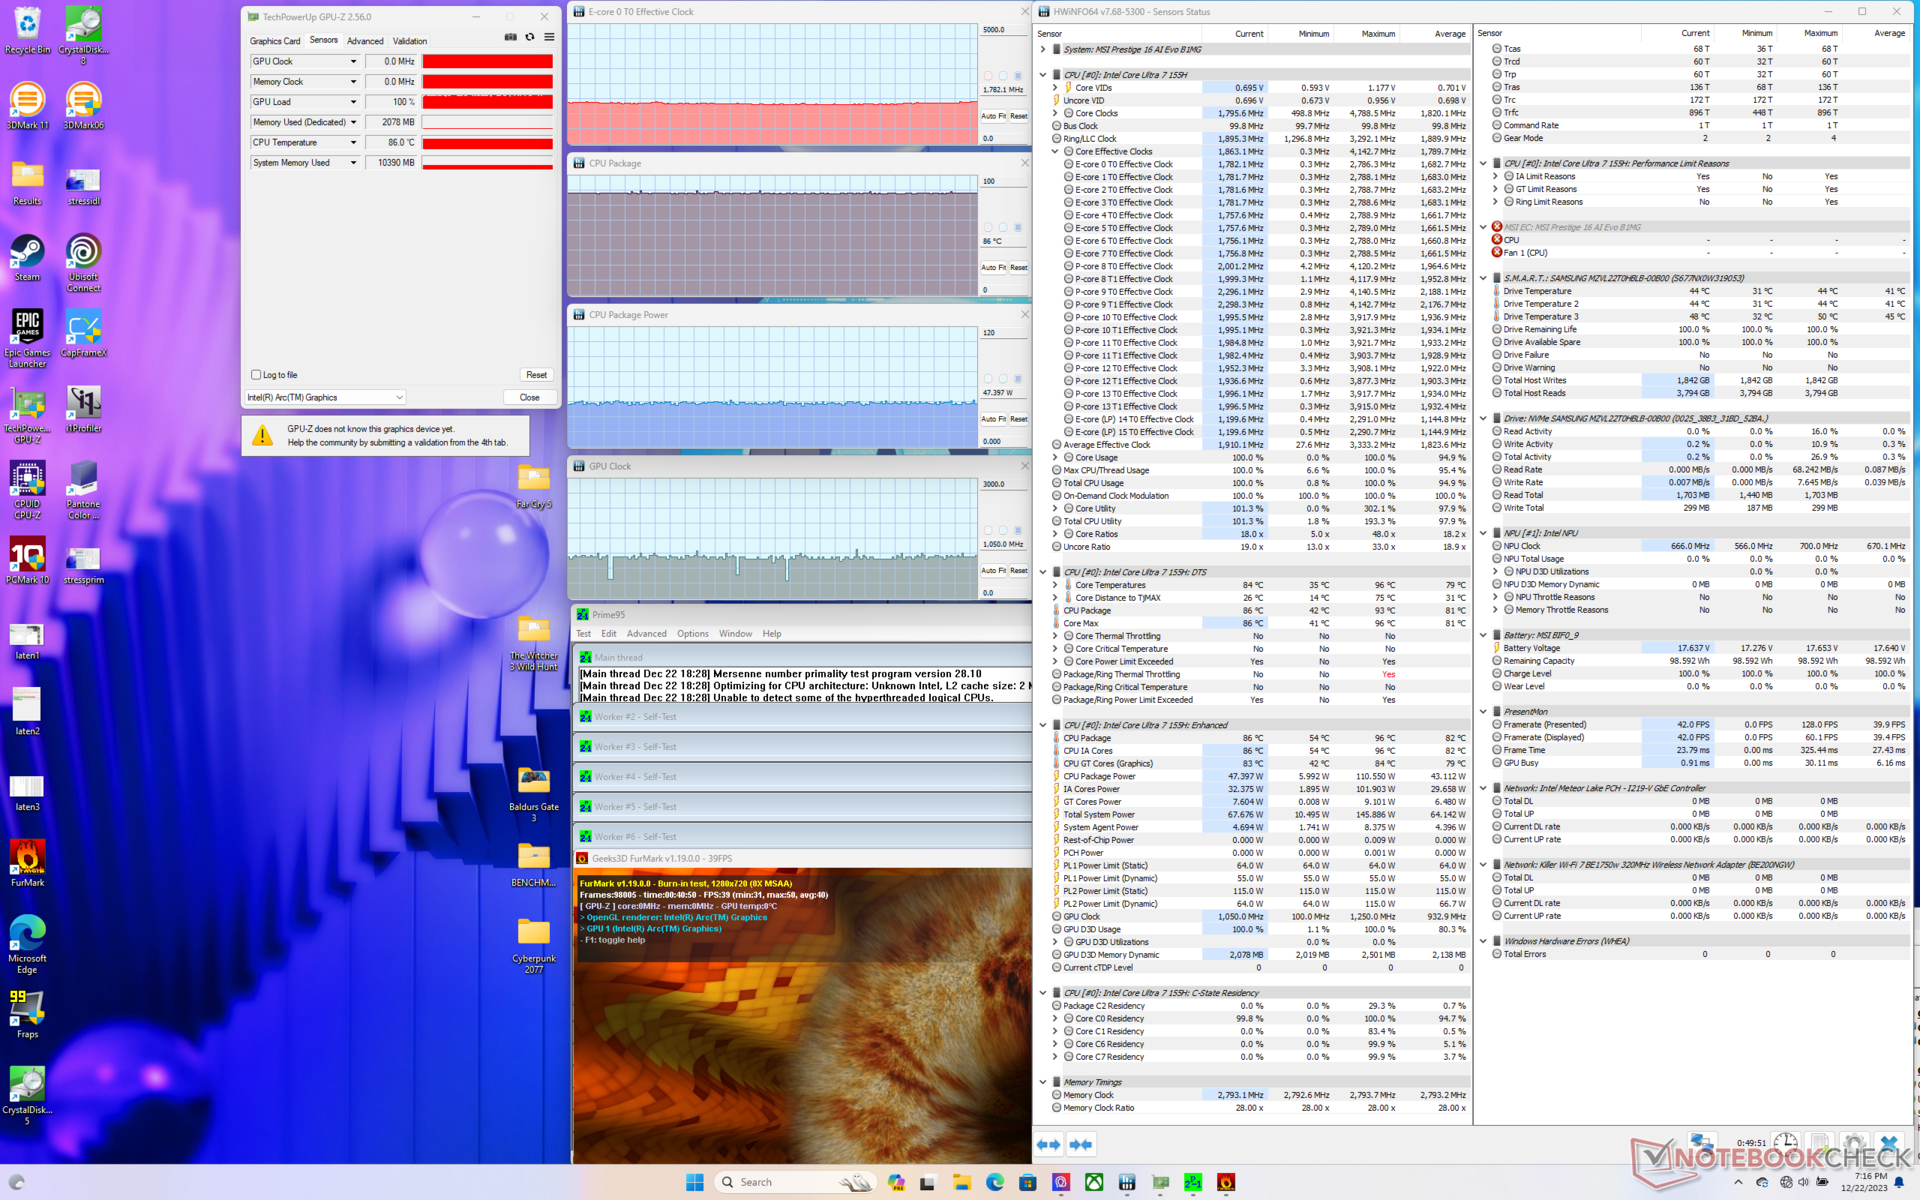
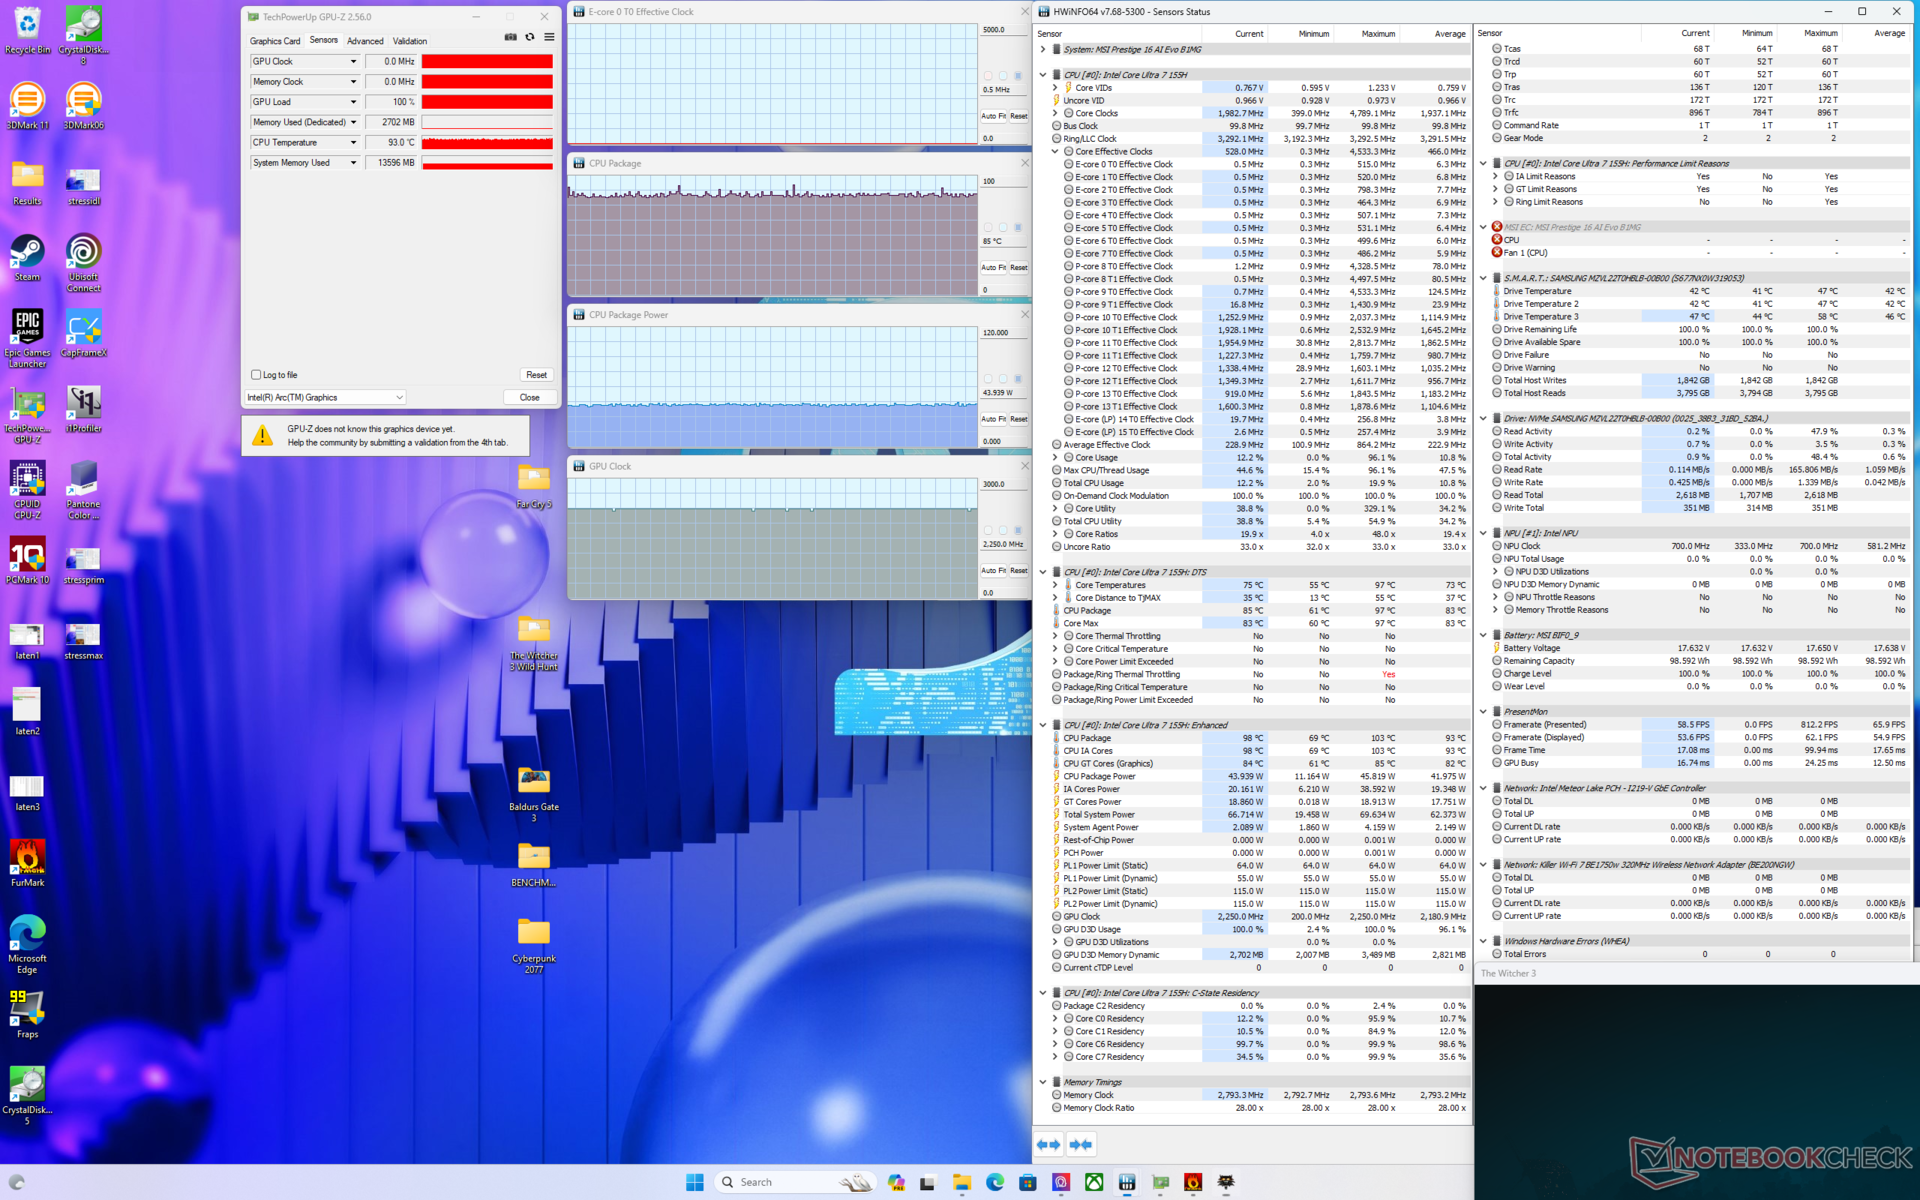

| Clock della CPU (GHz) | Clock della GPU (MHz) | Temperatura media della CPU (°C) | |
| Sistema inattivo | -- | -- | 42 |
| Prime95 Stress | 2,2 | -- | 83 |
| Prime95 + FurMark Stress | 1,8 | 1050 | 86 |
| Witcher 3 Stress (prestazioni estreme con Cooler Boost disattivato) | 0,5 | 2250 | 85 |
| Witcher 3 Stress (Prestazioni estreme con Cooler Boost attivato) | 0,5 | 2250 | 77 |
Altoparlanti
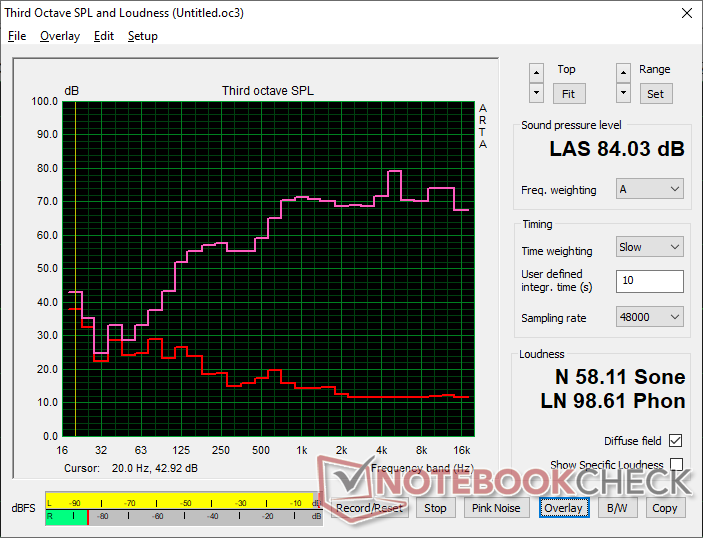
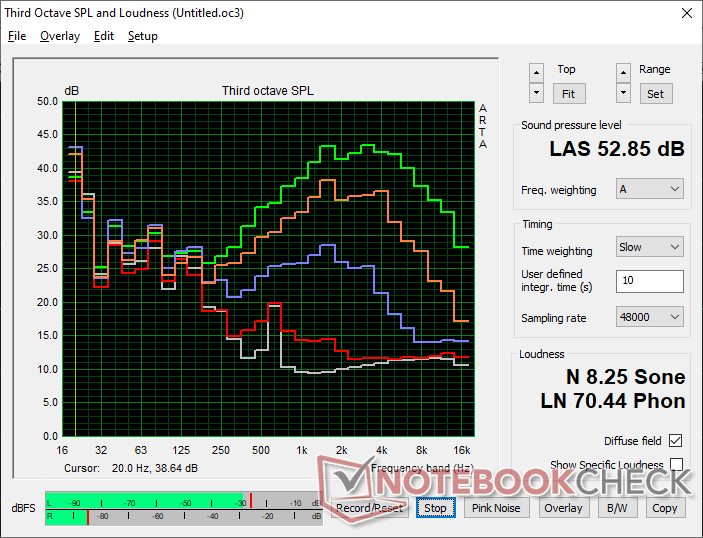
MSI Prestige 16 B1MG-001US analisi audio
(+) | gli altoparlanti sono relativamente potenti (84 dB)
Bassi 100 - 315 Hz
(-) | quasi nessun basso - in media 15.3% inferiori alla media
(±) | la linearità dei bassi è media (7% delta rispetto alla precedente frequenza)
Medi 400 - 2000 Hz
(+) | medi bilanciati - solo only 4.3% rispetto alla media
(+) | medi lineari (4.3% delta rispetto alla precedente frequenza)
Alti 2 - 16 kHz
(+) | Alti bilanciati - appena 3.2% dalla media
(+) | alti lineari (6.5% delta rispetto alla precedente frequenza)
Nel complesso 100 - 16.000 Hz
(+) | suono nel complesso lineare (13.3% differenza dalla media)
Rispetto alla stessa classe
» 28% di tutti i dispositivi testati in questa classe è stato migliore, 4% simile, 68% peggiore
» Il migliore ha avuto un delta di 5%, medio di 17%, peggiore di 45%
Rispetto a tutti i dispositivi testati
» 14% di tutti i dispositivi testati in questa classe è stato migliore, 3% similare, 83% peggiore
» Il migliore ha avuto un delta di 4%, medio di 23%, peggiore di 134%
Apple MacBook Pro 16 2021 M1 Pro analisi audio
(+) | gli altoparlanti sono relativamente potenti (84.7 dB)
Bassi 100 - 315 Hz
(+) | bassi buoni - solo 3.8% dalla media
(+) | bassi in lineaa (5.2% delta rispetto alla precedente frequenza)
Medi 400 - 2000 Hz
(+) | medi bilanciati - solo only 1.3% rispetto alla media
(+) | medi lineari (2.1% delta rispetto alla precedente frequenza)
Alti 2 - 16 kHz
(+) | Alti bilanciati - appena 1.9% dalla media
(+) | alti lineari (2.7% delta rispetto alla precedente frequenza)
Nel complesso 100 - 16.000 Hz
(+) | suono nel complesso lineare (4.6% differenza dalla media)
Rispetto alla stessa classe
» 0% di tutti i dispositivi testati in questa classe è stato migliore, 0% simile, 100% peggiore
» Il migliore ha avuto un delta di 5%, medio di 17%, peggiore di 45%
Rispetto a tutti i dispositivi testati
» 0% di tutti i dispositivi testati in questa classe è stato migliore, 0% similare, 100% peggiore
» Il migliore ha avuto un delta di 4%, medio di 23%, peggiore di 134%
Gestione dell'energia - Minimi più bassi con massimi più alti
Consumo di energia
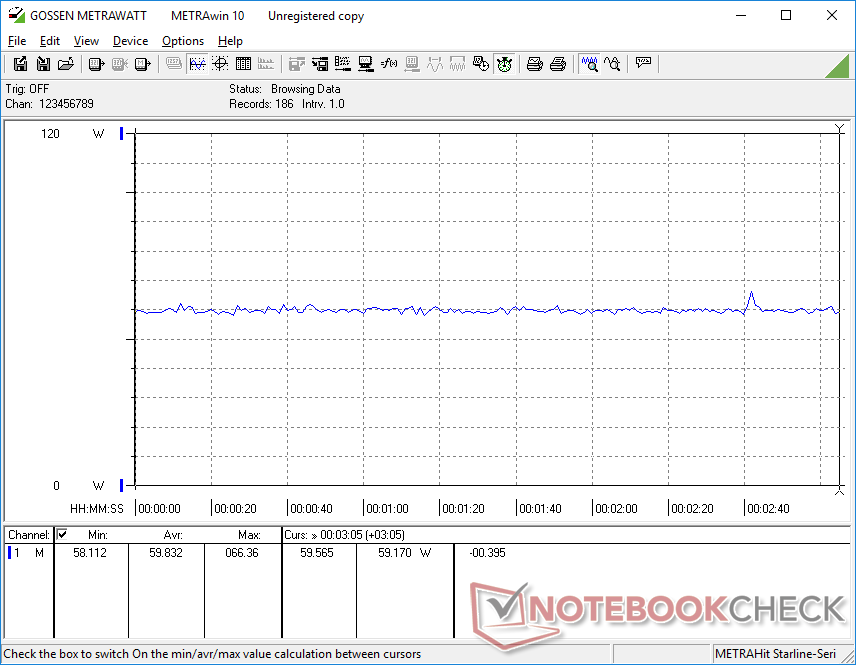
Il consumo di energia può arrivare a 3 W quando è al minimo, uno dei più bassi tra i portatili Intel da 16 pollici che abbiamo testato. Il livello molto basso è probabilmente responsabile della durata extra-lunga della batteria nella sezione successiva.
Sul versante opposto, il consumo sembra essere maggiore rispetto alla maggior parte degli altri laptop della serie U quando si eseguono carichi più impegnativi. L'esecuzione di 3DMark 06 o di giochi, ad esempio, consumerebbe tra i 60 W e i 70 W, rispetto ai 40 W-55 W di MSI Prestige 15, LG Gram 16 2-in-1acer Swift Edge SFE16, o il Core H alimentato da Schenker Vision 14 in condizioni simili. Questo vale anche quando la CPU viene stressata completamente con Prime95. Tuttavia, le prestazioni per watt sono ancora a favore della più recente CPU di 14esima generazione e quindi il consumo energetico più elevato non è necessariamente uno svantaggio.
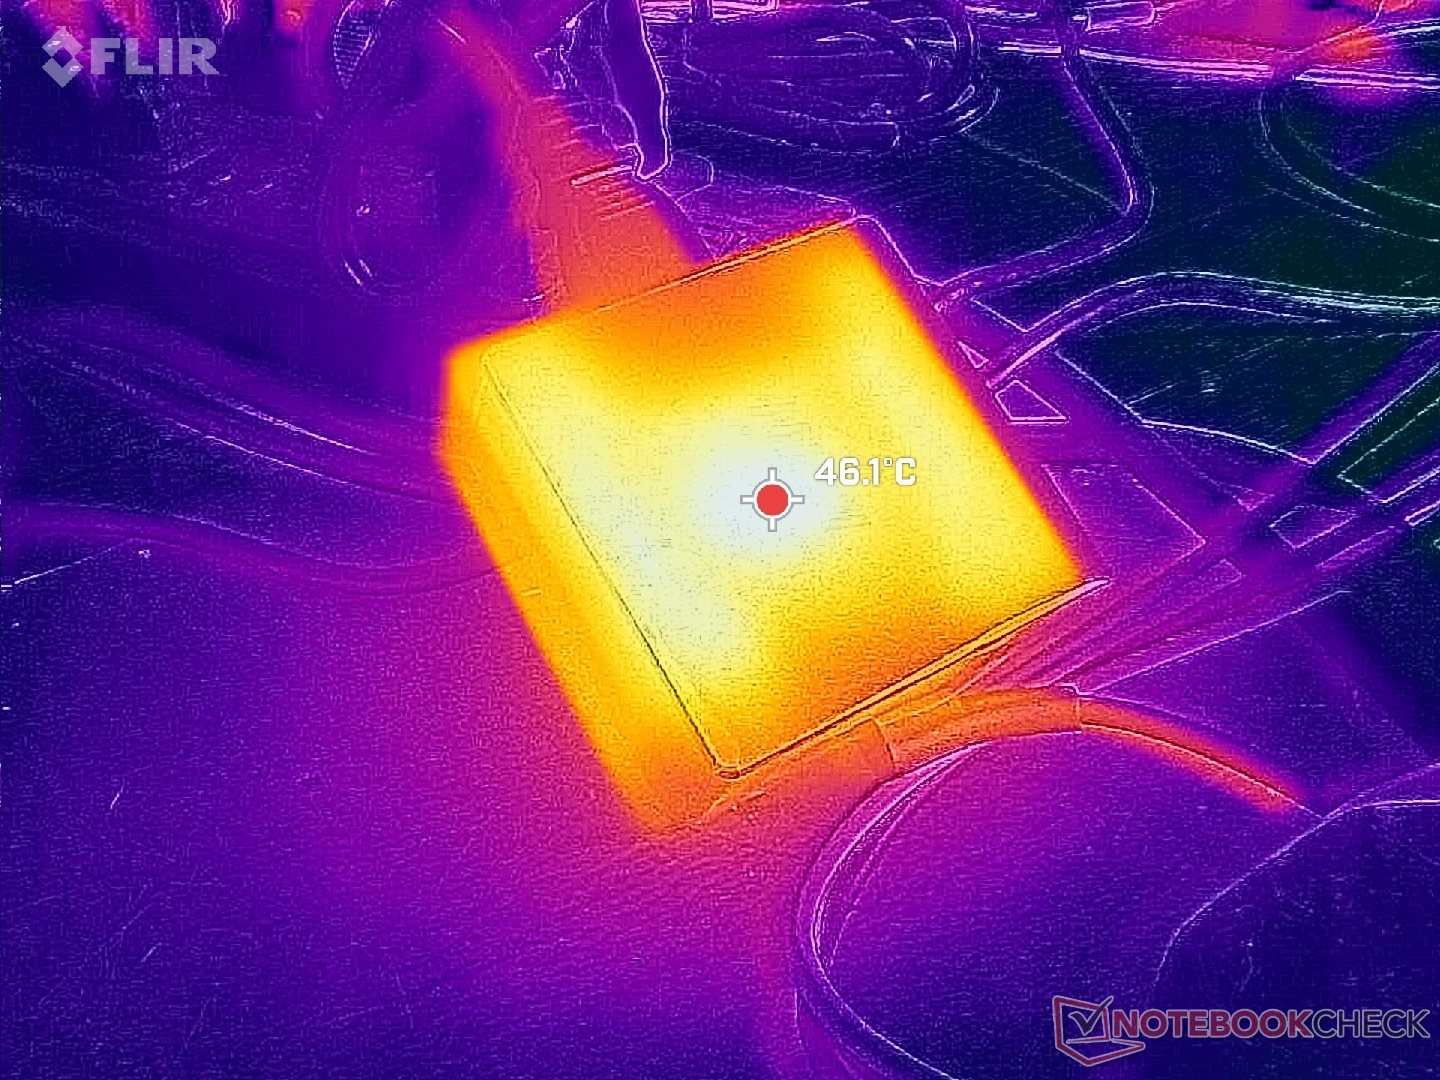
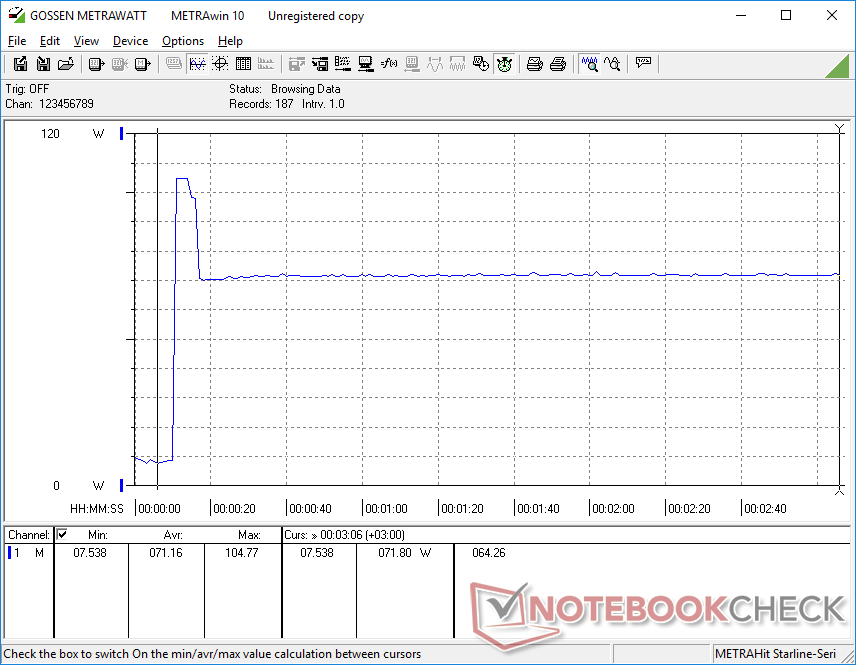
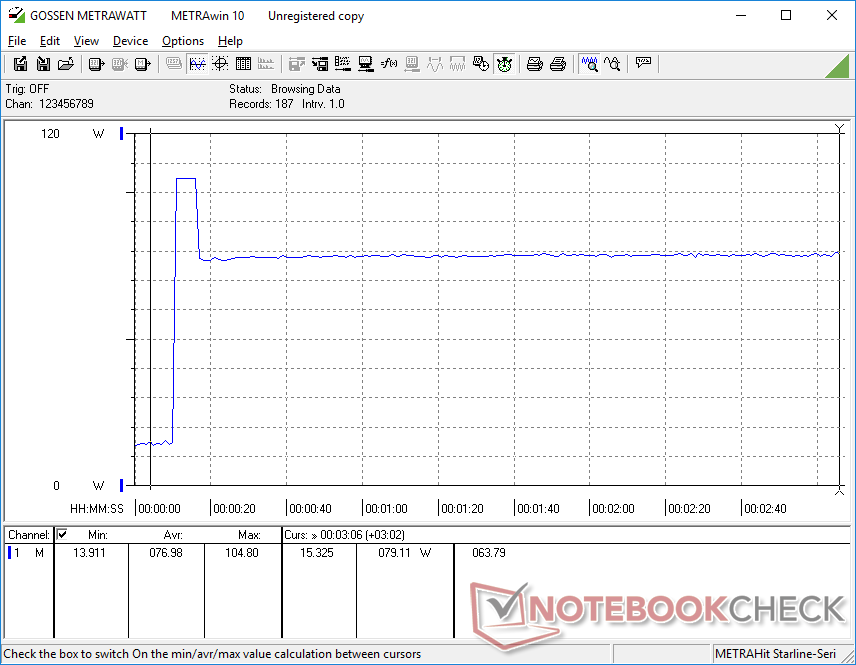
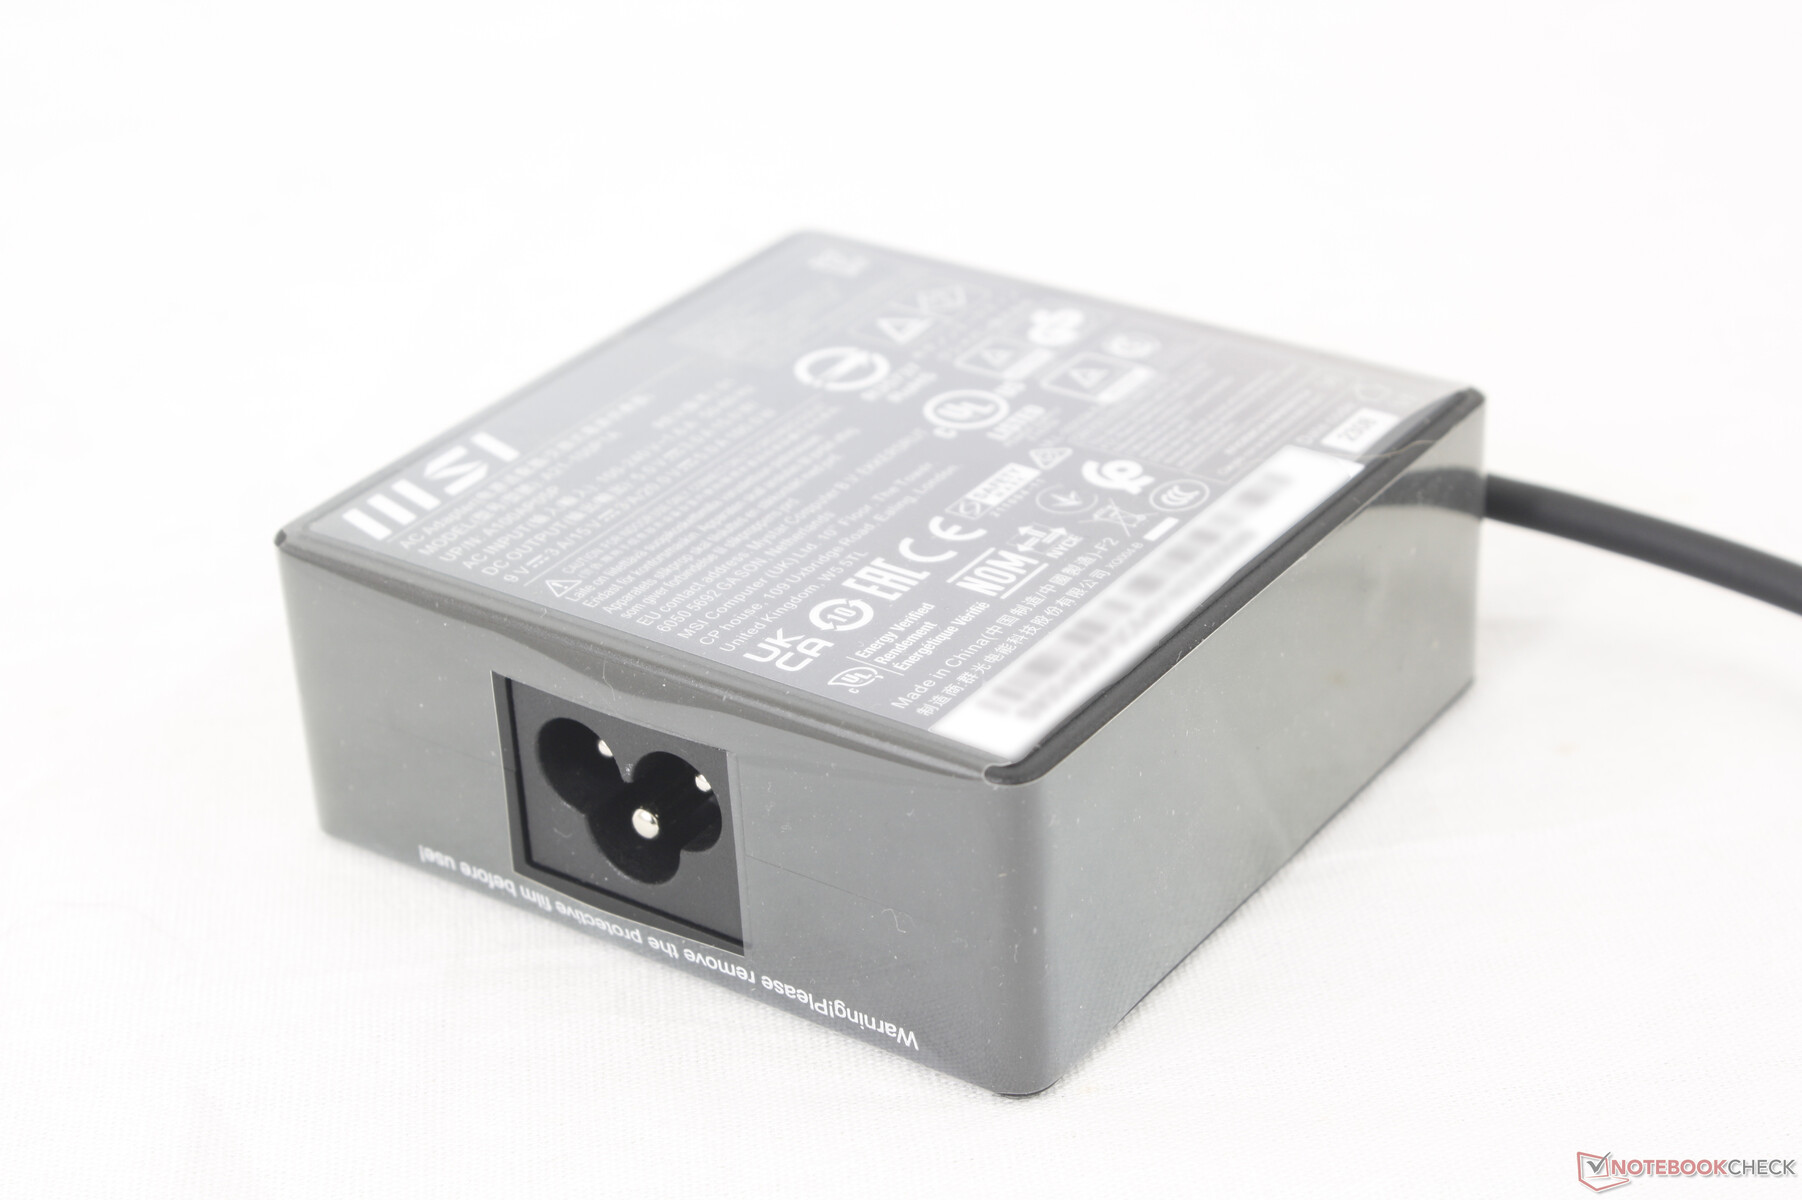
Siamo in grado di registrare un consumo massimo di 105 W dal piccolo (~7,5 x 7,5 x 3 cm) adattatore CA USB-C da 100 W quando la CPU è al 100% di utilizzo. Questo tasso è solo temporaneo a causa del potenziale Turbo Boost limitato e quindi tende a stabilizzarsi intorno ai 70 W quando si eseguono carichi pesanti. Si noti che le SKU con grafica discreta RTX 4060 o 4070 sono dotate invece di un adattatore CA USB-C più grande da 140 W.

| Off / Standby | |
| Idle | |
| Sotto carico |
|
Leggenda:
min: | |
| MSI Prestige 16 B1MG-001US Ultra 7 155H, Arc 8-Core, Samsung PM9A1 MZVL22T0HBLB, IPS, 2560x1600, 16" | MSI Prestige 15 A12UD-093 i7-1280P, GeForce RTX 3050 Ti Laptop GPU, Micron 3400 1TB MTFDKBA1T0TFH, IPS, 3840x2160, 15.6" | LG Gram 2in1 16 16T90R - G.AA78G i7-1360P, Iris Xe G7 96EUs, Samsung PM9A1 MZVL21T0HCLR, IPS, 2560x1600, 16" | Lenovo ThinkBook 16 G6 ABP R5 7530U, Vega 7, SK hynix HFS512GEJ9X125N, IPS, 1920x1200, 16" | Asus VivoBook Pro 16 K6602VU i9-13900H, GeForce RTX 4050 Laptop GPU, Micron 2400 MTFDKBA1T0QFM, OLED, 3200x2000, 16" | Dell Inspiron 16 Plus 7630 i7-13700H, GeForce RTX 4060 Laptop GPU, WD PC SN740 SDDPTQD-1T00, IPS, 2560x1600, 16" | |
|---|---|---|---|---|---|---|
| Power Consumption | -2% | 2% | 24% | -161% | -124% | |
| Idle Minimum * (Watt) | 3 | 5.4 -80% | 5.5 -83% | 3.7 -23% | 21.06 -602% | 15.6 -420% |
| Idle Average * (Watt) | 9.5 | 11.8 -24% | 7.2 24% | 7.1 25% | 24.27 -155% | 17.7 -86% |
| Idle Maximum * (Watt) | 12 | 12.7 -6% | 12.9 -8% | 7.7 36% | 25.12 -109% | 20.6 -72% |
| Load Average * (Watt) | 68.3 | 45.9 33% | 55 19% | 43.9 36% | 52.4 23% | 87.4 -28% |
| Witcher 3 ultra * (Watt) | 59.8 | 45.7 24% | 47 21% | 40.8 32% | 110.2 -84% | 121.7 -104% |
| Load Maximum * (Watt) | 104.8 | 63 40% | 63.6 39% | 66.6 36% | 146 -39% | 138 -32% |
* ... Meglio usare valori piccoli
Power Consumption Witcher 3 / Stresstest
Power Consumption external Monitor
Durata della batteria
La capacità della batteria è aumentata da 80 Wh sul Prestige 15 a 99 Wh sul nostro Prestige 16. Combinando questo con l'efficienza della nuova CPU Intel di 14esima generazione, si ottengono tempi di esecuzione estremamente lunghi, pari a quasi 18,5 ore di navigazione WLAN nel mondo reale. Si tratta di uno dei portatili Windows più longevi che abbiamo testato, con risultati che rivaleggiano con la serie MacBook.
La ricarica da vuoto a pieno regime richiede circa 90 minuti.
| MSI Prestige 16 B1MG-001US Ultra 7 155H, Arc 8-Core, 99.9 Wh | MSI Prestige 15 A12UD-093 i7-1280P, GeForce RTX 3050 Ti Laptop GPU, 80 Wh | LG Gram 2in1 16 16T90R - G.AA78G i7-1360P, Iris Xe G7 96EUs, 80 Wh | Lenovo ThinkBook 16 G6 ABP R5 7530U, Vega 7, 45 Wh | Asus VivoBook Pro 16 K6602VU i9-13900H, GeForce RTX 4050 Laptop GPU, 96 Wh | Dell Inspiron 16 Plus 7630 i7-13700H, GeForce RTX 4060 Laptop GPU, 86 Wh | |
|---|---|---|---|---|---|---|
| Autonomia della batteria | -51% | -32% | -45% | -45% | -43% | |
| Reader / Idle (h) | 25.1 | 17.6 -30% | ||||
| WiFi v1.3 (h) | 18.3 | 8.9 -51% | 11.9 -35% | 10.1 -45% | 10.1 -45% | 9.4 -49% |
| Load (h) | 2.8 | 1.4 -50% | 2 -29% | 1.4 -50% | ||
| H.264 (h) | 7.1 | 11.6 | 9.8 |
Pro
Contro
Verdetto - La Serie Prestige al suo meglio
la 14esima generazione di Intel dovrebbe rivelarsi un enorme vantaggio per gli Ultrabook come MSI Prestige 16. Mentre le prestazioni grezze della CPU non sono molto superiori alla generazione precedente, i guadagni nelle prestazioni grafiche integrate e nella durata della batteria sono probabilmente altrettanto importanti per la categoria degli Ultrabook. Intel Arc 8 ha superato con successo l'AMD Radeon 780M con margini notevoli, al punto che la maggior parte dei giocatori occasionali e degli editor di foto dovrebbero essere soddisfatti delle sue prestazioni.
Alcuni aspetti del modello possono essere migliorati. In primo luogo, la mancanza di una frequenza di aggiornamento elevata o di opzioni touchscreen significa che alternative come HP Spectre o Asus Vivobook hanno ancora alcuni vantaggi. In secondo luogo, il ghosting è molto evidente sulla configurazione IPS, al punto che anche i giocatori occasionali potrebbero essere infastiditi dai suoi effetti. La SKU OLED potrebbe quindi essere conveniente, nonostante l'inevitabile impatto sulla durata della batteria. Infine, le maggiori prestazioni dell'iGPU comportano un consumo energetico più elevato e un rumore più forte della ventola rispetto alla maggior parte degli altri Ultrabook della serie U, quando si eseguono attività ad alta intensità di GPU.
Gli studenti in particolare apprezzeranno la lunga durata della batteria, il nitido display DCI-P3 e l'ampia gamma di opzioni grafiche del Prestige 16, che rappresenta una valida alternativa al MacBook Pro.
Il design portatile, lo schermo colorato, la lunga durata della batteria, la grafica integrata veloce e il lettore di schede SD veloce sono i punti di forza del Prestige 16. Gli utenti vorranno sfruttare questi punti di forza. Gli utenti vorranno sfruttare questi punti di forza per ottenere il massimo dal modello MSI.
Prezzo e disponibilità
MSI Prestige 16 con CPU di 14a generazione è ora ampiamente disponibile su Amazon con OLED a $1650 USD o Best Buy con grafica discreta Arc A370M a $1400.
MSI Prestige 16 B1MG-001US
- 12/28/2023 v7 (old)
Allen Ngo
Transparency
La selezione dei dispositivi da recensire viene effettuata dalla nostra redazione. Il campione di prova è stato acquistato gratuitamente dall'autore a proprie spese. L'istituto di credito non ha avuto alcuna influenza su questa recensione, né il produttore ne ha ricevuto una copia prima della pubblicazione. Non vi era alcun obbligo di pubblicare questa recensione. In quanto società mediatica indipendente, Notebookcheck non è soggetta all'autorità di produttori, rivenditori o editori.
Ecco come Notebookcheck esegue i test
Ogni anno, Notebookcheck esamina in modo indipendente centinaia di laptop e smartphone utilizzando procedure standardizzate per garantire che tutti i risultati siano comparabili. Da circa 20 anni sviluppiamo continuamente i nostri metodi di prova e nel frattempo stabiliamo gli standard di settore. Nei nostri laboratori di prova, tecnici ed editori esperti utilizzano apparecchiature di misurazione di alta qualità. Questi test comportano un processo di validazione in più fasi. Il nostro complesso sistema di valutazione si basa su centinaia di misurazioni e parametri di riferimento ben fondati, che mantengono l'obiettività.Price comparison

