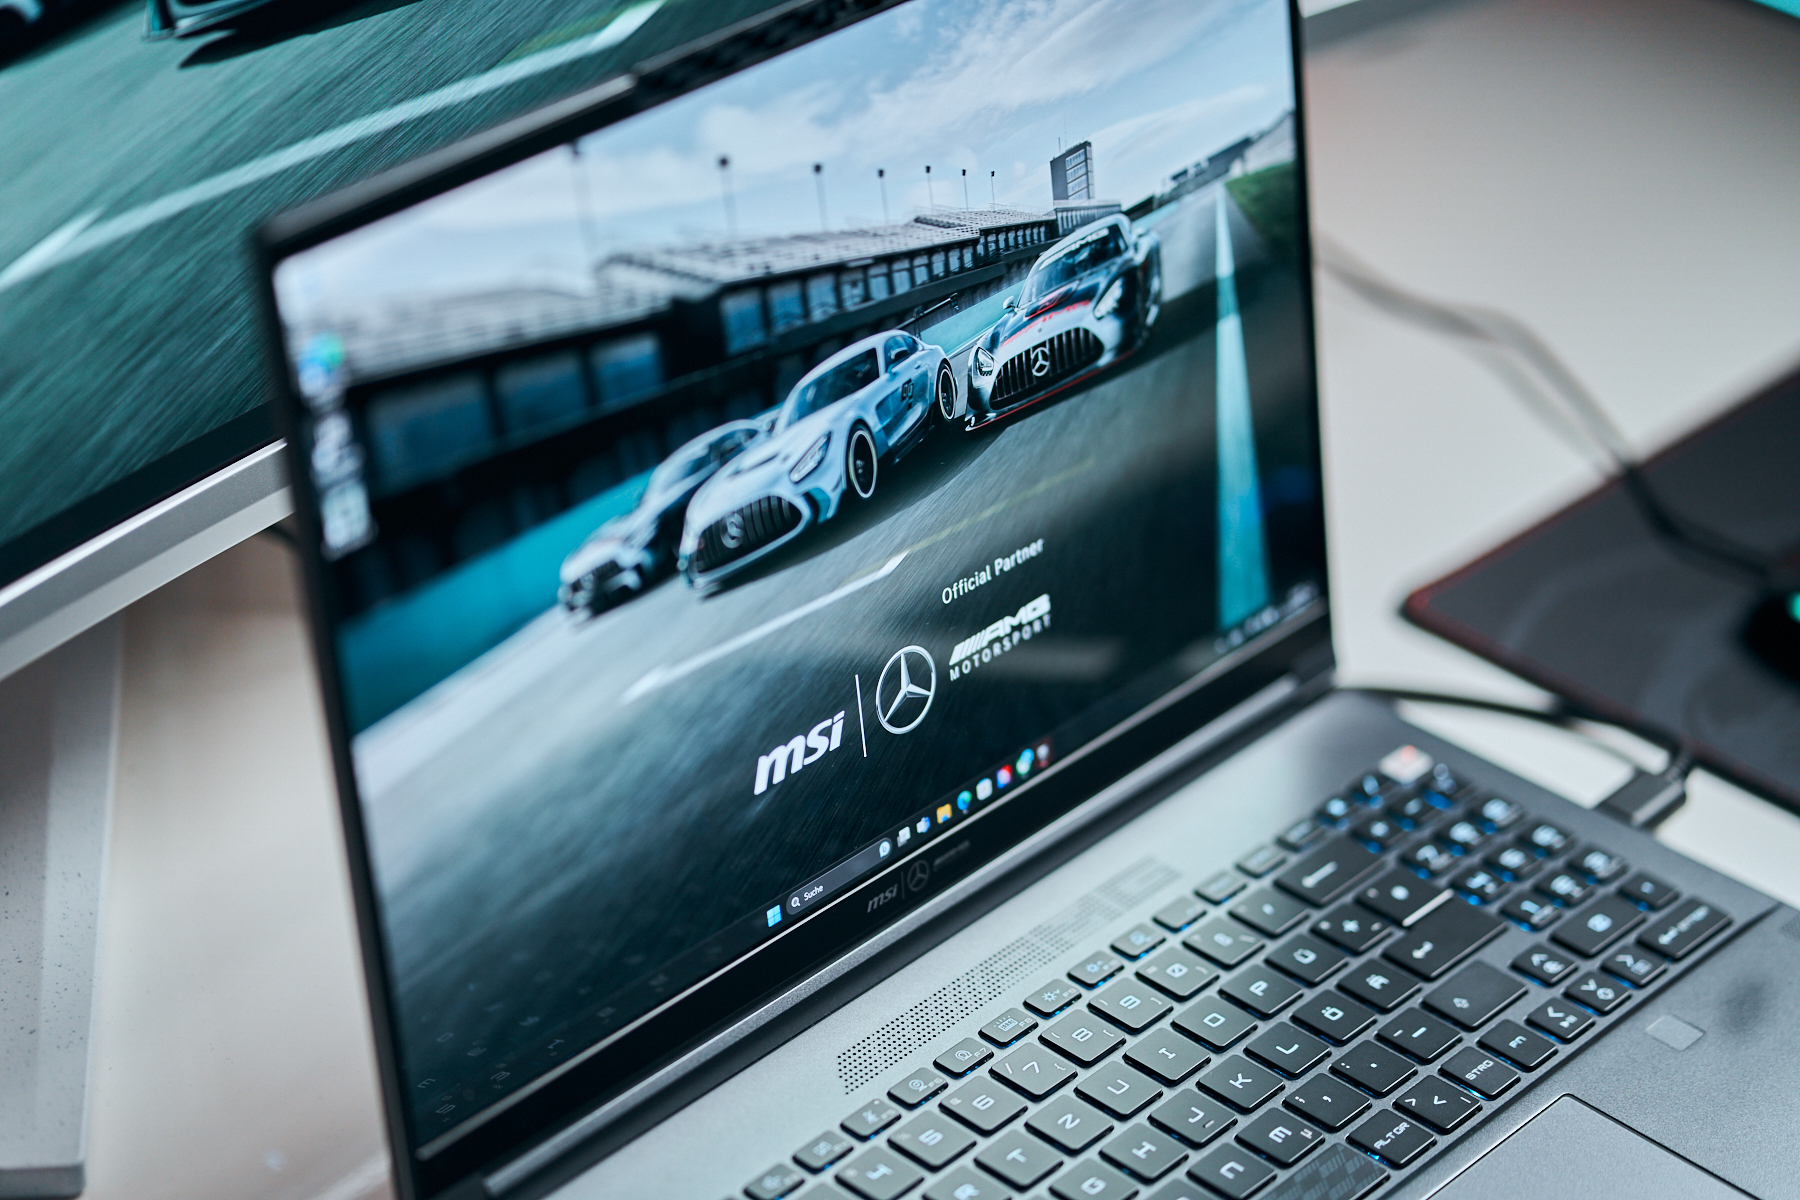
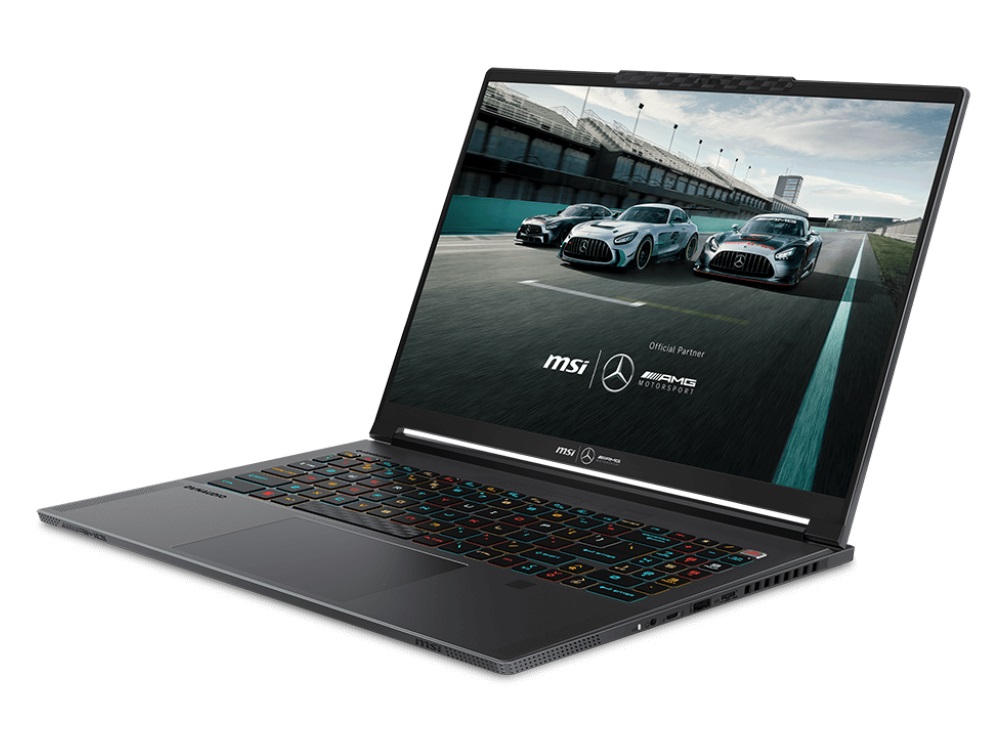
Recensione dell'MSI Stealth 16 Mercedes-AMG Motorsport: Auto da corsa mobile con display OLED

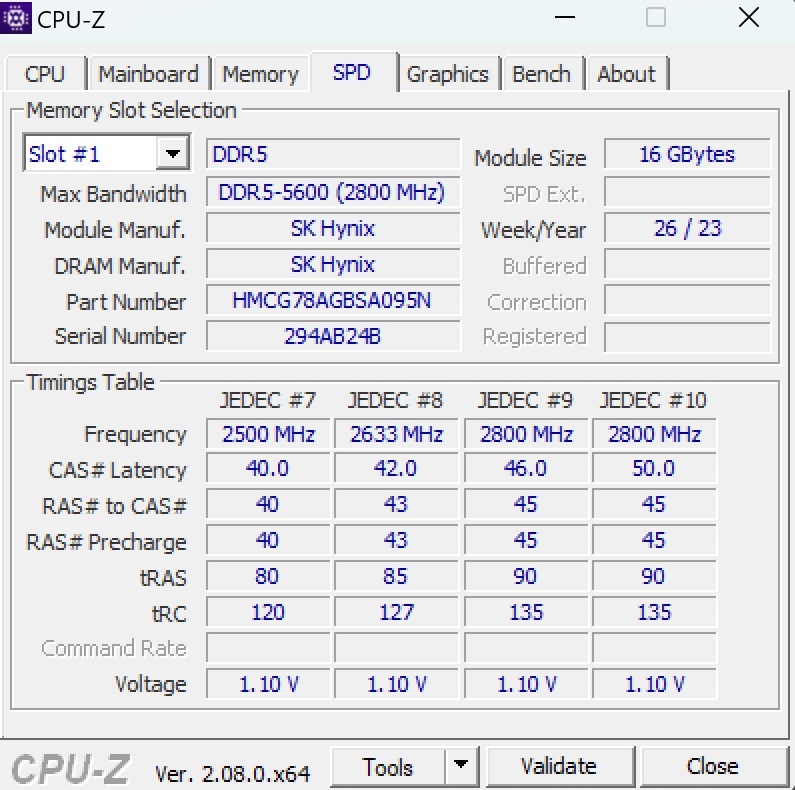
Mentre lo Stealth 16 'standard' è dotato di un Core i7-13700Hil modello Mercedes-AMG Motorsport fa un passo avanti con il leggermente più veloce Core i9-13900H. Al posto del pannello IPS QHD+ opaco che funziona a 240 Hz, la Motorsport Edition vanta un display OLED UHD+ lucido con una frequenza di aggiornamento di 60 Hz. La scheda grafica (RTX 4070), la RAM (2x 16 GB DDR5) e la capacità dell'SSD (2 TB) rimangono identiche al modello superiore. Dato che l'involucro, i dispositivi di input e le connessioni sono gli stessi, con solo alcuni dettagli ottici che li differenziano, non ripercorreremo categorie specifiche in questo articolo. Può consultare le informazioni pertinenti nella la recensione dello Stealth 16 Studio. La Motorsport Edition ha attualmente un prezzo di 2.899 dollari, un investimento notevole per un notebook RTX 4070.
I concorrenti dello Stealth 16 includono altri portatili da gioco da 16 pollici con RTX 4070, come ad esempio il modello HP Omen Transcend 16e il Lenovo Legion Pro 5 16ARX8e i portatili Schenker XMG Pro 16 Studio e XMG Core 16. Questi modelli sono elencati nelle tabelle di confronto
Potenziali concorrenti a confronto
Punteggio | Data | Modello | Peso | Altezza | Dimensione | Risoluzione | Prezzo |
|---|---|---|---|---|---|---|---|
| 89.1 % v7 (old) | 11/2023 | MSI Stealth 16 Mercedes-AMG Motorsport A13VG i9-13900H, GeForce RTX 4070 Laptop GPU | 1.9 kg | 20 mm | 16.00" | 3840x2400 | |
| 88.8 % v7 (old) | 07/2023 | MSI Stealth 16 Studio A13VG i7-13700H, GeForce RTX 4070 Laptop GPU | 2 kg | 19.95 mm | 16.00" | 2560x1600 | |
| 87.9 % v7 (old) | 10/2023 | Schenker XMG Pro 16 Studio (Mid 23) i9-13900H, GeForce RTX 4070 Laptop GPU | 2.6 kg | 19.9 mm | 16.00" | 2560x1600 | |
| 87.9 % v7 (old) | 08/2023 | HP Omen Transcend 16 i9-13900HX, GeForce RTX 4070 Laptop GPU | 2.3 kg | 19.8 mm | 16.00" | 2560x1600 | |
| 88.4 % v7 (old) | 05/2023 | Lenovo Legion Pro 5 16ARX8 R7 7745HX, GeForce RTX 4070 Laptop GPU | 2.5 kg | 26.8 mm | 16.00" | 2560x1600 | |
| 89.2 % v7 (old) | 10/2023 | Schenker XMG CORE 16 (L23) R7 7840HS, GeForce RTX 4070 Laptop GPU | 2.4 kg | 26.1 mm | 16.00" | 2560x1600 |
Caso
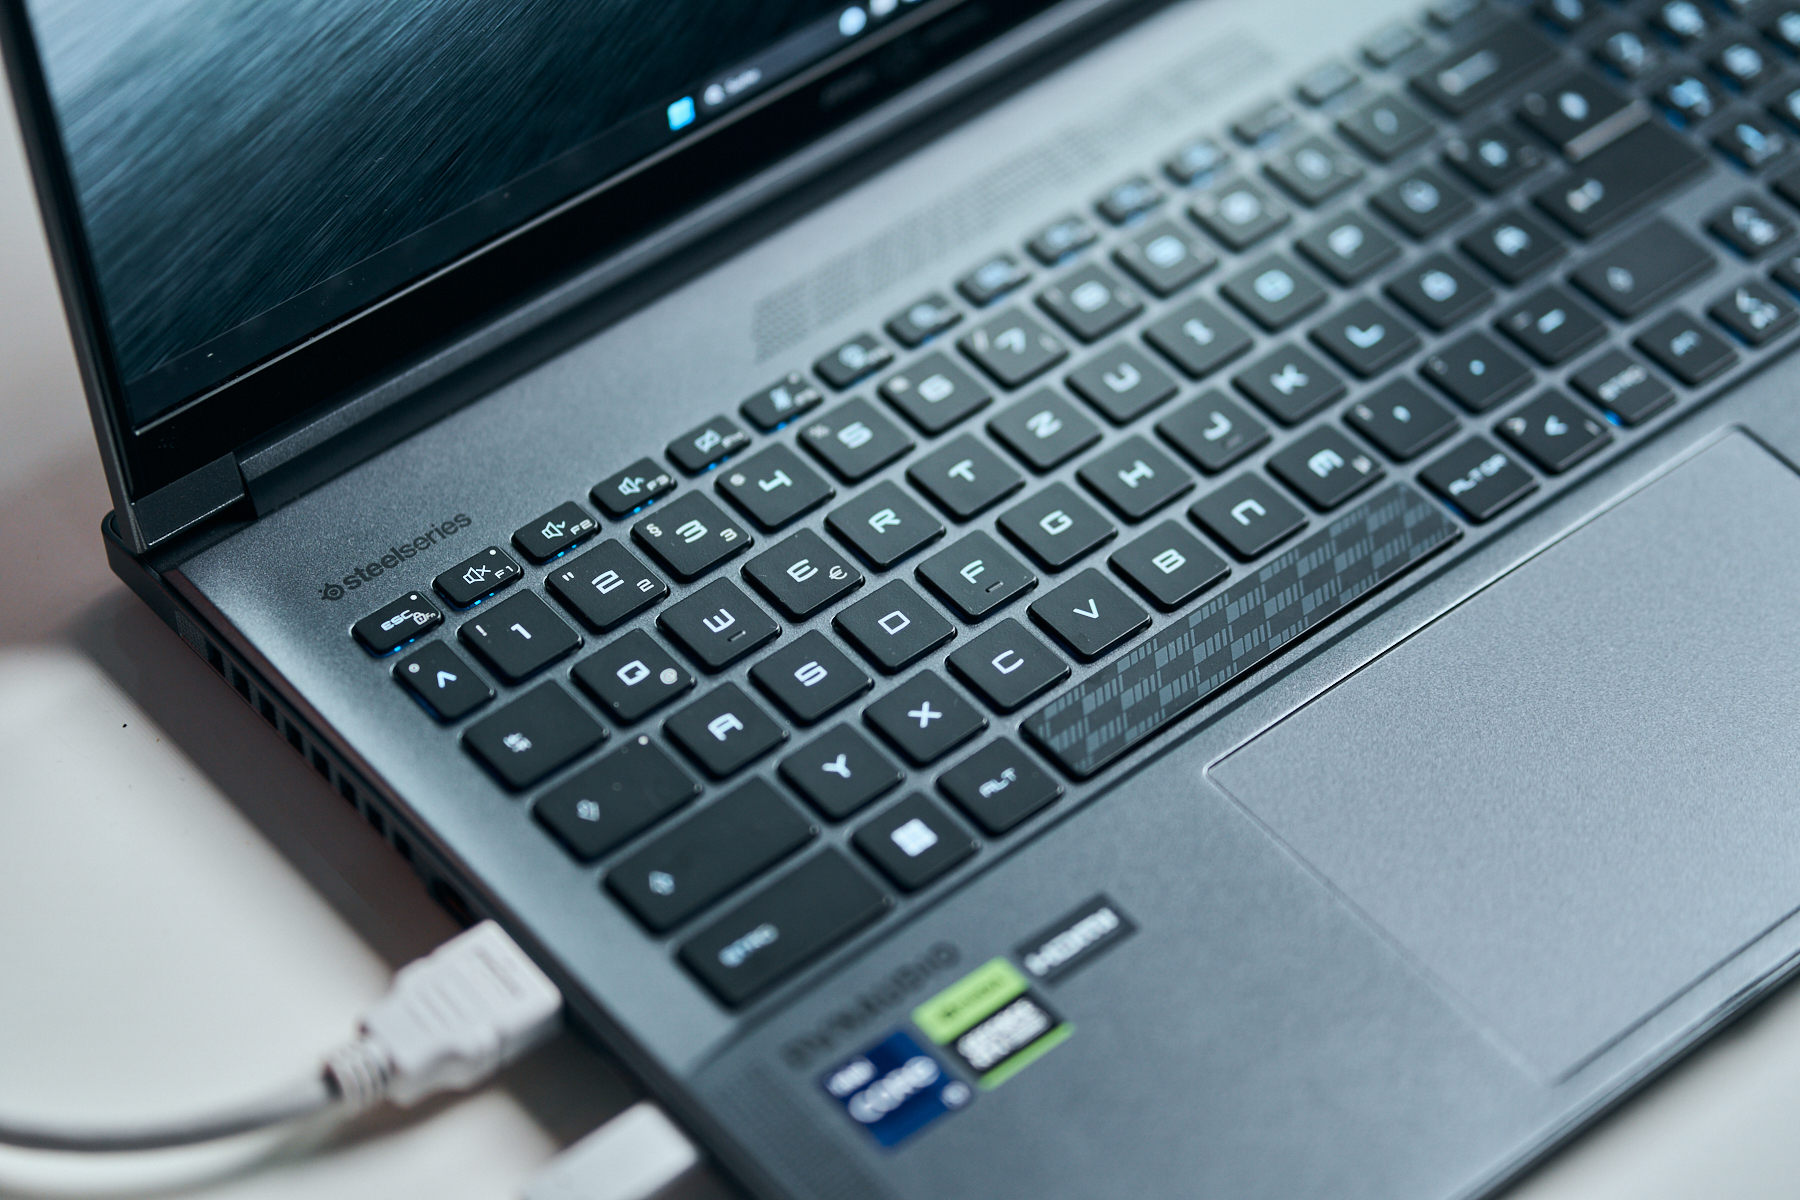
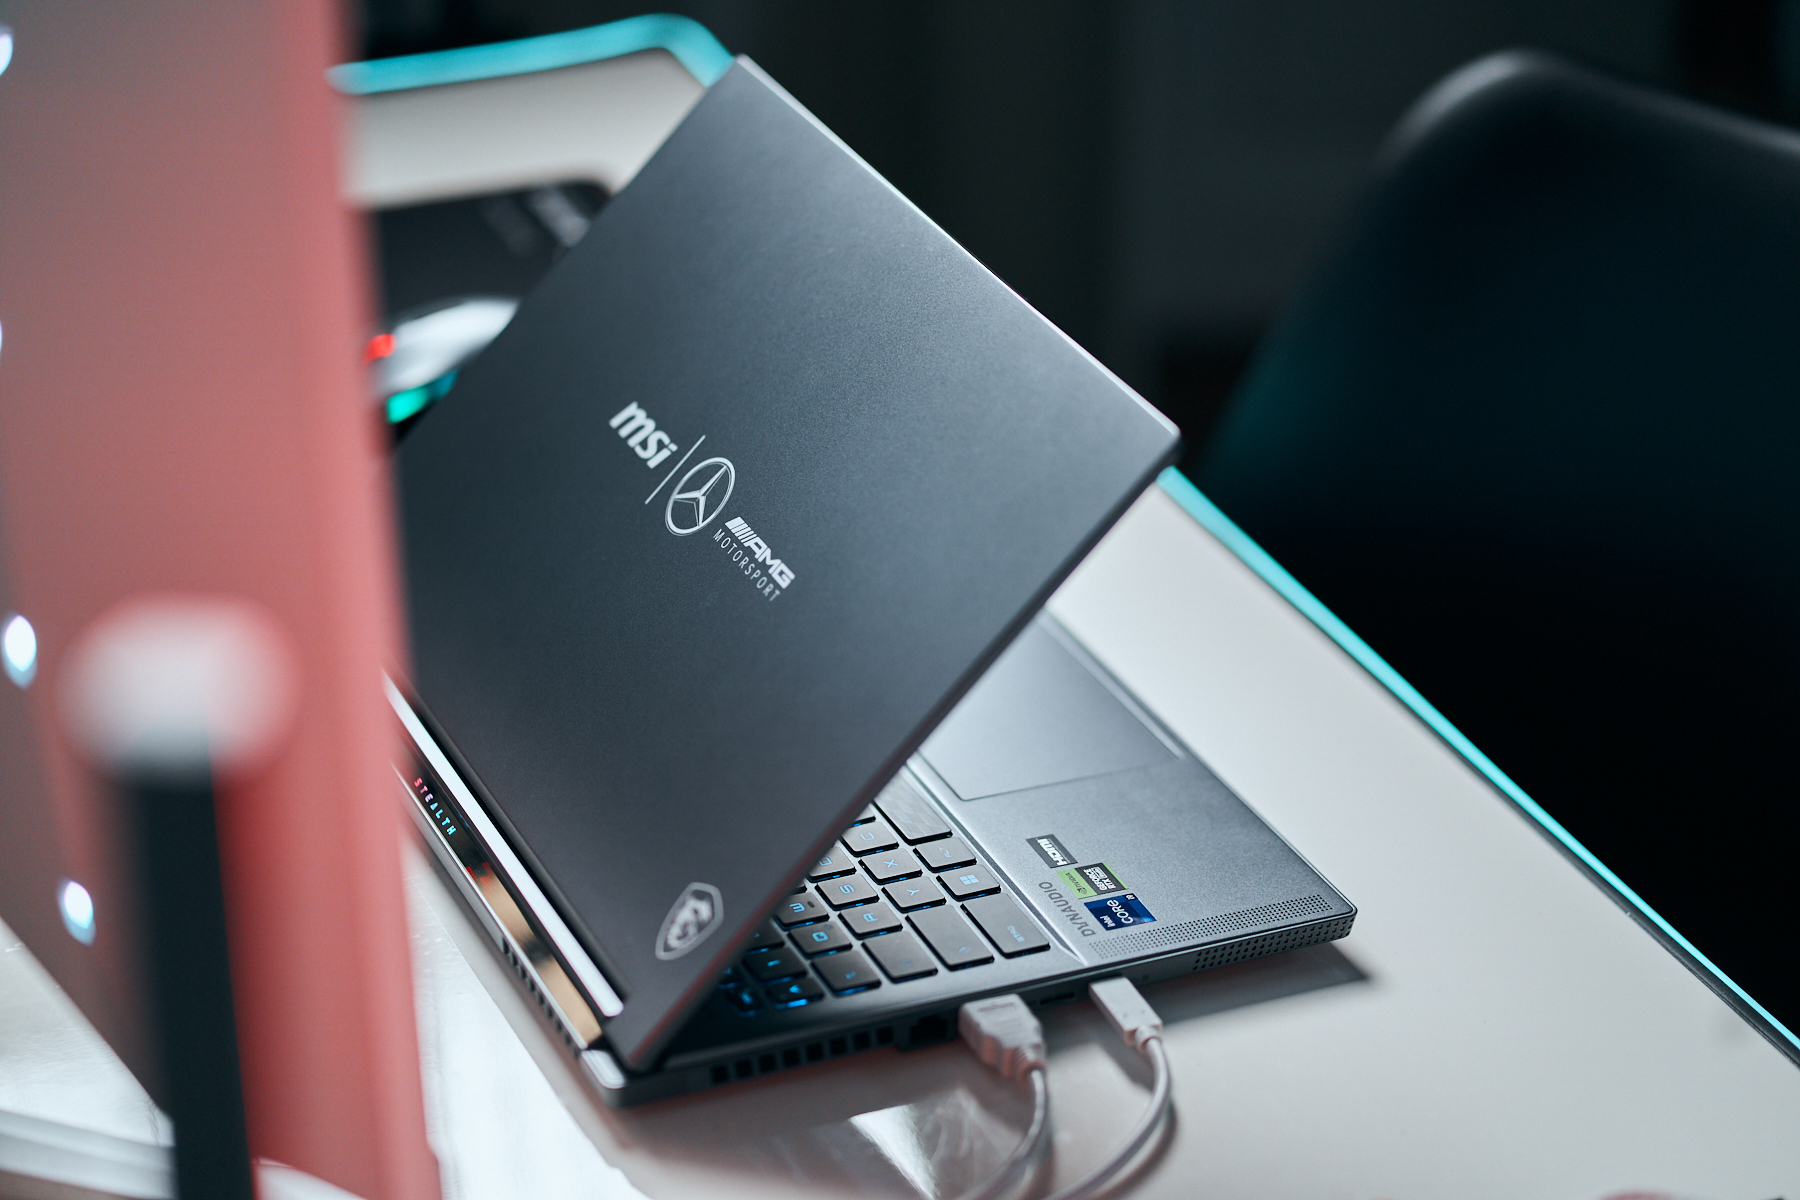
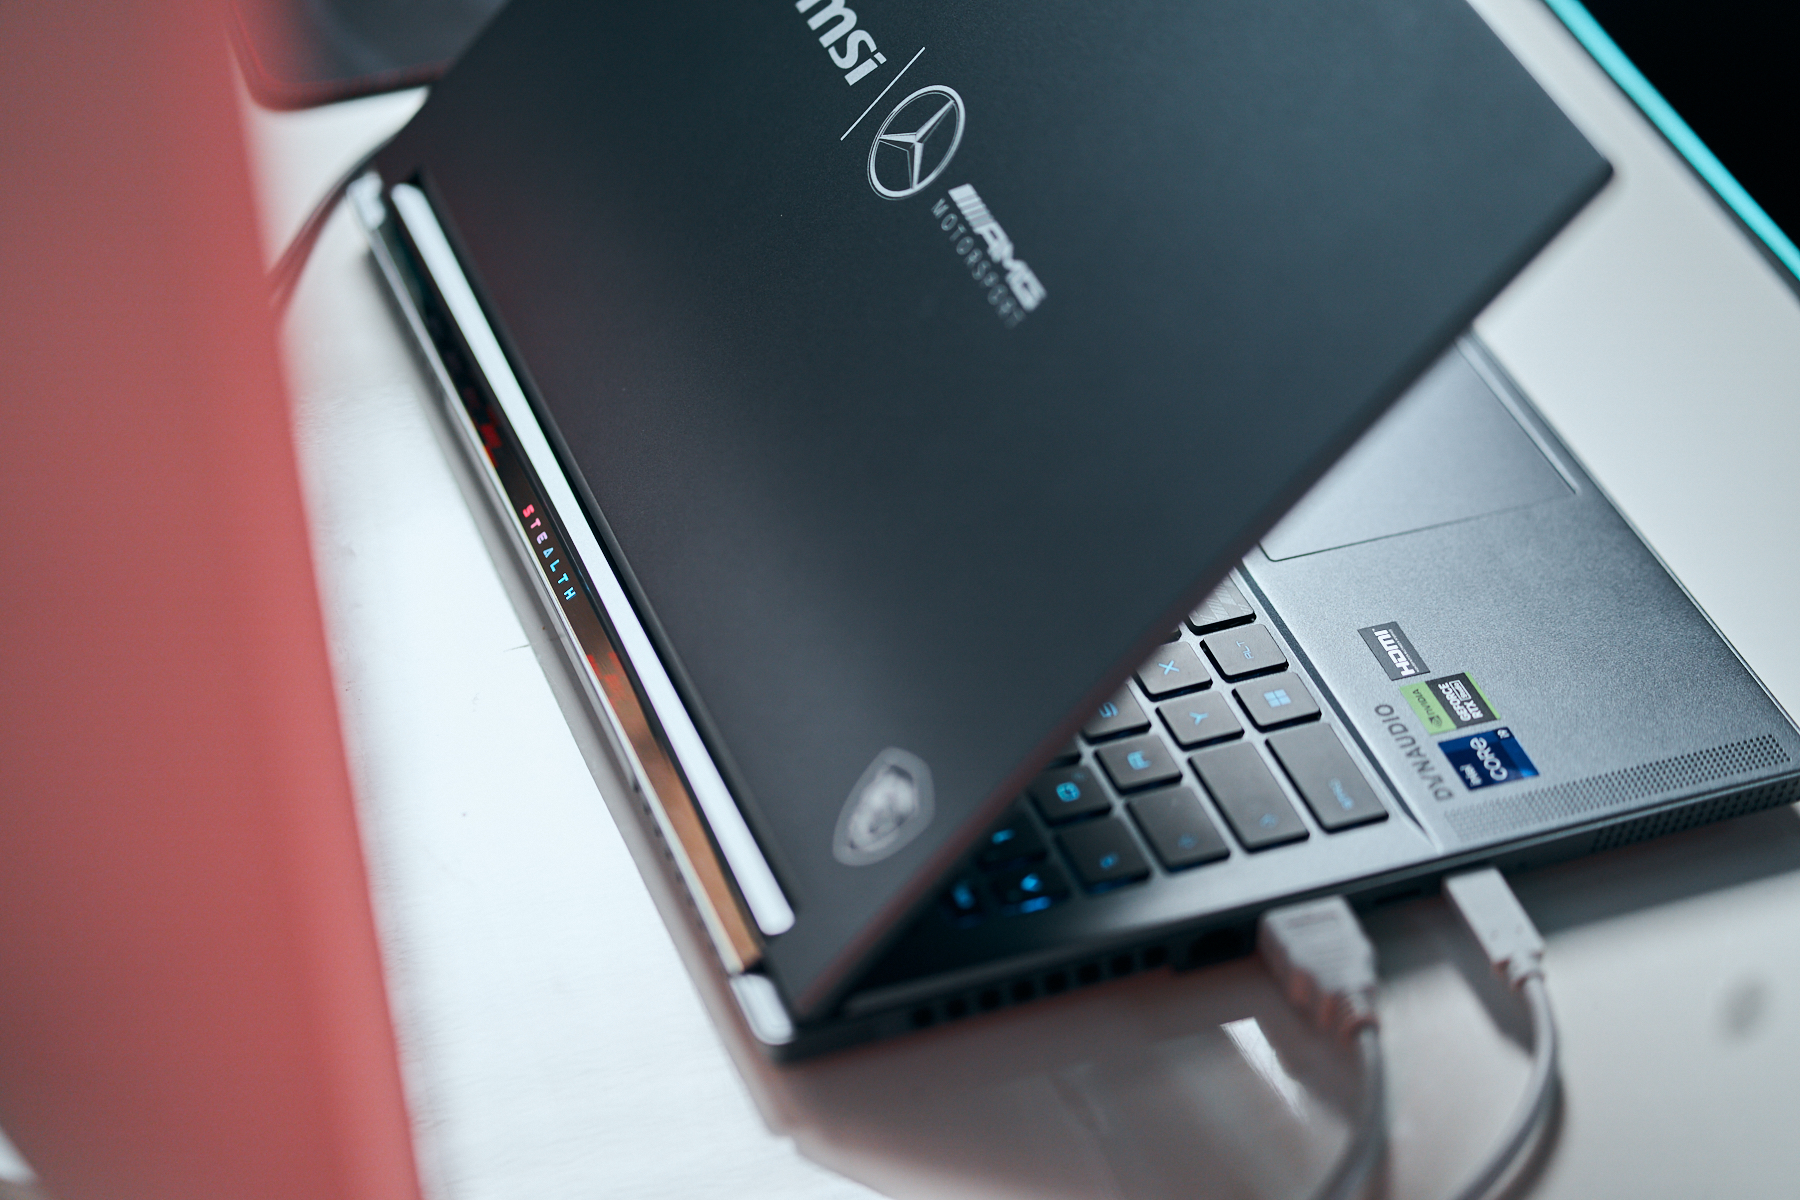
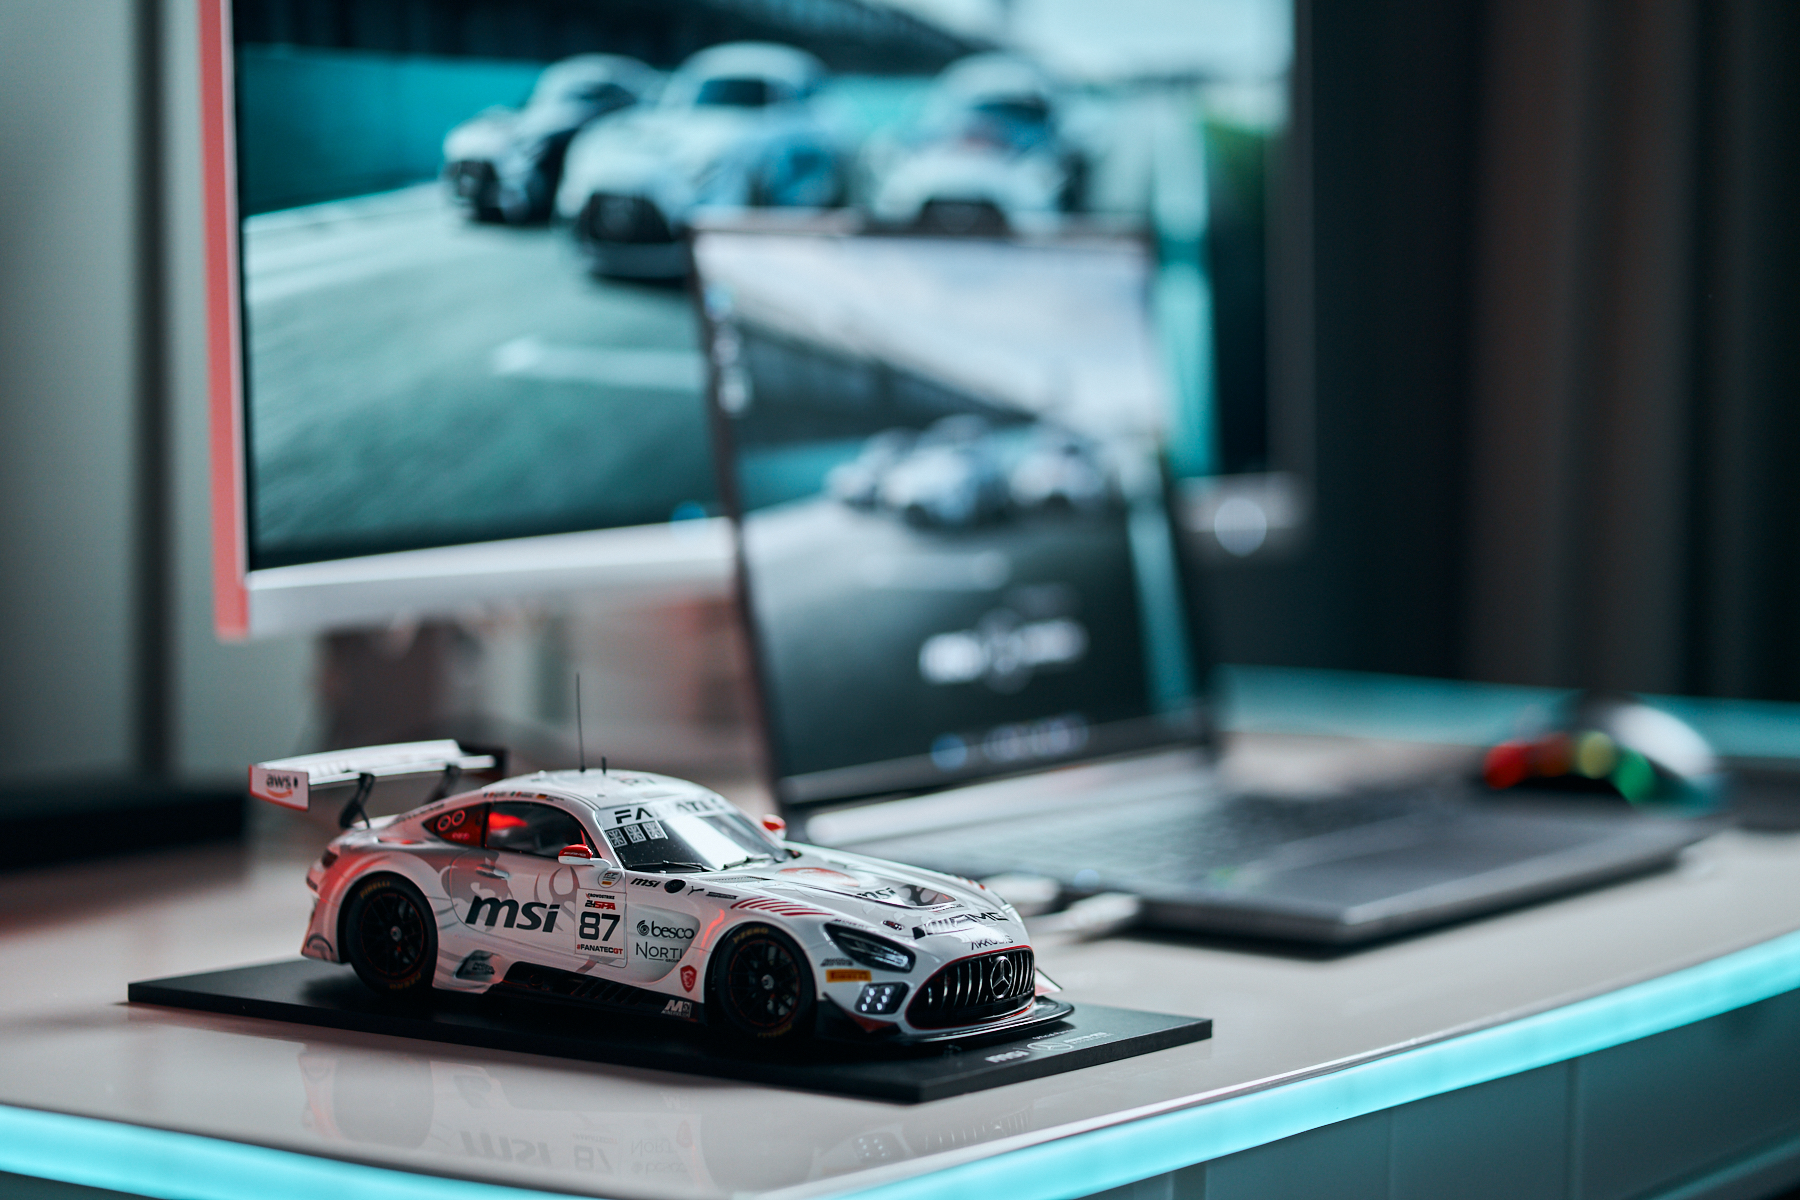
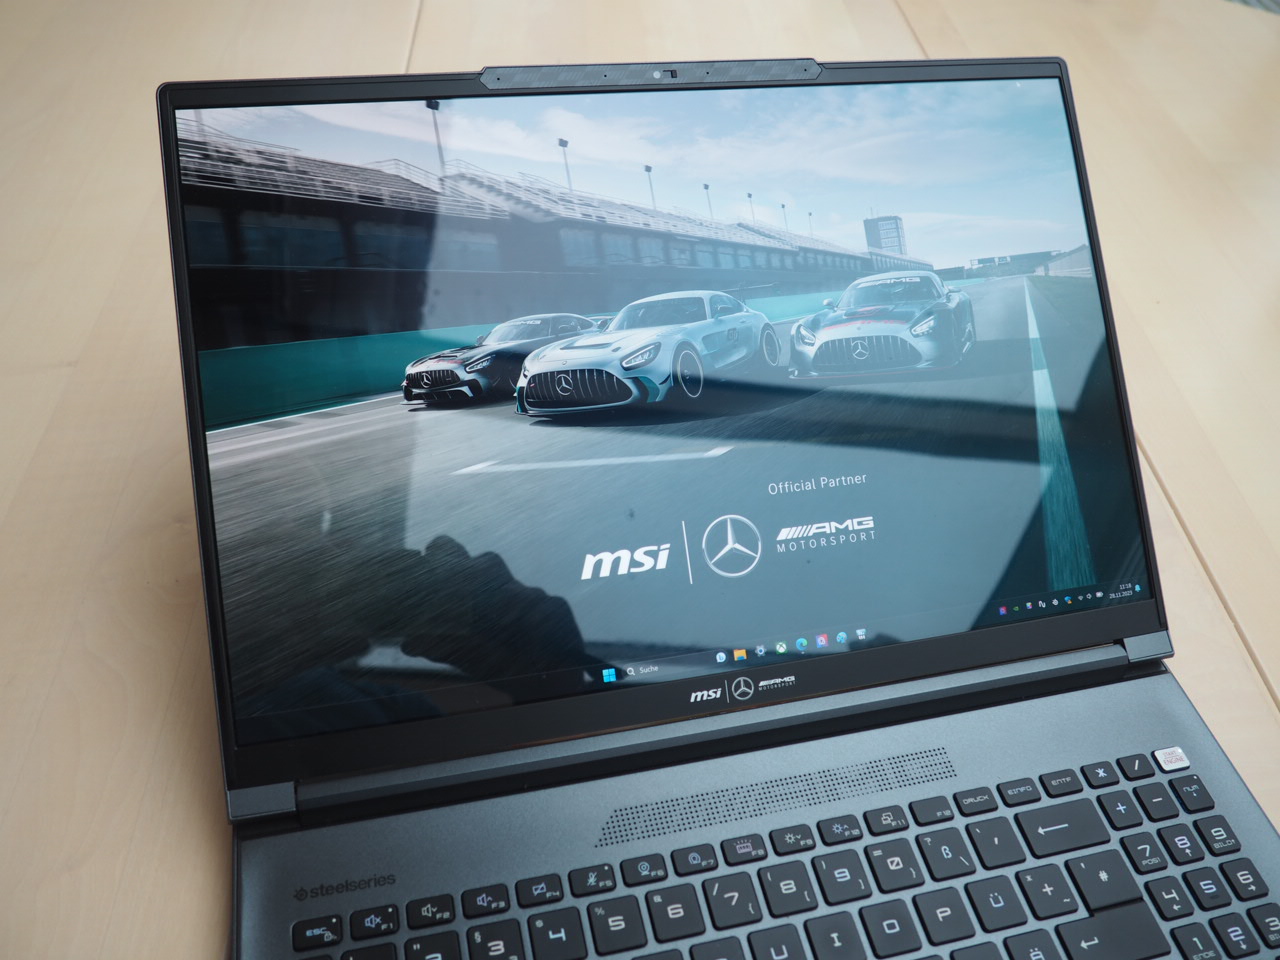
MSI ha investito molto nel design visivo dell'edizione speciale, incorporando riferimenti alla casa automobilistica in tutto il case. Questi includono varie collocazioni della scritta AMG (coperchio, parte anteriore, cornice del display, griglia di ventilazione, base), oltre ad altri elementi di design che ricordano gli sport motoristici. Tra gli esempi, un design a forma di bandiera sulla barra della webcam, il tasto spazio e i piedini in gomma, oltre a un pulsante di accensione con il testo 'Start Engine'.


Connettività
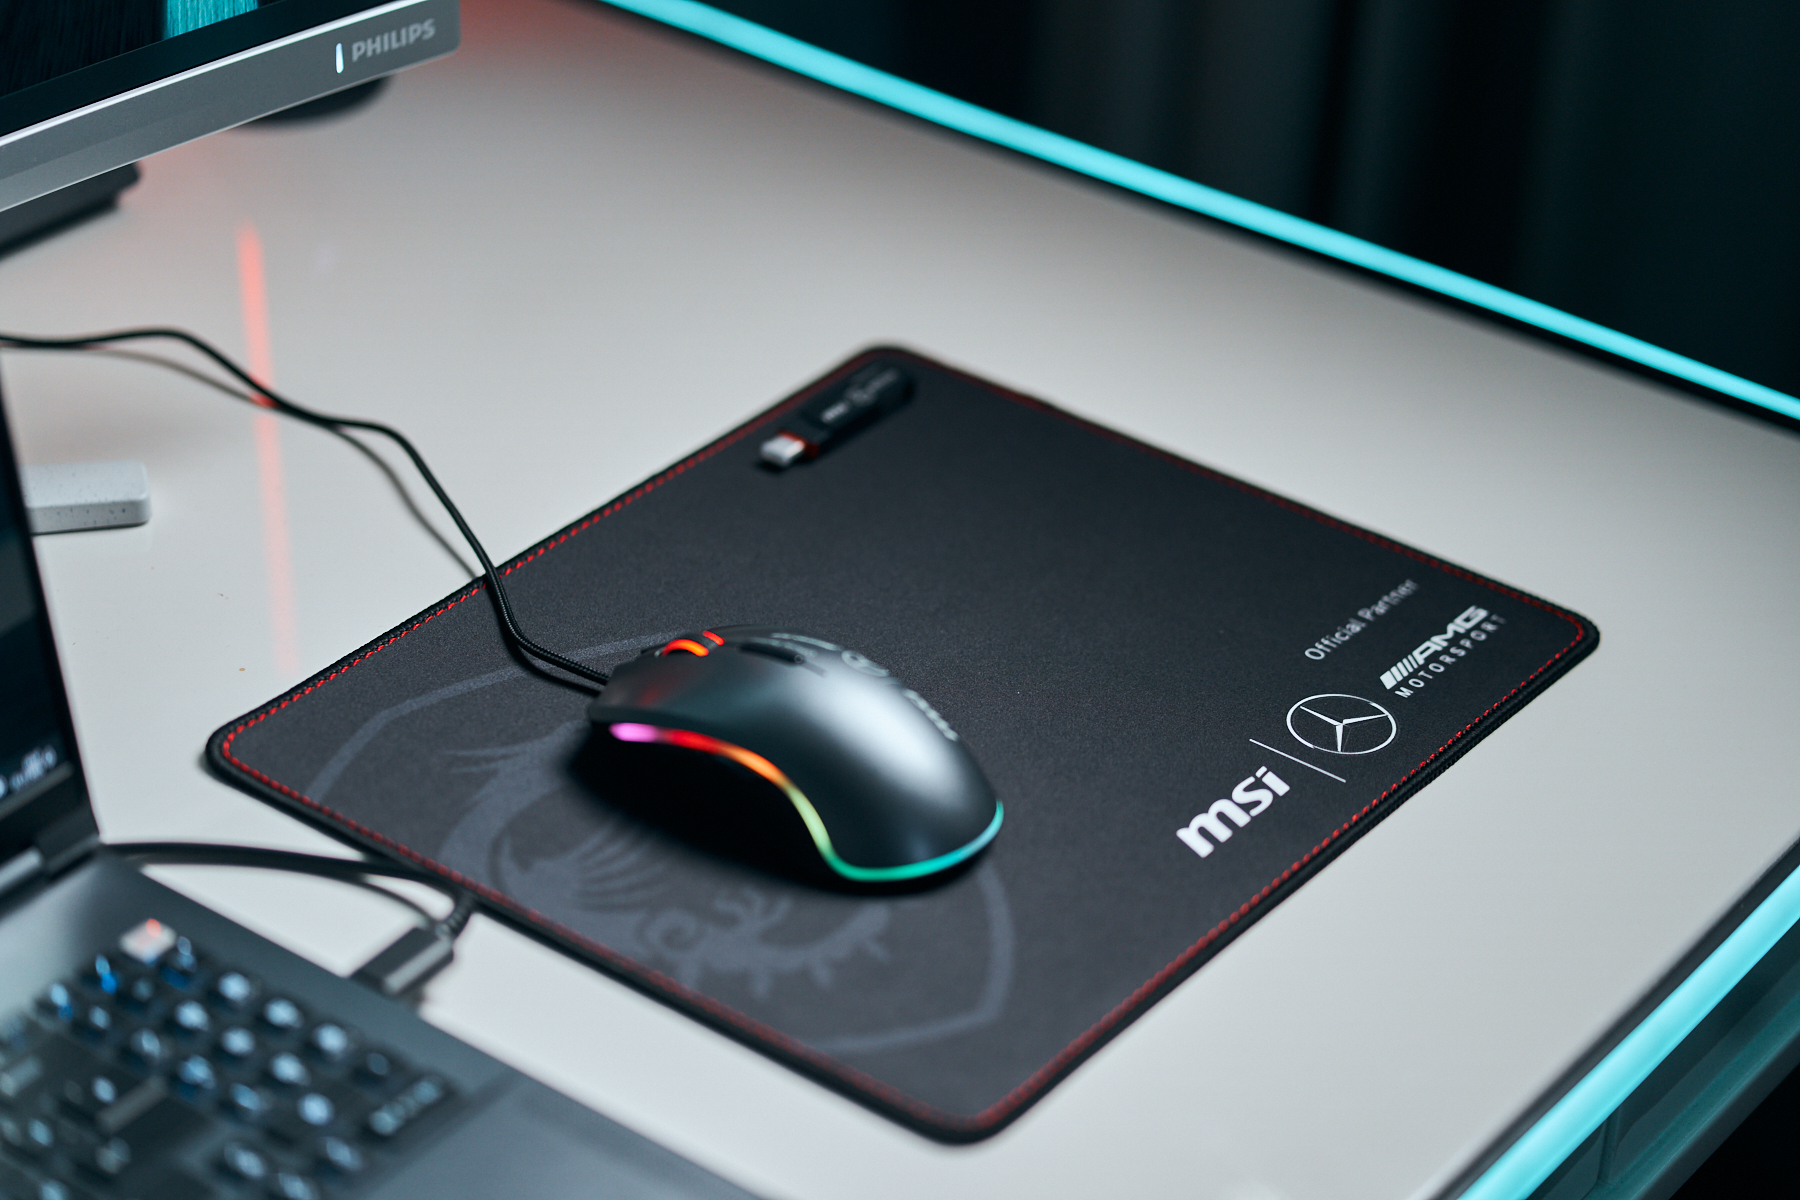
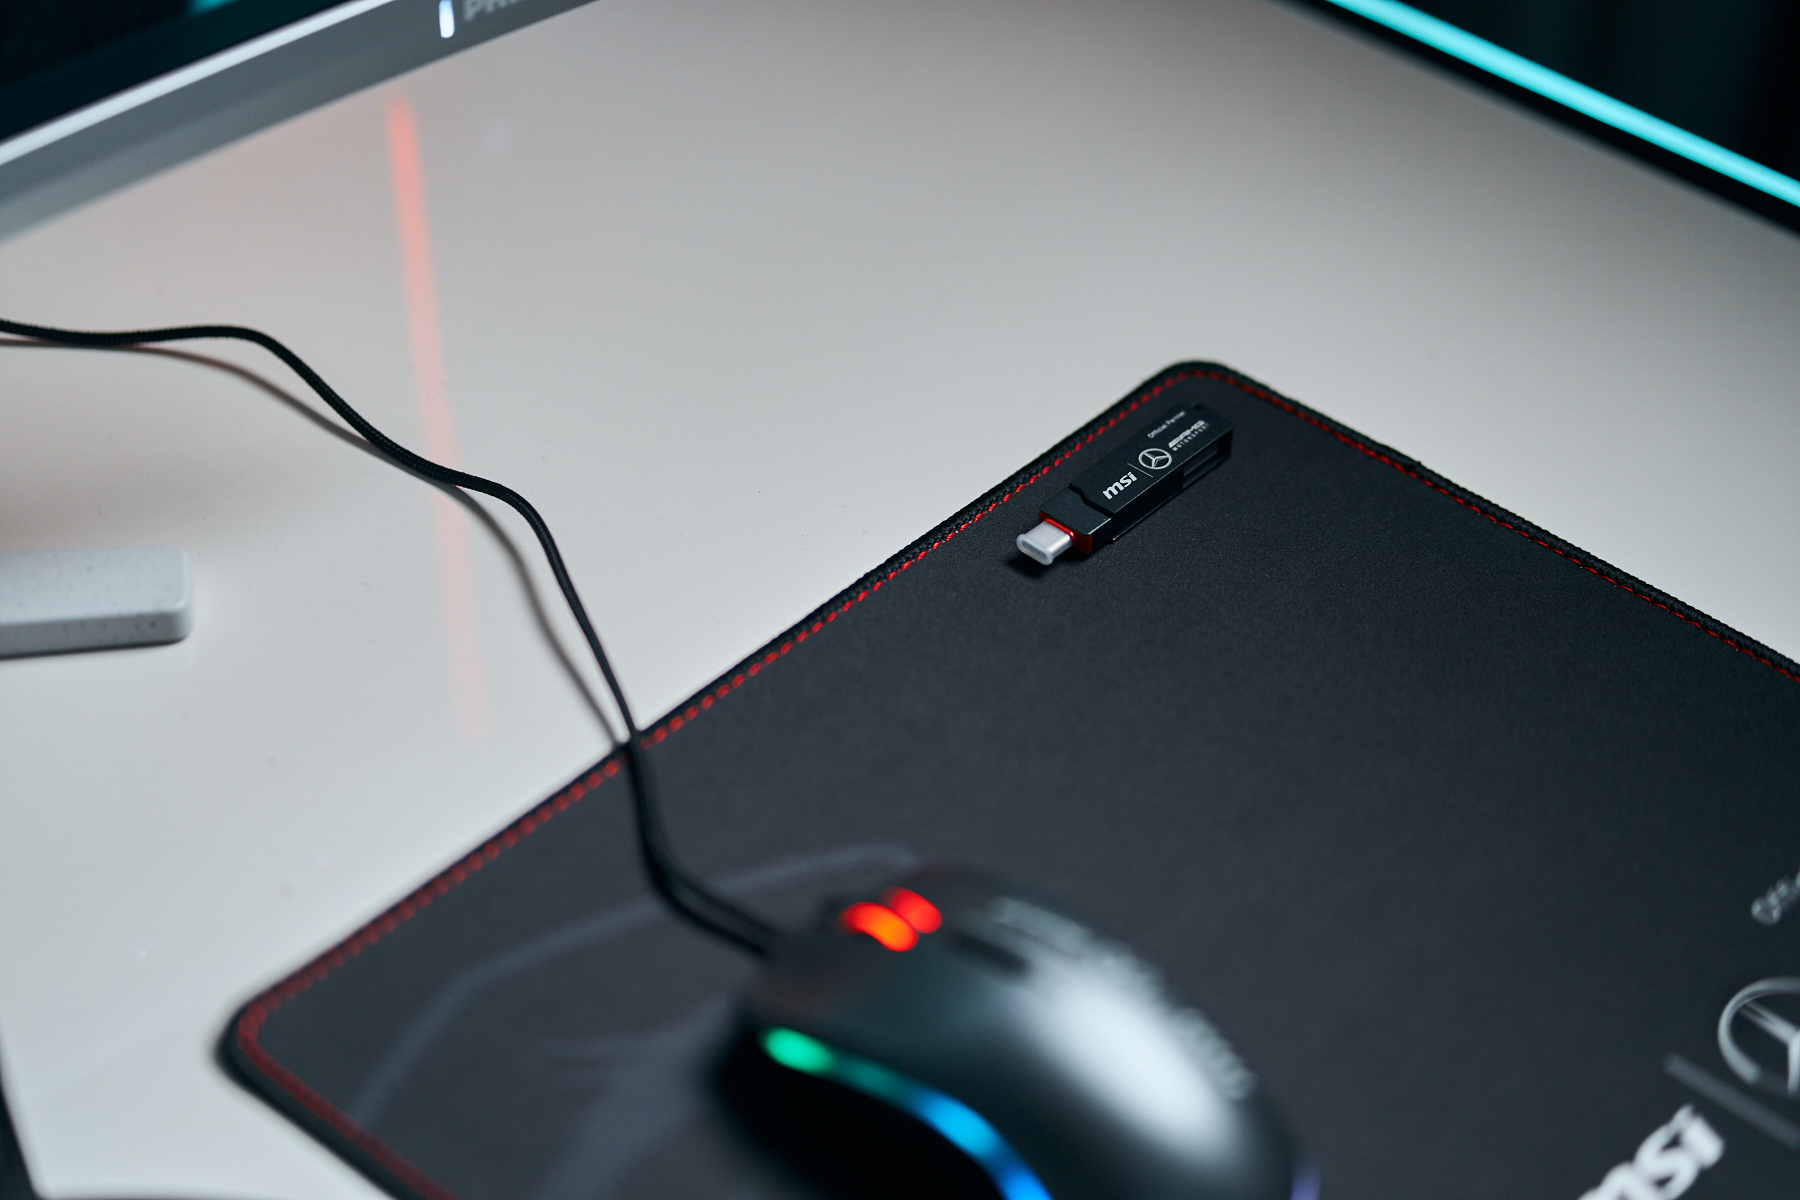
In termini di equipaggiamento, la ricca dotazione è particolarmente degna di nota. Oltre al notebook e all'alimentatore da 240 watt, la versione Mercedes include un mouse, un tappetino per il mouse, una chiavetta USB e una borsa per gli accessori.
Lettore di schede SD
| SD Card Reader | |
| average JPG Copy Test (av. of 3 runs) | |
| MSI Stealth 16 Mercedes-AMG Motorsport A13VG (AV PRO microSD 128 GB V60) | |
| MSI Stealth 16 Studio A13VG | |
| Media della classe Gaming (20.9 - 210, n=54, ultimi 2 anni) | |
| Schenker XMG Pro 16 Studio (Mid 23) (AV PRO microSD 128 GB V60) | |
| Schenker XMG CORE 16 (L23) | |
| maximum AS SSD Seq Read Test (1GB) | |
| MSI Stealth 16 Mercedes-AMG Motorsport A13VG (AV PRO microSD 128 GB V60) | |
| MSI Stealth 16 Studio A13VG | |
| Media della classe Gaming (25.5 - 261, n=51, ultimi 2 anni) | |
| Schenker XMG Pro 16 Studio (Mid 23) (AV PRO microSD 128 GB V60) | |
| Schenker XMG CORE 16 (L23) | |
Comunicazione
Webcam


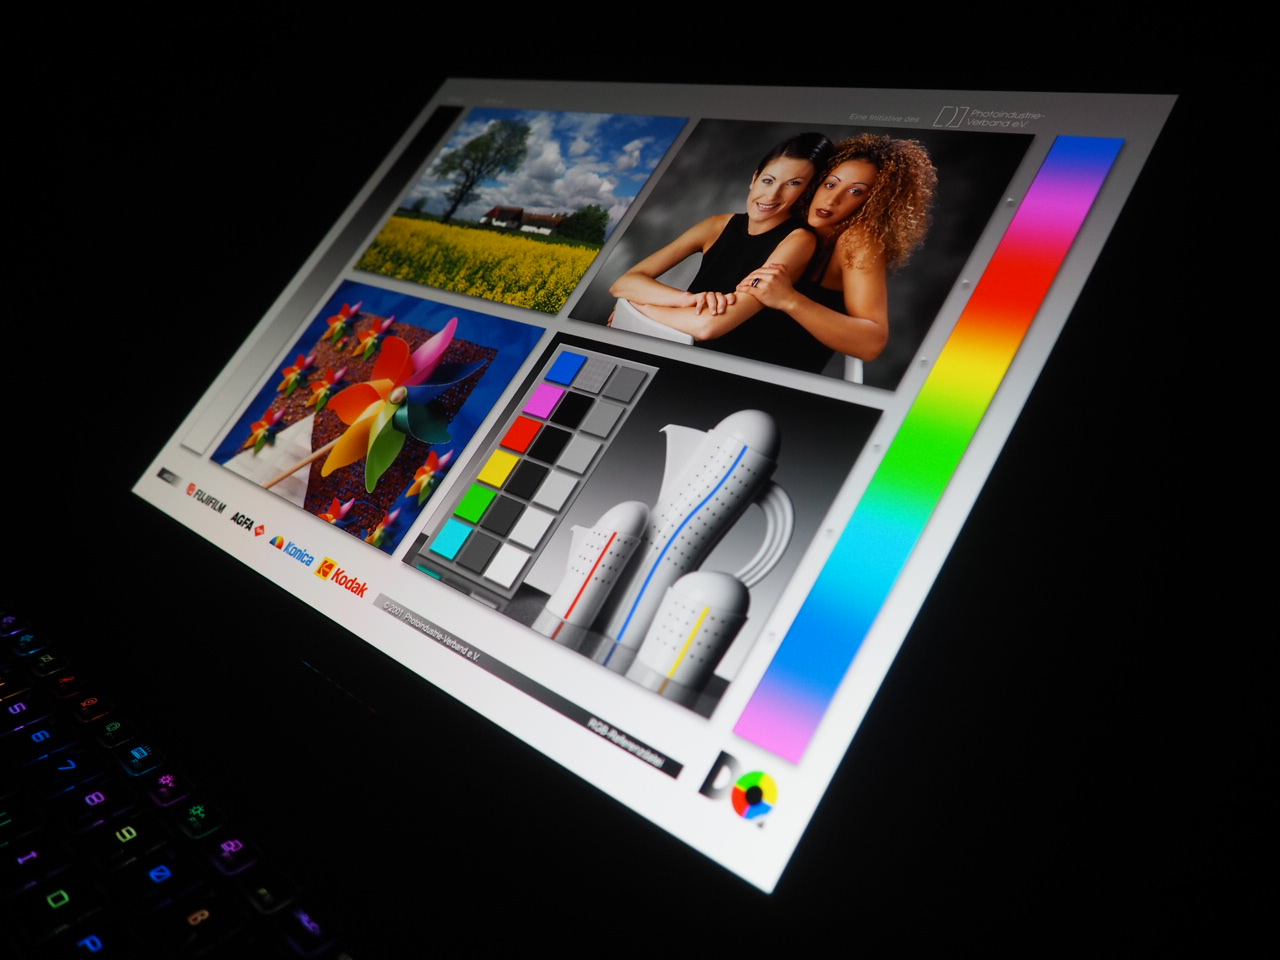
Display
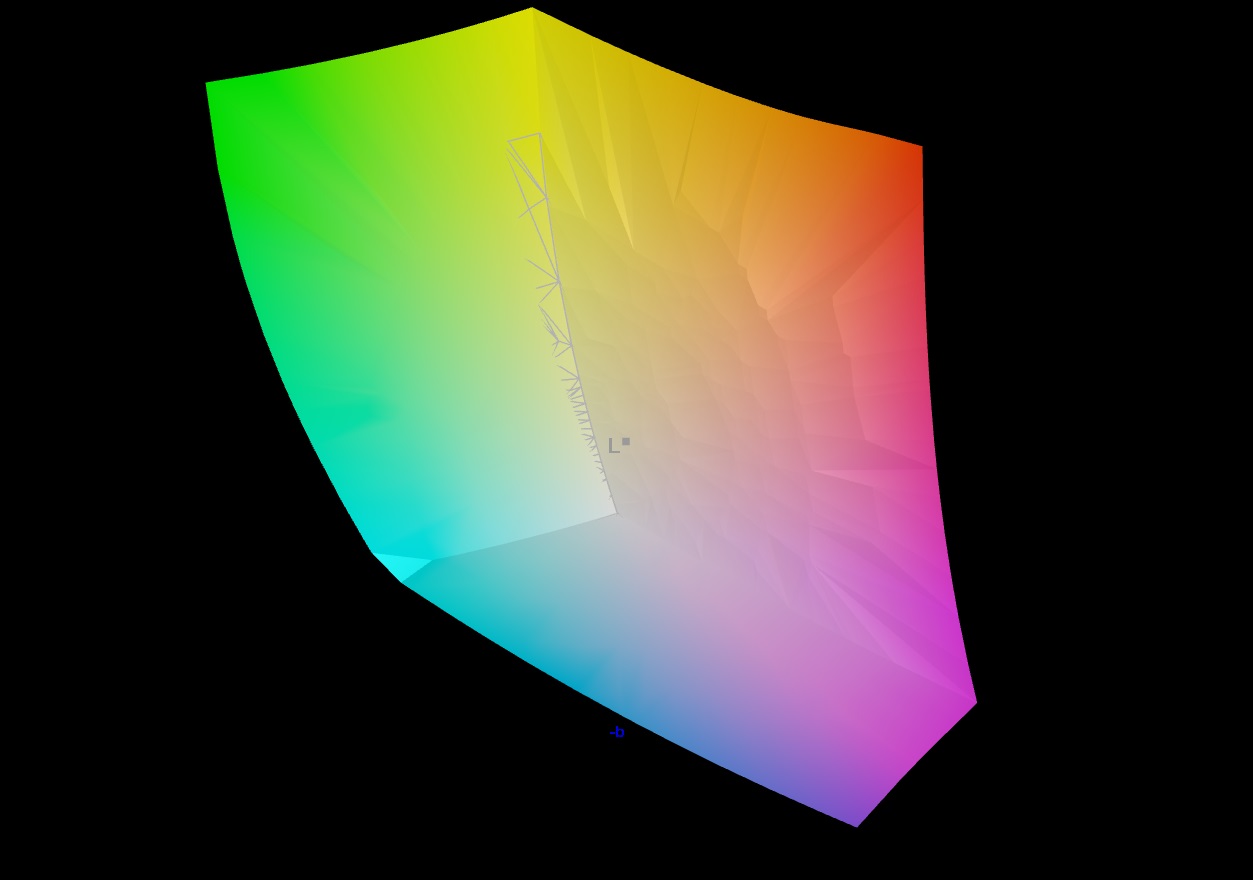
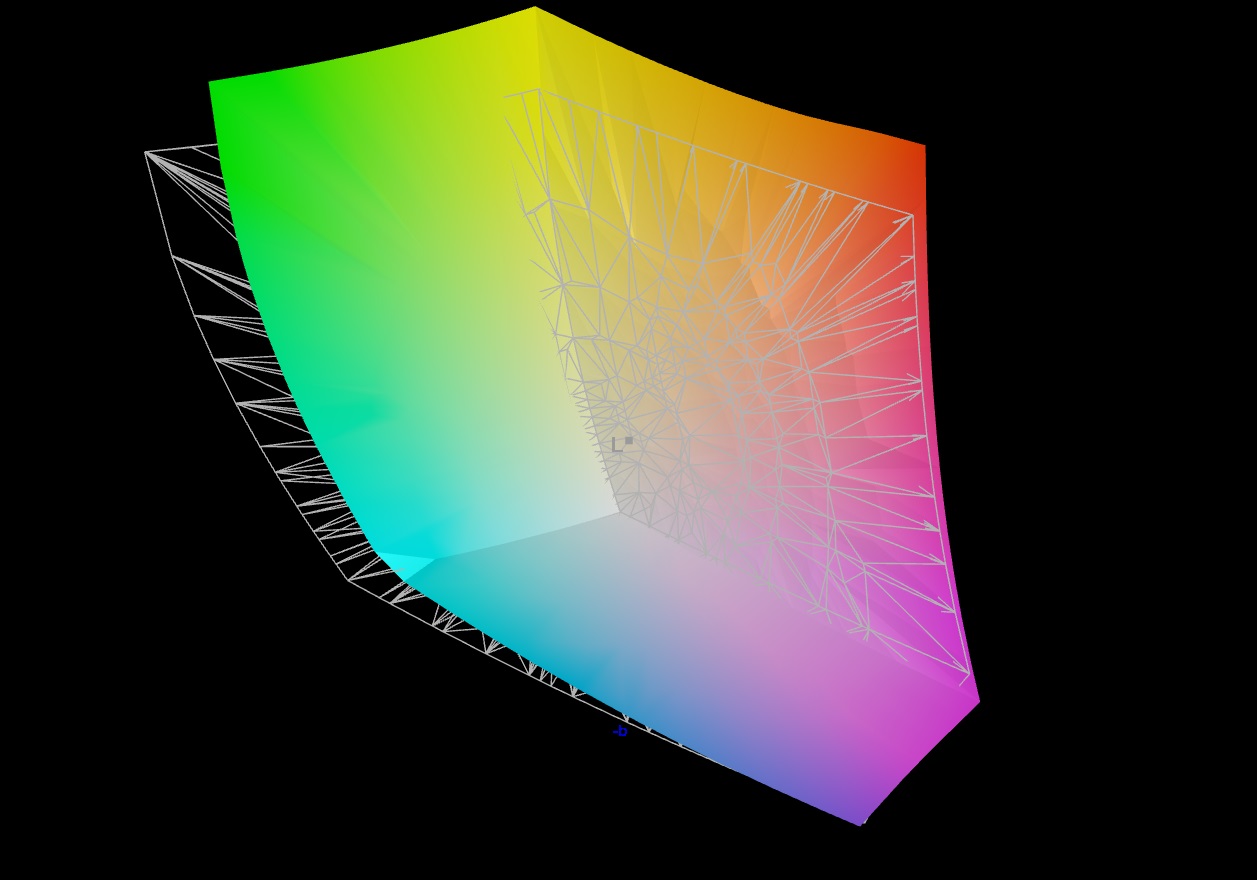
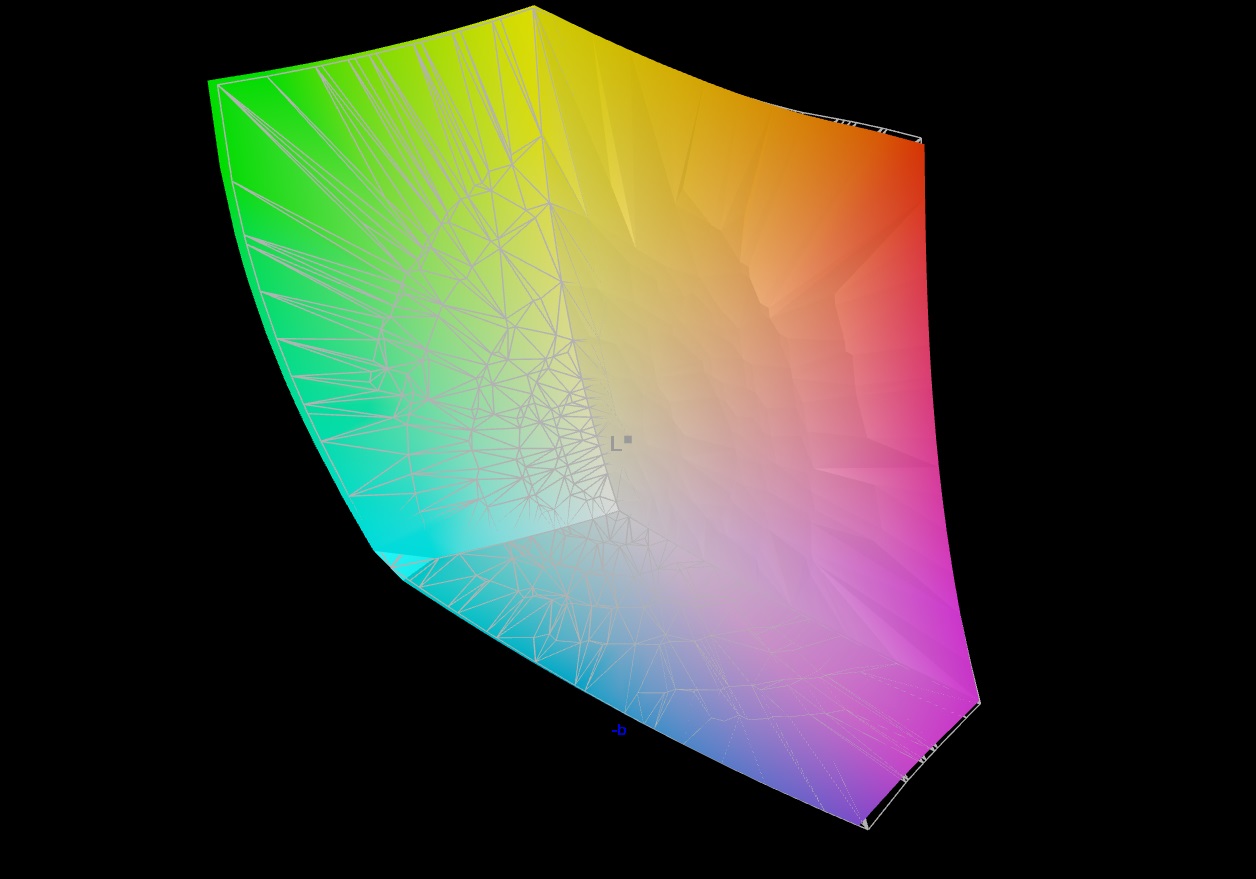
Come accennato in precedenza, l'edizione speciale è dotata di un pannello OLED che offre un'immagine estremamente nitida, grazie all'elevata risoluzione di 3.840 x 2.400 pixel in formato 16:10.
| |||||||||||||||||||||||||
Distribuzione della luminosità: 96 %
Al centro con la batteria: 382 cd/m²
Contrasto: ∞:1 (Nero: 0 cd/m²)
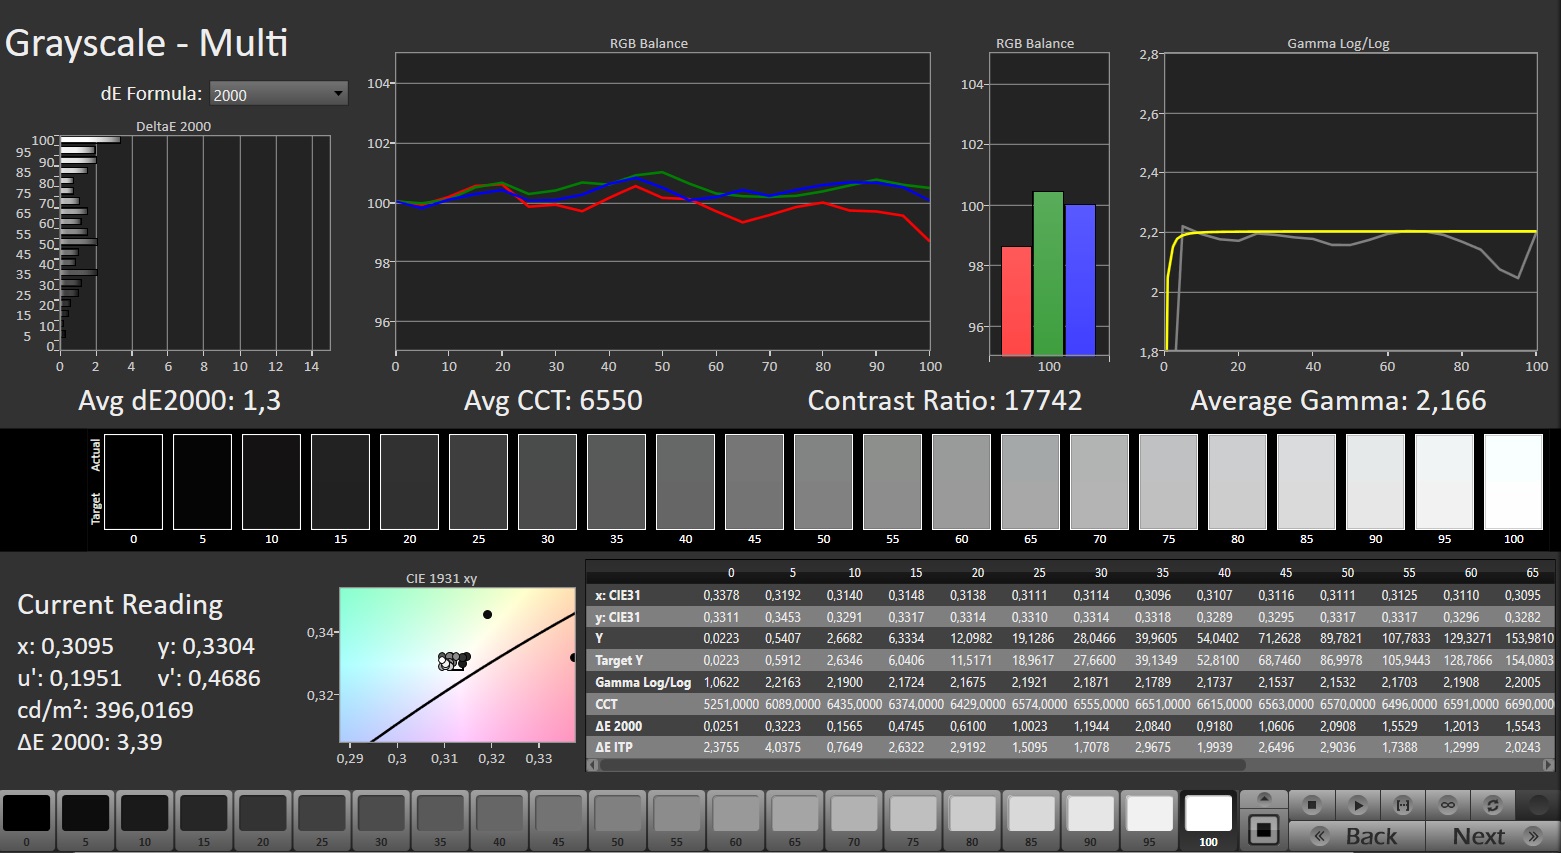
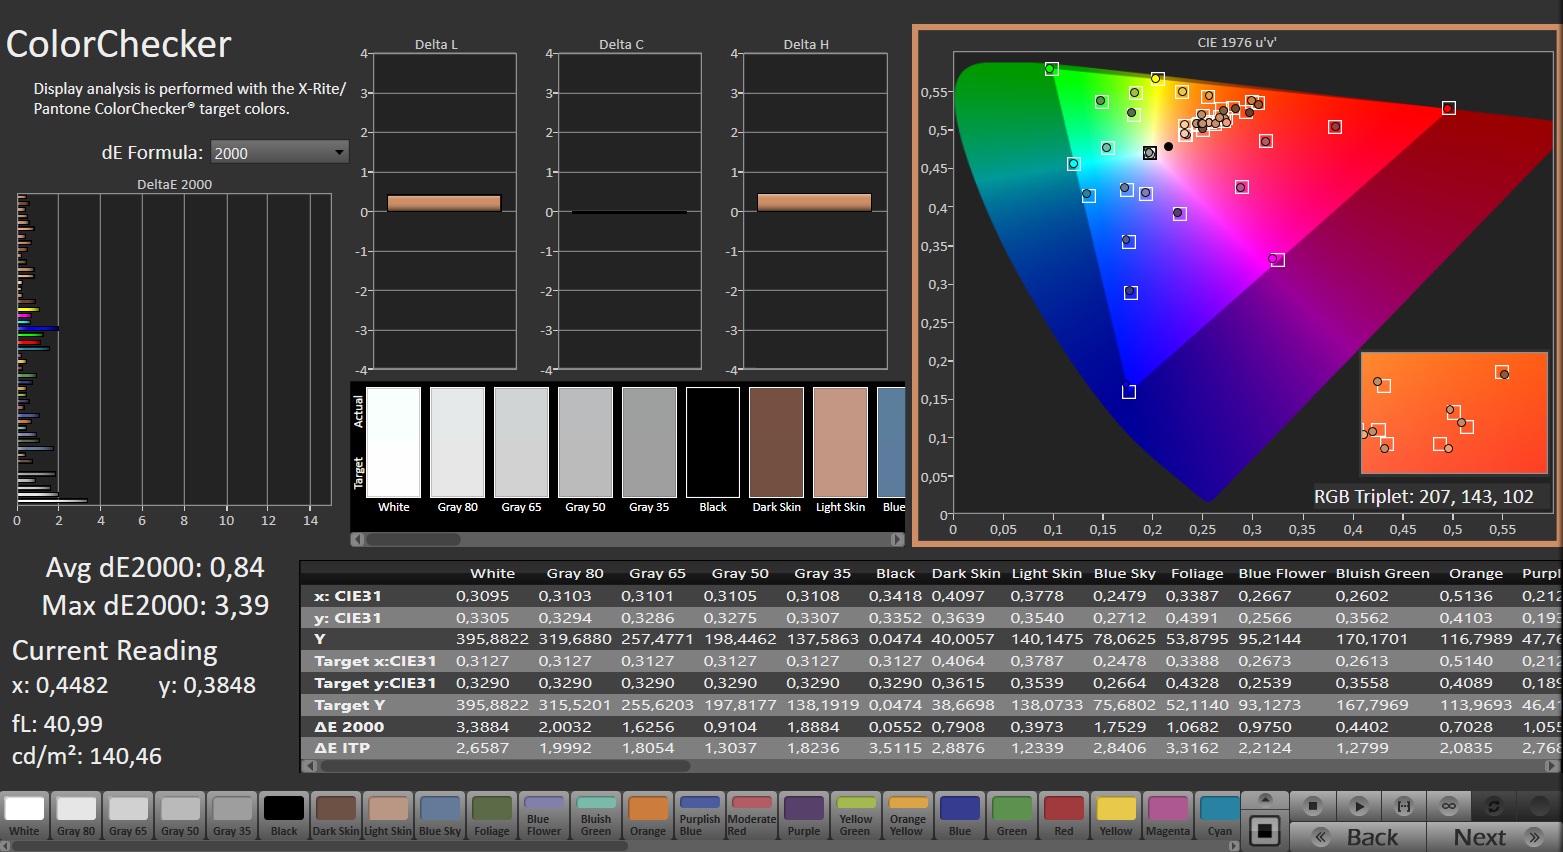
ΔE ColorChecker Calman: 0.84 | ∀{0.5-29.43 Ø4.71}
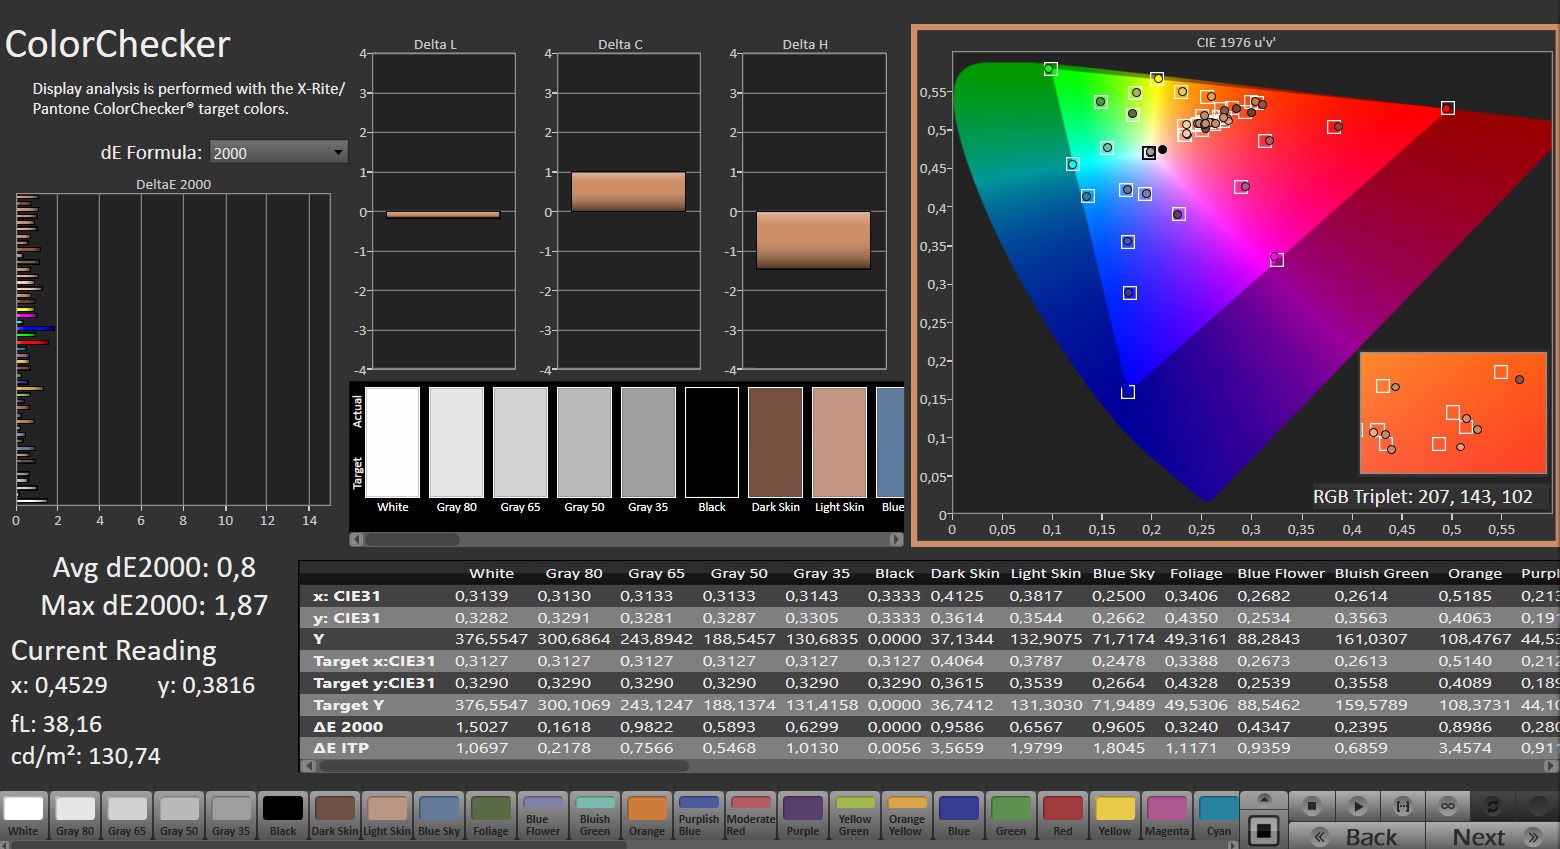
calibrated: 0.8
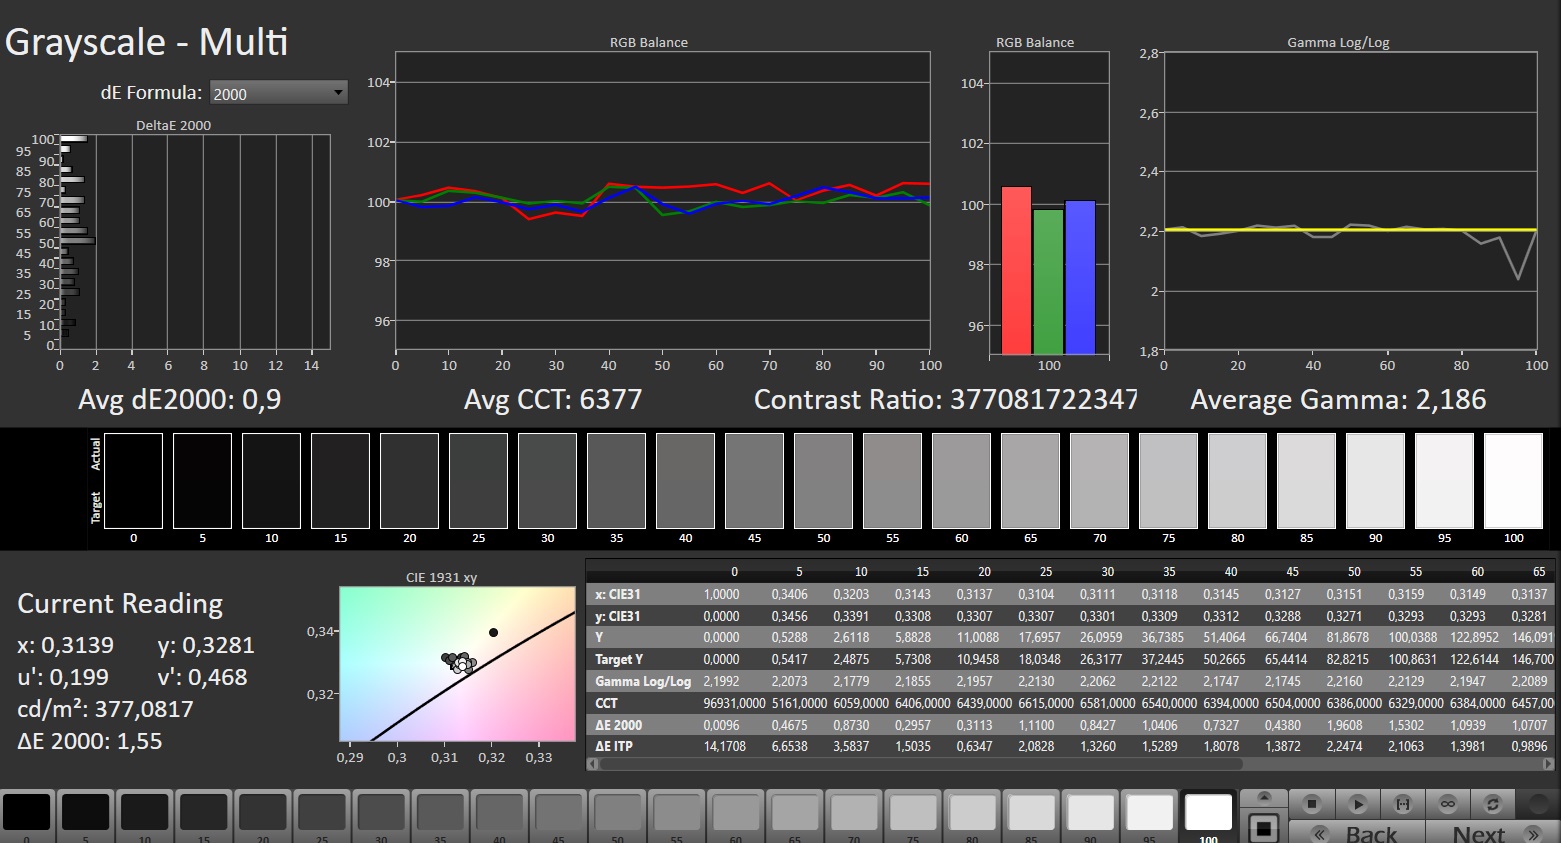
ΔE Greyscale Calman: 1.3 | ∀{0.09-98 Ø4.96}
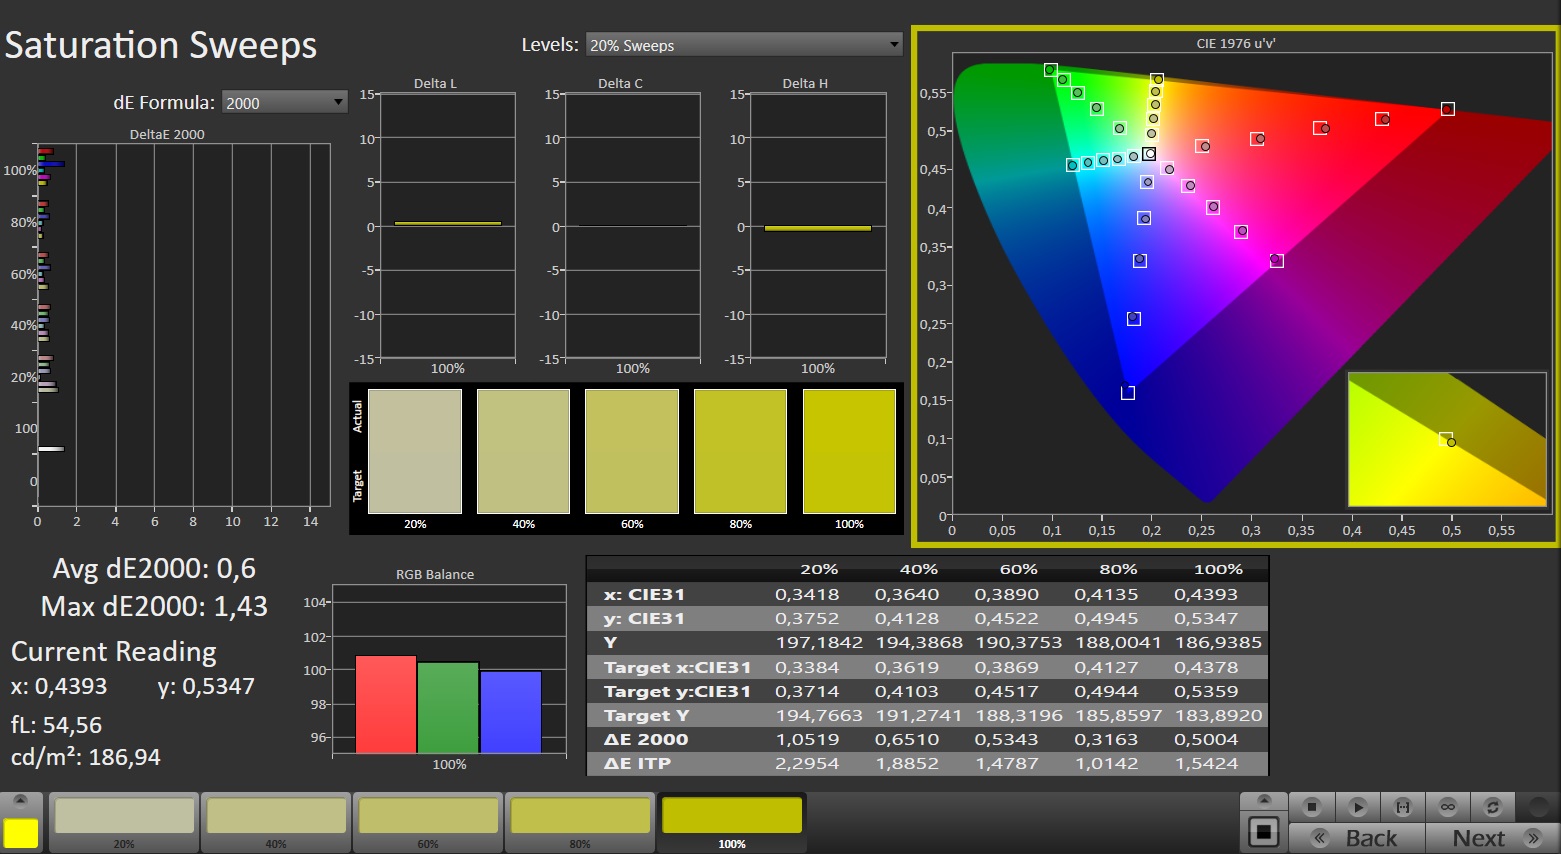
88.4% AdobeRGB 1998 (Argyll 3D)
99.9% sRGB (Argyll 3D)
99.2% Display P3 (Argyll 3D)
Gamma: 2.166
CCT: 6550 K
| MSI Stealth 16 Mercedes-AMG Motorsport A13VG ATNA60YV09-0 (SDC4191), OLED, 3840x2400, 16" | MSI Stealth 16 Studio A13VG AUO26A9, IPS, 2560x1600, 16" | Schenker XMG Pro 16 Studio (Mid 23) BOE CQ NE160QDM-NZ1, IPS, 2560x1600, 16" | HP Omen Transcend 16 AUOA3A6, Mini-LED, 2560x1600, 16" | Lenovo Legion Pro 5 16ARX8 CSOT T3 MNG007DA1-Q, IPS, 2560x1600, 16" | Schenker XMG CORE 16 (L23) BOE0AF0 (), IPS, 2560x1600, 16" | |
|---|---|---|---|---|---|---|
| Display | -2% | -18% | -0% | -16% | -18% | |
| Display P3 Coverage (%) | 99.2 | 96.4 -3% | 69.4 -30% | 99.2 0% | 70.4 -29% | 68.3 -31% |
| sRGB Coverage (%) | 99.9 | 99.7 0% | 98.2 -2% | 100 0% | 99.6 0% | 98.6 -1% |
| AdobeRGB 1998 Coverage (%) | 88.4 | 84.8 -4% | 70.1 -21% | 87.6 -1% | 72.6 -18% | 69.6 -21% |
| Response Times | -280% | -628% | -1955% | -513% | -615% | |
| Response Time Grey 50% / Grey 80% * (ms) | 1.5 ? | 4.4 ? -193% | 12.2 ? -713% | 26.4 ? -1660% | 7 ? -367% | 13.2 ? -780% |
| Response Time Black / White * (ms) | 1.2 ? | 5.6 ? -367% | 7.7 ? -542% | 28.2 ? -2250% | 9.1 ? -658% | 6.6 ? -450% |
| PWM Frequency (Hz) | 60 ? | 3506 ? | ||||
| Screen | -127% | -74% | -120% | 2% | -75% | |
| Brightness middle (cd/m²) | 382 | 424 11% | 349 -9% | 791.1 107% | 355.3 -7% | 376 -2% |
| Brightness (cd/m²) | 383 | 411 7% | 348 -9% | 800 109% | 340 -11% | 358 -7% |
| Brightness Distribution (%) | 96 | 88 -8% | 93 -3% | 95 -1% | 91 -5% | 88 -8% |
| Black Level * (cd/m²) | 0.37 | 0.32 | 0.04 | 0.32 | 0.33 | |
| Colorchecker dE 2000 * | 0.84 | 3.04 -262% | 1.98 -136% | 4.37 -420% | 1.13 -35% | 2.74 -226% |
| Colorchecker dE 2000 max. * | 3.39 | 7.5 -121% | 7.56 -123% | 10.39 -206% | 2.78 18% | 6.78 -100% |
| Colorchecker dE 2000 calibrated * | 0.8 | 3.04 -280% | 1.45 -81% | 1.04 -30% | 0.32 60% | 0.88 -10% |
| Greyscale dE 2000 * | 1.3 | 4.34 -234% | 3.3 -154% | 6.5 -400% | 1.4 -8% | 3.57 -175% |
| Gamma | 2.166 102% | 2.32 95% | 2.137 103% | 2.28 96% | 2.24 98% | 2.4 92% |
| CCT | 6550 99% | 6952 93% | 6672 97% | 6000 108% | 6372 102% | 7246 90% |
| Contrast (:1) | 1146 | 1091 | 19778 | 1110 | 1139 | |
| Media totale (Programma / Settaggio) | -136% /
-121% | -240% /
-152% | -692% /
-396% | -176% /
-88% | -236% /
-151% |
* ... Meglio usare valori piccoli
Lo schermo offre anche prestazioni da buone a molto buone in vari aspetti. Con quasi il 100% di copertura di sRGB o DCI-P3 e l'88% di copertura di AdobeRGB, eccelle nello spazio colore. Inoltre, la precisione del colore è di prima classe, eliminando la necessità di calibrazione, a differenza di alcuni concorrenti. L'eccezionale livello di nero del display, quasi 0,0 cd/m², contribuisce all'impressionante contrasto caratteristico degli OLED, superando i pannelli IPS tradizionali. La stessa superiorità si estende alla stabilità dell'angolo di visione e al tempo di risposta, rendendo i notebook OLED l'attuale riferimento in questi aspetti.

Tuttavia, gli acquirenti devono fare i conti con i tipici inconvenienti, tra cui la bassa frequenza e lo sfarfallio. Il display sfarfalla a 60 Hz sotto il 90% di luminosità e a 240 Hz sotto il 50%. Questi valori possono rappresentare un problema per le persone sensibili a questi fattori.
La superficie lucida, che a volte provoca riflessi significativi, potrebbe essere un problema per molti utenti nell'uso quotidiano. Nonostante una luminosità media rispettabile di 383 cd/m², l'idoneità dello Stealth 16 per gli ambienti esterni o ben illuminati è un po' limitata.
Tempi di risposta del Display
| ↔ Tempi di risposta dal Nero al Bianco | ||
|---|---|---|
| 1.2 ms ... aumenta ↗ e diminuisce ↘ combinato | ↗ 0.6 ms Incremento | 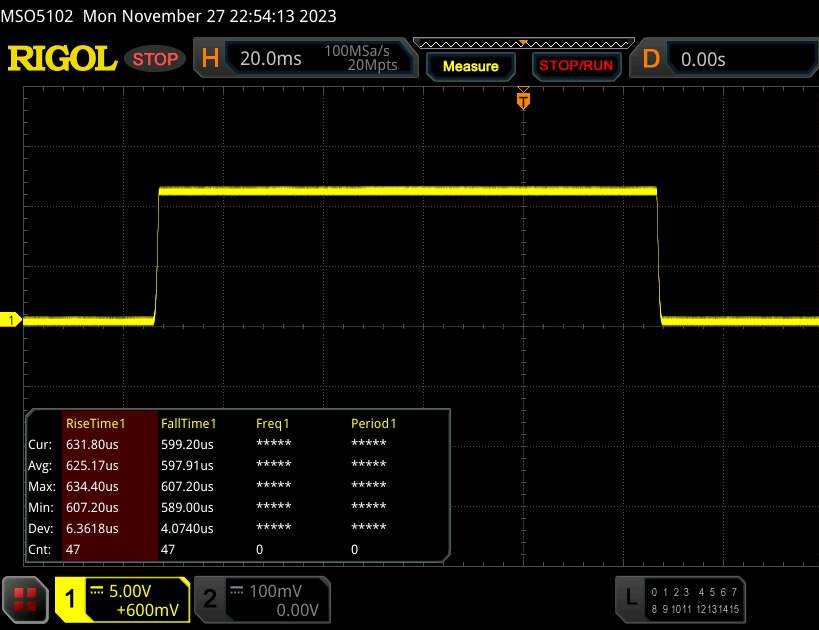 |
| ↘ 0.6 ms Calo | ||
| Lo schermo ha mostrato valori di risposta molto veloci nei nostri tests ed è molto adatto per i gaming veloce. In confronto, tutti i dispositivi di test variano da 0.1 (minimo) a 240 (massimo) ms. » 6 % di tutti i dispositivi è migliore. Questo significa che i tempi di risposta rilevati sono migliori rispettto alla media di tutti i dispositivi testati (19.8 ms). | ||
| ↔ Tempo di risposta dal 50% Grigio all'80% Grigio | ||
| 1.5 ms ... aumenta ↗ e diminuisce ↘ combinato | ↗ 0.8 ms Incremento | 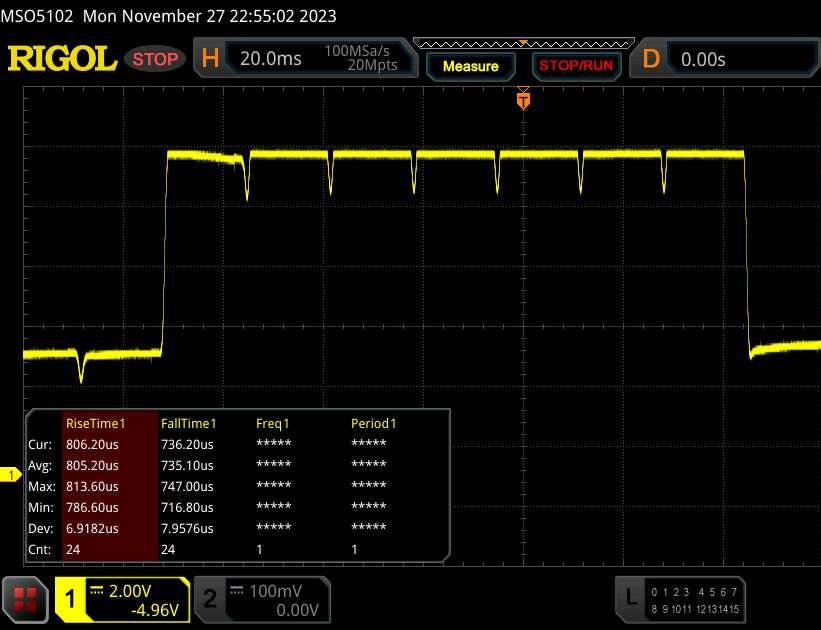 |
| ↘ 0.7 ms Calo | ||
| Lo schermo ha mostrato valori di risposta molto veloci nei nostri tests ed è molto adatto per i gaming veloce. In confronto, tutti i dispositivi di test variano da 0.165 (minimo) a 636 (massimo) ms. » 7 % di tutti i dispositivi è migliore. Questo significa che i tempi di risposta rilevati sono migliori rispettto alla media di tutti i dispositivi testati (31 ms). | ||
Sfarfallio dello schermo / PWM (Pulse-Width Modulation)
| flickering dello schermo / PWM rilevato | 60 Hz | ≤ 90 % settaggio luminosita' | 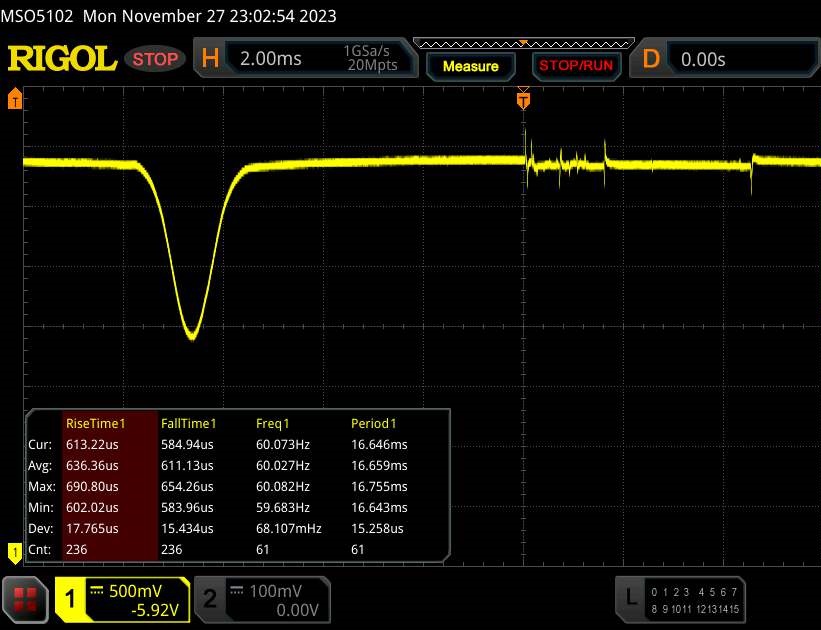 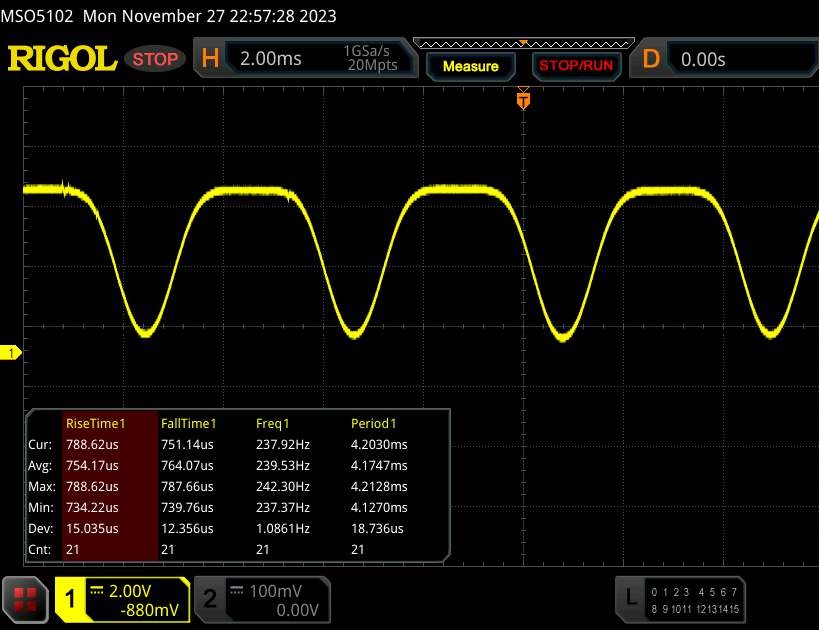 |
Il display sfarfalla a 60 Hz (Probabilmente a causa dell'uso di PWM) Flickering rilevato ad una luminosita' di 90 % o inferiore. Non dovrebbe verificarsi flickering o PWM sopra questo valore di luminosita'. La frequenza di 60 Hz è molto bassa, quindi il flickering potrebbe causare stanchezza agli occhi e mal di testa con un utilizzo prolungato. In confronto: 52 % di tutti i dispositivi testati non utilizza PWM per ridurre la luminosita' del display. Se è rilevato PWM, una media di 7747 (minimo: 5 - massimo: 343500) Hz è stata rilevata. | |||
Prestazioni
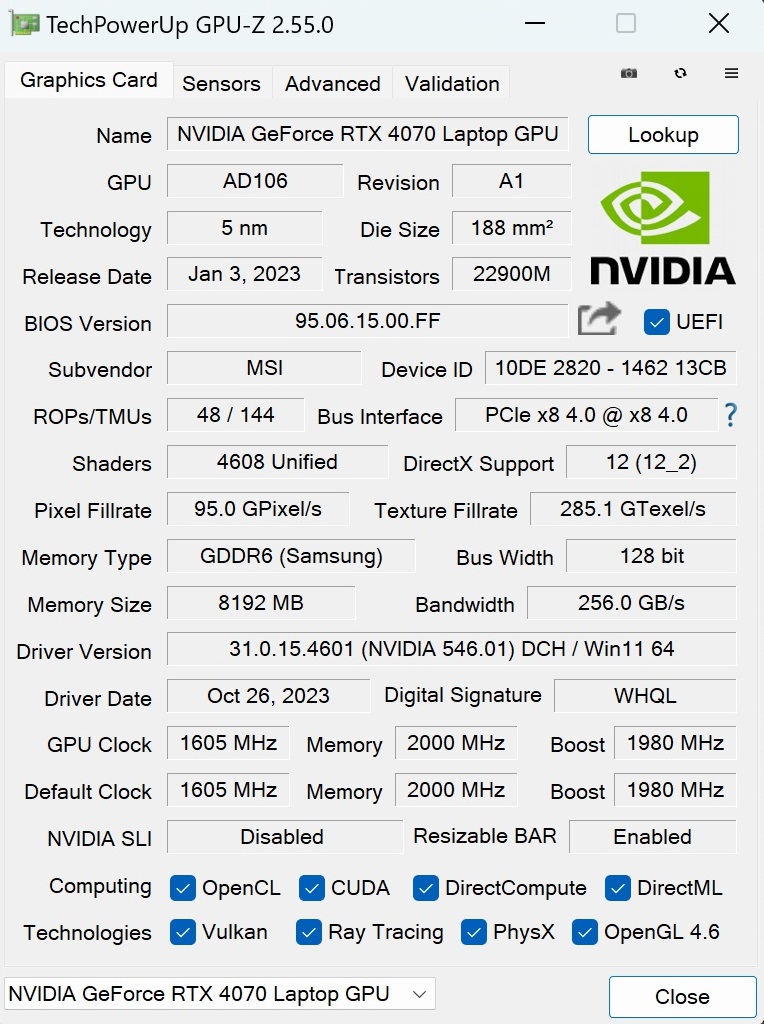
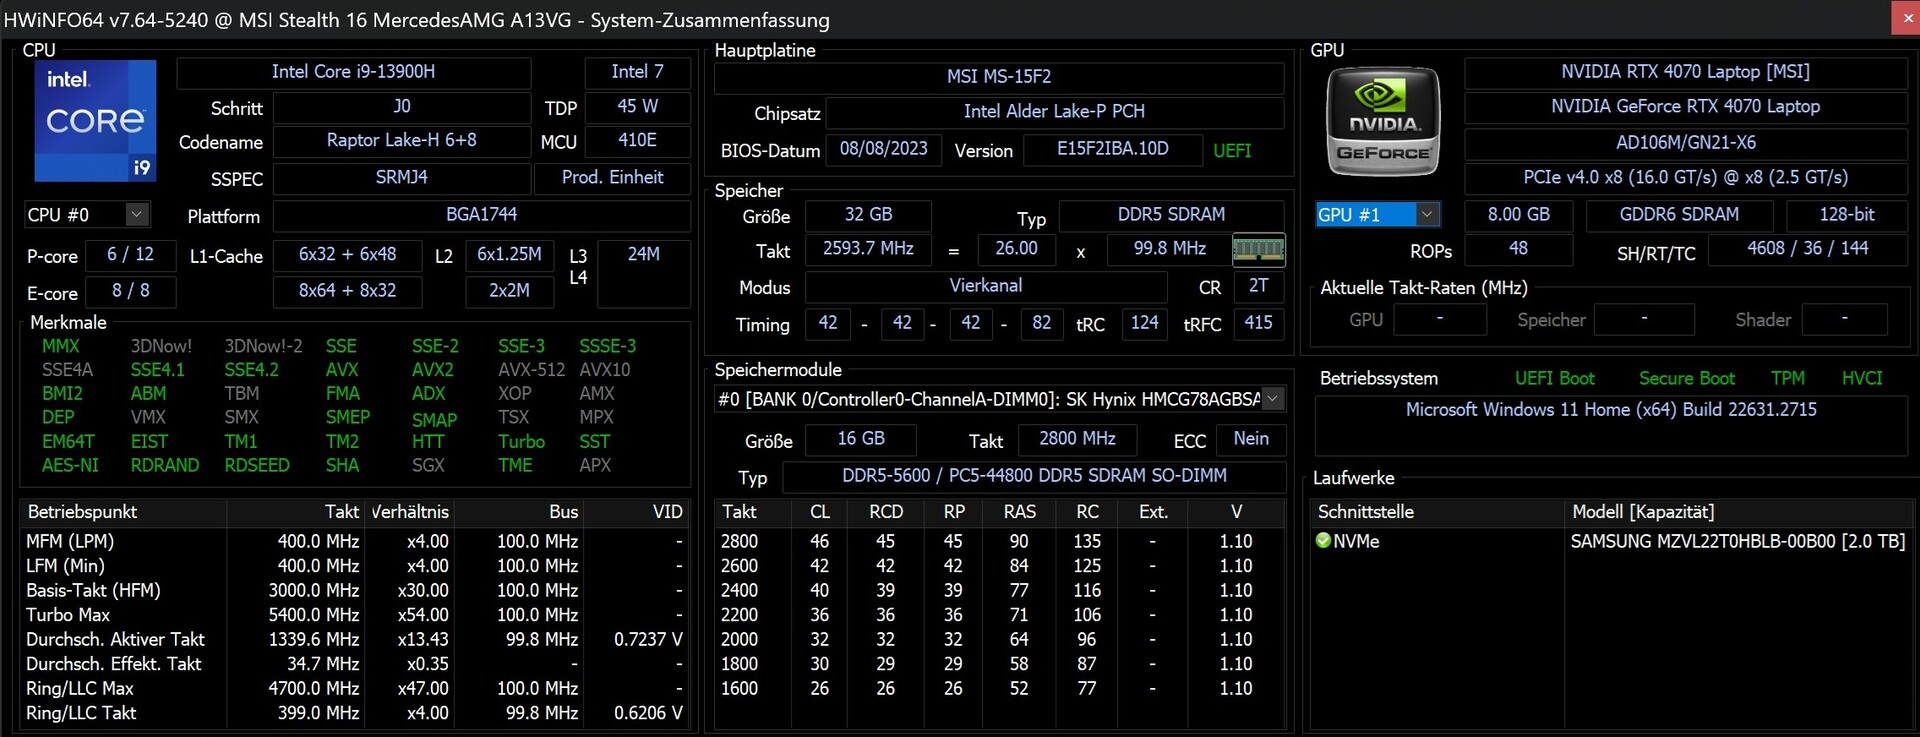
Con solo 8 GB di VRAM per la RTX 4070 di GeForce, che al momento dell'uscita era considerata obsoleta in questo segmento di prezzo, il 16 pollici si colloca nella fascia media superiore, soprattutto in termini di prestazioni della GPU. Le prestazioni della CPU sono di alto livello, lo Stealth 16 è proprio al top, e l'ampia configurazione di RAM e SSD dovrebbe offrire riserve sufficienti per la maggior parte degli utenti.
Condizioni del test
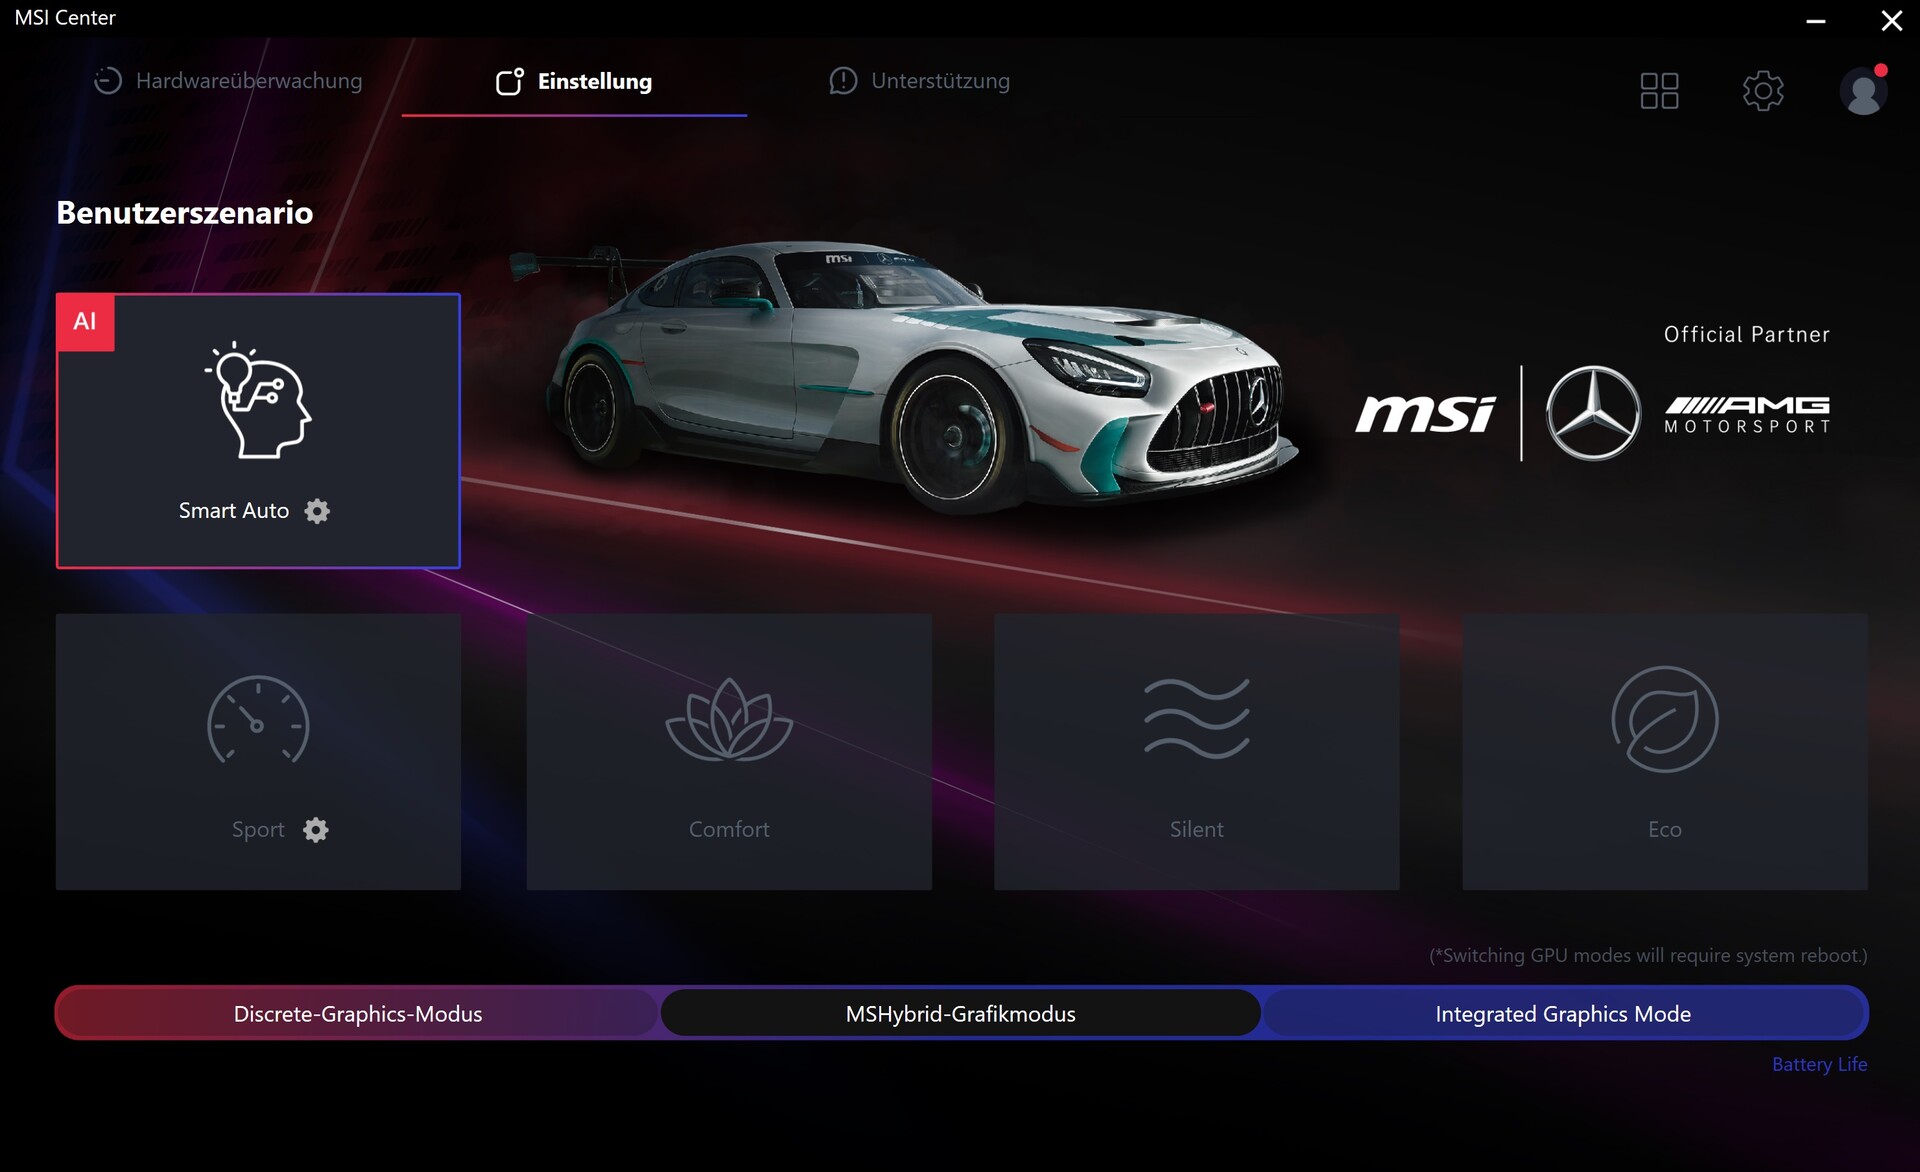
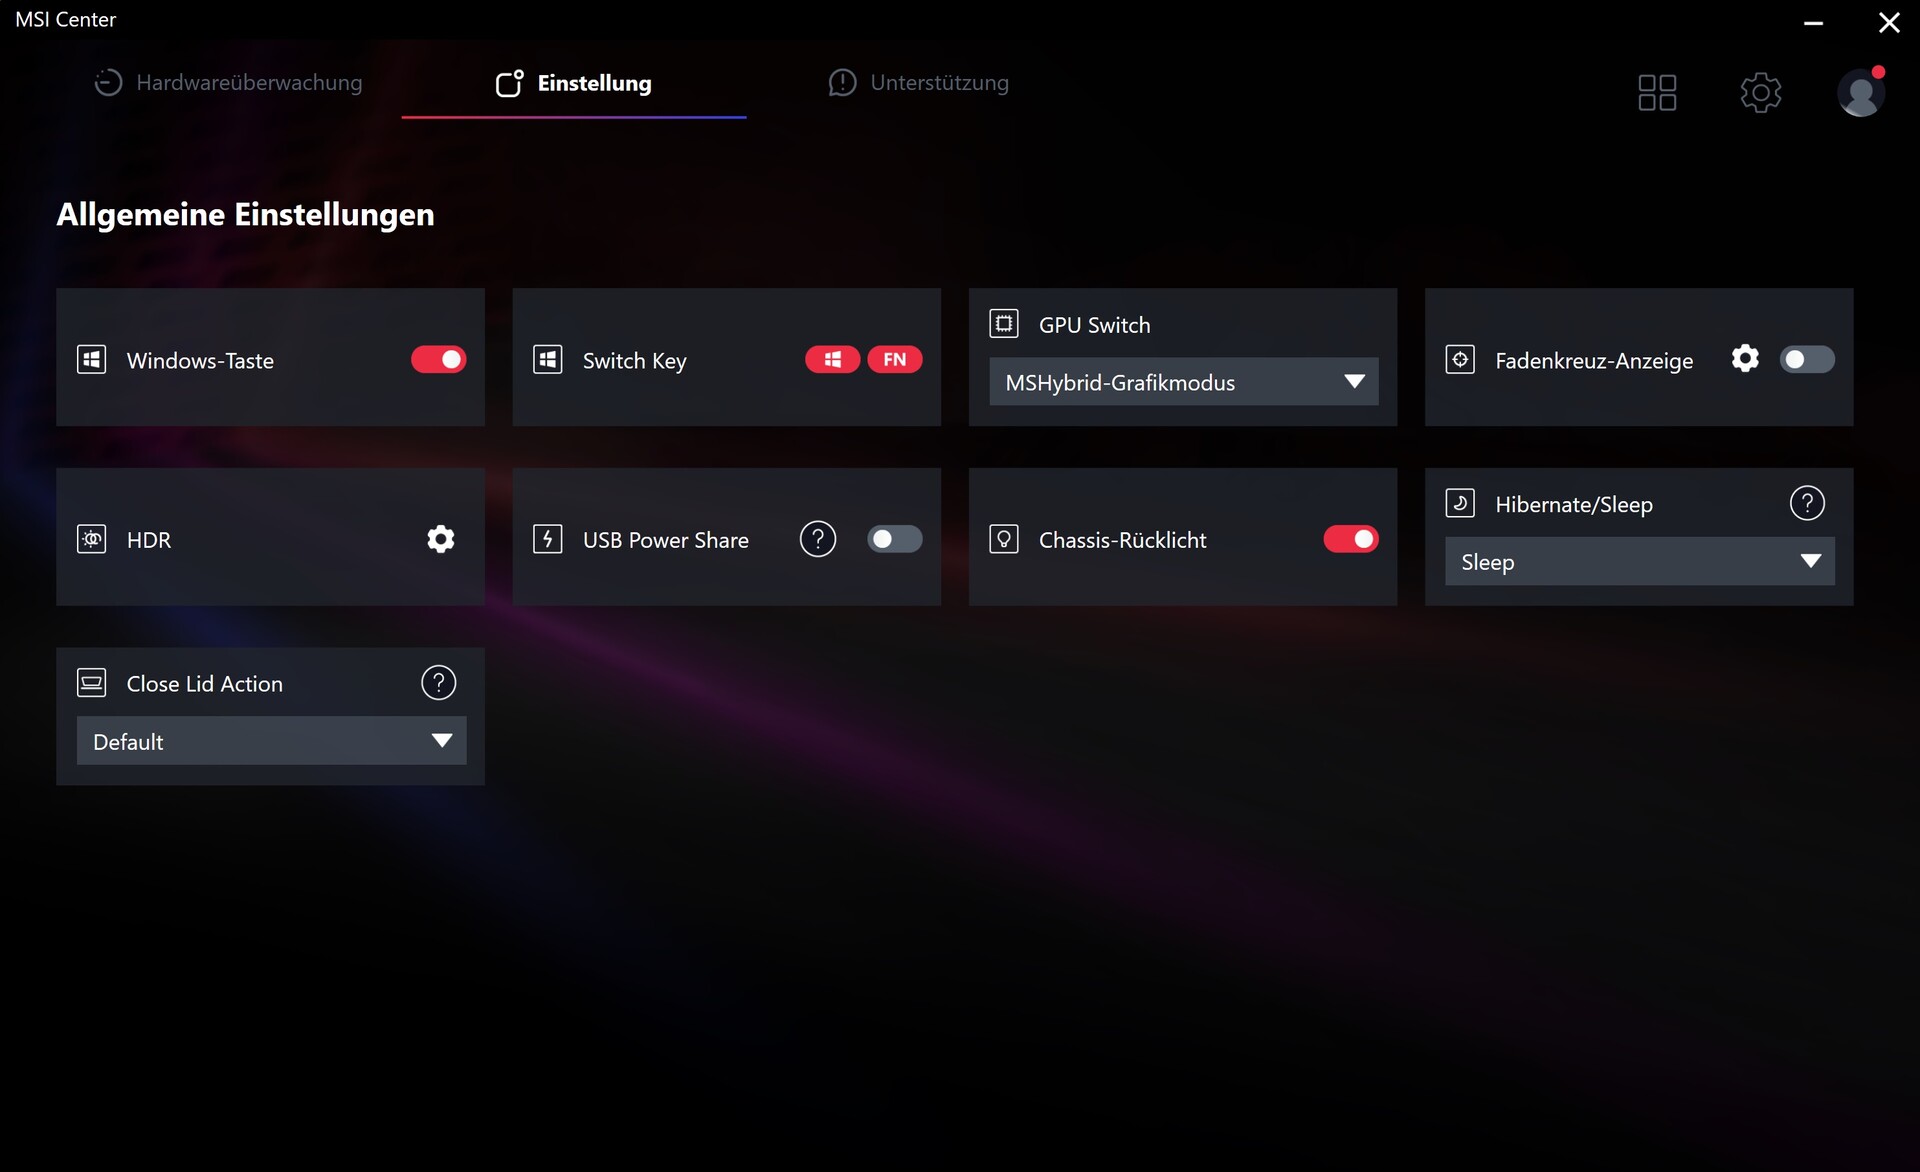
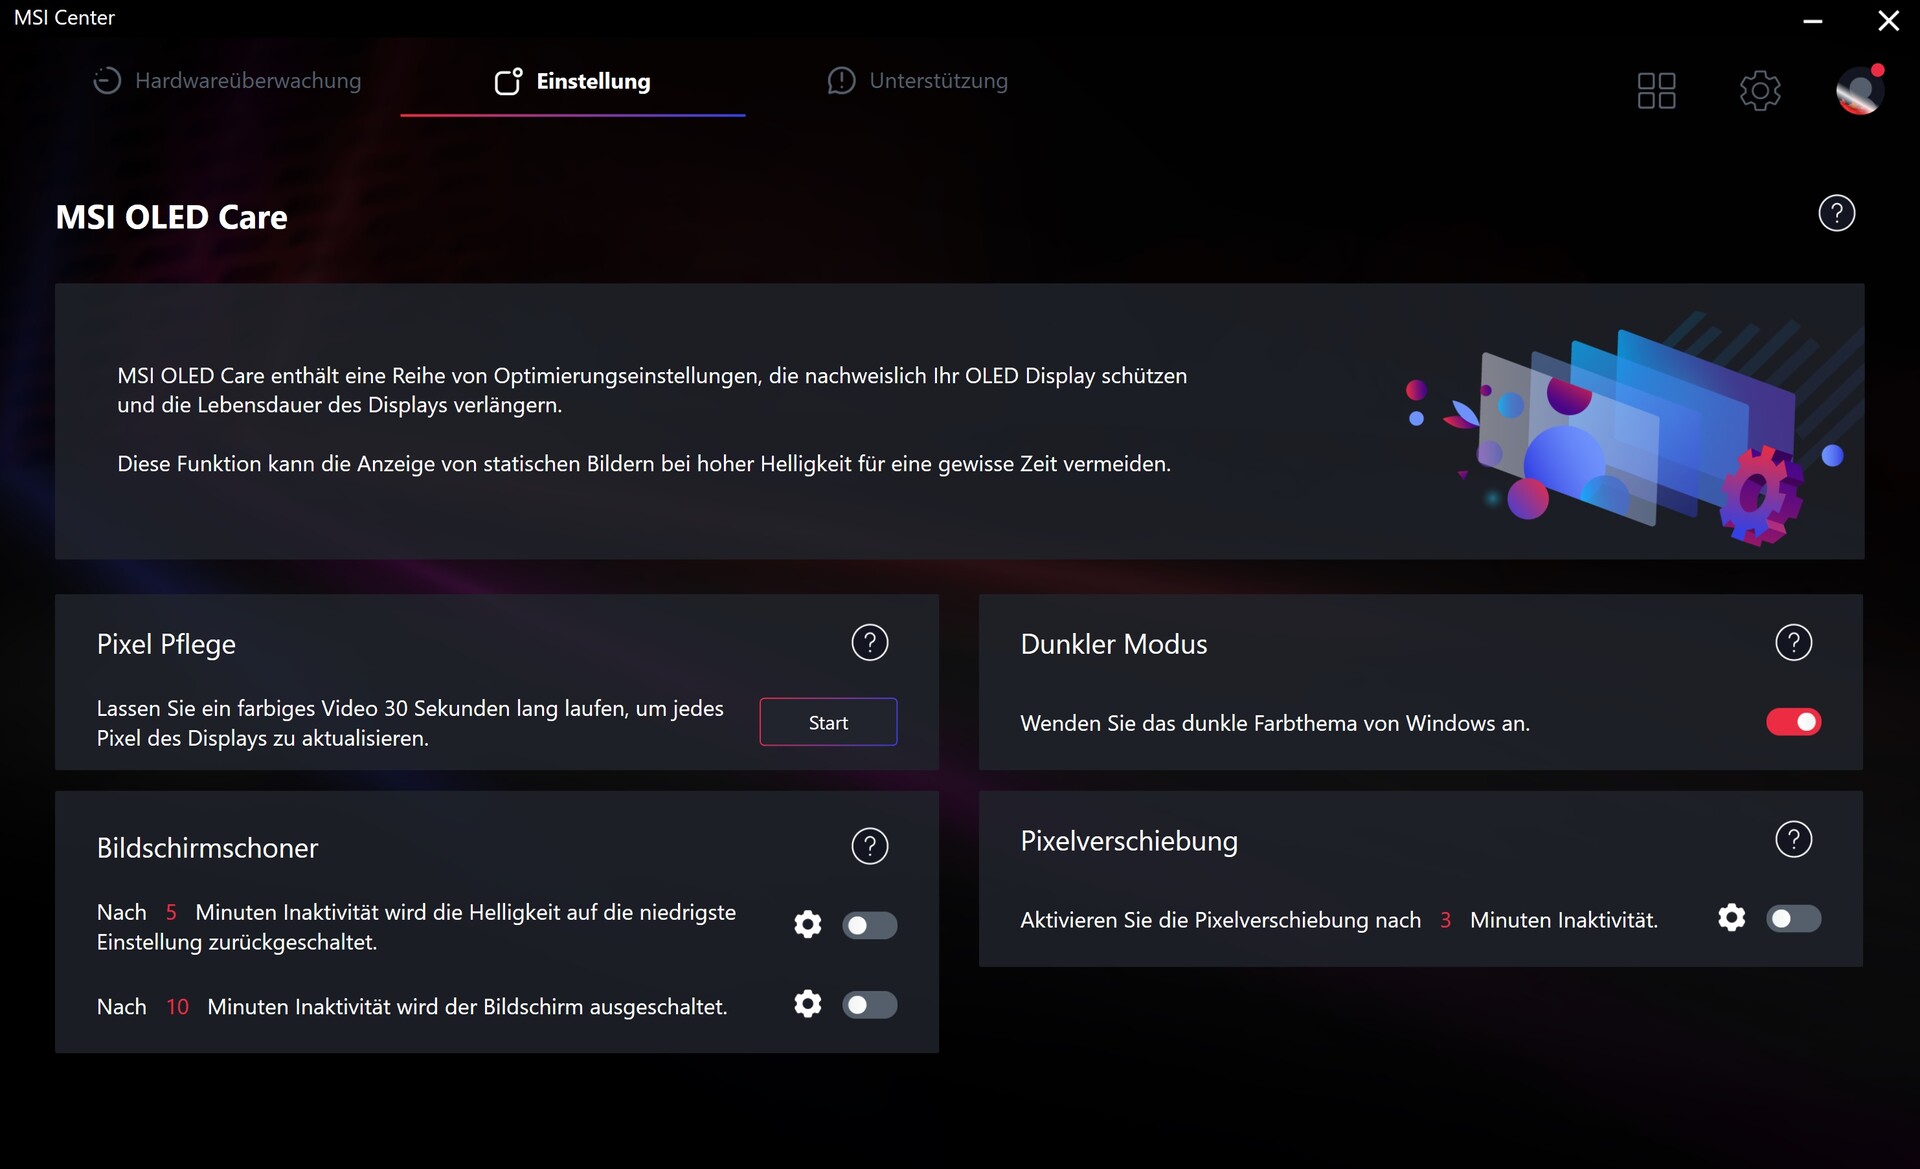
L'MSI Center preinstallato offre diverse modalità operative, da Eco a Sport. Tutte le misurazioni sono state effettuate in modalità Smart Auto, dove il sistema regola automaticamente le impostazioni. La commutazione grafica (MSHybrid) è stata attivata per impostazione predefinita.
| Sport | Comfort | Silenzioso | Eco | |
|---|---|---|---|---|
| Prestazioni (Witcher 3, FHD/Ultra) | 120 fps | 110 fps | 90 fps | 90 fps |
| Rumore (Witcher 3, FHD/Ultra) | 49 dB(A) | 45 dB(A) | 36 dB(A) | 34 dB(A) |
| Limite di potenza 1 (HWInfo) | 100 w | 45 w | 25 w | 15 w |
| Limite di potenza 2 (HWInfo) | 160 w | 45 w | 45 w | 15 w |
Processore
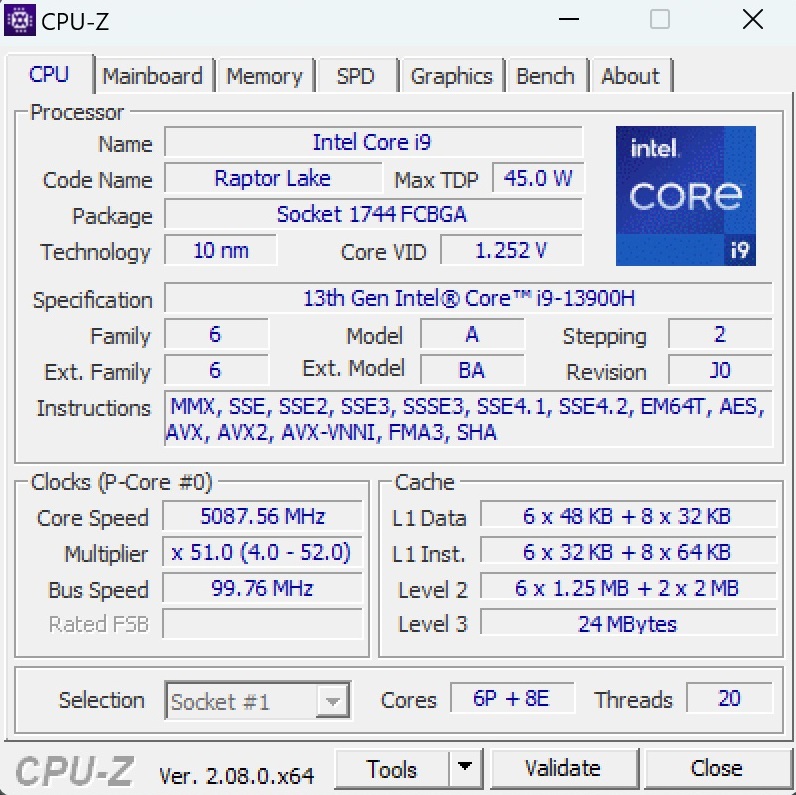
L'aggiornamento dall'i7-13700H all'i9-13900H nei nostri test sulla CPU ha mostrato un miglioramento marginale delle prestazioni. I risultati dei benchmark sono rimasti simili alla versione standard. Durante il ciclo Cinebench, si sono verificati due cali temporanei, a differenza della concorrenza. Il Core i9-13900H è un chip di fascia alta potente ma avido di energia, con 6 core di prestazioni con Hyper-Threading e 8 core di efficienza senza HT (20 thread in totale).
Cinebench R15 Multi Loop
* ... Meglio usare valori piccoli
AIDA64: FP32 Ray-Trace | FPU Julia | CPU SHA3 | CPU Queen | FPU SinJulia | FPU Mandel | CPU AES | CPU ZLib | FP64 Ray-Trace | CPU PhotoWorxx
| Performance rating | |
| Media della classe Gaming | |
| HP Omen Transcend 16 | |
| Lenovo Legion Pro 5 16ARX8 | |
| Schenker XMG CORE 16 (L23) | |
| MSI Stealth 16 Mercedes-AMG Motorsport A13VG | |
| Schenker XMG Pro 16 Studio (Mid 23) | |
| MSI Stealth 16 Studio A13VG | |
| Media Intel Core i9-13900H | |
| AIDA64 / FP32 Ray-Trace | |
| Media della classe Gaming (10227 - 85542, n=105, ultimi 2 anni) | |
| Lenovo Legion Pro 5 16ARX8 | |
| Schenker XMG CORE 16 (L23) | |
| HP Omen Transcend 16 | |
| MSI Stealth 16 Mercedes-AMG Motorsport A13VG | |
| MSI Stealth 16 Studio A13VG | |
| Schenker XMG Pro 16 Studio (Mid 23) | |
| Media Intel Core i9-13900H (6788 - 19557, n=25) | |
| AIDA64 / FPU Julia | |
| Media della classe Gaming (51376 - 238426, n=105, ultimi 2 anni) | |
| Lenovo Legion Pro 5 16ARX8 | |
| Schenker XMG CORE 16 (L23) | |
| HP Omen Transcend 16 | |
| MSI Stealth 16 Mercedes-AMG Motorsport A13VG | |
| Schenker XMG Pro 16 Studio (Mid 23) | |
| MSI Stealth 16 Studio A13VG | |
| Media Intel Core i9-13900H (22551 - 95579, n=25) | |
| AIDA64 / CPU SHA3 | |
| Media della classe Gaming (2180 - 10115, n=105, ultimi 2 anni) | |
| HP Omen Transcend 16 | |
| Lenovo Legion Pro 5 16ARX8 | |
| Schenker XMG CORE 16 (L23) | |
| MSI Stealth 16 Mercedes-AMG Motorsport A13VG | |
| MSI Stealth 16 Studio A13VG | |
| Schenker XMG Pro 16 Studio (Mid 23) | |
| Media Intel Core i9-13900H (2491 - 4270, n=25) | |
| AIDA64 / CPU Queen | |
| Lenovo Legion Pro 5 16ARX8 | |
| HP Omen Transcend 16 | |
| Media della classe Gaming (49785 - 173351, n=90, ultimi 2 anni) | |
| MSI Stealth 16 Mercedes-AMG Motorsport A13VG | |
| MSI Stealth 16 Studio A13VG | |
| Media Intel Core i9-13900H (65121 - 120936, n=25) | |
| Schenker XMG CORE 16 (L23) | |
| Schenker XMG Pro 16 Studio (Mid 23) | |
| AIDA64 / FPU SinJulia | |
| Lenovo Legion Pro 5 16ARX8 | |
| Schenker XMG CORE 16 (L23) | |
| Media della classe Gaming (4424 - 33636, n=105, ultimi 2 anni) | |
| HP Omen Transcend 16 | |
| MSI Stealth 16 Mercedes-AMG Motorsport A13VG | |
| MSI Stealth 16 Studio A13VG | |
| Schenker XMG Pro 16 Studio (Mid 23) | |
| Media Intel Core i9-13900H (6108 - 11631, n=25) | |
| AIDA64 / FPU Mandel | |
| Media della classe Gaming (25115 - 128721, n=105, ultimi 2 anni) | |
| Lenovo Legion Pro 5 16ARX8 | |
| Schenker XMG CORE 16 (L23) | |
| HP Omen Transcend 16 | |
| MSI Stealth 16 Mercedes-AMG Motorsport A13VG | |
| MSI Stealth 16 Studio A13VG | |
| Schenker XMG Pro 16 Studio (Mid 23) | |
| Media Intel Core i9-13900H (11283 - 48474, n=25) | |
| AIDA64 / CPU AES | |
| Schenker XMG Pro 16 Studio (Mid 23) | |
| HP Omen Transcend 16 | |
| Media della classe Gaming (39258 - 247074, n=105, ultimi 2 anni) | |
| Schenker XMG CORE 16 (L23) | |
| Media Intel Core i9-13900H (3691 - 149377, n=25) | |
| MSI Stealth 16 Mercedes-AMG Motorsport A13VG | |
| MSI Stealth 16 Studio A13VG | |
| Lenovo Legion Pro 5 16ARX8 | |
| AIDA64 / CPU ZLib | |
| HP Omen Transcend 16 | |
| Media della classe Gaming (574 - 2531, n=105, ultimi 2 anni) | |
| MSI Stealth 16 Mercedes-AMG Motorsport A13VG | |
| Lenovo Legion Pro 5 16ARX8 | |
| Schenker XMG CORE 16 (L23) | |
| Schenker XMG Pro 16 Studio (Mid 23) | |
| Media Intel Core i9-13900H (789 - 1254, n=25) | |
| MSI Stealth 16 Studio A13VG | |
| AIDA64 / FP64 Ray-Trace | |
| Media della classe Gaming (5509 - 45446, n=105, ultimi 2 anni) | |
| Lenovo Legion Pro 5 16ARX8 | |
| Schenker XMG CORE 16 (L23) | |
| HP Omen Transcend 16 | |
| MSI Stealth 16 Mercedes-AMG Motorsport A13VG | |
| MSI Stealth 16 Studio A13VG | |
| Schenker XMG Pro 16 Studio (Mid 23) | |
| Media Intel Core i9-13900H (3655 - 10716, n=25) | |
| AIDA64 / CPU PhotoWorxx | |
| HP Omen Transcend 16 | |
| Schenker XMG Pro 16 Studio (Mid 23) | |
| MSI Stealth 16 Mercedes-AMG Motorsport A13VG | |
| MSI Stealth 16 Studio A13VG | |
| Media della classe Gaming (12271 - 89891, n=105, ultimi 2 anni) | |
| Schenker XMG CORE 16 (L23) | |
| Media Intel Core i9-13900H (10871 - 50488, n=25) | |
| Lenovo Legion Pro 5 16ARX8 | |
Prestazioni del sistema
Nonostante l'alloggiamento di componenti molto veloci, le prestazioni di sistema dello Stealth 16 si collocano al penultimo posto nel confronto, appena davanti alla versione Studio standard. Le differenze sono minime e, nell'uso pratico, è improbabile che gli utenti notino distinzioni significative.
CrossMark: Overall | Productivity | Creativity | Responsiveness
| PCMark 10 / Score | |
| Media della classe Gaming (5828 - 12414, n=93, ultimi 2 anni) | |
| Lenovo Legion Pro 5 16ARX8 | |
| Schenker XMG CORE 16 (L23) | |
| HP Omen Transcend 16 | |
| Schenker XMG Pro 16 Studio (Mid 23) | |
| Media Intel Core i9-13900H, NVIDIA GeForce RTX 4070 Laptop GPU (5855 - 8538, n=8) | |
| MSI Stealth 16 Mercedes-AMG Motorsport A13VG | |
| MSI Stealth 16 Studio A13VG | |
| PCMark 10 / Essentials | |
| Schenker XMG Pro 16 Studio (Mid 23) | |
| HP Omen Transcend 16 | |
| Lenovo Legion Pro 5 16ARX8 | |
| Schenker XMG CORE 16 (L23) | |
| MSI Stealth 16 Mercedes-AMG Motorsport A13VG | |
| Media Intel Core i9-13900H, NVIDIA GeForce RTX 4070 Laptop GPU (8835 - 11940, n=8) | |
| Media della classe Gaming (8810 - 11935, n=97, ultimi 2 anni) | |
| MSI Stealth 16 Studio A13VG | |
| PCMark 10 / Productivity | |
| Media della classe Gaming (6845 - 25323, n=95, ultimi 2 anni) | |
| Schenker XMG CORE 16 (L23) | |
| Schenker XMG Pro 16 Studio (Mid 23) | |
| Lenovo Legion Pro 5 16ARX8 | |
| Media Intel Core i9-13900H, NVIDIA GeForce RTX 4070 Laptop GPU (7967 - 10991, n=8) | |
| HP Omen Transcend 16 | |
| MSI Stealth 16 Mercedes-AMG Motorsport A13VG | |
| MSI Stealth 16 Studio A13VG | |
| PCMark 10 / Digital Content Creation | |
| Media della classe Gaming (7602 - 19954, n=95, ultimi 2 anni) | |
| HP Omen Transcend 16 | |
| Lenovo Legion Pro 5 16ARX8 | |
| Schenker XMG CORE 16 (L23) | |
| Media Intel Core i9-13900H, NVIDIA GeForce RTX 4070 Laptop GPU (7738 - 13575, n=8) | |
| Schenker XMG Pro 16 Studio (Mid 23) | |
| MSI Stealth 16 Studio A13VG | |
| MSI Stealth 16 Mercedes-AMG Motorsport A13VG | |
| CrossMark / Overall | |
| Lenovo Legion Pro 5 16ARX8 | |
| Media della classe Gaming (1366 - 2409, n=94, ultimi 2 anni) | |
| HP Omen Transcend 16 | |
| Schenker XMG Pro 16 Studio (Mid 23) | |
| Media Intel Core i9-13900H, NVIDIA GeForce RTX 4070 Laptop GPU (1104 - 1974, n=7) | |
| MSI Stealth 16 Studio A13VG | |
| Schenker XMG CORE 16 (L23) | |
| CrossMark / Productivity | |
| Lenovo Legion Pro 5 16ARX8 | |
| Schenker XMG Pro 16 Studio (Mid 23) | |
| Media della classe Gaming (1386 - 2254, n=94, ultimi 2 anni) | |
| HP Omen Transcend 16 | |
| Media Intel Core i9-13900H, NVIDIA GeForce RTX 4070 Laptop GPU (1058 - 1914, n=7) | |
| MSI Stealth 16 Studio A13VG | |
| Schenker XMG CORE 16 (L23) | |
| CrossMark / Creativity | |
| HP Omen Transcend 16 | |
| Media della classe Gaming (1343 - 2786, n=94, ultimi 2 anni) | |
| Lenovo Legion Pro 5 16ARX8 | |
| Schenker XMG Pro 16 Studio (Mid 23) | |
| Media Intel Core i9-13900H, NVIDIA GeForce RTX 4070 Laptop GPU (1178 - 2254, n=7) | |
| MSI Stealth 16 Studio A13VG | |
| Schenker XMG CORE 16 (L23) | |
| CrossMark / Responsiveness | |
| Schenker XMG Pro 16 Studio (Mid 23) | |
| Lenovo Legion Pro 5 16ARX8 | |
| Media della classe Gaming (1226 - 2334, n=94, ultimi 2 anni) | |
| Media Intel Core i9-13900H, NVIDIA GeForce RTX 4070 Laptop GPU (1037 - 1952, n=7) | |
| MSI Stealth 16 Studio A13VG | |
| HP Omen Transcend 16 | |
| Schenker XMG CORE 16 (L23) | |
| PCMark 10 Score | 7334 punti | |
Aiuto | ||
| AIDA64 / Memory Copy | |
| HP Omen Transcend 16 | |
| Media della classe Gaming (21750 - 129946, n=105, ultimi 2 anni) | |
| Schenker XMG Pro 16 Studio (Mid 23) | |
| MSI Stealth 16 Studio A13VG | |
| MSI Stealth 16 Mercedes-AMG Motorsport A13VG | |
| Schenker XMG CORE 16 (L23) | |
| Media Intel Core i9-13900H (37448 - 74486, n=25) | |
| Lenovo Legion Pro 5 16ARX8 | |
| AIDA64 / Memory Read | |
| HP Omen Transcend 16 | |
| Schenker XMG Pro 16 Studio (Mid 23) | |
| Media della classe Gaming (22956 - 118858, n=105, ultimi 2 anni) | |
| MSI Stealth 16 Studio A13VG | |
| MSI Stealth 16 Mercedes-AMG Motorsport A13VG | |
| Media Intel Core i9-13900H (41599 - 75433, n=25) | |
| Schenker XMG CORE 16 (L23) | |
| Lenovo Legion Pro 5 16ARX8 | |
| AIDA64 / Memory Write | |
| Schenker XMG CORE 16 (L23) | |
| Media della classe Gaming (22297 - 135096, n=105, ultimi 2 anni) | |
| HP Omen Transcend 16 | |
| MSI Stealth 16 Mercedes-AMG Motorsport A13VG | |
| Schenker XMG Pro 16 Studio (Mid 23) | |
| MSI Stealth 16 Studio A13VG | |
| Media Intel Core i9-13900H (36152 - 88505, n=25) | |
| Lenovo Legion Pro 5 16ARX8 | |
| AIDA64 / Memory Latency | |
| Media della classe Gaming (75.3 - 259, n=105, ultimi 2 anni) | |
| Media Intel Core i9-13900H (75.8 - 102.3, n=25) | |
| MSI Stealth 16 Mercedes-AMG Motorsport A13VG | |
| Schenker XMG CORE 16 (L23) | |
| HP Omen Transcend 16 | |
| MSI Stealth 16 Studio A13VG | |
| Schenker XMG Pro 16 Studio (Mid 23) | |
| Lenovo Legion Pro 5 16ARX8 | |
* ... Meglio usare valori piccoli
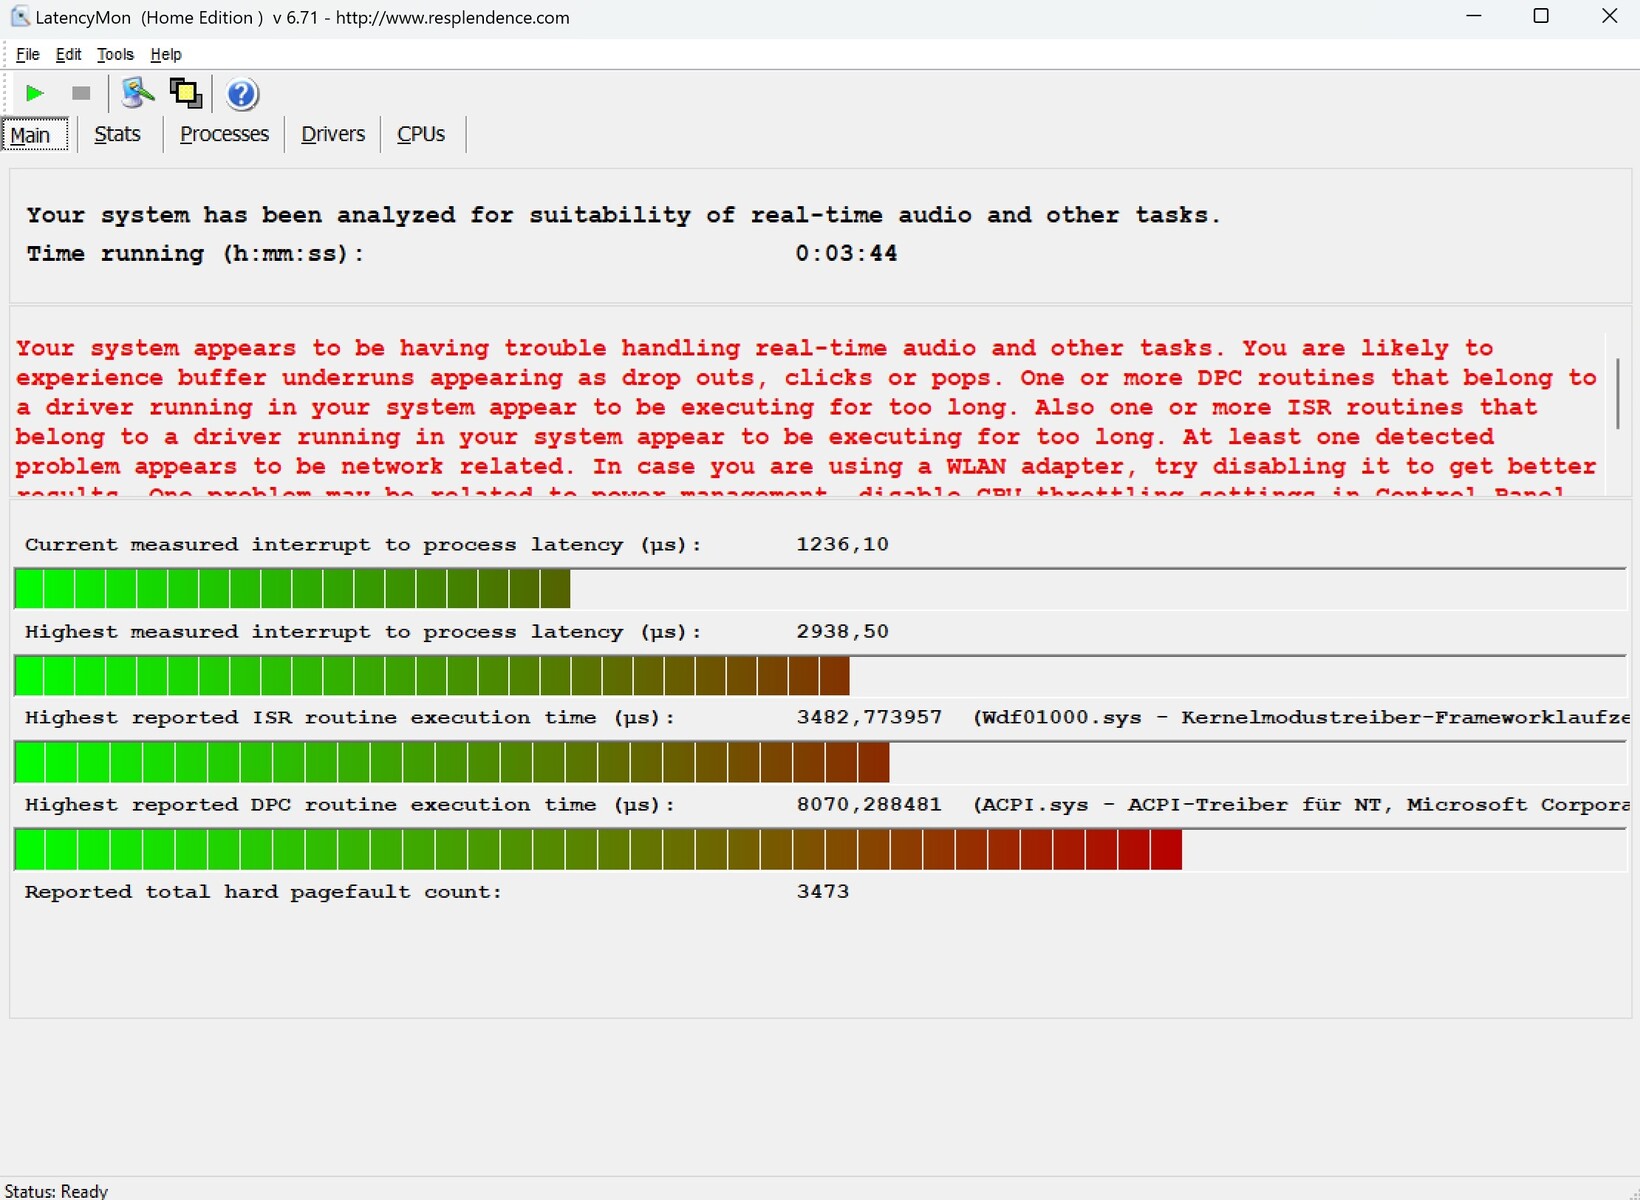
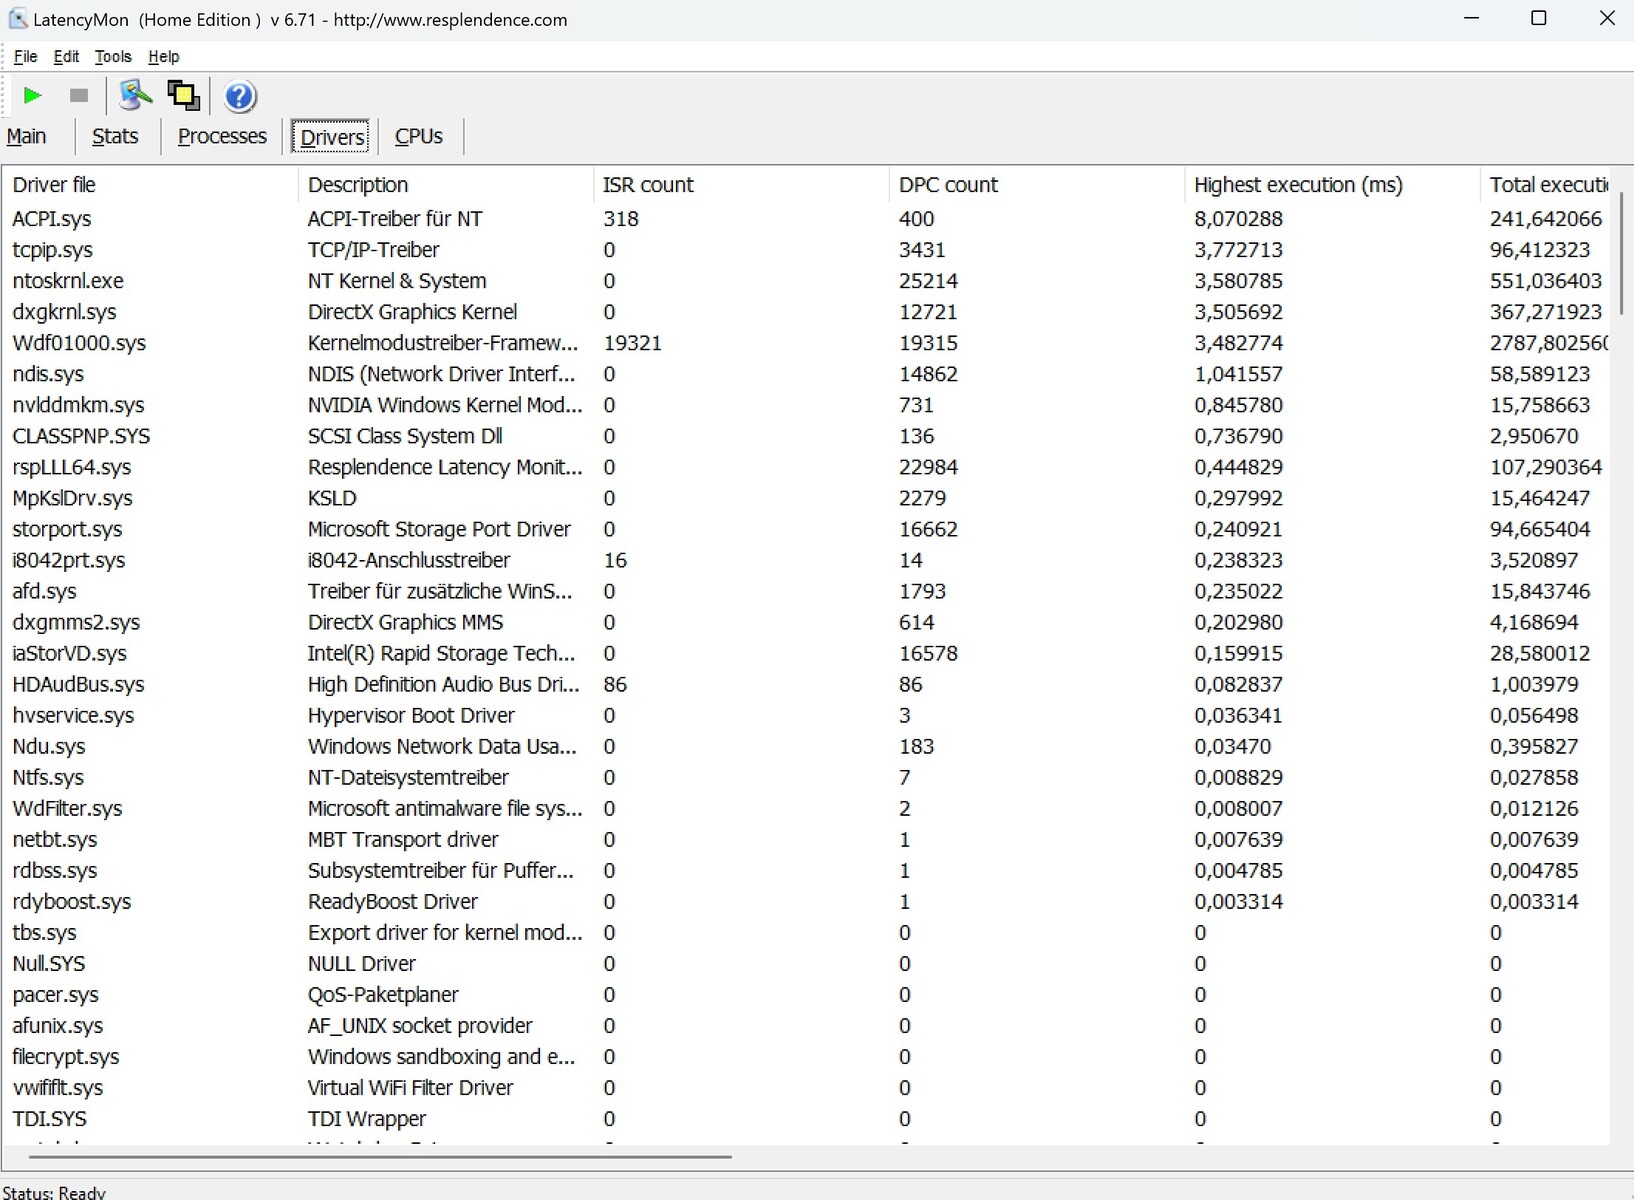
Latenza DPC
MSI potrebbe migliorare la latenza della Stealth 16. Nella versione consegnata, LatencyMon indica potenziali interruzioni nell'elaborazione audio e video in tempo reale. Questo fenomeno riguarda però molti notebook.
| DPC Latencies / LatencyMon - interrupt to process latency (max), Web, Youtube, Prime95 | |
| MSI Stealth 16 Studio A13VG | |
| MSI Stealth 16 Mercedes-AMG Motorsport A13VG | |
| Schenker XMG Pro 16 Studio (Mid 23) | |
| HP Omen Transcend 16 | |
| Schenker XMG CORE 16 (L23) | |
| Lenovo Legion Pro 5 16ARX8 | |
* ... Meglio usare valori piccoli
Dispositivi di archiviazione
L'SSD Samsung da 2 TB (modello PM9A1) nel dispositivo di test ha inizialmente ottenuto buone prestazioni, ma ha subito gravi cali di prestazioni, o throttling, sotto carico prolungato. Purtroppo, MSI non ha ancora affrontato questo problema, simile a quello dello Stealth 16 standard. La maggior parte della concorrenza si comporta meglio in questo senso, con l'eccezione di Lenovo Legion Pro 5.

* ... Meglio usare valori piccoli
Continuous power read: DiskSpd Read Loop, Queue Depth 8
Scheda grafica
Nonostante il TGP della GPU di 105 watt, le prestazioni della RTX 4070 nello Stealth 16 si allineano alla media di questa scheda grafica.
| 3DMark Ice Storm Standard Score | 99001 punti | |
| 3DMark Cloud Gate Standard Score | 52847 punti | |
| 3DMark Fire Strike Score | 22419 punti | |
| 3DMark Time Spy Score | 11694 punti | |
Aiuto | ||
* ... Meglio usare valori piccoli
Prestazioni di gioco
Poiché il display OLED non supporta una risoluzione UHD classica (3.840 x 2.160 pixel), abbiamo utilizzato un massimo di 2.560 x 1.440 pixel per i benchmark di gioco. L'aumento della risoluzione spesso sovraccarica la RTX 4070, soprattutto con le impostazioni più alte, come si evince dalla pagina dellaPagina GPU. Tuttavia, Stealth 16 si comporta in modo ammirevole in QHD, sfruttando appieno la capacità di 60 Hz del pannello OLED nella maggior parte dei titoli, ad eccezione di quelli più impegnativi e meno ottimizzati, come ad esempio Alan Wake 2.
| Counter-Strike 2 - 2560x1440 Very High Preset | |
| Media della classe Gaming (15.7 - 224, n=5, ultimi 2 anni) | |
| XMG Pro 15 E23 | |
| Media NVIDIA GeForce RTX 4070 Laptop GPU (87.9 - 100.6, n=2) | |
| MSI Stealth 16 Mercedes-AMG Motorsport A13VG | |
| Alan Wake 2 - 2560x1440 High Preset | |
| Media della classe Gaming (36.7 - 93.1, n=33, ultimi 2 anni) | |
| Media NVIDIA GeForce RTX 4070 Laptop GPU (40.2 - 44.5, n=7) | |
| MSI Stealth 16 Mercedes-AMG Motorsport A13VG | |
| XMG Pro 15 E23 | |
| EA Sports WRC - 2560x1440 Ultra Preset AA:Epic AF:16x | |
| XMG Pro 15 E23 | |
| Media NVIDIA GeForce RTX 4070 Laptop GPU (59.6 - 68.8, n=3) | |
| MSI Stealth 16 Mercedes-AMG Motorsport A13VG | |
Durante un test di 60 minuti di Witcher 3con impostazioni FHD/Ultra, non ci sono stati cali di frame rate, ma la velocità è diminuita di quasi il 10% nel corso del test.
Witcher 3 FPS chart
| basso | medio | alto | ultra | QHD | |
|---|---|---|---|---|---|
| GTA V (2015) | 176 | 164.9 | 100.3 | 87.6 | |
| The Witcher 3 (2015) | 317 | 205 | 110 | 77.7 | |
| Dota 2 Reborn (2015) | 178.3 | 144.5 | 135.9 | 126.9 | |
| Final Fantasy XV Benchmark (2018) | 138 | 101.4 | 74.1 | ||
| X-Plane 11.11 (2018) | 144.7 | 118.1 | 98 | ||
| Strange Brigade (2018) | 276 | 220 | 190.6 | 126.3 | |
| Counter-Strike 2 (2023) | 160.2 | 151.5 | 121.5 | 87.9 | |
| Alan Wake 2 (2023) | 66.9 | 65.1 | 42.3 | ||
| EA Sports WRC (2023) | 90.6 | 85 | 77.1 | 59.6 |
Emissioni
Rumore del sistema
Mentre il livello di rumore al minimo è simile a quello dello Stealth 16 standard, la Motorsport Edition è leggermente più rumorosa sotto carico. Tuttavia, rispetto alla concorrenza, i valori misurati rimangono entro limiti ragionevoli, con l'HP Omen Transcend 16 più evidente in modalità 3D.
Rumorosità
| Idle |
| 25 / 26 / 27 dB(A) |
| Sotto carico |
| 39 / 51 dB(A) |
 | ||
30 dB silenzioso 40 dB(A) udibile 50 dB(A) rumoroso |
||
min: | ||
| MSI Stealth 16 Mercedes-AMG Motorsport A13VG i9-13900H, GeForce RTX 4070 Laptop GPU | MSI Stealth 16 Studio A13VG i7-13700H, GeForce RTX 4070 Laptop GPU | Schenker XMG Pro 16 Studio (Mid 23) i9-13900H, GeForce RTX 4070 Laptop GPU | HP Omen Transcend 16 i9-13900HX, GeForce RTX 4070 Laptop GPU | Lenovo Legion Pro 5 16ARX8 R7 7745HX, GeForce RTX 4070 Laptop GPU | Schenker XMG CORE 16 (L23) R7 7840HS, GeForce RTX 4070 Laptop GPU | |
|---|---|---|---|---|---|---|
| Noise | 6% | -8% | -10% | 5% | -0% | |
| off /ambiente * (dB) | 25 | 24 4% | 25 -0% | 22.9 8% | 23.2 7% | 23 8% |
| Idle Minimum * (dB) | 25 | 24 4% | 26 -4% | 29.1 -16% | 23.2 7% | 23 8% |
| Idle Average * (dB) | 26 | 24 8% | 29 -12% | 29.1 -12% | 23.2 11% | 28.48 -10% |
| Idle Maximum * (dB) | 27 | 24 11% | 34 -26% | 29.1 -8% | 26.2 3% | 28.48 -5% |
| Load Average * (dB) | 39 | 34.81 11% | 43 -10% | 45.7 -17% | 31.4 19% | 30 23% |
| Witcher 3 ultra * (dB) | 45 | 44.05 2% | 48 -7% | 54.3 -21% | 48.4 -8% | 54.12 -20% |
| Load Maximum * (dB) | 51 | 51.57 -1% | 48 6% | 54.3 -6% | 53.8 -5% | 54.12 -6% |
* ... Meglio usare valori piccoli
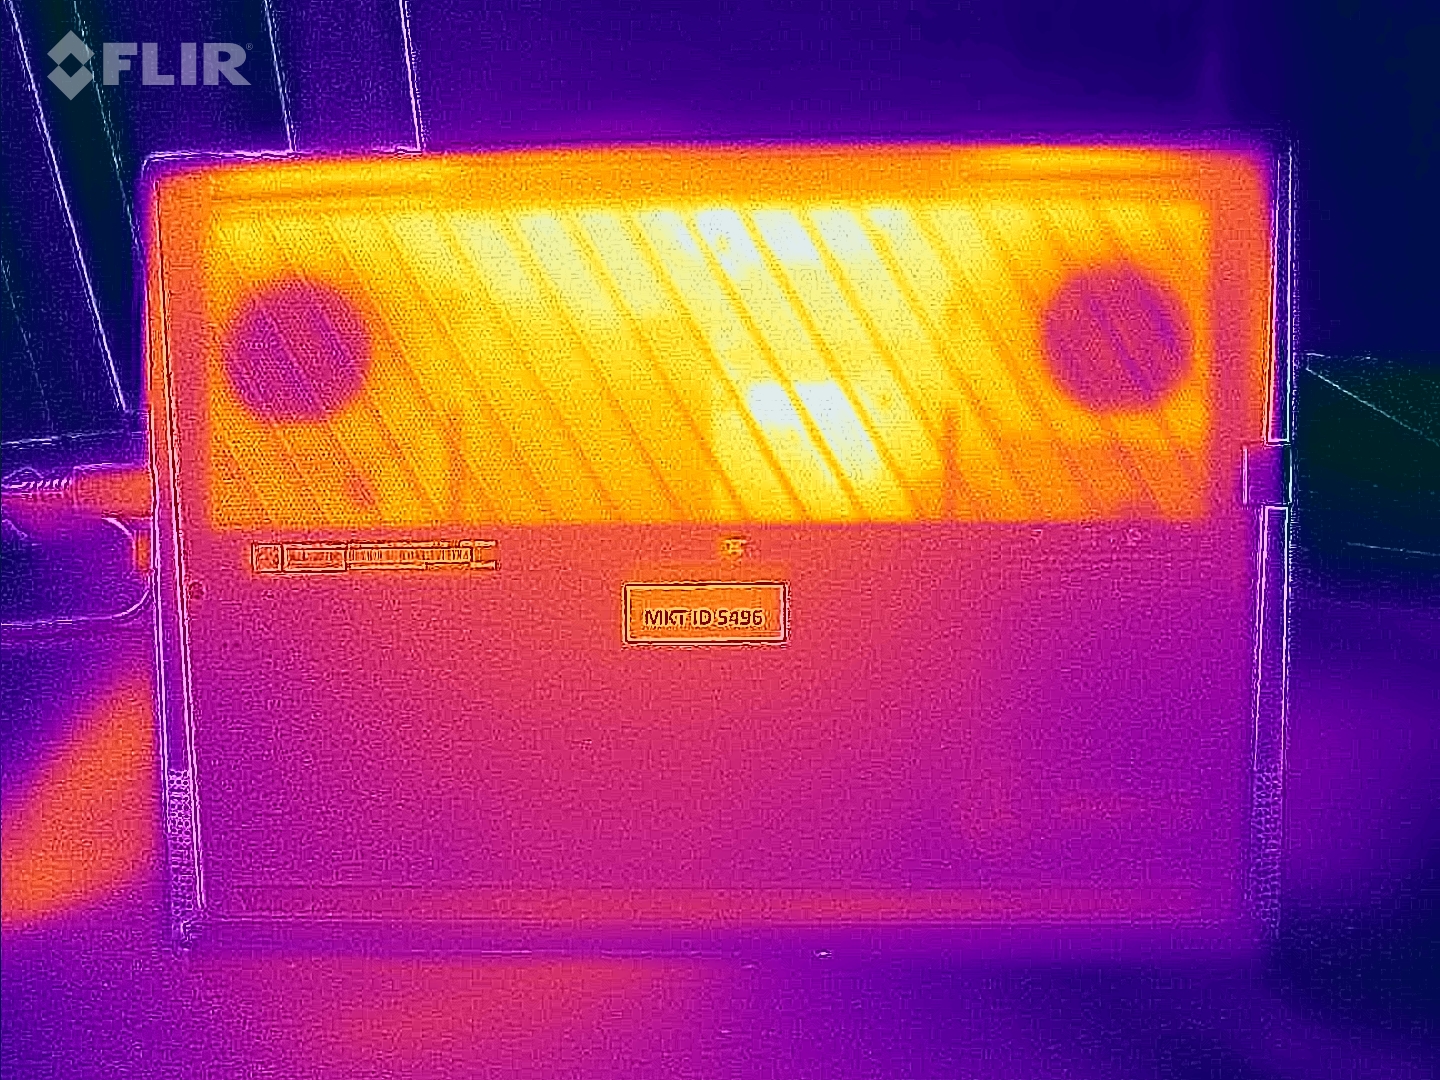
Temperatura
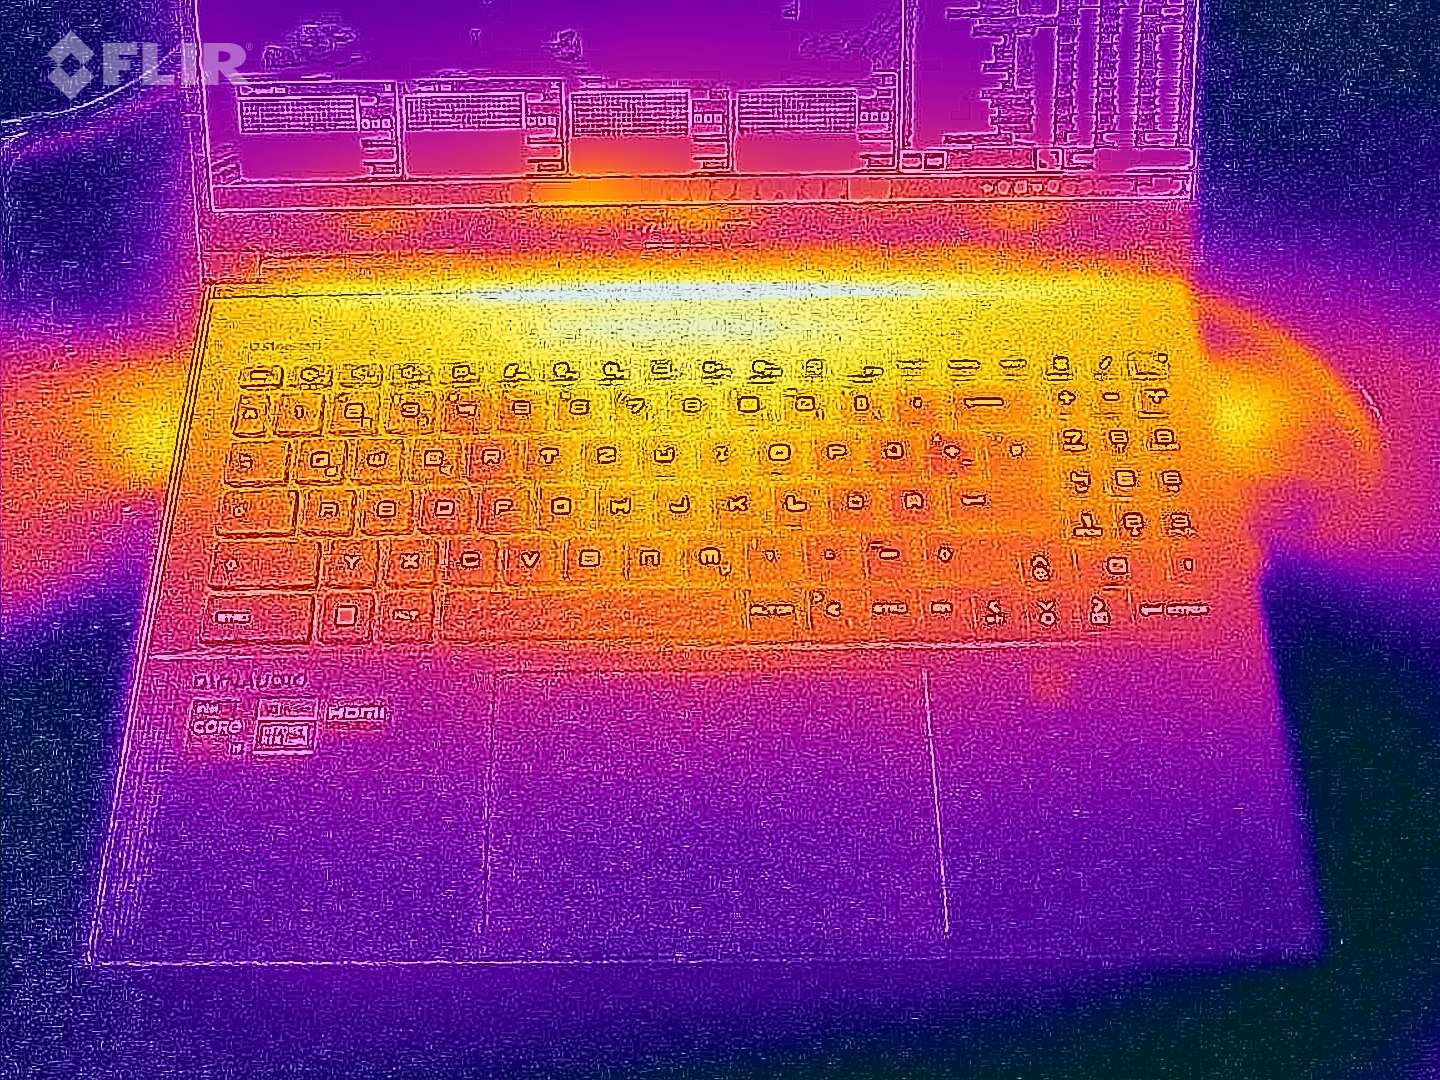
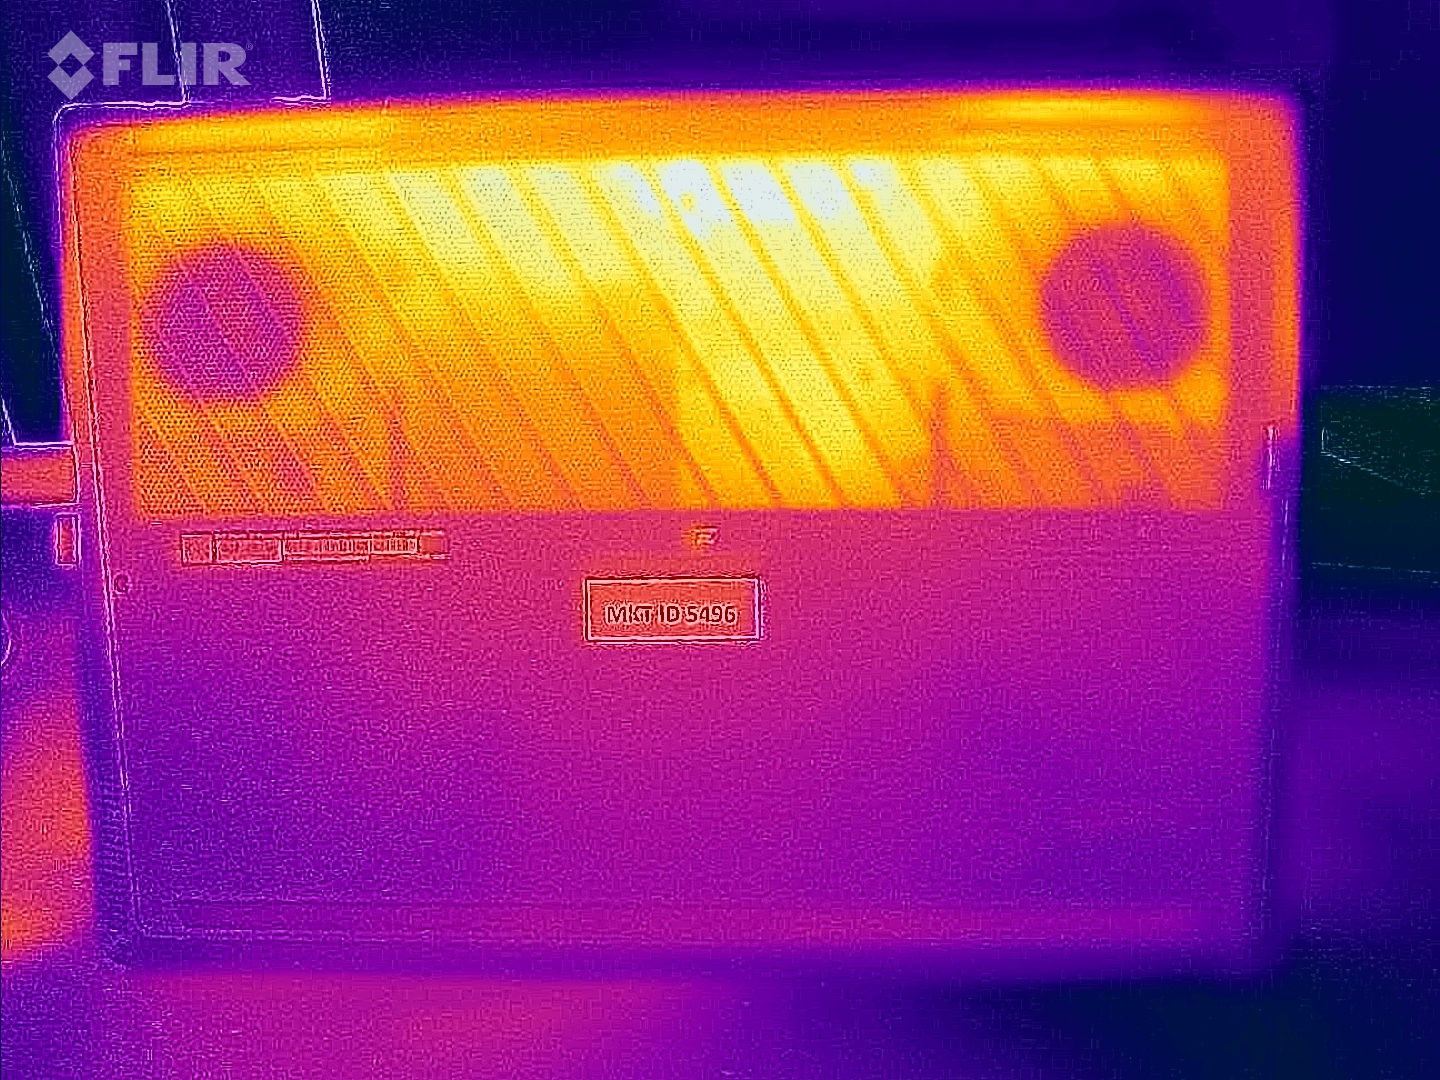
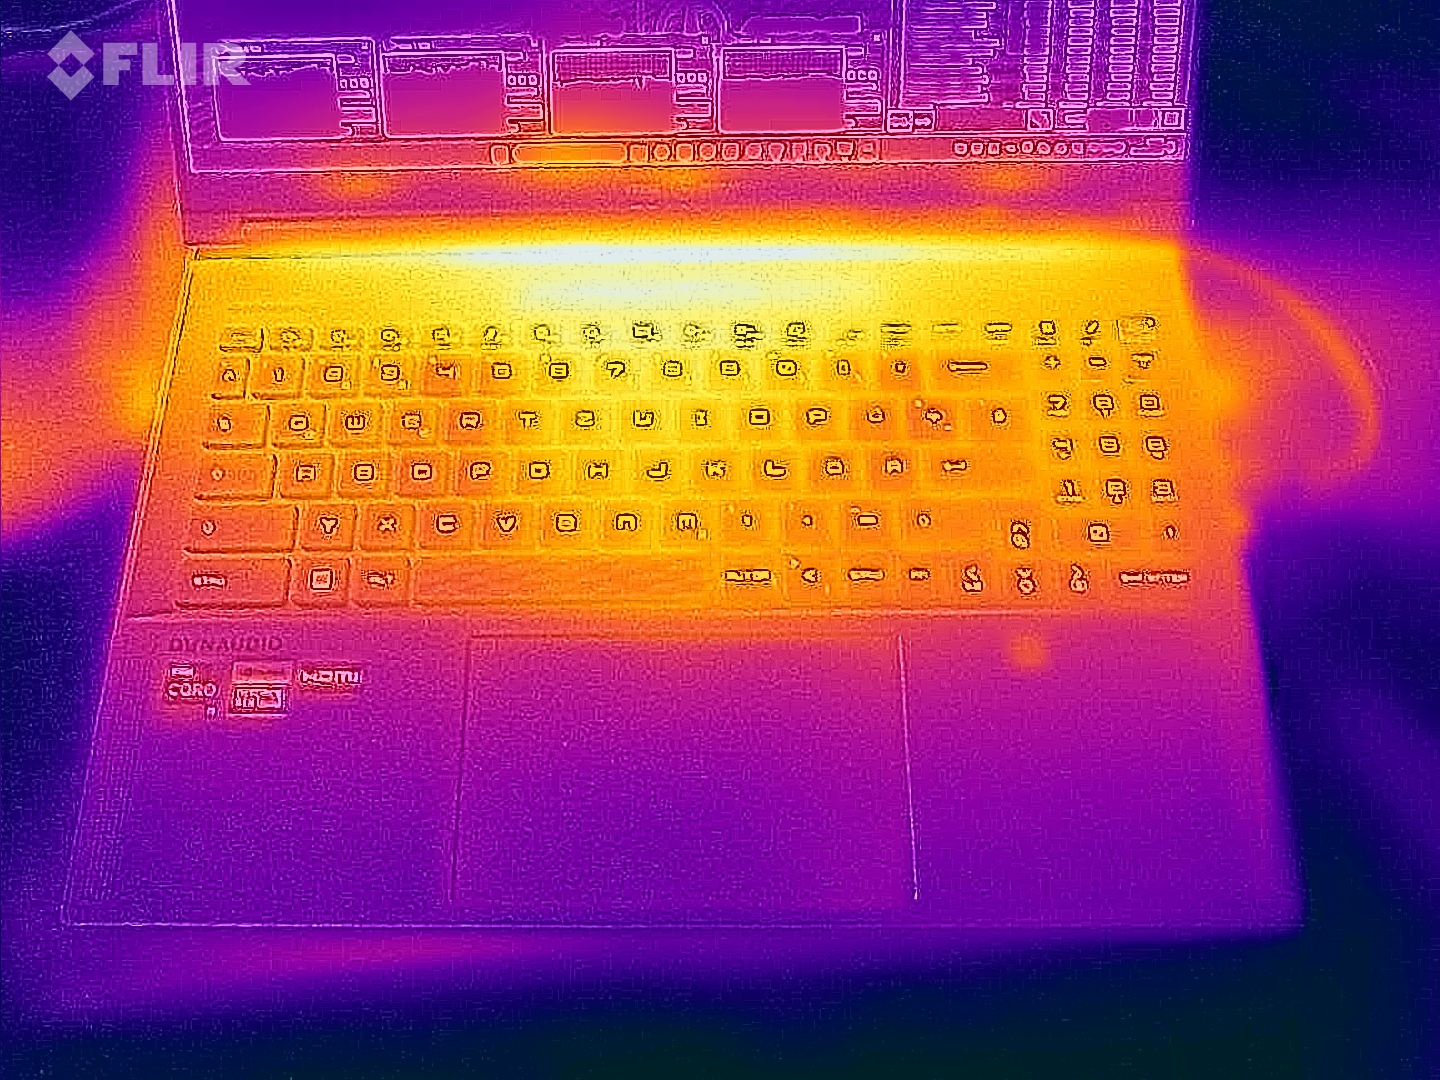
Le temperature sono nella fascia media, con un massimo di 120,2 °F nella parte superiore e 125,6 °F nella parte inferiore. Pur non essendo basse, sono comunque ragionevolmente accettabili per l'hardware installato, soprattutto perché l'area del palmo rimane piacevolmente fresca.
(-) La temperatura massima sul lato superiore è di 49 °C / 120 F, rispetto alla media di 40.4 °C / 105 F, che varia da 21.2 a 68.8 °C per questa classe Gaming.
(-) Il lato inferiore si riscalda fino ad un massimo di 52 °C / 126 F, rispetto alla media di 43.2 °C / 110 F
(+) In idle, la temperatura media del lato superiore è di 29.1 °C / 84 F, rispetto alla media deld ispositivo di 33.9 °C / 93 F.
(-) Riproducendo The Witcher 3, la temperatura media per il lato superiore e' di 40 °C / 104 F, rispetto alla media del dispositivo di 33.9 °C / 93 F.
(+) I poggiapolsi e il touchpad raggiungono la temperatura massima della pelle (32 °C / 89.6 F) e quindi non sono caldi.
(-) La temperatura media della zona del palmo della mano di dispositivi simili e'stata di 28.8 °C / 83.8 F (-3.2 °C / -5.8 F).
| MSI Stealth 16 Mercedes-AMG Motorsport A13VG i9-13900H, GeForce RTX 4070 Laptop GPU | MSI Stealth 16 Studio A13VG i7-13700H, GeForce RTX 4070 Laptop GPU | Schenker XMG Pro 16 Studio (Mid 23) i9-13900H, GeForce RTX 4070 Laptop GPU | HP Omen Transcend 16 i9-13900HX, GeForce RTX 4070 Laptop GPU | Lenovo Legion Pro 5 16ARX8 R7 7745HX, GeForce RTX 4070 Laptop GPU | Schenker XMG CORE 16 (L23) R7 7840HS, GeForce RTX 4070 Laptop GPU | |
|---|---|---|---|---|---|---|
| Heat | -17% | -11% | 6% | 14% | 6% | |
| Maximum Upper Side * (°C) | 49 | 60 -22% | 55 -12% | 47.4 3% | 41.8 15% | 46 6% |
| Maximum Bottom * (°C) | 52 | 61 -17% | 66 -27% | 54.4 -5% | 41.4 20% | 44 15% |
| Idle Upper Side * (°C) | 32 | 38.2 -19% | 33 -3% | 28.4 11% | 29 9% | 32 -0% |
| Idle Bottom * (°C) | 34 | 37.7 -11% | 35 -3% | 29.2 14% | 30.4 11% | 33 3% |
* ... Meglio usare valori piccoli
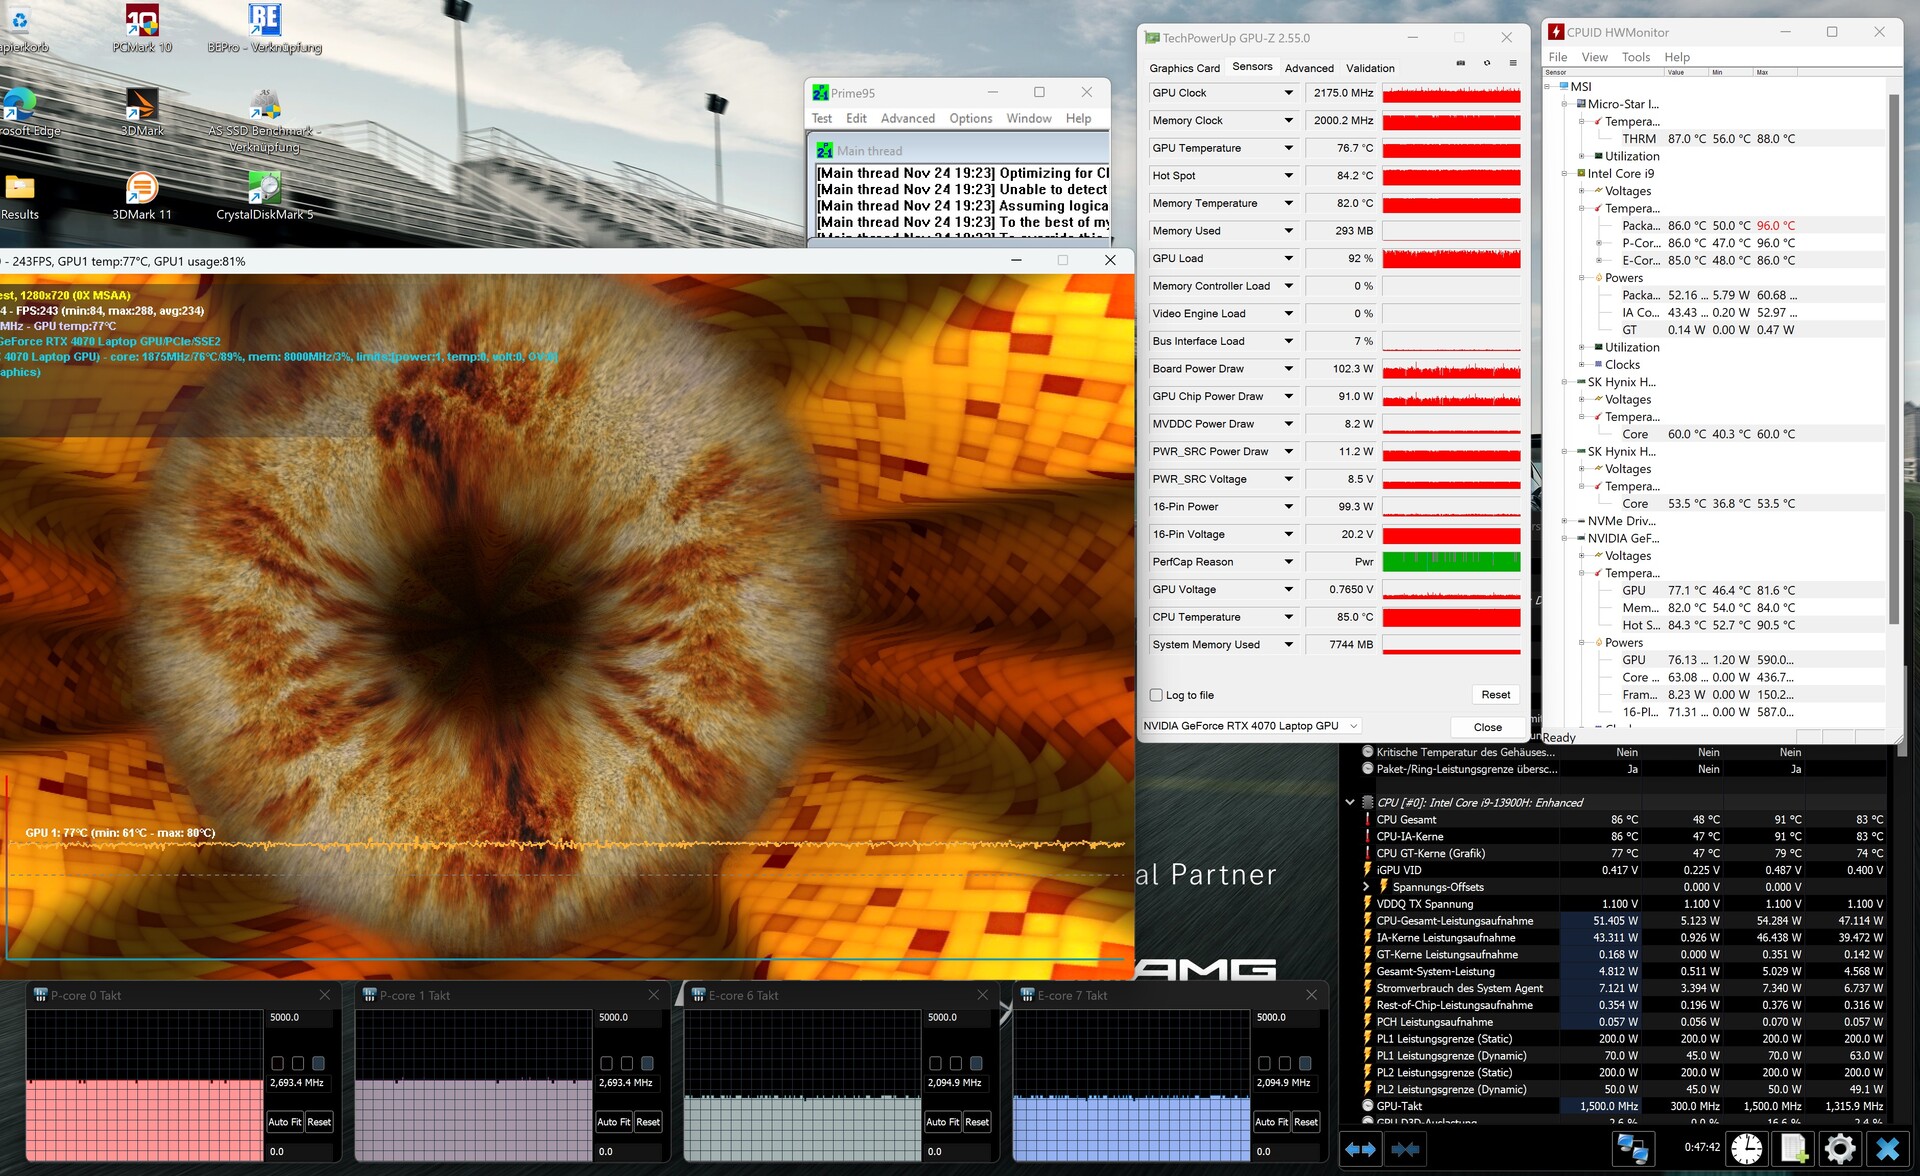
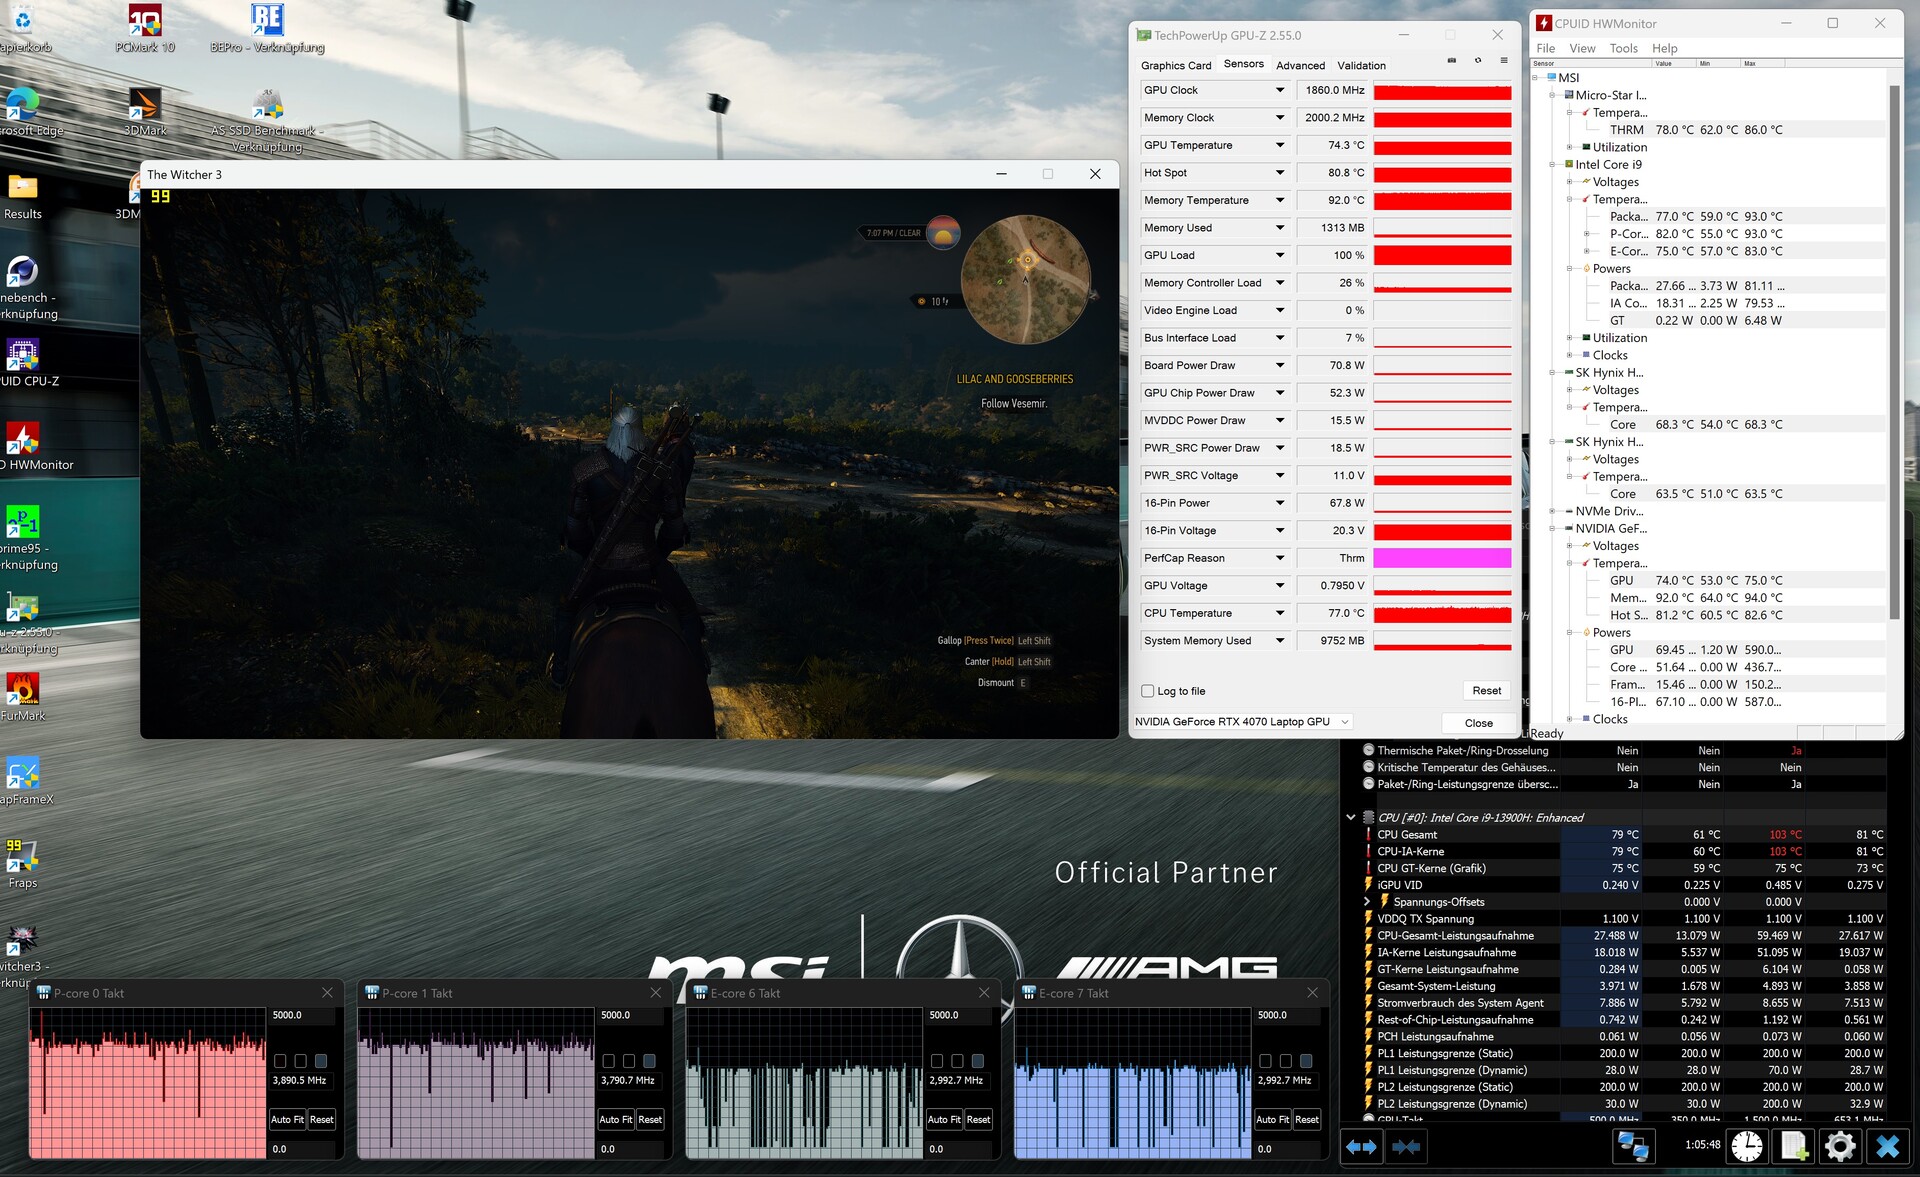
Test da sforzo
Durante lo stress test con Furmark e Prime95, la RTX 4070 ha mantenuto circa 183,2 °F (clock della GPU ~2.175 MHz) e il Core i9-13900H ha raggiunto circa 186,8 °F (core P ~2,7 GHz, core E ~2,1 GHz), entrambi accettabili.
Altoparlanti
MSI Stealth 16 Mercedes-AMG Motorsport A13VG analisi audio
(+) | gli altoparlanti sono relativamente potenti (91 dB)
Bassi 100 - 315 Hz
(-) | quasi nessun basso - in media 18.1% inferiori alla media
(±) | la linearità dei bassi è media (7.3% delta rispetto alla precedente frequenza)
Medi 400 - 2000 Hz
(+) | medi bilanciati - solo only 1.6% rispetto alla media
(+) | medi lineari (3.7% delta rispetto alla precedente frequenza)
Alti 2 - 16 kHz
(+) | Alti bilanciati - appena 3.2% dalla media
(+) | alti lineari (2.6% delta rispetto alla precedente frequenza)
Nel complesso 100 - 16.000 Hz
(+) | suono nel complesso lineare (11.8% differenza dalla media)
Rispetto alla stessa classe
» 11% di tutti i dispositivi testati in questa classe è stato migliore, 4% simile, 85% peggiore
» Il migliore ha avuto un delta di 6%, medio di 18%, peggiore di 132%
Rispetto a tutti i dispositivi testati
» 9% di tutti i dispositivi testati in questa classe è stato migliore, 3% similare, 89% peggiore
» Il migliore ha avuto un delta di 4%, medio di 23%, peggiore di 134%
HP Omen Transcend 16 analisi audio
(+) | gli altoparlanti sono relativamente potenti (82.3 dB)
Bassi 100 - 315 Hz
(-) | quasi nessun basso - in media 20% inferiori alla media
(±) | la linearità dei bassi è media (14.3% delta rispetto alla precedente frequenza)
Medi 400 - 2000 Hz
(±) | medi elevati - circa 5.2% superiore alla media
(+) | medi lineari (3.7% delta rispetto alla precedente frequenza)
Alti 2 - 16 kHz
(+) | Alti bilanciati - appena 2% dalla media
(+) | alti lineari (6.7% delta rispetto alla precedente frequenza)
Nel complesso 100 - 16.000 Hz
(±) | la linearità complessiva del suono è media (17% di differenza rispetto alla media
Rispetto alla stessa classe
» 45% di tutti i dispositivi testati in questa classe è stato migliore, 12% simile, 43% peggiore
» Il migliore ha avuto un delta di 6%, medio di 18%, peggiore di 132%
Rispetto a tutti i dispositivi testati
» 31% di tutti i dispositivi testati in questa classe è stato migliore, 8% similare, 62% peggiore
» Il migliore ha avuto un delta di 4%, medio di 23%, peggiore di 134%
Gestione dell'energia
Consumo di energia
Grazie alla commutazione grafica, il dispositivo da 16 pollici funziona in modo efficiente in modalità idle, consumando da 11 a 28 watt (media di 14 watt), in linea con la maggior parte dei concorrenti. Sotto carico, l'edizione AMG ha consumato da 83 watt (valore medio in 3DMark 06) a 204 watt (valore massimo nello stress test). L'alimentatore da 240 watt in dotazione, ornato da un logo motorsport, è adeguatamente dimensionato per questi requisiti.
| Off / Standby | |
| Idle | |
| Sotto carico |
|
Leggenda:
min: | |
| MSI Stealth 16 Mercedes-AMG Motorsport A13VG i9-13900H, GeForce RTX 4070 Laptop GPU | MSI Stealth 16 Studio A13VG i7-13700H, GeForce RTX 4070 Laptop GPU | Schenker XMG Pro 16 Studio (Mid 23) i9-13900H, GeForce RTX 4070 Laptop GPU | HP Omen Transcend 16 i9-13900HX, GeForce RTX 4070 Laptop GPU | Lenovo Legion Pro 5 16ARX8 R7 7745HX, GeForce RTX 4070 Laptop GPU | Schenker XMG CORE 16 (L23) R7 7840HS, GeForce RTX 4070 Laptop GPU | Media della classe Gaming | |
|---|---|---|---|---|---|---|---|
| Power Consumption | -2% | 2% | -63% | -16% | -1% | -20% | |
| Idle Minimum * (Watt) | 11 | 11 -0% | 8 27% | 19.2 -75% | 8.1 26% | 11 -0% | 13 ? -18% |
| Idle Average * (Watt) | 14 | 18 -29% | 12 14% | 22.7 -62% | 15.9 -14% | 15.2 -9% | 18.7 ? -34% |
| Idle Maximum * (Watt) | 28 | 19 32% | 23 18% | 55.4 -98% | 37.2 -33% | 16 43% | 24.3 ? 13% |
| Load Average * (Watt) | 83 | 91 -10% | 94 -13% | 128.4 -55% | 90.9 -10% | 64 23% | 110.2 ? -33% |
| Witcher 3 ultra * (Watt) | 140 | 130 7% | 181.5 -30% | 206 -47% | 189.6 -35% | 179 -28% | |
| Load Maximum * (Watt) | 204 | 228 -12% | 215 -5% | 292 -43% | 263.5 -29% | 280 -37% | 258 ? -26% |
* ... Meglio usare valori piccoli
Power consumption Witcher 3 / stress test
Power consumption with external monitor
Durata della batteria
A causa del Core i9-13900H e del pannello OLED, i tempi di esecuzione della Motorsport Edition sono leggermente più deboli rispetto alla versione standard. Raggiungere poco meno di 6,5 ore di navigazione in Internet con la luminosità ridotta a 150 cd/m² è comunque più che dignitoso per un notebook da gioco. La batteria, generosamente dimensionata a 99 Wh, contribuisce a queste cifre rispettabili.
| MSI Stealth 16 Mercedes-AMG Motorsport A13VG i9-13900H, GeForce RTX 4070 Laptop GPU, 99.99 Wh | MSI Stealth 16 Studio A13VG i7-13700H, GeForce RTX 4070 Laptop GPU, 99.9 Wh | Schenker XMG Pro 16 Studio (Mid 23) i9-13900H, GeForce RTX 4070 Laptop GPU, 73 Wh | HP Omen Transcend 16 i9-13900HX, GeForce RTX 4070 Laptop GPU, 97 Wh | Lenovo Legion Pro 5 16ARX8 R7 7745HX, GeForce RTX 4070 Laptop GPU, 80 Wh | Schenker XMG CORE 16 (L23) R7 7840HS, GeForce RTX 4070 Laptop GPU, 99 Wh | Media della classe Gaming | |
|---|---|---|---|---|---|---|---|
| Autonomia della batteria | 20% | 5% | -35% | -38% | 29% | 9% | |
| WiFi v1.3 (h) | 6.5 | 7.8 20% | 6.8 5% | 4.2 -35% | 4 -38% | 8.4 29% | 7.11 ? 9% |
| Reader / Idle (h) | 11 | 6.3 | 6.5 | 8.71 ? | |||
| H.264 (h) | 7.7 | 10.2 | 8.64 ? | ||||
| Load (h) | 2.4 | 1.2 | 1 | 2.4 | 1.502 ? |
Pro
Contro
Il verdetto
Al di là degli elementi di design di successo, l'edizione Mercedes-AMG Motorsport della Stealth 16 condivide quasi gli stessi punti di forza e di debolezza della versione standard (vedere la prova completa). Fortunatamente, gli aspetti positivi superano quelli negativi.
Sul lato positivo, il portatile vanta un case piacevolmente leggero e compatto ma robusto, un suono potente e dispositivi di input relativamente buoni. Le deduzioni arrivano principalmente sotto forma di voto B, a causa del throttling dell'SSD nel tempo e della connettività USB un po' limitata (solo una porta di tipo A).
La scelta tra il pannello OLED della versione Motorsport e il display IPS dipende dalle preferenze personali.
Sebbene il pannello OLED offra valori d'immagine eccezionali (livello di nero, contrasto, spazio colore, angolo di visione, tempo di risposta), presenta una superficie riflettente, una frequenza modesta (60 Hz) e un potenziale sfarfallio.
Nel complesso, si guadagna comunque una valutazione "molto buona". Le alternative includono i computer portatili con processore Intel, come HP Omen Transcend 16 e Schenker XMG Pro 16 menzionati nell'articolo. Per gli appassionati di AMD, vale la pena di prendere in considerazione Lenovo Legion Pro 5 e Schenker XMG Core 16, entrambi con una valutazione "molto buona".
Prezzo e disponibilità
MSI Stealth 16 Mercedes-AMG Motorsport A13VG ha un prezzo di 2.899 dollari e può essere acquistato direttamente sul sito MSI.
MSI Stealth 16 Mercedes-AMG Motorsport A13VG
- 11/28/2023 v7 (old)
Florian Glaser
Transparency
La selezione dei dispositivi da recensire viene effettuata dalla nostra redazione. Il campione di prova è stato fornito all'autore come prestito dal produttore o dal rivenditore ai fini di questa recensione. L'istituto di credito non ha avuto alcuna influenza su questa recensione, né il produttore ne ha ricevuto una copia prima della pubblicazione. Non vi era alcun obbligo di pubblicare questa recensione. In quanto società mediatica indipendente, Notebookcheck non è soggetta all'autorità di produttori, rivenditori o editori.
Ecco come Notebookcheck esegue i test
Ogni anno, Notebookcheck esamina in modo indipendente centinaia di laptop e smartphone utilizzando procedure standardizzate per garantire che tutti i risultati siano comparabili. Da circa 20 anni sviluppiamo continuamente i nostri metodi di prova e nel frattempo stabiliamo gli standard di settore. Nei nostri laboratori di prova, tecnici ed editori esperti utilizzano apparecchiature di misurazione di alta qualità. Questi test comportano un processo di validazione in più fasi. Il nostro complesso sistema di valutazione si basa su centinaia di misurazioni e parametri di riferimento ben fondati, che mantengono l'obiettività.Price comparison

