Recensione dell'XMG Pro 16 Studio (Mid 23): Il portatile RTX 4070 per gamers e creators
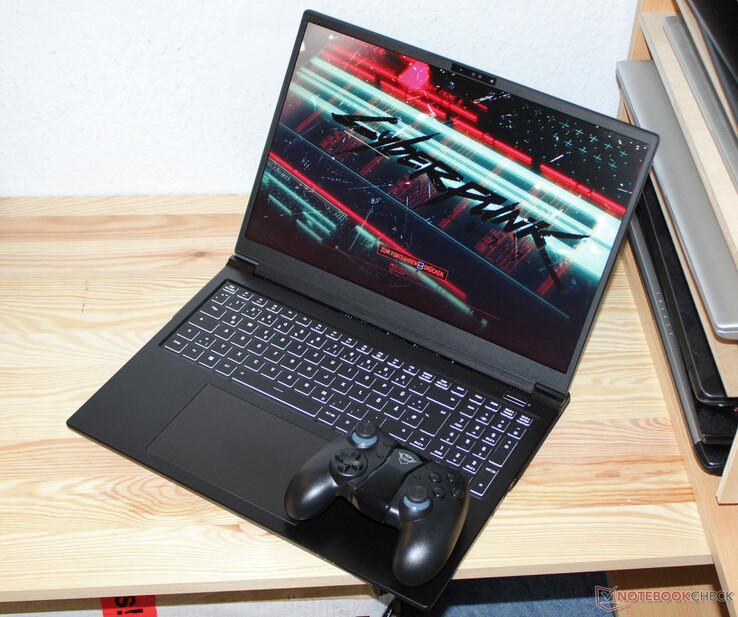
XMG Pro 16 Studio (Mid 23) - un portatile da 16 pollici per giocatori e creatori - si basa su un barebone (PE60RNE-S) prodotto da Clevo e la variante attuale si può trovare attualmente a circa 2.400 dollari. I concorrenti includono ilLenovo Legion Slim 7i 16 Gen 8, HP Omen Transcend 16, Asus Vivobook Pro 16X e ilMSI Stealth 16 Studio A13VG.
Potenziali concorrenti a confronto
Punteggio | Data | Modello | Peso | Altezza | Dimensione | Risoluzione | Prezzo |
|---|---|---|---|---|---|---|---|
| 87.9 % v7 (old) | 10/2023 | Schenker XMG Pro 16 Studio (Mid 23) i9-13900H, GeForce RTX 4070 Laptop GPU | 2.6 kg | 19.9 mm | 16.00" | 2560x1600 | |
| 86.2 % v7 (old) | 07/2023 | Asus Vivobook Pro 16X K6604JV-MX016W i9-13980HX, GeForce RTX 4060 Laptop GPU | 2.1 kg | 22.8 mm | 16.00" | 3200x2000 | |
| 90 % v7 (old) | 07/2023 | Lenovo Legion Slim 7i 16 Gen 8 i9-13900H, GeForce RTX 4070 Laptop GPU | 2.1 kg | 19.9 mm | 16.00" | 2560x1600 | |
| 87.9 % v7 (old) | 08/2023 | HP Omen Transcend 16 i9-13900HX, GeForce RTX 4070 Laptop GPU | 2.3 kg | 19.8 mm | 16.00" | 2560x1600 | |
| 88.8 % v7 (old) | 07/2023 | MSI Stealth 16 Studio A13VG i7-13700H, GeForce RTX 4070 Laptop GPU | 2 kg | 19.95 mm | 16.00" | 2560x1600 |
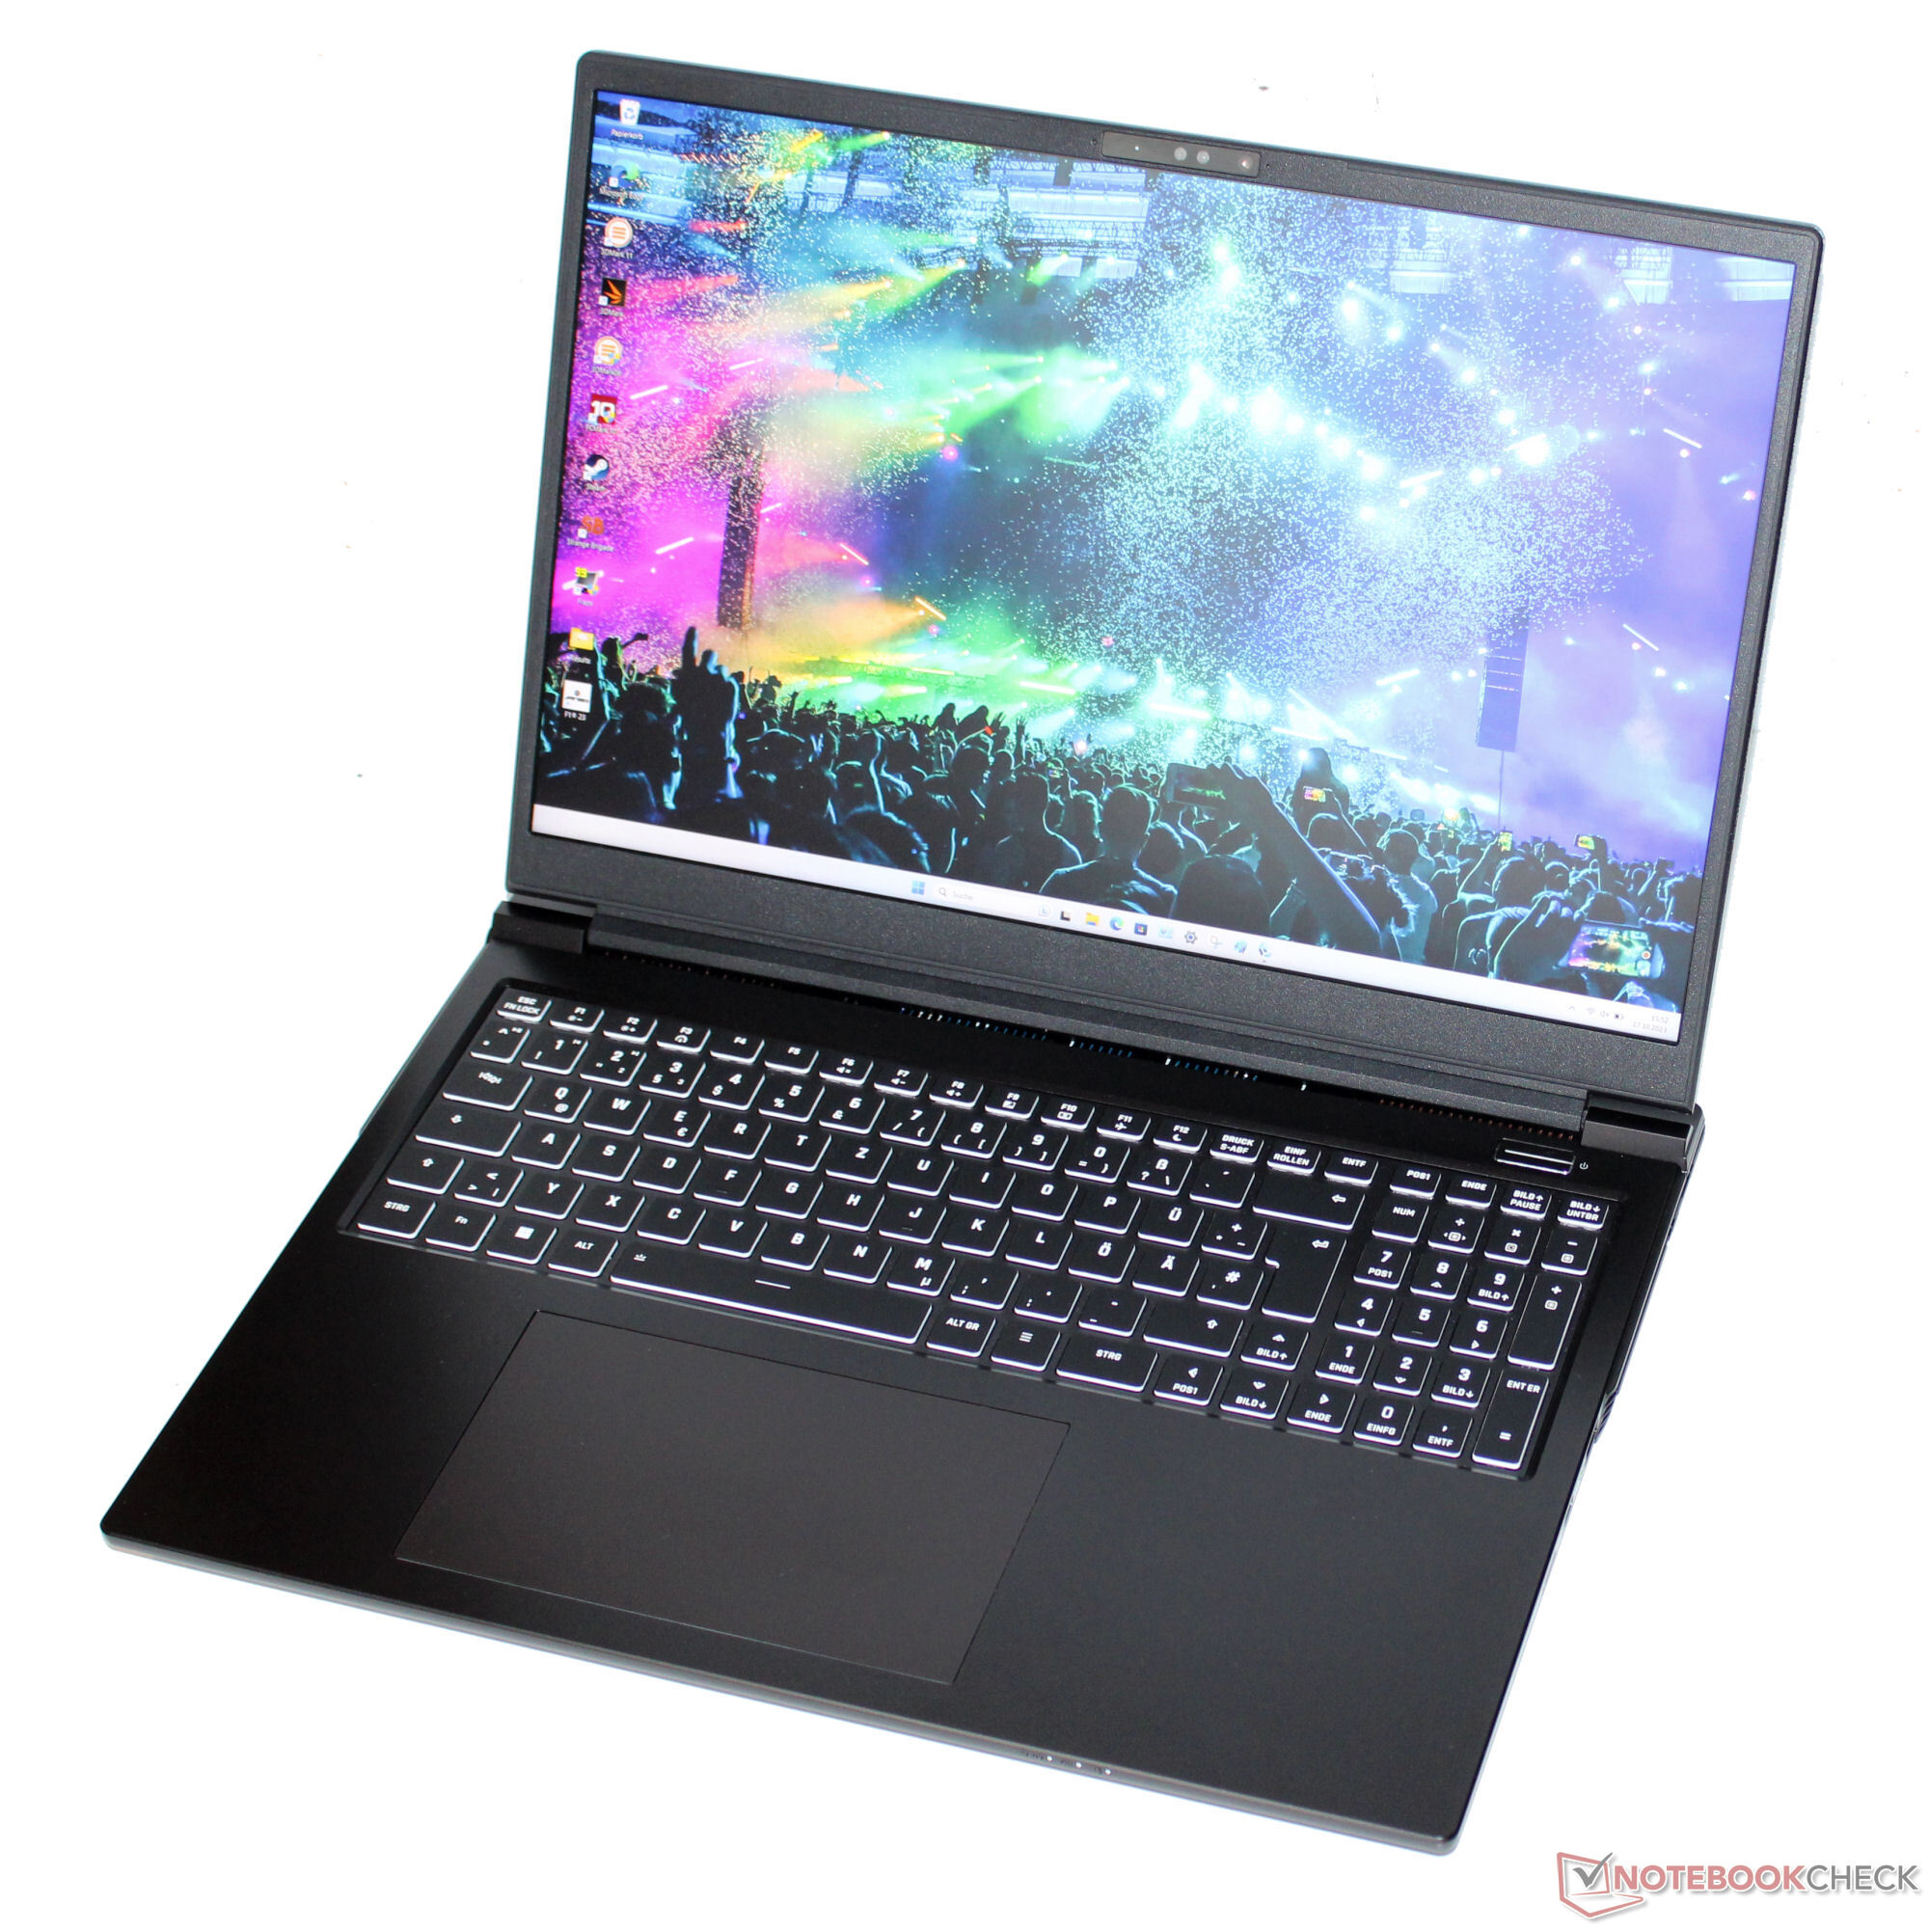
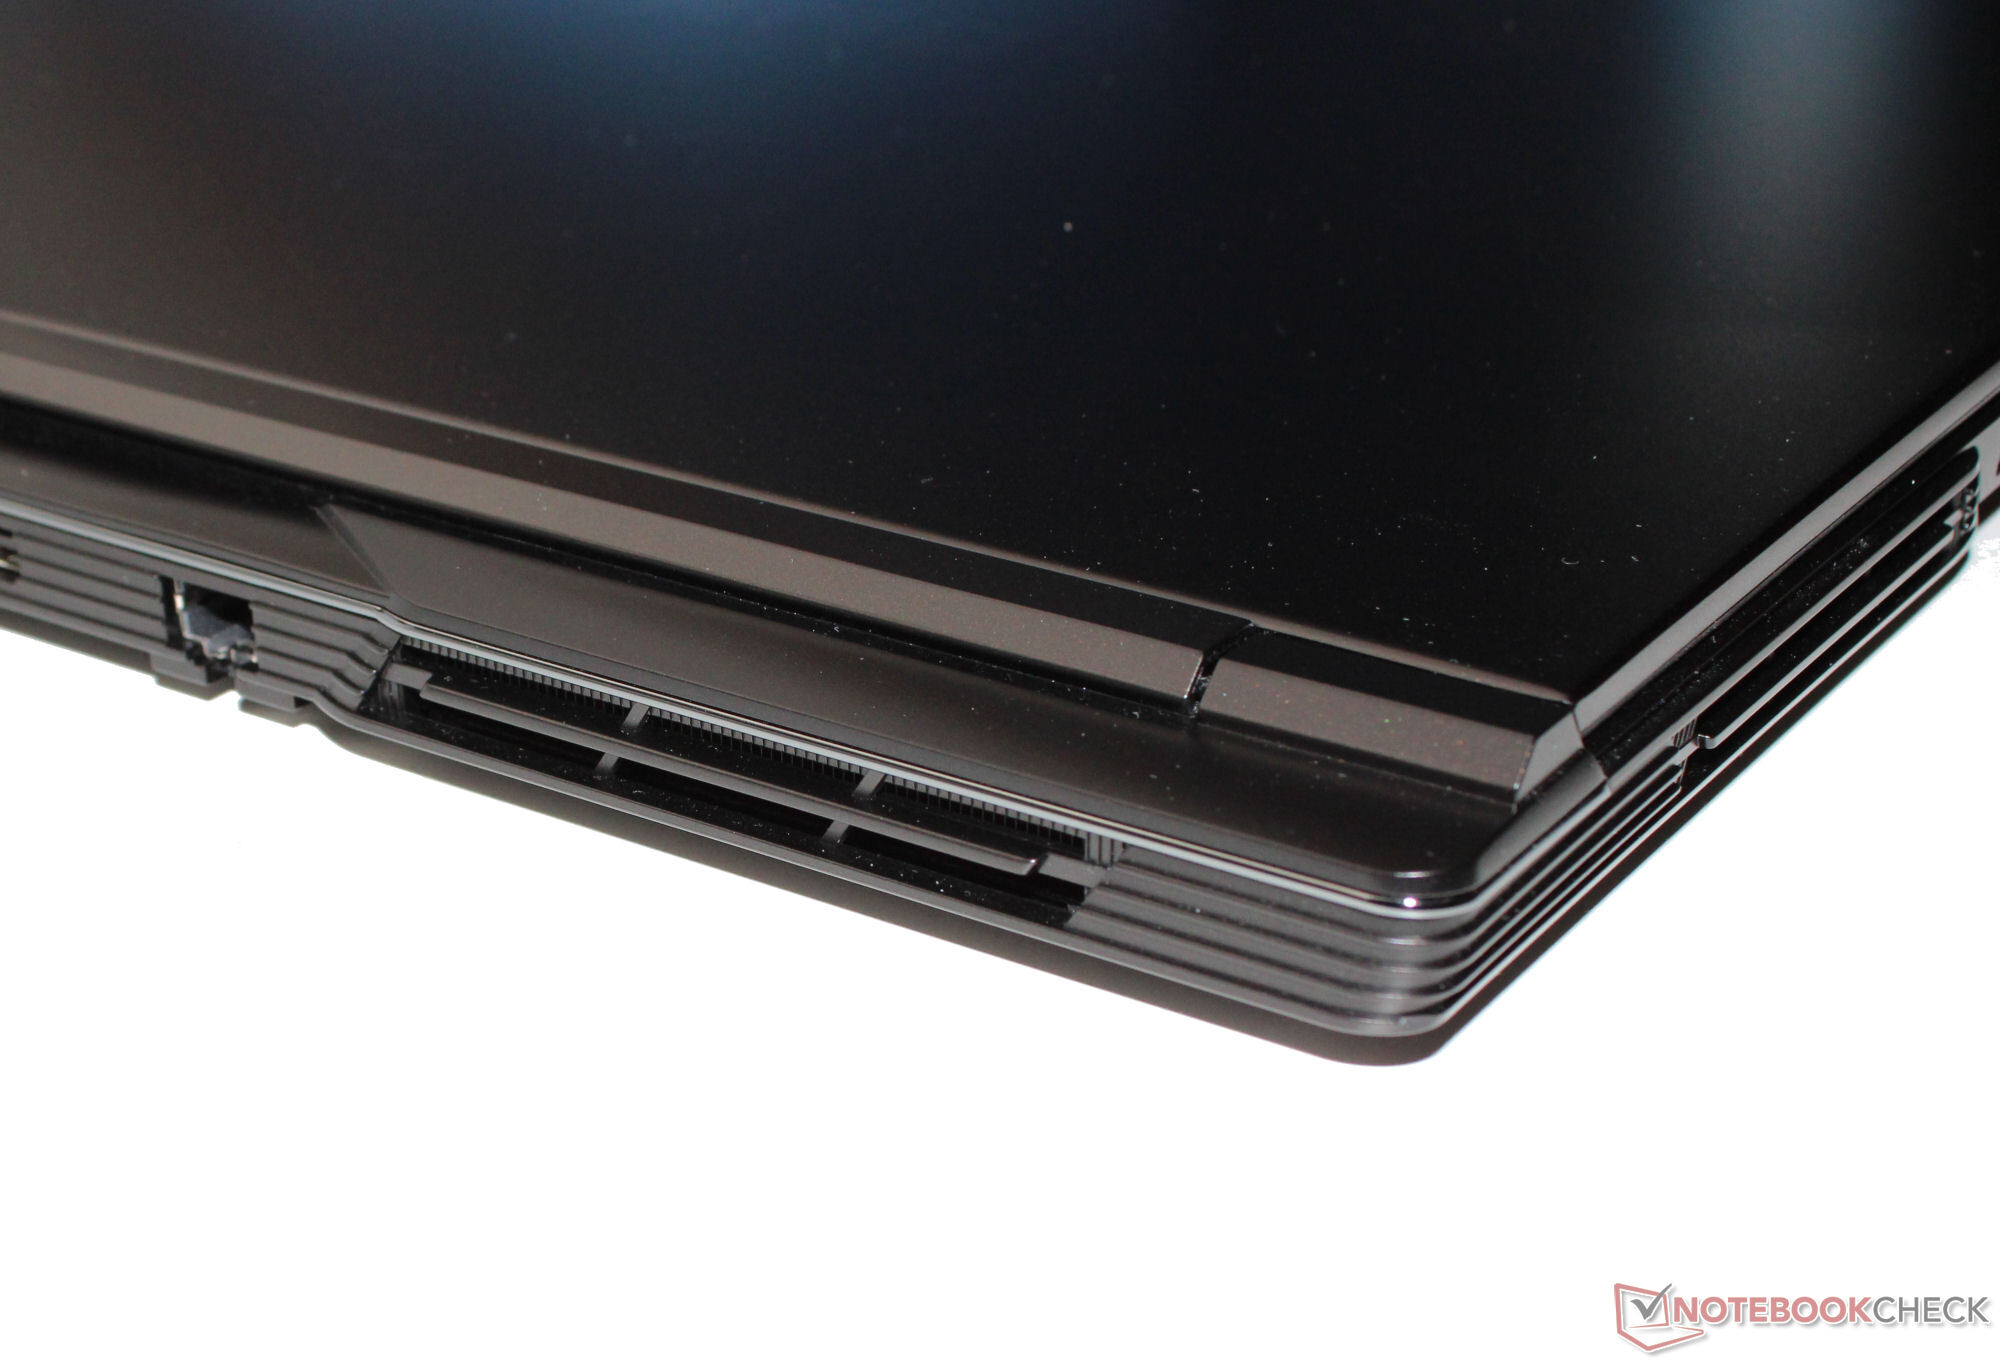
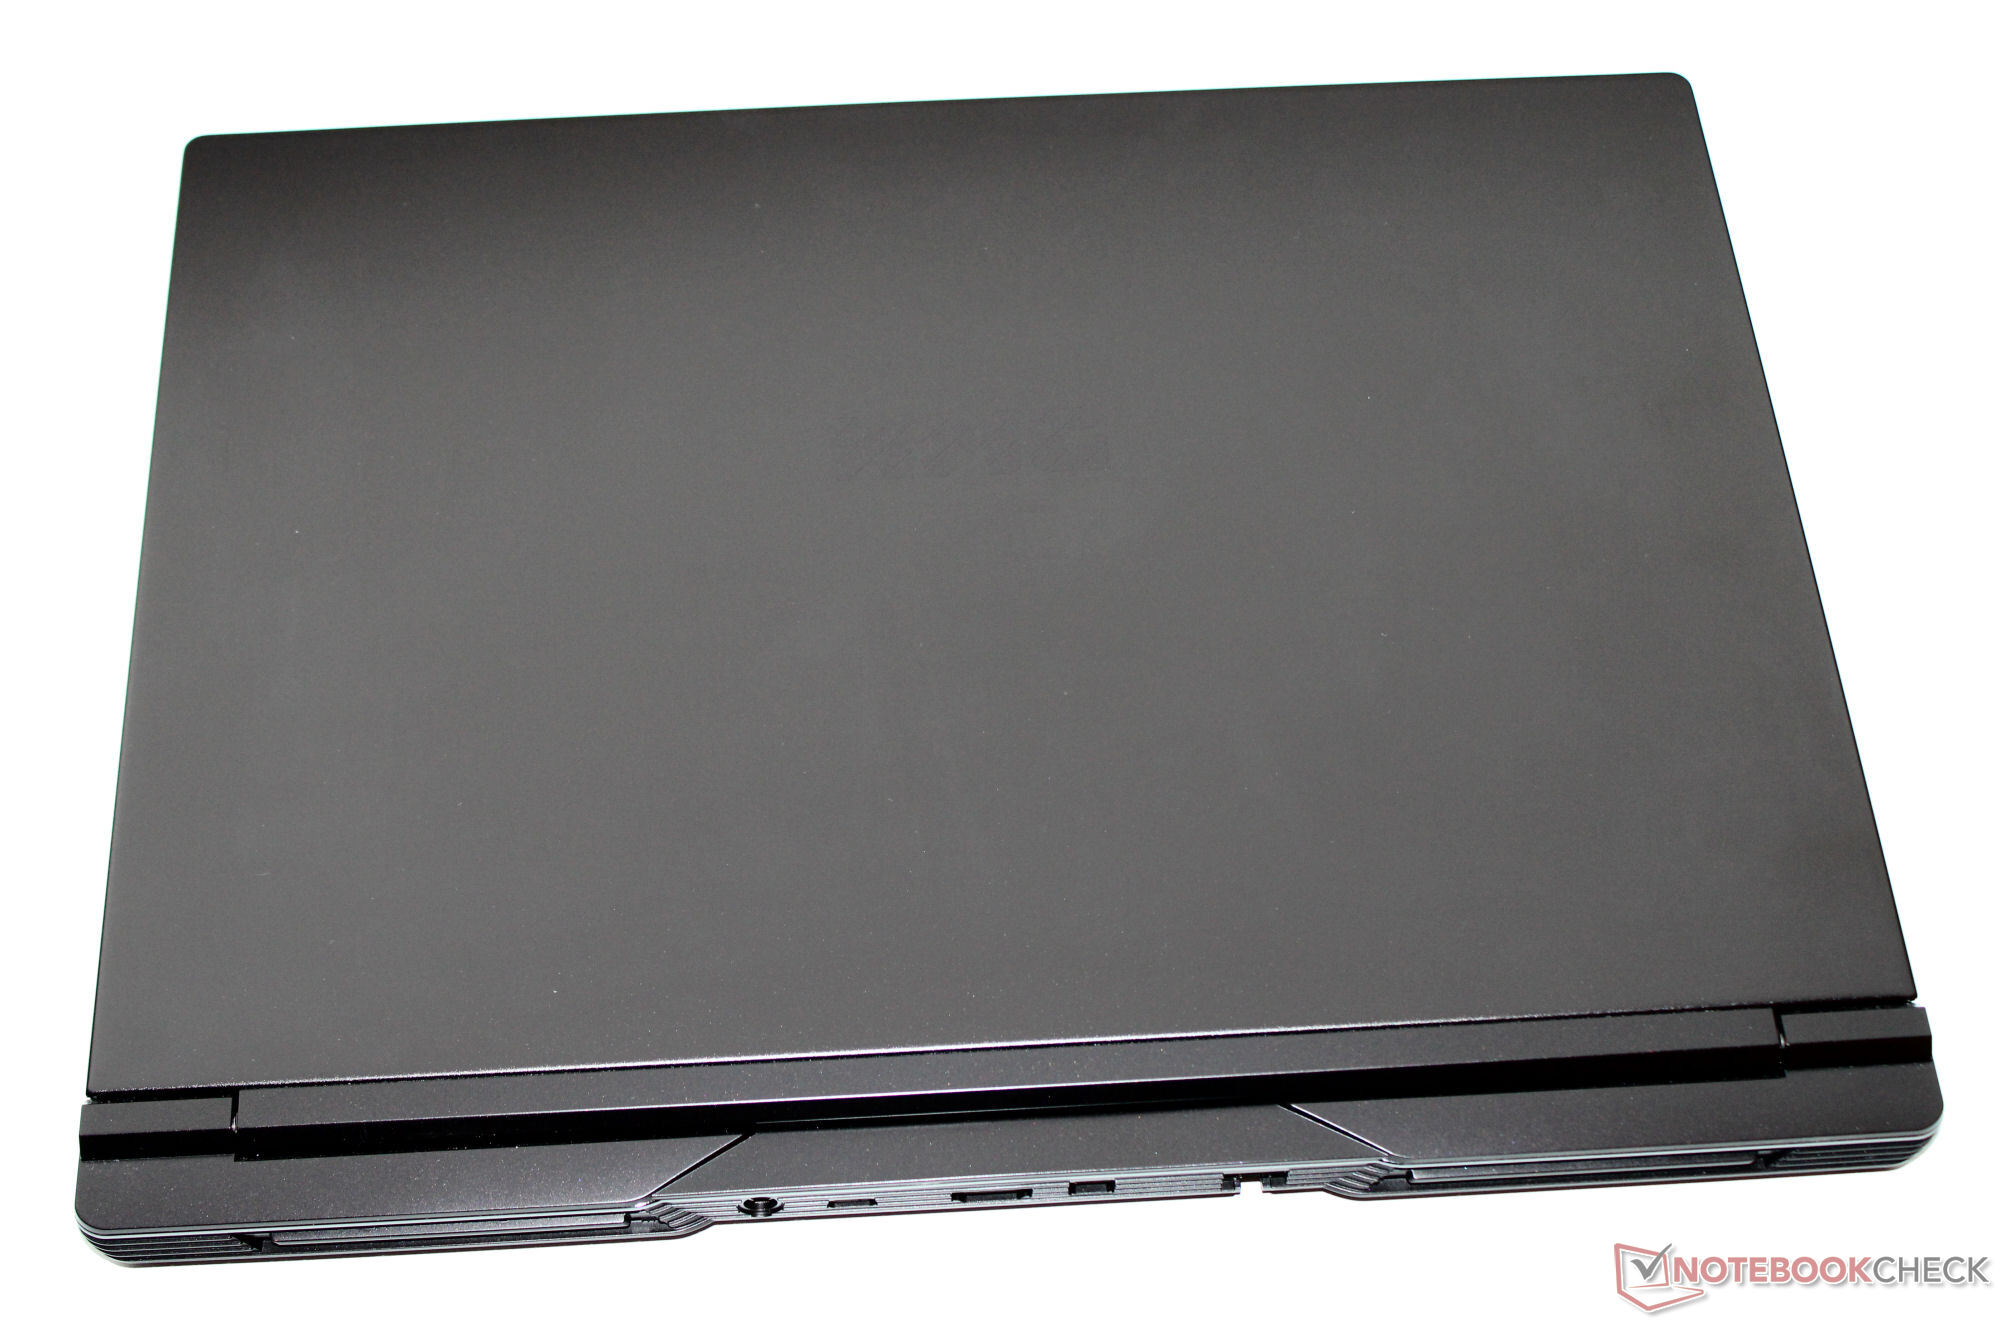
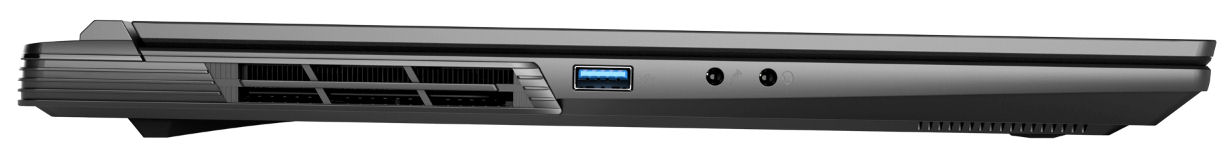
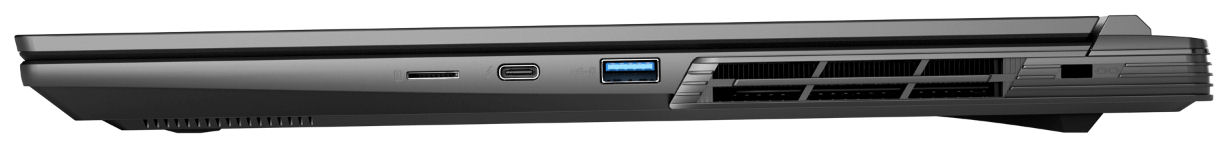
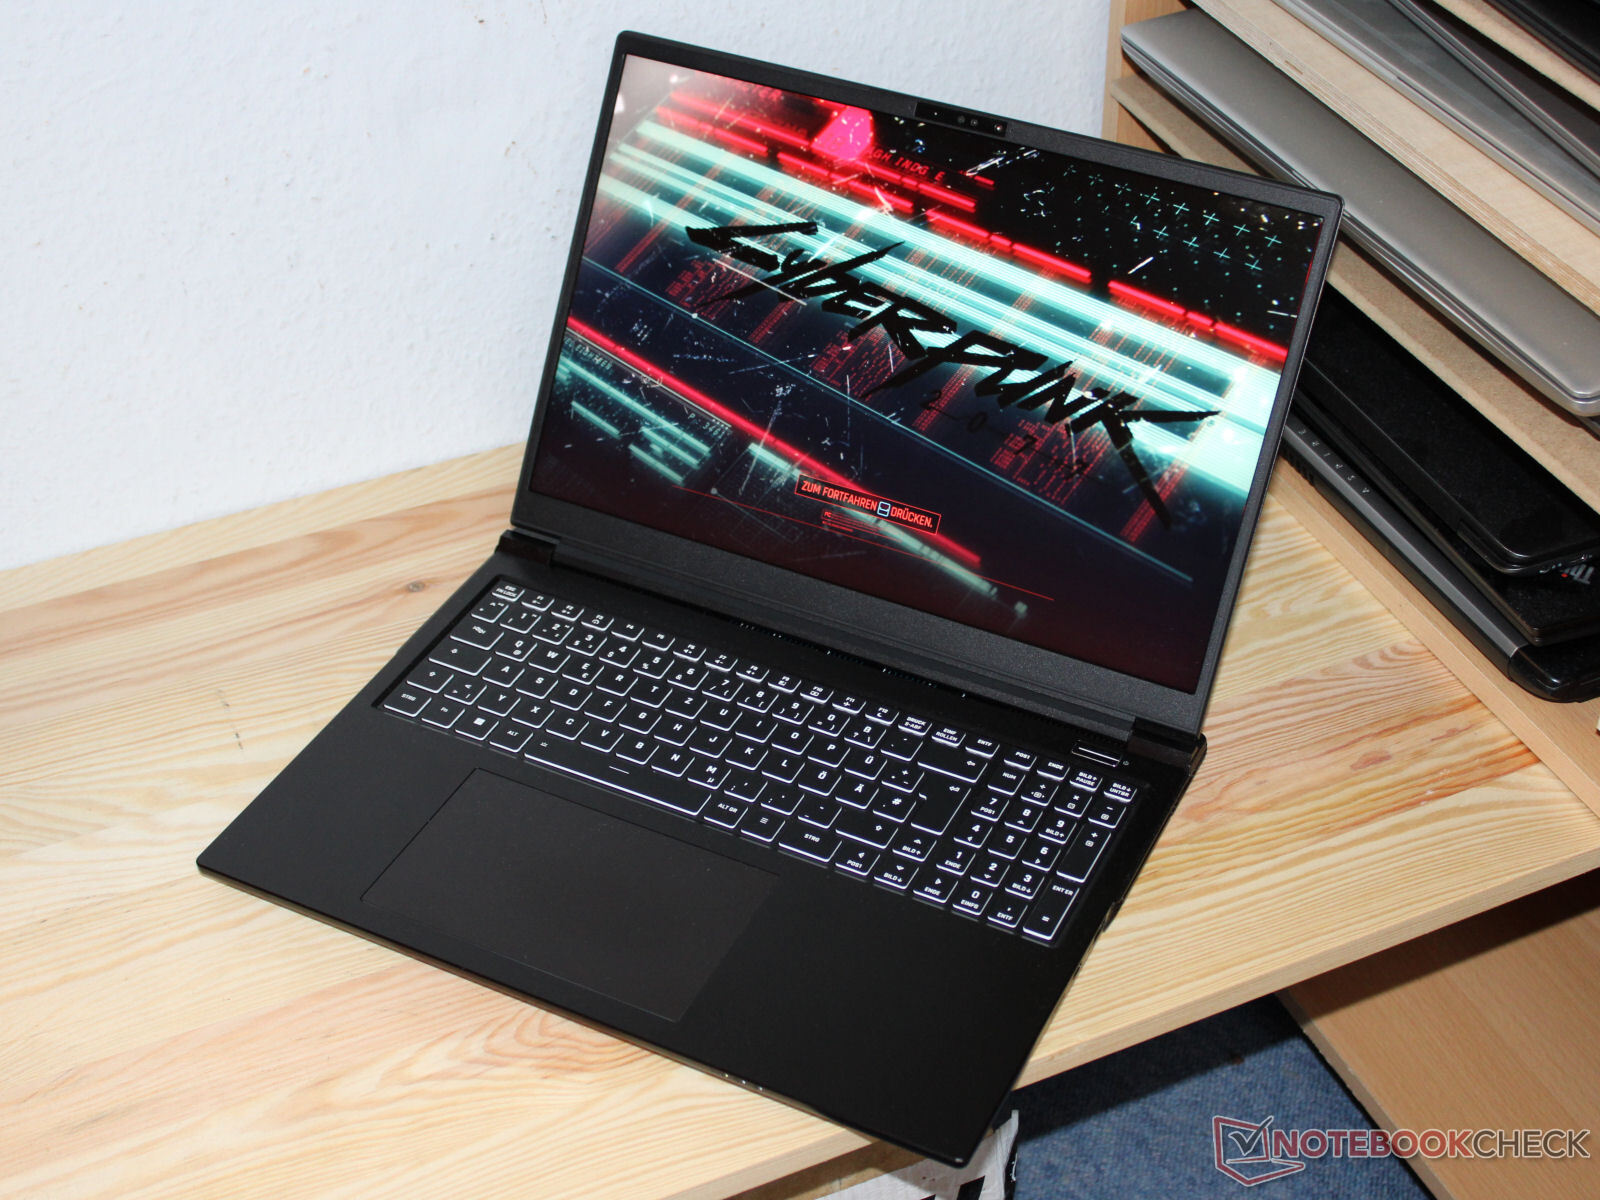
Case e connettività - Clevo barebone con Thunderbolt 4
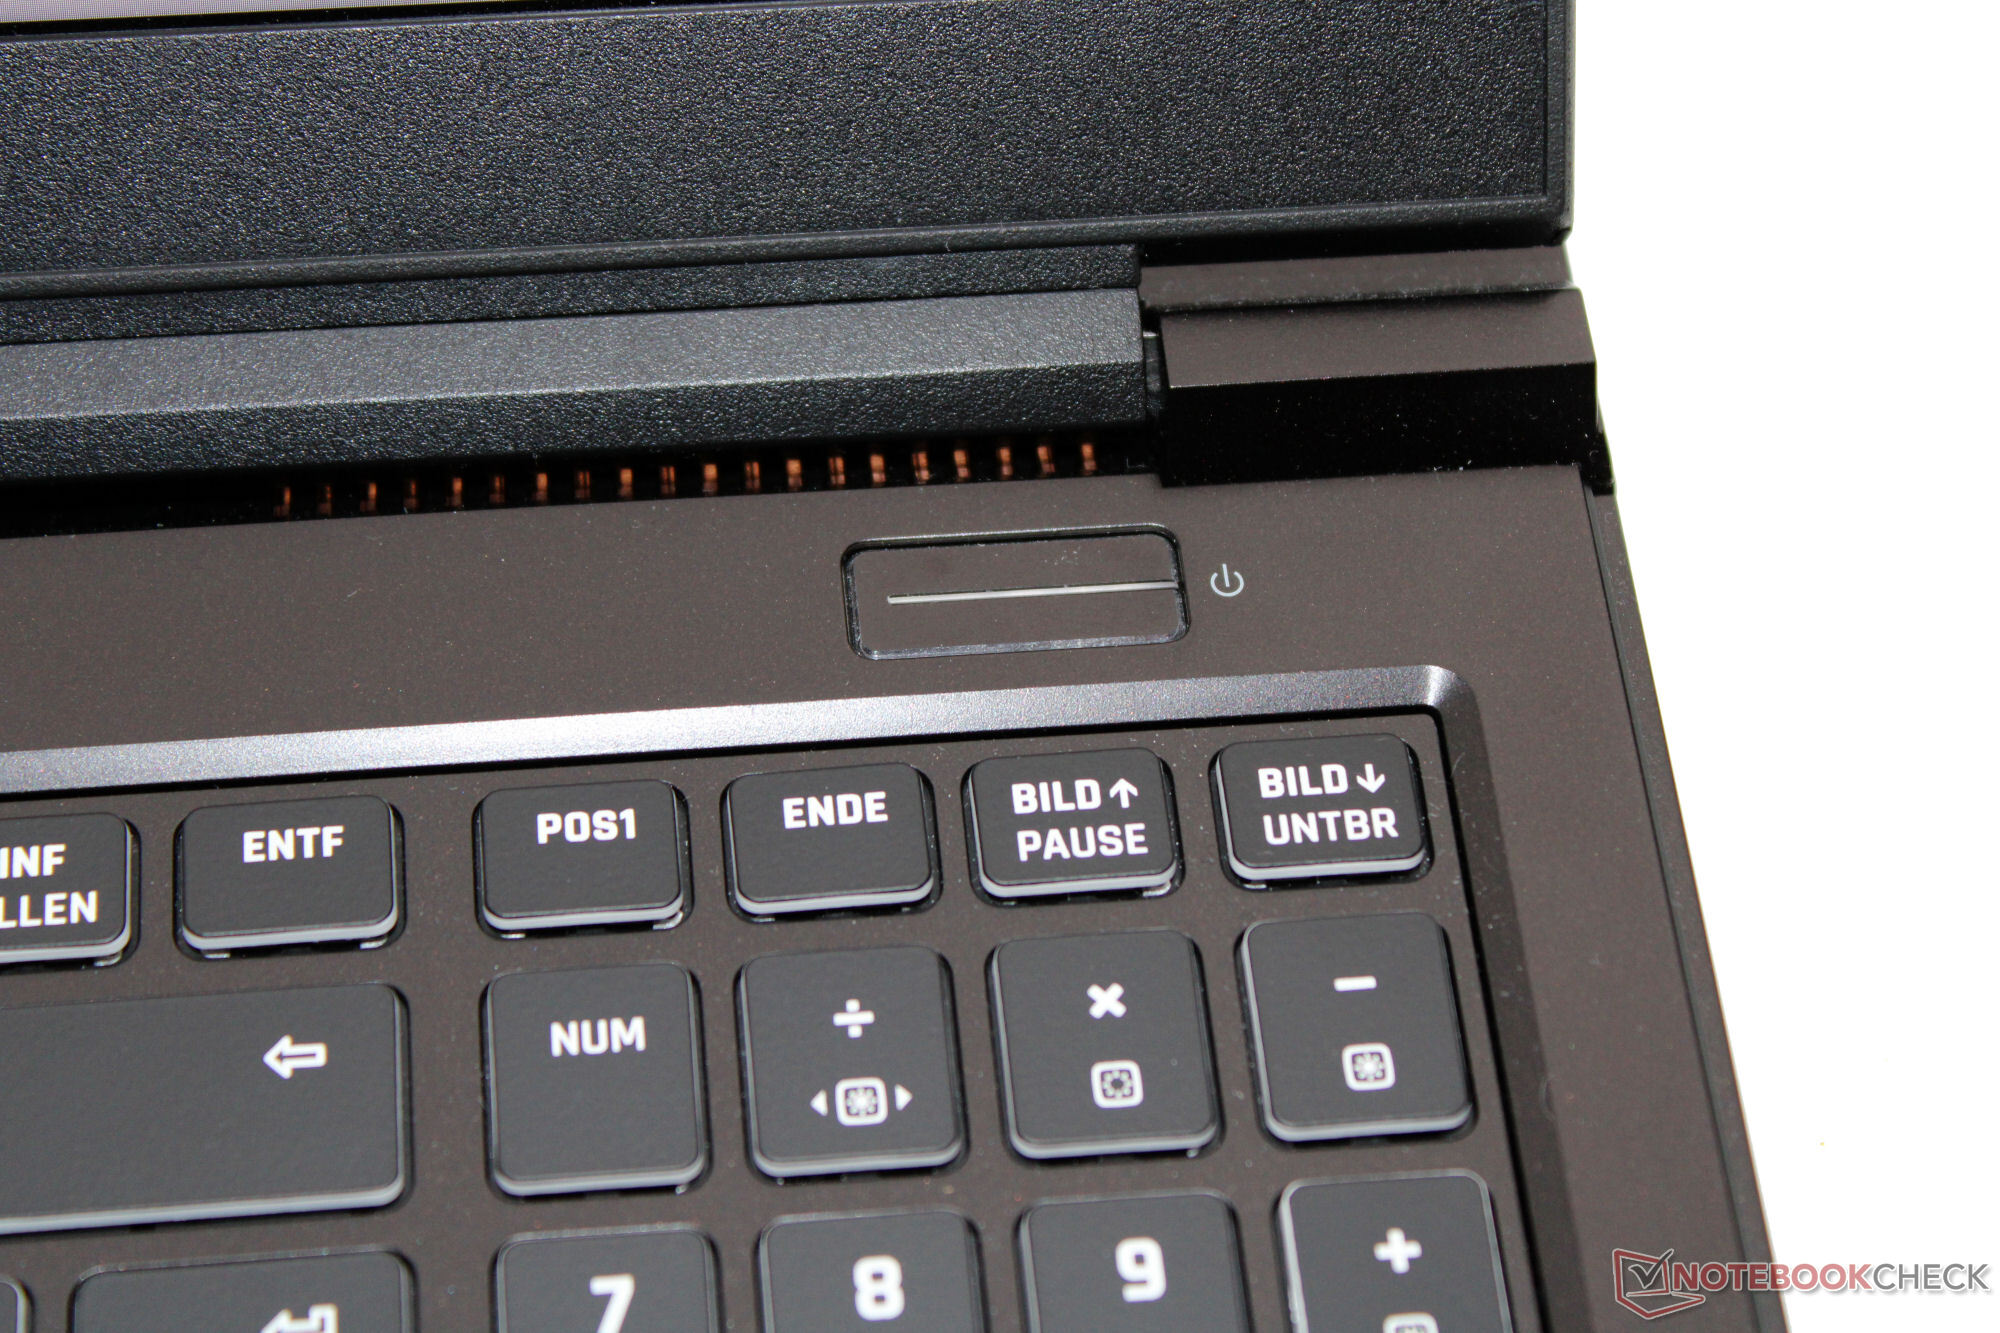
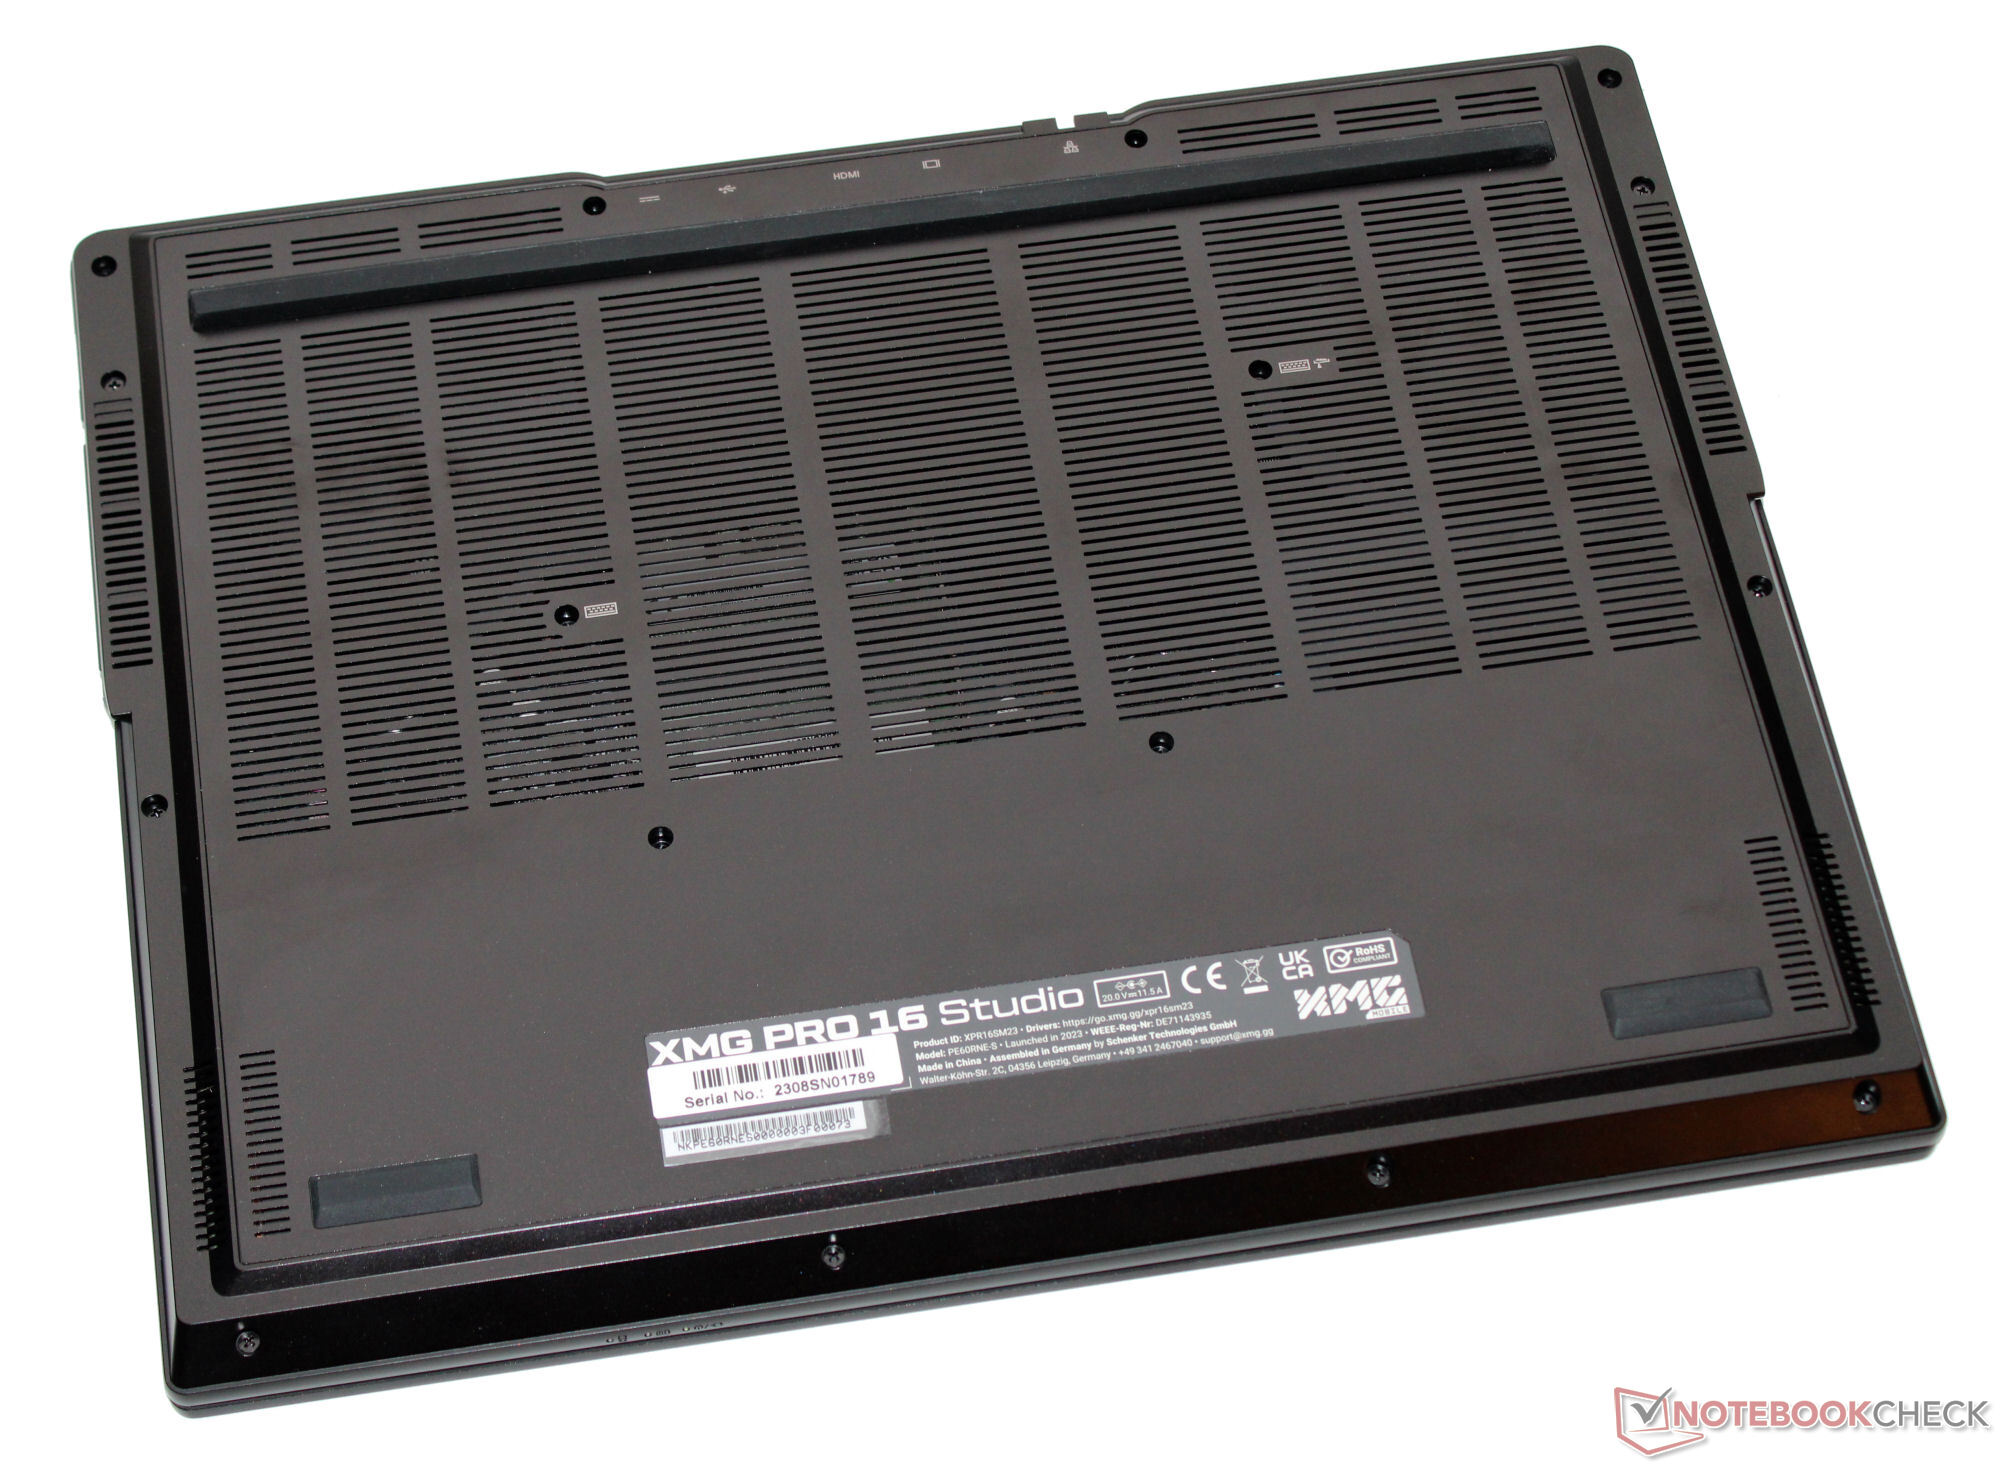
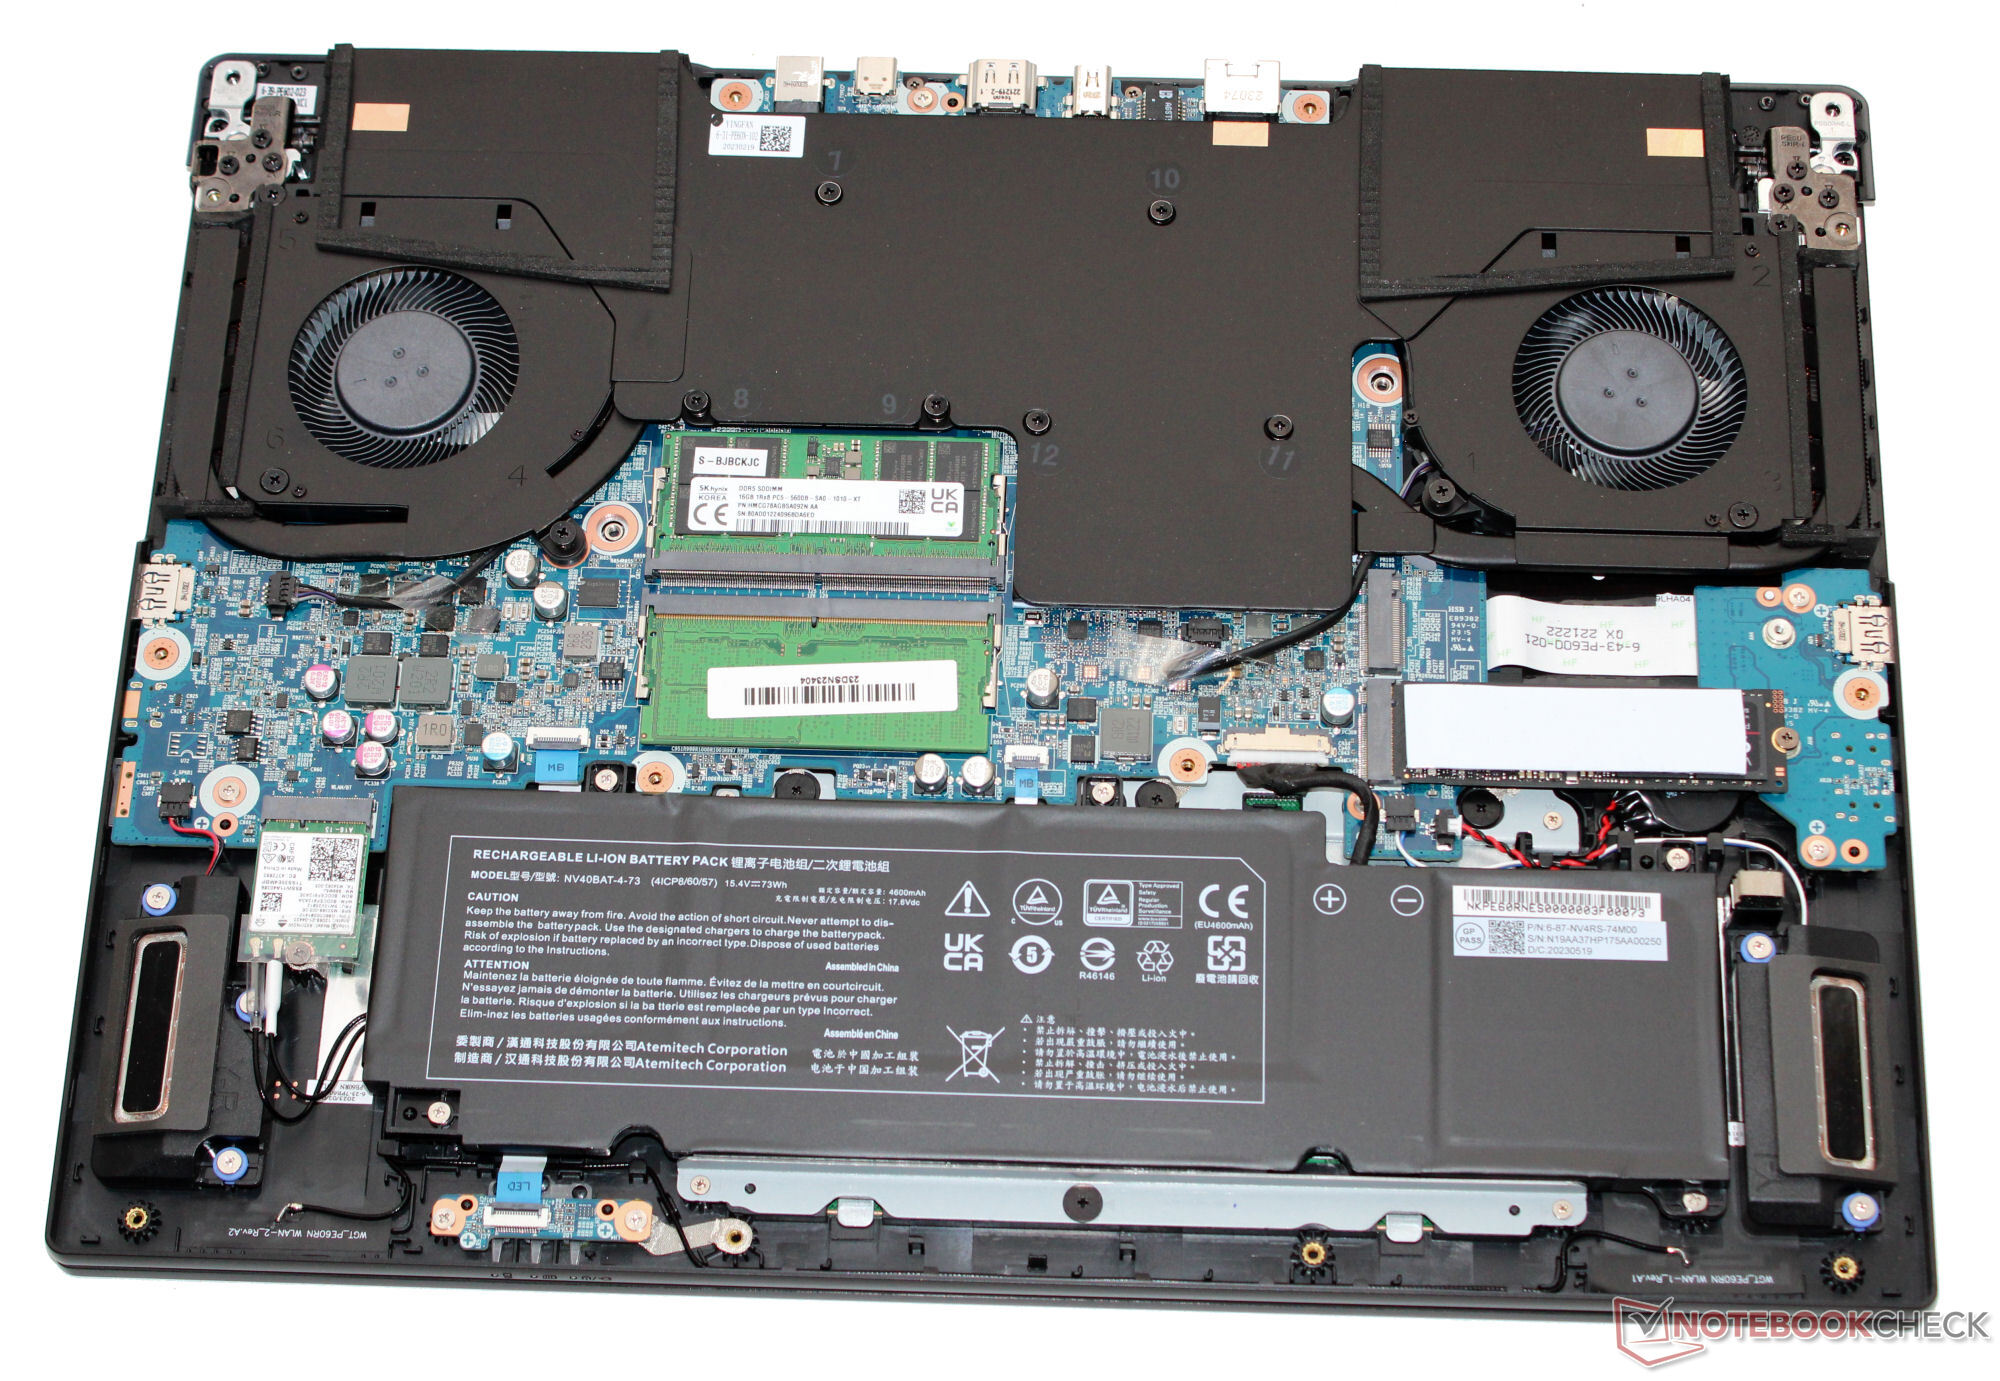
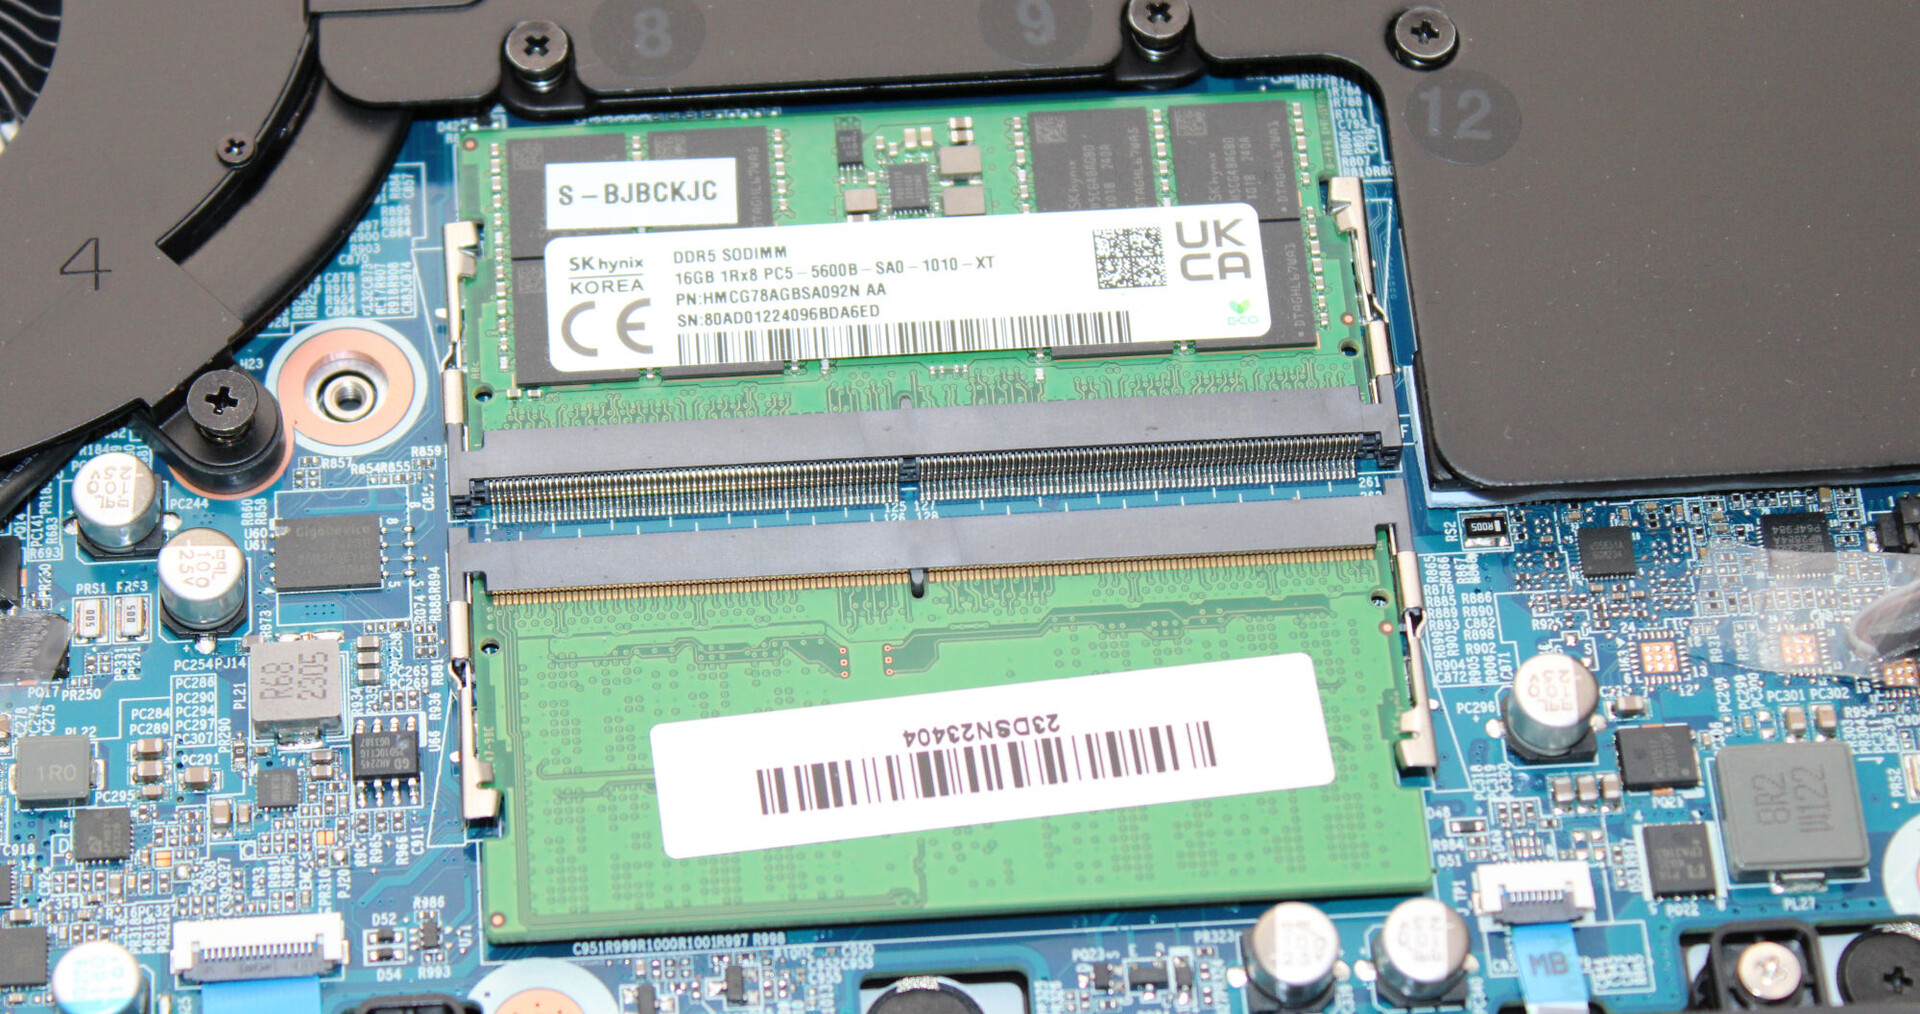
Il coperchio e il fondo della custodia nero opaco sono in alluminio, mentre il resto è in plastica. La custodia dal design sottile è costruita bene. L'unità di base e il coperchio possono essere leggermente ruotati, ma non c'è da preoccuparsi. La batteria (avvitata, non incollata) e il resto dei componenti interni del portatile sono accessibili una volta rimossa la piastra inferiore.
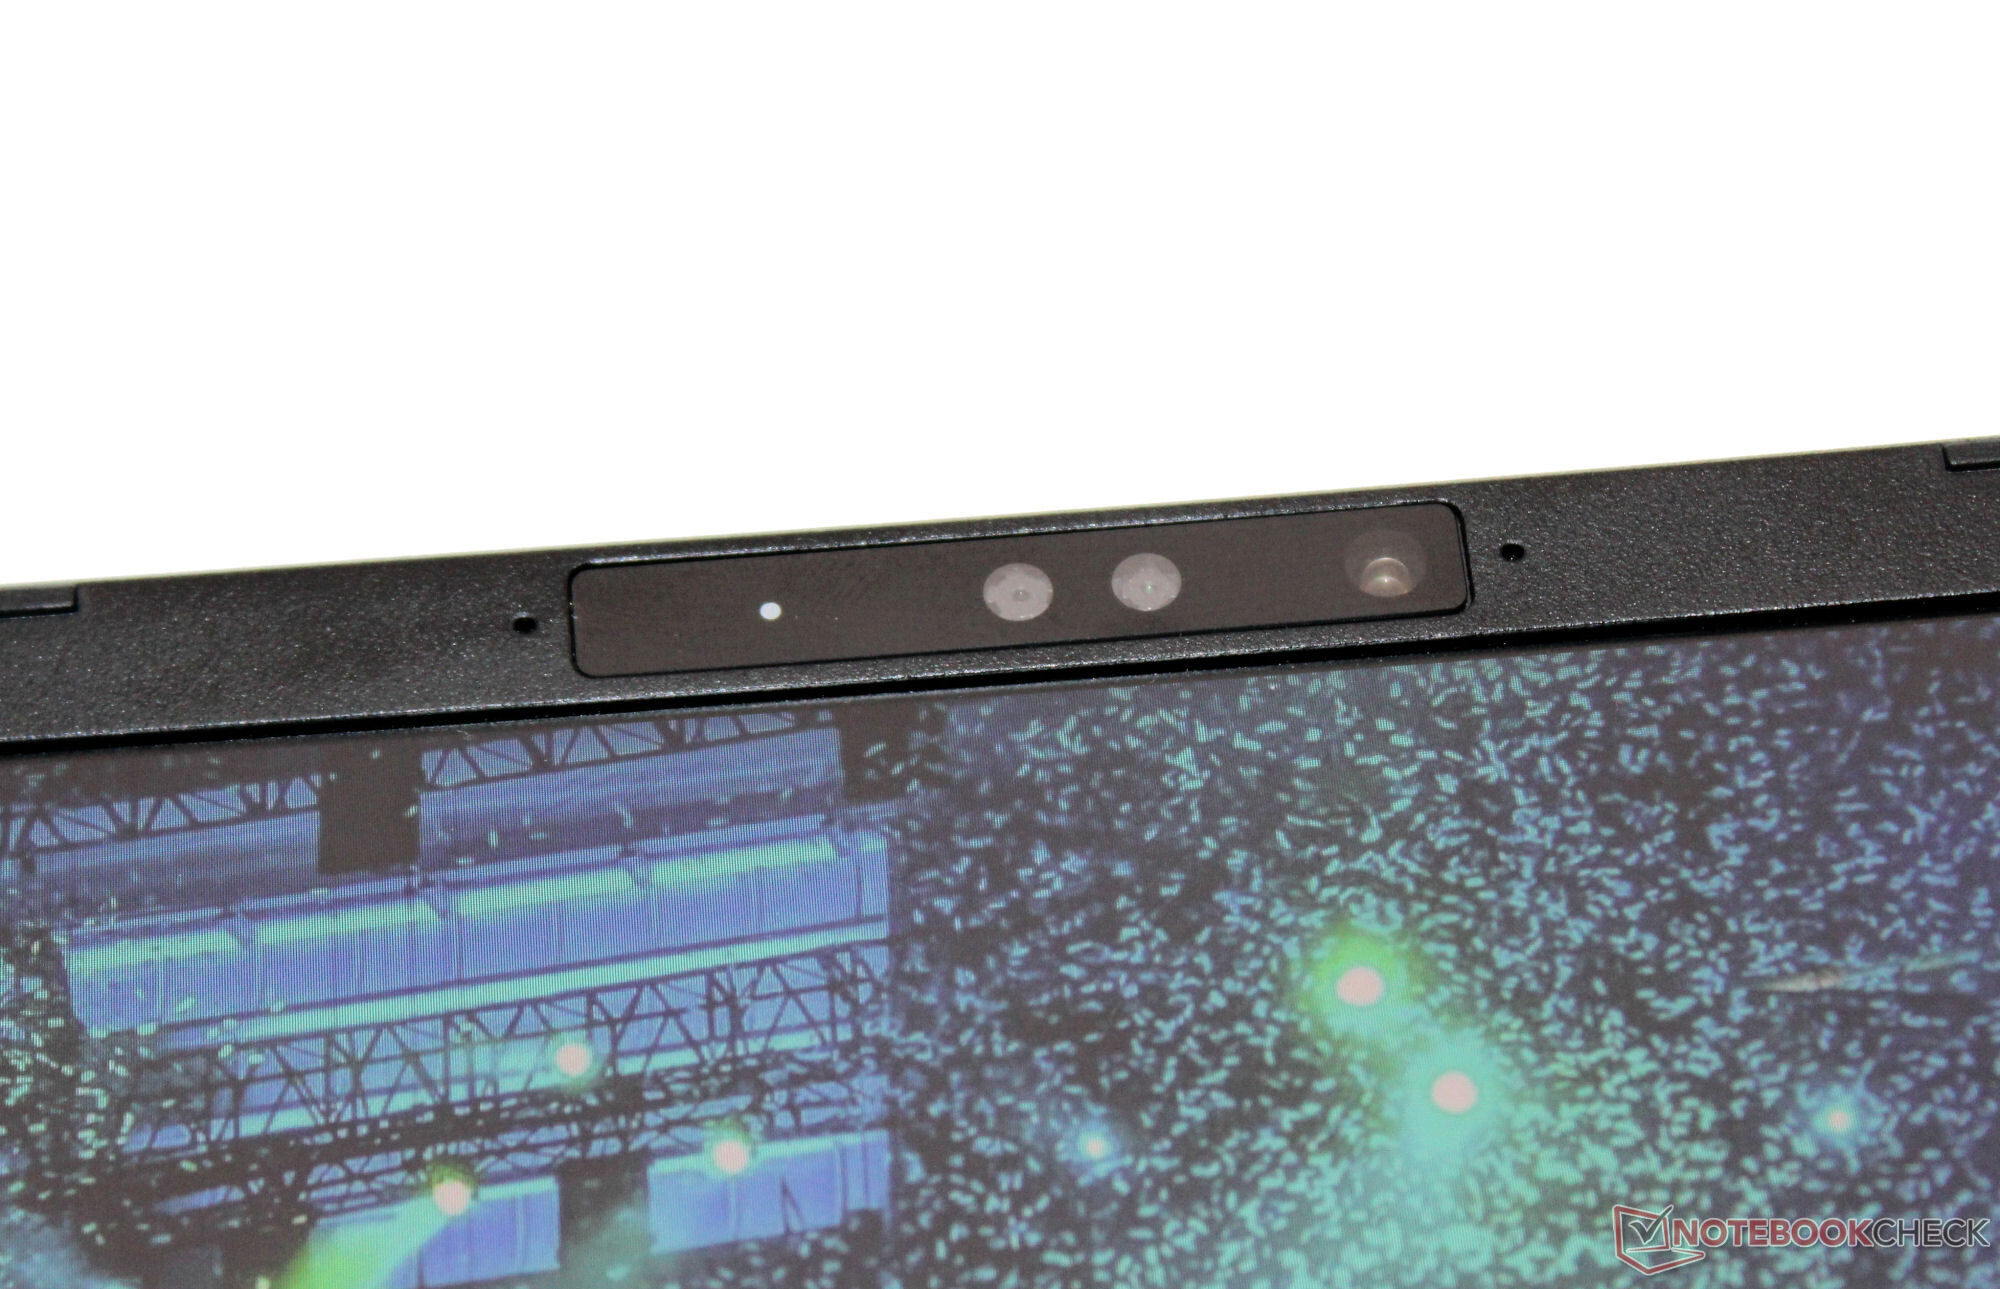
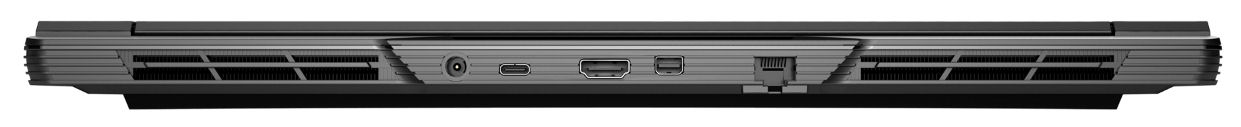
Il Pro dispone di due porte USB-A (USB 3.2 Gen 1) e due porte USB-C (1x USB 3.2 Gen 2, 1x Thunderbolt 4). La porta TB-4 supporta Power Delivery e può emettere un segnale DisplayPort. In totale, il portatile dispone di tre uscite video (1x HDMI, 2x DP). Il suo lettore di schede MicroSD (scheda di riferimento: AV PRO microSD 128 GB V60) può essere classificato come uno di velocità media. La sua webcam (2,1 MP, max. 1.920 x 1.080 pixel, senza copertura) è piuttosto standard.
In condizioni ottimali (nessun dispositivo WiFi nelle vicinanze, breve distanza tra il portatile e il PC server), raggiunge eccellenti velocità di trasmissione dati WiFi. Il portatile utilizza un chip WiFi 6E (Intel AX211), mentre le connessioni cablate sono gestite da un controller Realtek RTL8125 (2,5 GBit/s).
| SD Card Reader | |
| average JPG Copy Test (av. of 3 runs) | |
| MSI Stealth 16 Studio A13VG | |
| Media della classe Gaming (20.9 - 210, n=54, ultimi 2 anni) | |
| Asus Vivobook Pro 16X K6604JV-MX016W | |
| Schenker XMG Pro 16 Studio (Mid 23) (AV PRO microSD 128 GB V60) | |
| Lenovo Legion Slim 7i 16 Gen 8 (Toshiba Exceria Pro SDXC 64 GB UHS-II) | |
| maximum AS SSD Seq Read Test (1GB) | |
| MSI Stealth 16 Studio A13VG | |
| Media della classe Gaming (25.5 - 261, n=51, ultimi 2 anni) | |
| Asus Vivobook Pro 16X K6604JV-MX016W | |
| Schenker XMG Pro 16 Studio (Mid 23) (AV PRO microSD 128 GB V60) | |
| Lenovo Legion Slim 7i 16 Gen 8 (Toshiba Exceria Pro SDXC 64 GB UHS-II) | |

 GeForce RTX 4070 Laptop GPU, i9-13900H, Samsung 990 Pro 1 TB")
 GeForce RTX 4070 Laptop GPU, i9-13900H, Samsung 990 Pro 1 TB")
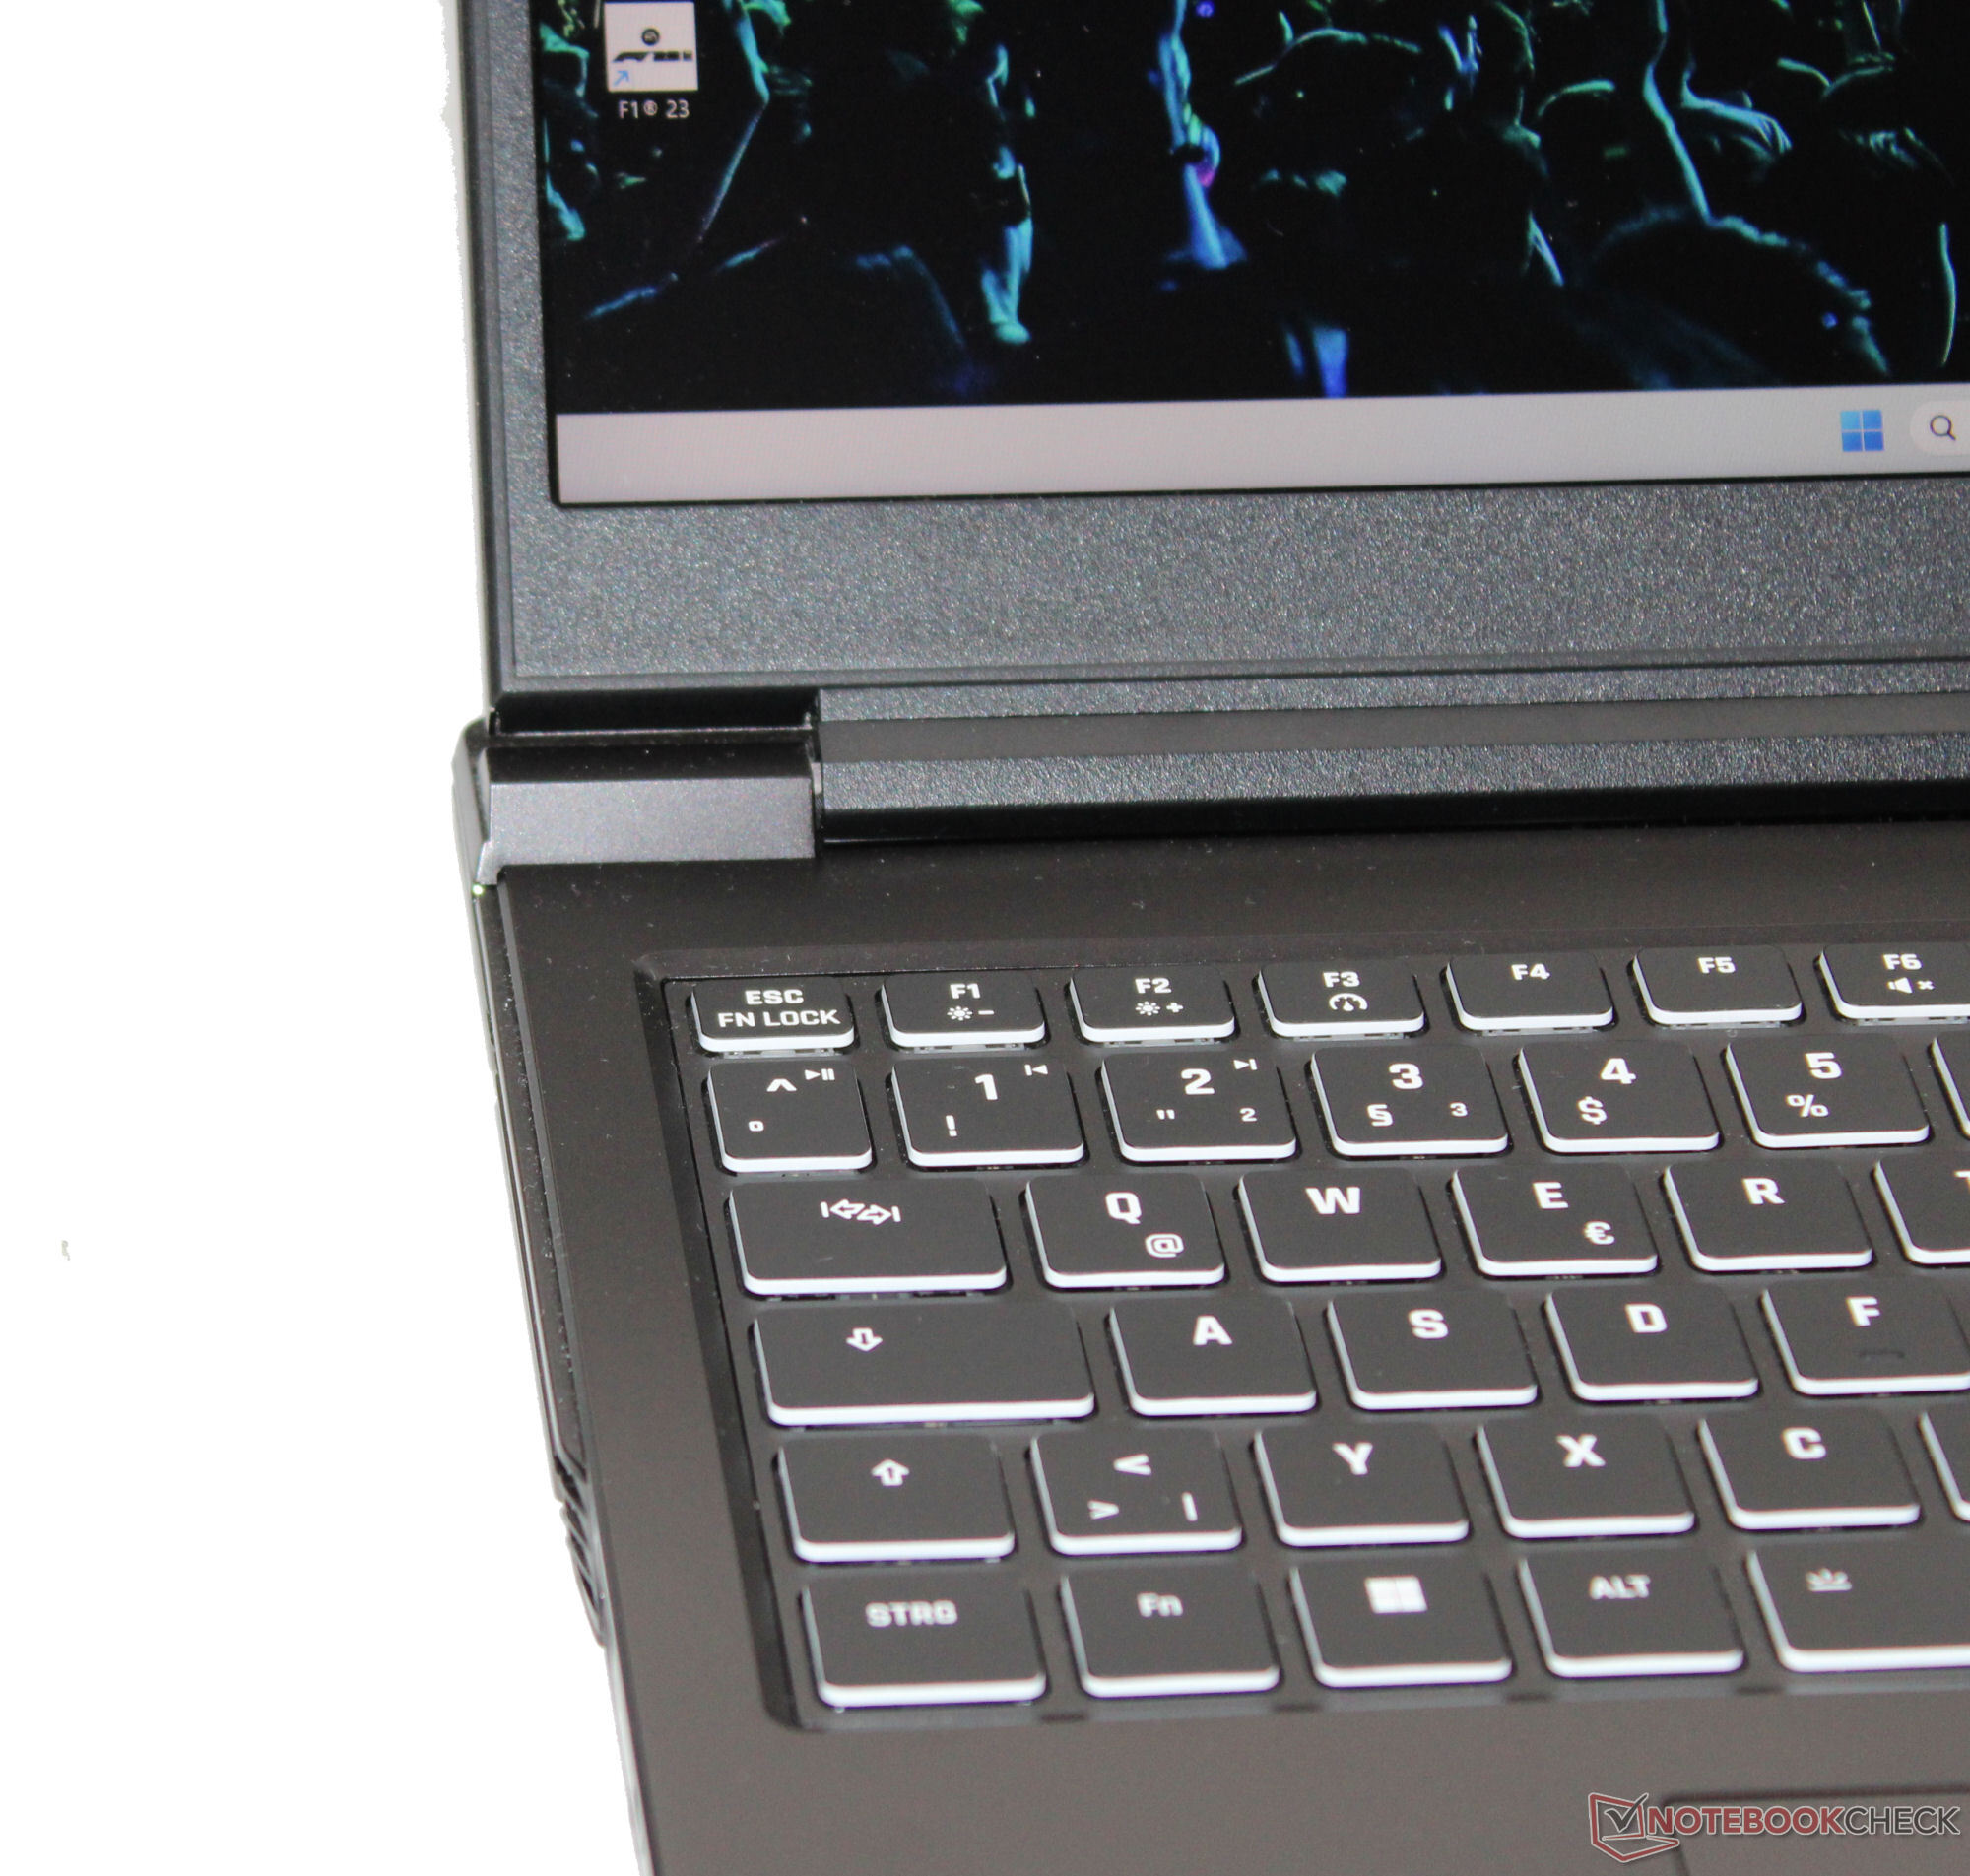
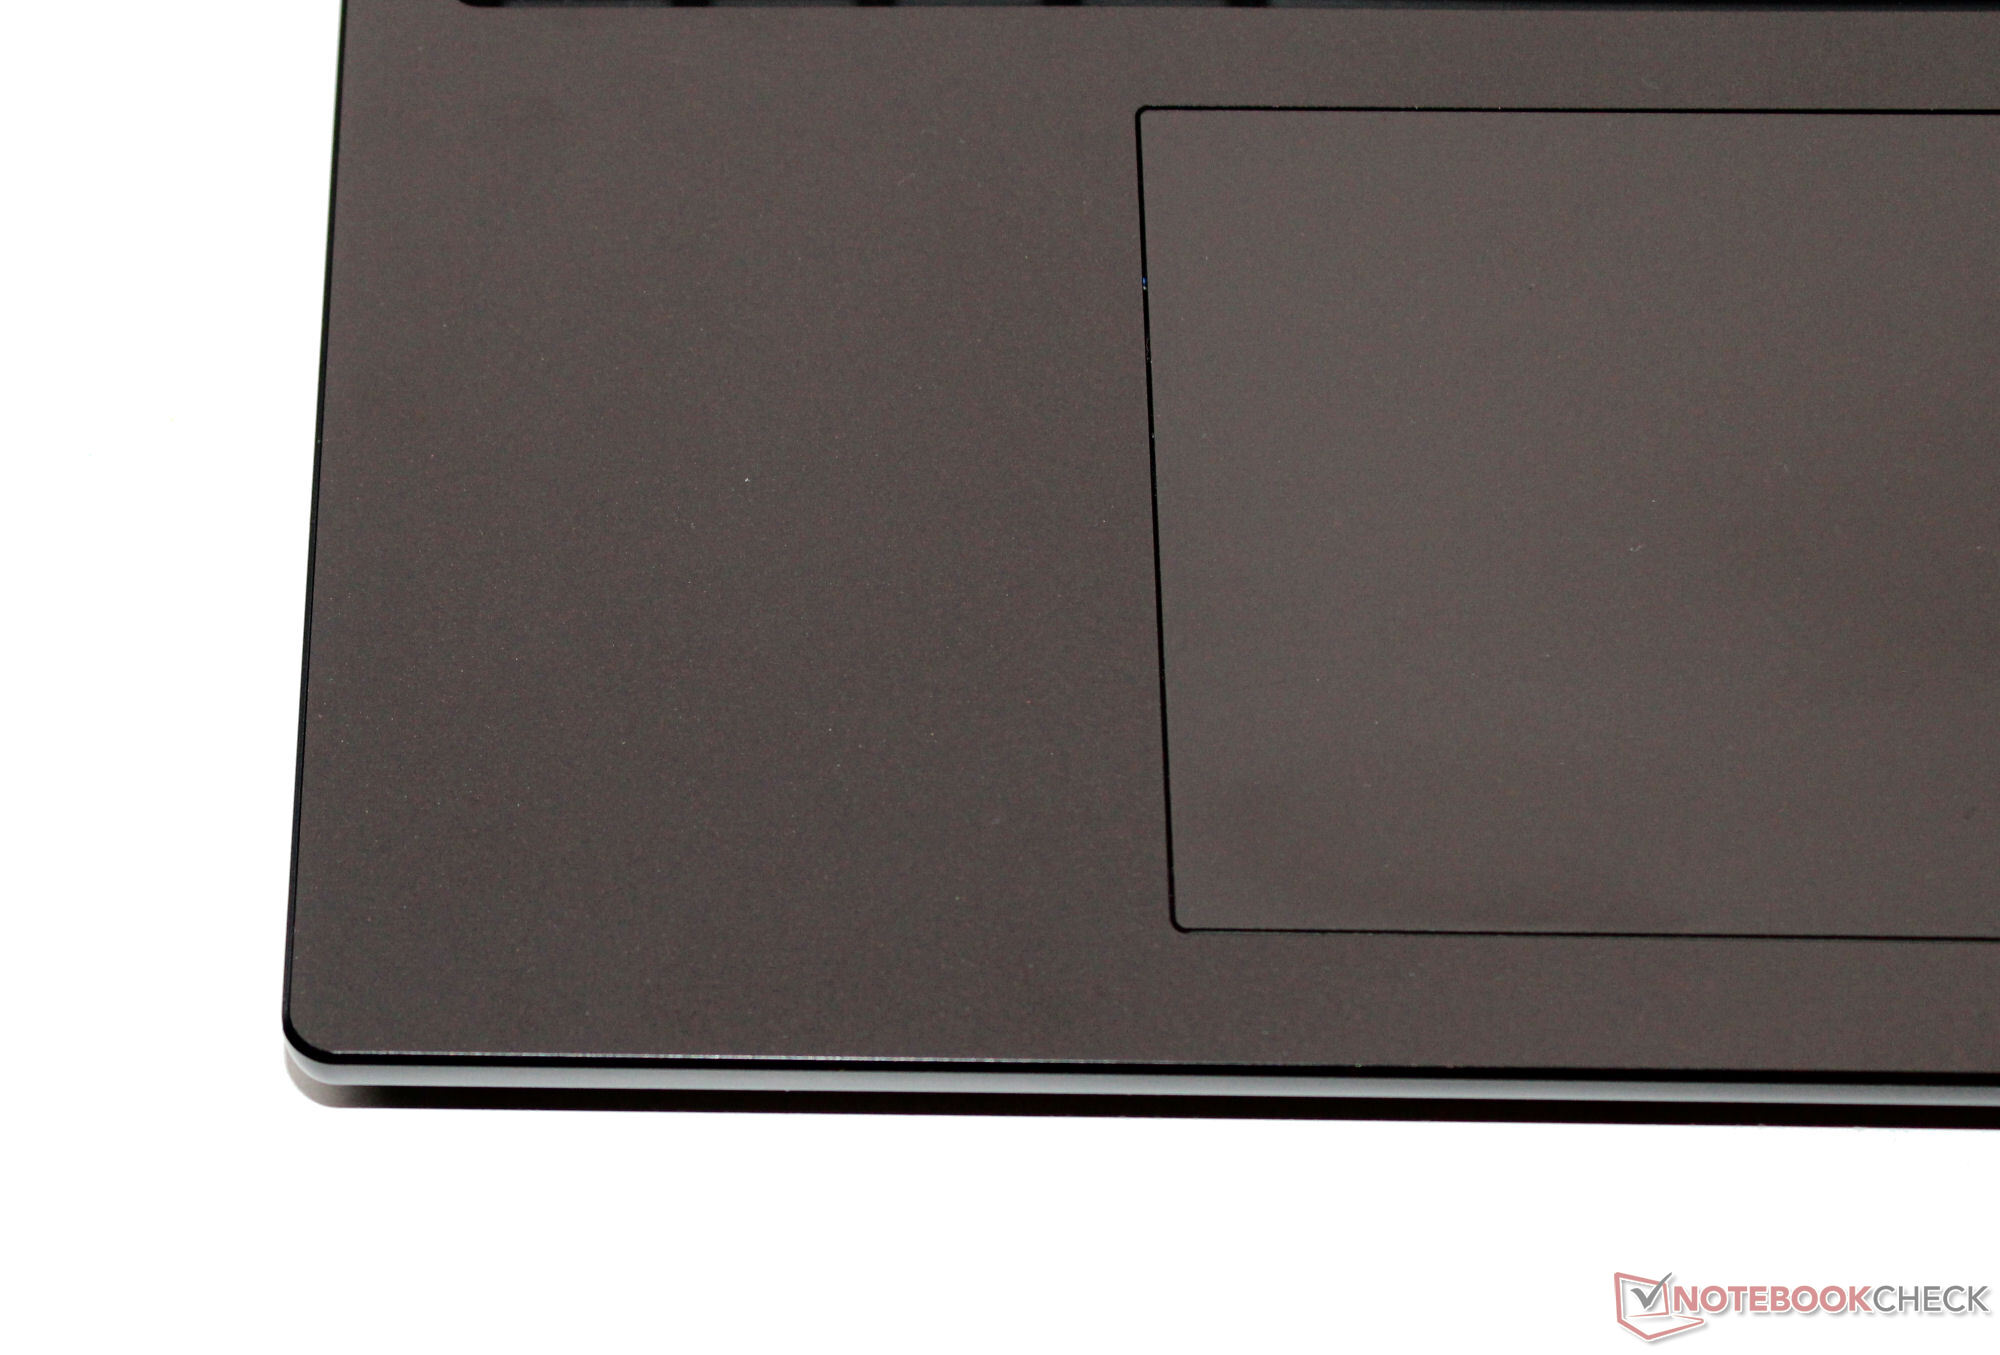
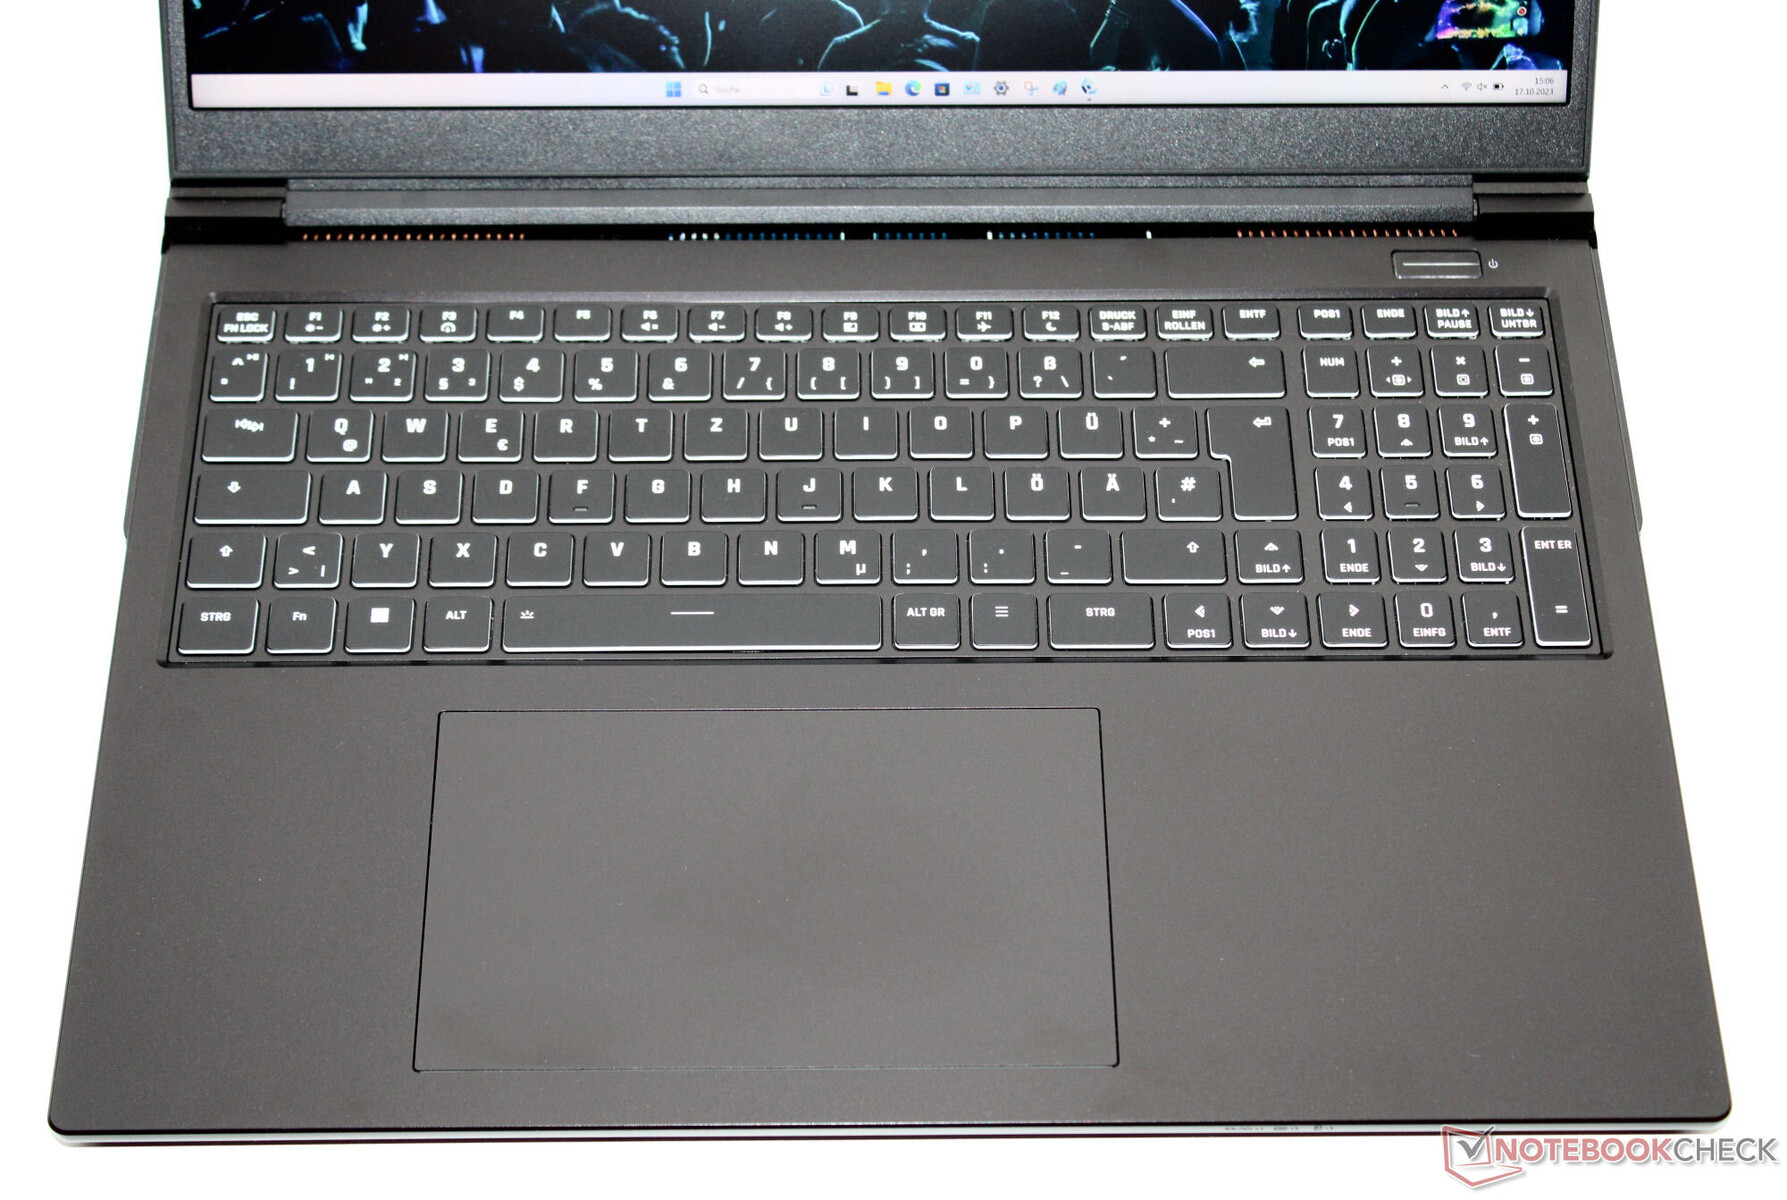
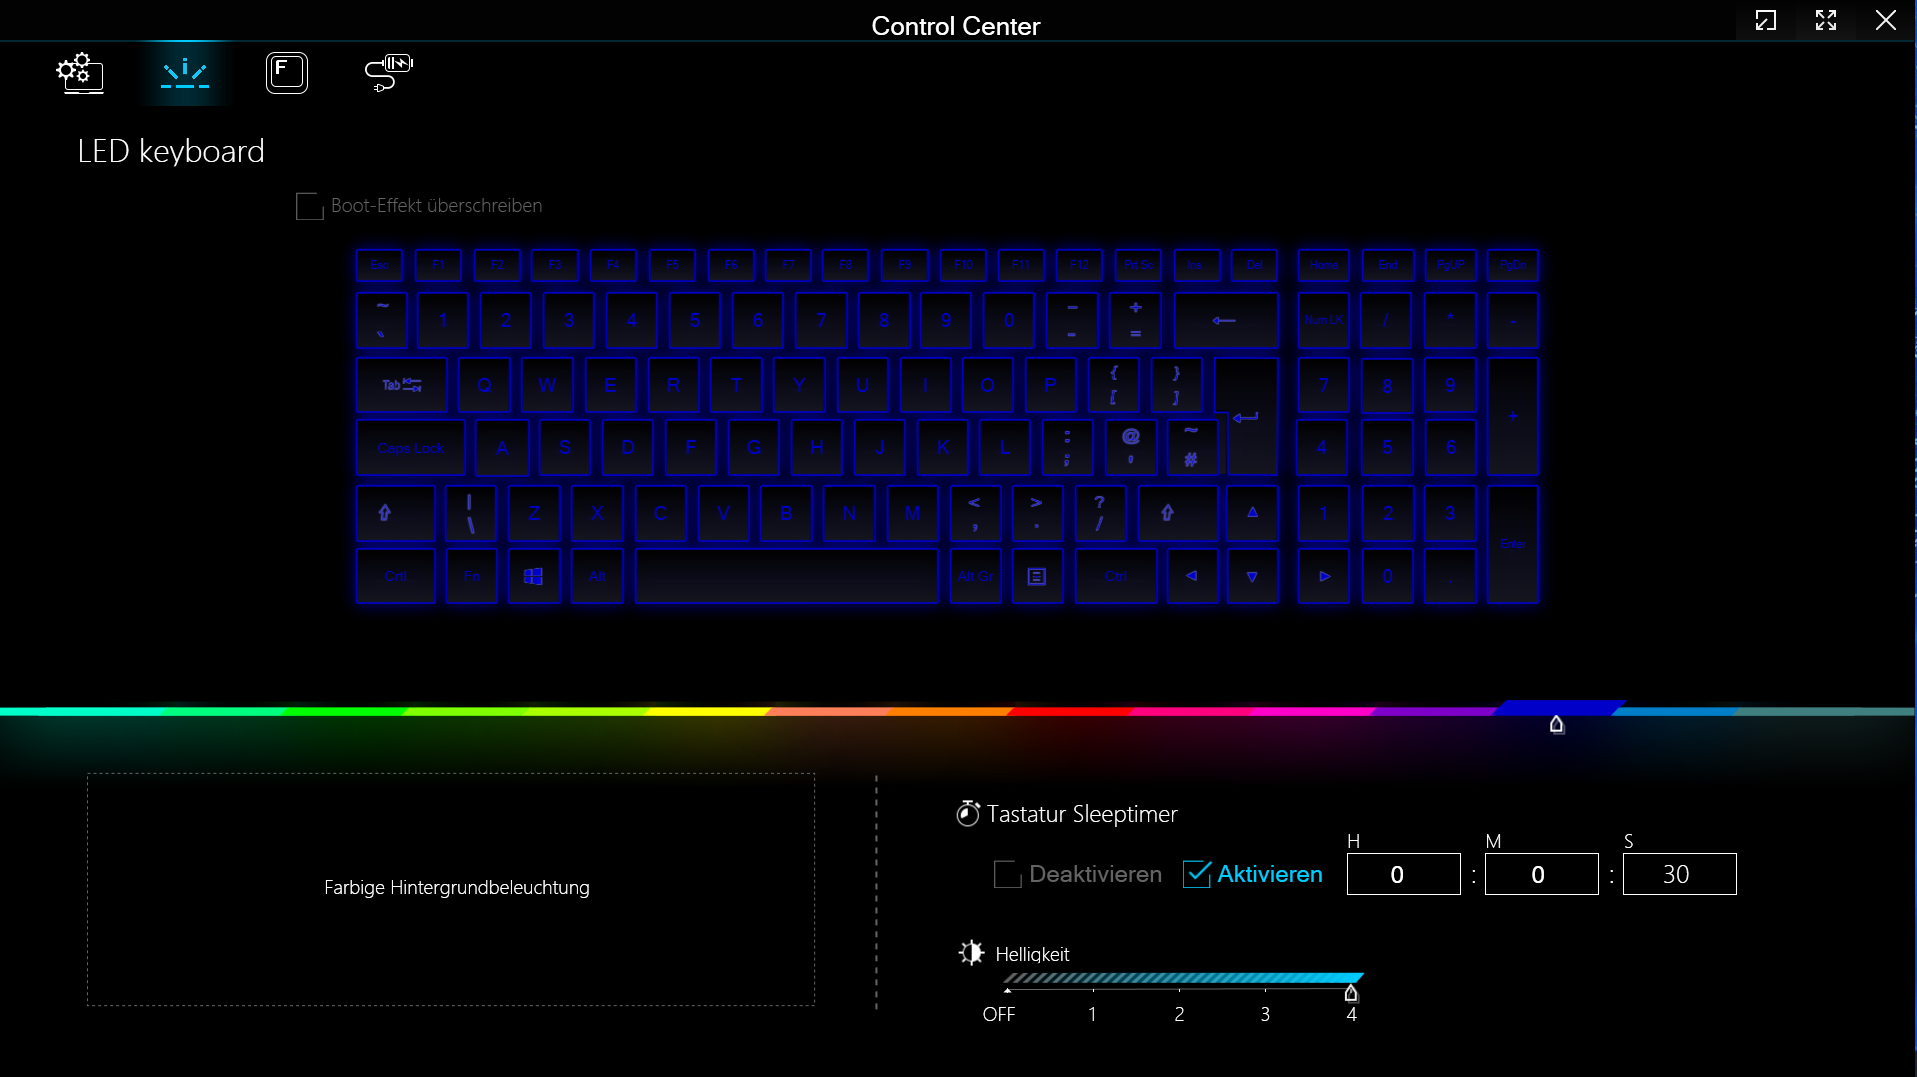
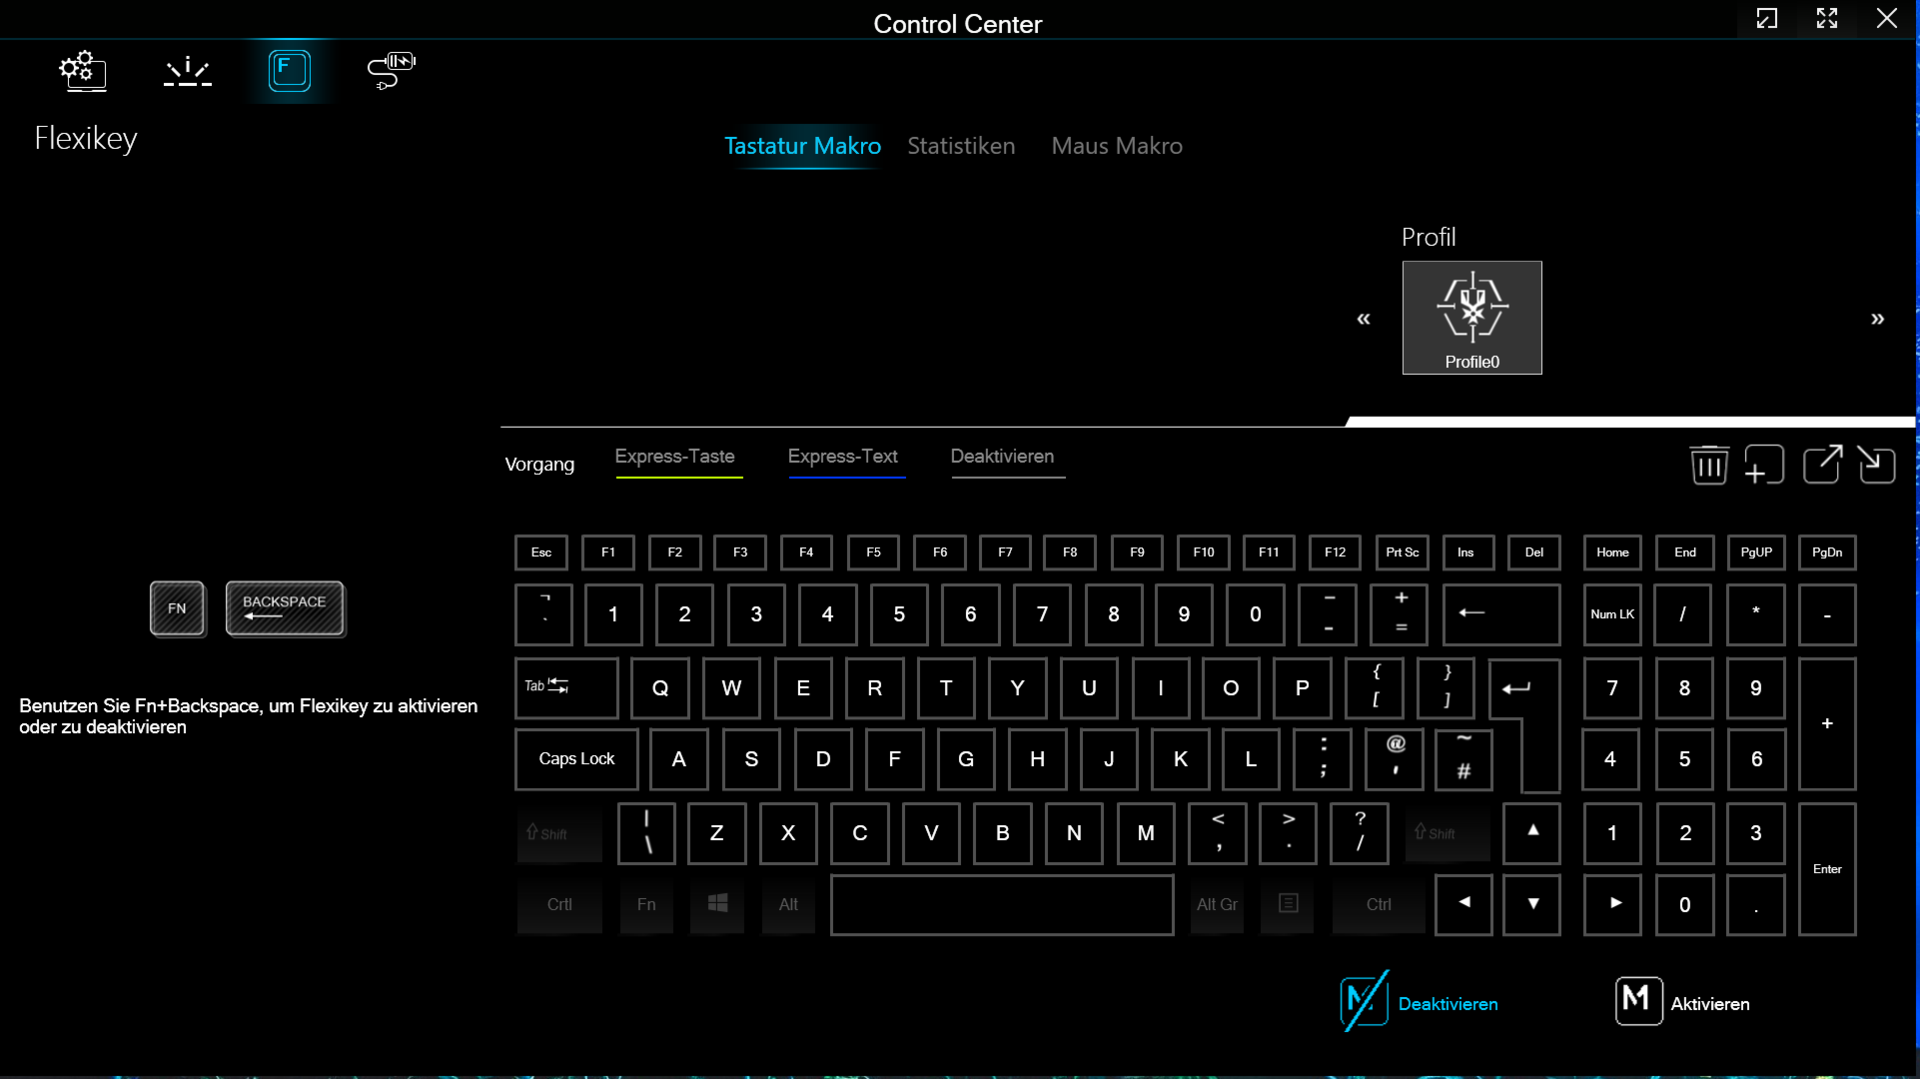
Dispositivi di input - Il laptop XMG è dotato di tasti illuminati
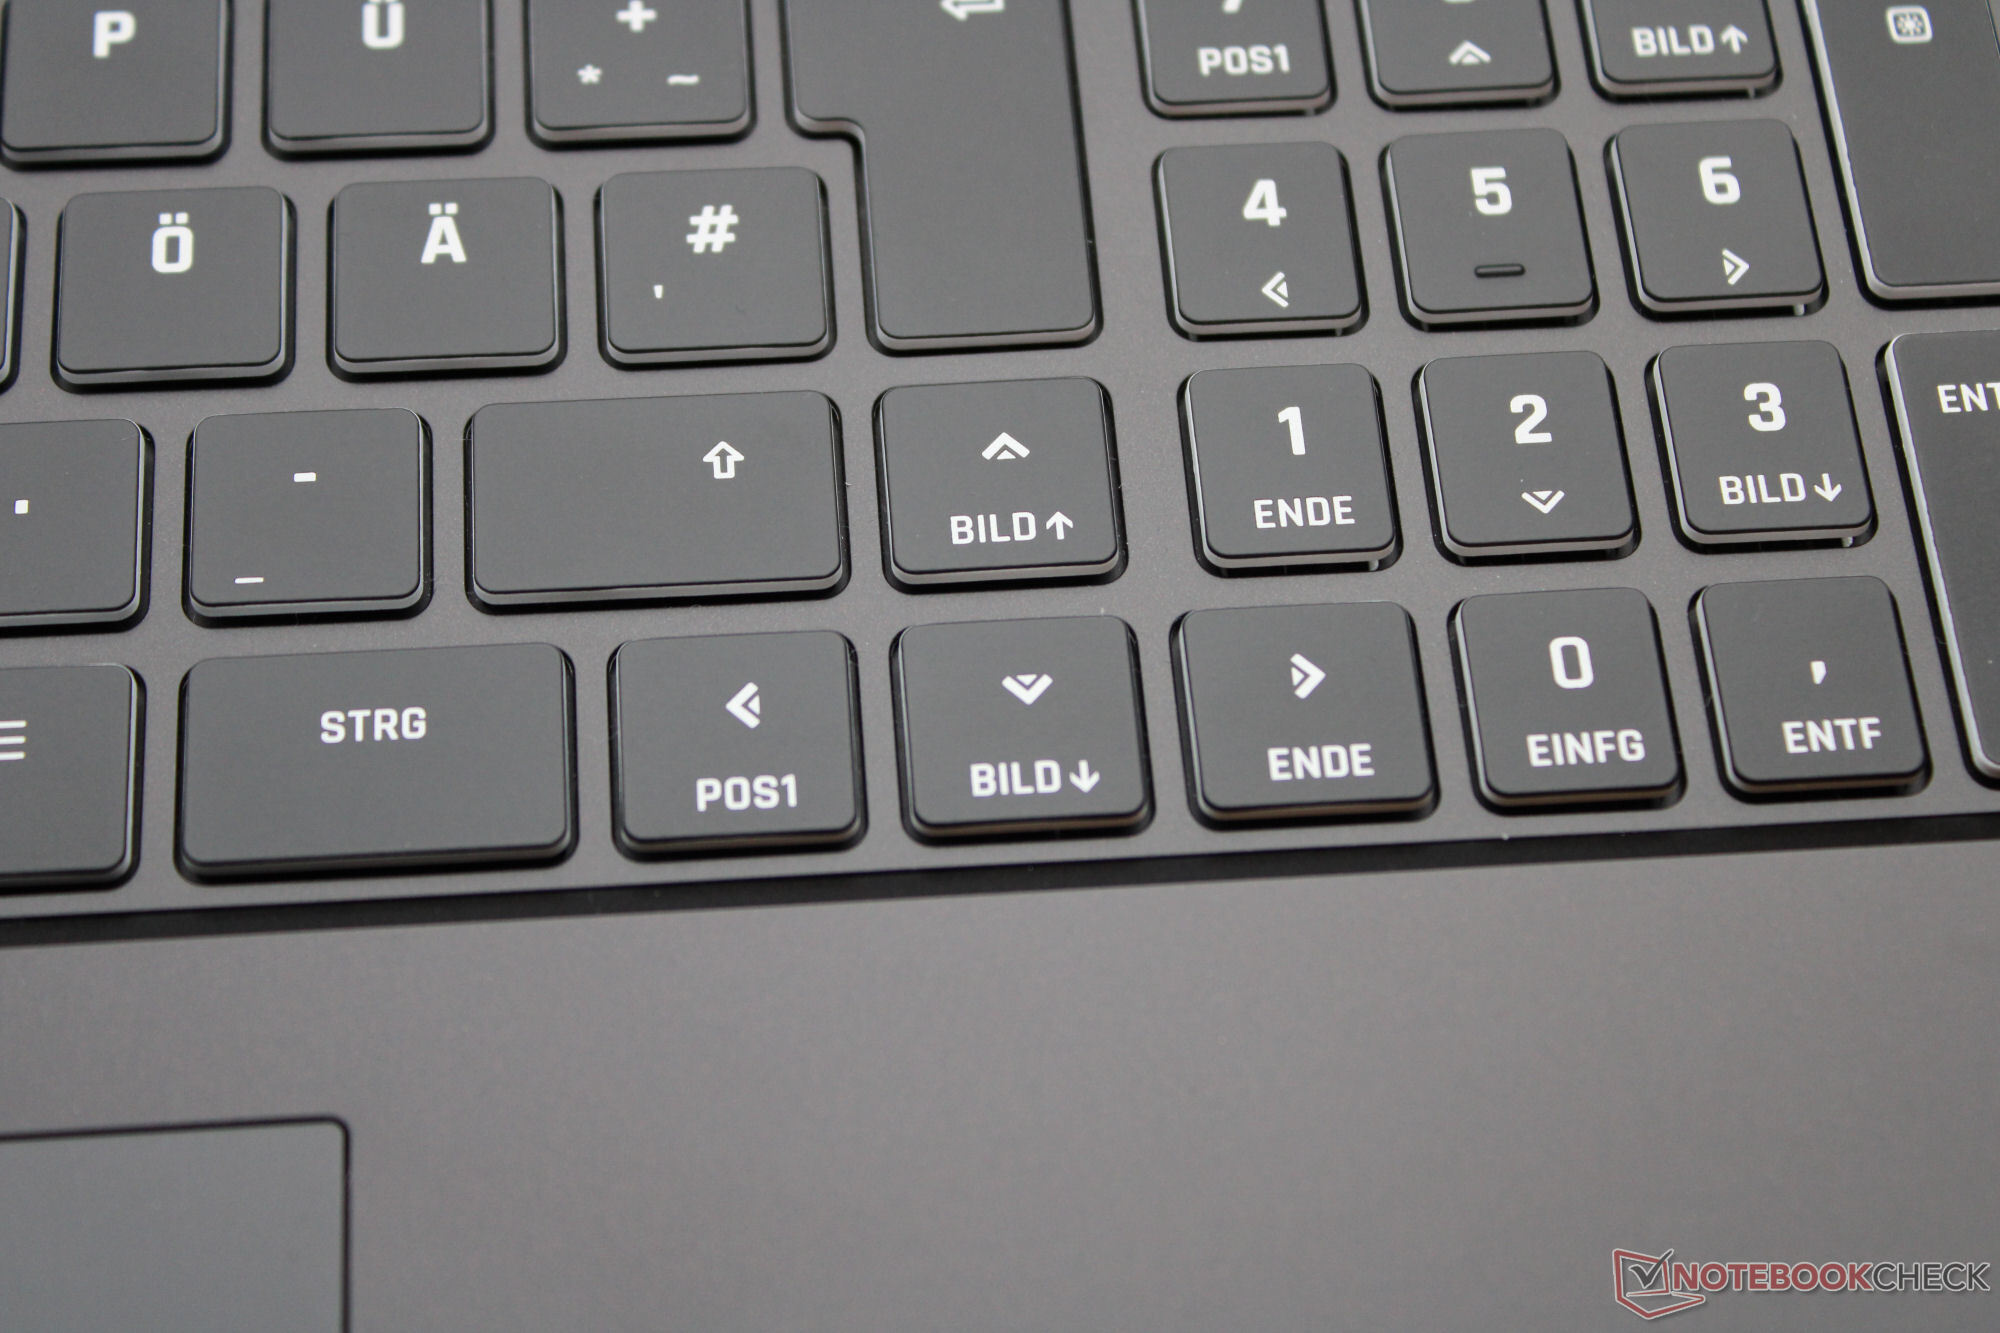
I tasti della tastiera chiclet (illuminazione RGB), uniformi e lisci, hanno un'inclinazione media e un punto di pressione chiaro. La resistenza dei tasti potrebbe essere un po' più nitida. In totale, Schenker ha fornito una tastiera adatta all'uso quotidiano. Un clickpad sostituisce il mouse (circa 15,1 x 9,1 cm), con un'alzata breve e un punto di pressione chiaro.
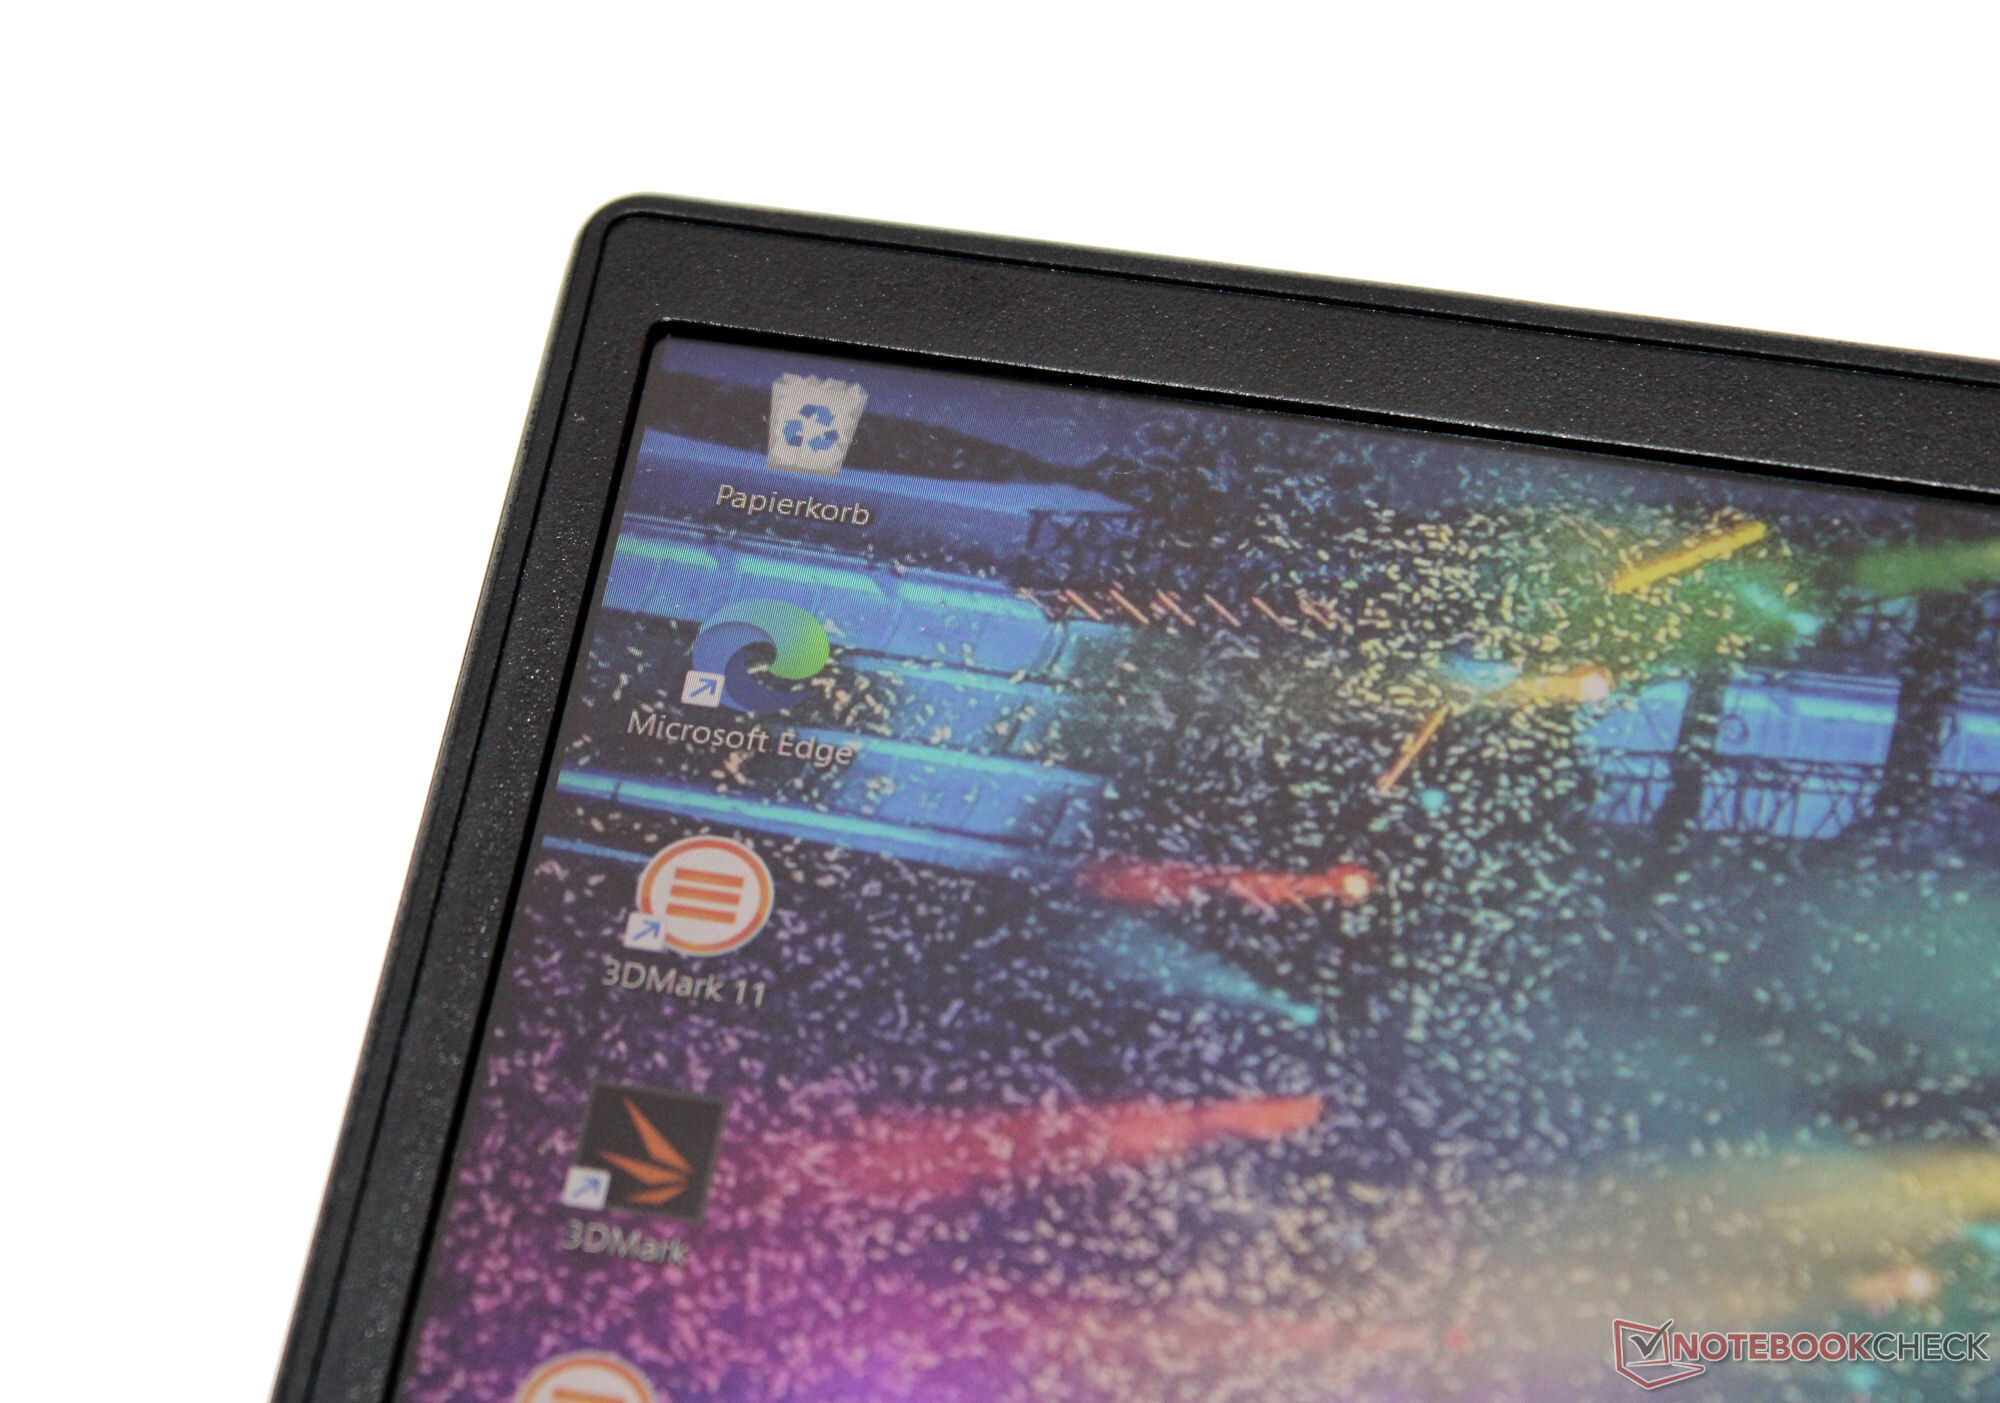
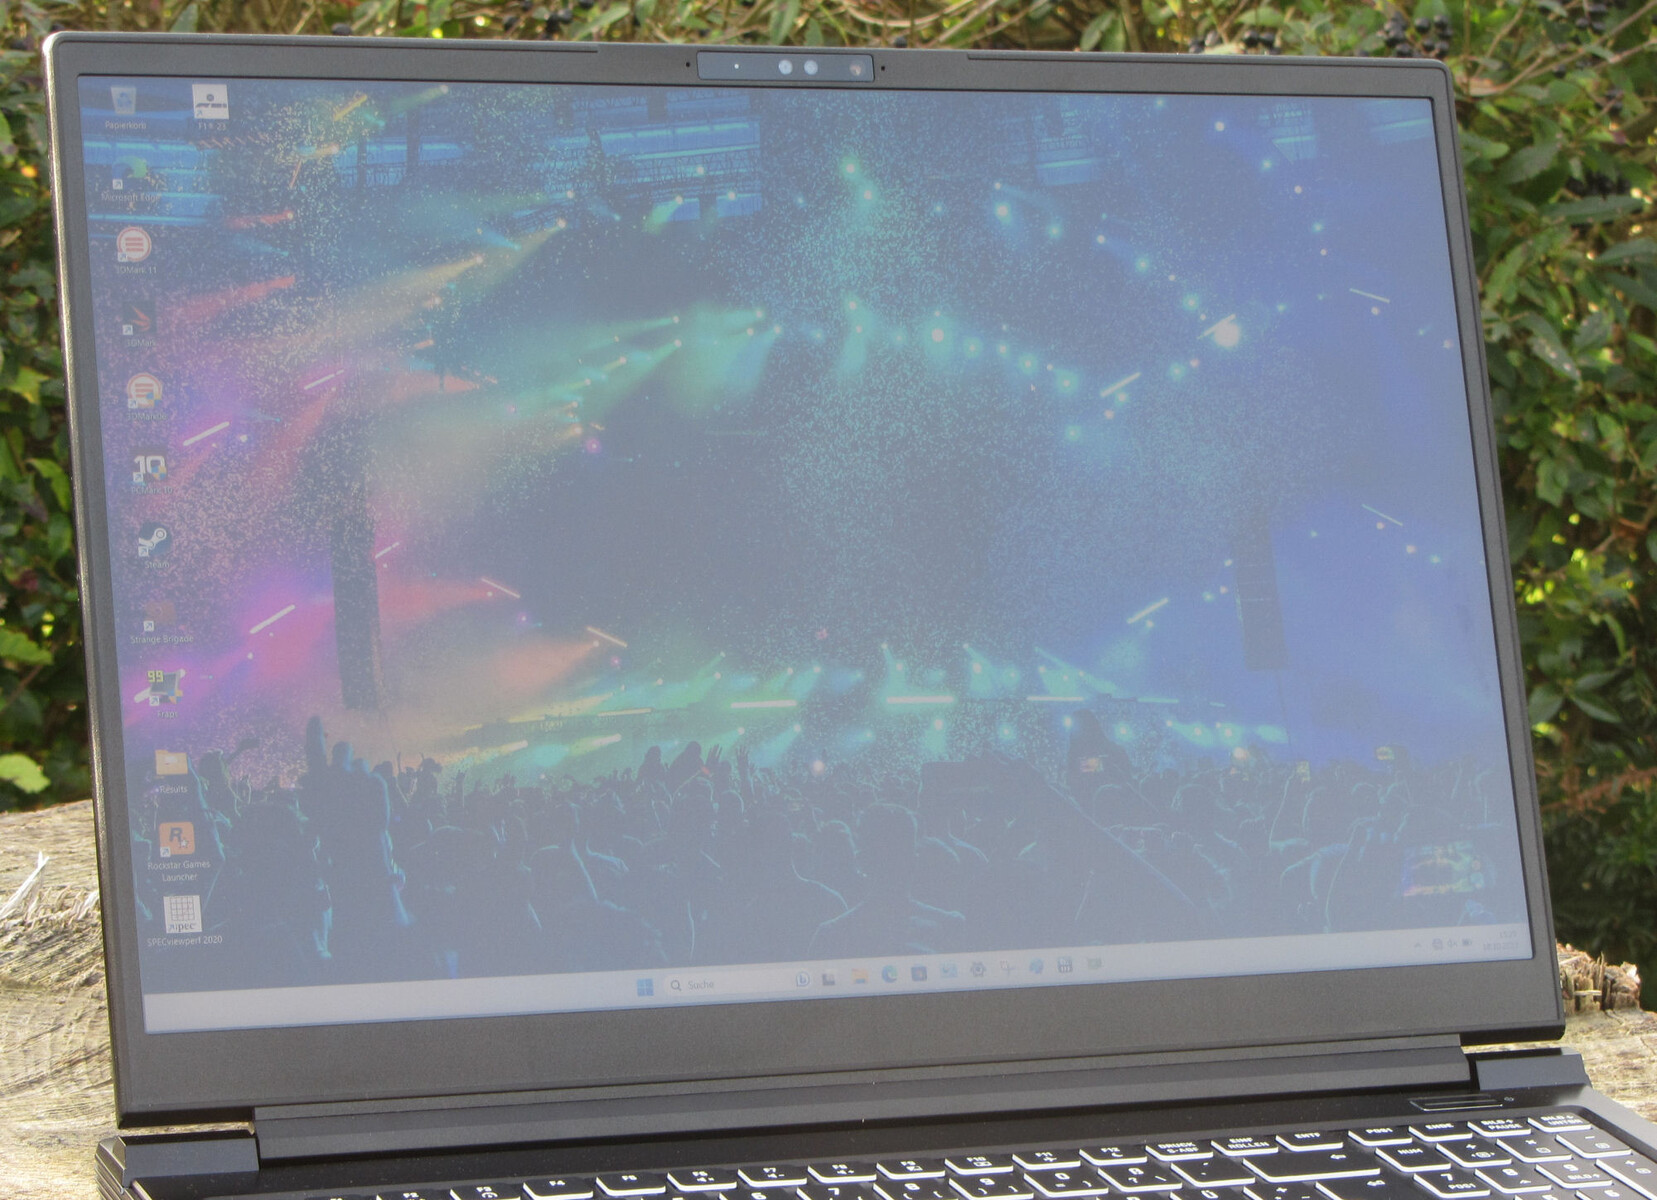
Display - Un pannello 16:10 con copertura sRGB
Il pannello a 240 Hz a reazione rapida del dispositivo, con un rapporto d'aspetto di 16:10, non mostra alcun segno di sfarfallio PWM a qualsiasi livello di luminosità. La luminosità e il contrasto del display opaco da 16 pollici (2.560 x 1.600 pixel) hanno entrambi raggiunto i rispettivi obiettivi (> 300 cd/m² e 1.000:1). Non sono disponibili display alternativi.
| |||||||||||||||||||||||||
Distribuzione della luminosità: 93 %
Al centro con la batteria: 349 cd/m²
Contrasto: 1091:1 (Nero: 0.32 cd/m²)
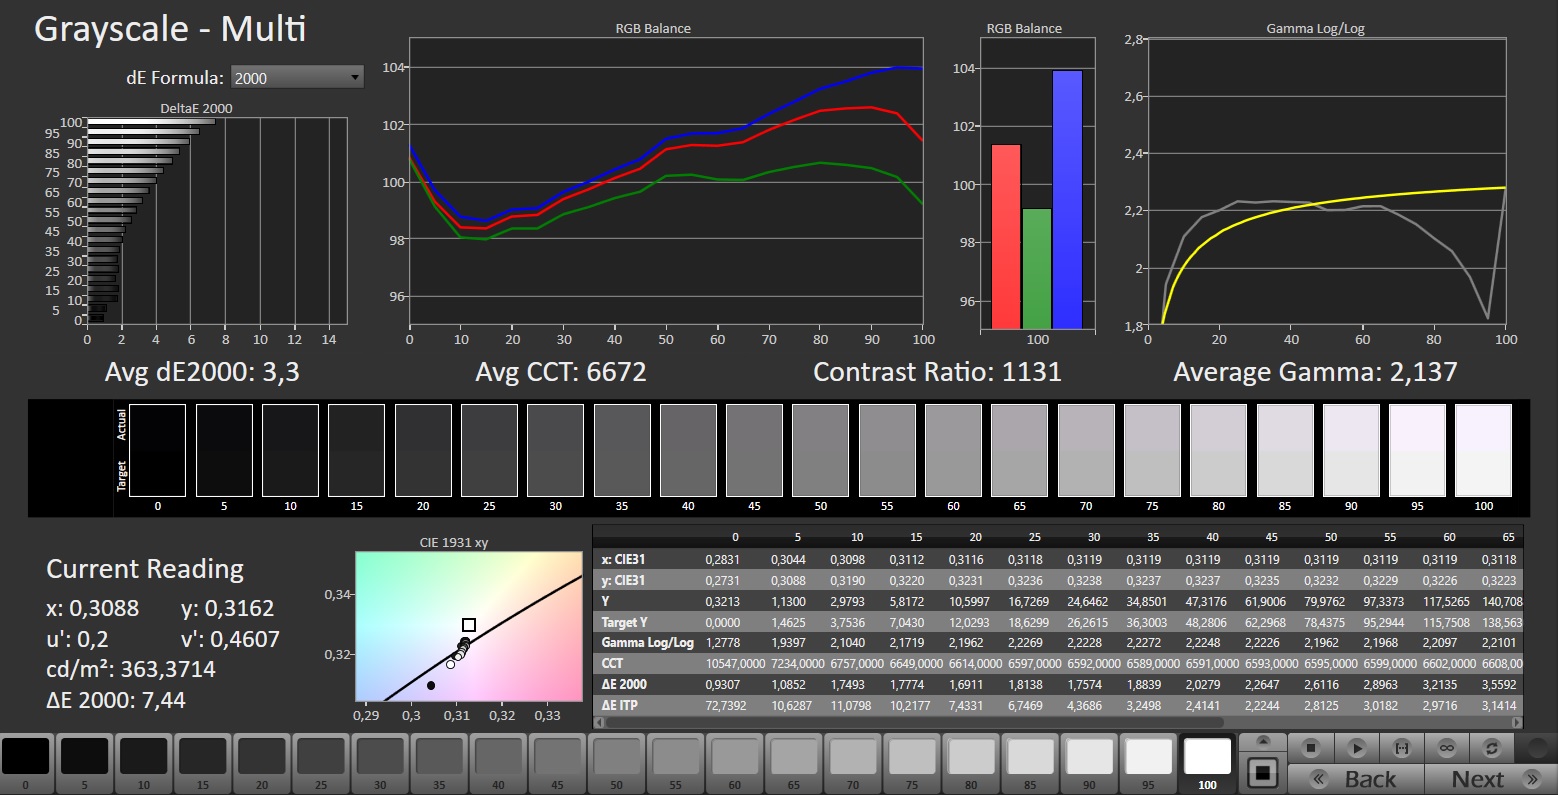
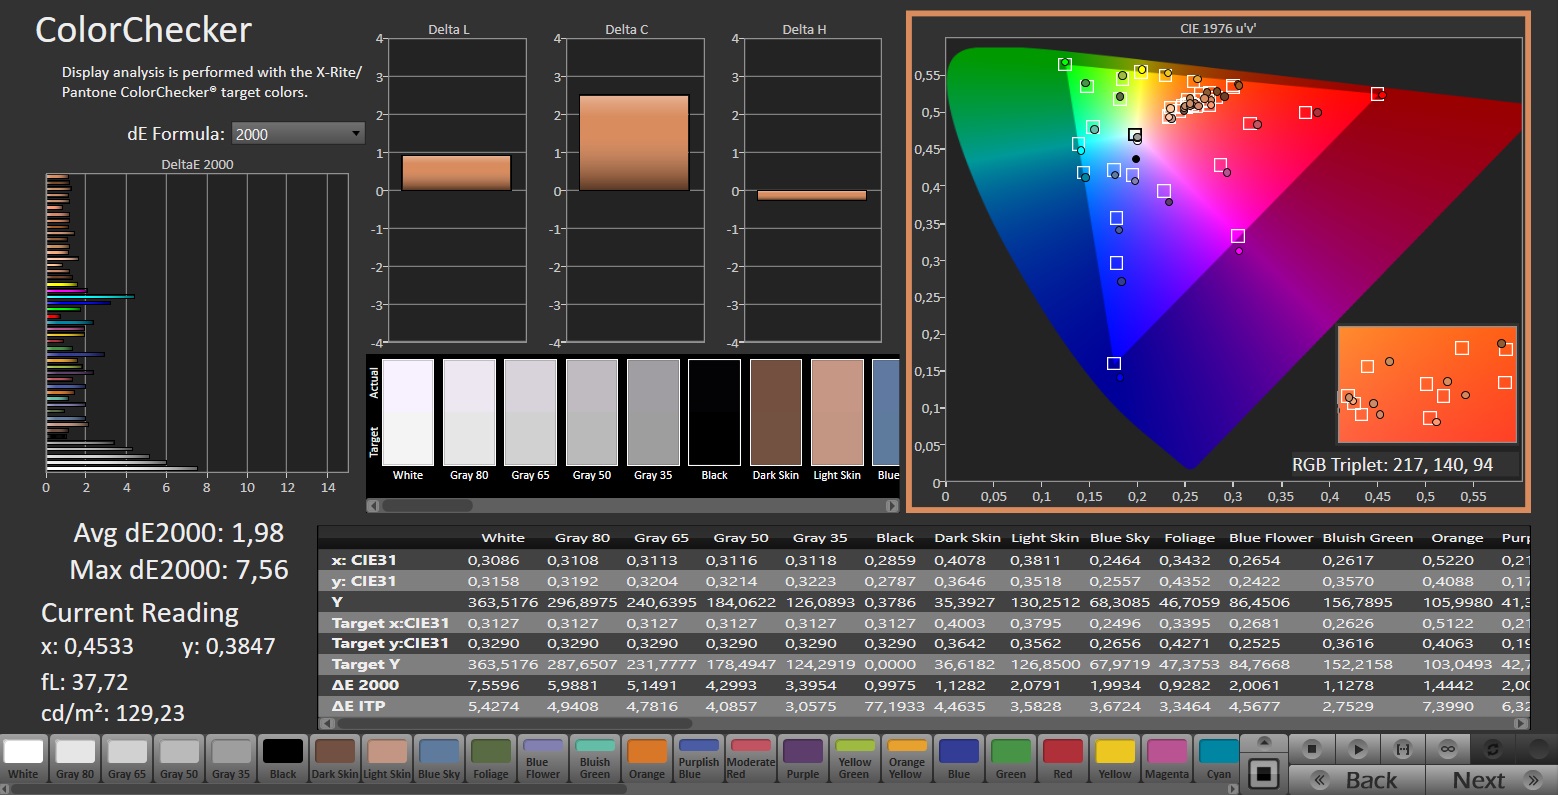
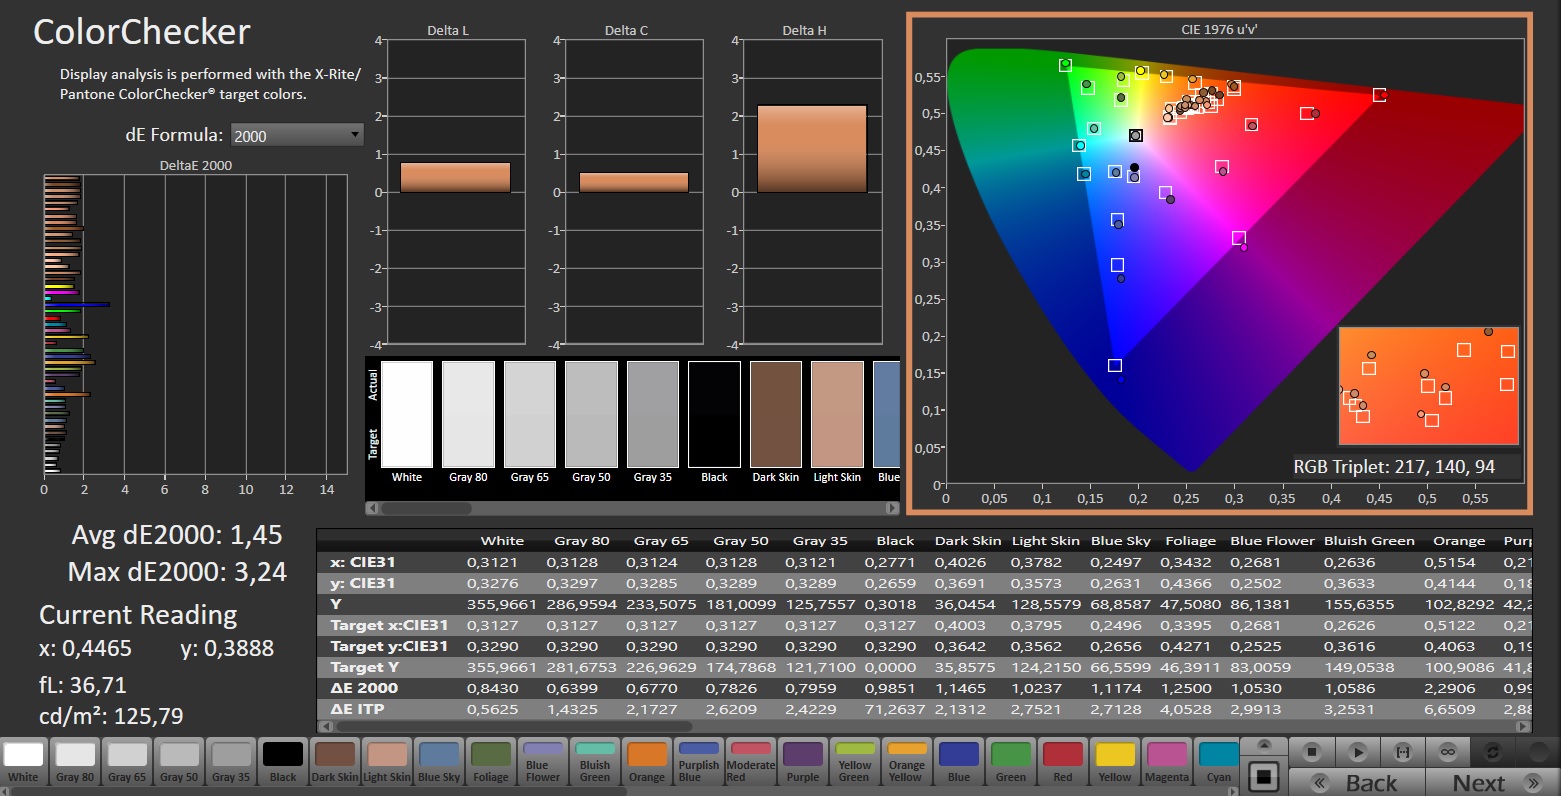
ΔE ColorChecker Calman: 1.98 | ∀{0.5-29.43 Ø4.71}
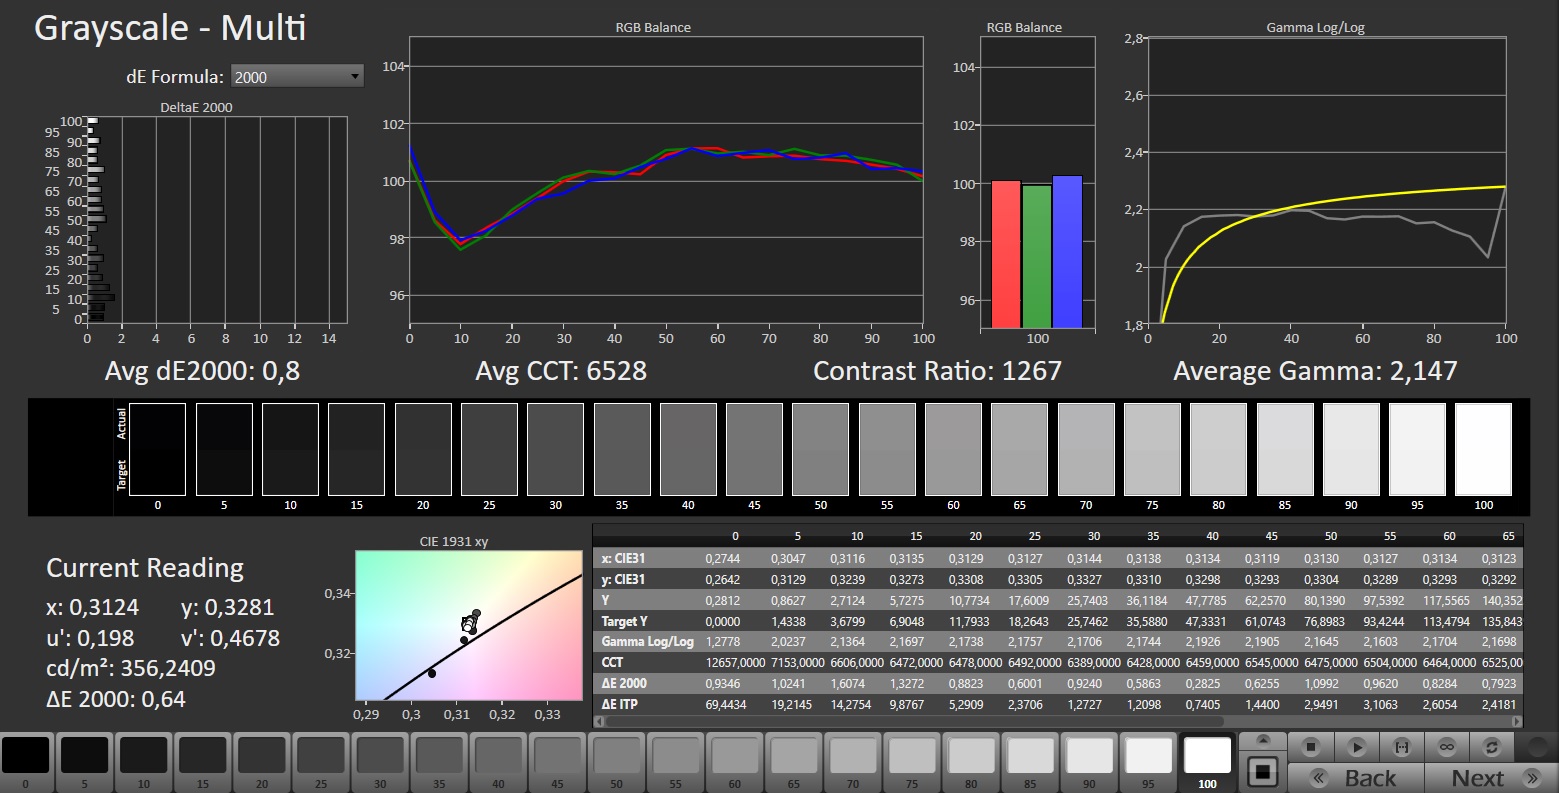
calibrated: 1.45
ΔE Greyscale Calman: 3.3 | ∀{0.09-98 Ø4.96}
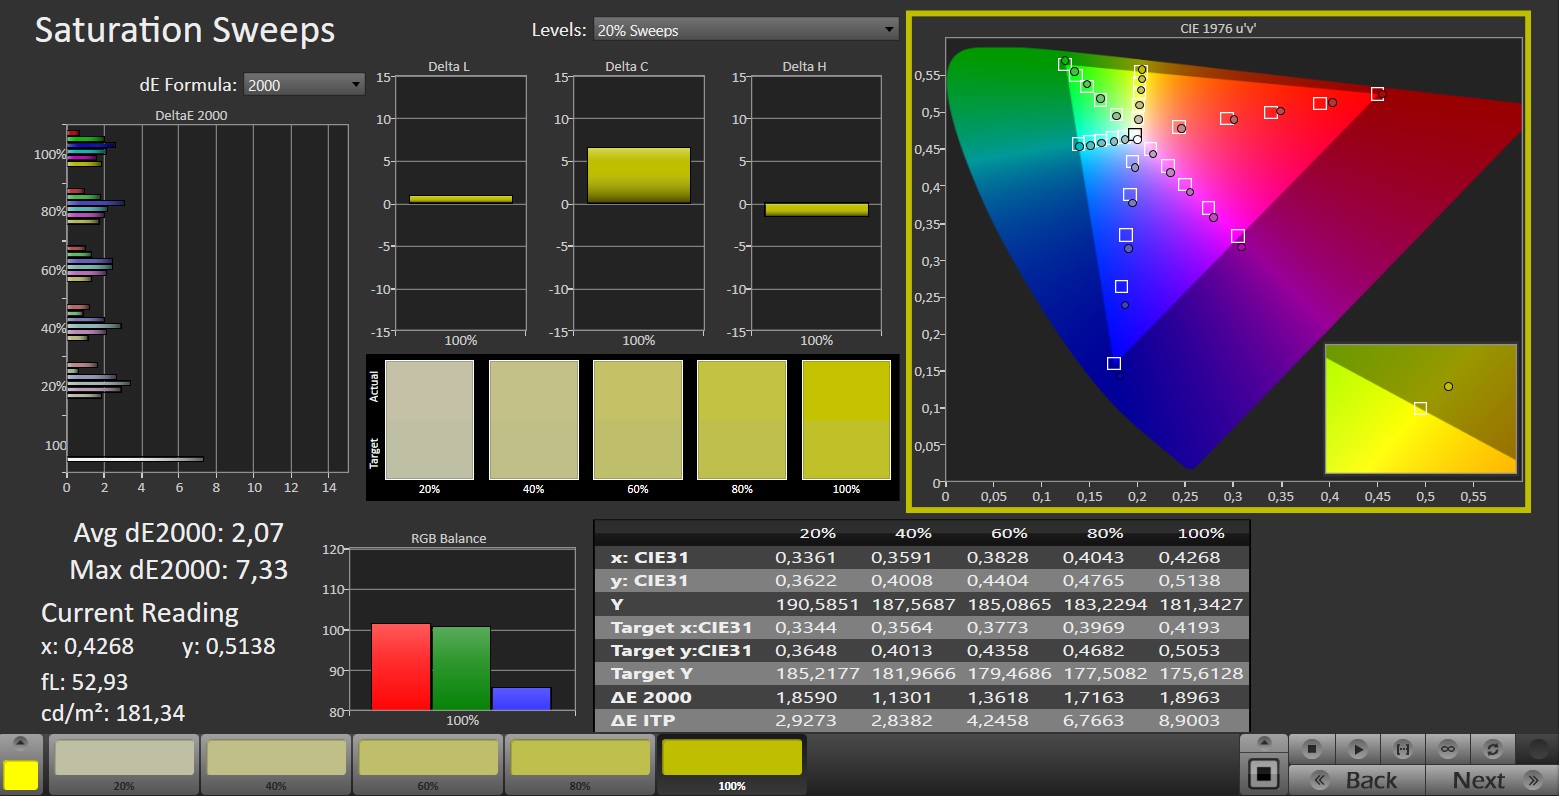
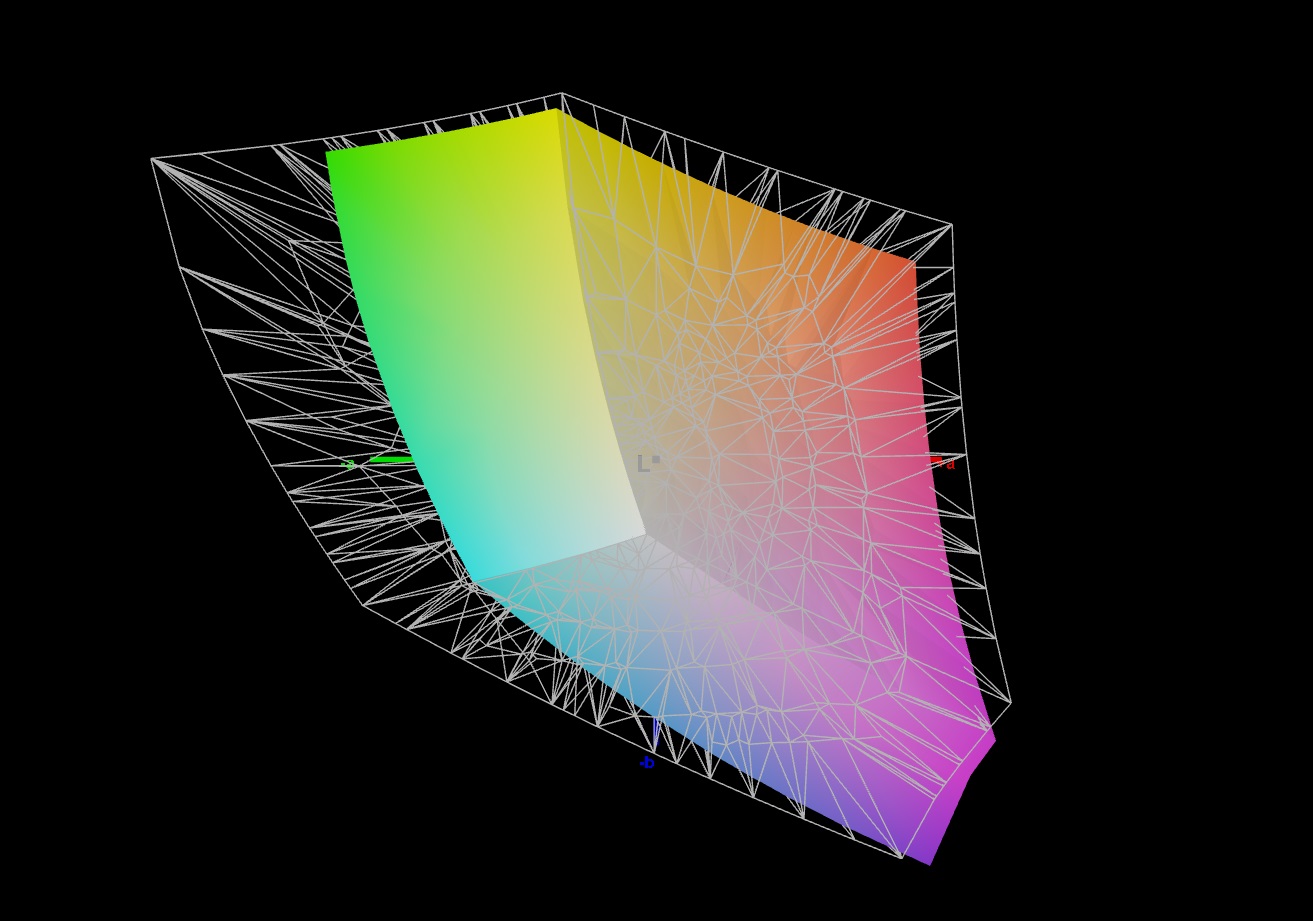
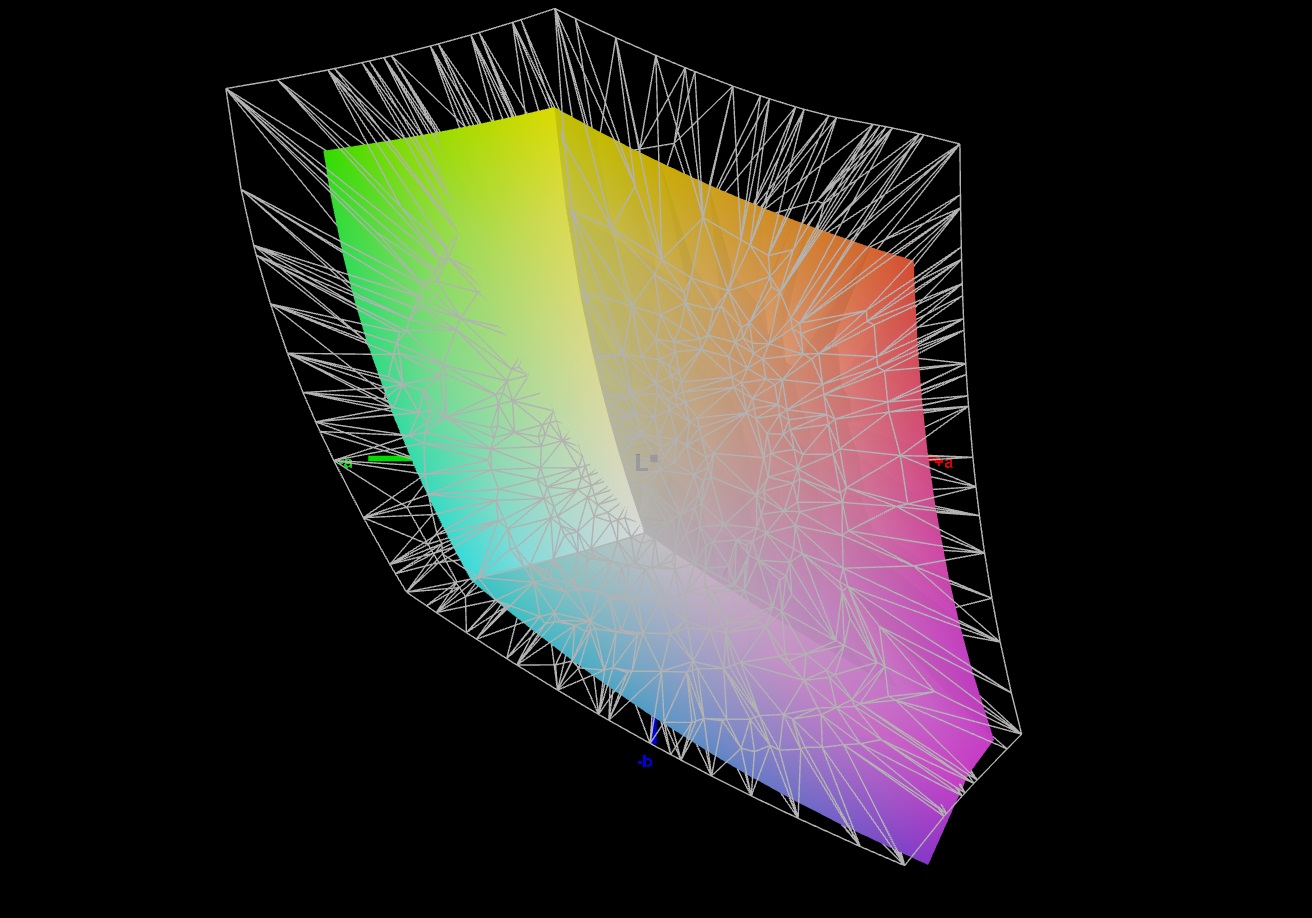
70.1% AdobeRGB 1998 (Argyll 3D)
98.2% sRGB (Argyll 3D)
69.4% Display P3 (Argyll 3D)
Gamma: 2.137
CCT: 6672 K
| Schenker XMG Pro 16 Studio (Mid 23) BOE CQ NE160QDM-NZ1, IPS, 2560x1600, 16" | Asus Vivobook Pro 16X K6604JV-MX016W Samsung SDC4178 ATNA60BX01-1, OLED, 3200x2000, 16" | Lenovo Legion Slim 7i 16 Gen 8 CSOT T3 MNG007DA2-3, IPS, 2560x1600, 16" | HP Omen Transcend 16 AUOA3A6, Mini-LED, 2560x1600, 16" | MSI Stealth 16 Studio A13VG AUO26A9, IPS, 2560x1600, 16" | |
|---|---|---|---|---|---|
| Display | 27% | 2% | 23% | 21% | |
| Display P3 Coverage (%) | 69.4 | 98.4 42% | 70.4 1% | 99.2 43% | 96.4 39% |
| sRGB Coverage (%) | 98.2 | 99.7 2% | 99.4 1% | 100 2% | 99.7 2% |
| AdobeRGB 1998 Coverage (%) | 70.1 | 95.8 37% | 72.5 3% | 87.6 25% | 84.8 21% |
| Response Times | 85% | -7% | -191% | 46% | |
| Response Time Grey 50% / Grey 80% * (ms) | 12.2 ? | 1.6 ? 87% | 12 ? 2% | 26.4 ? -116% | 4.4 ? 64% |
| Response Time Black / White * (ms) | 7.7 ? | 1.4 ? 82% | 8.9 ? -16% | 28.2 ? -266% | 5.6 ? 27% |
| PWM Frequency (Hz) | 120 ? | 3506 ? | |||
| Screen | 66% | 17% | 204% | -19% | |
| Brightness middle (cd/m²) | 349 | 347 -1% | 474.6 36% | 791.1 127% | 424 21% |
| Brightness (cd/m²) | 348 | 346 -1% | 445 28% | 800 130% | 411 18% |
| Brightness Distribution (%) | 93 | 97 4% | 86 -8% | 95 2% | 88 -5% |
| Black Level * (cd/m²) | 0.32 | 0.06 81% | 0.39 -22% | 0.04 87% | 0.37 -16% |
| Contrast (:1) | 1091 | 5783 430% | 1217 12% | 19778 1713% | 1146 5% |
| Colorchecker dE 2000 * | 1.98 | 1.89 5% | 2.12 -7% | 4.37 -121% | 3.04 -54% |
| Colorchecker dE 2000 max. * | 7.56 | 3.26 57% | 4.73 37% | 10.39 -37% | 7.5 1% |
| Colorchecker dE 2000 calibrated * | 1.45 | 1.97 -36% | 0.57 61% | 1.04 28% | 3.04 -110% |
| Greyscale dE 2000 * | 3.3 | 1.55 53% | 2.8 15% | 6.5 -97% | 4.34 -32% |
| Gamma | 2.137 103% | 2.39 92% | 2.22 99% | 2.28 96% | 2.32 95% |
| CCT | 6672 97% | 6458 101% | 6542 99% | 6000 108% | 6952 93% |
| Media totale (Programma / Settaggio) | 59% /
60% | 4% /
10% | 12% /
109% | 16% /
-1% |
* ... Meglio usare valori piccoli
Direttamente dalla scatola, lo schermo mostra una rappresentazione dei colori piuttosto buona: Con una deviazione di circa 2, il suo obiettivo (DeltaE < 3) viene raggiunto. La calibrazione del display porta a una deviazione minore di 1,45 e a toni di grigio più equilibrati. Il pannello è in grado di rappresentare quasi interamente lo spazio colore sRGB - ma non AdobeRGB o DCI P3. In questo caso, la concorrenza ha più da offrire a volte.


Tempi di risposta del Display
| ↔ Tempi di risposta dal Nero al Bianco | ||
|---|---|---|
| 7.7 ms ... aumenta ↗ e diminuisce ↘ combinato | ↗ 4 ms Incremento | 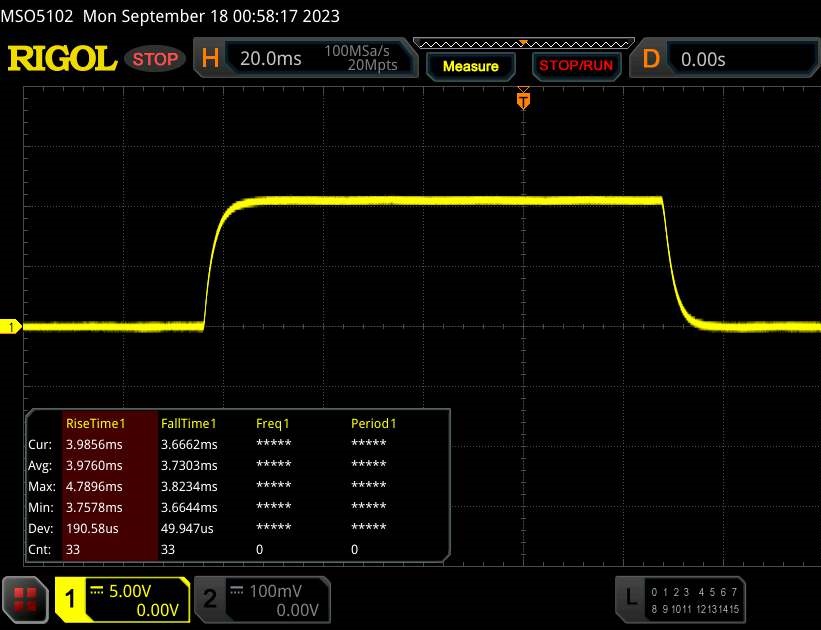 |
| ↘ 3.7 ms Calo | ||
| Lo schermo ha mostrato valori di risposta molto veloci nei nostri tests ed è molto adatto per i gaming veloce. In confronto, tutti i dispositivi di test variano da 0.1 (minimo) a 240 (massimo) ms. » 22 % di tutti i dispositivi è migliore. Questo significa che i tempi di risposta rilevati sono migliori rispettto alla media di tutti i dispositivi testati (19.8 ms). | ||
| ↔ Tempo di risposta dal 50% Grigio all'80% Grigio | ||
| 12.2 ms ... aumenta ↗ e diminuisce ↘ combinato | ↗ 5.9 ms Incremento | 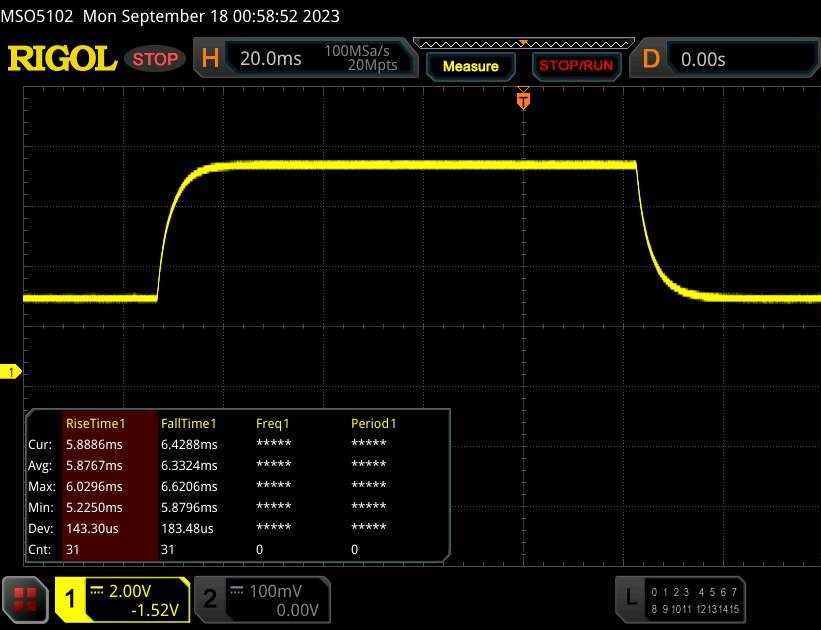 |
| ↘ 6.3 ms Calo | ||
| Lo schermo mostra buoni tempi di risposta durante i nostri tests, ma potrebbe essere troppo lento per i gamers competitivi. In confronto, tutti i dispositivi di test variano da 0.165 (minimo) a 636 (massimo) ms. » 26 % di tutti i dispositivi è migliore. Questo significa che i tempi di risposta rilevati sono migliori rispettto alla media di tutti i dispositivi testati (31 ms). | ||
Sfarfallio dello schermo / PWM (Pulse-Width Modulation)
| flickering dello schermo / PWM non rilevato | 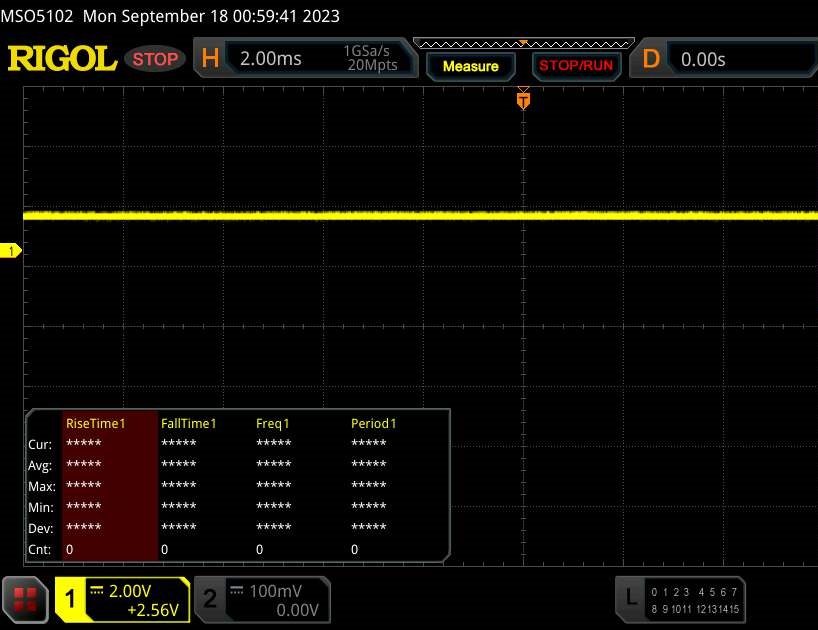 | ||
In confronto: 52 % di tutti i dispositivi testati non utilizza PWM per ridurre la luminosita' del display. Se è rilevato PWM, una media di 7757 (minimo: 5 - massimo: 343500) Hz è stata rilevata. | |||
Il pannello IPS stabile nell'angolo di visione del portatile rimane leggibile da ogni angolazione. All'esterno, può leggere dal display a condizione che il sole non sia troppo luminoso.
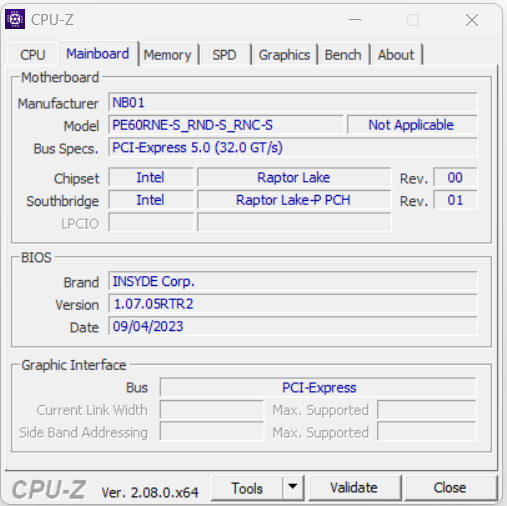
Prestazioni - Il portatile Schenker si affida a Raptor Lake e Ada Lovelace
XMG Pro 16 Studio, orientato ai giocatori e ai creatori, si basa su Raptor Lake e Ada Lovelace. La certificazione GeForce RTX Studio dovrebbe garantire prestazioni elevate, driver personalizzati, un buon supporto software e una copertura adeguata dello spazio colore del display. Il computer portatile può essere configurato individualmente tramite il negozio online di Schenker. La variante attuale può essere acquistata per circa 2.400 dollari, mentre i modelli più economici partono da circa 1.900 dollari.
Condizioni di test
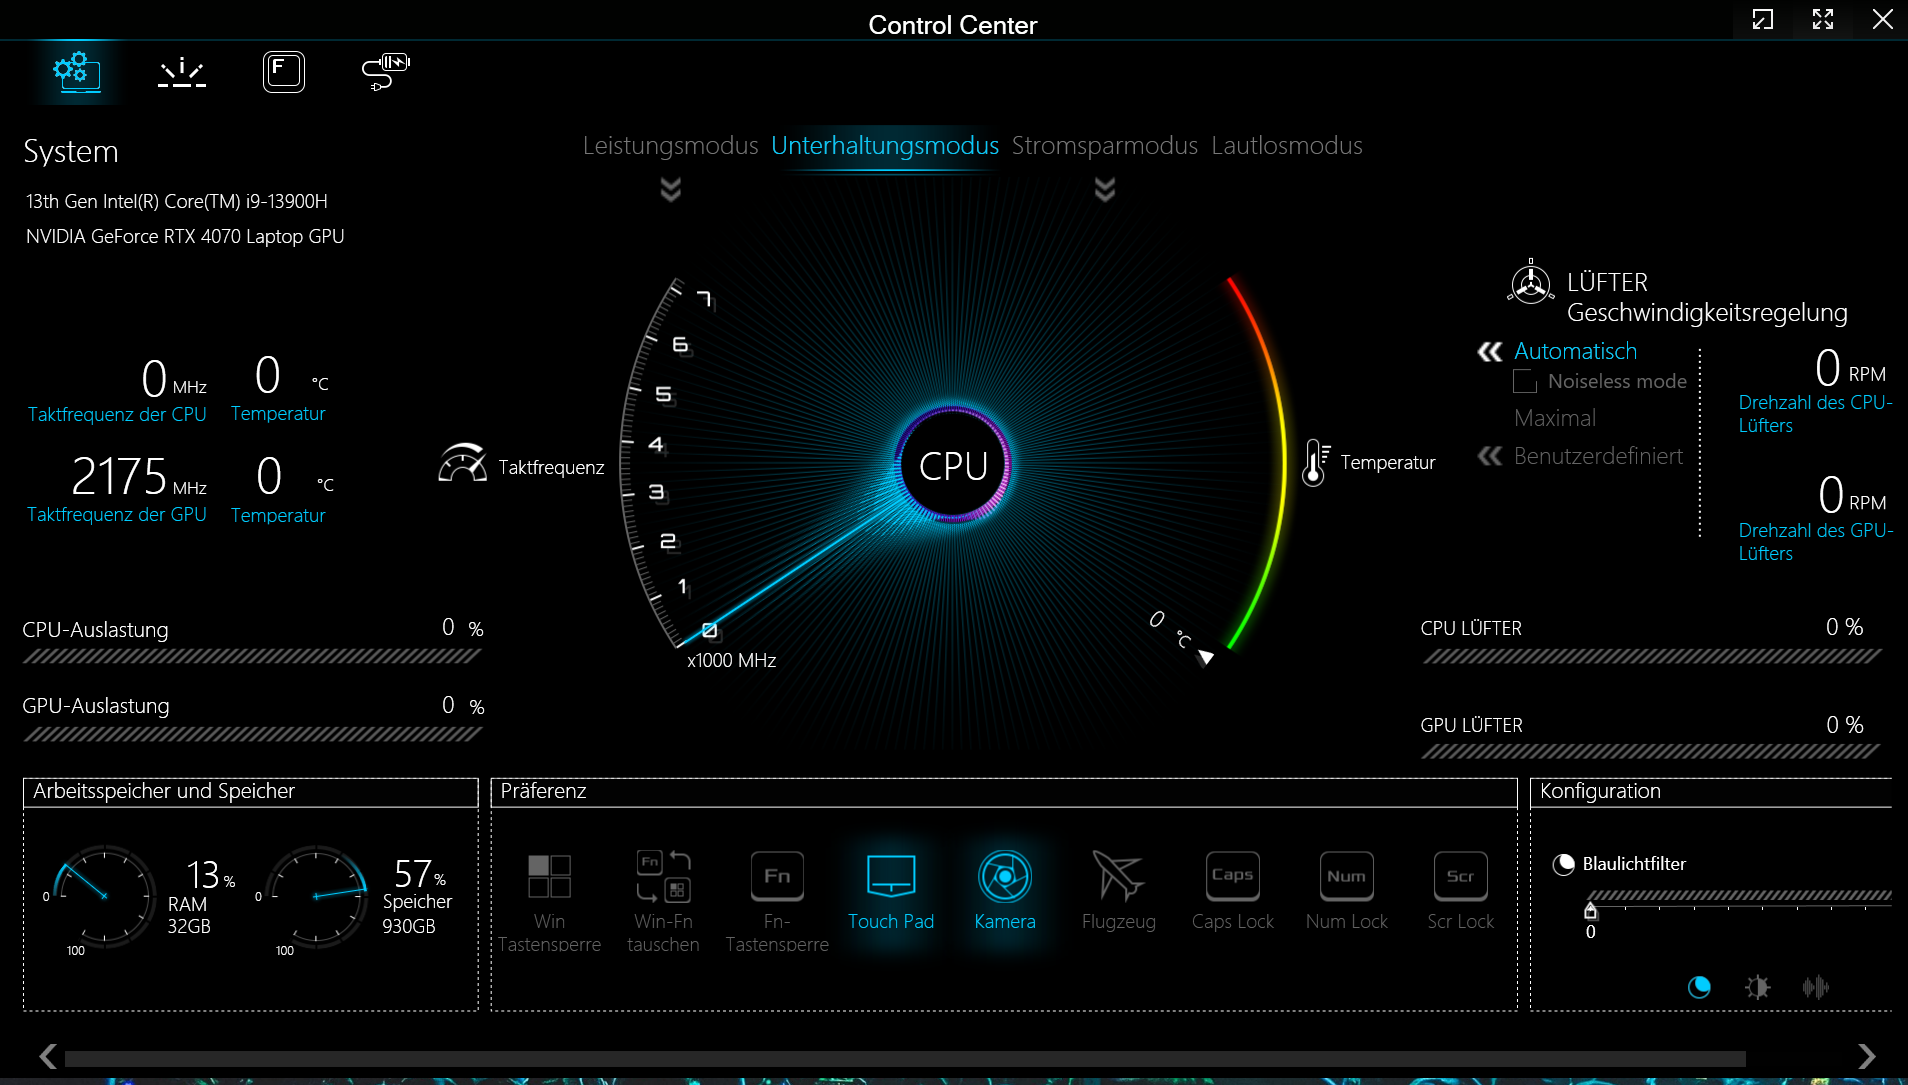
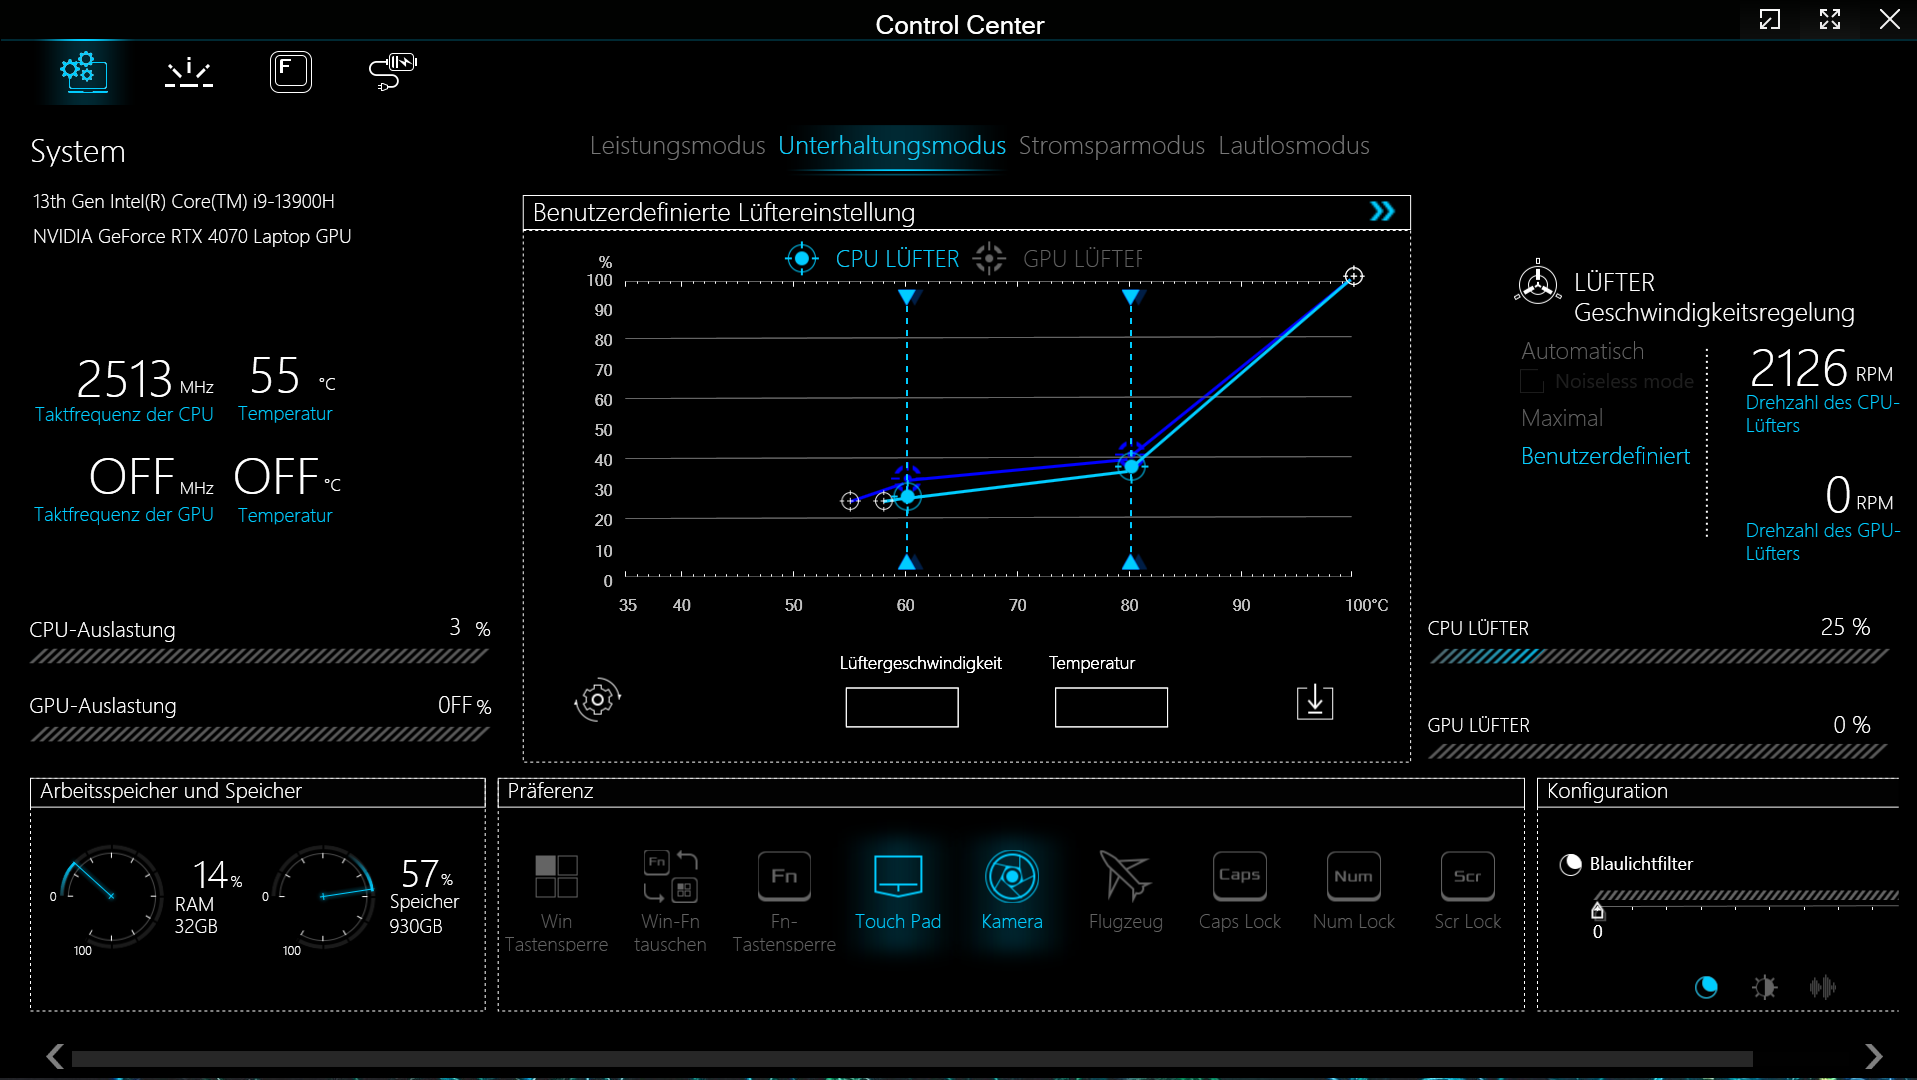
Il Pro offre quattro modalità di prestazioni specifiche del produttore (vedere tabella) che possono essere alternate tramite il software Control Center (il centro di controllo del portatile). sono state utilizzate le modalità "Intrattenimento" (benchmark) e "Risparmio energetico" (test della batteria). Optimus era attivo.
| Modalità Intrattenimento | Modalità Performance | Modalità Risparmio energetico | Modalità Silenziosa | |
|---|---|---|---|---|
| Limite di potenza 1 (HWInfo) | 70 watt | 100 watt | 15 watt | 15 watt |
| Limite di potenza 2 (HWInfo) | 90 watt | 120 watt | 30 watt | 30 watt |
| Rumore (Witcher 3) | 48 dB(A) | 55 dB (A) | - | 42 dB (A) |
| Prestazioni (Witcher 3) | ~114 fps | ~118 fps | - | ~100-114 fps |
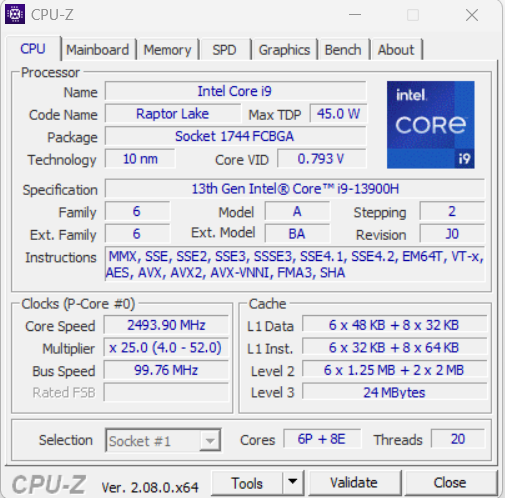
Processore
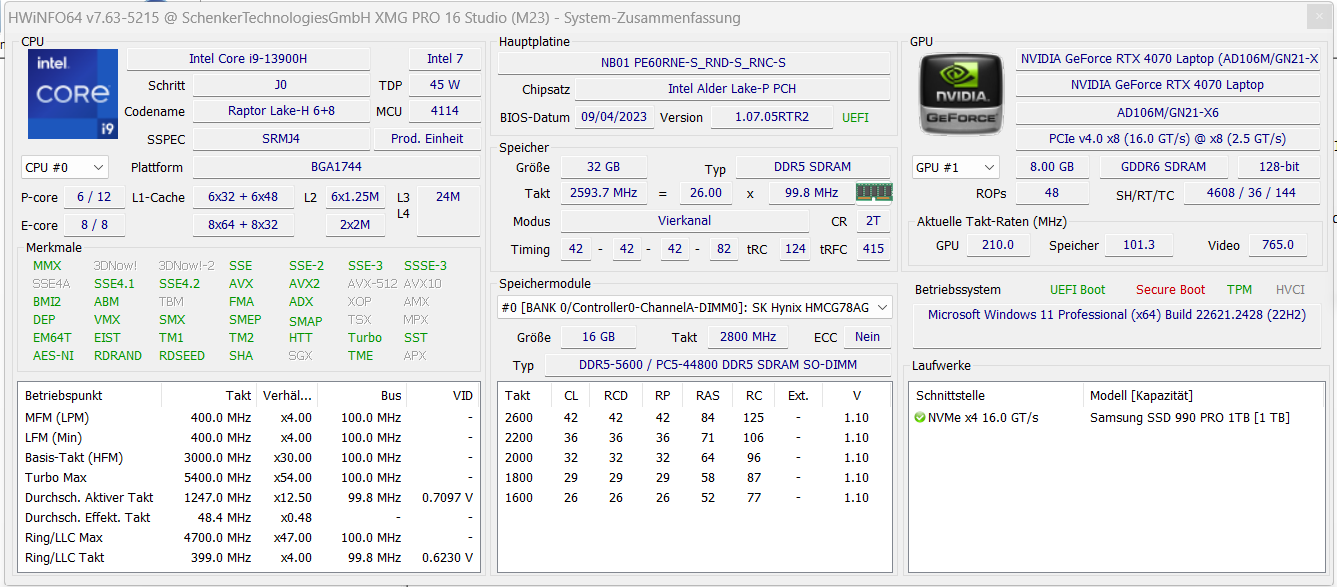
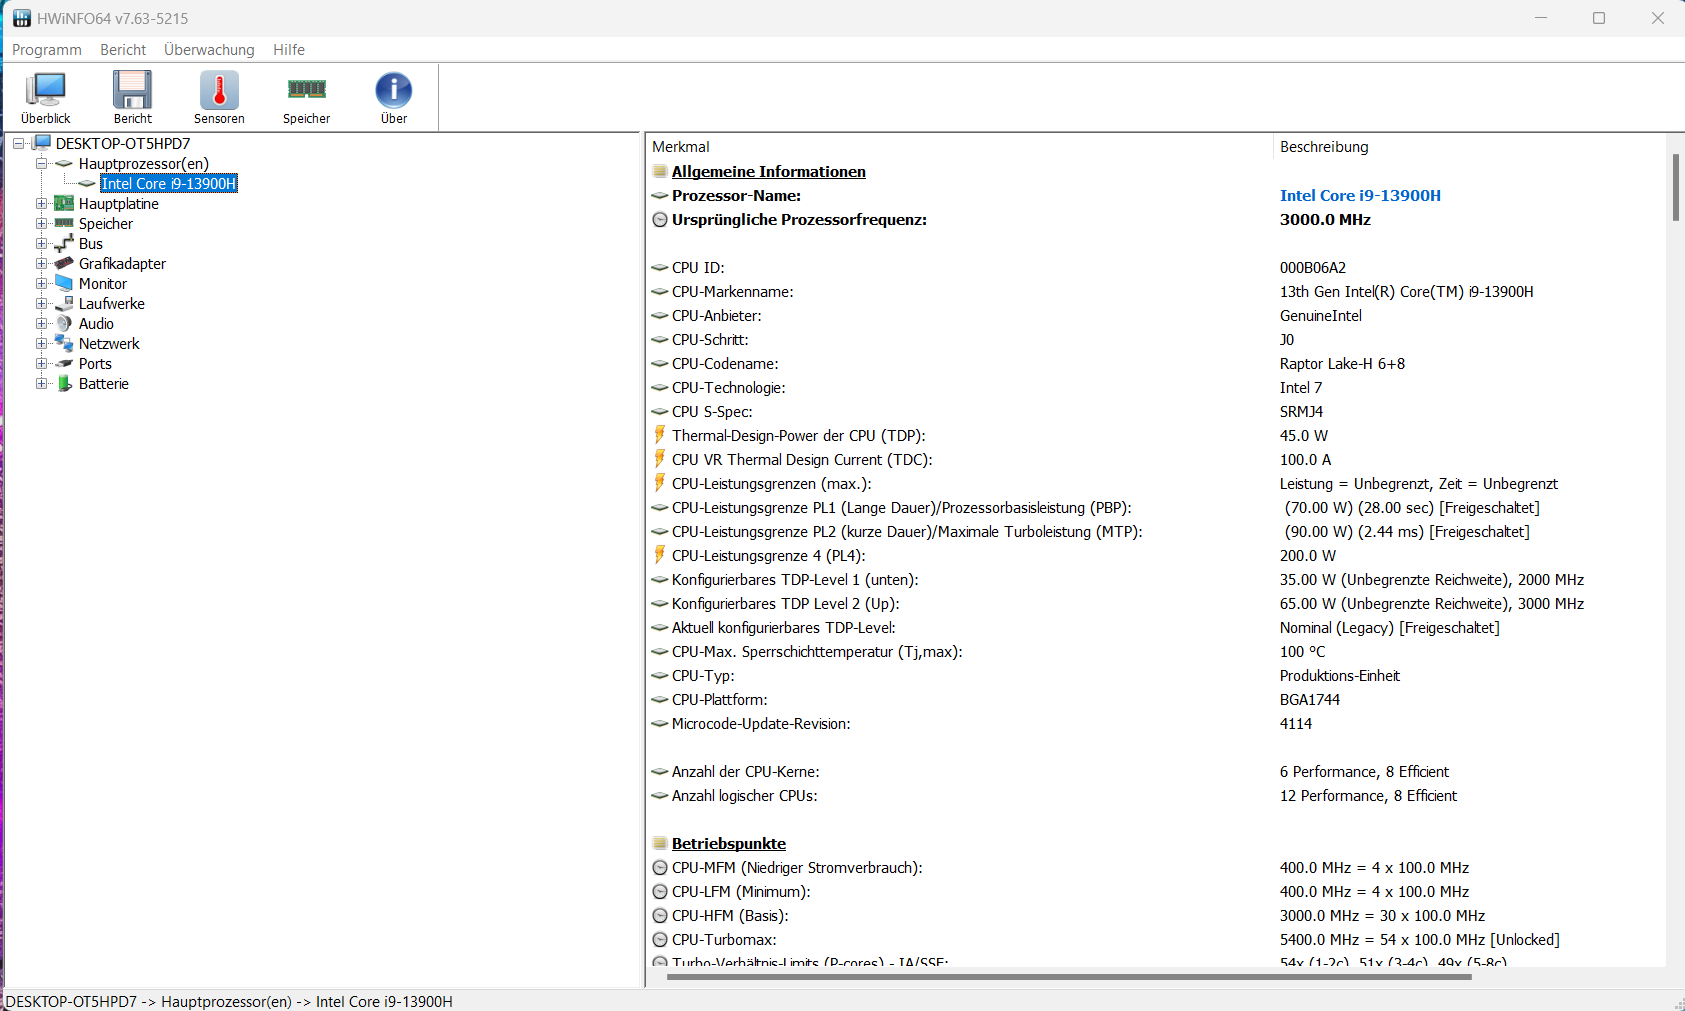
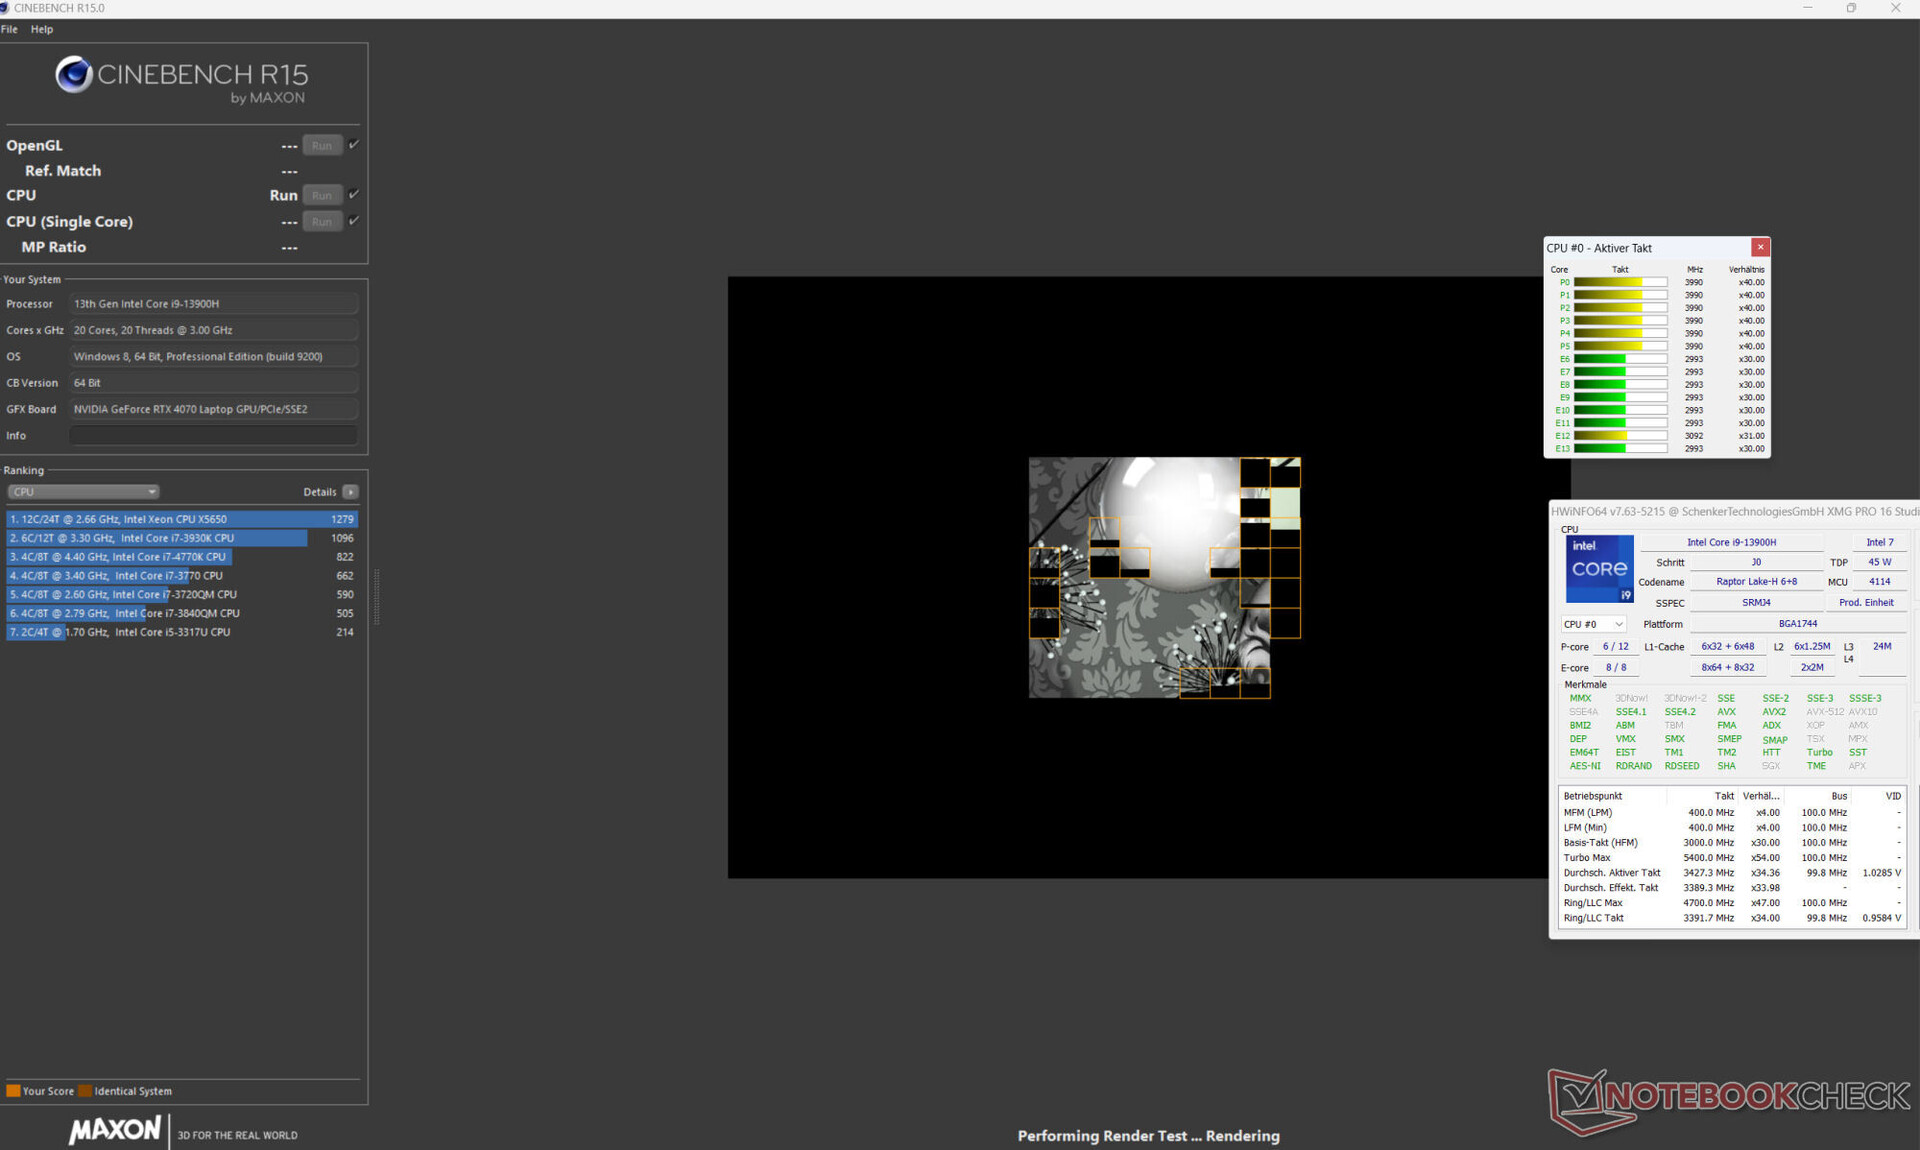
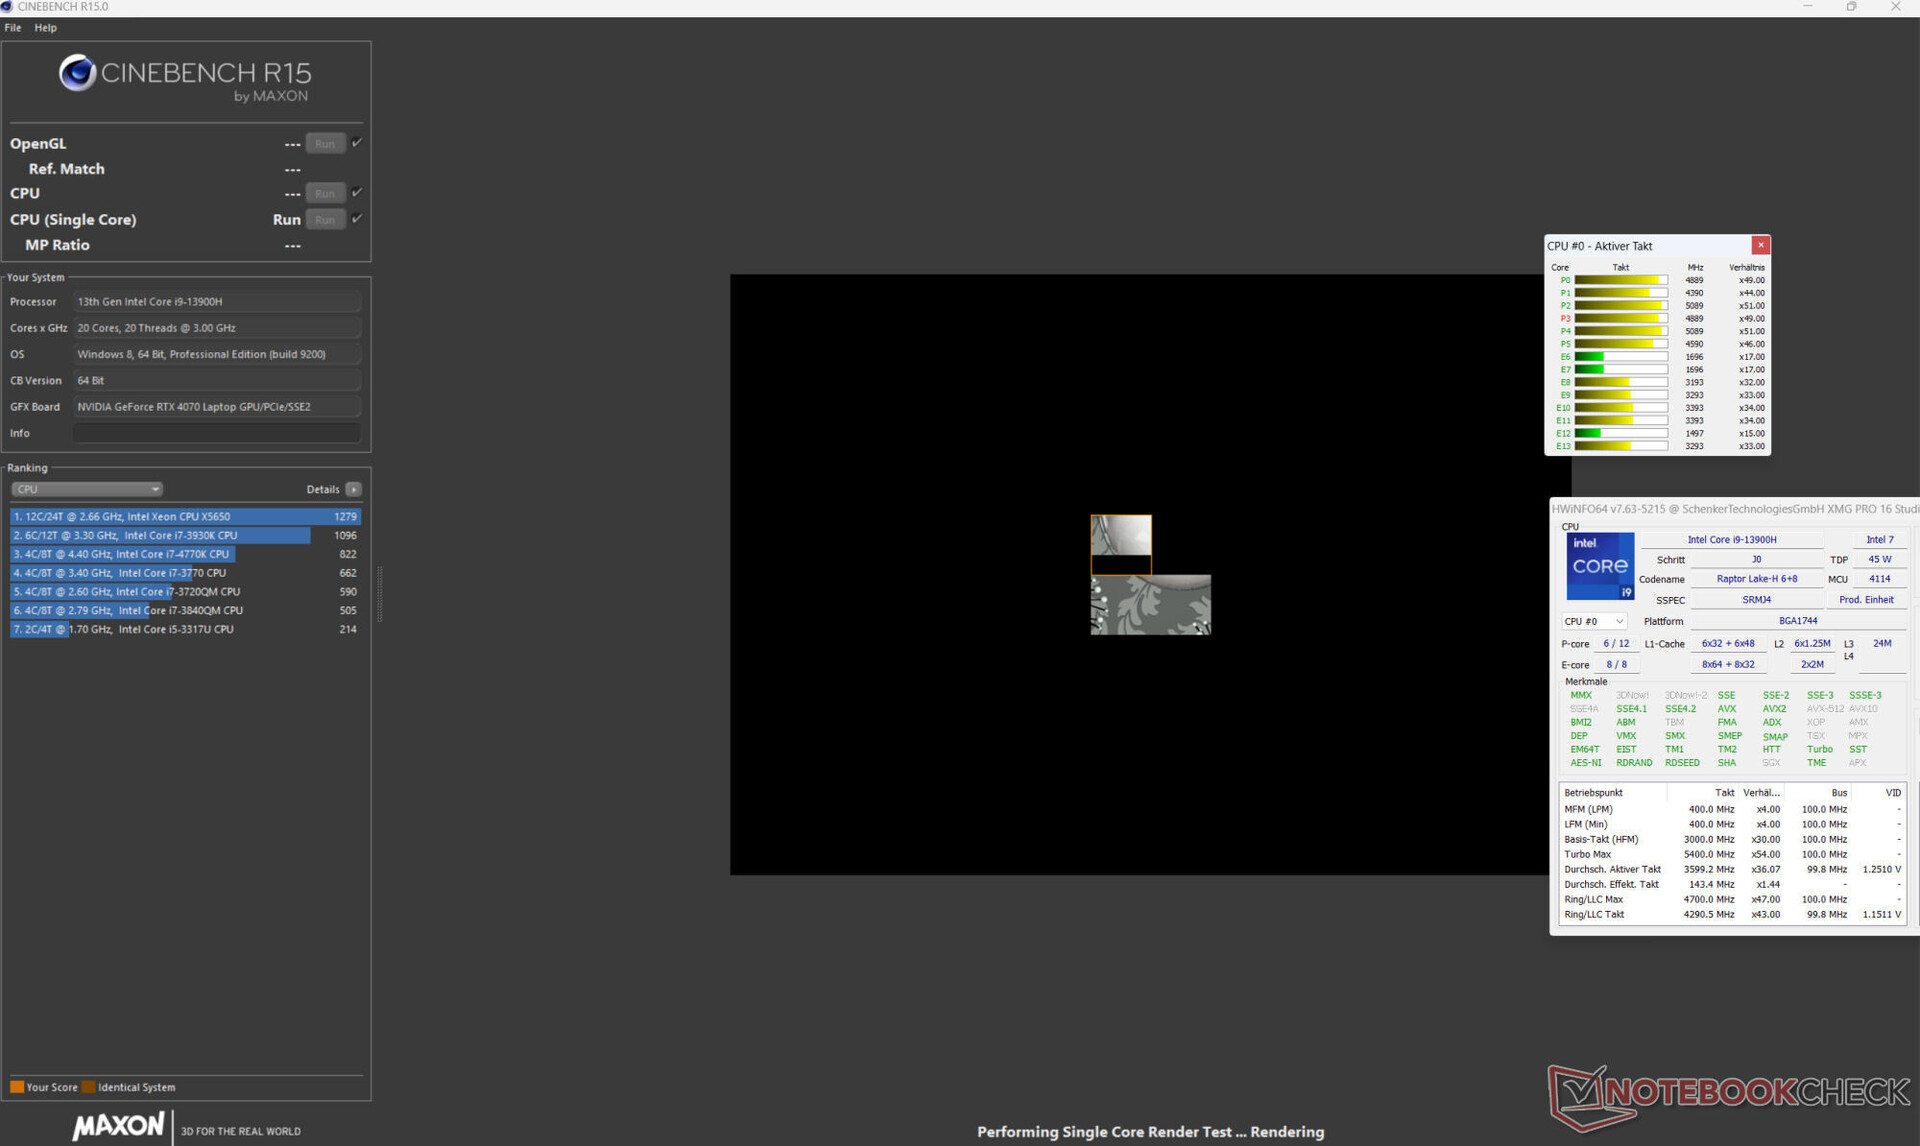
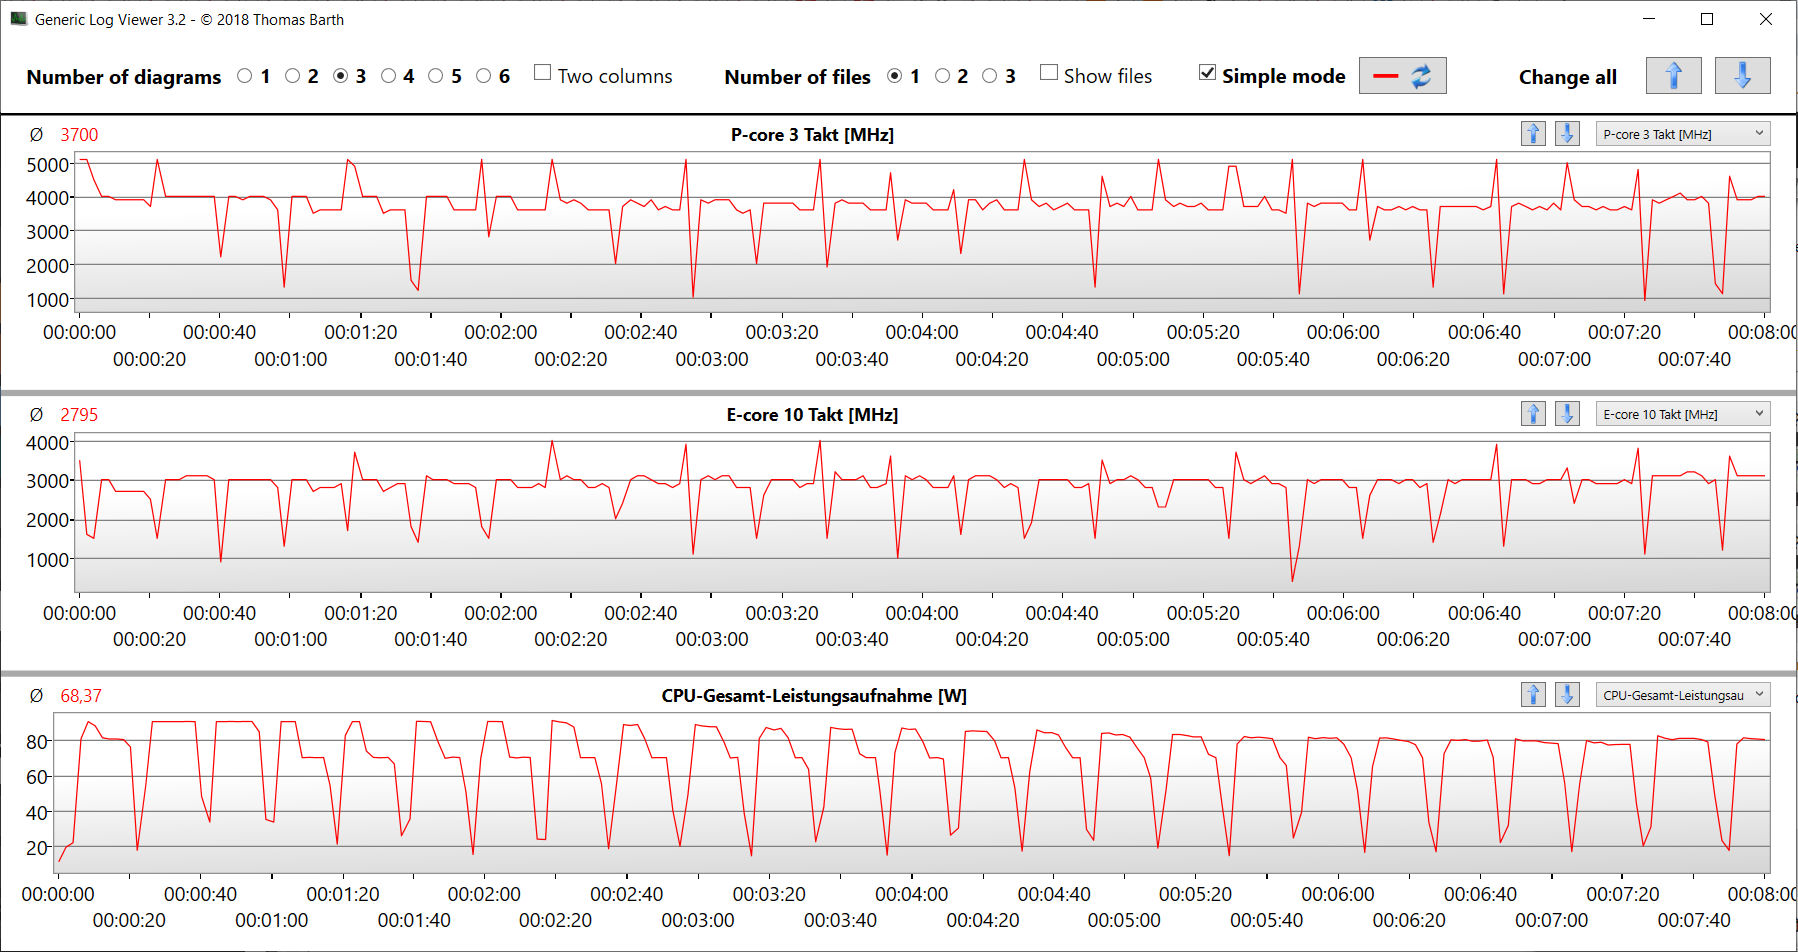
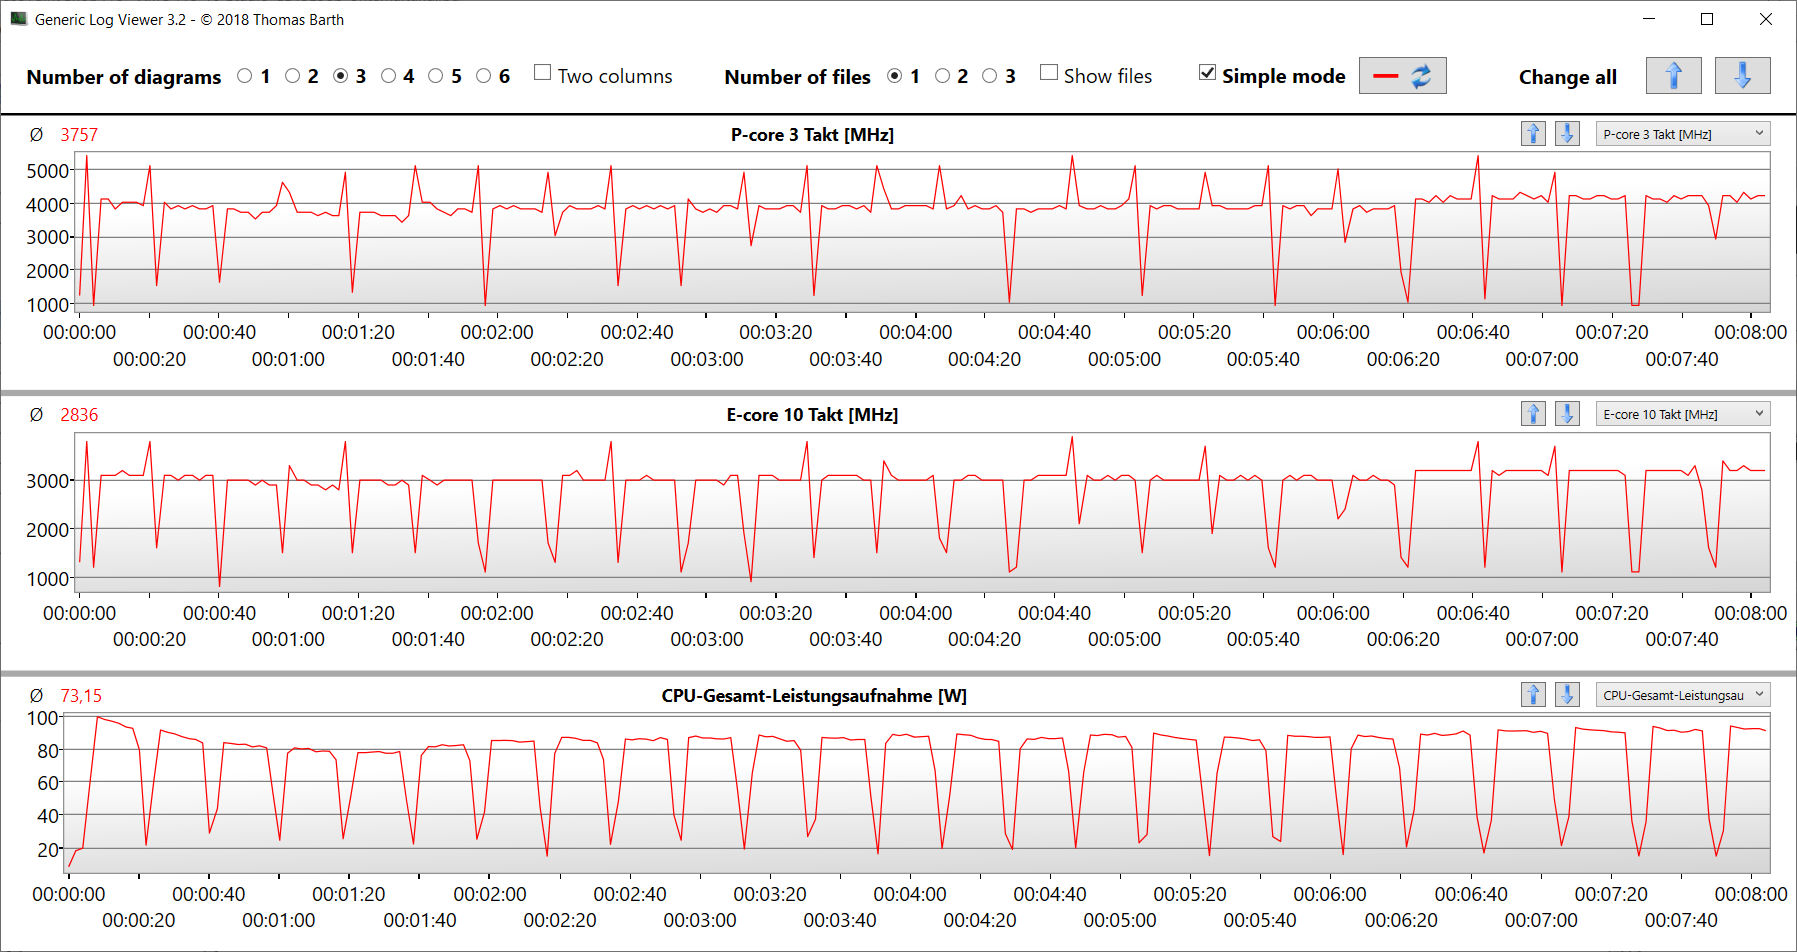
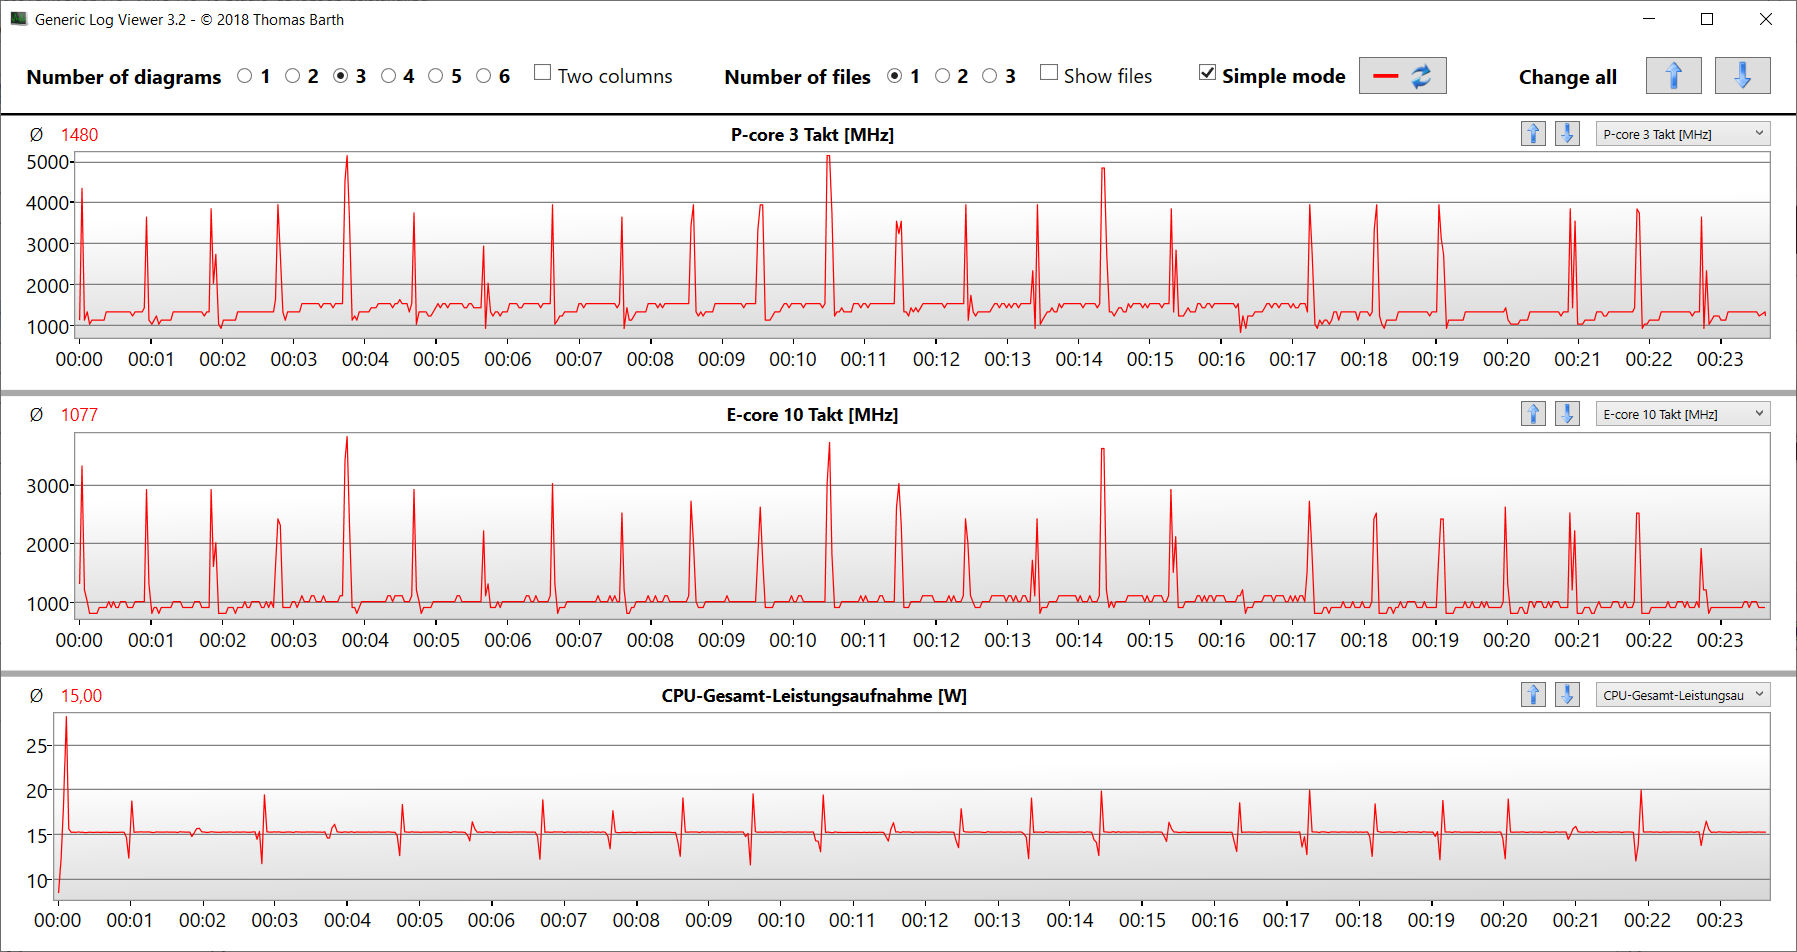
IlCore i9-13900H(6P, 8E) 14 core della CPU raggiungono velocità di clock massime di 5,4 GHz (P) e 4,1 GHz (E). Il carico permanente multi-thread (CB15 Loop) ha portato la velocità di clock a diminuire leggermente dal primo al quarto run. In seguito, i valori sono rimasti costanti.
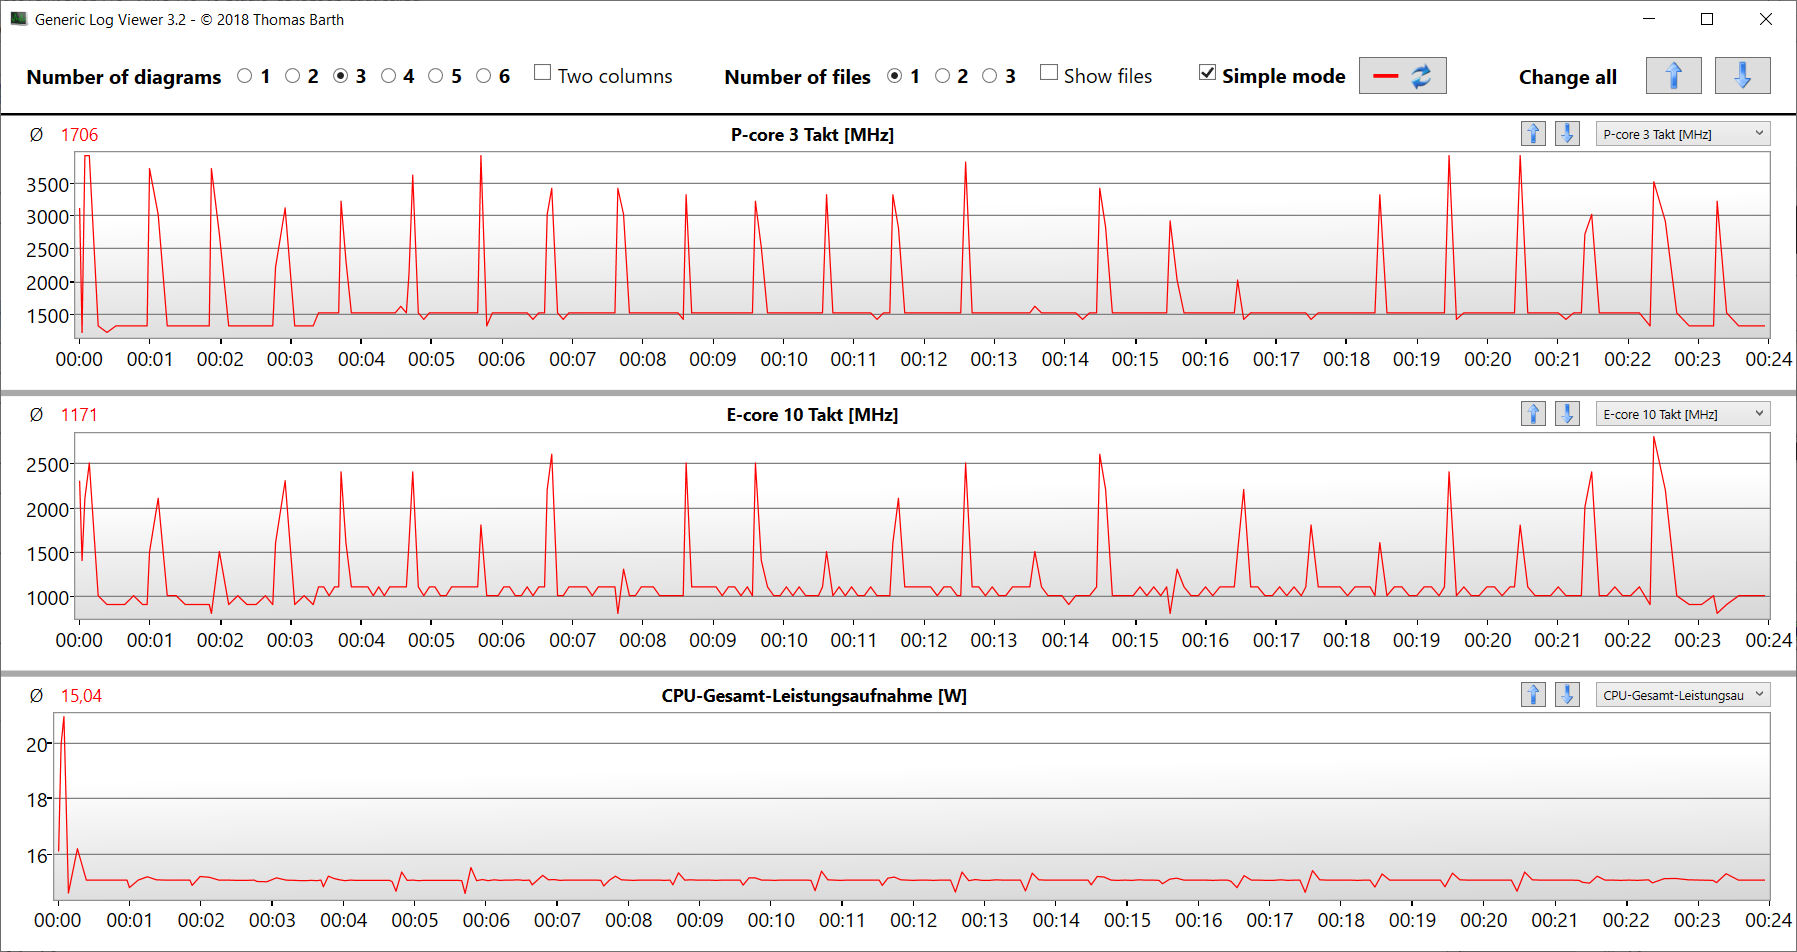
Abbiamo misurato risultati di benchmark leggermente superiori alla media della CPU determinata in precedenza (collegata alla rete elettrica). In modalità batteria, le prestazioni single-thread più rilevanti (158 punti; CB15) sono scese in misura maggiore rispetto alle prestazioni multi-thread (1.696 punti; CB15).
Cinebench R15 Multi continuous test
* ... Meglio usare valori piccoli
AIDA64: FP32 Ray-Trace | FPU Julia | CPU SHA3 | CPU Queen | FPU SinJulia | FPU Mandel | CPU AES | CPU ZLib | FP64 Ray-Trace | CPU PhotoWorxx
| Performance rating | |
| Media della classe Gaming | |
| HP Omen Transcend 16 | |
| Asus Vivobook Pro 16X K6604JV-MX016W | |
| Schenker XMG Pro 16 Studio (Mid 23) | |
| MSI Stealth 16 Studio A13VG | |
| Lenovo Legion Slim 7i 16 Gen 8 | |
| Media Intel Core i9-13900H | |
| AIDA64 / FP32 Ray-Trace | |
| Media della classe Gaming (10227 - 85542, n=105, ultimi 2 anni) | |
| HP Omen Transcend 16 | |
| Asus Vivobook Pro 16X K6604JV-MX016W | |
| MSI Stealth 16 Studio A13VG | |
| Lenovo Legion Slim 7i 16 Gen 8 | |
| Schenker XMG Pro 16 Studio (Mid 23) | |
| Media Intel Core i9-13900H (6788 - 19557, n=25) | |
| AIDA64 / FPU Julia | |
| Media della classe Gaming (51376 - 238426, n=105, ultimi 2 anni) | |
| HP Omen Transcend 16 | |
| Asus Vivobook Pro 16X K6604JV-MX016W | |
| Lenovo Legion Slim 7i 16 Gen 8 | |
| Schenker XMG Pro 16 Studio (Mid 23) | |
| MSI Stealth 16 Studio A13VG | |
| Media Intel Core i9-13900H (22551 - 95579, n=25) | |
| AIDA64 / CPU SHA3 | |
| Media della classe Gaming (2180 - 10115, n=105, ultimi 2 anni) | |
| HP Omen Transcend 16 | |
| Asus Vivobook Pro 16X K6604JV-MX016W | |
| MSI Stealth 16 Studio A13VG | |
| Lenovo Legion Slim 7i 16 Gen 8 | |
| Schenker XMG Pro 16 Studio (Mid 23) | |
| Media Intel Core i9-13900H (2491 - 4270, n=25) | |
| AIDA64 / CPU Queen | |
| Asus Vivobook Pro 16X K6604JV-MX016W | |
| HP Omen Transcend 16 | |
| Lenovo Legion Slim 7i 16 Gen 8 | |
| Media della classe Gaming (49785 - 173351, n=90, ultimi 2 anni) | |
| MSI Stealth 16 Studio A13VG | |
| Media Intel Core i9-13900H (65121 - 120936, n=25) | |
| Schenker XMG Pro 16 Studio (Mid 23) | |
| AIDA64 / FPU SinJulia | |
| Media della classe Gaming (4424 - 33636, n=105, ultimi 2 anni) | |
| Asus Vivobook Pro 16X K6604JV-MX016W | |
| HP Omen Transcend 16 | |
| Lenovo Legion Slim 7i 16 Gen 8 | |
| MSI Stealth 16 Studio A13VG | |
| Schenker XMG Pro 16 Studio (Mid 23) | |
| Media Intel Core i9-13900H (6108 - 11631, n=25) | |
| AIDA64 / FPU Mandel | |
| Media della classe Gaming (25115 - 128721, n=105, ultimi 2 anni) | |
| HP Omen Transcend 16 | |
| Asus Vivobook Pro 16X K6604JV-MX016W | |
| Lenovo Legion Slim 7i 16 Gen 8 | |
| MSI Stealth 16 Studio A13VG | |
| Schenker XMG Pro 16 Studio (Mid 23) | |
| Media Intel Core i9-13900H (11283 - 48474, n=25) | |
| AIDA64 / CPU AES | |
| Schenker XMG Pro 16 Studio (Mid 23) | |
| HP Omen Transcend 16 | |
| Media della classe Gaming (39258 - 247074, n=105, ultimi 2 anni) | |
| Asus Vivobook Pro 16X K6604JV-MX016W | |
| Media Intel Core i9-13900H (3691 - 149377, n=25) | |
| MSI Stealth 16 Studio A13VG | |
| Lenovo Legion Slim 7i 16 Gen 8 | |
| AIDA64 / CPU ZLib | |
| HP Omen Transcend 16 | |
| Media della classe Gaming (574 - 2531, n=105, ultimi 2 anni) | |
| Asus Vivobook Pro 16X K6604JV-MX016W | |
| Lenovo Legion Slim 7i 16 Gen 8 | |
| Schenker XMG Pro 16 Studio (Mid 23) | |
| Media Intel Core i9-13900H (789 - 1254, n=25) | |
| MSI Stealth 16 Studio A13VG | |
| AIDA64 / FP64 Ray-Trace | |
| Media della classe Gaming (5509 - 45446, n=105, ultimi 2 anni) | |
| HP Omen Transcend 16 | |
| Asus Vivobook Pro 16X K6604JV-MX016W | |
| MSI Stealth 16 Studio A13VG | |
| Lenovo Legion Slim 7i 16 Gen 8 | |
| Schenker XMG Pro 16 Studio (Mid 23) | |
| Media Intel Core i9-13900H (3655 - 10716, n=25) | |
| AIDA64 / CPU PhotoWorxx | |
| HP Omen Transcend 16 | |
| Schenker XMG Pro 16 Studio (Mid 23) | |
| MSI Stealth 16 Studio A13VG | |
| Media della classe Gaming (12271 - 89891, n=105, ultimi 2 anni) | |
| Asus Vivobook Pro 16X K6604JV-MX016W | |
| Media Intel Core i9-13900H (10871 - 50488, n=25) | |
| Lenovo Legion Slim 7i 16 Gen 8 | |
Prestazioni del sistema
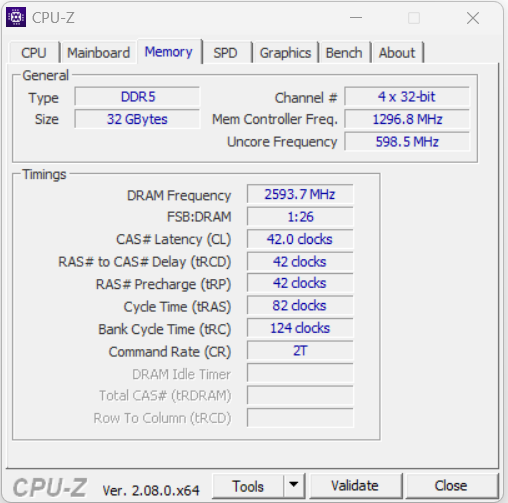
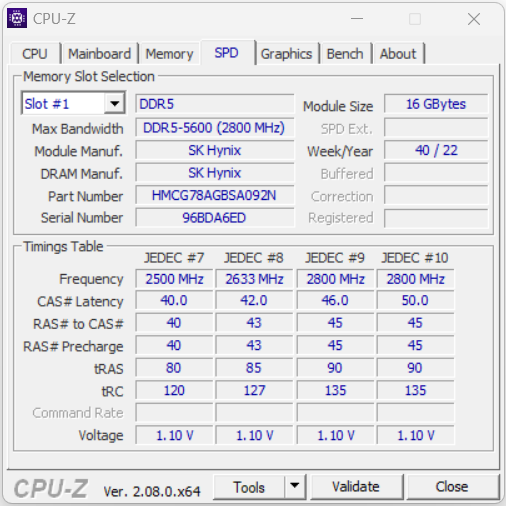
Il sistema, che funziona senza problemi, non manca di potenza di calcolo. Il gioco, il rendering e l'editing video sono tra le competenze principali del computer. Le velocità di trasferimento della RAM sono nella norma per una RAM DDR5-5600.
CrossMark: Overall | Productivity | Creativity | Responsiveness
| PCMark 10 / Score | |
| Lenovo Legion Slim 7i 16 Gen 8 | |
| Media della classe Gaming (5828 - 12414, n=93, ultimi 2 anni) | |
| HP Omen Transcend 16 | |
| Schenker XMG Pro 16 Studio (Mid 23) | |
| Media Intel Core i9-13900H, NVIDIA GeForce RTX 4070 Laptop GPU (5855 - 8538, n=8) | |
| MSI Stealth 16 Studio A13VG | |
| Asus Vivobook Pro 16X K6604JV-MX016W | |
| PCMark 10 / Essentials | |
| Schenker XMG Pro 16 Studio (Mid 23) | |
| Lenovo Legion Slim 7i 16 Gen 8 | |
| HP Omen Transcend 16 | |
| Media Intel Core i9-13900H, NVIDIA GeForce RTX 4070 Laptop GPU (8835 - 11940, n=8) | |
| Media della classe Gaming (8810 - 11935, n=97, ultimi 2 anni) | |
| Asus Vivobook Pro 16X K6604JV-MX016W | |
| MSI Stealth 16 Studio A13VG | |
| PCMark 10 / Productivity | |
| Media della classe Gaming (6845 - 25323, n=95, ultimi 2 anni) | |
| Lenovo Legion Slim 7i 16 Gen 8 | |
| Schenker XMG Pro 16 Studio (Mid 23) | |
| Media Intel Core i9-13900H, NVIDIA GeForce RTX 4070 Laptop GPU (7967 - 10991, n=8) | |
| HP Omen Transcend 16 | |
| MSI Stealth 16 Studio A13VG | |
| Asus Vivobook Pro 16X K6604JV-MX016W | |
| PCMark 10 / Digital Content Creation | |
| Media della classe Gaming (7602 - 19954, n=95, ultimi 2 anni) | |
| Lenovo Legion Slim 7i 16 Gen 8 | |
| HP Omen Transcend 16 | |
| Media Intel Core i9-13900H, NVIDIA GeForce RTX 4070 Laptop GPU (7738 - 13575, n=8) | |
| Schenker XMG Pro 16 Studio (Mid 23) | |
| MSI Stealth 16 Studio A13VG | |
| Asus Vivobook Pro 16X K6604JV-MX016W | |
| CrossMark / Overall | |
| Asus Vivobook Pro 16X K6604JV-MX016W | |
| Media della classe Gaming (1366 - 2409, n=94, ultimi 2 anni) | |
| Lenovo Legion Slim 7i 16 Gen 8 | |
| HP Omen Transcend 16 | |
| Schenker XMG Pro 16 Studio (Mid 23) | |
| Media Intel Core i9-13900H, NVIDIA GeForce RTX 4070 Laptop GPU (1104 - 1974, n=7) | |
| MSI Stealth 16 Studio A13VG | |
| CrossMark / Productivity | |
| Asus Vivobook Pro 16X K6604JV-MX016W | |
| Lenovo Legion Slim 7i 16 Gen 8 | |
| Schenker XMG Pro 16 Studio (Mid 23) | |
| Media della classe Gaming (1386 - 2254, n=94, ultimi 2 anni) | |
| HP Omen Transcend 16 | |
| Media Intel Core i9-13900H, NVIDIA GeForce RTX 4070 Laptop GPU (1058 - 1914, n=7) | |
| MSI Stealth 16 Studio A13VG | |
| CrossMark / Creativity | |
| Asus Vivobook Pro 16X K6604JV-MX016W | |
| HP Omen Transcend 16 | |
| Media della classe Gaming (1343 - 2786, n=94, ultimi 2 anni) | |
| Lenovo Legion Slim 7i 16 Gen 8 | |
| Schenker XMG Pro 16 Studio (Mid 23) | |
| Media Intel Core i9-13900H, NVIDIA GeForce RTX 4070 Laptop GPU (1178 - 2254, n=7) | |
| MSI Stealth 16 Studio A13VG | |
| CrossMark / Responsiveness | |
| Schenker XMG Pro 16 Studio (Mid 23) | |
| Lenovo Legion Slim 7i 16 Gen 8 | |
| Media della classe Gaming (1226 - 2334, n=94, ultimi 2 anni) | |
| Asus Vivobook Pro 16X K6604JV-MX016W | |
| Media Intel Core i9-13900H, NVIDIA GeForce RTX 4070 Laptop GPU (1037 - 1952, n=7) | |
| MSI Stealth 16 Studio A13VG | |
| HP Omen Transcend 16 | |
| PCMark 10 Score | 8010 punti | |
Aiuto | ||
| AIDA64 / Memory Copy | |
| HP Omen Transcend 16 | |
| Media della classe Gaming (21750 - 129946, n=105, ultimi 2 anni) | |
| Schenker XMG Pro 16 Studio (Mid 23) | |
| MSI Stealth 16 Studio A13VG | |
| Asus Vivobook Pro 16X K6604JV-MX016W | |
| Media Intel Core i9-13900H (37448 - 74486, n=25) | |
| Lenovo Legion Slim 7i 16 Gen 8 | |
| AIDA64 / Memory Read | |
| HP Omen Transcend 16 | |
| Asus Vivobook Pro 16X K6604JV-MX016W | |
| Schenker XMG Pro 16 Studio (Mid 23) | |
| Media della classe Gaming (22956 - 118858, n=105, ultimi 2 anni) | |
| MSI Stealth 16 Studio A13VG | |
| Media Intel Core i9-13900H (41599 - 75433, n=25) | |
| Lenovo Legion Slim 7i 16 Gen 8 | |
| AIDA64 / Memory Write | |
| Media della classe Gaming (22297 - 135096, n=105, ultimi 2 anni) | |
| HP Omen Transcend 16 | |
| Schenker XMG Pro 16 Studio (Mid 23) | |
| MSI Stealth 16 Studio A13VG | |
| Asus Vivobook Pro 16X K6604JV-MX016W | |
| Media Intel Core i9-13900H (36152 - 88505, n=25) | |
| Lenovo Legion Slim 7i 16 Gen 8 | |
| AIDA64 / Memory Latency | |
| Media della classe Gaming (75.3 - 259, n=105, ultimi 2 anni) | |
| Asus Vivobook Pro 16X K6604JV-MX016W | |
| Media Intel Core i9-13900H (75.8 - 102.3, n=25) | |
| HP Omen Transcend 16 | |
| MSI Stealth 16 Studio A13VG | |
| Schenker XMG Pro 16 Studio (Mid 23) | |
| Lenovo Legion Slim 7i 16 Gen 8 | |
* ... Meglio usare valori piccoli
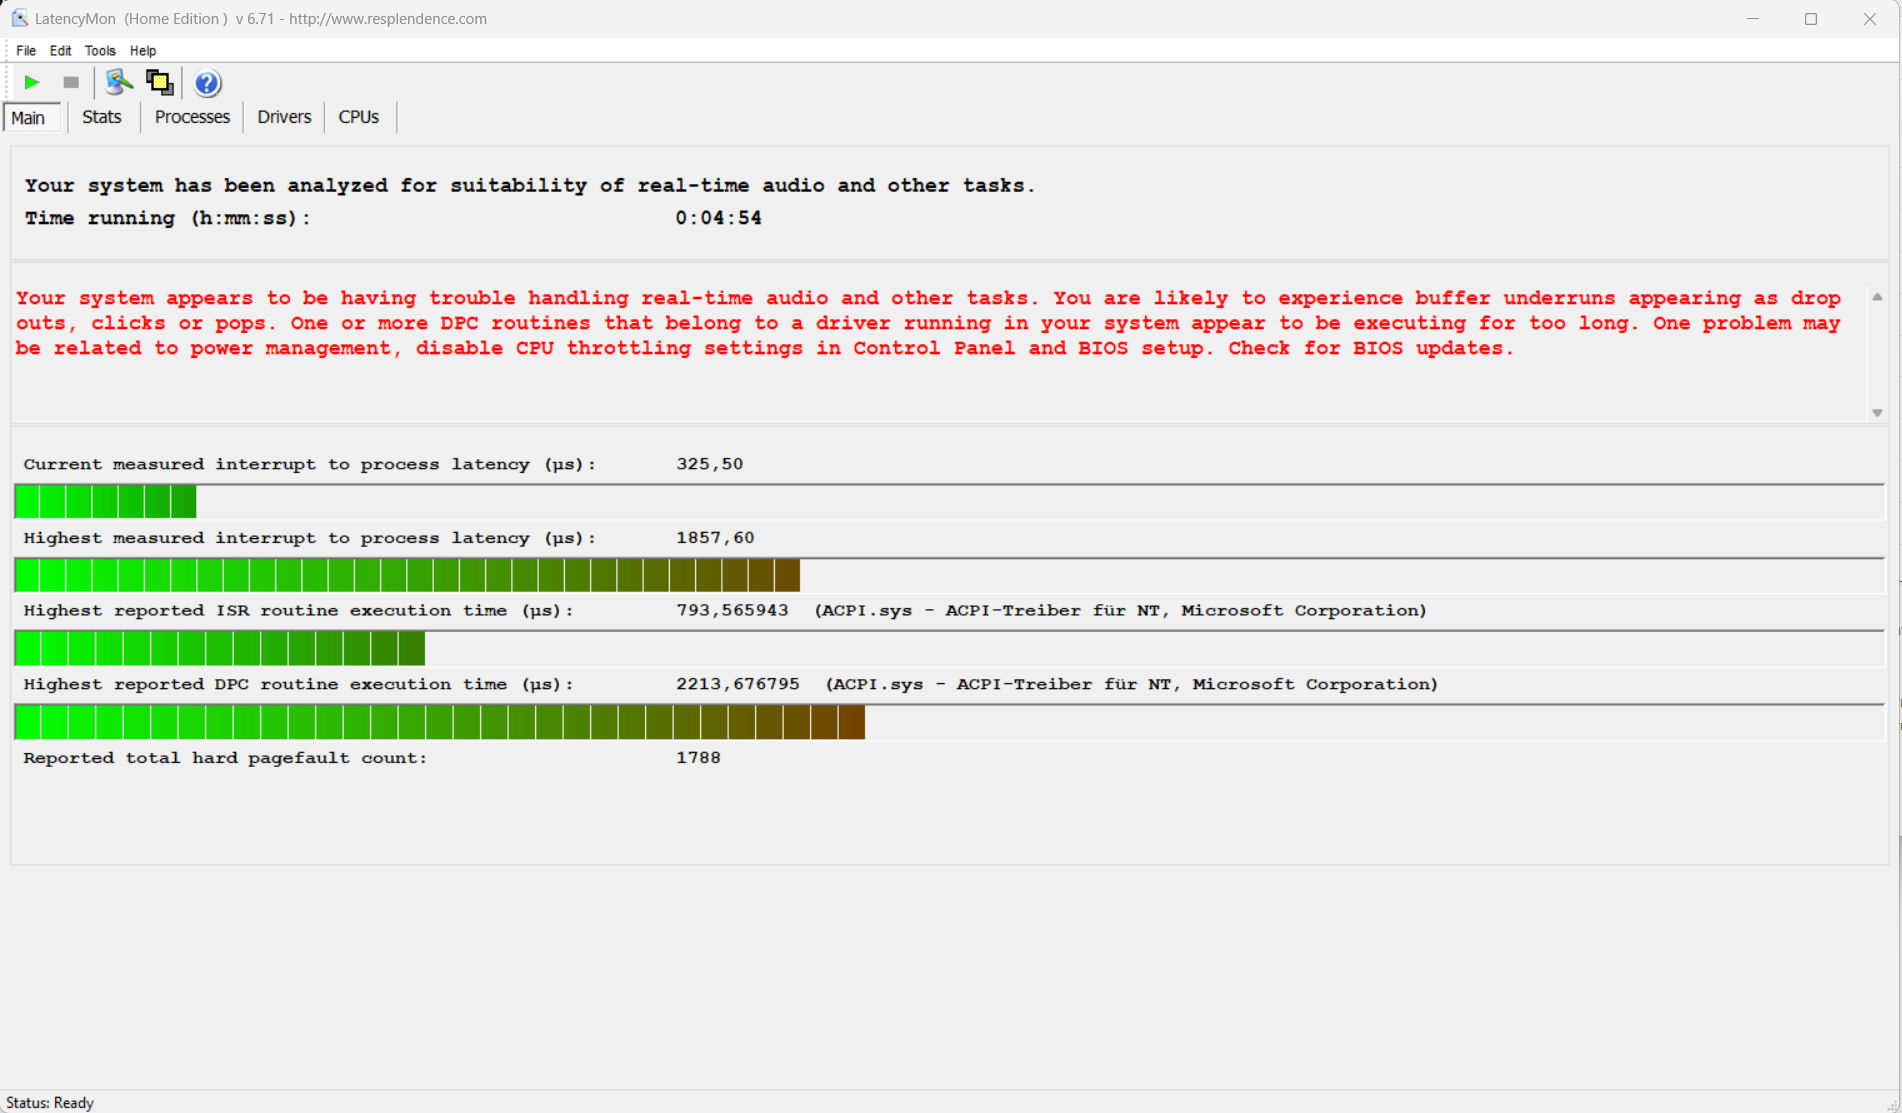
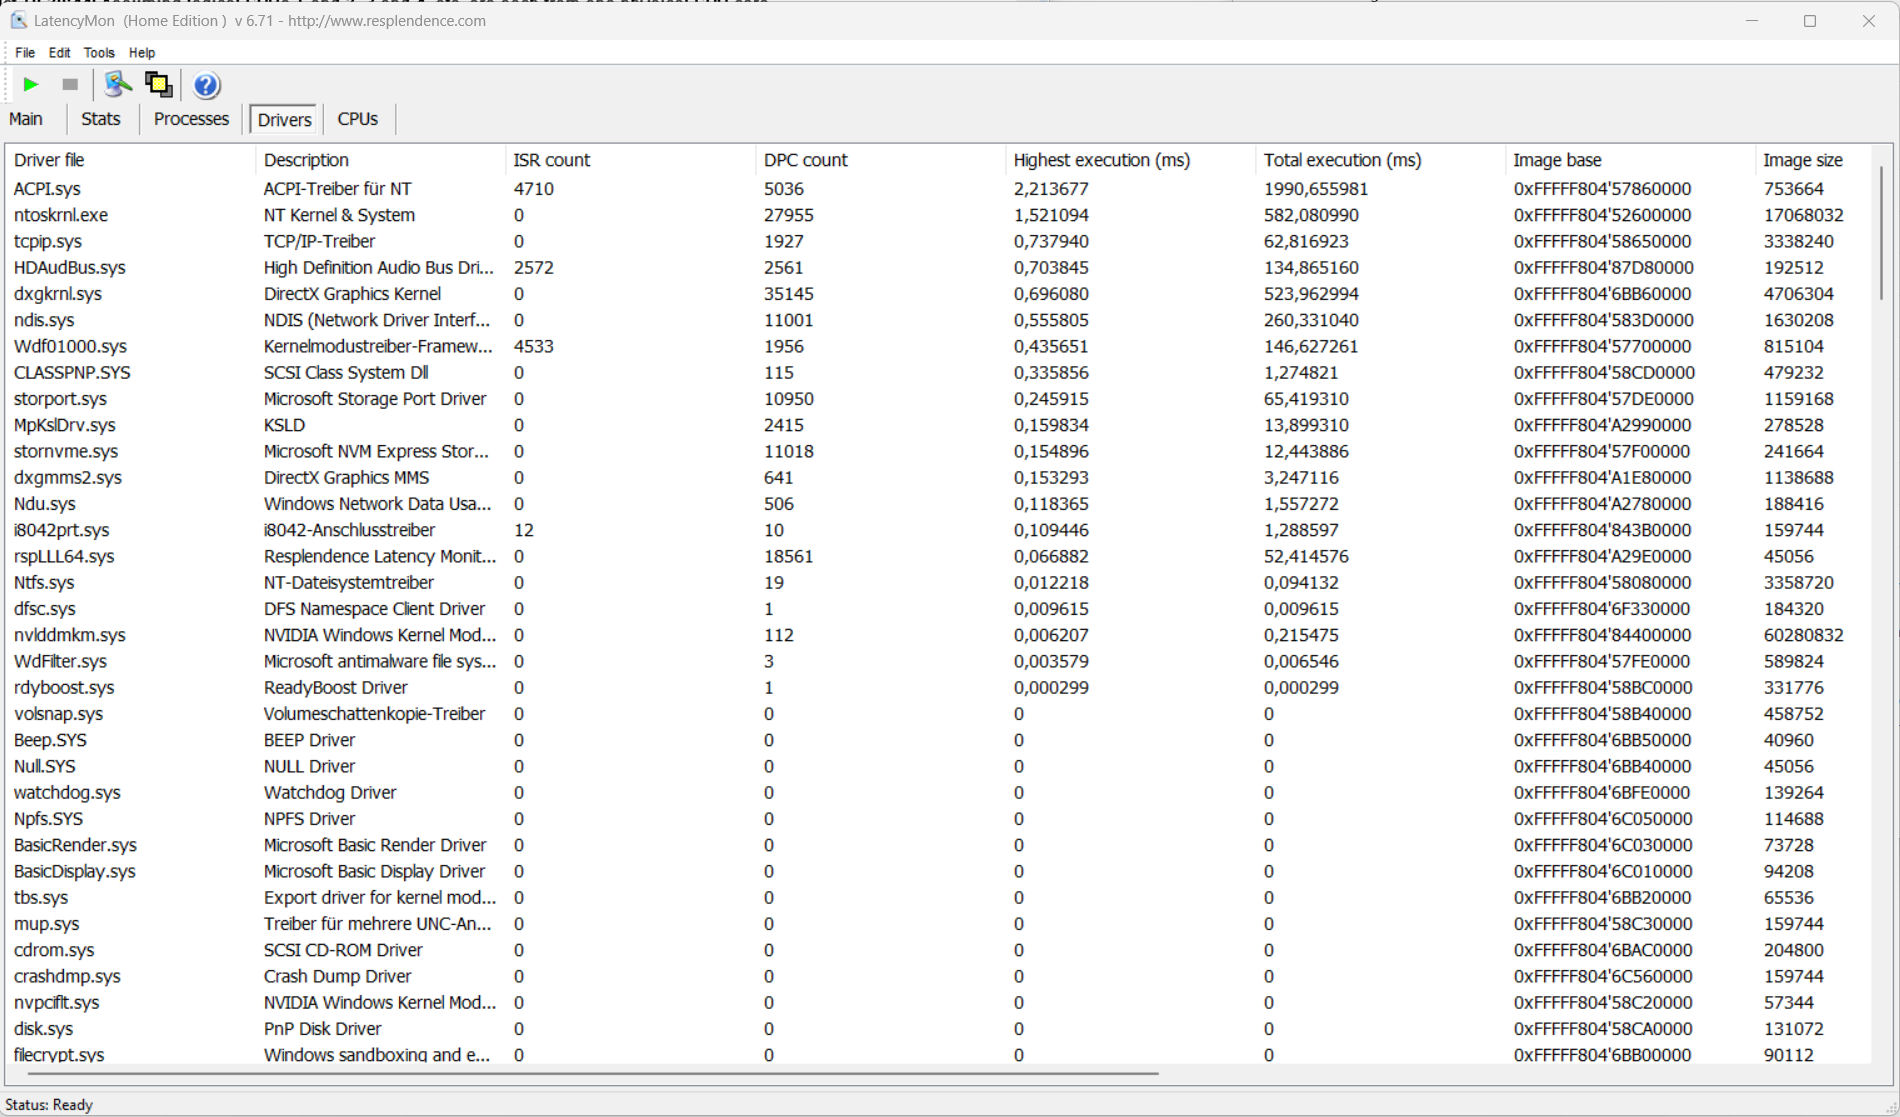
Latenza DPC
Il test standardizzato di monitoraggio della latenza (navigazione web, riproduzione video 4k, Prime95 ad alto carico) ha rivelato alcune anomalie. Il sistema non sembra essere adatto all'editing video e audio in tempo reale. I futuri aggiornamenti del software potrebbero portare a miglioramenti o addirittura a degradazioni.
| DPC Latencies / LatencyMon - interrupt to process latency (max), Web, Youtube, Prime95 | |
| MSI Stealth 16 Studio A13VG | |
| Lenovo Legion Slim 7i 16 Gen 8 | |
| Asus Vivobook Pro 16X K6604JV-MX016W | |
| Schenker XMG Pro 16 Studio (Mid 23) | |
| HP Omen Transcend 16 | |
* ... Meglio usare valori piccoli
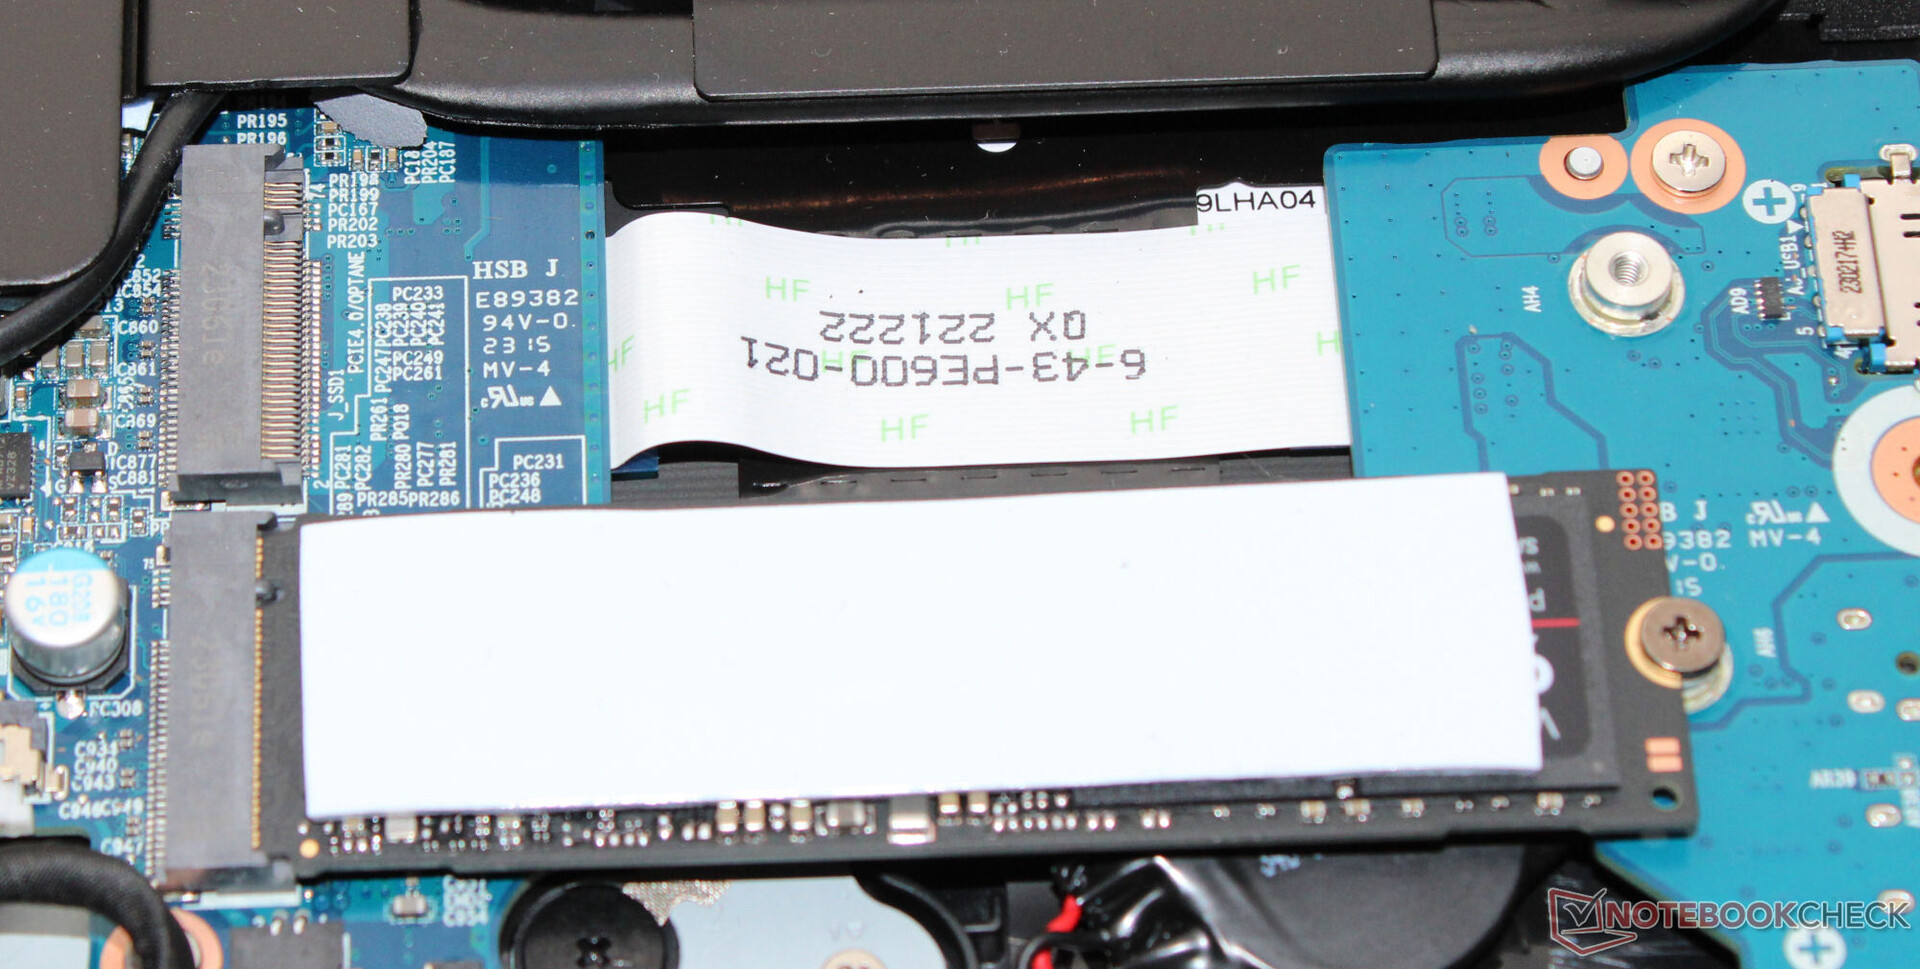
Dispositivi di archiviazione
Il Pro 16 può ospitare un totale di due SSD PCIe 4 con formato M.2-2280. È supportato il RAID-0/1. L'SSD Samsung (1 TB, PCIe 4, M.2-2280) nel nostro dispositivo di prova ha fornito eccellenti velocità di trasferimento. Positivo: Non si è verificato il throttling termico.

* ... Meglio usare valori piccoli
Reading continuous performance: DiskSpd Read Loop, Queue Depth 8
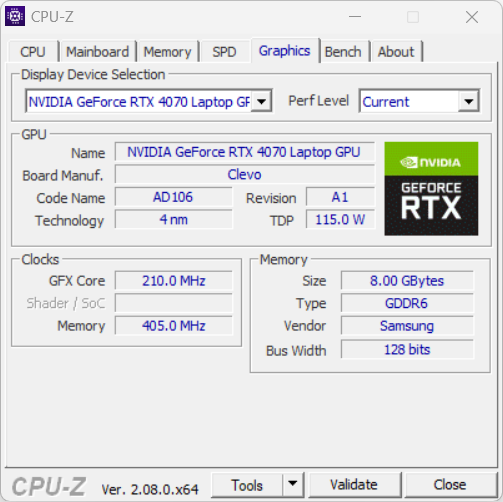
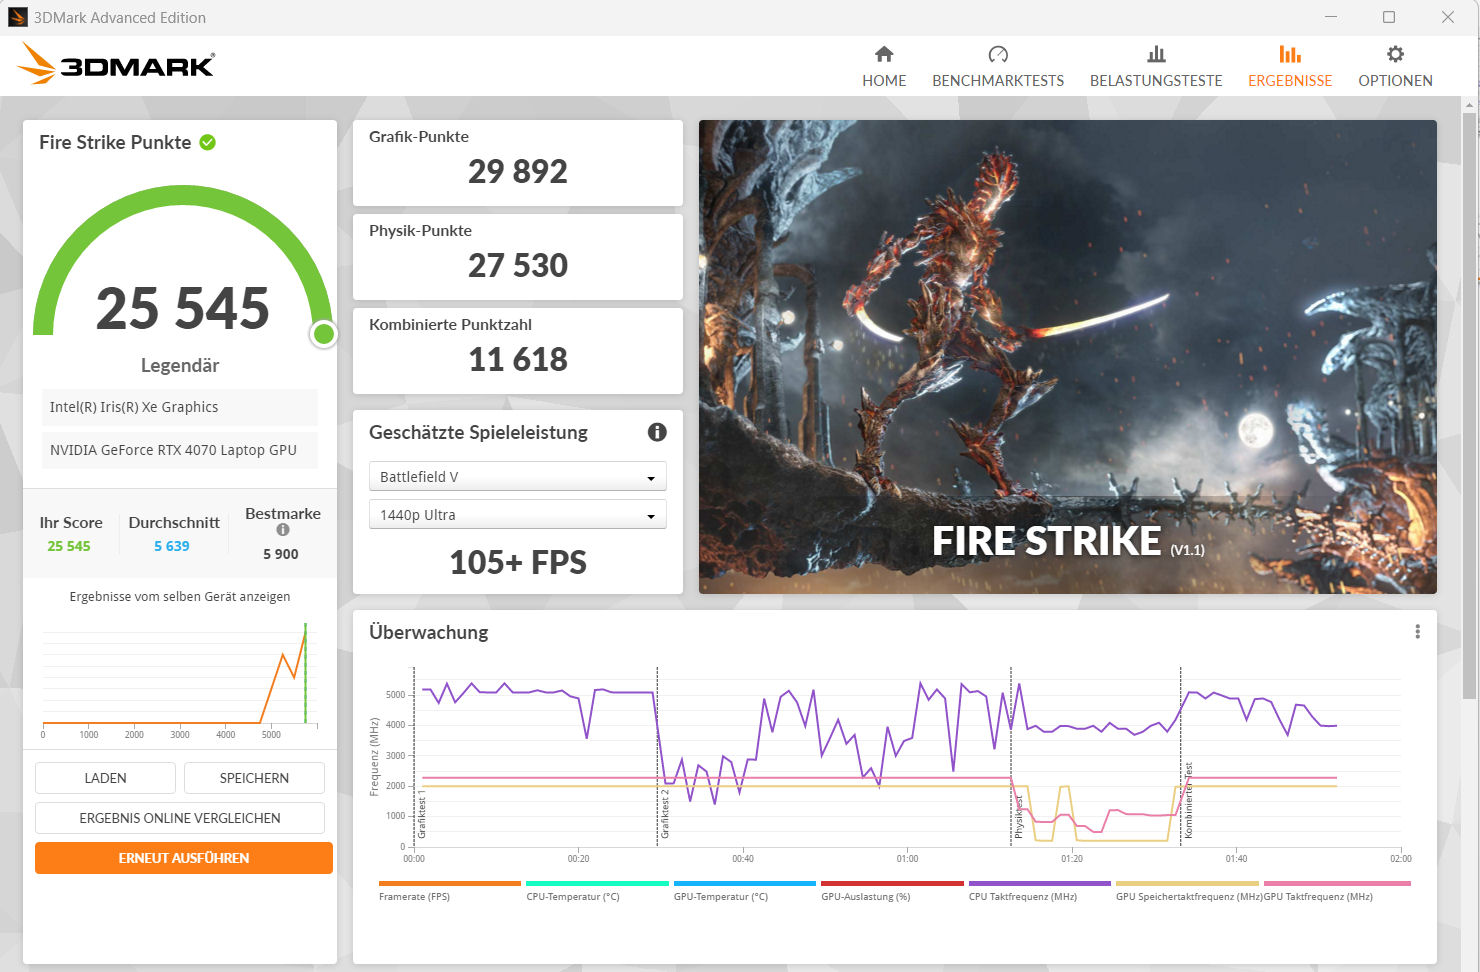
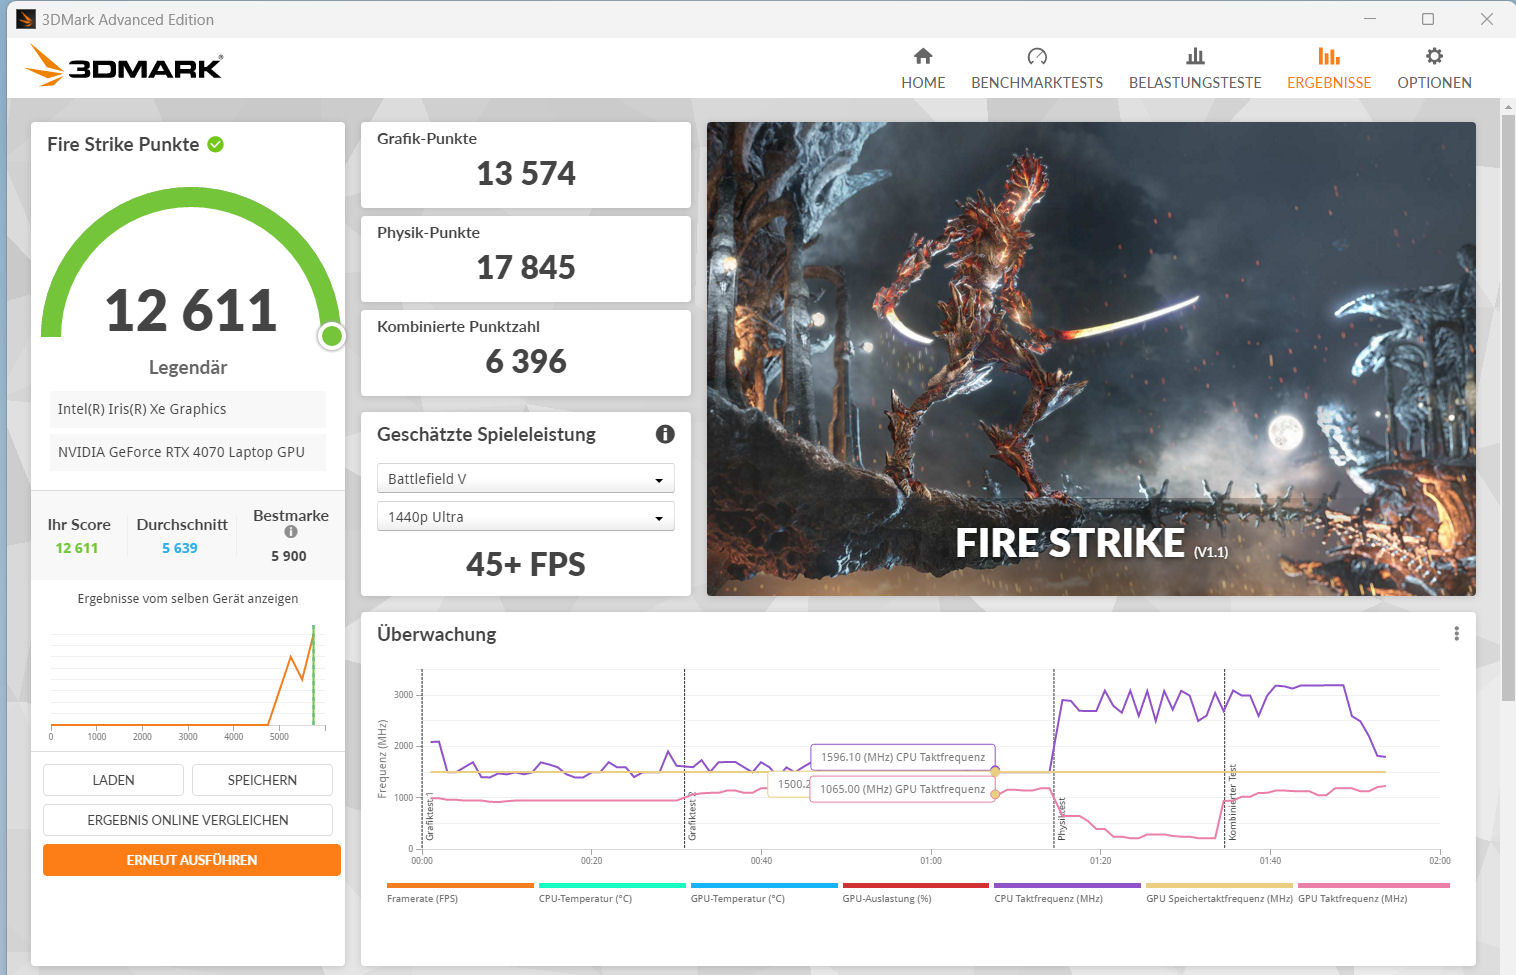
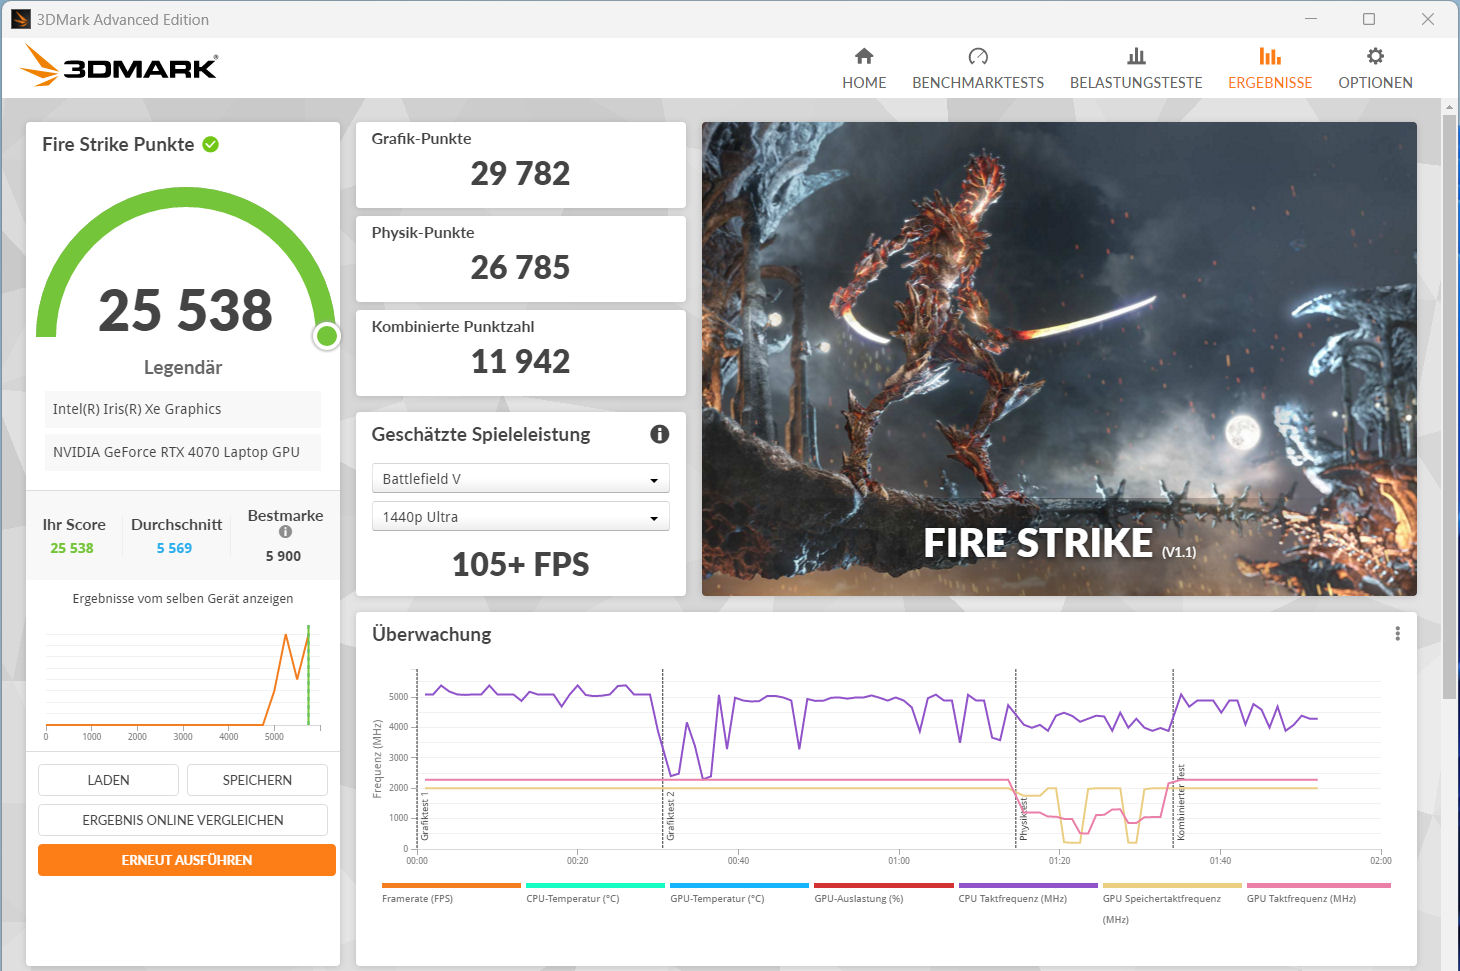
Scheda grafica
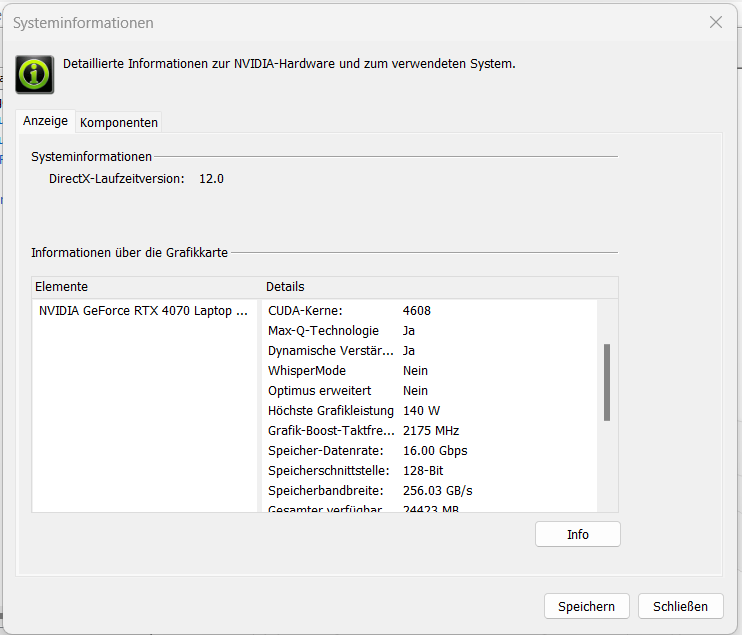
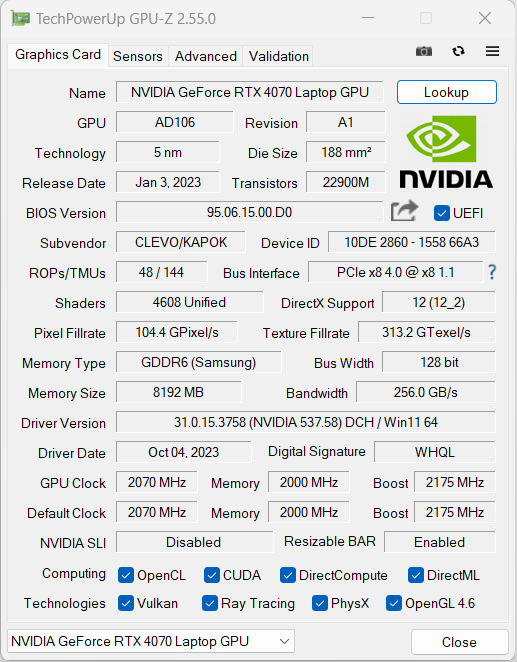
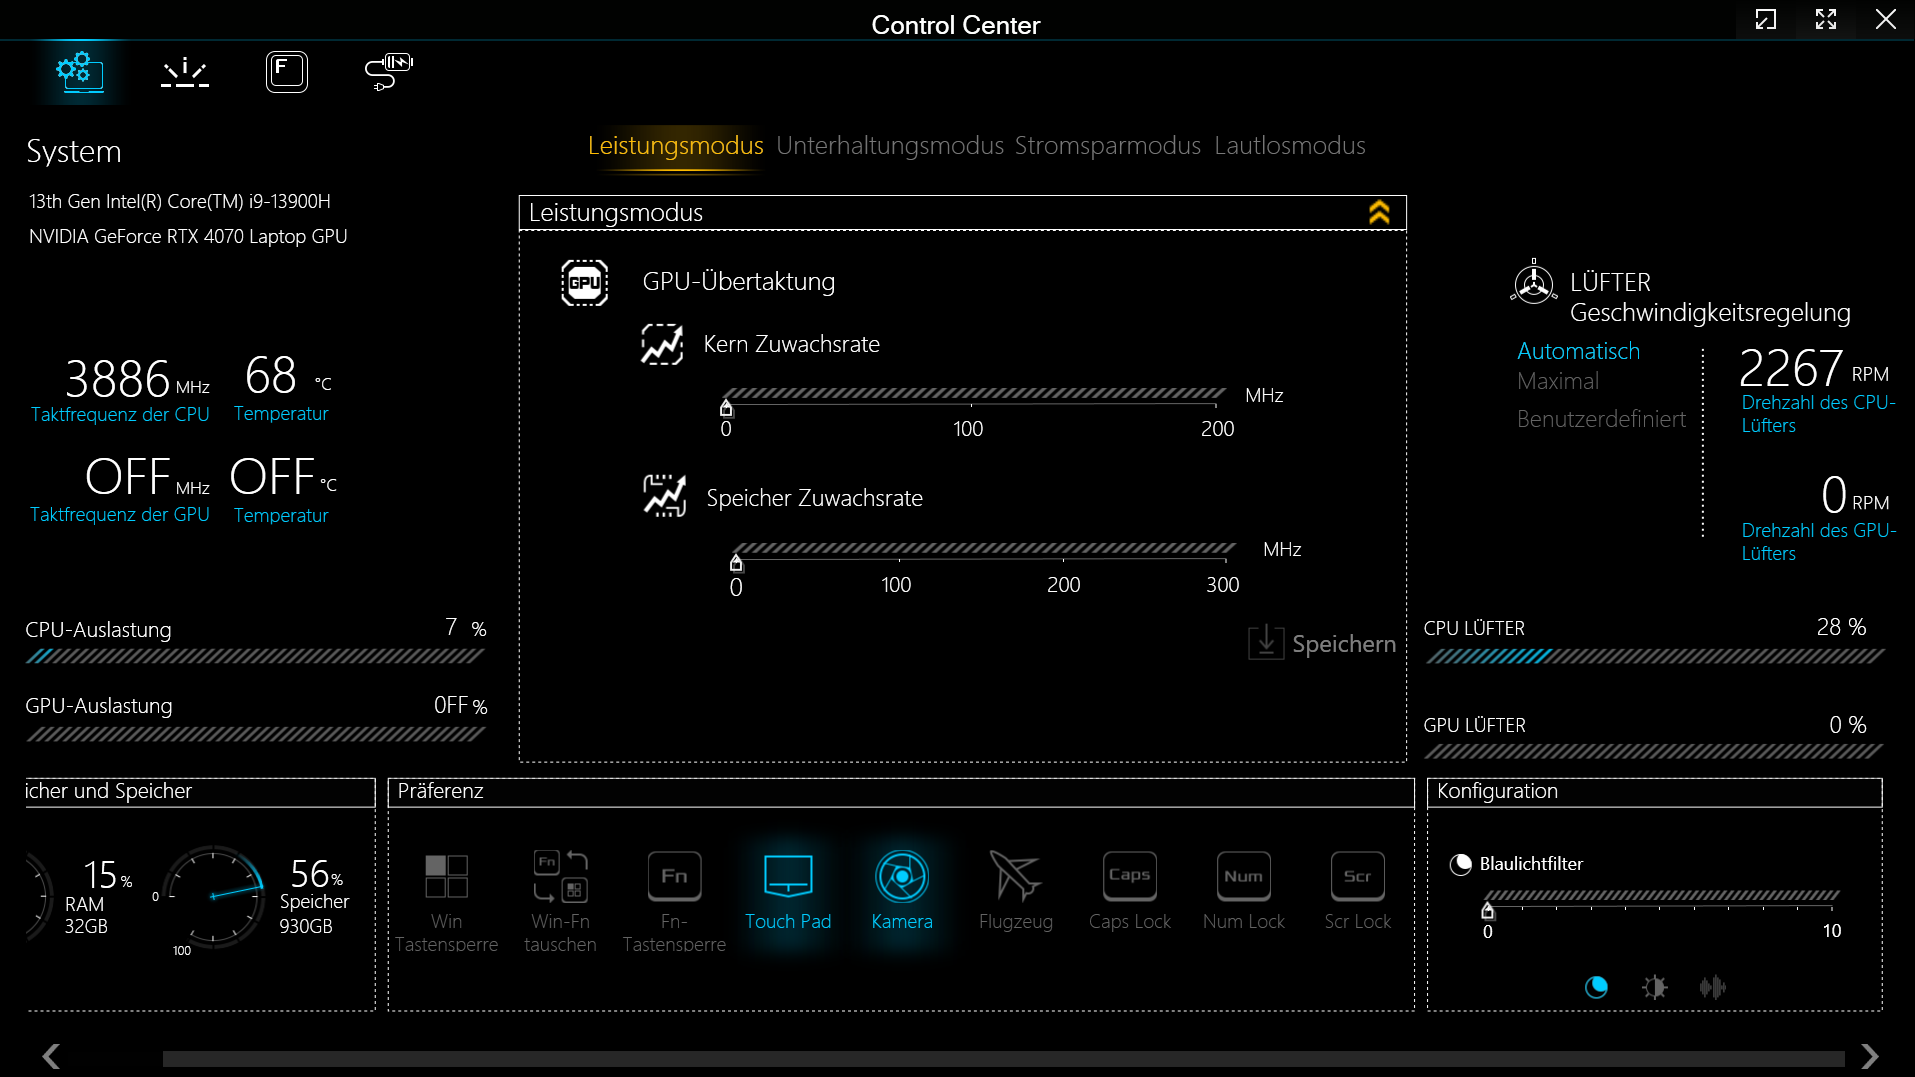
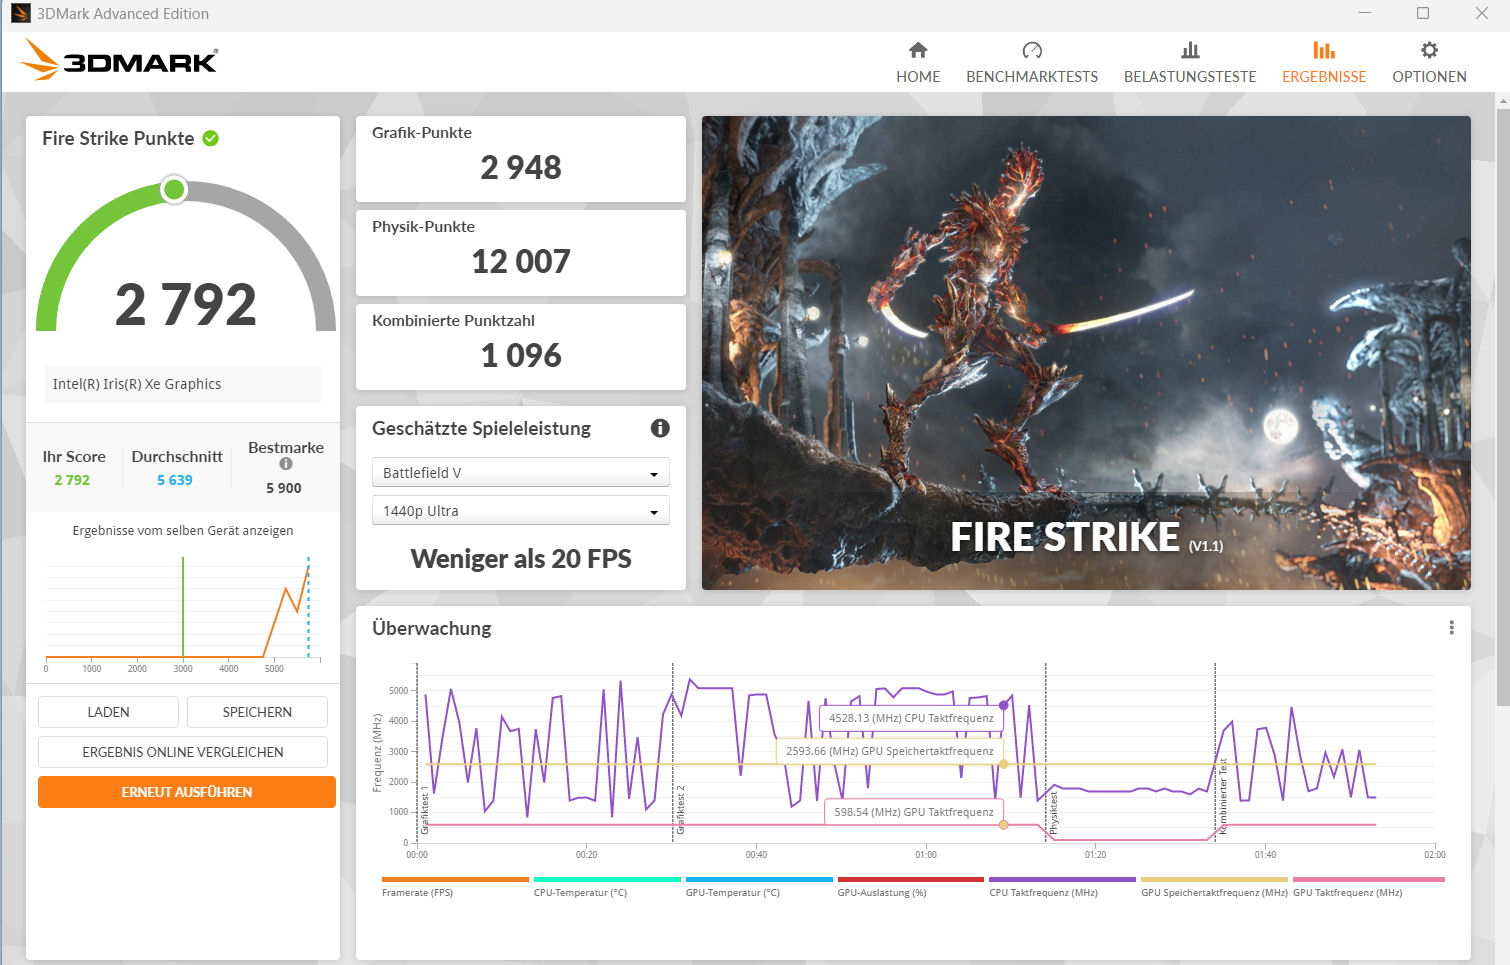
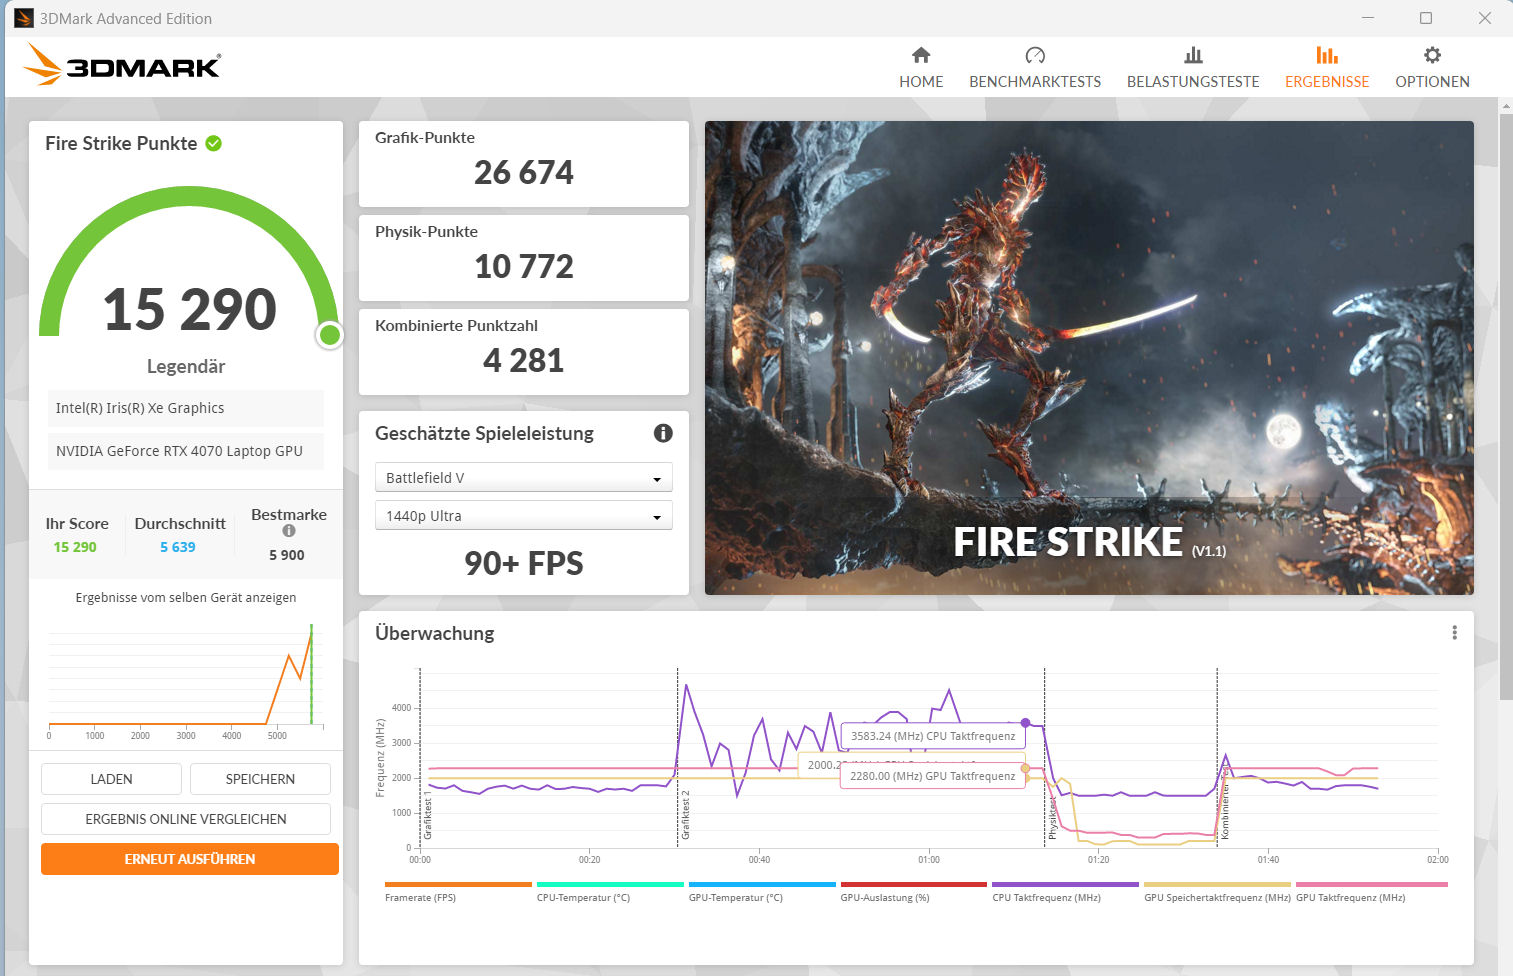
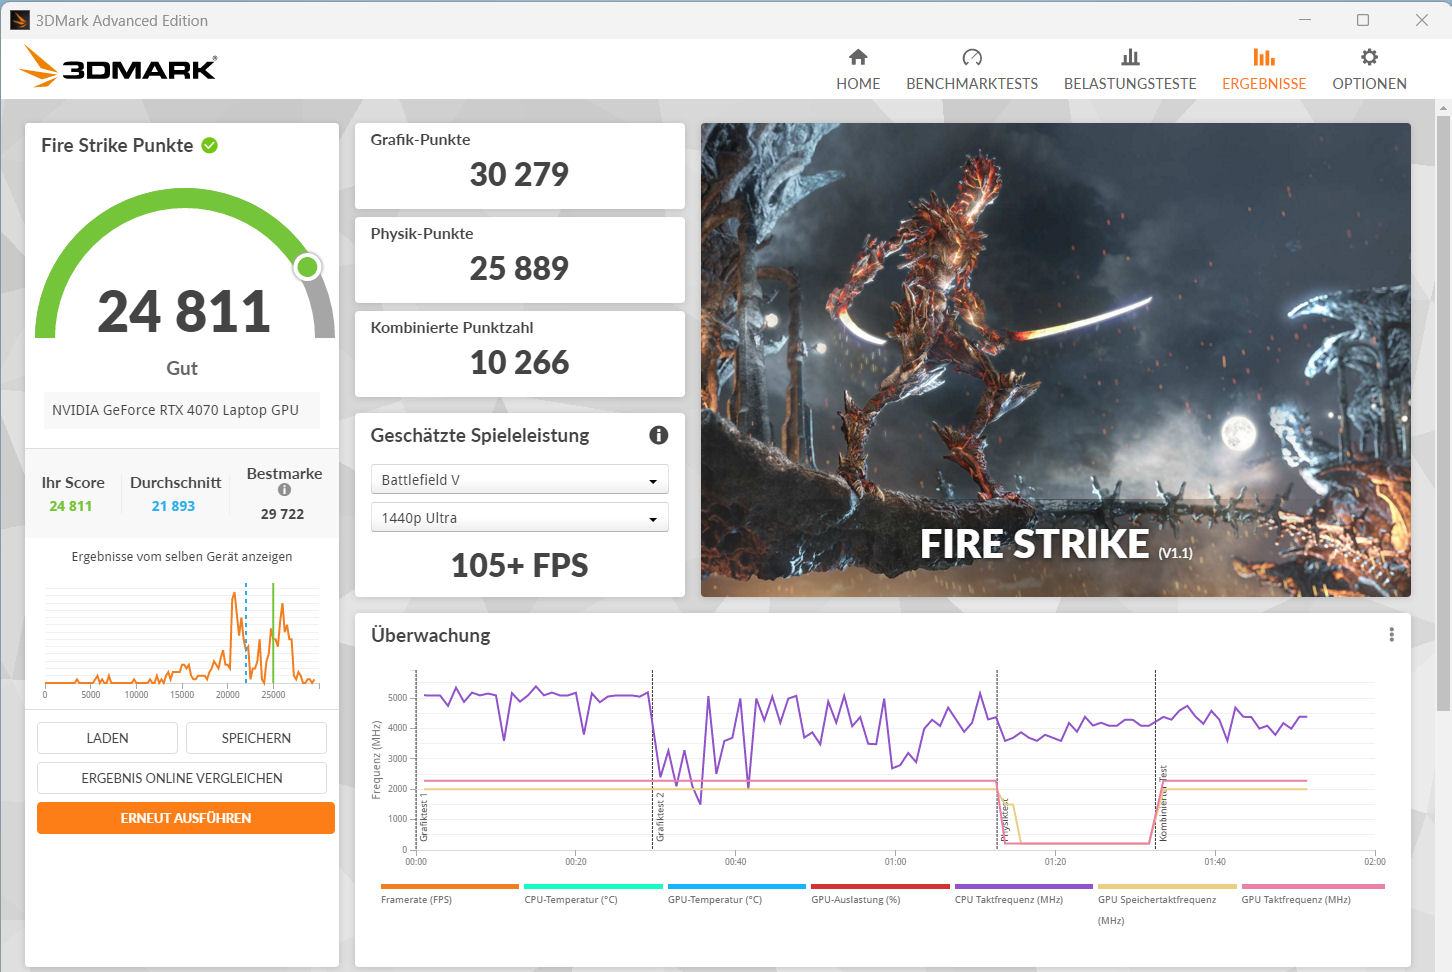
LaGeForce RTX 4070 offre 4.608 shader, un bus ampio 128 bit e una RAM GDDR6 veloce (8.192 MB). Schenker ha fissato il TGP massimo a 140 watt (115 watt + 25 watt Dynamic Boost) - non è possibile fare di più.
Il core grafico consente di giocare in QHD con impostazioni alte o massime. In questo modo, raggiunge frame rate superiori alla media della RTX 4070 precedentemente determinata. L'utilizzo della modalità dGPU (attivata tramite il BIOS) porta a un leggero aumento delle prestazioni. Il core grafico e la memoria possono essere overcloccati tramite il Control Center (Modalità Prestazioni -> fare clic sulle frecce rivolte verso il basso). Advanced Optimus non è supportato.
| 3DMark 06 Standard Score | 54913 punti | |
| 3DMark 11 Performance | 34302 punti | |
| 3DMark Cloud Gate Standard Score | 62061 punti | |
| 3DMark Fire Strike Score | 25545 punti | |
| 3DMark Time Spy Score | 12134 punti | |
Aiuto | ||
* ... Meglio usare valori piccoli
| The Witcher 3 - 1920x1080 Ultra Graphics & Postprocessing (HBAO+) | |
| Media della classe Gaming (104.7 - 240, n=7, ultimi 2 anni) | |
| MSI Stealth 16 Studio A13VG | |
| Schenker XMG Pro 16 Studio (Mid 23) | |
| Lenovo Legion Slim 7i 16 Gen 8 | |
| Media NVIDIA GeForce RTX 4070 Laptop GPU (69.8 - 133.7, n=57) | |
| HP Omen Transcend 16 | |
| Asus Vivobook Pro 16X K6604JV-MX016W | |
| Lies of P | |
| 1920x1080 Best Preset | |
| Media NVIDIA GeForce RTX 4070 Laptop GPU (137.4 - 148.1, n=4) | |
| Schenker XMG Pro 16 Studio (Mid 23) | |
| 2560x1440 Best Preset | |
| Media NVIDIA GeForce RTX 4070 Laptop GPU (97.2 - 98.8, n=4) | |
| Schenker XMG Pro 16 Studio (Mid 23) | |
| Assassin's Creed Mirage | |
| 1920x1080 Ultra High Preset (Adaptive Quality Off) | |
| Schenker XMG Pro 16 Studio (Mid 23) | |
| Media NVIDIA GeForce RTX 4070 Laptop GPU (91 - 99, n=6) | |
| 2560x1440 Ultra High Preset (Adaptive Quality Off) | |
| Media NVIDIA GeForce RTX 4070 Laptop GPU (73 - 80, n=6) | |
| Schenker XMG Pro 16 Studio (Mid 23) | |
| Lords of the Fallen | |
| 1920x1080 Ultra Preset | |
| Media NVIDIA GeForce RTX 4070 Laptop GPU (44.3 - 67.7, n=4) | |
| Schenker XMG Pro 16 Studio (Mid 23) | |
| 2560x1440 Ultra Preset | |
| Media NVIDIA GeForce RTX 4070 Laptop GPU (29.1 - 47.1, n=4) | |
| Schenker XMG Pro 16 Studio (Mid 23) | |
| Total War Pharaoh | |
| 1920x1080 Ultra Preset | |
| Media NVIDIA GeForce RTX 4070 Laptop GPU (110 - 136.2, n=5) | |
| Schenker XMG Pro 16 Studio (Mid 23) | |
| Media della classe Gaming (42.9 - 161.4, n=2, ultimi 2 anni) | |
| 2560x1440 Ultra Preset | |
| Media NVIDIA GeForce RTX 4070 Laptop GPU (87.2 - 96.6, n=5) | |
| Schenker XMG Pro 16 Studio (Mid 23) | |
| Media della classe Gaming (24.1 - 127.4, n=2, ultimi 2 anni) | |
| F1 23 | |
| 1920x1080 Ultra High Preset AA:T AF:16x | |
| MSI Stealth 16 Studio A13VG | |
| Media NVIDIA GeForce RTX 4070 Laptop GPU (49.5 - 100, n=14) | |
| Schenker XMG Pro 16 Studio (Mid 23) | |
| Asus Vivobook Pro 16X K6604JV-MX016W | |
| 2560x1440 Ultra High Preset AA:T AF:16x | |
| Schenker XMG Pro 16 Studio (Mid 23) | |
| MSI Stealth 16 Studio A13VG | |
| Media NVIDIA GeForce RTX 4070 Laptop GPU (35.2 - 49, n=13) | |
| Asus Vivobook Pro 16X K6604JV-MX016W | |
Witcher 3 FPS diagram
| basso | medio | alto | ultra | QHD | |
|---|---|---|---|---|---|
| GTA V (2015) | 186.8 | 185.9 | 181.3 | 125.4 | 93.2 |
| The Witcher 3 (2015) | 474.9 | 365.4 | 231.4 | 118.4 | 86.9 |
| Dota 2 Reborn (2015) | 210 | 187.5 | 176.5 | 162.8 | |
| Final Fantasy XV Benchmark (2018) | 219 | 159.8 | 115.5 | 84.1 | |
| X-Plane 11.11 (2018) | 166.7 | 146.4 | 119.5 | ||
| Strange Brigade (2018) | 544 | 280 | 232 | 202 | 132.8 |
| Cyberpunk 2077 1.6 (2022) | 147 | 115 | 95.3 | 86.7 | 55.4 |
| Returnal (2023) | 115 | 112 | 101 | 85 | 63 |
| F1 23 (2023) | 279 | 261 | 198.2 | 67.6 | 45.6 |
| Lies of P (2023) | 206 | 182 | 159.8 | 140.1 | 97.3 |
| Cyberpunk 2077 (2023) | 131.7 | 113.2 | 98.3 | 87.9 | 57.1 |
| Assassin's Creed Mirage (2023) | 143 | 132 | 125 | 99 | 75 |
| Total War Pharaoh (2023) | 385.9 | 239.5 | 146.2 | 113.3 | 87.2 |
| Lords of the Fallen (2023) | 96.9 | 84.1 | 63.4 | 45.9 | 29.1 |
Emissioni e potenza - Il Pro 16 offre buoni tempi di esecuzione
Emissioni di rumore
Durante il gioco, le emissioni acustiche possono salire fino a 55 dB(A) (Modalità Performance). la "Modalità Intrattenimento", che abbiamo utilizzato, offre emissioni acustiche moderate di 48 dB(A). Potrebbe essere più silenzioso: In modalità Silenziosa, è possibile ottenere emissioni di 42 dB(A), a scapito di alcune prestazioni di gioco. In modalità idle e nell'uso quotidiano (ufficio, internet), una delle due ventole è spesso in funzione e a volte rimangono entrambe spente.
Rumorosità
| Idle |
| 26 / 29 / 34 dB(A) |
| Sotto carico |
| 43 / 48 dB(A) |
 | ||
30 dB silenzioso 40 dB(A) udibile 50 dB(A) rumoroso |
||
min: | ||
| Schenker XMG Pro 16 Studio (Mid 23) i9-13900H, GeForce RTX 4070 Laptop GPU | Asus Vivobook Pro 16X K6604JV-MX016W i9-13980HX, GeForce RTX 4060 Laptop GPU | Lenovo Legion Slim 7i 16 Gen 8 i9-13900H, GeForce RTX 4070 Laptop GPU | HP Omen Transcend 16 i9-13900HX, GeForce RTX 4070 Laptop GPU | MSI Stealth 16 Studio A13VG i7-13700H, GeForce RTX 4070 Laptop GPU | |
|---|---|---|---|---|---|
| Noise | -4% | 10% | -3% | 11% | |
| off /ambiente * (dB) | 25 | 25.2 -1% | 22.8 9% | 22.9 8% | 24 4% |
| Idle Minimum * (dB) | 26 | 26.6 -2% | 23.6 9% | 29.1 -12% | 24 8% |
| Idle Average * (dB) | 29 | 26.6 8% | 23.6 19% | 29.1 -0% | 24 17% |
| Idle Maximum * (dB) | 34 | 29.2 14% | 25.7 24% | 29.1 14% | 24 29% |
| Load Average * (dB) | 43 | 53.4 -24% | 27.6 36% | 45.7 -6% | 34.81 19% |
| Witcher 3 ultra * (dB) | 48 | 54.4 -13% | 54.3 -13% | 44.05 8% | |
| Load Maximum * (dB) | 48 | 56.9 -19% | 54.4 -13% | 54.3 -13% | 51.57 -7% |
* ... Meglio usare valori piccoli
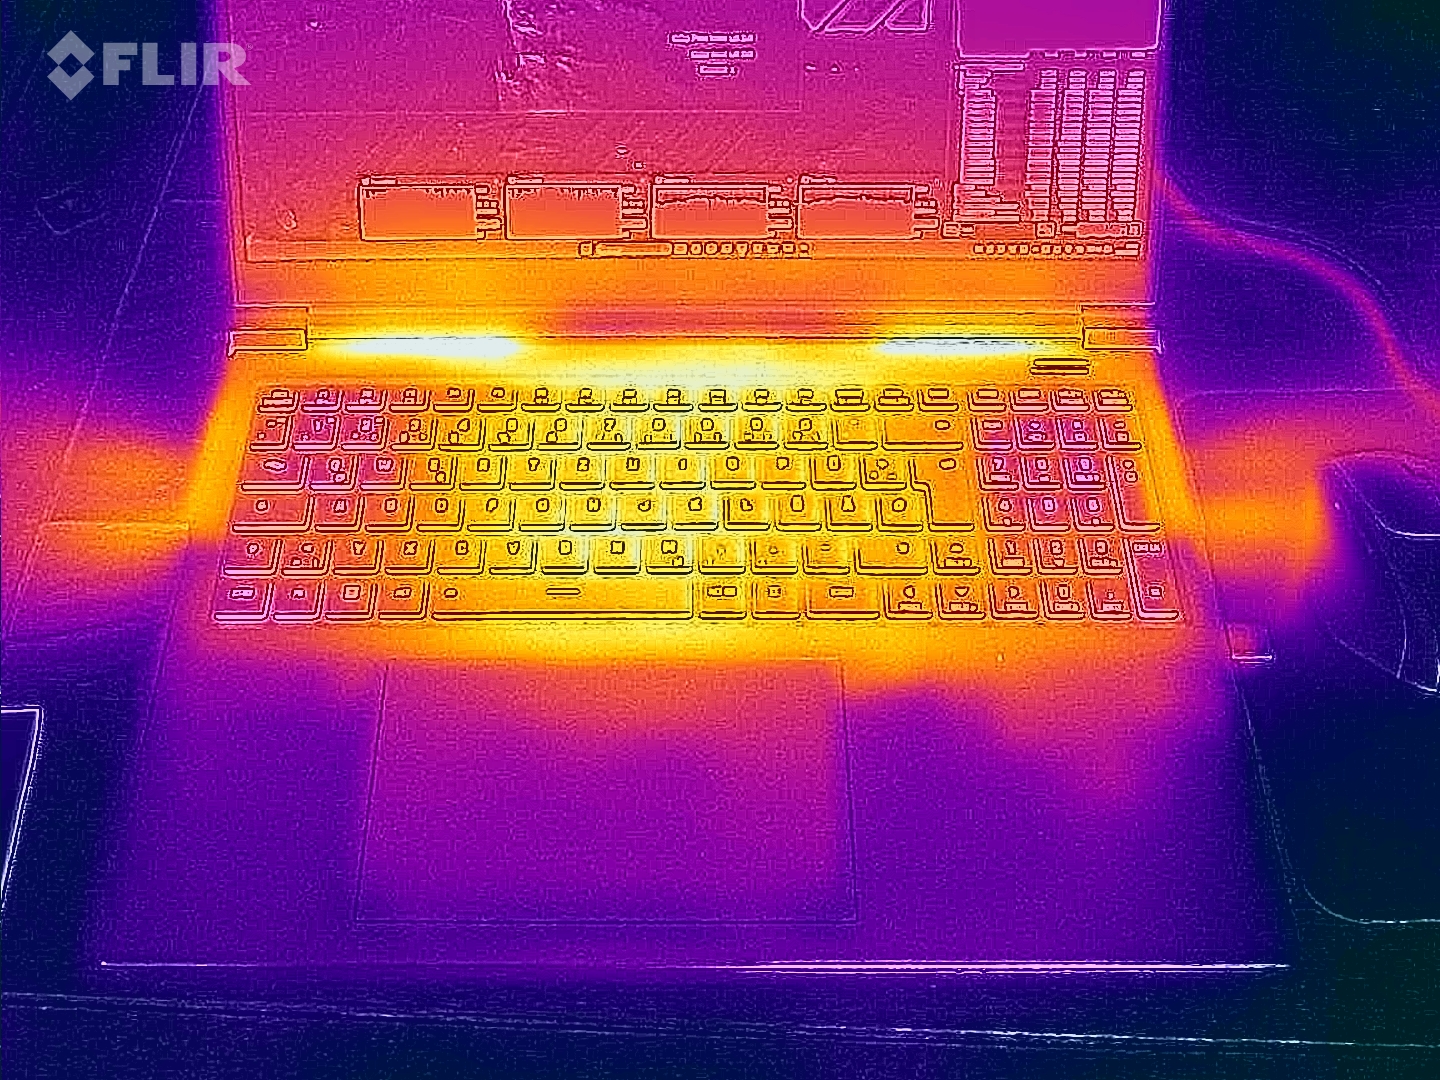
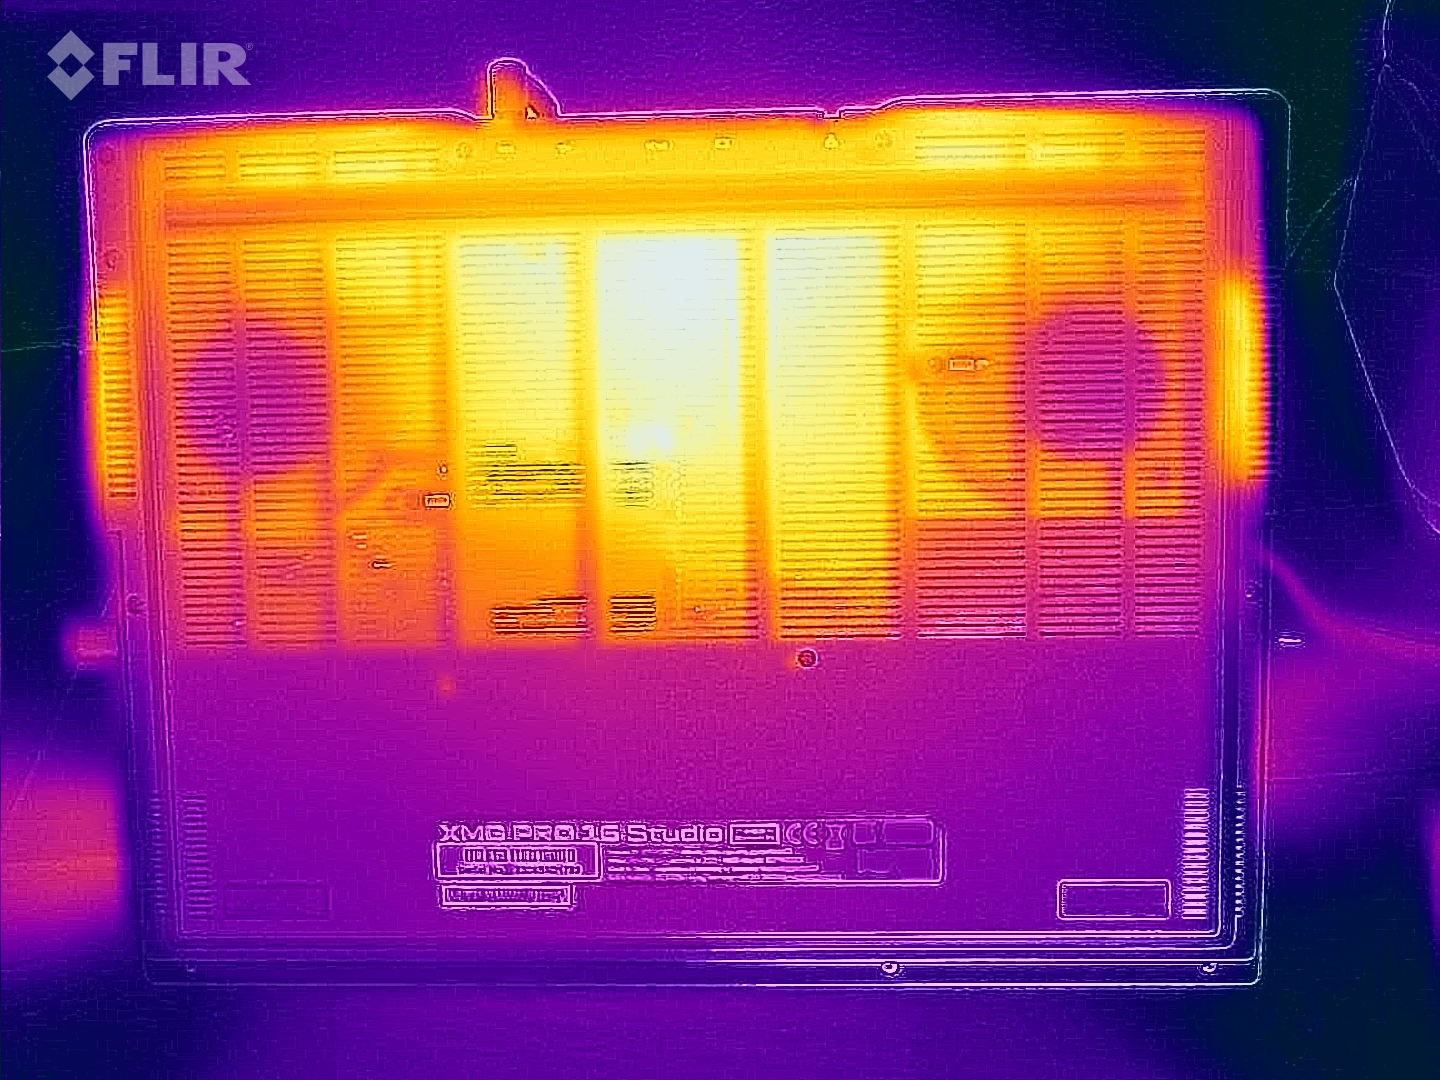
Temperatura
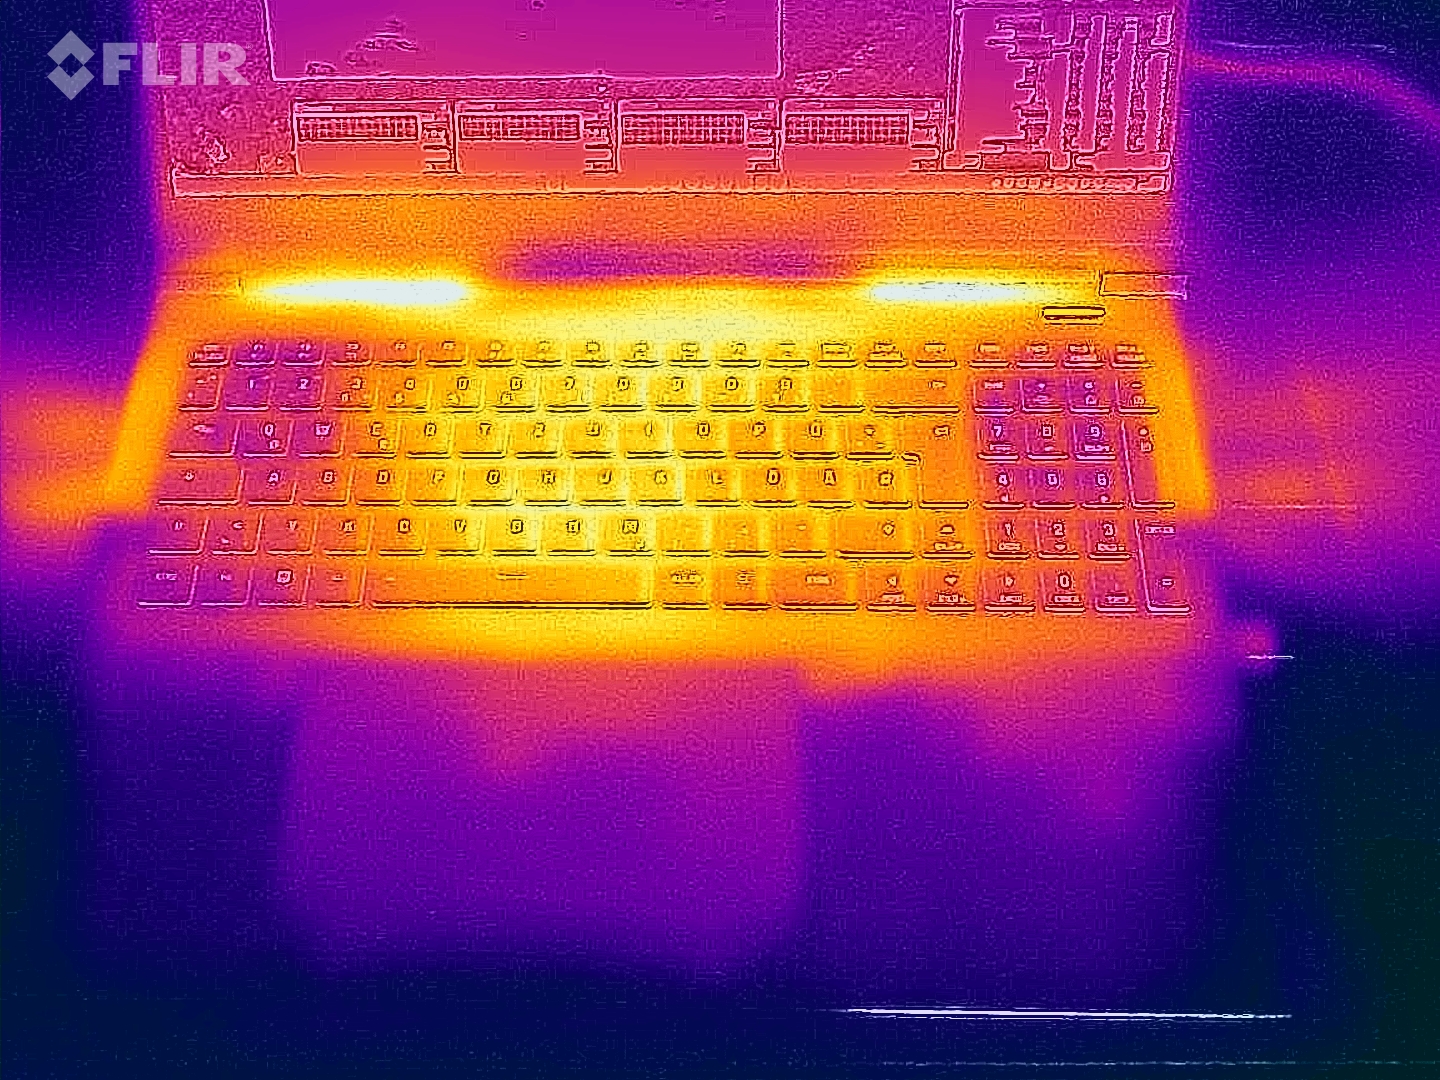
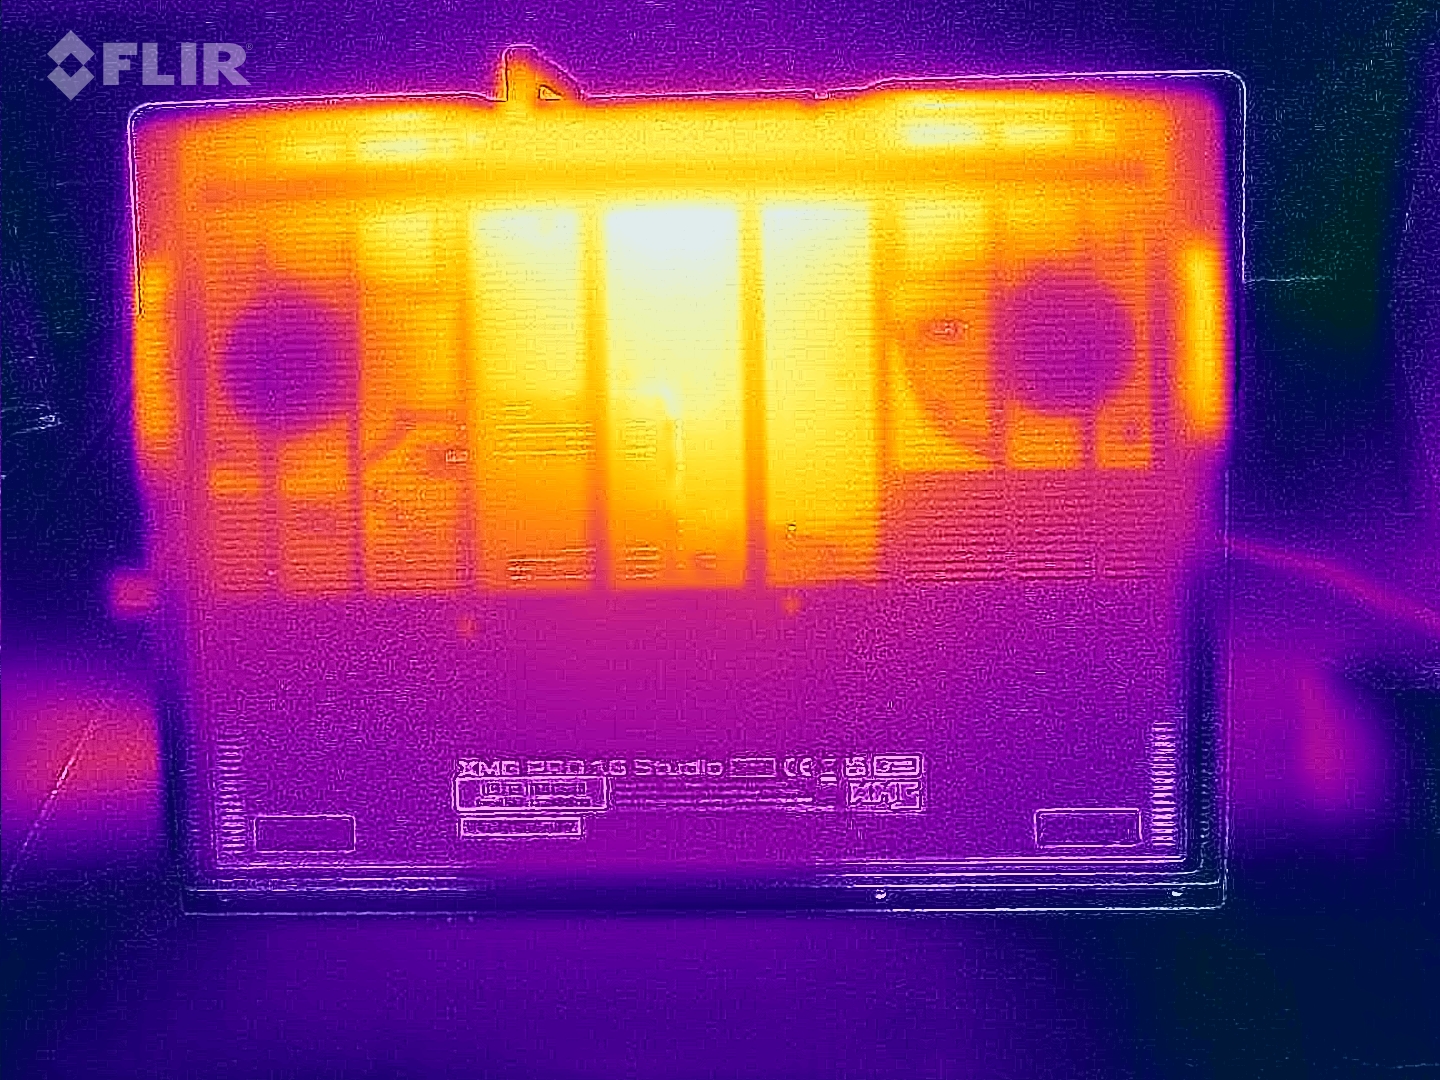
Lo stress test e il Witcher 3 test hanno fatto sì che le temperature del portatile aumentassero in modo significativo. In alcune aree, abbiamo misurato temperature superiori a 60 gradi Celsius. Nell'uso quotidiano (ufficio, internet), questi valori rimangono generalmente all'interno della zona verde - ma ad un livello superiore rispetto a concorrenti come il modelloLenovo Legion Slim 7i 16 Gen 8.
(-) La temperatura massima sul lato superiore è di 55 °C / 131 F, rispetto alla media di 40.4 °C / 105 F, che varia da 21.2 a 68.8 °C per questa classe Gaming.
(-) Il lato inferiore si riscalda fino ad un massimo di 66 °C / 151 F, rispetto alla media di 43.2 °C / 110 F
(+) In idle, la temperatura media del lato superiore è di 30.1 °C / 86 F, rispetto alla media deld ispositivo di 33.9 °C / 93 F.
(-) Riproducendo The Witcher 3, la temperatura media per il lato superiore e' di 43.9 °C / 111 F, rispetto alla media del dispositivo di 33.9 °C / 93 F.
(+) I poggiapolsi e il touchpad raggiungono la temperatura massima della pelle (33 °C / 91.4 F) e quindi non sono caldi.
(-) La temperatura media della zona del palmo della mano di dispositivi simili e'stata di 28.8 °C / 83.8 F (-4.2 °C / -7.6 F).
| Schenker XMG Pro 16 Studio (Mid 23) Intel Core i9-13900H, NVIDIA GeForce RTX 4070 Laptop GPU | Asus Vivobook Pro 16X K6604JV-MX016W Intel Core i9-13980HX, NVIDIA GeForce RTX 4060 Laptop GPU | Lenovo Legion Slim 7i 16 Gen 8 Intel Core i9-13900H, NVIDIA GeForce RTX 4070 Laptop GPU | HP Omen Transcend 16 Intel Core i9-13900HX, NVIDIA GeForce RTX 4070 Laptop GPU | MSI Stealth 16 Studio A13VG Intel Core i7-13700H, NVIDIA GeForce RTX 4070 Laptop GPU | |
|---|---|---|---|---|---|
| Heat | 11% | 15% | 16% | -6% | |
| Maximum Upper Side * (°C) | 55 | 39.7 28% | 49.8 9% | 47.4 14% | 60 -9% |
| Maximum Bottom * (°C) | 66 | 60 9% | 48.8 26% | 54.4 18% | 61 8% |
| Idle Upper Side * (°C) | 33 | 30.9 6% | 29.4 11% | 28.4 14% | 38.2 -16% |
| Idle Bottom * (°C) | 35 | 34.7 1% | 30 14% | 29.2 17% | 37.7 -8% |
* ... Meglio usare valori piccoli
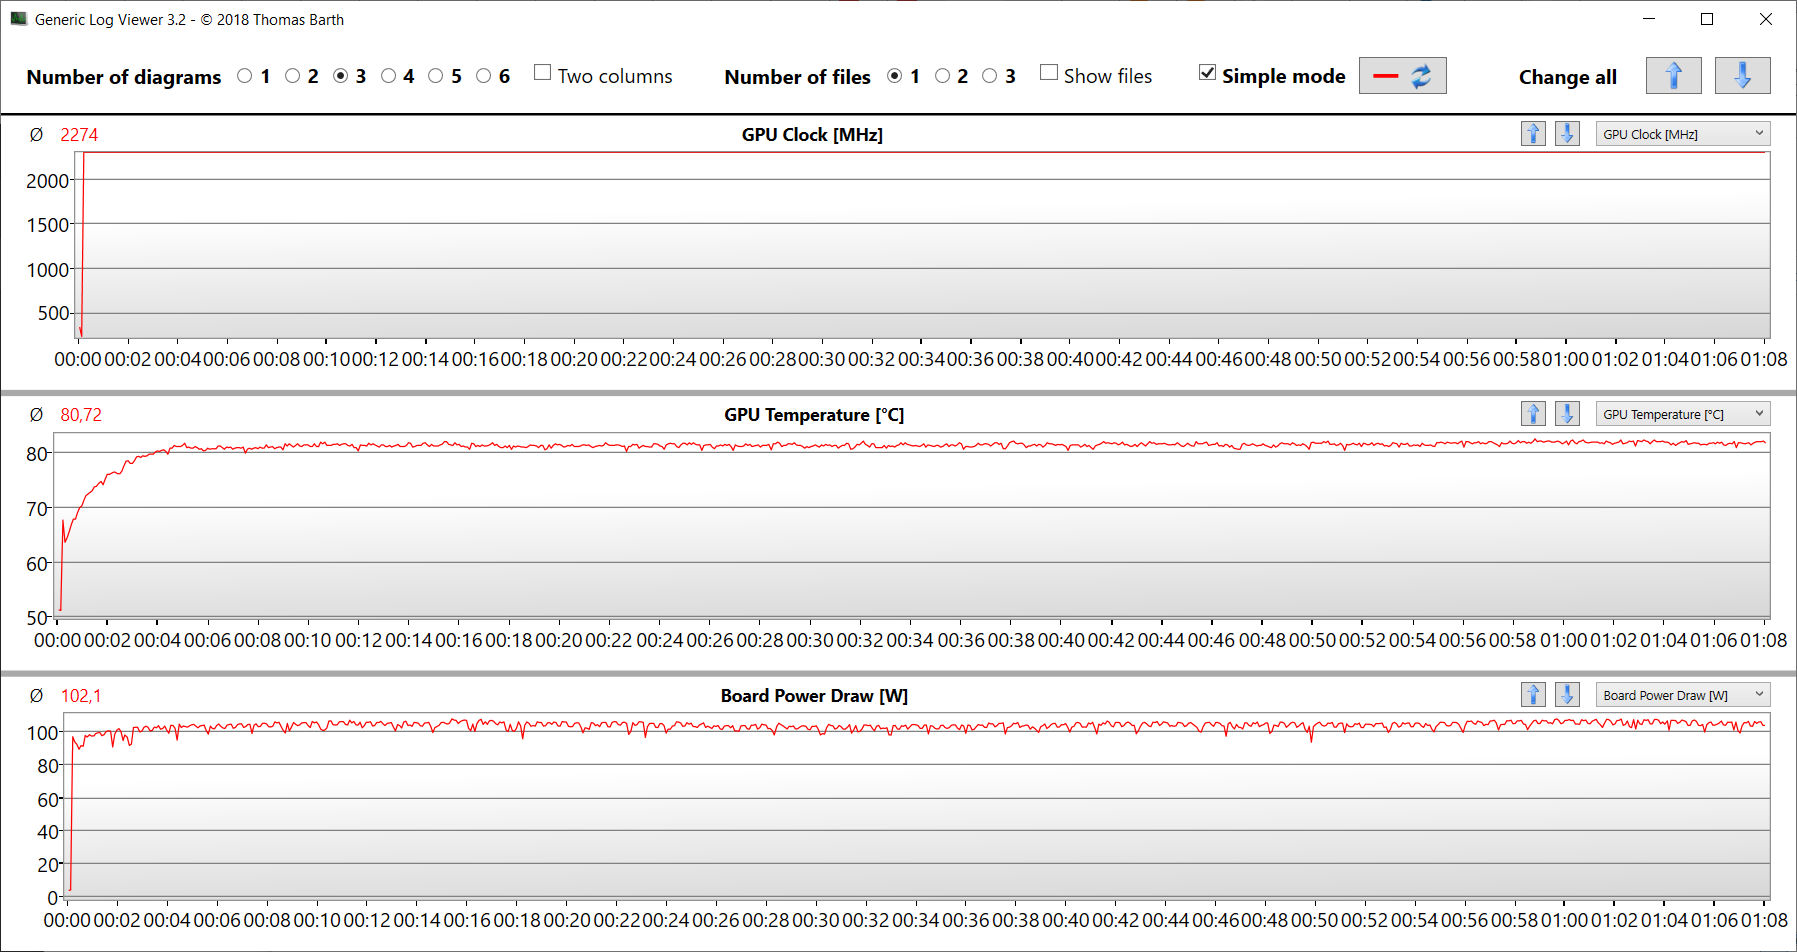
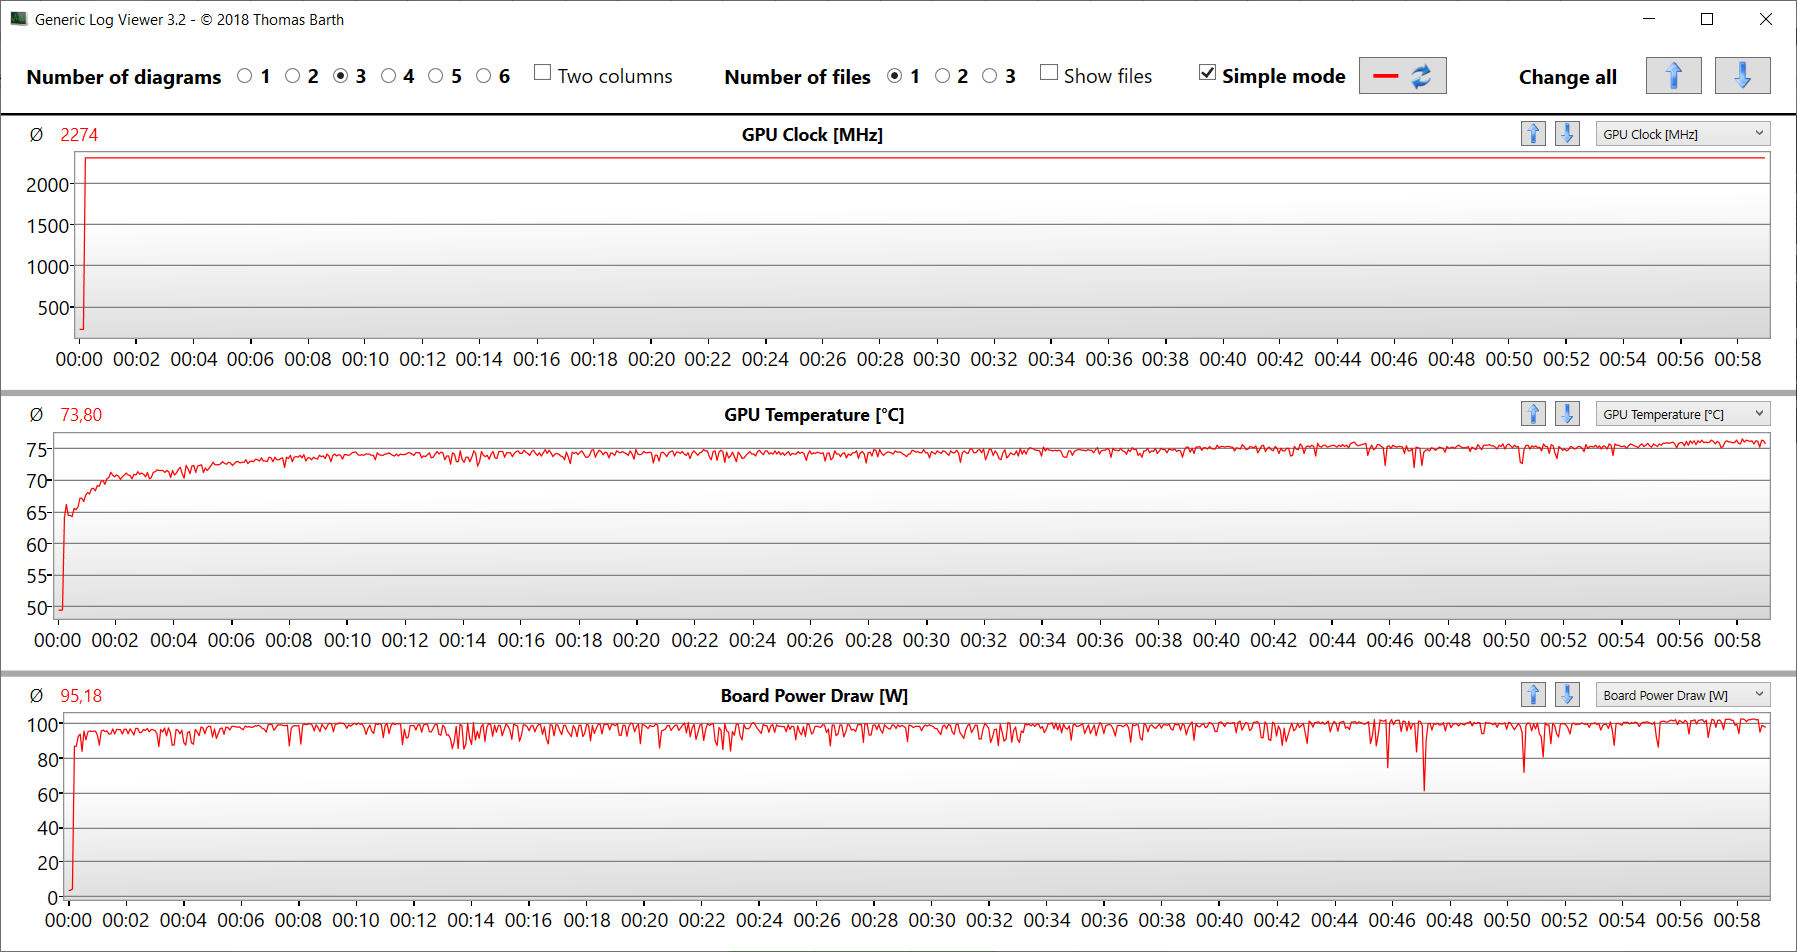
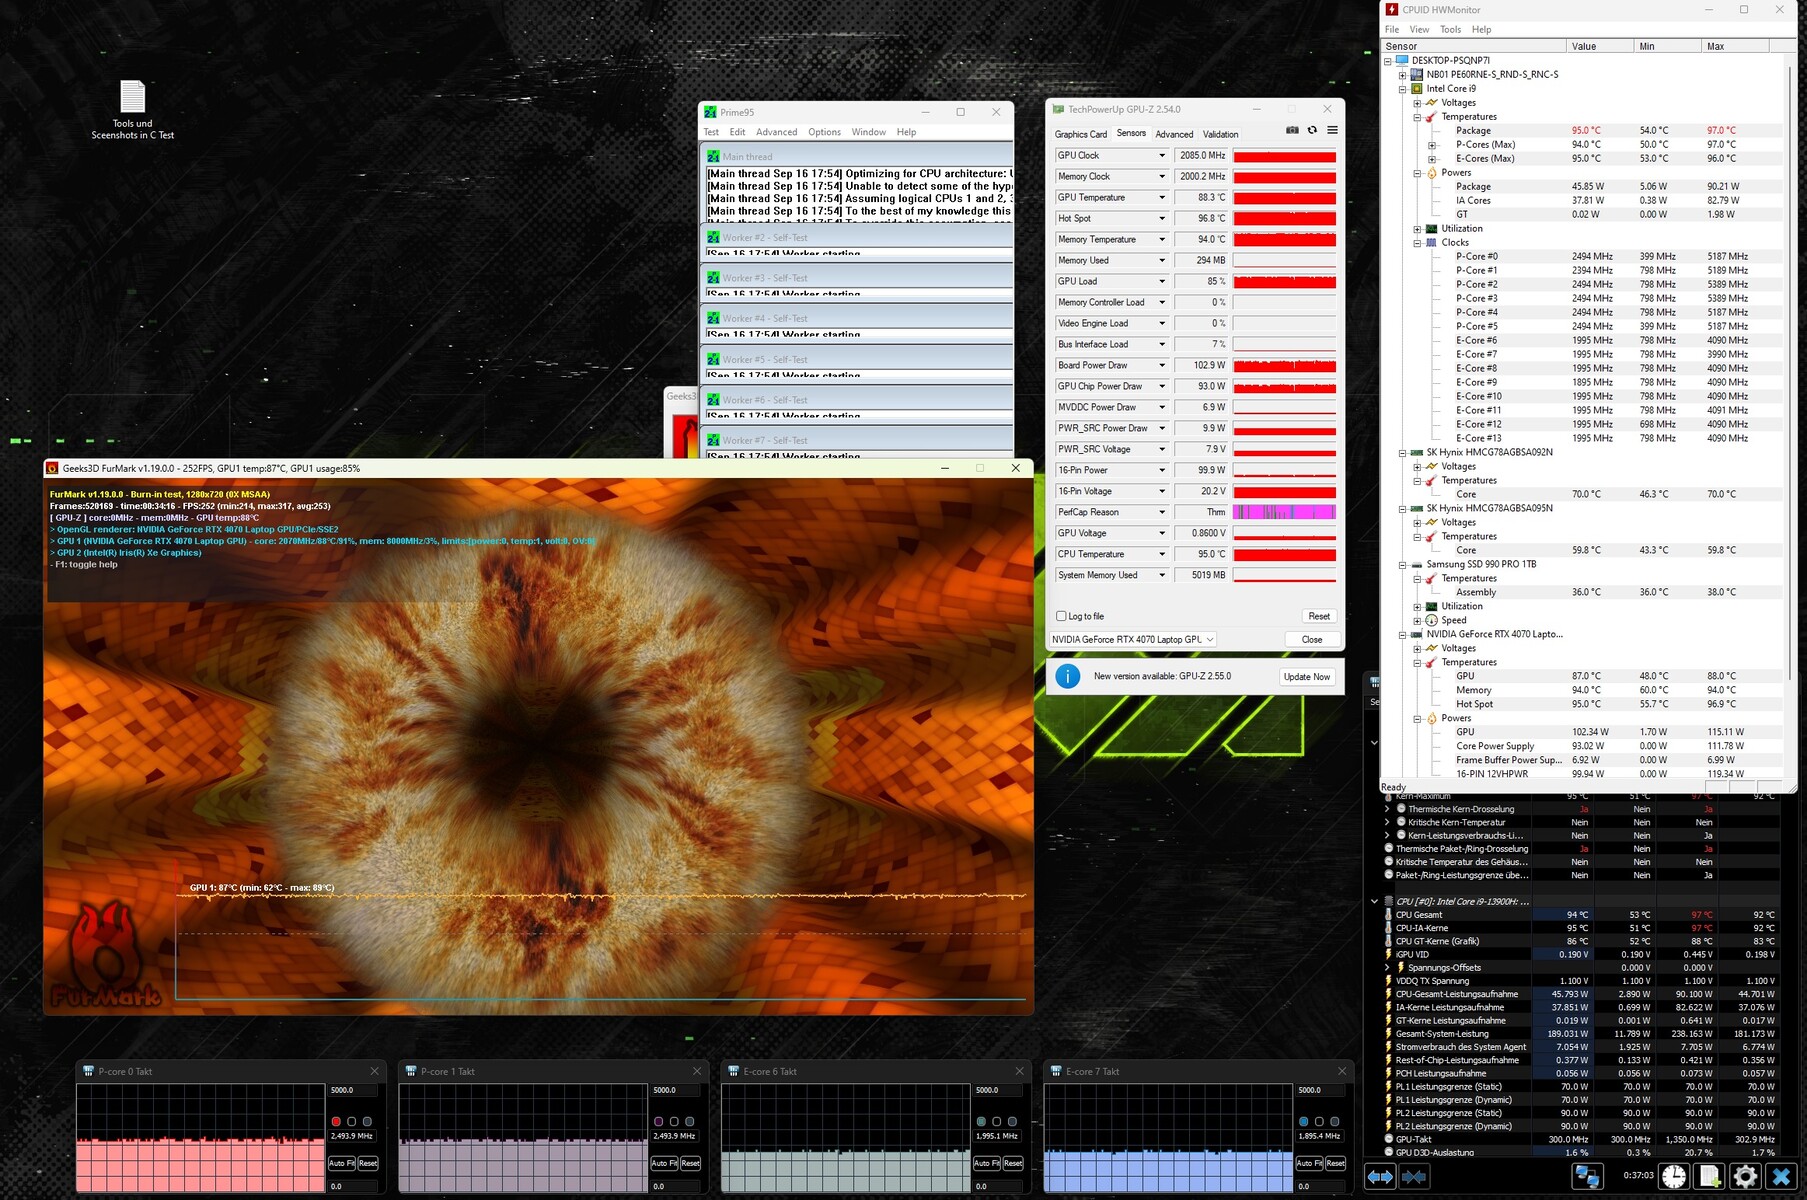
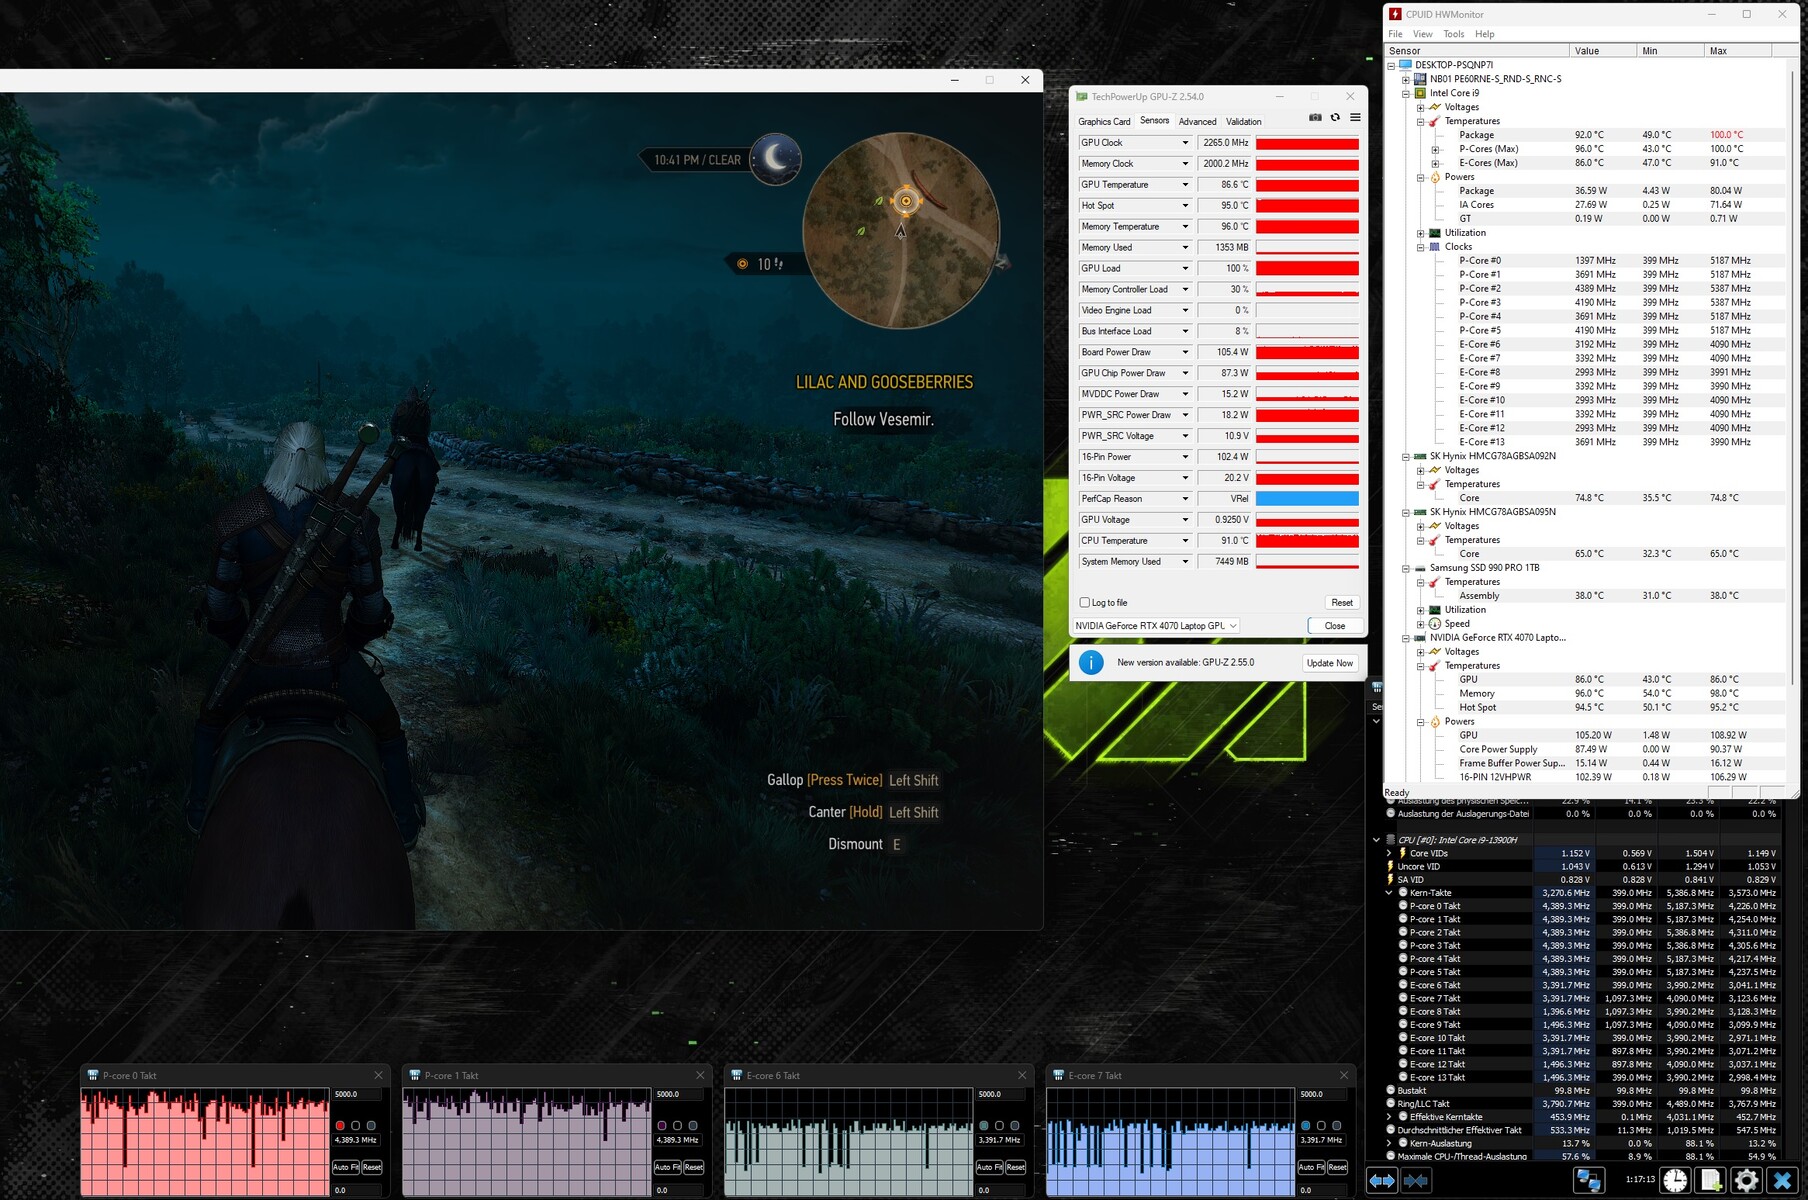
Test da sforzo
Il test di stress (Prime95 e Furmark in uso continuo) simula uno scenario estremo per verificare la stabilità del sistema a pieno carico. La CPU (P: da 3,8 a 3,9 GHz, E: 2,7 GHz) ha iniziato il test con velocità di clock elevate. Nel prosieguo, questi valori sono scesi fino a circa il livello di clock di base. La GPU ha funzionato quasi alla massima potenza.
Altoparlanti
Gli altoparlanti stereo producono un suono complessivamente molto decente. I bassi potrebbero essere più potenti.
Schenker XMG Pro 16 Studio (Mid 23) analisi audio
(±) | potenza degli altiparlanti media ma buona (80 dB)
Bassi 100 - 315 Hz
(±) | bassi ridotti - in media 12.7% inferiori alla media
(+) | bassi in lineaa (6.1% delta rispetto alla precedente frequenza)
Medi 400 - 2000 Hz
(+) | medi bilanciati - solo only 2.3% rispetto alla media
(+) | medi lineari (4.8% delta rispetto alla precedente frequenza)
Alti 2 - 16 kHz
(+) | Alti bilanciati - appena 2.6% dalla media
(+) | alti lineari (6% delta rispetto alla precedente frequenza)
Nel complesso 100 - 16.000 Hz
(+) | suono nel complesso lineare (10.9% differenza dalla media)
Rispetto alla stessa classe
» 7% di tutti i dispositivi testati in questa classe è stato migliore, 3% simile, 90% peggiore
» Il migliore ha avuto un delta di 6%, medio di 18%, peggiore di 132%
Rispetto a tutti i dispositivi testati
» 6% di tutti i dispositivi testati in questa classe è stato migliore, 2% similare, 92% peggiore
» Il migliore ha avuto un delta di 4%, medio di 23%, peggiore di 134%
Lenovo Legion Slim 7i 16 Gen 8 analisi audio
(+) | gli altoparlanti sono relativamente potenti (84.8 dB)
Bassi 100 - 315 Hz
(±) | bassi ridotti - in media 12.1% inferiori alla media
(±) | la linearità dei bassi è media (9% delta rispetto alla precedente frequenza)
Medi 400 - 2000 Hz
(+) | medi bilanciati - solo only 1.4% rispetto alla media
(+) | medi lineari (3.3% delta rispetto alla precedente frequenza)
Alti 2 - 16 kHz
(+) | Alti bilanciati - appena 4.4% dalla media
(+) | alti lineari (5.6% delta rispetto alla precedente frequenza)
Nel complesso 100 - 16.000 Hz
(+) | suono nel complesso lineare (10.5% differenza dalla media)
Rispetto alla stessa classe
» 6% di tutti i dispositivi testati in questa classe è stato migliore, 2% simile, 92% peggiore
» Il migliore ha avuto un delta di 6%, medio di 18%, peggiore di 132%
Rispetto a tutti i dispositivi testati
» 5% di tutti i dispositivi testati in questa classe è stato migliore, 1% similare, 93% peggiore
» Il migliore ha avuto un delta di 4%, medio di 23%, peggiore di 134%
Consumo di energia
Il Pro 16 non ha mostrato alcun valore di consumo energetico rilevante. I tassi si collocano su un livello normale per l'hardware installato. Il test e lo stress test sono stati eseguiti Witcher 3 test e lo stress test sono stati eseguiti con un consumo energetico leggermente in calo. L'alimentatore (230 watt) è sufficientemente dimensionato. Lodevole: Nell'ambito del confronto, il portatile XMG ha il consumo energetico complessivo più basso.
| Off / Standby | |
| Idle | |
| Sotto carico |
|
Leggenda:
min: | |
| Schenker XMG Pro 16 Studio (Mid 23) i9-13900H, GeForce RTX 4070 Laptop GPU | Asus Vivobook Pro 16X K6604JV-MX016W i9-13980HX, GeForce RTX 4060 Laptop GPU | Lenovo Legion Slim 7i 16 Gen 8 i9-13900H, GeForce RTX 4070 Laptop GPU | HP Omen Transcend 16 i9-13900HX, GeForce RTX 4070 Laptop GPU | MSI Stealth 16 Studio A13VG i7-13700H, GeForce RTX 4070 Laptop GPU | Media della classe Gaming | |
|---|---|---|---|---|---|---|
| Power Consumption | -23% | -65% | -76% | -8% | -33% | |
| Idle Minimum * (Watt) | 8 | 13.8 -73% | 22 -175% | 19.2 -140% | 11 -38% | 13 ? -63% |
| Idle Average * (Watt) | 12 | 16 -33% | 29 -142% | 22.7 -89% | 18 -50% | 19 ? -58% |
| Idle Maximum * (Watt) | 23 | 19 17% | 39.5 -72% | 55.4 -141% | 19 17% | 24.6 ? -7% |
| Load Average * (Watt) | 94 | 147 -56% | 98.7 -5% | 128.4 -37% | 91 3% | 110.7 ? -18% |
| Witcher 3 ultra * (Watt) | 181.5 | 147.8 19% | 171.8 5% | 206 -13% | 130 28% | |
| Load Maximum * (Watt) | 215 | 244 -13% | 213.2 1% | 292 -36% | 228 -6% | 259 ? -20% |
* ... Meglio usare valori piccoli
Power consumption Witcher 3 / stress test
Power consumption with external monitor
Tempi di esecuzione
Nel nostro test realistico sulla WLAN (che rappresenta il carico mentre si richiamano i siti web utilizzando uno script), il portatile da 16 pollici ha ottenuto tempi di esecuzione di 6:45 h - un risultato generalmente buono. Nell'ambito del confronto, il Pro 16 presenta la capacità della batteria più piccola (73 Wh), ma offre i migliori tempi di esecuzione per-Wh.
Pro
Contro
Verdetto - Una potenza armoniosa
L'editing di video e immagini, lo streaming, il rendering e i giochi fanno parte delle competenze del portatile. La potenza necessaria è fornita da unCore i9-13900He unaGeForce RTX 4070ad un livello costantemente elevato. È possibile trovare un buon compromesso tra prestazioni ed emissioni acustiche.
XMG Pro 16 Studio (Mid 23) di Schenker si rivela uno strumento potente per i giocatori e i creatori.
Il suo display QHD+ (16 pollici, 2.560 x 1.600 pixel, sRGB, IPS, 240 Hz) con un rapporto d'aspetto 16:10 adatto al lavoro ci ha lasciato in generale una buona impressione. Tuttavia: Lo schermo di un computer portatile per creatori dovrebbe essere in grado di rappresentare lo spazio colore DCI P3. Due slot SSD (PCIe 4) con supporto RAID-0/1 assicurano un'ampia capacità di archiviazione e tempi di caricamento ridotti.
Le sue porte USB-C (1x USB 3.2 Gen 2, 1x Thunderbolt 4) rendono il portatile facile da integrare nelle configurazioni esistenti dello spazio di lavoro e aprono ulteriori opzioni di espansione (GPU esterna, docking). La porta TB-4 può emettere un segnale DisplayPort e supporta Power Delivery. A questo si aggiungono tempi di esecuzione relativamente buoni.
Un'alternativa potrebbe essere ilLenovo Legion Slim 7i 16 Gen 8: Presenta la stessa CPU e GPU, ma può offrire una potenza di calcolo leggermente superiore. I punti deboli del portatile: Consumo energetico più elevato, RAM saldata, strozzatura dell'SSD.
Prezzo e disponibilità
XMG Pro 16 Studio può essere configurato individualmente e ordinato tramite il negozio online Schenker. Il nostro apparecchio di prova può essere acquistato per circa 2.400 dollari.
Schenker XMG Pro 16 Studio (Mid 23)
- 10/22/2023 v7 (old)
Sascha Mölck
Transparency
La selezione dei dispositivi da recensire viene effettuata dalla nostra redazione. Il campione di prova è stato fornito all'autore come prestito dal produttore o dal rivenditore ai fini di questa recensione. L'istituto di credito non ha avuto alcuna influenza su questa recensione, né il produttore ne ha ricevuto una copia prima della pubblicazione. Non vi era alcun obbligo di pubblicare questa recensione. In quanto società mediatica indipendente, Notebookcheck non è soggetta all'autorità di produttori, rivenditori o editori.
Ecco come Notebookcheck esegue i test
Ogni anno, Notebookcheck esamina in modo indipendente centinaia di laptop e smartphone utilizzando procedure standardizzate per garantire che tutti i risultati siano comparabili. Da circa 20 anni sviluppiamo continuamente i nostri metodi di prova e nel frattempo stabiliamo gli standard di settore. Nei nostri laboratori di prova, tecnici ed editori esperti utilizzano apparecchiature di misurazione di alta qualità. Questi test comportano un processo di validazione in più fasi. Il nostro complesso sistema di valutazione si basa su centinaia di misurazioni e parametri di riferimento ben fondati, che mantengono l'obiettività.Price comparison

