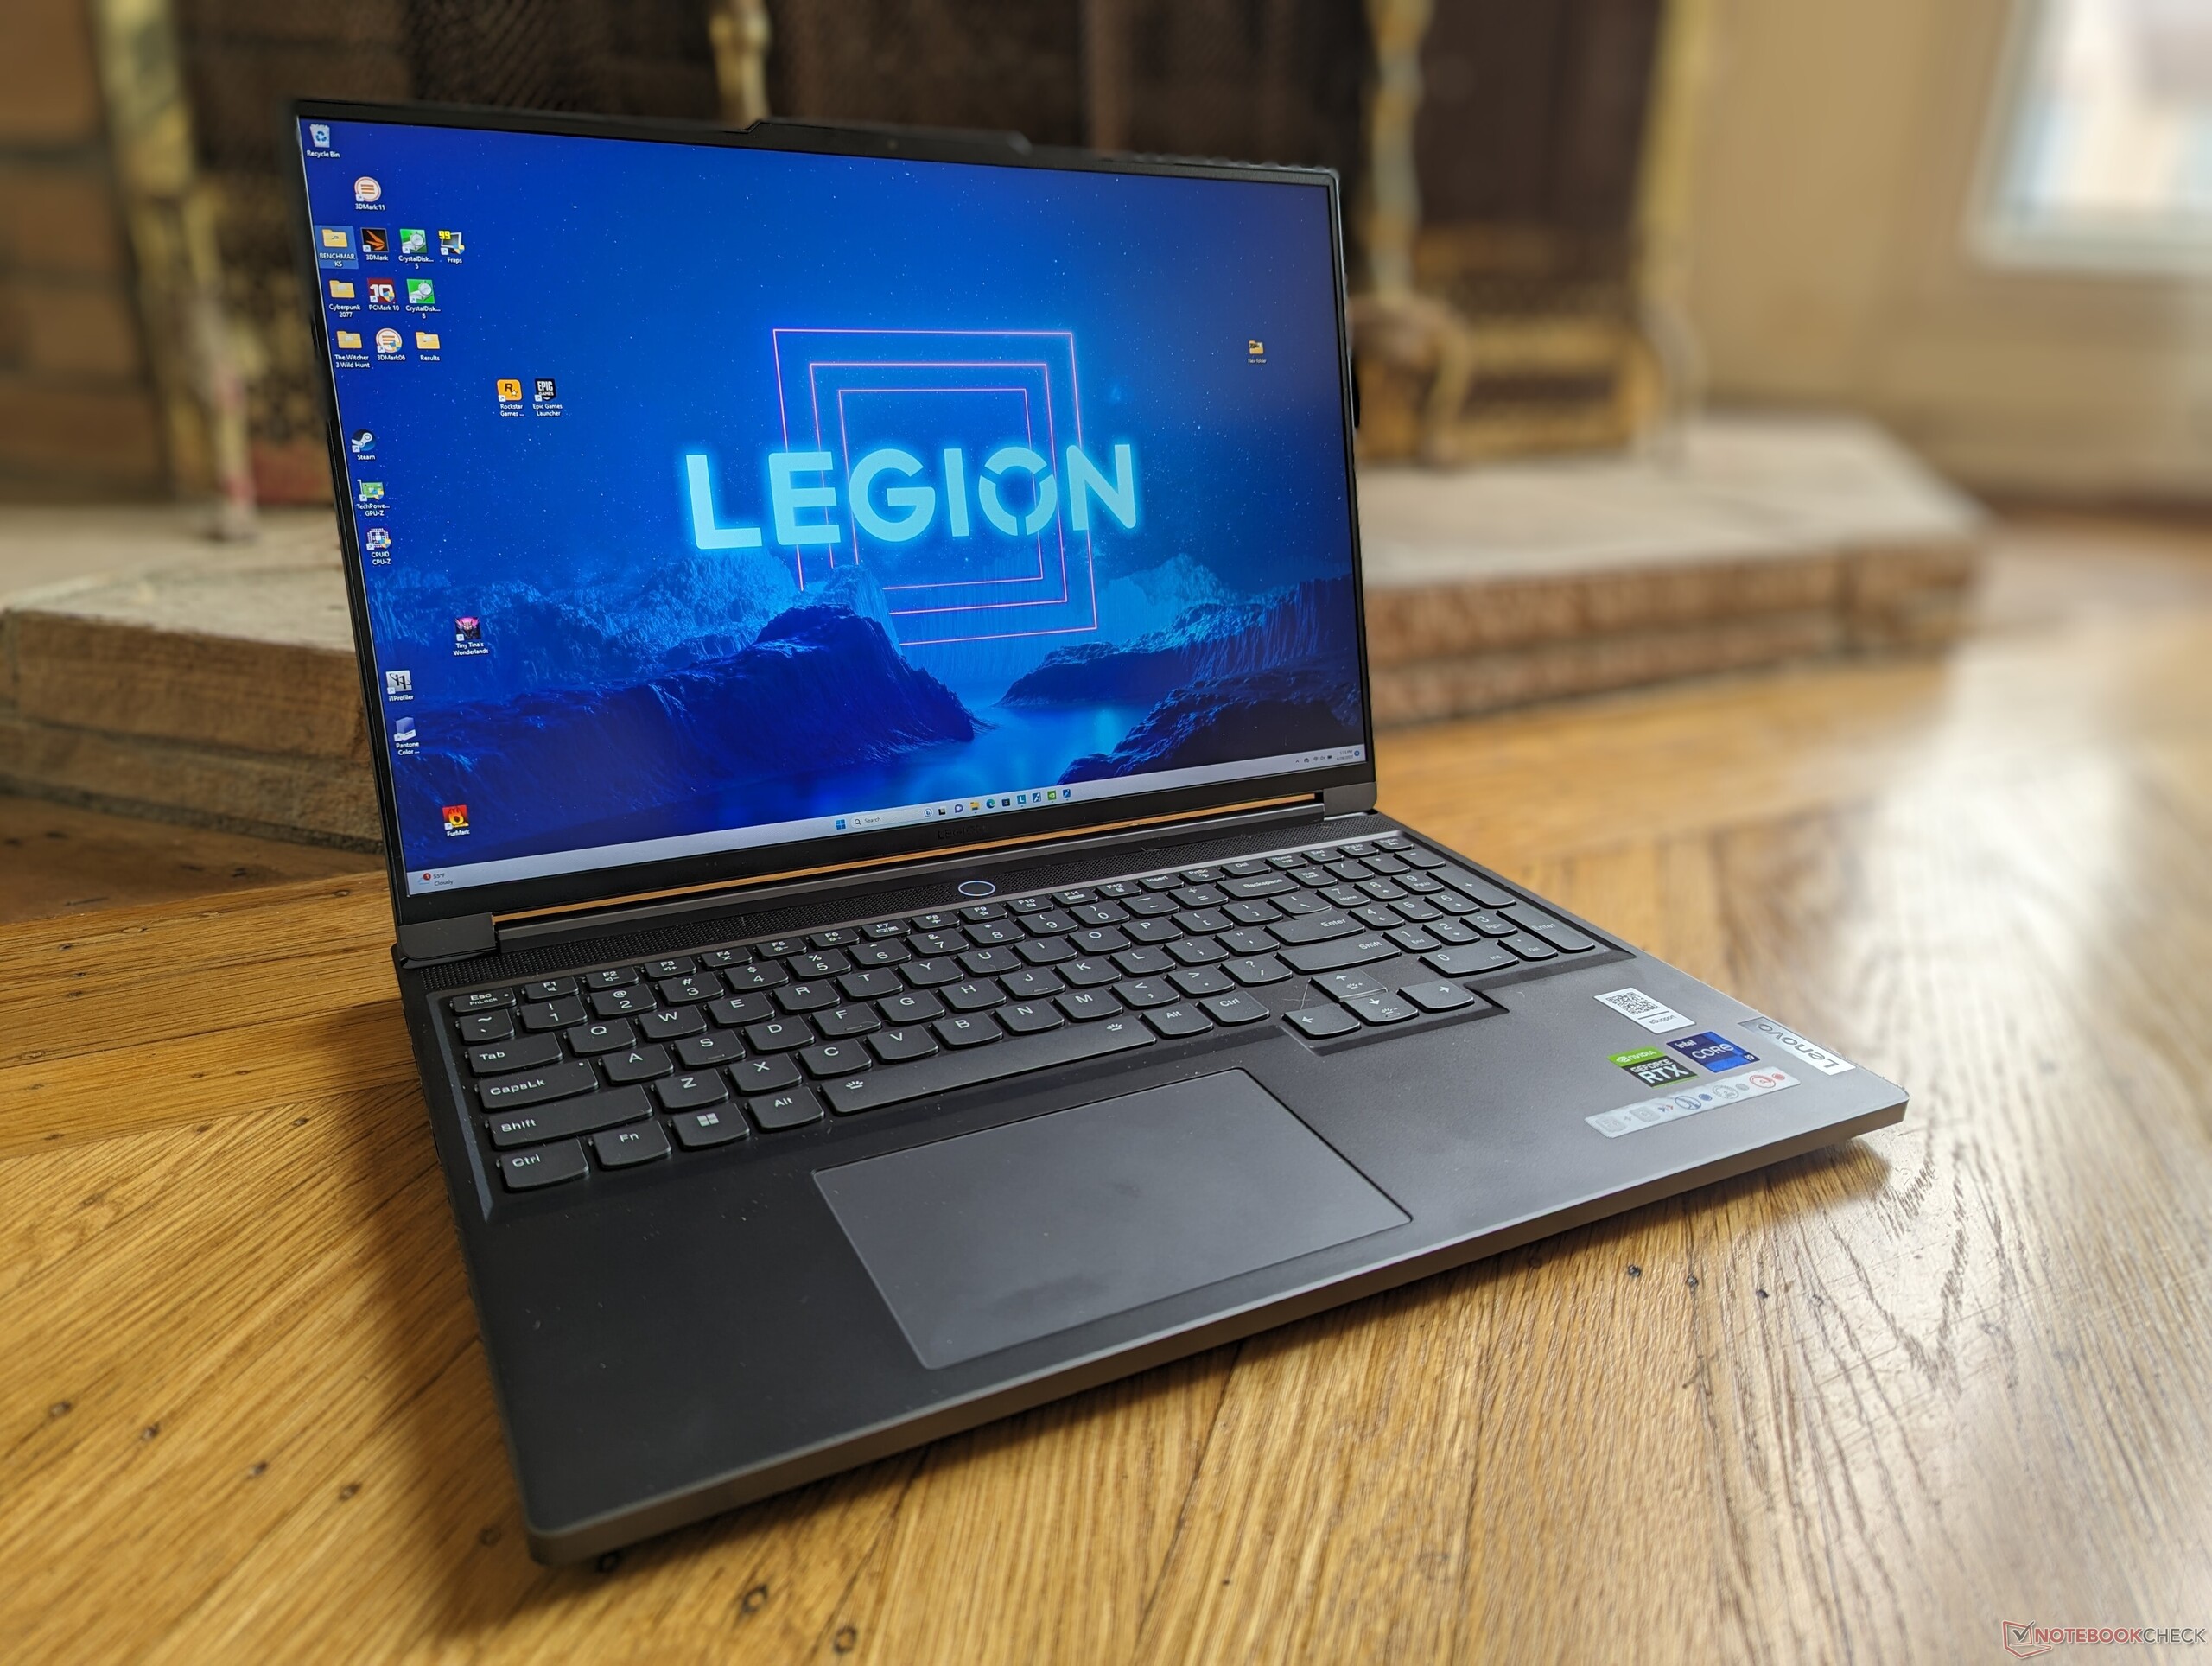
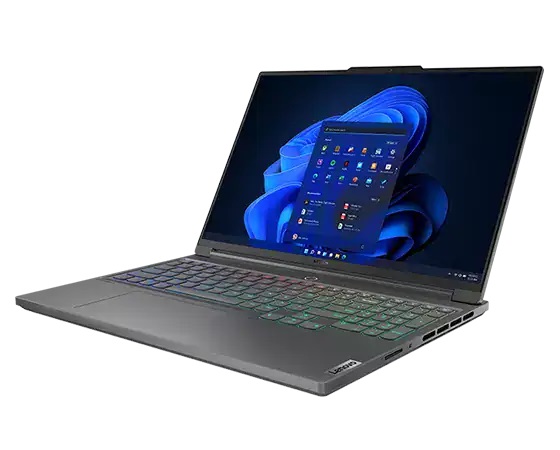
Recensione del laptop Lenovo Legion Slim 7i 16 Gen 8: Più sottile del Razer Blade 16

Il Lenovo Legion Slim 7i Gen 8 sostituisce il modello dello scorso anno Legion Slim 7i Gen 7 con le nuove CPU Raptor Lake-H di 13a generazione, le GPU Nvidia Ada Lovelace e un design rivisto dello chassis. Si affianca alla serie Pro 7i, più spessa e potente Legion Serie Pro 7.
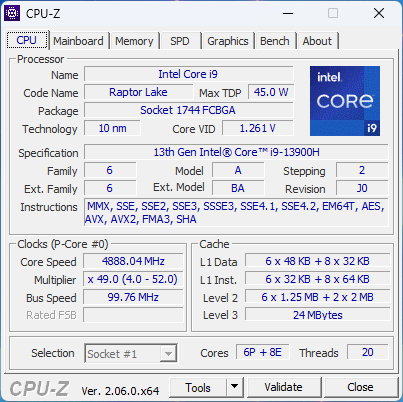
La nostra unità di recensione è una configurazione di fascia alta con Core i9-13900H, GPU RTX 4070 da 140 W GeForce e display IPS da 2560 x 1600 240 Hz al prezzo di circa 1600 dollari al dettaglio. Sono disponibili altre SKU con Core i7-13700H, RTX 4060 o display a risoluzione superiore 3200 x 2000 165 Hz a partire da circa 1500 dollari.
Tra i concorrenti di Legion Slim 7i G8 ci sono altri portatili da gioco da 16 pollici sottili e leggeri come il Razer Blade 16, HP Omen 16, Asus ROG Zephyrus M16o il modello Alienware x16 R1.
Altre recensioni Lenovo:
Potenziali concorrenti a confronto
Punteggio | Data | Modello | Peso | Altezza | Dimensione | Risoluzione | Prezzo |
|---|---|---|---|---|---|---|---|
| 90 % v7 (old) | 07/2023 | Lenovo Legion Slim 7i 16 Gen 8 i9-13900H, GeForce RTX 4070 Laptop GPU | 2.1 kg | 19.9 mm | 16.00" | 2560x1600 | |
| 87.4 % v7 (old) | 07/2023 | HP Omen 16-wf000 i7-13700HX, GeForce RTX 4080 Laptop GPU | 2.4 kg | 23.6 mm | 16.10" | 2560x1440 | |
| 88.4 % v7 (old) | 06/2023 | Alienware x16 R1 i9-13900HK, GeForce RTX 4080 Laptop GPU | 2.6 kg | 18.57 mm | 16.00" | 2560x1600 | |
| 88.8 % v7 (old) | 06/2023 | Lenovo Legion Pro 7 RTX4090 i9-13900HX, GeForce RTX 4090 Laptop GPU | 2.7 kg | 26 mm | 16.00" | 2560x1600 | |
| 88.4 % v7 (old) | 03/2023 | Asus ROG Strix G16 G614JZ i9-13980HX, GeForce RTX 4080 Laptop GPU | 2.4 kg | 30.4 mm | 16.00" | 2560x1600 | |
| 91.2 % v7 (old) | 02/2023 | Razer Blade 16 Early 2023 i9-13950HX, GeForce RTX 4080 Laptop GPU | 2.4 kg | 21.99 mm | 16.00" | 2560x1600 |
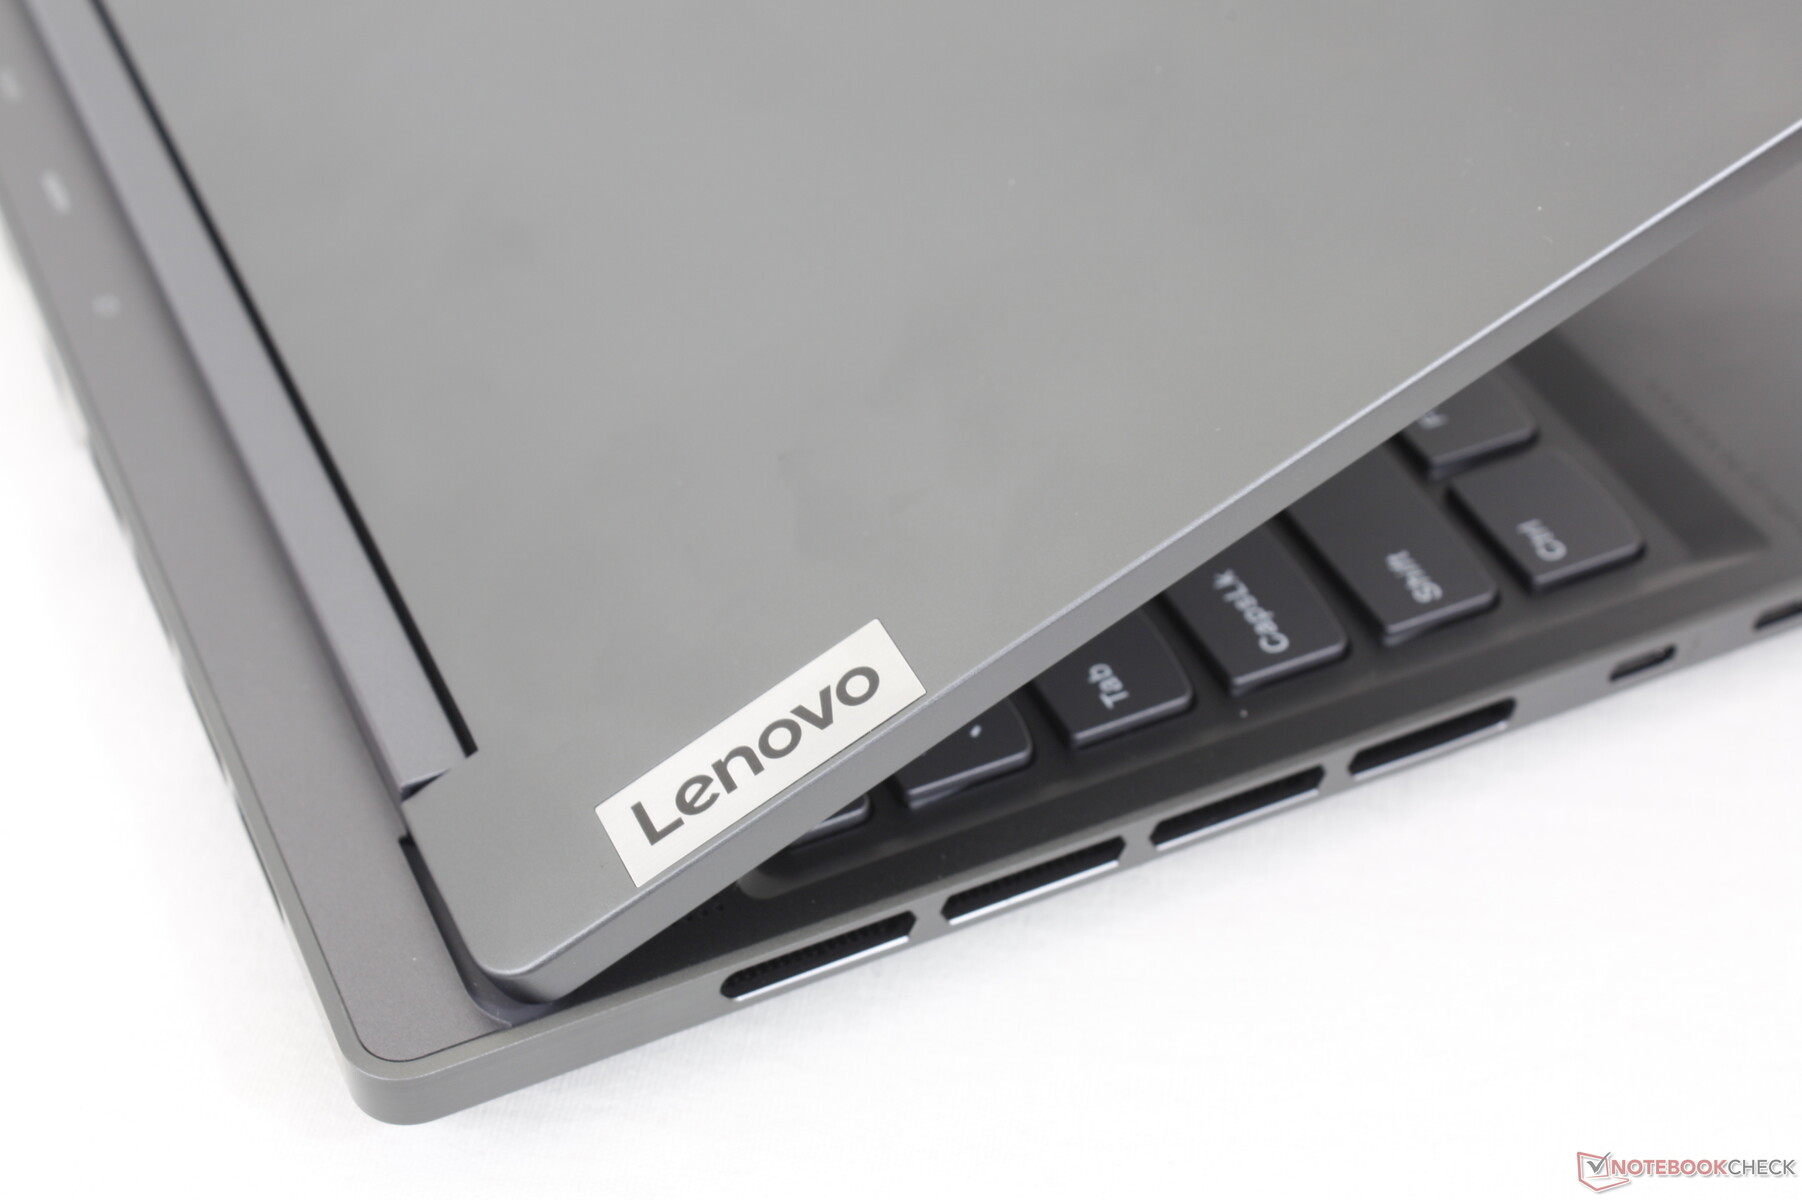
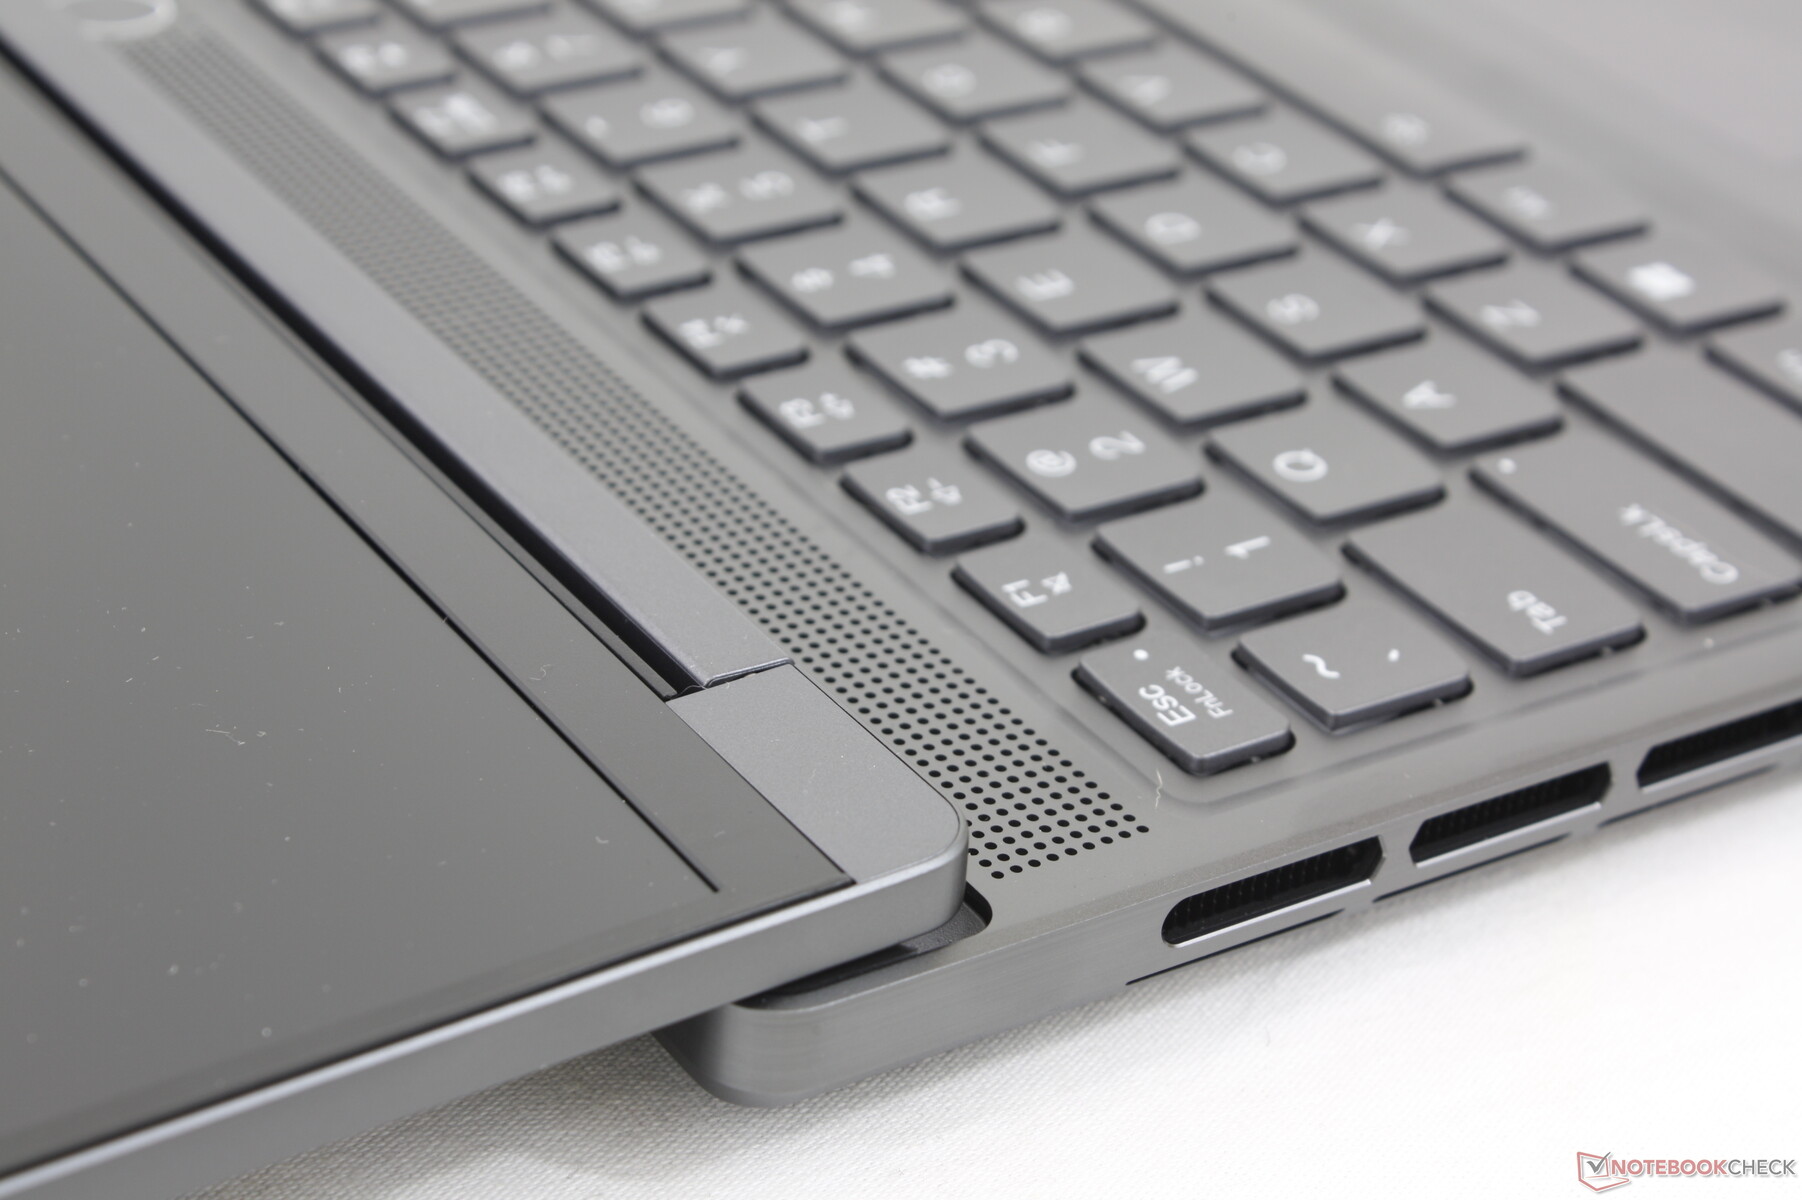
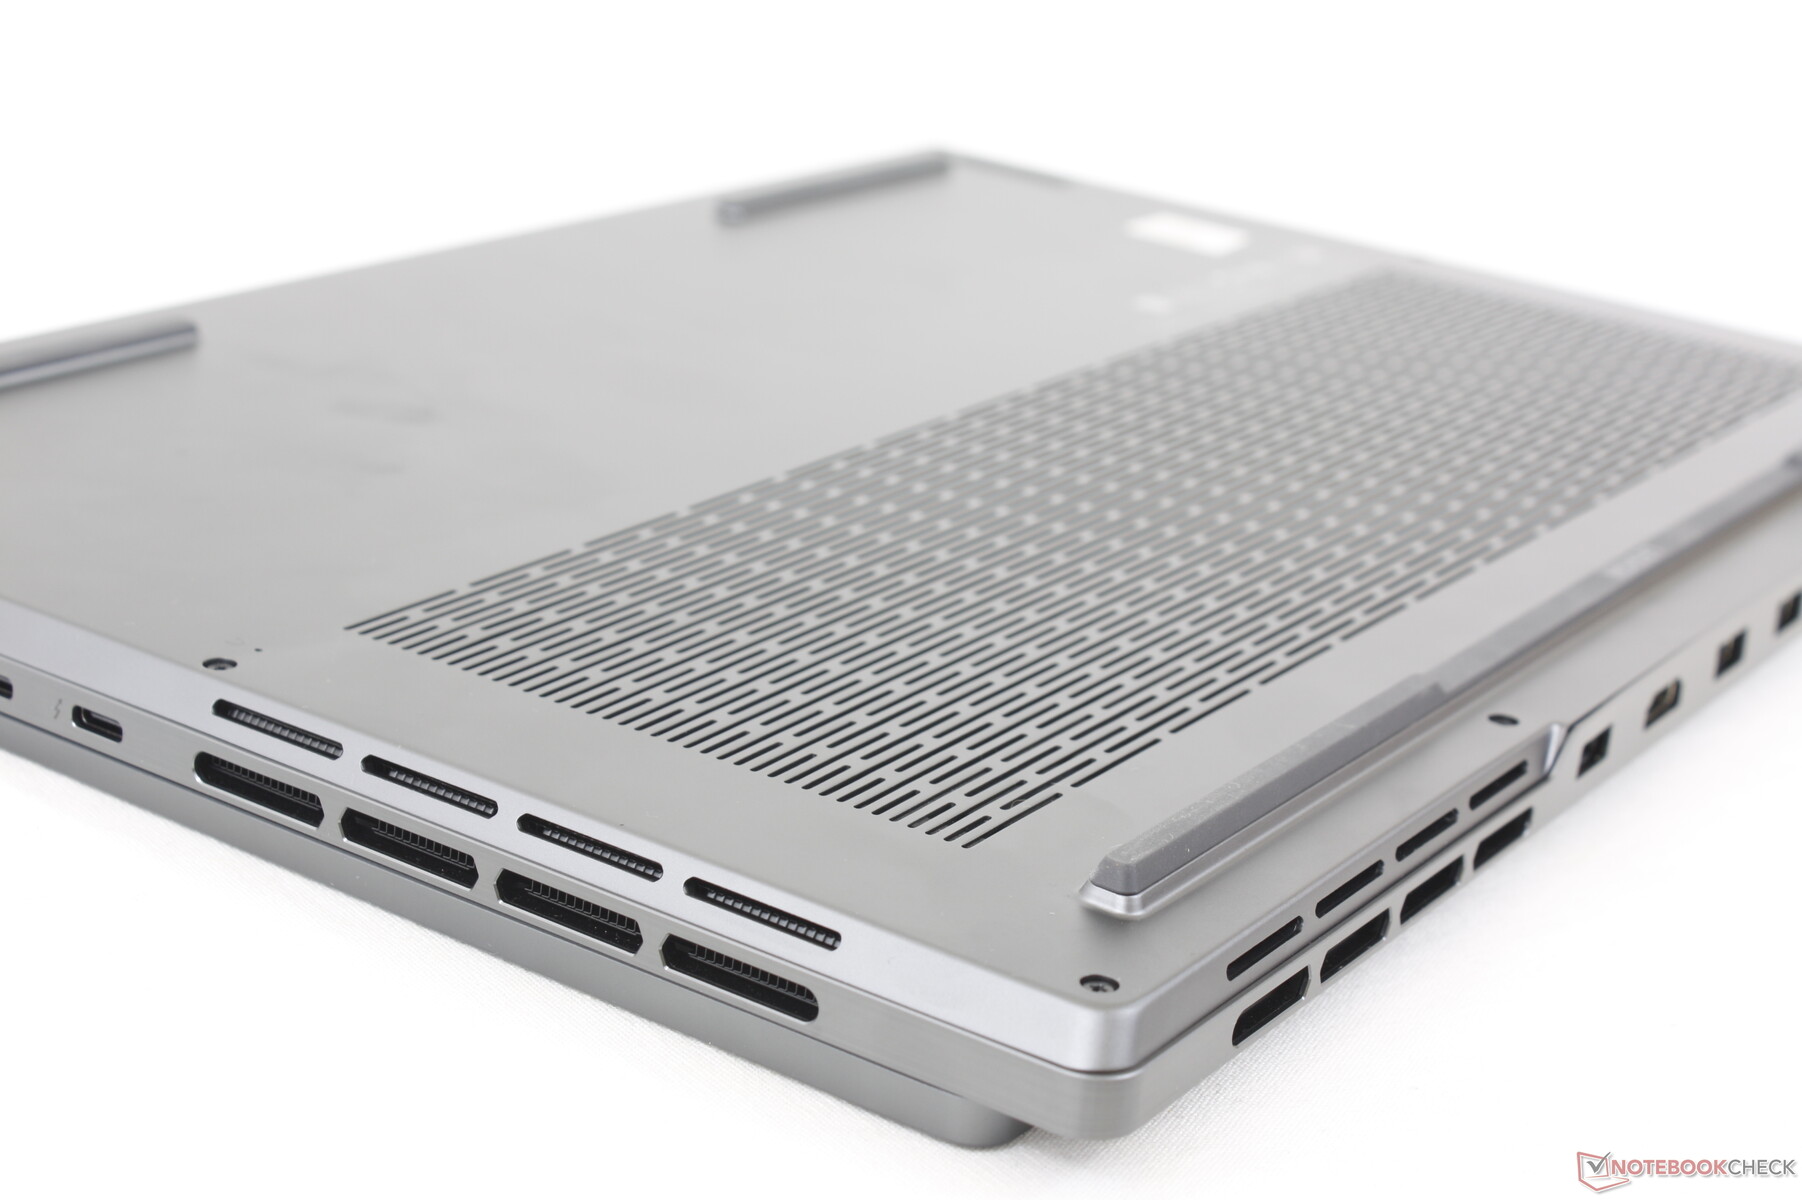
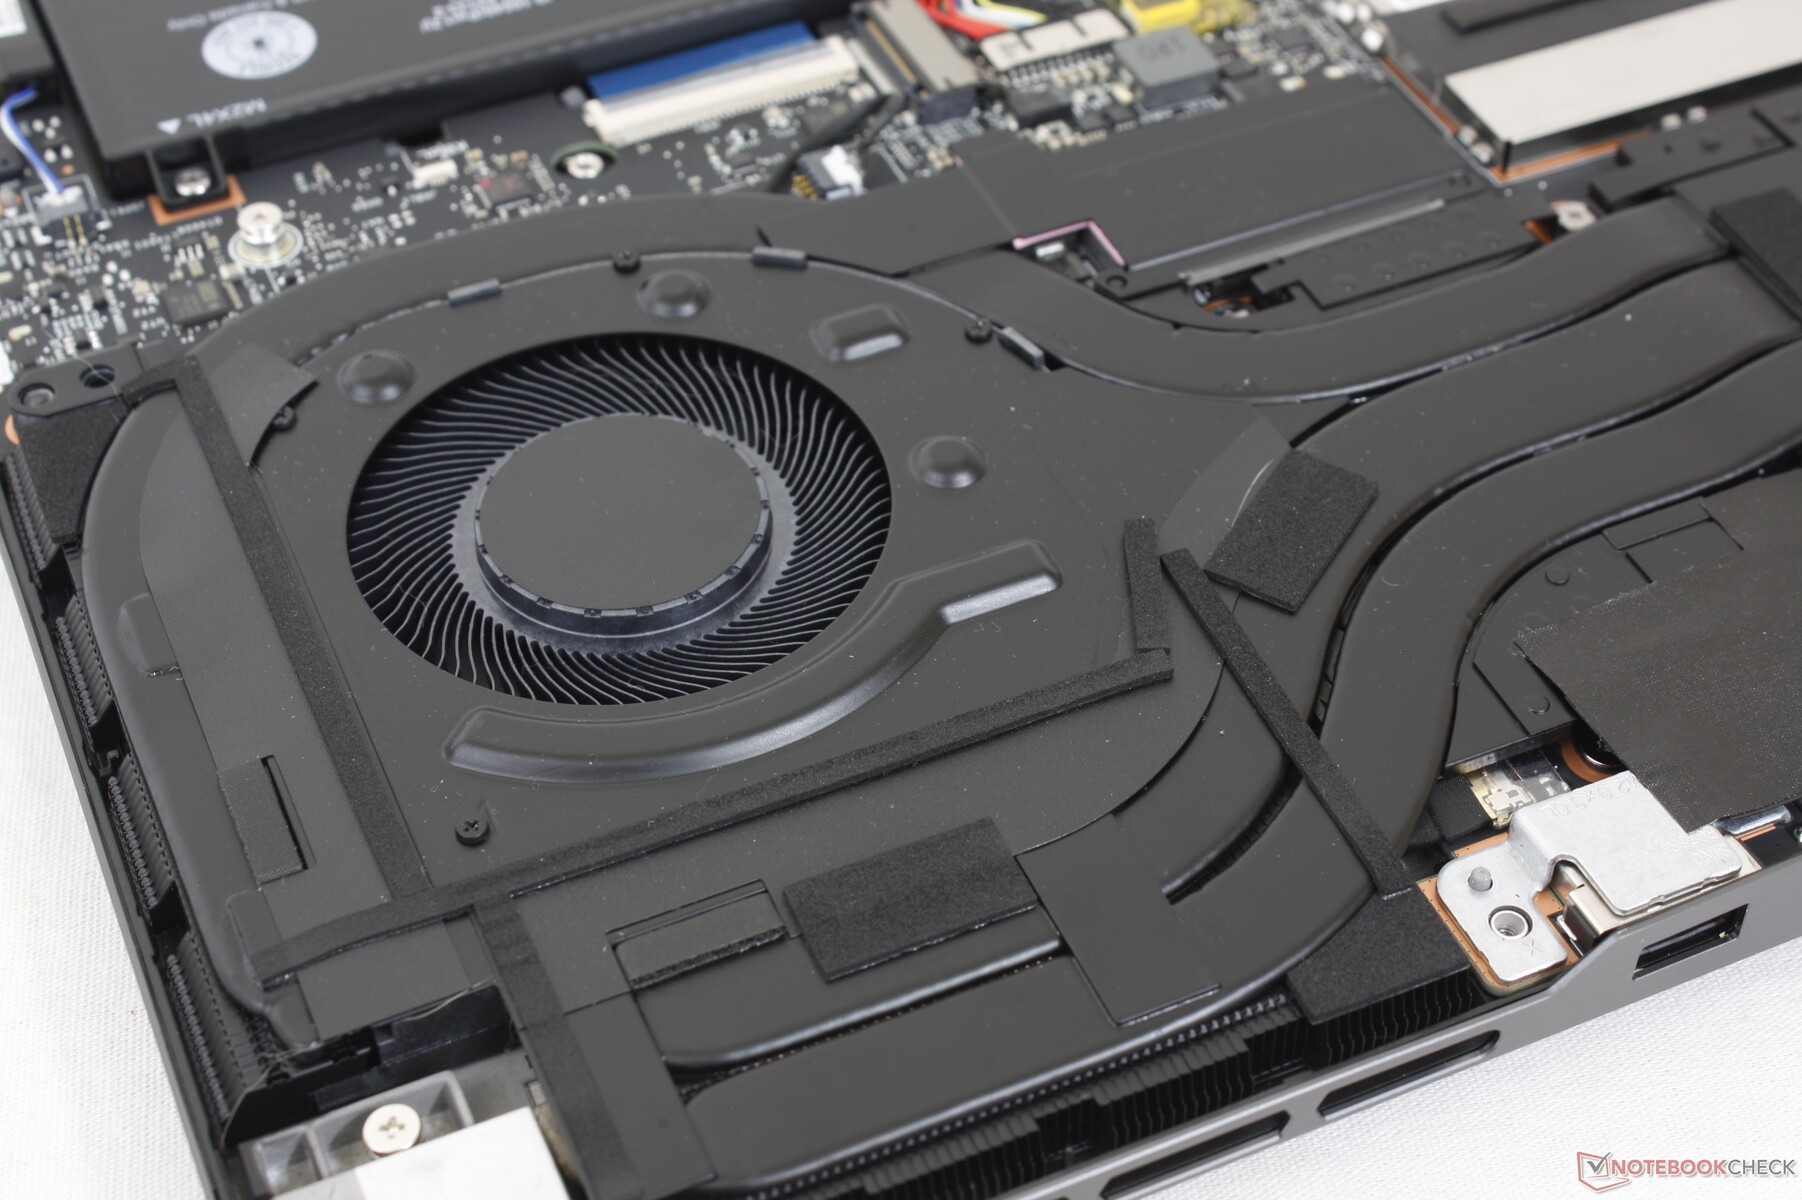
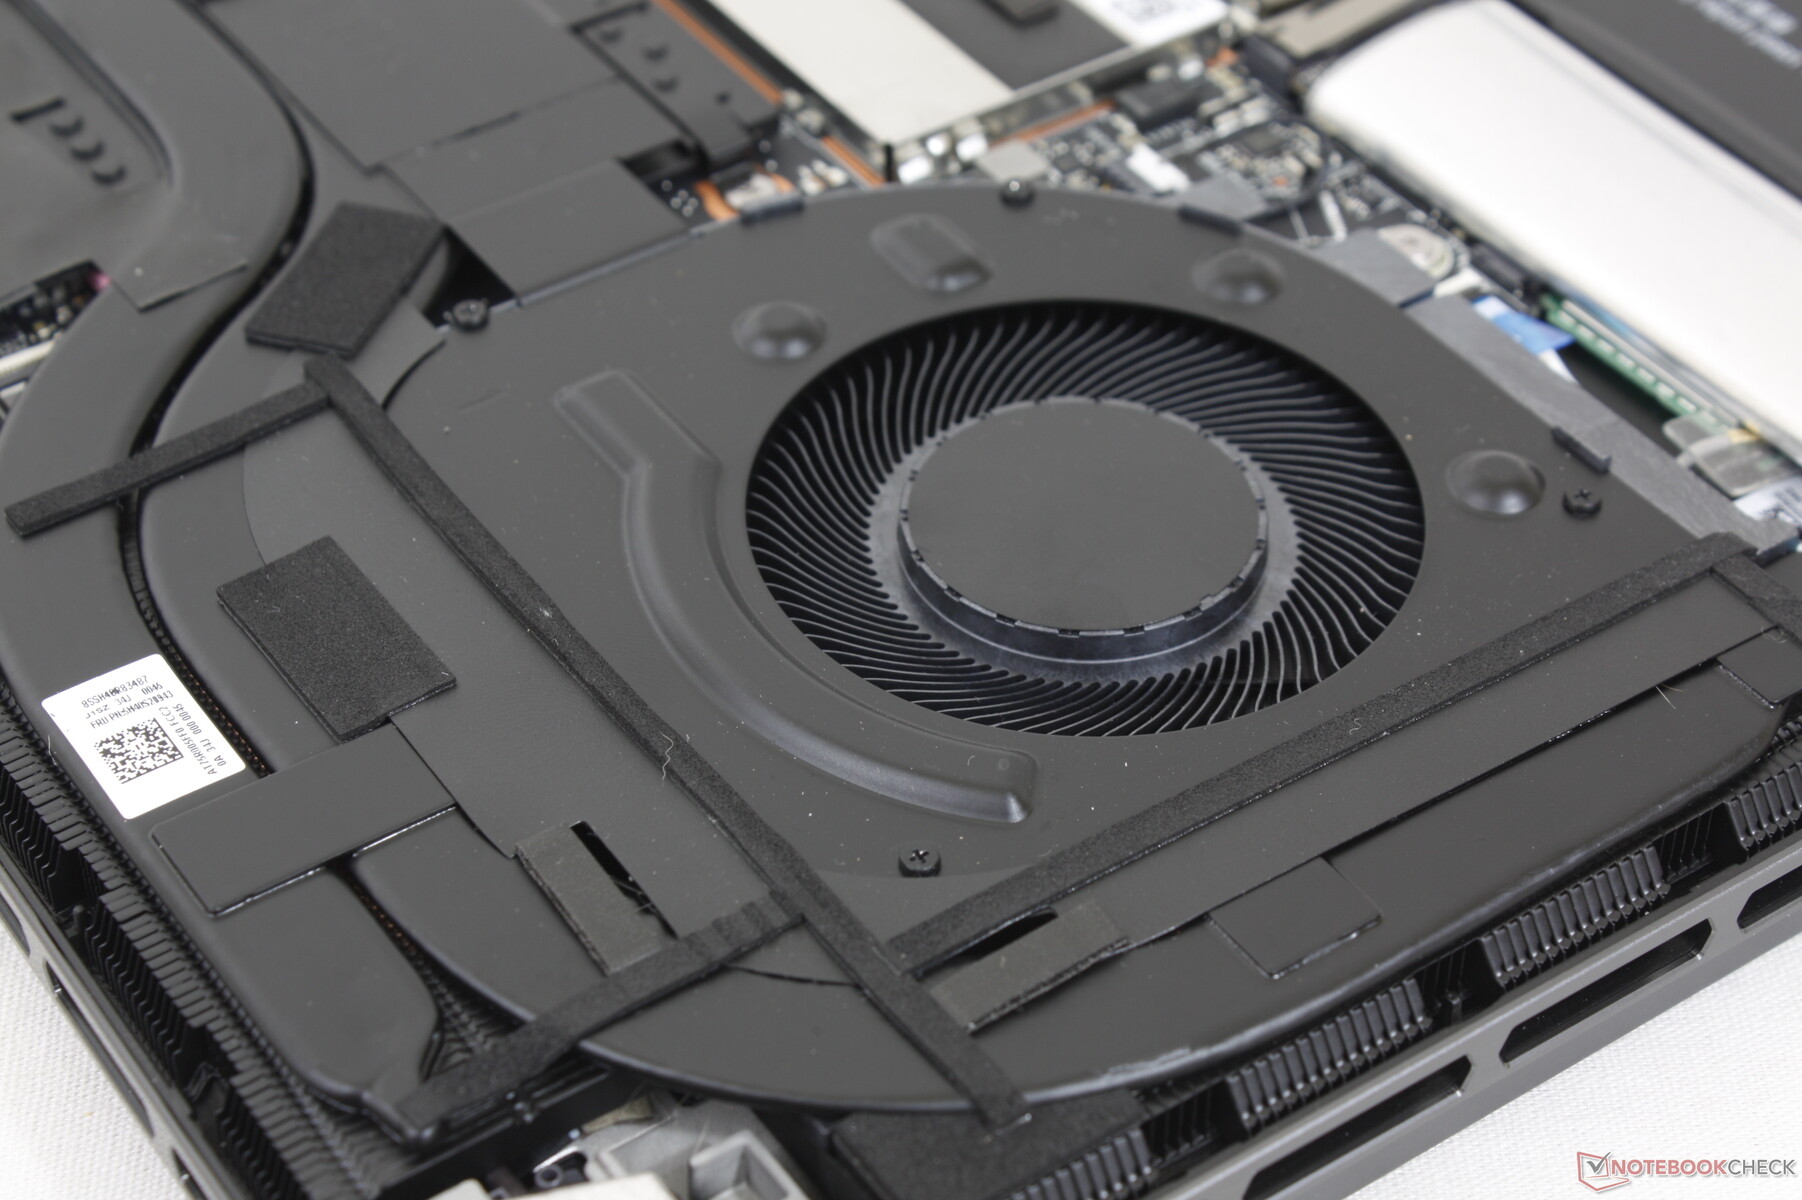
Valigetta - Ora con più griglie di ventilazione
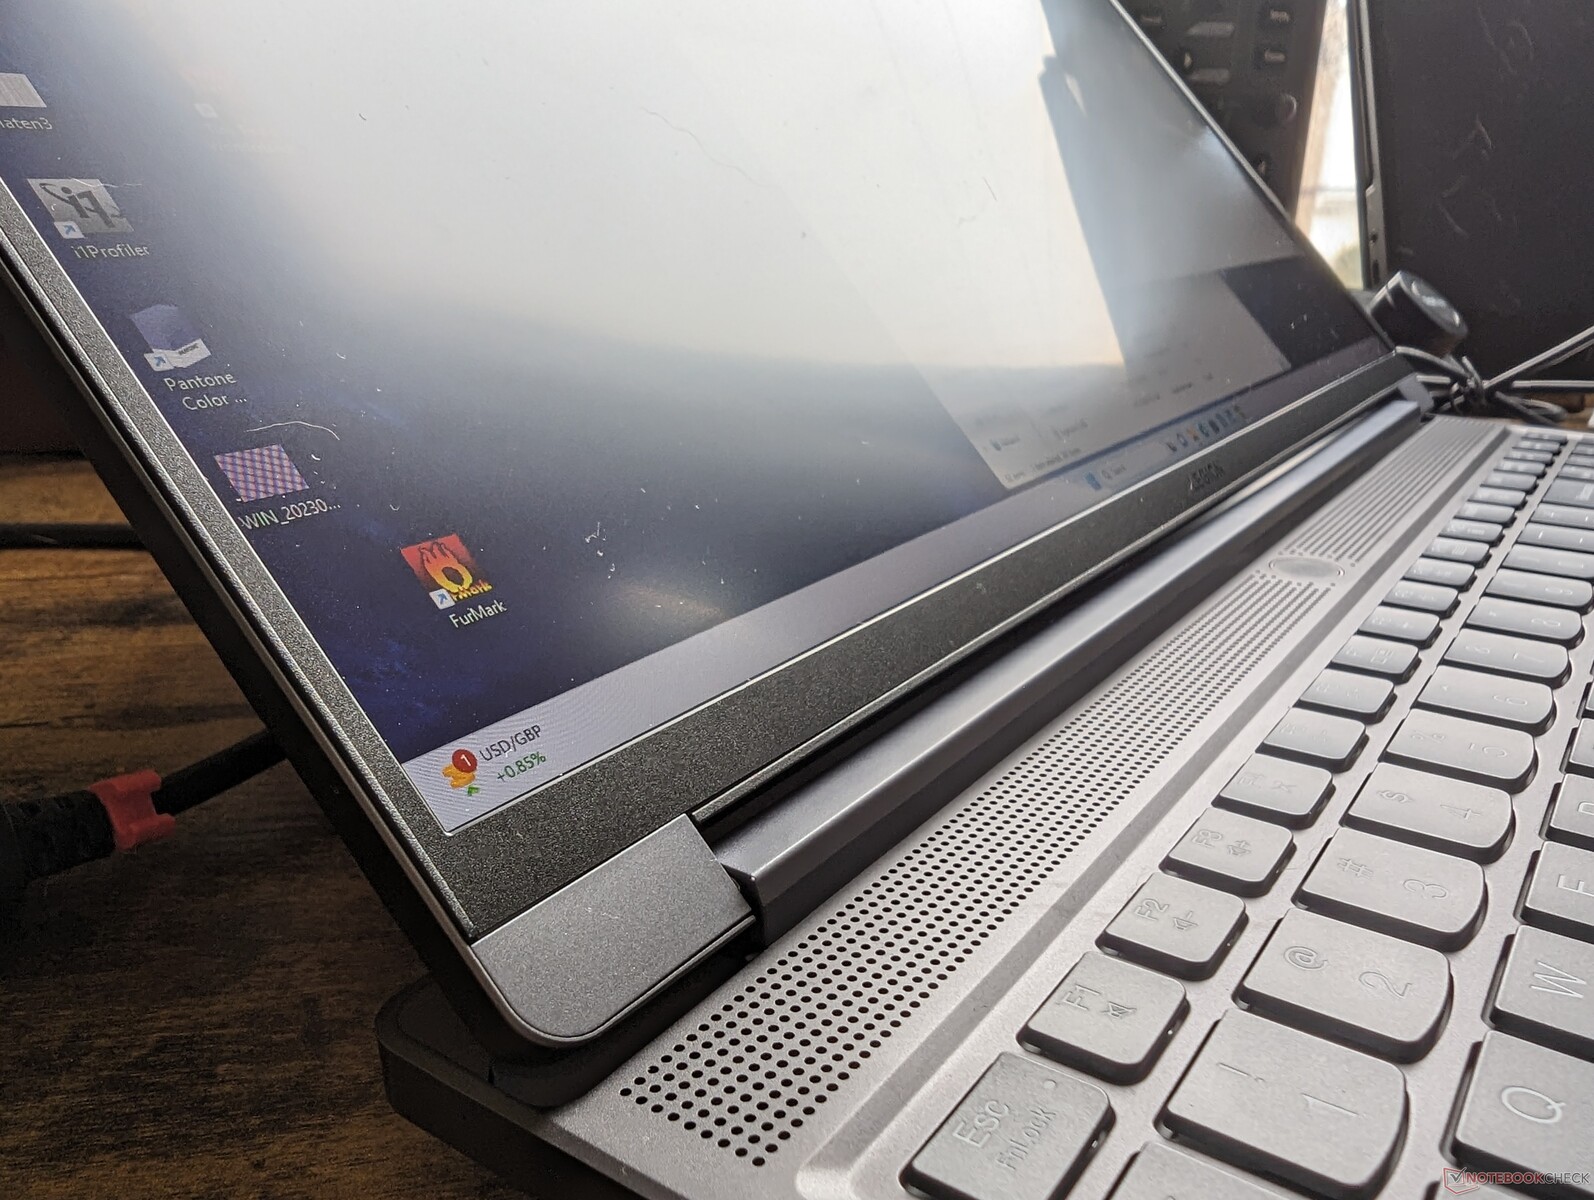
Il telaio può sembrare simile al Legion Slim 7i 16 G7 dell'anno scorso dal punto di vista frontale, ma la maggior parte dei cambiamenti esterni si trova sul retro e sui lati inferiori. Il bordo posteriore, per esempio, è ora piatto per un aspetto più pulito, mentre le griglie di ventilazione sono notevolmente più grandi questa volta per migliorare il raffreddamento.
Per il resto, i materiali del telaio presentano la stessa finitura in alluminio grigio e la stessa sensazione di altri modelli di Legion 7. La base rimane rigida nonostante il profilo sottile. La base rimane rigida nonostante il profilo sottile e anche il coperchio è relativamente solido. Le piccole cerniere non sono così solide come quelle più grandi dell'Asus ROG Strix G16 Asus ROG Strix G16ma consentono un'apertura completa di 180 gradi, cosa non comune nei portatili da gioco.
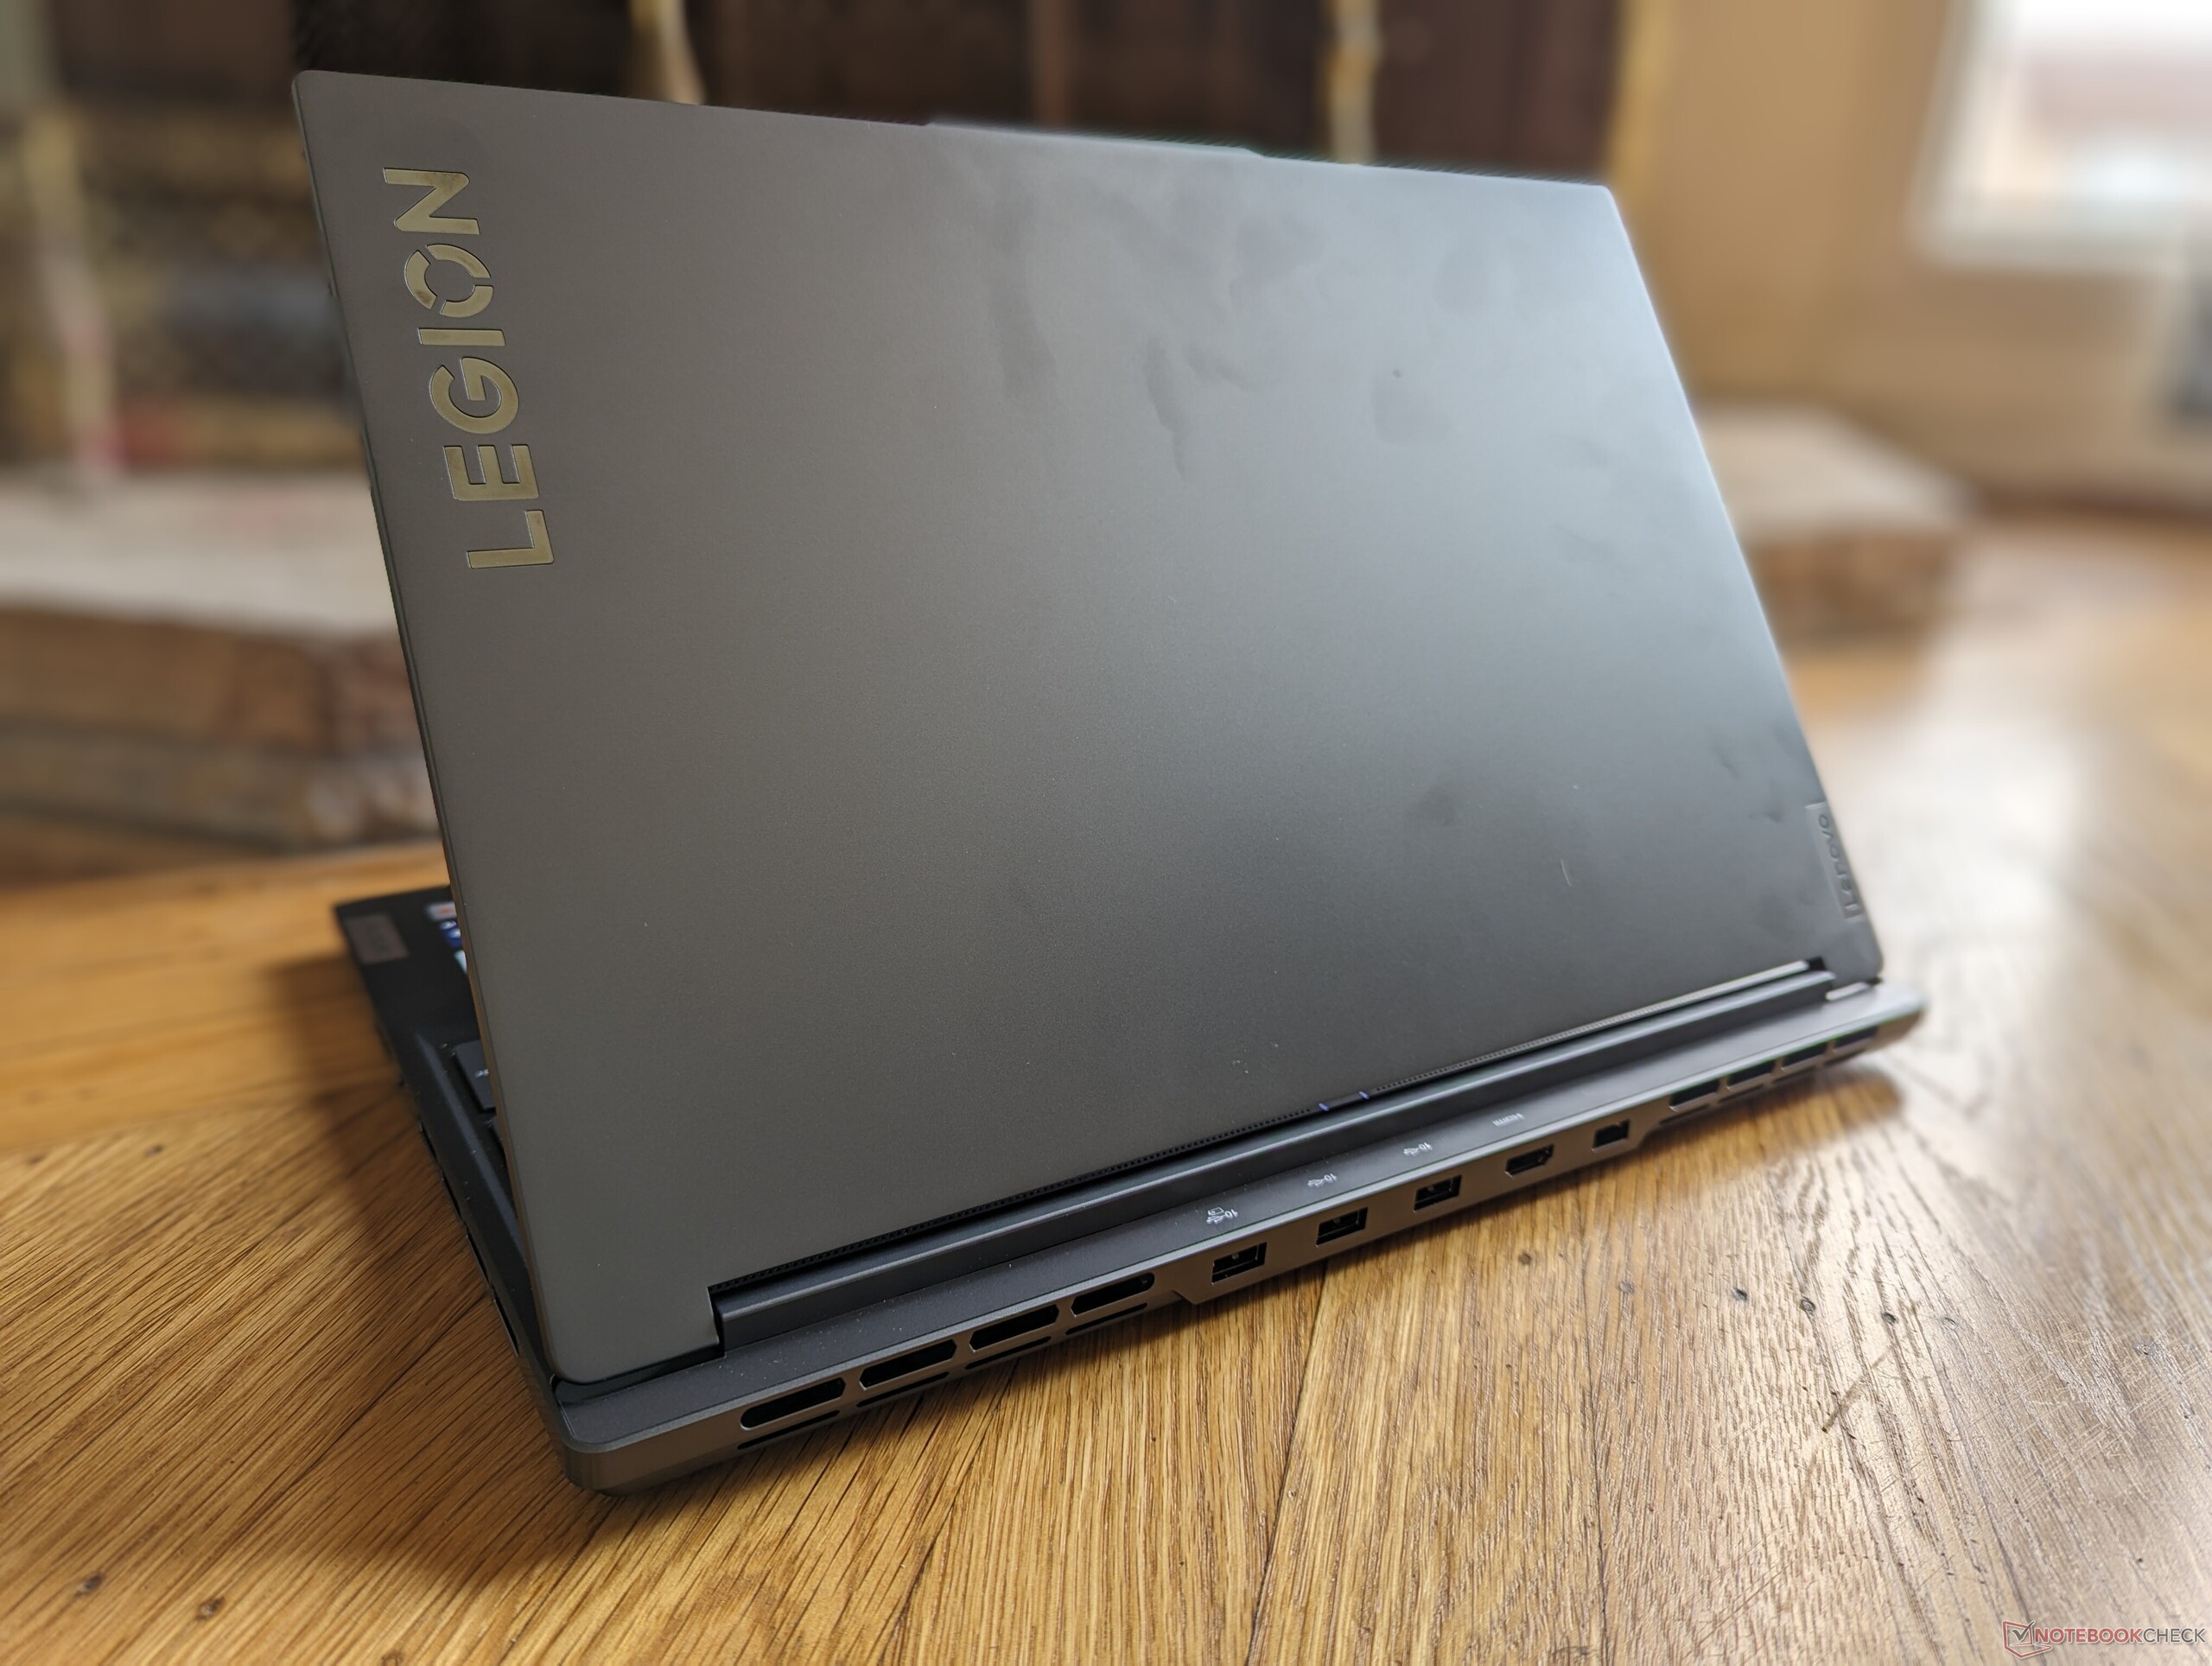
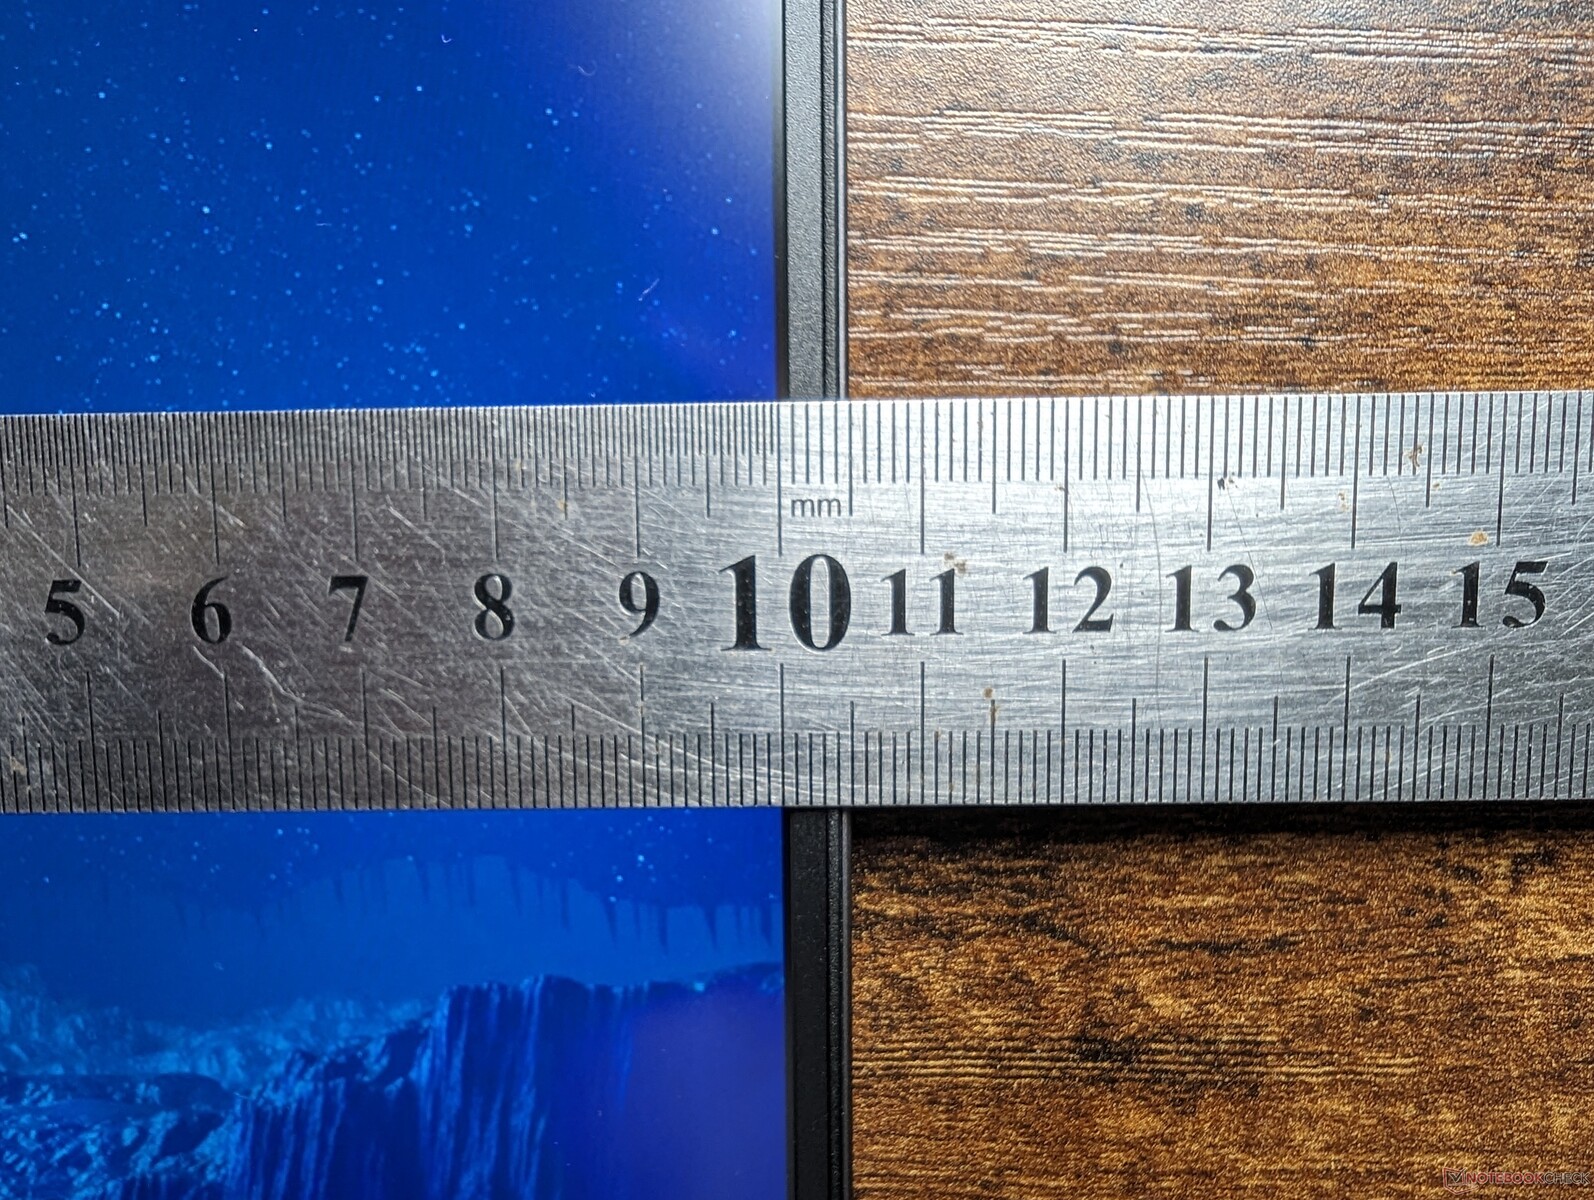
Lenovo non lo chiama Legion Slim 7 per niente. Rispetto al Legion Pro 7, la versione Slim è significativamente più leggera di 600 g e notevolmente più sottile di oltre 6 mm. In effetti, Legion Slim 7 è uno dei portatili da gioco da 16 pollici più sottili e leggeri disponibili sul mercato, secondo solo all'MSI GS666, leggermente più sottile e leggero MSI GS66.
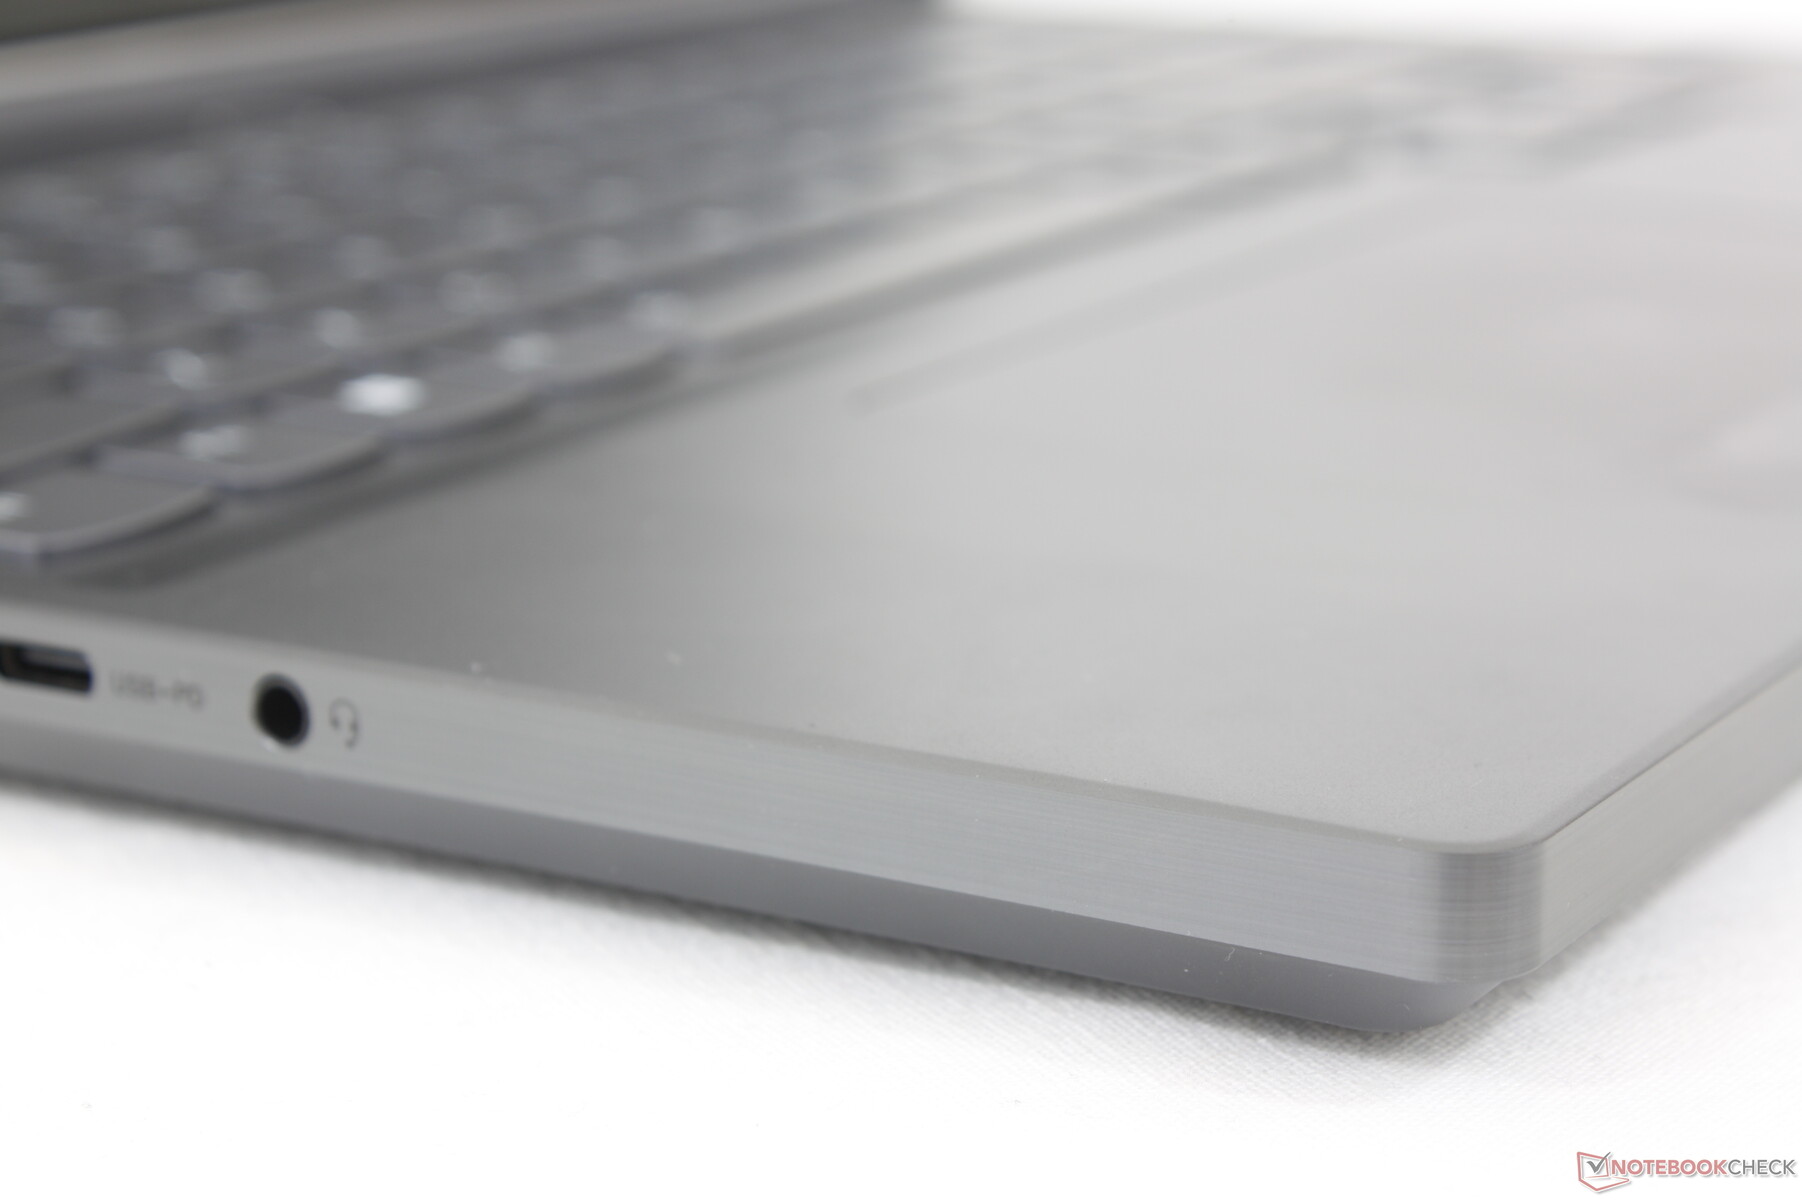
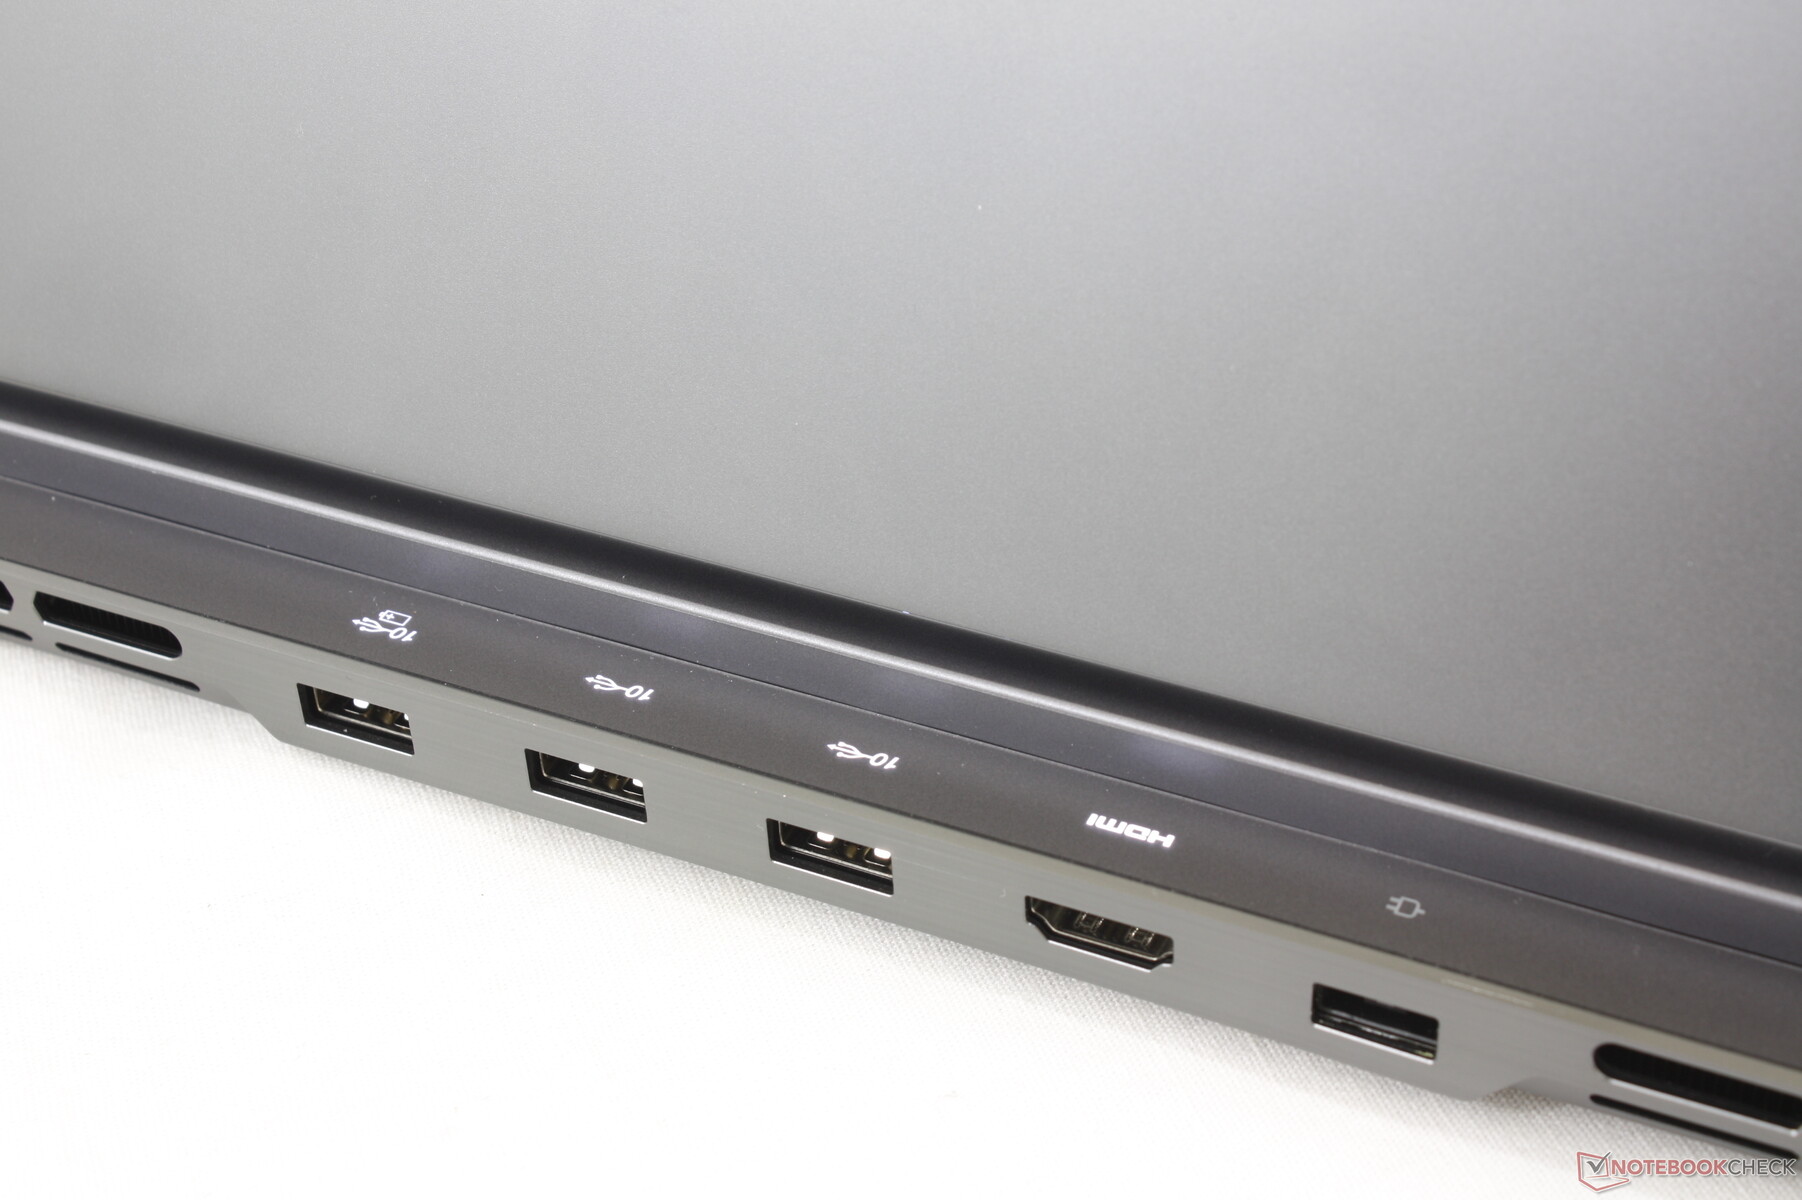
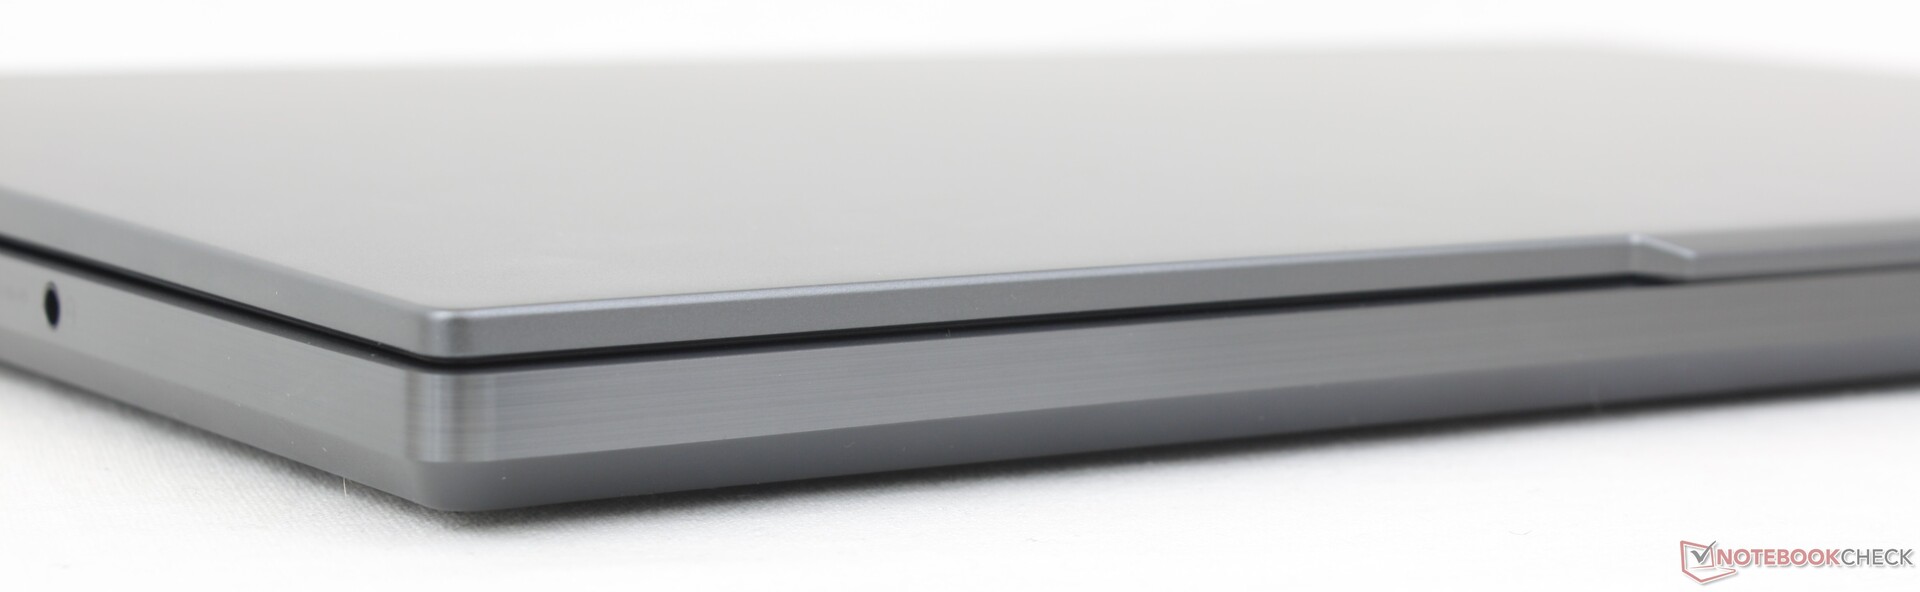
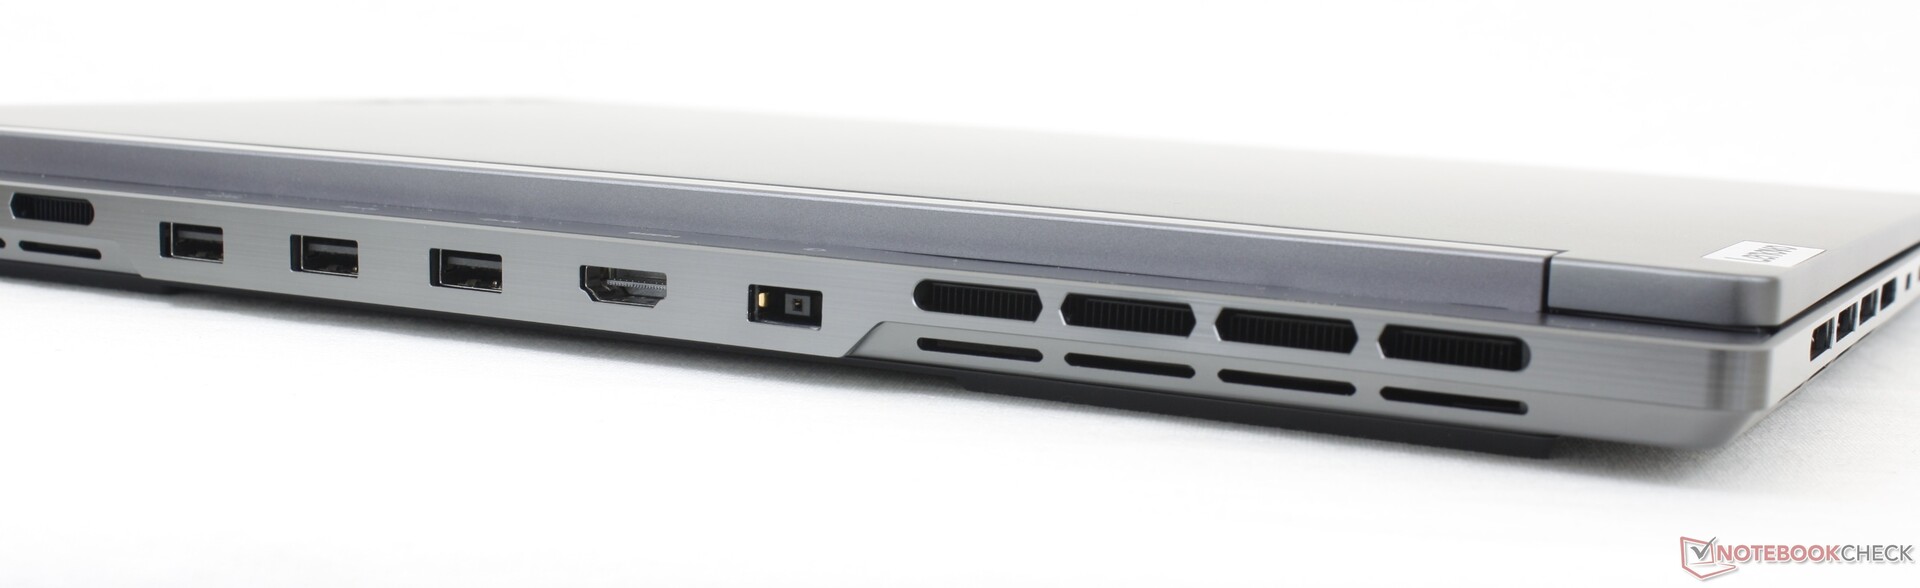
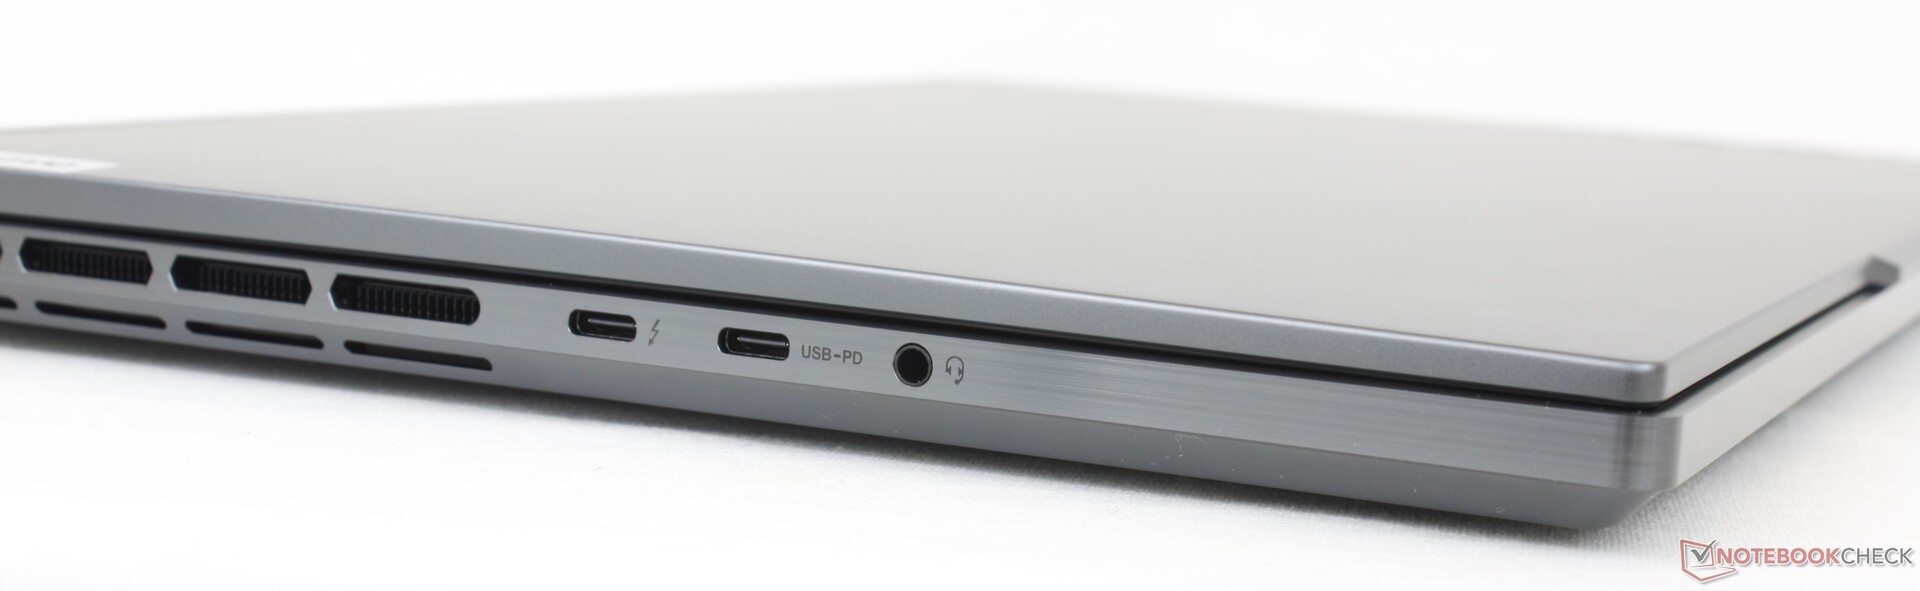
Connettività - Supporto Thunderbolt 4
Le porte sono varie e la maggior parte si trova lungo il bordo posteriore, come nella serie Alienware. A differenza dell'Alienware, tuttavia, le due porte USB-C del nostro Lenovo si trovano lungo il bordo sinistro per un accesso più agevole.
Si noti che solo una delle due porte USB-C supporta la tecnologia Thunderbolt 4. Se alcuni accessori non funzionano su una porta, assicuratevi di provare l'altra. Il nostro monitor esterno Lepow, ad esempio, funzionerebbe sulla porta USB-C 3.2 ma non sulla porta USB-C Thunderbolt.
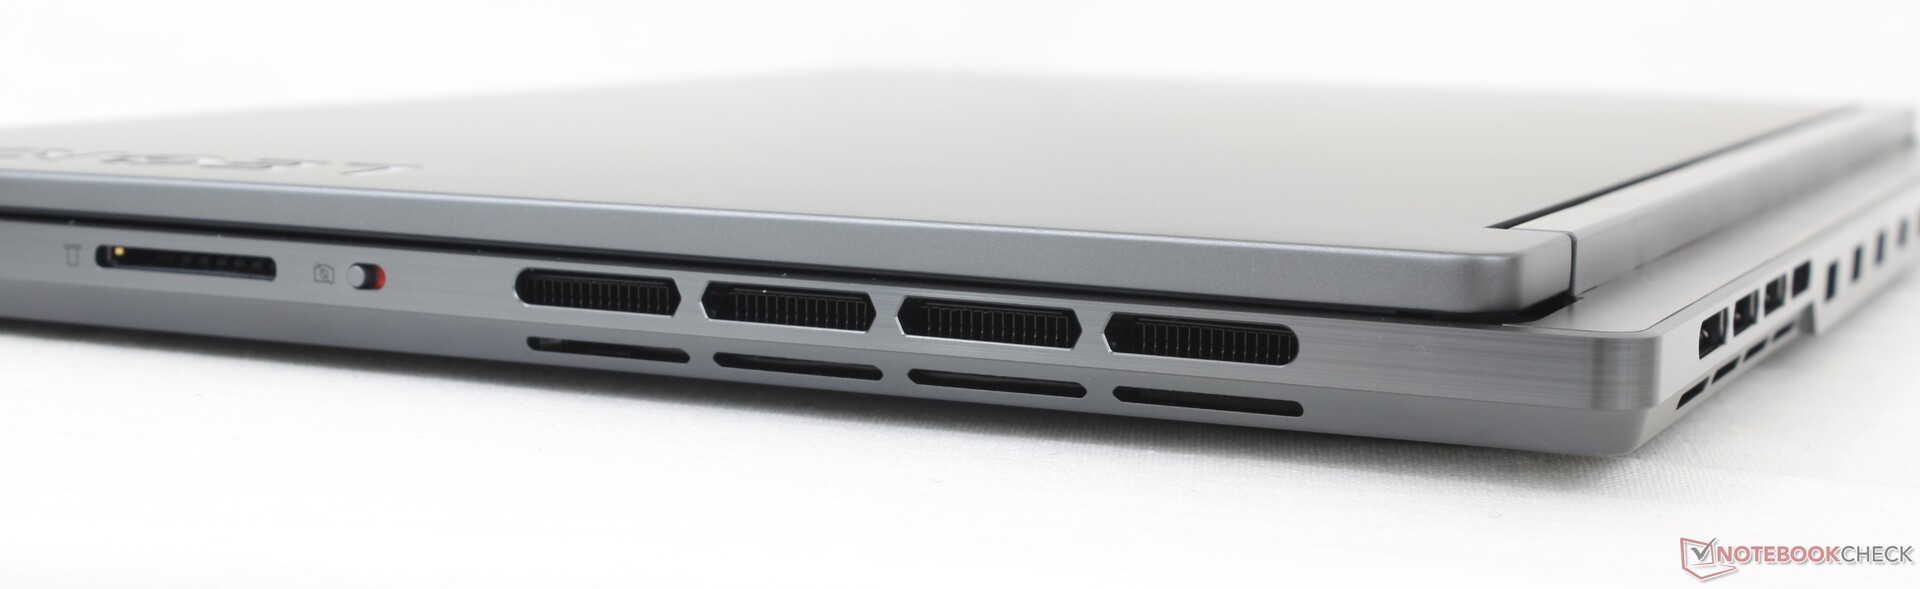
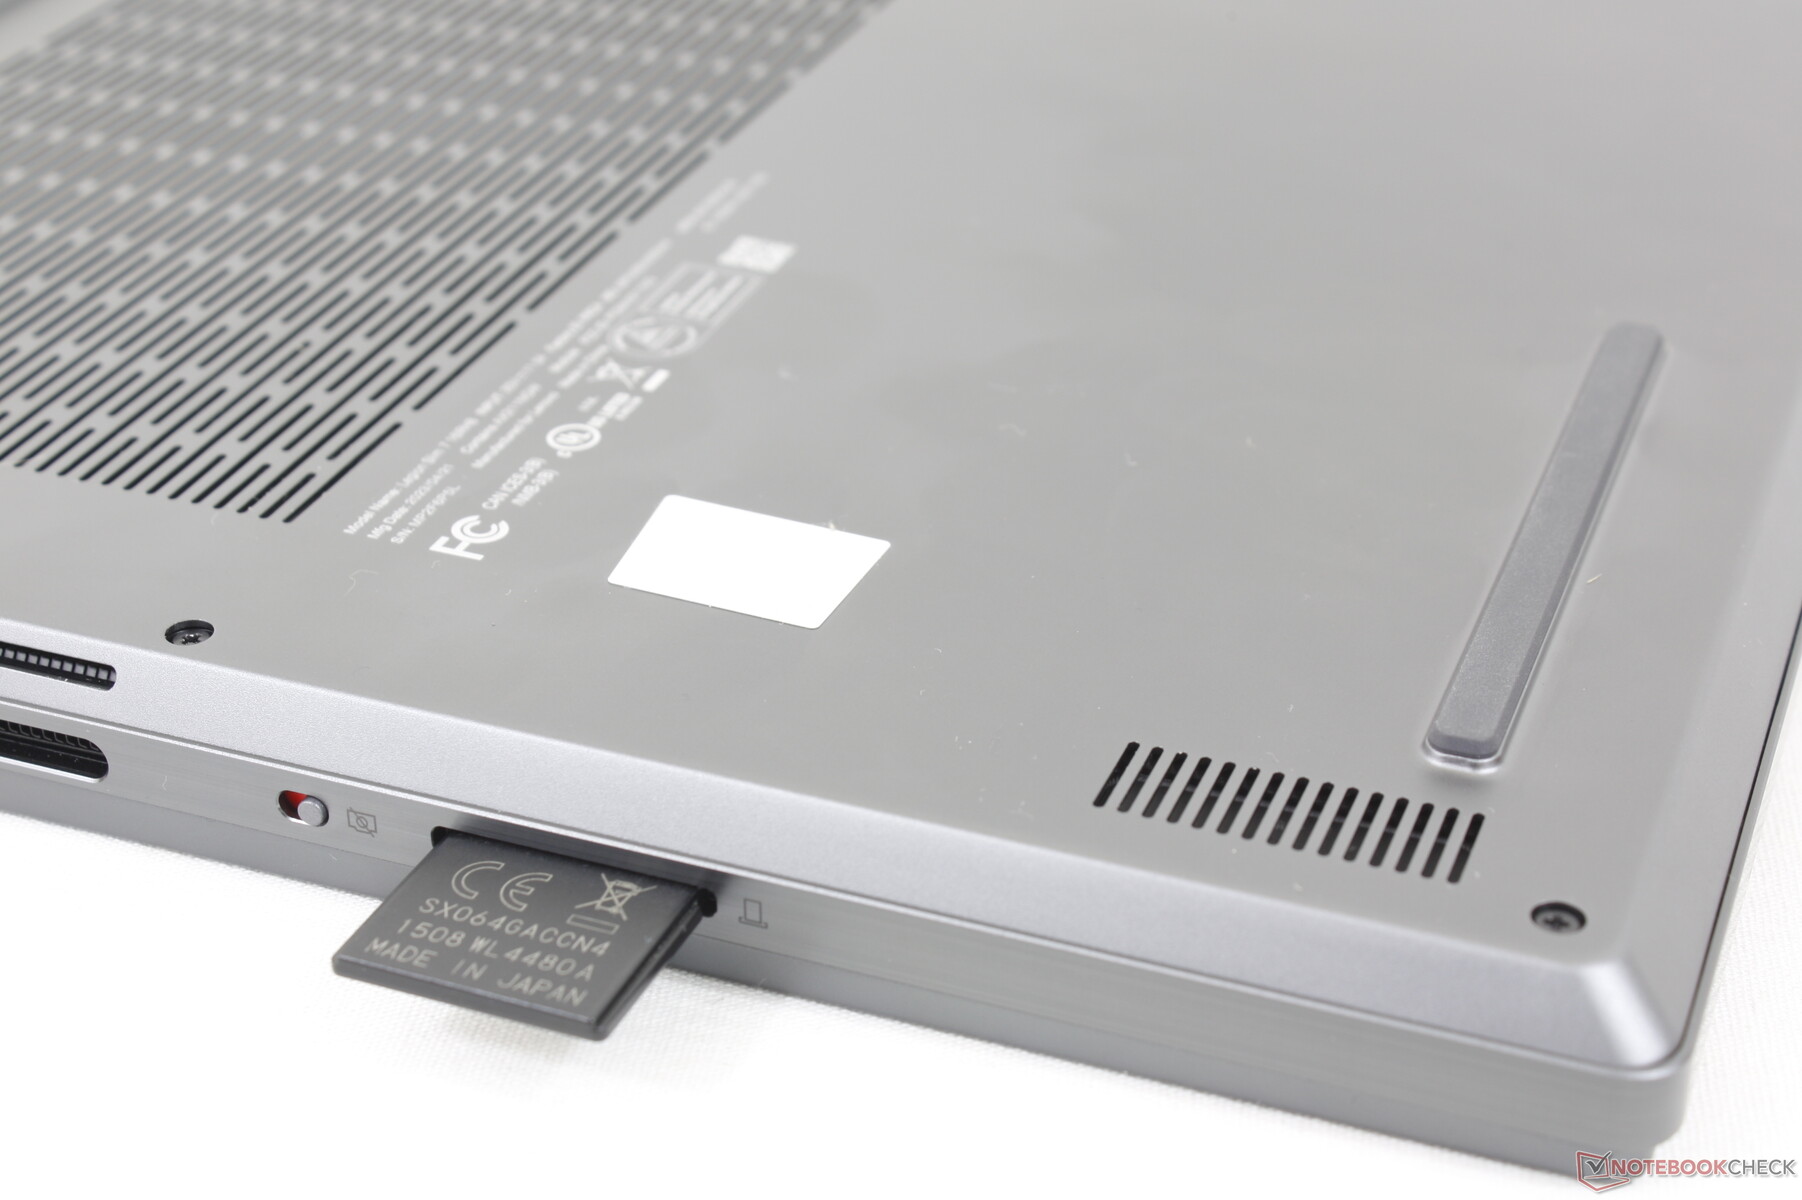
Lettore di schede SD
La velocità di trasferimento attraverso il lettore di schede SD è mediamente di circa 80 MB/s con la nostra scheda di prova UHS-II, circa la metà della velocità del lettore del Blade 16.
| SD Card Reader | |
| average JPG Copy Test (av. of 3 runs) | |
| Razer Blade 16 Early 2023 (AV PRO microSD 128 GB V60) | |
| Lenovo Legion Slim 7i 16 Gen 8 (Toshiba Exceria Pro SDXC 64 GB UHS-II) | |
| Alienware x16 R1 (AV PRO microSD 128 GB V60) | |
| maximum AS SSD Seq Read Test (1GB) | |
| Alienware x16 R1 (AV PRO microSD 128 GB V60) | |
| Razer Blade 16 Early 2023 (AV PRO microSD 128 GB V60) | |
| Lenovo Legion Slim 7i 16 Gen 8 (Toshiba Exceria Pro SDXC 64 GB UHS-II) | |
Comunicazione
L'Intel AX211 è fornito di serie per la connettività Wi-Fi 6E e Bluetooth 5.3. Le prestazioni sono costanti e affidabili se abbinate alla nostra rete Asus AXE11000 a 6 GHz.
| Networking | |
| iperf3 transmit AXE11000 | |
| Lenovo Legion Pro 7 RTX4090 | |
| Asus ROG Strix G16 G614JZ | |
| Razer Blade 16 Early 2023 | |
| Lenovo Legion Slim 7i 16 Gen 8 | |
| HP Omen 16-wf000 | |
| Alienware x16 R1 | |
| iperf3 receive AXE11000 | |
| Lenovo Legion Pro 7 RTX4090 | |
| Asus ROG Strix G16 G614JZ | |
| Razer Blade 16 Early 2023 | |
| Alienware x16 R1 | |
| HP Omen 16-wf000 | |
| Lenovo Legion Slim 7i 16 Gen 8 | |
| iperf3 transmit AXE11000 6GHz | |
| Lenovo Legion Slim 7i 16 Gen 8 | |
| Razer Blade 16 Early 2023 | |
| HP Omen 16-wf000 | |
| Alienware x16 R1 | |
| iperf3 receive AXE11000 6GHz | |
| Lenovo Legion Slim 7i 16 Gen 8 | |
| Razer Blade 16 Early 2023 | |
| HP Omen 16-wf000 | |
| Alienware x16 R1 | |
Webcam
La webcam da 2 MP rimane la stessa del modello dello scorso anno. Non c'è il supporto IR, ma l'interruttore di spegnimento della webcam è di serie.


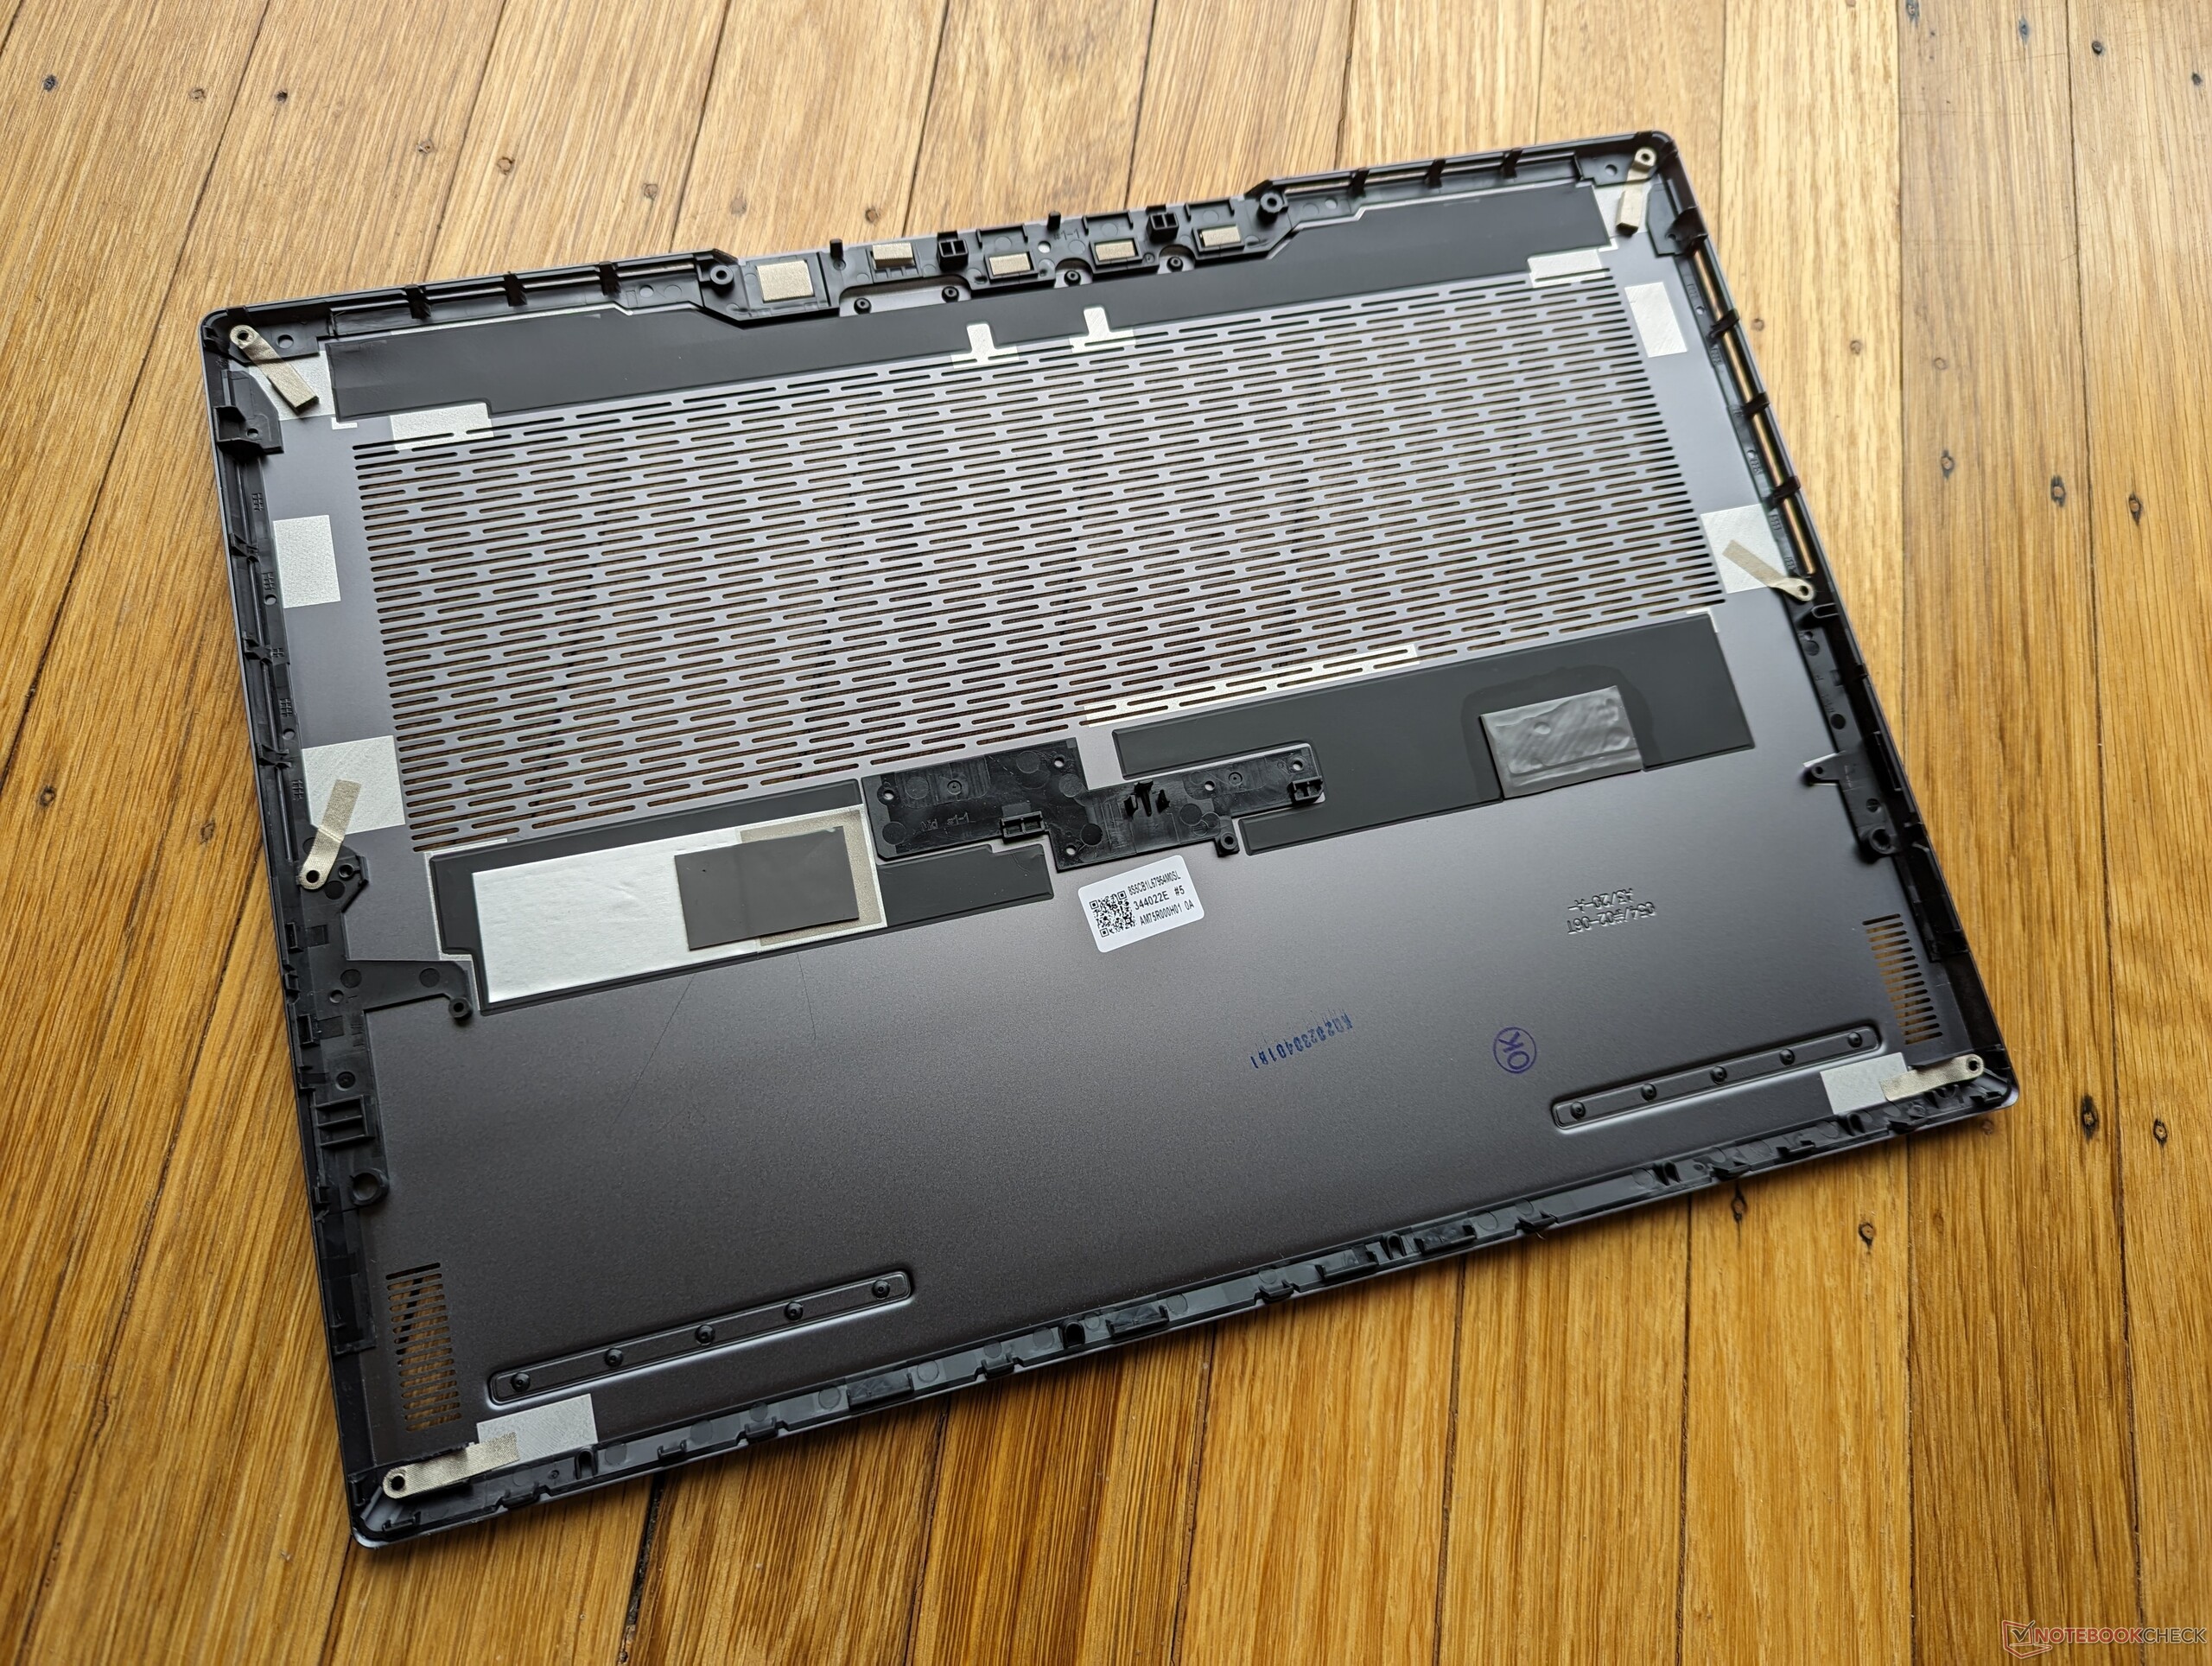
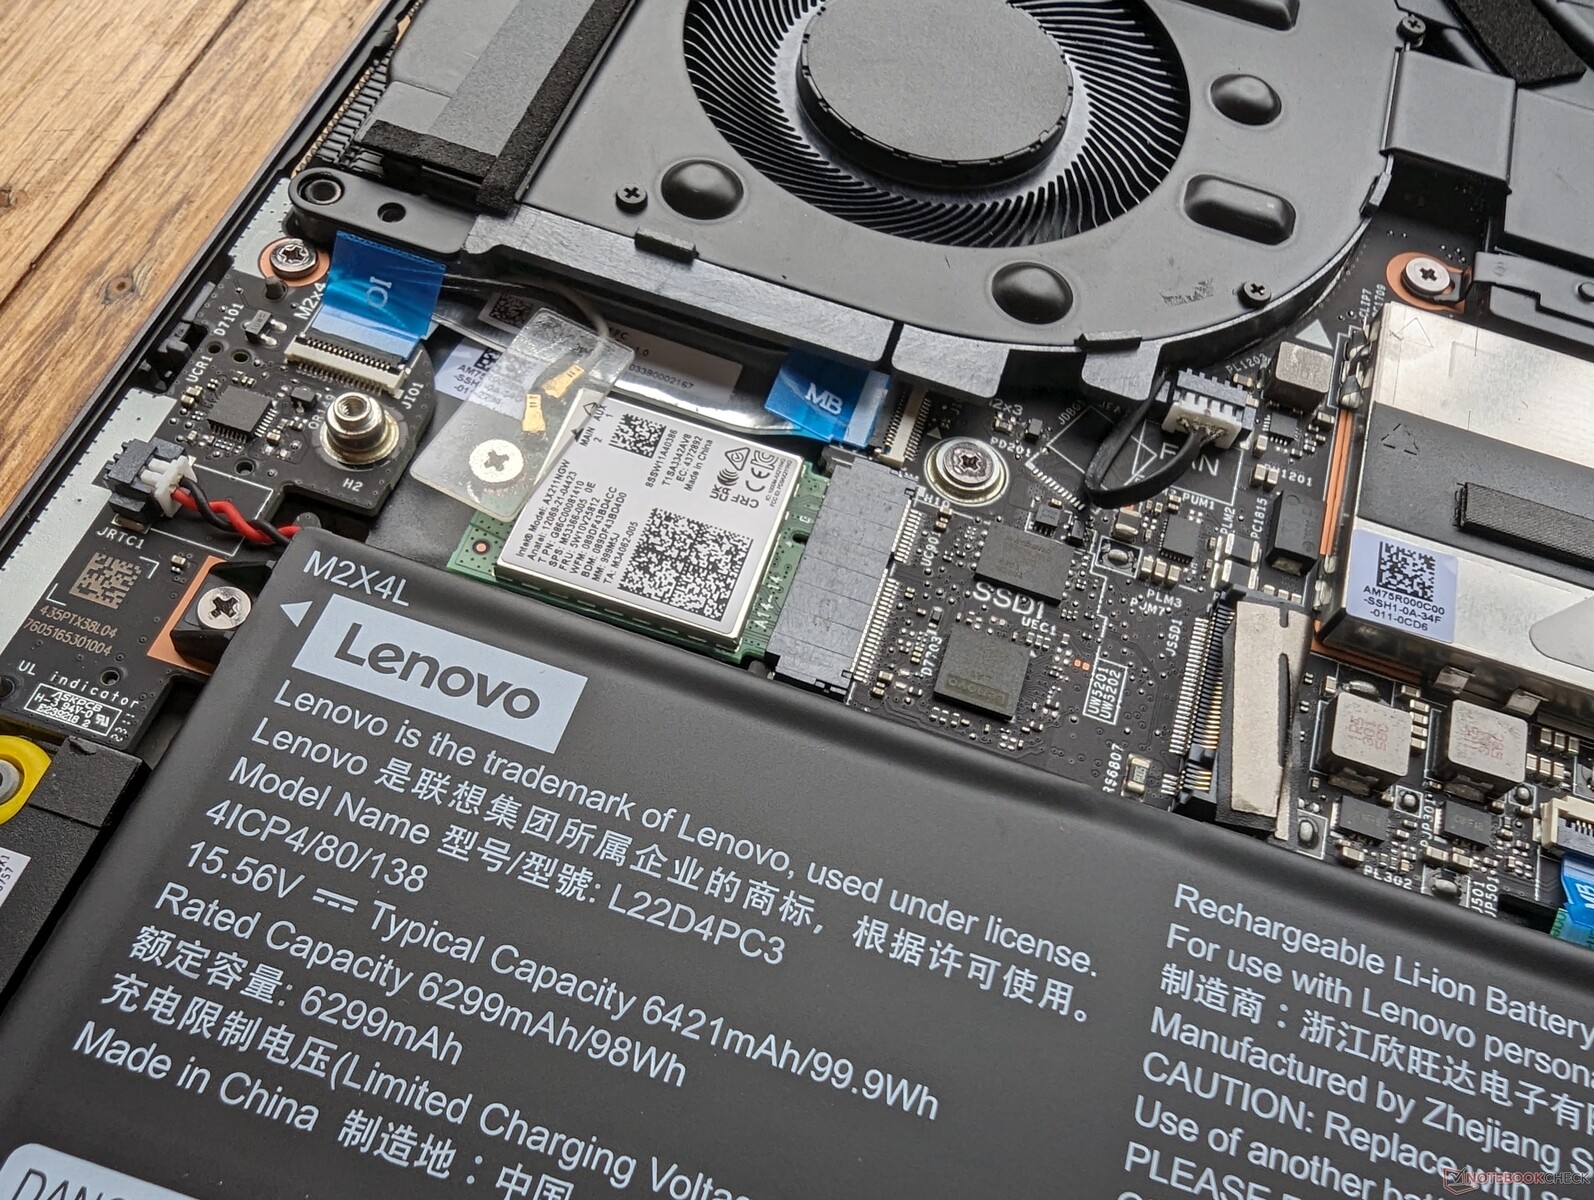
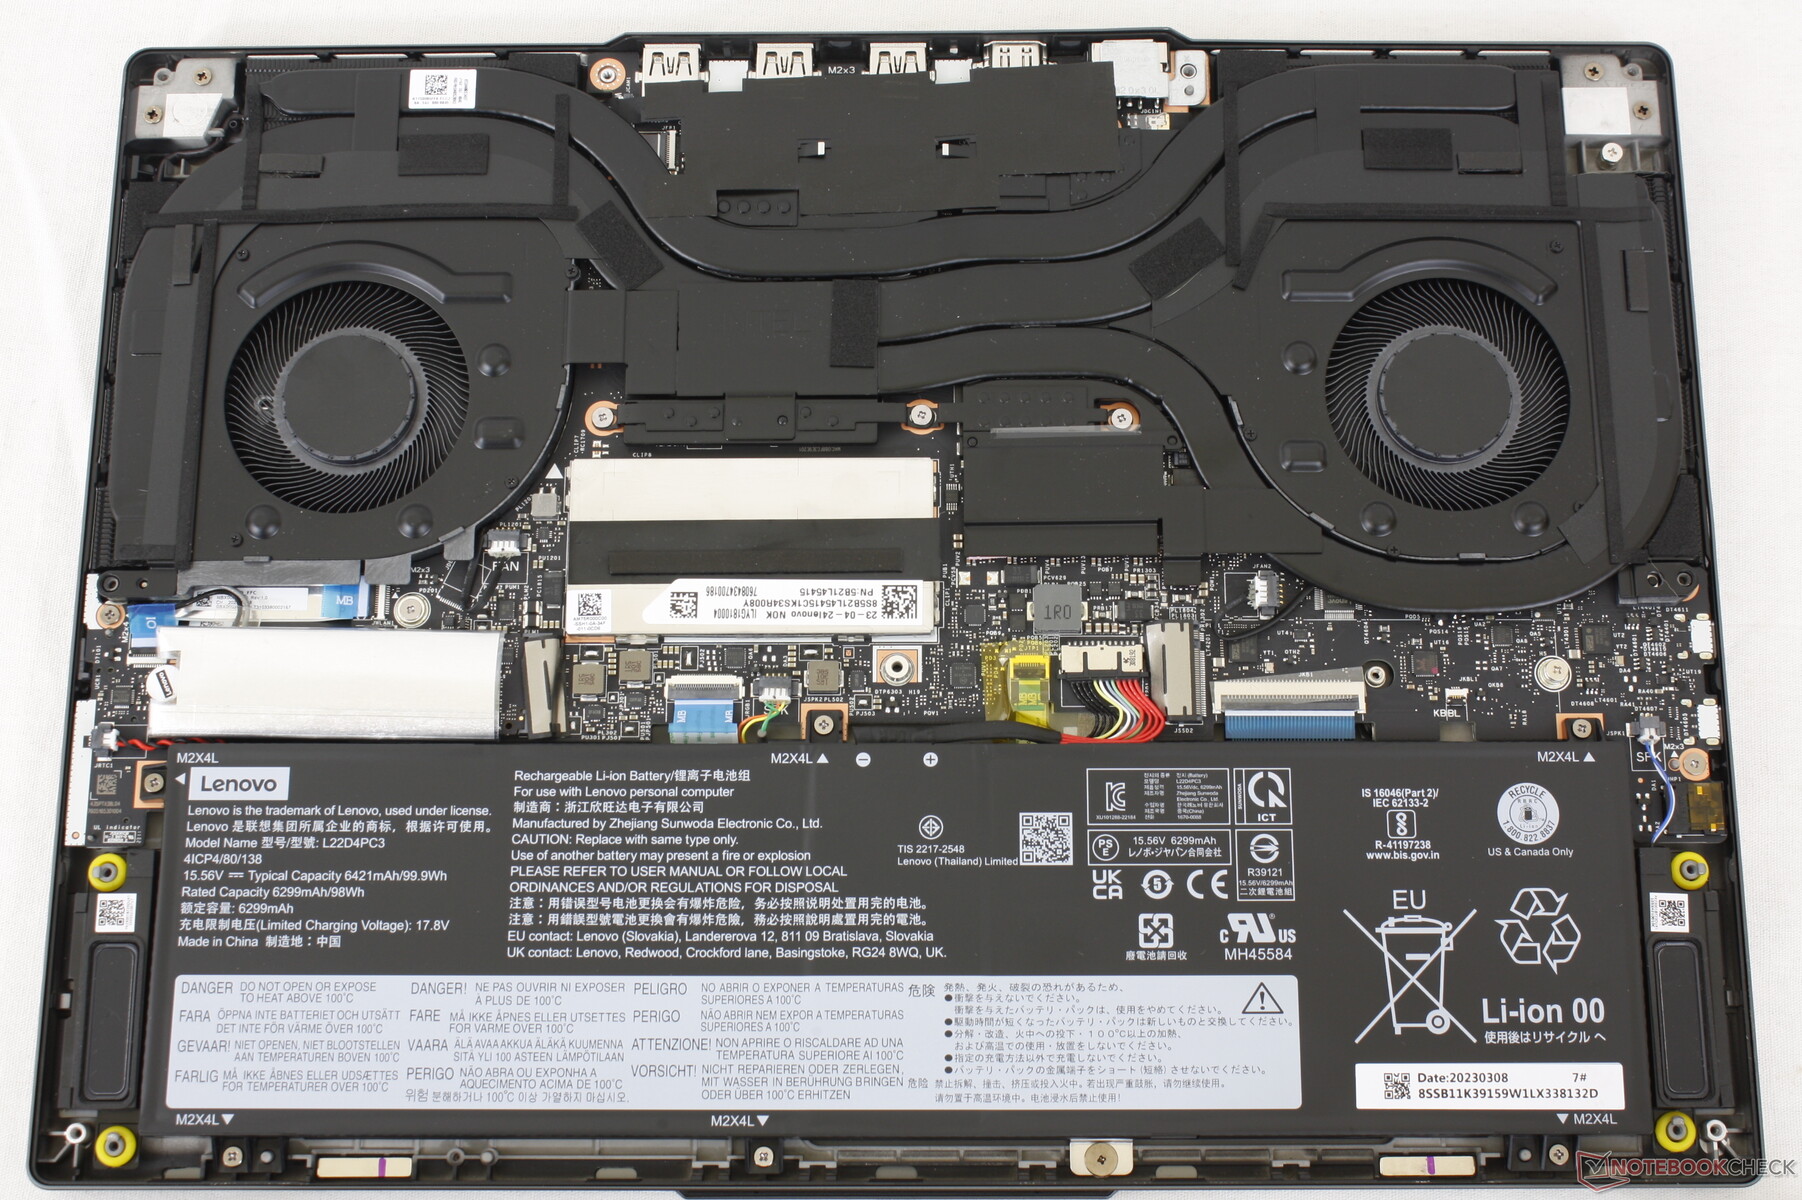
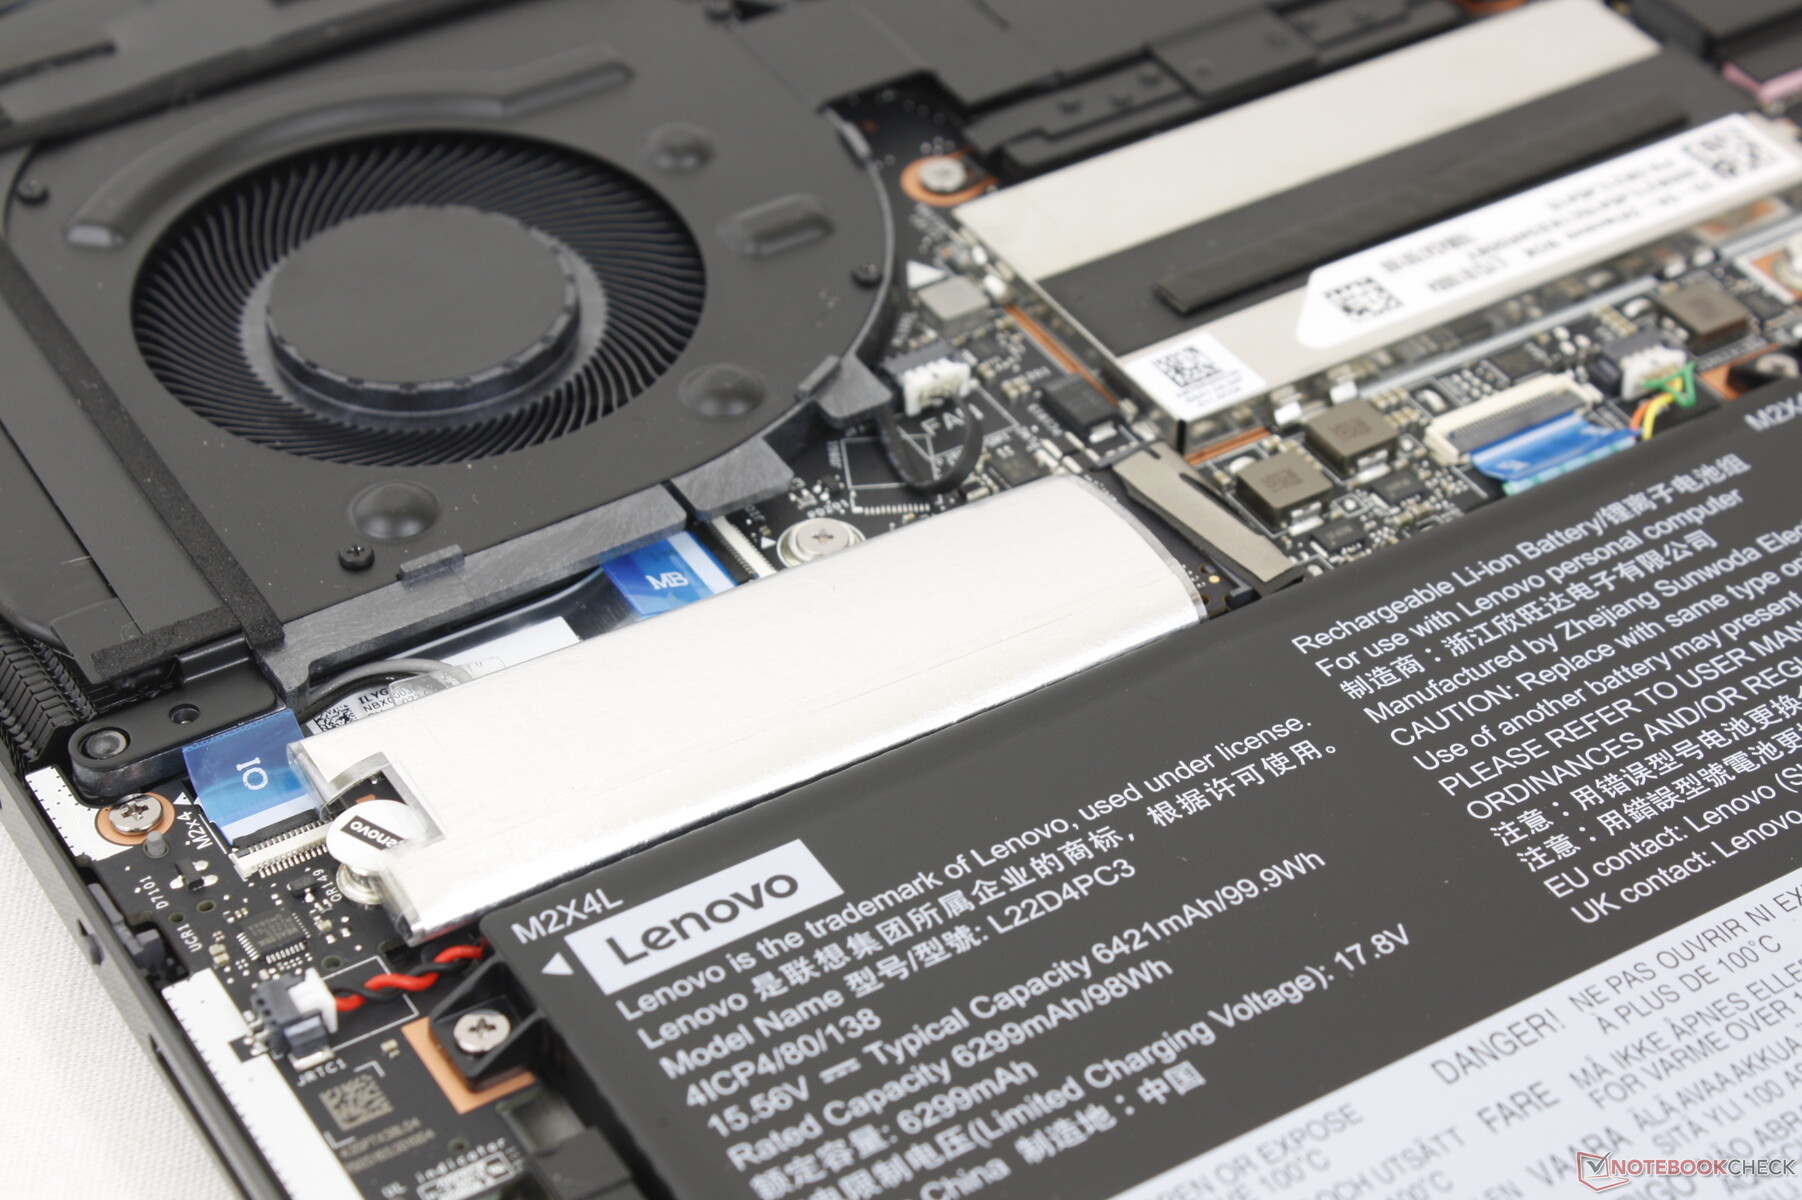
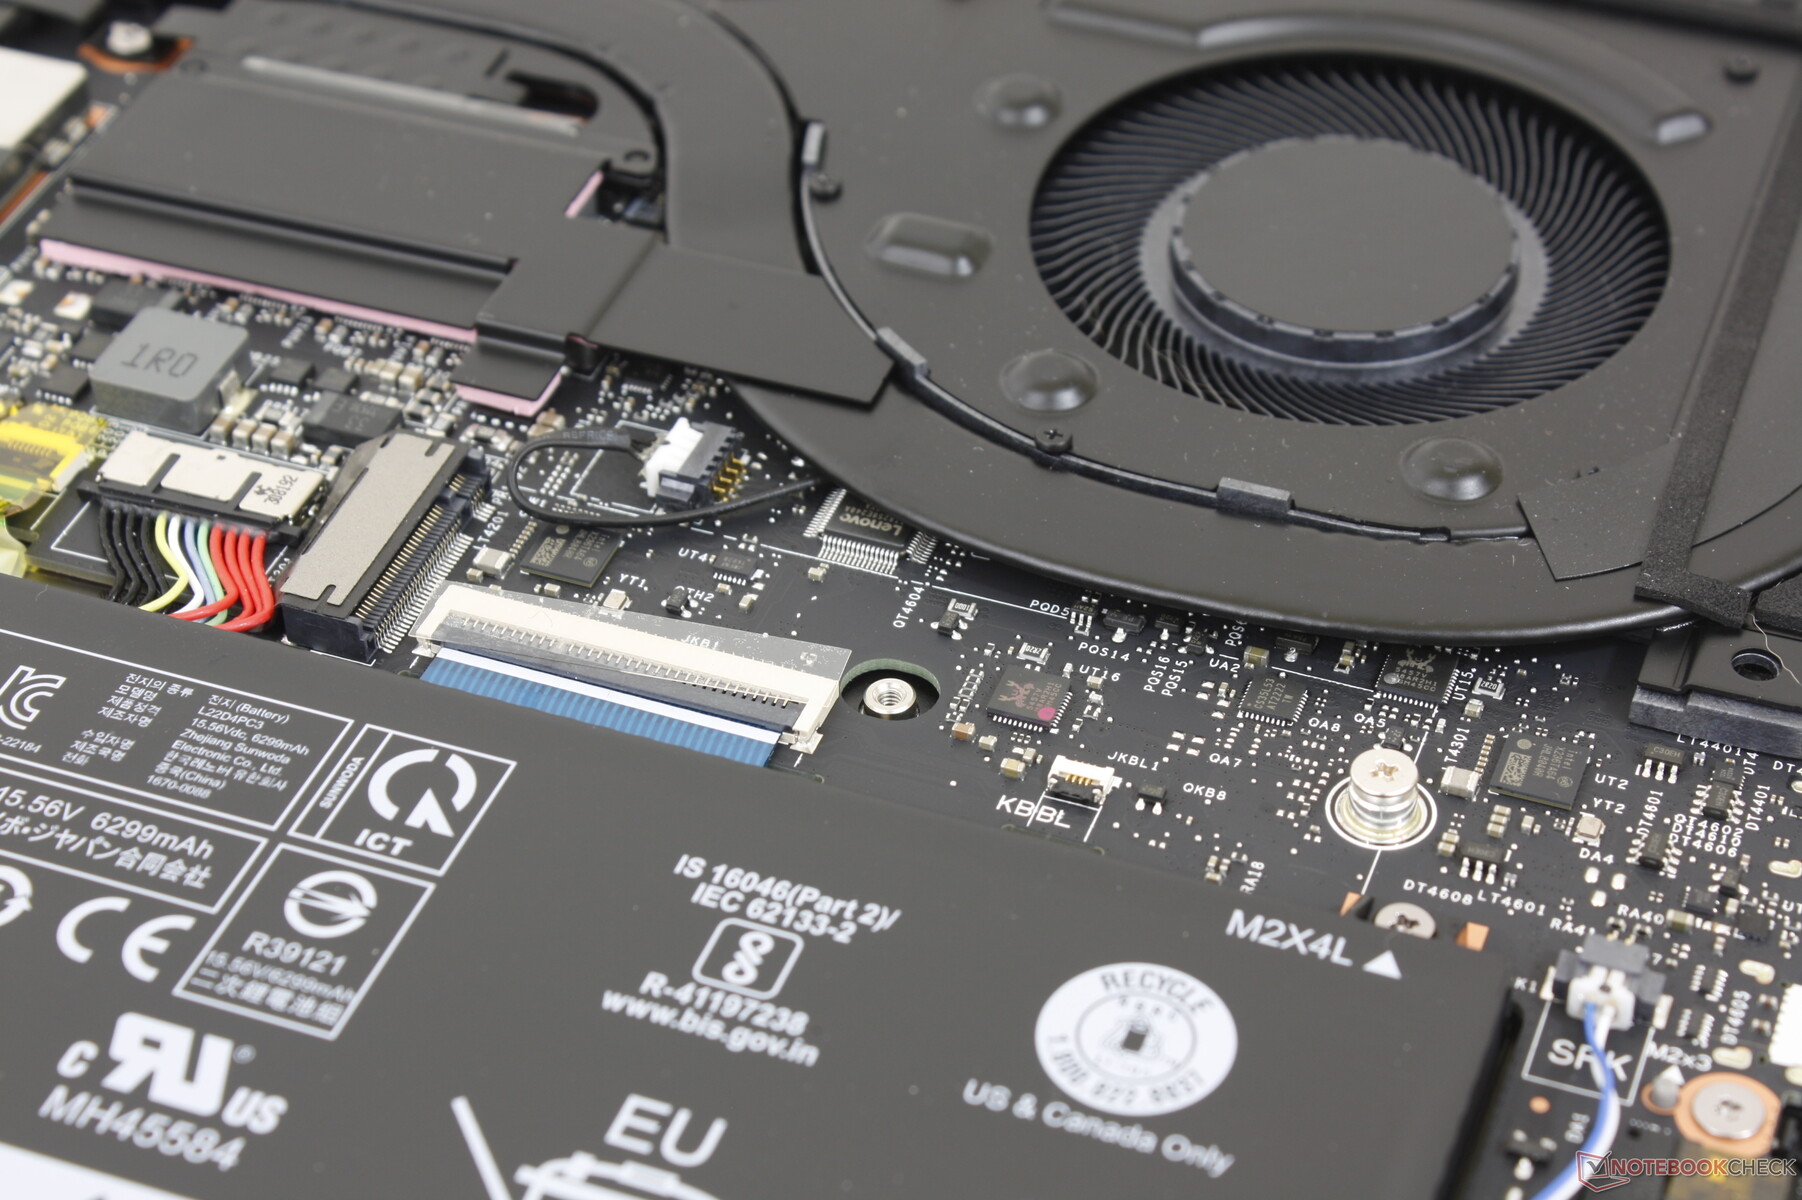
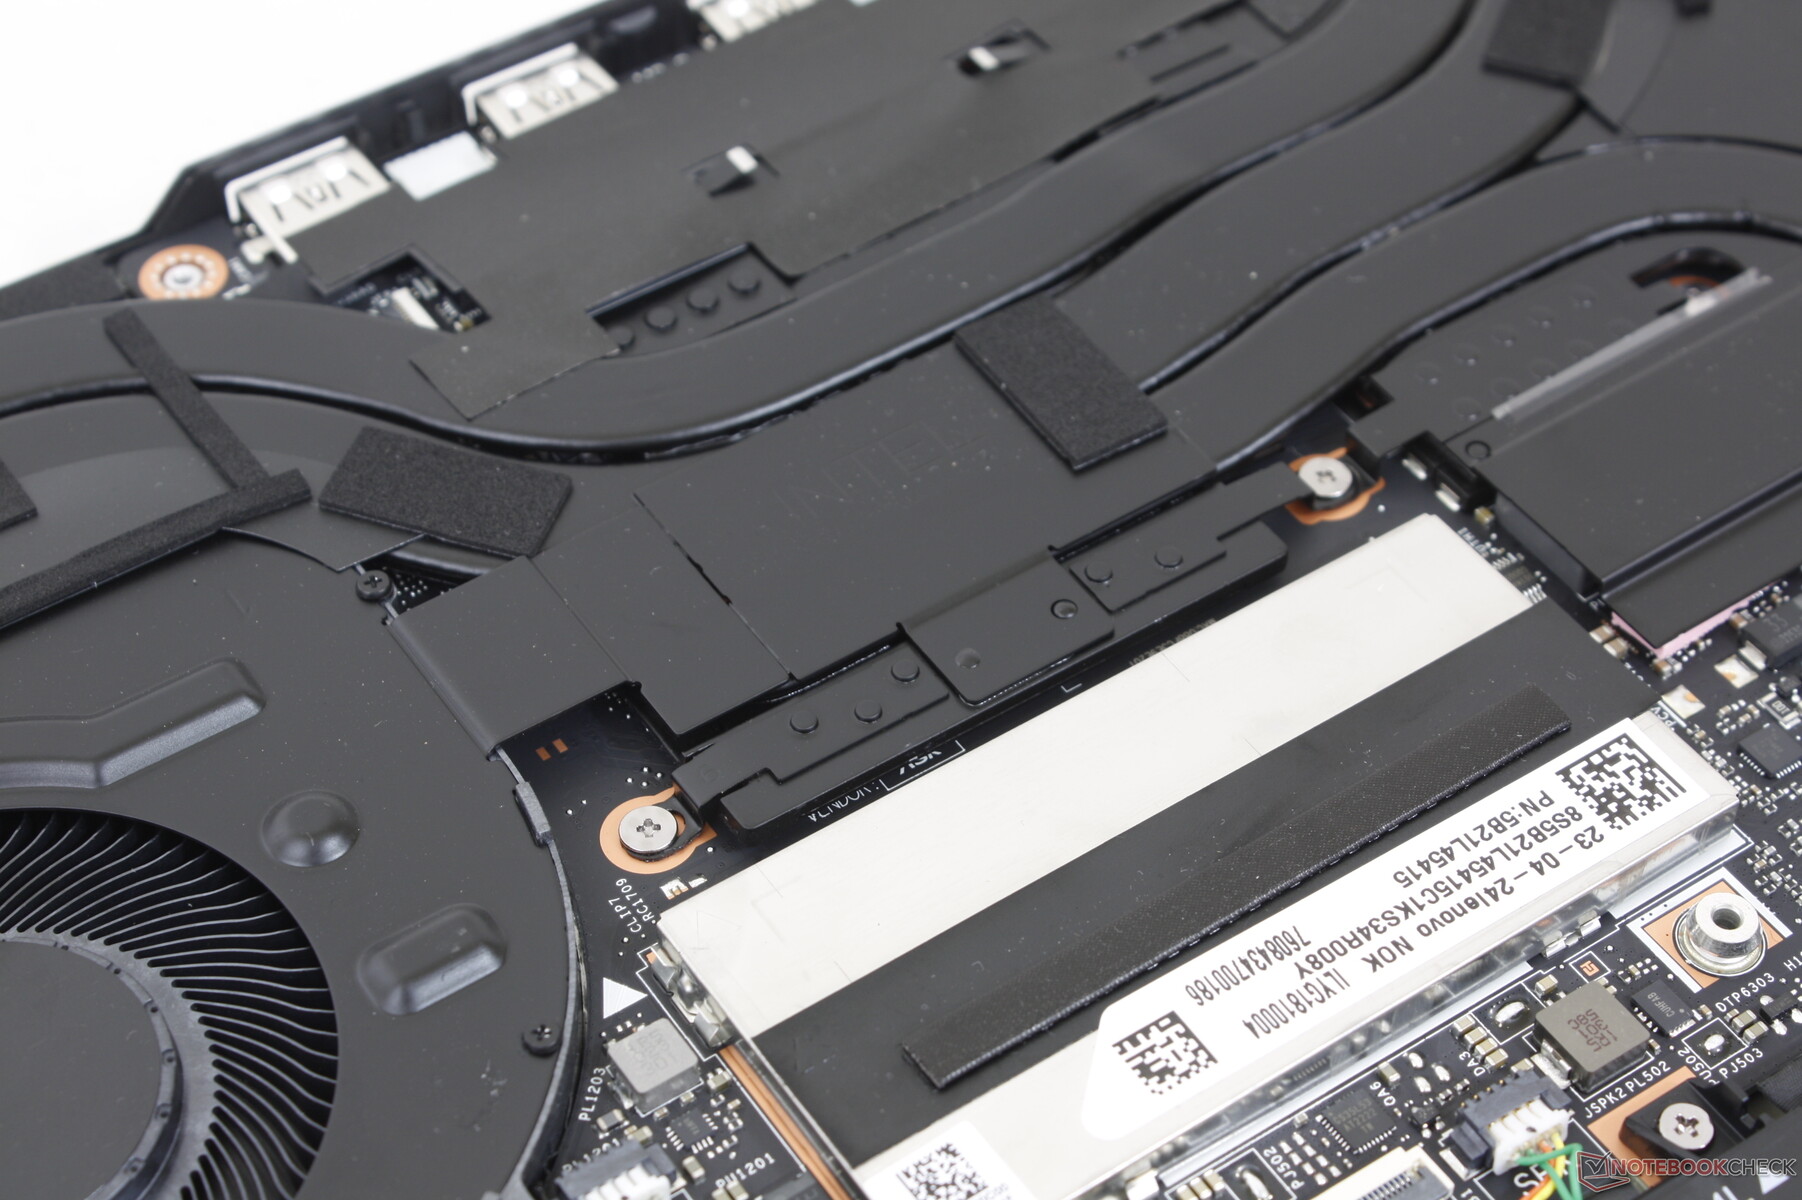
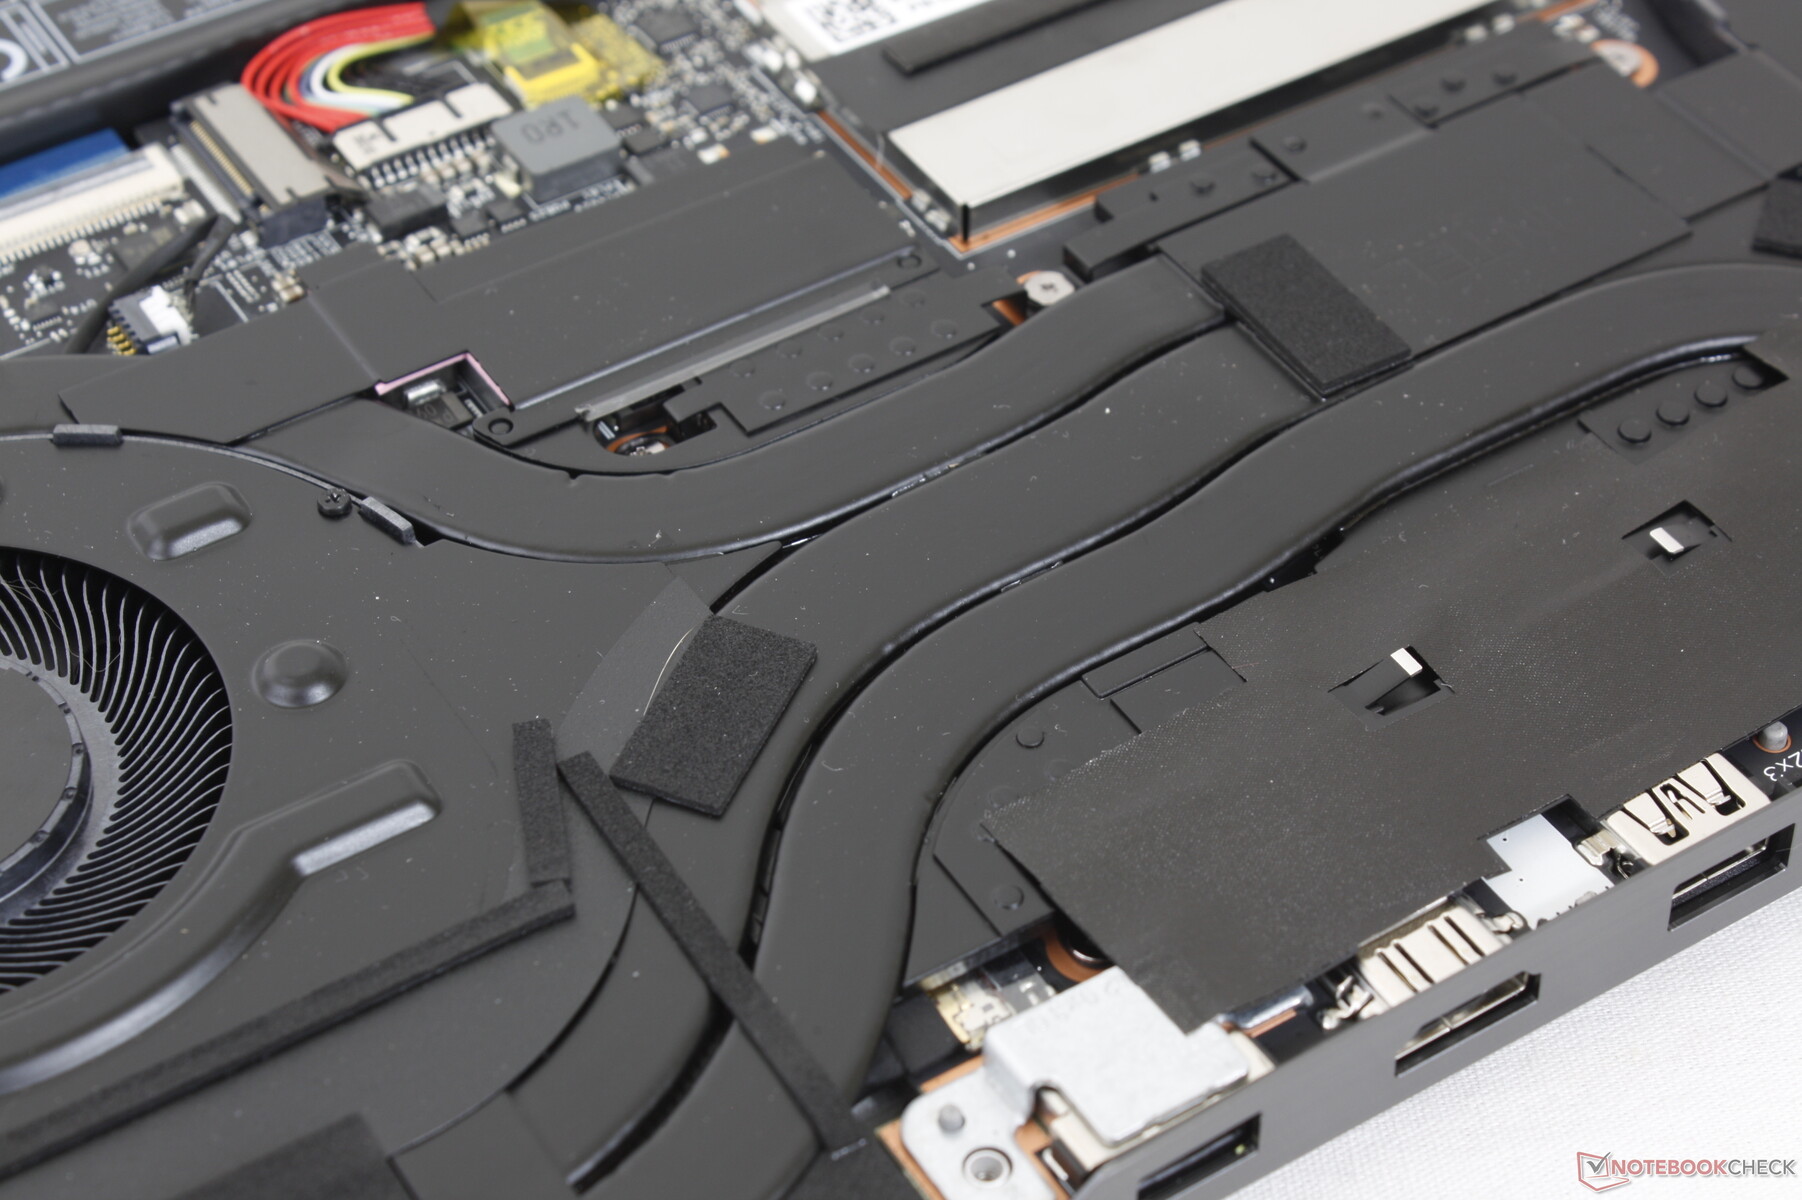
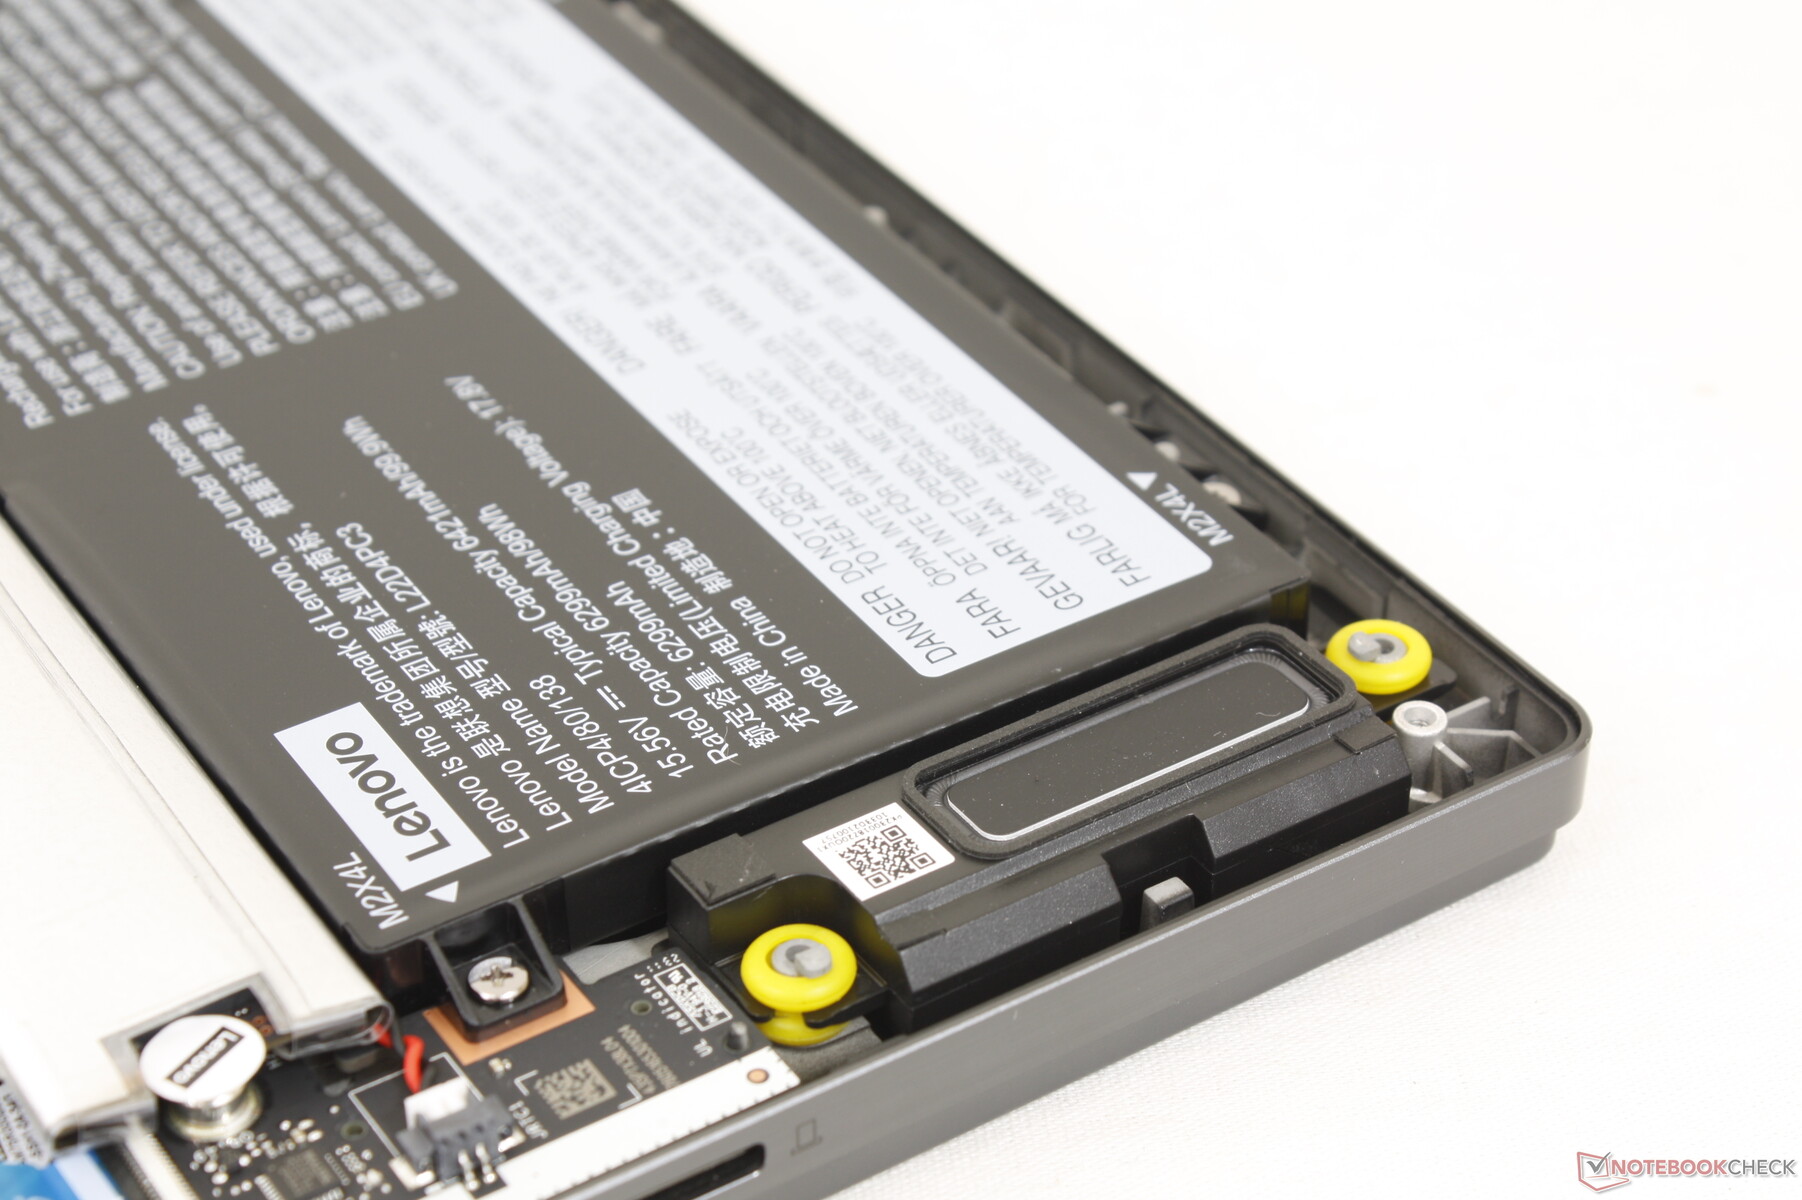
Manutenzione
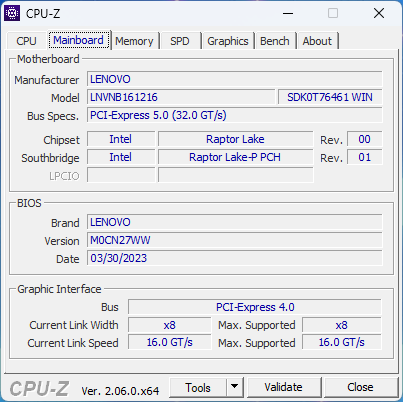
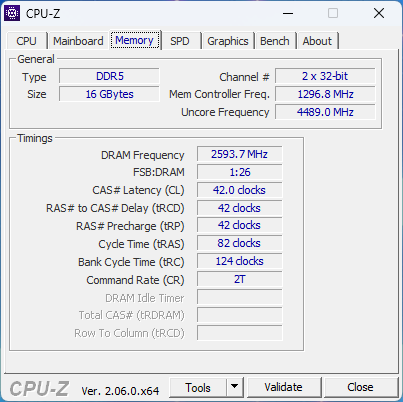
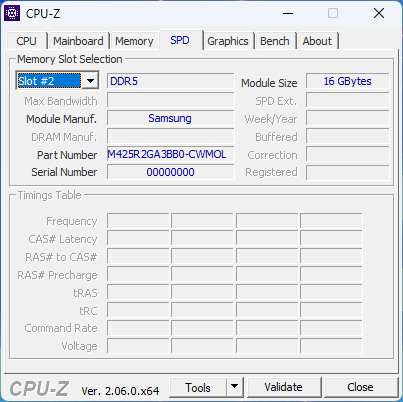
Il pannello inferiore è fissato da otto viti Phillips per una facile rimozione. I proprietari hanno accesso diretto ai due slot M.2 2280 PCIe4, al modulo WLAN e alla batteria. La RAM è costituita da 16 GB di DDR5-5200 saldati più uno slot SODIMM espandibile sotto la schermatura in alluminio vicino al centro.
Accessori e garanzia
La confezione non contiene altri extra oltre all'adattatore CA e alla documentazione. La garanzia standard limitata di un anno del produttore è valida se acquistata negli Stati Uniti.
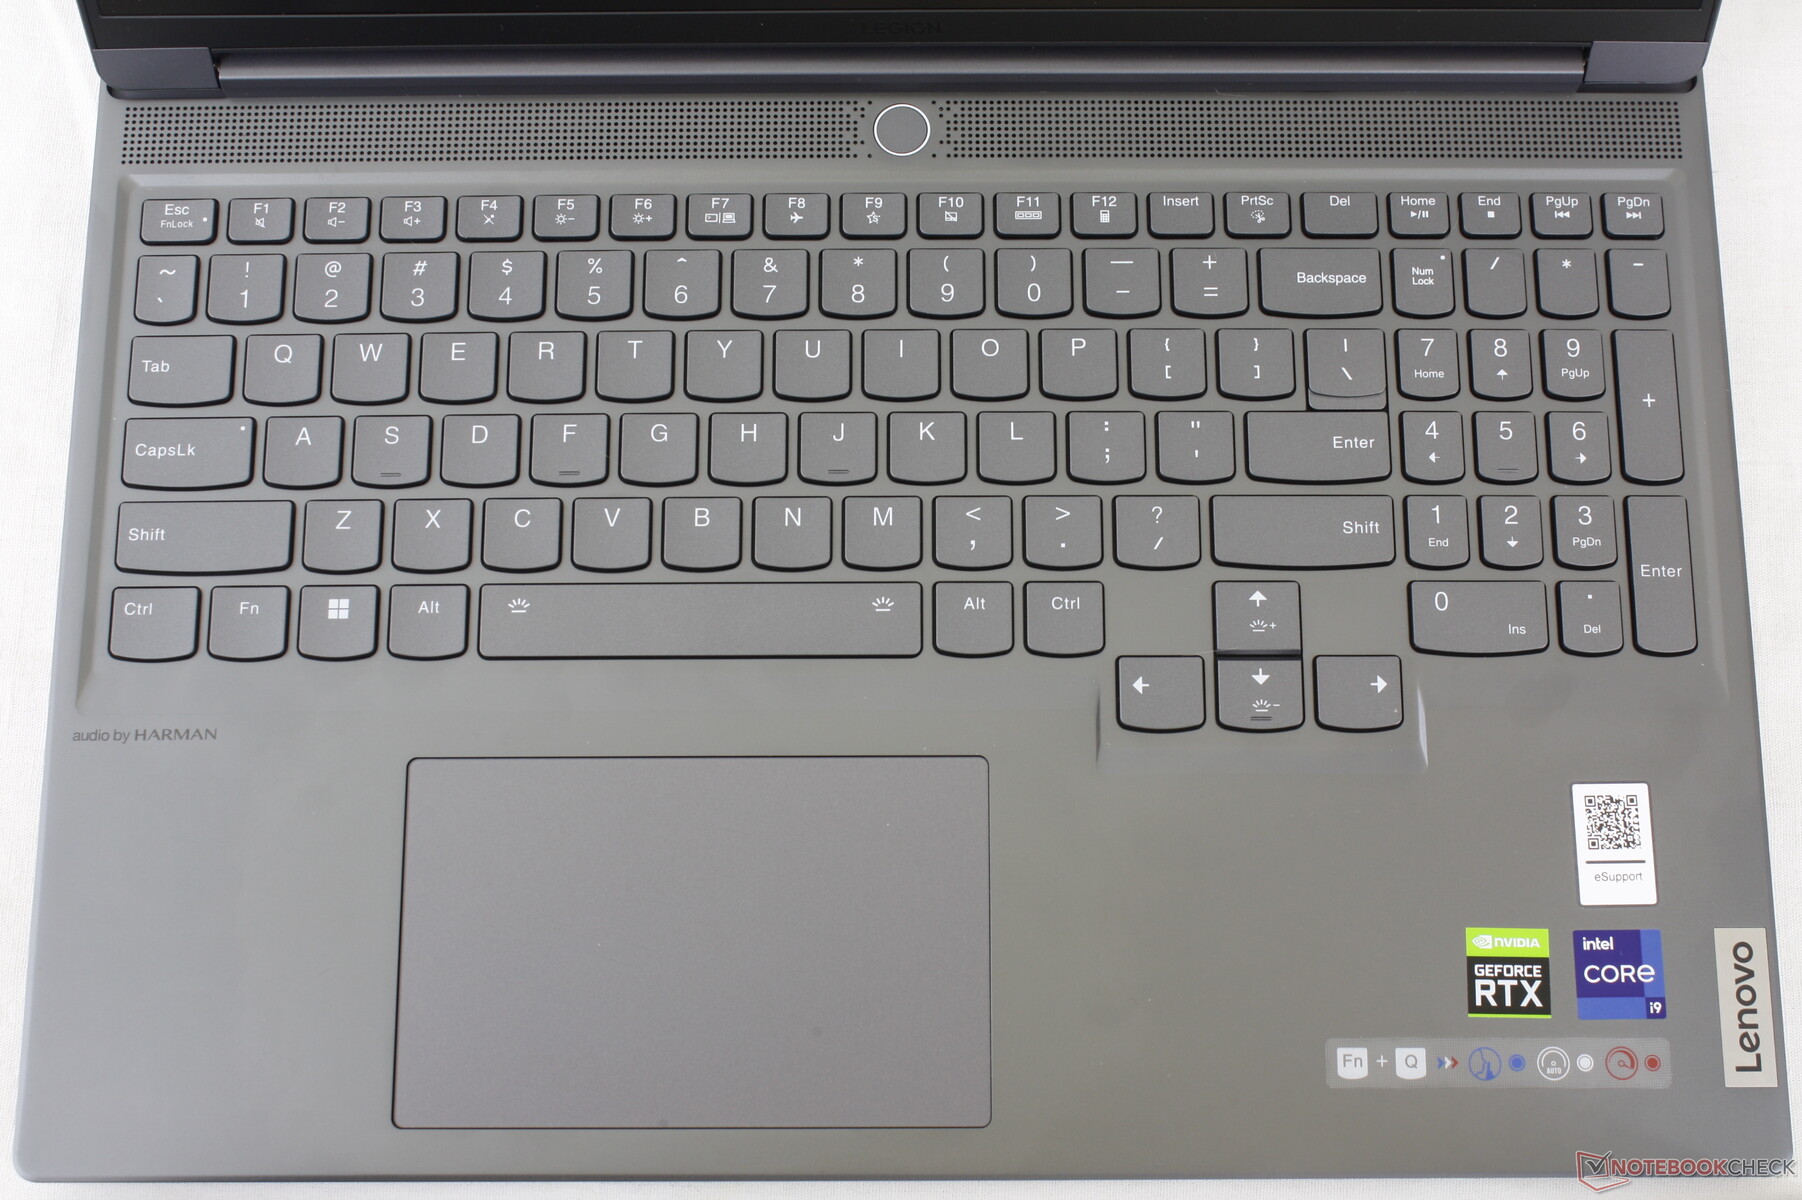
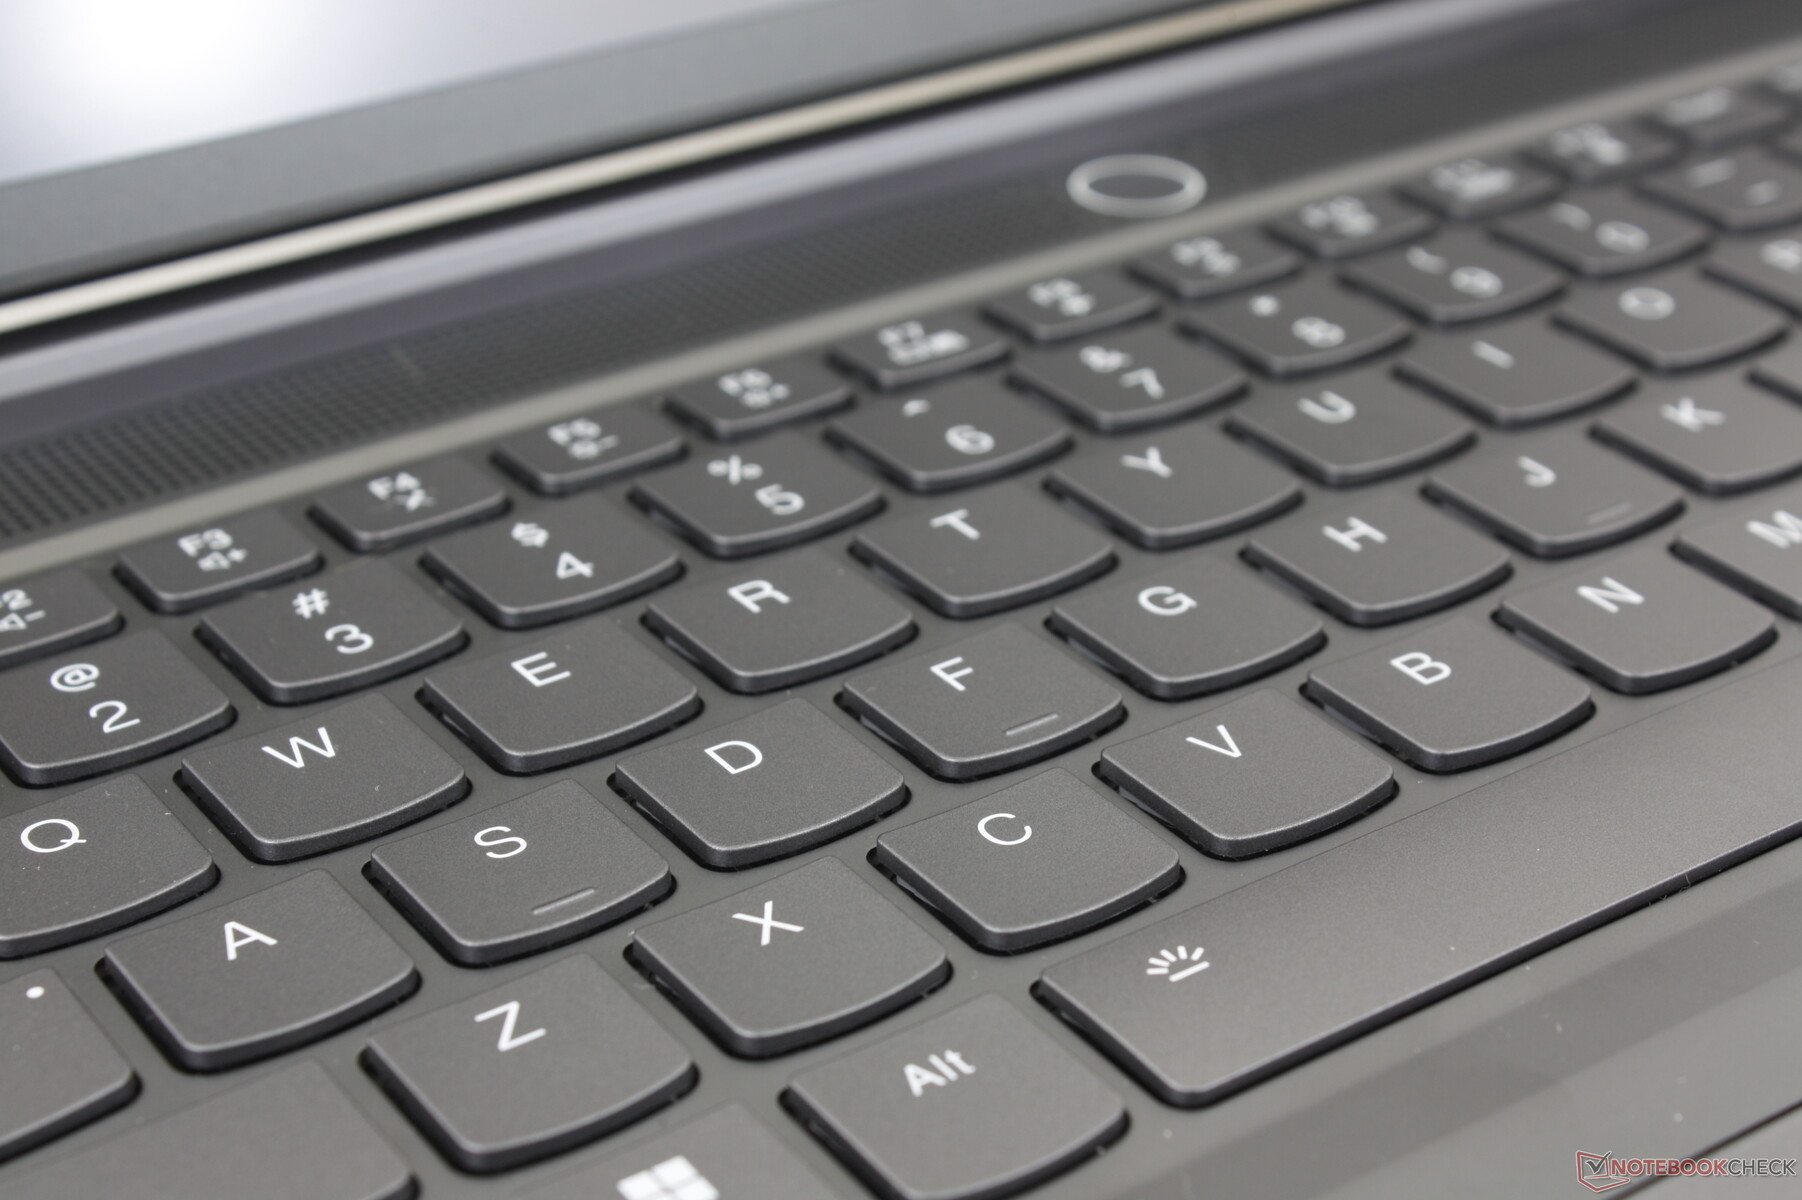
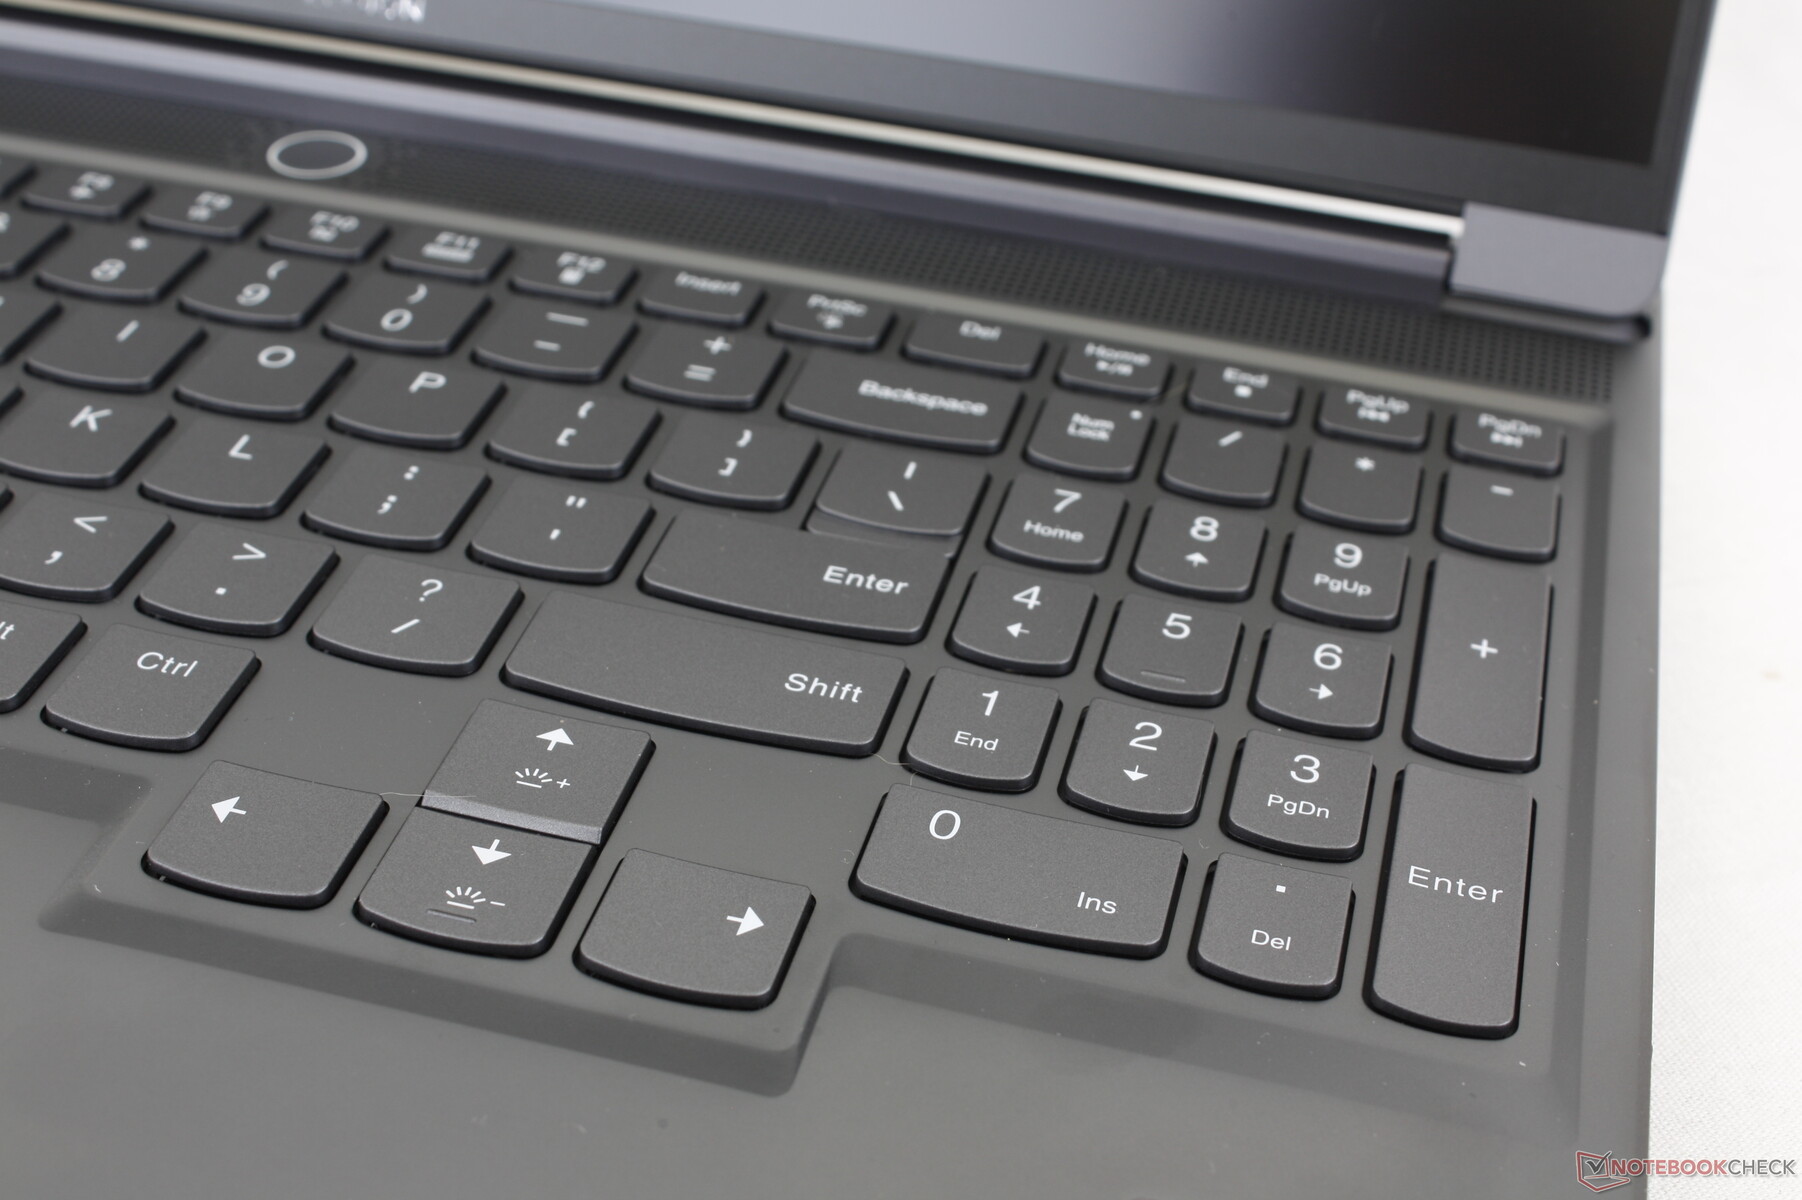
Dispositivi di input - Spaziosi con illuminazione RGB per tasto
La tastiera e il clickpad non sono cambiati rispetto al modello dello scorso anno Legion Slim 7i G7 e quindi l'esperienza dell'interfaccia utente rimane la stessa. Questo non è necessariamente un male, in quanto la corsa dei tasti di 1,5 mm e il feedback deciso sono comunque più comodi per la digitazione rispetto ai tasti meno profondi del Blade 16. Apprezziamo anche gli ampi tasti freccia, poiché questi stessi tasti sono spesso frustranti e piccoli su altri portatili da gioco come la serie ROG Strix di Asus Asus ROG Strix o la MSI Pulse.
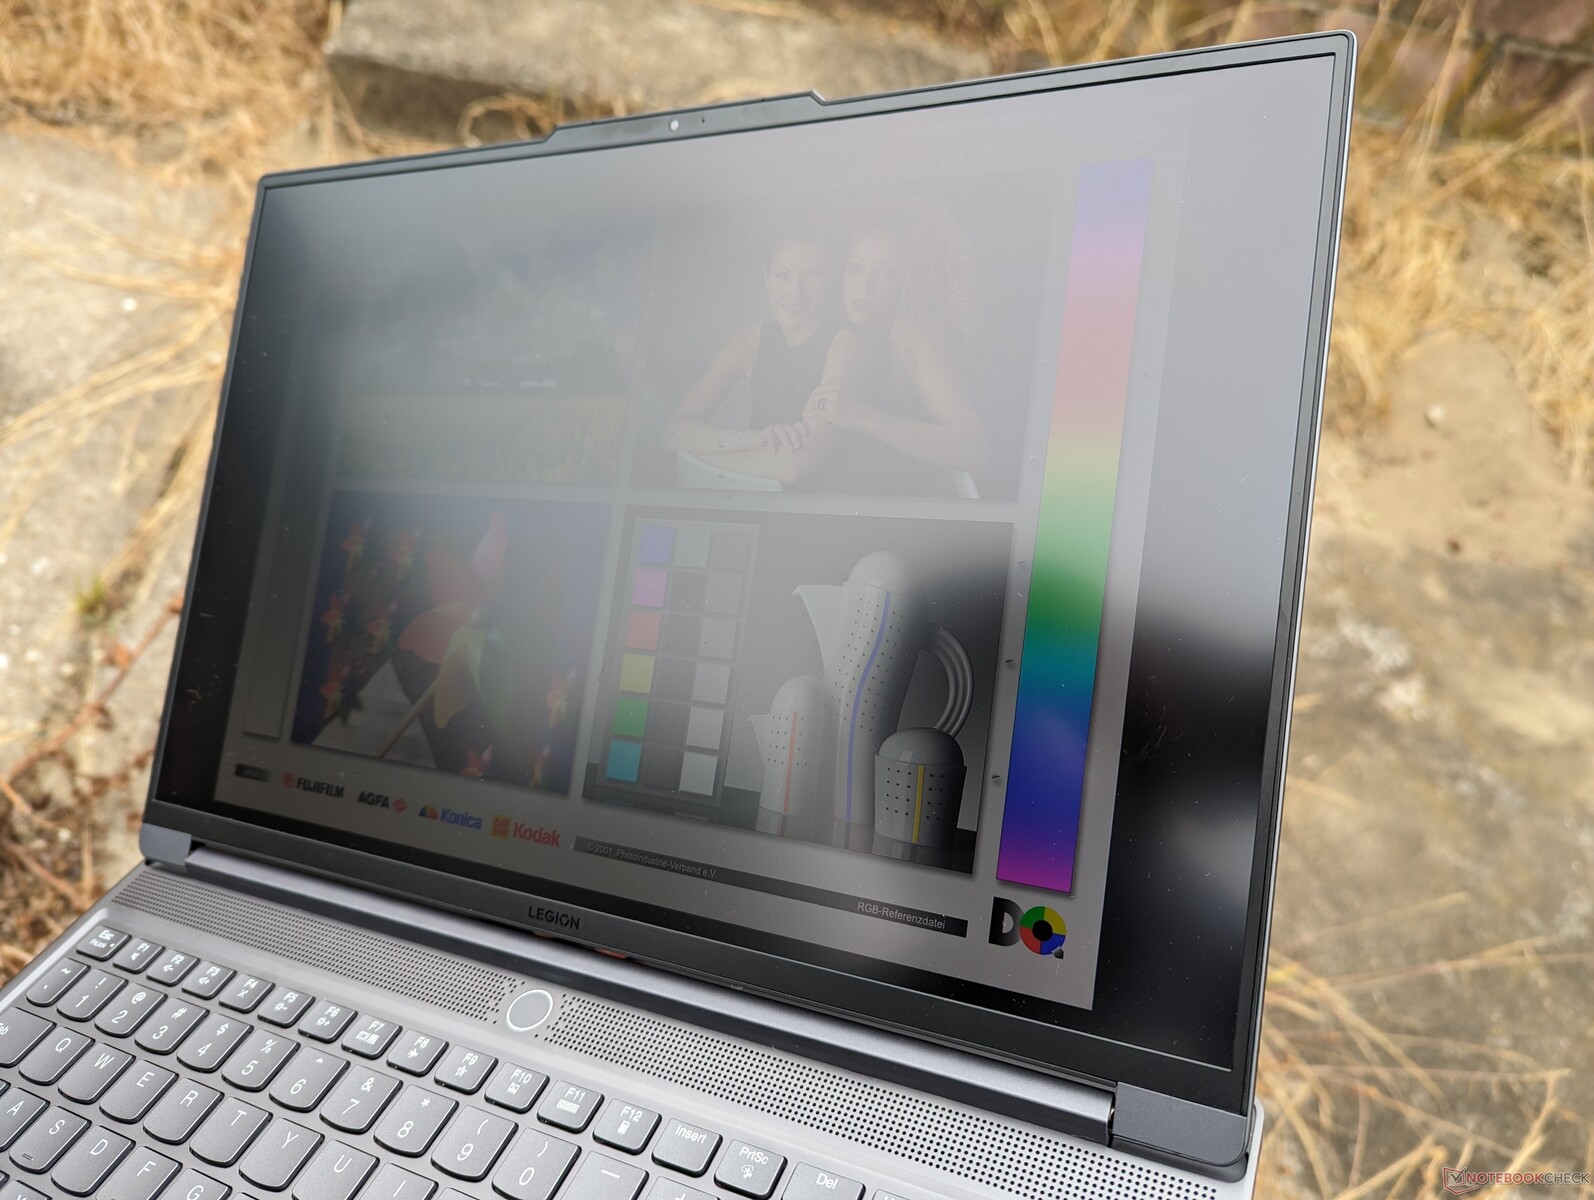
Display - Identico a quello di Legion Pro 7
Sono disponibili due opzioni di pannello, entrambe con supporto G-Sync:
- 2560 x 1600, 240 Hz, tempi di risposta di 5 ms, 100% sRGB, 500 nit, certificato Pantone
- 3000 x 2000, 165 Hz, tempi di risposta di 3 ms, 100% DCI-P3, 430 nits, certificato Pantone
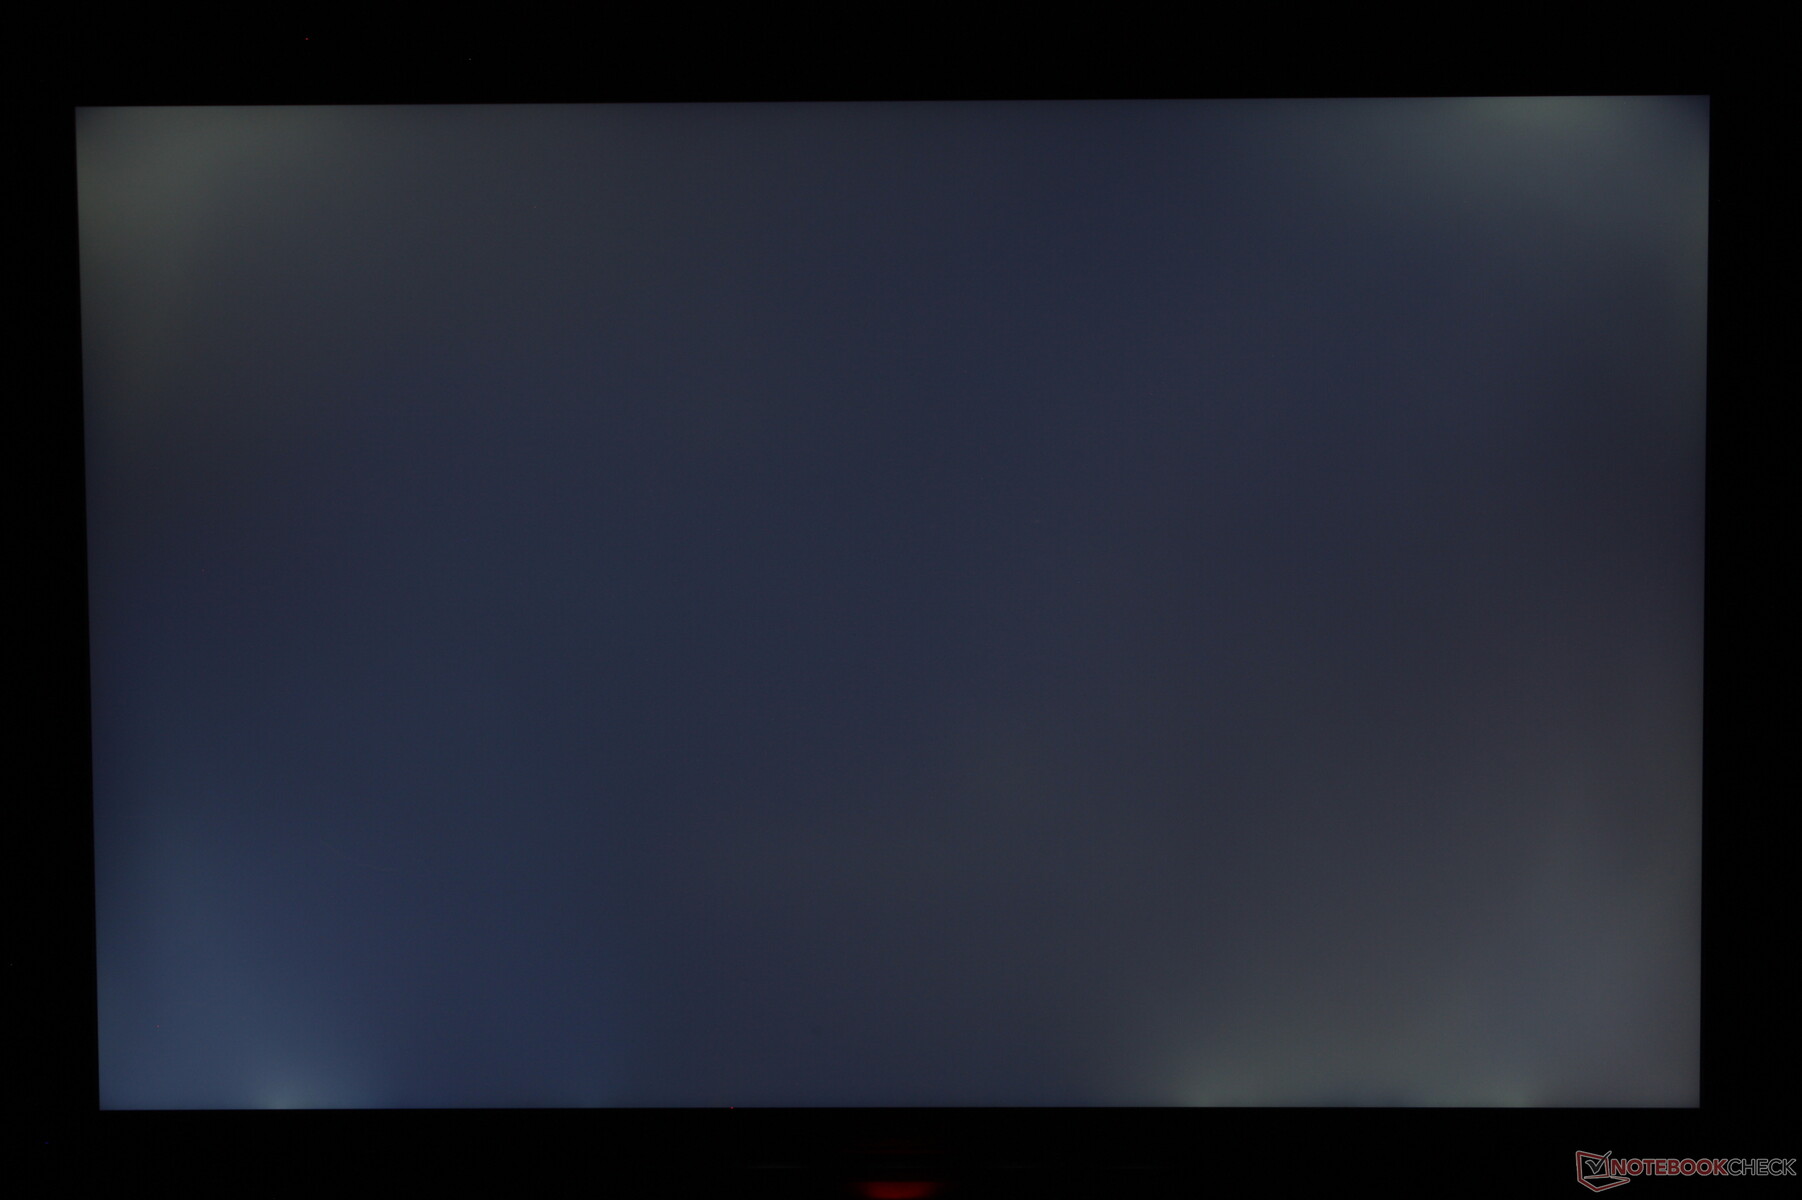
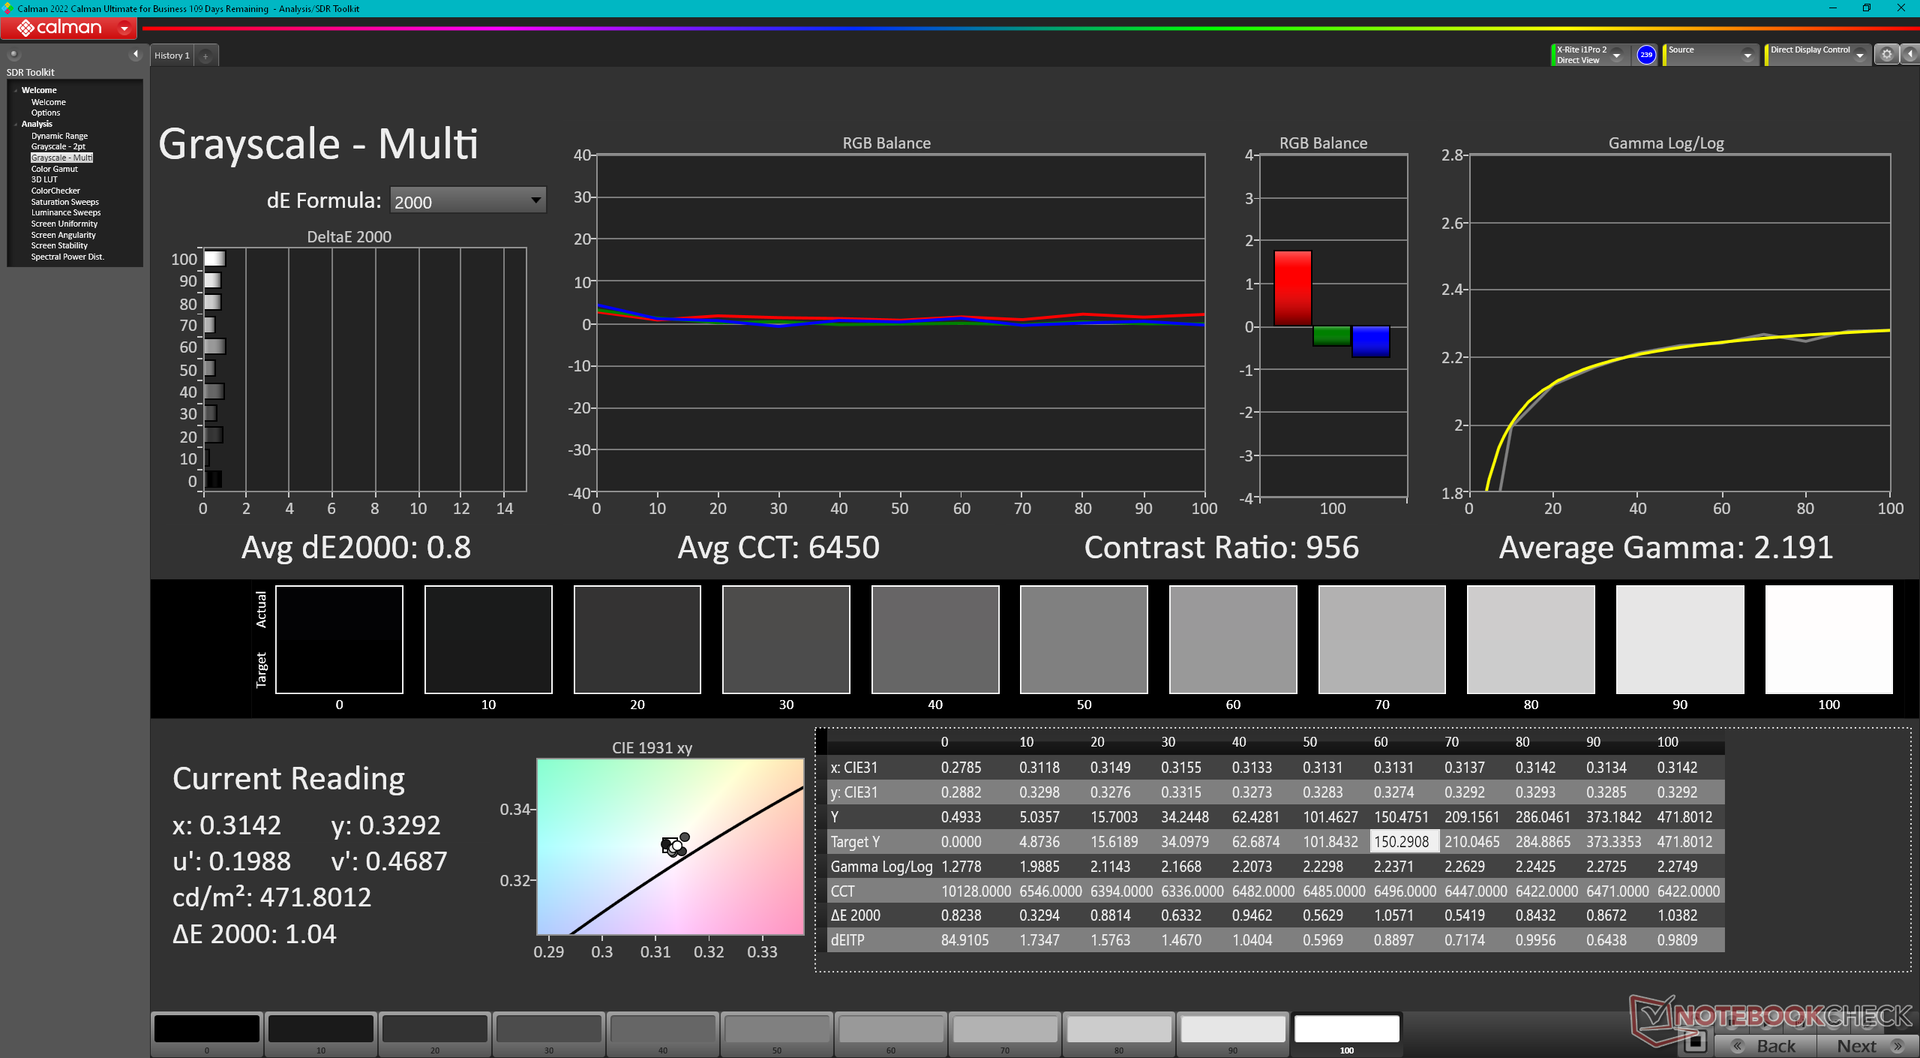
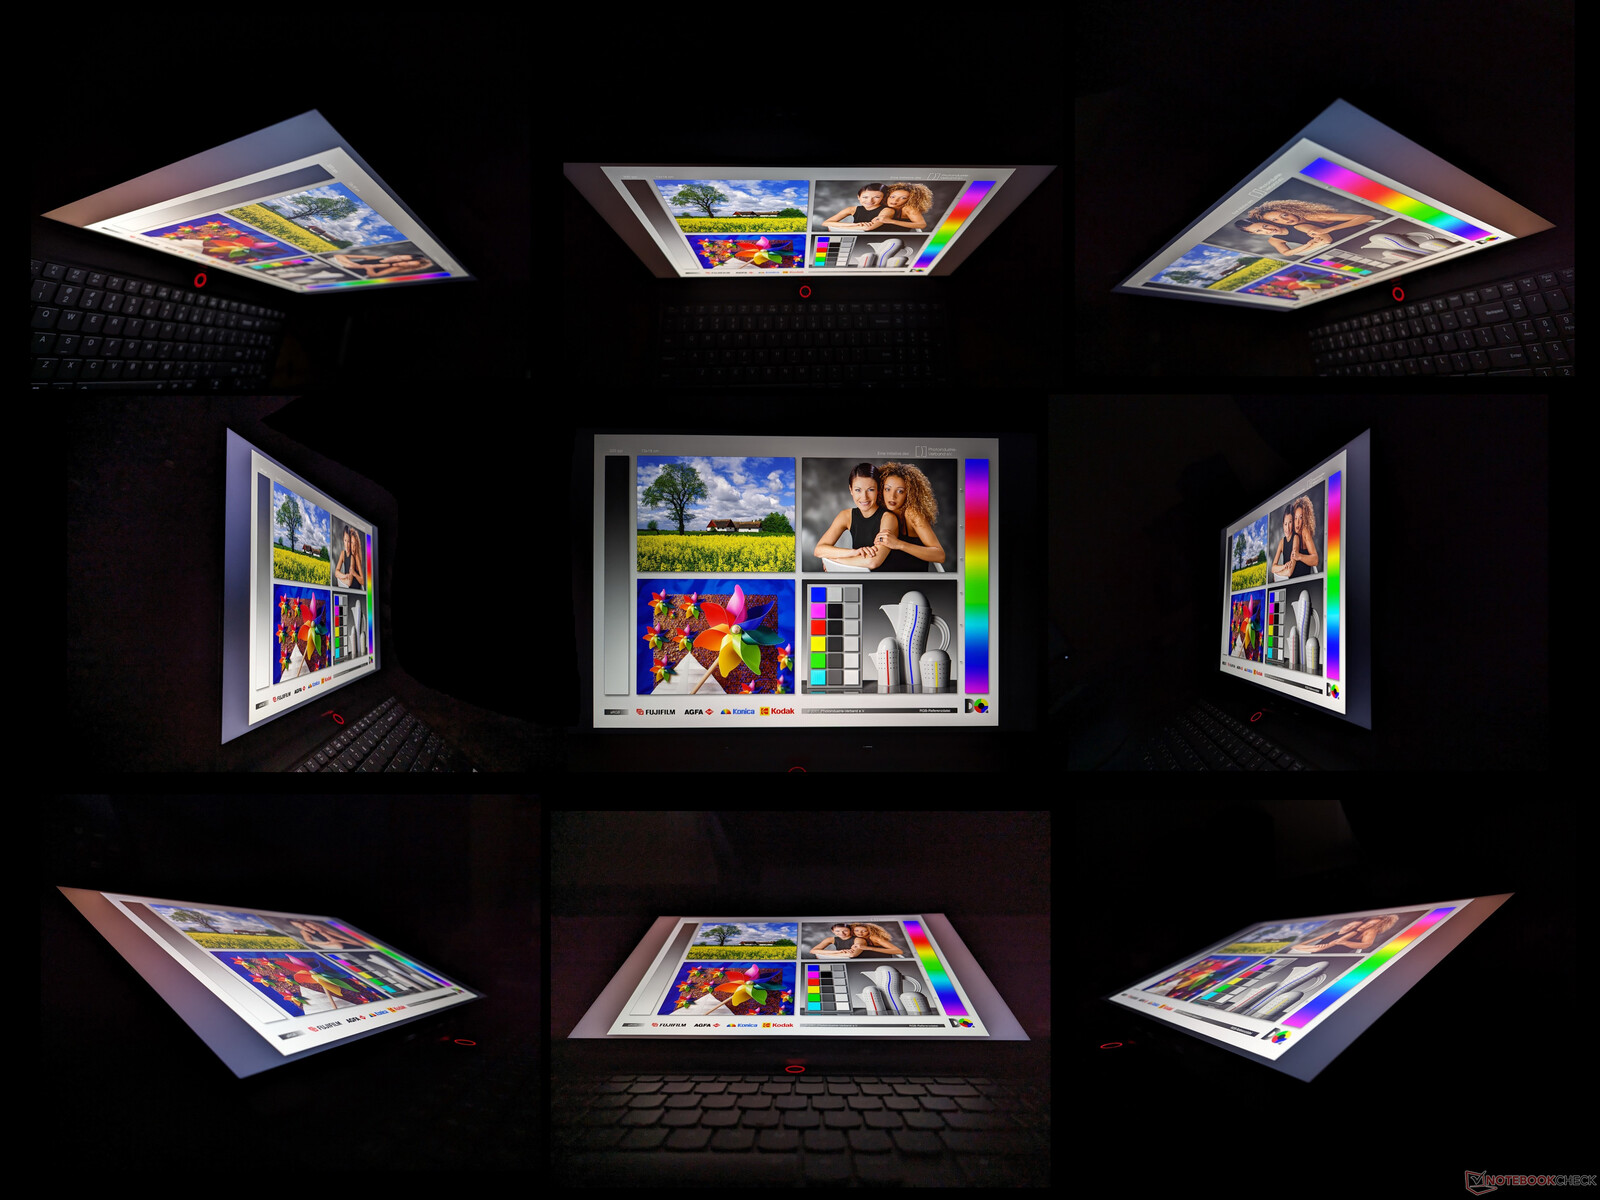
La nostra configurazione a 1600p è dotata dello stesso pannello IPS MNG007DA2-3 che si trova sul più grande e più costoso Legion Pro 7 per un'esperienza visiva identica tra i due modelli. Si tratta di un pannello di fascia alta adatto sia al gioco che all'editing grafico amatoriale, nonostante sia l'opzione base. Il backlight bleeding, tuttavia, è più evidente di quanto vorremmo, come mostra lo screenshot qui sotto.

| |||||||||||||||||||||||||
Distribuzione della luminosità: 86 %
Al centro con la batteria: 474.6 cd/m²
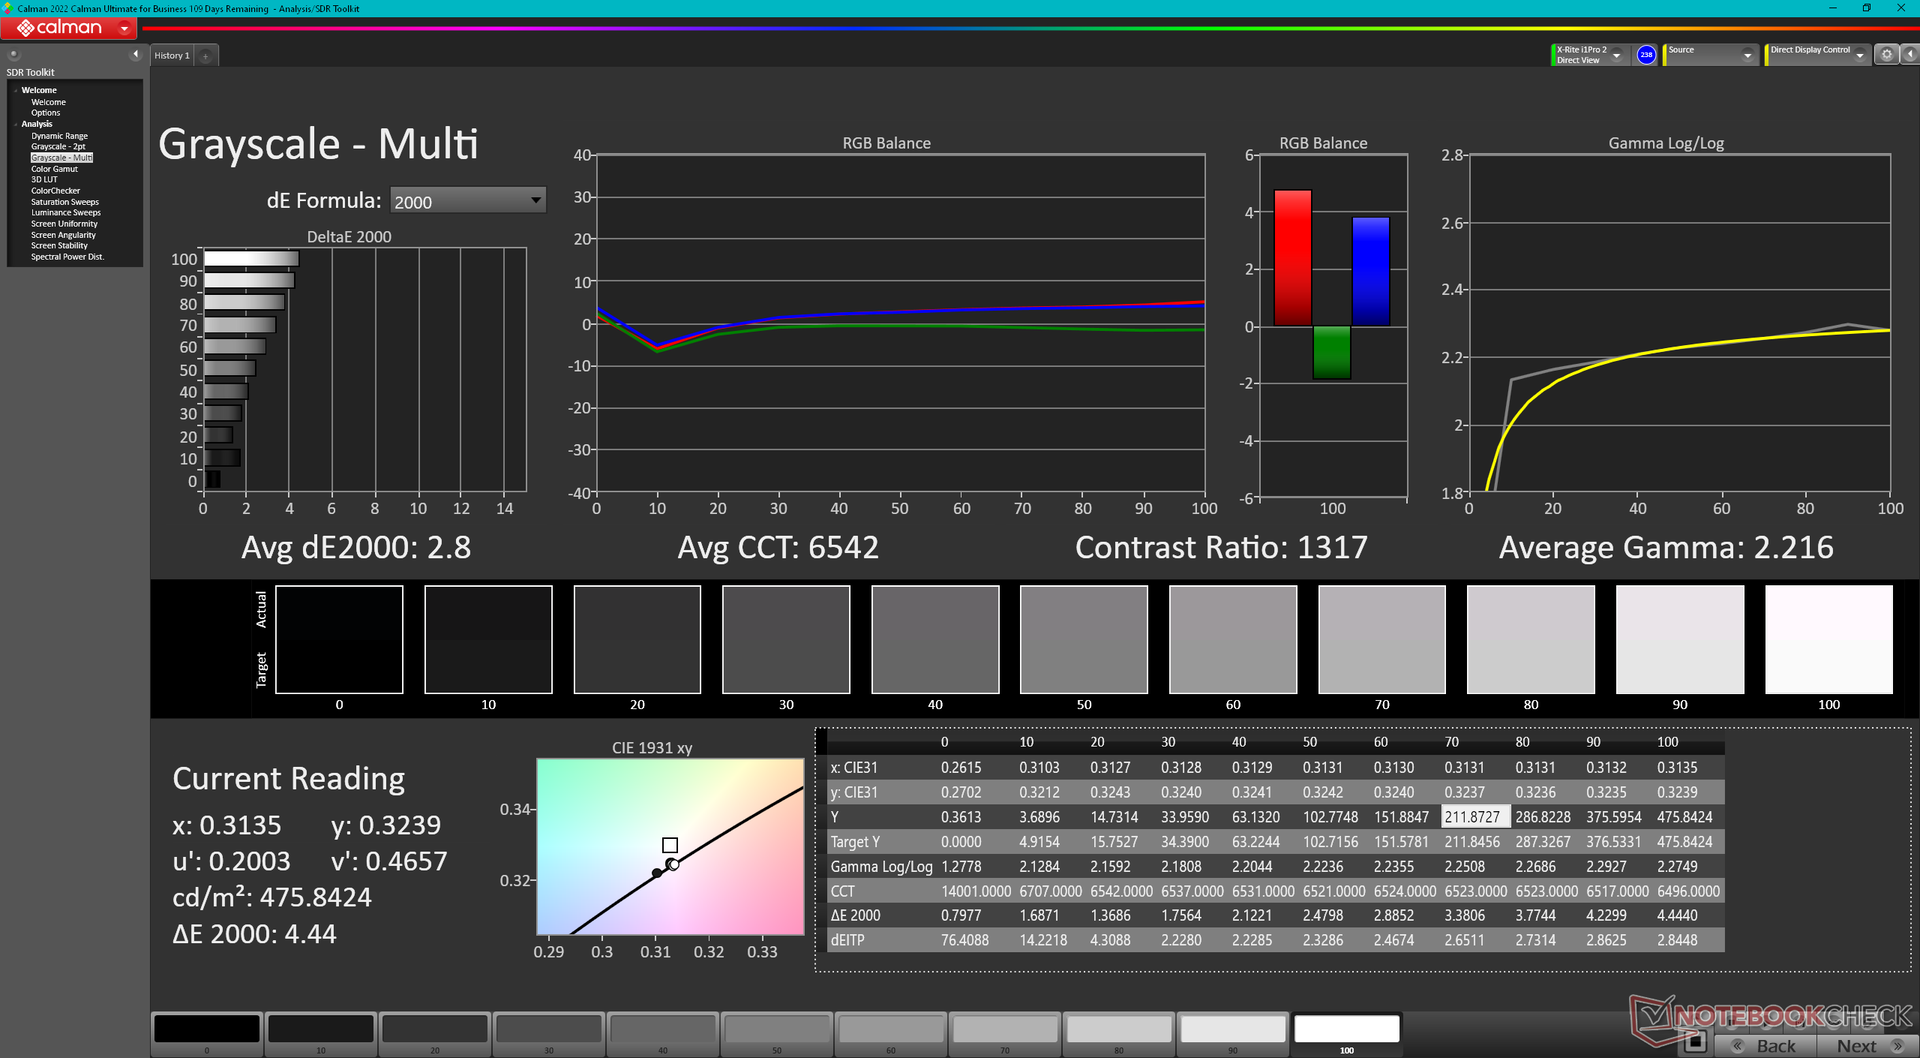
Contrasto: 1217:1 (Nero: 0.39 cd/m²)
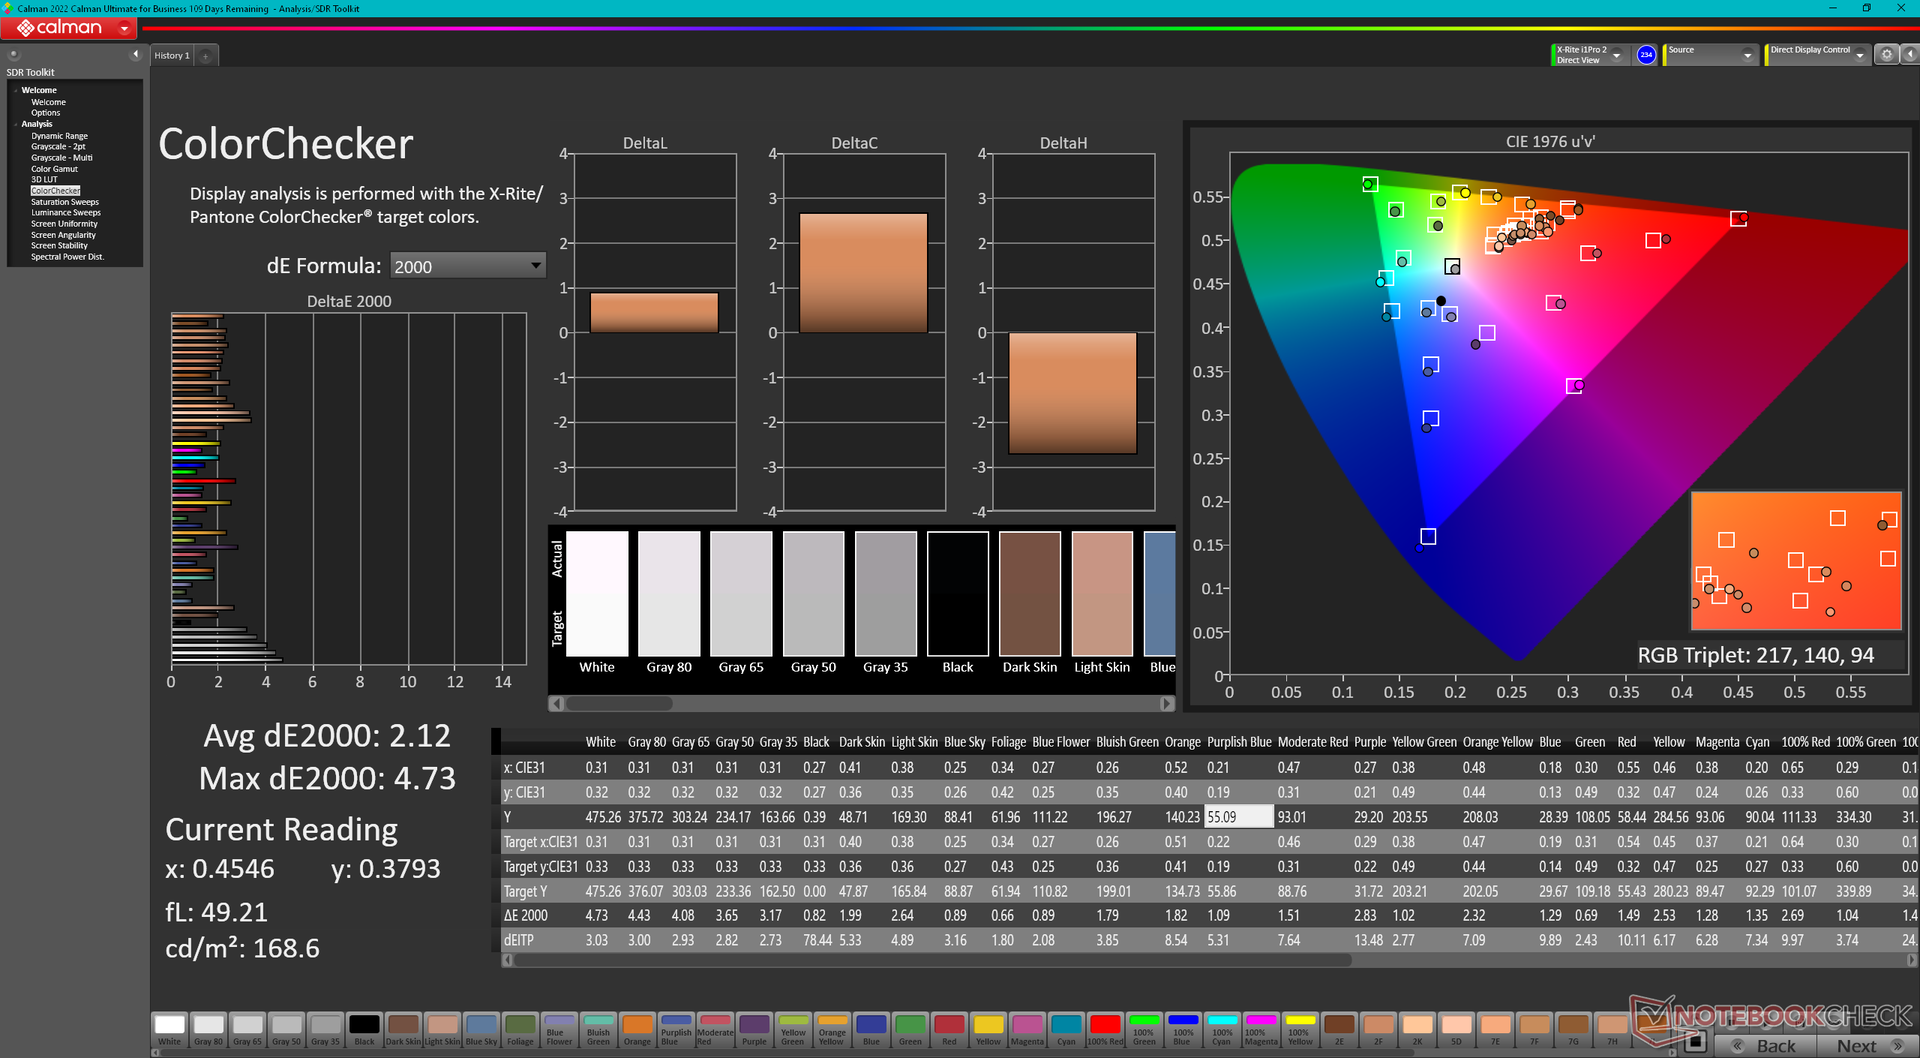
ΔE ColorChecker Calman: 2.12 | ∀{0.5-29.43 Ø4.71}
calibrated: 0.57
ΔE Greyscale Calman: 2.8 | ∀{0.09-98 Ø4.96}
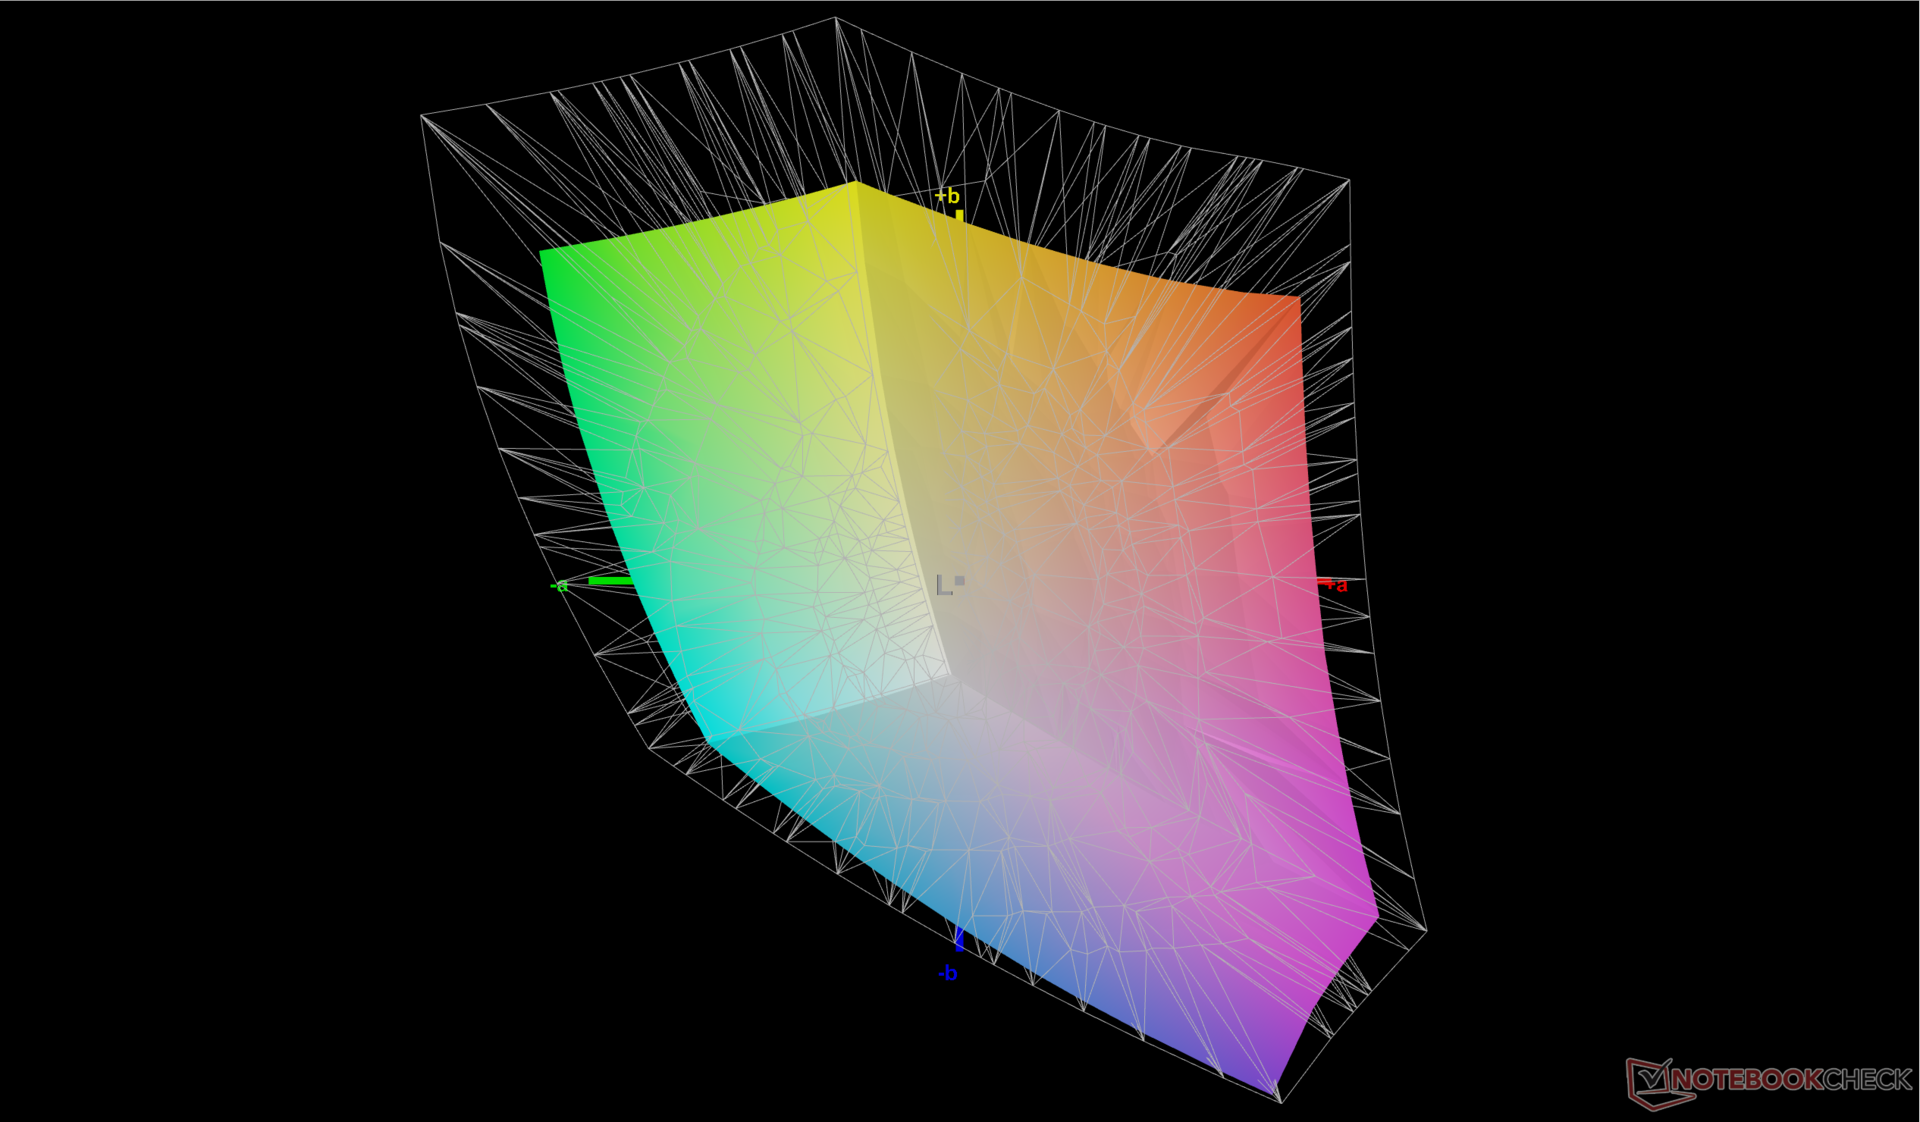
72.5% AdobeRGB 1998 (Argyll 3D)
99.4% sRGB (Argyll 3D)
70.4% Display P3 (Argyll 3D)
Gamma: 2.22
CCT: 6542 K
| Lenovo Legion Slim 7i 16 Gen 8 CSOT T3 MNG007DA2-3, IPS, 2560x1600, 16" | HP Omen 16-wf000 BOE0B7D, IPS, 2560x1440, 16.1" | Alienware x16 R1 BOE NE16NZ4, IPS, 2560x1600, 16" | Lenovo Legion Pro 7 RTX4090 MNG007DA2-3 (CSO1628), IPS, 2560x1600, 16" | Asus ROG Strix G16 G614JZ TL160ADMP03-0, IPS, 2560x1600, 16" | Razer Blade 16 Early 2023 CSOT T3 MNG007DA4-1, IPS, 2560x1600, 16" | |
|---|---|---|---|---|---|---|
| Display | -1% | 21% | -1% | 19% | 22% | |
| Display P3 Coverage (%) | 70.4 | 69 -2% | 99.2 41% | 69.5 -1% | 97 38% | 98.5 40% |
| sRGB Coverage (%) | 99.4 | 99.2 0% | 100 1% | 99.8 0% | 99.9 1% | 100 1% |
| AdobeRGB 1998 Coverage (%) | 72.5 | 71.2 -2% | 88.6 22% | 71.6 -1% | 84.9 17% | 89.7 24% |
| Response Times | 27% | 21% | 29% | 42% | 5% | |
| Response Time Grey 50% / Grey 80% * (ms) | 12 ? | 4.6 ? 62% | 5.1 ? 57% | 10.9 ? 9% | 5.1 ? 57% | 6.6 ? 45% |
| Response Time Black / White * (ms) | 8.9 ? | 9.7 ? -9% | 10.3 ? -16% | 4.6 ? 48% | 6.6 ? 26% | 12 ? -35% |
| PWM Frequency (Hz) | ||||||
| Screen | -5% | -11% | -5% | -4% | -12% | |
| Brightness middle (cd/m²) | 474.6 | 310.9 -34% | 302.2 -36% | 491 3% | 470 -1% | 456.8 -4% |
| Brightness (cd/m²) | 445 | 296 -33% | 285 -36% | 472 6% | 459 3% | 437 -2% |
| Brightness Distribution (%) | 86 | 91 6% | 89 3% | 91 6% | 93 8% | 83 -3% |
| Black Level * (cd/m²) | 0.39 | 0.35 10% | 0.26 33% | 0.4 -3% | 0.42 -8% | 0.35 10% |
| Contrast (:1) | 1217 | 888 -27% | 1162 -5% | 1228 1% | 1119 -8% | 1305 7% |
| Colorchecker dE 2000 * | 2.12 | 2.18 -3% | 1.63 23% | 1.6 25% | 1.86 12% | 3.7 -75% |
| Colorchecker dE 2000 max. * | 4.73 | 3.58 24% | 4.13 13% | 5.15 -9% | 3.87 18% | 6.42 -36% |
| Colorchecker dE 2000 calibrated * | 0.57 | 0.52 9% | 1.17 -105% | 0.97 -70% | 0.93 -63% | 0.66 -16% |
| Greyscale dE 2000 * | 2.8 | 2.8 -0% | 2.5 11% | 3 -7% | 2.7 4% | 2.6 7% |
| Gamma | 2.22 99% | 2.18 101% | 2.23 99% | 2.211 100% | 2.246 98% | 2.3 96% |
| CCT | 6542 99% | 6002 108% | 6590 99% | 6979 93% | 6711 97% | 6108 106% |
| Media totale (Programma / Settaggio) | 7% /
0% | 10% /
0% | 8% /
1% | 19% /
7% | 5% /
-3% |
* ... Meglio usare valori piccoli
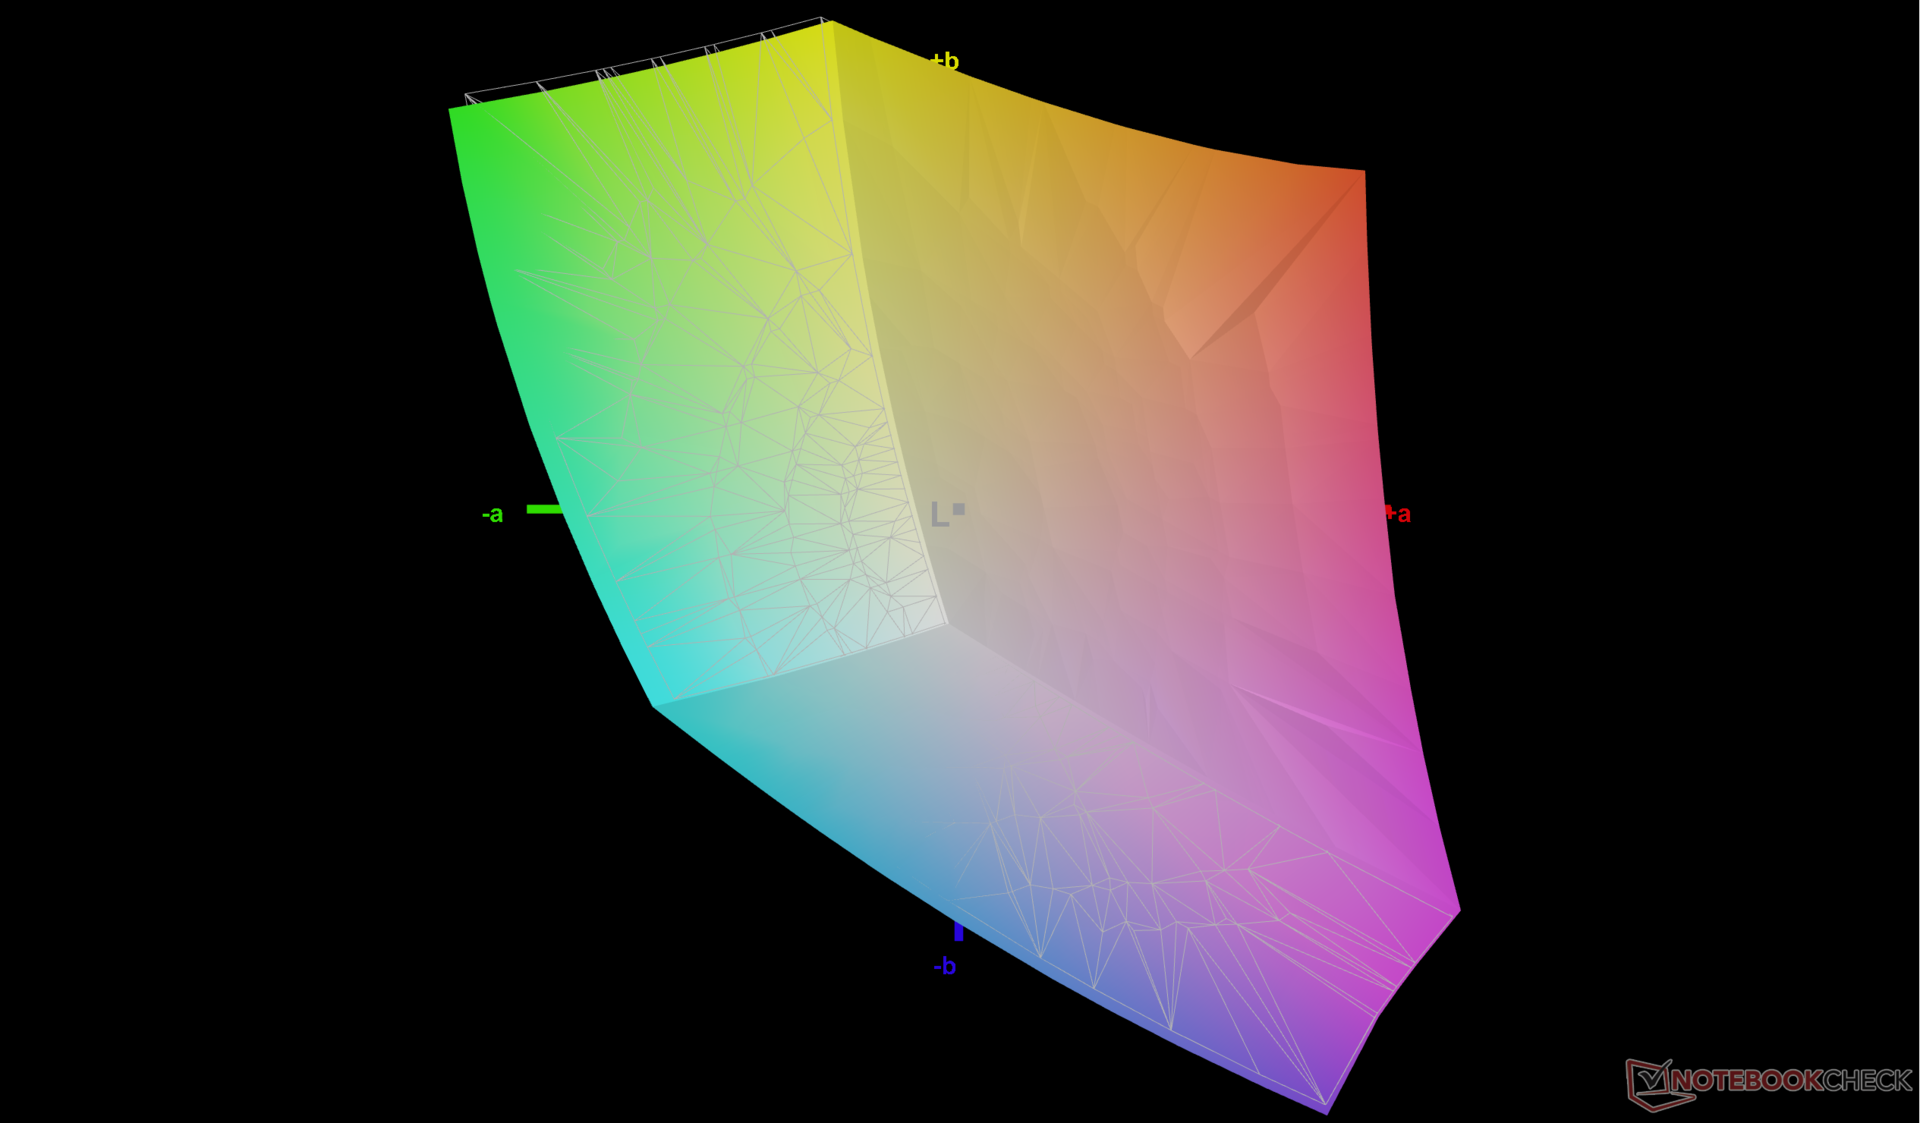
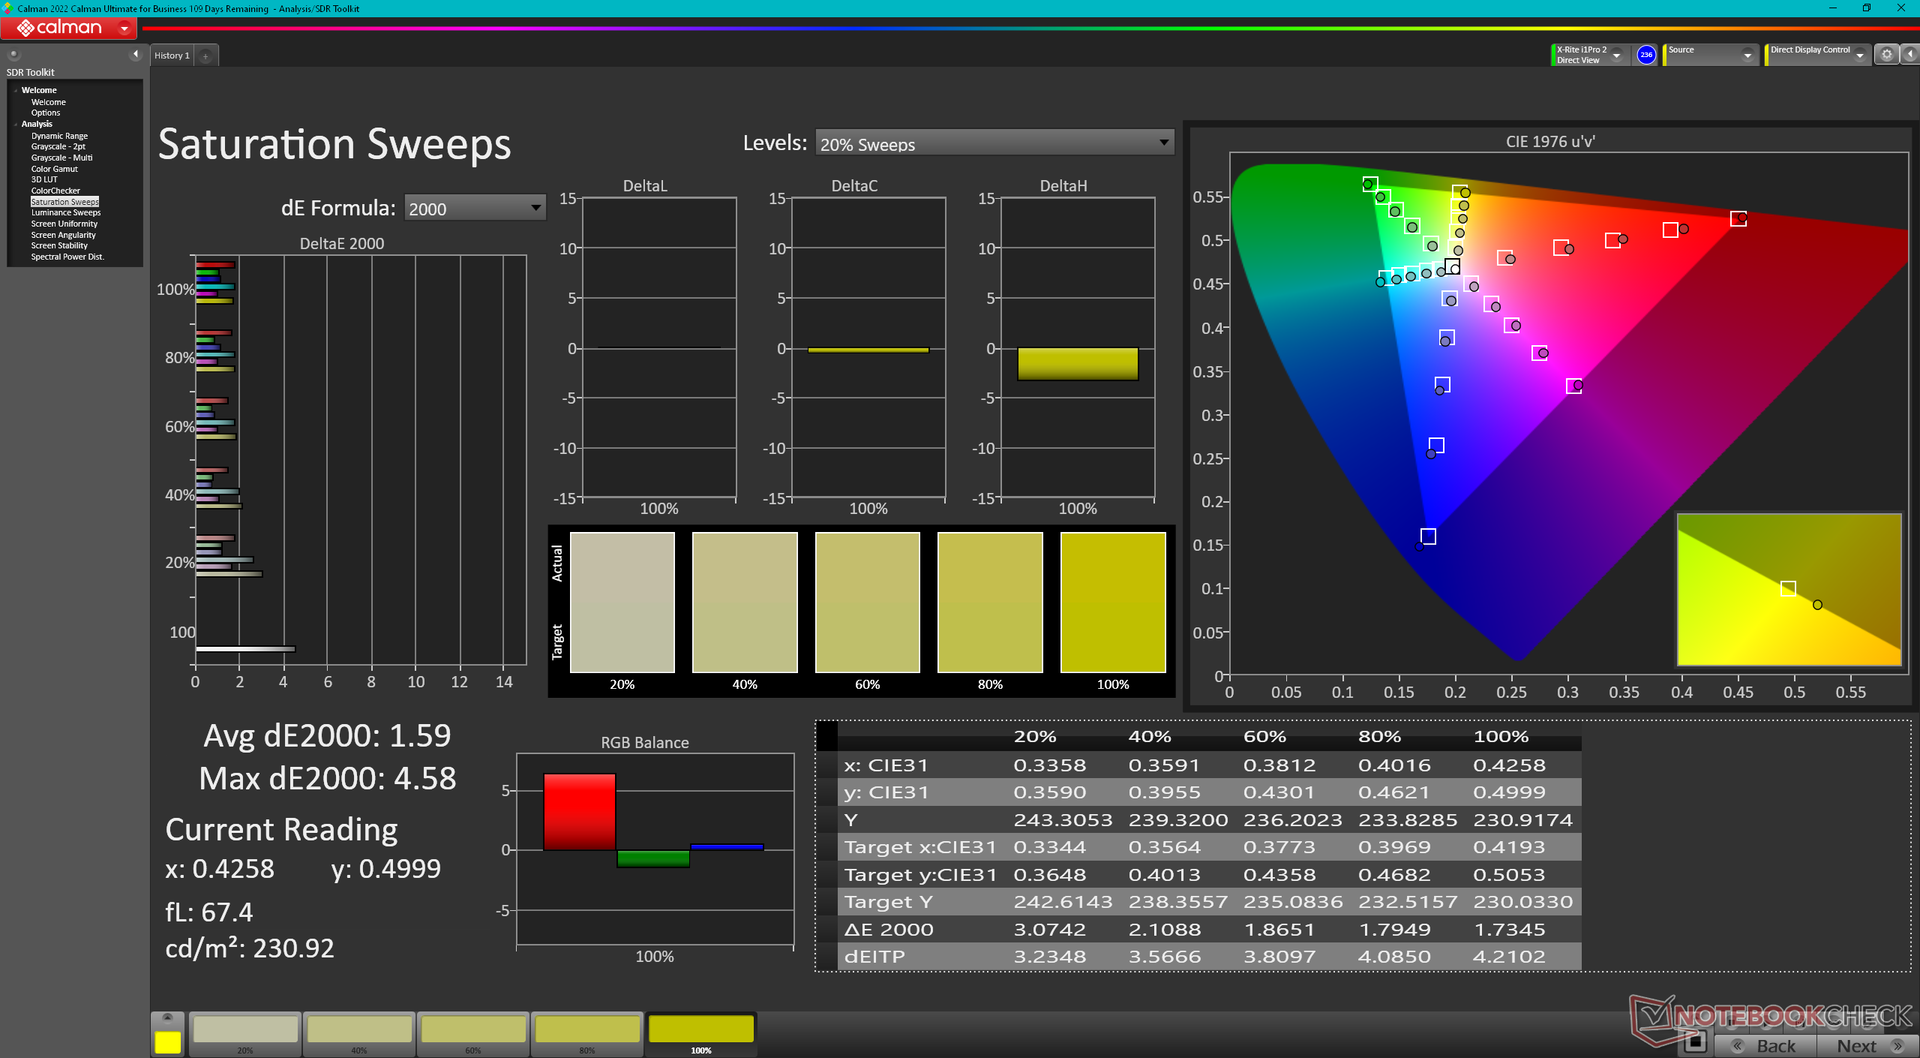
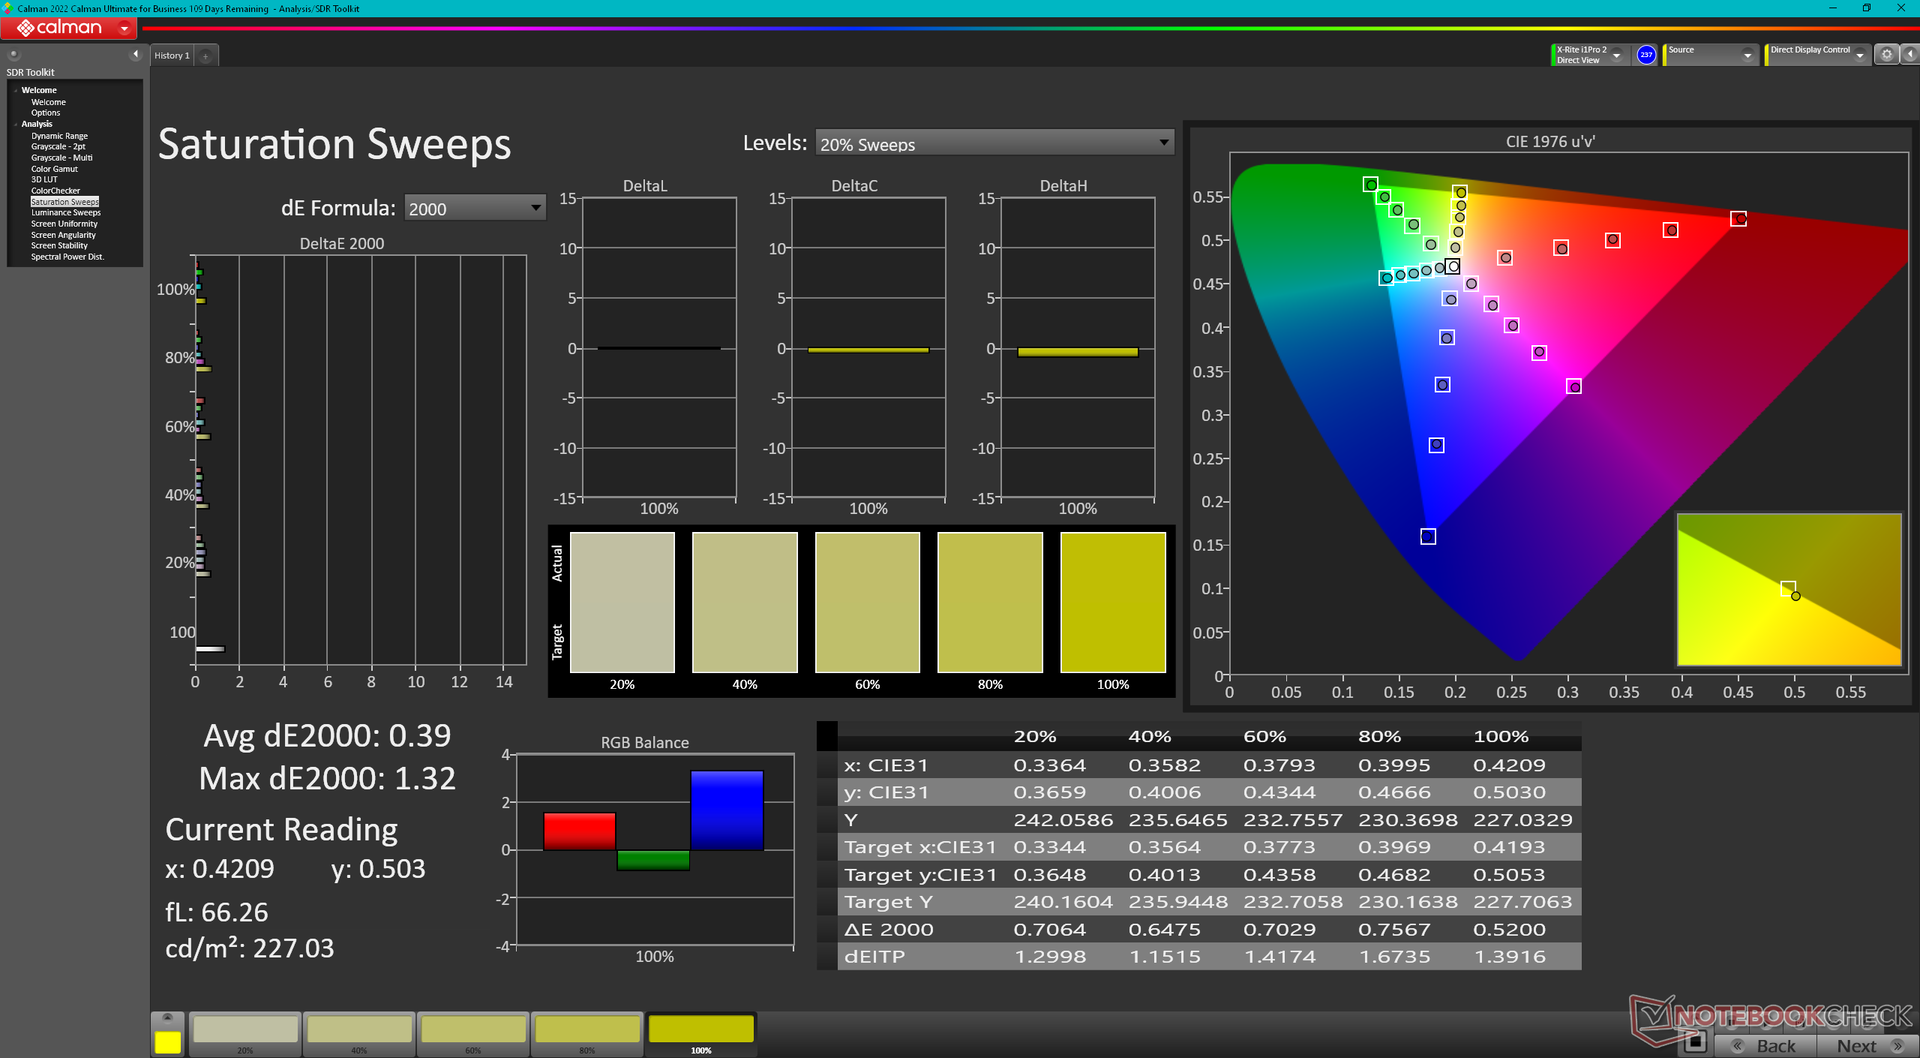
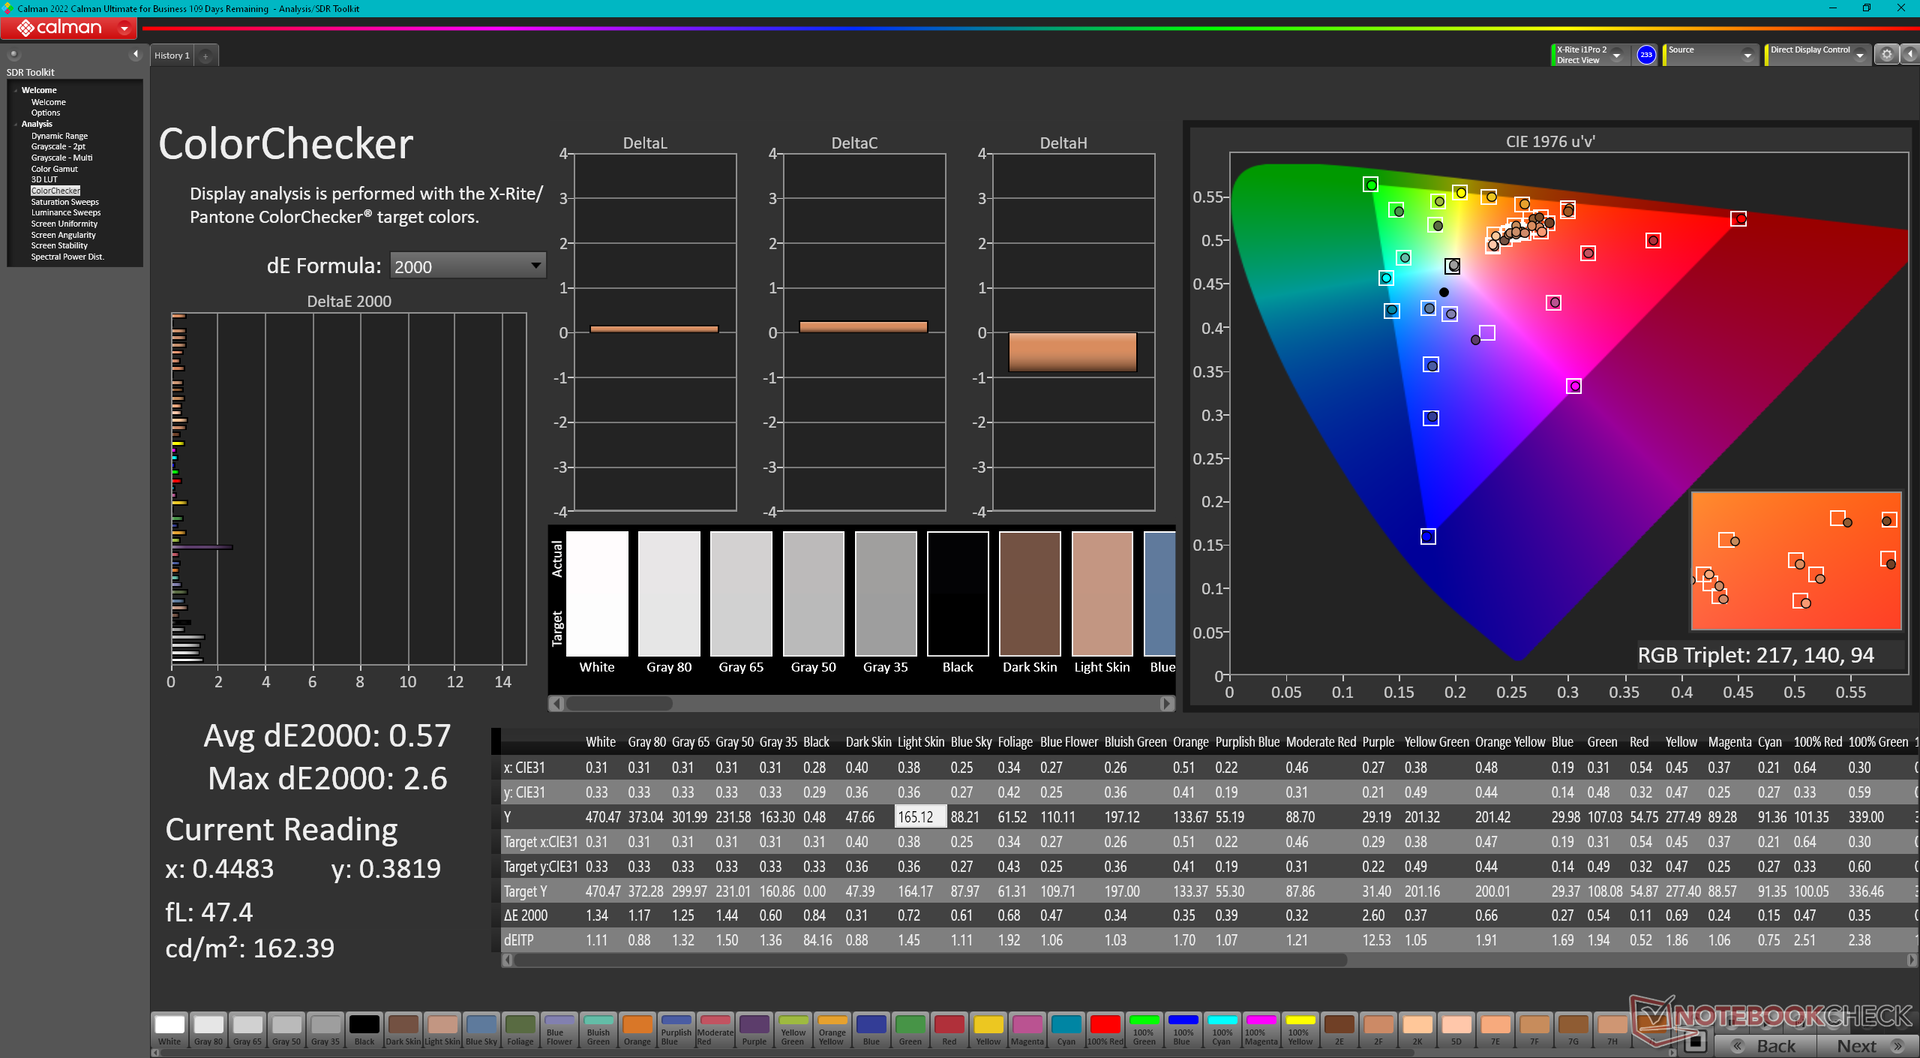
Il display viene fornito pre-calibrato con valori medi di deltaE in scala di grigi e a colori di soli 2,8 e 2,12, rispettivamente. La calibrazione da parte nostra con un colorimetro X-Rite migliorerebbe ulteriormente queste medie, portandole a soli 0,8 e 0,57, rispettivamente. Una calibrazione da parte dell'utente finale non è quindi del tutto necessaria, ma il nostro profilo ICM calibrato è comunque disponibile gratuitamente per gli utenti interessati.
Tempi di risposta del Display
| ↔ Tempi di risposta dal Nero al Bianco | ||
|---|---|---|
| 8.9 ms ... aumenta ↗ e diminuisce ↘ combinato | ↗ 5.1 ms Incremento | 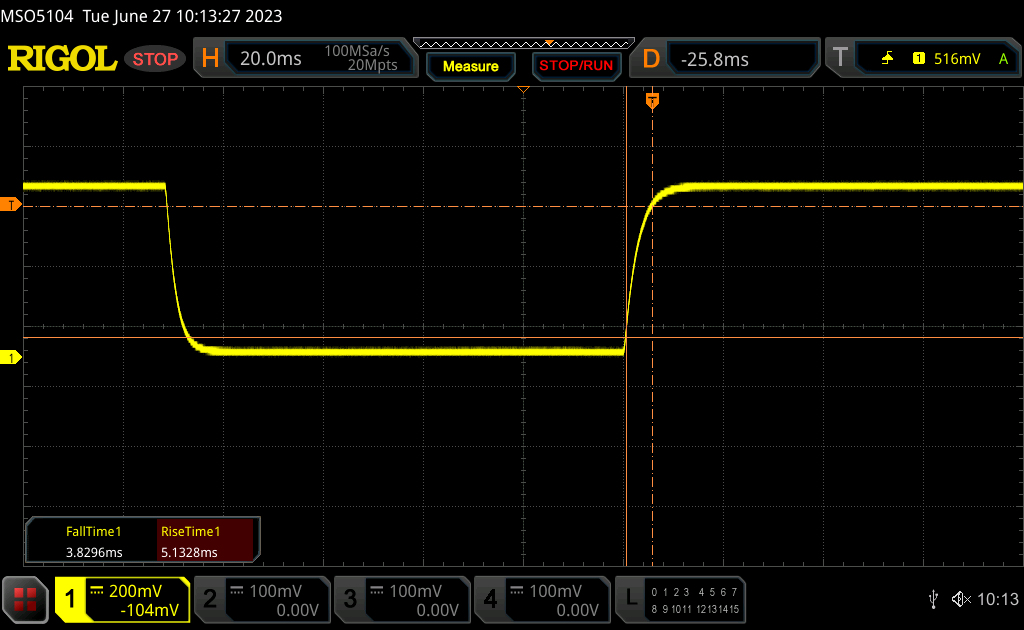 |
| ↘ 3.8 ms Calo | ||
| Lo schermo mostra veloci tempi di risposta durante i nostri tests e dovrebbe esere adatto al gaming In confronto, tutti i dispositivi di test variano da 0.1 (minimo) a 240 (massimo) ms. » 25 % di tutti i dispositivi è migliore. Questo significa che i tempi di risposta rilevati sono migliori rispettto alla media di tutti i dispositivi testati (19.8 ms). | ||
| ↔ Tempo di risposta dal 50% Grigio all'80% Grigio | ||
| 12 ms ... aumenta ↗ e diminuisce ↘ combinato | ↗ 6 ms Incremento | 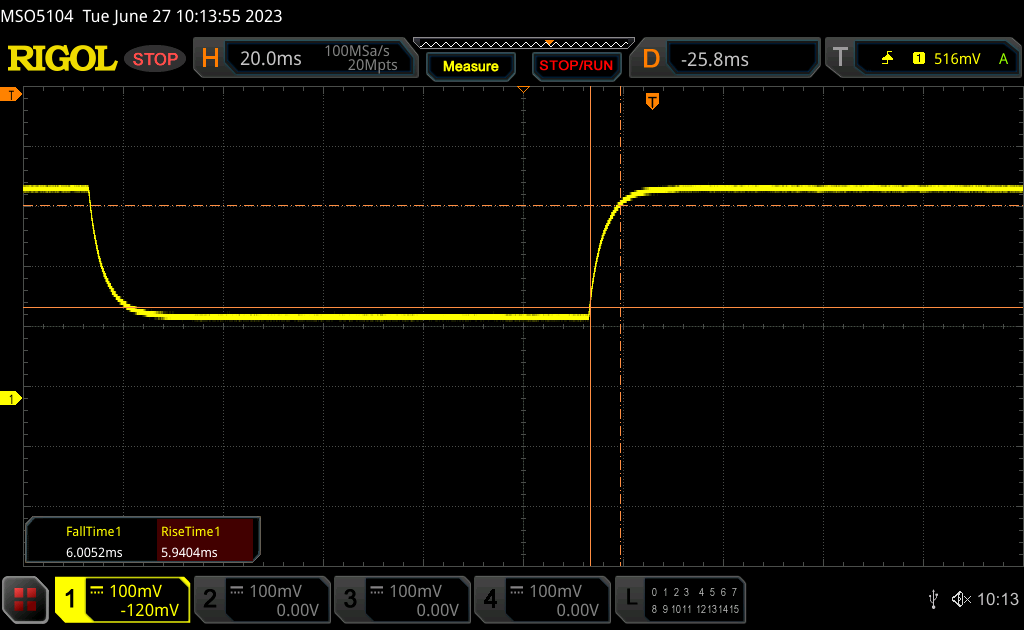 |
| ↘ 6 ms Calo | ||
| Lo schermo mostra buoni tempi di risposta durante i nostri tests, ma potrebbe essere troppo lento per i gamers competitivi. In confronto, tutti i dispositivi di test variano da 0.165 (minimo) a 636 (massimo) ms. » 25 % di tutti i dispositivi è migliore. Questo significa che i tempi di risposta rilevati sono migliori rispettto alla media di tutti i dispositivi testati (31 ms). | ||
Sfarfallio dello schermo / PWM (Pulse-Width Modulation)
| flickering dello schermo / PWM non rilevato | 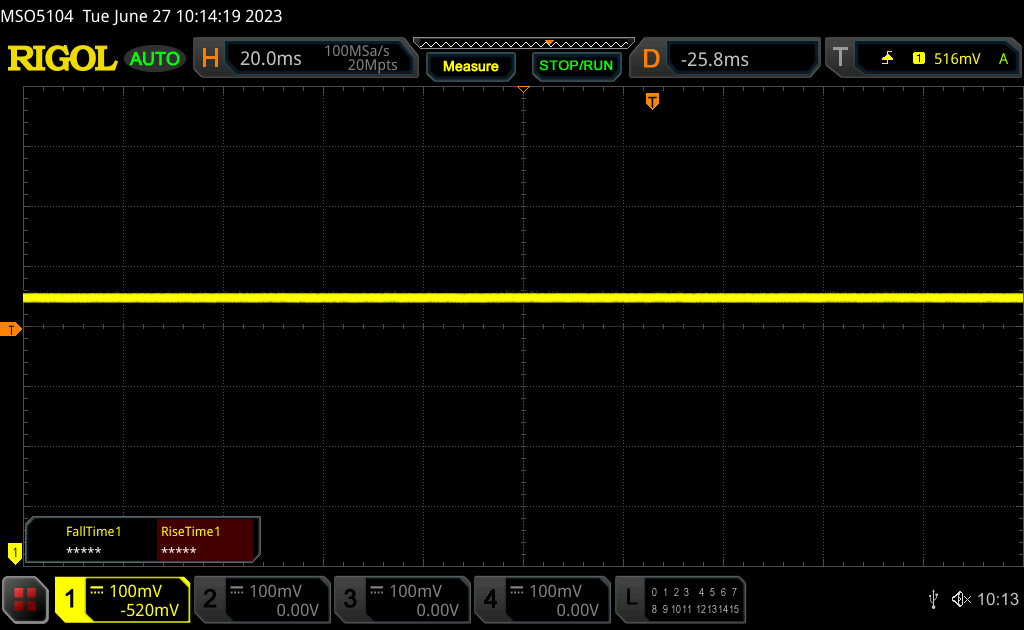 | ||
In confronto: 52 % di tutti i dispositivi testati non utilizza PWM per ridurre la luminosita' del display. Se è rilevato PWM, una media di 7747 (minimo: 5 - massimo: 343500) Hz è stata rilevata. | |||
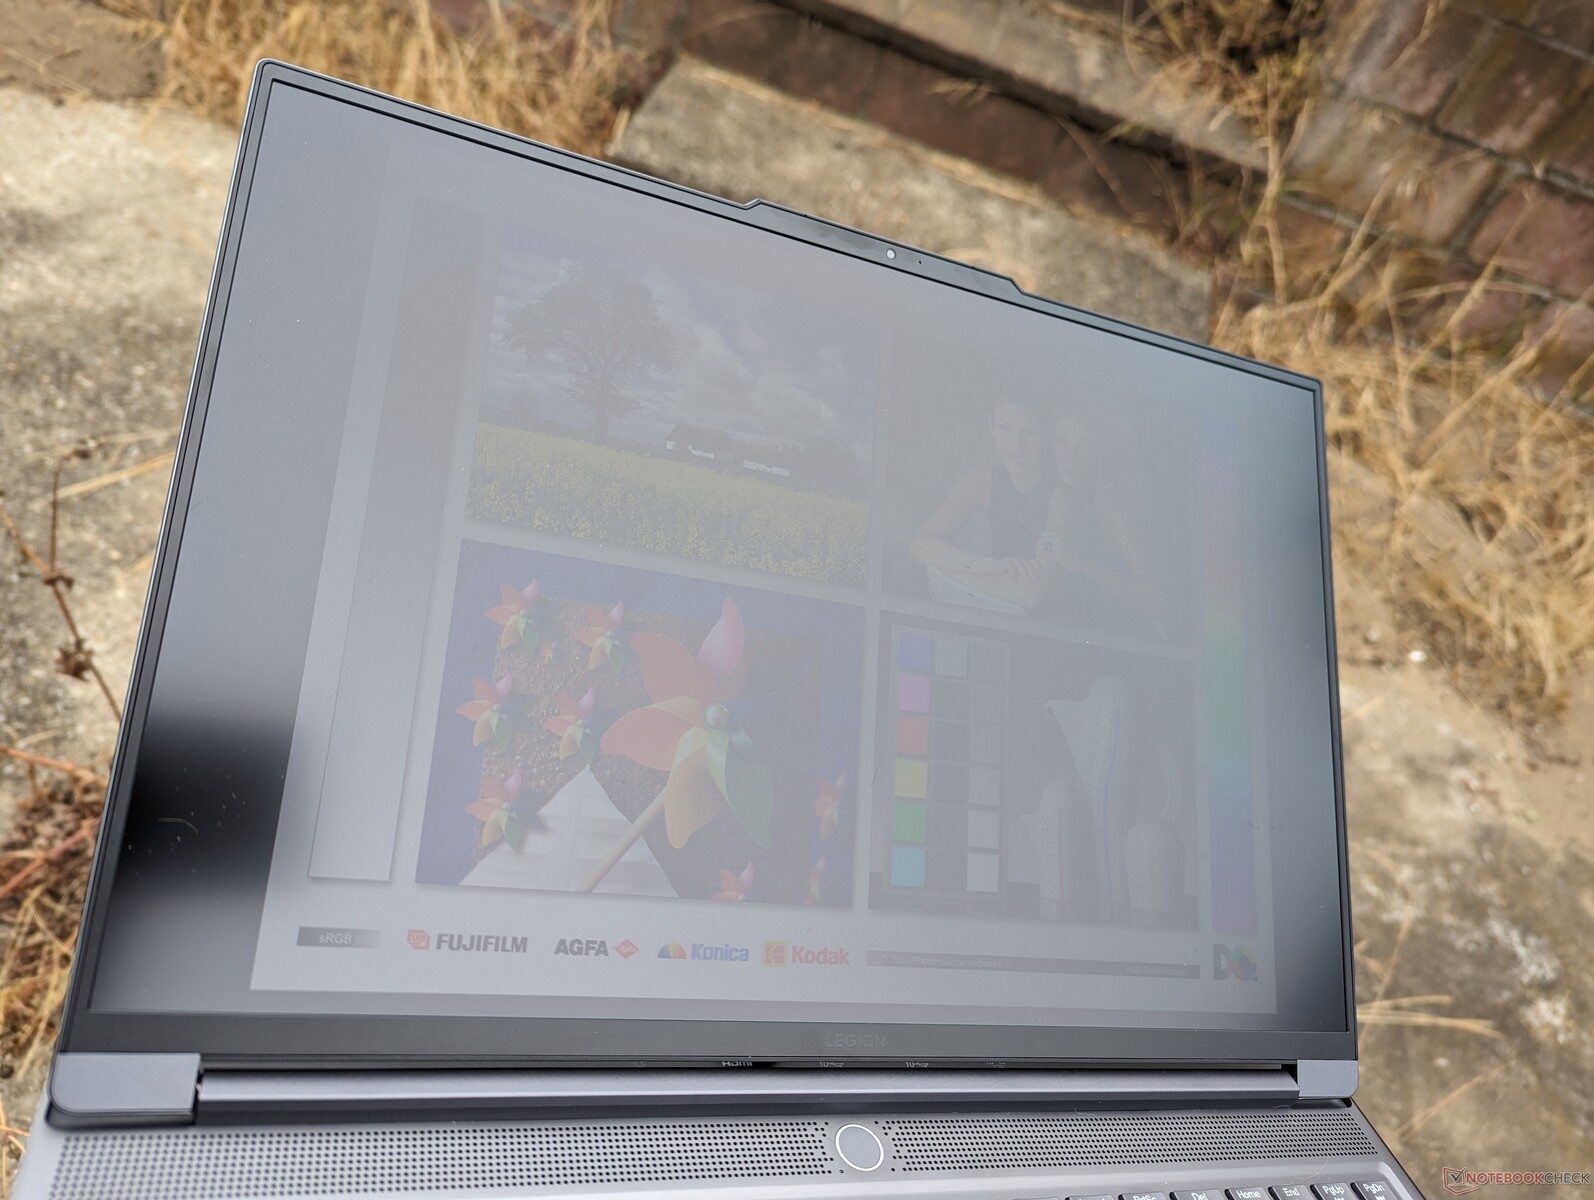
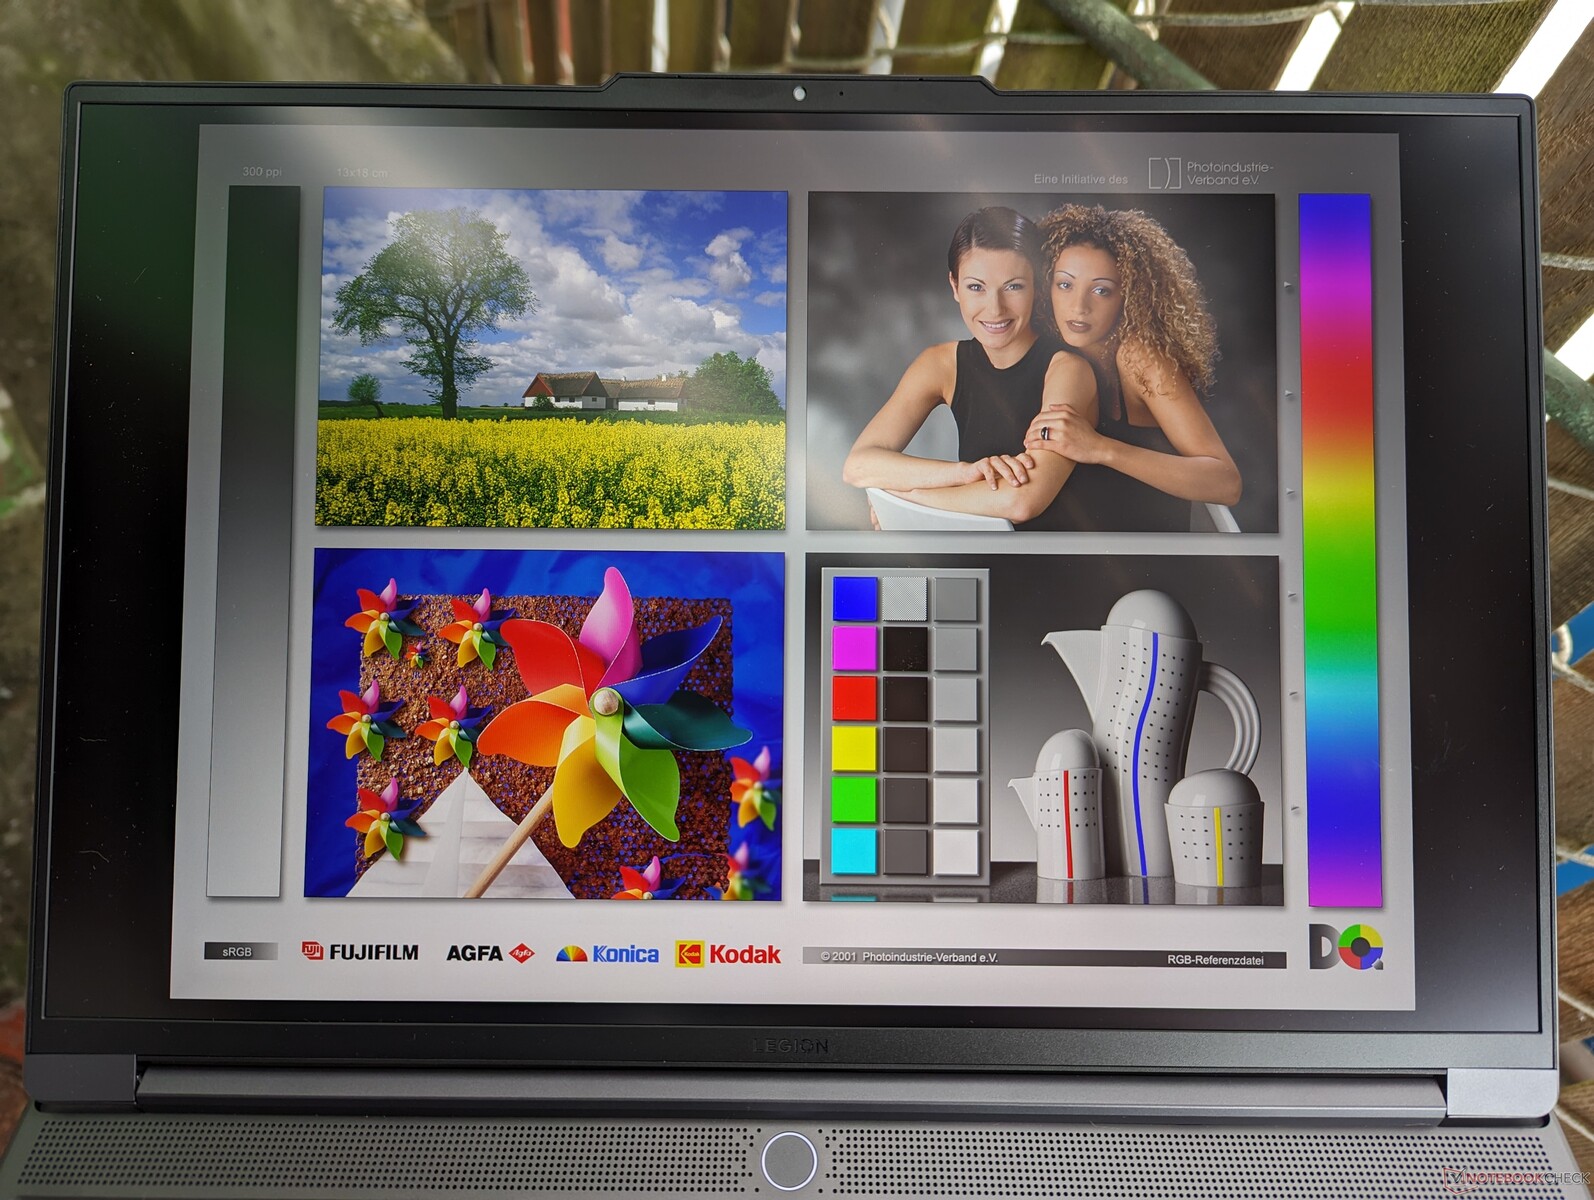
Il display è notevolmente più luminoso rispetto a quello del modelloOmen 16 o Alienware x16 R1 per una migliore leggibilità all'aperto. In effetti, l'impostazione di luminosità massima è solo del 10% inferiore rispetto a quella del MacBook Pro 16.
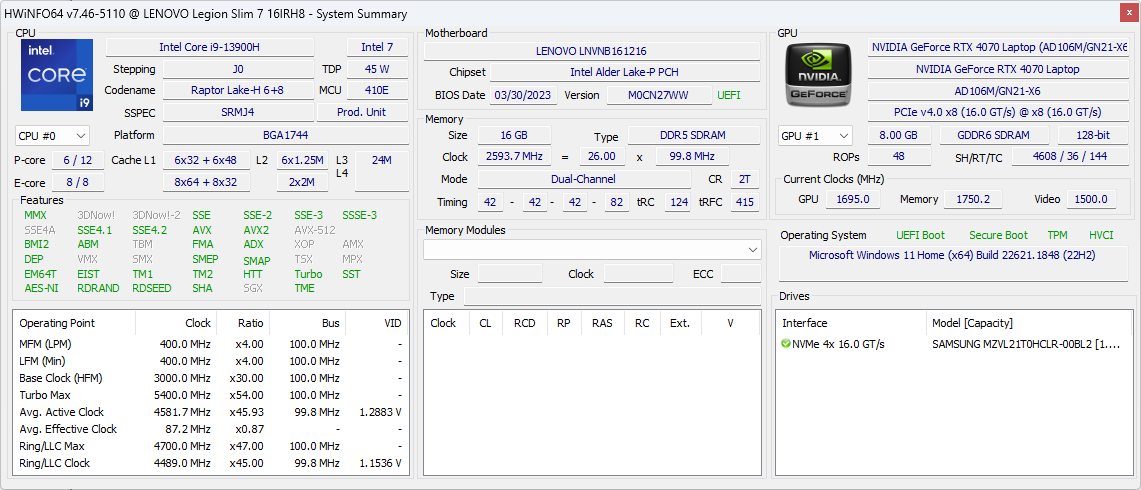
Prestazioni - Core i9 di 13a generazione
Condizioni di test
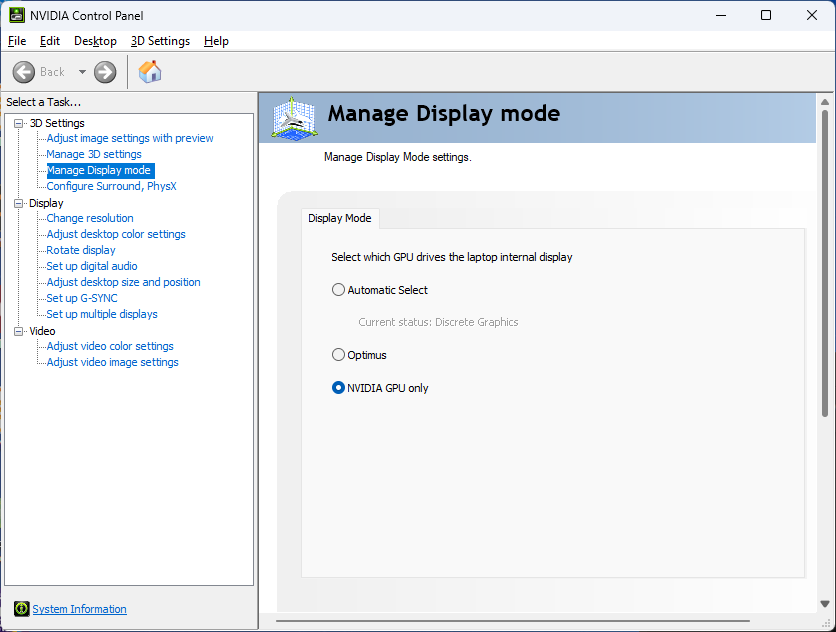
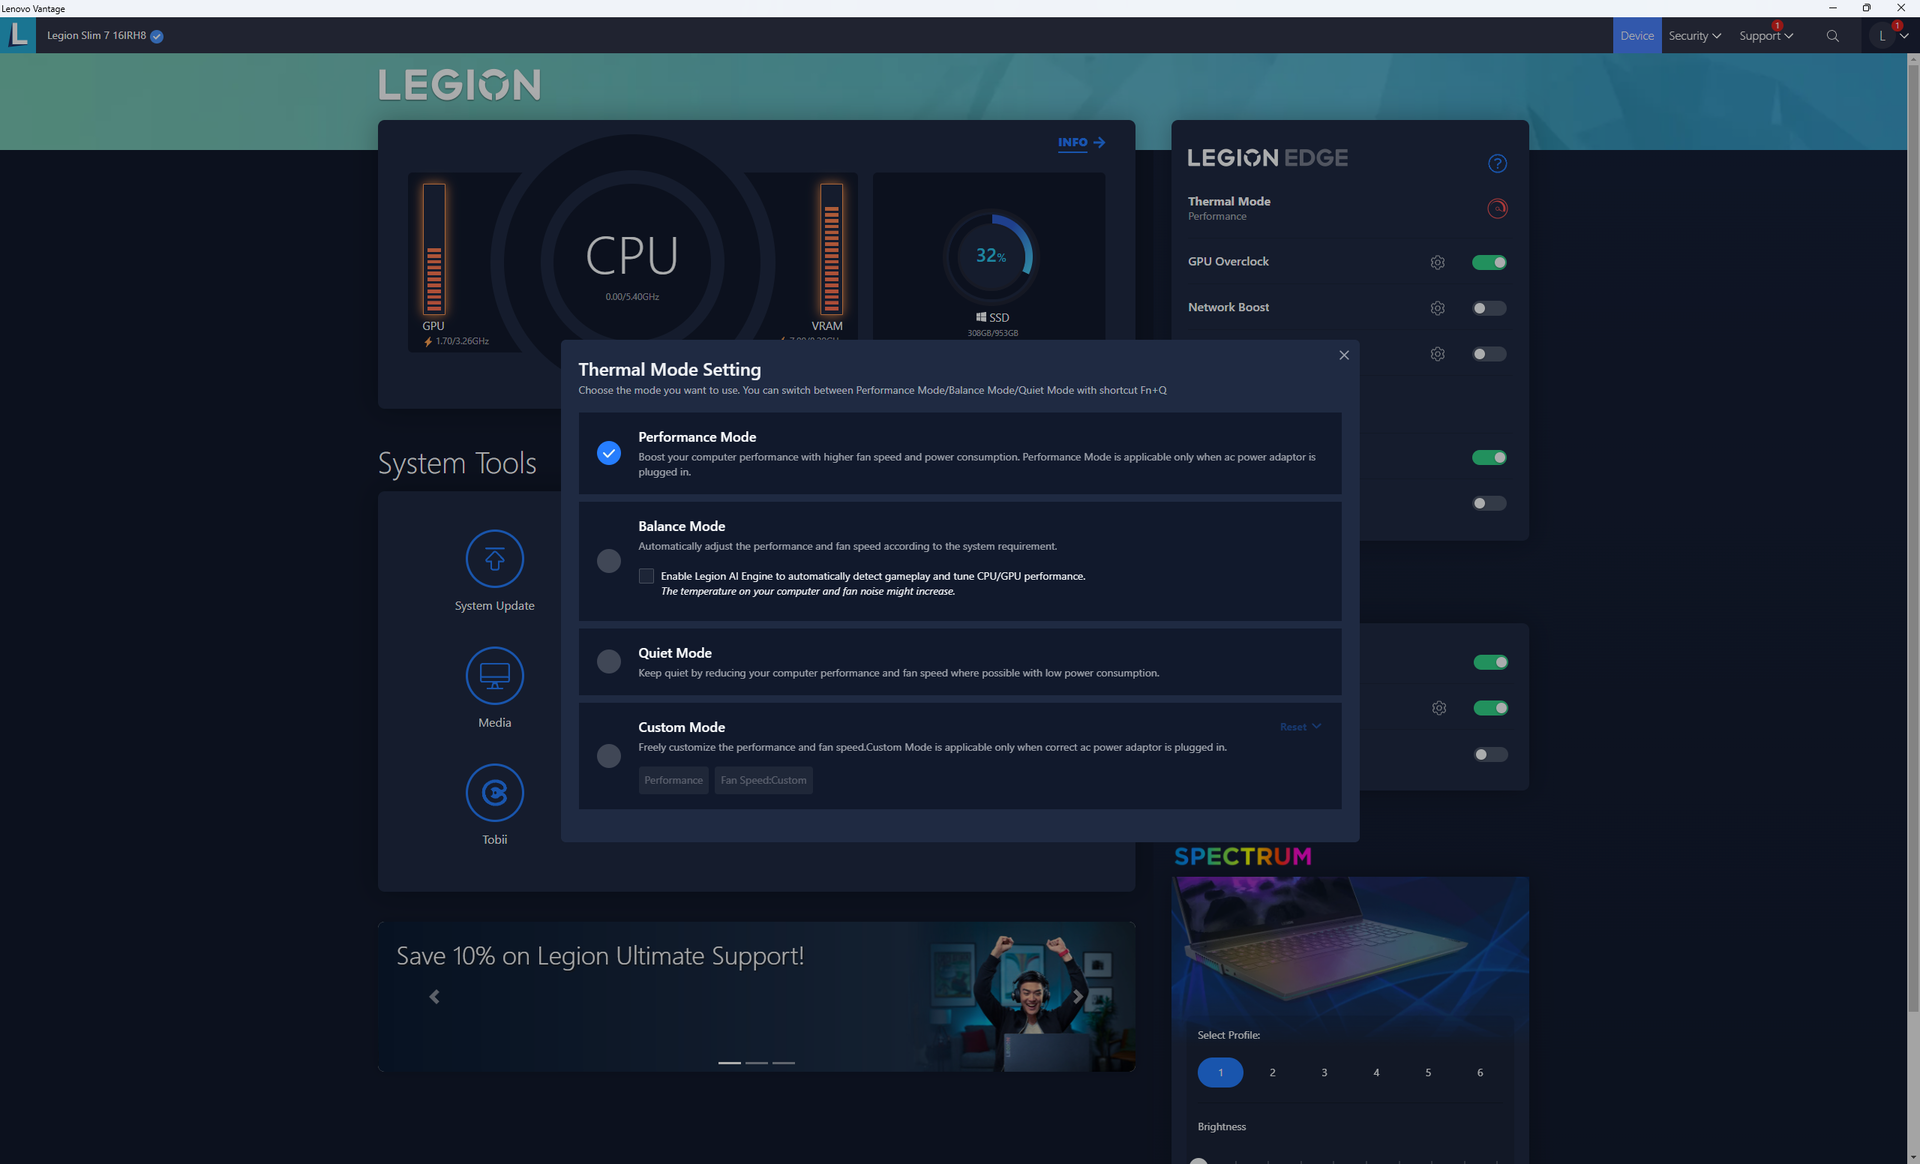
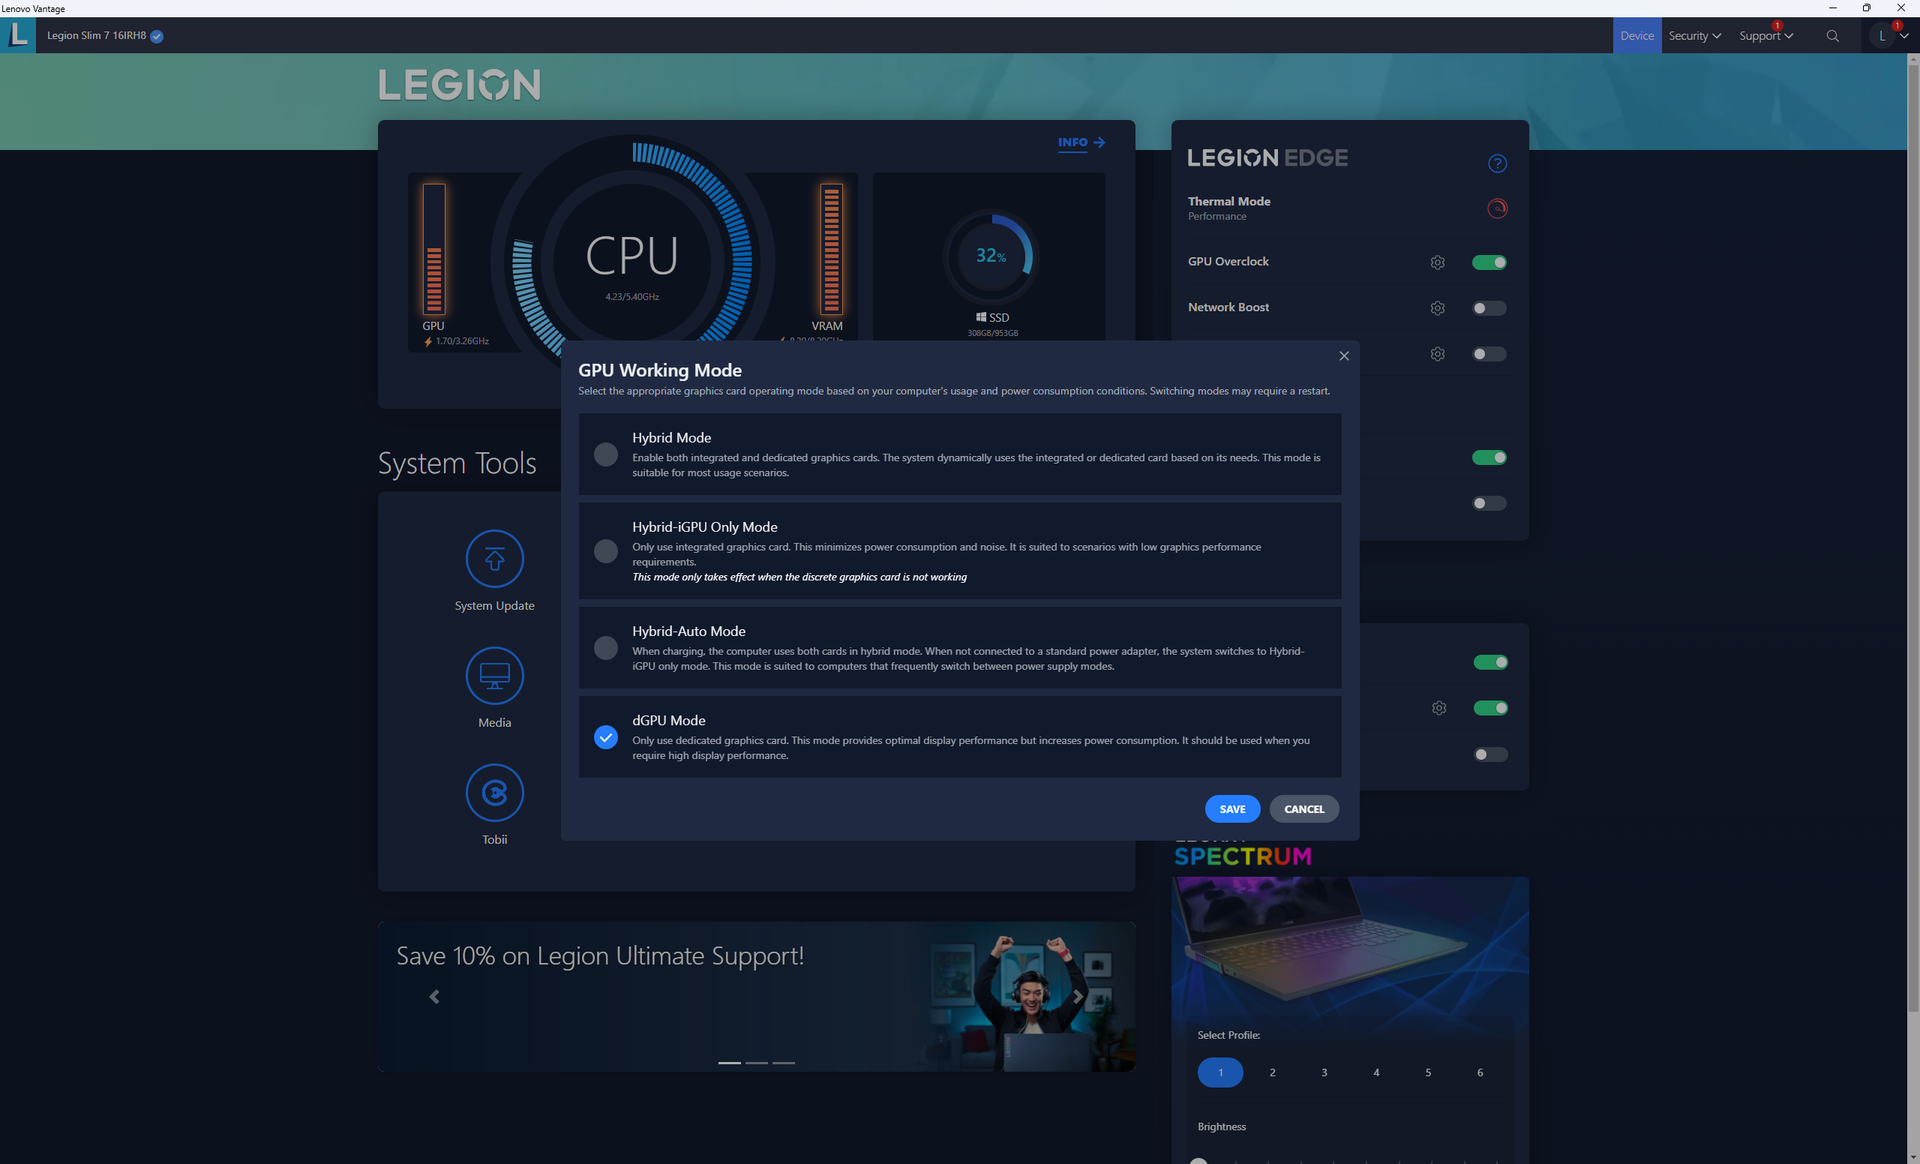
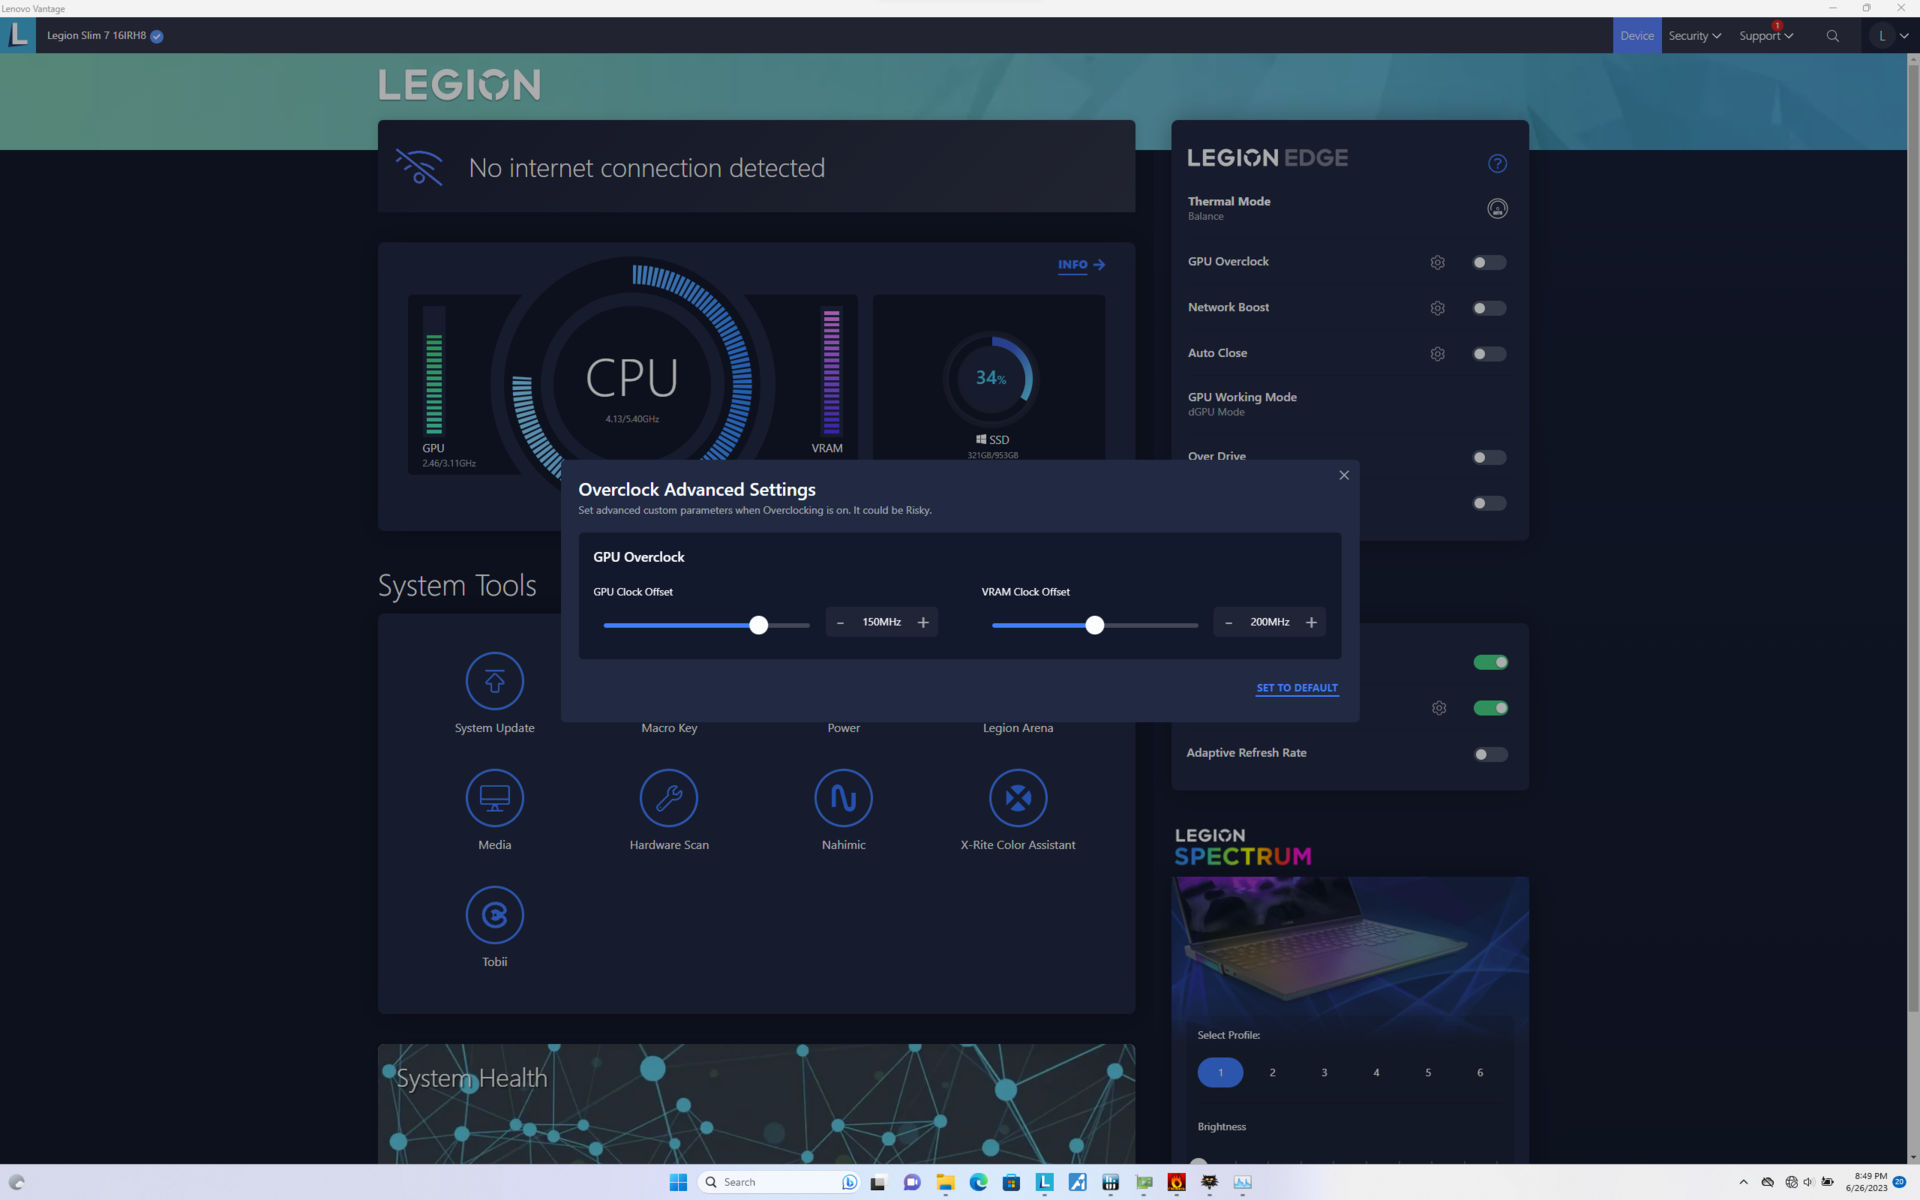
Abbiamo impostato la nostra unità in modalità dGPU e Performance con Overclock della GPU e Overdrive attivi prima di eseguire i benchmark qui sotto. Lenovo Vantage è il centro di controllo per regolare le prestazioni, gli aggiornamenti, la garanzia, l'RGB e altre caratteristiche.
Sono supportati Optimus o MUX avanzati.
È importante notare che la nostra unità ha uno slot SODIMM non occupato e quindi funziona solo con 16 GB di RAM saldata a canale singolo. I risultati del benchmark della memoria AIDA64 sono quindi molto più bassi rispetto alla maggior parte degli altri portatili da gioco.
Processore
Il Raptor Lake-H Core i9-13900H offre un rispettabile aumento del 25% delle prestazioni multi-thread rispetto al Core i93900H Alder Lake-H Core i9-12900H. In particolare, le prestazioni sono sostanzialmente identiche a quelle del più costosoCore i7-13700HX e Core i9-13900HK. Se vi trovate a decidere tra una di queste tre CPU di 13a generazione, l'opzione Core i9-13900H è la più conveniente.
Passando al modello base Core i7-13700H si prevede una riduzione delle prestazioni del processore di circa il 20-25%.
Cinebench R15 Multi Loop
Cinebench R20: CPU (Multi Core) | CPU (Single Core)
Cinebench R23: Multi Core | Single Core
Cinebench R15: CPU Multi 64Bit | CPU Single 64Bit
Blender: v2.79 BMW27 CPU
7-Zip 18.03: 7z b 4 | 7z b 4 -mmt1
Geekbench 5.5: Multi-Core | Single-Core
HWBOT x265 Benchmark v2.2: 4k Preset
LibreOffice : 20 Documents To PDF
R Benchmark 2.5: Overall mean
* ... Meglio usare valori piccoli
AIDA64: FP32 Ray-Trace | FPU Julia | CPU SHA3 | CPU Queen | FPU SinJulia | FPU Mandel | CPU AES | CPU ZLib | FP64 Ray-Trace | CPU PhotoWorxx
| Performance rating | |
| Lenovo Legion Pro 7 RTX4090 | |
| Asus ROG Strix G16 G614JZ | |
| Razer Blade 16 Early 2023 | |
| Alienware x16 R1 | |
| HP Omen 16-wf000 | |
| Lenovo Legion Slim 7i 16 Gen 8 | |
| Media Intel Core i9-13900H | |
| AIDA64 / FP32 Ray-Trace | |
| Asus ROG Strix G16 G614JZ | |
| Lenovo Legion Pro 7 RTX4090 | |
| Razer Blade 16 Early 2023 | |
| Razer Blade 16 Early 2023 | |
| Razer Blade 16 Early 2023 | |
| HP Omen 16-wf000 | |
| Alienware x16 R1 | |
| Lenovo Legion Slim 7i 16 Gen 8 | |
| Media Intel Core i9-13900H (6788 - 19557, n=25) | |
| AIDA64 / CPU Queen | |
| Asus ROG Strix G16 G614JZ | |
| Lenovo Legion Pro 7 RTX4090 | |
| Razer Blade 16 Early 2023 | |
| Razer Blade 16 Early 2023 | |
| Lenovo Legion Slim 7i 16 Gen 8 | |
| Alienware x16 R1 | |
| Media Intel Core i9-13900H (65121 - 120936, n=25) | |
| HP Omen 16-wf000 | |
| AIDA64 / FP64 Ray-Trace | |
| Asus ROG Strix G16 G614JZ | |
| Lenovo Legion Pro 7 RTX4090 | |
| Razer Blade 16 Early 2023 | |
| Razer Blade 16 Early 2023 | |
| Razer Blade 16 Early 2023 | |
| HP Omen 16-wf000 | |
| Alienware x16 R1 | |
| Lenovo Legion Slim 7i 16 Gen 8 | |
| Media Intel Core i9-13900H (3655 - 10716, n=25) | |
| AIDA64 / CPU PhotoWorxx | |
| Razer Blade 16 Early 2023 | |
| Razer Blade 16 Early 2023 | |
| Razer Blade 16 Early 2023 | |
| Lenovo Legion Pro 7 RTX4090 | |
| Alienware x16 R1 | |
| HP Omen 16-wf000 | |
| Media Intel Core i9-13900H (10871 - 50488, n=25) | |
| Asus ROG Strix G16 G614JZ | |
| Lenovo Legion Slim 7i 16 Gen 8 | |
Prestazioni del sistema
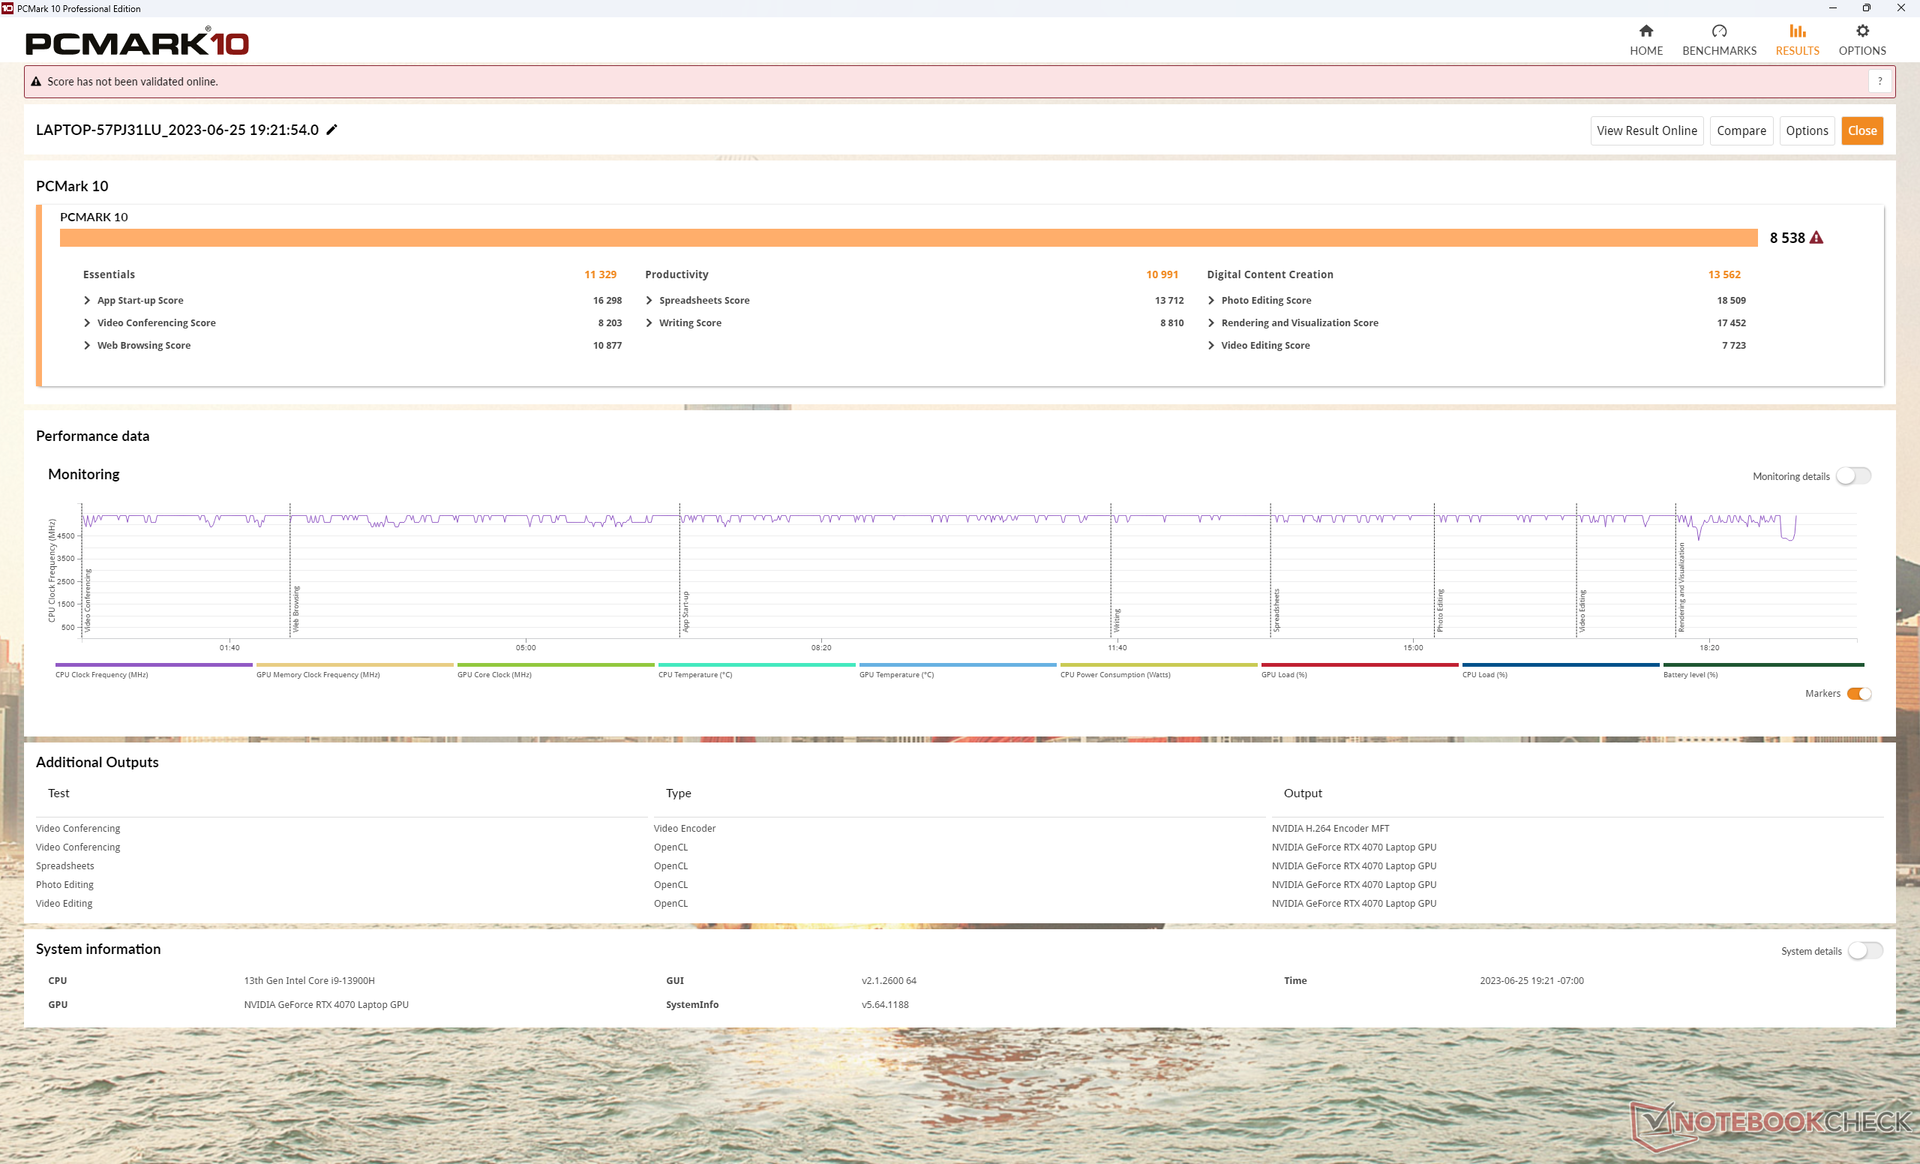
I risultati di PCMark sono eccellenti e paragonabili a quelli di altri portatili da gioco di fascia alta. Tuttavia, abbiamo riscontrato problemi di risveglio dal sonno, in cui il portatile impiegava spesso fino a 10 secondi prima che lo schermo si accendesse correttamente, rispetto a un paio di secondi al massimo su altri portatili.
CrossMark: Overall | Productivity | Creativity | Responsiveness
| PCMark 10 / Score | |
| Lenovo Legion Slim 7i 16 Gen 8 | |
| Alienware x16 R1 | |
| Lenovo Legion Pro 7 RTX4090 | |
| Razer Blade 16 Early 2023 | |
| HP Omen 16-wf000 | |
| Media Intel Core i9-13900H, NVIDIA GeForce RTX 4070 Laptop GPU (5855 - 8538, n=8) | |
| Asus ROG Strix G16 G614JZ | |
| PCMark 10 / Essentials | |
| Asus ROG Strix G16 G614JZ | |
| Lenovo Legion Slim 7i 16 Gen 8 | |
| Alienware x16 R1 | |
| Lenovo Legion Pro 7 RTX4090 | |
| Razer Blade 16 Early 2023 | |
| Media Intel Core i9-13900H, NVIDIA GeForce RTX 4070 Laptop GPU (8835 - 11940, n=8) | |
| HP Omen 16-wf000 | |
| PCMark 10 / Productivity | |
| Lenovo Legion Slim 7i 16 Gen 8 | |
| Alienware x16 R1 | |
| Media Intel Core i9-13900H, NVIDIA GeForce RTX 4070 Laptop GPU (7967 - 10991, n=8) | |
| HP Omen 16-wf000 | |
| Lenovo Legion Pro 7 RTX4090 | |
| Razer Blade 16 Early 2023 | |
| Asus ROG Strix G16 G614JZ | |
| PCMark 10 / Digital Content Creation | |
| Lenovo Legion Pro 7 RTX4090 | |
| Razer Blade 16 Early 2023 | |
| Alienware x16 R1 | |
| Lenovo Legion Slim 7i 16 Gen 8 | |
| HP Omen 16-wf000 | |
| Media Intel Core i9-13900H, NVIDIA GeForce RTX 4070 Laptop GPU (7738 - 13575, n=8) | |
| Asus ROG Strix G16 G614JZ | |
| CrossMark / Overall | |
| Asus ROG Strix G16 G614JZ | |
| Lenovo Legion Slim 7i 16 Gen 8 | |
| Alienware x16 R1 | |
| Media Intel Core i9-13900H, NVIDIA GeForce RTX 4070 Laptop GPU (1104 - 1974, n=7) | |
| HP Omen 16-wf000 | |
| Razer Blade 16 Early 2023 | |
| CrossMark / Productivity | |
| Asus ROG Strix G16 G614JZ | |
| Lenovo Legion Slim 7i 16 Gen 8 | |
| Alienware x16 R1 | |
| Media Intel Core i9-13900H, NVIDIA GeForce RTX 4070 Laptop GPU (1058 - 1914, n=7) | |
| HP Omen 16-wf000 | |
| Razer Blade 16 Early 2023 | |
| CrossMark / Creativity | |
| Asus ROG Strix G16 G614JZ | |
| Lenovo Legion Slim 7i 16 Gen 8 | |
| Alienware x16 R1 | |
| Media Intel Core i9-13900H, NVIDIA GeForce RTX 4070 Laptop GPU (1178 - 2254, n=7) | |
| HP Omen 16-wf000 | |
| Razer Blade 16 Early 2023 | |
| CrossMark / Responsiveness | |
| Asus ROG Strix G16 G614JZ | |
| Alienware x16 R1 | |
| Lenovo Legion Slim 7i 16 Gen 8 | |
| Media Intel Core i9-13900H, NVIDIA GeForce RTX 4070 Laptop GPU (1037 - 1952, n=7) | |
| HP Omen 16-wf000 | |
| Razer Blade 16 Early 2023 | |
| PCMark 10 Score | 8538 punti | |
Aiuto | ||
| AIDA64 / Memory Latency | |
| Alienware x16 R1 | |
| Razer Blade 16 Early 2023 | |
| Razer Blade 16 Early 2023 | |
| Razer Blade 16 Early 2023 | |
| Media Intel Core i9-13900H (75.8 - 102.3, n=25) | |
| Asus ROG Strix G16 G614JZ | |
| HP Omen 16-wf000 | |
| Lenovo Legion Pro 7 RTX4090 | |
| Lenovo Legion Slim 7i 16 Gen 8 | |
* ... Meglio usare valori piccoli
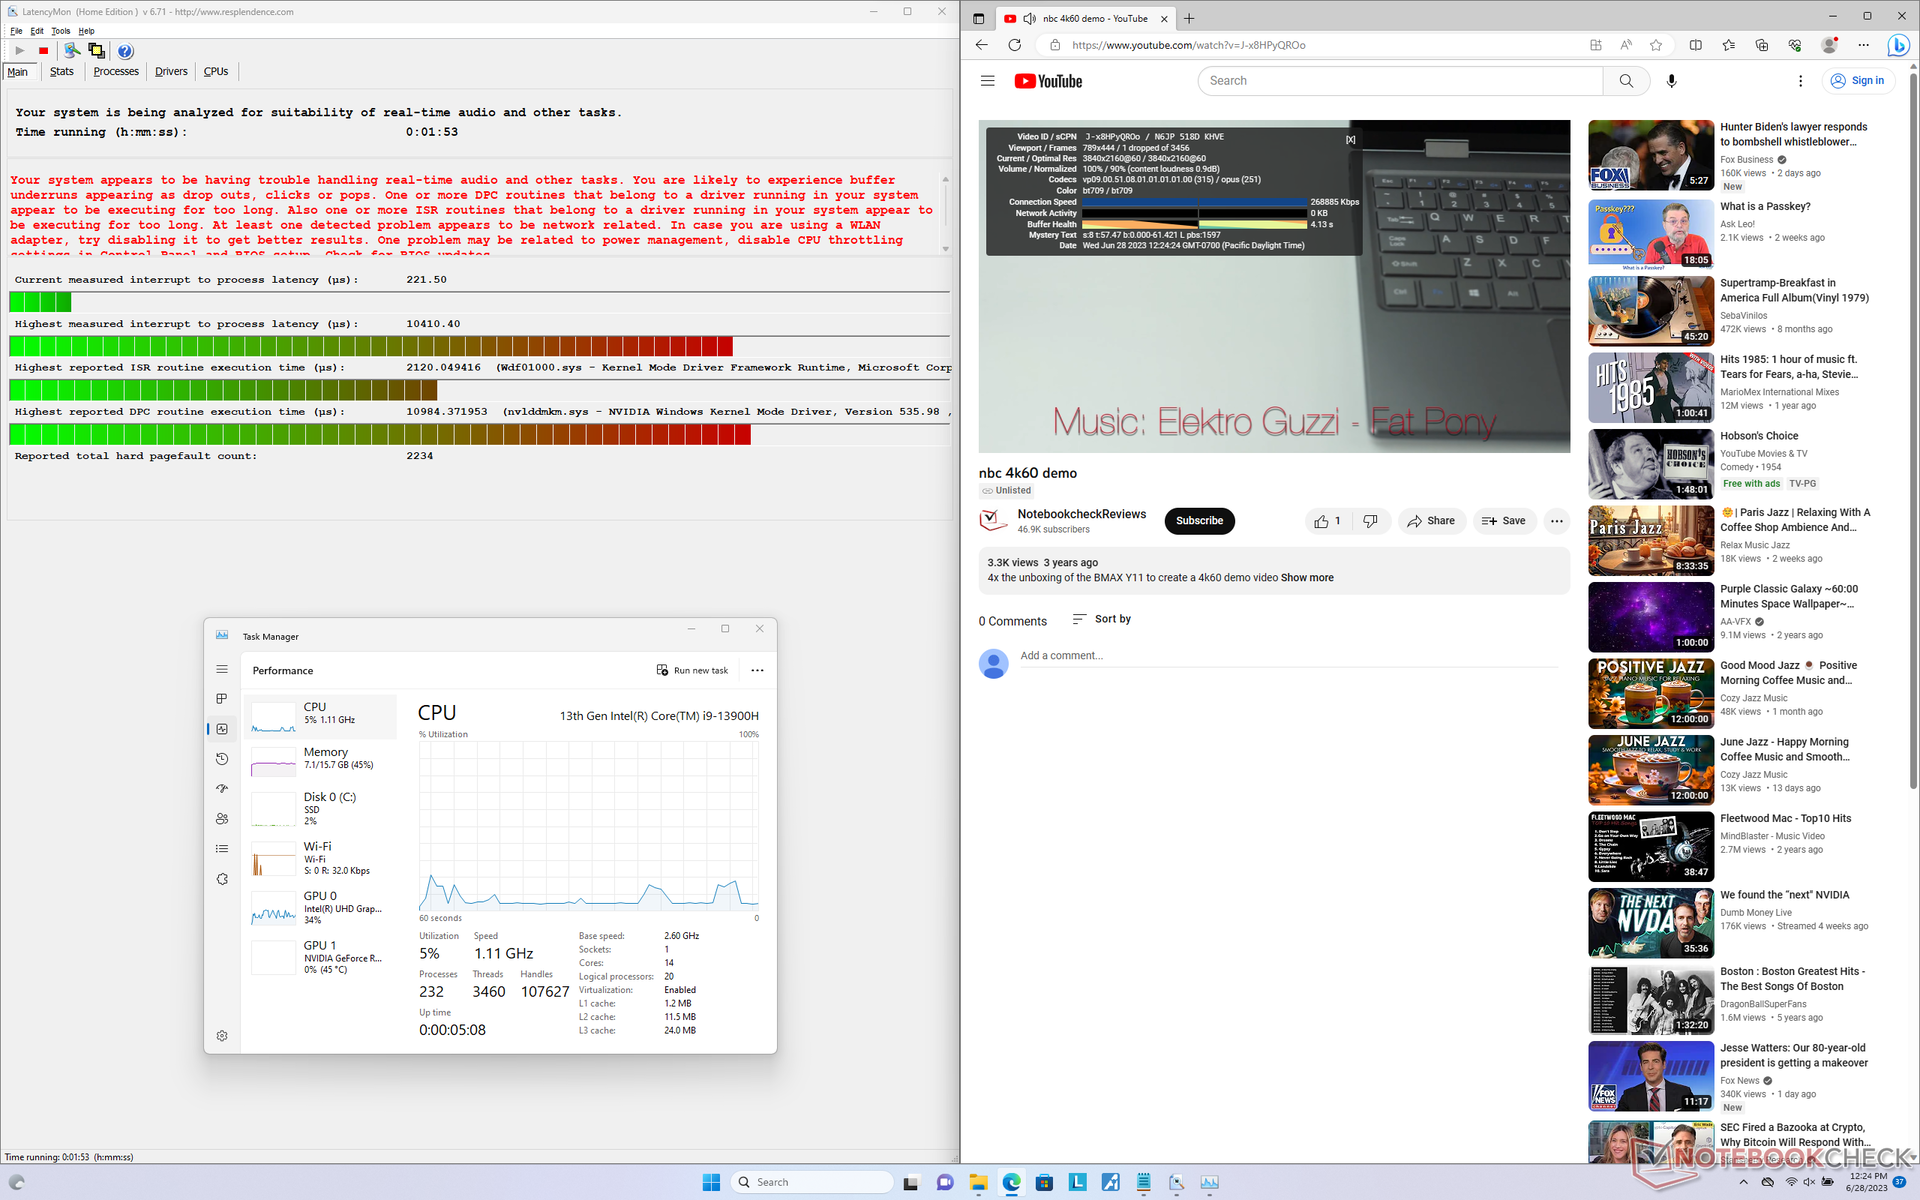
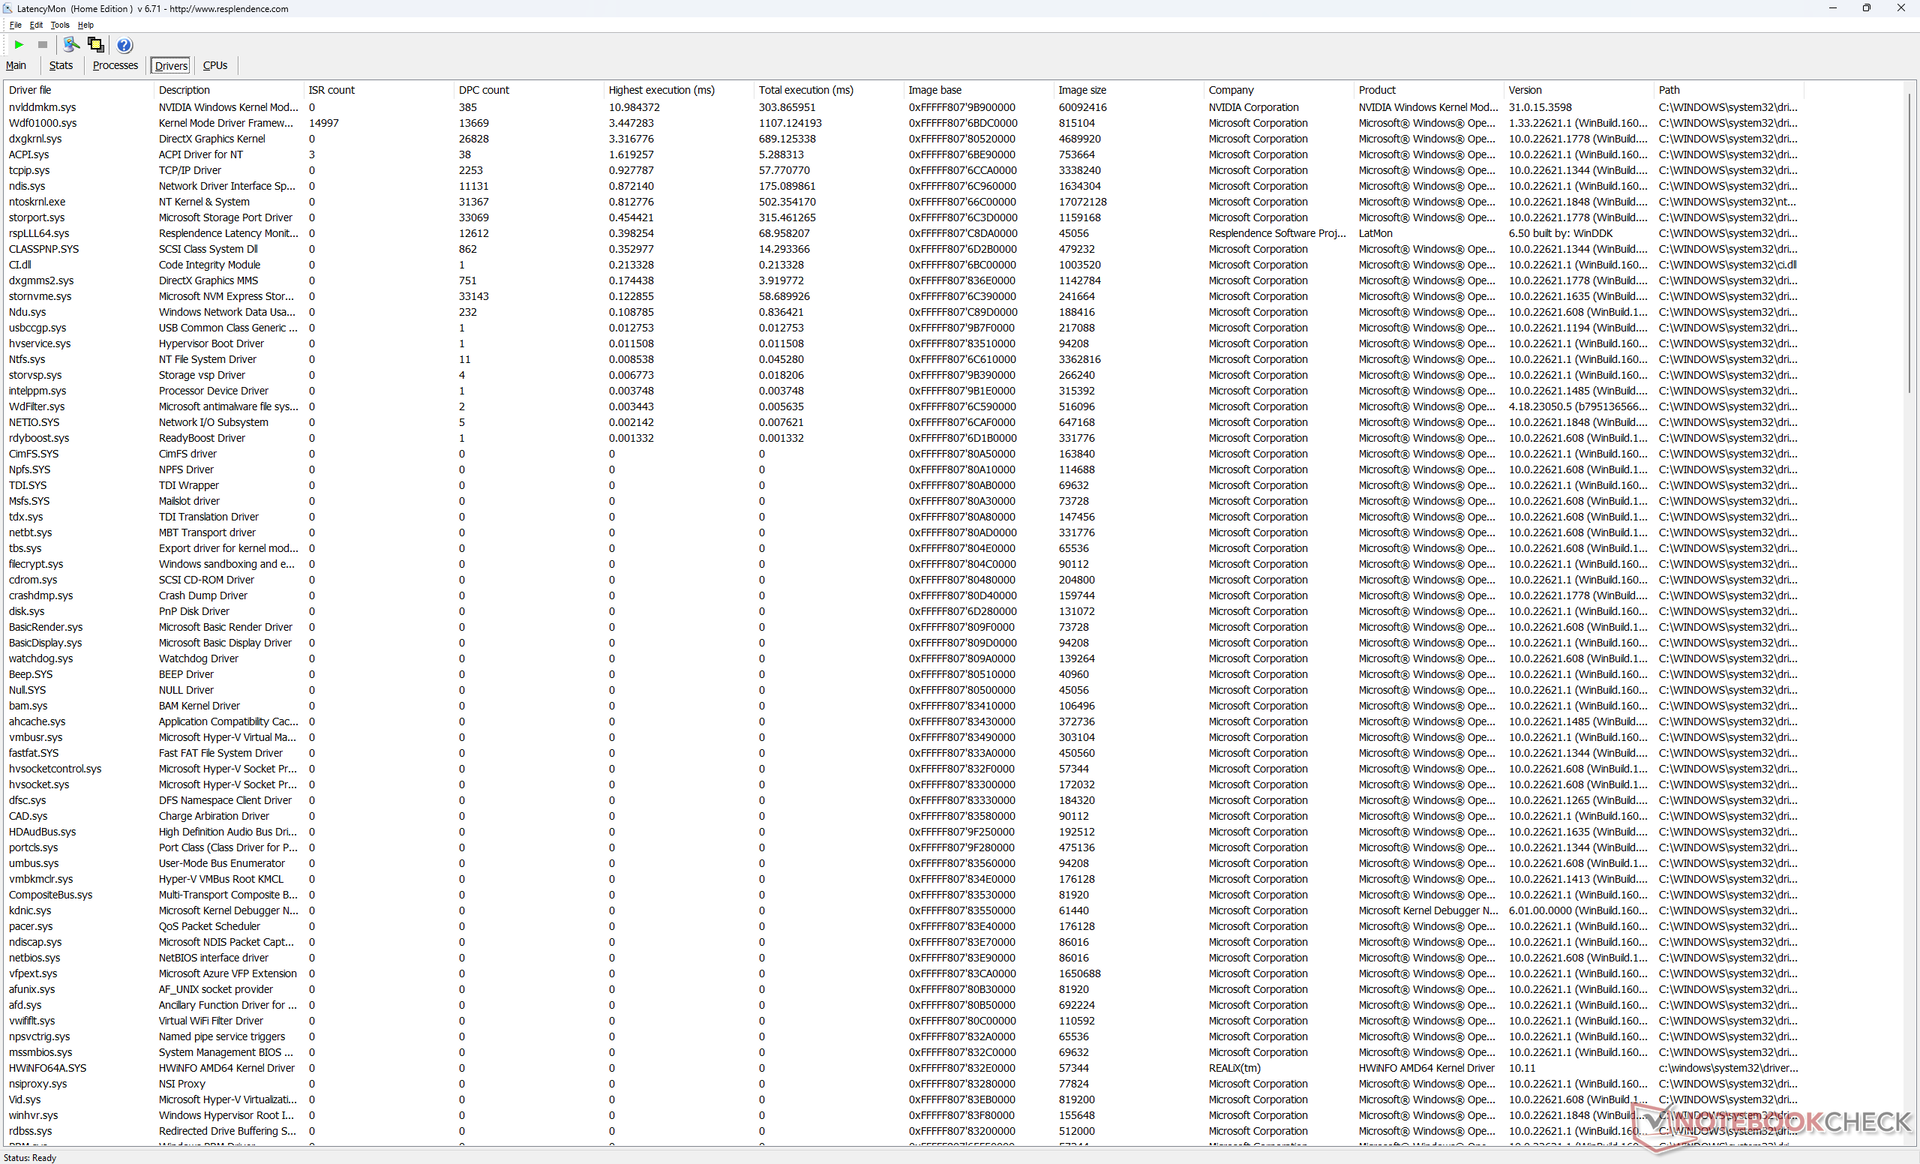
Latenza DPC
LatencyMon rivela problemi di DPC relativi al driver Nvidia NVLDDMKM, proprio come quelli osservati su Pro 7 Legion Pro 7 anche dopo diversi tentativi. la riproduzione di video 4K a 60 FPS è quasi perfetta, con un solo fotogramma perso durante il nostro video di prova.
| DPC Latencies / LatencyMon - interrupt to process latency (max), Web, Youtube, Prime95 | |
| Lenovo Legion Pro 7 RTX4090 | |
| Lenovo Legion Slim 7i 16 Gen 8 | |
| HP Omen 16-wf000 | |
| Asus ROG Strix G16 G614JZ | |
| Razer Blade 16 Early 2023 | |
| Alienware x16 R1 | |
* ... Meglio usare valori piccoli
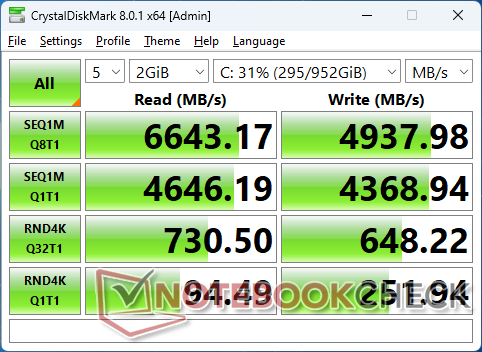
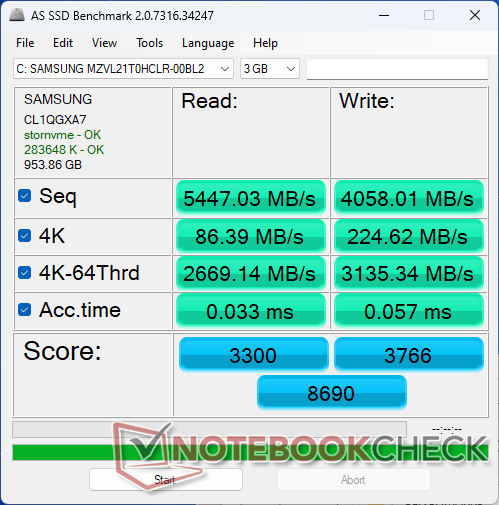
Dispositivi di archiviazione - Fino a due unità SSD M.2
La nostra unità viene fornita con un disco da 1 TBSamsung PM9A1 che è una delle unità PCIe4 x4 più veloci disponibili per i consumatori. Sfortunatamente, le velocità di trasferimento passavano da 6700 MB/s a 3300 MB/s in caso di stress, come mostra la tabella sottostante, che suggerisce una scarsa dissipazione del calore. IlRazer Blade 14 viene fornito con la stessa unità SSD Samsung e non presenta questi problemi.

| Drive Performance rating - Percent | |
| Alienware x16 R1 | |
| Lenovo Legion Slim 7i 16 Gen 8 | |
| Lenovo Legion Pro 7 RTX4090 | |
| HP Omen 16-wf000 | |
| Razer Blade 16 Early 2023 | |
| Asus ROG Strix G16 G614JZ | |
* ... Meglio usare valori piccoli
Disk Throttling: DiskSpd Read Loop, Queue Depth 8
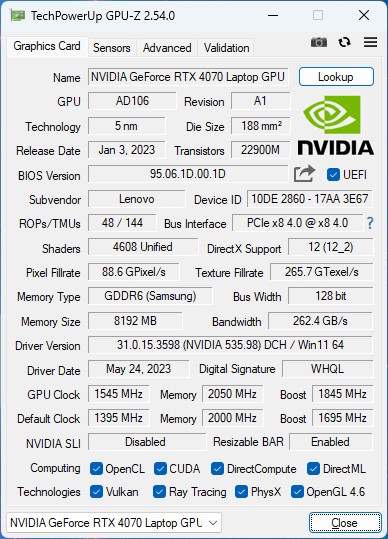
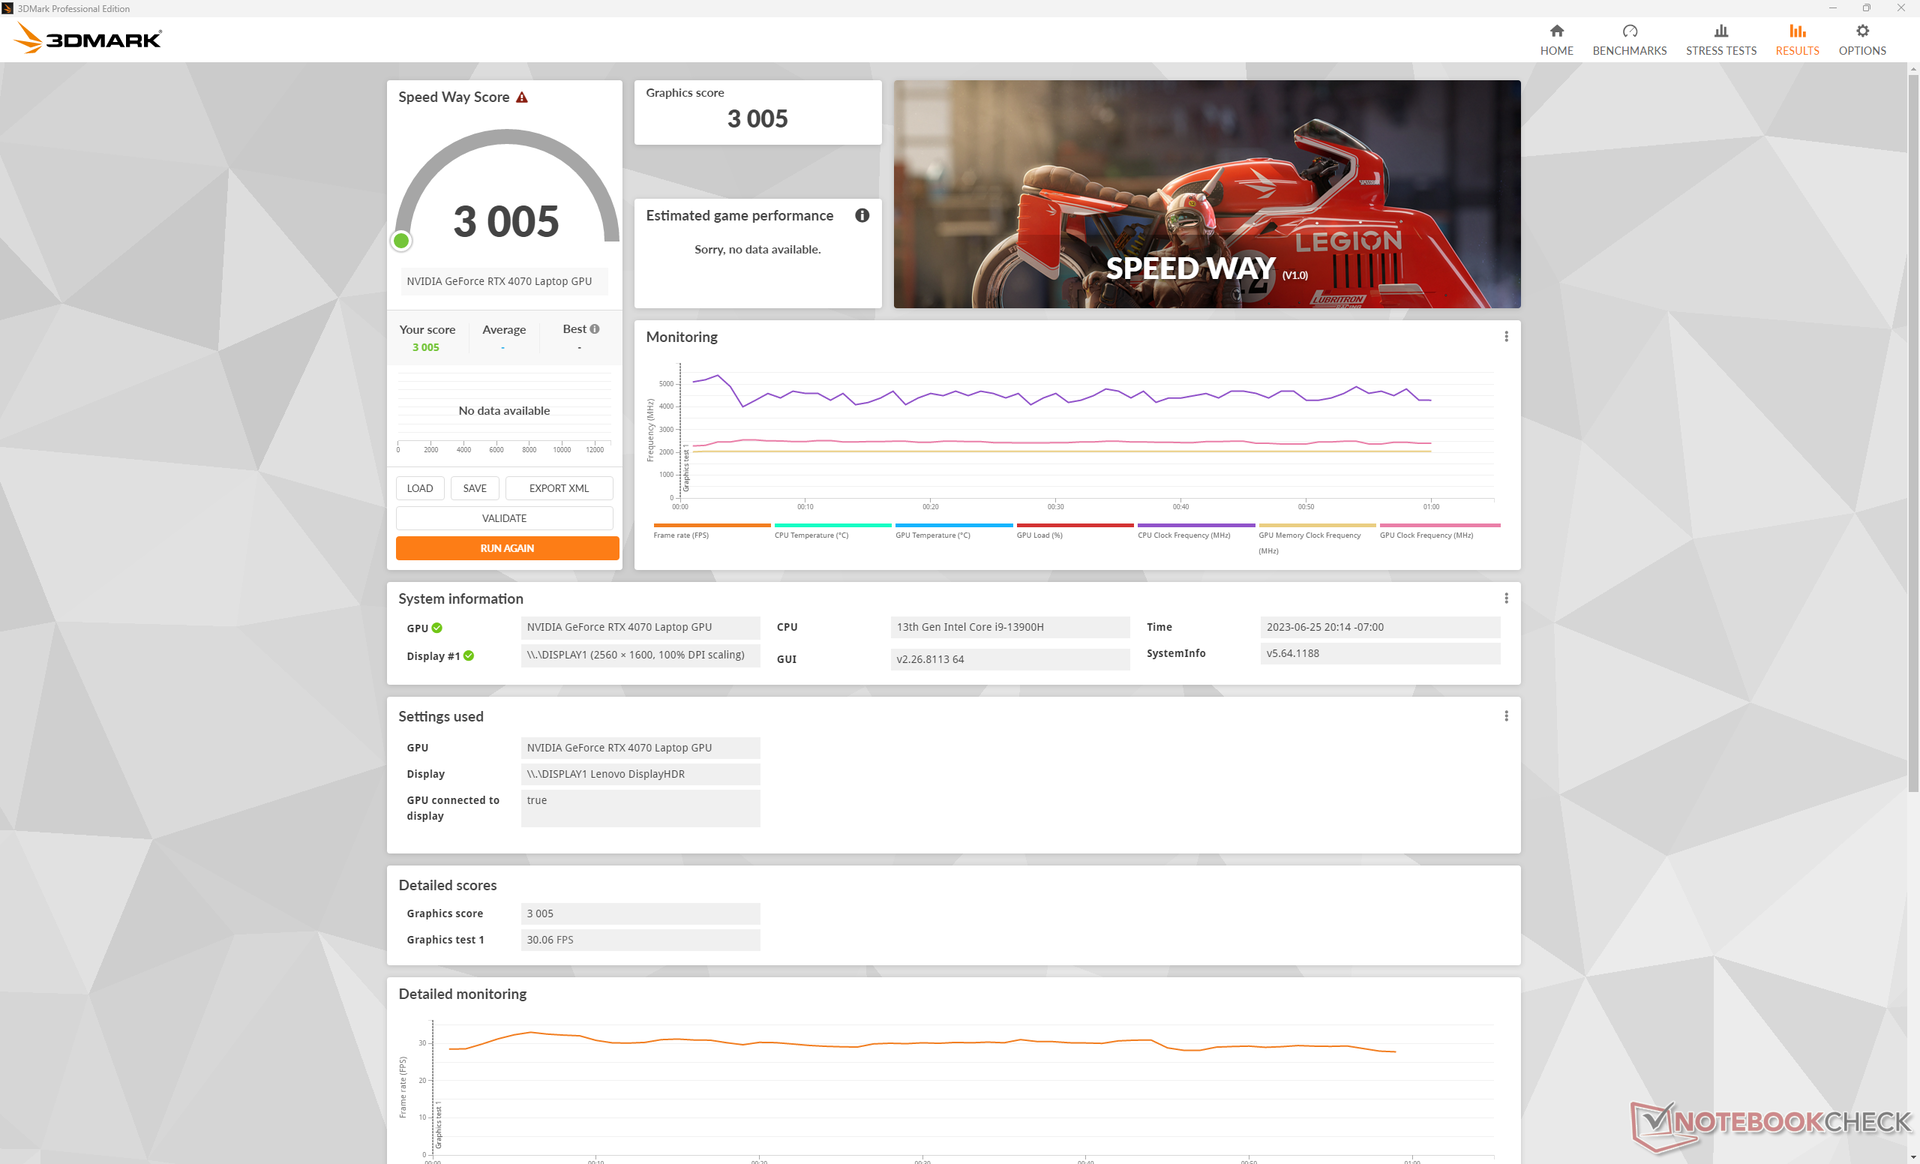
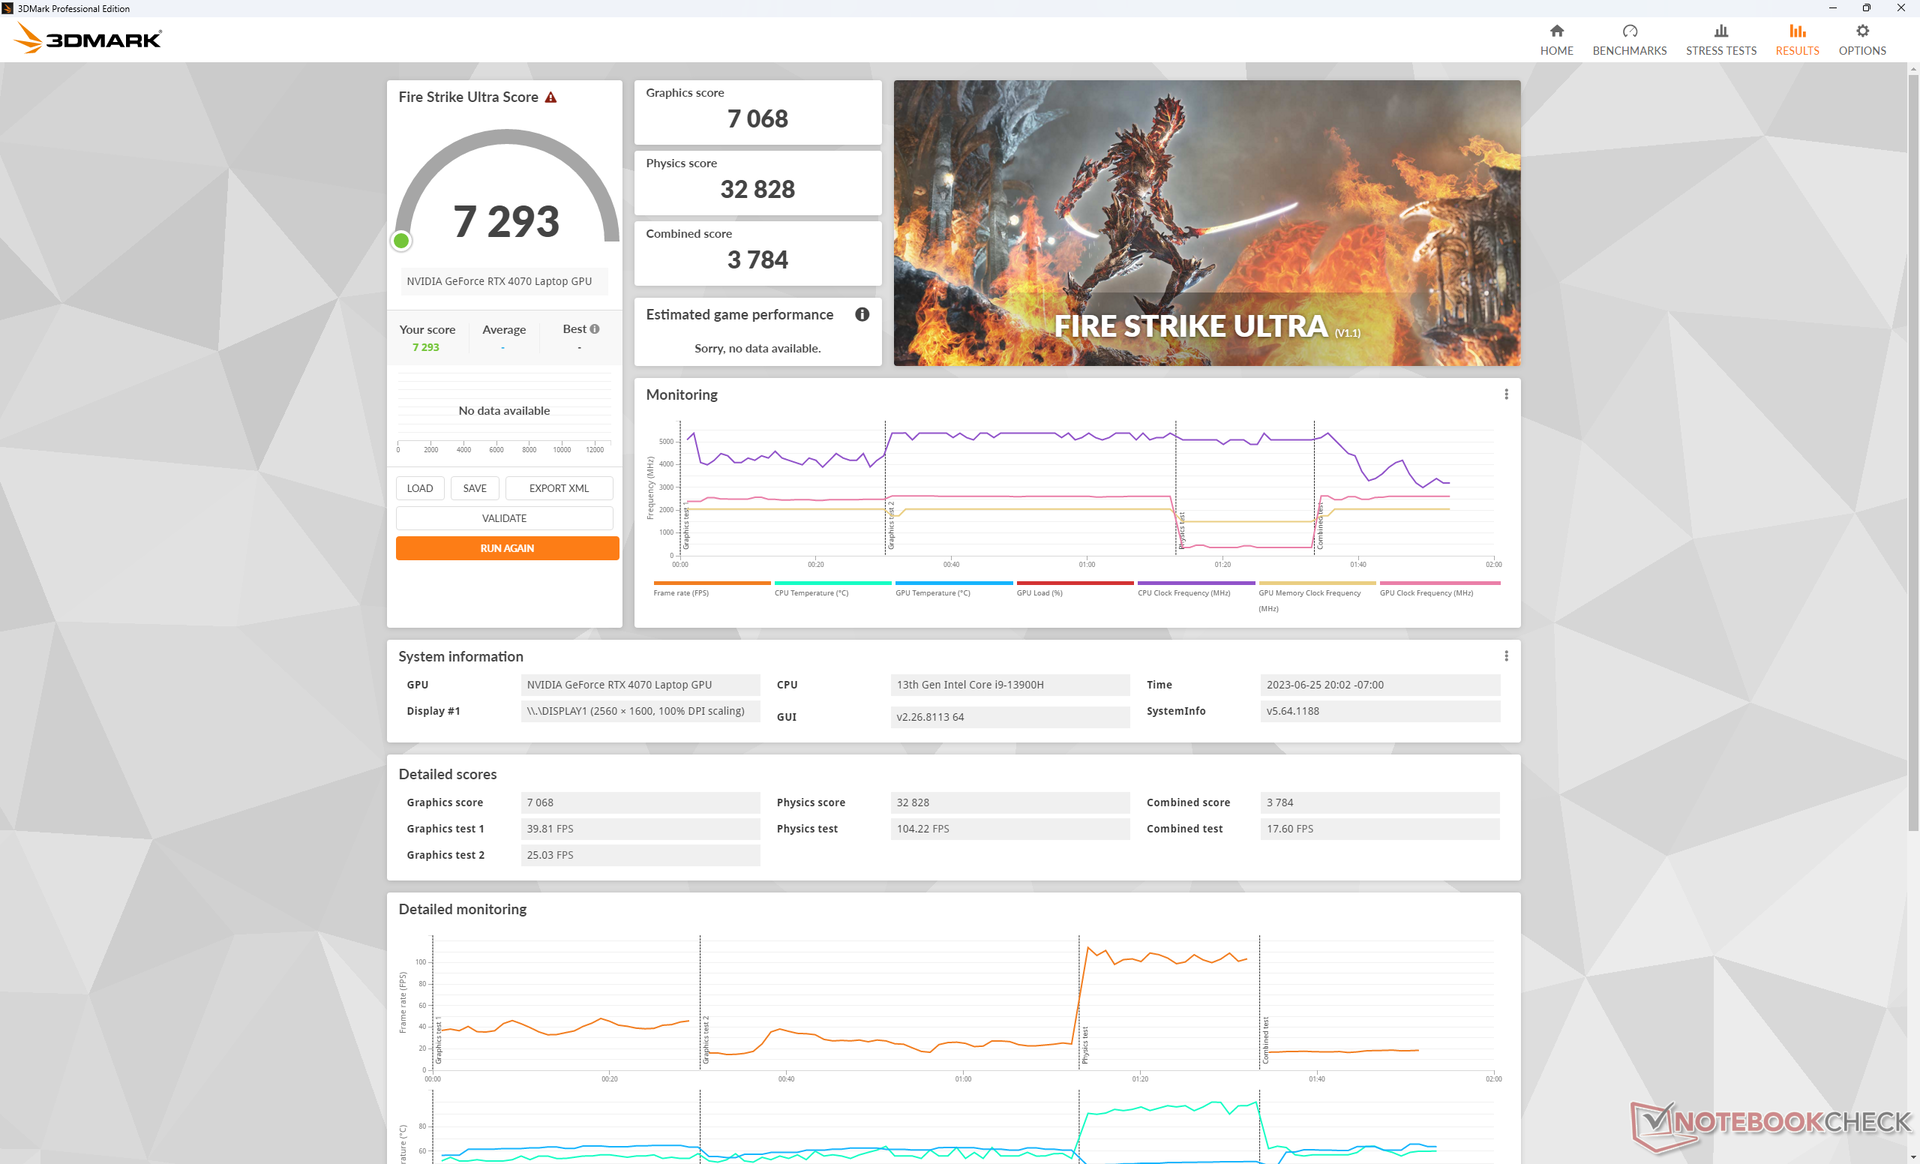
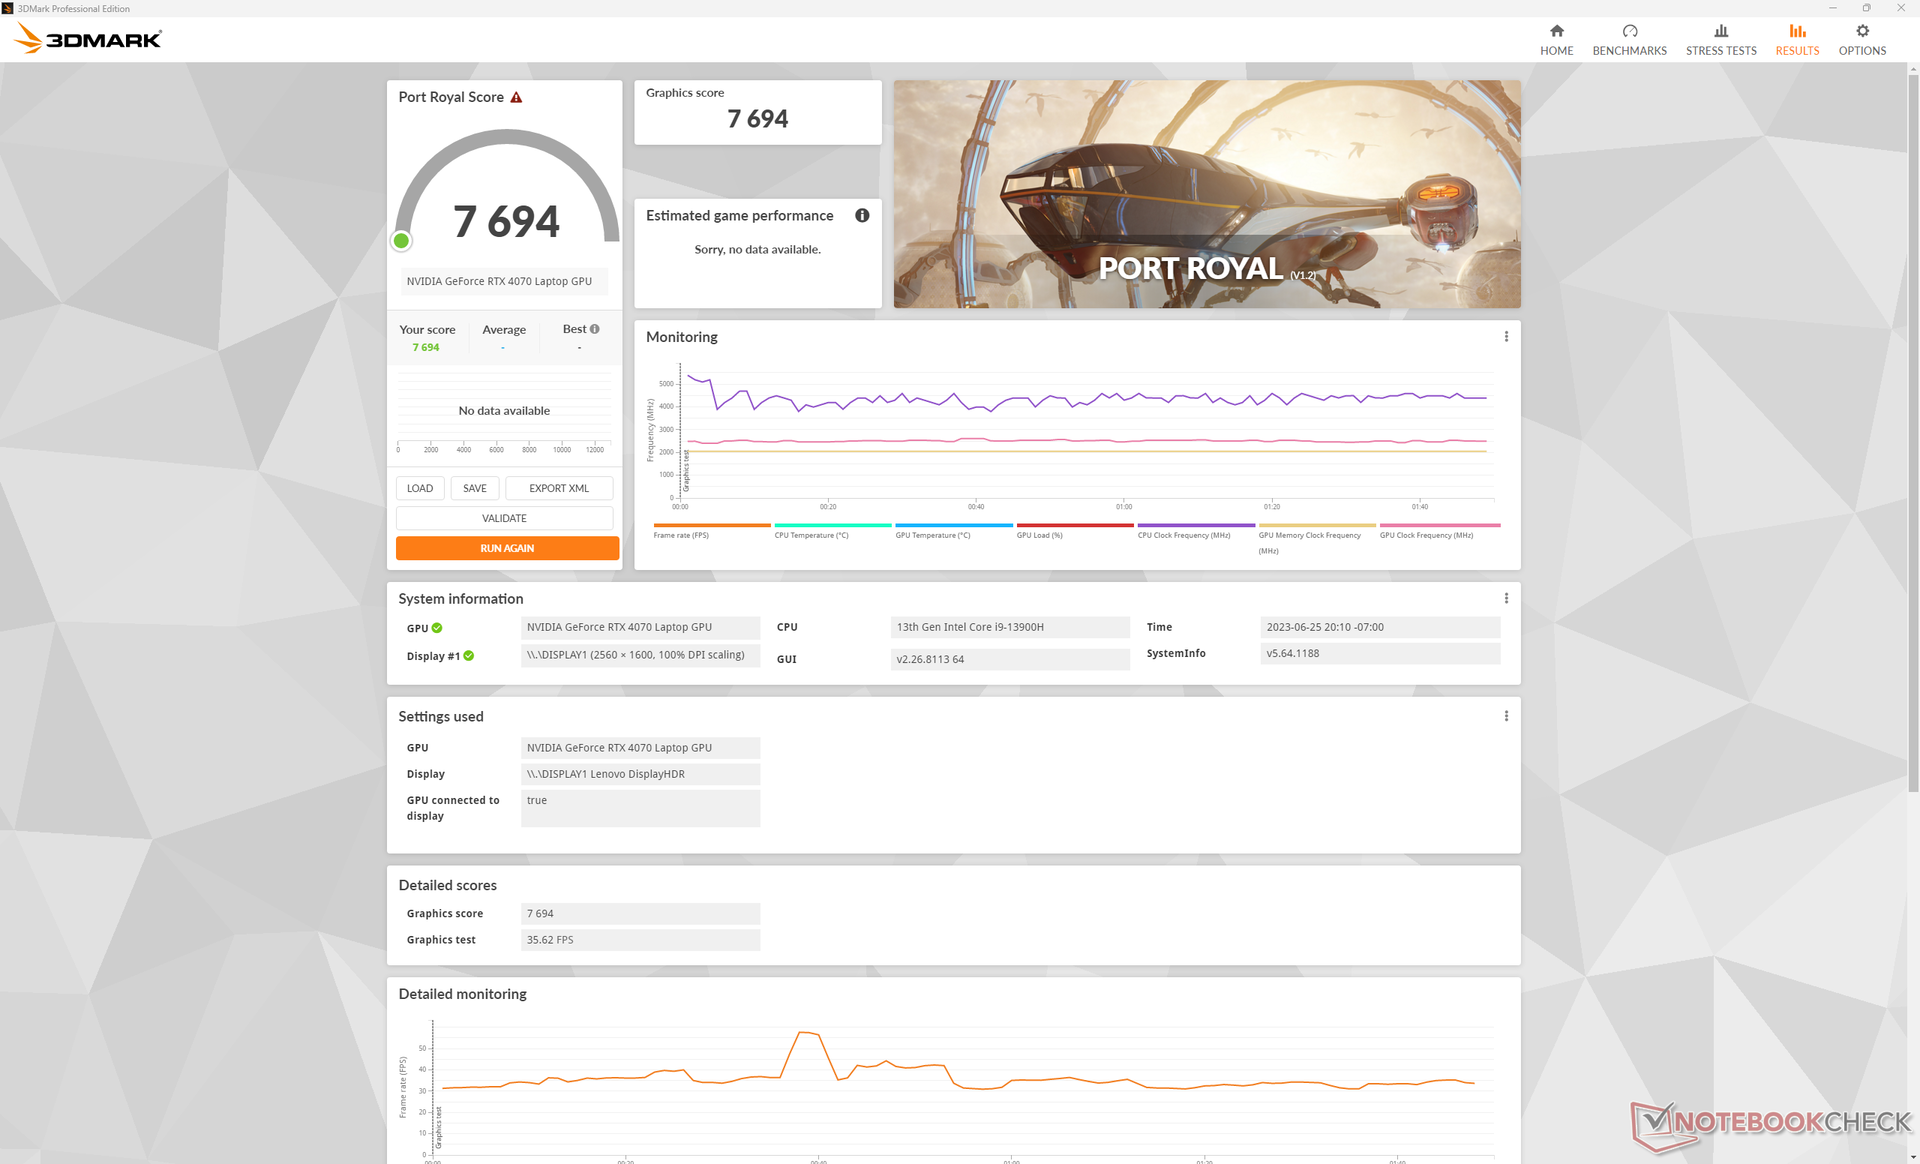
Prestazioni della GPU - Grafica RTX da 140 W
Le prestazioni grafiche grezze sono più veloci di circa il 5-10% rispetto alla media dei laptop del nostro database con la stessa RTX 4070 mobile mobile RTX 4070 GPU MOBILE. Le prestazioni complessive sono quindi all'incirca equivalenti a quelle della rTX 3080 Ti mobile dello scorso anno.
Le prestazioni della GPU diminuiscono del 5% se la funzione Overclock è disattivata. Se si attiva la modalità Balanced, le prestazioni della CPU e della GPU diminuiscono rispettivamente di circa il 10% e il 15%, come mostra la tabella seguente. Alcuni utenti potrebbero preferire le ventole più silenziose della modalità Bilanciata, anche se ciò comporta prestazioni inferiori.
Il downgrade alla RTX 4060 dalla nostra configurazione RTX 4070 dovrebbe avere un impatto sulle prestazioni della GPU di circa il 10-15%, in base alla nostra esperienza con il modello Legion Pro 5 16.
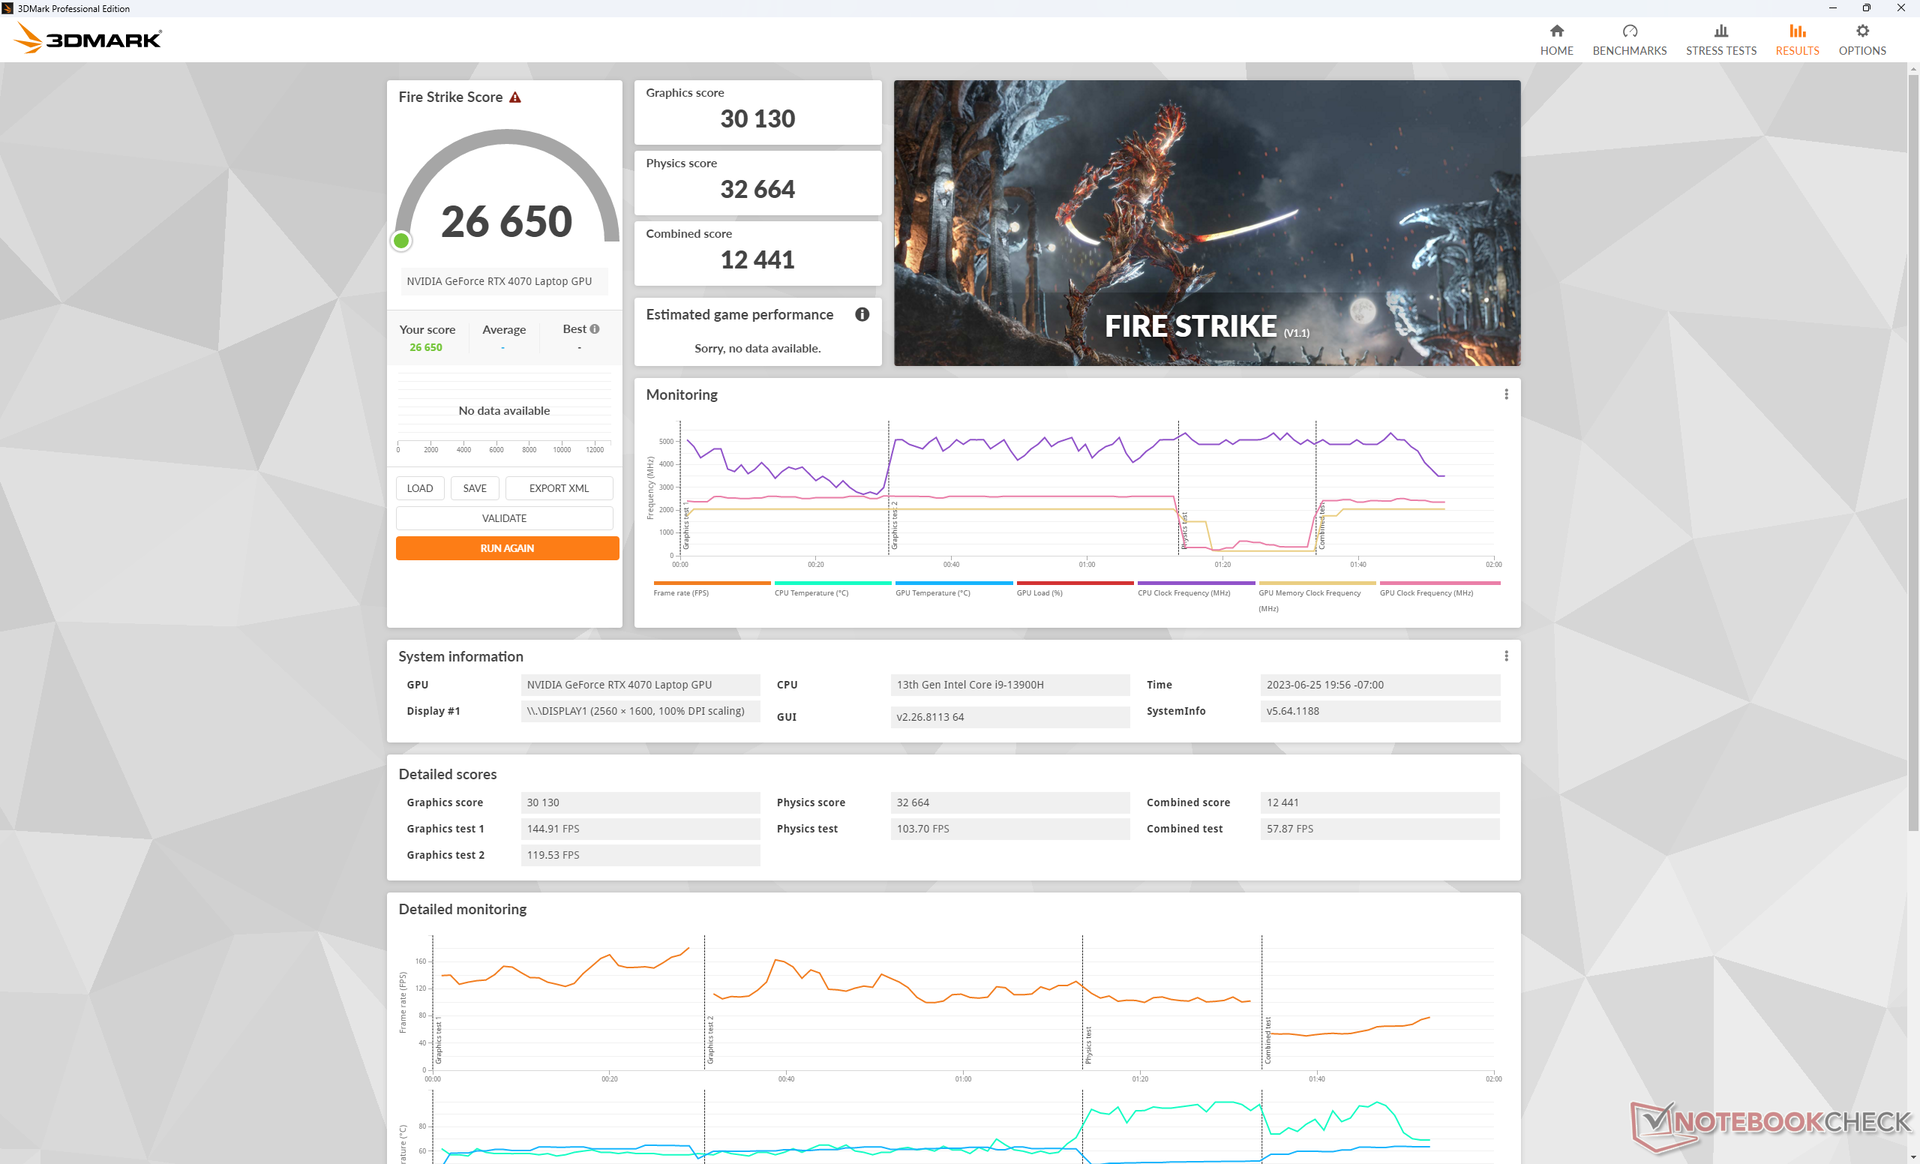
| Impostazione del profilo energetico | Fire Strike Punteggio fisico | Fire Strike Punteggio GPU | Fire Strike Punteggio combinato |
| Prestazioni + Overclock GPU attivo + Overdrive attivo | 32664 | 30130 | 12441 |
| Prestazioni + Overclock GPU On + Overdrive Off | 32439 | 30153 | 13360 |
| Prestazioni + Overclock GPU Off + Overdrive Off | 32550 | 28629 (-5%) | 12319 |
| Equilibrato | 27499 (-16%) | 27708 (-8%) | 11295 (-9%) |
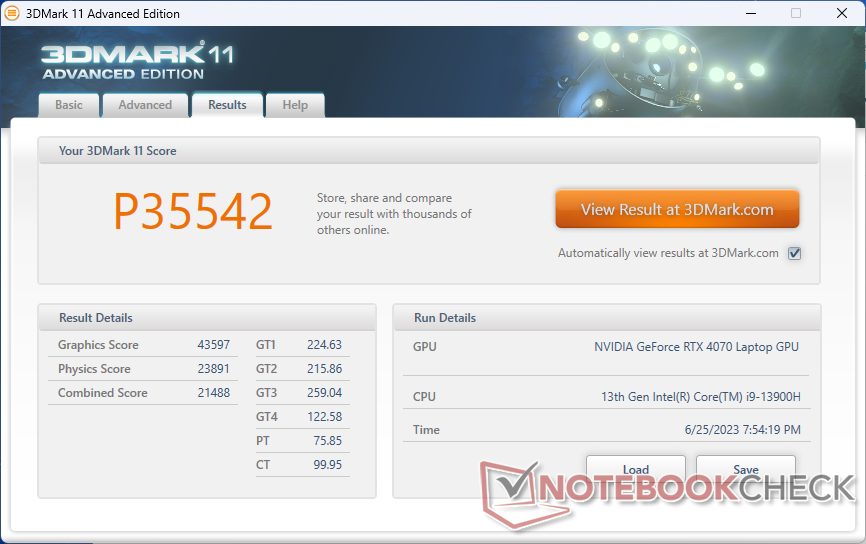
| 3DMark 11 Performance | 35542 punti | |
| 3DMark Fire Strike Score | 26650 punti | |
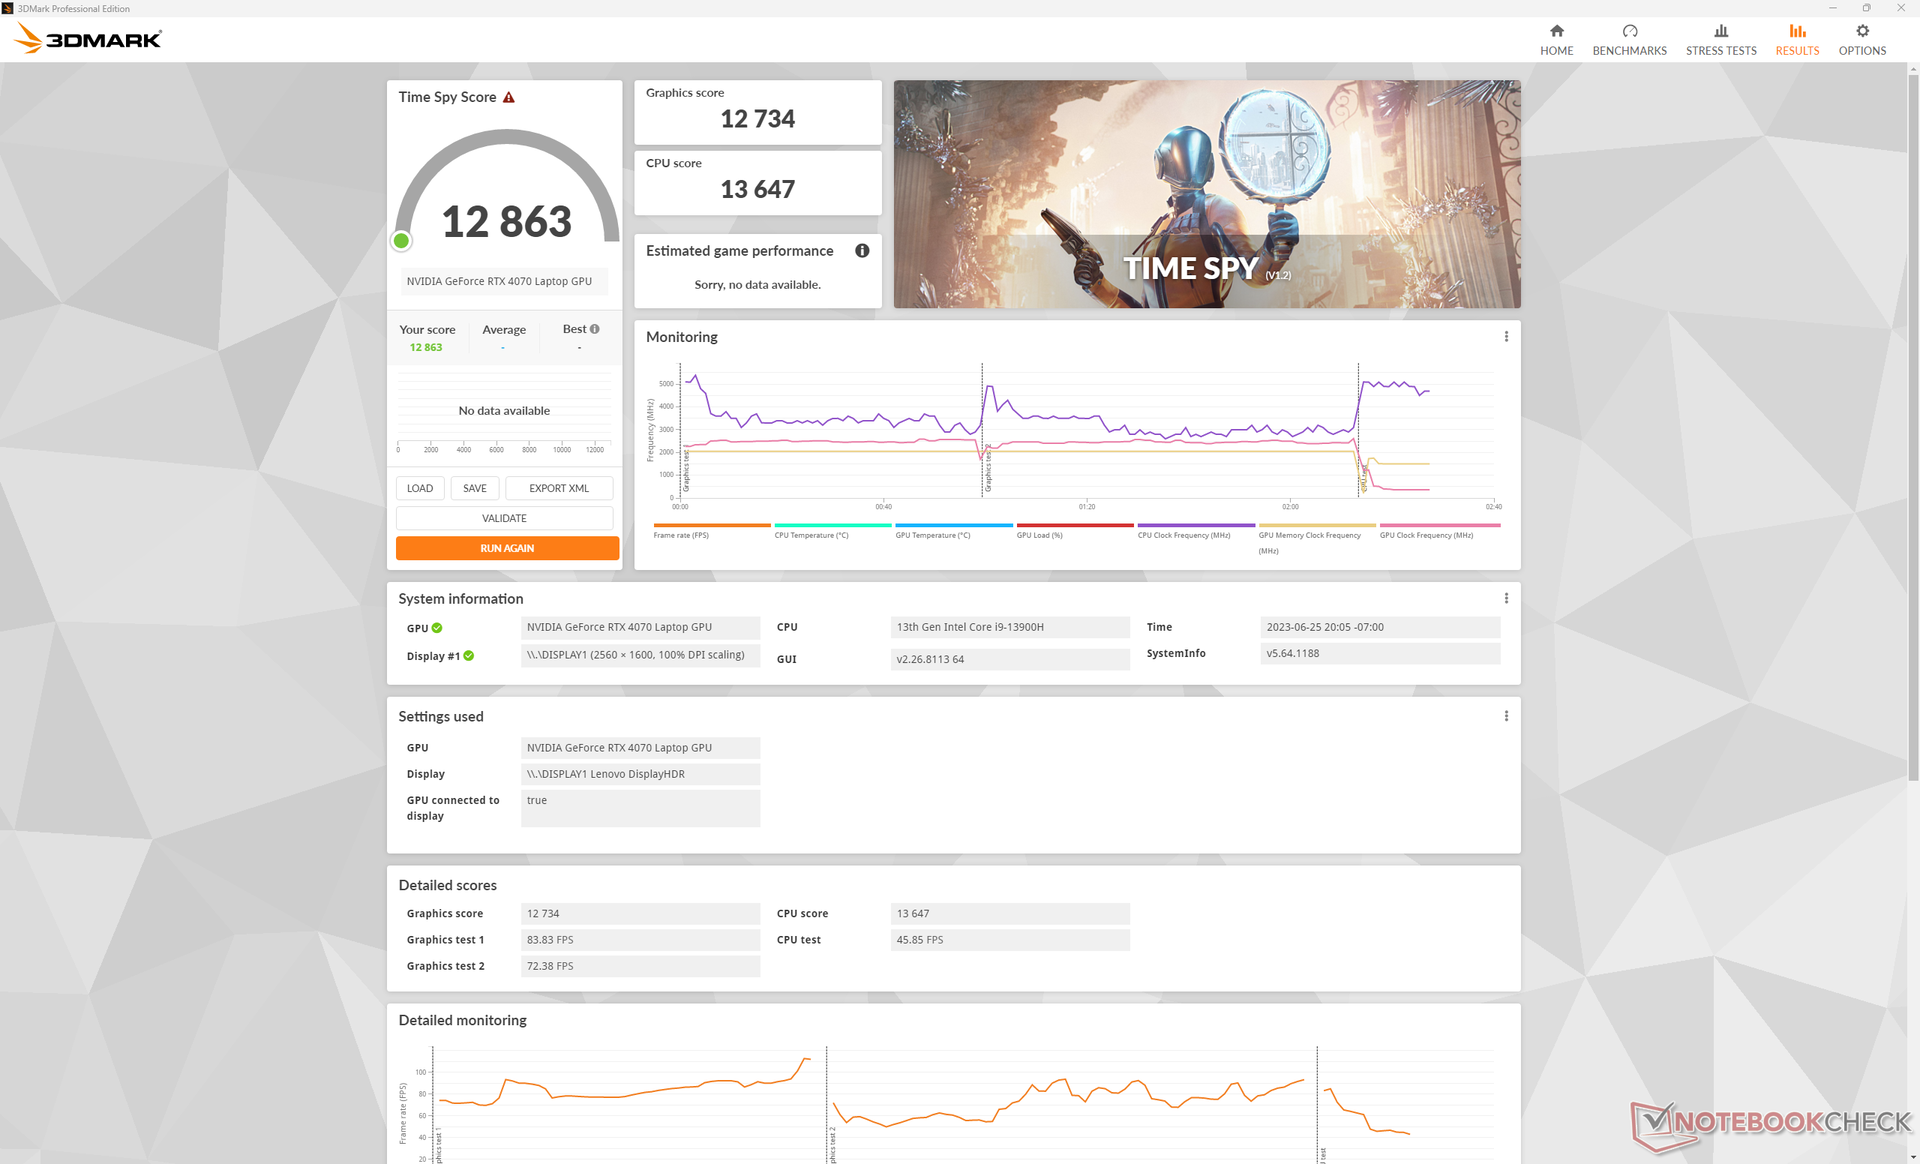
| 3DMark Time Spy Score | 12863 punti | |
Aiuto | ||
* ... Meglio usare valori piccoli
Prestazioni di gioco
La RTX 4070 mobile funziona bene per gli obiettivi 1440p/1600p e 60 FPS a impostazioni elevate mentre la molto più veloce rTX 4070 Ti per desktop può puntare a impostazioni Ultra o massime. Eseguendo Returnal con le impostazioni massime a 1440p con il nostro Lenovo, ad esempio, si superano a malapena i 50 FPS.
Il DLSS diventa molto più importante quando la RTX 4070 Ti inizia a sentirsi sottopotenziata. Eseguendo Cyberpunk 2077 in 4K con impostazioni Ultra, ad esempio, la media sarebbe di soli 23 FPS senza DLSS e di 38 FPS con DLSS2 attivato.
Witcher 3 FPS Chart
| basso | medio | alto | ultra | QHD | 4K | |
|---|---|---|---|---|---|---|
| GTA V (2015) | 184 | 180.3 | 175 | 115.2 | 94.3 | 98.7 |
| The Witcher 3 (2015) | 459.3 | 356.8 | 225.9 | 117.9 | 70 | |
| Dota 2 Reborn (2015) | 203 | 183.2 | 175.8 | 165.3 | 141.3 | |
| Final Fantasy XV Benchmark (2018) | 213 | 168.8 | 122.7 | 91.4 | 51.5 | |
| X-Plane 11.11 (2018) | 182.9 | 158.7 | 122.4 | 105.7 | ||
| Strange Brigade (2018) | 483 | 316 | 259 | 228 | 149.2 | 75.7 |
| Cyberpunk 2077 1.6 (2022) | 138.3 | 141.9 | 106.1 | 91 | 54.4 | 23.1 |
| Tiny Tina's Wonderlands (2022) | 244.3 | 204.8 | 143.7 | 113.9 | 78.1 | 37 |
| F1 22 (2022) | 258 | 261 | 219 | 81.5 | 46.2 | 25.9 |
| Returnal (2023) | 83 | 81 | 76 | 61 | 52 | 27 |
Emissioni
Rumore del sistema
Le ventole interne sono sempre attive a poco meno di 26 dB(A) contro uno sfondo silenzioso di 23 dB(A). Non sono abbastanza rumorose da essere fonte di distrazione nella maggior parte degli uffici o delle conferenze e fanno un ottimo lavoro nel rimanere silenziose per lunghi periodi, anche quando si introducono carichi più elevati come 3DMark 06.
Giocando in modalità Performance, la ventola emette un rumore costante di 54,4 dB(A), simile a quello dell'Alienware x16 R1, ma più forte di quello del Blade 16. Passando alla modalità Balanced si perde un po' di prestazioni, come detto sopra, per un rumore della ventola sensibilmente più silenzioso, pari a 48,9 dB(A).
Rumorosità
| Idle |
| 23.6 / 23.6 / 25.7 dB(A) |
| Sotto carico |
| 27.6 / 54.4 dB(A) |
 | ||
30 dB silenzioso 40 dB(A) udibile 50 dB(A) rumoroso |
||
min: | ||
| Lenovo Legion Slim 7i 16 Gen 8 GeForce RTX 4070 Laptop GPU, i9-13900H, Samsung PM9A1 MZVL21T0HCLR | HP Omen 16-wf000 GeForce RTX 4080 Laptop GPU, i7-13700HX, SK hynix PC801 HFS002TEJ9X101N | Alienware x16 R1 GeForce RTX 4080 Laptop GPU, i9-13900HK, SK hynix PC801 HFS001TEJ9X101N | Lenovo Legion Pro 7 RTX4090 GeForce RTX 4090 Laptop GPU, i9-13900HX, Samsung PM9A1 MZVL21T0HCLR | Asus ROG Strix G16 G614JZ GeForce RTX 4080 Laptop GPU, i9-13980HX, WD PC SN560 SDDPNQE-1T00 | Razer Blade 16 Early 2023 GeForce RTX 4080 Laptop GPU, i9-13950HX, SSSTC CA6-8D1024 | |
|---|---|---|---|---|---|---|
| Noise | -15% | -6% | -25% | -17% | -2% | |
| off /ambiente * (dB) | 22.8 | 23 -1% | 22.7 -0% | 25 -10% | 25 -10% | 23 -1% |
| Idle Minimum * (dB) | 23.6 | 29.6 -25% | 23.1 2% | 28 -19% | 26 -10% | 23 3% |
| Idle Average * (dB) | 23.6 | 29.8 -26% | 25.8 -9% | 30 -27% | 28 -19% | 23 3% |
| Idle Maximum * (dB) | 25.7 | 30.4 -18% | 25.8 -0% | 38 -48% | 30 -17% | 23.6 8% |
| Load Average * (dB) | 27.6 | 33.8 -22% | 39.3 -42% | 48 -74% | 48 -74% | 39 -41% |
| Witcher 3 ultra * (dB) | 54.4 | 57 -5% | 49.9 8% | 53 3% | 49 10% | 51.6 5% |
| Load Maximum * (dB) | 54.4 | 58.3 -7% | 54.8 -1% | 55 -1% | 52 4% | 51.3 6% |
* ... Meglio usare valori piccoli
Temperatura
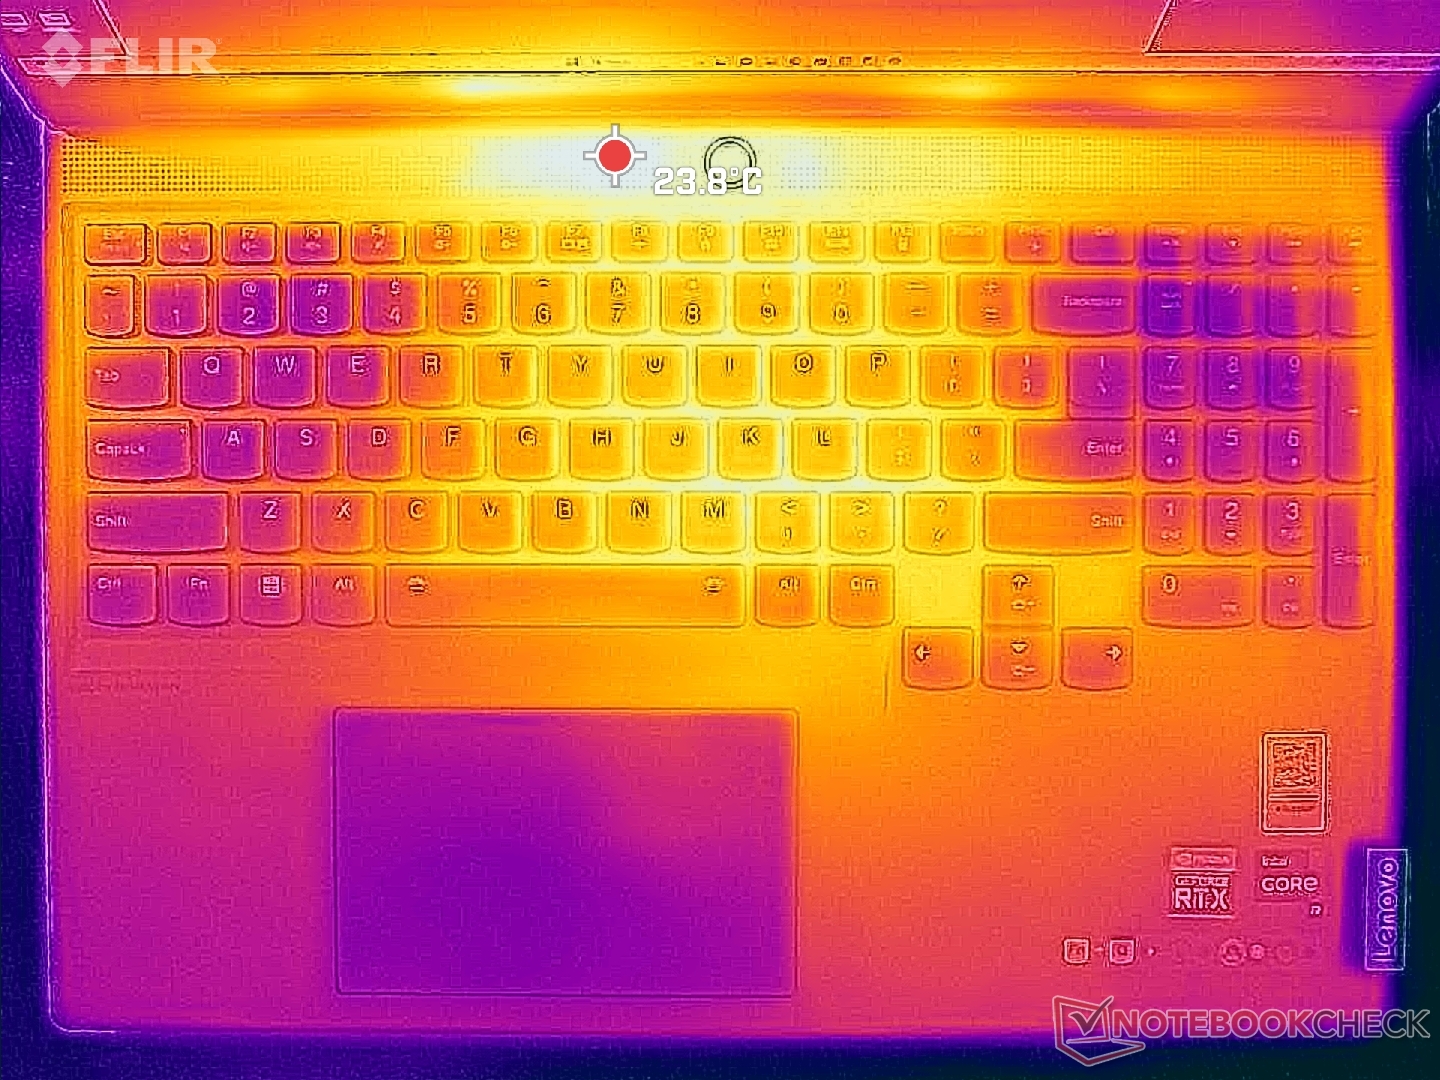
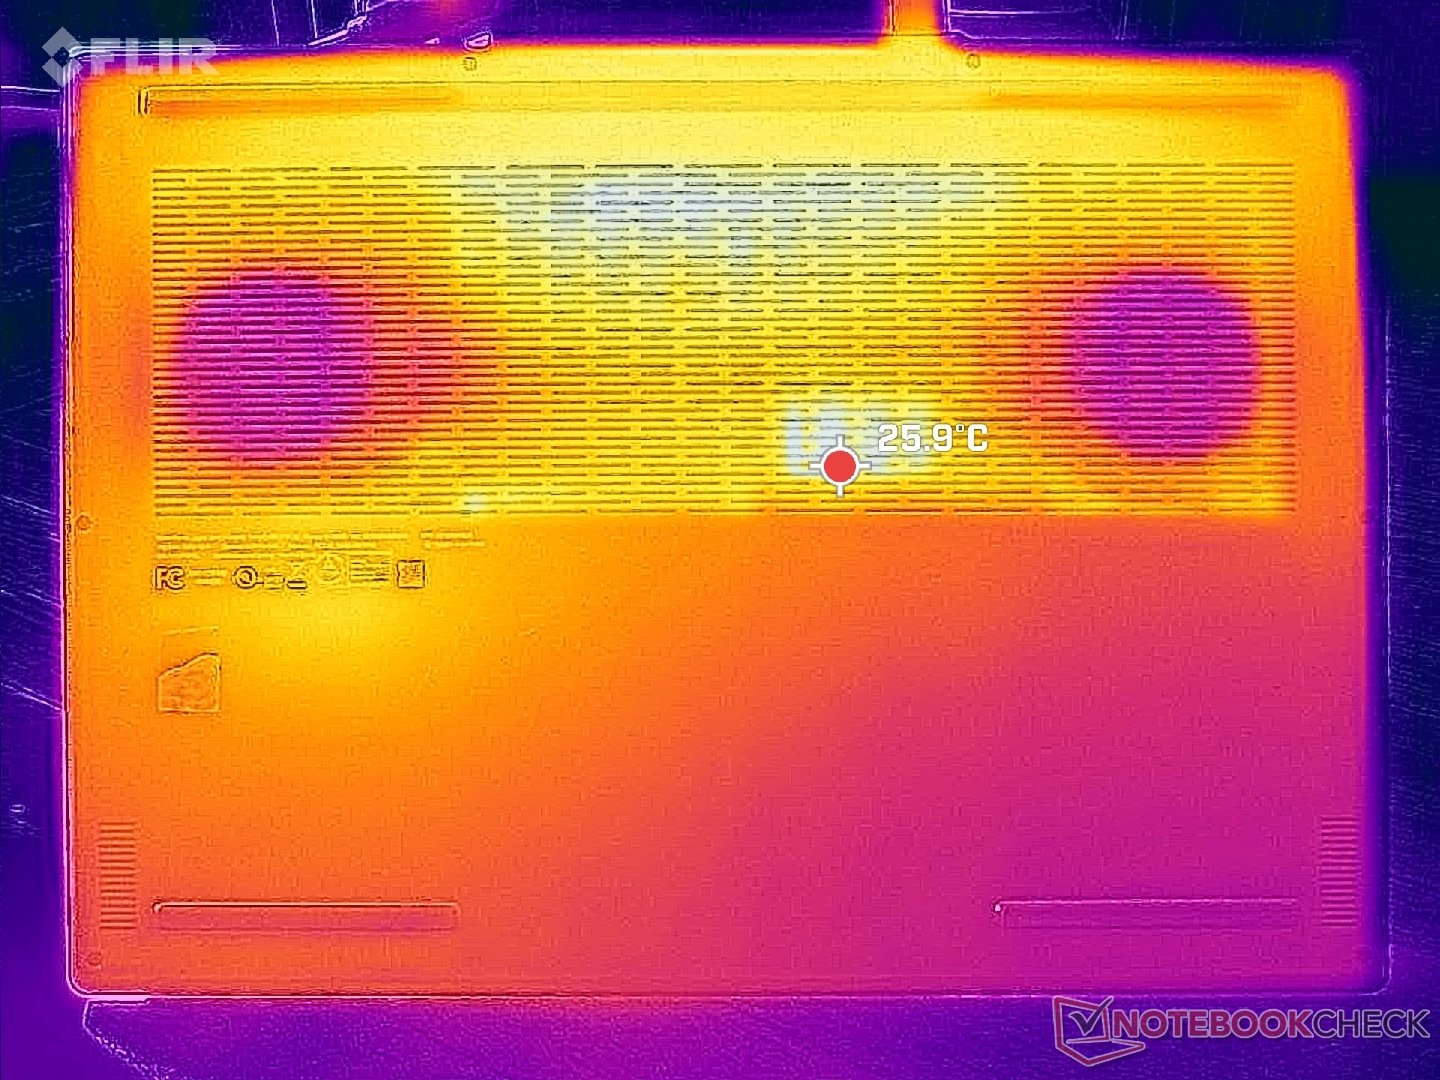
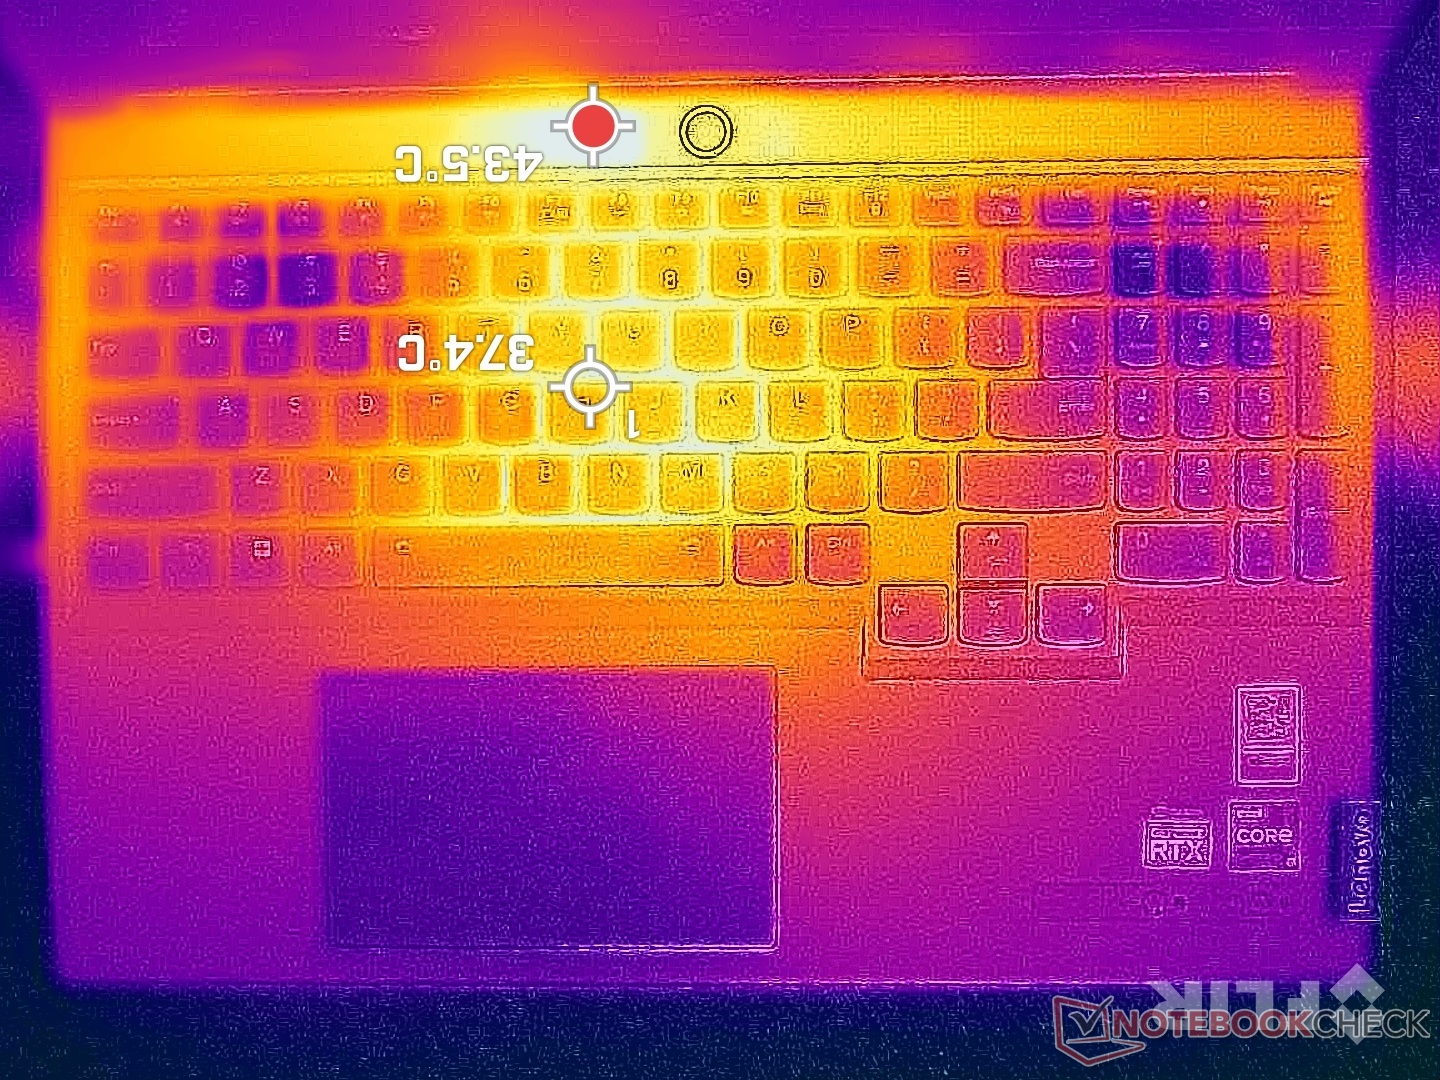
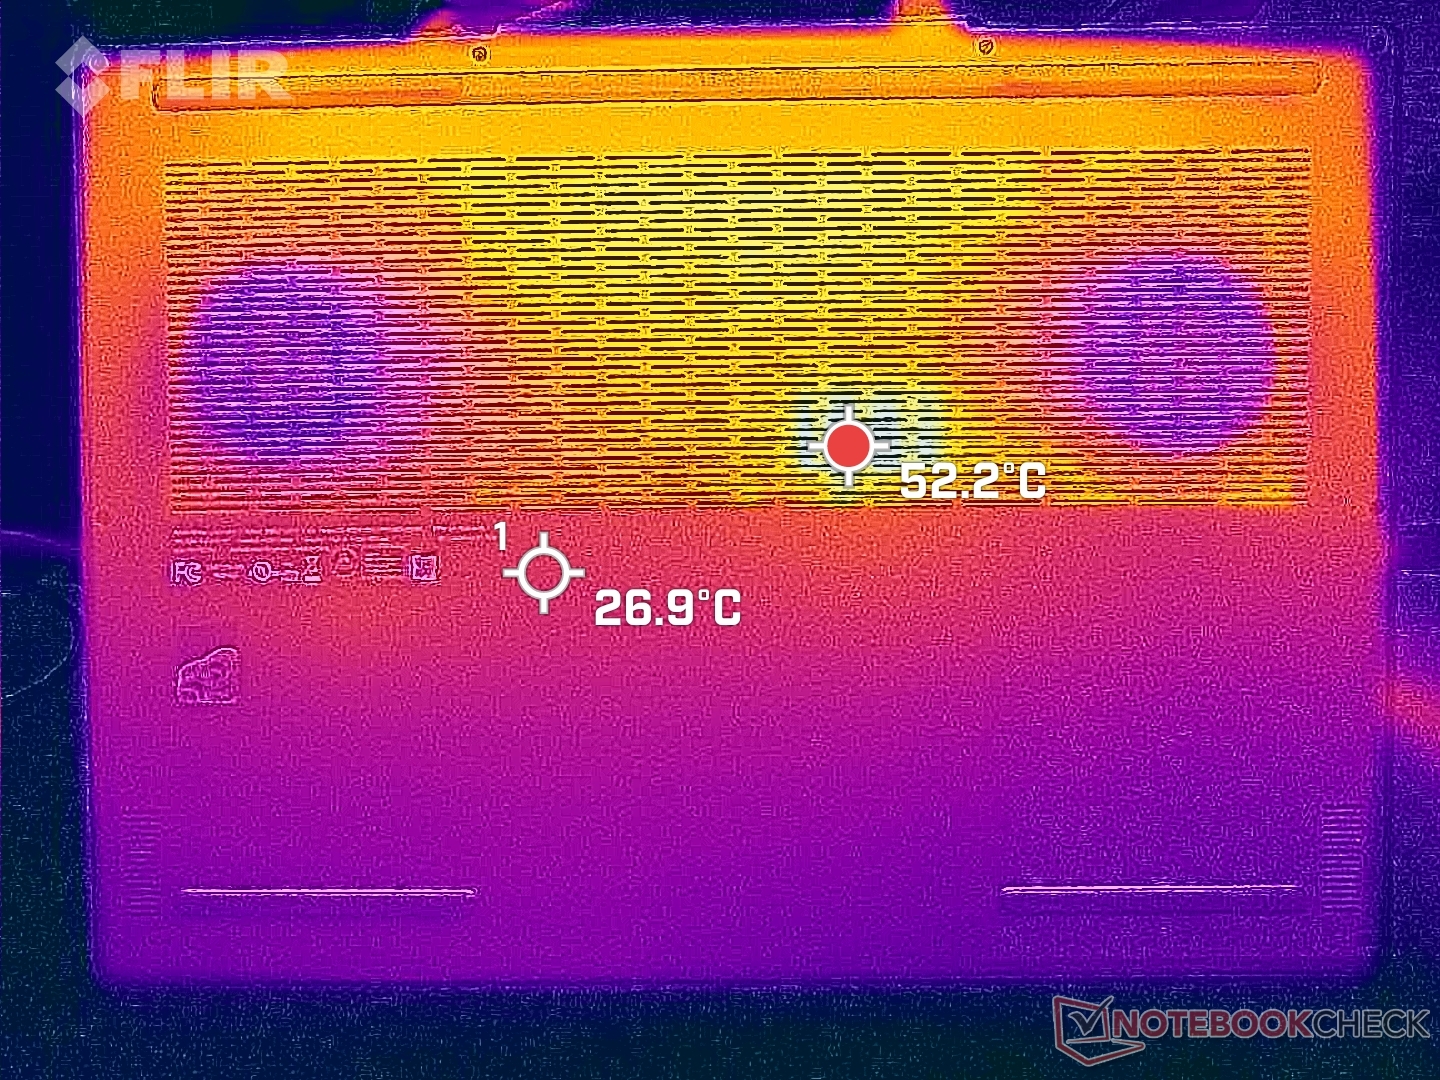
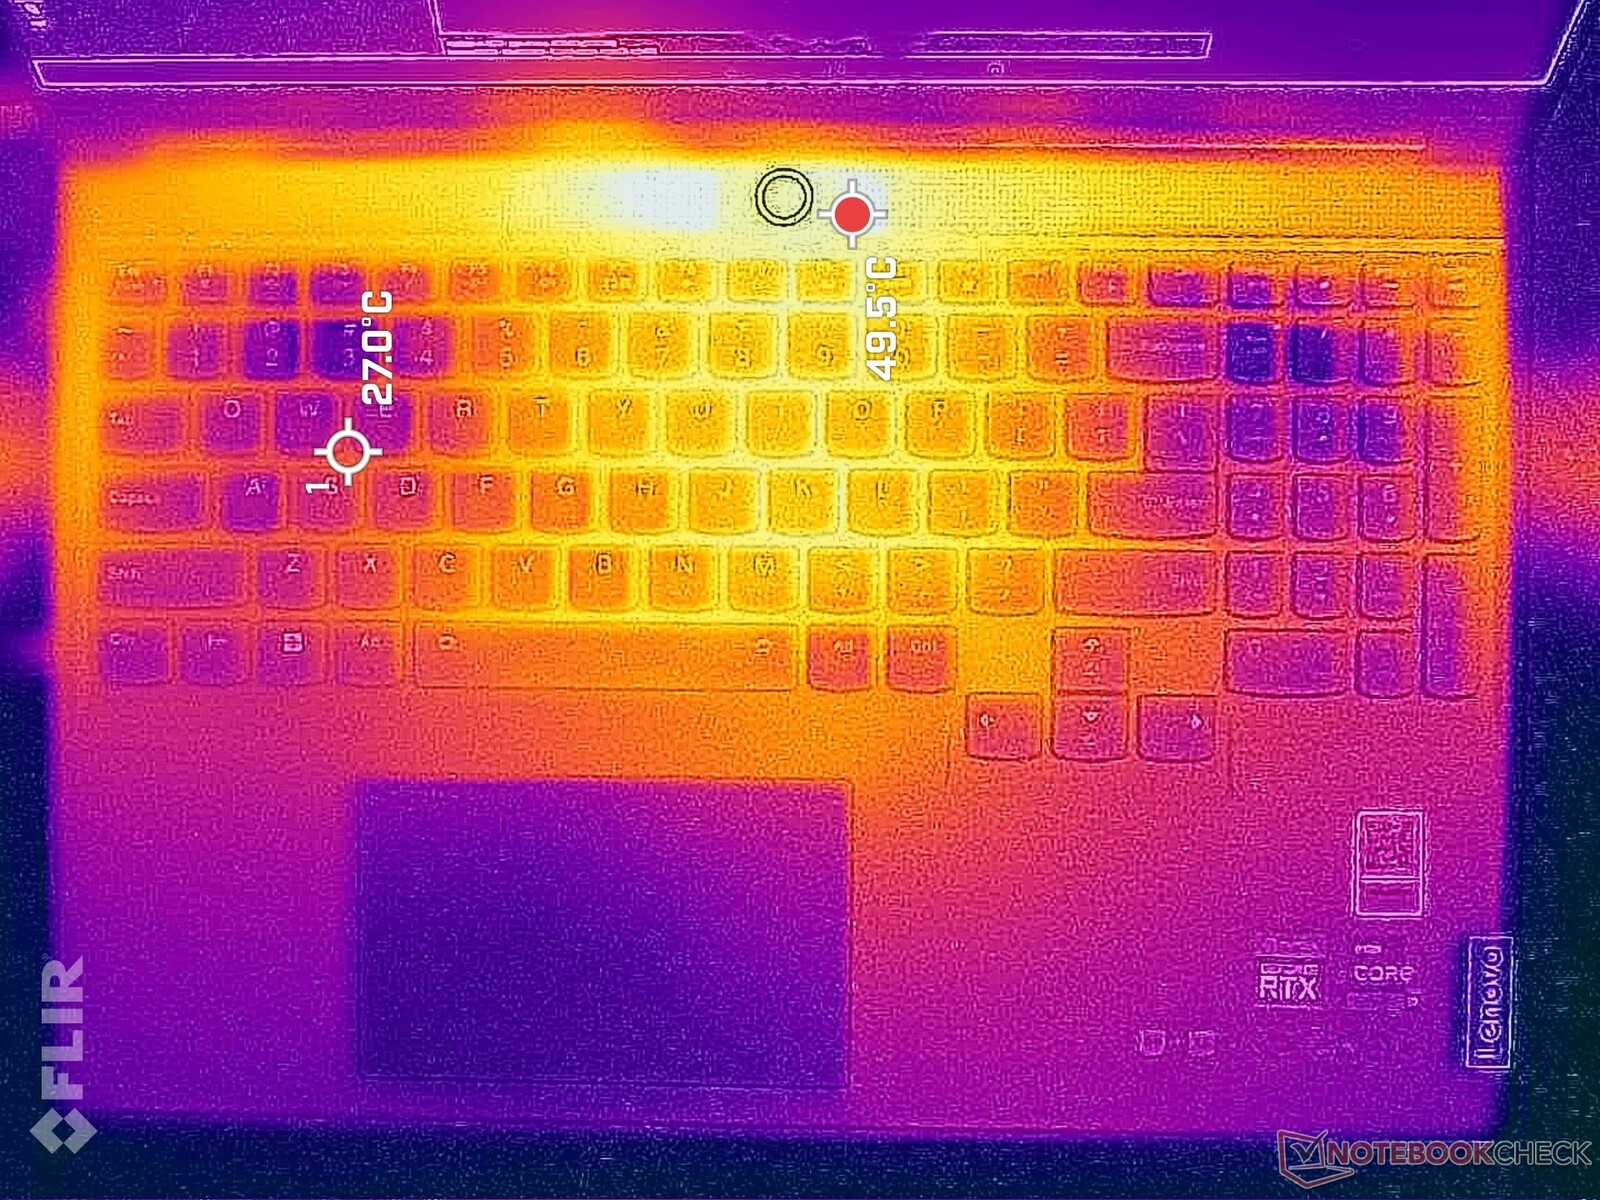
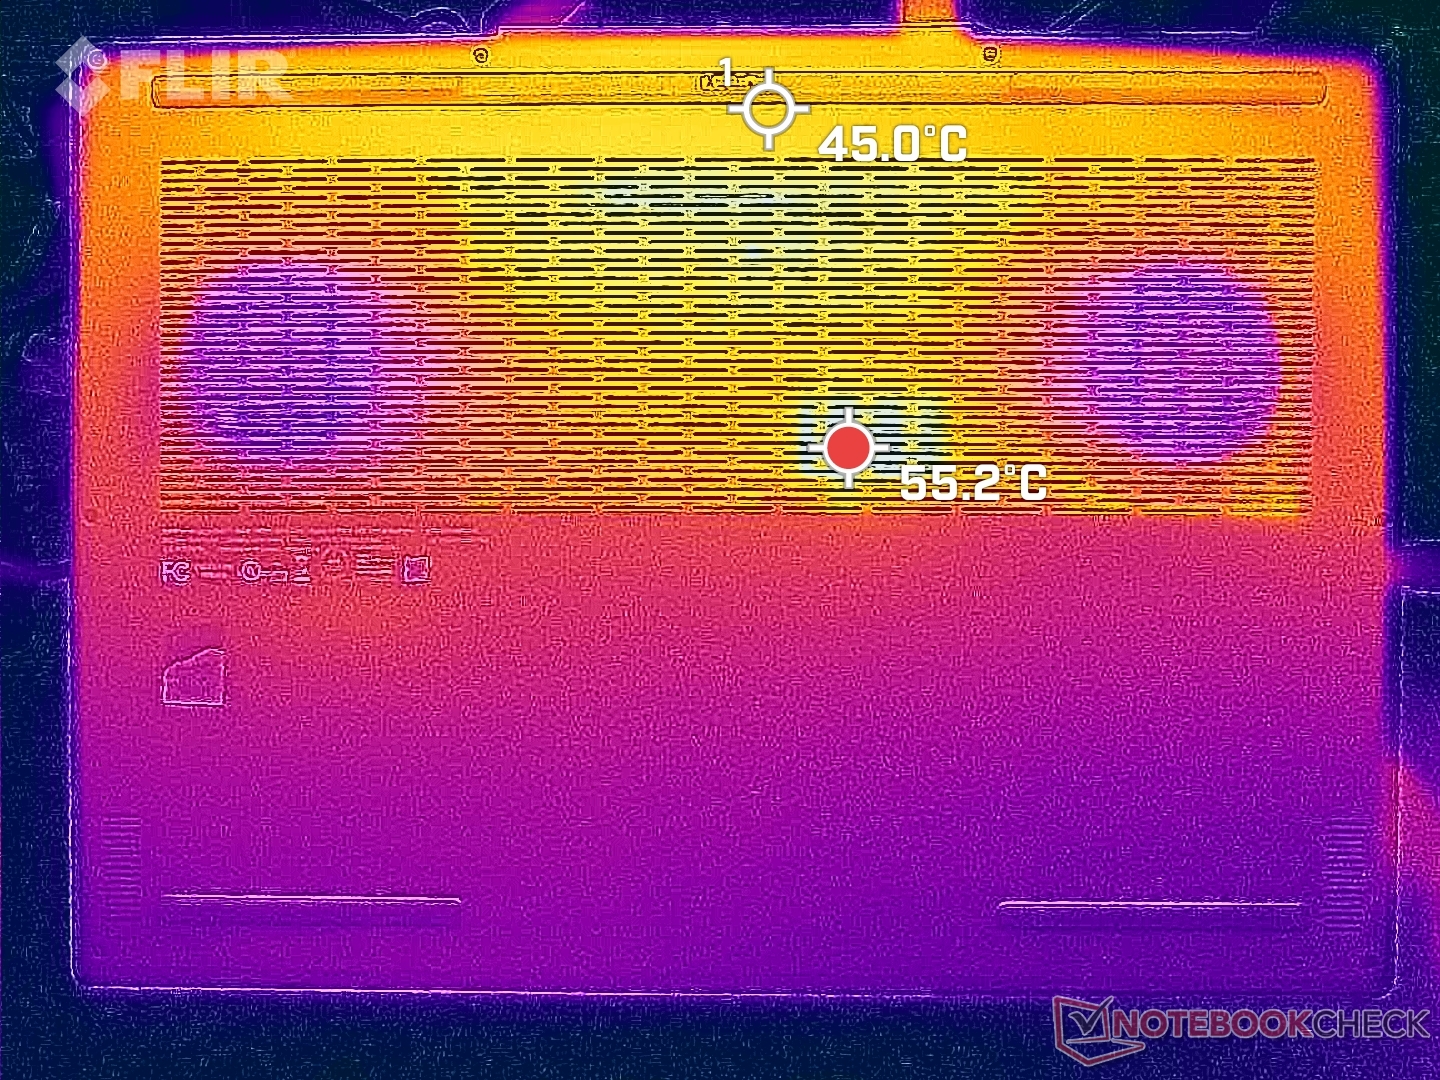
I punti caldi della temperatura di superficie possono raggiungere i 43-50 C, come nel caso dell'Alienware x16 R1 Alienware x16 R1 quando si eseguono carichi impegnativi come i giochi. Fortunatamente, il punto caldo è più vicino al bordo posteriore e appena sopra la prima fila di tasti della tastiera, come mostrano le mappe di temperatura qui sotto, dove è improbabile che le dita e la pelle vengano a contatto. I poggiapolsi e i tasti WASD rimangono più freddi in confronto.
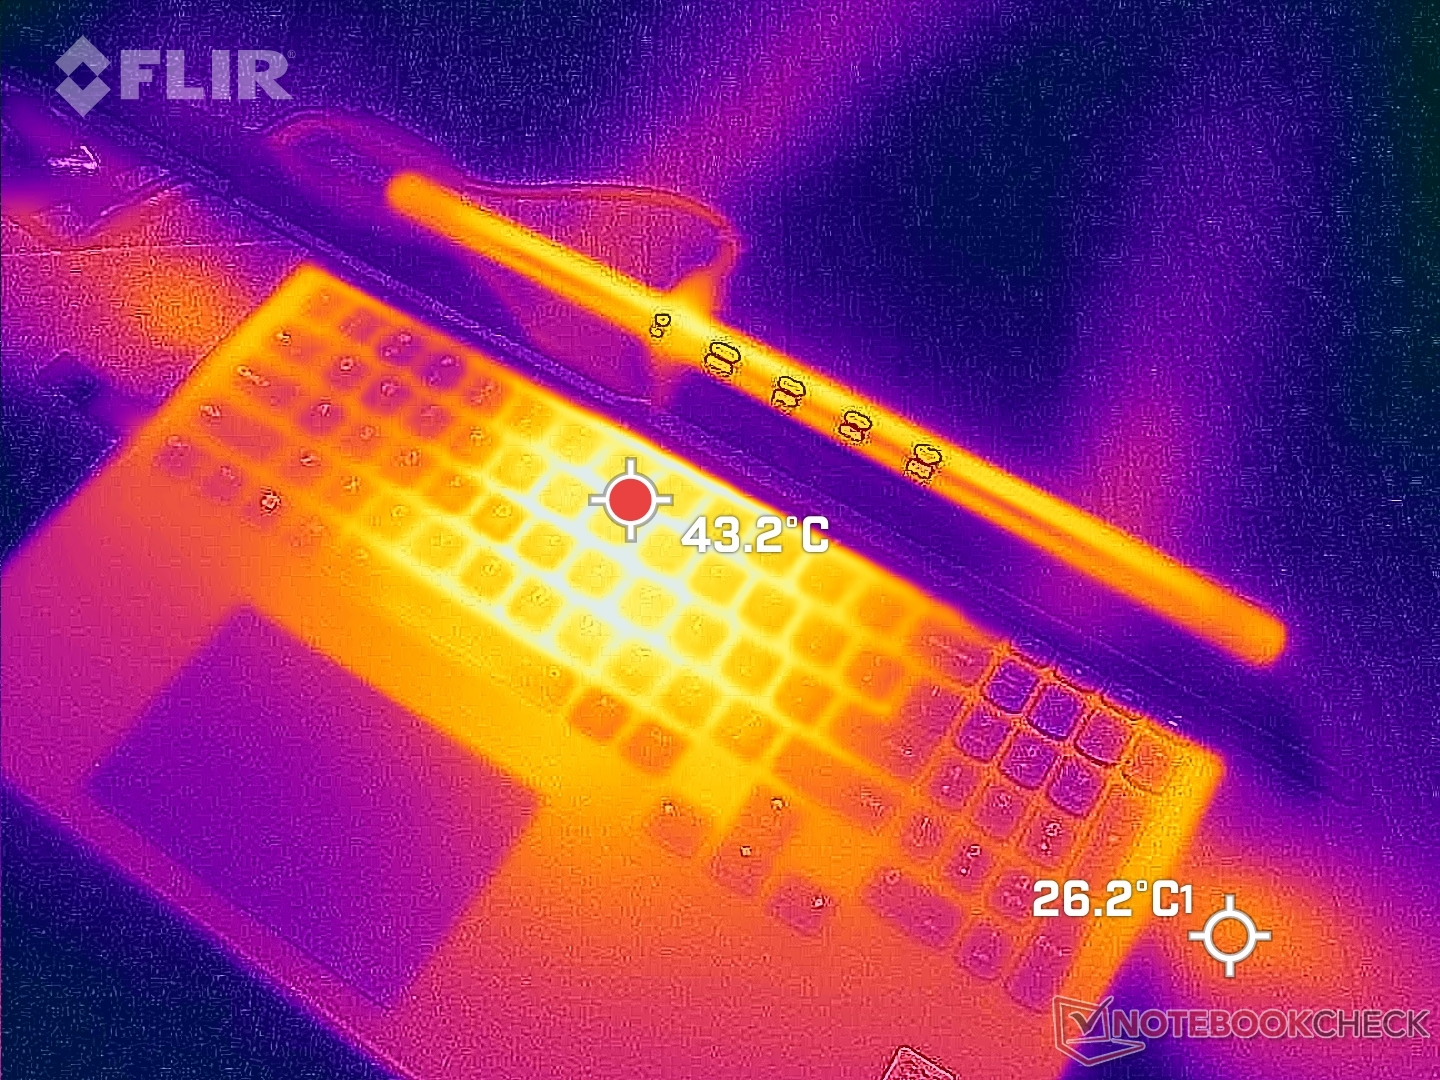
(-) La temperatura massima sul lato superiore è di 49.8 °C / 122 F, rispetto alla media di 40.4 °C / 105 F, che varia da 21.2 a 68.8 °C per questa classe Gaming.
(-) Il lato inferiore si riscalda fino ad un massimo di 48.8 °C / 120 F, rispetto alla media di 43.2 °C / 110 F
(+) In idle, la temperatura media del lato superiore è di 26 °C / 79 F, rispetto alla media deld ispositivo di 33.9 °C / 93 F.
(±) Riproducendo The Witcher 3, la temperatura media per il lato superiore e' di 35.1 °C / 95 F, rispetto alla media del dispositivo di 33.9 °C / 93 F.
(+) I poggiapolsi e il touchpad sono piu' freddi della temperatura della pelle con un massimo di 29.4 °C / 84.9 F e sono quindi freddi al tatto.
(±) La temperatura media della zona del palmo della mano di dispositivi simili e'stata di 28.8 °C / 83.8 F (-0.6 °C / -1.1 F).
| Lenovo Legion Slim 7i 16 Gen 8 Intel Core i9-13900H, NVIDIA GeForce RTX 4070 Laptop GPU | HP Omen 16-wf000 Intel Core i7-13700HX, NVIDIA GeForce RTX 4080 Laptop GPU | Alienware x16 R1 Intel Core i9-13900HK, NVIDIA GeForce RTX 4080 Laptop GPU | Lenovo Legion Pro 7 RTX4090 Intel Core i9-13900HX, NVIDIA GeForce RTX 4090 Laptop GPU | Asus ROG Strix G16 G614JZ Intel Core i9-13980HX, NVIDIA GeForce RTX 4080 Laptop GPU | Razer Blade 16 Early 2023 Intel Core i9-13950HX, NVIDIA GeForce RTX 4080 Laptop GPU | |
|---|---|---|---|---|---|---|
| Heat | 4% | -9% | -13% | -8% | 7% | |
| Maximum Upper Side * (°C) | 49.8 | 45 10% | 47.2 5% | 53 -6% | 54 -8% | 40 20% |
| Maximum Bottom * (°C) | 48.8 | 48.8 -0% | 47.8 2% | 59 -21% | 55 -13% | 37.6 23% |
| Idle Upper Side * (°C) | 29.4 | 29.2 1% | 36.8 -25% | 34 -16% | 29 1% | 32.4 -10% |
| Idle Bottom * (°C) | 30 | 28.8 4% | 35.8 -19% | 32 -7% | 33 -10% | 31.4 -5% |
* ... Meglio usare valori piccoli
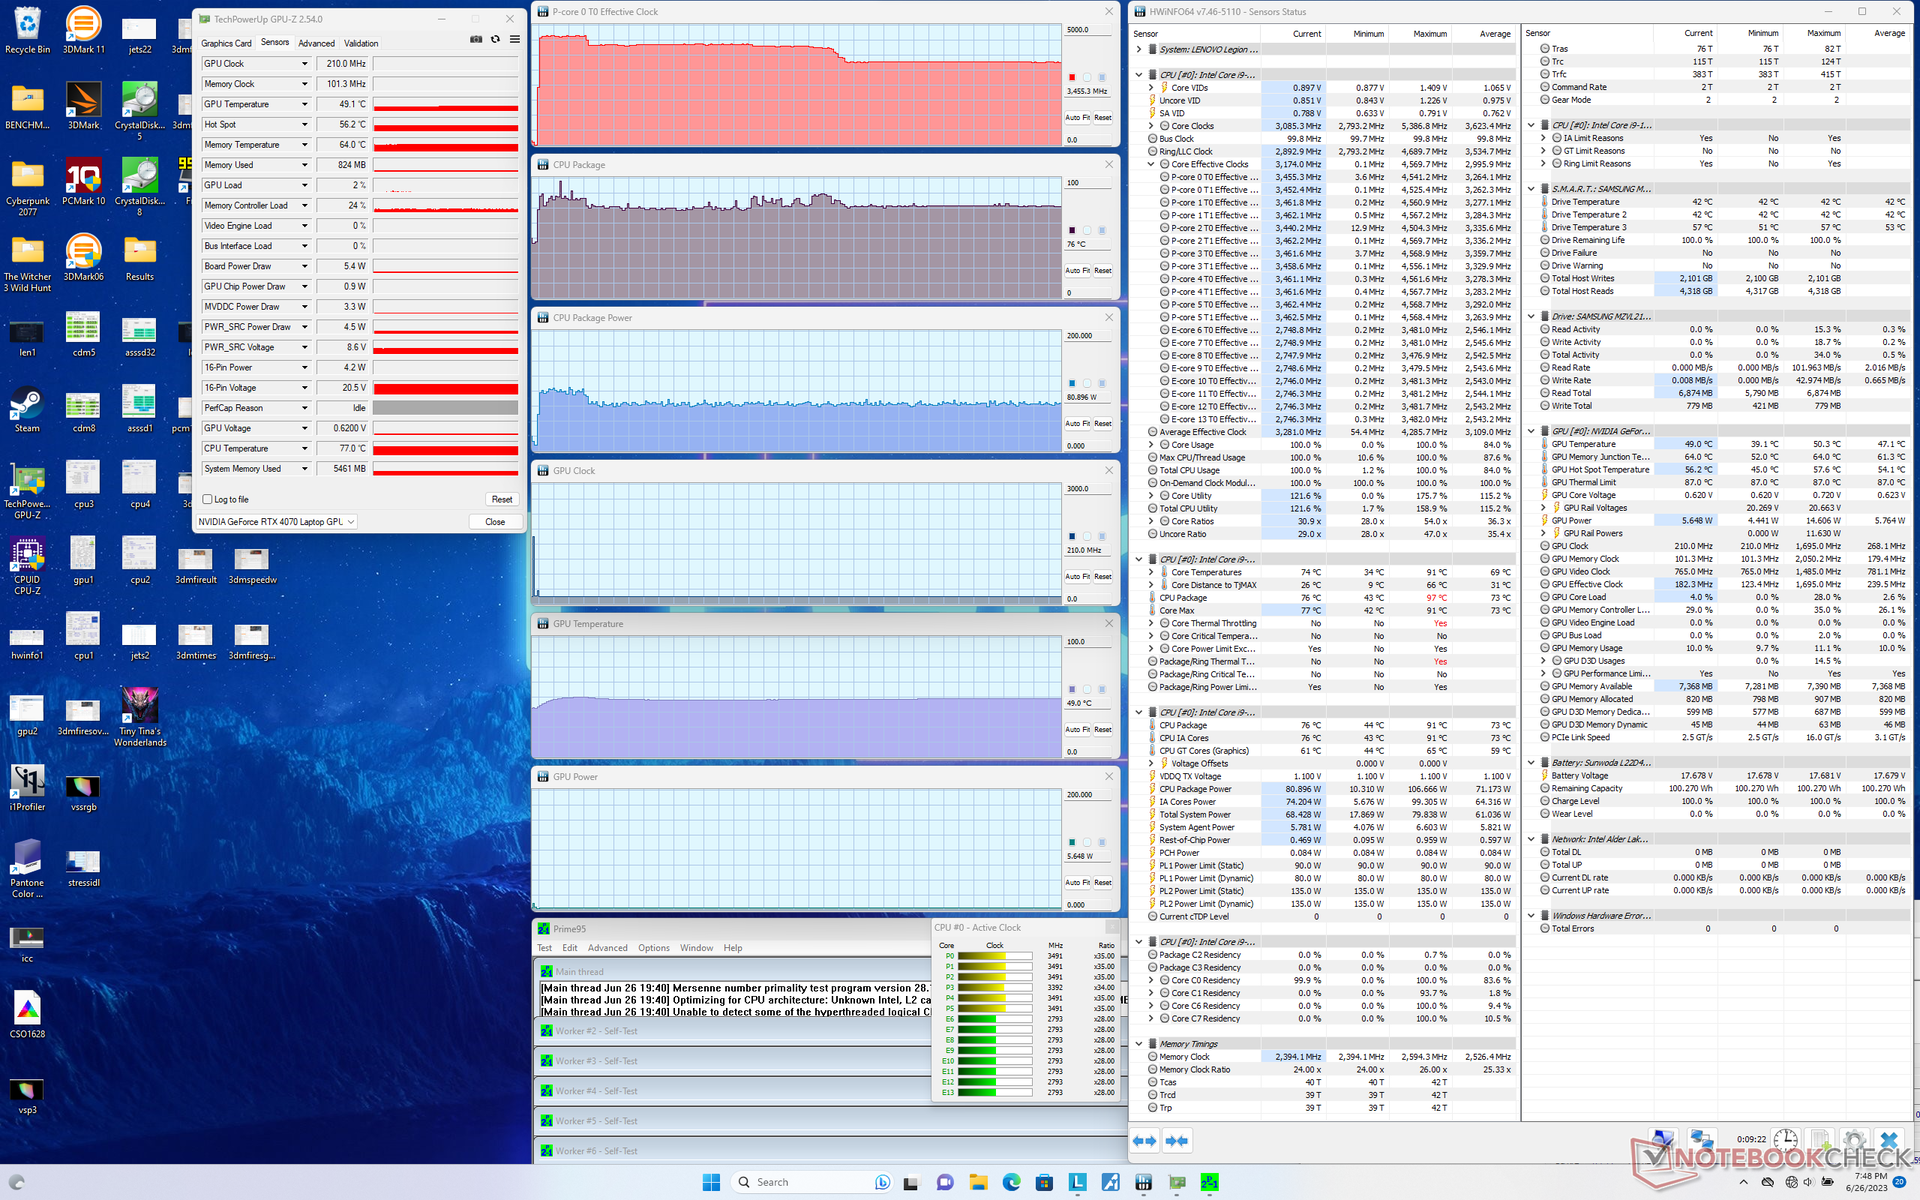
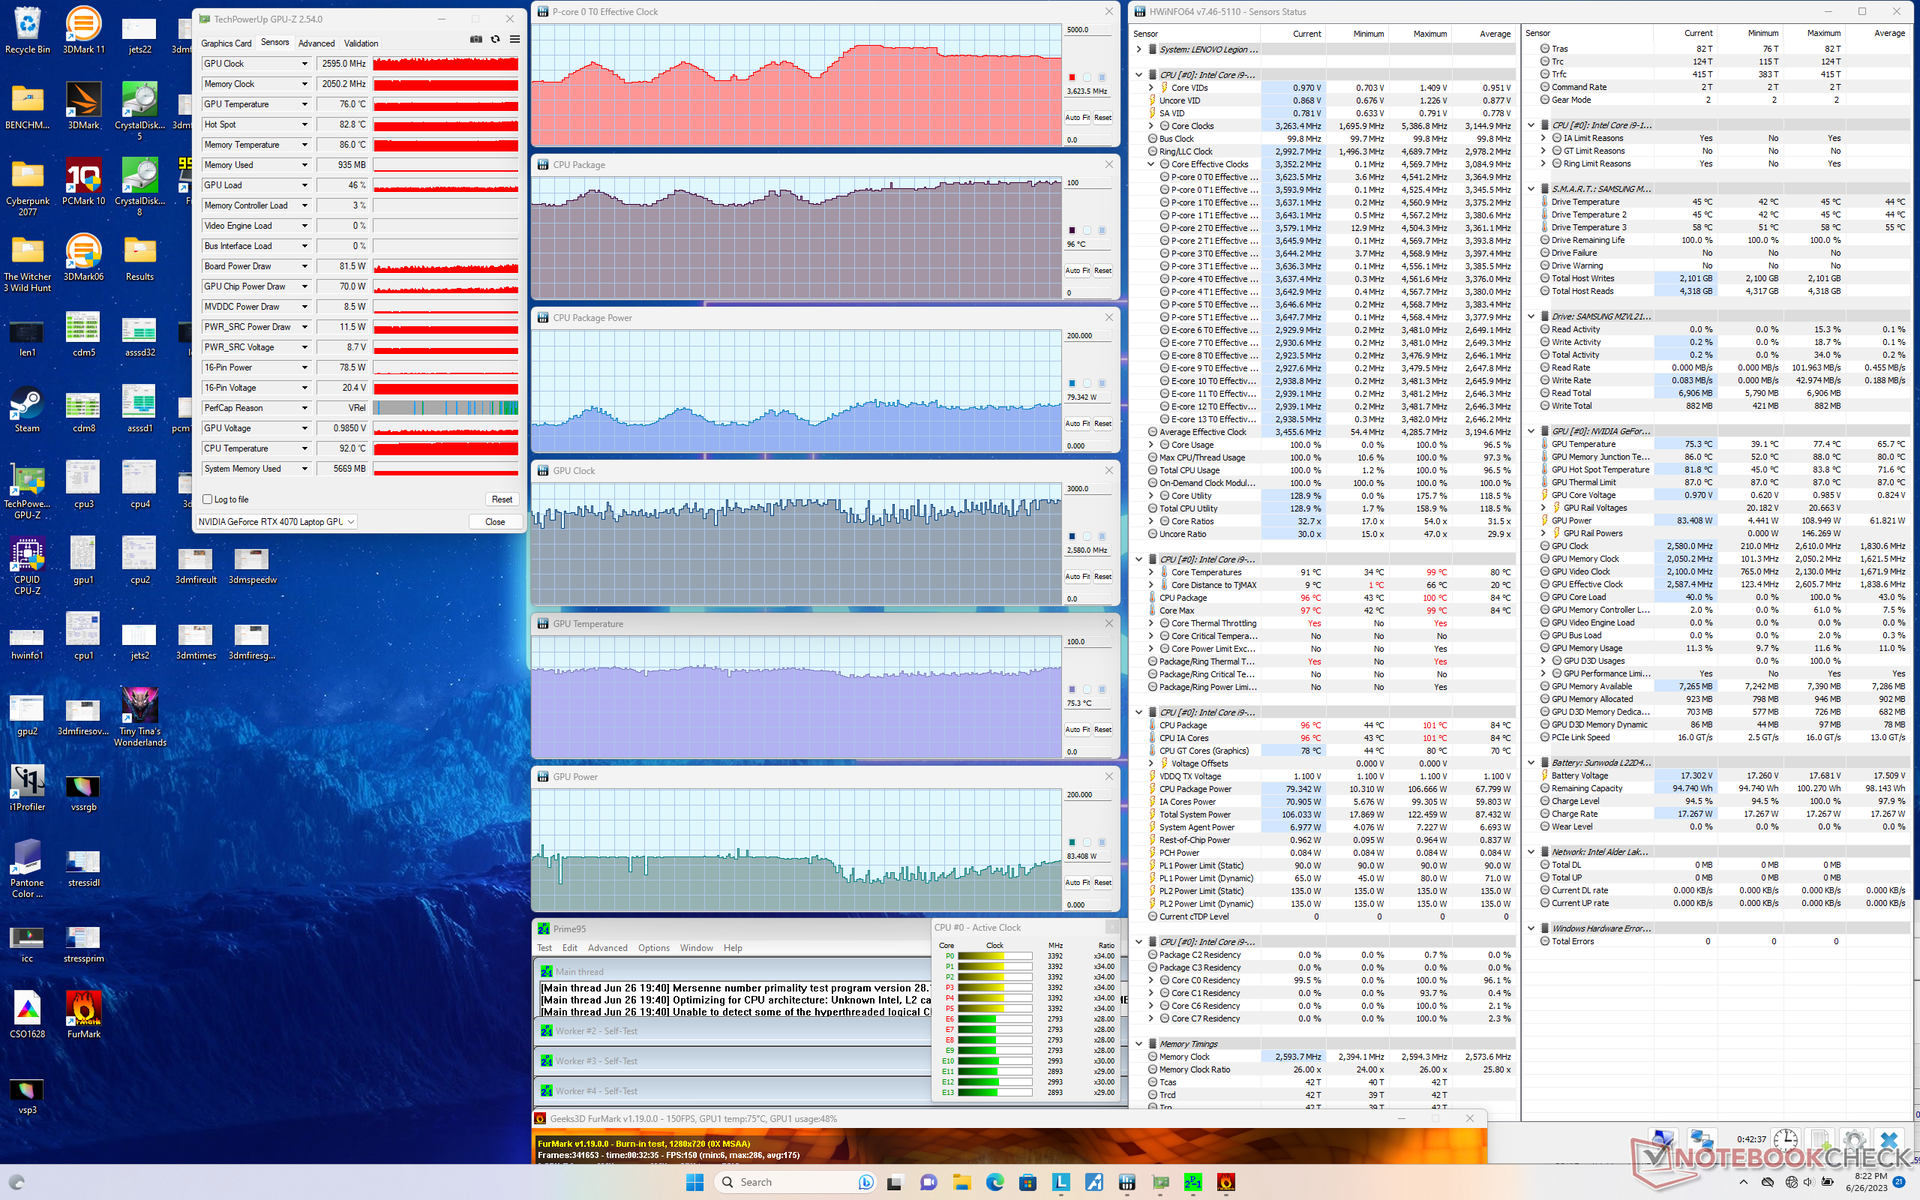
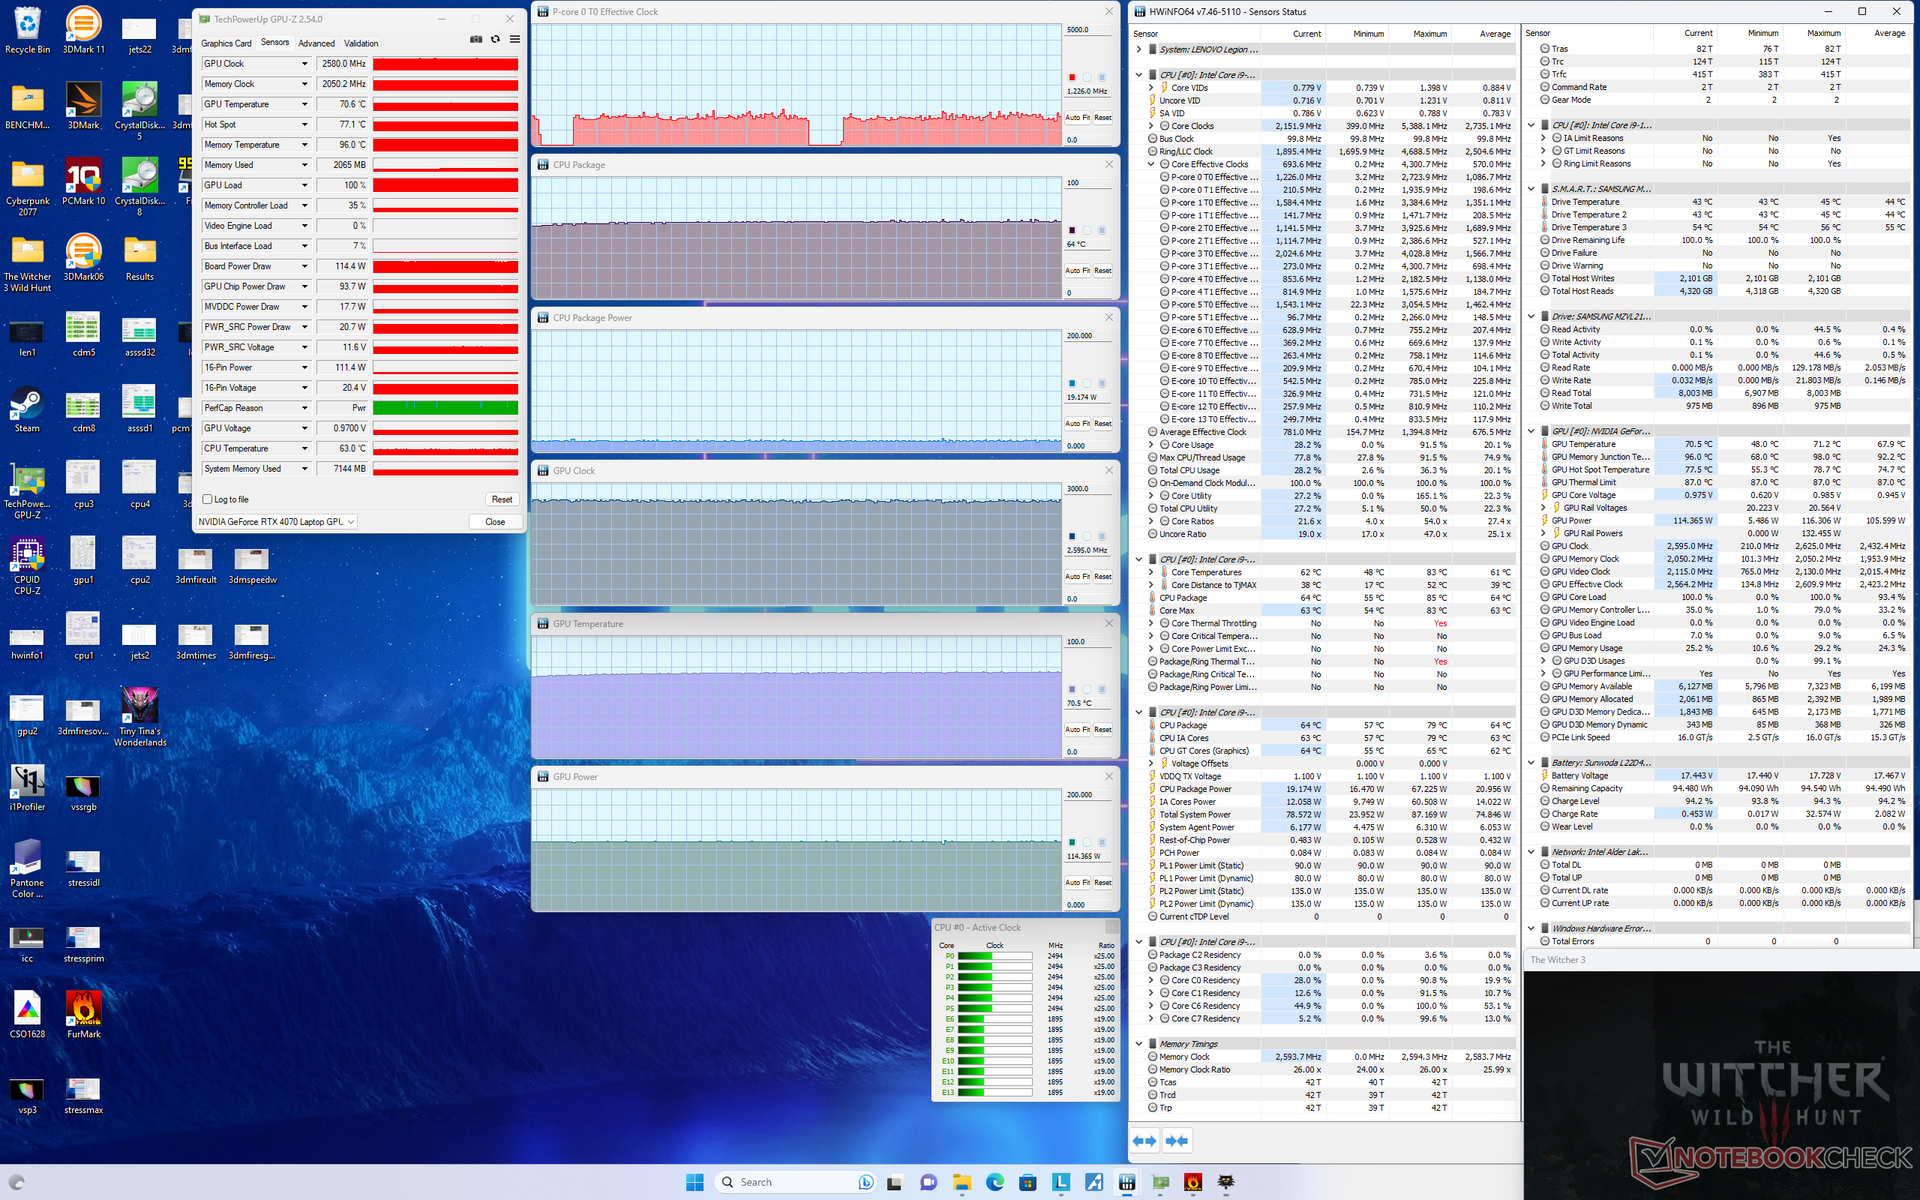
Stress test
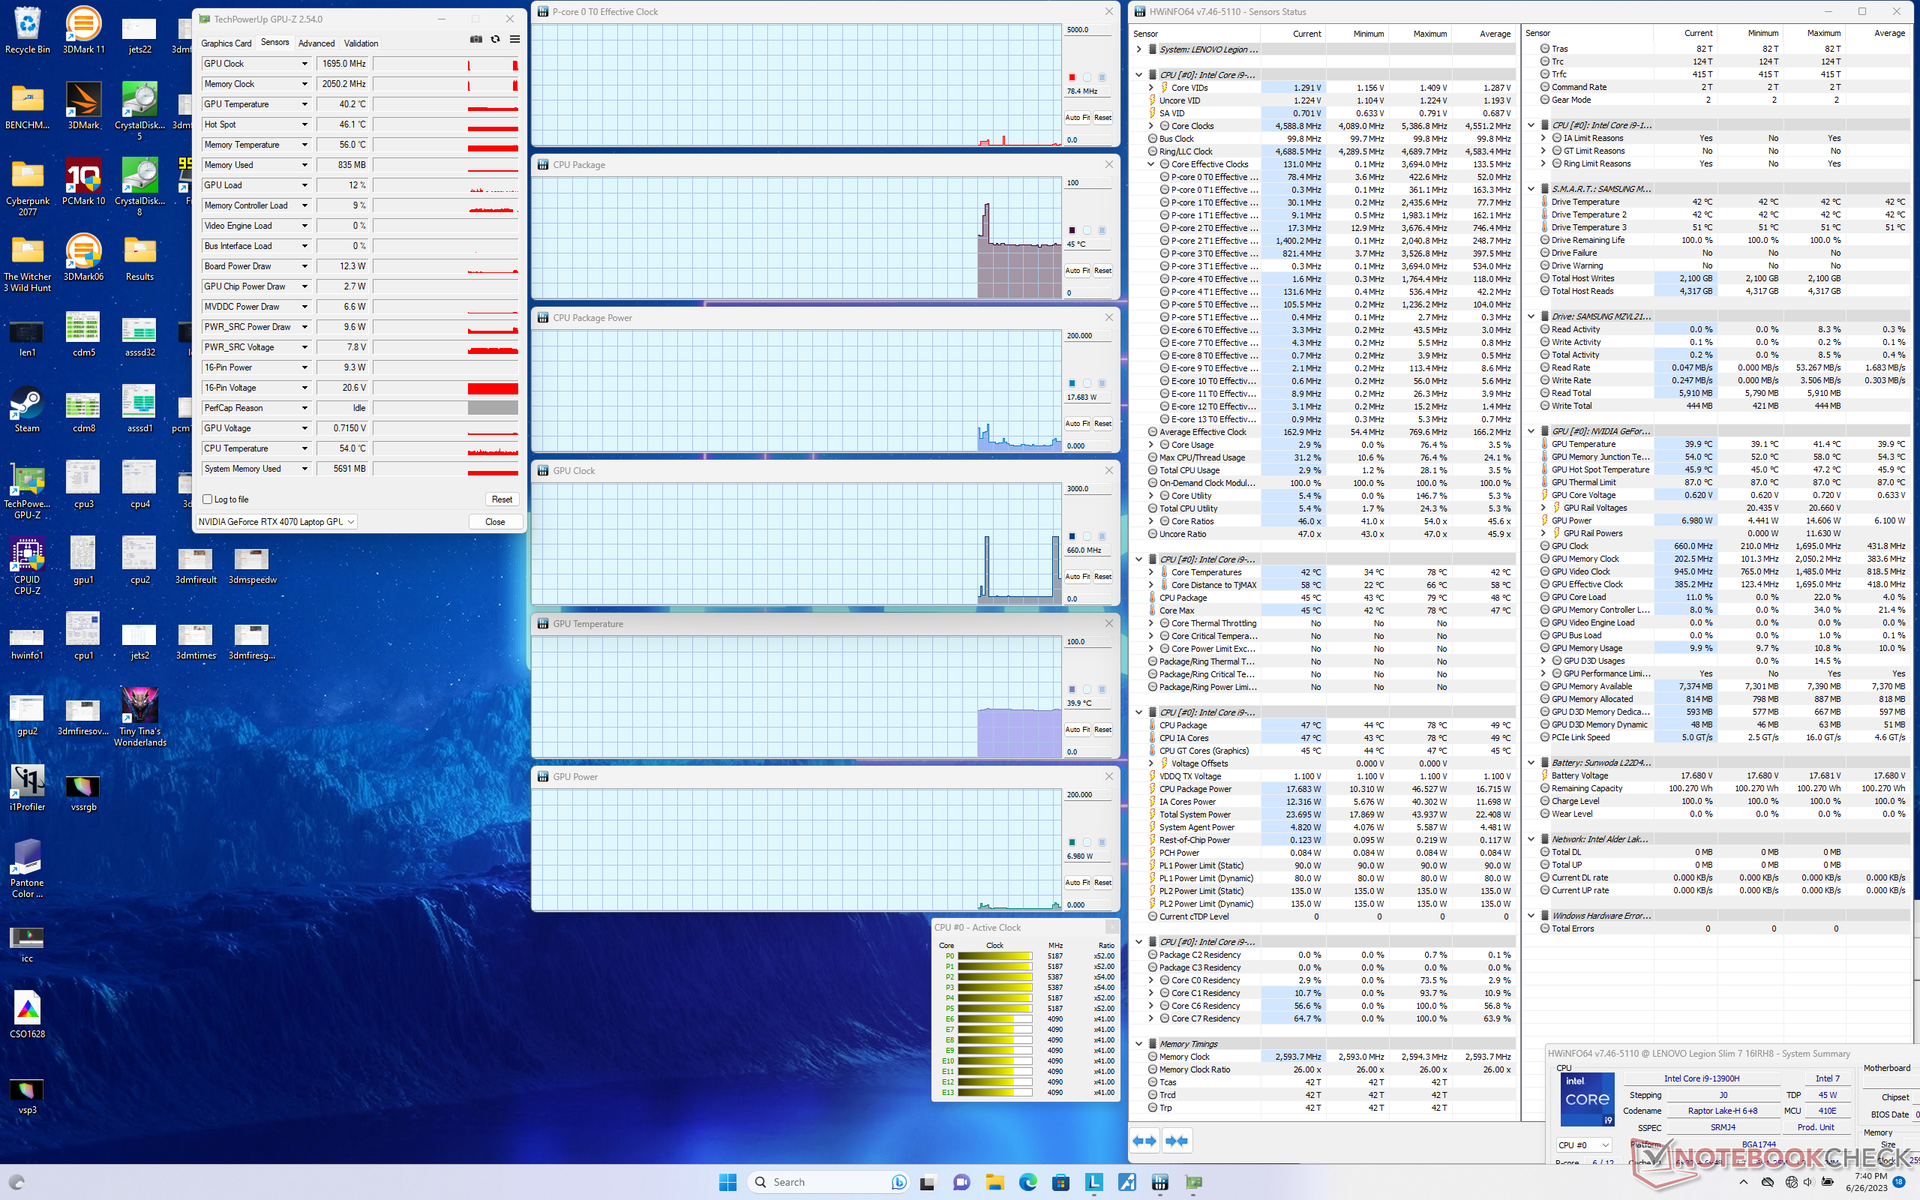
La velocità di clock della CPU, la temperatura e l'assorbimento di potenza della scheda durante l'esecuzione di Prime95 raggiungevano rispettivamente 4,5 GHz, 87 C e 100 W, con una durata di circa un minuto. Alla fine la CPU si stabilizzava a 3,5 GHz e 80 W per mantenere una temperatura ragionevole di 76 C. Ripetendo questo stesso test sul Blade 16 con blade 16 con il il più veloce Core i9-13950HX, la temperatura del core sarebbe stata più elevata, pari a 82°C.
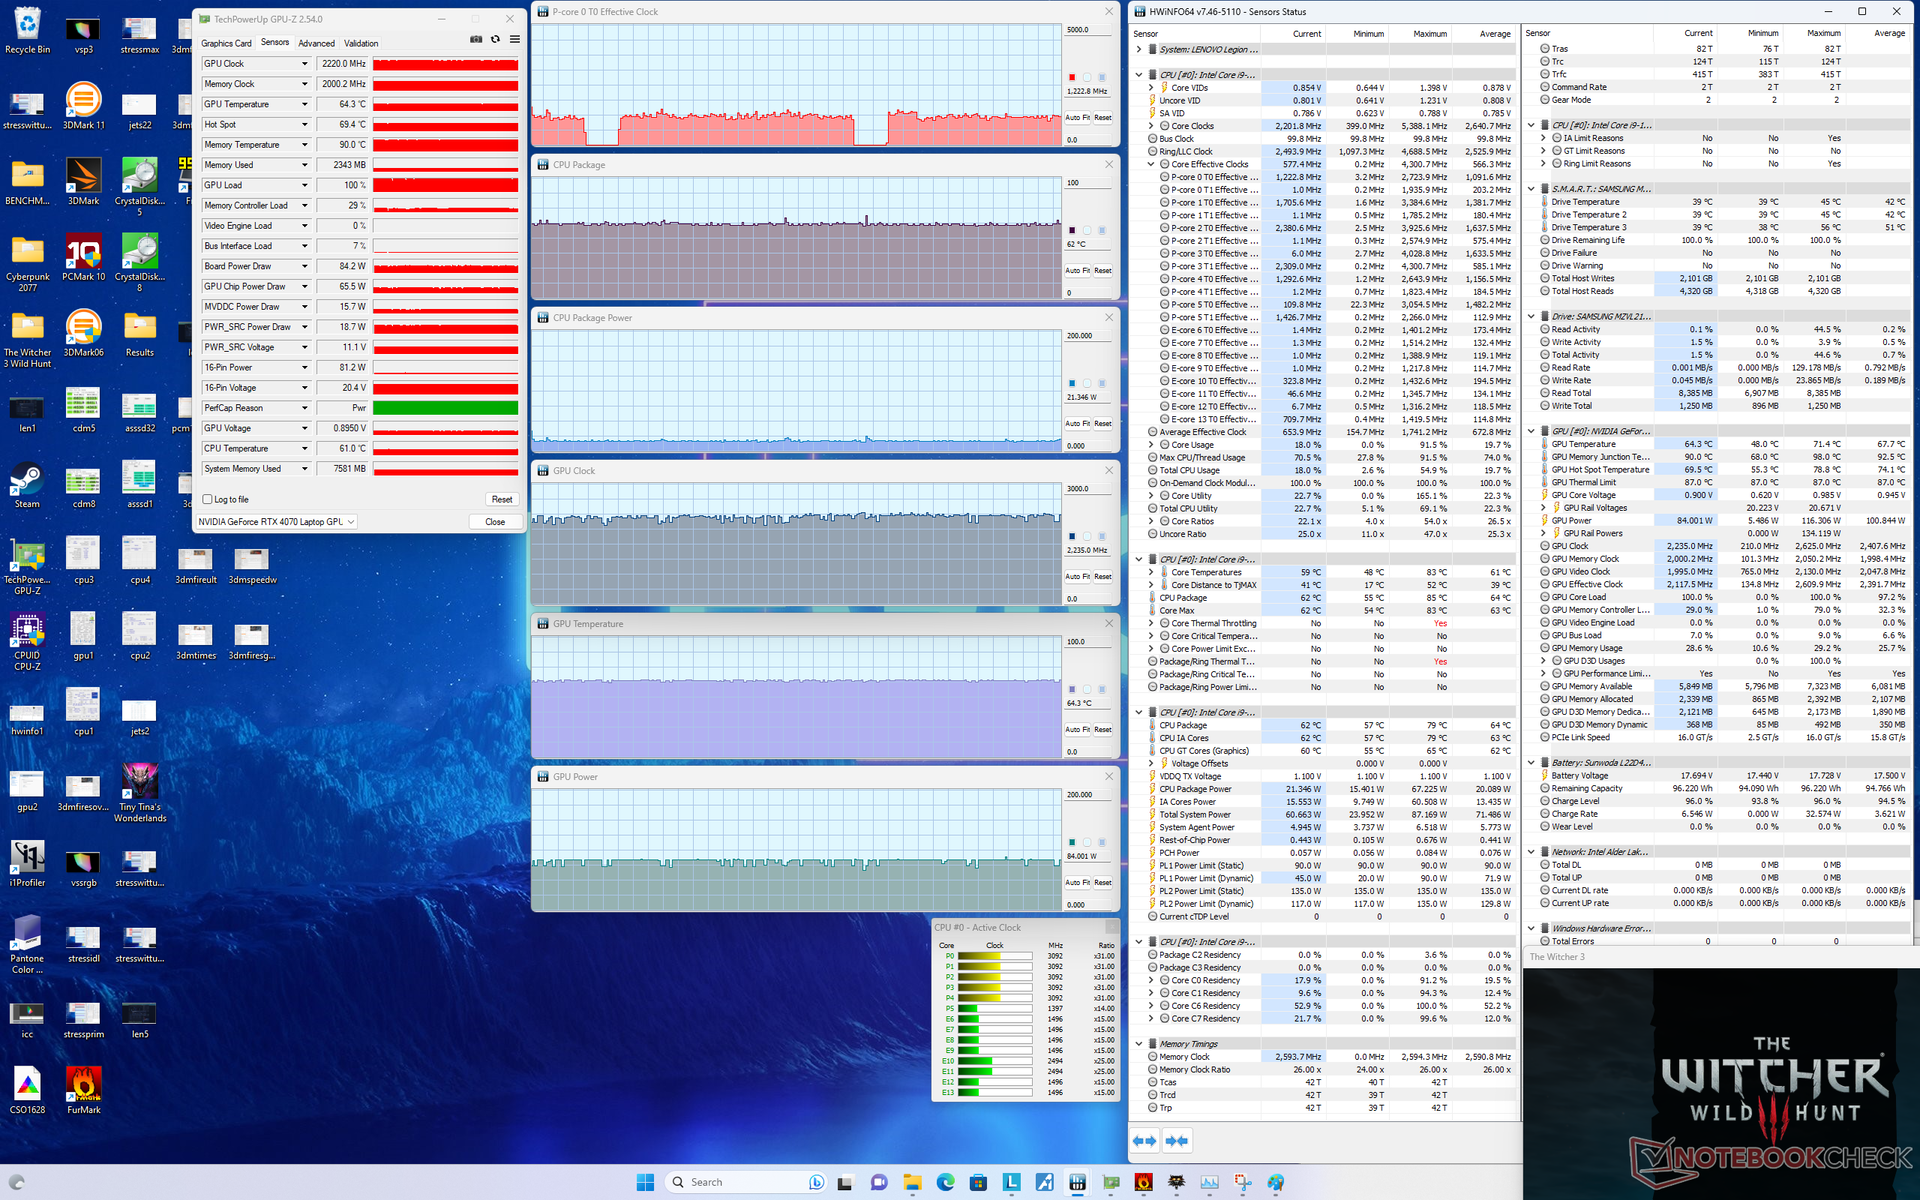
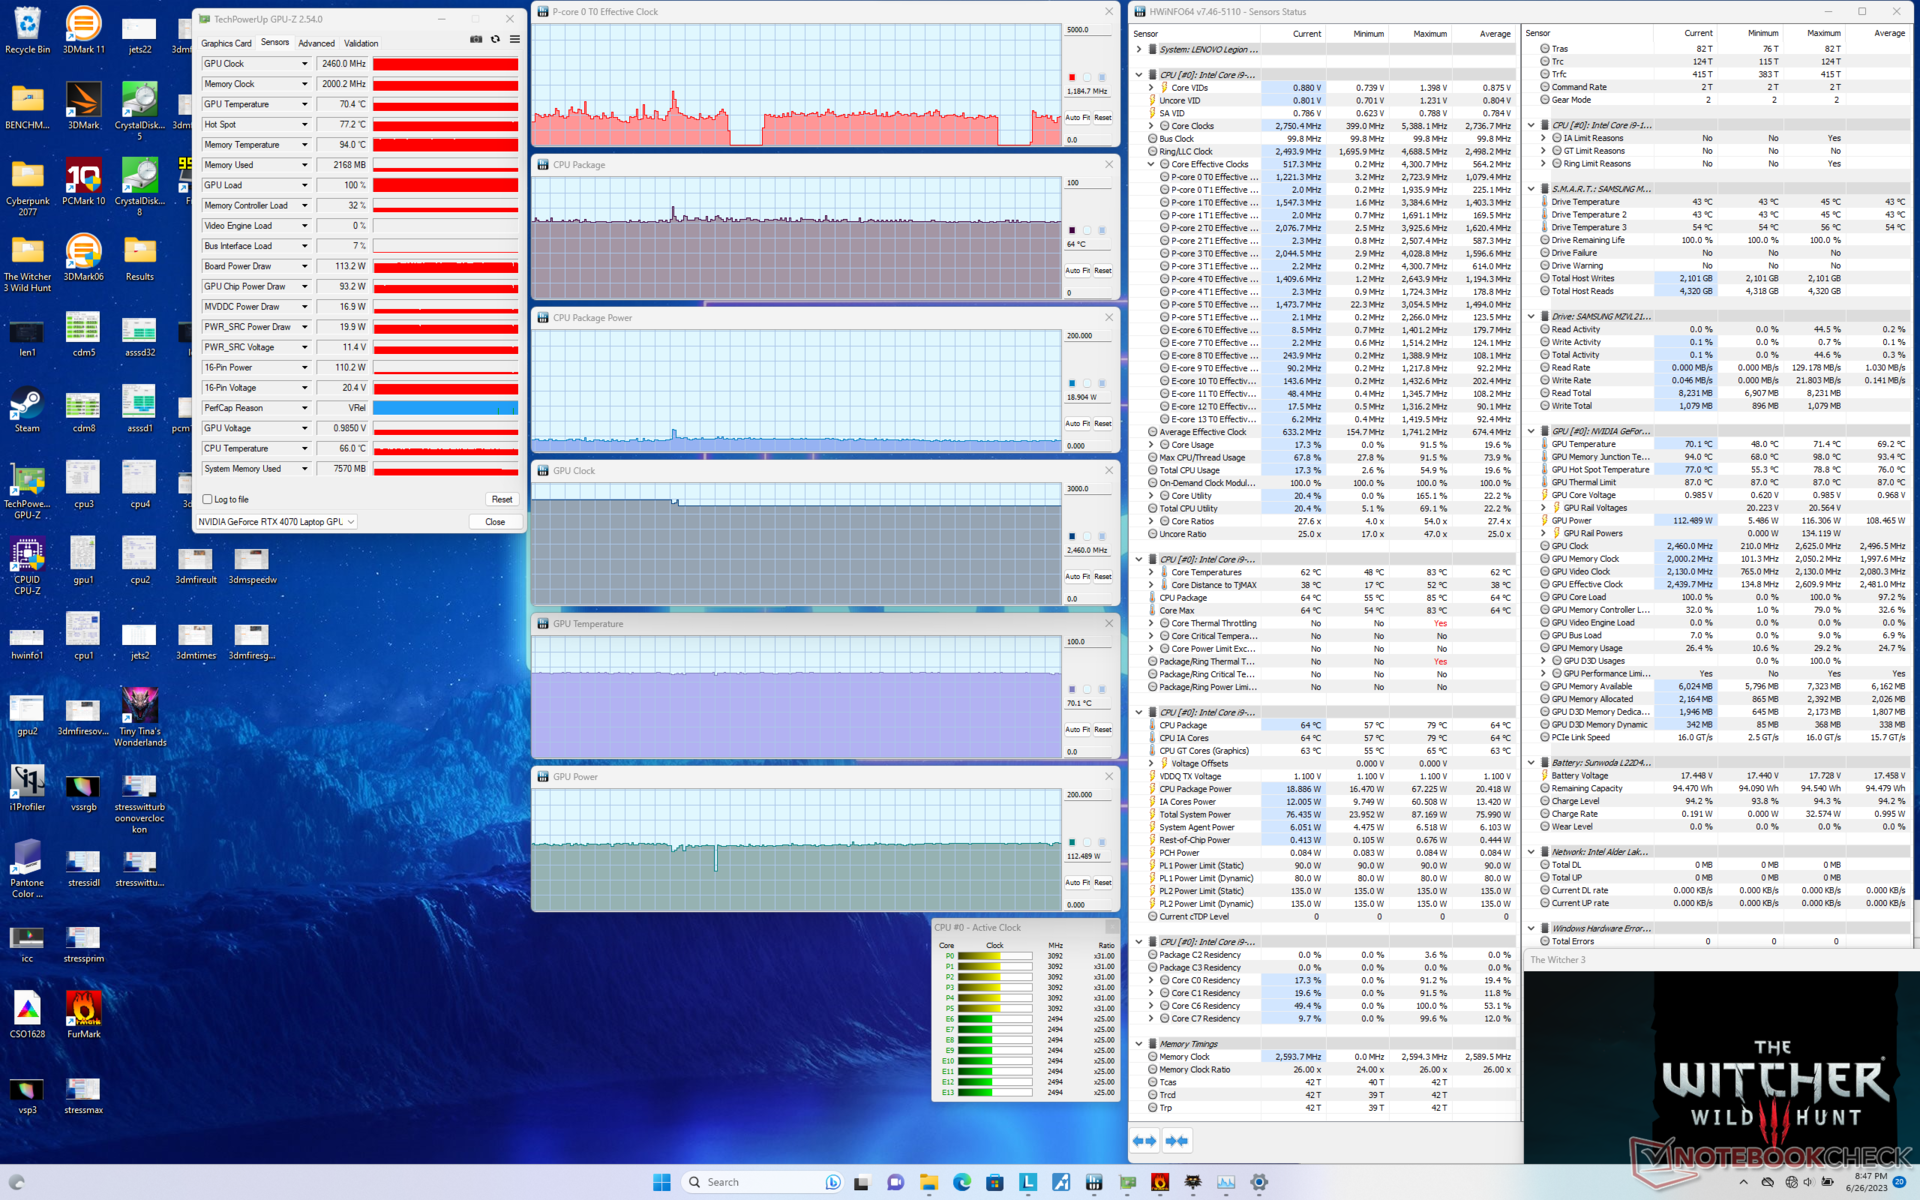
La GPU Nvidia si stabilizza a 2580 MHz, 114 W e 71 C, rispettivamente, quando è impostata in modalità Performance con Overdrive e Overclock GPU attivi. La GPU punta a 140 W sulla carta, ma siamo riusciti a raggiungere solo 123 W anche con Cyberpunk 2077. L'assorbimento di potenza della scheda e la temperatura del core scendono rispettivamente a 84 W e 64 C se si gioca in modalità Balanced. Le temperature del core sono piuttosto basse per un portatile da gioco sottile e leggero; le temperature della CPU e della GPU dell'Alienware x16 R1, ad esempio, sono comprese tra 80 e 95 C quando si eseguono gli stessi giochi.
L'utilizzo a batteria limita le prestazioni, in quanto il profilo di alimentazione Performance diventa grigio. Fire Strike a batteria restituisce punteggi di Fisica e Grafica rispettivamente di soli 25602 e 21049 punti, rispetto a 32664 e 30130 punti con la rete elettrica.
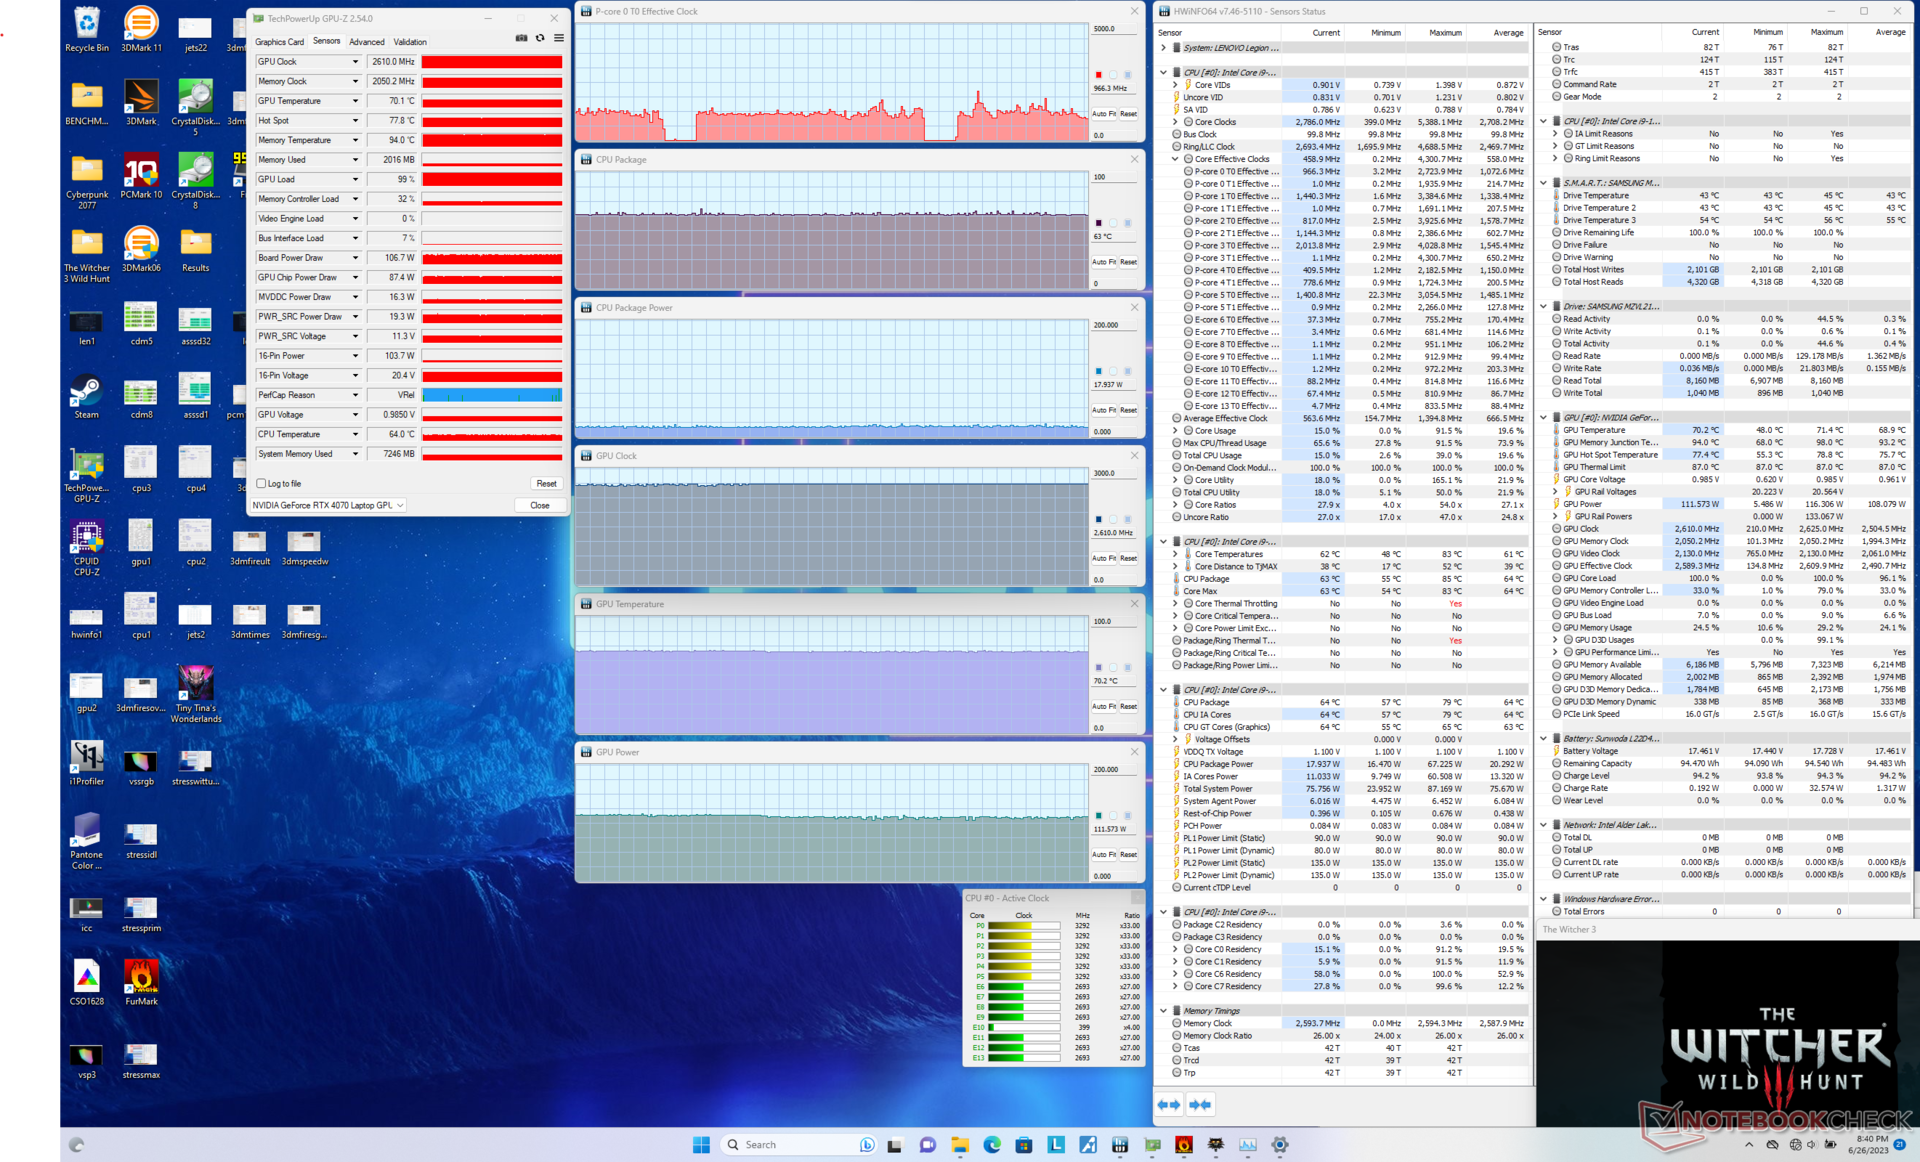
| Clock della CPU (GHz) | Clock della GPU (MHz) | Temperatura media della CPU (°C) | Temperatura media della GPU (°C) | |
| Sistema inattivo | -- | -- | 45 | 40 |
| Stress Prime95 | 3,5 | -- | 76 | 49 |
| Prime95 + FurMark Stress | 2,6 - 3,5 | 1920 - 2610 | 77 - 90 | 75 |
| Witcher 3 Stress (modalità bilanciata) | ~1,2 | 2220 | 62 | 64 |
| Witcher 3 Stress (prestazioni con Overclock GPU disattivato + Overdrive disattivato) | ~1,2 | 2460 | 64 | 70 |
| Witcher 3 Stress (prestazioni con GPU Overclock On + Overdrive Off) | ~1,2 | 2610 | 63 | 70 |
| Witcher 3 Stress (prestazioni con GPU Overclock On + Overdrive On) | ~1,2 | 2580 | 64 | 71 |
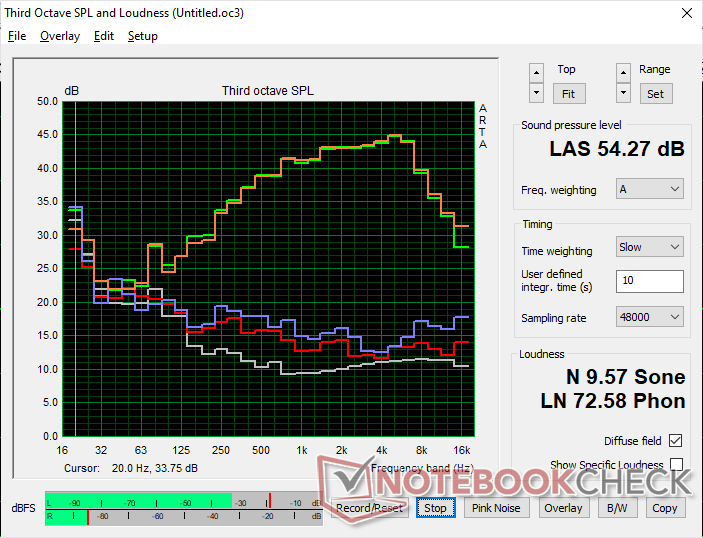
Altoparlanti
Con un massimo di circa 85 dB(A), gli altoparlanti hanno un volume pari a quello della maggior parte degli altri portatili da gioco. Non c'è nulla di speciale nella qualità dell'audio o nella riproduzione dei bassi. Gli altoparlanti si comportano meglio quando si gioca in modalità Bilanciata, poiché le ventole non sono così rumorose.
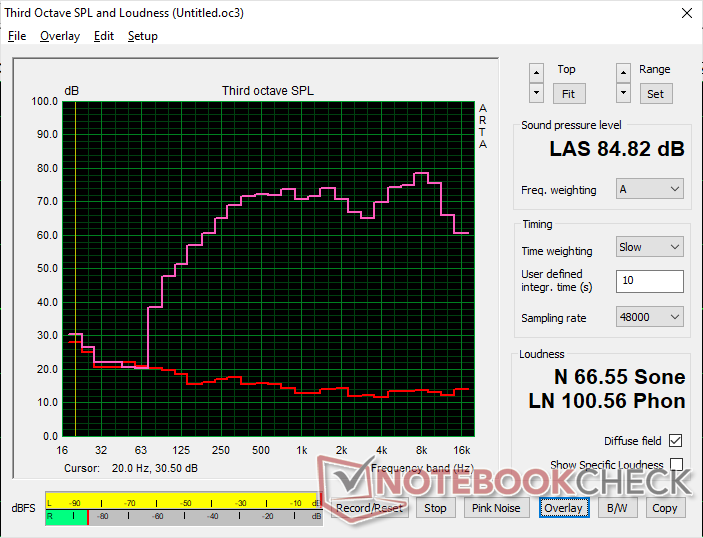
Lenovo Legion Slim 7i 16 Gen 8 analisi audio
(+) | gli altoparlanti sono relativamente potenti (84.8 dB)
Bassi 100 - 315 Hz
(±) | bassi ridotti - in media 12.1% inferiori alla media
(±) | la linearità dei bassi è media (9% delta rispetto alla precedente frequenza)
Medi 400 - 2000 Hz
(+) | medi bilanciati - solo only 1.4% rispetto alla media
(+) | medi lineari (3.3% delta rispetto alla precedente frequenza)
Alti 2 - 16 kHz
(+) | Alti bilanciati - appena 4.4% dalla media
(+) | alti lineari (5.6% delta rispetto alla precedente frequenza)
Nel complesso 100 - 16.000 Hz
(+) | suono nel complesso lineare (10.5% differenza dalla media)
Rispetto alla stessa classe
» 6% di tutti i dispositivi testati in questa classe è stato migliore, 2% simile, 92% peggiore
» Il migliore ha avuto un delta di 6%, medio di 18%, peggiore di 132%
Rispetto a tutti i dispositivi testati
» 5% di tutti i dispositivi testati in questa classe è stato migliore, 1% similare, 93% peggiore
» Il migliore ha avuto un delta di 4%, medio di 23%, peggiore di 134%
Apple MacBook Pro 16 2021 M1 Pro analisi audio
(+) | gli altoparlanti sono relativamente potenti (84.7 dB)
Bassi 100 - 315 Hz
(+) | bassi buoni - solo 3.8% dalla media
(+) | bassi in lineaa (5.2% delta rispetto alla precedente frequenza)
Medi 400 - 2000 Hz
(+) | medi bilanciati - solo only 1.3% rispetto alla media
(+) | medi lineari (2.1% delta rispetto alla precedente frequenza)
Alti 2 - 16 kHz
(+) | Alti bilanciati - appena 1.9% dalla media
(+) | alti lineari (2.7% delta rispetto alla precedente frequenza)
Nel complesso 100 - 16.000 Hz
(+) | suono nel complesso lineare (4.6% differenza dalla media)
Rispetto alla stessa classe
» 0% di tutti i dispositivi testati in questa classe è stato migliore, 0% simile, 100% peggiore
» Il migliore ha avuto un delta di 5%, medio di 17%, peggiore di 45%
Rispetto a tutti i dispositivi testati
» 0% di tutti i dispositivi testati in questa classe è stato migliore, 0% similare, 100% peggiore
» Il migliore ha avuto un delta di 4%, medio di 23%, peggiore di 134%
Gestione dell'energia
Consumo di energia - Elevati tassi di inattività
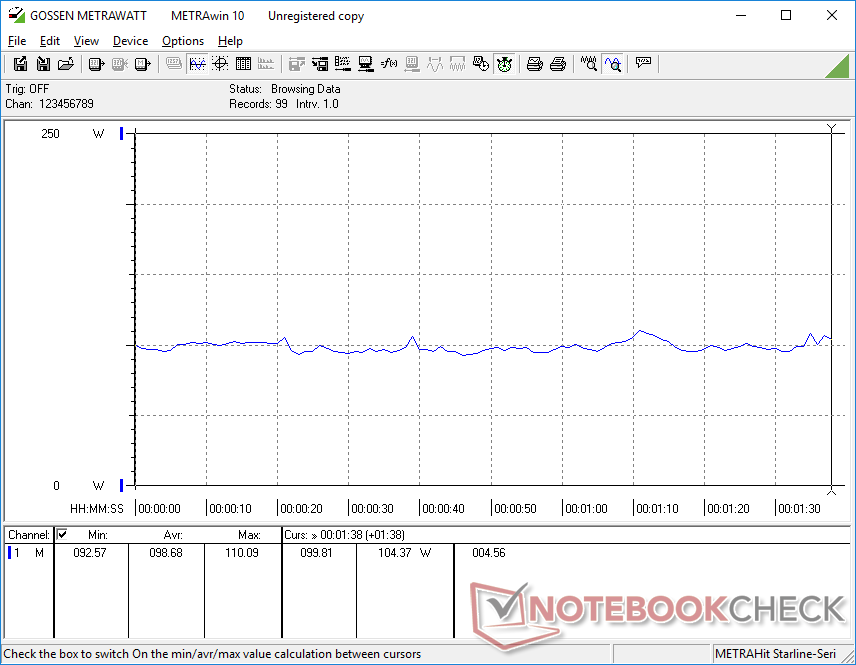
Il consumo di energia quando è al minimo sul desktop è relativamente alto, 22 W, anche con il risparmio energetico e le impostazioni di luminosità minime. Questo sembra essere un tratto comune tra i portatili da gioco dotati di CPU Core-H di 13a generazione, come mostra la tabella sottostante, che probabilmente contribuisce alla mediocre autonomia della batteria. In confronto, il portatile AMD Zen 4 alimentato da Legion Pro 5 16 può raggiungere gli 8 W in condizioni simili.
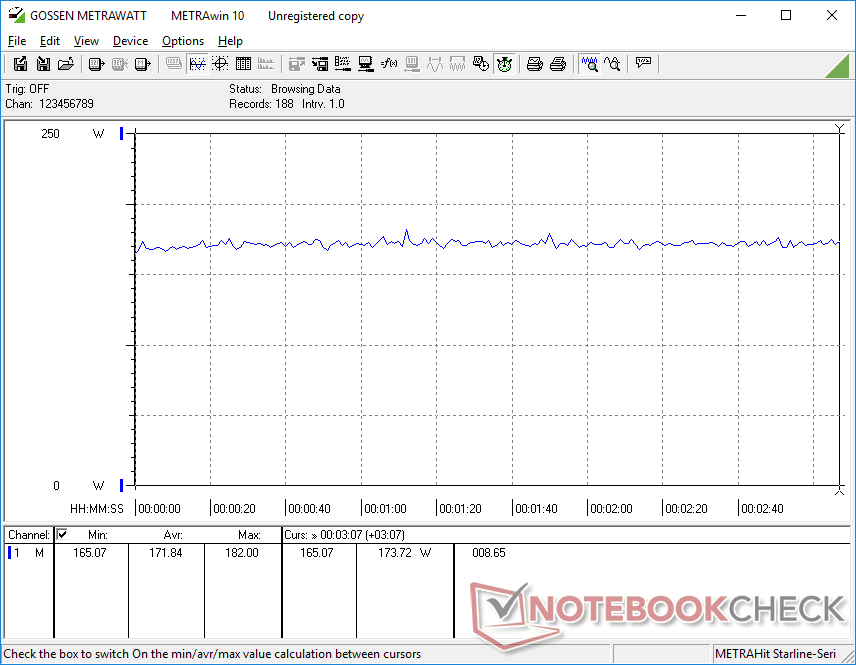
Il consumo per il gaming è di circa 172 W, molto simile a quello del più vecchio Zephyrus M16 con Core i9-12900H e RTX 3070 Ti. Il nostro Legion Slim 7 è quindi in grado di fornire prestazioni grafiche più veloci di circa il 15% senza dover consumare più energia, per prestazioni più elevate per watt rispetto ai vecchi laptop da gioco alimentati ad Ampere.
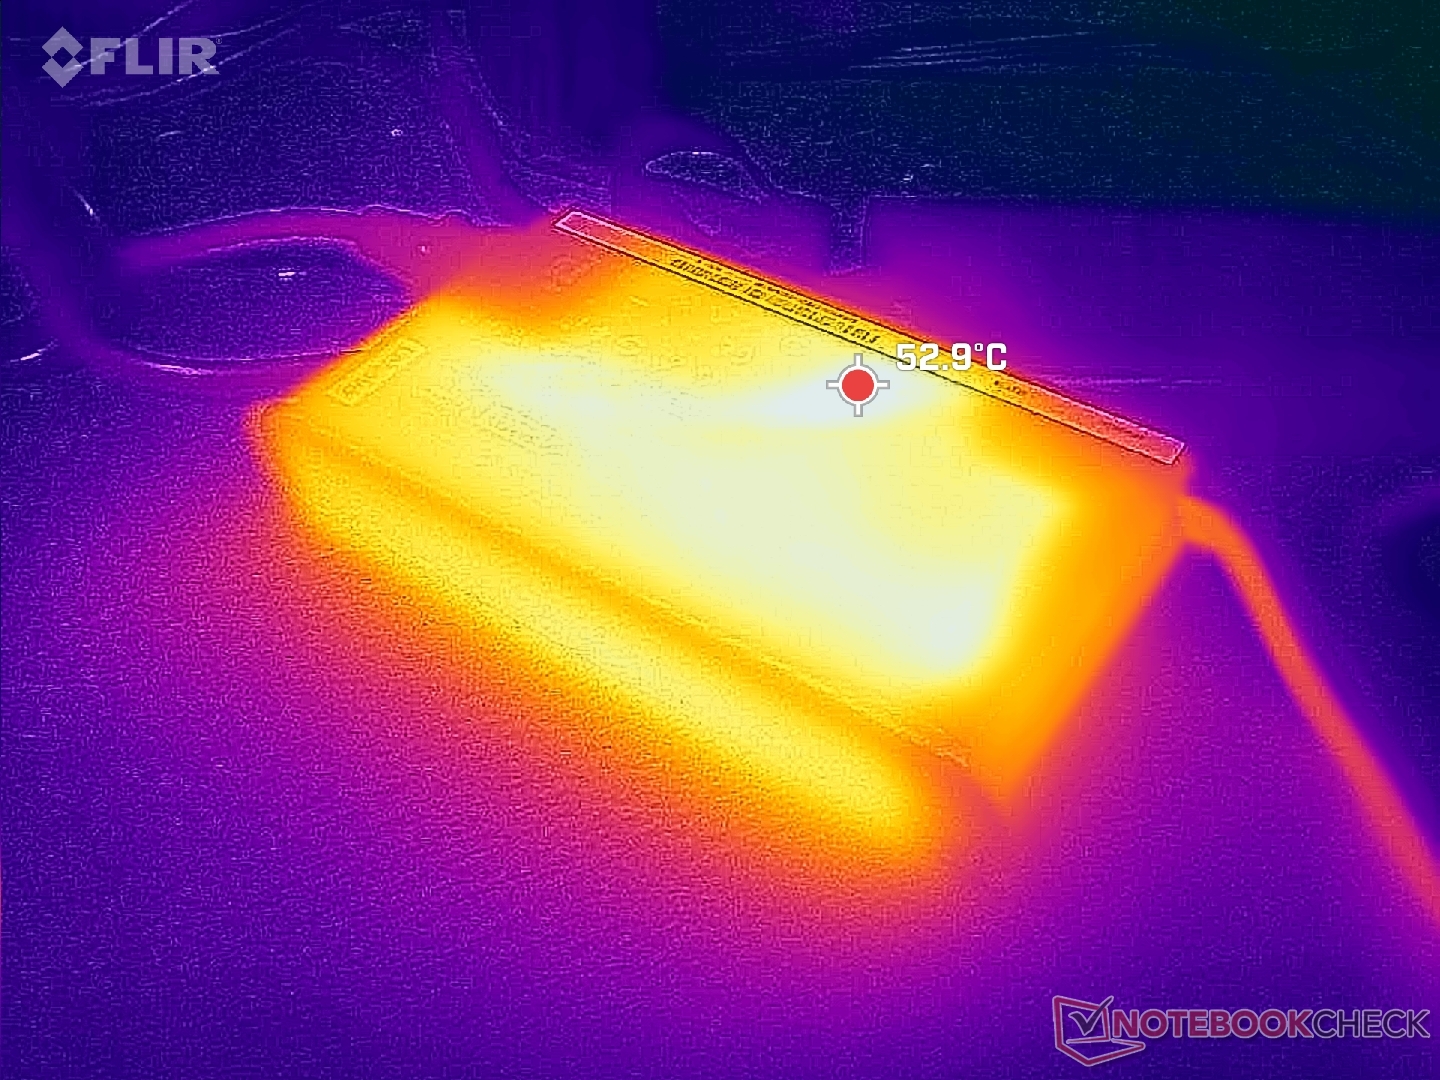
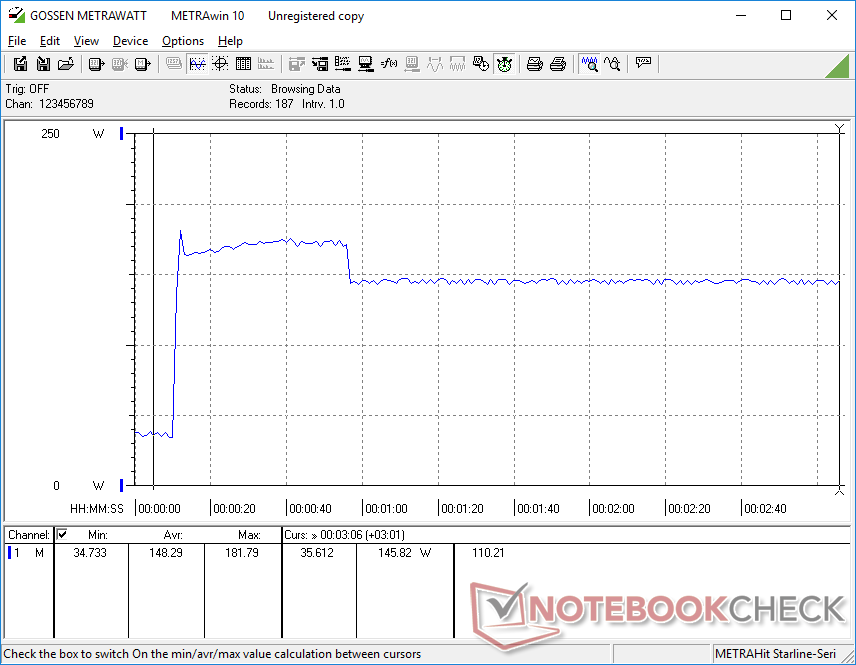
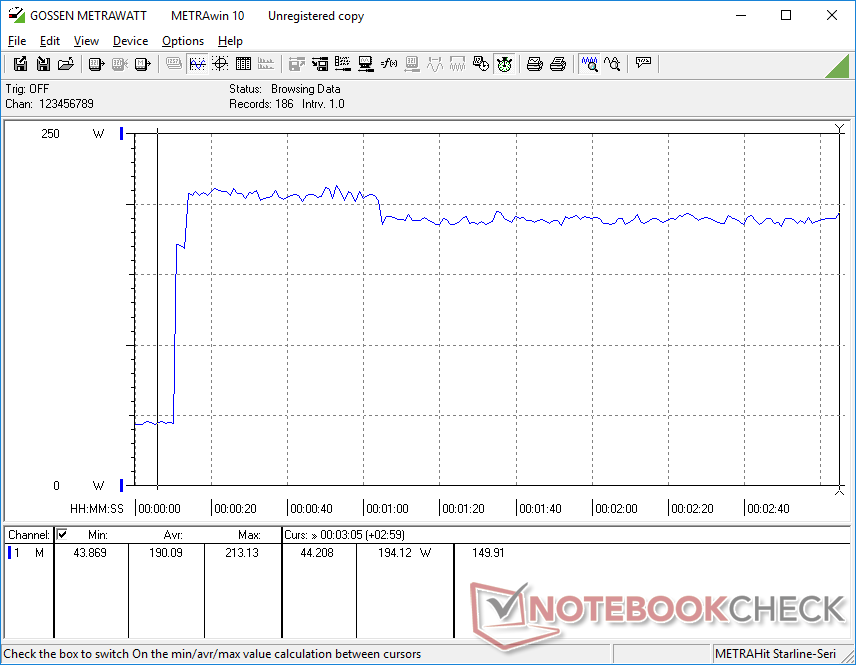
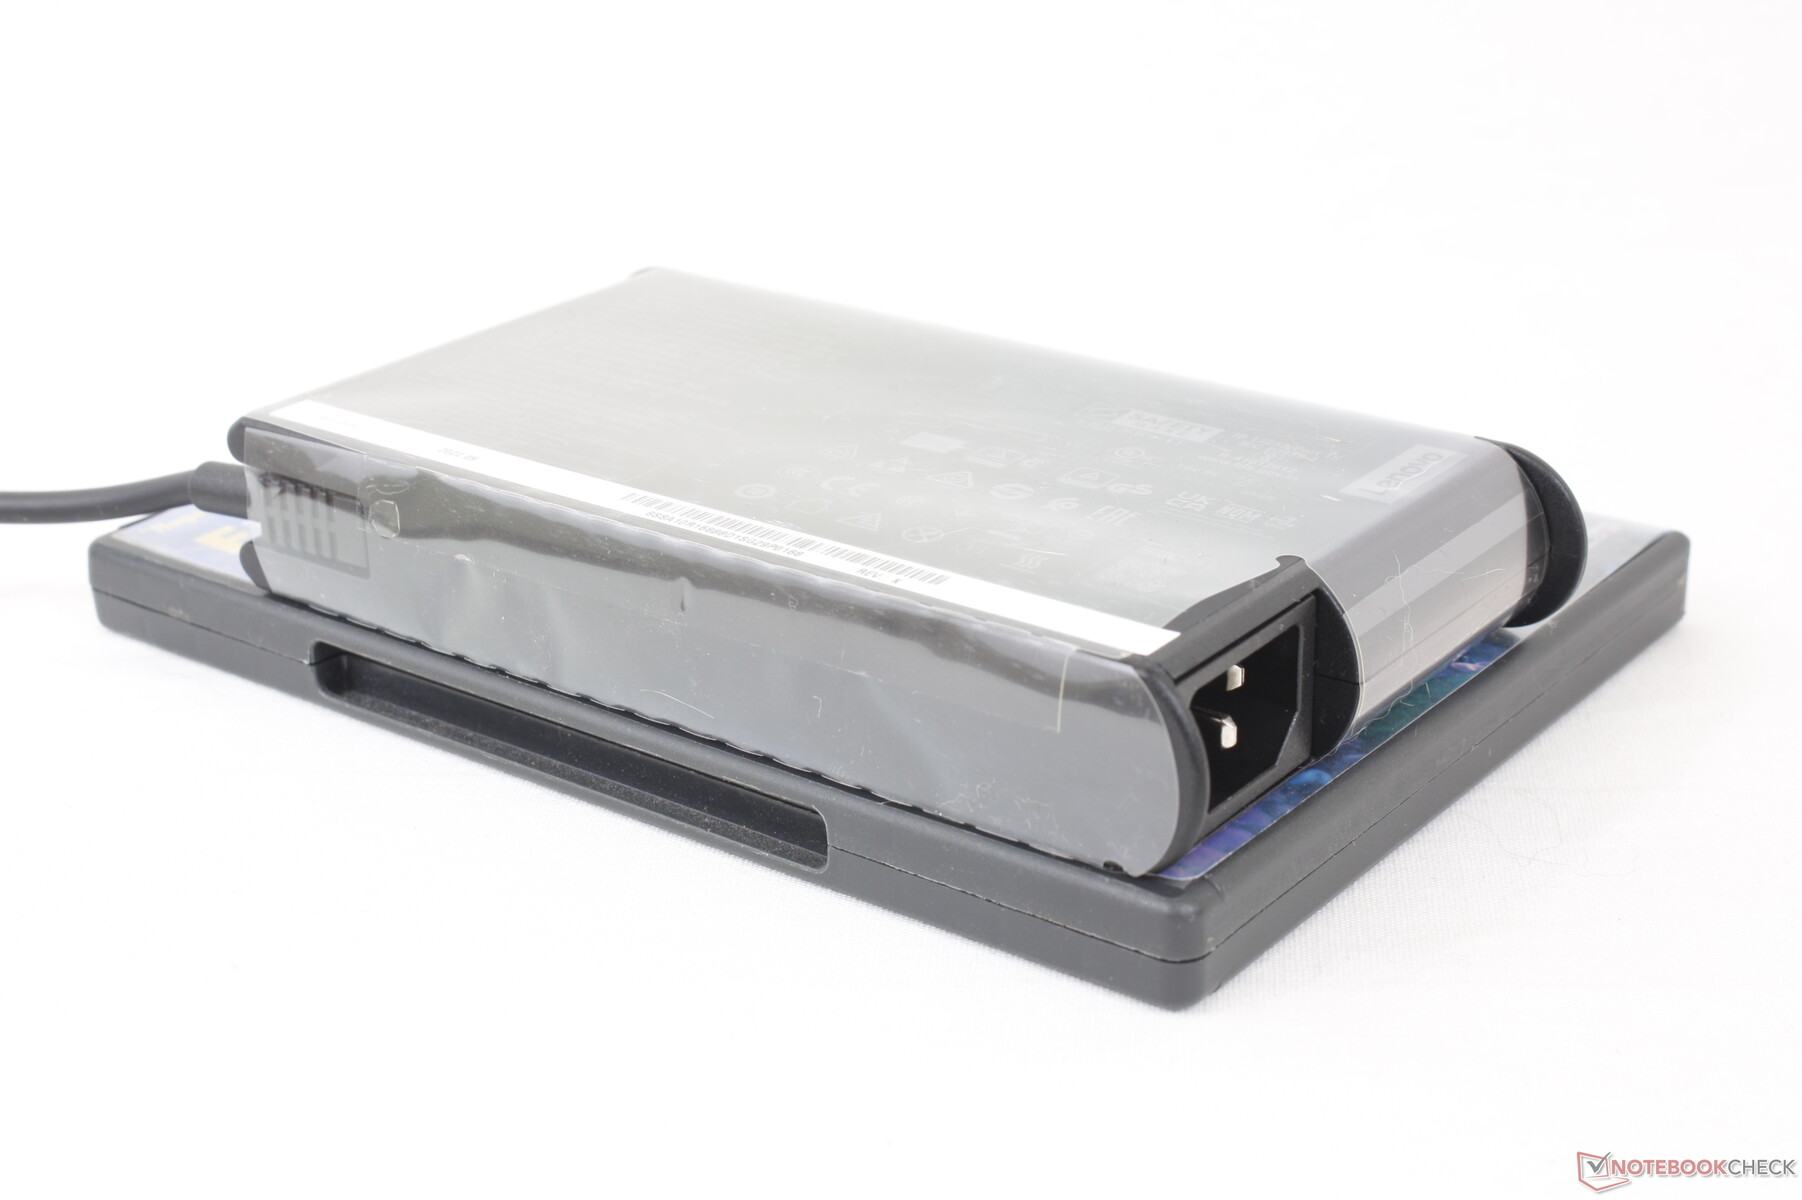
Abbiamo misurato un consumo di picco di 213 W dall'adattatore CA da 230 W di medie dimensioni (~16,9 x 8,8 x 2,6 cm). Un adattatore più grande, da 330 W, è incluso nel modello Legion Pro 7, dotato di un Core i9-13900HX e di una RTX 4080 molto più potenti.
| Off / Standby | |
| Idle | |
| Sotto carico |
|
Leggenda:
min: | |
| Lenovo Legion Slim 7i 16 Gen 8 i9-13900H, GeForce RTX 4070 Laptop GPU, Samsung PM9A1 MZVL21T0HCLR, IPS, 2560x1600, 16" | Acer Predator Helios 16 PH16-71-731Q i7-13700HX, GeForce RTX 4060 Laptop GPU, Micron 3400 1TB MTFDKBA1T0TFH, IPS-LED, 2560x1600, 16" | HP Omen 16-wf000 i7-13700HX, GeForce RTX 4080 Laptop GPU, SK hynix PC801 HFS002TEJ9X101N, IPS, 2560x1440, 16.1" | Lenovo Legion Pro 7 RTX4090 i9-13900HX, GeForce RTX 4090 Laptop GPU, Samsung PM9A1 MZVL21T0HCLR, IPS, 2560x1600, 16" | Alienware x16 R1 i9-13900HK, GeForce RTX 4080 Laptop GPU, SK hynix PC801 HFS001TEJ9X101N, IPS, 2560x1600, 16" | Lenovo Legion Pro 5 16ARX8 R7 7745HX, GeForce RTX 4070 Laptop GPU, Samsung PM9A1 MZVL21T0HCLR, IPS, 2560x1600, 16" | |
|---|---|---|---|---|---|---|
| Power Consumption | 11% | -8% | -20% | -25% | 15% | |
| Idle Minimum * (Watt) | 22 | 15.9 28% | 21.8 1% | 20 9% | 25.2 -15% | 8.1 63% |
| Idle Average * (Watt) | 29 | 20.5 29% | 26 10% | 25 14% | 29.9 -3% | 15.9 45% |
| Idle Maximum * (Watt) | 39.5 | 20.9 47% | 36 9% | 35 11% | 49.8 -26% | 37.2 6% |
| Load Average * (Watt) | 98.7 | 106 -7% | 115.5 -17% | 136 -38% | 105.4 -7% | 90.9 8% |
| Witcher 3 ultra * (Watt) | 171.8 | 175 -2% | 214 -25% | 282 -64% | 263 -53% | 189.6 -10% |
| Load Maximum * (Watt) | 213.2 | 276 -29% | 269.7 -27% | 320 -50% | 313.8 -47% | 263.5 -24% |
* ... Meglio usare valori piccoli
Power Consumption Witcher 3 / Stresstest
Power Consumption external Monitor
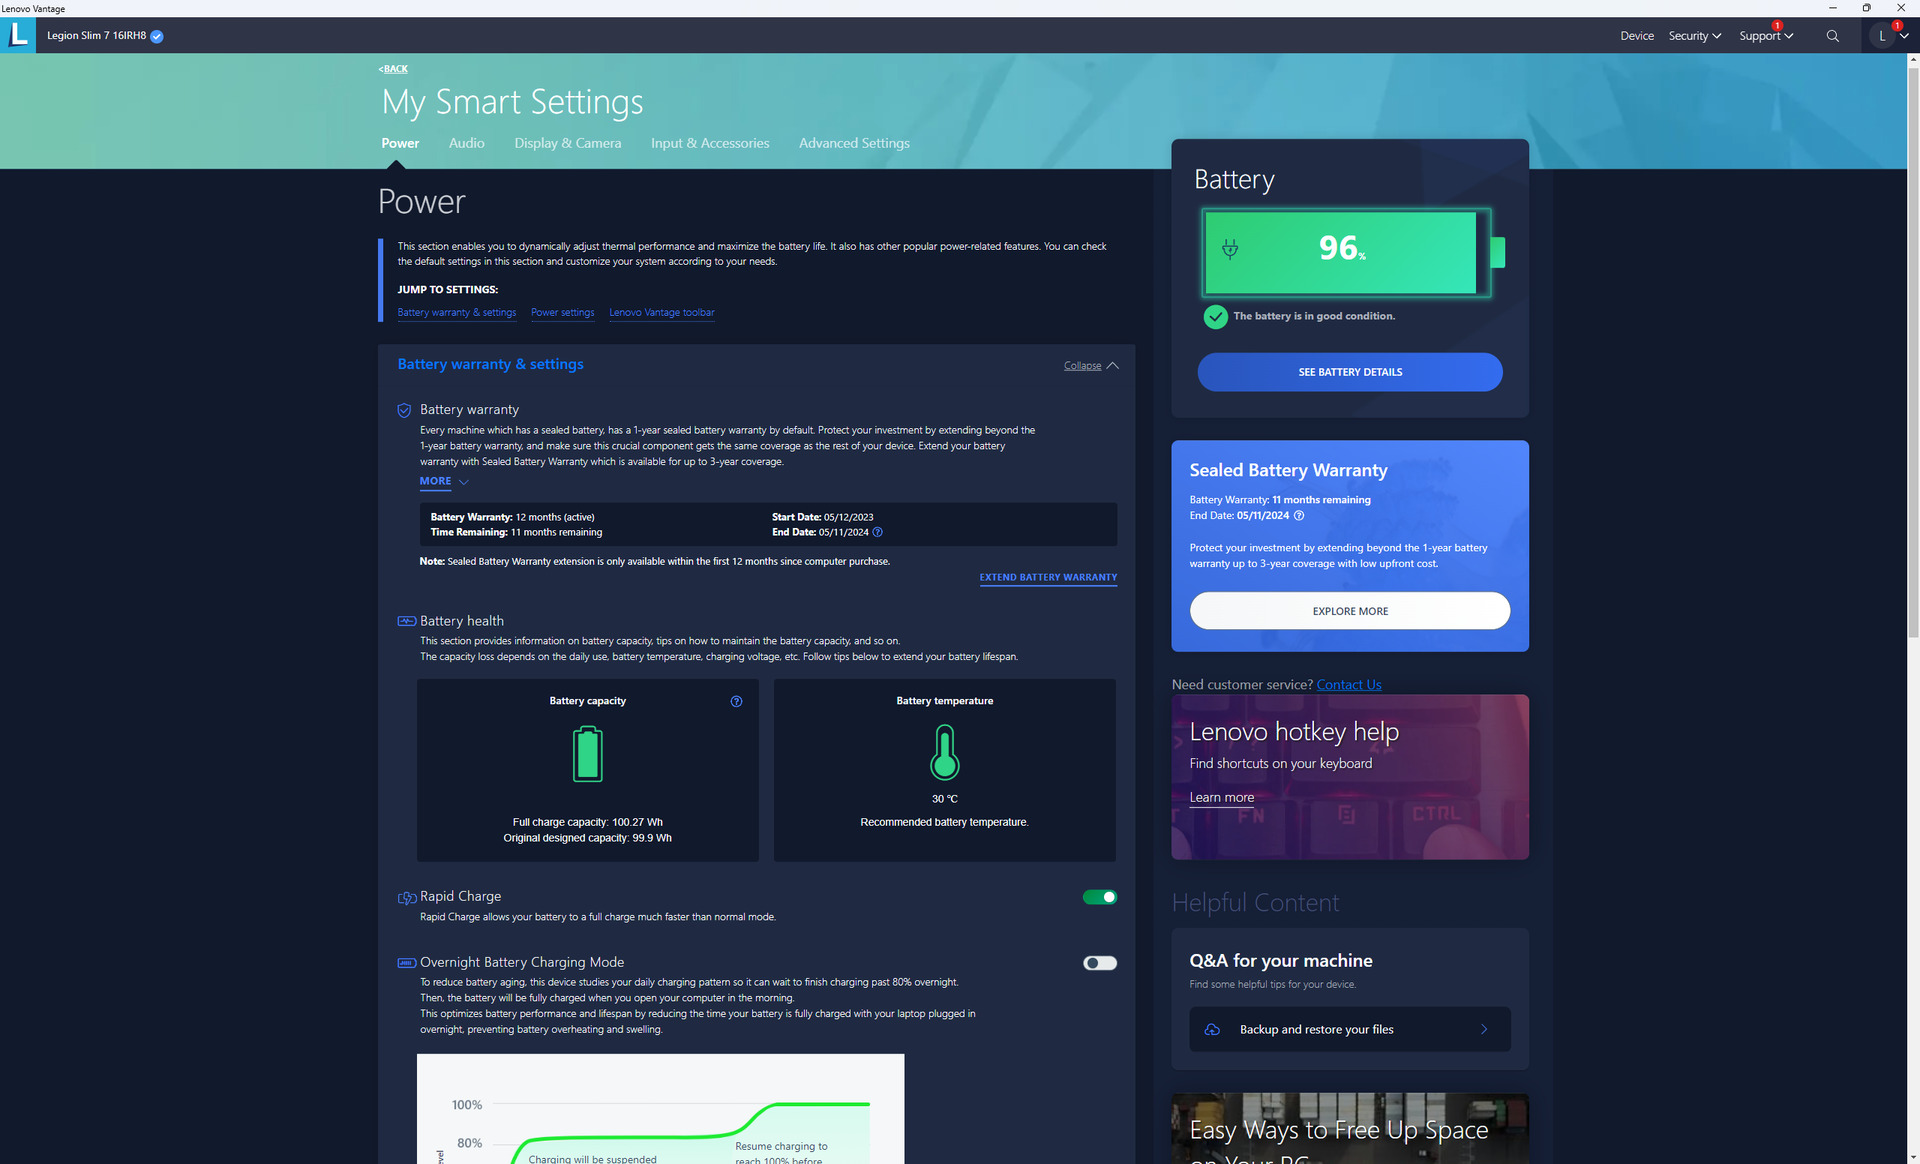
Durata della batteria
La capacità della batteria è sorprendentemente pari a quella del Legion Pro 7 17, nonostante il profilo più sottile del nostro Slim 7i. Tuttavia, la durata della batteria è ancora nella media, con poco meno di 4,5 ore di navigazione nel mondo reale. La maggior parte degli altri computer portatili da gioco con CPU Intel di 13a generazione hanno un'autonomia simile o inferiore, tra cui l' Omen 16 o l'Alienware x16 R1.
La ricarica da vuoto a pieno richiede solo 70 minuti con la funzione Rapid Charge attivata, rispetto ai 90 minuti o più della maggior parte degli altri portatili da gioco. Il sistema può essere ricaricato anche tramite USB-C con una potenza massima di 140 W.
| Lenovo Legion Slim 7i 16 Gen 8 i9-13900H, GeForce RTX 4070 Laptop GPU, 99.9 Wh | HP Omen 16-wf000 i7-13700HX, GeForce RTX 4080 Laptop GPU, 83 Wh | Alienware x16 R1 i9-13900HK, GeForce RTX 4080 Laptop GPU, 90 Wh | Lenovo Legion Pro 7 RTX4090 i9-13900HX, GeForce RTX 4090 Laptop GPU, 99.9 Wh | Asus ROG Strix G16 G614JZ i9-13980HX, GeForce RTX 4080 Laptop GPU, 90 Wh | Razer Blade 16 Early 2023 i9-13950HX, GeForce RTX 4080 Laptop GPU, 95.2 Wh | |
|---|---|---|---|---|---|---|
| Autonomia della batteria | 15% | -7% | 16% | 71% | 57% | |
| Reader / Idle (h) | 5.1 | 5.5 8% | 7.3 43% | 8.9 75% | ||
| WiFi v1.3 (h) | 4.4 | 5.1 16% | 2.5 -43% | 5.1 16% | 9.7 120% | 6.1 39% |
| Load (h) | 0.9 | 1.1 22% | 0.7 -22% | 1.1 22% | 1.4 56% |
Pro
Contro
Verdetto: convincente sotto quasi tutti gli aspetti
Il Legion Slim 7i 16 Gen 8 è uno dei portatili da gioco più equilibrati della famiglia Legion. Non solo è più sottile e leggero della maggior parte dei portatili da 16 pollici, ma non risparmia nemmeno le opzioni delle porte, la spaziosa tastiera RGB per tasto, le opzioni di visualizzazione di tutto rispetto per i giocatori e i creatori di contenuti e persino la capacità della batteria e il lettore SD. Il modello è in grado di soddisfare molte esigenze, considerando il suo profilo sottile.
Il Lenovo Legion Slim 7i 16 G8 sacrifica alcune opzioni di prestazioni per le dimensioni più sottili e il peso ridotto, ma per il resto il modello è così ben bilanciato in termini di prestazioni e portabilità che probabilmente la maggior parte dei giocatori non se ne preoccupa.
Alcune crepe iniziano a manifestarsi quando ci si immerge più a fondo nella macchina. La configurazione della RAM saldata ed espandibile, ad esempio, non è comune nei portatili da gioco, mentre l'SSD tende a bloccarsi quando è sotto stress. Le opzioni di CPU e GPU omettono rispettivamente il Core i9-13900HX e la RTX 4080 di fascia più alta, che sono disponibili solo sul più spesso e pesante Legion Pro 7 16. Gli appassionati che vogliono tutto e la cucina dovranno quindi accontentarsi di alternative più grandi e pesanti come il Legion Pro 7, Alienware m16 o il Razer Blade 16 ognuno dei quali offre opzioni di processore più veloci.
Prezzo e disponibilità
Lenovo sta spedendo il suo Legion Slim 7i 16 Gen 8 a partire da 1500 dollari per la configurazione base con Core i7-13700H e RTX 4060 fino a 1800 dollari con la configurazione con Core i9-13900H e RTX 4070. La configurazione di fascia più alta è disponibile anche presso Best Buy.
Lenovo Legion Slim 7i 16 Gen 8
- 07/03/2023 v7 (old)
Allen Ngo
Transparency
La selezione dei dispositivi da recensire viene effettuata dalla nostra redazione. Il campione di prova è stato fornito all'autore come prestito dal produttore o dal rivenditore ai fini di questa recensione. L'istituto di credito non ha avuto alcuna influenza su questa recensione, né il produttore ne ha ricevuto una copia prima della pubblicazione. Non vi era alcun obbligo di pubblicare questa recensione. In quanto società mediatica indipendente, Notebookcheck non è soggetta all'autorità di produttori, rivenditori o editori.
Ecco come Notebookcheck esegue i test
Ogni anno, Notebookcheck esamina in modo indipendente centinaia di laptop e smartphone utilizzando procedure standardizzate per garantire che tutti i risultati siano comparabili. Da circa 20 anni sviluppiamo continuamente i nostri metodi di prova e nel frattempo stabiliamo gli standard di settore. Nei nostri laboratori di prova, tecnici ed editori esperti utilizzano apparecchiature di misurazione di alta qualità. Questi test comportano un processo di validazione in più fasi. Il nostro complesso sistema di valutazione si basa su centinaia di misurazioni e parametri di riferimento ben fondati, che mantengono l'obiettività.Price comparison

