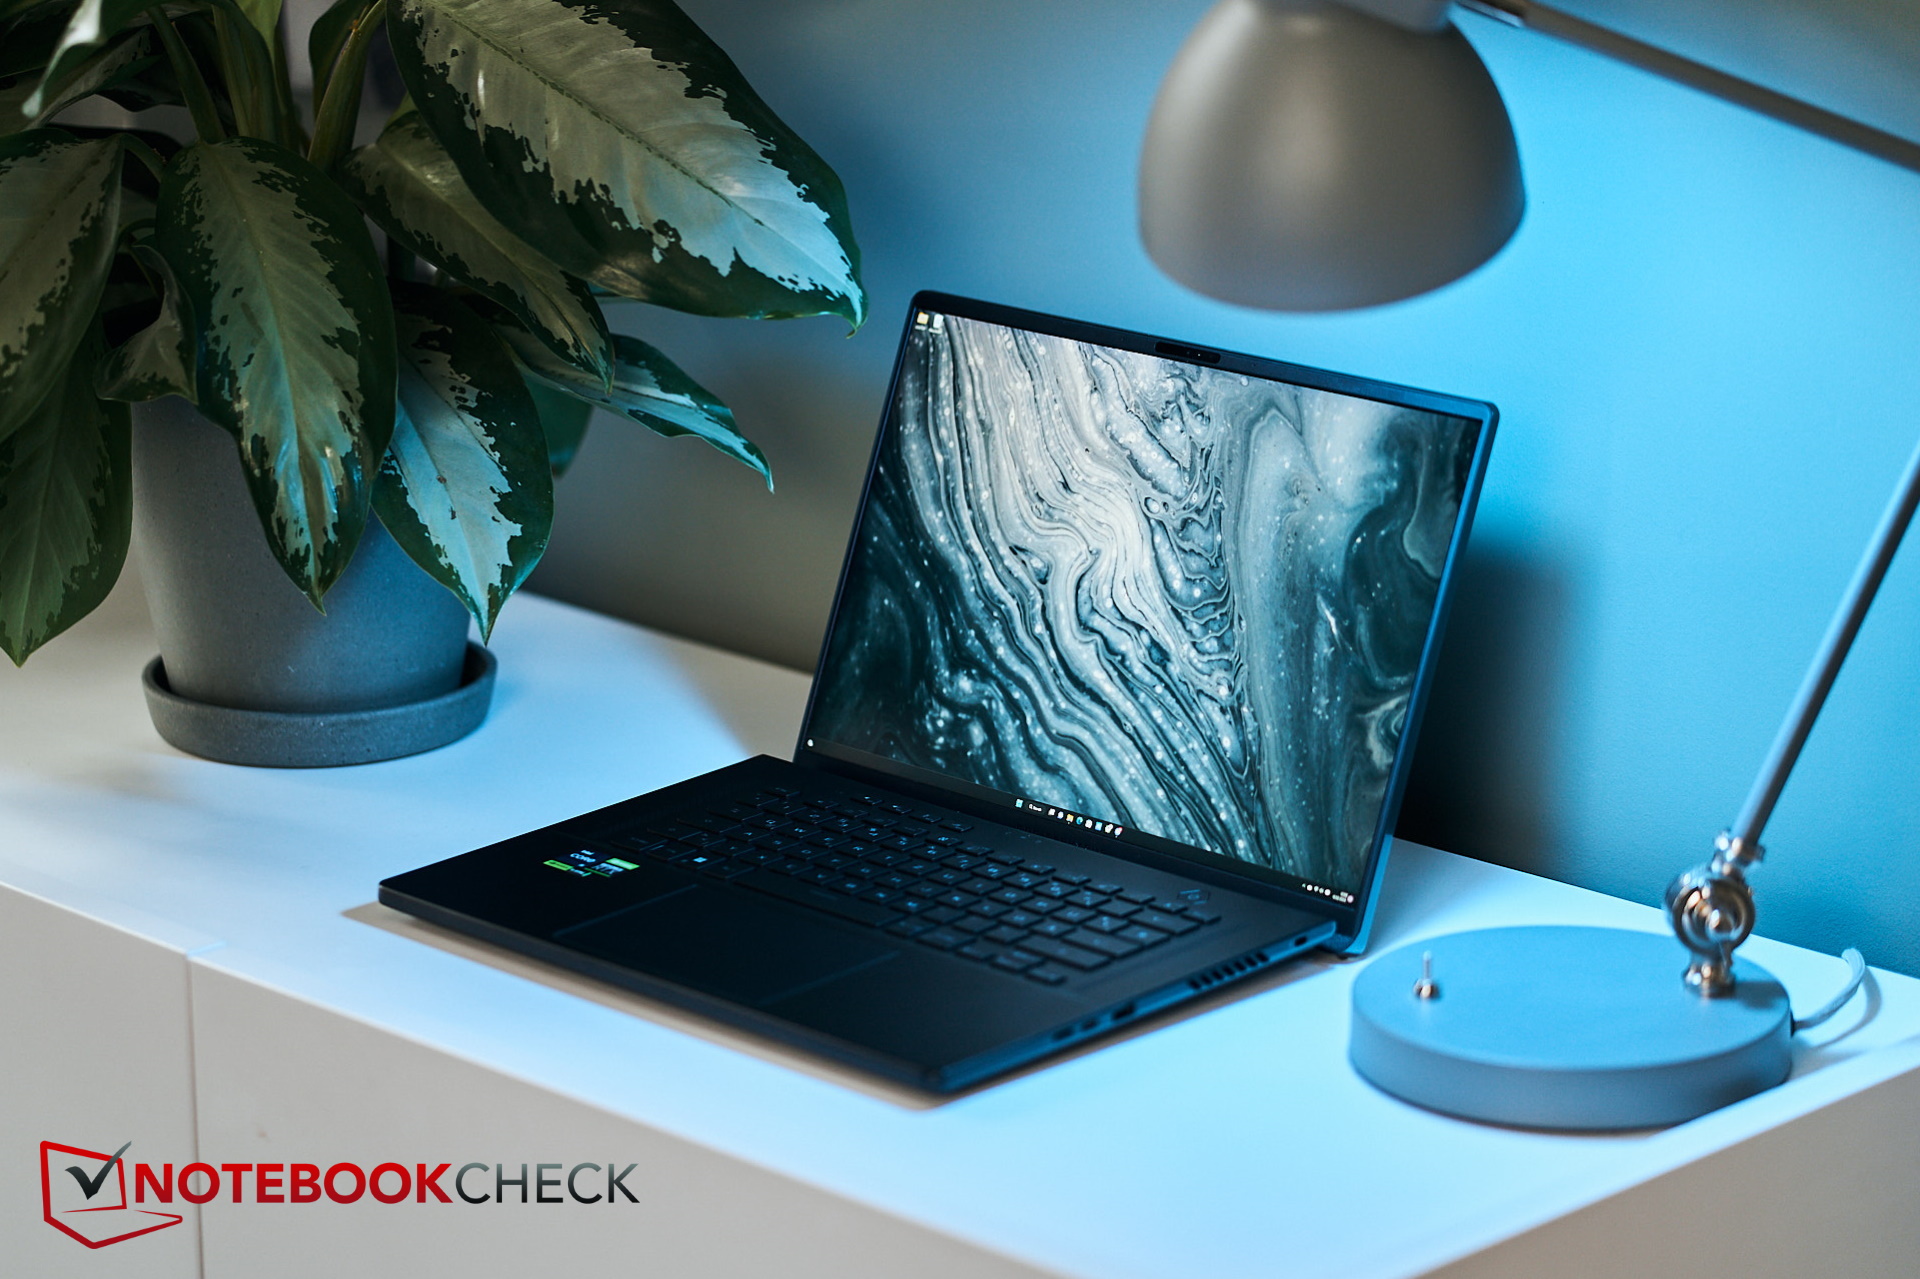
Recensione del portatile Asus ROG Zephyrus M16 (2023): RTX 4090 con un display Mini-LED super luminoso

Come uno degli ultimi esempi della "vecchia" generazione di CPU/GPU, abbiamo recentemente recensito il ROG Zephyrus M16che era equipaggiato con unCore i9-12900He unaRTX 3070 Ti. Ma ora, un cambio di guardia è arrivato sotto forma di M16, questa volta con unCore i9-13900He unaRTX 4090 all'interno di un case "AniMe Matrix". Quest'ultimo è leggermente cambiato, in quanto la matrice è diventata un po' più fine. Abbiamo dato un'occhiata dettagliata a questi cambiamenti e abbiamo verificato se l'M16 può andare d'accordo con la RTX 4090.
Ovviamente, abbiamo confrontato il nuovo dispositivo con il predecessore e con altre macchine da gioco di fascia alta. Dato che la RTX 4090 si trova normalmente in computer portatili più grandi, analizziamo anche il modello da 18 polliciAsus ROG Strix Scar 18 o il 17 polliciMSI Titan GT77. Consideriamo anche i modelli Lenovo Legion Pro 7 16IRX e il Razer Blade 16 sono concorrenti.
Potenziali concorrenti a confronto
Punteggio | Data | Modello | Peso | Altezza | Dimensione | Risoluzione | Prezzo |
|---|---|---|---|---|---|---|---|
| 89.4 % v7 (old) | 03/2023 | Asus ROG Zephyrus M16 GU604VY-NM042X i9-13900H, GeForce RTX 4090 Laptop GPU | 2.3 kg | 22.9 mm | 16.00" | 2560x1600 | |
| 87.8 % v7 (old) | 02/2023 | Asus ROG Zephyrus M16 GU603Z i9-12900H, GeForce RTX 3070 Ti Laptop GPU | 2.1 kg | 19.9 mm | 16.00" | 2560x1600 | |
| 86.6 % v7 (old) | 02/2023 | Asus ROG Strix Scar 18 2023 G834JY-N6005W i9-13980HX, GeForce RTX 4090 Laptop GPU | 3.1 kg | 30.8 mm | 18.00" | 2560x1600 | |
| 89 % v7 (old) | 02/2023 | MSI Titan GT77 HX 13VI i9-13950HX, GeForce RTX 4090 Laptop GPU | 3.5 kg | 23 mm | 17.30" | 3840x2160 | |
| 89.4 % v7 (old) | 02/2023 | Lenovo Legion Pro 7 16IRX8H i9-13900HX, GeForce RTX 4080 Laptop GPU | 2.7 kg | 26 mm | 16.00" | 2560x1600 | |
| 91.2 % v7 (old) | 02/2023 | Razer Blade 16 Early 2023 i9-13950HX, GeForce RTX 4080 Laptop GPU | 2.4 kg | 21.99 mm | 16.00" | 2560x1600 |
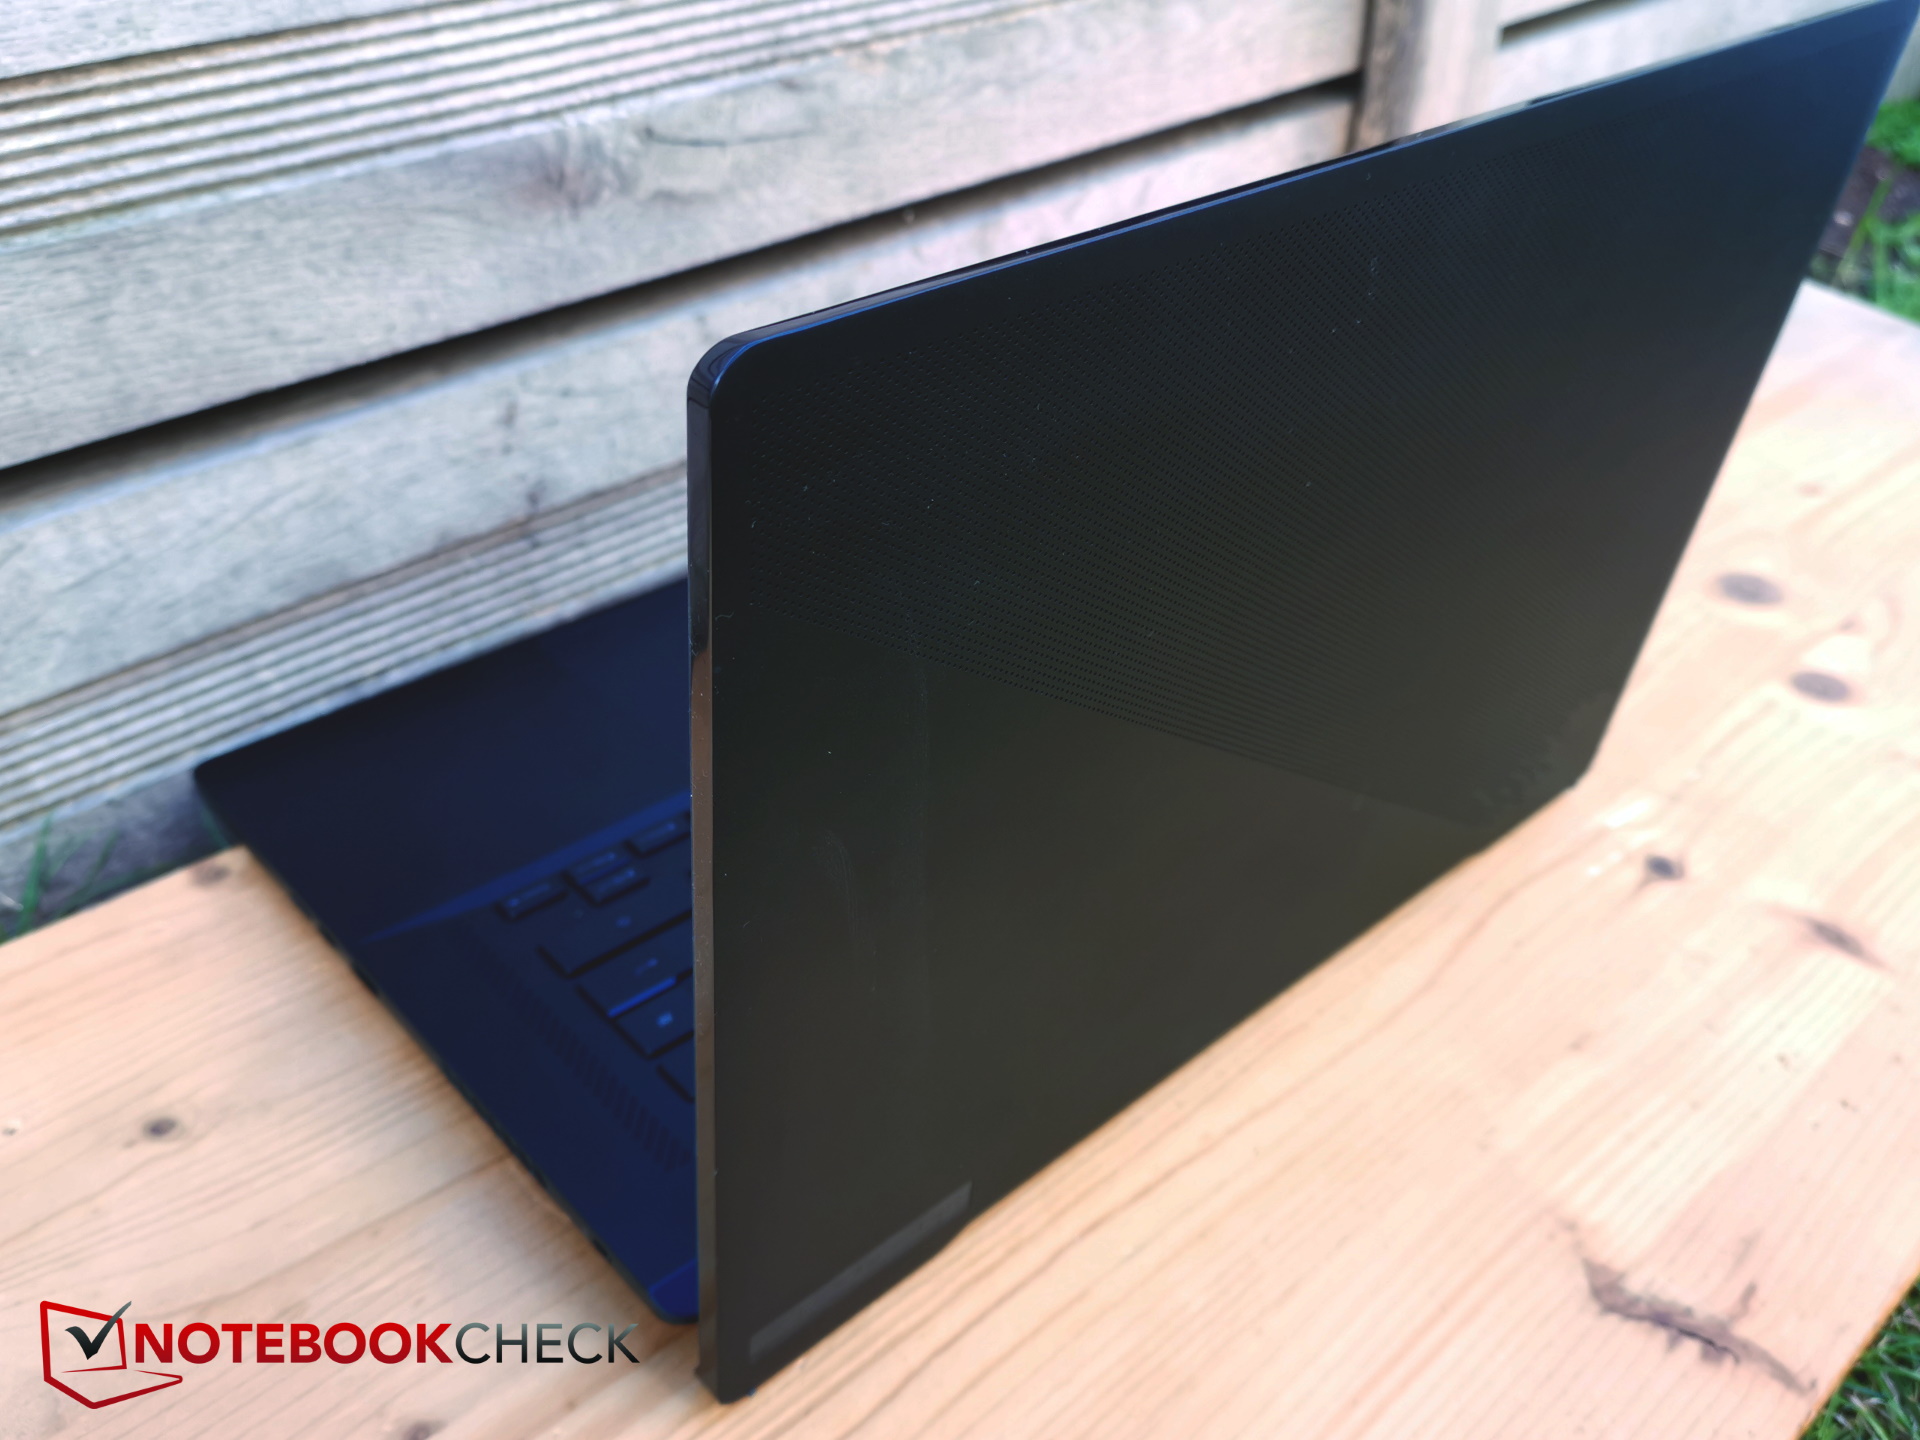
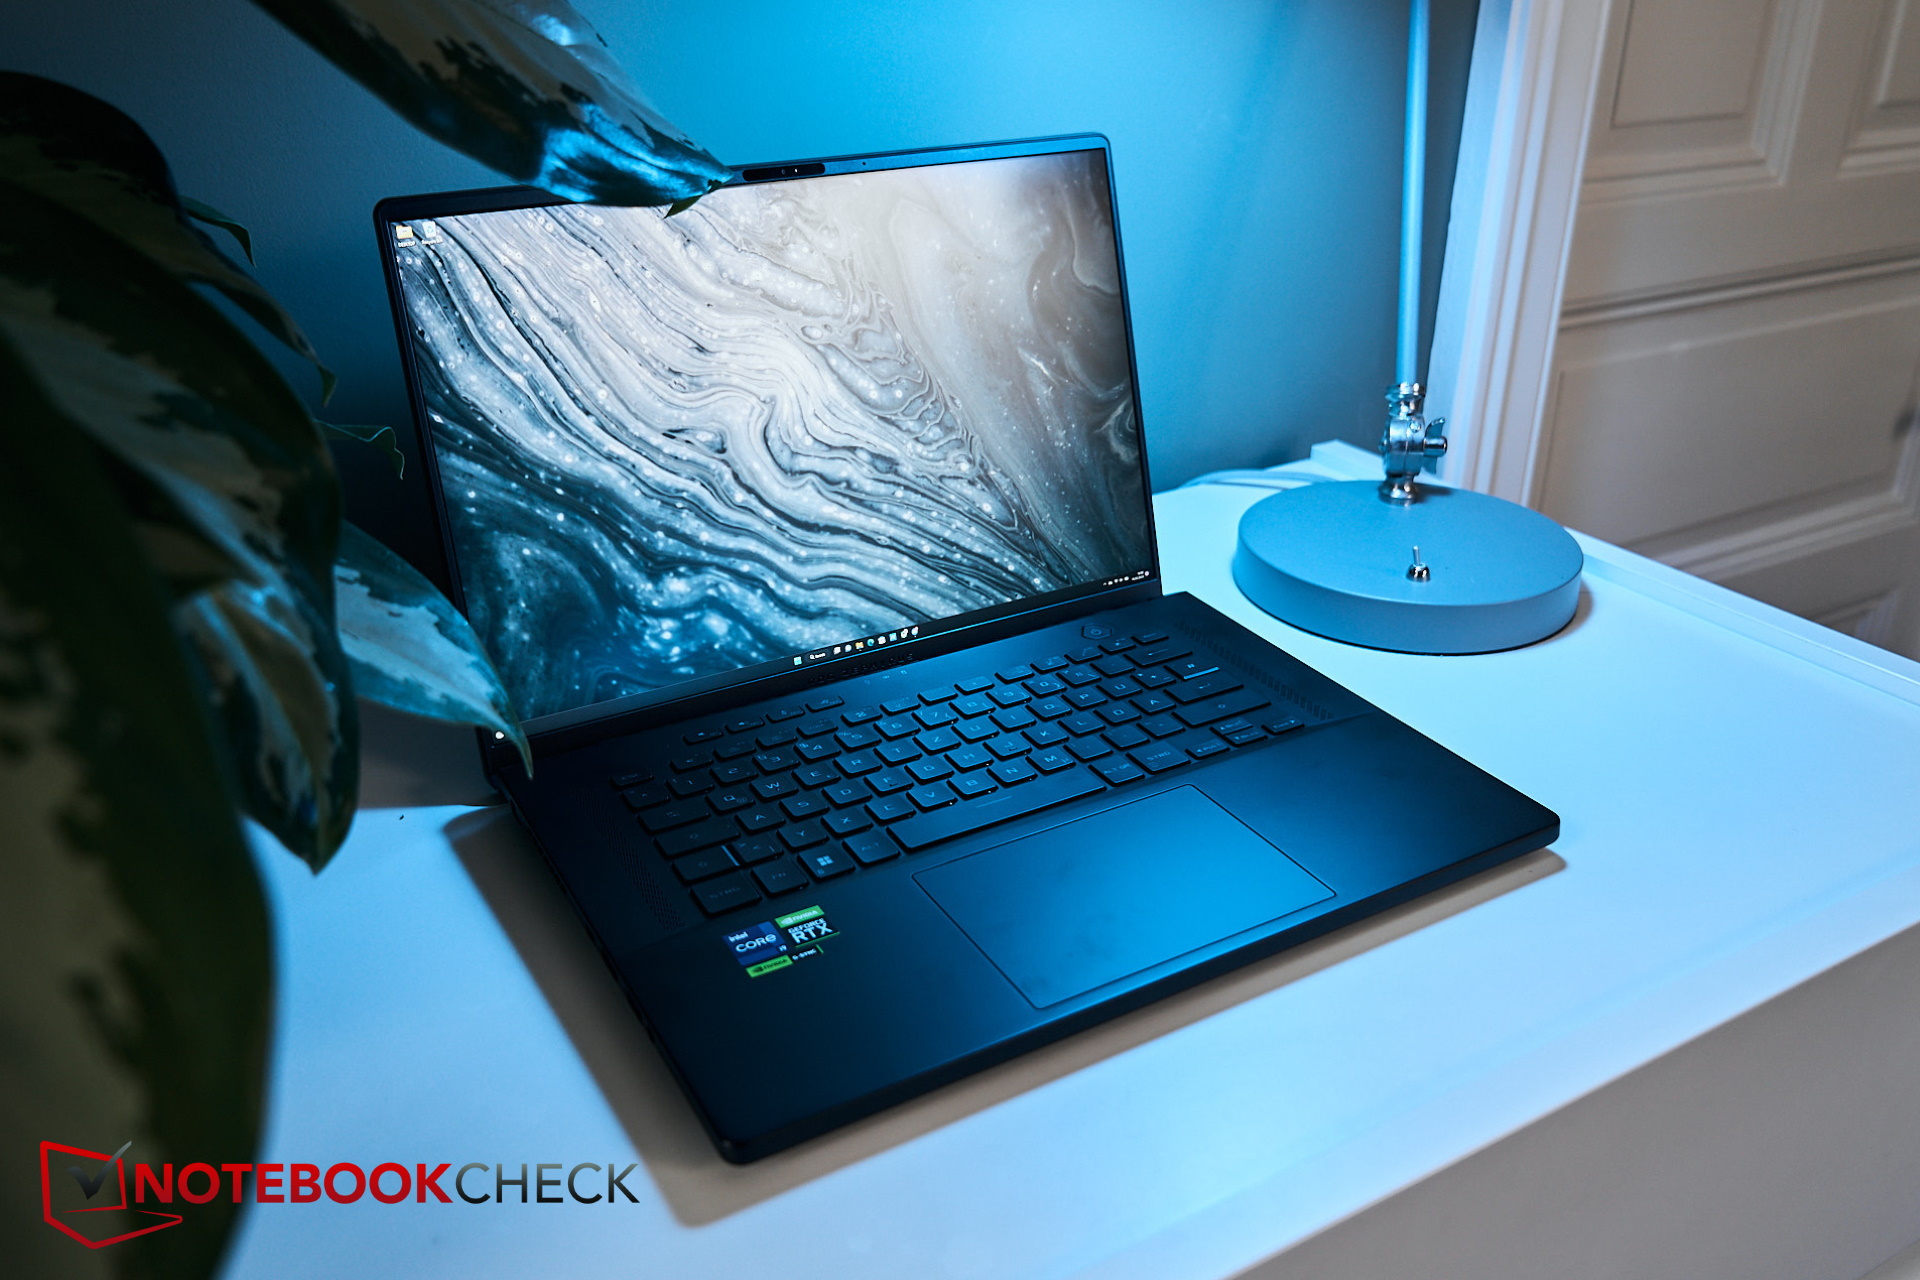
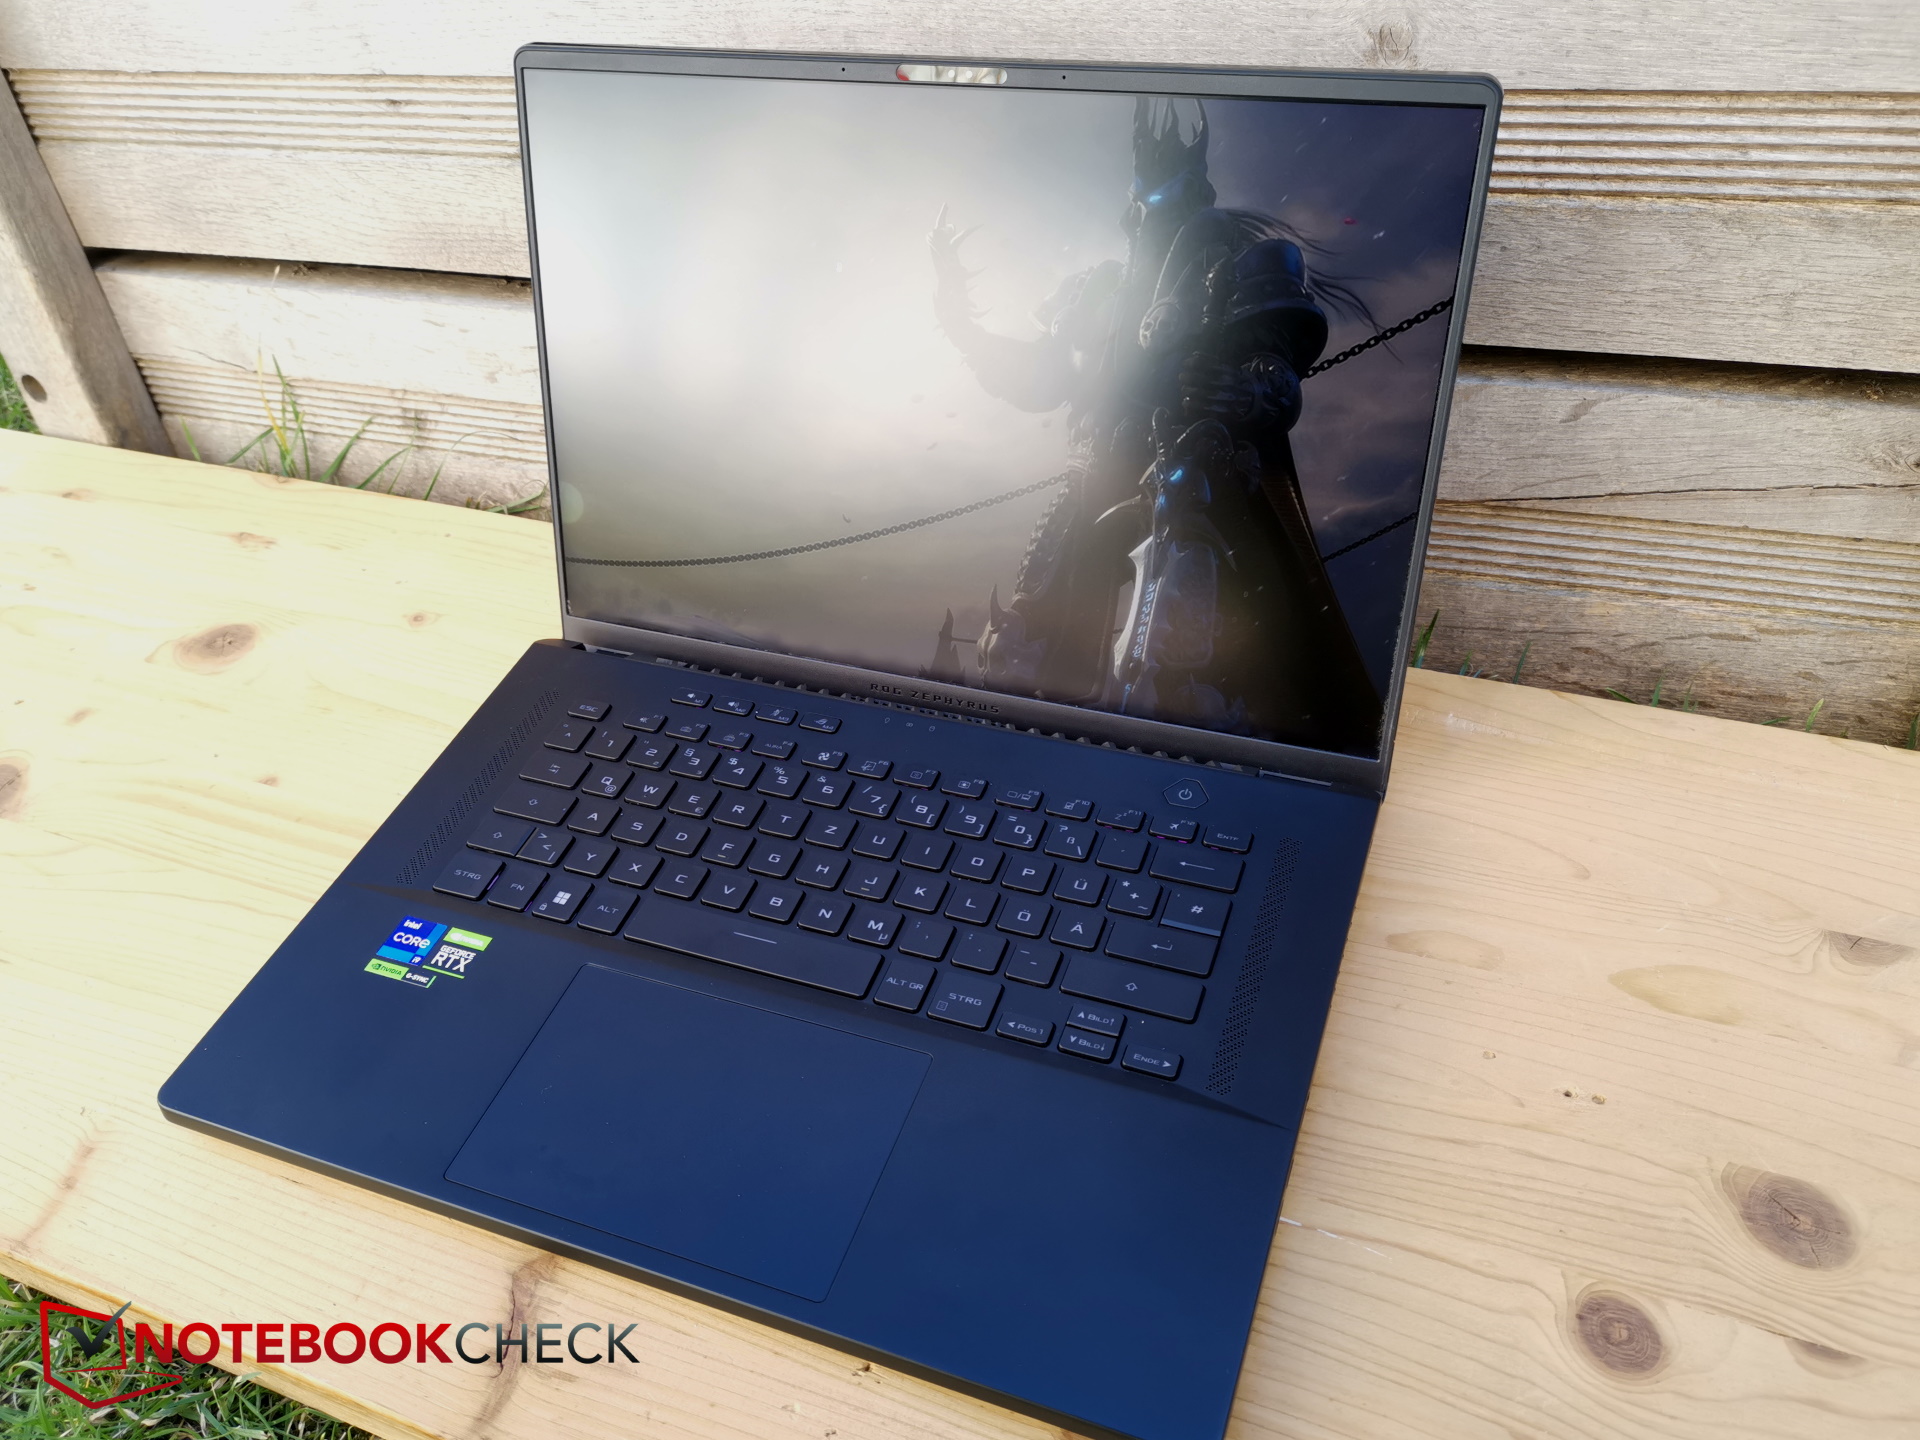
Caso - Un AniMe Matrix che fa girare la testa
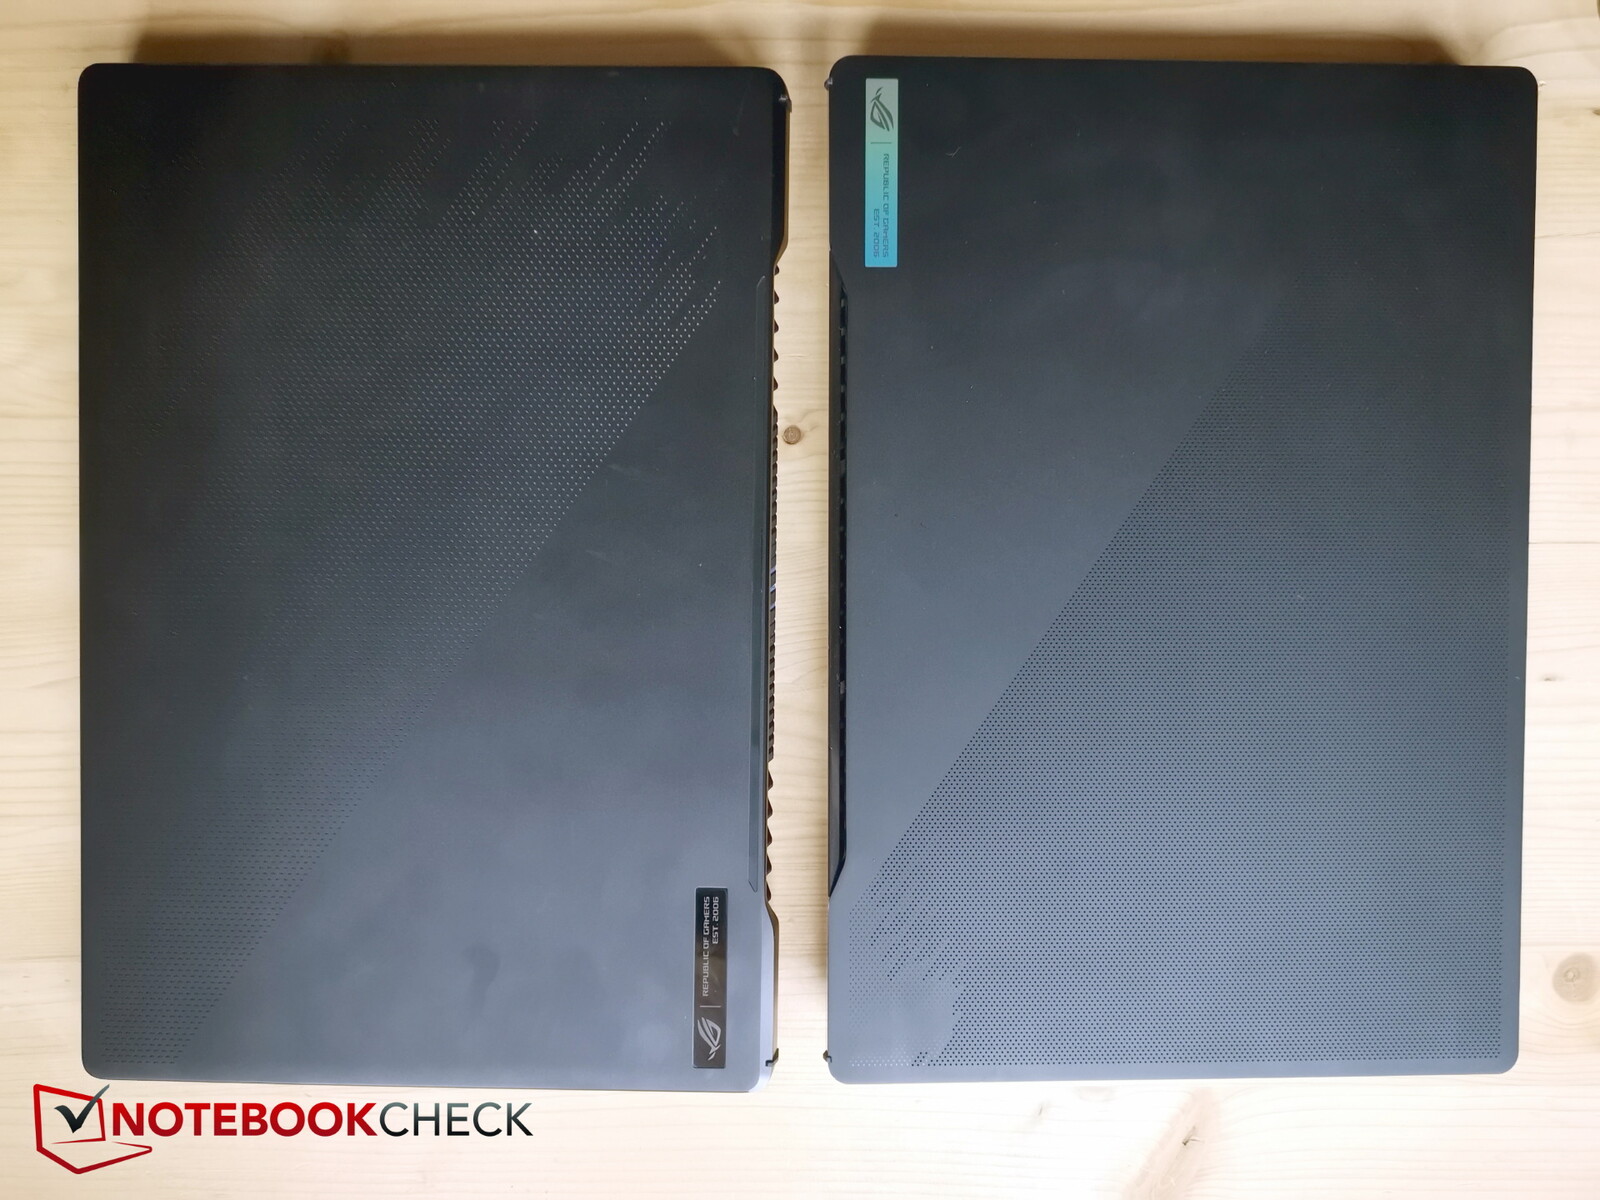
Gigabyte ha rivisto il case quest'anno ma, a prima vista, è difficile individuare differenze evidenti. Lo chassis continua a essere realizzato in plastica nera, ora leggermente più spessa.
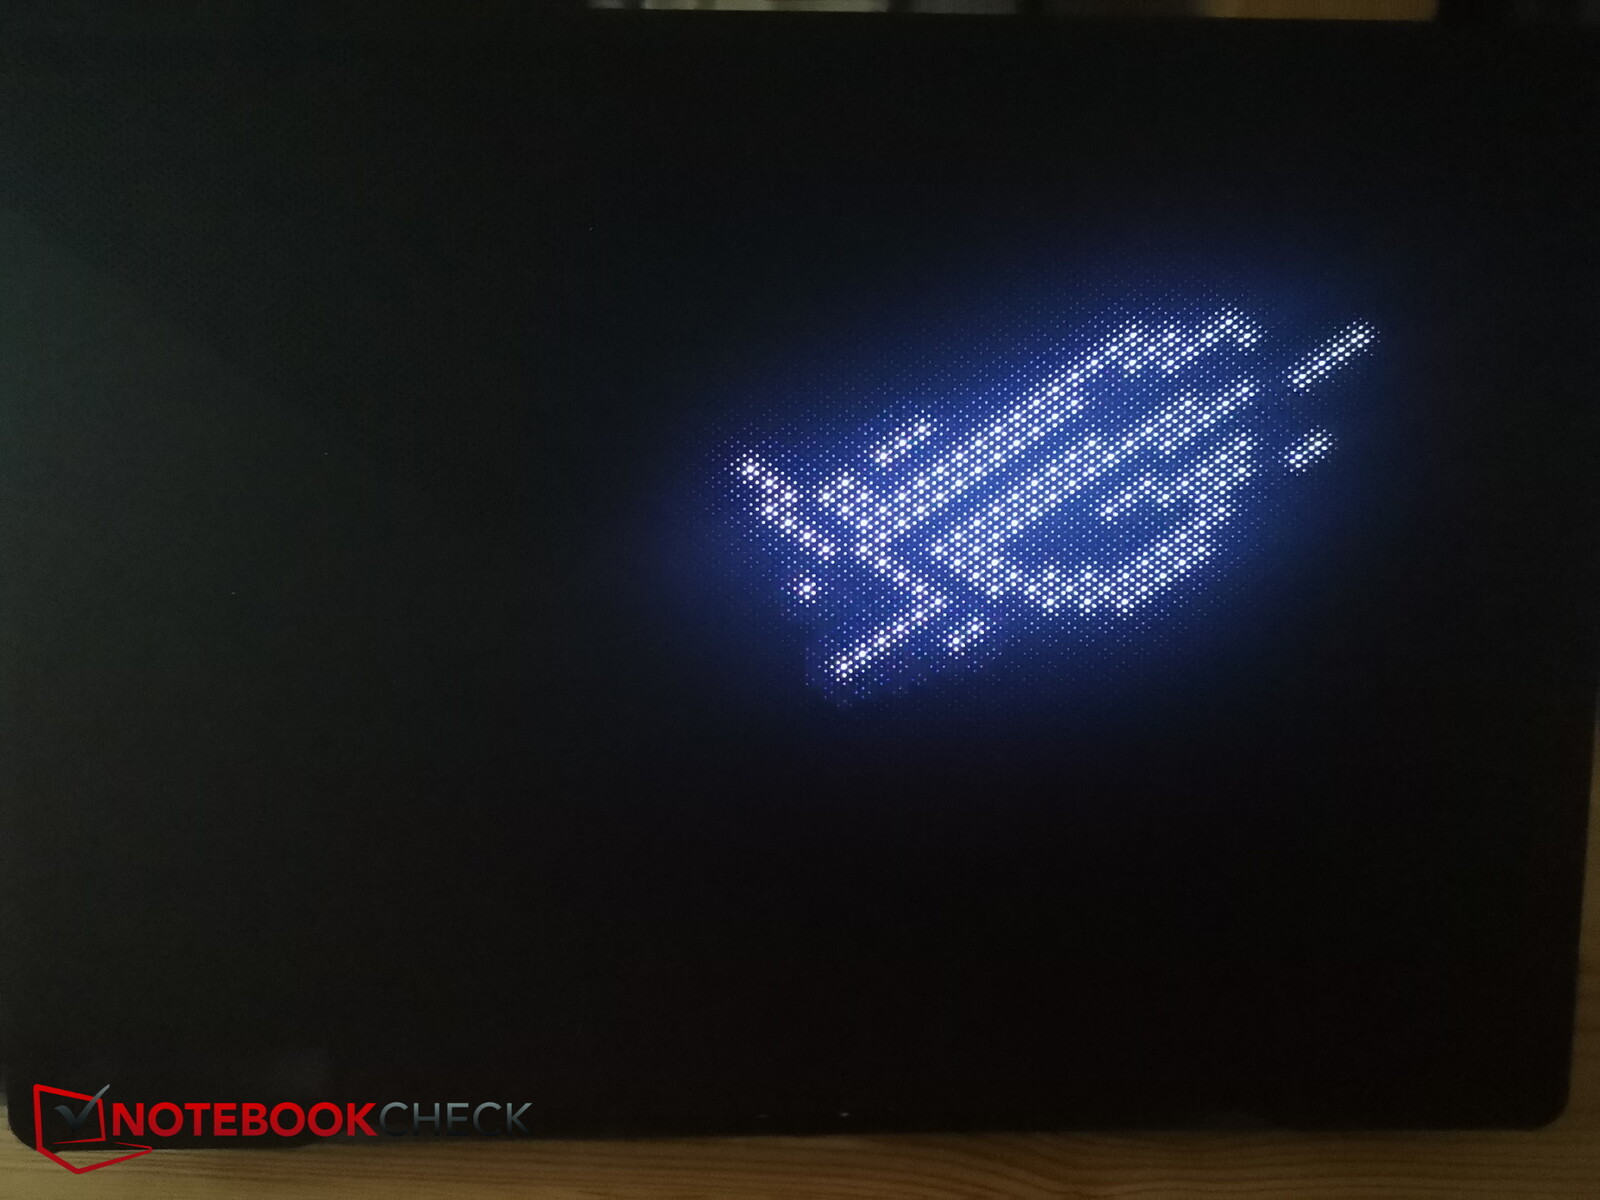
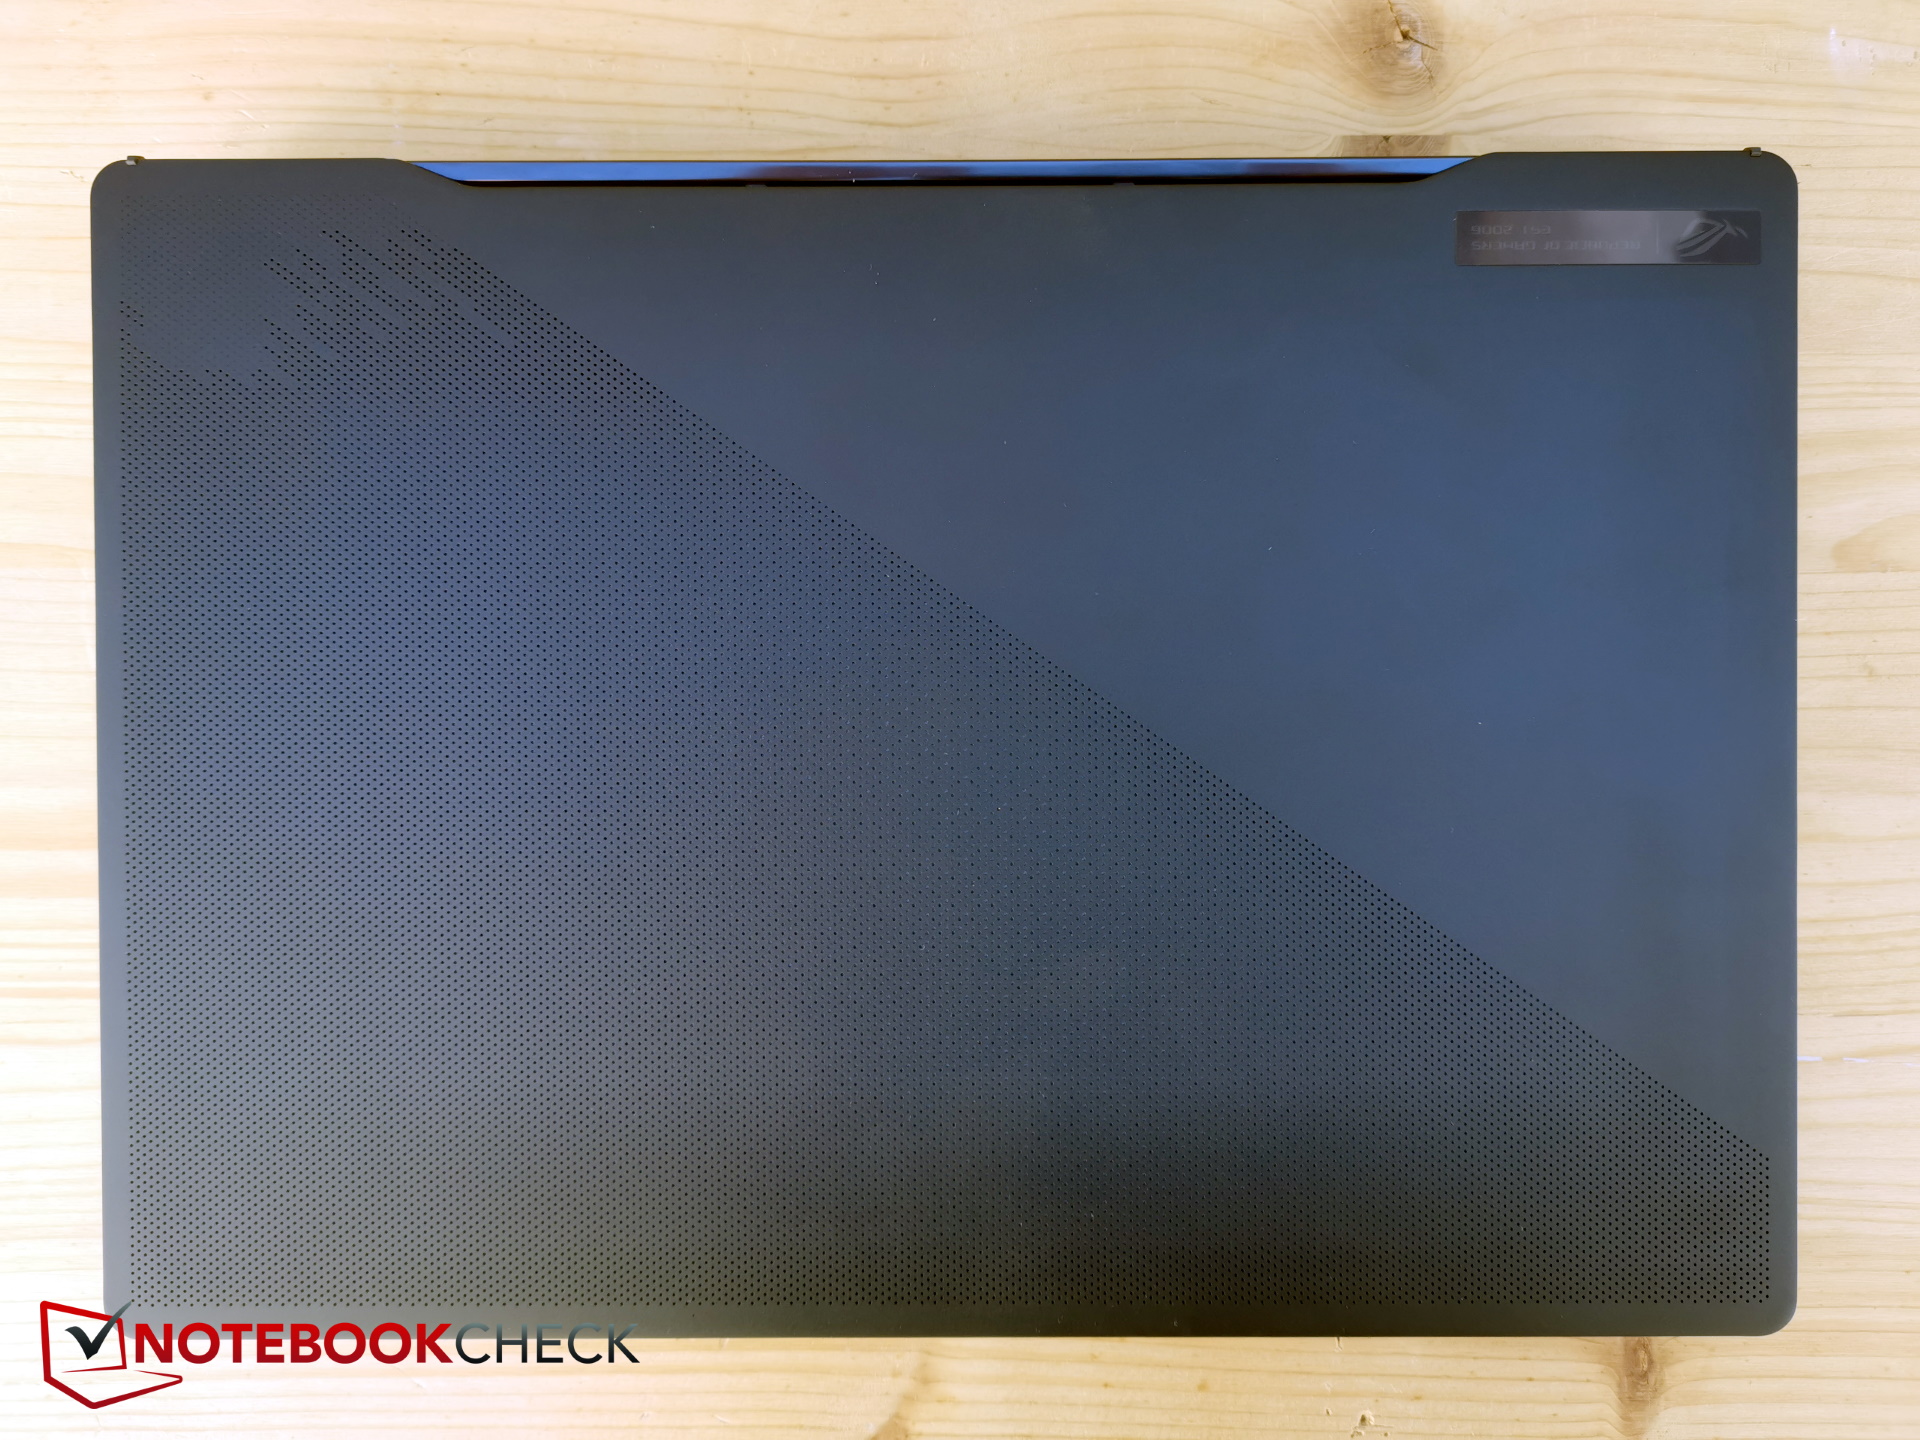
La cosiddetta AniMe Matrix sulla superficie superiore è più fine e dettagliata di prima e può visualizzare semplici loghi o testi in movimento con effetti aggiuntivi. Da un lato è interessante, ma non solo rischia di aumentare il consumo energetico del dispositivo, ma è in gran parte invisibile all'utente quando il portatile è aperto. Per questo motivo, l'effetto è più mirato a impressionare gli spettatori.
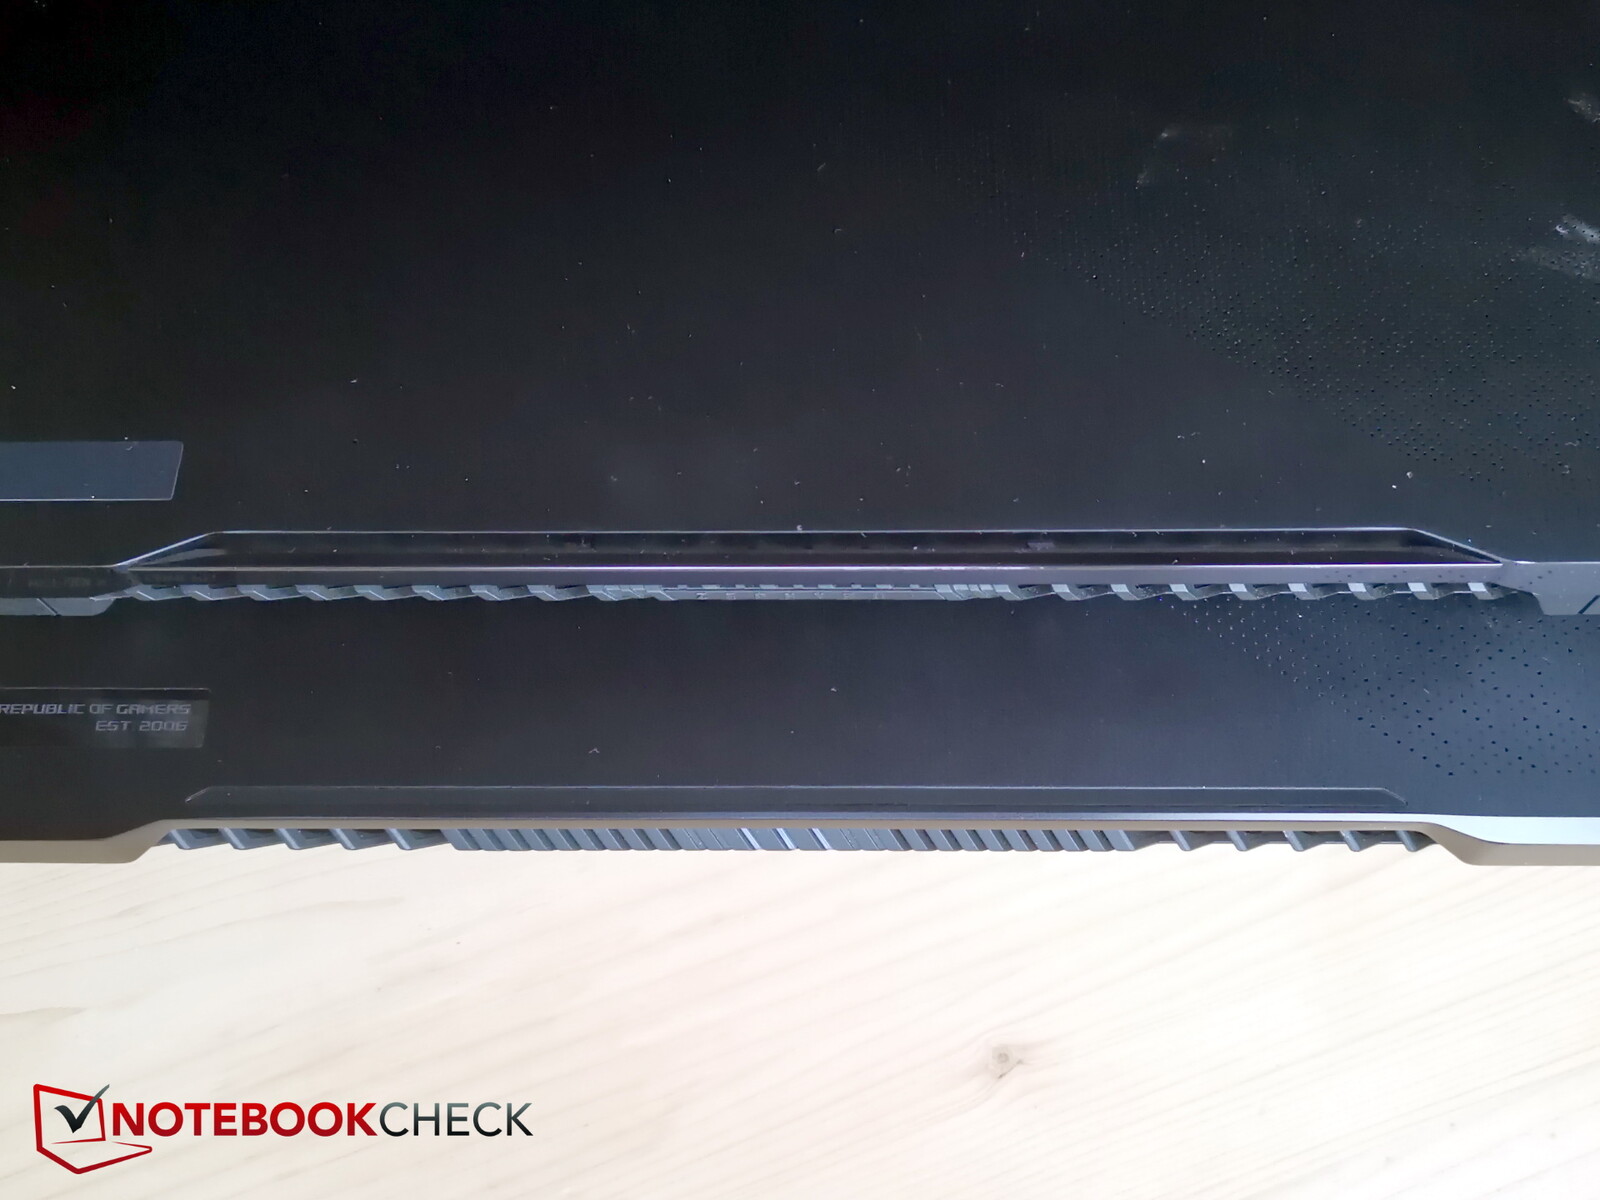
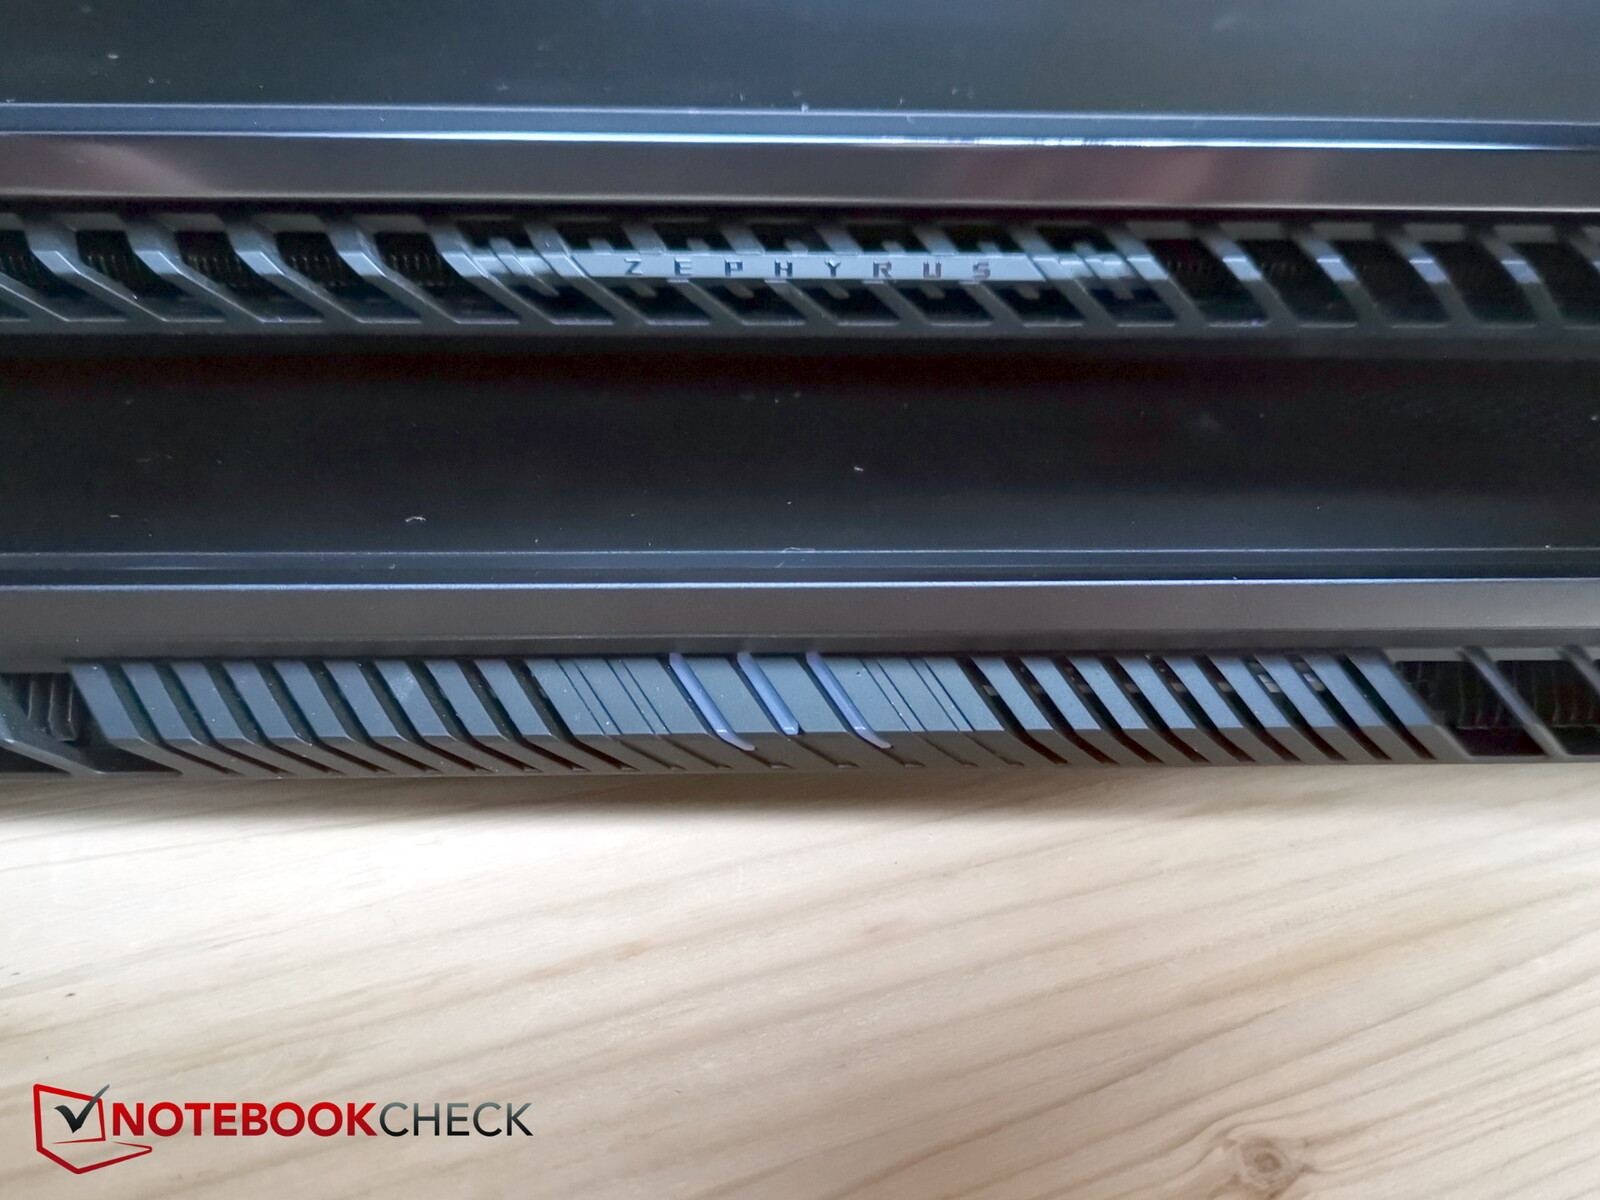
Non siamo rimasti colpiti dalla barra di plastica nera vuota nella parte superiore della parte posteriore del coperchio. Ha un aspetto un po' economico, non è molto stabile e ha già iniziato a mostrare segni di usura. Nel complesso, quasi tutte le griglie di ventilazione sui lati sono state leggermente modificate, così come la posizione delle porte.
La base sembra robusta, ma scricchiola e fa rumore quando si cerca di ruotare la custodia. Lo stesso vale per il coperchio del display, che si piega facilmente. Le cerniere tengono il display abbastanza saldamente e assicurano che il coperchio possa essere aperto fino a un angolo di 180 gradi. Aprendo il portatile, l'utente si accorge di due cose: la tastiera si solleva leggermente e le cornici del display sono piuttosto sottili.

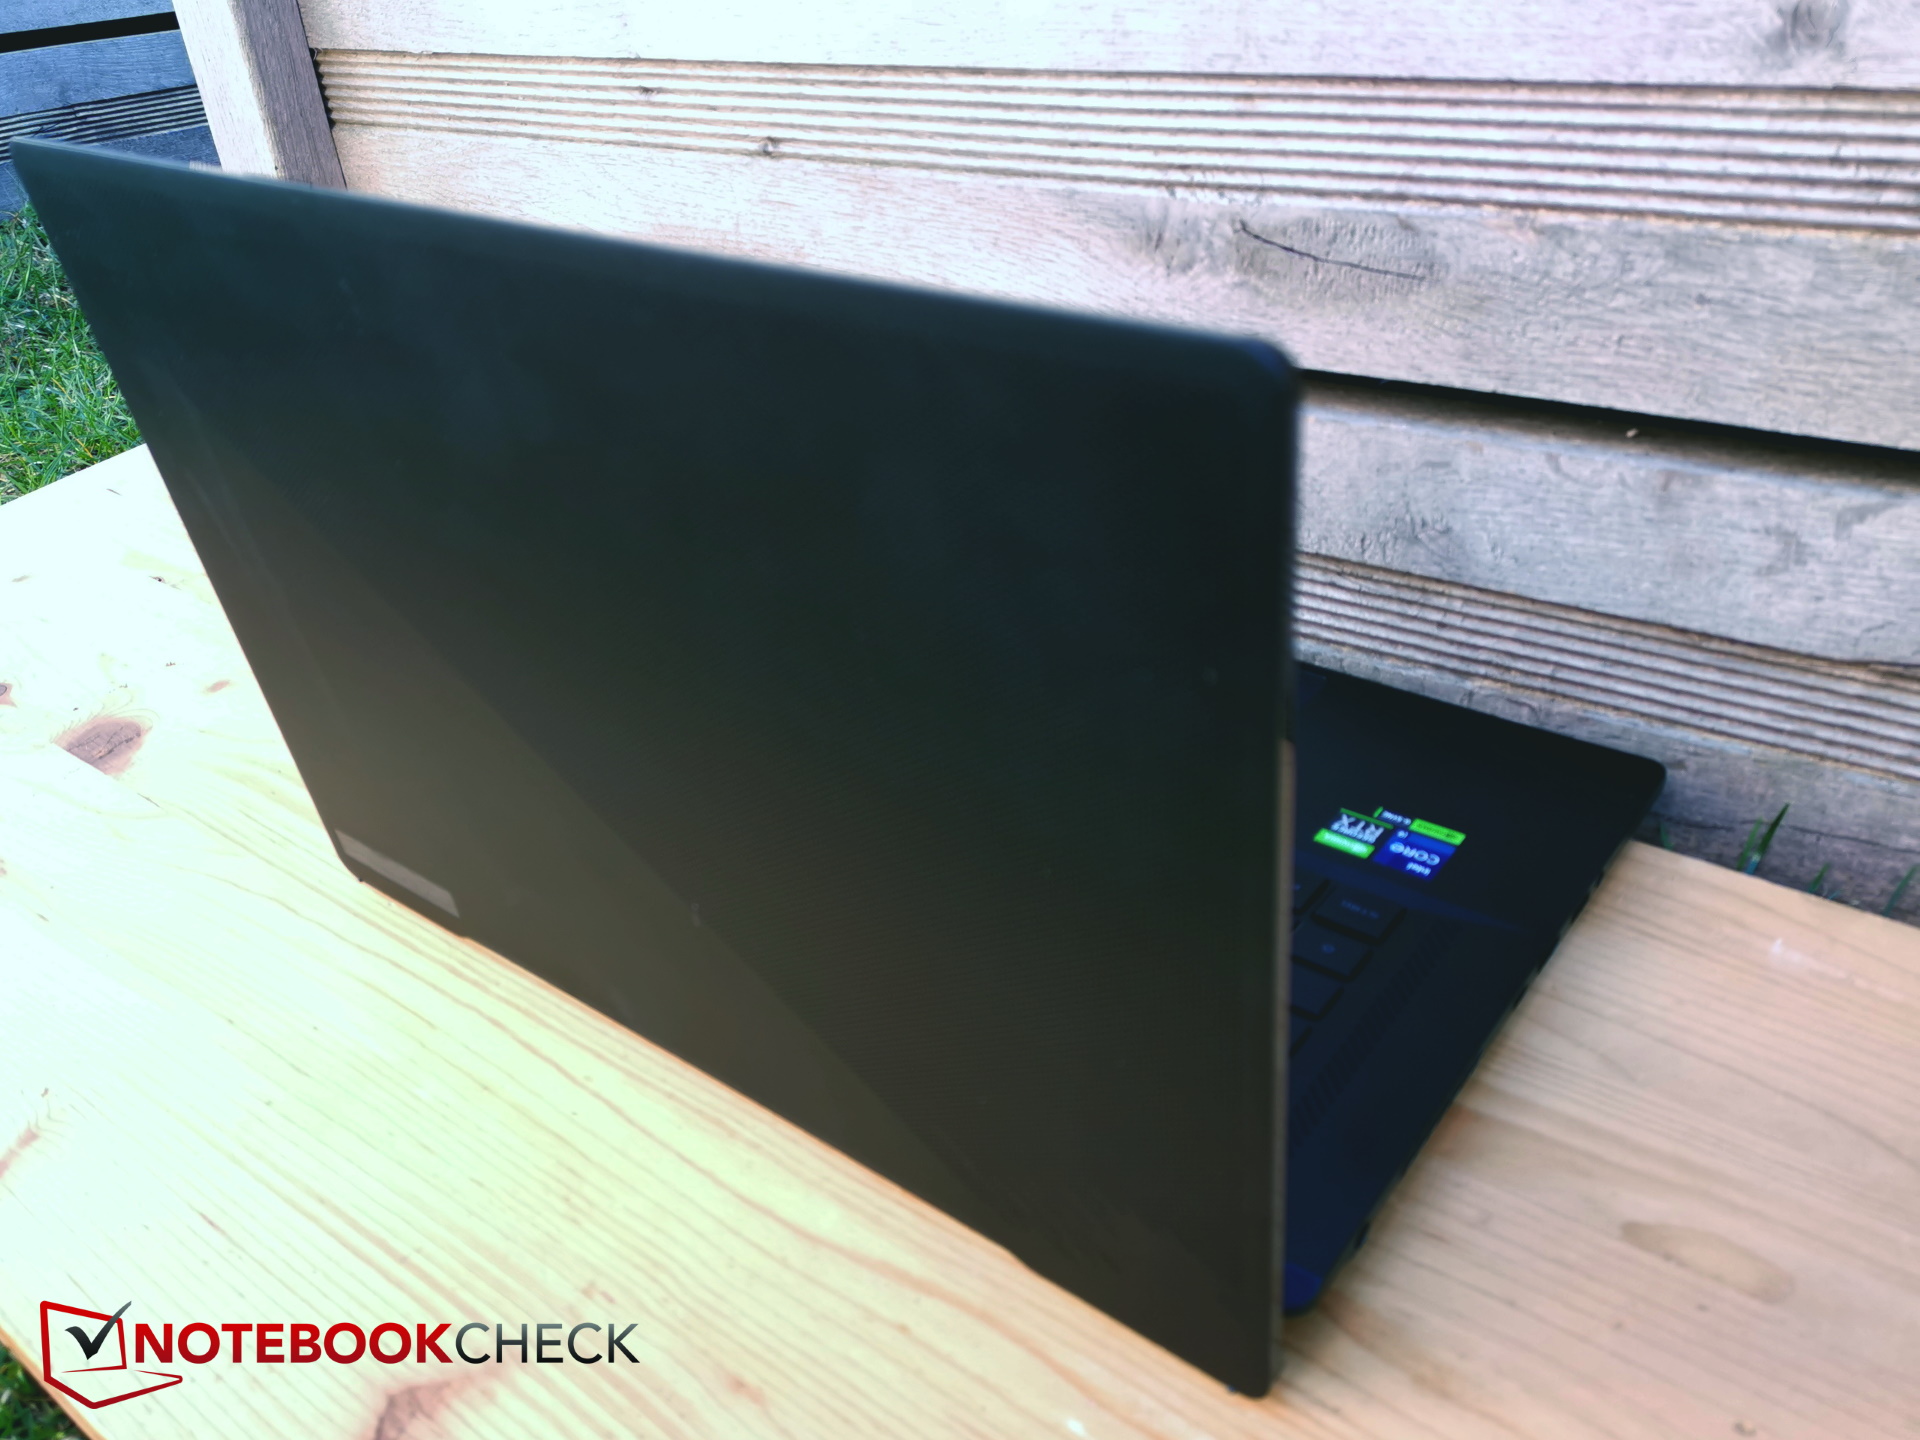
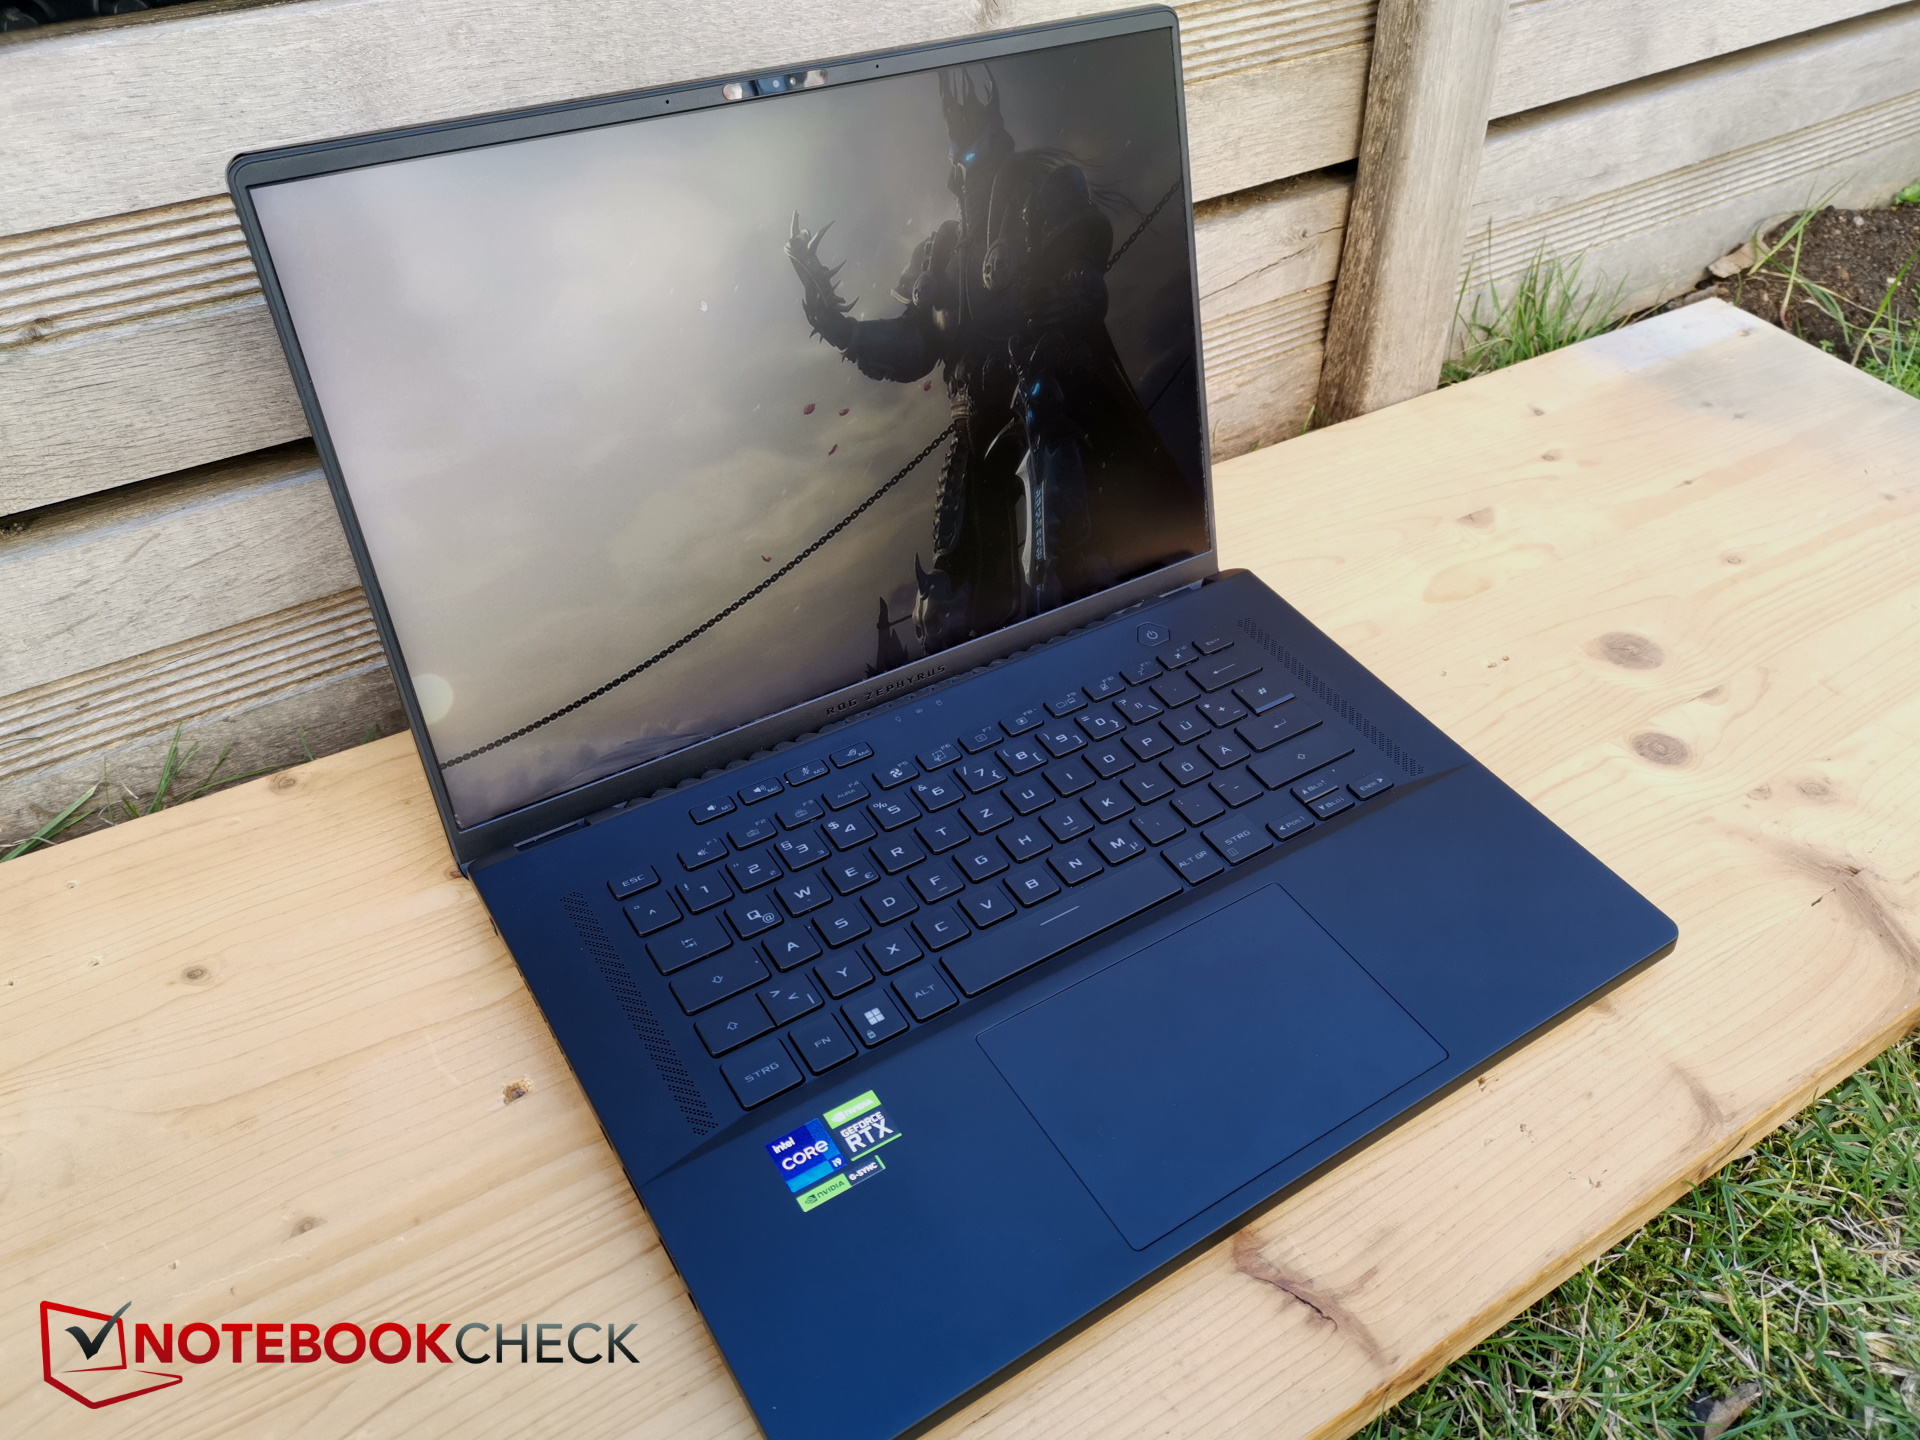
L'aspetto insolito è che l'ingombro del dispositivo è aumentato rispetto al suo predecessore. Contrariamente alla tendenza a rendere i dispositivi più piccoli, sottili e leggeri, il nuovo M16 è leggermente più grande e anche più spesso di 3 mm rispetto al modello della scorsa generazione.
IlRazer Blade 16 è solo 1 mm più sottile e ilLenovo Legion Pro 7è marginalmente più spesso, il che significa che il nuovo M16 si colloca nel mezzo, anche per quanto riguarda il peso.
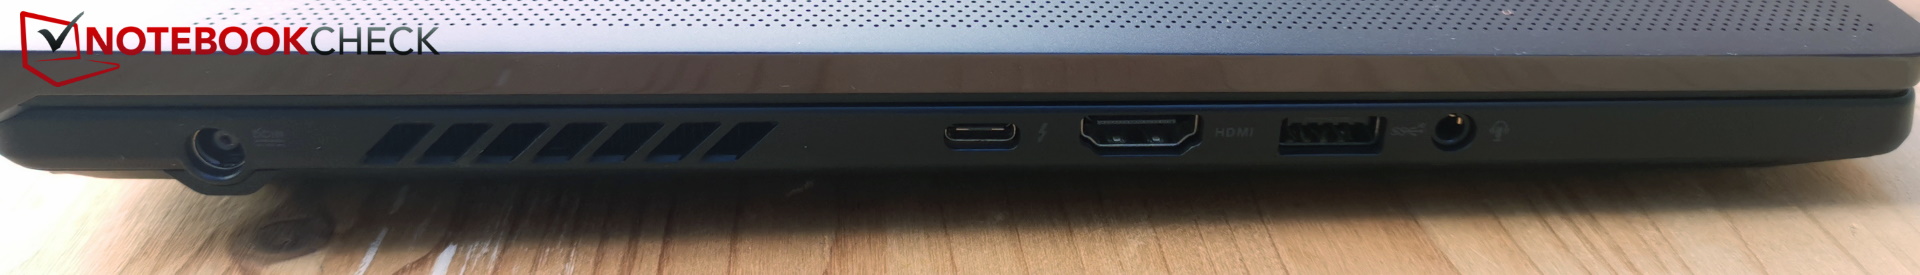
Caratteristiche - Una macchina da gioco senza porta LAN
Anche in questo campo non tutto è cambiato in meglio: La porta LAN è stata semplicemente omessa, il che significa che una connessione Internet veloce è possibile solo con un adattatore per i giocatori che cercano la latenza più breve e la connessione più veloce.
Una delle porte USB-C è stata spostata dal lato sinistro a quello destro. Questo significa che c'è più spazio a disposizione sulla sinistra del dispositivo. Sul retro, si trovano ancora solo le griglie delle ventole, il che comporta una mancanza di spazio per i connettori più ingombranti come l'HDMI o la porta LAN mancante.
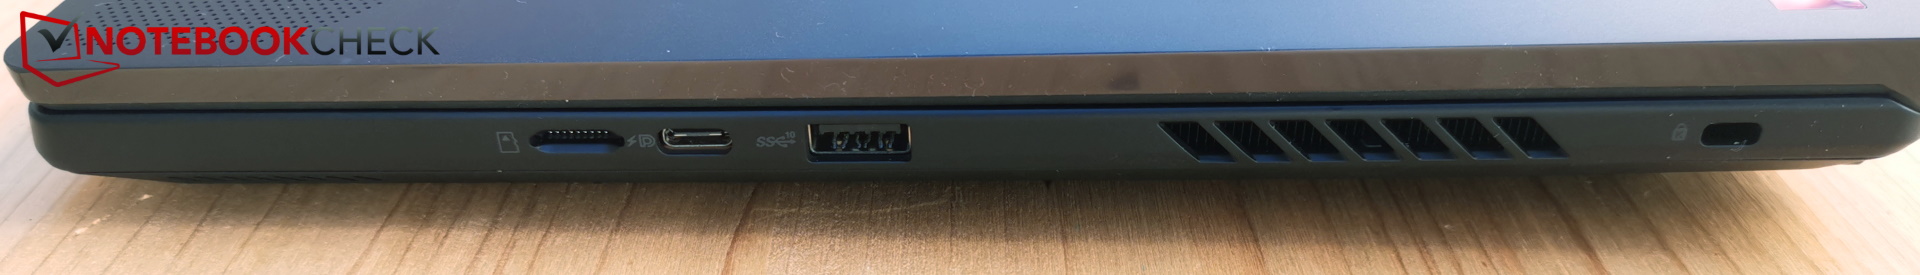
Lettore di schede SD
Almeno il portatile è dotato di un lettore di schede SD integrato e, anche se purtroppo è destinato solo alle schede microSD, è comunque molto veloce. Siamo riusciti a copiare un'immagine da 1 GB sul desktop in meno di 6 secondi utilizzando la nostra scheda di riferimento AV PRO microSD 128 GB V60.
| SD Card Reader | |
| average JPG Copy Test (av. of 3 runs) | |
| Asus ROG Zephyrus M16 GU604VY-NM042X | |
| Asus ROG Zephyrus M16 GU603Z | |
| Media della classe Gaming (20.9 - 210, n=54, ultimi 2 anni) | |
| Razer Blade 16 Early 2023 (AV PRO microSD 128 GB V60) | |
| MSI Titan GT77 HX 13VI (Angelibird AV Pro V60) | |
| maximum AS SSD Seq Read Test (1GB) | |
| Asus ROG Zephyrus M16 GU603Z | |
| Razer Blade 16 Early 2023 (AV PRO microSD 128 GB V60) | |
| Asus ROG Zephyrus M16 GU604VY-NM042X | |
| Media della classe Gaming (25.5 - 261, n=51, ultimi 2 anni) | |
| MSI Titan GT77 HX 13VI (Angelibird AV Pro V60) | |
Comunicazione
Purtroppo il produttore ha eliminato la porta LAN e non ha incluso un adattatore.
Le connessioni wireless sono gestite dal modulo Intel AX210 WiFi 6E. Questo trasmette a 2,4 GHz, 5 GHz e 6 GHz.
La velocità di trasferimento è veloce e costante.
Webcam
In quest'area, il produttore ha finalmente aggiornato la fotocamera a risoluzione FullHD e questo modello dispone persino di un sensore IR per l'accesso a Windows tramite Windows Hello. Tuttavia, le immagini hanno un'evidente tonalità gialla e la deviazione del colore è relativamente alta.


Sicurezza
Il TPM e il connettore Kensington sono entrambi presenti, ma manca il sensore di impronte digitali e, purtroppo, l'otturatore fisico della webcam.
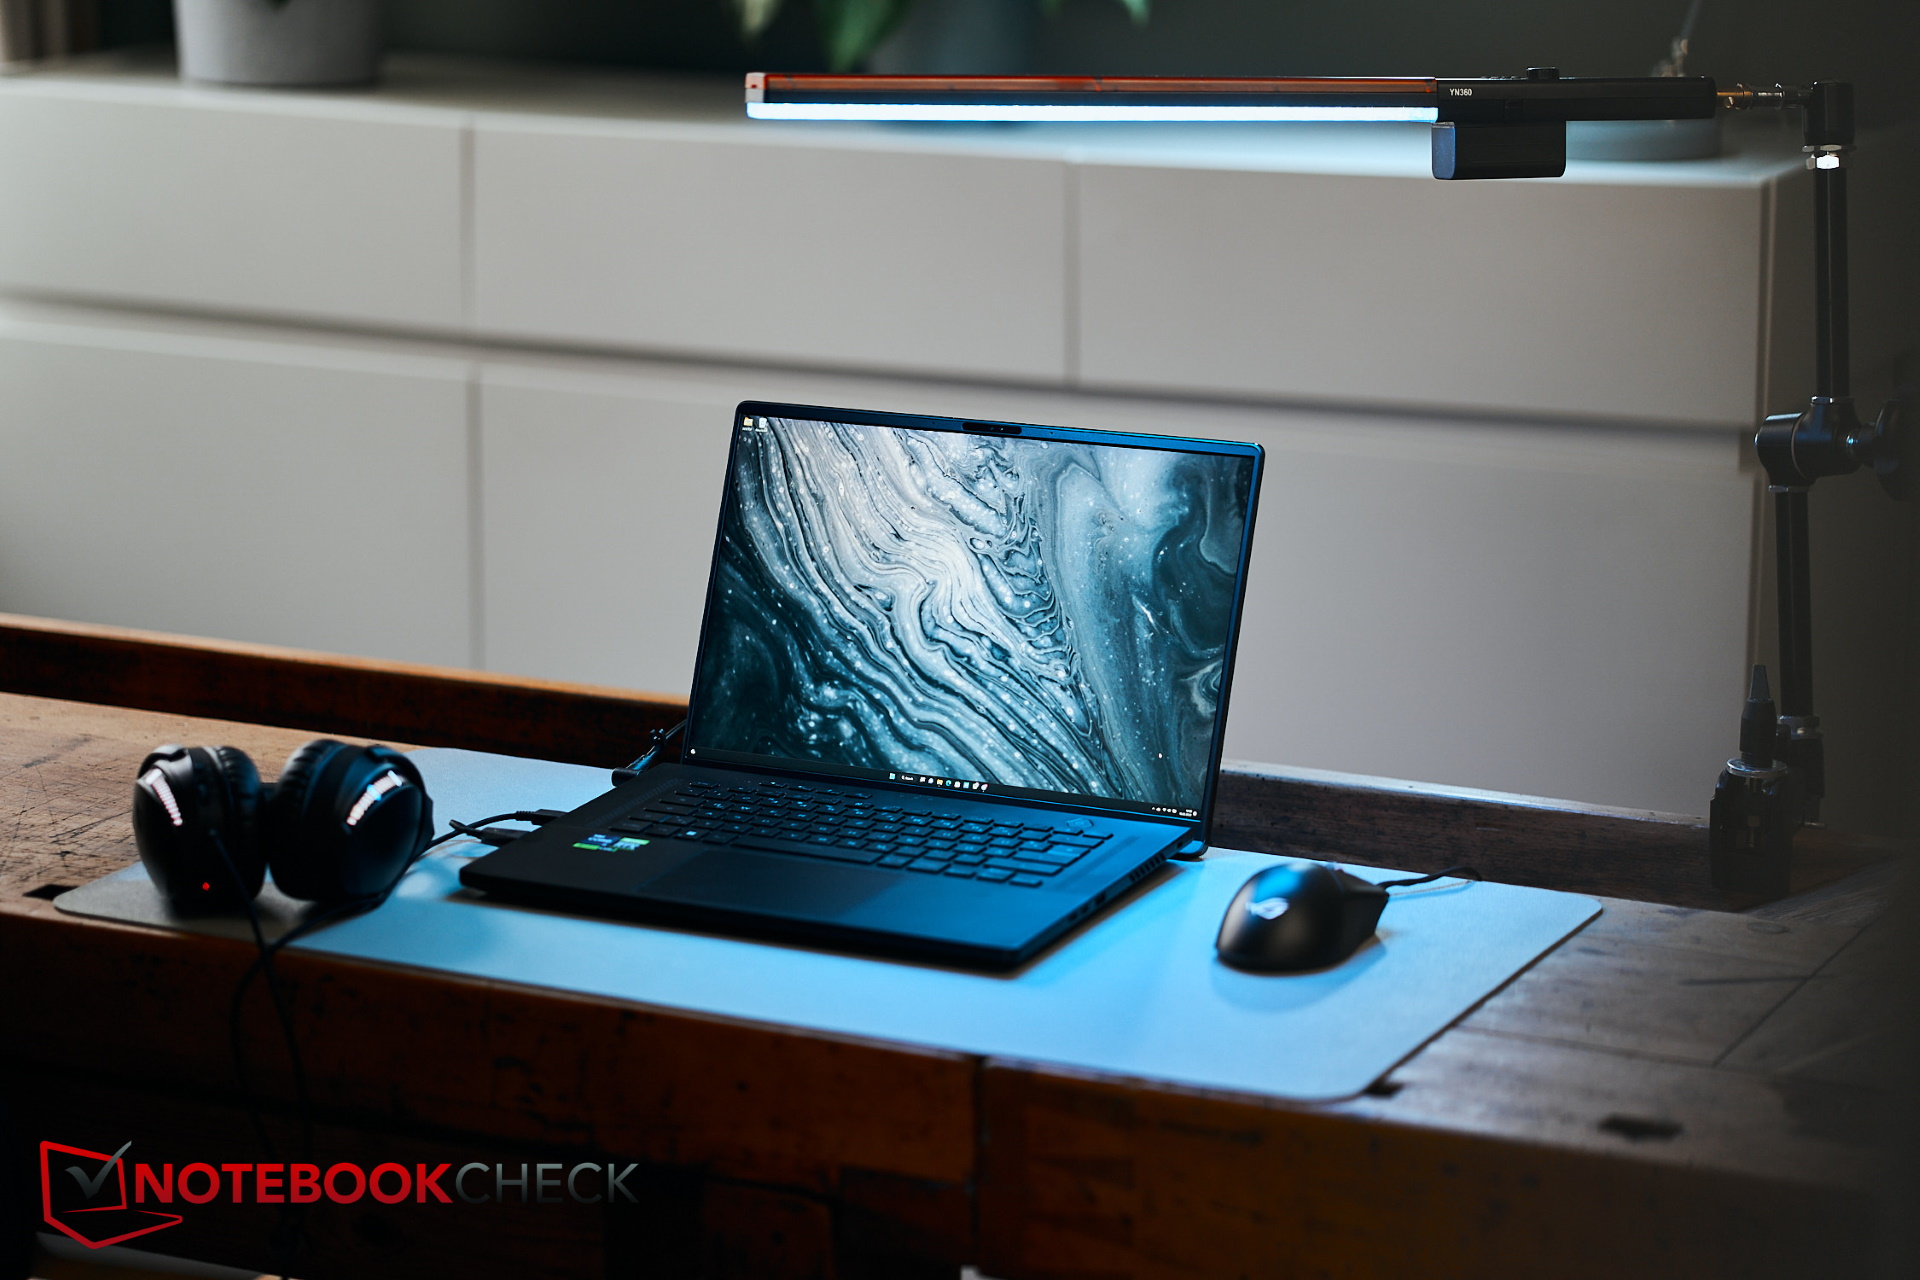
Accessori
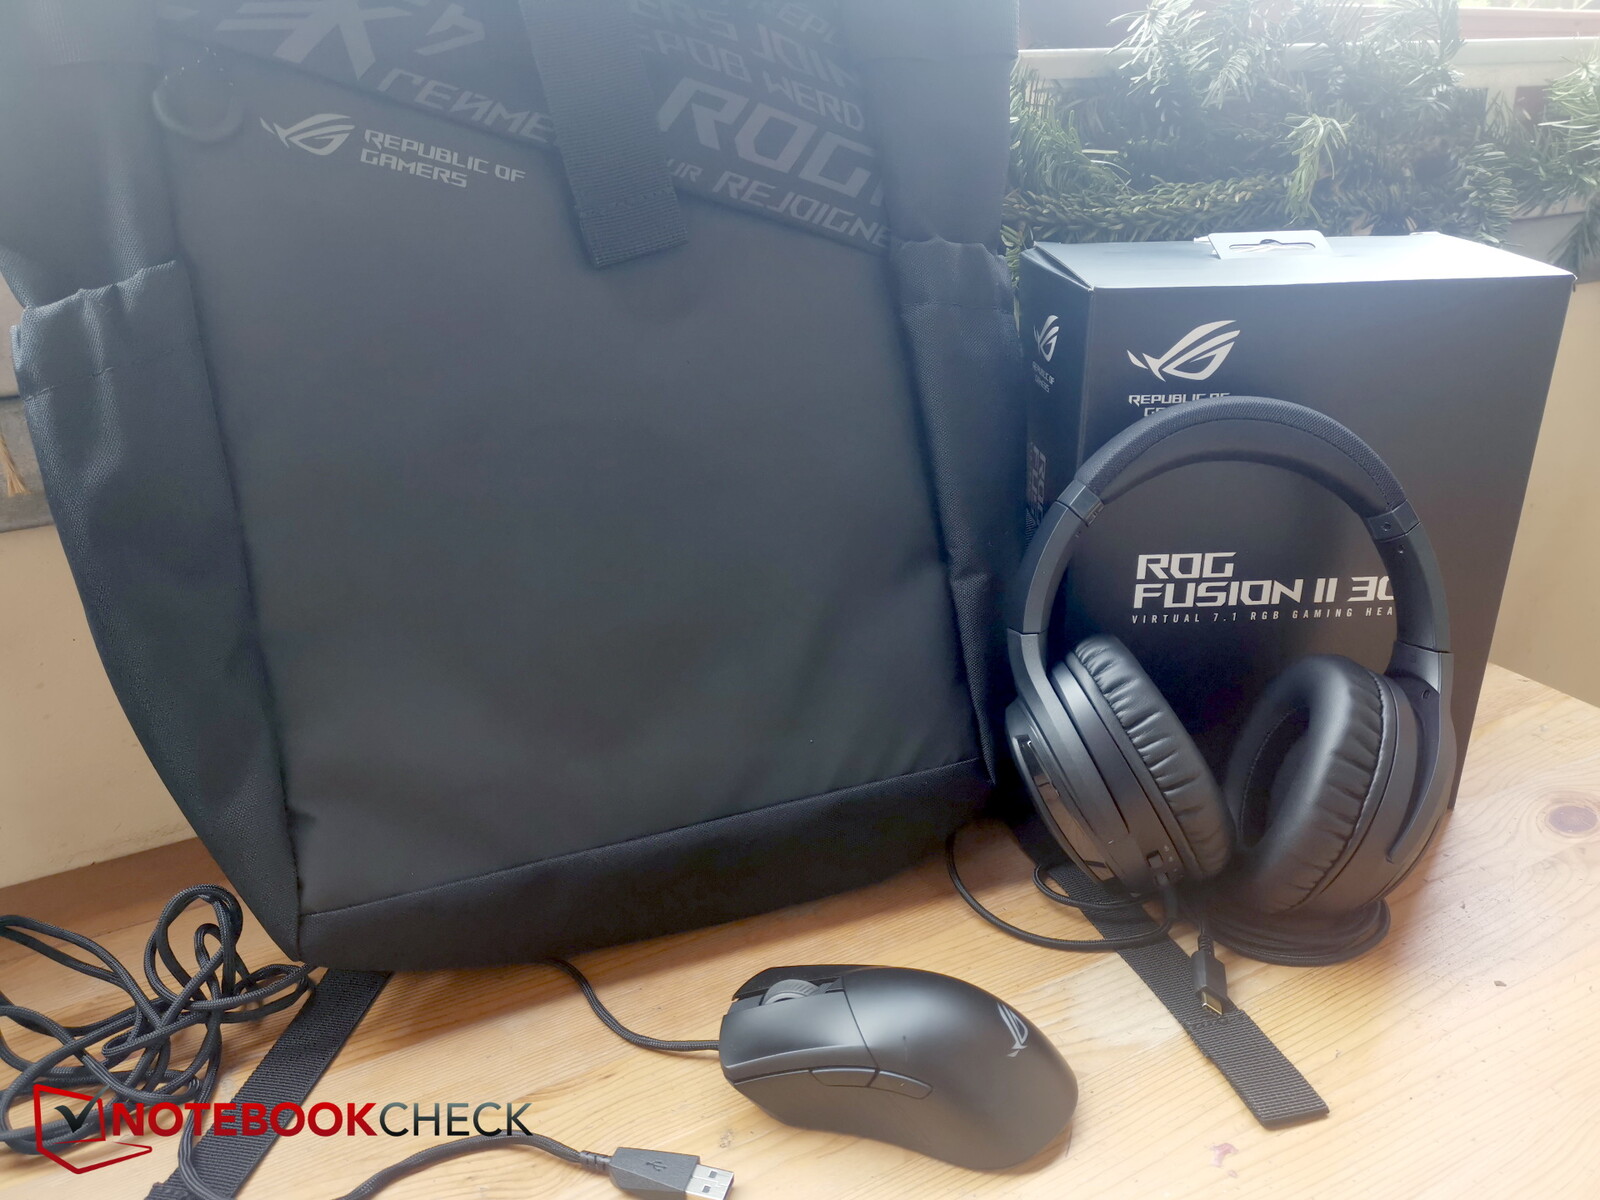
Il modello da noi recensito si presentava in una confezione enorme che ricordava più una centrale elettrica. Al contrario, sono stati inclusi numerosi accessori. Ad esempio, una borsa con scomparto per il laptop, un mouse (ROG Gladius III) e delle cuffie (ROG Fusion II 300), tutti contrassegnati dal marchio ROG.
Secondo Asus, questi accessori vengono forniti con il nostro modello di configurazione, ma l'M16 può essere acquistato anche come dispositivo indipendente.
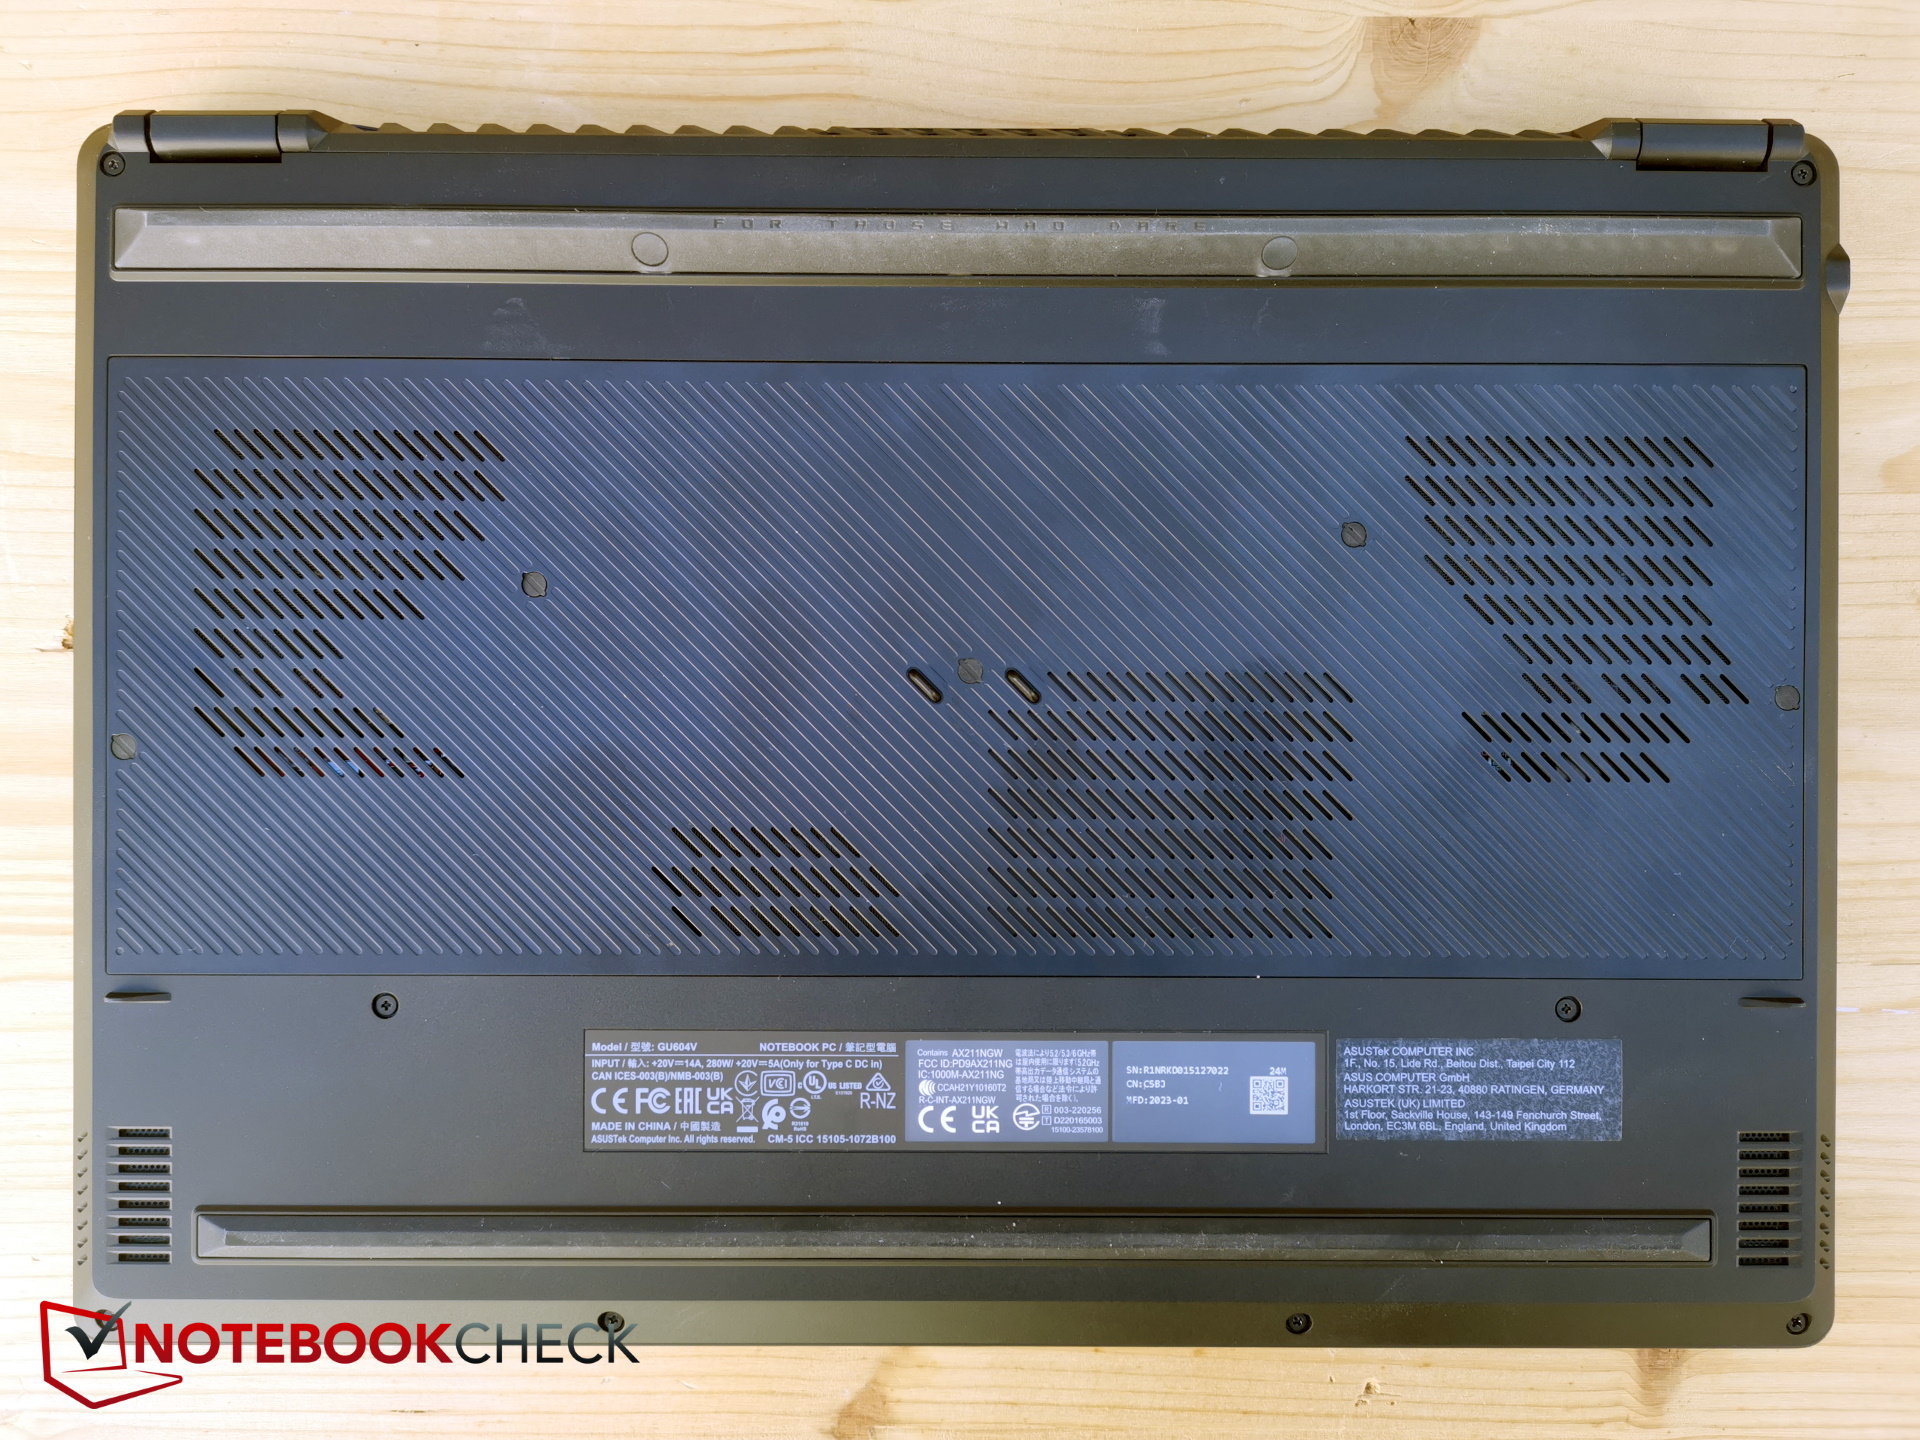
Manutenzione
Sulla base dell'unità, 15 viti a croce attendono di essere rimosse. Sfortunatamente, sette (!) di esse si trovano sotto dei tappi di gomma incollati, la cui rimozione è complicata e fastidiosa e risulta inutile per l'utente.
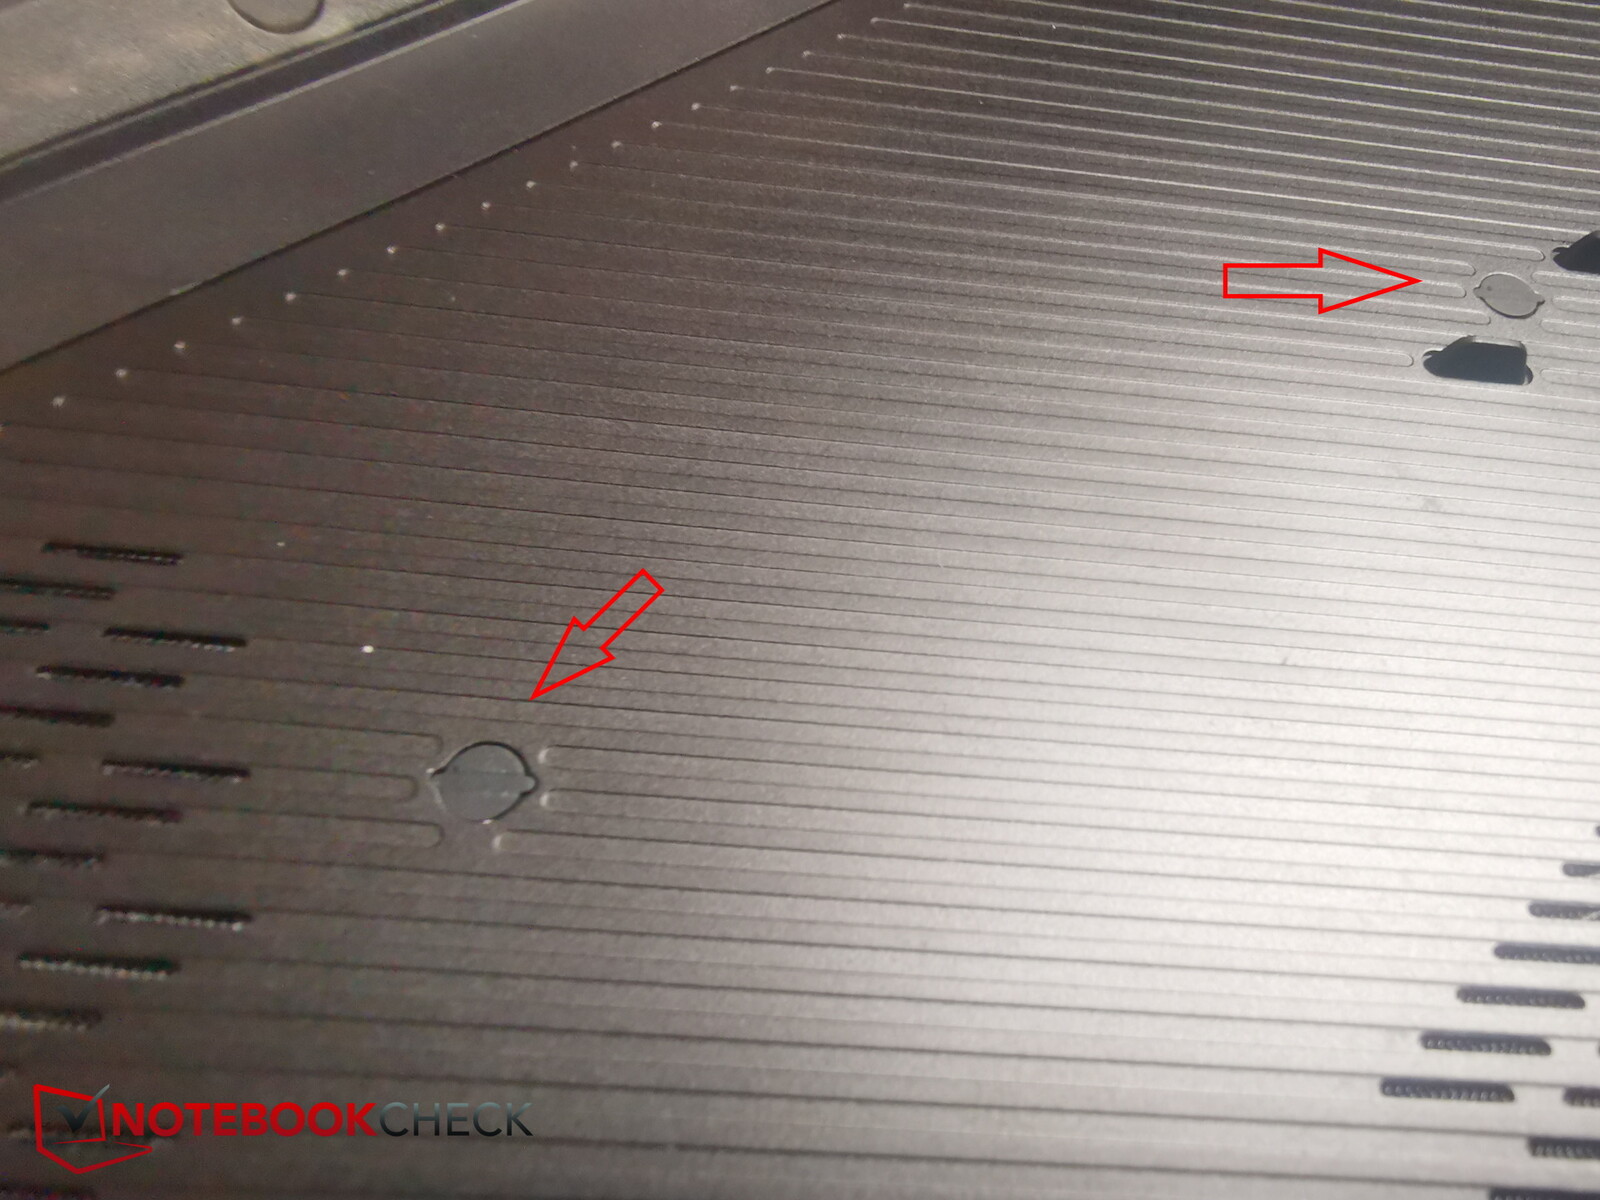
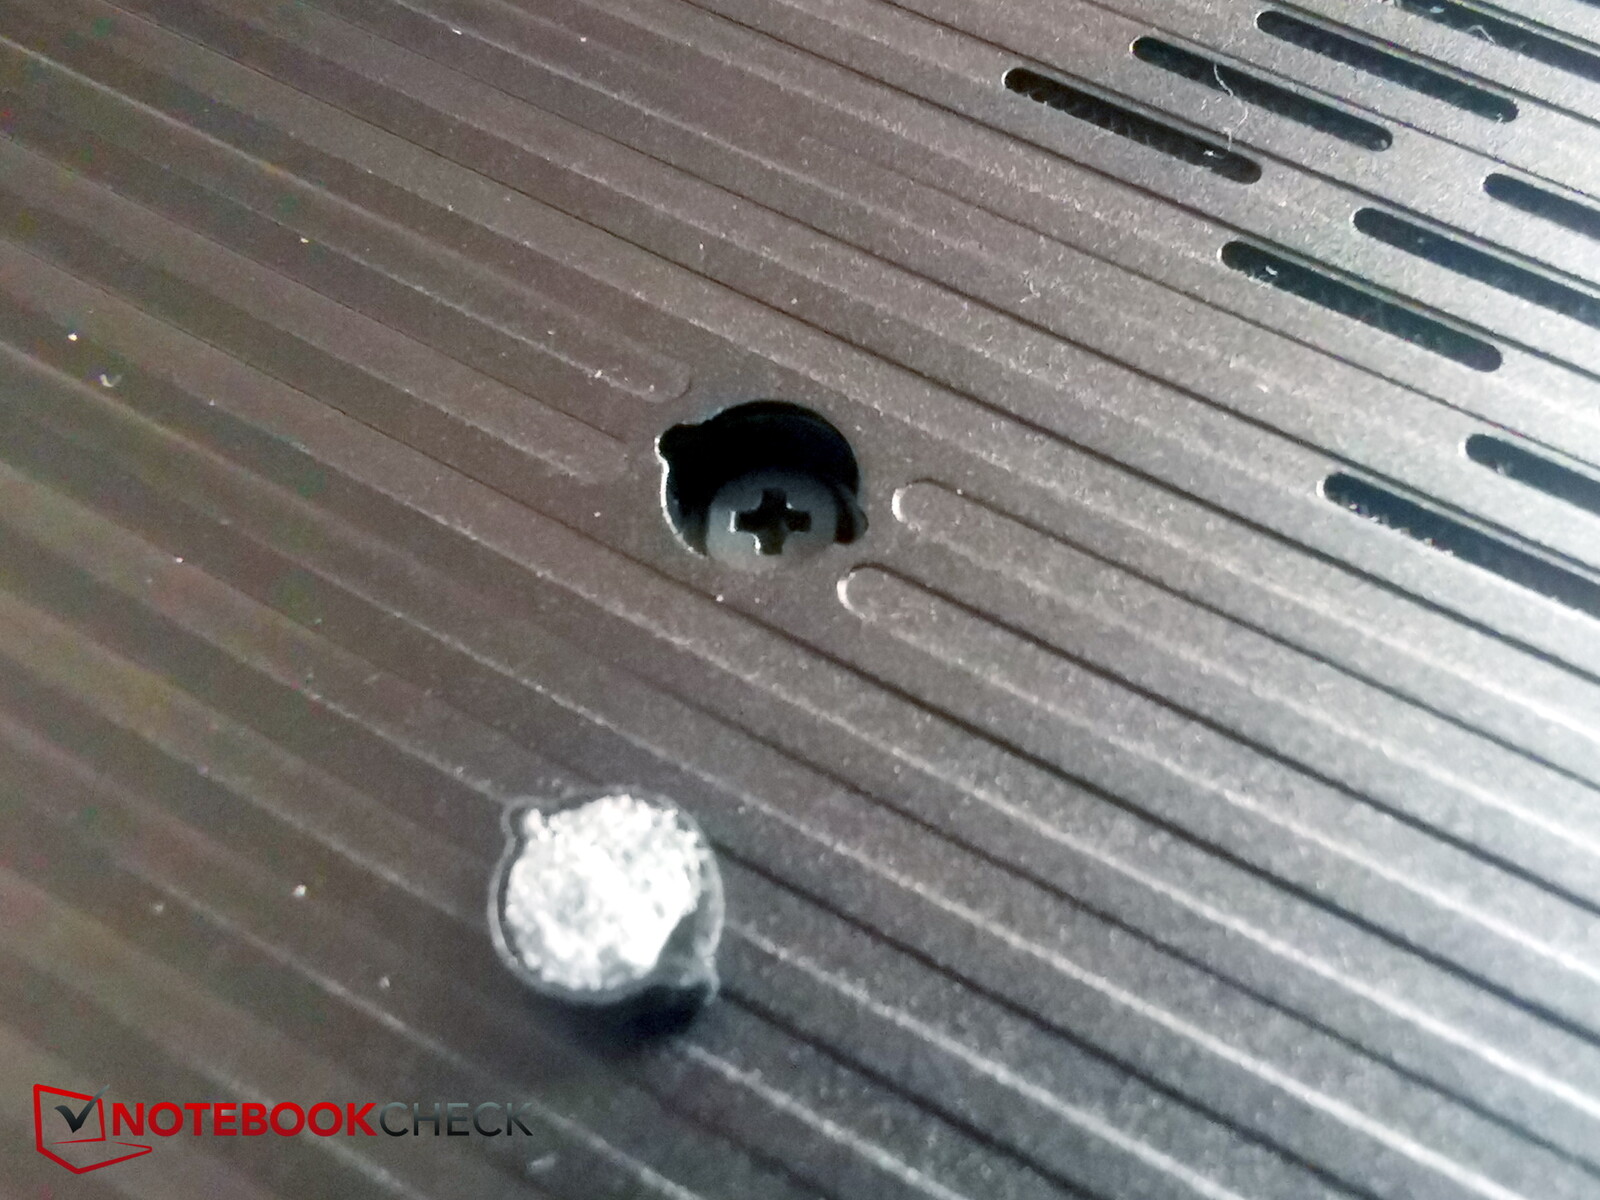
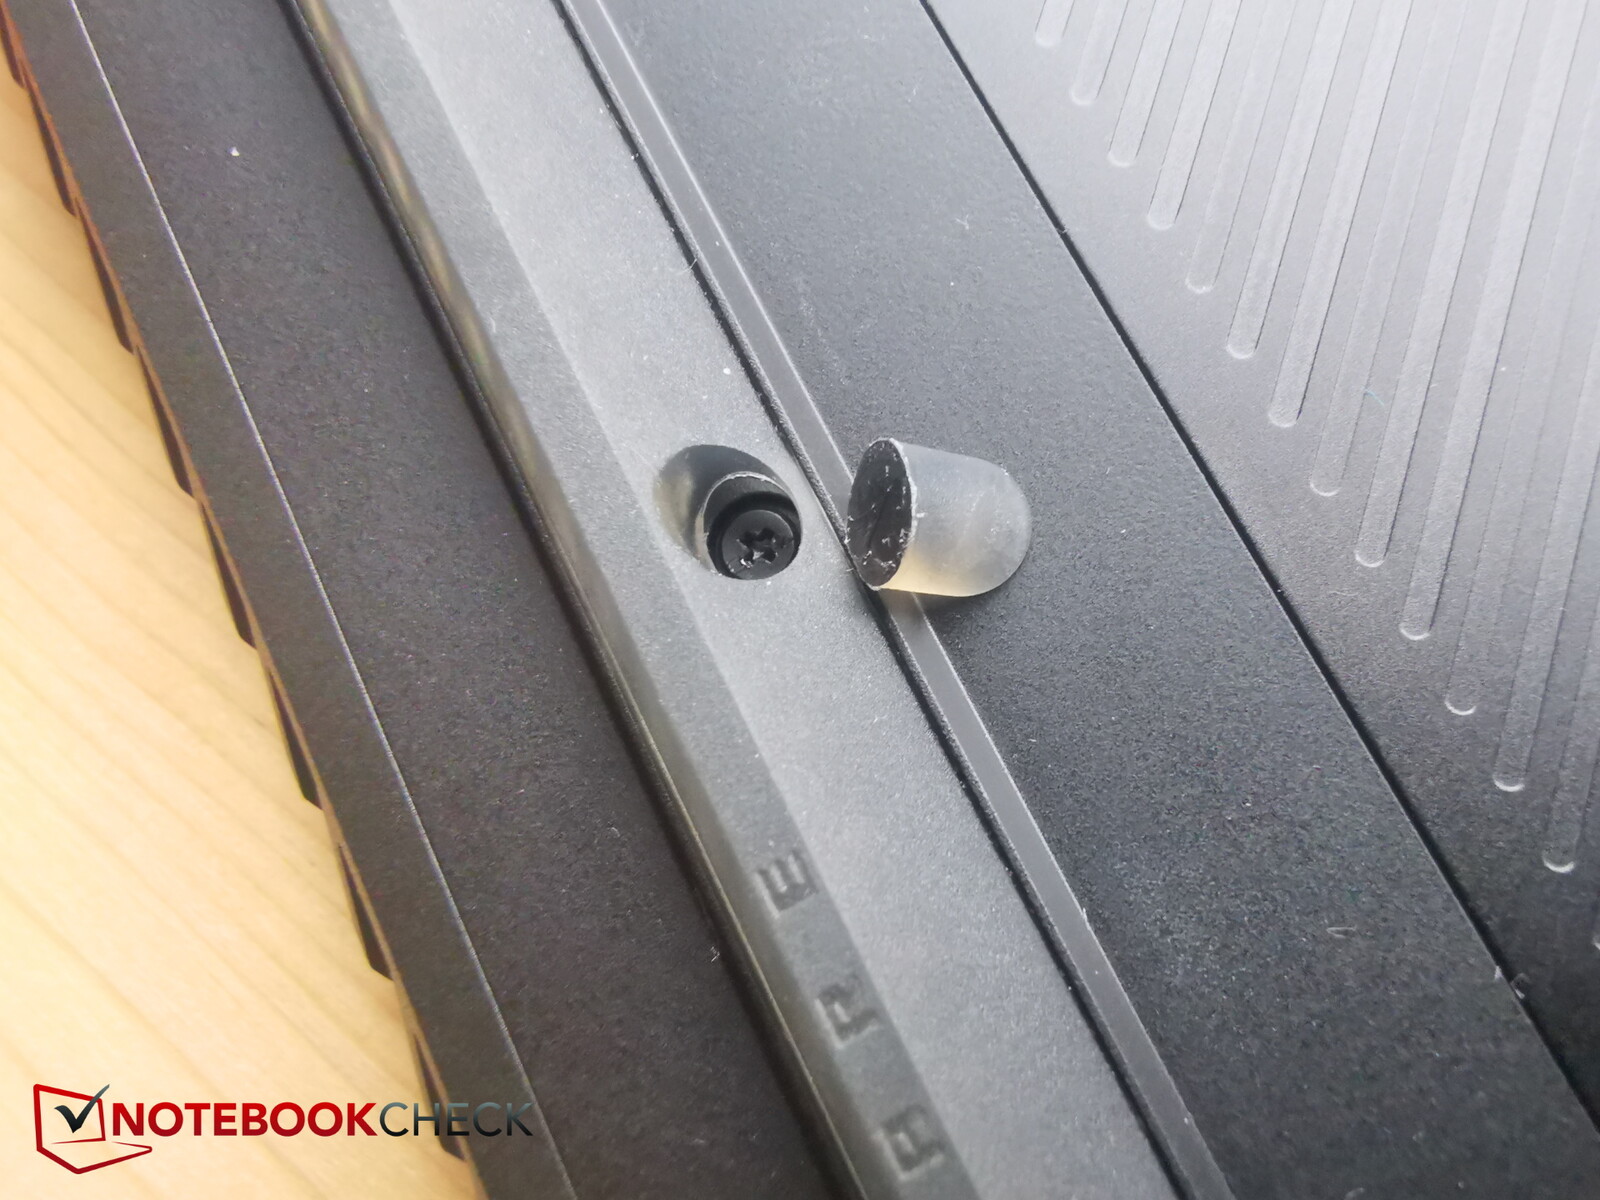
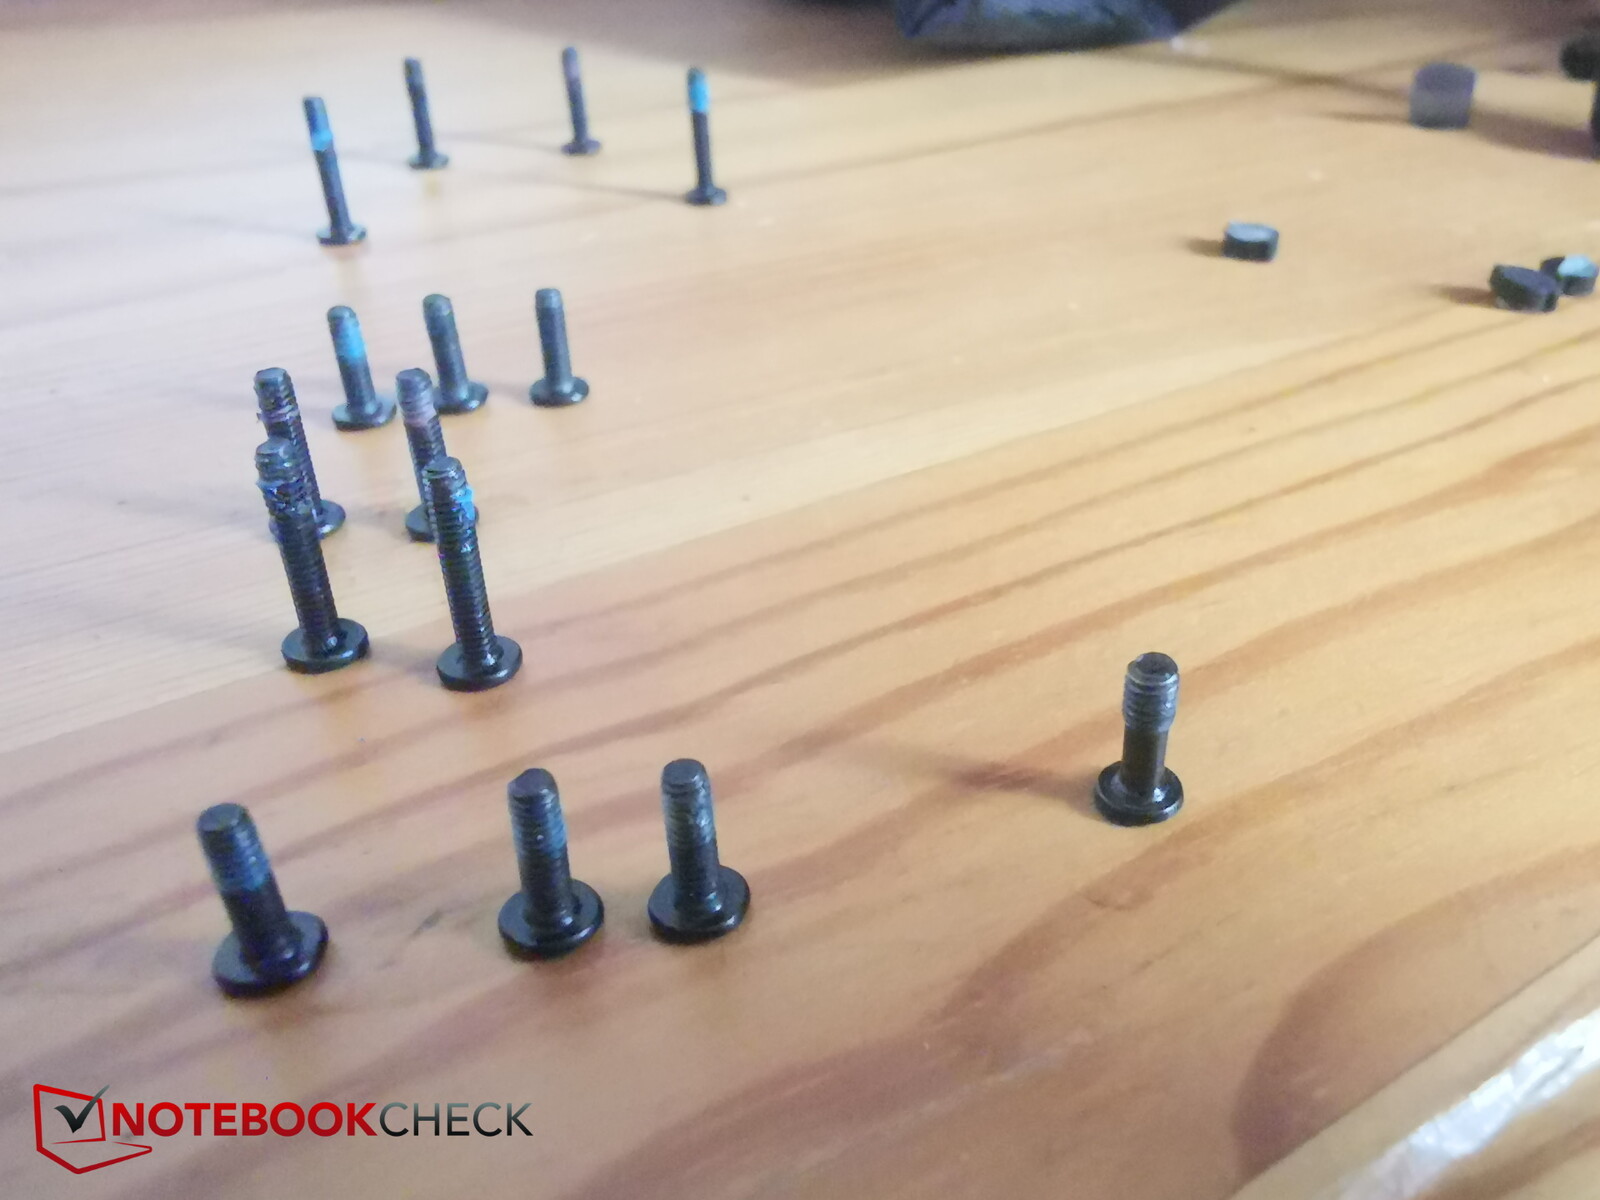
Complessivamente, abbiamo scoperto 4 diverse lunghezze/tipologie di viti! Pertanto, vale la pena di notare quali sono quelle che appartengono a un determinato punto. Insieme alle 7 viti nascoste e alla RAM SO-DIMM, l'M16 può essere considerato difficile da aggiornare o riparare.
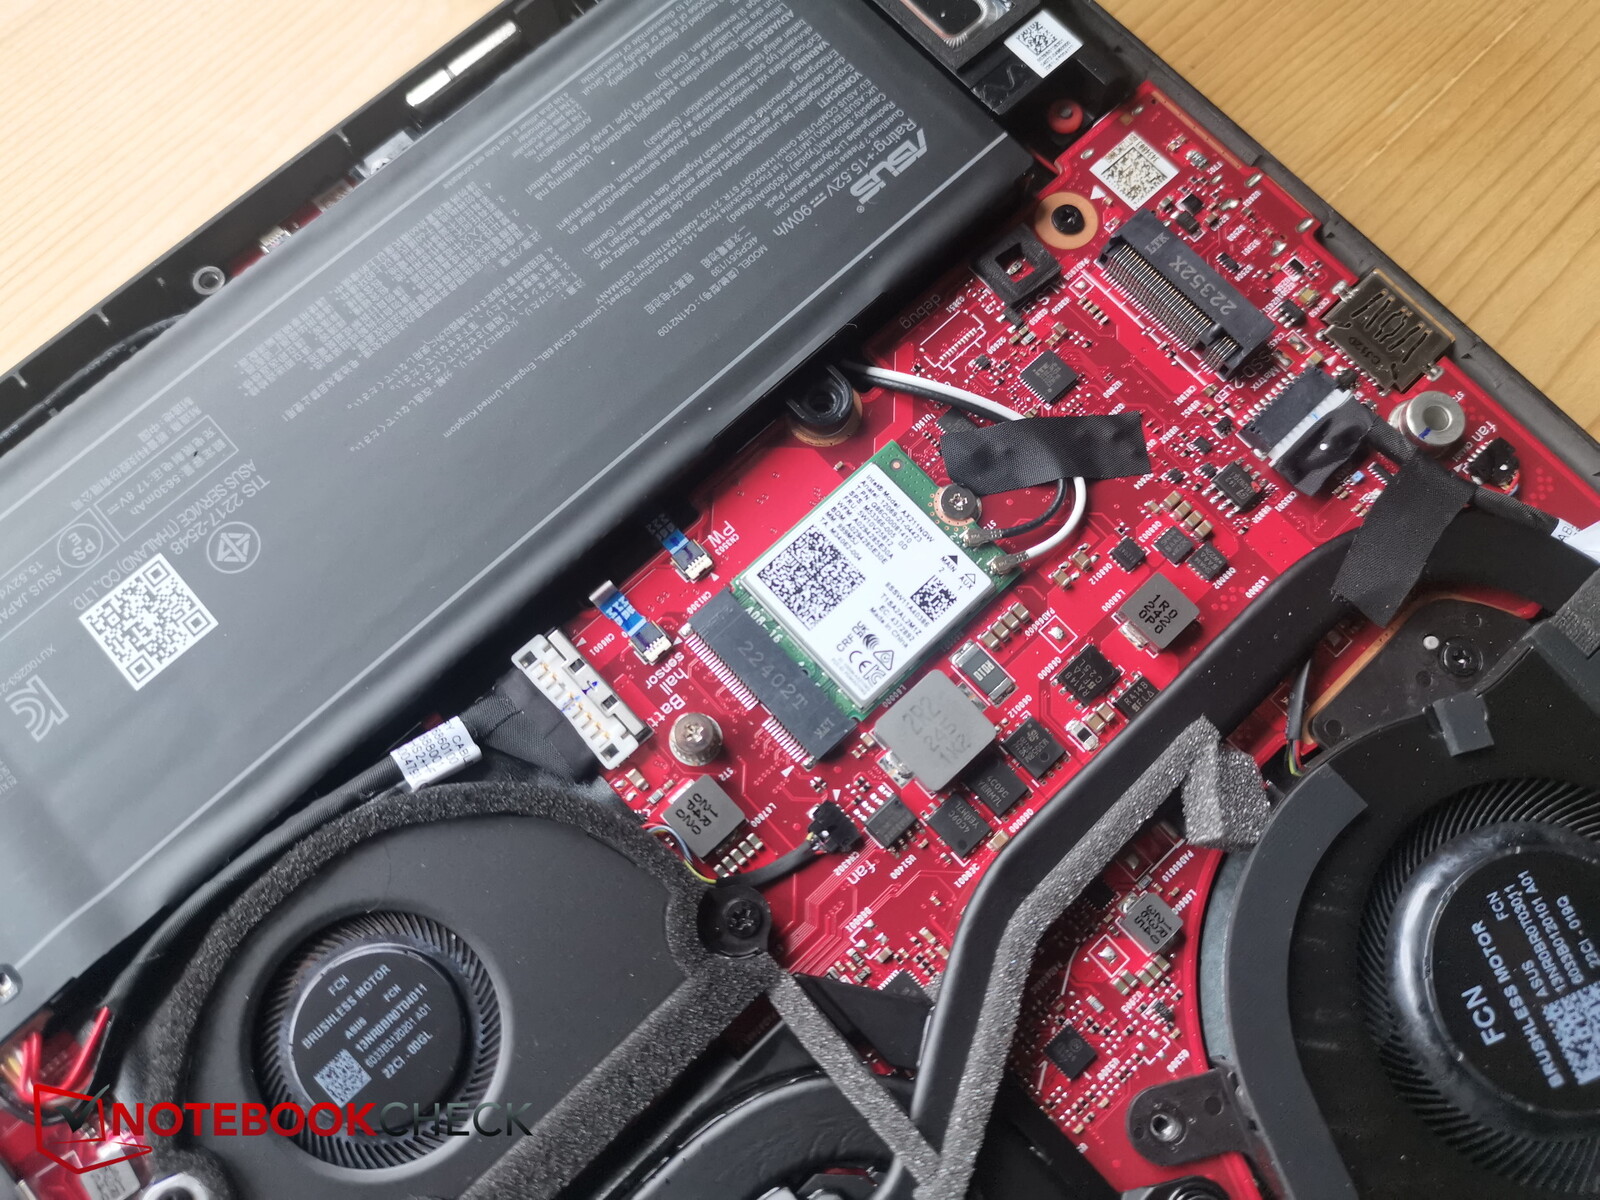
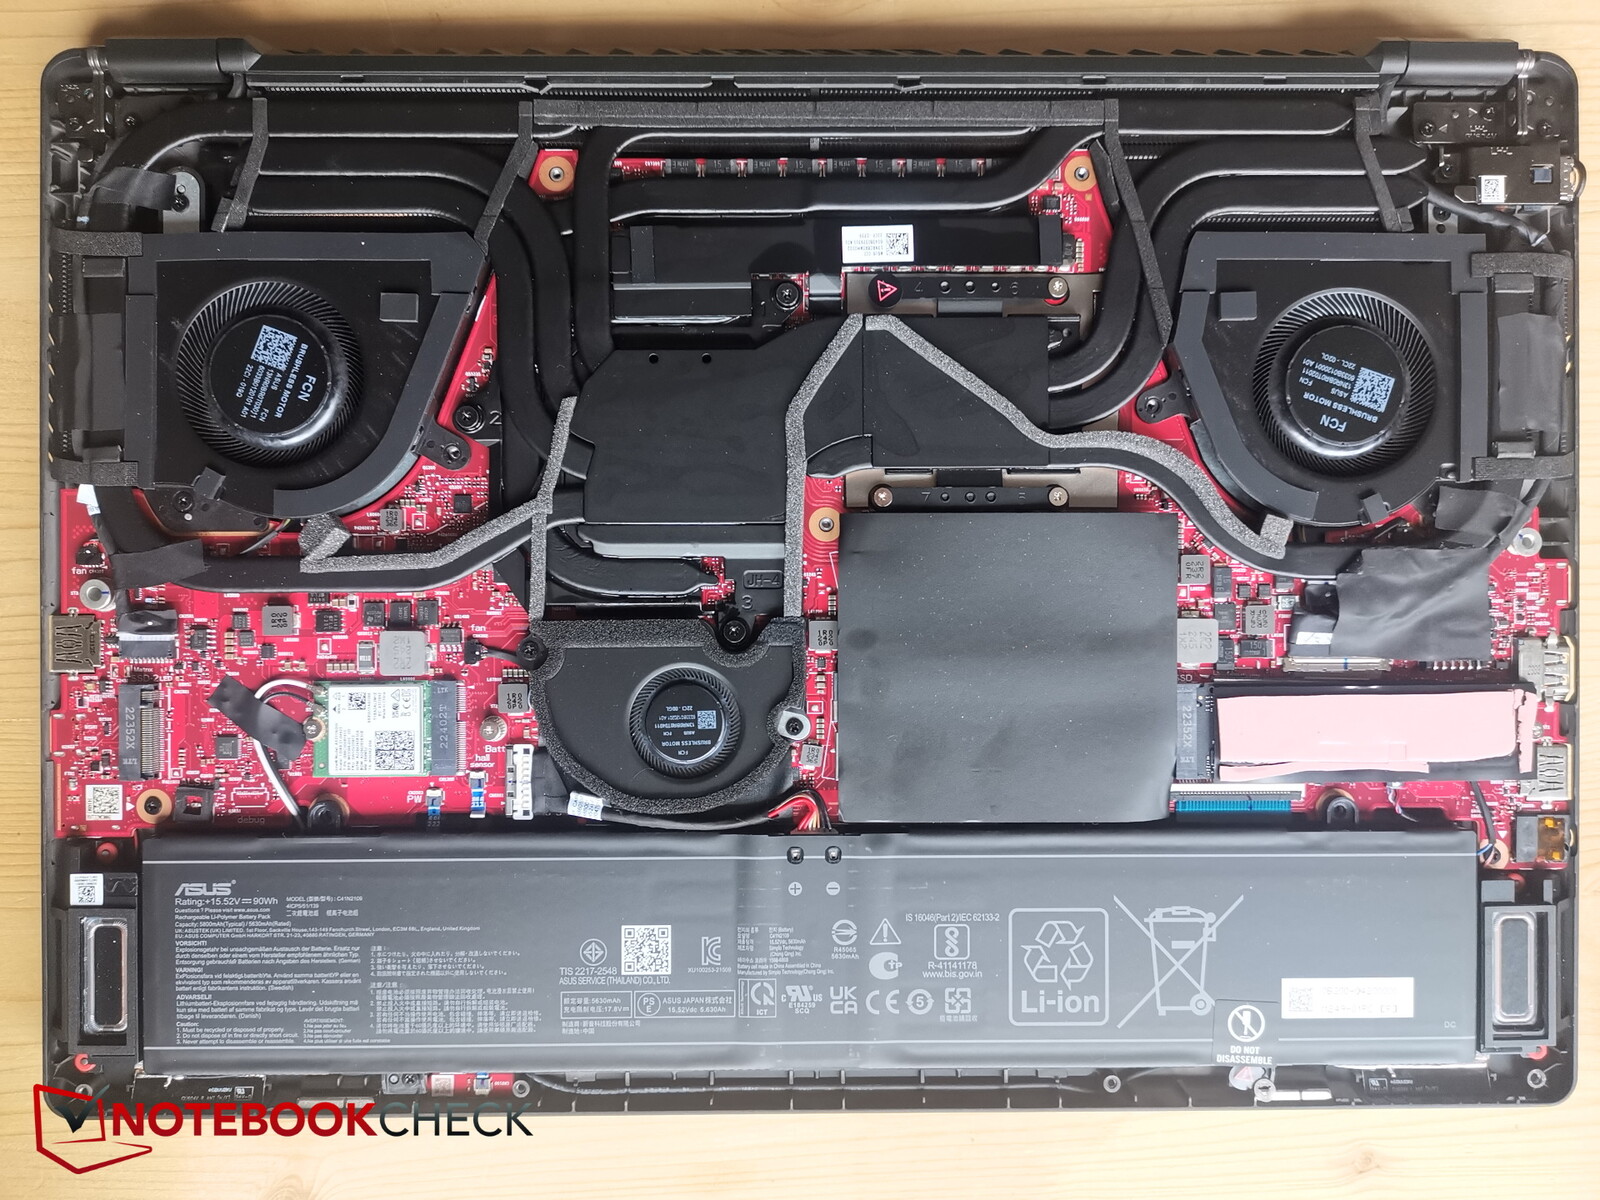
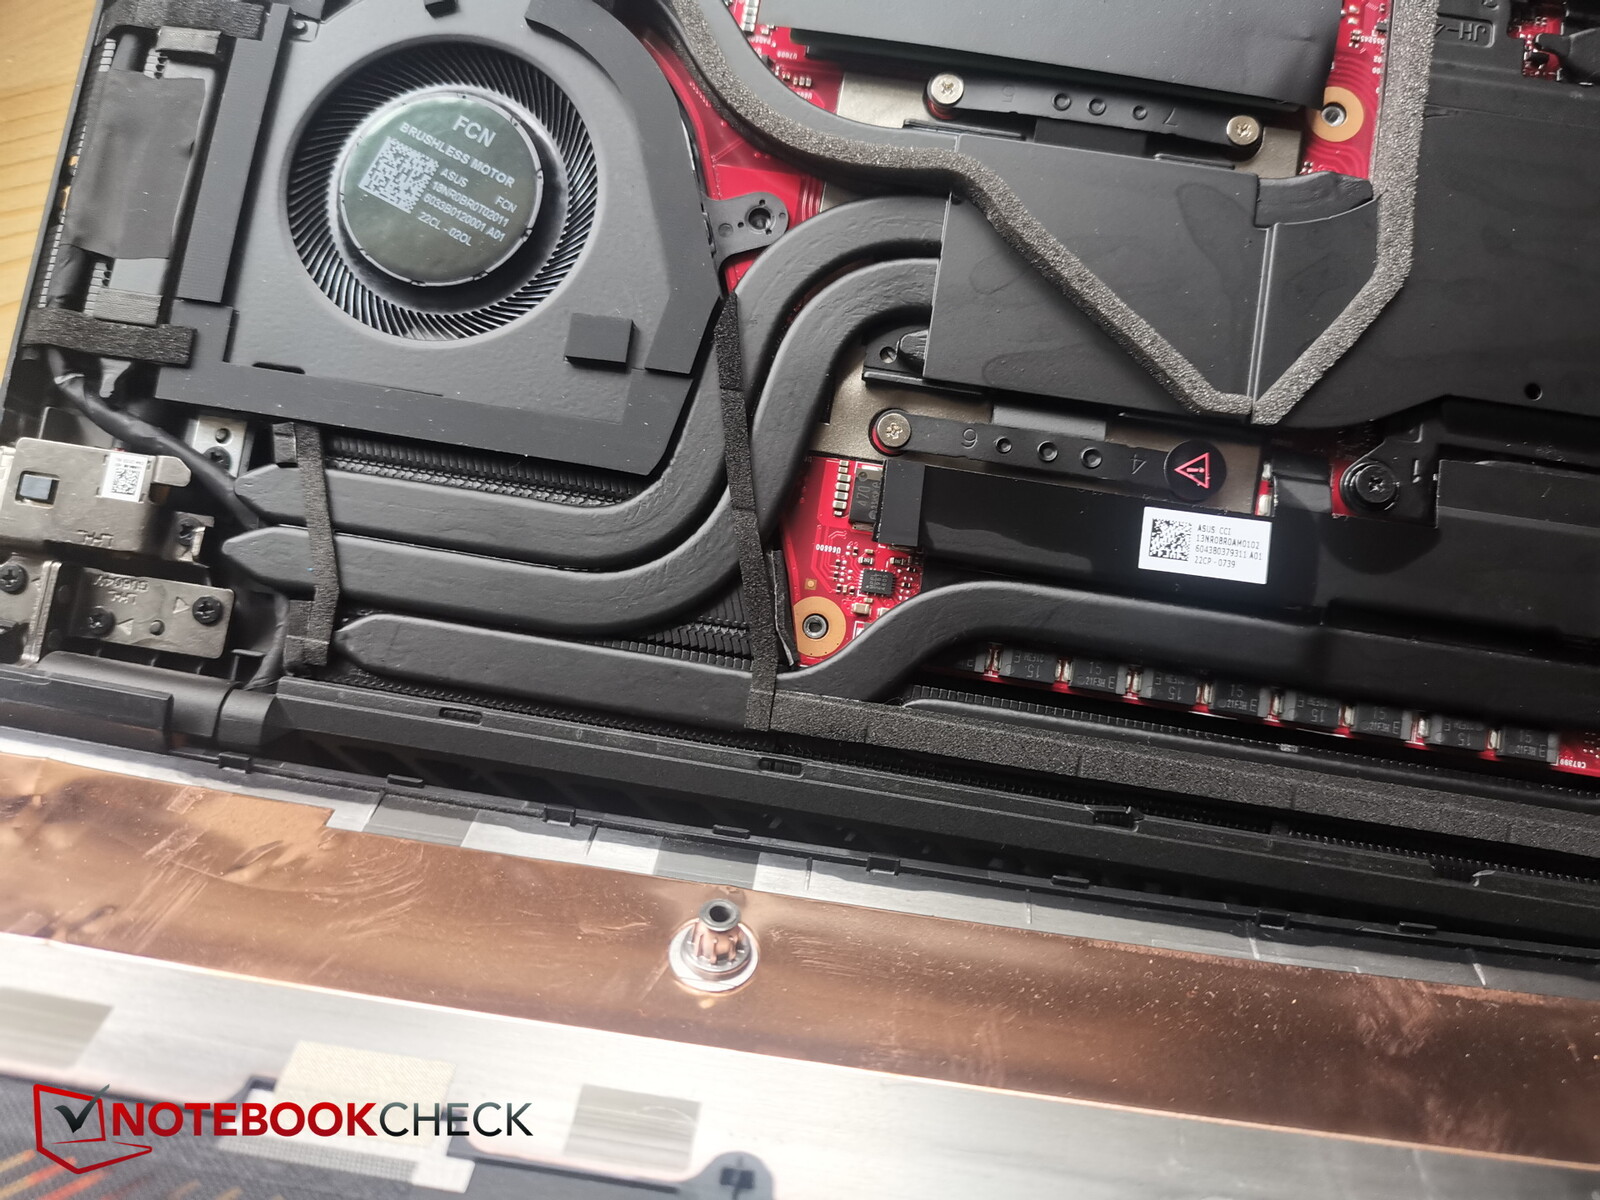
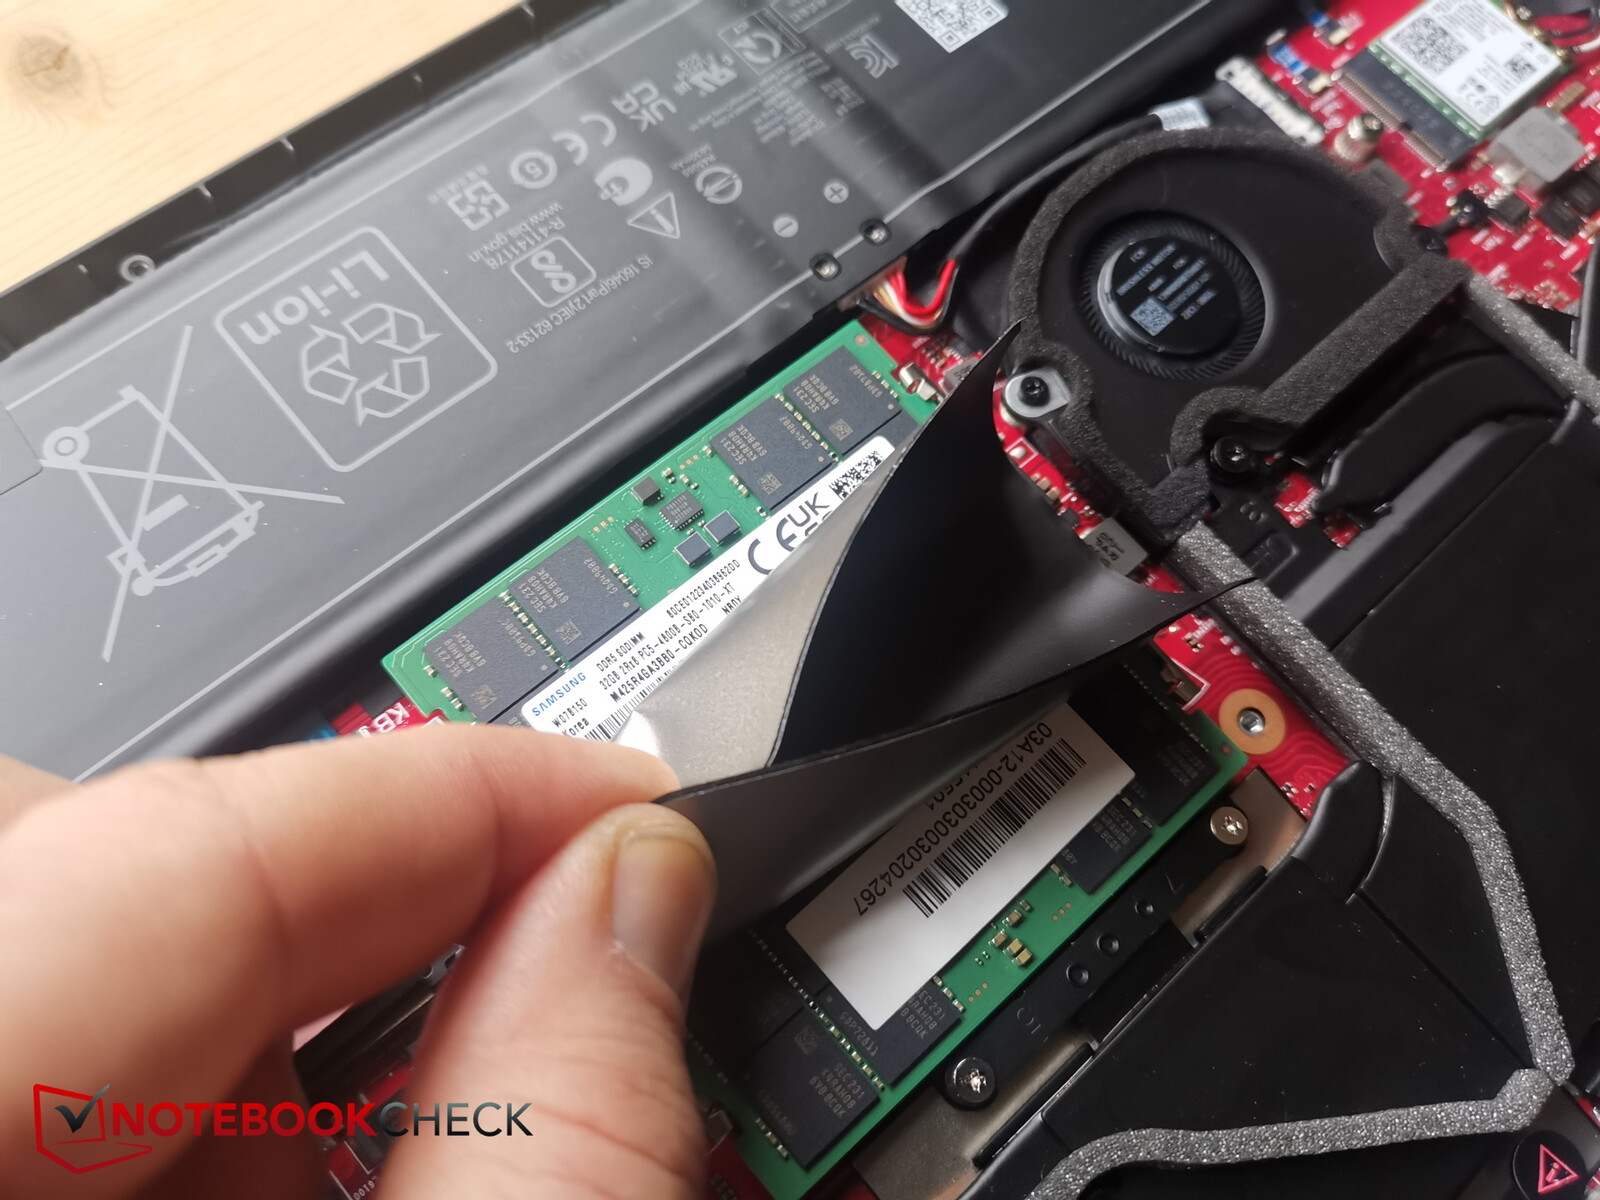
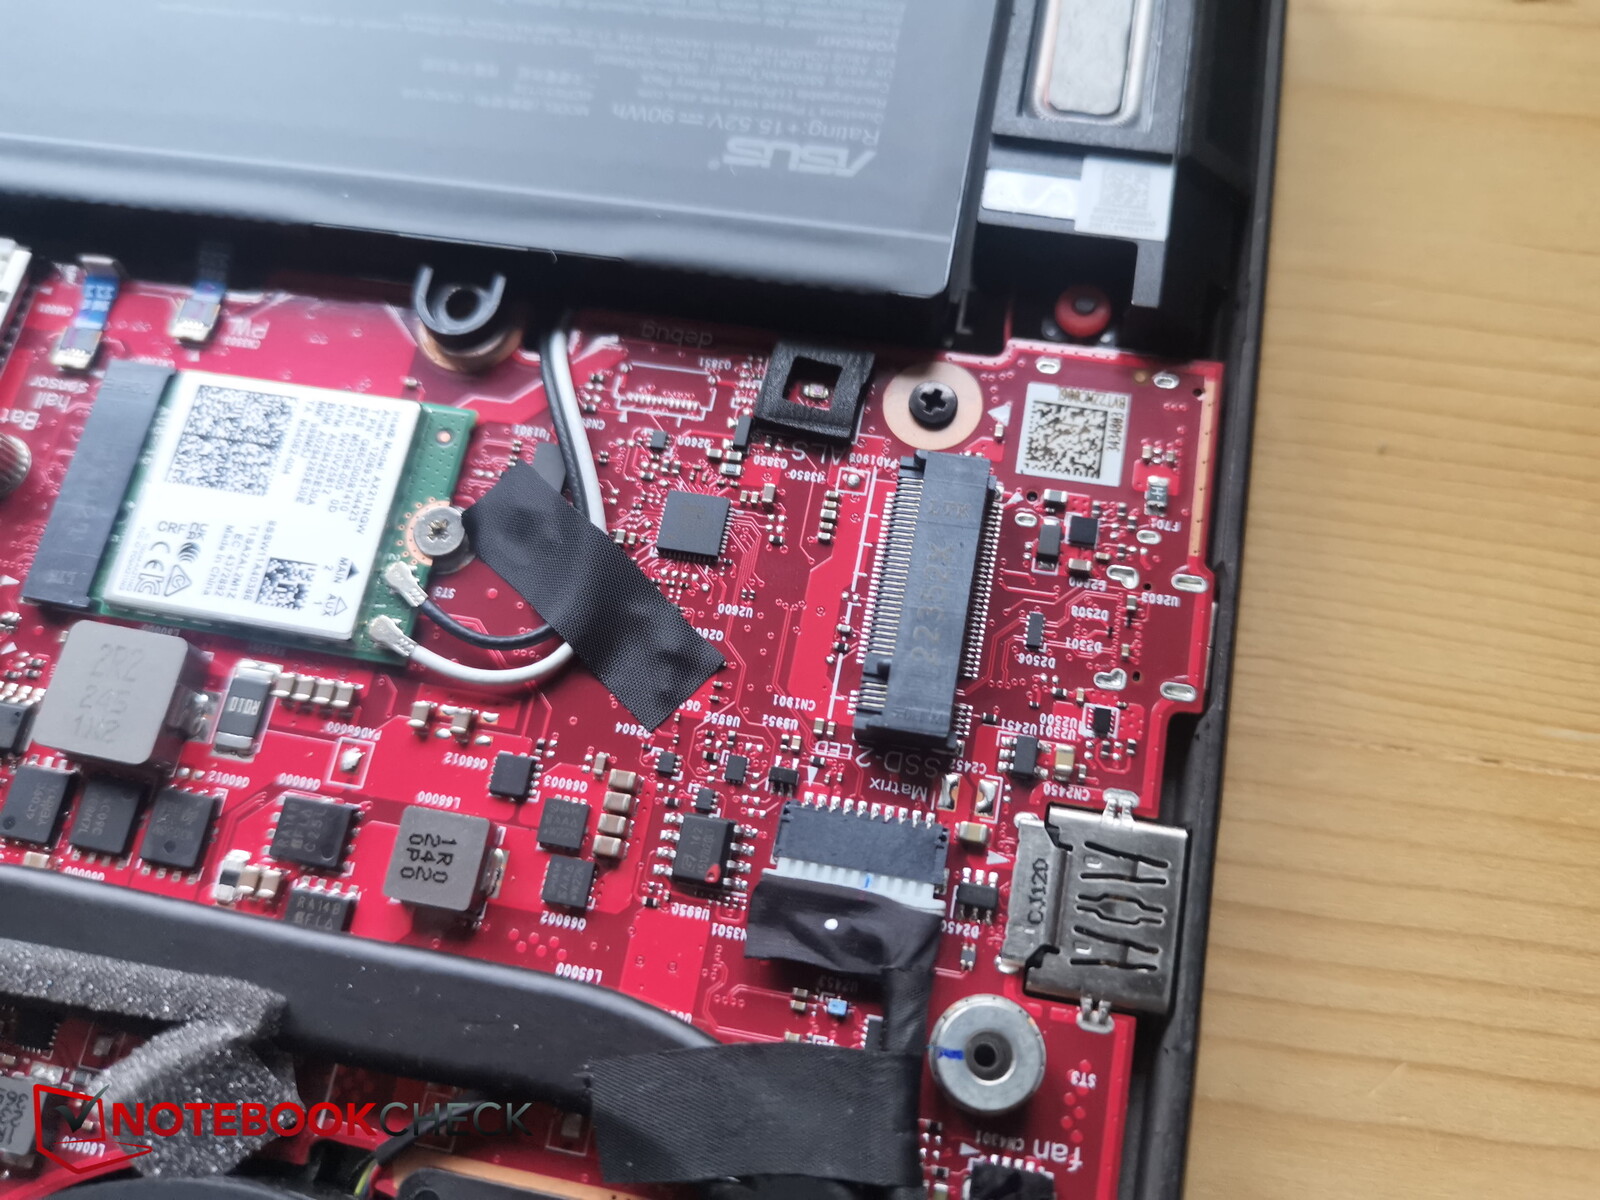
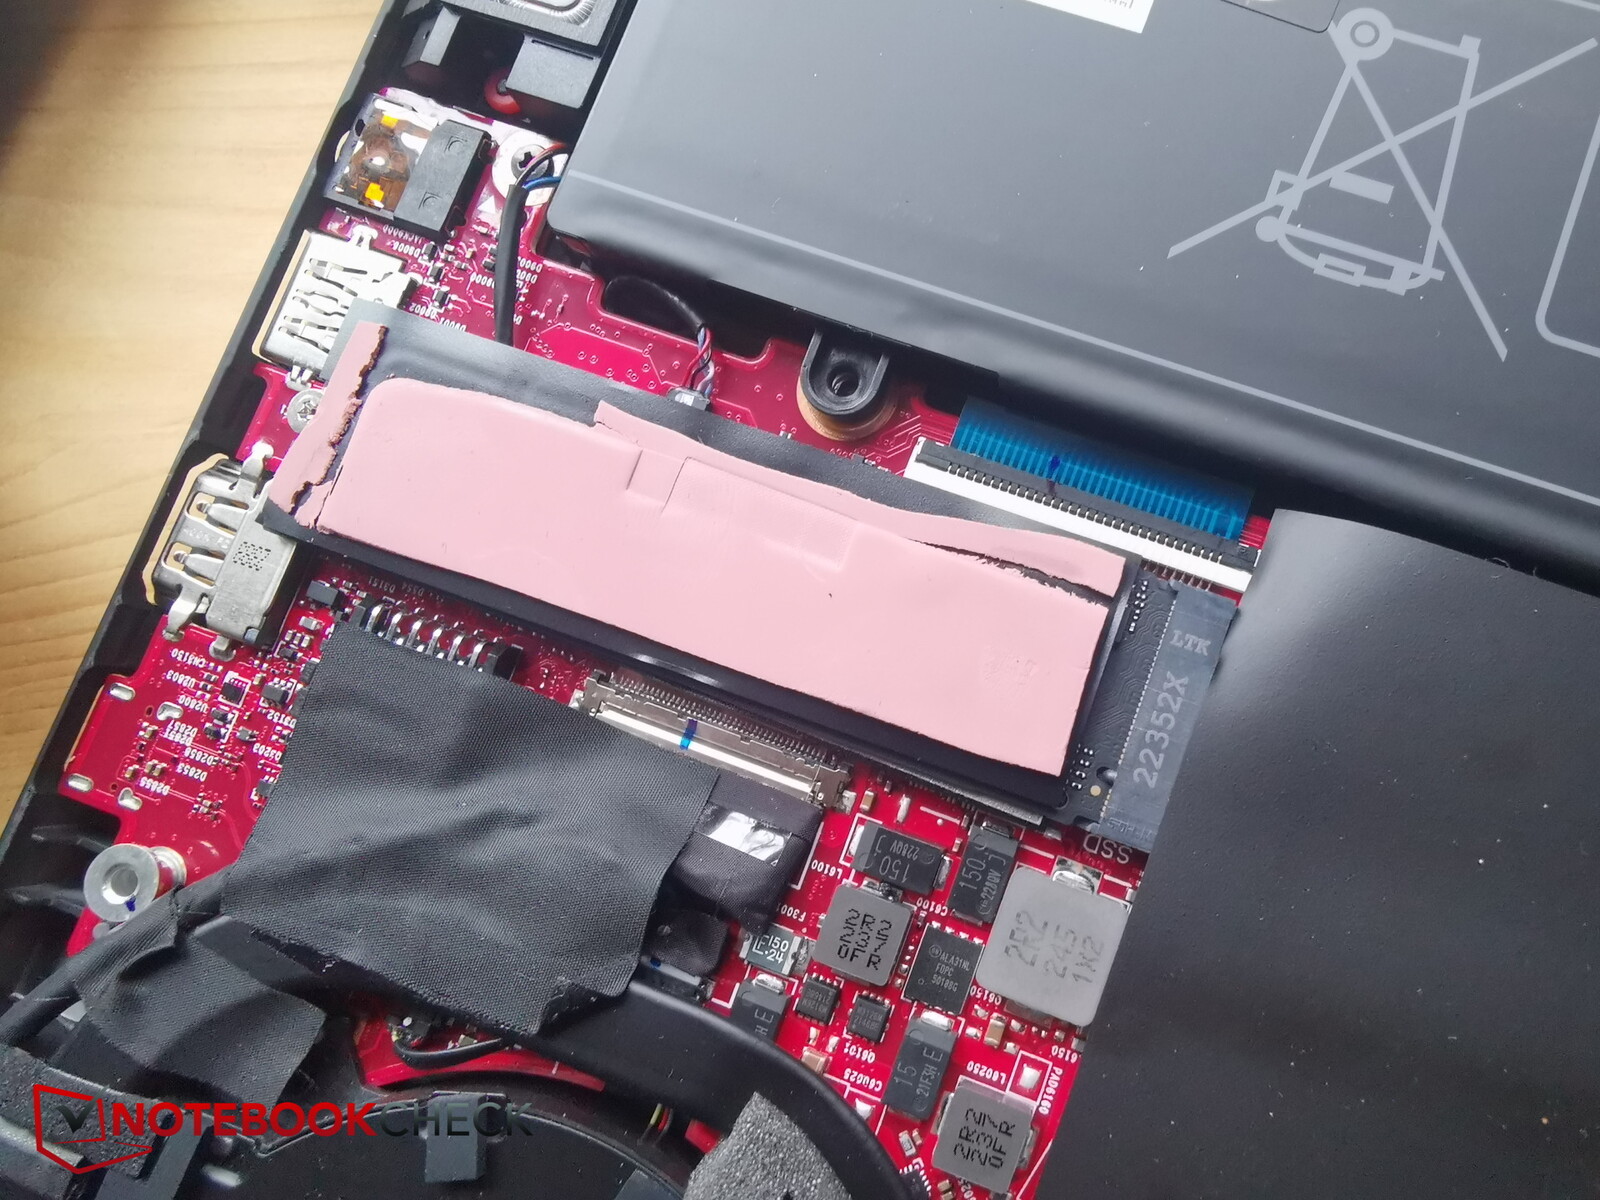
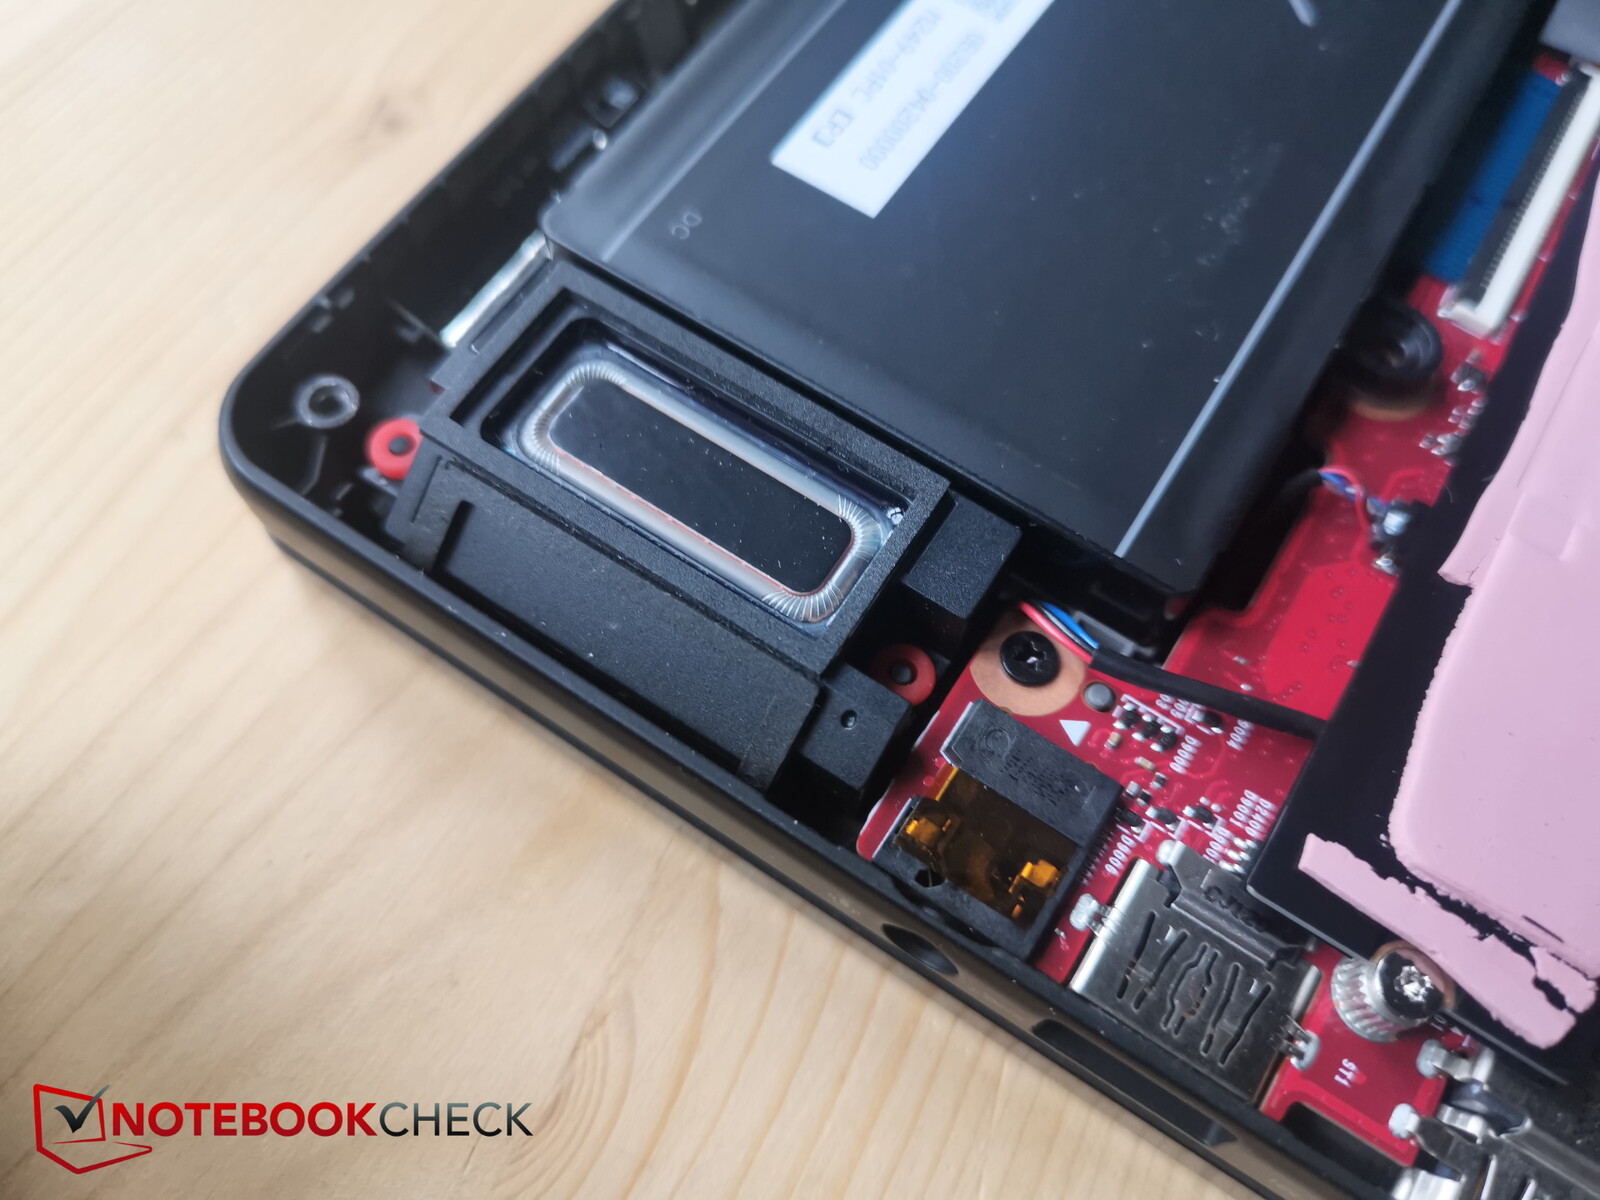
Almeno la piastra di base può essere facilmente aperta. All'interno è possibile accedere alle tre ventole, alla batteria, all'unità SSD, al secondo slot SSD M.2, al modulo WiFi sostituibile e allo slot RAM SO-DIMM.
Il sistema di raffreddamento è composto da 2 ventole di dimensioni normali e da un'ulteriore piccola ventola che presumibilmente si trova sopra l'unità grafica. L'SSD è dotato di un cuscinetto di raffreddamento che sembra piuttosto logoro nel nostro modello in prova.
Garanzia
I portatili Gigabyte sono coperti da una garanzia di 24 mesi.
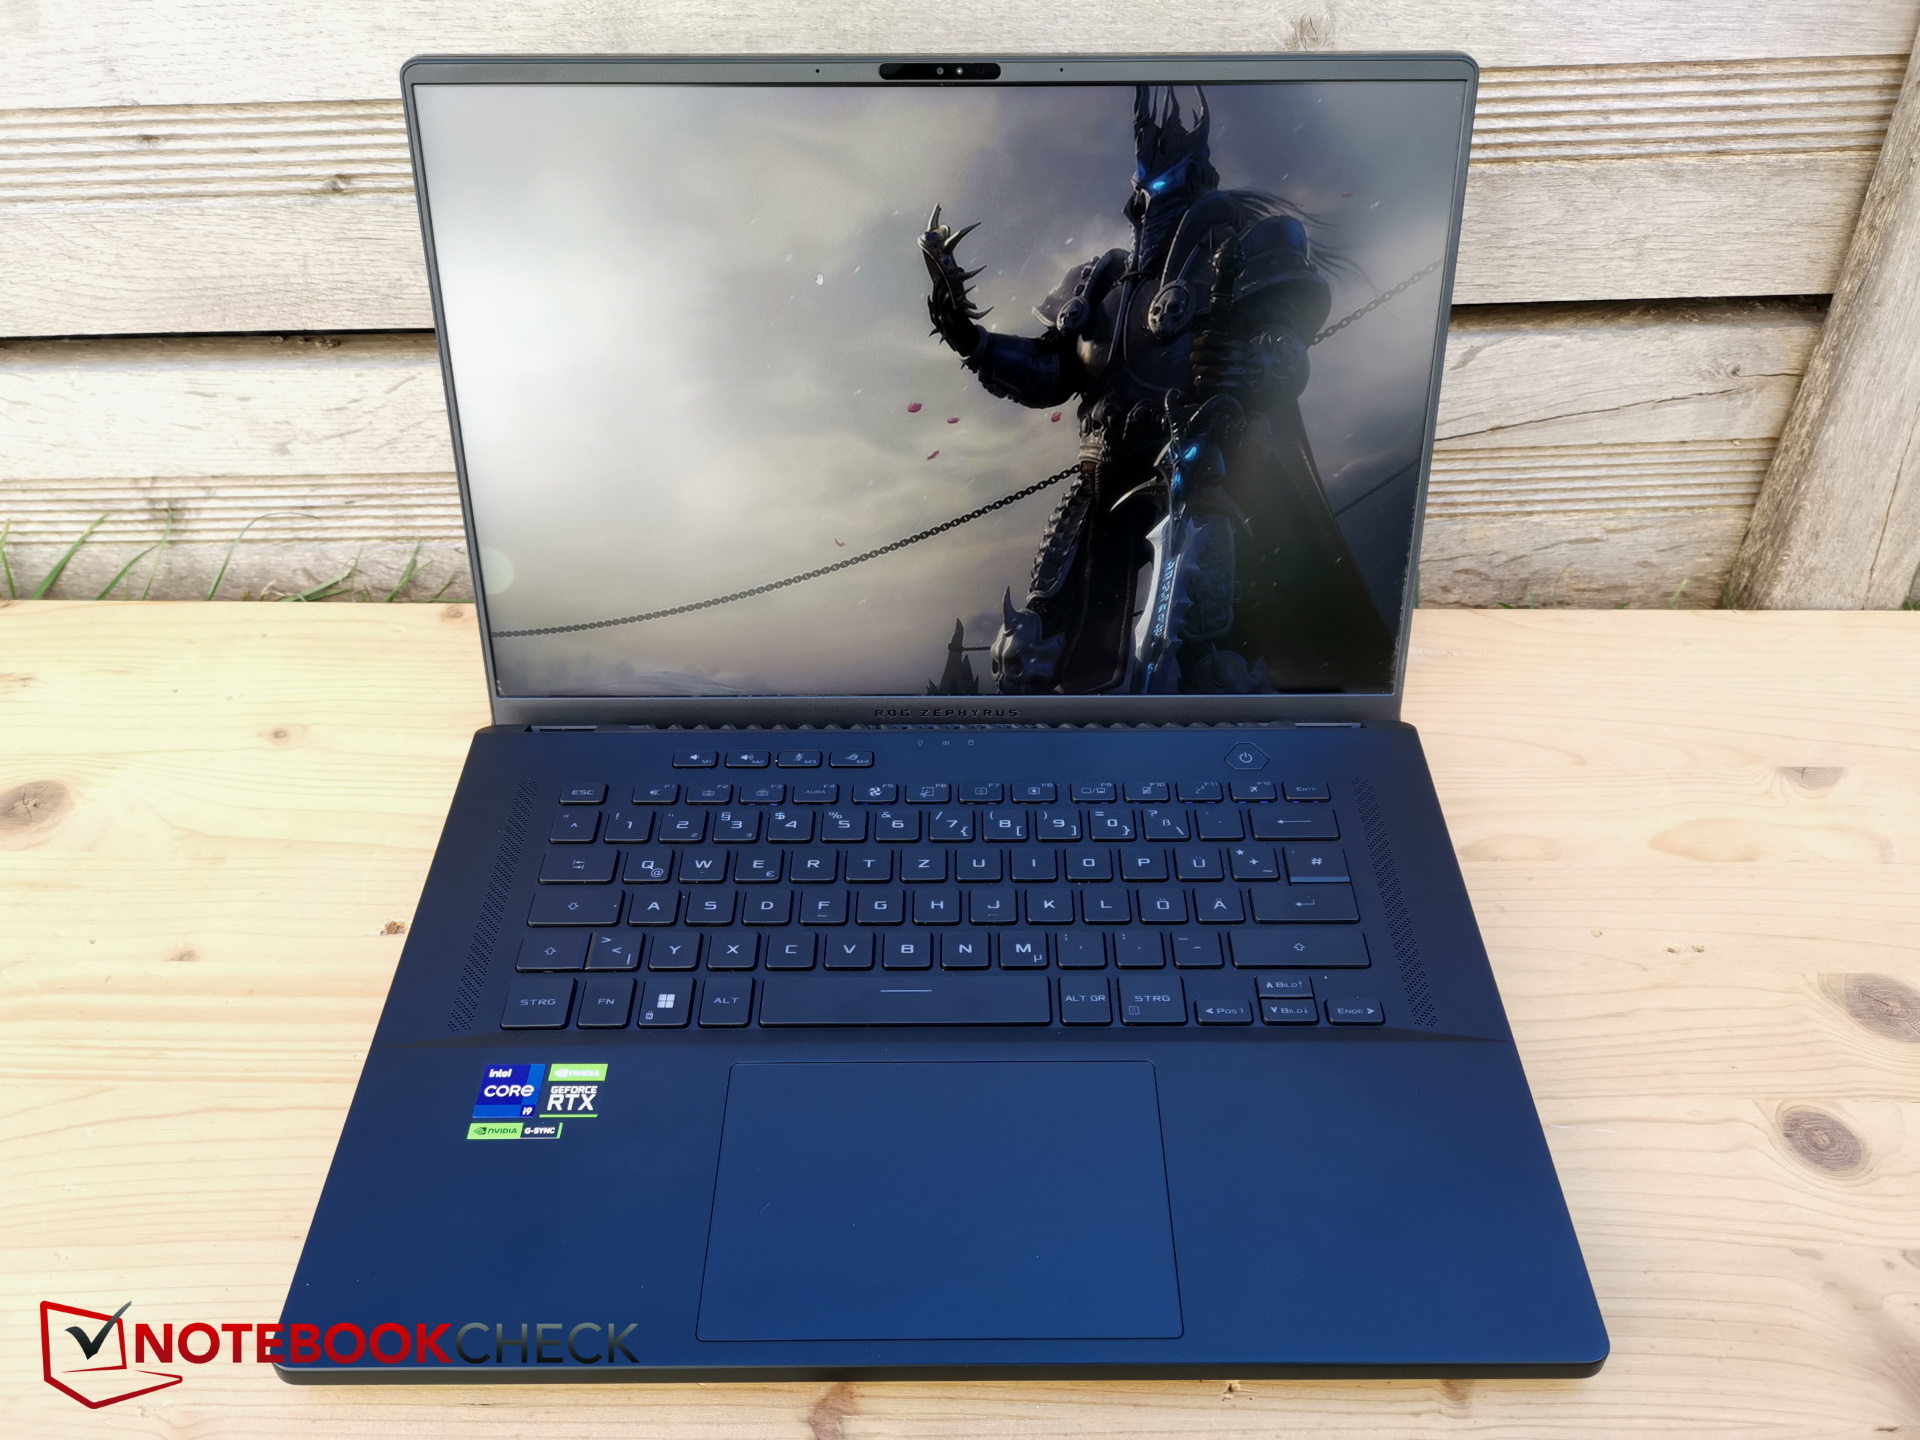
Dispositivi di input - Tasti poco profondi e un ampio touchpad
Tastiera
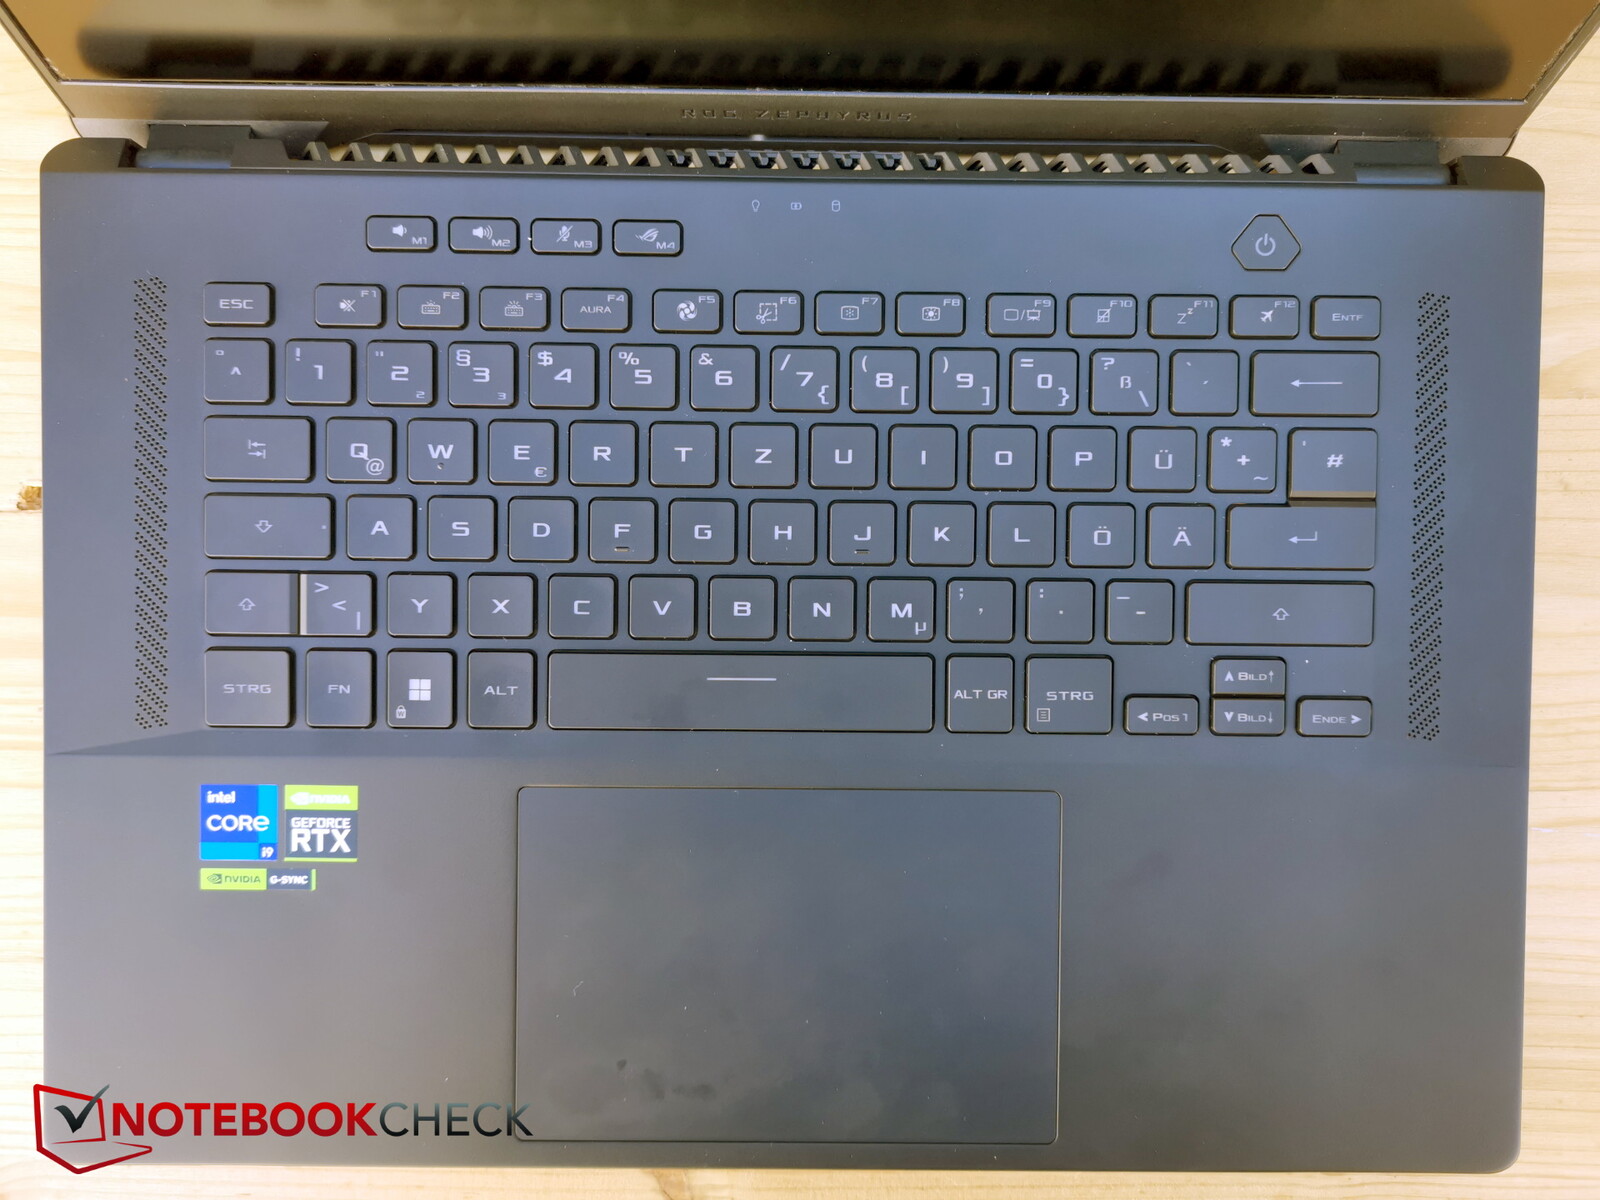
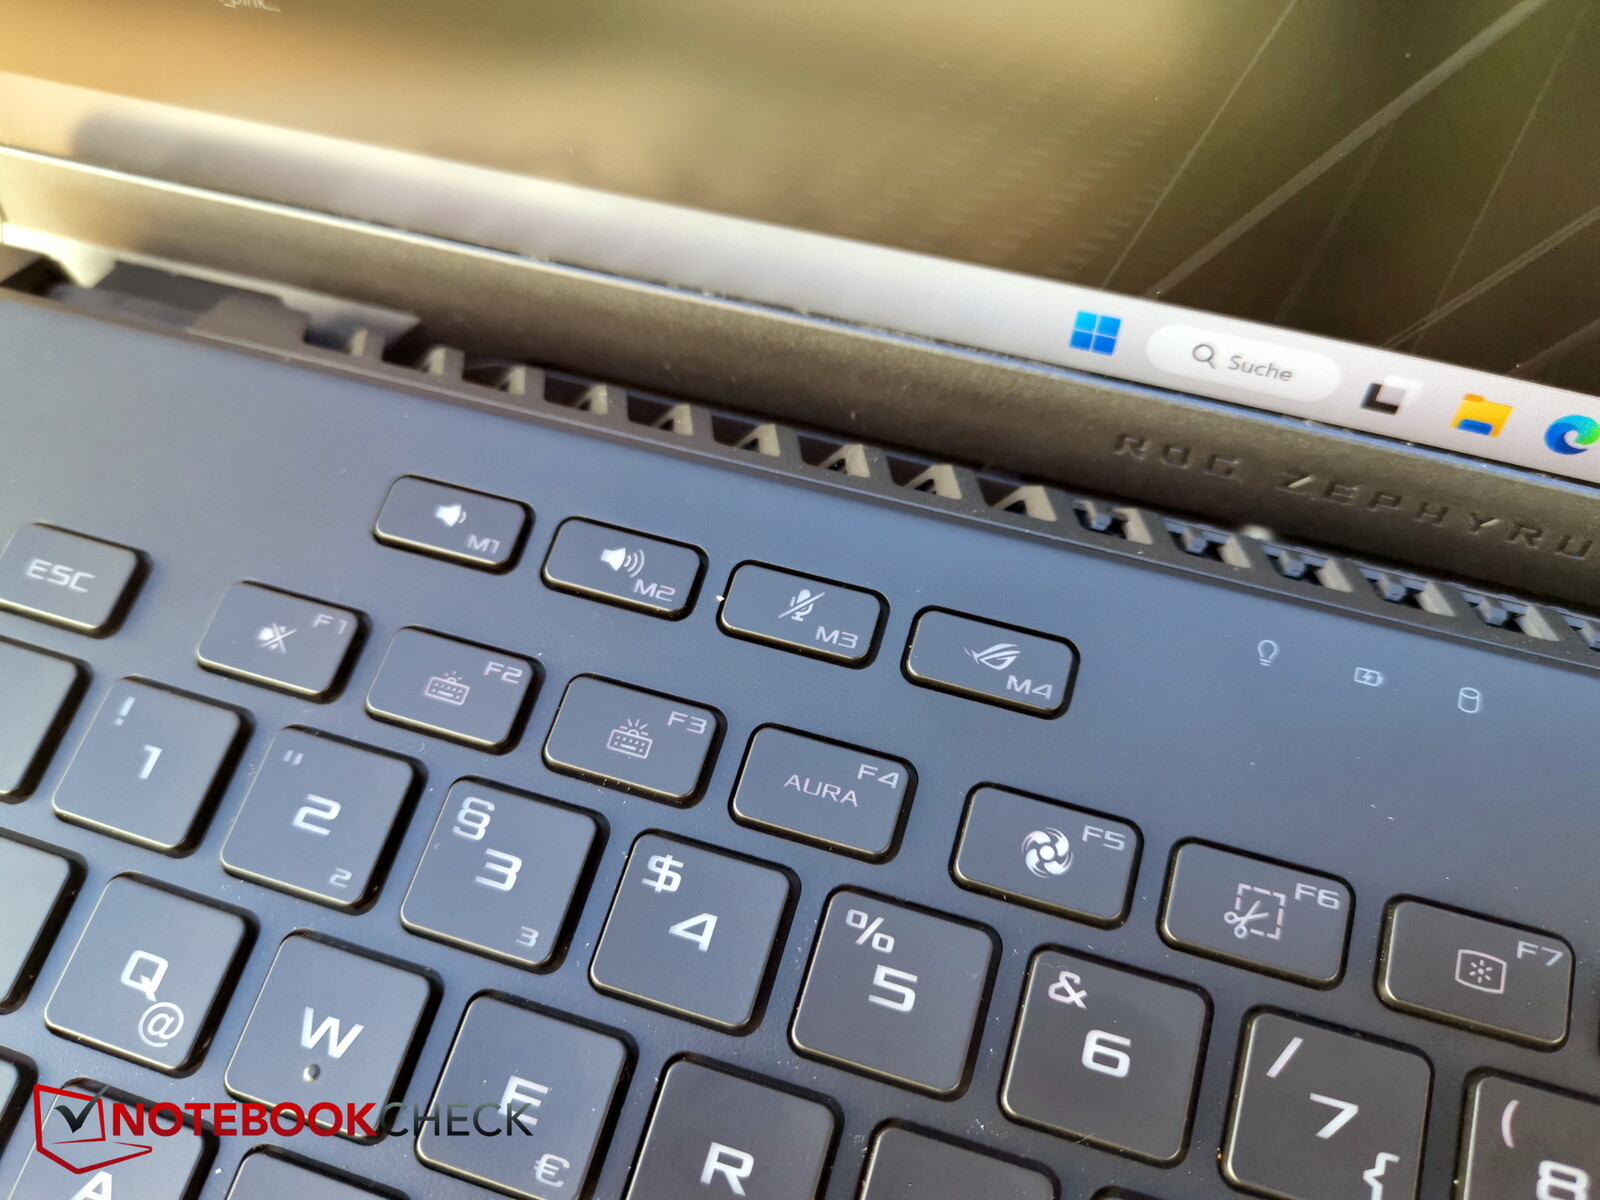
Il layout sembra molto spazioso. In alto a sinistra, Asus ha inserito quattro tasti speciali aggiuntivi per il controllo del volume, il microfono e il centro di controllo Asus. Anche questi possono essere configurati manualmente.
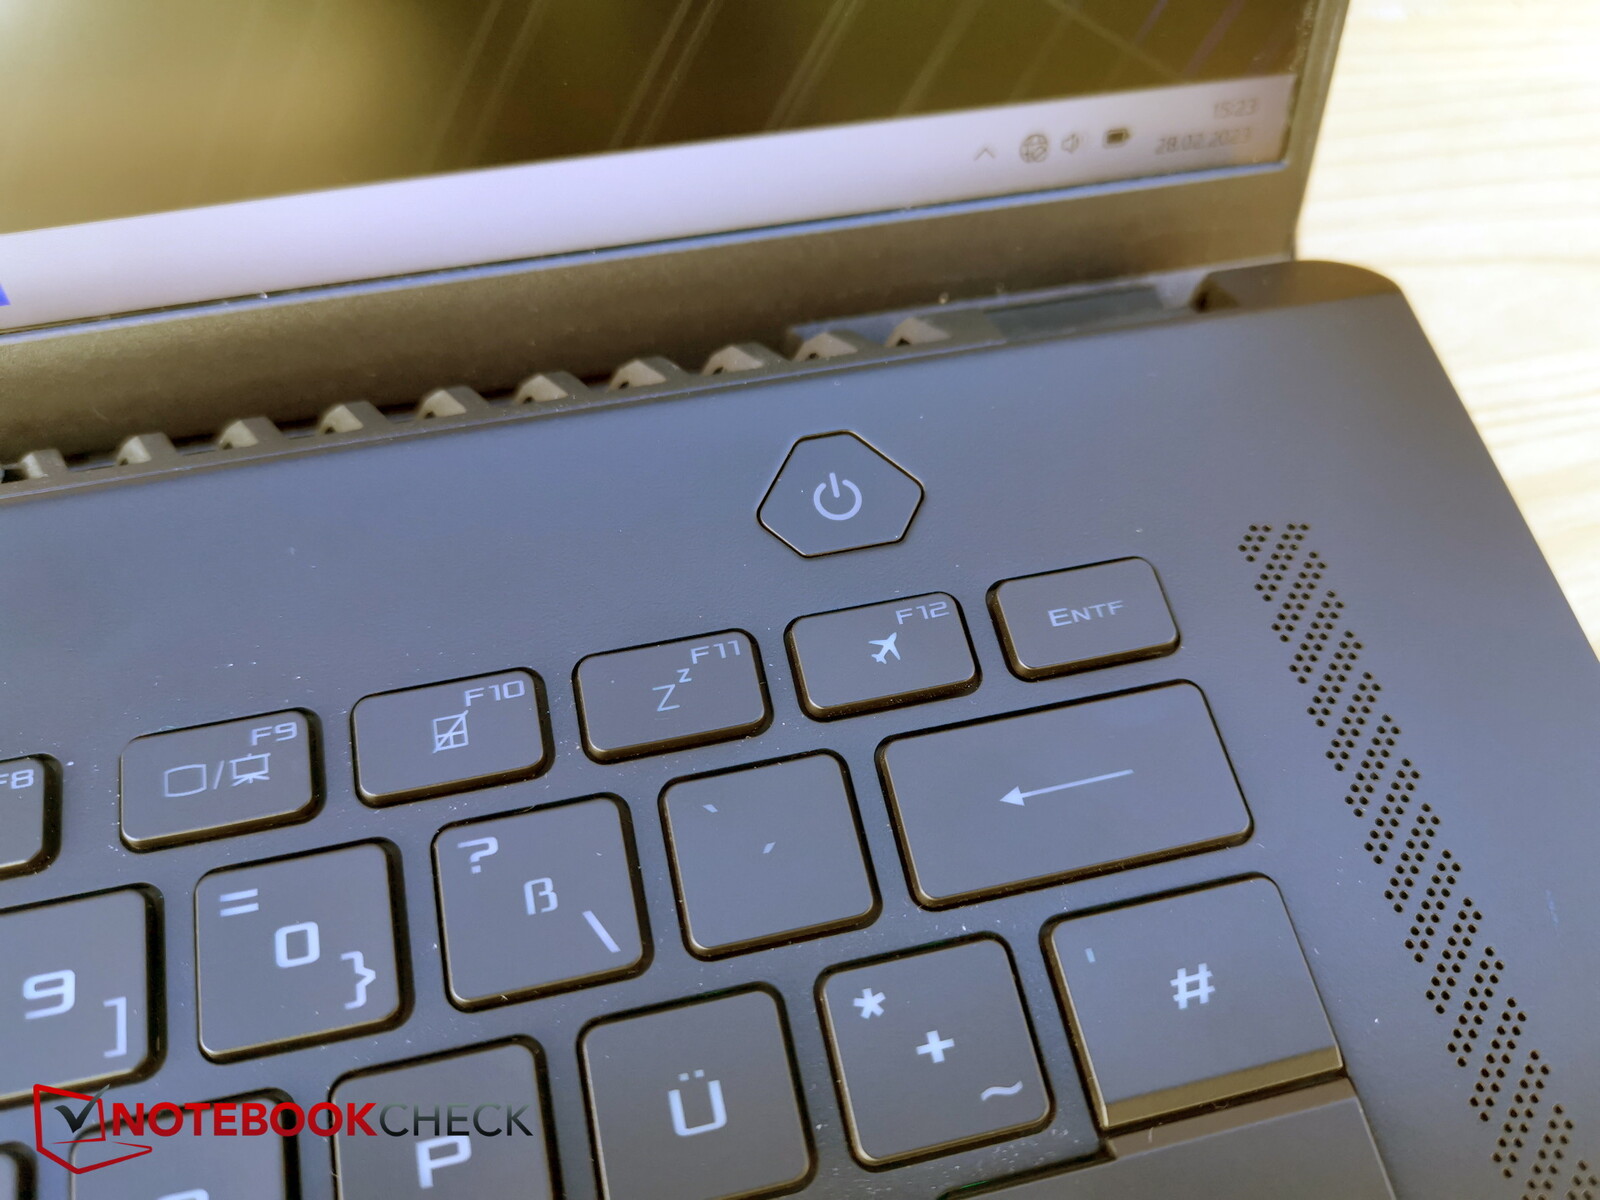
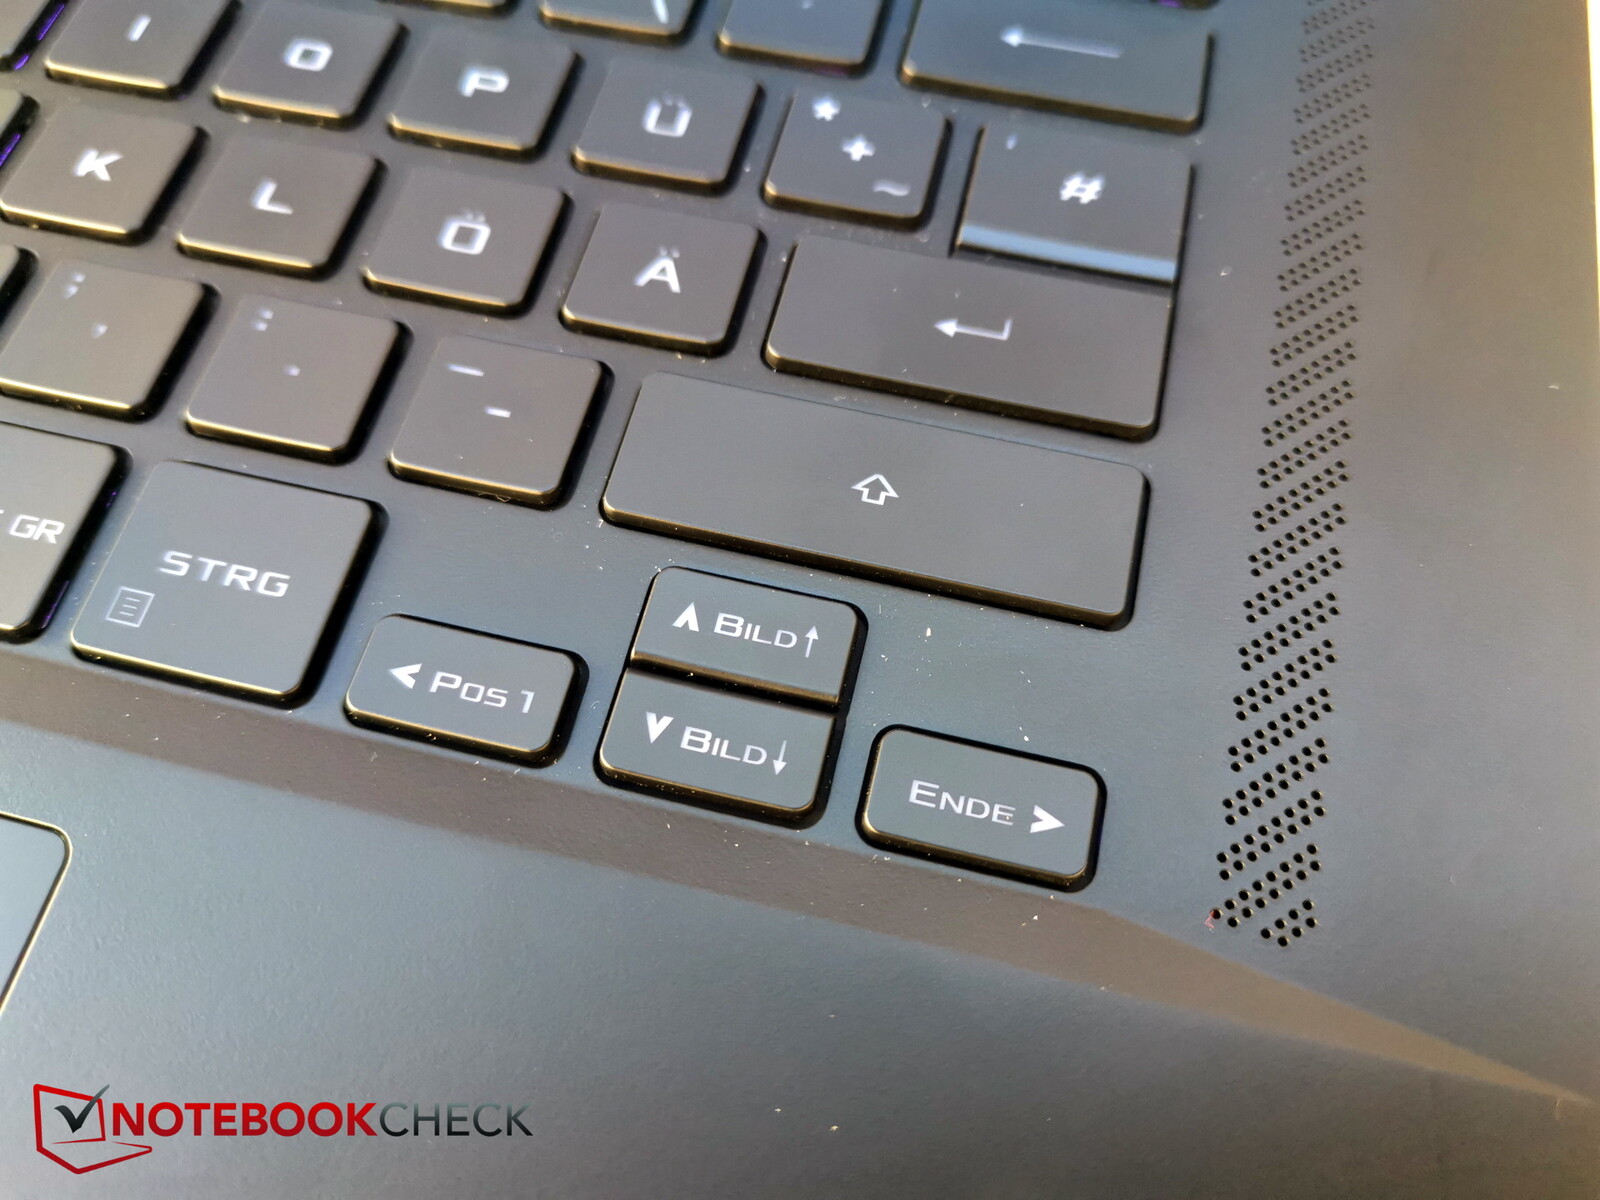
Purtroppo, i tasti freccia sono molto stretti e il tasto di accensione, tipico per questo tipo di tastiera, è un tasto separato. Nonostante si tratti di un dispositivo da 16 pollici, non è presente un tastierino numerico.
I tasti hanno una corsa molto breve e il feedback è un po' superficiale, ma comunque sufficientemente preciso. Nel complesso, sebbene l'esperienza di digitazione sia abbastanza buona, avremmo preferito dei tasti un po' più nitidi. Il rumore di battitura è moderato.
La retroilluminazione a 3 livelli si illumina in diversi colori RGB, ma solo a una zona.
Touchpad
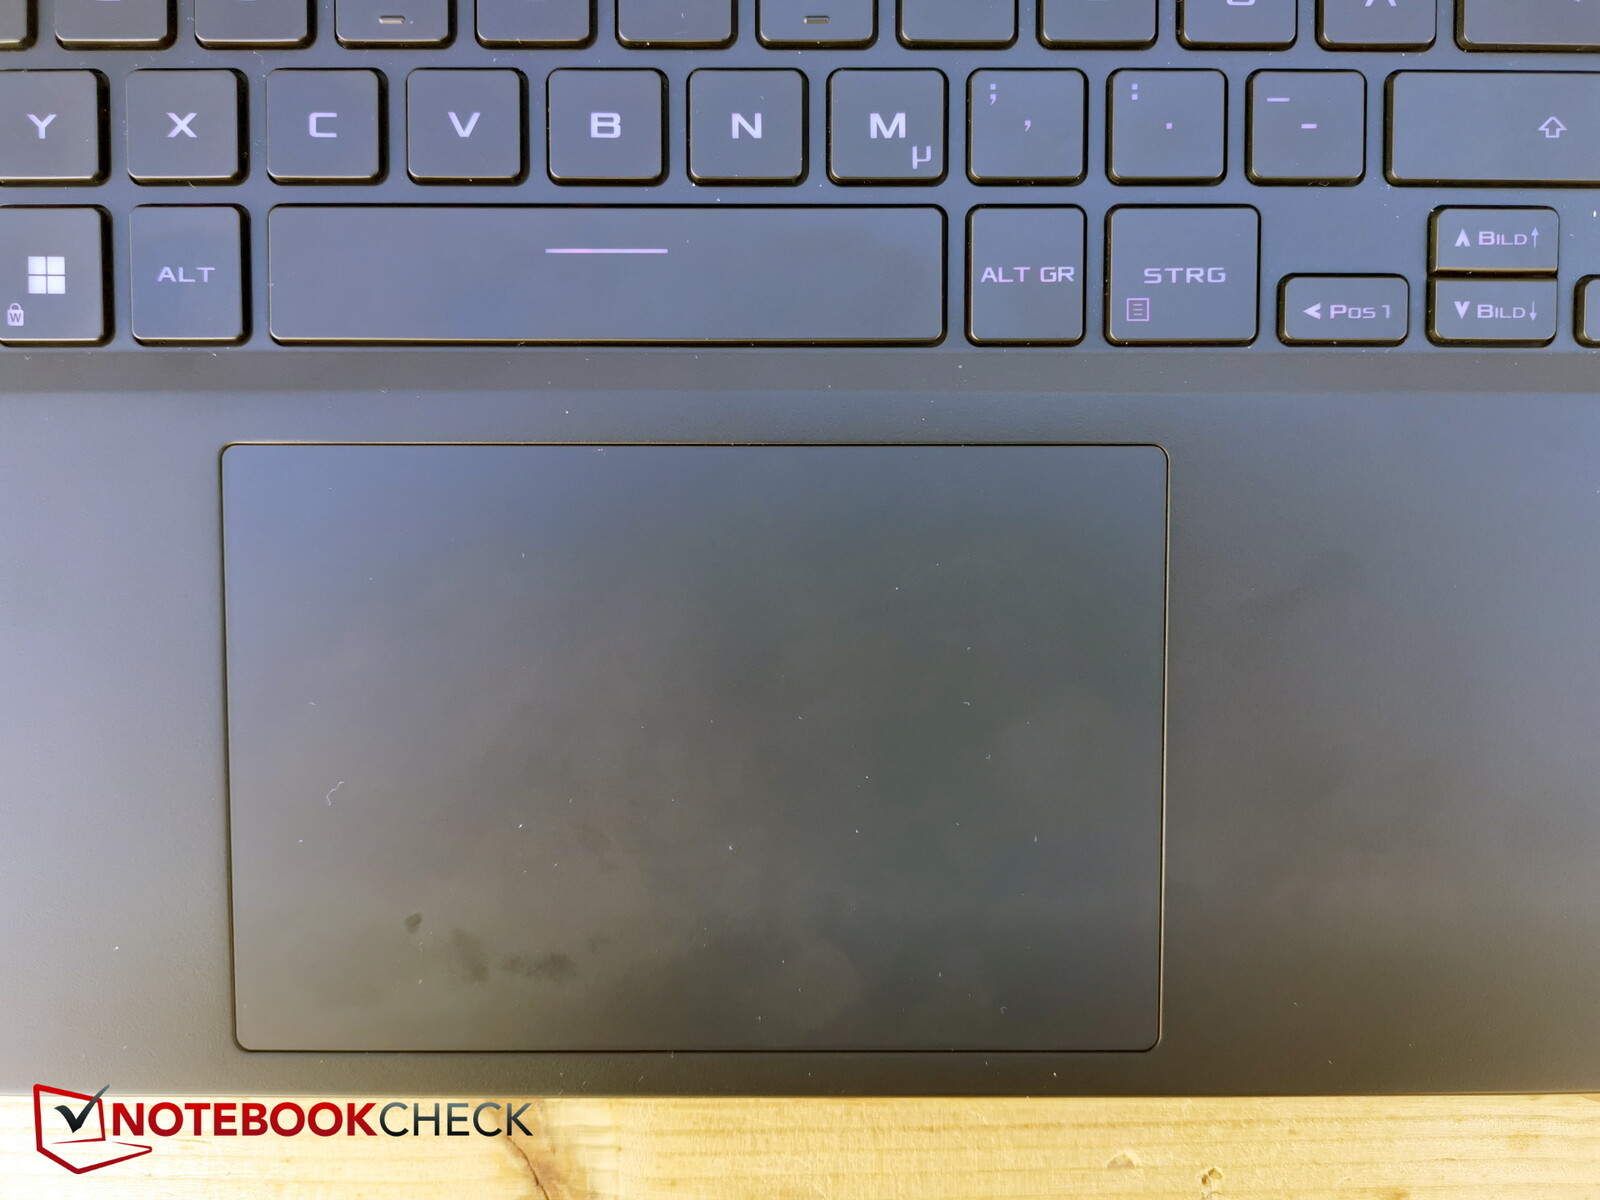
L'ampio touchpad (circa 13 x 8,5 cm) è leggermente decentrato verso destra e offre un'esperienza di scorrimento fluida anche quando si eseguono movimenti prolungati.
I tasti integrati hanno un punto di pressione breve ma buono, con un feedback chiaro. I rumori di scatto possono essere descritti come silenziosi o moderati.
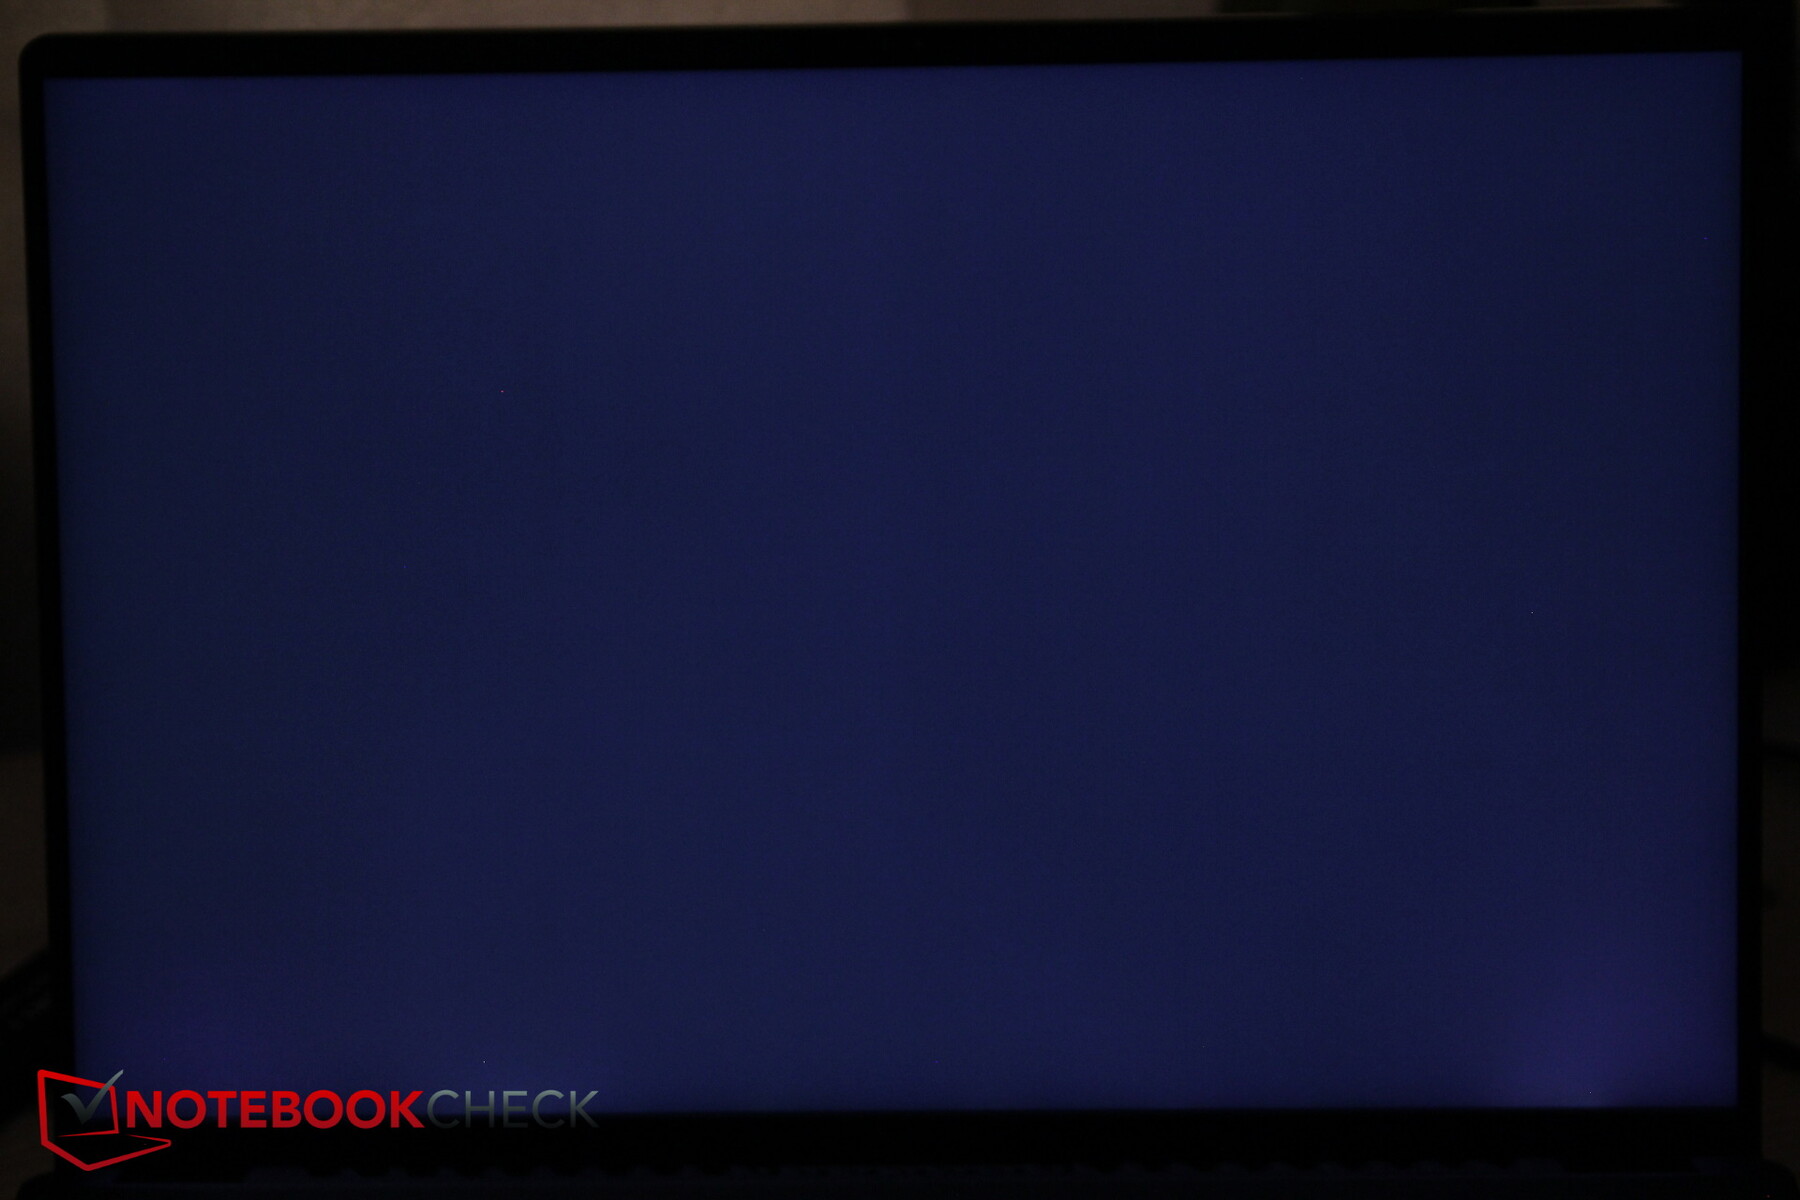
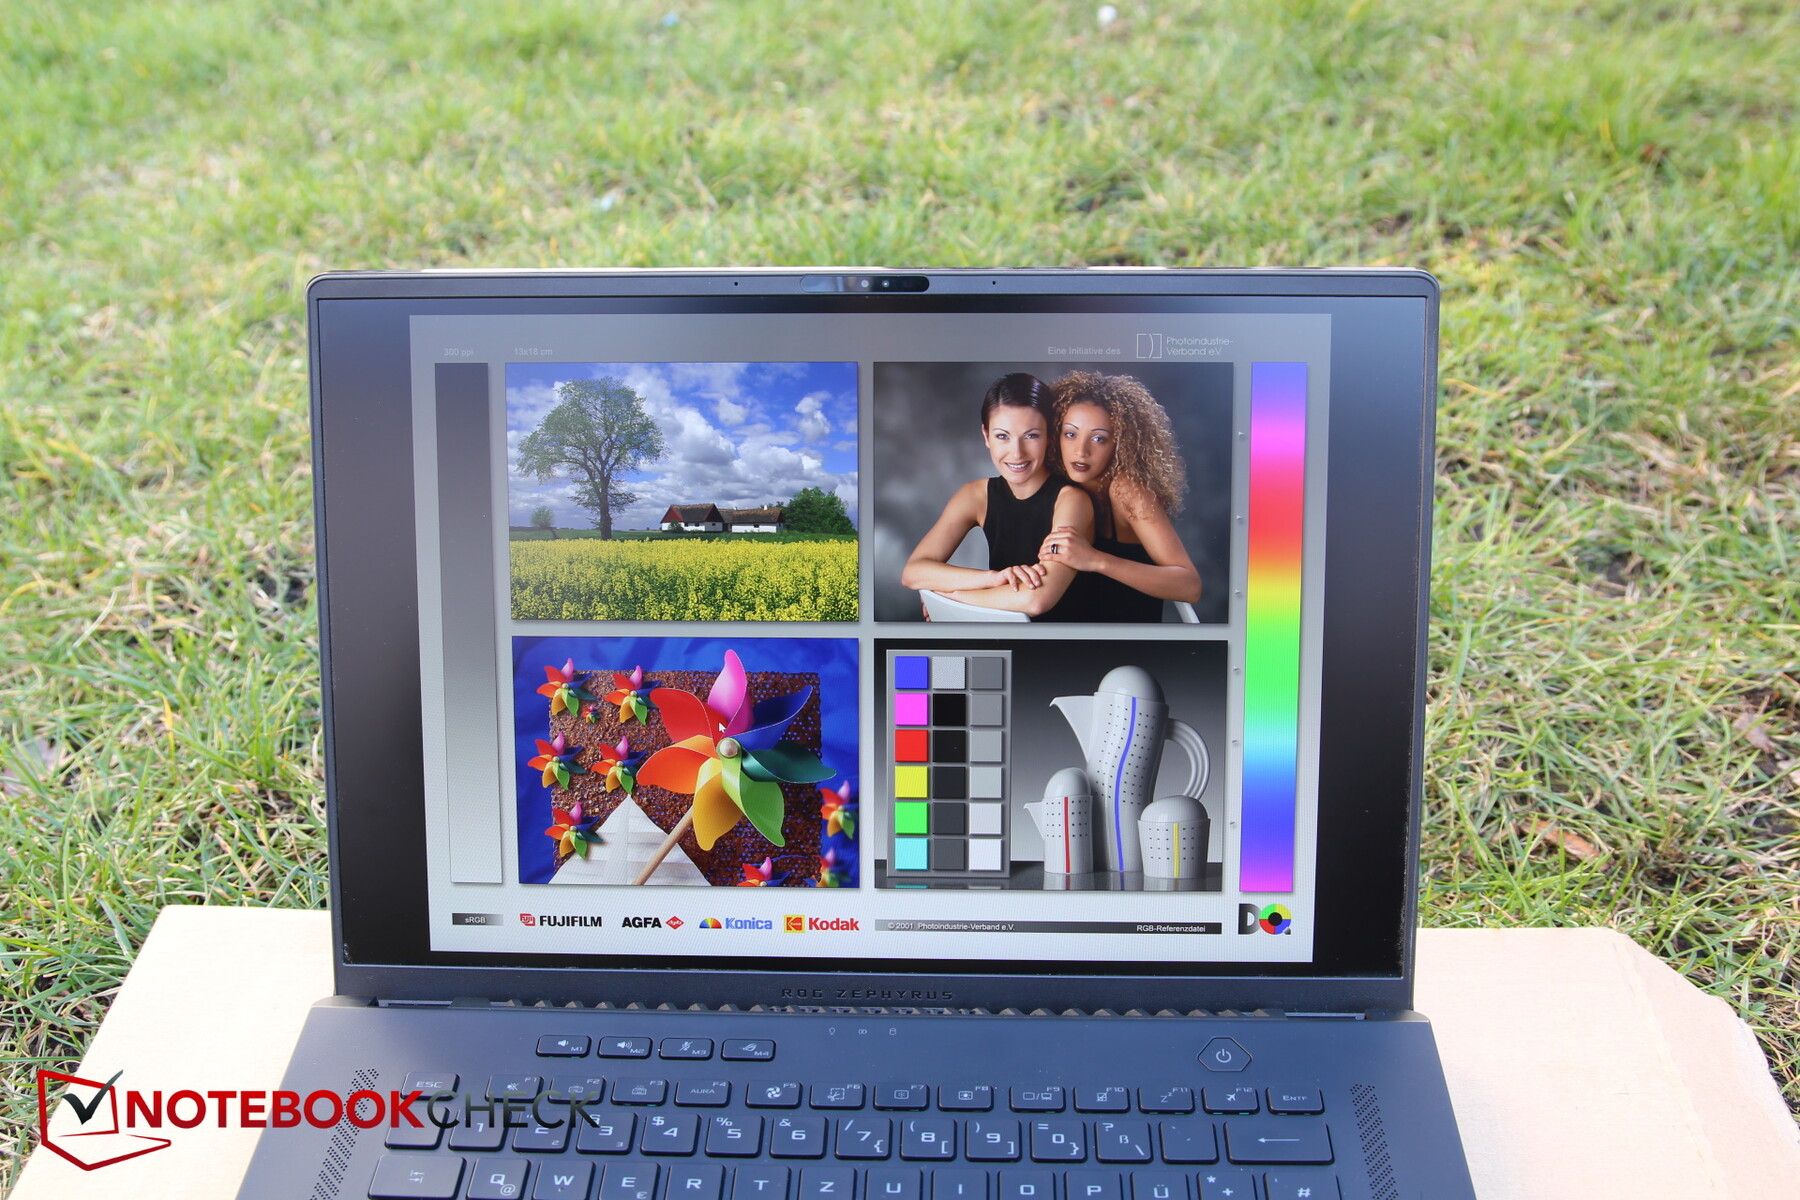
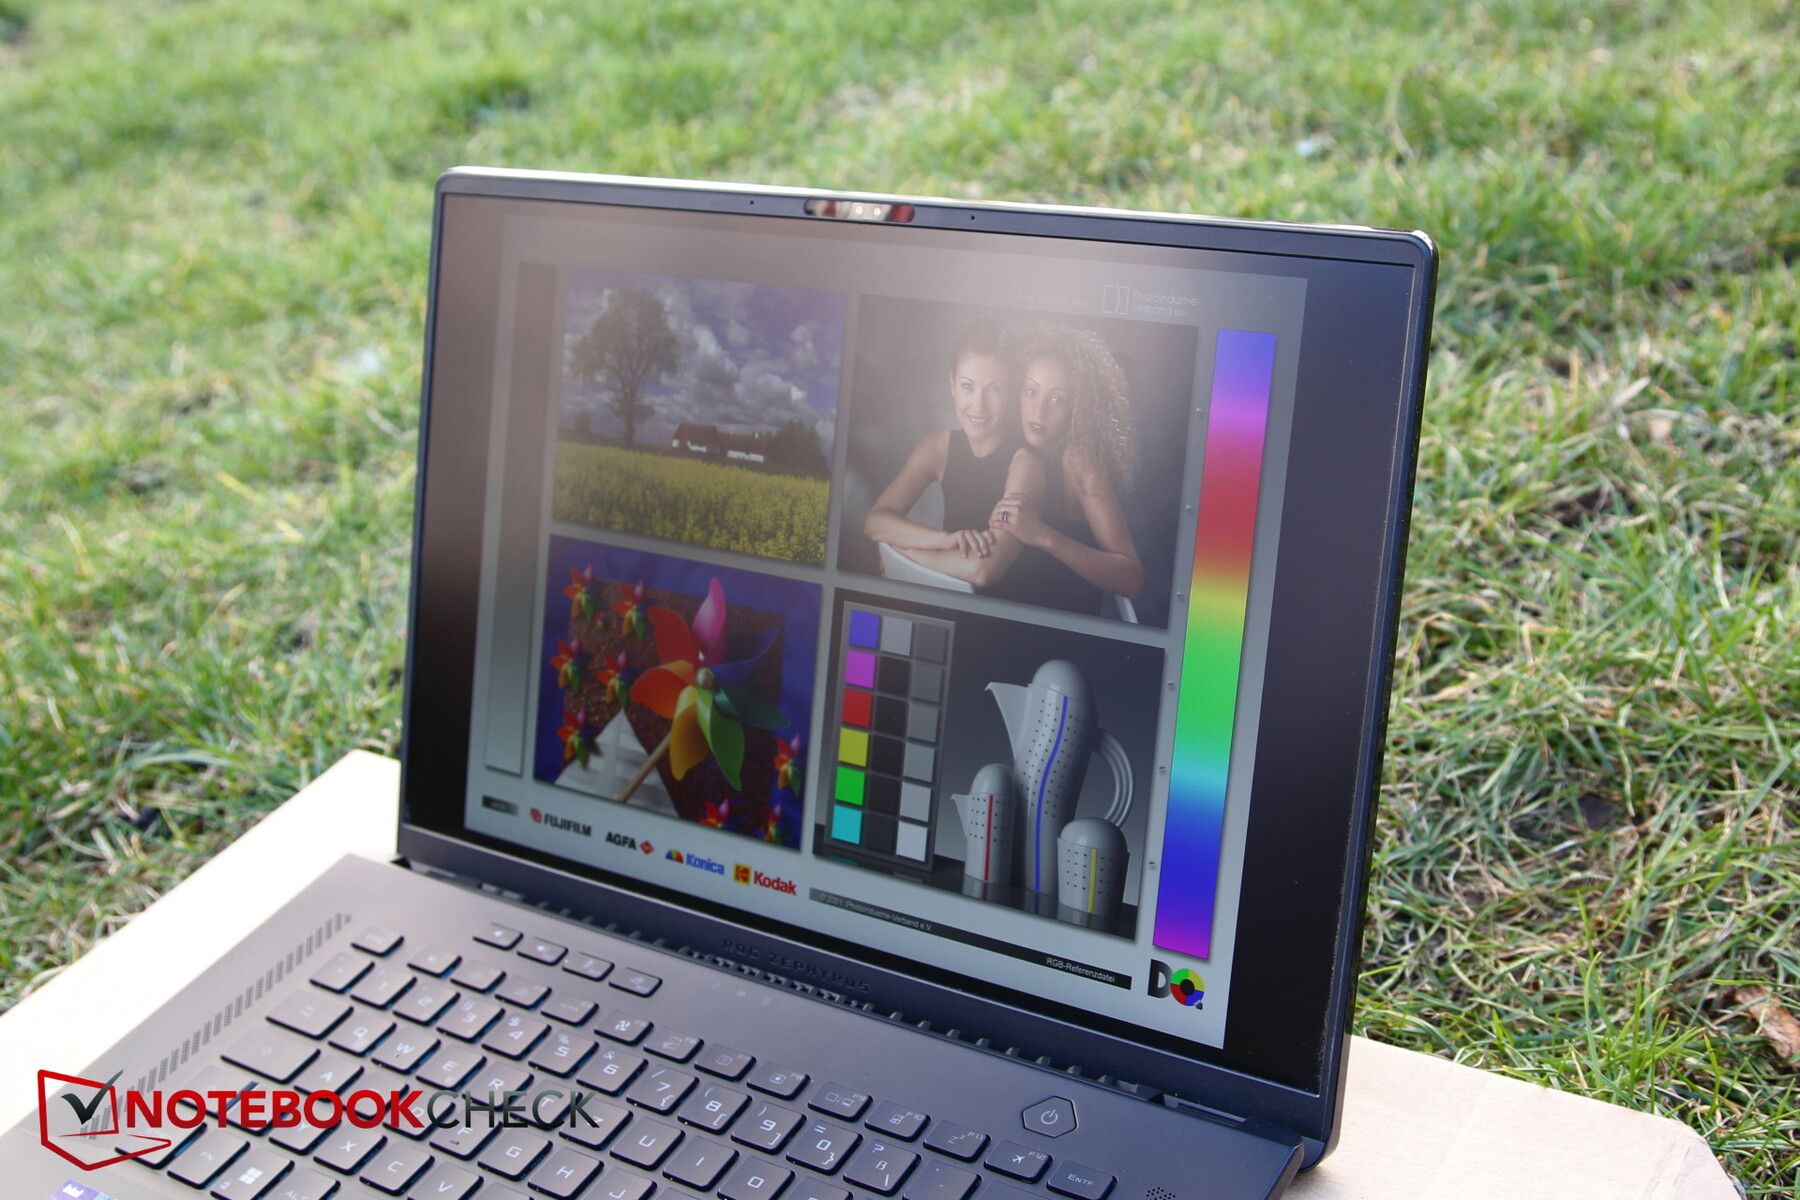
Display - Un Mini-LED molto luminoso con HDR
Ancora una volta, il produttore ha scelto un display IPS opaco, 16:10, con una risoluzione di 2.560 x 1.600 pixel. Tuttavia, non si tratta dello stesso pannello, poiché porta un nuovo numero di versione ed è ora retroilluminato con tecnologia Mini-LED. Asus non ha rivelato il numero di zone di oscuramento utilizzate dal pannello.
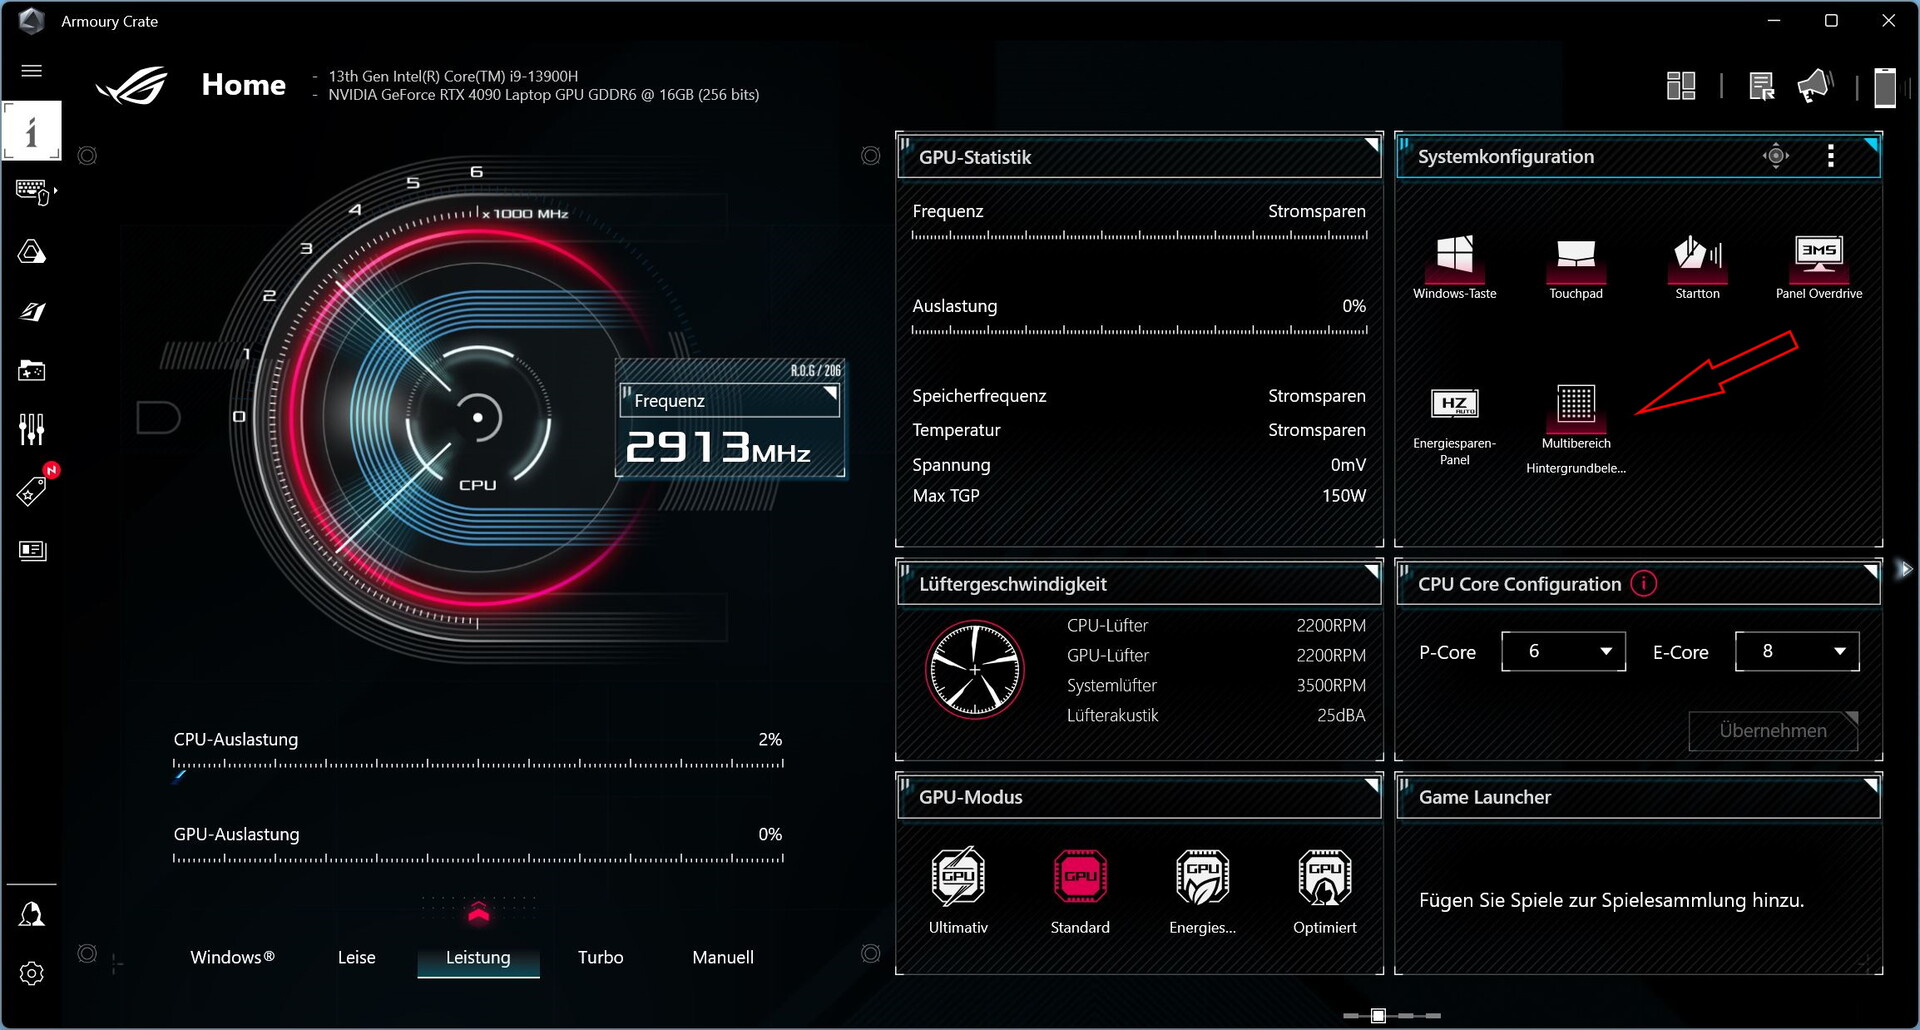
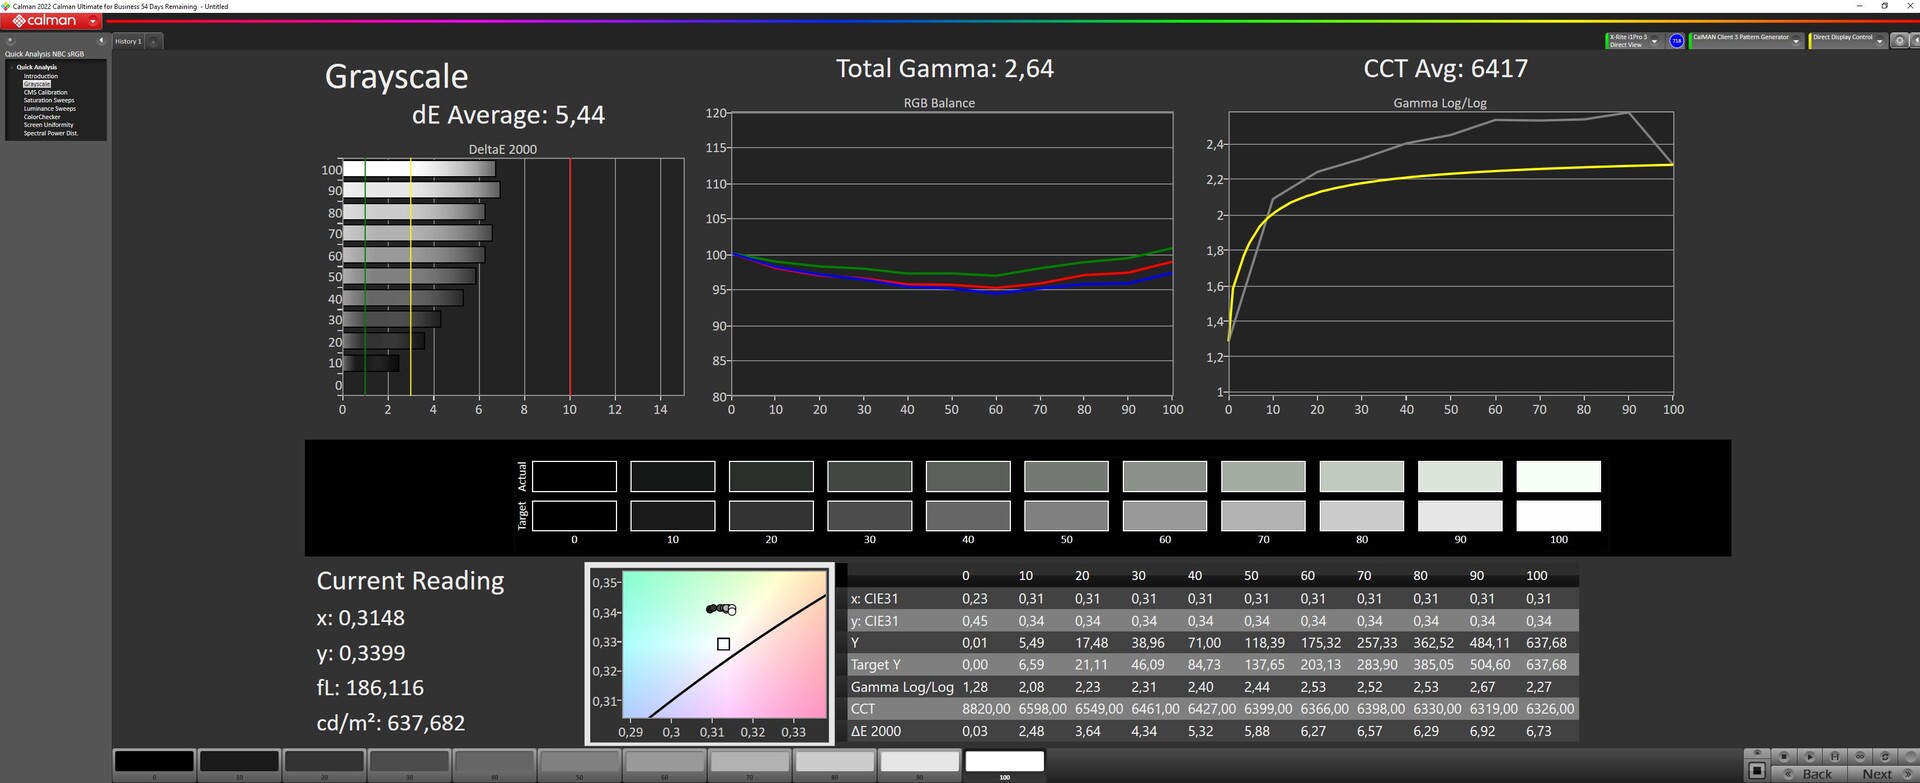
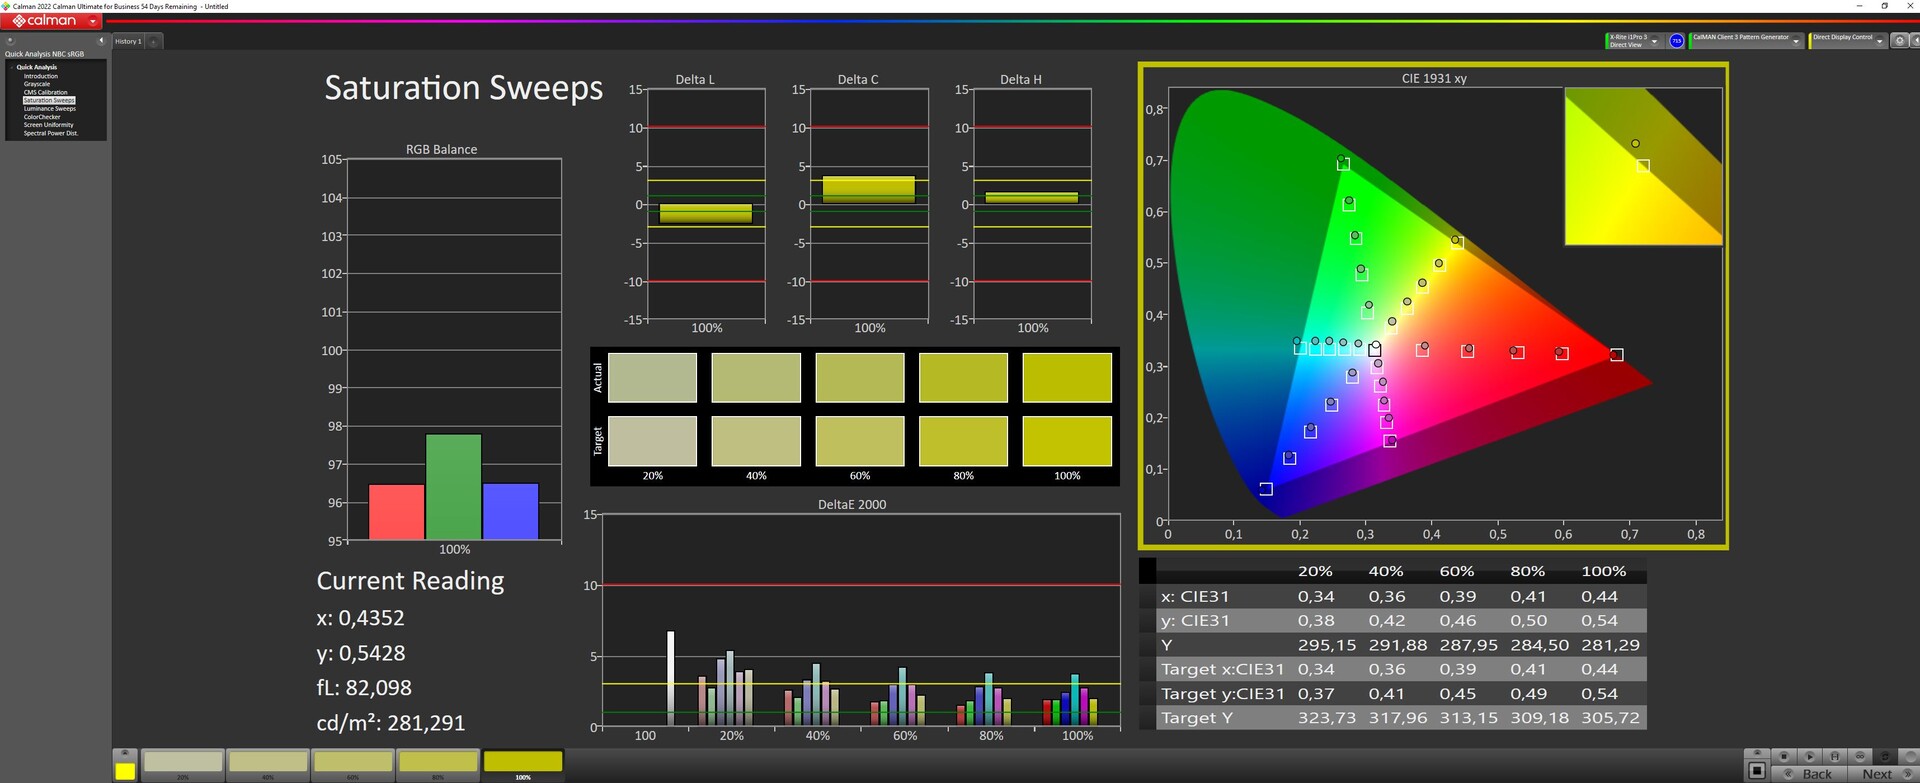
Quando si ha a che fare con i Mini-LED bisogna tenere conto di alcune cose: La luminosità massima può essere raggiunta solo quando la retroilluminazione è impostata su più zone utilizzando il software Armory Crate, il centro di controllo di Asus. In modalità HDR, questa impostazione è automatica e se l'HDR è disattivato (la modalità SDR è calibrata e presenta una minore deviazione dei colori), il pannello illumina automaticamente le singole aree. Utilizzando questa impostazione, la luminosità è inferiore di circa 100 nits.
Di seguito, evidenziamo i valori della modalità SDR con le multizone attivate. Tuttavia, questa modalità non è ideale per l'elaborazione delle immagini.
Anche i livelli di nero sono sorprendenti. Utilizzando la retroilluminazione a zona singola è di soli 0,55, ma il contrasto è scarso. Solo quando si utilizza l'impostazione multizona questo valore scende a un eccellente 0,03. Questo è uno dei motivi per cui abbiamo effettuato le nostre misurazioni con la multizona attivata.
Abbiamo misurato una luminosità di circa 627 nits (multizona, altrimenti circa 519 nits). Al 92%, l'illuminazione è molto buona, ma la luminosità diminuisce verso il lato destro del display. Rispetto al suo predecessore, la frequenza di aggiornamento del pannello è aumentata da 165 a 240 Hz.
| |||||||||||||||||||||||||
Distribuzione della luminosità: 92 %
Al centro con la batteria: 634 cd/m²
Contrasto: 21133:1 (Nero: 0.03 cd/m²)
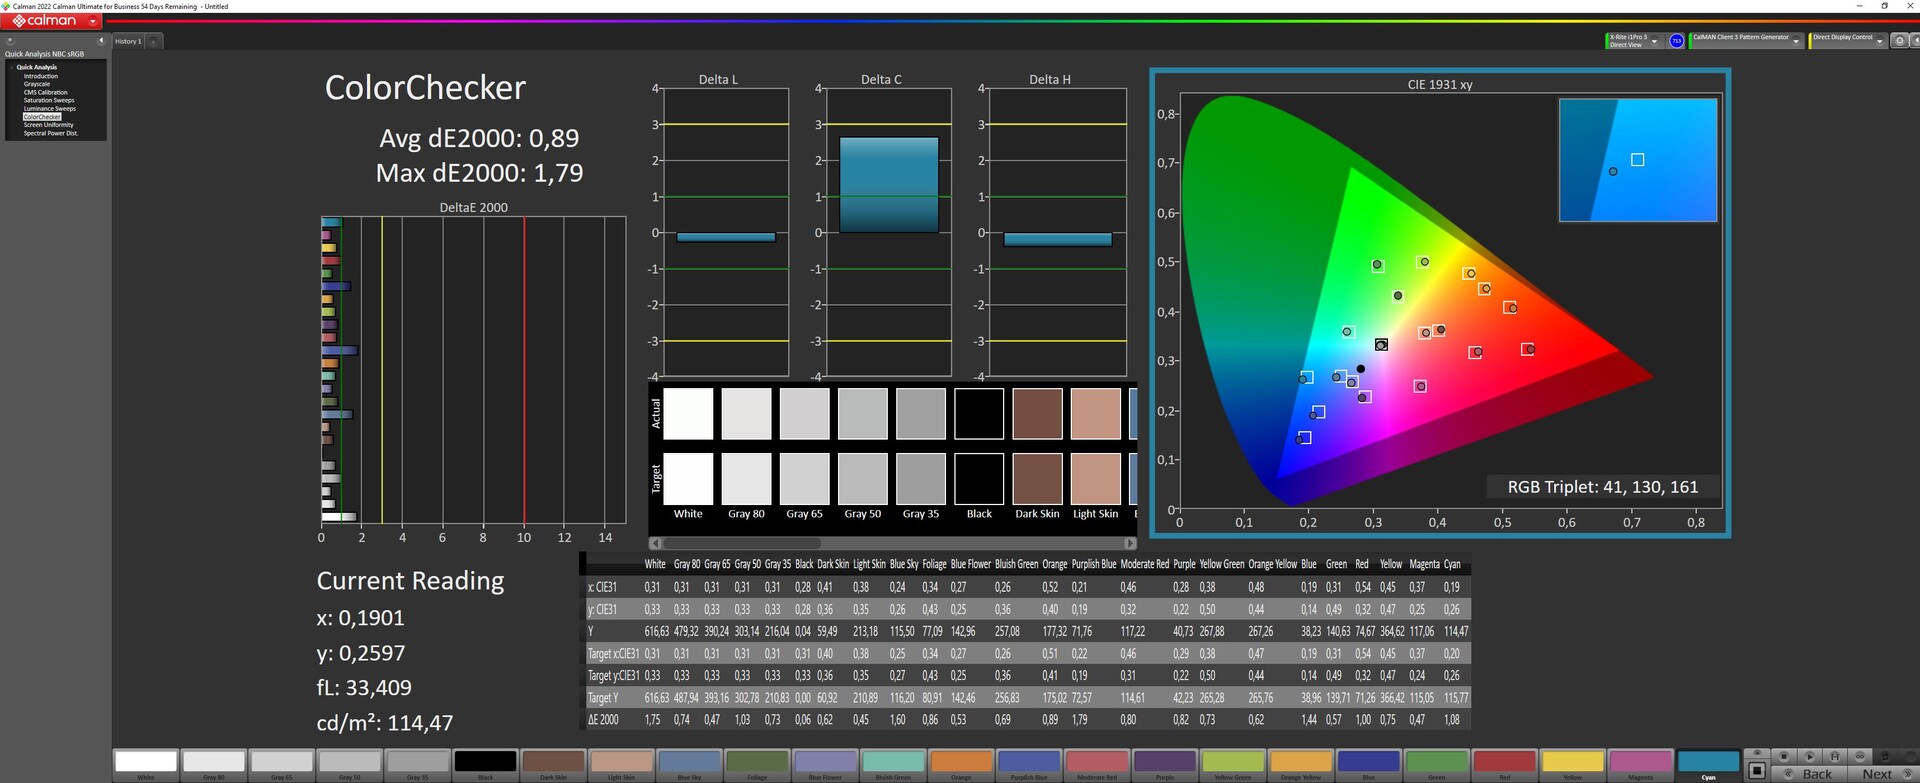
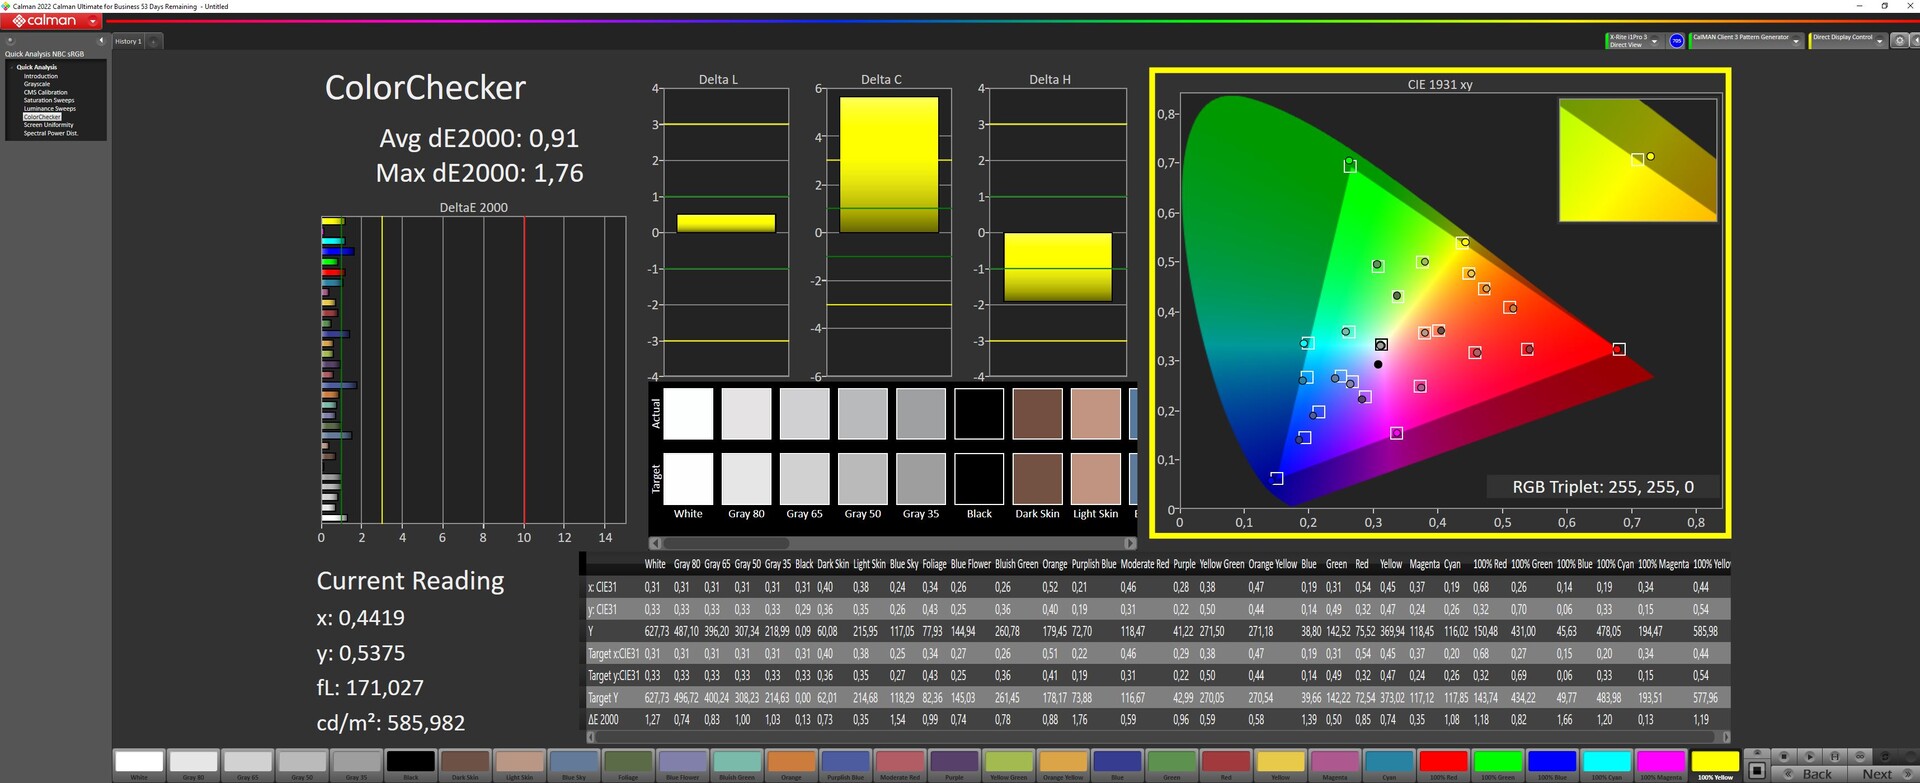
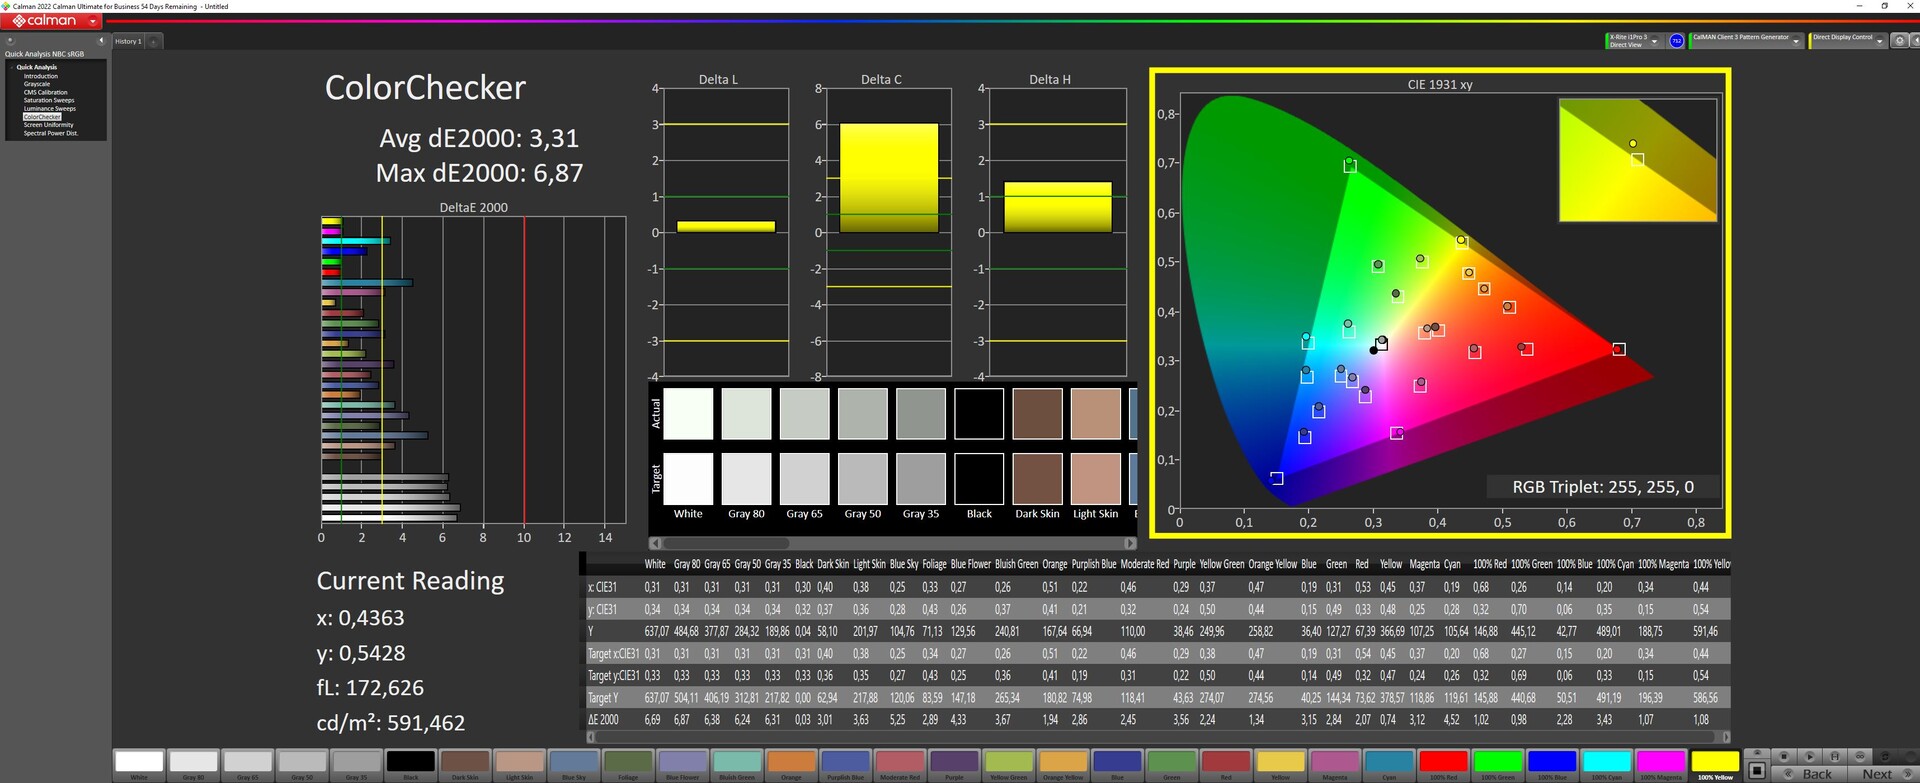
ΔE ColorChecker Calman: 0.89 | ∀{0.5-29.43 Ø4.71}
calibrated: 0.91
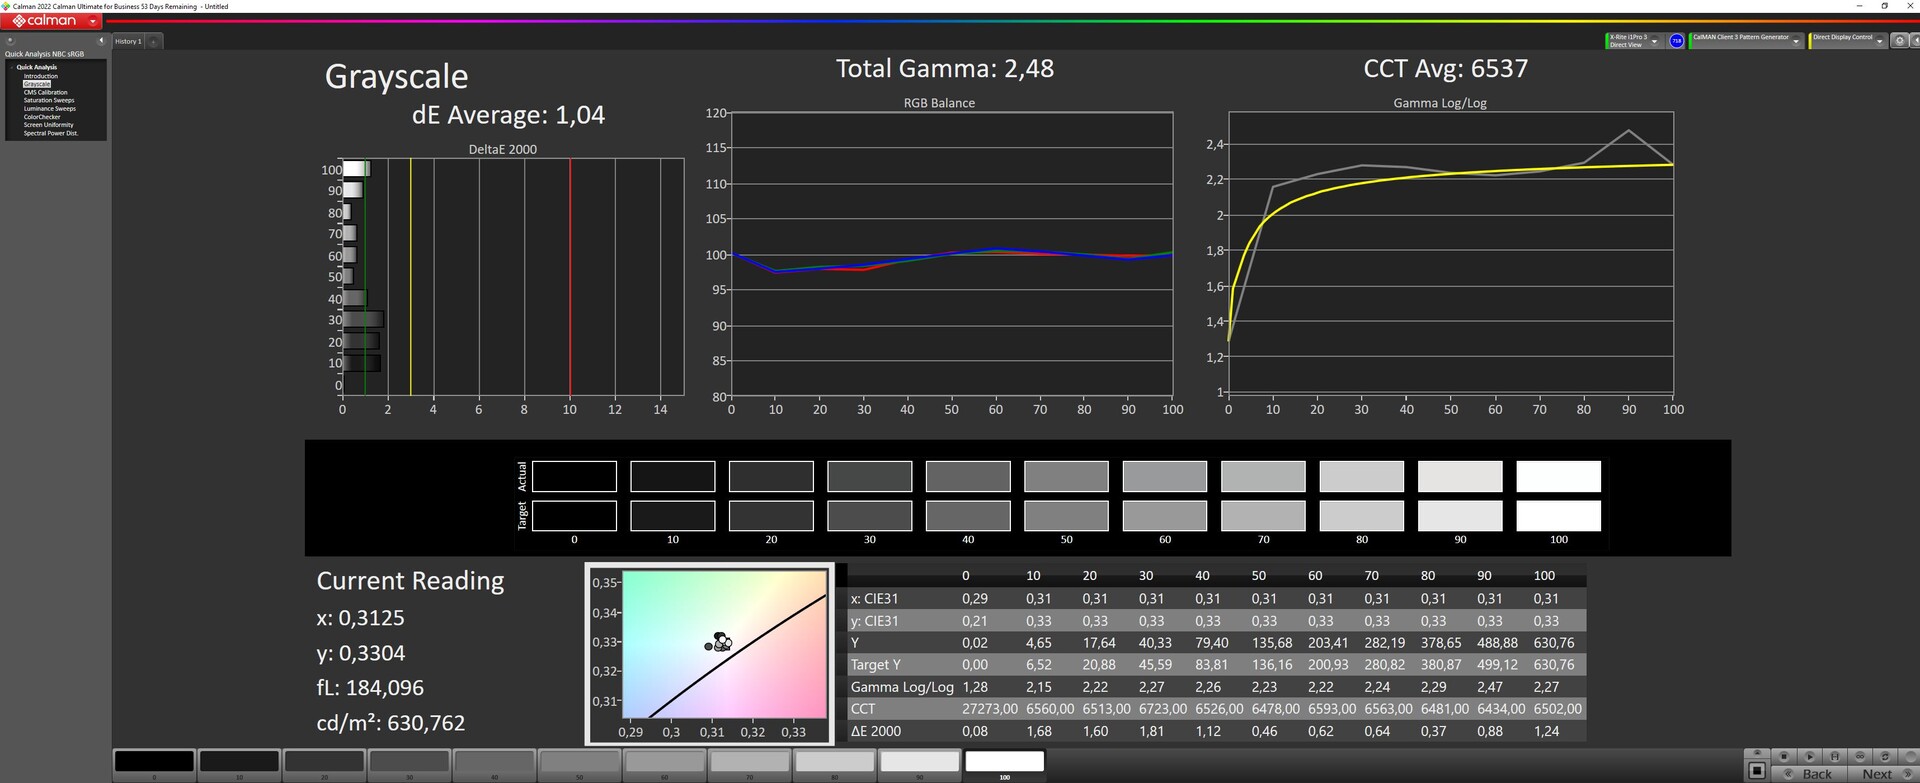
ΔE Greyscale Calman: 1.13 | ∀{0.09-98 Ø4.96}
90.01% AdobeRGB 1998 (Argyll 3D)
99.9% sRGB (Argyll 3D)
99.33% Display P3 (Argyll 3D)
Gamma: 2.47
CCT: 6497 K
| Asus ROG Zephyrus M16 GU604VY-NM042X BOE0B74 (NE160QDM-NM4, IPS, 2560x1600, 16" | Asus ROG Zephyrus M16 GU603Z BOE0A0B (BOE CQ NE160QDM-NY3), IPS, 2560x1600, 16" | Asus ROG Strix Scar 18 2023 G834JY-N6005W NE180QDM-NZ2, IPS, 2560x1600, 18" | MSI Titan GT77 HX 13VI B173ZAN06.C, Mini-LED, 3840x2160, 17.3" | Lenovo Legion Pro 7 16IRX8H MNG007DA2-3 (CSO1628), IPS, 2560x1600, 16" | Razer Blade 16 Early 2023 CSOT T3 MNG007DA4-1, IPS, 2560x1600, 16" | |
|---|---|---|---|---|---|---|
| Display | -5% | -3% | -0% | -17% | -0% | |
| Display P3 Coverage (%) | 99.33 | 92.8 -7% | 97.2 -2% | 94.9 -4% | 69.1 -30% | 98.5 -1% |
| sRGB Coverage (%) | 99.9 | 98.5 -1% | 99.9 0% | 99.9 0% | 99.7 0% | 100 0% |
| AdobeRGB 1998 Coverage (%) | 90.01 | 83.1 -8% | 84.9 -6% | 92.4 3% | 71.2 -21% | 89.7 0% |
| Response Times | 76% | 80% | 17% | 78% | 73% | |
| Response Time Grey 50% / Grey 80% * (ms) | 50.8 ? | 7.6 ? 85% | 5.41 ? 89% | 38.4 ? 24% | 12.3 ? 76% | 6.6 ? 87% |
| Response Time Black / White * (ms) | 29.6 ? | 10 ? 66% | 8.62 ? 71% | 26.6 ? 10% | 5.9 ? 80% | 12 ? 59% |
| PWM Frequency (Hz) | 12000 | 2380 ? | ||||
| Screen | -181% | -399% | 3033% | -150% | -212% | |
| Brightness middle (cd/m²) | 634 | 497 -22% | 490 -23% | 606 -4% | 511 -19% | 456.8 -28% |
| Brightness (cd/m²) | 627 | 481 -23% | 468 -25% | 602 -4% | 469 -25% | 437 -30% |
| Brightness Distribution (%) | 92 | 82 -11% | 86 -7% | 93 1% | 86 -7% | 83 -10% |
| Black Level * (cd/m²) | 0.03 | 0.21 -600% | 0.54 -1700% | 0.0001 100% | 0.4 -1233% | 0.35 -1067% |
| Contrast (:1) | 21133 | 2367 -89% | 907 -96% | 6060000 28576% | 1278 -94% | 1305 -94% |
| Colorchecker dE 2000 * | 0.89 | 3.53 -297% | 4.97 -458% | 4.8 -439% | 0.95 -7% | 3.7 -316% |
| Colorchecker dE 2000 max. * | 1.79 | 6.15 -244% | 11.02 -516% | 8.2 -358% | 2.07 -16% | 6.42 -259% |
| Colorchecker dE 2000 calibrated * | 0.91 | 3.53 -288% | 2.97 -226% | 1.8 -98% | 0.91 -0% | 0.66 27% |
| Greyscale dE 2000 * | 1.13 | 1.74 -54% | 7.2 -537% | 6.5 -475% | 0.6 47% | 2.6 -130% |
| Gamma | 2.47 89% | 2.2 100% | 2.161 102% | 2.63 84% | 2.176 101% | 2.3 96% |
| CCT | 6497 100% | 6418 101% | 6515 100% | 6596 99% | 6545 99% | 6108 106% |
| Media totale (Programma / Settaggio) | -37% /
-107% | -107% /
-245% | 1017% /
1952% | -30% /
-89% | -46% /
-126% |
* ... Meglio usare valori piccoli
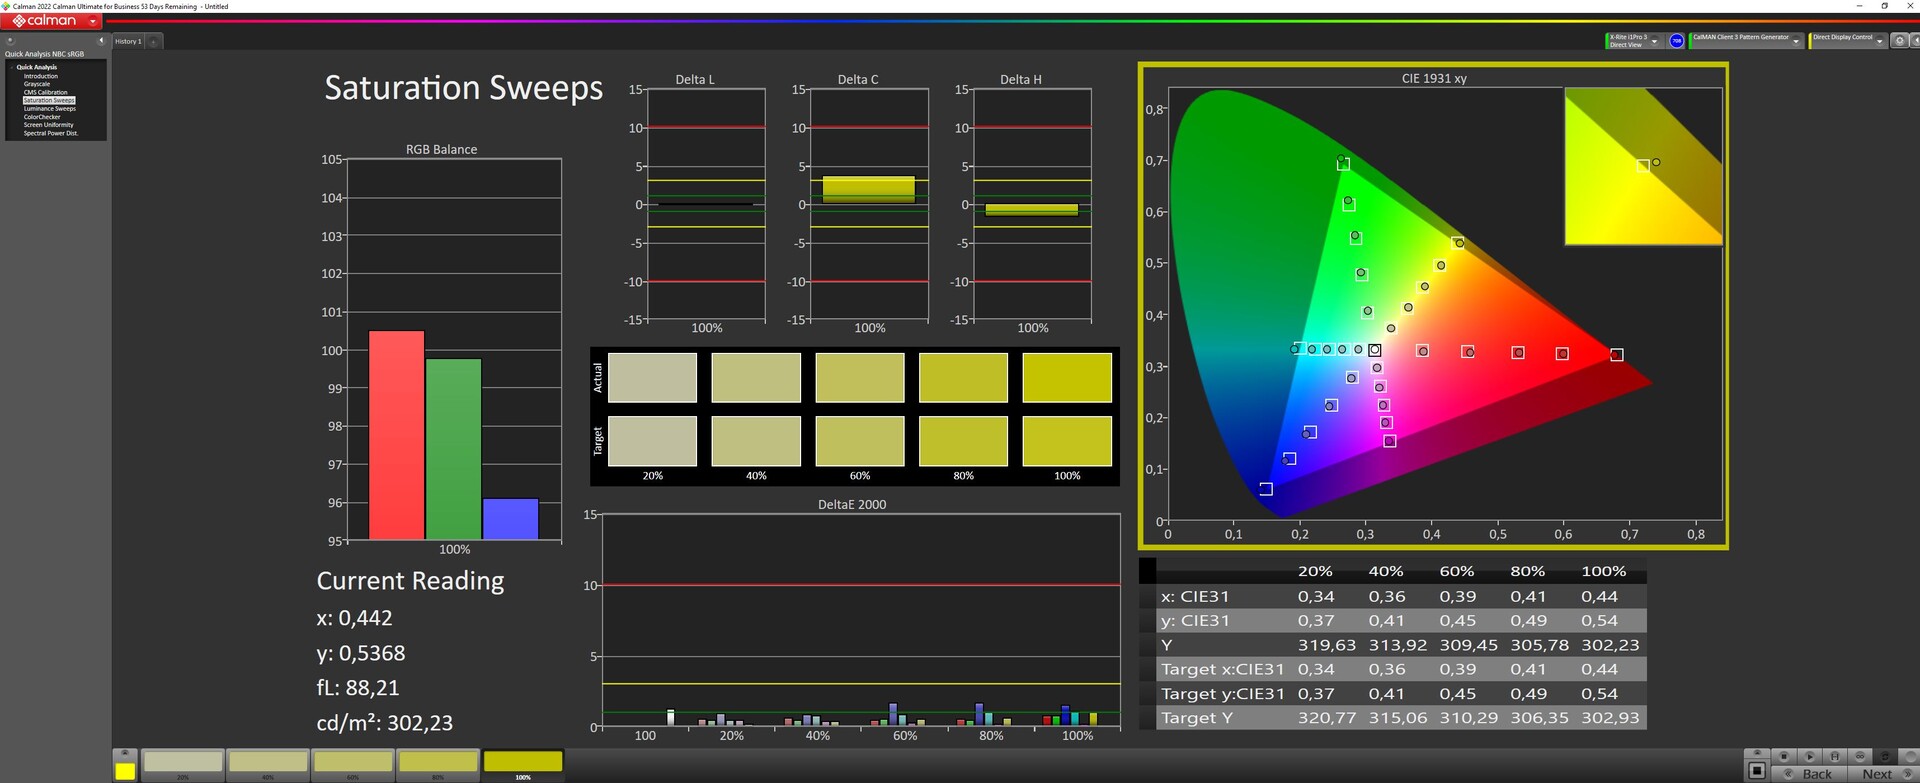
Asus pubblicizza il dispositivo come dotato di DCI P3 al 100% e la nostra analisi ha potuto confermarlo. AdobeRGB è riprodotto al 90%.
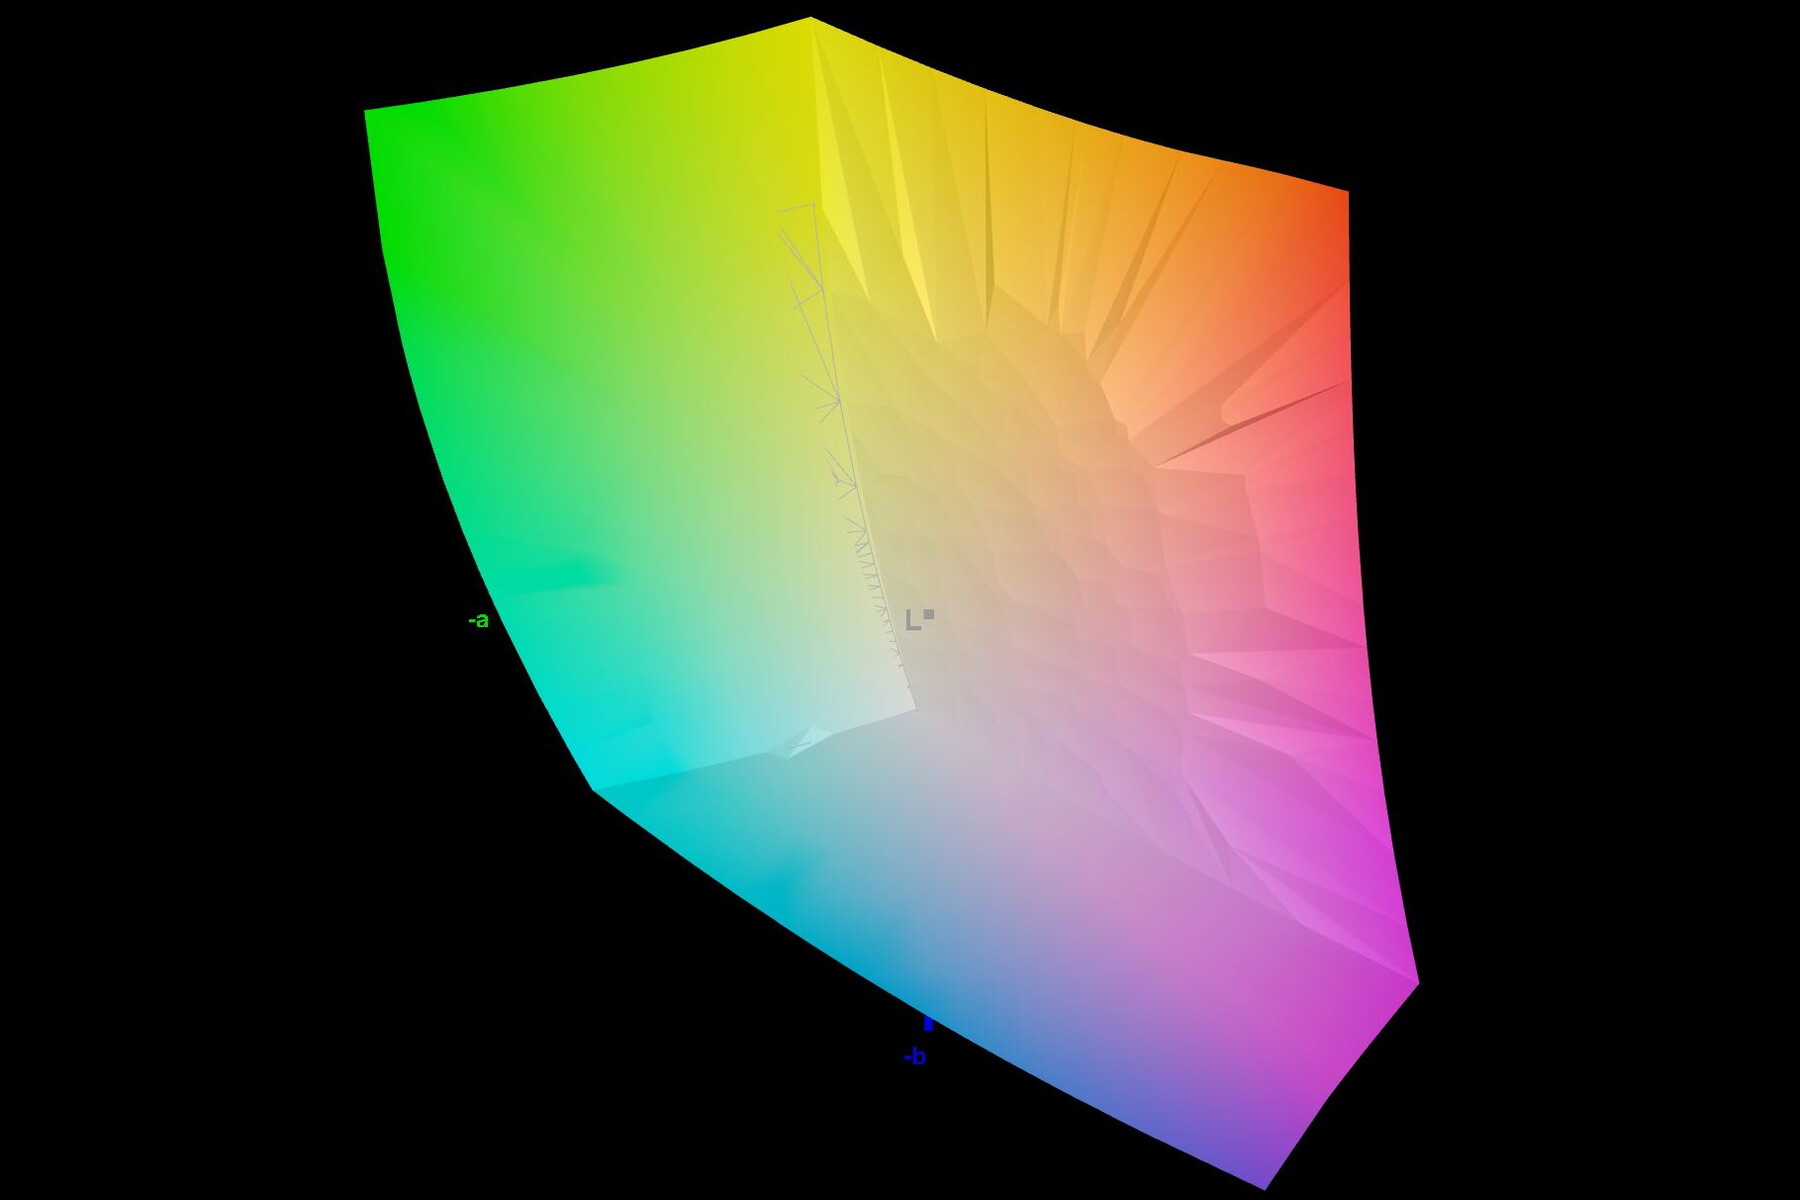
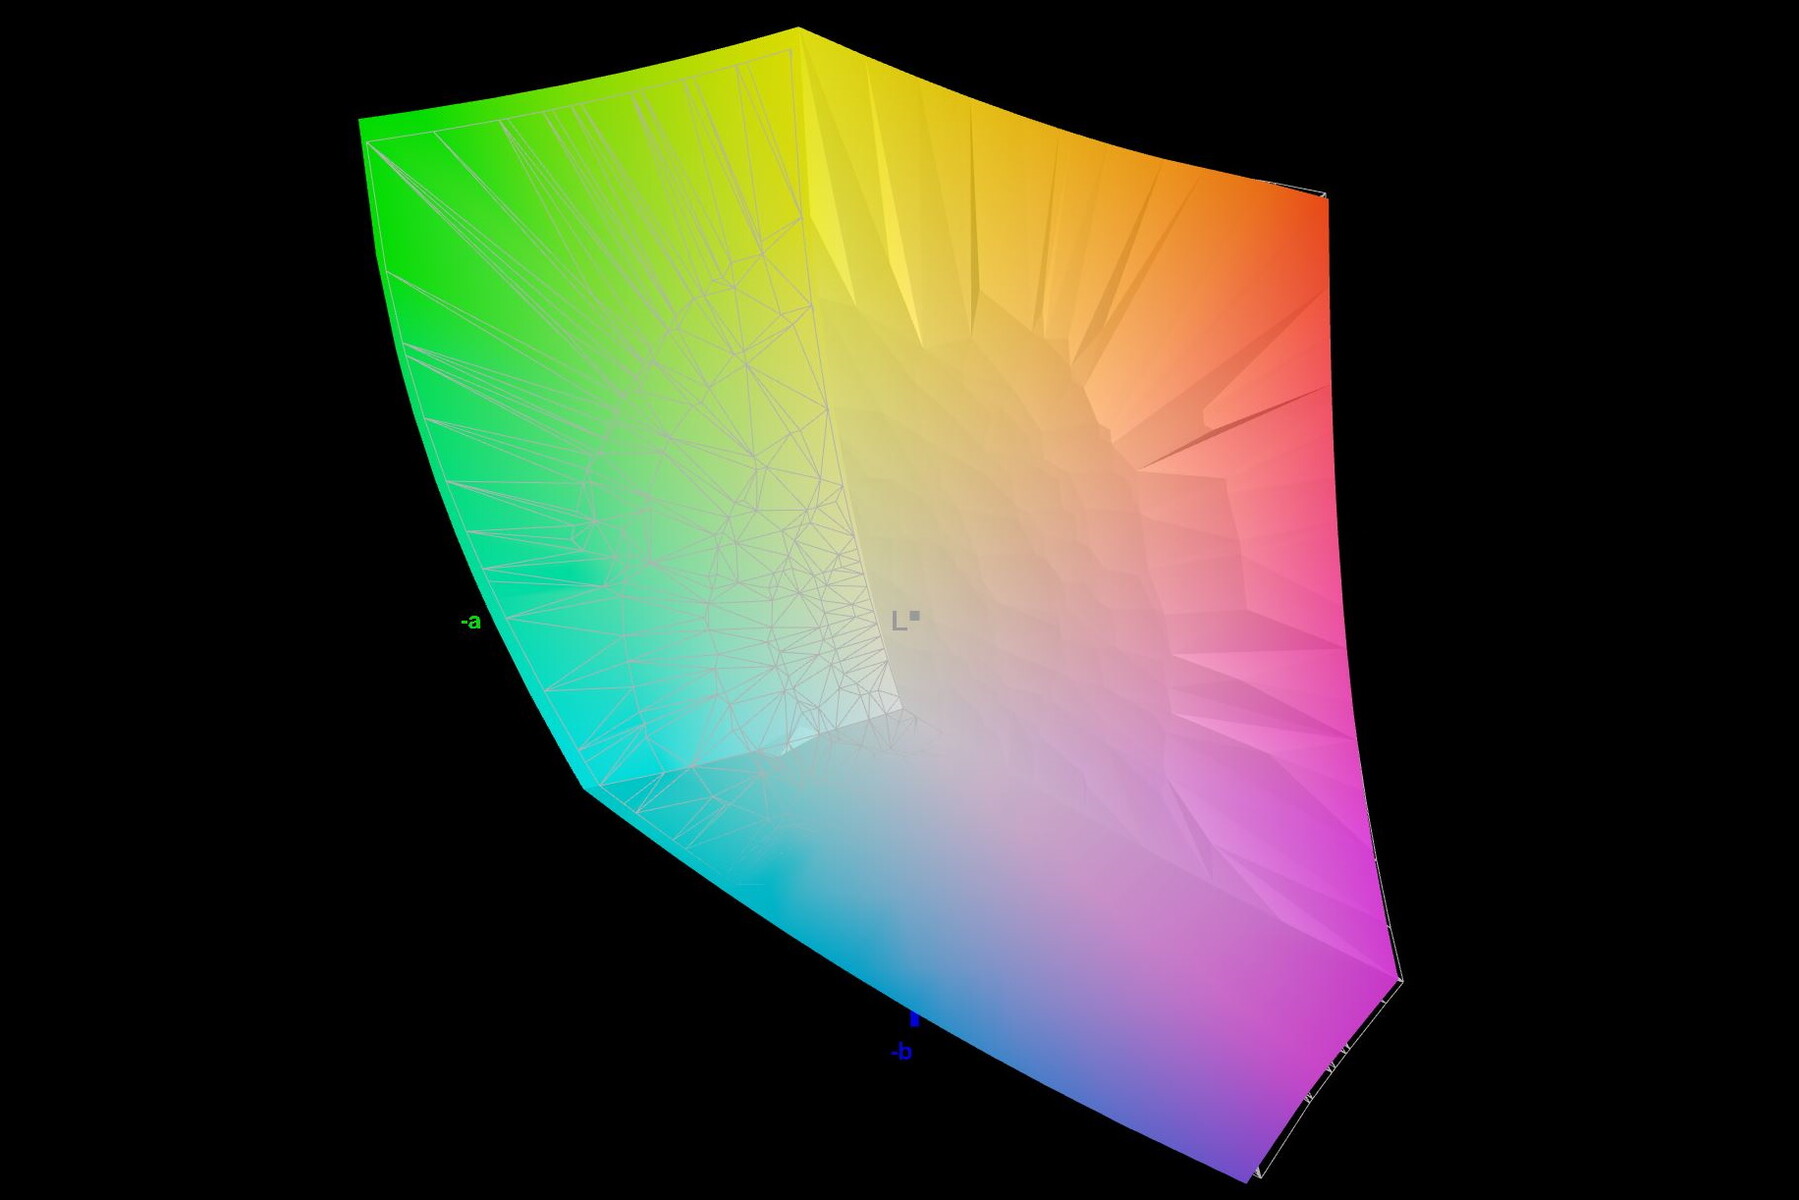
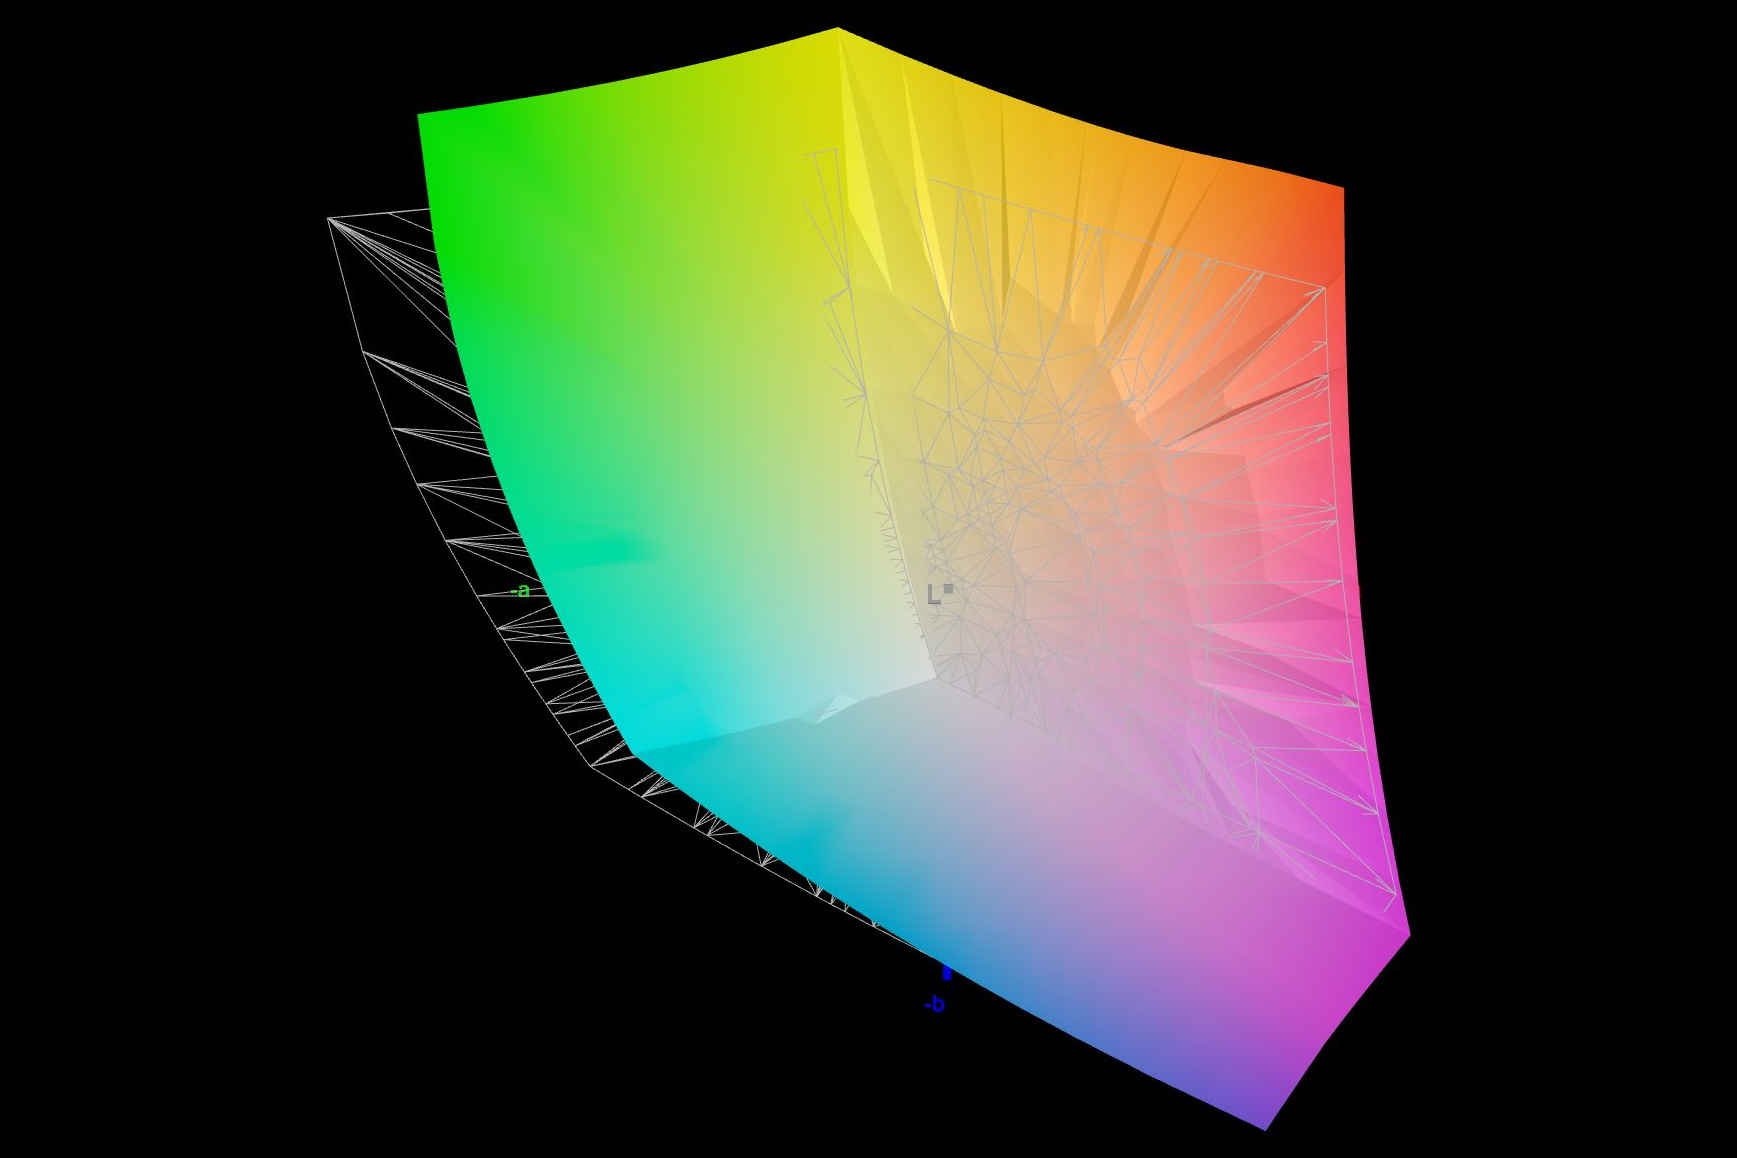
Fuori dalla scatola, il pannello è calibrato molto bene (SDR) e ha un valore di scala di grigi e ColorChecker DeltaE di soli 1,13 e 0,89. Una nuova calibrazione non è riuscita a migliorare la situazione. Il DeltaE della scala di grigi è sceso leggermente, mentre la deviazione del ColorChecker è aumentata leggermente.
Tuttavia, in modalità HDR la calibrazione è sparita (vedere l'ultima riga delle nostre schermate qui sotto).


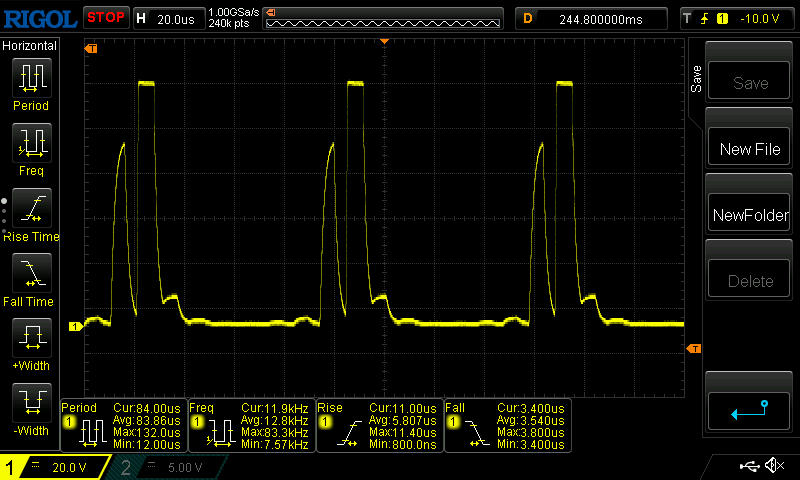
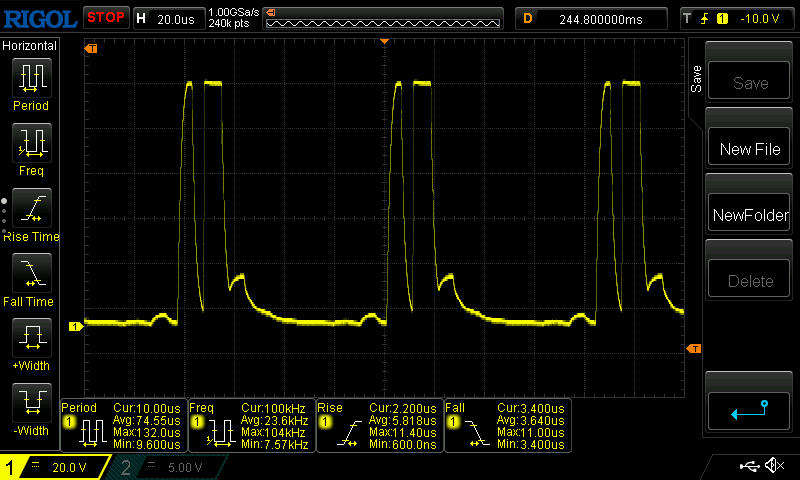
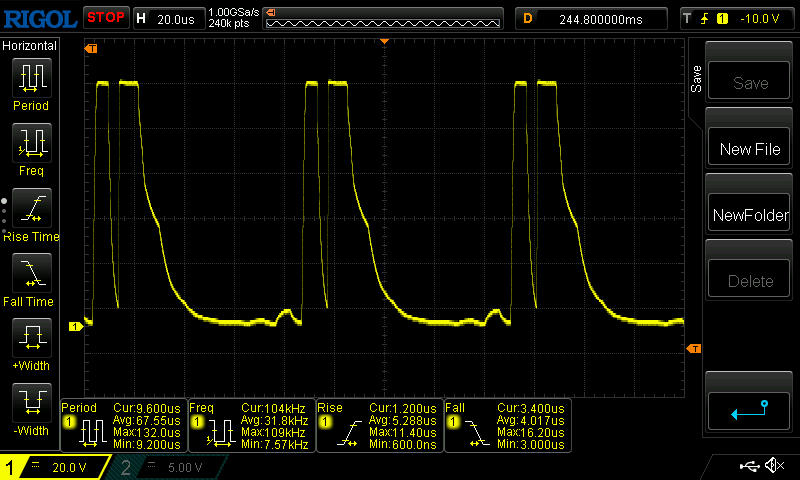
Determinare i tempi di risposta non è facile con il nostro modello in prova, poiché la frequenza PWM di almeno 12 kHz (vedi sotto) si sovrappone alle curve dei tempi di risposta. Asus indica un tempo di risposta di 3 ms, ma non rivela la tecnica di misurazione utilizzata. Alla massima luminosità, abbiamo misurato un tempo compreso tra i 30 e i 50 ms, che da un lato è elevato, ma dall'altro può essere influenzato dalla sovrapposizione della frequenza PWM.
Tempi di risposta del Display
| ↔ Tempi di risposta dal Nero al Bianco | ||
|---|---|---|
| 29.6 ms ... aumenta ↗ e diminuisce ↘ combinato | ↗ 25 ms Incremento | 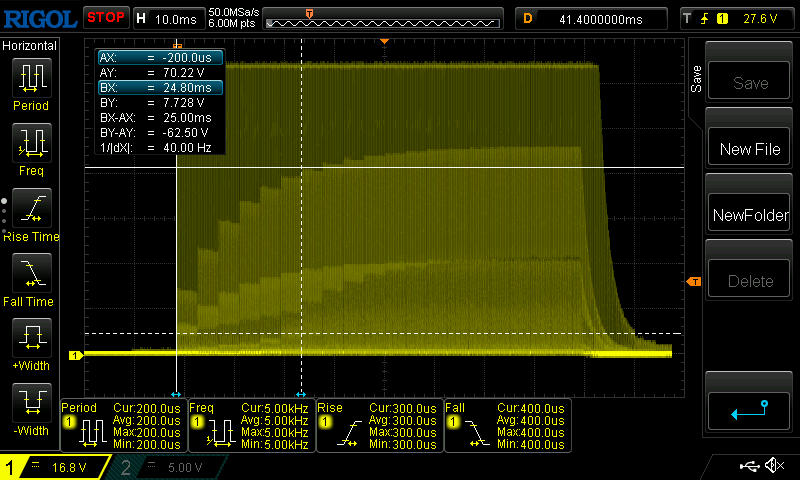 |
| ↘ 4.6 ms Calo | ||
| Lo schermo mostra tempi di risposta relativamente lenti nei nostri tests e potrebbe essere troppo lento per i gamers. In confronto, tutti i dispositivi di test variano da 0.1 (minimo) a 240 (massimo) ms. » 79 % di tutti i dispositivi è migliore. Questo significa che i tempi di risposta rilevati sono peggiori rispetto alla media di tutti i dispositivi testati (19.8 ms). | ||
| ↔ Tempo di risposta dal 50% Grigio all'80% Grigio | ||
| 50.8 ms ... aumenta ↗ e diminuisce ↘ combinato | ↗ 27.6 ms Incremento | 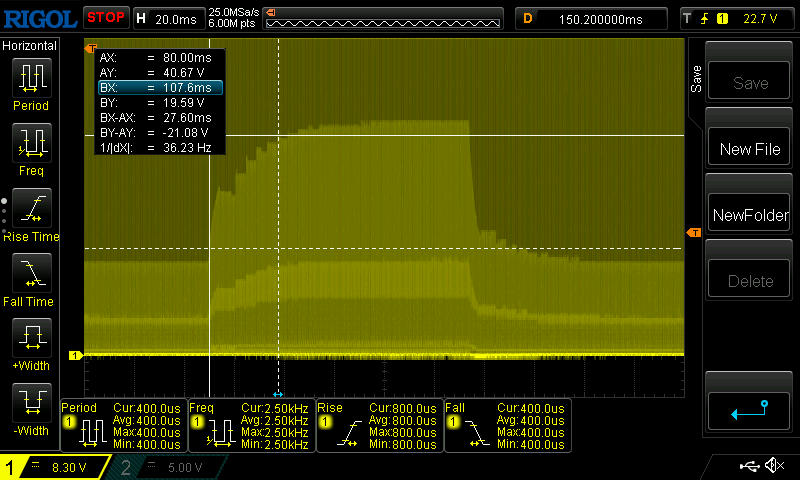 |
| ↘ 23.2 ms Calo | ||
| Lo schermo mostra tempi di risposta lenti nei nostri tests e sarà insoddisfacente per i gamers. In confronto, tutti i dispositivi di test variano da 0.165 (minimo) a 636 (massimo) ms. » 87 % di tutti i dispositivi è migliore. Questo significa che i tempi di risposta rilevati sono peggiori rispetto alla media di tutti i dispositivi testati (31 ms). | ||
Sfarfallio dello schermo / PWM (Pulse-Width Modulation)
| flickering dello schermo / PWM rilevato | 12000 Hz | 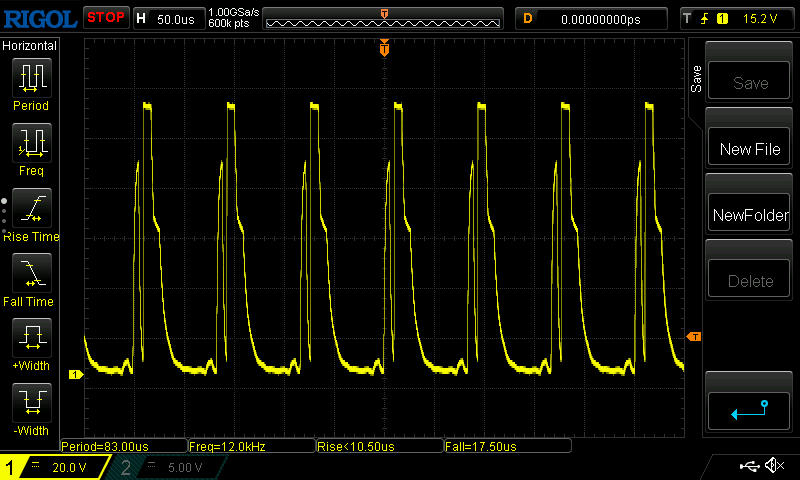 | |
Il display sfarfalla a 12000 Hz (Probabilmente a causa dell'uso di PWM) . La frequenza di 12000 Hz è abbastanza alta, quindi la maggioranza degli utenti sensibili al PWM non dovrebbero notare alcun flickering. In confronto: 52 % di tutti i dispositivi testati non utilizza PWM per ridurre la luminosita' del display. Se è rilevato PWM, una media di 7757 (minimo: 5 - massimo: 343500) Hz è stata rilevata. | |||
Il PWM viene utilizzato per regolare la luminosità. Con una luminosità compresa tra il 100 e l'83%, la frequenza si è attestata a 12 kHz, che non dovrebbe essere percepita dalle persone normalmente sensibili al PWM. Al di sotto di tale valore, la frequenza continuava a salire e si attestava tra i 69 e i 100 kHz.
All'esterno, la superficie opaca garantisce un livello di luminosità relativamente elevato e un'ottima leggibilità, almeno all'ombra. È necessario prestare attenzione quando si osserva il display dall'alto, poiché le immagini si sbiadiscono molto rapidamente.

Prestazioni - Al turbo manca una scintilla
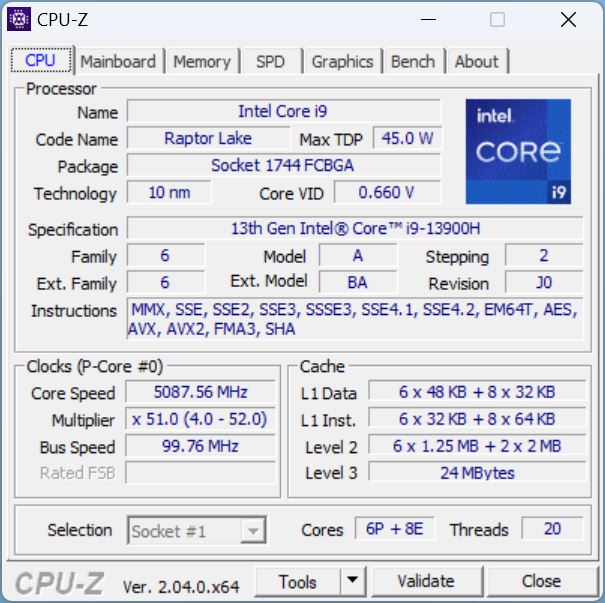
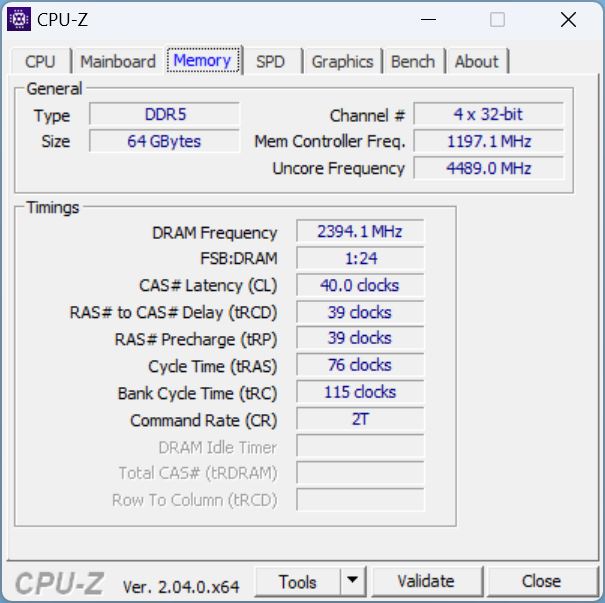
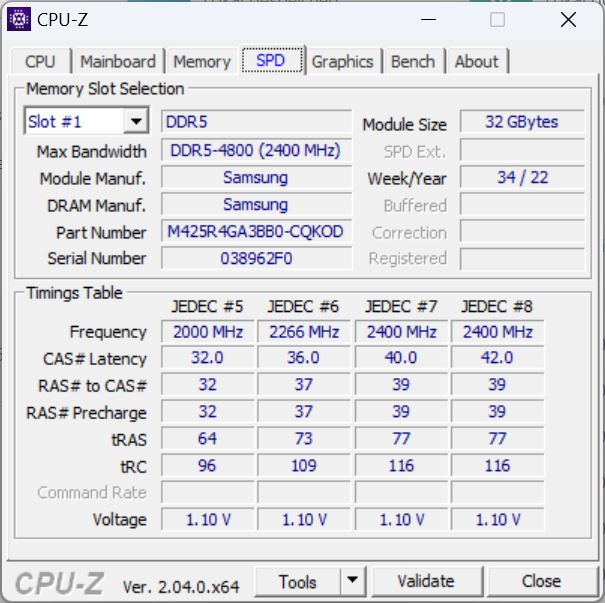
Sulla carta, il nuovo M16 dovrebbe essere un peso massimo in termini di prestazioni in un corpo da 16 pollici: Raptor Lake Core i9-13900H, Nvidia Geforce RTX 4090e 64 GB di RAM lanciano il guanto di sfida a tutti gli aspiranti contendenti al trono delle prestazioni.
Condizioni di prova
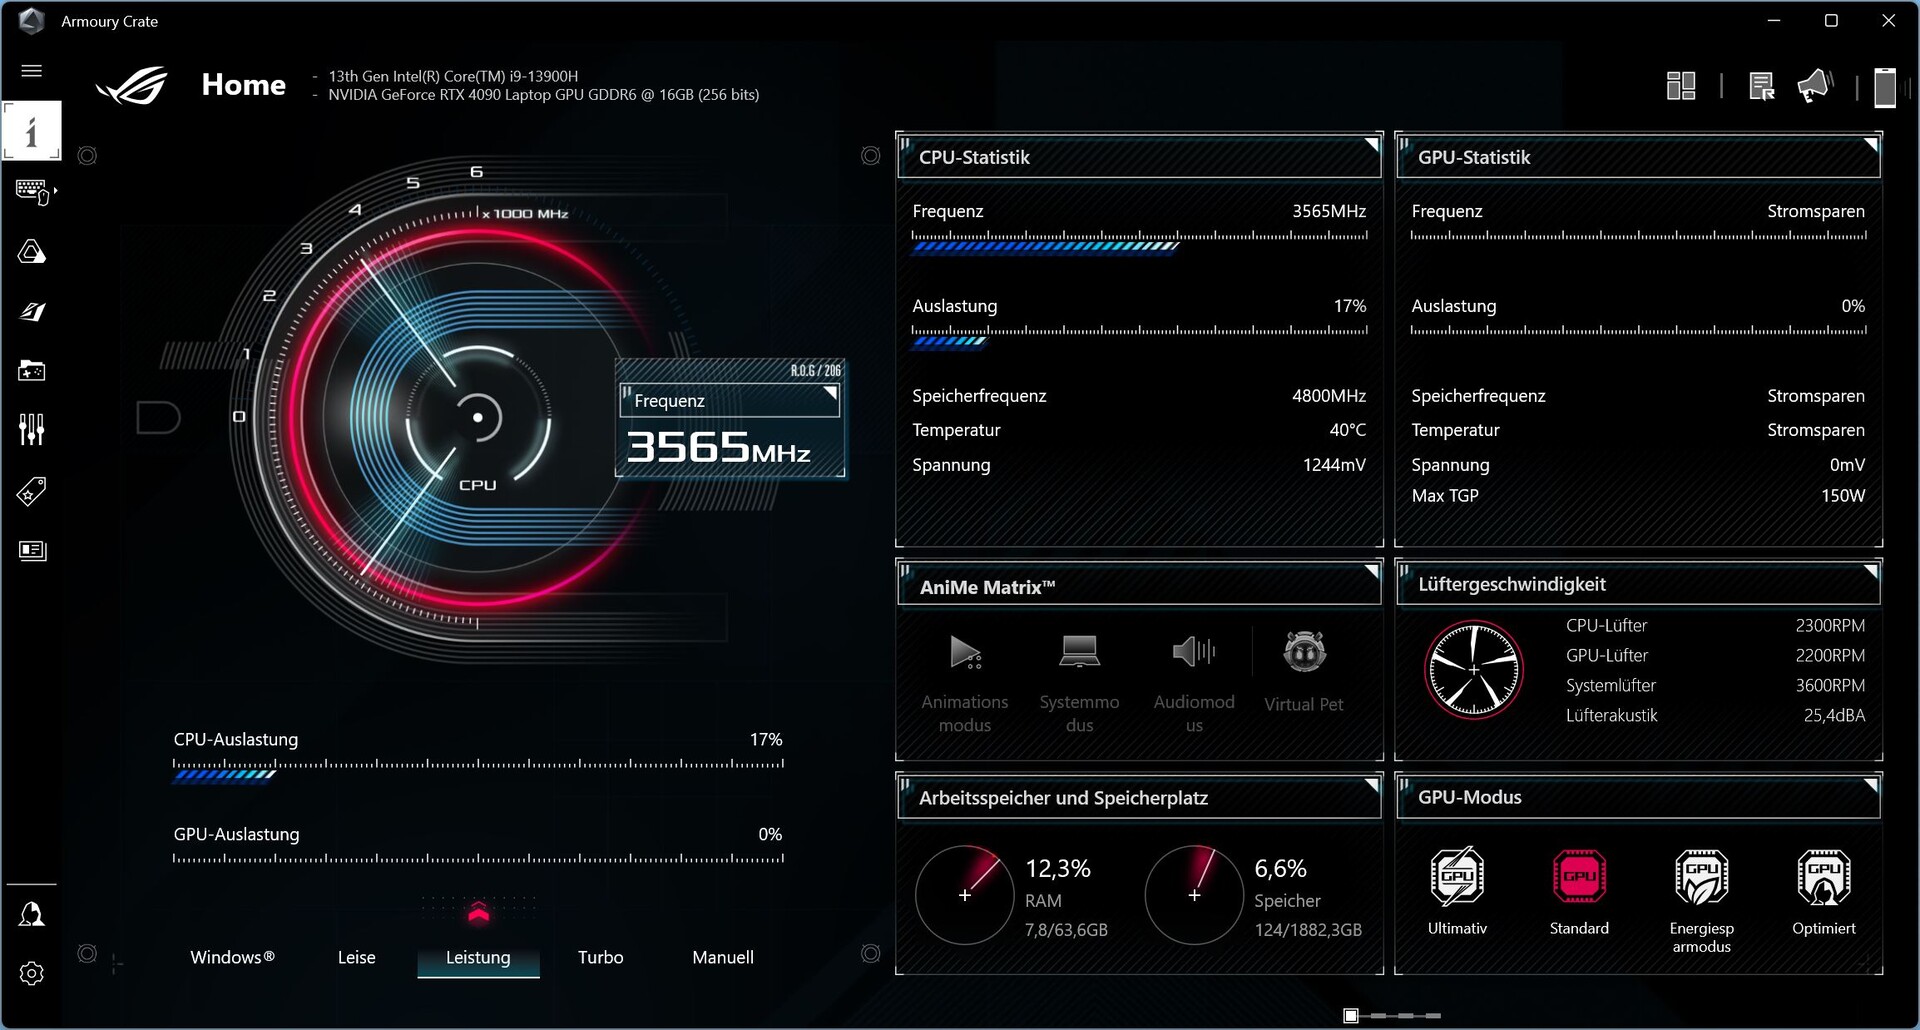
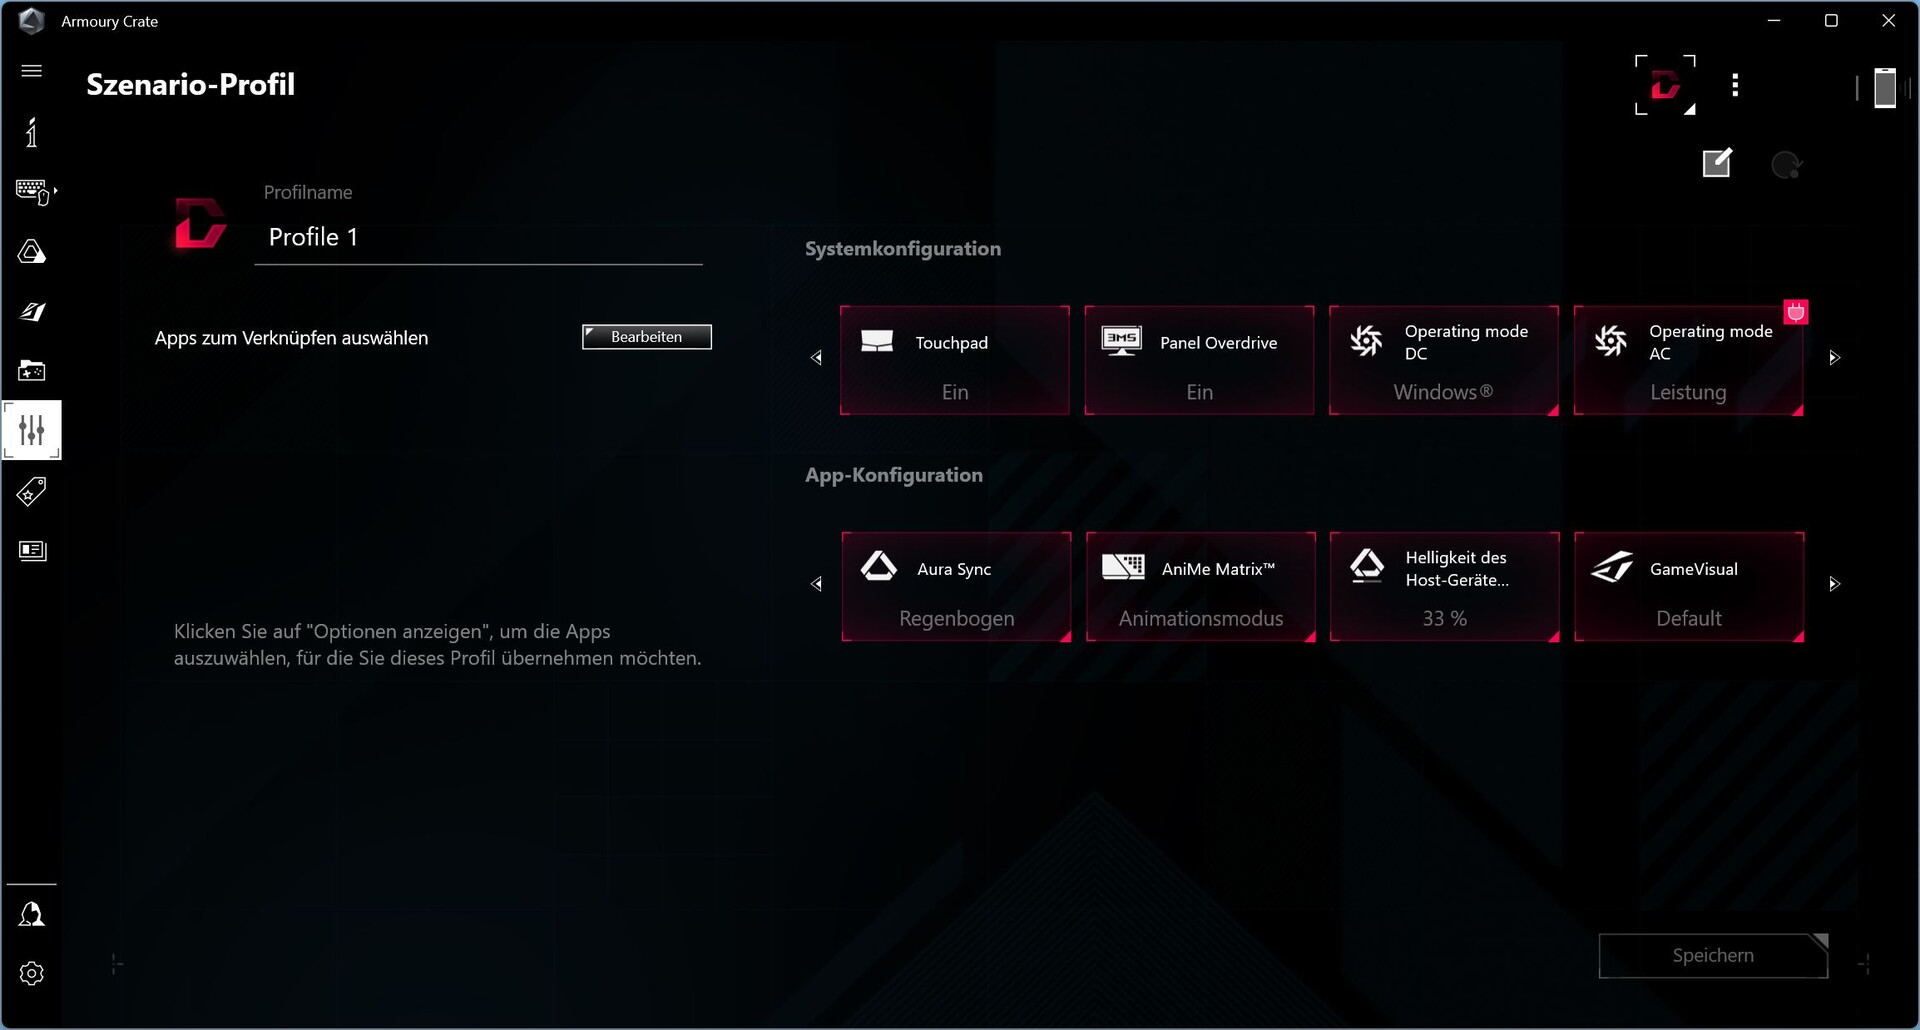
Il centro di controllo di Asus per i giocatori è il software Amoury Crate. Oltre alle varie modalità di prestazioni, è qui che vengono effettuate tutte le impostazioni più importanti e dove è possibile personalizzare elementi come AniMe Matrix e le curve delle ventole.
Per i nostri benchmark abbiamo selezionato la modalità Turbo nell'app per ottenere i migliori risultati possibili. Il suo predecessore è stato testato con la modalità Performance a causa delle elevate emissioni acustiche della generazione precedente ed è più simile alla modalità Balanced.
Processore
Fino ad oggi, ilCore i9-13900Hè l'unica opzione di CPU e uno dei processori più potenti della nuova serie Raptor Lake di Intel. Offre 6 core P e 8 core E, il primo con clock fino a 5,4 GHz in turbo. La velocità di clock di base del core E è di 1,9 GHz.
Nel nostro ciclo Cinebench, l'M16 ha superato l'intera concorrenza configurata con le CPU di ultima generazione. Tuttavia, il divario è relativamente piccolo anche se confrontato con il significativamente meno potente i7-12700H che si trova nel modelloHP Omen 16. Il vantaggio rispetto al suo predecessore è altrettanto ridotto, con un punteggio in modalità Performance probabilmente quasi identico.
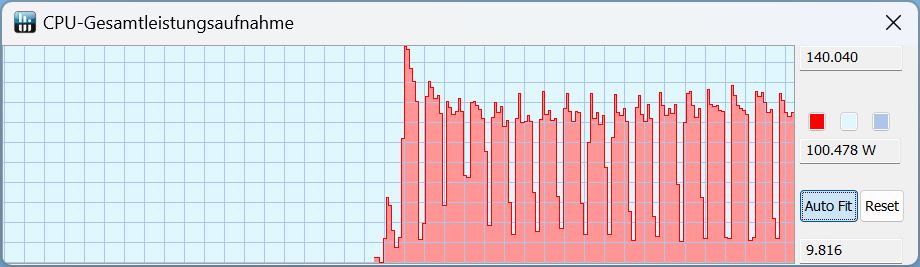
Dando un'occhiata al TDP, la prima esecuzione in modalità Turbo ha raggiunto un picco di 140 watt, mentre le altre si sono attestate intorno ai 100 watt.
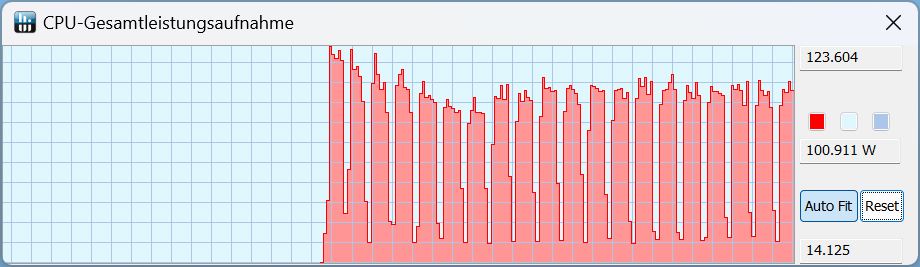
In modalità Performance, il picco iniziale di 140 watt è sceso a circa 120 watt, ma anche qui il TDP si attesta normalmente a circa 100 watt.
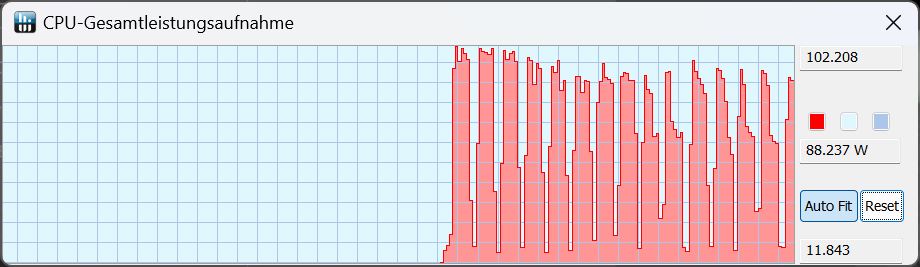
In modalità Quiet, il picco è scomparso e il TDP oscilla tra 60 e un massimo di 100 watt.
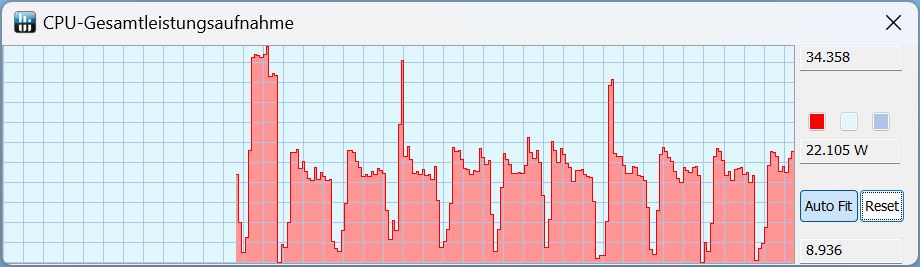
In modalità batteria, le prestazioni nella stessa modalità(Quiet) sono ancora più basse con un massimo di 34 watt brevemente disponibili e solo poco più di 20 watt raggiunti durante i periodi più lunghi di carico sostenuto.
Cinebench R15 Multi Continuous
Cinebench R23: Multi Core | Single Core
Cinebench R20: CPU (Multi Core) | CPU (Single Core)
Cinebench R15: CPU Multi 64Bit | CPU Single 64Bit
Blender: v2.79 BMW27 CPU
7-Zip 18.03: 7z b 4 | 7z b 4 -mmt1
Geekbench 5.5: Multi-Core | Single-Core
HWBOT x265 Benchmark v2.2: 4k Preset
LibreOffice : 20 Documents To PDF
R Benchmark 2.5: Overall mean
| CPU Performance rating | |
| Schenker XMG Neo 16 Raptor Lake | |
| Media della classe Gaming | |
| Asus ROG Zephyrus M16 GU604VY-NM042X | |
| MSI Creator Z16P B12UHST | |
| Lenovo Legion 5 Pro 16 G7 i7 RTX 3070Ti | |
| Asus ROG Zephyrus M16 GU603Z | |
| Media Intel Core i9-13900H | |
| Acer Predator Triton 300 SE | |
| HP Omen 17-ck1075ng | |
| Razer Blade 15 RZ09-0421NGG3-R3G1 | |
| Cinebench R23 / Multi Core | |
| Schenker XMG Neo 16 Raptor Lake | |
| Schenker XMG Neo 16 Raptor Lake | |
| Schenker XMG Neo 16 Raptor Lake | |
| Media della classe Gaming (10488 - 42661, n=107, ultimi 2 anni) | |
| Asus ROG Zephyrus M16 GU604VY-NM042X | |
| Lenovo Legion 5 Pro 16 G7 i7 RTX 3070Ti | |
| MSI Creator Z16P B12UHST | |
| Media Intel Core i9-13900H (11997 - 20385, n=28) | |
| Razer Blade 15 RZ09-0421NGG3-R3G1 | |
| Acer Predator Triton 300 SE | |
| Asus ROG Zephyrus M16 GU603Z | |
| HP Omen 17-ck1075ng | |
| Cinebench R23 / Single Core | |
| Schenker XMG Neo 16 Raptor Lake | |
| Media della classe Gaming (1166 - 2415, n=107, ultimi 2 anni) | |
| Asus ROG Zephyrus M16 GU604VY-NM042X | |
| MSI Creator Z16P B12UHST | |
| Acer Predator Triton 300 SE | |
| Media Intel Core i9-13900H (1297 - 2054, n=26) | |
| Asus ROG Zephyrus M16 GU603Z | |
| Lenovo Legion 5 Pro 16 G7 i7 RTX 3070Ti | |
| HP Omen 17-ck1075ng | |
| Razer Blade 15 RZ09-0421NGG3-R3G1 | |
| Cinebench R20 / CPU (Multi Core) | |
| Schenker XMG Neo 16 Raptor Lake | |
| Media della classe Gaming (4029 - 16433, n=106, ultimi 2 anni) | |
| Asus ROG Zephyrus M16 GU604VY-NM042X | |
| Lenovo Legion 5 Pro 16 G7 i7 RTX 3070Ti | |
| MSI Creator Z16P B12UHST | |
| Media Intel Core i9-13900H (4935 - 7716, n=25) | |
| Razer Blade 15 RZ09-0421NGG3-R3G1 | |
| Acer Predator Triton 300 SE | |
| Asus ROG Zephyrus M16 GU603Z | |
| HP Omen 17-ck1075ng | |
| Cinebench R20 / CPU (Single Core) | |
| Media della classe Gaming (442 - 913, n=106, ultimi 2 anni) | |
| Schenker XMG Neo 16 Raptor Lake | |
| Asus ROG Zephyrus M16 GU604VY-NM042X | |
| MSI Creator Z16P B12UHST | |
| Acer Predator Triton 300 SE | |
| Media Intel Core i9-13900H (428 - 792, n=25) | |
| Asus ROG Zephyrus M16 GU603Z | |
| Lenovo Legion 5 Pro 16 G7 i7 RTX 3070Ti | |
| HP Omen 17-ck1075ng | |
| Razer Blade 15 RZ09-0421NGG3-R3G1 | |
| Cinebench R15 / CPU Multi 64Bit | |
| Schenker XMG Neo 16 Raptor Lake | |
| Schenker XMG Neo 16 Raptor Lake | |
| Media della classe Gaming (1578 - 6330, n=105, ultimi 2 anni) | |
| Asus ROG Zephyrus M16 GU604VY-NM042X | |
| Lenovo Legion 5 Pro 16 G7 i7 RTX 3070Ti | |
| MSI Creator Z16P B12UHST | |
| Media Intel Core i9-13900H (2061 - 3100, n=26) | |
| Razer Blade 15 RZ09-0421NGG3-R3G1 | |
| Asus ROG Zephyrus M16 GU603Z | |
| HP Omen 17-ck1075ng | |
| HP Omen 17-ck1075ng | |
| Acer Predator Triton 300 SE | |
| Cinebench R15 / CPU Single 64Bit | |
| Media della classe Gaming (188.8 - 350, n=106, ultimi 2 anni) | |
| Schenker XMG Neo 16 Raptor Lake | |
| Schenker XMG Neo 16 Raptor Lake | |
| Asus ROG Zephyrus M16 GU604VY-NM042X | |
| MSI Creator Z16P B12UHST | |
| Acer Predator Triton 300 SE | |
| Media Intel Core i9-13900H (211 - 297, n=26) | |
| Lenovo Legion 5 Pro 16 G7 i7 RTX 3070Ti | |
| Asus ROG Zephyrus M16 GU603Z | |
| HP Omen 17-ck1075ng | |
| HP Omen 17-ck1075ng | |
| Razer Blade 15 RZ09-0421NGG3-R3G1 | |
| Blender / v2.79 BMW27 CPU | |
| HP Omen 17-ck1075ng | |
| Razer Blade 15 RZ09-0421NGG3-R3G1 | |
| Media Intel Core i9-13900H (166 - 268, n=24) | |
| Acer Predator Triton 300 SE | |
| Asus ROG Zephyrus M16 GU603Z | |
| MSI Creator Z16P B12UHST | |
| Lenovo Legion 5 Pro 16 G7 i7 RTX 3070Ti | |
| Asus ROG Zephyrus M16 GU604VY-NM042X | |
| Media della classe Gaming (79 - 330, n=104, ultimi 2 anni) | |
| Schenker XMG Neo 16 Raptor Lake | |
| 7-Zip 18.03 / 7z b 4 | |
| Schenker XMG Neo 16 Raptor Lake | |
| Media della classe Gaming (33491 - 148086, n=105, ultimi 2 anni) | |
| Asus ROG Zephyrus M16 GU604VY-NM042X | |
| MSI Creator Z16P B12UHST | |
| Lenovo Legion 5 Pro 16 G7 i7 RTX 3070Ti | |
| Media Intel Core i9-13900H (45045 - 79032, n=25) | |
| Asus ROG Zephyrus M16 GU603Z | |
| Acer Predator Triton 300 SE | |
| Razer Blade 15 RZ09-0421NGG3-R3G1 | |
| HP Omen 17-ck1075ng | |
| 7-Zip 18.03 / 7z b 4 -mmt1 | |
| Schenker XMG Neo 16 Raptor Lake | |
| Media della classe Gaming (4199 - 7436, n=105, ultimi 2 anni) | |
| Asus ROG Zephyrus M16 GU604VY-NM042X | |
| Asus ROG Zephyrus M16 GU603Z | |
| MSI Creator Z16P B12UHST | |
| Media Intel Core i9-13900H (3665 - 6600, n=25) | |
| Lenovo Legion 5 Pro 16 G7 i7 RTX 3070Ti | |
| HP Omen 17-ck1075ng | |
| Acer Predator Triton 300 SE | |
| Razer Blade 15 RZ09-0421NGG3-R3G1 | |
| Geekbench 5.5 / Multi-Core | |
| Schenker XMG Neo 16 Raptor Lake | |
| Media della classe Gaming (6460 - 28263, n=105, ultimi 2 anni) | |
| Asus ROG Zephyrus M16 GU604VY-NM042X | |
| MSI Creator Z16P B12UHST | |
| Lenovo Legion 5 Pro 16 G7 i7 RTX 3070Ti | |
| Acer Predator Triton 300 SE | |
| Asus ROG Zephyrus M16 GU603Z | |
| Media Intel Core i9-13900H (9094 - 15410, n=26) | |
| Razer Blade 15 RZ09-0421NGG3-R3G1 | |
| HP Omen 17-ck1075ng | |
| Geekbench 5.5 / Single-Core | |
| Media della classe Gaming (986 - 2474, n=105, ultimi 2 anni) | |
| Schenker XMG Neo 16 Raptor Lake | |
| Asus ROG Zephyrus M16 GU604VY-NM042X | |
| Media Intel Core i9-13900H (1140 - 2043, n=26) | |
| MSI Creator Z16P B12UHST | |
| Acer Predator Triton 300 SE | |
| Asus ROG Zephyrus M16 GU603Z | |
| HP Omen 17-ck1075ng | |
| Lenovo Legion 5 Pro 16 G7 i7 RTX 3070Ti | |
| Razer Blade 15 RZ09-0421NGG3-R3G1 | |
| HWBOT x265 Benchmark v2.2 / 4k Preset | |
| Schenker XMG Neo 16 Raptor Lake | |
| Media della classe Gaming (11.5 - 44.4, n=105, ultimi 2 anni) | |
| Asus ROG Zephyrus M16 GU604VY-NM042X | |
| Lenovo Legion 5 Pro 16 G7 i7 RTX 3070Ti | |
| MSI Creator Z16P B12UHST | |
| Asus ROG Zephyrus M16 GU603Z | |
| Acer Predator Triton 300 SE | |
| Media Intel Core i9-13900H (14.1 - 22.3, n=25) | |
| Razer Blade 15 RZ09-0421NGG3-R3G1 | |
| HP Omen 17-ck1075ng | |
| LibreOffice / 20 Documents To PDF | |
| Razer Blade 15 RZ09-0421NGG3-R3G1 | |
| Asus ROG Zephyrus M16 GU604VY-NM042X | |
| Media della classe Gaming (33.2 - 88.8, n=105, ultimi 2 anni) | |
| Media Intel Core i9-13900H (34.4 - 82.8, n=25) | |
| Schenker XMG Neo 16 Raptor Lake | |
| HP Omen 17-ck1075ng | |
| Asus ROG Zephyrus M16 GU603Z | |
| Lenovo Legion 5 Pro 16 G7 i7 RTX 3070Ti | |
| Acer Predator Triton 300 SE | |
| MSI Creator Z16P B12UHST | |
| R Benchmark 2.5 / Overall mean | |
| Razer Blade 15 RZ09-0421NGG3-R3G1 | |
| HP Omen 17-ck1075ng | |
| Lenovo Legion 5 Pro 16 G7 i7 RTX 3070Ti | |
| Media Intel Core i9-13900H (0.4052 - 0.723, n=25) | |
| Asus ROG Zephyrus M16 GU603Z | |
| MSI Creator Z16P B12UHST | |
| Acer Predator Triton 300 SE | |
| Media della classe Gaming (0.3439 - 0.759, n=106, ultimi 2 anni) | |
| Asus ROG Zephyrus M16 GU604VY-NM042X | |
| Schenker XMG Neo 16 Raptor Lake | |
* ... Meglio usare valori piccoli
AIDA64: FP32 Ray-Trace | FPU Julia | CPU SHA3 | CPU Queen | FPU SinJulia | FPU Mandel | CPU AES | CPU ZLib | FP64 Ray-Trace | CPU PhotoWorxx
| Performance rating | |
| MSI Titan GT77 HX 13VI | |
| Asus ROG Strix Scar 18 2023 G834JY-N6005W | |
| Lenovo Legion Pro 7 16IRX8H | |
| Media della classe Gaming | |
| Razer Blade 16 Early 2023 | |
| Asus ROG Zephyrus M16 GU604VY-NM042X | |
| Asus ROG Zephyrus M16 GU603Z | |
| Media Intel Core i9-13900H | |
| AIDA64 / FP32 Ray-Trace | |
| Media della classe Gaming (10227 - 85542, n=105, ultimi 2 anni) | |
| MSI Titan GT77 HX 13VI | |
| Asus ROG Strix Scar 18 2023 G834JY-N6005W | |
| Lenovo Legion Pro 7 16IRX8H | |
| Razer Blade 16 Early 2023 | |
| Razer Blade 16 Early 2023 | |
| Razer Blade 16 Early 2023 | |
| Asus ROG Zephyrus M16 GU604VY-NM042X | |
| Asus ROG Zephyrus M16 GU603Z | |
| Media Intel Core i9-13900H (6788 - 19557, n=25) | |
| AIDA64 / FPU Julia | |
| MSI Titan GT77 HX 13VI | |
| Media della classe Gaming (51376 - 238426, n=105, ultimi 2 anni) | |
| Asus ROG Strix Scar 18 2023 G834JY-N6005W | |
| Lenovo Legion Pro 7 16IRX8H | |
| Razer Blade 16 Early 2023 | |
| Razer Blade 16 Early 2023 | |
| Razer Blade 16 Early 2023 | |
| Asus ROG Zephyrus M16 GU604VY-NM042X | |
| Media Intel Core i9-13900H (22551 - 95579, n=25) | |
| Asus ROG Zephyrus M16 GU603Z | |
| AIDA64 / CPU SHA3 | |
| MSI Titan GT77 HX 13VI | |
| Asus ROG Strix Scar 18 2023 G834JY-N6005W | |
| Lenovo Legion Pro 7 16IRX8H | |
| Media della classe Gaming (2180 - 10115, n=105, ultimi 2 anni) | |
| Razer Blade 16 Early 2023 | |
| Razer Blade 16 Early 2023 | |
| Razer Blade 16 Early 2023 | |
| Asus ROG Zephyrus M16 GU604VY-NM042X | |
| Media Intel Core i9-13900H (2491 - 4270, n=25) | |
| Asus ROG Zephyrus M16 GU603Z | |
| AIDA64 / CPU Queen | |
| Asus ROG Strix Scar 18 2023 G834JY-N6005W | |
| MSI Titan GT77 HX 13VI | |
| Razer Blade 16 Early 2023 | |
| Razer Blade 16 Early 2023 | |
| Lenovo Legion Pro 7 16IRX8H | |
| Asus ROG Zephyrus M16 GU604VY-NM042X | |
| Media della classe Gaming (49785 - 173351, n=90, ultimi 2 anni) | |
| Asus ROG Zephyrus M16 GU603Z | |
| Media Intel Core i9-13900H (65121 - 120936, n=25) | |
| AIDA64 / FPU SinJulia | |
| Asus ROG Strix Scar 18 2023 G834JY-N6005W | |
| MSI Titan GT77 HX 13VI | |
| Razer Blade 16 Early 2023 | |
| Razer Blade 16 Early 2023 | |
| Razer Blade 16 Early 2023 | |
| Lenovo Legion Pro 7 16IRX8H | |
| Media della classe Gaming (4424 - 33636, n=105, ultimi 2 anni) | |
| Asus ROG Zephyrus M16 GU604VY-NM042X | |
| Media Intel Core i9-13900H (6108 - 11631, n=25) | |
| Asus ROG Zephyrus M16 GU603Z | |
| AIDA64 / FPU Mandel | |
| Media della classe Gaming (25115 - 128721, n=105, ultimi 2 anni) | |
| MSI Titan GT77 HX 13VI | |
| Asus ROG Strix Scar 18 2023 G834JY-N6005W | |
| Lenovo Legion Pro 7 16IRX8H | |
| Razer Blade 16 Early 2023 | |
| Razer Blade 16 Early 2023 | |
| Razer Blade 16 Early 2023 | |
| Asus ROG Zephyrus M16 GU604VY-NM042X | |
| Media Intel Core i9-13900H (11283 - 48474, n=25) | |
| Asus ROG Zephyrus M16 GU603Z | |
| AIDA64 / CPU AES | |
| Razer Blade 16 Early 2023 | |
| Razer Blade 16 Early 2023 | |
| Razer Blade 16 Early 2023 | |
| MSI Titan GT77 HX 13VI | |
| Asus ROG Strix Scar 18 2023 G834JY-N6005W | |
| Asus ROG Zephyrus M16 GU603Z | |
| Lenovo Legion Pro 7 16IRX8H | |
| Media della classe Gaming (39258 - 247074, n=105, ultimi 2 anni) | |
| Media Intel Core i9-13900H (3691 - 149377, n=25) | |
| Asus ROG Zephyrus M16 GU604VY-NM042X | |
| AIDA64 / CPU ZLib | |
| MSI Titan GT77 HX 13VI | |
| Asus ROG Strix Scar 18 2023 G834JY-N6005W | |
| Lenovo Legion Pro 7 16IRX8H | |
| Razer Blade 16 Early 2023 | |
| Razer Blade 16 Early 2023 | |
| Razer Blade 16 Early 2023 | |
| Media della classe Gaming (574 - 2531, n=105, ultimi 2 anni) | |
| Asus ROG Zephyrus M16 GU604VY-NM042X | |
| Media Intel Core i9-13900H (789 - 1254, n=25) | |
| Asus ROG Zephyrus M16 GU603Z | |
| AIDA64 / FP64 Ray-Trace | |
| Media della classe Gaming (5509 - 45446, n=105, ultimi 2 anni) | |
| MSI Titan GT77 HX 13VI | |
| Asus ROG Strix Scar 18 2023 G834JY-N6005W | |
| Lenovo Legion Pro 7 16IRX8H | |
| Razer Blade 16 Early 2023 | |
| Razer Blade 16 Early 2023 | |
| Razer Blade 16 Early 2023 | |
| Asus ROG Zephyrus M16 GU604VY-NM042X | |
| Asus ROG Zephyrus M16 GU603Z | |
| Media Intel Core i9-13900H (3655 - 10716, n=25) | |
| AIDA64 / CPU PhotoWorxx | |
| Razer Blade 16 Early 2023 | |
| Razer Blade 16 Early 2023 | |
| Razer Blade 16 Early 2023 | |
| Lenovo Legion Pro 7 16IRX8H | |
| Asus ROG Zephyrus M16 GU604VY-NM042X | |
| Media della classe Gaming (12271 - 89891, n=105, ultimi 2 anni) | |
| Asus ROG Strix Scar 18 2023 G834JY-N6005W | |
| Asus ROG Zephyrus M16 GU603Z | |
| MSI Titan GT77 HX 13VI | |
| Media Intel Core i9-13900H (10871 - 50488, n=25) | |
Prestazioni del sistema
Il nostro M16 non ha mostrato grossi punti deboli in PCMark10, ma non può nemmeno essere accusato di aver superato la concorrenza di ultima generazione. IlLegion 7 è in realtà più veloce di qualche punto percentuale. Nel test di creazione di contenuti digitali, i punteggi sono piuttosto deludenti, soprattutto nelle aree di editing e rendering.

CrossMark: Overall | Productivity | Creativity | Responsiveness
| PCMark 10 / Score | |
| Lenovo Legion 7 16IAX7-82TD004SGE | |
| Media della classe Gaming (5828 - 12414, n=93, ultimi 2 anni) | |
| Asus ROG Zephyrus M16 GU604VY-NM042X | |
| Alienware x17 R2 P48E | |
| Media Intel Core i9-13900H, NVIDIA GeForce RTX 4090 Laptop GPU (7985 - 8277, n=2) | |
| MSI Creator Z16P B12UHST | |
| Acer Predator Triton 500 SE PT516-52s-70KX | |
| Alienware x15 R2 P111F | |
| Asus ROG Zephyrus Duo 16 GX650RX | |
| PCMark 10 / Essentials | |
| Asus ROG Zephyrus M16 GU604VY-NM042X | |
| Media Intel Core i9-13900H, NVIDIA GeForce RTX 4090 Laptop GPU (11500 - 11659, n=2) | |
| Alienware x17 R2 P48E | |
| Lenovo Legion 7 16IAX7-82TD004SGE | |
| Alienware x15 R2 P111F | |
| MSI Creator Z16P B12UHST | |
| Acer Predator Triton 500 SE PT516-52s-70KX | |
| Media della classe Gaming (8810 - 11935, n=97, ultimi 2 anni) | |
| Asus ROG Zephyrus Duo 16 GX650RX | |
| PCMark 10 / Productivity | |
| Media della classe Gaming (6845 - 25323, n=95, ultimi 2 anni) | |
| MSI Creator Z16P B12UHST | |
| Asus ROG Zephyrus M16 GU604VY-NM042X | |
| Lenovo Legion 7 16IAX7-82TD004SGE | |
| Media Intel Core i9-13900H, NVIDIA GeForce RTX 4090 Laptop GPU (10526 - 11046, n=2) | |
| Alienware x15 R2 P111F | |
| Alienware x17 R2 P48E | |
| Acer Predator Triton 500 SE PT516-52s-70KX | |
| Asus ROG Zephyrus Duo 16 GX650RX | |
| PCMark 10 / Digital Content Creation | |
| Lenovo Legion 7 16IAX7-82TD004SGE | |
| Media della classe Gaming (7602 - 19954, n=95, ultimi 2 anni) | |
| Alienware x17 R2 P48E | |
| Asus ROG Zephyrus M16 GU604VY-NM042X | |
| Media Intel Core i9-13900H, NVIDIA GeForce RTX 4090 Laptop GPU (11412 - 11949, n=2) | |
| MSI Creator Z16P B12UHST | |
| Acer Predator Triton 500 SE PT516-52s-70KX | |
| Alienware x15 R2 P111F | |
| Asus ROG Zephyrus Duo 16 GX650RX | |
| CrossMark / Overall | |
| Lenovo Legion 7 16IAX7-82TD004SGE | |
| Schenker XMG Neo 16 Raptor Lake | |
| Media della classe Gaming (1366 - 2409, n=94, ultimi 2 anni) | |
| Asus ROG Zephyrus M16 GU604VY-NM042X | |
| Media Intel Core i9-13900H, NVIDIA GeForce RTX 4090 Laptop GPU (n=1) | |
| Alienware x15 R2 P111F | |
| Alienware x17 R2 P48E | |
| Acer Predator Triton 500 SE PT516-52s-70KX | |
| Asus ROG Zephyrus Duo 16 GX650RX | |
| Razer Blade 15 RZ09-0421NGG3-R3G1 | |
| CrossMark / Productivity | |
| Lenovo Legion 7 16IAX7-82TD004SGE | |
| Alienware x15 R2 P111F | |
| Media della classe Gaming (1386 - 2254, n=94, ultimi 2 anni) | |
| Asus ROG Zephyrus M16 GU604VY-NM042X | |
| Media Intel Core i9-13900H, NVIDIA GeForce RTX 4090 Laptop GPU (n=1) | |
| Schenker XMG Neo 16 Raptor Lake | |
| Alienware x17 R2 P48E | |
| Acer Predator Triton 500 SE PT516-52s-70KX | |
| Asus ROG Zephyrus Duo 16 GX650RX | |
| Razer Blade 15 RZ09-0421NGG3-R3G1 | |
| CrossMark / Creativity | |
| Schenker XMG Neo 16 Raptor Lake | |
| Lenovo Legion 7 16IAX7-82TD004SGE | |
| Media della classe Gaming (1343 - 2786, n=94, ultimi 2 anni) | |
| Asus ROG Zephyrus M16 GU604VY-NM042X | |
| Media Intel Core i9-13900H, NVIDIA GeForce RTX 4090 Laptop GPU (n=1) | |
| Alienware x15 R2 P111F | |
| Alienware x17 R2 P48E | |
| Acer Predator Triton 500 SE PT516-52s-70KX | |
| Razer Blade 15 RZ09-0421NGG3-R3G1 | |
| Asus ROG Zephyrus Duo 16 GX650RX | |
| CrossMark / Responsiveness | |
| Lenovo Legion 7 16IAX7-82TD004SGE | |
| Acer Predator Triton 500 SE PT516-52s-70KX | |
| Alienware x15 R2 P111F | |
| Asus ROG Zephyrus Duo 16 GX650RX | |
| Media della classe Gaming (1226 - 2334, n=94, ultimi 2 anni) | |
| Alienware x17 R2 P48E | |
| Asus ROG Zephyrus M16 GU604VY-NM042X | |
| Media Intel Core i9-13900H, NVIDIA GeForce RTX 4090 Laptop GPU (n=1) | |
| Schenker XMG Neo 16 Raptor Lake | |
| Razer Blade 15 RZ09-0421NGG3-R3G1 | |
| PCMark 10 Score | 8277 punti | |
Aiuto | ||
| AIDA64 / Memory Copy | |
| Razer Blade 16 Early 2023 | |
| Razer Blade 16 Early 2023 | |
| Razer Blade 16 Early 2023 | |
| Lenovo Legion Pro 7 16IRX8H | |
| Media della classe Gaming (21750 - 129946, n=105, ultimi 2 anni) | |
| Asus ROG Zephyrus M16 GU604VY-NM042X | |
| Asus ROG Strix Scar 18 2023 G834JY-N6005W | |
| MSI Titan GT77 HX 13VI | |
| Asus ROG Zephyrus M16 GU603Z | |
| Media Intel Core i9-13900H (37448 - 74486, n=25) | |
| AIDA64 / Memory Read | |
| Razer Blade 16 Early 2023 | |
| Razer Blade 16 Early 2023 | |
| Razer Blade 16 Early 2023 | |
| Lenovo Legion Pro 7 16IRX8H | |
| Asus ROG Strix Scar 18 2023 G834JY-N6005W | |
| Media della classe Gaming (22956 - 118858, n=105, ultimi 2 anni) | |
| Asus ROG Zephyrus M16 GU604VY-NM042X | |
| Asus ROG Zephyrus M16 GU603Z | |
| MSI Titan GT77 HX 13VI | |
| Media Intel Core i9-13900H (41599 - 75433, n=25) | |
| AIDA64 / Memory Write | |
| Razer Blade 16 Early 2023 | |
| Razer Blade 16 Early 2023 | |
| Razer Blade 16 Early 2023 | |
| Media della classe Gaming (22297 - 135096, n=105, ultimi 2 anni) | |
| Asus ROG Zephyrus M16 GU604VY-NM042X | |
| Lenovo Legion Pro 7 16IRX8H | |
| Asus ROG Strix Scar 18 2023 G834JY-N6005W | |
| Asus ROG Zephyrus M16 GU603Z | |
| Media Intel Core i9-13900H (36152 - 88505, n=25) | |
| MSI Titan GT77 HX 13VI | |
| AIDA64 / Memory Latency | |
| Media della classe Gaming (75.3 - 259, n=105, ultimi 2 anni) | |
| Razer Blade 16 Early 2023 | |
| Razer Blade 16 Early 2023 | |
| Razer Blade 16 Early 2023 | |
| MSI Titan GT77 HX 13VI | |
| Asus ROG Strix Scar 18 2023 G834JY-N6005W | |
| Media Intel Core i9-13900H (75.8 - 102.3, n=25) | |
| Asus ROG Zephyrus M16 GU603Z | |
| Asus ROG Zephyrus M16 GU604VY-NM042X | |
| Lenovo Legion Pro 7 16IRX8H | |
* ... Meglio usare valori piccoli
Latenze DPC
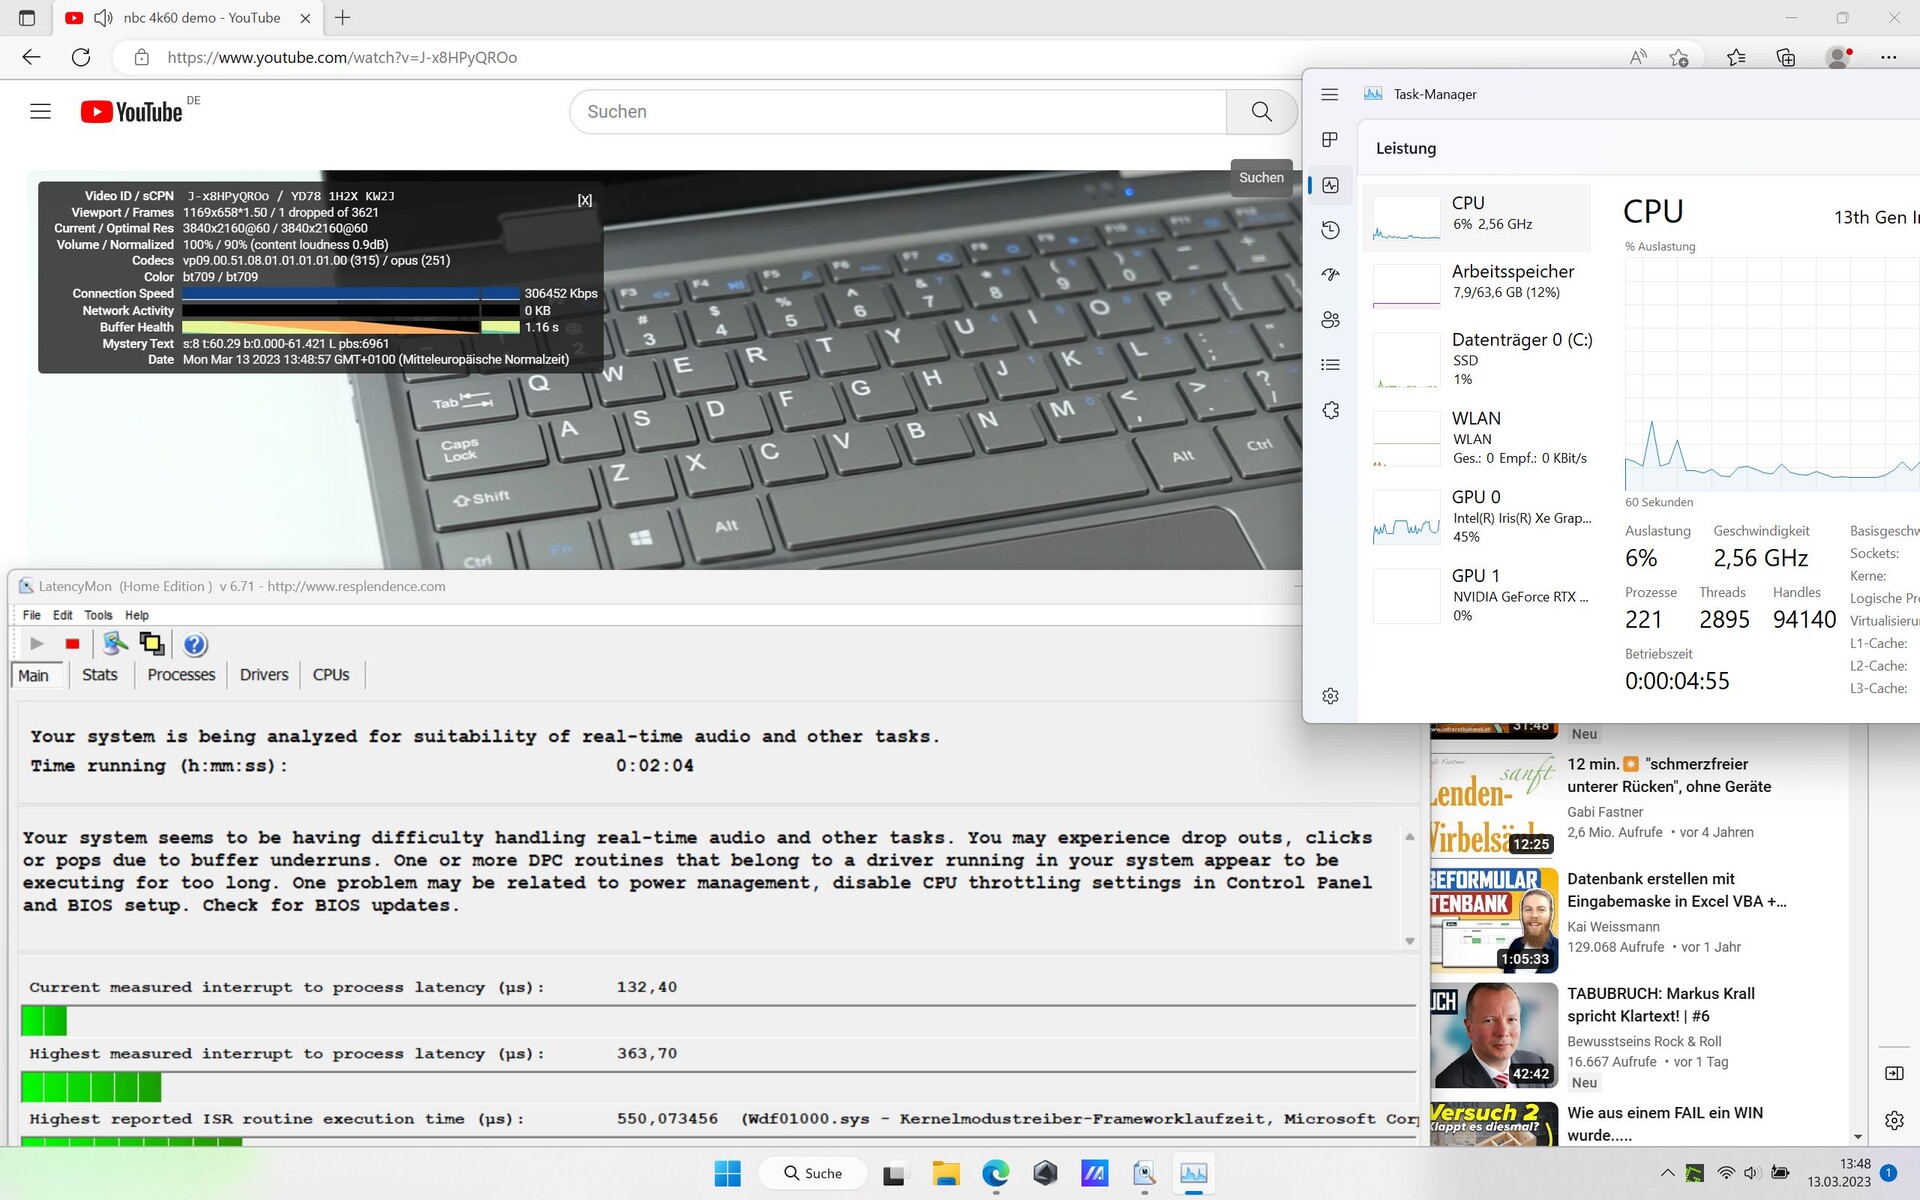
L'M16 non ha sudato quando ha dovuto aprire più schede del browser. Tutto è sembrato buono fino a quando non si sono verificate grandi latenze durante la riproduzione dei nostri video YouTube a 4k/60 fps e successivamente in Prime95. Quelli che fino a quel momento erano valori buoni, sono saliti alle stelle.
In questo modo, l'M16 ha latenze significativamente più elevate rispetto alla concorrenza di ultima generazione. I driver della nuova generazione non sembrano essere abbastanza maturi e questo è dimostrato dai valori di latenza altrettanto elevati riscontrati nellaMSI Titan.


| DPC Latencies / LatencyMon - interrupt to process latency (max), Web, Youtube, Prime95 | |
| MSI Titan GT77 HX 13VI | |
| Asus ROG Zephyrus M16 GU604VY-NM042X | |
| Razer Blade 16 Early 2023 | |
| Asus ROG Strix Scar 18 2023 G834JY-N6005W | |
| Asus ROG Zephyrus M16 GU603Z | |
| Lenovo Legion Pro 7 16IRX8H | |
* ... Meglio usare valori piccoli
Memoria di massa
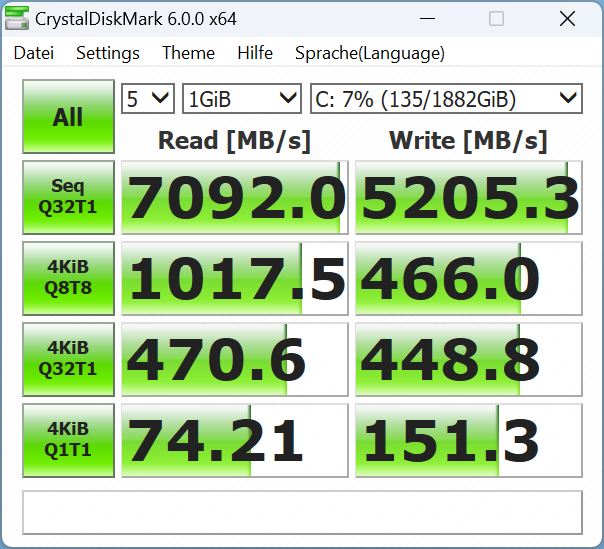
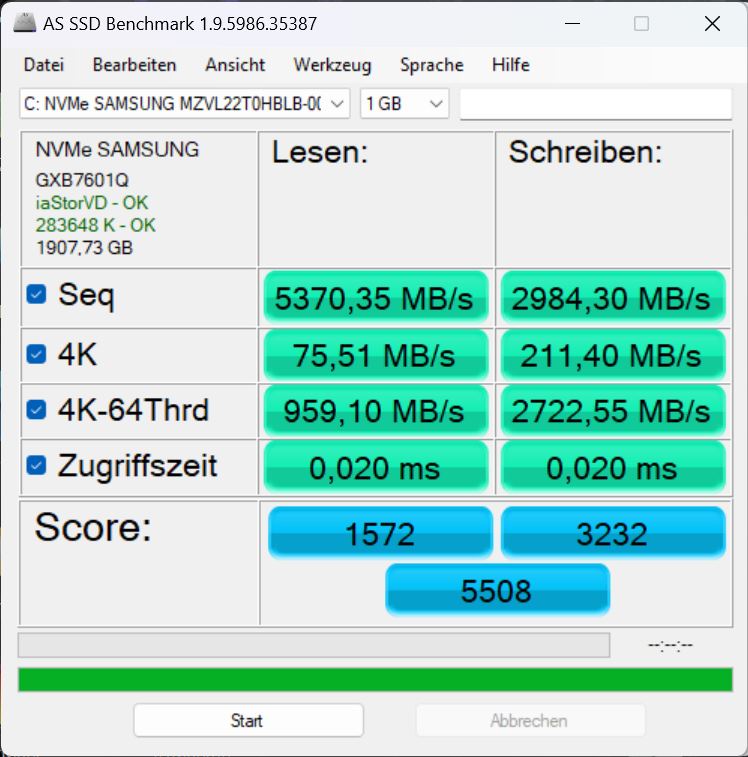
La nostra configurazione prevede un'unità SSD NVMe Samsung PM9A1 con quattro corsie PCIe 4 e una capacità di 2 TB e si colloca all'11° posto nella nostra classifica delle migliori unità SSD miglior SSD.
Le prestazioni dell'SSD M16 sono inferiori di circa il 20% rispetto a quanto ci si può aspettare per questo tipo di SSD. Tuttavia, nell'uso reale, questo aspetto passerà in gran parte inosservato e, in positivo, le prestazioni sono stabili per lunghi periodi di tempo.


* ... Meglio usare valori piccoli
Continuous performance Read: DiskSpd Read Loop, Queue Depth 8
Scheda grafica
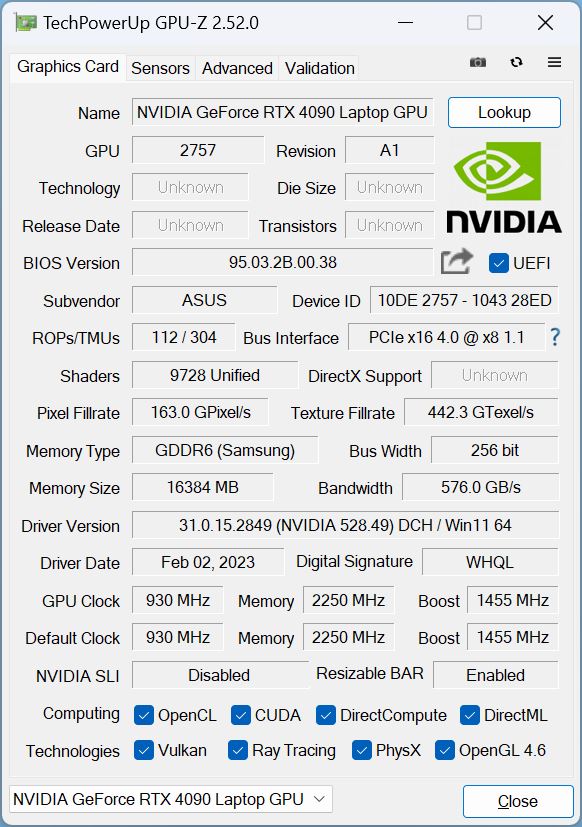
Con il nuovo M16, si può scegliere tra la RTX 4070, RTX 4080e RTX 4090. Nella nostra configurazione, il modello di punta è la GPU per laptop più veloce attualmente disponibile con un consumo energetico che varia tra 80 e 150 watt più 15 watt di boost dinamico. L'M16 può assorbire un massimo di 150 watt, compresi i 25 watt di boost dinamico.
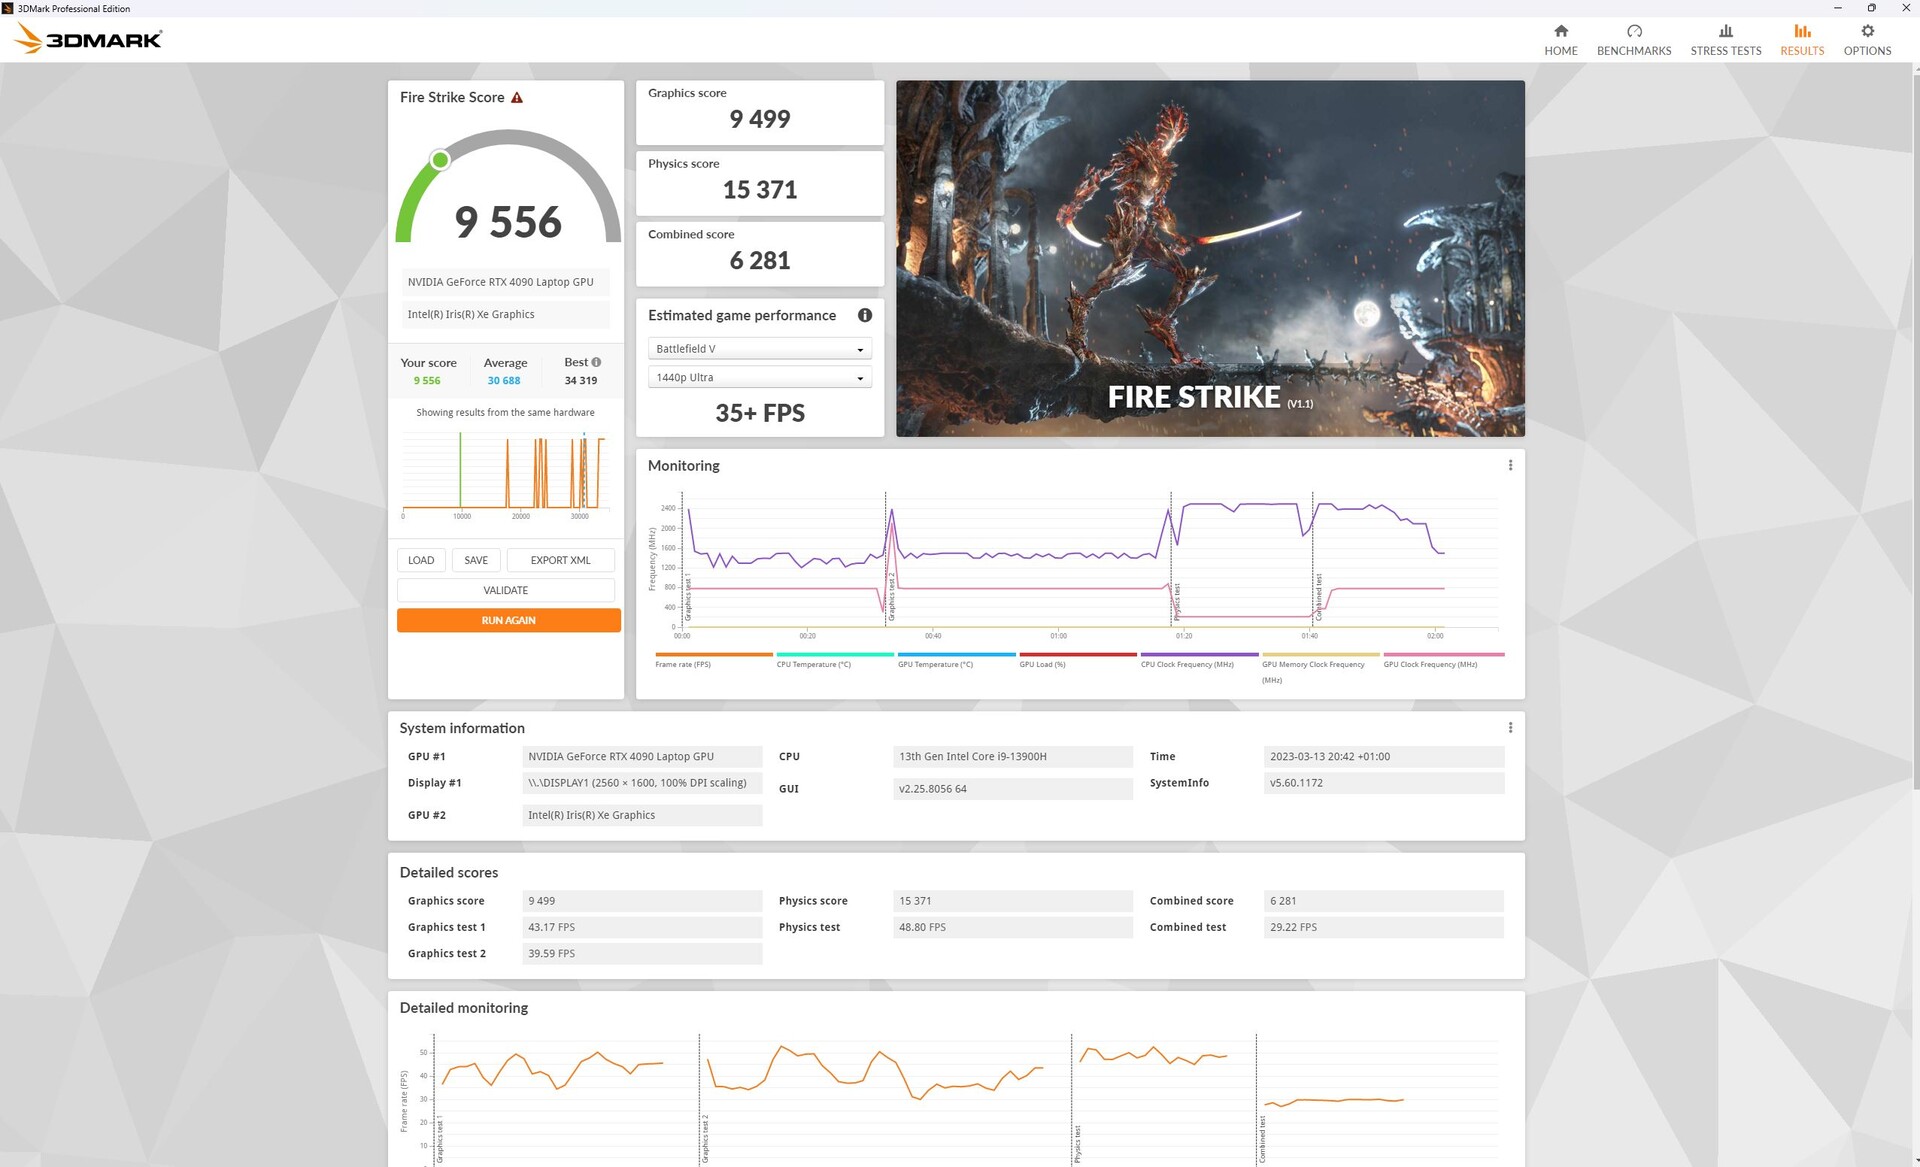
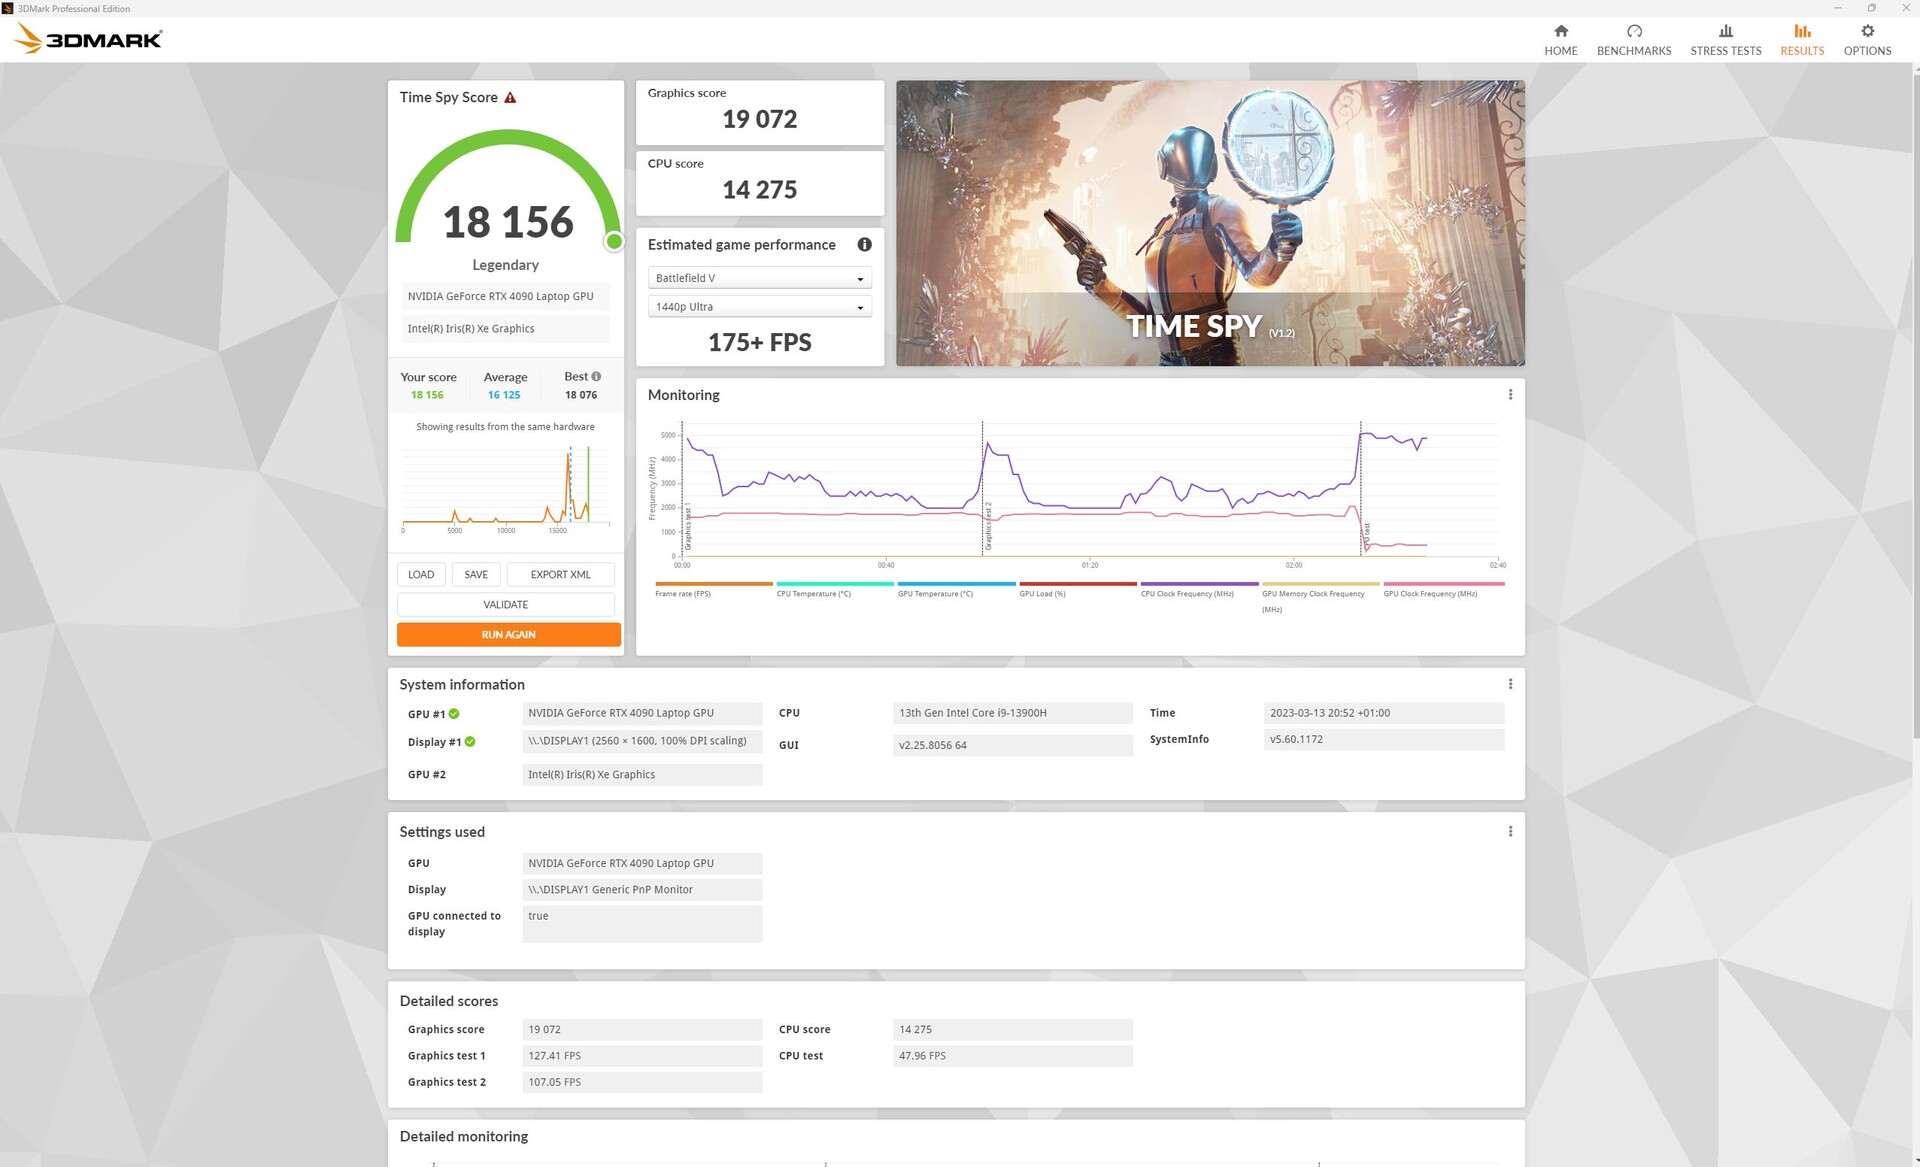
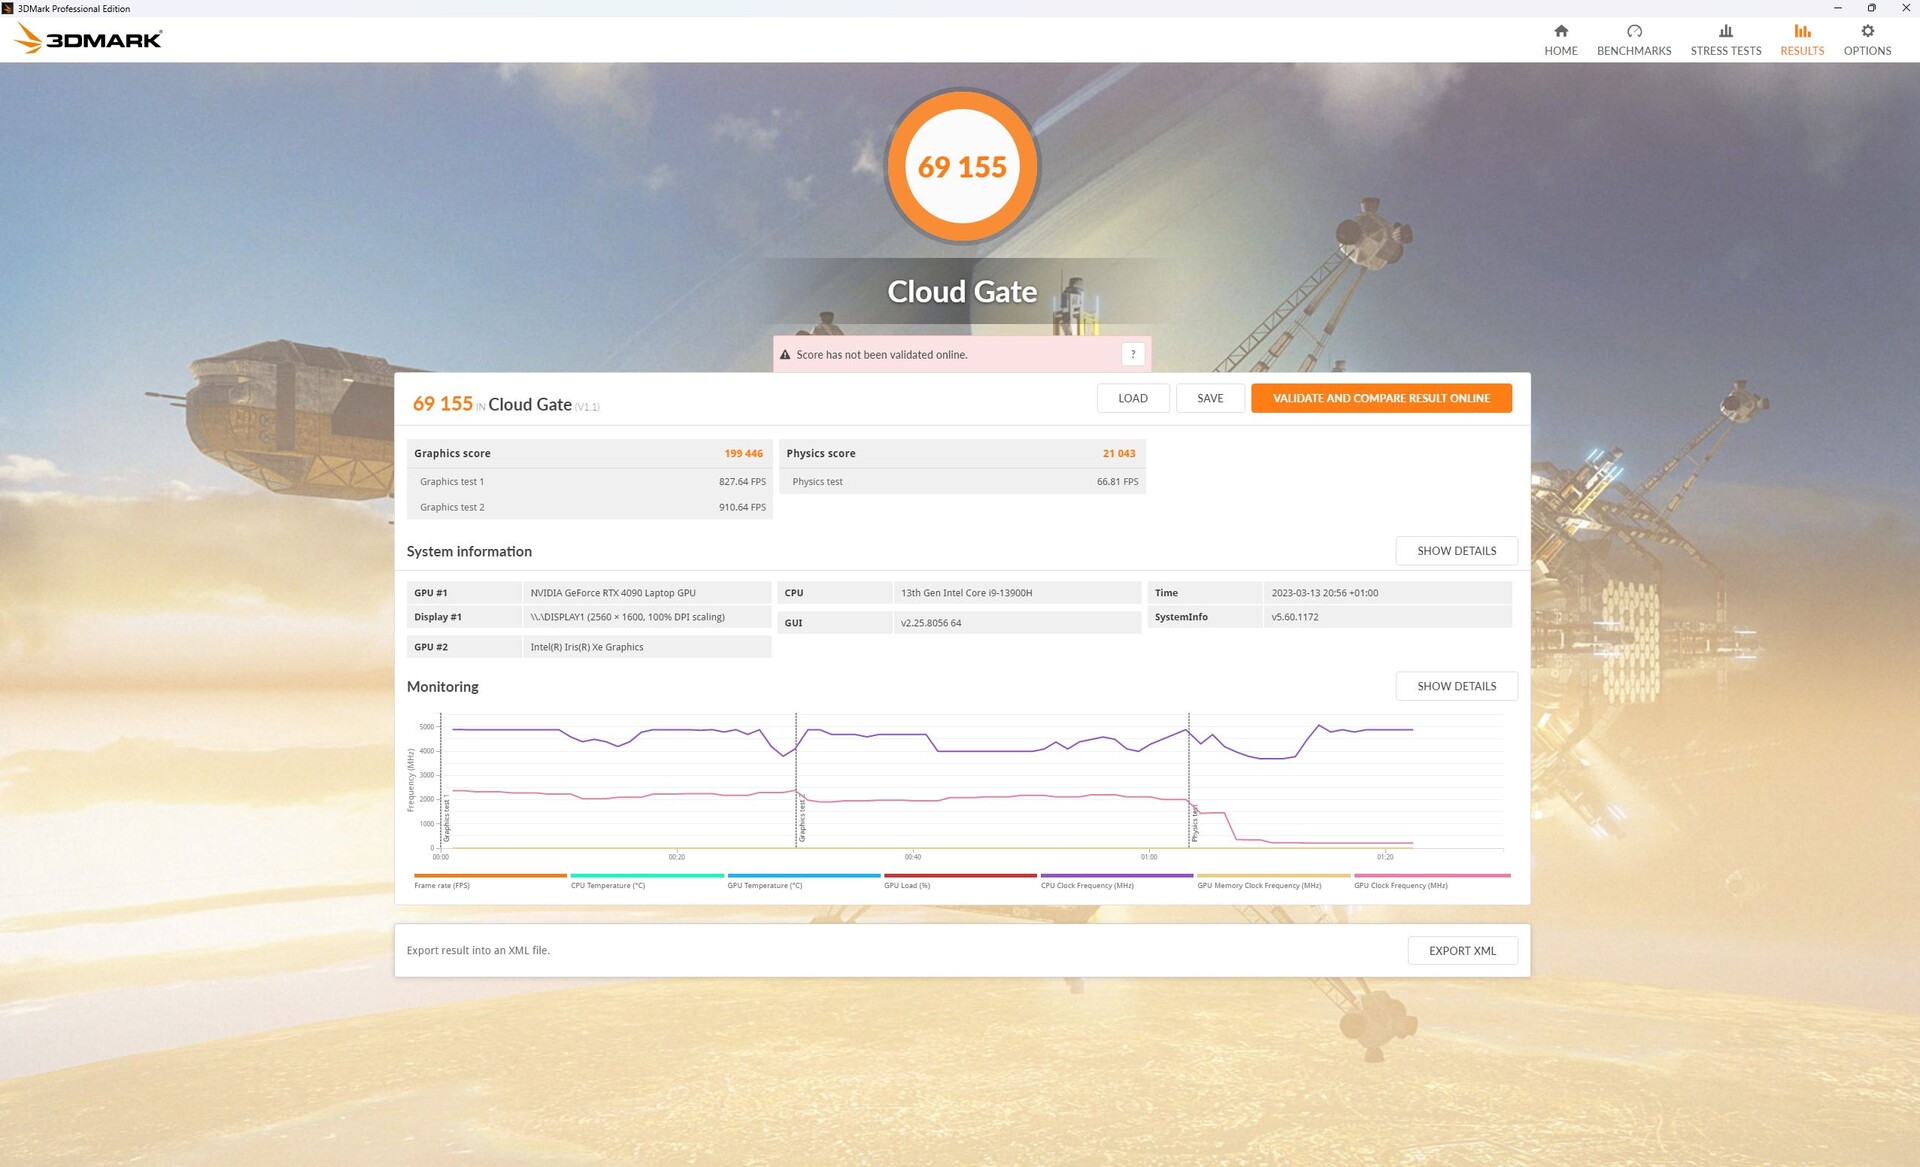
Nei benchmark 3DMark si sono verificati occasionalmente problemi di commutazione del dispositivo di visualizzazione alla dGPU tramite Optimus o MSHybrid/Standard, che a volte hanno fatto sì che i test venissero avviati dalla iGPU. Anche in questo caso, sembra che i driver non siano del tutto maturi. In caso di dubbio, la dGPU dovrebbe essere attivata manualmente (MUX).
Finora abbiamo testato solo la RTX 4090 abbinata a un processore HX (vedi la concorrenza). Non sorprende che la GPU dell'M16 sia, in tutti i test, circa il 10% più lenta della media della scheda, secondo il nostro (ancora) limitato database. IlRazer Blade 16, accoppiato con una RTX 4080 marginalmente più lenta, è indietro di appena il 4%.
In modalità batteria, le prestazioni 3D sono calate drasticamente e in Fire Strike sono rimasti solo 9.000 punti dai 44.000 iniziali, con un calo di quasi l'80%!

| 3DMark Performance rating - Percent | |
| Schenker XMG Neo 16 Raptor Lake | |
| Media NVIDIA GeForce RTX 4090 Laptop GPU | |
| Asus ROG Zephyrus M16 GU604VY-NM042X | |
| Razer Blade 16 Early 2023 | |
| Media della classe Gaming | |
| Lenovo Legion 7 16IAX7-82TD004SGE -1! | |
| Asus ROG Strix Scar 17 SE G733CX-LL014W | |
| MSI Raider GE66 12UHS | |
| Alienware x15 R2 P111F | |
| Acer Predator Triton 500 SE PT516-52s-70KX -1! | |
| Razer Blade 15 RZ09-0421NGG3-R3G1 -1! | |
| Asus ROG Zephyrus M16 GU603Z -1! | |
| 3DMark 11 Performance | 41060 punti | |
| 3DMark Fire Strike Score | 33550 punti | |
| 3DMark Time Spy Score | 15939 punti | |
Aiuto | ||
* ... Meglio usare valori piccoli
Prestazioni di gioco
Inoltre, quando si gioca, si notano le caratteristiche di M16RTX 4090 non è abbinata a una CPU HX. I portatili con CPU HX eRTX 4080come il Blade 16 o ilLegion 7sono solitamente più veloci, soprattutto se impostate a basse risoluzioni. LaMSI Titancon una RTX 4090 gode del maggior vantaggio in termini di prestazioni rispetto all'M16.
A parte questo, l'M16 ha ancora molta potenza a disposizione a 4K, con una quantità sufficiente di energia per il ray-tracing, specialmente in combinazione con la tecnologia di upscaling DLSS 3, AI. Potete trovare ulteriori benchmark e informazioni sulle nuove schede RTX 40 nella nostra analisi RTX 40 nel nostro articolo di analisi.
| The Witcher 3 - 1920x1080 Ultra Graphics & Postprocessing (HBAO+) | |
| MSI Titan GT77 HX 13VI | |
| Media della classe Gaming (104.7 - 240, n=7, ultimi 2 anni) | |
| Asus ROG Zephyrus M16 GU604VY-NM042X | |
| Lenovo Legion Pro 7 16IRX8H | |
| Razer Blade 16 Early 2023 | |
| Asus ROG Zephyrus M16 GU603Z | |
| Far Cry 6 | |
| 2560x1440 Ultra Graphics Quality + HD Textures AA:T | |
| MSI Titan GT77 HX 13VI | |
| Schenker XMG Neo 16 Raptor Lake | |
| Media NVIDIA GeForce RTX 4090 Laptop GPU (85 - 146, n=12) | |
| Media della classe Gaming (n=1ultimi 2 anni) | |
| Razer Blade 16 Early 2023 | |
| Asus ROG Zephyrus M16 GU604VY-NM042X | |
| 1920x1080 Ultra Graphics Quality + HD Textures + DXR AA:T | |
| Razer Blade 16 Early 2023 | |
| MSI Titan GT77 HX 13VI | |
| Schenker XMG Neo 16 Raptor Lake | |
| Media della classe Gaming (n=1ultimi 2 anni) | |
| Asus ROG Zephyrus M16 GU604VY-NM042X | |
| Media NVIDIA GeForce RTX 4090 Laptop GPU (81 - 116, n=5) | |
| Tiny Tina's Wonderlands - 2560x1440 Badass Preset (DX12) | |
| Schenker XMG Neo 16 Raptor Lake | |
| MSI Titan GT77 HX 13VI | |
| Media NVIDIA GeForce RTX 4090 Laptop GPU (103.4 - 137.8, n=14) | |
| Asus ROG Zephyrus M16 GU604VY-NM042X | |
| Media della classe Gaming (58.9 - 111.2, n=3, ultimi 2 anni) | |
| Spider-Man Miles Morales - 2560x1440 Very High Preset AA:T | |
| Schenker XMG Neo 16 Raptor Lake | |
| MSI Titan GT77 HX 13VI | |
| Media NVIDIA GeForce RTX 4090 Laptop GPU (93.3 - 119.8, n=7) | |
| Asus ROG Strix Scar 18 2023 G834JY-N6005W | |
| Lenovo Legion Pro 7 16IRX8H | |
| Asus ROG Zephyrus M16 GU604VY-NM042X | |
Dopo un'ora nel nostro stress test Witcher 3, è davvero evidente che le prestazioni sono allo stesso livello di unaRTX 4080abbinata a un processore HX. Tuttavia, le prestazioni sono tanto elevate quanto costanti.
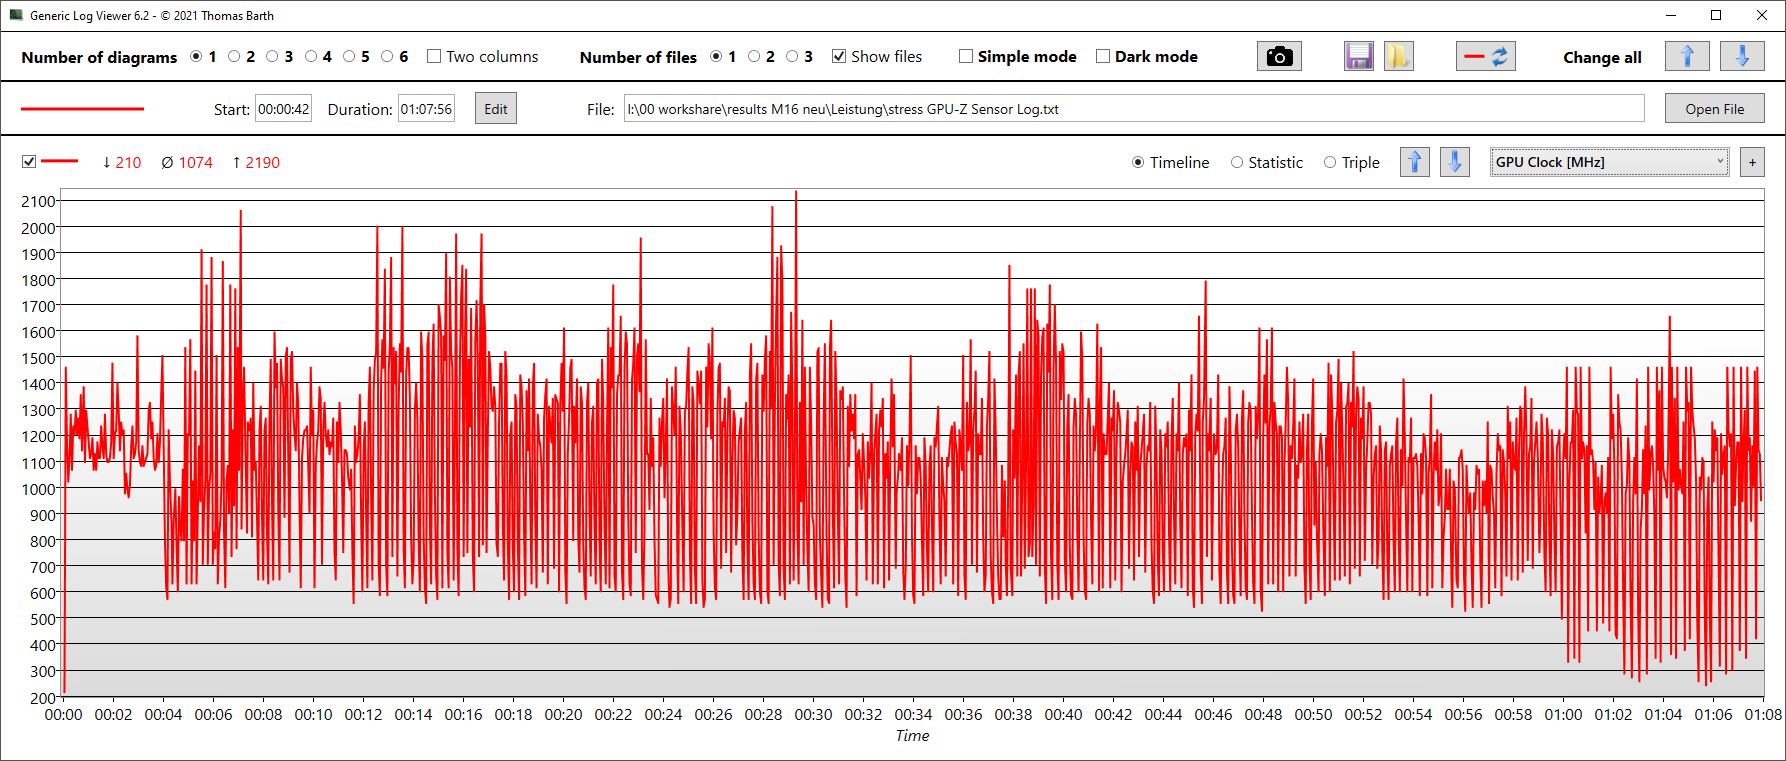
I dati di log di GPU-Z fanno un buon lavoro per evidenziare la differenza tra le modalitàTurbo e Performance: La frequenza di clock (1,9 vs. 1,5 GHz), la temperatura (70 vs. 66 °C), il consumo energetico (140 vs. 93 watt) e persino la velocità di clock della memoria (2.275 vs. 2.250 MHz) sono tutti diversi. Il frame rate è sceso da circa 175 a circa 145 fps.
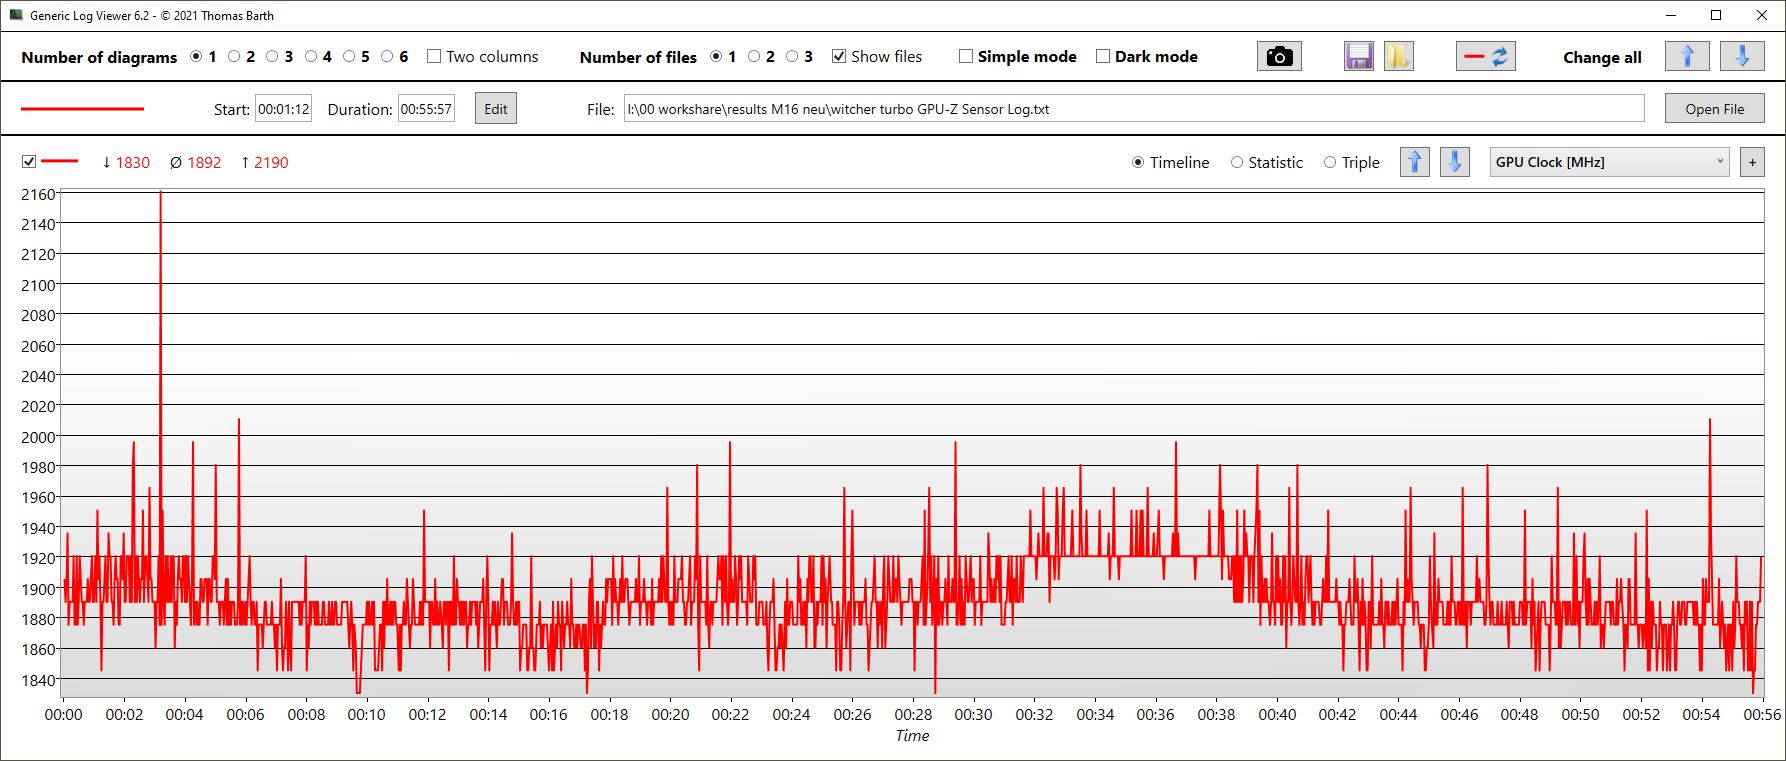
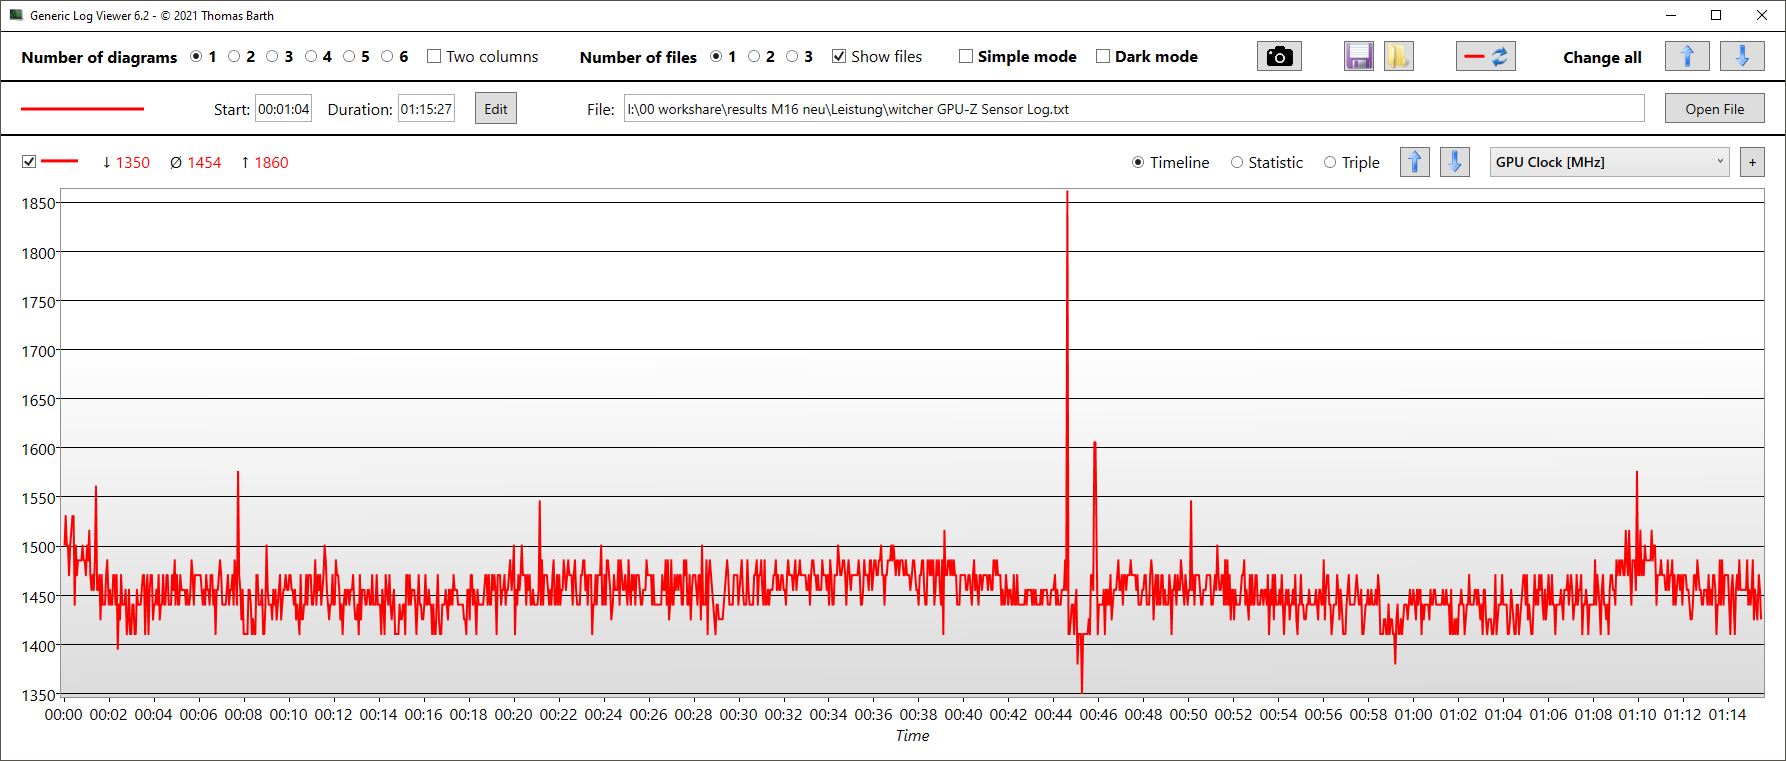
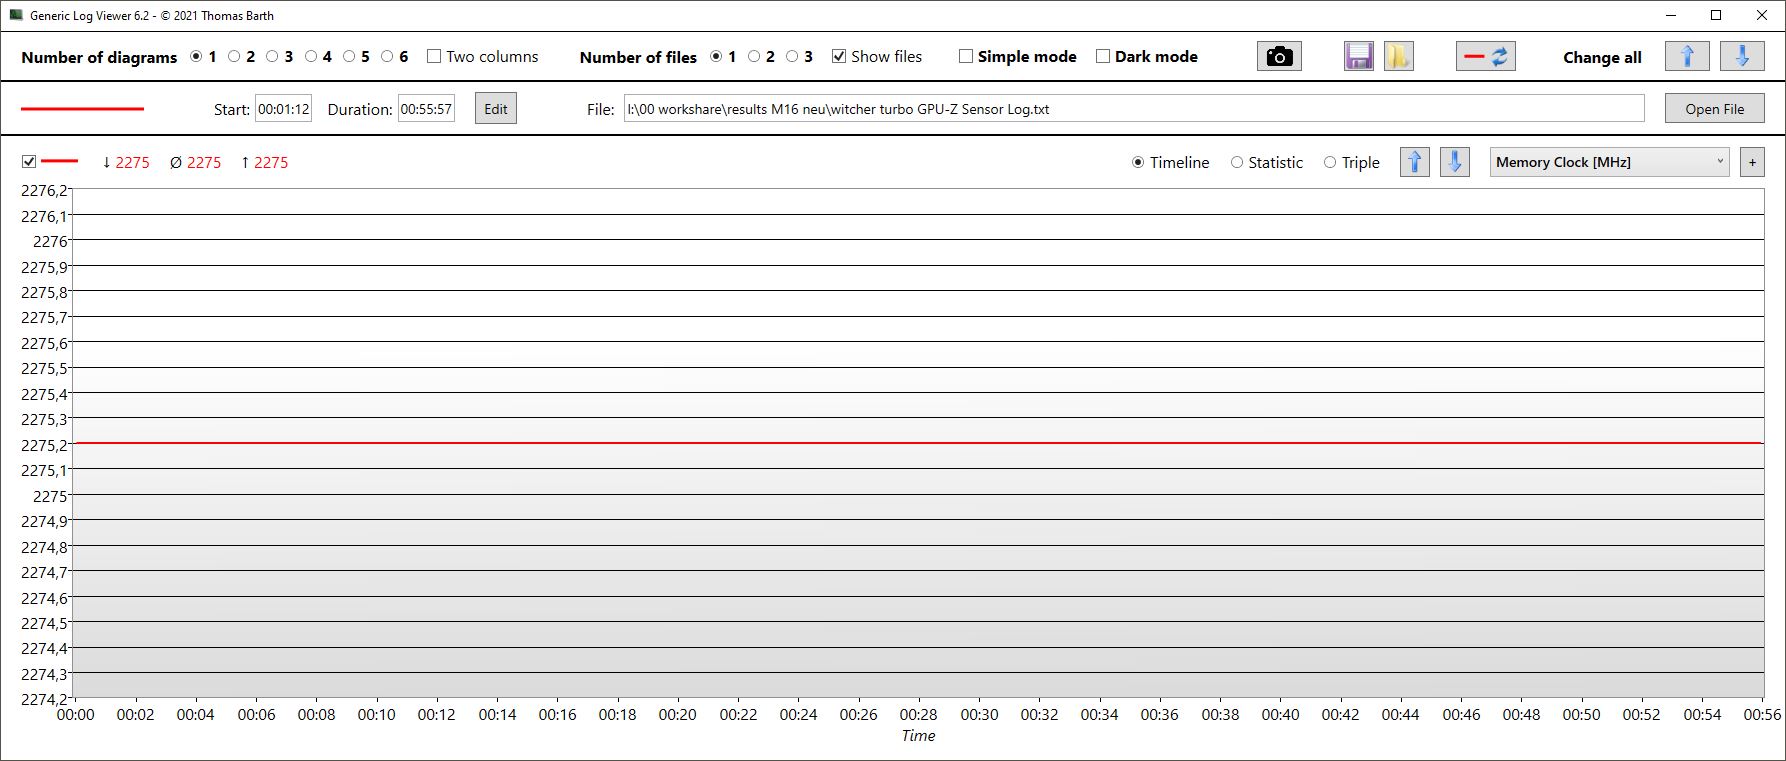
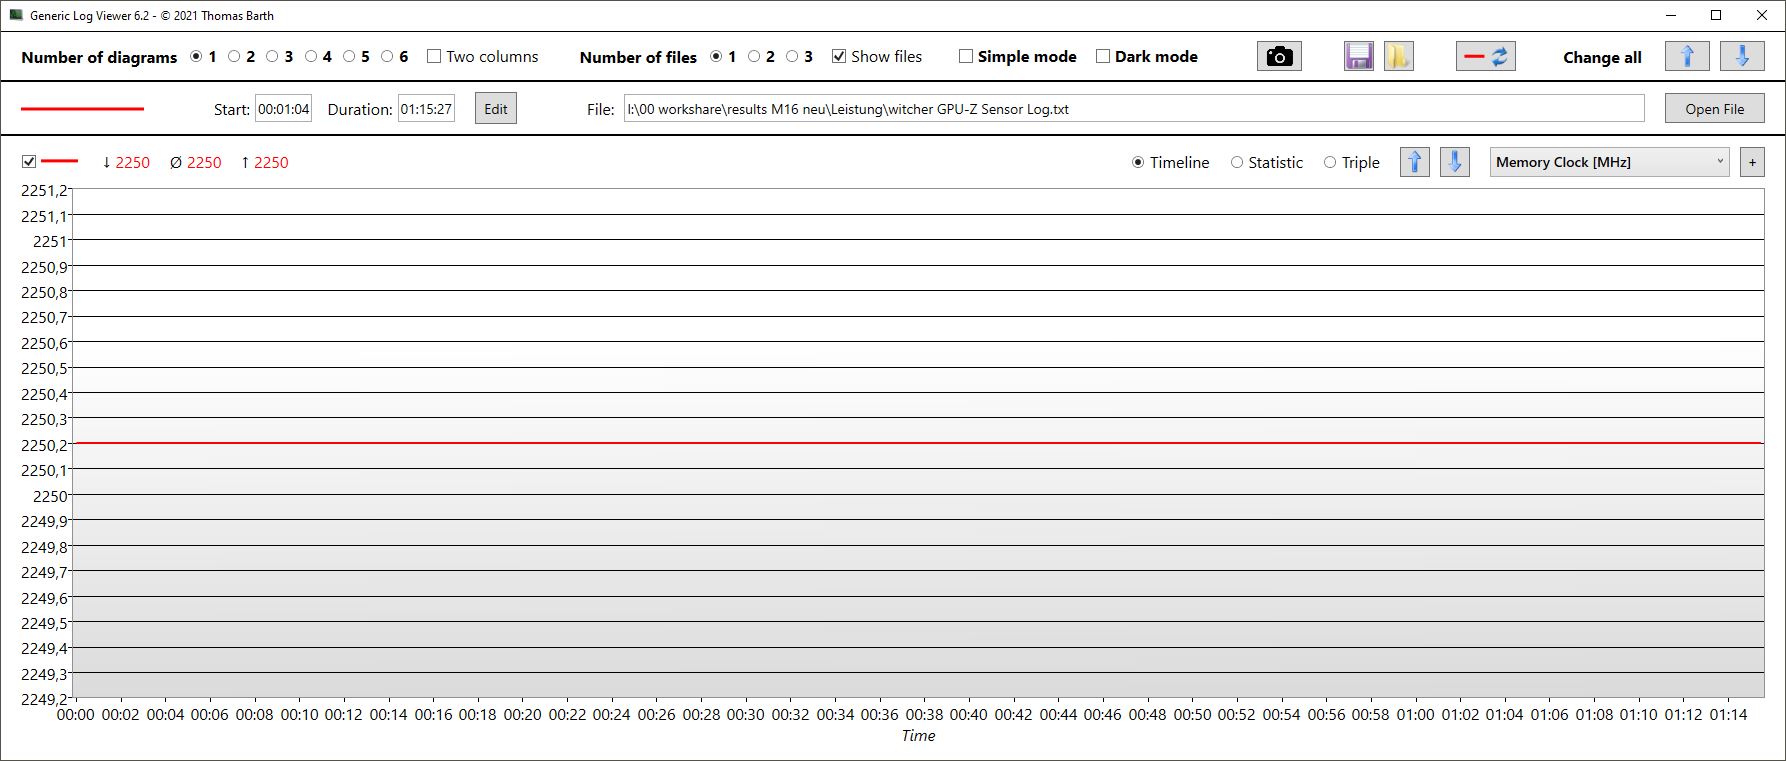
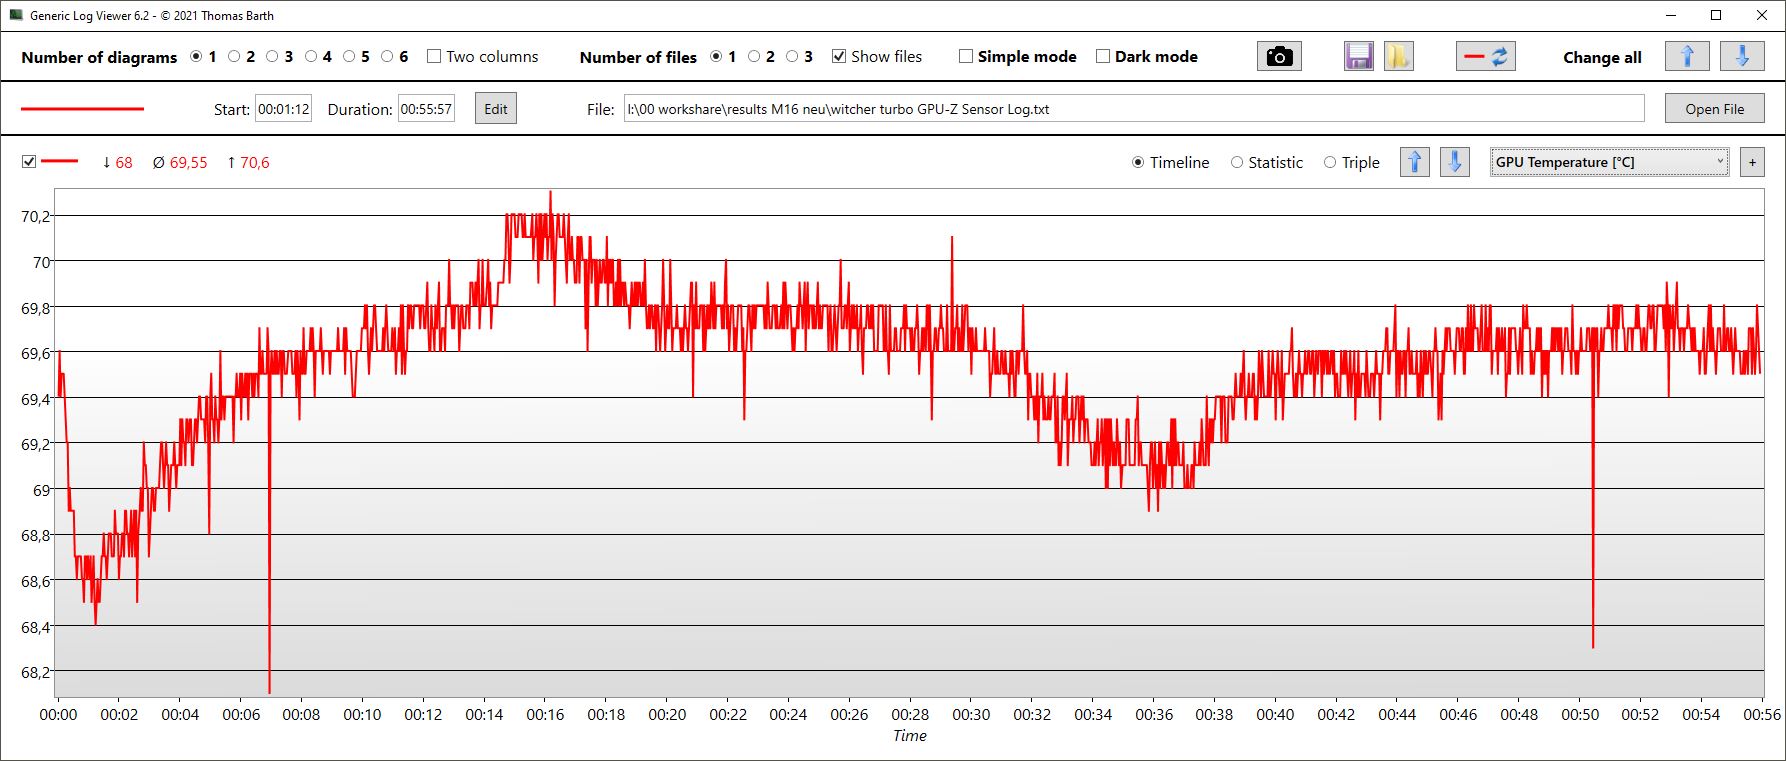
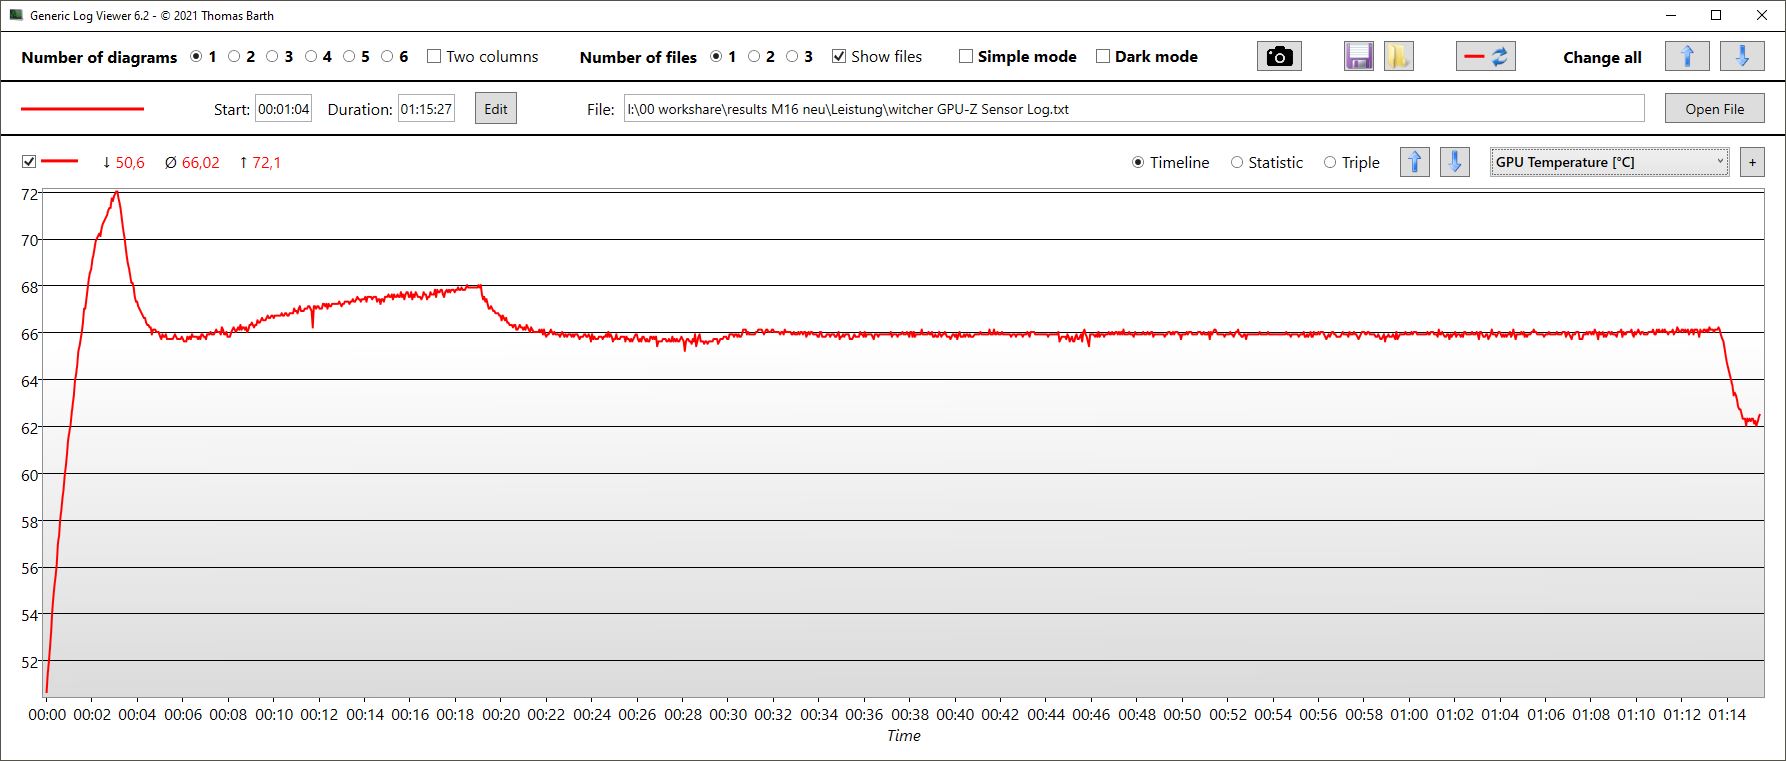
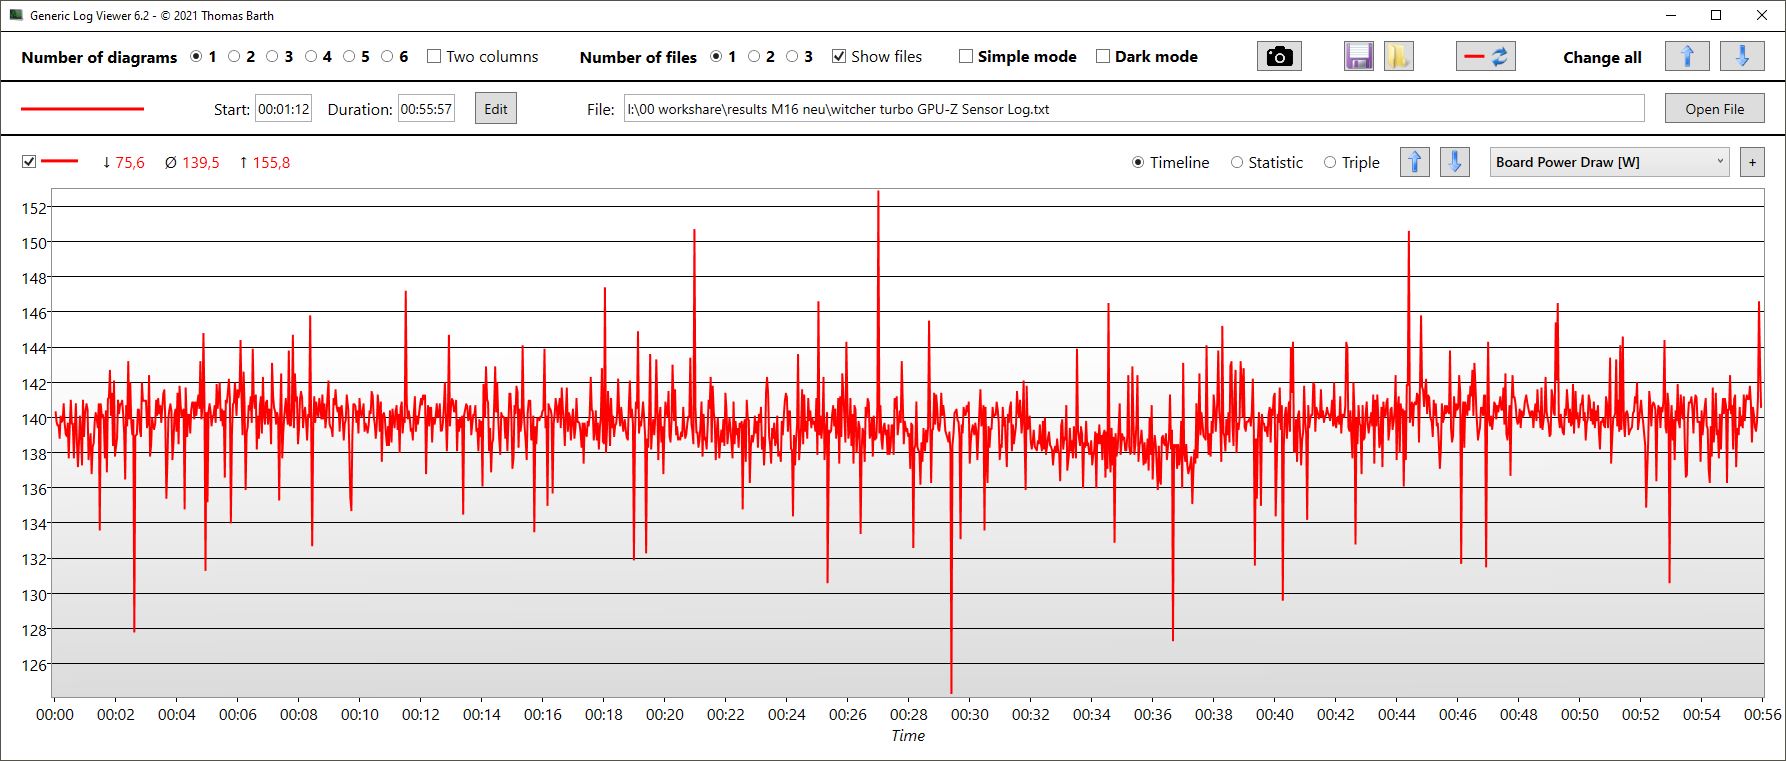
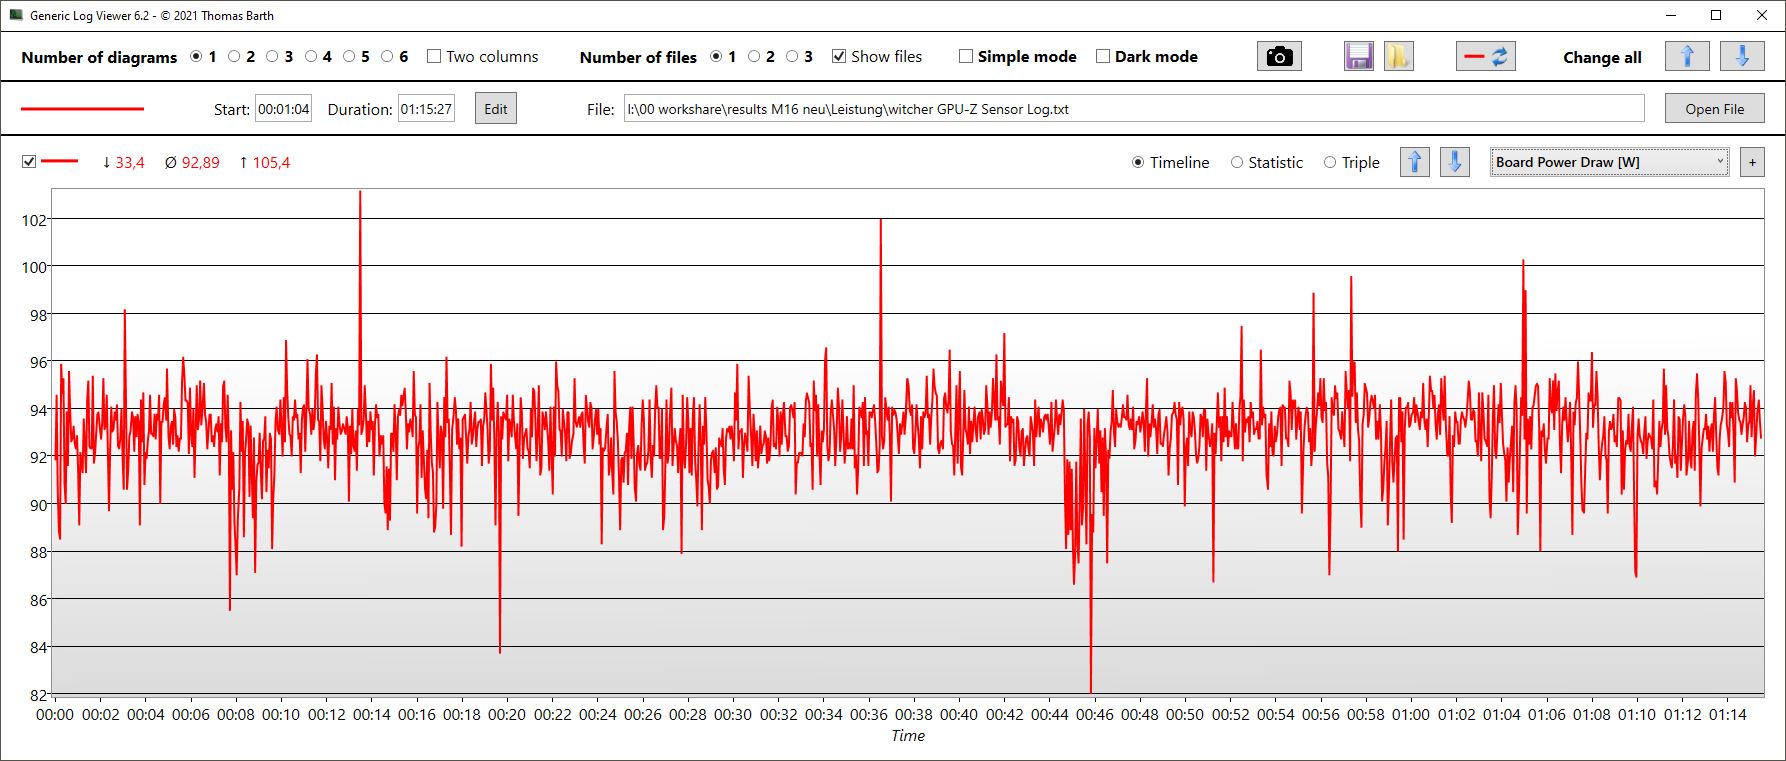
Witcher 3 FPS diagram
| basso | medio | alto | ultra | QHD | 4K DLSS | 4K | |
|---|---|---|---|---|---|---|---|
| GTA V (2015) | 186 | 183.1 | 179.8 | 127.7 | 123 | ||
| The Witcher 3 (2015) | 444 | 371 | 305 | 178 | |||
| Dota 2 Reborn (2015) | 192.9 | 177.3 | 169.9 | 160.7 | 161.9 | ||
| Final Fantasy XV Benchmark (2018) | 199.1 | 184.5 | 158.6 | 129.5 | |||
| X-Plane 11.11 (2018) | 177.2 | 154.7 | 116.4 | 121.8 | |||
| Far Cry 5 (2018) | 195 | 168 | 156 | 133 | 145 | ||
| Strange Brigade (2018) | 445 | 357 | 343 | 315 | 255 | ||
| Shadow of the Tomb Raider (2018) | 172 | 150 | 90 | ||||
| Watch Dogs Legion (2020) | 102 | 91 | 58 | ||||
| Assassin´s Creed Valhalla (2020) | 126 | 111 | 69 | ||||
| Far Cry 6 (2021) | 111 | 108 | 73 | ||||
| Dying Light 2 (2022) | 145.2 | 103.4 | 53.6 | ||||
| Cyberpunk 2077 1.6 (2022) | 104.49 | 75.69 | 41.9 | ||||
| Tiny Tina's Wonderlands (2022) | 144.06 | 109.64 | 62.33 | ||||
| A Plague Tale Requiem (2022) | 59.4 | ||||||
| Call of Duty Modern Warfare 2 2022 (2022) | 148 | 111 | 98 | 69 | |||
| Spider-Man Miles Morales (2022) | 98.1 | 93.3 | 65.7 | ||||
| The Callisto Protocol (2022) | 113.23 | 90.48 | 53.5 |
Emissioni - Senza dubbio, i turbocompressori sono rumorosi
Emissioni acustiche
In modalità silenziosa, le ventole sono per lo più inattive durante l'uso inattivo e rimangono tali anche con carichi leggeri, come la scrittura o la navigazione in Internet. Anche in modalitàPerformance, che il produttore considera simile a una modalità bilanciata, le ventole sono spesso in funzione, quando sono inattive.
Per i nostri benchmark abbiamo utilizzato la modalità Turbo. Le ventole sono tollerabili solo nell'uso inattivo, non sono mai silenziose e ruggiscono al massimo solo sotto carico pesante. A questo punto, rimangono a 57 dB costanti, rendendolo uno dei portatili più rumorosi della sua categoria. Solo l'MSI Titan GT77 è più rumoroso sotto carico massimo, ma è almeno più silenzioso quando si gioca. Vale la pena sottolineare che molti portatili dispongono di una modalità Turbo in cui le ventole funzionano al massimo durante l'uso inattivo, motivo per cui spesso ci asteniamo da questa modalità di test. La modalità Turbo dell'M16 è leggermente diversa, ma le cuffie sono comunque indispensabili quando si gioca.
In modalità prestazioni, i livelli di rumore sono tollerabili e paragonabili a quelli della concorrenza. In Witcher 3, abbiamo misurato solo 49 dB invece di 57. In compenso, le prestazioni di gioco sono diminuite di circa 1,5 punti percentuali. In compenso, le prestazioni di gioco sono diminuite di circa il 15-18%.
Rumorosità
| Idle |
| 24 / 29.96 / 34.27 dB(A) |
| Sotto carico |
| 35.89 / 57.54 dB(A) |
 | ||
30 dB silenzioso 40 dB(A) udibile 50 dB(A) rumoroso |
||
min: | ||
| Asus ROG Zephyrus M16 GU604VY-NM042X GeForce RTX 4090 Laptop GPU, i9-13900H, Samsung PM9A1 MZVL22T0HBLB | Asus ROG Zephyrus M16 GU603Z GeForce RTX 3070 Ti Laptop GPU, i9-12900H, Micron 3400 1TB MTFDKBA1T0TFH | Asus ROG Strix Scar 18 2023 G834JY-N6005W GeForce RTX 4090 Laptop GPU, i9-13980HX, 2x Samsung PM9A1 MZVL21T0HCLR (RAID 0) | MSI Titan GT77 HX 13VI GeForce RTX 4090 Laptop GPU, i9-13950HX, Samsung PM9A1 MZVL22T0HBLB | Lenovo Legion Pro 7 16IRX8H GeForce RTX 4080 Laptop GPU, i9-13900HX, Samsung PM9A1 MZVL21T0HCLR | Razer Blade 16 Early 2023 GeForce RTX 4080 Laptop GPU, i9-13950HX, SSSTC CA6-8D1024 | |
|---|---|---|---|---|---|---|
| Noise | -2% | -0% | -7% | -3% | 11% | |
| off /ambiente * (dB) | 24 | 23 4% | 23.9 -0% | 24.6 -3% | 24 -0% | 23 4% |
| Idle Minimum * (dB) | 24 | 23 4% | 23.9 -0% | 29.2 -22% | 26 -8% | 23 4% |
| Idle Average * (dB) | 29.96 | 24 20% | 32.6 -9% | 29.2 3% | 28 7% | 23 23% |
| Idle Maximum * (dB) | 34.27 | 47 -37% | 32.6 5% | 29.2 15% | 34 1% | 23.6 31% |
| Load Average * (dB) | 35.89 | 47.91 -33% | 35.9 -0% | 50.7 -41% | 47 -31% | 39 -9% |
| Witcher 3 ultra * (dB) | 57.5 | 48.91 15% | 53.3 7% | 55 4% | 51.6 10% | |
| Load Maximum * (dB) | 57.54 | 50.25 13% | 55.8 3% | 61 -6% | 56 3% | 51.3 11% |
* ... Meglio usare valori piccoli
Temperatura
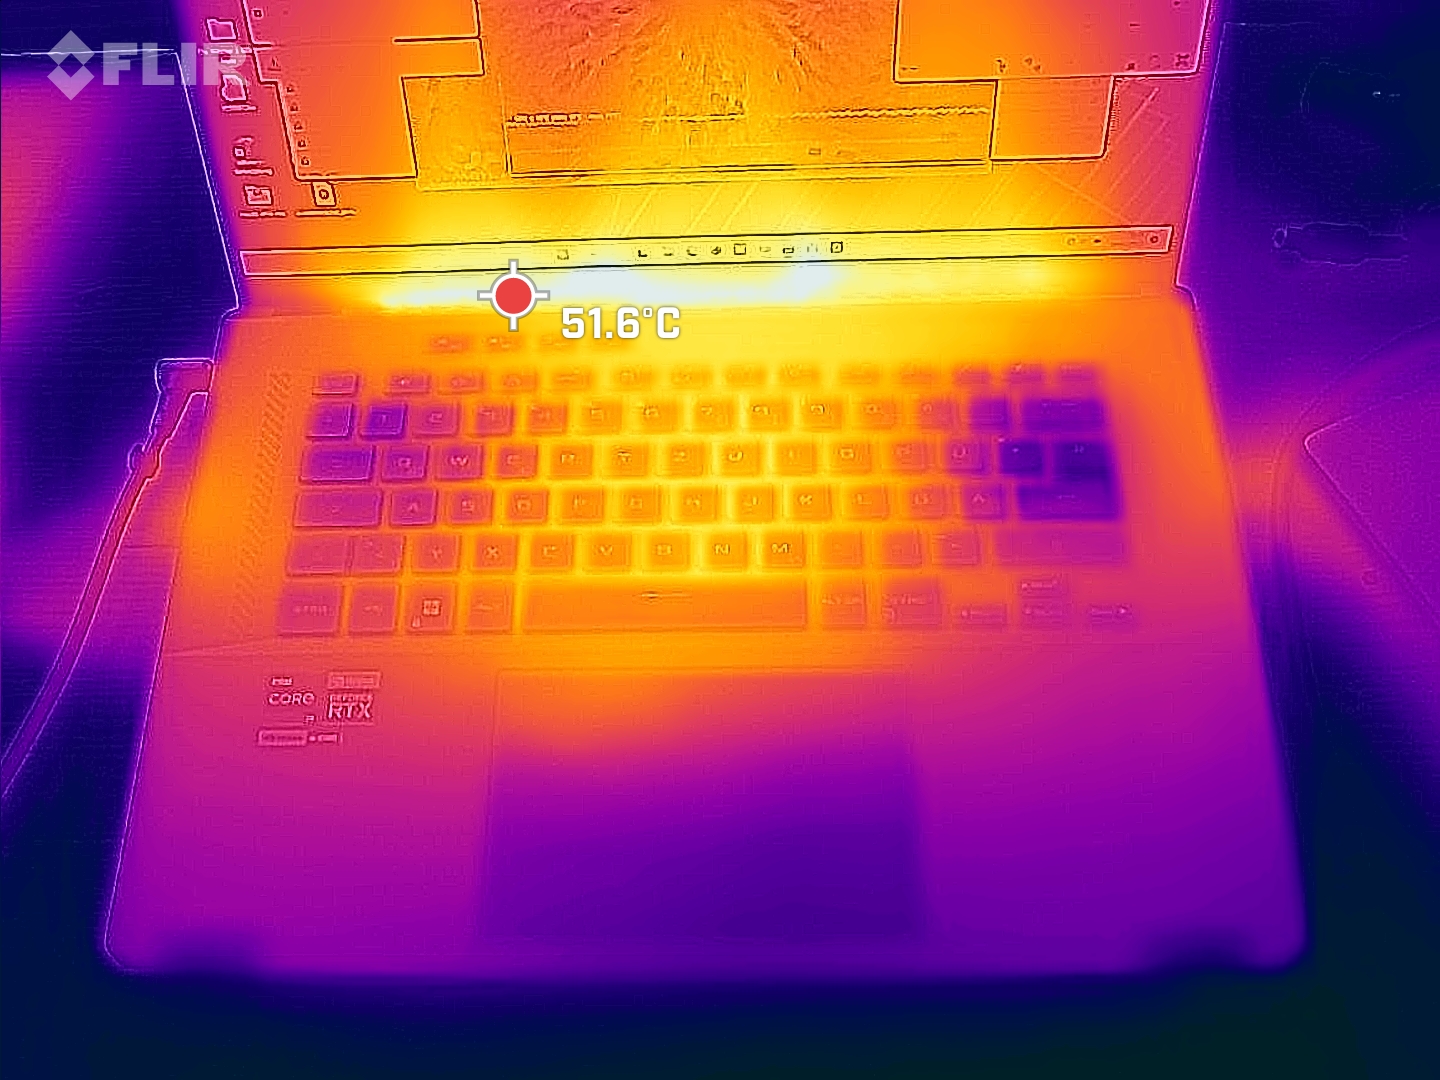
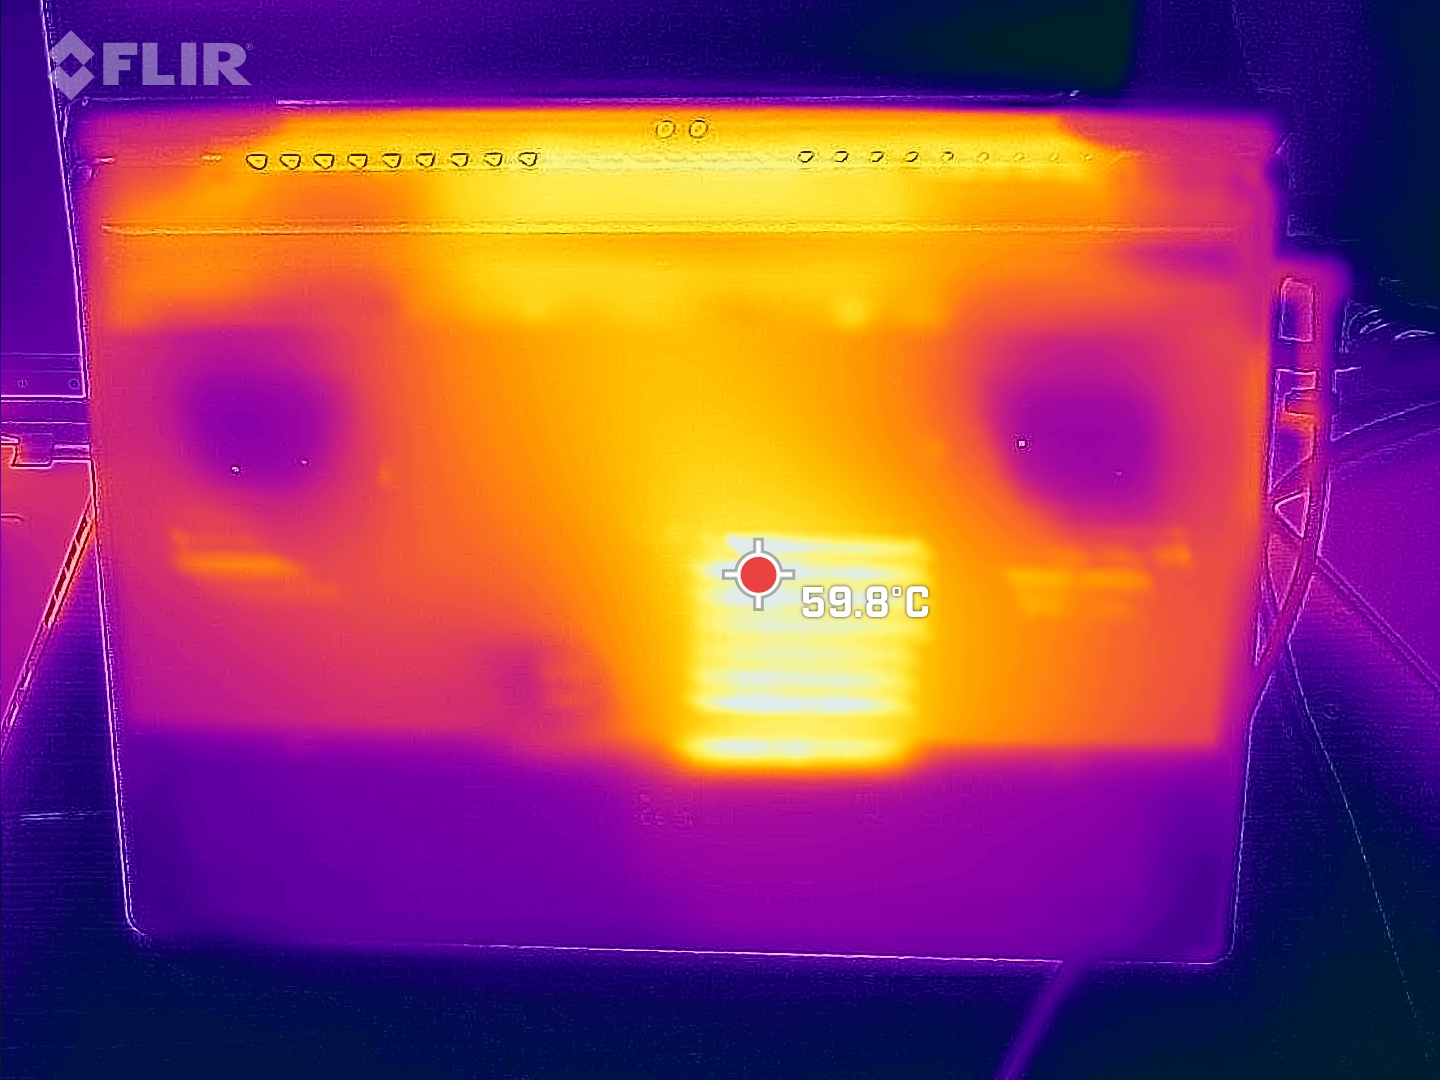
L'M16 si scalda un po', soprattutto nella parte inferiore del dispositivo. I punti caldi misurati sono stati di poco inferiori a 60 °C in condizioni di massimo stress e si trovano al centro e sul retro. Durante il gioco, gli stessi punti caldi hanno raggiunto temperature di soli 50 °C circa.
Al contrario, il poggiapolsi è rimasto per lo più fresco, il che vale anche per i tasti WASD.
(-) La temperatura massima sul lato superiore è di 50 °C / 122 F, rispetto alla media di 40.4 °C / 105 F, che varia da 21.2 a 68.8 °C per questa classe Gaming.
(-) Il lato inferiore si riscalda fino ad un massimo di 58 °C / 136 F, rispetto alla media di 43.2 °C / 110 F
(+) In idle, la temperatura media del lato superiore è di 24 °C / 75 F, rispetto alla media deld ispositivo di 33.9 °C / 93 F.
(-) Riproducendo The Witcher 3, la temperatura media per il lato superiore e' di 38.1 °C / 101 F, rispetto alla media del dispositivo di 33.9 °C / 93 F.
(±) I poggiapolsi e il touchpad possono diventare molto caldi al tatto con un massimo di 37 °C / 98.6 F.
(-) La temperatura media della zona del palmo della mano di dispositivi simili e'stata di 28.8 °C / 83.8 F (-8.2 °C / -14.8 F).
| Asus ROG Zephyrus M16 GU604VY-NM042X Intel Core i9-13900H, NVIDIA GeForce RTX 4090 Laptop GPU | Asus ROG Zephyrus M16 GU603Z Intel Core i9-12900H, NVIDIA GeForce RTX 3070 Ti Laptop GPU | Asus ROG Strix Scar 18 2023 G834JY-N6005W Intel Core i9-13980HX, NVIDIA GeForce RTX 4090 Laptop GPU | MSI Titan GT77 HX 13VI Intel Core i9-13950HX, NVIDIA GeForce RTX 4090 Laptop GPU | Lenovo Legion Pro 7 16IRX8H Intel Core i9-13900HX, NVIDIA GeForce RTX 4080 Laptop GPU | Razer Blade 16 Early 2023 Intel Core i9-13950HX, NVIDIA GeForce RTX 4080 Laptop GPU | |
|---|---|---|---|---|---|---|
| Heat | -6% | -3% | 10% | -13% | 5% | |
| Maximum Upper Side * (°C) | 50 | 52 -4% | 54 -8% | 40.6 19% | 48 4% | 40 20% |
| Maximum Bottom * (°C) | 58 | 51 12% | 46 21% | 41.1 29% | 49 16% | 37.6 35% |
| Idle Upper Side * (°C) | 26 | 29 -12% | 30 -15% | 26.2 -1% | 40 -54% | 32.4 -25% |
| Idle Bottom * (°C) | 28 | 33 -18% | 31 -11% | 30.3 -8% | 33 -18% | 31.4 -12% |
* ... Meglio usare valori piccoli
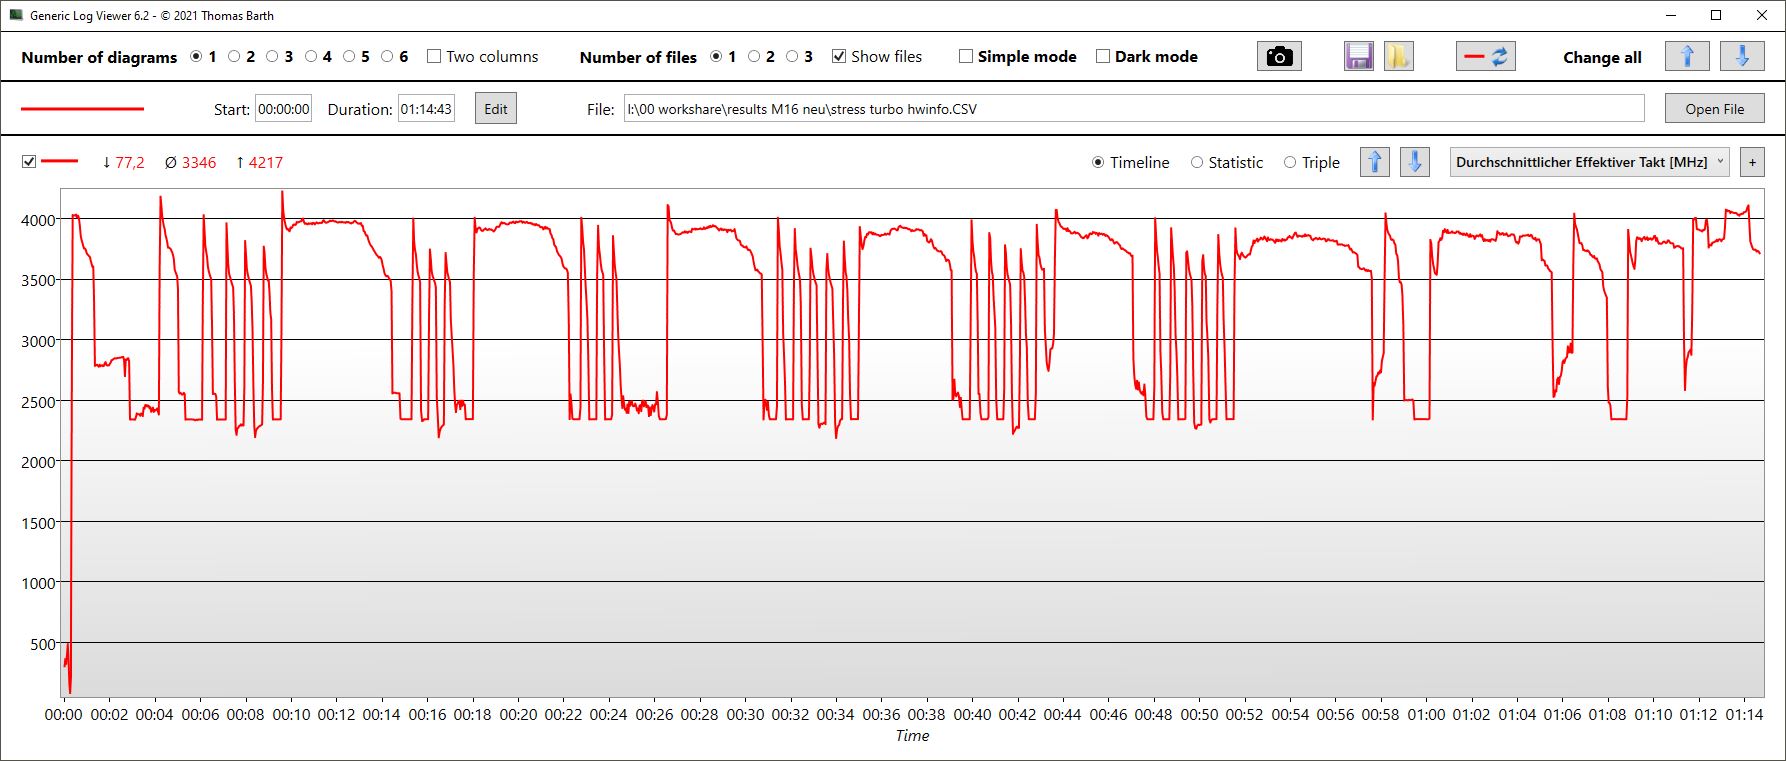
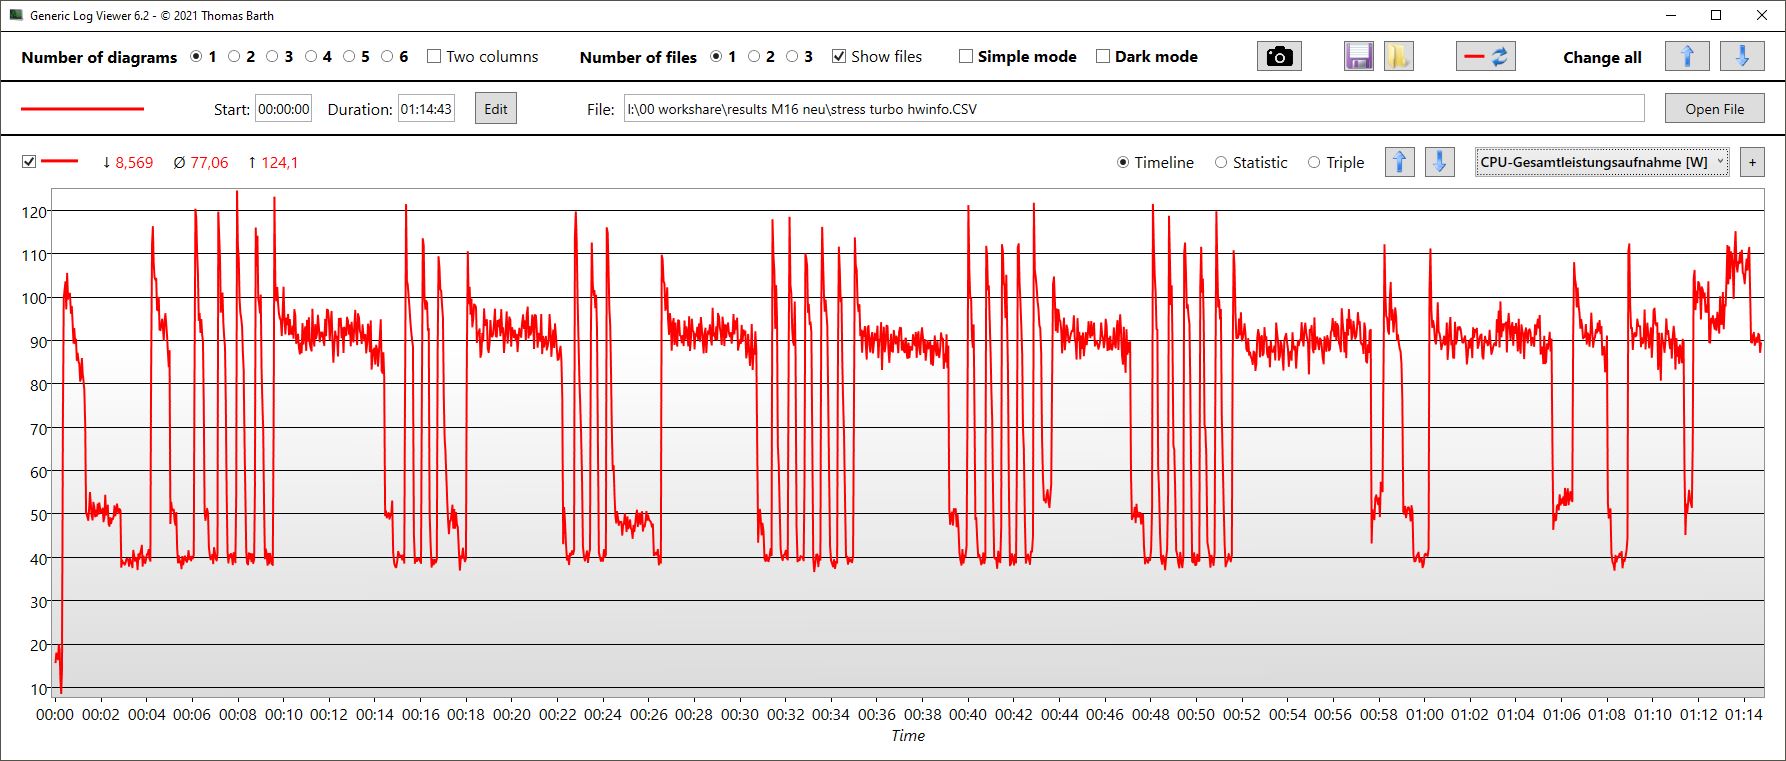
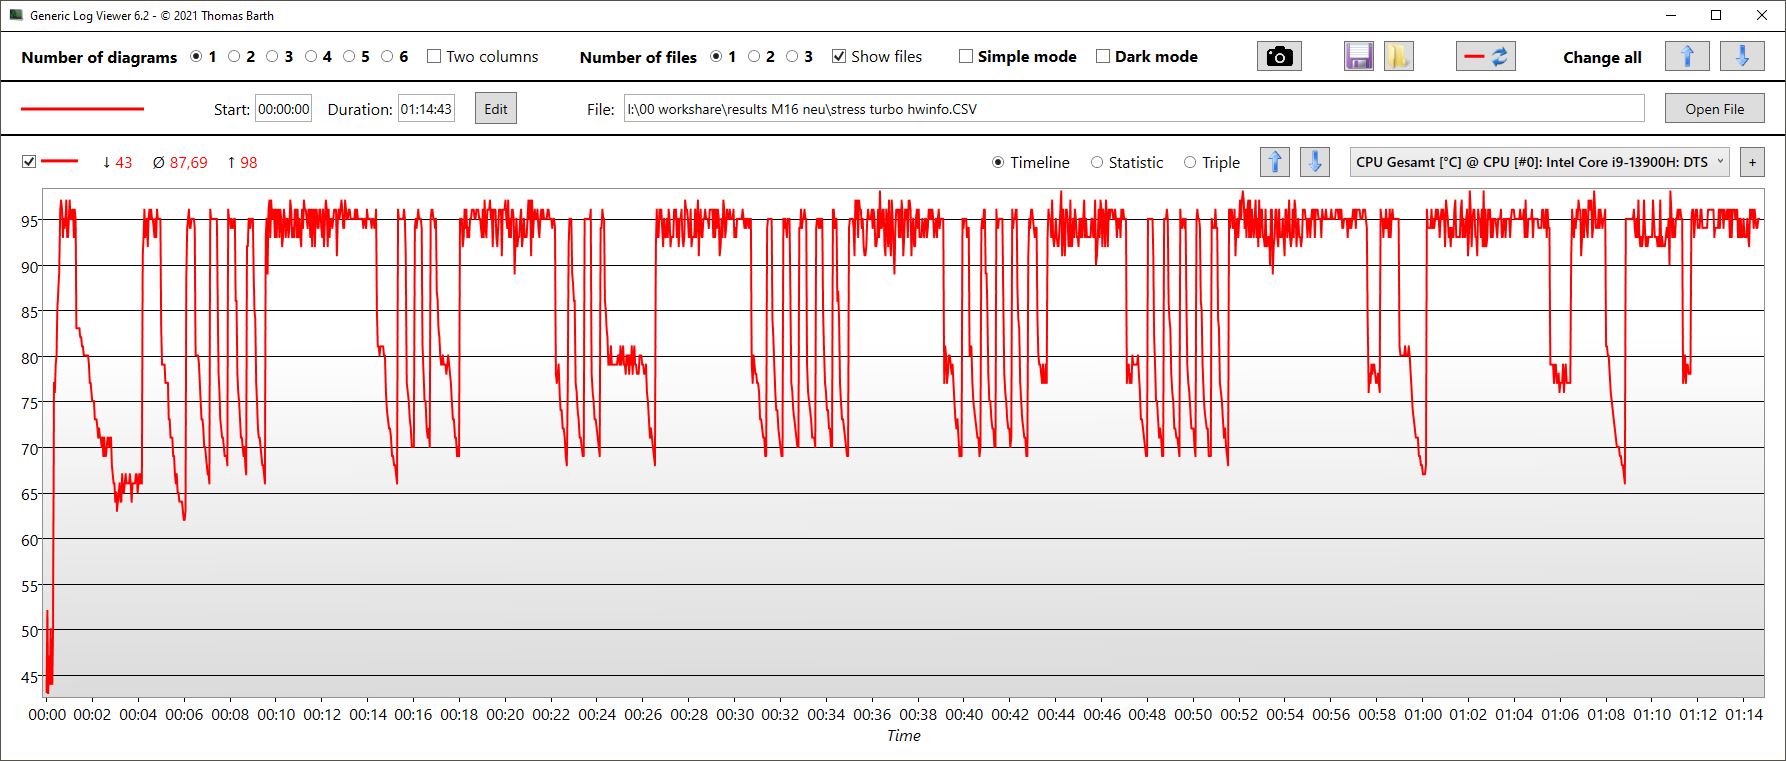
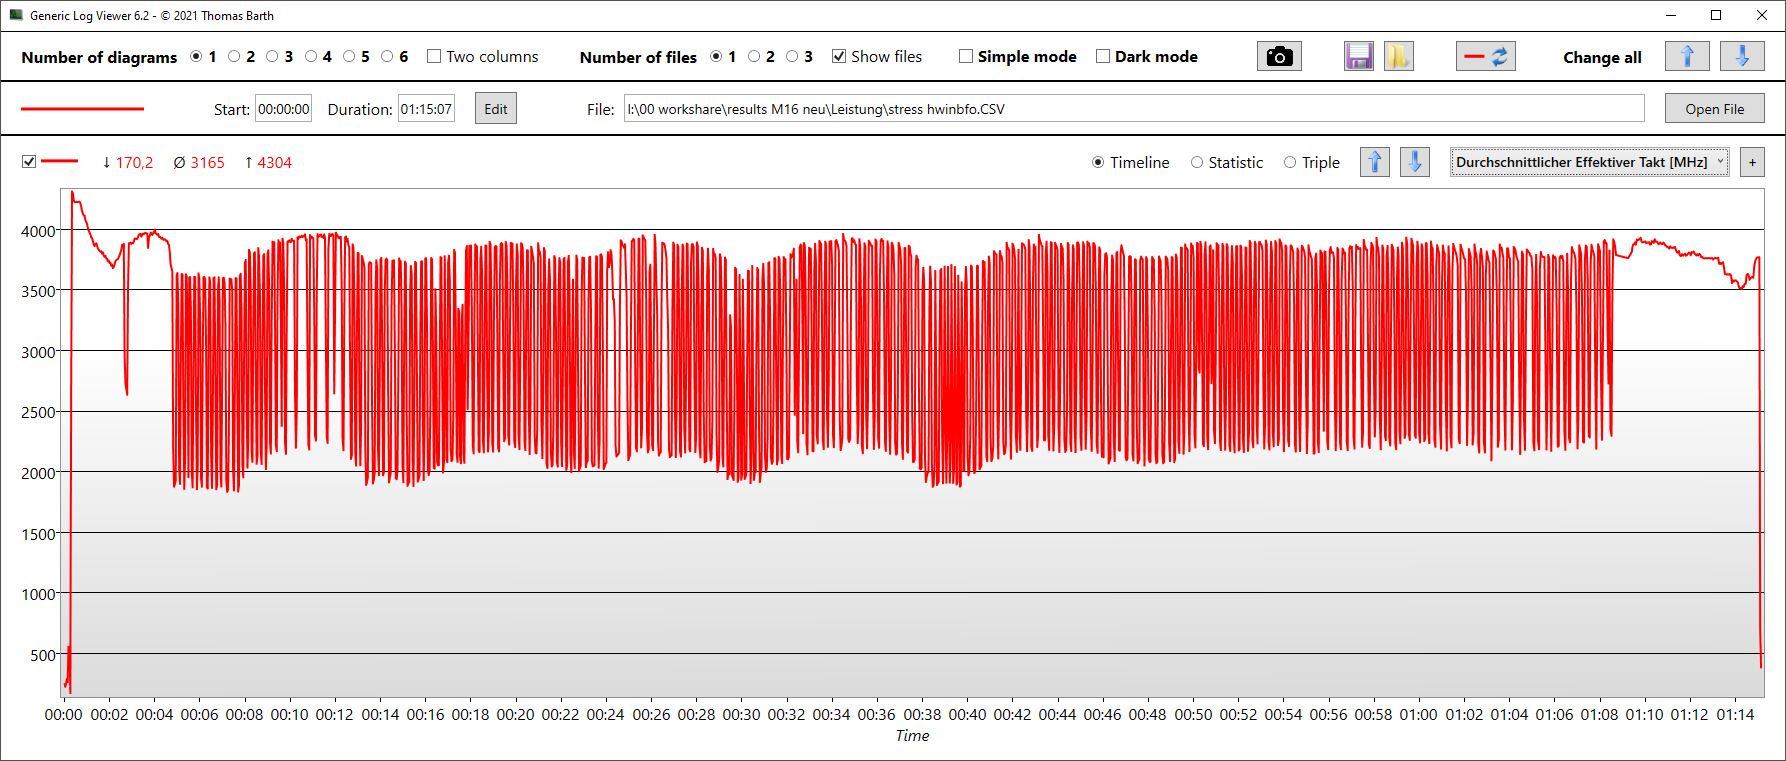
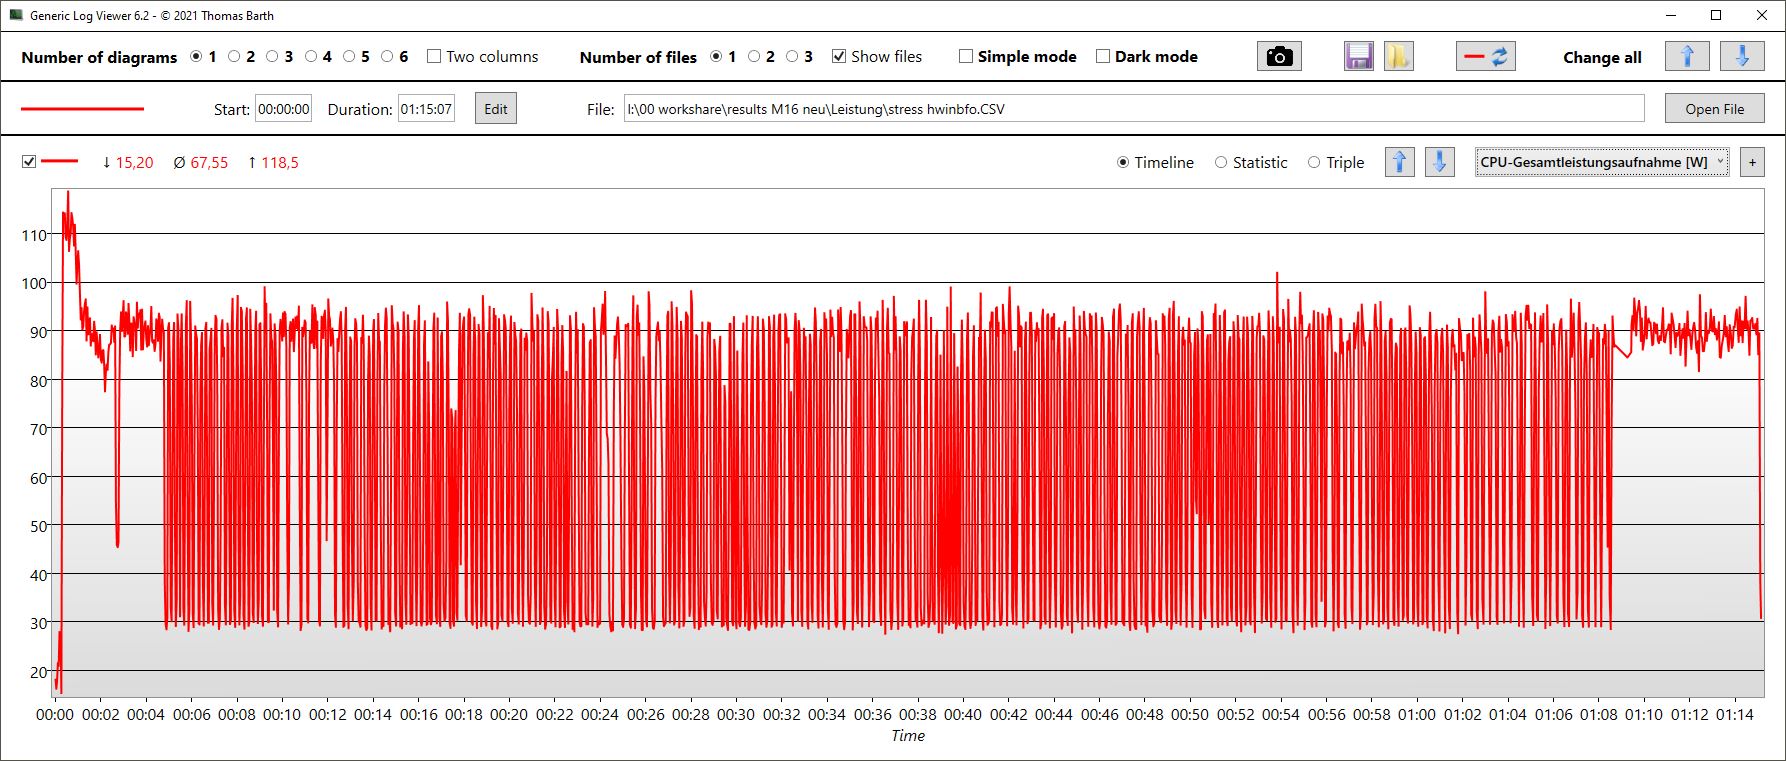
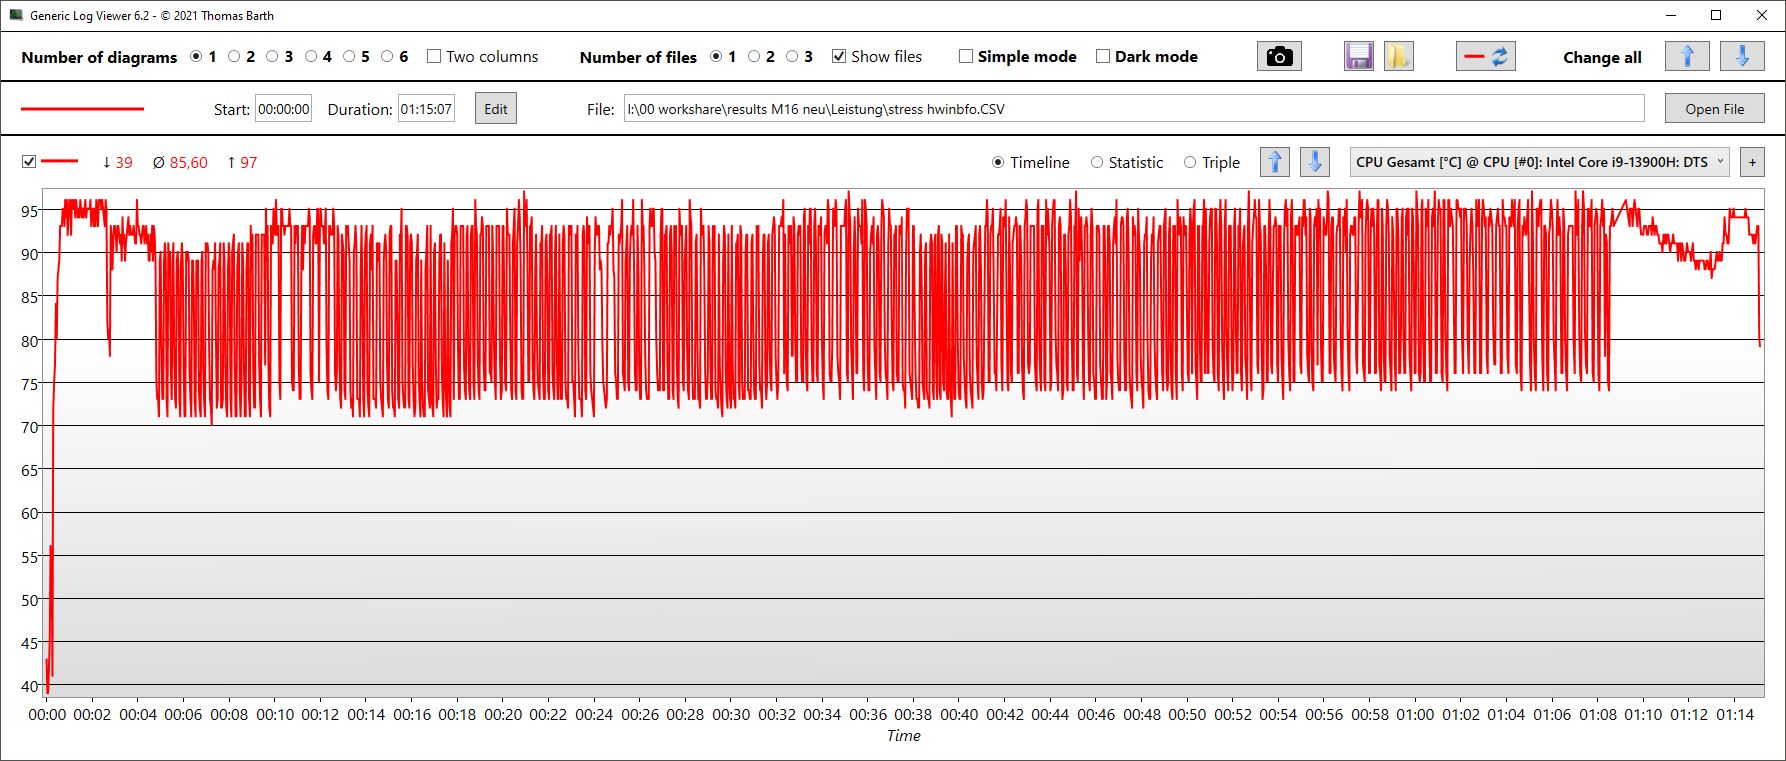
Test da sforzo
Il clock della CPU ha oscillato tra 2,2 e 4 GHz durante lo stress test, con velocità di clock che si aggirano intorno all'estremità superiore per un periodo di tempo più lungo. Parallelamente, il consumo energetico della CPU varia e si attesta, in media, sui 77 watt. Tuttavia, può anche salire a 120 watt e scendere nuovamente a 40 watt. A seconda degli altri valori, le temperature fluttuano in modo simile, con la CPU che si riscalda fino a 98 °C e si attesta in media a 88 °C.
In modalitàPerformance, la differenza con la CPU non è poi così grande e le temperature, il consumo energetico e le velocità di clock non sono particolarmente diverse tra loro, ma continuano a fluttuare a tassi elevati.
I valori della GPU (anche il clock della memoria) fluttuano fortemente. La velocità di clock del core si aggira intorno a una media di 1,3 GHz, il consumo energetico è in media di 58 watt e le temperature si aggirano intorno ai 64 °C.
In modalitàPerformance, i valori sono solo marginalmente inferiori. La velocità di clock scende di circa 200 MHz, la temperatura è altrettanto elevata e il consumo energetico si attesta intorno ai 42 watt.
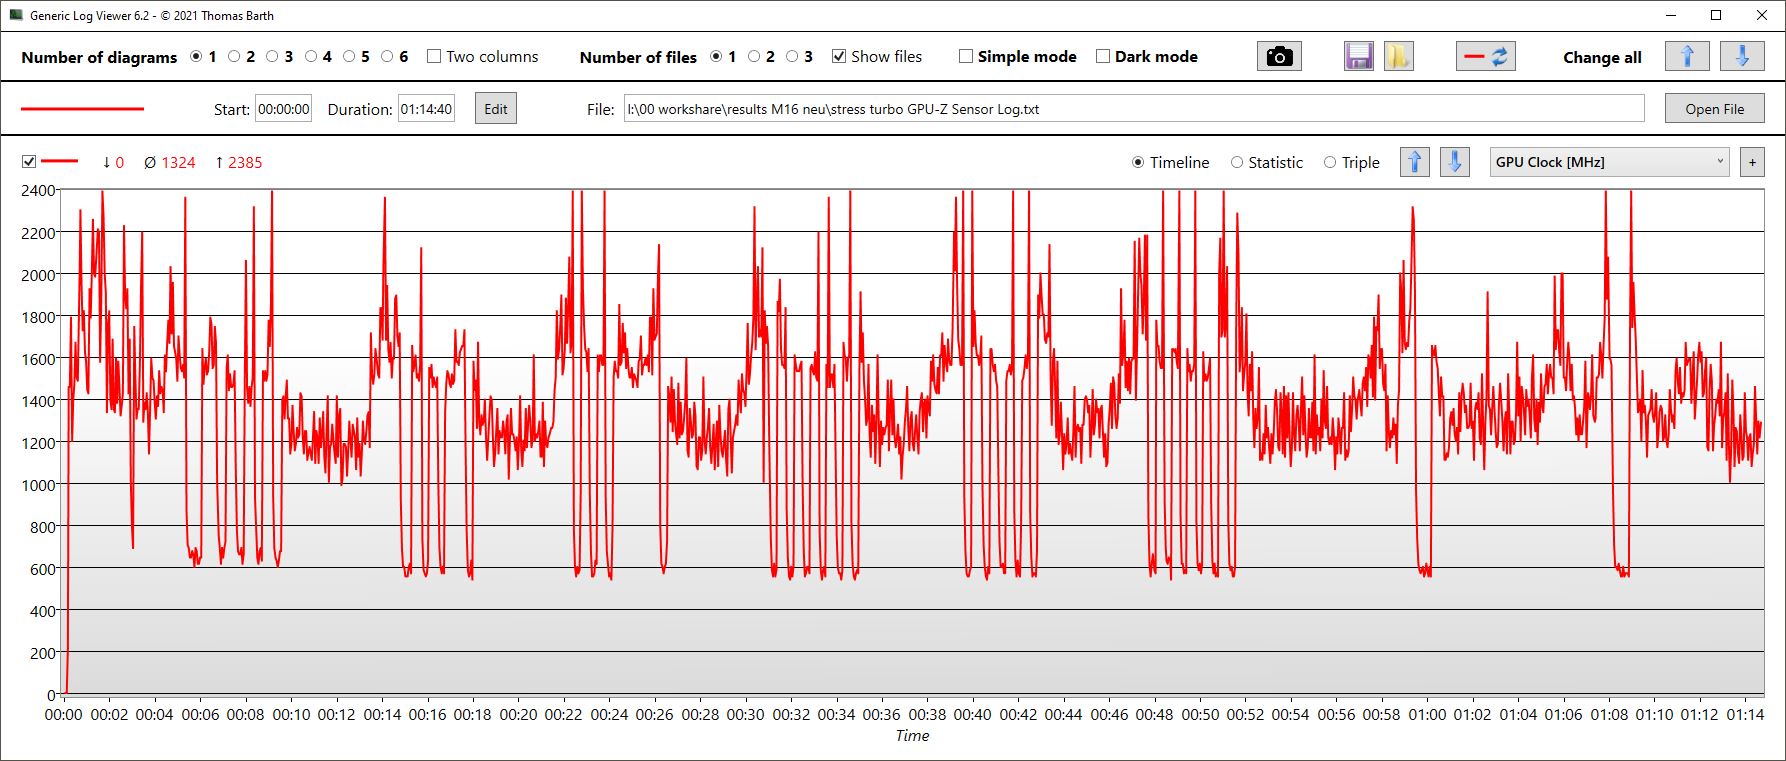
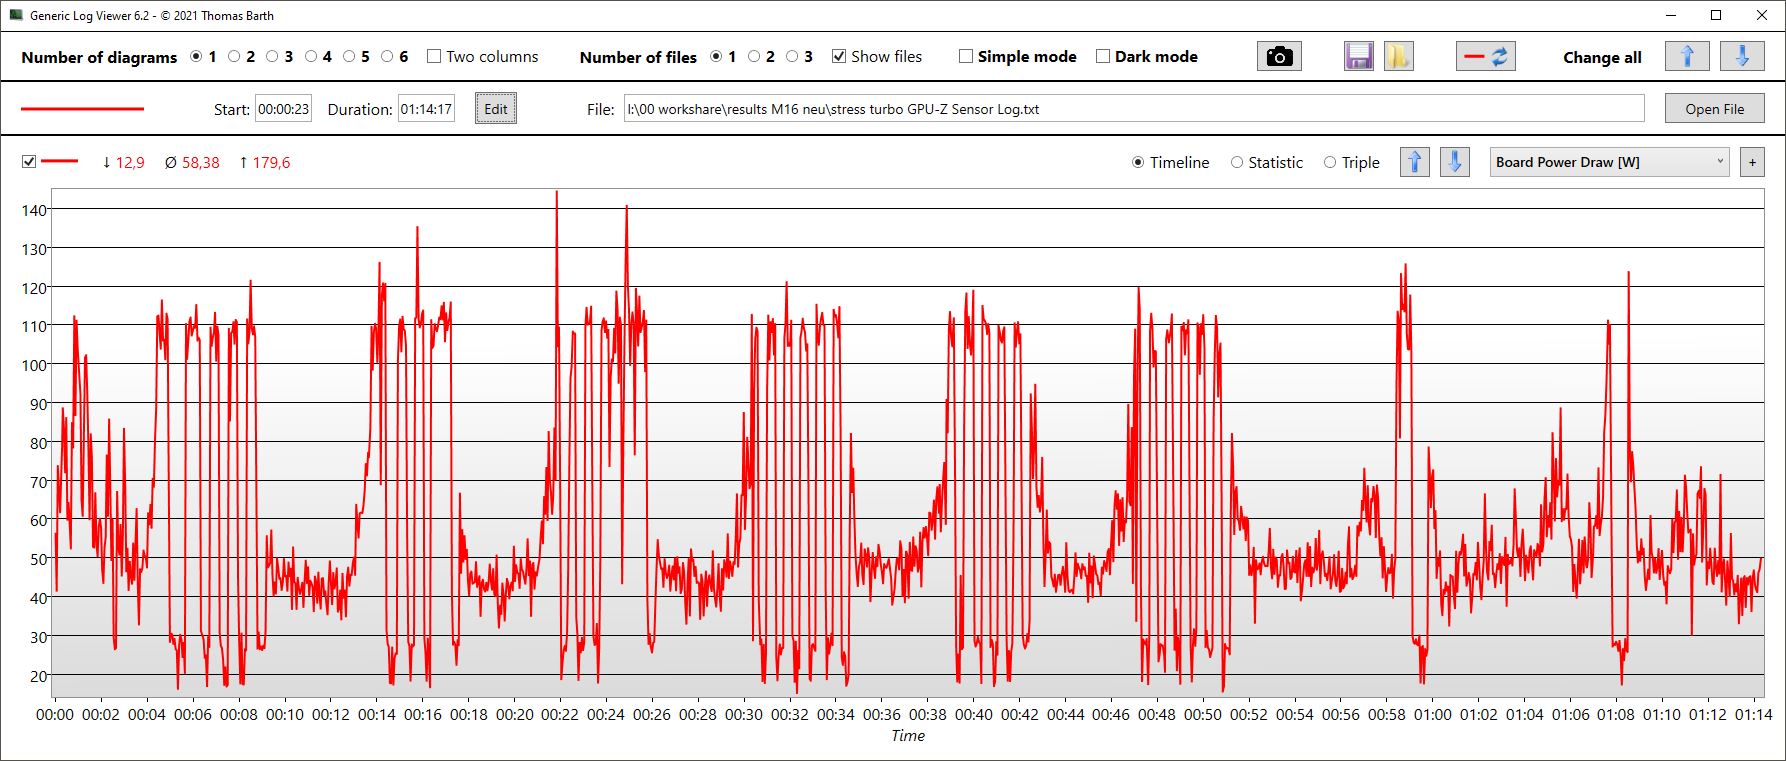
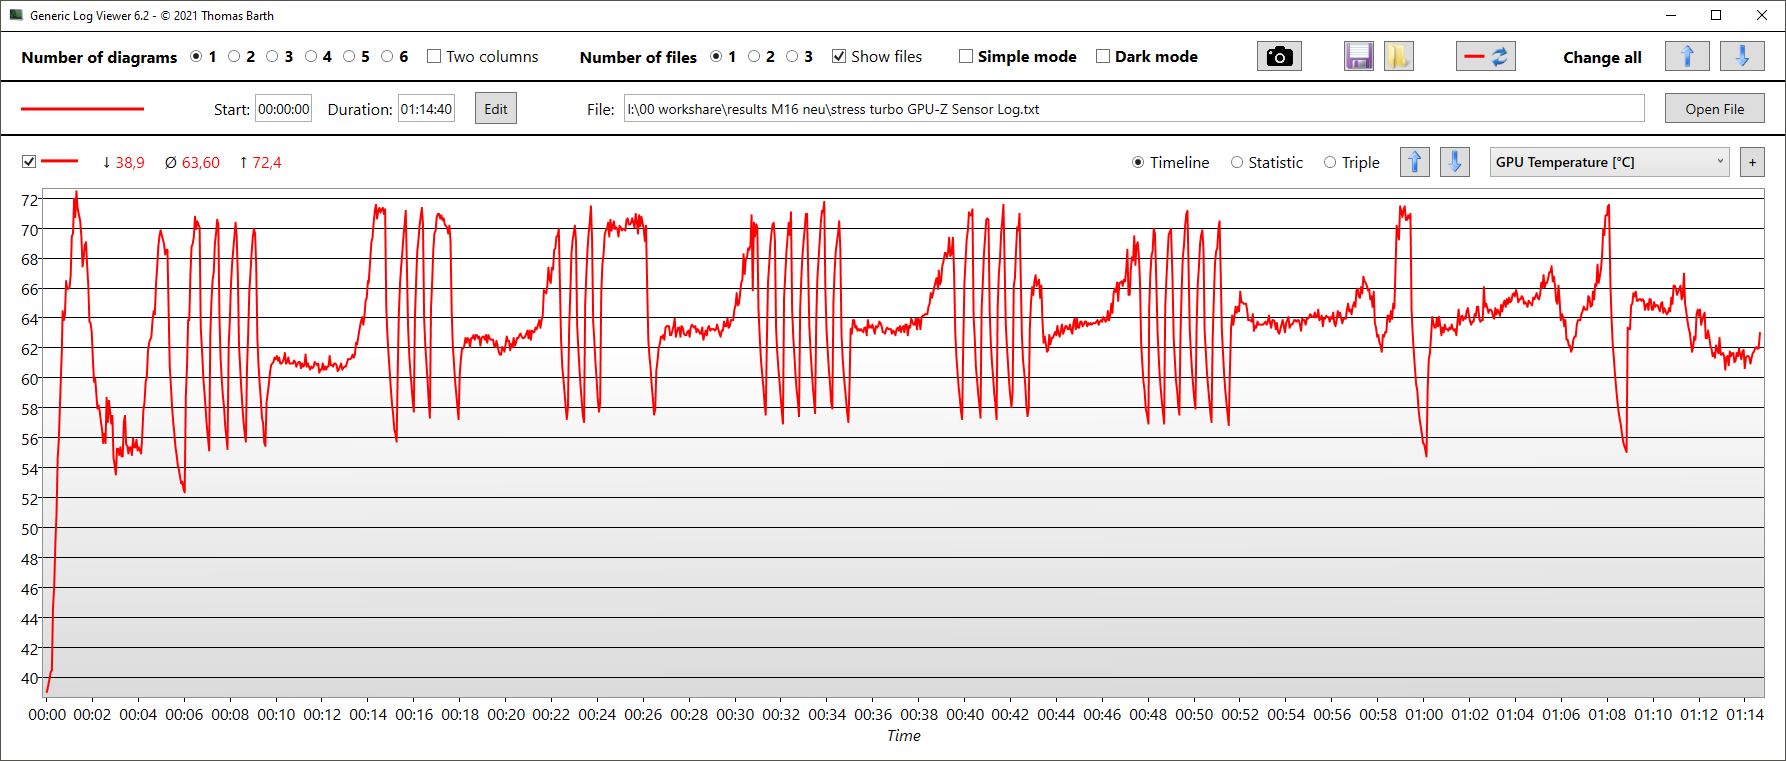
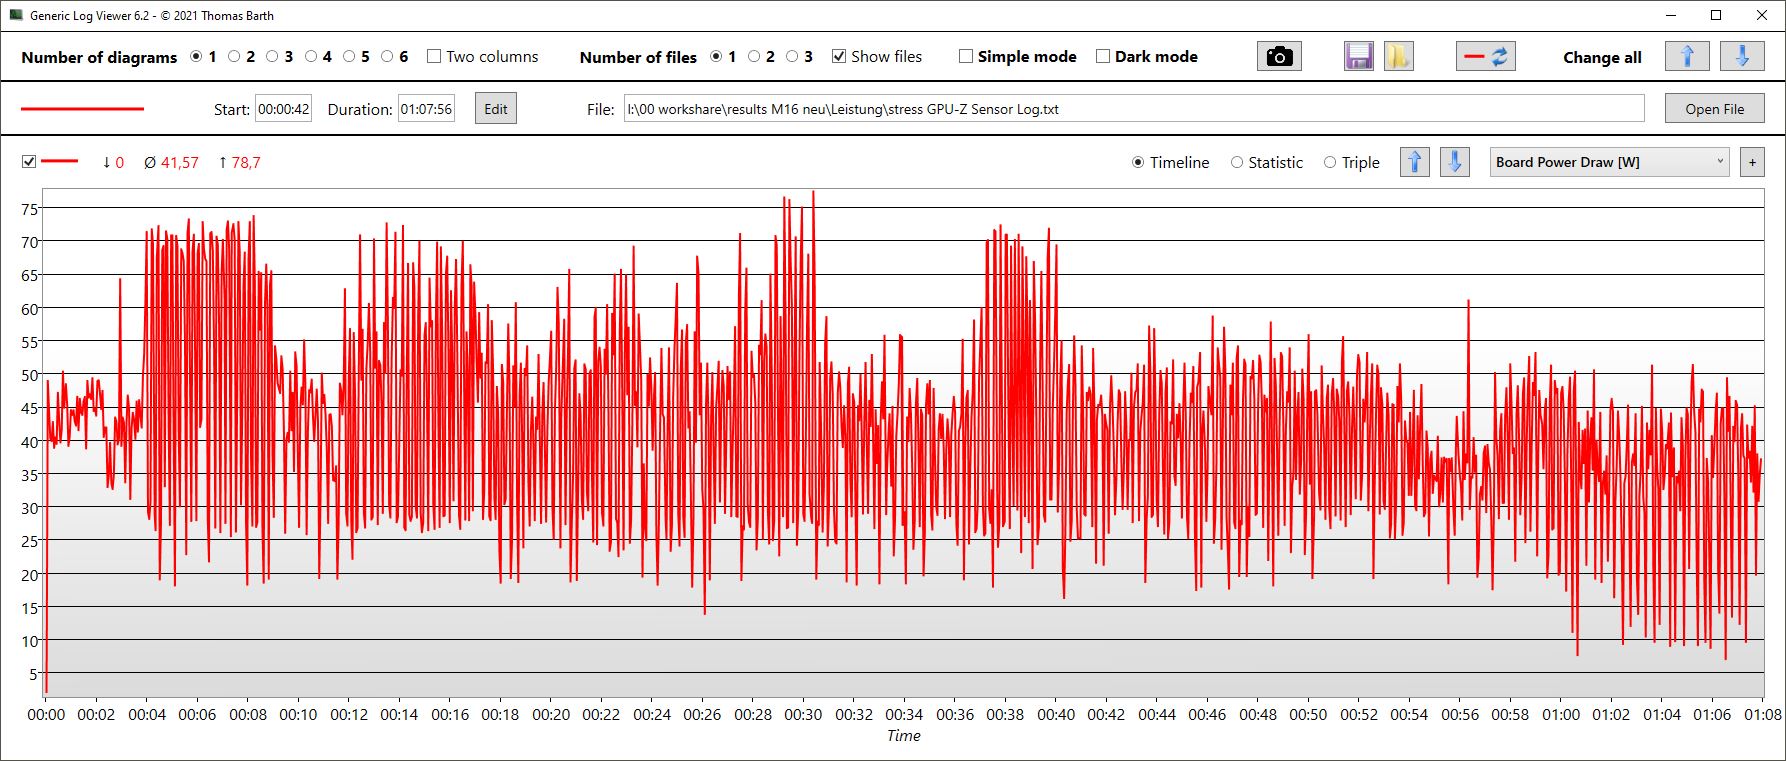
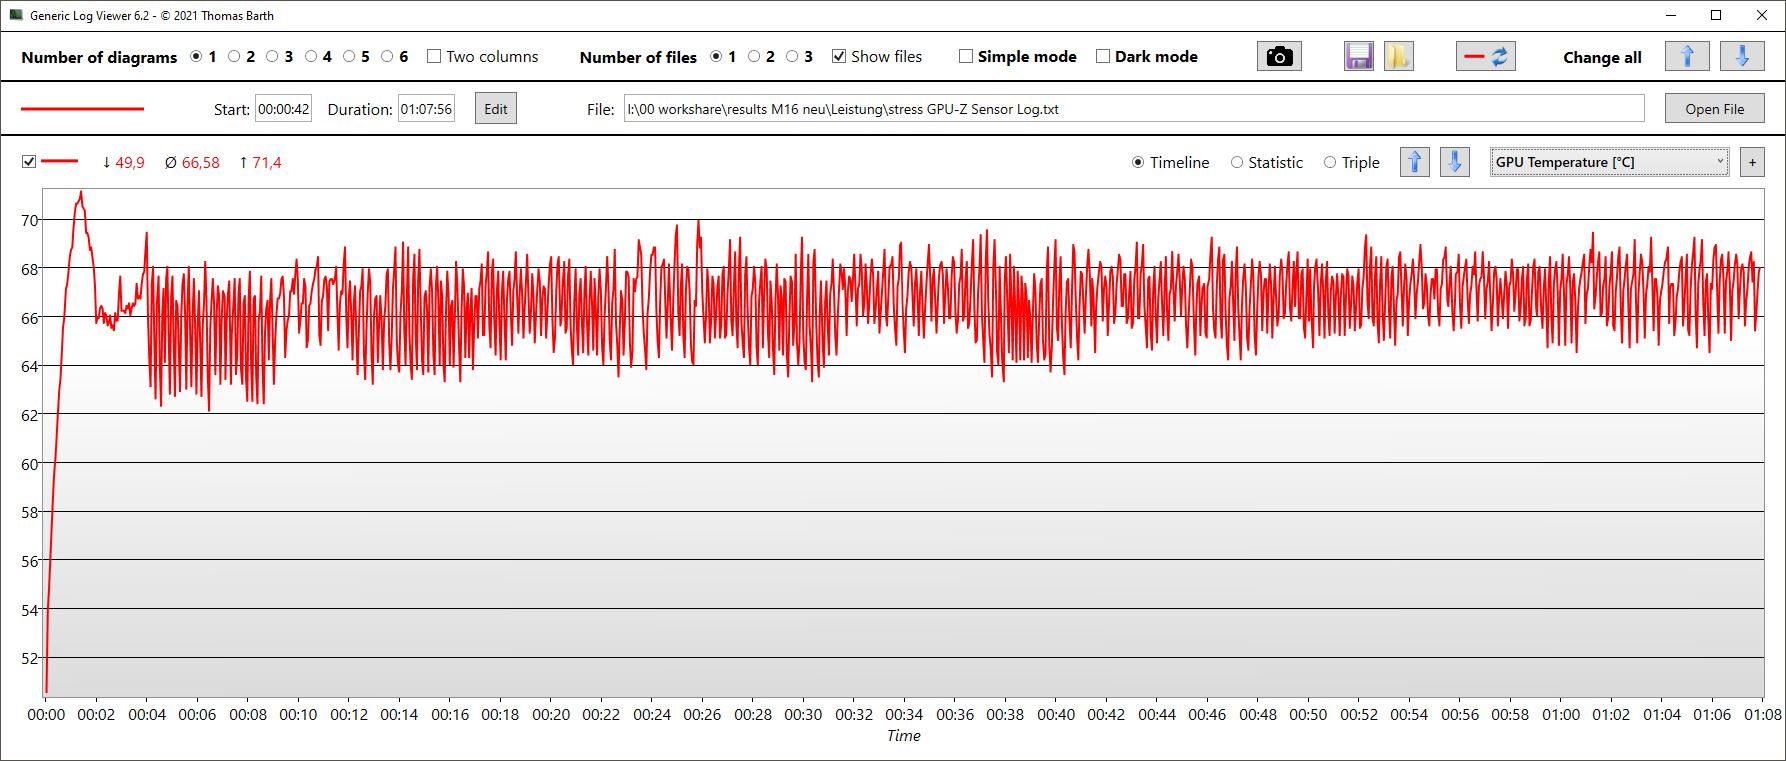
| Clock della CPU (GHz) | Clock della GPU (MHz) | Temperatura media della CPU (°C) | Temperatura media della GPU (°C) | |
| Prime95 + FurMark Stress | 3,3 | 1.324 | 88 | 64 |
| Witcher 3 Stress | 668 | 1.830 | 69 | 70 |
Altoparlanti
Rispetto a molti altri produttori, Asus ha dotato il portatile di quattro altoparlanti anziché due. Questo ha un effetto positivo, in quanto possono raggiungere un volume relativamente alto, offrono medi e alti equilibrati e anche i bassi sono un po' più incisivi rispetto a quanto purtroppo accade di solito con la concorrenza.
È possibile ottenere un ulteriore piacere audio collegando un dispositivo analogico esterno tramite il jack audio da 3,5 mm.
Asus ROG Zephyrus M16 GU604VY-NM042X analisi audio
(+) | gli altoparlanti sono relativamente potenti (84.45 dB)
Bassi 100 - 315 Hz
(±) | bassi ridotti - in media 11.5% inferiori alla media
(±) | la linearità dei bassi è media (10.1% delta rispetto alla precedente frequenza)
Medi 400 - 2000 Hz
(+) | medi bilanciati - solo only 4.1% rispetto alla media
(+) | medi lineari (4.9% delta rispetto alla precedente frequenza)
Alti 2 - 16 kHz
(+) | Alti bilanciati - appena 1.9% dalla media
(+) | alti lineari (4.9% delta rispetto alla precedente frequenza)
Nel complesso 100 - 16.000 Hz
(+) | suono nel complesso lineare (11.1% differenza dalla media)
Rispetto alla stessa classe
» 8% di tutti i dispositivi testati in questa classe è stato migliore, 3% simile, 89% peggiore
» Il migliore ha avuto un delta di 6%, medio di 18%, peggiore di 132%
Rispetto a tutti i dispositivi testati
» 7% di tutti i dispositivi testati in questa classe è stato migliore, 2% similare, 91% peggiore
» Il migliore ha avuto un delta di 4%, medio di 23%, peggiore di 134%
Razer Blade 16 Early 2023 analisi audio
(+) | gli altoparlanti sono relativamente potenti (88.2 dB)
Bassi 100 - 315 Hz
(-) | quasi nessun basso - in media 16.4% inferiori alla media
(±) | la linearità dei bassi è media (10.8% delta rispetto alla precedente frequenza)
Medi 400 - 2000 Hz
(+) | medi bilanciati - solo only 2.5% rispetto alla media
(+) | medi lineari (2.4% delta rispetto alla precedente frequenza)
Alti 2 - 16 kHz
(+) | Alti bilanciati - appena 4.9% dalla media
(±) | la linearità degli alti è media (7.9% delta rispetto alla precedente frequenza)
Nel complesso 100 - 16.000 Hz
(+) | suono nel complesso lineare (12.6% differenza dalla media)
Rispetto alla stessa classe
» 16% di tutti i dispositivi testati in questa classe è stato migliore, 4% simile, 81% peggiore
» Il migliore ha avuto un delta di 6%, medio di 18%, peggiore di 132%
Rispetto a tutti i dispositivi testati
» 11% di tutti i dispositivi testati in questa classe è stato migliore, 3% similare, 86% peggiore
» Il migliore ha avuto un delta di 4%, medio di 23%, peggiore di 134%
Gestione dell'alimentazione - Giochi efficienti, consumi elevati in modalità idle
Consumo di energia
Impostando la luminosità al minimo, la modalità silenziosa e quella di volo, il consumo in idle di circa 20 watt è piuttosto elevato. Quando si gioca e si è sotto carico pesante, i processori Intel HX sembrano assorbire molta più energia rispetto ad alcuni concorrenti HX di pari capacità (anche quelli con RTX 4080) che consumano di più.
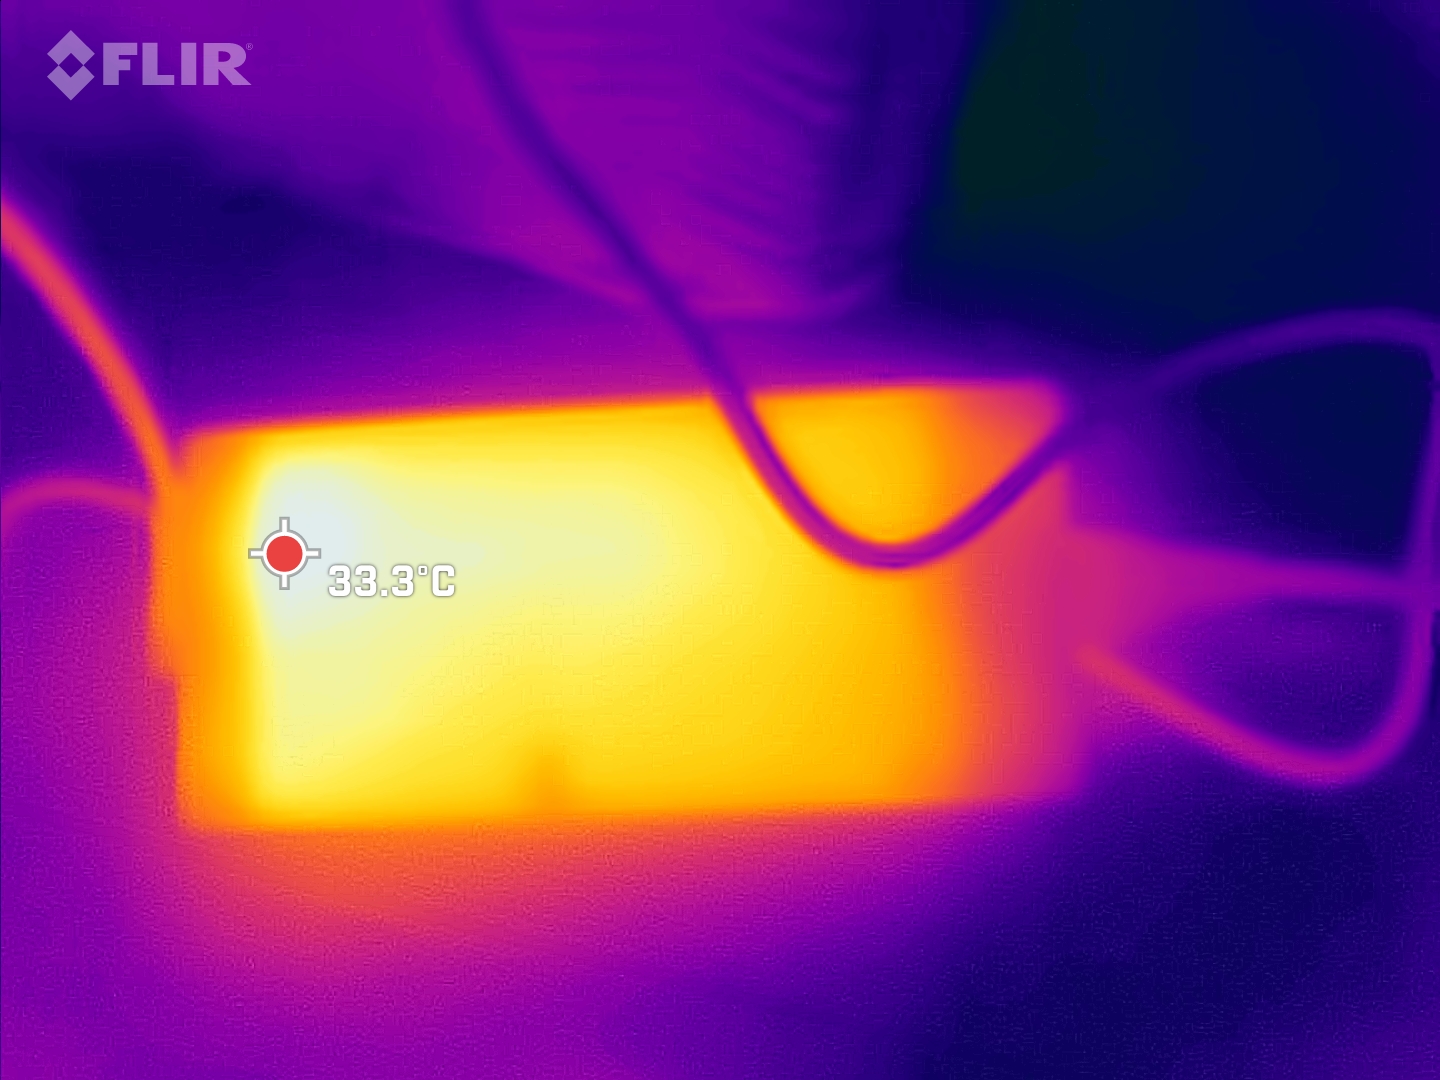
Per un breve periodo, abbiamo misurato picchi di carico di un massimo di 267 watt sull'alimentatore grande ma piatto (circa 18 x 8,3 x 2,5 cm). L'alimentatore è stato progettato per 280 watt e quindi offre un'ampia riserva.
| Off / Standby | |
| Idle | |
| Sotto carico |
|
Leggenda:
min: | |
| Asus ROG Zephyrus M16 GU604VY-NM042X i9-13900H, GeForce RTX 4090 Laptop GPU, Samsung PM9A1 MZVL22T0HBLB, IPS, 2560x1600, 16" | Asus ROG Zephyrus M16 GU603Z i9-12900H, GeForce RTX 3070 Ti Laptop GPU, Micron 3400 1TB MTFDKBA1T0TFH, IPS, 2560x1600, 16" | Asus ROG Strix Scar 18 2023 G834JY-N6005W i9-13980HX, GeForce RTX 4090 Laptop GPU, 2x Samsung PM9A1 MZVL21T0HCLR (RAID 0), IPS, 2560x1600, 18" | MSI Titan GT77 HX 13VI i9-13950HX, GeForce RTX 4090 Laptop GPU, Samsung PM9A1 MZVL22T0HBLB, Mini-LED, 3840x2160, 17.3" | Lenovo Legion Pro 7 16IRX8H i9-13900HX, GeForce RTX 4080 Laptop GPU, Samsung PM9A1 MZVL21T0HCLR, IPS, 2560x1600, 16" | Razer Blade 16 Early 2023 i9-13950HX, GeForce RTX 4080 Laptop GPU, SSSTC CA6-8D1024, IPS, 2560x1600, 16" | Media NVIDIA GeForce RTX 4090 Laptop GPU | Media della classe Gaming | |
|---|---|---|---|---|---|---|---|---|
| Power Consumption | 24% | -26% | -10% | -14% | -17% | -11% | 12% | |
| Idle Minimum * (Watt) | 20 | 10.8 46% | 17.3 13% | 14 30% | 18 10% | 15.2 24% | 16.2 ? 19% | 13 ? 35% |
| Idle Average * (Watt) | 24 | 17 29% | 27 -13% | 21.6 10% | 24 -0% | 22.8 5% | 23.1 ? 4% | 19 ? 21% |
| Idle Maximum * (Watt) | 25 | 17.8 29% | 46 -84% | 24.8 1% | 32 -28% | 49.8 -99% | 34.2 ? -37% | 24.6 ? 2% |
| Load Average * (Watt) | 107 | 116 -8% | 133 -24% | 122.5 -14% | 130 -21% | 121.2 -13% | 130.5 ? -22% | 110.7 ? -3% |
| Witcher 3 ultra * (Watt) | 208 | 144 31% | 265 -27% | 260 -25% | 242 -16% | |||
| Load Maximum * (Watt) | 267 | 220 18% | 329 -23% | 418 -57% | 320 -20% | 273.7 -3% | 324 ? -21% | 259 ? 3% |
* ... Meglio usare valori piccoli
Power consumption Witcher 3 / Stress test
Power consumption with an external monitor
Durata della batteria
Lo Zephyrus M16 ha una batteria con una capacità di 90 watt, il che significa che il portatile Asus può raggiungere circa 4,5 ore di utilizzo del WiFi a luminosità ridotta.
A piena luminosità, sono possibili 3 ore di navigazione in Internet (Mini-LED multizona). A luminosità ridotta, la durata può salire a quasi 4,5 ore.
Nel complesso, la durata della batteria non è particolarmente buona e ciò è dovuto all'elevato consumo al minimo.
| Asus ROG Zephyrus M16 GU604VY-NM042X i9-13900H, GeForce RTX 4090 Laptop GPU, 90 Wh | Asus ROG Zephyrus M16 GU603Z i9-12900H, GeForce RTX 3070 Ti Laptop GPU, 90 Wh | Asus ROG Strix Scar 18 2023 G834JY-N6005W i9-13980HX, GeForce RTX 4090 Laptop GPU, 90 Wh | MSI Titan GT77 HX 13VI i9-13950HX, GeForce RTX 4090 Laptop GPU, 99.9 Wh | Lenovo Legion Pro 7 16IRX8H i9-13900HX, GeForce RTX 4080 Laptop GPU, 99.9 Wh | Razer Blade 16 Early 2023 i9-13950HX, GeForce RTX 4080 Laptop GPU, 95.2 Wh | Media della classe Gaming | |
|---|---|---|---|---|---|---|---|
| Autonomia della batteria | 24% | 14% | -1% | -5% | -5% | 30% | |
| H.264 (h) | 4.8 | 7.3 52% | 7 46% | 6 25% | 8.32 ? 73% | ||
| WiFi v1.3 (h) | 4.3 | 7.4 72% | 7.1 65% | 5.3 23% | 5.1 19% | 6.1 42% | 7.11 ? 65% |
| Load (h) | 2.9 | 1.4 -52% | 0.9 -69% | 1.4 -52% | 2.1 -28% | 1.4 -52% | 1.502 ? -48% |
| Witcher 3 ultra (h) | 0.9 | ||||||
| Reader / Idle (h) | 6.4 | 8.9 | 8.27 ? |
Pro
Contro
Verdetto - Non (ancora) così ottimizzato come il suo predecessore

Quando si tratta di nuove generazioni di computer portatili, i produttori amano inviarci sistemi di fascia alta. E sì, laRTX 4090e Intel Gen13 non sono impressionanti solo sulla carta. Rispetto alla generazione precedente, le prestazioni e l'efficienza sono migliorate in modo significativo. Inoltre, il meraviglioso display Mini-LED Nebula si candida a diventare il punto di forza principale e riesce quasi a mettere in ombra la CPU e la GPU.
Già il suo predecessore ci era sembrato una macchina da gioco completa e ben ottimizzata. In generale, ma non inequivocabilmente, questo vale anche per il nuovo Asus M16. Come per la maggior parte dei nuovi portatili, abbiamo a che fare con un doppio salto generazionale in termini di CPU e GPU. Tuttavia, questo cambiamento non sempre avviene senza problemi. Molti laptop RTX 40 attualmente soffrono di latenze elevate a causa di ottimizzazioni dei driver non ancora finalizzate. Inoltre, il consumo energetico in idle dell'M16 è un po' troppo elevato. Questo comporta una durata della batteria non ottimale, ma è un problema che potrebbe essere risolto con l'aiuto di un aggiornamento software. È anche un po' fastidioso che Asus abbia reso la manutenzione inutilmente difficile a causa delle numerose viti nascoste e della RAM SO-DIMM. Inoltre, l'omissione di una porta LAN è difficile da capire per i giocatori e la RTX 4090 di fascia alta con una CPU H funziona "solo" come una RTX 4080.RTX 4080abbinata a una CPU HX.
L'Asus ROG Zephyrus M16 abbinato a una RTX 4090 è un potente pacchetto di gioco, completo di un fantastico display Mini-LED e potenza da vendere, anche in 4K. Tuttavia, il prezzo è elevato e ci sono alcuni piccoli problemi che devono essere risolti.
Per molti, il prezzo molto elevato sarà un vero svantaggio ma, come sempre, recensiremo ampiamente le possibili alternative (più economiche) non appena arriveranno.
Prezzo e disponibilità
Attualmente è possibile solo preordinare il nuovo M16. Tuttavia, la macchina è prevista per questo mese (marzo 2023).
Asus ROG Zephyrus M16 GU604VY-NM042X
- 03/15/2023 v7 (old)
Christian Hintze
Transparency
La selezione dei dispositivi da recensire viene effettuata dalla nostra redazione. Il campione di prova è stato fornito all'autore come prestito dal produttore o dal rivenditore ai fini di questa recensione. L'istituto di credito non ha avuto alcuna influenza su questa recensione, né il produttore ne ha ricevuto una copia prima della pubblicazione. Non vi era alcun obbligo di pubblicare questa recensione. In quanto società mediatica indipendente, Notebookcheck non è soggetta all'autorità di produttori, rivenditori o editori.
Ecco come Notebookcheck esegue i test
Ogni anno, Notebookcheck esamina in modo indipendente centinaia di laptop e smartphone utilizzando procedure standardizzate per garantire che tutti i risultati siano comparabili. Da circa 20 anni sviluppiamo continuamente i nostri metodi di prova e nel frattempo stabiliamo gli standard di settore. Nei nostri laboratori di prova, tecnici ed editori esperti utilizzano apparecchiature di misurazione di alta qualità. Questi test comportano un processo di validazione in più fasi. Il nostro complesso sistema di valutazione si basa su centinaia di misurazioni e parametri di riferimento ben fondati, che mantengono l'obiettività.Price comparison

