Notebookcheck Logo

Analisi della GPU per laptop Nvidia Ada RTX 40: la GPU per laptop RTX 4090 da 175 W supera la RTX 3090 da 350 W in termini di prestazioni ed efficienza energetica

MOLTE cornici come mai prima d'ora. I laptop alimentati dalle GPU Laptop Ada RTX 40 di Nvidia hanno iniziato a essere disponibili, attualmente con GPU di punta come la RTX 4080 e la RTX 4090. Abbiamo raccolto i dati di tre di questi dispositivi - MSI Titan GT77 HX 13V e Schenker XMG Neo 16, entrambi dotati di RTX 4090, e Razer Blade 16 con RTX 4080 - e valutiamo le prestazioni delle ultime offerte mobili di Nvidia rispetto a quelle di altri computer desktop e portatili.

Le GPU dei portatili sono tradizionalmente frenate da limiti di potenza e frequenza rispetto alle loro controparti desktop.

Anche se non siamo ancora arrivati alla fase in cui la fisica può essere scontata, le GPU di oggi si sono evolute per offrire maggiori prestazioni per watt rispetto al passato.

L'anno scorso, Nvidia ha annunciato l'architettura Ada Lovelace per i desktop consumer, segnata dall'avvento della serie RTX 40 di GeForce. Nei nostri test, la RTX 4090, RTX 4080e laRTX 4070 Ti hanno offerto un significativo aumento delle prestazioni e dell'efficienza rispetto alle loro controparti Turing.

Oggi tocca alle varianti mobili di Ada ripetere l'impresa.

I portatili dotati di GPU mobile Ada di punta come la RTX 4090 e RTX 4080 Le GPU per laptop sono ora disponibili in tutto il mondo. I dispositivi con schede Ada di fascia media saranno lanciati nel corso del mese.

Architettura mobile Ada: RTX 40 mobile a confronto con altre GPU Nvidia

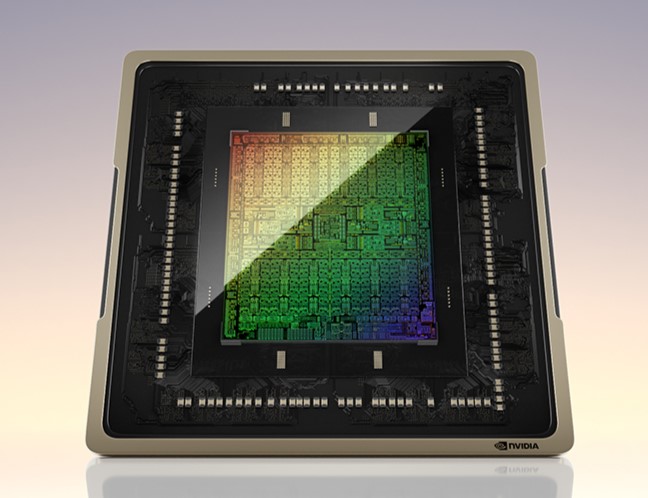
L'inserimento di un die AD102 full fat nello chassis di un laptop non è possibile senza compromettere seriamente la durata della batteria e la gestione termica. Per questo motivo, la linea RTX 40 mobile parte dalla GPU AD103, che è stata realizzata ex novo per le GPU mainstream come la RTX 4080 e inferiori e quindi non è una parte AD102 ridotta.

Pertanto, la GPU RTX 4090 per laptop è essenzialmente la stessa della RTX 4080 per desktop, con una nomenclatura fuorviante. Tuttavia, le somiglianze tra queste schede finiscono qui.

Panoramica di un singolo multiprocessore Ada Streaming. (Fonte: Nvidia)
Il die AD102 con 16.384 core CUDA. (Fonte: Nvidia)
Die AD103 con 9.728 core CUDA. (Fonte: Nvidia)
 

La GPU RTX 4090 Laptop può essere configurata con un TDP compreso tra 80 W e 150 W, con clock di boost compresi tra 1.455 MHz e 2.040 MHz.

Imparando dal Fiasco di Amperegli OEM stanno ora indicando in modo proattivo il wattaggio della GPU nelle specifiche, il che dovrebbe fornire agli acquirenti una migliore prospettiva delle prestazioni in relazione alla configurazione e allo chassis del portatile.

Si noti tuttavia che non tutti gli OEM pubblicano i valori di Dynamic Boost.

La GPU RTX 4090 Laptop utilizza lo stesso bus di memoria a 256 bit della RTX 4080 desktop, ma soffre di una riduzione di circa il 20% della larghezza di banda della memoria, pur essendo leggermente più veloce della GPU RTX 3080 Ti Laptop GPU RTX 3080 Ti per laptop.

La natura affamata di energia della GDDR6X significa che non può essere utilizzata in un fattore di forma portatile. Nvidia ha dichiarato che la VRAM GDDR6 di Ada mobile è stata progettata per essere altamente efficiente con un clock gating migliorato, una bassa tensione e l'aggiunta di stati di memoria a basso consumo.

La GPU RTX 4080 Laptop utilizza il die AD104 della RTX 4070 Ti desktop con una leggera riduzione del numero di core CUDA che corrisponde a quanto già visto nella GPU RTX 3080 Ti Laptop.

Sebbene la GPU RTX 3080 Ti Laptop sembri migliore sulla carta, almeno in termini di caratteristiche della VRAM, la RTX 4080 mobile compensa questa mancanza con miglioramenti architetturali in Ada.

Specifiche RTX 4090 FE RTX 4080 FE RTX 4070 Ti RTX 4090 Laptop GPU RTX 4080 Laptop GPU RTX 3090 Ti FE RTX 3090 FE RTX 3080 Ti FE RTX 3080 FE RTX 3080 Ti Laptop GPU
Chip AD102 AD103 AD104 AD103 AD104 GA102 GA102 GA102 GA102 GA103
Processo FinFET Custom 4N Custom 4N Custom 4N Custom 4N Custom 4N 8 nm 8 nm 8 nm 8 nm 8 nm
CUDA Cores 16.384 9.728 7.680 9.728 7.424 10.752 10.496 10.240 8.704 7.424
Unità di texture 512 304 240 304 232 336 328 320 272 232
Tensor Cores 512 4th Gen. 304 4th Gen. 240 4th Gen. 304 4th Gen. 232 4th Gen. 336 3rd Gen. 328 3rd Gen. 320 3rd Gen. 272 3rd Gen. 232 3rd Gen.
RT Cores 128 di 3a gen. 76 di 3a gen. 60 di 3a gen. 76 di 3a gen. 58 di 3a gen. 84 di 2a gen. 82 di 2a gen. 80 di 2a gen. 68 di 2a gen. 58 di 2a gen.
GPU Base Clock 2.235 MHz 2.205 MHz 2.310 MHz 1.590 MHz 1.530 MHz 1.560 MHz 1.395 MHz 1.365 MHz 1.440 MHz 1.230 MHz
GPU Boost Clock 2.520 MHz 2.505 MHz 2.760 MHz 2.040 MHz 1.995 MHz 1.860 MHz 1.695 MHz 1.665 MHz 1.710 MHz 1.590 MHz
Bus di memoria 384 bit 256 bit 192 bit 256 bit 192 bit 384 bit 384 bit 384 bit 320 bit 256 bit
Larghezza di banda della memoria 1.008 GB/s 716,8 GB/s 504 GB/s 576GB/s 432GB/s 1.008 GB/s 936 GB/s 912 GB/s 760 GB/s 512 GB/s
Memoria video 24 GB GDDR6X 16 GB GDDR6X 12 GB GDDR6X 16 GB GDDR6 12 GB GDDR6 24 GB GDDR6X 24 GB GDDR6X 12 GB GDDR6X 10 GB GDDR6X 16 GB GDDR6
Consumo energetico 450 W 320 W 285 W 150 W (+25 W DB) 150 W (+25 W DB) 450 W 350 W 350 W 320 W 150 W (+25 W DB)

La generazione Ada porta con sé anche alcuni cambiamenti notevoli all'implementazione Max-Q di Nvidia. Quando Max-Q ha fatto il suo debutto con Turing, l'attenzione era rivolta soprattutto al TDP. Le schede stesse erano distintamente etichettate come Max-Q, il che facilitava la selezione.

Tuttavia, a partire da Ampere, Nvidia ha scelto di mettere in difficoltà sia la stampa che gli utenti finali, eliminando il marchio Max-Q e utilizzandolo invece come termine ombrello per tecnologie quali Whisper Mode, Resizeable BAR, Dynamic Boost, Advanced Optimus e altre ancora.

Gli OEM possono ora scegliere di utilizzare qualsiasi sottoinsieme di tecnologie Max-Q che ritengono opportuno e di inserire una GPU di grandi dimensioni in uno chassis sottile per vantarsi, pur configurando il suo TDP vicino ai valori di base.

Con Ada, Nvidia sta introducendo quella che definisce la quinta generazione di Max-Q, in cui DLSS 3 e la memoria GDDR6 a basso consumo sono parte integrante.

Nuove pipeline DLSS 3 e ray tracing

Abbiamo accennato brevemente al DLSS 3 e alle nuove funzioni di ray tracing in Ada nella nostra recensione della RTX 4090 Founders Edition. Essenzialmente, DLSS 3 utilizza il nuovo Optical Flow Accelerator (OFA) standalone di Ada per inserire fotogrammi al volo. La generazione dei fotogrammi avviene sulla GPU e non nel gioco.

Più precisamente, DLSS 3 è una combinazione dell'attuale DLSS 2 Super Resolution e della generazione di fotogrammi. Secondo Nvidia, DLSS 3 ricostruisce 7/8 dell'immagine: 3/4 del primo fotogramma vengono ricostruiti con DLSS 2 Super Resolution, mentre il secondo fotogramma completo viene creato con la generazione di fotogrammi.

Poiché la generazione dei fotogrammi avviene sulla GPU, DLSS 3 può contribuire a incrementare i fotogrammi nei titoli che utilizzano la CPU o la fisica, come Microsoft Flight Simulator 2020.

Si noti che DLSS 3 richiede una GPU RTX 40, un titolo supportato e l'abilitazione di Hardware accelerated GPU scheduling e Nvidia Reflex.

Nucleo RT di seconda generazione di Ampere. (Fonte: Nvidia)
Ada 3rd gen RT core. (Fonte: Nvidia)

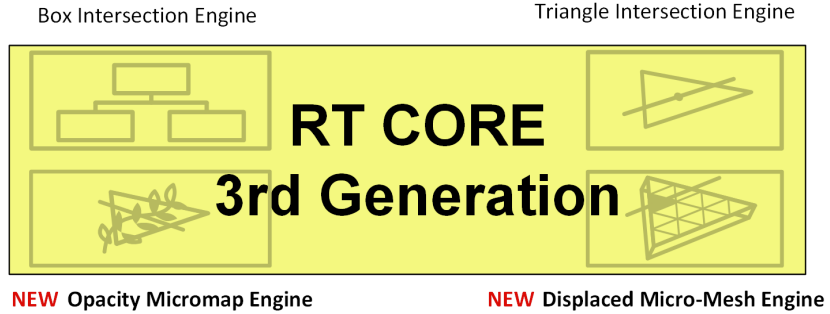
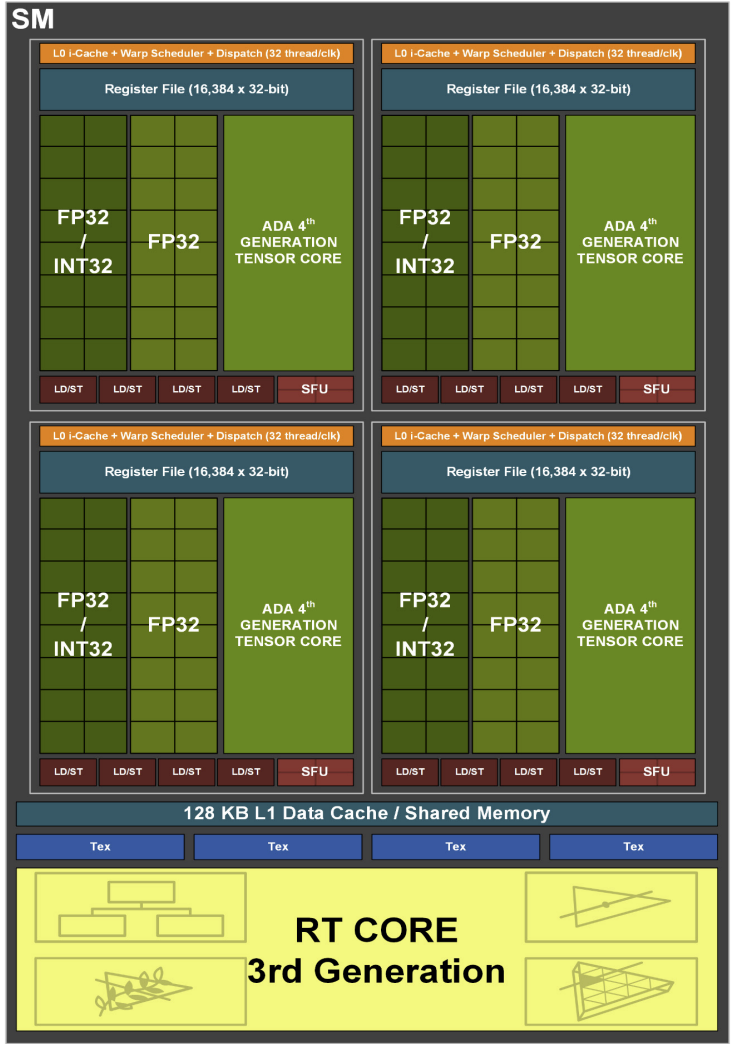
Ada dispone di core di ray-tracing (RT) di terza generazione con due nuove funzioni: il motore di micromappa di opacità e il motore di micro-mesh spostata. Queste funzioni si aggiungono al motore di intersezione dei riquadri e al motore di intersezione dei triangoli già presenti in Ampere.

È presente anche una nuova pipeline Shader Execution Reordering (SER), che funziona come un efficiente scheduler per i thread secondari dei raggi. Sebbene SER possa potenzialmente accelerare i calcoli RT intensivi come il path tracing, richiede il supporto dello sviluppatore del gioco.

Secondo Nvidia, l'implementazione di SER dovrebbe essere abbastanza semplice. Gli sviluppatori potranno ottenere un feedback sulle prestazioni di SER tramite Nvidia NSight. L'azienda ha dichiarato che sta lavorando con Microsoft e altri per aggiungere il supporto SER alle API grafiche come DirectX.

Dispositivi di prova: La crema del raccolto

Nei nostri laboratori sono presenti i seguenti dispositivi di prova:

Tutti i dispositivi testati sono stati eseguiti nelle loro modalità di prestazioni massime con il passaggio del MUX alla dGPU. Questo ha permesso alla RTX 4090 e alla RTX 4090 di utilizzare l'intero TGP da 175 W, compreso il Dynamic Boost.

MSI Titan GT77 HX 13V
Razer Blade 16
Razer Blade 16
Schenker XMG Neo 16
Schenker XMG Neo 16

Nota: siamo stati i primi a ricevere una variante precoce dello Schenker XMG Neo 16. Trattandosi di un modello di pre-produzione, i punteggi potrebbero non rispecchiare le prestazioni effettive del dispositivo nella nostra recensione ufficiale con un campione di vendita al dettaglio.

Prestazioni sintetiche: RTX 4090 mobile alle spalle di una RTX 4070 Ti desktop

Le prestazioni cumulative di 3DMark vedono la GPU RTX 4090 Laptop sia nella Titan GT77 HX che nella XMG Neo 16 con prestazioni simili, il che indica che non ci sono potenziali colli di bottiglia in altre parti della pipeline.

La GPU RTX 4080 Laptop del Razer Blade 16 è inferiore del 19% rispetto alla RTX 4090 Laptop, una percentuale simile a quella delle varianti desktop di queste GPU.

Detto questo, la GPU RTX 4090 Laptop è fino al 35% più lenta rispetto alla scheda RTX 4090 Founders Edition per desktop, mentre è inferiore fino al 26% rispetto alla Radeon RX 7900 XTX. Tuttavia, le sue prestazioni sono paragonabili a quelle della RTX 4070 Ti desktop.

Nonostante un numero simile di core CUDA, le limitazioni del TDP fanno sì che la RTX 4080 Founders Edition da 320 W sia più veloce del 20% rispetto a una GPU RTX 4090 Laptop da 175 W nelle prestazioni complessive di 3DMark.

Rispetto alle GPU mobili della generazione precedente, la generazione Ada sembra offrire un significativo aumento delle prestazioni. La GPU RTX 4090 Laptop è ben il 76% più veloce in tutti i test 3DMark presi insieme rispetto alla GPU RTX 3080 Ti Laptop media.

Anche la GPU RTX 4080 Laptop ha ottenuto un buon 43% in più rispetto alla variante mobile RTX 3080 Ti.

Performance Rating - Percent
NVIDIA GeForce RTX 4090 Founders Edition
NVIDIA GeForce RTX 4090, i9-13900K
99.6 pt
AMD Radeon RX 7900 XTX
Radeon RX 7900 XTX, R9 7950X
87.2 pt
NVIDIA GeForce RTX 4080 Founders Edition
NVIDIA GeForce RTX 4080, i9-13900K
80.8 pt
AMD Radeon RX 7900 XT
Radeon RX 7900 XT, R9 7950X
78.8 pt
Asus TUF Gaming GeForce RTX 4070 Ti
NVIDIA GeForce RTX 4070 Ti, i9-13900K
68.7 pt
MSI Titan GT77 HX 13VI
NVIDIA GeForce RTX 4090 Laptop GPU, i9-13950HX, Samsung PM9A1 MZVL22T0HBLB
65.3 pt
SCHENKER XMG Neo 16 Raptor Lake
NVIDIA GeForce RTX 4090 Laptop GPU, i9-13900HX
64.8 pt
Media NVIDIA GeForce RTX 3090
 
58.7 pt
Razer Blade 16 Early 2023
NVIDIA GeForce RTX 4080 Laptop GPU, i9-13950HX, SSSTC CA6-8D1024
53.2 pt
Media AMD Radeon RX 6800M
 
38.4 pt
Media NVIDIA GeForce RTX 3080 Ti Laptop GPU
 
37.2 pt
Media NVIDIA GeForce RTX 3080 Laptop GPU
 
34.6 pt
Media NVIDIA GeForce RTX 3070 Ti Laptop GPU
 
33.9 pt
Media AMD Radeon RX 6700M -1!
 
33.4 pt
Media AMD Radeon RX 6600M
 
27.5 pt
Media NVIDIA GeForce RTX 3060 Laptop GPU
 
25 pt
3DMark 11 - 1280x720 Performance GPU
NVIDIA GeForce RTX 4090 Founders Edition
NVIDIA GeForce RTX 4090, i9-13900K
99834 Points +76%
NVIDIA GeForce RTX 4080 Founders Edition
NVIDIA GeForce RTX 4080, i9-13900K
86838 Points +54%
AMD Radeon RX 7900 XTX
Radeon RX 7900 XTX, R9 7950X
83322 Points +47%
AMD Radeon RX 7900 XT
Radeon RX 7900 XT, R9 7950X
77784 Points +38%
Asus TUF Gaming GeForce RTX 4070 Ti
NVIDIA GeForce RTX 4070 Ti, i9-13900K
75990 Points +34%
Asus TUF Gaming GeForce RTX 4070 Ti
NVIDIA GeForce RTX 4070 Ti, i9-13900K
75612 Points +34%
SCHENKER XMG Neo 16 Raptor Lake
NVIDIA GeForce RTX 4090 Laptop GPU, i9-13900HX
71432 Points +26%
MSI Titan GT77 HX 13VI
NVIDIA GeForce RTX 4090 Laptop GPU, i9-13950HX, Samsung PM9A1 MZVL22T0HBLB
69211 Points +22%
Media NVIDIA GeForce RTX 3090
  (55144 - 66934, n=17)
60853 Points +8%
Razer Blade 16 Early 2023
NVIDIA GeForce RTX 4080 Laptop GPU, i9-13950HX, SSSTC CA6-8D1024
56565 Points
Media AMD Radeon RX 6800M
  (39075 - 41706, n=2)
40391 Points -29%
Media NVIDIA GeForce RTX 3080 Ti Laptop GPU
  (13920 - 45841, n=45)
39402 Points -30%
Media NVIDIA GeForce RTX 3080 Laptop GPU
  (31288 - 43744, n=39)
38345 Points -32%
Media NVIDIA GeForce RTX 3070 Ti Laptop GPU
  (13799 - 42569, n=36)
35944 Points -36%
Media AMD Radeon RX 6700M
  ()
33497 Points -41%
Media AMD Radeon RX 6600M
  (27030 - 32340, n=6)
31142 Points -45%
Media NVIDIA GeForce RTX 3060 Laptop GPU
  (13799 - 30772, n=43)
26816 Points -53%
3DMark
2560x1440 Time Spy Graphics
NVIDIA GeForce RTX 4090 Founders Edition
NVIDIA GeForce RTX 4090, i9-13900K
36101 Points +96%
AMD Radeon RX 7900 XTX
Radeon RX 7900 XTX, R9 7950X
29699 Points +61%
NVIDIA GeForce RTX 4080 Founders Edition
NVIDIA GeForce RTX 4080, i9-13900K
28133 Points +53%
AMD Radeon RX 7900 XT
Radeon RX 7900 XT, R9 7950X
25874 Points +40%
Asus TUF Gaming GeForce RTX 4070 Ti
NVIDIA GeForce RTX 4070 Ti, i9-13900K
22982 Points +25%
Asus TUF Gaming GeForce RTX 4070 Ti
NVIDIA GeForce RTX 4070 Ti, i9-13900K
22949 Points +24%
MSI Titan GT77 HX 13VI
NVIDIA GeForce RTX 4090 Laptop GPU, i9-13950HX, Samsung PM9A1 MZVL22T0HBLB
22254 Points +21%
SCHENKER XMG Neo 16 Raptor Lake
NVIDIA GeForce RTX 4090 Laptop GPU, i9-13900HX
21786 Points +18%
Media NVIDIA GeForce RTX 3090
  (18685 - 20433, n=17)
19266 Points +4%
Razer Blade 16 Early 2023
NVIDIA GeForce RTX 4080 Laptop GPU, i9-13950HX, SSSTC CA6-8D1024
18441 Points
Media NVIDIA GeForce RTX 3080 Ti Laptop GPU
  (4921 - 13835, n=43)
11850 Points -36%
Media AMD Radeon RX 6800M
  (10439 - 11316, n=4)
11067 Points -40%
Media NVIDIA GeForce RTX 3080 Laptop GPU
  (6407 - 13210, n=44)
10695 Points -42%
Media NVIDIA GeForce RTX 3070 Ti Laptop GPU
  (8142 - 12324, n=37)
10478 Points -43%
Media AMD Radeon RX 6700M
  (8654 - 9323, n=2)
8989 Points -51%
Media NVIDIA GeForce RTX 3060 Laptop GPU
  (6285 - 9235, n=49)
8057 Points -56%
Media AMD Radeon RX 6600M
  (7200 - 8234, n=7)
7864 Points -57%
1920x1080 Fire Strike Graphics
AMD Radeon RX 7900 XTX
Radeon RX 7900 XTX, R9 7950X
66967 Points +65%
NVIDIA GeForce RTX 4090 Founders Edition
NVIDIA GeForce RTX 4090, i9-13900K
65879 Points +62%
AMD Radeon RX 7900 XT
Radeon RX 7900 XT, R9 7950X
63712 Points +57%
NVIDIA GeForce RTX 4080 Founders Edition
NVIDIA GeForce RTX 4080, i9-13900K
58893 Points +45%
Asus TUF Gaming GeForce RTX 4070 Ti
NVIDIA GeForce RTX 4070 Ti, i9-13900K
53729 Points +32%
Asus TUF Gaming GeForce RTX 4070 Ti
NVIDIA GeForce RTX 4070 Ti, i9-13900K
52903 Points +30%
MSI Titan GT77 HX 13VI
NVIDIA GeForce RTX 4090 Laptop GPU, i9-13950HX, Samsung PM9A1 MZVL22T0HBLB
49247 Points +21%
Media NVIDIA GeForce RTX 3090
  (41298 - 49282, n=17)
46856 Points +15%
SCHENKER XMG Neo 16 Raptor Lake
NVIDIA GeForce RTX 4090 Laptop GPU, i9-13900HX
46240 Points +14%
Razer Blade 16 Early 2023
NVIDIA GeForce RTX 4080 Laptop GPU, i9-13950HX, SSSTC CA6-8D1024
40570 Points
Media AMD Radeon RX 6800M
  (30507 - 34993, n=3)
33233 Points -18%
Media NVIDIA GeForce RTX 3080 Ti Laptop GPU
  (6928 - 34439, n=43)
29496 Points -27%
Media AMD Radeon RX 6700M
  (27449 - 28399, n=2)
27924 Points -31%
Media NVIDIA GeForce RTX 3070 Ti Laptop GPU
  (22612 - 32550, n=37)
27554 Points -32%
Media NVIDIA GeForce RTX 3080 Laptop GPU
  (16455 - 32366, n=45)
27464 Points -32%
Media AMD Radeon RX 6600M
  (21876 - 24788, n=7)
23563 Points -42%
Media NVIDIA GeForce RTX 3060 Laptop GPU
  (16354 - 23109, n=49)
20436 Points -50%
3840x2160 Fire Strike Ultra Graphics
NVIDIA GeForce RTX 4090 Founders Edition
NVIDIA GeForce RTX 4090, i9-13900K
24276 Points +124%
AMD Radeon RX 7900 XTX
Radeon RX 7900 XTX, R9 7950X
20214 Points +87%
NVIDIA GeForce RTX 4080 Founders Edition
NVIDIA GeForce RTX 4080, i9-13900K
17122 Points +58%
AMD Radeon RX 7900 XT
Radeon RX 7900 XT, R9 7950X
17078 Points +58%
SCHENKER XMG Neo 16 Raptor Lake
NVIDIA GeForce RTX 4090 Laptop GPU, i9-13900HX
14184 Points +31%
MSI Titan GT77 HX 13VI
NVIDIA GeForce RTX 4090 Laptop GPU, i9-13950HX, Samsung PM9A1 MZVL22T0HBLB
13756 Points +27%
Asus TUF Gaming GeForce RTX 4070 Ti
NVIDIA GeForce RTX 4070 Ti, i9-13900K
13546 Points +25%
Asus TUF Gaming GeForce RTX 4070 Ti
NVIDIA GeForce RTX 4070 Ti, i9-13900K
13487 Points +25%
Media NVIDIA GeForce RTX 3090
  (11613 - 12587, n=14)
12289 Points +14%
Razer Blade 16 Early 2023
NVIDIA GeForce RTX 4080 Laptop GPU, i9-13950HX, SSSTC CA6-8D1024
10815 Points
Media AMD Radeon RX 6800M
  (7109 - 8434, n=3)
7939 Points -27%
Media NVIDIA GeForce RTX 3080 Ti Laptop GPU
  (6613 - 8613, n=17)
7891 Points -27%
Media NVIDIA GeForce RTX 3080 Laptop GPU
  (5859 - 8293, n=24)
7142 Points -34%
Media NVIDIA GeForce RTX 3070 Ti Laptop GPU
  (6267 - 7778, n=12)
7111 Points -34%
Media AMD Radeon RX 6600M
  (4952 - 5590, n=6)
5311 Points -51%
Media NVIDIA GeForce RTX 3060 Laptop GPU
  (3844 - 5480, n=23)
4898 Points -55%

Prestazioni di gioco: GPU RTX 4090 Laptop alla pari con RTX 4070 Ti a 4K

Una tendenza simile si riscontra anche nel gioco, dove la GPU RTX 4090 Laptop dell'XMG Neo 16 è a breve distanza dalla RTX 4070 Ti desktop in termini di prestazioni di gioco cumulative.

Vediamo che la GPU RTX 4080 Laptop è inferiore alla variante mobile RTX 4090 di ben il 17%, un valore simile ai distacchi riscontrati tra le versioni desktop della RTX 4090 e della RTX 4080.

I miglioramenti dell'architettura sembrano conferire alla RTX 4080 Laptop un vantaggio del 33% rispetto alla GPU RTX 3080 Ti Laptop in termini di prestazioni di gioco complessive, ma la RTX 4090 offre un enorme guadagno del 61% rispetto all'ammiraglia mobile di Ampere.

Proprio come le loro controparti desktop, anche le GPU RTX 40 mobile sembrano essere facilmente bloccate dalla CPU a risoluzioni inferiori. Metro Exodus (non potenziato), ad esempio, vede la GPU RTX 4090 per laptop in ritardo rispetto alla RTX 4070 Ti per desktop fino al 19% a 1080p Ultra. Tuttavia, a 4K Ultra, la GPU mobile di punta Ada si comporta alla pari con la RTX 4070 Ti.

Si nota anche un aumento del divario tra la GPU RTX 4090 per laptop e la scheda RTX 4090 per desktop a 4K Ultra rispetto a 1080p o QHD Ultra, per questo motivo: Ada ama essere sfruttata a 4K.

È interessante notare che anche il divario tra la GPU RTX 4080 per laptop e la GPU RTX 4090 per laptop aumenta a 4K.

Giochi eccessivamente legati alla CPU come Mafia: Definitive Edition mostrano differenze percepibili tra la RTX 4070 Ti e la GPU RTX 4090 Laptop solo a 1080p. All'aumentare della risoluzione, la GPU RTX 4090 Laptop è in grado di colmare il divario o addirittura di battere la RTX 4070 Ti per un soffio in questo gioco.

Performance Rating - Percent
NVIDIA GeForce RTX 4090 Founders Edition
NVIDIA GeForce RTX 4090, i9-13900K
99.8 pt
NVIDIA GeForce RTX 4080 Founders Edition
NVIDIA GeForce RTX 4080, i9-13900K
85.9 pt
AMD Radeon RX 7900 XTX -3!
Radeon RX 7900 XTX, R9 7950X
85.5 pt
AMD Radeon RX 7900 XT -3!
Radeon RX 7900 XT, R9 7950X
75.8 pt
Asus TUF Gaming GeForce RTX 4070 Ti
NVIDIA GeForce RTX 4070 Ti, i9-13900K
72.3 pt
SCHENKER XMG Neo 16 Raptor Lake
NVIDIA GeForce RTX 4090 Laptop GPU, i9-13900HX
66.1 pt
MSI Titan GT77 HX 13VI
NVIDIA GeForce RTX 4090 Laptop GPU, i9-13950HX, Samsung PM9A1 MZVL22T0HBLB
65 pt
Media NVIDIA GeForce RTX 3090
 
61.7 pt
Razer Blade 16 Early 2023
NVIDIA GeForce RTX 4080 Laptop GPU, i9-13950HX, SSSTC CA6-8D1024
54.6 pt
Media NVIDIA GeForce RTX 3080 Ti Laptop GPU -1!
 
41.1 pt
Media AMD Radeon RX 6700M -12!
 
34.5 pt
Media NVIDIA GeForce RTX 3070 Ti Laptop GPU -6!
 
33.1 pt
Media AMD Radeon RX 6800M -3!
 
32.9 pt
Media NVIDIA GeForce RTX 3080 Laptop GPU
 
32.4 pt
Media NVIDIA GeForce RTX 3060 Laptop GPU
 
27.1 pt
Media AMD Radeon RX 6600M
 
24.8 pt
The Witcher 3
1920x1080 Ultra Graphics & Postprocessing (HBAO+)
NVIDIA GeForce RTX 4090 Founders Edition
NVIDIA GeForce RTX 4090, i9-13900K
297 (271min, 271P1 - 345max) fps +68%
AMD Radeon RX 7900 XTX
Radeon RX 7900 XTX, R9 7950X
297 (41.3min, 167.7P0.1, 245P1 - 507max) fps +68%
AMD Radeon RX 7900 XT
Radeon RX 7900 XT, R9 7950X
265 (104.1min, 151.5P0.1, 214P1 - 491max) fps +50%
NVIDIA GeForce RTX 4080 Founders Edition
NVIDIA GeForce RTX 4080, i9-13900K
254 (227min, 227P1 - 291max) fps +44%
Asus TUF Gaming GeForce RTX 4070 Ti
NVIDIA GeForce RTX 4070 Ti, i9-13900K
230 (207min, 208.68P1 - 258max) fps +30%
SCHENKER XMG Neo 16 Raptor Lake
NVIDIA GeForce RTX 4090 Laptop GPU, i9-13900HX
216.4 (5.6P0.1, 144.3P1) fps +22%
MSI Titan GT77 HX 13VI
NVIDIA GeForce RTX 4090 Laptop GPU, i9-13950HX, Samsung PM9A1 MZVL22T0HBLB
198.9 (190min, 191P1 - 214max) fps +13%
Media NVIDIA GeForce RTX 3090
  (160 - 192.6, n=16)
179.9 fps +2%
Razer Blade 16 Early 2023
NVIDIA GeForce RTX 4080 Laptop GPU, i9-13950HX, SSSTC CA6-8D1024
176.8 (159min - 192max) fps
Media NVIDIA GeForce RTX 3080 Ti Laptop GPU
  (30 - 130.6, n=43)
112.1 fps -37%
Media AMD Radeon RX 6800M
  (108 - 110, n=2)
109 fps -38%
Media NVIDIA GeForce RTX 3080 Laptop GPU
  (85.1 - 123, n=39)
105.2 fps -40%
Media NVIDIA GeForce RTX 3070 Ti Laptop GPU
  (76.8 - 124.1, n=39)
102.4 fps -42%
Media AMD Radeon RX 6700M
  ()
95.4 fps -46%
Media AMD Radeon RX 6600M
  (75.4 - 88.2, n=6)
84 fps -52%
Media NVIDIA GeForce RTX 3060 Laptop GPU
  (58.2 - 91.5, n=48)
76.9 fps -57%
3840x2160 Ultra Graphics & Postprocessing (HBAO+)
NVIDIA GeForce RTX 4090 Founders Edition
NVIDIA GeForce RTX 4090, i9-13900K
170.7 (154min, 154.59P1 - 187max) fps +111%
NVIDIA GeForce RTX 4080 Founders Edition
NVIDIA GeForce RTX 4080, i9-13900K
128 (113min, 114.12P1 - 141max) fps +58%
AMD Radeon RX 7900 XTX
Radeon RX 7900 XTX, R9 7950X
125.8 (9.5min, 66.1P0.1, 94.8P1 - 400max) fps +56%
AMD Radeon RX 7900 XT
Radeon RX 7900 XT, R9 7950X
109.4 (57.5min, 60.1P0.1, 86.2P1 - 358max) fps +35%
SCHENKER XMG Neo 16 Raptor Lake
NVIDIA GeForce RTX 4090 Laptop GPU, i9-13900HX
107.6 fps +33%
MSI Titan GT77 HX 13VI
NVIDIA GeForce RTX 4090 Laptop GPU, i9-13950HX, Samsung PM9A1 MZVL22T0HBLB
100 fps +24%
Asus TUF Gaming GeForce RTX 4070 Ti
NVIDIA GeForce RTX 4070 Ti, i9-13900K
98.3 (88min, 88.56P1 - 108max) fps +22%
Media NVIDIA GeForce RTX 3090
  (85.4 - 98.5, n=8)
93.4 fps +16%
Razer Blade 16 Early 2023
NVIDIA GeForce RTX 4080 Laptop GPU, i9-13950HX, SSSTC CA6-8D1024
80.8 (76min - 87max) fps
Media NVIDIA GeForce RTX 3080 Ti Laptop GPU
  (44.8 - 62.7, n=5)
56.4 fps -30%
Media NVIDIA GeForce RTX 3070 Ti Laptop GPU
  (48.4 - 52.3, n=2)
50.4 fps -38%
Media NVIDIA GeForce RTX 3080 Laptop GPU
  (47 - 51.6, n=4)
49.2 fps -39%
Media AMD Radeon RX 6800M
  ()
44.5 fps -45%
Media NVIDIA GeForce RTX 3060 Laptop GPU
  ()
37.4 fps -54%
Media AMD Radeon RX 6600M
  (33 - 33.8, n=3)
33.3 fps -59%
Metro Exodus
1920x1080 Ultra Quality AF:16x
NVIDIA GeForce RTX 4090 Founders Edition
NVIDIA GeForce RTX 4090, i9-13900K
191.2 (84.99min - 313.09max) fps +57%
AMD Radeon RX 7900 XTX
Radeon RX 7900 XTX, R9 7950X
183.5 (102.51min - 295.07max) fps +51%
NVIDIA GeForce RTX 4080 Founders Edition
NVIDIA GeForce RTX 4080, i9-13900K
180 (82.56min - 319.08max) fps +48%
AMD Radeon RX 7900 XT
Radeon RX 7900 XT, R9 7950X
164.6 (92.11min - 256.61max) fps +35%
Asus TUF Gaming GeForce RTX 4070 Ti
NVIDIA GeForce RTX 4070 Ti, i9-13900K
161.4 (78.05min - 296.03max) fps +33%
Media NVIDIA GeForce RTX 3090
  (108 - 145, n=12)
135.3 fps +11%
MSI Titan GT77 HX 13VI
NVIDIA GeForce RTX 4090 Laptop GPU, i9-13950HX, Samsung PM9A1 MZVL22T0HBLB
132 fps +8%
SCHENKER XMG Neo 16 Raptor Lake
NVIDIA GeForce RTX 4090 Laptop GPU, i9-13900HX
131.51 (63.87min - 211.51max) fps +8%
Razer Blade 16 Early 2023
NVIDIA GeForce RTX 4080 Laptop GPU, i9-13950HX, SSSTC CA6-8D1024
121.7 (54.5min - 212.1max) fps
Media NVIDIA GeForce RTX 3080 Ti Laptop GPU
  ()
88.1 fps -28%
Media AMD Radeon RX 6800M
  (78.7 - 79.3, n=3)
79 fps -35%
Media NVIDIA GeForce RTX 3080 Laptop GPU
  (68.7 - 87.9, n=5)
78.5 fps -35%
Media NVIDIA GeForce RTX 3070 Ti Laptop GPU
  (71 - 77.2, n=2)
74.1 fps -39%
Media NVIDIA GeForce RTX 3060 Laptop GPU
  (59.4 - 63.2, n=3)
61.6 fps -49%
Media AMD Radeon RX 6600M
  (55.6 - 62.3, n=4)
59.8 fps -51%
2560x1440 Ultra Quality AF:16x
NVIDIA GeForce RTX 4090 Founders Edition
NVIDIA GeForce RTX 4090, i9-13900K
176 (81.25min - 295.51max) fps +73%
NVIDIA GeForce RTX 4080 Founders Edition
NVIDIA GeForce RTX 4080, i9-13900K
155.1 (77.58min - 279.33max) fps +52%
AMD Radeon RX 7900 XTX
Radeon RX 7900 XTX, R9 7950X
154.5 (90.83min - 228.57max) fps +51%
AMD Radeon RX 7900 XT
Radeon RX 7900 XT, R9 7950X
135 (79.57min - 198.77max) fps +32%
Asus TUF Gaming GeForce RTX 4070 Ti
NVIDIA GeForce RTX 4070 Ti, i9-13900K
132.1 (72.92min - 245.28max) fps +30%
SCHENKER XMG Neo 16 Raptor Lake
NVIDIA GeForce RTX 4090 Laptop GPU, i9-13900HX
117.44 (57.38min - 200.04max) fps +15%
MSI Titan GT77 HX 13VI
NVIDIA GeForce RTX 4090 Laptop GPU, i9-13950HX, Samsung PM9A1 MZVL22T0HBLB
116 fps +14%
Media NVIDIA GeForce RTX 3090
  (102 - 118.2, n=12)
113.2 fps +11%
Razer Blade 16 Early 2023
NVIDIA GeForce RTX 4080 Laptop GPU, i9-13950HX, SSSTC CA6-8D1024
102 (50.6min - 175.9max) fps
Media NVIDIA GeForce RTX 3080 Ti Laptop GPU
  ()
73.2 fps -28%
Media AMD Radeon RX 6800M
  (55.9 - 61.4, n=2)
58.7 fps -42%
Media NVIDIA GeForce RTX 3080 Laptop GPU
  (45.1 - 59.4, n=4)
54.1 fps -47%
Media NVIDIA GeForce RTX 3070 Ti Laptop GPU
  ()
52.7 fps -48%
Media NVIDIA GeForce RTX 3060 Laptop GPU
  ()
49.6 fps -51%
Media AMD Radeon RX 6600M
  (45.1 - 47.6, n=3)
46.5 fps -54%
3840x2160 Ultra Quality AF:16x
NVIDIA GeForce RTX 4090 Founders Edition
NVIDIA GeForce RTX 4090, i9-13900K
135 (72.48min - 235.85max) fps +101%
NVIDIA GeForce RTX 4080 Founders Edition
NVIDIA GeForce RTX 4080, i9-13900K
105.7 (67.17min - 159.57max) fps +58%
AMD Radeon RX 7900 XTX
Radeon RX 7900 XTX, R9 7950X
103.5 (66.43min - 144.4max) fps +54%
AMD Radeon RX 7900 XT
Radeon RX 7900 XT, R9 7950X
86.9 (56.86min - 117.84max) fps +30%
Asus TUF Gaming GeForce RTX 4070 Ti
NVIDIA GeForce RTX 4070 Ti, i9-13900K
84.5 (55.02min - 124.04max) fps +26%
SCHENKER XMG Neo 16 Raptor Lake
NVIDIA GeForce RTX 4090 Laptop GPU, i9-13900HX
83.98 (50.46min - 137.42max) fps +25%
MSI Titan GT77 HX 13VI
NVIDIA GeForce RTX 4090 Laptop GPU, i9-13950HX, Samsung PM9A1 MZVL22T0HBLB
81 fps +21%
Media NVIDIA GeForce RTX 3090
  (70.6 - 77.3, n=12)
75 fps +12%
Razer Blade 16 Early 2023
NVIDIA GeForce RTX 4080 Laptop GPU, i9-13950HX, SSSTC CA6-8D1024
67 (34min - 118.9max) fps
Media NVIDIA GeForce RTX 3080 Ti Laptop GPU
  ()
47.6 fps -29%
Media NVIDIA GeForce RTX 3080 Laptop GPU
  (35.4 - 45.1, n=4)
38.9 fps -42%
Media AMD Radeon RX 6800M
  (37.1 - 39.6, n=2)
38.4 fps -43%
Media NVIDIA GeForce RTX 3060 Laptop GPU
  ()
31.4 fps -53%
Media AMD Radeon RX 6600M
  (27.3 - 28.7, n=3)
28.1 fps -58%
Control
1920x1080 High Quality Preset (DX11)
AMD Radeon RX 7900 XTX
Radeon RX 7900 XTX, R9 7950X
240 (18.1min, 136.2P0.1, 151.8P1 - 606max) fps +53%
NVIDIA GeForce RTX 4090 Founders Edition
NVIDIA GeForce RTX 4090, i9-13900K
238 (14.4min, 62.9P0.1, 153.8P1 - 672max) fps +52%
NVIDIA GeForce RTX 4080 Founders Edition
NVIDIA GeForce RTX 4080, i9-13900K
233 (7.49min, 27.2P0.1, 156.1P1 - 694max) fps +48%
AMD Radeon RX 7900 XT
Radeon RX 7900 XT, R9 7950X
233 (67.8min, 133.8P0.1, 152.6P1 - 638max) fps +48%
Asus TUF Gaming GeForce RTX 4070 Ti
NVIDIA GeForce RTX 4070 Ti, i9-13900K
202 (88min, 151.4P0.1, 165P1 - 504max) fps +29%
MSI Titan GT77 HX 13VI
NVIDIA GeForce RTX 4090 Laptop GPU, i9-13950HX, Samsung PM9A1 MZVL22T0HBLB
187 fps +19%
SCHENKER XMG Neo 16 Raptor Lake
NVIDIA GeForce RTX 4090 Laptop GPU, i9-13900HX
183.7 (38.8P0.1, 119.5P1) fps +17%
Media NVIDIA GeForce RTX 3090
  (172.2 - 189.2, n=5)
179.9 fps +15%
Razer Blade 16 Early 2023
NVIDIA GeForce RTX 4080 Laptop GPU, i9-13950HX, SSSTC CA6-8D1024
157 fps
Media AMD Radeon RX 6800M
  ()
108 fps -31%
Media NVIDIA GeForce RTX 3080 Laptop GPU
  (82.3 - 94.8, n=3)
89.5 fps -43%
Media AMD Radeon RX 6700M
  ()
82.2 fps -48%
Media NVIDIA GeForce RTX 3060 Laptop GPU
  ()
78.1 fps -50%
Media AMD Radeon RX 6600M
  (69.7 - 72, n=4)
70.5 fps -55%
2560x1440 High Quality Preset (DX11)
NVIDIA GeForce RTX 4090 Founders Edition
NVIDIA GeForce RTX 4090, i9-13900K
201 (84.1min, 146.6P0.1, 159P1 - 509max) fps +97%
AMD Radeon RX 7900 XTX
Radeon RX 7900 XTX, R9 7950X
184.9 (66.6min, 105.1P0.1, 121.7P1 - 629max) fps +81%
NVIDIA GeForce RTX 4080 Founders Edition
NVIDIA GeForce RTX 4080, i9-13900K
164.2 (59.2min, 121.2P0.1, 135.5P1 - 753max) fps +61%
AMD Radeon RX 7900 XT
Radeon RX 7900 XT, R9 7950X
156.4 (53.3min, 89.4P0.1, 95.9P1 - 575max) fps +53%
Asus TUF Gaming GeForce RTX 4070 Ti
NVIDIA GeForce RTX 4070 Ti, i9-13900K
130.6 (59min, 74P0.1, 107.3P1 - 355max) fps +28%
MSI Titan GT77 HX 13VI
NVIDIA GeForce RTX 4090 Laptop GPU, i9-13950HX, Samsung PM9A1 MZVL22T0HBLB
122 fps +20%
SCHENKER XMG Neo 16 Raptor Lake
NVIDIA GeForce RTX 4090 Laptop GPU, i9-13900HX
121.9 (31P0.1, 85.8P1) fps +20%
Media NVIDIA GeForce RTX 3090
  (115.8 - 123.7, n=5)
120.4 fps +18%
Razer Blade 16 Early 2023
NVIDIA GeForce RTX 4080 Laptop GPU, i9-13950HX, SSSTC CA6-8D1024
102 fps
Media NVIDIA GeForce RTX 3080 Ti Laptop GPU
  ()
72.9 fps -29%
Media AMD Radeon RX 6800M
  ()
69 fps -32%
Media NVIDIA GeForce RTX 3080 Laptop GPU
  (55.7 - 62.3, n=3)
58.7 fps -42%
Media NVIDIA GeForce RTX 3060 Laptop GPU
  ()
51.1 fps -50%
Media AMD Radeon RX 6600M
  (44.9 - 45.6, n=2)
45.3 fps -56%
3840x2160 High Quality Preset (DX11)
NVIDIA GeForce RTX 4090 Founders Edition
NVIDIA GeForce RTX 4090, i9-13900K
107.7 (83.4min, 85.3P0.1, 91.1P1 - 134.9max) fps +115%
AMD Radeon RX 7900 XTX
Radeon RX 7900 XTX, R9 7950X
89.4 (46.8min, 48.3P0.1, 52.1P1 - 369max) fps +78%
NVIDIA GeForce RTX 4080 Founders Edition
NVIDIA GeForce RTX 4080, i9-13900K
82.6 (15.4min, 68.7P0.1, 71.9P1 - 374max) fps +65%
AMD Radeon RX 7900 XT
Radeon RX 7900 XT, R9 7950X
75.8 (40.1min, 41.7P0.1, 43.6P1 - 277max) fps +51%
Asus TUF Gaming GeForce RTX 4070 Ti
NVIDIA GeForce RTX 4070 Ti, i9-13900K
64.9 (50min, 51.9P0.1, 56.5P1 - 105max) fps +30%
SCHENKER XMG Neo 16 Raptor Lake
NVIDIA GeForce RTX 4090 Laptop GPU, i9-13900HX
63.5 (21.7P0.1, 30.5P1) fps +27%
MSI Titan GT77 HX 13VI
NVIDIA GeForce RTX 4090 Laptop GPU, i9-13950HX, Samsung PM9A1 MZVL22T0HBLB
63 fps +26%
Media NVIDIA GeForce RTX 3090
  (61.3 - 66, n=5)
62.9 fps +26%
Razer Blade 16 Early 2023
NVIDIA GeForce RTX 4080 Laptop GPU, i9-13950HX, SSSTC CA6-8D1024
50.1 fps
Media NVIDIA GeForce RTX 3080 Ti Laptop GPU
  ()
34.5 fps -31%
Media AMD Radeon RX 6800M
  ()
34 fps -32%
Media NVIDIA GeForce RTX 3080 Laptop GPU
  (29 - 30.9, n=3)
29.7 fps -41%
Media NVIDIA GeForce RTX 3060 Laptop GPU
  ()
26 fps -48%
Media AMD Radeon RX 6600M
  (21.7 - 22.2, n=2)
22 fps -56%
Borderlands 3
1920x1080 Badass Overall Quality (DX11)
NVIDIA GeForce RTX 4090 Founders Edition
NVIDIA GeForce RTX 4090, i9-13900K
201 fps +51%
NVIDIA GeForce RTX 4080 Founders Edition
NVIDIA GeForce RTX 4080, i9-13900K
199.4 fps +49%
Asus TUF Gaming GeForce RTX 4070 Ti
NVIDIA GeForce RTX 4070 Ti, i9-13900K
186.9 fps +40%
AMD Radeon RX 7900 XTX
Radeon RX 7900 XTX, R9 7950X
180.2 fps +35%
SCHENKER XMG Neo 16 Raptor Lake
NVIDIA GeForce RTX 4090 Laptop GPU, i9-13900HX
176 fps +32%
AMD Radeon RX 7900 XT
Radeon RX 7900 XT, R9 7950X
169.4 fps +27%
MSI Titan GT77 HX 13VI
NVIDIA GeForce RTX 4090 Laptop GPU, i9-13950HX, Samsung PM9A1 MZVL22T0HBLB
151 fps +13%
Media NVIDIA GeForce RTX 3090
  (117 - 170.1, n=13)
150.7 fps +13%
Razer Blade 16 Early 2023
NVIDIA GeForce RTX 4080 Laptop GPU, i9-13950HX, SSSTC CA6-8D1024
133.5 fps
Media NVIDIA GeForce RTX 3080 Ti Laptop GPU
  ()
90.7 fps -32%
Media NVIDIA GeForce RTX 3080 Laptop GPU
  (76.5 - 90, n=3)
84 fps -37%
Media NVIDIA GeForce RTX 3070 Ti Laptop GPU
  ()
80.9 fps -39%
Media AMD Radeon RX 6800M
  (77.6 - 83.9, n=3)
80.2 fps -40%
Media NVIDIA GeForce RTX 3060 Laptop GPU
  (69.3 - 74.3, n=4)
72.2 fps -46%
Media AMD Radeon RX 6700M
  ()
71.2 fps -47%
Media AMD Radeon RX 6600M
  (59.9 - 67.3, n=5)
64.8 fps -51%
2560x1440 Badass Overall Quality (DX11)
NVIDIA GeForce RTX 4090 Founders Edition
NVIDIA GeForce RTX 4090, i9-13900K
190 fps +75%
NVIDIA GeForce RTX 4080 Founders Edition
NVIDIA GeForce RTX 4080, i9-13900K
170.5 fps +57%
AMD Radeon RX 7900 XTX
Radeon RX 7900 XTX, R9 7950X
152.2 fps +40%
Asus TUF Gaming GeForce RTX 4070 Ti
NVIDIA GeForce RTX 4070 Ti, i9-13900K
140.6 fps +29%
AMD Radeon RX 7900 XT
Radeon RX 7900 XT, R9 7950X
135.2 fps +24%
SCHENKER XMG Neo 16 Raptor Lake
NVIDIA GeForce RTX 4090 Laptop GPU, i9-13900HX
132.34 fps +22%
MSI Titan GT77 HX 13VI
NVIDIA GeForce RTX 4090 Laptop GPU, i9-13950HX, Samsung PM9A1 MZVL22T0HBLB
130 fps +20%
Media NVIDIA GeForce RTX 3090
  (105 - 131.6, n=13)
123.8 fps +14%
Razer Blade 16 Early 2023
NVIDIA GeForce RTX 4080 Laptop GPU, i9-13950HX, SSSTC CA6-8D1024
108.7 fps
Media NVIDIA GeForce RTX 3080 Ti Laptop GPU
  ()
78.2 fps -28%
Media AMD Radeon RX 6800M
  (57 - 67.2, n=2)
62.1 fps -43%
Media NVIDIA GeForce RTX 3080 Laptop GPU
  (55.7 - 64.4, n=3)
60.9 fps -44%
Media NVIDIA GeForce RTX 3070 Ti Laptop GPU
  ()
58.7 fps -46%
Media NVIDIA GeForce RTX 3060 Laptop GPU
  (51.3 - 52.4, n=2)
51.9 fps -52%
Media AMD Radeon RX 6600M
  (44.9 - 45.7, n=3)
45.2 fps -58%
3840x2160 Badass Overall Quality (DX11)
NVIDIA GeForce RTX 4090 Founders Edition
NVIDIA GeForce RTX 4090, i9-13900K
133.4 fps +123%
NVIDIA GeForce RTX 4080 Founders Edition
NVIDIA GeForce RTX 4080, i9-13900K
95.7 fps +60%
AMD Radeon RX 7900 XTX
Radeon RX 7900 XTX, R9 7950X
88.4 fps +48%
MSI Titan GT77 HX 13VI
NVIDIA GeForce RTX 4090 Laptop GPU, i9-13950HX, Samsung PM9A1 MZVL22T0HBLB
76 fps +27%
AMD Radeon RX 7900 XT
Radeon RX 7900 XT, R9 7950X
74.6 fps +25%
Asus TUF Gaming GeForce RTX 4070 Ti
NVIDIA GeForce RTX 4070 Ti, i9-13900K
74.1 fps +24%
Media NVIDIA GeForce RTX 3090
  (68 - 75.3, n=13)
72.8 fps +22%
SCHENKER XMG Neo 16 Raptor Lake
NVIDIA GeForce RTX 4090 Laptop GPU, i9-13900HX
70.5 fps +18%
Razer Blade 16 Early 2023
NVIDIA GeForce RTX 4080 Laptop GPU, i9-13950HX, SSSTC CA6-8D1024
59.8 fps
Media NVIDIA GeForce RTX 3080 Ti Laptop GPU
  ()
46.1 fps -23%
Media NVIDIA GeForce RTX 3080 Laptop GPU
  (32.3 - 36, n=3)
34.4 fps -42%
Media AMD Radeon RX 6800M
  (30.3 - 35.8, n=2)
33.1 fps -45%
Media NVIDIA GeForce RTX 3060 Laptop GPU
  ()
28.5 fps -52%
Media AMD Radeon RX 6600M
  (23.7 - 24.1, n=3)
23.9 fps -60%
Shadow of the Tomb Raider
1920x1080 Highest Preset AA:T
NVIDIA GeForce RTX 4090 Founders Edition
NVIDIA GeForce RTX 4090, i9-13900K
306 fps +74%
NVIDIA GeForce RTX 4080 Founders Edition
NVIDIA GeForce RTX 4080, i9-13900K
303 fps +72%
AMD Radeon RX 7900 XTX
Radeon RX 7900 XTX, R9 7950X
301 fps +71%
AMD Radeon RX 7900 XT
Radeon RX 7900 XT, R9 7950X
282 fps +60%
Asus TUF Gaming GeForce RTX 4070 Ti
NVIDIA GeForce RTX 4070 Ti, i9-13900K
280 fps +59%
MSI Titan GT77 HX 13VI
NVIDIA GeForce RTX 4090 Laptop GPU, i9-13950HX, Samsung PM9A1 MZVL22T0HBLB
214 fps +22%
SCHENKER XMG Neo 16 Raptor Lake
NVIDIA GeForce RTX 4090 Laptop GPU, i9-13900HX
207 (140min - 309max) fps +18%
Media NVIDIA GeForce RTX 3090
  (145 - 240, n=14)
204 fps +16%
Razer Blade 16 Early 2023
NVIDIA GeForce RTX 4080 Laptop GPU, i9-13950HX, SSSTC CA6-8D1024
176 (117min - 277max) fps
Media NVIDIA GeForce RTX 3080 Ti Laptop GPU
  ()
156.5 fps -11%
Media NVIDIA GeForce RTX 3070 Ti Laptop GPU
  (119 - 129, n=2)
124 fps -30%
Media NVIDIA GeForce RTX 3080 Laptop GPU
  (76.6 - 151, n=12)
116.4 fps -34%
Media AMD Radeon RX 6700M
  ()
116 fps -34%
Media AMD Radeon RX 6800M
  (104 - 106.1, n=2)
105.1 fps -40%
Media AMD Radeon RX 6600M
  (103.2 - 106.2, n=5)
105.1 fps -40%
Media NVIDIA GeForce RTX 3060 Laptop GPU
  (84 - 95, n=4)
88.8 fps -50%
2560x1440 Highest Preset AA:T
NVIDIA GeForce RTX 4090 Founders Edition
NVIDIA GeForce RTX 4090, i9-13900K
282 fps +83%
NVIDIA GeForce RTX 4080 Founders Edition
NVIDIA GeForce RTX 4080, i9-13900K
248 fps +61%
AMD Radeon RX 7900 XTX
Radeon RX 7900 XTX, R9 7950X
230 fps +49%
AMD Radeon RX 7900 XT
Radeon RX 7900 XT, R9 7950X
203 fps +32%
Asus TUF Gaming GeForce RTX 4070 Ti
NVIDIA GeForce RTX 4070 Ti, i9-13900K
202 fps +31%
MSI Titan GT77 HX 13VI
NVIDIA GeForce RTX 4090 Laptop GPU, i9-13950HX, Samsung PM9A1 MZVL22T0HBLB
187 fps +21%
SCHENKER XMG Neo 16 Raptor Lake
NVIDIA GeForce RTX 4090 Laptop GPU, i9-13900HX
168 (162min - 327max) fps +9%
Media NVIDIA GeForce RTX 3090
  (137 - 172.3, n=12)
165.6 fps +8%
Razer Blade 16 Early 2023
NVIDIA GeForce RTX 4080 Laptop GPU, i9-13950HX, SSSTC CA6-8D1024
154 (121min - 248max) fps
Media NVIDIA GeForce RTX 3080 Ti Laptop GPU
  ()
123.9 fps -20%
Media NVIDIA GeForce RTX 3080 Laptop GPU
  (79 - 113, n=6)
95.7 fps -38%
Media NVIDIA GeForce RTX 3070 Ti Laptop GPU
  ()
83 fps -46%
Media AMD Radeon RX 6800M
  ()
80.5 fps -48%
Media NVIDIA GeForce RTX 3060 Laptop GPU
  (66 - 71, n=3)
68.3 fps -56%
Media AMD Radeon RX 6600M
  (66 - 69.5, n=3)
67.6 fps -56%
3840x2160 Highest Preset AA:T
NVIDIA GeForce RTX 4090 Founders Edition
NVIDIA GeForce RTX 4090, i9-13900K
182 fps +117%
NVIDIA GeForce RTX 4080 Founders Edition
NVIDIA GeForce RTX 4080, i9-13900K
134 fps +60%
AMD Radeon RX 7900 XTX
Radeon RX 7900 XTX, R9 7950X
130.1 fps +55%
AMD Radeon RX 7900 XT
Radeon RX 7900 XT, R9 7950X
109.6 fps +30%
Asus TUF Gaming GeForce RTX 4070 Ti
NVIDIA GeForce RTX 4070 Ti, i9-13900K
104.4 fps +24%
MSI Titan GT77 HX 13VI
NVIDIA GeForce RTX 4090 Laptop GPU, i9-13950HX, Samsung PM9A1 MZVL22T0HBLB
103 fps +23%
SCHENKER XMG Neo 16 Raptor Lake
NVIDIA GeForce RTX 4090 Laptop GPU, i9-13900HX
103 (88min - 150max) fps +23%
Media NVIDIA GeForce RTX 3090
  (89.3 - 99.7, n=12)
96.4 fps +15%
Razer Blade 16 Early 2023
NVIDIA GeForce RTX 4080 Laptop GPU, i9-13950HX, SSSTC CA6-8D1024
84 (77min - 219max) fps
Media NVIDIA GeForce RTX 3080 Ti Laptop GPU
  ()
72.4 fps -14%
Media NVIDIA GeForce RTX 3080 Laptop GPU
  (43 - 56.3, n=4)
50.6 fps -40%
Media AMD Radeon RX 6800M
  ()
43.2 fps -49%
Media NVIDIA GeForce RTX 3060 Laptop GPU
  ()
42 fps -50%
Media AMD Radeon RX 6600M
  (31 - 33.6, n=3)
31.9 fps -62%
Mafia Definitive Edition
1920x1080 High Preset
NVIDIA GeForce RTX 4080 Founders Edition
NVIDIA GeForce RTX 4080, i9-13900K
260 (58.1min, 133.7P0.1, 187.5P1 - 469max) fps +52%
NVIDIA GeForce RTX 4090 Founders Edition
NVIDIA GeForce RTX 4090, i9-13900K
255 (80.7min, 89.2P0.1, 169.4P1 - 479max) fps +49%
Asus TUF Gaming GeForce RTX 4070 Ti
NVIDIA GeForce RTX 4070 Ti, i9-13900K
241 (107.5min, 136.3P0.1, 183.2P1 - 470max) fps +41%
SCHENKER XMG Neo 16 Raptor Lake
NVIDIA GeForce RTX 4090 Laptop GPU, i9-13900HX
187.9 (68.8P0.1, 118.8P1) fps +10%
MSI Titan GT77 HX 13VI
NVIDIA GeForce RTX 4090 Laptop GPU, i9-13950HX, Samsung PM9A1 MZVL22T0HBLB
179 fps +4%
Razer Blade 16 Early 2023
NVIDIA GeForce RTX 4080 Laptop GPU, i9-13950HX, SSSTC CA6-8D1024
171.3 (150min - 193max) fps
Media NVIDIA GeForce RTX 3090
  (157 - 158.8, n=2)
157.9 fps -8%
Media NVIDIA GeForce RTX 3080 Ti Laptop GPU
  ()
151 fps -12%
Media NVIDIA GeForce RTX 3070 Ti Laptop GPU
  (95.1 - 111.5, n=2)
103.3 fps -40%
Media NVIDIA GeForce RTX 3080 Laptop GPU
  (98.7 - 104, n=3)
101.6 fps -41%
Media NVIDIA GeForce RTX 3060 Laptop GPU
  (86.1 - 98.5, n=2)
92.3 fps -46%
Media AMD Radeon RX 6700M
  ()
85.5 fps -50%
Media AMD Radeon RX 6600M
  (79.2 - 85.6, n=4)
80.8 fps -53%
2560x1440 High Preset
NVIDIA GeForce RTX 4090 Founders Edition
NVIDIA GeForce RTX 4090, i9-13900K
238 (71.6min, 84.3P0.1, 162.7P1 - 422max) fps +96%
NVIDIA GeForce RTX 4080 Founders Edition
NVIDIA GeForce RTX 4080, i9-13900K
214 (100.6min, 149.1P0.1, 172.3P1 - 322max) fps +76%
Asus TUF Gaming GeForce RTX 4070 Ti
NVIDIA GeForce RTX 4070 Ti, i9-13900K
171.9 (100min, 119.6P0.1, 144.6P1 - 300max) fps +41%
SCHENKER XMG Neo 16 Raptor Lake
NVIDIA GeForce RTX 4090 Laptop GPU, i9-13900HX
168.1 (52.7P0.1, 117P1) fps +38%
MSI Titan GT77 HX 13VI
NVIDIA GeForce RTX 4090 Laptop GPU, i9-13950HX, Samsung PM9A1 MZVL22T0HBLB
161 fps +32%
Media NVIDIA GeForce RTX 3090
  (142.3 - 149, n=2)
145.7 fps +20%
Razer Blade 16 Early 2023
NVIDIA GeForce RTX 4080 Laptop GPU, i9-13950HX, SSSTC CA6-8D1024
121.6 (104min - 135max) fps
Media NVIDIA GeForce RTX 3080 Ti Laptop GPU
  ()
108 fps -11%
Media NVIDIA GeForce RTX 3080 Laptop GPU
  (69.3 - 70.7, n=2)
70 fps -42%
Media NVIDIA GeForce RTX 3060 Laptop GPU
  ()
67.4 fps -45%
Media NVIDIA GeForce RTX 3070 Ti Laptop GPU
  ()
66.1 fps -46%
Media AMD Radeon RX 6600M
  ()
57.7 fps -53%
3840x2160 High Preset
NVIDIA GeForce RTX 4090 Founders Edition
NVIDIA GeForce RTX 4090, i9-13900K
160.2 (42.5min, 66.5P0.1, 122.8P1 - 370max) fps +128%
NVIDIA GeForce RTX 4080 Founders Edition
NVIDIA GeForce RTX 4080, i9-13900K
115.6 (34.7min, 70.3P0.1, 99.3P1 - 305max) fps +64%
MSI Titan GT77 HX 13VI
NVIDIA GeForce RTX 4090 Laptop GPU, i9-13950HX, Samsung PM9A1 MZVL22T0HBLB
93 fps +32%
SCHENKER XMG Neo 16 Raptor Lake
NVIDIA GeForce RTX 4090 Laptop GPU, i9-13900HX
91.8 (40.5P0.1, 70.4P1) fps +30%
Asus TUF Gaming GeForce RTX 4070 Ti
NVIDIA GeForce RTX 4070 Ti, i9-13900K
88.9 (34.4min, 62P0.1, 77.4P1 - 370max) fps +26%
Media NVIDIA GeForce RTX 3090
  (84.5 - 89.1, n=2)
86.8 fps +23%
Razer Blade 16 Early 2023
NVIDIA GeForce RTX 4080 Laptop GPU, i9-13950HX, SSSTC CA6-8D1024
70.4 (61min - 81max) fps
Media NVIDIA GeForce RTX 3080 Ti Laptop GPU
  ()
58.6 fps -17%
Media NVIDIA GeForce RTX 3080 Laptop GPU
  (37.2 - 37.4, n=2)
37.3 fps -47%
Media NVIDIA GeForce RTX 3060 Laptop GPU
  ()
36.2 fps -49%
Media NVIDIA GeForce RTX 3070 Ti Laptop GPU
  ()
35.7 fps -49%
Media AMD Radeon RX 6600M
  ()
27.3 fps -61%

Prestazioni del Ray Tracing

Nonostante lo stesso numero di core RT della RTX 4080 desktop, la GPU RTX 4090 Laptop può essere fino al 25% più lenta nelle prestazioni complessive del ray tracing. Tuttavia, si registrano ottimi guadagni, fino al 58%, rispetto alla GPU RTX 3080 Ti per laptop.

Mentre vediamo ottimi numeri di fps a 1080p nativi, il ray-tracing nativo a 4K con frame rate giocabili non è ancora una possibilità, come si vede nei risultati di Cyberpunk 2077. Nvidia sta spingendo DLSS 3 come l'unico mezzo possibile per giocare a risoluzioni più elevate con RT abilitato.

Performance Rating - Percent
NVIDIA GeForce RTX 4090 Founders Edition
NVIDIA GeForce RTX 4090, i9-13900K
98.7 pt
NVIDIA GeForce RTX 4080 Founders Edition
NVIDIA GeForce RTX 4080, i9-13900K
87.4 pt
Asus TUF Gaming GeForce RTX 4070 Ti
NVIDIA GeForce RTX 4070 Ti, i9-13900K
75.9 pt
AMD Radeon RX 7900 XTX -2!
Radeon RX 7900 XTX, R9 7950X
74.5 pt
AMD Radeon RX 7900 XT -2!
Radeon RX 7900 XT, R9 7950X
66.2 pt
MSI Titan GT77 HX 13VI
NVIDIA GeForce RTX 4090 Laptop GPU, i9-13950HX, Samsung PM9A1 MZVL22T0HBLB
65.8 pt
SCHENKER XMG Neo 16 Raptor Lake
NVIDIA GeForce RTX 4090 Laptop GPU, i9-13900HX
65.2 pt
Media NVIDIA GeForce RTX 3090
 
63.9 pt
Razer Blade 16 Early 2023
NVIDIA GeForce RTX 4080 Laptop GPU, i9-13950HX, SSSTC CA6-8D1024
62.2 pt
Media NVIDIA GeForce RTX 3080 Ti Laptop GPU
 
41.7 pt
Media NVIDIA GeForce RTX 3080 Laptop GPU
 
35.7 pt
Media NVIDIA GeForce RTX 3070 Ti Laptop GPU
 
31.8 pt
Media NVIDIA GeForce RTX 3060 Laptop GPU -1!
 
25.4 pt
Media AMD Radeon RX 6700M -5!
 
25.3 pt
Media AMD Radeon RX 6600M -2!
 
23.5 pt
Media AMD Radeon RX 6800M -1!
 
23 pt
Metro Exodus - 1920x1080 Ultra Quality DXR AF:16x
AMD Radeon RX 7900 XTX
Radeon RX 7900 XTX, R9 7950X
141.2 (89.03min - 194.63max) fps +35%
NVIDIA GeForce RTX 4080 Founders Edition
NVIDIA GeForce RTX 4080, i9-13900K
137.2 (68.42min - 213.17max) fps +31%
NVIDIA GeForce RTX 4090 Founders Edition
NVIDIA GeForce RTX 4090, i9-13900K
135 (73.53min - 215.75max) fps +29%
Asus TUF Gaming GeForce RTX 4070 Ti
NVIDIA GeForce RTX 4070 Ti, i9-13900K
128.8 (62.96min - 211.1max) fps +23%
AMD Radeon RX 7900 XT
Radeon RX 7900 XT, R9 7950X
124.3 (78.88min - 166max) fps +19%
Media NVIDIA GeForce RTX 3090
  (68.6 - 122.2, n=12)
111.4 fps +7%
MSI Titan GT77 HX 13VI
NVIDIA GeForce RTX 4090 Laptop GPU, i9-13950HX, Samsung PM9A1 MZVL22T0HBLB
108 fps +3%
Razer Blade 16 Early 2023
NVIDIA GeForce RTX 4080 Laptop GPU, i9-13950HX, SSSTC CA6-8D1024
104.4 (50.2min - 162.5max) fps
SCHENKER XMG Neo 16 Raptor Lake
NVIDIA GeForce RTX 4090 Laptop GPU, i9-13900HX
101.25 (55.8min - 158.6max) fps -3%
Media NVIDIA GeForce RTX 3080 Ti Laptop GPU
  ()
77.9 fps -25%
Media NVIDIA GeForce RTX 3080 Laptop GPU
  (59.1 - 74.5, n=5)
69 fps -34%
Media NVIDIA GeForce RTX 3070 Ti Laptop GPU
  (61.3 - 65.1, n=2)
63.2 fps -39%
Media AMD Radeon RX 6800M
  (54.9 - 57.4, n=3)
56.1 fps -46%
Media NVIDIA GeForce RTX 3060 Laptop GPU
  (50.9 - 54.4, n=3)
52.9 fps -49%
Media AMD Radeon RX 6600M
  (43.8 - 54.4, n=3)
47.5 fps -55%
Watch Dogs Legion - 1920x1080 Ultra Preset + Ultra Ray Tracing (DX12)
NVIDIA GeForce RTX 4090 Founders Edition
NVIDIA GeForce RTX 4090, i9-13900K
115.7 (18.56min, 92.59P1 - 160.3max) fps +45%
NVIDIA GeForce RTX 4080 Founders Edition
NVIDIA GeForce RTX 4080, i9-13900K
111.6 (76.88min, 90.46P1 - 161.11max) fps +40%
Asus TUF Gaming GeForce RTX 4070 Ti
NVIDIA GeForce RTX 4070 Ti, i9-13900K
98.9 (72.06min, 82.17P1 - 137.41max) fps +24%
SCHENKER XMG Neo 16 Raptor Lake
NVIDIA GeForce RTX 4090 Laptop GPU, i9-13900HX
90 (26min - 128max) fps +13%
Media NVIDIA GeForce RTX 3090
  (75.7 - 110, n=3)
88 fps +10%
MSI Titan GT77 HX 13VI
NVIDIA GeForce RTX 4090 Laptop GPU, i9-13950HX, Samsung PM9A1 MZVL22T0HBLB
84 fps +5%
Razer Blade 16 Early 2023
NVIDIA GeForce RTX 4080 Laptop GPU, i9-13950HX, SSSTC CA6-8D1024
80 (58min - 115max) fps
Media NVIDIA GeForce RTX 3080 Ti Laptop GPU
  (50 - 70, n=3)
58.6 fps -27%
Media NVIDIA GeForce RTX 3080 Laptop GPU
  (41 - 59.5, n=5)
46.2 fps -42%
Media NVIDIA GeForce RTX 3070 Ti Laptop GPU
  (36 - 41.2, n=2)
38.6 fps -52%
Media AMD Radeon RX 6800M
  ()
29 fps -64%
Media NVIDIA GeForce RTX 3060 Laptop GPU
  (15.4 - 27, n=2)
21.2 fps -73%
Media AMD Radeon RX 6700M
  ()
18 fps -77%
Media AMD Radeon RX 6600M
  ()
17.5 fps -78%
Far Cry 6 - 1920x1080 Ultra Graphics Quality + HD Textures + DXR AA:T
NVIDIA GeForce RTX 4080 Founders Edition
NVIDIA GeForce RTX 4080, i9-13900K
154 (125min - 209max) fps +29%
AMD Radeon RX 7900 XTX
Radeon RX 7900 XTX, R9 7950X
152.1 (75min - 229max) fps +28%
NVIDIA GeForce RTX 4090 Founders Edition
NVIDIA GeForce RTX 4090, i9-13900K
147 (125min - 209max) fps +24%
Asus TUF Gaming GeForce RTX 4070 Ti
NVIDIA GeForce RTX 4070 Ti, i9-13900K
146 (122min - 194max) fps +23%
AMD Radeon RX 7900 XT
Radeon RX 7900 XT, R9 7950X
143.6 (46min - 227max) fps +21%
Razer Blade 16 Early 2023
NVIDIA GeForce RTX 4080 Laptop GPU, i9-13950HX, SSSTC CA6-8D1024
119 (88min - 165max) fps
MSI Titan GT77 HX 13VI
NVIDIA GeForce RTX 4090 Laptop GPU, i9-13950HX, Samsung PM9A1 MZVL22T0HBLB
116 fps -3%
Media NVIDIA GeForce RTX 3090
  (76 - 138.2, n=8)
112.6 fps -5%
SCHENKER XMG Neo 16 Raptor Lake
NVIDIA GeForce RTX 4090 Laptop GPU, i9-13900HX
108 (90min - 160max) fps -9%
Media NVIDIA GeForce RTX 3080 Ti Laptop GPU
  (91 - 92, n=3)
91.3 fps -23%
Media NVIDIA GeForce RTX 3070 Ti Laptop GPU
  (59 - 77.7, n=2)
68.4 fps -43%
Media NVIDIA GeForce RTX 3080 Laptop GPU
  (59 - 84, n=3)
68 fps -43%
Media AMD Radeon RX 6700M
  ()
54 fps -55%
Media AMD Radeon RX 6600M
  (45.6 - 66.8, n=4)
53.8 fps -55%
Media NVIDIA GeForce RTX 3060 Laptop GPU
  (34 - 66, n=2)
50 fps -58%
Dying Light 2 - 1920x1080 High Quality Raytracing
NVIDIA GeForce RTX 4090 Founders Edition
NVIDIA GeForce RTX 4090, i9-13900K
130 (49min, 97.7P0.1, 106.7P1 - 261max) fps +55%
NVIDIA GeForce RTX 4080 Founders Edition
NVIDIA GeForce RTX 4080, i9-13900K
98.7 (37.6min, 46.5P0.1, 74.3P1 - 245max) fps +18%
Razer Blade 16 Early 2023
NVIDIA GeForce RTX 4080 Laptop GPU, i9-13950HX, SSSTC CA6-8D1024
83.9 (66.4min - 121.8max) fps
Asus TUF Gaming GeForce RTX 4070 Ti
NVIDIA GeForce RTX 4070 Ti, i9-13900K
82.9 (36.6min, 45.4P0.1, 69.2P1 - 247max) fps -1%
Media NVIDIA GeForce RTX 3090
  (67.9 - 80.2, n=2)
74.1 fps -12%
SCHENKER XMG Neo 16 Raptor Lake
NVIDIA GeForce RTX 4090 Laptop GPU, i9-13900HX
74 (27.6P0.1, 52P1) fps -12%
MSI Titan GT77 HX 13VI
NVIDIA GeForce RTX 4090 Laptop GPU, i9-13950HX, Samsung PM9A1 MZVL22T0HBLB
73 fps -13%
Media NVIDIA GeForce RTX 3080 Ti Laptop GPU
  (33.4 - 42.3, n=5)
38.5 fps -54%
Media NVIDIA GeForce RTX 3070 Ti Laptop GPU
  (28.7 - 54.9, n=6)
36.6 fps -56%
Media NVIDIA GeForce RTX 3080 Laptop GPU
  ()
36 fps -57%
Media NVIDIA GeForce RTX 3060 Laptop GPU
  ()
26.1 fps -69%
Media AMD Radeon RX 6800M
  ()
17.8 fps -79%
Cyberpunk 2077 1.6
1920x1080 Ray Tracing Ultra Preset (DLSS off)
NVIDIA GeForce RTX 4090 Founders Edition
NVIDIA GeForce RTX 4090, i9-13900K
118.4 (92min - 154.9max) fps +81%
NVIDIA GeForce RTX 4080 Founders Edition
NVIDIA GeForce RTX 4080, i9-13900K
100.1 (77.6min - 133.3max) fps +53%
Asus TUF Gaming GeForce RTX 4070 Ti
NVIDIA GeForce RTX 4070 Ti, i9-13900K
81 (62.6min - 103.6max) fps +24%
MSI Titan GT77 HX 13VI
NVIDIA GeForce RTX 4090 Laptop GPU, i9-13950HX, Samsung PM9A1 MZVL22T0HBLB
74 fps +13%
SCHENKER XMG Neo 16 Raptor Lake
NVIDIA GeForce RTX 4090 Laptop GPU, i9-13900HX
73.86 (23.84min - 119.71max) fps +13%
Media NVIDIA GeForce RTX 3090
  (61.3 - 68, n=5)
65.5 fps 0%
Razer Blade 16 Early 2023
NVIDIA GeForce RTX 4080 Laptop GPU, i9-13950HX, SSSTC CA6-8D1024
65.3 (31.7min - 96.9max) fps
AMD Radeon RX 7900 XTX
Radeon RX 7900 XTX, R9 7950X
64.6 (49.1min - 85.9max) fps -1%
AMD Radeon RX 7900 XT
Radeon RX 7900 XT, R9 7950X
57.1 (41.7min - 77.1max) fps -13%
Media NVIDIA GeForce RTX 3080 Ti Laptop GPU
  (39.2 - 49.9, n=7)
43.3 fps -34%
Media NVIDIA GeForce RTX 3070 Ti Laptop GPU
  (27.9 - 63, n=7)
36.8 fps -44%
Media NVIDIA GeForce RTX 3080 Laptop GPU
  (34.6 - 37.8, n=2)
36.2 fps -45%
Media NVIDIA GeForce RTX 3060 Laptop GPU
  (12.6 - 28.9, n=7)
23.9 fps -63%
Media AMD Radeon RX 6800M
  ()
23.5 fps -64%
Media AMD Radeon RX 6600M
  (15.6 - 26.6, n=2)
21.1 fps -68%
3840x2160 Ray Tracing Ultra Preset (DLSS off)
NVIDIA GeForce RTX 4090 Founders Edition
NVIDIA GeForce RTX 4090, i9-13900K
42.6 (32min - 55.4max) fps +121%
NVIDIA GeForce RTX 4080 Founders Edition
NVIDIA GeForce RTX 4080, i9-13900K
30.7 (23.5min - 40.6max) fps +59%
Asus TUF Gaming GeForce RTX 4070 Ti
NVIDIA GeForce RTX 4070 Ti, i9-13900K
23.7 (18.1min - 31.3max) fps +23%
SCHENKER XMG Neo 16 Raptor Lake
NVIDIA GeForce RTX 4090 Laptop GPU, i9-13900HX
22.43 (17.52min - 31.11max) fps +16%
MSI Titan GT77 HX 13VI
NVIDIA GeForce RTX 4090 Laptop GPU, i9-13950HX, Samsung PM9A1 MZVL22T0HBLB
22 fps +14%
Media NVIDIA GeForce RTX 3090
  (19.8 - 22.1, n=5)
21 fps +9%
AMD Radeon RX 7900 XTX
Radeon RX 7900 XTX, R9 7950X
20.7 (14.4min - 28.9max) fps +7%
Razer Blade 16 Early 2023
NVIDIA GeForce RTX 4080 Laptop GPU, i9-13950HX, SSSTC CA6-8D1024
19.3 (13.3min - 26.5max) fps
AMD Radeon RX 7900 XT
Radeon RX 7900 XT, R9 7950X
17.6 (12min - 25max) fps -9%
Media NVIDIA GeForce RTX 3080 Ti Laptop GPU
  (9.22 - 12.3, n=3)
10.9 fps -44%
Media NVIDIA GeForce RTX 3080 Laptop GPU
  (10.2 - 10.7, n=2)
10.5 fps -46%
Media AMD Radeon RX 6600M
  ()
6.77 fps -65%
Media AMD Radeon RX 6800M
  ()
6.6 fps -66%
Media NVIDIA GeForce RTX 3070 Ti Laptop GPU
  ()
5.29 fps -73%
Ghostwire Tokyo - 1920x1080 Highest Settings + Maximum Ray Tracing
NVIDIA GeForce RTX 4090 Founders Edition
NVIDIA GeForce RTX 4090, i9-13900K
193.7 (38.5min, 66.5P0.1, 142.5P1 - 275max) fps +100%
NVIDIA GeForce RTX 4080 Founders Edition
NVIDIA GeForce RTX 4080, i9-13900K
166.2 (30.4min, 60P0.1, 115.2P1 - 248max) fps +71%
Asus TUF Gaming GeForce RTX 4070 Ti
NVIDIA GeForce RTX 4070 Ti, i9-13900K
139.3 (31.3min, 53.2P0.1, 89.7P1 - 236max) fps +44%
AMD Radeon RX 7900 XTX
Radeon RX 7900 XTX, R9 7950X
136.3 (39.1min, 76.4P0.1, 95.8P1 - 243max) fps +41%
MSI Titan GT77 HX 13VI
NVIDIA GeForce RTX 4090 Laptop GPU, i9-13950HX, Samsung PM9A1 MZVL22T0HBLB
127 fps +31%
SCHENKER XMG Neo 16 Raptor Lake
NVIDIA GeForce RTX 4090 Laptop GPU, i9-13900HX
125.9 (35.6P0.1, 87.3P1) fps +30%
AMD Radeon RX 7900 XT
Radeon RX 7900 XT, R9 7950X
116.5 (30.3min, 71.6P0.1, 78.1P1 - 246max) fps +20%
Media NVIDIA GeForce RTX 3090
  (106 - 122, n=3)
111.6 fps +15%
Razer Blade 16 Early 2023
NVIDIA GeForce RTX 4080 Laptop GPU, i9-13950HX, SSSTC CA6-8D1024
97 fps
Media NVIDIA GeForce RTX 3080 Ti Laptop GPU
  (66.1 - 68.3, n=2)
67.2 fps -31%
Media NVIDIA GeForce RTX 3080 Laptop GPU
  (64.7 - 65.9, n=2)
65.3 fps -33%
Media NVIDIA GeForce RTX 3070 Ti Laptop GPU
  (48.9 - 59.9, n=3)
55.3 fps -43%
Media NVIDIA GeForce RTX 3060 Laptop GPU
  ()
46.6 fps -52%
Media AMD Radeon RX 6800M
  ()
46.6 fps -52%

Prestazioni DLSS 3

La tabella seguente illustra i vantaggi di DLSS 3 nei titoli supportati con la GPU RTX 4090 Laptop di MSI Titan GT77 HX 13V.

Rispetto al 4K nativo, DLSS 3 in modalità Balanced mostra vantaggi prestazionali fenomenali con impostazioni 4K Ultra. Cyberpunk 2077 è stato per qualche tempo l'esempio di Nvidia per le prestazioni del ray-tracing e del DLSS, e di conseguenza vediamo uno stupefacente guadagno del 331% in fps medi dopo aver attivato il DLSS 3 rispetto al 4K nativo a impostazioni Ultra.

Gioco Impostazione DLSS off DLSS on (Balanced) Differenza
Spider-Man Miles Morales 4K Ultra 83 FPS 132 FPS +59 %
The Witcher 3 4.00 4K RT Ultra 27 FPS 50 FPS +85 %
Cyberpunk 2077 1.5 4K RT Ultra 22 FPS 95 FPS +331 %
God of War 4K Ultra 80 FPS 111 FPS +38 %
Horizon Zero Dawn 4K Ultra 95 FPS 143 FPS +51 %

MSI Titan GT77 HX 13VI

basso medio alto ultraQHD4K DLSS4K
GTA V (2015) 184.1 182.6 140.9 138.5 175.7
The Witcher 3 (2015) 619 546 422 198.9 160
Dota 2 Reborn (2015) 225 206 194.1 185.9 178.9
Final Fantasy XV Benchmark (2018) 230 221 187.4 162.9 94.7
X-Plane 11.11 (2018) 203 177.5 134.1 114.3
Far Cry 5 (2018) 186 173 160 159 113
Strange Brigade (2018) 490 396 391 373 309 159.3
Shadow of the Tomb Raider (2018) 245 227 219 214 187 103
Metro Exodus (2019) 204 183 153 132 116 81
Control (2019) 240 232 187 122 63
Borderlands 3 (2019) 201 176 162 151 130 76
Horizon Zero Dawn (2020) 209 189 174 163 154 131 95
Mafia Definitive Edition (2020) 219 189 179 161 93
Watch Dogs Legion (2020) 152 144 131 120 109 69
F1 2021 (2021) 501 449 417 209 192.4 114.4
Far Cry 6 (2021) 167 147 144 135 89
Forza Horizon 5 (2021) 220 181 174 124 113 95
God of War (2022) 201 200 180 133 115 80
Rainbow Six Extraction (2022) 378 347 346 314 219 112
Dying Light 2 (2022) 240 206 174 121 62
GRID Legends (2022) 254 230 210 199 190 132
Cyberpunk 2077 1.6 (2022) 156 144 138 135 98 56
Ghostwire Tokyo (2022) 237 236 234 231 206 100
Tiny Tina's Wonderlands (2022) 339 289 224 182 131 70
F1 22 (2022) 316 294 283 138.2 90.1 44.9
Call of Duty Modern Warfare 2 2022 (2022) 230 215 183 176 135 126 85
Spider-Man Miles Morales (2022) 134 131 118 116 113 83
The Callisto Protocol (2022) 195 181 145 144 114 68
The Witcher 3 v4.00 (2023) 240 189 173 150 104 50
Dead Space Remake (2023) 147 141 130 129 100 53

Razer Blade 16 Early 2023

basso medio alto ultraQHD4K DLSS4K FSR4K
GTA V (2015) 186.6 185.2 183.4 140.7 125.2 143.7
The Witcher 3 (2015) 609.6 462.7 353.5 176.8 120.6
Dota 2 Reborn (2015) 218 204 196 194.7 176.7
Final Fantasy XV Benchmark (2018) 195.8 184.1 157.8 120.1 74.1
X-Plane 11.11 (2018) 201 177.7 137 117.5
Strange Brigade (2018) 438 365 351 323 237 122.3
Shadow of the Tomb Raider (2018) 228 201 196 176 154 84
Metro Exodus (2019) 197 170.4 145 121.7 102 67
Control (2019) 239.1 204.7 157 102 50.1
Borderlands 3 (2019) 207.7 176.6 158.1 133.5 108.7 59.8
Mafia Definitive Edition (2020) 280.3 184 171.3 121.6 70.4
Watch Dogs Legion (2020) 140 129 121 110 93 56
Far Cry 6 (2021) 181 149 134 125 115 71
Dying Light 2 (2022) 184.1 160.4 140.9 97.8 48.6
Cyberpunk 2077 1.6 (2022) 121.1 118.1 113.8 106.2 81.2 40
Ghostwire Tokyo (2022) 198.7 159.6 154 145 135.9 73.1
The Callisto Protocol (2022) 177.8 159.8 119.9 120.4 93.1 55.3
Skull & Bones (2024) 50
Horizon Forbidden West (2024) 56.1 54.8 39.5

Schenker XMG Neo 16

basso medio alto ultraQHD4K
GTA V (2015) 137.5 137.7 88.9
The Witcher 3 (2015) 216.4 137.1
Dota 2 Reborn (2015) 227 202 191.2 177.3 179.4
Final Fantasy XV Benchmark (2018) 180.7 158 91.5
X-Plane 11.11 (2018) 204 179.7 135.5 124.2
Strange Brigade (2018) 482 396 372 350 311 160.3
Shadow of the Tomb Raider (2018) 207 168 103
Metro Exodus (2019) 131.51 117.44 83.98
Control (2019) 183.7 121.9 63.5
Borderlands 3 (2019) 176 132.34 70.5
Mafia Definitive Edition (2020) 187.9 168.1 91.8
Watch Dogs Legion (2020) 127 113 71
Assassin´s Creed Valhalla (2020) 161 130 78
Far Cry 6 (2021) 139 134 92
Dying Light 2 (2022) 171.8 118.4 61.7
Cyberpunk 2077 1.6 (2022) 122.8 94.26 49.15
Ghostwire Tokyo (2022) 230.1 196.8 97.7
Tiny Tina's Wonderlands (2022) 189.4 135.8 73.7
F1 22 (2022) 137.4 90.5 45.3
Call of Duty Modern Warfare 2 2022 (2022) 181 137 86
Spider-Man Miles Morales (2022) 121.4 115.7 84.2
The Callisto Protocol (2022) 143.5 116.5 69.8
The Witcher 3 v4.00 (2023) 141.8 102.9 52.8

Test da sforzo

I modelli di laptop testati non hanno mostrato alcuna incongruenza significativa dovuta al throttling termico quando sono stati stressati con The Witcher 3 a 1080p Ultra.

La RTX 4090 della Titan GT77 HX 13V sembra avere qualche problema a sostenere il framerate iniziale, ma riesce a recuperare dopo qualche tempo. L'implementazione RTX 4090 di XMG Neo 16 se la cava leggermente meglio da questo punto di vista.

La RTX 4080 del Razer Blade 16, invece, è in grado di affrontare bene questo stress test.

0153045607590105120135150165180195210Tooltip
Razer Blade 16 Early 2023 NVIDIA GeForce RTX 4080 Laptop GPU, i9-13950HX, SSSTC CA6-8D1024; The Witcher 3: Ø166.9 (141-179)
SCHENKER XMG Neo 16 Raptor Lake NVIDIA GeForce RTX 4090 Laptop GPU, i9-13900HX; The Witcher 3: Ø204 (195-219)
MSI Titan GT77 HX 13VI NVIDIA GeForce RTX 4090 Laptop GPU, i9-13950HX, Samsung PM9A1 MZVL22T0HBLB; The Witcher 3: Ø198.9 (190-214)

Consumo energetico: RTX 4090 mobile è più efficiente del 53% rispetto alla GPU RTX 3080 Ti per computer portatili

Il consumo di energia dalla parete nel caso delle GPU per laptop non è realmente paragonabile a quello osservato con le parti per desktop. In effetti, la scheda RTX 4090 Founders Edition da sola è in grado di assorbire più di 700 W sotto carico se configurata per utilizzare un target di potenza più elevato.

L'aspetto interessante è che ora si ottengono molte più prestazioni per Watt rispetto a qualsiasi altra GPU mobile Nvidia fino ad oggi.

Ad esempio, la MSI Titan GT77 12UHS con RTX 3080 Ti ha un consumo totale di sistema simile a quello della Titan GT77 HX 13V con circa 248 W in The Witcher 3 a 1080p ultra e circa l'11% in più di 241 W in FurMark (1280 x 720, senza AA). Tuttavia, la Titan GT77 HX 13V ha un'efficienza energetica superiore del 53% in The Witcher 3 rispetto al suo predecessore di 12a generazione.

Il Razer Blade 16 con la sua GPU RTX 4080 Laptop consuma il 7% in più (236 W) rispetto al Blade 17 con una GPU RTX 3080 Ti Laptop (220 W) in The Witcher 3. Nonostante il consumo energetico complessivo sia leggermente superiore, il nuovo Blade 16 con la GPU RTX 4080 Laptop ha un'efficienza energetica superiore del 32% rispetto al Blade 17, nonostante la RTX 3080 Ti di quest'ultimo sia configurata a 165 W.

Questo dato è in linea con il fatto che Nvidia ha progettato Ada per essere molto più efficiente dal punto di vista energetico rispetto ad Ampere. A parte i vantaggi del processo 4N personalizzato, la GPU Ada cerca di raggiungere i limiti massimi di clock e tensione prima di aumentare la potenza, ottenendo prestazioni più elevate e una maggiore efficienza a parità di potenza rispetto ad Ampere.

Power consumption: External monitor

04080120160200240280320360400440480520560600640680Tooltip
Razer Blade 16 Early 2023 NVIDIA GeForce RTX 4080 Laptop GPU, i9-13950HX, SSSTC CA6-8D1024; Power Consumption; 1920x1080 The Witcher 3 ultra (external Monitor): Ø236 (225-245)
MSI Titan GT77 HX 13VI NVIDIA GeForce RTX 4090 Laptop GPU, i9-13950HX, Samsung PM9A1 MZVL22T0HBLB; Power Consumption; 1920x1080 The Witcher 3 ultra (external Monitor): Ø250 (245-260)
NVIDIA GeForce RTX 4090 Founders Edition NVIDIA GeForce RTX 4090, i9-13900K; Power Consumption; 1920x1080 The Witcher 3 ultra (external Monitor); 133% PT OC: Ø552 (541-569)
NVIDIA GeForce RTX 4090 Founders Edition NVIDIA GeForce RTX 4090, i9-13900K; Power Consumption; 1920x1080 The Witcher 3 ultra (external Monitor); 100% PT: Ø499 (493-519)
NVIDIA GeForce RTX 4080 Founders Edition NVIDIA GeForce RTX 4080, i9-13900K; Power Consumption; 1920x1080 The Witcher 3 ultra (external Monitor); 110% PT: Ø463 (451-481)
NVIDIA GeForce RTX 4080 Founders Edition NVIDIA GeForce RTX 4080, i9-13900K; Power Consumption; 1920x1080 The Witcher 3 ultra (external Monitor); 100% PT: Ø420 (410-448)
Razer Blade 16 Early 2023 NVIDIA GeForce RTX 4080 Laptop GPU, i9-13950HX, SSSTC CA6-8D1024; Power Consumption; 1280x720 FurMark 1.19 GPU Stress Test (external Monitor): Ø242 (232-253)
MSI Titan GT77 HX 13VI NVIDIA GeForce RTX 4090 Laptop GPU, i9-13950HX, Samsung PM9A1 MZVL22T0HBLB; Power Consumption; 1280x720 FurMark 1.19 GPU Stress Test (external Monitor): Ø218 (183.4-250)
NVIDIA GeForce RTX 4090 Founders Edition NVIDIA GeForce RTX 4090, i9-13900K; Power Consumption; 1280x720 FurMark 1.19 GPU Stress Test (external Monitor); 133% PT OC: Ø704 (666-717)
NVIDIA GeForce RTX 4090 Founders Edition NVIDIA GeForce RTX 4090, i9-13900K; Power Consumption; 1280x720 FurMark 1.19 GPU Stress Test (external Monitor); 100% PT: Ø558 (551-566)
NVIDIA GeForce RTX 4080 Founders Edition NVIDIA GeForce RTX 4080, i9-13900K; Power Consumption; 1280x720 FurMark 1.19 GPU Stress Test (external Monitor); 110% PT: Ø466 (461-488)
NVIDIA GeForce RTX 4080 Founders Edition NVIDIA GeForce RTX 4080, i9-13900K; Power Consumption; 1280x720 FurMark 1.19 GPU Stress Test (external Monitor); 100% PT: Ø429 (423-436)
Power Consumption / The Witcher 3 ultra (external Monitor)
NVIDIA GeForce RTX 4090 Founders Edition
NVIDIA GeForce RTX 4090, i9-13900K (133% PT OC, Idle: 81.25 W)
552 (541min, 545P1 - 569max) Watt * -134%
NVIDIA GeForce RTX 4090 Founders Edition
NVIDIA GeForce RTX 4090, i9-13900K (100% PT, Idle: 81.25 W)
499 (493min, 494P1 - 519max) Watt * -111%
AMD Radeon RX 7900 XTX
Radeon RX 7900 XTX, R9 7950X (Idle: 86.5 W)
540 (527min, 530P1 - 564max) Watt * -129%
Media NVIDIA GeForce RTX 3090
  (Idle: 464 - 597, n=17 W)
524 Watt * -122%
NVIDIA GeForce RTX 4080 Founders Edition
NVIDIA GeForce RTX 4080, i9-13900K (110% PT, Idle: 78.45 W)
463 (451min, 453P1 - 481max) Watt * -96%
NVIDIA GeForce RTX 4080 Founders Edition
NVIDIA GeForce RTX 4080, i9-13900K (100% PT, Idle: 78.45 W)
420 (410min, 411P1 - 448max) Watt * -78%
AMD Radeon RX 7900 XT
Radeon RX 7900 XT, R9 7950X (Idle: 84.6 W)
459 (451min, 453P1 - 488max) Watt * -94%
Asus TUF Gaming GeForce RTX 4070 Ti
NVIDIA GeForce RTX 4070 Ti, i9-13900K (Perf BIOS / 110% PT, Idle: 75.4 W)
422 (412min, 413P1 - 452max) Watt * -79%
Asus TUF Gaming GeForce RTX 4070 Ti
NVIDIA GeForce RTX 4070 Ti, i9-13900K (Perf BIOS / 100% PT, Idle: 75.4 W)
419 (414min, 415P1 - 438max) Watt * -78%
Asus TUF Gaming GeForce RTX 4070 Ti
NVIDIA GeForce RTX 4070 Ti, i9-13900K (Quiet BIOS / 100% PT, Idle: 75.4 W)
418 (411min, 412P1 - 433max) Watt * -77%
MSI Titan GT77 HX 13VI
NVIDIA GeForce RTX 4090 Laptop GPU, i9-13950HX, Samsung PM9A1 MZVL22T0HBLB
250 (245min, 246P1 - 260max) Watt * -6%
MSI Titan GT77 12UHS
GeForce RTX 3080 Ti Laptop GPU, i9-12900HX, Samsung PM9A1 MZVL21T0HCLR
248 (242min, 244P1 - 259max) Watt * -5%
Razer Blade 16 Early 2023
NVIDIA GeForce RTX 4080 Laptop GPU, i9-13950HX, SSSTC CA6-8D1024
236 (225min, 225P1 - 245max) Watt *
Razer Blade 17 Early 2022
GeForce RTX 3080 Ti Laptop GPU, i9-12900H, Samsung PM9A1 MZVL21T0HCLR
220 (215min, 215P1 - 227max) Watt * +7%
Media NVIDIA GeForce RTX 3080 Ti Laptop GPU
  (Idle: 144 - 287, n=27 W)
213 Watt * +10%
Media AMD Radeon RX 6800M
  (Idle:  W)
211 Watt * +11%
Media NVIDIA GeForce RTX 3080 Laptop GPU
  (Idle: 124 - 244, n=25 W)
183.8 Watt * +22%
Media AMD Radeon RX 6700M
  (Idle:  W)
182 Watt * +23%
Media NVIDIA GeForce RTX 3070 Ti Laptop GPU
  (Idle: 115 - 234, n=25 W)
181 Watt * +23%
Media AMD Radeon RX 6600M
  (Idle: 124 - 191, n=6 W)
164.5 Watt * +30%
Media NVIDIA GeForce RTX 3060 Laptop GPU
  (Idle: 107.5 - 191, n=38 W)
148.9 Watt * +37%
Power Consumption / FurMark 1.19 GPU Stress Test (external Monitor)
NVIDIA GeForce RTX 4090 Founders Edition
NVIDIA GeForce RTX 4090, i9-13900K (133% PT OC, Idle: 81.25 W)
704 (666min, 670P1 - 717max) Watt * -191%
NVIDIA GeForce RTX 4090 Founders Edition
NVIDIA GeForce RTX 4090, i9-13900K (100% PT, Idle: 81.25 W)
558 (551min, 553P1 - 566max) Watt * -131%
AMD Radeon RX 7900 XTX
Radeon RX 7900 XTX, R9 7950X (Idle: 86.5 W)
518 (501min, 502P1 - 525max) Watt * -114%
AMD Radeon RX 7900 XT
Radeon RX 7900 XT, R9 7950X (Idle: 84.6 W)
513 (500min, 506P1 - 527max) Watt * -112%
Media NVIDIA GeForce RTX 3090
  (Idle: 281 - 551, n=8 W)
469 Watt * -94%
NVIDIA GeForce RTX 4080 Founders Edition
NVIDIA GeForce RTX 4080, i9-13900K (110% PT, Idle: 78.45 W)
466 (461min, 462P1 - 488max) Watt * -93%
NVIDIA GeForce RTX 4080 Founders Edition
NVIDIA GeForce RTX 4080, i9-13900K (100% PT, Idle: 78.45 W)
429 (423min, 424P1 - 436max) Watt * -77%
Asus TUF Gaming GeForce RTX 4070 Ti
NVIDIA GeForce RTX 4070 Ti, i9-13900K (Perf BIOS / 110% PT, Idle: 75.4 W)
443 (440min, 440P1 - 465max) Watt * -83%
Asus TUF Gaming GeForce RTX 4070 Ti
NVIDIA GeForce RTX 4070 Ti, i9-13900K (Quiet BIOS / 100% PT, Idle: 75.4 W)
410 (408min, 409P1 - 415max) Watt * -69%
Asus TUF Gaming GeForce RTX 4070 Ti
NVIDIA GeForce RTX 4070 Ti, i9-13900K (Perf BIOS / 100% PT, Idle: 75.4 W)
406 (401min, 402P1 - 430max) Watt * -68%
Razer Blade 16 Early 2023
NVIDIA GeForce RTX 4080 Laptop GPU, i9-13950HX, SSSTC CA6-8D1024
242 (232min, 234P1 - 253max) Watt *
MSI Titan GT77 12UHS
GeForce RTX 3080 Ti Laptop GPU, i9-12900HX, Samsung PM9A1 MZVL21T0HCLR
241 (230min, 231P1 - 249max) Watt * -0%
Razer Blade 17 Early 2022
GeForce RTX 3080 Ti Laptop GPU, i9-12900H, Samsung PM9A1 MZVL21T0HCLR
221 (213min, 216P1 - 227max) Watt * +9%
MSI Titan GT77 HX 13VI
NVIDIA GeForce RTX 4090 Laptop GPU, i9-13950HX, Samsung PM9A1 MZVL22T0HBLB
218 (183.4min, 211P1 - 250max) Watt * +10%
Media NVIDIA GeForce RTX 3080 Ti Laptop GPU
  (Idle: 139.2 - 288, n=28 W)
203 Watt * +16%
Media AMD Radeon RX 6800M
  (Idle:  W)
198.4 Watt * +18%
Media NVIDIA GeForce RTX 3080 Laptop GPU
  (Idle: 122 - 254, n=26 W)
175.4 Watt * +28%
Media NVIDIA GeForce RTX 3070 Ti Laptop GPU
  (Idle: 123.6 - 211, n=27 W)
175.1 Watt * +28%
Media AMD Radeon RX 6600M
  (Idle: 113 - 187, n=6 W)
166 Watt * +31%
Media AMD Radeon RX 6700M
  (Idle:  W)
155 Watt * +36%
Media NVIDIA GeForce RTX 3060 Laptop GPU
  (Idle: 94.1 - 202, n=38 W)
145.4 Watt * +40%
Power Consumption / Witcher 3 ultra Efficiency (external Monitor)
MSI Titan GT77 HX 13VI
NVIDIA GeForce RTX 4090 Laptop GPU, i9-13950HX, Samsung PM9A1 MZVL22T0HBLB
0.796 fps per Watt +12%
Razer Blade 16 Early 2023
NVIDIA GeForce RTX 4080 Laptop GPU, i9-13950HX, SSSTC CA6-8D1024
0.71 fps per Watt
Media NVIDIA GeForce RTX 3080 Laptop GPU
  (0.4696 - 0.736, n=23)
0.583 fps per Watt -18%
Media NVIDIA GeForce RTX 3070 Ti Laptop GPU
  (0.4399 - 0.97, n=24)
0.579 fps per Watt -18%
AMD Radeon RX 7900 XT
Radeon RX 7900 XT, R9 7950X
0.577 fps per Watt -19%
Media NVIDIA GeForce RTX 3080 Ti Laptop GPU
  (0.4432 - 0.69, n=26)
0.555 fps per Watt -22%
AMD Radeon RX 7900 XTX
Radeon RX 7900 XTX, R9 7950X
0.55 fps per Watt -23%
NVIDIA GeForce RTX 4080 Founders Edition
NVIDIA GeForce RTX 4080, i9-13900K
0.549 fps per Watt -23%
Asus TUF Gaming GeForce RTX 4070 Ti
NVIDIA GeForce RTX 4070 Ti, i9-13900K
0.545 fps per Watt -23%
Razer Blade 17 Early 2022
GeForce RTX 3080 Ti Laptop GPU, i9-12900H, Samsung PM9A1 MZVL21T0HCLR
0.544 fps per Watt -23%
NVIDIA GeForce RTX 4090 Founders Edition
NVIDIA GeForce RTX 4090, i9-13900K
0.538 fps per Watt -24%
Media NVIDIA GeForce RTX 3060 Laptop GPU
  (0.4181 - 0.651, n=33)
0.538 fps per Watt -24%
Media AMD Radeon RX 6700M
  ()
0.524 fps per Watt -26%
MSI Titan GT77 12UHS
GeForce RTX 3080 Ti Laptop GPU, i9-12900HX, Samsung PM9A1 MZVL21T0HCLR
0.521 fps per Watt -27%
Media AMD Radeon RX 6600M
  (0.4398 - 0.608, n=6)
0.519 fps per Watt -27%
Media NVIDIA GeForce RTX 3090
  (0.268 - 0.3954, n=14)
0.3429 fps per Watt -52%

* ... Meglio usare valori piccoli

Il verdetto: Prestazioni di classe RTX 3090 per desktop a 175 W

Le GPU Nvidia Ada RTX 40 Laptop offrono prestazioni eccellenti ed efficienza energetica. (Fonte: Nvidia)

La generazione Ampere di Nvidia aveva molto da offrire in termini di prestazioni rispetto a Turing, ma il suo lancio è avvenuto in un momento in cui l'ordine globale stava andando in tilt.

Di conseguenza, le schede erano poco disponibili e a prezzi eccessivi, il che ha portato a ogni sorta di scalping. Insieme al boom delle criptovalute, volubile ed effimero, molti giocatori ritennero che fosse economicamente sensato optare per i computer portatili alimentati ad Ampere invece che per le schede desktop.

Arriviamo al 2023 e la maggior parte di queste esperienze strazianti sono ormai alle spalle. Le ultime GPU Ada di Nvidia hanno stabilito parametri di riferimento molto elevati in termini di prestazioni ed efficienza energetica, tanto da sembrare un vero e proprio salto generazionale.

Siamo rimasti molto colpiti dalle prestazioni di Ada sul desktop e siamo felici di vedere che la maggior parte di questi vantaggi si sta traducendo anche sul versante dei portatili.

Le GPU Nvidia RTX 4080 e RTX 4090 per laptop mostrano abilmente i punti di forza di Ada in termini di prestazioni ed efficienza, con la prima che ha prestazioni più o meno simili a quelle di una RTX 3090 da 350 W per desktop. Tuttavia, questi vantaggi si notano solo con le specifiche di fascia più alta che consumano 175 W.

Tuttavia, non tutto va bene con Ada mobile. I dispositivi che abbiamo testato consentivano alle RTX 4080 e RTX 4090 di mostrare pienamente i loro muscoli a 150 W con 25 W aggiuntivi di Dynamic Boost. Non tutti i portatili in circolazione permetteranno a queste GPU di funzionare a questi TDP.

E anche quelli che lo fanno non sono esattamente portatili: il solo alimentatore della Titan GT77 pesa 1,4 kg e i suoi livelli di rumore sotto carico massimo possono dare l'impressione di essere seduti nella cabina di pilotaggio di un F16.

L'altro problema è il marchio fuorviante di Nvidia. Il cliente medio generalmente si relaziona meglio con il marchio numerico che con le specifiche effettive della GPU, quindi qualcuno a Santa Clara ha pensato che fosse perfettamente sensato dal punto di vista del marketing battezzare la top dog come RTX 4090 Laptop GPU solo perché ha prestazioni migliori di una RTX 3090 desktop!

Ma coloro che cercano i laptop con RTX 4090 non sono i tipici consumatori medi. E non parliamo nemmeno di tutti i problemi di prestazioni che ci si può aspettare con un TDP compreso tra 80 e 150 W.

Il prezzo è un altro fattore importante da considerare. I portatili che abbiamo utilizzato in questo confronto hanno il potenziale per fare un bel buco nelle vostre tasche. Tanto che l'acquisto di un'auto usata potrebbe sembrare un investimento migliore. Ma questa è la natura dei dispositivi di punta in generale.

Detto questo, Ada mobile è un passo avanti nella giusta direzione. I vantaggi riscontrati con le configurazioni di fascia alta si ripercuoteranno sicuramente anche sulle offerte di fascia media e entry-level, e caratteristiche come DLSS 3 contribuiranno sicuramente ad accelerare l'adozione di Ada tra i giocatori mobili.

Avremo un quadro più completo dei miglioramenti dell'efficienza di Ada mobile quando, nei prossimi mesi, testeremo altri portatili RTX 40 configurati con vari TDP.

Speriamo che anche i dispositivi AMD RDNA 3 siano disponibili in quantità significative e che siano in grado di competere a vantaggio di tutti noi.

Pricecompare

Please share our article, every link counts!
> Recensioni e prove di notebook, tablets e smartphones > Recensioni e prove > Recensioni e prove > Analisi della GPU per laptop Nvidia Ada RTX 40: la GPU per laptop RTX 4090 da 175 W supera la RTX 3090 da 350 W in termini di prestazioni ed efficienza energetica
Vaidyanathan Subramaniam, 2023-02-10 (Update: 2023-02-10)