Notebookcheck Logo

Recensione dell'Asus TUF Gaming GeForce RTX 4070 Ti: Ada mid-ranger con prestazioni RTX 3090 Ti, inferiore alla Radeon RX 7900 XT di AMD di 50 dollari

TUF pareggia con la 3090 Ti. La Nvidia GeForce RTX 4070 Ti viene lanciata in un momento in cui i giocatori si trovano di fronte a un dilemma di acquisto. La Asus TUF Gaming GeForce RTX 4070 Ti è una delle tante offerte dei partner per la GPU AD104. Nvidia sostiene che la RTX 4070 Ti può competere con la RTX 3090 Ti in termini di prestazioni. Nella nostra recensione valutiamo questa affermazione e confrontiamo anche la posizione dell'AD104 rispetto alle offerte concorrenti di AMD Radeon RDNA 3.

Nota: questa è una recensione in corso. Le misure di temperatura, rumore, potenza e altre caratteristiche della scheda verranno aggiunte a breve

Confronto tra la TUF Gaming RTX 4070 Ti e altre GPU Nvidia

Specifiche RTX 4090 FE RTX 4080 FE TUF Gaming RTX 4070 Ti RTX 3090 Ti FE RTX 3090 FE RTX 3080 Ti FE RTX 3080 FE RTX 3070 FE Titan RTX Titan X Pascal
Chip AD102 AD103 AD104 GA102 GA102 GA102 GA102 GA104 TU102 GP102
Processo FinFET Custom 4N Custom 4N Custom 4N 8 nm 8 nm 8 nm 8 nm 8 nm 12 nm 16 nm
CUDA Cores 16.384 9.728 7.680 10.752 10.496 10.240 8.704 5.888 4.608 3.584
Unità di texture 512 304 240 336 328 320 272 184 288 224
Tensor Cores 512 4th Gen. 304 4th Gen. 240 4th Gen. 336 3rd Gen. 328 3rd Gen. 320 3rd Gen. 272 3rd Gen. 184 3rd Gen. 576 2nd Gen. -
RT Cores 128 di terza generazione 76 di terza generazione 60 di terza generazione 84 di seconda generazione 82 di seconda generazione 80 di seconda generazione 68 di seconda generazione 46 di seconda generazione 72 -
GPU Base Clock 2.235 MHz 2.205 MHz 2.310 MHz 1.560 MHz 1.395 MHz 1.365 MHz 1.440 MHz 1.500 MHz 1.350 MHz 1.417 MHz
GPU Boost Clock 2.520 MHz 2.505 MHz 2.760 MHz 1.860 MHz 1.695 MHz 1.665 MHz 1.710 MHz 1.750 MHz 1.770 MHz 1.531 MHz
Bus di memoria 384-bit 256-bit 192-bit 384-bit 384-bit 384-bit 320-bit 256-bit 384-bit 384-bit
Larghezza di banda della memoria 1.008 GB/s 716,8 GB/s 504 GB/s 1.008 GB/s 936 GB/s 912 GB/s 760 GB/s 448 GB/s 672 GB/s 480,4 GB/s
Memoria video 24 GB GDDR6X 16 GB GDDR6X 12 GB GDDR6X 24 GB GDDR6X 24 GB GDDR6X 12 GB GDDR6X 10 GB GDDR6X 8 GB GDDR6 24 GB GDDR6 12 GB GDDR5X
Consumo energetico 450 W 320 W 285 W 450 W 350 W 350 W 320 W 220 W 280 W 250 W

Il banco di prova: TUF Gaming RTX 4070 Ti incontra l'Intel Core i9-13900K

Il sistema di prova è in gran parte identico a quello che abbiamo utilizzato per le nostre recensioni della RTX 4090 FE e della RTX 4080 FE. Include i seguenti componenti:

  • Banco di prova Cooler MasterFrame 700
  • Intel Core i9-13900K
  • Scheda madre Gigabyte Z790 Aorus Master
  • Gigabyte Aorus Gen 4 2 TB NVMe SSD per i benchmark e i giochi
  • 2x 16 GB di RAM Kingston Fury Renegade DDR5-6400 con timing 32-39-39-80 a 1,40 V
  • Monitor Gigabyte M28U 4K 144 Hz
  • Raffreddatore AIO Cooler Master MasterLiquid ML360L V2 ARGB
  • Thermaltake ToughPower Grand RGB 850 W
  • È stata utilizzata una nuova installazione di Windows 11 22H2 con le ultime patch e il driver di test Game Ready versione 527.62

Ringraziamo Cooler Master per averci fornito il banco di prova e l'AIO, Gigabyte per il Core i9-13900K, la scheda madre Z790, il monitor M28U e l'SSD NVMe e Kingston per la memoria.

Parametri sintetici: supera di poco la RTX 3090 Ti mentre cerca di raggiungere la RX 7900 XT

L'Asus TUF Gaming RTX 4070 Ti si colloca in una posizione di vantaggio rispetto allaAMD Radeon RX 7900 XTdel 16% in Fire Strike Graphics e del 10% rispetto alla RTX 4080 Founders Edition.

Il divario con la RX 7900 XT si allarga fino al 21% in Fire Strike Ultra e Fire Strike Extreme. La Radeon RX 7900 XTXè molto più avanti della TUF Gaming RTX 4070 Ti, con un vantaggio fino al 49% in Fire Strike Ultra.

Time Spy Per quanto riguarda la grafica, la TUF Gaming RTX 4070 Ti subisce un calo del 18% rispetto alla RTX 4080 e un calo dell'11% rispetto alla RX 7900 XT.

Sebbene sia ancora in ritardo, la TUF Gaming RTX 4070 Ti è in grado di ridurre il divario con la RX 7900 XT, mentre si comporta generalmente alla pari con la RTX 3090 Ti in vari test Unigine. Non sorprende che la RTX 4090 FE regni sovrana in Unigine Superposition con le impostazioni 4K ottimizzate e 8K ottimizzate.

Nel complesso, l'Asus TUF Gaming RTX 4070 Ti è leggermente superiore alla RTX 3090 Ti nelle prestazioni complessive dei benchmark sintetici, che comprendono vari test 3DMark e Unigine. La nuova GPU AD104 non è troppo lontana dalla RX 700 XT, ma non può competere con RX 7900 XTX e RTX 4080.

Non abbiamo notato cali di prestazioni evidenti in alcuni test 3DMark in modalità Quiet BIOS.

Performance Rating - Percent
NVIDIA GeForce RTX 4090
Intel Core i9-13900K, NVIDIA GeForce RTX 4090
99.9 pt
AMD Radeon RX 7900 XTX
AMD Ryzen 9 7950X, AMD Radeon RX 7900 XTX
82.5 pt
NVIDIA GeForce RTX 4080
Intel Core i9-13900K, NVIDIA GeForce RTX 4080
81.2 pt
AMD Radeon RX 7900 XT
AMD Ryzen 9 7950X, AMD Radeon RX 7900 XT
72.8 pt
Asus TUF Gaming GeForce RTX 4070 Ti
Intel Core i9-13900K, NVIDIA GeForce RTX 4070 Ti
67.5 pt
NVIDIA GeForce RTX 3090 Ti
AMD Ryzen 7 5800X3D, NVIDIA GeForce RTX 3090 Ti
66.1 pt
NVIDIA GeForce RTX 3090
Intel Core i9-13900K, NVIDIA GeForce RTX 3090
63.1 pt
AMD Radeon RX 6950 XT
AMD Ryzen 9 5900X, AMD Radeon RX 6950 XT
62.6 pt
Media NVIDIA GeForce RTX 3080 Ti
 
61.5 pt
Media NVIDIA GeForce RTX 3090
 
61.3 pt
AMD Radeon RX 6900 XT
AMD Ryzen 9 5950X, AMD Radeon RX 6900 XT
56.2 pt
AMD Radeon RX 6800 XT
AMD Ryzen 9 5950X, AMD Radeon RX 6800 XT
53 pt
Media NVIDIA GeForce RTX 3080
 
51.3 pt
Media della classe Desktop
 
49 pt
Media NVIDIA Titan RTX
 
47.9 pt
3DMark 11 - 1280x720 Performance GPU
NVIDIA GeForce RTX 4090
Intel Core i9-13900K, NVIDIA GeForce RTX 4090
99834 Points +31%
NVIDIA GeForce RTX 4080
Intel Core i9-13900K, NVIDIA GeForce RTX 4080
86838 Points +14%
AMD Radeon RX 7900 XTX
AMD Ryzen 9 7950X, AMD Radeon RX 7900 XTX
83322 Points +10%
AMD Radeon RX 7900 XT
AMD Ryzen 9 7950X, AMD Radeon RX 7900 XT
77784 Points +2%
Asus TUF Gaming GeForce RTX 4070 Ti
Intel Core i9-13900K, NVIDIA GeForce RTX 4070 Ti
75990 Points
Asus TUF Gaming GeForce RTX 4070 Ti
Intel Core i9-13900K, NVIDIA GeForce RTX 4070 Ti (Quiet BIOS)
75612 Points 0%
AMD Radeon RX 6950 XT
AMD Ryzen 9 5900X, AMD Radeon RX 6950 XT
70480 Points -7%
NVIDIA GeForce RTX 3090 Ti
AMD Ryzen 7 5800X3D, NVIDIA GeForce RTX 3090 Ti
69481 Points -9%
Media NVIDIA GeForce RTX 3080 Ti
  (59799 - 62189, n=4)
60987 Points -20%
Media NVIDIA GeForce RTX 3090
  (55144 - 66934, n=17)
60853 Points -20%
NVIDIA GeForce RTX 3090
Intel Core i9-13900K, NVIDIA GeForce RTX 3090
59972 Points -21%
AMD Radeon RX 6900 XT
AMD Ryzen 9 5950X, AMD Radeon RX 6900 XT
59119 Points -22%
Media NVIDIA GeForce RTX 3080
  (47287 - 57662, n=4)
53094 Points -30%
AMD Radeon RX 6800 XT
AMD Ryzen 9 5950X, AMD Radeon RX 6800 XT
52046 Points -32%
Media della classe Desktop
  (650 - 104464, n=36, ultimi 2 anni)
49254 Points -35%
Media NVIDIA Titan RTX
  (43461 - 51863, n=30)
49062 Points -35%
3DMark
1920x1080 Fire Strike Graphics
AMD Radeon RX 7900 XTX
AMD Ryzen 9 7950X, AMD Radeon RX 7900 XTX
66967 Points +25%
NVIDIA GeForce RTX 4090
Intel Core i9-13900K, NVIDIA GeForce RTX 4090
65879 Points +23%
AMD Radeon RX 7900 XT
AMD Ryzen 9 7950X, AMD Radeon RX 7900 XT
63712 Points +19%
AMD Radeon RX 6950 XT
AMD Ryzen 9 5900X, AMD Radeon RX 6950 XT
60092 Points +12%
NVIDIA GeForce RTX 4080
Intel Core i9-13900K, NVIDIA GeForce RTX 4080
58893 Points +10%
Asus TUF Gaming GeForce RTX 4070 Ti
Intel Core i9-13900K, NVIDIA GeForce RTX 4070 Ti
53729 Points
Asus TUF Gaming GeForce RTX 4070 Ti
Intel Core i9-13900K, NVIDIA GeForce RTX 4070 Ti (Quiet BIOS)
52903 Points -2%
NVIDIA GeForce RTX 3090 Ti
AMD Ryzen 7 5800X3D, NVIDIA GeForce RTX 3090 Ti
53110 Points -1%
AMD Radeon RX 6900 XT
AMD Ryzen 9 5950X, AMD Radeon RX 6900 XT
50587 Points -6%
AMD Radeon RX 6800 XT
AMD Ryzen 9 5950X, AMD Radeon RX 6800 XT
49735 Points -7%
NVIDIA GeForce RTX 3090
Intel Core i9-13900K, NVIDIA GeForce RTX 3090
47241 Points -12%
Media NVIDIA GeForce RTX 3080 Ti
  (45785 - 48709, n=4)
47180 Points -12%
Media NVIDIA GeForce RTX 3090
  (41298 - 49282, n=17)
46856 Points -13%
Media NVIDIA GeForce RTX 3080
  (37604 - 40910, n=2)
39257 Points -27%
Media NVIDIA Titan RTX
  (33377 - 40910, n=30)
36062 Points -33%
Media della classe Desktop
  (523 - 70246, n=34, ultimi 2 anni)
31665 Points -41%
3840x2160 Fire Strike Ultra Graphics
NVIDIA GeForce RTX 4090
Intel Core i9-13900K, NVIDIA GeForce RTX 4090
24276 Points +79%
AMD Radeon RX 7900 XTX
AMD Ryzen 9 7950X, AMD Radeon RX 7900 XTX
20214 Points +49%
NVIDIA GeForce RTX 4080
Intel Core i9-13900K, NVIDIA GeForce RTX 4080
17122 Points +26%
AMD Radeon RX 7900 XT
AMD Ryzen 9 7950X, AMD Radeon RX 7900 XT
17078 Points +26%
AMD Radeon RX 6950 XT
AMD Ryzen 9 5900X, AMD Radeon RX 6950 XT
14978 Points +11%
NVIDIA GeForce RTX 3090 Ti
AMD Ryzen 7 5800X3D, NVIDIA GeForce RTX 3090 Ti
14026 Points +4%
Asus TUF Gaming GeForce RTX 4070 Ti
Intel Core i9-13900K, NVIDIA GeForce RTX 4070 Ti
13546 Points
Asus TUF Gaming GeForce RTX 4070 Ti
Intel Core i9-13900K, NVIDIA GeForce RTX 4070 Ti (Quiet BIOS)
13487 Points 0%
AMD Radeon RX 6900 XT
AMD Ryzen 9 5950X, AMD Radeon RX 6900 XT
13370 Points -1%
AMD Radeon RX 6800 XT
AMD Ryzen 9 5950X, AMD Radeon RX 6800 XT
12626 Points -7%
NVIDIA GeForce RTX 3090
Intel Core i9-13900K, NVIDIA GeForce RTX 3090
12301 Points -9%
Media NVIDIA GeForce RTX 3090
  (11613 - 12587, n=14)
12289 Points -9%
Media NVIDIA GeForce RTX 3080 Ti
  (12050 - 12341, n=4)
12173 Points -10%
Media NVIDIA GeForce RTX 3080
  (10645 - 10793, n=2)
10719 Points -21%
Media della classe Desktop
  (141 - 24650, n=24, ultimi 2 anni)
10444 Points -23%
Media NVIDIA Titan RTX
  (8461 - 10793, n=29)
8868 Points -35%
Fire Strike Extreme Graphics
NVIDIA GeForce RTX 4090
Intel Core i9-13900K, NVIDIA GeForce RTX 4090
44295 Points +64%
AMD Radeon RX 7900 XTX
AMD Ryzen 9 7950X, AMD Radeon RX 7900 XTX
39570 Points +47%
AMD Radeon RX 7900 XT
AMD Ryzen 9 7950X, AMD Radeon RX 7900 XT
33747 Points +25%
NVIDIA GeForce RTX 4080
Intel Core i9-13900K, NVIDIA GeForce RTX 4080
33475 Points +24%
AMD Radeon RX 6950 XT
AMD Ryzen 9 5900X, AMD Radeon RX 6950 XT
29704 Points +10%
Asus TUF Gaming GeForce RTX 4070 Ti
Intel Core i9-13900K, NVIDIA GeForce RTX 4070 Ti
26970 Points
Asus TUF Gaming GeForce RTX 4070 Ti
Intel Core i9-13900K, NVIDIA GeForce RTX 4070 Ti (Quiet BIOS)
26925 Points 0%
NVIDIA GeForce RTX 3090 Ti
AMD Ryzen 7 5800X3D, NVIDIA GeForce RTX 3090 Ti
26797 Points -1%
AMD Radeon RX 6900 XT
AMD Ryzen 9 5950X, AMD Radeon RX 6900 XT
26650 Points -1%
AMD Radeon RX 6800 XT
AMD Ryzen 9 5950X, AMD Radeon RX 6800 XT
25015 Points -7%
NVIDIA GeForce RTX 3090
Intel Core i9-13900K, NVIDIA GeForce RTX 3090
23839 Points -12%
Media NVIDIA GeForce RTX 3090
  (22075 - 24730, n=14)
23806 Points -12%
Media NVIDIA GeForce RTX 3080 Ti
  (23127 - 24250, n=4)
23668 Points -12%
Media NVIDIA GeForce RTX 3080
  (20007 - 20861, n=2)
20434 Points -24%
Media della classe Desktop
  (1053 - 44549, n=24, ultimi 2 anni)
20318 Points -25%
Media NVIDIA Titan RTX
  (16484 - 20861, n=29)
17649 Points -35%
2560x1440 Time Spy Graphics
NVIDIA GeForce RTX 4090
Intel Core i9-13900K, NVIDIA GeForce RTX 4090
36101 Points +57%
AMD Radeon RX 7900 XTX
AMD Ryzen 9 7950X, AMD Radeon RX 7900 XTX
29699 Points +29%
NVIDIA GeForce RTX 4080
Intel Core i9-13900K, NVIDIA GeForce RTX 4080
28133 Points +22%
AMD Radeon RX 7900 XT
AMD Ryzen 9 7950X, AMD Radeon RX 7900 XT
25874 Points +13%
Asus TUF Gaming GeForce RTX 4070 Ti
Intel Core i9-13900K, NVIDIA GeForce RTX 4070 Ti
22982 Points
Asus TUF Gaming GeForce RTX 4070 Ti
Intel Core i9-13900K, NVIDIA GeForce RTX 4070 Ti (Quiet BIOS)
22949 Points 0%
AMD Radeon RX 6950 XT
AMD Ryzen 9 5900X, AMD Radeon RX 6950 XT
21719 Points -5%
NVIDIA GeForce RTX 3090 Ti
AMD Ryzen 7 5800X3D, NVIDIA GeForce RTX 3090 Ti
21645 Points -6%
Media NVIDIA GeForce RTX 3090
  (18685 - 20433, n=17)
19266 Points -16%
Media NVIDIA GeForce RTX 3080 Ti
  (19041 - 19460, n=4)
19237 Points -16%
NVIDIA GeForce RTX 3090
Intel Core i9-13900K, NVIDIA GeForce RTX 3090
19198 Points -16%
AMD Radeon RX 6900 XT
AMD Ryzen 9 5950X, AMD Radeon RX 6900 XT
18210 Points -21%
AMD Radeon RX 6800 XT
AMD Ryzen 9 5950X, AMD Radeon RX 6800 XT
17603 Points -23%
Media NVIDIA GeForce RTX 3080
  (17467 - 17604, n=2)
17536 Points -24%
Media della classe Desktop
  (173 - 37589, n=33, ultimi 2 anni)
17279 Points -25%
Media NVIDIA Titan RTX
  (14216 - 15283, n=29)
14884 Points -35%
Unigine Heaven 4.0
Extreme Preset DX11
NVIDIA GeForce RTX 4090
Intel Core i9-13900K, NVIDIA GeForce RTX 4090
466 (11min - 1031max) fps +47%
NVIDIA GeForce RTX 4080
Intel Core i9-13900K, NVIDIA GeForce RTX 4080
389.4 (11.3min - 813.1max) fps +23%
AMD Radeon RX 7900 XTX
AMD Ryzen 9 7950X, AMD Radeon RX 7900 XTX
357.6 fps +13%
AMD Radeon RX 7900 XT
AMD Ryzen 9 7950X, AMD Radeon RX 7900 XT
319.7 fps +1%
Asus TUF Gaming GeForce RTX 4070 Ti
Intel Core i9-13900K, NVIDIA GeForce RTX 4070 Ti
317.6 (57.8min - 692.1max) fps
NVIDIA GeForce RTX 3090
Intel Core i9-13900K, NVIDIA GeForce RTX 3090
309.2 fps -3%
NVIDIA GeForce RTX 3090 Ti
AMD Ryzen 7 5800X3D, NVIDIA GeForce RTX 3090 Ti
308.5 (9.7min - 627.1max) fps -3%
Media NVIDIA GeForce RTX 3090
  (272 - 315, n=11)
300 fps -6%
Media NVIDIA GeForce RTX 3080 Ti
  (290 - 312, n=4)
300 fps -6%
AMD Radeon RX 6950 XT
AMD Ryzen 9 5900X, AMD Radeon RX 6950 XT
293.8 fps -7%
AMD Radeon RX 6900 XT
AMD Ryzen 9 5950X, AMD Radeon RX 6900 XT
259.5 (49.3min - 537.2max) fps -18%
AMD Radeon RX 6800 XT
AMD Ryzen 9 5950X, AMD Radeon RX 6800 XT
247.9 fps -22%
Media NVIDIA GeForce RTX 3080
  (233 - 253, n=2)
243 fps -23%
Media NVIDIA Titan RTX
  (207 - 248, n=12)
236 fps -26%
Media della classe Desktop
  (4.5 - 472, n=24, ultimi 2 anni)
220 fps -31%
Extreme Preset OpenGL
NVIDIA GeForce RTX 4090
Intel Core i9-13900K, NVIDIA GeForce RTX 4090
443 (15min - 902max) fps +51%
AMD Radeon RX 7900 XTX
AMD Ryzen 9 7950X, AMD Radeon RX 7900 XTX
370.2 fps +27%
NVIDIA GeForce RTX 4080
Intel Core i9-13900K, NVIDIA GeForce RTX 4080
364.2 (15min - 770.5max) fps +24%
AMD Radeon RX 7900 XT
AMD Ryzen 9 7950X, AMD Radeon RX 7900 XT
330.2 fps +13%
Asus TUF Gaming GeForce RTX 4070 Ti
Intel Core i9-13900K, NVIDIA GeForce RTX 4070 Ti
292.6 (15.2min - 600.3max) fps
NVIDIA GeForce RTX 3090 Ti
AMD Ryzen 7 5800X3D, NVIDIA GeForce RTX 3090 Ti
292.5 (11.4min - 577.9max) fps 0%
NVIDIA GeForce RTX 3090
Intel Core i9-13900K, NVIDIA GeForce RTX 3090
277.9 fps -5%
Media NVIDIA GeForce RTX 3080 Ti
  (264 - 282, n=4)
274 fps -6%
Media NVIDIA GeForce RTX 3090
  (188.2 - 284, n=10)
270 fps -8%
Media NVIDIA GeForce RTX 3080
  (232 - 243, n=2)
238 fps -19%
Media NVIDIA Titan RTX
  (203 - 299, n=12)
223 fps -24%
AMD Radeon RX 6950 XT
AMD Ryzen 9 5900X, AMD Radeon RX 6950 XT
222.7 fps -24%
Media della classe Desktop
  (4 - 450, n=24, ultimi 2 anni)
209 fps -29%
AMD Radeon RX 6900 XT
AMD Ryzen 9 5950X, AMD Radeon RX 6900 XT
206.5 (8.2min - 453.7max) fps -29%
AMD Radeon RX 6800 XT
AMD Ryzen 9 5950X, AMD Radeon RX 6800 XT
204 fps -30%
Unigine Valley 1.0
1920x1080 Extreme HD DirectX AA:x8
NVIDIA GeForce RTX 4090
Intel Core i9-13900K, NVIDIA GeForce RTX 4090
283 (80min - 527max) fps +23%
NVIDIA GeForce RTX 4080
Intel Core i9-13900K, NVIDIA GeForce RTX 4080
277.5 (71.7min - 487.9max) fps +20%
AMD Radeon RX 7900 XTX
AMD Ryzen 9 7950X, AMD Radeon RX 7900 XTX
264.5 fps +15%
NVIDIA GeForce RTX 3090
Intel Core i9-13900K, NVIDIA GeForce RTX 3090
245 fps +6%
AMD Radeon RX 7900 XT
AMD Ryzen 9 7950X, AMD Radeon RX 7900 XT
243.3 fps +6%
Asus TUF Gaming GeForce RTX 4070 Ti
Intel Core i9-13900K, NVIDIA GeForce RTX 4070 Ti
230.3 (78.9min - 451.1max) fps
Media NVIDIA GeForce RTX 3080 Ti
  (206 - 240, n=4)
228 fps -1%
Media NVIDIA GeForce RTX 3090
  (184.2 - 247, n=11)
225 fps -2%
AMD Radeon RX 6950 XT
AMD Ryzen 9 5900X, AMD Radeon RX 6950 XT
209.2 fps -9%
NVIDIA GeForce RTX 3090 Ti
AMD Ryzen 7 5800X3D, NVIDIA GeForce RTX 3090 Ti
201.7 (48.5min - 338.7max) fps -12%
AMD Radeon RX 6900 XT
AMD Ryzen 9 5950X, AMD Radeon RX 6900 XT
200.8 (53.4min - 359.1max) fps -13%
AMD Radeon RX 6800 XT
AMD Ryzen 9 5950X, AMD Radeon RX 6800 XT
190.6 fps -17%
Media NVIDIA GeForce RTX 3080
  (176.2 - 181.8, n=2)
179 fps -22%
Media NVIDIA Titan RTX
  (135 - 191.4, n=12)
173.3 fps -25%
Media della classe Desktop
  (3.7 - 292, n=24, ultimi 2 anni)
158.9 fps -31%
1920x1080 Extreme HD Preset OpenGL AA:x8
NVIDIA GeForce RTX 4090
Intel Core i9-13900K, NVIDIA GeForce RTX 4090
315 (64min - 559max) fps +52%
NVIDIA GeForce RTX 4080
Intel Core i9-13900K, NVIDIA GeForce RTX 4080
257 (79.3min - 462.8max) fps +24%
AMD Radeon RX 7900 XTX
AMD Ryzen 9 7950X, AMD Radeon RX 7900 XTX
254.2 fps +23%
AMD Radeon RX 7900 XT
AMD Ryzen 9 7950X, AMD Radeon RX 7900 XT
225.9 fps +9%
NVIDIA GeForce RTX 3090
Intel Core i9-13900K, NVIDIA GeForce RTX 3090
210.8 fps +2%
NVIDIA GeForce RTX 3090 Ti
AMD Ryzen 7 5800X3D, NVIDIA GeForce RTX 3090 Ti
208.4 (49.3min - 353max) fps +1%
Asus TUF Gaming GeForce RTX 4070 Ti
Intel Core i9-13900K, NVIDIA GeForce RTX 4070 Ti
206.8 (64.6min - 374.1max) fps
Media NVIDIA GeForce RTX 3080 Ti
  (195.1 - 210, n=4)
204 fps -1%
Media NVIDIA GeForce RTX 3090
  (158.8 - 226, n=10)
203 fps -2%
AMD Radeon RX 6950 XT
AMD Ryzen 9 5900X, AMD Radeon RX 6950 XT
176.9 fps -14%
Media NVIDIA GeForce RTX 3080
  (163.8 - 172, n=2)
167.9 fps -19%
AMD Radeon RX 6900 XT
AMD Ryzen 9 5950X, AMD Radeon RX 6900 XT
167.4 (56.7min - 375.7max) fps -19%
AMD Radeon RX 6800 XT
AMD Ryzen 9 5950X, AMD Radeon RX 6800 XT
158.2 fps -24%
Media NVIDIA Titan RTX
  (139.2 - 181.2, n=12)
158.1 fps -24%
Media della classe Desktop
  (3.4 - 315, n=24, ultimi 2 anni)
151.3 fps -27%
Unigine Superposition
1280x720 720p Low
Asus TUF Gaming GeForce RTX 4070 Ti
Intel Core i9-13900K, NVIDIA GeForce RTX 4070 Ti
56132 Points
NVIDIA GeForce RTX 4090
Intel Core i9-13900K, NVIDIA GeForce RTX 4090
55915 Points 0%
NVIDIA GeForce RTX 4080
Intel Core i9-13900K, NVIDIA GeForce RTX 4080
55670 Points -1%
NVIDIA GeForce RTX 3090
Intel Core i9-13900K, NVIDIA GeForce RTX 3090
53341 Points -5%
Media NVIDIA GeForce RTX 3080 Ti
  (43163 - 50738, n=4)
47400 Points -16%
AMD Radeon RX 7900 XTX
AMD Ryzen 9 7950X, AMD Radeon RX 7900 XTX
47274 Points -16%
Media NVIDIA GeForce RTX 3090
  (33329 - 54879, n=10)
46049 Points -18%
AMD Radeon RX 7900 XT
AMD Ryzen 9 7950X, AMD Radeon RX 7900 XT
45904 Points -18%
NVIDIA GeForce RTX 3090 Ti
AMD Ryzen 7 5800X3D, NVIDIA GeForce RTX 3090 Ti
45444 Points -19%
Media NVIDIA Titan RTX
  (25622 - 50876, n=9)
40891 Points -27%
Media della classe Desktop
  (2704 - 56132, n=22, ultimi 2 anni)
38418 Points -32%
AMD Radeon RX 6900 XT
AMD Ryzen 9 5950X, AMD Radeon RX 6900 XT
37023 Points -34%
AMD Radeon RX 6800 XT
AMD Ryzen 9 5950X, AMD Radeon RX 6800 XT
36452 Points -35%
AMD Radeon RX 6950 XT
AMD Ryzen 9 5900X, AMD Radeon RX 6950 XT
33955 Points -40%
Media NVIDIA GeForce RTX 3080
  (30851 - 32183, n=2)
31517 Points -44%
1920x1080 1080p High
NVIDIA GeForce RTX 4090
Intel Core i9-13900K, NVIDIA GeForce RTX 4090
47981 Points +62%
NVIDIA GeForce RTX 4080
Intel Core i9-13900K, NVIDIA GeForce RTX 4080
37399 Points +26%
AMD Radeon RX 7900 XTX
AMD Ryzen 9 7950X, AMD Radeon RX 7900 XTX
36536 Points +23%
AMD Radeon RX 7900 XT
AMD Ryzen 9 7950X, AMD Radeon RX 7900 XT
31426 Points +6%
Asus TUF Gaming GeForce RTX 4070 Ti
Intel Core i9-13900K, NVIDIA GeForce RTX 4070 Ti
29686 Points
NVIDIA GeForce RTX 3090 Ti
AMD Ryzen 7 5800X3D, NVIDIA GeForce RTX 3090 Ti
29422 Points -1%
AMD Radeon RX 6950 XT
AMD Ryzen 9 5900X, AMD Radeon RX 6950 XT
28478 Points -4%
NVIDIA GeForce RTX 3090
Intel Core i9-13900K, NVIDIA GeForce RTX 3090
26393 Points -11%
Media NVIDIA GeForce RTX 3090
  (23626 - 27207, n=11)
26018 Points -12%
Media NVIDIA GeForce RTX 3080 Ti
  (24997 - 26711, n=4)
26008 Points -12%
AMD Radeon RX 6900 XT
AMD Ryzen 9 5950X, AMD Radeon RX 6900 XT
25029 Points -16%
Media della classe Desktop
  (700 - 47981, n=21, ultimi 2 anni)
22503 Points -24%
AMD Radeon RX 6800 XT
AMD Ryzen 9 5950X, AMD Radeon RX 6800 XT
22265 Points -25%
Media NVIDIA GeForce RTX 3080
  (21333 - 21912, n=2)
21623 Points -27%
Media NVIDIA Titan RTX
  (19460 - 20658, n=9)
20301 Points -32%
1920x1080 1080p Extreme
NVIDIA GeForce RTX 4090
Intel Core i9-13900K, NVIDIA GeForce RTX 4090
20729 Points +56%
AMD Radeon RX 7900 XTX
AMD Ryzen 9 7950X, AMD Radeon RX 7900 XTX
17264 Points +30%
NVIDIA GeForce RTX 4080
Intel Core i9-13900K, NVIDIA GeForce RTX 4080
16623 Points +25%
AMD Radeon RX 7900 XT
AMD Ryzen 9 7950X, AMD Radeon RX 7900 XT
14181 Points +7%
NVIDIA GeForce RTX 3090 Ti
AMD Ryzen 7 5800X3D, NVIDIA GeForce RTX 3090 Ti
13803 Points +4%
Asus TUF Gaming GeForce RTX 4070 Ti
Intel Core i9-13900K, NVIDIA GeForce RTX 4070 Ti
13266 Points
Media NVIDIA GeForce RTX 3090
  (11806 - 12694, n=11)
12209 Points -8%
Media NVIDIA GeForce RTX 3080 Ti
  (12038 - 12347, n=4)
12139 Points -8%
AMD Radeon RX 6950 XT
AMD Ryzen 9 5900X, AMD Radeon RX 6950 XT
12079 Points -9%
NVIDIA GeForce RTX 3090
Intel Core i9-13900K, NVIDIA GeForce RTX 3090
12069 Points -9%
Media NVIDIA GeForce RTX 3080
  (10572 - 10822, n=2)
10697 Points -19%
AMD Radeon RX 6900 XT
AMD Ryzen 9 5950X, AMD Radeon RX 6900 XT
10683 Points -19%
Media della classe Desktop
  (286 - 21332, n=22, ultimi 2 anni)
10122 Points -24%
AMD Radeon RX 6800 XT
AMD Ryzen 9 5950X, AMD Radeon RX 6800 XT
10046 Points -24%
Media NVIDIA Titan RTX
  (8916 - 9285, n=9)
9051 Points -32%
3840x2160 4k Optimized
NVIDIA GeForce RTX 4090
Intel Core i9-13900K, NVIDIA GeForce RTX 4090
32977 Points +92%
AMD Radeon RX 7900 XTX
AMD Ryzen 9 7950X, AMD Radeon RX 7900 XTX
23174 Points +35%
NVIDIA GeForce RTX 4080
Intel Core i9-13900K, NVIDIA GeForce RTX 4080
22343 Points +30%
AMD Radeon RX 7900 XT
AMD Ryzen 9 7950X, AMD Radeon RX 7900 XT
18806 Points +9%
NVIDIA GeForce RTX 3090 Ti
AMD Ryzen 7 5800X3D, NVIDIA GeForce RTX 3090 Ti
18426 Points +7%
AMD Radeon RX 6950 XT
AMD Ryzen 9 5900X, AMD Radeon RX 6950 XT
17725 Points +3%
Asus TUF Gaming GeForce RTX 4070 Ti
Intel Core i9-13900K, NVIDIA GeForce RTX 4070 Ti
17184 Points
Media NVIDIA GeForce RTX 3090
  (15794 - 16868, n=11)
16326 Points -5%
NVIDIA GeForce RTX 3090
Intel Core i9-13900K, NVIDIA GeForce RTX 3090
16322 Points -5%
Media NVIDIA GeForce RTX 3080 Ti
  (16108 - 16412, n=4)
16199 Points -6%
AMD Radeon RX 6900 XT
AMD Ryzen 9 5950X, AMD Radeon RX 6900 XT
14955 Points -13%
Media della classe Desktop
  (559 - 33488, n=21, ultimi 2 anni)
14724 Points -14%
Media NVIDIA GeForce RTX 3080
  (13984 - 14243, n=2)
14114 Points -18%
AMD Radeon RX 6800 XT
AMD Ryzen 9 5950X, AMD Radeon RX 6800 XT
13471 Points -22%
Media NVIDIA Titan RTX
  (11937 - 12644, n=9)
12203 Points -29%
7680x4320 8k Optimized
NVIDIA GeForce RTX 4090
Intel Core i9-13900K, NVIDIA GeForce RTX 4090
12826 Points +100%
AMD Radeon RX 7900 XTX
AMD Ryzen 9 7950X, AMD Radeon RX 7900 XTX
8751 Points +36%
NVIDIA GeForce RTX 4080
Intel Core i9-13900K, NVIDIA GeForce RTX 4080
8556 Points +33%
NVIDIA GeForce RTX 3090 Ti
AMD Ryzen 7 5800X3D, NVIDIA GeForce RTX 3090 Ti
8213 Points +28%
Media NVIDIA GeForce RTX 3090
  (6969 - 7521, n=11)
7144 Points +11%
NVIDIA GeForce RTX 3090
Intel Core i9-13900K, NVIDIA GeForce RTX 3090
7072 Points +10%
Media NVIDIA GeForce RTX 3080 Ti
  (6920 - 7161, n=4)
7070 Points +10%
AMD Radeon RX 7900 XT
AMD Ryzen 9 7950X, AMD Radeon RX 7900 XT
7034 Points +9%
AMD Radeon RX 6950 XT
AMD Ryzen 9 5900X, AMD Radeon RX 6950 XT
6645 Points +3%
Asus TUF Gaming GeForce RTX 4070 Ti
Intel Core i9-13900K, NVIDIA GeForce RTX 4070 Ti
6427 Points
Media NVIDIA GeForce RTX 3080
  (6243 - 6346, n=2)
6295 Points -2%
Media della classe Desktop
  (237 - 13008, n=21, ultimi 2 anni)
5826 Points -9%
AMD Radeon RX 6900 XT
AMD Ryzen 9 5950X, AMD Radeon RX 6900 XT
5764 Points -10%
Media NVIDIA Titan RTX
  (5255 - 5571, n=9)
5393 Points -16%
AMD Radeon RX 6800 XT
AMD Ryzen 9 5950X, AMD Radeon RX 6800 XT
5256 Points -18%
3DMark 11 Performance
55728 punti
3DMark Ice Storm Standard Score
289247 punti
3DMark Cloud Gate Standard Score
87562 punti
3DMark Fire Strike Score
42479 punti
3DMark Fire Strike Extreme Score
26604 punti
3DMark Time Spy Score
22481 punti
Aiuto

Prestazioni di calcolo: Alla pari con le ammiraglie Ampere, ma continuano i problemi di Blender CUDA con Ada

Gli effetti della riduzione del numero di core CUDA in AD104 iniziano a diventare più chiari nei benchmark di calcolo. La TUF Gaming RTX 4070 Ti perde rispetto alla RTX 4080 del 24% nei test V-Ray 5 CUDA e RTX e questo divario aumenta al 45% se confrontata con la RTX 4090 FE. Tuttavia, la TUF Gaming RTX 4070 Ti mostra miglioramenti decenti rispetto alla RTX 3090 e RTX 3090 Ti in questi test

Blender Classroom CUDA mostra ancora una volta risultati distorti con la RTX 4070 Ti, simili a quelli osservati con la RTX 4090 e la RTX 4080 anche con i driver più recenti. Abbiamo contattato Nvidia e non abbiamo ancora ricevuto risposta in merito. Il rendering Optix con la TUF Gaming RTX 4070 Ti è più lento di soli due secondi rispetto alla RTX 4080

È interessante notare che il test LuxMark Room per sole GPU mostra la TUF Gaming RTX 4070 Ti con un guadagno del 35% rispetto alla RTX 3090 Ti e un enorme vantaggio del 63% rispetto alla RX 7900 XTX. Tuttavia, le GPU AMD compensano questo deficit nel benchmark Sala per sole GPU, in cui la Radeon RX 6900 XTX è in grado di offrire un'ottima prestazione Radeon RX 6900 XT e la RX 6950 XT sono in cima alla classifica con un vantaggio fino al 37% rispetto alla TUF Gaming RTX 4070 Ti.

La TUF Gaming RTX 4070 Ti è in grado di ottenere prestazioni pari a quelle della RTX 3090 Ti in ComputeMark, ma è inferiore alla RX 7900 XT del 10%.

V-Ray 5 Benchmark
GPU CUDA
NVIDIA GeForce RTX 4090
Intel Core i9-13900K, NVIDIA GeForce RTX 4090 (5.0.1)
4224 mpaths +82%
NVIDIA GeForce RTX 4080
Intel Core i9-13900K, NVIDIA GeForce RTX 4080 (5.0.1)
3067 mpaths +32%
Asus TUF Gaming GeForce RTX 4070 Ti
Intel Core i9-13900K, NVIDIA GeForce RTX 4070 Ti (5.0.1)
2322 mpaths
NVIDIA GeForce RTX 3090 Ti
AMD Ryzen 7 5800X3D, NVIDIA GeForce RTX 3090 Ti (5.0.1)
2195 mpaths -5%
NVIDIA GeForce RTX 3090
Intel Core i9-13900K, NVIDIA GeForce RTX 3090 (5.0.1)
2106 mpaths -9%
Media NVIDIA GeForce RTX 3080 Ti
  (2045 - 2070, n=3)
2057 mpaths -11%
Media NVIDIA GeForce RTX 3090
  (1616 - 2131, n=14)
2019 mpaths -13%
Media della classe Desktop
  (13 - 4322, n=27, ultimi 2 anni)
1808 mpaths -22%
Media NVIDIA Titan RTX
  (668 - 1052, n=7)
910 mpaths -61%
AMD Radeon RX 6950 XT
AMD Ryzen 9 5900X, AMD Radeon RX 6950 XT (5.0.1)
383 mpaths -84%
GPU RTX
NVIDIA GeForce RTX 4090
Intel Core i9-13900K, NVIDIA GeForce RTX 4090 (5.0.1)
5935 mpaths +87%
NVIDIA GeForce RTX 4080
Intel Core i9-13900K, NVIDIA GeForce RTX 4080 (5.0.1)
4193 mpaths +32%
Media della classe Desktop
  (992 - 6019, n=18, ultimi 2 anni)
3574 mpaths +12%
Asus TUF Gaming GeForce RTX 4070 Ti
Intel Core i9-13900K, NVIDIA GeForce RTX 4070 Ti (5.0.1)
3180 mpaths
NVIDIA GeForce RTX 3090
Intel Core i9-13900K, NVIDIA GeForce RTX 3090 (5.0.1)
2913 mpaths -8%
NVIDIA GeForce RTX 3090 Ti
AMD Ryzen 7 5800X3D, NVIDIA GeForce RTX 3090 Ti (5.0.1)
2880 mpaths -9%
Media NVIDIA GeForce RTX 3090
  (2551 - 2979, n=14)
2813 mpaths -12%
Media NVIDIA GeForce RTX 3080 Ti
  (2727 - 2883, n=3)
2784 mpaths -12%
Media NVIDIA Titan RTX
  (1246 - 1348, n=7)
1299 mpaths -59%
V-Ray Benchmark Next 4.10 - GPU
NVIDIA GeForce RTX 4090
Intel Core i9-13900K, NVIDIA GeForce RTX 4090 (v4.10.07 )
1847 mpaths +74%
NVIDIA GeForce RTX 4080
Intel Core i9-13900K, NVIDIA GeForce RTX 4080 (v4.10.07 )
1455 mpaths +37%
Asus TUF Gaming GeForce RTX 4070 Ti
Intel Core i9-13900K, NVIDIA GeForce RTX 4070 Ti (v4.10.07 )
1060 mpaths
NVIDIA GeForce RTX 3090 Ti
AMD Ryzen 7 5800X3D, NVIDIA GeForce RTX 3090 Ti (v4.10.07 )
902 mpaths -15%
NVIDIA GeForce RTX 3090
Intel Core i9-13900K, NVIDIA GeForce RTX 3090 (v4.10.07 )
875 mpaths -17%
Media NVIDIA GeForce RTX 3090
  (781 - 877, n=16)
856 mpaths -19%
Media NVIDIA GeForce RTX 3080 Ti
  (854 - 855, n=3)
854 mpaths -19%
Media della classe Desktop
  (4 - 1880, n=29, ultimi 2 anni)
792 mpaths -25%
Media NVIDIA GeForce RTX 3080
  (636 - 643, n=2)
640 mpaths -40%
Media NVIDIA Titan RTX
  (386 - 439, n=16)
400 mpaths -62%
AMD Radeon RX 6800 XT
AMD Ryzen 9 5950X, AMD Radeon RX 6800 XT (v4.10.07 )
157 mpaths -85%
AMD Radeon RX 6950 XT
AMD Ryzen 9 5900X, AMD Radeon RX 6950 XT (v4.10.07 )
137 mpaths -87%
Blender
v3.3 Classroom CUDA
Media NVIDIA Titan RTX
  ()
31 Seconds *
Media NVIDIA GeForce RTX 3080 Ti
  (21 - 22, n=2)
21.5 Seconds *
Media NVIDIA GeForce RTX 3090
  (20 - 22, n=11)
21.4 Seconds *
NVIDIA GeForce RTX 3090
Intel Core i9-13900K, NVIDIA GeForce RTX 3090 (3.3.0)
21 Seconds *
Media della classe Desktop
  (10 - 23, n=15, ultimi 2 anni)
16.2 Seconds *
v3.3 Classroom OPTIX/RTX
Media NVIDIA Titan RTX
  ()
21 Seconds * -75%
Media NVIDIA GeForce RTX 3080 Ti
  (14 - 15, n=2)
14.5 Seconds * -21%
Media NVIDIA GeForce RTX 3090
  (13 - 14, n=11)
13.4 Seconds * -12%
NVIDIA GeForce RTX 3090
Intel Core i9-13900K, NVIDIA GeForce RTX 3090 (3.3.0)
13 Seconds * -8%
Asus TUF Gaming GeForce RTX 4070 Ti
Intel Core i9-13900K, NVIDIA GeForce RTX 4070 Ti (3.3.2)
12 Seconds *
Media della classe Desktop
  (7 - 15, n=17, ultimi 2 anni)
10.6 Seconds * +12%
NVIDIA GeForce RTX 4080
Intel Core i9-13900K, NVIDIA GeForce RTX 4080 (3.3.0)
10 Seconds * +17%
NVIDIA GeForce RTX 4090
Intel Core i9-13900K, NVIDIA GeForce RTX 4090 (3.3.0)
8 Seconds * +33%
LuxMark v2.0 64Bit
Room GPUs-only
NVIDIA GeForce RTX 4090
Intel Core i9-13900K, NVIDIA GeForce RTX 4090
12730 Samples/s +51%
NVIDIA GeForce RTX 4080
Intel Core i9-13900K, NVIDIA GeForce RTX 4080
10491 Samples/s +25%
Asus TUF Gaming GeForce RTX 4070 Ti
Intel Core i9-13900K, NVIDIA GeForce RTX 4070 Ti
8413 Samples/s
NVIDIA GeForce RTX 3090 Ti
AMD Ryzen 7 5800X3D, NVIDIA GeForce RTX 3090 Ti
6221 Samples/s -26%
Media NVIDIA GeForce RTX 3080 Ti
  (5772 - 6464, n=4)
6138 Samples/s -27%
NVIDIA GeForce RTX 3090
Intel Core i9-13900K, NVIDIA GeForce RTX 3090
5930 Samples/s -30%
Media NVIDIA GeForce RTX 3090
  (5727 - 5985, n=9)
5893 Samples/s -30%
Media della classe Desktop
  (81 - 12730, n=23, ultimi 2 anni)
5398 Samples/s -36%
AMD Radeon RX 7900 XTX
AMD Ryzen 9 7950X, AMD Radeon RX 7900 XTX
5161 Samples/s -39%
Media NVIDIA GeForce RTX 3080
  (5112 - 5198, n=2)
5155 Samples/s -39%
AMD Radeon RX 6950 XT
AMD Ryzen 9 5900X, AMD Radeon RX 6950 XT
5097 Samples/s -39%
AMD Radeon RX 6900 XT
AMD Ryzen 9 5950X, AMD Radeon RX 6900 XT
5084 Samples/s -40%
AMD Radeon RX 6800 XT
AMD Ryzen 9 5950X, AMD Radeon RX 6800 XT
5057 Samples/s -40%
Media NVIDIA Titan RTX
  (4643 - 4703, n=2)
4673 Samples/s -44%
AMD Radeon RX 7900 XT
AMD Ryzen 9 7950X, AMD Radeon RX 7900 XT
4451 Samples/s -47%
Sala GPUs-only
AMD Radeon RX 6950 XT
AMD Ryzen 9 5900X, AMD Radeon RX 6950 XT
31954 Samples/s +58%
AMD Radeon RX 6900 XT
AMD Ryzen 9 5950X, AMD Radeon RX 6900 XT
31400 Samples/s +56%
AMD Radeon RX 6800 XT
AMD Ryzen 9 5950X, AMD Radeon RX 6800 XT
28023 Samples/s +39%
NVIDIA GeForce RTX 4090
Intel Core i9-13900K, NVIDIA GeForce RTX 4090
27828 Samples/s +38%
NVIDIA GeForce RTX 4080
Intel Core i9-13900K, NVIDIA GeForce RTX 4080
24835 Samples/s +23%
Asus TUF Gaming GeForce RTX 4070 Ti
Intel Core i9-13900K, NVIDIA GeForce RTX 4070 Ti
20171 Samples/s
NVIDIA GeForce RTX 3090 Ti
AMD Ryzen 7 5800X3D, NVIDIA GeForce RTX 3090 Ti
16046 Samples/s -20%
Media NVIDIA GeForce RTX 3080 Ti
  (14871 - 16438, n=4)
15612 Samples/s -23%
NVIDIA GeForce RTX 3090
Intel Core i9-13900K, NVIDIA GeForce RTX 3090
15088 Samples/s -25%
AMD Radeon RX 7900 XTX
AMD Ryzen 9 7950X, AMD Radeon RX 7900 XTX
15019 Samples/s -26%
Media NVIDIA GeForce RTX 3090
  (14590 - 15242, n=9)
14945 Samples/s -26%
AMD Radeon RX 7900 XT
AMD Ryzen 9 7950X, AMD Radeon RX 7900 XT
13489 Samples/s -33%
Media NVIDIA GeForce RTX 3080
  (12797 - 12980, n=2)
12889 Samples/s -36%
Media della classe Desktop
  (147 - 27828, n=23, ultimi 2 anni)
12288 Samples/s -39%
Media NVIDIA Titan RTX
  (10799 - 10996, n=2)
10898 Samples/s -46%
ComputeMark v2.1
1024x600 Normal, Score
NVIDIA GeForce RTX 4090
Intel Core i9-13900K, NVIDIA GeForce RTX 4090
86583 Points +68%
AMD Radeon RX 7900 XTX
AMD Ryzen 9 7950X, AMD Radeon RX 7900 XTX
62963 Points +22%
NVIDIA GeForce RTX 4080
Intel Core i9-13900K, NVIDIA GeForce RTX 4080
62720 Points +22%
AMD Radeon RX 7900 XT
AMD Ryzen 9 7950X, AMD Radeon RX 7900 XT
57570 Points +12%
NVIDIA GeForce RTX 3090 Ti
AMD Ryzen 7 5800X3D, NVIDIA GeForce RTX 3090 Ti
52258 Points +1%
Asus TUF Gaming GeForce RTX 4070 Ti
Intel Core i9-13900K, NVIDIA GeForce RTX 4070 Ti
51616 Points
NVIDIA GeForce RTX 3090
Intel Core i9-13900K, NVIDIA GeForce RTX 3090
49118 Points -5%
Media NVIDIA GeForce RTX 3080 Ti
  (47377 - 48892, n=4)
48266 Points -6%
Media NVIDIA GeForce RTX 3090
  (44948 - 49118, n=9)
47804 Points -7%
AMD Radeon RX 6950 XT
AMD Ryzen 9 5900X, AMD Radeon RX 6950 XT
44959 Points -13%
AMD Radeon RX 6900 XT
AMD Ryzen 9 5950X, AMD Radeon RX 6900 XT
40857 Points -21%
Media NVIDIA GeForce RTX 3080
  (39924 - 41594, n=2)
40759 Points -21%
AMD Radeon RX 6800 XT
AMD Ryzen 9 5950X, AMD Radeon RX 6800 XT
38823 Points -25%
Media della classe Desktop
  (476 - 90920, n=24, ultimi 2 anni)
35064 Points -32%
Media NVIDIA Titan RTX
  (27907 - 29830, n=3)
28802 Points -44%
1024x600 Normal, QJuliaRayTrace
NVIDIA GeForce RTX 4090
Intel Core i9-13900K, NVIDIA GeForce RTX 4090
31780 Points +49%
NVIDIA GeForce RTX 4080
Intel Core i9-13900K, NVIDIA GeForce RTX 4080
24307 Points +14%
Asus TUF Gaming GeForce RTX 4070 Ti
Intel Core i9-13900K, NVIDIA GeForce RTX 4070 Ti
21276 Points
NVIDIA GeForce RTX 3090 Ti
AMD Ryzen 7 5800X3D, NVIDIA GeForce RTX 3090 Ti
18550 Points -13%
AMD Radeon RX 7900 XTX
AMD Ryzen 9 7950X, AMD Radeon RX 7900 XTX
17915 Points -16%
NVIDIA GeForce RTX 3090
Intel Core i9-13900K, NVIDIA GeForce RTX 3090
17911 Points -16%
Media NVIDIA GeForce RTX 3080 Ti
  (17050 - 17749, n=4)
17475 Points -18%
Media NVIDIA GeForce RTX 3090
  (16403 - 18223, n=10)
17454 Points -18%
AMD Radeon RX 7900 XT
AMD Ryzen 9 7950X, AMD Radeon RX 7900 XT
16990 Points -20%
Media NVIDIA GeForce RTX 3080
  (14718 - 15508, n=2)
15113 Points -29%
AMD Radeon RX 6950 XT
AMD Ryzen 9 5900X, AMD Radeon RX 6950 XT
13580 Points -36%
Media della classe Desktop
  (159 - 33698, n=24, ultimi 2 anni)
13343 Points -37%
AMD Radeon RX 6900 XT
AMD Ryzen 9 5950X, AMD Radeon RX 6900 XT
12255 Points -42%
AMD Radeon RX 6800 XT
AMD Ryzen 9 5950X, AMD Radeon RX 6800 XT
11304 Points -47%
Media NVIDIA Titan RTX
  (9418 - 10129, n=3)
9748 Points -54%
1024x600 Normal, Mandel Scalar
NVIDIA GeForce RTX 4090
Intel Core i9-13900K, NVIDIA GeForce RTX 4090
21571 Points +75%
AMD Radeon RX 7900 XTX
AMD Ryzen 9 7950X, AMD Radeon RX 7900 XTX
15458 Points +25%
NVIDIA GeForce RTX 4080
Intel Core i9-13900K, NVIDIA GeForce RTX 4080
14733 Points +20%
AMD Radeon RX 7900 XT
AMD Ryzen 9 7950X, AMD Radeon RX 7900 XT
13989 Points +14%
NVIDIA GeForce RTX 3090 Ti
AMD Ryzen 7 5800X3D, NVIDIA GeForce RTX 3090 Ti
12406 Points +1%
Asus TUF Gaming GeForce RTX 4070 Ti
Intel Core i9-13900K, NVIDIA GeForce RTX 4070 Ti
12320 Points
AMD Radeon RX 6950 XT
AMD Ryzen 9 5900X, AMD Radeon RX 6950 XT
11854 Points -4%
NVIDIA GeForce RTX 3090
Intel Core i9-13900K, NVIDIA GeForce RTX 3090
11344 Points -8%
Media NVIDIA GeForce RTX 3080 Ti
  (11049 - 11318, n=4)
11196 Points -9%
Media NVIDIA GeForce RTX 3090
  (10650 - 11564, n=10)
11162 Points -9%
AMD Radeon RX 6900 XT
AMD Ryzen 9 5950X, AMD Radeon RX 6900 XT
10834 Points -12%
AMD Radeon RX 6800 XT
AMD Ryzen 9 5950X, AMD Radeon RX 6800 XT
10018 Points -19%
Media NVIDIA GeForce RTX 3080
  (9554 - 9938, n=2)
9746 Points -21%
Media della classe Desktop
  (75 - 22731, n=24, ultimi 2 anni)
8325 Points -32%
Media NVIDIA Titan RTX
  (5977 - 6406, n=3)
6184 Points -50%
1024x600 Normal, Mandel Vector
NVIDIA GeForce RTX 4090
Intel Core i9-13900K, NVIDIA GeForce RTX 4090
16199 Points +50%
AMD Radeon RX 7900 XTX
AMD Ryzen 9 7950X, AMD Radeon RX 7900 XTX
13737 Points +28%
AMD Radeon RX 7900 XT
AMD Ryzen 9 7950X, AMD Radeon RX 7900 XT
13022 Points +21%
NVIDIA GeForce RTX 4080
Intel Core i9-13900K, NVIDIA GeForce RTX 4080
11772 Points +9%
Asus TUF Gaming GeForce RTX 4070 Ti
Intel Core i9-13900K, NVIDIA GeForce RTX 4070 Ti
10771 Points
NVIDIA GeForce RTX 3090 Ti
AMD Ryzen 7 5800X3D, NVIDIA GeForce RTX 3090 Ti
10652 Points -1%
NVIDIA GeForce RTX 3090
Intel Core i9-13900K, NVIDIA GeForce RTX 3090
9836 Points -9%
Media NVIDIA GeForce RTX 3080 Ti
  (9513 - 9860, n=4)
9730 Points -10%
AMD Radeon RX 6950 XT
AMD Ryzen 9 5900X, AMD Radeon RX 6950 XT
9555 Points -11%
Media NVIDIA GeForce RTX 3090
  (8038 - 10097, n=10)
9467 Points -12%
AMD Radeon RX 6900 XT
AMD Ryzen 9 5950X, AMD Radeon RX 6900 XT
8690 Points -19%
AMD Radeon RX 6800 XT
AMD Ryzen 9 5950X, AMD Radeon RX 6800 XT
8399 Points -22%
Media NVIDIA GeForce RTX 3080
  (7148 - 7540, n=2)
7344 Points -32%
Media della classe Desktop
  (97 - 16942, n=24, ultimi 2 anni)
6936 Points -36%
Media NVIDIA Titan RTX
  (4944 - 5440, n=3)
5158 Points -52%
1024x600 Normal, Fluid 2DTexArr
AMD Radeon RX 7900 XTX
AMD Ryzen 9 7950X, AMD Radeon RX 7900 XTX
7315 Points +105%
NVIDIA GeForce RTX 4090
Intel Core i9-13900K, NVIDIA GeForce RTX 4090
6567 Points +84%
AMD Radeon RX 7900 XT
AMD Ryzen 9 7950X, AMD Radeon RX 7900 XT
6460 Points +81%
NVIDIA GeForce RTX 4080
Intel Core i9-13900K, NVIDIA GeForce RTX 4080
5523 Points +55%
NVIDIA GeForce RTX 3090 Ti
AMD Ryzen 7 5800X3D, NVIDIA GeForce RTX 3090 Ti
4886 Points +37%
NVIDIA GeForce RTX 3090
Intel Core i9-13900K, NVIDIA GeForce RTX 3090
4548 Points +28%
Media NVIDIA GeForce RTX 3080 Ti
  (4453 - 4546, n=4)
4498 Points +26%
Media NVIDIA GeForce RTX 3090
  (4344 - 4608, n=10)
4492 Points +26%
AMD Radeon RX 6950 XT
AMD Ryzen 9 5900X, AMD Radeon RX 6950 XT
4455 Points +25%
Media NVIDIA GeForce RTX 3080
  (4087 - 4159, n=2)
4123 Points +16%
AMD Radeon RX 6800 XT
AMD Ryzen 9 5950X, AMD Radeon RX 6800 XT
3947 Points +11%
AMD Radeon RX 6900 XT
AMD Ryzen 9 5950X, AMD Radeon RX 6900 XT
3924 Points +10%
Media NVIDIA Titan RTX
  (3691 - 3828, n=3)
3757 Points +5%
Asus TUF Gaming GeForce RTX 4070 Ti
Intel Core i9-13900K, NVIDIA GeForce RTX 4070 Ti
3566 Points
Media della classe Desktop
  (60 - 6800, n=24, ultimi 2 anni)
2929 Points -18%
1024x600 Normal, Fluid 3DTex
NVIDIA GeForce RTX 4090
Intel Core i9-13900K, NVIDIA GeForce RTX 4090
10465 Points +184%
AMD Radeon RX 7900 XTX
AMD Ryzen 9 7950X, AMD Radeon RX 7900 XTX
8537 Points +132%
AMD Radeon RX 7900 XT
AMD Ryzen 9 7950X, AMD Radeon RX 7900 XT
7109 Points +93%
NVIDIA GeForce RTX 4080
Intel Core i9-13900K, NVIDIA GeForce RTX 4080
6385 Points +73%
NVIDIA GeForce RTX 3090 Ti
AMD Ryzen 7 5800X3D, NVIDIA GeForce RTX 3090 Ti
5764 Points +57%
AMD Radeon RX 6950 XT
AMD Ryzen 9 5900X, AMD Radeon RX 6950 XT
5515 Points +50%
NVIDIA GeForce RTX 3090
Intel Core i9-13900K, NVIDIA GeForce RTX 3090
5479 Points +49%
Media NVIDIA GeForce RTX 3090
  (5246 - 5520, n=10)
5448 Points +48%
Media NVIDIA GeForce RTX 3080 Ti
  (5312 - 5422, n=4)
5368 Points +46%
AMD Radeon RX 6800 XT
AMD Ryzen 9 5950X, AMD Radeon RX 6800 XT
5154 Points +40%
AMD Radeon RX 6900 XT
AMD Ryzen 9 5950X, AMD Radeon RX 6900 XT
5154 Points +40%
Media NVIDIA GeForce RTX 3080
  (4417 - 4450, n=2)
4434 Points +20%
Media NVIDIA Titan RTX
  (3877 - 4027, n=3)
3955 Points +7%
Asus TUF Gaming GeForce RTX 4070 Ti
Intel Core i9-13900K, NVIDIA GeForce RTX 4070 Ti
3683 Points
Media della classe Desktop
  (65 - 10749, n=24, ultimi 2 anni)
3532 Points -4%

* ... Meglio usare valori piccoli

Prestazioni di gioco: Guadagni significativi rispetto alla RTX 3090

L'Asus TUF Gaming RTX 4070 Ti continua a tallonare la RTX 3090 Ti nei test di gioco con guadagni percepibili rispetto alla RTX 3090. Complessivamente, la TUF Gaming RTX 4070 Ti è alla pari con la RTX 3090 Ti e può essere fino al 13% più veloce rispetto alla RTX 3090 nei giochi testati

Le prestazioni non sono troppo inferiori a quelle della RX 7900 XT e, in alcuni casi come le impostazioni QHD, la RTX 4070 Ti è alla pari o può addirittura superare la seconda migliore GPU RDNA 3 di AMD di questa generazione.

In generale, la RTX 4070 Ti di TUF Gaming si presenta come una scheda estremamente capace di giocare in QHD a 100 fps con impostazioni Ultra. La scheda è anche in grado di eseguire la maggior parte dei titoli AAA moderni a 4K Ultra 60 fps, ma è in QHD che l'AD104 brilla di più.

Rispetto alla top dog RTX 4090 FE, la RTX 4070 Ti è in ritardo di circa il 28% nelle prestazioni raster. Nvidia sta spingendo DLSS 3 come panacea per aumentare gli fps a impostazioni massime, quindi dovrebbe essere possibile ottenere frame ancora più elevati a 4K con DLSS 3 nei titoli supportati

Il fatto che ora stiamo ottenendo i livelli di prestazioni della RTX 3090 Ti a un prezzo MSRP di 799 dollari dimostra quanto l'ammiraglia di Ampere sia stata un'occasione per fare cassa al momento del lancio.

Performance Rating - Percent
NVIDIA GeForce RTX 4090
Intel Core i9-13900K, NVIDIA GeForce RTX 4090
99.8 pt
NVIDIA GeForce RTX 4080
Intel Core i9-13900K, NVIDIA GeForce RTX 4080
85.2 pt
AMD Radeon RX 7900 XTX -3!
AMD Ryzen 9 7950X, AMD Radeon RX 7900 XTX
83.8 pt
AMD Radeon RX 7900 XT -3!
AMD Ryzen 9 7950X, AMD Radeon RX 7900 XT
74.6 pt
Asus TUF Gaming RTX 4070 Ti
Intel Core i9-13900K, NVIDIA GeForce RTX 4070 Ti
71.4 pt
NVIDIA GeForce RTX 3090 Ti
AMD Ryzen 7 5800X3D, NVIDIA GeForce RTX 3090 Ti
71.1 pt
Media della classe Desktop
 
65.2 pt
NVIDIA GeForce RTX 3090 -7!
Intel Core i9-13900K, NVIDIA GeForce RTX 3090
64 pt
AMD Radeon RX 6950 XT
AMD Ryzen 9 5900X, AMD Radeon RX 6950 XT
62.4 pt
Media NVIDIA GeForce RTX 3080 Ti
 
61.8 pt
Media NVIDIA GeForce RTX 3090
 
61.3 pt
AMD Radeon RX 6900 XT
AMD Ryzen 9 5950X, AMD Radeon RX 6900 XT
54.1 pt
Media NVIDIA GeForce RTX 3080
 
53 pt
AMD Radeon RX 6800 XT -1!
AMD Ryzen 9 5950X, AMD Radeon RX 6800 XT
50.7 pt
Media NVIDIA Titan RTX
 
45 pt
The Witcher 3
3840x2160 Ultra Graphics & Postprocessing (HBAO+)
NVIDIA GeForce RTX 4090
Intel Core i9-13900K, NVIDIA GeForce RTX 4090
170.7 (154min, 154.59P1) fps +74%
NVIDIA GeForce RTX 4080
Intel Core i9-13900K, NVIDIA GeForce RTX 4080
128 (113min, 114.12P1) fps +30%
AMD Radeon RX 7900 XTX
AMD Ryzen 9 7950X, AMD Radeon RX 7900 XTX
125.8 (9.5min, 66.1P0.1, 94.8P1) fps +28%
Media della classe Desktop
  (55.9 - 178.6, n=20, ultimi 2 anni)
114.9 fps +17%
AMD Radeon RX 7900 XT
AMD Ryzen 9 7950X, AMD Radeon RX 7900 XT
109.4 (57.5min, 60.1P0.1, 86.2P1) fps +11%
NVIDIA GeForce RTX 3090 Ti
AMD Ryzen 7 5800X3D, NVIDIA GeForce RTX 3090 Ti
107.5 (97min, 97.56P1) fps +9%
Asus TUF Gaming RTX 4070 Ti
Intel Core i9-13900K, NVIDIA GeForce RTX 4070 Ti
98.3 (88min, 88.56P1) fps
Media NVIDIA GeForce RTX 3080 Ti
  (93.1 - 96.4, n=4)
94.7 fps -4%
Media NVIDIA GeForce RTX 3090
  (85.4 - 98.5, n=8)
93.4 fps -5%
AMD Radeon RX 6950 XT
AMD Ryzen 9 5900X, AMD Radeon RX 6950 XT
92.3 (10.8min, 48.8P0.1, 54.2P1) fps -6%
Media NVIDIA GeForce RTX 3080
  (78 - 85.7, n=2)
81.9 fps -17%
AMD Radeon RX 6900 XT
AMD Ryzen 9 5950X, AMD Radeon RX 6900 XT
76.6 (70min, 70P1) fps -22%
Media NVIDIA Titan RTX
  ()
71.8 fps -27%
3840x2160 High Graphics & Postprocessing (Nvidia HairWorks Off)
NVIDIA GeForce RTX 4090
Intel Core i9-13900K, NVIDIA GeForce RTX 4090
274 (243min, 244.12P1) fps +80%
NVIDIA GeForce RTX 4080
Intel Core i9-13900K, NVIDIA GeForce RTX 4080
204 (183min, 183.55P1) fps +34%
NVIDIA GeForce RTX 3090 Ti
AMD Ryzen 7 5800X3D, NVIDIA GeForce RTX 3090 Ti
172.9 (152min, 152.57P1) fps +14%
AMD Radeon RX 7900 XTX
AMD Ryzen 9 7950X, AMD Radeon RX 7900 XTX
163.8 (49.6min, 112P0.1, 134.1P1) fps +8%
Media della classe Desktop
  (16.1 - 282, n=23, ultimi 2 anni)
163.8 fps +8%
AMD Radeon RX 7900 XT
AMD Ryzen 9 7950X, AMD Radeon RX 7900 XT
158.5 (83.2min, 111.2P0.1, 122.8P1) fps +4%
Media NVIDIA GeForce RTX 3080 Ti
  (149 - 156.8, n=4)
152.4 fps 0%
Asus TUF Gaming RTX 4070 Ti
Intel Core i9-13900K, NVIDIA GeForce RTX 4070 Ti
151.9 (137min, 138.12P1) fps
NVIDIA GeForce RTX 3090
Intel Core i9-13900K, NVIDIA GeForce RTX 3090
151.6 (24.7min, 114.1P0.1, 131.8P1) fps 0%
Media NVIDIA GeForce RTX 3090
  (128 - 160.2, n=12)
151.5 fps 0%
AMD Radeon RX 6950 XT
AMD Ryzen 9 5900X, AMD Radeon RX 6950 XT
139.7 (10.4min, 105.6P0.1, 118.6P1) fps -8%
AMD Radeon RX 6900 XT
AMD Ryzen 9 5950X, AMD Radeon RX 6900 XT
122 (105min, 105P1) fps -20%
Media NVIDIA GeForce RTX 3080
  (114 - 115, n=2)
114.5 fps -25%
AMD Radeon RX 6800 XT
AMD Ryzen 9 5950X, AMD Radeon RX 6800 XT
110 (97min) fps -28%
Media NVIDIA Titan RTX
  (94 - 107.1, n=28)
102.4 fps -33%
1920x1080 Ultra Graphics & Postprocessing (HBAO+)
NVIDIA GeForce RTX 4090
Intel Core i9-13900K, NVIDIA GeForce RTX 4090
297 (271min, 271P1) fps +29%
AMD Radeon RX 7900 XTX
AMD Ryzen 9 7950X, AMD Radeon RX 7900 XTX
297 (41.3min, 167.7P0.1, 245P1) fps +29%
AMD Radeon RX 7900 XT
AMD Ryzen 9 7950X, AMD Radeon RX 7900 XT
265 (104.1min, 151.5P0.1, 214P1) fps +15%
NVIDIA GeForce RTX 4080
Intel Core i9-13900K, NVIDIA GeForce RTX 4080
254 (227min, 227P1) fps +10%
Asus TUF Gaming RTX 4070 Ti
Intel Core i9-13900K, NVIDIA GeForce RTX 4070 Ti
230 (207min, 208.68P1) fps
AMD Radeon RX 6950 XT
AMD Ryzen 9 5900X, AMD Radeon RX 6950 XT
205 (10.2min, 109.8P0.1, 161.2P1) fps -11%
NVIDIA GeForce RTX 3090 Ti
AMD Ryzen 7 5800X3D, NVIDIA GeForce RTX 3090 Ti (110% PT)
196.3 (192min, 193P1) fps -15%
NVIDIA GeForce RTX 3090 Ti
AMD Ryzen 7 5800X3D, NVIDIA GeForce RTX 3090 Ti (100% PT)
193.4 (173min, 173.56P1) fps -16%
Media NVIDIA GeForce RTX 3080 Ti
  (174 - 184.6, n=4)
180.2 fps -22%
Media NVIDIA GeForce RTX 3090
  (160 - 192.6, n=16)
179.9 fps -22%
NVIDIA GeForce RTX 3090
Intel Core i9-13900K, NVIDIA GeForce RTX 3090
179.8 (98.3min, 120.2P0.1, 148.7P1) fps -22%
Media della classe Desktop
  (3.9 - 314, n=31, ultimi 2 anni)
168.6 fps -27%
AMD Radeon RX 6900 XT
AMD Ryzen 9 5950X, AMD Radeon RX 6900 XT
163.6 (139min) fps -29%
AMD Radeon RX 6800 XT
AMD Ryzen 9 5950X, AMD Radeon RX 6800 XT
160 (138min) fps -30%
Media NVIDIA GeForce RTX 3080
  (145 - 152, n=2)
148.5 fps -35%
Media NVIDIA Titan RTX
  (124 - 150, n=28)
137.7 fps -40%
Metro Exodus
3840x2160 Ultra Quality AF:16x
NVIDIA GeForce RTX 4090
Intel Core i9-13900K, NVIDIA GeForce RTX 4090
135 (72.48min) fps +60%
NVIDIA GeForce RTX 4080
Intel Core i9-13900K, NVIDIA GeForce RTX 4080
105.7 (67.17min) fps +25%
AMD Radeon RX 7900 XTX
AMD Ryzen 9 7950X, AMD Radeon RX 7900 XTX
103.5 (66.43min) fps +22%
AMD Radeon RX 7900 XT
AMD Ryzen 9 7950X, AMD Radeon RX 7900 XT
86.9 (56.86min) fps +3%
Asus TUF Gaming RTX 4070 Ti
Intel Core i9-13900K, NVIDIA GeForce RTX 4070 Ti
84.5 (55.02min) fps
NVIDIA GeForce RTX 3090 Ti
AMD Ryzen 7 5800X3D, NVIDIA GeForce RTX 3090 Ti
84.3 (52.3min) fps 0%
Media della classe Desktop
  (8.47 - 138.5, n=23, ultimi 2 anni)
83.6 fps -1%
NVIDIA GeForce RTX 3090
Intel Core i9-13900K, NVIDIA GeForce RTX 3090
76.2 (48.9min) fps -10%
Media NVIDIA GeForce RTX 3080 Ti
  (74.2 - 77.1, n=4)
75.7 fps -10%
AMD Radeon RX 6950 XT
AMD Ryzen 9 5900X, AMD Radeon RX 6950 XT
75 (50.07min) fps -11%
Media NVIDIA GeForce RTX 3090
  (70.6 - 77.3, n=12)
75 fps -11%
AMD Radeon RX 6900 XT
AMD Ryzen 9 5950X, AMD Radeon RX 6900 XT
66.7 (42.71min) fps -21%
Media NVIDIA GeForce RTX 3080
  (64.1 - 65.9, n=2)
65 fps -23%
AMD Radeon RX 6800 XT
AMD Ryzen 9 5950X, AMD Radeon RX 6800 XT
56.3 (40.14min) fps -33%
Media NVIDIA Titan RTX
  (51.3 - 57.9, n=27)
54.9 fps -35%
2560x1440 Ultra Quality AF:16x
NVIDIA GeForce RTX 4090
Intel Core i9-13900K, NVIDIA GeForce RTX 4090
176 (81.25min) fps +33%
NVIDIA GeForce RTX 4080
Intel Core i9-13900K, NVIDIA GeForce RTX 4080
155.1 (77.58min) fps +17%
AMD Radeon RX 7900 XTX
AMD Ryzen 9 7950X, AMD Radeon RX 7900 XTX
154.5 (90.83min) fps +17%
AMD Radeon RX 7900 XT
AMD Ryzen 9 7950X, AMD Radeon RX 7900 XT
135 (79.57min) fps +2%
Asus TUF Gaming RTX 4070 Ti
Intel Core i9-13900K, NVIDIA GeForce RTX 4070 Ti
132.1 (72.92min) fps
NVIDIA GeForce RTX 3090 Ti
AMD Ryzen 7 5800X3D, NVIDIA GeForce RTX 3090 Ti
125.3 (64.48min) fps -5%
Media della classe Desktop
  (14.8 - 181.3, n=23, ultimi 2 anni)
120.8 fps -9%
NVIDIA GeForce RTX 3090
Intel Core i9-13900K, NVIDIA GeForce RTX 3090
116.4 (67.43min) fps -12%
AMD Radeon RX 6950 XT
AMD Ryzen 9 5900X, AMD Radeon RX 6950 XT
115.5 (70.52min) fps -13%
Media NVIDIA GeForce RTX 3080 Ti
  (110 - 118, n=4)
114 fps -14%
Media NVIDIA GeForce RTX 3090
  (102 - 118.2, n=12)
113.2 fps -14%
AMD Radeon RX 6900 XT
AMD Ryzen 9 5950X, AMD Radeon RX 6900 XT
102 (59.52min) fps -23%
Media NVIDIA GeForce RTX 3080
  (92.2 - 97.4, n=2)
94.8 fps -28%
AMD Radeon RX 6800 XT
AMD Ryzen 9 5950X, AMD Radeon RX 6800 XT
94.6 (55.44min) fps -28%
Media NVIDIA Titan RTX
  (69 - 92.9, n=26)
84 fps -36%
1920x1080 Ultra Quality AF:16x
NVIDIA GeForce RTX 4090
Intel Core i9-13900K, NVIDIA GeForce RTX 4090
191.2 (84.99min) fps +18%
AMD Radeon RX 7900 XTX
AMD Ryzen 9 7950X, AMD Radeon RX 7900 XTX
183.5 (102.51min) fps +14%
NVIDIA GeForce RTX 4080
Intel Core i9-13900K, NVIDIA GeForce RTX 4080
180 (82.56min) fps +12%
AMD Radeon RX 7900 XT
AMD Ryzen 9 7950X, AMD Radeon RX 7900 XT
164.6 (92.11min) fps +2%
Asus TUF Gaming RTX 4070 Ti
Intel Core i9-13900K, NVIDIA GeForce RTX 4070 Ti
161.4 (78.05min) fps
NVIDIA GeForce RTX 3090 Ti
AMD Ryzen 7 5800X3D, NVIDIA GeForce RTX 3090 Ti
145.9 (68.14min) fps -10%
NVIDIA GeForce RTX 3090
Intel Core i9-13900K, NVIDIA GeForce RTX 3090
141.3 (72.08min) fps -12%
AMD Radeon RX 6950 XT
AMD Ryzen 9 5900X, AMD Radeon RX 6950 XT
140 (81.08min) fps -13%
Media NVIDIA GeForce RTX 3080 Ti
  (131 - 144.2, n=5)
135.4 fps -16%
Media NVIDIA GeForce RTX 3090
  (108 - 145, n=12)
135.3 fps -16%
AMD Radeon RX 6900 XT
AMD Ryzen 9 5950X, AMD Radeon RX 6900 XT
123 (67.67min) fps -24%
Media della classe Desktop
  (5.22 - 194.7, n=27, ultimi 2 anni)
121.2 fps -25%
AMD Radeon RX 6800 XT
AMD Ryzen 9 5950X, AMD Radeon RX 6800 XT
115 (64.52min) fps -29%
Media NVIDIA GeForce RTX 3080
  (111 - 116, n=2)
113.5 fps -30%
Media NVIDIA Titan RTX
  (73 - 116, n=27)
102.2 fps -37%
Control
3840x2160 High Quality Preset (DX11)
NVIDIA GeForce RTX 4090
Intel Core i9-13900K, NVIDIA GeForce RTX 4090
107.7 (83.4min, 85.3P0.1, 91.1P1) fps +66%
AMD Radeon RX 7900 XTX
AMD Ryzen 9 7950X, AMD Radeon RX 7900 XTX
89.4 (46.8min, 48.3P0.1, 52.1P1) fps +38%
NVIDIA GeForce RTX 4080
Intel Core i9-13900K, NVIDIA GeForce RTX 4080
82.6 (15.4min, 68.7P0.1, 71.9P1) fps +27%
AMD Radeon RX 7900 XT
AMD Ryzen 9 7950X, AMD Radeon RX 7900 XT
75.8 (40.1min, 41.7P0.1, 43.6P1) fps +17%
NVIDIA GeForce RTX 3090 Ti
AMD Ryzen 7 5800X3D, NVIDIA GeForce RTX 3090 Ti
73.9 (46.2min, 53.2P0.1, 62.6P1) fps +14%
Media della classe Desktop
  (30.3 - 114.4, n=15, ultimi 2 anni)
66.5 fps +2%
Asus TUF Gaming RTX 4070 Ti
Intel Core i9-13900K, NVIDIA GeForce RTX 4070 Ti
64.9 (50min, 51.9P0.1, 56.5P1) fps
AMD Radeon RX 6950 XT
AMD Ryzen 9 5900X, AMD Radeon RX 6950 XT
64.8 (33.1min, 33.6P0.1, 36.3P1) fps 0%
Media NVIDIA GeForce RTX 3080 Ti
  (63.9 - 64.9, n=3)
64.3 fps -1%
Media NVIDIA GeForce RTX 3090
  (61.3 - 66, n=5)
62.9 fps -3%
Media NVIDIA GeForce RTX 3080
  (56.2 - 56.7, n=2)
56.5 fps -13%
AMD Radeon RX 6900 XT
AMD Ryzen 9 5950X, AMD Radeon RX 6900 XT
54.7 (39.8min, 41.7P0.1, 44.9P1) fps -16%
AMD Radeon RX 6900 XT
AMD Ryzen 9 5950X, AMD Radeon RX 6900 XT (SAM ENABLED)
53.9 (36.6min, 41.7P0.1, 43.5P1) fps -17%
AMD Radeon RX 6800 XT
AMD Ryzen 9 5950X, AMD Radeon RX 6800 XT
51.6 (46min) fps -20%
Media NVIDIA Titan RTX
  (45.2 - 47.3, n=3)
46.5 fps -28%
2560x1440 High Quality Preset (DX11)
NVIDIA GeForce RTX 4090
Intel Core i9-13900K, NVIDIA GeForce RTX 4090
201 (84.1min, 146.6P0.1, 159P1) fps +54%
AMD Radeon RX 7900 XTX
AMD Ryzen 9 7950X, AMD Radeon RX 7900 XTX
184.9 (66.6min, 105.1P0.1, 121.7P1) fps +42%
NVIDIA GeForce RTX 4080
Intel Core i9-13900K, NVIDIA GeForce RTX 4080
164.2 (59.2min, 121.2P0.1, 135.5P1) fps +26%
AMD Radeon RX 7900 XT
AMD Ryzen 9 7950X, AMD Radeon RX 7900 XT
156.4 (53.3min, 89.4P0.1, 95.9P1) fps +20%
NVIDIA GeForce RTX 3090 Ti
AMD Ryzen 7 5800X3D, NVIDIA GeForce RTX 3090 Ti
142.5 (51.8min, 81.9P0.1, 115.5P1) fps +9%
AMD Radeon RX 6950 XT
AMD Ryzen 9 5900X, AMD Radeon RX 6950 XT
133.5 (73.5min, 75.3P0.1, 83.4P1) fps +2%
Asus TUF Gaming RTX 4070 Ti
Intel Core i9-13900K, NVIDIA GeForce RTX 4070 Ti
130.6 (59min, 74P0.1, 107.3P1) fps
Media della classe Desktop
  (60.9 - 232, n=15, ultimi 2 anni)
129.4 fps -1%
Media NVIDIA GeForce RTX 3080 Ti
  (122 - 125.5, n=3)
123.8 fps -5%
Media NVIDIA GeForce RTX 3090
  (115.8 - 123.7, n=5)
120.4 fps -8%
AMD Radeon RX 6900 XT
AMD Ryzen 9 5950X, AMD Radeon RX 6900 XT
113 (71.5min, 73.2P0.1, 79.6P1) fps -13%
AMD Radeon RX 6900 XT
AMD Ryzen 9 5950X, AMD Radeon RX 6900 XT (SAM ENABLED)
113 (68min, 71.3P0.1, 81.1P1) fps -13%
AMD Radeon RX 6800 XT
AMD Ryzen 9 5950X, AMD Radeon RX 6800 XT
108 (93min) fps -17%
Media NVIDIA GeForce RTX 3080
  (105 - 106, n=2)
105.5 fps -19%
Media NVIDIA Titan RTX
  (89 - 93.6, n=3)
91.5 fps -30%
1920x1080 High Quality Preset (DX11)
AMD Radeon RX 7900 XTX
AMD Ryzen 9 7950X, AMD Radeon RX 7900 XTX
240 (18.1min, 136.2P0.1, 151.8P1) fps +19%
NVIDIA GeForce RTX 4090
Intel Core i9-13900K, NVIDIA GeForce RTX 4090
238 (14.4min, 62.9P0.1, 153.8P1) fps +18%
NVIDIA GeForce RTX 4080
Intel Core i9-13900K, NVIDIA GeForce RTX 4080
233 (7.49min, 27.2P0.1, 156.1P1) fps +15%
AMD Radeon RX 7900 XT
AMD Ryzen 9 7950X, AMD Radeon RX 7900 XT
233 (67.8min, 133.8P0.1, 152.6P1) fps +15%
NVIDIA GeForce RTX 3090 Ti
AMD Ryzen 7 5800X3D, NVIDIA GeForce RTX 3090 Ti
209 (55.6min, 119.8P0.1, 162.7P1) fps +3%
AMD Radeon RX 6950 XT
AMD Ryzen 9 5900X, AMD Radeon RX 6950 XT
205 (45.2min, 129.1P0.1, 150.8P1) fps +1%
Asus TUF Gaming RTX 4070 Ti
Intel Core i9-13900K, NVIDIA GeForce RTX 4070 Ti
202 (88min, 151.4P0.1, 165P1) fps
Media NVIDIA GeForce RTX 3080 Ti
  (181 - 190.7, n=3)
186.2 fps -8%
Media della classe Desktop
  (93.7 - 238, n=15, ultimi 2 anni)
181.3 fps -10%
Media NVIDIA GeForce RTX 3090
  (172.2 - 189.2, n=5)
179.9 fps -11%
AMD Radeon RX 6900 XT
AMD Ryzen 9 5950X, AMD Radeon RX 6900 XT
175 (56.8min, 96P0.1, 112P1) fps -13%
AMD Radeon RX 6900 XT
AMD Ryzen 9 5950X, AMD Radeon RX 6900 XT (SAM ENABLED)
174 (54min, 99P0.1, 112P1) fps -14%
AMD Radeon RX 6800 XT
AMD Ryzen 9 5950X, AMD Radeon RX 6800 XT
168 (145min) fps -17%
Media NVIDIA GeForce RTX 3080
  (151 - 155, n=2)
153 fps -24%
Media NVIDIA Titan RTX
  (135 - 141.9, n=3)
137.3 fps -32%
Borderlands 3
3840x2160 Badass Overall Quality (DX11)
NVIDIA GeForce RTX 4090
Intel Core i9-13900K, NVIDIA GeForce RTX 4090
133.4 fps +80%
NVIDIA GeForce RTX 4080
Intel Core i9-13900K, NVIDIA GeForce RTX 4080
95.7 fps +29%
AMD Radeon RX 7900 XTX
AMD Ryzen 9 7950X, AMD Radeon RX 7900 XTX
88.4 fps +19%
NVIDIA GeForce RTX 3090 Ti
AMD Ryzen 7 5800X3D, NVIDIA GeForce RTX 3090 Ti
83.8 fps +13%
AMD Radeon RX 7900 XT
AMD Ryzen 9 7950X, AMD Radeon RX 7900 XT
74.6 fps +1%
Media della classe Desktop
  (5.54 - 133.4, n=22, ultimi 2 anni)
74.4 fps 0%
Asus TUF Gaming RTX 4070 Ti
Intel Core i9-13900K, NVIDIA GeForce RTX 4070 Ti
74.1 fps
NVIDIA GeForce RTX 3090
Intel Core i9-13900K, NVIDIA GeForce RTX 3090
73.1 fps -1%
Media NVIDIA GeForce RTX 3090
  (68 - 75.3, n=13)
72.8 fps -2%
Media NVIDIA GeForce RTX 3080 Ti
  (71.2 - 74, n=4)
72.8 fps -2%
Media NVIDIA GeForce RTX 3080
  (61.5 - 61.9, n=2)
61.7 fps -17%
AMD Radeon RX 6950 XT
AMD Ryzen 9 5900X, AMD Radeon RX 6950 XT
59.9 fps -19%
AMD Radeon RX 6900 XT
AMD Ryzen 9 5950X, AMD Radeon RX 6900 XT (SAM ENABLED)
59.8 fps -19%
AMD Radeon RX 6900 XT
AMD Ryzen 9 5950X, AMD Radeon RX 6900 XT
57.1 fps -23%
AMD Radeon RX 6800 XT
AMD Ryzen 9 5950X, AMD Radeon RX 6800 XT
53.6 fps -28%
Media NVIDIA Titan RTX
  (46 - 52.8, n=29)
47.3 fps -36%
2560x1440 Badass Overall Quality (DX11)
NVIDIA GeForce RTX 4090
Intel Core i9-13900K, NVIDIA GeForce RTX 4090
190 fps +35%
NVIDIA GeForce RTX 4080
Intel Core i9-13900K, NVIDIA GeForce RTX 4080
170.5 fps +21%
AMD Radeon RX 7900 XTX
AMD Ryzen 9 7950X, AMD Radeon RX 7900 XTX
152.2 fps +8%
NVIDIA GeForce RTX 3090 Ti
AMD Ryzen 7 5800X3D, NVIDIA GeForce RTX 3090 Ti
143.1 fps +2%
Asus TUF Gaming RTX 4070 Ti
Intel Core i9-13900K, NVIDIA GeForce RTX 4070 Ti
140.6 fps
AMD Radeon RX 7900 XT
AMD Ryzen 9 7950X, AMD Radeon RX 7900 XT
135.2 fps -4%
NVIDIA GeForce RTX 3090
Intel Core i9-13900K, NVIDIA GeForce RTX 3090
128.3 fps -9%
Media NVIDIA GeForce RTX 3080 Ti
  (114 - 130.2, n=4)
124.5 fps -11%
Media NVIDIA GeForce RTX 3090
  (105 - 131.6, n=13)
123.8 fps -12%
Media della classe Desktop
  (13.4 - 190, n=23, ultimi 2 anni)
120.8 fps -14%
AMD Radeon RX 6950 XT
AMD Ryzen 9 5900X, AMD Radeon RX 6950 XT
110 fps -22%
AMD Radeon RX 6900 XT
AMD Ryzen 9 5950X, AMD Radeon RX 6900 XT (SAM ENABLED)
107 fps -24%
AMD Radeon RX 6900 XT
AMD Ryzen 9 5950X, AMD Radeon RX 6900 XT
105 fps -25%
Media NVIDIA GeForce RTX 3080
  (95.7 - 103, n=2)
99.4 fps -29%
AMD Radeon RX 6800 XT
AMD Ryzen 9 5950X, AMD Radeon RX 6800 XT
93.6 fps -33%
Media NVIDIA Titan RTX
  (74 - 93.1, n=29)
84.7 fps -40%
1920x1080 Badass Overall Quality (DX11)
NVIDIA GeForce RTX 4090
Intel Core i9-13900K, NVIDIA GeForce RTX 4090
201 fps +8%
NVIDIA GeForce RTX 4080
Intel Core i9-13900K, NVIDIA GeForce RTX 4080
199.4 fps +7%
Asus TUF Gaming RTX 4070 Ti
Intel Core i9-13900K, NVIDIA GeForce RTX 4070 Ti
186.9 fps
AMD Radeon RX 7900 XTX
AMD Ryzen 9 7950X, AMD Radeon RX 7900 XTX
180.2 fps -4%
NVIDIA GeForce RTX 3090 Ti
AMD Ryzen 7 5800X3D, NVIDIA GeForce RTX 3090 Ti
173.3 fps -7%
AMD Radeon RX 7900 XT
AMD Ryzen 9 7950X, AMD Radeon RX 7900 XT
169.4 fps -9%
NVIDIA GeForce RTX 3090
Intel Core i9-13900K, NVIDIA GeForce RTX 3090
163 fps -13%
Media NVIDIA GeForce RTX 3080 Ti
  (129 - 164.9, n=4)
151.5 fps -19%
Media NVIDIA GeForce RTX 3090
  (117 - 170.1, n=13)
150.7 fps -19%
AMD Radeon RX 6900 XT
AMD Ryzen 9 5950X, AMD Radeon RX 6900 XT (SAM ENABLED)
131 fps -30%
AMD Radeon RX 6900 XT
AMD Ryzen 9 5950X, AMD Radeon RX 6900 XT
130 fps -30%
Media della classe Desktop
  (6.48 - 201, n=26, ultimi 2 anni)
129.9 fps -30%
AMD Radeon RX 6950 XT
AMD Ryzen 9 5900X, AMD Radeon RX 6950 XT
128.5 fps -31%
Media NVIDIA GeForce RTX 3080
  (117 - 128, n=2)
122.5 fps -34%
AMD Radeon RX 6800 XT
AMD Ryzen 9 5950X, AMD Radeon RX 6800 XT
120 fps -36%
Media NVIDIA Titan RTX
  (77.2 - 128.7, n=29)
112 fps -40%
Shadow of the Tomb Raider
3840x2160 Highest Preset AA:T
NVIDIA GeForce RTX 4090
Intel Core i9-13900K, NVIDIA GeForce RTX 4090
182 fps +74%
NVIDIA GeForce RTX 4080
Intel Core i9-13900K, NVIDIA GeForce RTX 4080
134 fps +28%
AMD Radeon RX 7900 XTX
AMD Ryzen 9 7950X, AMD Radeon RX 7900 XTX
130.1 fps +25%
AMD Radeon RX 7900 XT
AMD Ryzen 9 7950X, AMD Radeon RX 7900 XT
109.6 fps +5%
NVIDIA GeForce RTX 3090 Ti
AMD Ryzen 7 5800X3D, NVIDIA GeForce RTX 3090 Ti
106 fps +2%
Asus TUF Gaming RTX 4070 Ti
Intel Core i9-13900K, NVIDIA GeForce RTX 4070 Ti
104.4 fps
Media della classe Desktop
  (33 - 186, n=20, ultimi 2 anni)
103.4 fps -1%
AMD Radeon RX 6950 XT
AMD Ryzen 9 5900X, AMD Radeon RX 6950 XT
97.4 fps -7%
NVIDIA GeForce RTX 3090
Intel Core i9-13900K, NVIDIA GeForce RTX 3090
97.1 fps -7%
Media NVIDIA GeForce RTX 3090
  (89.3 - 99.7, n=12)
96.4 fps -8%
Media NVIDIA GeForce RTX 3080 Ti
  (93 - 98.6, n=3)
95.1 fps -9%
AMD Radeon RX 6900 XT
AMD Ryzen 9 5950X, AMD Radeon RX 6900 XT (SAM ENABLED)
86 fps -18%
AMD Radeon RX 6900 XT
AMD Ryzen 9 5950X, AMD Radeon RX 6900 XT
84 fps -20%
Media NVIDIA GeForce RTX 3080
  (83.9 - 87.9, n=2)
85.9 fps -18%
AMD Radeon RX 6800 XT
AMD Ryzen 9 5950X, AMD Radeon RX 6800 XT
79.6 fps -24%
Media NVIDIA Titan RTX
  (59 - 71.1, n=24)
66.9 fps -36%
2560x1440 Highest Preset AA:T
NVIDIA GeForce RTX 4090
Intel Core i9-13900K, NVIDIA GeForce RTX 4090
282 fps +40%
NVIDIA GeForce RTX 4080
Intel Core i9-13900K, NVIDIA GeForce RTX 4080
248 fps +23%
AMD Radeon RX 7900 XTX
AMD Ryzen 9 7950X, AMD Radeon RX 7900 XTX
230 fps +14%
AMD Radeon RX 7900 XT
AMD Ryzen 9 7950X, AMD Radeon RX 7900 XT
203 fps 0%
Asus TUF Gaming RTX 4070 Ti
Intel Core i9-13900K, NVIDIA GeForce RTX 4070 Ti
202 fps
NVIDIA GeForce RTX 3090 Ti
AMD Ryzen 7 5800X3D, NVIDIA GeForce RTX 3090 Ti
184 fps -9%
AMD Radeon RX 6950 XT
AMD Ryzen 9 5900X, AMD Radeon RX 6950 XT
184 fps -9%
Media della classe Desktop
  (61 - 282, n=21, ultimi 2 anni)
173.6 fps -14%
NVIDIA GeForce RTX 3090
Intel Core i9-13900K, NVIDIA GeForce RTX 3090
167.4 fps -17%
Media NVIDIA GeForce RTX 3090
  (137 - 172.3, n=12)
165.6 fps -18%
Media NVIDIA GeForce RTX 3080 Ti
  (157 - 173.3, n=3)
164.8 fps -18%
AMD Radeon RX 6900 XT
AMD Ryzen 9 5950X, AMD Radeon RX 6900 XT (SAM ENABLED)
163 fps -19%
AMD Radeon RX 6900 XT
AMD Ryzen 9 5950X, AMD Radeon RX 6900 XT
155 fps -23%
Media NVIDIA GeForce RTX 3080
  (147 - 152, n=2)
149.5 fps -26%
AMD Radeon RX 6800 XT
AMD Ryzen 9 5950X, AMD Radeon RX 6800 XT
148 fps -27%
Media NVIDIA Titan RTX
  (98 - 128, n=23)
117.8 fps -42%
1920x1080 Highest Preset AA:T
NVIDIA GeForce RTX 4090
Intel Core i9-13900K, NVIDIA GeForce RTX 4090
306 fps +9%
NVIDIA GeForce RTX 4080
Intel Core i9-13900K, NVIDIA GeForce RTX 4080
303 fps +8%
AMD Radeon RX 7900 XTX
AMD Ryzen 9 7950X, AMD Radeon RX 7900 XTX
301 fps +8%
AMD Radeon RX 7900 XT
AMD Ryzen 9 7950X, AMD Radeon RX 7900 XT
282 fps +1%
Asus TUF Gaming RTX 4070 Ti
Intel Core i9-13900K, NVIDIA GeForce RTX 4070 Ti
280 fps
NVIDIA GeForce RTX 3090 Ti
AMD Ryzen 7 5800X3D, NVIDIA GeForce RTX 3090 Ti
244 fps -13%
NVIDIA GeForce RTX 3090
Intel Core i9-13900K, NVIDIA GeForce RTX 3090
230 fps -18%
AMD Radeon RX 6950 XT
AMD Ryzen 9 5900X, AMD Radeon RX 6950 XT
227 fps -19%
Media NVIDIA GeForce RTX 3080 Ti
  (178 - 238, n=3)
209 fps -25%
Media NVIDIA GeForce RTX 3090
  (145 - 240, n=14)
204 fps -27%
AMD Radeon RX 6900 XT
AMD Ryzen 9 5950X, AMD Radeon RX 6900 XT
202 fps -28%
AMD Radeon RX 6900 XT
AMD Ryzen 9 5950X, AMD Radeon RX 6900 XT (SAM ENABLED)
199 fps -29%
Media della classe Desktop
  (10.5 - 306, n=24, ultimi 2 anni)
194.9 fps -30%
AMD Radeon RX 6800 XT
AMD Ryzen 9 5950X, AMD Radeon RX 6800 XT
194 fps -31%
Media NVIDIA GeForce RTX 3080
  (177 - 185, n=2)
181 fps -35%
Media NVIDIA Titan RTX
  (106 - 178.8, n=24)
149.5 fps -47%
Mafia Definitive Edition
3840x2160 High Preset
NVIDIA GeForce RTX 4090
Intel Core i9-13900K, NVIDIA GeForce RTX 4090
160.2 (42.5min, 66.5P0.1, 122.8P1) fps +80%
NVIDIA GeForce RTX 4080
Intel Core i9-13900K, NVIDIA GeForce RTX 4080
115.6 (34.7min, 70.3P0.1, 99.3P1) fps +30%
Media della classe Desktop
  (72.3 - 160.2, n=11, ultimi 2 anni)
100.8 fps +13%
NVIDIA GeForce RTX 3090 Ti
AMD Ryzen 7 5800X3D, NVIDIA GeForce RTX 3090 Ti
99.2 (29.7min, 56P0.1, 77.1P1) fps +12%
Asus TUF Gaming RTX 4070 Ti
Intel Core i9-13900K, NVIDIA GeForce RTX 4070 Ti
88.9 (34.4min, 62P0.1, 77.4P1) fps
Media NVIDIA GeForce RTX 3090
  (84.5 - 89.1, n=2)
86.8 fps -2%
Media NVIDIA GeForce RTX 3080 Ti
  ()
86.6 fps -3%
AMD Radeon RX 6950 XT
AMD Ryzen 9 5900X, AMD Radeon RX 6950 XT
80.4 (44.2min, 56.8P0.1, 70.5P1) fps -10%
Media NVIDIA GeForce RTX 3080
  (78.1 - 78.2, n=2)
78.2 fps -12%
AMD Radeon RX 6900 XT
AMD Ryzen 9 5950X, AMD Radeon RX 6900 XT
67 (32.3min, 41.7P0.1, 44.7P1) fps -25%
Media NVIDIA Titan RTX
  ()
63.4 fps -29%
AMD Radeon RX 6800 XT
AMD Ryzen 9 5950X, AMD Radeon RX 6800 XT
62.6 (28min, 37.6P0.1, 49.2P1) fps -30%
2560x1440 High Preset
NVIDIA GeForce RTX 4090
Intel Core i9-13900K, NVIDIA GeForce RTX 4090
238 (71.6min, 84.3P0.1, 162.7P1) fps +38%
NVIDIA GeForce RTX 4080
Intel Core i9-13900K, NVIDIA GeForce RTX 4080
214 (100.6min, 149.1P0.1, 172.3P1) fps +24%
Media della classe Desktop
  (141.1 - 238, n=11, ultimi 2 anni)
181.4 fps +6%
NVIDIA GeForce RTX 3090 Ti
AMD Ryzen 7 5800X3D, NVIDIA GeForce RTX 3090 Ti
173.9 (73.1min, 101.4P0.1, 134.6P1) fps +1%
Asus TUF Gaming RTX 4070 Ti
Intel Core i9-13900K, NVIDIA GeForce RTX 4070 Ti
171.9 (100min, 119.6P0.1, 144.6P1) fps
AMD Radeon RX 6950 XT
AMD Ryzen 9 5900X, AMD Radeon RX 6950 XT
156.2 (30min, 87.3P0.1, 114P1) fps -9%
Media NVIDIA GeForce RTX 3090
  (142.3 - 149, n=2)
145.7 fps -15%
Media NVIDIA GeForce RTX 3080 Ti
  ()
142 fps -17%
Media NVIDIA GeForce RTX 3080
  (127 - 137, n=2)
132 fps -23%
AMD Radeon RX 6900 XT
AMD Ryzen 9 5950X, AMD Radeon RX 6900 XT
120 (17.6min, 61.2P0.1, 83.1P1) fps -30%
AMD Radeon RX 6800 XT
AMD Ryzen 9 5950X, AMD Radeon RX 6800 XT
112 (23.5min, 64P0.1, 80.8P1) fps -35%
Media NVIDIA Titan RTX
  ()
109 fps -37%
1920x1080 High Preset
NVIDIA GeForce RTX 4080
Intel Core i9-13900K, NVIDIA GeForce RTX 4080
260 (58.1min, 133.7P0.1, 187.5P1) fps +8%
NVIDIA GeForce RTX 4090
Intel Core i9-13900K, NVIDIA GeForce RTX 4090
255 (80.7min, 89.2P0.1, 169.4P1) fps +6%
Asus TUF Gaming RTX 4070 Ti
Intel Core i9-13900K, NVIDIA GeForce RTX 4070 Ti
241 (107.5min, 136.3P0.1, 183.2P1) fps
Media della classe Desktop
  (207 - 260, n=11, ultimi 2 anni)
232 fps -4%
NVIDIA GeForce RTX 3090 Ti
AMD Ryzen 7 5800X3D, NVIDIA GeForce RTX 3090 Ti
231 (84.7min, 116.2P0.1, 160.4P1) fps -4%
AMD Radeon RX 6950 XT
AMD Ryzen 9 5900X, AMD Radeon RX 6950 XT
175.5 (38.6min, 86.6P0.1, 117.6P1) fps -27%
Media NVIDIA GeForce RTX 3080 Ti
  ()
163 fps -32%
Media NVIDIA GeForce RTX 3090
  (157 - 158.8, n=2)
157.9 fps -34%
Media NVIDIA GeForce RTX 3080
  (144 - 169, n=2)
156.5 fps -35%
AMD Radeon RX 6900 XT
AMD Ryzen 9 5950X, AMD Radeon RX 6900 XT
138 (32.8min, 68.1P0.1, 90.2P1) fps -43%
Media NVIDIA Titan RTX
  ()
123.7 fps -49%
AMD Radeon RX 6800 XT
AMD Ryzen 9 5950X, AMD Radeon RX 6800 XT
121 (23.7min, 68P0.1, 83.3P1) fps -50%

Prestazioni del Ray Tracing

La TUF Gaming RTX 4070 Ti beneficia anche delle nuove pipeline di ray tracing introdotte con l'architettura Ada, tra cui il nuovo Opacity Micromap Engine e il Displaced Micro-mesh Engine.

Ada offre anche un nuovo sistema di scheduling SER (Shader Execution Reordering) per un riordino più efficiente dei thread secondari del ray, ma gli sviluppatori dovranno sfruttarlo in modo specifico

La RTX 4070 Ti ha il 29% di core RT in meno rispetto alla RTX 3090 Ti. Tuttavia, i miglioramenti di cui sopra alla pipeline RT di Ada portano la RTX 4070 Ti alla pari con l'ammiraglia Ampere. Naturalmente, questo dipende anche dal modo in cui il motore di gioco stesso implementa le varie funzionalità RT, motivo per cui non sempre si notano guadagni significativi

Metro Exodus (non-Enhanced Edition), ad esempio, mostra un guadagno dell'11% in RT a 1080p Ultra rispetto alla RTX 3090, ma non vediamo grandi differenze nemmeno con la RTX 4090 o la RTX 4080. Solo la RX 7900 XTX è in grado di offrire un 10% di fps in più in questa impostazione. Lo stesso vale per

Far Cry 6 RT a 1080p Ultra.

Titoli come

Control, Ghostwire:Tokyo e Dying Light 2 mostrano una separazione molto più evidente tra la RTX 4070 Ti e le schede Ada di punta per quanto riguarda le prestazioni di ray tracing nativo

Come per la RTX 3090 Ti, il ray tracing a 4K Ultra nativo senza upscaling rappresenta una sfida per la RTX 4070 Ti, come si evince dai test di Cyberpunk 2077 1.5 - non c'è da sorprendersi, considerando che anche la RTX 4090 FE può gestire solo circa 42 fps in queste impostazioni.

Metro Exodus - 1920x1080 Ultra Quality DXR AF:16x
AMD Radeon RX 7900 XTX
AMD Ryzen 9 7950X, AMD Radeon RX 7900 XTX
141.2 (89.03min) fps +10%
NVIDIA GeForce RTX 4080
Intel Core i9-13900K, NVIDIA GeForce RTX 4080
137.2 (68.42min) fps +7%
NVIDIA GeForce RTX 4090
Intel Core i9-13900K, NVIDIA GeForce RTX 4090
135 (73.53min) fps +5%
Asus TUF Gaming RTX 4070 Ti
Intel Core i9-13900K, NVIDIA GeForce RTX 4070 Ti
128.8 (62.96min) fps
NVIDIA GeForce RTX 3090 Ti
AMD Ryzen 7 5800X3D, NVIDIA GeForce RTX 3090 Ti
128.5 (64.07min) fps 0%
AMD Radeon RX 7900 XT
AMD Ryzen 9 7950X, AMD Radeon RX 7900 XT
124.3 (78.88min) fps -3%
Media della classe Desktop
  (62.8 - 163.7, n=22, ultimi 2 anni)
119.4 fps -7%
NVIDIA GeForce RTX 3090
Intel Core i9-13900K, NVIDIA GeForce RTX 3090
116.1 (61.11min) fps -10%
Media NVIDIA GeForce RTX 3080 Ti
  (110 - 121.2, n=4)
114.8 fps -11%
Media NVIDIA GeForce RTX 3090
  (68.6 - 122.2, n=12)
111.4 fps -14%
Media NVIDIA GeForce RTX 3080
  (91.5 - 102, n=2)
96.8 fps -25%
AMD Radeon RX 6900 XT
AMD Ryzen 9 5950X, AMD Radeon RX 6900 XT
90.5 (55.53min) fps -30%
Media NVIDIA Titan RTX
  (69 - 95.5, n=23)
86.1 fps -33%
AMD Radeon RX 6800 XT
AMD Ryzen 9 5950X, AMD Radeon RX 6800 XT
85.5 (52.71min) fps -34%
Control - 1920x1080 High Quality Preset & High Ray Tracing Preset (DX12)
NVIDIA GeForce RTX 4090
Intel Core i9-13900K, NVIDIA GeForce RTX 4090
185.1 (103.4min, 132.2P0.1, 140.8P1) fps +44%
NVIDIA GeForce RTX 4080
Intel Core i9-13900K, NVIDIA GeForce RTX 4080
162.8 (28.9min, 60.8P0.1, 129.4P1) fps +27%
AMD Radeon RX 7900 XTX
AMD Ryzen 9 7950X, AMD Radeon RX 7900 XTX
133.7 (23.2min, 92.6P0.1, 104.6P1) fps +4%
NVIDIA GeForce RTX 3090 Ti
AMD Ryzen 7 5800X3D, NVIDIA GeForce RTX 3090 Ti
130.8 (62.6min, 107.5P0.1, 113.8P1) fps +2%
Asus TUF Gaming RTX 4070 Ti
Intel Core i9-13900K, NVIDIA GeForce RTX 4070 Ti
128.3 (6.22min, 61.8P0.1, 107P1) fps
Media della classe Desktop
  (58.6 - 185.1, n=15, ultimi 2 anni)
116.6 fps -9%
AMD Radeon RX 7900 XT
AMD Ryzen 9 7950X, AMD Radeon RX 7900 XT
116.1 (8.47min, 62.1P0.1, 91.4P1) fps -10%
Media NVIDIA GeForce RTX 3080 Ti
  (111 - 120.6, n=3)
115.2 fps -10%
Media NVIDIA GeForce RTX 3090
  (91.4 - 122.6, n=5)
111.1 fps -13%
Media NVIDIA GeForce RTX 3080
  (98.1 - 103, n=2)
100.6 fps -22%
AMD Radeon RX 6950 XT
AMD Ryzen 9 5900X, AMD Radeon RX 6950 XT
97.7 (7.66min, 62.8P0.1, 73.5P1) fps -24%
Media NVIDIA Titan RTX
  (63 - 120, n=3)
88.1 fps -31%
AMD Radeon RX 6900 XT
AMD Ryzen 9 5950X, AMD Radeon RX 6900 XT (SAM ENABLED)
76.2 (38.7min, 43.3P0.1, 62.8P1) fps -41%
AMD Radeon RX 6900 XT
AMD Ryzen 9 5950X, AMD Radeon RX 6900 XT
73.1 (31.6min, 40.9P0.1, 62.6P1) fps -43%
AMD Radeon RX 6800 XT
AMD Ryzen 9 5950X, AMD Radeon RX 6800 XT
66.9 (60min) fps -48%
Watch Dogs Legion - 1920x1080 Ultra Preset + Ultra Ray Tracing (DX12)
NVIDIA GeForce RTX 4090
Intel Core i9-13900K, NVIDIA GeForce RTX 4090
115.7 (18.56min, 92.59P1) fps +17%
NVIDIA GeForce RTX 4080
Intel Core i9-13900K, NVIDIA GeForce RTX 4080
111.6 (76.88min, 90.46P1) fps +13%
Asus TUF Gaming RTX 4070 Ti
Intel Core i9-13900K, NVIDIA GeForce RTX 4070 Ti
98.9 (72.06min, 82.17P1) fps
NVIDIA GeForce RTX 3090 Ti
AMD Ryzen 7 5800X3D, NVIDIA GeForce RTX 3090 Ti
88.7 (50.06min, 72.42P1) fps -10%
Media NVIDIA GeForce RTX 3090
  (75.7 - 110, n=3)
88 fps -11%
Media della classe Desktop
  (35 - 115.7, n=14, ultimi 2 anni)
83.7 fps -15%
Media NVIDIA GeForce RTX 3080 Ti
  ()
75.1 fps -24%
AMD Radeon RX 6800 XT
AMD Ryzen 9 5950X, AMD Radeon RX 6800 XT
71.4 (47.71min, 55.63P1) fps -28%
Media NVIDIA GeForce RTX 3080
  (70.9 - 71.3, n=2)
71.1 fps -28%
AMD Radeon RX 6950 XT
AMD Ryzen 9 5900X, AMD Radeon RX 6950 XT
69 fps -30%
AMD Radeon RX 6900 XT
AMD Ryzen 9 5950X, AMD Radeon RX 6900 XT
55.6 (35.81min, 41.86P1) fps -44%
AMD Radeon RX 6900 XT
AMD Ryzen 9 5950X, AMD Radeon RX 6900 XT (SAM ENABLED)
55.5 (36.48min, 43.27P1) fps -44%
Media NVIDIA Titan RTX
  ()
55.4 fps -44%
Far Cry 6 - 1920x1080 Ultra Graphics Quality + HD Textures + DXR AA:T
NVIDIA GeForce RTX 4080
Intel Core i9-13900K, NVIDIA GeForce RTX 4080
154 (125min) fps +5%
AMD Radeon RX 7900 XTX
AMD Ryzen 9 7950X, AMD Radeon RX 7900 XTX
152.1 (75min) fps +4%
NVIDIA GeForce RTX 4090
Intel Core i9-13900K, NVIDIA GeForce RTX 4090
147 (125min) fps +1%
Asus TUF Gaming RTX 4070 Ti
Intel Core i9-13900K, NVIDIA GeForce RTX 4070 Ti
146 (122min) fps
AMD Radeon RX 7900 XT
AMD Ryzen 9 7950X, AMD Radeon RX 7900 XT
143.6 (46min) fps -2%
Media della classe Desktop
  (19.1 - 154, n=17, ultimi 2 anni)
125 fps -14%
NVIDIA GeForce RTX 3090 Ti
AMD Ryzen 7 5800X3D, NVIDIA GeForce RTX 3090 Ti
122 (95min) fps -16%
Media NVIDIA GeForce RTX 3080 Ti
  (112 - 128.6, n=2)
120.3 fps -18%
Media NVIDIA GeForce RTX 3090
  (76 - 138.2, n=8)
112.6 fps -23%
Media NVIDIA Titan RTX
  (97 - 109.3, n=2)
103.2 fps -29%
AMD Radeon RX 6950 XT
AMD Ryzen 9 5900X, AMD Radeon RX 6950 XT
101.6 (24min) fps -30%
Media NVIDIA GeForce RTX 3080
  ()
73 fps -50%
Dying Light 2 - 1920x1080 High Quality Raytracing
NVIDIA GeForce RTX 4090
Intel Core i9-13900K, NVIDIA GeForce RTX 4090
130 (49min, 97.7P0.1, 106.7P1) fps +57%
NVIDIA GeForce RTX 4080
Intel Core i9-13900K, NVIDIA GeForce RTX 4080
98.7 (37.6min, 46.5P0.1, 74.3P1) fps +19%
Media NVIDIA GeForce RTX 3080 Ti
  ()
83.5 fps +1%
Media della classe Desktop
  (59.4 - 130, n=11, ultimi 2 anni)
83.5 fps +1%
Asus TUF Gaming RTX 4070 Ti
Intel Core i9-13900K, NVIDIA GeForce RTX 4070 Ti
82.9 (36.6min, 45.4P0.1, 69.2P1) fps
Media NVIDIA Titan RTX
  ()
80.1 fps -3%
NVIDIA GeForce RTX 3090 Ti
AMD Ryzen 7 5800X3D, NVIDIA GeForce RTX 3090 Ti
76.4 (33.4min, 57.9P0.1, 62.6P1) fps -8%
Media NVIDIA GeForce RTX 3090
  (67.9 - 80.2, n=2)
74.1 fps -11%
Media NVIDIA GeForce RTX 3080
  ()
59.7 fps -28%
Cyberpunk 2077 1.6
3840x2160 Ray Tracing Ultra Preset (DLSS off)
NVIDIA GeForce RTX 4090
Intel Core i9-13900K, NVIDIA GeForce RTX 4090 (1.6)
42.6 (32min) fps +80%
NVIDIA GeForce RTX 4080
Intel Core i9-13900K, NVIDIA GeForce RTX 4080 (1.6)
30.7 (23.5min) fps +30%
Media della classe Desktop
  (1.4 - 43.8, n=19, ultimi 2 anni)
24.4 fps +3%
NVIDIA GeForce RTX 3090 Ti
AMD Ryzen 7 5800X3D, NVIDIA GeForce RTX 3090 Ti (1.52)
24.3 (16.3min) fps +3%
Asus TUF Gaming RTX 4070 Ti
Intel Core i9-13900K, NVIDIA GeForce RTX 4070 Ti (1.61)
23.7 (18.1min) fps
Media NVIDIA GeForce RTX 3090
  (19.8 - 22.1, n=5)
21 fps -11%
AMD Radeon RX 7900 XTX
AMD Ryzen 9 7950X, AMD Radeon RX 7900 XTX (1.61)
20.7 (14.4min) fps -13%
Media NVIDIA GeForce RTX 3080 Ti
  ()
18.6 fps -22%
AMD Radeon RX 7900 XT
AMD Ryzen 9 7950X, AMD Radeon RX 7900 XT (1.61)
17.6 (12min) fps -26%
Media NVIDIA Titan RTX
  ()
13.4 fps -43%
Media NVIDIA GeForce RTX 3080
  ()
12.1 fps -49%
1920x1080 Ray Tracing Ultra Preset (DLSS off)
NVIDIA GeForce RTX 4090
Intel Core i9-13900K, NVIDIA GeForce RTX 4090 (1.6)
118.4 (92min) fps +46%
NVIDIA GeForce RTX 4080
Intel Core i9-13900K, NVIDIA GeForce RTX 4080 (1.6)
100.1 (77.6min) fps +24%
Asus TUF Gaming RTX 4070 Ti
Intel Core i9-13900K, NVIDIA GeForce RTX 4070 Ti (1.61)
81 (62.6min) fps
Media della classe Desktop
  (23.8 - 130.1, n=20, ultimi 2 anni)
77.1 fps -5%
NVIDIA GeForce RTX 3090 Ti
AMD Ryzen 7 5800X3D, NVIDIA GeForce RTX 3090 Ti (1.52)
74.7 (57.7min) fps -8%
Media NVIDIA GeForce RTX 3080 Ti
  ()
69.1 fps -15%
Media NVIDIA GeForce RTX 3090
  (61.3 - 68, n=5)
65.5 fps -19%
AMD Radeon RX 7900 XTX
AMD Ryzen 9 7950X, AMD Radeon RX 7900 XTX (1.61)
64.6 (49.1min) fps -20%
Media NVIDIA GeForce RTX 3080
  ()
61.1 fps -25%
AMD Radeon RX 7900 XT
AMD Ryzen 9 7950X, AMD Radeon RX 7900 XT (1.61)
57.1 (41.7min) fps -30%
Media NVIDIA Titan RTX
  ()
43.3 fps -47%
Ghostwire Tokyo - 1920x1080 Highest Settings + Maximum Ray Tracing
NVIDIA GeForce RTX 4090
Intel Core i9-13900K, NVIDIA GeForce RTX 4090
193.7 (38.5min, 66.5P0.1, 142.5P1) fps +39%
NVIDIA GeForce RTX 4080
Intel Core i9-13900K, NVIDIA GeForce RTX 4080
166.2 (30.4min, 60P0.1, 115.2P1) fps +19%
Asus TUF Gaming RTX 4070 Ti
Intel Core i9-13900K, NVIDIA GeForce RTX 4070 Ti
139.3 (31.3min, 53.2P0.1, 89.7P1) fps
AMD Radeon RX 7900 XTX
AMD Ryzen 9 7950X, AMD Radeon RX 7900 XTX
136.3 (39.1min, 76.4P0.1, 95.8P1) fps -2%
Media della classe Desktop
  (55.9 - 193.7, n=13, ultimi 2 anni)
136.3 fps -2%
NVIDIA GeForce RTX 3090 Ti
AMD Ryzen 7 5800X3D, NVIDIA GeForce RTX 3090 Ti
120.2 (33.8min, 55.2P0.1, 79.1P1) fps -14%
Media NVIDIA GeForce RTX 3080 Ti
  ()
119.9 fps -14%
AMD Radeon RX 7900 XT
AMD Ryzen 9 7950X, AMD Radeon RX 7900 XT
116.5 (30.3min, 71.6P0.1, 78.1P1) fps -16%
Media NVIDIA GeForce RTX 3090
  (106 - 122, n=3)
111.6 fps -20%
Media NVIDIA GeForce RTX 3080
  ()
97.9 fps -30%
Media NVIDIA Titan RTX
  (74.5 - 79, n=2)
76.8 fps -45%
The Callisto Protocol - 1920x1080 Ultra Preset (without FSR Upscaling) + Full Ray-Tracing
AMD Radeon RX 7900 XTX
AMD Ryzen 9 7950X, AMD Radeon RX 7900 XTX
98 fps +11%
AMD Radeon RX 7900 XT
AMD Ryzen 9 7950X, AMD Radeon RX 7900 XT
89 fps 0%
Asus TUF Gaming RTX 4070 Ti
Intel Core i9-13900K, NVIDIA GeForce RTX 4070 Ti
88.58 fps
Media della classe Desktop
  (50.2 - 97.6, n=7, ultimi 2 anni)
86 fps -3%
Media NVIDIA GeForce RTX 3080 Ti
  ()
76 fps -14%
Media NVIDIA GeForce RTX 3080
  ()
71.3 fps -20%
Media NVIDIA Titan RTX
  ()
58.7 fps -34%
basso medio alto ultraQHD4K
GTA V (2015) 187.9 187.9 187.6 172.3 158.4 171.8
The Witcher 3 (2015) 460 230 151.9
Dota 2 Reborn (2015) 303 274.2 261.2 245.5 231.5
Final Fantasy XV Benchmark (2018) 236 235 209 167 90.5
Shadow of the Tomb Raider (2018) 298 280 202 104.4
Metro Exodus (2019) 194.6 161.4 132.1 84.5
Control (2019) 202 130.6 64.9
Borderlands 3 (2019) 212 186.9 140.6 74.1
Mafia Definitive Edition (2020) 241 171.9 88.9
Watch Dogs Legion (2020) 174.3 152 121 68.4
F1 2021 (2021) 713 614 499 263 199.8 114.4
Far Cry 6 (2021) 197 183 159 89
Dying Light 2 (2022) 175.5 120.9 59.1
Cyberpunk 2077 1.6 (2022) 185.7 167.4 122.9 50.1
Ghostwire Tokyo (2022) 318 329 219 95.2
F1 22 (2022) 407 417 342 143.5 92.4 47
Uncharted Legacy of Thieves Collection (2022) 137.7 133.8 108.8 63.2
Call of Duty Modern Warfare 2 2022 (2022) 187 179 132 83
The Callisto Protocol (2022) 155.26 155.75 117.62 68.34

Emissioni: Nessuna differenza percepibile tra le modalità BIOS Performance e Quiet

Asus equipaggia la TUF Gaming RTX 4070 Ti con un sistema di raffreddamento a tre ventole - due delle ventole ruotano in senso antiorario rispetto alla ventola centrale e si fermano completamente a temperature inferiori o uguali a 50 °C. Come accade spesso con la maggior parte delle schede AiB, è presente un selettore BIOS tra le modalità Performance e Quiet.

La TUF Gaming RTX 4070 Ti O12G consente di aumentare il TGP del 10% fino a 314 W, quindi non c'è molto potenziale di overclocking.
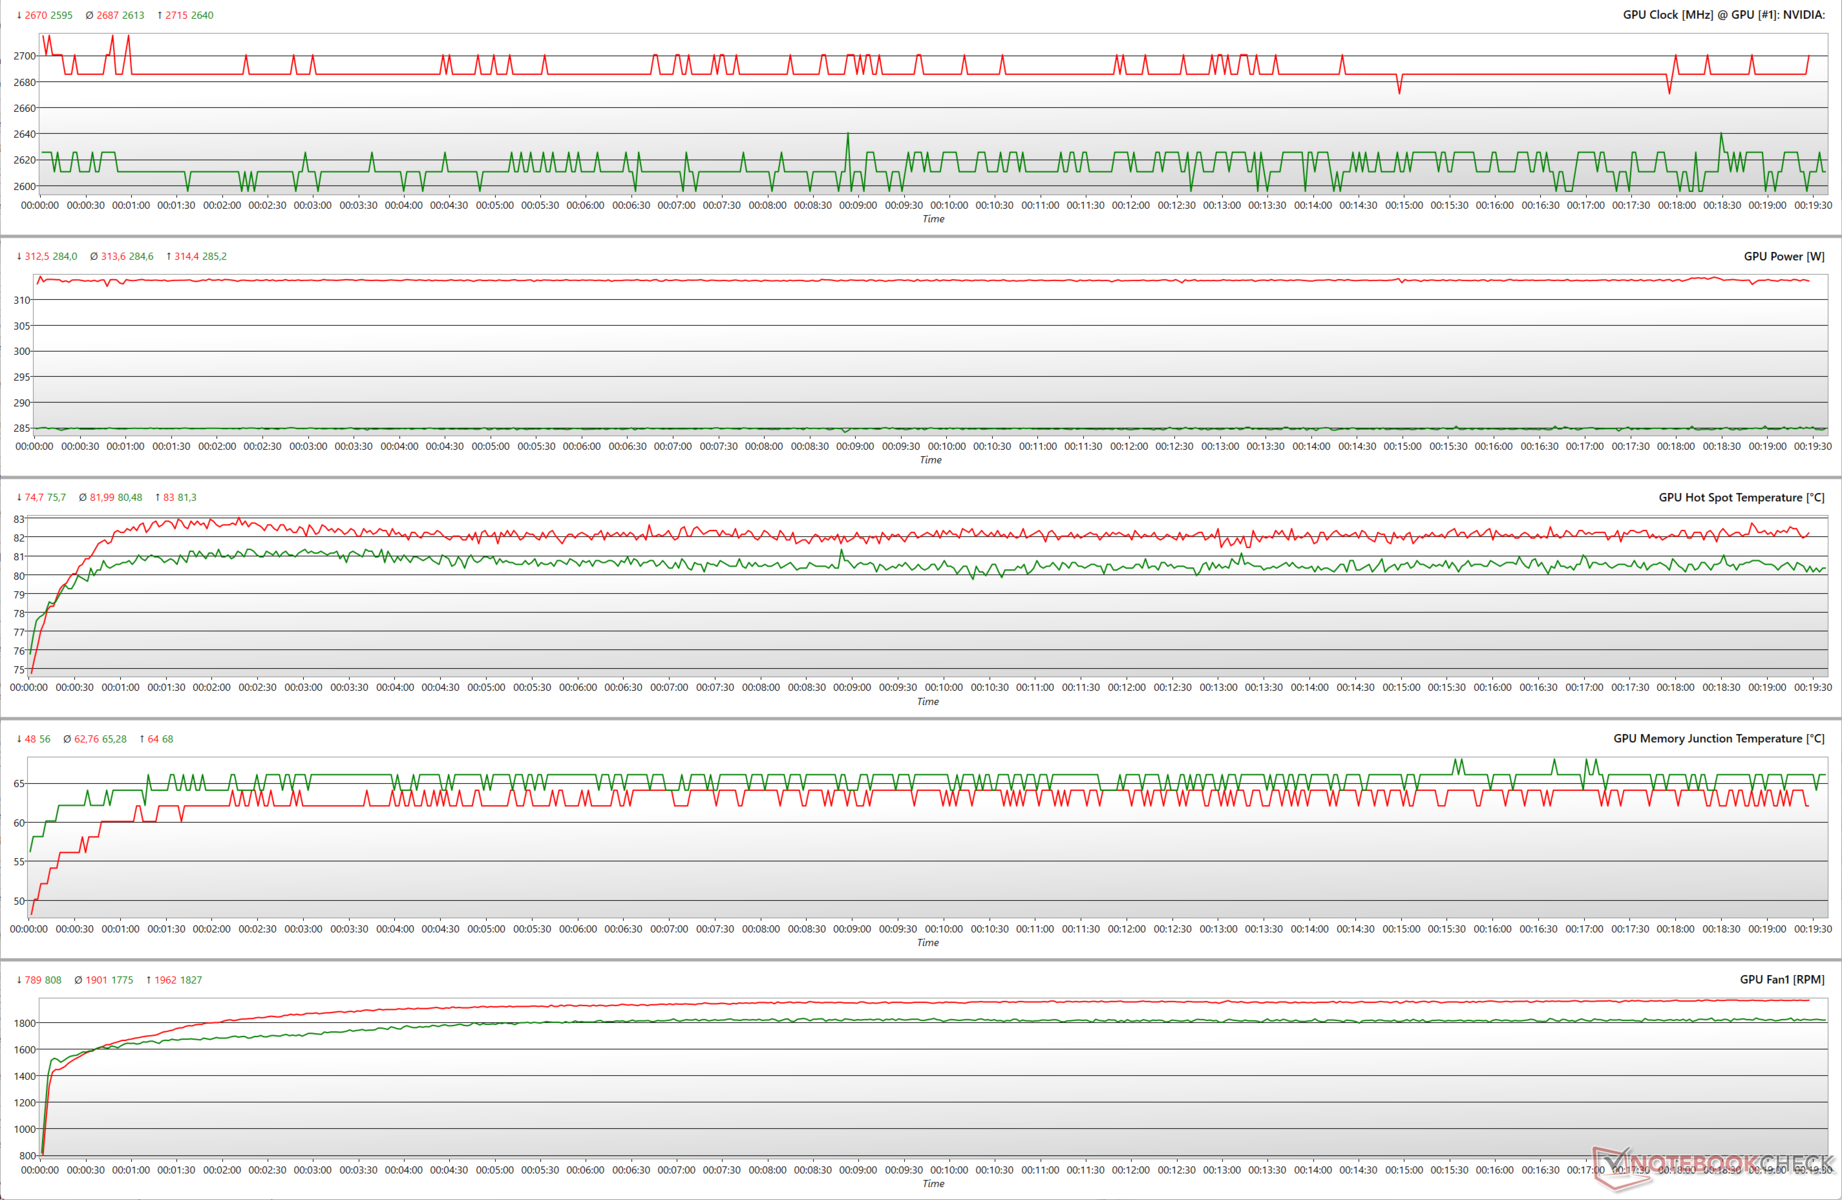
Test di stress

Durante uno stress test FurMark a 1280 x 720 senza AA, vediamo che la TUF Gaming RTX 4070 Ti sfrutta appieno il suo TGP da 285 W e funziona a una media di 2.613 MHz, raggiungendo a volte il boost massimo di 2.640 MHz. Aumentando il TGP a 314 W, i clock salgono a 2.715 MHz con una media di 2.687 MHz. Questo ha solo un impatto minimo sulle temperature hotspot della GPU, che possono aumentare fino a 83 °C.

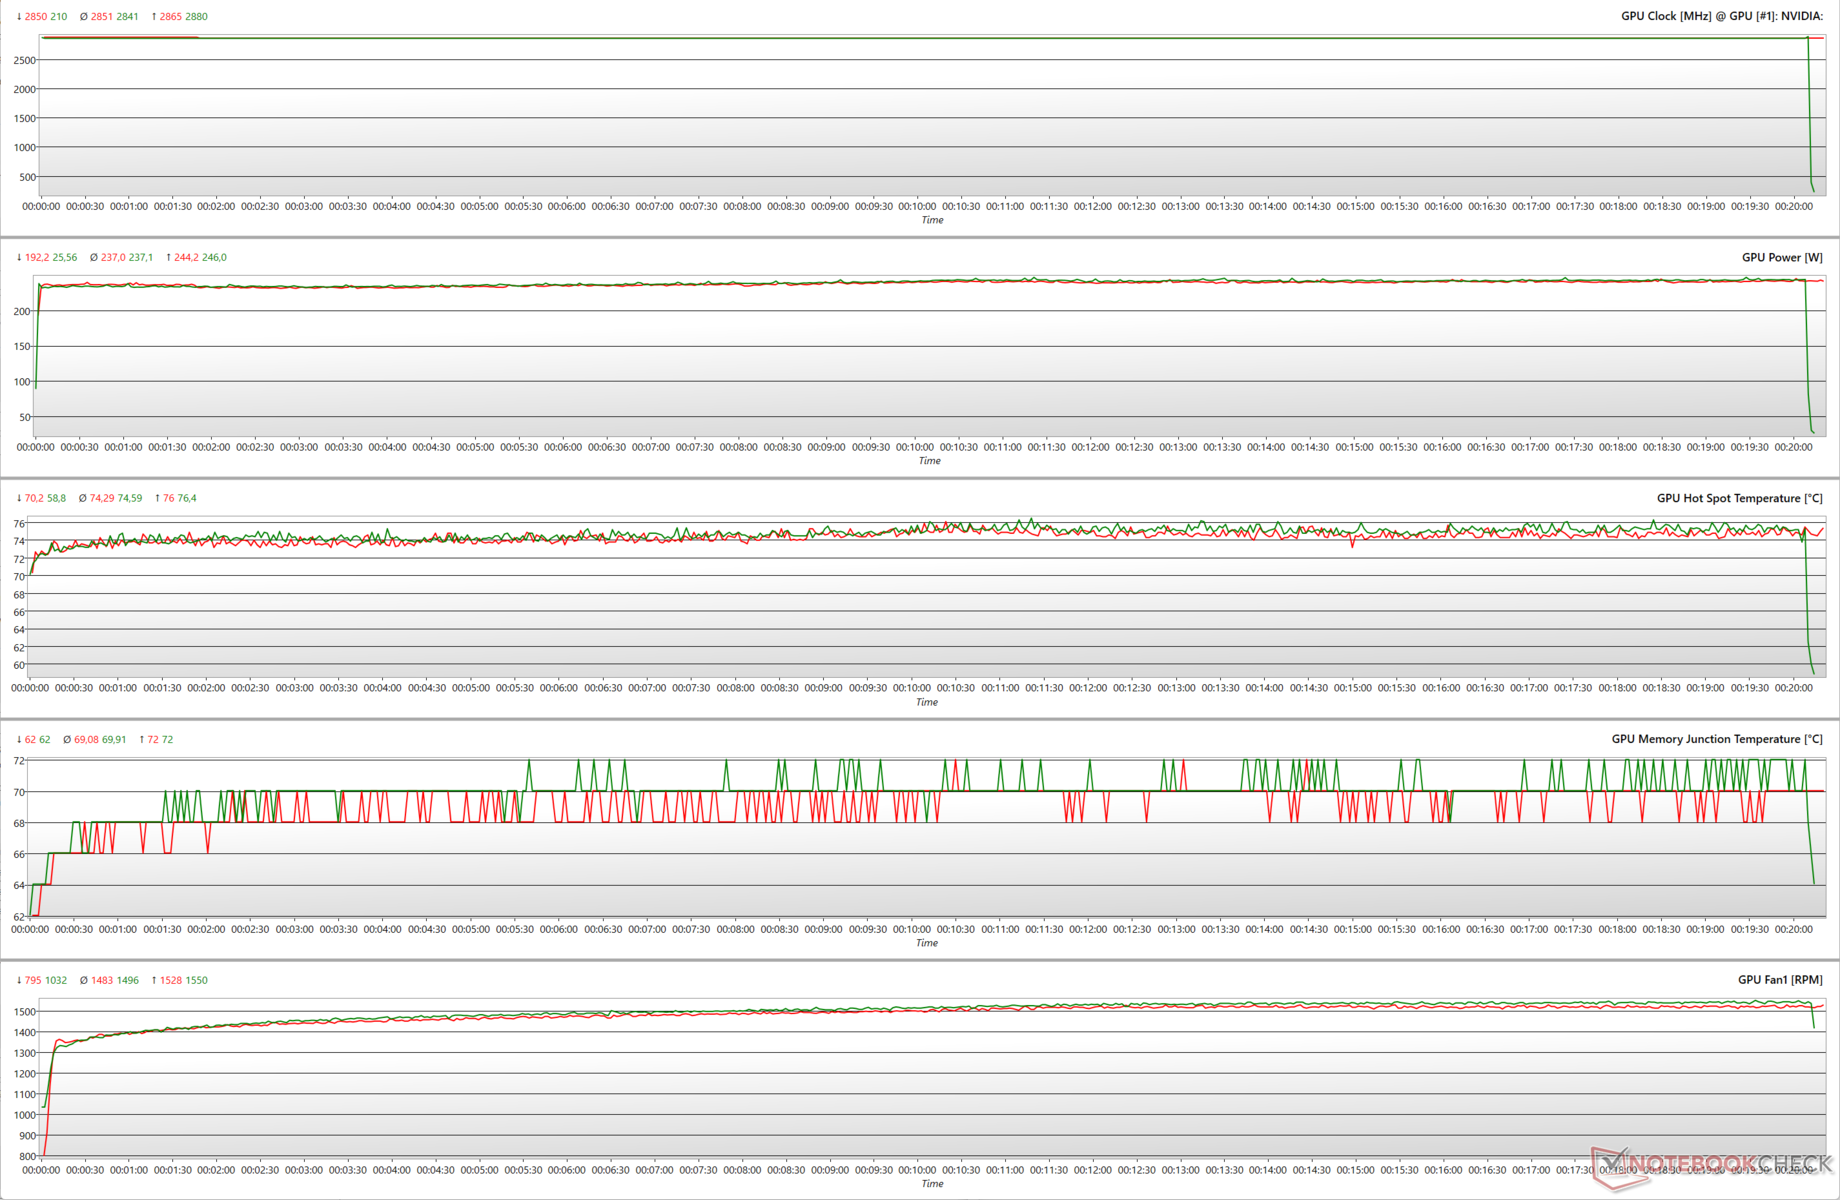
Stressare la GPU con Il sito Witcher 3 a 1080p Ultra presenta uno scenario più reale. Qui vediamo che non c'è praticamente alcuna differenza nei vari parametri della GPU tra 285 W e 314 TGP. Questo perché Ada non si basa solo sui limiti di potenza per aumentare i clock. In questo caso, la RTX 4070 Ti è in grado di raggiungere una frequenza di boost di 2.880 MHz con una potenza di 246 W circa.

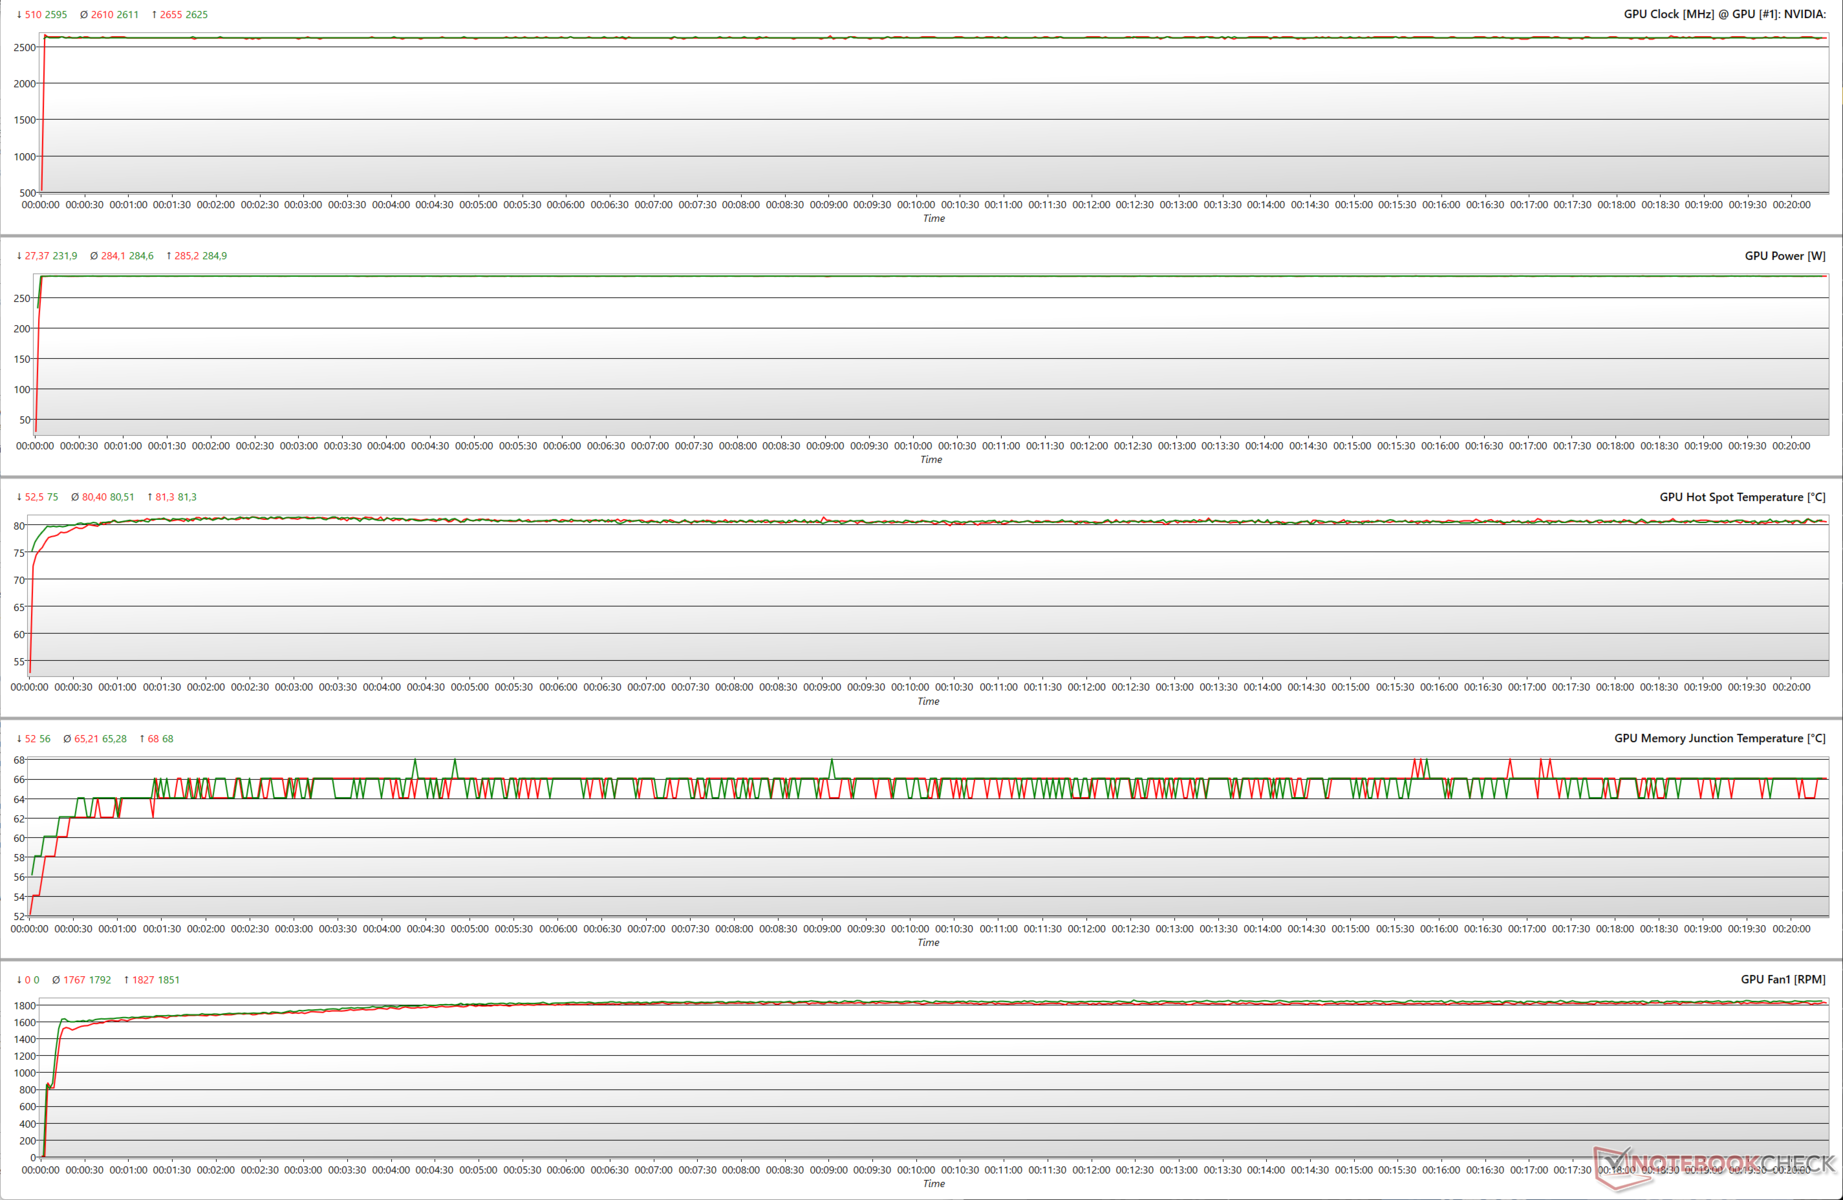
Asus sostiene che il BIOS in modalità Performance consente alla scheda di funzionare 9 °C più fredda, ma non abbiamo osservato alcuna differenza percepibile nei parametri della GPU in entrambe le modalità del BIOS con i test di stress FurMark e The Witcher 3.

Parametri della GPU durante lo stress FurMark (Performance BIOS; Verde - 100% PT; Rosso - 110% PT)
Parametri della GPU durante lo stress di The Witcher 3 a 1080p Ultra (BIOS Performance; Verde - 100% PT; Rosso - 110% PT)
Parametri della GPU durante lo stress FurMark (100% PT; verde - BIOS silenzioso; rosso - BIOS performante)
Parametri della GPU durante lo stress di Witcher 3 (100% PT; Verde - BIOS silenzioso; Rosso - BIOS performante)

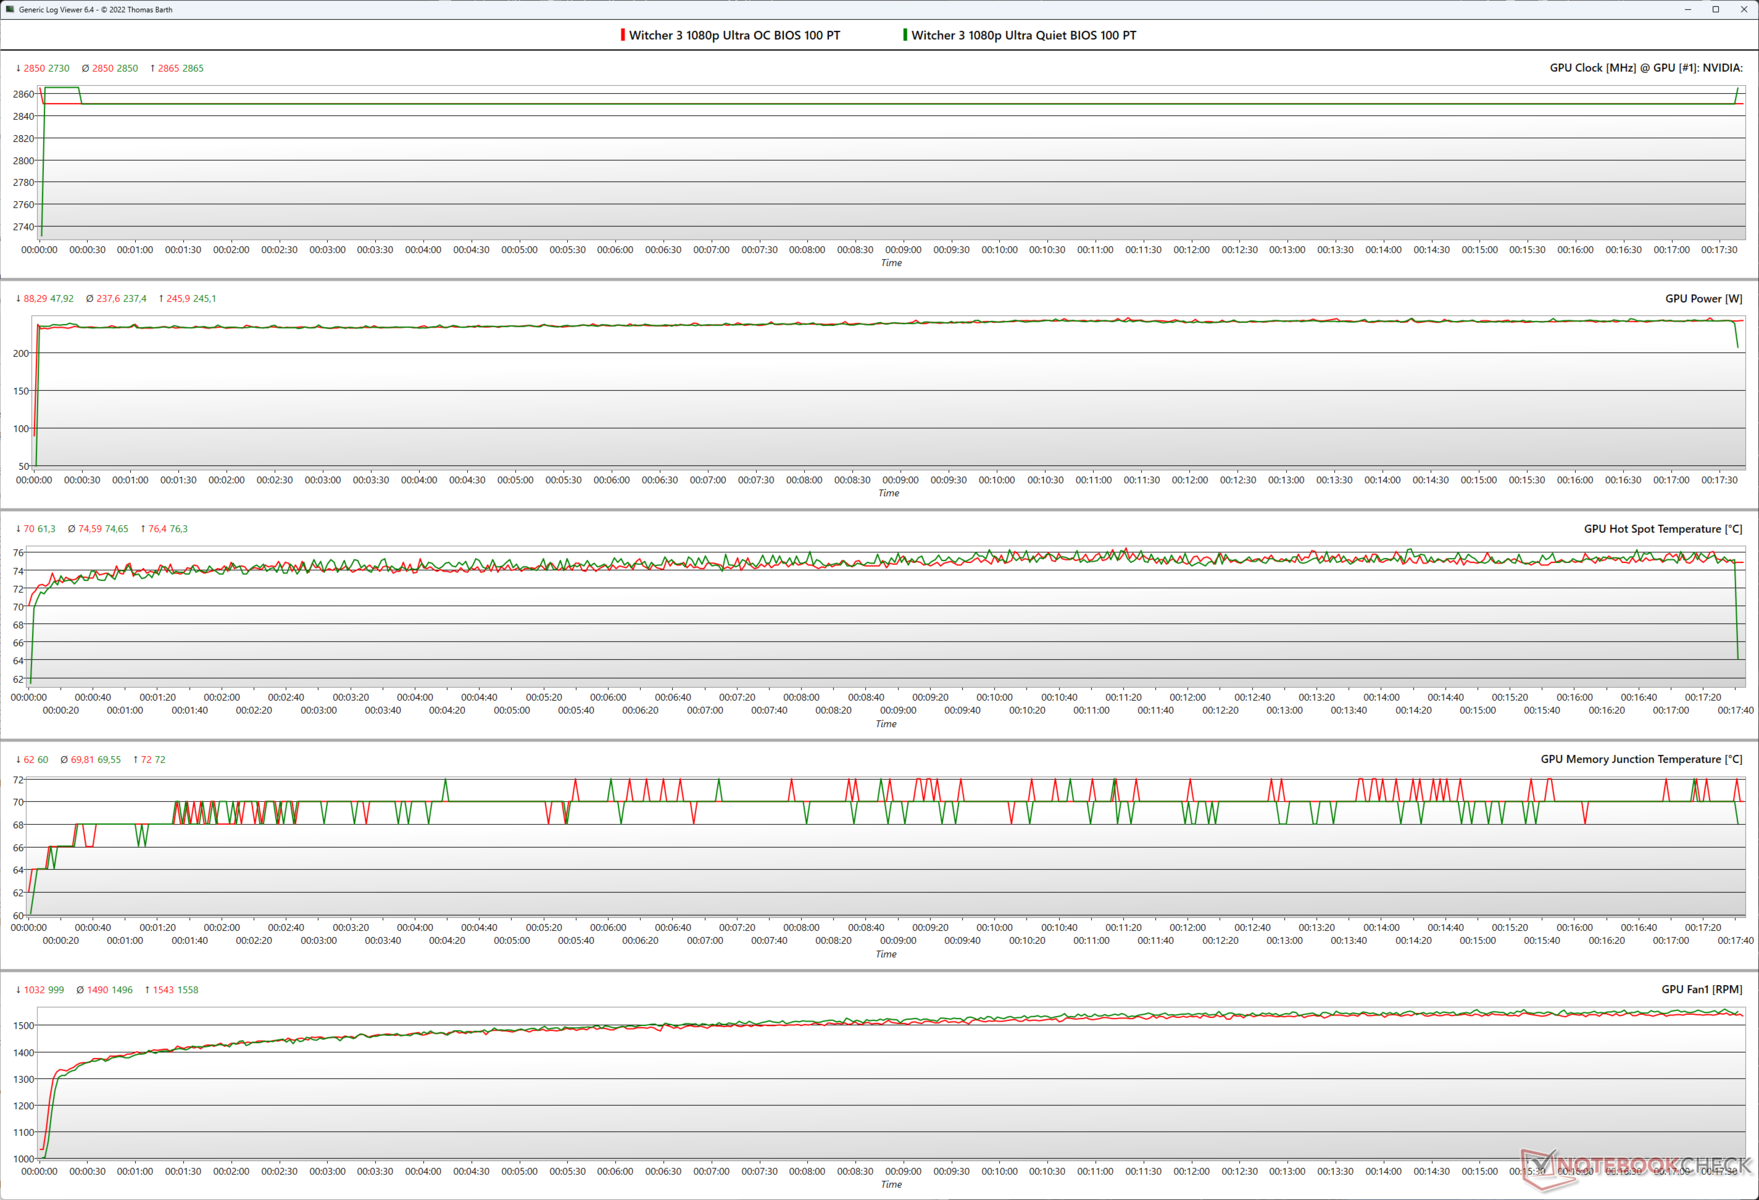
Il grafico FPS di Witcher 3

Asus ha fatto un buon lavoro con il raffreddamento, come dimostrato dalle prestazioni ben sostenute viste in The Witcher 3 con impostazioni 1080p Ultra e 4K Ultra.

0153045607590105120135150165180195210225Tooltip
Asus TUF Gaming GeForce RTX 4070 Ti i9-13900K, NVIDIA GeForce RTX 4070 Ti; 1920x1080 Ultra Graphics & Postprocessing (HBAO+): Ø223 (217-228)
Asus TUF Gaming GeForce RTX 4070 Ti i9-13900K, NVIDIA GeForce RTX 4070 Ti; 3840x2160 Ultra Graphics & Postprocessing (HBAO+): Ø97.1 (94-100)

Pricecompare

Please share our article, every link counts!
> Recensioni e prove di notebook, tablets e smartphones > Recensioni e prove > Recensioni e prove > Recensione dell'Asus TUF Gaming GeForce RTX 4070 Ti: Ada mid-ranger con prestazioni RTX 3090 Ti, inferiore alla Radeon RX 7900 XT di AMD di 50 dollari
Vaidyanathan Subramaniam, 2023-01- 5 (Update: 2023-01- 9)