Notebookcheck Logo

Control: Benchmarks Laptop e Desktop

Una sintesi artistica. Sviluppato da Remedy Entertainment, Control è una storia d'azione-avventura che invia il personaggio principale attraverso un edificio in continua evoluzione. Continuate a leggere per scoprire come questo spettacolo visivo si svolge su varie GPU per desktop e laptop.
Control

Tecnologia

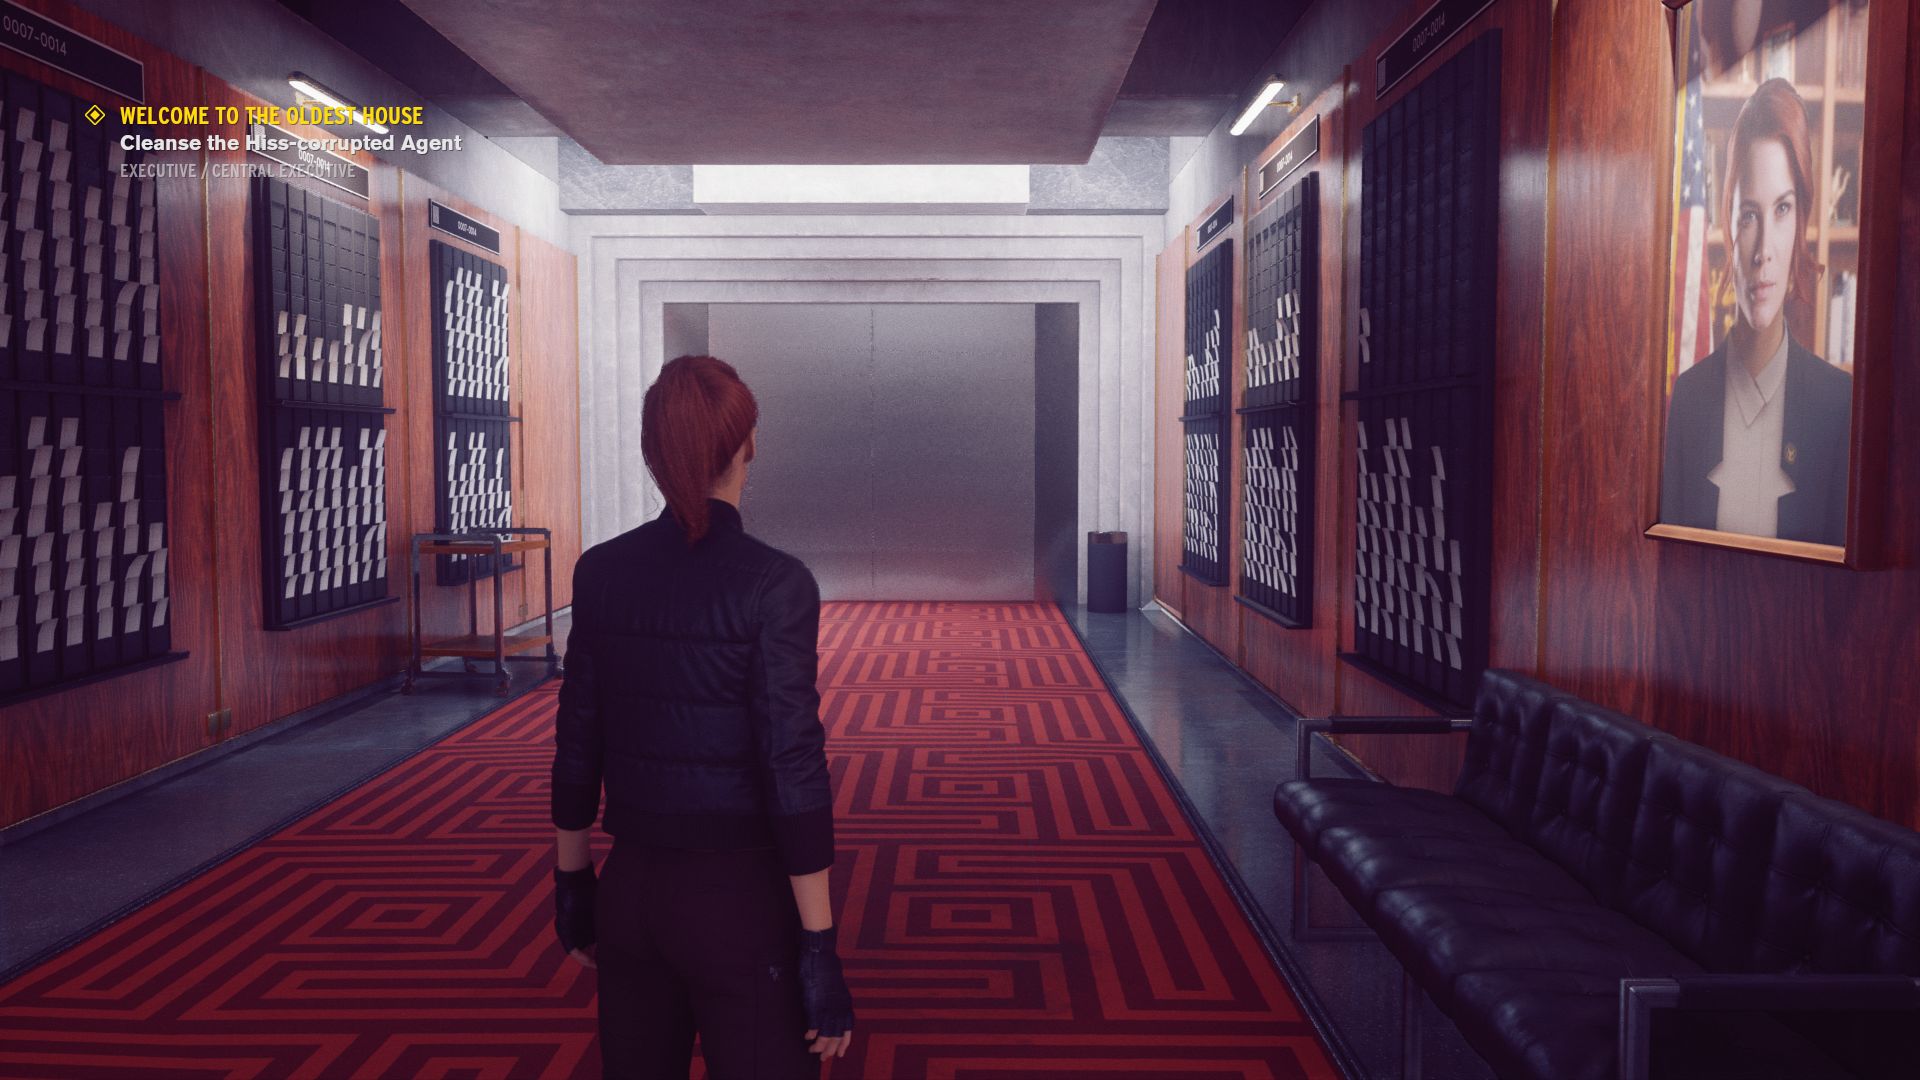
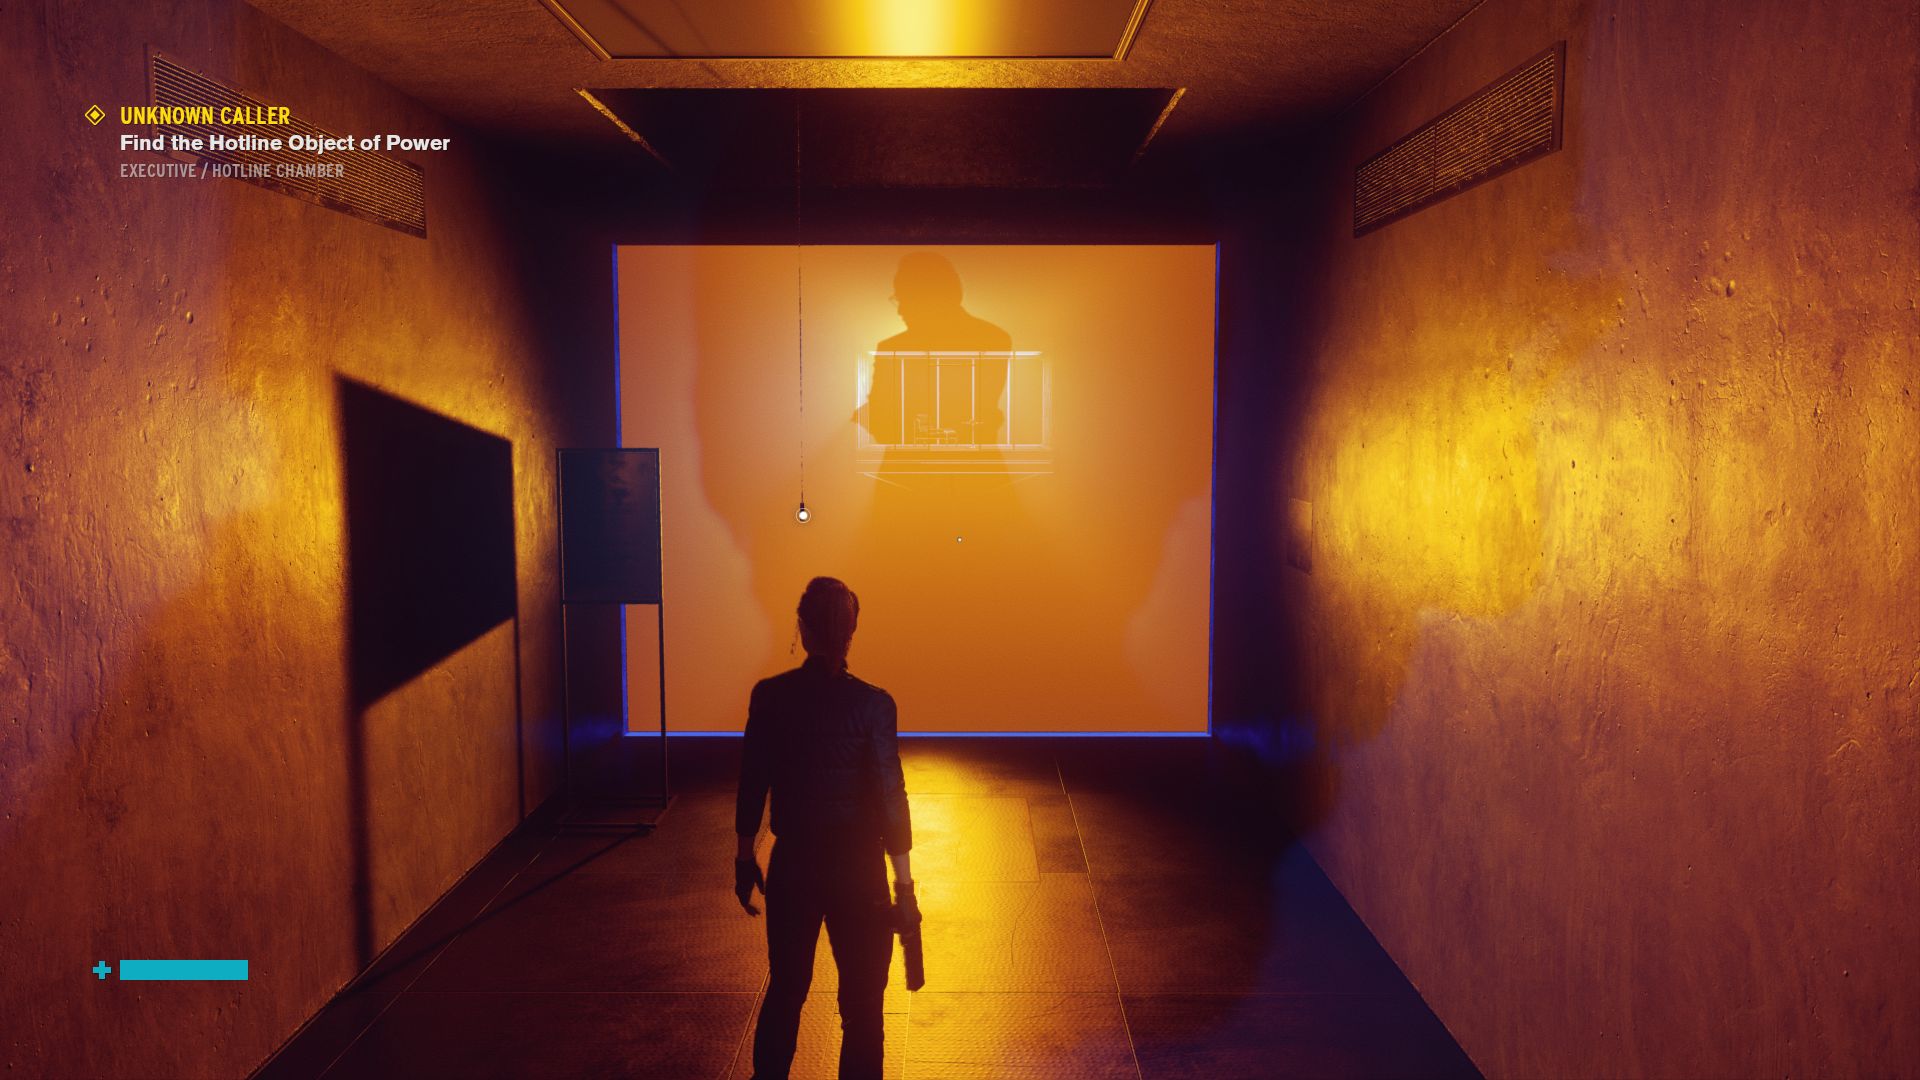
Control è stato sviluppato da Remedy Entertainment, lo studio dietro le serie Alan Wake, Quantum Break e Max Payne. Control può sembrare familiare se avete giocato a uno qualsiasi di questi giochi, con Remedy che opta ancora una volta per un punto di vista (POV) in terza persona. In breve, Control ha una grafica eccellente, se il vostro computer è abbastanza potente da poterla visualizzare, che Remedy ha completato con un design creativo dei livelli, e scene dettagliate. Lo studio ha incorporato una splendida telecamera cinematic e un eccellente doppiaggio in inglese. In generale, Control ci ha impressionato con un'atmosfera di prima classe e la sua emozionante narrazione.

Control
Control
Control
Control
Control
Control

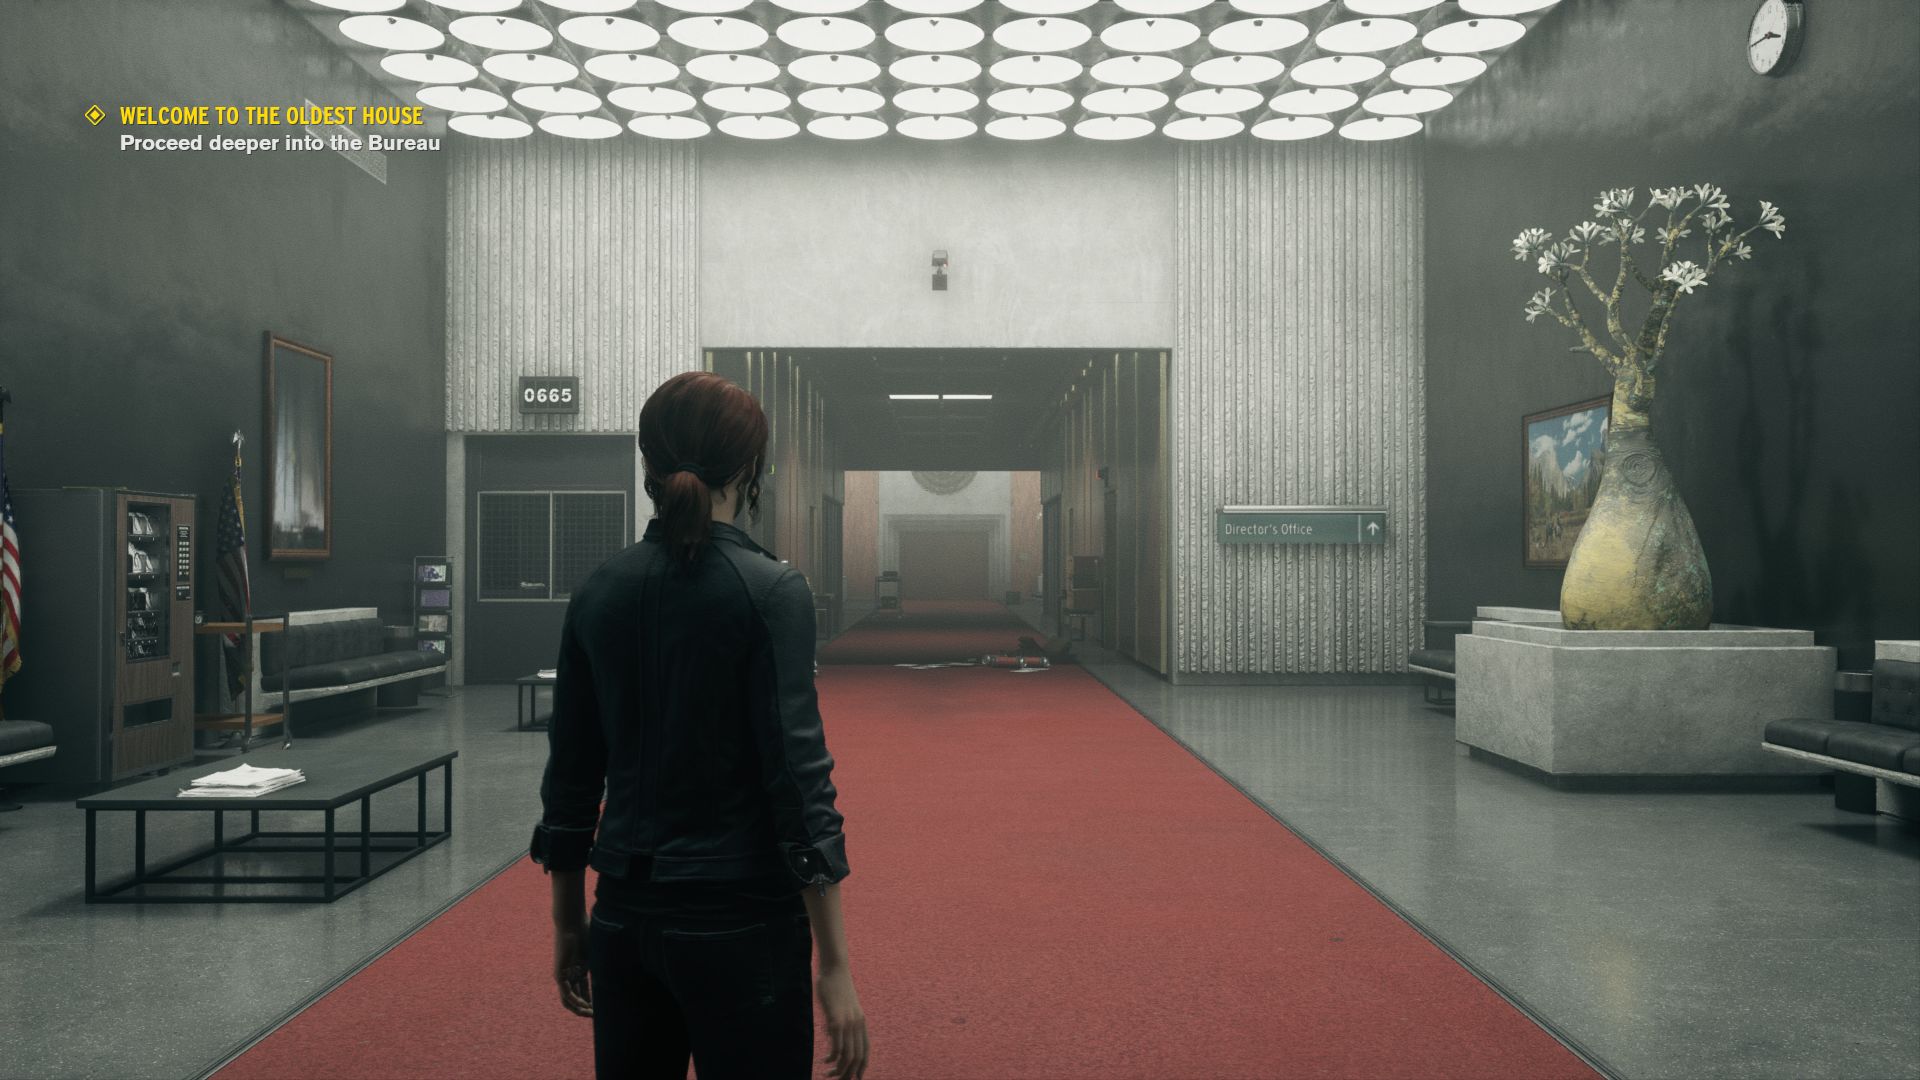
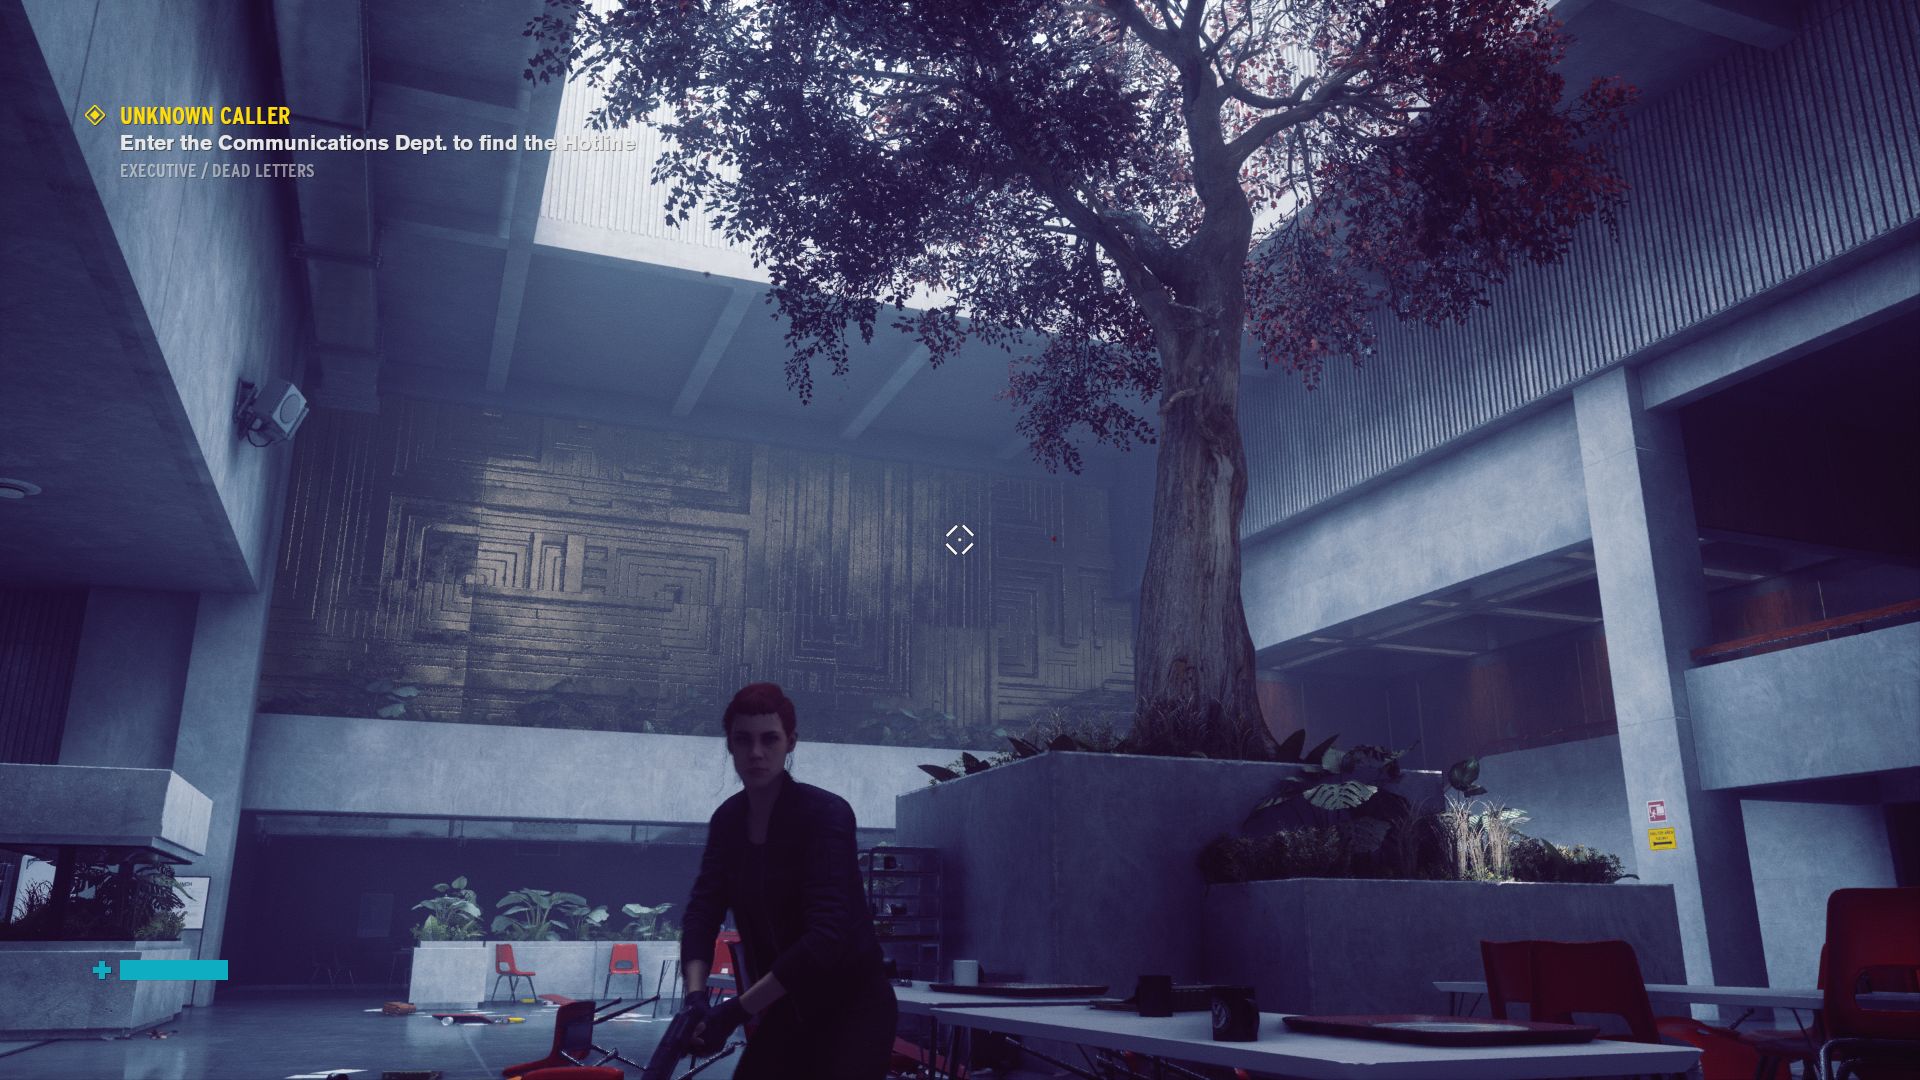
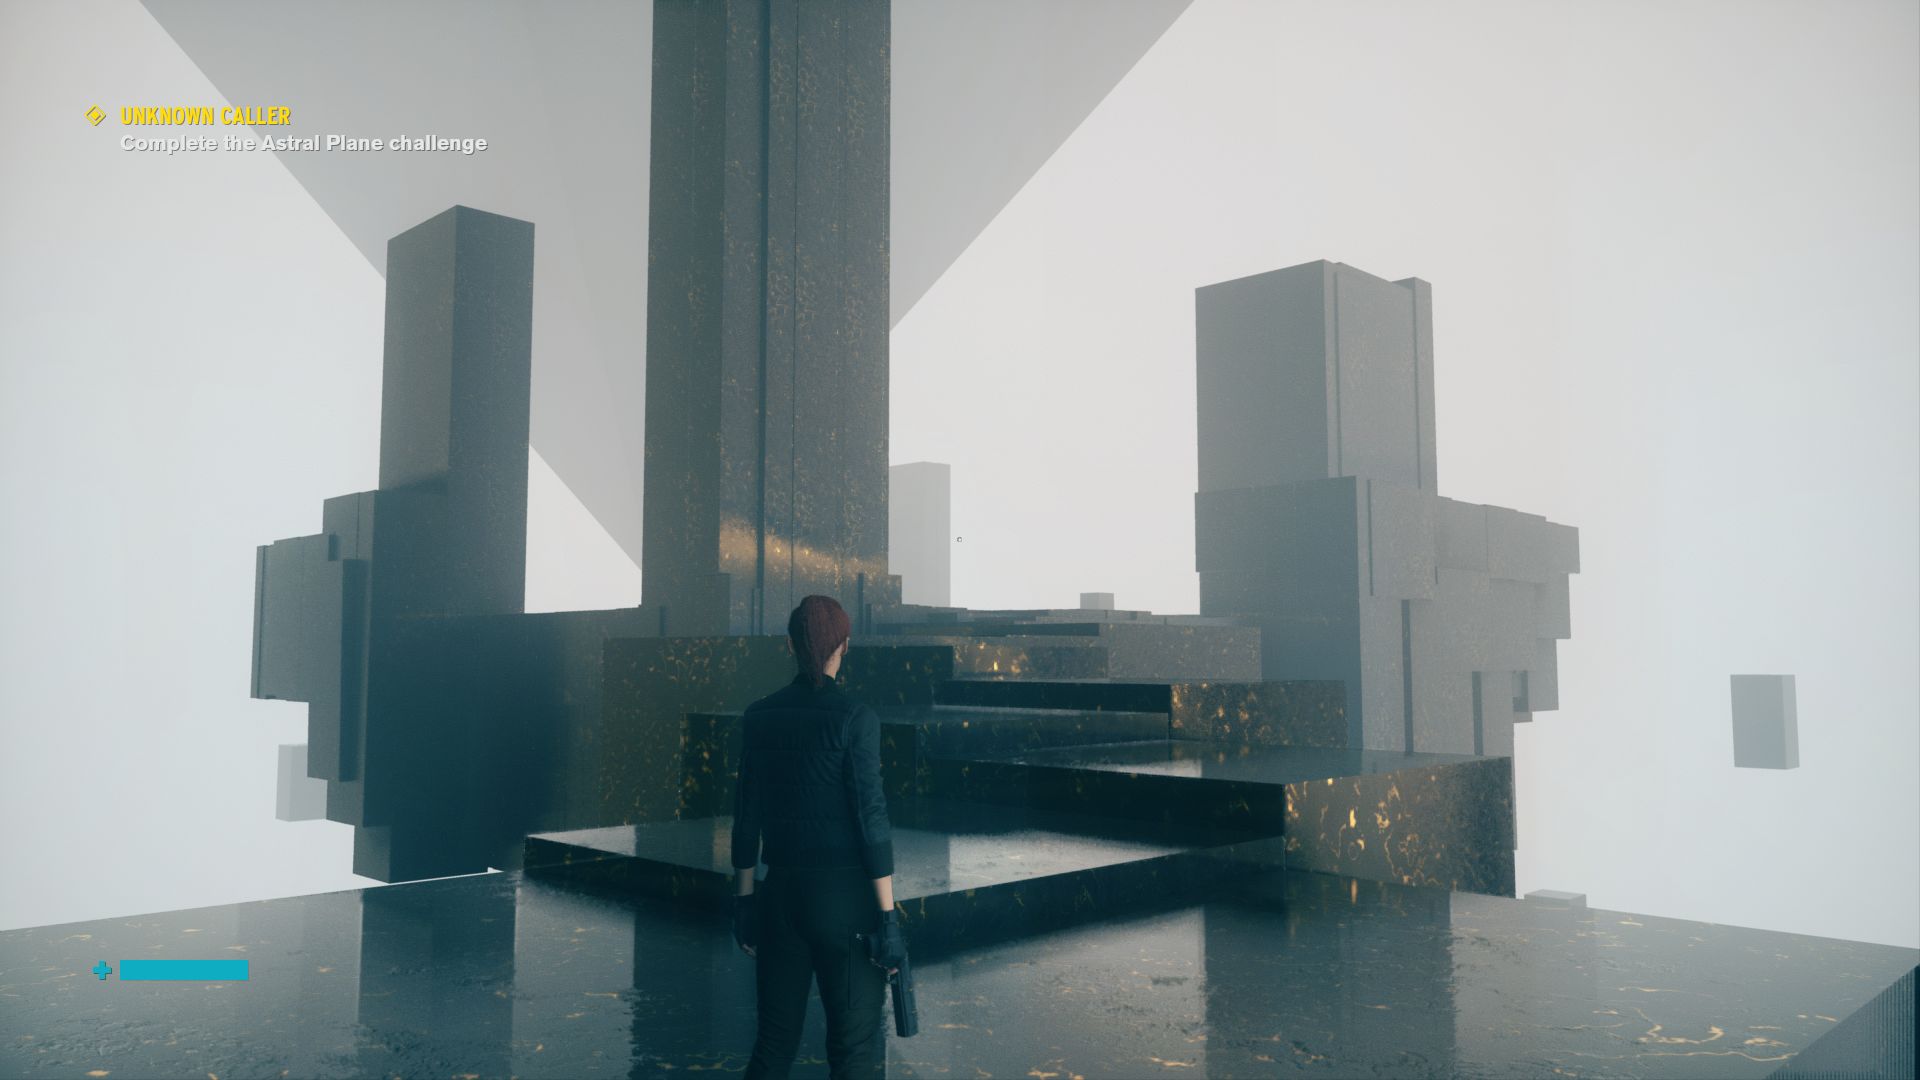
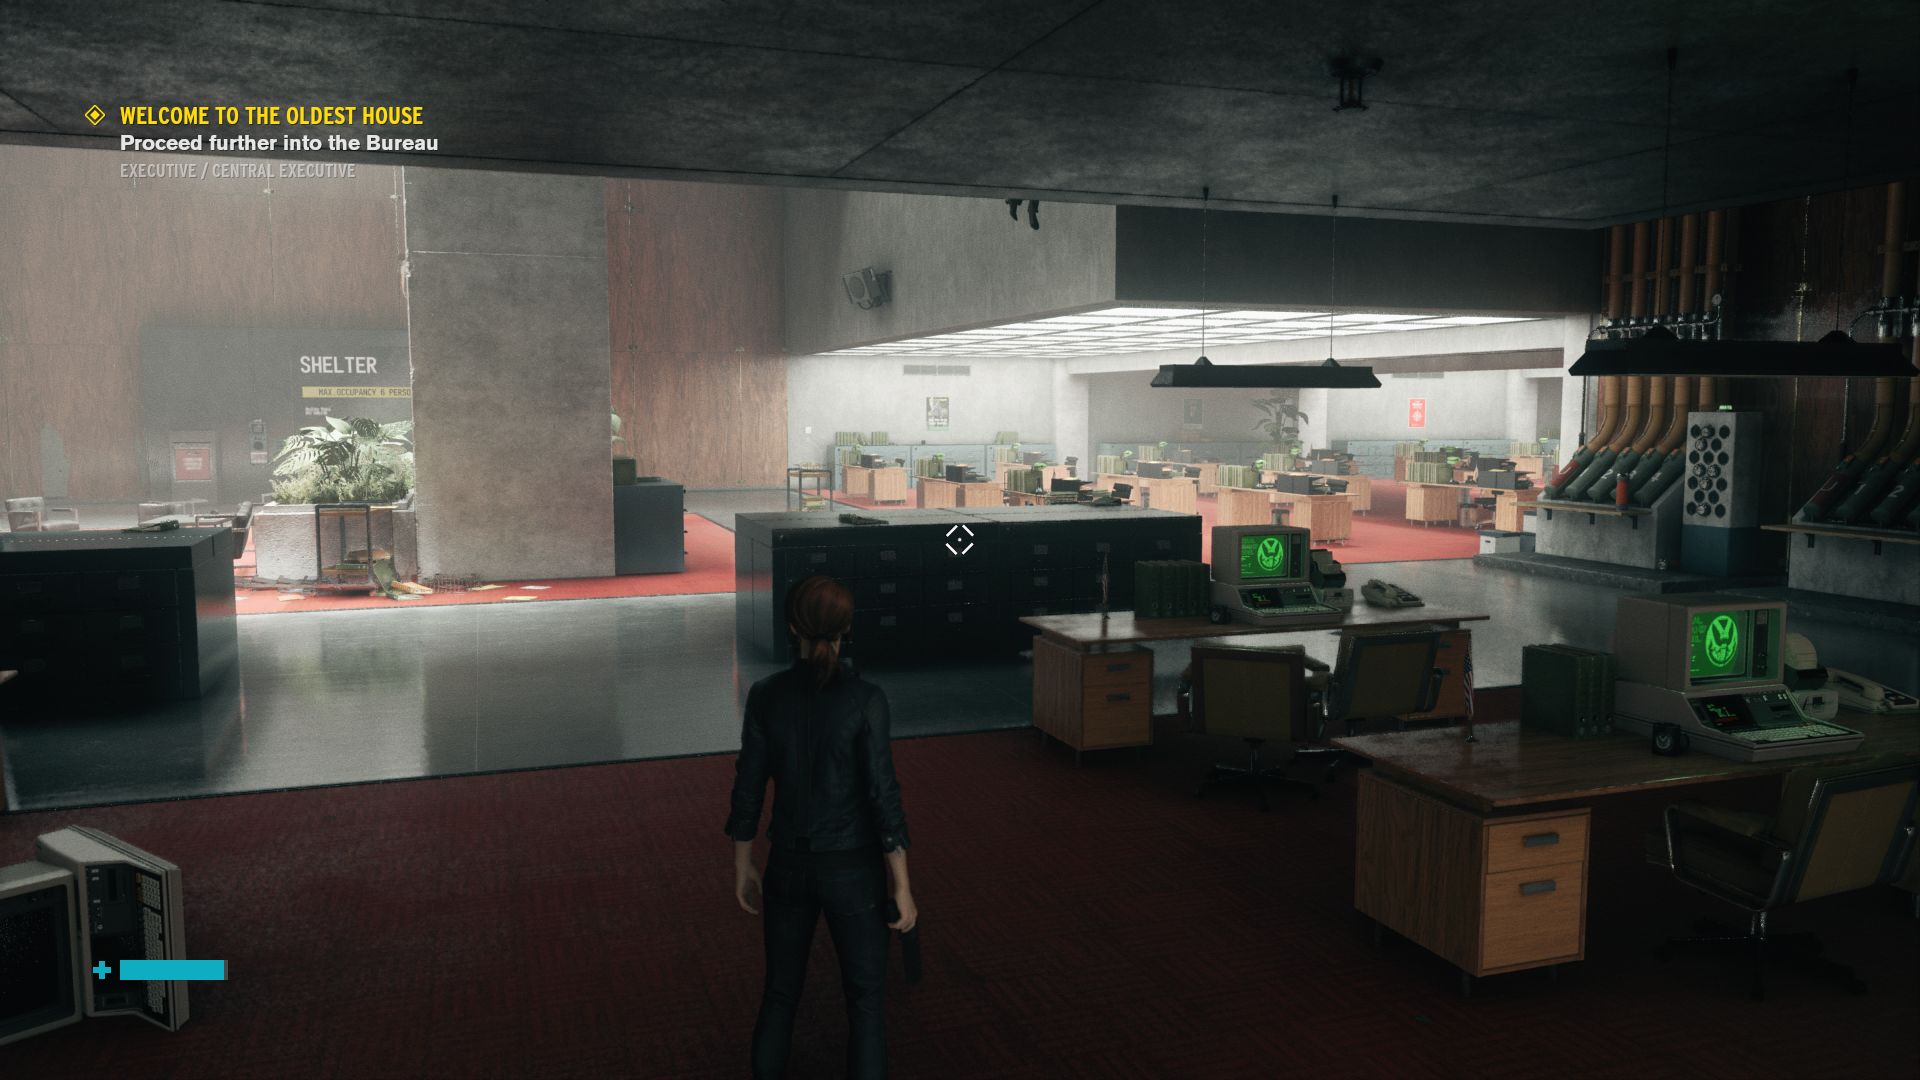
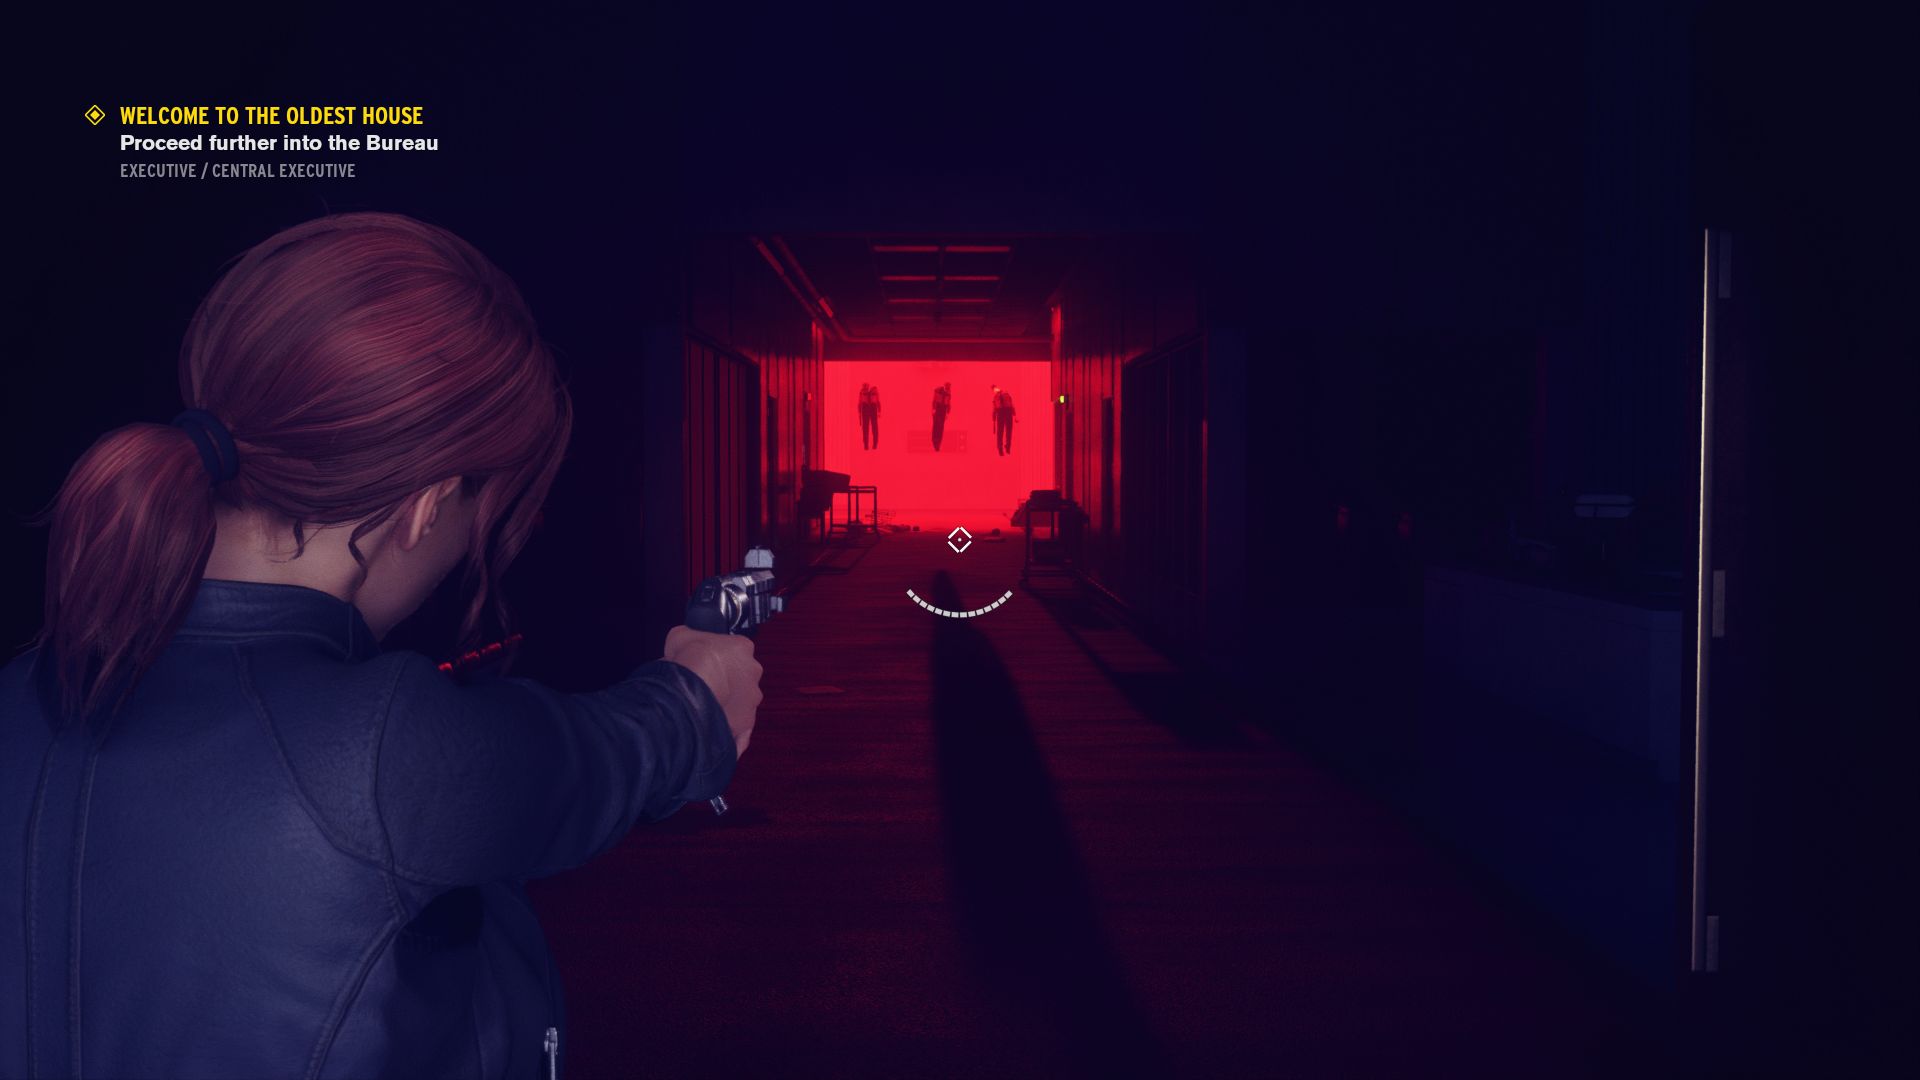
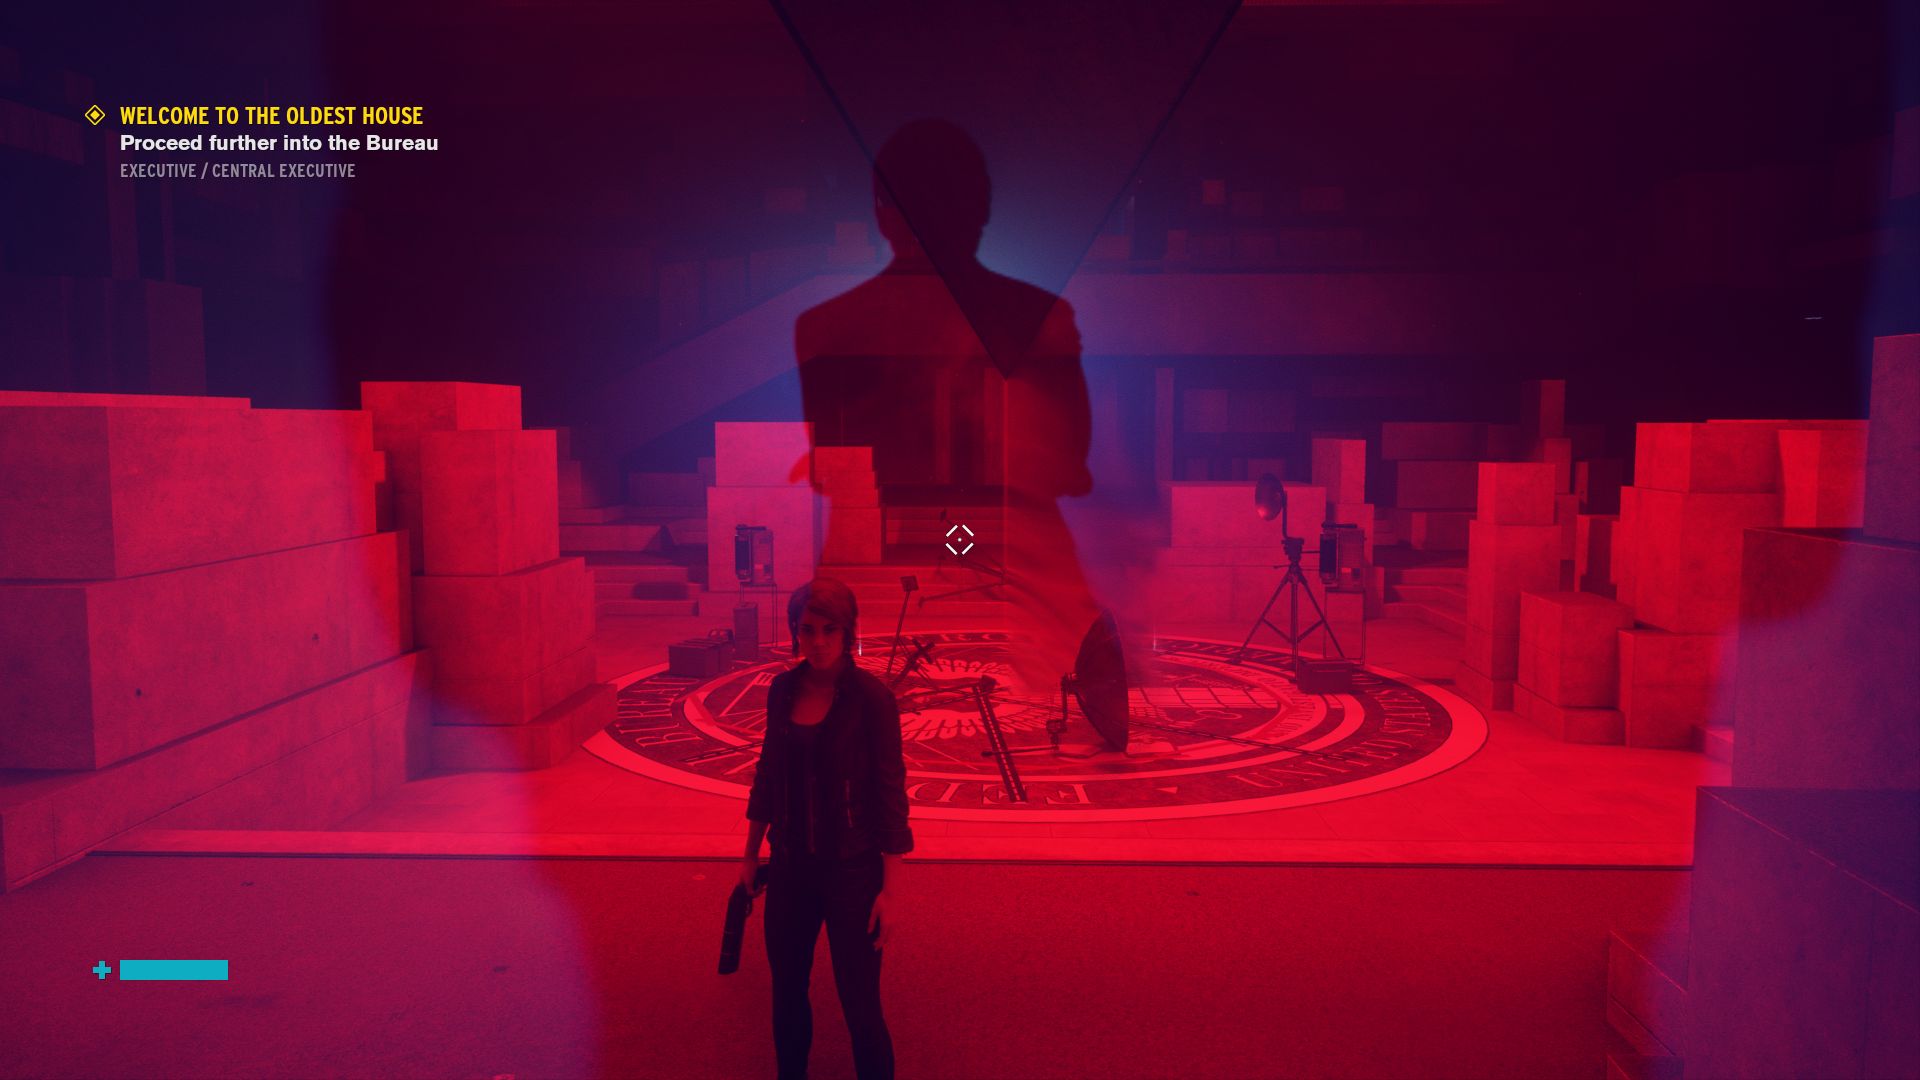
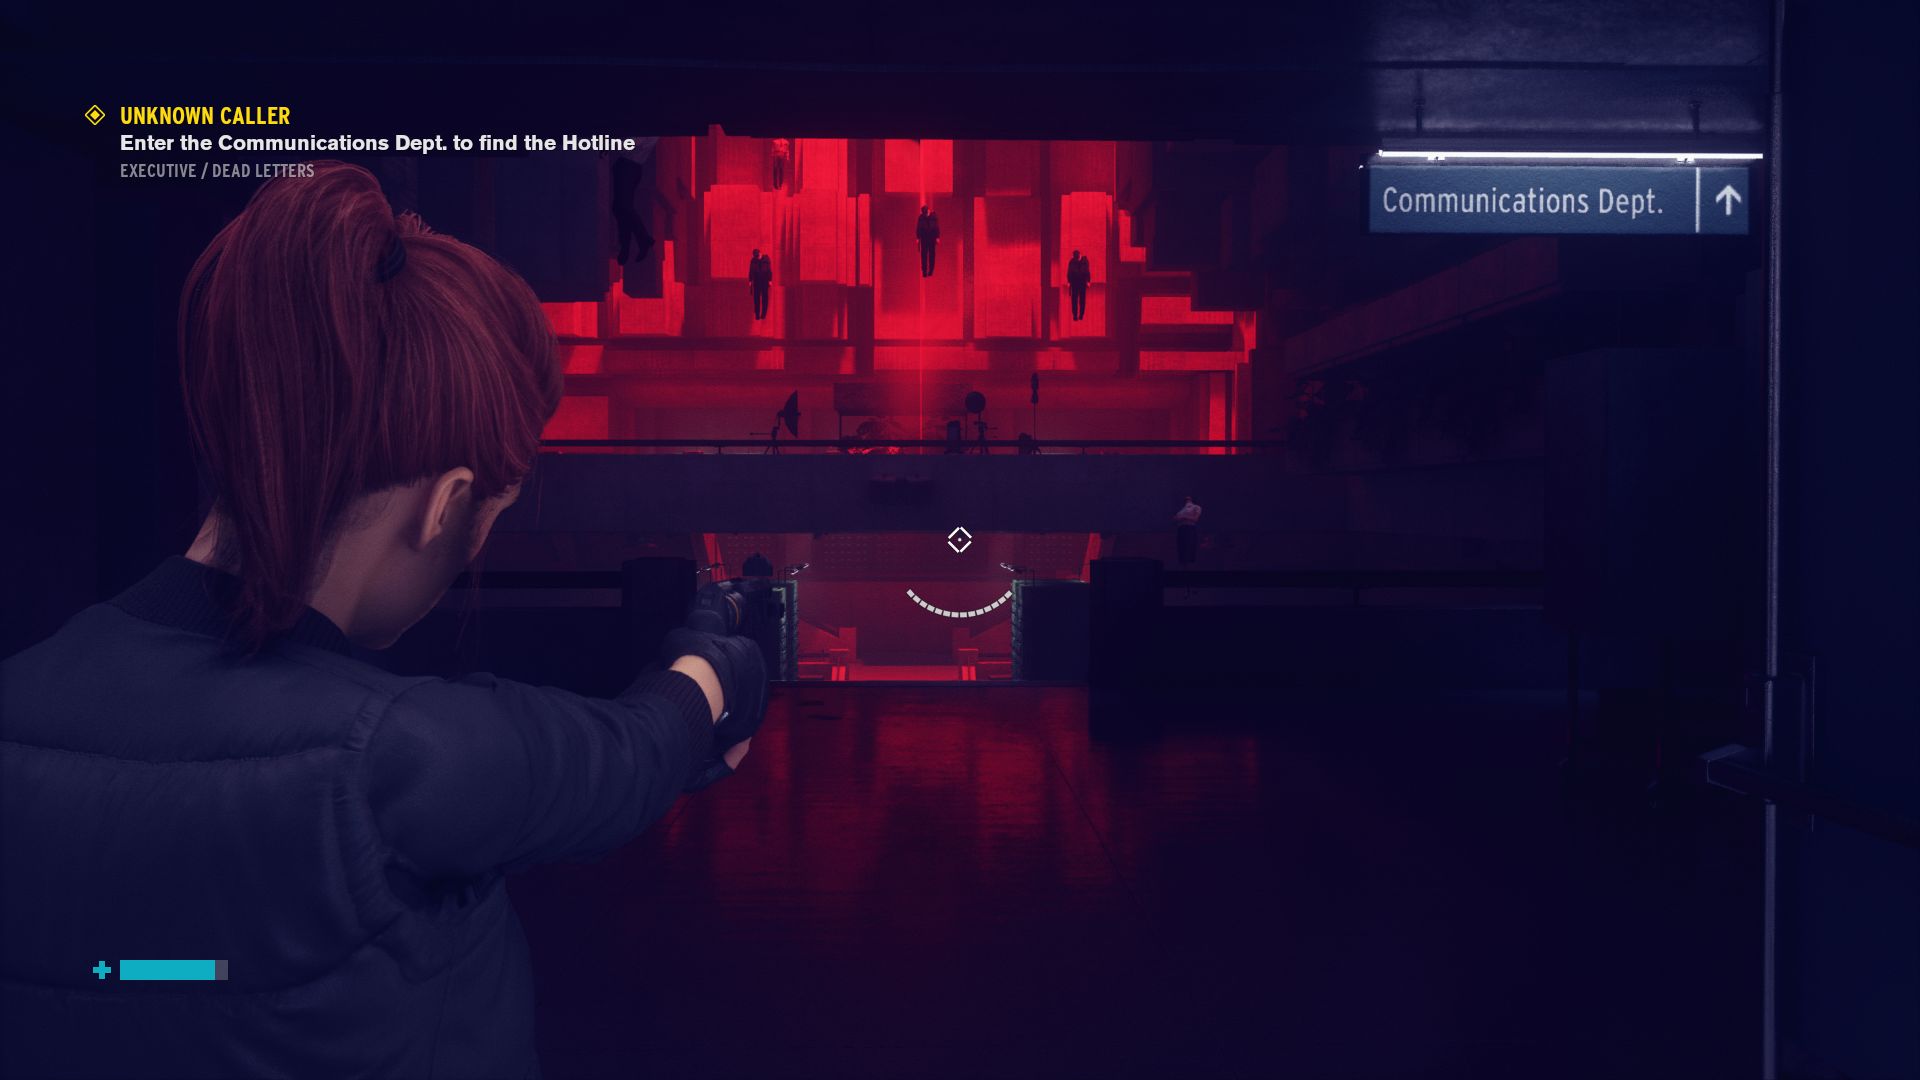
La grafica è visivamente impressionante a livello macro, ma le cose diventano più ambigue se si guarda da vicino. Le texture, ad esempio, non sono così nitide come potrebbero essere. Tuttavia, gli effetti di luce lo compensano leggermente e danno vita al gioco. Remedy ha incorporato anche un sofisticato sistema fisico che include ambienti distruttibili, mettendoti nel vivo dell'azione.
Purtroppo, il gameplay non riesce a tenere il passo con lo spettacolo visivo. Nonostante i vari aggiornamenti e abilità, le sequenze di combattimento diventano ripetitive. Ci sarebbe piaciuto vedere Remedy includere qualcosa come il bullet-time, come ha fatto nella serie Max Payne, che avrebbe mantenuto i combattimenti divertenti anche dopo diverse ore di gioco.

Control
Control
Control
Control
Control
Control

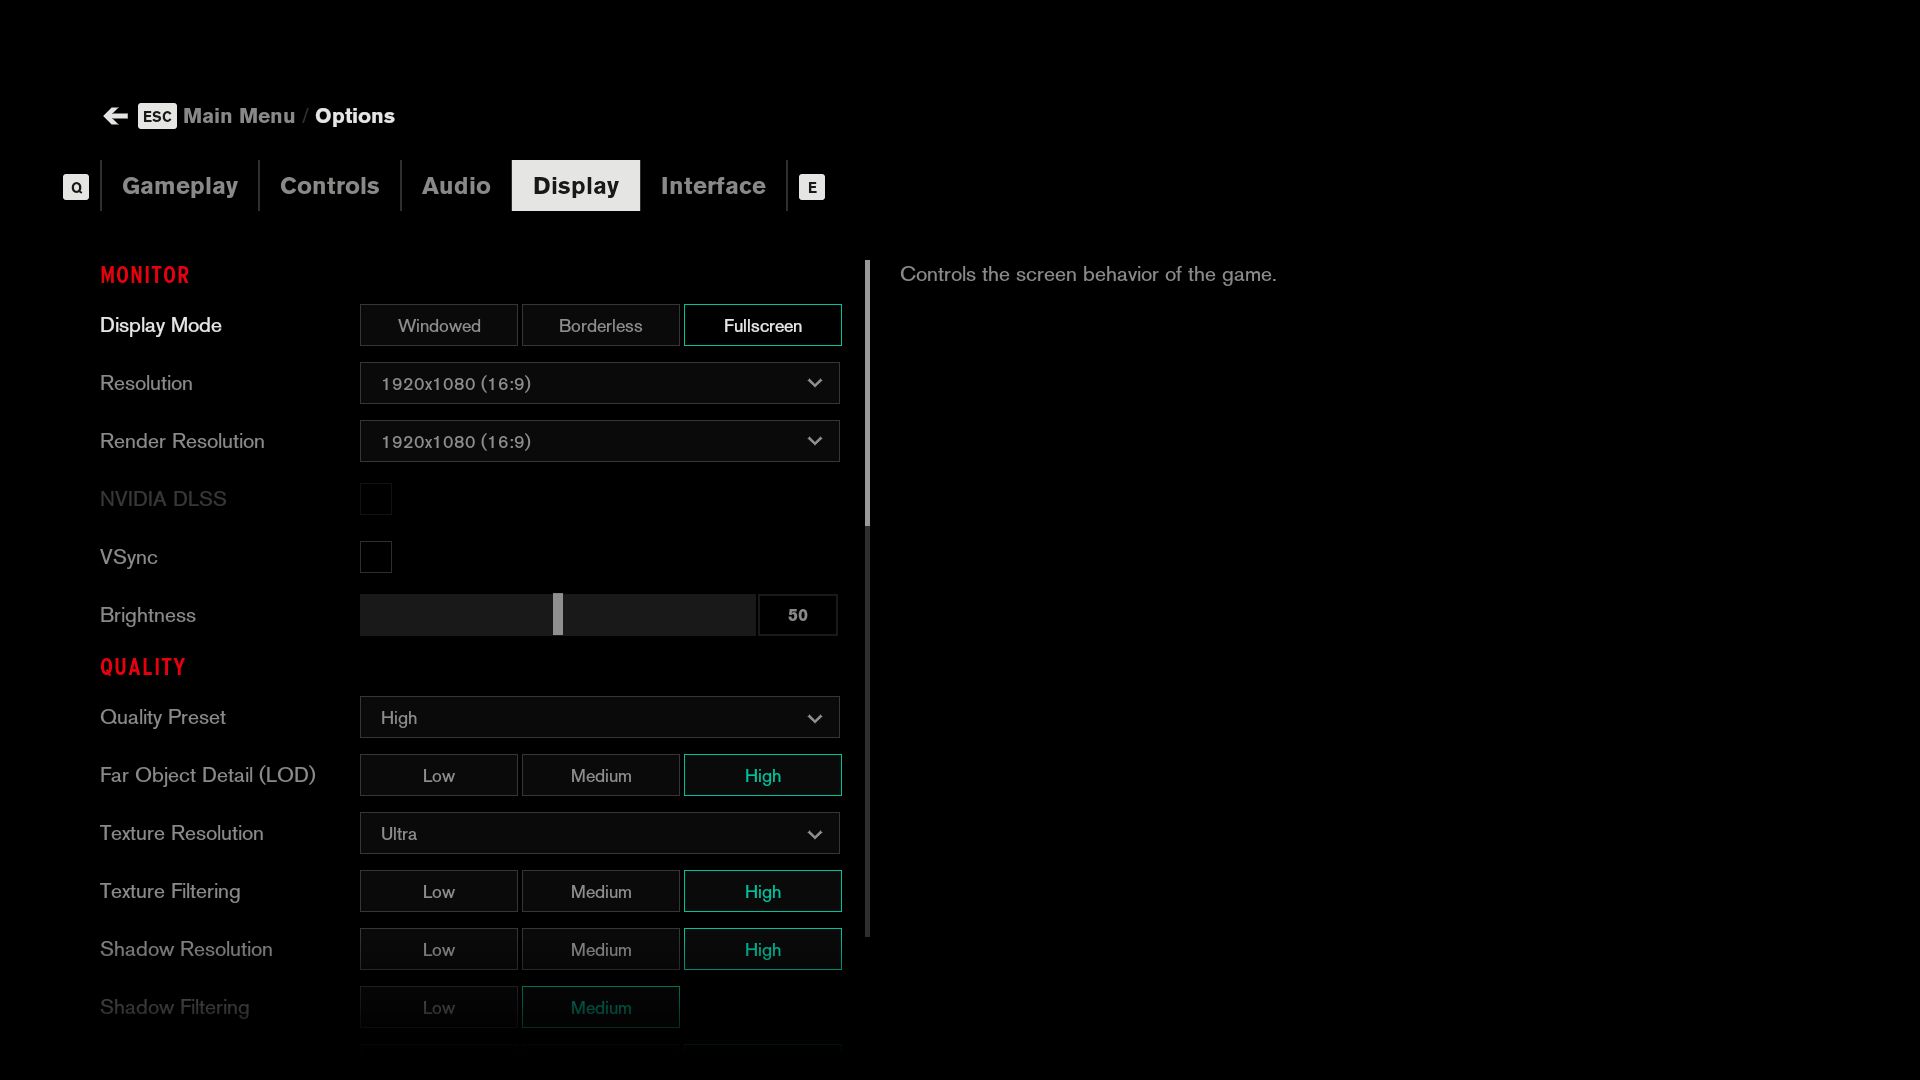
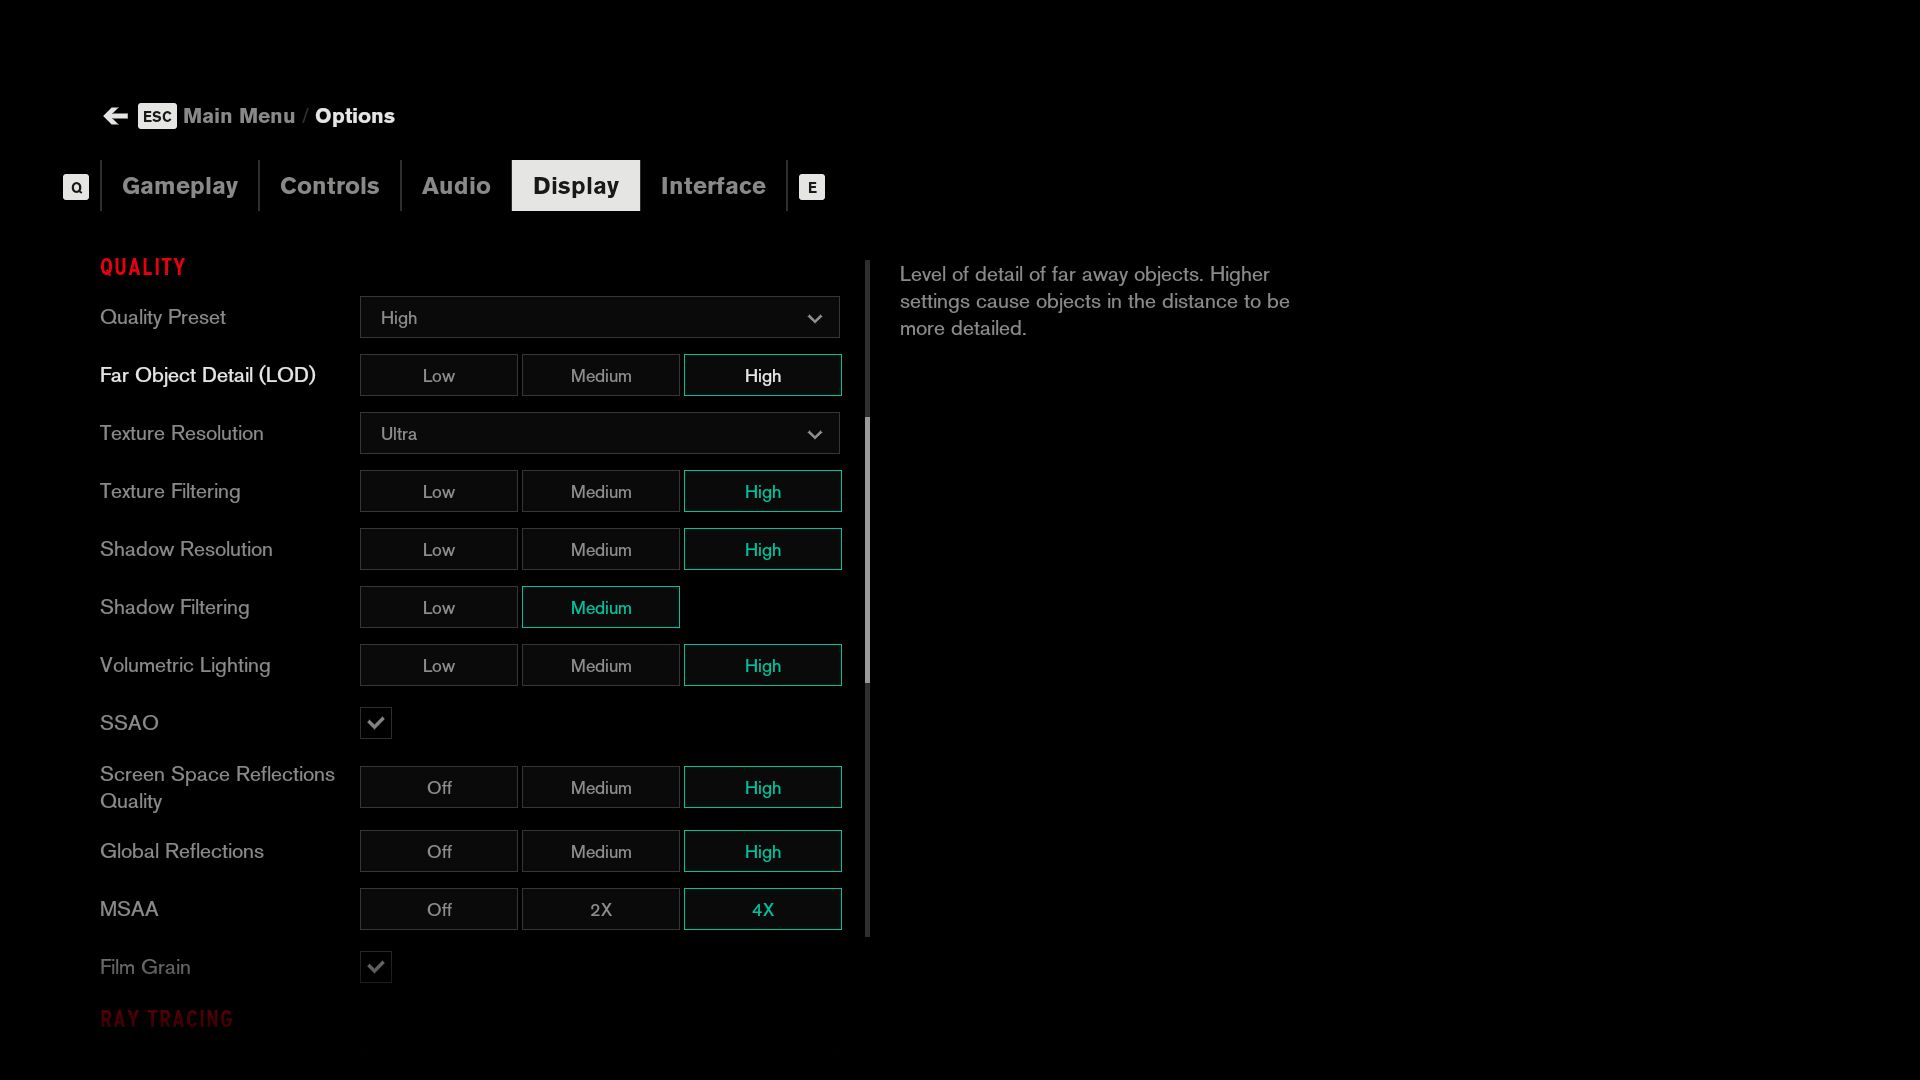
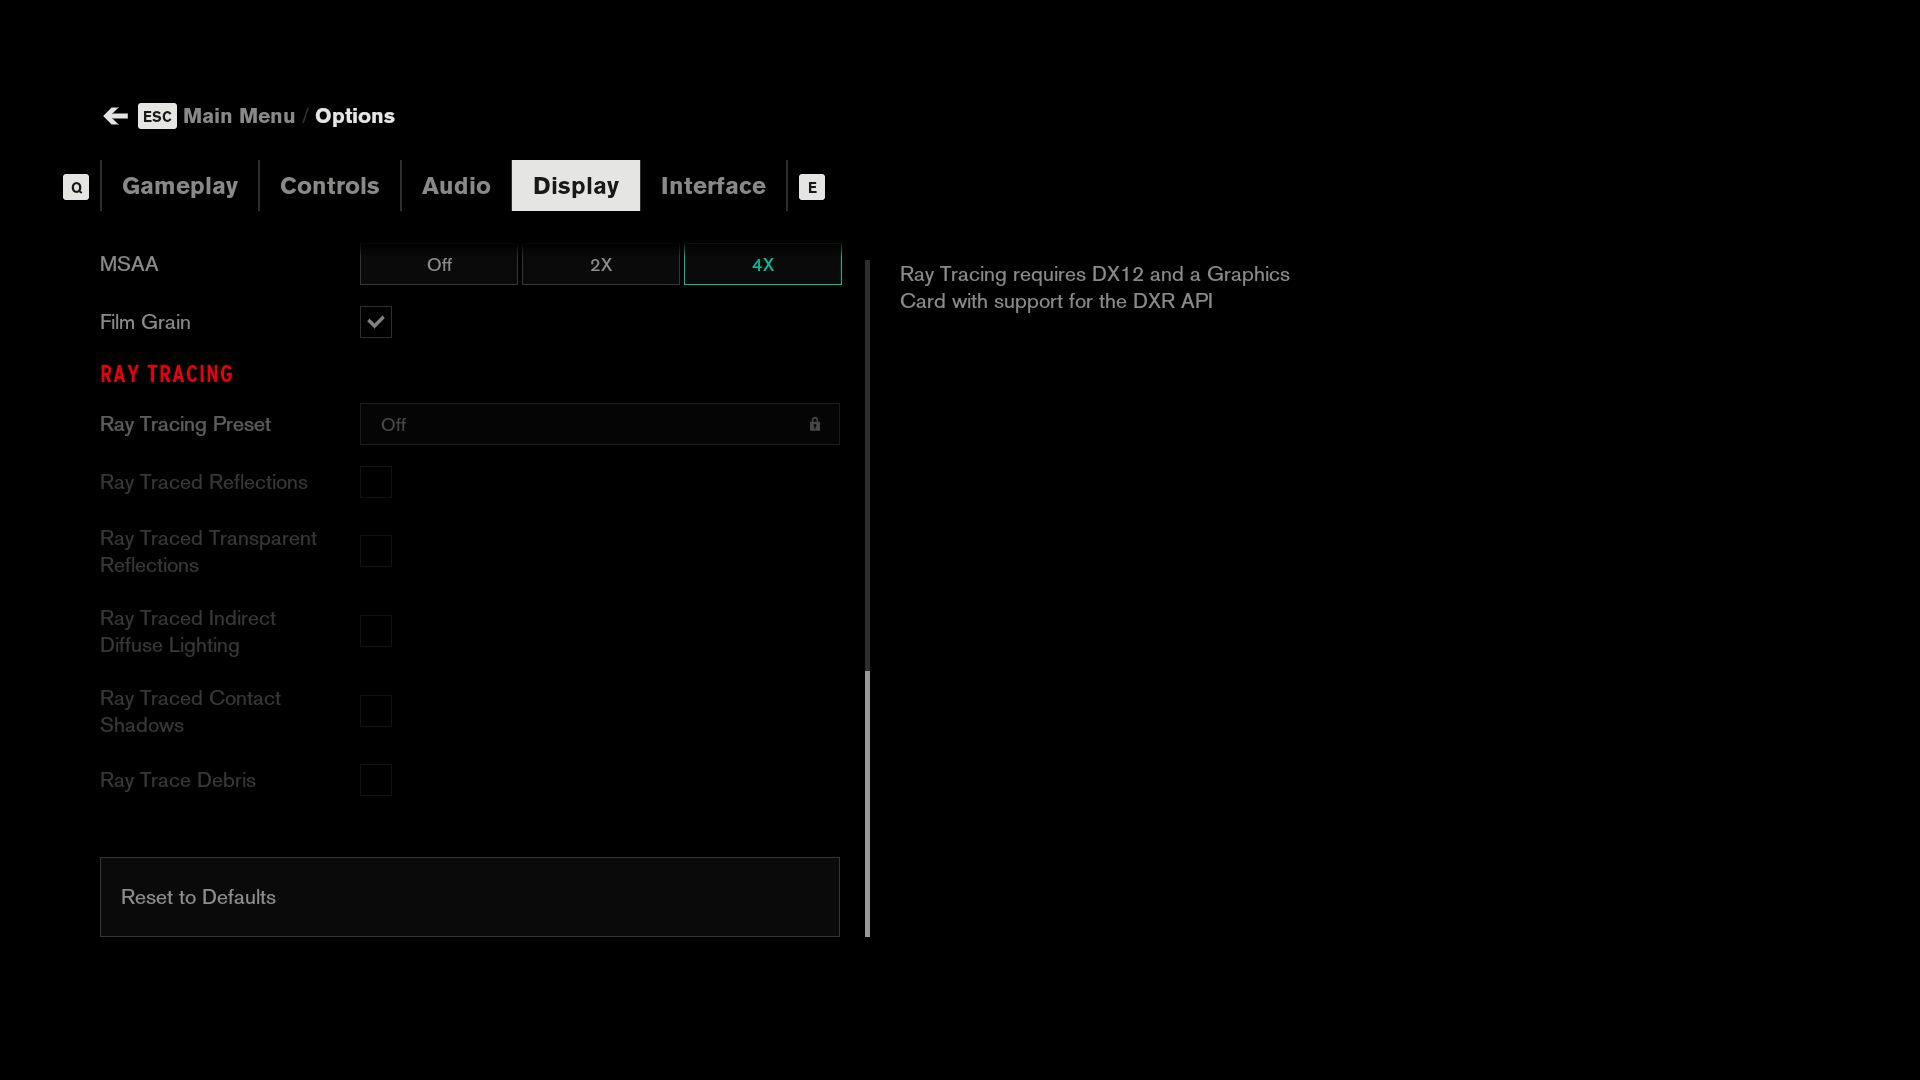
Mettendo da parte le sequenze di combattimento, Remedy ha fatto un ottimo lavoro nell'organizzazione del menu grafico. È necessario scorrere ciascuna delle schede, ma le opzioni sono disposte in modo chiaro, con il testo rosso e bianco in netto contrasto con lo sfondo nero. Abbiamo incluso gli screenshots del menu Display qui sotto, che separa le opzioni grafiche in Monitor, Quality e Ray Tracing. Quest'ultimo si attiva solo se si avvia il gioco in DirectX 12. Lo stesso vale per NVIDIA DLSS. Control può applicare tutte le modifiche grafiche senza dover essere riavviato, cosa che apprezziamo sempre.

Control
Control
Control
Control
Control
Control

Anche se Control si presenta e funziona bene senza problemi di grafica, abbiamo incontrato strane anomalie su alcuni dispositivi. In particolare, l'installer si è bloccato su alcuni computer portatili, e abbiamo notato frequenti problemi di ridimensionamento sul nostro monitor esterno 4K se abbiamo impostato il gioco su DirectX 12. Un riavvio in genere ha risolto quest'ultimo problema, mentre l'installazione di Microsoft Visual C+++ 2015 Redistributable ha ridotto al minimo i crashes dell'installer sui computer portatili.

Control
Control
Control

Stranamente, Control ha rifiutato di mostrare la modalità DX12 su alcuni sistemi, nonostante fosse presente un hardware adeguato. Abbiamo anche sperimentato diversi crashes con il ray-tracing attivo. Anche i tempi di caricamento sono un po' lunghi, anche quando si utilizza un veloce SSD PCIe NVMe. Tuttavia, il gioco si è installato rapidamente, nonostante abbia bisogno di 23 GB di spazio.

Preset basso
Preset basso
Preset medio
Preset medio
Preset alto
Preset alto
Preset alto - Ray Tracing

Benchmark

Control non ha un benchmark integrato come molti giochi, quindi abbiamo scelto una parte riproducibile del gioco. Come dimostra il video qui sotto, abbiamo scelto la missione Directorial Override come nostro benchmark, che si raggiunge dopo circa 1-2 ore di gioco. Il nostro benchmark dura circa 25 secondi, durante i quali facciamo uno sprint intorno al piano superiore della sala grande. Il nostro benchmark non è particolarmente impegnativo, il che lo rende una buona rappresentazione dei frame rate medi per tutto il gioco. 35 FPS sembravano fluidi ai nostri occhi, soprattutto perché il gioco rimane sempre in terza persona POV.
Remedy ha incluso tre presets, che chiama Low, Medium e High. Come abbiamo detto prima, c'è anche Ray Tracing, anche se non tutte le scene sembrano utilizzare la sua illuminazione avanzata. Abbiamo incluso screenshots della stessa scena in esecuzione su ogni preset e con il ray-tracing acceso. Il Ray Tracing migliora la qualità del riflesso delle vetrate, ad esempio, ma non di tutte le texture.

Risultati

HD (1280x720) & FHD (1920x1080)

Si consiglia di utilizzare almeno una GPU per laptop dedicata recente se si desidera riprodurre Control a 720p sul preset Low. La NVIDIA GeForce GTX 1050, ad esempio, aveva una media di 80 FPS. Tuttavia, il gioco si dimostra troppo per l'AMD Radeon RX Vega 8 con queste impostazioni. Passare a 1080p e al preset Medium richiede il salto ad almeno una Radeon RX 460 se si utilizza un desktop e una GeForce GTX 1060 o GeForce GTX 1650 su un laptop. La versione desktop della GeForce GTX 1060 dovrebbe essere abbastanza potente per giocare a Control in 1080p sul preset High, mentre noi raccomandiamo una GeForce GTX 1070 o GeForce GTX 1660 Ti su un laptop.

Control
    1280x720 Low Quality Preset (DX11)     1920x1080 Medium Quality Preset (DX11)     1920x1080 High Quality Preset (DX11)
NVIDIA GeForce RTX 2080 (Desktop), i9-9900K
MSI GeForce RTX 2080
240 (226min) fps ∼20%
137 (121min) fps ∼15%
106 (94min) fps ∼11%
NVIDIA GeForce RTX 2080 Mobile, i9-9900K
MSI GT76 Titan DT 9SG
239 (237min) fps ∼20%
123 (108min) fps ∼13%
94.8 (83min) fps ∼9%
NVIDIA GeForce RTX 2070 (Desktop), i9-9900K
MSI GeForce RTX 2070
239 (226min) fps ∼20%
115 (102min) fps ∼12%
87.1 (76min) fps ∼9%
NVIDIA GeForce RTX 2060 (Desktop), i9-9900K
MSI GeForce RTX 2060
237 (217min) fps ∼20%
96.2 (84min) fps ∼10%
72.7 (64min) fps ∼7%
NVIDIA GeForce GTX 1080 Ti (Desktop), i7-7740X
Nvidia GeForce GTX 1080 Ti Founders Edition
233 (206min) fps ∼20%
107 (93min) fps ∼11%
82 (71min) fps ∼8%
NVIDIA GeForce GTX 1080 (Desktop), i9-9900K
MSI GeForce GTX 1080
233 (213min) fps ∼20%
88.4 (78min) fps ∼9%
67.1 (57min) fps ∼7%
NVIDIA GeForce RTX 2070 Mobile, i7-9750H
MSI GP65 Leopard 9SF
222 (198min) fps ∼19%
97.3 (86min) fps ∼10%
72.3 (63min) fps ∼7%
NVIDIA GeForce GTX 1080 Mobile, i7-7820HK
Alienware 17 R4
212 (184min) fps ∼18%
81.1 (71min) fps ∼9%
61.9 (53min) fps ∼6%
NVIDIA GeForce RTX 2060 Mobile, i7-9750H
MSI GE65 Raider 9SE
212 (157min) fps ∼18%
80 (70min) fps ∼9%
59.1 (52min) fps ∼6%
NVIDIA GeForce GTX 1660 Ti Mobile, i7-9750H
MSI GP65 Leopard 9SD
210 (190min) fps ∼18%
72.3 (63min) fps ∼8%
52.8 (45min) fps ∼5%
NVIDIA GeForce GTX 1070 (Desktop), i9-9900K
MSI GeForce GTX 1070
207 (188min) fps ∼17%
74.8 (65min) fps ∼8%
55.6 (48min) fps ∼6%
NVIDIA GeForce GTX 1070 Mobile, 6820HK
Asus G752VS
202 (170min) fps ∼17%
70.6 (62min) fps ∼8%
51 (44min) fps ∼5%
NVIDIA GeForce GTX 1070 Ti (Desktop), i7-7740X
i7-7740X Asus X299 Prime
200 (173min) fps ∼17%
78 (68min) fps ∼8%
58.5 (50min) fps ∼6%
AMD Radeon RX 480 (Desktop), i7-7740X
i7-7740X Asus X299 Prime
158 (136min) fps ∼13%
55 (47min) fps ∼6%
39.3 (33min) fps ∼4%
NVIDIA GeForce GTX 1060 (Desktop), i9-9900K
NVIDIA GeForce GTX 1060
152 (137min) fps ∼13%
51.6 (45min) fps ∼6%
37.8 (32min) fps ∼4%
NVIDIA GeForce GTX 1060 Mobile, 6820HK
MSI GT62VR
144 (129min) fps ∼12%
46.6 (41min) fps ∼5%
33.7 (29min) fps ∼3%
NVIDIA GeForce GTX 1650 Mobile, i7-9750H
MSI GP75 Leopard 9SC
143 (127min) fps ∼12%
45.7 (39min) fps ∼5%
33.4 (28min) fps ∼3%
NVIDIA GeForce GTX 1050 Ti Mobile, i7-7700HQ
MSI GE72 7RE
95 (84min) fps ∼8%
30.2 (26min) fps ∼3%
21.9 (18min) fps ∼2%
AMD Radeon RX 460 (Desktop), i7-7740X
XFX RX-460P4DFG5 Double Dissipation 4 GB, Asus X299 Prime
83 (72min) fps ∼7%
23.8 (20min) fps ∼3%
16.3 (14min) fps ∼2%
NVIDIA GeForce GTX 1050 Mobile, i7-7700HQ
MSI GL62M 7RD-077
80 (69min) fps ∼7%
24.4 (21min) fps ∼3%
17.4 (15min) fps ∼2%
NVIDIA GeForce GTX 1050 Mobile, i7-7700HQ
Asus GL753VD
74.8 (66min) fps ∼6%
23.5 (20min) fps ∼3%
16.9 (14min) fps ∼2%
NVIDIA GeForce GTX 965M, 6700HQ
MSI GE72 965M Ti
56 (47min) fps ∼5%
19 (14min) fps ∼2%
13 (11min) fps ∼1%
AMD Radeon RX Vega 8 (Ryzen 2000/3000), R5 2500U
Honor Magicbook
25.6 fps ∼2%
8.3 fps ∼1%
5.9 fps ∼1%
NVIDIA GeForce 940M, 5700HQ
MSI GP62 2QD
11 (6min) fps ∼1%

QHD (2560x1400) & UHD (3840x2160)

Il gioco in QHD sul preset High richiede almeno una GeForce GTX 1080 o GeForce RTX 2060 su un laptop, o una versione desktop della GeForce GTX 1070. Consigliamo la versione desktop della GeForce GTX 1080 e della GeForce RTX 2060, se il vostro budget lo consente. Tuttavia, nessuna GPU nella nostra tabella di confronto può avere una media di 35 FPS in 4K sul preset High.

Control
    2560x1440 High Quality Preset (DX11)     3840x2160 High Quality Preset (DX11)
NVIDIA GeForce RTX 2080 (Desktop), i9-9900K
MSI GeForce RTX 2080
70.2 (61min) fps ∼3%
34.8 (29min) fps ∼5%
NVIDIA GeForce RTX 2080 Mobile, i9-9900K
MSI GT76 Titan DT 9SG
62.8 (55min) fps ∼3%
31.6 (27min) fps ∼4%
NVIDIA GeForce RTX 2070 (Desktop), i9-9900K
MSI GeForce RTX 2070
56.7 (50min) fps ∼3%
28.1 (24min) fps ∼4%
NVIDIA GeForce GTX 1080 Ti (Desktop), i7-7740X
Nvidia GeForce GTX 1080 Ti Founders Edition
53.2 (46min) fps ∼2%
25.8 (22min) fps ∼3%
NVIDIA GeForce RTX 2060 (Desktop), i9-9900K
MSI GeForce RTX 2060
47 (40min) fps ∼2%
22.7 (19min) fps ∼3%
NVIDIA GeForce RTX 2070 Mobile, i7-9750H
MSI GP65 Leopard 9SF
46.9 (41min) fps ∼2%
23 (20min) fps ∼3%
NVIDIA GeForce GTX 1080 (Desktop), i9-9900K
MSI GeForce GTX 1080
41.4 (35min) fps ∼2%
19.7 (16min) fps ∼3%
NVIDIA GeForce GTX 1080 Mobile, i7-7820HK
Alienware 17 R4
38.7 (33min) fps ∼2%
18.8 (16min) fps ∼2%
NVIDIA GeForce RTX 2060 Mobile, i7-9750H
MSI GE65 Raider 9SE
37.7 (33min) fps ∼2%
18.4 (16min) fps ∼2%
NVIDIA GeForce GTX 1070 Ti (Desktop), i7-7740X
i7-7740X Asus X299 Prime
37.1 (31min) fps ∼2%
17.9 (15min) fps ∼2%
NVIDIA GeForce GTX 1070 (Desktop), i9-9900K
MSI GeForce GTX 1070
35.2 (30min) fps ∼2%
17.2 (14min) fps ∼2%
NVIDIA GeForce GTX 1660 Ti Mobile, i7-9750H
MSI GP65 Leopard 9SD
33.1 (28min) fps ∼1%
15.1 (13min) fps ∼2%
NVIDIA GeForce GTX 1070 Mobile, 6820HK
Asus G752VS
32.1 (27min) fps ∼1%
15.7 (13min) fps ∼2%
AMD Radeon RX 480 (Desktop), i7-7740X
i7-7740X Asus X299 Prime
24.9 (21min) fps ∼1%
12.1 (10min) fps ∼2%
NVIDIA GeForce GTX 1060 (Desktop), i9-9900K
NVIDIA GeForce GTX 1060
23.6 (20min) fps ∼1%
11.3 (10min) fps ∼1%
NVIDIA GeForce GTX 1060 Mobile, 6820HK
MSI GT62VR
20.8 (18min) fps ∼1%
9.7 (8min) fps ∼1%
NVIDIA GeForce GTX 1650 Mobile, i7-9750H
MSI GP75 Leopard 9SC
20.6 (17min) fps ∼1%
9.8 (8min) fps ∼1%
NVIDIA GeForce GTX 1050 Ti Mobile, i7-7700HQ
MSI GE72 7RE
11.8 (9min) fps ∼1%
3.3 (2min) fps ∼0%
NVIDIA GeForce GTX 1050 Mobile, i7-7700HQ
Asus GL753VD
10.4 (9min) fps ∼0%
5.2 (4min) fps ∼1%

Ray Tracing (1920x1080)

Il Ray Tracing mette a dura prova le GPUs, e nemmeno la GeForce RTX 2080 può avere una media di 60 FPS a 1080p e il preset High. L'intero portafoglio della serie RTX 20 può gestire il Ray Tracing a 1080p, anche se i frame rates possono scendere fino a 30 FPS sulla versione portatile della GeForce RTX 2060. Abbiamo anche provato il Ray Tracing su schede GTX, ma nessuna è stato in grado di ottenere una media di 20 FPS.

Control
    1920x1080 High Quality Preset & High Ray Tracing Preset (DX12)
NVIDIA GeForce RTX 2080 (Desktop), i9-9900K
MSI GeForce RTX 2080
58.8 (52min) fps ∼16%
NVIDIA GeForce RTX 2080 Mobile, i9-9900K
MSI GT76 Titan DT 9SG
56.2 (51min) fps ∼16%
NVIDIA GeForce RTX 2070 (Desktop), i9-9900K
MSI GeForce RTX 2070
49.1 (44min) fps ∼14%
NVIDIA GeForce RTX 2070 Mobile, i7-9750H
MSI GP65 Leopard 9SF
43.6 (37min) fps ∼12%
NVIDIA GeForce RTX 2060 (Desktop), i9-9900K
MSI GeForce RTX 2060
40.8 (37min) fps ∼11%
NVIDIA GeForce RTX 2060 Mobile, i7-9750H
MSI GE65 Raider 9SE
35.2 (30min) fps ∼10%
NVIDIA GeForce GTX 1660 Ti Mobile, i7-9750H
MSI GP65 Leopard 9SD
18.2 (15min) fps ∼5%
NVIDIA GeForce GTX 1080 (Desktop), i9-9900K
MSI GeForce GTX 1080
17.4 (14min) fps ∼5%
NVIDIA GeForce GTX 1080 Mobile, i7-7820HK
Alienware 17 R4
16.9 (12min) fps ∼5%
NVIDIA GeForce GTX 1070 (Desktop), i9-9900K
MSI GeForce GTX 1070
13.9 (11min) fps ∼4%
NVIDIA GeForce GTX 1070 Mobile, 6820HK
Asus G752VS
13.8 (11min) fps ∼4%
NVIDIA GeForce GTX 1060 (Desktop), i9-9900K
NVIDIA GeForce GTX 1060
9.1 (7min) fps ∼3%
NVIDIA GeForce GTX 1060 Mobile, 6820HK
MSI GT62VR
8.4 (7min) fps ∼2%

Nota bene:

I test di gioco sono spesso dispendiosi in termini di tempo e sono ostacolati dai limiti di attivazione o di installazione. Pertanto, al momento possiamo fornire solo alcuni dei benchmarks per Control. Aggiorneremo questo articolo con altre GPU nei prossimi giorni e settimane.

Mostra Limitazioni
PosModello< PrevNext >Control
 Control (2019)
basso
1280x720
Low Quality Preset (DX11)
medi
1920x1080
Medium Quality Preset (DX11)
alto
1920x1080
High Quality Preset (DX11)
QHD
2560x1440
High Quality Preset (DX11)
4K
3840x2160
High Quality Preset (DX11)

3840x2160
High Quality, High Ray Tracing, DLSS
NVIDIA GeForce RTX 4090
239.5n6
239n6
239n6
219.5n6
113.55n6
137.5n3
AMD Radeon RX 7900 XTX
239.5n2
239n2
238.5n2
188.4n2
91.45n2
NVIDIA GeForce RTX 4080 Super
237.5n2
238n2
236n2
166.8n2
84.5n2
98
NVIDIA GeForce RTX 4080
238.5n2
238.5n2
234n2
163.1n2
82.5n2
NVIDIA GeForce RTX 3090 Ti
240n2
209n2
142.5n2
73.9n2
NVIDIA GeForce RTX 4070 Ti SUPER
226
196.9
130.3
66.4
78.9
AMD Radeon RX 7900 XT
240
240
233
156.4
75.8
NVIDIA GeForce RTX 4070 Ti
240n2
239.5n2
200.5n4
128.55n4
64.9n4
73.1
AMD Radeon RX 7900 GRE
240n2
239.5n2
199.6n2
127.85n2
61.45n2
AMD Radeon RX 6950 XT
239.5n2
239n2
209n2
135.55n2
66n2
NVIDIA GeForce RTX 4090 Laptop GPU
240
232
184.4n3
122n3
63.25n2
72.6
NVIDIA GeForce RTX 3090
239.2n3
220n4
175.5n4
120.5n4
62.25n4
74
NVIDIA GeForce RTX 3080 Ti
240n2
235.5n2
187n3
124n3
64n3
AMD Radeon RX 7800 XT
240
240
190.1
120.3
58.2
NVIDIA GeForce RTX 4070 SUPER
224
176.4n2
114.05n2
57.8n2
68.05n2
AMD Radeon RX 6900 XT
240
234
174.5n2
113n2
54.3n2
NVIDIA GeForce RTX 4080 Laptop GPU
239.1
204.7
157
102
50.1
NVIDIA GeForce RTX 3080 12 GB
240
220
166.8
112.1
57.9
NVIDIA GeForce RTX 3080
237.5n2
190.5n2
153n2
105.5n2
56.45n2
PosModello< PrevNext >Control
basso medi alto QHD 4K
NVIDIA GeForce RTX 4070
240
220
159.95n2
101.65n2
50n2
60.7
AMD Radeon RX 6800 XT
240
229
168
108
51.6
AMD Radeon RX 6800
237
206
145
92.8
43.8
AMD Radeon RX 7700 XT
240
214
156.1
96.1
46.4
NVIDIA Titan RTX
240n3
176n3
135n3
92n3
47n3
NVIDIA GeForce RTX 4060 Ti 16G
240
155.2
113.3
73.1
36
42.8
NVIDIA GeForce RTX 4060 Ti 8G
239n3
160.8n3
118.3n3
75.2n3
35.6n3
43.5n3
NVIDIA GeForce RTX 3080 Ti Laptop GPU
72.9
34.5
46.3
NVIDIA GeForce RTX 3070
238n3
149n3
122n3
81.3n3
41n3
AMD Radeon RX 6750 XT
240n2
185.35n2
126.05n2
79.3n2
37.75n2
NVIDIA GeForce RTX 2080 Ti (Desktop)
239.5n2
166n2
129n2
86.5n2
44.2n2
AMD Radeon RX 6700 XT
240
166
115
72
34
NVIDIA GeForce RTX 3080 Laptop GPU
239
124.7
91.3n3
58.2n3
29.1n3
NVIDIA GeForce RTX 3060 Ti
240n2
153.05n2
112.4n2
72.75n2
36.25n2
Intel Arc A770
212
108.5
89.4
65.1
34.9
NVIDIA GeForce RTX 4060
236
130.5
92.6
58.4
28.4
34.1
AMD Radeon RX 7600
240
139.7
100.3
63.6
31.3
NVIDIA GeForce RTX 4060 Laptop GPU
238
119
89
NVIDIA GeForce RTX 2080 Super (Desktop)
240
124
95
62
30.4
AMD Radeon RX 6800M
218
149
108
69
34
PosModello< PrevNext >Control
basso medi alto QHD 4K
AMD Radeon RX 6650 XT
240n2
135n2
92.4n2
58.5n2
28.3n2
AMD Radeon RX 6600 XT
239.1
116.6
84
52.6
25.6
NVIDIA GeForce RTX 2080 (Desktop)
240
137
106
70.2
34.8
NVIDIA GeForce RTX 2080 Super Mobile
113
87.6
58.9
29.8
NVIDIA GeForce RTX 3070 Laptop GPU
240n2
129.85n2
94.9n4
60.95n4
30.3n4
AMD Radeon RX 7600M XT
236
110.4
81.5
53.4
27.2
Intel Arc A750
195.3
99.2
81.6
59.4
31.6
NVIDIA GeForce RTX 3060
240
115
84.1
54.2
26.3
NVIDIA GeForce RTX 2080 Mobile
239
123
92.1n3
62.8
31.6
AMD Radeon RX 6700M
117
82.2
NVIDIA GeForce GTX 1080 Ti (Desktop)
233
107
82
53.2
25.8
NVIDIA Titan X Pascal
240
112
83
53.5
25.8
NVIDIA GeForce RTX 2070 Super (Desktop)
238.5n4
123n4
94n4
61.5n4
30.15n4
AMD Radeon VII
194
124.3
87.9
56.8
28.6
AMD Radeon RX 5700 XT (Desktop)
236n2
125.15n2
102.45n2
72.2n2
40.75n2
NVIDIA GeForce RTX 2070 (Desktop)
239
115
87.1
56.7
28.1
NVIDIA GeForce RTX 3060 Laptop GPU
78.1
51.1
26
AMD Radeon RX 7600S
235
116.6
83.5
NVIDIA GeForce RTX 2070 Super Mobile
107
80.8
52.6
25.6
NVIDIA GeForce GTX 1080 (Desktop)
233
88.4
67.1
41.4
19.7
PosModello< PrevNext >Control
basso medi alto QHD 4K
NVIDIA GeForce RTX 2080 Super Max-Q
221.7
101.8n2
71.1n3
47.25n2
23.45n2
Intel Arc A580
226
102.2
80
54
27.7
NVIDIA GeForce RTX 2060 Super (Desktop)
239n3
108n3
80n3
52.1n3
25.7n3
AMD Radeon RX 6600
239n2
102.5n2
71.4n2
44.8n2
21.55n2
AMD Radeon RX 5700 (Desktop)
235.5n2
109.8n2
76.1n2
47.85n2
23.6n2
AMD Radeon RX 6600M
212n4
98.1n4
70.05n4
45.25n2
21.95n2
NVIDIA GeForce RTX 2070 Mobile
180n3
93n3
68n3
46.9
23
NVIDIA GeForce RTX 2080 Max-Q
231.9
92.8
71.9
NVIDIA GeForce RTX 2060 (Desktop)
237
96.2
72.7
47
22.7
AMD Radeon RX Vega 64
231
96
67
43.7
22.2
NVIDIA GeForce GTX 1080 Mobile
212
81.1
61.9
38.7
18.8
NVIDIA GeForce RTX 2070 Super Max-Q
92.6
64.3n2
42.25n2
22.45n2
NVIDIA GeForce GTX 1070 Ti (Desktop)
200
78
58.5
37.1
17.9
NVIDIA GeForce RTX 2070 Max-Q
220
81
59.3n4
18.1
NVIDIA GeForce RTX 2060 Mobile
212n3
77.6n3
57.4n5
37.7
18.4
NVIDIA GeForce RTX 3050
231n2
81.45n2
60.15n2
38.25n2
18.65n2
22.7
NVIDIA GeForce GTX 1070 (Desktop)
207
74.8
55.6
35.2
17.2
AMD Radeon RX 5600 XT (Desktop)
230.5n2
101n2
71n2
44.55n2
21.6n2
NVIDIA GeForce GTX 1080 Max-Q
201
71
53.6
32.6
16
NVIDIA GeForce GTX 1070 Mobile
202
70.6
51
32.1
15.7
PosModello< PrevNext >Control
basso medi alto QHD 4K
NVIDIA GeForce RTX 2060 Max-Q
183.7
67.1
50.4
NVIDIA GeForce GTX 1660 Ti (Desktop)
215
81.2
59.4
37.4
17.9
NVIDIA GeForce GTX 1660 Super (Desktop)
213
77
56.3
35.3
17
AMD Radeon RX 6500 XT
186.85n2
64.25n2
43.4n2
27.65n2
7.74n2
AMD Radeon RX 5500 XT (Desktop)
200.75n2
58.65n2
42.8n2
26.2n2
12.5n2
NVIDIA GeForce RTX 4050 Laptop GPU
100
74
48
24
Intel Arc A730M
145.7
66
51.1
AMD Radeon RX 5600M
176.7
72.3
53.1
NVIDIA GeForce GTX 1660 Ti Mobile
210
70.75n2
51.75n2
33.1
15.1
NVIDIA GeForce RTX 3050 Ti Laptop GPU
69.3
52.8
34
16.5
NVIDIA GeForce GTX 980 Ti
52.1
33.6
16.4
NVIDIA GeForce GTX 1660 (Desktop)
198
70
52.5
31.6
15.8
NVIDIA GeForce GTX 1650 Super (Desktop)
171
62
45
28
13
NVIDIA GeForce RTX 3050 4GB Laptop GPU
62.1
45.1
29.1
13.3
NVIDIA GeForce GTX 1660 Ti Max-Q
158.3
63.7
47.1
AMD Radeon RX 590 (Desktop)
196
66
48.3
30.6
15
NVIDIA GeForce GTX 1060 (Desktop)
152
51.6
37.8
23.6
11.3
AMD Radeon RX 570 (Desktop)
167
55.1
40.2
25.2
12.4
AMD Radeon RX 480 (Desktop)
158
55
39.3
24.9
12.1
NVIDIA GeForce GTX 1060 Mobile
144
46.6
33.7
20.8
9.7
PosModello< PrevNext >Control
basso medi alto QHD 4K
NVIDIA GeForce GTX 1650 Ti Mobile
48.6
35.5
21.9
10.5
AMD Radeon RX 5500M
123.95n2
48.8n2
35.55n2
AMD Radeon Pro 5500M
139
41.5
29.2
18.1
NVIDIA GeForce GTX 1650 (Desktop)
137
45.4
33.3
20.7
8.1
NVIDIA GeForce GTX 1650 Mobile
138.5n5
45.5n5
33.4n5
20.6
9.8
Intel Arc A380
115.2
42.2
31.3
AMD Radeon RX 5300M
132
41.8
29.4
NVIDIA GeForce GTX 970
153
50
36
22.8
NVIDIA GeForce GTX 1650 Ti Max-Q
104.7
39.2
29.1
NVIDIA GeForce GTX 1650 Max-Q
111.4n2
38n2
27.7n2
NVIDIA Quadro T1000 (Laptop)
136.8
42.4
31.2
AMD Radeon RX Vega M GH
102
34
24
15
AMD Radeon 780M
106.1
35.9
27.9
17.4
8.11
NVIDIA GeForce GTX 1050 Ti Mobile
95
30.2
21.9
11.8
3.3
NVIDIA GeForce GTX 1050 Ti (Desktop)
94
29.9
21.3
AMD Radeon 680M
79.9
28.2
20.5
13.3
6.54
NVIDIA GeForce MX450
72.8n2
23.25n2
15.35n2
AMD Radeon RX Vega M GL / 870
87.6
27.5
19.8
12.6
5.9
NVIDIA GeForce GTX 1050 (Desktop)
75
23.6
15.8
NVIDIA GeForce GTX 1050 Mobile
78.6n3
24.4n3
17.4n3
10.4
5.2
PosModello< PrevNext >Control
basso medi alto QHD 4K
NVIDIA GeForce GTX 1050 Max-Q
67.8
23
16.8
10.5
5.1
AMD Radeon RX 460 (Desktop)
83
23.8
16.3
NVIDIA GeForce GTX 965M
56
19
13
AMD Radeon RX 560X (Laptop)
83.6
24.6
17.5
Intel Iris Xe MAX Graphics
45.9
19.1
14
AMD Radeon Pro 560X
56.5
21.6
15.2
Intel Iris Xe Graphics G7 96EUs
51.3n2
16.85n2
11.65n2
NVIDIA GeForce MX350
52.4n2
17.5n2
12.25n2
AMD Radeon RX 550 (Laptop)
37.8
10.2
6.92
AMD Radeon Pro WX 3200
42.4
12.5
8.3
NVIDIA GeForce GT 1030 (Desktop)
43.2
13.6
9.4
NVIDIA GeForce MX250
41.55n2
13.85n2
9.75n2
NVIDIA GeForce MX330
44.4
13.9
9.72
NVIDIA GeForce MX150
40
12.8
9.3
Intel Iris Xe Graphics G7 80EUs
57.9
17.3
11.6
NVIDIA GeForce GTX 950M
49.4
14.4
AMD Radeon 540X
37.4
10.6
7.4
AMD Radeon RX Vega 11
41.2
12.5
7.1
Intel Iris Plus Graphics G7 (Ice Lake 64 EU)
23.1n2
7.65n2
4.9
AMD Radeon RX Vega 10
34.4n3
11.4n3
8.5n2
PosModello< PrevNext >Control
basso medi alto QHD 4K
Intel UHD Graphics Xe 32EUs (Tiger Lake-H)
29
8.4
Intel UHD Graphics 770
38.1
11
NVIDIA GeForce MX230
34.8
11
7.5
AMD Radeon RX Vega 8 (Ryzen 4000/5000)
51.3
17.1
12.6
7.68
AMD Radeon RX Vega 7
39.85n2
12.6n2
9.9
NVIDIA GeForce MX130
33.1
9.75
AMD Radeon RX Vega 8 (Ryzen 2000/3000)
26n3
9.1n3
6n3
NVIDIA GeForce 940M
11
Intel Iris Plus Graphics G4 (Ice Lake 48 EU)
22.6
7.6
NVIDIA GeForce 930MX
21.6
6.6
Intel Iris Plus Graphics 655
25.4
NVIDIA GeForce 930M
19.6
Intel Iris Graphics 550
23.3
6.79
AMD Radeon 530
24
7.1
4.9
AMD Radeon RX Vega 6 (Ryzen 4000/5000)
30.85n2
10.17n2
7.8
NVIDIA GeForce MX110
22.6
6.6
AMD Radeon RX Vega 6 (Ryzen 2000/3000)
27.7
9
AMD Radeon RX Vega 5
31.4
9.6
Intel UHD Graphics G1 (Ice Lake 32 EU)
16.7
5.4
Intel UHD Graphics 630
16.2
PosModello< PrevNext >Control
basso medi alto QHD 4K
Intel UHD Graphics Xe 16EUs (Tiger Lake-H)
15.4
4.77
Intel HD Graphics 630
14.65n2
4.7n2
AMD Radeon R5 (Bristol Ridge)
10.2
Intel UHD Graphics 620
14.2n2
4.8
3.3
AMD Radeon R5 M255
16.4
AMD Radeon RX Vega 3
15.6
5
Intel Iris Graphics 6100
13.5
NVIDIA GeForce GT 720M
8.6
Intel HD Graphics 4600
10.4
Intel HD Graphics 5500
12.1
Intel UHD Graphics 615
7.6
2.4
Intel HD Graphics 4400
7.4
AMD Radeon R4 (Stoney Ridge)
8.1
AMD Radeon R5 (Beema/Carrizo-L)
7.3
(-) * Meglio usare valori piccoli. / n123 Numero di parametri di riferimento per questo valore mediano / Posizione approssimativa


Legenda
5stutters - Il gioco probabilmente non sarà fluido con questo settaggio e con questa scheda grafica in quanto il framerate si trova al di sotto del limite di 25fps
potrebbero verificarsi problemi di stuttering - Informazioni interpolate Una scheda grafica più lenta non era in grado di utilizzare il gioco in modo fluido e non si cono benchmarks per questa scheda. Pertanto, potrebbe anche non funzionare.
30Fluido - il gioco dovrebbe essere eseguito in modo fluido in quanto tutti i benchmarks conosciuti sono superiori al limite di 25fps
40Fluido - il gioco dovrebbe essere eseguito in modo fluido in quanto tutti i benchmarks conosciuti sono superiori al limite di 35fps
60Fluido - il gioco dovrebbe essere eseguito in modo fluido in quanto tutti i benchmarks conosciuti sono superiori al limite di 58fps
Potrebbe funzionare in modo fluido - Una scheda grafica più lenta ha ottenuto un framerates giocabile e non ci sono benchmarks per questa scheda grafica. Pertanto, questa scheda grafica più veloce potrebbe essere in grado di far funzionare il gioco in modo fluido.
?incerto - Il framerate minimo ottenuto è stato sotto i limiti, ma la media era superiore, o una scheda grafica più lenta ha ottenuto un framerates giocabile ma questa no.
non sicuro - una scheda grafica più lenta è stata indicata come non sicura e non ci sono benchmarks per questa scheda.
In valore in questi campi mostra il framerate medio di tutti i valori del database. Sposta il tuo mouse sul valore per vedere i singoli risultati.

Test Systems

Device Graphics Card Processor RAM OS
Desktop-PC I MSI GeForce RTX 2080 (8 GB GDDR6)
MSI GeForce RTX 2070 (8 GB GDDR6)
MSI GeForce RTX 2060 (6 GB GDDR6)
MSI GeForce GTX 1080 (8 GB GDDR5X)
MSI GeForce GTX 1070 (8 GB GDDR5)
NVIDIA GeForce GTX 1060 (6 GB GDDR5)
Intel Core i9-9900K 4 x 8 GB DDR4 Windows 10 64 Bit
Desktop-PC II NVIDIA GeForce GTX 1080 Ti (11 GB GDDR5X)
ASUS GeForce GTX 980 Ti (6 GB GDDR5)
XFX Radeon R9 Fury (4 GB HBM)
Sapphire Radeon R9 290X (4 GB GDDR5)
Sapphire Radeon R9 280X (3 GB GDDR5)
MSI Radeon R7 370 (2 GB GDDR5)
Intel Core i7-7740X 2 x 8 GB DDR4 Windows 10 64 Bit
Desktop-PC III NVIDIA GeForce RTX 2070 Super (8 GB GDDR6)
NVIDIA GeForce RTX 2060 Super (8 GB GDDR6)
NVIDIA Titan X (Pascal) (12 GB GDDR5X)
AMD Radeon RX Vega 64 (8 GB HBM2)
XFX AMD Radeon RX 590 (8 GB GDDR5)
Sapphire AMD Radeon RX 580 (8 GB GDDR5)
Sapphire AMD Radeon RX 570 (8 GB GDDR5)
Gainward GeForce GTX 1650 (4 GB GDDR5)
Zotac GeForce GT 1030 (2 GB GDDR5)
AMD Ryzen 9 3900X 2 x 8 GB DDR4 Windows 10 64 Bit
Desktop-PC IV NVIDIA Titan RTX (24 GB GDDR6) AMD Ryzen Threadripper 2920X 4 x 16 GB DDR4 Windows 10 64 Bit
MSI GT76 NVIDIA GeForce RTX 2080 (8 GB GDDR6) Intel Core i9-9900K 2 x 16 GB DDR4 Windows 10 64 Bit
MSI GP65 NVIDIA GeForce RTX 2070 (8 GB GDDR6) Intel Core i7-9750H 2 x 16 GB DDR4 Windows 10 64 Bit
MSI GE65 NVIDIA GeForce RTX 2060 (6 GB GDDR6) Intel Core i7-9750H 2 x 8 GB DDR4 Windows 10 64 Bit
MSI GP65 NVIDIA GeForce GTX 1660 Ti (6 GB GDDR6) Intel Core i7-9750H 2 x 16 GB DDR4 Windows 10 64 Bit
MSI GP75 NVIDIA GeForce GTX 1650 (4 GB GDDR5) Intel Core i7-9750H 2 x 8 GB DDR4 Windows 10 64 Bit
Alienware 17 R4 NVIDIA GeForce GTX 1080 (8 GB GDDR5X) Intel Core i7-7820HK 2 x 16 GB DDR4 Windows 10 64 Bit
ASUS G752VS NVIDIA GeForce GTX 1070 (8 GB GDDR5) Intel Core i7-6820HK 2 x 16 GB DDR4 Windows 10 64 Bit
MSI GT62VR NVIDIA GeForce GTX 1060 (6 GB GDDR5) Intel Core i7-6820HK 2 x 8 GB DDR4 Windows 10 64 Bit
MSI GE72 NVIDIA GeForce GTX 1050 Ti (2 GB GDDR5) Intel Core i7-7700HQ 2 x 4 GB DDR4 Windows 10 64 Bit
ASUS GL753VD NVIDIA GeForce GTX 1050 (4 GB GDDR5) Intel Core i7-7700HQ 1 x 16 GB DDR4 Windows 10 64 Bit
MSI GL62 NVIDIA GeForce GTX 1050 (2 GB GDDR5) Intel Core i7-7700HQ 2 x 4 GB DDR4 Windows 10 64 Bit
MSI GE72 NVIDIA GeForce GTX 965M (2 GB GDDR5) Intel Core i7-6700HQ 1 x 8 GB DDR4 Windows 10 64 Bit
MSI PE60 NVIDIA GeForce GTX 950M (2 GB GDDR5) Intel Core i7-6700HQ 2 x 4 GB DDR4 Windows 10 64 Bit
MSI CX72 NVIDIA GeForce 940MX (2 GB DDR3) Intel Core i7-6700HQ 2 x 8 GB DDR4 Windows 10 64 Bit
MSI GP62 NVIDIA GeForce 940M (2 GB DDR3) Intel Core i7-5700HQ 1 x 8 GB DDR3 Windows 10 64 Bit
MSI CX61 NVIDIA GeForce 920M (2 GB DDR3) Intel Celeron 2970M 1 x 8 GB DDR3 Windows 10 64 Bit
Honor Magicbook AMD Radeon RX Vega 8 AMD Ryzen 5 2500U 1 x 8 GB DDR4 Windows 10 64 Bit
Please share our article, every link counts!
Florian Glaser, 2019-09-14 (Update: 2019-09-14)