Recensione dell'Asus TUF Gaming GeForce RTX 4070 Ti Super: AD103 mid-ranger che sfida la RX 7900 XT e sostituisce la RTX 3090 Ti per 300 dollari in meno

Nvidia ha lanciato rTX 4070 Ti Super insieme alla RTX 4070 Super e la RTX 4080 Super durante il CES 2024. Con questo aggiornamento, la RTX 4070 Ti Super è diventata una GPU AD103, che porta con sé un sostanziale aggiornamento del sottosistema di memoria insieme al consueto aumento del numero di core CUDA.
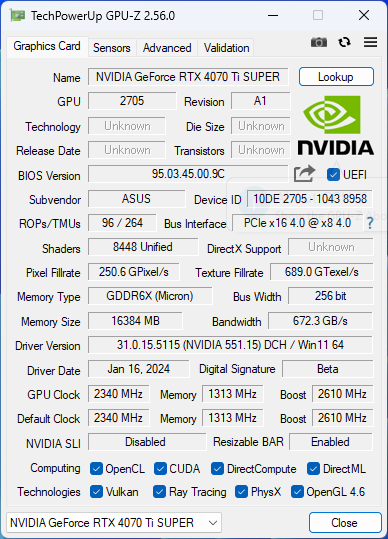
La RTX 4070 Ti Super vanta ora 8.448 core CUDA, che rappresentano un aumento del 10% rispetto ai 7.680 shader della RTX 4070 Ti originale. Il passaggio al silicio AD103 offre alla scheda un bus di memoria GDDR6X da 16 GB a 256 bit, che produce una larghezza di banda di 672 GB/s.
Nvidia ha scelto ancora una volta di non offrire una Founders Edition per la RTX 4070 Ti Super, ma ci sono molte opzioni tra cui scegliere tra le offerte dei partner di schede aggiuntive (AiB). La maggior parte delle AiB ha schede che puntano a un MSRP di 799 dollari, ma offre anche SKU con caratteristiche aggiuntive a un prezzo maggiorato.
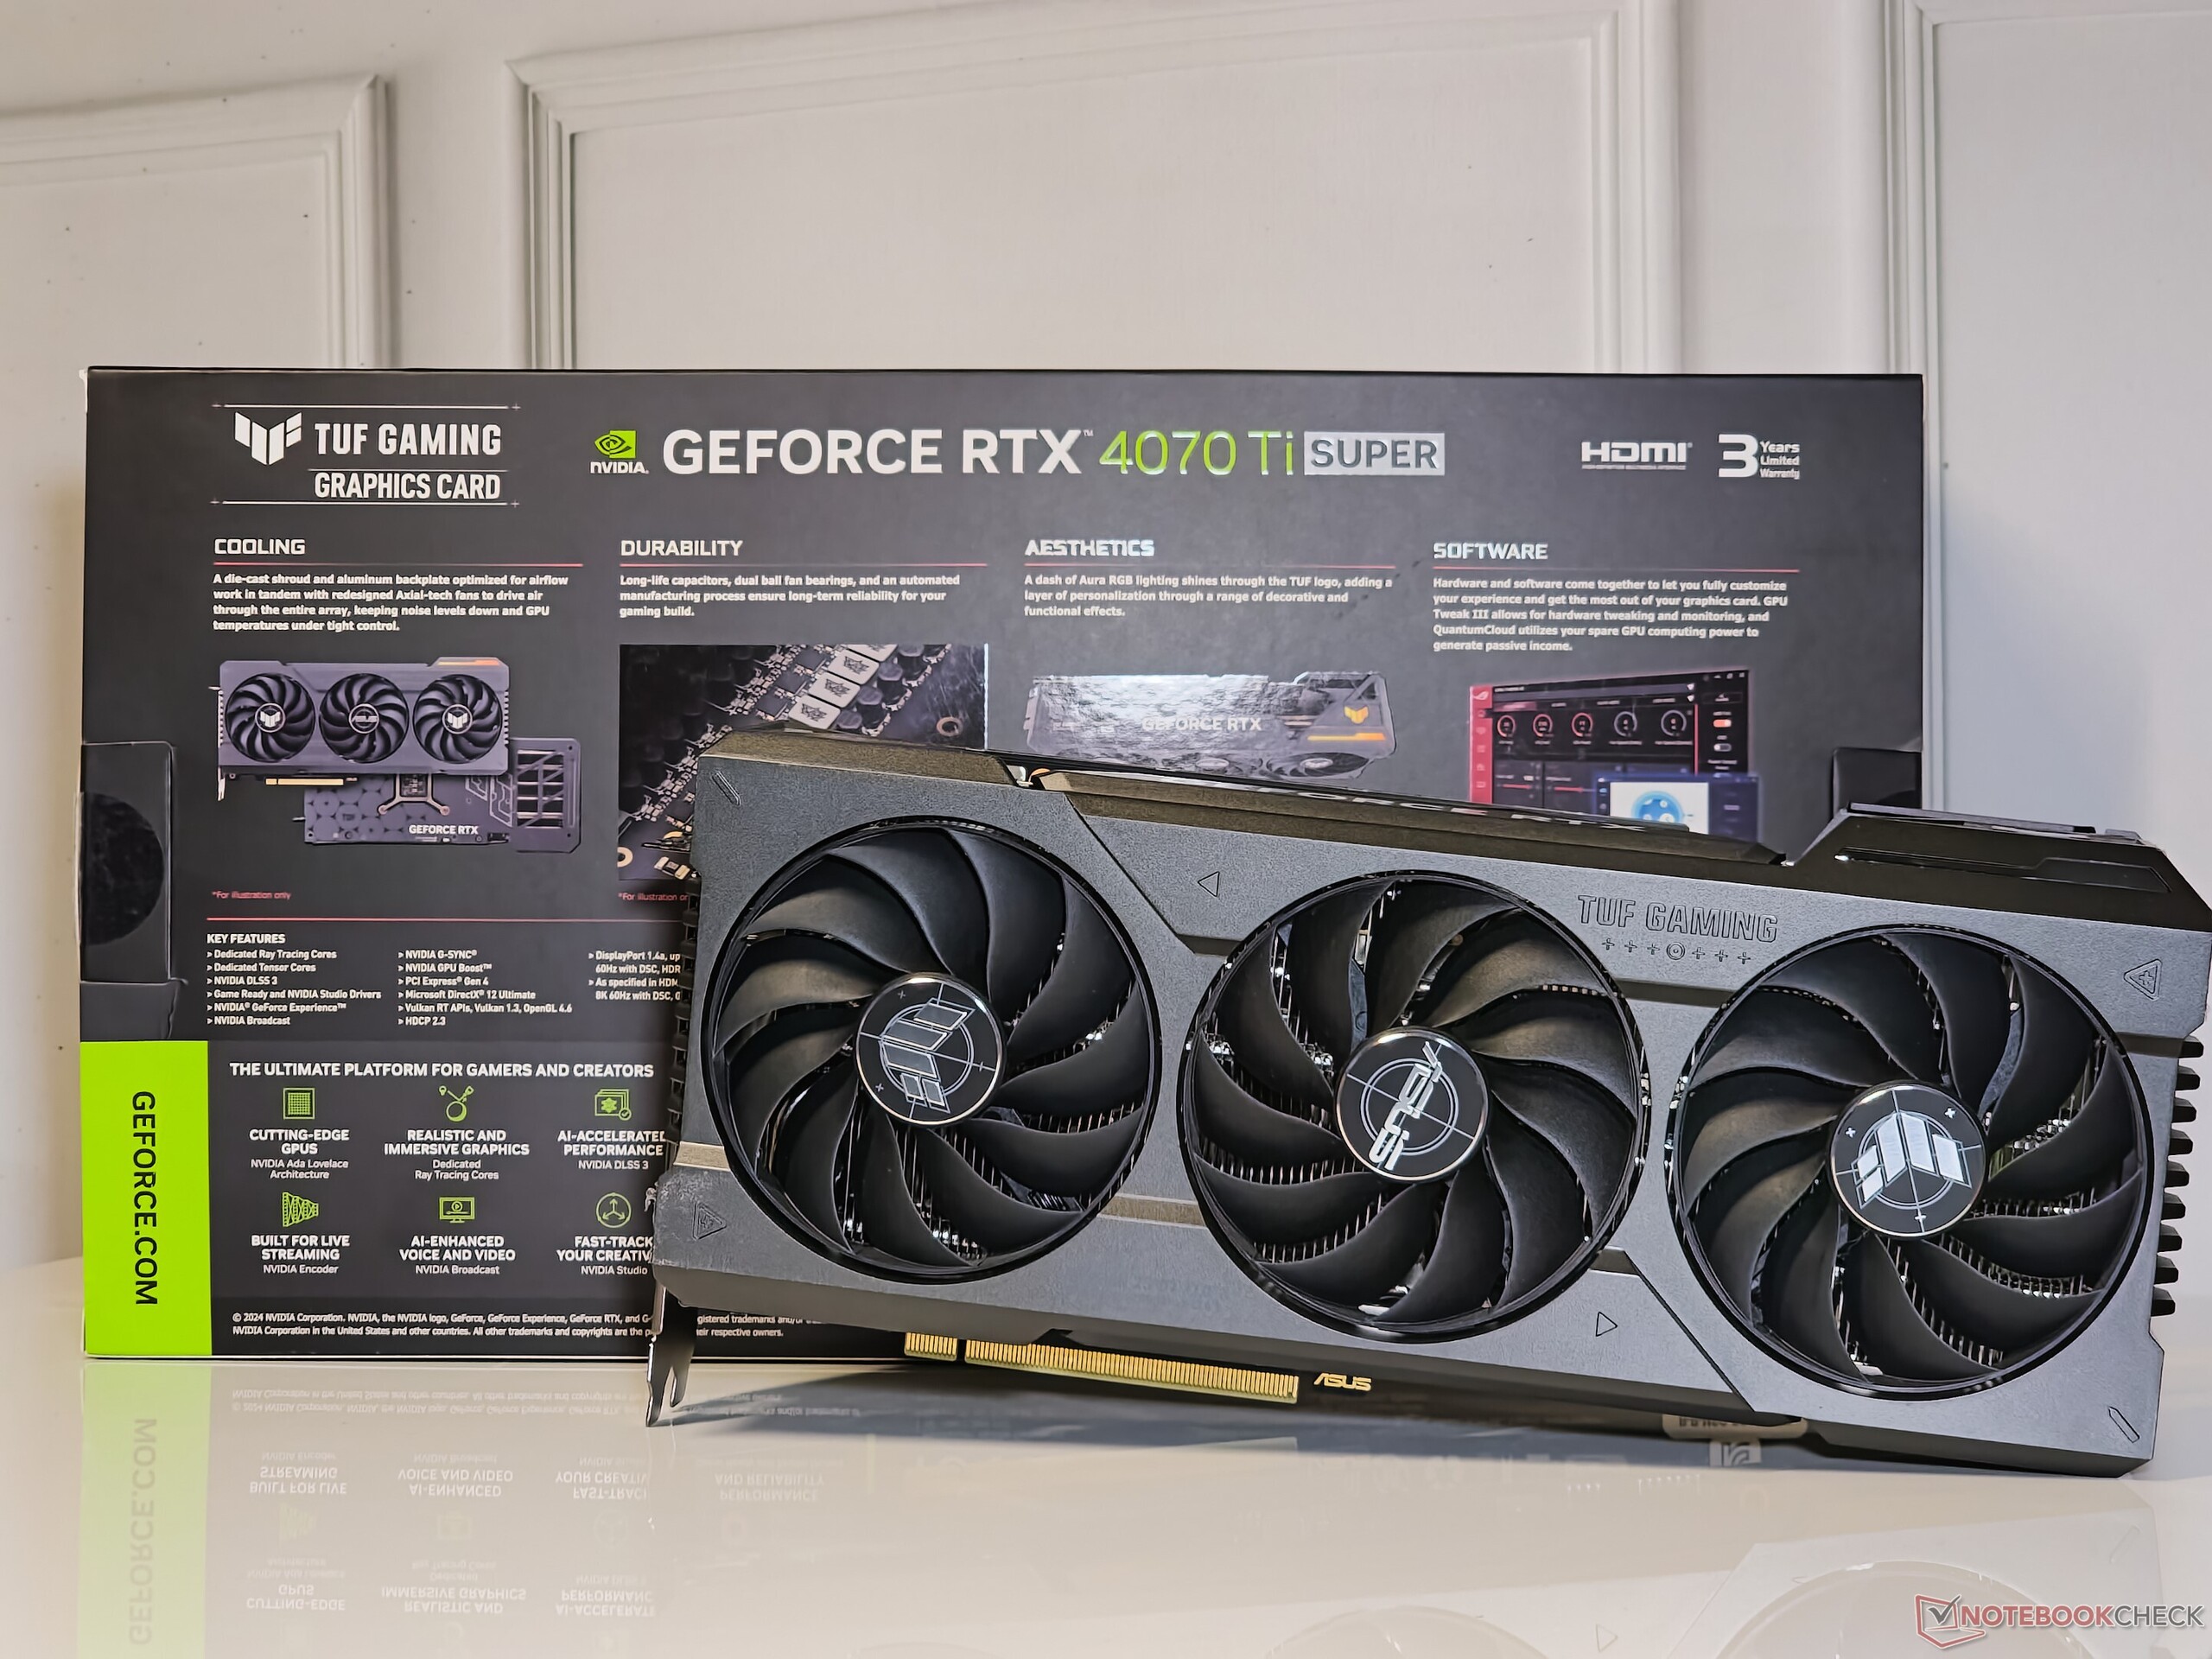
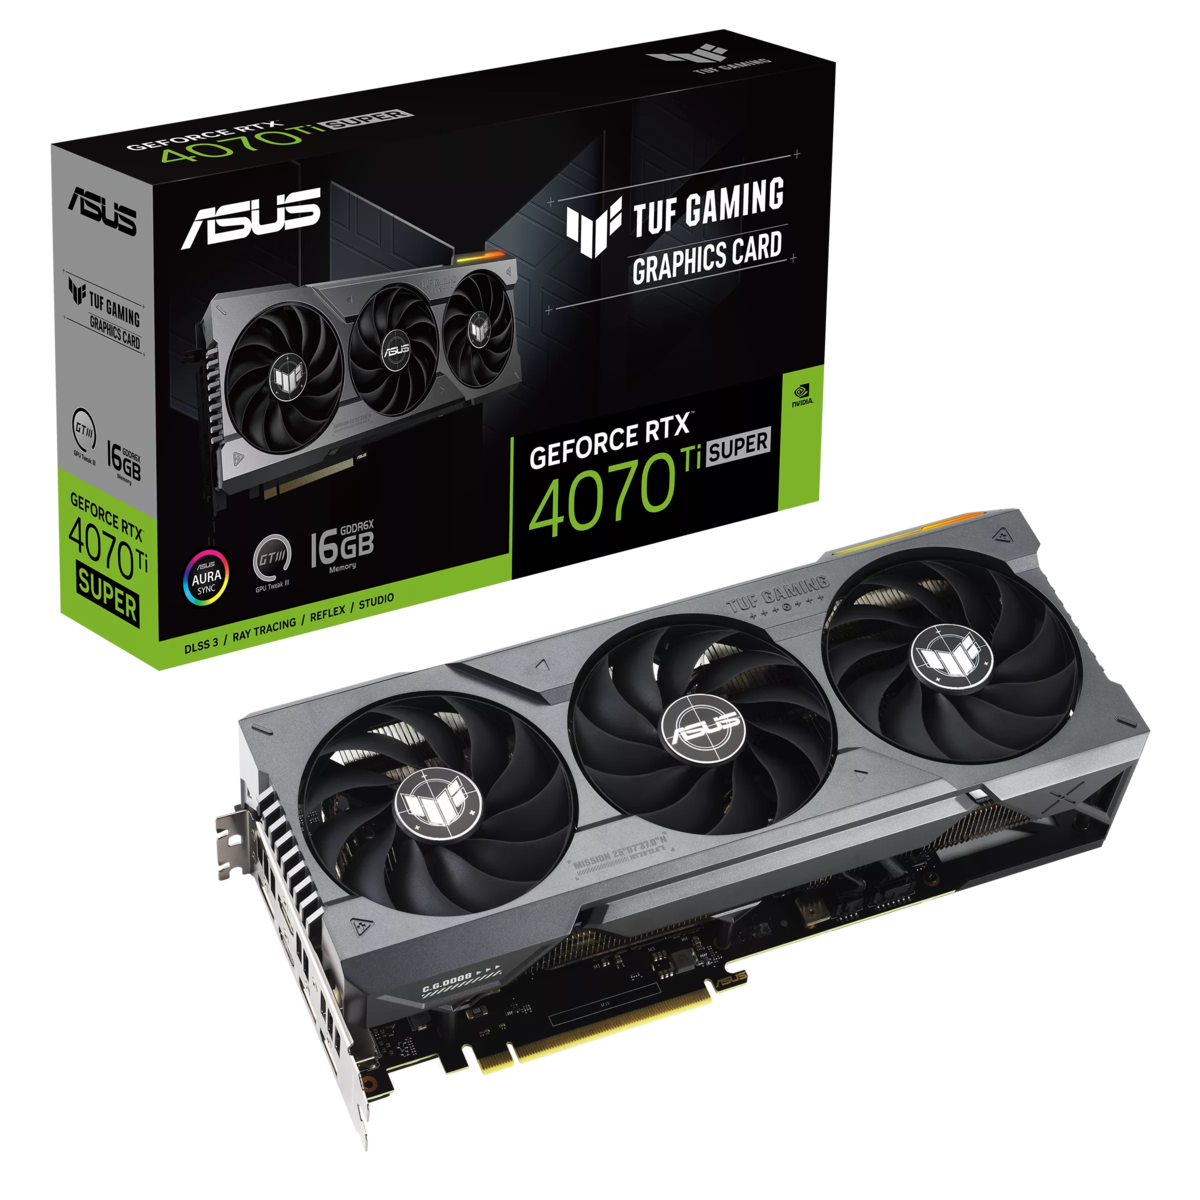
A questo proposito, abbiamo ora la nuova Asus TUF Gaming GeForce RTX 4070 Ti Super. Questa scheda viene venduta a 799 dollari o ₹95.000 in India e viene fornita con una garanzia di tre anni. Asus offre anche una variante OC di questa scheda che sostituisce completamente l'originale TUF Gaming GeForce RTX 4070 Ti OC che abbiamo recensito lo scorso anno.
In questa recensione, mettiamo alla prova Asus TUF Gaming GeForce RTX 4070 Ti Super e vediamo se questi miglioramenti hardware si traducono in guadagni tangibili nei benchmark sintetici e nei giochi.
Confronto tra Asus TUF Gaming RTX 4070 Ti Super e altre GPU Nvidia
| Specifiche | RTX 4090 FE | RTX 4080 Super FE | RTX 4080 FE | Asus TUF RTX 4070 Ti Super | Asus TUF RTX 4070 Ti | RTX 4070 Super | ZotacRTX 4070 AMP Airo | KFA2RTX 4060 Ti EX | RTX 3090 Ti FE | RTX 3090 FE | RTX 3080 Ti FE | RTX 3070 Ti FE | RTX 3070 FE | Titan RTX |
|---|---|---|---|---|---|---|---|---|---|---|---|---|---|---|
| Chip | AD102 | AD103 | AD103 | AD103 | AD104 | AD104 | AD104 | AD106 | GA102 | GA102 | GA102 | GA104 | GA104 | TU102 |
| Processo FinFET | Custom 4N | Custom 4N | Custom 4N | Custom 4N | Custom 4N | Custom 4N | Custom 4N | Custom 4N | 8 nm | 8 nm | 8 nm | 8 nm | 8 nm | 12 nm |
| CUDA Cores | 16.384 | 10.240 | 9.728 | 8.448 | 7.680 | 7.168 | 5.888 | 4.352 | 10.752 | 10.496 | 10.240 | 6.144 | 5.888 | 4.608 |
| Unità di texture | 512 | 320 | 304 | 264 | 240 | 224 | 184 | 136 | 336 | 328 | 320 | 192 | 184 | 288 |
| Core Tensor | 512 4th Gen. | 320 4th Gen. | 304 4th Gen. | 264 4th Gen. | 240 4th Gen. | 224 4th Gen. | 184 4th Gen. | 136 4th Gen. | 336 3rd Gen. | 328 3rd Gen. | 320 3rd Gen. | 192 3rd Gen. | 184 3rd Gen. | 576 2nd Gen. |
| RT Cores | 128 3a Gen. | 80 3a Gen. | 76 3a Gen. | 66 3a Gen. | 60 3a Gen. | 56 3a Gen. | 46 3a Gen. | 34 3a Gen. | 84 2a Gen. | 82 2a Gen. | 80 2a Gen. | 48 2a Gen. | 46 2a Gen. | 72 |
| GPU Base Clock | 2.235 MHz | 2.295 MHz | 2.205 MHz | 2.340 MHz | 2.310 MHz | 1.980 MHz | 1.920 MHz | 2.310 MHz | 1.560 MHz | 1.395 MHz | 1.365 MHz | 1.575 MHz | 1.500 MHz | 1.350 MHz |
| GPU Boost Clock | 2.520 MHz | 2.550 MHz | 2.505 MHz | 2.610 MHz | 2.760 MHz | 2.565 MHz | 2.535 MHz | 2.535 MHz | 1.860 MHz | 1.695 MHz | 1.665 MHz | 1.770 MHz | 1.750 MHz | 1.770 MHz |
| Bus di memoria | 384-bit | 256-bit | 256-bit | 256-bit | 192-bit | 192-bit | 192-bit | 128-bit | 384-bit | 384-bit | 384-bit | 256-bit | 256-bit | 384-bit |
| Larghezza di banda della memoria | 1.008 GB/s | 736,3 GB/s | 716,8 GB/s | 672GB/s | 504 GB/s | 504 GB/s | 504 GB/s | 288 GB/s | 1.008 GB/s | 936 GB/s | 912 GB/s | 608 GB/s | 448 GB/s | 672 GB/s |
| Memoria video | 24 GB GDDR6X | 16 GB GDDR6X | 16 GB GDDR6X | 16 GB GDDR6X | 12 GB GDDR6X | 12 GB GDDR6X | 12 GB GDDR6X | 8 GB GDDR6 | 24 GB GDDR6X | 24 GB GDDR6X | 12 GB GDDR6X | 8 GB GDDR6X | 8 GB GDDR6 | 24 GB GDDR6 |
| Consumo energetico | 450 W | 320 W | 320 W | 285 W | 285 W | 220 W | 215 W | 160 W | 450 W | 350 W | 350 W | 290 W | 220 W | 280 W |
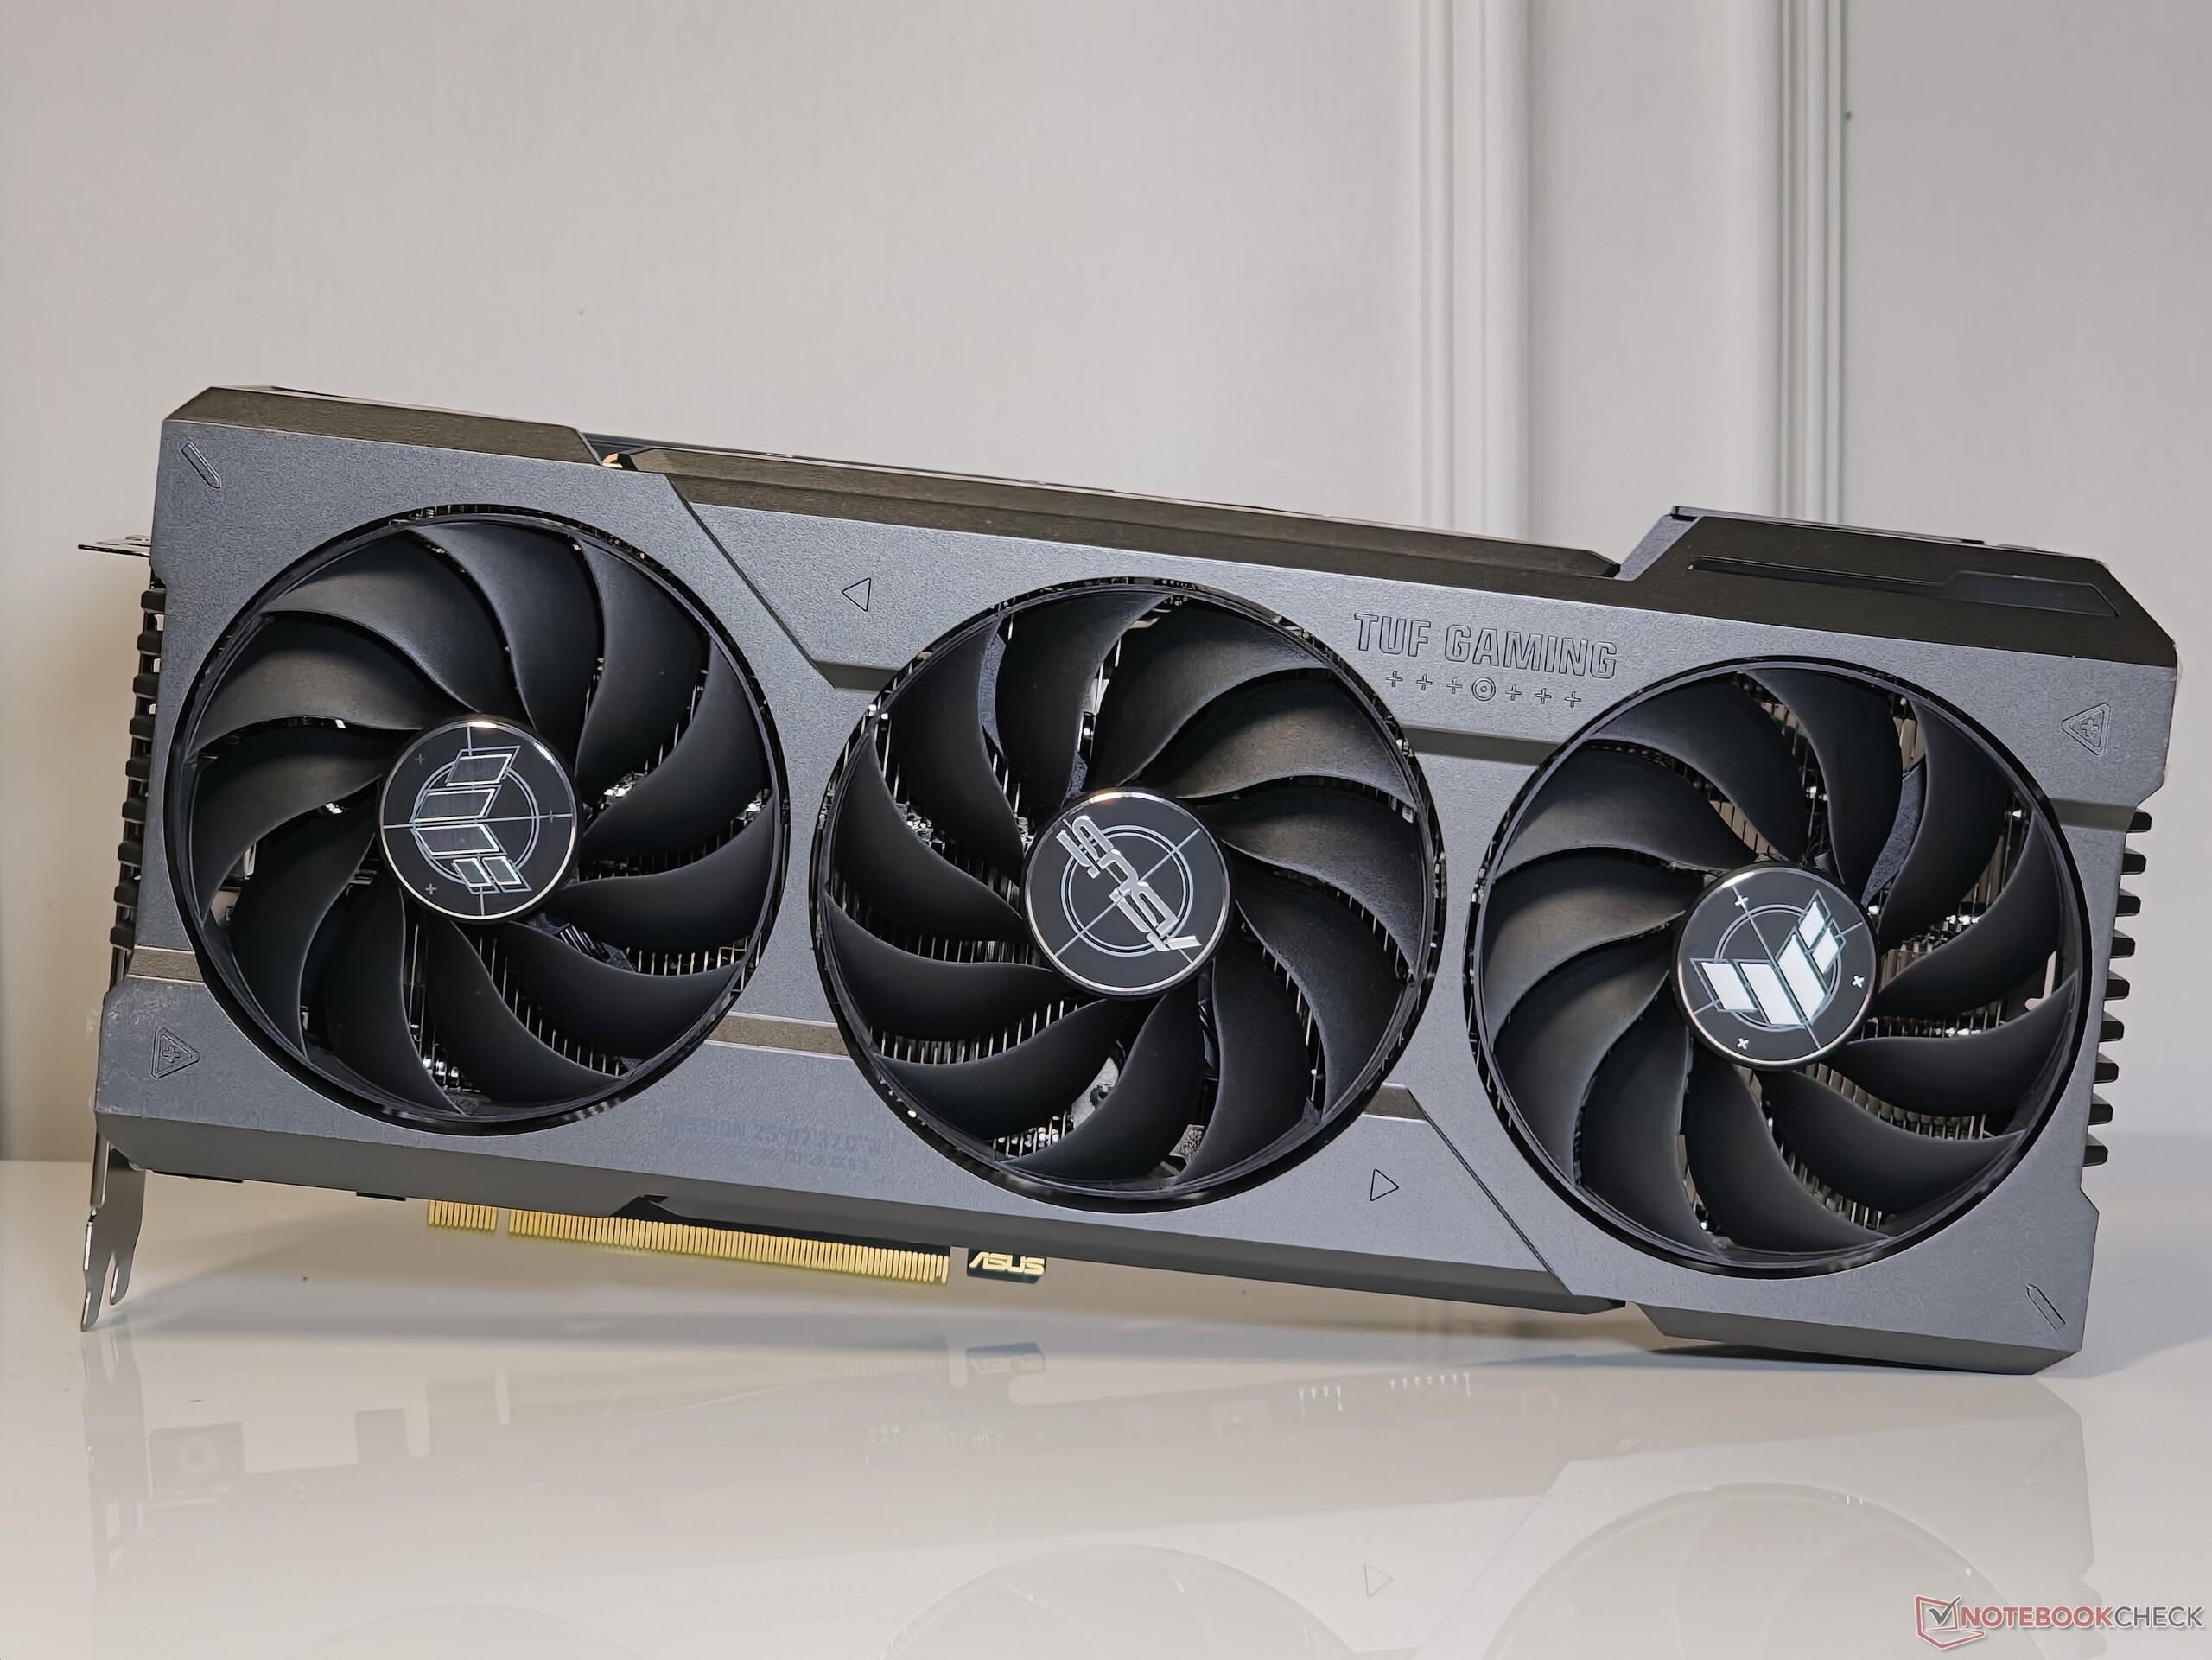
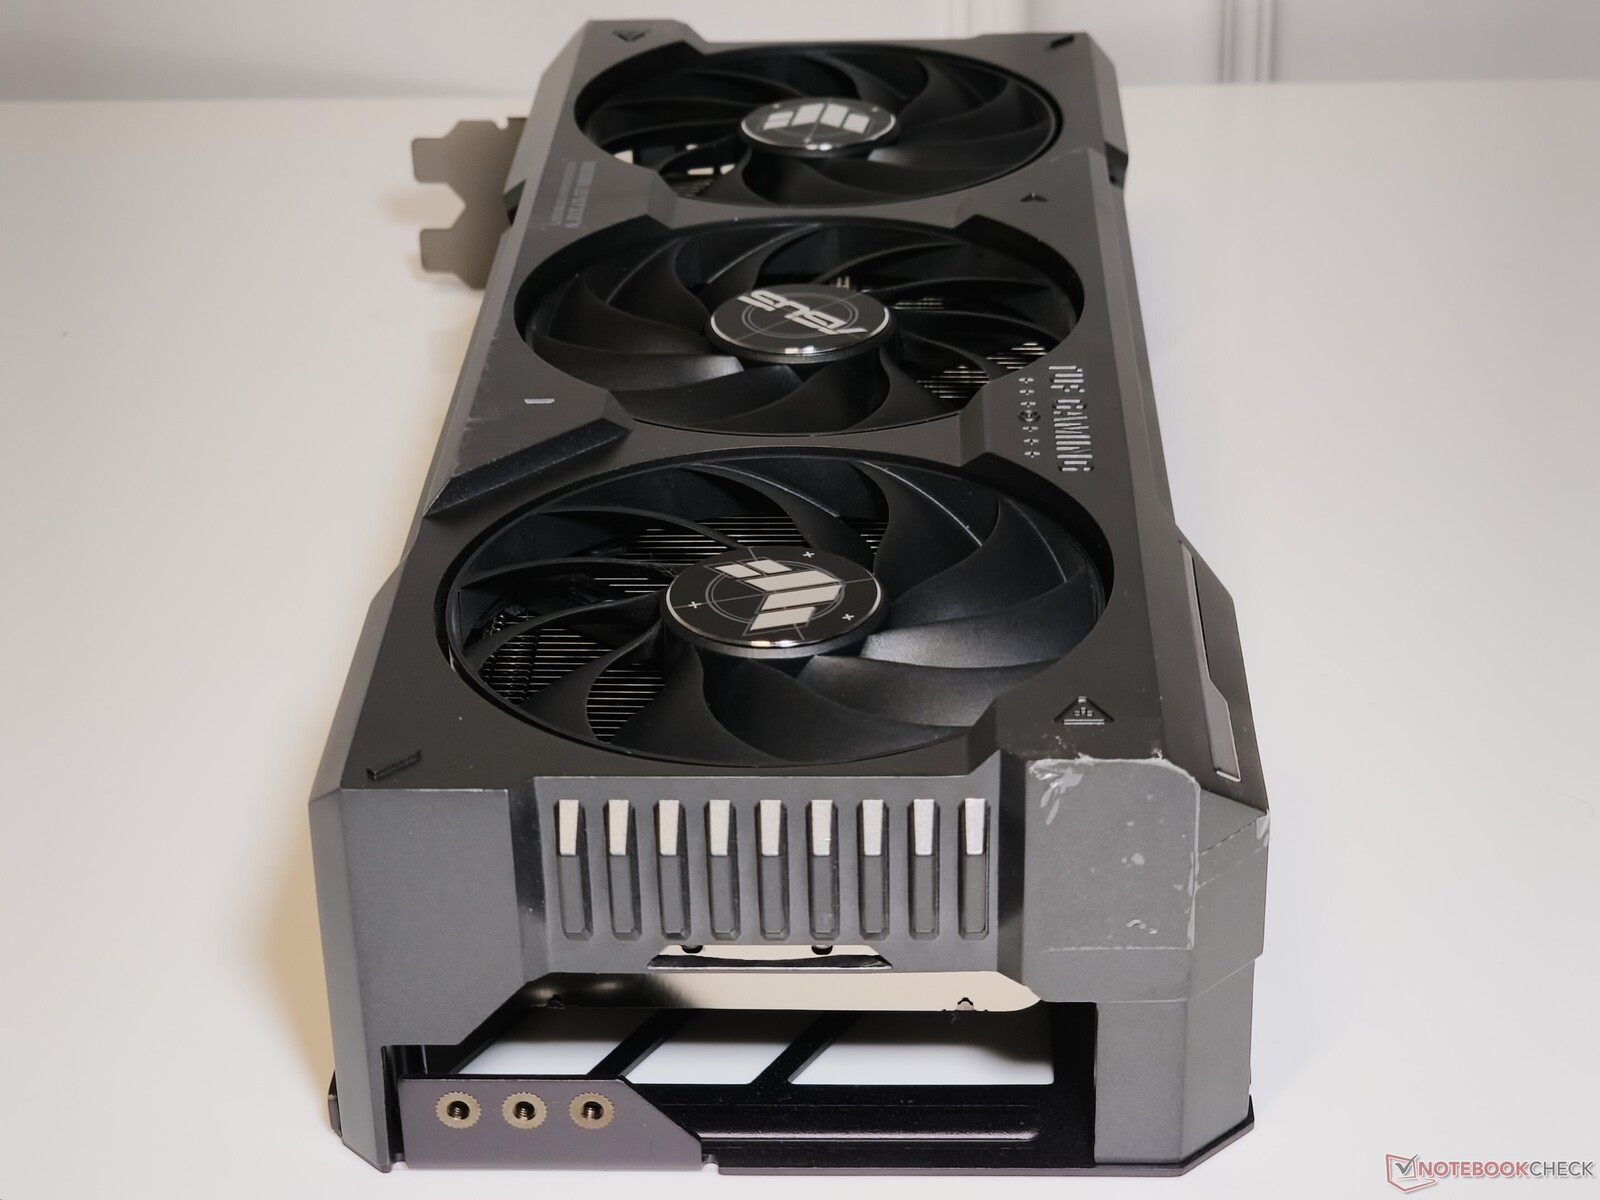
Asus TUF Gaming GeForce RTX 4070 Ti Super da vicino
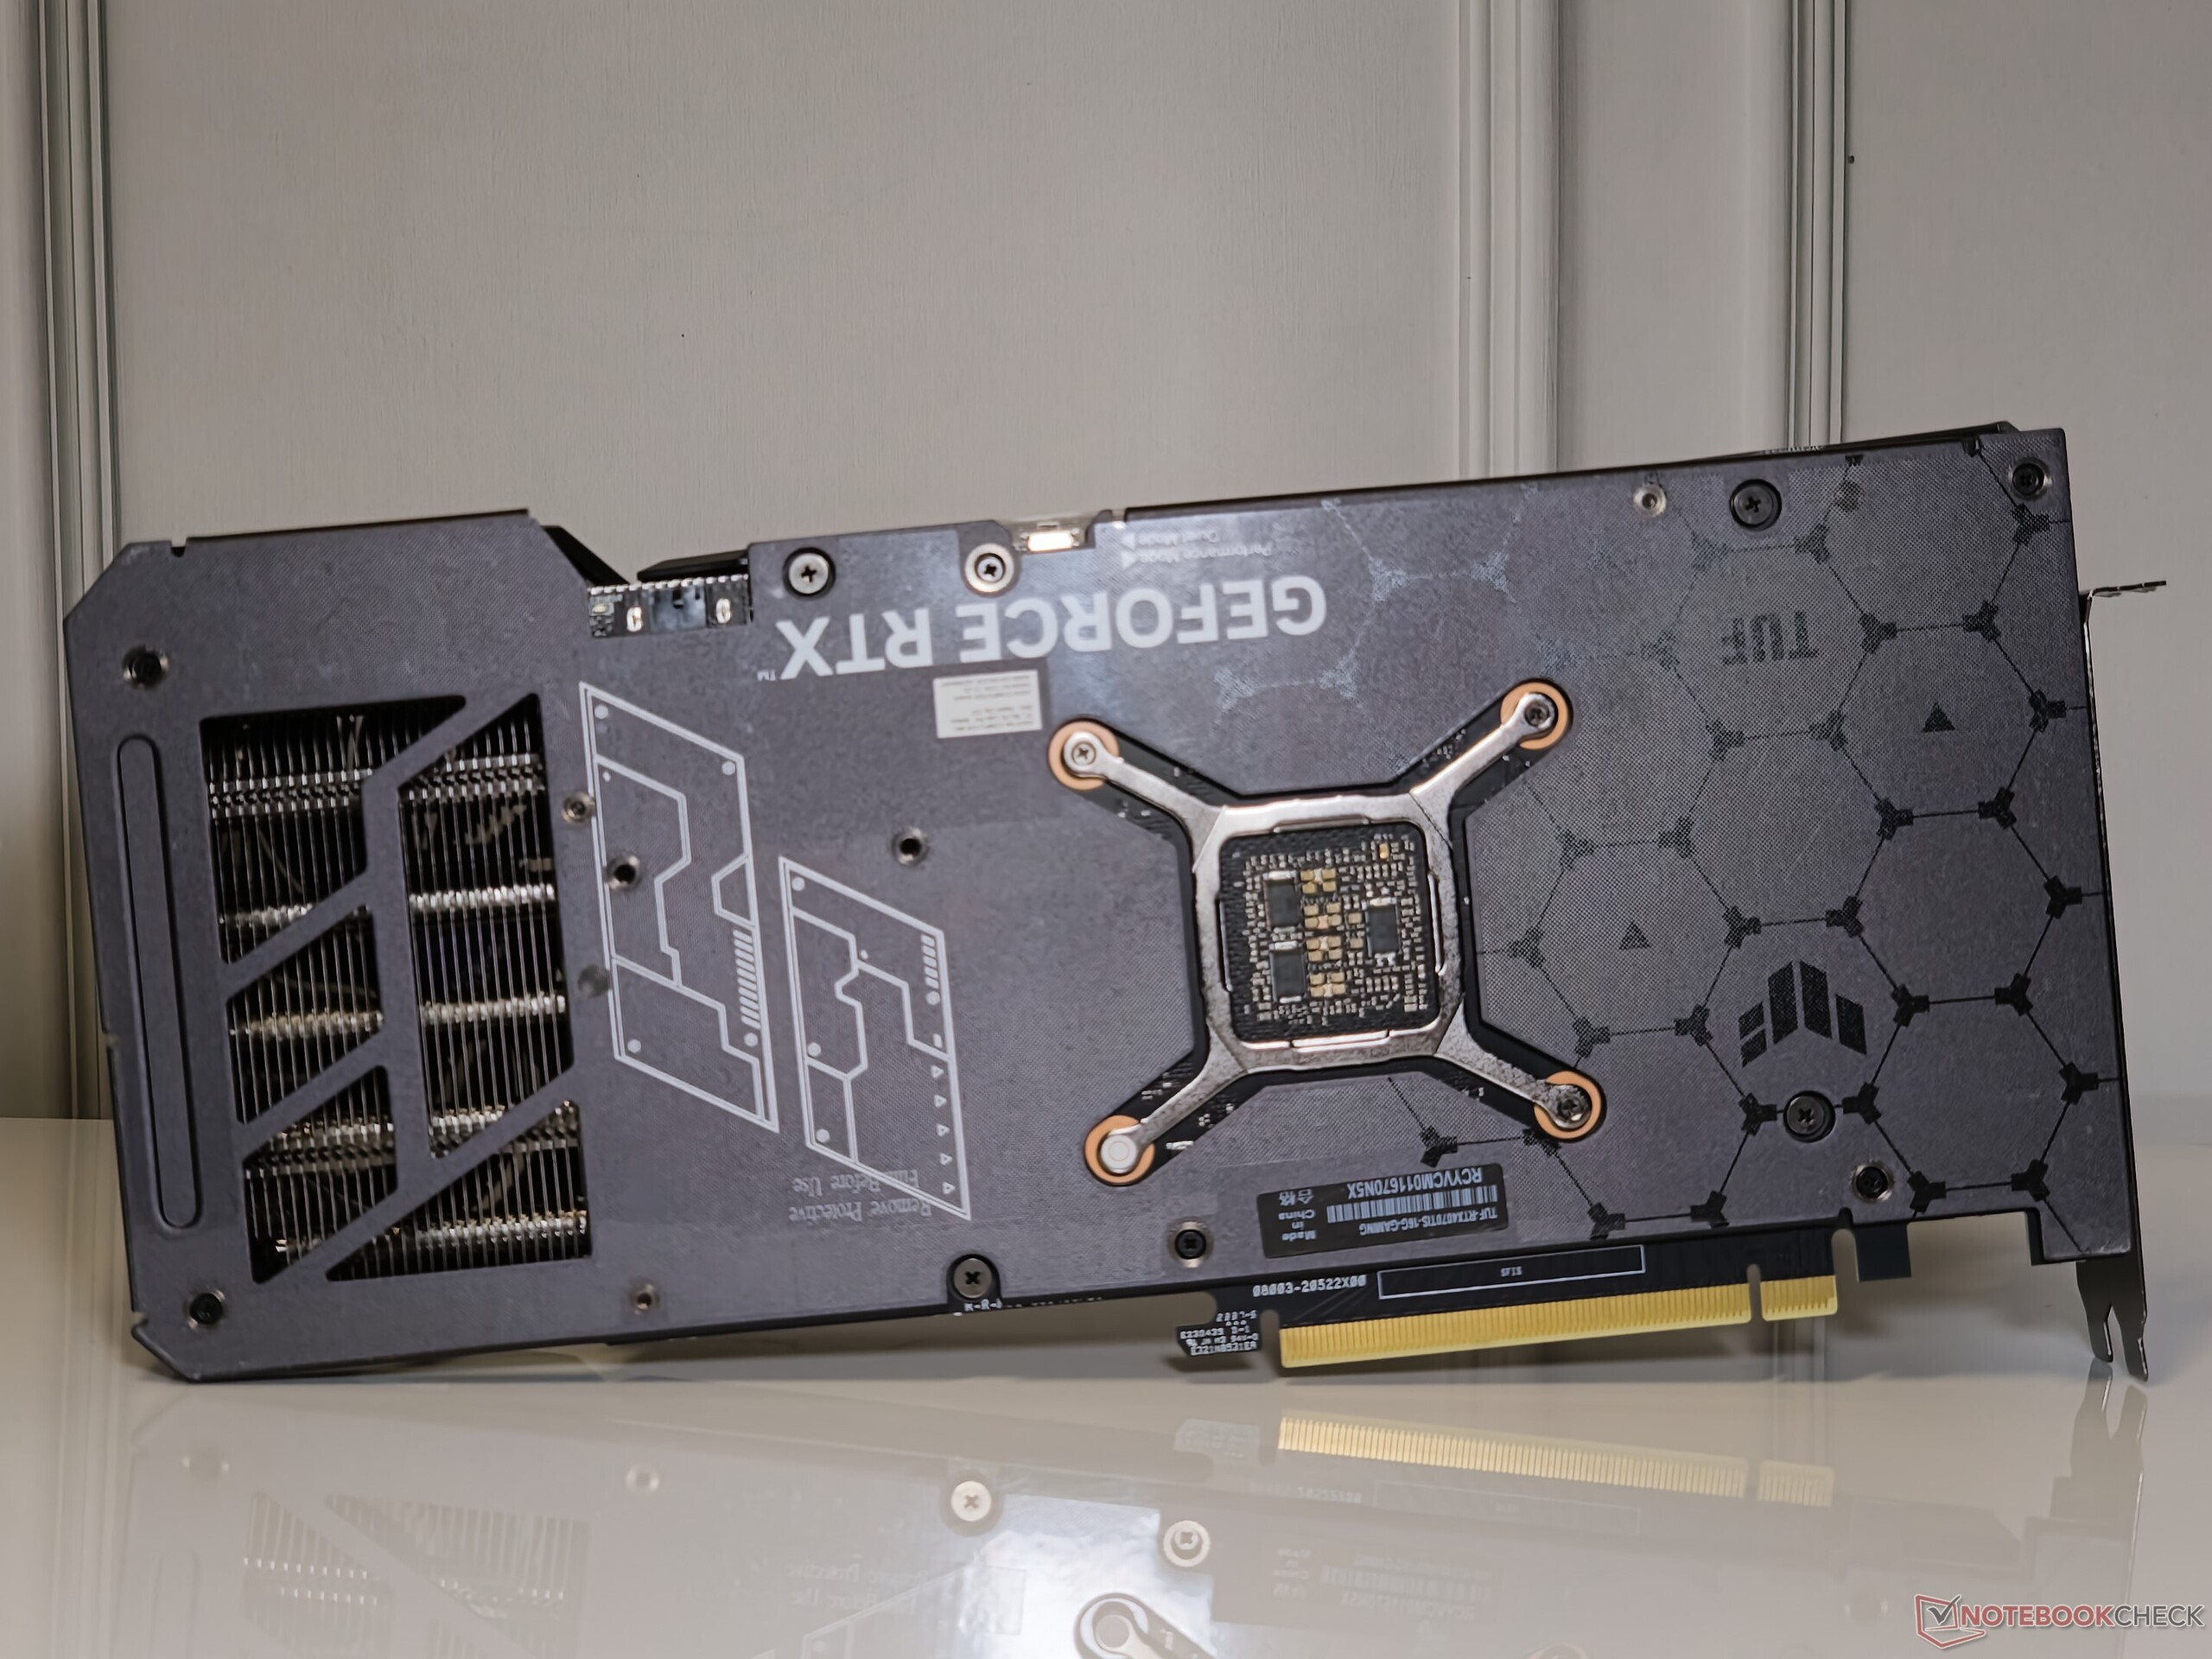
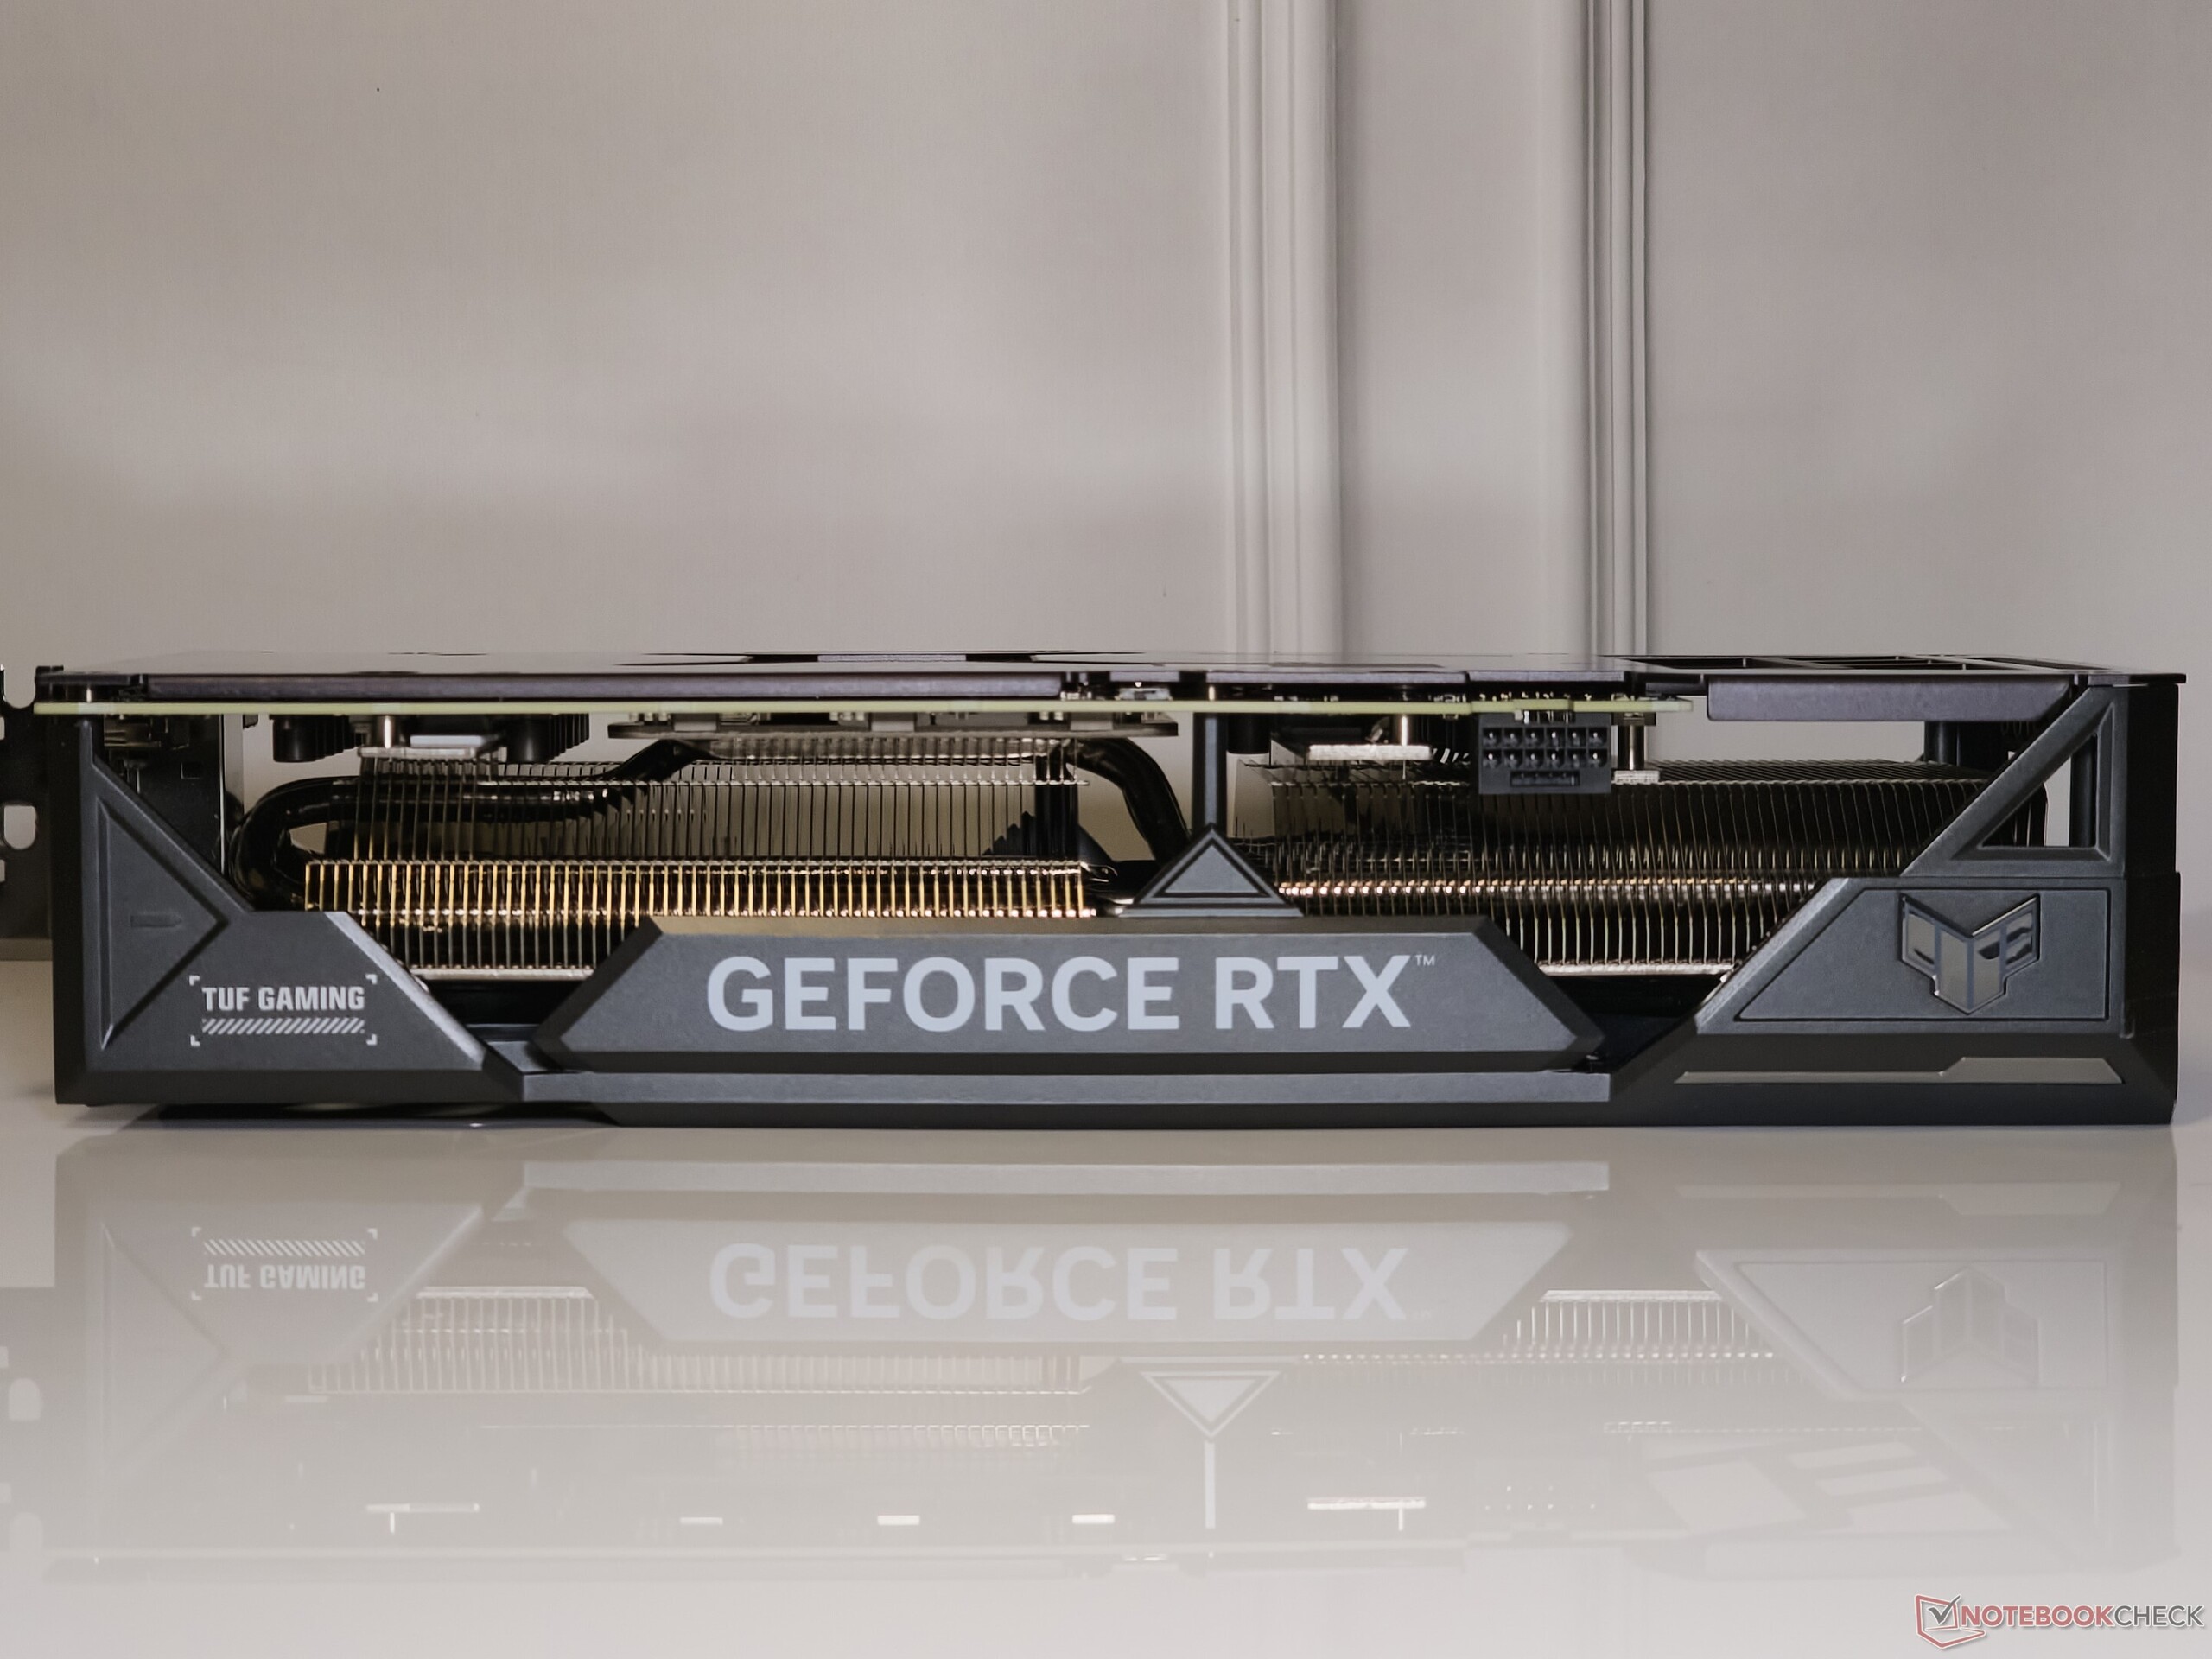
La scheda TUF può essere l'offerta entry-level di Asus per la RTX 4070 Ti Super, ma è costruita come un carro armato. La scheda presenta un rivestimento metallico, una rarità nelle offerte non premium. La piastra posteriore in metallo aggiunge un peso rassicurante e presenta dei ritagli per la ventilazione.
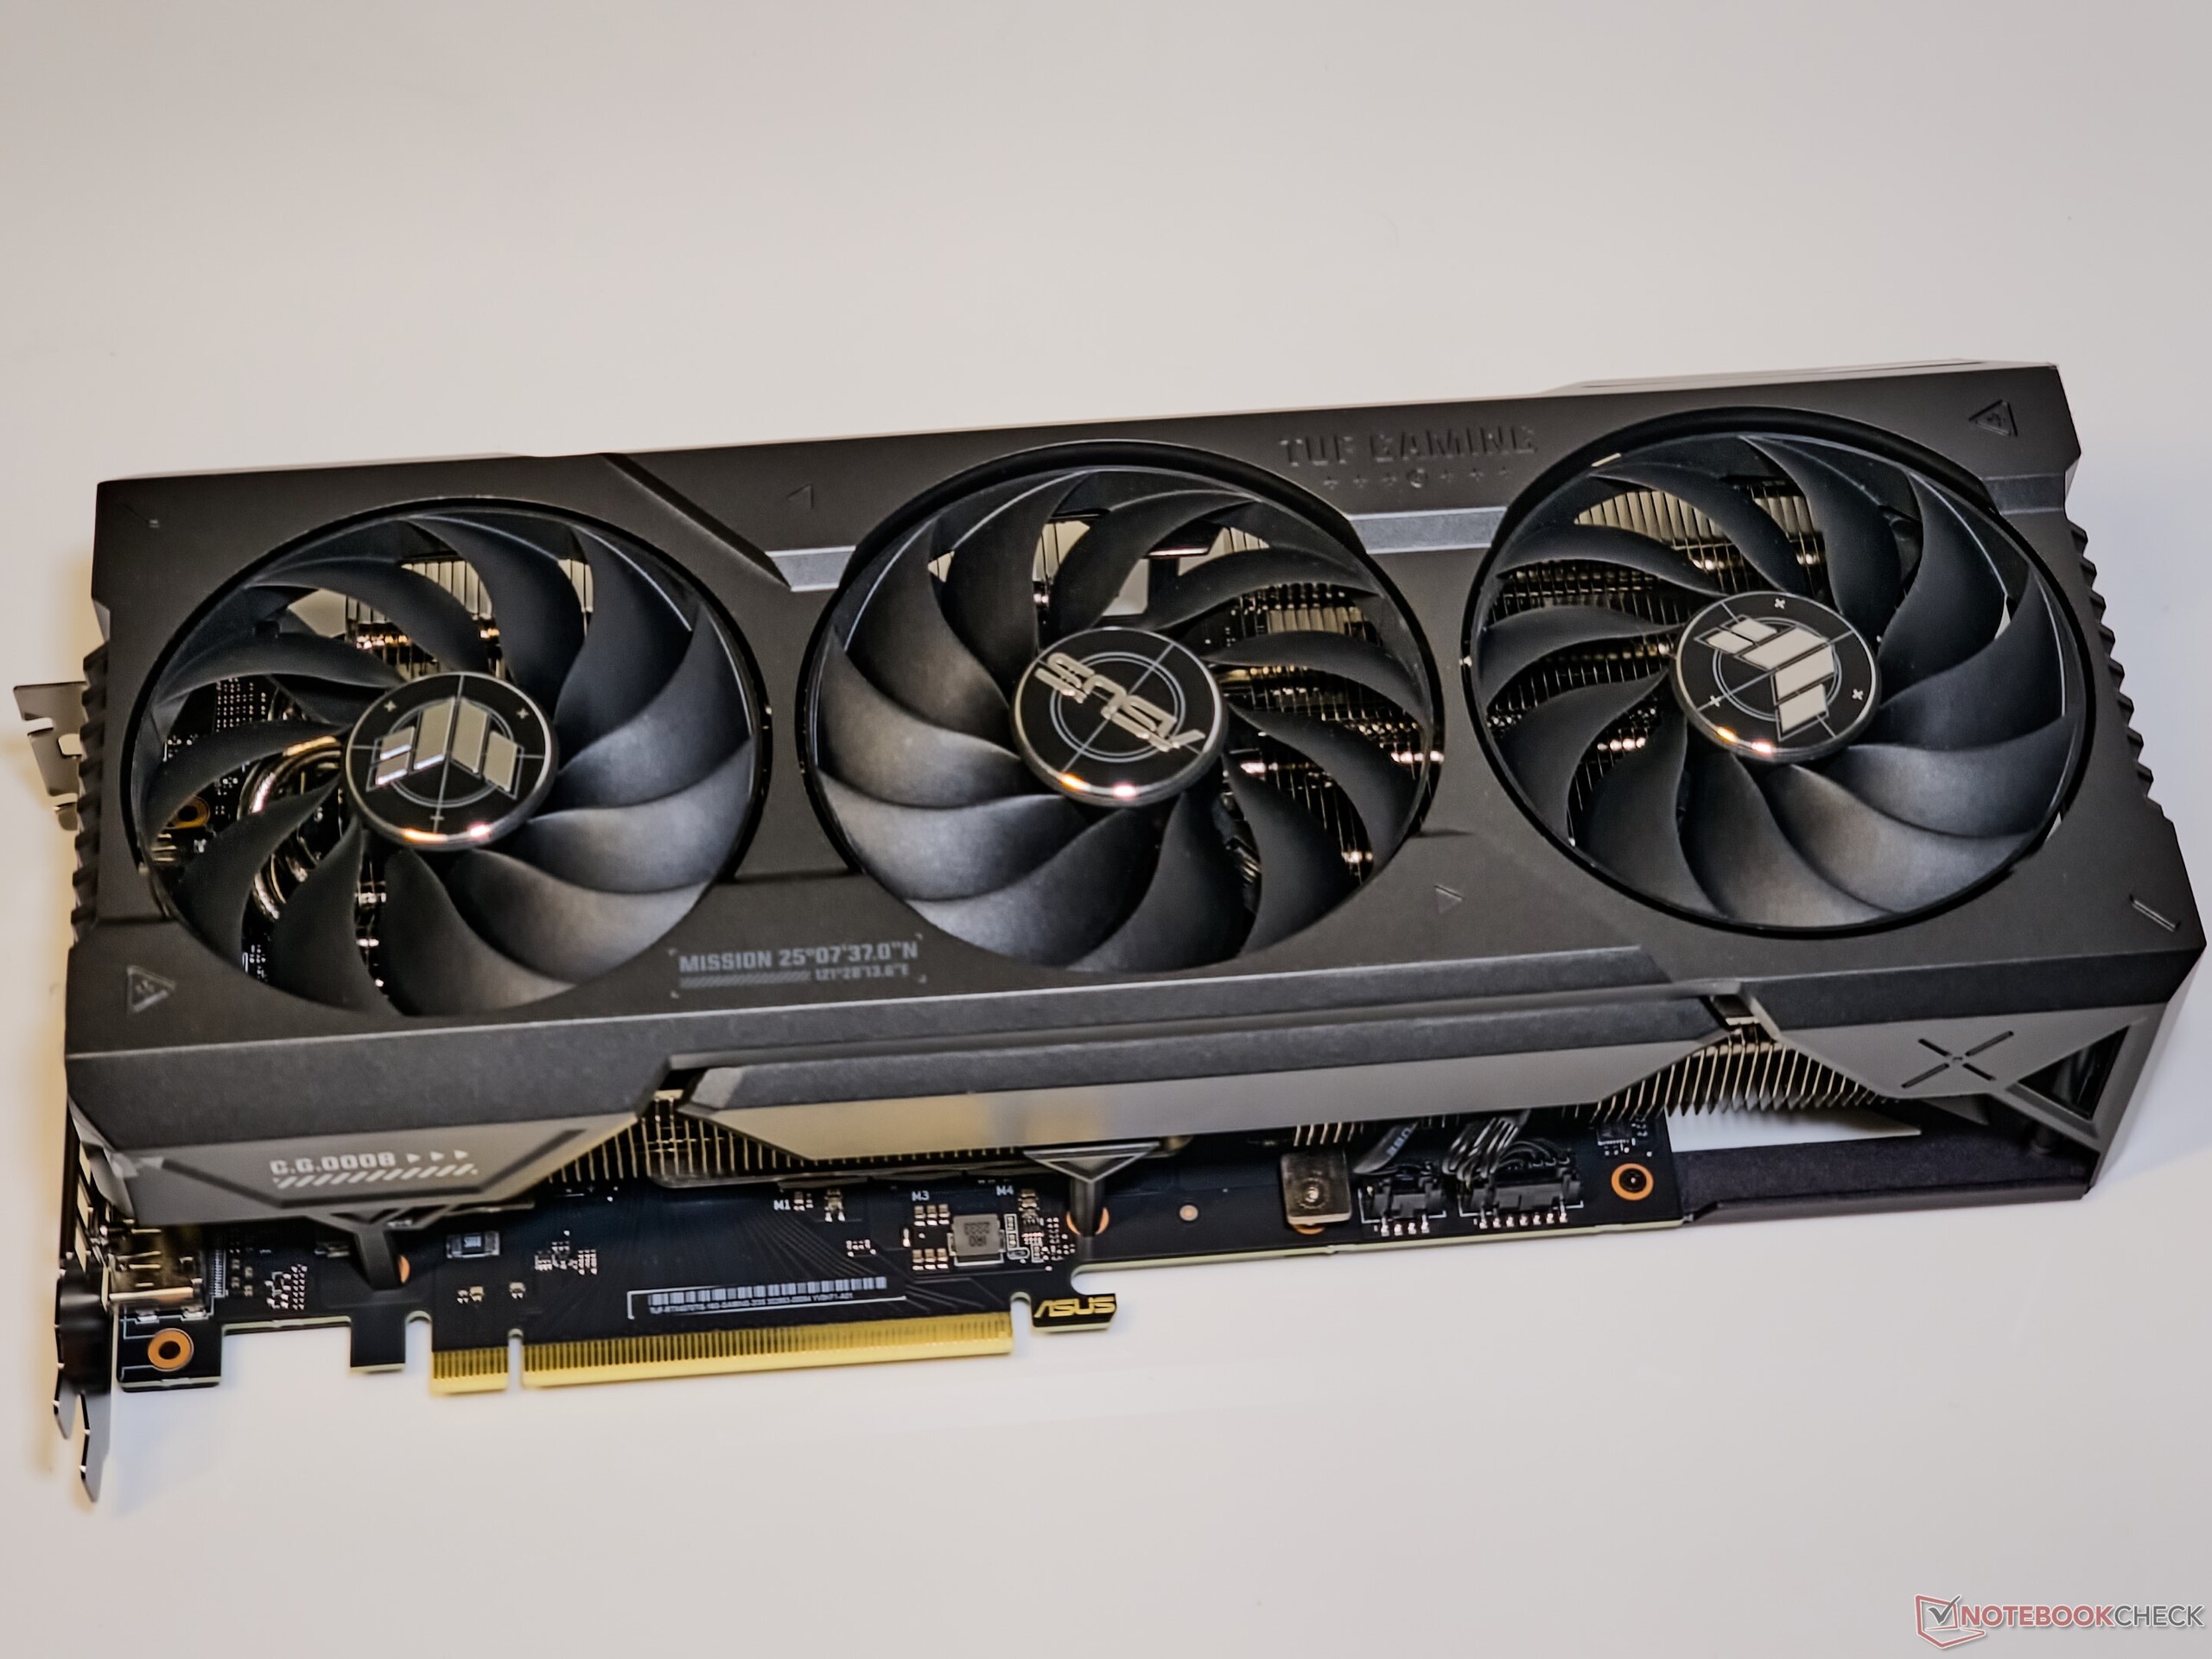
Con dimensioni di 305 x 138 x 65 mm, la TUF Gaming GeForce RTX 4070 Ti Super non rinuncia ad occupare quasi 3,5 slot sulla scheda. Questo è un aspetto da tenere presente se ha intenzione di aggiungere altre schede di espansione e se dispone di una scheda ATX o più piccola con slot PCIe molto distanziati.
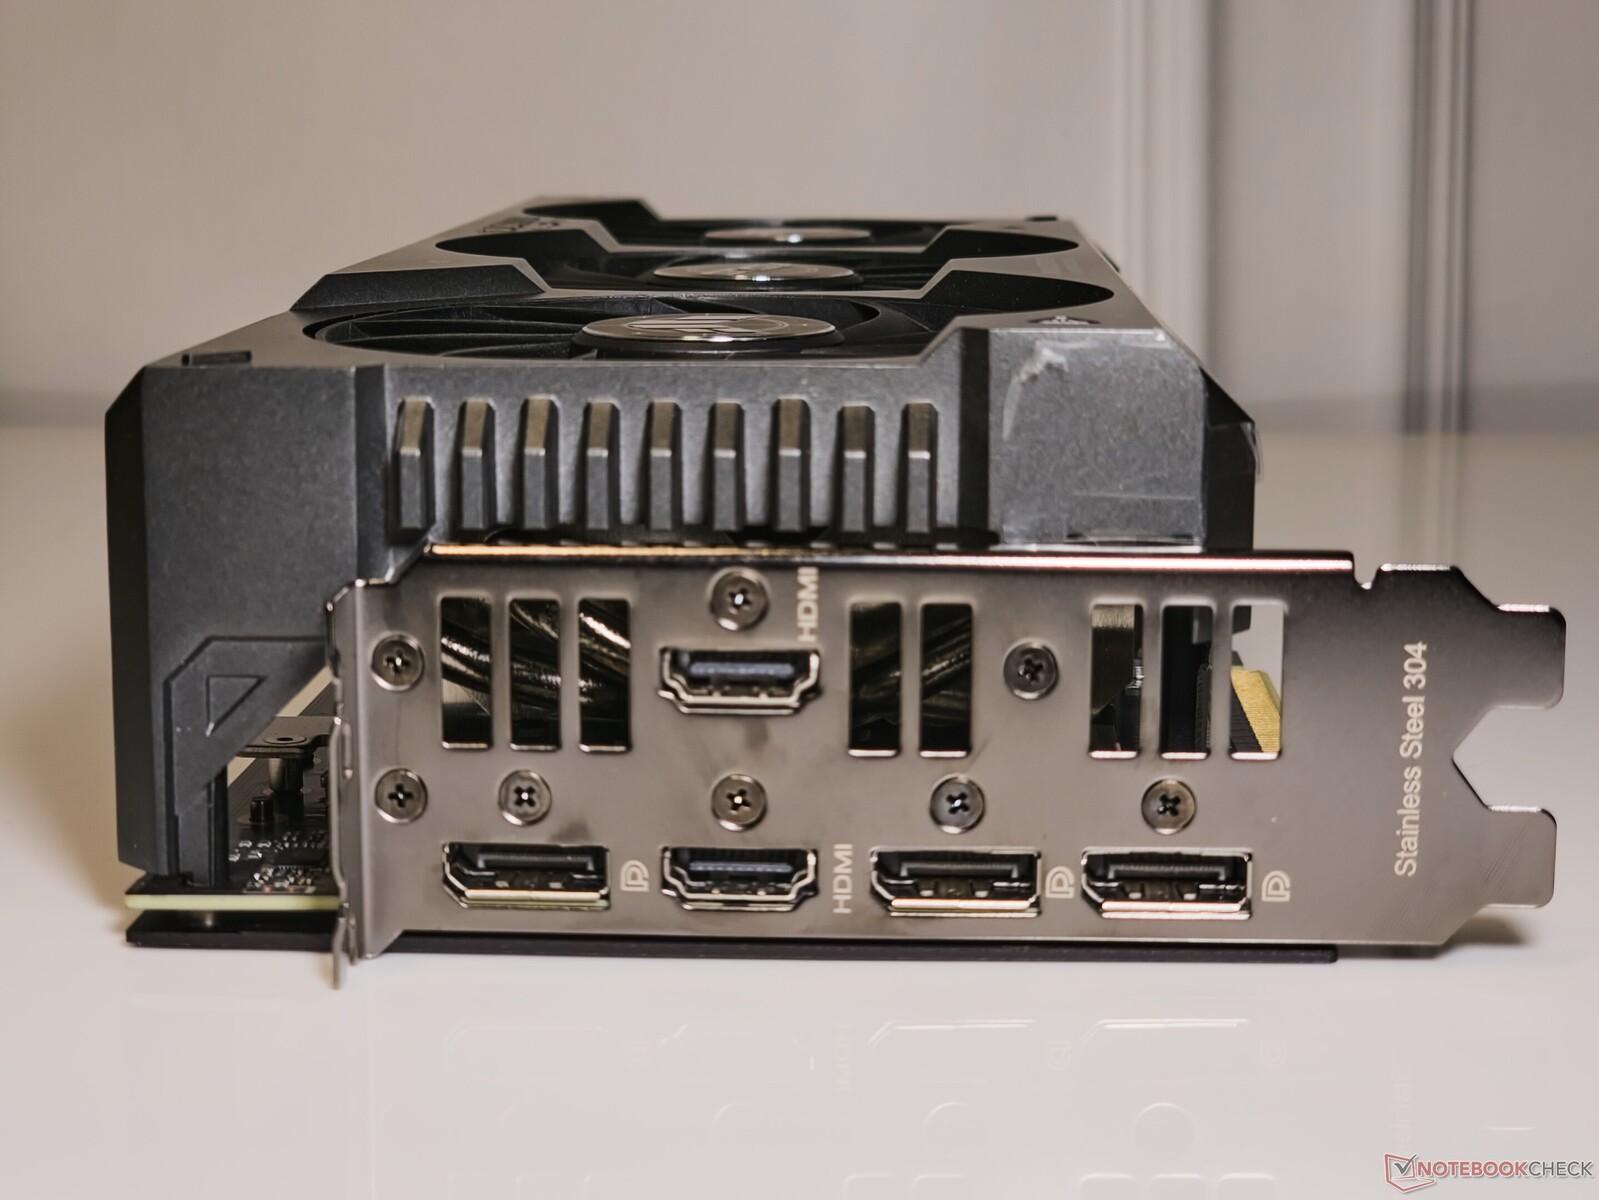
Come la maggior parte delle altre schede Asus, anche TUF Gaming GeForce RTX 4070 Ti Super è dotata di cinque porte, cosa che non accade spesso con la maggior parte delle schede in circolazione.
Oltre alle solite 3 uscite DisplayPort-1.4 e all'uscita HDMI 2.1a, Asus offre anche un'ulteriore porta HDMI 2.1a che può essere utile per collegare una TV o display che non dispongono di una DisplayPort.
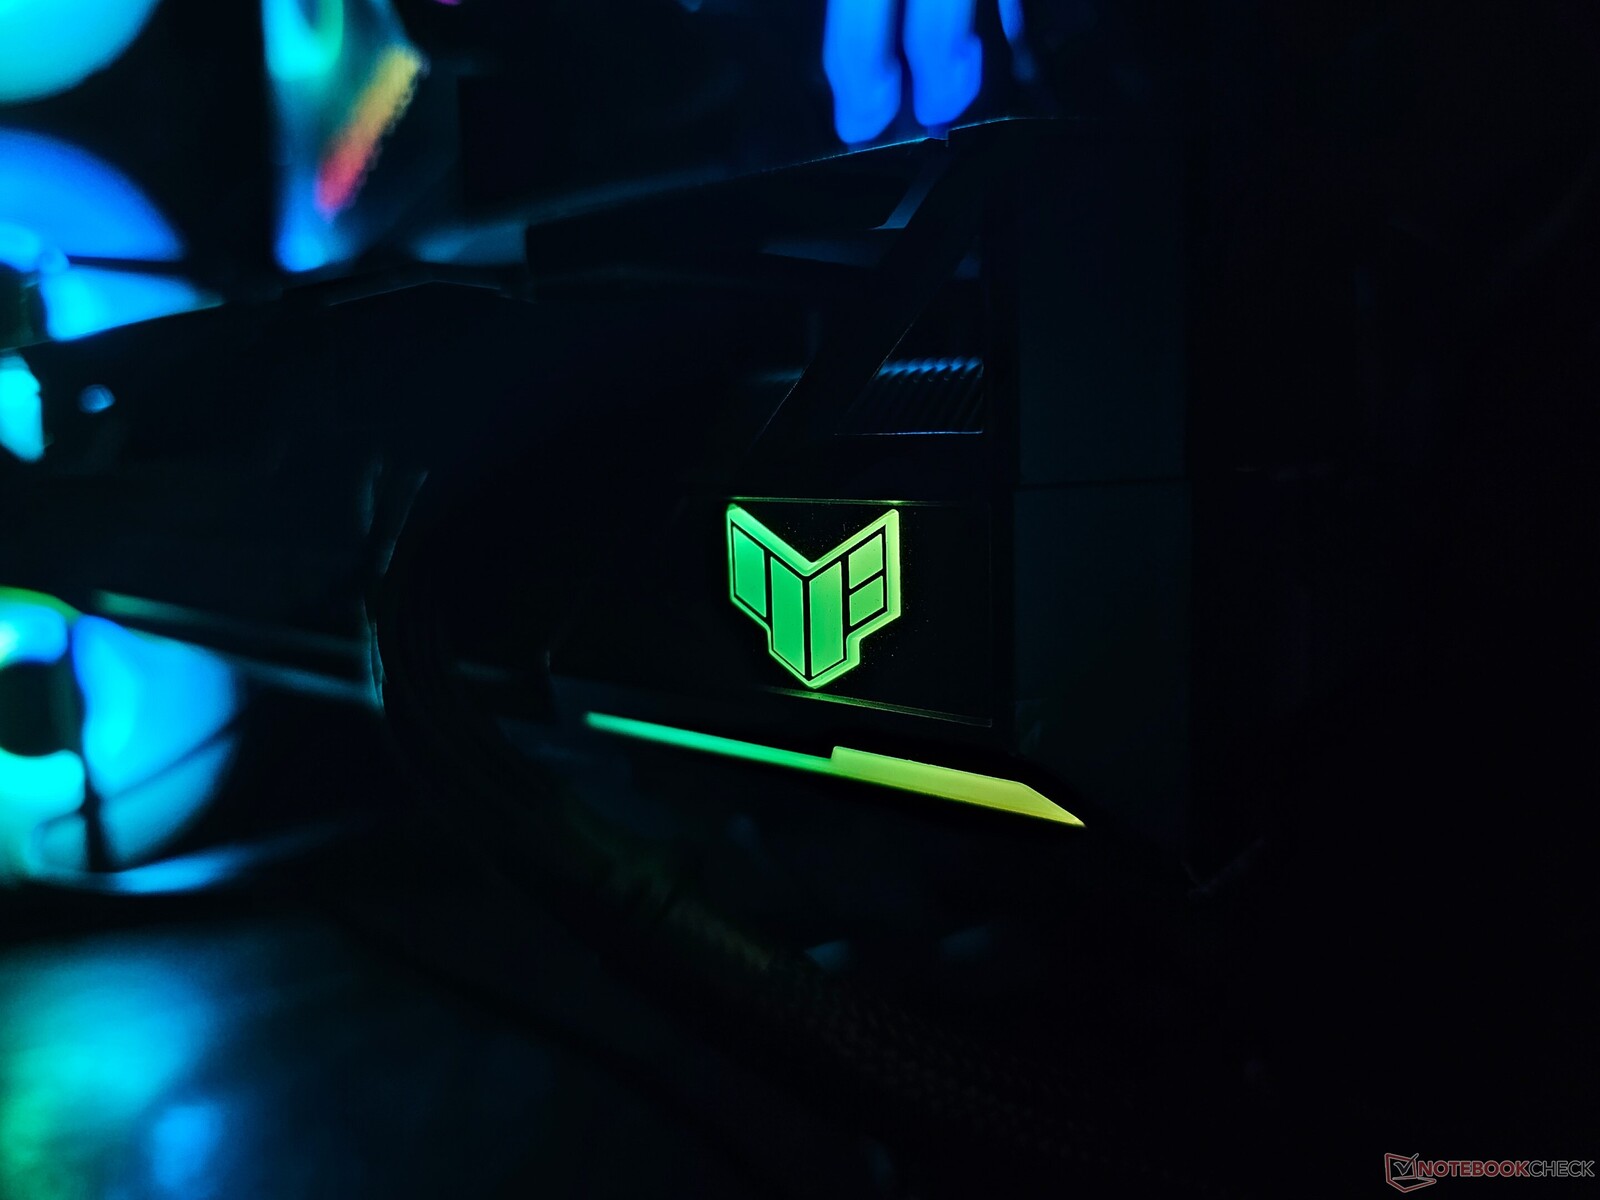
A differenza delle loro controparti Strix, le schede TUF hanno un'illuminazione RGB più tenue. Le uniche aree illuminate sono il logo TUF e una breve barra luminosa sotto di esso. Tuttavia, l'illuminazione è efficace e può essere personalizzata tramite il software GPU Tweak III di Asus o qualsiasi utility compatibile con Aura Sync.
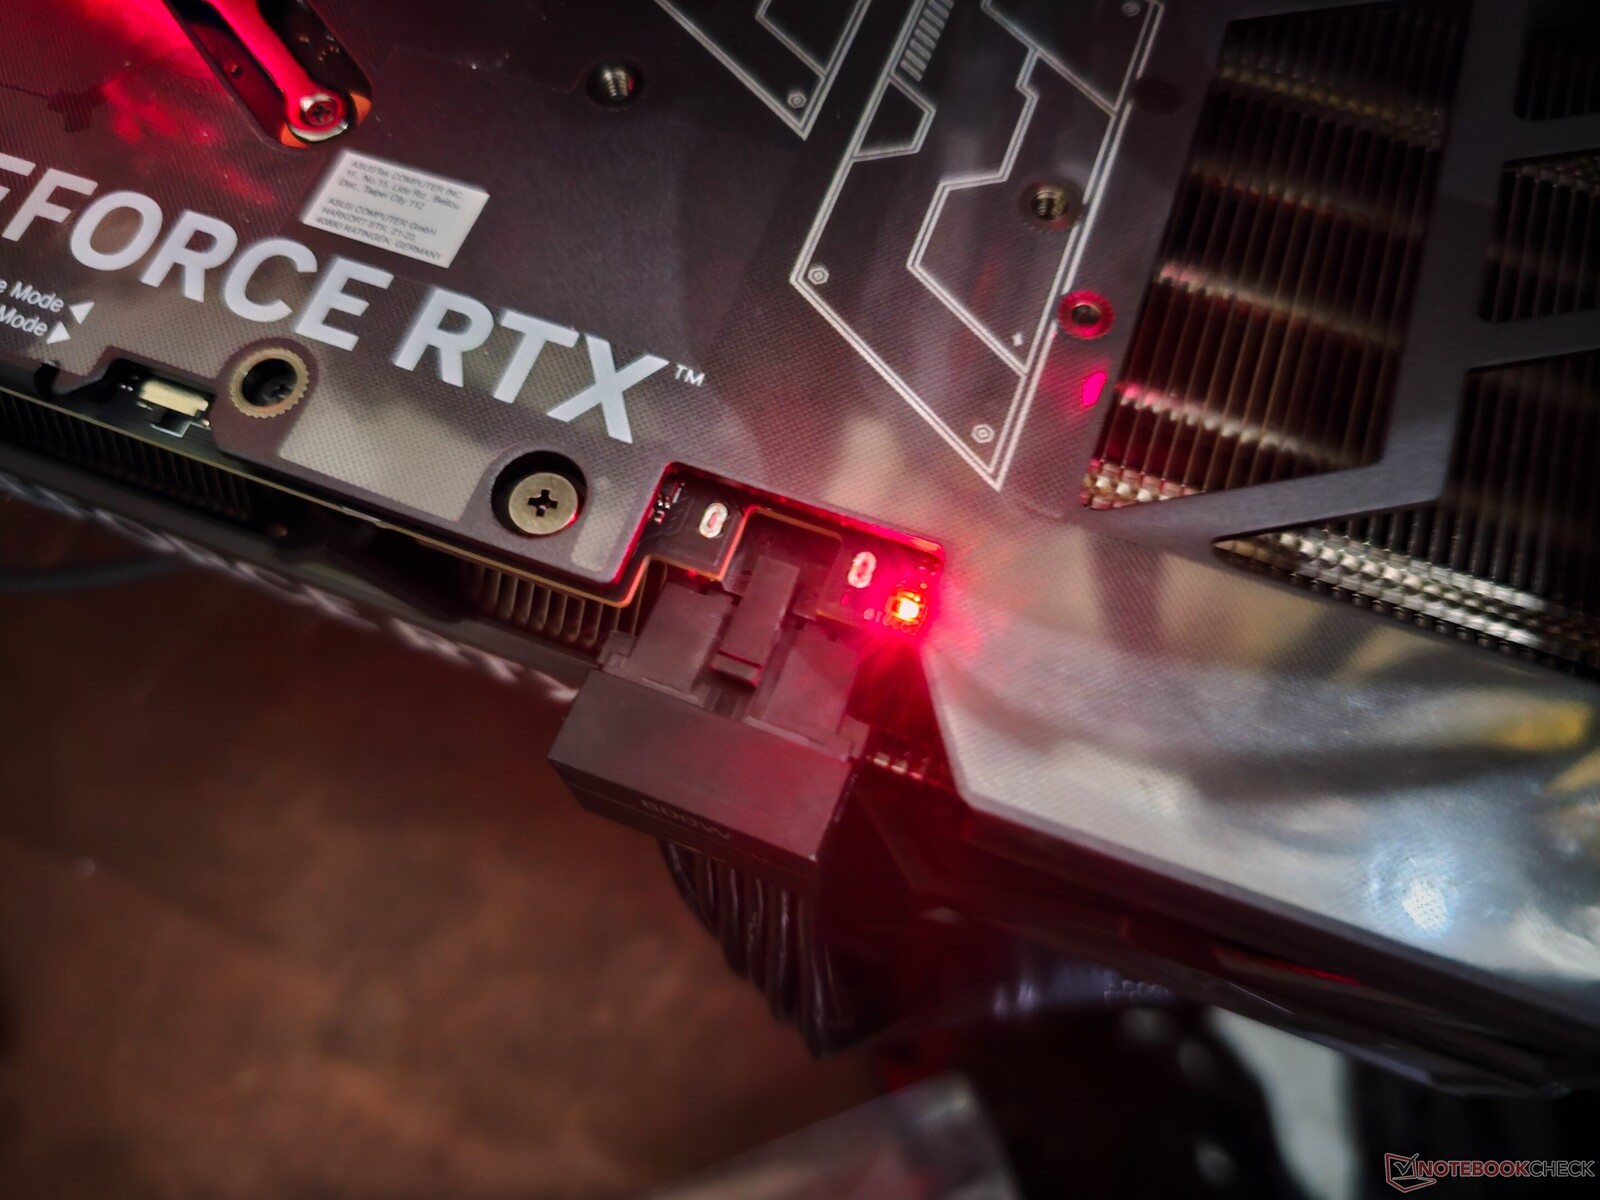
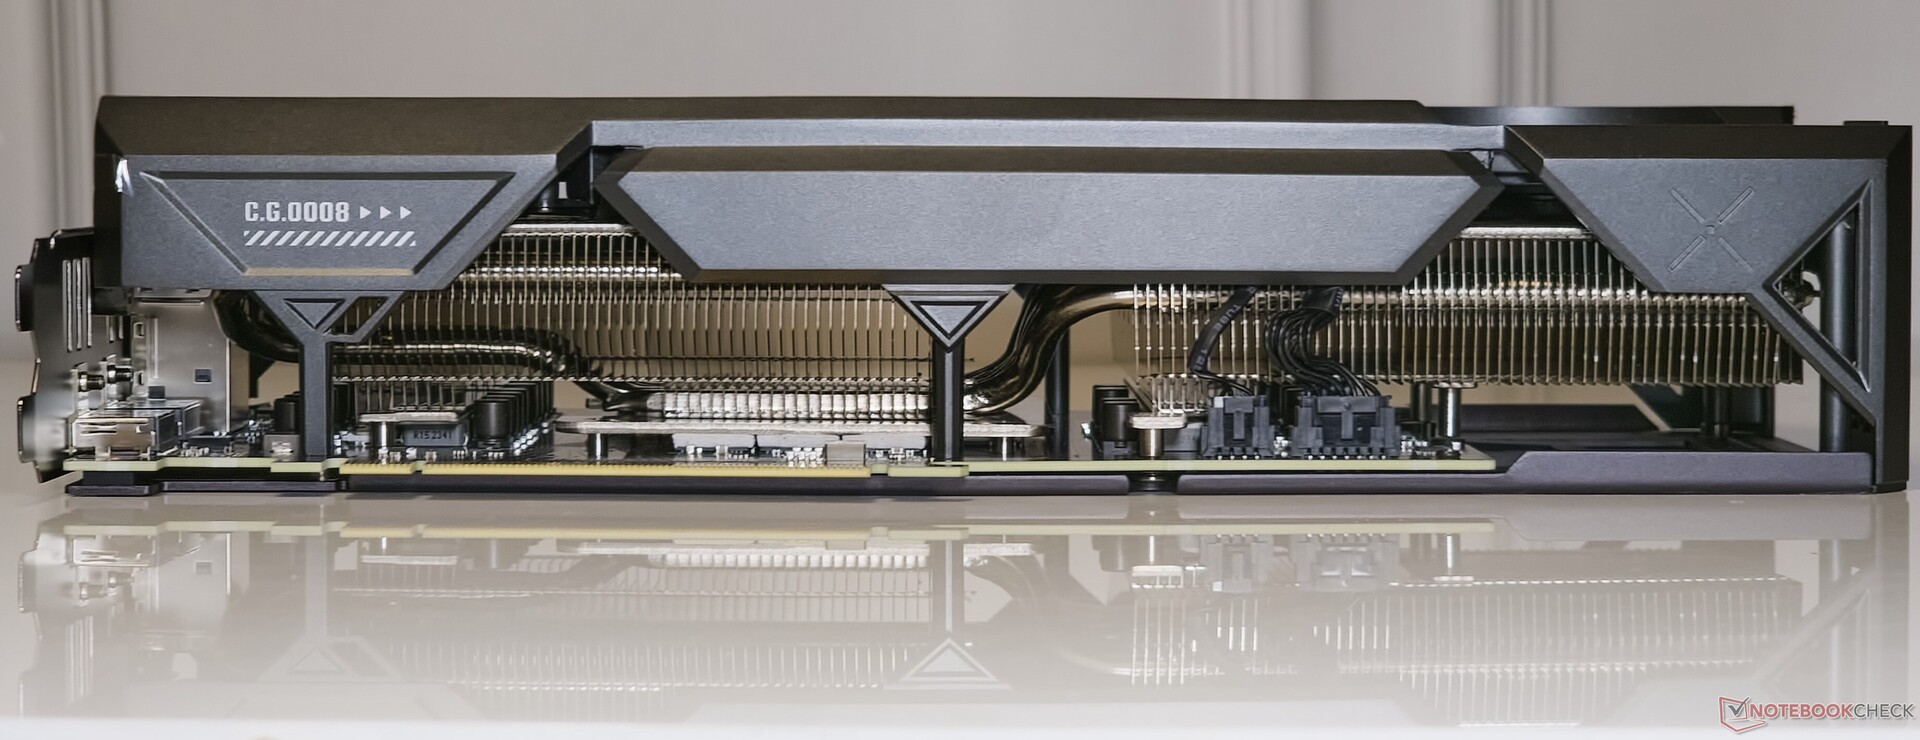
L'alimentazione è gestita dal connettore standard 12VHPWR. Asus fornisce nella confezione un adattatore da 12VHPWR a 2x 8-pin che si inserisce perfettamente nel connettore.
Il connettore di alimentazione presenta anche un utile indicatore LED rosso che si accende per indicare una connessione non corretta o un'alimentazione inadeguata. Purtroppo, l'indicatore si accende anche durante lo spegnimento del sistema, il che può confondere gli utenti.
Asus offre un sistema dual-BIOS che può essere commutato tra le modalità Performance e Quiet. Abbiamo eseguito tutti i test in modalità Performance e abbiamo utilizzato la modalità Quiet per confrontare i livelli di rumore della ventola.

Le schede TUF vengono fornite anche con un discreto set di accessori, che comprende:
- Scheda di raccolta TUF
- adattatore di alimentazione da 12VHPWR a 2x 8-pin
- Carta di ringraziamento
- Certificato di gioco TUF
- Guida rapida
- Informazioni sulla garanzia
- Gancio e anello in velcro TUF
- Supporto GPU TUF con cacciavite incorporato
TUF Gaming GeForce RTX 4070 Ti Super ha un boost nominale fino a 2.610 MHz, che è la specifica di riferimento di Nvidia per questa GPU. Si tratta di 150 MHz in meno rispetto a quanto offerto con l'originale RTX 4070 Ti non-Super, ma il clock di base riceve ora un aumento di 30 MHz a 2.340 MHz.
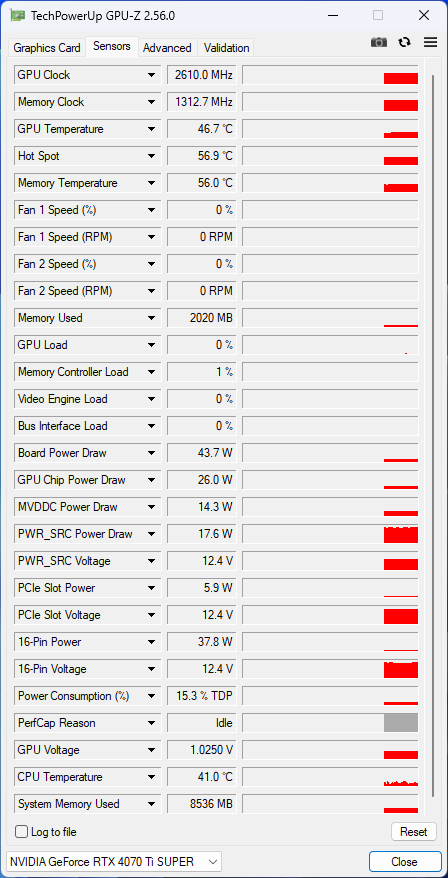
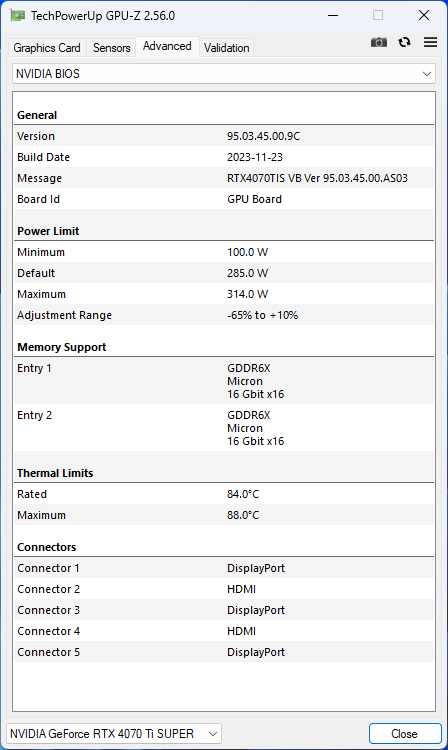
Nonostante gli aumenti della larghezza di banda della memoria e del numero di shader, TUF Gaming GeForce RTX 4070 Ti Super funziona con un TGP di 285 W, simile a quello della RTX 4070 Ti.
Esiste un potenziale limitato per aumentare l'utilizzo dell'energia del 10%, per un TGP maggiore di 314 W.
Il banco di prova: RTX 4070 Ti Super e il Core i9-13900K formano una coppia eccezionale
Il nostro sistema di prova si basa sulla piattaforma Intel Core i9-13900K e Z790. Include i seguenti componenti:
- Banco di prova Cooler MasterFrame 700
- Intel Core i9-13900K con PL1=PL2
- Scheda madre Gigabyte Z790 Aorus Master
- Gigabyte Aorus Gen4 2 TB NVMe SSD
- Sabrent Rocket 4 Plus Gen4 2 TB NVMe SSD
- 2x 16 GB di RAM Kingston Fury Renegade DDR5-6400 con timing 32-39-39-80 a 1,40 V
- Monitor Gigabyte M28U 4K 144 Hz
- Gigabyte Aorus Waterforce X II 360 Raffreddatore AiO
- Alimentatore Cooler Master MVE Gold V2 1250 ATX 3.0 completamente modulare
È stato utilizzato Windows 11 23H2 con le ultime patch, insieme a Nvidia Game Ready Driver versione 551.15.
Desideriamo ringraziare Cooler Master per aver fornito il banco di prova e l'alimentatore, Gigabyte per la scheda madre, la CPU, l'SSD, il raffreddatore AiO e il monitor, Sabrent per l'SSD e Kingston per la memoria.
Parametri di riferimento sintetici: Consolida saldamente i suoi guadagni rispetto alla RTX 3090 Ti
Nei test sintetici cumulativi, vediamo solo un miglioramento complessivo del 3% con la TUF Gaming GeForce RTX 4070 Ti Super rispetto alla RTX 4070 Ti e fino al 12% rispetto alla RTX 4070 Super Founders Edition.
Singolarmente, i guadagni migliori derivano dai benchmark a risoluzioni più elevate. Ad esempio, 3DMark Fire Strike Ultra mostra un guadagno del 4% rispetto alla RTX 4070 Ti media, mentre i test Unigine Superposition 4K e 8K Optimized aumentano questo delta all'11%.
La RTX 4070 Ti Super è ancora più avanti rispetto all'ammiraglia Ampere RTX 3090 Ti del 5%, mentre resta indietro rispetto alla AMD Radeon RX 7900 XT dello stesso margine.
3DMark 11: 1280x720 Performance GPU
3DMark: 1920x1080 Fire Strike Graphics | 3840x2160 Fire Strike Ultra Graphics | Fire Strike Extreme Graphics | 2560x1440 Time Spy Graphics
Unigine Heaven 4.0: Extreme Preset DX11 | Extreme Preset OpenGL
Unigine Valley 1.0: 1920x1080 Extreme HD DirectX AA:x8 | 1920x1080 Extreme HD Preset OpenGL AA:x8
Unigine Superposition: 1280x720 720p Low | 1920x1080 1080p Extreme | 3840x2160 4k Optimized | 7680x4320 8k Optimized
| Performance rating | |
| NVIDIA GeForce RTX 4090 Founders Edition | |
| AMD Radeon RX 7900 XTX | |
| NVIDIA GeForce RTX 4080 Founders Edition | |
| Media della classe Desktop | |
| AMD Radeon RX 7900 XT | |
| Asus TUF Gaming GeForce RTX 4070 Ti Super | |
| Gigabyte Aorus GeForce RTX 4070 Ti Master | |
| Asus TUF Gaming GeForce RTX 4070 Ti | |
| Media NVIDIA GeForce RTX 4070 Ti | |
| Zotac Gaming GeForce RTX 3090 Ti AMP Extreme Holo | |
| Sapphire AMD Radeon RX 6950 XT Nitro+ Pure | |
| Gigabyte GeForce RTX 4070 Super Gaming OC 12G | |
| Media NVIDIA GeForce RTX 3090 | |
| Media NVIDIA GeForce RTX 3080 Ti | |
| NVIDIA GeForce RTX 4070 Super Founders Edition | |
| AMD Radeon RX 7800 XT | |
| AMD Radeon RX 6900 XT | |
| Zotac Gaming GeForce RTX 4070 AMP Airo | |
| AMD Radeon RX 6800 XT | |
| Media NVIDIA GeForce RTX 3080 | |
| KFA2 GeForce RTX 3070 Ti SG | |
| Sapphire Pulse Radeon RX 7700 XT | |
| Media NVIDIA Titan RTX | |
| Media NVIDIA GeForce RTX 3070 | |
| Media NVIDIA GeForce RTX 4060 Ti 8G | |
| KFA2 GeForce RTX 4060 Ti EX, 16GB GDDR6 | |
| XFX Speedster QICK 308 Radeon RX 7600 Black Edition | |
| KFA2 GeForce RTX 4060 1-Click-OC 2X | |
3DMark 11: 1280x720 Performance GPU
3DMark: 1920x1080 Fire Strike Graphics | 3840x2160 Fire Strike Ultra Graphics | Fire Strike Extreme Graphics | 2560x1440 Time Spy Graphics
Unigine Heaven 4.0: Extreme Preset DX11 | Extreme Preset OpenGL
Unigine Valley 1.0: 1920x1080 Extreme HD DirectX AA:x8 | 1920x1080 Extreme HD Preset OpenGL AA:x8
Unigine Superposition: 1280x720 720p Low | 1920x1080 1080p Extreme | 3840x2160 4k Optimized | 7680x4320 8k Optimized
| 3DMark 11 Performance | 54278 punti | |
| 3DMark Ice Storm Standard Score | 287297 punti | |
| 3DMark Cloud Gate Standard Score | 79438 punti | |
| 3DMark Fire Strike Score | 42631 punti | |
| 3DMark Fire Strike Extreme Score | 27105 punti | |
| 3DMark Time Spy Score | 23540 punti | |
Aiuto | ||
Prestazioni di calcolo: Scala corrispondente all'aumento del numero di core CUDA
L'impatto dell'aumento del numero di core CUDA è più evidente nei test di calcolo come V-Ray e Blender. In V-Ray 5, TUF Gaming GeForce RTX 4070 Ti Super ottiene un impressionante vantaggio dell'11% e del 14% nei benchmark CUDA e RTX rispetto alla media RTX 4070 Ti. Le schede AMD sono in evidente svantaggio in questi test.
Dove brillano, tuttavia, è nei test GPU LuxMark Sala, con persino la RX 6950 XT AMD Radeon RX 6950 XT che mostra un buon vantaggio rispetto alla RTX 4090 Founders Edition Recensione della Nvidia GeForce RTX 4090 Founders Edition: Un colosso ineguagliabile a 4K e 100 fps per 400 dollari in meno rispetto alla RTX 3090 Ti . Detto questo, la RTX 4070 Ti Super mostra un discreto aumento dell'11% sia rispetto alla TUF Gaming GeForce RTX 4070 Ti OC che alla Aorus GeForce RTX 4070 Ti Master nei GPU LuxMark Sala.
TUF Gaming GeForce RTX 4070 Ti Super è anche in grado di completare il rendering di Blender 3.3 Classroom CUDA e Optix 1,5 secondi più velocemente della RTX 4070 Ti media.
V-Ray Benchmark Next 4.10: GPU
Blender: v3.3 Classroom CUDA | v3.3 Classroom OPTIX/RTX
LuxMark v2.0 64Bit: Room GPUs-only | Sala GPUs-only
ComputeMark v2.1: 1024x600 Normal, Score | 1024x600 Normal, QJuliaRayTrace | 1024x600 Normal, Mandel Scalar | 1024x600 Normal, Mandel Vector | 1024x600 Normal, Fluid 2DTexArr | 1024x600 Normal, Fluid 3DTex
| Blender / v3.3 Classroom CUDA | |
| KFA2 GeForce RTX 4060 1-Click-OC 2X (3.3.3) | |
| Media NVIDIA GeForce RTX 3070 (n=1) | |
| KFA2 GeForce RTX 3070 Ti SG (3.3.0) | |
| Media NVIDIA Titan RTX (n=1) | |
| Media NVIDIA GeForce RTX 4060 Ti 8G (n=1) | |
| Zotac Gaming GeForce RTX 4070 AMP Airo (3.3.3) | |
| Media NVIDIA GeForce RTX 3080 Ti (21 - 22, n=2) | |
| Media NVIDIA GeForce RTX 3090 (20 - 22, n=13) | |
| NVIDIA GeForce RTX 4070 Super Founders Edition (3.3.3) | |
| Gigabyte GeForce RTX 4070 Super Gaming OC 12G (3.3.3) | |
| Media NVIDIA GeForce RTX 4070 Ti (18 - 19, n=3) | |
| Media della classe Desktop (8 - 54, n=31, ultimi 2 anni) | |
| Gigabyte Aorus GeForce RTX 4070 Ti Master (3.3.2) | |
| Asus TUF Gaming GeForce RTX 4070 Ti Super (3.3.3) | |
| Blender / v3.3 Classroom OPTIX/RTX | |
| Media NVIDIA GeForce RTX 3070 (n=1) | |
| KFA2 GeForce RTX 4060 1-Click-OC 2X (3.3.3) | |
| Media NVIDIA Titan RTX (n=1) | |
| KFA2 GeForce RTX 3070 Ti SG (3.3.0) | |
| KFA2 GeForce RTX 4060 Ti EX, 16GB GDDR6 (3.3.3) | |
| Media NVIDIA GeForce RTX 4060 Ti 8G (17 - 18, n=3) | |
| Media NVIDIA GeForce RTX 3080 Ti (14 - 15, n=2) | |
| Zotac Gaming GeForce RTX 4070 AMP Airo (3.3.3) | |
| Media NVIDIA GeForce RTX 3090 (13 - 14, n=13) | |
| Asus TUF Gaming GeForce RTX 4070 Ti (3.3.2) | |
| Media NVIDIA GeForce RTX 4070 Ti (11 - 12, n=5) | |
| Gigabyte Aorus GeForce RTX 4070 Ti Master (3.3.2) | |
| NVIDIA GeForce RTX 4070 Super Founders Edition (3.3.3) | |
| Gigabyte GeForce RTX 4070 Super Gaming OC 12G (3.3.3) | |
| Media della classe Desktop (5 - 19, n=30, ultimi 2 anni) | |
| NVIDIA GeForce RTX 4080 Founders Edition (3.3.0) | |
| Asus TUF Gaming GeForce RTX 4070 Ti Super (3.3.3) | |
| NVIDIA GeForce RTX 4090 Founders Edition (3.3.0) | |
V-Ray Benchmark Next 4.10: GPU
Blender: v3.3 Classroom CUDA | v3.3 Classroom OPTIX/RTX
LuxMark v2.0 64Bit: Room GPUs-only | Sala GPUs-only
ComputeMark v2.1: 1024x600 Normal, Score | 1024x600 Normal, QJuliaRayTrace | 1024x600 Normal, Mandel Scalar | 1024x600 Normal, Mandel Vector | 1024x600 Normal, Fluid 2DTexArr | 1024x600 Normal, Fluid 3DTex
* ... Meglio usare valori piccoli
Prestazioni di gioco: Alla pari con RTX 3090 Ti e RX 7900 XT in QHD e 4K Ultra
A differenza dei test sintetici, non tutti i giochi scalano in base all'aumento del numero di shader. Di conseguenza, vediamo solo un aumento del 4% rispetto alla RTX 4070 Ti media non-Super nelle prestazioni di gioco cumulative QHD e 4K.
Giochi come The Witcher 3 e Shadow of the Tomb Raider mostrano guadagni fino al 5% in 4K Ultra con la RTX 4070 Ti Super rispetto alla RTX 4070 Ti media non-Super. I divari aumentano fino all'8% con Borderlands 3 e fino all'11% con Final Fantasy XV a 4K Ultra.
Ciò colloca la RTX 4070 Ti Super nella stessa categoria della RTX 3090 Ti e della Radeon RX 7900 XT per quanto riguarda i giochi, in particolare nelle impostazioni QHD e 4K Ultra.
Come la RTX 4070 Super, Nvidia continua a proporre la RTX 4070 Ti Super per i giocatori QHD. Sebbene questa scheda sia certamente vantaggiosa per coloro che dispongono di schermi QHD ad alta frequenza di aggiornamento, la RTX 4070 Ti Super può eseguire comodamente un buon numero di titoli AAA moderni e leggermente più vecchi a 4K 60 o oltre.
Tuttavia, alcuni di quelli particolarmente pesanti dal punto di vista delle texture, come Cyberpunk 2077 Phantom Liberty, Alan Wake 2, Avatar: Frontiers of Pandora e simili, richiederanno un'assistenza di upscaling per un'esperienza di gioco più fluida a 4K Ultra.
Prestazioni del ray-tracing nativo
Le prestazioni di ray tracing a 1080p Ultra sono alla pari o solo marginalmente migliori rispetto alla RTX 4070 Ti, con The Callisto Protocol che mostra un discreto guadagno del 9%.
La RTX 4070 Ti Super ha un vantaggio nel ray tracing a 4K Ultra, evidenziato da un aumento del 4% in Cyberpunk 2077 1.6 e un guadagno del 10% in Control.
La differenza diventa più marcata se confrontata con la RTX 4070 Super Founders Edition. In questo caso, la RTX 4070 Ti Super mostra un vantaggio significativo del 22% nel ray tracing di Alan Wake 2 1080p e Cyberpunk 2077 Phantom Liberty 4K.
| basso | medio | alto | ultra | QHD | 4K DLSS | 4K | |
|---|---|---|---|---|---|---|---|
| GTA V (2015) | 187.6 | 187.6 | 187.4 | 160.1 | 155.3 | 182.1 | |
| The Witcher 3 (2015) | 558 | 430 | 210 | 159.3 | |||
| Dota 2 Reborn (2015) | 245 | 228 | 226 | 202 | 203 | ||
| Final Fantasy XV Benchmark (2018) | 235 | 235 | 209 | 168.8 | 98.9 | ||
| X-Plane 11.11 (2018) | 224 | 196.7 | 150 | 127.8 | |||
| Far Cry 5 (2018) | 203 | 197 | 188 | 187 | 119 | ||
| Strange Brigade (2018) | 568 | 467 | 442 | 407 | 306 | 161.9 | |
| Shadow of the Tomb Raider (2018) | 273 | 269 | 256 | 205 | 109.5 | ||
| Metro Exodus (2019) | 236 | 193.5 | 158.3 | 130.9 | 84.4 | ||
| Control (2019) | 226 | 196.9 | 130.3 | 78.9 | 66.4 | ||
| Borderlands 3 (2019) | 192.1 | 176.8 | 169.6 | 143.6 | 79.4 | ||
| Mafia Definitive Edition (2020) | 239 | 231 | 181 | 96.6 | |||
| Watch Dogs Legion (2020) | 171.2 | 159.3 | 144.2 | 115.9 | 68.6 | ||
| Far Cry 6 (2021) | 209 | 191 | 169 | 154 | 91 | ||
| Dying Light 2 (2022) | 213 | 162.2 | 121.5 | 63.7 | |||
| Cyberpunk 2077 1.6 (2022) | 196.9 | 195.9 | 172.3 | 157.5 | 103.6 | 49.7 | |
| Ghostwire Tokyo (2022) | 278 | 282 | 283 | 217 | 99.2 | ||
| F1 22 (2022) | 371 | 384 | 336 | 144.9 | 95.1 | 48.9 | |
| The Callisto Protocol (2022) | 210.62 | 202.94 | 149.39 | 114.82 | 70.04 | ||
| F1 23 (2023) | 385 | 402 | 363 | 138.2 | 90 | 77.4 | 45.1 |
| Baldur's Gate 3 (2023) | 246 | 223 | 218 | 157.8 | 133.9 | 117.2 | |
| Cyberpunk 2077 (2023) | 188.5 | 188.5 | 170.8 | 150.3 | 94.9 | 42.3 | |
| Assassin's Creed Mirage (2023) | 221 | 206 | 170 | 136 | 112 | 84 | |
| Alan Wake 2 (2023) | 124.7 | 114.4 | 82.5 | 63.7 | 44.7 | ||
| Call of Duty Modern Warfare 3 2023 (2023) | 227 | 184 | 179 | 133 | 112 | 84 | |
| Avatar Frontiers of Pandora (2023) | 163 | 141.8 | 113.2 | 76.6 | 68.9 | 39.8 |
Emissioni: Basso rumore della ventola, ma temperature superficiali più elevate sotto carico
Asus TUF Gaming GeForce RTX 4070 Ti Super presenta quelle che l'azienda definisce ventole a tecnologia assiale con doppi cuscinetti a sfera, che dovrebbero ridurre il rumore e durare più a lungo.
Un tocco di classe è la possibilità di rimuovere la copertura metallica per pulire le ventole, se necessario, senza dover smontare la scheda stessa.
TUF Gaming GeForce RTX 4070 Ti Super impiega un totale di sei heatpipes per un trasferimento di calore efficiente da GPU, VRM e memoria.
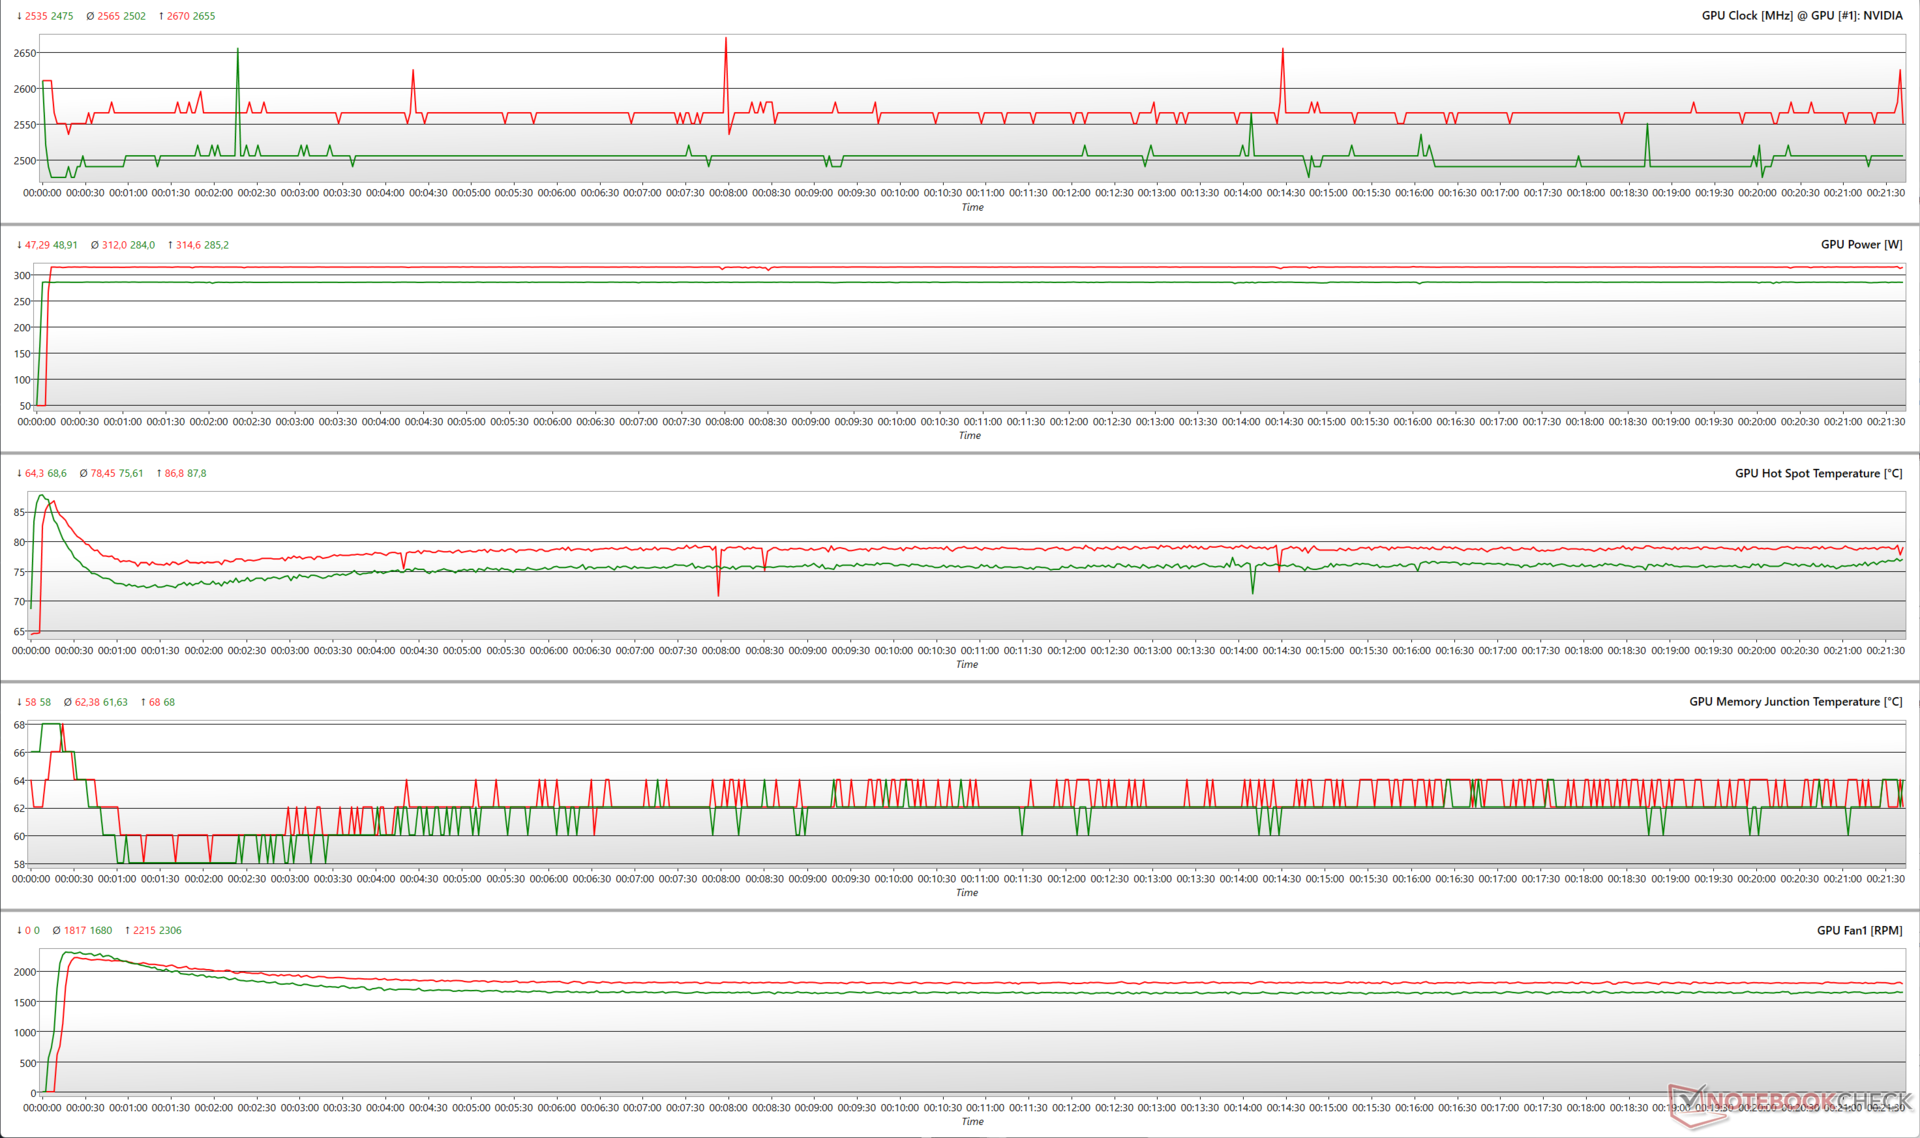
Test di stress
Con un target energetico del 100% (PT), TUF Gaming GeForce RTX 4070 Ti Super è in grado di aumentare la potenza fino a 2.655 MHz durante uno stress FurMark a 1280 x 720 senza AA, utilizzando un TGP da 285 W.
Aumentando l'obiettivo di potenza al 110%, la scheda raggiunge un boost fino a 2.670 MHz, consumando quasi 315 W. Questo comporta anche una temperatura media del punto caldo leggermente superiore, pari a ~78,5 °C, e una velocità media della ventola più elevata, pari a 1.817 RPM.
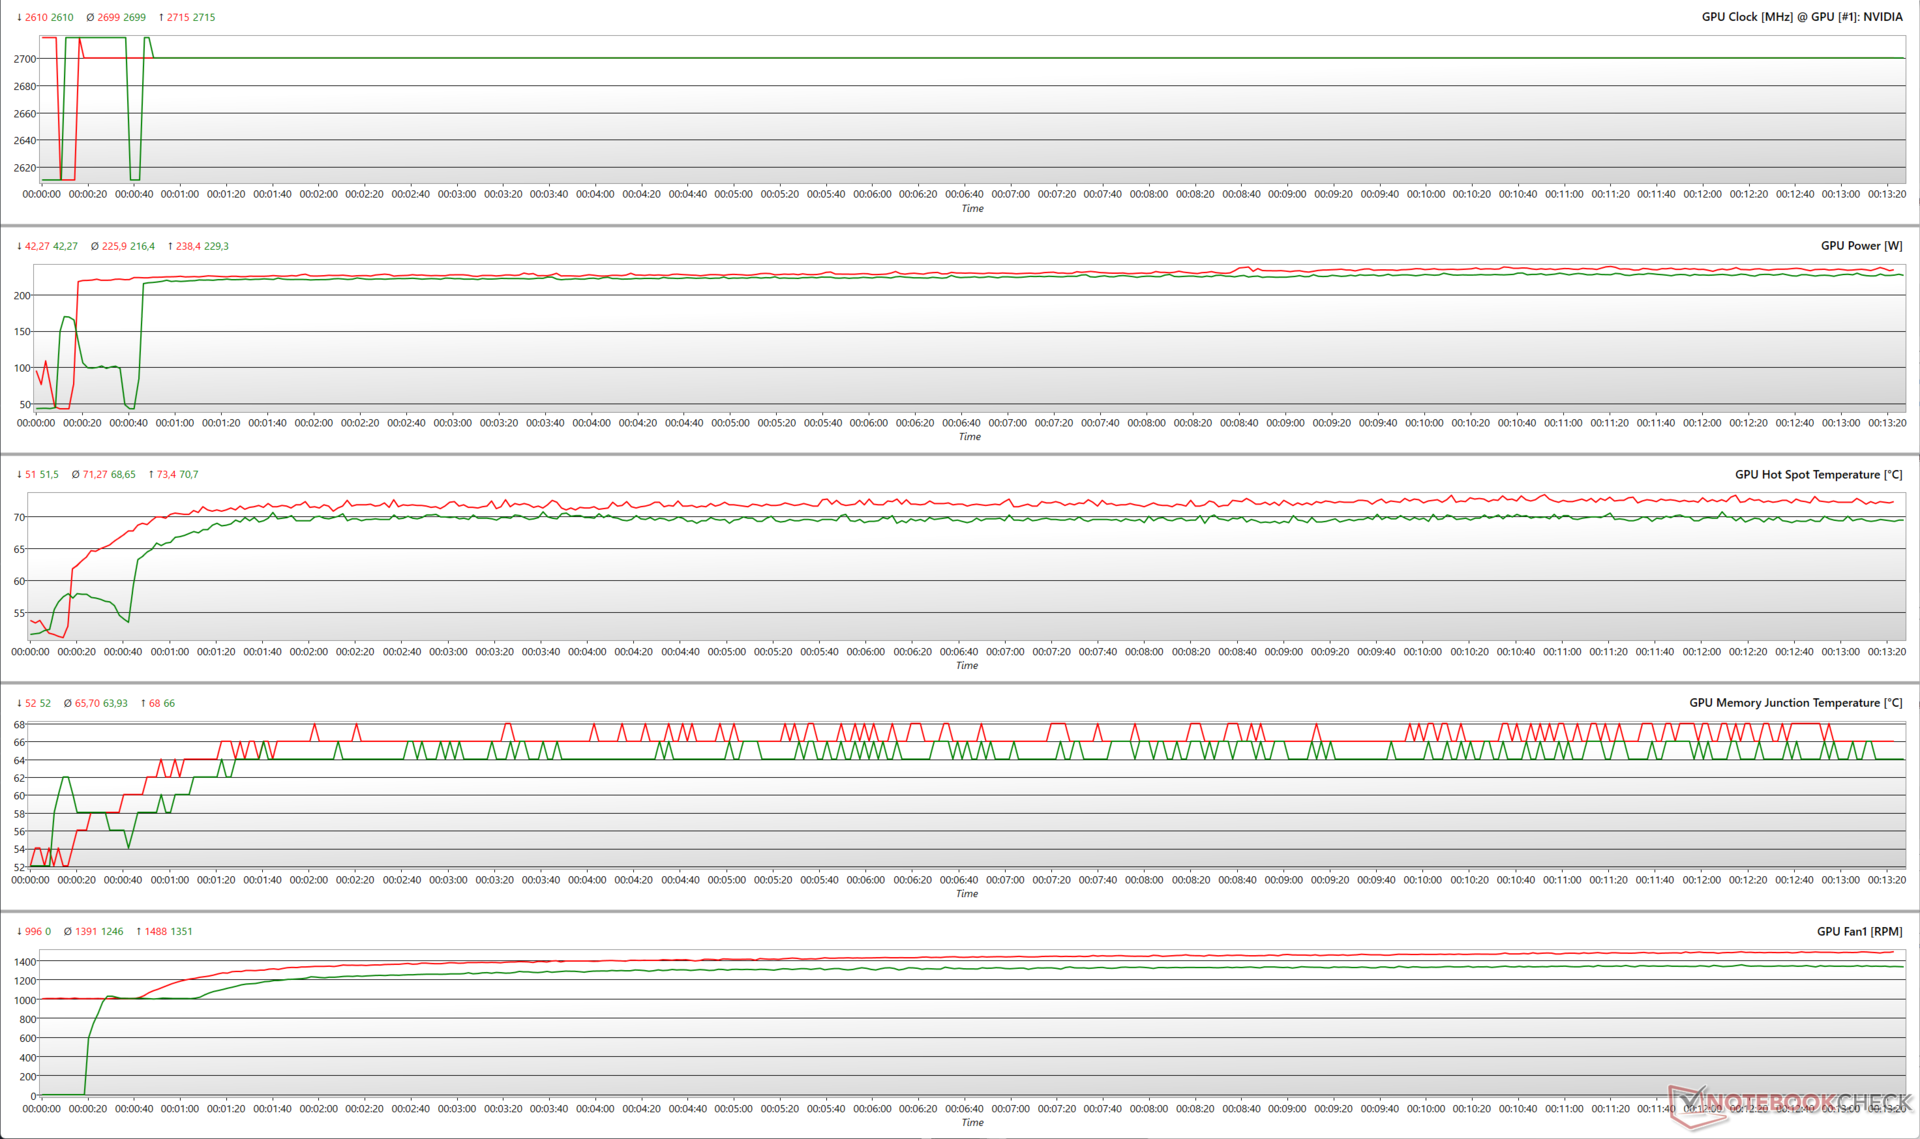
Lo stress con Witcher 3 a 1080p Ultra mostra un profilo di clock simile sia al 100% PT che al 110% PT con boost massimo a 2.715 MHz. La RTX 4070 Ti Super non ha bisogno di utilizzare tutti i 315 W disponibili per raggiungere questo clock - un comportamento coerente con le altre GPU Ada che abbiamo recensito finora.
La temperatura media del punto caldo della GPU e la velocità media della ventola vedono solo aumenti nominali del 3,8% e dell'11%, rispettivamente, al 110% PT.
Il grafico FPS di Witcher 3
Il sistema di raffreddamento di Asus sembra fare un buon lavoro nell'aiutare TUF Gaming GeForce RTX 4070 Ti Super a mantenere un frame rate costante in The Witcher 3 sia a 1080p Ultra che a 4K Ultra.
il 4K Ultra mostra un calo iniziale da 109 a 101 fps, ma in seguito la scheda riesce a mantenere un frame rate abbastanza costante.
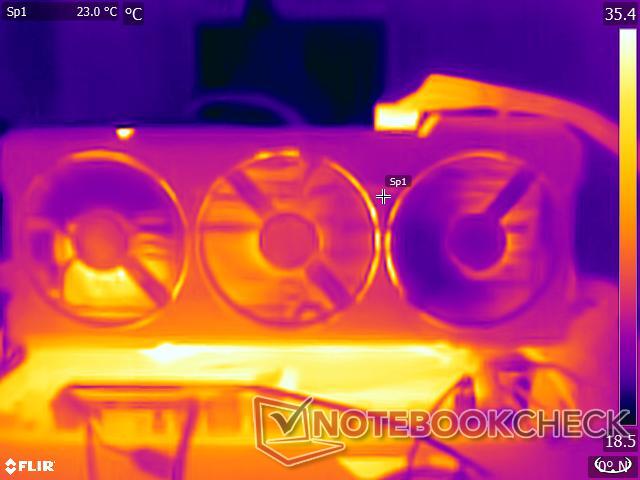
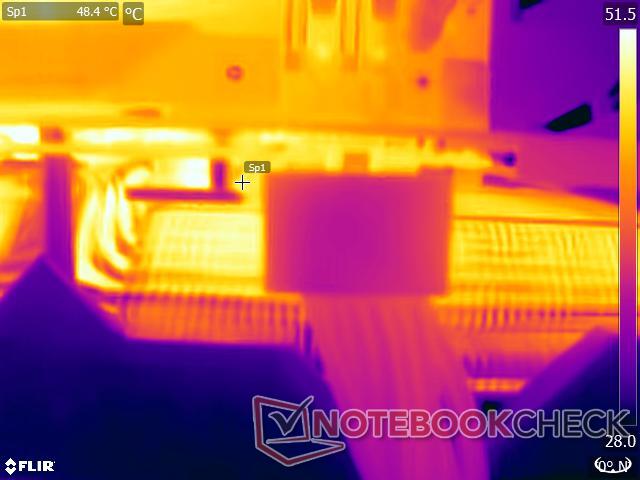
Temperature di superficie
Sebbene il sistema di raffreddamento sia in grado di garantire una prestazione priva di ostacoli per la GPU stessa, troviamo che TUF Gaming GeForce RTX 4070 Ti Super mostra temperature superficiali relativamente elevate.
A una temperatura ambiente di 22 °C, il rivestimento anteriore in metallo non si scalda molto, ma il pannello posteriore si riscalda fino a ~56 °C, mentre l'area della GPU può raggiungere i 76 °C. L'area intorno al connettore 12VHPWR rimane relativamente fresca a 48,4 °C.


Livelli di rumore
L'implementazione a tripla ventola di Asus ha in genere emissioni di rumore della ventola tollerabili, che abbiamo già visto in precedenza con il modello TUF Gaming GeForce RTX 4070 Ti OC anche.
Tra le tre ventole della TUF RTX 4070 Ti Super, due ruotano in senso antiorario, mentre la ventola centrale si bilancia con una rotazione in senso orario. Asus implementa un arresto completo delle ventole quando sono in idle, con 55 °C come soglia di temperatura del core prima che le ventole si attivino.
TUF Gaming RTX 4070 Ti Super consente di alternare le modalità VBIOS Performance e Quiet. La modalità Quiet permette di avere curve delle ventole più strette, mentre tutti gli altri parametri non sono influenzati. Detto questo, non c'è alcuna differenza percepibile tra queste modalità VBIOS per tutti gli scopi pratici.
La scheda è rimasta sotto i 35 dB(A) in tutti i carichi FurMark e sotto i 30 dB(A) durante lo stress di The Witcher 3 1080p Ultra. Il livello massimo di pressione sonora (SPL) che abbiamo registrato è stato di 35,88 dB(A) nel VBIOS Performance con un PT del 110%.
Si tratta di un buon miglioramento rispetto alla precedente TUF RTX 4070 Ti OC, che aveva emissioni vicine a 46 dB(A) nel carico FurMark. Si noti anche che le nostre misurazioni SPL sono state effettuate con una configurazione aperta del banco di prova, il che significa che le ventole dovrebbero essere praticamente inudibili in un tipico case ATX.
| Stress Test | Modalità VBIOS/ Power Target | Rumore della ventola dB(A) |
|---|---|---|
| FurMark 1280 x 720, senza AA | Prestazioni / 100% | 33,71 |
| FurMark 1280 x 720, senza AA | Silenziosità / 100% | 33,05 |
| FurMark 1280 x 720, senza AA | Prestazioni / 110% | 35,88 |
| FurMark 1280 x 720, senza AA | Silenzioso / 110% | 35,55 |
| Witcher 3 1080p Ultra | Prestazioni / 100% | 28,40 |
| Witcher 3 1080p Ultra | Silenzioso / 100% | 27,77 |
| Witcher 3 1080p Ultra | Prestazioni / 110% | 29,51 |
| Il Witcher 3 1080p Ultra | Silenzioso / 110% | 28,55 |
Gestione dell'energia: Consumi energetici più frugali rispetto alla RTX 4070 Ti
Nonostante l'aumento delle specifiche, la TUF RTX 4070 Ti Super è piuttosto parsimoniosa quando si tratta di consumo energetico ed è persino più economica della RTX 4070 Ti media in entrambi i test di consumo energetico FurMark e The Witcher 3. In termini di efficienza energetica, la TUF RTX 4070 Ti Super è alle calcagna della RTX 4090 Founders Edition.
Come di consueto con le schede Nvidia Ada Lovelace, la RTX 4070 Ti Super mostra consumi totali del sistema simili a quelli della parete, sia al 100% che al 110%, in The Witcher 3 a 1080p Ultra. Questo è in linea con le nostre osservazioni nel test di stress di cui sopra.
Power Consumption: External monitor
| 1280x720 FurMark 1.19 GPU Stress Test (external Monitor) | |
| 1920x1080 The Witcher 3 ultra (external Monitor) | |
* ... Meglio usare valori piccoli
Pro
Contro
Verdetto: Quello che la RTX 4070 Ti originale avrebbe dovuto essere

La RTX 4070 Ti Super sostituisce la rTX 4070 Ti originale con lo stesso MSRP di 799 dollari. A differenza della RTX 4070 Superche vede un sostanziale aumento del 21% degli shader rispetto alla RTX 4070la RTX 4070 Ti Super offre solo un aumento del 10% dei core CUDA rispetto alla RTX 4070 Ti, il che potrebbe non offrire sempre guadagni tangibili negli scenari di gioco reali.
Tuttavia, il passaggio al silicio AD103 significa che la RTX 4070 Ti Super è ora una sorta di "GPU di fascia media completa", che condivide il tavolo da pranzo con modelli del calibro di RTX 4080 e RTX 4080 Super. Un vantaggio conseguente è un sottosistema di memoria più veloce a 256 bit e 16 GB di GDDR6X VRAM che AD104 non è in grado di supportare.
Da parte sua, Asus TUF Gaming GeForce RTX 4070 Ti Super offre una qualità costruttiva superba, porte aggiunte e prestazioni eccellenti in base alle specifiche di riferimento. Sebbene esista anche una SKU OC, la SKU base testata da 799 dollari offre tutto ciò che serve per sfruttare al meglio l'ultimo arrivato AD103.
La nuova Asus TUF Gaming GeForce RTX 4070 Ti Super, basata su AD103, è in grado di giocare a 1440p Ultra ad alta frequenza di frame con eleganza, offrendo anche discrete capacità di calcolo e 4K Ultra, e merita quindi di essere presa in seria considerazione al prezzo di 799 dollari.
Asus ha dotato TUF Gaming GeForce RTX 4070 Ti Super di un robusto sistema di raffreddamento. Sebbene le temperature di superficie appaiano più elevate, il raffreddamento a tre ventole e sei heatpipe consente alla GPU AD103 di funzionare senza problemi di throttling, con livelli di rumore delle ventole altamente tollerabili.
La RTX 4070 Ti Super fa miracoli per i giochi a 1440p Ultra, ma è francamente eccessiva per questa risoluzione. Se è principalmente un giocatore a 1440p che non si diletta molto con i carichi di lavoro di calcolo, può risparmiare ben 200 dollari optando invece per la RTX 4070 Super.
AMD Radeon RX 7900 XT schede come XFX Speedster MERC310(US$740 su Amazon) o Asus TUF Gaming RX 7900 XT OC(US$880 su Amazon) sono anch'esse opzioni valide, soprattutto se dà priorità alle sole prestazioni raster e si accontenta dell'upscaling FSR.
Detto questo, la TUF Gaming RTX 4070 Ti Super offre una migliore proposta complessiva, grazie alla sua superiore abilità nel ray tracing e al supporto per la generazione di fotogrammi DLSS 3 e la ricostruzione del raggio DLSS 3.5.
Interessante, considerando che la RTX 3090 Ti, che questa scheda sostituisce in modo eccellente, costava 2,5 volte l'MSRP di un tempo.
Prezzo e disponibilità
Asus TUF Gaming GeForce RTX 4070 Ti Super può essere acquistato da Best Buy US a 800 dollari per la variante base, mentre la SKU OC viene venduta a 850 dollari.
In India, la TUF Gaming GeForce RTX 4070 Ti Super ha un prezzo ufficiale di ₹95.000, mentre il prezzo effettivo dipende dal distributore. Amazon India sta attualmente offrendo l'edizione OC di questa scheda a ₹1.08.499.
Transparency
La selezione dei dispositivi da recensire viene effettuata dalla nostra redazione. Il campione di prova è stato fornito all'autore come prestito dal produttore o dal rivenditore ai fini di questa recensione. L'istituto di credito non ha avuto alcuna influenza su questa recensione, né il produttore ne ha ricevuto una copia prima della pubblicazione. Non vi era alcun obbligo di pubblicare questa recensione. In quanto società mediatica indipendente, Notebookcheck non è soggetta all'autorità di produttori, rivenditori o editori.
Ecco come Notebookcheck esegue i test
Ogni anno, Notebookcheck esamina in modo indipendente centinaia di laptop e smartphone utilizzando procedure standardizzate per garantire che tutti i risultati siano comparabili. Da circa 20 anni sviluppiamo continuamente i nostri metodi di prova e nel frattempo stabiliamo gli standard di settore. Nei nostri laboratori di prova, tecnici ed editori esperti utilizzano apparecchiature di misurazione di alta qualità. Questi test comportano un processo di validazione in più fasi. Il nostro complesso sistema di valutazione si basa su centinaia di misurazioni e parametri di riferimento ben fondati, che mantengono l'obiettività.Price comparison

